UNITED STATES
SECURITIES AND EXCHANGE COMMISSION
Washington, D.C. 20549
FORM N-CSR
CERTIFIED SHAREHOLDER REPORT OF REGISTERED
MANAGEMENT INVESTMENT COMPANIES
Investment Company Act file number 811-22378
DoubleLine Funds Trust
(Exact name of Registrant as specified in charter)
2002 North Tampa Street, Suite 200
Tampa, FL 33602
(Address of principal executive offices) (Zip code)
Ronald R. Redell
President
DoubleLine Funds Trust
2002 North Tampa Street, Suite 200
Tampa, FL 33602
(Name and address of agent for service)
(813) 791-7333
Registrant’s telephone number, including area code
Date of fiscal year end: March 31
Date of reporting period: March 31, 2024
Item 1. Reports to Stockholders.
(a)
| | |
| |
 | | Annual Report March 31, 2024 |
| | | | | | | | | | | | | | | | | | | | | | | | |
| | | Class | | | | Class | | | | Class |
| | | | | I | | | | | | | | N | | | | | | | | R6 | | | | |
| | | Shares | | | | Shares | | | | Shares |
| | | | | |
DoubleLine Total Return Bond Fund | | DBLTX | | | | DLTNX | | | | DDTRX |
| | | | | |
DoubleLine Core Fixed Income Fund | | DBLFX | | | | DLFNX | | | | DDCFX |
| | | | | |
DoubleLine Emerging Markets Fixed Income Fund | | DBLEX | | | | DLENX | | | | – |
| | | | | |
DoubleLine Low Duration Bond Fund | | DBLSX | | | | DLSNX | | | | DDLDX |
| | | | | |
DoubleLine Floating Rate Fund | | DBFRX | | | | DLFRX | | | | – |
| | | | | |
DoubleLine Shiller Enhanced CAPE® | | DSEEX | | | | DSENX | | | | DDCPX |
| | | | | |
DoubleLine Flexible Income Fund | | DFLEX | | | | DLINX | | | | DFFLX |
| | | | | |
DoubleLine Low Duration Emerging Markets Fixed Income Fund | | DBLLX | | | | DELNX | | | | – |
| | | | | |
DoubleLine Long Duration Total Return Bond Fund | | DBLDX | | | | DLLDX | | | | – |
| | | | | |
DoubleLine Strategic Commodity Fund | | DBCMX | | | | DLCMX | | | | – |
| | | | | |
DoubleLine Global Bond Fund | | DBLGX | | | | DLGBX | | | | – |
| | | | | |
DoubleLine Infrastructure Income Fund | | BILDX | | | | BILTX | | | | – |
| | | | | |
DoubleLine Shiller Enhanced International CAPE® | | DSEUX | | | | DLEUX | | | | – |
| | | | | |
DoubleLine Emerging Markets Local Currency Bond Fund | | DBELX | | | | DLELX | | | | – |
| | | | | |
DoubleLine Income Fund | | DBLIX | | | | DBLNX | | | | – |
| | | | | |
DoubleLine Multi-Asset Trend Fund | | DBMOX | | | | DLMOX | | | | – |
DoubleLine || 2002 North Tampa Street, Suite 200 || Tampa, FL 33602 || (813) 791-7333
fundinfo@doubleline.com || www.doubleline.com

| | | | | | | | | | |
| | | | Annual Report | | | | | March 31, 2024 | | 3 |
| | |
President’s Letter | | (Unaudited) March 31, 2024 |
Dear Shareholder,
On behalf of the DoubleLine Funds, I am pleased to deliver the Annual Report for the 12-month period ended March 31, 2024. On the following pages, you will find specific information regarding each Fund’s operation and holdings. In addition, we discuss each Fund’s investment performance and main drivers of that performance during the reporting period.
Over the 12-month period, financial markets, including many of the asset classes and sectors in which the DoubleLine Funds invest, experienced strong returns amid improved risk sentiment. Stocks rallied while bond returns were muted, as represented respectively by the S&P 500® Index’s 29.88% return and Bloomberg US Aggregate Bond Index’s 1.70% return. A broad trend in fixed income was lower-rated credit and floating-rate sectors outperforming traditional sectors, driven primarily by high interest income and lower interest-rate sensitivity, with large return dispersion across subsectors.
The Federal Reserve continued to tighten monetary policy at the beginning of the period, including what appears to have been the last increase in this hiking cycle in July, which raised the federal funds rate to a range of 5.25% to 5.50%. At the start of the period, market participants’ expectations for the path of monetary policy, as tracked by the Bloomberg World Interest Rate Probability function, were largely at odds with the Fed’s forecast published in its quarterly Summary of Economic Projections (SEP). However, by the close of the period, market expectations ultimately converged with those of the SEP, in which the median projection for the federal funds rate was for three cuts of 25 basis points (bps) each by year-end 2024.
Broadly speaking, economic fundamentals were largely resilient during the reporting period. U.S. gross domestic product (GDP) was positive on a year-over-year (YoY) and quarter-over-quarter (QoQ) basis across the final three quarters of 2023, with the strongest YoY print at a 3.1% seasonally adjusted annualized rate for the fourth quarter. Domestic growth was buoyed by a robust labor
market across the 12-month period, as the U-3 unemployment rate finished the period at 3.8%, just 0.4% above the measure’s lowest reading in over 50 years. The labor market still appeared tight by historical standards, as Job Openings and Labor Turnover Survey data for February showed the ratio of vacancies per unemployed jobseeker to be 1.45. A strong labor market and relatedly strong consumer have contributed to higher growth estimates, with first quarter real GDP forecast to grow at a seasonally adjusted annualized rate of 2.0% QoQ. Survey-based measures of economic activity similarly show resilience, with the ISM Services PMI and ISM Manufacturing PMI registering in expansionary territory as of March. One outlier is the Conference Board Leading Economic Index, which has been negative for some time and at a level historically associated with recession.
Over the 12-month period, the two-year U.S. Treasury yield rose 59 bps, the five-year yield rose 64 bps, the 10-year yield rose 73 bps, and the 30-year yield rose 69 bps. Traditional fixed-income sectors, including Treasuries and Agency mortgage-backed securities (MBS) were impacted by rising interest rates across the Treasury curve. Disparate returns throughout the fixed income universe were largely attributable to duration risk, as Treasuries and Agency MBS experienced muted positive returns while corporate bonds outperformed, driven by spread tightening amid strong corporate earnings. Sovereign bonds from developed markets (DMs) posted negative returns while sovereign bonds from emerging markets (EMs) were among the best-performing sectors in the global fixed-income landscape.
The European Central Bank hiked its deposit facility rate 100 bps over the period, with the most recent hike in September pushing the rate to 4.00% from 3.75%. Most of the DM countries, absent Japan, followed similar tightening paths during the period. Monetary policy and inflation differentiation between EM and DM countries became an increasingly relevant theme. EM central banks broadly moved earlier and more aggressively in raising rates in response to inflationary pressure.
| | |
| | | (Unaudited) March 31, 2024 |
Disinflation subsequently allowed EM central banks to ease rates, which should bode well for EM growth. While geopolitical tensions remained a risk across the period, any threat of escalation seemed to be brushed off by markets generally.
In China, weak consumer demand and a prolonged slowdown in the property sector continued to hamper confidence during the period in the world’s second largest economy despite piecemeal stimulus measures from policymakers in the second half of 2023 and first quarter of 2024. In March, the People’s Bank of China announced an ambitious economic growth target of 5%, citing further stimulus measures in monetary, fiscal and regulatory policy. The Bank of Japan at its March meeting delivered on a well-telegraphed message and removed its negative interest-rate policy and ended its yield curve control.
As we look toward the remainder of 2024 and beyond, we believe the Fed and other DM central banks will eye the second half of the year for an opening to relax monetary policy. The conditions that could permit the start of a cutting cycle still seem tied to the degree of confidence the Fed, and other central banks, will have that inflation will not reaccelerate.
The DoubleLine investment team strives to deliver attractive risk-adjusted returns to our investors through full economic cycles and variable interest-rate
environments using a time-tested process. We are confident in our ability to take advantage of future opportunities by drawing upon the extensive experience of our team.
If you have any questions regarding the DoubleLine Funds, please don’t hesitate to call us at 1 (877) DLINE 11 / 1 (877) 354-6311 or visit our website www.doubleline.com, where our investment management team offers deeper insights and analysis on relevant capital market activity impacting investors today.
Thank you for your continued support and entrusting DoubleLine with your investments. We deeply value your trust, and we will continue to work diligently to meet your broad investment needs.
Sincerely,
Ronald R. Redell, CFA
President
DoubleLine Funds Trust
May 1, 2024
| | | | | | | | | | |
| | | | Annual Report | | | | | March 31, 2024 | | 5 |
| | |
Management’s Discussion of Fund Performance | | (Unaudited) March 31, 2024 |
DoubleLine Total Return Bond Fund
For the 12-month period ended March 31, 2024, the DoubleLine Total Return Bond Fund’s Class I shares outperformed the benchmark Bloomberg US Aggregate Bond Index return of 1.70%. The biggest contributor to Fund performance was the Fund’s overweight relative to the index to securitized credit, including non-Agency residential mortgage-backed securities (MBS), non-Agency commercial MBS, asset-backed securities and collateralized loan obligations, all of which outperformed investment grade corporate bonds in the index. The Fund’s government-backed exposure, including U.S. Treasuries and Agency MBS, which generally exhibited longer durations than the Treasuries and Agency MBS in the index, detracted from performance, as Treasury rates rose in the period.
| | | | | | | | |
| | |
| 12-Month Period Ended 3-31-24 | | | | | 12-months | |
| | |
I Share | | | | | | | 1.75% | |
| | |
N Share | | | | | | | 1.50% | |
| | |
R6 Share | | | | | | | 1.81% | |
| | |
Bloomberg US Aggregate Bond Index* | | | | | | | 1.70% | |
| * | Reflects no deduction for fees, expenses, or taxes. |
For additional performance information, please refer to the “Standardized Performance Summary.”
DoubleLine Core Fixed Income Fund
For the 12-month period ended March 31, 2024, the DoubleLine Core Fixed Income Fund outperformed the benchmark Bloomberg US Aggregate Bond Index return of 1.70%. The biggest contributor to Fund performance was its overweight relative to the index to credit-sensitive debt. Non-Agency residential mortgage-backed securities (MBS), non-Agency commercial MBS, asset-backed securities, collateralized loan obligations, bank loans, high yield and investment grade (IG) corporate bonds, and emerging markets debt all outperformed IG corporate bonds within the index. The Fund’s average duration in the period was slightly shorter than the index’s, which contributed to the Fund’s relative outperformance. During the period, U.S. Treasury rates rose in the period, which resulted in Treasuries and Agency MBS in the Fund detracting from performance.
| | | | | | | | |
| | |
| 12-Month Period Ended 3-31-24 | | | | | 12 months | |
| | |
I Share | | | | | | | 2.60% | |
| | |
N Share | | | | | | | 2.46% | |
| | |
R6 Share | | | | | | | 2.74% | |
| | |
Bloomberg US Aggregate Bond Index* | | | | | | | 1.70% | |
| * | Reflects no deduction for fees, expenses, or taxes. |
For additional performance information, please refer to the “Standardized Performance Summary.”
DoubleLine Emerging Markets Fixed Income Fund
For the 12-month period ended March 31, 2024, the DoubleLine Emerging Markets Fixed Income Fund outperformed the benchmark J.P. Morgan Emerging Markets Bond Global Diversified Index return of 11.28%. The strong index performance was primarily driven by spread tightening, particularly within the high yield subsector as default risk in several frontier market economies subsided after policymakers undertook significant policy adjustments. The biggest contributor to Fund performance was the Fund’s overweight relative to the index to India, Brazil and Colombia. The biggest detractor was the Fund’s underweight to Argentina and the region of Africa, the best-performing region in the index.
| | | | | | | | |
| | |
| 12-Month Period Ended 3-31-24 | | | | | 12 months | |
| | |
I Share | | | | | | | 11.78% | |
| | |
N Share | | | | | | | 11.37% | |
| | |
J.P. Morgan Emerging Markets Bond Global Diversified Index* | | | | | | | 11.28% | |
| * | Reflects no deduction for fees, expenses, or taxes. |
For additional performance information, please refer to the “Standardized Performance Summary.”
| | |
| | | (Unaudited) March 31, 2024 |
DoubleLine Low Duration Bond Fund
For the 12-month period ended March 31, 2024, the DoubleLine Low Duration Bond Fund outperformed the benchmark ICE BofA 1-3 Year U.S. Treasury Index return of 2.97% as all holdings within the Fund contributed to performance. The biggest contributor was the Fund’s overweight relative to the index to nontraditional credit sectors, which outperformed U.S. Treasuries in the index. Those nontraditional sectors included non-Agency residential mortgage-backed securities (MBS), non-Agency commercial MBS, asset-backed securities, collateralized loan obligations, bank loans and emerging markets debt. The Fund’s allocations to Treasuries and Agency MBS were the laggards to performance, but they outperformed Treasuries in the index. Treasury rates rose across the yield curve in the period, benefiting relative performance of the Fund, as the Fund’s average duration was less than the index’s average duration.
| | | | | | | | |
| | |
| 12-Month Period Ended 3-31-24 | | | | | 12 months | |
| | |
I Share | | | | | | | 6.16% | |
| | |
N Share | | | | | | | 5.90% | |
| | |
R6 Share | | | | | | | 6.20% | |
| | |
ICE BofA 1-3 Year U.S. Treasury Index*, ** | | | | | | | 2.97% | |
| | |
Bloomberg US Aggregate 1-3 Year Bond Index** | | | | | | | 3.56% | |
| * | Beginning in July 2022, transaction costs were incorporated into the calculation of total return for ICE fixed income indices. |
| ** | Reflects no deduction for fees, expenses, or taxes. |
For additional performance information, please refer to the “Standardized Performance Summary.”
DoubleLine Floating Rate Fund
For the 12-month period ended March 31, 2024, the DoubleLine Floating Rate Fund posted positive performance but underperformed the benchmark Morningstar LSTA US Leveraged Loan TR USD Index return of 12.47%. Risk markets rebounded from depressed levels in the period as economic growth indicators remained resilient and the Federal Reserve ended its hiking campaign. Accordingly, the riskiest segments of the markets rebounded the most. The biggest contributor to Fund performance was its underweight relative to the index to the telecommunication services and media and entertainment sectors. Among the biggest detractors to Fund performance was the Fund’s underweight to bank loans rated CCC, which returned 18.97% in the period. Also detracting was the Fund’s exposure to certain software names that experienced competitive pressure and certain healthcare providers that struggled with inflationary costs.
| | | | | | | | |
| | |
| 12-Month Period Ended 3-31-24 | | | | | 12 months | |
| | |
I Share* | | | | | | | 9.61% | |
| | |
N Share* | | | | | | | 9.43% | |
| | |
Morningstar LSTA US Leveraged Loan TR USD Index** | | | | | | | 12.47% | |
| * | The Floating Rate Fund imposes a 1.00% redemption fee on all share classes if shares are sold within 90 days of purchase. Performance data does not reflect the redemption fee. If it had, returns would be reduced. |
| ** | Reflects no deduction for fees, expenses, or taxes. |
For additional performance information, please refer to the “Standardized Performance Summary.”
DoubleLine Shiller Enhanced CAPE®
For the 12-month period ended March 31, 2024, the DoubleLine Shiller Enhanced CAPE® posted positive performance but underperformed the benchmark S&P 500® Index return of 29.88%. During the period, the Shiller Barclays CAPE® U.S. Sector Total Return USD Index, to which the Fund gained exposure through the use of swap contracts, was allocated to seven sectors: communication services, consumer discretionary, consumer staples, financials, healthcare, materials and real estate. The communication services and financials allocations were the biggest contributors to Fund performance while real estate and consumer staples were the biggest detractors. The Fund’s fixed income portfolio increased in value during the period, with all holdings contributing to Fund performance. The biggest
| | | | | | | | | | |
| | | | Annual Report | | | | | March 31, 2024 | | 7 |
| | |
Management’s Discussion of Fund Performance (Cont.) | | |
contributor by sector to portfolio performance was collateralized loan obligations; the biggest laggard was commercial mortgage-backed securities.
| | | | | | | | |
| | |
| 12-Month Period Ended 3-31-24 | | | | | 12 months | |
| | |
I Share | | | | | | | 23.36% | |
| | |
N Share | | | | | | | 23.07% | |
| | |
R6 Share | | | | | | | 23.41% | |
| | |
S&P 500® Index* | | | | | | | 29.88% | |
| | |
Shiller Barclays CAPE® U.S. Sector Total Return USD Index* | | | | | | | 24.68% | |
| * | Reflects no deduction for fees, expenses, or taxes. |
For additional performance information, please refer to the “Standardized Performance Summary.”
DoubleLine Flexible Income Fund
For the 12-month period ended March 31, 2024, the DoubleLine Flexible Income Fund outperformed the benchmark ICE BofA 1-3 Year Eurodollar Index return of 4.56%. Overall risk-on sentiment in the markets benefited credit-sensitive debt in the form of credit spread compression. All sectors of the Fund contributed to performance. U.S. Treasury yields increased across the curve in the period, which benefited the two floating-rate security types in the Fund, bank loans and collateralized loan obligations. Non-Agency residential mortgage-backed securities, in conjunction with the floating-rate sectors, were the biggest contributors by sector to Fund performance. Non-Agency commercial mortgage-backed securities provided positive returns over the period but contributed the least to Fund performance.
| | | | | | | | |
| | |
| 12-Month Period Ended 3-31-24 | | | | | 12 months | |
| | |
I Share | | | | | | | 8.69% | |
| | |
N Share | | | | | | | 8.42% | |
| | |
R6 Share | | | | | | | 8.73% | |
| | |
ICE BofA 1-3 Year Eurodollar Index* | | | | | | | 4.56% | |
| | |
ICE BofA SOFR Overnight Rate Index* | | | | | | | 5.44% | |
| * | Reflects no deduction for fees or taxes. Beginning in July 2022, transaction costs were incorporated into the calculation of total return for ICE fixed income indexes. |
For additional performance information, please refer to the “Standardized Performance Summary.”
DoubleLine Low Duration Emerging Markets Fixed Income Fund
For the 12-month period ended March 31, 2024, the DoubleLine Low Duration Emerging Markets Fixed Income Fund posted positive performance but underperformed the benchmark J.P. Morgan Corporate Emerging Markets Bond Index Broad Diversified 1-3 Year Index return of 8.45%. The strong performance of the index was driven by spread tightening. The biggest contributor to Fund performance was its overweight relative to the index to Latin America, which was among the best-performing regions in the index, and underweight to the Middle East, a laggard among its regional peers. The biggest detractors to Fund performance, relative to the index, were its longer duration and overweight to investment grade credits, which significantly underperformed their high yield counterparts in a period of risk-on sentiment.
| | | | | | | | |
| | |
| 12-Month Period Ended 3-31-24 | | | | | 12 months | |
| | |
I Share | | | | | | | 8.23% | |
| | |
N Share | | | | | | | 8.07% | |
| | |
J.P. Morgan CEMBI Broad Diversified 1-3 Year Index * | | | | | | | 8.45% | |
| * | Reflects no deduction for fees, expenses, or taxes. |
For additional performance information, please refer to the “Standardized Performance Summary.”
| | |
| | | (Unaudited) March 31, 2024 |
DoubleLine Long Duration Total Return Bond Fund
For the 12-month period ended March 31, 2024, the DoubleLine Long Duration Total Return Bond Fund underperformed the benchmark Bloomberg US Long Government/Credit Index return of negative 1.15%. The best-performing sector in the index was long-duration corporate bonds, which the Fund did not own, as it utilizes long-duration Agency mortgage-backed securities in lieu of corporate bonds. The biggest contributor by sector to Fund performance was Agency mortgage-backed securities, which generated a modest positive return. The biggest detractors were its allocation to U.S. Treasuries that were longer in duration than those in the index and lack of exposure to corporate bonds. The Fund’s average duration was 14.2 years for the period, slightly shorter than the index’s 14.4 years, which benefited Fund performance in a period of rising interest rates.
| | | | | | | | |
| | |
| 12-Month Period Ended 3-31-24 | | | | | 12 months | |
| | |
I Share | | | | | | | -4.39% | |
| | |
N Share | | | | | | | -4.63% | |
| | |
Bloomberg US Long Government/Credit Index* | | | | | | | -1.15% | |
| * | Reflects no deduction for fees, expenses, or taxes. |
For additional performance information, please refer to the “Standardized Performance Summary.”
DoubleLine Strategic Commodity Fund
For the 12-month period ended March 31, 2024, the DoubleLine Strategic Commodity Fund posted positive performance and outperformed the benchmark Bloomberg Commodity (BCOM) Index Total Return return of negative 0.56%. During the period, the Fund was allocated to the Morgan Stanley Backwardation Focused Multi-Commodity Index (MSBFMCI beta exposure) and the DoubleLine Commodity Long Short Strategy (DCLSS alpha exposure), which the Fund gained exposure to through the use of swap contracts. The Fund’s MSBFMCI exposure decreased in value during the period, detracting from Fund performance. The DCLSS increased in value, contributing to Fund performance. The Fund’s outperformance relative to the BCOM Index Total Return was driven by the positive return of the DCLSS and the less-negative performance of the MSBFMCI relative to the BCOM Index Total Return. The Fund’s use of derivative instruments to gain exposure to commodities facilitated investment of the Fund’s remaining assets in U.S. Treasuries, which increased in value during the period.
| | | | | | | | |
| | |
| 12-Month Period Ended 3-31-24 | | | | | 12 months | |
| | |
I Share | | | | | | | 6.72% | |
| | |
N Share | | | | | | | 6.50% | |
| | |
Bloomberg Commodity Index Total Return* | | | | | | | -0.56% | |
| * | Reflects no deduction for fees, expenses, or taxes. |
For additional performance information, please refer to the “Standardized Performance Summary.”
DoubleLine Global Bond Fund
For the 12-month period ended March 31, 2024, the DoubleLine Global Bond Fund’s Class I shares performed in line with the benchmark FTSE World Government Bond Index return of negative 0.83%. The negative performance of the Fund and index was driven by a continued rise in global bond yields and foreign exchange market depreciation against the U.S. dollar, as measured by the U.S. Dollar Index. The dollar strengthened in the period against its G-10 peers as upside surprises in U.S. economic data led investors to curb bets for when the Federal Reserve might begin easing monetary policy. The biggest contributors to Fund performance were its shorter duration and overweight to Mexico relative to the index, and its cash balance. The biggest detractor was the Fund’s underweight to developed Europe, in particular a lack of exposure to Italy.
| | | | | | | | |
| | |
| 12-Month Period Ended 3-31-24 | | | | | 12 months | |
| | |
I Share | | | | | | | -0.83% | |
| | |
N Share | | | | | | | -1.19% | |
| | |
FTSE World Government Bond Index* | | | | | | | -0.83% | |
| * | Reflects no deduction for fees, expenses, or taxes. |
For additional performance information, please refer to the “Standardized Performance Summary.”
| | | | | | | | | | |
| | | | Annual Report | | | | | March 31, 2024 | | 9 |
| | |
Management’s Discussion of Fund Performance (Cont.) | | |
DoubleLine Infrastructure Income Fund
For the 12-month period ended March 31, 2024, the DoubleLine Infrastructure Income Fund outperformed the Bloomberg US Aggregate Bond Index return of 1.70%. The biggest contributor to Fund performance was duration positioning, as the Fund tactically maintained a lower duration than the index in a period of rising interest rates. The biggest contributors to Fund performance by sector were securitized infrastructure exposures, including senior aviation securitizations. Despite contributing positively to Fund performance, corporate infrastructure exposures lagged their securitized counterparts. However, income and spread return on these holdings overcame the adverse duration impacts of rising interest rates, generating strong relative and absolute performance.
| | | | | | | | |
| | |
| 12-Month Period Ended 3-31-24 | | | | | 12 months | |
| | |
I Share | | | | | | | 5.68% | |
| | |
N Share | | | | | | | 5.42% | |
| | |
Bloomberg US Aggregate Bond Index* | | | | | | | 1.70% | |
| * | Reflects no deduction for fees, expenses, or taxes. |
For additional performance information, please refer to the “Standardized Performance Summary.”
DoubleLine Shiller Enhanced International CAPE®
For the 12-month period ended March 31, 2024, DoubleLine Shiller Enhanced International CAPE® posted positive performance but underperformed the broad European equity market as measured by the benchmark MSCI Europe Net Total Return USD Index return of 14.11%. During the period, the Shiller Barclays CAPE® Europe Sector Net TR NoC USD Index, which the Fund gained exposure to through the use of swap contracts, was allocated to eight sectors: consumer discretionary, consumer staples, financials and real estate, healthcare, information technology, materials, communication services and utilities. Healthcare was the biggest contributor to Fund performance while communication services was the biggest detractor. The Fund’s fixed income portfolio increased in value during the period, contributing to Fund performance. The biggest contributor by sector to portfolio performance was collateralized loan obligations while the biggest laggard was U.S. government securities, but both contributed to portfolio performance.
| | | | | | | | |
| | |
| 12-Month Period Ended 3-31-24 | | | | | 12 months | |
| | |
I Share | | | | | | | 8.88% | |
| | |
N Share | | | | | | | 8.59% | |
| | |
MSCI Europe Net Total Return USD Index* | | | | | | | 14.11% | |
| * | Reflects no deduction for fees, expenses, or taxes. |
For additional performance information, please refer to the “Standardized Performance Summary.”
DoubleLine Emerging Markets Local Currency Bond Fund
For the 12-month period ended March 31, 2024, the DoubleLine Emerging Markets Local Currency Bond Fund outperformed the benchmark J.P. Morgan Government Bond Index Emerging Markets Global Diversified return of 4.91%. The performance of the index was driven primarily by its Latin America exposure. Among the biggest contributors to Fund performance was its shorter duration relative to the index in a period of rising interest rates. Also contributing was the Fund’s underweight relative to the index to emerging Asia, and security selection in Central and Eastern Europe, in particular, its lack of exposure to Turkey. The biggest detractor was the Fund’s underweight relative to the index to Colombia.
| | | | | | | | |
| | |
| 12-Month Period Ended 3-31-24 | | | | | 12 months | |
| | |
I Share | | | | | | | 5.21% | |
| | |
N Share | | | | | | | 5.10% | |
| | |
J.P. Morgan GBI-EM GD* | | | | | | | 4.91% | |
| * | Reflects no deduction for fees, expenses, or taxes. |
For additional performance information, please refer to the “Standardized Performance Summary.”
| | | | | | | | | | |
| 10 | | DoubleLine Funds Trust | | | | | | | | |
| | |
| | | (Unaudited) March 31, 2024 |
DoubleLine Income Fund
For the 12-month period ended March 31, 2024, the DoubleLine Income Fund outperformed the Bloomberg US Aggregate Bond Index return of 1.70%. The biggest contributors to Fund performance were asset allocation and duration positioning. The Fund’s diversified mix of subordinated, short-duration securitized credit outperformed the various components of the index. The biggest contributor to Fund performance by sector was collateralized loan obligations, as the asset class experienced spread compression and high interest income due to its coupons that reference short-term interest rates. The biggest laggard was Agency mortgage-backed securities, which generated a positive return but was the only Fund asset class to underperform the index.
| | | | | | | | |
| | |
| 12-Month Period Ended 3-31-24 | | | | | 12 months | |
| | |
I Share | | | | | | | 11.67% | |
| | |
N Share | | | | | | | 11.38% | |
| | |
Bloomberg US Aggregate Bond Index* | | | | | | | 1.70% | |
| * | Reflects no deduction for fees, expenses, or taxes. |
For additional performance information, please refer to the “Standardized Performance Summary.”
DoubleLine Multi-Asset Trend Fund
For the 12-month period ended March 31, 2024, the DoubleLine Multi-Asset Trend Fund posted positive performance and outperformed the benchmark Credit Suisse Managed Futures Liquid Total Return U.S. Dollar Index return of negative 1.07%. During the period, the Fund’s exposure to trend-following investments was obtained through the use of swap contracts referencing the BNP Paribas Multi-Asset Trend Index, which returned negative 0.08%. The biggest contributors to index performance were its equity exposures; the biggest detractors were commodity exposures. The Fund’s fixed income portfolio was the main contributor to Fund performance. The biggest contributor by sector to portfolio performance was bank loans while the biggest laggard was U.S. government securities, but both contributed to portfolio performance.
| | | | | | | | |
| | |
| 12-Month Period Ended 3-31-24 | | | | | 12 months | |
| | |
I Share | | | | | | | 6.37% | |
| | |
N Share | | | | | | | 5.97% | |
| | |
Credit Suisse Managed Futures Liquid Total Return USD Index* | | | | | | | -1.07% | |
| * | Reflects no deduction for fees, expenses, or taxes. |
For additional performance information, please refer to the “Standardized Performance Summary.”
Past Performance is not a guarantee of future results.
Opinions expressed herein are as of March 31, 2024, and are subject to change at any time, are not guaranteed and should not be considered investment advice. This report is for the information of shareholders of the Funds. It may also be used as sales literature when preceded or accompanied by the current prospectus.
A Fund’s investment objectives, risks, charges and expenses must be considered carefully before investing. You can obtain a Fund’s current prospectus and certain other regulatory filings by calling 1 (877) DLINE 11 / 1 (877) 354-6311, or visiting www.doubleline.com. You should read the prospectus and other filings carefully before investing.
The performance information shown assumes the reinvestment of all dividends and distributions. Investment performance reflects management fees and other fund expenses, including any applicable fee waivers that are in effect with respect to a particular Fund. In the absence of such waivers, total return would be reduced. Returns over 1 year are average annual returns. Performance data quoted represents past performance; past performance does not guarantee future results and does not reflect the deduction of any taxes a shareholder would pay on fund distributions or the sale of fund shares. The investment return and principal value of an investment will fluctuate so that an investor’s shares, when redeemed, may be worth more or less than the original cost. Current performance of the Fund may be lower or higher than the performance quoted. The Funds’ gross and net expense ratios shown are from the most recent prospectus and may change over time. See the financial highlights section of the financial statements for more recent expense ratios. The Funds’ gross and net expense ratios also include “acquired fund fees and expenses,” which are expenses incurred indirectly as a result of a Fund’s investments in one or more underlying funds, including ETFs and money market funds. Because these costs are indirect, the expense ratios will not correlate to the expense ratios in the Funds’ financial statements, since financial statements only include direct costs of the Funds and not indirect costs of investing in the underlying funds. Performance data current to the most recent month-end may be obtained by calling 1 (877) DLINE 11 / 1 (877) 354-6311 or by visiting www.doubleline.com.
Fund holdings and sector allocations are subject to change at any time and are not recommendations to buy or sell any security. Please refer to the Schedules of Investments for a complete list of Fund holdings as of period end.
Mutual fund investing involves risk. Principal loss is possible.
Investments in securities related to real estate may decline in value as a result of factors affecting the real estate industry. Investments in debt securities typically decline in value when interest rates rise. This risk is usually greater for longer-term debt securities. Investments in asset-backed and mortgage-backed securities include additional risks that investors should be aware of including credit risk, prepayment risk, possible illiquidity and default, as well as increased susceptibility to
| | | | | | | | | | |
| | | | Annual Report | | | | | March 31, 2024 | | 11 |
| | |
Management’s Discussion of Fund Performance (Cont.) | | |
adverse economic developments. The Funds may invest in foreign securities (or derivatives which give exposure to foreign securities) which involve greater volatility and political, economic and currency risks and differences in accounting methods. These risks are greater for investments in emerging markets. Investments in lower rated and non-rated securities present a greater risk of loss to principal and interest than higher rated securities. Commodity-linked derivative instruments may involve additional costs and risks such as changes in commodity index volatility or factors affecting a particular industry or commodity, such as drought, floods, weather, livestock disease, embargoes, tariffs and international economic, political and regulatory developments. Investing in derivatives could result in losing more than the amount invested. Derivatives involve risks different from, and in certain cases, greater than the risks presented by more traditional investments. Derivatives may involve certain costs and risks such as liquidity, interest rate, market, credit, management and the risk that a position could not be closed when most advantageous. Investing in derivatives could lose more than the amount invested. Equities may decline in value due to both real and perceived general market, economic, and industry conditions. Exchange-traded fund investments involve additional risks such as the market price trading at a discount to its net asset value, an active secondary trading market may not develop or be maintained, or trading may be halted by the exchange in which they trade, which may impact a fund’s ability to sell its shares. Floating rate loans and other floating rate investments are subject to credit risk, interest rate risk, counterparty risk and financial services risks, among others. In addition, the Funds may invest in other asset classes and investments such as, among others, REITs, credit default swaps, short sales, derivatives and smaller companies which include additional risks. Investment strategies may not achieve the desired results due to implementation lag, other timing factors, portfolio management decision-making, economic or market conditions or other unanticipated factors. Additional principal risks for the Funds can be found in the prospectus.
Diversification does not assure a profit or protect against loss in a declining market.
Earnings growth is not representative of a fund’s future performance.
Credit ratings from Moody’s Investor Services, Inc. (“Moody’s”) range from the highest rating of Aaa for bonds of the highest quality that offer the lowest degree of investment risk to the lowest rating of C for the lowest rated class of bonds. Credit ratings from S&P Global Ratings (“S&P”) range from the highest rating of AAA for bonds of the highest quality that offer the lowest degree of investment risk to the lowest rating of D for bonds that are in default. In limited situations when the rating agency has not issued a formal rating, the rating agency will classify the security as nonrated.
Credit ratings are determined from the highest available credit rating from any Nationally Recognized Statistical Rating Organization (“NRSRO”, generally S&P, Moody’s and Fitch Ratings, Inc.). DoubleLine chooses to display credit ratings using S&P’s rating convention, although the rating itself might be sourced from another NRSRO.
The reference and link to any websites in this Annual Report have been provided as a convenience, and the information contained on such websites is not incorporated by reference into this Annual Report.
Index Disclaimers
Shiller Barclays CAPE® Index Disclaimers
Barclays Capital Inc. and its affiliates (“Barclays”) is not the issuer, sponsor or promoter of DoubleLine Shiller Enhanced CAPE® or DoubleLine Shiller Enhanced International CAPE® (together, in this paragraph, the “Funds”) and Barclays has no responsibilities, obligations or duties to investors in the Funds. The Shiller Barclays CAPE® US Sector TR USD Index and Shiller Barclays CAPE® Europe Sector Net TR NoC USD Index (each an “Index” and together the “Indices”) consist of the respective trademarks of Barclays Bank PLC and trademarks owned by or licensed to RSBB-I, LLC and Barclays Bank PLC and that are licensed for use by DoubleLine Funds Trust as the issuer of the Funds (the “Issuer”). Barclays’ only relationship with the Issuer in respect of the Indices is the licensing of these trademarks and the Indices which are determined, composed and calculated by Barclays without regard to the Issuer or the Funds or the owners of the Funds. Additionally, DoubleLine Capital LP may for the Funds execute transaction(s) with Barclays in or relating to the Funds’ respective Index; Fund investors acquire interests solely in the respective Fund; Fund investors neither acquire any interest in that Fund’s respective Index nor enter into any relationship of any kind whatsoever with Barclays upon making an investment in that Fund. The Funds are not sponsored, endorsed, sold or promoted by Barclays. Barclays does not make any representation or warranty, express or implied regarding the advisability of investing in the Funds or the advisability of investing in securities generally or the ability of the Indices to track corresponding or relative market performance. Barclays has not passed on the legality or suitability of the Funds’ names or the Indices with respect to any person or entity. Barclays is not responsible for and has not participated in the determination of the timing of, prices of, or quantities of the shares of the Funds to be issued. Barclays has no obligation to take the needs of the Issuer or the owners of the Funds or any other third party into consideration in determining, composing or calculating the Indices. Barclays has no obligation or liability in connection with administration, marketing or trading of the Funds. The licensing agreement between DoubleLine Funds Trust and Barclays is solely for the benefit of the Funds and Barclays and not for the benefit of the owners of the Funds, investors or other third parties.
BARCLAYS SHALL HAVE NO LIABILITY TO THE ISSUER, INVESTORS OR TO OTHER THIRD PARTIES FOR THE USE OF THE DOUBLELINE SHILLER ENHANCED CAPE® AND DOUBLELINE SHILLER ENHANCED INTERNATIONAL CAPE® NAMES, OR THE QUALITY, ACCURACY AND/OR COMPLETENESS OF THE SHILLER BARCLAYS CAPE® US SECTOR TR USD INDEX OR SHILLER BARCLAYS CAPE® EUROPE SECTOR NET TR NOC USD INDEX OR ANY DATA INCLUDED THEREIN OR FOR INTERRUPTIONS IN THE DELIVERY OF THE SHILLER BARCLAYS CAPE® US SECTOR TR USD INDEX OR SHILLER BARCLAYS CAPE® EUROPE SECTOR NET TR NOC USD INDEX. BARCLAYS MAKES NO WARRANTY, EXPRESS OR IMPLIED, AS TO RESULTS TO BE OBTAINED BY THE ISSUER, THE INVESTORS OR ANY OTHER PERSON OR ENTITY FROM THE USE OF THE SHILLER BARCLAYS CAPE® US SECTOR TR USD INDEX OR SHILLER BARCLAYS CAPE® EUROPE SECTOR NET TR NOC USD INDEX OR ANY DATA INCLUDED THEREIN. BARCLAYS MAKES NO EXPRESS OR IMPLIED WARRANTIES, AND HEREBY EXPRESSLY DISCLAIMS ALL WARRANTIES OF MERCHANTABILITY OR FITNESS FOR A PARTICULAR PURPOSE OR USE WITH RESPECT TO DOUBLELINE SHILLER ENHANCED CAPE® AND DOUBLELINE SHILLER ENHANCED INTERNATIONAL CAPE® NAMES, THE SHILLER BARCLAYS CAPE® US SECTOR TR USD INDEX OR SHILLER BARCLAYS CAPE® EUROPE SECTOR NET TR NOC USD INDEX OR ANY DATA INCLUDED THEREIN. BARCLAYS RESERVES THE RIGHT TO CHANGE THE METHODS OF CALCULATION OR PUBLICATION, OR TO CEASE THE CALCULATION OR PUBLICATION OF THE SHILLER BARCLAYS CAPE® US SECTOR TR USD INDEX AND SHILLER BARCLAYS CAPE® EUROPE SECTOR NET TR NOC USD INDEX, AND BARCLAYS SHALL NOT BE LIABLE FOR ANY MISCALCULATION OF OR ANY INCORRECT, DELAYED OR INTERRUPTED PUBLICATION WITH RESPECT TO ANY OF THE SHILLER BARCLAYS CAPE® US SECTOR TR USD INDEX AND SHILLER BARCLAYS CAPE® EUROPE SECTOR NET TR NOC USD INDEX. BARCLAYS SHALL NOT BE LIABLE FOR ANY DAMAGES, INCLUDING, WITHOUT LIMITATION, ANY SPECIAL, INDIRECT OR CONSEQUENTIAL DAMAGES, OR ANY LOST PROFITS AND EVEN IF ADVISED OF THE POSSIBILITY OF SUCH, RESULTING FROM THE USE OF THE SHILLER BARCLAYS CAPE® US SECTOR TR USD INDEX OR SHILLER BARCLAYS CAPE® EUROPE SECTOR NET TR NOC USD INDEX OR ANY DATA INCLUDED THEREIN OR WITH RESPECT TO THE DOUBLELINE SHILLER ENHANCED CAPE® OR DOUBLELINE SHILLER ENHANCED INTERNATIONAL CAPE®.
None of the information supplied by Barclays Bank PLC and used in this publication may be reproduced in any manner without the prior written permission of Barclays Capital, the investment banking division of Barclays Bank PLC. Barclays Bank PLC is registered in England No. 1026167. Registered office 1 Churchill Place London E14 5HP.
THE SHILLER BARCLAYS INDICES HAVE BEEN DEVELOPED IN PART BY RSBB-I, LLC, THE RESEARCH PRINCIPAL OF WHICH IS ROBERT J. SHILLER. RSBB-I, LLC IS NOT AN INVESTMENT ADVISOR, AND DOES NOT GUARANTEE THE ACCURACY OR COMPLETENESS OF THE SHILLER BARCLAYS INDICES OR ANY DATA OR METHODOLOGY EITHER INCLUDED THEREIN OR UPON WHICH IT IS BASED. NEITHER RSBB-I, LLC NOR ROBERT J. SHILLER OR ANY OF THEIR RESPECTIVE PARTNERS, EMPLOYEES, SUBCONTRACTORS, AGENTS, SUPPLIERS AND VENDORS (COLLECTIVELY, THE “PROTECTED PARTIES”), SHALL HAVE ANY LIABILITY, WHETHER CAUSED BY THE NEGLIGENCE OF A PROTECTED PARTY OR OTHERWISE, FOR ANY ERRORS, OMISSIONS, OR INTERRUPTIONS THEREIN, AND MAKE NO WARRANTIES, EXPRESS OR IMPLIED, AS TO PERFORMANCE OR RESULTS EXPERIENCED BY ANY PARTY FROM THE USE OF ANY INFORMATION INCLUDED THEREIN OR UPON WHICH IT IS BASED, AND EXPRESSLY DISCLAIM ALL WARRANTIES OF MERCHANTABILITY OR FITNESS FOR A PARTICULAR PURPOSE WITH RESPECT THERETO, AND SHALL NOT BE LIABLE FOR ANY CLAIMS OR LOSSES OF ANY NATURE IN CONNECTION WITH THE USE OF SUCH INFORMATION, INCLUDING BUT NOT LIMITED TO, LOST PROFITS OR PUNITIVE OR CONSEQUENTIAL DAMAGES, EVEN IF RSBB-I, LLC, ROBERT J. SHILLER OR ANY PROTECTED PARTY IS ADVISED OF THE POSSIBILITY OF SAME.
| | | | | | | | | | |
| 12 | | DoubleLine Funds Trust | | | | | | | | |
| | |
| | | (Unaudited) March 31, 2024 |
LSTA Morningstar Disclaimer
The DoubleLine Floating Rate Fund is not sponsored, endorsed, sold or promoted by Morningstar, Inc., or any of its affiliated companies (all such entities, collectively, “Morningstar Entities”) or the Loan Syndications and Trading Association (“LSTA”). The Morningstar Entities and LSTA make no representation or warranty, express or implied, to the owners of the DoubleLine Floating Rate Fund or any member of the public regarding the advisability of investing in leveraged loans generally or in the DoubleLine Floating Rate Fund in particular or the ability of the LSTA/Morningstar Leveraged Loan Index to track general leveraged loan market performance. The Morningstar Entities’ only relationship to the DoubleLine Floating Rate Fund is the licensing of certain service marks and service names of Morningstar and of the LSTA/Morningstar Leveraged Loan Index which is determined, composed and calculated by the Morningstar Entities without regard to DoubleLine or the DoubleLine Floating Rate Fund. The Morningstar Entities have no obligation to take the needs of DoubleLine or the owners of the DoubleLine Floating Rate Fund into consideration in determining, composing or calculating the LSTA/Morningstar Leveraged Loan Index. The Morningstar Entities and LSTA are not responsible for and have not participated in the determination of the prices and amount of the DoubleLine Floating Rate Fund or the timing of the issuance or sale of the DoubleLine Floating Rate Fund or in the determination or calculation of the equation by which the DoubleLine Floating Rate Fund is converted into cash. The Morningstar Entities and LSTA have no obligation or liability in connection with the administration, marketing or trading of the DoubleLine Floating Rate Fund.
THE MORNINGSTAR ENTITIES AND LSTA DO NOT GUARANTEE THE ACCURACY AND/OR THE COMPLETENESS OF THE LSTA/MORNINGSTAR LEVERAGED LOAN INDEX OR ANY DATA INCLUDED THEREIN AND HAVE NO LIABILITY FOR ANY ERRORS, OMISSIONS, OR INTERRUPTIONS THEREIN. THE MORNINGSTAR ENTITIES AND LSTA MAKE NO WARRANTY, EXPRESS OR IMPLIED, AS TO RESULTS TO BE OBTAINED BY DOUBLELINE, OWNERS OR USERS OF THE DOUBLELINE FLOATING RATE FUND, OR ANY OTHER PERSON OR ENTITY FROM THE USE OF THE LSTA/ MORNINGSTAR LEVERAGED LOAN INDEX OR ANY DATA INCLUDED THEREIN. THE MORNINGSTAR ENTITIES AND LSTA MAKE NO EXPRESS OR IMPLIED WARRANTIES, AND EXPRESSLY DISCLAIM ALL WARRANTIES OF MERCHANTABILITY OR FITNESS FOR A PARTICULAR PURPOSE OR USE WITH RESPECT TO THE LSTA/MORNINGSTAR LEVERAGED LOAN INDEX OR ANY DATA INCLUDED THEREIN. WITHOUT LIMITING ANY OF THE FOREGOING, IN NO EVENT SHALL THE MORNINGSTAR ENTITIES OR LSTA HAVE ANY LIABILITY FOR ANY SPECIAL, PUNITIVE, INDIRECT, OR CONSEQUENTIAL DAMAGES (INCLUDING LOST PROFITS), EVEN IF NOTIFIED OF THE POSSIBILITY OF SUCH DAMAGES.
Morgan Stanley Index Disclaimers
NOTHING IN THE FOLLOWING DISCLAIMER IS INTENDED TO MODIFY THE OBLIGATIONS OF ANY MORGAN STANLEY AFFILIATE, INCLUDING WITHOUT LIMITATION, MORGAN STANLEY SMITH BARNEY LLC (“MSSB”), UNDER ANY APPLICABLE AGREEMENT BETWEEN ANY SUCH AFFILIATE AND ITS RESPECTIVE CLIENTS WHO PURCHASE FUND SHARES THROUGH SUCH AFFILIATE.
THIS FUND IS NOT SPONSORED, ENDORSED, SOLD OR PROMOTED BY MORGAN STANLEY CAPITAL GROUP INC. (“MORGAN STANLEY”). NEITHER MORGAN STANLEY NOR ANY OF ITS OR ITS AFFILIATES’ AGENTS (INCLUDING CALCULATION AGENTS), DATA PROVIDERS (WHICH FOR PURPOSES OF THIS DISCLAIMER INCLUDES WITHOUT LIMITATION ICE DATA, LLP, CHICAGO MERCANTILE EXCHANGE INC., AND THE LONDON METAL EXCHANGE) OR ANY THIRD PARTY PROVIDING SERVICES IN CONNECTION WITH THE INDEX MAKES ANY REPRESENTATION OR WARRANTY, EXPRESS OR IMPLIED, REGARDING THE ADVISABILITY OF INVESTING IN THIS FUND OR THE ABILITY OF THE MORGAN STANLEY BFMCISM (THE “INDEX”) TO TRACK MARKET PERFORMANCE. THE INDEX IS THE EXCLUSIVE PROPERTY OF MORGAN STANLEY. MORGAN STANLEY AND THE INDEX ARE SERVICE MARKS OF MORGAN STANLEY AND/OR A MORGAN STANLEY AFFILIATE AND HAVE BEEN LICENSED TO DOUBLELINE ALTERNATIVES LP FOR USE FOR CERTAIN PURPOSES BY DOUBLELINE ALTERNATIVES LP (“LICENSEE”). MORGAN STANLEY HAS NO OBLIGATION TO TAKE THE NEEDS OF THE LICENSEE, ISSUER OR OWNERS OF THIS FUND INTO CONSIDERATION IN DETERMINING, COMPOSING OR CALCULATING THE INDEX. NEITHER MORGAN STANLEY NOR ANY OF ITS OR ITS AFFILIATES’ AGENTS (INCLUDING CALCULATION AGENTS), DATA PROVIDERS OR ANY THIRD PARTY PROVIDING SERVICES IN CONNECTION WITH THE INDEX IS RESPONSIBLE FOR AND HAS NOT PARTICIPATED IN THE DETERMINATION OF THE TIMING OF, PRICES AT, OR QUANTITIES OF THIS FUND OR ITS ASSETS OR IN THE DETERMINATION OR CALCULATION OF THE EQUATION BY WHICH THIS FUND IS REDEEMABLE. NEITHER MORGAN STANLEY NOR ANY OF ITS OR ITS AFFILIATES’ AGENTS (INCLUDING CALCULATION AGENTS), DATA PROVIDERS OR ANY THIRD PARTY PROVIDING SERVICES IN CONNECTION WITH THE INDEX HAS OR WILL HAVE ANY OBLIGATION OR LIABILITY TO OWNERS OF THIS FUND IN CONNECTION WITH THE ADMINISTRATION, MARKETING OR TRADING OF THIS FUND.
ALTHOUGH MORGAN STANLEY OR ITS AGENTS OR SERVICE PROVIDERS SHALL OBTAIN INFORMATION FOR INCLUSION IN OR FOR USE IN THE CALCULATION OF THE INDEX FROM SOURCES WHICH MORGAN STANLEY CONSIDERS RELIABLE, NEITHER MORGAN STANLEY NOR ANY OF ITS OR ITS AFFILIATES’ AGENTS (INCLUDING CALCULATION AGENTS), DATA PROVIDERS OR ANY THIRD PARTY PROVIDING SERVICES IN CONNECTION WITH THE INDEX GUARANTEES THE ACCURACY AND/OR THE COMPLETENESS OF THE INDEX OR ANY DATA INCLUDED THEREIN. NEITHER MORGAN STANLEY NOR ANY OF ITS OR ITS AFFILIATES’ AGENTS (INCLUDING CALCULATION AGENTS), DATA PROVIDERS OR ANY THIRD PARTY PROVIDING SERVICES IN CONNECTION WITH THE INDEX MAKES ANY WARRANTY, EXPRESS OR IMPLIED, AS TO RESULTS TO BE OBTAINED BY LICENSEE, LICENSEE’S CUSTOMERS AND COUNTERPARTIES, OWNERS OF OR INVESTORS IN THE FUND, OR ANY OTHER PERSON OR ENTITY FROM THE USE OF THE INDEX OR ANY DATA INCLUDED THEREIN IN CONNECTION WITH THE RIGHTS LICENSED HEREUNDER OR FOR ANY OTHER USE. NEITHER MORGAN STANLEY NOR ANY OF ITS OR ITS AFFILIATES’ AGENTS (INCLUDING CALCULATION AGENTS), DATA PROVIDERS OR ANY THIRD PARTY PROVIDING SERVICES IN CONNECTION WITH THE INDEX MAKES ANY EXPRESS OR IMPLIED WARRANTIES, AND DO HEREBY EXPRESSLY DISCLAIM ALL WARRANTIES OF MERCHANTABILITY OR FITNESS FOR A PARTICULAR PURPOSE WITH RESPECT TO THE INDEX OR ANY DATA INCLUDED THEREIN. WITHOUT LIMITING ANY OF THE FOREGOING, IN NO EVENT SHALL MORGAN STANLEY OR ANY AGENT OF MORGAN STANLEY OR ANY MORGAN STANLEY AFFILIATE (INCLUDING CALCULATION AGENTS), DATA PROVIDERS OR ANY THIRD PARTY PROVIDING SERVICES IN CONNECTION WITH THE INDEX HAVE ANY LIABILITY FOR ANY DIRECT, INDIRECT, SPECIAL, PUNITIVE, CONSEQUENTIAL OR ANY OTHER DAMAGES (INCLUDING LOST PROFITS) EVEN IF NOTIFIED OF THE POSSIBILITY OF SUCH DAMAGES.
NO PURCHASER, SELLER OR HOLDER OF THIS SECURITY, OR ANY OTHER PERSON OR ENTITY, SHOULD USE OR REFER TO ANY MORGAN STANLEY TRADE NAME, TRADEMARK OR SERVICE MARK TO SPONSOR, ENDORSE, MARKET OR PROMOTE THIS PRODUCT WITHOUT FIRST CONTACTING MORGAN STANLEY TO DETERMINE WHETHER MORGAN STANLEY’S PERMISSION IS REQUIRED. UNDER NO CIRCUMSTANCES MAY ANY PERSON OR ENTITY CLAIM ANY AFFILIATION WITH MORGAN STANLEY WITHOUT THE PRIOR WRITTEN PERMISSION OF MORGAN STANLEY.
BNP Paribas Multi-Asset Trend Index Disclaimers
This material is confidential and distributed to intended recipients only and may not be reproduced (in whole or in part) or transmitted to any other person. The information contained in this material is for general reference purposes only and should not be construed or used as an offer, solicitation or recommendation to buy or sell any securities or investment.
The BNP Paribas Multi-Asset Trend Index (the “Index”) is the exclusive property of BNP Paribas, the Index sponsor and Index calculation agent (the “Index Sponsor” and the “Index Calculation Agent”). The Index Sponsor does not guarantee the accuracy and/or completeness of the composition, calculation, publication and adjustment of the Index, any data included therein, or any data on which it is based, and the Index Sponsor shall have no liability for any errors, omissions, or interruptions therein. The Index Sponsor makes no warranty, express or implied, as to results to be obtained from the use of the Index. The Index Sponsor makes no express or implied warranties, and expressly disclaims all warranties of merchantability or fitness for a particular purpose or use with respect to the Index or any data included therein. Without limiting any of the foregoing, in no event shall the Index Sponsor have any liability for any special, punitive, indirect, or consequential damages (including lost profits), even if notified of the possibility of such damages.
For the avoidance of doubt the Index and/or any account, transaction or product using the information relating to the Index, is not sponsored, endorsed, sold, or promoted by any provider of the underlying data (the “Reference Assets”) comprised in the Index (each a “Reference Asset Sponsor”) and no Reference Asset Sponsor makes any representation whatsoever, whether express or implied, either as to the results to be obtained from the use of the relevant Reference Asset or the index and/or the levels at which the relevant Reference Asset or the Index stands at any particular time on any particular date or otherwise. No Reference Asset Sponsor shall be liable (whether in negligence or otherwise) to any person for any error in a Reference Asset and/or in the Index and a Reference Asset Sponsor is under no
| | | | | | | | | | |
| | | | Annual Report | | | | | March 31, 2024 | | 13 |
| | |
Management’s Discussion of Fund Performance (Cont.) | | |
obligation to advise any person of any error therein. No Reference Asset Sponsor is making any representation whatsoever, whether express or implied, as to the advisability of purchasing or assuming any risk in connection with the DoubleLine Multi-Asset Trend Fund managed by DoubleLine; or any product or investment strategy referencing the DoubleLine Multi-Asset Trend Fund managed by DoubleLine. No Reference Asset Sponsor shall have any liability for any act or failure to act by the Index Sponsor in connection with the calculation, adjustment or maintenance of the Index. None of the Reference Asset Sponsors or their affiliates have any affiliation with or control over the Index or the Index Sponsor or any control over the computation, composition or dissemination of the Index.
The Index Sponsor and the Index Calculation Agent shall not be held liable for any modification or change in the methodology used in calculating the index or any index components thereof (the “BNP Paribas Indices”). The Index Sponsor and the Index Calculation Agent are under no obligation to continue the calculation, publication or dissemination of the BNP Paribas Indices and shall not be held liable for any suspension or interruption in the calculation of any BNP Paribas Indices. The Index Sponsor and the Index Calculation Agent decline any liability in connection with the level of any BNP Paribas Index at any given time. None of BNP Paribas, the Index Sponsor, the Index Calculation Agent nor any of their affiliates shall be held liable for any loss whatsoever, directly or indirectly related to any BNP Paribas Index.
BNP Paribas, the Index Sponsor and the Index Calculation Agent do not guarantee the accuracy or completeness of the methodology or rules of the BNP Paribas Indices (the “BNP Paribas Index Rules”) or the calculation methods, any errors or omissions in computing or disseminating the BNP Paribas Indices, or for any use thereof, and the Index Sponsor and the Index Calculation Agent shall have no liability for any errors or omissions therein.
The BNP Paribas Index Rules are based on certain assumptions, certain pricing models and calculation methods adopted by the Index Sponsor and have certain inherent limitations. Information prepared on the basis of different models, calculation methods or assumptions may yield different results. Numerous factors may affect the analysis, which may or may not be taken into account. Therefore, the analysis of information may vary significantly from analysis obtained from other sources or market participants.
BNP Paribas, the Index Sponsor and Index Calculation Agent do not make any representation whatsoever, either as to the results to be obtained from the use of the BNP Paribas Indices, the levels of any BNP Paribas Index at any time or any use of any Index Component or the price, level or rate of any Index Component at any time.
The market data used to calculate the level of any BNP Paribas Index may be furnished by third party sources and is believed to be reliable; however, BNP Paribas, the Index Sponsor and the Index Calculation Agent make no representation or guarantee with respect to, and are under no obligation to verify, the accuracy and completeness thereof.
Index Descriptions and Other Definitions
An investment cannot be made directly in an index. The performance of any index mentioned in this commentary has not been adjusted for ongoing management, distribution and operating expenses applicable to mutual fund investments.
The index descriptions provided herein are based on information provided on the respective index provider’s website or from other third-party sources. The Funds and DoubleLine have not verified these index descriptions and disclaim responsibility for their accuracy and completeness.
Agency—Refers to mortgage-backed securities (MBS) whose principal and interest are guaranteed by a U.S. government agency such as Fannie Mae (FNMA) or Freddie Mac (FHLMC).
Alpha—Term used in investing to describe a strategy’s ability to beat the market, or its “edge.” Alpha is thus also often referred to as “excess return” or “abnormal rate of return,” which refers to the idea that markets are efficient, and so there is no way to systematically earn returns that exceed the broad market as a whole.
Asset-Backed Securities (ABS)—Investment securities, such as bond or notes, that are collateralized by a pool of assets, such as loans, leases, credit card debt, royalties or receivables.
Basis Points (bps)—Basis points (or basis point (bp)) refer to a common unit of measure for interest rates and other percentages in finance. One basis point is equal to 1/100th of 1%, or 0.01% or 0.0001, and is used to denote the percentage change in a financial instrument. The relationship between percentage changes and basis points can be summarized as: 1% change = 100 basis points; 0.01% = 1 basis point.
Beta Exposure—Beta is the return generated from a portfolio that can be attributed to overall market returns. Beta exposure is equivalent to exposure to systematic risk.
Bloomberg Commodity (BCOM) Index Total Return—The BCOM Index Total Return tracks the performance of the BCOM on a total return basis. The BCOM is calculated on an excess return basis and reflects the price movements of commodity futures. It rebalances annually, weighted two-thirds by trading volume and one-third by world production, and weight caps are applied at the commodity, sector and group levels for diversification. The roll period typically occurs from the sixth to 10th business day based on the roll schedule.
Bloomberg US Aggregate Bond Index—This index (the “Agg”) represents securities that are SEC registered, taxable and U.S. dollar denominated. It covers the U.S. investment grade, fixed-rate bond market, with components for government and corporate securities, mortgage pass-through securities and asset-backed securities. These major sectors are subdivided into more specific indices that are calculated and reported on a regular basis.
Bloomberg US Aggregate 1-3 Year Bond Index—This index tracks the one- to three-year component of the Bloomberg US Aggregate Bond Index, which represents securities that are SEC registered, taxable and dollar denominated in the U.S. investment grade, fixed-rate bond market.
Bloomberg US Long Government/Credit Index—This index tracks the market for investment grade, U.S. dollar-denominated, fixed-rate U.S. Treasuries, and government-related and corporate securities.
Bloomberg World Interest Rate Probability (WIRP) Function—Statistical function developed by Bloomberg that uses fed funds futures and options to assess the probability of future Federal Open Market Committee (FOMC) decisions. It seeks to calculate the chances of a rate hike at each of the FOMC meetings using futures trading data.
BNP Paribas Multi-Asset Trend Index—This index has been designed to seek investment exposure to trends in price movements of a broad universe of assets across different markets, including domestic, foreign and emerging markets equities; sovereign bonds and other debt securities; interest rates; currencies; and commodities (e.g., energy and metals). The index was selected, in significant part, because it reflects trend-following strategies using a broadly diversified set of investments.
Collateralized Loan Obligation (CLO)—Single security backed by a pool of debt.
Conference Board Leading Economic Index (LEI)—This index tracks a group of composite indexes (manufacturers’ orders, initial unemployment insurance claims, et al.) as a means of gauging the strength of a particular industry or the economy.
Credit Suisse Managed Futures Liquid Total Return U.S. Dollar Index—This index measures on a total return, U.S. dollar-denominated basis the performance of the Credit Suisse Managed Futures Liquid Index, which is designed to provide exposure to both up and down price trends in four broad asset classes: equities, fixed income, commodities and currencies.
Duration—Measure of the sensitivity of the price of a bond or other debt instrument to a change in interest rates.
Federal Funds Rate—Target interest rate, set by the Federal Reserve at its Federal Open Market Committee (FOMC) meetings, at which commercial banks borrow and lend their excess reserves to each other overnight. The Fed sets a target federal funds rate eight times a year, based on prevailing economic conditions.
| | | | | | | | | | |
| 14 | | DoubleLine Funds Trust | | | | | | | | |
| | |
| | | (Unaudited) March 31, 2024 |
FTSE World Government Bond Index (FTSE WGBI)—This broad index measures the performance of fixed-rate, local currency, investment grade sovereign bonds. It is a widely used benchmark comprising sovereign debt from more than 20 countries that is denominated in a variety of currencies.
G-10 (Group of Ten)—The G-10 comprises 11 industrialized nations that meet on an annual basis, or more frequently as needed, to consult each other, debate and cooperate on international financial matters. The member countries are: Belgium, Canada, France, Germany, Italy, Japan, the Netherlands, Sweden, Switzerland, the United Kingdom and the United States.
High Yield (HY)—Bonds that pay higher interest rates because they have lower credit ratings than investment grade (IG) bonds. HY bonds are more likely to default, so they must pay a higher yield than IG bonds to compensate investors.
ICE BofA 1-3 Year Eurodollar Index—This index includes all securities with a remaining term to final maturity of three years or less on the ICE BofA Eurodollar Index, which tracks the performance of U.S. dollar-denominated, investment grade, quasi-government, corporate, securitized and collateralized debt publicly issued in the eurobond markets.
ICE BofA 1-3 Year U.S. Treasury Index—An unmanaged index that tracks the performance of the direct sovereign debt of the U.S. government having a maturity of at least one year and less than three years.
ICE BofA SOFR Overnight Rate Index—This index tracks the performance of a synthetic asset paying the Secured Overnight Financing Rate (SOFR) to a stated maturity. The index is based on the assumed purchase at par of a synthetic instrument having exactly its stated maturity and with a coupon equal to that day’s fixing rate. That issue is assumed to be sold the following business day (priced at a yield equal to the current-day fixing rate) and rolled into a new instrument.
Investment Grade (IG)—Rating that signifies a municipal or corporate bond presents a relatively low risk of default. Bonds below this designation are considered to have a high risk of default and are commonly referred to as high yield (HY) or “junk bonds.” The higher the bond rating the more likely the bond will return 100 cents on the U.S. dollar.
ISM Manufacturing PMI—This index (which used to be called the ISM Manufacturing Purchasing Managers Index) is compiled by the Institute for Supply Management and tracks the economic health of the manufacturing sector. The index is based on five major indicators: new orders, inventory levels, production, supplier deliveries and employment environment. A number below 50 is considered a contractionary signal for the economy; a number above 50 is considered expansionary.
ISM Services PMI—This index (which used to be called the ISM Non-Manufacturing Purchasing Managers Index) is compiled by the Institute for Supply Management and tracks the economic health of the services (formerly nonmanufacturing) sector. A number below 50 is considered a contractionary signal for the economy; a number above 50 is considered expansionary.
Job Openings and Labor Turnover Survey (JOLTS)—Conducted by the U.S. Bureau of Labor Statistics, JOLTS involves the monthly collection, processing and dissemination of job openings and labor turnover data. The data, collected from sampled establishments on a voluntary basis, includes employment, job openings, hires, quits, layoffs, discharges and other separations. The number of unfilled jobs—used to calculate the job openings rate—is an important measure of the unmet demand for labor, providing a more complete picture of the U.S. labor market than by looking solely at the unemployment rate.
J.P. Morgan Corporate Emerging Markets Bond Index Broad Diversified (CEMBI BD) 1-3 Year Index—This index tracks corporate bonds with a maturity of one to three years and includes smaller issues and a wider array of bonds than the CEMBI, which is a market capitalization-weighted index consisting of U.S. dollar-denominated corporate bonds from emerging markets. The CEMBI is a liquid global corporate benchmark representing Asia, Latin America, Europe and the Middle East/Africa.
J.P. Morgan Emerging Markets Bond Global Diversified Index (EMBI GD)—This index is a uniquely weighted version of the EMBI. The EMBI tracks bonds from emerging markets (EM), and comprises sovereign debt and EM corporate bonds. The EMBI GD limits the weights of index countries with larger debt stocks by only including specified portions of those countries’ eligible current face amounts of debt outstanding.
J.P. Morgan Government Bond Index Emerging Markets Global Diversified (GBI-EM GD)—This custom-weighted index tracks local currency bonds issued by emerging market governments, excluding China and India, and has a broader roster of countries than the base GBI-EM, which limits inclusion to countries that are readily accessible and where no impediments exist for foreign investors.
Morgan Stanley Backwardation Focused Multi-Commodity Index (MSBFMCI)—This index comprises futures contracts selected based on the contracts’ historical backwardation relative to other commodity-related futures contracts and the contracts’ historical liquidity. The sectors represented in the index (industrial metals, energy and agricultural/livestock) have been selected to provide diversified exposure. The index is typically rebalanced annually in January.
Morningstar LSTA US Leveraged Loan TR USD Index—This index tracks the market-weighted performance of institutional weighted loans based on market weightings, spreads and interest payments.
Mortgage-Backed Securities (MBS)—Investment similar to a bond that is made up of a bundle of home loans bought from the banks that issued them. Investors in MBS receive periodic payments similar to bond coupon payments.
MSCI Europe Index—This index is U.S. dollar denominated and represents the performance of large- and mid-cap equities across 15 developed countries in Europe. It covers approximately 85% of the free float-adjusted market capitalization in each country.
MSCI Europe Net Total Return USD Index—This index is a component of the MSCI Europe Index and measures performance on a net total return basis.
S&P 500® Index—This unmanaged capitalization-weighted index of the stocks of the 500 largest publicly traded U.S. companies is designed to measure performance of the broad domestic economy through changes in the aggregate market value of the 500 stocks, which represent all major industries.
Shiller Barclays CAPE® Europe Sector Net TR NoC USD Index (European CAPE Index)—This index incorporates the principles of long-term investing distilled by Dr. Robert Shiller and expressed through the CAPE® (Cyclically Adjusted Price Earnings) Ratio (the “CAPE® Ratio”). The classic CAPE® Ratio assesses equity market valuations and averages 10 years of inflation-adjusted earnings to account for earnings and market cycles.
Shiller Barclays CAPE® U.S. Sector Total Return USD Index—This index incorporates the principles of long-term investing distilled by Dr. Robert Shiller and expressed through the CAPE® (Cyclically Adjusted Price Earnings) Ratio (the “CAPE® Ratio”). It aims to identify undervalued sectors based on a modified CAPE® Ratio, and then uses a momentum factor to seek to mitigate the effects of potential value traps.
Spread—Difference between yields on differing debt instruments, calculated by deducting the yield of one instrument from another. The higher the yield spread, the greater the difference between the yields offered by each instrument. The spread can be measured between debt instruments of differing maturities, credit ratings or risk.
U-3 Unemployment Rate—Officially recognized rate of unemployment, compiled and released monthly by the U.S. Bureau of Labor Statistics, measuring the number of unemployed people as a percentage of the labor force.
U.S. Dollar Index (DXY)—A weighted geometric mean of the U.S. dollar’s value relative to a basket of six major foreign currencies: the euro, Japanese yen, British pound, Canadian dollar, Swedish krona and Swiss franc.
| | | | | | | | | | |
| | | | Annual Report | | | | | March 31, 2024 | | 15 |
| | |
Management’s Discussion of Fund Performance (Cont.) | | |
This commentary may include statements that constitute “forward-looking statements” under the U.S. securities laws. Forward-looking statements include, among other things, projections, estimates, and information about possible or future results related to a Fund and market or regulatory developments. The views expressed above are not guarantees of future performance or economic results and involve certain risks, uncertainties and assumptions that could cause actual outcomes and results to differ materially from the views expressed herein.
DoubleLine has no obligation to provide revised assessments in the event of changed circumstances. While we have gathered this information from sources believed to be reliable, DoubleLine cannot guarantee the accuracy of the information provided. Securities discussed are not recommendations and are presented as examples of issue selection or portfolio management processes. They have been picked for comparison or illustration purposes only. No security presented within is either offered for sale or purchase. DoubleLine reserves the right to change its investment perspective and outlook without notice as market conditions dictate or as additional information becomes available.
Investment strategies may not achieve the desired results due to implementation lag, other timing factors, portfolio management decision making, economic or market conditions or other unanticipated factors. The views and forecasts expressed in this material are as of the date indicated, are subject to change without notice, may not come to pass and do not represent a recommendation or offer of any particular security, strategy, or investment. Past performance is no guarantee of future results.
The DoubleLine Funds are distributed by Quasar Distributors, LLC.
DoubleLine® is a registered trademark of DoubleLine Capital LP.
| | | | | | | | | | |
| 16 | | DoubleLine Funds Trust | | | | | | | | |
| | |
Standardized Performance Summary | | (Unaudited) March 31, 2024 |
The performance information shown assumes the reinvestment of all dividends and distributions. Returns over 1 year are average annual returns. Performance data quoted represents past performance; past performance does not guarantee future results and does not reflect the deduction of any taxes a shareholder would pay on fund distributions or the sale of fund shares. The investment return and principal value of an investment will fluctuate so that an investor’s shares, when redeemed, may be worth more or less than the original cost. Current performance of the Fund may be lower or higher than the performance quoted. The Funds’ gross and net expense ratios shown are from the most recent prospectus and may change over time. See the financial highlights section of the financial statements for more recent expense ratios. The Funds’ gross and net expense ratios also include “acquired fund fees and expenses,” which are expenses incurred indirectly as a result of a Fund’s investments in one or more underlying funds, including ETFs and money market funds. Because these costs are indirect, the expense ratios will not correlate to the expense ratios in the Funds’ financial statements, since financial statements only include direct costs of the Funds and not indirect costs of investing in the underlying funds. Performance data current to the most recent month-end may be obtained by calling (877) 354-6311 or by visiting www.doubleline.com.
| | | | | | | | | | | | | | | | | | | | | | | | | | | | | |
| DBLTX/DLTNX/DDTRX | | | | | | | | | | | | | | |
DoubleLine Total Return Bond Fund
Returns as of March 31, 2024 | | 1-Year | | 3-Years
Annualized | | 5-Years
Annualized | | 10-Years
Annualized | | Since Inception
Annualized
(4-6-10 to 3-31-24) | | Expense Ratio |
| | | | | | |
I Share (DBLTX) | | | | 1.75% | | | | | -2.20% | | | | | -0.09% | | | | | 1.57% | | | | | 3.72% | | | 0.49% |
| | | | | | |
N Share (DLTNX) | | | | 1.50% | | | | | -2.44% | | | | | -0.34% | | | | | 1.32% | | | | | 3.47% | | | 0.74% |
| | | | | | |
R6 Share (DDTRX)1 | | | | 1.81% | | | | | -2.11% | | | | | -0.02% | | | | | 1.60% | | | | | 3.75% | | | 0.44% |
| | | | | | |
Bloomberg US Aggregate Bond Index2 | | | | 1.70% | | | | | -2.46% | | | | | 0.36% | | | | | 1.54% | | | | | 2.31% | | | |
| DBLFX/DLFNX/DDCFX | | | | | | | | | | | | | | |
DoubleLine Core Fixed Income Fund
Returns as of March 31, 2024 | | 1-Year | | 3-Years
Annualized | | 5-Years
Annualized | | 10-Years
Annualized | | Since Inception
Annualized
(6-1-10 to 3-31-24) | | Gross
Expense
Ratio | | Net
Expense
Ratio3 |
| | | | | | | |
I Share (DBLFX) | | | | 2.60% | | | | | -1.92% | | | | | 0.46% | | | | | 1.85% | | | | | 3.36% | | | 0.51% | | 0.48% |
| | | | | | | |
N Share (DLFNX) | | | | 2.46% | | | | | -2.14% | | | | | 0.23% | | | | | 1.61% | | | | | 3.11% | | | 0.76% | | 0.73% |
| | | | | | | |
R6 Share (DDCFX)4 | | | | 2.74% | | | | | -1.89% | | | | | 0.51% | | | | | 1.88% | | | | | 3.38% | | | 0.48% | | 0.45% |
| | | | | | | |
Bloomberg US Aggregate Bond Index2 | | | | 1.70% | | | | | -2.46% | | | | | 0.36% | | | | | 1.54% | | | | | 2.15% | | | | | |
| DBLEX/DLENX | | | | | | | | | | | | | | |
DoubleLine Emerging Markets Fixed Income
Fund
Returns as of March 31, 2024 | | 1-Year | | 3-Years
Annualized | | 5-Years
Annualized | | 10-Years
Annualized | | Since Inception
Annualized
(4-6-10 to 3-31-24) | | Expense Ratio |
| | | | | | |
I Share (DBLEX) | | | | 11.78% | 11 | | | | -0.70% | | | | | 1.81% | | | | | 3.09% | | | | | 4.21% | | | 0.90% |
| | | | | | |
N Share (DLENX) | | | | 11.37% | 11 | | | | -0.96% | | | | | 1.54% | | | | | 2.83% | | | | | 3.95% | | | 1.15% |
| | | | | | | |
J.P. Morgan Emerging Markets Bond Global Diversified Index2 | | | | 11.28% | | | | | -1.40% | | | | | 0.71% | | | | | 3.05% | | | | | 4.28% | | | | | |
| DBLSX/DLSNX/DDLDX | | | | | | | | | | | | | | |
DoubleLine Low Duration Bond Fund
Returns as of March 31, 2024 | | 1-Year | | 3-Years
Annualized | | 5-Years
Annualized | | 10-Years
Annualized | | Since Inception
Annualized
(9-30-11 to 3-31-24) | | Expense Ratio |
| | | | | | |
I Share (DBLSX) | | | | 6.16% | | | | | 1.84% | | | | | 2.17% | | | | | 2.15% | | | | | 2.27% | | | 0.43% |
| | | | | | |
N Share (DLSNX) | | | | 5.90% | | | | | 1.59% | | | | | 1.91% | | | | | 1.90% | | | | | 2.01% | | | 0.67% |
| | | | | | |
R6 Share (DDLDX)5 | | | | 6.20% | | | | | 1.88% | | | | | 2.20% | | | | | 2.17% | | | | | 2.28% | | | 0.39% |
| | | | | | | |
ICE BofA 1-3 Year U.S. Treasury Index2,6 | | | | 2.97% | | | | | 0.08% | | | | | 1.16% | | | | | 1.07% | | | | | 0.94% | | | | | |
| | | | | | | |
Bloomberg US Aggregate 1-3 Year Bond Index2 | | | | 3.56% | | | | | 0.26% | | | | | 1.31% | | | | | 1.27% | | | | | 1.22% | | | | | |
| DBFRX/DLFRX | | | | | | | | | | | | | | |
DoubleLine Floating Rate Fund
Returns as of March 31, 2024 | | 1-Year | | 3-Years
Annualized | | 5-Years
Annualized | | 10-Years
Annualized | | Since Inception
Annualized
(2-1-13 to 3-31-24) | | Expense Ratio |
| | | | | | |
I Share (DBFRX)7 | | | | 9.61% | | | | | 4.38% | | | | | 4.12% | | | | | 3.54% | | | | | 3.52% | | | 0.69% |
| | | | | | |
N Share (DLFRX)7 | | | | 9.43% | | | | | 4.14% | | | | | 3.86% | | | | | 3.29% | | | | | 3.29% | | | 0.93% |
| | | | | | | |
Morningstar LSTA US Leveraged Loan TR USD Index2 | | | | 12.47% | | | | | 5.99% | | | | | 5.47% | | | | | 4.54% | | | | | 4.56% | | | | | |
| DSEEX/DSENX/DDCPX | | | | | | | | | | | | | | |
DoubleLine Shiller Enhanced CAPE®
Returns as of March 31, 2024 | | 1-Year | | 3-Years
Annualized | | 5-Years
Annualized | | 10-Years
Annualized | | Since Inception
Annualized
(10-31-13 to 3-31-24) | | Expense Ratio |
| | | | | | |
I Share (DSEEX) | | | | 23.36% | | | | | 6.38% | | | | | 11.35% | | | | | 12.78% | | | | | 13.06% | | | 0.55% |
| | | | | | |
N Share (DSENX) | | | | 23.07% | | | | | 6.11% | | | | | 11.07% | | | | | 12.50% | | | | | 12.78% | | | 0.80% |
| | | | | | |
R6 Share (DDCPX)8 | | | | 23.41% | | | | | 6.45% | | | | | 11.41% | | | | | 12.81% | | | | | 13.09% | | | 0.50% |
| | | | | | | |
S&P 500® Index2 | | | | 29.88% | | | | | 11.49% | | | | | 15.05% | | | | | 12.96% | | | | | 13.20% | | | | | |
| | | | | | | |
Shiller Barclays CAPE® U.S. Sector Total Return USD Index2 | | | | 24.68% | | | | | 8.99% | | | | | 13.24% | | | | | 13.41% | | | | | 13.55% | | | | | |
| | | | | | | | | | |
| | | | Annual Report | | | | | March 31, 2024 | | 17 |
| | |
Standardized Performance Summary (Cont.) | | |
| | | | | | | | | | | | | | | | | | | | | | | | | | | | | |
| DFLEX/DLINX/DFFLX | | | | | | | | | | | | | | |
DoubleLine Flexible Income Fund
Returns as of March 31, 2024 | | 1-Year | | 3-Years
Annualized | | 5-Years
Annualized | | | | Since Inception
Annualized
(4-7-14 to 3-31-24) | | Expense Ratio |
| | | | | | |
I Share (DFLEX) | | | | 8.69% | | | | | 1.12% | | | | | 2.38% | | | | | | | | | | 2.86% | | | 0.75% |
| | | | | | |
N Share (DLINX) | | | | 8.42% | | | | | 0.87% | | | | | 2.14% | | | | | | | | | | 2.61% | | | 1.00% |
| | | | | | |
R6 Share (DFFLX)9 | | | | 8.73% | | | | | 1.17% | | | | | 2.44% | | | | | | | | | | 2.89% | | | 0.71% |
| | | | | | | |
ICE BofA 1-3 Year Eurodollar Index2 | | | | 4.56% | | | | | 0.70% | | | | | 1.86% | | | | | | | | | | 1.77% | | | | | |
| | | | | | | |
ICE BofA SOFR Overnight Rate Index2 | | | | 5.44% | | | | | 2.73% | | | | | 2.02% | | | | | | | | | | 1.37% | | | | | |
| DBLLX/DELNX | | | | | | | | | | | | | | |
DoubleLine Low Duration Emerging Markets
Fixed Income Fund
Returns as of March 31, 2024 | | 1-Year | | 3-Years
Annualized | | 5-Years
Annualized | | | | Since Inception
Annualized
(4-7-14 to 3-31-24) | | Gross
Expense
Ratio | | Net
Expense
Ratio10 |
| | | | | | | |
I Share (DBLLX) | | | | 8.23% | | | | | 1.33% | | | | | 2.29% | | | | | | | | | | 2.60% | | | 0.69% | | 0.59% |
| | | | | | | |
N Share (DELNX) | | | | 8.07% | | | | | 1.10% | | | | | 2.05% | | | | | | | | | | 2.35% | | | 0.93% | | 0.84% |
| | | | | | | |
J.P. Morgan CEMBI Broad Diversified 1-3 Year Index2 | | | | 8.45% | | | | | 1.00% | | | | | 2.70% | | | | | | | | | | 3.08% | | | | | |
| DBLDX/DLLDX | | | | | | | | | | | | | | |
DoubleLine Long Duration Total Return
Bond Fund
Returns as of March 31, 2024 | | 1-Year | | 3-Years
Annualized | | 5-Years
Annualized | | | | Since Inception
Annualized
(12-15-14 to 3-31-24) | | Gross
Expense
Ratio | | Net
Expense
Ratio10 |
| | | | | | | |
I Share (DBLDX) | | | | -4.39% | | | | | -8.19% | | | | | -3.25% | | | | | | | | | | -0.46% | | | 0.59% | | 0.50% |
| | | | | | | |
N Share (DLLDX) | | | | -4.63% | | | | | -8.52% | | | | | -3.55% | | | | | | | | | | -0.74% | | | 0.83% | | 0.75% |
| | | | | | | |
Bloomberg US Long Government/Credit Index2 | | | | -1.15% | | | | | -6.04% | | | | | -0.62% | | | | | | | | | | 1.31% | | | | | |
| DBCMX/DLCMX | | | | | | | | | | | | | | |
DoubleLine Strategic Commodity Fund
Returns as of March 31, 2024 | | 1-Year | | 3-Years
Annualized | | 5-Years
Annualized | | | | Since Inception
Annualized
(5-18-15 to 3-31-24) | | Expense Ratio |
| | | | | | |
I Share (DBCMX) | | | | 6.72% | | | | | 11.74% | | | | | 6.84% | | | | | | | | | | 4.28% | | | 1.03% |
| | | | | | |
N Share (DLCMX) | | | | 6.50% | | | | | 11.46% | | | | | 6.60% | | | | | | | | | | 4.01% | | | 1.28% |
| | | | | | | |
Bloomberg Commodity Index Total Return2 | | | | -0.56% | | | | | 9.11% | | | | | 6.38% | | | | | | | | | | 1.01% | | | | | |
| DBLGX/DLGBX | | | | | | | | | | | | | | |
DoubleLine Global Bond Fund
Returns as of March 31, 2024 | | 1-Year | | 3-Years
Annualized | | 5-Years
Annualized | | | | Since Inception
Annualized
(12-17-15 to 3-31-24) | | Expense Ratio |
| | | | | | |
I Share (DBLGX) | | | | -0.83% | | | | | -5.99% | | | | | -3.25% | | | | | | | | | | -1.29% | | | 0.66% |
| | | | | | |
N Share (DLGBX) | | | | -1.19% | | | | | -6.24% | | | | | -3.50% | | | | | | | | | | -1.54% | | | 0.92% |
| | | | | | | |
FTSE World Government Bond Index2 | | | | -0.83% | | | | | -6.11% | | | | | -2.20% | | | | | | | | | | -0.13% | | | | | |
| BILDX/BILTX | | | | | | | | | | | | | | |
DoubleLine Infrastructure Income Fund
Returns as of March 31, 2024 | | 1-Year | | 3-Years
Annualized | | 5-Years
Annualized | | | | Since Inception
Annualized
(4-1-16 to 3-31-24) | | Expense Ratio |
| | | | | | |
I Share (BILDX) | | | | 5.68% | | | | | -0.75% | | | | | 1.49% | | | | | | | | | | 2.21% | | | 0.57% |
| | | | | | |
N Share (BILTX) | | | | 5.42% | | | | | -0.99% | | | | | 1.24% | | | | | | | | | | 1.96% | | | 0.82% |
| | | | | | | |
Bloomberg US Aggregate Bond Index2 | | | | 1.70% | | | | | -2.46% | | | | | 0.36% | | | | | | | | | | 0.99% | | | | | |
| DSEUX/DLEUX | | | | | | | | | | | | | | |
DoubleLine Shiller Enhanced International
CAPE® Returns as of March 31, 2024 | | 1-Year | | 3-Years
Annualized | | 5-Years
Annualized | | | | Since Inception
Annualized
(12-23-16 to 3-31-24) | | Gross
Expense
Ratio | | Net
Expense
Ratio3,10 |
| | | | | | | |
I Share (DSEUX) | | | | 8.88% | | | | | 3.35% | | | | | 7.77% | | | | | | | | | | 7.73% | | | 1.00% | | 0.68% |
| | | | | | | |
N Share (DLEUX) | | | | 8.59% | | | | | 3.06% | | | | | 7.49% | | | | | | | | | | 7.46% | | | 1.27% | | 0.93% |
| | | | | | | |
MSCI Europe Net Total Return USD Index2 | | | | 14.11% | | | | | 6.19% | | | | | 7.96% | | | | | | | | | | 8.07% | | | | | |
| DBELX/DLELX | | | | | | | | | | | | | | |
DoubleLine Emerging Markets Local Currency
Bond Fund
Returns as of March 31, 2024 | | 1-Year | | 3-Years
Annualized | | | | | | Since Inception
Annualized
(6-28-19 to 3-31-24) | | Gross
Expense
Ratio | | Net
Expense
Ratio10 |
| | | | | | | |
I Share (DBELX) | | | | 5.21% | | | | | -0.28% | | | | | | | | | | | | | | | -0.86% | | | 2.46% | | 0.91% |
| | | | | | | |
N Share (DLELX) | | | | 5.10% | | | | | -0.47% | | | | | | | | | | | | | | | -1.10% | | | 2.67% | | 1.16% |
| | | | | | | |
J.P. Morgan GBI-EM GD2 | | | | 4.91% | | | | | -1.60% | | | | | | | | | | | | | | | -1.01% | | | | | |
| | | | | | | | | | |
| 18 | | DoubleLine Funds Trust | | | | | | | | |
| | |
| | | (Unaudited) March 31, 2024 |
| | | | | | | | | | | | | | | | | | | | | | | | | | | | | |
| DBLIX/DBLNX | | | | | | | | | | | | | | |
DoubleLine Income Fund
Returns as of March 31, 2024 | | 1-Year | | 3-Years
Annualized | | | | | | Since Inception
Annualized
(9-3-19 to 3-31-24) | | Gross
Expense
Ratio | | Net
Expense
Ratio10 |
| | | | | | | |
I Share (DBLIX) | | | | 11.67% | | | | | 0.05% | | | | | | | | | | | | | | | -0.20% | | | 0.84% | | 0.66% |
| | | | | | | |
N Share (DBLNX) | | | | 11.38% | | | | | -0.24% | | | | | | | | | | | | | | | -0.43% | | | 1.09% | | 0.91% |
| | | | | | | |
Bloomberg US Aggregate Bond Index2 | | | | 1.70% | | | | | -2.46% | | | | | | | | | | | | | | | -0.91% | | | | | |
| DBMOX/DLMOX | | | | | | | | | | | | | | |
DoubleLine Multi-Asset Trend Fund
Returns as of March 31, 2024 | | 1-Year | | 3-Years
Annualized | | | | | | Since Inception
Not Annualized
(2-26-21 to 3-31-24) | | Gross
Expense
Ratio | | Net
Expense
Ratio3,10 |
| | | | | | | |
I Share (DBMOX) | | | | 6.37% | | | | | 1.21% | | | | | | | | | | | | | | | 0.80% | | | 2.48% | | 0.72% |
| | | | | | | |
N Share (DLMOX) | | | | 5.97% | | | | | 0.96% | | | | | | | | | | | | | | | 0.55% | | | 2.77% | | 0.98% |
| | | | | | | |
Credit Suisse Managed Futures Liquid Total Return USD Index2 | | | | -1.07% | | | | | 4.95% | | | | | | | | | | | | | | | 5.17% | | | | | |
1 The inception date of the Class I shares of DoubleLine Total Return Bond Fund (DBLTX) was 4/6/2010, while the inception date of the R6 Class (DDTRX) was 7/31/2019. The returns of DDTRX shown for periods prior to its inception date reflect the returns of DBLTX.
2 Reflects no deduction for fees, expenses, or taxes.
3 The Adviser has contractually agreed to waive fees incurred from investments made in other Doubleline Funds through August 1, 2025. For additional information regarding these expense limitation arrangements, please see Note 3 in the Notes to the Financial Statements.
4 The inception date of the Class I shares of DoubleLine Core Fixed Income Fund (DBLFX) was 6/1/2010, while the inception date of the R6 Class (DDCFX) was 7/31/2019. The returns of DDCFX shown for periods prior to its inception date reflect the returns of DBLFX.
5 The inception date of the Class I shares of DoubleLine Low Duration Bond Fund (DBLSX) was 9/30/2011, while the inception date of the R6 Class (DDLDX) was 7/31/2019. The returns of DDLDX shown for periods prior to its inception date reflect the returns of DBLSX.
6 Reflects no deduction for fees or taxes. Beginning in July 2022, transaction costs were incorporated into the calculation of total return for ICE fixed income indices.
7 The Floating Rate Fund imposes a 1.00% redemption fee on all share classes if shares are sold within 90 days of purchase. Performance data does not reflect the redemption fee. If it had, returns would be reduced.
8 The inception date of the Class I shares of DoubleLine Shiller Enhanced CAPE® (DSEEX) was 10/31/2013, while the inception date of the R6 Class (DDCPX) was 7/31/2019. The returns of DDCPX shown for periods prior to its inception date reflect the returns of DSEEX.
9 The inception date of the Class I shares of DoubleLine Flexible Income Fund (DFLEX) was 4/7/2014, while the inception date of the R6 Class (DFFLX) was 7/31/2019. The returns of DFFLX shown for periods prior to its inception date reflect the returns of DFLEX.
10 The Adviser has contractually agreed to waive fees and reimburse expenses through August 1, 2025. For additional information regarding these expense limitation arrangements, please see Note 3 in the Notes to the Financial Statements.
11 The return shown is based on net asset values calculated for shareholder transactions and may differ from the return shown in the Financial Highlights, which reflects adjustments made to the net asset values in accordance with accounting principles generally accepted in the United States of America.
Short term performance, in particular, is not a good indication of the fund’s future performance, and an investment should not be made based solely on returns.
Mutual fund investing involves risk. Principal loss is possible.
| | | | | | | | | | |
| | | | Annual Report | | | | | March 31, 2024 | | 19 |
| | |
Growth of Investment | | (Unaudited) March 31, 2024 |
DoubleLine Total Return Bond Fund
Value of a $100,000 Investment
Class I Shares1
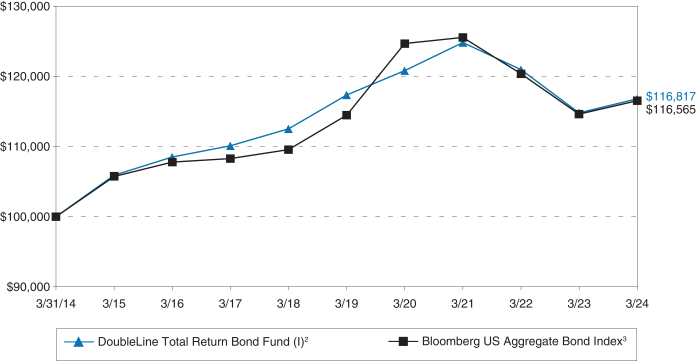
Average Annual Total Returns1
As of March 31, 2024
| | | | | | | | | | | | | | | | | | | | | | | | | |
| | | | | |
| | | | | 1 Year | | 5 Years | | 10 Years | | Since
Inception
(4-6-10) |
| | | | | |
DoubleLine Total Return Bond Fund Class I | | | | | | | | | 1.75% | | | | | -0.09% | | | | | 1.57% | | | | | 3.72% | |
| | | | | |
Bloomberg US Aggregate Bond Index | | | | | | | | | 1.70% | | | | | 0.36% | | | | | 1.54% | | | | | 2.31% | |
| | | | | |
DoubleLine Total Return Bond Fund Class R6 | | | | | | | | | 1.81% | | | | | -0.02% | | | | | 1.60% | | | | | 3.75% | |
| | | | | |
DoubleLine Total Return Bond Fund Class N | | | | | | | | | 1.50% | | | | | -0.34% | | | | | 1.32% | | | | | 3.47% | |
| 1 | Past performance is not an indication of future results. Returns represent past performance and reflect changes in share prices, the reinvestment of all dividends and capital gains, expense limitations and the effects of compounding. The prospectus contains more complete information on the investment objectives, risks, charges and expenses of the investment company, which investors should read and consider carefully before investing. To obtain a prospectus, contact a registered representative or visit www.doubleline.com. The Fund’s adviser waived a portion of its management fee and/or reimbursed Fund expenses during the period shown. Had the adviser not done so, the Fund’s total returns would have been lower. Total investment return and principal value of your investment will fluctuate, and your shares, when redeemed, may be worth more or less than their original cost. Current performance may be higher or lower than the performance data quoted. Performance data current to the most recent month-end may be obtained by calling (877) 354-6311 or by visiting www.doubleline.com. |
| 2 | Performance of other classes will be greater or less than the line shown based on the differences in loads and fees paid by shareholders investing in the different classes. |
| 3 | Bloomberg US Aggregate Bond Index—This index (the “Agg”) represents securities that are SEC registered, taxable and U.S. dollar denominated. It covers the U.S. investment grade, fixed-rate bond market, with components for government and corporate securities, mortgage pass-through securities and asset-backed securities. These major sectors are subdivided into more specific indices that are calculated and reported on a regular basis. Index performance reflects no deduction for fees, expenses or taxes. |
| | The Fund’s investments likely will diverge widely from the components of the benchmark index, which could lead to performance dispersion between the Fund and the benchmark index, meaning that the Fund could outperform or underperform the indices at any given time. Please note that an investor cannot invest directly in an index. |
| | | | | | | | | | |
| 20 | | DoubleLine Funds Trust | | | | | | | | |
| | |
| | | (Unaudited) March 31, 2024 |
DoubleLine Core Fixed Income Fund
Value of a $100,000 Investment
Class I Shares1
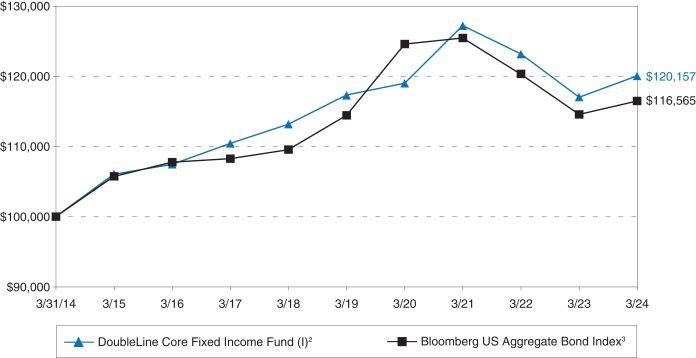
Average Annual Total Returns1
As of March 31, 2024
| | | | | | | | | | | | | | | | | | | | | | | | | |
| | | | | |
| | | | | 1 Year | | 5 Years | | 10 Years | | Since
Inception
(6-1-10) |
| | | | | |
DoubleLine Core Fixed Income Fund Class I | | | | | | | | | 2.60% | | | | | 0.46% | | | | | 1.85% | | | | | 3.36% | |
| | | | | |
Bloomberg US Aggregate Bond Index | | | | | | | | | 1.70% | | | | | 0.36% | | | | | 1.54% | | | | | 2.15% | |
| | | | | |
DoubleLine Core Fixed Income Fund Class R6 | | | | | | | | | 2.74% | | | | | 0.51% | | | | | 1.88% | | | | | 3.38% | |
| | | | | |
DoubleLine Core Fixed Income Fund Class N | | | | | | | | | 2.46% | | | | | 0.23% | | | | | 1.61% | | | | | 3.11% | |
| 1 | Past performance is not an indication of future results. Returns represent past performance and reflect changes in share prices, the reinvestment of all dividends and capital gains, expense limitations and the effects of compounding. The prospectus contains more complete information on the investment objectives, risks, charges and expenses of the investment company, which investors should read and consider carefully before investing. To obtain a prospectus, contact a registered representative or visit www.doubleline.com. The Fund’s adviser waived a portion of its management fee and/or reimbursed Fund expenses during the period shown. Had the adviser not done so, the Fund’s total returns would have been lower. Total investment return and principal value of your investment will fluctuate, and your shares, when redeemed, may be worth more or less than their original cost. Current performance may be higher or lower than the performance data quoted. Performance data current to the most recent month-end may be obtained by calling (877) 354-6311 or by visiting www.doubleline.com. |
| 2 | Performance of other classes will be greater or less than the line shown based on the differences in loads and fees paid by shareholders investing in the different classes. |
| 3 | Bloomberg US Aggregate Bond Index—This index (the “Agg”) represents securities that are SEC registered, taxable and U.S. dollar denominated. It covers the U.S. investment grade, fixed-rate bond market, with components for government and corporate securities, mortgage pass-through securities and asset-backed securities. These major sectors are subdivided into more specific indices that are calculated and reported on a regular basis. Index performance reflects no deduction for fees, expenses or taxes. |
| | The Fund’s investments likely will diverge widely from the components of the benchmark index, which could lead to performance dispersion between the Fund and the benchmark index, meaning that the Fund could outperform or underperform the indices at any given time. Please note that an investor cannot invest directly in an index. |
| | | | | | | | | | |
| | | | Annual Report | | | | | March 31, 2024 | | 21 |
| | |
Growth of Investment (Cont.) | | |
DoubleLine Emerging Markets Fixed Income Fund
Value of a $100,000 Investment
Class I Shares1
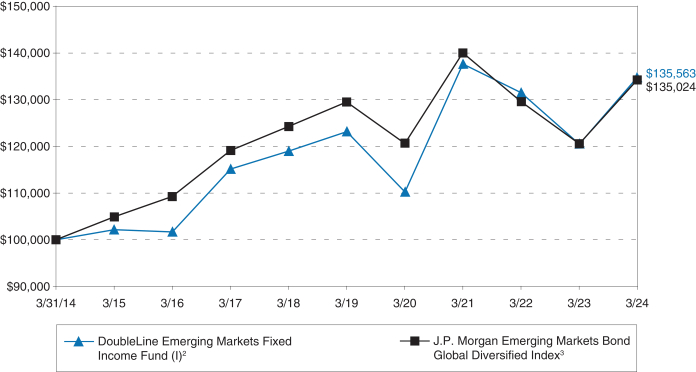
Average Annual Total Returns1
As of March 31, 2024
| | | | | | | | | | | | | | | | | | | | | | | | | |
| | | | | |
| | | | | 1 Year | | 5 Years | | 10 Years | | Since
Inception (4-6-10) |
| | | | | |
DoubleLine Emerging Markets Fixed Income Fund Class I | | | | | | | | | 11.78% | 4 | | | | 1.81% | | | | | 3.09% | | | | | 4.21% | |
| | | | | |
J.P. Morgan Emerging Markets Bond Global Diversified Index | | | | | | | | | 11.28% | | | | | 0.71% | | | | | 3.05% | | | | | 4.28% | |
| | | | | |
DoubleLine Emerging Markets Fixed Income Fund Class N | | | | | | | | | 11.37% | 4 | | | | 1.54% | | | | | 2.83% | | | | | 3.95% | |
| 1 | Past performance is not an indication of future results. Returns represent past performance and reflect changes in share prices, the reinvestment of all dividends and capital gains, expense limitations and the effects of compounding. The prospectus contains more complete information on the investment objectives, risks, charges and expenses of the investment company, which investors should read and consider carefully before investing. To obtain a prospectus, contact a registered representative or visit www.doubleline.com. The Fund’s adviser waived a portion of its management fee and/or reimbursed Fund expenses during the period shown. Had the adviser not done so, the Fund’s total returns would have been lower. Total investment return and principal value of your investment will fluctuate, and your shares, when redeemed, may be worth more or less than their original cost. Current performance may be higher or lower than the performance data quoted. Performance data current to the most recent month-end may be obtained by calling (877) 354-6311 or by visiting www.doubleline.com. |
| 2 | Performance of other classes will be greater or less than the line shown based on the differences in loads and fees paid by shareholders investing in the different classes. |
| 3 | .J.P. Morgan Emerging Markets Bond Global Diversified Index (EMBI GD)—This index is a uniquely weighted version of the EMBI. The EMBI tracks bonds from emerging markets (EM), and comprises sovereign debt and EM corporate bonds. The EMBI GD limits the weights of index countries with larger debt stocks by only including specified portions of those countries’ eligible current face amounts of debt outstanding. Index performance reflects no deduction for fees, expenses or taxes. |
| 4 | The return shown is based on net asset values calculated for shareholder transactions and may differ from the return shown in the financial highlights, which reflects adjustments made to the net asset values in accordance with accounting principles generally accepted in the United States of America. |
| | The Fund’s investments likely will diverge widely from the components of the benchmark index, which could lead to performance dispersion between the Fund and the benchmark index, meaning that the Fund could outperform or underperform the indices at any given time. Please note that an investor cannot invest directly in an index. |
| | | | | | | | | | |
| 22 | | DoubleLine Funds Trust | | | | | | | | |
| | |
| | | (Unaudited) March 31, 2024 |
DoubleLine Low Duration Bond Fund
Value of a $100,000 Investment
Class I Shares1
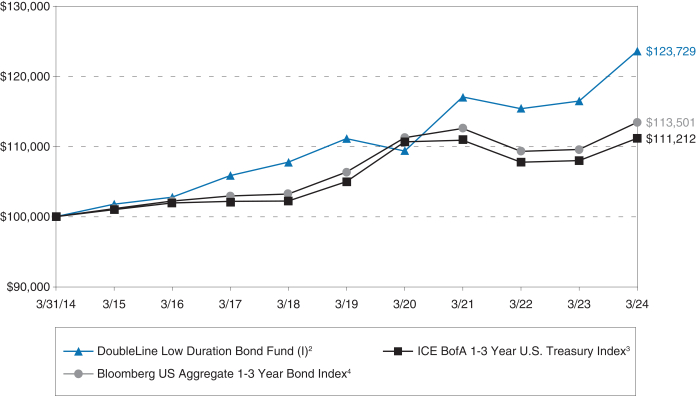
Average Annual Total Returns1
As of March 31, 2024
| | | | | | | | | | | | | | | | | | | | | | | | | |
| | | | | |
| | | | | 1 Year | | 5 Years | | 10 Years | | Since
Inception (9-30-11) |
| | | | | |
DoubleLine Low Duration Bond Fund Class I | | | | | | | | | 6.16% | | | | | 2.17% | | | | | 2.15% | | | | | 2.27% | |
| | | | | |
ICE BofA 1-3 Year U.S. Treasury Index | | | | | | | | | 2.97% | | | | | 1.16% | | | | | 1.07% | | | | | 0.94% | |
| | | | | |
Bloomberg US Aggregate 1-3 Year Bond Index | | | | | | | | | 3.56% | | | | | 1.31% | | | | | 1.27% | | | | | 1.22% | |
| | | | | |
DoubleLine Low Duration Bond Fund Class R6 | | | | | | | | | 6.20% | | | | | 2.20% | | | | | 2.17% | | | | | 2.28% | |
| | | | | |
DoubleLine Low Duration Bond Fund Class N | | | | | | | | | 5.90% | | | | | 1.91% | | | | | 1.90% | | | | | 2.01% | |
| 1 | Past performance is not an indication of future results. Returns represent past performance and reflect changes in share prices, the reinvestment of all dividends and capital gains, expense limitations and the effects of compounding. The prospectus contains more complete information on the investment objectives, risks, charges and expenses of the investment company, which investors should read and consider carefully before investing. To obtain a prospectus, contact a registered representative or visit www.doubleline.com. The Fund’s adviser waived a portion of its management fee and/or reimbursed Fund expenses during the period shown. Had the adviser not done so, the Fund’s total returns would have been lower. Total investment return and principal value of your investment will fluctuate, and your shares, when redeemed, may be worth more or less than their original cost. Current performance may be higher or lower than the performance data quoted. Performance data current to the most recent month-end may be obtained by calling (877) 354-6311 or by visiting www.doubleline.com. |
| 2 | Performance of other classes will be greater or less than the line shown based on the differences in loads and fees paid by shareholders investing in the different classes. |
| 3 | ICE BofA 1-3 Year U.S. Treasury Index—An unmanaged index that tracks the performance of the direct sovereign debt of the U.S. government having a maturity of at least one year and less than three years. Index performance reflects no deduction for fees, expenses or taxes. |
| 4 | Bloomberg US Aggregate 1-3 Year Bond Index—This index tracks the one- to three-year component of the Bloomberg US Aggregate Bond Index, which represents securities that are SEC registered, taxable and dollar denominated in the U.S. investment grade, fixed-rate bond market. Index performance reflects no deduction for fees, expenses or taxes. |
| | The Fund’s investments likely will divergewidely from the components of the indices, which could lead to performance dispersion between the Fund and each applicable index, meaning that the Fund could outperform or underperform the indices at any given time. Please note that an investor cannot invest directly in an index. |
| | | | | | | | | | |
| | | | Annual Report | | | | | March 31, 2024 | | 23 |
| | |
Growth of Investment (Cont.) | | |
DoubleLine Floating Rate Fund
Value of a $100,000 Investment
Class I Shares1
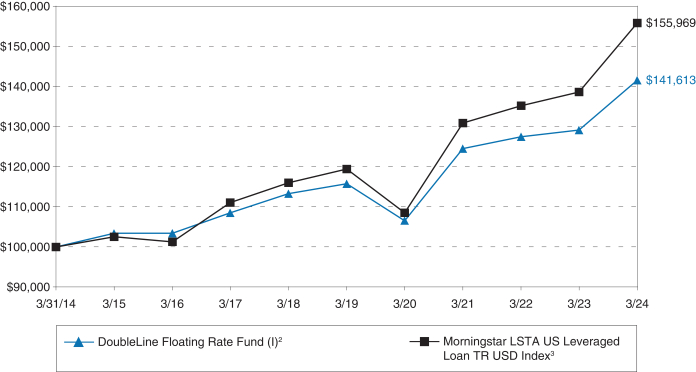
Average Annual Total Returns1
As of March 31, 2024
| | | | | | | | | | | | | | | | | | | | | | | | | |
| | | | | |
| | | | | 1 Year | | 5 Years | | 10 Years | | Since
Inception (2-1-13) |
| | | | | |
DoubleLine Floating Rate Fund Class I | | | | | | | | | 9.61% | | | | | 4.12% | | | | | 3.54% | | | | | 3.52% | |
| | | | | |
Morningstar LSTA US Leveraged Loan TR USD Index | | | | | | | | | 12.47% | | | | | 5.47% | | | | | 4.54% | | | | | 4.56% | |
| | | | | |
DoubleLine Floating Rate Fund Class N | | | | | | | | | 9.43% | | | | | 3.86% | | | | | 3.29% | | | | | 3.29% | |
| 1 | Past performance is not an indication of future results. Returns represent past performance and reflect changes in share prices, the reinvestment of all dividends and capital gains, expense limitations and the effects of compounding. The prospectus contains more complete information on the investment objectives, risks, charges and expenses of the investment company, which investors should read and consider carefully before investing. To obtain a prospectus, contact a registered representative or visit www.doubleline.com. The Fund’s adviser waived a portion of its management fee and/or reimbursed Fund expenses during the period shown. Had the adviser not done so, the Fund’s total returns would have been lower. Total investment return and principal value of your investment will fluctuate, and your shares, when redeemed, may be worth more or less than their original cost. Current performance may be higher or lower than the performance data quoted. Performance data current to the most recent month-end may be obtained by calling (877) 354-6311 or by visiting www.doubleline.com. |
| 2 | Performance of other classes will be greater or less than the line shown based on the differences in loads and fees paid by shareholders investing in the different classes. |
| 3 | Morningstar LSTA US Leveraged Loan TR USD Index—This index tracks the market-weighted performance of institutional weighted loans based on market weightings, spreads and interest payments. Index performance reflects no deduction for fees, expenses or taxes. |
| | The Fund’s investments likely will diverge widely from the components of the benchmark index, which could lead to performance dispersion between the Fund and the benchmark index, meaning that the Fund could outperform or underperform the indices at any given time. Please note that an investor cannot invest directly in an index. |
| | | | | | | | | | |
| 24 | | DoubleLine Funds Trust | | | | | | | | |
| | |
| | | (Unaudited) March 31, 2024 |
DoubleLine Shiller Enhanced CAPE®
Value of a $100,000 Investment
Class I Shares1
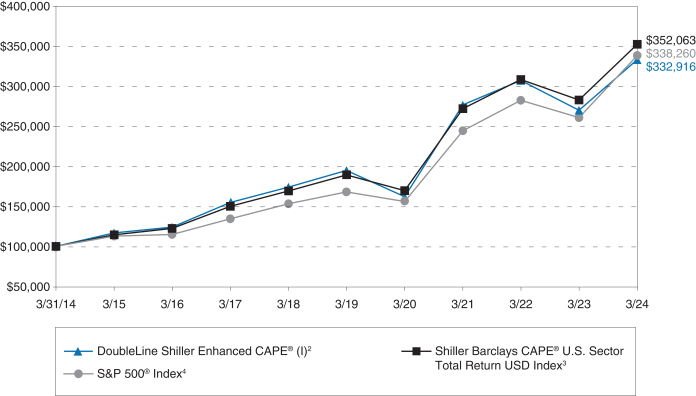
Average Annual Total Returns1
As of March 31, 2024
| | | | | | | | | | | | | | | | | | | | | | | | | |
| | | | | |
| | | | | 1 Year | | 5 Years | | 10 Years | | Since
Inception (10-31-13) |
| | | | | |
DoubleLine Shiller Enhanced CAPE® Class I | | | | | | | | | 23.36% | | | | | 11.35% | | | | | 12.78% | | | | | 13.06% | |
| | | | | |
S&P 500® Index | | | | | | | | | 29.88% | | | | | 15.05% | | | | | 12.96% | | | | | 13.20% | |
| | | | | |
Shiller Barclays CAPE® U.S. Sector Total Return USD Index | | | | | | | | | 24.68% | | | | | 13.24% | | | | | 13.41% | | | | | 13.55% | |
| | | | | |
DoubleLine Shiller Enhanced CAPE® Class R6 | | | | | | | | | 23.41% | | | | | 11.41% | | | | | 12.81% | | | | | 13.09% | |
| | | | | |
DoubleLine Shiller Enhanced CAPE® Class N | | | | | | | | | 23.07% | | | | | 11.07% | | | | | 12.50% | | | | | 12.78% | |
| 1 | Past performance is not an indication of future results. Returns represent past performance and reflect changes in share prices, the reinvestment of all dividends and capital gains, expense limitations and the effects of compounding. The prospectus contains more complete information on the investment objectives, risks, charges and expenses of the investment company, which investors should read and consider carefully before investing. To obtain a prospectus, contact a registered representative or visit www.doubleline.com. The Fund’s adviser waived a portion of its management fee and/or reimbursed Fund expenses during the period shown. Had the adviser not done so, the Fund’s total returns would have been lower. Total investment return and principal value of your investment will fluctuate, and your shares, when redeemed, may be worth more or less than their original cost. Current performance may be higher or lower than the performance data quoted. Performance data current to the most recent month-end may be obtained by calling (877) 354-6311 or by visiting www.doubleline.com. |
| 2 | Performance of other classes will be greater or less than the line shown based on the differences in loads and fees paid by shareholders investing in the different classes. |
| 3 | Shiller Barclays CAPE® U.S. Sector Total Return USD Index—The Index incorporates the principles of long-term investing distilled by Dr. Robert Shiller and expressed through the CAPE® (Cyclically Adjusted Price Earnings) ratio (the “CAPE® Ratio”). It aims to identify undervalued sectors based on a modified CAPE® Ratio, and then uses a momentum factor to seek to mitigate the effects of potential value traps. Index performance reflects no deduction for fees, expenses or taxes. |
| 4 | S&P 500® Index—This unmanaged capitalization-weighted index of the stocks of the 500 largest publicly traded U.S. companies is designed to measure performance of the broad domestic economy through changes in the aggregate market value of the 500 stocks, which represent all major industries. Index performance reflects no deduction for fees, expenses or taxes. |
| | The Fund’s investments likely will divergewidely from the components of the indices, which could lead to performance dispersion between the Fund and each applicable index, meaning that the Fund could outperform or underperform the indices at any given time. Please note that an investor cannot invest directly in an index. |
| | | | | | | | | | |
| | | | Annual Report | | | | | March 31, 2024 | | 25 |
| | |
Growth of Investment (Cont.) | | |
DoubleLine Flexible Income Fund
Value of a $100,000 Investment
Class I Shares1
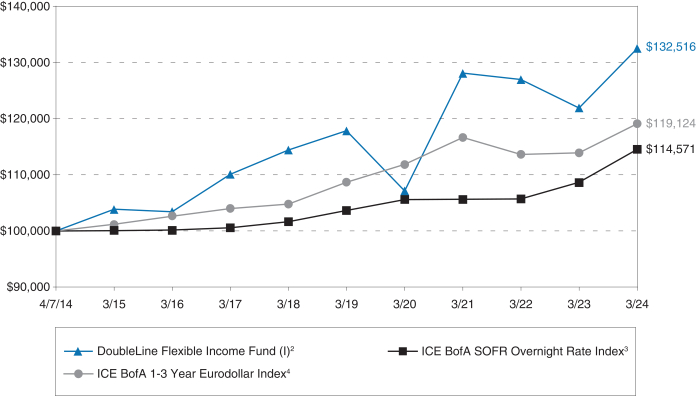
Average Annual Total Returns1
As of March 31, 2024
| | | | | | | | | | | | | | | | | | | | |
| | | | |
| | | | | 1 Year | | 5 Years | | Since
Inception (4-7-14) |
| | | | |
DoubleLine Flexible Income Fund Class I | | | | | | | | | 8.69% | | | | | 2.38% | | | | | 2.86% | |
| | | | |
ICE BofA SOFR Overnight Rate Index | | | | | | | | | 5.44% | | | | | 2.02% | | | | | 1.37% | |
| | | | |
ICE BofA 1-3 Year Eurodollar Index | | | | | | | | | 4.56% | | | | | 1.86% | | | | | 1.77% | |
| | | | |
DoubleLine Flexible Income Fund Class R6 | | | | | | | | | 8.73% | | | | | 2.44% | | | | | 2.89% | |
| | | | |
DoubleLine Flexible Income Fund Class N | | | | | | | | | 8.42% | | | | | 2.14% | | | | | 2.61% | |
| 1 | Past performance is not an indication of future results. Returns represent past performance and reflect changes in share prices, the reinvestment of all dividends and capital gains, expense limitations and the effects of compounding. The prospectus contains more complete information on the investment objectives, risks, charges and expenses of the investment company, which investors should read and consider carefully before investing. To obtain a prospectus, contact a registered representative or visit www.doubleline.com. The Fund’s adviser waived a portion of its management fee and/or reimbursed Fund expenses during the period shown. Had the adviser not done so, the Fund’s total returns would have been lower. Total investment return and principal value of your investment will fluctuate, and your shares, when redeemed, may be worth more or less than their original cost. Current performance may be higher or lower than the performance data quoted. Performance data current to the most recent month-end may be obtained by calling (877) 354-6311 or by visiting www.doubleline.com. |
| 2 | Performance of other classes will be greater or less than the line shown based on the differences in loads and fees paid by shareholders investing in the different classes. |
| 3 | ICE BofA SOFR Overnight Rate Index—This index tracks the performance of a synthetic asset paying the Secured Overnight Financing Rate (SOFR) to a stated maturity. The index is based on the assumed purchase at par of a synthetic instrument having exactly its stated maturity and with a coupon equal to that day’s fixing rate. That issue is assumed to be sold the following business day (priced at a yield equal to the current-day fixing rate) and rolled into a new instrument. Index performance reflects no deduction for fees, expenses or taxes. |
| 4 | ICE BofA 1-3 Year Eurodollar Index—This index includes all securities with a remaining term to final maturity of three years or less on the ICE BofA Eurodollar Index, which tracks the performance of U.S. dollar-denominated, investment grade, quasi-government, corporate, securitized and collateralized debt publicly issued in the eurobond markets. Index performance reflects no deduction for fees, expenses or taxes. |
| | The Fund’s investments likely will divergewidely from the components of the benchmark index, which could lead to performance dispersion between the Fund and the benchmark index, meaning that the Fund could outperform or underperform the indices at any given time. Please note that an investor cannot invest directly in an index. |
| | | | | | | | | | |
| 26 | | DoubleLine Funds Trust | | | | | | | | |
| | |
| | | (Unaudited) March 31, 2024 |
DoubleLine Low Duration Emerging Markets Fixed Income Fund
Value of a $100,000 Investment
Class I Shares1

Average Annual Total Returns1
As of March 31, 2024
| | | | | | | | | | | | | | | | | | | | |
| | | | |
| | | | | 1 Year | | 5 Years | | Since
Inception
(4-7-14) |
| | | | |
DoubleLine Low Duration Emerging Markets Fixed Income Fund Class I | | | | | | | | | 8.23% | | | | | 2.29% | | | | | 2.60% | |
| | | | |
J.P. Morgan Corporate Emerging Markets Bond Index Broad Diversified 1-3 Year | | | | | | | | | 8.45% | | | | | 2.70% | | | | | 3.08% | |
| | | | |
DoubleLine Low Duration Emerging Markets Fixed Income Fund Class N | | | | | | | | | 8.07% | | | | | 2.05% | | | | | 2.35% | |
| 1 | Past performance is not an indication of future results. Returns represent past performance and reflect changes in share prices, the reinvestment of all dividends and capital gains, expense limitations and the effects of compounding. The prospectus contains more complete information on the investment objectives, risks, charges and expenses of the investment company, which investors should read and consider carefully before investing. To obtain a prospectus, contact a registered representative or visit www.doubleline.com. The Fund’s adviser waived a portion of its management fee and/or reimbursed Fund expenses during the period shown. Had the adviser not done so, the Fund’s total returns would have been lower. Total investment return and principal value of your investment will fluctuate, and your shares, when redeemed, may be worth more or less than their original cost. Current performance may be higher or lower than the performance data quoted. Performance data current to the most recent month-end may be obtained by calling (877) 354-6311 or by visiting www.doubleline.com. |
| 2 | Performance of other classes will be greater or less than the line shown based on the differences in loads and fees paid by shareholders investing in the different classes. |
| 3 | J.P. Morgan Corporate Emerging Markets Bond Index Broad Diversified (CEMBI BD) 1-3 Year Index—This index tracks corporate bonds with a maturity of one to three years and includes smaller issues and a wider array of bonds than the CEMBI, which is a market capitalization-weighted index consisting of U.S. dollar-denominated corporate bonds from emerging markets. The CEMBI is a liquid global corporate benchmark representing Asia, Latin America, Europe and the Middle East/Africa. Index performance reflects no deduction for fees, expenses or taxes. |
| | The Fund’s investments likely will diverge widely from the components of the benchmark index, which could lead to performance dispersion between the Fund and the benchmark index, meaning that the Fund could outperform or underperform the indices at any given time. Please note that an investor cannot invest directly in an index. |
| | | | | | | | | | |
| | | | Annual Report | | | | | March 31, 2024 | | 27 |
| | |
Growth of Investment (Cont.) | | |
DoubleLine Long Duration Total Return Bond Fund
Value of a $100,000 Investment
Class I Shares1
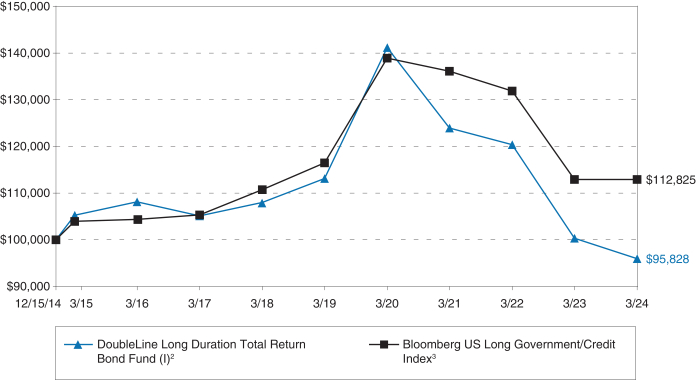
Average Annual Total Returns1
As of March 31, 2024
| | | | | | | | | | | | | | | | | | | | |
| | | | |
| | | | | 1 Year | | 5 Years | | Since
Inception (12-15-14) |
| | | | |
DoubleLine Long Duration Total Return Bond Fund Class I | | | | | | | | | -4.39% | | | | | -3.25% | | | | | -0.46% | |
| | | | |
Bloomberg US Long Government/Credit Index | | | | | | | | | -1.15% | | | | | -0.62% | | | | | 1.31% | |
| | | | |
DoubleLine Long Duration Total Return Bond Fund Class N | | | | | | | | | -4.63% | | | | | -3.55% | | | | | -0.74% | |
| 1 | Past performance is not an indication of future results. Returns represent past performance and reflect changes in share prices, the reinvestment of all dividends and capital gains, expense limitations and the effects of compounding. The prospectus contains more complete information on the investment objectives, risks, charges and expenses of the investment company, which investors should read and consider carefully before investing. To obtain a prospectus, contact a registered representative or visit www.doubleline.com. The Fund’s adviser waived a portion of its management fee and/or reimbursed Fund expenses during the period shown. Had the adviser not done so, the Fund’s total returns would have been lower. Total investment return and principal value of your investment will fluctuate, and your shares, when redeemed, may be worth more or less than their original cost. Current performance may be higher or lower than the performance data quoted. Performance data current to the most recent month-end may be obtained by calling (877) 354-6311 or by visiting www.doubleline.com. |
| 2 | Performance of other classes will be greater or less than the line shown based on the differences in loads and fees paid by shareholders investing in the different classes. |
| 3 | Bloomberg US Long Government/Credit Index—This index tracks the market for investment grade, U.S. dollar-denominated, fixed-rate U.S. Treasuries, and government-related and corporate securities. Index performance reflects no deduction for fees, expenses or taxes. |
| | The Fund’s investments likely will diverge widely from the components of the benchmark index, which could lead to performance dispersion between the Fund and the benchmark index, meaning that the Fund could outperform or underperform the indices at any given time. Please note that an investor cannot invest directly in an index. |
| | | | | | | | | | |
| 28 | | DoubleLine Funds Trust | | | | | | | | |
| | |
| | | (Unaudited) March 31, 2024 |
DoubleLine Strategic Commodity Fund
Value of a $100,000 Investment
Class I Shares1
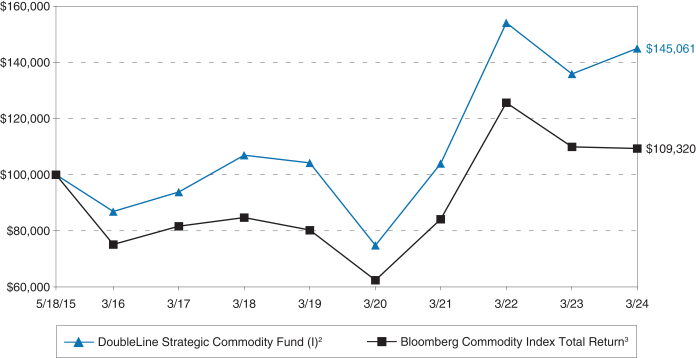
Average Annual Total Returns1
As of March 31, 2024
| | | | | | | | | | | | | | | | | | | | |
| | | | |
| | | | | 1 Year | | 5 Years | | Since
Inception (5-18-15) |
| | | | |
DoubleLine Strategic Commodity Fund Class I | | | | | | | | | 6.72% | | | | | 6.84% | | | | | 4.28% | |
| | | | |
Bloomberg Commodity Index Total Return | | | | | | | | | -0.56% | | | | | 6.38% | | | | | 1.01% | |
| | | | |
DoubleLine Strategic Commodity Fund Class N | | | | | | | | | 6.50% | | | | | 6.60% | | | | | 4.01% | |
| 1 | Past performance is not an indication of future results. Returns represent past performance and reflect changes in share prices, the reinvestment of all dividends and capital gains, expense limitations and the effects of compounding. The prospectus contains more complete information on the investment objectives, risks, charges and expenses of the investment company, which investors should read and consider carefully before investing. To obtain a prospectus, contact a registered representative or visit www.doubleline.com. The Fund’s adviser waived a portion of its management fee and/or reimbursed Fund expenses during the period shown. Had the adviser not done so, the Fund’s total returns would have been lower. Total investment return and principal value of your investment will fluctuate, and your shares, when redeemed, may be worth more or less than their original cost. Current performance may be higher or lower than the performance data quoted. Performance data current to the most recent month-end may be obtained by calling (877) 354-6311 or by visiting www.doubleline.com. |
| 2 | Performance of other classes will be greater or less than the line shown based on the differences in loads and fees paid by shareholders investing in the different classes. |
| 3 | Bloomberg Commodity (BCOM) Index Total Return—The BCOM Index Total Return tracks the performance of the BCOM on a total return basis. The BCOM is calculated on an excess return basis and reflects the price movements of commodity futures. It rebalances annually, weighted two-thirds by trading volume and one-third by world production, and weight caps are applied at the commodity, sector and group levels for diversification. The roll period typically occurs from the sixth to 10th business day based on the roll schedule. Index performance reflects no deduction for fees, expenses or taxes. |
| | The Fund’s investments likely will diverge widely from the components of the benchmark index, which could lead to performance dispersion between the Fund and the benchmark index, meaning that the Fund could outperform or underperform the indices at any given time. Please note that an investor cannot invest directly in an index. |
| | | | | | | | | | |
| | | | Annual Report | | | | | March 31, 2024 | | 29 |
| | |
Growth of Investment (Cont.) | | |
DoubleLine Global Bond Fund
Value of a $100,000 Investment
Class I Shares1

Average Annual Total Returns1
As of March 31, 2024
| | | | | | | | | | | | | | | | | | | | |
| | | | |
| | | | | 1 Year | | 5 Years | | Since
Inception
(12-17-15) |
| | | | |
DoubleLine Global Bond Fund Class I | | | | | | | | | -0.83% | | | | | -3.25% | | | | | -1.29% | |
| | | | |
FTSE World Government Bond Index | | | | | | | | | -0.83% | | | | | -2.20% | | | | | -0.13% | |
| | | | |
DoubleLine Global Bond Fund Class N | | | | | | | | | -1.19% | | | | | -3.50% | | | | | -1.54% | |
| 1 | Past performance is not an indication of future results. Returns represent past performance and reflect changes in share prices, the reinvestment of all dividends and capital gains, expense limitations and the effects of compounding. The prospectus contains more complete information on the investment objectives, risks, charges and expenses of the investment company, which investors should read and consider carefully before investing. To obtain a prospectus, contact a registered representative or visit www.doubleline.com. The Fund’s adviser waived a portion of its management fee and/or reimbursed Fund expenses during the period shown. Had the adviser not done so, the Fund’s total returns would have been lower. Total investment return and principal value of your investment will fluctuate, and your shares, when redeemed, may be worth more or less than their original cost. Current performance may be higher or lower than the performance data quoted. Performance data current to the most recent month-end may be obtained by calling (877) 354-6311 or by visiting www.doubleline.com. |
| 2 | Performance of other classes will be greater or less than the line shown based on the differences in loads and fees paid by shareholders investing in the different classes. |
| 3 | FTSE World Government Bond Index—This broad index measures the performance of fixed-rate, local currency, investment grade sovereign bonds. It is a widely used benchmark comprising sovereign debt from more than 20 countries that is denominated in a variety of currencies. Index performance reflects no deduction for fees, expenses or taxes. |
| | The Fund’s investments likely will diverge widely from the components of the benchmark index, which could lead to performance dispersion between the Fund and the benchmark index, meaning that the Fund could outperform or underperform the indices at any given time. Please note that an investor cannot invest directly in an index. |
| | | | | | | | | | |
| 30 | | DoubleLine Funds Trust | | | | | | | | |
| | |
| | | (Unaudited) March 31, 2024 |
DoubleLine Infrastructure Income Fund
Value of a $100,000 Investment
Class I Shares1
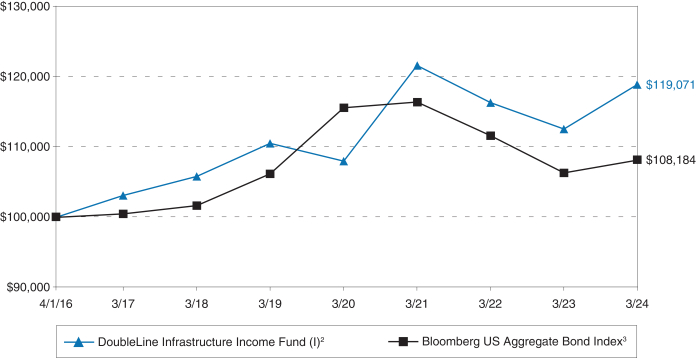
Average Annual Total Returns1
As of March 31, 2024
| | | | | | | | | | | | | | | | | | | | |
| | | | |
| | | | | 1 Year | | 5 Years | | Since
Inception
(4-1-16) |
| | | | |
DoubleLine Infrastructure Income Fund Class I | | | | | | | | | 5.68% | | | | | 1.49% | | | | | 2.21% | |
| | | | |
Bloomberg US Aggregate Bond Index | | | | | | | | | 1.70% | | | | | 0.36% | | | | | 0.99% | |
| | | | |
DoubleLine Infrastructure Income Fund Class N | | | | | | | | | 5.42% | | | | | 1.24% | | | | | 1.96% | |
| 1 | Past performance is not an indication of future results. Returns represent past performance and reflect changes in share prices, the reinvestment of all dividends and capital gains, expense limitations and the effects of compounding. The prospectus contains more complete information on the investment objectives, risks, charges and expenses of the investment company, which investors should read and consider carefully before investing. To obtain a prospectus, contact a registered representative or visit www.doubleline.com. The Fund’s adviser waived a portion of its management fee and/or reimbursed Fund expenses during the period shown. Had the adviser not done so, the Fund’s total returns would have been lower. Total investment return and principal value of your investment will fluctuate, and your shares, when redeemed, may be worth more or less than their original cost. Current performance may be higher or lower than the performance data quoted. Performance data current to the most recent month-end may be obtained by calling (877) 354-6311 or by visiting www.doubleline.com. |
| 2 | Performance of other classes will be greater or less than the line shown based on the differences in loads and fees paid by shareholders investing in the different classes. |
| 3 | Bloomberg US Aggregate Bond Index—This index represents securities that are SEC registered, taxable and dollar denominated. It covers the U.S. investment grade, fixed-rate bond market, with components for government and corporate securities, mortgage pass-through securities and asset-backed securities. These major sectors are subdivided into more specific indexes that are calculated and reported on a regular basis. Index performance reflects no deduction for fees, expenses or taxes. |
| | The Fund’s investments likely will diverge widely from the components of the benchmark index, which could lead to performance dispersion between the Fund and the benchmark index, meaning that the Fund could outperform or underperform the indices at any given time. Please note that an investor cannot invest directly in an index. |
| | | | | | | | | | |
| | | | Annual Report | | | | | March 31, 2024 | | 31 |
| | |
Growth of Investment (Cont.) | | |
DoubleLine Shiller Enhanced International CAPE®
Value of a $100,000 Investment
Class I Shares1
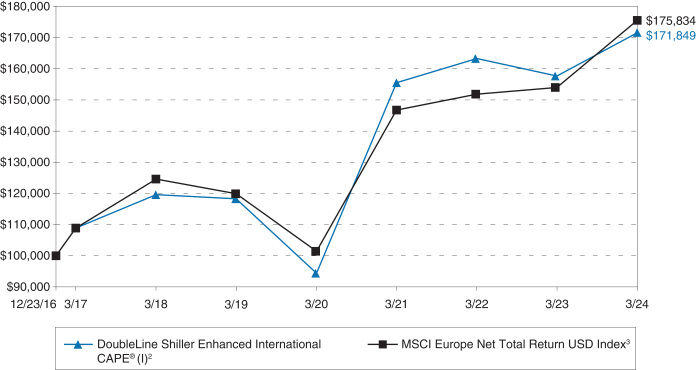
Average Annual Total Returns1
As of March 31, 2024
| | | | | | | | | | | | | | | | | | | | |
| | | | |
| | | | | 1 Year | | 5 Years | | Since
Inception
(12-23-16) |
| | | | |
DoubleLine Shiller Enhanced International CAPE® Class I | | | | | | | | | 8.88% | | | | | 7.77% | | | | | 7.73% | |
| | | | |
MSCI Europe Net Total Return USD Index | | | | | | | | | 14.11% | | | | | 7.96% | | | | | 8.07% | |
| | | | |
DoubleLine Shiller Enhanced International CAPE® Class N | | | | | | | | | 8.59% | | | | | 7.49% | | | | | 7.46% | |
| 1 | Past performance is not an indication of future results. Returns represent past performance and reflect changes in share prices, the reinvestment of all dividends and capital gains, expense limitations and the effects of compounding. The prospectus contains more complete information on the investment objectives, risks, charges and expenses of the investment company, which investors should read and consider carefully before investing. To obtain a prospectus, contact a registered representative or visit www.doubleline.com. The Fund’s adviser waived a portion of its management fee and/or reimbursed Fund expenses during the period shown. Had the adviser not done so, the Fund’s total returns would have been lower. Total investment return and principal value of your investment will fluctuate, and your shares, when redeemed, may be worth more or less than their original cost. Current performance may be higher or lower than the performance data quoted. Performance data current to the most recent month-end may be obtained by calling (877) 354-6311 or by visiting www.doubleline.com. |
| 2 | Performance of other classes will be greater or less than the line shown based on the differences in loads and fees paid by shareholders investing in the different classes. |
| 3 | MSCI Europe Net Total Return USD Index—This index is a component of the MSCI Europe Index and measures performance on a net total return basis. Index performance reflects no deduction for fees, expenses or taxes. |
| | The Fund’s investments likely will diverge widely from the components of the benchmark index, which could lead to performance dispersion between the Fund and the benchmark index, meaning that the Fund could outperform or underperform the indices at any given time. Please note that an investor cannot invest directly in an index. |
| | | | | | | | | | |
| 32 | | DoubleLine Funds Trust | | | | | | | | |
| | |
| | | (Unaudited) March 31, 2024 |
DoubleLine Emerging Markets Local Currency Bond
Value of a $100,000 Investment
Class I Shares1
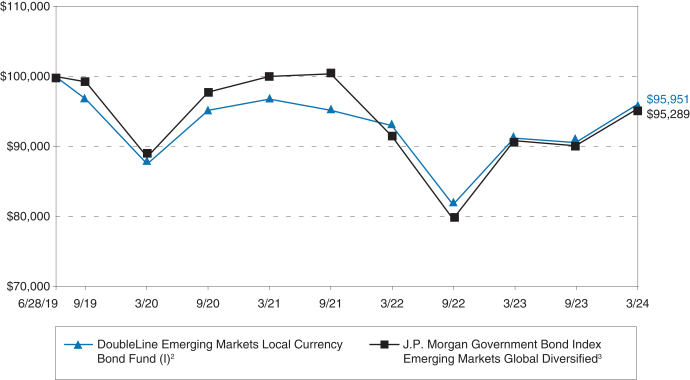
Average Annual Total Returns1
As of March 31, 2024
| | | | | | | | | | | | | | | |
| | | |
| | | | | 1 Year | | Since
Inception
(6-28-19) |
| | | |
DoubleLine Emerging Markets Local Currency Bond Fund Class I | | | | | | | | | 5.21% | | | | | -0.86% | |
| | | |
J.P. Morgan Government Bond Index Emerging Markets Global Diversified | | | | | | | | | 4.91% | | | | | -1.01% | |
| | | |
DoubleLine Emerging Markets Local Currency Bond Fund Class N | | | | | | | | | 5.10% | | | | | -1.10% | |
| 1 | Past performance is not an indication of future results. Returns represent past performance and reflect changes in share prices, the reinvestment of all dividends and capital gains, expense limitations and the effects of compounding. The prospectus contains more complete information on the investment objectives, risks, charges and expenses of the investment company, which investors should read and consider carefully before investing. To obtain a prospectus, contact a registered representative or visit www.doubleline.com. The Fund’s adviser waived a portion of its management fee and/or reimbursed Fund expenses during the period shown. Had the adviser not done so, the Fund’s total returns would have been lower. Total investment return and principal value of your investment will fluctuate, and your shares, when redeemed, may be worth more or less than their original cost. Current performance may be higher or lower than the performance data quoted. Performance data current to the most recent month-end may be obtained by calling (877) 354-6311 or by visiting www.doubleline.com. |
| 2 | Performance of other classes will be greater or less than the line shown based on the differences in loads and fees paid by shareholders investing in the different classes. |
| 3 | J.P. Morgan Government Bond Index Emerging Markets Global Diversified (GBI-EM GD)—This custom-weighted index tracks local currency bonds issued by emerging market governments, excluding China and India, and has a broader roster of countries than the base GBI-EM, which limits inclusion to countries that are readily accessible and where no impediments exist for foreign investors. Index performance reflects no deduction for fees, expenses or taxes. |
| | The Fund’s investments likely will diverge widely from the components of the benchmark index, which could lead to performance dispersion between the Fund and the benchmark index, meaning that the Fund could outperform or underperform the indices at any given time. Please note that an investor cannot invest directly in an index. |
| | | | | | | | | | |
| | | | Annual Report | | | | | March 31, 2024 | | 33 |
| | |
Growth of Investment (Cont.) | | |
DoubleLine Income Fund
Value of a $100,000 Investment
Class I Shares1
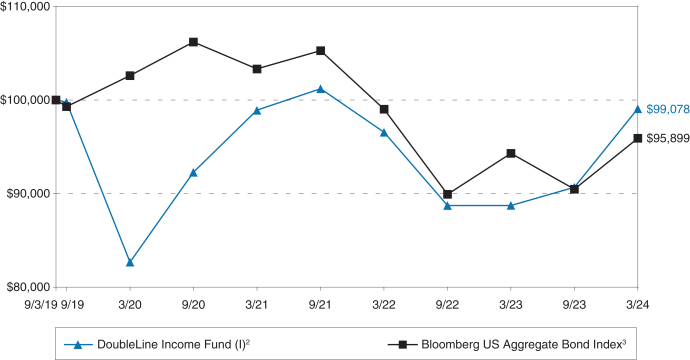
Average Annual Total Returns1
As of March 31, 2024
| | | | | | | | | | | | | | | |
| | | |
| | | | | 1 Year | | Since
Inception
(9-3-19) |
| | | |
DoubleLine Income Fund Class I | | | | | | | | | 11.67% | | | | | -0.20% | |
| | | |
Bloomberg US Aggregate Bond Index | | | | | | | | | 1.70% | | | | | -0.91% | |
| | | |
DoubleLine Income Fund Class N | | | | | | | | | 11.38% | | | | | -0.43% | |
| 1 | Past performance is not an indication of future results. Returns represent past performance and reflect changes in share prices, the reinvestment of all dividends and capital gains, expense limitations and the effects of compounding. The prospectus contains more complete information on the investment objectives, risks, charges and expenses of the investment company, which investors should read and consider carefully before investing. To obtain a prospectus, contact a registered representative or visit www.doubleline.com. The Fund’s adviser waived a portion of its management fee and/or reimbursed Fund expenses during the period shown. Had the adviser not done so, the Fund’s total returns would have been lower. Total investment return and principal value of your investment will fluctuate, and your shares, when redeemed, may be worth more or less than their original cost. Current performance may be higher or lower than the performance data quoted. Performance data current to the most recent month-end may be obtained by calling (877) 354-6311 or by visiting www.doubleline.com. |
| 2 | Performance of other classes will be greater or less than the line shown based on the differences in loads and fees paid by shareholders investing in the different classes. |
| 3 | Bloomberg US Aggregate Bond Index—This index represents securities that are SEC registered, taxable and dollar denominated. It covers the U.S. investment grade, fixed-rate bond market, with components for government and corporate securities, mortgage pass-through securities and asset-backed securities. These major sectors are subdivided into more specific indices that are calculated and reported on a regular basis. Index performance reflects no deduction for fees, expenses or taxes. |
| | The Fund’s investments likely will diverge widely from the components of the benchmark index, which could lead to performance dispersion between the Fund and the benchmark index, meaning that the Fund could outperform or underperform the indices at any given time. Please note that an investor cannot invest directly in an index. |
| | | | | | | | | | |
| 34 | | DoubleLine Funds Trust | | | | | | | | |
| | |
| | | (Unaudited) March 31, 2024 |
DoubleLine Multi-Asset Trend Fund
Value of a $100,000 Investment
Class I Shares1
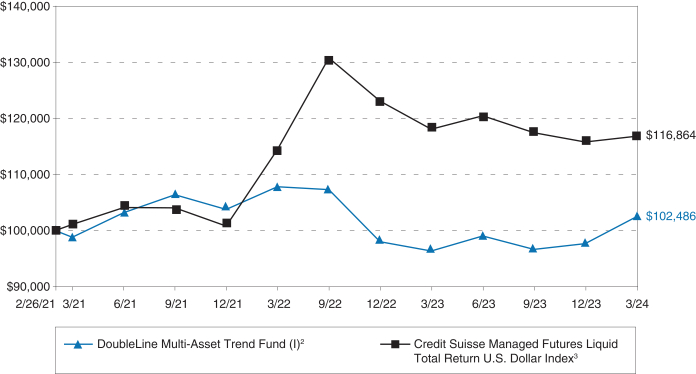
Average Annual Total Returns1
As of March 31, 2024
| | | | | | | | | | | | | | | |
| | | |
| | | | | 1 Year | | Since
Inception
(2-26-21) |
| | | |
DoubleLine Mult-Asset Trend Fund Class I | | | | | | | | | 6.37% | | | | | 0.80% | |
| | | |
Credit Suisse Managed Futures Liquid Total Return U.S. Dollar Index | | | | | | | | | -1.07% | | | | | 5.17% | |
| | | |
DoubleLine Mult-Asset Trend Fund Class N | | | | | | | | | 5.97% | | | | | 0.55% | |
| 1 | Past performance is not an indication of future results. Returns represent past performance and reflect changes in share prices, the reinvestment of all dividends and capital gains, expense limitations and the effects of compounding. The prospectus contains more complete information on the investment objectives, risks, charges and expenses of the investment company, which investors should read and consider carefully before investing. To obtain a prospectus, contact a registered representative or visit www.doubleline.com. The Fund’s adviser waived a portion of its management fee and/or reimbursed Fund expenses during the period shown. Had the adviser not done so, the Fund’s total returns would have been lower. Total investment return and principal value of your investment will fluctuate, and your shares, when redeemed, may be worth more or less than their original cost. Current performance may be higher or lower than the performance data quoted. Performance data current to the most recent month-end may be obtained by calling (877) 354-6311 or by visiting www.doubleline.com. |
| 2 | Performance of other classes will be greater or less than the line shown based on the differences in loads and fees paid by shareholders investing in the different classes. |
| 3 | Credit Suisse Managed Futures Liquid Total Return U.S. Dollar Index—This index measures on a total return, U.S. dollar-denominated basis the performance of the Credit Suisse Managed Futures Liquid Index, which is designed to provide exposure to both up and down price trends in four broad asset classes: equities, fixed income, commodities and currencies. Index performance reflects no deduction for fees, expenses or taxes. |
| | The Fund’s investments likely will diverge widely from the components of the benchmark index, which could lead to performance dispersion between the Fund and the benchmark index, meaning that the Fund could outperform or underperform the indices at any given time. Please note that an investor cannot invest directly in an index. |
| | | | | | | | | | |
| | | | Annual Report | | | | | March 31, 2024 | | 35 |
| | |
Schedule of Investments - Summary DoubleLine Total Return Bond Fund | | March 31, 2024 |
| | | | | | | | | | | | | | | | | | | | |
PRINCIPAL
AMOUNT $ | | | SECURITY DESCRIPTION | | RATE | | | MATURITY | | | VALUE $ | | | % OF NET
ASSETS | |
| | ASSET BACKED OBLIGATIONS(a) | |
| | | | Total Asset Backed Obligations
(Cost $1,485,593,013) | | | | | | | | | | | 1,354,418,733 | | | | 4.4% | |
| | | | | | | | | | | | | | | | | | | | |
| | COLLATERALIZED LOAN OBLIGATIONS(a) | |
| | | | Total Collateralized Loan Obligations
($1,054,721,412) | | | | | | | | | | | 1,056,643,143 | | | | 3.4% | |
| | | | | | | | | | | | | | | | | | | | |
| | NON-AGENCY COMMERCIAL MORTGAGE BACKED OBLIGATIONS | |
| | | | | |
| | | | BX Trust | | | | | | | | | | | | | | | | |
| | 173,184,000 | | | Series 2019-OC11-E | | | 3.94% | (b)(c) | | | 12/09/2041 | | | | 149,938,082 | | | | 0.5% | |
| | | | |
| | Other Non-Agency Commercial Mortgage Backed Obligations(a) | | | | | | | | | | | 2,117,534,778 | | | | 6.8% | |
| | | | | | | | | | | | | | | | | | | | |
| | | | Total Non-Agency Commercial Mortgage Backed Obligations
(Cost $3,087,645,564) | | | | 2,267,472,860 | | | | 7.3% | |
| | | | | | | | | | | | | | | | | | | | |
| | NON-AGENCY RESIDENTIAL COLLATERALIZED MORTGAGE OBLIGATIONS | |
| | | | | |
| | | | CAFL Issuer LLC | | | | | | | | | | | | | | | | |
| | 100,200,000 | | | Series 2021-RTL1-A1 | | | 2.24% | (b)(d) | | | 03/28/2029 | | | | 96,476,046 | | | | 0.3% | |
| | | | | |
| | | | Citigroup Mortgage Loan Trust, Inc. | | | | | | | | | | | | | | | | |
| | 104,146,978 | | | Series 2019-A-PT1 | | | 3.92% | (b) | | | 10/25/2058 | | | | 85,918,340 | | | | 0.3% | |
| | 161,032,680 | | | Series 2019-D-PT1 | | | 3.51% | (b)(c) | | | 04/25/2064 | | | | 133,470,647 | | | | 0.4% | |
| | 200,104,707 | | | Series 2020-RP1-A1 | | | 1.50% | (b)(c) | | | 08/25/2064 | | | | 172,951,658 | | | | 0.6% | |
| | 260,347,108 | | | Series 2021-RP2-A1 | | | 1.75% | (b)(c) | | | 03/25/2065 | | | | 229,306,286 | | | | 0.7% | |
| | 167,433,597 | | | Citigroup Mortgage Loan Trust, Inc. | | | 3.25% – 5.88% | (b)(c) | | | 03/25/2065 | | | | 136,514,948 | | | | 0.4% | |
| | | | | |
| | | | Credit Suisse Mortgage Capital Certificates | | | | | | | | | | | | | | | | |
| | 171,649,437 | | | Series 2019-RPL6-PT1 | | | 4.14% | (b)(c) | | | 11/25/2058 | | | | 146,805,583 | | | | 0.5% | |
| | 169,008,354 | | | Series 2020-RPL1-PT1 | | | 3.33% | (b)(c) | | | 10/25/2069 | | | | 132,435,012 | | | | 0.4% | |
| | | | | |
| | | | Freddie Mac Structured Agency Credit Risk Debt Notes | | | | | | | | | | | | | | | | |
| | 75,600,000 | | | Series 2022-DNA3-M1B (US 30 Day Average Secured Overnight Financing Rate + 2.90%) | | | 8.22% | (b) | | | 04/25/2042 | | | | 78,276,194 | | | | 0.3% | |
| | | | | |
| | | | GS Mortgage-Backed Securities Trust | | | | | | | | | | | | | | | | |
| | 100,027,730 | | | Series 2020-RPL2-A1 | | | 1.75% | (b)(c) | | | 05/25/2060 | | | | 88,061,262 | | | | 0.3% | |
| | | | | |
| | | | Legacy Mortgage Asset Trust | | | | | | | | | | | | | | | | |
| | 117,230,912 | | | Series 2019-RPL3-PT1 | | | 0.00% | (b) | | | 06/25/2058 | | | | 98,383,861 | | | | 0.3% | |
| | | | | |
| | | | PR Mortgage Loan Trust | | | | | | | | | | | | | | | | |
| | 108,539,570 | | | Series 2014-1-APT | | | 5.86% | (b)(c) | | | 10/25/2049 | | | | 100,352,885 | | | | 0.3% | |
| | | | | |
| | | | PRPM LLC | | | | | | | | | | | | | | | | |
| | 163,073,784 | | | Series 2021-10-A1 | | | 2.49% | (b)(d) | | | 10/25/2026 | | | | 160,714,757 | | | | 0.5% | |
| | 79,221,114 | | | Series 2021-11-A1 | | | 2.49% | (b)(d) | | | 11/25/2026 | | | | 77,829,903 | | | | 0.3% | |
| | | | | |
| | | | Securitized Mortgage Asset Loan Trust | | | | | | | | | | | | | | | | |
| | 181,516,151 | | | Series 2015-1-PC | | | 2.41% | (b)(c) | | | 02/25/2054 | | | | 151,109,780 | | | | 0.5% | |
| | | | |
| | Other Non-Agency Residential Collateralized Mortgage Obligations(a) | | | | | | | | | | | 6,203,244,892 | | | | 20.0% | |
| | | | | | | | | | | | | | | | | | | | |
| | | | Total Non-Agency Residential Collateralized Mortgage Obligations
($10,173,071,346) | | | | 8,091,852,054 | | | | 26.1% | |
| | | | | | | | | | | | | | | | | | | | |
| | US GOVERNMENT AND AGENCY MORTGAGE BACKED OBLIGATIONS | |
| | | | | |
| | 82,615,238 | | | Federal Home Loan Mortgage Corp. | | | 3.00% | | | | 06/15/2044 | | | | 77,067,413 | | | | 0.3% | |
| | | | Series 4533-AB | | | | | | | | | | | | | | | | |
| | | | Series 4483-CA | | | | | | | | | | | | | | | | |
| | | | | |
| | 189,715,229 | | | Federal Home Loan Mortgage Corp. | | | 3.00% | (g) | | | 09/15/2044 | | | | 165,065,508 | | | | 0.5% | |
| | | | Series 4384-ZY | | | | | | | | | | | | | | | | |
| | | | Series 4390-NZ | | | | | | | | | | | | | | | | |
| | | | | |
| | | | Federal Home Loan Mortgage Corp. | | | | | | | | | | | | | | | | |
| | 146,362,699 | | | Pool U69911 | | | 4.00% | | | | 04/01/2045 | | | | 139,258,790 | | | | 0.4% | |
| | | | | |
| | 134,028,074 | | | Federal Home Loan Mortgage Corp. | | | 3.00% | | | | 04/01/2045 | | | | 119,507,239 | | | | 0.4% | |
| | | | Pool G08635 | | | | | | | | | | | | | | | | |
| | | | Pool Z40117 | | | | | | | | | | | | | | | | |
| | | | | |
| | | | Federal Home Loan Mortgage Corp. | | | | | | | | | | | | | | | | |
| | 135,726,045 | | | Pool G08675 | | | 3.00% | | | | 11/01/2045 | | | | 120,317,853 | | | | 0.4% | |
| | | | | |
| | | | Federal Home Loan Mortgage Corp. | | | | | | | | | | | | | | | | |
| | 84,862,774 | | | Pool Z40256 | | | 3.00% | | | | 12/01/2046 | | | | 75,655,966 | | | | 0.2% | |
| | | | | |
| | | | Federal Home Loan Mortgage Corp. | | | | | | | | | | | | | | | | |
| | 194,462,606 | | | Pool SD7534 | | | 2.50% | | | | 02/01/2051 | | | | 164,456,510 | | | | 0.5% | |
| | | | |
| 36 | | DoubleLine Funds Trust | | The accompanying notes are an integral part of these financial statements. |
| | | | | | | | | | | | | | | | | | | | |
PRINCIPAL
AMOUNT $ | | | SECURITY DESCRIPTION | | RATE | | | MATURITY | | | VALUE $ | | | % OF NET
ASSETS | |
| | | | | |
| | 114,714,802 | | | Federal Home Loan Mortgage Corp. | | | 2.00% | | | | 09/01/2051 | | | | 90,444,951 | | | | 0.3% | |
| | | | Pool SD0715 | | | | | | | | | | | | | | | | |
| | | | Pool SE9043 | | | | | | | | | | | | | | | | |
| | | | Pool QU7965 | | | | | | | | | | | | | | | | |
| | | | Pool QU7970 | | | | | | | | | | | | | | | | |
| | | | | |
| | 87,080,512 | | | Federal Home Loan Mortgage Corp. | | | 2.50% | | | | 03/01/2052 | | | | 72,835,580 | | | | 0.2% | |
| | | | Pool SD2971 | | | | | | | | | | | | | | | | |
| | | | Pool SD3093 | | | | | | | | | | | | | | | | |
| | | | | |
| | | | Federal Home Loan Mortgage Corp. | | | | | | | | | | | | | | | | |
| | 89,059,981 | | | Pool RA7939 | | | 5.00% | | | | 09/01/2052 | | | | 87,053,037 | | | | 0.3% | |
| | | | | |
| | 880,939,902 | | | Federal Home Loan Mortgage Corp. | | | 2.50% – 5.00% | | | | 03/01/2028 – 06/01/2048 | | | | 797,046,300 | | | | 2.6% | |
| | 1,118,363,267 | | | Federal Home Loan Mortgage Corp. | | | 1.50% – 6.50% | | | | 12/01/2029 – 02/01/2054 | | | | 1,014,180,600 | | | | 3.3% | |
| | 3,281,402,253 | | | Federal Home Loan Mortgage Corp. | | | 0.00% – 6.42% | (c)(e)(f)(h) | | | 12/15/2030 – 11/15/2056 | | | | 2,090,839,261 | | | | 6.7% | |
| | | | | |
| | 159,468,000 | | | Federal National Mortgage Association | | | 4.33% | | | | 12/01/2032 | | | | 153,764,993 | | | | 0.5% | |
| | | | Pool BS6912 | | | | | | | | | | | | | | | | |
| | | | | |
| | | | Federal National Mortgage Association | | | | | | | | | | | | | | | | |
| | 170,877,863 | | | Pool BM6831 | | | 1.93% | (c) | | | 10/01/2033 | | | | 135,754,556 | | | | 0.4% | |
| | | | | |
| | | | Federal National Mortgage Association | | | | | | | | | | | | | | | | |
| | 77,485,000 | | | Pool BZ0107 | | | 4.94% | | | | 12/01/2033 | | | | 78,839,841 | | | | 0.3% | |
| | | | | |
| | 193,203,757 | | | Federal National Mortgage Association | | | 3.00% | (g) | | | 10/25/2044 | | | | 169,492,978 | | | | 0.5% | |
| | | | Series 2014-60-EZ | | | | | | | | | | | | | | | | |
| | | | Series 2014-61-ZV | | | | | | | | | | | | | | | | |
| | | | Series 2014-64-NZ | | | | | | | | | | | | | | | | |
| | | | Series 2014-67-DZ | | | | | | | | | | | | | | | | |
| | | | Series 2016-32-LA | | | | | | | | | | | | | | | | |
| | | | | |
| | 109,367,071 | | | Federal National Mortgage Association | | | 3.00% | | | | 03/01/2045 | | | | 97,077,633 | | | | 0.3% | |
| | | | Pool AS4625 | | | | | | | | | | | | | | | | |
| | | | Pool AS4645 | | | | | | | | | | | | | | | | |
| | | | Pool AY3974 | | | | | | | | | | | | | | | | |
| | | | Pool AY5471 | | | | | | | | | | | | | | | | |
| | | | | |
| | 84,834,513 | | | Federal National Mortgage Association | | | 3.00% | | | | 11/01/2046 | | | | 74,544,365 | | | | 0.2% | |
| | | | Pool AS8269 | | | | | | | | | | | | | | | | |
| | | | Pool AS8356 | | | | | | | | | | | | | | | | |
| | | | Pool BC9003 | | | | | | | | | | | | | | | | |
| | | | Pool MA2806 | | | | | | | | | | | | | | | | |
| | | | | |
| | | | Federal National Mortgage Association | | | | | | | | | | | | | | | | |
| | 81,933,657 | | | Series 2022-4-EA | | | 2.50% | | | | 10/25/2047 | | | | 72,918,111 | | | | 0.2% | |
| | | | | |
| | | | Federal National Mortgage Association | | | | | | | | | | | | | | | | |
| | 217,500,000 | | | Pool AN6680 | | | 3.37% | | | | 11/01/2047 | | | | 169,271,053 | | | | 0.5% | |
| | | | | |
| | | | Federal National Mortgage Association | | | | | | | | | | | | | | | | |
| | 146,422,881 | | | Series 2022-3-AB | | | 2.00% | | | | 11/25/2047 | | | | 126,542,328 | | | | 0.4% | |
| | | | | |
| | 115,681,316 | | | Federal National Mortgage Association | | | 2.50% | | | | 11/01/2050 | | | | 97,156,792 | | | | 0.3% | |
| | | | Pool FM4752 | | | | | | | | | | | | | | | | |
| | | | Pool FM4792 | | | | | | | | | | | | | | | | |
| | | | Pool FM4913 | | | | | | | | | | | | | | | | |
| | | | | |
| | 173,141,809 | | | Federal National Mortgage Association | | | 2.50% | | | | 03/01/2051 | | | | 146,102,072 | | | | 0.5% | |
| | | | Pool FM8215 | | | | | | | | | | | | | | | | |
| | | | Pool FM8533 | | | | | | | | | | | | | | | | |
| | | | | |
| | 227,127,168 | | | Federal National Mortgage Association | | | 2.50% | | | | 04/01/2051 | | | | 189,433,816 | | | | 0.6% | |
| | | | Pool FS2320 | | | | | | | | | | | | | | | | |
| | | | Pool FS5987 | | | | | | | | | | | | | | | | |
| | | | Pool MA4306 | | | | | | | | | | | | | | | | |
| | | | | |
| | 165,536,067 | | | Federal National Mortgage Association | | | 2.50% | | | | 09/01/2051 | | | | 139,180,104 | | | | 0.4% | |
| | | | Pool FM8435 | | | | | | | | | | | | | | | | |
| | | | Pool FM8769 | | | | | | | | | | | | | | | | |
| | | | Pool FM8780 | | | | | | | | | | | | | | | | |
| | | | | |
| | 142,361,635 | | | Federal National Mortgage Association | | | 2.00% | (g) | | | 02/25/2052 | | | | 78,188,657 | | | | 0.3% | |
| | | | Series 2022-3-NZ | | | | | | | | | | | | | | | | |
| | | | Series 2022-3-Z | | | | | | | | | | | | | | | | |
| | | | | |
| | 142,499,982 | | | Federal National Mortgage Association | | | 5.00% | | | | 08/01/2052 | | | | 140,086,270 | | | | 0.5% | |
| | | | Pool CB4291 | | | | | | | | | | | | | | | | |
| | | | Pool CB4347 | | | | | | | | | | | | | | | | |
| | | | | |
| | 83,280,497 | | | Federal National Mortgage Association | | | 4.50% | | | | 08/01/2052 | | | | 79,408,900 | | | | 0.3% | |
| | | | Pool BV8021 | | | | | | | | | | | | | | | | |
| | | | Pool CB4391 | | | | | | | | | | | | | | | | |
| | | | Pool FS2588 | | | | | | | | | | | | | | | | |
| | | | | | | | |
| The accompanying notes are an integral part of these financial statements. | | Annual Report | | | | | March 31, 2024 | | 37 |
| | |
Schedule of Investments - Summary DoubleLine Total Return Bond Fund (Cont.) | | |
| | | | | | | | | | | | | | | | | | | | |
PRINCIPAL
AMOUNT $/
SHARES | | | SECURITY DESCRIPTION | | RATE | | | MATURITY | | | VALUE $ | | | % OF NET
ASSETS | |
| | | | | |
| | 4,357,289,119 | | | Federal National Mortgage Association | | | 1.20% – 6.50% | (c) | | | 04/01/2026 – 02/01/2054 | | | | 3,793,283,322 | | | | 12.2% | |
| | 2,626,830,284 | | | Federal National Mortgage Association | | | 0.00% – 6.00% | (c)(e)(f)(h) | | | 01/25/2026 – 09/25/2060 | | | | 1,729,263,594 | | | | 5.6% | |
| | | | | |
| | 204,108,043 | | | Ginnie Mae II Pool | | | 2.50% | | | | 03/20/2051 | | | | 173,341,535 | | | | 0.6% | |
| | | | Pool CB2017 | | | | | | | | | | | | | | | | |
| | | | Pool CB4182 | | | | | | | | | | | | | | | | |
| | | | Pool CB5487 | | | | | | | | | | | | | | | | |
| | | | Pool MA7255 | | | | | | | | | | | | | | | | |
| | | | Pool 785374 | | | | | | | | | | | | | | | | |
| | | | Pool 785412 | | | | | | | | | | | | | | | | |
| | | | Pool 785595 | | | | | | | | | | | | | | | | |
| | | | | |
| | 95,871,270 | | | Ginnie Mae II Pool | | | 2.50% | | | | 08/20/2051 | | | | 81,427,234 | | | | 0.3% | |
| | | | Pool 785609 | | | | | | | | | | | | | | | | |
| | | | Pool 785638 | | | | | | | | | | | | | | | | |
| | | | Pool 785639 | | | | | | | | | | | | | | | | |
| | 324,562,606 | | | Ginnie Mae II Pool | | | 2.00% – 3.50% | | | | 01/20/2045 – 02/20/2052 | | | | 272,920,963 | | | | 0.9% | |
| | | | | |
| | 493,014,210 | | | Government National Mortgage Association | | | 3.00% | (e) | | | 08/20/2051 | | | | 78,799,546 | | | | 0.3% | |
| | | | Series 2021-135-GI | | | | | | | | | | | | | | | | |
| | | | Series 2021-136-EI | | | | | | | | | | | | | | | | |
| | | | Series 2021-138-IL | | | | | | | | | | | | | | | | |
| | | | Series 2021-138-KI | | | | | | | | | | | | | | | | |
| | | | Series 2021-140-IJ | | | | | | | | | | | | | | | | |
| | | | Series 2021-142-IO | | | | | | | | | | | | | | | | |
| | | | Series 2021-142-XI | | | | | | | | | | | | | | | | |
| | | | Series 2022-207-IO | | | | | | | | | | | | | | | | |
| | | | | |
| | 371,623,691 | | | Government National Mortgage Association | | | 2.50% | (e) | | | 11/20/2051 | | | | 133,515,207 | | | | 0.4% | |
| | | | Series 2021-196-IO | | | | | | | | | | | | | | | | |
| | | | Series 2021-205-DI | | | | | | | | | | | | | | | | |
| | | | Series 2022-83-IO | | | | | | | | | | | | | | | | |
| | | | Series 2024-20-LA | | | | | | | | | | | | | | | | |
| | | | Series 2024-20-LB | | | | | | | | | | | | | | | | |
| | | | Series 2024-20-LI | | | | | | | | | | | | | | | | |
| | 15,520,302,548 | | | Government National Mortgage Association | | | 0.00% – 6.32% | (c)(e)(f)(h) | | | 08/20/2033 – 08/16/2065 | | | | 1,920,115,792 | | | | 6.2% | |
| | | | |
| | Other US Government and Agency Mortgage Backed Obligations(a) | | | | | | | | | | | 562,256,306 | | | | 1.8% | |
| | | | | | | | | | | | | | | | | | | | |
| | | | Total US Government and Agency Mortgage Backed Obligations (Cost $17,418,671,129) | | | | 15,706,414,976 | | | | 50.6% | |
| | | | | | | | | | | | | | | | | | | | |
| | US GOVERNMENT AND AGENCY OBLIGATIONS | | | | | | | | | | | | | | | | |
| | | | | |
| | 780,000,000 | | | United States Treasury Note/Bond | | | 4.38% | | | | 08/15/2043 | | | | 770,981,250 | | | | 2.5% | |
| | 950,000,000 | | | United States Treasury Note/Bond | | | 4.75% | | | | 11/15/2043 | | | | 985,773,437 | | | | 3.2% | |
| | |
| | Other US Government and Agency Obligations(a) | | | | 48,221,341 | | | | 0.1% | |
| | | | | | | | | | | | | | | | | | | | |
| | | | Total US Government and Agency Obligations
(Cost $1,728,792,504) | | | | 1,804,976,028 | | | | 5.8% | |
| | | | | | | | | | | | | | | | | | | | |
| | SHORT TERM INVESTMENTS | |
| | | | | |
| | 211,153,380 | | | First American Government Obligations Fund-U | | | 5.26% | (i) | | | | | | | 211,153,380 | | | | 0.7% | |
| | 211,153,380 | | | JPMorgan US Government Money Market Fund-IM | | | 5.25% | (i) | | | | | | | 211,153,380 | | | | 0.7% | |
| | 211,153,380 | | | MSILF Government Portfolio-Institutional | | | 5.22% | (i) | | | | | | | 211,153,380 | | | | 0.6% | |
| | | | | | | | | | | | | | | | | | | | |
| | | | Total Short Term Investments
(Cost $633,460,140) | | | | | | | | | | | 633,460,140 | | | | 2.0% | |
| | | | | | | | | | | | | | | | | | | | |
| | | | Total Investments
(Cost $35,581,955,108) | | | | | | | | | | | 30,915,237,934 | | | | 99.6% | |
| | | | Other Assets in Excess of Liabilities | | | | | | | | | | | 120,173,498 | | | | 0.4% | |
| | | | | | | | | | | | | | | | | | | | |
| | | | NET ASSETS | | | | | | | | | | $ | 31,035,411,432 | | | | 100.0% | |
| | | | | | | | | | | | | | | | | | | | |
| | | | | |
| SECURITY TYPE BREAKDOWN as a % of Net Assets: | | | | | |
US Government and Agency Mortgage Backed Obligations | | | | 50.6% | |
Non-Agency Residential Collateralized Mortgage Obligations | | | | 26.1% | |
Non-Agency Commercial Mortgage Backed Obligations | | | | 7.3% | |
US Government and Agency Obligations | | | | 5.8% | |
Asset Backed Obligations | | | | 4.4% | |
Collateralized Loan Obligations | | | | 3.4% | |
Short Term Investments | | | | 2.0% | |
Other Assets and Liabilities | | | | 0.4% | |
| | | | | |
Net Assets | | | | 100.0% | |
| | | | | |
| | | | |
| 38 | | DoubleLine Funds Trust | | The accompanying notes are an integral part of these financial statements. |
| (a) | Represents issues not identified as the top 50 holdings in terms of market value and issues or issuers not exceeding 1% of net assets individually or in aggregate, respectively as of period end. |
| (b) | Includes securities exempt from registration under Rule 144A of the Securities Act of 1933. These securities may be resold in transactions exempt from registration to qualified institutional buyers. |
| (c) | Includes securities where coupon rate is variable based on the weighted average coupon of the underlying collateral. To the extent the weighted average coupon of the underlying assets which comprise the collateral increases or decreases, the coupon rate of this security will increase or decrease correspondingly. The rate disclosed is as of period end. |
| (d) | Step Bond; Coupon rate changes based on a predetermined schedule or event. The interest rate shown is the rate in effect as of period end. |
| (e) | Includes interest only securities |
| (f) | Includes inverse floating rate securities whose interest rate moves in the opposite direction of reference interest rates. Reference interest rates are typically based on a negative multiplier or slope. Interest rate may also be subject to a cap or floor. |
| (g) | Security accrues interest which is added to the outstanding principal balance. The interest payment will be deferred until all other tranches in the structure are paid off. The rate disclosed is as of period end. |
| (h) | Includes principal only securities |
| (i) | Seven-day yield as of period end |
Futures Contracts
| | | | | | | | | | | | | | | | | | | | | | | | | |
| Description | | Long/ Short | | Contract Quantity | | Expiration Date | | Notional Amount(1) | | Unrealized
Appreciation
(Depreciation)/
Value |
U.S. Treasury Long Bonds | | Long | | | | 20,000 | | | | | 6/18/2024 | | | | $ | 2,408,750,000 | | | | $ | 34,869,762 | |
U.S. Treasury 5 Year Note | | Long | | | | 25,000 | | | | | 6/28/2024 | | | | | 2,675,390,625 | | | | | 3,267,313 | |
U.S. Treasury Ultra Bonds | | Long | | | | 1,925 | | | | | 6/18/2024 | | | | | 248,325,000 | | | | | 2,477,172 | |
10 Year U.S. Ultra Treasury Notes | | Short | | | | (30,000 | ) | | | | 6/18/2024 | | | | | (3,438,281,250 | ) | | | | (21,744,764 | ) |
U.S. Treasury 2 Year Notes | | Long | | | | 57,500 | | | | | 6/28/2024 | | | | | 11,757,851,620 | | | | | (34,191,550 | ) |
| | | | | | | | | | | | | | | | | | | | | | |
| | | | | | | | | | | | | | | | | | | | $ | (15,322,067 | ) |
| | | | | | | | | | | | | | | | | | | | | | |
| (1) | Notional Amount is determined based on the number of contracts multiplied by the contract size and the quoted daily settlement price in US dollars. |
| | | | | | | | |
| The accompanying notes are an integral part of these financial statements. | | Annual Report | | | | | March 31, 2024 | | 39 |
| | |
Schedule of Investments - Summary DoubleLine Core Fixed Income Fund | | March 31, 2024 |
| | | | | | | | | | | | | | | | | | | | |
PRINCIPAL
AMOUNT $ | | | SECURITY DESCRIPTION | | RATE | | | MATURITY | | | VALUE $ | | | % OF NET
ASSETS | |
| | ASSET BACKED OBLIGATIONS | | | | | | | | | | | | | | | | |
| |
| | | | Primrose Holdings, Inc. | |
| | 19,350,000 | | | Series 2019-1A-A2 | | | 4.48% | (b) | | | 07/30/2049 | | | | 18,572,183 | | | | 0.3% | |
| | | | | |
| | | | Upstart Securitization Trust | | | | | | | | | | | | | | | | |
| | 16,882,150 | | | Series 2021-2-C | | | 3.61% | (b) | | | 06/20/2031 | | | | 16,461,620 | | | | 0.2% | |
| | |
| | Other Asset Backed Obligations(a) | | | | 204,183,388 | | | | 3.0% | |
| | | | | | | | | | | | | | | | | | | | |
| | | | Total Asset Backed Obligations
(Cost $259,326,979) | | | | | | | | 239,217,191 | | | | 3.5% | |
| | | | | | | | | | | | | | | | | | | | |
| | BANK LOANS(a) | |
| | | | Total Bank Loans
(Cost $222,908,471) | | | | | | | | 221,605,026 | | | | 3.2% | |
| | | | | | | | | | | | | | | | | | | | |
| | COLLATERALIZED LOAN OBLIGATIONS(a) | |
| | | | Total Collateralized Loan Obligations
(Cost $235,243,052) | | | | | | | | 231,116,271 | | | | 3.3% | |
| | | | | | | | | | | | | | | | | | | | |
| | FOREIGN CORPORATE BONDS(a) | |
| | | | Total Foreign Corporate Bonds
(Cost $470,702,420) | | | | | | | | 427,157,930 | | | | 6.2% | |
| | | | | | | | | | | | | | | | | | | | |
| | FOREIGN GOVERNMENT BONDS, FOREIGN AGENCIES AND FOREIGN GOVERNMENT SPONSORED CORPORATIONS(a) | |
| | | | Total Foreign Government Bonds, Foreign Agencies and Foreign Government Sponsored Corporations
(Cost $59,093,612) | | | | 49,771,887 | | | | 0.7% | |
| | | | | | | | | | | | | | | | | | | | |
| | NON-AGENCY COMMERCIAL MORTGAGE BACKED OBLIGATIONS(a) | |
| | | | Total Non-Agency Commercial Mortgage Backed Obligations
(Cost $505,557,469) | | | | | | | | 368,566,209 | | | | 5.3% | |
| | | | | | | | | | | | | | | | | | | | |
| | NON-AGENCY RESIDENTIAL COLLATERALIZED MORTGAGE OBLIGATIONS | |
| | | | | |
| | | | Citigroup Mortgage Loan Trust, Inc. | | | | | | | | | | | | | | | | |
| | 24,669,540 | | | Series 2019-A-PT1 | | | 3.92% | (b) | | | 10/25/2058 | | | | 20,351,680 | | | | 0.3% | |
| | 43,209,655 | | | Series 2021-RP2-A1 | | | 1.75% | (b)(c) | | | 03/25/2065 | | | | 38,057,829 | | | | 0.5% | |
| | | | | |
| | | | Credit Suisse Mortgage Capital Certificates | | | | | | | | | | | | | | | | |
| | 29,191,592 | | | Series 2020-RPL1-PT1 | | | 3.33% | (b)(c) | | | 10/25/2069 | | | | 22,874,543 | | | | 0.3% | |
| | | | | |
| | | | Impac Secured Assets CMN Owner Trust | | | | | | | | | | | | | | | | |
| | 22,560,658 | | | Series 2006-5-1A1C (CME Term SOFR 1 Month + 0.65%, 0.54% Floor, 11.50% Cap) | | | 5.98% | | | | 02/25/2037 | | | | 20,122,503 | | | | 0.3% | |
| | | | | |
| | | | Legacy Mortgage Asset Trust | | | | | | | | | | | | | | | | |
| | 22,274,727 | | | Series 2019-RPL3-PT1 | | | 0.00% | (b) | | | 06/25/2058 | | | | 18,693,650 | | | | 0.3% | |
| | | | | |
| | | | Redwood Funding Trust | | | | | | | | | | | | | | | | |
| | 19,816,111 | | | Series 2019-1-PT | | | 4.97% | (b)(e) | | | 09/27/2024 | | | | 19,830,662 | | | | 0.3% | |
| | | | | |
| | | | Securitized Mortgage Asset Loan Trust | | | | | | | | | | | | | | | | |
| | 22,764,250 | | | Series 2015-1-PC | | | 2.41% | (b)(c) | | | 02/25/2054 | | | | 18,950,935 | | | | 0.3% | |
| | |
| | Other Non-Agency Residential Collateralized Mortgage Obligations(a) | | | | 600,582,242 | | | | 8.7% | |
| | | | | | | | | | | | | | | | | | | | |
| | | | Total Non-Agency Residential Collateralized Mortgage Obligations
(Cost $934,032,904) | | | | 759,464,044 | | | | 11.0% | |
| | | | | | | | | | | | | | | | | | | | |
| | US CORPORATE BONDS(a) | |
| | | | Total US Corporate Bonds
(Cost $1,107,461,242) | | | | 1,050,592,366 | | | | 15.2% | |
| | | | | | | | | | | | | | | | | | | | |
| | US GOVERNMENT AND AGENCY MORTGAGE BACKED OBLIGATIONS | |
| |
| | | | Federal Home Loan Mortgage Corp. | |
| | 25,540,886 | | | Pool SD2912 | | | 5.00% | | | | 05/01/2053 | | | | 25,121,924 | | | | 0.4% | |
| | 42,284,674 | | | Pool SD2969 | | | 2.50% | | | | 05/01/2052 | | | | 35,575,158 | | | | 0.5% | |
| | 29,054,504 | | | Pool SD3721 | | | 5.00% | | | | 07/01/2053 | | | | 28,623,062 | | | | 0.4% | |
| | 59,028,207 | | | Federal Home Loan Mortgage Corp. | | | 5.50% | | | | 09/01/2053 | | | | 59,040,291 | | | | 0.9% | |
| | | | Pool SD3892 | | | | | | | | | | | | | | | | |
| | | | Pool RA9843 | | | | | | | | | | | | | | | | |
| | | | |
| 40 | | DoubleLine Funds Trust | | The accompanying notes are an integral part of these financial statements. |
| | | | | | | | | | | | | | | | | | | | |
PRINCIPAL
AMOUNT $/
SHARES | | | SECURITY DESCRIPTION | | RATE | | | MATURITY | | | VALUE $ | | | % OF NET
ASSETS | |
| |
| | | | Federal Home Loan Mortgage Corp. | |
| | 21,112,781 | | | Pool SD4888 | | | 6.00% | | | | 02/01/2054 | | | | 21,542,905 | | | | 0.3% | |
| | 58,541,938 | | | Pool SD7538 | | | 2.00% | | | | 04/01/2051 | | | | 47,777,786 | | | | 0.7% | |
| | 25,491,364 | | | Pool SD7564 | | | 5.00% | | | | 06/01/2053 | | | | 25,258,824 | | | | 0.4% | |
| | 34,934,000 | | | Series 5138-HM | | | 2.00% | | | | 04/25/2051 | | | | 25,930,757 | | | | 0.4% | |
| | 64,646,920 | | | Federal Home Loan Mortgage Corp. | | | 2.00% – 5.50% | | | | 04/01/2047 – 05/01/2053 | | | | 56,933,955 | | | | 0.8% | |
| | 82,860,604 | | | Federal Home Loan Mortgage Corp. | | | 0.00% – 5.50% | (c)(d)(f) | | | 12/15/2030 – 01/15/2054 | | | | 64,378,323 | | | | 0.9% | |
| |
| | | | Federal National Mortgage Association | |
| | 28,707,000 | | | Pool BL4425 | | | 2.14% | | | | 10/01/2029 | | | | 25,317,202 | | | | 0.4% | |
| | 32,930,000 | | | Pool BL4592 | | | 2.28% | | | | 11/01/2029 | | | | 29,045,266 | | | | 0.4% | |
| | 18,090,000 | | | Pool BL5484 | | | 2.26% | | | | 01/01/2030 | | | | 15,883,691 | | | | 0.2% | |
| | 45,476,877 | | | Pool BR2217 | | | 2.50% | | | | 08/01/2051 | | | | 38,228,736 | | | | 0.5% | |
| | 36,599,790 | | | Pool BS4941 | | | 2.46% | | | | 04/01/2032 | | | | 31,078,816 | | | | 0.4% | |
| | 25,824,171 | | | Pool CB3127 | | | 3.50% | | | | 03/01/2052 | | | | 23,346,984 | | | | 0.3% | |
| | 24,274,416 | | | Pool CB6266 | | | 6.00% | | | | 05/01/2053 | | | | 24,651,583 | | | | 0.4% | |
| | 37,828,363 | | | Pool CB7272 | | | 6.00% | | | | 10/01/2053 | | | | 38,429,836 | | | | 0.6% | |
| | 27,849,189 | | | Pool FM8214 | | | 4.00% | | | | 05/01/2049 | | | | 26,265,215 | | | | 0.4% | |
| | 21,989,497 | | | Pool FM8972 | | | 4.00% | | | | 06/01/2049 | | | | 20,773,359 | | | | 0.3% | |
| | 38,327,270 | | | Pool FS1472 | | | 3.50% | | | | 11/01/2050 | | | | 34,842,494 | | | | 0.5% | |
| | | | | |
| | 62,178,488 | | | Federal National Mortgage Association | | | 2.50% | | | | 04/01/2052 | | | | 51,867,649 | | | | 0.7% | |
| | | | Pool FS5417 | | | | | | | | | | | | | | | | |
| | | | Pool FS5875 | | | | | | | | | | | | | | | | |
| |
| | | | Federal National Mortgage Association | |
| | 17,302,793 | | | Pool MA5086 | | | 5.00% | | | | 07/01/2043 | | | | 17,151,559 | | | | 0.2% | |
| | 18,060,879 | | | Series 2013-6-ZB | | | 3.00% | | | | 02/25/2043 | | | | 15,900,063 | | | | 0.2% | |
| | 29,250,926 | | | Series 2018-35-PO | | | 0.00% | (g) | | | 05/25/2048 | | | | 20,917,253 | | | | 0.3% | |
| | 33,412,323 | | | Series 2020-49-ZD | | | 2.00% | (h) | | | 07/25/2050 | | | | 21,197,883 | | | | 0.3% | |
| | 68,251,692 | | | Series 2022-3-ZW | | | 2.00% | (h) | | | 02/25/2052 | | | | 39,274,343 | | | | 0.6% | |
| | 26,375,905 | | | Series 2022-28-Z | | | 2.50% | (h) | | | 02/25/2052 | | | | 18,466,639 | | | | 0.3% | |
| | 190,216,340 | | | Federal National Mortgage Association | | | 2.00% – 6.00% | | | | 10/01/2029 – 12/01/2053 | | | | 168,659,971 | | | | 2.4% | |
| | 119,943,957 | | | Federal National Mortgage Association | | | 0.00% – 5.88% | (d)(f)(g) | | | 04/25/2026 – 06/25/2057 | | | | 66,118,565 | | | | 1.0% | |
| |
| | | | Ginnie Mae I Pool | |
| | 27,779,371 | | | Pool 779384 | | | 3.50% | | | | 06/15/2042 | | | | 25,912,147 | | | | 0.4% | |
| |
| | | | Ginnie Mae II Pool | |
| | 27,372,013 | | | Pool MA5076 | | | 3.00% | | | | 03/20/2048 | | | | 24,435,434 | | | | 0.4% | |
| | 29,920,728 | | | Pool MA5191 | | | 3.50% | | | | 05/20/2048 | | | | 27,571,920 | | | | 0.4% | |
| | 26,215,508 | | | Pool 785713 | | | 2.50% | | | | 10/20/2051 | | | | 22,246,421 | | | | 0.3% | |
| | 31,897,248 | | | Pool 786009 | | | 3.00% | | | | 02/20/2052 | | | | 27,990,493 | | | | 0.4% | |
| | 48,676,090 | | | Ginnie Mae II Pool | | | 2.50% – 3.50% | | | | 04/20/2047 – 04/20/2052 | | | | 43,543,970 | | | | 0.6% | |
| |
| | | | Government National Mortgage Association | |
| | 20,029,595 | | | Series 2020-62-KF (CME Term SOFR 1 Month + 0.46%, 0.35% Floor, 6.50% Cap) | | | 5.79% | | | | 05/20/2050 | | | | 19,543,928 | | | | 0.3% | |
| | 143,432,300 | | | Government National Mortgage Association | | | 0.16% – 6.05% | (d)(f) | | | 08/20/2033 – 05/20/2052 | | | | 68,449,704 | | | | 1.0% | |
| | |
| | Other US Government and Agency Mortgage Backed Obligations(a) | | | | 58,764,465 | | | | 0.9% | |
| | | | | | | | | | | | | | | | | | | | |
| | | | Total US Government and Agency Mortgage Backed Obligations
(Cost $1,579,751,186) | | | | 1,436,058,574 | | | | 20.8% | |
| | | | | | | | | | | | | | | | | | | | |
| | US GOVERNMENT AND AGENCY OBLIGATIONS | |
| | | | | |
| | 250,000,000 | | | United States Treasury Note/Bond | | | 4.63% | | | | 02/28/2026 | | | | 249,814,453 | | | | 3.7% | |
| | 620,000,000 | | | United States Treasury Note/Bond | | | 4.00% | | | | 01/31/2029 | | | | 613,703,125 | | | | 8.9% | |
| | 600,000,000 | | | United States Treasury Note/Bond | | | 4.75% | | | | 11/15/2043 | | | | 622,593,749 | | | | 9.0% | |
| | | | | | | | | | | | | | | | | | | | |
| | | | Total US Government and Agency Obligations
(Cost $1,477,825,023) | | | | | | | | | | | 1,486,111,327 | | | | 21.6% | |
| | | | | | | | | | | | | | | | | | | | |
| | COMMON STOCKS(a)(i) | |
| | | | Total Common Stocks
(Cost $1,405,753) | | | | | | | | | | | 741,433 | | | | 0.0% | |
| | | | | | | | | | | | | | | | | | | | |
| | WARRANTS(a)(i) | |
| | | | Total Warrants
(Cost $—) | | | | | | | | | | | 5,881 | | | | 0.0% | |
| | | | | | | | | | | | | | | | | | | | |
| | AFFILIATED MUTUAL FUNDS | |
| | | | | |
| | 12,929,742 | | | DoubleLine Global Bond Fund - Class I | | | | | | | | | | | 108,480,538 | | | | 1.6% | |
| | 32,972,257 | | | DoubleLine Infrastructure Income Fund - Class I | | | | | | | | | | | 304,004,213 | | | | 4.4% | |
| | 5,000,000 | | | DoubleLine Long Duration Total Return Bond Fund - Class I | | | | | | | | | | | 32,900,000 | | | | 0.4% | |
| | | | | | | | | | | | | | | | | | | | |
| | | | Total Affiliated Mutual Funds
(Cost $504,557,903) | | | | | | | | | | | 445,384,751 | | | | 6.4% | |
| | | | | | | | | | | | | | | | | | | | |
| | | | | | | | |
| The accompanying notes are an integral part of these financial statements. | | Annual Report | | | | | March 31, 2024 | | 41 |
| | |
Schedule of Investments - Summary DoubleLine Core Fixed Income Fund (Cont.) | | |
| | | | | | | | | | | | | | | | | | | | |
| SHARES | | | SECURITY DESCRIPTION | | RATE | | | | | | VALUE $ | | | % OF NET
ASSETS | |
| | SHORT TERM INVESTMENTS | |
| | | | | |
| | 51,996,608 | | | First American Government Obligations Fund-U | | | 5.26% | (j) | | | | | | | 51,996,608 | | | | 0.8% | |
| | 51,996,608 | | | JPMorgan US Government Money Market Fund-IM | | | 5.25% | (j) | | | | | | | 51,996,608 | | | | 0.8% | |
| | 51,996,608 | | | MSILF Government Portfolio-Institutional | | | 5.22% | (j) | | | | | | | 51,996,608 | | | | 0.7% | |
| | | | | | | | | | | | | | | | | | | | |
| | | | Total Short Term Investments
(Cost $155,989,824) | | | | | | | | | | | 155,989,824 | | | | 2.3% | |
| | | | | | | | | | | | | | | | | | | | |
| | | | Total Investments (Cost $7,513,855,838) | | | | | | | | | | | 6,871,782,714 | | | | 99.5% | |
| | | | Other Assets in Excess of Liabilities | | | | | | | | | | | 33,496,677 | | | | 0.5% | |
| | | | | | | | | | | | | | | | | | | | |
| | | | NET ASSETS | | | | | | | | | | $ | 6,905,279,391 | | | | 100.0% | |
| | | | | | | | | | | | | | | | | | | | |
| | | | | |
| SECURITY TYPE BREAKDOWN as a % of Net Assets: | | | | | |
US Government and Agency Obligations | | | | 21.6% | |
US Government and Agency Mortgage Backed Obligations | | | | 20.8% | |
US Corporate Bonds | | | | 15.2% | |
Non-Agency Residential Collateralized Mortgage Obligations | | | | 11.0% | |
Affiliated Mutual Funds | | | | 6.4% | |
Foreign Corporate Bonds | | | | 6.2% | |
Non-Agency Commercial Mortgage Backed Obligations | | | | 5.3% | |
Asset Backed Obligations | | | | 3.5% | |
Collateralized Loan Obligations | | | | 3.3% | |
Bank Loans | | | | 3.2% | |
Short Term Investments | | | | 2.3% | |
Foreign Government Bonds, Foreign Agencies and Foreign Government Sponsored Corporations | | | | 0.7% | |
Common Stocks | | | | 0.0% | (i) |
Warrants | | | | 0.0% | (i) |
Other Assets and Liabilities | | | | 0.5% | |
| | | | | |
Net Assets | | | | 100.0% | |
| | | | | |
| | | | | |
| INVESTMENT BREAKDOWN as a % of Net Assets: | | | | | |
US Government and Agency Obligations | | | | 21.6% | |
US Government and Agency Mortgage Backed Obligations | | | | 20.8% | |
Non-Agency Residential Collateralized Mortgage Obligations | | | | 11.0% | |
Affiliated Mutual Funds | | | | 6.4% | |
Non-Agency Commercial Mortgage Backed Obligations | | | | 5.3% | |
Banking | | | | 3.9% | |
Asset Backed Obligations | | | | 3.5% | |
Collateralized Loan Obligations | | | | 3.3% | |
Energy | | | | 2.4% | |
Short Term Investments | | | | 2.3% | |
Utilities | | | | 1.9% | |
Technology | | | | 1.8% | |
Healthcare | | | | 1.5% | |
Transportation | | | | 1.1% | |
Finance | | | | 0.9% | |
Telecommunications | | | | 0.9% | |
Mining | | | | 0.8% | |
Media | | | | 0.8% | |
Insurance | | | | 0.7% | |
Real Estate | | | | 0.7% | |
Pharmaceuticals | | | | 0.7% | |
Retailers (other than Food/Drug) | | | | 0.6% | |
Hotels/Motels/Inns and Casinos | | | | 0.6% | |
Automotive | | | | 0.5% | |
Electronics/Electric | | | | 0.5% | |
Commercial Services | | | | 0.5% | |
Food Products | | | | 0.4% | |
Chemicals/Plastics | | | | 0.4% | |
Consumer Products | | | | 0.4% | |
Construction | | | | 0.4% | |
Foreign Government Bonds, Foreign Agencies and Foreign Government Sponsored Corporations | | | | 0.4% | |
Aerospace & Defense | | | | 0.3% | |
Industrial Equipment | | | | 0.3% | |
Containers and Glass Products | | | | 0.3% | |
Diversified Manufacturing | | | | 0.3% | |
Pulp & Paper | | | | 0.3% | |
Leisure | | | | 0.2% | |
Beverage and Tobacco | | | | 0.2% | |
Building and Development (including Steel/Metals) | | | | 0.2% | |
Business Equipment and Services | | | | 0.2% | |
Food Service | | | | 0.1% | |
Chemical Products | | | | 0.1% | |
Environmental Control | | | | 0.0% | (i) |
Financial Intermediaries | | | | 0.0% | (i) |
Conglomerates | | | | 0.0% | (i) |
Other Assets and Liabilities | | | | 0.5% | |
| | | | | |
Net Assets | | | | 100.0% | |
| | | | | |
| | | | |
| 42 | | DoubleLine Funds Trust | | The accompanying notes are an integral part of these financial statements. |
| (a) | Represents issues not identified as the top 50 holdings in terms of market value and issues or issuers not exceeding 1% of net assets individually or in aggregate, respectively as of period end. |
| (b) | Security exempt from registration under Rule 144A of the Securities Act of 1933. These securities may be resold in transactions exempt from registration to qualified institutional buyers. |
| (c) | Includes securities where coupon rate is variable based on the weighted average coupon of the underlying collateral. To the extent the weighted average coupon of the underlying assets which comprise the collateral increases or decreases, the coupon rate of this security will increase or decrease correspondingly. The rate disclosed is as of period end. |
| (d) | Includes interest only securities |
| (e) | Step Bond; Coupon rate changes based on a predetermined schedule or event. The interest rate shown is the rate in effect as of period end. |
| (f) | Includes inverse floating rate securities whose interest rate moves in the opposite direction of reference interest rates. Reference interest rates are typically based on a negative multiplier or slope. Interest rate may also be subject to a cap or floor. |
| (g) | Includes principal only securities |
| (h) | Security accrues interest which is added to the outstanding principal balance. The interest payment will be deferred until all other tranches in the structure are paid off. The rate disclosed is as of period end. |
| (i) | Represents less than 0.05% of net assets |
| (j) | Seven-day yield as of period end |
| | | | | | | | | | | | | | | | | | | | | | | | | |
| | | | | |
| Futures Contracts | | | | | | | | | | |
| Description | | Long/ Short | | Contract
Quantity | | Expiration
Date | | Notional
Amount(1) | | Unrealized
Appreciation
(Depreciation)/
Value |
U.S. Treasury Ultra Bonds | | Short | | | | (1,025 | ) | | | | 6/18/2024 | | | | $ | (132,225,000 | ) | | | $ | 1,123,584 | |
10 Year U.S. Ultra Treasury Notes | | Short | | | | (500 | ) | | | | 6/18/2024 | | | | | (57,304,688 | ) | | | | (559,679 | ) |
U.S. Treasury 2 Year Notes | | Long | | | | 18,150 | | | | | 6/28/2024 | | | | | 3,711,391,424 | | | | | (7,890,162 | ) |
| | | | | | | | | | | | | | | | | | | | | | |
| | | | | | | | | | | | | | | | | | | | $ | (7,326,257 | ) |
| | | | | | | | | | | | | | | | | | | | | | |
| (1) | Notional Amount is determined based on the number of contracts multiplied by the contract size and the quoted daily settlement price in US dollars. |
Affiliated Mutual Funds
A summary of the DoubleLine Core Fixed Income Fund’s investments in affiliated mutual funds for the period ended March 31, 2024 is as follows:
| | | | | | | | | | | | | | | | | | | | | | | | | | | | | | | | | | | | | | | | |
| Fund | | Value at
March 31,
2023 | | Gross
Purchases | | Gross
Sales | | Net Realized
Gain (Loss) for
the Period Ended
March 31, 2024 | | Change in
Unrealized for the
Period Ended
March 31, 2024 | | Value at
March 31,
2024 | | Shares Held at
March 31,
2024 | | Dividend Income
Earned for the
Period Ended
March 31,
2024 |
DoubleLine Infrastructure Income Fund (Class I) | | | $ | 298,398,929 | | | | $ | — | | | | $ | — | | | | $ | — | | | | $ | 5,605,284 | | | | $ | 304,004,213 | | | | | 32,972,257 | | | | $ | 10,926,500 | |
DoubleLine Global Bond Fund (Class I) | | | | 109,385,620 | | | | | — | | | | | — | | | | | — | | | | | (905,082 | ) | | | | 108,480,538 | | | | | 12,929,742 | | | | | — | |
DoubleLine Long Duration Total Return Bond Fund (Class I) | | | | 35,750,000 | | | | | — | | | | | — | | | | | — | | | | | (2,850,000 | ) | | | | 32,900,000 | | | | | 5,000,000 | | | | | 1,257,559 | |
| | | | | | | | | | | | | | | | | | | | | | | | | | | | | | | | | | | | | | | | |
| | | $ | 443,534,549 | | | | $ | — | | | | $ | — | | | | $ | — | | | | $ | 1,850,202 | | | | $ | 445,384,751 | | | | | 50,901,999 | | | | $ | 12,184,059 | |
| | | | | | | | | | | | | | | | | | | | | | | | | | | | | | | | | | | | | | | | |
| | | | | | | | |
| The accompanying notes are an integral part of these financial statements. | | Annual Report | | | | | March 31, 2024 | | 43 |
| | |
Schedule of Investments DoubleLine Emerging Markets Fixed Income Fund | | March 31, 2024 |
| | | | | | | | | | | | | | | | |
PRINCIPAL
AMOUNT $ | | | SECURITY DESCRIPTION | | RATE | | | MATURITY | | | VALUE $ | |
| | FOREIGN CORPORATE BONDS 80.9% | |
| | |
| | BRAZIL 13.5% | |
| | 505,000 | | | Banco do Estado do Rio Grande do Sul SA (5 Year CMT Rate + 4.93%) | | | 5.38% | (a) | | | 01/28/2031 | | | | 488,406 | |
| | 2,300,000 | | | Banco do Estado do Rio Grande do Sul SA (5 Year CMT Rate + 4.93%) | | | 5.38% | | | | 01/28/2031 | | | | 2,224,423 | |
| | 500,000 | | | Braskem Netherlands Finance BV | | | 7.25% | | | | 02/13/2033 | | | | 481,275 | |
| | 7,700,000 | | | Braskem Netherlands Finance BV (5 Year CMT Rate + 8.22%) | | | 8.50% | | | | 01/23/2081 | | | | 7,727,990 | |
| | 7,200,000 | | | Cosan Overseas Ltd. | | | 8.25% | (b) | | | 05/05/2024 | | | | 7,375,499 | |
| | 4,350,000 | | | CSN Resources SA | | | 5.88% | | | | 04/08/2032 | | | | 3,808,728 | |
| | 11,511,830 | | | Guara Norte SARL | | | 5.20% | | | | 06/15/2034 | | | | 10,512,259 | |
| | 1,929,352 | | | Invepar Holdings | | | 0.00% | (c)(d) | | | 12/30/2028 | | | | — | |
| | 1,700,000 | | | Itau Unibanco Holding SA/Cayman Island (5 Year CMT Rate + 3.22%) | | | 4.63% | (b) | | | 02/27/2025 | | | | 1,600,783 | |
| | 7,846,000 | | | MARB BondCo PLC | | | 3.95% | | | | 01/29/2031 | | | | 6,475,192 | |
| | 1,426,127 | | | MC Brazil Downstream Trading SARL | | | 7.25% | | | | 06/30/2031 | | | | 1,292,032 | |
| | 5,500,000 | | | Minerva Luxembourg SA | | | 4.38% | | | | 03/18/2031 | | | | 4,601,685 | |
| | 1,100,000 | | | Minerva Luxembourg SA | | | 8.88% | (a) | | | 09/13/2033 | | | | 1,158,058 | |
| | 1,600,000 | | | Minerva Luxembourg SA | | | 8.88% | | | | 09/13/2033 | | | | 1,684,448 | |
| | 1,000,000 | | | Movida Europe SA | | | 5.25% | | | | 02/08/2031 | | | | 885,757 | |
| | 6,773,424 | | | MV24 Capital BV | | | 6.75% | | | | 06/01/2034 | | | | 6,378,575 | |
| | 7,475,184 | | | Prumo Participacoes e Investimentos S/A | | | 7.50% | | | | 12/31/2031 | | | | 7,471,225 | |
| | 975,000 | | | Simpar Europe SA | | | 5.20% | | | | 01/26/2031 | | | | 853,112 | |
| | 850,000 | | | Unigel Luxembourg SA | | | 8.75% | (c) | | | 10/01/2026 | | | | 264,946 | |
| | | | | | | | | | | | | | | | |
| | | | | | | | | | | | | | | 65,284,393 | |
| | | | | | | | | | | | | | | | |
| | CHILE 7.2% | |
| | 4,803,000 | | | AES Andes SA
(5 Year Swap Rate USD + 4.64%) | | | 7.13% | | | | 03/26/2079 | | | | 4,758,884 | |
| | 4,800,000 | | | AES Andes SA
(5 Year Swap Rate USD + 4.64%) | | | 7.13% | (a) | | | 03/26/2079 | | | | 4,755,912 | |
| | 578,000 | | | AES Andes SA
(5 Year CMT Rate + 4.92%) | | | 6.35% | | | | 10/07/2079 | | | | 564,258 | |
| | 1,000,000 | | | Agrosuper SA | | | 4.60% | (a) | | | 01/20/2032 | | | | 864,584 | |
| | 1,000,000 | | | Agrosuper SA | | | 4.60% | | | | 01/20/2032 | | | | 864,584 | |
| | 6,000,000 | | | CAP SA | | | 3.90% | | | | 04/27/2031 | | | | 4,716,986 | |
| | 2,900,000 | | | CAP SA | | | 3.90% | (a) | | | 04/27/2031 | | | | 2,279,877 | |
| | 12,017,073 | | | Chile Electricity PEC SpA | | | 0.00% | (a) | | | 01/25/2028 | | | | 9,451,429 | |
| | 2,629,000 | | | Empresa Electrica Angamos SA | | | 4.88% | | | | 05/25/2029 | | | | 2,382,728 | |
| | 3,061,912 | | | Empresa Electrica Cochrane SpA | | | 5.50% | | | | 05/14/2027 | | | | 2,966,269 | |
| | 388,320 | | | GNL Quintero SA | | | 4.63% | | | | 07/31/2029 | | | | 380,156 | |
| | 1,000,000 | | | Inversiones La Construccion SA | | | 4.75% | | | | 02/07/2032 | | | | 855,000 | |
| | 200,000 | | | Mercury Chile Holdco LLC | | | 6.50% | | | | 01/24/2027 | | | | 194,012 | |
| | | | | | | | | | | | | | | | |
| | | | | | | | | | | | | | | 35,034,679 | |
| | | | | | | | | | | | | | | | |
| | COLOMBIA 10.2% | |
| | 1,196,248 | | | AI Candelaria Spain SA | | | 7.50% | | | | 12/15/2028 | | | | 1,172,456 | |
| | 7,100,000 | | | AI Candelaria Spain SA | | | 5.75% | | | | 06/15/2033 | | | | 5,767,749 | |
| | 3,800,000 | | | AI Candelaria Spain SA | | | 5.75% | (a) | | | 06/15/2033 | | | | 3,086,964 | |
| | 2,850,000 | | | Banco Davivienda SA (10 Year CMT Rate + 5.10%) | | | 6.65% | (a)(b) | | | 04/22/2031 | | | | 2,005,688 | |
| | | | | | | | | | | | | | | | |
PRINCIPAL
AMOUNT $ | | | SECURITY DESCRIPTION | | RATE | | | MATURITY | | | VALUE $ | |
| | | | |
| | 2,300,000 | | | Banco de Bogota SA | | | 6.25% | | | | 05/12/2026 | | | | 2,300,986 | |
| | 10,100,000 | | | Bancolombia SA (5 Year CMT Rate + 2.94%) | | | 4.63% | | | | 12/18/2029 | | | | 9,851,686 | |
| | 5,213,000 | | | Canacol Energy Ltd. | | | 5.75% | | | | 11/24/2028 | | | | 2,311,284 | |
| | 7,000,000 | | | Empresas Publicas de Medellin ESP | | | 4.25% | | | | 07/18/2029 | | | | 6,083,897 | |
| | 4,392,000 | | | Empresas Publicas de Medellin ESP | | | 4.38% | | | | 02/15/2031 | | | | 3,673,389 | |
| | 1,203,020 | | | Fideicomiso PA Pacifico Tres | | | 8.25% | | | | 01/15/2035 | | | | 1,143,714 | |
| | 5,684,000 | | | Geopark Ltd. | | | 5.50% | | | | 01/17/2027 | | | | 5,167,037 | |
| | 7,139,000 | | | Gran Tierra Energy, Inc. | | | 9.50% | (a) | | | 10/15/2029 | | | | 6,676,700 | |
| | | | | | | | | | | | | | | | |
| | | | | | | | | | | | | | | 49,241,550 | |
| | | | | | | | | | | | | | | | |
| | DOMINICAN REPUBLIC 0.8% | |
| | 4,000,000 | | | AES Espana BV | | | 5.70% | (a) | | | 05/04/2028 | | | | 3,692,040 | |
| | | | | | | | | | | | | | | | |
| | | | | | | | | | | | | | | 3,692,040 | |
| | | | | | | | | | | | | | | | |
| | GUATEMALA 3.5% | |
| | 3,850,000 | | | Banco Industrial SA/Guatemala (5 Year CMT Rate + 4.44%) | | | 4.88% | | | | 01/29/2031 | | | | 3,691,149 | |
| | 5,700,000 | | | CT Trust | | | 5.13% | | | | 02/03/2032 | | | | 5,057,397 | |
| | 3,974,400 | | | Millicom International Cellular SA | | | 6.63% | | | | 10/15/2026 | | | | 3,959,714 | |
| | 1,890,000 | | | Millicom International Cellular SA | | | 5.13% | | | | 01/15/2028 | | | | 1,794,279 | |
| | 2,700,000 | | | Millicom International Cellular SA | | | 6.25% | | | | 03/25/2029 | | | | 2,638,620 | |
| | | | | | | | | | | | | | | | |
| | | | | | | | | | | | | | | 17,141,159 | |
| | | | | | | | | | | | | | | | |
| | INDIA 10.8% | |
| | 3,390,000 | | | Adani Electricity Mumbai Ltd. | | | 3.95% | | | | 02/12/2030 | | | | 2,885,274 | |
| | 2,200,000 | | | Adani Electricity Mumbai Ltd. | | | 3.87% | | | | 07/22/2031 | | | | 1,812,851 | |
| | 3,891,500 | | | Adani International Container Terminal Pvt Ltd. | | | 3.00% | | | | 02/16/2031 | | | | 3,320,288 | |
| | 2,752,000 | | | Adani International Container Terminal Pvt Ltd. | | | 3.00% | (a) | | | 02/16/2031 | | | | 2,348,049 | |
| | 2,400,000 | | | Adani Ports & Special Economic Zone Ltd. | | | 4.00% | | | | 07/30/2027 | | | | 2,204,659 | |
| | 2,300,000 | | | Adani Ports & Special Economic Zone Ltd. | | | 4.20% | | | | 08/04/2027 | | | | 2,126,601 | |
| | 900,000 | | | Adani Ports & Special Economic Zone Ltd. | | | 4.38% | | | | 07/03/2029 | | | | 803,293 | |
| | 4,450,000 | | | Adani Ports & Special Economic Zone Ltd. | | | 3.10% | | | | 02/02/2031 | | | | 3,547,792 | |
| | 2,300,000 | | | Adani Transmission Step-One Ltd. | | | 4.00% | | | | 08/03/2026 | | | | 2,163,575 | |
| | 1,491,500 | | | Adani Transmission Step-One Ltd. | | | 4.25% | | | | 05/21/2036 | | | | 1,266,249 | |
| | 322,000 | | | JSW Hydro Energy Ltd. | | | 4.13% | | | | 05/18/2031 | | | | 285,668 | |
| | 3,200,000 | | | JSW Steel Ltd. | | | 5.05% | | | | 04/05/2032 | | | | 2,821,582 | |
| | 4,960,000 | | | Network i2i Ltd. (5 Year CMT Rate + 4.27%) | | | 5.65% | (b) | | | 01/15/2025 | | | | 4,930,907 | |
| | 4,000,000 | | | Reliance Industries Ltd. | | | 4.13% | | | | 01/28/2025 | | | | 3,948,829 | |
| | 250,000 | | | Reliance Industries Ltd. | | | 3.67% | | | | 11/30/2027 | | | | 237,093 | |
| | 8,000,000 | | | UPL Corp. Ltd. | | | 4.63% | | | | 06/16/2030 | | | | 6,444,769 | |
| | 2,400,000 | | | Vedanta Resources Finance II PLC | | | 9.25% | (a) | | | 04/23/2026 | | | | 1,960,737 | |
| | 10,246,000 | | | Vedanta Resources Ltd. | | | 13.88% | | | | 12/09/2028 | | | | 8,976,372 | |
| | | | | | | | | | | | | | | | |
| | | | | | | | | | | | | | | 52,084,588 | |
| | | | | | | | | | | | | | | | |
| | INDONESIA 7.2% | |
| | 1,000,000 | | | Adaro Indonesia PT | | | 4.25% | | | | 10/31/2024 | | | | 987,448 | |
| | 2,500,000 | | | Freeport Indonesia PT | | | 4.76% | | | | 04/14/2027 | | | | 2,447,208 | |
| | | | |
| 44 | | DoubleLine Funds Trust | | The accompanying notes are an integral part of these financial statements. |
| | |
| | | (Unaudited) March 31, 2024 |
| | | | | | | | | | | | | | | | |
PRINCIPAL
AMOUNT $ | | | SECURITY DESCRIPTION | | RATE | | | MATURITY | | | VALUE $ | |
| | | | |
| | 3,100,000 | | | Freeport Indonesia PT | | | 5.32% | (a) | | | 04/14/2032 | | | | 3,035,483 | |
| | 2,400,000 | | | Freeport Indonesia PT | | | 5.32% | | | | 04/14/2032 | | | | 2,350,051 | |
| | 200,000 | | | Freeport-McMoRan, Inc. | | | 4.38% | | | | 08/01/2028 | | | | 192,389 | |
| | 4,500,000 | | | Freeport-McMoRan, Inc. | | | 4.63% | | | | 08/01/2030 | | | | 4,327,023 | |
| | 3,251,640 | | | LLPL Capital Pte Ltd. | | | 6.88% | | | | 02/04/2039 | | | | 3,255,736 | |
| | 6,580,700 | | | LLPL Capital Pte Ltd. | | | 6.88% | (a) | | | 02/04/2039 | | | | 6,588,989 | |
| | 3,254,300 | | | Minejesa Capital BV | | | 4.63% | | | | 08/10/2030 | | | | 3,096,722 | |
| | 9,500,000 | | | Minejesa Capital BV | | | 5.63% | | | | 08/10/2037 | | | | 8,650,358 | |
| | | | | | | | | | | | | | | | |
| | | | | | | | | | | | | | | 34,931,407 | |
| | | | | | | | | | | | | | | | |
| | JAMAICA 0.1% | |
| | 1,260,282 | | | Digicel Group Holdings Ltd. | | | 0.00% | (a)(d) | | | 12/31/2030 | | | | 194,710 | |
| | 32,500 | | | Digicel Group Holdings Ltd. | | | 0.00% | (a)(d) | | | 12/31/2030 | | | | 26,251 | |
| | 251,431 | | | Digicel Group Holdings Ltd. | | | 0.00% | (a)(d) | | | 12/31/2030 | | | | 232,178 | |
| | 3,187,632 | | | Digicel Group Holdings Ltd. | | | 0.00% | (a)(d) | | | 12/31/2030 | | | | 36,606 | |
| | | | | | | | | | | | | | | | |
| | | | | | | | | | | | | | | 489,745 | |
| | | | | | | | | | | | | | | | |
| | KUWAIT 0.2% | |
| | 1,000,000 | | | MEGlobal Canada ULC | | | 5.00% | | | | 05/18/2025 | | | | 988,666 | |
| | | | | | | | | | | | | | | | |
| | | | | | | | | | | | | | | 988,666 | |
| | | | | | | | | | | | | | | | |
| | MEXICO 8.9% | |
| | 4,400,000 | | | Banco Mercantil del Norte SA/Grand Cayman (10 Year CMT Rate + 5.35%) | | | 7.63% | (b) | | | 01/10/2028 | | | | 4,407,510 | |
| | 5,000,000 | | | Banco Mercantil del Norte SA/Grand Cayman (10 Year CMT Rate + 5.47%) | | | 7.50% | (a)(b) | | | 06/27/2029 | | | | 4,991,027 | |
| | 1,000,000 | | | Banco Mercantil del Norte SA/Grand Cayman (10 Year CMT Rate + 5.03%) | | | 6.63% | (b) | | | 01/24/2032 | | | | 914,375 | |
| | 10,200,000 | | | BBVA Bancomer SA/Texas (5 Year CMT Rate + 2.65%) | | | 5.13% | | | | 01/18/2033 | | | | 9,485,896 | |
| | 2,300,000 | | | BBVA Bancomer SA/Texas (5 Year CMT Rate + 4.31%) | | | 5.88% | | | | 09/13/2034 | | | | 2,178,080 | |
| | 200,000 | | | BBVA Bancomer SA/Texas (5 Year CMT Rate + 4.66%) | | | 8.45% | | | | 06/29/2038 | | | | 211,322 | |
| | 2,400,000 | | | Braskem Idesa SAPI | | | 6.99% | | | | 02/20/2032 | | | | 1,864,585 | |
| | 2,200,000 | | | Buffalo Energy Mexico Holdings / Buffalo Energy Infrastructure / Buffalo Energy | | | 7.88% | (a) | | | 02/15/2039 | | | | 2,383,295 | |
| | 9,800,000 | | | Cemex SAB de CV (5 Year CMT Rate + 4.53%) | | | 5.13% | (b) | | | 06/08/2026 | | | | 9,477,410 | |
| | 300,000 | | | Cemex SAB de CV (5 Year CMT Rate + 5.16%) | | | 9.13% | (a)(b) | | | 03/14/2028 | | | | 326,094 | |
| | 401,000 | | | Cometa Energia SAB de CV | | | 6.38% | | | | 04/24/2035 | | | | 404,515 | |
| | 5,200,000 | | | Credito Real SAB de CV SOFOM ER (5 Year CMT Rate + 7.03%) | | | 9.13% | (b)(c) | | | 11/29/2027 | | | | 13,520 | |
| | 375,738 | | | Fermaca Enterprises S de RL de CV | | | 6.38% | | | | 03/30/2038 | | | | 367,832 | |
| | 2,000,000 | | | KUO SAB De CV | | | 5.75% | | | | 07/07/2027 | | | | 1,886,972 | |
| | 4,600,000 | | | Mexarrend SAPI de CV | | | 10.25% | (a)(c) | | | 07/24/2024 | | | | 966,000 | |
| | 2,078,411 | | | Mexico Generadora de Energia S de RL | | | 5.50% | | | | 12/06/2032 | | | | 2,047,729 | |
| | | | | | | | | | | | | | | | |
PRINCIPAL
AMOUNT $ | | | SECURITY DESCRIPTION | | RATE | | | MATURITY | | | VALUE $ | |
| | | | |
| | 1,239,397 | | | Tierra Mojada Luxembourg II SARL | | | 5.75% | | | | 12/01/2040 | | | | 1,139,702 | |
| | 16,033,000 | | | Unifin Financiera SAB de CV (5 Year CMT Rate + 6.31%) | | | 8.88% | (b)(c) | | | 01/29/2025 | | | | 81,768 | |
| | | | | | | | | | | | | | | | |
| | | | | | | | | | | | | | | 43,147,632 | |
| | | | | | | | | | | | | | | | |
| | PANAMA 1.0% | |
| | 200,000 | | | Banistmo SA | | | 4.25% | | | | 07/31/2027 | | | | 186,670 | |
| | 4,683,862 | | | UEP Penonome II SA | | | 6.50% | (a) | | | 10/01/2038 | | | | 3,665,122 | |
| | 1,342,648 | | | UEP Penonome II SA | | | 6.50% | | | | 10/01/2038 | | | | 1,050,622 | |
| | | | | | | | | | | | | | | | |
| | | | | | | | | | | | | | | 4,902,414 | |
| | | | | | | | | | | | | | | | |
| | PARAGUAY 1.5% | |
| | 2,224,000 | | | Frigorifico Concepcion SA | | | 7.70% | | | | 07/21/2028 | | | | 1,950,715 | |
| | 7,729,166 | | | Rutas 2 & 7 Finance Ltd. | | | 0.00% | | | | 09/30/2036 | | | | 5,277,804 | |
| | | | | | | | | | | | | | | | |
| | | | | | | | | | | | | | | 7,228,519 | |
| | | | | | | | | | | | | | | | |
| | PERU 10.5% | |
| | 1,300,000 | | | Banco de Credito del Peru SA | | | 5.85% | (a) | | | 01/11/2029 | | | | 1,315,919 | |
| | 8,000,000 | | | Banco de Credito del Peru SA (5 Year CMT Rate + 3.00%) | | | 3.13% | | | | 07/01/2030 | | | | 7,666,866 | |
| | 2,600,000 | | | Banco de Credito del Peru SA (5 Year CMT Rate + 2.45%) | | | 3.25% | | | | 09/30/2031 | | | | 2,403,082 | |
| | 12,172,000 | | | Banco Internacional del Peru SAA Interbank (5 Year CMT Rate + 3.71%) | | | 4.00% | | | | 07/08/2030 | | | | 11,698,560 | |
| | 7,950,000 | | | Cia de Minas Buenaventura SAA | | | 5.50% | | | | 07/23/2026 | | | | 7,674,788 | |
| | 6,804,000 | | | Inkia Energy Ltd. | | | 5.88% | | | | 11/09/2027 | | | | 6,664,119 | |
| | 1,672,000 | | | InRetail Consumer | | | 3.25% | | | | 03/22/2028 | | | | 1,503,222 | |
| | 1,641,000 | | | InRetail Shopping Malls | | | 5.75% | | | | 04/03/2028 | | | | 1,602,316 | |
| | 300,000 | | | Intercorp Financial Services, Inc. | | | 4.13% | | | | 10/19/2027 | | | | 282,268 | |
| | 6,100,000 | | | Minsur SA | | | 4.50% | | | | 10/28/2031 | | | | 5,350,284 | |
| | 1,425,000 | | | Nexa Resources SA | | | 5.38% | | | | 05/04/2027 | | | | 1,392,281 | |
| | 2,310,000 | | | Orazul Energy Peru SA | | | 5.63% | | | | 04/28/2027 | | | | 2,189,510 | |
| | 995,000 | | | Southern Copper Corp. | | | 3.88% | | | | 04/23/2025 | | | | 975,829 | |
| | | | | | | | | | | | | | | | |
| | | | | | | | | | | | | | | 50,719,044 | |
| | | | | | | | | | | | | | | | |
| | SINGAPORE 3.4% | |
| | 7,900,000 | | | Oversea-Chinese Banking Corp. Ltd. (5 Year CMT Rate + 1.58%) | | | 1.83% | | | | 09/10/2030 | | | | 7,469,831 | |
| | 7,000,000 | | | United Overseas Bank Ltd. (5 Year CMT Rate + 1.52%) | | | 1.75% | | | | 03/16/2031 | | | | 6,500,145 | |
| | 2,500,000 | | | United Overseas Bank Ltd. (5 Year CMT Rate + 1.23%) | | | 2.00% | | | | 10/14/2031 | | | | 2,291,205 | |
| | | | | | | | | | | | | | | | |
| | | | | | | | | | | | | | | 16,261,181 | |
| | | | | | | | | | | | | | | | |
| | SOUTH AFRICA 1.6% | |
| | 1,200,000 | | | Gold Fields Orogen Holdings BVI Ltd. | | | 5.13% | | | | 05/15/2024 | | | | 1,196,253 | |
| | 1,200,000 | | | Sasol Financing USA LLC | | | 4.38% | | | | 09/18/2026 | | | | 1,135,861 | |
| | 6,500,000 | | | Sasol Financing USA LLC | | | 5.50% | | | | 03/18/2031 | | | | 5,481,541 | |
| | | | | | | | | | | | | | | | |
| | | | | | | | | | | | | | | 7,813,655 | |
| | | | | | | | | | | | | | | | |
| | | | | | | | |
| The accompanying notes are an integral part of these financial statements. | | Annual Report | | | | | March 31, 2024 | | 45 |
| | |
Schedule of Investments DoubleLine Emerging Markets Fixed Income Fund (Cont.) | | |
| | | | | | | | | | | | | | | | |
PRINCIPAL
AMOUNT $ | | | SECURITY DESCRIPTION | | RATE | | | MATURITY | | | VALUE $ | |
| | VIETNAM 0.5% | |
| | 2,536,298 | | | Mong Duong Finance Holdings BV | | | 5.13% | | | | 05/07/2029 | | | | 2,426,667 | |
| | | | | | | | | | | | | | | | |
| | | | | | | | | | | | | | | 2,426,667 | |
| | | | | | | | | | | | | | | | |
| | | | Total Foreign Corporate Bonds
(Cost $434,801,128) | | | | 391,387,339 | |
| | | | | | | | | | | | | | | | |
| FOREIGN GOVERNMENT BONDS, FOREIGN AGENCIES AND FOREIGN
GOVERNMENT SPONSORED CORPORATIONS 18.4% |
|
| | |
| | BRAZIL 1.3% | |
| | 6,400,000 | | | Banco do Brasil SA/Cayman (10 Year CMT Rate + 4.40%) | | | 6.25% | (b) | | | 10/15/2024 | | | | 6,435,846 | |
| | | | | | | | | | | | | | | | |
| | COLOMBIA 3.2% | |
| | 2,000,000 | | | Colombia Government International Bond | | | 5.00% | | | | 06/15/2045 | | | | 1,456,041 | |
| | 3,000,000 | | | Colombia Government International Bond | | | 4.13% | | | | 05/15/2051 | | | | 1,869,291 | |
| | 800,000 | | | Ecopetrol SA | | | 5.88% | | | | 05/28/2045 | | | | 597,925 | |
| | 5,000,000 | | | Ecopetrol SA | | | 4.63% | | | | 11/02/2031 | | | | 4,162,897 | |
| | 10,300,000 | | | Ecopetrol SA | | | 5.88% | | | | 11/02/2051 | | | | 7,421,174 | |
| | | | | | | | | | | | | | | | |
| | | | | | | | | | | | | | | 15,507,328 | |
| | | | | | | | | | | | | | | | |
| | INDONESIA 2.1% | |
| | 3,200,000 | | | Bank Negara Indonesia Persero Tbk PT | | | 3.75% | | | | 03/30/2026 | | | | 3,058,275 | |
| | 4,600,000 | | | Indonesia Asahan Aluminium PT / Mineral Industri Indonesia Persero PT | | | 5.45% | | | | 05/15/2030 | | | | 4,548,857 | |
| | 2,800,000 | | | Indonesia Asahan Aluminium PT / Mineral Industri Indonesia Persero PT | | | 4.75% | | | | 05/15/2025 | | | | 2,766,171 | |
| | | | | | | | | | | | | | | | |
| | | | | | | | | | | | | | | 10,373,303 | |
| | | | | | | | | | | | | | | | |
| | MEXICO 6.1% | |
| | 8,000,000 | | | Banco Nacional de Comercio Exterior SNC/Cayman Islands (5 Year CMT Rate + 2.00%) | | | 2.72% | | | | 08/11/2031 | | | | 7,246,394 | |
| | 2,500,000 | | | Comision Federal de Electricidad | | | 3.35% | | | | 02/09/2031 | | | | 2,093,560 | |
| | 11,000,000 | | | Mexico Government International Bond | | | 4.40% | | | | 02/12/2052 | | | | 8,430,596 | |
| | 7,000,000 | | | Mexico Government International Bond | | | 6.34% | | | | 05/04/2053 | | | | 6,923,682 | |
| | 7,400,000 | | | Petroleos Mexicanos | | | 6.75% | | | | 09/21/2047 | | | | 4,926,772 | |
| | | | | | | | | | | | | | | | |
| | | | | | | | | | | | | | | 29,621,004 | |
| | | | | | | | | | | | | | | | |
| | PANAMA 1.9% | |
| | 1,500,000 | | | Panama Government International Bond | | | 4.30% | | | | 04/29/2053 | | | | 976,731 | |
| | 13,700,000 | | | Panama Government International Bond | | | 3.87% | | | | 07/23/2060 | | | | 7,979,840 | |
| | | | | | | | | | | | | | | | |
| | | | | | | | | | | | | | | 8,956,571 | |
| | | | | | | | | | | | | | | | |
| | PARAGUAY 0.7% | |
| | 4,468,861 | | | Bioceanico Sovereign Certificate Ltd. | | | 0.00% | | | | 06/05/2034 | | | | 3,285,318 | |
| | | | | | | | | | | | | | | | |
| | | | | | | | | | | | | | | | |
PRINCIPAL
AMOUNT $/
SHARES | | | SECURITY DESCRIPTION | | RATE | | | MATURITY | | | VALUE $ | |
| | PERU 2.3% | |
| | 4,000,000 | | | Corp. Financiera de Desarrollo SA (3 Month LIBOR USD + 5.61%) | | | 5.25% | (e) | | | 07/15/2029 | | | | 3,996,680 | |
| | 1,528,648 | | | Lima Metro Line 2 Finance Ltd. | | | 5.88% | | | | 07/05/2034 | | | | 1,517,706 | |
| | 2,800,000 | | | Petroleos del Peru SA | | | 5.63% | | | | 06/19/2047 | | | | 1,883,447 | |
| | 4,700,000 | | | Petroleos del Peru SA | | | 4.75% | | | | 06/19/2032 | | | | 3,720,458 | |
| | | | | | | | | | | | | | | | |
| | | | | | | | | | | | | | | 11,118,291 | |
| | | | | | | | | | | | | | | | |
| | SOUTH AFRICA 0.8% | |
| | 4,200,000 | | | Republic of South Africa Government International Bond | | | 4.30% | | | | 10/12/2028 | | | | 3,779,117 | |
| | | | | | | | | | | | | | | | |
| | | | Total Foreign Government Bonds, Foreign Agencies and Foreign Government Sponsored Corporations
(Cost $103,874,968) | | | | 89,076,778 | |
| | | | | | | | | | | | | | | | |
| | SHORT TERM INVESTMENTS 0.8% | |
| | 1,309,764 | | | First American Government Obligations Fund - U | | | 5.26% | (f) | | | | | | | 1,309,764 | |
| | 1,309,764 | | | JPMorgan US Government Money Market Fund - IM | | | 5.25% | (f) | | | | | | | 1,309,764 | |
| | 1,309,763 | | | MSILF Government Portfolio -
Institutional | | | 5.22% | (f) | | | | | | | 1,309,763 | |
| | | | | | | | | | | | | | | | |
| | | | Total Short Term Investments
(Cost $3,929,291) | | | | 3,929,291 | |
| | | | | | | | | | | | | | | | |
| | | | Total Investments 100.1%
(Cost $542,605,387) | | | | 484,393,408 | |
| | | | Other Liabilities in Excess of Assets (0.1)% | | | | (257,349 | ) |
| | | | | | | | | | | | | | | | |
| | | | NET ASSETS 100.0% | | | | | | | | | | $ | 484,136,059 | |
| | | | | | | | | | | | | | | | |
| | | | | |
| SECURITY TYPE BREAKDOWN as a % of Net Assets: | | | | | |
Foreign Corporate Bonds | | | | 80.9% | |
Foreign Government Bonds, Foreign Agencies and Foreign Government Sponsored Corporations | | | | 18.4% | |
Short Term Investments | | | | 0.8% | |
Other Assets and Liabilities | | | | (0.1)% | |
| | | | | |
Net Assets | | | | 100.0% | |
| | | | | |
| | | | | |
| INVESTMENT BREAKDOWN as a % of Net Assets: | | | | | |
Banking | | | | 21.0% | |
Utilities | | | | 18.7% | |
Energy | | | | 12.3% | |
Mining | | | | 11.4% | |
Transportation | | | | 9.4% | |
Foreign Government Bonds, Foreign Agencies and Foreign Government Sponsored Corporations | | | | 7.6% | |
Consumer Products | | | | 4.9% | |
Telecommunications | | | | 3.9% | |
Building and Development (including Steel/Metals) | | | | 3.4% | |
Chemicals/Plastics | | | | 2.7% | |
Chemical Products | | | | 2.4% | |
Short Term Investments | | | | 0.8% | |
Retailers (other than Food/Drug) | | | | 0.6% | |
Finance | | | | 0.4% | |
Conglomerates | | | | 0.4% | |
Food Products | | | | 0.2% | |
Other Assets and Liabilities | | | | (0.1)% | |
| | | | | |
Net Assets | | | | 100.0% | |
| | | | | |
| | | | |
| 46 | | DoubleLine Funds Trust | | The accompanying notes are an integral part of these financial statements. |
| | | | | |
| COUNTRY BREAKDOWN as a % of Net Assets: | | | | | |
Mexico | | | | 15.0% | |
Brazil | | | | 14.8% | |
Colombia | | | | 13.4% | |
Peru | | | | 12.8% | |
India | | | | 10.8% | |
Indonesia | | | | 9.3% | |
Chile | | | | 7.2% | |
Guatemala | | | | 3.5% | |
Singapore | | | | 3.4% | |
Panama | | | | 2.9% | |
South Africa | | | | 2.4% | |
Paraguay | | | | 2.2% | |
United States | | | | 0.8% | |
Dominican Republic | | | | 0.8% | |
Vietnam | | | | 0.5% | |
Kuwait | | | | 0.2% | |
Jamaica | | | | 0.1% | |
Other Assets and Liabilities | | | | (0.1)% | |
| | | | | |
Net Assets | | | | 100.0% | |
| | | | | |
| (a) | Security exempt from registration under Rule 144A of the Securities Act of 1933. These securities may be resold in transactions exempt from registration to qualified institutional buyers. |
| (b) | Perpetual maturity. The date disclosed is the next call date of the security. |
| (c) | Security is in default or has failed to make a scheduled payment. Income is not being accrued. |
| (d) | Value determined using significant unobservable inputs. |
| (e) | Securities referencing LIBOR are expected to transition to an alternative reference rate by the security’s next scheduled coupon reset date. |
| (f) | Seven-day yield as of period end. |
| | | | | | | | |
| The accompanying notes are an integral part of these financial statements. | | Annual Report | | | | | March 31, 2024 | | 47 |
| | |
Schedule of Investments DoubleLine Low Duration Bond Fund | | March 31, 2024 |
| | | | | | | | | | | | | | | | |
PRINCIPAL
AMOUNT $ | | | SECURITY DESCRIPTION | | RATE | | | MATURITY | | | VALUE $ | |
| | ASSET BACKED OBLIGATIONS 7.5% | |
| | |
| | | | AccessLex Institute | | | | | |
| | 1,930,263 | | | Series 2007-A-B (CME Term SOFR 3 Month + 0.81%) | | | 6.14% | | | | 02/25/2037 | | | | 1,868,919 | |
| | |
| | | | ACHV Trust | | | | | |
| | 695,214 | | | Series 2023-1PL-B | | | 6.80% | (a) | | | 03/18/2030 | | | | 696,255 | |
| | 59,530 | | | Series 2023-3PL-A | | | 6.60% | (a) | | | 08/19/2030 | | | | 59,545 | |
| | 2,750,000 | | | Series 2023-3PL-C | | | 7.35% | (a) | | | 08/19/2030 | | | | 2,789,413 | |
| | 2,530,477 | | | Series 2023-4CP-A | | | 6.81% | (a) | | | 11/25/2030 | | | | 2,534,376 | |
| | |
| | | | Affirm, Inc. | | | | | |
| | 759,685 | | | Series 2021-Z1-A | | | 1.07% | (a) | | | 08/15/2025 | | | | 754,503 | |
| | 16,550,029 | | | Series 2023-X1-A | | | 7.11% | (a) | | | 11/15/2028 | | | | 16,630,767 | |
| | 5,300,000 | | | Series 2024-A-A | | | 5.61% | (a) | | | 02/15/2029 | | | | 5,291,314 | |
| | |
| | | | Aqua Finance Trust | | | | | |
| | 1,889,253 | | | Series 2020-AA-A | | | 1.90% | (a) | | | 07/17/2046 | | | | 1,755,703 | |
| | |
| | | | Arivo Acceptance Auto Loan Receivables Trust | | | | | |
| | 393,380 | | | Series 2021-1A-A | | | 1.19% | (a) | | | 01/15/2027 | | | | 389,654 | |
| | |
| | | | CAI International, Inc. | | | | | |
| | 7,551,875 | | | Series 2020-1A-A | | | 2.22% | (a) | | | 09/25/2045 | | | | 6,846,249 | |
| | |
| | | | Carvana Auto Receivables Trust | | | | | |
| | 7,656,700 | | | Series 2023-N3-A | | | 6.41% | (a) | | | 09/10/2027 | | | | 7,689,330 | |
| | 12,000,000 | | | Series 2024-N1-A2 | | | 5.76% | (a) | | | 04/12/2027 | | | | 12,005,759 | |
| | |
| | | | Citizens Auto Receivables Trust | | | | | |
| | 14,665,961 | | | Series 2023-2-A2A | | | 6.09% | (a) | | | 10/15/2026 | | | | 14,697,751 | |
| | |
| | | | Commonbond Student Loan Trust | | | | | |
| | 999,605 | | | Series 2017-BGS-A1 | | | 2.68% | (a) | | | 09/25/2042 | | | | 910,769 | |
| | 919,323 | | | Series 2020-AGS-A | | | 1.98% | (a) | | | 08/25/2050 | | | | 800,534 | |
| | |
| | | | Compass Datacenters LLC | | | | | |
| | 15,000,000 | | | Series 2024-1A-A1 | | | 5.25% | (a) | | | 02/25/2049 | | | | 14,721,720 | |
| | |
| | | | CPS Auto Trust | | | | | |
| | 882,569 | | | Series 2022-D-A | | | 6.09% | (a) | | | 01/15/2027 | | | | 883,425 | |
| | 4,749,559 | | | Series 2024-A-A | | | 5.71% | (a) | | | 09/15/2027 | | | | 4,748,339 | |
| | |
| | | | DataBank Issuer | | | | | |
| | 1,599,000 | | | Series 2021-1A-A2 | | | 2.06% | (a) | | | 02/27/2051 | | | | 1,466,719 | |
| | 10,000,000 | | | Series 2023-1A-A2 | | | 5.12% | (a) | | | 02/25/2053 | | | | 9,515,057 | |
| | |
| | | | Diamond Resorts Owner Trust | | | | | |
| | 1,636,034 | | | Series 2021-1A-B | | | 2.05% | (a) | | | 11/21/2033 | | | | 1,543,324 | |
| | |
| | | | Exeter Automobile Receivables Trust | | | | | |
| | 4,100,000 | | | Series 2023-3A-A3 | | | 6.04% | | | | 07/15/2026 | | | | 4,102,771 | |
| | 17,663,612 | | | Series 2023-5A-A2 | | | 6.20% | | | | 04/15/2026 | | | | 17,686,535 | |
| | |
| | | | ExteNet LLC | | | | | |
| | 4,250,000 | | | Series 2019-1A-B | | | 4.14% | (a) | | | 07/25/2049 | | | | 4,205,323 | |
| | |
| | | | Foundation Finance Trust | | | | | |
| | 271,789 | | | Series 2019-1A-A | | | 3.86% | (a) | | | 11/15/2034 | | | | 270,371 | |
| | |
| | | | Global Sea Containers Two SRL | | | | | |
| | 3,049,255 | | | Series 2020-1A-A | | | 2.17% | (a) | | | 10/17/2040 | | | | 2,816,537 | |
| | |
| | | | GLS Auto Receivables Trust | | | | | |
| | 1,128,200 | | | Series 2021-1A-D | | | 1.68% | (a) | | | 01/15/2027 | | | | 1,098,983 | |
| | 2,895,951 | | | Series 2021-2A-C | | | 1.08% | (a) | | | 06/15/2026 | | | | 2,869,350 | |
| | 19,000,000 | | | Series 2023-4A-A2 | | | 6.40% | (a) | | | 12/15/2026 | | | | 19,061,855 | |
| | |
| | | | Hertz Global Holdings, Inc. | | | | | |
| | 10,200,000 | | | Series 2021-1A-B | | | 1.56% | (a) | | | 12/26/2025 | | | | 9,956,195 | |
| | |
| | | | Hilton Grand Vacations, Inc. | | | | | |
| | 672,051 | | | Series 2018-AA-A | | | 3.54% | (a) | | | 02/25/2032 | | | | 658,677 | |
| | 359,255 | | | Series 2020-AA-A | | | 2.74% | (a) | | | 02/25/2039 | | | | 342,528 | |
| | |
| | | | LAD Auto Receivables Trust | | | | | |
| | 15,000,000 | | | Series 2024-1A-A2 | | | 5.44% | (a) | | | 11/16/2026 | | | | 14,980,955 | |
| | |
| | | | Laurel Road Prime Student Loan Trust | | | | | |
| | 389,134 | | | Series 2019-A-A1FX | | | 2.34% | (a) | | | 10/25/2048 | | | | 379,364 | |
| | |
| | | | Lendbuzz Securitization Trust | | | | | |
| | 8,042,983 | | | Series 2023-1A-A2 | | | 6.92% | (a) | | | 08/15/2028 | | | | 8,105,366 | |
| | 3,642,139 | | | Series 2023-2A-A2 | | | 7.09% | (a) | | | 10/16/2028 | | | | 3,679,387 | |
| | |
| | | | Lendingpoint Asset Securitization Trust | | | | | |
| | 4,111,705 | | | Series 2022-C-A | | | 6.56% | (a) | | | 02/15/2030 | | | | 4,110,338 | |
| | | | | | | | | | | | | | | | |
PRINCIPAL
AMOUNT $ | | | SECURITY DESCRIPTION | | RATE | | | MATURITY | | | VALUE $ | |
| | |
| | | | Loanpal Solar Loan Ltd. | | | | | |
| | 8,069,391 | | | Series 2020-3GS-A | | | 2.47% | (a) | | | 12/20/2047 | | | | 6,263,204 | |
| | |
| | | | Marlette Funding Trust | | | | | |
| | 411,412 | | | Series 2019-4A-C | | | 3.76% | (a) | | | 12/17/2029 | | | | 410,931 | |
| | 1,039,205 | | | Series 2022-1A-B | | | 2.34% | (a) | | | 04/15/2032 | | | | 1,028,987 | |
| | 3,043,204 | | | Series 2022-2A-B | | | 5.50% | (a) | | | 08/15/2032 | | | | 3,033,789 | |
| | |
| | | | MVW Owner Trust | | | | | |
| | 465,816 | | | Series 2018-1A-C | | | 3.90% | (a) | | | 01/21/2036 | | | | 461,123 | |
| | |
| | | | Navient Student Loan Trust | | | | | |
| | 2,683,189 | | | Series 2020-FA-A | | | 1.22% | (a) | | | 07/15/2069 | | | | 2,431,779 | |
| | 1,521,476 | | | Series 2020-GA-A | | | 1.17% | (a) | | | 09/16/2069 | | | | 1,372,643 | |
| | |
| | | | NP Railcar Holdings LLC | | | | | |
| | 2,338,162 | | | Series 2019-1A-A1 | | | 2.57% | (a) | | | 09/20/2049 | | | | 2,245,267 | |
| | |
| | | | Oxford Finance Funding Trust | | | | | |
| | 3,386,780 | | | Series 2020-1A-A2 | | | 3.10% | (a) | | | 02/15/2028 | | | | 3,291,209 | |
| | |
| | | | Pagaya AI Debt Selection Trust | | | | | |
| | 3,294,028 | | | Series 2021-HG1-A | | | 1.22% | (a) | | | 01/16/2029 | | | | 3,220,904 | |
| | 4,860,635 | | | Series 2022-1-A | | | 2.03% | (a) | | | 10/15/2029 | | | | 4,813,585 | |
| | 6,101,971 | | | Series 2022-3-A | | | 6.06% | (a) | | | 03/15/2030 | | | | 6,095,271 | |
| | 10,674,361 | | | Series 2023-1-A | | | 7.56% | (a) | | | 07/15/2030 | | | | 10,724,951 | |
| | 5,061,135 | | | Series 2023-3-A | | | 7.60% | (a) | | | 12/16/2030 | | | | 5,096,977 | |
| | 8,137,103 | | | Series 2023-5-A | | | 7.18% | (a) | | | 04/15/2031 | | | | 8,159,326 | |
| | 4,445,962 | | | Series 2023-5-B | | | 7.63% | (a) | | | 04/15/2031 | | | | 4,488,485 | |
| | 8,307,357 | | | Series 2023-7-A | | | 7.23% | (a) | | | 07/15/2031 | | | | 8,340,901 | |
| | |
| | | | Prosper Marketplace Issuance Trust | | | | | |
| | 4,007,127 | | | Series 2023-1A-A | | | 7.06% | (a) | | | 07/16/2029 | | | | 4,020,990 | |
| | 3,750,000 | | | Series 2024-1A-A | | | 6.12% | (a) | | | 08/15/2029 | | | | 3,759,176 | |
| | |
| | | | Santander Consumer USA Holdings, Inc. | | | | | |
| | 2,618,430 | | | Series 2023-4-A2 | | | 6.18% | | | | 02/16/2027 | | | | 2,623,518 | |
| | |
| | | | Santander Consumer USA, Inc. | | | | | |
| | 2,259,001 | | | Series 2021-3-C | | | 1.47% | | | | 01/15/2027 | | | | 2,225,310 | |
| | |
| | | | Santander Drive Auto Receivables LLC | | | | | |
| | 2,690,854 | | | Series 2020-4-D | | | 1.48% | | | | 01/15/2027 | | | | 2,644,133 | |
| | |
| | | | SFS Auto Receivables Securitization Trust | | | | | |
| | 5,000,000 | | | Series 2024-1A-A2 | | | 5.35% | (a) | | | 06/21/2027 | | | | 4,993,669 | |
| | |
| | | | Sierra Timeshare Conduit Receivables Funding LLC | | | | | |
| | 1,246,985 | | | Series 2021-2A-C | | | 1.95% | (a) | | | 09/20/2038 | | | | 1,163,109 | |
| | |
| | | | SLM Student Loan Trust | | | | | |
| | 4,795,029 | | | Series 2006-A-A5 (CME Term SOFR 3 Month + 0.55%) | | | 5.88% | | | | 06/15/2039 | | | | 4,652,595 | |
| | 2,857,377 | | | Series 2006-B-A5 (CME Term SOFR 3 Month + 0.53%) | | | 5.86% | | | | 12/15/2039 | | | | 2,783,672 | |
| | |
| | | | SOFI Alternative Trust | | | | | |
| | 5,025,051 | | | Series 2021-1-PT1 | | | 9.72% | (a)(b) | | | 05/25/2030 | | | | 4,975,615 | |
| | 7,066,076 | | | Series 2021-2-A | | | 1.25% | (a) | | | 08/15/2030 | | | | 6,854,072 | |
| | 13,538,380 | | | Series 2021-3-A | | | 1.50% | (a) | | | 11/15/2030 | | | | 13,080,512 | |
| | |
| | | | SoFi Consumer Loan Program Trust | | | | | |
| | 452,759 | | | Series 2022-1S-A | | | 6.21% | (a) | | | 04/15/2031 | | | | 452,812 | |
| | 922,783 | | | Series 2023-1S-A | | | 5.81% | (a) | | | 05/15/2031 | | | | 922,376 | |
| | |
| | | | SoFi Professional Loan Program LLC | | | | | |
| | 975,346 | | | Series 2018-D-A2FX | | | 3.60% | (a) | | | 02/25/2048 | | | | 946,008 | |
| | 3,787,595 | | | Series 2020-C-AFX | | | 1.95% | (a) | | | 02/15/2046 | | | | 3,454,082 | |
| | |
| | | | TAL Advantage LLC | | | | | |
| | 3,162,500 | | | Series 2020-1A-A | | | 2.05% | (a) | | | 09/20/2045 | | | | 2,879,129 | |
| | |
| | | | Tesla Auto Lease Trust | | | | | |
| | 12,250,000 | | | Series 2021-B-B | | | 0.91% | (a) | | | 09/22/2025 | | | | 12,142,356 | |
| | |
| | | | UPCL | | | | | |
| | 25,000,000 | | | Series 2023-1-A | | | 7.65% | (c) | | | 04/22/2030 | | | | 25,130,000 | |
| | |
| | | | Upgrade Master Pass-Thru Trust | | | | | |
| | 1,074,833 | | | Series 2021-PT3-A | | | 13.84% | (a)(b) | | | 07/15/2027 | | | | 984,899 | |
| | |
| | | | Upstart Pass-Through Trust Series | | | | | |
| | 699,572 | | | Series 2020-ST5-A | | | 3.00% | (a) | | | 12/20/2026 | | | | 694,516 | |
| | 884,139 | | | Series 2021-ST5-A | | | 2.00% | (a) | | | 07/20/2027 | | | | 860,270 | |
| | 2,503,806 | | | Series 2021-ST6-A | | | 1.85% | (a) | | | 08/20/2027 | | | | 2,437,500 | |
| | | | |
| 48 | | DoubleLine Funds Trust | | The accompanying notes are an integral part of these financial statements. |
| | | | | | | | | | | | | | | | |
PRINCIPAL
AMOUNT $ | | | SECURITY DESCRIPTION | | RATE | | | MATURITY | | | VALUE $ | |
| | |
| | | | Upstart Securitization Trust | | | | | |
| | 540,905 | | | Series 2021-3-B | | | 1.66% | (a) | | | 07/20/2031 | | | | 538,126 | |
| | 1,431,432 | | | Series 2023-1-A | | | 6.59% | (a) | | | 02/20/2033 | | | | 1,430,975 | |
| | 7,943,105 | | | Series 2023-2-A | | | 6.77% | (a) | | | 06/20/2033 | | | | 7,959,835 | |
| | 7,696,218 | | | Series 2023-3-A | | | 6.90% | (a) | | | 10/20/2033 | | | | 7,736,250 | |
| | |
| | | | Westgate Resorts LLC | | | | | |
| | 4,847,811 | | | Series 2022-1A-C | | | 2.49% | (a) | | | 08/20/2036 | | | | 4,625,255 | |
| | |
| | | | Westlake Automobile Receivables Trust | | | | | |
| | 16,025,000 | | | Series 2023-4A-A2 | | | 6.23% | (a) | | | 01/15/2027 | | | | 16,106,240 | |
| | 7,150,000 | | | Series 2024-1A-A2A | | | 5.62% | (a) | | | 03/15/2027 | | | | 7,148,995 | |
| | | | | | | | | | | | | |
| | | | Total Asset Backed Obligations
(Cost $429,517,785) | | | | 424,629,287 | |
| | | | | | | | | | | | | |
| | BANK LOANS 3.5% | |
| | |
| | | | 1011778 BC ULC | | | | | |
| | 5,884,222 | | | Senior Secured First Lien Term Loan (1 Month US Secured Overnight Financing Rate + 2.25%) | | | 7.58% | | | | 09/23/2030 | | | | 5,887,899 | |
| | |
| | | | American Builders & Contractors Supply Co., Inc. | | | | | |
| | 560,000 | | | Senior Secured First Lien Term Loan (1 Month US Secured Overnight Financing Rate + 2.00%) | | | 7.33% | | | | 01/31/2031 | | | | 560,787 | |
| | |
| | | | APi Group DE, Inc. | | | | | |
| | 3,470,000 | | | Senior Secured First Lien Term Loan (1 Month US Secured Overnight Financing Rate + 2.61%) | | | 7.94% | | | | 01/03/2029 | | | | 3,481,572 | |
| | |
| | | | Aramark Services T/L B-8 (03/24)- Target 2 | | | | | |
| | 368,150 | | | Senior Secured First Lien Term Loan (1 Month US Secured Overnight Financing Rate + 2.00%) | | | 7.33% | | | | 06/24/2030 | | | | 364,469 | |
| | |
| | | | Asplundh Tree Expert LLC | | | | | |
| | 5,953,667 | | | Senior Secured First Lien Term Loan (1 Month US Secured Overnight Financing Rate + 1.85%) | | | 7.18% | | | | 09/06/2027 | | | | 5,961,942 | |
| | |
| | | | Avantor Funding T/L (03/24) | | | | | |
| | 3,775,000 | | | Senior Secured Term Loan | | | 7.43% | (d) | | | 11/08/2027 | | | | 3,775,000 | |
| | |
| | | | Avantor Funding, Inc. | | | | | |
| | 2,797,938 | | | Senior Secured First Lien Term Loan (1 Month US Secured Overnight Financing Rate + 2.35%, 0.50% Floor) | | | 7.68% | | | | 11/08/2027 | | | | 2,805,409 | |
| | |
| | | | Axalta Coating Systems US Holdings, Inc. | | | | | |
| | 3,586,073 | | | Senior Secured First Lien Term Loan (3 Month US Secured Overnight Financing Rate + 2.00%) | | | 7.33% | | | | 12/20/2029 | | | | 3,595,665 | |
| | |
| | | | Beacon Roofing Supply, Inc. | | | | | |
| | 2,705,000 | | | Senior Secured Term Loan (CME Term SOFR 1 Month + 2.00%) | | | 7.32% | | | | 05/19/2028 | | | | 2,710,843 | |
| | |
| | | | Berry Global, Inc. | | | | | |
| | 7,141,267 | | | Senior Secured First Lien Term Loan (1 Month US Secured Overnight Financing Rate + 1.86%) | | | 7.18% | | | | 07/02/2029 | | | | 7,146,409 | |
| | | | | | | | | | | | | | | | |
PRINCIPAL
AMOUNT $ | | | SECURITY DESCRIPTION | | RATE | | | MATURITY | | | VALUE $ | |
| | |
| | | | Buckeye Partners LP | | | | | |
| | 950,000 | | | Senior Secured First Lien Term Loan (1 Month US Secured Overnight Financing Rate + 2.00%) | | | 7.33% | | | | 11/02/2026 | | | | 952,841 | |
| | |
| | | | Calpine Corp. | | | | | |
| | 1,895,000 | | | Senior Secured First Lien Term Loan (1 Month US Secured Overnight Financing Rate + 2.00%) | | | 7.33% | | | | 01/31/2031 | | | | 1,886,510 | |
| | 5,420,773 | | | Senior Secured First Lien Term Loan (1 Month US Secured Overnight Financing Rate + 2.00%) | | | 7.33% | | | | 12/16/2027 | | | | 5,421,857 | |
| | 300,000 | | | Senior Secured Term Loan (CME Term SOFR 1 Month + 2.00%) | | | 7.33% | | | | 01/31/2031 | | | | 298,515 | |
| | |
| | | | Catalent Pharma Solutions, Inc. | | | | | |
| | 2,884,000 | | | Senior Secured First Lien Term Loan (1 Month US Secured Overnight Financing Rate + 2.11%, 0.50% Floor) | | | 7.44% | | | | 02/22/2028 | | | | 2,885,802 | |
| | |
| | | | Clean Harbors, Inc. | | | | | |
| | 1,820,000 | | | Senior Secured Term Loan (CME Term SOFR 1 Month + 1.75%) | | | 7.19% | | | | 10/10/2028 | | | | 1,825,688 | |
| | |
| | | | Element Solutions, Inc. | | | | | |
| | 2,927,663 | | | Senior Secured First Lien Term Loan (1 Month US Secured Overnight Financing Rate + 2.00%) | | | 7.33% | | | | 12/18/2030 | | | | 2,933,767 | |
| | |
| | | | Energizer Holdings, Inc. | | | | | |
| | 4,123,222 | | | Senior Secured First Lien Term Loan (1 Month US Secured Overnight Financing Rate + 2.36%, 0.50% Floor) | | | 7.69% | | | | 12/22/2027 | | | | 4,126,314 | |
| | |
| | | | FleetCor Technologies Operating Co. LLC | | | | | |
| | 7,458,706 | | | Senior Secured First Lien Term Loan (1 Month US Secured Overnight Financing Rate + 1.85%) | | | 7.18% | | | | 05/01/2028 | | | | 7,461,279 | |
| | |
| | | | Flutter Financing BV | | | | | |
| | 8,393,963 | | | Senior Secured First Lien Term Loan (3 Month US Secured Overnight Financing Rate + 2.25%, 0.50% Floor) | | | 7.56% | | | | 11/29/2030 | | | | 8,412,680 | |
| | |
| | | | Focus Financial Partners LLC | | | | | |
| | 2,487,623 | | | Senior Secured First Lien Term Loan (1 Month US Secured Overnight Financing Rate + 2.50%, 0.50% Floor) | | | 7.83% | | | | 06/30/2028 | | | | 2,481,105 | |
| | |
| | | | Gen Digital, Inc. | | | | | |
| | 5,375,556 | | | Senior Secured First Lien Term Loan (1 Month US Secured Overnight Financing Rate + 2.10%, 0.50% Floor) | | | 7.43% | | | | 09/12/2029 | | | | 5,379,883 | |
| | |
| | | | Generac Power Systems, Inc. | | | | | |
| | 890,307 | | | Senior Secured First Lien Term Loan (1 Month US Secured Overnight Financing Rate + 1.85%) | | | 7.18% | | | | 12/14/2026 | | | | 890,726 | |
| | |
| | | | Go Daddy Operating Co. LLC | | | | | |
| | 7,221,900 | | | Senior Secured First Lien Term Loan (1 Month US Secured Overnight Financing Rate + 2.00%) | | | 7.33% | | | | 11/12/2029 | | | | 7,225,691 | |
| | |
| | | | Grifols Worldwide Operations USA, Inc. | | | | | |
| | 9,458,635 | | | Senior Secured First Lien Term Loan (3 Month US Secured Overnight Financing Rate + 2.15%) | | | 7.46% | | | | 11/15/2027 | | | | 9,178,991 | |
| | | | | | | | |
| The accompanying notes are an integral part of these financial statements. | | Annual Report | | | | | March 31, 2024 | | 49 |
| | |
Schedule of Investments DoubleLine Low Duration Bond Fund (Cont.) | | |
| | | | | | | | | | | | | | | | |
PRINCIPAL
AMOUNT $ | | | SECURITY DESCRIPTION | | RATE | | | MATURITY | | | VALUE $ | |
| | |
| | | | HB Fuller Co. | | | | | |
| | 2,665,000 | | | Senior Secured First Lien Term Loan (1 Month US Secured Overnight Financing Rate + 2.00%, 0.50% Floor) | | | 7.33% | | | | 02/15/2030 | | | | 2,674,328 | |
| | |
| | | | Hilton Domestic Operating Co., Inc. | | | | | |
| | 2,050,000 | | | Senior Secured First Lien Term Loan (1 Month US Secured Overnight Financing Rate + 2.10%) | | | 7.43% | | | | 11/08/2030 | | | | 2,056,581 | |
| | |
| | | | ICON Luxembourg SARL | | | | | |
| | 1,158,294 | | | Senior Secured First Lien Term Loan (1 Month US Secured Overnight Financing Rate + 2.00%, 0.50% Floor) | | | 7.33% | | | | 07/03/2028 | | | | 1,162,441 | |
| | 4,648,972 | | | Senior Secured First Lien Term Loan (1 Month US Secured Overnight Financing Rate + 2.00%, 0.50% Floor) | | | 7.33% | | | | 07/03/2028 | | | | 4,665,615 | |
| | |
| | | | Ingersoll-Rand Services Co. | | | | | |
| | 2,777,269 | | | Senior Secured First Lien Term Loan (1 Month US Secured Overnight Financing Rate + 1.85%) | | | 7.18% | | | | 03/01/2027 | | | | 2,786,239 | |
| | |
| | | | Installed Building Products T/L B (03/24) | | | | | |
| | 890,000 | | | Senior Secured Term Loan | | | 7.33% | (d) | | | 03/21/2031 | | | | 893,062 | |
| | |
| | | | IQVIA, Inc. | | | | | |
| | 5,835,375 | | | Senior Secured First Lien Term Loan (3 Month US Secured Overnight Financing Rate + 2.00%) | | | 7.31% | | | | 01/02/2031 | | | | 5,870,300 | |
| | |
| | | | Iron Mountain, Inc. | | | | | |
| | 5,782,312 | | | Senior Secured First Lien Term Loan (1 Month US Secured Overnight Financing Rate + 1.86%) | | | 7.19% | | | | 01/02/2026 | | | | 5,784,712 | |
| | |
| | | | KFC Holding Co. | | | | | |
| | 6,735,868 | | | Senior Secured First Lien Term Loan (1 Month US Secured Overnight Financing Rate + 1.86%) | | | 7.19% | | | | 03/15/2028 | | | | 6,740,381 | |
| | |
| | | | Lamar Media Corp. | | | | | |
| | 4,880,263 | | | Senior Secured First Lien Term Loan (1 Month US Secured Overnight Financing Rate + 1.60%) | | | 6.93% | | | | 02/08/2027 | | | | 4,880,263 | |
| | |
| | | | Marriott Ownership Resorts, Inc. | | | | | |
| | 3,968,960 | | | Senior Secured First Lien Term Loan (1 Month US Secured Overnight Financing Rate + 1.85%) | | | 7.18% | | | | 09/02/2025 | | | | 3,963,007 | |
| | 4,595,000 | | | Senior Secured Term Loan (CME Term SOFR 1 Month + 2.25%) | | | 7.57% | | | | 03/17/2031 | | | | 4,583,513 | |
| | |
| | | | Mileage Plus Holdings LLC | | | | | |
| | 1,978,744 | | | Senior Secured First Lien Term Loan (3 Month US Secured Overnight Financing Rate + 5.40%, 1.00% Floor) | | | 10.73% | | | | 06/21/2027 | | | | 2,040,124 | |
| | |
| | | | NRG Energy T/L B (03/24) | | | | | |
| | 4,860,000 | | | Senior Secured Term Loan | | | 7.33% | (d) | | | 03/27/2031 | | | | 4,856,986 | |
| | |
| | | | Resideo Funding, Inc. | | | | | |
| | 3,027,403 | | | Senior Secured First Lien Term Loan (1 Month US Secured Overnight Financing Rate + 2.36%, 0.50% Floor) | | | 7.68% | | | | 02/14/2028 | | | | 3,032,141 | |
| | | | | | | | | | | | | | | | |
PRINCIPAL
AMOUNT $ | | | SECURITY DESCRIPTION | | RATE | | | MATURITY | | | VALUE $ | |
| | |
| | | | Resideo Funding, Inc. (Cont.) | | | | | |
| | 1,407,824 | | | Senior Secured First Lien Term Loan (1 Month US Secured Overnight Financing Rate + 2.36%, 0.50% Floor) | | | 7.69% | | | | 02/14/2028 | | | | 1,410,027 | |
| | 1,282,923 | | | Senior Secured First Lien Term Loan (1 Month US Secured Overnight Financing Rate + 2.36%, 0.50% Floor) | | | 7.69% | | | | 02/14/2028 | | | | 1,284,931 | |
| | |
| | | | Reynolds Consumer Products LLC | | | | | |
| | 5,454,497 | | | Senior Secured First Lien Term Loan (1 Month US Secured Overnight Financing Rate + 1.85%) | | | 7.18% | | | | 02/04/2027 | | | | 5,470,288 | |
| | |
| | | | SS&C Technologies, Inc. | | | | | |
| | 4,043,252 | | | Senior Secured First Lien Term Loan (1 Month US Secured Overnight Financing Rate + 1.86%) | | | 7.19% | | | | 04/16/2025 | | | | 4,048,266 | |
| | |
| | | | Standard Industries, Inc./NJ | | | | | |
| | 4,793,740 | | | Senior Secured First Lien Term Loan (1 Month US Secured Overnight Financing Rate + 2.36%, 0.50% Floor) | | | 7.69% | | | | 09/22/2028 | | | | 4,801,338 | |
| | |
| | | | Trans Union LLC | | | | | |
| | 5,983,454 | | | Senior Secured First Lien Term Loan (1 Month US Secured Overnight Financing Rate + 1.85%) | | | 7.18% | | | | 11/16/2026 | | | | 5,987,882 | |
| | |
| | | | US Foods, Inc. | | | | | |
| | 4,553,833 | | | Senior Secured First Lien Term Loan (1 Month US Secured Overnight Financing Rate + 2.11%) | | | 7.44% | | | | 09/14/2026 | | | | 4,568,611 | |
| | |
| | | | Vestis Corp. | | | | | |
| | 1,040,000 | | | Senior Secured First Lien Term Loan (3 Month US Secured Overnight Financing Rate + 2.25%) | | | 7.58% | | | | 02/24/2031 | | | | 1,041,300 | |
| | |
| | | | Vistra Operations Co. LLC | | | | | |
| | 5,991,205 | | | Senior Secured First Lien Term Loan (1 Month US Secured Overnight Financing Rate + 2.00%) | | | 7.33% | | | | 12/20/2030 | | | | 5,992,163 | |
| | |
| | | | WMG Acquisition Corp. | | | | | |
| | 6,011,326 | | | Senior Secured First Lien Term Loan (1 Month US Secured Overnight Financing Rate + 2.00%) | | | 7.33% | | | | 01/24/2031 | | | | 6,011,326 | |
| | |
| | | | Wyndham Hotels & Resorts, Inc. | | | | | |
| | 1,151,300 | | | Senior Secured First Lien Term Loan (1 Month US Secured Overnight Financing Rate + 2.35%) | | | 7.68% | | | | 05/28/2030 | | | | 1,156,700 | |
| | | | | | | | | | | | | |
| | | | Total Bank Loans (Cost $194,835,081) | | | | | | | | | | | 195,414,169 | |
| | | | | | | | | | | | | |
| | COLLATERALIZED LOAN OBLIGATIONS 13.9% | |
| | | | |
| | | | Allegro CLO Ltd. | | | | | | | | | | | | |
| | 9,500,000 | | | Series 2019-1A-AR (CME Term SOFR 3 Month + 1.41%, 1.15% Floor) | | | 6.73% | (a) | | | 07/20/2032 | | | | 9,501,900 | |
| | | | |
| 50 | | DoubleLine Funds Trust | | The accompanying notes are an integral part of these financial statements. |
| | | | | | | | | | | | | | | | |
PRINCIPAL
AMOUNT $ | | | SECURITY DESCRIPTION | | RATE | | | MATURITY | | | VALUE $ | |
| | |
| | | | Battalion CLO Ltd. | | | | | |
| | 30,000,000 | | | Series 2017-11A-AR (CME Term SOFR 3 Month + 1.41%, 1.15% Floor) | | | 6.73% | (a) | | | 04/24/2034 | | | | 30,080,934 | |
| | 22,000,000 | | | Series 2021-20A-A (CME Term SOFR 3 Month + 1.44%, 1.18% Floor) | | | 6.76% | (a) | | | 07/15/2034 | | | | 22,009,350 | |
| | |
| | | | BlueMountain CLO Ltd. | | | | | |
| | 22,000,000 | | | Series 2021-31A-A1 (CME Term SOFR 3 Month + 1.41%, 1.15% Floor) | | | 6.72% | (a) | | | 04/19/2034 | | | | 21,993,442 | |
| | |
| | | | Bridge Street CLO Ltd. | | | | | |
| | 20,000,000 | | | Series 2021-1A-A1A (CME Term SOFR 3 Month + 1.49%, 1.23% Floor) | | | 6.81% | (a) | | | 07/20/2034 | | | | 20,019,002 | |
| | |
| | | | Capital Four US CLO Ltd. | | | | | |
| | 15,000,000 | | | Series 2021-1A-A (CME Term SOFR 3 Month + 1.47%, 1.21% Floor) | | | 6.77% | (a) | | | 01/18/2035 | | | | 15,025,893 | |
| | |
| | | | Carlyle Global Market Strategies | | | | | |
| | 25,000,000 | | | Series 2016-1A-A1R2 (CME Term SOFR 3 Month + 1.40%, 1.14% Floor) | | | 6.72% | (a) | | | 04/20/2034 | | | | 25,037,908 | |
| | |
| | | | CarVal CLO | | | | | |
| | 42,000,000 | | | Series 2019-1A-ANR (CME Term SOFR 3 Month + 1.37%, 1.37% Floor) | | | 6.69% | (a) | | | 04/20/2032 | | | | 42,026,581 | |
| | |
| | | | Cathedral Lake CLO Ltd. | | | | | |
| | 21,422,893 | | | Series 2018-5A-A1 (CME Term SOFR 3 Month + 1.46%, 1.20% Floor) | | | 6.78% | (a) | | | 10/21/2030 | | | | 21,417,148 | |
| | |
| | | | CBAM Ltd. | | | | | |
| | 10,000,000 | | | Series 2017-2A-AR (CME Term SOFR 3 Month + 1.45%, 1.19% Floor) | | | 6.77% | (a) | | | 07/17/2034 | | | | 10,008,999 | |
| | 10,500,000 | | | Series 2019-10A-A1R (CME Term SOFR 3 Month + 1.38%, 1.12% Floor) | | | 6.70% | (a) | | | 04/20/2032 | | | | 10,502,100 | |
| | |
| | | | CFIP CLO Ltd. | | | | | |
| | 20,000,000 | | | Series 2021-1A-A (CME Term SOFR 3 Month + 1.48%, 1.22% Floor) | | | 6.80% | (a) | | | 01/20/2035 | | | | 20,020,536 | |
| | |
| | | | Clover CLO | | | | | |
| | 20,000,000 | | | Series 2018-1A-A1R (CME Term SOFR 3 Month + 1.38%, 1.38% Floor) | | | 6.70% | (a) | | | 04/20/2032 | | | | 20,034,090 | |
| | 10,000,000 | | | Series 2021-2A-A (CME Term SOFR 3 Month + 1.43%, 1.17% Floor) | | | 6.75% | (a) | | | 07/20/2034 | | | | 10,003,123 | |
| | |
| | | | CQS US CLO | | | | | |
| | 25,000,000 | | | Series 2021-1A-A (CME Term SOFR 3 Month + 1.48%, 1.22% Floor) | | | 6.80% | (a) | | | 01/20/2035 | | | | 25,073,788 | |
| | |
| | | | Crown City CLO | | | | | |
| | 18,000,000 | | | Series 2021-1A-A1A (CME Term SOFR 3 Month + 1.43%, 1.17% Floor) | | | 6.75% | (a) | | | 07/20/2034 | | | | 17,948,318 | |
| | |
| | | | Generate CLO Ltd. | | | | | |
| | 10,000,000 | | | Series 6A-A1R (CME Term SOFR 3 Month + 1.46%, 1.20% Floor) | | | 6.78% | (a) | | | 01/22/2035 | | | | 10,009,143 | |
| | 14,000,000 | | | Series 8A-AR (CME Term SOFR 3 Month + 1.46%, 1.20% Floor) | | | 6.78% | (a) | | | 10/20/2034 | | | | 14,018,395 | |
| | 46,500,000 | | | Series 9A-A (CME Term SOFR 3 Month + 1.46%, 1.20% Floor) | | | 6.78% | (a) | | | 10/20/2034 | | | | 46,461,730 | |
| | |
| | | | Halsey Point CLO Ltd. | | | | | |
| | 52,000,000 | | | Series 2021-5A-A1A (CME Term SOFR 3 Month + 1.47%, 1.21% Floor) | | | 6.79% | (a) | | | 01/30/2035 | | | | 52,015,599 | |
| | | | | | | | | | | | | | | | |
PRINCIPAL
AMOUNT $ | | | SECURITY DESCRIPTION | | RATE | | | MATURITY | | | VALUE $ | |
| | |
| | | | Harbourview CLO VII LLC | | | | | |
| | 6,595,858 | | | Series 7RA-A1 (CME Term SOFR 3 Month + 1.39%, 1.13% Floor) | | | 6.69% | (a) | | | 07/18/2031 | | | | 6,603,312 | |
| | |
| | | | Hayfin US | | | | | |
| | 19,256,327 | | | Series 2018-8A-A (CME Term SOFR 3 Month + 1.38%, 1.12% Floor) | | | 6.70% | (a) | | | 04/20/2031 | | | | 19,262,365 | |
| | |
| | | | Invesco CLO Ltd. | | | | | |
| | 10,000,000 | | | Series 2023-3A-A (CME Term SOFR 3 Month + 1.80%, 1.80% Floor) | | | 7.22% | (a) | | | 07/15/2036 | | | | 10,074,403 | |
| | |
| | | | Jackson Financial, Inc. | | | | | |
| | 20,000,000 | | | Series 2021-5A-A (CME Term SOFR 3 Month + 1.46%, 1.20% Floor) | | | 6.76% | (a) | | | 10/18/2034 | | | | 20,018,928 | |
| | |
| | | | Jefferson Mill CLO Ltd. | | | | | |
| | 9,426,006 | | | Series 2015-1A-AR (CME Term SOFR 3 Month + 1.44%) | | | 6.75% | (a) | | | 10/20/2031 | | | | 9,450,189 | |
| | |
| | | | Katayma CLO Ltd. | | | | | |
| | 20,000,000 | | | Series 2024-2A-A1 (CME Term SOFR 3 Month + 1.65%, 1.65% Floor) | | | 6.94% | (a) | | | 04/20/2037 | | | | 20,000,000 | |
| | |
| | | | Marathon CLO Ltd. | | | | | |
| | 19,786,930 | | | Series 2018-12A-A1 (CME Term SOFR 3 Month + 1.44%) | | | 6.74% | (a) | | | 04/18/2031 | | | | 19,809,010 | |
| | |
| | | | Marble Point CLO | | | | | |
| | 35,000,000 | | | Series 2021-2A-A (CME Term SOFR 3 Month + 1.46%, 1.20% Floor) | | | 6.79% | (a) | | | 07/25/2034 | | | | 34,991,303 | |
| | |
| | | | MP CLO Ltd. | | | | | |
| | 15,000,000 | | | Series 2015-2A-ARR (CME Term SOFR 3 Month + 1.46%, 1.20% Floor) | | | 6.78% | (a) | | | 04/28/2034 | | | | 15,022,652 | |
| | |
| | | | Ocean Trails CLO | | | | | |
| | 22,322,569 | | | Series 2014-5A-ARR (CME Term SOFR 3 Month + 1.54%, 1.28% Floor) | | | 6.86% | (a) | | | 10/13/2031 | | | | 22,304,877 | |
| | |
| | | | OCP CLO Ltd. | | | | | |
| | 3,000,000 | | | Series 2020-20A-A1R (CME Term SOFR 3 Month + 1.53%, 1.53% Floor) | | | 0.00% | (a) | | | 04/18/2037 | | | | 3,000,000 | |
| | |
| | | | Palmer Square CLO Ltd. | | | | | |
| | 8,700,000 | | | Series 2021-2A-A (CME Term SOFR 3 Month + 1.41%, 1.41% Floor) | | | 6.73% | (a) | | | 07/15/2034 | | | | 8,707,782 | |
| | |
| | | | Romark LLC | | | | | |
| | 12,929,228 | | | Series 2018-1A-A1 (CME Term SOFR 3 Month + 1.29%) | | | 6.61% | (a) | | | 04/20/2031 | | | | 12,952,692 | |
| | |
| | | | Shackleton CLO Ltd. | | | | | |
| | 19,506,967 | | | Series 2015-7RA-AR (CME Term SOFR 3 Month + 1.41%, 1.15% Floor) | | | 6.73% | (a) | | | 07/15/2031 | | | | 19,541,412 | |
| | |
| | | | Sound Point CLO Ltd. | | | | | |
| | 16,000,000 | | | Series 2014-2RA-A (CME Term SOFR 3 Month + 1.51%, 1.25% Floor) | | | 6.83% | (a) | | | 10/20/2031 | | | | 16,035,480 | |
| | 25,000,000 | | | Series 2020-1A-AR (CME Term SOFR 3 Month + 1.43%, 1.43% Floor) | | | 6.75% | (a) | | | 07/20/2034 | | | | 25,009,453 | |
| | |
| | | | Steele Creek CLO Ltd. | | | | | |
| | 900,000 | | | Series 2019-1A-BR (CME Term SOFR 3 Month + 2.06%, 1.80% Floor) | | | 7.38% | (a) | | | 04/15/2032 | | | | 897,598 | |
| | 18,000,000 | | | Series 2019-2A-AR (CME Term SOFR 3 Month + 1.43%, 1.17% Floor) | | | 6.75% | (a) | | | 07/15/2032 | | | | 18,035,915 | |
| | | | | | | | |
| The accompanying notes are an integral part of these financial statements. | | Annual Report | | | | | March 31, 2024 | | 51 |
| | |
Schedule of Investments DoubleLine Low Duration Bond Fund (Cont.) | | |
| | | | | | | | | | | | | | | | |
PRINCIPAL
AMOUNT $ | | | SECURITY DESCRIPTION | | RATE | | | MATURITY | | | VALUE $ | |
| | |
| | | | Symphony CLO Ltd. | | | | | |
| | 12,925,000 | | | Series 2014-15A-AR3 (CME Term SOFR 3 Month + 1.34%, 1.08% Floor) | | | 6.66% | (a) | | | 01/17/2032 | | | | 12,918,129 | |
| | |
| | | | Trestles CLO LLC | | | | | |
| | 20,000,000 | | | Series 2021-4A-A (CME Term SOFR 3 Month + 1.43%, 1.17% Floor) | | | 6.75% | (a) | | | 07/21/2034 | | | | 20,004,000 | |
| | |
| | | | Trimaran CAVU LLC | | | | | |
| | 5,750,000 | | | Series 2021-1A-A (CME Term SOFR 3 Month + 1.47%, 1.21% Floor) | | | 6.79% | (a) | | | 04/23/2032 | | | | 5,760,033 | |
| | 10,000,000 | | | Series 2021-3A-A (CME Term SOFR 3 Month + 1.47%, 1.21% Floor) | | | 6.77% | (a) | | | 01/18/2035 | | | | 10,021,792 | |
| | |
| | | | Wellfleet CLO Ltd. | | | | | |
| | 4,242,619 | | | Series 2017-2A-A1R (CME Term SOFR 3 Month + 1.32%) | | | 6.64% | (a) | | | 10/20/2029 | | | | 4,243,659 | |
| | 4,596,606 | | | Series 2018-1A-A (CME Term SOFR 3 Month + 1.36%, 1.10% Floor) | | | 6.68% | (a) | | | 07/17/2031 | | | | 4,599,664 | |
| | 5,000,000 | | | Series 2021-2A-A1 (CME Term SOFR 3 Month + 1.46%, 1.20% Floor) | | | 6.78% | (a) | | | 07/15/2034 | | | | 5,006,709 | |
| | | | | | | | | | | | | | | | |
| | | | Total Collateralized Loan Obligations
(Cost $786,748,472) | | | | 787,479,336 | |
| | | | | | | | | | | | | | | | |
| | FOREIGN CORPORATE BONDS 8.7% | |
| | 2,575,700 | | | Adani International Container Terminal Pvt Ltd. | | | 3.00% | | | | 02/16/2031 | | | | 2,197,627 | |
| | 610,000 | | | Adani Ports & Special Economic Zone Ltd. | | | 3.38% | | | | 07/24/2024 | | | | 604,088 | |
| | 7,300,000 | | | Adani Ports & Special Economic Zone Ltd. | | | 4.00% | | | | 07/30/2027 | | | | 6,705,838 | |
| | 4,300,000 | | | Adani Transmission Step-One Ltd. | | | 4.00% | | | | 08/03/2026 | | | | 4,044,944 | |
| | 5,600,000 | | | Adaro Indonesia PT | | | 4.25% | | | | 10/31/2024 | | | | 5,529,707 | |
| | 4,897,000 | | | AerCap Ireland Capital DAC / AerCap Global Aviation Trust | | | 6.45% | (a) | | | 04/15/2027 | | | | 5,029,904 | |
| | 3,000,000 | | | AES Andes SA (5 Year Swap Rate USD + 4.64%) | | | 7.13% | | | | 03/26/2079 | | | | 2,972,445 | |
| | 2,800,000 | | | AES Andes SA (5 Year Swap Rate USD + 4.64%) | | | 7.13% | (a) | | | 03/26/2079 | | | | 2,774,282 | |
| | 7,315,263 | | | AI Candelaria Spain SA | | | 7.50% | | | | 12/15/2028 | | | | 7,169,773 | |
| | 800,000 | | | Algonquin Power & Utilities Corp. | | | 5.37% | (e) | | | 06/15/2026 | | | | 795,907 | |
| | 1,900,000 | | | AngloGold Ashanti Holdings PLC | | | 3.38% | | | | 11/01/2028 | | | | 1,711,401 | |
| | 5,455,000 | | | Avolon Holdings Funding Ltd. | | | 2.13% | (a) | | | 02/21/2026 | | | | 5,084,624 | |
| | 3,500,000 | | | Axiata SPV2 Bhd | | | 4.36% | | | | 03/24/2026 | | | | 3,431,587 | |
| | 6,285,000 | | | BAE Systems PLC | | | 5.00% | (a) | | | 03/26/2027 | | | | 6,274,027 | |
| | 400,000 | | | Banco Bilbao Vizcaya Argentaria Colombia SA | | | 4.88% | | | | 04/21/2025 | | | | 393,208 | |
| | 2,300,000 | | | Banco BTG Pactual SA/Cayman Islands | | | 4.50% | | | | 01/10/2025 | | | | 2,270,796 | |
| | 3,000,000 | | | Banco Continental SAECA | | | 2.75% | (a) | | | 12/10/2025 | | | | 2,830,519 | |
| | 400,000 | | | Banco Continental SAECA | | | 2.75% | | | | 12/10/2025 | | | | 377,403 | |
| | 6,000,000 | | | Banco de Bogota SA | | | 6.25% | | | | 05/12/2026 | | | | 6,002,573 | |
| | 500,000 | | | Banco de Credito del Peru SA | | | 5.85% | (a) | | | 01/11/2029 | | | | 506,123 | |
| | | | | | | | | | | | | | | | |
PRINCIPAL
AMOUNT $ | | | SECURITY DESCRIPTION | | RATE | | | MATURITY | | | VALUE $ | |
| | | | |
| | 3,050,000 | | | Banco de Credito del Peru SA (5 Year CMT Rate + 3.00%) | | | 3.13% | | | | 07/01/2030 | | | | 2,922,993 | |
| | 1,800,000 | | | Banco de Credito del Peru SA (5 Year CMT Rate + 2.45%) | | | 3.25% | | | | 09/30/2031 | | | | 1,663,672 | |
| | 9,350,000 | | | Banco de Credito del Peru SA (5 Year CMT Rate + 2.45%) | | | 3.25% | (a) | | | 09/30/2031 | | | | 8,641,853 | |
| | 3,177,000 | | | Banco Inbursa SA Institucion De Banca Multiple Grupo Financiero Inbursa | | | 4.38% | | | | 04/11/2027 | | | | 3,064,378 | |
| | 3,801,000 | | | Banco Industrial SA/Guatemala (5 Year CMT Rate + 4.44%) | | | 4.88% | | | | 01/29/2031 | | | | 3,644,171 | |
| | 8,750,000 | | | Banco Internacional del Peru SAA Interbank (5 Year CMT Rate + 3.71%) | | | 4.00% | | | | 07/08/2030 | | | | 8,409,661 | |
| | 2,000,000 | | | Banco Latinoamericano de Comercio Exterior SA | | | 2.38% | (a) | | | 09/14/2025 | | | | 1,899,420 | |
| | 2,900,000 | | | Banco Latinoamericano de Comercio Exterior SA | | | 2.38% | | | | 09/14/2025 | | | | 2,754,159 | |
| | 4,400,000 | | | Banco Santander Mexico SA Institucion de Banca Multiple Grupo Financiero Santand (5 Year CMT Rate + 3.00%) | | | 7.53% | | | | 10/01/2028 | | | | 4,579,507 | |
| | 3,200,000 | | | Bancolombia SA (5 Year CMT Rate + 2.93%) | | | 6.91% | | | | 10/18/2027 | | | | 3,216,326 | |
| | 11,800,000 | | | Bancolombia SA (5 Year CMT Rate + 2.94%) | | | 4.63% | | | | 12/18/2029 | | | | 11,509,892 | |
| | 2,605,000 | | | Bank of Montreal | | | 1.50% | | | | 01/10/2025 | | | | 2,528,428 | |
| | 2,688,000 | | | Bank of Nova Scotia/The | | | 4.75% | | | | 02/02/2026 | | | | 2,669,254 | |
| | 1,965,000 | | | BAT Capital Corp. | | | 2.79% | | | | 09/06/2024 | | | | 1,940,407 | |
| | 3,380,000 | | | BAT International Finance PLC | | | 1.67% | | | | 03/25/2026 | | | | 3,148,045 | |
| | 6,221,000 | | | BBVA Bancomer SA/Texas (5 Year CMT Rate + 3.00%) | | | 5.35% | | | | 11/12/2029 | | | | 6,167,754 | |
| | 6,150,000 | | | BBVA Bancomer SA/Texas (5 Year CMT Rate + 2.65%) | | | 5.13% | | | | 01/18/2033 | | | | 5,719,437 | |
| | 600,000 | | | Bharti Airtel Ltd. | | | 4.38% | | | | 06/10/2025 | | | | 590,366 | |
| | 3,990,000 | | | BHP Billiton Finance USA Ltd. | | | 5.25% | | | | 09/08/2026 | | | | 4,014,863 | |
| | 2,510,000 | | | BMW US Capital LLC (Secured Overnight Financing Rate + 0.62%) | | | 5.96% | (a) | | | 08/11/2025 | | | | 2,520,135 | |
| | 5,185,000 | | | BPCE SA | | | 2.38% | (a) | | | 01/14/2025 | | | | 5,049,219 | |
| | 8,800,000 | | | Braskem Netherlands Finance BV (5 Year CMT Rate + 8.22%) | | | 8.50% | | | | 01/23/2081 | | | | 8,831,988 | |
| | 1,127,000 | | | BRF GmbH | | | 4.35% | | | | 09/29/2026 | | | | 1,071,950 | |
| | 1,750,000 | | | Camposol SA | | | 6.00% | | | | 02/03/2027 | | | | 1,350,740 | |
| | 3,065,000 | | | Canadian Imperial Bank of Commerce | | | 3.95% | | | | 08/04/2025 | | | | 3,011,141 | |
| | 5,225,000 | | | Canadian Pacific Railway Co. | | | 1.35% | | | | 12/02/2024 | | | | 5,081,423 | |
| | 1,100,000 | | | Cencosud SA | | | 5.15% | | | | 02/12/2025 | | | | 1,093,634 | |
| | 11,883,385 | | | Chile Electricity PEC SpA | | | 0.00% | (a) | | | 01/25/2028 | | | | 9,346,283 | |
| | 3,600,000 | | | Cia de Minas Buenaventura SAA | | | 5.50% | | | | 07/23/2026 | | | | 3,475,376 | |
| | 4,920,000 | | | Commonwealth Bank of Australia (US Secured Overnight Financing Rate + 0.40%) | | | 5.75% | (a) | | | 07/07/2025 | | | | 4,924,553 | |
| | 8,100,000 | | | Cosan Luxembourg SA | | | 7.00% | | | | 01/20/2027 | | | | 8,160,126 | |
| | 1,400,000 | | | Credicorp Ltd. | | | 2.75% | | | | 06/17/2025 | | | | 1,348,121 | |
| | 3,320,000 | | | Daimler Truck Finance North America LLC | | | 1.63% | (a) | | | 12/13/2024 | | | | 3,230,619 | |
| | | | |
| 52 | | DoubleLine Funds Trust | | The accompanying notes are an integral part of these financial statements. |
| | | | | | | | | | | | | | | | |
PRINCIPAL
AMOUNT $ | | | SECURITY DESCRIPTION | | RATE | | | MATURITY | | | VALUE $ | |
| | | | |
| | 2,185,000 | | | Daimler Truck Finance North America LLC | | | 5.15% | (a) | | | 01/16/2026 | | | | 2,177,939 | |
| | 13,000,000 | | | DBS Group Holdings Ltd. (5 Year CMT Rate + 1.10%) | | | 1.82% | | | | 03/10/2031 | | | | 12,103,331 | |
| | 686,381 | | | Digicel Group Holdings Ltd. | | | 0.00% | (a)(c) | | | 12/31/2030 | | | | 106,044 | |
| | 1,961 | | | Digicel Group Holdings Ltd. | | | 0.00% | (a)(c) | | | 12/31/2030 | | | | 1,584 | |
| | 192,410 | | | Digicel Group Holdings Ltd. | | | 0.00% | (a)(c) | | | 12/31/2030 | | | | 2,210 | |
| | 136,935 | | | Digicel Group Holdings Ltd. | | | 0.00% | (a)(c) | | | 12/31/2030 | | | | 126,449 | |
| | 2,055,400 | | | Empresa Electrica Angamos SA | | | 4.88% | | | | 05/25/2029 | | | | 1,862,860 | |
| | 2,909,865 | | | Empresa Electrica Cochrane SpA | | | 5.50% | | | | 05/14/2027 | | | | 2,818,971 | |
| | 5,195,000 | | | Enbridge, Inc. | | | 2.50% | | | | 02/14/2025 | | | | 5,061,215 | |
| | 7,000,000 | | | Enel Generacion Chile SA | | | 4.25% | | | | 04/15/2024 | | | | 6,997,988 | |
| | 9,126,471 | | | Fenix Power Peru SA | | | 4.32% | | | | 09/20/2027 | | | | 8,794,496 | |
| | 1,350,000 | | | Freeport Indonesia PT | | | 4.76% | (a) | | | 04/14/2027 | | | | 1,321,492 | |
| | 3,700,000 | | | Freeport Indonesia PT | | | 4.76% | | | | 04/14/2027 | | | | 3,621,867 | |
| | 5,950,000 | | | Freeport-McMoRan, Inc. | | | 5.00% | | | | 09/01/2027 | | | | 5,908,417 | |
| | 5,500,000 | | | Freeport-McMoRan, Inc. | | | 4.13% | | | | 03/01/2028 | | | | 5,265,605 | |
| | 9,569,680 | | | Galaxy Pipeline Assets Bidco Ltd. | | | 1.75% | | | | 09/30/2027 | | | | 8,987,673 | |
| | 3,990,000 | | | Glencore Funding LLC | | | 4.00% | (a) | | | 04/16/2025 | | | | 3,926,385 | |
| | 3,985,000 | | | Glencore Funding LLC (Secured Overnight Financing Rate + 1.06%) | | | 6.41% | (a) | | | 04/04/2027 | | | | 3,987,441 | |
| | 3,779,000 | | | Global Bank Corp. (3 Month LIBOR USD + 3.30%) | | | 5.25% | (f) | | | 04/16/2029 | | | | 3,478,063 | |
| | 6,407,280 | | | GNL Quintero SA | | | 4.63% | | | | 07/31/2029 | | | | 6,272,575 | |
| | 6,400,000 | | | Gold Fields Orogen Holdings BVI Ltd. | | | 5.13% | | | | 05/15/2024 | | | | 6,380,018 | |
| | 3,615,000 | | | Grupo de Inversiones Suramericana SA | | | 5.50% | | | | 04/29/2026 | | | | 3,545,158 | |
| | 8,053,826 | | | Guara Norte SARL | | | 5.20% | | | | 06/15/2034 | | | | 7,354,512 | |
| | 748,920 | | | Hunt Oil Co. of Peru LLC Sucursal Del Peru | | | 6.38% | (a) | | | 06/01/2028 | | | | 741,926 | |
| | 3,000,000 | | | Industrias Penoles SAB de CV | | | 4.15% | | | | 09/12/2029 | | | | 2,807,516 | |
| | 7,334,000 | | | Inkia Energy Ltd. | | | 5.88% | | | | 11/09/2027 | | | | 7,183,223 | |
| | 1,200,000 | | | Intercorp Financial Services, Inc. | | | 4.13% | | | | 10/19/2027 | | | | 1,129,073 | |
| | 627,775 | | | Interoceanica IV Finance Ltd. Series 2007 | | | 0.00% | | | | 11/30/2025 | | | | 592,463 | |
| | 8,000,000 | | | Itau Unibanco Holding SA/Cayman Island (5 Year CMT Rate + 3.45%) | | | 3.88% | | | | 04/15/2031 | | | | 7,648,212 | |
| | 500,000 | | | JBS USA LUX SA / JBS USA Food Co. / JBS USA Finance, Inc. | | | 2.50% | | | | 01/15/2027 | | | | 461,208 | |
| | 900,000 | | | JBS USA LUX SA / JBS USA Food Co. / JBS USA Finance, Inc. | | | 3.00% | | | | 02/02/2029 | | | | 797,539 | |
| | 2,615,000 | | | JDE Peet’s NV | | | 0.80% | (a) | | | 09/24/2024 | | | | 2,550,550 | |
| | 2,696,750 | | | JSW Hydro Energy Ltd. | | | 4.13% | | | | 05/18/2031 | | | | 2,392,466 | |
| | 1,000,000 | | | Kallpa Generacion SA | | | 4.88% | | | | 05/24/2026 | | | | 976,575 | |
| | 3,500,000 | | | KT Corp. | | | 1.00% | | | | 09/01/2025 | | | | 3,294,404 | |
| | 2,000,000 | | | KT Corp. | | | 2.50% | | | | 07/18/2026 | | | | 1,883,283 | |
| | 4,600,000 | | | LG Chem Ltd. | | | 3.25% | | | | 10/15/2024 | | | | 4,539,636 | |
| | 3,638,740 | | | LLPL Capital Pte Ltd. | | | 6.88% | | | | 02/04/2039 | | | | 3,643,323 | |
| | 2,485,000 | | | Macquarie Bank Ltd. (US Secured Overnight Financing Rate + 1.20%) | | | 6.55% | (a) | | | 12/07/2026 | | | | 2,512,102 | |
| | 5,525,000 | | | Magna International, Inc. | | | 5.05% | | | | 03/14/2029 | | | | 5,526,383 | |
| | 300,000 | | | MEGlobal BV | | | 4.25% | | | | 11/03/2026 | | | | 289,190 | |
| | 11,800,000 | | | MEGlobal Canada ULC | | | 5.00% | (a) | | | 05/18/2025 | | | | 11,666,259 | |
| | 200,000 | | | MEGlobal Canada ULC | | | 5.00% | | | | 05/18/2025 | | | | 197,733 | |
| | 2,000,000 | | | Mercury Chile Holdco LLC | | | 6.50% | (a) | | | 01/24/2027 | | | | 1,940,121 | |
| | 1,300,000 | | | Mercury Chile Holdco LLC | | | 6.50% | | | | 01/24/2027 | | | | 1,261,079 | |
| | 4,117,630 | | | Mexico Generadora de Energia S de RL | | | 5.50% | | | | 12/06/2032 | | | | 4,056,845 | |
| | | | | | | | | | | | | | | | |
PRINCIPAL
AMOUNT $ | | | SECURITY DESCRIPTION | | RATE | | | MATURITY | | | VALUE $ | |
| | | | |
| | 3,235,500 | | | Millicom International Cellular SA | | | 6.63% | | | | 10/15/2026 | | | | 3,223,544 | |
| | 6,570,000 | | | Millicom International Cellular SA | | | 5.13% | | | | 01/15/2028 | | | | 6,237,256 | |
| | 10,692,700 | | | Minejesa Capital BV | | | 4.63% | | | | 08/10/2030 | | | | 10,174,942 | |
| | 3,130,000 | | | Minerva Luxembourg SA | | | 5.88% | | | | 01/19/2028 | | | | 3,030,279 | |
| | 6,405,000 | | | Mitsubishi UFJ Financial Group, Inc. | | | 3.78% | | | | 03/02/2025 | | | | 6,309,827 | |
| | 2,496,000 | | | Mizuho Financial Group, Inc. (US Secured Overnight Financing Rate + 0.96%) | | | 6.30% | | | | 05/22/2026 | | | | 2,505,862 | |
| | 1,614,008 | | | Mong Duong Finance Holdings BV | | | 5.13% | | | | 05/07/2029 | | | | 1,544,243 | |
| | 800,000 | | | Multibank, Inc. | | | 7.75% | (a) | | | 02/03/2028 | | | | 808,042 | |
| | 7,083,873 | | | MV24 Capital BV | | | 6.75% | | | | 06/01/2034 | | | | 6,670,927 | |
| | 7,100,000 | | | NBM US Holdings, Inc. | | | 7.00% | | | | 05/14/2026 | | | | 7,132,788 | |
| | 4,035,000 | | | Nutrien Ltd. | | | 4.90% | | | | 03/27/2028 | | | | 4,015,849 | |
| | 2,579,000 | | | NXP BV / NXP Funding LLC / NXP USA, Inc. | | | 4.40% | | | | 06/01/2027 | | | | 2,529,683 | |
| | 5,400,000 | | | Orazul Energy Peru SA | | | 5.63% | | | | 04/28/2027 | | | | 5,118,336 | |
| | 9,000,000 | | | Oversea-Chinese Banking Corp. Ltd. (5 Year CMT Rate + 1.58%) | | | 1.83% | (a) | | | 09/10/2030 | | | | 8,509,935 | |
| | 500,000 | | | Oversea-Chinese Banking Corp. Ltd. (5 Year CMT Rate + 1.58%) | | | 1.83% | | | | 09/10/2030 | | | | 472,774 | |
| | 1,180,292 | | | Prumo Participacoes e Investimentos S/A | | | 7.50% | | | | 12/31/2031 | | | | 1,179,667 | |
| | 10,000,000 | | | Reliance Industries Ltd. | | | 4.13% | | | | 01/28/2025 | | | | 9,872,072 | |
| | 2,390,000 | | | Royal Bank of Canada (Secured Overnight Financing Rate + 0.53%) | | | 5.87% | | | | 01/20/2026 | | | | 2,390,163 | |
| | 3,100,000 | | | Sasol Financing USA LLC | | | 4.38% | | | | 09/18/2026 | | | | 2,934,308 | |
| | 6,400,000 | | | Sociedad Quimica y Minera de Chile SA | | | 4.38% | | | | 01/28/2025 | | | | 6,323,610 | |
| | 1,900,000 | | | Southern Copper Corp. | | | 3.88% | | | | 04/23/2025 | | | | 1,863,393 | |
| | 3,200,000 | | | St Marys Cement, Inc. Canada | | | 5.75% | | | | 01/28/2027 | | | | 3,221,600 | |
| | 3,000,000 | | | Suzano International Finance BV | | | 4.00% | | | | 01/14/2025 | | | | 2,956,141 | |
| | 3,601,000 | | | Telefonica Celular del Paraguay SA | | | 5.88% | | | | 04/15/2027 | | | | 3,502,605 | |
| | 2,585,000 | | | Toronto-Dominion Bank/The | | | 0.70% | | | | 09/10/2024 | | | | 2,531,823 | |
| | 3,700,000 | | | Transportadora de Gas del Peru SA | | | 4.25% | | | | 04/30/2028 | | | | 3,600,950 | |
| | 5,400,000 | | | United Overseas Bank Ltd. (5 Year CMT Rate + 1.52%) | | | 1.75% | | | | 03/16/2031 | | | | 5,014,397 | |
| | 200,000 | | | United Overseas Bank Ltd. (5 Year CMT Rate + 1.23%) | | | 2.00% | | | | 10/14/2031 | | | | 183,296 | |
| | 940,000 | | | Vedanta Resources Ltd. | | | 13.88% | | | | 12/09/2028 | | | | 823,520 | |
| | 3,765,000 | | | Westpac Banking Corp. (US Secured Overnight Financing Rate + 0.72%) | | | 6.06% | | | | 11/17/2025 | | | | 3,779,964 | |
| | | | | | | | | | | | | | | | |
| | | | Total Foreign Corporate Bonds
(Cost $498,661,813) | | | | 490,941,868 | |
| | | | | | | | | | | | | | | | |
| | | | | | | | |
| The accompanying notes are an integral part of these financial statements. | | Annual Report | | | | | March 31, 2024 | | 53 |
| | |
Schedule of Investments DoubleLine Low Duration Bond Fund (Cont.) | | |
| | | | | | | | | | | | | | | | |
PRINCIPAL
AMOUNT $ | | | SECURITY DESCRIPTION | | RATE | | | MATURITY | | | VALUE $ | |
| FOREIGN GOVERNMENT BONDS, FOREIGN AGENCIES AND FOREIGN
GOVERNMENT SPONSORED CORPORATIONS 1.8% |
|
| | 7,486,000 | | | Banco Nacional de Comercio Exterior SNC/Cayman Islands (5 Year CMT Rate + 2.00%) | | | 2.72% | | | | 08/11/2031 | | | | 6,780,813 | |
| | 2,363,724 | | | Bioceanico Sovereign Certificate Ltd. | | | 0.00% | | | | 06/05/2034 | | | | 1,737,710 | |
| | 17,400,000 | | | Colombia Government International Bond | | | 4.50% | | | | 01/28/2026 | | | | 17,048,252 | |
| | 6,336,000 | | | Corp. Financiera de Desarrollo SA (3 Month LIBOR USD + 5.61%) | | | 5.25% | (f) | | | 07/15/2029 | | | | 6,330,741 | |
| | 2,000,000 | | | Dominican Republic International Bond | | | 5.50% | | | | 01/27/2025 | | | | 1,990,000 | |
| | 3,700,000 | | | Indonesia Asahan Aluminium PT / Mineral Industri Indonesia Persero PT | | | 4.75% | | | | 05/15/2025 | | | | 3,655,297 | |
| | 3,000,000 | | | Korea Development Bank/The | | | 1.00% | | | | 09/09/2026 | | | | 2,731,688 | |
| | 5,000,000 | | | Korea Development Bank/The | | | 0.80% | | | | 04/27/2026 | | | | 4,599,660 | |
| | 4,000,000 | | | Korea East-West Power Co. Ltd. | | | 1.75% | (a) | | | 05/06/2025 | | | | 3,846,773 | |
| | 2,000,000 | | | Korea East-West Power Co. Ltd. | | | 1.75% | | | | 05/06/2025 | | | | 1,923,387 | |
| | 4,200,000 | | | Korea Hydro & Nuclear Power Co. Ltd. | | | 1.25% | (a) | | | 04/27/2026 | | | | 3,874,458 | |
| | 7,000,000 | | | Korea Southern Power Co. Ltd. | | | 0.75% | (a) | | | 01/27/2026 | | | | 6,459,986 | |
| | 1,834,377 | | | Lima Metro Line 2 Finance Ltd. | | | 5.88% | | | | 07/05/2034 | | | | 1,821,247 | |
| | 1,000,000 | | | Oleoducto Central SA | | | 4.00% | | | | 07/14/2027 | | | | 935,153 | |
| | 900,000 | | | ONGC Videsh Ltd. | | | 4.63% | | | | 07/15/2024 | | | | 896,413 | |
| | 2,000,000 | | | Panama Government International Bond | | | 3.75% | | | | 03/16/2025 | | | | 1,950,231 | |
| | 6,100,000 | | | Paraguay Government International Bond | | | 4.70% | | | | 03/27/2027 | | | | 5,949,838 | |
| | 9,000,000 | | | Pertamina Persero PT | | | 1.40% | | | | 02/09/2026 | | | | 8,358,426 | |
| | 1,400,000 | | | Perusahaan Perseroan Persero PT Perusahaan Listrik Negara | | | 4.13% | | | | 05/15/2027 | | | | 1,349,690 | |
| | 3,634,000 | | | Petrobras Global Finance BV | | | 7.38% | | | | 01/17/2027 | | | | 3,780,229 | |
| | 1,800,000 | | | Republic of South Africa Government International Bond | | | 4.88% | | | | 04/14/2026 | | | | 1,755,169 | |
| | 1,000,000 | | | SingTel Group Treasury Pte Ltd. | | | 2.38% | | | | 10/03/2026 | | | | 939,050 | |
| | 11,500,000 | | | TNB Global Ventures Capital Bhd | | | 3.24% | | | | 10/19/2026 | | | | 10,944,248 | |
| | | | | | | | | | | | | | | | |
| | | | Total Foreign Government Bonds, Foreign Agencies and Foreign Government Sponsored Corporations
(Cost $103,663,401) | | | | 99,658,459 | |
| | | | | | | | | | | | | | | | |
| | NON-AGENCY COMMERCIAL MORTGAGE BACKED OBLIGATIONS 14.2% | |
| |
| | | | ACREC Trust | |
| | 13,965,699 | | | Series 2021-FL1-A (CME Term SOFR 1 Month + 1.26%, 1.15% Floor) | | | 6.59% | (a) | | | 10/16/2036 | | | | 13,930,520 | |
| |
| | | | Arbor Multifamily Mortgage Securities Trust | |
| | 14,340,000 | | | Series 2021-MF2-A2 | | | 2.02% | (a) | | | 06/15/2054 | | | | 13,389,413 | |
| |
| | | | Arbor Realty Trust, Inc. | |
| | 5,000,000 | | | Series 2021-FL1-AS (CME Term SOFR 1 Month + 1.31%, 1.20% Floor) | | | 6.64% | (a) | | | 12/15/2035 | | | | 4,944,345 | |
| | 11,840,000 | | | Series 2021-FL3-A (CME Term SOFR 1 Month + 1.18%, 1.18% Floor) | | | 6.51% | (a) | | | 08/15/2034 | | | | 11,791,124 | |
| | | | | | | | | | | | | | | | |
PRINCIPAL
AMOUNT $ | | | SECURITY DESCRIPTION | | RATE | | | MATURITY | | | VALUE $ | |
| |
| | | | AREIT Trust | |
| | 4,591,074 | | | Series 2022-CRE6-A (US 30 Day Average Secured Overnight Financing Rate + 1.25%, 1.25% Floor) | | | 6.57% | (a) | | | 01/20/2037 | | | | 4,576,874 | |
| |
| | | | Ares Commercial Real Estate Corp. | |
| | 5,000,000 | | | Series 2021-FL4-AS (CME Term SOFR 1 Month + 1.21%, 1.10% Floor) | | | 6.54% | (a) | | | 12/18/2037 | | | | 4,927,810 | |
| |
| | | | Atrium Hotel Portfolio Trust | |
| | 2,579,000 | | | Series 2018-ATRM-A (CME Term SOFR 1 Month + 1.25%, 0.95% Floor) | | | 6.57% | (a) | | | 06/15/2035 | | | | 2,567,340 | |
| |
| | | | Banc of America Merrill Lynch Commercial Mortgage, Inc. | |
| | 30,754,958 | | | Series 2016-UB10-XA | | | 1.73% | (b)(g) | | | 07/15/2049 | | | | 759,986 | |
| |
| | | | BANK | |
| | 72,076,720 | | | Series 2017-BNK5-XA | | | 0.94% | (b)(g) | | | 06/15/2060 | | | | 1,647,083 | |
| | 89,810,102 | | | Series 2017-BNK6-XA | | | 0.77% | (b)(g) | | | 07/15/2060 | | | | 1,693,666 | |
| | 21,237,776 | | | Series 2019-BN20-XA | | | 0.81% | (b)(g) | | | 09/15/2062 | | | | 754,311 | |
| | 189,622,214 | | | Series 2020-BN26-XA | | | 1.21% | (b)(g) | | | 03/15/2063 | | | | 9,994,740 | |
| |
| | | | BANK5 | |
| | 4,044,982 | | | Series 2023-5YR2-A1 | | | 6.20% | | | | 07/15/2056 | | | | 4,101,604 | |
| |
| | | | BBCMS Trust | |
| | 78,960,988 | | | Series 2017-C1-XA | | | 1.45% | (b)(g) | | | 02/15/2050 | | | | 2,610,750 | |
| | 17,989,000 | | | Series 2018-TALL-A (CME Term SOFR 1 Month + 0.92%, 0.87% Floor) | | | 6.25% | (a) | | | 03/15/2037 | | | | 17,290,958 | |
| | 117,780,924 | | | Series 2020-C6-XA | | | 1.04% | (b)(g) | | | 02/15/2053 | | | | 5,339,221 | |
| | 59,000,000 | | | Series 2020-C6-XB | | | 0.67% | (b)(g) | | | 02/15/2053 | | | | 2,152,261 | |
| | 1,691,564 | | | Series 2023-C22-A1 | | | 6.36% | | | | 11/15/2056 | | | | 1,735,647 | |
| |
| | | | BDS Ltd. | |
| | 1,619,073 | | | Series 2021-FL7-A (CME Term SOFR 1 Month + 1.18%, 1.07% Floor) | | | 6.51% | (a) | | | 06/16/2036 | | | | 1,605,177 | |
| | 3,832,100 | | | Series 2021-FL8-A (CME Term SOFR 1 Month + 1.03%, 0.92% Floor) | | | 6.36% | (a) | | | 01/18/2036 | | | | 3,831,380 | |
| |
| | | | Benchmark Mortgage Trust | |
| | 88,154,251 | | | Series 2018-B1-XA | | | 0.52% | (b)(g) | | | 01/15/2051 | | | | 1,362,424 | |
| | 174,366,345 | | | Series 2020-B16-XA | | | 1.04% | (b)(g) | | | 02/15/2053 | | | | 7,206,439 | |
| | 35,720,000 | | | Series 2020-IG1-XB | | | 0.13% | (b)(g) | | | 09/15/2043 | | | | 301,227 | |
| | 2,187,067 | | | Series 2023-B39-A1 | | | 6.04% | | | | 07/15/2056 | | | | 2,207,373 | |
| | 1,573,352 | | | Series 2023-V2-A1 | | | 5.85% | | | | 05/15/2055 | | | | 1,575,056 | |
| |
| | | | Blackstone Mortgage Trust, Inc. | |
| | 19,256,970 | | | Series 2021-FL4-A (CME Term SOFR 1 Month + 1.16%, 1.05% Floor) | | | 6.49% | (a) | | | 05/15/2038 | | | | 18,384,553 | |
| |
| | | | BMO Mortgage Trust | |
| | 2,286,912 | | | Series 2023-C5-A1 | | | 5.74% | | | | 06/15/2056 | | | | 2,300,955 | |
| |
| | | | BPR Trust | |
| | 8,789,000 | | | Series 2021-TY-A (CME Term SOFR 1 Month + 1.16%, 1.05% Floor) | | | 6.49% | (a) | | | 09/15/2038 | | | | 8,741,181 | |
| |
| | | | BRSP Ltd. | |
| | 13,927,976 | | | Series 2021-FL1-A (CME Term SOFR 1 Month + 1.26%, 1.15% Floor) | | | 6.59% | (a) | | | 08/19/2038 | | | | 13,776,119 | |
| |
| | | | BSPRT Co.-Issuer LLC | |
| | 17,471,695 | | | Series 2021-FL6-A (CME Term SOFR 1 Month + 1.21%, 1.10% Floor) | | | 6.54% | (a) | | | 03/15/2036 | | | | 17,365,223 | |
| | 13,021,318 | | | Series 2021-FL7-A (CME Term SOFR 1 Month + 1.43%, 1.43% Floor) | | | 6.76% | (a) | | | 12/15/2038 | | | | 12,974,272 | |
| | 6,259,484 | | | Series 2022-FL8-A (US 30 Day Average Secured Overnight Financing Rate + 1.50%, 1.50% Floor) | | | 6.82% | (a) | | | 02/15/2037 | | | | 6,236,392 | |
| | | | |
| 54 | | DoubleLine Funds Trust | | The accompanying notes are an integral part of these financial statements. |
| | | | | | | | | | | | | | | | |
PRINCIPAL
AMOUNT $ | | | SECURITY DESCRIPTION | | RATE | | | MATURITY | | | VALUE $ | |
| |
| | | | BSREP Commercial Mortgage Trust | |
| | 12,366,617 | | | Series 2021-DC-A (CME Term SOFR 1 Month + 1.06%, 0.95% Floor) | | | 6.39% | (a) | | | 08/15/2038 | | | | 11,859,963 | |
| |
| | | | BX Trust | |
| | 6,893,217 | | | Series 2020-VKNG-A (CME Term SOFR 1 Month + 1.04%, 0.93% Floor) | | | 6.37% | (a) | | | 10/15/2037 | | | | 6,885,337 | |
| | 3,908,430 | | | Series 2021-21M-A (CME Term SOFR 1 Month + 0.84%, 0.73% Floor) | | | 6.17% | (a) | | | 10/15/2036 | | | | 3,879,375 | |
| | 7,752,000 | | | Series 2021-VIEW-A (CME Term SOFR 1 Month + 1.39%, 1.28% Floor) | | | 6.72% | (a) | | | 06/15/2036 | | | | 7,543,675 | |
| | 16,787,000 | | | Series 2021-VOLT-B (CME Term SOFR 1 Month + 1.06%, 0.95% Floor) | | | 6.39% | (a) | | | 09/15/2036 | | | | 16,612,774 | |
| | 5,474,293 | | | Series 2021-XL2-B (CME Term SOFR 1 Month + 1.11%, 1.00% Floor) | | | 6.44% | (a) | | | 10/15/2038 | | | | 5,427,753 | |
| |
| | | | BXMT Ltd. | |
| | 827,376 | | | Series 2020-FL2-A (CME Term SOFR 1 Month + 1.01%, 1.01% Floor) | | | 6.34% | (a) | | | 02/15/2038 | | | | 797,295 | |
| |
| | | | CFCRE Commercial Mortgage Trust | |
| | 42,452,000 | | | Series 2017-C8-XB | | | 0.89% | (b)(g) | | | 06/15/2050 | | | | 1,031,554 | |
| |
| | | | CFK Trust | |
| | 116,365,000 | | | Series 2020-MF2-X | | | 0.77% | (a)(b)(g) | | | 03/15/2039 | | | | 2,245,007 | |
| |
| | | | Citigroup Commercial Mortgage Trust | |
| | 3,814,591 | | | Series 2014-GC23-A3 | | | 3.36% | | | | 07/10/2047 | | | | 3,798,614 | |
| | 3,099,807 | | | Series 2015-P1-A4 | | | 3.46% | | | | 09/15/2048 | | | | 3,032,060 | |
| | 29,967,430 | | | Series 2016-GC36-XA | | | 1.21% | (b)(g) | | | 02/10/2049 | | | | 504,981 | |
| | 7,054,738 | | | Series 2016-P3-A3 | | | 3.06% | | | | 04/15/2049 | | | | 6,797,167 | |
| | 50,867,473 | | | Series 2016-P3-XA | | | 1.65% | (b)(g) | | | 04/15/2049 | | | | 1,030,829 | |
| | 6,330,745 | | | Series 2017-P7-A3 | | | 3.44% | | | | 04/14/2050 | | | | 6,014,468 | |
| | 9,000,000 | | | Series 2018-TBR-A (CME Term SOFR 1 Month + 1.19%, 0.83% Floor) | | | 6.52% | (a) | | | 12/15/2036 | | | | 8,946,845 | |
| |
| | | | Citigroup/Deutsche Bank Commercial Mortgage Trust | |
| | 700,000 | | | Series 2016-C3-A5 | | | 2.89% | | | | 08/10/2049 | | | | 657,850 | |
| | 20,392,332 | | | Series 2017-CD4-XA | | | 1.22% | (b)(g) | | | 05/10/2050 | | | | 576,100 | |
| |
| | | | CLNC Ltd. | |
| | 16,347,927 | | | Series 2019-FL1-AS (CME Term SOFR 1 Month + 1.66%, 1.55% Floor) | | | 6.99% | (a) | | | 08/20/2035 | | | | 16,173,070 | |
| |
| | | | Commercial Mortgage Pass Through Certificates | |
| | 10,354,714 | | | Series 2013-CR12-XA | | | 0.56% | (b)(g) | | | 10/10/2046 | | | | 674 | |
| | 225,000 | | | Series 2014-CR18-AM | | | 4.10% | | | | 07/15/2047 | | | | 223,886 | |
| | 9,391,290 | | | Series 2014-UBS5-A3 | | | 3.57% | | | | 09/10/2047 | | | | 9,344,122 | |
| | 135,328,113 | | | Series 2015-CR25-XA | | | 0.79% | (b)(g) | | | 08/10/2048 | | | | 1,073,910 | |
| | 6,818,000 | | | Series 2015-DC1-A5 | | | 3.35% | | | | 02/10/2048 | | | | 6,678,146 | |
| | 11,308,000 | | | Series 2018-HCLV-A (CME Term SOFR 1 Month + 1.30%, 1.00% Floor) | | | 6.62% | (a) | | | 09/15/2033 | | | | 10,650,985 | |
| |
| | | | Computershare Corporate Trust | |
| | 23,662,763 | | | Series 2015-LC22-XA | | | 0.73% | (b)(g) | | | 09/15/2058 | | | | 195,152 | |
| | 156,349,497 | | | Series 2019-C51-XA | | | 1.28% | (b)(g) | | | 06/15/2052 | | | | 8,272,311 | |
| | 11,851,000 | | | Series 2021-C60-A2 | | | 2.04% | | | | 08/15/2054 | | | | 11,062,123 | |
| | 3,201,089 | | | Series 2021-SAVE-A (CME Term SOFR 1 Month + 1.26%, 1.15% Floor) | | | 6.59% | (a) | | | 02/15/2040 | | | | 3,182,722 | |
| | 4,472,000 | | | Series 2021-SAVE-B (CME Term SOFR 1 Month + 1.56%, 1.45% Floor) | | | 6.89% | (a) | | | 02/15/2040 | | | | 4,430,399 | |
| |
| | | | Cross Harbor Capital Partners | |
| | 2,175,240 | | | Series 2021-FL1-A (CME Term SOFR 1 Month + 1.16%, 1.05% Floor) | | | 6.49% | (a) | | | 02/15/2038 | | | | 2,169,707 | |
| | 4,590,000 | | | Series 2021-FL1-AS (CME Term SOFR 1 Month + 1.41%, 1.30% Floor) | | | 6.74% | (a) | | | 02/15/2038 | | | | 4,552,247 | |
| | | | | | | | | | | | | | | | |
PRINCIPAL
AMOUNT $ | | | SECURITY DESCRIPTION | | RATE | | | MATURITY | | | VALUE $ | |
| |
| | | | CSAIL Commercial Mortgage Trust | |
| | 2,435,663 | | | Series 2015-C3-A3 | | | 3.45% | | | | 08/15/2048 | | | | 2,382,629 | |
| | 87,124,477 | | | Series 2017-C8-XA | | | 1.07% | (b)(g) | | | 06/15/2050 | | | | 2,303,815 | |
| | 12,851,276 | | | Series 2017-CX9-XA | | | 0.61% | (b)(g) | | | 09/15/2050 | | | | 142,284 | |
| |
| | | | DBCG Mortgage Trust | |
| | 12,925,000 | | | Series 2017-BBG-B (Prime Rate + 0.00%) | | | 8.50% | (a) | | | 06/15/2034 | | | | 12,925,248 | |
| |
| | | | EQUS Mortgage Trust | |
| | 18,292,633 | | | Series 2021-EQAZ-A (CME Term SOFR 1 Month + 0.87%, 0.76% Floor) | | | 6.20% | (a) | | | 10/15/2038 | | | | 18,202,786 | |
| |
| | | | Extended Stay America Trust | |
| | 5,101,547 | | | Series 2021-ESH-A (CME Term SOFR 1 Month + 1.19%, 1.08% Floor) | | | 6.52% | (a) | | | 07/15/2038 | | | | 5,103,222 | |
| |
| | | | FS Rialto | |
| | 4,941,817 | | | Series 2019-FL1-A (CME Term SOFR 1 Month + 1.31%, 1.20% Floor) | | | 6.64% | (a) | | | 12/16/2036 | | | | 4,919,381 | |
| | 18,205,050 | | | Series 2021-FL2-A (CME Term SOFR 1 Month + 1.33%, 1.33% Floor) | | | 6.66% | (a) | | | 05/16/2038 | | | | 18,034,432 | |
| | 8,822,378 | | | Series 2021-FL3-A (CME Term SOFR 1 Month + 1.36%, 1.36% Floor) | | | 6.69% | (a) | | | 11/16/2036 | | | | 8,807,027 | |
| |
| | | | Granite Point Mortgage Trust, Inc. | |
| | 13,069,720 | | | Series 2021-FL3-A (CME Term SOFR 1 Month + 1.36%, 1.36% Floor) | | | 6.69% | (a) | | | 07/16/2035 | | | | 12,926,633 | |
| | 12,166,663 | | | Series 2021-FL4-A (CME Term SOFR 1 Month + 1.46%, 1.35% Floor) | | | 6.79% | (a) | | | 12/15/2036 | | | | 11,922,746 | |
| |
| | | | Great Wolf Trust | |
| | 4,694,828 | | | Series 2019-WOLF-A (CME Term SOFR 1 Month + 1.35%, 1.12% Floor) | | | 6.67% | (a) | | | 12/15/2036 | | | | 4,694,490 | |
| | 13,500,000 | | | Series 2024-WOLF-A (CME Term SOFR 1 Month + 1.54%, 1.54% Floor) | | | 6.84% | (a) | | | 03/15/2039 | | | | 13,542,873 | |
| |
| | | | Greystone Commercial Real Estate Notes | |
| | 14,146 | | | Series 2019-FL2-A (CME Term SOFR 1 Month + 1.29%, 1.18% Floor) | | | 6.62% | (a) | | | 09/15/2037 | | | | 14,086 | |
| | 14,933,000 | | | Series 2021-FL3-A (CME Term SOFR 1 Month + 1.13%, 1.02% Floor) | | | 6.46% | (a) | | | 07/15/2039 | | | | 14,861,501 | |
| |
| | | | GS Mortgage Securities Corp. II | |
| | 2,404,561 | | | Series 2013-GC13-AS | | | 3.84% | (a)(b) | | | 07/10/2046 | | | | 2,294,463 | |
| | 1,860,000 | | | Series 2014-GC26-A5 | | | 3.63% | | | | 11/10/2047 | | | | 1,830,308 | |
| | 105,538,323 | | | Series 2017-GS6-XA | | | 1.01% | (b)(g) | | | 05/10/2050 | | | | 2,648,136 | |
| | 125,585,323 | | | Series 2017-GS7-XA | | | 1.08% | (b)(g) | | | 08/10/2050 | | | | 3,380,041 | |
| | 135,711,056 | | | Series 2017-GS8-XA | | | 0.93% | (b)(g) | | | 11/10/2050 | | | | 3,562,293 | |
| | 2,615,000 | | | Series 2018-TWR-A (CME Term SOFR 1 Month + 1.20%, 0.90% Floor) | | | 6.52% | (a) | | | 07/15/2031 | | | | 2,174,046 | |
| | 51,226,802 | | | Series 2019-GC42-XA | | | 0.81% | (b)(g) | | | 09/10/2052 | | | | 1,745,835 | |
| | 9,296,000 | | | Series 2021-IP-A (CME Term SOFR 1 Month + 1.06%, 0.95% Floor) | | | 6.39% | (a) | | | 10/15/2036 | | | | 9,174,163 | |
| |
| | | | HGI CRE CLO Ltd. | |
| | 2,169,370 | | | Series 2021-FL1-A (CME Term SOFR 1 Month + 1.16%, 1.16% Floor) | | | 6.49% | (a) | | | 06/16/2036 | | | | 2,148,694 | |
| |
| | | | JP Morgan Chase Commercial Mortgage Securities | |
| | 2,829,088 | | | Series 2014-C20-XA | | | 0.59% | (b)(g) | | | 07/15/2047 | | | | 174 | |
| | 55,597,276 | | | Series 2016-JP4-XA | | | 0.57% | (b)(g) | | | 12/15/2049 | | | | 643,372 | |
| | 24,647,037 | | | Series 2019-COR5-XA | | | 1.47% | (b)(g) | | | 06/13/2052 | | | | 1,294,901 | |
| | 59,178,200 | | | Series 2020-ACE-XA | | | 0.34% | (a)(b)(g) | | | 01/10/2037 | | | | 137,175 | |
| | 117,285,000 | | | Series 2020-MKST-XCP | | | 0.00% | (a)(b)(g) | | | 12/15/2036 | | | | 1,173 | |
| | | | | | | | |
| The accompanying notes are an integral part of these financial statements. | | Annual Report | | | | | March 31, 2024 | | 55 |
| | |
Schedule of Investments DoubleLine Low Duration Bond Fund (Cont.) | | |
| | | | | | | | | | | | | | | | |
PRINCIPAL
AMOUNT $ | | | SECURITY DESCRIPTION | | RATE | | | MATURITY | | | VALUE $ | |
| |
| | | | JPMBB Commercial Mortgage Securities Trust | |
| | 309,335 | | | Series 2014-C18-A5 | | | 4.08% | | | | 02/15/2047 | | | | 308,527 | |
| | 2,654,342 | | | Series 2014-C21-A5 | | | 3.77% | | | | 08/15/2047 | | | | 2,638,744 | |
| | 2,550,000 | | | Series 2014-C25-B | | | 4.35% | (b) | | | 11/15/2047 | | | | 2,346,190 | |
| | 1,183,810 | | | Series 2015-C30-A4 | | | 3.55% | | | | 07/15/2048 | | | | 1,146,331 | |
| | 49,866,549 | | | Series 2015-C32-XA | | | 1.09% | (b)(g) | | | 11/15/2048 | | | | 431,261 | |
| | 8,970,000 | | | Series 2015-C33-AS | | | 4.02% | | | | 12/15/2048 | | | | 8,573,345 | |
| | 425,336 | | | Series 2016-C1-A5 | | | 3.58% | | | | 03/17/2049 | | | | 409,612 | |
| |
| | | | KREF | |
| | 11,569,000 | | | Series 2021-FL2-A (CME Term SOFR 1 Month + 1.18%, 1.07% Floor) | | | 6.51% | (a) | | | 02/15/2039 | | | | 11,394,620 | |
| | 11,380,000 | | | Series 2021-FL2-B (CME Term SOFR 1 Month + 1.76%, 1.65% Floor) | | | 7.09% | (a) | | | 02/15/2039 | | | | 10,835,285 | |
| |
| | | | Ladder Capital Commercial Mortgage Securities LLC | |
| | 746,971 | | | Series 2017-LC26-A3 | | | 3.29% | (a) | | | 07/12/2050 | | | | 707,834 | |
| | 12,365,500 | | | Series 2021-FL2-A (CME Term SOFR 1 Month + 1.31%, 1.31% Floor) | | | 6.64% | (a) | | | 12/13/2038 | | | | 12,210,572 | |
| | 9,891,367 | | | Series 2021-FL3-A (CME Term SOFR 1 Month + 1.56%, 1.56% Floor) | | | 6.89% | (a) | | | 11/15/2038 | | | | 9,780,861 | |
| |
| | | | Life Mortgage Trust US | |
| | 5,652,078 | | | Series 2021-BMR-A (CME Term SOFR 1 Month + 0.81%, 0.70% Floor) | | | 6.14% | (a) | | | 03/15/2038 | | | | 5,592,693 | |
| |
| | | | LoanCore | |
| | 6,274,833 | | | Series 2021-CRE5-A (CME Term SOFR 1 Month + 1.41%, 1.41% Floor) | | | 6.74% | (a) | | | 07/15/2036 | | | | 6,246,301 | |
| | 14,503,161 | | | Series 2021-CRE6-A (CME Term SOFR 1 Month + 1.41%, 1.30% Floor) | | | 6.74% | (a) | | | 11/15/2038 | | | | 14,431,733 | |
| |
| | | | LSTAR Commercial Mortgage Trust | |
| | 48,180,356 | | | Series 2017-5-X | | | 0.83% | (a)(b)(g) | | | 03/10/2050 | | | | 720,214 | |
| |
| | | | Lument Finance Trust, Inc. | |
| | 15,250,763 | | | Series 2021-FL1-A (CME Term SOFR 1 Month + 1.28%, 1.28% Floor) | | | 6.61% | (a) | | | 06/15/2039 | | | | 15,187,441 | |
| |
| | | | Mcp Holding Co. LLC | |
| | 6,615,000 | | | Series 2023-SHIP-A | | | 4.32% | (a)(b) | | | 09/10/2038 | | | | 6,431,791 | |
| |
| | | | Med Trust | |
| | 965,367 | | | Series 2021-MDLN-A (CME Term SOFR 1 Month + 1.06%, 0.95% Floor) | | | 6.39% | (a) | | | 11/15/2038 | | | | 963,634 | |
| |
| | | | Merit 2020 | |
| | 5,302,858 | | | Series 2022-MHIL-A (CME Term SOFR 1 Month + 0.81%, 0.82% Floor) | | | 6.14% | (a) | | | 01/15/2027 | | | | 5,260,346 | |
| |
| | | | MF1 Multifamily Housing Mortgage Loan Trust | |
| | 1,060,093 | | | Series 2021-FL5-A (CME Term SOFR 1 Month + 0.96%, 0.96% Floor) | | | 6.29% | (a) | | | 07/15/2036 | | | | 1,058,572 | |
| | 10,343,000 | | | Series 2021-FL5-AS (CME Term SOFR 1 Month + 1.31%, 1.31% Floor) | | | 6.64% | (a) | | | 07/15/2036 | | | | 10,212,844 | |
| | 13,849,370 | | | Series 2021-FL6-A (CME Term SOFR 1 Month + 1.21%, 1.10% Floor) | | | 6.54% | (a) | | | 07/16/2036 | | | | 13,785,649 | |
| | 9,267,792 | | | Series 2021-FL7-A (CME Term SOFR 1 Month + 1.19%, 1.08% Floor) | | | 6.52% | (a) | | | 10/16/2036 | | | | 9,222,917 | |
| | 9,222,443 | | | Series 2022-FL8-A (CME Term SOFR 1 Month + 1.35%, 1.35% Floor) | | | 6.68% | (a) | | | 02/19/2037 | | | | 9,169,705 | |
| |
| | | | Morgan Stanley ABS Capital I, Inc. | |
| | 18,374,239 | | | Series 2021-ILP-A (CME Term SOFR 1 Month + 0.89%, 0.78% Floor) | | | 6.22% | (a) | | | 11/15/2036 | | | | 18,249,672 | |
| | | | | | | | | | | | | | | | |
PRINCIPAL
AMOUNT $ | | | SECURITY DESCRIPTION | | RATE | | | MATURITY | | | VALUE $ | |
| |
| | | | Morgan Stanley Bank of America Merrill Lynch Trust | |
| | 1,137,799 | | | Series 2014-C16-A5 | | | 3.89% | | | | 06/15/2047 | | | | 1,133,370 | |
| | 13,698,806 | | | Series 2014-C19-LNCX | | | 0.60% | (a)(b)(g) | | | 12/15/2046 | | | | 16,229 | |
| | 2,425,000 | | | Series 2015-C23-AS | | | 4.00% | (b) | | | 07/15/2050 | | | | 2,352,513 | |
| | 227,944 | | | Series 2015-C26-A3 | | | 3.21% | | | | 10/15/2048 | | | | 227,345 | |
| |
| | | | Morgan Stanley Capital I, Inc. | |
| | 1,117,410 | | | Series 2006-HQ10-X1 | | | 0.21% | (a)(b)(g) | | | 11/12/2041 | | | | 14,626 | |
| | 56,538,031 | | | Series 2017-H1-XA | | | 1.30% | (b)(g) | | | 06/15/2050 | | | | 1,438,865 | |
| | 7,895,000 | | | Series 2019-PLND-D (CME Term SOFR 1 Month + 1.86%, 1.75% Floor) | | | 7.19% | (a) | | | 05/15/2036 | | | | 6,222,556 | |
| | 344,614 | | | Series 2021-L5-A1 | | | 0.79% | | | | 05/15/2054 | | | | 326,358 | |
| | 14,862,000 | | | Series 2021-L6-A2 | | | 2.13% | (b) | | | 06/15/2054 | | | | 12,908,999 | |
| |
| | | | Natixis Commercial Mortgage Securities Trust | |
| | 1,862,886 | | | Series 2018-FL1-A (Prime Rate + 0.00%) | | | 8.50% | (a) | | | 06/15/2035 | | | | 1,724,997 | |
| |
| | | | PFP III Ltd. | |
| | 2,460,519 | | | Series 2021-8-A (CME Term SOFR 1 Month + 1.11%, 1.00% Floor) | | | 6.44% | (a) | | | 08/09/2037 | | | | 2,444,701 | |
| |
| | | | Ready Capital Corp. | |
| | 1,923,568 | | | Series 2021-FL6-A (CME Term SOFR 1 Month + 1.06%, 0.95% Floor) | | | 6.39% | (a) | | | 07/25/2036 | | | | 1,913,161 | |
| |
| | | | SREIT Trust | |
| | 9,380,127 | | | Series 2021-MFP-A (CME Term SOFR 1 Month + 0.85%, 0.73% Floor) | | | 6.17% | (a) | | | 11/15/2038 | | | | 9,318,820 | |
| |
| | | | Starwood Property Mortgage Trust | |
| | 12,887,000 | | | Series 2019-FL1-AS (CME Term SOFR 1 Month + 1.51%, 1.51% Floor) | | | 6.84% | (a) | | | 07/15/2038 | | | | 12,726,711 | |
| | 11,811,982 | | | Series 2021-FL2-A (CME Term SOFR 1 Month + 1.31%, 1.20% Floor) | | | 6.64% | (a) | | | 04/18/2038 | | | | 11,672,128 | |
| |
| | | | TPG Real Estate Finance Issuer Ltd. | |
| | 11,517,706 | | | Series 2021-FL4-A (CME Term SOFR 1 Month + 1.31%, 1.20% Floor) | | | 6.64% | (a) | | | 03/15/2038 | | | | 11,419,092 | |
| | 3,680,000 | | | Series 2022-FL5-A (US 30 Day Average Secured Overnight Financing Rate + 1.65%, 1.65% Floor) | | | 6.97% | (a) | | | 02/15/2039 | | | | 3,661,751 | |
| |
| | | | TTAN | |
| | 4,551,276 | | | Series 2021-MHC-A (CME Term SOFR 1 Month + 0.96%, 0.85% Floor) | | | 6.29% | (a) | | | 03/15/2038 | | | | 4,546,968 | |
| |
| | | | UBS Commercial Mortgage Trust | |
| | 50,824,021 | | | Series 2017-C1-XA | | | 1.52% | (b)(g) | | | 06/15/2050 | | | | 1,814,819 | |
| | 85,536,586 | | | Series 2017-C3-XA | | | 1.11% | (b)(g) | | | 08/15/2050 | | | | 2,134,796 | |
| | 424,779 | | | Series 2018-C13-A3 | | | 4.07% | | | | 10/15/2051 | | | | 410,511 | |
| | 93,736,830 | | | Series 2018-C8-XA | | | 0.81% | (b)(g) | | | 02/15/2051 | | | | 2,509,316 | |
| |
| | | | WB Commercial Mortgage Trust | |
| | 7,445,000 | | | Series 2024-HQ-A | | | 6.13% | (a)(b) | | | 03/15/2040 | | | | 7,512,355 | |
| | | | | | | | | | | | | | | | |
| | | | Total Non-Agency Commercial Mortgage Backed Obligations
(Cost $918,149,389) | | | | 805,312,133 | |
| | | | | | | | | | | | | | | | |
| NON-AGENCY RESIDENTIAL COLLATERALIZED MORTGAGE
OBLIGATIONS 13.0% |
|
| | |
| | | | Angel Oak Mortgage Trust LLC | | | | | |
| | 14,953,151 | | | Series 2021-7-A1 | | | 1.98% | (a)(b) | | | 10/25/2066 | | | | 12,554,968 | |
| | |
| | | | Arroyo Mortgage Trust | | | | | |
| | 4,836,510 | | | Series 2019-3-A2 | | | 3.21% | (a)(b) | | | 10/25/2048 | | | | 4,483,503 | |
| | 2,613,888 | | | Series 2019-3-A3 | | | 3.42% | (a)(b) | | | 10/25/2048 | | | | 2,428,209 | |
| | | | |
| 56 | | DoubleLine Funds Trust | | The accompanying notes are an integral part of these financial statements. |
| | | | | | | | | | | | | | | | |
PRINCIPAL
AMOUNT $ | | | SECURITY DESCRIPTION | | RATE | | | MATURITY | | | VALUE $ | |
| | |
| | | | Banc of America Mortgage Securities, Inc. | | | | | |
| | 325,788 | | | Series 2005-E-2A1 | | | 4.57% | (b) | | | 06/25/2035 | | | | 281,907 | |
| | |
| | | | BCAP LLC Trust | | | | | |
| | 508,418 | | | Series 2011-RR1-8A3 | | | 15.48% | (a)(b)(c) | | | 09/30/2056 | | | | 383,779 | |
| | |
| | | | Bear Stearns Adjustable Rate Mortgage Trust | | | | | |
| | 1,249,050 | | | Series 2003-9-4A1 | | | 5.80% | (b) | | | 02/25/2034 | | | | 1,229,957 | |
| | |
| | | | Bear Stearns Asset Backed Securities Trust | | | | | |
| | 156,990 | | | Series 2004-AC2-2A | | | 5.00% | | | | 05/25/2034 | | | | 129,744 | |
| | |
| | | | BRAVO Residential Funding Trust | | | | | |
| | 3,939,972 | | | Series 2020-RPL1-A1 | | | 2.50% | (a)(b) | | | 05/26/2059 | | | | 3,773,424 | |
| | 12,025,781 | | | Series 2021-A-A1 | | | 4.99% | (a)(e) | | | 10/25/2059 | | | | 11,867,117 | |
| | 15,873,646 | | | Series 2021-B-A1 | | | 5.12% | (a)(e) | | | 04/01/2069 | | | | 15,682,086 | |
| | 6,701,361 | | | Series 2022-RPL1-A1 | | | 2.75% | (a)(b) | | | 09/25/2061 | | | | 6,047,978 | |
| | |
| | | | Carrington Mortgage Loan Trust | | | | | |
| | 1,930,473 | | | Series 2006-NC3-A3 (CME Term SOFR 1 Month + 0.26%, 0.15% Floor, 12.50% Cap) | | | 5.59% | | | | 08/25/2036 | | | | 1,839,413 | |
| |
| | | | Chase Funding Mortgage Loan Asset-Backed Certificates | |
| | 1,783,453 | | | Series 2004-2-1A5 | | | 6.20% | (e) | | | 02/26/2035 | | | | 1,751,309 | |
| | |
| | | | Citigroup Mortgage Loan Trust, Inc. | | | | | |
| | 334,488 | | | Series 2006-AR1-2A1 (1 Year CMT Rate + 2.40%, 2.40% Floor, 9.87% Cap) | | | 7.86% | | | | 03/25/2036 | | | | 301,941 | |
| | 1,911,382 | | | Series 2020-EXP1-A1A | | | 1.80% | (a)(b) | | | 05/25/2060 | | | | 1,728,793 | |
| | |
| | | | COLT Funding LLC | | | | | |
| | 5,070,811 | | | Series 2021-1R-A1 | | | 0.86% | (a)(b) | | | 05/25/2065 | | | | 4,316,162 | |
| | 5,179,433 | | | Series 2021-5-A1 | | | 1.73% | (a)(b) | | | 11/26/2066 | | | | 4,449,009 | |
| | 14,671,105 | | | Series 2021-RPL1-A1 | | | 1.67% | (a)(b) | | | 09/25/2061 | | | | 12,893,451 | |
| | 3,585,228 | | | Series 2023-2-A1 | | | 6.60% | (a)(e) | | | 07/25/2068 | | | | 3,614,220 | |
| |
| | | | Countrywide Home Loan Mortgage Pass Through Trust | |
| | 259,772 | | | Series 2004-HYB9-1A1 | | | 5.08% | (b) | | | 02/20/2035 | | | | 258,905 | |
| | 3,637,085 | | | Series 2005-3-1A2 (CME Term SOFR 1 Month + 0.69%, 0.58% Floor) | | | 6.02% | | | | 04/25/2035 | | | | 3,311,187 | |
| | |
| | | | Credit Suisse Management LLC | | | | | |
| | 26,475 | | | Series 2005-11-5A1 | | | 5.25% | | | | 06/25/2026 | | | | 17,266 | |
| | |
| | | | Credit Suisse Mortgage Capital Certificates | | | | | |
| | 10,483,258 | | | Series 2020-RPL3-A1 | | | 4.08% | (a)(b) | | | 03/25/2060 | | | | 10,448,723 | |
| | 1,811,908 | | | Series 2021-NQM1-A2 | | | 0.99% | (a)(b) | | | 05/25/2065 | | | | 1,546,796 | |
| | 3,019,846 | | | Series 2021-NQM1-A3 | | | 1.20% | (a)(b) | | | 05/25/2065 | | | | 2,592,096 | |
| | 7,215,594 | | | Series 2021-NQM5-A3 | | | 1.35% | (a)(b) | | | 05/25/2066 | | | | 5,832,587 | |
| | 4,890,492 | | | Series 2021-RPL4-A1 | | | 1.80% | (a)(b) | | | 12/27/2060 | | | | 4,755,332 | |
| | 17,138,319 | | | Series 2022-NQM1-A1 | | | 2.27% | (a)(b) | | | 11/25/2066 | | | | 15,026,826 | |
| | 2,867,019 | | | Series 2022-NQM5-A1 | | | 5.17% | (a)(b) | | | 05/25/2067 | | | | 2,843,592 | |
| | 8,552,262 | | | Series 2022-RPL4-A1 | | | 3.90% | (a)(b) | | | 04/25/2062 | | | | 7,996,928 | |
| | |
| | | | Cross Mortgage Trust | | | | | |
| | 4,878,517 | | | Series 2024-H1-A1 | | | 6.09% | (a)(e) | | | 12/25/2068 | | | | 4,876,749 | |
| | |
| | | | CSMCM Trust | | | | | |
| | 29,463,364 | | | Series 2019-RP10-A1 | | | 3.14% | (a)(b) | | | 12/26/2059 | | | | 29,724,515 | |
| | |
| | | | Ellington Financial Mortgage Trust | | | | | |
| | 936,118 | | | Series 2020-1-A1 | | | 2.01% | (a)(b) | | | 05/25/2065 | | | | 907,978 | |
| | |
| | | | Fannie Mae Connecticut Avenue Securities | | | | | |
| | 7,462,405 | | | Series 2023-R08-1M1 (US 30 Day Average Secured Overnight Financing Rate + 1.50%) | | | 6.82% | (a) | | | 10/25/2043 | | | | 7,499,116 | |
| | 14,465,918 | | | Series 2024-R01-1M1 (US 30 Day Average Secured Overnight Financing Rate + 1.05%, 1.05% Floor) | | | 6.37% | (a) | | | 01/25/2044 | | | | 14,476,800 | |
| | 16,868,240 | | | Series 2024-R02-1M1 (US 30 Day Average Secured Overnight Financing Rate + 1.10%, 1.10% Floor) | | | 6.42% | (a) | | | 02/25/2044 | | | | 16,882,195 | |
| | | | | | | | | | | | | | | | |
PRINCIPAL
AMOUNT $ | | | SECURITY DESCRIPTION | | RATE | | | MATURITY | | | VALUE $ | |
| | |
| | | | First Horizon Asset Securities, Inc. | | | | | |
| | 1,807,397 | | | Series 2007-AR2-1A1 | | | 5.81% | (b) | | | 08/25/2037 | | | | 620,763 | |
| | |
| | | | FirstKey Homes Trust | | | | | |
| | 7,252,226 | | | Series 2020-SFR2-A | | | 1.27% | (a) | | | 10/19/2037 | | | | 6,789,145 | |
| |
| | | | Freddie Mac Structured Agency Credit Risk Debt Notes | |
| | 2,030,072 | | | Series 2022-DNA2-M1A (US 30 Day Average Secured Overnight Financing Rate + 1.30%) | | | 6.62% | (a) | | | 02/25/2042 | | | | 2,035,413 | |
| | |
| | | | GCAT | | | | | |
| | 5,185,438 | | | Series 2022-NQM4-A1 | | | 5.27% | (a)(e) | | | 08/25/2067 | | | | 5,128,100 | |
| | |
| | | | GSR Mortgage Loan Trust | | | | | |
| | 2,406,879 | | | Series 2005-9F-2A2 | | | 6.00% | | | | 01/25/2036 | | | | 1,110,980 | |
| | |
| | | | HOMES Trust | | | | | |
| | 13,518,876 | | | Series 2023-NQM2-A1 | | | 6.46% | (a)(e) | | | 02/25/2068 | | | | 13,542,153 | |
| | |
| | | | Homeward Opportunities Fund I Trust | | | | | |
| | 12,024,515 | | | Series 2022-1-A1 | | | 5.08% | (a)(e) | | | 07/25/2067 | | | | 11,882,885 | |
| | |
| | | | JP Morgan Alternative Loan Trust | | | | | |
| | 16,725 | | | Series 2006-S4-A6 | | | 6.21% | (e) | | | 12/25/2036 | | | | 16,323 | |
| | |
| | | | Legacy Mortgage Asset Trust | | | | | |
| | 236,068 | | | Series 2020-SL1-A | | | 5.73% | (a)(e) | | | 01/25/2060 | | | | 236,184 | |
| | 911,134 | | | Series 2021-GS1-A1 | | | 4.89% | (a)(e) | | | 10/25/2066 | | | | 900,189 | |
| | 10,016,989 | | | Series 2021-GS2-A1 | | | 1.75% | (a)(e) | | | 04/25/2061 | | | | 9,735,743 | |
| | 17,934,240 | | | Series 2021-GS3-A1 | | | 1.75% | (a)(e) | | | 07/25/2061 | | | | 17,395,095 | |
| | 23,303,309 | | | Series 2021-GS4-A1 | | | 1.65% | (a)(e) | | | 11/25/2060 | | | | 22,608,387 | |
| | 2,513,645 | | | Series 2021-SL1-A | | | 4.99% | (a)(b) | | | 09/25/2060 | | | | 2,515,565 | |
| | |
| | | | Mastr Adjustable Rate Mortgages Trust | | | | | |
| | 1,748,770 | | | Series 2006-2-2A1 | | | 6.17% | (b) | | | 04/25/2036 | | | | 929,592 | |
| | |
| | | | MFRA Trust | | | | | |
| | 1,640,680 | | | Series 2021-NPL1-A1 | | | 5.36% | (a)(e) | | | 03/25/2060 | | | | 1,626,373 | |
| | 9,948,850 | | | Series 2021-NQM2-A1 | | | 1.03% | (a)(b) | | | 11/25/2064 | | | | 8,597,934 | |
| | 1,291,432 | | | Series 2021-NQM2-A2 | | | 1.32% | (a)(b) | | | 11/25/2064 | | | | 1,112,899 | |
| | |
| | | | Mill City Mortgage Trust | | | | | |
| | 1,735,938 | | | Series 2017-3-A1 | | | 2.75% | (a)(b) | | | 01/25/2061 | | | | 1,706,461 | |
| | |
| | | | MLCC Mortgage Investors, Inc. | | | | | |
| | 399,861 | | | Series 2005-3-2A | | | 5.28% | (b) | | | 11/25/2035 | | | | 384,593 | |
| | |
| | | | Morgan Stanley Mortgage Loan Trust | | | | | |
| | 7,105 | | | Series 2004-1-1A1 | | | 5.00% | | | | 11/25/2033 | | | | 5,193 | |
| | |
| | | | New Residential Mortgage Loan Trust | | | | | |
| | 9,000,000 | | | Series 2024-NQM1-A1 | | | 6.13% | (a)(e) | | | 03/25/2064 | | | | 9,044,532 | |
| | |
| | | | OBX Trust | | | | | |
| | 13,000,000 | | | Series 2024-NQM5-A1 | | | 5.99% | (a)(e) | | | 03/25/2028 | | | | 13,096,187 | |
| | |
| | | | Onslow Bay Mortgage Loan Trust | | | | | |
| | 1,205,257 | | | Series 2018-1-A2 (CME Term SOFR 1 Month + 0.76%) | | | 6.09% | (a) | | | 06/25/2057 | | | | 1,162,081 | |
| | 10,038,204 | | | Series 2022-NQM1-A1 | | | 2.31% | (a)(b) | | | 11/25/2061 | | | | 8,655,116 | |
| | 2,539,732 | | | Series 2022-NQM7-A1 | | | 5.11% | (a)(e) | | | 08/25/2062 | | | | 2,508,275 | |
| | 8,703,404 | | | Series 2023-NQM5-A1A | | | 6.57% | (a)(e) | | | 06/25/2063 | | | | 8,786,085 | |
| | 11,500,000 | | | Series 2024-NQM4-A1 | | | 6.07% | (a)(e) | | | 01/25/2064 | | | | 11,516,461 | |
| | |
| | | | Pretium Mortgage Credit Partners LLC | | | | | |
| | 7,857,611 | | | Series 2021-NPL1-A1 | | | 5.24% | (a)(e) | | | 09/27/2060 | | | | 7,775,020 | |
| | 3,085,458 | | | Series 2021-NPL2-A1 | | | 1.99% | (a)(e) | | | 06/27/2060 | | | | 2,999,093 | |
| | 24,790,149 | | | Series 2021-NPL3-A1 | | | 1.87% | (a)(e) | | | 07/25/2051 | | | | 23,998,639 | |
| | 14,438,395 | | | Series 2021-RN1-A1 | | | 1.99% | (a)(e) | | | 02/25/2061 | | | | 14,113,359 | |
| | 4,791,539 | | | Series 2021-RN2-A1 | | | 1.74% | (a)(e) | | | 07/25/2051 | | | | 4,644,966 | |
| | 17,090,081 | | | Series 2021-RN3-A1 | | | 1.84% | (a)(e) | | | 09/25/2051 | | | | 16,364,983 | |
| | |
| | | | PRPM LLC | | | | | |
| | 6,319,103 | | | Series 2020-4-A1 | | | 5.61% | (a)(e) | | | 10/25/2025 | | | | 6,311,158 | |
| | 8,862,777 | | | Series 2021-2-A1 | | | 5.12% | (a)(b) | | | 03/25/2026 | | | | 8,785,539 | |
| | 8,635,371 | | | Series 2021-3-A1 | | | 1.87% | (a)(e) | | | 04/25/2026 | | | | 8,499,847 | |
| | 13,444,954 | | | Series 2021-4-A1 | | | 1.87% | (a)(e) | | | 04/25/2026 | | | | 13,143,016 | |
| | 9,880,226 | | | Series 2021-5-A1 | | | 1.79% | (a)(e) | | | 06/25/2026 | | | | 9,681,309 | |
| | 11,927,012 | | | Series 2021-6-A1 | | | 1.79% | (a)(e) | | | 07/25/2026 | | | | 11,610,095 | |
| | 22,522,084 | | | Series 2021-7-A1 | | | 1.87% | (a)(e) | | | 08/25/2026 | | | | 21,850,270 | |
| | |
| | | | Securitized Asset Backed Receivables LLC | | | | | |
| | 3,792,276 | | | Series 2006-NC1-A3 (CME Term SOFR 1 Month + 0.65%, 0.54% Floor) | | | 5.98% | | | | 03/25/2036 | | | | 3,409,077 | |
| | | | | | | | |
| The accompanying notes are an integral part of these financial statements. | | Annual Report | | | | | March 31, 2024 | | 57 |
| | |
Schedule of Investments DoubleLine Low Duration Bond Fund (Cont.) | | |
| | | | | | | | | | | | | | | | |
PRINCIPAL
AMOUNT $ | | | SECURITY DESCRIPTION | | RATE | | | MATURITY | | | VALUE $ | |
| | |
| | | | Starwood Mortgage Residential Trust | | | | | |
| | 544,878 | | | Series 2020-3-A1 | | | 1.49% | (a)(b) | | | 04/25/2065 | | | | 515,677 | |
| | 24,639,750 | | | Series 2021-5-A1 | | | 1.92% | (a)(b) | | | 09/25/2066 | | | | 20,316,185 | |
| | |
| | | | Structured Asset Securities Corp. | | | | | |
| | 86,865 | | | Series 2003-24A-1A3 | | | 6.92% | (b) | | | 07/25/2033 | | | | 84,355 | |
| | |
| | | | Terwin Mortgage Trust | | | | | |
| | 684,312 | | | Series 2003-4HE-M1 (CME Term SOFR 1 Month + 1.24%, 1.13% Floor) | | | 6.57% | | | | 09/25/2034 | | | | 693,022 | |
| | |
| | | | VCAT Asset Securitization LLC | | | | | |
| | 6,918,566 | | | Series 2021-NPL1-A1 | | | 5.29% | (a)(e) | | | 12/26/2050 | | | | 6,876,188 | |
| | 4,599,455 | | | Series 2021-NPL3-A1 | | | 1.74% | (a)(e) | | | 05/25/2051 | | | | 4,468,359 | |
| | 15,136,947 | | | Series 2021-NPL4-A1 | | | 1.87% | (a)(e) | | | 08/25/2051 | | | | 14,688,831 | |
| | 6,869,528 | | | Series 2021-NPL5-A1 | | | 1.87% | (a)(e) | | | 08/25/2051 | | | | 6,712,416 | |
| | 9,379,771 | | | Series 2021-NPL6-A1 | | | 1.92% | (a)(e) | | | 09/25/2051 | | | | 9,116,946 | |
| | |
| | | | Velocity Commercial Capital Loan Trust | | | | | |
| | 2,111,424 | | | Series 2019-2-A | | | 3.13% | (a)(b) | | | 07/25/2049 | | | | 1,960,956 | |
| | 5,100,252 | | | Series 2021-1-M1 | | | 1.79% | (a)(b) | | | 05/25/2051 | | | | 4,046,081 | |
| | 19,385,051 | | | Series 2021-2-A | | | 1.52% | (a)(b) | | | 08/25/2051 | | | | 16,295,099 | |
| | 4,521,946 | | | Series 2021-2-M1 | | | 1.82% | (a)(b) | | | 08/25/2051 | | | | 3,720,693 | |
| | |
| | | | Vericrest Opportunity Loan Transferee | | | | | |
| | 7,067,509 | | | Series 2021-NP10-A1 | | | 1.99% | (a)(e) | | | 05/25/2051 | | | | 6,814,545 | |
| | 15,905,572 | | | Series 2021-NP11-A1 | | | 1.87% | (a)(e) | | | 08/25/2051 | | | | 15,393,195 | |
| | 8,146,806 | | | Series 2021-NPL1-A1 | | | 4.89% | (a)(e) | | | 02/27/2051 | | | | 7,964,660 | |
| | 5,359,786 | | | Series 2021-NPL3-A1 | | | 5.24% | (a)(e) | | | 02/27/2051 | | | | 5,248,515 | |
| | 4,217,135 | | | Series 2021-NPL5-A1 | | | 5.12% | (a)(e) | | | 03/27/2051 | | | | 4,134,413 | |
| | 4,030,549 | | | Series 2021-NPL6-A1 | | | 5.24% | (a)(e) | | | 04/25/2051 | | | | 3,972,662 | |
| | 17,049,293 | | | Series 2021-NPL8-A1 | | | 5.12% | (a)(e) | | | 04/25/2051 | | | | 16,630,274 | |
| | 2,832,986 | | | Series 2021-NPL9-A1 | | | 1.99% | (a)(e) | | | 05/25/2051 | | | | 2,738,666 | |
| | |
| | | | Verus Securitization Trust | | | | | |
| | 626,037 | | | Series 2020-2-A1 | | | 2.23% | (a)(b) | | | 05/25/2060 | | | | 618,974 | |
| | 186,122 | | | Series 2020-INV1-A1 | | | 1.98% | (a)(b) | | | 03/25/2060 | | | | 185,195 | |
| | 8,010,319 | | | Series 2021-4-A3 | | | 1.35% | (a)(b) | | | 07/25/2066 | | | | 6,375,744 | |
| | 7,271,949 | | | Series 2021-7-A1 | | | 1.83% | (a)(b) | | | 10/25/2066 | | | | 6,325,419 | |
| | 12,725,040 | | | Series 2022-INV1-A1 | | | 5.04% | (a)(e) | | | 08/25/2067 | | | | 12,554,575 | |
| | 424,169 | | | Series 2022-INV1-A2 | | | 5.80% | (a)(e) | | | 08/25/2067 | | | | 420,777 | |
| | 19,416,165 | | | Series 2023-4-A1 | | | 5.81% | (a)(e) | | | 05/25/2068 | | | | 19,321,016 | |
| | |
| | | | WaMu Mortgage Pass Through Certificates | | | | | |
| | 139,001 | | | Series 2002-AR16-A | | | 6.33% | (b) | | | 12/25/2032 | | | | 130,322 | |
| | |
| | | | Wells Fargo Mortgage Backed Securities Trust | | | | | |
| | 211,741 | | | Series 2007-7-A36 | | | 6.00% | | | | 06/25/2037 | | | | 188,757 | |
| | | | | | | | | | | | | | | | |
| | | | Total Non-Agency Residential Collateralized Mortgage Obligations
(Cost $772,917,128) | | | | 734,102,156 | |
| | | | | | | | | | | | | | | | |
| | US CORPORATE BONDS 7.0% | |
| | 2,515,000 | | | AbbVie, Inc. | | | 2.60% | | | | 11/21/2024 | | | | 2,470,182 | |
| | 1,205,000 | | | AGCO Corp. | | | 5.45% | | | | 03/21/2027 | | | | 1,210,910 | |
| | 1,370,000 | | | American Electric Power Co., Inc. | | | 5.20% | | | | 01/15/2029 | | | | 1,374,012 | |
| | 5,015,000 | | | American Express Co. (Secured Overnight Financing Rate + 1.00%) | | | 6.34% | | | | 02/16/2028 | | | | 5,033,520 | |
| | 2,670,000 | | | Amgen, Inc. | | | 5.51% | | | | 03/02/2026 | | | | 2,667,521 | |
| | 2,625,000 | | | Arrow Electronics, Inc. | | | 6.13% | | | | 03/01/2026 | | | | 2,624,228 | |
| | 2,995,000 | | | AT&T, Inc. | | | 5.54% | | | | 02/20/2026 | | | | 2,993,466 | |
| | 7,500,000 | | | Athene Global Funding (Secured Overnight Financing Rate + 0.70%) | | | 6.04% | (a) | | | 05/24/2024 | | | | 7,504,047 | |
| | 1,625,000 | | | Avery Dennison Corp. | | | 0.85% | | | | 08/15/2024 | | | | 1,594,142 | |
| | 4,200,000 | | | Aviation Capital Group LLC | | | 1.95% | (a) | | | 09/20/2026 | | | | 3,839,243 | |
| | 2,605,000 | | | Boeing Co. | | | 4.88% | | | | 05/01/2025 | | | | 2,576,463 | |
| | 5,050,000 | | | BP Capital Markets America, Inc. | | | 4.70% | | | | 04/10/2029 | | | | 5,039,704 | |
| | | | | | | | | | | | | | | | |
PRINCIPAL
AMOUNT $ | | | SECURITY DESCRIPTION | | RATE | | | MATURITY | | | VALUE $ | |
| | | | |
| | 2,775,000 | | | Bristol-Myers Squibb Co. (US Secured Overnight Financing Rate + 0.49%) | | | 5.83% | | | | 02/20/2026 | | | | 2,784,954 | |
| | 2,465,000 | | | Broadcom Corp. / Broadcom Cayman Finance Ltd. | | | 3.88% | | | | 01/15/2027 | | | | 2,390,262 | |
| | 2,615,000 | | | Broadcom, Inc. | | | 3.15% | | | | 11/15/2025 | | | | 2,530,748 | |
| | 5,030,000 | | | Brown & Brown, Inc. | | | 4.20% | | | | 09/15/2024 | | | | 4,995,099 | |
| | 5,245,000 | | | Campbell Soup Co. | | | 3.95% | | | | 03/15/2025 | | | | 5,166,660 | |
| | 2,015,000 | | | Campbell Soup Co. | | | 5.20% | | | | 03/19/2027 | | | | 2,020,518 | |
| | 7,110,000 | | | Cardinal Health, Inc. | | | 3.08% | | | | 06/15/2024 | | | | 7,069,644 | |
| | 1,760,000 | | | Carrier Global Corp. | | | 5.80% | | | | 11/30/2025 | | | | 1,772,340 | |
| | 2,370,000 | | | Charles Schwab Corp. (Secured Overnight Financing Rate + 1.05%) | | | 6.40% | | | | 03/03/2027 | | | | 2,377,980 | |
| | 1,505,000 | | | Charter Communications Operating LLC / Charter Communications Operating Capital | | | 6.15% | | | | 11/10/2026 | | | | 1,517,154 | |
| | 5,587,000 | | | Citigroup, Inc. (CME Term SOFR 3 Month + 1.16%) | | | 3.35% | | | | 04/24/2025 | | | | 5,577,810 | |
| | 3,150,000 | | | Citigroup, Inc. (US Secured Overnight Financing Rate + 1.53%) | | | 3.29% | | | | 03/17/2026 | | | | 3,079,122 | |
| | 2,665,000 | | | Constellation Brands, Inc. | | | 3.60% | | | | 05/09/2024 | | | | 2,658,733 | |
| | 2,570,000 | | | Crown Castle, Inc. | | | 4.80% | | | | 09/01/2028 | | | | 2,521,251 | |
| | 2,705,000 | | | CVS Health Corp. | | | 5.00% | | | | 02/20/2026 | | | | 2,696,799 | |
| | 2,425,000 | | | Dell International LLC / EMC Corp. | | | 4.00% | | | | 07/15/2024 | | | | 2,413,131 | |
| | 2,635,000 | | | Dell International LLC / EMC Corp. | | | 5.85% | | | | 07/15/2025 | | | | 2,648,944 | |
| | 2,645,000 | | | Dollar General Corp. | | | 4.15% | | | | 11/01/2025 | | | | 2,595,565 | |
| | 4,620,000 | | | Dollar Tree, Inc. | | | 4.00% | | | | 05/15/2025 | | | | 4,543,167 | |
| | 7,664,000 | | | Elevance Health, Inc. | | | 3.50% | | | | 08/15/2024 | | | | 7,603,180 | |
| | 2,770,000 | | | Eli Lilly & Co. | | | 5.00% | | | | 02/27/2026 | | | | 2,767,241 | |
| | 5,115,000 | | | Energy Transfer LP | | | 6.05% | | | | 12/01/2026 | | | | 5,219,115 | |
| | 5,415,000 | | | Entergy Corp. | | | 0.90% | | | | 09/15/2025 | | | | 5,077,950 | |
| | 5,430,000 | | | Equinix, Inc. | | | 1.25% | | | | 07/15/2025 | | | | 5,138,379 | |
| | 2,525,000 | | | Exelon Corp. | | | 5.15% | | | | 03/15/2029 | | | | 2,531,779 | |
| | 5,060,000 | | | Expedia Group, Inc. | | | 6.25% | (a) | | | 05/01/2025 | | | | 5,083,037 | |
| | 5,385,000 | | | Ford Motor Co. | | | 4.35% | | | | 12/08/2026 | | | | 5,244,440 | |
| | 2,690,000 | | | General Mills, Inc. | | | 4.00% | | | | 04/17/2025 | | | | 2,651,490 | |
| | 2,020,000 | | | General Mills, Inc. | | | 5.24% | | | | 11/18/2025 | | | | 2,014,439 | |
| | 5,035,000 | | | General Motors Financial Co., Inc. | | | 4.00% | | | | 01/15/2025 | | | | 4,969,456 | |
| | 5,225,000 | | | General Motors Financial Co., Inc. | | | 5.25% | | | | 03/01/2026 | | | | 5,211,235 | |
| | 2,475,000 | | | Georgia Power Co. | | | 5.00% | | | | 02/23/2027 | | | | 2,479,182 | |
| | 2,690,000 | | | Gilead Sciences, Inc. | | | 3.65% | | | | 03/01/2026 | | | | 2,622,172 | |
| | 3,210,000 | | | Goldman Sachs Bank USA/New York NY (US Secured Overnight Financing Rate + 0.77%) | | | 6.12% | | | | 03/18/2027 | | | | 3,210,027 | |
| | 5,080,000 | | | HCA, Inc. | | | 5.38% | | | | 02/01/2025 | | | | 5,066,509 | |
| | 3,760,000 | | | Hewlett Packard Enterprise Co. | | | 5.90% | | | | 10/01/2024 | | | | 3,766,243 | |
| | 4,205,000 | | | Hyatt Hotels Corp. | | | 5.75% | | | | 01/30/2027 | | | | 4,271,845 | |
| | 5,245,000 | | | Hyundai Capital America | | | 1.00% | (a) | | | 09/17/2024 | | | | 5,131,920 | |
| | 2,515,000 | | | Hyundai Capital America | | | 5.30% | (a) | | | 03/19/2027 | | | | 2,516,102 | |
| | 2,490,000 | | | Intuit, Inc. | | | 5.25% | | | | 09/15/2026 | | | | 2,513,868 | |
| | 2,087,000 | | | JPMorgan Chase & Co. (CME Term SOFR 3 Month + 0.54%) | | | 0.82% | | | | 06/01/2025 | | | | 2,069,004 | |
| | 1,642,000 | | | JPMorgan Chase & Co. (CME Term SOFR 3 Month + 0.58%) | | | 0.97% | | | | 06/23/2025 | | | | 1,623,015 | |
| | 5,254,000 | | | JPMorgan Chase & Co. | | | 3.90% | | | | 07/15/2025 | | | | 5,169,073 | |
| | 4,308,000 | | | JPMorgan Chase & Co. (US Secured Overnight Financing Rate + 0.49%) | | | 0.77% | | | | 08/09/2025 | | | | 4,227,032 | |
| | 2,706,000 | | | Kinder Morgan, Inc. | | | 4.30% | | | | 06/01/2025 | | | | 2,668,324 | |
| | 2,505,000 | | | Kinder Morgan, Inc. | | | 5.00% | | | | 02/01/2029 | | | | 2,496,250 | |
| | 1,535,000 | | | Lowe’s Cos., Inc. | | | 4.40% | | | | 09/08/2025 | | | | 1,516,668 | |
| | 5,030,000 | | | Marriott International, Inc./MD | | | 3.60% | | | | 04/15/2024 | | | | 5,025,278 | |
| | 2,574,000 | | | McDonald’s Corp. | | | 3.38% | | | | 05/26/2025 | | | | 2,520,003 | |
| | | | |
| 58 | | DoubleLine Funds Trust | | The accompanying notes are an integral part of these financial statements. |
| | | | | | | | | | | | | | | | |
PRINCIPAL
AMOUNT $ | | | SECURITY DESCRIPTION | | RATE | | | MATURITY | | | VALUE $ | |
| | | | |
| | 2,850,000 | | | McDonald’s Corp. | | | 1.45% | | | | 09/01/2025 | | | | 2,705,546 | |
| | 2,705,000 | | | McKesson Corp. | | | 5.25% | | | | 02/15/2026 | | | | 2,698,583 | |
| | 1,645,000 | | | Meta Platforms, Inc. | | | 4.60% | | | | 05/15/2028 | | | | 1,644,866 | |
| | 4,494,000 | | | Microchip Technology, Inc. | | | 0.98% | | | | 09/01/2024 | | | | 4,403,279 | |
| | 675,000 | | | Microchip Technology, Inc. | | | 4.25% | | | | 09/01/2025 | | | | 664,166 | |
| | 1,005,000 | | | Microchip Technology, Inc. | | | 5.05% | | | | 03/15/2029 | | | | 1,005,565 | |
| | 5,135,000 | | | Morgan Stanley (US Secured Overnight Financing Rate + 0.53%) | | | 0.79% | | | | 05/30/2025 | | | | 5,087,624 | |
| | 5,140,000 | | | Morgan Stanley | | | 3.88% | | | | 01/27/2026 | | | | 5,022,775 | |
| | 5,075,000 | | | Motorola Solutions, Inc. | | | 5.00% | | | | 04/15/2029 | | | | 5,052,049 | |
| | 2,120,000 | | | New York Life Global Funding | | | 3.60% | (a) | | | 08/05/2025 | | | | 2,076,016 | |
| | 1,550,000 | | | NextEra Energy Capital Holdings, Inc. | | | 4.20% | | | | 06/20/2024 | | | | 1,544,749 | |
| | 950,000 | | | NextEra Energy Capital Holdings, Inc. | | | 4.26% | | | | 09/01/2024 | | | | 943,774 | |
| | 2,480,000 | | | NiSource, Inc. | | | 5.25% | | | | 03/30/2028 | | | | 2,498,285 | |
| | 3,954,000 | | | Northrop Grumman Corp. | | | 2.93% | | | | 01/15/2025 | | | | 3,881,182 | |
| | 5,140,000 | | | NVIDIA Corp. | | | 0.58% | | | | 06/14/2024 | | | | 5,089,268 | |
| | 3,835,000 | | | Omnicom Group, Inc. / Omnicom Capital, Inc. | | | 3.65% | | | | 11/01/2024 | | | | 3,788,681 | |
| | 5,037,000 | | | Oracle Corp. | | | 5.80% | | | | 11/10/2025 | | | | 5,080,448 | |
| | 2,405,000 | | | O’Reilly Automotive, Inc. | | | 5.75% | | | | 11/20/2026 | | | | 2,445,208 | |
| | 2,555,000 | | | Pacific Gas and Electric Co. | | | 4.95% | | | | 06/08/2025 | | | | 2,534,991 | |
| | 2,760,000 | | | Pacific Gas and Electric Co. | | | 2.10% | | | | 08/01/2027 | | | | 2,486,168 | |
| | 1,786,000 | | | Packaging Corp. of America | | | 3.65% | | | | 09/15/2024 | | | | 1,768,533 | |
| | 5,140,000 | | | Parker-Hannifin Corp. | | | 3.65% | | | | 06/15/2024 | | | | 5,117,911 | |
| | 4,581,000 | | | Penske Truck Leasing Co. LP / PTL Finance Corp. | | | 4.00% | (a) | | | 07/15/2025 | | | | 4,487,815 | |
| | 5,235,000 | | | Penske Truck Leasing Co. LP / PTL Finance Corp. | | | 4.40% | (a) | | | 07/01/2027 | | | | 5,099,108 | |
| | 1,505,000 | | | PepsiCo, Inc. (Secured Overnight Financing Rate + 0.40%) | | | 5.74% | | | | 11/12/2024 | | | | 1,507,018 | |
| | 995,000 | | | Pfizer Investment Enterprises Pte Ltd. | | | 4.65% | | | | 05/19/2025 | | | | 988,849 | |
| | 5,035,000 | | | Philip Morris International, Inc. | | | 4.88% | | | | 02/13/2026 | | | | 5,017,327 | |
| | 1,442,000 | | | Phillips 66 | | | 3.85% | | | | 04/09/2025 | | | | 1,420,467 | |
| | 1,260,000 | | | Phillips 66 | | | 1.30% | | | | 02/15/2026 | | | | 1,172,920 | |
| | 3,240,000 | | | PNC Financial Services Group, Inc. (US Secured Overnight Financing Rate + 1.32%) | | | 5.81% | | | | 06/12/2026 | | | | 3,251,770 | |
| | 3,698,000 | | | Public Service Enterprise Group, Inc. | | | 5.85% | | | | 11/15/2027 | | | | 3,789,106 | |
| | 5,220,000 | | | Republic Services, Inc. | | | 2.50% | | | | 08/15/2024 | | | | 5,158,824 | |
| | 5,635,000 | | | Royalty Pharma PLC | | | 1.75% | | | | 09/02/2027 | | | | 5,033,912 | |
| | 5,014,000 | | | Ryder System, Inc. | | | 5.25% | | | | 06/01/2028 | | | | 5,039,508 | |
| | 2,464,000 | | | Sabine Pass Liquefaction LLC | | | 5.63% | | | | 03/01/2025 | | | | 2,462,475 | |
| | 4,110,000 | | | Simon Property Group LP | | | 2.00% | | | | 09/13/2024 | | | | 4,045,596 | |
| | 3,475,000 | | | Solventum Corp. | | | 5.45% | (a) | | | 02/25/2027 | | | | 3,487,864 | |
| | 1,920,000 | | | Southern California Edison Co. (Secured Overnight Financing Rate + 0.83%) | | | 6.18% | | | | 04/01/2024 | | | | 1,920,000 | |
| | 1,655,000 | | | Southern California Edison Co. | | | 4.90% | | | | 06/01/2026 | | | | 1,647,250 | |
| | 2,665,000 | | | Southern Co. | | | 5.15% | | | | 10/06/2025 | | | | 2,661,475 | |
| | 3,480,000 | | | Stryker Corp. | | | 4.85% | | | | 12/08/2028 | | | | 3,482,777 | |
| | 5,093,000 | | | Synchrony Financial | | | 4.25% | | | | 08/15/2024 | | | | 5,060,711 | |
| | 4,995,000 | | | Take-Two Interactive Software, Inc. | | | 4.95% | | | | 03/28/2028 | | | | 4,977,767 | |
| | 2,410,000 | | | Truist Financial Corp. (US Secured Overnight Financing Rate + 0.40%) | | | 5.75% | | | | 06/09/2025 | | | | 2,404,469 | |
| | 5,007,000 | | | Union Pacific Corp. | | | 4.75% | | | | 02/21/2026 | | | | 5,003,121 | |
| | 1,420,000 | | | UnitedHealth Group, Inc. | | | 0.55% | | | | 05/15/2024 | | | | 1,411,676 | |
| | 2,680,000 | | | Veralto Corp. | | | 5.50% | (a) | | | 09/18/2026 | | | | 2,691,432 | |
| | 2,695,000 | | | Viatris, Inc. | | | 1.65% | | | | 06/22/2025 | | | | 2,563,603 | |
| | 5,260,000 | | | VICI Properties LP / VICI Note Co., Inc. | | | 4.25% | (a) | | | 12/01/2026 | | | | 5,061,001 | |
| | 2,525,000 | | | WEC Energy Group, Inc. | | | 4.75% | | | | 01/09/2026 | | | | 2,502,782 | |
| | | | | | | | | | | | | | | | |
PRINCIPAL
AMOUNT $ | | | SECURITY DESCRIPTION | | RATE | | | MATURITY | | | VALUE $ | |
| | | | |
| | 9,275,000 | | | Wells Fargo & Co. (CME Term SOFR 3 Month + 1.09%) | | | 2.41% | | | | 10/30/2025 | | | | 9,099,585 | |
| | 5,153,000 | | | Welltower OP LLC | | | 4.00% | | | | 06/01/2025 | | | | 5,066,893 | |
| | 2,765,000 | | | Workday, Inc. | | | 3.50% | | | | 04/01/2027 | | | | 2,648,336 | |
| | 5,260,000 | | | Zimmer Biomet Holdings, Inc. | | | 1.45% | | | | 11/22/2024 | | | | 5,120,019 | |
| | | | | | | | | | | | | | | | |
| | | | Total US Corporate Bonds (Cost $397,880,592) | | | | 395,516,698 | |
| | | | | | | | | | | | | | | | |
| US GOVERNMENT AND AGENCY MORTGAGE BACKED
OBLIGATIONS 2.6% |
|
| |
| | | | Federal Home Loan Mortgage Corp. | |
| | 455,070 | | | Pool 840632 (Refinitiv USD IBOR Consumer Cash Fallbacks Term 1 Year + 1.62%, 1.62% Floor, 7.67% Cap) | | | 5.55% | | | | 05/01/2045 | | | | 464,088 | |
| | 104,437 | | | Pool N70081 | | | 5.50% | | | | 07/01/2038 | | | | 102,405 | |
| | 14,197,100 | | | Pool SC0321 | | | 3.50% | | | | 10/01/2042 | | | | 13,023,948 | |
| | 3,828,236 | | | Series 276-F5 (US 30 Day Average Secured Overnight Financing Rate + 0.61%, 0.50% Floor, 6.50% Cap) | | | 5.93% | | | | 09/15/2042 | | | | 3,801,139 | |
| | 2,489,476 | | | Series 339-F5 (US 30 Day Average Secured Overnight Financing Rate + 0.56%, 0.45% Floor, 6.50% Cap) | | | 5.88% | | | | 11/15/2044 | | | | 2,449,761 | |
| | 10,980 | | | Series 3872-BA | | | 4.00% | | | | 06/15/2041 | | | | 10,566 | |
| | 4,522,912 | | | Series 4068-UF (US 30 Day Average Secured Overnight Financing Rate + 0.61%, 0.50% Floor, 6.50% Cap) | | | 5.93% | | | | 06/15/2042 | | | | 4,462,351 | |
| | 348,911 | | | Series 4203-NB | | | 2.00% | | | | 10/15/2040 | | | | 339,066 | |
| | 4,713,448 | | | Series 4211-AP | | | 1.60% | | | | 03/15/2043 | | | | 4,321,736 | |
| | 2,379,038 | | | Series 4484-CD | | | 1.75% | | | | 07/15/2030 | | | | 2,221,785 | |
| | 7,129,840 | | | Series 4631-FA (US 30 Day Average Secured Overnight Financing Rate + 0.61%, 0.50% Floor, 6.50% Cap) | | | 5.93% | | | | 11/15/2046 | | | | 7,005,540 | |
| | 2,786,743 | | | Series 4851-PF (US 30 Day Average Secured Overnight Financing Rate + 0.51%, 0.40% Floor, 6.50% Cap) | | | 5.83% | | | | 08/15/2057 | | | | 2,700,342 | |
| | 2,681,546 | | | Series 4878-FA (US 30 Day Average Secured Overnight Financing Rate + 0.51%, 0.40% Floor, 6.50% Cap) | | | 5.83% | | | | 05/15/2049 | | | | 2,635,909 | |
| | 1,975,703 | | | Series 4939-CF (US 30 Day Average Secured Overnight Financing Rate + 0.61%, 0.50% Floor, 6.50% Cap) | | | 5.93% | | | | 12/25/2049 | | | | 1,944,574 | |
| | 3,959,231 | | | Series 4987-BF (US 30 Day Average Secured Overnight Financing Rate + 0.51%, 0.40% Floor, 6.50% Cap) | | | 5.83% | | | | 06/25/2050 | | | | 3,886,785 | |
| |
| | | | Federal National Mortgage Association | |
| | 17,723 | | | Pool AB3850 | | | 4.00% | | | | 11/01/2041 | | | | 16,612 | |
| | 794,060 | | | Pool AL2987 (Refinitiv USD IBOR Consumer Cash Fallbacks Term 1 Year + 1.62%, 1.62% Floor, 7.31% Cap) | | | 5.87% | | | | 11/01/2042 | | | | 811,497 | |
| | 241,577 | | | Pool AL4292 | | | 4.50% | | | | 04/01/2026 | | | | 238,746 | |
| | | | | | | | |
| The accompanying notes are an integral part of these financial statements. | | Annual Report | | | | | March 31, 2024 | | 59 |
| | |
Schedule of Investments DoubleLine Low Duration Bond Fund (Cont.) | | |
| | | | | | | | | | | | | | | | |
PRINCIPAL
AMOUNT $ | | | SECURITY DESCRIPTION | | RATE | | | MATURITY | | | VALUE $ | |
| |
| | | | Federal National Mortgage Association (Cont.) | |
| | 739,336 | | | Pool BM3520 (Refinitiv USD IBOR Consumer Cash Fallbacks Term 1 Year + 1.56%, 1.56% Floor, 7.00% Cap) | | | 5.51% | | | | 05/01/2045 | | | | 749,481 | |
| | 3,000,000 | | | Pool BS7662 | | | 4.90% | | | | 03/01/2028 | | | | 2,994,029 | |
| | 4,168,266 | | | Pool MA5112 | | | 5.00% | | | | 08/01/2043 | | | | 4,131,830 | |
| | 2,530,235 | | | Series 2010-57-FA (US 30 Day Average Secured Overnight Financing Rate + 0.66%, 0.55% Floor, 7.00% Cap) | | | 5.98% | | | | 06/25/2040 | | | | 2,521,687 | |
| | 2,537,195 | | | Series 2010-68-FJ (US 30 Day Average Secured Overnight Financing Rate + 0.56%, 0.45% Floor, 7.00% Cap) | | | 5.88% | | | | 07/25/2040 | | | | 2,520,671 | |
| | 1,002,383 | | | Series 2011-134-FT (US 30 Day Average Secured Overnight Financing Rate + 0.61%, 0.50% Floor, 6.50% Cap) | | | 5.93% | | | | 12/25/2041 | | | | 990,126 | |
| | 39,467 | | | Series 2011-64-DB | | | 4.00% | | | | 07/25/2041 | | | | 37,968 | |
| | 1,897,681 | | | Series 2016-62-FB (US 30 Day Average Secured Overnight Financing Rate + 0.51%, 0.40% Floor, 6.50% Cap) | | | 5.83% | | | | 09/25/2046 | | | | 1,877,665 | |
| | 3,976,776 | | | Series 2016-84-FT (US 30 Day Average Secured Overnight Financing Rate + 0.61%, 0.50% Floor, 6.50% Cap) | | | 5.93% | | | | 11/25/2046 | | | | 3,934,853 | |
| | 7,559,258 | | | Series 2018-72-FB (US 30 Day Average Secured Overnight Financing Rate + 0.46%, 0.35% Floor, 6.50% Cap) | | | 5.78% | | | | 10/25/2058 | | | | 7,352,551 | |
| | 2,888,588 | | | Series 2018-85-FE (US 30 Day Average Secured Overnight Financing Rate + 0.41%, 0.30% Floor, 6.50% Cap) | | | 5.73% | | | | 12/25/2048 | | | | 2,833,291 | |
| | 1,062,658 | | | Series 2019-14-FA (US 30 Day Average Secured Overnight Financing Rate + 0.51%, 0.40% Floor, 6.50% Cap) | | | 5.83% | | | | 04/25/2049 | | | | 1,053,632 | |
| | 11,200,462 | | | Series 2019-43-FD (US 30 Day Average Secured Overnight Financing Rate + 0.51%, 0.40% Floor, 6.50% Cap) | | | 5.83% | | | | 08/25/2049 | | | | 10,986,929 | |
| | 4,713,356 | | | Series 2019-49-FB (US 30 Day Average Secured Overnight Financing Rate + 0.59%, 0.48% Floor, 6.50% Cap) | | | 5.91% | | | | 09/25/2049 | | | | 4,651,403 | |
| | 2,230,997 | | | Series 2019-M21-3A1 | | | 2.10% | | | | 06/25/2034 | | | | 2,102,660 | |
| | 11,704,121 | | | Series 2020-M49-1A1 | | | 1.26% | (b) | | | 11/25/2030 | | | | 10,454,245 | |
| | 9,209,597 | | | Series 2021-21-HG | | | 2.00% | | | | 11/25/2047 | | | | 8,043,004 | |
| | 15,792,501 | | | Series 2021-M7-A1 | | | 1.73% | (b) | | | 03/25/2031 | | | | 14,182,588 | |
| |
| | | | Government National Mortgage Association | |
| | 4,031,878 | | | Series 2013-116-WU | | | 3.00% | | | | 12/20/2042 | | | | 3,890,365 | |
| | 3,798,101 | | | Series 2016-16-DF (CME Term SOFR 1 Month + 0.41%, 0.30% Floor, 6.50% Cap) | | | 5.74% | | | | 02/16/2046 | | | | 3,738,302 | |
| | 4,914,861 | | | Series 2022-183-B | | | 5.00% | | | | 04/20/2047 | | | | 4,877,068 | |
| | | | | | | | | | | | | | | | |
PRINCIPAL
AMOUNT $/
SHARES | | | SECURITY DESCRIPTION | | RATE | | | MATURITY | | | VALUE $ | |
| |
| | | | Government National Mortgage Association (Cont.) | |
| | 4,161,236 | | | Series 2024-25-AF (US 30 Day Average Secured Overnight Financing Rate + 0.51%, 0.51% Floor, 6.50% Cap) | | | 5.83% | | | | 02/20/2049 | | | | 4,077,739 | |
| | | | | | | | | | | | | | | | |
| | | | Total US Government and Agency Mortgage Backed Obligations (Cost $153,873,906) | | | | 148,438,937 | |
| | | | | | | | | | | | | | | | |
| | US GOVERNMENT AND AGENCY OBLIGATIONS 23.2% | |
| | 123,700,000 | | | United States Treasury Note/Bond | | | 4.00% | | | | 01/15/2027 | | | | 122,235,894 | |
| | 165,900,000 | | | United States Treasury Note/Bond | | | 4.25% | | | | 01/31/2026 | | | | 164,610,386 | |
| | 137,200,000 | | | United States Treasury Note/Bond | | | 4.25% | | | | 05/31/2025 | | | | 136,098,649 | |
| | 73,700,000 | | | United States Treasury Note/Bond | | | 4.63% | | | | 06/30/2025 | | | | 73,443,778 | |
| | 53,700,000 | | | United States Treasury Note/Bond | | | 4.63% | | | | 11/15/2026 | | | | 53,882,496 | |
| | 112,000,000 | | | United States Treasury Note/Bond | | | 4.13% | | | | 02/15/2027 | | | | 111,068,125 | |
| | 176,000,000 | | | United States Treasury Note/Bond | | | 4.88% | | | | 11/30/2025 | | | | 176,281,875 | |
| | 192,900,000 | | | United States Treasury Note/Bond | | | 4.25% | | | | 12/31/2025 | | | | 191,332,689 | |
| | 108,500,000 | | | United States Treasury Note/Bond | | | 4.38% | | | | 12/15/2026 | | | | 108,249,941 | |
| | 181,200,000 | | | United States Treasury Note/Bond | | | 4.63% | | | | 02/28/2026 | | | | 181,065,515 | |
| | | | | | | | | | | | | | | | |
| | | | Total US Government and Agency Obligations (Cost $1,324,565,131) | | | | 1,318,269,348 | |
| | | | | | | | | |
| | SHORT TERM INVESTMENTS 4.0% | |
| | 55,661,756 | | | First American Government Obligations Fund - U | | | 5.26% | (h) | | | | | | | 55,661,756 | |
| | 55,661,756 | | | JPMorgan US Government Money Market Fund - IM | | | 5.25% | (h) | | | | | | | 55,661,756 | |
| | 55,661,756 | | | MSILF Government Portfolio - Institutional | | | 5.22% | (h) | | | | | | | 55,661,756 | |
| | 56,400,000 | | | United States Treasury Bill | | | 0.00% | | | | 05/16/2024 | | | | 56,031,716 | |
| | | | | | | | | | | | | | | | |
| | | | Total Short Term Investments (Cost $223,030,348) | | | | 223,016,984 | |
| | | | | | | | | | | | | | | | |
| | | | Total Investments 99.4% (Cost $5,803,843,046) | | | | 5,622,779,375 | |
| | | | Other Assets in Excess of Liabilities 0.6% | | | | 33,419,545 | |
| | | | | | | | | | | | | | | | |
| | | | NET ASSETS 100.0% | | | $ | 5,656,198,920 | |
| | | | | | | | | | | | | | | | |
| | | | |
| 60 | | DoubleLine Funds Trust | | The accompanying notes are an integral part of these financial statements. |
| | | | | |
| SECURITY TYPE BREAKDOWN as a % of Net Assets: | |
US Government and Agency Obligations | | | | 23.2% | |
Non-Agency Commercial Mortgage Backed Obligations | | | | 14.2% | |
Collateralized Loan Obligations | | | | 13.9% | |
Non-Agency Residential Collateralized Mortgage Obligations | | | | 13.0% | |
Foreign Corporate Bonds | | | | 8.7% | |
Asset Backed Obligations | | | | 7.5% | |
US Corporate Bonds | | | | 7.0% | |
Short Term Investments | | | | 4.0% | |
Bank Loans | | | | 3.5% | |
US Government and Agency Mortgage Backed Obligations | | | | 2.6% | |
Foreign Government Bonds, Foreign Agencies and Foreign Government Sponsored Corporations | | | | 1.8% | |
Other Assets and Liabilities | | | | 0.6% | |
| | | | | |
Net Assets | | | | 100.0% | |
| | | | | |
| | | | | |
| INVESTMENT BREAKDOWN as a % of Net Assets: | | | | | |
US Government and Agency Obligations | | | | 23.2% | |
Non-Agency Commercial Mortgage Backed Obligations | | | | 14.2% | |
Collateralized Loan Obligations | | | | 13.9% | |
Non-Agency Residential Collateralized Mortgage Obligations | | | | 13.0% | |
Asset Backed Obligations | | | | 7.5% | |
Banking | | | | 4.2% | |
Short Term Investments | | | | 4.0% | |
US Government and Agency Mortgage Backed Obligations | | | | 2.6% | |
Utilities | | | | 2.5% | |
Energy | | | | 1.4% | |
Transportation | | | | 1.2% | |
Healthcare | | | | 1.0% | |
Mining | | | | 1.0% | |
Technology | | | | 0.9% | |
Hotels/Motels/Inns and Casinos | | | | 0.8% | |
Automotive | | | | 0.7% | |
Pharmaceuticals | | | | 0.6% | |
Foreign Government Bonds, Foreign Agencies and Foreign Government Sponsored Corporations | | | | 0.5% | |
Telecommunications | | | | 0.5% | |
Chemicals/Plastics | | | | 0.5% | |
Electronics/Electric | | | | 0.4% | |
Consumer Products | | | | 0.4% | |
Media | | | | 0.4% | |
Finance | | | | 0.4% | |
Food Products | | | | 0.4% | |
Chemical Products | | | | 0.3% | |
Building and Development (including Steel/Metals) | | | | 0.3% | |
Real Estate | | | | 0.3% | |
Insurance | | | | 0.3% | |
Commercial Services | | | | 0.3% | |
Containers and Glass Products | | | | 0.3% | |
Aerospace & Defense | | | | 0.2% | |
Retailers (other than Food/Drug) | | | | 0.2% | |
Beverage and Tobacco | | | | 0.2% | |
Food Service | | | | 0.2% | |
Diversified Manufacturing | | | | 0.1% | |
Business Equipment and Services | | | | 0.1% | |
Environmental Control | | | | 0.1% | |
Pulp & Paper | | | | 0.1% | |
Construction | | | | 0.1% | |
Industrial Equipment | | | | 0.1% | |
Other Assets and Liabilities | | | | 0.6% | |
| | | | | |
Net Assets | | | | 100.0% | |
| | | | | |
| (a) | Security exempt from registration under Rule 144A of the Securities Act of 1933. These securities may be resold in transactions exempt from registration to qualified institutional buyers. |
| (b) | Coupon rate is variable based on the weighted average coupon of the underlying collateral. To the extent the weighted average coupon of the underlying assets which comprise the collateral increases or decreases, the coupon rate of this security will increase or decrease correspondingly. The rate disclosed is as of period end. |
| (c) | Value determined using significant unobservable inputs. |
| (d) | Coupon rate is variable or floats based on components including but not limited to reference rate and spread. These securities may not indicate a reference rate and/or spread in their description. The rate disclosed is as of period end. |
| (e) | Step Bond; Coupon rate changes based on a predetermined schedule or event. The interest rate shown is the rate in effect as of period end. |
| (f) | Securities referencing LIBOR are expected to transition to an alternative reference rate by the security’s next scheduled coupon reset date. |
| (g) | Interest only security |
| (h) | Seven-day yield as of period end. |
| | | | | | | | |
| The accompanying notes are an integral part of these financial statements. | | Annual Report | | | | | March 31, 2024 | | 61 |
| | |
Schedule of Investments DoubleLine Floating Rate Fund | | March 31, 2024 |
| | | | | | | | | | | | | | | | |
PRINCIPAL
AMOUNT $ | | | SECURITY DESCRIPTION | | RATE | | | MATURITY | | | VALUE $ | |
| | BANK LOANS 86.1% | |
| | |
| | AEROSPACE & DEFENSE 1.6% | |
| |
| | | | Dynasty Acquisition Co., Inc. | |
| | 826,565 | | | Senior Secured Term Loan (CME Term SOFR 1 Month + 3.50%) | | | 8.83% | | | | 08/24/2028 | | | | 828,710 | |
| |
| | | | Standard Aero Ltd. | |
| | 318,702 | | | Senior Secured First Lien Term Loan (1 Month US Secured Overnight Financing Rate + 3.50%) | | | 8.82% | | | | 08/24/2028 | | | | 319,529 | |
| |
| | | | TransDigm, Inc. | |
| | 1,796,425 | | | Senior Secured First Lien Term Loan (3 Month US Secured Overnight Financing Rate + 2.75%) | | | 8.06% | | | | 08/24/2028 | | | | 1,794,063 | |
| | | | | | | | | | | | | | | | |
| | | | | | | | | | | | | | | 2,942,302 | |
| | | | | | | | | | | | | | | | |
| | AUTOMOTIVE 0.8% | |
| |
| | | | Clarios Global LP | |
| | 1,007,475 | | | Senior Secured First Lien Term Loan (1 Month US Secured Overnight Financing Rate + 3.00%) | | | 8.33% | | | | 05/06/2030 | | | | 1,011,253 | |
| |
| | | | Dexko Global, Inc. | |
| | 342,074 | | | Senior Secured First Lien Term Loan (3 Month US Secured Overnight Financing Rate + 4.01%, 0.50% Floor) | | | 9.32% | | | | 10/04/2028 | | | | 339,294 | |
| | | | | | | | | | | | | | | | |
| | | | | | | | | | | | | | | 1,350,547 | |
| | | | | | | | | | | | | | | | |
| | BEVERAGE AND TOBACCO 0.6% | |
| |
| | | | Triton Water Holdings, Inc. | |
| | 1,153,896 | | | Senior Secured First Lien Term Loan (3 Month US Secured Overnight Financing Rate + 3.51%, 0.50% Floor) | | | 8.86% | | | | 03/31/2028 | | | | 1,143,229 | |
| | | | | | | | | | | | | | | | |
| | BUILDING AND DEVELOPMENT (INCLUDING STEEL/METALS) 0.8% | |
| |
| | | | Cornerstone Building Brands, Inc. | |
| | 415,714 | | | Senior Secured First Lien Term Loan (1 Month US Secured Overnight Financing Rate + 3.35%, 0.50% Floor) | | | 8.68% | | | | 04/12/2028 | | | | 414,299 | |
| |
| | | | LBM Acquisition LLC | |
| | 783,463 | | | Senior Secured First Lien Term Loan (1 Month US Secured Overnight Financing Rate + 3.85%, 0.75% Floor) | | | 9.18% | | | | 12/20/2027 | | | | 782,977 | |
| |
| | | | MIWD Holdco II LLC | |
| | 160,000 | | | Senior Secured Term Loan (CME Term SOFR 1 Month + 3.50%) | | | 8.83% | | | | 03/28/2031 | | | | 160,950 | |
| | | | | | | | | | | | | | | | |
| | | | | | | | | | | | | | | 1,358,226 | |
| | | | | | | | | | | | | | | | |
| | BUSINESS EQUIPMENT AND SERVICES 3.4% | |
| |
| | | | Camelot US Acquisition LLC | |
| | 14,027 | | | Senior Secured First Lien Term Loan (1 Month US Secured Overnight Financing Rate + 2.75%) | | | 8.08% | | | | 01/31/2031 | | | | 14,038 | |
| | 165,028 | | | Senior Secured First Lien Term Loan (1 Month US Secured Overnight Financing Rate + 2.75%) | | | 8.08% | | | | 01/31/2031 | | | | 165,152 | |
| | | | | | | | | | | | | | | | |
PRINCIPAL
AMOUNT $ | | | SECURITY DESCRIPTION | | RATE | | | MATURITY | | | VALUE $ | |
| |
| | | | Camelot US Acquisition LLC (Cont.) | |
| | 707,971 | | | Senior Secured First Lien Term Loan (1 Month US Secured Overnight Financing Rate + 2.75%) | | | 8.08% | | | | 01/31/2031 | | | | 708,502 | |
| |
| | | | CoreLogic, Inc. | |
| | 1,008,131 | | | Senior Secured First Lien Term Loan (1 Month US Secured Overnight Financing Rate + 3.61%, 0.50% Floor) | | | 8.94% | | | | 06/02/2028 | | | | 988,206 | |
| |
| | | | Deerfield Dakota Holding LLC | |
| | 1,003,072 | | | Senior Secured First Lien Term Loan (3 Month US Secured Overnight Financing Rate + 3.75%, 1.00% Floor) | | | 9.06% | | | | 04/09/2027 | | | | 999,381 | |
| |
| | | | Dun & Bradstreet Corp. | |
| | 247,143 | | | Senior Secured First Lien Term Loan (1 Month US Secured Overnight Financing Rate + 2.75%) | | | 8.08% | | | | 01/18/2029 | | | | 247,375 | |
| |
| | | | EAB Global, Inc. | |
| | 765,215 | | | Senior Secured First Lien Term Loan (1 Month US Secured Overnight Financing Rate + 3.61%, 0.50% Floor) | | | 8.94% | | | | 08/16/2028 | | | | 766,554 | |
| |
| | | | Eisner Advisory Group LLC | |
| | 550,000 | | | Senior Secured First Lien Term Loan (1 Month US Secured Overnight Financing Rate + 4.00%, 0.50% Floor) | | | 9.33% | | | | 02/28/2031 | | | | 552,923 | |
| |
| | | | Element Materials Technology Group US Holdings, Inc. | |
| | 183,987 | | | Senior Secured First Lien Term Loan (3 Month US Secured Overnight Financing Rate + 4.35%, 0.50% Floor) | | | 9.66% | | | | 06/25/2029 | | | | 184,370 | |
| | 398,638 | | | Senior Secured First Lien Term Loan (3 Month US Secured Overnight Financing Rate + 4.35%, 0.50% Floor) | | | 9.66% | | | | 06/25/2029 | | | | 399,469 | |
| |
| | | | First Advantage Holdings LLC | |
| | 745,013 | | | Senior Secured First Lien Term Loan (1 Month US Secured Overnight Financing Rate + 2.86%) | | | 8.19% | | | | 01/29/2027 | | | | 745,247 | |
| |
| | | | VT Topco, Inc. | |
| | 294,263 | | | Senior Secured First Lien Term Loan (1 Month US Secured Overnight Financing Rate + 4.25%, 0.50% Floor) | | | 9.58% | | | | 08/12/2030 | | | | 295,419 | |
| | | | | | | | | | | | | | | | |
| | | | | | | | | | | | | | | 6,066,636 | |
| | | | | | | | | | | | | | | | |
| | CHEMICALS/PLASTICS 3.8% | |
| |
| | | | Charter Next Generation, Inc. | |
| | 680,000 | | | Senior Secured First Lien Term Loan (1 Month US Secured Overnight Financing Rate + 3.50%, 0.75% Floor) | | | 8.83% | | | | 12/01/2027 | | | | 682,009 | |
| |
| | | | Ecovyst Catalyst Technologies LLC | |
| | 464,294 | | | Senior Secured First Lien Term Loan (3 Month US Secured Overnight Financing Rate + 2.60%, 0.50% Floor) | | | 7.91% | | | | 06/09/2028 | | | | 464,656 | |
| | 1,207,164 | | | Senior Secured First Lien Term Loan (3 Month US Secured Overnight Financing Rate + 2.60%, 0.50% Floor) | | | 7.91% | | | | 06/09/2028 | | | | 1,208,106 | |
| |
| | | | Hexion Holdings Corp. | |
| | 701,223 | | | Senior Secured First Lien Term Loan (3 Month US Secured Overnight Financing Rate + 4.50%, 0.50% Floor) | | | 9.98% | | | | 03/15/2029 | | | | 691,459 | |
| | | | |
| 62 | | DoubleLine Funds Trust | | The accompanying notes are an integral part of these financial statements. |
| | | | | | | | | | | | | | | | |
PRINCIPAL
AMOUNT $ | | | SECURITY DESCRIPTION | | RATE | | | MATURITY | | | VALUE $ | |
| |
| | | | INEOS US Finance LLC | |
| | 896,857 | | | Senior Secured First Lien Term Loan (1 Month US Secured Overnight Financing Rate + 3.60%) | | | 8.93% | | | | 02/19/2030 | | | | 897,979 | |
| | 215,000 | | | Senior Secured First Lien Term Loan (1 Month US Secured Overnight Financing Rate + 3.75%) | | | 9.08% | | | | 01/31/2031 | | | | 215,538 | |
| |
| | | | INEOS US Petrochem LLC | |
| | 880,000 | | | Senior Secured Term Loan (CME Term SOFR 1 Month + 4.25%) | | | 9.68% | | | | 03/29/2029 | | | | 879,454 | |
| |
| | | | Nouryon USA LLC | |
| | 149,453 | | | Senior Secured First Lien Term Loan (3 Month US Secured Overnight Financing Rate + 4.10%) | | | 9.42% | | | | 04/03/2028 | | | | 150,106 | |
| | 575,756 | | | Senior Secured First Lien Term Loan (3 Month US Secured Overnight Financing Rate + 4.10%) | | | 9.42% | | | | 04/03/2028 | | | | 578,275 | |
| |
| | | | Olympus Water US Holding Corp. | |
| | 539,024 | | | Senior Secured First Lien Term Loan (CME Term SOFR 1 Month + 4.25%) | | | 9.57% | | | | 11/09/2028 | | | | 541,385 | |
| | 180,625 | | | Senior Secured First Lien Term Loan (3 Month US Secured Overnight Financing Rate + 4.01%, 0.50% Floor) | | | 9.32% | | | | 11/09/2028 | | | | 180,953 | |
| |
| | | | Polar US Borrower LLC | |
| | 124,196 | | | Senior Secured First Lien Term Loan (3 Month US Secured Overnight Financing Rate + 4.85%) | | | 10.16% | | | | 10/15/2025 | | | | 94,622 | |
| | 145,319 | | | Senior Secured First Lien Term Loan (3 Month US Secured Overnight Financing Rate + 4.85%) | | | 10.16% | | | | 10/15/2025 | | | | 110,716 | |
| |
| | | | Vantage Specialty Chemicals, Inc. | |
| | 128,375 | | | Senior Secured First Lien Term Loan (3 Month US Secured Overnight Financing Rate + 4.75%, 0.50% Floor) | | | 10.07% | | | | 10/26/2026 | | | | 127,171 | |
| | | | | | | | | | | | | | | | |
| | | | | | | | | | | | | | | 6,822,429 | |
| | | | | | | | | | | | | | | | |
| | COMMERCIAL SERVICES 3.3% | |
| |
| | | | Allied Universal Holdco LLC | |
| | 371,492 | | | Senior Secured First Lien Term Loan (1 Month US Secured Overnight Financing Rate + 3.85%, 0.50% Floor) | | | 9.18% | | | | 05/15/2028 | | | | 371,456 | |
| |
| | | | Ascend Learning LLC | |
| | 285,000 | | | Senior Secured Second Lien Term Loan (1 Month US Secured Overnight Financing Rate + 5.85%, 0.50% Floor) | | | 11.18% | | | | 12/10/2029 | | | | 282,240 | |
| | 432,466 | | | Senior Secured First Lien Term Loan (1 Month US Secured Overnight Financing Rate + 3.60%, 0.50% Floor) | | | 8.93% | | | | 12/10/2028 | | | | 430,630 | |
| | 418,879 | | | Senior Secured First Lien Term Loan (1 Month US Secured Overnight Financing Rate + 3.60%, 0.50% Floor) | | | 8.93% | | | | 12/10/2028 | | | | 417,101 | |
| | | | | | | | | | | | | | | | |
PRINCIPAL
AMOUNT $ | | | SECURITY DESCRIPTION | | RATE | | | MATURITY | | | VALUE $ | |
| |
| | | | Cengage Learning, Inc. | |
| | 395,000 | | | Senior Secured First Lien Term Loan (1 Month US Secured Overnight Financing Rate + 4.25%, 1.00% Floor) | | | 9.58% | | | | 03/24/2031 | | | | 395,061 | |
| |
| | | | Coherent Corp. T/L B (03/24) | |
| | 125,000 | | | Senior Secured Term Loan | | | 7.83% | (a) | | | 07/02/2029 | | | | 125,000 | |
| |
| | | | Flame Newco LLC | |
| | 7,996 | | | Senior Secured First Lien Term Loan (1 Month US Secured Overnight Financing Rate + 2.10%, 1.00% Floor) | | | 7.43% | | | | 06/30/2028 | | | | 7,536 | |
| | 259,722 | | | Senior Secured First Lien Term Loan (1 Month US Secured Overnight Financing Rate + 2.10%, 1.00% Floor) | | | 7.43% | | | | 06/30/2028 | | | | 244,788 | |
| |
| | | | Garda World Security Corp. | |
| | 1,029,476 | | | Senior Secured First Lien Term Loan (3 Month US Secured Overnight Financing Rate + 4.35%) | | | 9.58% | | | | 02/01/2029 | | | | 1,032,698 | |
| |
| | | | Mister Car Wash Holdings T/L (03/24) | |
| | 155,000 | | | Senior Secured Term Loan | | | 8.33% | (a) | | | 03/21/2031 | | | | 155,549 | |
| |
| | | | OMNIA Partners LLC | |
| | 438,900 | | | Senior Secured First Lien Term Loan (3 Month US Secured Overnight Financing Rate + 3.75%) | | | 9.07% | | | | 07/25/2030 | | | | 441,437 | |
| |
| | | | Packers Holdings LLC | |
| | 303,035 | | | Senior Secured First Lien Term Loan (1 Month US Secured Overnight Financing Rate + 3.35%, 0.75% Floor) | | | 8.68% | | | | 03/09/2028 | | | | 194,700 | |
| |
| | | | PECF USS Intermediate Holding III Corp. | |
| | 495,370 | | | Senior Secured First Lien Term Loan (3 Month US Secured Overnight Financing Rate + 4.51%, 0.50% Floor) | | | 9.82% | | | | 12/15/2028 | | | | 379,580 | |
| |
| | | | Vestis Corp. | |
| | 270,000 | | | Senior Secured First Lien Term Loan (3 Month US Secured Overnight Financing Rate + 2.25%) | | | 7.58% | | | | 02/24/2031 | | | | 270,338 | |
| |
| | | | Viad Corp. | |
| | 554,619 | | | Senior Secured First Lien Term Loan (1 Month US Secured Overnight Financing Rate + 5.11%, 0.50% Floor) | | | 10.44% | | | | 07/31/2028 | | | | 556,874 | |
| |
| | | | Wand NewCo 3, Inc. | |
| | 480,000 | | | Senior Secured First Lien Term Loan (1 Month US Secured Overnight Financing Rate + 3.75%) | | | 9.08% | | | | 01/30/2031 | | | | 481,913 | |
| | | | | | | | | | | | | | | | |
| | | | | | | | | | | | | | | 5,786,901 | |
| | | | | | | | | | | | | | | | |
| | CONSTRUCTION 1.5% | |
| |
| | | | Artera Services LLC | |
| | 660,000 | | | Senior Secured First Lien Term Loan (3 Month US Secured Overnight Financing Rate + 4.50%) | | | 9.81% | | | | 02/10/2031 | | | | 663,299 | |
| | | | | | | | |
| The accompanying notes are an integral part of these financial statements. | | Annual Report | | | | | March 31, 2024 | | 63 |
| | |
Schedule of Investments DoubleLine Floating Rate Fund (Cont.) | | |
| | | | | | | | | | | | | | | | |
PRINCIPAL
AMOUNT $ | | | SECURITY DESCRIPTION | | RATE | | | MATURITY | | | VALUE $ | |
| |
| | | | Brand Industrial Services, Inc. | |
| | 502,699 | | | Senior Secured First Lien Term Loan (3 Month US Secured Overnight Financing Rate + 5.50%, 0.50% Floor) | | | 10.81% | | | | 08/01/2030 | | | | 505,482 | |
| |
| | | | Quikrete Holdings, Inc. | |
| | 125,000 | | | Senior Secured Term Loan (CME Term SOFR 1 Month + 2.50%) | | | 7.94% | | | | 03/25/2031 | | | | 125,209 | |
| | 395,960 | | | Senior Secured First Lien Term Loan (1 Month US Secured Overnight Financing Rate + 2.86%) | | | 8.19% | | | | 03/19/2029 | | | | 396,613 | |
| |
| | | | Tamko Building Products LLC | |
| | 398,000 | | | Senior Secured First Lien Term Loan (3 Month US Secured Overnight Financing Rate + 3.50%) | | | 8.83% | | | | 09/20/2030 | | | | 398,498 | |
| |
| | | | Tecta America Corp. | |
| | 560,746 | | | Senior Secured First Lien Term Loan (1 Month US Secured Overnight Financing Rate + 4.11%, 0.75% Floor) | | | 9.44% | | | | 04/10/2028 | | | | 562,894 | |
| | | | | | | | | | | | | | | | |
| | | | | | | | | | | | | | | 2,651,995 | |
| | | | | | | | | | | | | | | | |
| | CONSUMER PRODUCTS 2.1% | |
| |
| | | | APX Group, Inc. | |
| | 612,563 | | | Senior Secured First Lien Term Loan (1 Month US Secured Overnight Financing Rate + 3.36%, 0.50% Floor) | | | 8.69% | | | | 07/10/2028 | | | | 614,789 | |
| | 1,687 | | | Senior Secured First Lien Term Loan (Prime Rate + 2.25%, 0.50% Floor) | | | 10.75% | | | | 07/10/2028 | | | | 1,693 | |
| |
| | | | Energizer Holdings, Inc. | |
| | 311,871 | | | Senior Secured First Lien Term Loan (1 Month US Secured Overnight Financing Rate + 2.36%, 0.50% Floor) | | | 7.69% | | | | 12/22/2027 | | | | 312,105 | |
| |
| | | | Hunter Douglas, Inc. | |
| | 618,964 | | | Senior Secured First Lien Term Loan (3 Month US Secured Overnight Financing Rate + 3.50%, 0.50% Floor) | | | 8.82% | | | | 02/26/2029 | | | | 612,920 | |
| | 227,276 | | | Senior Secured First Lien Term Loan (3 Month US Secured Overnight Financing Rate + 3.50%, 0.50% Floor) | | | 8.82% | | | | 02/26/2029 | | | | 225,056 | |
| |
| | | | Kronos Acquisition Holdings, Inc. | |
| | 514,127 | | | Senior Secured First Lien Term Loan (3 Month US Secured Overnight Financing Rate + 4.01%, 0.50% Floor) | | | 9.36% | | | | 12/22/2026 | | | | 515,381 | |
| | 219,176 | | | Senior Secured First Lien Term Loan (3 Month US Secured Overnight Financing Rate + 4.01%, 0.50% Floor) | | | 9.36% | | | | 12/22/2026 | | | | 219,711 | |
| |
| | | | RH | |
| | 482,637 | | | Senior Secured First Lien Term Loan (1 Month US Secured Overnight Financing Rate + 2.61%, 0.50% Floor) | | | 7.94% | | | | 10/20/2028 | | | | 471,665 | |
| | | | | | | | | | | | | | | | |
PRINCIPAL
AMOUNT $ | | | SECURITY DESCRIPTION | | RATE | | | MATURITY | | | VALUE $ | |
| |
| | | | SWF Holdings I Corp. | |
| | 798,272 | | | Senior Secured First Lien Term Loan (1 Month US Secured Overnight Financing Rate + 4.11%, 0.75% Floor) | | | 9.44% | | | | 10/06/2028 | | | | 736,737 | |
| | | | | | | | | | | | | | | | |
| | | | | | | | | | | | | | | 3,710,057 | |
| | | | | | | | | | | | | | | | |
| | CONTAINERS AND GLASS PRODUCTS 3.1% | |
| |
| | | | Clydesdale Acquisition Holdings, Inc. | |
| | 738,122 | | | Senior Secured First Lien Term Loan (1 Month US Secured Overnight Financing Rate + 3.78%, 0.50% Floor) | | | 9.11% | | | | 04/13/2029 | | | | 739,967 | |
| |
| | | | Graham Packaging Co., Inc. | |
| | 1,051,214 | | | Senior Secured First Lien Term Loan (1 Month US Secured Overnight Financing Rate + 3.11%, 0.75% Floor) | | | 8.44% | | | | 08/04/2027 | | | | 1,052,202 | |
| |
| | | | Kloeckner Pentaplast of America, Inc. | |
| | 267,928 | | | Senior Secured First Lien Term Loan (6 Month US Secured Overnight Financing Rate + 4.98%, 0.50% Floor) | | | 10.27% | | | | 02/09/2026 | | | | 252,857 | |
| |
| | | | Pregis TopCo LLC | |
| | 989,528 | | | Senior Secured First Lien Term Loan (1 Month US Secured Overnight Financing Rate + 3.75%) | | | 9.08% | | | | 07/31/2026 | | | | 992,175 | |
| |
| | | | Pretium PKG Holdings, Inc. | |
| | 174,026 | | | Senior Secured First Lien Term Loan (3 Month US Secured Overnight Financing Rate + 2.50%, 1.00% Floor) 2.50% PIK | | | 10.31% | | | | 10/02/2028 | | | | 176,746 | |
| | 386,326 | | | Senior Secured First Lien Term Loan (3 Month US Secured Overnight Financing Rate + 3.20%, 1.00% Floor) 1.40% PIK | | | 9.90% | | | | 10/02/2028 | | | | 347,210 | |
| | 1,477 | | | Senior Secured First Lien Term Loan (3 Month US Secured Overnight Financing Rate + 2.50%, 1.00% Floor) 2.50% PIK | | | 7.81% | | | | 10/02/2028 | | | | 1,500 | |
| | 155,000 | | | Senior Secured Second Lien Term Loan (3 Month US Secured Overnight Financing Rate + 7.01%, 0.50% Floor) | | | 12.33% | | | | 10/01/2029 | | | | 96,924 | |
| | 3,085 | | | Senior Secured First Lien Term Loan (3 Month US Secured Overnight Financing Rate + 3.20%, 1.00% Floor) 1.40% PIK | | | 8.50% | | | | 10/02/2028 | | | | 2,773 | |
| |
| | | | TricorBraun Holdings, Inc. | |
| | 793,878 | | | Senior Secured First Lien Term Loan (1 Month US Secured Overnight Financing Rate + 3.36%, 0.50% Floor) | | | 8.69% | | | | 03/03/2028 | | | | 785,974 | |
| |
| | | | Trident TPI Holdings, Inc. | |
| | 1,131,546 | | | Senior Secured First Lien Term Loan (3 Month US Secured Overnight Financing Rate + 4.26%, 0.50% Floor) | | | 9.57% | | | | 09/18/2028 | | | | 1,133,351 | |
| | | | | | | | | | | | | | | | |
| | | | | | | | | | | | | | | 5,581,679 | |
| | | | | | | | | | | | | | | | |
| | | | |
| 64 | | DoubleLine Funds Trust | | The accompanying notes are an integral part of these financial statements. |
| | | | | | | | | | | | | | | | |
PRINCIPAL
AMOUNT $ | | | SECURITY DESCRIPTION | | RATE | | | MATURITY | | | VALUE $ | |
| | ELECTRONICS/ELECTRIC 13.9% | |
| |
| | | | Access CIG LLC | |
| | 1,024,850 | | | Senior Secured First Lien Term Loan (1 Month US Secured Overnight Financing Rate + 5.00%, 0.50% Floor) | | | 10.33% | | | | 08/18/2028 | | | | 1,027,253 | |
| |
| | | | Applied Systems, Inc. | |
| | 235,000 | | | Senior Secured Second Lien Term Loan (3 Month US Secured Overnight Financing Rate + 5.25%) | | | 10.56% | | | | 02/23/2032 | | | | 243,740 | |
| | 650,000 | | | Senior Secured First Lien Term Loan (3 Month US Secured Overnight Financing Rate + 3.50%) | | | 8.81% | | | | 02/24/2031 | | | | 654,644 | |
| |
| | | | Astra Acquisition Corp. | |
| | 514,876 | | | Senior Secured Second Lien Term Loan (3 Month US Secured Overnight Financing Rate + 8.99%, 0.75% Floor) | | | 14.48% | | | | 10/25/2029 | | | | 159,290 | |
| | 747,411 | | | Senior Secured First Lien Term Loan (3 Month US Secured Overnight Financing Rate + 5.36%, 0.50% Floor) | | | 10.86% | | | | 10/25/2028 | | | | 316,716 | |
| |
| | | | Asurion LLC | |
| | 135,000 | | | Senior Secured Second Lien Term Loan (1 Month US Secured Overnight Financing Rate + 5.36%) | | | 10.69% | | | | 02/03/2028 | | | | 122,428 | |
| | 114,399 | | | Senior Secured First Lien Term Loan (1 Month US Secured Overnight Financing Rate + 4.35%) | | | 9.68% | | | | 08/19/2028 | | | | 110,681 | |
| | 697,666 | | | Senior Secured First Lien Term Loan (1 Month US Secured Overnight Financing Rate + 3.36%) | | | 8.69% | | | | 07/31/2027 | | | | 672,128 | |
| | 420,985 | | | Senior Secured First Lien Term Loan (1 Month US Secured Overnight Financing Rate + 3.36%) | | | 8.69% | | | | 12/23/2026 | | | | 413,466 | |
| | 500,000 | | | Senior Secured Second Lien Term Loan (1 Month US Secured Overnight Financing Rate + 5.36%) | | | 10.69% | | | | 01/20/2029 | | | | 449,728 | |
| |
| | | | Boost Newco Borrower LLC | |
| | 915,000 | | | Senior Secured First Lien Term Loan (3 Month US Secured Overnight Financing Rate + 3.00%) | | | 8.31% | | | | 01/31/2031 | | | | 919,387 | |
| |
| | | | Boxer Parent Co., Inc. | |
| | 1,266,825 | | | Senior Secured First Lien Term Loan (1 Month US Secured Overnight Financing Rate + 4.25%) | | | 9.58% | | | | 12/29/2028 | | | | 1,276,458 | |
| |
| | | | Castle US Holding Corp. | |
| | 240,725 | | | Senior Secured First Lien Term Loan (3 Month US Secured Overnight Financing Rate + 4.01%) | | | 9.35% | | | | 01/29/2027 | | | | 170,442 | |
| |
| | | | Central Parent, Inc. | |
| | 904,975 | | | Senior Secured First Lien Term Loan (3 Month US Secured Overnight Financing Rate + 4.00%) | | | 9.31% | | | | 07/06/2029 | | | | 908,694 | |
| |
| | | | Chariot Buyer LLC | |
| | 315,000 | | | Senior Secured First Lien Term Loan (1 Month US Secured Overnight Financing Rate + 3.75%, 0.50% Floor) | | | 9.08% | | | | 11/03/2028 | | | | 316,051 | |
| | | | | | | | | | | | | | | | |
PRINCIPAL
AMOUNT $ | | | SECURITY DESCRIPTION | | RATE | | | MATURITY | | | VALUE $ | |
| |
| | | | Conservice Midco LLC | |
| | 448,763 | | | Senior Secured First Lien Term Loan (1 Month US Secured Overnight Financing Rate + 4.00%) | | | 9.33% | | | | 05/13/2027 | | | | 450,802 | |
| |
| | | | Constant Contact, Inc. | |
| | 599,236 | | | Senior Secured First Lien Term Loan (3 Month US Secured Overnight Financing Rate + 4.26%, 0.75% Floor) | | | 9.59% | | | | 02/10/2028 | | | | 583,827 | |
| |
| | | | Cornerstone OnDemand, Inc. | |
| | 525,053 | | | Senior Secured First Lien Term Loan (1 Month US Secured Overnight Financing Rate + 4.01%, 0.50% Floor) | | | 9.19% | | | | 10/16/2028 | | | | 516,085 | |
| |
| | | | Cyxtera DC Holdings, Inc. | |
| | 288,397 | | | Senior Secured First Lien Term Loan (3 Month US Secured Overnight Financing Rate + 2.00%, 1.00% Floor) | | | 10.50% | (b) | | | 05/01/2024 | | | | 14,805 | |
| |
| | | | Dcert Buyer, Inc. | |
| | 285,000 | | | Senior Secured Second Lien Term Loan (1 Month US Secured Overnight Financing Rate + 7.00%) | | | 12.33% | | | | 02/16/2029 | | | | 258,837 | |
| | 677,161 | | | Senior Secured First Lien Term Loan (1 Month US Secured Overnight Financing Rate + 4.00%) | | | 9.33% | | | | 10/16/2026 | | | | 674,839 | |
| |
| | | | DG Investment Intermediate Holdings 2, Inc. | |
| | 378,056 | | | Senior Secured First Lien Term Loan (1 Month US Secured Overnight Financing Rate + 3.86%, 0.75% Floor) | | | 9.19% | | | | 03/31/2028 | | | | 378,461 | |
| | 150,000 | | | Senior Secured Second Lien Term Loan (1 Month US Secured Overnight Financing Rate + 6.86%, 0.75% Floor) | | | 12.19% | | | | 03/31/2029 | | | | 140,813 | |
| | 253,073 | | | Senior Secured First Lien Term Loan (1 Month US Secured Overnight Financing Rate + 4.75%, 0.75% Floor) | | | 10.08% | | | | 03/31/2028 | | | | 253,864 | |
| |
| | | | Ellucian Holdings, Inc. | |
| | 1,122,563 | | | Senior Secured First Lien Term Loan (1 Month US Secured Overnight Financing Rate + 3.60%, 0.50% Floor) | | | 8.93% | | | | 10/29/2029 | | | | 1,128,737 | |
| |
| | | | Gainwell Acquisition Corp. | |
| | 1,388,521 | | | Senior Secured First Lien Term Loan (3 Month US Secured Overnight Financing Rate + 4.10%, 0.75% Floor) | | | 9.41% | | | | 10/01/2027 | | | | 1,330,723 | |
| |
| | | | Genesys Cloud Services Holdings II T/L B | |
| | 673,396 | | | Senior Secured Term Loan | | | 0.00% | | | | 12/01/2027 | | | | 666,558 | |
| |
| | | | Helios Software Holdings, Inc. | |
| | 577,440 | | | Senior Secured First Lien Term Loan (3 Month US Secured Overnight Financing Rate + 3.75%) | | | 9.07% | | | | 07/15/2030 | | | | 573,473 | |
| |
| | | | Informatica LLC | |
| | 1,048,600 | | | Senior Secured First Lien Term Loan (1 Month US Secured Overnight Financing Rate + 2.86%) | | | 8.19% | | | | 10/30/2028 | | | | 1,050,697 | |
| | | | | | | | |
| The accompanying notes are an integral part of these financial statements. | | Annual Report | | | | | March 31, 2024 | | 65 |
| | |
Schedule of Investments DoubleLine Floating Rate Fund (Cont.) | | |
| | | | | | | | | | | | | | | | |
PRINCIPAL
AMOUNT $ | | | SECURITY DESCRIPTION | | RATE | | | MATURITY | | | VALUE $ | |
| |
| | | | ION Trading Finance Ltd. | |
| | 333,598 | | | Senior Secured First Lien Term Loan (3 Month US Secured Overnight Financing Rate + 4.85%) | | | 10.20% | | | | 04/03/2028 | | | | 333,598 | |
| |
| | | | Ivanti Software, Inc. | |
| | 313,184 | | | Senior Secured First Lien Term Loan (3 Month US Secured Overnight Financing Rate + 4.51%, 0.75% Floor) | | | 9.84% | | | | 12/01/2027 | | | | 294,001 | |
| |
| | | | McAfee Corp. | |
| | 766,365 | | | Senior Secured First Lien Term Loan (1 Month US Secured Overnight Financing Rate + 3.85%, 0.50% Floor) | | | 9.18% | | | | 03/01/2029 | | | | 766,740 | |
| |
| | | | Mirion Technologies US, Inc. | |
| | 656,965 | | | Senior Secured First Lien Term Loan (3 Month US Secured Overnight Financing Rate + 3.01%, 0.50% Floor) | | | 8.36% | | | | 10/20/2028 | | | | 659,428 | |
| |
| | | | Mitchell International, Inc. | |
| | 130,000 | | | Senior Secured Second Lien Term Loan (1 Month US Secured Overnight Financing Rate + 6.61%, 0.50% Floor) | | | 11.94% | | | | 10/15/2029 | | | | 130,081 | |
| | 816,035 | | | Senior Secured First Lien Term Loan (1 Month US Secured Overnight Financing Rate + 3.86%, 0.50% Floor) | | | 9.19% | | | | 10/15/2028 | | | | 817,292 | |
| |
| | | | Newfold Digital Holdings Group, Inc. | |
| | 790,152 | | | Senior Secured First Lien Term Loan (6 Month US Secured Overnight Financing Rate + 3.93%, 0.75% Floor) | | | 9.42% | | | | 02/10/2028 | | | | 772,966 | |
| |
| | | | Polaris Newco LLC | |
| | 553,182 | | | Senior Secured First Lien Term Loan (3 Month US Secured Overnight Financing Rate + 4.11%, 0.50% Floor) | | | 9.57% | | | | 06/05/2028 | | | | 548,472 | |
| |
| | | | Proofpoint, Inc. | |
| | 1,055,686 | | | Senior Secured First Lien Term Loan (1 Month US Secured Overnight Financing Rate + 3.36%, 0.50% Floor) | | | 8.69% | | | | 08/31/2028 | | | | 1,057,412 | |
| |
| | | | RealPage, Inc. | |
| | 1,040,169 | | | Senior Secured First Lien Term Loan (1 Month US Secured Overnight Financing Rate + 3.11%, 0.50% Floor) | | | 8.44% | | | | 04/24/2028 | | | | 1,013,369 | |
| |
| | | | Travelport Finance Luxembourg SARL | |
| | 97,804 | | | Senior Secured First Lien Term Loan (3 Month US Secured Overnight Financing Rate + 8.26%, 1.00% Floor) | | | 13.61% | | | | 09/29/2028 | | | | 91,581 | |
| | 338,888 | | | Senior Secured First Lien Term Loan (3 Month US Secured Overnight Financing Rate + 8.26%, 1.00% Floor) | | | 13.61% | | | | 09/29/2028 | | | | 317,328 | |
| | | | | | | | | | | | | | | | |
PRINCIPAL
AMOUNT $ | | | SECURITY DESCRIPTION | | RATE | | | MATURITY | | | VALUE $ | |
| |
| | | | UKG, Inc. | |
| | 150,690 | | | Senior Secured Second Lien Term Loan (3 Month US Secured Overnight Financing Rate + 5.35%, 0.50% Floor) | | | 10.68% | | | | 05/03/2027 | | | | 152,291 | |
| | 870,122 | | | Senior Secured First Lien Term Loan (3 Month US Secured Overnight Financing Rate + 3.50%) | | | 8.81% | | | | 02/10/2031 | | | | 875,695 | |
| |
| | | | Ultra Clean Holdings T/L (03/24) | |
| | 240,000 | | | Senior Secured Term Loan | | | 8.82% | (a) | | | 02/29/2028 | | | | 240,601 | |
| |
| | | | Ultra Clean Holdings, Inc. | |
| | 283,961 | | | Senior Secured First Lien Term Loan (1 Month US Secured Overnight Financing Rate + 3.86%) | | | 9.19% | | | | 08/27/2025 | | | | 284,673 | |
| |
| | | | Wec US Holdings Ltd. | |
| | 900,000 | | | Senior Secured First Lien Term Loan (1 Month US Secured Overnight Financing Rate + 2.75%) | | | 8.08% | | | | 01/27/2031 | | | | 900,000 | |
| | | | | | | | | | | | | | | | |
| | | | | | | | | | | | | | | 25,039,155 | |
| | | | | | | | | | | | | | | | |
| | ENERGY 2.9% | |
| |
| | | | BCP Renaissance Parent LLC | |
| | 527,442 | | | Senior Secured First Lien Term Loan (3 Month US Secured Overnight Financing Rate + 3.50%, 1.00% Floor) | | | 8.83% | | | | 10/31/2028 | | | | 529,586 | |
| |
| | | | Buckeye Partners LP | |
| | 415,000 | | | Senior Secured First Lien Term Loan (1 Month US Secured Overnight Financing Rate + 2.00%) | | | 7.33% | | | | 11/02/2026 | | | | 416,241 | |
| |
| | | | Compass Power Generation LLC | |
| | 912,417 | | | Senior Secured First Lien Term Loan (1 Month US Secured Overnight Financing Rate + 4.36%, 1.00% Floor) | | | 9.69% | | | | 04/14/2029 | | | | 919,132 | |
| |
| | | | Delek US Holdings, Inc. | |
| | 313,186 | | | Senior Secured First Lien Term Loan (1 Month US Secured Overnight Financing Rate + 3.60%, 0.50% Floor) | | | 8.93% | | | | 11/19/2029 | | | | 313,438 | |
| |
| | | | Freeport LNG Investments LLLP | |
| | 509,428 | | | Senior Secured First Lien Term Loan (3 Month US Secured Overnight Financing Rate + 3.76%, 0.50% Floor) | | | 9.08% | | | | 12/21/2028 | | | | 506,621 | |
| |
| | | | GIP II Blue Holding LP | |
| | 259,132 | | | Senior Secured First Lien Term Loan (1 Month US Secured Overnight Financing Rate + 4.61%, 1.00% Floor) | | | 9.94% | | | | 09/29/2028 | | | | 260,306 | |
| |
| | | | GIP Pilot Acquisition Partners LP | |
| | 350,000 | | | Senior Secured First Lien Term Loan (3 Month US Secured Overnight Financing Rate + 3.00%) | | | 8.33% | | | | 10/04/2030 | | | | 351,575 | |
| |
| | | | NRG Energy T/L B (03/24) | |
| | 420,000 | | | Senior Secured Term Loan | | | 7.33% | (a) | | | 03/27/2031 | | | | 419,740 | |
| | | | |
| 66 | | DoubleLine Funds Trust | | The accompanying notes are an integral part of these financial statements. |
| | | | | | | | | | | | | | | | |
PRINCIPAL
AMOUNT $ | | | SECURITY DESCRIPTION | | RATE | | | MATURITY | | | VALUE $ | |
| |
| | | | Oryx Midstream Services Permian Basin LLC | |
| | 728,175 | | | Senior Secured First Lien Term Loan (1 Month US Secured Overnight Financing Rate + 3.11%, 0.50% Floor) | | | 8.44% | | | | 10/05/2028 | | | | 731,754 | |
| |
| | | | Par Petroleum LLC | |
| | 237,600 | | | Senior Secured First Lien Term Loan (3 Month US Secured Overnight Financing Rate + 4.35%, 0.50% Floor) | | | 9.69% | | | | 02/28/2030 | | | | 238,268 | |
| |
| | | | Traverse Midstream Partners LLC | |
| | 248,027 | | | Senior Secured First Lien Term Loan (3 Month US Secured Overnight Financing Rate + 3.60%, 0.50% Floor) | | | 8.82% | | | | 02/16/2028 | | | | 248,957 | |
| |
| | | | WhiteWater DBR HoldCo LLC | |
| | 315,000 | | | Senior Secured First Lien Term Loan (1 Month US Secured Overnight Financing Rate + 2.75%) | | | 8.08% | | | | 03/03/2031 | | | | 315,918 | |
| | | | | | | | | | | | | | | | |
| | | | | | | | | | | | | | | 5,251,536 | |
| | | | | | | | | | | | | | | | |
| | FINANCE 2.9% | |
| |
| | | | Allspring Buyer LLC | |
| | 748,340 | | | Senior Secured First Lien Term Loan (3 Month US Secured Overnight Financing Rate + 3.51%, 0.50% Floor) | | | 8.89% | | | | 11/01/2028 | | | | 748,751 | |
| |
| | | | Edelman Financial Engines Center LLC/The | |
| | 675,400 | | | Senior Secured First Lien Term Loan (1 Month US Secured Overnight Financing Rate + 3.61%, 0.75% Floor) | | | 8.94% | | | | 04/07/2028 | | | | 676,309 | |
| | 413,234 | | | Senior Secured Second Lien Term Loan (1 Month US Secured Overnight Financing Rate + 6.86%) | | | 12.19% | | | | 07/20/2026 | | | | 415,947 | |
| |
| | | | Focus Financial Partners LLC | |
| | 666,273 | | | Senior Secured First Lien Term Loan (1 Month US Secured Overnight Financing Rate + 2.50%, 0.50% Floor) | | | 7.83% | | | | 06/30/2028 | | | | 664,527 | |
| | 683,288 | | | Senior Secured First Lien Term Loan (1 Month US Secured Overnight Financing Rate + 2.75%, 0.50% Floor) | | | 8.08% | | | | 06/30/2028 | | | | 681,900 | |
| |
| | | | Hightower Holding LLC | |
| | 905,502 | | | Senior Secured First Lien Term Loan (3 Month US Secured Overnight Financing Rate + 4.26%, 0.75% Floor) | | | 9.59% | | | | 04/21/2028 | | | | 907,766 | |
| |
| | | | Minotaur Acquisition, Inc. | |
| | 1,021,627 | | | Senior Secured First Lien Term Loan (1 Month US Secured Overnight Financing Rate + 4.85%) | | | 10.18% | | | | 03/30/2026 | | | | 1,023,926 | |
| | | | | | | | | | | | | | | | |
| | | | | | | | | | | | | | | 5,119,126 | |
| | | | | | | | | | | | | | | | |
| | FINANCIAL INTERMEDIARIES 0.3% | |
| |
| | | | Greystone Select Financial LLC | |
| | 221,508 | | | Senior Secured First Lien Term Loan (3 Month US Secured Overnight Financing Rate + 5.26%, 0.75% Floor) | | | 10.57% | | | | 06/17/2028 | | | | 221,508 | |
| | | | | | | | | | | | | | | | |
PRINCIPAL
AMOUNT $ | | | SECURITY DESCRIPTION | | RATE | | | MATURITY | | | VALUE $ | |
| |
| | | | Walker & Dunlop, Inc. | |
| | 356,788 | | | Senior Secured First Lien Term Loan (1 Month US Secured Overnight Financing Rate + 2.50%, 0.50% Floor) | | | 7.68% | | | | 12/18/2028 | | | | 356,341 | |
| | | | | | | | | | | | | | | | |
| | | | | | | | | | | | | | | 577,849 | |
| | | | | | | | | | | | | | | | |
| | FOOD PRODUCTS 1.0% | |
| |
| | | | CHG PPC Parent LLC | |
| | 834,858 | | | Senior Secured First Lien Term Loan (1 Month US Secured Overnight Financing Rate + 3.11%, 0.50% Floor) | | | 8.44% | | | | 12/08/2028 | | | | 836,946 | |
| |
| | | | H-Food Holdings LLC | |
| | 220,206 | | | Senior Secured First Lien Term Loan (3 Month US Secured Overnight Financing Rate + 3.95%) | | | 9.29% | | | | 05/30/2025 | | | | 161,164 | |
| |
| | | | Monogram Food Solutions LLC | |
| | 830,875 | | | Senior Secured First Lien Term Loan (1 Month US Secured Overnight Financing Rate + 4.11%, 0.50% Floor) | | | 9.44% | | | | 08/27/2028 | | | | 832,952 | |
| | | | | | | | | | | | | | | | |
| | | | | | | | | | | | | | | 1,831,062 | |
| | | | | | | | | | | | | | | | |
| | HEALTHCARE 10.4% | |
| |
| | | | ADMI Corp. | |
| | 410,776 | | | Senior Secured First Lien Term Loan (1 Month US Secured Overnight Financing Rate + 3.86%, 0.50% Floor) | | | 9.19% | | | | 12/23/2027 | | | | 397,683 | |
| | 532,325 | | | Senior Secured First Lien Term Loan (1 Month US Secured Overnight Financing Rate + 5.75%) | | | 11.08% | | | | 12/23/2027 | | | | 533,491 | |
| |
| | | | Air Methods Corp. | |
| | 13,321 | | | Senior Secured First Lien Term Loan (3 Month US Secured Overnight Financing Rate + 9.10%) | | | 14.41% | | | | 12/28/2028 | | | | 13,554 | |
| |
| | | | AthenaHealth Group, Inc. | |
| | 1,144,564 | | | Senior Secured First Lien Term Loan (1 Month US Secured Overnight Financing Rate + 3.25%, 0.50% Floor) | | | 8.58% | | | | 02/15/2029 | | | | 1,136,609 | |
| |
| | | | Aveanna Healthcare LLC | |
| | 581,925 | | | Senior Secured First Lien Term Loan (3 Month US Secured Overnight Financing Rate + 3.85%, 0.50% Floor) | | | 9.19% | | | | 07/17/2028 | | | | 561,037 | |
| | 376,650 | | | Senior Secured Second Lien Term Loan (3 Month US Secured Overnight Financing Rate + 7.15%, 0.50% Floor) | | | 12.49% | | | | 12/10/2029 | | | | 324,861 | |
| |
| | | | Bausch + Lomb Corp. | |
| | 278,600 | | | Senior Secured First Lien Term Loan (1 Month US Secured Overnight Financing Rate + 4.00%) | | | 9.33% | | | | 09/29/2028 | | | | 278,950 | |
| | 1,145,211 | | | Senior Secured First Lien Term Loan (1 Month US Secured Overnight Financing Rate + 3.35%, 0.50% Floor) | | | 8.68% | | | | 05/10/2027 | | | | 1,134,618 | |
| | | | | | | | |
| The accompanying notes are an integral part of these financial statements. | | Annual Report | | | | | March 31, 2024 | | 67 |
| | |
Schedule of Investments DoubleLine Floating Rate Fund (Cont.) | | |
| | | | | | | | | | | | | | | | |
PRINCIPAL
AMOUNT $ | | | SECURITY DESCRIPTION | | RATE | | | MATURITY | | | VALUE $ | |
| |
| | | | Catalent Pharma Solutions, Inc. | |
| | 569,133 | | | Senior Secured First Lien Term Loan (1 Month US Secured Overnight Financing Rate + 2.11%, 0.50% Floor) | | | 7.44% | | | | 02/22/2028 | | | | 569,488 | |
| |
| | | | CHG Healthcare Services, Inc. | |
| | 539,138 | | | Senior Secured First Lien Term Loan (3 Month US Secured Overnight Financing Rate + 3.75%, 0.50% Floor) | | | 9.09% | | | | 10/02/2028 | | | | 541,162 | |
| | 49,387 | | | Senior Secured First Lien Term Loan (1 Month US Secured Overnight Financing Rate + 3.75%, 0.50% Floor) | | | 9.08% | | | | 10/02/2028 | | | | 49,573 | |
| | 549,365 | | | Senior Secured First Lien Term Loan (1 Month US Secured Overnight Financing Rate + 3.36%, 0.50% Floor) | | | 8.69% | | | | 09/29/2028 | | | | 550,453 | |
| |
| | | | CNT Holdings I Corp. | |
| | 124,688 | | | Senior Secured First Lien Term Loan (3 Month US Secured Overnight Financing Rate + 3.50%, 0.75% Floor) | | | 8.82% | | | | 11/08/2027 | | | | 125,067 | |
| |
| | | | Cotiviti, Inc. | |
| | 805,000 | | | Senior Secured Term Loan (CME Term SOFR 1 Month + 3.25%) | | | 8.58% | | | | 02/24/2031 | | | | 803,994 | |
| |
| | | | FinThrive Software Intermediate Holdings, Inc. | |
| | 301,805 | | | Senior Secured First Lien Term Loan (3 Month US Secured Overnight Financing Rate + 4.11%, 0.50% Floor) | | | 9.42% | | | | 12/18/2028 | | | | 254,743 | |
| |
| | | | Fortrea Holdings, Inc. | |
| | 143,913 | | | Senior Secured First Lien Term Loan (1 Month US Secured Overnight Financing Rate + 3.75%, 0.50% Floor) | | | 9.08% | | | | 07/01/2030 | | | | 144,512 | |
| |
| | | | LifePoint Health, Inc. | |
| | 1,152,031 | | | Senior Secured First Lien Term Loan (3 Month US Secured Overnight Financing Rate + 5.50%) | | | 11.09% | | | | 11/16/2028 | | | | 1,156,455 | |
| |
| | | | Maravai Intermediate Holdings LLC | |
| | 493,569 | | | Senior Secured First Lien Term Loan (3 Month US Secured Overnight Financing Rate + 3.00%, 0.50% Floor) | | | 8.31% | | | | 10/19/2027 | | | | 485,753 | |
| |
| | | | Medline Borrower LP | |
| | 847,287 | | | Senior Secured First Lien Term Loan (CME Term SOFR 1 Month + 2.86%) | | | 8.19% | | | | 10/23/2028 | | | | 850,080 | |
| |
| | | | Outcomes Group Holdings, Inc. | |
| | 307,648 | | | Senior Secured First Lien Term Loan (1 Month US Secured Overnight Financing Rate + 3.51%) | | | 8.69% | | | | 10/24/2025 | | | | 308,079 | |
| |
| | | | Pacific Dental Services T/L B (02/24) | |
| | 640,000 | | | Senior Secured Term Loan | | | 8.58% | (a) | | | 03/07/2031 | | | | 640,934 | |
| |
| | | | Packaging Coordinators Midco, Inc. | |
| | 1,075,299 | | | Senior Secured First Lien Term Loan (3 Month US Secured Overnight Financing Rate + 3.76%, 0.75% Floor) | | | 9.07% | | | | 11/30/2027 | | | | 1,078,810 | |
| | | | | | | | | | | | | | | | |
PRINCIPAL
AMOUNT $ | | | SECURITY DESCRIPTION | | RATE | | | MATURITY | | | VALUE $ | |
| |
| | | | Phoenix Newco, Inc. | |
| | 1,515,668 | | | Senior Secured First Lien Term Loan (1 Month US Secured Overnight Financing Rate + 3.36%, 0.50% Floor) | | | 8.69% | | | | 11/15/2028 | | | | 1,520,835 | |
| |
| | | | PointClickCare Technologies, Inc. | |
| | 287,140 | | | Senior Secured First Lien Term Loan (3 Month US Secured Overnight Financing Rate + 3.26%, 0.75% Floor) | | | 8.57% | | | | 12/29/2027 | | | | 288,039 | |
| |
| | | | Radiology Partners T/L | |
| | 458,150 | | | Senior Secured First Lien Term Loan (3 Month US Secured Overnight Financing Rate + 3.50%) | | | 9.09% | | | | 01/31/2029 | | | | 443,750 | |
| | 4,721 | | | Senior Secured First Lien Term Loan (3 Month US Secured Overnight Financing Rate + 3.50%) | | | 9.09% | | | | 01/31/2029 | | | | 4,572 | |
| |
| | | | Select Medical Corp. | |
| | 987,679 | | | Senior Secured First Lien Term Loan (1 Month US Secured Overnight Financing Rate + 3.00%) | | | 8.33% | | | | 03/05/2027 | | | | 990,459 | |
| |
| | | | Sotera Health Holdings LLC | |
| | 972,650 | | | Senior Secured First Lien Term Loan (1 Month US Secured Overnight Financing Rate + 3.75%, 0.50% Floor) | | | 9.08% | | | | 12/14/2026 | | | | 972,047 | |
| |
| | | | Sound Inpatient Physicians Holdings LLC | |
| | 300,000 | | | Senior Secured Second Lien Term Loan (3 Month US Secured Overnight Financing Rate + 7.01%) | | | 12.32% | | | | 06/29/2026 | | | | 21,000 | |
| |
| | | | Southern Veterinary Partners LLC | |
| | 1,220,800 | | | Senior Secured First Lien Term Loan (1 Month US Secured Overnight Financing Rate + 4.11%, 1.00% Floor) | | | 9.44% | | | | 10/05/2027 | | | | 1,223,546 | |
| |
| | | | Team Health Holdings, Inc. | |
| | 242,916 | | | Senior Secured First Lien Term Loan (3 Month US Secured Overnight Financing Rate + 5.25%, 1.00% Floor) | | | 10.56% | | | | 03/02/2027 | | | | 216,195 | |
| |
| | | | Verscend Holding Corp. | |
| | 960,796 | | | Senior Secured First Lien Term Loan (1 Month US Secured Overnight Financing Rate + 4.11%) | | | 9.44% | | | | 08/27/2025 | | | | 961,997 | |
| | | | | | | | | | | | | | | | |
| | | | | | | | | | | | | | | 18,582,346 | |
| | | | | | | | | | | | | | | | |
| | HOTELS/MOTELS/INNS AND CASINOS 7.4% | |
| |
| | | | Alterra Mountain Co. | |
| | 825,209 | | | Senior Secured First Lien Term Loan (1 Month US Secured Overnight Financing Rate + 3.61%, 0.50% Floor) | | | 8.94% | | | | 08/17/2028 | | | | 829,682 | |
| | 397,750 | | | Senior Secured First Lien Term Loan (1 Month US Secured Overnight Financing Rate + 3.85%) | | | 9.18% | | | | 05/31/2030 | | | | 400,236 | |
| | 105,000 | | | Senior Secured Term Loan (CME Term SOFR 1 Month + 3.50%) | | | 8.83% | | | | 05/31/2030 | | | | 105,656 | |
| | | | |
| 68 | | DoubleLine Funds Trust | | The accompanying notes are an integral part of these financial statements. |
| | | | | | | | | | | | | | | | |
PRINCIPAL
AMOUNT $ | | | SECURITY DESCRIPTION | | RATE | | | MATURITY | | | VALUE $ | |
| |
| | | | Bally’s Corp. | |
| | 766,667 | | | Senior Secured First Lien Term Loan (3 Month US Secured Overnight Financing Rate + 3.51%, 0.50% Floor) | | | 8.83% | | | | 10/02/2028 | | | | 721,782 | |
| |
| | | | Caesars Entertainment, Inc. | |
| | 267,300 | | | Senior Secured First Lien Term Loan (3 Month US Secured Overnight Financing Rate + 3.35%, 0.50% Floor) | | | 8.66% | | | | 02/06/2030 | | | | 268,396 | |
| | 650,000 | | | Senior Secured First Lien Term Loan (3 Month US Secured Overnight Financing Rate + 2.75%, 0.50% Floor) | | | 8.04% | | | | 02/06/2031 | | | | 651,320 | |
| |
| | | | Carnival Corp. | |
| | 455,229 | | | Senior Secured First Lien Term Loan (1 Month US Secured Overnight Financing Rate + 3.36%, 0.75% Floor) | | | 8.69% | | | | 10/18/2028 | | | | 456,415 | |
| | 114,138 | | | Senior Secured First Lien Term Loan (1 Month US Secured Overnight Financing Rate + 3.00%, 0.75% Floor) | | | 8.32% | | | | 08/09/2027 | | | | 114,447 | |
| |
| | | | ClubCorp Holdings, Inc. | |
| | 23,191 | | | Senior Secured First Lien Term Loan (3 Month US Secured Overnight Financing Rate + 5.26%) | | | 10.61% | | | | 09/18/2026 | | | | 23,265 | |
| | 643,291 | | | Senior Secured First Lien Term Loan (3 Month US Secured Overnight Financing Rate + 5.26%) | | | 10.61% | | | | 09/18/2026 | | | | 645,362 | |
| |
| | | | Fertitta Entertainment LLC/NV | |
| | 1,662,371 | | | Senior Secured First Lien Term Loan (1 Month US Secured Overnight Financing Rate + 3.75%, 0.50% Floor) | | | 9.08% | | | | 01/29/2029 | | | | 1,668,263 | |
| |
| | | | Flutter Financing BV | |
| | 224,438 | | | Senior Secured First Lien Term Loan (3 Month US Secured Overnight Financing Rate + 2.25%, 0.50% Floor) | | | 7.56% | | | | 11/29/2030 | | | | 224,938 | |
| |
| | | | Hilton Grand Vacations Borrower LLC | |
| | 445,000 | | | Senior Secured First Lien Term Loan (1 Month US Secured Overnight Financing Rate + 2.75%) | | | 8.08% | | | | 01/17/2031 | | | | 446,322 | |
| |
| | | | MIC Glen LLC | |
| | 681,466 | | | Senior Secured First Lien Term Loan (1 Month US Secured Overnight Financing Rate + 3.36%, 0.50% Floor) | | | 8.69% | | | | 07/21/2028 | | | | 681,412 | |
| |
| | | | Motion Finco SARL | |
| | 1,015,000 | | | Senior Secured First Lien Term Loan (3 Month US Secured Overnight Financing Rate + 3.76%) | | | 9.07% | | | | 11/30/2029 | | | | 1,014,618 | |
| |
| | | | Ontario Gaming GTA LP | |
| | 943,115 | | | Senior Secured First Lien Term Loan (3 Month US Secured Overnight Financing Rate + 4.25%, 0.50% Floor) | | | 9.56% | | | | 08/01/2030 | | | | 947,496 | |
| | | | | | | | | | | | | | | | |
PRINCIPAL
AMOUNT $ | | | SECURITY DESCRIPTION | | RATE | | | MATURITY | | | VALUE $ | |
| |
| | | | Playa Resorts Holding BV | |
| | 938,944 | | | Senior Secured First Lien Term Loan (1 Month US Secured Overnight Financing Rate + 3.25%, 0.50% Floor) | | | 8.58% | | | | 01/05/2029 | | | | 942,789 | |
| |
| | | | Scientific Games Holdings LP | |
| | 783,311 | | | Senior Secured First Lien Term Loan (3 Month US Secured Overnight Financing Rate + 2.75%, 0.50% Floor) | | | 8.58% | | | | 04/04/2029 | | | | 784,067 | |
| |
| | | | SMG US Midco 2, Inc. | |
| | 338,578 | | | Senior Secured First Lien Term Loan (3 Month US Secured Overnight Financing Rate + 2.76%) | | | 8.07% | | | | 01/23/2025 | | | | 338,879 | |
| | 918,269 | | | Senior Secured First Lien Term Loan (3 Month US Secured Overnight Financing Rate + 2.76%) | | | 8.07% | | | | 01/23/2025 | | | | 919,086 | |
| |
| | | | Station Casinos LLC | |
| | 265,000 | | | Senior Secured First Lien Term Loan (CME Term SOFR 1 Month + 2.25%) | | | 7.82% | | | | 03/14/2031 | | | | 264,970 | |
| |
| | | | Whatabrands LLC | |
| | 876,359 | | | Senior Secured First Lien Term Loan (1 Month US Secured Overnight Financing Rate + 3.36%, 0.50% Floor) | | | 8.69% | | | | 08/03/2028 | | | | 877,897 | |
| | | | | | | | | | | | | | | | |
| | | | | | | | | | | | | | | 13,327,298 | |
| | | | | | | | | | | | | | | | |
| | INDUSTRIAL EQUIPMENT 6.4% | |
| |
| | | | AI Aqua Merger Sub, Inc. | |
| | 1,132,843 | | | Senior Secured First Lien Term Loan (1 Month US Secured Overnight Financing Rate + 3.75%, 0.50% Floor) | | | 9.07% | | | | 07/31/2028 | | | | 1,136,150 | |
| |
| | | | BCPE Empire Holdings, Inc. | |
| | 1,003,959 | | | Senior Secured First Lien Term Loan (1 Month US Secured Overnight Financing Rate + 4.00%, 0.50% Floor) | | | 9.33% | | | | 12/25/2028 | | | | 1,006,218 | |
| |
| | | | Castlelake Aviation One DAC | |
| | 905,840 | | | Senior Secured First Lien Term Loan (3 Month US Secured Overnight Financing Rate + 2.50%, 0.50% Floor) | | | 7.83% | | | | 10/22/2026 | | | | 907,027 | |
| | 570 | | | Senior Secured First Lien Term Loan (3 Month LIBOR USD + 2.50%, 0.50% Floor) | | | 7.83% | (c) | | | 10/22/2026 | | | | 571 | |
| |
| | | | Columbus McKinnon Corp./NY | |
| | 484,335 | | | Senior Secured First Lien Term Loan (3 Month US Secured Overnight Financing Rate + 2.50%) | | | 7.81% | | | | 05/15/2028 | | | | 486,152 | |
| |
| | | | Crosby US Acquisition Corp. | |
| | 219,450 | | | Senior Secured First Lien Term Loan (1 Month US Secured Overnight Financing Rate + 4.00%, 0.50% Floor) | | | 9.32% | | | | 08/16/2029 | | | | 220,936 | |
| |
| | | | Gates Global LLC | |
| | 290,575 | | | Senior Secured First Lien Term Loan (1 Month US Secured Overnight Financing Rate + 3.00%, 0.50% Floor) | | | 8.33% | | | | 11/16/2029 | | | | 291,872 | |
| | | | | | | | |
| The accompanying notes are an integral part of these financial statements. | | Annual Report | | | | | March 31, 2024 | | 69 |
| | |
Schedule of Investments DoubleLine Floating Rate Fund (Cont.) | | |
| | | | | | | | | | | | | | | | |
PRINCIPAL
AMOUNT $ | | | SECURITY DESCRIPTION | | RATE | | | MATURITY | | | VALUE $ | |
| |
| | | | Lummus Technology Holdings V LLC | |
| | 1,007,132 | | | Senior Secured First Lien Term Loan (1 Month US Secured Overnight Financing Rate + 3.61%) | | | 8.94% | | | | 12/31/2029 | | | | 1,009,549 | |
| |
| | | | Madison IAQ LLC | |
| | 1,016,148 | | | Senior Secured First Lien Term Loan (1 Month US Secured Overnight Financing Rate + 3.36%, 0.50% Floor) | | | 8.69% | | | | 06/21/2028 | | | | 1,015,884 | |
| |
| | | | Restaurant Technologies, Inc. | |
| | 65,458 | | | Senior Secured First Lien Term Loan (1 Month US Secured Overnight Financing Rate + 4.25%, 0.50% Floor) | | | 9.57% | | | | 04/02/2029 | | | | 64,988 | |
| | 65,458 | | | Senior Secured First Lien Term Loan (3 Month US Secured Overnight Financing Rate + 4.25%, 0.50% Floor) | | | 9.60% | | | | 04/02/2029 | | | | 64,988 | |
| | 693,753 | | | Senior Secured First Lien Term Loan (3 Month US Secured Overnight Financing Rate + 4.25%, 0.50% Floor) | | | 9.60% | | | | 04/02/2029 | | | | 688,768 | |
| |
| | | | Spin Holdco, Inc. | |
| | 278,570 | | | Senior Secured First Lien Term Loan (3 Month US Secured Overnight Financing Rate + 4.26%, 0.75% Floor) | | | 9.59% | | | | 03/06/2028 | | | | 258,701 | |
| |
| | | | SRS Distribution, Inc. | |
| | 1,136,715 | | | Senior Secured First Lien Term Loan (1 Month US Secured Overnight Financing Rate + 3.61%, 0.50% Floor) | | | 8.94% | | | | 06/05/2028 | | | | 1,145,860 | |
| |
| | | | Titan Acquisition Ltd./Canada | |
| | 845,000 | | | Senior Secured Term Loan (CME Term SOFR 1 Month + 5.00%) | | | 10.33% | | | | 02/01/2029 | | | | 848,257 | |
| | 1,218,114 | | | Senior Secured First Lien Term Loan (1 Month US Secured Overnight Financing Rate + 3.11%) | | | 8.44% | | | | 03/28/2025 | | | | 1,218,620 | |
| |
| | | | TK Elevator US Newco, Inc. | |
| | 1,131,086 | | | Senior Secured Term Loan (CME Term SOFR 1 Month + 3.50%) | | | 8.83% | | | | 04/15/2030 | | | | 1,136,192 | |
| | | | | | | | | | | | | | | | |
| | | | | | | | | | | | | | | 11,500,733 | |
| | | | | | | | | | | | | | | | |
| | INSURANCE 2.1% | |
| |
| | | | Acrisure LLC | |
| | 439,875 | | | Senior Secured First Lien Term Loan (1 Month Synthetic LIBOR + 4.25%, 0.50% Floor) | | | 9.69% | (c) | | | 02/15/2027 | | | | 441,799 | |
| | 699,847 | | | Senior Secured First Lien Term Loan (1 Month Synthetic LIBOR + 3.50%) | | | 8.94% | (c) | | | 02/15/2027 | | | | 700,285 | |
| |
| | | | Alliant Holdings Intermediate LLC | |
| | 805,950 | | | Senior Secured First Lien Term Loan (1 Month US Secured Overnight Financing Rate + 3.50%, 0.50% Floor) | | | 8.83% | | | | 11/06/2030 | | | | 810,154 | |
| | | | | | | | | | | | | | | | |
PRINCIPAL
AMOUNT $ | | | SECURITY DESCRIPTION | | RATE | | | MATURITY | | | VALUE $ | |
| |
| | | | AssuredPartners, Inc. | |
| | 367,500 | | | Senior Secured First Lien Term Loan (1 Month US Secured Overnight Financing Rate + 3.50%, 0.50% Floor) | | | 8.83% | | | | 02/12/2027 | | | | 368,248 | |
| | 801,182 | | | Senior Secured First Lien Term Loan (1 Month US Secured Overnight Financing Rate + 3.61%) | | | 8.94% | | | | 02/12/2027 | | | | 802,912 | |
| | 30,000 | | | Senior Secured First Lien Term Loan (1 Month US Secured Overnight Financing Rate + 3.50%, 0.50% Floor) | | | 8.82% | | | | 02/14/2031 | | | | 30,075 | |
| |
| | | | Cross Financial Corp. | |
| | 537,245 | | | Senior Secured First Lien Term Loan (1 Month US Secured Overnight Financing Rate + 3.50%, 0.75% Floor) | | | 8.83% | | | | 09/15/2027 | | | | 537,916 | |
| | | | | | | | | | | | | | | | |
| | | | | | | | | | | | | | | 3,691,389 | |
| | | | | | | | | | | | | | | | |
| | MEDIA 3.2% | |
| |
| | | | Acuris Finance US, Inc. | |
| | 1,231,458 | | | Senior Secured First Lien Term Loan (3 Month US Secured Overnight Financing Rate + 4.10%, 0.50% Floor) | | | 9.50% | | | | 02/16/2028 | | | | 1,231,649 | |
| |
| | | | AMC Entertainment Holdings, Inc. | |
| | 218,098 | | | Senior Secured First Lien Term Loan (1 Month US Secured Overnight Financing Rate + 3.11%) | | | 8.44% | | | | 04/22/2026 | | | | 183,475 | |
| |
| | | | Century DE Buyer LLC | |
| | 155,000 | | | Senior Secured First Lien Term Loan (3 Month US Secured Overnight Financing Rate + 4.00%) | | | 9.32% | | | | 10/30/2030 | | | | 155,756 | |
| |
| | | | Charter Communications Operating LLC | |
| | 1,004,950 | | | Senior Secured First Lien Term Loan (3 Month US Secured Overnight Financing Rate + 2.00%) | | | 7.33% | | | | 12/09/2030 | | | | 996,081 | |
| | 2,525 | | | Senior Secured First Lien Term Loan (3 Month US Secured Overnight Financing Rate + 2.00%) | | | 7.32% | | | | 12/09/2030 | | | | 2,503 | |
| |
| | | | CMG Media Corp. | |
| | 647,032 | | | Senior Secured First Lien Term Loan (3 Month US Secured Overnight Financing Rate + 3.60%) | | | 8.91% | | | | 12/17/2026 | | | | 565,865 | |
| |
| | | | CSC Holdings LLC | |
| | 711,295 | | | Senior Secured First Lien Term Loan (1 Month Synthetic LIBOR + 2.50%) | | | 7.94% | (c) | | | 04/15/2027 | | | | 644,992 | |
| |
| | | | Directv Financing LLC | |
| | 428,339 | | | Senior Secured First Lien Term Loan (1 Month US Secured Overnight Financing Rate + 5.26%, 0.75% Floor) | | | 10.44% | | | | 08/02/2027 | | | | 429,410 | |
| |
| | | | iHeartCommunications, Inc. | |
| | 311,103 | | | Senior Secured First Lien Term Loan (1 Month US Secured Overnight Financing Rate + 3.11%) | | | 8.44% | | | | 05/01/2026 | | | | 273,271 | |
| | | | |
| 70 | | DoubleLine Funds Trust | | The accompanying notes are an integral part of these financial statements. |
| | | | | | | | | | | | | | | | |
PRINCIPAL
AMOUNT $ | | | SECURITY DESCRIPTION | | RATE | | | MATURITY | | | VALUE $ | |
| |
| | | | Nascar Holdings LLC | |
| | 241,084 | | | Senior Secured First Lien Term Loan (1 Month US Secured Overnight Financing Rate + 2.61%) | | | 7.94% | | | | 10/19/2026 | | | | 242,399 | |
| |
| | | | NEP Group, Inc. | |
| | 24,105 | | | Senior Secured First Lien Term Loan (1 Month US Secured Overnight Financing Rate + 3.36%) 1.50% PIK | | | 8.69% | | | | 08/19/2026 | | | | 23,043 | |
| | 491,285 | | | Senior Secured First Lien Term Loan (1 Month US Secured Overnight Financing Rate + 3.36%) 1.50% PIK | | | 8.69% | | | | 08/19/2026 | | | | 469,639 | |
| |
| | | | Sinclair Television Group, Inc. | |
| | 298,606 | | | Senior Secured First Lien Term Loan (1 Month US Secured Overnight Financing Rate + 2.61%) | | | 7.94% | | | | 09/30/2026 | | | | 285,206 | |
| |
| | | | Univision Communications, Inc. | |
| | 206,325 | | | Senior Secured First Lien Term Loan (3 Month US Secured Overnight Financing Rate + 4.25%, 0.50% Floor) | | | 9.56% | | | | 06/24/2029 | | | | 207,021 | |
| | | | | | | | | | | | | | | | |
| | | | | | | | | | | | | | | 5,710,310 | |
| | | | | | | | | | | | | | | | |
| | MINING 0.4% | | | | | | | | | | | | |
| |
| | | | Foresight Energy LLC | |
| | 387,201 | | | Senior Secured First Lien Term Loan (3 Month US Secured Overnight Financing Rate + 8.10%, 1.50% Floor) | | | 13.41% | (d) | | | 06/30/2027 | | | | 387,201 | |
| |
| | | | Vibrantz Technologies, Inc. | |
| | 266,038 | | | Senior Secured First Lien Term Loan (3 Month US Secured Overnight Financing Rate + 4.40%, 0.50% Floor) | | | 9.72% | | | | 04/23/2029 | | | | 263,736 | |
| | | | | | | | | | | | | | | | |
| | | | | | | | | | | | | | | 650,937 | |
| | | | | | | | | | | | | | | | |
| | PHARMACEUTICALS 2.1% | |
| |
| | | | Curium Bidco SARL | |
| | 107,800 | | | Senior Secured First Lien Term Loan (3 Month US Secured Overnight Financing Rate + 4.50%) | | | 9.81% | | | | 07/31/2029 | | | | 108,474 | |
| | 242,615 | | | Senior Secured First Lien Term Loan (3 Month US Secured Overnight Financing Rate + 4.50%) | | | 9.81% | | | | 07/31/2029 | | | | 244,131 | |
| | 369,147 | | | Senior Secured First Lien Term Loan (3 Month US Secured Overnight Financing Rate + 4.50%) | | | 9.81% | | | | 07/31/2029 | | | | 371,454 | |
| |
| | | | Grifols Worldwide Operations USA, Inc. | |
| | 596,073 | | | Senior Secured First Lien Term Loan (3 Month US Secured Overnight Financing Rate + 2.15%) | | | 7.46% | | | | 11/15/2027 | | | | 578,450 | |
| |
| | | | Jazz Financing Lux SARL | |
| | 1,126,847 | | | Senior Secured First Lien Term Loan (1 Month US Secured Overnight Financing Rate + 3.11%, 0.50% Floor) | | | 8.44% | | | | 05/05/2028 | | | | 1,133,891 | |
| | | | | | | | | | | | | | | | |
PRINCIPAL
AMOUNT $ | | | SECURITY DESCRIPTION | | RATE | | | MATURITY | | | VALUE $ | |
| |
| | | | Organon & Co. | |
| | 665,982 | | | Senior Secured First Lien Term Loan (1 Month US Secured Overnight Financing Rate + 3.11%, 0.50% Floor) | | | 8.43% | | | | 06/02/2028 | | | | 669,175 | |
| |
| | | | Perrigo Investments LLC | |
| | 710,986 | | | Senior Secured First Lien Term Loan (1 Month US Secured Overnight Financing Rate + 2.35%, 0.50% Floor) | | | 7.68% | | | | 04/20/2029 | | | | 709,803 | |
| | | | | | | | | | | | | | | | |
| | | | | | | | | | | | | | | 3,815,378 | |
| | | | | | | | | | | | | | | | |
| | REAL ESTATE 0.8% | |
| |
| | | | Iron Mountain, Inc. | |
| | 842,888 | | | Senior Secured First Lien Term Loan (1 Month US Secured Overnight Financing Rate + 2.25%) | | | 7.58% | | | | 01/31/2031 | | | | 837,969 | |
| |
| | | | Starwood Property Mortgage LLC | |
| | 508,563 | | | Senior Secured First Lien Term Loan (1 Month US Secured Overnight Financing Rate + 3.25%, 0.50% Floor) | | | 8.58% | | | | 11/18/2027 | | | | 509,198 | |
| | | | | | | | | | | | | | | | |
| | | | | | | | | | | | | | | 1,347,167 | |
| | | | | | | | | | | | | | | | |
| | RETAILERS (OTHER THAN FOOD/DRUG) 3.3% | |
| |
| | | | American Tire Distributors, Inc. | |
| | 174,390 | | | Senior Secured First Lien Term Loan (3 Month US Secured Overnight Financing Rate + 6.51%, 0.75% Floor) | | | 11.83% | | | | 10/23/2028 | | | | 152,156 | |
| |
| | | | EG America LLC | |
| | 85,881 | | | Senior Secured First Lien Term Loan (Daily US Secured Overnight Financing Rate + 4.36%, 0.50% Floor) | | | 10.10% | | | | 03/31/2026 | | | | 85,988 | |
| | 498,747 | | | Senior Secured First Lien Term Loan (Daily US Secured Overnight Financing Rate + 5.93%, 0.50% Floor) | | | 11.24% | | | | 02/07/2028 | | | | 497,500 | |
| |
| | | | Great Outdoors Group LLC | |
| | 967,392 | | | Senior Secured First Lien Term Loan (1 Month US Secured Overnight Financing Rate + 3.86%, 0.75% Floor) | | | 9.19% | | | | 03/05/2028 | | | | 969,138 | |
| |
| | | | HomeServe USA Corp. | |
| | 685,000 | | | Senior Secured First Lien Term Loan (1 Month US Secured Overnight Financing Rate + 3.00%) | | | 8.33% | | | | 10/21/2030 | | | | 687,483 | |
| |
| | | | Mavis Tire Express Services Topco Corp. | |
| | 667,883 | | | Senior Secured First Lien Term Loan (1 Month US Secured Overnight Financing Rate + 3.75%, 0.75% Floor) | | | 9.08% | | | | 05/04/2028 | | | | 669,780 | |
| |
| | | | Michaels Cos., Inc. | |
| | 644,095 | | | Senior Secured First Lien Term Loan (3 Month US Secured Overnight Financing Rate + 4.51%, 0.75% Floor) | | | 9.82% | | | | 04/15/2028 | | | | 579,541 | |
| | | | | | | | |
| The accompanying notes are an integral part of these financial statements. | | Annual Report | | | | | March 31, 2024 | | 71 |
| | |
Schedule of Investments DoubleLine Floating Rate Fund (Cont.) | | |
| | | | | | | | | | | | | | | | |
PRINCIPAL
AMOUNT $ | | | SECURITY DESCRIPTION | | RATE | | | MATURITY | | | VALUE $ | |
| |
| | | | PetSmart LLC | |
| | 1,270,992 | | | Senior Secured First Lien Term Loan (1 Month US Secured Overnight Financing Rate + 3.85%, 0.75% Floor) | | | 9.18% | | | | 02/12/2028 | | | | 1,269,670 | |
| |
| | | | StubHub Holdco Sub LLC | |
| | 655,000 | | | Senior Secured First Lien Term Loan (1 Month US Secured Overnight Financing Rate + 4.75%) | | | 10.08% | | | | 03/12/2030 | | | | 656,772 | |
| |
| | | | Upbound Group, Inc. | |
| | 369,015 | | | Senior Secured First Lien Term Loan (6 Month US Secured Overnight Financing Rate + 3.68%, 0.50% Floor) | | | 9.12% | | | | 02/17/2028 | | | | 369,552 | |
| | | | | | | | | | | | | | | | |
| | | | | | | | | | | | | | | 5,937,580 | |
| | | | | | | | | | | | | | | | |
| | TECHNOLOGY 0.4% | |
| |
| | | | CommScope, Inc. | |
| | 182,793 | | | Senior Secured First Lien Term Loan (1 Month US Secured Overnight Financing Rate + 3.36%) | | | 8.69% | | | | 04/06/2026 | | | | 166,342 | |
| |
| | | | Tiger Acquisition LLC | |
| | 569,683 | | | Senior Secured First Lien Term Loan (1 Month US Secured Overnight Financing Rate + 3.35%, 0.50% Floor) | | | 8.68% | | | | 06/01/2028 | | | | 565,612 | |
| | | | | | | | | | | | | | | | |
| | | | | | | | | | | | | | | 731,954 | |
| | | | | | | | | | | | | | | | |
| | TELECOMMUNICATIONS 2.8% | |
| |
| | | | Altice France SA/France | |
| | 721,063 | | | Senior Secured First Lien Term Loan (3 Month US Secured Overnight Financing Rate + 5.50%) | | | 10.81% | | | | 08/31/2028 | | | | 577,077 | |
| |
| | | | Aventiv Technologies LLC | |
| | 456,727 | | | First Lien Term Loan (CME Term SOFR 3 Month + 5.35%) | | | 10.70% | | | | 07/31/2025 | | | | 342,432 | |
| |
| | | | Connect Finco SARL | |
| | 573,012 | | | Senior Secured First Lien Term Loan (1 Month US Secured Overnight Financing Rate + 3.50%, 1.00% Floor) | | | 8.83% | | | | 12/11/2026 | | | | 573,146 | |
| |
| | | | Gogo Intermediate Holdings LLC | |
| | 846,514 | | | Senior Secured First Lien Term Loan (1 Month US Secured Overnight Financing Rate + 3.86%, 0.75% Floor) | | | 9.19% | | | | 04/28/2028 | | | | 846,281 | |
| |
| | | | Level 3 Financing, Inc. | |
| | 132,180 | | | Senior Secured First Lien Term Loan (CME Term SOFR 1 Month + 6.67%) | | | 12.00% | | | | 04/15/2029 | | | | 131,395 | |
| | 132,180 | | | Senior Secured First Lien Term Loan (CME Term SOFR 1 Month + 6.67%) | | | 12.00% | | | | 04/15/2030 | | | | 131,395 | |
| |
| | | | Telesat LLC | |
| | 139,852 | | | Senior Secured First Lien Term Loan (3 Month US Secured Overnight Financing Rate + 2.86%) | | | 8.35% | | | | 12/07/2026 | | | | 85,092 | |
| | | | | | | | | | | | | | | | |
PRINCIPAL
AMOUNT $ | | | SECURITY DESCRIPTION | | RATE | | | MATURITY | | | VALUE $ | |
| |
| | | | Virgin Media Bristol LLC | |
| | 1,120,000 | | | Senior Secured First Lien Term Loan (6 Month US Secured Overnight Financing Rate + 3.35%) | | | 8.79% | | | | 03/31/2031 | | | | 1,104,908 | |
| |
| | | | Zayo Group Holdings, Inc. | |
| | 948,773 | | | Senior Secured First Lien Term Loan (1 Month US Secured Overnight Financing Rate + 3.11%) | | | 8.44% | | | | 03/09/2027 | | | | 835,191 | |
| |
| | | | Ziggo Financing Partnership | |
| | 470,000 | | | Senior Secured First Lien Term Loan (1 Month US Secured Overnight Financing Rate + 2.61%) | | | 7.94% | | | | 04/30/2028 | | | | 463,831 | |
| | | | | | | | | | | | | | | | |
| | | | | | | | | | | | | | | 5,090,748 | |
| | | | | | | | | | | | | | | | |
| | TRANSPORTATION 3.9% | |
| |
| | | | AAdvantage Loyalty IP Ltd. | |
| | 756,500 | | | Senior Secured First Lien Term Loan (3 Month US Secured Overnight Financing Rate + 5.01%, 0.75% Floor) | | | 10.33% | | | | 04/20/2028 | | | | 786,919 | |
| |
| | | | Air Canada | |
| | 320,000 | | | Senior Secured First Lien Term Loan (3 Month US Secured Overnight Financing Rate + 2.50%) | | | 7.83% | | | | 03/21/2031 | | | | 321,002 | |
| |
| | | | American Airlines, Inc. | |
| | 842,885 | | | Senior Secured First Lien Term Loan (6 Month US Secured Overnight Financing Rate + 3.50%) | | | 8.77% | | | | 06/04/2029 | | | | 846,573 | |
| |
| | | | ASP LS Acquisition Corp. | |
| | 433,875 | | | Senior Secured First Lien Term Loan (6 Month US Secured Overnight Financing Rate + 4.76%, 0.75% Floor) | | | 10.07% | | | | 05/07/2028 | | | | 405,348 | |
| |
| | | | Brown Group Holding LLC | |
| | 855,000 | | | Senior Secured First Lien Term Loan (CME Term SOFR 1 Month + 2.75%) | | | 8.18% | | | | 06/07/2028 | | | | 855,389 | |
| |
| | | | Echo Global Logistics, Inc. | |
| | 384,427 | | | Senior Secured First Lien Term Loan (1 Month US Secured Overnight Financing Rate + 3.60%, 0.50% Floor) | | | 8.93% | | | | 11/23/2028 | | | | 379,897 | |
| |
| | | | Kenan Advantage Group, Inc. | |
| | 600,000 | | | Senior Secured First Lien Term Loan (1 Month US Secured Overnight Financing Rate + 3.75%) | | | 9.08% | | | | 01/25/2029 | | | | 601,314 | |
| |
| | | | Lasership, Inc. | |
| | 135,000 | | | Senior Secured Second Lien Term Loan (6 Month US Secured Overnight Financing Rate + 7.93%, 0.75% Floor) | | | 13.07% | | | | 05/07/2029 | | | | 111,780 | |
| |
| | | | Mileage Plus Holdings LLC | |
| | 292,500 | | | Senior Secured First Lien Term Loan (3 Month US Secured Overnight Financing Rate + 5.40%, 1.00% Floor) | | | 10.73% | | | | 06/21/2027 | | | | 301,573 | |
| | | | |
| 72 | | DoubleLine Funds Trust | | The accompanying notes are an integral part of these financial statements. |
| | | | | | | | | | | | | | | | |
PRINCIPAL
AMOUNT $ | | | SECURITY DESCRIPTION | | RATE | | | MATURITY | | | VALUE $ | |
| |
| | | | SkyMiles IP Ltd. | |
| | 277,500 | | | Senior Secured First Lien Term Loan (3 Month US Secured Overnight Financing Rate + 3.75%, 1.00% Floor) | | | 9.07% | | | | 10/20/2027 | | | | 286,548 | |
| |
| | | | United Airlines, Inc. | |
| | 805,000 | | | Senior Secured First Lien Term Loan (3 Month US Secured Overnight Financing Rate + 2.75%) | | | 8.08% | | | | 02/24/2031 | | | | 807,262 | |
| |
| | | | WestJet Airlines Ltd. | |
| | 66,569 | | | Senior Secured First Lien Term Loan (1 Month US Secured Overnight Financing Rate + 3.10%, 1.00% Floor) | | | 8.43% | | | | 12/11/2026 | | | | 66,637 | |
| |
| | | | WestJet Loyalty LP | |
| | 985,000 | | | Senior Secured First Lien Term Loan (3 Month US Secured Overnight Financing Rate + 3.75%) | | | 9.08% | | | | 02/14/2031 | | | | 986,230 | |
| |
| | | | WWEX Uni Topco Holdings LLC | |
| | 203,276 | | | Senior Secured First Lien Term Loan (3 Month US Secured Overnight Financing Rate + 4.26%, 0.75% Floor) | | | 9.57% | | | | 07/26/2028 | | | | 202,572 | |
| | | | | | | | | | | | | | | | |
| | | | | | | | | | | | | | | 6,959,044 | |
| | | | | | | | | | | | | | | | |
| | UTILITIES 0.9% | |
| |
| | | | CQP Holdco LP | |
| | 693,263 | | | Senior Secured First Lien Term Loan (3 Month US Secured Overnight Financing Rate + 3.00%, 0.50% Floor) | | | 8.35% | | | | 12/31/2030 | | | | 696,184 | |
| |
| | | | PG&E Corp. | |
| | 200,000 | | | Senior Secured First Lien Term Loan (1 Month US Secured Overnight Financing Rate + 2.50%, 0.50% Floor) | | | 7.83% | | | | 06/23/2027 | | | | 200,562 | |
| |
| | | | Vistra Zero Operating Co. LLC | |
| | 290,000 | | | Senior Secured Term Loan (CME Term SOFR 1 Month + 2.75%) | | | 8.07% | | | | 03/26/2031 | | | | 290,363 | |
| |
| | | | WaterBridge Midstream Operating LLC | |
| | 324,272 | | | Senior Secured First Lien Term Loan (3 Month US Secured Overnight Financing Rate + 6.01%, 1.00% Floor) | | | 11.34% | | | | 06/21/2026 | | | | 325,033 | |
| | 54,399 | | | Senior Secured First Lien Term Loan (3 Month US Secured Overnight Financing Rate + 6.01%, 1.00% Floor) | | | 11.34% | | | | 06/21/2026 | | | | 54,527 | |
| | | | | | | | | | | | | | | | |
| | | | | | | | | | | | | | | 1,566,669 | |
| | | | | | | | | | | | | | | | |
| | | | Total Bank Loans
(Cost $155,456,786) | | | | | | | | | | | 154,144,282 | |
| | | | | | | | | | | | | | | | |
| | COLLATERALIZED LOAN OBLIGATIONS 2.2% | | | | | |
| | |
| | | | Bridge Street CLO Ltd. | | | | | |
| | 2,000,000 | | | Series 2024-1A-A (CME Term SOFR 3 Month + 1.60%, 1.60% Floor) | | | 0.00% | (e) | | | 04/20/2037 | | | | 2,000,000 | |
| | | | | | | | | | | | | | | | |
PRINCIPAL
AMOUNT $/
SHARES | | | SECURITY DESCRIPTION | | RATE | | | MATURITY | | | VALUE $ | |
| |
| | | | Katayma CLO Ltd. | |
| | 2,000,000 | | | Series 2023-1A-A1 (CME Term SOFR 3 Month + 2.00%, 2.00% Floor) | | | 7.32% | (e) | | | 10/20/2036 | | | | 2,016,975 | |
| | | | | | | | | | | | | | | | |
| | | | Total Collateralized Loan Obligations
(Cost $4,000,000) | | | | 4,016,975 | |
| | | | | | | | | | | | | |
| | US CORPORATE BONDS 3.8% | | | | | |
| | 298,000 | | | Allied Universal Holdco LLC / Allied Universal Finance Corp. | | | 6.63% | (e) | | | 07/15/2026 | | | | 298,054 | |
| | 2,000,000 | | | American Express Co. (Secured Overnight Financing Rate + 1.00%) | | | 6.34% | | | | 02/16/2028 | | | | 2,007,386 | |
| | 1,000,000 | | | Carnival Corp. | | | 4.00% | (e) | | | 08/01/2028 | | | | 932,170 | |
| | 2,000,000 | | | Charles Schwab Corp. (Secured Overnight Financing Rate + 1.05%) | | | 6.40% | | | | 03/03/2027 | | | | 2,006,734 | |
| | 1,000,000 | | | IRB Holding Corp. | | | 7.00% | (e) | | | 06/15/2025 | | | | 1,000,733 | |
| | 252,000 | | | Six Flags Theme Parks, Inc. | | | 7.00% | (e) | | | 07/01/2025 | | | | 252,521 | |
| | 400,000 | | | Univision Communications, Inc. | | | 7.38% | (e) | | | 06/30/2030 | | | | 395,867 | |
| | | | | | | | | | | | | | | | |
| | | | Total US Corporate Bonds
(Cost $6,847,323) | | | | | | | | 6,893,465 | |
| | | | | | |
| | COMMON STOCKS 0.1% | |
| | 22,003 | | | Flame Aggregator - Series R(d)(f) | | | | | | | | | | | 185,925 | |
| | 2,186 | | | Flame Aggregator - Series U(d)(f) | | | | | | | | | | | 18,472 | |
| | | | | | | | | | | | | | | | |
| | | | Total Common Stocks
(Cost $49,603) | | | | | | | | | | | 204,397 | |
| | | | | | |
| | SHORT TERM INVESTMENTS 12.3% | |
| | 7,373,011 | | | First American Government Obligations Fund - U | | | 5.26% | (g) | | | | | | | 7,373,011 | |
| | 7,373,011 | | | JPMorgan US Government Money Market Fund - IM | | | 5.25% | (g) | | | | | | | 7,373,011 | |
| | 7,373,011 | | | MSILF Government Portfolio - Institutional | | | 5.22% | (g) | | | | | | | 7,373,011 | |
| | | | | | | | | | | | |
| | | | Total Short Term Investments
(Cost $22,119,033) | | | | 22,119,033 | |
| | | | | | | | | | | | | | | | |
| | | | Total Investments 104.5%
(Cost $188,472,745) | | | | 187,378,152 | |
| | | | Other Liabilities in Excess of Assets (4.5)% | | | | (8,038,719 | ) |
| | | | | | |
| | | | NET ASSETS 100.0% | | | | | | | | | | $ | 179,339,433 | |
| | | | | | |
| | | | | |
| SECURITY TYPE BREAKDOWN as a % of Net Assets: | |
Bank Loans | | | | 86.1% | |
Short Term Investments | | | | 12.3% | |
US Corporate Bonds | | | | 3.8% | |
Collateralized Loan Obligations | | | | 2.2% | |
Common Stocks | | | | 0.1% | |
Other Assets and Liabilities | | | | (4.5)% | |
| | | | | |
Net Assets | | | | 100.0% | |
| | | | | |
| | | | | | | | |
| The accompanying notes are an integral part of these financial statements. | | Annual Report | | | | | March 31, 2024 | | 73 |
| | |
Schedule of Investments DoubleLine Floating Rate Fund (Cont.) | | |
| | | | | |
| INVESTMENT BREAKDOWN as a % of Net Assets: | |
Electronics/Electric | | | | 14.0% | |
Short Term Investments | | | | 12.3% | |
Healthcare | | | | 10.4% | |
Hotels/Motels/Inns and Casinos | | | | 7.4% | |
Industrial Equipment | | | | 6.4% | |
Finance | | | | 4.0% | |
Transportation | | | | 3.9% | |
Chemicals/Plastics | | | | 3.8% | |
Media | | | | 3.4% | |
Commercial Services | | | | 3.4% | |
Business Equipment and Services | | | | 3.4% | |
Retailers (other than Food/Drug) | | | | 3.3% | |
Containers and Glass Products | | | | 3.1% | |
Energy | | | | 2.8% | |
Telecommunications | | | | 2.8% | |
Collateralized Loan Obligations | | | | 2.2% | |
Pharmaceuticals | | | | 2.1% | |
Insurance | | | | 2.1% | |
Consumer Products | | | | 2.1% | |
Aerospace & Defense | | | | 1.6% | |
Construction | | | | 1.5% | |
Banking | | | | 1.1% | |
Food Products | | | | 1.0% | |
Utilities | | | | 0.9% | |
Building and Development (including Steel/Metals) | | | | 0.8% | |
Automotive | | | | 0.8% | |
Real Estate | | | | 0.8% | |
Leisure | | | | 0.7% | |
Beverage and Tobacco | | | | 0.6% | |
Food Service | | | | 0.6% | |
Mining | | | | 0.5% | |
Technology | | | | 0.4% | |
Financial Intermediaries | | | | 0.3% | |
Other Assets and Liabilities | | | | (4.5)% | |
| | | | | |
Net Assets | | | | 100.0% | |
| | | | | |
| (a) | Coupon rate is variable or floats based on components including but not limited to reference rate and spread. These securities may not indicate a reference rate and/or spread in their description. The rate disclosed is as of period end. |
| (b) | Security is in default or has failed to make a scheduled payment. Income is not being accrued. |
| (c) | Securities referencing LIBOR are expected to transition to an alternative reference rate by the security’s next scheduled coupon reset date. |
| (d) | Value determined using significant unobservable inputs. |
| (e) | Security exempt from registration under Rule 144A of the Securities Act of 1933. These securities may be resold in transactions exempt from registration to qualified institutional buyers. |
| (f) | Non-income producing security. |
| (g) | Seven-day yield as of period end. |
| PIK | A payment-in-kind security in which the issuer may make interest or dividend payments in cash or additional securities. These additional securities generally have the same terms as the original holdings. |
| | | | |
| 74 | | DoubleLine Funds Trust | | The accompanying notes are an integral part of these financial statements. |
| | |
Schedule of Investments - Summary DoubleLine Shiller Enhanced CAPE® | | March 31, 2024 |
| | | | | | | | | | | | | | | | | | | | |
PRINCIPAL
AMOUNT $ | | | SECURITY DESCRIPTION | | RATE | | | MATURITY | | | VALUE $ | | | % OF NET
ASSETS | |
| | ASSET BACKED OBLIGATIONS | |
| | | | | |
| | | | GLS Auto Receivables Trust | | | | | | | | | | | | | | | | |
| | 11,500,000 | | | Series 2023-4A-A2 | | | 6.40% | (b) | | | 12/15/2026 | | | | 11,537,439 | | | | 0.3% | |
| | | | | |
| | | | Horizon Aircraft Finance Ltd. | | | | | | | | | | | | | | | | |
| | 15,771,008 | | | Series 2019-2-A | | | 3.43% | (b) | | | 11/15/2039 | | | | 12,671,075 | | | | 0.3% | |
| | | | | |
| | | | Pagaya AI Debt Selection Trust | | | | | | | | | | | | | | | | |
| | 16,647,798 | | | Series 2022-1-B | | | 3.34% | (b) | | | 10/15/2029 | | | | 16,226,973 | | | | 0.4% | |
| | | | | |
| | | | Sapphire Aviation Finance Ltd. | | | | | | | | | | | | | | | | |
| | 14,280,740 | | | Series 2020-1A-A | | | 3.23% | (b) | | | 03/15/2040 | | | | 12,581,204 | | | | 0.3% | |
| | | |
| | Other Asset Backed Obligations(a) | | | | | | | | 239,570,331 | | | | 5.7% | |
| | | | | | | | | | | | | | | | | | | | |
| | | | Total Asset Backed Obligations
(Cost $310,458,849) | | | | | | | | | | | 292,587,022 | | | | 7.0% | |
| | | | | | | | | | | | | | | | | | | | |
| | BANK LOANS(a) | |
| | | | Total Bank Loans
(Cost $205,887,043) | | | | | | | | | | | 206,500,952 | | | | 4.9% | |
| | | | | | | | | | | | | | | | | | | | |
| | COLLATERALIZED LOAN OBLIGATIONS | |
| | | | | |
| | | | 37 Capital CLO | | | | | | | | | | | | | | | | |
| | 27,000,000 | | | Series 2021-1A-A (CME Term SOFR 3 Month + 1.46%, 1.20% Floor) | | | 6.78% | (b) | | | 10/15/2034 | | | | 27,005,400 | | | | 0.6% | |
| | | | | |
| | | | Anchorage Capital CLO Ltd. | | | | | | | | | | | | | | | | |
| | 23,000,000 | | | Series 2021-19A-A (CME Term SOFR 3 Month + 1.47%, 1.21% Floor) | | | 6.79% | (b) | | | 10/15/2034 | | | | 23,029,688 | | | | 0.5% | |
| | | | | |
| | | | ArrowMark Colorado Holdings | | | | | | | | | | | | | | | | |
| | 18,223,916 | | | Series 2018-9A-A1(CME Term SOFR 3 Month +1.38%, 1.38% Floor) | | | 6.70% | (b) | | | 07/15/2031 | | | | 18,254,671 | | | | 0.4% | |
| | | | | |
| | | | Battalion CLO Ltd. | | | | | | | | | | | | | | | | |
| | 29,500,000 | | | Series 2017-11A-AR (CME Term SOFR 3 Month + 1.41%, 1.15% Floor) | | | 6.73% | (b) | | | 04/24/2034 | | | | 29,579,585 | | | | 0.7% | |
| | | | | |
| | | | CQS US CLO | | | | | | | | | | | | | | | | |
| | 25,000,000 | | | Series 2021-1A-A (CME Term SOFR 3 Month + 1.48%, 1.22% Floor) | | | 6.80% | (b) | | | 01/20/2035 | | | | 25,073,788 | | | | 0.6% | |
| | | | | |
| | | | Dryden Senior Loan Fund | | | | | | | | | | | | | | | | |
| | 25,000,000 | | | Series 2020-85A-AR (CME Term SOFR 3 Month + 1.41%, 1.15% Floor) | | | 6.73% | (b) | | | 10/15/2035 | | | | 24,991,310 | | | | 0.6% | |
| | | | | |
| | | | Jamestown CLO Ltd. | | | | | | | | | | | | | | | | |
| | 15,000,000 | | | Series 2016-9A-A1RR (CME Term SOFR 3 Month + 1.50%, 1.24% Floor) | | | 6.83% | (b) | | | 07/25/2034 | | | | 14,993,946 | | | | 0.4% | |
| | | | | |
| | | | Logan CLO | | | | | | | | | | | | | | | | |
| | 14,000,000 | | | Series 2022-1A-B (CME Term SOFR 3 Month + 2.05%, 2.05% Floor) | | | 7.37% | (b) | | | 04/21/2035 | | | | 14,033,909 | | | | 0.3% | |
| | | | | |
| | | | Marble Point CLO | | | | | | | | | | | | | | | | |
| | 29,500,000 | | | Series 2020-1A-A (CME Term SOFR 3 Month + 1.56%, 1.30% Floor) | | | 6.88% | (b) | | | 04/20/2033 | | | | 29,476,701 | | | | 0.7% | |
| | 25,000,000 | | | Series 2021-2A-A (CME Term SOFR 3 Month + 1.46%, 1.20% Floor) | | | 6.79% | (b) | | | 07/25/2034 | | | | 24,993,788 | | | | 0.6% | |
| | 23,000,000 | | | Series 2021-3A-A1 (CME Term SOFR 3 Month + 1.50%, 1.24% Floor) | | | 6.82% | (b) | | | 10/17/2034 | | | | 22,977,064 | | | | 0.5% | |
| | | | | |
| | | | Nassau Global Credit LLC | | | | | | | | | | | | | | | | |
| | 20,728,857 | | | Series 2018-IA-A (CME Term SOFR 3 Month + 1.41%) | | | 6.73% | (b) | | | 07/15/2031 | | | | 20,727,802 | | | | 0.5% | |
| | | | | |
| | | | Sandstone Peak Ltd. | | | | | | | | | | | | | | | | |
| | 14,000,000 | | | Series 2021-1A-A1 (CME Term SOFR 3 Month + 1.48%, 1.22% Floor) | | | 6.80% | (b) | | | 10/15/2034 | | | | 14,002,800 | | | | 0.3% | |
| | | | | |
| | | | Sound Point CLO Ltd. | | | | | | | | | | | | | | | | |
| | 25,000,000 | | | Series 2019-2A-AR (CME Term SOFR 3 Month + 1.43%, 1.17% Floor) | | | 6.75% | (b) | | | 07/15/2034 | | | | 24,941,640 | | | | 0.6% | |
| | | | | |
| | | | Steele Creek CLO Ltd. | | | | | | | | | | | | | | | | |
| | 18,000,000 | | | Series 2019-2A-AR (CME Term SOFR 3 Month + 1.43%, 1.17% Floor) | | | 6.75% | (b) | | | 07/15/2032 | | | | 18,035,915 | | | | 0.4% | |
| | | | | |
| | | | Trimaran CAVU LLC | | | | | | | | | | | | | | | | |
| | 20,000,000 | | | Series 2021-3A-A (CME Term SOFR 3 Month + 1.47%, 1.21% Floor) | | | 6.77% | (b) | | | 01/18/2035 | | | | 20,043,584 | | | | 0.5% | |
| | | | | |
| | | | Wellfleet CLO Ltd. | | | | | | | | | | | | | | | | |
| | 15,990,000 | | | Series 2020-2A-AR (CME Term SOFR 3 Month + 1.48%, 1.22% Floor) | | | 6.80% | (b) | | | 07/15/2034 | | | | 15,980,718 | | | | 0.4% | |
| | | | | |
| | | | Whitebox CLO Ltd. | | | | | | | | | | | | | | | | |
| | 25,000,000 | | | Series 2021-3A-A1 (CME Term SOFR 3 Month + 1.48%, 1.22% Floor) | | | 6.80% | (b) | | | 10/15/2034 | | | | 25,009,038 | | | | 0.6% | |
| | | |
| | Other Collateralized Loan Obligations(a) | | | | | | | | 149,981,603 | | | | 3.7% | |
| | | | | | | | | | | | | | | | | | | | |
| | | | Total Collateralized Loan Obligations
(Cost $542,563,286) | | | | | | | | | | | 543,132,950 | | | | 12.9% | |
| | | | | | | | | | | | | | | | | | | | |
| | FOREIGN CORPORATE BONDS(a) | |
| | | | Total Foreign Corporate Bonds
(Cost $218,136,408) | | | | | | | | | | | 214,839,365 | | | | 5.1% | |
| | | | | | | | | | | | | | | | | | | | |
| | FOREIGN GOVERNMENT BONDS, FOREIGN AGENCIES AND FOREIGN GOVERNMENT SPONSORED CORPORATIONS(a) | |
| | | | Total Foreign Government Bonds, Foreign Agencies and Foreign Government Sponsored Corporations
(Cost $29,176,564) | | | | 28,147,187 | | | | 0.7% | |
| | | | | | | | | | | | | | | | | | | | |
| | | | | | | | |
| The accompanying notes are an integral part of these financial statements. | | Annual Report | | | | | March 31, 2024 | | 75 |
| | |
Schedule of Investments - Summary DoubleLine Shiller Enhanced CAPE® (Cont.) | | |
| | | | | | | | | | | | | | | | | | | | |
PRINCIPAL
AMOUNT $ | | | SECURITY DESCRIPTION | | RATE | | | MATURITY | | | VALUE $ | | | % OF NET
ASSETS | |
| | NON-AGENCY COMMERCIAL MORTGAGE BACKED OBLIGATIONS | |
| | | | | |
| | | | BRSP Ltd. | | | | | | | | | | | | | | | | |
| | 13,968,000 | | | Series 2021-FL1-AS (CME Term SOFR 1 Month + 1.71%, 1.60% Floor) | | | 7.04% | (b) | | | 08/19/2038 | | | | 13,663,888 | | | | 0.3% | |
| | | | | |
| | | | CLNC Ltd. | | | | | | | | | | | | | | | | |
| | 19,958,000 | | | Series 2019-FL1-D (CME Term SOFR 1 Month + 3.01%, 2.90% Floor) | | | 8.34% | (b) | | | 08/20/2035 | | | | 19,139,322 | | | | 0.5% | |
| | | | | |
| | 20,416,000 | | | JP Morgan Chase Commercial Mortgage Securities | | | 4.45% | (b)(c) | | | 05/05/2032 | | | | 20,271,619 | | | | 0.5% | |
| | | | Series 2019-UES-D | | | | | | | | | | | | | | | 0.0% | |
| | | | Series 2019-UES-E | | | | | | | | | | | | | | | 0.0% | |
| | | | Series 2019-UES-F | | | | | | | | | | | | | | | 0.0% | |
| | | | Series 2019-UES-G | | | | | | | | | | | | | | | 0.0% | |
| | | | | |
| | | | MF1 Multifamily Housing Mortgage Loan Trust | | | | | | | | | | | | | | | | |
| | 12,550,000 | | | Series 2022-FL8-AS (CME Term SOFR 1 Month + 1.75%, 1.75% Floor) | | | 7.08% | (b) | | | 02/19/2037 | | | | 12,361,340 | | | | 0.3% | |
| | | | | |
| | | | TPG Real Estate Finance Issuer Ltd. | | | | | | | | | | | | | | | | |
| | 11,630,000 | | | Series 2022-FL5-A (US 30 Day Average Secured Overnight Financing Rate + 1.65%, 1.65% Floor) | | | 6.97% | (b) | | | 02/15/2039 | | | | 11,572,327 | | | | 0.3% | |
| | | |
| | Other Non-Agency Commercial Mortgage Backed Obligations(a) | | | | | | | | 410,196,568 | | | | 9.7% | |
| | | | | | | | | | | | | | | | | | | | |
| | | | Total Non-Agency Commercial Mortgage Backed Obligations
(Cost $632,068,131) | | | | | | | | | | | 487,205,064 | | | | 11.6% | |
| | | | | | | | | | | | | | | | | | | | |
| | NON-AGENCY RESIDENTIAL COLLATERALIZED MORTGAGE OBLIGATIONS | |
| | | | | |
| | | | BRAVO Residential Funding Trust | | | | | | | | | | | | | | | | |
| | 14,881,543 | | | Series 2021-B-A1 | | | 5.12% | (b)(d) | | | 04/01/2069 | | | | 14,701,956 | | | | 0.3% | |
| | | | | |
| | | | Credit Suisse Mortgage Capital Certificates | | | | | | | | | | | | | | | | |
| | 17,138,319 | | | Series 2022-NQM1-A1 | | | 2.27% | (b)(c) | | | 11/25/2066 | | | | 15,026,825 | | | | 0.4% | |
| | | | | |
| | | | JP Morgan Alternative Loan Trust | | | | | | | | | | | | | | | | |
| | 32,547,741 | | | Series 2005-S1-1A4 | | | 6.00% | | | | 12/25/2035 | | | | 11,876,140 | | | | 0.3% | |
| | | | | |
| | | | CSMCM Trust | | | | | | | | | | | | | | | | |
| | 20,624,355 | | | Series 2019-RP10-A1 | | | 3.14% | (b)(c) | | | 12/26/2059 | | | | 20,807,160 | | | | 0.5% | |
| | | | | |
| | | | Pretium Mortgage Credit Partners LLC | | | | | | | | | | | | | | | | |
| | 24,790,149 | | | Series 2021-NPL3-A1 | | | 1.87% | (b)(d) | | | 07/25/2051 | | | | 23,998,639 | | | | 0.6% | |
| | | | | |
| | | | Vericrest Opportunity Loan Transferee | | | | | | | | | | | | | | | | |
| | 17,455,373 | | | Series 2021-NPL8-A1 | | | 5.12% | (b)(d) | | | 04/25/2051 | | | | 17,026,373 | | | | 0.4% | |
| | | | | |
| | | | Verus Securitization Trust | | | | | | | | | | | | | | | | |
| | 14,481,360 | | | Series 2021-7-A1 | | | 1.83% | (b)(c) | | | 10/25/2066 | | | | 12,596,440 | | | | 0.3% | |
| | | |
| | Other Non-Agency Residential Collateralized Mortgage Obligations(a) | | | | | | | | 319,659,415 | | | | 7.6% | |
| | | | | | | | | | | | | | | | | | | | |
| | | | Total Non-Agency Residential Collateralized Mortgage Obligations
(Cost $530,592,042) | | | | | | | | | | | 435,692,948 | | | | 10.4% | |
| | | | | | | | | | | | | | | | | | | | |
| | US CORPORATE BONDS(a) | |
| | | | Total US Corporate Bonds
(Cost $264,305,520) | | | | | | | | | | | 262,815,736 | | | | 6.2% | |
| | | | | | | | | | | | | | | | | | | | |
| | US GOVERNMENT AND AGENCY MORTGAGE BACKED OBLIGATIONS | |
| | | | | |
| | | | Federal National Mortgage Association | | | | | | | | | | | | | | | | |
| | 21,360,020 | | | Series 2020-M49-1A1 | | | 1.26% | (c) | | | 11/25/2030 | | | | 19,078,996 | | | | 0.5% | |
| | | |
| | Other US Government and Agency Mortgage Backed Obligations(a) | | | | | | | | 82,876,085 | | | | 1.9% | |
| | | | | | | | | | | | | | | | | | | | |
| | | | Total US Government and Agency Mortgage Backed Obligations
(Cost $106,974,498) | | | | | | | | | | | 101,955,081 | | | | 2.4% | |
| | | | | | | | | | | | | | | | | | | | |
| | US GOVERNMENT AND AGENCY OBLIGATIONS | |
| | 103,600,000 | | | United States Treasury Note/Bond | | | 4.25% | | | | 05/31/2025 | | | | 102,768,368 | | | | 2.4% | |
| | 55,600,000 | | | United States Treasury Note/Bond | | | 4.63% | | | | 06/30/2025 | | | | 55,406,703 | | | | 1.3% | |
| | 132,800,000 | | | United States Treasury Note/Bond | | | 4.88% | | | | 11/30/2025 | | | | 133,012,687 | | | | 3.2% | |
| | 145,500,000 | | | United States Treasury Note/Bond | | | 4.25% | | | | 12/31/2025 | | | | 144,317,813 | | | | 3.4% | |
| | 125,100,000 | | | United States Treasury Note/Bond | | | 4.25% | | | | 01/31/2026 | | | | 124,127,543 | | | | 3.0% | |
| | 136,700,000 | | | United States Treasury Note/Bond | | | 4.63% | | | | 02/28/2026 | | | | 136,598,542 | | | | 3.2% | |
| | 40,500,000 | | | United States Treasury Note/Bond | | | 4.63% | | | | 11/15/2026 | | | | 40,637,637 | | | | 1.0% | |
| | 81,800,000 | | | United States Treasury Note/Bond | | | 4.38% | | | | 12/15/2026 | | | | 81,611,476 | | | | 1.9% | |
| | 93,400,000 | | | United States Treasury Note/Bond | | | 4.00% | | | | 01/15/2027 | | | | 92,294,523 | | | | 2.2% | |
| | 84,500,000 | | | United States Treasury Note/Bond | | | 4.13% | | | | 02/15/2027 | | | | 83,796,934 | | | | 2.0% | |
| | | | | | | | | | | | | | | | | | | | |
| | | | Total US Government and Agency Obligations
(Cost $999,238,965) | | | | | | | | | | | 994,572,226 | | | | 23.6% | |
| | | | | | | | | | | | | | | | | | | | |
| | | | |
| 76 | | DoubleLine Funds Trust | | The accompanying notes are an integral part of these financial statements. |
| | | | | | | | | | | | | | | | | | | | |
SHARES/ PRINCIPAL
AMOUNT $ | | | SECURITY DESCRIPTION | | RATE | | | MATURITY | | | VALUE $ | | | % OF NET
ASSETS | |
| | COMMON STOCKS(a)(e) | |
| | | | Total Common Stocks
(Cost $20,580) | | | | | | | | | | | 84,804 | | | | 0.0% | |
| | | | | | | | | | | | | | | | | | | | |
| | SHORT TERM INVESTMENTS | |
| | 41,236,706 | | | First American Government Obligations Fund-U | | | 5.26% | (f) | | | | | | | 41,236,706 | | | | 1.0% | |
| | 41,236,706 | | | JPMorgan US Government Money Market Fund-IM | | | 5.25% | (f) | | | | | | | 41,236,706 | | | | 1.0% | |
| | 41,236,706 | | | MSILF Government Portfolio-Institutional | | | 5.22% | (f) | | | | | | | 41,236,706 | | | | 1.0% | |
| | 42,600,000 | | | United States Treasury Bill | | | 0.00% | | | | 05/16/2024 | | | | 42,321,829 | | | | 1.0% | |
| | 75,000,000 | | | United States Treasury Bill | | | 0.00% | | | | 06/27/2024 | | | | 74,055,234 | | | | 1.7% | |
| | | | | | | | | | | | | | | | | | | | |
| | | | Total Short Term Investments
(Cost $240,097,484) | | | | 240,087,181 | | | | 5.7% | |
| | | | | | | | | | | | | | | | | | | | |
| | | | Total Investments
(Cost $4,079,519,370) | | | | 3,807,620,516 | | | | 90.5% | |
| | | | Other Assets in Excess of Liabilities | | | | 397,681,224 | | | | 9.5% | |
| | | | | | | | | | | | | | | | | | | | |
| | | | NET ASSETS | | | $ | 4,205,301,740 | | | | 100.0% | |
| | | | | | | | | | | | | | | | | | | | |
| | | | | |
| SECURITY TYPE BREAKDOWN as a % of Net Assets: | | | | | |
US Government and Agency Obligations | | | | 23.6% | |
Collateralized Loan Obligations | | | | 12.9% | |
Non-Agency Commercial Mortgage Backed Obligations | | | | 11.6% | |
Non-Agency Residential Collateralized Mortgage Obligations | | | | 10.4% | |
Asset Backed Obligations | | | | 7.0% | |
US Corporate Bonds | | | | 6.2% | |
Short Term Investments | | | | 5.7% | |
Foreign Corporate Bonds | | | | 5.1% | |
Bank Loans | | | | 4.9% | |
US Government and Agency Mortgage Backed Obligations | | | | 2.4% | |
Foreign Government Bonds, Foreign Agencies and Foreign Government Sponsored Corporations | | | | 0.7% | |
Common Stocks | | | | 0.0% | (e) |
Other Assets and Liabilities | | | | 9.5% | |
| | | | | |
Net Assets | | | | 100.0% | |
| | | | | |
| | | | | |
| INVESTMENT BREAKDOWN as a % of Net Assets: | | | | | |
US Government and Agency Obligations | | | | 23.6% | |
Collateralized Loan Obligations | | | | 12.9% | |
Non-Agency Commercial Mortgage Backed Obligations | | | | 11.6% | |
Non-Agency Residential Collateralized Mortgage Obligations | | | | 10.4% | |
Asset Backed Obligations | | | | 7.0% | |
Short Term Investments | | | | 5.7% | |
Banking | | | | 2.9% | |
US Government and Agency Mortgage Backed Obligations | | | | 2.4% | |
Utilities | | | | 1.5% | |
Healthcare | | | | 1.2% | |
Hotels/Motels/Inns and Casinos | | | | 1.0% | |
Energy | | | | 0.9% | |
Technology | | | | 0.8% | |
Transportation | | | | 0.8% | |
Mining | | | | 0.6% | |
Automotive | | | | 0.6% | |
Industrial Equipment | | | | 0.5% | |
Electronics/Electric | | | | 0.5% | |
Pharmaceuticals | | | | 0.5% | |
Media | | | | 0.5% | |
Finance | | | | 0.4% | |
Chemicals/Plastics | | | | 0.4% | |
Commercial Services | | | | 0.4% | |
Containers and Glass Products | | | | 0.4% | |
Food Products | | | | 0.3% | |
Consumer Products | | | | 0.3% | |
Real Estate | | | | 0.2% | |
Insurance | | | | 0.2% | |
Telecommunications | | | | 0.2% | |
Chemical Products | | | | 0.2% | |
Aerospace & Defense | | | | 0.2% | |
Building and Development (including Steel/Metals) | | | | 0.2% | |
Retailers (other than Food/Drug) | | | | 0.2% | |
Beverage and Tobacco | | | | 0.2% | |
Diversified Manufacturing | | | | 0.1% | |
Foreign Government Bonds, Foreign Agencies and Foreign Government Sponsored Corporations | | | | 0.1% | |
Food Service | | | | 0.1% | |
Construction | | | | 0.1% | |
Environmental Control | | | | 0.1% | |
Pulp & Paper | | | | 0.1% | |
Business Equipment and Services | | | | 0.1% | |
Financial Intermediaries | | | | 0.1% | |
Other Assets and Liabilities | | | | 9.5% | |
| | | | | |
Net Assets | | | | 100.0% | |
| | | | | |
| | | | | | | | |
| The accompanying notes are an integral part of these financial statements. | | Annual Report | | | | | March 31, 2024 | | 77 |
| | |
Schedule of Investments - Summary DoubleLine Shiller Enhanced CAPE® (Cont.) | | |
| (a) | Represents issues not identified as the top 50 holdings in terms of market value and issues or issuers not exceeding 1% of net assets individually or in aggregate, respectively as of period end. |
| (b) | Security exempt from registration under Rule 144A of the Securities Act of 1933. These securities may be resold in transactions exempt from registration to qualified institutional buyers. |
| (c) | Coupon rate is variable based on the weighted average coupon of the underlying collateral. To the extent the weighted average coupon of the underlying assets which comprise the collateral increases or decreases, the coupon rate of this security will increase or decrease correspondingly. The rate disclosed is as of period end. |
| (d) | Step Bond; Coupon rate changes based on a predetermined schedule or event. The interest rate shown is the rate in effect as of period end. |
| (e) | Represents less than 0.05% of net assets |
| (f) | Seven-day yield as of period end |
| | | | | | | | | | | | | | | | | | | | | | | | | | | | | | | | | | | | | | | | | | |
| | | | | | | | | |
| Excess Return Swaps | | | | | | | | | | | | | | | | | | |
| Reference Entity | | Counterparty | | Long/ Short | | Financing
Rate | | Payment
Frequency | | Termination
Date | | Notional
Amount | | Value | | Upfront
Premiums
Paid/
(Received) | | Unrealized
Appreciation
(Depreciation) |
Shiller Barclays CAPE® US Sector II ER USD Index(1) | | Barclays Capital, Inc. | | Long | | | | 0.40 | % | | | | Termination | | | | | 06/13/2024 | | | | | 100,000,000 | | | | $ | 18,069,097 | | | | $ | — | | | | $ | 18,069,097 | |
Shiller Barclays CAPE® US Sector II ER USD Index(1) | | BNP Paribas Securities Corp. | | Long | | | | 0.39 | % | | | | Termination | | | | | 05/01/2024 | | | | | 80,000,000 | | | | | 17,245,235 | | | | | — | | | | | 17,245,235 | |
Shiller Barclays CAPE® US Sector II ER USD Index(1) | | Barclays Capital, Inc. | | Long | | | | 0.40 | % | | | | Termination | | | | | 05/09/2024 | | | | | 70,000,000 | | | | | 15,090,852 | | | | | — | | | | | 15,090,852 | |
Shiller Barclays CAPE® US Sector II ER USD Index(1) | | Canadian Imperial Bank Of Commerce | | Long | | | | 0.40 | % | | | | Termination | | | | | 05/21/2024 | | | | | 69,000,000 | | | | | 13,795,726 | | | | | — | | | | | 13,795,726 | |
Shiller Barclays CAPE® US Sector II ER USD Index(1) | | Barclays Capital, Inc. | | Long | | | | 0.40 | % | | | | Termination | | | | | 10/17/2024 | | | | | 85,000,000 | | | | | 13,196,826 | | | | | — | | | | | 13,196,826 | |
Shiller Barclays CAPE® US Sector II ER USD Index(1) | | BNP Paribas Securities Corp. | | Long | | | | 0.39 | % | | | | Termination | | | | | 06/05/2024 | | | | | 65,000,000 | | | | | 12,866,764 | | | | | — | | | | | 12,866,764 | |
Shiller Barclays CAPE® US Sector II ER USD Index(1) | | Canadian Imperial Bank Of Commerce | | Long | | | | 0.40 | % | | | | Termination | | | | | 04/23/2024 | | | | | 75,000,000 | | | | | 12,749,539 | | | | | — | | | | | 12,749,539 | |
Shiller Barclays CAPE® US Sector II ER USD Index(1) | | Barclays Capital, Inc. | | Long | | | | 0.40 | % | | | | Termination | | | | | 06/27/2024 | | | | | 86,000,000 | | | | | 12,343,935 | | | | | — | | | | | 12,343,935 | |
Shiller Barclays CAPE® US Sector II ER USD Index(1) | | Barclays Capital, Inc. | | Long | | | | 0.40 | % | | | | Termination | | | | | 12/05/2024 | | | | | 80,000,000 | | | | | 12,304,821 | | | | | — | | | | | 12,304,821 | |
Shiller Barclays CAPE® US Sector II ER USD Index(1) | | Bank of America Securities, Inc. | | Long | | | | 0.38 | % | | | | Termination | | | | | 04/16/2024 | | | | | 64,000,000 | | | | | 11,964,636 | | | | | — | | | | | 11,964,636 | |
Shiller Barclays CAPE® US Sector II ER USD Index(1) | | Bank of America Securities, Inc. | | Long | | | | 0.38 | % | | | | Termination | | | | | 06/18/2024 | | | | | 80,000,000 | | | | | 11,749,744 | | | | | — | | | | | 11,749,744 | |
Shiller Barclays CAPE® US Sector II ER USD Index(1) | | Canadian Imperial Bank Of Commerce | | Long | | | | 0.40 | % | | | | Termination | | | | | 05/28/2024 | | | | | 62,000,000 | | | | | 11,665,158 | | | | | — | | | | | 11,665,158 | |
Shiller Barclays CAPE® US Sector II ER USD Index(1) | | BNP Paribas Securities Corp. | | Long | | | | 0.39 | % | | | | Termination | | | | | 10/09/2024 | | | | | 75,000,000 | | | | | 11,660,288 | | | | | — | | | | | 11,660,288 | |
Shiller Barclays CAPE® US Sector II ER USD Index(1) | | Bank of America Securities, Inc. | | Long | | | | 0.38 | % | | | | Termination | | | | | 11/19/2024 | | | | | 75,000,000 | | | | | 10,769,052 | | | | | — | | | | | 10,769,052 | |
Shiller Barclays CAPE® US Sector II ER USD Index(1) | | Barclays Capital, Inc. | | Long | | | | 0.40 | % | | | | Termination | | | | | 11/14/2024 | | | | | 55,000,000 | | | | | 10,666,821 | | | | | — | | | | | 10,666,821 | |
Shiller Barclays CAPE® US Sector II ER USD Index(1) | | Bank of America Securities, Inc. | | Long | | | | 0.38 | % | | | | Termination | | | | | 10/22/2024 | | | | | 72,000,000 | | | | | 10,360,560 | | | | | — | | | | | 10,360,560 | |
Shiller Barclays CAPE® US Sector II ER USD Index(1) | | Canadian Imperial Bank Of Commerce | | Long | | | | 0.40 | % | | | | Termination | | | | | 11/07/2024 | | | | | 60,000,000 | | | | | 10,212,266 | | | | | — | | | | | 10,212,266 | |
Shiller Barclays CAPE® US Sector II ER USD Index(1) | | BNP Paribas Securities Corp. | | Long | | | | 0.39 | % | | | | Termination | | | | | 10/30/2024 | | | | | 65,000,000 | | | | | 10,035,515 | | | | | — | | | | | 10,035,515 | |
Shiller Barclays CAPE® US Sector II ER USD Index(1) | | Bank of America Securities, Inc. | | Long | | | | 0.38 | % | | | | Termination | | | | | 12/10/2024 | | | | | 100,000,000 | | | | | 9,971,262 | | | | | — | | | | | 9,971,262 | |
Shiller Barclays CAPE® US Sector II ER USD Index(1) | | Barclays Capital, Inc. | | Long | | | | 0.40 | % | | | | Termination | | | | | 07/11/2024 | | | | | 88,000,000 | | | | | 9,895,971 | | | | | — | | | | | 9,895,971 | |
Shiller Barclays CAPE® US Sector II ER USD Index(1) | | Canadian Imperial Bank Of Commerce | | Long | | | | 0.40 | % | | | | Termination | | | | | 07/16/2024 | | | | | 96,000,000 | | | | | 9,828,593 | | | | | — | | | | | 9,828,593 | |
Shiller Barclays CAPE® US Sector II ER USD Index(1) | | Barclays Capital, Inc. | | Long | | | | 0.40 | % | | | | Termination | | | | | 09/12/2024 | | | | | 100,000,000 | | | | | 9,801,542 | | | | | — | | | | | 9,801,542 | |
Shiller Barclays CAPE® US Sector II ER USD Index(1) | | BNP Paribas Securities Corp. | | Long | | | | 0.39 | % | | | | Termination | | | | | 10/02/2024 | | | | | 80,000,000 | | | | | 8,940,236 | | | | | — | | | | | 8,940,236 | |
Shiller Barclays CAPE® US Sector II ER USD Index(1) | | Canadian Imperial Bank Of Commerce | | Long | | | | 0.40 | % | | | | Termination | | | | | 09/19/2024 | | | | | 88,000,000 | | | | | 8,860,191 | | | | | — | | | | | 8,860,191 | |
Shiller Barclays CAPE® US Sector II ER USD Index(1) | | BNP Paribas Securities Corp. | | Long | | | | 0.39 | % | | | | Termination | | | | | 12/18/2024 | | | | | 83,000,000 | | | | | 7,850,222 | | | | | — | | | | | 7,850,222 | |
| | | | |
| 78 | | DoubleLine Funds Trust | | The accompanying notes are an integral part of these financial statements. |
| | | | | | | | | | | | | | | | | | | | | | | | | | | | | | | | | | | | | | | | | | |
| | | | | | | | | |
| Excess Return Swaps | | | | | | | | | | | | | | | | | | |
| Reference Entity | | Counterparty | | Long/Short | | Financing
Rate | | Payment
Frequency | | Termination
Date | | Notional
Amount | | Value | | Upfront
Premiums
Paid/
(Received) | | Unrealized
Appreciation
(Depreciation) |
Shiller Barclays CAPE® US Sector II ER USD Index(1) | | BNP Paribas Securities Corp. | | Long | | | | 0.39 | % | | | | Termination | | | | | 08/14/2024 | | | | | 95,000,000 | | | | $ | 7,766,310 | | | | $ | — | | | | $ | 7,766,310 | |
Shiller Barclays CAPE® US Sector II ER USD Index(1) | | Bank of America Securities, Inc. | | Long | | | | 0.38 | % | | | | Termination | | | | | 11/26/2024 | | | | | 65,000,000 | | | | | 7,268,213 | | | | | — | | | | | 7,268,213 | |
Shiller Barclays CAPE® US Sector II ER USD Index(1) | | Barclays Capital, Inc. | | Long | | | | 0.40 | % | | | | Termination | | | | | 08/08/2024 | | | | | 95,000,000 | | | | | 7,227,053 | | | | | — | | | | | 7,227,053 | |
Shiller Barclays CAPE® US Sector II ER USD Index(1) | | Barclays Capital, Inc. | | Long | | | | 0.40 | % | | | | Termination | | | | | 08/22/2024 | | | | | 65,000,000 | | | | | 6,964,274 | | | | | — | | | | | 6,964,274 | |
Shiller Barclays CAPE® US Sector II ER USD Index(1) | | Barclays Capital, Inc. | | Long | | | | 0.40 | % | | | | Termination | | | | | 09/26/2024 | | | | | 77,000,000 | | | | | 6,652,296 | | | | | — | | | | | 6,652,296 | |
Shiller Barclays CAPE® US Sector II ER USD Index(1) | | BNP Paribas Securities Corp. | | Long | | | | 0.39 | % | | | | Termination | | | | | 07/24/2024 | | | | | 80,000,000 | | | | | 6,418,678 | | | | | — | | | | | 6,418,678 | |
Shiller Barclays CAPE® US Sector II ER USD Index(1) | | Bank of America Securities, Inc. | | Long | | | | 0.38 | % | | | | Termination | | | | | 09/03/2024 | | | | | 55,000,000 | | | | | 6,284,773 | | | | | — | | | | | 6,284,773 | |
Shiller Barclays CAPE® US Sector II ER USD Index(1) | | Bank of America Securities, Inc. | | Long | | | | 0.38 | % | | | | Termination | | | | | 07/30/2024 | | | | | 80,000,000 | | | | | 6,088,122 | | | | | — | | | | | 6,088,122 | |
Shiller Barclays CAPE® US Sector II ER USD Index(1) | | Bank of America Securities, Inc. | | Long | | | | 0.38 | % | | | | Termination | | | | | 08/13/2024 | | | | | 85,000,000 | | | | | 5,823,829 | | | | | — | | | | | 5,823,829 | |
Shiller Barclays CAPE® US Sector II ER USD Index(1) | | Canadian Imperial Bank Of Commerce | | Long | | | | 0.40 | % | | | | Termination | | | | | 02/18/2025 | | | | | 85,000,000 | | | | | 5,206,277 | | | | | — | | | | | 5,206,277 | |
Shiller Barclays CAPE® US Sector II ER USD Index(1) | | BNP Paribas Securities Corp. | | Long | | | | 0.39 | % | | | | Termination | | | | | 01/08/2025 | | | | | 100,000,000 | | | | | 5,178,196 | | | | | — | | | | | 5,178,196 | |
Shiller Barclays CAPE® US Sector II ER USD Index(1) | | BNP Paribas Securities Corp. | | Long | | | | 0.39 | % | | | | Termination | | | | | 08/28/2024 | | | | | 50,000,000 | | | | | 4,889,887 | | | | | — | | | | | 4,889,887 | |
Shiller Barclays CAPE® US Sector II ER USD Index(1) | | BNP Paribas Securities Corp. | | Long | | | | 0.39 | % | | | | Termination | | | | | 02/12/2025 | | | | | 86,000,000 | | | | | 4,278,962 | | | | | — | | | | | 4,278,962 | |
Shiller Barclays CAPE® US Sector II ER USD Index(1) | | Morgan Stanley | | Long | | | | 0.36 | % | | | | Termination | | | | | 01/07/2025 | | | | | 54,000,000 | | | | | 4,263,947 | | | | | — | | | | | 4,263,947 | |
Shiller Barclays CAPE® US Sector II ER USD Index(1) | | Morgan Stanley | | Long | | | | 0.36 | % | | | | Termination | | | | | 03/04/2025 | | | | | 78,000,000 | | | | | 4,210,285 | | | | | — | | | | | 4,210,285 | |
Shiller Barclays CAPE® US Sector II ER USD Index(1) | | Bank of America Securities, Inc. | | Long | | | | 0.38 | % | | | | Termination | | | | | 02/25/2025 | | | | | 80,000,000 | | | | | 4,113,706 | | | | | — | | | | | 4,113,706 | |
Shiller Barclays CAPE® US Sector II ER USD Index(1) | | Canadian Imperial Bank Of Commerce | | Long | | | | 0.40 | % | | | | Termination | | | | | 01/09/2025 | | | | | 97,000,000 | | | | | 3,959,411 | | | | | — | | | | | 3,959,411 | |
Shiller Barclays CAPE® US Sector II ER USD Index(1) | | Canadian Imperial Bank Of Commerce | | Long | | | | 0.40 | % | | | | Termination | | | | | 03/11/2025 | | | | | 75,000,000 | | | | | 2,862,792 | | | | | — | | | | | 2,862,792 | |
Shiller Barclays CAPE® US Sector II ER USD Index(1) | | Morgan Stanley | | Long | | | | 0.36 | % | | | | Termination | | | | | 02/04/2025 | | | | | 47,000,000 | | | | | 2,701,762 | | | | | — | | | | | 2,701,762 | |
Shiller Barclays CAPE® US Sector II ER USD Index(1) | | Canadian Imperial Bank Of Commerce | | Long | | | | 0.40 | % | | | | Termination | | | | | 03/20/2025 | | | | | 65,000,000 | | | | | 2,274,129 | | | | | — | | | | | 2,274,129 | |
Shiller Barclays CAPE® US Sector II ER USD Index(1) | | BNP Paribas Securities Corp. | | Long | | | | 0.39 | % | | | | Termination | | | | | 01/29/2025 | | | | | 64,000,000 | | | | | 2,206,275 | | | | | — | | | | | 2,206,275 | |
Shiller Barclays CAPE® US Sector II ER USD Index(1) | | Morgan Stanley | | Long | | | | 0.36 | % | | | | Termination | | | | | 01/14/2025 | | | | | 50,000,000 | | | | | 1,727,556 | | | | | — | | | | | 1,727,556 | |
Shiller Barclays CAPE® US Sector II ER USD Index(1) | | Bank of America Securities, Inc. | | Long | | | | 0.38 | % | | | | Termination | | | | | 04/08/2025 | | | | | 91,000,000 | | | | | 1,470,335 | | | | | — | | | | | 1,470,335 | |
Shiller Barclays CAPE® US Sector II ER USD Index(1) | | Canadian Imperial Bank Of Commerce | | Long | | | | 0.40 | % | | | | Termination | | | | | 04/01/2025 | | | | | 93,000,000 | | | | | 1,449,460 | | | | | — | | | | | 1,449,460 | |
Shiller Barclays CAPE® US Sector II ER USD Index(1) | | Bank of America Securities, Inc. | | Long | | | | 0.38 | % | | | | Termination | | | | | 03/25/2025 | | | | | 62,000,000 | | | | | 887,246 | | | | | — | | | | | 887,246 | |
| | | | | | | | | | | | | | | | | | | | | | | | | | | | | | | |
| | | | | | | | | | | | | | | | | | | | | | | | | | | $ | 404,068,626 | | | | $ | — | | | | $ | 404,068,626 | |
| | | | | | | | | | | | | | | | | | | | | | | | | | | | | | | |
| (1) | Shiller Barclays CAPE® US Sector II ER USD Index aims to provide notional long exposure to the top four United States equity sectors that are relatively undervalued, as defined by a modified version of the classic CAPE® Ratio (the “Relative CAPE® Indicator”) and that possess relatively strong price momentum over the prior twelve months. Each U.S. equity sector is represented by an index of equity securities of companies in the relevant sector. Information on the sector constituents as of March 31, 2024, is available on the Barclays Capital, Inc. website at https://indices.cib.barclays/IM/12/en/indices/details.app;ticker=BXIICS2E. |
| | | | | | | | |
| The accompanying notes are an integral part of these financial statements. | | Annual Report | | | | | March 31, 2024 | | 79 |
| | |
Schedule of Investments - Summary DoubleLine Flexible Income Fund | | March 31, 2024 |
| | | | | | | | | | | | | | | | | | | | |
PRINCIPAL
AMOUNT $ | | | SECURITY DESCRIPTION | | RATE | | | MATURITY | | | VALUE $ | | | % OF NET
ASSETS | |
| | ASSET BACKED OBLIGATIONS | |
| |
| | | | ExteNet LLC | |
| | 6,250,000 | | | Series 2019-1A-C | | | 5.22% | (b) | | | 07/25/2049 | | | | 6,184,799 | | | | 0.7% | |
| | | | | |
| | | | Pagaya AI Debt Selection Trust | | | | | | | | | | | | | | | | |
| | 5,499,701 | | | Series 2021-3-C | | | 3.27% | (b) | | | 05/15/2029 | | | | 4,790,280 | | | | 0.5% | |
| | | | | |
| | | | Vivant Solar Financing V Parent LLC | | | | | | | | | | | | | | | | |
| | 4,405,395 | | | Series 2018-1A-A | | | 4.73% | (b) | | | 04/30/2048 | | | | 4,113,898 | | | | 0.4% | |
| | |
| | Other Asset Backed Obligations(a) | | | | 29,944,968 | | | | 3.1% | |
| | | | | | | | | | | | | | | | | | | | |
| | | | Total Asset Backed Obligations
(Cost $55,337,606) | | | | | | | | | | | 45,033,945 | | | | 4.7% | |
| | | | | | | | | | | | | | | | | | | | |
| | BANK LOANS(a) | |
| | | | Total Bank Loans
(Cost $84,182,300) | | | | | | | | | | | 84,004,315 | | | | 8.8% | |
| | | | | | | | | | | | | | | | | | | | |
| | COLLATERALIZED LOAN OBLIGATIONS | |
| | | | | |
| | | | BlueMountain CLO Ltd. | | | | | | | | | | | | | | | | |
| | 3,770,000 | | | Series 2013-2A-DR (CME Term SOFR 3 Month + 3.16%) | | | 8.48% | (b) | | | 10/22/2030 | | | | 3,704,186 | | | | 0.4% | |
| | | | | |
| | | | Cathedral Lake CLO Ltd. | | | | | | | | | | | | | | | | |
| | 3,500,000 | | | Series 2021-8A-C (CME Term SOFR 3 Month + 2.88%, 2.62% Floor) | | | 8.20% | (b) | | | 01/20/2035 | | | | 3,544,197 | | | | 0.4% | |
| | | | | |
| | | | LCM LP | | | | | | | | | | | | | | | | |
| | 5,000,000 | | | Series 26A-D (CME Term SOFR 3 Month + 2.76%, 2.50% Floor) | | | 8.08% | (b) | | | 01/20/2031 | | | | 4,682,638 | | | | 0.5% | |
| | | | | |
| | | | Madison Park Funding Ltd. | | | | | | | | | | | | | | | | |
| | 4,500,000 | | | Series 2015-18A-BR (CME Term SOFR 3 Month + 1.86%) | | | 7.18% | (b) | | | 10/21/2030 | | | | 4,503,055 | | | | 0.5% | |
| | | | | |
| | | | Neuberger Berman CLO Ltd. | | | | | | | | | | | | | | | | |
| | 4,000,000 | | | Series 2017-16SA-DR (CME Term SOFR 3 Month + 3.16%, 2.90% Floor) | | | 8.48% | (b) | | | 04/15/2034 | | | | 3,991,812 | | | | 0.4% | |
| | | | | |
| | | | Octagon Investment Partners Ltd. | | | | | | | | | | | | | | | | |
| | 4,500,000 | | | Series 2012-1A-CRR (CME Term SOFR 3 Month + 4.16%, 3.90% Floor) | | | 9.48% | (b) | | | 07/15/2029 | | | | 4,516,974 | | | | 0.5% | |
| | 4,000,000 | | | Series 2018-1A-C (CME Term SOFR 3 Month + 2.86%, 2.60% Floor) | | | 8.18% | (b) | | | 01/20/2031 | | | | 3,848,878 | | | | 0.4% | |
| | | | | |
| | | | RR Ltd./Cayman Islands | | | | | | | | | | | | | | | | |
| | 4,000,000 | | | Series 2018-4A-C (CME Term SOFR 3 Month + 3.21%, 0.26% Floor) | | | 8.53% | (b) | | | 04/15/2030 | | | | 3,972,471 | | | | 0.4% | |
| | | | | |
| | | | Sound Point CLO Ltd. | | | | | | | | | | | | | | | | |
| | 6,000,000 | | | Series 2019-2A-DR (CME Term SOFR 3 Month + 3.56%, 3.30% Floor) | | | 8.88% | (b) | | | 07/15/2034 | | | | 5,689,881 | | | | 0.6% | |
| | 5,000,000 | | | Series 2020-2A-DR (CME Term SOFR 3 Month + 3.61%, 3.35% Floor) | | | 8.94% | (b) | | | 10/25/2034 | | | | 4,750,979 | | | | 0.5% | |
| | | | | |
| | | | Steele Creek CLO Ltd. | | | | | | | | | | | | | | | | |
| | 5,000,000 | | | Series 2019-2A-BR (CME Term SOFR 3 Month + 2.11%, 1.85% Floor) | | | 7.43% | (b) | | | 07/15/2032 | | | | 5,002,069 | | | | 0.5% | |
| | | | | |
| | | | Wind River CLO Ltd. | | | | | | | | | | | | | | | | |
| | 4,000,000 | | | Series 2014-2A-DR (CME Term SOFR 3 Month + 3.16%, 2.90% Floor) | | | 8.48% | (b) | | | 01/15/2031 | | | | 3,874,644 | | | | 0.4% | |
| | | | | |
| | | | Trimaran CAVU LLC | | | | | | | | | | | | | | | | |
| | 6,000,000 | | | Series 2019-1A-B (CME Term SOFR 3 Month + 2.46%, 2.20% Floor) | | | 7.78% | (b) | | | 07/20/2032 | | | | 6,004,896 | | | | 0.6% | |
| | | | | |
| | | | ING Investment Management CLO Ltd. | | | | | | | | | | | | | | | | |
| | 3,900,000 | | | Series 2013-1A-CR (CME Term SOFR 3 Month + 3.21%) | | | 8.53% | (b) | | | 10/15/2030 | | | | 3,810,414 | | | | 0.4% | |
| | |
| | Other Collateralized Loan Obligations(a) | | | | 105,337,990 | | | | 11.1% | |
| | | | | | | | | | | | | | | | | | | | |
| | | | Total Collateralized Loan Obligations
(Cost $170,880,163) | | | | | | | | | | | 167,235,084 | | | | 17.6% | |
| | | | | | | | | | | | | | | | | | | | |
| | FOREIGN CORPORATE BONDS(a) | |
| | | | Total Foreign Corporate Bonds
(Cost $54,911,347) | | | | | | | | | | | 49,092,640 | | | | 5.2% | |
| | | | | | | | | | | | | | | | | | | | |
| | FOREIGN GOVERNMENT BONDS, FOREIGN AGENCIES AND FOREIGN GOVERNMENT SPONSORED CORPORATIONS(a) | |
| | | | Total Foreign Government Bonds, Foreign Agencies and Foreign Government Sponsored Corporations
(Cost $12,110,775) | | | | 10,083,658 | | | | 1.1% | |
| | | | | | | | | | | | | | | | | | | | |
| | NON-AGENCY COMMERCIAL MORTGAGE BACKED OBLIGATIONS | |
| | 3,708,000 | | | JP Morgan Chase Commercial Mortgage Securities | | | 4.45% | (b)(e) | | | 05/05/2032 | | | | 3,681,777 | | | | 0.4% | |
| | | | Series 2019-UES-D | | | | | | | | | | | | | | | | |
| | | | Series 2019-UES-E | | | | | | | | | | | | | | | | |
| | | | Series 2019-UES-F | | | | | | | | | | | | | | | | |
| | | | Series 2019-UES-G | | | | | | | | | | | | | | | | |
| | |
| | Other Non-Agency Commercial Mortgage Backed Obligations (a) | | | | 84,041,113 | | | | 8.8% | |
| | | | | | | | | | | | | | | | | | | | |
| | | | Total Non-Agency Commercial Mortgage Backed Obligations
(Cost $116,446,593) | | | | | | | | | | | 87,722,890 | | | | 9.2% | |
| | | | | | | | | | | | | | | | | | | | |
| | | | |
| 80 | | DoubleLine Funds Trust | | The accompanying notes are an integral part of these financial statements. |
| | | | | | | | | | | | | | | | | | | | |
PRINCIPAL
AMOUNT $ | | | SECURITY DESCRIPTION | | RATE | | | MATURITY | | | VALUE $ | | | % OF NET
ASSETS | |
| | NON-AGENCY RESIDENTIAL COLLATERALIZED MORTGAGE OBLIGATIONS | |
| | | | | |
| | | | AMSR Trust | | | | | | | | | | | | | | | | |
| | 5,122,000 | | | Series 2021-SFR3-G | | | 3.80% | (b) | | | 10/17/2038 | | | | 4,564,472 | | | | 0.5% | |
| | | | | |
| | | | APS Resecuritization Trust | | | | | | | | | | | | | | | | |
| | 7,765,840 | | | Series 2015-3-1MZ (12 Month US Treasury Average + 0.96%, 0.96% Floor) | | | 4.47% | (b) | | | 10/27/2046 | | | | 6,633,234 | | | | 0.7% | |
| | | | | |
| | | | Credit Suisse Mortgage Capital Certificates | | | | | | | | | | | | | | | | |
| | 7,700,000 | | | Series 2020-RPL6-A2 | | | 3.40% | (b)(e) | | | 03/25/2059 | | | | 7,088,264 | | | | 0.7% | |
| | | | | |
| | | | Fannie Mae Connecticut Avenue Securities | | | | | | | | | | | | | | | | |
| | 6,200,000 | | | Series 2024-R01-1M2 (US 30 Day Average Secured Overnight Financing Rate + 1.80%, 1.80% Floor) | | | 7.12% | (b) | | | 01/25/2044 | | | | 6,241,917 | | | | 0.7% | |
| | | | | |
| | | | FirstKey Homes Trust | | | | | | | | | | | | | | | | |
| | 6,452,000 | | | Series 2021-SFR1-F1 | | | 3.24% | (b) | | | 08/17/2038 | | | | 5,822,276 | | | | 0.6% | |
| | | | | |
| | | | FMC GMSR Issuer Trust | | | | | | | | | | | | | | | | |
| | 8,000,000 | | | Series 2021-GT1-A | | | 3.62% | (b)(e) | | | 07/25/2026 | | | | 7,057,253 | | | | 0.7% | |
| | | | | |
| | | | Freddie Mac Structured Agency Credit Risk Debt Notes | | | | | | | | | | | | | | | | |
| | 4,300,000 | | | Series 2024-DNA1-M2 (US 30 Day Average Secured Overnight Financing Rate + 1.95%) | | | 7.27% | (b) | | | 02/25/2044 | | | | 4,318,757 | | | | 0.5% | |
| | 9,000,000 | | | Series 2024-HQA1-M2 (US 30 Day Average Secured Overnight Financing Rate + 2.00%) | | | 7.32% | (b) | | | 03/25/2044 | | | | 9,024,646 | | | | 0.9% | |
| | | | | |
| | | | Home Partners of America Trust | | | | | | | | | | | | | | | | |
| | 6,435,698 | | | Series 2019-2-F | | | 3.87% | (b) | | | 10/19/2039 | | | | 5,668,209 | | | | 0.6% | |
| | | | | |
| | | | Morgan Stanley Resecuritization Trust | | | | | | | | | | | | | | | | |
| | 7,380,795 | | | Series 2013-R7-8B (12 Month US Treasury Average + 0.96%, 0.96% Floor) | | | 6.04% | (b)(c) | | | 12/26/2046 | | | | 6,848,140 | | | | 0.7% | |
| | | | | |
| | | | Novastar Home Equity Loan | | | | | | | | | | | | | | | | |
| | 9,679,231 | | | Series 2006-3-A2C (CME Term SOFR 1 Month + 0.43%, 0.32% Floor, 11.00% Cap) | | | 5.76% | | | | 10/25/2036 | | | | 5,095,863 | | | | 0.5% | |
| | | | | |
| | | | Progress Residential Trust | | | | | | | | | | | | | | | | |
| | 7,500,000 | | | Series 2021-SFR2-F | | | 3.40% | (b) | | | 04/19/2038 | | | | 6,862,486 | | | | 0.7% | |
| | 8,100,000 | | | Series 2021-SFR3-F | | | 3.44% | (b) | | | 05/17/2026 | | | | 7,423,958 | | | | 0.8% | |
| | | | | |
| | | | Residential Mortgage Loan Trust | | | | | | | | | | | | | | | | |
| | 5,750,000 | | | Series 2020-1-B1 | | | 3.95% | (b)(e) | | | 01/26/2060 | | | | 4,908,327 | | | | 0.5% | |
| | | | | |
| | | | Structured Asset Securities Corp. | | | | | | | | | | | | | | | | |
| | 7,454,445 | | | Series 2007-OSI-A4 (CME Term SOFR 1 Month + 0.31%, 0.20% Floor) | | | 5.64% | | | | 06/25/2037 | | | | 4,809,154 | | | | 0.5% | |
| | 5,092,983 | | | Series 2007-RF1-1A (CME Term SOFR 1 Month + 0.30%, 0.19% Floor) | | | 5.63% | (b) | | | 03/25/2037 | | | | 4,111,514 | | | | 0.4% | |
| | | | | |
| | | | Toorak Mortgage Corp. | | | | | | | | | | | | | | | | |
| | 6,600,000 | | | Series 2021-1-A2 | | | 5.10% | (b)(d) | | | 06/25/2024 | | | | 6,430,118 | | | | 0.7% | |
| | | | | |
| | | | Tricon American Homes Trust | | | | | | | | | | | | | | | | |
| | 5,000,000 | | | Series 2019-SFR1-F | | | 3.75% | (b) | | | 03/17/2038 | | | | 4,732,995 | | | | 0.5% | |
| | | | | |
| | | | Verus Securitization Trust | | | | | | | | | | | | | | | | |
| | 5,000,000 | | | Series 2021-7-B1 | | | 4.14% | (b)(e) | | | 10/25/2066 | | | | 3,794,417 | | | | 0.4% | |
| | | | |
| | Other Non-Agency Residential Collateralized Mortgage Obligations(a) | | | | | | | | | | | 62,497,937 | | | | 6.6% | |
| | | | | | | | | | | | | | | | | | | | |
| | | | Total Non-Agency Residential Collateralized Mortgage Obligations
(Cost $208,214,860) | | | | | | | | | | | 173,933,937 | | | | 18.2% | |
| | | | | | | | | | | | | | | | | | | | |
| | US CORPORATE BONDS(a) | |
| | | | Total US Corporate Bonds
(Cost $38,461,245) | | | | | | | | | | | 36,688,390 | | | | 3.9% | |
| | | | | | | | | | | | | | | | | | | | |
| | US GOVERNMENT AND AGENCY MORTGAGE BACKED OBLIGATIONS | |
| |
| | | | Federal Home Loan Mortgage Corp. | |
| | 13,164,956 | | | Series 4851-PF (US 30 Day Average Secured Overnight Financing Rate + 0.51%, 0.40% Floor, 6.50% Cap) | | | 5.83% | | | | 08/15/2057 | | | | 12,756,786 | | | | 1.3% | |
| | 10,948,609 | | | Series 4944-F (US 30 Day Average Secured Overnight Financing Rate + 0.56%, 0.45% Floor, 6.50% Cap) | | | 5.88% | | | | 01/25/2050 | | | | 10,806,690 | | | | 1.1% | |
| | 7,450,128 | | | Series KF89-AS (US 30 Day Average Secured Overnight Financing Rate + 0.37%) | | | 5.69% | | | | 09/25/2030 | | | | 7,376,978 | | | | 0.8% | |
| | 16,829,178 | | | Federal Home Loan Mortgage Corp. | | | 1.02% – 5.93% | (f)(g) | | | 04/15/2040 – 09/25/2051 | | | | 7,421,504 | | | | 0.8% | |
| | | | | |
| | | | Federal National Mortgage Association | | | | | | | | | | | | | | | | |
| | 6,014,737 | | | Series 2013-12-FT (US 30 Day Average Secured Overnight Financing Rate + 0.46%, 0.35% Floor, 6.50% Cap) | | | 5.78% | | | | 02/25/2043 | | | | 5,888,144 | | | | 0.6% | |
| | 3,988,130 | | | Series 2018-86-MF (US 30 Day Average Secured Overnight Financing Rate + 0.41%, 0.30% Floor, 6.50% Cap) | | | 5.73% | | | | 12/25/2048 | | | | 3,924,196 | | | | 0.4% | |
| | 5,207,911 | | | Series 2022-43-FA (US 30 Day Average Secured Overnight Financing Rate + 0.55%, 0.55% Floor, 6.00% Cap) | | | 5.87% | | | | 07/25/2052 | | | | 4,917,245 | | | | 0.5% | |
| | 24,438,448 | | | Federal National Mortgage Association | | | 0.62% – 3.00% | (f)(g) | | | 05/25/2046 – 08/25/2050 | | | | 2,927,554 | | | | 0.3% | |
| | | | | | | | |
| The accompanying notes are an integral part of these financial statements. | | Annual Report | | | | | March 31, 2024 | | 81 |
| | |
Schedule of Investments - Summary DoubleLine Flexible Income Fund (Cont.) | | |
| | | | | | | | | | | | | | | | | | | | |
PRINCIPAL
AMOUNT $/
SHARES | | | SECURITY DESCRIPTION | | RATE | | | MATURITY | | | VALUE $ | | | % OF NET
ASSETS | |
| | | | | |
| | | | Government National Mortgage Association | | | | | | | | | | | | | | | | |
| | 35,285,790 | | | Series 2020-146-IJ | | | 2.50% | (f) | | | 10/20/2050 | | | | 4,169,390 | | | | 0.4% | |
| | 298,811,144 | | | Government National Mortgage Association | | | 0.00% – 1.03% | (e)(f)(g) | | | 10/20/2049 – 10/16/2065 | | | | 17,304,889 | | | | 1.8% | |
| | | | |
| | Other US Government and Agency Mortgage Backed Obligations(a) | | | | | | | | | | | 6,414,977 | | | | 0.8% | |
| | | | | | | | | | | | | | | | | | | | |
| | | | Total US Government and Agency Mortgage Backed Obligations
(Cost $92,446,027) | | | | | | | | | | | 83,908,353 | | | | 8.8% | |
| | | | | | | | | | | | | | | | | | | | |
| | US GOVERNMENT AND AGENCY OBLIGATIONS | |
| | 10,000,000 | | | United States Treasury Note/Bond | | | 3.13% | | | | 08/15/2025 | | | | 9,773,633 | | | | 1.0% | |
| | 50,000,000 | | | United States Treasury Note/Bond | | | 4.63% | | | | 02/28/2025 | | | | 49,799,073 | | | | 5.2% | |
| | | | | | | | | | | | | | | | | | | | |
| | | | Total US Government and Agency Obligations
(Cost $59,641,079) | | | | | | | | | | | 59,572,706 | | | | 6.3% | |
| | | | | | | | | | | | | | | | | | | | |
| | COMMON STOCKS(a)(i) | |
| | | | Total Common Stocks
(Cost $341,010) | | | | | | | | | | | 180,092 | | | | 0.0% | |
| | | | | | | | | | | | | | | | | | | | |
| | WARRANTS(a)(i) | |
| | | | Total Warrants
(Cost $—) | | | | | | | | | | | 663 | | | | 0.0% | |
| | | | | | | | | | | | | | | | | | | | |
| | SHORT TERM INVESTMENTS | |
| | 7,763,728 | | | First American Government Obligations Fund-U | | | 5.26% | (h) | | | | | | | 7,763,728 | | | | 0.8% | |
| | 7,763,728 | | | JPMorgan US Government Money Market Fund-IM | | | 5.25% | (h) | | | | | | | 7,763,728 | | | | 0.8% | |
| | 7,763,728 | | | MSILF Government Portfolio-Institutional | | | 5.22% | (h) | | | | | | | 7,763,728 | | | | 0.8% | |
| | 140,000,000 | | | United States Treasury Bill | | | 0.00% | | | | 05/02/2024 | | | | 139,364,130 | | | | 14.6% | |
| | | | | | | | | | | | | | | | | | | | |
| | | | Total Short Term Investments
(Cost $162,658,736) | | | | | | | | | | | 162,655,314 | | | | 17.0% | |
| | | | | | | | | | | | | | | | | | | | |
| | | | Total Investments
(Cost $1,055,631,741) | | | | | | | | | | | 960,111,987 | | | | 100.8% | |
| | | | Liabilities in Excess of Other Assets | | | | | | | | | | | (7,747,596 | ) | | | (0.8)% | |
| | | | | | | | | | | | | | | | | | | | |
| | | | NET ASSETS | | | | | | | | | | $ | 952,364,391 | | | | 100.0% | |
| | | | | | | | | | | | | | | | | | | | |
| | | | | |
| SECURITY TYPE BREAKDOWN as a % of Net Assets: | | | | | |
Non-Agency Residential Collateralized Mortgage Obligations | | | | 18.2% | |
Collateralized Loan Obligations | | | | 17.6% | |
Short Term Investments | | | | 17.0% | |
Non-Agency Commercial Mortgage Backed Obligations | | | | 9.2% | |
Bank Loans | | | | 8.8% | |
US Government and Agency Mortgage Backed Obligations | | | | 8.8% | |
US Government and Agency Obligations | | | | 6.3% | |
Foreign Corporate Bonds | | | | 5.2% | |
Asset Backed Obligations | | | | 4.7% | |
US Corporate Bonds | | | | 3.9% | |
Foreign Government Bonds, Foreign Agencies and Foreign Government Sponsored Corporations | | | | 1.1% | |
Common Stocks | | | | 0.0% | (i) |
Warrants | | | | 0.0% | (i) |
Other Assets and Liabilities | | | | (0.8)% | |
| | | | | |
Net Assets | | | | 100.0% | |
| | | | | |
| | | | | |
| INVESTMENT BREAKDOWN as a % of Net Assets: | | | | | |
Non-Agency Residential Collateralized Mortgage Obligations | | | | 18.2% | |
Collateralized Loan Obligations | | | | 17.6% | |
Short Term Investments | | | | 17.0% | |
Non-Agency Commercial Mortgage Backed Obligations | | | | 9.2% | |
US Government and Agency Mortgage Backed Obligations | | | | 8.8% | |
US Government and Agency Obligations | | | | 6.3% | |
Asset Backed Obligations | | | | 4.7% | |
Energy | | | | 1.6% | |
Utilities | | | | 1.4% | |
Electronics/Electric | | | | 1.4% | |
Healthcare | | | | 1.4% | |
Transportation | | | | 1.1% | |
Banking | | | | 1.1% | |
Hotels/Motels/Inns and Casinos | | | | 1.0% | |
Industrial Equipment | | | | 0.8% | |
Mining | | | | 0.7% | |
Media | | | | 0.6% | |
Chemicals/Plastics | | | | 0.6% | |
Retailers (other than Food/Drug) | | | | 0.6% | |
Consumer Products | | | | 0.6% | |
Telecommunications | | | | 0.6% | |
Commercial Services | | | | 0.6% | |
Finance | | | | 0.6% | |
Insurance | | | | 0.5% | |
Foreign Government Bonds, Foreign Agencies and Foreign Government Sponsored Corporations | | | | 0.5% | |
Construction | | | | 0.4% | |
Business Equipment and Services | | | | 0.4% | |
| | | | |
| 82 | | DoubleLine Funds Trust | | The accompanying notes are an integral part of these financial statements. |
| | | | | |
INVESTMENT BREAKDOWN as a % of Net Assets:
(Cont.) | | | | | |
Containers and Glass Products | | | | 0.3% | |
Aerospace & Defense | | | | 0.3% | |
Technology | | | | 0.3% | |
Leisure | | | | 0.3% | |
Building and Development (including Steel/Metals) | | | | 0.2% | |
Automotive | | | | 0.2% | |
Pharmaceuticals | | | | 0.2% | |
Food Products | | | | 0.2% | |
Diversified Manufacturing | | | | 0.2% | |
Chemical Products | | | | 0.1% | |
Real Estate | | | | 0.1% | |
Beverage and Tobacco | | | | 0.1% | |
Pulp & Paper | | | | 0.0% | (i) |
Environmental Control | | | | 0.0% | (i) |
Conglomerates | | | | 0.0% | (i) |
Food Service | | | | 0.0% | (i) |
Financial Intermediaries | | | | 0.0% | (i) |
Other Assets and Liabilities | | | | (0.8)% | |
| | | | | |
Net Assets | | | | 100.0% | |
| | | | | |
| (a) | Represents issues not identified as the top 50 holdings in terms of market value and issues or issuers not exceeding 1% of net assets individually or in aggregate, respectively as of period end. |
| (b) | Security exempt from registration under Rule 144A of the Securities Act of 1933. These securities may be resold in transactions exempt from registration to qualified institutional buyers. |
| (c) | Value determined using significant unobservable inputs. |
| (d) | Step Bond; Coupon rate changes based on a predetermined schedule or event. The interest rate shown is the rate in effect as of period end. |
| (e) | Includes securities where coupon rate is variable based on the weighted average coupon of the underlying collateral. To the extent the weighted average coupon of the underlying assets which comprise the collateral increases or decreases, the coupon rate of this security will increase or decrease correspondingly. The rate disclosed is as of period end. |
| (f) | Includes interest only securities |
| (g) | Includes inverse floating rate securities whose interest rate moves in the opposite direction of reference interest rates. Reference interest rates are typically based on a negative multiplier or slope. Interest rate may also be subject to a cap or floor. |
| (h) | Seven-day yield as of period end |
| (i) | Represents less than 0.05% of net assets |
| | | | | | | | |
| The accompanying notes are an integral part of these financial statements. | | Annual Report | | | | | March 31, 2024 | | 83 |
| | |
Schedule of Investments DoubleLine Low Duration Emerging Markets Fixed Income Fund | | March 31, 2024 |
| | | | | | | | | | | | | | | | |
PRINCIPAL
AMOUNT $ | | | SECURITY DESCRIPTION | | RATE | | | MATURITY | | | VALUE $ | |
| | FOREIGN CORPORATE BONDS 84.3% | |
| | |
| | BRAZIL 13.2% | | | | | | | | | | | | |
| | 3,800,000 | | | Braskem Netherlands Finance BV (5 Year CMT Rate + 8.22%) | | | 8.50% | | | | 01/23/2081 | | | | 3,813,814 | |
| | 376,000 | | | BRF GmbH | | | 4.35% | | | | 09/29/2026 | | | | 357,634 | |
| | 3,100,000 | | | Cosan Luxembourg SA | | | 7.00% | | | | 01/20/2027 | | | | 3,123,012 | |
| | 2,870,247 | | | Guara Norte SARL | | | 5.20% | | | | 06/15/2034 | | | | 2,621,023 | |
| | 105,102 | | | Invepar Holdings | | | 0.00% | (a)(b) | | | 12/30/2028 | | | | — | |
| | 550,000 | | | Itau Unibanco Holding SA/Cayman Island (5 Year CMT Rate + 3.45%) | | | 3.88% | | | | 04/15/2031 | | | | 525,815 | |
| | 1,200,000 | | | JBS USA LUX SA / JBS USA Food Co. / JBS USA Finance, Inc. | | | 2.50% | | | | 01/15/2027 | | | | 1,106,899 | |
| | 400,000 | | | JBS USA LUX SA / JBS USA Food Co. / JBS USA Finance, Inc. | | | 3.00% | | | | 02/02/2029 | | | | 354,462 | |
| | 1,300,000 | | | Minerva Luxembourg SA | | | 5.88% | | | | 01/19/2028 | | | | 1,258,582 | |
| | 2,552,129 | | | MV24 Capital BV | | | 6.75% | | | | 06/01/2034 | | | | 2,403,356 | |
| | 2,800,000 | | | NBM US Holdings, Inc. | | | 7.00% | | | | 05/14/2026 | | | | 2,812,930 | |
| | 708,175 | | | Prumo Participacoes e Investimentos S/A | | | 7.50% | | | | 12/31/2031 | | | | 707,800 | |
| | 1,200,000 | | | St Marys Cement, Inc. Canada | | | 5.75% | | | | 01/28/2027 | | | | 1,208,100 | |
| | 600,000 | | | Suzano International Finance BV | | | 4.00% | | | | 01/14/2025 | | | | 591,228 | |
| | | | | | | | | | | | | | | | |
| | | | | | | | | | | | | | | 20,884,655 | |
| | | | | | | | | | | | | | | | |
| | CHILE 9.4% | | | | | | | | | | | | |
| | 4,802,868 | | | Chile Electricity PEC SpA | | | 0.00% | (c) | | | 01/25/2028 | | | | 3,777,456 | |
| | 478,000 | | | Empresa Electrica Angamos SA | | | 4.88% | | | | 05/25/2029 | | | | 433,223 | |
| | 1,520,470 | | | Empresa Electrica Cochrane SpA | | | 5.50% | | | | 05/14/2027 | | | | 1,472,976 | |
| | 4,500,000 | | | Enel Generacion Chile SA | | | 4.25% | | | | 04/15/2024 | | | | 4,498,707 | |
| | 1,553,280 | | | GNL Quintero SA | | | 4.63% | | | | 07/31/2029 | | | | 1,520,624 | |
| | 700,000 | | | Mercury Chile Holdco LLC | | | 6.50% | (c) | | | 01/24/2027 | | | | 679,042 | |
| | 900,000 | | | Mercury Chile Holdco LLC | | | 6.50% | | | | 01/24/2027 | | | | 873,054 | |
| | 1,588,000 | | | Sociedad Quimica y Minera de Chile SA | | | 4.38% | | | | 01/28/2025 | | | | 1,569,046 | |
| | | | | | | | | | | | | | | | |
| | | | | | | | | | | | | | | 14,824,128 | |
| | | | | | | | | | | | | | | | |
| | COLOMBIA 7.2% | | | | | | | | | | | | |
| | 3,832,119 | | | AI Candelaria Spain SA | | | 7.50% | | | | 12/15/2028 | | | | 3,755,903 | |
| | 2,100,000 | | | Banco de Bogota SA | | | 6.25% | | | | 05/12/2026 | | | | 2,100,900 | |
| | 4,600,000 | | | Bancolombia SA (5 Year CMT Rate + 2.94%) | | | 4.63% | | | | 12/18/2029 | | | | 4,486,906 | |
| | 1,100,000 | | | Grupo de Inversiones Suramericana SA | | | 5.50% | | | | 04/29/2026 | | | | 1,078,748 | |
| | | | | | | | | | | | | | | | |
| | | | | | | | | | | | | | | 11,422,457 | |
| | | | | | | | | | | | | | | | |
| | GUATEMALA 2.7% | | | | | | | | | | | | |
| | 1,100,000 | | | Banco Industrial SA/Guatemala (5 Year CMT Rate + 4.44%) | | | 4.88% | | | | 01/29/2031 | | | | 1,054,614 | |
| | 1,350,000 | | | Millicom International Cellular SA | | | 6.63% | | | | 10/15/2026 | | | | 1,345,011 | |
| | 1,936,800 | | | Millicom International Cellular SA | | | 5.13% | | | | 01/15/2028 | | | | 1,838,709 | |
| | | | | | | | | | | | | | | | |
| | | | | | | | | | | | | | | 4,238,334 | |
| | | | | | | | | | | | | | | | |
| | INDIA 6.6% | | | | | | | | | | | | |
| | 1,204,000 | | | Adani International Container Terminal Pvt Ltd. | | | 3.00% | | | | 02/16/2031 | | | | 1,027,271 | |
| | 336,000 | | | Adani Ports & Special Economic Zone Ltd. | | | 3.38% | | | | 07/24/2024 | | | | 332,744 | |
| | 3,100,000 | | | Adani Ports & Special Economic Zone Ltd. | | | 4.00% | | | | 07/30/2027 | | | | 2,847,684 | |
| | 2,400,000 | | | Adani Transmission Step-One Ltd. | | | 4.00% | | | | 08/03/2026 | | | | 2,257,643 | |
| | | | | | | | | | | | | | | | |
PRINCIPAL
AMOUNT $ | | | SECURITY DESCRIPTION | | RATE | | | MATURITY | | | VALUE $ | |
| | 200,000 | | | Bharti Airtel Ltd. | | | 4.38% | | | | 06/10/2025 | | | | 196,789 | |
| | 644,000 | | | JSW Hydro Energy Ltd. | | | 4.13% | | | | 05/18/2031 | | | | 571,335 | |
| | 3,150,000 | | | Reliance Industries Ltd. | | | 4.13% | | | | 01/28/2025 | | | | 3,109,703 | |
| | | | | | | | | | | | | | | | |
| | | | | | | | | | | | | | | 10,343,169 | |
| | | | | | | | | | | | | | | | |
| | INDONESIA 8.6% | | | | | | | | | | | | |
| | 2,000,000 | | | Adaro Indonesia PT | | | 4.25% | | | | 10/31/2024 | | | | 1,974,895 | |
| | 400,000 | | | Freeport Indonesia PT | | | 4.76% | (c) | | | 04/14/2027 | | | | 391,553 | |
| | 1,800,000 | | | Freeport Indonesia PT | | | 4.76% | | | | 04/14/2027 | | | | 1,761,989 | |
| | 4,900,000 | | | Freeport-McMoRan, Inc. | | | 4.13% | | | | 03/01/2028 | | | | 4,691,176 | |
| | 967,750 | | | LLPL Capital Pte Ltd. | | | 6.88% | | | | 02/04/2039 | | | | 968,969 | |
| | 3,998,140 | | | Minejesa Capital BV | | | 4.63% | | | | 08/10/2030 | | | | 3,804,544 | |
| | | | | | | | | | | | | | | | |
| | | | | | | | | | | | | | | 13,593,126 | |
| | | | | | | | | | | | | | | | |
| | JAMAICA 0.0%(d) | | | | | | | | | | | | |
| | 56,495 | | | Digicel Group Holdings Ltd. | | | 0.00% | (b)(c) | | | 12/31/2030 | | | | 649 | |
| | 40,275 | | | Digicel Group Holdings Ltd. | | | 0.00% | (b)(c) | | | 12/31/2030 | | | | 37,191 | |
| | 201,875 | | | Digicel Group Holdings Ltd. | | | 0.00% | (b)(c) | | | 12/31/2030 | | | | 31,189 | |
| | 576 | | | Digicel Group Holdings Ltd. | | | 0.00% | (b)(c) | | | 12/31/2030 | | | | 465 | |
| | | | | | | | | | | | | | | | |
| | | | | | | | | | | | | | | 69,494 | |
| | | | | | | | | | | | | | | | |
| | KOREA 1.9% | | | | | | | | | | | | |
| | 3,000,000 | | | LG Chem Ltd. | | | 3.25% | | | | 10/15/2024 | | | | 2,960,632 | |
| | | | | | | | | | | | | | | | |
| | | | | | | | | | | | | | | 2,960,632 | |
| | | | | | | | | | | | | | | | |
| | KUWAIT 2.3% | | | | | | | | | | | | |
| | 400,000 | | | MEGlobal BV | | | 4.25% | | | | 11/03/2026 | | | | 385,587 | |
| | 3,400,000 | | | MEGlobal Canada ULC | | | 5.00% | | | | 05/18/2025 | | | | 3,361,464 | |
| | | | | | | | | | | | | | | | |
| | | | | | | | | | | | | | | 3,747,051 | |
| | | | | | | | | | | | | | | | |
| | MALAYSIA 0.8% | | | | | | | | | | | | |
| | 1,244,000 | | | Axiata SPV2 Bhd | | | 4.36% | | | | 03/24/2026 | | | | 1,219,684 | |
| | | | | | | | | | | | | | | | |
| | | | | | | | | | | | | | | 1,219,684 | |
| | | | | | | | | | | | | | | | |
| | MEXICO 5.9% | | | | | | | | | | | | |
| | 1,200,000 | | | Banco Santander Mexico SA Institucion de Banca Multiple Grupo Financiero Santand
(5 Year CMT Rate + 3.00%) | | | 7.53% | | | | 10/01/2028 | | | | 1,248,956 | |
| | 1,800,000 | | | BBVA Bancomer SA/Texas (5 Year CMT Rate + 3.00%) | | | 5.35% | | | | 11/12/2029 | | | | 1,784,594 | |
| | 2,450,000 | | | BBVA Bancomer SA/Texas (5 Year CMT Rate + 2.65%) | | | 5.13% | | | | 01/18/2033 | | | | 2,278,475 | |
| | 2,000,000 | | | Industrias Penoles SAB de CV | | | 4.15% | | | | 09/12/2029 | | | | 1,871,677 | |
| | 2,168,172 | | | Mexico Generadora de Energia S de RL | | | 5.50% | | | | 12/06/2032 | | | | 2,136,165 | |
| | | | | | | | | | | | | | | | |
| | | | | | | | | | | | | | | 9,319,867 | |
| | | | | | | | | | | | | | | | |
| | PANAMA 1.6% | | | | | | | | | | | | |
| | 1,877,000 | | | Global Bank Corp.
(3 Month LIBOR USD + 3.30%) | | | 5.25% | (e) | | | 04/16/2029 | | | | 1,727,527 | |
| | 800,000 | | | Multibank, Inc. | | | 7.75% | (c) | | | 02/03/2028 | | | | 808,042 | |
| | | | | | | | | | | | | | | | |
| | | | | | | | | | | | | | | 2,535,569 | |
| | | | | | | | | | | | | | | | |
| | PARAGUAY 1.5% | | | | | | | | | | | | |
| | 1,050,000 | | | Banco Continental SAECA | | | 2.75% | | | | 12/10/2025 | | | | 990,682 | |
| | 1,482,000 | | | Telefonica Celular del Paraguay SA | | | 5.88% | | | | 04/15/2027 | | | | 1,441,505 | |
| | | | | | | | | | | | | | | | |
| | | | | | | | | | | | | | | 2,432,187 | |
| | | | | | | | | | | | | | | | |
| | | | |
| 84 | | DoubleLine Funds Trust | | The accompanying notes are an integral part of these financial statements. |
| | | | | | | | | | | | | | | | |
PRINCIPAL
AMOUNT $ | | | SECURITY DESCRIPTION | | RATE | | | MATURITY | | | VALUE $ | |
| | PERU 11.9% | | | | | | | | | | | | |
| | 200,000 | | | Banco de Credito del Peru SA | | | 5.85% | (c) | | | 01/11/2029 | | | | 202,449 | |
| | 2,100,000 | | | Banco de Credito del Peru SA (5 Year CMT Rate + 3.00%) | | | 3.13% | | | | 07/01/2030 | | | | 2,012,552 | |
| | 2,000,000 | | | Banco de Credito del Peru SA (5 Year CMT Rate + 2.45%) | | | 3.25% | (c) | | | 09/30/2031 | | | | 1,848,525 | |
| | 1,400,000 | | | Banco Internacional del Peru SAA Interbank (5 Year CMT Rate + 3.71%) | | | 4.00% | | | | 07/08/2030 | | | | 1,345,546 | |
| | 500,000 | | | Camposol SA | | | 6.00% | | | | 02/03/2027 | | | | 385,926 | |
| | 1,200,000 | | | Cia de Minas Buenaventura SAA | | | 5.50% | | | | 07/23/2026 | | | | 1,158,459 | |
| | 2,675,000 | | | Fenix Power Peru SA | | | 4.32% | | | | 09/20/2027 | | | | 2,577,697 | |
| | 316,000 | | | Hunt Oil Co. of Peru LLC Sucursal Del Peru | | | 6.38% | (c) | | | 06/01/2028 | | | | 313,049 | |
| | 2,355,000 | | | Inkia Energy Ltd. | | | 5.88% | | | | 11/09/2027 | | | | 2,306,585 | |
| | 240,000 | | | Intercorp Financial Services, Inc. | | | 4.13% | | | | 10/19/2027 | | | | 225,815 | |
| | 118,262 | | | Interoceanica IV Finance Ltd. Series 2007 | | | 0.00% | | | | 11/30/2025 | | | | 111,610 | |
| | 2,300,000 | | | Kallpa Generacion SA | | | 4.88% | | | | 05/24/2026 | | | | 2,246,123 | |
| | 1,885,000 | | | Orazul Energy Peru SA | | | 5.63% | | | | 04/28/2027 | | | | 1,786,678 | |
| | 658,000 | | | Southern Copper Corp. | | | 3.88% | | | | 04/23/2025 | | | | 645,322 | |
| | 1,600,000 | | | Transportadora de Gas del Peru SA | | | 4.25% | | | | 04/30/2028 | | | | 1,557,168 | |
| | | | | | | | | | | | | | | | |
| | | | | | | | | | | | | | | 18,723,504 | |
| | | | | | | | | | | | | | | | |
| | SINGAPORE 6.7% | | | | | | | | | | | | |
| | 4,000,000 | | | DBS Group Holdings Ltd. (5 Year CMT Rate + 1.10%) | | | 1.82% | | | | 03/10/2031 | | | | 3,724,101 | |
| | 3,500,000 | | | Oversea-Chinese Banking Corp. Ltd.
(5 Year CMT Rate + 1.58%) | | | 1.83% | | | | 09/10/2030 | | | | 3,309,419 | |
| | 3,800,000 | | | United Overseas Bank Ltd. (5 Year CMT Rate + 1.52%) | | | 1.75% | | | | 03/16/2031 | | | | 3,528,650 | |
| | | | | | | | | | | | | | | | |
| | | | | | | | | | | | | | | 10,562,170 | |
| | | | | | | | | | | | | | | | |
| | SOUTH AFRICA 3.2% | | | | | | | | | | | | |
| | 650,000 | | | AngloGold Ashanti Holdings PLC | | | 3.38% | | | | 11/01/2028 | | | | 585,479 | |
| | 2,300,000 | | | Gold Fields Orogen Holdings BVI Ltd. | | | 5.13% | | | | 05/15/2024 | | | | 2,292,820 | |
| | 2,300,000 | | | Sasol Financing USA LLC | | | 4.38% | | | | 09/18/2026 | | | | 2,177,068 | |
| | | | | | | | | | | | | | | | |
| | | | | | | | | | | | | | | 5,055,367 | |
| | | | | | | | | | | | | | | | |
| | UNITED ARAB EMIRATES 0.2% | | | | | | | | | | | | |
| | 323,300 | | | Galaxy Pipeline Assets Bidco Ltd. | | | 1.75% | | | | 09/30/2027 | | | | 303,638 | |
| | | | | | | | | | | | | | | | |
| | | | | | | | | | | | | | | 303,638 | |
| | | | | | | | | | | | | | | | |
| | VIETNAM 0.6% | | | | | | | | | | | | |
| | 922,290 | | | Mong Duong Finance Holdings BV | | | 5.13% | | | | 05/07/2029 | | | | 882,424 | |
| | | | | | | | | | | | | | | | |
| | | | | | | | | | | | | | | 882,424 | |
| | | | | | | | | | | | | | | | |
| | | | Total Foreign Corporate Bonds (Cost $135,263,202) | | | | | | | | | | | 133,117,456 | |
| | | | | | | | | | | | | | | | |
| | | | | | | | | | | | | | | | |
PRINCIPAL
AMOUNT $ | | | SECURITY DESCRIPTION | | RATE | | | MATURITY | | | VALUE $ | |
| FOREIGN GOVERNMENT BONDS, FOREIGN AGENCIES AND FOREIGN
GOVERNMENT SPONSORED CORPORATIONS 14.0% |
|
| | |
| | BRAZIL 0.7% | | | | | | | | | | | | |
| | 1,100,000 | | | Petrobras Global Finance BV | | | 7.38% | | | | 01/17/2027 | | | | 1,144,263 | |
| | | | | | | | | | | | | | | | |
| | COLOMBIA 2.4% | | | | | | | | | | | | |
| | 1,500,000 | | | Colombia Government International Bond | | | 4.50% | | | | 01/28/2026 | | | | 1,469,677 | |
| | 2,500,000 | | | Oleoducto Central SA | | | 4.00% | | | | 07/14/2027 | | | | 2,337,881 | |
| | | | | | | | | | | | | | | | |
| | | | | | | | | | | | | | | 3,807,558 | |
| | | | | | | | | | | | | | | | |
| | DOMINICAN REPUBLIC 0.4% | | | | | | | | | | | | |
| | 700,000 | | | Dominican Republic International Bond | | | 5.50% | | | | 01/27/2025 | | | | 696,500 | |
| | | | | | | | | | | | | | | | |
| | INDIA 1.9% | | | | | | | | | | | | |
| | 1,000,000 | | | ONGC Videsh Ltd. | | | 4.63% | | | | 07/15/2024 | | | | 996,014 | |
| | 2,000,000 | | | ONGC Videsh Vankorneft Pte Ltd. | | | 3.75% | | | | 07/27/2026 | | | | 1,927,682 | |
| | | | | | | | | | | | | | | | |
| | | | | | | | | | | | | | | 2,923,696 | |
| | | | | | | | | | | | | | | | |
| | INDONESIA 0.8% | | | | | | | | | | | | |
| | 1,300,000 | | | Indonesia Asahan Aluminium PT / Mineral Industri Indonesia Persero PT | | | 4.75% | | | | 05/15/2025 | | | | 1,284,294 | |
| | | | | | | | | | | | | | | | |
| | KOREA 0.9% | | | | | | | | | | | | |
| | 500,000 | | | Korea Hydro & Nuclear Power Co. Ltd. | | | 1.25% | (c) | | | 04/27/2026 | | | | 461,245 | |
| | 1,000,000 | | | Korea Southern Power Co. Ltd. | | | 0.75% | (c) | | | 01/27/2026 | | | | 922,855 | |
| | | | | | | | | | | | | | | | |
| | | | | | | | | | | | | | | 1,384,100 | |
| | | | | | | | | | | | | | | | |
| | MALAYSIA 1.8% | | | | | | | | | | | | |
| | 3,000,000 | | | TNB Global Ventures Capital Bhd | | | 3.24% | | | | 10/19/2026 | | | | 2,855,022 | |
| | | | | | | | | | | | | | | | |
| | MEXICO 2.0% | | | | | | | | | | | | |
| | 3,400,000 | | | Banco Nacional de Comercio Exterior SNC/Cayman Islands (5 Year CMT Rate + 2.00%) | | | 2.72% | | | | 08/11/2031 | | | | 3,079,717 | |
| | | | | | | | | | | | | | | | |
| | PARAGUAY 0.5% | | | | | | | | | | | | |
| | 824,353 | | | Bioceanico Sovereign Certificate Ltd. | | | 0.00% | | | | 06/05/2034 | | | | 606,030 | |
| | 200,000 | | | Paraguay Government International Bond | | | 4.70% | | | | 03/27/2027 | | | | 195,077 | |
| | | | | | | | | | | | | | | | |
| | | | | | | | | | | | | | | 801,107 | |
| | | | | | | | | | | | | | | | |
| | PERU 1.8% | | | | | | | | | | | | |
| | 1,959,000 | | | Corp. Financiera de Desarrollo SA (3 Month LIBOR USD + 5.61%) | | | 5.25% | (e) | | | 07/15/2029 | | | | 1,957,374 | |
| | 917,189 | | | Lima Metro Line 2 Finance Ltd. | | | 5.88% | | | | 07/05/2034 | | | | 910,624 | |
| | | | | | | | | | | | | | | | |
| | | | | | | | | | | | | | | 2,867,998 | |
| | | | | | | | | | | | | | | | |
| | SOUTH AFRICA 0.8% | | | | | | | | | | | | |
| | 1,300,000 | | | Republic of South Africa Government International Bond | | | 4.88% | | | | 04/14/2026 | | | | 1,267,621 | |
| | | | | | | | | | | | | | | | |
| | | | Total Foreign Government Bonds, Foreign Agencies and Foreign Government Sponsored Corporations (Cost $22,401,826) | | | | 22,111,876 | |
| | | | | | | | | | | | | | | | |
| | | | | | | | |
| The accompanying notes are an integral part of these financial statements. | | Annual Report | | | | | March 31, 2024 | | 85 |
| | |
Schedule of Investments DoubleLine Low Duration Emerging Markets Fixed Income Fund (Cont.) | | |
| | | | | | | | | | | | | | | | |
SHARES | | | SECURITY DESCRIPTION | | RATE | | | | | | VALUE $ | |
| | SHORT TERM INVESTMENTS 0.9% | | | | | |
| | 492,515 | | | First American Government Obligations Fund - U | | | 5.26% | (f) | | | | | | | 492,515 | |
| | 492,515 | | | JPMorgan US Government Money Market Fund - IM | | | 5.25% | (f) | | | | | | | 492,515 | |
| | 492,515 | | | MSILF Government Portfolio -Institutional | | | 5.22% | (f) | | | | | | | 492,515 | |
| | | | | | | | | | | | | | | | |
| | | | Total Short Term Investments
(Cost $1,477,545) | | | | 1,477,545 | |
| | | | | | | | | | | | | | | | |
| | | | Total Investments 99.2%
(Cost $159,142,573) | | | | 156,706,877 | |
| | | | Other Assets in Excess of Liabilities 0.8% | | | | 1,201,437 | |
| | | | | | | | | | | | | | | | |
| | | | NET ASSETS 100.0% | | | $ | 157,908,314 | |
| | | | | | | | | | | | | | | | |
| | | | | | | | | | | | | | | | |
| | | | | |
| SECURITY TYPE BREAKDOWN as a % of Net Assets: | | | | | |
Foreign Corporate Bonds | | | | 84.3% | |
Foreign Government Bonds, Foreign Agencies and Foreign Government Sponsored Corporations | | | | 14.0% | |
Short Term Investments | | | | 0.9% | |
Other Assets and Liabilities | | | | 0.8% | |
| | | | | |
Net Assets | | | | 100.0% | |
| | | | | |
| | | | | |
| INVESTMENT BREAKDOWN as a % of Net Assets: | | | | | |
Banking | | | | 24.2% | |
Utilities | | | | 22.5% | |
Mining | | | | 10.5% | |
Transportation | | | | 10.0% | |
Energy | | | | 7.9% | |
Consumer Products | | | | 4.8% | |
Chemical Products | | | | 4.8% | |
Chemicals/Plastics | | | | 4.3% | |
Telecommunications | | | | 3.9% | |
Foreign Government Bonds, Foreign Agencies and Foreign Government Sponsored Corporations | | | | 2.3% | |
Food Products | | | | 1.2% | |
Short Term Investments | | | | 0.9% | |
Building and Development (including Steel/Metals) | | | | 0.8% | |
Finance | | | | 0.7% | |
Pulp & Paper | | | | 0.4% | |
Other Assets and Liabilities | | | | 0.8% | |
| | | | | |
Net Assets | | | | 100.0% | |
| | | | | |
| | | | | |
| | | | | |
| COUNTRY BREAKDOWN as a % of Net Assets: | | | | | |
Brazil | | | | 13.9% | |
Peru | | | | 13.7% | |
Colombia | | | | 9.6% | |
Chile | | | | 9.4% | |
Indonesia | | | | 9.4% | |
India | | | | 8.5% | |
Mexico | | | | 7.9% | |
Singapore | | | | 6.7% | |
South Africa | | | | 4.0% | |
Korea | | | | 2.8% | |
Guatemala | | | | 2.7% | |
Malaysia | | | | 2.6% | |
Kuwait | | | | 2.3% | |
Paraguay | | | | 2.0% | |
Panama | | | | 1.6% | |
United States | | | | 0.9% | |
Vietnam | | | | 0.6% | |
Dominican Republic | | | | 0.4% | |
United Arab Emirates | | | | 0.2% | |
Jamaica | | | | 0.0% | (d) |
Other Assets and Liabilities | | | | 0.8% | |
| | | | | |
Net Assets | | | | 100.0% | |
| | | | | |
| (a) | Security is in default or has failed to make a scheduled payment. Income is not being accrued. |
| (b) | Value determined using significant unobservable inputs. |
| (c) | Security exempt from registration under Rule 144A of the Securities Act of 1933. These securities may be resold in transactions exempt from registration to qualified institutional buyers. |
| (d) | Represents less than 0.05% of net assets. |
| (e) | Securities referencing LIBOR are expected to transition to an alternative reference rate by the security’s next scheduled coupon reset date. |
| (f) | Seven-day yield as of period end. |
| | | | |
| 86 | | DoubleLine Funds Trust | | The accompanying notes are an integral part of these financial statements. |
| | |
Schedule of Investments DoubleLine Long Duration Total Return Bond Fund | | March 31, 2024 |
| | | | | | | | | | | | | | | | |
PRINCIPAL
AMOUNT $ | | | SECURITY DESCRIPTION | | RATE | | | MATURITY | | | VALUE $ | |
| US GOVERNMENT AND AGENCY MORTGAGE BACKED
OBLIGATIONS 77.2% |
|
| |
| | | | Federal Home Loan Mortgage Corp. | |
| | 1,373,487 | | | Series 4057-ZB | | | 3.50% | | | | 06/15/2042 | | | | 1,267,561 | |
| | 1,386,928 | | | Series 4194-ZL | | | 3.00% | (a) | | | 04/15/2043 | | | | 1,207,127 | |
| | 2,190,391 | | | Series 4206-LZ | | | 3.50% | (a) | | | 05/15/2043 | | | | 1,937,967 | |
| | 2,977,608 | | | Series 4390-NZ | | | 3.00% | (a) | | | 09/15/2044 | | | | 2,588,195 | |
| | 1,061,513 | | | Series 4460-KB | | | 3.50% | | | | 03/15/2045 | | | | 928,148 | |
| | 575,542 | | | Series 4839-WO | | | 0.00% | (b) | | | 08/15/2056 | | | | 403,112 | |
| | 2,000,000 | | | Series 4994-AV | | | 2.00% | | | | 12/25/2045 | | | | 1,542,116 | |
| | 1,841,303 | | | Series 5105-GZ | | | 2.50% | (a) | | | 05/25/2051 | | | | 1,160,751 | |
| | 1,283,335 | | | Series 5145-HZ | | | 3.00% | (a) | | | 09/25/2051 | | | | 766,961 | |
| | 1,884,504 | | | Series 5155-JZ | | | 3.00% | (a) | | | 10/25/2051 | | | | 1,120,836 | |
| | 1,716,439 | | | Series 5155-KZ | | | 3.00% | (a) | | | 10/25/2051 | | | | 1,057,158 | |
| | 1,531,494 | | | Series 5160-ZY | | | 3.00% | (a) | | | 10/25/2050 | | | | 1,059,109 | |
| | 1,844,556 | | | Series 5171-Z | | | 2.00% | (a) | | | 12/25/2051 | | | | 978,964 | |
| | 1,376,636 | | | Series 5319-PO | | | 0.00% | (b) | | | 08/25/2050 | | | | 950,950 | |
| | 358,278 | | | Series 5326-UO | | | 0.00% | (b) | | | 10/25/2050 | | | | 241,200 | |
| |
| | | | Federal National Mortgage Association | |
| | 1,000,000 | | | Pool AN7330 | | | 3.26% | | | | 12/01/2037 | | | | 845,373 | |
| | 1,500,000 | | | Pool BL2643 | | | 3.39% | | | | 07/01/2034 | | | | 1,327,249 | |
| | 967,000 | | | Pool BS7220 | | | 5.23% | | | | 11/01/2032 | | | | 997,844 | |
| | 1,274,553 | | | Series 2012-103-ZP | | | 3.00% | (a) | | | 09/25/2042 | | | | 945,729 | |
| | 1,260,000 | | | Series 2012-128-UC | | | 2.50% | | | | 11/25/2042 | | | | 933,649 | |
| | 641,186 | | | Series 2013-66-ZK | | | 3.00% | (a) | | | 07/25/2043 | | | | 461,500 | |
| | 1,648,366 | | | Series 2013-74-ZH | | | 3.50% | | | | 07/25/2043 | | | | 1,509,090 | |
| | 1,548,033 | | | Series 2014-42-BZ | | | 3.00% | (a) | | | 07/25/2044 | | | | 1,323,487 | |
| | 379,115 | | | Series 2014-68-TD | | | 3.00% | | | | 11/25/2044 | | | | 339,142 | |
| | 487,742 | | | Series 2014-80-KL | | | 2.00% | | | | 05/25/2043 | | | | 324,940 | |
| | 761,813 | | | Series 2016-64-SA (-1 x US 30 Day Average Secured Overnight Financing Rate + 5.89%, 6.00% Cap) | | | 0.57% | (c)(d) | | | 09/25/2046 | | | | 74,203 | |
| | 228,495 | | | Series 2018-21-PO | | | 0.00% | (b) | | | 04/25/2048 | | | | 173,011 | |
| | 2,791,538 | | | Series 2019-68-ZL | | | 2.50% | (a) | | | 11/25/2049 | | | | 2,089,523 | |
| | 1,604,000 | | | Series 2020-57-LJ | | | 2.00% | | | | 08/25/2050 | | | | 1,145,766 | |
| | 1,806,807 | | | Series 2021-17-SB (-1 x US 30 Day Average Secured Overnight Financing Rate + 3.30%, 3.30% Cap) | | | 0.00% | (c)(d) | | | 04/25/2051 | | | | 31,538 | |
| | 1,781,808 | | | Series 2021-93-Z | | | 3.00% | (a) | | | 08/25/2051 | | | | 1,168,976 | |
| | 3,178,000 | | | Series 2023-M1-2A2 | | | 3.95% | (e) | | | 07/25/2040 | | | | 2,850,824 | |
| |
| | | | Government National Mortgage Association | |
| | 240,018 | | | Series 2013-180-LO | | | 0.00% | (b) | | | 11/16/2043 | | | | 182,498 | |
| | 3,813,977 | | | Series 2015-53-EZ | | | 2.00% | (a) | | | 04/16/2045 | | | | 2,322,101 | |
| | 3,484,011 | | | Series 2015-79-VZ | | | 2.50% | (a) | | | 05/20/2045 | | | | 2,889,569 | |
| | 345,147 | | | Series 2016-12-MZ | | | 3.00% | (a) | | | 01/20/2046 | | | | 267,172 | |
| | 1,177,857 | | | Series 2017-122-CZ | | | 3.00% | (a) | | | 08/20/2047 | | | | 900,476 | |
| | 1,608,685 | | | Series 2021-105-JS (-1 x US 30 Day Average Secured Overnight Financing Rate + 3.65%, 3.65% Cap) | | | 0.00% | (c)(d) | | | 06/20/2051 | | | | 39,057 | |
| | 1,357,117 | | | Series 2021-223-EZ | | | 3.00% | (a) | | | 12/20/2051 | | | | 982,223 | |
| | 757,957 | | | Series 2021-42-SB (-1 x CME Term SOFR 1 Month + 6.24%, 6.35% Cap) | | | 0.91% | (c)(d) | | | 03/20/2051 | | | | 102,043 | |
| | 1,663,924 | | | Series 2021-89-SA (-1 x CME Term SOFR 1 Month + 3.64%, 3.75% Cap) | | | 0.00% | (c)(d) | | | 05/20/2051 | | | | 40,268 | |
| | 364,280 | | | Series 2022-160-DZ | | | 4.50% | (a) | | | 09/20/2052 | | | | 282,620 | |
| | 1,764,513 | | | Series 2022-9-MZ | | | 3.50% | (a) | | | 01/20/2052 | | | | 1,299,456 | |
| | 1,052,000 | | | Series 2022-99-QG | | | 3.50% | | | | 01/20/2052 | | | | 889,901 | |
| | 858,585 | | | Series 2023-140-PO | | | 0.00% | (b) | | | 06/20/2048 | | | | 537,551 | |
| | 1,292,000 | | | Series 2023-81-YJ | | | 3.50% | | | | 06/20/2053 | | | | 1,106,906 | |
| |
| | | | Seasoned Credit Risk Transfer Trust | |
| | 1,005,000 | | | Series 2021-2-MBU | | | 2.50% | | | | 11/25/2060 | | | | 672,939 | |
| | | | | | | | | | | | | | | | |
| | | | Total US Government and Agency Mortgage Backed Obligations (Cost $51,120,493) | | | | 46,266,779 | |
| | | | | | | | | | | | | |
| | | | | | | | | | | | | | | | |
PRINCIPAL
AMOUNT $/
SHARES | | | SECURITY DESCRIPTION | | RATE | | | MATURITY | | | VALUE $ | |
| | US GOVERNMENT AND AGENCY OBLIGATIONS 19.0% | |
| | 6,700,000 | | | United States Treasury Note/Bond | | | 4.25% | | | | 02/15/2054 | | | | 6,590,601 | |
| | 2,000,000 | | | United States Treasury Note/Bond | | | 4.13% | | | | 02/15/2027 | | | | 1,983,359 | |
| | 2,800,000 | | | United States Treasury Note/Bond | | | 4.50% | | | | 02/15/2044 | | | | 2,816,187 | |
| | | | | | | | | | | | | | | | |
| | | | Total US Government and Agency Obligations (Cost $11,337,792) | | | | 11,390,147 | |
| | | | | | | | | | | | | |
| | SHORT TERM INVESTMENTS 2.0% | |
| | 390,092 | | | First American Government Obligations Fund - U | | | 5.26% | (f) | | | | | | | 390,092 | |
| | 390,092 | | | JPMorgan US Government Money Market Fund - IM | | | 5.25% | (f) | | | | | | | 390,092 | |
| | 390,092 | | | MSILF Government Portfolio - Institutional | | | 5.22% | (f) | | | | | | | 390,092 | |
| | | | | | | | | | | | | | | | |
| | | | Total Short Term Investments (Cost $1,170,276) | | | | 1,170,276 | |
| | | | | | | | | | | | | |
| | | | Total Investments 98.2%
(Cost $63,628,561) | | | | 58,827,202 | |
| | | | Other Assets in Excess of Liabilities 1.8% | | | | 1,093,195 | |
| | | | | | | | | | | | | |
| | | | NET ASSETS 100.0% | | | $ | 59,920,397 | |
| | | | | | | | | | | | | |
| | | | | |
| SECURITY TYPE BREAKDOWN as a % of Net Assets: | | | | | |
US Government and Agency Mortgage Backed Obligations | | | | 77.2% | |
US Government and Agency Obligations | | | | 19.0% | |
Short Term Investments | | | | 2.0% | |
Other Assets and Liabilities | | | | 1.8% | |
| | | | | |
Net Assets | | | | 100.0% | |
| | | | | |
| | | | | | | | |
| The accompanying notes are an integral part of these financial statements. | | Annual Report | | | | | March 31, 2024 | | 87 |
| | |
Schedule of Investments DoubleLine Long Duration Total Return Bond Fund (Cont.) | | |
| (a) | This security accrues interest which is added to the outstanding principal balance. The interest payment will be deferred until all other tranches in the structure are paid off. The rate disclosed is as of period end. |
| (b) | Principal only security |
| (c) | Interest only security |
| (d) | Inverse floating rate security whose interest rate moves in the opposite direction of reference interest rates. Reference interest rates are typically based on a negative multiplier or slope. Interest rate may also be subject to a cap or floor. |
| (e) | Coupon rate is variable based on the weighted average coupon of the underlying collateral. To the extent the weighted average coupon of the underlying assets which comprise the collateral increases or decreases, the coupon rate of this security will increase or decrease correspondingly. The rate disclosed is as of period end. |
| (f) | Seven-day yield as of period end. |
| | | | | | | | | | | | | | | | | | |
| | | | | |
| Futures Contracts | | | | | | | | | | | | | | |
| Description | | Long/Short | | Contract Quantity | | | Expiration Date | | | Notional Amount(1) | | | Unrealized
Appreciation
(Depreciation) / Value | |
U.S. Treasury Long Bonds | | Long | | | 216 | | | | 06/18/2024 | | | $ | 26,014,500 | | | $ | 330,088 | |
U.S. Treasury Ultra Bonds | | Long | | | 113 | | | | 06/18/2024 | | | | 14,577,000 | | | | 143,648 | |
U.S. Treasury 5 Year Note | | Short | | | (68 | ) | | | 06/28/2024 | | | | (7,277,063 | ) | | | (9,707 | ) |
U.S. Treasury 2 Year Notes | | Long | | | 83 | | | | 06/28/2024 | | | | 16,972,203 | | | | (19,235 | ) |
10 Year U.S. Ultra Treasury Notes | | Short | | | (348 | ) | | | 06/18/2024 | | | | (39,884,062 | ) | | | (210,138 | ) |
| | | | | | | | | | | | | | | | | | |
| | | | | | | | | | | | | | | | $ | 234,656 | |
| | | | | | | | | | | | | | | | | | |
| (1) | Notional Amount is determined based on the number of contracts multiplied by the contract size and the quoted daily settlement price in US dollars. |
| | | | |
| 88 | | DoubleLine Funds Trust | | The accompanying notes are an integral part of these financial statements. |
| | |
Schedule of Investments DoubleLine Strategic Commodity Fund (Consolidated) | | March 31, 2024 |
| | | | | | | | | | | | | | | | |
PRINCIPAL
AMOUNT $/
SHARES | | | SECURITY DESCRIPTION | | RATE | | | MATURITY | | | VALUE $ | |
| | SHORT TERM INVESTMENTS 102.6% | | | | | | | | | |
| | 4,531,912 | | | First American Government Obligations Fund - U | | | 5.26% | (a)(b) | | | | | | | 4,531,912 | |
| | 4,531,912 | | | JPMorgan US Government Money Market Fund - IM | | | 5.25% | (a)(b) | | | | | | | 4,531,912 | |
| | 4,531,912 | | | MSILF Government Portfolio - Institutional | | | 5.22% | (a)(b) | | | | | | | 4,531,912 | |
| | 6,000,000 | | | United States Treasury Bill | | | 0.00% | (a) | | | 04/04/2024 | | | | 5,997,407 | |
| | 16,500,000 | | | United States Treasury Bill | | | 0.00% | | | | 04/18/2024 | | | | 16,459,025 | |
| | 4,500,000 | | | United States Treasury Bill | | | 0.00% | (a)(c) | | | 04/23/2024 | | | | 4,485,521 | |
| | 10,000,000 | | | United States Treasury Bill | | | 0.00% | | | | 05/02/2024 | | | | 9,954,581 | |
| | 52,000,000 | | | United States Treasury Bill | | | 0.00% | (a) | | | 06/25/2024 | | | | 51,365,648 | |
| | 42,000,000 | | | United States Treasury Bill | | | 0.00% | (a)(c) | | | 07/09/2024 | | | | 41,401,017 | |
| | | | | | | | | | | | | | | | |
PRINCIPAL
AMOUNT $ | | | SECURITY DESCRIPTION | | RATE | | | MATURITY | | | VALUE $ | |
| | 10,000,000 | | | United States Treasury Bill | | | 0.00% | | | | 07/30/2024 | | | | 9,828,152 | |
| | | | | | | | | | | | |
| | | | Total Short Term Investments
(Cost $153,071,254) | | | | 153,087,087 | |
| | | | | | | | | | | | | | | | |
| | | | Total Investments 102.6%
(Cost $153,071,254) | | | | 153,087,087 | |
| | | | Other Liabilities in Excess of Assets (2.6)% | | | | (3,938,692 | ) |
| | | | | | |
| | | | NET ASSETS 100.0% | | | $ | 149,148,395 | |
| | | | | | |
| | | | | |
| SECURITY TYPE BREAKDOWN as a % of Net Assets: | |
Short Term Investments | | | | 102.6% | |
Other Assets and Liabilities | | | | (2.6)% | |
| | | | | |
Net Assets | | | | 100.0% | |
| | | | | |
| (a) | All or a portion of this security is owned by DoubleLine Strategic Commodity Ltd., which is a wholly owned subsidiary of the DoubleLine Strategic Commodity Fund. |
| (b) | Seven-day yield as of period end. |
| (c) | All or a portion of security has been pledged as collateral. |
| | | | | | | | | | | | | | | | | | | | | | | | | | | | | | | | | | | | | | | | | | |
| | | | | | | | | |
| Excess Return Swaps | | | | | | | | | | | | | | | | | | |
| Reference Entity | | Counterparty | | Long/Short | | Financing
Rate | | Payment
Frequency | | Termination
Date | | Notional
Amount | | Value | | Upfront
Premiums
Paid/
(Received) | | Unrealized
Appreciation
(Depreciation) |
Long Commodity Basket Swap(1)(2) | | Bank of America Securities, Inc. | | | | Long | | | | | 0.20 | % | | | | Termination | | | | | 04/02/2024 | | | | | 14,800,000 | | | | $ | 1,956,716 | | | | $ | — | | | | $ | 1,956,716 | |
Long Commodity Basket Swap(1)(3) | | Canadian Imperial Bank Of Commerce | | | | Long | | | | | 0.20 | % | | | | Termination | | | | | 04/02/2024 | | | | | 13,900,000 | | | | | 1,900,585 | | | | | — | | | | | 1,900,585 | |
Commodity Beta Basket Swap(1)(4) | | Barclays Capital, Inc. | | | | Long | | | | | 0.20 | % | | | | Termination | | | | | 04/02/2024 | | | | | 47,200,000 | | | | | 927,519 | | | | | — | | | | | 927,519 | |
Commodity Beta Basket Swap(1)(4) | | Bank of America Securities, Inc. | | | | Long | | | | | 0.23 | % | | | | Termination | | | | | 04/02/2024 | | | | | 20,600,000 | | | | | 372,288 | | | | | — | | | | | 372,288 | |
Commodity Beta Basket Swap(1)(4) | | Canadian Imperial Bank Of Commerce | | | | Long | | | | | 0.21 | % | | | | Termination | | | | | 04/02/2024 | | | | | 18,000,000 | | | | | 353,567 | | | | | — | | | | | 353,567 | |
Short Commodity Basket Swap(1)(5) | | Canadian Imperial Bank Of Commerce | | | | Short | | | | | 0.00 | % | | | | Termination | | | | | 04/02/2024 | | | | | (13,900,000 | ) | | | | (216,336 | ) | | | | — | | | | | (216,336 | ) |
Short Commodity Basket Swap(1)(6) | | Bank of America Securities, Inc. | | | | Short | | | | | 0.00 | % | | | | Termination | | | | | 04/02/2024 | | | | | (14,800,000 | ) | | | | (222,789 | ) | | | | — | | | | | (222,789 | ) |
| | | | | | | | | | | | | | | | | | | | | | | | | | | | | | | | | | | | | | | | | | |
| | | | | | | | | | | | | | | | | | | | | | | | | | | | | | $ | 5,071,550 | | | | $ | — | | | | $ | 5,071,550 | |
| | | | | | | | | | | | | | | | | | | | | | | | | | | | | | | | | | | | | | | | | | |
| (1) | All or a portion of this security is owned by DoubleLine Strategic Commodity Ltd., which is a wholly owned subsidiary of the DoubleLine Strategic Commodity Fund. |
| (2) | Long Commodity Basket Swap represents a swap on a basket of commodity sub-indices of the S&P GSCI index. At March 31, 2024, all constituents and their weightings were as follows: |
| | | | | | | | | | | | | | | | | | | | |
| Sub-Index | | Ticker | | Contract Value(7) | | Value of Index | | Weightings |
S&P GSCI 2 Month Forward Cocoa ER | | | | SG2MCCP | | | | | 0.24 | | | | $ | 56 | | | | | 27.4 | % |
S&P GSCI 2 Month Forward Brent Crude ER | | | | SG2MBRP | | | | | 0.03 | | | | | 38 | | | | | 18.5 | % |
S&P GSCI 2 Month Forward Crude Oil ER | | | | SG2MCLP | | | | | 0.06 | | | | | 38 | | | | | 18.5 | % |
S&P GSCI 2 Month Forward Unleaded Gas ER | | | | SG2MHUP | | | | | 0.02 | | | | | 38 | | | | | 18.4 | % |
S&P GSCI 2 Month Forward Cotton ER | | | | SG2MCTP | | | | | 0.68 | | | | | 36 | | | | | 17.2 | % |
| | | | | | | | | | | | | | | | | | | | |
| | | | | | | | | | | | | $ | 206 | | | | | 100.0 | % |
| | | | | | | | | | | | | | | | | | | | |
| | | | | | | | |
| The accompanying notes are an integral part of these financial statements. | | Annual Report | | | | | March 31, 2024 | | 89 |
| | |
Schedule of Investments DoubleLine Strategic Commodity Fund (Consolidated) (Cont.) | | |
| (3) | Long Commodity Basket Swap represents a swap on a basket of commodity sub-indices of the S&P GSCI index. At March 31, 2024, all constituents and their weightings were as follows: |
| | | | | | | | | | | | | | | | | | | | |
| Sub-Index | | Ticker | | Contract Value(7) | | Value of Index | | Weightings |
S&P GSCI 2 Month Forward Cocoa ER | | | | SG2MCCP | | | | | 0.18 | | | | $ | 43 | | | | | 27.4 | % |
S&P GSCI 2 Month Forward Brent Crude ER | | | | SG2MBRP | | | | | 0.02 | | | | | 29 | | | | | 18.5 | % |
S&P GSCI 2 Month Forward Crude Oil ER | | | | SG2MCLP | | | | | 0.05 | | | | | 29 | | | | | 18.5 | % |
S&P GSCI 2 Month Forward Unleaded Gas ER | | | | SG2MHUP | | | | | 0.02 | | | | | 29 | | | | | 18.4 | % |
S&P GSCI 2 Month Forward Cotton ER | | | | SG2MCTP | | | | | 0.52 | | | | | 28 | | | | | 17.2 | % |
| | | | | | | | | | | | | | | | | | | | |
| | | | | | | | | | | | | $ | 158 | | | | | 100.0 | % |
| | | | | | | | | | | | | | | | | | | | |
| (4) | Commodity Beta Basket Swap represents a swap on a basket of commodity indices designed to approximate the broad commodity market. At March 31, 2024, all constituents and their weightings were as follows: |
| | | | | | | | | | | | | | |
| Index | | Ticker | | Contract Value(7) | | | Value of Index | | | Weightings | |
Electrolytic Copper Future | | LP1 | | | 0.22 | | | $ | 141 | | | | 20.1 | % |
Soybean Future | | S1 | | | 0.35 | | | | 136 | | | | 19.3 | % |
Nickel Future | | LN1 | | | 0.28 | | | | 90 | | | | 12.8 | % |
Crude Oil Future | | CL1 | | | 0.10 | | | | 72 | | | | 10.3 | % |
Brent Crude Future | | CO1 | | | 0.10 | | | | 72 | | | | 10.3 | % |
Gasoline RBOB Future | | XB1 | | | 0.06 | | | | 38 | | | | 5.4 | % |
Low Sulphur Gas Oil Future | | QS1 | | | 0.08 | | | | 35 | | | | 5.0 | % |
Live Cattle Future | | LC1 | | | 0.18 | | | | 34 | | | | 4.9 | % |
Sugar No. 11 Future | | SB1 | | | 0.16 | | | | 34 | | | | 4.8 | % |
Cotton No. 2 Future | | CT1 | | | 0.40 | | | | 29 | | | | 4.2 | % |
NY Harbor ULSD Heating Oil Future | | HO1 | | | 0.06 | | | | 20 | | | | 2.9 | % |
| | | | | | | | | | | | | | |
| | | | | | | | $ | 701 | | | | 100.0 | % |
| | | | | | | | | | | | | | |
| (5) | Short Commodity Basket Swap represents a swap on a basket of commodity sub-indices of the S&P GSCI index. At March 31, 2024, all constituents and their weightings were as follows: |
| | | | | | | | | | | | | | |
| Sub-Index | | Ticker | | Contract Value(7) | | | Value of Index | | | Weightings | |
S&P GSCI 2 Month Forward Kansas Wheat ER | | SG2MKWP | | | 1.63 | | | $ | 43 | | | | 20.6 | % |
S&P GSCI 2 Month Forward Corn ER | | SG2MCNP | | | 1.51 | | | | 43 | | | | 20.5 | % |
S&P GSCI 2 Month Forward Soybeans ER | | SG2MSOP | | | 0.11 | | | | 43 | | | | 20.4 | % |
S&P GSCI 2 Month Forward Wheat ER | | SG2MWHP | | | 4.42 | | | | 43 | | | | 20.2 | % |
S&P GSCI 2 Month Forward Natural Gas ER | | SG2MNGP | | | 7.51 | | | | 39 | | | | 18.3 | % |
| | | | | | | | | | | | | | |
| | | | | | | | $ | 211 | | | | 100.0 | % |
| | | | | | | | | | | | | | |
| (6) | Short Commodity Basket Swap represents a swap on a basket of commodity sub-indices of the S&P GSCI index. At March 31, 2024, all constituents and their weightings were as follows: |
| | | | | | | | | | | | | | |
| Sub-Index | | Ticker | | Contract Value(7) | | | Value of Index | | | Weightings | |
S&P GSCI 2 Month Forward Kansas Wheat ER | | SG2MKWP | | | 1.49 | | | $ | 40 | | | | 20.6 | % |
S&P GSCI 2 Month Forward Corn ER | | SG2MCNP | | | 1.38 | | | | 40 | | | | 20.5 | % |
S&P GSCI 2 Month Forward Soybeans ER | | SG2MSOP | | | 0.10 | | | | 39 | | | | 20.4 | % |
S&P GSCI 2 Month Forward Wheat ER | | SG2MWHP | | | 4.04 | | | | 39 | | | | 20.2 | % |
S&P GSCI 2 Month Forward Natural Gas ER | | SG2MNGP | | | 6.87 | | | | 35 | | | | 18.3 | % |
| | | | | | | | | | | | | | |
| | | | | | | | $ | 193 | | | | 100.0 | % |
| | | | | | | | | | | | | | |
| (7) | Contract value represents the number of units of the underlying constituent’s index in one unit of the custom basket index at creation. The contract value is calculated by multiplying each constituent’s weight by the starting price of the custom basket index and dividing by the starting price of the constituent’s index. The contract value will differ depending on the date the swap is initiated. |
| | | | |
| 90 | | DoubleLine Funds Trust | | The accompanying notes are an integral part of these financial statements. |
| | |
Schedule of Investments DoubleLine Global Bond Fund | | March 31, 2024 |
| | | | | | | | | | | | | | | | | | | | |
PRINCIPAL
AMOUNT | | | | | | SECURITY DESCRIPTION | | RATE | | | MATURITY | | | VALUE $ | |
| FOREIGN GOVERNMENT BONDS, FOREIGN AGENCIES AND FOREIGN
GOVERNMENT SPONSORED CORPORATIONS 56.6% |
|
| | | | | | |
| | AUSTRALIA 3.2% | |
| | 1,050,000 | | | | AUD | | | Australia Government Bond | | | 2.75% | | | | 04/21/2024 | | | | 683,703 | |
| | 1,300,000 | | | | AUD | | | Australia Government Bond | | | 1.00% | | | | 12/21/2030 | | | | 708,800 | |
| | 5,817,000 | | | | AUD | | | Australia Government Bond | | | 1.50% | | | | 06/21/2031 | | | | 3,240,878 | |
| | | | | | | | | | | | | | | | | | | | |
| | | | | | | | | | | | | | | | | | | 4,633,381 | |
| | | | | | | | | | | | | | | | | | | | |
| | BELGIUM 3.8% | |
| | 3,126,000 | | | | EUR | | | Kingdom of Belgium Government Bond | | | 0.90% | (a) | | | 06/22/2029 | | | | 3,095,203 | |
| | 2,300,000 | | | | EUR | | | Kingdom of Belgium Government Bond | | | 1.00% | (a) | | | 06/22/2026 | | | | 2,384,659 | |
| | | | | | | | | | | | | | | | | | | | |
| | | | | | | | | | | | | | | | | | | 5,479,862 | |
| | | | | | | | | | | | | | | | | | | | |
| | CANADA 1.7% | |
| | 3,800,000 | | | | CAD | | | Canadian Government Bond | | | 1.50% | | | | 06/01/2031 | | | | 2,459,150 | |
| | | | | | | | | | | | | | | | | | | | |
| | FRANCE 5.8% | |
| | 2,460,000 | | | | EUR | | | French Republic Government Bond OAT | | | 3.00% | (a) | | | 05/25/2033 | | | | 2,704,076 | |
| | 3,377,461 | | | | EUR | | | French Republic Government Bond OAT | | | 0.70% | (a) | | | 07/25/2030 | | | | 3,725,111 | |
| | 1,290,000 | | | | EUR | | | French Republic Government Bond OAT | | | 2.00% | (a) | | | 11/25/2032 | | | | 1,314,217 | |
| | 660,000 | | | | EUR | | | French Republic Government Bond OAT | | | 0.00% | (a) | | | 11/25/2029 | | | | 615,456 | |
| | | | | | | | | | | | | | | | | | | | |
| | | | | | | | | | | | | | | | | | | 8,358,860 | |
| | | | | | | | | | | | | | | | | | | | |
| | GERMANY 7.3% | |
| | 1,630,000 | | | | EUR | | | Bundesrepublik Deutschland Bundesanleihe | | | 1.70% | | | | 08/15/2032 | | | | 1,687,184 | |
| | 2,500,000 | | | | EUR | | | Bundesrepublik Deutschland Bundesanleihe | | | 0.00% | | | | 02/15/2031 | | | | 2,319,613 | |
| | 4,390,000 | | | | EUR | | | Bundesrepublik Deutschland Bundesanleihe | | | 0.00% | | | | 08/15/2030 | | | | 4,117,846 | |
| | 2,650,000 | | | | EUR | | | Bundesrepublik Deutschland Bundesanleihe | | | 1.00% | | | | 05/15/2038 | | | | 2,372,020 | |
| | | | | | | | | | | | | | | | | | | | |
| | | | | | | | | | | | | | | | | | | 10,496,663 | |
| | | | | | | | | | | | | | | | | | | | |
| | IRELAND 2.5% | |
| | 1,020,000 | | | | EUR | | | Ireland Government Bond | | | 1.00% | | | | 05/15/2026 | | | | 1,060,214 | |
| | 680,000 | | | | EUR | | | Ireland Government Bond | | | 0.90% | | | | 05/15/2028 | | | | 687,440 | |
| | 1,910,000 | | | | EUR | | | Ireland Government Bond | | | 1.10% | | | | 05/15/2029 | | | | 1,919,528 | |
| | | | | | | | | | | | | | | | | | | | |
| | | | | | | | | | | | | | | | | | | 3,667,182 | |
| | | | | | | | | | | | | | | | | | | | |
| | JAPAN 9.6% | |
| | 361,000,000 | | | | JPY | | | Japan Government Ten Year Bond | | | 0.10% | | | | 12/20/2026 | | | | 2,378,994 | |
| | 812,500,000 | | | | JPY | | | Japan Government Ten Year Bond | | | 0.10% | | | | 12/20/2027 | | | | 5,337,955 | |
| | 500,000,000 | | | | JPY | | | Japan Government Twenty Year Bond | | | 1.90% | | | | 03/20/2031 | | | | 3,628,852 | |
| | 418,000,000 | | | | JPY | | | Japan Government Twenty Year Bond | | | 0.50% | | | | 03/20/2038 | | | | 2,565,941 | |
| | | | | | | | | | | | | | | | | | | | |
| | | | | | | | | | | | | | | | | | | 13,911,742 | |
| | | | | | | | | | | | | | | | | | | | |
| | | | | | | | | | | | | | | | | | | | |
PRINCIPAL
AMOUNT | | | | | | SECURITY DESCRIPTION | | RATE | | | MATURITY | | | VALUE $ | |
| | MEXICO 4.6% | |
| | 273,000 | | | | MXN | | | Mexican Bonos | | | 7.75% | (b) | | | 11/23/2034 | | | | 1,469,581 | |
| | 220,000 | | | | MXN | | | Mexican Bonos | | | 7.50% | (b) | | | 05/26/2033 | | | | 1,179,156 | |
| | 276,800 | | | | MXN | | | Mexican Bonos | | | 7.75% | (b) | | | 05/29/2031 | | | | 1,531,545 | |
| | 120,000 | | | | MXN | | | Mexican Bonos | | | 8.00% | (b) | | | 09/05/2024 | | | | 712,149 | |
| | 295,000 | | | | MXN | | | Mexican Bonos | | | 5.00% | (b) | | | 03/06/2025 | | | | 1,688,284 | |
| | | | | | | | | | | | | | | | | | | | |
| | | | | | | | | | | | | | | | | | | 6,580,715 | |
| | | | | | | | | | | | | | | | | | | | |
| | NEW ZEALAND 2.0% | |
| | 5,800,000 | | | | NZD | | | New Zealand Government Bond | | | 1.50% | | | | 05/15/2031 | | | | 2,847,782 | |
| | | | | | | | | | | | | | | | | | | | |
| | PERU 1.4% | |
| | 8,100,000 | | | | PEN | | | Peru Government Bond | | | 6.15% | | | | 08/12/2032 | | | | 2,047,309 | |
| | | | | | | | | | | | | | | | | | | | |
| | POLAND 2.4% | |
| | 5,000,000 | | | | PLN | | | Republic of Poland Government Bond | | | 6.00% | | | | 10/25/2033 | | | | 1,303,142 | |
| | 11,100,000 | | | | PLN | | | Republic of Poland Government Bond | | | 1.75% | | | | 04/25/2032 | | | | 2,131,301 | |
| | | | | | | | | | | | | | | | | | | | |
| | | | | | | | | | | | | | | | | | | 3,434,443 | |
| | | | | | | | | | | | | | | | | | | | |
| | PORTUGAL 2.1% | |
| | 1,420,000 | | | | EUR | | | Portugal Obrigacoes do Tesouro OT | | | 0.48% | (a) | | | 10/18/2030 | | | | 1,337,374 | |
| | 1,590,000 | | | | EUR | | | Portugal Obrigacoes do Tesouro OT | | | 1.95% | (a) | | | 06/15/2029 | | | | 1,663,977 | |
| | | | | | | | | | | | | | | | | | | | |
| | | | | | | | | | | | | | | | | | | 3,001,351 | |
| | | | | | | | | | | | | | | | | | | | |
| | ROMANIA 3.2% | |
| | 21,250,000 | | | | RON | | | Romania Government Bond | | | 3.70% | | | | 11/25/2024 | | | | 4,554,978 | |
| | | | | | | | | | | | | | | | | | | | |
| | SOUTH AFRICA 2.4% | |
| | 38,190,000 | | | | ZAR | | | Republic of South Africa Government Bond | | | 8.00% | | | | 01/31/2030 | | | | 1,794,164 | |
| | 38,570,000 | | | | ZAR | | | Republic of South Africa Government Bond | | | 8.88% | | | | 02/28/2035 | | | | 1,626,090 | |
| | | | | | | | | | | | | | | | | | | | |
| | | | | | | | | | | | | | | | | | | 3,420,254 | |
| | | | | | | | | | | | | | | | | | | | |
| | SPAIN 4.6% | |
| | 4,440,000 | | | | EUR | | | Spain Government Bond | | | 0.60% | (a) | | | 10/31/2029 | | | | 4,246,379 | |
| | 970,000 | | | | EUR | | | Spain Government Bond | | | 0.50% | (a) | | | 04/30/2030 | | | | 911,365 | |
| | 1,470,000 | | | | EUR | | | Spain Government Bond | | | 1.30% | (a) | | | 10/31/2026 | | | | 1,523,493 | |
| | | | | | | | | | | | | | | | | | | | |
| | | | | | | | | | | | | | | | | | | 6,681,237 | |
| | | | | | | | | | | | | | | | | | | | |
| | | | | | | | Total Foreign Government Bonds, Foreign Agencies and Foreign Government Sponsored Corporations
(Cost $91,770,590) | | | | 81,574,909 | |
| | | | | | | | | | | | | | | | | | | | |
| | US GOVERNMENT AND AGENCY OBLIGATIONS 37.5% | |
| | | | | | |
| | UNITED STATES 37.5% | |
| | 2,140,000 | | | | USD | | | United States Treasury Note/Bond | | | 3.75% | | | | 06/30/2030 | | | | 2,083,825 | |
| | 2,450,000 | | | | USD | | | United States Treasury Note/Bond | | | 4.13% | | | | 08/15/2053 | | | | 2,355,445 | |
| | 2,780,000 | | | | USD | | | United States Treasury Note/Bond | | | 4.38% | | | | 11/30/2028 | | | | 2,795,150 | |
| | 2,220,000 | | | | USD | | | United States Treasury Note/Bond | | | 4.63% | | | | 11/15/2026 | | | | 2,227,545 | |
| | 3,000,000 | | | | USD | | | United States Treasury Note/Bond | | | 3.88% | | | | 02/15/2043 | | | | 2,774,180 | |
| | 1,740,000 | | | | USD | | | United States Treasury Note/Bond | | | 4.00% | | | | 07/31/2030 | | | | 1,717,604 | |
| | 1,800,000 | | | | USD | | | United States Treasury Note/Bond | | | 3.38% | | | | 05/15/2033 | | | | 1,686,551 | |
| | 2,200,000 | | | | USD | | | United States Treasury Note/Bond | | | 4.38% | | | | 08/15/2026 | | | | 2,191,879 | |
| | 2,300,000 | | | | USD | | | United States Treasury Note/Bond | | | 4.00% | | | | 02/28/2030 | | | | 2,272,867 | |
| | | | | | | | |
| The accompanying notes are an integral part of these financial statements. | | Annual Report | | | | | March 31, 2024 | | 91 |
| | |
Schedule of Investments DoubleLine Global Bond Fund (Cont.) | | |
| | | | | | | | | | | | | | | | | | | | |
PRINCIPAL
AMOUNT/
SHARES | | | | | | SECURITY DESCRIPTION | | RATE | | | MATURITY | | | VALUE $ | |
| | 2,190,000 | | | | USD | | | United States Treasury Note/Bond | | | 4.13% | | | | 09/30/2027 | | | | 2,173,404 | |
| | 2,230,000 | | | | USD | | | United States Treasury Note/Bond | | | 4.38% | | | | 11/30/2030 | | | | 2,248,859 | |
| | 2,270,000 | | | | USD | | | United States Treasury Note/Bond | | | 4.13% | | | | 10/31/2027 | | | | 2,252,443 | |
| | 2,500,000 | | | | USD | | | United States Treasury Note/Bond | | | 4.13% | | | | 07/31/2028 | | | | 2,484,814 | |
| | 2,300,000 | | | | USD | | | United States Treasury Note/Bond | | | 4.00% | | | | 02/29/2028 | | | | 2,273,496 | |
| | 2,260,000 | | | | USD | | | United States Treasury Note/Bond | | | 3.88% | | | | 12/31/2027 | | | | 2,223,981 | |
| | 670,000 | | | | USD | | | United States Treasury Note/Bond | | | 4.13% | | | | 01/31/2025 | | | | 664,574 | |
| | 2,190,000 | | | | USD | | | United States Treasury Note/Bond | | | 4.75% | | | | 07/31/2025 | | | | 2,186,493 | |
| | 1,860,000 | | | | USD | | | United States Treasury Note/Bond | | | 3.88% | | | | 05/15/2043 | | | | 1,717,230 | |
| | 2,250,000 | | | | USD | | | United States Treasury Note/Bond | | | 4.75% | | | | 11/15/2043 | | | | 2,334,727 | |
| | 2,280,000 | | | | USD | | | United States Treasury Note/Bond | | | 4.63% | | | | 06/30/2025 | | | | 2,272,073 | |
| | 2,790,000 | | | | USD | | | United States Treasury Note/Bond | | | 4.88% | | | | 11/30/2025 | | | | 2,794,468 | |
| | 1,690,000 | | | | USD | | | United States Treasury Note/Bond | | | 4.13% | | | | 06/15/2026 | | | | 1,673,628 | |
| | 2,290,000 | | | | USD | | | United States Treasury Note/Bond | | | 3.88% | | | | 11/30/2027 | | | | 2,253,369 | |
| | 2,390,000 | | | | USD | | | United States Treasury Note/Bond | | | 4.75% | | | | 11/15/2053 | | | | 2,551,885 | |
| | 1,860,000 | | | | USD | | | United States Treasury Note/Bond | | | 4.50% | | | | 11/15/2033 | | | | 1,901,705 | |
| | | | | | | | | | | | | | | | | | | | |
| | | | | | | | Total US Government and Agency Obligations
(Cost $54,181,449) | | | | 54,112,195 | |
| | | | | | | | | | | | | | | | | | | | |
| | SHORT TERM INVESTMENTS 4.6% | |
| | 1,627,023 | | | | USD | | | First American Government Obligations Fund - U | | | 5.26% | (c) | | | | | | | 1,627,023 | |
| | 1,627,023 | | | | USD | | | JPMorgan US Government Money Market Fund - IM | | | 5.25% | (c) | | | | | | | 1,627,023 | |
| | 1,627,023 | | | | USD | | | MSILF Government Portfolio - Institutional | | | 5.22% | (c) | | | | | | | 1,627,023 | |
| | 1,700,000 | | | | USD | | | United States Treasury Bill | | | 0.00% | | | | 06/18/2024 | | | | 1,680,917 | |
| | | | | | | | | | | | | | | | | | | | |
| | | | | | | | Total Short Term Investments
(Cost $6,561,852) | | | | 6,561,986 | |
| | | | | | | | | | | | | | | | | | | | |
| | | | | | | | Total Investments 98.7%
(Cost $152,513,891) | | | | 142,249,090 | |
| | | | | | | | Other Assets in Excess of Liabilities 1.3% | | | | 1,912,018 | |
| | | | | | | | | | | | | | | | | | | | |
| | | | | | | | NET ASSETS 100.0% | | | | | | | | | | $ | 144,161,108 | |
| | | | | | | | | | | | | | | | | | | | |
| | | | | |
| | | |
| SECURITY TYPE BREAKDOWN as a % of Net Assets: | |
Foreign Government Bonds, Foreign Agencies and Foreign Government Sponsored Corporations | | | | 56.6% | |
US Government and Agency Obligations | | | | 37.5% | |
Short Term Investments | | | | 4.6% | |
Other Assets and Liabilities | | | | 1.3% | |
| | | | | |
Net Assets | | | | 100.0% | |
| | | | | |
| | | | | |
| COUNTRY BREAKDOWN as a % of Net Assets: | |
United States | | | | 42.1% | |
Japan | | | | 9.6% | |
Germany | | | | 7.3% | |
France | | | | 5.8% | |
Spain | | | | 4.6% | |
Mexico | | | | 4.6% | |
Belgium | | | | 3.8% | |
Australia | | | | 3.2% | |
Romania | | | | 3.2% | |
Ireland | | | | 2.5% | |
Poland | | | | 2.4% | |
South Africa | | | | 2.4% | |
Portugal | | | | 2.1% | |
New Zealand | | | | 2.0% | |
Canada | | | | 1.7% | |
Peru | | | | 1.4% | |
Other Assets and Liabilities | | | | 1.3% | |
| | | | | |
Net Assets | | | | 100.0% | |
| | | | | |
| (a) | Security exempt from registration under Rule 144A of the Securities Act of 1933. These securities may be resold in transactions exempt from registration to qualified institutional buyers. |
| (b) | Principal amount is stated in 100 Mexican Peso Units. |
| (c) | Seven-day yield as of period end. |
| | | | |
| 92 | | DoubleLine Funds Trust | | The accompanying notes are an integral part of these financial statements. |
| | |
Schedule of Investments DoubleLine Infrastructure Income Fund | | March 31, 2024 |
| | | | | | | | | | | | | | | | |
PRINCIPAL
AMOUNT $ | | | SECURITY DESCRIPTION | | RATE | | | MATURITY | | | VALUE $ | |
| | ASSET BACKED OBLIGATIONS 39.5% | |
| |
| | | | American Airlines Group, Inc. | |
| | 1,682,108 | | | Series 2016-3 | | | 3.25% | | | | 10/15/2028 | | | | 1,518,103 | |
| | 1,798,489 | | | Series B | | | 3.85% | | | | 02/15/2028 | | | | 1,668,098 | |
| |
| | | | Blackbird Capital Aircraft | |
| | 3,451,076 | | | Series 2016-1A-B | | | 5.68% | (a)(b) | | | 12/16/2041 | | | | 3,377,975 | |
| |
| | | | Blue Stream Communications LLC | |
| | 2,000,000 | | | Series 2023-1A-C | | | 8.90% | (a) | | | 05/20/2053 | | | | 1,863,907 | |
| |
| | | | Cologix Data Centers US Issuer LLC | |
| | 2,250,000 | | | Series 2021-1A-B | | | 3.79% | (a) | | | 12/26/2051 | | | | 2,031,062 | |
| |
| | | | Compass Datacenters LLC | |
| | 5,000,000 | | | Series 2024-1A-A2 | | | 5.75% | (a) | | | 02/25/2049 | | | | 4,950,255 | |
| |
| | | | CyrusOne Data Centers Issuer I LLC | |
| | 2,000,000 | | | Series 2023-1A-A2 | | | 4.30% | (a) | | | 04/20/2048 | | | | 1,884,835 | |
| | 1,399,095 | | | Series 2023-1A-B | | | 5.45% | (a) | | | 04/20/2048 | | | | 1,304,809 | |
| |
| | | | DataBank Issuer | |
| | 6,900,000 | | | Series 2021-1A-A2 | | | 2.06% | (a) | | | 02/27/2051 | | | | 6,329,182 | |
| | 2,100,000 | | | Series 2021-1A-C | | | 4.43% | (a) | | | 02/27/2051 | | | | 1,754,861 | |
| | 6,000,000 | | | Series 2021-2A-A2 | | | 2.40% | (a) | | | 10/25/2051 | | | | 5,371,516 | |
| |
| | | | Diamond Infrastructure Funding LLC | |
| | 2,250,000 | | | Series 2021-1A-B | | | 2.36% | (a) | | | 04/15/2049 | | | | 2,010,558 | |
| |
| | | | Falcon Aerospace Ltd. | |
| | 1,905,086 | | | Series 2017-1-A | | | 4.58% | (a) | | | 02/15/2042 | | | | 1,851,201 | |
| |
| | | | Falko Regional Aircraft Ltd. | |
| | 3,583,979 | | | Series 2021-1A-A | | | 5.75% | | | | 04/15/2041 | | | | 3,304,414 | |
| |
| | | | GAIA Aviation Ltd. | |
| | 2,562,511 | | | Series 2019-1-A | | | 3.97% | (a)(b) | | | 12/15/2044 | | | | 2,337,074 | |
| |
| | | | Goodgreen Trust | |
| | 3,286,064 | | | Series 2020-1A-A | | | 2.63% | (a) | | | 04/15/2055 | | | | 2,708,909 | |
| |
| | | | GoodLeap Sustainable Home Solutions Trust | |
| | 3,314,491 | | | Series 2021-3CS-B | | | 2.41% | (a) | | | 05/20/2048 | | | | 2,399,057 | |
| |
| | | | Helios Issuer LLC | |
| | 2,424,111 | | | Series 2018-1A-A | | | 4.87% | (a) | | | 07/20/2048 | | | | 2,297,044 | |
| | 7,158,291 | | | Series 2020-2A-A | | | 2.73% | (a) | | | 11/01/2055 | | | | 5,445,188 | |
| | 2,413,167 | | | Series 2021-B-B | | | 2.01% | (a) | | | 07/20/2048 | | | | 2,001,597 | |
| |
| | | | HERO Funding Trust | |
| | 11,917 | | | Series 2015-2A-A | | | 3.99% | (a) | | | 09/20/2040 | | | | 10,893 | |
| | 346,396 | | | Series 2016-3A-A2 | | | 3.91% | (a) | | | 09/20/2042 | | | | 314,368 | |
| | 853,387 | | | Series 2016-4A-A2 | | | 4.29% | (a) | | | 09/20/2047 | | | | 780,407 | |
| |
| | | | Horizon Aircraft Finance Ltd. | |
| | 3,700,057 | | | Series 2019-1-A | | | 3.72% | (a) | | | 07/15/2039 | | | | 3,290,290 | |
| |
| | | | ITE Rail Fund LP | |
| | 3,451,359 | | | Series 2021-1A-A | | | 2.25% | (a) | | | 02/28/2051 | | | | 3,072,105 | |
| | 2,219,737 | | | Series 2021-3A-A | | | 2.21% | (a) | | | 06/28/2051 | | | | 2,003,294 | |
| |
| | | | JOL Air Ltd. | |
| | 3,197,859 | | | Series 2019-1-A | | | 3.97% | (a) | | | 04/15/2044 | | | | 2,957,895 | |
| |
| | | | Kestrel Aircraft Funding USA LLC | |
| | 1,189,638 | | | Series 2018-1A-A | | | 4.25% | (a) | | | 12/15/2038 | | | | 1,112,136 | |
| |
| | | | Loanpal Solar Loan Ltd. | |
| | 5,023,745 | | | Series 2020-3GS-A | | | 2.47% | (a) | | | 12/20/2047 | | | | 3,899,271 | |
| |
| | | | Mosaic Solar Loans LLC | |
| | 1,486,812 | | | Series 2018-1A-A | | | 4.01% | (a) | | | 06/22/2043 | | | | 1,393,158 | |
| | 2,065,567 | | | Series 2019-2A-B | | | 3.28% | (a) | | | 09/20/2040 | | | | 1,836,247 | |
| | 2,126,111 | | | Series 2020-1A-A | | | 2.10% | (a) | | | 04/20/2046 | | | | 1,846,110 | |
| | 2,889,738 | | | Series 2020-2A-B | | | 2.21% | (a) | | | 08/20/2046 | | | | 2,335,513 | |
| | 3,095,777 | | | Series 2021-3A-B | | | 1.92% | (a) | | | 06/20/2052 | | | | 2,336,528 | |
| | 2,091,444 | | | Series 2022-1A-B | | | 3.16% | (a) | | | 01/20/2053 | | | | 1,707,556 | |
| |
| | | | NP Railcar Holdings LLC | |
| | 60,159 | | | Series 2016-1A-A1 | | | 4.16% | (a) | | | 04/20/2046 | | | | 58,933 | |
| | 1,253,664 | | | Series 2017-1A-A1 | | | 3.37% | (a) | | | 10/21/2047 | | | | 1,201,928 | |
| | 3,978,883 | | | Series 2021-1A-A1 | | | 2.23% | (a) | | | 03/19/2051 | | | | 3,623,222 | |
| |
| | | | Purewest Funding LLC | |
| | 2,432,498 | | | Series 2021-1-A1 | | | 4.09% | (a) | | | 12/22/2036 | | | | 2,356,003 | |
| |
| | | | Retained Vantage Data Centers Issuer LLC | |
| | 6,250,000 | | | Series 2023-1A-B | | | 5.75% | (a) | | | 09/15/2048 | | | | 5,869,500 | |
| | | | | | | | | | | | | | | | |
PRINCIPAL
AMOUNT $ | | | SECURITY DESCRIPTION | | RATE | | | MATURITY | | | VALUE $ | |
| |
| | | | Shenton Aircraft Investment Ltd. | |
| | 102,559 | | | Series 2015-1A-A | | | 4.75% | (a) | | | 10/15/2042 | | | | 95,229 | |
| |
| | | | Signal Rail | |
| | 4,509,493 | | | Series 2021-1-A | | | 2.23% | (a) | | | 08/17/2051 | | | | 4,000,252 | |
| |
| | | | Start/Bermuda | |
| | 886,034 | | | Series 2018-1-A | | | 4.09% | (a) | | | 05/15/2043 | | | | 817,781 | |
| |
| | | | Sunnova Energy International, Inc. | |
| | 2,070,779 | | | Series 2020-AA-A | | | 2.98% | (a) | | | 06/20/2047 | | | | 1,909,874 | |
| | 3,928,114 | | | Series 2021-A-A | | | 1.80% | (a) | | | 02/20/2048 | | | | 3,436,589 | |
| |
| | | | Sunrun, Inc. | |
| | 5,297,208 | | | Series 2021-2A-A | | | 2.27% | (a) | | | 01/30/2057 | | | | 4,332,935 | |
| |
| | | | Switch ABS Issuer LLC | |
| | 4,000,000 | | | Series 2024-1A-B | | | 6.50% | (a) | | | 03/25/2054 | | | | 3,889,832 | |
| |
| | | | Thunderbolt Aircraft Lease | |
| | 1,000,386 | | | Series 2017-A-A | | | 6.21% | (a)(b) | | | 05/17/2032 | | | | 987,711 | |
| | 1,184,532 | | | Series 2017-A-B | | | 7.75% | (a)(b) | | | 05/17/2032 | | | | 1,129,227 | |
| | 1,218,567 | | | Series 2018-A-A | | | 4.15% | (a)(b) | | | 09/15/2038 | | | | 1,033,217 | |
| | 2,678,571 | | | Series 2018-A-B | | | 5.07% | (a)(b) | | | 09/15/2038 | | | | 1,893,646 | |
| |
| | | | Trinity Industries Leasing Co. | |
| | 2,763,806 | | | Series 2010-1A-A | | | 5.19% | (a) | | | 10/16/2040 | | | | 2,725,703 | |
| |
| | | | United Airlines, Inc. | |
| | 1,229,375 | | | Series 2016-1B | | | 3.65% | | | | 01/07/2026 | | | | 1,177,127 | |
| | 3,888,889 | | | Series 2016-2B | | | 3.65% | | | | 10/07/2025 | | | | 3,752,778 | |
| |
| | | | Vantage Data Centers Holding LLC | |
| | 4,558,678 | | | Series 2019-1A-A2 | | | 3.19% | (a) | | | 07/15/2044 | | | | 4,516,194 | |
| |
| | | | Vault DI Issuer LLC | |
| | 5,000,000 | | | Series 2021-1A-A2 | | | 2.80% | (a) | | | 07/15/2046 | | | | 4,376,638 | |
| |
| | | | Vivant Solar Financing V Parent LLC | |
| | 4,405,395 | | | Series 2018-1A-A | | | 4.73% | (a) | | | 04/30/2048 | | | | 4,113,898 | |
| |
| | | | WAVE USA | |
| | 1,821,106 | | | Series 2017-1A-A | | | 3.84% | (a) | | | 11/15/2042 | | | | 1,613,391 | |
| | | | | | | | | | | | | | | | |
| | | | Total Asset Backed Obligations
(Cost $159,725,179) | | | | 144,217,024 | |
| | | | | | | | | | | | | | | | |
| | FOREIGN CORPORATE BONDS 10.5% | |
| | 3,650,000 | | | Adani Ports & Special Economic Zone Ltd. | | | 4.00% | (a) | | | 07/30/2027 | | | | 3,352,919 | |
| | 5,500,000 | | | APA Infrastructure Ltd. | | | 4.25% | (a) | | | 07/15/2027 | | | | 5,392,566 | |
| | 2,000,000 | | | Emirates Semb Corp. Water & Power Co. PJSC | | | 4.45% | (a) | | | 08/01/2035 | | | | 1,879,000 | |
| | 2,005,053 | | | Energia Eolica SA | | | 6.00% | (c) | | | 08/30/2034 | | | | 1,969,965 | |
| | 2,532,475 | | | Fermaca Enterprises S de RL de CV | | | 6.38% | (a) | | | 03/30/2038 | | | | 2,479,190 | |
| | 1,379,710 | | | Fermaca Enterprises S de RL de CV | | | 6.38% | | | | 03/30/2038 | | | | 1,350,680 | |
| | 492,760 | | | Interoceanica IV Finance Ltd. Series 2007 | | | 0.00% | (a) | | | 11/30/2025 | | | | 465,043 | |
| | 1,133,347 | | | Interoceanica IV Finance Ltd.
Series 2007 | | | 0.00% | | | | 11/30/2025 | | | | 1,069,596 | |
| | 4,216,000 | | | Sydney Airport Finance Co. Pty Ltd. | | | 3.38% | (a) | | | 04/30/2025 | | | | 4,115,181 | |
| | 2,440,000 | | | Sydney Airport Finance Co. Pty Ltd. | | | 3.63% | (a) | | | 04/28/2026 | | | | 2,353,262 | |
| | 8,299,000 | | | TransCanada PipeLines Ltd. | | | 4.63% | | | | 03/01/2034 | | | | 7,839,862 | |
| | 500,000 | | | Transelec SA | | | 4.25% | (a) | | | 01/14/2025 | | | | 493,815 | |
| | 6,000,000 | | | Transelec SA | | | 3.88% | (a) | | | 01/12/2029 | | | | 5,678,930 | |
| | | | | | | | | | | | | | | | |
| | | | Total Foreign Corporate Bonds
(Cost $39,508,633) | | | | 38,440,009 | |
| | | | | | | | | | | | | | | | |
| FOREIGN GOVERNMENT BONDS, FOREIGN AGENCIES AND FOREIGN
GOVERNMENT SPONSORED CORPORATIONS 1.8% |
|
| | 3,640,000 | | | Israel Electric Corp. Ltd. | | | 5.00% | (a) | | | 11/12/2024 | | | | 3,623,520 | |
| | | | | | | | |
| The accompanying notes are an integral part of these financial statements. | | Annual Report | | | | | March 31, 2024 | | 93 |
| | |
Schedule of Investments DoubleLine Infrastructure Income Fund (Cont.) | | |
| | | | | | | | | | | | | | | | |
PRINCIPAL
AMOUNT $ | | | SECURITY DESCRIPTION | | RATE | | | MATURITY | | | VALUE $ | |
| | 152,865 | | | Lima Metro Line 2 Finance Ltd. | | | 5.88% | | | | 07/05/2034 | | | | 151,771 | |
| | 2,838,917 | | | Lima Metro Line 2 Finance Ltd. | | | 5.88% | (a) | | | 07/05/2034 | | | | 2,818,596 | |
| | | | | | | | | | | | | | | | |
| | | | Total Foreign Government Bonds, Foreign Agencies and Foreign Government Sponsored Corporations
(Cost $6,770,836) | | | | 6,593,887 | |
| | | | | | | | | | | | | | | | |
| | US CORPORATE BONDS 37.5% | |
| | 4,000,000 | | | Ameren Illinois Co. | | | 3.85% | | | | 09/01/2032 | | | | 3,667,198 | |
| | 1,500,000 | | | Ameren Illinois Co. | | | 4.95% | | | | 06/01/2033 | | | | 1,485,697 | |
| | 11,015,000 | | | AT&T, Inc. | | | 4.30% | | | | 12/15/2042 | | | | 9,456,000 | |
| | 3,500,000 | | | Cheniere Energy, Inc. | | | 5.65% | (a) | | | 04/15/2034 | | | | 3,527,180 | |
| | 8,000,000 | | | Crown Castle, Inc. | | | 5.10% | | | | 05/01/2033 | | | | 7,806,133 | |
| | 10,250,000 | | | Dominion Energy, Inc. | | | 3.38% | | | | 04/01/2030 | | | | 9,320,973 | |
| | 5,000,000 | | | Duke Energy Florida LLC | | | 5.88% | | | | 11/15/2033 | | | | 5,286,194 | |
| | 6,655,000 | | | Duquesne Light Holdings, Inc. | | | 3.62% | (a) | | | 08/01/2027 | | | | 6,250,527 | |
| | 8,000,000 | | | Energy Transfer LP | | | 5.75% | | | | 02/15/2033 | | | | 8,132,525 | |
| | 8,500,000 | | | Eversource Energy | | | 5.13% | | | | 05/15/2033 | | | | 8,332,832 | |
| | 7,688,000 | | | Exelon Corp. | | | 4.05% | | | | 04/15/2030 | | | | 7,254,352 | |
| | 5,750,000 | | | Flex Intermediate Holdco LLC | | | 4.32% | (a) | | | 12/30/2039 | | | | 4,204,277 | |
| | 2,000,000 | | | Foundry JV Holdco LLC | | | 5.88% | (a) | | | 01/25/2034 | | | | 2,005,235 | |
| | 7,500,000 | | | ITC Holdings Corp. | | | 5.40% | (a) | | | 06/01/2033 | | | | 7,507,571 | |
| | 8,000,000 | | | MPLX LP | | | 5.00% | | | | 03/01/2033 | | | | 7,769,222 | |
| | 9,900,000 | | | NiSource, Inc. | | | 3.60% | | | | 05/01/2030 | | | | 9,124,648 | |
| | 8,500,000 | | | Ohio Power Co. | | | 5.00% | | | | 06/01/2033 | | | | 8,345,865 | |
| | 3,500,000 | | | ONEOK, Inc. | | | 6.63% | | | | 09/01/2053 | | | | 3,859,967 | |
| | 5,000,000 | | | Sempra | | | 5.50% | | | | 08/01/2033 | | | | 5,016,745 | |
| | 10,000,000 | | | Southern Co. | | | 3.70% | | | | 04/30/2030 | | | | 9,277,503 | |
| | 4,500,000 | | | T-Mobile USA, Inc. | | | 5.50% | | | | 01/15/2055 | | | | 4,494,701 | |
| | 5,000,000 | | | Venture Global Calcasieu Pass LLC | | | 6.25% | (a) | | | 01/15/2030 | | | | 5,034,064 | |
| | | | | | | | | | | | | | | | |
| | | | Total US Corporate Bonds
(Cost $141,769,659) | | | | 137,159,409 | |
| | | | | | | | | | | | | | | | |
| | US GOVERNMENT AND AGENCY OBLIGATIONS 8.7% | |
| | 20,000,000 | | | United States Treasury Note/Bond | | | 4.25% | | | | 02/28/2029 | | | | 20,029,687 | |
| | 12,100,000 | | | United States Treasury Note/Bond | | | 4.25% | | | | 02/15/2054 | | | | 11,902,430 | |
| | | | | | | | | | | | | | | | |
| | | | Total US Government and Agency Obligations
(Cost $31,615,953) | | | | 31,932,117 | |
| | | | | | | | | | | | | | | | |
| | | | | | | | | | | | | | | | |
SHARES | | | SECURITY DESCRIPTION | | RATE | | | MATURITY | | | VALUE $ | |
| | SHORT TERM INVESTMENTS 1.5% | |
| | 1,879,065 | | | First American Government Obligations Fund - U | | | 5.26% | (d) | | | | | | | 1,879,065 | |
| | 1,879,065 | | | JPMorgan US Government Money Market Fund - IM | | | 5.25% | (d) | | | | | | | 1,879,065 | |
| | 1,879,064 | | | MSILF Government Portfolio - Institutional | | | 5.22% | (d) | | | | | | | 1,879,064 | |
| | | | | | | | | | | | | | | | |
| | | | Total Short Term Investments (Cost $5,637,194) | | | | 5,637,194 | |
| | | | | | | | | | | | | | | | |
| | | | Total Investments 99.5%
(Cost $385,027,454) | | | | 363,979,640 | |
| | | | Other Assets in Excess of Liabilities 0.5% | | | | 1,903,689 | |
| | | | | | | | | | | | | | | | |
| | | | NET ASSETS 100.0% | | | $ | 365,883,329 | |
| | | | | | | | | | | | | | | | |
| | | | | |
| SECURITY TYPE BREAKDOWN as a % of Net Assets: | |
Asset Backed Obligations | | | | 39.5% | |
US Corporate Bonds | | | | 37.5% | |
Foreign Corporate Bonds | | | | 10.5% | |
US Government and Agency Obligations | | | | 8.7% | |
Foreign Government Bonds, Foreign Agencies and Foreign Government Sponsored Corporations | | | | 1.8% | |
Short Term Investments | | | | 1.5% | |
Other Assets and Liabilities | | | | 0.5% | |
| | | | | |
Net Assets | | | | 100.0% | |
| | | | | |
| | | | | |
| INVESTMENT BREAKDOWN as a % of Net Assets: | |
Asset Backed Obligations | | | | 39.5% | |
Utilities | | | | 22.0% | |
Energy | | | | 16.4% | |
US Government and Agency Obligations | | | | 8.7% | |
Telecommunications | | | | 5.8% | |
Transportation | | | | 5.0% | |
Short Term Investments | | | | 1.5% | |
Technology | | | | 0.6% | |
Other Assets and Liabilities | | | | 0.5% | |
| | | | | |
Net Assets | | | | 100.0% | |
| | | | | |
| (a) | Security exempt from registration under Rule 144A of the Securities Act of 1933. These securities may be resold in transactions exempt from registration to qualified institutional buyers. |
| (b) | Step Bond; Coupon rate changes based on a predetermined schedule or event. The interest rate shown is the rate in effect as of period end. |
| (c) | Value determined using significant unobservable inputs. |
| (d) | Seven-day yield as of period end. |
| | | | |
| 94 | | DoubleLine Funds Trust | | The accompanying notes are an integral part of these financial statements. |
| | |
Schedule of Investments DoubleLine Shiller Enhanced International CAPE® | | March 31, 2024 |
| | | | | | | | | | | | | | | | |
PRINCIPAL
AMOUNT $ | | | SECURITY DESCRIPTION | | RATE | | | MATURITY | | | VALUE $ | |
| | ASSET BACKED OBLIGATIONS 7.3% | |
| | |
| | | | Bridgecrest Lending Auto Securitization Trust | | | | | |
| | 250,000 | | | Series 2024-1-A2 | | | 5.82% | | | | 09/15/2026 | | | | 249,960 | |
| | |
| | | | Commonbond Student Loan Trust | | | | | |
| | 371,462 | | | Series 2017-BGS-B | | | 3.26% | (a) | | | 09/25/2042 | | | | 330,483 | |
| | |
| | | | Diamond Resorts Owner Trust | | | | | |
| | 314,622 | | | Series 2021-1A-A | | | 1.51% | (a) | | | 11/21/2033 | | | | 294,998 | |
| | |
| | | | Marlette Funding Trust | | | | | |
| | 500,000 | | | Series 2022-3A-B | | | 5.95% | (a) | | | 11/15/2032 | | | | 499,160 | |
| | |
| | | | Mosaic Solar Loans LLC | | | | | |
| | 385,252 | | | Series 2021-3A-A | | | 1.44% | (a) | | | 06/20/2052 | | | | 312,834 | |
| | |
| | | | National Collegiate Student Loan Trust | | | | | |
| | 402,085 | | | Series 2006-1-A5 (CME Term SOFR 1 Month + 0.46%) | | | 5.79% | | | | 03/25/2033 | | | | 389,158 | |
| | |
| | | | Navient Student Loan Trust | | | | | |
| | 412,867 | | | Series 2018-A-B | | | 3.68% | (a) | | | 02/18/2042 | | | | 393,698 | |
| | |
| | | | Pagaya AI Debt Selection Trust | | | | | |
| | 150,131 | | | Series 2023-5-A | | | 7.18% | (a) | | | 04/15/2031 | | | | 150,541 | |
| | 250,000 | | | Series 2024-1-A | | | 6.66% | (a) | | | 07/15/2031 | | | | 250,938 | |
| | |
| | | | Retained Vantage Data Centers Issuer LLC | | | | | |
| | 500,000 | | | Series 2023-1A-A2A | | | 5.00% | (a) | | | 09/15/2048 | | | | 484,513 | |
| | | | | | | | | | | | | | | | |
| | | | Total Asset Backed Obligations
(Cost $3,390,009) | | | | 3,356,283 | |
| | | | | | | | | | | | | | | | |
| | COLLATERALIZED LOAN OBLIGATIONS 13.9% | |
| | |
| | | | Allegro CLO Ltd. | | | | | |
| | 500,000 | | | Series 2019-1A-AR (CME Term SOFR 3 Month + 1.41%, 1.15% Floor) | | | 6.73% | (a) | | | 07/20/2032 | | | | 500,100 | |
| | |
| | | | CBAM Ltd. | | | | | |
| | 500,000 | | | Series 2017-2A-AR (CME Term SOFR 3 Month + 1.45%, 1.19% Floor) | | | 6.77% | (a) | | | 07/17/2034 | | | | 500,450 | |
| | |
| | | | CFIP CLO Ltd. | | | | | |
| | 500,000 | | | Series 2021-1A-A (CME Term SOFR 3 Month + 1.48%, 1.22% Floor) | | | 6.80% | (a) | | | 01/20/2035 | | | | 500,513 | |
| | |
| | | | Highbridge Loan Management Ltd. | | | | | |
| | 500,000 | | | Series 3A-2014-CR (CME Term SOFR 3 Month + 3.86%) | | | 9.16% | (a) | | | 07/18/2029 | | | | 501,363 | |
| | |
| | | | Logan CLO | | | | | |
| | 500,000 | | | Series 2022-1A-B (CME Term SOFR 3 Month + 2.05%, 2.05% Floor) | | | 7.37% | (a) | | | 04/21/2035 | | | | 501,211 | |
| | |
| | | | Palmer Square CLO Ltd. | | | | | |
| | 500,000 | | | Series 2021-2A-A (CME Term SOFR 3 Month + 1.41%, 1.41% Floor) | | | 6.73% | (a) | | | 07/15/2034 | | | | 500,447 | |
| | |
| | | | RR Ltd./Cayman Islands | | | | | |
| | 500,000 | | | Series 2021-14A-A1 (CME Term SOFR 3 Month + 1.38%, 1.38% Floor) | | | 6.70% | (a) | | | 04/15/2036 | | | | 500,300 | |
| | |
| | | | Shackleton CLO Ltd. | | | | | |
| | 487,674 | | | Series 2015-7RA-AR (CME Term SOFR 3 Month + 1.41%, 1.15% Floor) | | | 6.73% | (a) | | | 07/15/2031 | | | | 488,535 | |
| | |
| | | | Sound Point CLO Ltd. | | | | | |
| | 500,000 | | | Series 2019-2A-AR (CME Term SOFR 3 Month + 1.43%, 1.17% Floor) | | | 6.75% | (a) | | | 07/15/2034 | | | | 498,833 | |
| | 1,000,000 | | | Series 2020-1A-AR (CME Term SOFR 3 Month + 1.43%, 1.43% Floor) | | | 6.75% | (a) | | | 07/20/2034 | | | | 1,000,378 | |
| | |
| | | | Venture CDO Ltd. | | | | | |
| | 401,880 | | | Series 2017-29A-AR (CME Term SOFR 3 Month + 1.25%, 0.99% Floor) | | | 6.56% | (a) | | | 09/07/2030 | | | | 402,081 | |
| | | | | | | | | | | | | | | | |
PRINCIPAL
AMOUNT $ | | | SECURITY DESCRIPTION | | RATE | | | MATURITY | | | VALUE $ | |
| | | | |
| | | | Wellfleet CLO Ltd. | | | | | | | | | | | | |
| | 500,000 | | | Series 2020-2A-AR (CME Term SOFR 3 Month + 1.48%, 1.22% Floor) | | | 6.80% | (a) | | | 07/15/2034 | | | | 499,710 | |
| | | | | | | | | | | | | | | | |
| | | | Total Collateralized Loan Obligations (Cost $6,381,726) | | | | 6,393,921 | |
| | | | | | | | | | | | | | | | |
| | FOREIGN CORPORATE BONDS 5.1% | |
| | 177,500 | | | Adani International Container Terminal Pvt Ltd. | | | 3.00% | | | | 02/16/2031 | | | | 151,445 | |
| | 10,000 | | | Algonquin Power & Utilities Corp. | | | 5.37% | (b) | | | 06/15/2026 | | | | 9,949 | |
| | 85,000 | | | Avolon Holdings Funding Ltd. | | | 2.13% | (a) | | | 02/21/2026 | | | | 79,229 | |
| | 200,000 | | | Bancolombia SA (5 Year CMT Rate + 2.94%) | | | 4.63% | | | | 12/18/2029 | | | | 195,083 | |
| | 45,000 | | | Bank of Montreal | | | 1.50% | | | | 01/10/2025 | | | | 43,677 | |
| | 80,000 | | | Bank of Nova Scotia/The | | | 4.75% | | | | 02/02/2026 | | | | 79,442 | |
| | 200,000 | | | BBVA Bancomer SA/Texas (5 Year CMT Rate + 2.65%) | | | 5.13% | | | | 01/18/2033 | | | | 185,998 | |
| | 200,000 | | | Braskem Netherlands Finance BV (5 Year CMT Rate + 8.22%) | | | 8.50% | | | | 01/23/2081 | | | | 200,727 | |
| | 80,000 | | | Canadian Pacific Railway Co. | | | 1.35% | | | | 12/02/2024 | | | | 77,802 | |
| | 80,000 | | | Commonwealth Bank of Australia (US Secured Overnight Financing Rate + 0.63%) | | | 5.98% | (a) | | | 09/12/2025 | | | | 80,312 | |
| | 95,600 | | | Empresa Electrica Angamos SA | | | 4.88% | | | | 05/25/2029 | | | | 86,645 | |
| | 75,000 | | | Enbridge, Inc. | | | 5.90% | | | | 11/15/2026 | | | | 76,414 | |
| | 80,000 | | | Glencore Funding LLC | | | 1.63% | (a) | | | 09/01/2025 | | | | 75,748 | |
| | 60,000 | | | Glencore Funding LLC (Secured Overnight Financing Rate + 1.06%) | | | 6.41% | (a) | | | 04/04/2027 | | | | 60,037 | |
| | 200,000 | | | Inkia Energy Ltd. | | | 5.88% | | | | 11/09/2027 | | | | 195,888 | |
| | 180,000 | | | Millicom International Cellular SA | | | 5.13% | | | | 01/15/2028 | | | | 170,884 | |
| | 200,000 | | | Multibank, Inc. | | | 7.75% | (a) | | | 02/03/2028 | | | | 202,010 | |
| | 80,000 | | | NXP BV / NXP Funding LLC / NXP USA, Inc. | | | 4.40% | | | | 06/01/2027 | | | | 78,470 | |
| | 200,000 | | | Sasol Financing USA LLC | | | 4.38% | | | | 09/18/2026 | | | | 189,310 | |
| | 50,000 | | | Southern Copper Corp. | | | 3.88% | | | | 04/23/2025 | | | | 49,037 | |
| | 80,000 | | | Toronto-Dominion Bank/The | | | 0.70% | | | | 09/10/2024 | | | | 78,354 | |
| | | | | | | | | | | | | | | | |
| | | | Total Foreign Corporate Bonds
(Cost $2,318,791) | | | | 2,366,461 | |
| | | | | | | | | | | | | | | | |
| FOREIGN GOVERNMENT BONDS, FOREIGN AGENCIES AND FOREIGN
GOVERNMENT SPONSORED CORPORATIONS 0.8% |
|
| | 200,000 | | | Banco Nacional de Comercio Exterior SNC/Cayman Islands (5 Year CMT Rate + 2.00%) | | | 2.72% | | | | 08/11/2031 | | | | 181,160 | |
| | 130,161 | | | Bioceanico Sovereign Certificate Ltd. | | | 0.00% | | | | 06/05/2034 | | | | 95,689 | |
| | 87,351 | | | Lima Metro Line 2 Finance Ltd. | | | 5.88% | | | | 07/05/2034 | | | | 86,726 | |
| | | | | | | | | | | | | | | | |
| | | | Total Foreign Government Bonds, Foreign Agencies and Foreign Government Sponsored Corporations (Cost $359,073) | | | | 363,575 | |
| | | | | | | | | | | | | | | | |
| | | | | | | | |
| The accompanying notes are an integral part of these financial statements. | | Annual Report | | | | | March 31, 2024 | | 95 |
| | |
Schedule of Investments DoubleLine Shiller Enhanced International CAPE® (Cont.) | | |
| | | | | | | | | | | | | | | | |
PRINCIPAL
AMOUNT $ | | | SECURITY DESCRIPTION | | RATE | | | MATURITY | | | VALUE $ | |
| | NON-AGENCY COMMERCIAL MORTGAGE BACKED OBLIGATIONS 11.8% | |
| | |
| | | | Arbor Multifamily Mortgage Securities Trust | | | | | |
| | 1,629,822 | | | Series 2021-MF2-XA | | | 1.11% | (a)(c)(d) | | | 06/15/2054 | | | | 95,038 | |
| | |
| | | | AREIT Trust | | | | | |
| | 89,407 | | | Series 2022-CRE6-A (US 30 Day Average Secured Overnight Financing Rate + 1.25%, 1.25% Floor) | | | 6.57% | (a) | | | 01/20/2037 | | | | 89,131 | |
| | |
| | | | BANK | | | | | |
| | 2,739,185 | | | Series 2021-BN36-XA | | | 0.90% | (c)(d) | | | 09/15/2064 | | | | 110,696 | |
| | |
| | | | BB-UBS Trust | | | | | |
| | 3,844,000 | | | Series 2012-SHOW-XB | | | 0.14% | (a)(c)(d) | | | 11/05/2036 | | | | 2,769 | |
| | |
| | | | BDS Ltd. | | | | | |
| | 96,376 | | | Series 2021-FL10-A (CME Term SOFR 1 Month + 1.46%, 1.46% Floor) | | | 6.79% | (a) | | | 12/16/2036 | | | | 95,739 | |
| | |
| | | | Benchmark Mortgage Trust | | | | | |
| | 4,719,649 | | | Series 2018-B2-XA | | | 0.45% | (c)(d) | | | 02/15/2051 | | | | 58,392 | |
| | 2,271,000 | | | Series 2021-B26-XB | | | 0.64% | (a)(c)(d) | | | 06/15/2054 | | | | 82,080 | |
| | 1,792,356 | | | Series 2021-B28-XA | | | 1.27% | (c)(d) | | | 08/15/2054 | | | | 115,069 | |
| | |
| | | | BRSP Ltd. | | | | | |
| | 82,614 | | | Series 2021-FL1-A (CME Term SOFR 1 Month + 1.26%, 1.15% Floor) | | | 6.59% | (a) | | | 08/19/2038 | | | | 81,714 | |
| | |
| | | | BSPRT Co.-Issuer LLC | | | | | |
| | 99,992 | | | Series 2022-FL8-A (US 30 Day Average Secured Overnight Financing Rate + 1.50%, 1.50% Floor) | | | 6.82% | (a) | | | 02/15/2037 | | | | 99,623 | |
| | |
| | | | BX Trust | | | | | |
| | 99,393 | | | Series 2020-VKNG-A (CME Term SOFR 1 Month + 1.04%, 0.93% Floor) | | | 6.37% | (a) | | | 10/15/2037 | | | | 99,280 | |
| | 100,000 | | | Series 2021-CIP-A (CME Term SOFR 1 Month + 1.04%, 0.92% Floor) | | | 6.36% | (a) | | | 12/15/2038 | | | | 99,027 | |
| | |
| | | | Citigroup Commercial Mortgage Trust | | | | | |
| | 2,638,093 | | | Series 2016-C1-XA | | | 1.82% | (c)(d) | | | 05/10/2049 | | | | 76,773 | |
| | 100,000 | | | Series 2016-P3-A4 | | | 3.33% | | | | 04/15/2049 | | | | 95,355 | |
| | |
| | | | Citigroup/Deutsche Bank Commercial Mortgage Trust | | | | | |
| | 165,000 | | | Series 2016-C1-B | | | 4.20% | (c) | | | 05/10/2049 | | | | 150,065 | |
| | 250,000 | | | Series 2017-CD6-C | | | 4.23% | (c) | | | 11/13/2050 | | | | 204,870 | |
| | |
| | | | Commercial Mortgage Pass Through Certificates | | | | | |
| | 72,072 | | | Series 2014-UBS5-A3 | | | 3.57% | | | | 09/10/2047 | | | | 71,710 | |
| | 5,863,094 | | | Series 2015-CR27-XA | | | 0.90% | (c)(d) | | | 10/10/2048 | | | | 58,558 | |
| | 5,899,257 | | | Series 2015-LC21-XD | | | 1.07% | (a)(c)(d) | | | 07/10/2048 | | | | 66,882 | |
| | |
| | | | Commercial Mortgage Trust | | | | | |
| | 2,400,000 | | | Series 2021-PF1-XD | | | 1.11% | (a)(c)(d) | | | 11/15/2054 | | | | 157,744 | |
| | |
| | | | Computershare Corporate Trust | | | | | |
| | 5,658,382 | | | Series 2015-NXS2-XA | | | 0.58% | (c)(d) | | | 07/15/2058 | | | | 27,534 | |
| | 3,457,209 | | | Series 2015-P2-XA | | | 0.92% | (c)(d) | | | 12/15/2048 | | | | 41,985 | |
| | 2,482,335 | | | Series 2018-C48-XA | | | 0.93% | (c)(d) | | | 01/15/2052 | | | | 83,748 | |
| | 850,184 | | | Series 2021-C59-XA | | | 1.52% | (c)(d) | | | 04/15/2054 | | | | 63,019 | |
| | |
| | | | Credit Suisse Mortgage Capital Certificates | | | | | |
| | 164,000 | | | Series 2017-TIME-A | | | 3.65% | (a) | | | 11/13/2039 | | | | 107,717 | |
| | 99,752 | | | Series 2019-ICE4-A (CME Term SOFR 1 Month + 1.03%, 0.98% Floor) | | | 6.35% | (a) | | | 05/15/2036 | | | | 99,755 | |
| | |
| | | | Cross Harbor Capital Partners | | | | | |
| | 100,000 | | | Series 2021-FL1-C (CME Term SOFR 1 Month + 2.21%, 2.10% Floor) | | | 7.54% | (a) | | | 02/15/2038 | | | | 97,858 | |
| | |
| | | | Extended Stay America Trust | | | | | |
| | 109,711 | | | Series 2021-ESH-A (CME Term SOFR 1 Month + 1.19%, 1.08% Floor) | | | 6.52% | (a) | | | 07/15/2038 | | | | 109,747 | |
| | | | | | | | | | | | | | | | |
PRINCIPAL
AMOUNT $ | | | SECURITY DESCRIPTION | | RATE | | | MATURITY | | | VALUE $ | |
| | |
| | | | FS Rialto | | | | | |
| | 88,805 | | | Series 2021-FL2-A (CME Term SOFR 1 Month + 1.33%, 1.33% Floor) | | | 6.66% | (a) | | | 05/16/2038 | | | | 87,973 | |
| | 94,977 | | | Series 2021-FL3-A (CME Term SOFR 1 Month + 1.36%, 1.36% Floor) | | | 6.69% | (a) | | | 11/16/2036 | | | | 94,811 | |
| | |
| | | | Granite Point Mortgage Trust, Inc. | | | | | |
| | 43,441 | | | Series 2021-FL3-A (CME Term SOFR 1 Month + 1.36%, 1.36% Floor) | | | 6.69% | (a) | | | 07/16/2035 | | | | 42,965 | |
| | |
| | | | Great Wolf Trust | | | | | |
| | 100,000 | | | Series 2024-WOLF-A (CME Term SOFR 1 Month + 1.54%, 1.54% Floor) | | | 6.84% | (a) | | | 03/15/2039 | | | | 100,318 | |
| | |
| | | | Greystone Commercial Real Estate Notes | | | | | |
| | 100,000 | | | Series 2021-FL3-A (CME Term SOFR 1 Month + 1.13%, 1.02% Floor) | | | 6.46% | (a) | | | 07/15/2039 | | | | 99,521 | |
| | |
| | | | GS Mortgage Securities Corp. II | | | | | |
| | 4,199,173 | | | Series 2016-GS4-XA | | | 0.56% | (c)(d) | | | 11/10/2049 | | | | 48,456 | |
| | 186,000 | | | Series 2020-UPTN-F | | | 3.25% | (a)(c) | | | 02/10/2037 | | | | 170,375 | |
| | |
| | | | JPMBB Commercial Mortgage Securities Trust | | | | | |
| | 200,000 | | | Series 2015-C27-C | | | 4.30% | (c) | | | 02/15/2048 | | | | 161,887 | |
| | |
| | | | KREF | | | | | |
| | 100,000 | | | Series 2021-FL2-A (CME Term SOFR 1 Month + 1.18%, 1.07% Floor) | | | 6.51% | (a) | | | 02/15/2039 | | | | 98,493 | |
| | |
| | | | Ladder Capital Commercial Mortgage Securities LLC | | | | | |
| | 125,000 | | | Series 2021-FL3-AS (CME Term SOFR 1 Month + 1.91%, 1.91% Floor) | | | 7.24% | (a) | | | 11/15/2038 | | | | 122,396 | |
| | 125,000 | | | Series 2021-FL3-B (CME Term SOFR 1 Month + 2.31%, 2.31% Floor) | | | 7.64% | (a) | | | 11/15/2038 | | | | 121,331 | |
| | |
| | | | LoanCore | | | | | |
| | 65,705 | | | Series 2021-CRE5-A (CME Term SOFR 1 Month + 1.41%, 1.41% Floor) | | | 6.74% | (a) | | | 07/15/2036 | | | | 65,406 | |
| | 93,750 | | | Series 2021-CRE6-A (CME Term SOFR 1 Month + 1.41%, 1.30% Floor) | | | 6.74% | (a) | | | 11/15/2038 | | | | 93,289 | |
| | |
| | | | Lument Finance Trust, Inc. | | | | | |
| | 87,497 | | | Series 2021-FL1-A (CME Term SOFR 1 Month + 1.28%, 1.28% Floor) | | | 6.61% | (a) | | | 06/15/2039 | | | | 87,134 | |
| | |
| | | | Med Trust | | | | | |
| | 119,427 | | | Series 2021-MDLN-A (CME Term SOFR 1 Month + 1.06%, 0.95% Floor) | | | 6.39% | (a) | | | 11/15/2038 | | | | 119,212 | |
| | |
| | | | MF1 Multifamily Housing Mortgage Loan Trust | | | | | |
| | 150,000 | | | Series 2021-FL6-C (CME Term SOFR 1 Month + 1.96%, 1.85% Floor) | | | 7.29% | (a) | | | 07/16/2036 | | | | 144,932 | |
| | 97,181 | | | Series 2022-FL8-A (CME Term SOFR 1 Month + 1.35%, 1.35% Floor) | | | 6.68% | (a) | | | 02/19/2037 | | | | 96,625 | |
| | 100,000 | | | Series 2024-FL14-A (CME Term SOFR 1 Month + 1.74%, 1.74% Floor) | | | 7.06% | (a) | | | 03/19/2039 | | | | 100,316 | |
| | |
| | | | MFT Trust | | | | | |
| | 186,000 | | | Series 2020-ABC-D | | | 3.48% | (a)(c) | | | 02/10/2042 | | | | 98,833 | |
| | |
| | | | Morgan Stanley Bank of America Merrill Lynch Trust | | | | | |
| | 90,000 | | | Series 2015-C23-AS | | | 4.00% | (c) | | | 07/15/2050 | | | | 87,310 | |
| | 4,953,748 | | | Series 2017-C34-XE | | | 0.87% | (a)(c)(d) | | | 11/15/2052 | | | | 131,309 | |
| | |
| | | | Morgan Stanley Capital I, Inc. | | | | | |
| | 15,277,000 | | | Series 2017-ASHF-XCP | | | 0.00% | (a)(c)(d) | | | 11/15/2024 | | | | 15 | |
| | | | |
| 96 | | DoubleLine Funds Trust | | The accompanying notes are an integral part of these financial statements. |
| | | | | | | | | | | | | | | | |
PRINCIPAL
AMOUNT $ | | | SECURITY DESCRIPTION | | RATE | | | MATURITY | | | VALUE $ | |
| | |
| | | | Ready Capital Corp. | | | | | |
| | 69,155 | | | Series 2021-FL7-A (CME Term SOFR 1 Month + 1.31%, 1.20% Floor) | | | 6.64% | (a) | | | 11/25/2036 | | | | 69,054 | |
| | |
| | | | SG Commercial Mortgage Securities LLC | | | | | |
| | 2,147,569 | | | Series 2016-C5-XA | | | 1.85% | (c)(d) | | | 10/10/2048 | | | | 60,636 | |
| | |
| | | | SLG Office Trust | | | | | |
| | 18,169,000 | | | Series 2021-OVA-X | | | 0.26% | (a)(c)(d) | | | 07/15/2041 | | | | 263,346 | |
| | |
| | | | TPG Real Estate Finance Issuer Ltd. | | | | | |
| | 67,751 | | | Series 2021-FL4-A (CME Term SOFR 1 Month + 1.31%, 1.20% Floor) | | | 6.64% | (a) | | | 03/15/2038 | | | | 67,171 | |
| | 100,000 | | | Series 2022-FL5-A (US 30 Day Average Secured Overnight Financing Rate + 1.65%, 1.65% Floor) | | | 6.97% | (a) | | | 02/15/2039 | | | | 99,504 | |
| | |
| | | | UBS Commercial Mortgage Trust | | | | | |
| | 5,378,000 | | | Series 2017-C3-XB | | | 0.43% | (c)(d) | | | 08/15/2050 | | | | 76,777 | |
| | |
| | | | VMC Finance LLC | | | | | |
| | 99,347 | | | Series 2022-FL5-A (US 30 Day Average Secured Overnight Financing Rate + 1.90%, 1.90% Floor) | | | 7.22% | (a) | | | 02/18/2039 | | | | 97,730 | |
| | | | | | | | | | | | | | | | |
| | | | Total Non-Agency Commercial Mortgage Backed Obligations
(Cost $7,219,604) | | | | 5,449,003 | |
| | | | | | | | | | | | | | | | |
| NON-AGENCY RESIDENTIAL COLLATERALIZED MORTGAGE
OBLIGATIONS 12.8% |
|
| | |
| | | | AJAX Mortgage Loan Trust | | | | | |
| | 238,679 | | | Series 2021-C-A | | | 2.12% | (a)(b) | | | 01/25/2061 | | | | 232,128 | |
| | |
| | | | Chase Mortgage Finance Corp. | | | | | |
| | 663,671 | | | Series 2006-A1-2A2 | | | 5.12% | (c) | | | 09/25/2036 | | | | 575,054 | |
| | |
| | | | Citigroup Mortgage Loan Trust, Inc. | | | | | |
| | 54,787 | | | Series 2006-AR2-1A2 | | | 5.31% | (c) | | | 03/25/2036 | | | | 51,125 | |
| | |
| | | | COLT Funding LLC | | | | | |
| | 474,370 | | | Series 2021-HX1-A1 | | | 1.11% | (a)(c) | | | 10/25/2066 | | | | 394,597 | |
| | |
| | | | Countrywide Alternative Loan Trust | | | | | |
| | 310,980 | | | Series 2007-9T1-1A6 | | | 6.00% | | | | 05/25/2037 | | | | 151,589 | |
| | |
| | | | Credit Suisse Mortgage Capital Certificates | | | | | |
| | 678,745 | | | Series 2022-NQM1-A1 | | | 2.27% | (a)(c) | | | 11/25/2066 | | | | 595,122 | |
| | |
| | | | Deutsche ALT-A Securities, Inc. | | | | | |
| | 323,751 | | | Series 2006-AR6-A6 (CME Term SOFR 1 Month + 0.49%, 0.38% Floor, 10.50% Cap) | | | 5.82% | | | | 02/25/2037 | | | | 275,436 | |
| | |
| | | | Lehman XS Trust | | | | | |
| | 143,788 | | | Series 2007-6-2A1 (CME Term SOFR 1 Month + 0.53%, 0.42% Floor) | | | 5.86% | | | | 05/25/2037 | | | | 106,697 | |
| | |
| | | | Merrill Lynch Alternative Note Asset | | | | | |
| | 792,731 | | | Series 2007-OAR5-1A1 | | | 3.53% | (c) | | | 10/25/2047 | | | | 239,262 | |
| | |
| | | | Merrill Lynch Mortgage Backed Securities Trust | | | | | |
| | 936,021 | | | Series 2007-2-1A1 (1 Year CMT Rate + 2.40%, 2.40% Floor) | | | 7.40% | | | | 08/25/2036 | | | | 810,068 | |
| | |
| | | | Onslow Bay Mortgage Loan Trust | | | | | |
| | 183,479 | | | Series 2020-EXP2-A3 | | | 2.50% | (a)(c) | | | 05/25/2060 | | | | 150,488 | |
| | |
| | | | PRPM LLC | | | | | |
| | 306,124 | | | Series 2021-4-A1 | | | 1.87% | (a)(b) | | | 04/25/2026 | | | | 299,249 | |
| | |
| | | | RALI Trust | | | | | |
| | 679,021 | | | Series 2007-QS8-A3 (CME Term SOFR 1 Month + 0.71%, 0.60% Floor, 6.00% Cap) | | | 6.00% | | | | 06/25/2037 | | | | 486,783 | |
| | | | | | | | | | | | | | | | |
PRINCIPAL
AMOUNT $ | | | SECURITY DESCRIPTION | | RATE | | | MATURITY | | | VALUE $ | |
| | |
| | | | Starwood Mortgage Residential Trust | | | | | |
| | 500,000 | | | Series 2020-2-M1E | | | 3.00% | (a) | | | 04/25/2060 | | | | 481,504 | |
| | 346,064 | | | Series 2021-5-A1 | | | 1.92% | (a)(c) | | | 09/25/2066 | | | | 285,340 | |
| | |
| | | | Velocity Commercial Capital Loan Trust | | | | | |
| | 214,841 | | | Series 2018-2-A | | | 4.05% | (a)(c) | | | 10/26/2048 | | | | 202,605 | |
| | 463,672 | | | Series 2021-2-M2 | | | 2.20% | (a)(c) | | | 08/25/2051 | | | | 381,035 | |
| | |
| | | | Vericrest Opportunity Loan Transferee | | | | | |
| | 203,670 | | | Series 2021-NPL1-A1 | | | 4.89% | (a)(b) | | | 02/27/2051 | | | | 199,116 | |
| | | | | | | | | | | | | | | | |
| | | | Total Non-Agency Residential Collateralized Mortgage Obligations
(Cost $6,827,417) | | | | 5,917,198 | |
| | | | | | | | | | | | | | | | |
| | US CORPORATE BONDS 6.8% | |
| | 20,000 | | | AGCO Corp. | | | 5.45% | | | | 03/21/2027 | | | | 20,098 | |
| | 80,000 | | | American Electric Power Co., Inc. | | | 5.20% | | | | 01/15/2029 | | | | 80,234 | |
| | 78,000 | | | American Express Co. (Secured Overnight Financing Rate + 1.00%) | | | 6.34% | | | | 02/16/2028 | | | | 78,288 | |
| | 80,000 | | | Amgen, Inc. | | | 5.51% | | | | 03/02/2026 | | | | 79,926 | |
| | 70,000 | | | Athene Global Funding (Secured Overnight Financing Rate + 0.70%) | | | 6.04% | (a) | | | 05/24/2024 | | | | 70,037 | |
| | 10,000 | | | Athene Global Funding | | | 1.72% | (a) | | | 01/07/2025 | | | | 9,697 | |
| | 80,000 | | | Boeing Co. | | | 4.88% | | | | 05/01/2025 | | | | 79,124 | |
| | 78,000 | | | BP Capital Markets America, Inc. | | | 4.70% | | | | 04/10/2029 | | | | 77,841 | |
| | 45,000 | | | Bristol-Myers Squibb Co. (US Secured Overnight Financing Rate + 0.49%) | | | 5.83% | | | | 02/20/2026 | | | | 45,161 | |
| | 81,000 | | | Broadcom, Inc. | | | 3.15% | | | | 11/15/2025 | | | | 78,390 | |
| | 30,000 | | | Campbell Soup Co. | | | 5.20% | | | | 03/19/2027 | | | | 30,082 | |
| | 55,000 | | | Carrier Global Corp. | | | 5.80% | | | | 11/30/2025 | | | | 55,386 | |
| | 110,000 | | | Citigroup, Inc. (CME Term SOFR 3 Month + 1.16%) | | | 3.35% | | | | 04/24/2025 | | | | 109,820 | |
| | 10,000 | | | Citigroup, Inc. (US Secured Overnight Financing Rate + 1.53%) | | | 3.29% | | | | 03/17/2026 | | | | 9,775 | |
| | 80,000 | | | Constellation Brands, Inc. | | | 5.00% | | | | 02/02/2026 | | | | 79,512 | |
| | 80,000 | | | Dollar Tree, Inc. | | | 4.00% | | | | 05/15/2025 | | | | 78,670 | |
| | 80,000 | | | Elevance Health, Inc. | | | 3.50% | | | | 08/15/2024 | | | | 79,365 | |
| | 75,000 | | | Energy Transfer LP | | | 6.05% | | | | 12/01/2026 | | | | 76,527 | |
| | 80,000 | | | Entergy Louisiana LLC | | | 0.95% | | | | 10/01/2024 | | | | 78,200 | |
| | 40,000 | | | Exelon Corp. | | | 5.15% | | | | 03/15/2029 | | | | 40,107 | |
| | 78,000 | | | Expedia Group, Inc. | | | 6.25% | (a) | | | 05/01/2025 | | | | 78,355 | |
| | 80,000 | | | Ford Motor Co. | | | 4.35% | | | | 12/08/2026 | | | | 77,912 | |
| | 80,000 | | | General Motors Financial Co., Inc. | | | 5.25% | | | | 03/01/2026 | | | | 79,789 | |
| | 50,000 | | | Goldman Sachs Bank USA/New York NY (US Secured Overnight Financing Rate + 0.77%) | | | 6.12% | | | | 03/18/2027 | | | | 50,000 | |
| | 80,000 | | | HCA, Inc. | | | 5.38% | | | | 02/01/2025 | | | | 79,788 | |
| | 5,000 | | | JPMorgan Chase & Co. (CME Term SOFR 3 Month + 0.54%) | | | 0.82% | | | | 06/01/2025 | | | | 4,957 | |
| | 80,000 | | | JPMorgan Chase & Co. | | | 3.90% | | | | 07/15/2025 | | | | 78,707 | |
| | 10,000 | | | JPMorgan Chase & Co. (US Secured Overnight Financing Rate + 0.49%) | | | 0.77% | | | | 08/09/2025 | | | | 9,812 | |
| | 70,000 | | | Marriott International, Inc./MD | | | 3.60% | | | | 04/15/2024 | | | | 69,934 | |
| | 10,000 | | | Marriott International, Inc./MD | | | 5.00% | | | | 10/15/2027 | | | | 9,973 | |
| | 70,000 | | | Microchip Technology, Inc. | | | 0.98% | | | | 09/01/2024 | | | | 68,587 | |
| | | | | | | | |
| The accompanying notes are an integral part of these financial statements. | | Annual Report | | | | | March 31, 2024 | | 97 |
| | |
Schedule of Investments DoubleLine Shiller Enhanced International CAPE® (Cont.) | | |
| | | | | | | | | | | | | | | | |
PRINCIPAL
AMOUNT $ | | | SECURITY DESCRIPTION | | RATE | | | MATURITY | | | VALUE $ | |
| | 10,000 | | | Microchip Technology, Inc. | | | 4.25% | | | | 09/01/2025 | | | | 9,840 | |
| | 80,000 | | | Morgan Stanley | | | 3.88% | | | | 01/27/2026 | | | | 78,175 | |
| | 77,000 | | | Oracle Corp. | | | 5.80% | | | | 11/10/2025 | | | | 77,664 | |
| | 65,000 | | | Pacific Gas and Electric Co. | | | 4.95% | | | | 06/08/2025 | | | | 64,491 | |
| | 15,000 | | | Pacific Gas and Electric Co. | | | 2.10% | | | | 08/01/2027 | | | | 13,512 | |
| | 40,000 | | | Packaging Corp. of America | | | 3.65% | | | | 09/15/2024 | | | | 39,609 | |
| | 78,000 | | | Parker-Hannifin Corp. | | | 3.65% | | | | 06/15/2024 | | | | 77,665 | |
| | 80,000 | | | Penske Truck Leasing Co. LP / PTL Finance Corp. | | | 4.40% | (a) | | | 07/01/2027 | | | | 77,923 | |
| | 40,000 | | | PNC Financial Services Group, Inc. (US Secured Overnight Financing Rate + 1.32%) | | | 5.81% | | | | 06/12/2026 | | | | 40,145 | |
| | 80,000 | | | Republic Services, Inc. | | | 2.50% | | | | 08/15/2024 | | | | 79,062 | |
| | 87,000 | | | Royalty Pharma PLC | | | 1.75% | | | | 09/02/2027 | | | | 77,720 | |
| | 77,000 | | | Ryder System, Inc. | | | 5.25% | | | | 06/01/2028 | | | | 77,392 | |
| | 75,000 | | | Take-Two Interactive Software, Inc. | | | 4.95% | | | | 03/28/2028 | | | | 74,741 | |
| | 85,000 | | | Truist Financial Corp. (US Secured Overnight Financing Rate + 1.46%) | | | 4.26% | | | | 07/28/2026 | | | | 83,643 | |
| | 80,000 | | | Veralto Corp. | | | 5.50% | (a) | | | 09/18/2026 | | | | 80,341 | |
| | 80,000 | | | VICI Properties LP / VICI Note Co., Inc. | | | 4.25% | (a) | | | 12/01/2026 | | | | 76,974 | |
| | 80,000 | | | Wells Fargo & Co.
(CME Term SOFR 3 Month + 1.09%) | | | 2.41% | | | | 10/30/2025 | | | | 78,487 | |
| | 80,000 | | | Welltower OP LLC | | | 4.00% | | | | 06/01/2025 | | | | 78,663 | |
| | 80,000 | | | Zimmer Biomet Holdings, Inc. | | | 1.45% | | | | 11/22/2024 | | | | 77,871 | |
| | | | | | | | | | | | | | | | |
| | | | Total US Corporate Bonds
(Cost $3,136,181) | | | | 3,127,972 | |
| | | | | | | | | | | | | | | | |
| US GOVERNMENT AND AGENCY MORTGAGE BACKED
OBLIGATIONS 3.1% |
|
| | |
| | | | Federal Home Loan Mortgage Corp. | | | | | |
| | 42,372 | | | Series 2021-MN1-M1 (US 30 Day Average Secured Overnight Financing Rate + 2.00%) | | | 7.32% | (a) | | | 01/25/2051 | | | | 41,535 | |
| | | | |
| | | | Federal National Mortgage Association | | | | | | | | | | | | |
| | 1,409,467 | | | Series 2013-92-FA (US 30 Day Average Secured Overnight Financing Rate + 0.66%, 0.55% Floor, 6.50% Cap) | | | 5.98% | | | | 09/25/2043 | | | | 1,392,669 | |
| | | | | | | | | | | | | | | | |
| | | | Total US Government and Agency Mortgage Backed Obligations
(Cost $1,406,252) | | | | 1,434,204 | |
| | | | | | | | | | | | | | | | |
| | US GOVERNMENT AND AGENCY OBLIGATIONS 23.8% | |
| | 1,600,000 | | | United States Treasury Note/Bond | | | 4.25% | | | | 12/31/2025 | | | | 1,587,000 | |
| | 1,140,000 | | | United States Treasury Note/Bond | | | 4.25% | | | | 05/31/2025 | | | | 1,130,849 | |
| | 610,000 | | | United States Treasury Note/Bond | | | 4.63% | | | | 06/30/2025 | | | | 607,879 | |
| | 450,000 | | | United States Treasury Note/Bond | | | 4.63% | | | | 11/15/2026 | | | | 451,529 | |
| | 1,030,000 | | | United States Treasury Note/Bond | | | 4.00% | | | | 01/15/2027 | | | | 1,017,809 | |
| | 1,510,000 | | | United States Treasury Note/Bond | | | 4.63% | | | | 02/28/2026 | | | | 1,508,879 | |
| | 1,380,000 | | | United States Treasury Note/Bond | | | 4.25% | | | | 01/31/2026 | | | | 1,369,273 | |
| | | | | | | | | | | | | | | | |
PRINCIPAL
AMOUNT $/ SHARES | | | SECURITY DESCRIPTION | | RATE | | | MATURITY | | | VALUE $ | |
| | 930,000 | | | United States Treasury Note/Bond | | | 4.13% | | | | 02/15/2027 | | | | 922,262 | |
| | 900,000 | | | United States Treasury Note/Bond | | | 4.38% | | | | 12/15/2026 | | | | 897,926 | |
| | 1,460,000 | | | United States Treasury Note/Bond | | | 4.88% | | | | 11/30/2025 | | | | 1,462,338 | |
| | | | | | | | | | | | | | | | |
| | | | Total US Government and Agency Obligations (Cost $11,004,089) | | | | 10,955,744 | |
| | | | | | | | | | | | | | | | |
| | AFFILIATED MUTUAL FUNDS 5.1% | |
| | 259,675 | | | DoubleLine Floating Rate Fund - Class I | | | | | | | | | | | 2,347,465 | |
| | | | | | | | | | | | | | | | |
| | | | Total Affiliated Mutual Funds
(Cost $2,472,710) | | | | 2,347,465 | |
| | | | | | | | | | | | | | | | |
| | SHORT TERM INVESTMENTS 2.0% | |
| | 152,786 | | | First American Government Obligations Fund - U | | | 5.26% | (e) | | | | | | | 152,786 | |
| | 152,786 | | | JPMorgan US Government Money Market Fund - IM | | | 5.25% | (e) | | | | | | | 152,786 | |
| | 152,786 | | | MSILF Government Portfolio - Institutional | | | 5.22% | (e) | | | | | | | 152,786 | |
| | 470,000 | | | United States Treasury Bill | | | 0.00% | | | | 05/16/2024 | | | | 466,930 | |
| | | | | | | | | | | | | | | | |
| | | | Total Short Term Investments
(Cost $925,308) | | | | 925,288 | |
| | | | | | | | | | | | | | | | |
| | | | Total Investments 92.5%
(Cost $45,441,160) | | | | 42,637,114 | |
| | | | Other Assets in Excess of Liabilities 7.5% | | | | 3,474,444 | |
| | | | | | | | | | | | | | | | |
| | | | NET ASSETS 100.0% | | | | | | | | | | $ | 46,111,558 | |
| | | | | | | | | | | | | | | | |
| | | | | |
| SECURITY TYPE BREAKDOWN as a % of Net Assets: | | | | | |
US Government and Agency Obligations | | | | 23.8% | |
Collateralized Loan Obligations | | | | 13.9% | |
Non-Agency Residential Collateralized Mortgage Obligations | | | | 12.8% | |
Non-Agency Commercial Mortgage Backed Obligations | | | | 11.8% | |
Asset Backed Obligations | | | | 7.3% | |
US Corporate Bonds | | | | 6.8% | |
Foreign Corporate Bonds | | | | 5.1% | |
Affiliated Mutual Funds | | | | 5.1% | |
US Government and Agency Mortgage Backed Obligations | | | | 3.1% | |
Short Term Investments | | | | 2.0% | |
Foreign Government Bonds, Foreign Agencies and Foreign Government Sponsored Corporations | | | | 0.8% | |
Other Assets and Liabilities | | | | 7.5% | |
| | | | | |
Net Assets | | | | 100.0% | |
| | | | | |
| | | | |
| 98 | | DoubleLine Funds Trust | | The accompanying notes are an integral part of these financial statements. |
| | | | | |
| INVESTMENT BREAKDOWN as a % of Net Assets: | | | | | |
US Government and Agency Obligations | | | | 23.8% | |
Collateralized Loan Obligations | | | | 13.9% | |
Non-Agency Residential Collateralized Mortgage Obligations | | | | 12.8% | |
Non-Agency Commercial Mortgage Backed Obligations | | | | 11.8% | |
Asset Backed Obligations | | | | 7.3% | |
Affiliated Mutual Funds | | | | 5.1% | |
Banking | | | | 3.6% | |
US Government and Agency Mortgage Backed Obligations | | | | 3.1% | |
Short Term Investments | | | | 2.0% | |
Utilities | | | | 1.2% | |
Transportation | | | | 1.2% | |
Technology | | | | 0.7% | |
Healthcare | | | | 0.5% | |
Energy | | | | 0.5% | |
Diversified Manufacturing | | | | 0.5% | |
Pharmaceuticals | | | | 0.4% | |
Chemical Products | | | | 0.4% | |
Chemicals/Plastics | | | | 0.4% | |
Mining | | | | 0.4% | |
Telecommunications | | | | 0.4% | |
Automotive | | | | 0.3% | |
Hotels/Motels/Inns and Casinos | | | | 0.3% | |
Food Products | | | | 0.2% | |
Insurance | | | | 0.2% | |
Finance | | | | 0.2% | |
Aerospace & Defense | | | | 0.2% | |
Environmental Control | | | | 0.2% | |
Retailers (other than Food/Drug) | | | | 0.2% | |
Real Estate | | | | 0.2% | |
Commercial Services | | | | 0.2% | |
Media | | | | 0.2% | |
Pulp & Paper | | | | 0.1% | |
Construction | | | | 0.0% | (f) |
Other Assets and Liabilities | | | | 7.5% | |
| | | | | |
Net Assets | | | | 100.0% | |
| | | | | |
| (a) | Security exempt from registration under Rule 144A of the Securities Act of 1933. These securities may be resold in transactions exempt from registration to qualified institutional buyers. |
| (b) | Step Bond; Coupon rate changes based on a predetermined schedule or event. The interest rate shown is the rate in effect as of period end. |
| (c) | Coupon rate is variable based on the weighted average coupon of the underlying collateral. To the extent the weighted average coupon of the underlying assets which comprise the collateral increases or decreases, the coupon rate of this security will increase or decrease correspondingly. The rate disclosed is as of period end. |
| (d) | Interest only security |
| (e) | Seven-day yield as of period end. |
| (f) | Represents less than 0.05% of net assets. |
| | | | | | | | | | | | | | | | | | | | | | | | | | | | | | | | | | | | | | | | | | | | | | | |
|
| Swap Agreements |
|
| Excess Return Swaps |
| Reference Entity | | Counterparty | | Long/Short | | Financing
Rate | | Payment
Frequency | | Termination
Date | | Notional Amount | | Value | | Upfront
Premiums
Paid/ (Received) | | Unrealized
Appreciation
(Depreciation) |
Shiller Barclays CAPE® Europe Sector Net ER NoC Index(1) | | BNP Paribas Securities Corp. | | | | Long | | | | | 0.20% | | | | | Termination | | | | | 04/17/2024 | | | | | 14,000,000 | | | | | EUR | | | | $ | 1,621,164 | | | | $ | — | | | | $ | 1,621,164 | |
Shiller Barclays CAPE® Europe Sector Net ER NoC Index(1) | | Barclays Capital, Inc. | | | | Long | | | | | 0.20% | | | | | Termination | | | | | 09/19/2024 | | | | | 6,400,000 | | | | | EUR | | | | | 571,779 | | | | | — | | | | | 571,779 | |
Shiller Barclays CAPE® Europe Sector Net ER NoC Index(1) | | BNP Paribas Securities Corp. | | | | Long | | | | | 0.20% | | | | | Termination | | | | | 01/08/2025 | | | | | 10,000,000 | | | | | EUR | | | | | 517,739 | | | | | — | | | | | 517,739 | |
Shiller Barclays CAPE® Europe Sector Net ER NoC Index(1) | | Barclays Capital, Inc. | | | | Long | | | | | 0.20% | | | | | Termination | | | | | 02/05/2025 | | | | | 9,500,000 | | | | | EUR | | | | | 491,852 | | | | | — | | | | | 491,852 | |
| | | | | | | | | | | | | | | | | | | | | | | | | | | | | | | | | | | | | |
| | | | | | | | | | | | | | | | | | | | | | | | | | | | | | | | | | | $ | 3,202,534 | | | | $ | — | | | | $ | 3,202,534 | |
| | | | | | | | | | | | | | | | | | | | | | | | | | | | | | | | | | | | | |
| (1) | Shiller Barclays CAPE® Europe Sector Net ER NoC Index aims to provide notional long exposure to the top four European equity sectors that are relatively undervalued, as defined by a modified version of the classic CAPE® Ratio (the “Relative CAPE® Indicator”) and that possess relatively strong price momentum over the prior twelve months. Each European sector is represented by an index of equity securities of companies in the relevant sector. Information on the sector constituents as of March 31, 2024, is available on the Barclays Capital, Inc. website at https://indices.barclays/IM/12/en/indices/details.app;ticker=BXIIESAE. |
| | | | | | | | |
| The accompanying notes are an integral part of these financial statements. | | Annual Report | | | | | March 31, 2024 | | 99 |
| | |
Schedule of Investments DoubleLine Shiller Enhanced International CAPE® (Cont.) | | |
| | | | | | | | | | | | | | | | | | | | | | | | | | |
|
| Forward Currency Exchange Contracts | |
| Settlement Date | | Counterparty | | Currency to be Delivered | | Value | | | Currency to be Received | | Value | | | Unrealized
Appreciation
(Depreciation) | |
| 10/09/2024 | | J.P. Morgan Securities, Inc. | | | 11,566,760 | | | USD | | $ | 11,566,760 | | | | 10,700,000 | | | EUR | | $ | 11,643,629 | | | $ | 76,869 | |
| 10/09/2024 | | Goldman Sachs | | | 3,227,897 | | | USD | | | 3,227,897 | | | | 3,000,000 | | | EUR | | | 3,264,569 | | | | 36,672 | |
| 02/05/2025 | | Barclays Capital, Inc. | | | 9,383,377 | | | USD | | | 9,383,377 | | | | 8,600,000 | | | EUR | | | 9,414,536 | | | | 31,160 | |
| 06/04/2024 | | J.P. Morgan Securities, Inc. | | | 2,400,000 | | | EUR | | | 2,596,405 | | | | 2,619,793 | | | USD | | | 2,619,793 | | | | 23,388 | |
| 02/05/2025 | | Goldman Sachs | | | 5,675,472 | | | USD | | | 5,675,472 | | | | 5,200,000 | | | EUR | | | 5,692,510 | | | | 17,038 | |
| 06/04/2024 | | Barclays Capital, Inc. | | | 800,000 | | | EUR | | | 865,468 | | | | 873,181 | | | USD | | | 873,181 | | | | 7,712 | |
| 10/09/2024 | | J.P. Morgan Securities, Inc. | | | 1,000,000 | | | EUR | | | 1,088,190 | | | | 1,094,907 | | | USD | | | 1,094,907 | | | | 6,718 | |
| 10/09/2024 | | Barclays Capital, Inc. | | | 322,692 | | | USD | | | 322,692 | | | | 300,000 | | | EUR | | | 326,457 | | | | 3,765 | |
| 06/04/2024 | | Goldman Sachs | | | 3,000,000 | | | EUR | | | 3,245,506 | | | | 3,241,258 | | | USD | | | 3,241,258 | | | | (4,248 | ) |
| 06/04/2024 | | Barclays Capital, Inc. | | | 330,194 | | | USD | | | 330,194 | | | | 300,000 | | | EUR | | | 324,551 | | | | (5,644 | ) |
| 06/04/2024 | | J.P. Morgan Securities, Inc. | | | 2,951,849 | | | USD | | | 2,951,849 | | | | 2,700,000 | | | EUR | | | 2,920,956 | | | | (30,893 | ) |
| 06/04/2024 | | Goldman Sachs | | | 17,772,543 | | | USD | | | 17,772,543 | | | | 16,300,000 | | | EUR | | | 17,633,917 | | | | (138,626 | ) |
| | | | | | | | | | | | | | | | | | | | | | | | | | |
| | | | | | | | | | | | | | | | | | | | | | | | $ | 23,911 | |
| | | | | | | | | | | | | | | | | | | | | | | | | | |
Affiliated Mutual Funds
A summary of the DoubleLine Shiller Enhanced International CAPE®’s investments in affiliated mutual funds for the period ended March 31, 2024 is as follows:
| | | | | | | | | | | | | | | | | | | | | | | | | | | | | | | | | | | | | | | | |
| Fund | | Value at
March 31,
2023 | | Gross
Purchases | | Gross Sales | | Net Realized
Gain (Loss) for the Period Ended
March 31,
2024 | | Change in
Unrealized for the
Period Ended
March 31, 2024 | | Value at
March 31, 2024 | | Shares Held at
March 31,
2024 | | Dividend Income
Earned for the
Period Ended
March 31,
2024 |
DoubleLine Floating Rate Fund (Class I) | | | $ | 3,931,367 | | | | $ | — | | | | $ | (1,600,000 | ) | | | $ | (115,270 | ) | | | $ | 131,368 | | | | $ | 2,347,465 | | | | | 259,675 | | | | $ | 233,788 | |
| | | | |
| 100 | | DoubleLine Funds Trust | | The accompanying notes are an integral part of these financial statements. |
| | |
Schedule of Investments DoubleLine Emerging Markets Local Currency Bond Fund | | March 31, 2024 |
| | | | | | | | | | | | | | | | | | | | |
PRINCIPAL
AMOUNT | | | | | | SECURITY DESCRIPTION | | RATE | | | MATURITY | | | VALUE $ | |
| | FOREIGN CORPORATE BONDS 21.0% | |
| | BRAZIL 0.7% | | | | | | | | | | | | |
| | 550,000 | | | | BRL | | | Simpar Finance SARL | | | 10.75% | (a) | | | 02/12/2028 | | | | 91,294 | |
| | | | | | | | | | | | | | | | | | | | |
| | | | | | | | | | | | | | | | | | | 91,294 | |
| | | | | | | | | | | | | | | | | | | | |
| | CHINA 4.6% | | | | | | | | | | | | |
| | 2,000,000 | | | | CNY | | | European Bank for Reconstruction & Development | | | 2.75% | | | | 04/27/2032 | | | | 279,739 | |
| | 2,210,000 | | | | CNY | | | International Bank for Reconstruction & Development | | | 2.00% | | | | 02/18/2026 | | | | 303,207 | |
| | | | | | | | | | | | | | | | | | | | |
| | | | | | | | | | | | | | | | | | | 582,946 | |
| | | | | | | | | | | | | | | | | | | | |
| | COLOMBIA 1.5% | | | | | | | | | | | | |
| | 833,000,000 | | | | COP | | | Empresas Publicas de Medellin ESP | | | 8.38% | (a) | | | 11/08/2027 | | | | 191,644 | |
| | | | | | | | | | | | | | | | | | | | |
| | | | | | | | | | | | | | | | | | | 191,644 | |
| | | | | | | | | | | | | | | | | | | | |
| | INDIA 2.8% | | | | | | | | | | | | |
| | 11,500,000 | | | | INR | | | Asian Development Bank | | | 6.20% | | | | 10/06/2026 | | | | 136,252 | |
| | 18,000,000 | | | | INR | | | International Bank for Reconstruction & Development | | | 6.85% | | | | 04/24/2028 | | | | 215,891 | |
| | | | | | | | | | | | | | | | | | | | |
| | | | | | | | | | | | | | | | | | | 352,143 | |
| | | | | | | | | | | | | | | | | | | | |
| | INDONESIA 2.3% | | | | | | | | | | | | |
| | 4,800,000,000 | | | | IDR | | | European Bank for Reconstruction & Development | | | 4.25% | | | | 02/07/2028 | | | | 284,397 | |
| | | | | | | | | | | | | | | | | | | | |
| | | | | | | | | | | | | | | | | | | 284,397 | |
| | | | | | | | | | | | | | | | | | | | |
| | MEXICO 5.2% | | | | | | | | | | | | |
| | 4,500,000 | | | | MXN | | | America Movil SAB de CV | | | 10.30% | | | | 01/30/2034 | | | | 271,362 | |
| | 6,900,000 | | | | MXN | | | International Finance Corp. | | | 7.50% | | | | 01/18/2028 | | | | 391,998 | |
| | | | | | | | | | | | | | | | | | | | |
| | | | | | | | | | | | | | | | | | | 663,360 | |
| | | | | | | | | | | | | | | | | | | | |
| | PERU 0.7% | | | | | | | | | | | | |
| | 325,000 | | | | PEN | | | Banco de Credito del Peru SA | | | 4.65% | (a) | | | 09/17/2024 | | | | 86,390 | |
| | | | | | | | | | | | | | | | | | | | |
| | | | | | | | | | | | | | | | | | | 86,390 | |
| | | | | | | | | | | | | | | | | | | | |
| | POLAND 3.2% | | | | | | | | | | | | |
| | 1,840,000 | | | | PLN | | | European Investment Bank | | | 3.00% | | | | 11/25/2029 | | | | 406,203 | |
| | | | | | | | | | | | | | | | | | | | |
| | | | | | | | | | | | | | | | | | | 406,203 | |
| | | | | | | | | | | | | | | | | | | | |
| | | | | | | | Total Foreign Corporate Bonds (Cost $2,705,132) | | | | 2,658,377 | |
| | | | | | | | | | | | | | | | | | | | |
| FOREIGN GOVERNMENT BONDS, FOREIGN AGENCIES AND FOREIGN
GOVERNMENT SPONSORED CORPORATIONS 75.1% |
|
| | | | | | |
| | BRAZIL 13.0% | | | | | | | | | | | | |
| | 2,000 | | | | BRL | | | Brazil Notas de Tesouro Nacional - Serie F | | | 10.00% | (b) | | | 01/01/2031 | | | | 382,584 | |
| | 1,000 | | | | BRL | | | Brazil Notas de Tesouro Nacional - Serie F | | | 10.00% | (b) | | | 01/01/2025 | | | | 199,355 | |
| | 1,500 | | | | BRL | | | Brazil Notas de Tesouro Nacional - Serie F | | | 10.00% | (b) | | | 01/01/2035 | | | | 280,386 | |
| | 2,000 | | | | BRL | | | Brazil Notas de Tesouro Nacional - Serie F | | | 10.00% | (b) | | | 01/01/2029 | | | | 389,850 | |
| | | | | | | | | | | | | | | | | | | | |
PRINCIPAL
AMOUNT | | | | | | SECURITY DESCRIPTION | | RATE | | | MATURITY | | | VALUE $ | |
| | 2,000 | | | | BRL | | | Brazil Notas de Tesouro Nacional - Serie F | | | 10.00% | (b) | | | 01/01/2027 | | | | 397,078 | |
| | | | | | | | | | | | | | | | | | | | |
| | | | | | | | | | | | | | | | | | | 1,649,253 | |
| | | | | | | | | | | | | | | | | | | | |
| | CHILE 2.1% | | | | | | | | | | | | |
| | 95,000,000 | | | | CLP | | | Bonos de la Tesoreria de la Republica en pesos | | | 2.50% | | | | 03/01/2025 | | | | 94,361 | |
| | 90,000,000 | | | | CLP | | | Bonos de la Tesoreria de la Republica en pesos | | | 4.50% | | | | 03/01/2026 | | | | 90,050 | |
| | 75,000,000 | | | | CLP | | | Bonos de la Tesoreria de la Republica en pesos | | | 5.80% | (a) | | | 06/01/2024 | | | | 76,433 | |
| | | | | | | | | | | | | | | | | | | | |
| | | | | | | | | | | | | | | | | | | 260,844 | |
| | | | | | | | | | | | | | | | | | | | |
| | COLOMBIA 1.4% | | | | | | | | | | | | |
| | 350,000,000 | | | | COP | | | Colombian TES | | | 7.50% | | | | 08/26/2026 | | | | 87,471 | |
| | 350,000,000 | | | | COP | | | Colombian TES | | | 6.25% | | | | 11/26/2025 | | | | 88,092 | |
| | | | | | | | | | | | | | | | | | | | |
| | | | | | | | | | | | | | | | | | | 175,563 | |
| | | | | | | | | | | | | | | | | | | | |
| | CZECH REPUBLIC 4.4% | | | | | | | | | | | | |
| | 2,700,000 | | | | CZK | | | Czech Republic Government Bond | | | 4.90% | | | | 04/14/2034 | | | | 124,046 | |
| | 10,600,000 | | | | CZK | | | Czech Republic Government Bond | | | 2.75% | | | | 07/23/2029 | | | | 431,073 | |
| | | | | | | | | | | | | | | | | | | | |
| | | | | | | | | | | | | | | | | | | 555,119 | |
| | | | | | | | | | | | | | | | | | | | |
| | HUNGARY 3.3% | | | | | | | | | | | | |
| | 90,000,000 | | | | HUF | | | Hungary Government Bond | | | 2.50% | | | | 10/24/2024 | | | | 240,575 | |
| | 64,000,000 | | | | HUF | | | Hungary Government Bond | | | 3.00% | | | | 06/26/2024 | | | | 173,757 | |
| | | | | | | | | | | | | | | | | | | | |
| | | | | | | | | | | | | | | | | | | 414,332 | |
| | | | | | | | | | | | | | | | | | | | |
| | INDONESIA 9.6% | | | | | | | | | | | | |
| | 6,065,000,000 | | | | IDR | | | Indonesia Treasury Bond | | | 8.25% | | | | 05/15/2029 | | | | 410,454 | |
| | 1,800,000,000 | | | | IDR | | | Indonesia Treasury Bond | | | 7.00% | | | | 02/15/2033 | | | | 116,214 | |
| | 6,170,000,000 | | | | IDR | | | Indonesia Treasury Bond | | | 8.38% | | | | 03/15/2034 | | | | 436,395 | |
| | 3,662,000,000 | | | | IDR | | | Indonesia Treasury Bond | | | 7.50% | | | | 06/15/2035 | | | | 244,942 | |
| | | | | | | | | | | | | | | | | | | | |
| | | | | | | | | | | | | | | | | | | 1,208,005 | |
| | | | | | | | | | | | | | | | | | | | |
| | MALAYSIA 5.0% | | | | | | | | | | | | |
| | 1,300,000 | | | | MYR | | | Malaysia Government Bond | | | 3.58% | | | | 07/15/2032 | | | | 269,660 | |
| | 1,700,000 | | | | MYR | | | Malaysia Government Bond | | | 3.50% | | | | 05/31/2027 | | | | 359,244 | |
| | | | | | | | | | | | | | | | | | | | |
| | | | | | | | | | | | | | | | | | | 628,904 | |
| | | | | | | | | | | | | | | | | | | | |
| | MEXICO 7.9% | | | | | | | | | | | | |
| | 58,000 | | | | MXN | | | Mexican Bonos | | | 7.50% | (c) | | | 05/26/2033 | | | | 310,868 | |
| | 66,000 | | | | MXN | | | Mexican Bonos | | | 7.75% | (c) | | | 11/23/2034 | | | | 355,283 | |
| | 59,800 | | | | MXN | | | Mexican Bonos | | | 7.75% | (c) | | | 05/29/2031 | | | | 330,876 | |
| | | | | | | | | | | | | | | | | | | | |
| | | | | | | | | | | | | | | | | | | 997,027 | |
| | | | | | | | | | | | | | | | | | | | |
| | PERU 1.9% | | | | | | | | | | | | |
| | 1,030,000 | | | | PEN | | | Peru Government Bond | | | 5.40% | | | | 08/12/2034 | | | | 238,556 | |
| | | | | | | | | | | | | | | | | | | | |
| | PHILIPPINES 2.4% | | | | | | | | | | | | |
| | 4,500,000 | | | | PHP | | | Philippine Government Bond | | | 6.88% | | | | 01/10/2029 | | | | 82,195 | |
| | 13,000,000 | | | | PHP | | | Philippine Government International Bond | | | 6.25% | | | | 01/14/2036 | | | | 218,691 | |
| | | | | | | | | | | | | | | | | | | | |
| | | | | | | | | | | | | | | | | | | 300,886 | |
| | | | | | | | | | | | | | | | | | | | |
| | | | | | | | |
| The accompanying notes are an integral part of these financial statements. | | Annual Report | | | | | March 31, 2024 | | 101 |
| | |
Schedule of Investments DoubleLine Emerging Markets Local Currency Bond Fund (Cont.) | | |
| | | | | | | | | | | | | | | | | | | | |
PRINCIPAL
AMOUNT/
SHARES | | | | | | SECURITY DESCRIPTION | | RATE | | | MATURITY | | | VALUE $ | |
| | POLAND 5.6% | | | | | | | | | | | | |
| | 1,160,000 | | | | PLN | | | Republic of Poland Government Bond | | | 3.25% | | | | 07/25/2025 | | | | 283,484 | |
| | 2,200,000 | | | | PLN | | | Republic of Poland Government Bond | | | 1.75% | | | | 04/25/2032 | | | | 422,420 | |
| | | | | | | | | | | | | | | | | | | | |
| | | | | | | | | | | | | | | | | | | 705,904 | |
| | | | | | | | | | | | | | | | | | | | |
| | ROMANIA 4.4% | | | | | | | | | | | | |
| | 1,600,000 | | | | RON | | | Romania Government Bond | | | 8.00% | | | | 04/29/2030 | | | | 376,101 | |
| | 830,000 | | | | RON | | | Romania Government Bond | | | 3.70% | | | | 11/25/2024 | | | | 177,912 | |
| | | | | | | | | | | | | | | | | | | | |
| | | | | | | | | | | | | | | | | | | 554,013 | |
| | | | | | | | | | | | | | | | | | | | |
| | SOUTH AFRICA 9.6% | | | | | | | | | | | | |
| | 10,120,000 | | | | ZAR | | | Republic of South Africa Government Bond | | | 8.50% | | | | 01/31/2037 | | | | 394,808 | |
| | 5,300,000 | | | | ZAR | | | Republic of South Africa Government Bond | | | 8.00% | | | | 01/31/2030 | | | | 248,994 | |
| | 4,060,000 | | | | ZAR | | | Republic of South Africa Government Bond | | | 8.25% | | | | 03/31/2032 | | | | 179,013 | |
| | 9,360,000 | | | | ZAR | | | Republic of South Africa Government Bond | | | 8.88% | | | | 02/28/2035 | | | | 394,613 | |
| | | | | | | | | | | | | | | | | | | | |
| | | | | | | | | | | | | | | | | | | 1,217,428 | |
| | | | | | | | | | | | | | | | | | | | |
| | THAILAND 4.5% | | | | | | | | | | | | |
| | 8,000,000 | | | | THB | | | Thailand Government Bond | | | 1.59% | | | | 12/17/2035 | | | | 196,746 | |
| | 6,150,000 | | | | THB | | | Thailand Government Bond | | | 3.85% | | | | 12/12/2025 | | | | 173,296 | |
| | 7,000,000 | | | | THB | | | Thailand Government Bond | | | 3.35% | | | | 06/17/2033 | | | | 204,707 | |
| | | | | | | | | | | | | | | | | | | | |
| | | | | | | | | | | | | | | | | | | 574,749 | |
| | | | | | | | | | | | | | | | | | | | |
| | | | | | | | Total Foreign Government Bonds, Foreign Agencies and Foreign Government Sponsored Corporations (Cost $10,414,360) | | | | 9,480,583 | |
| | | | | | | | | | | | | | | | | |
| | SHORT TERM INVESTMENTS 2.2% | |
| | 91,889 | | | | USD | | | BlackRock Liquidity FedFund - Institutional | | | 5.20% | (d) | | | | | | | 91,889 | |
| | 91,890 | | | | USD | | | Fidelity Government Portfolio - Institutional | | | 5.21% | (d) | | | | | | | 91,890 | |
| | 91,889 | | | | USD | | | MSILF Government Portfolio - Institutional | | | 5.22% | (d) | | | | | | | 91,889 | |
| | | | | | | | | | | | | | | | | | | | |
| | | | | | | | Total Short Term Investments (Cost $275,668) | | | | 275,668 | |
| | | | | | | | | | | | | | | | | | | | |
| | | | | | | | Total Investments 98.3%
(Cost $13,395,160) | | | | 12,414,628 | |
| | | | | | | | Other Assets in Excess of Liabilities 1.7% | | | | 220,471 | |
| | | | | | | | | | | | | | | | | | | | |
| | | | | | | | NET ASSETS 100.0% | | | | | | | | | | $ | 12,635,099 | |
| | | | | | | | | | | | | | | | | | | | |
| | | | | |
| SECURITY TYPE BREAKDOWN as a % of Net Assets: | | | | | |
Foreign Government Bonds, Foreign Agencies and Foreign Government Sponsored Corporations | | | | 75.1% | |
Foreign Corporate Bonds | | | | 21.0% | |
Short Term Investments | | | | 2.2% | |
Other Assets and Liabilities | | | | 1.7% | |
| | | | | |
Net Assets | | | | 100.0% | |
| | | | | |
| | | | | |
| INVESTMENT BREAKDOWN as a % of Net Assets: | |
Foreign Government Bonds, Foreign Agencies and Foreign Government Sponsored Corporations | | | | 75.1% | |
Finance | | | | 16.0% | |
Short Term Investments | | | | 2.2% | |
Telecommunications | | | | 2.1% | |
Utilities | | | | 1.5% | |
Transportation | | | | 0.7% | |
Banking | | | | 0.7% | |
Other Assets and Liabilities | | | | 1.7% | |
| | | | | |
Net Assets | | | | 100.0% | |
| | | | | |
| | | | | |
| COUNTRY BREAKDOWN as a % of Net Assets: | |
Brazil | | | | 13.7% | |
Mexico | | | | 13.1% | |
Indonesia | | | | 11.9% | |
South Africa | | | | 9.6% | |
Poland | | | | 8.8% | |
Malaysia | | | | 5.0% | |
China | | | | 4.6% | |
Thailand | | | | 4.5% | |
Czech Republic | | | | 4.4% | |
Romania | | | | 4.4% | |
Hungary | | | | 3.3% | |
Colombia | | | | 2.9% | |
India | | | | 2.8% | |
Peru | | | | 2.6% | |
Philippines | | | | 2.4% | |
United States | | | | 2.2% | |
Chile | | | | 2.1% | |
Other Assets and Liabilities | | | | 1.7% | |
| | | | | |
Net Assets | | | | 100.0% | |
| | | | | |
| (a) | Security exempt from registration under Rule 144A of the Securities Act of 1933. These securities may be resold in transactions exempt from registration to qualified institutional buyers. |
| (b) | Principal amount is stated in 1,000 Brazilian Real Units. |
| (c) | Principal amount is stated in 100 Mexican Peso Units. |
| (d) | Seven-day yield as of period end. |
| | | | |
| 102 | | DoubleLine Funds Trust | | The accompanying notes are an integral part of these financial statements. |
| | |
Schedule of Investments DoubleLine Income Fund | | March 31, 2024 |
| | | | | | | | | | | | | | | | |
PRINCIPAL
AMOUNT $ | | | SECURITY DESCRIPTION | | RATE | | | MATURITY | | | VALUE $ | |
| | ASSET BACKED OBLIGATIONS 9.2% | |
| | |
| | | | Affirm, Inc. | | | | | |
| | 500,000 | | | Series 2023-B-D | | | 8.78% | (a) | | | 09/15/2028 | | | | 513,401 | |
| | | | |
| | | | APL Finance DAC | | | | | | | | | | | | |
| | 548,000 | | | Series 2023-1A-C | | | 8.50% | (a)(b) | | | 07/21/2031 | | | | 547,559 | |
| | | | |
| | | | Bojangles Issuer LLC | | | | | | | | | | | | |
| | 245,625 | | | Series 2020-1A-A2 | | | 3.83% | (a) | | | 10/20/2050 | | | | 231,971 | |
| |
| | | | Business Jet Securities LLC | |
| | 419,509 | | | Series 2021-1A-C | | | 5.07% | (a)(b) | | | 04/15/2036 | | | | 395,573 | |
| |
| | | | Compass Datacenters LLC | |
| | 500,000 | | | Series 2024-1A-B | | | 7.00% | (a) | | | 02/25/2049 | | | | 500,531 | |
| |
| | | | Flagship Credit Auto Trust | |
| | 9,500 | | | Series 2018-4-R | | | 0.00% | (a)(b)(c) | | | 03/16/2026 | | | | 466,847 | |
| | | | |
| | | | Hardee’s Funding | | | | | | | | | | | | |
| | 500,000 | | | Series 2024-1A-A2 | | | 7.25% | (a) | | | 03/20/2054 | | | | 505,888 | |
| | | | |
| | | | Helios Issuer LLC | | | | | | | | | | | | |
| | 1,125,693 | | | Series 2019-AA-B | | | 4.49% | (a) | | | 06/20/2046 | | | | 996,702 | |
| | | | |
| | | | Hotwire Funding LLC | | | | | | | | | | | | |
| | 1,000,000 | | | Series 2021-1-B | | | 2.66% | (a) | | | 11/20/2051 | | | | 884,982 | |
| |
| | | | Lunar Structured Aircraft Portfolio Notes | |
| | 734,351 | | | Series 2021-1-C | | | 5.68% | (a)(b) | | | 10/15/2046 | | | | 646,543 | |
| |
| | | | Retained Vantage Data Centers Issuer LLC | |
| | 500,000 | | | Series 2023-1A-B | | | 5.75% | (a) | | | 09/15/2048 | | | | 469,560 | |
| | | | |
| | | | Start Ltd./Bermuda | | | | | | | | | | | | |
| | 314,042 | | | Series 2019-1-C | | | 6.41% | (a)(b) | | | 03/15/2044 | | | | 282,999 | |
| | | | |
| | | | Switch ABS Issuer LLC | | | | | | | | | | | | |
| | 500,000 | | | Series 2024-1A-B | | | 6.50% | (a) | | | 03/25/2054 | | | | 486,229 | |
| |
| | | | WAVE USA | |
| | 2,421,481 | | | Series 2019-1-C | | | 6.41% | (a)(b) | | | 09/15/2044 | | | | 768,198 | |
| | | | | | | | | | | | | | | | |
| | | | Total Asset Backed Obligations
(Cost $9,447,835) | | | | 7,696,983 | |
| | | | | | | | | | | | | | | | |
| | COLLATERALIZED LOAN OBLIGATIONS 22.1% | |
| | | | |
| | | | Aimco CDO | | | | | | | | | | | | |
| | 700,000 | | | Series 2021-15A-E (CME Term SOFR 3 Month + 6.21%, 5.95% Floor) | | | 11.53% | (a) | | | 10/17/2034 | | | | 698,485 | |
| |
| | | | Bain Capital CLO 2024-1 Ltd. | |
| | 500,000 | | | Series 2024-1A-D1 (CME Term SOFR 3 Month + 3.85%, 3.85% Floor) | | | 9.17% | (a) | | | 04/16/2037 | | | | 506,500 | |
| | | | |
| | | | Canyon Capital CLO Ltd. | | | | | | | | | | | | |
| | 500,000 | | | Series 2021-1A-E (CME Term SOFR 3 Month + 6.67%, 6.41% Floor) | | | 11.99% | (a) | | | 04/15/2034 | | | | 493,097 | |
| | | | |
| | | | Canyon CLO | | | | | | | | | | | | |
| | 500,000 | | | Series 2021-3A-E (CME Term SOFR 3 Month + 6.46%, 6.20% Floor) | | | 11.78% | (a) | | | 07/15/2034 | | | | 488,398 | |
| |
| | | | Carlyle Global Market Strategies | |
| | 500,000 | | | Series 2024-2A-D (CME Term SOFR 3 Month + 3.85%, 3.85% Floor) | | | 0.00% | (a) | | | 04/25/2037 | | | | 500,000 | |
| | | | |
| | | | CarVal CLO | | | | | | | | | | | | |
| | 500,000 | | | Series 2024-1A-B (CME Term SOFR 3 Month + 2.10%, 2.10% Floor) | | | 7.42% | (a) | | | 04/20/2037 | | | | 500,560 | |
| | 1,000,000 | | | Series 2024-1A-D (CME Term SOFR 3 Month + 3.90%, 3.90% Floor) | | | 9.22% | (a) | | | 04/20/2037 | | | | 1,004,457 | |
| | | | |
| | | | CIFC Funding Ltd. | | | | | | | | | | | | |
| | 500,000 | | | Series 2021-4A-E (CME Term SOFR 3 Month + 6.26%, 6.00% Floor) | | | 11.58% | (a) | | | 07/15/2033 | | | | 500,915 | |
| | | | | | | | | | | | | | | | |
PRINCIPAL
AMOUNT $ | | | SECURITY DESCRIPTION | | RATE | | | MATURITY | | | VALUE $ | |
| |
| | | | Empower CLO Ltd. | |
| | 500,000 | | | Series 2024-1A-A1 (CME Term SOFR 3 Month + 1.60%, 1.60% Floor) | | | 6.91% | (a) | | | 04/25/2037 | | | | 500,206 | |
| | 500,000 | | | Series 2024-1A-D1 (CME Term SOFR 3 Month + 3.75%, 3.75% Floor) | | | 9.06% | (a) | | | 04/25/2037 | | | | 505,240 | |
| |
| | | | Goldentree Loan Opportunities Ltd. | |
| | 500,000 | | | Series 2024-19A-D (CME Term SOFR 3 Month + 3.40%, 3.40% Floor) | | | 8.72% | (a) | | | 04/20/2037 | | | | 501,895 | |
| | | | |
| | | | Harvest US CLO | | | | | | | | | | | | |
| | 500,000 | | | Series 2024-1A-D (CME Term SOFR 3 Month + 4.50%, 4.50% Floor) | | | 9.81% | (a) | | | 04/18/2037 | | | | 508,088 | |
| |
| | | | Highbridge Loan Management Ltd. | |
| | 1,000,000 | | | Series 12A-18-C (CME Term SOFR 3 Month + 3.01%, 2.75% Floor) | | | 8.31% | (a) | | | 07/18/2031 | | | | 992,459 | |
| | | | |
| | | | Katayma CLO Ltd. | | | | | | | | | | | | |
| | 1,000,000 | | | Series 2023-1A-D (CME Term SOFR 3 Month + 5.25%, 5.25% Floor) | | | 10.57% | (a) | | | 10/20/2036 | | | | 1,033,673 | |
| | 500,000 | | | Series 2024-2A-A1 (CME Term SOFR 3 Month + 1.65%, 1.65% Floor) | | | 6.94% | (a) | | | 04/20/2037 | | | | 500,000 | |
| | 500,000 | | | Series 2024-2A-D (CME Term SOFR 3 Month + 4.50%, 4.50% Floor) | | | 9.79% | (a) | | | 04/20/2037 | | | | 502,600 | |
| |
| | | | Octagon Investment Partners Ltd. | |
| | 1,000,000 | | | Series 2012-1A-CRR (CME Term SOFR 3 Month + 4.16%, 3.90% Floor) | | | 9.48% | (a) | | | 07/15/2029 | | | | 1,003,772 | |
| | 500,000 | | | Series 2018-2A-C (CME Term SOFR 3 Month + 3.11%) | | | 8.44% | (a) | | | 07/25/2030 | | | | 486,049 | |
| | 500,000 | | | Series 2021-1A-E (CME Term SOFR 3 Month + 6.76%, 6.50% Floor) | | | 12.08% | (a) | | | 04/15/2034 | | | | 494,173 | |
| |
| | | | Point Au Roche Park CLO | |
| | 500,000 | | | Series 2021-1A-E (CME Term SOFR 3 Month + 6.36%, 6.10% Floor) | | | 11.68% | (a) | | | 07/20/2034 | | | | 493,671 | |
| |
| | | | Rockford Tower CLO Ltd. | |
| | 1,000,000 | | | Series 2024-1A-A1 (CME Term SOFR 3 Month + 1.61%, 1.61% Floor) | | | 0.00% | (a) | | | 04/20/2037 | | | | 1,000,000 | |
| |
| | | | RR Ltd./Cayman Islands | |
| | 1,000,000 | | | Series 2017-2A-DR (CME Term SOFR 3 Month + 6.06%, 5.80% Floor) | | | 11.38% | (a) | | | 04/15/2036 | | | | 981,738 | |
| | | | |
| | | | Sound Point CLO Ltd. | | | | | | | | | | | | |
| | 1,000,000 | | | Series 2020-1A-ER (CME Term SOFR 3 Month + 7.12%, 7.12% Floor) | | | 12.44% | (a) | | | 07/20/2034 | | | | 930,183 | |
| | 500,000 | | | Series 2021-3A-D (CME Term SOFR 3 Month + 3.51%, 3.25% Floor) | | | 8.84% | (a) | | | 10/25/2034 | | | | 485,979 | |
| | | | |
| | | | Steele Creek CLO Ltd. | | | | | | | | | | | | |
| | 940,000 | | | Series 2014-1RA-D (CME Term SOFR 3 Month + 3.06%, 2.80% Floor) | | | 8.38% | (a) | | | 04/21/2031 | | | | 888,917 | |
| | | | |
| | | | Trimaran CAVU LLC | | | | | | | | | | | | |
| | 2,000,000 | | | Series 2019-2A-C (CME Term SOFR 3 Month + 4.98%, 4.72% Floor) | | | 10.28% | (a) | | | 11/26/2032 | | | | 2,006,672 | |
| | | | | | | | | | | | | | | | |
| | | | Total Collateralized Loan Obligations (Cost $18,491,192) | | | | 18,507,727 | |
| | | | | | | | | | | | | | | | |
| | | | | | | | |
| The accompanying notes are an integral part of these financial statements. | | Annual Report | | | | | March 31, 2024 | | 103 |
| | |
Schedule of Investments DoubleLine Income Fund (Cont.) | | |
| | | | | | | | | | | | | | | | |
PRINCIPAL
AMOUNT $ | | | SECURITY DESCRIPTION | | RATE | | | MATURITY | | | VALUE $ | |
| NON-AGENCY COMMERCIAL MORTGAGE BACKED
OBLIGATIONS 16.9% |
|
| | | | |
| | | | Alen Mortgage Trust | | | | | | | | | | | | |
| | 1,000,000 | | | Series 2021-ACEN-F (CME Term SOFR 1 Month + 5.11%, 5.00% Floor) | | | 10.44% | (a) | | | 04/15/2034 | | | | 420,115 | |
| |
| | | | Benchmark Mortgage Trust | |
| | 236,962 | | | Series 2020-B16-A2 | | | 2.88% | | | | 02/15/2053 | | | | 227,856 | |
| |
| | | | BLP Commercial Mortgage Trust | |
| | 180,000 | | | Series 2024-IND2-A (CME Term SOFR 1 Month + 1.34%, 1.34% Floor) | | | 6.67% | (a) | | | 03/15/2041 | | | | 180,087 | |
| | | | |
| | | | BX Trust | | | | | | | | | | | | |
| | 404,949 | | | Series 2021-21M-A (CME Term SOFR 1 Month + 0.84%, 0.73% Floor) | | | 6.17% | (a) | | | 10/15/2036 | | | | 401,938 | |
| | 400,000 | | | Series 2021-CIP-A (CME Term SOFR 1 Month + 1.04%, 0.92% Floor) | | | 6.36% | (a) | | | 12/15/2038 | | | | 396,108 | |
| | 181,399 | | | Series 2021-VINO-A (CME Term SOFR 1 Month + 0.77%, 0.77% Floor) | | | 6.09% | (a) | | | 05/15/2038 | | | | 180,140 | |
| | 156,386 | | | Series 2021-XL2-A (CME Term SOFR 1 Month + 0.80%, 0.69% Floor) | | | 6.13% | (a) | | | 10/15/2038 | | | | 155,315 | |
| | 500,000 | | | Series 2024-MF-A (CME Term SOFR 1 Month + 1.44%, 1.44% Floor) | | | 6.77% | (a) | | | 02/15/2039 | | | | 501,984 | |
| |
| | | | CEDR Commercial Mortgage Trust | |
| | 350,000 | | | Series 2022-SNAI-A (CME Term SOFR 1 Month + 0.99%, 0.99% Floor) | | | 6.31% | (a) | | | 02/15/2039 | | | | 333,125 | |
| |
| | | | Commercial Mortgage Pass Through Certificates | |
| | 300,000 | | | Series 2014-CR18-B | | | 4.46% | (d) | | | 07/15/2047 | | | | 294,941 | |
| |
| | | | Computershare Corporate Trust | |
| | 180,000 | | | Series 2015-C28-A4 | | | 3.54% | | | | 05/15/2048 | | | | 175,276 | |
| | 539,000 | | | Series 2015-LC22-A4 | | | 3.84% | | | | 09/15/2058 | | | | 523,985 | |
| |
| | | | Credit Suisse Mortgage Capital Certificates | |
| | 510,000 | | | Series 2017-PFHP-A (CME Term SOFR 1 Month + 1.00%, 0.95% Floor) | | | 6.32% | (a) | | | 12/15/2030 | | | | 488,566 | |
| | 498,759 | | | Series 2019-ICE4-B (CME Term SOFR 1 Month + 1.28%, 1.23% Floor) | | | 6.60% | (a) | | | 05/15/2036 | | | | 498,441 | |
| |
| | | | Extended Stay America Trust | |
| | 457,128 | | | Series 2021-ESH-A (CME Term SOFR 1 Month + 1.19%, 1.08% Floor) | | | 6.52% | (a) | | | 07/15/2038 | | | | 457,278 | |
| | | | |
| | | | FS Rialto | | | | | | | | | | | | |
| | 355,220 | | | Series 2021-FL2-A (CME Term SOFR 1 Month + 1.33%, 1.33% Floor) | | | 6.66% | (a) | | | 05/16/2038 | | | | 351,891 | |
| | 474,883 | | | Series 2021-FL3-A (CME Term SOFR 1 Month + 1.36%, 1.36% Floor) | | | 6.69% | (a) | | | 11/16/2036 | | | | 474,057 | |
| |
| | | | Granite Point Mortgage Trust, Inc. | |
| | 300,000 | | | Series 2021-FL4-B (CME Term SOFR 1 Month + 2.06%, 1.95% Floor) | | | 7.39% | (a) | | | 12/15/2036 | | | | 280,656 | |
| | | | |
| | | | Great Wolf Trust | | | | | | | | | | | | |
| | 144,318 | | | Series 2019-WOLF-F (CME Term SOFR 1 Month + 3.45%, 3.33% Floor) | | | 8.77% | (a) | | | 12/15/2036 | | | | 143,209 | |
| | 250,000 | | | Series 2024-WOLF-C (CME Term SOFR 1 Month + 2.39%, 2.39% Floor) | | | 7.69% | (a) | | | 03/15/2039 | | | | 250,924 | |
| |
| | | | JP Morgan Chase Commercial Mortgage Securities | |
| | 1,000,000 | | | Series 2019-UES-G | | | 4.45% | (a)(d) | | | 05/05/2032 | | | | 990,849 | |
| | | | | | | | | | | | | | | | |
PRINCIPAL
AMOUNT $ | | | SECURITY DESCRIPTION | | RATE | | | MATURITY | | | VALUE $ | |
| |
| | | | JPMBB Commercial Mortgage Securities Trust | |
| | 300,000 | | | Series 2014-C23-UH5 | | | 4.71% | (a) | | | 09/15/2047 | | | | 288,805 | |
| | 417,195 | | | Series 2015-C31-A3 | | | 3.80% | | | | 08/15/2048 | | | | 403,954 | |
| | 250,000 | | | Series 2015-C33-AS | | | 4.02% | | | | 12/15/2048 | | | | 238,945 | |
| | | | |
| | | | LFT CRE Ltd. | | | | | | | | | | | | |
| | 300,000 | | | Series 2021-FL1-B (CME Term SOFR 1 Month + 1.86%, 1.86% Floor) | | | 7.19% | (a) | | | 06/15/2039 | | | | 294,367 | |
| | | | |
| | | | LoanCore | | | | | | | | | | | | |
| | 281,251 | | | Series 2021-CRE6-A (CME Term SOFR 1 Month + 1.41%, 1.30% Floor) | | | 6.74% | (a) | | | 11/15/2038 | | | | 279,866 | |
| | | | |
| | | | Lument Finance Trust, Inc. | | | | | | | | | | | | |
| | 437,486 | | | Series 2021-FL1-A (CME Term SOFR 1 Month + 1.28%, 1.28% Floor) | | | 6.61% | (a) | | | 06/15/2039 | | | | 435,670 | |
| | | | |
| | | | Med Trust | | | | | | | | | | | | |
| | 447,851 | | | Series 2021-MDLN-A (CME Term SOFR 1 Month + 1.06%, 0.95% Floor) | | | 6.39% | (a) | | | 11/15/2038 | | | | 447,047 | |
| |
| | | | MF1 Multifamily Housing Mortgage Loan Trust | |
| | 435,515 | | | Series 2021-FL6-A (CME Term SOFR 1 Month + 1.21%, 1.10% Floor) | | | 6.54% | (a) | | | 07/16/2036 | | | | 433,511 | |
| | 300,000 | | | Series 2024-FL14-A (CME Term SOFR 1 Month + 1.74%, 1.74% Floor) | | | 7.06% | (a) | | | 03/19/2039 | | | | 300,947 | |
| |
| | | | MHC Commercial Mortgage Trust | |
| | 301,996 | | | Series 2021-MHC-A (CME Term SOFR 1 Month + 0.92%, 0.80% Floor) | | | 6.24% | (a) | | | 04/15/2038 | | | | 300,806 | |
| |
| | | | Morgan Stanley Capital I, Inc. | |
| | 300,000 | | | Series 2016-UB11-AS | | | 2.98% | | | | 08/15/2049 | | | | 276,026 | |
| | | | |
| | | | Ready Capital Corp. | | | | | | | | | | | | |
| | 484,084 | | | Series 2021-FL7-A (CME Term SOFR 1 Month + 1.31%, 1.20% Floor) | | | 6.64% | (a) | | | 11/25/2036 | | | | 483,379 | |
| | 180,870 | | | Series 2022-FL9-A (CME Term SOFR 1 Month + 2.47%, 2.47% Floor) | | | 7.80% | (a) | | | 06/25/2037 | | | | 181,753 | |
| | | | |
| | | | SREIT Trust | | | | | | | | | | | | |
| | 500,000 | | | Series 2021-MFP2-A (CME Term SOFR 1 Month + 0.94%, 0.82% Floor) | | | 6.26% | (a) | | | 11/15/2036 | | | | 497,691 | |
| | | | |
| | | | Starwood Property Mortgage Trust | | | | | | | | | | | | |
| | 222,113 | | | Series 2021-FL2-A (CME Term SOFR 1 Month + 1.31%, 1.20% Floor) | | | 6.64% | (a) | | | 04/18/2038 | | | | 219,483 | |
| | | | |
| | | | STWD Ltd. | | | | | | | | | | | | |
| | 400,000 | | | Series 2022-FL3-B (US 30 Day Average Secured Overnight Financing Rate + 1.95%, 1.95% Floor) | | | 7.27% | (a) | | | 11/15/2038 | | | | 386,540 | |
| |
| | | | TPG Real Estate Finance Issuer Ltd. | |
| | 300,000 | | | Series 2021-FL4-B (CME Term SOFR 1 Month + 1.96%, 1.85% Floor) | | | 7.29% | (a) | | | 03/15/2038 | | | | 284,840 | |
| |
| | | | UBS-Barclays Commercial Mortgage Trust | |
| | 562,000 | | | Series 2013-C5-D | | | 3.69% | (a)(d) | | | 03/10/2046 | | | | 398,661 | |
| |
| | | | WB Commercial Mortgage Trust | |
| | 300,000 | | | Series 2024-HQ-A | | | 6.13% | (a)(d) | | | 03/15/2040 | | | | 302,714 | |
| | | | | | | | | | | | | | | | |
| | | | Total Non-Agency Commercial Mortgage Backed Obligations
(Cost $14,824,587) | | | | 14,181,746 | |
| | | | | | | | | | | | | | | | |
| | | | |
| 104 | | DoubleLine Funds Trust | | The accompanying notes are an integral part of these financial statements. |
| | | | | | | | | | | | | | | | |
PRINCIPAL
AMOUNT $ | | | SECURITY DESCRIPTION | | RATE | | | MATURITY | | | VALUE $ | |
| NON-AGENCY RESIDENTIAL COLLATERALIZED MORTGAGE
OBLIGATIONS 25.1% |
|
| |
| | | | Credit Suisse Mortgage Capital Certificates | |
| | 1,372,000 | | | Series 2021-NQM4-B2 | | | 4.18% | (a)(d) | | | 05/25/2066 | | | | 981,394 | |
| | | | |
| | | | Cross Mortgage Trust | | | | | | | | | | | | |
| | 1,219,629 | | | Series 2024-H1-A1 | | | 6.09% | (a)(e) | | | 12/25/2068 | | | | 1,219,187 | |
| |
| | | | Fannie Mae Connecticut Avenue Securities | |
| | 1,250,000 | | | Series 2021-R01-1M2 (US 30 Day Average Secured Overnight Financing Rate + 1.55%) | | | 6.87% | (a) | | | 10/25/2041 | | | | 1,255,883 | |
| | 1,300,000 | | | Series 2022-R01-1M2 (US 30 Day Average Secured Overnight Financing Rate + 1.90%) | | | 7.22% | (a) | | | 12/25/2041 | | | | 1,310,649 | |
| | 1,250,000 | | | Series 2023-R01-1M2 (US 30 Day Average Secured Overnight Financing Rate + 3.75%) | | | 9.07% | (a) | | | 12/25/2042 | | | | 1,338,490 | |
| | 1,300,000 | | | Series 2024-R01-1M2 (US 30 Day Average Secured Overnight Financing Rate + 1.80%, 1.80% Floor) | | | 7.12% | (a) | | | 01/25/2044 | | | | 1,308,789 | |
| | 1,000,000 | | | Series 2024-R02-1B1 (US 30 Day Average Secured Overnight Financing Rate + 2.50%, 2.50% Floor) | | | 7.82% | (a) | | | 02/25/2044 | | | | 1,009,137 | |
| |
| | | | Freddie Mac Structured Agency Credit Risk Debt Notes | |
| | 1,200,000 | | | Series 2024-DNA1-M2 (US 30 Day Average Secured Overnight Financing Rate + 1.95%) | | | 7.27% | (a) | | | 02/25/2044 | | | | 1,205,235 | |
| | 1,000,000 | | | Series 2024-HQA1-M2 (US 30 Day Average Secured Overnight Financing Rate + 2.00%) | | | 7.32% | (a) | | | 03/25/2044 | | | | 1,002,739 | |
| |
| | | | Onslow Bay Mortgage Loan Trust | |
| | 1,225,485 | | | Series 2024-NQM2-A1 | | | 5.88% | (a)(e) | | | 12/25/2063 | | | | 1,223,954 | |
| |
| | | | Pretium Mortgage Credit Partners LLC | |
| | 1,228,066 | | | Series 2024-NPL2-A1 | | | 7.02% | (a)(e) | | | 02/25/2054 | | | | 1,225,168 | |
| |
| | | | Progress Residential Trust | |
| | 500,000 | | | Series 2020-SFR3-H | | | 6.23% | (a) | | | 10/17/2027 | | | | 485,231 | |
| | 1,200,000 | | | Series 2024-SFR2-D | | | 3.40% | (a)(d) | | | 04/17/2041 | | | | 1,057,063 | |
| |
| | | | SGR Residential Mortgage Trust | |
| | 1,250,000 | | | Series 2021-1-B2 | | | 4.30% | (a)(d) | | | 07/25/2061 | | | | 888,254 | |
| |
| | | | Velocity Commercial Capital Loan Trust | |
| | 175,510 | | | Series 2019-1-M4 | | | 4.61% | (a)(d) | | | 03/25/2049 | | | | 146,850 | |
| | 95,107 | | | Series 2019-1-M5 | | | 5.70% | (a)(d) | | | 03/25/2049 | | | | 81,285 | |
| | 161,763 | | | Series 2019-1-M6 | | | 6.79% | (a)(d) | | | 03/25/2049 | | | | 115,526 | |
| |
| | | | Vericrest Opportunity Loan Transferee | |
| | 1,108,866 | | | Series 2021-NPL5-A2 | | | 4.83% | (a)(e)(f) | | | 03/27/2051 | | | | 1,002,541 | |
| |
| | | | Verus Securitization Trust | |
| | 1,400,000 | | | Series 2020-5-B2 | | | 4.71% | (a)(d) | | | 05/25/2065 | | | | 1,221,812 | |
| | 1,500,000 | | | Series 2021-3-B2 | | | 3.96% | (a)(d) | | | 06/25/2066 | | | | 1,040,460 | |
| | 993,557 | | | Series 2023-1-A1 | | | 5.85% | (a)(e) | | | 12/25/2067 | | | | 988,678 | |
| | 1,000,000 | | | Series 2024-1-M1 | | | 6.67% | (a)(d) | | | 01/25/2069 | | | | 999,883 | |
| | | | | | | | | | | | | | | | |
| | | | Total Non-Agency Residential Collateralized Mortgage Obligations
(Cost $22,516,555) | | | | 21,108,208 | |
| | | | | | | | | | | | | | | | |
| US GOVERNMENT AND AGENCY MORTGAGE BACKED
OBLIGATIONS 7.8% |
|
| |
| | | | Federal Home Loan Mortgage Corp. | |
| | 1,229,328 | | | Series 5004-LS (-1 x US 30 Day Average Secured Overnight Financing Rate + 6.04%, 6.15% Cap) | | | 0.72% | (g)(h) | | | 07/25/2050 | | | | 138,478 | |
| | | | | | | | | | | | | | | | |
PRINCIPAL
AMOUNT $/
SHARES | | | SECURITY DESCRIPTION | | RATE | | | MATURITY | | | VALUE $ | |
| |
| | | | Federal Home Loan Mortgage Corp. (Cont.) | |
| | 4,124,636 | | | Series 5112-SC (-1 x US 30 Day Average Secured Overnight Financing Rate + 2.50%, 2.50% Cap) | | | 0.00% | (g)(h) | | | 06/25/2051 | | | | 25,813 | |
| | 3,795,259 | | | Series 5166-DI | | | 3.00% | (g) | | | 09/15/2048 | | | | 497,474 | |
| |
| | | | Federal National Mortgage Association | |
| | 1,062,836 | | | Pool CB3168 | | | 3.00% | | | | 03/01/2052 | | | | 916,130 | |
| | 1,107,888 | | | Series 2020-54-AS (-1 x US 30 Day Average Secured Overnight Financing Rate + 6.04%, 6.15% Cap) | | | 0.72% | (g)(h) | | | 08/25/2050 | | | | 141,751 | |
| | 1,250,415 | | | Series 2020-77-S (-1 x US 30 Day Average Secured Overnight Financing Rate + 4.15%, 4.15% Cap) | | | 0.00% | (g)(h) | | | 11/25/2050 | | | | 47,302 | |
| | 2,215,162 | | | Series 2020-77-SB (-1 x US 30 Day Average Secured Overnight Financing Rate + 4.10%, 4.10% Cap) | | | 0.00% | (g)(h) | | | 11/25/2050 | | | | 85,233 | |
| | 965,219 | | | Series 2020-M10-X2 | | | 1.72% | (d)(g) | | | 12/25/2030 | | | | 66,362 | |
| | 1,930,675 | | | Series 2020-M17-X1 | | | 1.36% | (d)(g) | | | 01/25/2028 | | | | 63,358 | |
| |
| | | | Government National Mortgage Association | |
| | 1,348,654 | | | Series 2015-124-AF (CME Term SOFR 1 Month + 0.36%, 0.25% Floor, 6.50% Cap) | | | 5.69% | | | | 09/20/2045 | | | | 1,322,325 | |
| | 2,277,974 | | | Series 2020-138-IL | | | 3.50% | (g) | | | 09/20/2050 | | | | 393,735 | |
| | 1,659,912 | | | Series 2020-142-SD (-1 x CME Term SOFR 1 Month + 6.19%, 6.30% Cap) | | | 0.86% | (g)(h) | | | 09/20/2050 | | | | 203,005 | |
| | 982,293 | | | Series 2020-189-SP (-1 x CME Term SOFR 1 Month + 6.19%, 6.30% Cap) | | | 0.86% | (g)(h) | | | 12/20/2050 | | | | 117,394 | |
| | 2,351,976 | | | Series 2020-196-DI | | | 2.50% | (g) | | | 12/20/2050 | | | | 303,440 | |
| | 3,711,338 | | | Series 2021-125-AS (-1 x US 30 Day Average Secured Overnight Financing Rate + 3.25%, 3.25% Cap) | | | 0.00% | (g)(h) | | | 07/20/2051 | | | | 46,739 | |
| | 2,792,484 | | | Series 2021-15-PI | | | 3.00% | (g) | | | 01/20/2051 | | | | 430,177 | |
| | 2,203,346 | | | Series 2021-189-IO | | | 0.88% | (d)(g) | | | 06/16/2061 | | | | 145,380 | |
| | 1,835,698 | | | Series 2021-197-IB | | | 3.50% | (g) | | | 11/20/2051 | | | | 320,034 | |
| | 2,430,361 | | | Series 2021-2-IO | | | 0.88% | (d)(g) | | | 06/16/2063 | | | | 154,777 | |
| | 2,791,792 | | | Series 2021-46-ES (-1 x CME Term SOFR 1 Month + 2.69%, 2.80% Cap) | | | 0.00% | (g)(h) | | | 03/20/2051 | | | | 21,534 | |
| | 4,338,519 | | | Series 2021-59-S (-1 x US 30 Day Average Secured Overnight Financing Rate + 2.60%, 2.60% Cap) | | | 0.00% | (g)(h) | | | 04/20/2051 | | | | 38,094 | |
| | 3,362,157 | | | Series 2021-80-IO | | | 0.90% | (d)(g) | | | 12/16/2062 | | | | 228,610 | |
| | 1,598,034 | | | Series 2021-98-SB (-1 x CME Term SOFR 1 Month + 6.19%, 6.30% Cap) | | | 0.86% | (g)(h) | | | 06/20/2051 | | | | 176,581 | |
| | 2,519,209 | | | Series 2023-79-JI | | | 2.50% | (g) | | | 02/20/2051 | | | | 316,730 | |
| | 2,023,627 | | | Series 2024-13-IA | | | 3.00% | (g) | | | 05/20/2051 | | | | 314,426 | |
| | | | | | | | | | | | | | | | |
| | | | Total US Government and Agency Mortgage Backed Obligations
(Cost $7,862,718) | | | | 6,514,882 | |
| | | | | | | | | | | | | | | | |
| | SHORT TERM INVESTMENTS 21.8% | |
| | 5,407,682 | | | First American Government Obligations Fund - U | | | 5.26% | (i) | | | | | | | 5,407,682 | |
| | 5,407,682 | | | JPMorgan US Government Money Market Fund - IM | | | 5.25% | (i) | | | | | | | 5,407,682 | |
| | 5,407,682 | | | MSILF Government Portfolio - Institutional | | | 5.22% | (i) | | | | | | | 5,407,682 | |
| | | | | | | | |
| The accompanying notes are an integral part of these financial statements. | | Annual Report | | | | | March 31, 2024 | | 105 |
| | |
Schedule of Investments DoubleLine Income Fund (Cont.) | | |
| | | | | | | | | | | | | | | | |
PRINCIPAL
AMOUNT $ | | | SECURITY DESCRIPTION | | RATE | | | MATURITY | | | VALUE $ | |
| | 2,000,000 | | | United States Treasury Bill | | | 0.00% | | | | 07/02/2024 | | | | 1,973,380 | |
| | | | | | | | | | | | | | | | |
| | | | Total Short Term Investments (Cost $18,196,482) | | | | 18,196,426 | |
| | | | | | | | | | | | | | | | |
| | | | Total Investments 102.9%
(Cost $91,339,369) | | | | 86,205,972 | |
| | | | Other Liabilities in Excess of Assets (2.9)% | | | | (2,450,064 | ) |
| | | | | | | | | | | | | | | | |
| | | | NET ASSETS 100.0% | | | | | | | | | | $ | 83,755,908 | |
| | | | | | | | | | | | | | | | |
| | | | | |
| SECURITY TYPE BREAKDOWN as a % of Net Assets: | | | | | |
Non-Agency Residential Collateralized Mortgage Obligations | | | | 25.1% | |
Collateralized Loan Obligations | | | | 22.1% | |
Short Term Investments | | | | 21.8% | |
Non-Agency Commercial Mortgage Backed Obligations | | | | 16.9% | |
Asset Backed Obligations | | | | 9.2% | |
US Government and Agency Mortgage Backed Obligations | | | | 7.8% | |
Other Assets and Liabilities | | | | (2.9)% | |
| | | | | |
Net Assets | | | | 100.0% | |
| | | | | |
| (a) | Security exempt from registration under Rule 144A of the Securities Act of 1933. These securities may be resold in transactions exempt from registration to qualified institutional buyers. |
| (b) | Value determined using significant unobservable inputs. |
| (c) | Security pays interest at rates that represent residual cashflows available after more senior tranches have been paid. The interest rate disclosed reflects the estimated rate in effect as of period end. |
| (d) | Coupon rate is variable based on the weighted average coupon of the underlying collateral. To the extent the weighted average coupon of the underlying assets which comprise the collateral increases or decreases, the coupon rate of this security will increase or decrease correspondingly. The rate disclosed is as of period end. |
| (e) | Step Bond; Coupon rate changes based on a predetermined schedule or event. The interest rate shown is the rate in effect as of period end. |
| (f) | This security accrues interest which is added to the outstanding principal balance. The interest payment will be deferred until all other tranches in the structure are paid off. The rate disclosed is as of period end. |
| (g) | Interest only security |
| (h) | Inverse floating rate security whose interest rate moves in the opposite direction of reference interest rates. Reference interest rates are typically based on a negative multiplier or slope. Interest rate may also be subject to a cap or floor. |
| (i) | Seven-day yield as of period end. |
| | | | |
| 106 | | DoubleLine Funds Trust | | The accompanying notes are an integral part of these financial statements. |
| | |
Schedule of Investments DoubleLine Multi-Asset Trend Fund (Consolidated) | | March 31, 2024 |
| | | | | | | | | | | | | | | | |
PRINCIPAL
AMOUNT $/ SHARES | | | SECURITY DESCRIPTION | | RATE | | | MATURITY | | | VALUE $ | |
| | US GOVERNMENT AND AGENCY OBLIGATIONS 6.4% | |
| | 140,000 | | | United States Treasury Note/Bond | | | 0.75% | (a)(b) | | | 11/15/2024 | | | | 136,205 | |
| | 700,000 | | | United States Treasury Note/Bond | | | 4.38% | | | | 11/30/2028 | | | | 703,814 | |
| | | | | | | | | | | | | | | | |
| | | | Total US Government and Agency Obligations (Cost $853,058) | | | | 840,019 | |
| | | | | | | | | | | | | | | | |
| | AFFILIATED MUTUAL FUNDS 75.0% | |
| | 215,135 | | | DoubleLine Floating Rate Fund - Class I | | | | | | | | | | | 1,944,818 | |
| | 176,467 | | | DoubleLine Income Fund - Class I | | | | | | | | | | | 1,376,443 | |
| | 689,286 | | | DoubleLine Low Duration Bond Fund - Class R6 | | | | | | | | | | | 6,603,356 | |
| | | | | | | | | | | | | | | | |
| | | | Total Affiliated Mutual Funds
(Cost $10,303,410) | | | | 9,924,617 | |
| | | | | | | | | | | | | | | | |
| | SHORT TERM INVESTMENTS 10.8% | |
| | 474,484 | | | First American Government Obligations Fund - U | | | 5.26% | (a)(c) | | | | | | | 474,484 | |
| | | | | | | | | | | | | | | | |
SHARES | | | SECURITY DESCRIPTION | | RATE | | | MATURITY | | | VALUE $ | |
| | 474,484 | | | JPMorgan US Government Money Market Fund - IM | | | 5.25% | (a)(c) | | | | | | | 474,484 | |
| | 474,484 | | | MSILF Government Portfolio - Institutional | | | 5.22% | (a)(c) | | | | | | | 474,484 | |
| | | | | | | | | | | | | | | | |
| | | | Total Short Term Investments (Cost $1,423,452) | | | | 1,423,452 | |
| | | | | | | | | | | | | | | | |
| | | | Total Investments 92.2%
(Cost $12,579,920) | | | | 12,188,088 | |
| | | | Other Assets in Excess of Liabilities 7.8% | | | | 1,033,967 | |
| | | | | | | | | | | | | | | | |
| | | | NET ASSETS 100.0% | | | | | | | | | | $ | 13,222,055 | |
| | | | | | | | | | | | | | | | |
| | | | | |
| SECURITY TYPE BREAKDOWN as a % of Net Assets: | | | | | |
Affiliated Mutual Funds | | | | 75.0% | |
Short Term Investments | | | | 10.8% | |
US Government and Agency Obligations | | | | 6.4% | |
Other Assets and Liabilities | | | | 7.8% | |
| | | | | |
Net Assets | | | | 100.0% | |
| | | | | |
| (a) | All or a portion of this security is owned by DoubleLine Multi-Asset Trend Ltd., which is a wholly owned subsidiary of the DoubleLine Multi-Asset Trend Fund. |
| (b) | All or a portion of security has been pledged as collateral. |
| (c) | Seven-day yield as of period end. |
| | | | | | | | | | | | | | | | | | | | | | | | | | | | | | | | | | | | | | | | | | | | | |
| | | | | | | | |
| Swap Agreements | | | | | | | | | | | | | | | | |
| | | | | | | | |
| Excess Return Swaps | | | | | | | | | | | | | | | | |
| Reference Entity | | Counterparty | | Long/Short | | Financing
Rate | | Payment
Frequency | | Termination
Date | | Notional
Amount | | Value | | Upfront
Premiums
Paid/
(Received) | | Unrealized
Appreciation
(Depreciation) |
BNP Paribas Multi-Asset Trend Index ER USD ex-Commodity Sub-Basket(1)(2)(3) | | BNP Paribas Securities Corp. | | | | Long | | | | | 0.00 | % | | | | Termination | | | | | 04/17/2024 | | | | $ | 9,408,567 | | | | $ | 652,144 | | | | $ | — | | | | $ | 652,144 | |
BNP Paribas Multi-Asset Trend Index ER USD Commodity Sub-Basket(2)(3)(4)(5) | | BNP Paribas Securities Corp. | | | | Long | | | | | 0.00 | % | | | | Termination | | | | | 04/17/2024 | | | | | 3,791,430 | | | | | (737,874 | ) | | | | — | | | | | (737,874 | ) |
| | | | | | | | | | | | | | | | | | | | | | | | | | | | | | | | | | | | | | | | | | |
| | | | | | | | | | | | | | | | | | | | | | | | | | | | | | $ | (85,730 | ) | | | $ | — | | | | $ | (85,730 | ) |
| | | | | | | | | | | | | | | | | | | | | | | | | | | | | | | | | | | | | | | | | | |
| (1) | The BNP Paribas Multi-Asset Trend Index aims to generate excess return by using a trend following strategy and to offer diversification in a multi-asset class universe. Ex-Commodity Sub-Basket Swap represents a swap on a basket of indices without commodities. Information on the sector constituents as of March 31, 2024, is available on the BNP Paribas website https://marketing-indx.bnpparibas.com/multi-asset-trend/. |
| (2) | Entry fee incurs when the Fund puts on new swap exposure. It is a trading cost and incorporated in the cost of the swap. The entry fee is 0.05%. |
| (3) | Exit fee incurs when the Fund terminates the swap exposure. It is incorporated into daily valuation of the swap. The exit fee is 0.05%. |
| (4) | The BNP Paribas Multi-Asset Trend Index aims to generate excess return by using a trend following strategy and to offer diversification in a multi-asset class universe. Commodity Sub-Basket Swap represents a swap on a basket of commodity indices. Information on the sector constituents as of March 31, 2024, is available on the BNP Paribas website https://marketing-indx.bnpparibas.com/multi-asset-trend/. |
| (5) | All or a portion of this security is owned by DoubleLine Multi-Asset Trend Ltd., which is a wholly-owned subsidiary of the DoubleLine Multi-Asset Trend Fund. |
| | | | | | | | |
| The accompanying notes are an integral part of these financial statements. | | Annual Report | | | | | March 31, 2024 | | 107 |
| | |
Schedule of Investments DoubleLine Multi-Asset Trend Fund (Consolidated) (Cont.) | | |
Affiliated Mutual Funds
A summary of the DoubleLine Multi-Asset Trend Fund’s investments in affiliated mutual funds for the period ended March 31, 2024 is as follows:
| | | | | | | | | | | | | | | | | | | | | | | | | | | | | | | | | | | | | | | | |
| Fund | | Value at
March 31,
2023 | | Gross
Purchases | | Gross
Sales | | Net Realized
Gain (Loss) for the
Period Ended
March 31, 2024 | | Change in
Unrealized for the
Period Ended
March 31, 2024 | | Value at
March 31,
2024 | | Shares Held at
March 31,
2024 | | Dividend Income
Earned for the
Period Ended
March 31, 2024 |
DoubleLine Low Duration Bond Fund (Class R6) | | | $ | 6,520,642 | | | | $ | — | | | | $ | — | | | | $ | — | | | | $ | 82,714 | | | | $ | 6,603,356 | | | | | 689,286 | | | | $ | 311,485 | |
DoubleLine Floating Rate Fund (Class I) | | | | 1,929,758 | | | | | — | | | | | — | | | | | — | | | | | 15,060 | | | | | 1,944,818 | | | | | 215,135 | | | | | 162,792 | |
Doubleline Income Fund (Class I) | | | | 1,328,797 | | | | | — | | | | | — | | | | | — | | | | | 47,646 | | | | | 1,376,443 | | | | | 176,467 | | | | | 100,485 | |
| | | | | |
| | | $ | 9,779,197 | | | | $ | — | | | | $ | — | | | | $ | — | | | | $ | 145,420 | | | | $ | 9,924,617 | | | | | 1,080,888 | | | | $ | 574,762 | |
| | | | | |
| | | | |
| 108 | | DoubleLine Funds Trust | | The accompanying notes are an integral part of these financial statements. |
| | |
Statements of Assets and Liabilities | | March 31, 2024 |
| | | | | | | | | | | | | | | | | | | | | | | | | | | | | | |
| | | DoubleLine Total Return
Bond Fund | | DoubleLine
Core Fixed
Income Fund | | DoubleLine
Emerging Markets
Fixed Income Fund | | DoubleLine
Low Duration
Bond Fund | | DoubleLine
Floating
Rate Fund | | DoubleLine
Shiller Enhanced
CAPE® |
| | | | | | |
ASSETS | | | | | | | | | | | | | | | | | | | | | | | | | | | | | | |
Investments in Unaffiliated Securities, at Value * | | | $ | 30,281,777,794 | | | | $ | 6,270,408,139 | | | | $ | 480,464,117 | | | | $ | 5,399,762,391 | | | | $ | 165,259,119 | | | | $ | 3,567,533,335 | |
Investments in Affiliated Mutual Funds, at Value * | | | | — | | | | | 445,384,751 | | | | | — | | | | | — | | | | | — | | | | | — | |
Short Term Investments * | | | | 633,460,140 | | | | | 155,989,824 | | | | | 3,929,291 | | | | | 223,016,984 | | | | | 22,119,033 | | | | | 240,087,181 | |
Cash | | | | 17,711,498 | | | | | 2,173,178 | | | | | 439,746 | | | | | 1,335,293 | | | | | 1,296,822 | | | | | 1,454,032 | |
Foreign Currency, at Value * | | | | — | | | | | — | | | | | — | | | | | — | | | | | — | | | | | — | |
Interest and Dividends Receivable | | | | 152,761,673 | | | | | 50,743,820 | | | | | 7,189,404 | | | | | 41,835,904 | | | | | 1,008,338 | | | | | 28,621,398 | |
Deposit at Broker for Futures | | | | 138,853,752 | | | | | 21,130,620 | | | | | — | | | | | — | | | | | — | | | | | — | |
Receivable for Fund Shares Sold | | | | 62,857,867 | | | | | 16,774,850 | | | | | 654,734 | | | | | 14,986,072 | | | | | 299,925 | | | | | 5,993,420 | |
Receivable for Investments Sold | | | | 35,110,510 | | | | | 2,690,844 | | | | | 667,349 | | | | | 35,264,271 | | | | | 1,409,356 | | | | | 3,847,032 | |
Prepaid Expenses and Other Assets | | | | 433,670 | | | | | 123,517 | | | | | 51,406 | | | | | 76,267 | | | | | 27,887 | | | | | 38,003 | |
Net Unrealized Appreciation on Swaps | | | | — | | | | | — | | | | | — | | | | | — | | | | | — | | | | | 404,068,626 | |
Variation Margin Receivable | | | | — | | | | | — | | | | | — | | | | | — | | | | | — | | | | | — | |
Net Unrealized Appreciation on Forward Currency Exchange Contracts | | | | — | | | | | — | | | | | — | | | | | — | | | | | — | | | | | — | |
Due from Advisor (See Note 3) | | | | — | | | | | — | | | | | — | | | | | — | | | | | — | | | | | — | |
Total Assets | | | | 31,322,966,904 | | | | | 6,965,419,543 | | | | | 493,396,047 | | | | | 5,716,277,182 | | | | | 191,420,480 | | | | | 4,251,643,027 | |
| | | | | | |
LIABILITIES | | | | | | | | | | | | | | | | | | | | | | | | | | | | | | |
Payable for Investments Purchased | | | | 156,601,355 | | | | | 36,784,984 | | | | | 1,224,417 | | | | | 42,950,029 | | | | | 11,124,227 | | | | | 27,046,400 | |
Payable for Fund Shares Redeemed | | | | 70,305,534 | | | | | 6,935,789 | | | | | 6,945,192 | | | | | 8,358,044 | | | | | 103,769 | | | | | 6,719,087 | |
Distribution Payable | | | | 31,270,394 | | | | | 8,549,435 | | | | | 572,620 | | | | | 5,060,774 | | | | | 647,104 | | | | | 9,758,662 | |
Investment Advisory Fees Payable | | | | 10,519,518 | | | | | 2,144,407 | | | | | 299,673 | | | | | 1,674,711 | | | | | 75,636 | | | | | 1,587,600 | |
Variation Margin Payable | | | | 9,175,736 | | | | | 4,174,982 | | | | | — | | | | | — | | | | | — | | | | | — | |
Sub-Transfer Agent Expenses Payable | | | | 2,158,270 | | | | | 214,195 | | | | | 47,211 | | | | | 222,484 | | | | | 6,933 | | | | | 349,193 | |
Administration, Fund Accounting and Custodian Fees Payable | | | | 2,105,892 | | | | | 546,521 | | | | | 37,156 | | | | | 516,074 | | | | | 45,951 | | | | | 320,435 | |
Distribution Fees Payable | | | | 1,867,933 | | | | | 38,880 | | | | | 1,831 | | | | | 694,909 | | | | | 4,852 | | | | | 53,644 | |
Trustees Fees Payable (See Note 8) | | | | 1,489,086 | | | | | 279,652 | | | | | 25,645 | | | | | 181,596 | | | | | 9,474 | | | | | 157,833 | |
Transfer Agent Expenses Payable | | | | 1,270,279 | | | | | 258,037 | | | | | 14,063 | | | | | 231,543 | | | | | 6,590 | | | | | 157,620 | |
Professional Fees Payable | | | | 415,385 | | | | | 164,926 | | | | | 79,282 | | | | | 131,925 | | | | | 50,188 | | | | | 122,595 | |
Accrued Expenses | | | | 376,090 | | | | | 48,344 | | | | | 12,898 | | | | | 56,173 | | | | | 1,156 | | | | | 68,218 | |
Interest Expense Payable | | | | — | | | | | — | | | | | — | | | | | — | | | | | 5,167 | | | | | — | |
Net Unrealized Depreciation on Forward Currency Exchange Contracts | | | | — | | | | | — | | | | | — | | | | | — | | | | | — | | | | | — | |
Payable to Broker | | | | — | | | | | — | | | | | — | | | | | — | | | | | — | | | | | — | |
Net Unrealized Depreciation on Swaps | | | | — | | | | | — | | | | | — | | | | | — | | | | | — | | | | | — | |
Total Liabilities | | | | 287,555,472 | | | | | 60,140,152 | | | | | 9,259,988 | | | | | 60,078,262 | | | | | 12,081,047 | | | | | 46,341,287 | |
Commitments and Contingencies (See Note 2) | | | | | | | | | | | | | | | | | | | | | | | | | | | | | | |
Net Assets | | | $ | 31,035,411,432 | | | | $ | 6,905,279,391 | | | | $ | 484,136,059 | | | | $ | 5,656,198,920 | | | | $ | 179,339,433 | | | | $ | 4,205,301,740 | |
| | | | | | |
NET ASSETS CONSIST OF: | | | | | | | | | | | | | | | | | | | | | | | | | | | | | | |
Paid-in Capital | | | $ | 42,203,768,157 | | | | $ | 8,586,276,309 | | | | $ | 706,379,085 | | | | $ | 6,097,534,224 | | | | $ | 237,549,703 | | | | $ | 4,872,739,773 | |
Total Distributable Earnings (Loss) (See Note 6) | | | | (11,168,356,725 | ) | | | | (1,680,996,918 | ) | | | | (222,243,026 | ) | | | | (441,335,304 | ) | | | | (58,210,270 | ) | | | | (667,438,033 | ) |
Net Assets | | | $ | 31,035,411,432 | | | | $ | 6,905,279,391 | | | | $ | 484,136,059 | | | | $ | 5,656,198,920 | | | | $ | 179,339,433 | | | | $ | 4,205,301,740 | |
| | | | | | |
*Identified Cost: | | | | | | | | | | | | | | | | | | | | | | | | | | | | | | |
Investments in Unaffiliated Securities | | | $ | 34,948,494,968 | | | | $ | 6,853,308,111 | | | | $ | 538,676,096 | | | | $ | 5,580,812,698 | | | | $ | 166,353,712 | | | | $ | 3,839,421,886 | |
Investments in Affiliated Mutual Funds | | | | — | | | | | 504,557,903 | | | | | — | | | | | — | | | | | — | | | | | — | |
Short Term Investments | | | | 633,460,140 | | | | | 155,989,824 | | | | | 3,929,291 | | | | | 223,030,348 | | | | | 22,119,033 | | | | | 240,097,484 | |
Foreign Currency (Due to Custodian) | | | | — | | | | | — | | | | | — | | | | | — | | | | | — | | | | | — | |
| | | | | | |
Class I (unlimited shares authorized): | | | | | | | | | | | | | | | | | | | | | | | | | | | | | | |
Net Assets | | | $ | 25,498,119,051 | | | | $ | 6,346,592,813 | | | | $ | 461,232,182 | | | | $ | 4,788,703,180 | | | | $ | 162,268,995 | | | | $ | 3,905,581,805 | |
Shares Outstanding | | | | 2,922,466,169 | | | | | 689,477,247 | | | | | 51,773,721 | | | | | 500,042,349 | | | | | 17,947,485 | | | | | 262,835,645 | |
Net Asset Value, Offering and Redemption Price per Share | | | $ | 8.72 | | | | $ | 9.20 | | | | $ | 8.91 | | | | $ | 9.58 | | | | $ | 9.04 | | | | $ | 14.86 | |
| | | | | | |
Class N (unlimited shares authorized): | | | | | | | | | | | | | | | | | | | | | | | | | | | | | | |
Net Assets | | | $ | 4,269,591,612 | | | | $ | 235,339,442 | | | | $ | 22,903,877 | | | | $ | 739,659,426 | | | | $ | 17,070,438 | | | | $ | 281,125,068 | |
Shares Outstanding | | | | 489,586,235 | | | | | 25,590,786 | | | | | 2,568,627 | | | | | 77,295,367 | | | | | 1,883,086 | | | | | 18,937,291 | |
Net Asset Value, Offering and Redemption Price per Share | | | $ | 8.72 | | | | $ | 9.20 | | | | $ | 8.92 | | | | $ | 9.57 | | | | $ | 9.07 | | | | $ | 14.85 | |
| | | | | | |
Class R6 (unlimited shares authorized): | | | | | | | | | | | | | | | | | | | | | | | | | | | | | | |
Net Assets | | | $ | 1,267,700,769 | | | | $ | 323,347,136 | | | | $ | — | | | | $ | 127,836,314 | | | | $ | — | | | | $ | 18,594,867 | |
Shares Outstanding | | | | 145,273,090 | | | | | 35,115,362 | | | | | — | | | | | 13,343,461 | | | | | — | | | | | 1,250,519 | |
Net Asset Value, Offering and Redemption Price per Share | | | $ | 8.73 | | | | $ | 9.21 | | | | $ | — | | | | $ | 9.58 | | | | $ | — | | | | $ | 14.87 | |
| | | | | | | | |
| The accompanying notes are an integral part of these financial statements. | | Annual Report | | | | | March 31, 2024 | | 109 |
| | |
Statements of Assets and Liabilities (Cont.) | | |
| | | | | | | | | | | | | | | | | | | | | | | | | | | | | | |
| | | DoubleLine
Flexible
Income Fund | | DoubleLine
Low Duration
Emerging
Markets Fixed
Income Fund | | DoubleLine
Long Duration
Total Return
Bond Fund | | DoubleLine
Strategic
Commodity
Fund
(Consolidated) | | DoubleLine
Global
Bond Fund | | DoubleLine
Infrastructure
Income Fund |
| | | | | | |
ASSETS | | | | | | | | | | | | | | | | | | | | | | | | | | | | | | |
Investments in Unaffiliated Securities, at Value * | | | $ | 797,456,673 | | | | $ | 155,229,332 | | | | $ | 57,656,926 | | | | $ | — | | | | $ | 135,687,104 | | | | $ | 358,342,446 | |
Investments in Affiliated Mutual Funds, at Value * | | | | — | | | | | — | | | | | — | | | | | — | | | | | — | | | | | — | |
Short Term Investments * | | | | 162,655,314 | | | | | 1,477,545 | | | | | 1,170,276 | | | | | 153,087,087 | | | | | 6,561,986 | | | | | 5,637,194 | |
Cash | | | | 687,301 | | | | | 8,118 | | | | | — | | | | | — | | | | | 10 | | | | | 19,844 | |
Foreign Currency, at Value * | | | | — | | | | | — | | | | | — | | | | | — | | | | | 464,553 | | | | | — | |
Interest and Dividends Receivable | | | | 6,938,460 | | | | | 2,006,391 | | | | | 206,569 | | | | | 66,901 | | | | | 1,602,851 | | | | | 3,128,773 | |
Deposit at Broker for Futures | | | | — | | | | | — | | | | | 919,110 | | | | | — | | | | | — | | | | | — | |
Receivable for Fund Shares Sold | | | | 3,829,925 | | | | | 154,720 | | | | | 38,626 | | | | | 920,141 | | | | | — | | | | | 86,354 | |
Receivable for Investments Sold | | | | 1,120,597 | | | | | 38,500 | | | | | — | | | | | — | | | | | — | | | | | — | |
Prepaid Expenses and Other Assets | | | | 57,142 | | | | | 33,274 | | | | | 31,276 | | | | | 58,725 | | | | | 26,028 | | | | | 17,689 | |
Net Unrealized Appreciation on Swaps | | | | — | | | | | — | | | | | — | | | | | 5,071,550 | | | | | — | | | | | — | |
Variation Margin Receivable | | | | — | | | | | — | | | | | 92,641 | | | | | — | | | | | — | | | | | — | |
Net Unrealized Appreciation on Forward Currency Exchange Contracts | | | | — | | | | | — | | | | | — | | | | | — | | | | | — | | | | | — | |
Due from Advisor (See Note 3) | | | | — | | | | | — | | | | | — | | | | | — | | | | | — | | | | | — | |
Total Assets | | | | 972,745,412 | | | | | 158,947,880 | | | | | 60,115,424 | | | | | 159,204,404 | | | | | 144,342,532 | | | | | 367,232,300 | |
| | | | | | |
LIABILITIES | | | | | | | | | | | | | | | | | | | | | | | | | | | | | | |
Payable for Investments Purchased | | | | 17,665,388 | | | | | 535,137 | | | | | — | | | | | 9,827,863 | | | | | — | | | | | — | |
Payable for Fund Shares Redeemed | | | | 621,368 | | | | | 251,209 | | | | | 21,883 | | | | | 69,236 | | | | | — | | | | | 4,220 | |
Distribution Payable | | | | 1,220,123 | | | | | 124,596 | | | | | 131,168 | | | | | — | | | | | — | | | | | 1,098,658 | |
Investment Advisory Fees Payable | | | | 494,369 | | | | | 39,396 | | | | | 6,013 | | | | | 103,794 | | | | | 71,653 | | | | | 154,490 | |
Variation Margin Payable | | | | — | | | | | — | | | | | — | | | | | — | | | | | — | | | | | — | |
Sub-Transfer Agent Expenses Payable | | | | 43,217 | | | | | 14,127 | | | | | 51 | | | | | 10,794 | | | | | 1,431 | | | | | 7,798 | |
Administration, Fund Accounting and Custodian Fees Payable | | | | 149,248 | | | | | 19,056 | | | | | 5,358 | | | | | 2,467 | | | | | 18,960 | | | | | 28,723 | |
Distribution Fees Payable | | | | 50,075 | | | | | — | | | | | 4,210 | | | | | 1,490 | | | | | — | | | | | 1,617 | |
Trustees Fees Payable (See Note 8) | | | | 28,826 | | | | | 5,932 | | | | | 2,049 | | | | | 5,037 | | | | | 17,694 | | | | | 10,778 | |
Transfer Agent Expenses Payable | | | | 33,148 | | | | | 7,191 | | | | | — | | | | | 5,825 | | | | | 20,428 | | | | | 11,581 | |
Professional Fees Payable | | | | 58,632 | | | | | 35,084 | | | | | 23,993 | | | | | 28,874 | | | | | 30,432 | | | | | 27,890 | |
Accrued Expenses | | | | 16,627 | | | | | 7,025 | | | | | 302 | | | | | 629 | | | | | 20,826 | | | | | 3,216 | |
Interest Expense Payable | | | | — | | | | | 813 | | | | | — | | | | | — | | | | | — | | | | | — | |
Net Unrealized Depreciation on Forward Currency Exchange Contracts | | | | — | | | | | — | | | | | — | | | | | — | | | | | — | | | | | — | |
Payable to Broker | | | | — | | | | | — | | | | | — | | | | | — | | | | | — | | | | | — | |
Net Unrealized Depreciation on Swaps | | | | — | | | | | — | | | | | — | | | | | — | | | | | — | | | | | — | |
Total Liabilities | | | | 20,381,021 | | | | | 1,039,566 | | | | | 195,027 | | | | | 10,056,009 | | | | | 181,424 | | | | | 1,348,971 | |
Commitments and Contingencies (See Note 2) | | | | | | | | | | | | | | | | | | | — | | | | | | | | | | | |
Net Assets | | | $ | 952,364,391 | | | | $ | 157,908,314 | | | | $ | 59,920,397 | | | | $ | 149,148,395 | | | | $ | 144,161,108 | | | | $ | 365,883,329 | |
| | | | | | |
NET ASSETS CONSIST OF: | | | | | | | | | | | | | | | | | | | | | | | | | | | | | | |
Paid-in Capital | | | $ | 1,156,699,555 | | | | $ | 175,354,445 | | | | $ | 82,611,248 | | | | $ | 143,435,813 | | | | $ | 185,879,677 | | | | $ | 415,889,572 | |
Total Distributable Earnings (Loss) (See Note 6) | | | | (204,335,164 | ) | | | | (17,446,131 | ) | | | | (22,690,851 | ) | | | | 5,712,582 | | | | | (41,718,569 | ) | | | | (50,006,243 | ) |
Net Assets | | | $ | 952,364,391 | | | | $ | 157,908,314 | | | | $ | 59,920,397 | | | | $ | 149,148,395 | | | | $ | 144,161,108 | | | | $ | 365,883,329 | |
| | | | | | |
*Identified Cost: | | | | | | | | | | | | | | | | | | | | | | | | | | | | | | |
Investments in Unaffiliated Securities | | | $ | 892,973,005 | | | | $ | 157,665,028 | | | | $ | 62,458,285 | | | | $ | — | | | | $ | 145,952,039 | | | | $ | 379,390,260 | |
Investments in Affiliated Mutual Funds | | | | — | | | | | — | | | | | — | | | | | — | | | | | — | | | | | — | |
Short Term Investments | | | | 162,658,736 | | | | | 1,477,545 | | | | | 1,170,276 | | | | | 153,071,254 | | | | | 6,561,852 | | | | | 5,637,194 | |
Foreign Currency (Due to Custodian) | | | | — | | | | | — | | | | | — | | | | | — | | | | | 457,214 | | | | | — | |
| | | | | | |
Class I (unlimited shares authorized): | | | | | | | | | | | | | | | | | | | | | | | | | | | | | | |
Net Assets | | | $ | 802,933,371 | | | | $ | 153,250,049 | | | | $ | 47,884,276 | | | | $ | 136,093,645 | | | | $ | 144,005,419 | | | | $ | 358,912,578 | |
Shares Outstanding | | | | 93,327,636 | | | | | 16,280,692 | | | | | 7,277,392 | | | | | 17,475,344 | | | | | 17,171,225 | | | | | 38,912,234 | |
Net Asset Value, Offering and Redemption Price per Share | | | $ | 8.60 | | | | $ | 9.41 | | | | $ | 6.58 | | | | $ | 7.79 | | | | $ | 8.39 | | | | $ | 9.22 | |
| | | | | | |
Class N (unlimited shares authorized): | | | | | | | | | | | | | | | | | | | | | | | | | | | | | | |
Net Assets | | | $ | 69,796,124 | | | | $ | 4,658,265 | | | | $ | 12,036,121 | | | | $ | 13,054,750 | | | | $ | 155,689 | | | | $ | 6,970,751 | |
Shares Outstanding | | | | 8,118,287 | | | | | 494,029 | | | | | 1,833,966 | | | | | 1,700,026 | | | | | 18,726 | | | | | 754,904 | |
Net Asset Value, Offering and Redemption Price per Share | | | $ | 8.60 | | | | $ | 9.43 | | | | $ | 6.56 | | | | $ | 7.68 | | | | $ | 8.31 | | | | $ | 9.23 | |
| | | | | | |
Class R6 (unlimited shares authorized): | | | | | | | | | | | | | | | | | | | | | | | | | | | | | | |
Net Assets | | | $ | 79,634,896 | | | | $ | — | | | | $ | — | | | | $ | — | | | | $ | — | | | | $ | — | |
Shares Outstanding | | | | 9,250,339 | | | | | — | | | | | — | | | | | — | | | | | — | | | | | — | |
Net Asset Value, Offering and Redemption Price per Share | | | $ | 8.61 | | | | $ | — | | | | $ | — | | | | $ | — | | | | $ | — | | | | $ | — | |
| | | | |
| 110 | | DoubleLine Funds Trust | | The accompanying notes are an integral part of these financial statements. |
| | | | | | | | | | | | | | | | | | | | |
| | | DoubleLine
Shiller Enhanced
International CAPE® | | DoubleLine
Emerging Markets
Local Currency
Bond Fund | | DoubleLine
Income Fund | | DoubleLine
Multi-Asset
Trend Fund
(Consolidated) |
| | | | |
ASSETS | | | | | | | | | | | | | | | | | | | | |
Investments in Unaffiliated Securities, at Value * | | | $ | 39,364,361 | | | | $ | 12,138,960 | | | | $ | 68,009,546 | | | | $ | 840,019 | |
Investments in Affiliated Mutual Funds, at Value * | | | | 2,347,465 | | | | | — | | | | | — | | | | | 9,924,617 | |
Short Term Investments * | | | | 925,288 | | | | | 275,668 | | | | | 18,196,426 | | | | | 1,423,452 | |
Cash | | | | — | | | | | 11,445 | | | | | — | | | | | — | |
Foreign Currency, at Value * | | | | — | | | | | 281 | | | | | — | | | | | — | |
Interest and Dividends Receivable | | | | 371,653 | | | | | 265,320 | | | | | 589,746 | | | | | 60,226 | |
Deposit at Broker for Futures and Swaps | | | | — | | | | | — | | | | | — | | | | | 1,055,000 | |
Receivable for Fund Shares Sold | | | | 30,650 | | | | | 9,500 | | | | | 202,014 | | | | | 4,395 | |
Receivable for Investments Sold | | | | 135,949 | | | | | — | | | | | — | | | | | — | |
Prepaid Expenses and Other Assets | | | | 37,358 | | | | | 24,882 | | | | | 39,879 | | | | | 40,679 | |
Net Unrealized Appreciation on Swaps | | | | 3,202,534 | | | | | — | | | | | — | | | | | — | |
Variation Margin Receivable | | | | — | | | | | — | | | | | — | | | | | — | |
Net Unrealized Appreciation on Forward Currency Exchange Contracts | | | | 113,075 | | | | | — | | | | | — | | | | | — | |
Due from Advisor (See Note 3) | | | | — | | | | | 14,713 | | | | | — | | | | | 8,622 | |
Total Assets | | | | 46,528,333 | | | | | 12,740,769 | | | | | 87,037,611 | | | | | 13,357,010 | |
| | | | |
LIABILITIES | | | | | | | | | | | | | | | | | | | | |
Payable for Investments Purchased | | | | 138,193 | | | | | — | | | | | 3,056,563 | | | | | — | |
Payable for Fund Shares Redeemed | | | | 119,816 | | | | | 29,033 | | | | | 105,101 | | | | | 496 | |
Distribution Payable | | | | 11,035 | | | | | 2,122 | | | | | 31,747 | | | | | 791 | |
Investment Advisory Fees Payable | | | | 1,766 | | | | | — | | | | | 20,441 | | | | | — | |
Variation Margin Payable | | | | — | | | | | — | | | | | — | | | | | — | |
Sub-Transfer Agent Expenses Payable | | | | 4,317 | | | | | — | | | | | 4,208 | | | | | 1,779 | |
Administration, Fund Accounting and Custodian Fees Payable | | | | 13,369 | | | | | 2,541 | | | | | 18,235 | | | | | 3,058 | |
Distribution Fees Payable | | | | 1,282 | | | | | 464 | | | | | 1,221 | | | | | 334 | |
Trustees Fees Payable (See Note 8) | | | | 1,539 | | | | | 325 | | | | | 1,403 | | | | | 202 | |
Transfer Agent Expenses Payable | | | | — | | | | | — | | | | | 1,636 | | | | | 289 | |
Professional Fees Payable | | | | 36,294 | | | | | 28,415 | | | | | 32,383 | | | | | 39,936 | |
Accrued Expenses | | | | — | | | | | 40,200 | | | | | 8,765 | | | | | 2,340 | |
Interest Expense Payable | | | | — | | | | | — | | | | | — | | | | | — | |
Net Unrealized Depreciation on Forward Currency Exchange Contracts | | | | 89,164 | | | | | — | | | | | — | | | | | — | |
Payable to Broker | | | | — | | | | | 2,570 | | | | | — | | | | | — | |
Net Unrealized Depreciation on Swaps | | | | — | | | | | — | | | | | — | | | | | 85,730 | |
Total Liabilities | | | | 416,775 | | | | | 105,670 | | | | | 3,281,703 | | | | | 134,955 | |
Commitments and Contingencies (See Note 2) | | | | | | | | | | | | | | | | | | | | |
Net Assets | | | $ | 46,111,558 | | | | $ | 12,635,099 | | | | $ | 83,755,908 | | | | $ | 13,222,055 | |
| | | | |
NET ASSETS CONSIST OF: | | | | | | | | | | | | | | | | | | | | |
Paid-in Capital | | | $ | 61,627,325 | | | | $ | 13,960,437 | | | | $ | 106,471,810 | | | | $ | 15,452,861 | |
Total Distributable Earnings (Loss) (See Note 6) | | | | (15,515,767 | ) | | | | (1,325,338 | ) | | | | (22,715,902 | ) | | | | (2,230,806 | ) |
Net Assets | | | $ | 46,111,558 | | | | $ | 12,635,099 | | | | $ | 83,755,908 | | | | $ | 13,222,055 | |
| | | | |
*Identified Cost: | | | | | | | | | | | | | | | | | | | | |
Investments in Unaffiliated Securities | | | $ | 42,043,142 | | | | $ | 13,119,492 | | | | $ | 73,142,887 | | | | $ | 853,058 | |
Investments in Affiliated Mutual Funds | | | | 2,472,710 | | | | | — | | | | | — | | | | | 10,303,410 | |
Short Term Investments | | | | 925,308 | | | | | 275,668 | | | | | 18,196,482 | | | | | 1,423,452 | |
Foreign Currency (Due to Custodian) | | | | — | | | | | 271 | | | | | — | | | | | — | |
| | | | |
Class I (unlimited shares authorized): | | | | | | | | | | | | | | | | | | | | |
Net Assets | | | $ | 36,996,233 | | | | $ | 11,674,829 | | | | $ | 79,772,279 | | | | $ | 12,997,280 | |
Shares Outstanding | | | | 2,994,850 | | | | | 1,342,837 | | | | | 10,229,254 | | | | | 1,606,397 | |
Net Asset Value, Offering and Redemption Price per Share | | | $ | 12.35 | | | | $ | 8.69 | | | | $ | 7.80 | | | | $ | 8.09 | |
| | | | |
Class N (unlimited shares authorized): | | | | | | | | | | | | | | | | | | | | |
Net Assets | | | $ | 9,115,325 | | | | $ | 960,270 | | | | $ | 3,983,629 | | | | $ | 224,775 | |
Shares Outstanding | | | | 738,061 | | | | | 110,692 | | | | | 509,942 | | | | | 27,881 | |
Net Asset Value, Offering and Redemption Price per Share | | | $ | 12.35 | | | | $ | 8.68 | | | | $ | 7.81 | | | | $ | 8.09 | |
| | | | |
Class R6 (unlimited shares authorized): | | | | | | | | | | | | | | | | | | | | |
Net Assets | | | $ | — | | | | $ | — | | | | $ | — | | | | $ | — | |
Shares Outstanding | | | | — | | | | | — | | | | | — | | | | | — | |
Net Asset Value, Offering and Redemption Price per Share | | | $ | — | | | | $ | — | | | | $ | — | | | | $ | — | |
| | | | | | | | |
| The accompanying notes are an integral part of these financial statements. | | Annual Report | | | | | March 31, 2024 | | 111 |
| | |
Statements of Operations | | For the Year Ended March 31, 2024 |
| | | | | | | | | | | | | | | | | | | | | | | | | | | | | | |
| | | DoubleLine
Total Return
Bond Fund | | DoubleLine
Core Fixed
Income Fund | | DoubleLine
Emerging Markets
Fixed Income Fund | | DoubleLine
Low Duration
Bond Fund | | DoubleLine
Floating
Rate Fund | | DoubleLine
Shiller
Enhanced
CAPE® |
| | | | | | |
INVESTMENT INCOME | | | | | | | | | | | | | | | | | | | | | | | | | | | | | | |
Income: | | | | | | | | | | | | | | | | | | | | | | | | | | | | | | |
Interest | | | $ | 1,520,900,154 | | | | $ | 336,738,413 | | | | $ | 31,888,224 | | | | $ | 299,279,510 | | | | $ | 17,451,181 | | | | $ | 219,714,626 | |
Dividends from Affiliated Mutual Funds | | | | — | | | | | 12,184,059 | | | | | — | | | | | — | | | | | — | | | | | — | |
Dividends from Unaffiliated Securities | | | | — | | | | | 27,822 | | | | | — | | | | | — | | | | | — | | | | | — | |
Non-Cash Interest | | | | — | | | | | — | | | | | — | | | | | — | | | | | — | | | | | — | |
Total Investment Income | | | | 1,520,900,154 | | | | | 348,950,294 | | | | | 31,888,224 | | | | | 299,279,510 | | | | | 17,451,181 | | | | | 219,714,626 | |
| | | | | | |
Expenses: | | | | | | | | | | | | | | | | | | | | | | | | | | | | | | |
Investment Advisory Fees | | | | 129,728,145 | | | | | 27,740,380 | | | | | 3,654,869 | | | | | 20,365,392 | | | | | 960,871 | | | | | 18,693,748 | |
Distribution Fees - Class N | | | | 11,881,019 | | | | | 627,216 | | | | | 63,507 | | | | | 1,984,864 | | | | | 43,641 | | | | | 761,109 | |
Sub-Transfer Agent Expenses - Class I | | | | 16,348,603 | | | | | 1,835,813 | | | | | 369,449 | | | | | 1,889,285 | | | | | 53,750 | | | | | 2,070,600 | |
Sub-Transfer Agent Expenses - Class N | | | | 2,946,943 | | | | | 71,242 | | | | | 20,337 | | | | | 304,307 | | | | | 5,374 | | | | | 164,618 | |
Administration, Fund Accounting and Custodian Fees | | | | 4,114,090 | | | | | 1,058,658 | | | | | 99,331 | | | | | 940,872 | | | | | 125,910 | | | | | 557,217 | |
Transfer Agent Expenses | | | | 3,061,336 | | | | | 649,638 | | | | | 44,024 | | | | | 546,551 | | | | | 17,507 | | | | | 331,550 | |
Professional Fees | | | | 1,167,780 | | | | | 353,370 | | | | | 154,246 | | | | | 287,407 | | | | | 106,004 | | | | | 265,763 | |
Trustees Fees | | | | 902,546 | | | | | 185,967 | | | | | 13,091 | | | | | 162,635 | | | | | 4,986 | | | | | 103,922 | |
Shareholder Reporting Expenses | | | | 897,469 | | | | | 113,161 | | | | | 34,478 | | | | | 182,766 | | | | | 11,705 | | | | | 75,165 | |
Insurance Expenses | | | | 664,059 | | | | | 148,073 | | | | | 12,873 | | | | | 125,408 | | | | | 7,060 | | | | | 89,473 | |
Registration Fees | | | | 661,240 | | | | | 229,608 | | | | | 49,710 | | | | | 114,427 | | | | | 34,159 | | | | | 57,750 | |
Miscellaneous Expenses | | | | 285,083 | | | | | 71,375 | | | | | 26,166 | | | | | 65,940 | | | | | 25,903 | | | | | 49,075 | |
Interest Expense | | | | — | | | | | — | | | | | 27,285 | | | | | — | | | | | 61,000 | | | | | — | |
Total Expenses | | | | 172,658,313 | | | | | 33,084,501 | | | | | 4,569,366 | | | | | 26,969,854 | | | | | 1,457,870 | | | | | 23,219,990 | |
Less: Investment Advisory Fees (Waived) | | | | — | | | | | (2,141,067 | ) | | | | — | | | | | — | | | | | — | | | | | — | |
Less: Other Fees (Reimbursed)/Recouped | | | | — | | | | | — | | | | | (7,486 | ) | | | | — | | | | | (41 | ) | | | | — | |
Net Expenses | | | | 172,658,313 | | | | | 30,943,434 | | | | | 4,561,880 | | | | | 26,969,854 | | | | | 1,457,829 | | | | | 23,219,990 | |
| | | | | | |
Net Investment Income (Loss) | | | | 1,348,241,841 | | | | | 318,006,860 | | | | | 27,326,344 | | | | | 272,309,656 | | | | | 15,993,352 | | | | | 196,494,636 | |
| | | | | | |
REALIZED & UNREALIZED GAIN (LOSS) ON
INVESTMENTS | | | | | | | | | | | | | | | | | | | | | | | | | | | | | | |
| | | | | | |
Net Realized Gain (Loss) on: | | | | | | | | | | | | | | | | | | | | | | | | | | | | | | |
| | | | | | |
Investments in Unaffiliated Securities | | | | (821,166,267 | ) | | | | (262,369,398 | ) | | | | (46,652,386 | ) | | | | (36,768,752 | ) | | | | (7,312,322 | ) | | | | (41,143,118 | ) |
| | | | | | |
Investments in Affiliated Mutual Funds | | | | — | | | | | — | | | | | — | | | | | — | | | | | — | | | | | — | |
| | | | | | |
Foreign Currency | | | | — | | | | | — | | | | | — | | | | | — | | | | | — | | | | | — | |
| | | | | | |
Forwards | | | | — | | | | | — | | | | | — | | | | | — | | | | | — | | | | | — | |
| | | | | | |
Futures | | | | (255,921,521 | ) | | | | (42,991,361 | ) | | | | — | | | | | — | | | | | — | | | | | — | |
| | | | | | |
Swaps | | | | — | | | | | — | | | | | — | | | | | — | | | | | — | | | | | 205,787,691 | |
| | | | | | |
Net Change in Unrealized Appreciation (Depreciation) on: | | | | | | | | | | | | | | | | | | | | | | | | | | | | | | |
| | | | | | |
Investments in Unaffiliated Securities | | | | 324,017,220 | | | | | 192,502,773 | | | | | 69,334,543 | | | | | 107,051,610 | | | | | 8,427,864 | | | | | 37,463,179 | |
| | | | | | |
Investments in Affiliated Mutual Funds | | | | — | | | | | 1,850,202 | | | | | — | | | | | — | | | | | — | | | | | — | |
| | | | | | |
Short Term Investments | | | | — | | | | | (36,243 | ) | | | | — | | | | | (25,271 | ) | | | | — | | | | | (17,046 | ) |
| | | | | | |
Unfunded Loan Commitments | | | | — | | | | | 2,277 | | | | | — | | | | | — | | | | | 1,372 | | | | | 456 | |
| | | | | | |
Foreign Currency | | | | — | | | | | — | | | | | — | | | | | — | | | | | — | | | | | — | |
| | | | | | |
Forwards | | | | — | | | | | — | | | | | — | | | | | — | | | | | — | | | | | — | |
| | | | | | |
Futures | | | | (136,401,869 | ) | | | | (25,912,923 | ) | | | | — | | | | | — | | | | | — | | | | | — | |
| | | | | | |
Swaps | | | | — | | | | | — | | | | | — | | | | | — | | | | | — | | | | | 473,173,658 | |
Translation of Other Assets and Liabilities Denominated in Foreign Currency | | | | — | | | | | — | | | | | — | | | | | — | | | | | — | | | | | — | |
Net Realized and Unrealized Gain (Loss) on Investments | | | | (889,472,437 | ) | | | | (136,954,673 | ) | | | | 22,682,157 | | | | | 70,257,587 | | | | | 1,116,914 | | | | | 675,264,820 | |
| | | | | | |
NET INCREASE (DECREASE) IN NET ASSETS
RESULTING FROM OPERATIONS | | | $ | 458,769,404 | | | | $ | 181,052,187 | | | | $ | 50,008,501 | | | | $ | 342,567,243 | | | | $ | 17,110,266 | | | | $ | 871,759,456 | |
| | | | |
| 112 | | DoubleLine Funds Trust | | The accompanying notes are an integral part of these financial statements. |
| | |
| | | For the Year Ended March 31, 2024 |
| | | | | | | | | | | | | | | | | | | | | | | | | | | | | | |
| | | DoubleLine
Flexible
Income Fund | | DoubleLine
Low Duration
Emerging
Markets Fixed
Income Fund | | DoubleLine
Long Duration
Total Return
Bond Fund | | DoubleLine
Strategic
Commodity
Fund
(Consolidated) | | DoubleLine
Global
Bond Fund | | DoubleLine
Infrastructure
Income Fund |
| | | | | | |
INVESTMENT INCOME | | | | | | | | | | | | | | | | | | | | | | | | | | | | | | |
Income: | | | | | | | | | | | | | | | | | | | | | | | | | | | | | | |
Interest | | | $ | 59,318,401 | | | | $ | 8,053,946 | | | | $ | 1,090,317 | | | | $ | 8,420,511 | | | | $ | 4,563,696 | | | | $ | 14,916,913 | |
Dividends from Affiliated Mutual Funds | | | | — | | | | | — | | | | | — | | | | | — | | | | | — | | | | | — | |
Dividends from Unaffiliated Securities | | | | 6,670 | | | | | — | | | | | — | | | | | — | | | | | — | | | | | — | |
Non-Cash Interest | | | | — | | | | | — | | | | | 1,250,759 | | | | | — | | | | | — | | | | | — | |
Total Investment Income | | | | 59,325,071 | | | | | 8,053,946 | | | | | 2,341,076 | | | | | 8,420,511 | | | | | 4,563,696 | | | | | 14,916,913 | |
| | | | | | |
Expenses: | | | | | | | | | | | | | | | | | | | | | | | | | | | | | | |
Investment Advisory Fees | | | | 5,484,944 | | | | | 870,441 | | | | | 184,922 | | | | | 1,478,304 | | | | | 710,177 | | | | | 1,737,855 | |
Distribution Fees - Class N | | | | 166,414 | | | | | 11,061 | | | | | 14,846 | | | | | 37,577 | | | | | 437 | | | | | 6,232 | |
Sub-Transfer Agent Expenses - Class I | | | | 301,919 | | | | | 134,952 | | | | | 7,422 | | | | | 97,131 | | | | | — | | | | | — | |
Sub-Transfer Agent Expenses - Class N | | | | 27,860 | | | | | 3,534 | | | | | 1,363 | | | | | 9,785 | | | | | — | | | | | — | |
Administration, Fund Accounting and Custodian Fees | | | | 341,601 | | | | | 50,298 | | | | | 28,512 | | | | | 31,176 | | | | | 20,141 | | | | | 76,445 | |
Transfer Agent Expenses | | | | 79,219 | | | | | 17,163 | | | | | 2,226 | | | | | 15,999 | | | | | 3,162 | | | | | 30,132 | |
Professional Fees | | | | 116,937 | | | | | 81,663 | | | | | 65,067 | | | | | 84,877 | | | | | 61,339 | | | | | 68,559 | |
Trustees Fees | | | | 24,694 | | | | | 4,721 | | | | | 1,457 | | | | | 3,712 | | | | | 2,759 | | | | | 7,946 | |
Shareholder Reporting Expenses | | | | 25,722 | | | | | 23,988 | | | | | 1,303 | | | | | 6,530 | | | | | 1,447 | | | | | 533 | |
Insurance Expenses | | | | 22,674 | | | | | 5,498 | | | | | 2,022 | | | | | 5,209 | | | | | 4,298 | | | | | 9,006 | |
Registration Fees | | | | 53,980 | | | | | 36,705 | | | | | 28,718 | | | | | 33,843 | | | | | 29,135 | | | | | 29,940 | |
Miscellaneous Expenses | | | | 28,855 | | | | | 46,148 | | | | | 7,253 | | | | | 11,430 | | | | | 9,217 | | | | | 22,795 | |
Interest Expense | | | | — | | | | | 6,065 | | | | | 324 | | | | | — | | | | | — | | | | | 789 | |
Total Expenses | | | | 6,674,819 | | | | | 1,292,237 | | | | | 345,435 | | | | | 1,815,573 | | | | | 842,112 | | | | | 1,990,232 | |
Less: Investment Advisory Fees (Waived) | | | | — | | | | | — | | | | | — | | | | | — | | | | | — | | | | | — | |
Less: Other Fees (Reimbursed)/Recouped | | | | — | | | | | (254,449 | ) | | | | (66,826 | ) | | | | (18,057 | ) | | | | 10,628 | | | | | — | |
Net Expenses | | | | 6,674,819 | | | | | 1,037,788 | | | | | 278,609 | | | | | 1,797,516 | | | | | 852,740 | | | | | 1,990,232 | |
| | | | | | |
Net Investment Income (Loss) | | | | 52,650,252 | | | | | 7,016,158 | | | | | 2,062,467 | | | | | 6,622,995 | | | | | 3,710,956 | | | | | 12,926,681 | |
| | | | | | |
REALIZED & UNREALIZED GAIN (LOSS) ON
INVESTMENTS | | | | | | | | | | | | | | | | | | | | | | | | | | | | | | |
| | | | | | |
Net Realized Gain (Loss) on: | | | | | | | | | | | | | | | | | | | | | | | | | | | | | | |
| | | | | | |
Investments in Unaffiliated Securities | | | | (25,409,554 | ) | | | | (5,773,678 | ) | | | | (2,334,345 | ) | | | | (6,521 | ) | | | | (4,511,766 | ) | | | | (14,357,550 | ) |
| | | | | | |
Investments in Affiliated Mutual Funds | | | | — | | | | | — | | | | | — | | | | | — | | | | | — | | | | | — | |
| | | | | | |
Foreign Currency | | | | — | | | | | — | | | | | — | | | | | — | | | | | 33,126 | | | | | — | |
| | | | | | |
Forwards | | | | — | | | | | — | | | | | — | | | | | — | | | | | 57,081 | | | | | — | |
| | | | | | |
Futures | | | | — | | | | | — | | | | | (1,151,402 | ) | | | | — | | | | | — | | | | | — | |
| | | | | | |
Swaps | | | | — | | | | | — | | | | | — | | | | | (5,463,047 | ) | | | | — | | | | | — | |
| | | | | | |
Net Change in Unrealized Appreciation (Depreciation) on: | | | | | | | | | | | | | | | | | | | | | | | | | | | | | | |
| | | | | | |
Investments in Unaffiliated Securities | | | | 46,390,325 | | | | | 12,240,679 | | | | | 26,372 | | | | | — | | | | | (466,934 | ) | | | | 20,920,412 | |
| | | | | | |
Investments in Affiliated Mutual Funds | | | | — | | | | | — | | | | | — | | | | | — | | | | | — | | | | | — | |
| | | | | | |
Short Term Investments | | | | 91,306 | | | | | — | | | | | (2,483 | ) | | | | 113,940 | | | | | (8,143 | ) | | | | — | |
| | | | | | |
Unfunded Loan Commitments | | | | 561 | | | | | — | | | | | — | | | | | — | | | | | — | | | | | — | |
| | | | | | |
Foreign Currency | | | | — | | | | | — | | | | | — | | | | | — | | | | | (5,839 | ) | | | | — | |
| | | | | | |
Forwards | | | | — | | | | | — | | | | | — | | | | | — | | | | | — | | | | | — | |
| | | | | | |
Futures | | | | — | | | | | — | | | | | (446,892 | ) | | | | — | | | | | — | | | | | — | |
| | | | | | |
Swaps | | | | — | | | | | — | | | | | — | | | | | 7,442,550 | | | | | — | | | | | — | |
Translation of Other Assets and Liabilities Denominated in Foreign Currency | | | | — | | | | | — | | | | | — | | | | | — | | | | | (12,928 | ) | | | | — | |
Net Realized and Unrealized Gain (Loss) on Investments | | | | 21,072,638 | | | | | 6,467,001 | | | | | (3,908,750 | ) | | | | 2,086,922 | | | | | (4,915,403 | ) | | | | 6,562,862 | |
| | | | | | |
NET INCREASE (DECREASE) IN NET ASSETS
RESULTING FROM OPERATIONS | | | $ | 73,722,890 | | | | $ | 13,483,159 | | | | $ | (1,846,283 | ) | | | $ | 8,709,917 | | | | $ | (1,204,447 | ) | | | $ | 19,489,543 | |
| | | | | | | | |
| The accompanying notes are an integral part of these financial statements. | | Annual Report | | | | | March 31, 2024 | | 113 |
| | |
Statements of Operations (Cont.) | | |
| | | | | | | | | | | | | | | | | | | | |
| | | DoubleLine
Shiller Enhanced
International CAPE® | | DoubleLine
Emerging Markets
Local Currency
Bond Fund | | DoubleLine
Income Fund | | DoubleLine
Multi-Asset
Trend Fund
(Consolidated) |
| | | | |
INVESTMENT INCOME | | | | | | | | | | | | | | | | | | | | |
Income: | | | | | | | | | | | | | | | | | | | | |
Interest | | | $ | 2,659,616 | | | | $ | 736,978 | | | | $ | 3,551,057 | | | | $ | 145,799 | |
Dividends from Affiliated Mutual Funds | | | | 233,788 | | | | | — | | | | | — | | | | | 574,762 | |
Dividends from Unaffiliated Securities | | | | — | | | | | — | | | | | — | | | | | — | |
Non-Cash Interest | | | | — | | | | | — | | | | | — | | | | | — | |
Total Investment Income | | | | 2,893,404 | | | | | 736,978 | | | | | 3,551,057 | | | | | 720,561 | |
| | | | |
Expenses: | | | | | | | | | | | | | | | | | | | | |
Investment Advisory Fees | | | | 248,102 | | | | | 88,777 | | | | | 261,872 | | | | | 64,741 | |
Distribution Fees - Class N | | | | 21,290 | | | | | 2,745 | | | | | 8,041 | | | | | 638 | |
Sub-Transfer Agent Expenses - Class I | | | | 25,571 | | | | | 927 | | | | | 30,134 | | | | | — | |
Sub-Transfer Agent Expenses - Class N | | | | 5,287 | | | | | 93 | | | | | 1,931 | | | | | — | |
Administration, Fund Accounting and Custodian Fees | | | | 47,034 | | | | | 23,028 | | | | | 52,915 | | | | | 18,122 | |
Transfer Agent Expenses | | | | 2,425 | | | | | 570 | | | | | 3,335 | | | | | 1,002 | |
Professional Fees | | | | 72,008 | | | | | 77,556 | | | | | 69,188 | | | | | 66,112 | |
Trustees Fees | | | | 1,441 | | | | | 190 | | | | | 1,353 | | | | | 551 | |
Shareholder Reporting Expenses | | | | 7,747 | | | | | 2,253 | | | | | 905 | | | | | 367 | |
Insurance Expenses | | | | 2,833 | | | | | 711 | | | | | 2,265 | | | | | 868 | |
Registration Fees | | | | 30,164 | | | | | 27,041 | | | | | 33,638 | | | | | 24,762 | |
Miscellaneous Expenses | | | | 12,461 | | | | | 57,152 | | | | | 659 | | | | | 6,014 | |
Interest Expense | | | | 83 | | | | | — | | | | | 2,374 | | | | | — | |
Total Expenses | | | | 476,446 | | | | | 281,043 | | | | | 468,610 | | | | | 183,177 | |
Less: Investment Advisory Fees (Waived) | | | | (14,135 | ) | | | | — | | | | | — | | | | | (39,275 | ) |
Less: Other Fees (Reimbursed)/Recouped | | | | (132,622 | ) | | | | (171,745 | ) | | | | (120,118 | ) | | | | (99,735 | ) |
Net Expenses | | | | 329,689 | | | | | 109,298 | | | | | 348,492 | | | | | 44,167 | |
| | | | |
Net Investment Income (Loss) | | | | 2,563,715 | | | | | 627,680 | | | | | 3,202,565 | | | | | 676,394 | |
| | | | |
REALIZED & UNREALIZED GAIN (LOSS) ON
INVESTMENTS | | | | | | | | | | | | | | | | | | | | |
| | | | |
Net Realized Gain (Loss) on: | | | | | | | | | | | | | | | | | | | | |
| | | | |
Investments in Unaffiliated Securities | | | | (647,609 | ) | | | | (152,381 | ) | | | | (4,967,822 | ) | | | | (7,142 | ) |
| | | | |
Investments in Affiliated Mutual Funds | | | | (115,270 | ) | | | | — | | | | | — | | | | | — | |
| | | | |
Foreign Currency | | | | 1,817 | | | | | (11,176 | ) | | | | — | | | | | — | |
| | | | |
Forwards | | | | (2,946,571 | ) | | | | — | | | | | — | | | | | — | |
| | | | |
Futures | | | | — | | | | | — | | | | | — | | | | | — | |
| | | | |
Swaps | | | | 1,398,491 | | | | | — | | | | | — | | | | | (1,359,164 | ) |
| | | | |
Net Change in Unrealized Appreciation (Depreciation) on: | | | | | | | | | | | | | | | | | | | | |
| | | | |
Investments in Unaffiliated Securities | | | | 887,595 | | | | | 97,492 | | | | | 7,428,252 | | | | | (16,275 | ) |
| | | | |
Investments in Affiliated Mutual Funds | | | | 131,368 | | | | | — | | | | | — | | | | | 145,420 | |
| | | | |
Short Term Investments | | | | 9,193 | | | | | — | | | | | (56 | ) | | | | 2,528 | |
| | | | |
Unfunded Loan Commitments | | | | — | | | | | — | | | | | — | | | | | — | |
| | | | |
Foreign Currency | | | | — | | | | | (3 | ) | | | | — | | | | | — | |
| | | | |
Forwards | | | | 1,635,110 | | | | | — | | | | | — | | | | | — | |
| | | | |
Futures | | | | — | | | | | — | | | | | — | | | | | — | |
| | | | |
Swaps | | | | 999,098 | | | | | — | | | | | — | | | | | 1,343,495 | |
Translation of Other Assets and Liabilities Denominated in Foreign Currency | | | | — | | | | | (2,829 | ) | | | | — | | | | | — | |
Net Realized and Unrealized Gain (Loss) on Investments | | | | 1,353,222 | | | | | (68,897 | ) | | | | 2,460,374 | | | | | 108,862 | |
| | | | |
NET INCREASE (DECREASE) IN NET ASSETS
RESULTING FROM OPERATIONS | | | $ | 3,916,937 | | | | $ | 558,783 | | | | $ | 5,662,939 | | | | $ | 785,256 | |
| | | | |
| 114 | | DoubleLine Funds Trust | | The accompanying notes are an integral part of these financial statements. |
| | |
Statements of Changes in Net Assets | | |
| | | | | | | | | | | | | | | | | | | | |
| | | DoubleLine
Total Return Bond Fund | | DoubleLine
Core Fixed Income Fund |
| | | Year Ended
March 31, 2024 | | Year Ended
March 31, 2023 | | Year Ended
March 31, 2024 | | Year Ended
March 31, 2023 |
| | | | |
OPERATIONS | | | | | | | | | | | | | | | | | | | | |
Net Investment Income (Loss) | | | $ | 1,348,241,841 | | | | $ | 1,186,218,807 | | | | $ | 318,006,860 | | | | $ | 305,039,769 | |
Net Realized Gain (Loss) on Investments | | | | (1,077,087,788 | ) | | | | (1,493,804,927 | ) | | | | (305,360,759 | ) | | | | (560,681,990 | ) |
Net Change in Unrealized Appreciation (Depreciation) on Investments | | | | 187,615,351 | | | | | (1,938,176,230 | ) | | | | 168,406,086 | | | | | (293,016,454 | ) |
Net Increase (Decrease) in Net Assets Resulting from Operations | | | | 458,769,404 | | | | | (2,245,762,350 | ) | | | | 181,052,187 | | | | | (548,658,675 | ) |
| | | | |
DISTRIBUTIONS TO SHAREHOLDERS | | | | | | | | | | | | | | | | | | | | |
From Earnings | | | | | | | | | | | | | | | | | | | | |
Class I | | | | (1,197,790,386 | ) | | | | (1,133,672,670 | ) | | | | (309,961,556 | ) | | | | (310,579,203 | ) |
Class N | | | | (202,590,572 | ) | | | | (176,439,753 | ) | | | | (11,384,179 | ) | | | | (13,631,858 | ) |
Class R6 | | | | (60,800,302 | ) | | | | (48,939,575 | ) | | | | (11,086,461 | ) | | | | (4,129,937 | ) |
| | | | |
Total Distributions to Shareholders | | | | (1,461,181,260 | ) | | | | (1,359,051,998 | ) | | | | (332,432,196 | ) | | | | (328,340,998 | ) |
| | | | |
NET SHARE TRANSACTIONS | | | | | | | | | | | | | | | | | | | | |
Class I | | | | (1,190,480,589 | ) | | | | (6,854,848,412 | ) | | | | (396,428,497 | ) | | | | (2,128,401,225 | ) |
Class N | | | | (681,077,905 | ) | | | | 556,592,256 | | | | | (33,074,677 | ) | | | | (126,447,238 | ) |
Class R6 | | | | 91,081,992 | | | | | (361,855,711 | ) | | | | 203,954,115 | | | | | 34,352,610 | |
Increase (Decrease) in Net Assets Resulting from Net Share Transactions | | | | (1,780,476,502 | ) | | | | (6,660,111,867 | ) | | | | (225,549,059 | ) | | | | (2,220,495,853 | ) |
| | | | |
Total Increase (Decrease) in Net Assets | | | $ | (2,782,888,358 | ) | | | $ | (10,264,926,215 | ) | | | $ | (376,929,068 | ) | | | $ | (3,097,495,526 | ) |
| | | | |
NET ASSETS | | | | | | | | | | | | | | | | | | | | |
Beginning of Period | | | $ | 33,818,299,790 | | | | $ | 44,083,226,005 | | | | $ | 7,282,208,459 | | | | $ | 10,379,703,985 | |
End of Period | | | $ | 31,035,411,432 | | | | $ | 33,818,299,790 | | | | $ | 6,905,279,391 | | | | $ | 7,282,208,459 | |
| | | | | | | | |
| The accompanying notes are an integral part of these financial statements. | | Annual Report | | | | | March 31, 2024 | | 115 |
| | |
Statements of Changes in Net Assets (Cont.) | | |
| | | | | | | | | | | | | | | | | | | | |
| | | DoubleLine
Emerging Markets
Fixed Income Fund | | DoubleLine
Low Duration Bond Fund |
| | | Year Ended
March 31, 2024 | | Year Ended
March 31, 2023 | | Year Ended
March 31, 2024 | | Year Ended
March 31, 2023 |
| | | | |
OPERATIONS | | | | | | | | | | | | | | | | | | | | |
Net Investment Income (Loss) | | | $ | 27,326,344 | | | | $ | 28,304,571 | | | | $ | 272,309,656 | | | | $ | 192,805,910 | |
Net Realized Gain (Loss) on Investments | | | | (46,652,386 | ) | | | | (70,584,947 | ) | | | | (36,768,752 | ) | | | | (125,179,923 | ) |
Net Change in Unrealized Appreciation (Depreciation) on Investments | | | | 69,334,543 | | | | | (21,120,187 | ) | | | | 107,026,339 | | | | | (34,718,469 | ) |
Net Increase (Decrease) in Net Assets Resulting from Operations | | | | 50,008,501 | | | | | (63,400,563 | ) | | | | 342,567,243 | | | | | 32,907,518 | |
| | | | |
DISTRIBUTIONS TO SHAREHOLDERS | | | | | | | | | | | | | | | | | | | | |
From Earnings | | | | | | | | | | | | | | | | | | | | |
Class I | | | | (26,668,163 | ) | | | | (28,239,825 | ) | | | | (230,720,953 | ) | | | | (170,179,376 | ) |
Class N | | | | (1,410,031 | ) | | | | (1,431,212 | ) | | | | (35,174,928 | ) | | | | (25,550,460 | ) |
Class R6 | | | | — | | | | | — | | | | | (4,914,904 | ) | | | | (1,755,927 | ) |
| | | | |
Total Distributions to Shareholders | | | | (28,078,194 | ) | | | | (29,671,037 | ) | | | | (270,810,785 | ) | | | | (197,485,763 | ) |
| | | | |
NET SHARE TRANSACTIONS | | | | | | | | | | | | | | | | | | | | |
Class I | | | | (52,388,152 | ) | | | | (139,814,008 | ) | | | | (527,964,125 | ) | | | | (827,959,245 | ) |
Class N | | | | (5,980,257 | ) | | | | (6,328,453 | ) | | | | (116,480,695 | ) | | | | (174,619,414 | ) |
Class R6 | | | | — | | | | | — | | | | | 72,153,985 | | | | | 13,776,622 | |
Increase (Decrease) in Net Assets Resulting from Net Share Transactions | | | | (58,368,409 | ) | | | | (146,142,461 | ) | | | | (572,290,835 | ) | | | | (988,802,037 | ) |
| | | | |
Total Increase (Decrease) in Net Assets | | | $ | (36,438,102 | ) | | | $ | (239,214,061 | ) | | | $ | (500,534,377 | ) | | | $ | (1,153,380,282 | ) |
| | | | |
NET ASSETS | | | | | | | | | | | | | | | | | | | | |
Beginning of Period | | | $ | 520,574,161 | | | | $ | 759,788,222 | | | | $ | 6,156,733,297 | | | | $ | 7,310,113,579 | |
End of Period | | | $ | 484,136,059 | | | | $ | 520,574,161 | | | | $ | 5,656,198,920 | | | | $ | 6,156,733,297 | |
| | | | |
| 116 | | DoubleLine Funds Trust | | The accompanying notes are an integral part of these financial statements. |
| | | | | | | | | | | | | | | | | | | | |
| | | DoubleLine
Floating Rate Fund | | DoubleLine
Shiller Enhanced CAPE® |
| | | Year Ended
March 31, 2024 | | Year Ended
March 31, 2023 | | Year Ended
March 31, 2024 | | Year Ended
March 31, 2023 |
| | | | |
OPERATIONS | | | | | | | | | | | | | | | | | | | | |
Net Investment Income (Loss) | | | $ | 15,993,352 | | | | $ | 17,350,887 | | | | $ | 196,494,636 | | | | $ | 199,664,900 | |
Net Realized Gain (Loss) on Investments | | | | (7,312,322 | ) | | | | (10,471,808 | ) | | | | 164,644,573 | | | | | (923,040,150 | ) |
Net Change in Unrealized Appreciation (Depreciation) on Investments | | | | 8,429,236 | | | | | (6,853,536 | ) | | | | 510,620,247 | | | | | (372,891,957 | ) |
Net Increase (Decrease) in Net Assets Resulting from Operations | | | | 17,110,266 | | | | | 25,543 | | | | | 871,759,456 | | | | | (1,096,267,207 | ) |
| | | | |
DISTRIBUTIONS TO SHAREHOLDERS | | | | | | | | | | | | | | | | | | | | |
From Earnings | | | | | | | | | | | | | | | | | | | | |
Class I | | | | (14,530,183 | ) | | | | (15,628,546 | ) | | | | (190,008,198 | ) | | | | (650,038,241 | ) |
Class N | | | | (1,403,828 | ) | | | | (1,768,371 | ) | | | | (14,327,670 | ) | | | | (51,023,171 | ) |
Class R6 | | | | — | | | | | — | | | | | (705,957 | ) | | | | (1,612,841 | ) |
| | | | |
Total Distributions to Shareholders | | | | (15,934,011 | ) | | | | (17,396,917 | ) | | | | (205,041,825 | ) | | | | (702,674,253 | ) |
| | | | |
NET SHARE TRANSACTIONS | | | | | | | | | | | | | | | | | | | | |
Class I | | | | (38,987,841 | ) | | | | (118,075,555 | ) | | | | (699,748,123 | ) | | | | (2,166,818,800 | ) |
Class N | | | | (3,655,586 | ) | | | | (22,626,454 | ) | | | | (79,320,566 | ) | | | | (131,268,786 | ) |
Class R6 | | | | — | | | | | — | | | | | 8,235,469 | | | | | (3,700,587 | ) |
Increase (Decrease) in Net Assets Resulting from Net Share Transactions | | | | (42,643,427 | ) | | | | (140,702,009 | ) | | | | (770,833,220 | ) | | | | (2,301,788,173 | ) |
| | | | |
Total Increase (Decrease) in Net Assets | | | $ | (41,467,172 | ) | | | $ | (158,073,383 | ) | | | $ | (104,115,589 | ) | | | $ | (4,100,729,633 | ) |
| | | | |
NET ASSETS | | | | | | | | | | | | | | | | | | | | |
Beginning of Period | | | $ | 220,806,605 | | | | $ | 378,879,988 | | | | $ | 4,309,417,329 | | | | $ | 8,410,146,962 | |
End of Period | | | $ | 179,339,433 | | | | $ | 220,806,605 | | | | $ | 4,205,301,740 | | | | $ | 4,309,417,329 | |
| | | | | | | | |
| The accompanying notes are an integral part of these financial statements. | | Annual Report | | | | | March 31, 2024 | | 117 |
| | |
Statements of Changes in Net Assets (Cont.) | | |
| | | | | | | | | | | | | | | | | | | | |
| | | DoubleLine
Flexible Income Fund | | DoubleLine
Low Duration
Emerging Markets Fixed Income Fund |
| | | Year Ended
March 31, 2024 | | Year Ended
March 31, 2023 | | Year Ended
March 31, 2024 | | Year Ended
March 31, 2023 |
| | | | |
OPERATIONS | | | | | | | | | | | | | | | | | | | | |
Net Investment Income (Loss) | | | $ | 52,650,252 | | | | $ | 48,462,923 | | | | $ | 7,016,158 | | | | $ | 6,918,266 | |
Net Realized Gain (Loss) on Investments | | | | (25,409,554 | ) | | | | (29,811,153 | ) | | | | (5,773,678 | ) | | | | (9,229,837 | ) |
Net Change in Unrealized Appreciation (Depreciation) on Investments | | | | 46,482,192 | | | | | (66,340,683 | ) | | | | 12,240,679 | | | | | (1,099,992 | ) |
Net Increase (Decrease) in Net Assets Resulting from Operations | | | | 73,722,890 | | | | | (47,688,913 | ) | | | | 13,483,159 | | | | | (3,411,563 | ) |
| | | | |
DISTRIBUTIONS TO SHAREHOLDERS | | | | | | | | | | | | | | | | | | | | |
From Earnings | | | | | | | | | | | | | | | | | | | | |
Class I | | | | (45,496,140 | ) | | | | (38,406,012 | ) | | | | (6,726,859 | ) | | | | (6,405,153 | ) |
Class N | | | | (3,945,038 | ) | | | | (4,735,103 | ) | | | | (165,152 | ) | | | | (428,580 | ) |
Class R6 | | | | (5,259,414 | ) | | | | (6,781,634 | ) | | | | — | | | | | — | |
| | | | |
Total Distributions to Shareholders | | | | (54,700,592 | ) | | | | (49,922,749 | ) | | | | (6,892,011 | ) | | | | (6,833,733 | ) |
| | | | |
NET SHARE TRANSACTIONS | | | | | | | | | | | | | | | | | | | | |
Class I | | | | 60,598,970 | | | | | (168,776,775 | ) | | | | (35,190,518 | ) | | | | (47,129,892 | ) |
Class N | | | | (26,706,309 | ) | | | | (36,501,181 | ) | | | | (853,185 | ) | | | | (16,377,784 | ) |
Class R6 | | | | (47,199,504 | ) | | | | 23,412,123 | | | | | — | | | | | — | |
Increase (Decrease) in Net Assets Resulting from Net Share Transactions | | | | (13,306,843 | ) | | | | (181,865,833 | ) | | | | (36,043,703 | ) | | | | (63,507,676 | ) |
| | | | |
Total Increase (Decrease) in Net Assets | | | $ | 5,715,455 | | | | $ | (279,477,495 | ) | | | | (29,452,555 | ) | | | $ | (73,752,972 | ) |
| | | | |
NET ASSETS | | | | | | | | | | | | | | | | | | | | |
Beginning of Period | | | $ | 946,648,936 | | | | $ | 1,226,126,431 | | | | $ | 187,360,869 | | | | $ | 261,113,841 | |
End of Period | | | $ | 952,364,391 | | | | $ | 946,648,936 | | | | $ | 157,908,314 | | | | $ | 187,360,869 | |
| | | | |
| 118 | | DoubleLine Funds Trust | | The accompanying notes are an integral part of these financial statements. |
| | | | | | | | | | | | | | | | | | | | |
| | | DoubleLine
Long Duration
Total Return
Bond Fund | | DoubleLine
Strategic Commodity Fund
(Consolidated) |
| | | Year Ended
March 31, 2024 | | Year Ended
March 31, 2023 | | Year Ended
March 31, 2024 | | Year Ended
March 31, 2023 |
| | | | |
OPERATIONS | | | | | | | | | | | | | | | | | | | | |
Net Investment Income (Loss) | | | $ | 2,062,467 | | | | $ | 1,443,592 | | | | $ | 6,622,995 | | | | $ | 1,336,306 | |
Net Realized Gain (Loss) on Investments | | | | (3,485,747 | ) | | | | (7,721,335 | ) | | | | (5,469,568 | ) | | | | (12,670,604 | ) |
Net Change in Unrealized Appreciation (Depreciation) on Investments | | | | (423,003 | ) | | | | (3,556,796 | ) | | | | 7,556,490 | | | | | (17,431,981 | ) |
Net Increase (Decrease) in Net Assets Resulting from Operations | | | | (1,846,283 | ) | | | | (9,834,539 | ) | | | | 8,709,917 | | | | | (28,766,279 | ) |
| | | | |
DISTRIBUTIONS TO SHAREHOLDERS | | | | | | | | | | | | | | | | | | | | |
From Earnings | | | | | | | | | | | | | | | | | | | | |
Class I | | | | (1,791,604 | ) | | | | (1,395,538 | ) | | | | (4,156,315 | ) | | | | (59,541,258 | ) |
Class N | | | | (247,566 | ) | | | | (48,695 | ) | | | | (401,257 | ) | | | | (5,999,114 | ) |
| | | | |
Total Distributions to Shareholders | | | | (2,039,170 | ) | | | | (1,444,233 | ) | | | | (4,557,572 | ) | | | | (65,540,372 | ) |
| | | | |
NET SHARE TRANSACTIONS | | | | | | | | | | | | | | | | | | | | |
Class I | | | | 2,917,726 | | | | | 4,497,689 | | | | | (26,162,286 | ) | | | | 20,462,781 | |
Class N | | | | 10,336,015 | | | | | (2,928,587 | ) | | | | (4,199,172 | ) | | | | 1,496,327 | |
Increase (Decrease) in Net Assets Resulting from Net Share Transactions | | | | 13,253,741 | | | | | 1,569,102 | | | | | (30,361,458 | ) | | | | 21,959,108 | |
| | | | |
Total Increase (Decrease) in Net Assets | | | $ | 9,368,288 | | | | $ | (9,709,670 | ) | | | $ | (26,209,113 | ) | | | $ | (72,347,543 | ) |
| | | | |
NET ASSETS | | | | | | | | | | | | | | | | | | | | |
Beginning of Period | | | $ | 50,552,109 | | | | $ | 60,261,779 | | | | $ | 175,357,508 | | | | $ | 247,705,051 | |
End of Period | | | $ | 59,920,397 | | | | $ | 50,552,109 | | | | $ | 149,148,395 | | | | $ | 175,357,508 | |
| | | | | | | | |
| The accompanying notes are an integral part of these financial statements. | | Annual Report | | | | | March 31, 2024 | | 119 |
| | |
Statements of Changes in Net Assets (Cont.) | | |
| | | | | | | | | | | | | | | | | | | | |
| | | DoubleLine
Global Bond Fund | | DoubleLine
Infrastructure Income Fund |
| | | Year Ended
March 31, 2024 | | Year Ended
March 31, 2023 | | Year Ended
March 31, 2024 | | Year Ended
March 31, 2023 |
| | | | |
OPERATIONS | | | | | | | | | | | | | | | | | | | | |
Net Investment Income (Loss) | | | $ | 3,710,956 | | | | $ | 1,622,078 | | | | $ | 12,926,681 | | | | $ | 12,750,009 | |
Net Realized Gain (Loss) on Investments | | | | (4,421,559 | ) | | | | (20,226,964 | ) | | | | (14,357,550 | ) | | | | (14,491,616 | ) |
Net Change in Unrealized Appreciation (Depreciation) on Investments | | | | (493,844 | ) | | | | 6,094,281 | | | | | 20,920,412 | | | | | (17,544,166 | ) |
Net Increase (Decrease) in Net Assets Resulting from Operations | | | | (1,204,447 | ) | | | | (12,510,605 | ) | | | | 19,489,543 | | | | | (19,285,773 | ) |
| | | | |
DISTRIBUTIONS TO SHAREHOLDERS | | | | | | | | | | | | | | | | | | | | |
From Earnings | | | | | | | | | | | | | | | | | | | | |
Class I | | | | — | | | | | — | | | | | (12,689,557 | ) | | | | (13,587,479 | ) |
Class N | | | | — | | | | | — | | | | | (93,327 | ) | | | | (20,057 | ) |
| | | | |
Total Distributions to Shareholders | | | | — | | | | | — | | | | | (12,782,884 | ) | | | | (13,607,536 | ) |
| | | | |
NET SHARE TRANSACTIONS | | | | | | | | | | | | | | | | | | | | |
Class I | | | | 751,040 | | | | | (119,629,668 | ) | | | | 6,061,598 | | | | | (142,837,231 | ) |
Class N | | | | (81,847 | ) | | | | (137,882 | ) | | | | 6,286,861 | | | | | (1,124,509 | ) |
Increase (Decrease) in Net Assets Resulting from Net Share Transactions | | | | 669,193 | | | | | (119,767,550 | ) | | | | 12,348,459 | | | | | (143,961,740 | ) |
| | | | |
Total Increase (Decrease) in Net Assets | | | $ | (535,254 | ) | | | $ | (132,278,155 | ) | | | $ | 19,055,118 | | | | $ | (176,855,049 | ) |
| | | | |
NET ASSETS | | | | | | | | | | | | | | | | | | | | |
Beginning of Period | | | $ | 144,696,362 | | | | $ | 276,974,517 | | | | $ | 346,828,211 | | | | $ | 523,683,260 | |
End of Period | | | $ | 144,161,108 | | | | $ | 144,696,362 | | | | $ | 365,883,329 | | | | $ | 346,828,211 | |
| | | | |
| 120 | | DoubleLine Funds Trust | | The accompanying notes are an integral part of these financial statements. |
| | | | | | | | | | | | | | | | | | | | |
| | | DoubleLine
Shiller Enhanced International CAPE® | | DoubleLine
Emerging Markets Local
Currency Bond Fund |
| | | Year Ended
March 31, 2024 | | Year Ended
March 31, 2023 | | Year Ended
March 31, 2024 | | Year Ended
March 31, 2023 |
| | | | |
OPERATIONS | | | | | | | | | | | | | | | | | | | | |
Net Investment Income (Loss) | | | $ | 2,563,715 | | | | $ | 2,512,563 | | | | $ | 627,680 | | | | $ | 373,748 | |
Net Realized Gain (Loss) on Investments | | | | (2,309,142 | ) | | | | (14,293,448 | ) | | | | (163,557 | ) | | | | (213,661 | ) |
Net Change in Unrealized Appreciation (Depreciation) on Investments | | | | 3,662,364 | | | | | 4,877,553 | | | | | 94,660 | | | | | (315,586 | ) |
Net Increase (Decrease) in Net Assets Resulting from Operations | | | | 3,916,937 | | | | | (6,903,332 | ) | | | | 558,783 | | | | | (155,499 | ) |
| | | | |
DISTRIBUTIONS TO SHAREHOLDERS | | | | | | | | | | | | | | | | | | | | |
From Earnings | | | | | | | | | | | | | | | | | | | | |
Class I | | | | (2,310,834 | ) | | | | (2,446,375 | ) | | | | (387,741 | ) | | | | (182,403 | ) |
Class N | | | | (451,256 | ) | | | | (317,577 | ) | | | | (38,071 | ) | | | | (2,547 | ) |
| | | | |
Total Distributions to Shareholders | | | | (2,762,090 | ) | | | | (2,763,952 | ) | | | | (425,812 | ) | | | | (184,950 | ) |
| | | | |
NET SHARE TRANSACTIONS | | | | | | | | | | | | | | | | | | | | |
Class I | | | | (9,215,887 | ) | | | | (38,995,905 | ) | | | | 2,126,583 | | | | | 524,065 | |
Class N | | | | (427,180 | ) | | | | 2,809,445 | | | | | 743,979 | | | | | 83,359 | |
Increase (Decrease) in Net Assets Resulting from Net Share Transactions | | | | (9,643,067 | ) | | | | (36,186,460 | ) | | | | 2,870,562 | | | | | 607,424 | |
| | | | |
Total Increase (Decrease) in Net Assets | | | $ | (8,488,220 | ) | | | $ | (45,853,744 | ) | | | $ | 3,003,533 | | | | $ | 266,975 | |
| | | | |
NET ASSETS | | | | | | | | | | | | | | | | | | | | |
Beginning of Period | | | $ | 54,599,778 | | | | $ | 100,453,522 | | | | $ | 9,631,566 | | | | $ | 9,364,591 | |
End of Period | | | $ | 46,111,558 | | | | $ | 54,599,778 | | | | $ | 12,635,099 | | | | $ | 9,631,566 | |
| | | | | | | | |
| The accompanying notes are an integral part of these financial statements. | | Annual Report | | | | | March 31, 2024 | | 121 |
| | |
Statements of Changes in Net Assets (Cont.) | | |
| | | | | | | | | | | | | | | | | | | | |
| | | DoubleLine
Income Fund | | DoubleLine
Multi-Asset Trend Fund
(Consolidated) |
| | | Year Ended
March 31, 2024 | | Year Ended
March 31, 2023 | | Year Ended
March 31, 2024 | | Year Ended
March 31, 2023 |
| | | | |
OPERATIONS | | | | | | | | | | | | | | | | | | | | |
Net Investment Income (Loss) | | | $ | 3,202,565 | | | | $ | 3,498,791 | | | | $ | 676,394 | | | | $ | 474,865 | |
Net Realized Gain (Loss) on Investments | | | | (4,967,822 | ) | | | | (8,161,598 | ) | | | | (1,366,306 | ) | | | | (597,318 | ) |
Net Change in Unrealized Appreciation (Depreciation) on Investments | | | | 7,428,196 | | | | | (2,250,669 | ) | | | | 1,475,168 | | | | | (1,555,238 | ) |
Net Increase (Decrease) in Net Assets Resulting from Operations | | | | 5,662,939 | | | | | (6,913,476 | ) | | | | 785,256 | | | | | (1,677,691 | ) |
| | | | |
DISTRIBUTIONS TO SHAREHOLDERS | | | | | | | | | | | | | | | | | | | | |
From Earnings | | | | | | | | | | | | | | | | | | | | |
Class I | | | | (3,693,184 | ) | | | | (2,942,942 | ) | | | | (610,034 | ) | | | | (2,306,129 | ) |
Class N | | | | (229,194 | ) | | | | (416,205 | ) | | | | (11,310 | ) | | | | (89,716 | ) |
| | | | |
Total Distributions to Shareholders | | | | (3,922,378 | ) | | | | (3,359,147 | ) | | | | (621,344 | ) | | | | (2,395,845 | ) |
| | | | |
NET SHARE TRANSACTIONS | | | | | | | | | | | | | | | | | | | | |
Class I | | | | 27,417,772 | | | | | (30,180,303 | ) | | | | (14,960 | ) | | | | 2,990,773 | |
Class N | | | | 671,994 | | | | | (8,191,153 | ) | | | | (140,392 | ) | | | | 330,542 | |
Increase (Decrease) in Net Assets Resulting from Net Share Transactions | | | | 28,089,766 | | | | | (38,371,456 | ) | | | | (155,352 | ) | | | | 3,321,315 | |
| | | | |
Total Increase (Decrease) in Net Assets | | | $ | 29,830,327 | | | | $ | (48,644,079 | ) | | | $ | 8,560 | | | | $ | (752,221 | ) |
| | | | |
NET ASSETS | | | | | | | | | | | | | | | | | | | | |
Beginning of Period | | | $ | 53,925,581 | | | | $ | 102,569,660 | | | | $ | 13,213,495 | | | | $ | 13,965,716 | |
End of Period | | | $ | 83,755,908 | | | | $ | 53,925,581 | | | | $ | 13,222,055 | | | | $ | 13,213,495 | |
| | | | |
| 122 | | DoubleLine Funds Trust | | The accompanying notes are an integral part of these financial statements. |
| | | | | | | | | | | | | | | | | | | | | | | | | | | | | | | | | | | | | | | | | | | | | | | | | | | | | | | | | | | | | | | | | | | | | | |
| | | | | Income (Loss) from
Investment Operations: | | Less Distributions: | | | | | | | | Ratios to Average Net Assets: |
For the
Year or
Period Ended | | Net Asset
Value,
Beginning
of Period | | Net
Investment
Income
(Loss)(a) | | Net Gain
(Loss) on
Investments
(Realized and
Unrealized) | | Total from
Investment
Operations | | Distributions
from Net
Investment
Income | | Distributions
from Net
Realized
Gain | | Total
Distributions | | Net Asset
Value,
End of
Period | | Total
Return(c) | | Net Assets,
End of Period
(000’s) | | Expenses
Before
Advisory Fees
(Waived) and
Other Fees
(Reimbursed)/
Recouped(d) | | Expenses
After
Investment
Advisory
Fees
(Waived)(d) | | Expenses
After
Advisory Fees
(Waived) and
Other Fees
(Reimbursed)/
Recouped(d) | | Net
Investment
Income
(Loss)(d) |
|
| DoubleLine Total Return Bond Fund - Class I: | |
| 3/31/2024 | | | $ | 8.97 | | | | | 0.36 | | | | | (0.21 | ) | | | | 0.15 | | | | | (0.40 | ) | | | | — | | | | | (0.40 | ) | | | $ | 8.72 | | | | | 1.75 | % | | | $ | 25,498,119 | | | | | 0.50 | % | | | | 0.50 | % | | | | 0.50 | % | | | | 4.19 | % |
| 3/31/2023 | | | $ | 9.82 | | | | | 0.30 | | | | | (0.80 | ) | | | | (0.50 | ) | | | | (0.35 | ) | | | | — | | | | | (0.35 | ) | | | $ | 8.97 | | | | | (5.08 | )% | | | $ | 27,489,784 | | | | | 0.49 | % | | | | 0.49 | % | | | | 0.49 | % | | | | 3.28 | % |
| 3/31/2022 | | | $ | 10.46 | | | | | 0.29 | | | | | (0.60 | ) | | | | (0.31 | ) | | | | (0.33 | ) | | | | — | | | | | (0.33 | ) | | | $ | 9.82 | | | | | (3.14 | )% | | | $ | 37,399,379 | | | | | 0.48 | % | | | | 0.48 | % | | | | 0.48 | % | | | | 2.75 | % |
| 3/31/2021 | | | $ | 10.46 | | | | | 0.31 | | | | | 0.04 | | | | | 0.35 | | | | | (0.35 | ) | | | | — | | | | | (0.35 | ) | | | $ | 10.46 | | | | | 3.32 | % | | | $ | 42,909,929 | | | | | 0.49 | % | | | | 0.49 | % | | | | 0.49 | % | | | | 2.95 | % |
| 3/31/2020 | | | $ | 10.53 | | | | | 0.34 | | | | | (0.03 | ) | | | | 0.31 | | | | | (0.38 | ) | | | | — | | | | | (0.38 | ) | | | $ | 10.46 | | | | | 2.97 | % | | | $ | 44,623,760 | | | | | 0.49 | % | | | | 0.48 | % | | | | 0.48 | % | | | | 3.28 | % |
|
| DoubleLine Total Return Bond Fund - Class N: | |
| 3/31/2024 | | | $ | 8.97 | | | | | 0.34 | | | | | (0.21 | ) | | | | 0.13 | | | | | (0.38 | ) | | | | — | | | | | (0.38 | ) | | | $ | 8.72 | | | | | 1.50 | % | | | $ | 4,269,591 | | | | | 0.75 | % | | | | 0.75 | % | | | | 0.75 | % | | | | 3.94 | % |
| 3/31/2023 | | | $ | 9.82 | | | | | 0.28 | | | | | (0.80 | ) | | | | (0.52 | ) | | | | (0.33 | ) | | | | — | | | | | (0.33 | ) | | | $ | 8.97 | | | | | (5.32 | )% | | | $ | 5,109,737 | | | | | 0.74 | % | | | | 0.74 | % | | | | 0.74 | % | | | | 3.08 | % |
| 3/31/2022 | | | $ | 10.46 | | | | | 0.26 | | | | | (0.60 | ) | | | | (0.34 | ) | | | | (0.30 | ) | | | | — | | | | | (0.30 | ) | | | $ | 9.82 | | | | | (3.38 | )% | | | $ | 4,972,381 | | | | | 0.73 | % | | | | 0.73 | % | | | | 0.73 | % | | | | 2.50 | % |
| 3/31/2021 | | | $ | 10.46 | | | | | 0.29 | | | | | 0.03 | | | | | 0.32 | | | | | (0.32 | ) | | | | — | | | | | (0.32 | ) | | | $ | 10.46 | | | | | 3.06 | % | | | $ | 5,239,001 | | | | | 0.74 | % | | | | 0.74 | % | | | | 0.74 | % | | | | 2.70 | % |
| 3/31/2020 | | | $ | 10.53 | | | | | 0.32 | | | | | (0.03 | ) | | | | 0.29 | | | | | (0.36 | ) | | | | — | | | | | (0.36 | ) | | | $ | 10.46 | | | | | 2.71 | % | | | $ | 6,552,760 | | | | | 0.73 | % | | | | 0.73 | % | | | | 0.73 | % | | | | 3.03 | % |
|
| DoubleLine Total Return Bond Fund - Class R6: | |
| 3/31/2024 | | | $ | 8.98 | | | | | 0.37 | | | | | (0.22 | ) | | | | 0.15 | | | | | (0.40 | ) | | | | — | | | | | (0.40 | ) | | | $ | 8.73 | | | | | 1.81 | % | | | $ | 1,267,701 | | | | | 0.44 | % | | | | 0.44 | % | | | | 0.44 | % | | | | 4.27 | % |
| 3/31/2023 | | | $ | 9.83 | | | | | 0.31 | | | | | (0.81 | ) | | | | (0.50 | ) | | | | (0.35 | ) | | | | — | | | | | (0.35 | ) | | | $ | 8.98 | | | | | (5.02 | )% | | | $ | 1,218,779 | | | | | 0.44 | % | | | | 0.44 | % | | | | 0.44 | % | | | | 3.35 | % |
| 3/31/2022 | | | $ | 10.46 | | | | | 0.29 | | | | | (0.59 | ) | | | | (0.30 | ) | | | | (0.33 | ) | | | | — | | | | | (0.33 | ) | | | $ | 9.83 | | | | | (2.99 | )% | | | $ | 1,711,466 | | | | | 0.43 | % | | | | 0.43 | % | | | | 0.43 | % | | | | 2.81 | % |
| 3/31/2021 | | | $ | 10.46 | | | | | 0.31 | | | | | 0.05 | | | | | 0.36 | | | | | (0.36 | ) | | | | — | | | | | (0.36 | ) | | | $ | 10.46 | | | | | 3.38 | % | | | $ | 2,071,388 | | | | | 0.44 | % | | | | 0.44 | % | | | | 0.44 | % | | | | 2.89 | % |
| 3/31/2020(b) | | | $ | 10.66 | | | | | 0.24 | | | | | (0.18 | ) | | | | 0.06 | | | | | (0.26 | ) | | | | — | | | | | (0.26 | ) | | | $ | 10.46 | | | | | 0.52 | % | | | $ | 65,403 | | | | | 0.45 | % | | | | 0.45 | % | | | | 0.45 | % | | | | 3.33 | % |
| | | | | | | | | | |
| | | | | | | | | | | | | | | | | | | | | For the Year or Period Ended |
| | | | | | | | | | | | | | | | | | | | | 3/31/2024 | | 3/31/2023 | | 3/31/2022 | | 3/31/2021 | | 3/31/2020 |
| | | | | | | | |
Portfolio turnover rate for all share classes | | | | | | | | | | | | | | | | | | | | 36% | | | | | 37% | | | | | 89% | | | | | 91% | | | | | 31% | |
|
(a) Calculated based on average shares outstanding during the period. (b) Commencement of operations on July 31, 2019. Total return is based on operations for a period that is less than a year. (c) Not annualized for periods less than one year. (d) Annualized for periods less than one year. | |
| | | | | | | |
| | | | | Income (Loss) from
Investment Operations: | | Less Distributions: | | | | | | | | Ratios to Average Net Assets: |
For the
Year or
Period Ended | | Net Asset
Value,
Beginning
of Period | | Net
Investment
Income
(Loss)(a) | | Net Gain
(Loss) on
Investments
(Realized and
Unrealized) | | Total from
Investment
Operations | | Distributions
from Net
Investment
Income | | Distributions
from Net
Realized
Gain | | Total
Distributions | | Net Asset
Value,
End of
Period | | Total
Return(c) | | Net Assets,
End of Period
(000’s) | | Expenses
Before
Advisory Fees
(Waived) and
Other Fees
(Reimbursed)/
Recouped(d) | | Expenses
After
Investment
Advisory
Fees
(Waived)(d) | | Expenses
After
Advisory Fees
(Waived) and
Other Fees
(Reimbursed)/
Recouped(d) | | Net
Investment
Income
(Loss)(d) |
|
| DoubleLine Core Fixed Income Fund - Class I: | |
| 3/31/2024 | | | $ | 9.41 | | | | | 0.42 | | | | | (0.19 | ) | | | | 0.23 | | | | | (0.44 | ) | | | | — | | | | | (0.44 | ) | | | $ | 9.20 | | | | | 2.60 | % | | | $ | 6,346,593 | | | | | 0.47 | % | | | | 0.44 | % | | | | 0.44 | % | | | | 4.59 | % |
| 3/31/2023 | | | $ | 10.33 | | | | | 0.36 | | | | | (0.88 | ) | | | | (0.52 | ) | | | | (0.40 | ) | | | | — | | | | | (0.40 | ) | | | $ | 9.41 | | | | | (5.03 | )% | | | $ | 6,889,213 | | | | | 0.47 | % | | | | 0.44 | % | | | | 0.44 | % | | | | 3.75 | % |
| 3/31/2022 | | | $ | 11.01 | | | | | 0.28 | | | | | (0.62 | ) | | | | (0.34 | ) | | | | (0.31 | ) | | | | (0.03 | ) | | | | (0.34 | ) | | | $ | 10.33 | | | | | (3.19 | )% | | | $ | 9,843,189 | | | | | 0.46 | % | | | | 0.42 | % | | | | 0.42 | % | | | | 2.55 | % |
| 3/31/2021 | | | $ | 10.62 | | | | | 0.32 | | | | | 0.42 | | | | | 0.74 | | | | | (0.33 | ) | | | | (0.02 | ) | | | | (0.35 | ) | | | $ | 11.01 | | | | | 6.94 | % | | | $ | 10,772,238 | | | | | 0.47 | % | | | | 0.42 | % | | | | 0.42 | % | | | | 2.83 | % |
| 3/31/2020 | | | $ | 10.83 | | | | | 0.36 | | | | | (0.20 | ) | | | | 0.16 | | | | | (0.37 | ) | | | | — | | | | | (0.37 | ) | | | $ | 10.62 | | | | | 1.42 | % | | | $ | 10,724,409 | | | | | 0.47 | % | | | | 0.41 | % | | | | 0.41 | % | | | | 3.30 | % |
|
| DoubleLine Core Fixed Income Fund - Class N: | |
| 3/31/2024 | | | $ | 9.40 | | | | | 0.40 | | | | | (0.18 | ) | | | | 0.22 | | | | | (0.42 | ) | | | | — | | | | | (0.42 | ) | | | $ | 9.20 | | | | | 2.46 | % | | | $ | 235,339 | | | | | 0.72 | % | | | | 0.69 | % | | | | 0.69 | % | | | | 4.34 | % |
| 3/31/2023 | | | $ | 10.32 | | | | | 0.33 | | | | | (0.88 | ) | | | | (0.55 | ) | | | | (0.37 | ) | | | | — | | | | | (0.37 | ) | | | $ | 9.40 | | | | | (5.27 | )% | | | $ | 274,332 | | | | | 0.72 | % | | | | 0.69 | % | | | | 0.69 | % | | | | 3.48 | % |
| 3/31/2022 | | | $ | 11.00 | | | | | 0.25 | | | | | (0.61 | ) | | | | (0.36 | ) | | | | (0.29 | ) | | | | (0.03 | ) | | | | (0.32 | ) | | | $ | 10.32 | | | | | (3.43 | )% | | | $ | 443,006 | | | | | 0.71 | % | | | | 0.67 | % | | | | 0.67 | % | | | | 2.30 | % |
| 3/31/2021 | | | $ | 10.61 | | | | | 0.29 | | | | | 0.42 | | | | | 0.71 | | | | | (0.30 | ) | | | | (0.02 | ) | | | | (0.32 | ) | | | $ | 11.00 | | | | | 6.67 | % | | | $ | 544,493 | | | | | 0.72 | % | | | | 0.66 | % | | | | 0.66 | % | | | | 2.58 | % |
| 3/31/2020 | | | $ | 10.82 | | | | | 0.34 | | | | | (0.20 | ) | | | | 0.14 | | | | | (0.35 | ) | | | | — | | | | | (0.35 | ) | | | $ | 10.61 | | | | | 1.17 | % | | | $ | 706,970 | | | | | 0.72 | % | | | | 0.66 | % | | | | 0.66 | % | | | | 3.05 | % |
|
| DoubleLine Core Fixed Income Fund - Class R6: | |
| 3/31/2024 | | | $ | 9.41 | | | | | 0.43 | | | | | (0.19 | ) | | | | 0.24 | | | | | (0.44 | ) | | | | — | | | | | (0.44 | ) | | | $ | 9.21 | | | | | 2.74 | % | | | $ | 323,347 | | | | | 0.44 | % | | | | 0.41 | % | | | | 0.41 | % | | | | 4.70 | % |
| 3/31/2023 | | | $ | 10.33 | | | | | 0.37 | | | | | (0.89 | ) | | | | (0.52 | ) | | | | (0.40 | ) | | | | — | | | | | (0.40 | ) | | | $ | 9.41 | | | | | (5.00 | )% | | | $ | 118,663 | | | | | 0.44 | % | | | | 0.41 | % | | | | 0.41 | % | | | | 3.88 | % |
| 3/31/2022 | | | $ | 11.01 | | | | | 0.28 | | | | | (0.61 | ) | | | | (0.33 | ) | | | | (0.32 | ) | | | | (0.03 | ) | | | | (0.35 | ) | | | $ | 10.33 | | | | | (3.16 | )% | | | $ | 93,509 | | | | | 0.44 | % | | | | 0.39 | % | | | | 0.39 | % | | | | 2.58 | % |
| 3/31/2021 | | | $ | 10.62 | | | | | 0.32 | | | | | 0.42 | | | | | 0.74 | | | | | (0.33 | ) | | | | (0.02 | ) | | | | (0.35 | ) | | | $ | 11.01 | | | | | 6.94 | % | | | $ | 104,731 | | | | | 0.44 | % | | | | 0.38 | % | | | | 0.38 | % | | | | 2.88 | % |
| 3/31/2020(b) | | | $ | 11.05 | | | | | 0.24 | | | | | (0.42 | ) | | | | (0.18 | ) | | | | (0.25 | ) | | | | — | | | | | (0.25 | ) | | | $ | 10.62 | | | | | (1.72 | )% | | | $ | 112,911 | | | | | 0.45 | % | | | | 0.39 | % | | | | 0.39 | % | | | | 3.26 | % |
| | | | | | | | | | |
| | | | | | | | | | | | | | | | | | | | | For the Year or Period Ended |
| | | | | | | | | | | | | | | | | | | | | 3/31/2024 | | 3/31/2023 | | 3/31/2022 | | 3/31/2021 | | 3/31/2020 |
| | | | | | | | |
Portfolio turnover rate for all share classes | | | | | | | | | | | | | | | | | | | | 119% | | | | | 119% | | | | | 177% | | | | | 155% | | | | | 43% | |
|
(a) Calculated based on average shares outstanding during the period. (b) Commencement of operations on July 31, 2019. Total return is based on operations for a period that is less than a year. (c) Not annualized for periods less than one year. (d) Annualized for periods less than one year. | |
| | | | | | | | |
| The accompanying notes are an integral part of these financial statements. | | Annual Report | | | | | March 31, 2024 | | 123 |
| | |
Financial Highlights (Cont.) | | |
| | | | | | | | | | | | | | | | | | | | | | | | | | | | | | | | | | | | | | | | | | | | | | | | | | | | | | | | | | | | | | | | | | | | | | |
| | | | | Income (Loss) from
Investment Operations: | | Less Distributions: | | | | | | | | Ratios to Average Net Assets: |
For the
Year or
Period Ended | | Net Asset
Value,
Beginning
of Period | | Net
Investment
Income
(Loss)(a) | | Net Gain
(Loss) on
Investments
(Realized and
Unrealized) | | Total from
Investment
Operations | | Distributions
from Net
Investment
Income | | Distributions
from Net
Realized
Gain | | Total
Distributions | | Net Asset
Value,
End of
Period | | Total
Return | | Net Assets,
End of Period
(000’s) | | Expenses
Before
Advisory Fees
(Waived) and
Other Fees
(Reimbursed)/
Recouped | | Expenses
After
Investment
Advisory
Fees
(Waived) | | Expenses
After
Advisory Fees
(Waived) and
Other Fees
(Reimbursed)/
Recouped | | Net
Investment
Income
(Loss) |
|
| DoubleLine Emerging Markets Fixed Income Fund - Class I: | |
| 3/31/2024 | | | $ | 8.46 | | | | | 0.48 | | | | | 0.47 | | | | | 0.95 | | | | | (0.50 | ) | | | | — | | | | | (0.50 | ) | | | $ | 8.91 | | | | | 11.65 | % | | | $ | 461,232 | | | | | 0.92 | % | | | | 0.92 | % | | | | 0.92 | % | | | | 5.62 | % |
| 3/31/2023 | | | $ | 9.71 | | | | | 0.42 | | | | | (1.22 | ) | | | | (0.80 | ) | | | | (0.45 | ) | | | | — | | | | | (0.45 | ) | | | $ | 8.46 | | | | | (8.22 | )% | | | $ | 492,903 | | | | | 0.90 | % | | | | 0.90 | % | | | | 0.90 | % | | | | 4.80 | % |
| 3/31/2022 | | | $ | 10.55 | | | | | 0.39 | | | | | (0.84 | ) | | | | (0.45 | ) | | | | (0.39 | ) | | | | — | | | | | (0.39 | ) | | | $ | 9.71 | | | | | (4.46 | )% | | | $ | 721,060 | | | | | 0.87 | % | | | | 0.87 | % | | | | 0.87 | % | | | | 3.76 | % |
| 3/31/2021 | | | $ | 8.83 | | | | | 0.41 | | | | | 1.75 | | | | | 2.16 | | | | | (0.44 | ) | | | | — | | | | | (0.44 | ) | | | $ | 10.55 | | | | | 24.72 | % | | | $ | 799,879 | | | | | 0.89 | % | | | | 0.89 | % | | | | 0.89 | % | | | | 4.06 | % |
| 3/31/2020 | | | $ | 10.34 | | | | | 0.49 | | | | | (1.51 | ) | | | | (1.02 | ) | | | | (0.49 | ) | | | | — | | | | | (0.49 | ) | | | $ | 8.83 | | | | | (10.43 | )% | | | $ | 755,648 | | | | | 0.90 | % | | | | 0.90 | % | | | | 0.90 | % | | | | 4.69 | % |
|
| DoubleLine Emerging Markets Fixed Income Fund - Class N: | |
| 3/31/2024 | | | $ | 8.46 | | | | | 0.46 | | | | | 0.48 | | | | | 0.94 | | | | | (0.48 | ) | | | | — | | | | | (0.48 | ) | | | $ | 8.92 | | | | | 11.49 | % | | | $ | 22,904 | | | | | 1.17 | % | | | | 1.17 | % | | | | 1.17 | % | | | | 5.37 | % |
| 3/31/2023 | | | $ | 9.71 | | | | | 0.40 | | | | | (1.23 | ) | | | | (0.83 | ) | | | | (0.42 | ) | | | | — | | | | | (0.42 | ) | | | $ | 8.46 | | | | | (8.45 | )% | | | $ | 27,671 | | | | | 1.15 | % | | | | 1.15 | % | | | | 1.15 | % | | | | 4.56 | % |
| 3/31/2022 | | | $ | 10.55 | | | | | 0.37 | | | | | (0.85 | ) | | | | (0.48 | ) | | | | (0.36 | ) | | | | — | | | | | (0.36 | ) | | | $ | 9.71 | | | | | (4.70 | )% | | | $ | 38,728 | | | | | 1.12 | % | | | | 1.12 | % | | | | 1.12 | % | | | | 3.51 | % |
| 3/31/2021 | | | $ | 8.83 | | | | | 0.39 | | | | | 1.74 | | | | | 2.13 | | | | | (0.41 | ) | | | | — | | | | | (0.41 | ) | | | $ | 10.55 | | | | | 24.38 | % | | | $ | 44,972 | | | | | 1.14 | % | | | | 1.14 | % | | | | 1.14 | % | | | | 3.86 | % |
| 3/31/2020 | | | $ | 10.34 | | | | | 0.47 | | | | | (1.51 | ) | | | | (1.04 | ) | | | | (0.47 | ) | | | | — | | | | | (0.47 | ) | | | $ | 8.83 | | | | | (10.68 | )% | | | $ | 122,727 | | | | | 1.15 | % | | | | 1.15 | % | | | | 1.15 | % | | | | 4.46 | % |
| | | | | | | | | | |
| | | | | | | | | | | | | | | | | | | | | For the Year or Period Ended |
| | | | | | | | | | | | | | | | | | | | | 3/31/2024 | | 3/31/2023 | | 3/31/2022 | | 3/31/2021 | | 3/31/2020 |
| | | | | | | | |
Portfolio turnover rate for all share classes | | | | | | | | | | | | | | | | | | | | 49% | | | | | 34% | | | | | 51% | | | | | 81% | | | | | 37% | |
|
(a) Calculated based on average shares outstanding during the period. | |
| | | | | | | |
| | | | | Income (Loss) from
Investment Operations: | | Less Distributions: | | | | | | | | Ratios to Average Net Assets: |
For the
Year or
Period Ended | | Net Asset
Value,
Beginning
of Period | | Net
Investment
Income
(Loss)(a) | | Net Gain
(Loss) on
Investments
(Realized and
Unrealized) | | Total from
Investment
Operations | | Distributions
from Net
Investment
Income | | Distributions
from Net
Realized
Gain | | Total
Distributions | | Net Asset
Value,
End of
Period | | Total
Return(c) | | Net Assets,
End of Period
(000’s) | | Expenses
Before
Advisory Fees
(Waived) and
Other Fees
(Reimbursed)/
Recouped(d) | | Expenses
After
Investment
Advisory
Fees
(Waived)(d) | | Expenses
After
Advisory Fees
(Waived) and
Other Fees
(Reimbursed)/
Recouped(d) | | Net
Investment
Income
(Loss)(d) |
|
| DoubleLine Low Duration Bond Fund - Class I: | |
| 3/31/2024 | | | $ | 9.46 | | | | | 0.45 | | | | | 0.12 | | | | | 0.57 | | | | | (0.45 | ) | | | | — | | | | | (0.45 | ) | | | $ | 9.58 | | | | | 6.16 | % | | | $ | 4,788,703 | | | | | 0.43 | % | | | | 0.43 | % | | | | 0.43 | % | | | | 4.71 | % |
| 3/31/2023 | | | $ | 9.67 | | | | | 0.28 | | | | | (0.19 | ) | | | | 0.09 | | | | | (0.30 | ) | | | | — | | | | | (0.30 | ) | | | $ | 9.46 | | | | | 0.94 | % | | | $ | 5,256,310 | | | | | 0.43 | % | | | | 0.43 | % | | | | 0.43 | % | | | | 2.98 | % |
| 3/31/2022 | | | $ | 9.97 | | | | | 0.15 | | | | | (0.29 | ) | | | | (0.14 | ) | | | | (0.16 | ) | | | | — | | | | | (0.16 | ) | | | $ | 9.67 | | | | | (1.42 | )% | | | $ | 6,224,937 | | | | | 0.41 | % | | | | 0.41 | % | | | | 0.41 | % | | | | 1.55 | % |
| 3/31/2021 | | | $ | 9.51 | | | | | 0.20 | | | | | 0.47 | | | | | 0.67 | | | | | (0.21 | ) | | | | — | | | | | (0.21 | ) | | | $ | 9.97 | | | | | 7.08 | % | | | $ | 5,689,932 | | | | | 0.42 | % | | | | 0.42 | % | | | | 0.42 | % | | | | 2.05 | % |
| 3/31/2020 | | | $ | 9.97 | | | | | 0.30 | | | | | (0.45 | ) | | | | (0.15 | ) | | | | (0.31 | ) | | | | — | | | | | (0.31 | ) | | | $ | 9.51 | | | | | (1.59 | )% | | | $ | 5,296,795 | | | | | 0.42 | % | | | | 0.41 | % | | | | 0.41 | % | | | | 3.05 | % |
|
| DoubleLine Low Duration Bond Fund - Class N: | |
| 3/31/2024 | | | $ | 9.45 | | | | | 0.42 | | | | | 0.12 | | | | | 0.54 | | | | | (0.42 | ) | | | | — | | | | | (0.42 | ) | | | $ | 9.57 | | | | | 5.90 | % | | | $ | 739,660 | | | | | 0.68 | % | | | | 0.68 | % | | | | 0.68 | % | | | | 4.46 | % |
| 3/31/2023 | | | $ | 9.67 | | | | | 0.26 | | | | | (0.21 | ) | | | | 0.05 | | | | | (0.27 | ) | | | | — | | | | | (0.27 | ) | | | $ | 9.45 | | | | | 0.58 | % | | | $ | 846,389 | | | | | 0.67 | % | | | | 0.67 | % | | | | 0.67 | % | | | | 2.73 | % |
| 3/31/2022 | | | $ | 9.96 | | | | | 0.13 | | | | | (0.28 | ) | | | | (0.15 | ) | | | | (0.14 | ) | | | | — | | | | | (0.14 | ) | | | $ | 9.67 | | | | | (1.57 | )% | | | $ | 1,043,811 | | | | | 0.66 | % | | | | 0.66 | % | | | | 0.66 | % | | | | 1.30 | % |
| 3/31/2021 | | | $ | 9.50 | | | | | 0.18 | | | | | 0.46 | | | | | 0.64 | | | | | (0.18 | ) | | | | — | | | | | (0.18 | ) | | | $ | 9.96 | | | | | 6.82 | % | | | $ | 1,194,295 | | | | | 0.67 | % | | | | 0.67 | % | | | | 0.67 | % | | | | 1.83 | % |
| 3/31/2020 | | | $ | 9.96 | | | | | 0.28 | | | | | (0.45 | ) | | | | (0.17 | ) | | | | (0.29 | ) | | | | — | | | | | (0.29 | ) | | | $ | 9.50 | | | | | (1.84 | )% | | | $ | 1,483,316 | | | | | 0.67 | % | | | | 0.66 | % | | | | 0.66 | % | | | | 2.80 | % |
|
| DoubleLine Low Duration Bond Fund - Class R6: | |
| 3/31/2024 | | | $ | 9.46 | | | | | 0.46 | | | | | 0.11 | | | | | 0.57 | | | | | (0.45 | ) | | | | — | | | | | (0.45 | ) | | | $ | 9.58 | | | | | 6.20 | % | | | $ | 127,836 | | | | | 0.39 | % | | | | 0.39 | % | | | | 0.39 | % | | | | 4.83 | % |
| 3/31/2023 | | | $ | 9.67 | | | | | 0.30 | | | | | (0.21 | ) | | | | 0.09 | | | | | (0.30 | ) | | | | — | | | | | (0.30 | ) | | | $ | 9.46 | | | | | 0.97 | % | | | $ | 54,035 | | | | | 0.39 | % | | | | 0.39 | % | | | | 0.39 | % | | | | 3.13 | % |
| 3/31/2022 | | | $ | 9.97 | | | | | 0.15 | | | | | (0.29 | ) | | | | (0.14 | ) | | | | (0.16 | ) | | | | — | | | | | (0.16 | ) | | | $ | 9.67 | | | | | (1.39 | )% | | | $ | 41,366 | | | | | 0.39 | % | | | | 0.39 | % | | | | 0.39 | % | | | | 1.53 | % |
| 3/31/2021 | | | $ | 9.51 | | | | | 0.20 | | | | | 0.47 | | | | | 0.67 | | | | | (0.21 | ) | | | | — | | | | | (0.21 | ) | | | $ | 9.97 | | | | | 7.12 | % | | | $ | 8,840 | | | | | 0.40 | % | | | | 0.39 | % | | | | 0.39 | % | | | | 2.05 | % |
| 3/31/2020(b) | | | $ | 10.03 | | | | | 0.20 | | | | | (0.52 | ) | | | | (0.32 | ) | | | | (0.20 | ) | | | | — | | | | | (0.20 | ) | | | $ | 9.51 | | | | | (3.25 | )% | | | $ | 369 | | | | | 0.39 | % | | | | 0.38 | % | | | | 0.38 | % | | | | 2.98 | % |
| | | | | | | | | | |
| | | | | | | | | | | | | | | | | | | | | For the Year or Period Ended |
| | | | | | | | | | | | | | | | | | | | | 3/31/2024 | | 3/31/2023 | | 3/31/2022 | | 3/31/2021 | | 3/31/2020 |
| | | | | | | | |
Portfolio turnover rate for all share classes | | | | | | | | | | | | | | | | | | | | 76% | | | | | 72% | | | | | 80% | | | | | 71% | | | | | 60% | |
|
(a) Calculated based on average shares outstanding during the period. (b) Commencement of operations on July 31, 2019. Total return is based on operations for a period that is less than a year. (c) Not annualized for periods less than one year. (d) Annualized for periods less than one year. | |
| | | | |
| 124 | | DoubleLine Funds Trust | | The accompanying notes are an integral part of these financial statements. |
| | | | | | | | | | | | | | | | | | | | | | | | | | | | | | | | | | | | | | | | | | | | | | | | | | | | | | | | | | | | | | | | | | | | | | |
| | | | | Income (Loss) from
Investment Operations: | | Less Distributions: | | | | | | | | Ratios to Average Net Assets: |
For the
Year or
Period Ended | | Net Asset
Value,
Beginning
of Period | | Net
Investment
Income
(Loss)(a) | | Net Gain
(Loss) on
Investments
(Realized and
Unrealized) | | Total from
Investment
Operations | | Distributions
from Net
Investment
Income | | Distributions
from Net
Realized
Gain | | Total
Distributions | | Net Asset
Value,
End of
Period | | Total
Return | | Net Assets,
End of Period
(000’s) | | Expenses
Before
Advisory Fees
(Waived) and
Other Fees
(Reimbursed)/
Recouped | | Expenses
After
Investment
Advisory
Fees
(Waived) | | Expenses
After
Advisory Fees
(Waived) and
Other Fees
(Reimbursed)/
Recouped | | Net
Investment
Income
(Loss) |
|
| DoubleLine Floating Rate Fund - Class I: | |
| 3/31/2024 | | | $ | 8.97 | | | | | 0.75 | | | | | 0.08 | | | | | 0.83 | | | | | (0.76 | ) | | | | — | | | | | (0.76 | ) | | | $ | 9.04 | | | | | 9.61 | % | | | $ | 162,269 | | | | | 0.74 | % | | | | 0.74 | % | | | | 0.74 | % | | | | 8.34 | % |
| 3/31/2023 | | | $ | 9.42 | | | | | 0.53 | | | | | (0.42 | ) | | | | 0.11 | | | | | (0.56 | ) | | | | — | | | | | (0.56 | ) | | | $ | 8.97 | | | | | 1.31 | % | | | $ | 200,203 | | | | | 0.68 | % | | | | 0.68 | % | | | | 0.68 | % | | | | 5.81 | % |
| 3/31/2022 | | | $ | 9.51 | | | | | 0.32 | | | | | (0.09 | ) | | | | 0.23 | | | | | (0.32 | ) | | | | — | | | | | (0.32 | ) | | | $ | 9.42 | | | | | 2.40 | % | | | $ | 333,518 | | | | | 0.64 | % | | | | 0.64 | % | | | | 0.64 | % | | | | 3.37 | % |
| 3/31/2021 | | | $ | 8.44 | | | | | 0.34 | | | | | 1.07 | | | | | 1.41 | | | | | (0.34 | ) | | | | — | | | | | (0.34 | ) | | | $ | 9.51 | | | | | 16.95 | % | | | $ | 240,442 | | | | | 0.72 | % | | | | 0.72 | % | | | | 0.72 | % | | | | 3.69 | % |
| 3/31/2020 | | | $ | 9.65 | | | | | 0.47 | | | | | (1.20 | ) | | | | (0.73 | ) | | | | (0.48 | ) | | | | — | | | | | (0.48 | ) | | | $ | 8.44 | | | | | (7.99 | )% | | | $ | 150,892 | | | | | 0.70 | % | | | | 0.70 | % | | | | 0.70 | % | | | | 4.84 | % |
|
| DoubleLine Floating Rate Fund - Class N: | |
| 3/31/2024 | | | $ | 8.99 | | | | | 0.73 | | | | | 0.08 | | | | | 0.81 | | | | | (0.73 | ) | | | | — | | | | | (0.73 | ) | | | $ | 9.07 | | | | | 9.43 | % | | | $ | 17,070 | | | | | 0.99 | % | | | | 0.99 | % | | | | 0.99 | % | | | | 8.10 | % |
| 3/31/2023 | | | $ | 9.44 | | | | | 0.48 | | | | | (0.40 | ) | | | | 0.08 | | | | | (0.53 | ) | | | | — | | | | | (0.53 | ) | | | $ | 8.99 | | | | | 1.04 | % | | | $ | 20,603 | | | | | 0.92 | % | | | | 0.92 | % | | | | 0.92 | % | | | | 5.32 | % |
| 3/31/2022 | | | $ | 9.53 | | | | | 0.30 | | | | | (0.10 | ) | | | | 0.20 | | | | | (0.29 | ) | | | | — | | | | | (0.29 | ) | | | $ | 9.44 | | | | | 2.15 | % | | | $ | 45,362 | | | | | 0.90 | % | | | | 0.90 | % | | | | 0.90 | % | | | | 3.16 | % |
| 3/31/2021 | | | $ | 8.45 | | | | | 0.32 | | | | | 1.08 | | | | | 1.40 | | | | | (0.32 | ) | | | | — | | | | | (0.32 | ) | | | $ | 9.53 | | | | | 16.73 | % | | | $ | 18,339 | | | | | 0.98 | % | | | | 0.98 | % | | | | 0.98 | % | | | | 3.54 | % |
| 3/31/2020 | | | $ | 9.67 | | | | | 0.44 | | | | | (1.20 | ) | | | | (0.76 | ) | | | | (0.46 | ) | | | | — | | | | | (0.46 | ) | | | $ | 8.45 | | | | | (8.32 | )% | | | $ | 51,646 | | | | | 0.95 | % | | | | 0.95 | % | | | | 0.95 | % | | | | 4.59 | % |
| | | | | | | | | | |
| | | | | | | | | | | | | | | | | | | | | For the Year or Period Ended |
| | | | | | | | | | | | | | | | | | | | | 3/31/2024 | | 3/31/2023 | | 3/31/2022 | | 3/31/2021 | | 3/31/2020 |
| | | | | | | | |
Portfolio turnover rate for all share classes | | | | | | | | | | | | | | | | | | | | 50% | | | | | 17% | | | | | 40% | | | | | 76% | | | | | 58% | |
|
(a) Calculated based on average shares outstanding during the period. | |
| | | | | | | |
| | | | | Income (Loss) from
Investment Operations: | | Less Distributions: | | | | | | | | Ratios to Average Net Assets: |
For the
Year or
Period Ended | | Net Asset
Value,
Beginning
of Period | | Net
Investment
Income
(Loss)(a) | | Net Gain
(Loss) on
Investments
(Realized and
Unrealized) | | Total from
Investment
Operations | | Distributions
from Net
Investment
Income | | Distributions
from Net
Realized
Gain | | Total
Distributions | | Net Asset
Value,
End of
Period | | Total
Return(c) | | Net Assets,
End of Period
(000’s) | | Expenses
Before
Advisory Fees
(Waived) and
Other Fees
(Reimbursed)/
Recouped(d) | | Expenses
After
Investment
Advisory
Fees
(Waived)(d) | | Expenses
After
Advisory Fees
(Waived) and
Other Fees
(Reimbursed)/
Recouped(d) | | Net
Investment
Income
(Loss)(d) |
|
| DoubleLine Shiller Enhanced CAPE® - Class I: | |
| 3/31/2024 | | | $ | 12.66 | | | | | 0.64 | | | | | 2.23 | | | | | 2.87 | | | | | (0.67 | ) | | | | — | | | | | (0.67 | ) | | | $ | 14.86 | | | | | 23.36 | % | | | $ | 3,905,582 | | | | | 0.54 | % | | | | 0.54 | % | | | | 0.54 | % | | | | 4.75 | % |
| 3/31/2023 | | | $ | 16.79 | | | | | 0.49 | | | | | (2.60 | ) | | | | (2.11 | ) | | | | (0.54 | ) | | | | (1.48 | ) | | | | (2.02 | ) | | | $ | 12.66 | | | | | (12.06 | )% | | | $ | 3,988,448 | | | | | 0.55 | % | | | | 0.55 | % | | | | 0.55 | % | | | | 3.48 | % |
| 3/31/2022 | | | $ | 19.62 | | | | | 0.26 | | | | | 2.00 | | | | | 2.26 | | | | | (0.30 | ) | | | | (4.79 | ) | | | | (5.09 | ) | | | $ | 16.79 | | | | | 10.96 | % | | | $ | 7,828,188 | | | | | 0.54 | % | | | | 0.53 | % | | | | 0.53 | % | | | | 1.29 | % |
| 3/31/2021 | | | $ | 11.69 | | | | | 0.27 | | | | | 7.95 | | | | | 8.22 | | | | | (0.29 | ) | | | | — | | | | | (0.29 | ) | | | $ | 19.62 | | | | | 70.87 | % | | | $ | 8,169,623 | | | | | 0.55 | % | | | | 0.54 | % | | | | 0.54 | % | | | | 1.64 | % |
| 3/31/2020 | | | $ | 14.81 | | | | | 0.42 | | | | | (2.72 | ) | | | | (2.30 | ) | | | | (0.43 | ) | | | | (0.39 | ) | | | | (0.82 | ) | | | $ | 11.69 | | | | | (16.78 | )% | | | $ | 4,633,848 | | | | | 0.55 | % | | | | 0.54 | % | | | | 0.54 | % | | | | 2.70 | % |
|
| DoubleLine Shiller Enhanced CAPE® - Class N: | |
| 3/31/2024 | | | $ | 12.65 | | | | | 0.60 | | | | | 2.24 | | | | | 2.84 | | | | | (0.64 | ) | | | | — | | | | | (0.64 | ) | | | $ | 14.85 | | | | | 23.07 | % | | | $ | 281,125 | | | | | 0.79 | % | | | | 0.79 | % | | | | 0.79 | % | | | | 4.50 | % |
| 3/31/2023 | | | $ | 16.78 | | | | | 0.46 | | | | | (2.61 | ) | | | | (2.15 | ) | | | | (0.50 | ) | | | | (1.48 | ) | | | | (1.98 | ) | | | $ | 12.65 | | | | | (12.29 | )% | | | $ | 312,867 | | | | | 0.80 | % | | | | 0.80 | % | | | | 0.80 | % | | | | 3.26 | % |
| 3/31/2022 | | | $ | 19.61 | | | | | 0.21 | | | | | 1.99 | | | | | 2.20 | | | | | (0.24 | ) | | | | (4.79 | ) | | | | (5.03 | ) | | | $ | 16.78 | | | | | 10.69 | % | | | $ | 566,561 | | | | | 0.79 | % | | | | 0.78 | % | | | | 0.78 | % | | | | 1.03 | % |
| 3/31/2021 | | | $ | 11.68 | | | | | 0.24 | | | | | 7.93 | | | | | 8.17 | | | | | (0.24 | ) | | | | — | | | | | (0.24 | ) | | | $ | 19.61 | | | | | 70.45 | % | | | $ | 705,156 | | | | | 0.80 | % | | | | 0.79 | % | | | | 0.79 | % | | | | 1.56 | % |
| 3/31/2020 | | | $ | 14.80 | | | | | 0.38 | | | | | (2.72 | ) | | | | (2.34 | ) | | | | (0.39 | ) | | | | (0.39 | ) | | | | (0.78 | ) | | | $ | 11.68 | | | | | (17.00 | )% | | | $ | 1,246,723 | | | | | 0.80 | % | | | | 0.79 | % | | | | 0.79 | % | | | | 2.46 | % |
|
| DoubleLine Shiller Enhanced CAPE® - Class R6: | |
| 3/31/2024 | | | $ | 12.67 | | | | | 0.65 | | | | | 2.23 | | | | | 2.88 | | | | | (0.68 | ) | | | | — | | | | | (0.68 | ) | | | $ | 14.87 | | | | | 23.41 | % | | | $ | 18,595 | | | | | 0.48 | % | | | | 0.48 | % | | | | 0.48 | % | | | | 4.82 | % |
| 3/31/2023 | | | $ | 16.80 | | | | | 0.50 | | | | | (2.60 | ) | | | | (2.10 | ) | | | | (0.55 | ) | | | | (1.48 | ) | | | | (2.03 | ) | | | $ | 12.67 | | | | | (12.00 | )% | | | $ | 8,103 | | | | | 0.50 | % | | | | 0.50 | % | | | | 0.50 | % | | | | 3.58 | % |
| 3/31/2022 | | | $ | 19.62 | | | | | 0.27 | | | | | 2.01 | | | | | 2.28 | | | | | (0.31 | ) | | | | (4.79 | ) | | | | (5.10 | ) | | | $ | 16.80 | | | | | 11.07 | % | | | $ | 15,398 | | | | | 0.49 | % | | | | 0.49 | % | | | | 0.49 | % | | | | 1.35 | % |
| 3/31/2021 | | | $ | 11.70 | | | | | 0.27 | | | | | 7.95 | | | | | 8.22 | | | | | (0.30 | ) | | | | — | | | | | (0.30 | ) | | | $ | 19.62 | | | | | 70.82 | % | | | $ | 12,333 | | | | | 0.51 | % | | | | 0.51 | % | | | | 0.51 | % | | | | 1.47 | % |
| 3/31/2020 (b) | | | $ | 15.69 | | | | | 0.27 | | | | | (3.59 | ) | | | | (3.32 | ) | | | | (0.28 | ) | | | | (0.39 | ) | | | | (0.67 | ) | | | $ | 11.70 | | | | | (22.15 | )% | | | $ | 124 | | | | | 0.49 | % | | | | 0.48 | % | | | | 0.48 | % | | | | 2.60 | % |
| | | | | | | | | | |
| | | | | | | | | | | | | | | | | | | | | For the Year or Period Ended |
| | | | | | | | | | | | | | | | | | | | | 3/31/2024 | | 3/31/2023 | | 3/31/2022 | | 3/31/2021 | | 3/31/2020 |
| | | | | | | | |
Portfolio turnover rate for all share classes | | | | | | | | | | | | | | | | | | | | 75% | | | | | 77% | | | | | 110% | | | | | 69% | | | | | 62% | |
|
(a) Calculated based on average shares outstanding during the period. (b) Commencement of operations on July 31, 2019. Total return is based on operations for a period that is less than a year. (c) Not annualized for periods less than one year. (d) Annualized for periods less than one year. | |
| | | | | | | | |
| The accompanying notes are an integral part of these financial statements. | | Annual Report | | | | | March 31, 2024 | | 125 |
| | |
Financial Highlights (Cont.) | | |
| | | | | | | | | | | | | | | | | | | | | | | | | | | | | | | | | | | | | | | | | | | | | | | | | | | | | | | | | | | | | | | | | | | | | | |
| | | | | Income (Loss) from
Investment Operations: | | Less Distributions: | | | | | | | | Ratios to Average Net Assets: |
For the
Year or
Period Ended | | Net Asset
Value,
Beginning
of Period | | Net
Investment
Income
(Loss)(a) | | Net Gain
(Loss) on
Investments
(Realized and
Unrealized) | | Total from
Investment
Operations | | Distributions
from Net
Investment
Income | | Distributions
from Net
Realized
Gain | | Total
Distributions | | Net Asset
Value,
End of
Period | | Total
Return(c) | | Net Assets,
End of Period
(000’s) | | Expenses
Before
Advisory Fees
(Waived) and
Other Fees
(Reimbursed)/
Recouped(d) | | Expenses
After
Investment
Advisory
Fees
(Waived)(d) | | Expenses
After
Advisory Fees
(Waived) and
Other Fees
(Reimbursed)/
Recouped(d) | | Net
Investment
Income
(Loss)(d) |
|
| DoubleLine Flexible Income Fund - Class I: | |
| 3/31/2024 | | | $ | 8.42 | | | | | 0.50 | | | | | 0.21 | | | | | 0.71 | | | | | (0.53 | ) | | | | — | | | | | (0.53 | ) | | | $ | 8.60 | | | | | 8.69 | % | | | $ | 802,933 | | | | | 0.74 | % | | | | 0.74 | % | | | | 0.74 | % | | | | 5.97 | % |
| 3/31/2023 | | | $ | 9.21 | | | | | 0.41 | | | | | (0.78 | ) | | | | (0.37 | ) | | | | (0.42 | ) | | | | — | | | | | (0.42 | ) | | | $ | 8.42 | | | | | (3.99 | )% | | | $ | 726,230 | | | | | 0.74 | % | | | | 0.74 | % | | | | 0.74 | % | | | | 4.74 | % |
| 3/31/2022 | | | $ | 9.65 | | | | | 0.35 | | | | | (0.43 | ) | | | | (0.08 | ) | | | | (0.36 | ) | | | | — | | | | | (0.36 | ) | | | $ | 9.21 | | | | | (0.91 | )% | | | $ | 971,543 | | | | | 0.73 | % | | | | 0.71 | % | | | | 0.71 | % | | | | 3.65 | % |
| 3/31/2021 | | | $ | 8.40 | | | | | 0.35 | | | | | 1.28 | | | | | 1.63 | | | | | (0.38 | ) | | | | — | | | | | (0.38 | ) | | | $ | 9.65 | | | | | 19.59 | % | | | $ | 1,086,763 | | | | | 0.76 | % | | | | 0.73 | % | | | | 0.73 | % | | | | 3.71 | % |
| 3/31/2020 | | | $ | 9.65 | | | | | 0.39 | | | | | (1.22 | ) | | | | (0.83 | ) | | | | (0.42 | ) | | | | — | | | | | (0.42 | ) | | | $ | 8.40 | | | | | (9.06 | )% | | | $ | 874,594 | | | | | 0.73 | % | | | | 0.69 | % | | | | 0.69 | % | | | | 4.12 | % |
|
| DoubleLine Flexible Income Fund - Class N: | |
| 3/31/2024 | | | $ | 8.42 | | | | | 0.48 | | | | | 0.20 | | | | | 0.68 | | | | | (0.50 | ) | | | | — | | | | | (0.50 | ) | | | $ | 8.60 | | | | | 8.42 | % | | | $ | 69,796 | | | | | 0.99 | % | | | | 0.99 | % | | | | 0.99 | % | | | | 5.70 | % |
| 3/31/2023 | | | $ | 9.20 | | | | | 0.39 | | | | | (0.77 | ) | | | | (0.38 | ) | | | | (0.40 | ) | | | | — | | | | | (0.40 | ) | | | $ | 8.42 | | | | | (4.13 | )% | | | $ | 95,069 | | | | | 0.99 | % | | | | 0.99 | % | | | | 0.99 | % | | | | 4.47 | % |
| 3/31/2022 | | | $ | 9.65 | | | | | 0.33 | | | | | (0.44 | ) | | | | (0.11 | ) | | | | (0.34 | ) | | | | — | | | | | (0.34 | ) | | | $ | 9.20 | | | | | (1.26 | )% | | | $ | 142,205 | | | | | 0.98 | % | | | | 0.96 | % | | | | 0.96 | % | | | | 3.39 | % |
| 3/31/2021 | | | $ | 8.39 | | | | | 0.32 | | | | | 1.29 | | | | | 1.61 | | | | | (0.35 | ) | | | | — | | | | | (0.35 | ) | | | $ | 9.65 | | | | | 19.43 | % | | | $ | 155,408 | | | | | 1.01 | % | | | | 0.97 | % | | | | 0.97 | % | | | | 3.49 | % |
| 3/31/2020 | | | $ | 9.64 | | | | | 0.37 | | | | | (1.22 | ) | | | | (0.85 | ) | | | | (0.40 | ) | | | | — | | | | | (0.40 | ) | | | $ | 8.39 | | | | | (9.30 | )% | | | $ | 230,033 | | | | | 0.98 | % | | | | 0.94 | % | | | | 0.94 | % | | | | 3.83 | % |
|
| DoubleLine Flexible Income Fund - Class R6: | |
| 3/31/2024 | | | $ | 8.43 | | | | | 0.51 | | | | | 0.20 | | | | | 0.71 | | | | | (0.53 | ) | | | | — | | | | | (0.53 | ) | | | $ | 8.61 | | | | | 8.73 | % | | | $ | 79,635 | | | | | 0.70 | % | | | | 0.70 | % | | | | 0.70 | % | | | | 5.98 | % |
| 3/31/2023 | | | $ | 9.21 | | | | | 0.42 | | | | | (0.78 | ) | | | | (0.36 | ) | | | | (0.42 | ) | | | | — | | | | | (0.42 | ) | | | $ | 8.43 | | | | | (3.84 | )% | | | $ | 125,350 | | | | | 0.70 | % | | | | 0.70 | % | | | | 0.70 | % | | | | 4.86 | % |
| 3/31/2022 | | | $ | 9.66 | | | | | 0.34 | | | | | (0.43 | ) | | | | (0.09 | ) | | | | (0.36 | ) | | | | — | | | | | (0.36 | ) | | | $ | 9.21 | | | | | (0.98 | )% | | | $ | 112,378 | | | | | 0.70 | % | | | | 0.68 | % | | | | 0.68 | % | | | | 3.55 | % |
| 3/31/2021 | | | $ | 8.40 | | | | | 0.32 | | | | | 1.32 | | | | | 1.64 | | | | | (0.38 | ) | | | | — | | | | | (0.38 | ) | | | $ | 9.66 | | | | | 19.78 | % | | | $ | 758 | | | | | 0.72 | % | | | | 0.70 | % | | | | 0.70 | % | | | | 3.42 | % |
| 3/31/2020(b) | | | $ | 9.74 | | | | | 0.25 | | | | | (1.32 | ) | | | | (1.07 | ) | | | | (0.27 | ) | | | | — | | | | | (0.27 | ) | | | $ | 8.40 | | | | | (11.26 | )% | | | $ | 89 | | | | | 0.68 | % | | | | 0.65 | % | | | | 0.65 | % | | | | 3.91 | % |
| | | | | | | | | | |
| | | | | | | | | | | | | | | | | | | | | For the Year or Period Ended |
| | | | | | | | | | | | | | | | | | | | | 3/31/2024 | | 3/31/2023 | | 3/31/2022 | | 3/31/2021 | | 3/31/2020 |
| | | | | | | | |
Portfolio turnover rate for all share classes | | | | | | | | | | | | | | | | | | | | 32% | | | | | 13% | | | | | 41% | | | | | 46% | | | | | 41% | |
|
(a) Calculated based on average shares outstanding during the period. (b) Commencement of operations on July 31, 2019. Total return is based on operations for a period that is less than a year. (c) Not annualized for periods less than one year. (d) Annualized for periods less than one year. | |
| | | | | | | |
| | | | | Income (Loss) from
Investment Operations: | | Less Distributions: | | | | | | | | Ratios to Average Net Assets: |
For the
Year or
Period Ended | | Net Asset
Value,
Beginning
of Period | | Net
Investment
Income
(Loss)(a) | | Net Gain
(Loss) on
Investments
(Realized and
Unrealized) | | Total from
Investment
Operations | | Distributions
from Net
Investment
Income | | Distributions
from Net
Realized
Gain | | Total
Distributions | | Net Asset
Value,
End of
Period | | Total
Return | | Net Assets,
End of Period
(000’s) | | Expenses
Before
Advisory Fees
(Waived) and
Other Fees
(Reimbursed)/
Recouped | | Expenses
After
Investment
Advisory
Fees
(Waived) | | Expenses
After
Advisory Fees
(Waived) and
Other Fees
(Reimbursed)/
Recouped | | Net
Investment
Income
(Loss) |
|
| DoubleLine Low Duration Emerging Markets Fixed Income Fund - Class I: | |
| 3/31/2024 | | | $ | 9.05 | | | | | 0.37 | | | | | 0.36 | | | | | 0.73 | | | | | (0.37 | ) | | | | — | | | | | (0.37 | ) | | | $ | 9.41 | | | | | 8.23 | % | | | $ | 153,250 | | | | | 0.74 | % | | | | 0.74 | % | | | | 0.59 | % | | | | 4.04 | % |
| 3/31/2023 | | | $ | 9.40 | | | | | 0.26 | | | | | (0.35 | ) | | | | (0.09 | ) | | | | (0.26 | ) | | | | — | | | | | (0.26 | ) | | | $ | 9.05 | | | | | (0.90 | )% | | | $ | 182,023 | | | | | 0.69 | % | | | | 0.69 | % | | | | 0.59 | % | | | | 2.81 | % |
| 3/31/2022 | | | $ | 9.90 | | | | | 0.16 | | | | | (0.45 | ) | | | | (0.29 | ) | | | | (0.17 | ) | | | | (0.04 | ) | | | | (0.21 | ) | | | $ | 9.40 | | | | | (3.00 | )% | | | $ | 238,613 | | | | | 0.68 | % | | | | 0.68 | % | | | | 0.59 | % | | | | 1.67 | % |
| 3/31/2021 | | | $ | 9.36 | | | | | 0.22 | | | | | 0.56 | | | | | 0.78 | | | | | (0.24 | ) | | | | — | | | | | (0.24 | ) | | | $ | 9.90 | | | | | 8.33 | % | | | $ | 215,744 | | | | | 0.66 | % | | | | 0.66 | % | | | | 0.59 | % | | | | 2.21 | % |
| 3/31/2020 | | | $ | 9.80 | | | | | 0.32 | | | | | (0.36 | ) | | | | (0.04 | ) | | | | (0.32 | ) | | | | (0.08 | ) | | | | (0.40 | ) | | | $ | 9.36 | | | | | (0.62 | )% | | | $ | 180,730 | | | | | 0.63 | % | | | | 0.63 | % | | | | 0.59 | % | | | | 3.24 | % |
|
| DoubleLine Low Duration Emerging Markets Fixed Income Fund - Class N: | |
| 3/31/2024 | | | $ | 9.06 | | | | | 0.35 | | | | | 0.37 | | | | | 0.72 | | | | | (0.35 | ) | | | | — | | | | | (0.35 | ) | | | $ | 9.43 | | | | | 8.07 | % | | | $ | 4,658 | | | | | 0.99 | % | | | | 0.99 | % | | | | 0.84 | % | | | | 3.82 | % |
| 3/31/2023 | | | $ | 9.41 | | | | | 0.23 | | | | | (0.34 | ) | | | | (0.11 | ) | | | | (0.24 | ) | | | | — | | | | | (0.24 | ) | | | $ | 9.06 | | | | | (1.18 | )% | | | $ | 5,337 | | | | | 0.93 | % | | | | 0.93 | % | | | | 0.84 | % | | | | 2.51 | % |
| 3/31/2022 | | | $ | 9.91 | | | | | 0.14 | | | | | (0.46 | ) | | | | (0.32 | ) | | | | (0.14 | ) | | | | (0.04 | ) | | | | (0.18 | ) | | | $ | 9.41 | | | | | (3.24 | )% | | | $ | 22,501 | | | | | 0.93 | % | | | | 0.93 | % | | | | 0.84 | % | | | | 1.42 | % |
| 3/31/2021 | | | $ | 9.38 | | | | | 0.19 | | | | | 0.55 | | | | | 0.74 | | | | | (0.21 | ) | | | | — | | | | | (0.21 | ) | | | $ | 9.91 | | | | | 7.94 | % | | | $ | 25,849 | | | | | 0.91 | % | | | | 0.91 | % | | | | 0.84 | % | | | | 1.95 | % |
| 3/31/2020 | | | $ | 9.81 | | | | | 0.30 | | | | | (0.36 | ) | | | | (0.06 | ) | | | | (0.29 | ) | | | | (0.08 | ) | | | | (0.37 | ) | | | $ | 9.38 | | | | | (0.77 | )% | | | $ | 16,922 | | | | | 0.88 | % | | | | 0.88 | % | | | | 0.84 | % | | | | 3.03 | % |
| | | | | | | | | | |
| | | | | | | | | | | | | | | | | | | | | For the Year or Period Ended |
| | | | | | | | | | | | | | | | | | | | | 3/31/2024 | | 3/31/2023 | | 3/31/2022 | | 3/31/2021 | | 3/31/2020 |
| | | | | | | | |
Portfolio turnover rate for all share classes | | | | | | | | | | | | | | | | | | | | 29% | | | | | 37% | | | | | 39% | | | | | 72% | | | | | 65% | |
|
(a) Calculated based on average shares outstanding during the period. | |
| | | | |
| 126 | | DoubleLine Funds Trust | | The accompanying notes are an integral part of these financial statements. |
| | | | | | | | | | | | | | | | | | | | | | | | | | | | | | | | | | | | | | | | | | | | | | | | | | | | | | | | | | | | | | | | | | | | | | |
| | | | | Income (Loss) from
Investment Operations: | | Less Distributions: | | | | | | | | Ratios to Average Net Assets: |
For the
Year or
Period Ended | | Net Asset
Value,
Beginning
of Period | | Net
Investment
Income
(Loss)(a) | | Net Gain
(Loss) on
Investments
(Realized and
Unrealized) | | Total from
Investment
Operations | | Distributions
from Net
Investment
Income | | Distributions
from Net
Realized
Gain | | Total
Distributions | | Net Asset
Value,
End of
Period | | Total
Return | | Net Assets,
End of Period
(000’s) | | Expenses
Before
Advisory Fees
(Waived) and
Other Fees
(Reimbursed)/
Recouped | | Expenses
After
Investment
Advisory
Fees
(Waived) | | Expenses
After
Advisory Fees
(Waived) and
Other Fees
(Reimbursed)/
Recouped | | Net
Investment
Income
(Loss) |
|
| DoubleLine Long Duration Total Return Bond Fund - Class I: | |
| 3/31/2024 | | | $ | 7.15 | | | | | 0.26 | | | | | (0.58 | ) | | | | (0.32 | ) | | | | (0.25 | ) | | | | — | | | | | (0.25 | ) | | | $ | 6.58 | | | | | (4.39 | )% | | | $ | 47,884 | | | | | 0.62 | % | | | | 0.62 | % | | | | 0.50 | % | | | | 3.88 | % |
| 3/31/2023 | | | $ | 8.84 | | | | | 0.22 | | | | | (1.69 | ) | | | | (1.47 | ) | | | | (0.22 | ) | | | | — | | | | | (0.22 | ) | | | $ | 7.15 | | | | | (16.66 | )% | | | $ | 48,859 | | | | | 0.59 | % | | | | 0.59 | % | | | | 0.50 | % | | | | 2.97 | % |
| 3/31/2022 | | | $ | 9.37 | | | | | 0.28 | | | | | (0.53 | ) | | | | (0.25 | ) | | | | (0.28 | ) | | | | — | | | | | (0.28 | ) | | | $ | 8.84 | | | | | (2.89 | )% | | | $ | 54,898 | | | | | 0.54 | % | | | | 0.54 | % | | | | 0.50 | % | | | | 2.87 | % |
| 3/31/2021 | | | $ | 11.75 | | | | | 0.29 | | | | | (1.62 | ) | | | | (1.33 | ) | | | | (0.29 | ) | | | | (0.76 | ) | | | | (1.05 | ) | | | $ | 9.37 | | | | | (12.24 | )% | | | $ | 71,267 | | | | | 0.55 | % | | | | 0.55 | % | | | | 0.51 | % | | | | 2.56 | % |
| 3/31/2020 | | | $ | 9.88 | | | | | 0.28 | | | | | 2.11 | | | | | 2.39 | | | | | (0.27 | ) | | | | (0.25 | ) | | | | (0.52 | ) | | | $ | 11.75 | | | | | 24.85 | % | | | $ | 87,469 | | | | | 0.68 | % | | | | 0.68 | % | | | | 0.65 | % | | | | 2.55 | % |
|
| DoubleLine Long Duration Total Return Bond Fund - Class N: | |
| 3/31/2024 | | | $ | 7.13 | | | | | 0.26 | | | | | (0.59 | ) | | | | (0.33 | ) | | | | (0.24 | ) | | | | — | | | | | (0.24 | ) | | | $ | 6.56 | | | | | (4.63 | )% | | | $ | 12,036 | | | | | 0.92 | % | | | | 0.92 | % | | | | 0.75 | % | | | | 4.07 | % |
| 3/31/2023 | | | $ | 8.81 | | | | | 0.21 | | | | | (1.69 | ) | | | | (1.48 | ) | | | | (0.20 | ) | | | | — | | | | | (0.20 | ) | | | $ | 7.13 | | | | | (16.83 | )% | | | $ | 1,693 | | | | | 0.83 | % | | | | 0.83 | % | | | | 0.75 | % | | | | 2.73 | % |
| 3/31/2022 | | | $ | 9.37 | | | | | 0.25 | | | | | (0.56 | ) | | | | (0.31 | ) | | | | (0.25 | ) | | | | — | | | | | (0.25 | ) | | | $ | 8.81 | | | | | (3.48 | )% | | | $ | 5,364 | | | | | 0.77 | % | | | | 0.77 | % | | | | 0.75 | % | | | | 2.59 | % |
| 3/31/2021 | | | $ | 11.74 | | | | | 0.26 | | | | | (1.61 | ) | | | | (1.35 | ) | | | | (0.26 | ) | | | | (0.76 | ) | | | | (1.02 | ) | | | $ | 9.37 | | | | | (12.38 | )% | | | $ | 11,234 | | | | | 0.80 | % | | | | 0.80 | % | | | | 0.76 | % | | | | 2.29 | % |
| 3/31/2020 | | | $ | 9.88 | | | | | 0.24 | | | | | 2.11 | | | | | 2.35 | | | | | (0.24 | ) | | | | (0.25 | ) | | | | (0.49 | ) | | | $ | 11.74 | | | | | 24.44 | % | | | $ | 20,225 | | | | | 0.93 | % | | | | 0.93 | % | | | | 0.90 | % | | | | 2.31 | % |
| | | | | | | | | | |
| | | | | | | | | | | | | | | | | | | | | For the Year or Period Ended |
| | | | | | | | | | | | | | | | | | | | | 3/31/2024 | | 3/31/2023 | | 3/31/2022 | | 3/31/2021 | | 3/31/2020 |
| | | | | | | | |
Portfolio turnover rate for all share classes | | | | | | | | | | | | | | | | | | | | 146% | | | | | 227% | | | | | 95% | | | | | 89% | | | | | 40% | |
|
(a) Calculated based on average shares outstanding during the period. | |
| | | | | | | |
| | | | | Income (Loss) from
Investment Operations: | | Less Distributions: | | | | | | | | Ratios to Average Net Assets: |
For the
Year or
Period Ended | | Net Asset
Value,
Beginning
of Period | | Net
Investment
Income
(Loss)(a) | | Net Gain
(Loss) on
Investments
(Realized and
Unrealized) | | Total from
Investment
Operations | | Distributions
from Net
Investment
Income | | Distributions
from Net
Realized
Gain | | Total
Distributions | | Net Asset
Value,
End of
Period | | Total
Return | | Net Assets,
End of Period
(000’s) | | Expenses
Before
Advisory Fees
(Waived) and
Other Fees
(Reimbursed)/
Recouped | | Expenses
After
Investment
Advisory
Fees
(Waived) | | Expenses
After
Advisory Fees
(Waived) and
Other Fees
(Reimbursed)/
Recouped | | Net
Investment
Income
(Loss) |
|
| DoubleLine Strategic Commodity Fund (Consolidated) - Class I: | |
| 3/31/2024 | | | $ | 7.54 | | | | | 0.31 | | | | | 0.18 | | | | | 0.49 | | | | | (0.24 | ) | | | | — | | | | | (0.24 | ) | | | $ | 7.79 | | | | | 6.72 | % | | | $ | 136,093 | | | | | 1.08 | % | | | | 1.08 | % | | | | 1.07 | % | | | | 4.05 | % |
| 3/31/2023 | | | $ | 12.56 | | | | | 0.07 | | | | | (1.47 | ) | | | | (1.40 | ) | | | | (3.62 | ) | | | | — | | | | | (3.62 | ) | | | $ | 7.54 | | | | | (11.83 | )% | | | $ | 158,615 | | | | | 1.02 | % | | | | 1.02 | % | | | | 1.02 | % | | | | 0.64 | % |
| 3/31/2022 | | | $ | 9.61 | | | | | (0.11 | ) | | | | 4.41 | | | | | 4.30 | | | | | (1.35 | ) | | | | — | | | | | (1.35 | ) | | | $ | 12.56 | | | | | 48.24 | % | | | $ | 223,799 | | | | | 1.04 | % | | | | 1.04 | % | | | | 1.10 | % | | | | (0.97 | )% |
| 3/31/2021 | | | $ | 6.91 | | | | | (0.05 | ) | | | | 2.75 | | | | | 2.70 | | | | | — | | | | | — | | | | | — | | | | $ | 9.61 | | | | | 39.07 | % | | | $ | 151,565 | | | | | 1.14 | % | | | | 1.14 | % | | | | 1.10 | % | | | | (0.66 | )% |
| 3/31/2020 | | | $ | 9.72 | | | | | 0.07 | | | | | (2.78 | ) | | | | (2.71 | ) | | | | (0.10 | ) | | | | — | | | | | (0.10 | ) | | | $ | 6.91 | | | | | (28.25 | )% | | | $ | 116,739 | | | | | 1.09 | % | | | | 1.09 | % | | | | 1.10 | % | | | | 1.00 | % |
|
| DoubleLine Strategic Commodity Fund (Consolidated) - Class N: | |
| 3/31/2024 | | | $ | 7.43 | | | | | 0.28 | | | | | 0.19 | | | | | 0.47 | | | | | (0.22 | ) | | | | — | | | | | (0.22 | ) | | | $ | 7.68 | | | | | 6.50 | % | | | $ | 13,055 | | | | | 1.33 | % | | | | 1.33 | % | | | | 1.32 | % | | | | 3.81 | % |
| 3/31/2023 | | | $ | 12.42 | | | | | 0.04 | | | | | (1.44 | ) | | | | (1.40 | ) | | | | (3.59 | ) | | | | — | | | | | (3.59 | ) | | | $ | 7.43 | | | | | (12.02 | )% | | | $ | 16,743 | | | | | 1.27 | % | | | | 1.27 | % | | | | 1.27 | % | | | | 0.40 | % |
| 3/31/2022 | | | $ | 9.52 | | | | | (0.13 | ) | | | | 4.35 | | | | | 4.22 | | | | | (1.32 | ) | | | | — | | | | | (1.32 | ) | | | $ | 12.42 | | | | | 47.78 | % | | | $ | 23,906 | | | | | 1.29 | % | | | | 1.29 | % | | | | 1.35 | % | | | | (1.22 | )% |
| 3/31/2021 | | | $ | 6.87 | | | | | (0.07 | ) | | | | 2.72 | | | | | 2.65 | | | | | — | | | | | — | | | | | — | | | | $ | 9.52 | | | | | 38.57 | % | | | $ | 20,205 | | | | | 1.39 | % | | | | 1.39 | % | | | | 1.34 | % | | | | (0.88 | )% |
| 3/31/2020 | | | $ | 9.65 | | | | | 0.07 | | | | | (2.78 | ) | | | | (2.71 | ) | | | | (0.07 | ) | | | | — | | | | | (0.07 | ) | | | $ | 6.87 | | | | | (28.28 | )% | | | $ | 25,421 | | | | | 1.34 | % | | | | 1.34 | % | | | | 1.35 | % | | | | 0.75 | % |
| | | | | | | | | | |
| | | | | | | | | | | | | | | | | | | | | For the Year or Period Ended |
| | | | | | | | | | | | | | | | | | | | | 3/31/2024 | | 3/31/2023 | | 3/31/2022 | | 3/31/2021 | | 3/31/2020 |
| | | | | | | | |
Portfolio turnover rate for all share classes | | | | | | | | | | | | | | | | | | | | 0% | | | | | 0% | | | | | 0% | | | | | 0% | | | | | 0% | |
|
(a) Calculated based on average shares outstanding during the period. | |
| | | | | | | | |
| The accompanying notes are an integral part of these financial statements. | | Annual Report | | | | | March 31, 2024 | | 127 |
| | |
Financial Highlights (Cont.) | | |
| | | | | | | | | | | | | | | | | | | | | | | | | | | | | | | | | | | | | | | | | | | | | | | | | | | | | | | | | | | | | | | | | | | | | | | | | | | |
| | | | | Income (Loss) from
Investment Operations: | | Less Distributions: | | | | | | | | | | Ratios to Average Net Assets: |
For the
Year or
Period Ended | | Net Asset
Value,
Beginning
of Period | | Net
Investment
Income
(Loss)(a) | | Net Gain
(Loss) on
Investments
(Realized and
Unrealized) | | Total from
Investment
Operations | | Distributions
from Net
Investment
Income | | Distributions
from Net
Realized
Gain | | Distribution
in Excess | | Total
Distributions | | Net Asset
Value,
End of
Period | | Total
Return | | Net Assets,
End of Period
(000’s) | | Expenses
Before
Advisory Fees
(Waived) and
Other Fees
(Reimbursed)/
Recouped | | Expenses
After
Investment
Advisory
Fees
(Waived) | | Expenses
After
Advisory Fees
(Waived) and
Other Fees
(Reimbursed)/
Recouped | | Net
Investment
Income
(Loss) |
| |
| DoubleLine Global Bond Fund - Class I: | | | | | | |
| 3/31/2024 | | | $ | 8.46 | | | | | 0.22 | | | | | (0.29 | ) | | | | (0.07 | ) | | | | — | | | | | — | | | | | — | | | | | — | | | | $ | 8.39 | | | | | (0.83 | )% | | | $ | 144,005 | | | | | 0.59 | % | | | | 0.59 | % | | | | 0.60 | % | | | | 2.61 | % |
| 3/31/2023 | | | $ | 9.26 | | | | | 0.11 | | | | | (0.91 | ) | | | | (0.80 | ) | | | | — | | | | | — | | | | | — | | | | | — | | | | $ | 8.46 | | | | | (8.64 | %) | | | $ | 144,457 | | | | | 0.66 | % | | | | 0.66 | % | | | | 0.65 | % | | | | 1.26 | % |
| 3/31/2022 | | | $ | 10.21 | | | | | 0.04 | | | | | (0.88 | ) | | | | (0.84 | ) | | | | (0.03 | ) | | | | (0.08 | ) | | | | — | (b) | | | | (0.11 | ) | | | $ | 9.26 | | | | | (8.29 | %) | | | $ | 276,559 | | | | | 0.56 | % | | | | 0.56 | % | | | | 0.56 | % | | | | 0.37 | % |
| 3/31/2021 | | | $ | 10.21 | | | | | 0.05 | | | | | 0.12 | | | | | 0.17 | | | | | — | | | | | (0.17 | ) | | | | — | | | | | (0.17 | ) | | | $ | 10.21 | | | | | 1.59 | % | | | $ | 787,064 | | | | | 0.55 | % | | | | 0.55 | % | | | | 0.55 | % | | | | 0.50 | % |
| 3/31/2020 | | | $ | 10.28 | | | | | 0.15 | | | | | (0.10 | ) | | | | 0.05 | | | | | (0.12 | ) | | | | — | (b) | | | | — | | | | | (0.12 | ) | | | $ | 10.21 | | | | | 0.43 | % | | | $ | 1,217,100 | | | | | 0.55 | % | | | | 0.55 | % | | | | 0.55 | % | | | | 1.34 | % |
| |
| DoubleLine Global Bond Fund - Class N: | | | | | | |
| 3/31/2024 | | | $ | 8.41 | | | | | 0.19 | | | | | (0.29 | ) | | | | (0.10 | ) | | | | — | | | | | — | | | | | — | | | | | — | | | | $ | 8.31 | | | | | (1.19 | )% | | | $ | 156 | | | | | 0.84 | % | | | | 0.84 | % | | | | 0.85 | % | | | | 2.34 | % |
| 3/31/2023 | | | $ | 9.23 | | | | | 0.08 | | | | | (0.90 | ) | | | | (0.82 | ) | | | | — | | | | | — | | | | | — | | | | | — | | | | $ | 8.41 | | | | | (8.88 | )% | | | $ | 240 | | | | | 0.92 | % | | | | 0.92 | % | | | | 0.91 | % | | | | 0.95 | % |
| 3/31/2022 | | | $ | 10.18 | | | | | 0.01 | | | | | (0.87 | ) | | | | (0.86 | ) | | | | (0.01 | ) | | | | (0.08 | ) | | | | — | (b) | | | | (0.09 | ) | | | $ | 9.23 | | | | | (8.45 | )% | | | $ | 416 | | | | | 0.81 | % | | | | 0.81 | % | | | | 0.81 | % | | | | 0.12 | % |
| 3/31/2021 | | | $ | 10.21 | | | | | 0.03 | | | | | 0.11 | | | | | 0.14 | | | | | — | | | | | (0.17 | ) | | | | — | | | | | (0.17 | ) | | | $ | 10.18 | | | | | 1.30 | % | | | $ | 815 | | | | | 0.80 | % | | | | 0.80 | % | | | | 0.80 | % | | | | 0.29 | % |
| 3/31/2020 | | | $ | 10.26 | | | | | 0.12 | | | | | (0.10 | ) | | | | 0.02 | | | | | (0.07 | ) | | | | — | (b) | | | | — | | | | | (0.07 | ) | | | $ | 10.21 | | | | | 0.23 | % | | | $ | 2,407 | | | | | 0.80 | % | | | | 0.80 | % | | | | 0.80 | % | | | | 1.13 | % |
| | | | | | | | | | | |
| | | | | | | | | | | | | | | | | | | | | | | For the Year or Period Ended |
| | | | | | | | | | | | | | | | | | | | | | | 3/31/2024 | | 3/31/2023 | | 3/31/2022 | | 3/31/2021 | | 3/31/2020 |
| | | | | | | | | |
Portfolio turnover rate for all share classes (b) | | | | | | | | | | | | | | | | | | | | | | | | | 49% | | | | | 112% | | | | | 83% | | | | | 63% | | | | | 21% | |
| |
(a) Calculated based on average shares outstanding during the period. (b) Less than $0.005 per share. | | | | | | |
| | | | | | | | | | | | | | | | | | | | | | | | | | | | | | | | | | | | | | | | | | | | | | | | | | | | | | | | | | | | | | | | | | | | | | |
| | | | | Income (Loss) from
Investment Operations: | | Less Distributions: | | | | | | | | Ratios to Average Net Assets: |
For the
Year or
Period Ended | | Net Asset
Value,
Beginning
of Period | | Net
Investment
Income
(Loss)(a) | | Net Gain
(Loss) on
Investments
(Realized and
Unrealized) | | Total from
Investment
Operations | | Distributions
from Net
Investment
Income | | Distributions
from Net
Realized
Gain | | Total
Distributions | | Net Asset
Value,
End of
Period | | Total
Return | | Net Assets,
End of Period
(000’s) | | Expenses
Before
Advisory Fees
(Waived) and
Other Fees
(Reimbursed)/
Recouped | | Expenses
After
Investment
Advisory
Fees
(Waived) | | Expenses
After
Advisory Fees
(Waived) and
Other Fees
(Reimbursed)/
Recouped | | Net
Investment
Income
(Loss) |
|
| DoubleLine Infrastructure Income Fund - Class I: | |
| 3/31/2024 | | | $ | 9.05 | | | | | 0.34 | | | | | 0.16 | | | | | 0.50 | | | | | (0.33 | ) | | | | — | | | | | (0.33 | ) | | | $ | 9.22 | | | | | 5.68 | % | | | $ | 358,912 | | | | | 0.57 | % | | | | 0.57 | % | | | | 0.57 | % | | | | 3.72 | % |
| 3/31/2023 | | | $ | 9.67 | | | | | 0.28 | | | | | (0.60 | ) | | | | (0.32 | ) | | | | (0.27 | ) | | | | (0.03 | ) | | | | (0.30 | ) | | | $ | 9.05 | | | | | (3.24 | )% | | | $ | 346,227 | | | | | 0.57 | % | | | | 0.57 | % | | | | 0.57 | % | | | | 3.02 | % |
| 3/31/2022 | | | $ | 10.46 | | | | | 0.27 | | | | | (0.71 | ) | | | | (0.44 | ) | | | | (0.28 | ) | | | | (0.07 | ) | | | | (0.35 | ) | | | $ | 9.67 | | | | | (4.39 | )% | | | $ | 521,889 | | | | | 0.57 | % | | | | 0.57 | % | | | | 0.57 | % | | | | 2.63 | % |
| 3/31/2021 | | | $ | 9.56 | | | | | 0.29 | | | | | 0.92 | | | | | 1.21 | | | | | (0.31 | ) | | | | — | | | | | (0.31 | ) | | | $ | 10.46 | | | | | 12.73 | % | | | $ | 566,994 | | | | | 0.56 | % | | | | 0.56 | % | | | | 0.56 | % | | | | 2.82 | % |
| 3/31/2020 | | | $ | 10.11 | | | | | 0.33 | | | | | (0.54 | ) | | | | (0.21 | ) | | | | (0.34 | ) | | | | — | | | | | (0.34 | ) | | | $ | 9.56 | | | | | (2.32 | )% | | | $ | 503,146 | | | | | 0.56 | % | | | | 0.56 | % | | | | 0.56 | % | | | | 3.19 | % |
|
| DoubleLine Infrastructure Income Fund - Class N: | |
| 3/31/2024 | | | $ | 9.06 | | | | | 0.33 | | | | | 0.15 | | | | | 0.48 | | | | | (0.31 | ) | | | | — | | | | | (0.31 | ) | | | $ | 9.23 | | | | | 5.42 | % | | | $ | 6,971 | | | | | 0.83 | % | | | | 0.83 | % | | | | 0.83 | % | | | | 3.60 | % |
| 3/31/2023 | | | $ | 9.68 | | | | | 0.25 | | | | | (0.59 | ) | | | | (0.34 | ) | | | | (0.25 | ) | | | | (0.03 | ) | | | | (0.28 | ) | | | $ | 9.06 | | | | | (3.49 | )% | | | $ | 601 | | | | | 0.82 | % | | | | 0.82 | % | | | | 0.82 | % | | | | 2.74 | % |
| 3/31/2022 | | | $ | 10.46 | | | | | 0.25 | | | | | (0.71 | ) | | | | (0.46 | ) | | | | (0.25 | ) | | | | (0.07 | ) | | | | (0.32 | ) | | | $ | 9.68 | | | | | (4.60 | )% | | | $ | 1,794 | | | | | 0.82 | % | | | | 0.82 | % | | | | 0.82 | % | | | | 2.38 | % |
| 3/31/2021 | | | $ | 9.56 | | | | | 0.27 | | | | | 0.92 | | | | | 1.19 | | | | | (0.29 | ) | | | | — | | | | | (0.29 | ) | | | $ | 10.46 | | | | | 12.45 | % | | | $ | 9,700 | | | | | 0.81 | % | | | | 0.81 | % | | | | 0.81 | % | | | | 2.58 | % |
| 3/31/2020 | | | $ | 10.11 | | | | | 0.30 | | | | | (0.54 | ) | | | | (0.24 | ) | | | | (0.31 | ) | | | | — | | | | | (0.31 | ) | | | $ | 9.56 | | | | | (2.55 | )% | | | $ | 9,784 | | | | | 0.81 | % | | | | 0.81 | % | | | | 0.81 | % | | | | 2.93 | % |
| | | | | | | | | | |
| | | | | | | | | | | | | | | | | | | | | For the Year or Period Ended |
| | | | | | | | | | | | | | | | | | | | | 3/31/2024 | | 3/31/2023 | | 3/31/2022 | | 3/31/2021 | | 3/31/2020 |
| | | | | | | | |
Portfolio turnover rate for all share classes | | | | | | | | | | | | | | | | | | | | 49% | | | | | 8% | | | | | 23% | | | | | 39% | | | | | 10% | |
|
(a) Calculated based on average shares outstanding during the period. | |
| | | | |
| 128 | | DoubleLine Funds Trust | | The accompanying notes are an integral part of these financial statements. |
| | | | | | | | | | | | | | | | | | | | | | | | | | | | | | | | | | | | | | | | | | | | | | | | | | | | | | | | | | | | | | | | | | | | | | |
| | | | | Income (Loss) from
Investment Operations: | | Less Distributions: | | | | | | | | Ratios to Average Net Assets: |
For the
Year or
Period Ended | | Net Asset
Value,
Beginning
of Period | | Net
Investment
Income
(Loss)(a) | | Net Gain
(Loss) on
Investments
(Realized and
Unrealized) | | Total from
Investment
Operations | | Distributions
from Net
Investment
Income | | Distributions
from Net
Realized
Gain | | Total
Distributions | | Net Asset
Value,
End of
Period | | Total
Return | | Net Assets,
End of Period
(000’s) | | Expenses
Before
Advisory Fees
(Waived) and
Other Fees
(Reimbursed)/
Recouped | | Expenses
After
Investment
Advisory
Fees
(Waived) | | Expenses
After
Advisory Fees
(Waived) and
Other Fees
(Reimbursed)/
Recouped | | Net
Investment
Income
(Loss) |
|
| DoubleLine Shiller Enhanced International CAPE® - Class I: | |
| 3/31/2024 | | | $ | 12.01 | | | | | 0.62 | | | | | 0.39 | | | | | 1.01 | | | | | (0.67 | ) | | | | — | | | | | (0.67 | ) | | | $ | 12.35 | | | | | 8.88 | % | | | $ | 36,996 | | | | | 0.92 | % | | | | 0.89 | % | | | | 0.62 | % | | | | 5.23 | % |
| 3/31/2023 | | | $ | 13.07 | | | | | 0.48 | | | | | (0.99 | ) | | | | (0.51 | ) | | | | (0.55 | ) | | | | — | | | | | (0.55 | ) | | | $ | 12.01 | | | | | (3.48 | )% | | | $ | 45,489 | | | | | 0.93 | % | | | | 0.89 | % | | | | 0.61 | % | | | | 4.17 | % |
| 3/31/2022 | | | $ | 12.75 | | | | | 0.26 | | | | | 0.39 | | | | | 0.65 | | | | | (0.33 | ) | | | | — | | | | | (0.33 | ) | | | $ | 13.07 | | | | | 5.05 | % | | | $ | 94,443 | | | | | 0.79 | % | | | | 0.75 | % | | | | 0.61 | % | | | | 1.91 | % |
| 3/31/2021 | | | $ | 7.88 | | | | | 0.21 | | | | | 4.88 | | | | | 5.09 | | | | | (0.22 | ) | | | | — | | | | | (0.22 | ) | | | $ | 12.75 | | | | | 65.24 | % | | | $ | 40,292 | | | | | 0.93 | % | | | | 0.91 | % | | | | 0.62 | % | | | | 1.96 | % |
| 3/31/2020 | | | $ | 10.17 | | | | | 0.29 | | | | | (2.29 | ) | | | | (2.00 | ) | | | | (0.29 | ) | | | | — | | | | | (0.29 | ) | | | $ | 7.88 | | | | | (20.29 | )% | | | $ | 27,523 | | | | | 0.80 | % | | | | 0.77 | % | | | | 0.62 | % | | | | 2.84 | % |
|
| DoubleLine Shiller Enhanced International CAPE® - Class N: | |
| 3/31/2024 | | | $ | 12.01 | | | | | 0.58 | | | | | 0.40 | | | | | 0.98 | | | | | (0.64 | ) | | | | — | | | | | (0.64 | ) | | | $ | 12.35 | | | | | 8.59 | % | | | $ | 9,116 | | | | | 1.17 | % | | | | 1.14 | % | | | | 0.87 | % | | | | 4.88 | % |
| 3/31/2023 | | | $ | 13.07 | | | | | 0.47 | | | | | (1.01 | ) | | | | (0.54 | ) | | | | (0.52 | ) | | | | — | | | | | (0.52 | ) | | | $ | 12.01 | | | | | (3.73 | )% | | | $ | 9,111 | | | | | 1.20 | % | | | | 1.16 | % | | | | 0.86 | % | | | | 4.13 | % |
| 3/31/2022 | | | $ | 12.76 | | | | | 0.22 | | | | | 0.39 | | | | | 0.61 | | | | | (0.30 | ) | | | | — | | | | | (0.30 | ) | | | $ | 13.07 | | | | | 4.70 | % | | | $ | 6,011 | | | | | 1.03 | % | | | | 0.99 | % | | | | 0.86 | % | | | | 1.59 | % |
| 3/31/2021 | | | $ | 7.88 | | | | | 0.19 | | | | | 4.88 | | | | | 5.07 | | | | | (0.19 | ) | | | | — | | | | | (0.19 | ) | | | $ | 12.76 | | | | | 64.90 | % | | | $ | 6,002 | | | | | 1.18 | % | | | | 1.16 | % | | | | 0.87 | % | | | | 1.85 | % |
| 3/31/2020 | | | $ | 10.17 | | | | | 0.27 | | | | | (2.29 | ) | | | | (2.02 | ) | | | | (0.27 | ) | | | | — | | | | | (0.27 | ) | | | $ | 7.88 | | | | | (20.50 | )% | | | $ | 13,044 | | | | | 1.05 | % | | | | 1.02 | % | | | | 0.87 | % | | | | 2.61 | % |
| | | | | | | | | | |
| | | | | | | | | | | | | | | | | | | | | For the Year or Period Ended |
| | | | | | | | | | | | | | | | | | | | | 3/31/2024 | | 3/31/2023 | | 3/31/2022 | | 3/31/2021 | | 3/31/2020 |
| | | | | | | | |
Portfolio turnover rate for all share classes | | | | | | | | | | | | | | | | | | | | 85% | | | | | 91% | | | | | 125% | | | | | 97% | | | | | 48% | |
|
(a) Calculated based on average shares outstanding during the period. | |
| | | | | | | |
| | | | | Income (Loss) from
Investment Operations: | | Less Distributions: | | | | | | | | Ratios to Average Net Assets: |
For the
Year or
Period Ended | | Net Asset
Value,
Beginning
of Period | | Net
Investment
Income
(Loss)(a) | | Net Gain
(Loss) on
Investments
(Realized and
Unrealized) | | Total from
Investment
Operations | | Distributions
from Net
Investment
Income | | Distributions
from Net
Realized
Gain | | Total
Distributions | | Net Asset
Value,
End of
Period | | Total
Return(b) | | Net Assets,
End of Period
(000’s) | | Expenses
Before
Advisory Fees
(Waived) and
Other Fees
(Reimbursed)/
Recouped(d) | | Expenses
After
Investment
Advisory
Fees
(Waived)(d) | | Expenses
After
Advisory Fees
(Waived) and
Other Fees
(Reimbursed)/
Recouped(d) | | Net
Investment
Income
(Loss)(d) |
|
| DoubleLine Emerging Markets Local Currency Bond Fund - Class I: | |
| 3/31/2024 | | | $ | 8.55 | | | | | 0.46 | | | | | (0.02 | ) | | | | 0.44 | | | | | (0.30 | ) | | | | — | | | | | (0.30 | ) | | | $ | 8.69 | | | | | 5.21 | % | | | $ | 11,675 | | | | | 2.34 | % | | | | 2.34 | % | | | | 0.90 | % | | | | 5.32 | % |
| 3/31/2023 | | | $ | 8.91 | | | | | 0.35 | | | | | (0.54 | ) | | | | (0.19 | ) | | | | (0.17 | ) | | | | — | | | | | (0.17 | ) | | | $ | 8.55 | | | | | (1.92 | )% | | | $ | 9,423 | | | | | 2.45 | % | | | | 2.45 | % | | | | 0.90 | % | | | | 4.21 | % |
| 3/31/2022 | | | $ | 9.38 | | | | | 0.32 | | | | | (0.68 | ) | | | | (0.36 | ) | | | | (0.11 | ) | | | | — | | | | | (0.11 | ) | | | $ | 8.91 | | | | | (3.90 | )% | | | $ | 9,238 | | | | | 2.75 | % | | | | 2.75 | % | | | | 0.90 | % | | | | 3.51 | % |
| 3/31/2021 | | | $ | 8.64 | | | | | 0.30 | | | | | 0.61 | | | | | 0.91 | | | | | (0.17 | ) | | | | — | | | | | (0.17 | ) | | | $ | 9.38 | | | | | 10.60 | % | | | $ | 9,604 | | | | | 2.57 | % | | | | 2.57 | % | | | | 0.90 | % | | | | 3.11 | % |
| 3/31/2020(b) | | | $ | 10.00 | | | | | 0.25 | | | | | (1.49 | ) | | | | (1.24 | ) | | | | (0.12 | ) | | | | — | | | | | (0.12 | ) | | | $ | 8.64 | | | | | (12.52 | )% | | | $ | 8,664 | | | | | 6.23 | % | | | | 6.23 | % | | | | 0.90 | % | | | | 3.45 | % |
|
| DoubleLine Emerging Markets Local Currency Bond Fund - Class N: | |
| 3/31/2024 | | | $ | 8.53 | | | | | 0.45 | | | | | (0.02 | ) | | | | 0.43 | | | | | (0.28 | ) | | | | — | | | | | (0.28 | ) | | | $ | 8.68 | | | | | 5.10 | % | | | $ | 960 | | | | | 2.70 | % | | | | 2.70 | % | | | | 1.15 | % | | | | 5.16 | % |
| 3/31/2023 | | | $ | 8.90 | | | | | 0.33 | | | | | (0.54 | ) | | | | (0.21 | ) | | | | (0.16 | ) | | | | — | | | | | (0.16 | ) | | | $ | 8.53 | | | | | (2.21 | )% | | | $ | 209 | | | | | 2.66 | % | | | | 2.66 | % | | | | 1.15 | % | | | | 3.99 | % |
| 3/31/2022 | | | $ | 9.37 | | | | | 0.30 | | | | | (0.68 | ) | | | | (0.38 | ) | | | | (0.09 | ) | | | | — | | | | | (0.09 | ) | | | $ | 8.90 | | | | | (4.08 | )% | | | $ | 127 | | | | | 2.90 | % | | | | 2.90 | % | | | | 1.15 | % | | | | 3.27 | % |
| 3/31/2021 | | | $ | 8.64 | | | | | 0.27 | | | | | 0.61 | | | | | 0.88 | | | | | (0.15 | ) | | | | — | | | | | (0.15 | ) | | | $ | 9.37 | | | | | 10.24 | % | | | $ | 96 | | | | | 2.82 | % | | | | 2.82 | % | | | | 1.15 | % | | | | 2.86 | % |
| 3/31/2020(b) | | | $ | 10.00 | | | | | 0.23 | | | | | (1.49 | ) | | | | (1.26 | ) | | | | (0.10 | ) | | | | — | | | | | (0.10 | ) | | | $ | 8.64 | | | | | (12.69 | )% | | | $ | 87 | | | | | 6.48 | % | | | | 6.48 | % | | | | 1.15 | % | | | | 3.19 | % |
| | | | | | | | | | |
| | | | | | | | | | | | | | | | | | | | | For the Year or Period Ended |
| | | | | | | | | | | | | | | | | | | | | 3/31/2024 | | 3/31/2023 | | 3/31/2022 | | 3/31/2021 | | 3/31/2020 |
| | | | | | | | |
Portfolio turnover rate for all share classes (c) | | | | | | | | | | | | | | | | | | | | 31% | | | | | 20% | | | | | 36% | | | | | 20% | | | | | 13% | |
|
(a) Calculated based on average shares outstanding during the period. (b) Commencement of operations on June 28, 2019. Total return is based on operations for a period that is less than a year. (c) Not annualized for periods less than one year. (d) Annualized for periods less than one year. | |
| | | | | | | | |
| The accompanying notes are an integral part of these financial statements. | | Annual Report | | | | | March 31, 2024 | | 129 |
| | |
Financial Highlights (Cont.) | | |
| | | | | | | | | | | | | | | | | | | | | | | | | | | | | | | | | | | | | | | | | | | | | | | | | | | | | | | | | | | | | | | | | | | | | | | | | | | |
| | | | | Income (Loss) from
Investment Operations: | | Less Distributions: | | | | | | | | | | Ratios to Average Net Assets: |
For the
Year or
Period Ended | | Net Asset
Value,
Beginning
of Period | | Net
Investment
Income
(Loss)(a) | | Net Gain
(Loss) on
Investments
(Realized and
Unrealized) | | Total from
Investment
Operations | | Distributions
from Net
Investment
Income | | Distributions
from Net
Realized
Gain | | Distribution
in Excess | | Total
Distributions | | Net Asset
Value,
End of
Period | | Total
Return(c) | | Net Assets,
End of Period
(000’s) | | Expenses
Before
Advisory Fees
(Waived) and
Other Fees
(Reimbursed)/
Recouped(d) | | Expenses
After
Investment
Advisory
Fees
(Waived)(d) | | Expenses
After
Advisory Fees
(Waived) and
Other Fees
(Reimbursed)/
Recouped(d) | | Net
Investment
Income
(Loss)(d) |
| |
| DoubleLine Income Fund - Class I: | | | | | | |
| 3/31/2024 | | | $ | 7.53 | | | | | 0.46 | | | | | 0.38 | | | | | 0.84 | | | | | (0.57 | ) | | | | — | | | | | — | | | | | (0.57 | ) | | | $ | 7.80 | | | | | 11.67 | % | | | $ | 79,772 | | | | | 0.88 | % | | | | 0.88 | % | | | | 0.65 | % | | | | 6.13 | % |
| 3/31/2023 | | | $ | 8.62 | | | | | 0.40 | | | | | (1.09 | ) | | | | (0.69 | ) | | | | (0.40 | ) | | | | — | | | | | — | | | | | (0.40 | ) | | | $ | 7.53 | | | | | (8.10 | )% | | | $ | 50,732 | | | | | 0.83 | % | | | | 0.83 | % | | | | 0.65 | % | | | | 5.01 | % |
| 3/31/2022 | | | $ | 9.28 | | | | | 0.42 | | | | | (0.63 | ) | | | | (0.21 | ) | | | | (0.44 | ) | | | | — | | | | | (0.01 | ) | | | | (0.45 | ) | | | $ | 8.62 | | | | | (2.42 | )% | | | $ | 89,732 | | | | | 0.72 | % | | | | 0.72 | % | | | | 0.65 | % | | | | 4.55 | % |
| 3/31/2021 | | | $ | 8.05 | | | | | 0.36 | | | | | 1.20 | | | | | 1.56 | | | | | (0.33 | ) | | | | — | | | | | — | | | | | (0.33 | ) | | | $ | 9.28 | | | | | 19.70 | % | | | $ | 136,369 | | | | | 0.74 | % | | | | 0.74 | % | | | | 0.65 | % | | | | 4.07 | % |
| 3/31/2020(b) | | | $ | 10.00 | | | | | 0.24 | | | | | (1.94 | ) | | | | (1.70 | ) | | | | (0.25 | ) | | | | — | | | | | — | | | | | (0.25 | ) | | | $ | 8.05 | | | | | (17.35 | )% | | | $ | 69,580 | | | | | 1.13 | % | | | | 1.13 | % | | | | 0.65 | % | | | | 4.07 | % |
| |
| DoubleLine Income Fund - Class N: | | | | | | |
| 3/31/2024 | | | $ | 7.54 | | | | | 0.45 | | | | | 0.37 | | | | | 0.82 | | | | | (0.55 | ) | | | | — | | | | | — | | | | | (0.55 | ) | | | $ | 7.81 | | | | | 11.38 | % | | | $ | 3,984 | | | | | 1.13 | % | | | | 1.13 | % | | | | 0.90 | % | | | | 5.92 | % |
| 3/31/2023 | | | $ | 8.63 | | | | | 0.38 | | | | | (1.09 | ) | | | | (0.71 | ) | | | | (0.38 | ) | | | | — | | | | | — | | | | | (0.38 | ) | | | $ | 7.54 | | | | | (8.35 | )% | | | $ | 3,194 | | | | | 1.08 | % | | | | 1.08 | % | | | | 0.90 | % | | | | 4.73 | % |
| 3/31/2022 | | | $ | 9.30 | | | | | 0.39 | | | | | (0.63 | ) | | | | (0.24 | ) | | | | (0.42 | ) | | | | — | | | | | (0.01 | ) | | | | (0.43 | ) | | | $ | 8.63 | | | | | (2.75 | )% | | | $ | 12,838 | | | | | 1.03 | % | | | | 1.03 | % | | | | 0.90 | % | | | | 4.30 | % |
| 3/31/2021 | | | $ | 8.05 | | | | | 0.34 | | | | | 1.22 | | | | | 1.56 | | | | | (0.31 | ) | | | | — | | | | | — | | | | | (0.31 | ) | | | $ | 9.30 | | | | | 19.67 | % | | | $ | 2,676 | | | | | 0.99 | % | | | | 0.99 | % | | | | 0.90 | % | | | | 3.84 | % |
| 3/31/2020(b) | | | $ | 10.00 | | | | | 0.23 | | | | | (1.94 | ) | | | | (1.71 | ) | | | | (0.24 | ) | | | | — | | | | | — | | | | | (0.24 | ) | | | $ | 8.05 | | | | | (17.46 | )% | | | $ | 592 | | | | | 1.26 | % | | | | 1.26 | % | | | | 0.90 | % | | | | 4.13 | % |
| | | | | | | | | | | |
| | | | | | | | | | | | | | | | | | | | | | | For the Year or Period Ended |
| | | | | | | | | | | | | | | | | | | | | | | 3/31/2024 | | 3/31/2023 | | 3/31/2022 | | 3/31/2021 | | 3/31/2020 |
| | | | | | | | | |
Portfolio turnover rate for all share classes (c) | | | | | | | | | | | | | | | | | | | | | | | | | 66% | | | | | 23% | | | | | 14% | | | | | 30% | | | | | 33% | |
| |
(a) Calculated based on average shares outstanding during the period. (b) Commencement of operations on September 3, 2019. Total return is based on operations for a period that is less than a year. (c) Not annualized for periods less than one year (d) Annualized for periods less than one year | | | | | | |
| | | | | | | | | | | | | | | | | | | | | | | | | | | | | | | | | | | | | | | | | | | | | | | | | | | | | | | | | | | | | | | | | | | | | | |
| | | | | Income (Loss) from
Investment Operations: | | Less Distributions: | | | | | | | | Ratios to Average Net Assets: |
For the
Year or
Period Ended | | Net Asset
Value,
Beginning
of Period | | Net
Investment
Income
(Loss)(a) | | Net Gain
(Loss) on
Investments
(Realized and
Unrealized) | | Total from
Investment
Operations | | Distributions
from Net
Investment
Income | | Distributions
from Net
Realized
Gain | | Total
Distributions | | Net Asset
Value,
End of
Period | | Total
Return(c) | | Net Assets,
End of Period
(000’s) | | Expenses
Before
Advisory Fees
(Waived) and
Other Fees
(Reimbursed)/
Recouped(d) | | Expenses
After
Investment
Advisory
Fees
(Waived)(d) | | Expenses
After
Advisory Fees
(Waived) and
Other Fees
(Reimbursed)/
Recouped(d) | | Net
Investment
Income
(Loss)(d) |
|
| DoubleLine Multi-Asset Trend Fund (Consolidated) - Class I: | |
| 3/31/2024 | | | $ | 7.98 | | | | | 0.41 | | | | | 0.08 | | | | | 0.49 | | | | | (0.38 | ) | | | | — | | | | | (0.38 | ) | | | $ | 8.09 | | | | | 6.37 | % | | | $ | 12,996 | | | | | 1.41 | % | | | | 1.11 | % | | | | 0.34 | % | | | | 5.23 | % |
| 3/31/2023 | | | $ | 10.56 | | | | | 0.29 | | | | | (1.25 | ) | | | | (0.96 | ) | | | | (1.62 | ) | | | | — | | | | | (1.62 | ) | | | $ | 7.98 | | | | | (10.67 | )% | | | $ | 12,849 | | | | | 2.14 | % | | | | 1.87 | % | | | | 0.38 | % | | | | 3.21 | % |
| 3/31/2022 | | | $ | 9.87 | | | | | 0.17 | | | | | 0.73 | | | | | 0.90 | | | | | (0.20 | ) | | | | (0.01 | ) | | | | (0.21 | ) | | | $ | 10.56 | | | | | 9.12 | % | | | $ | 13,761 | | | | | 5.51 | % | | | | 5.21 | % | | | | 0.35 | % | | | | 1.68 | % |
| 3/31/2021(b) | | | $ | 10.00 | | | | | 0.01 | | | | | (0.13 | ) | | | | (0.12 | ) | | | | (0.01 | ) | | | | — | | | | | (0.01 | ) | | | $ | 9.87 | | | | | (1.15 | )% | | | $ | 10,547 | | | | | 11.70 | % | | | | 11.39 | % | | | | 0.34 | % | | | | 1.61 | % |
|
| DoubleLine Multi-Asset Trend Fund (Consolidated) - Class N: | |
| 3/31/2024 | | | $ | 7.99 | | | | | 0.38 | | | | | 0.08 | | | | | 0.46 | | | | | (0.36 | ) | | | | — | | | | | (0.36 | ) | | | $ | 8.09 | | | | | 5.97 | % | | | $ | 226 | | | | | 1.64 | % | | | | 1.34 | % | | | | 0.57 | % | | | | 4.84 | % |
| 3/31/2023 | | | $ | 10.56 | | | | | 0.27 | | | | | (1.24 | ) | | | | (0.97 | ) | | | | (1.60 | ) | | | | — | | | | | (1.60 | ) | | | $ | 7.99 | | | | | (10.78 | )% | | | $ | 365 | | | | | 2.43 | % | | | | 2.17 | % | | | | 0.64 | % | | | | 2.98 | % |
| 3/31/2022 | | | $ | 9.87 | | | | | 0.14 | | | | | 0.73 | | | | | 0.87 | | | | | (0.17 | ) | | | | (0.01 | ) | | | | (0.18 | ) | | | $ | 10.56 | | | | | 8.85 | % | | | $ | 205 | | | | | 6.04 | % | | | | 5.74 | % | | | | 0.60 | % | | | | 1.33 | % |
| 3/31/2021(b) | | | $ | 10.00 | | | | | 0.01 | | | | | (0.13 | ) | | | | (0.12 | ) | | | | (0.01 | ) | | | | — | | | | | (0.01 | ) | | | $ | 9.87 | | | | | (1.17 | )% | | | $ | 130 | | | | | 12.06 | % | | | | 11.75 | % | | | | 0.58 | % | | | | 1.52 | % |
| | | | | | | | | | | |
| | | | | | | | | | | | | | | | | | | | | | | For the Year or Period Ended |
| | | | | | | | | | | | | | | | | | | | | | | 3/31/2024 | | 3/31/2023 | | 3/31/2022 | | 3/31/2021 |
| | | | | | | | |
Portfolio turnover rate for all share classes(c) | | | | | | | | | | | | | | | | | | | | | | | | | 17% | | | | | 119% | | | | | 183% | | | | | 0% | |
|
(a) Calculated based on average shares outstanding during the period. (b) Commenced operations on February 26, 2021. Total return is based on operations for a period that is less than one year. (c) Not annualized for periods less than one year. (d) Annualized for periods less than one year. | |
| | | | |
| 130 | | DoubleLine Funds Trust | | The accompanying notes are an integral part of these financial statements. |
| | |
Notes to Financial Statements | | March 31, 2024 |
1. Organization
DoubleLine Funds Trust, a Delaware statutory trust (the “Trust”), is an open-end investment management company registered under the Investment Company Act of 1940, as amended (the “1940 Act”). The Trust consists of 17 funds, the DoubleLine Total Return Bond Fund, DoubleLine Core Fixed Income Fund, DoubleLine Emerging Markets Fixed Income Fund, DoubleLine Low Duration Bond Fund, DoubleLine Floating Rate Fund, DoubleLine Shiller Enhanced CAPE®, DoubleLine Flexible Income Fund, DoubleLine Low Duration Emerging Markets Fixed Income Fund, DoubleLine Long Duration Total Return Bond Fund, DoubleLine Strategic Commodity Fund, DoubleLine Global Bond Fund, DoubleLine Infrastructure Income Fund, DoubleLine Shiller Enhanced International CAPE®, DoubleLine Emerging Markets Local Currency Bond Fund, DoubleLine Income Fund and DoubleLine Multi-Asset Trend Fund (each, a “Fund” and, collectively, the “Funds”), along with DoubleLine Selective Credit Fund. For financial information related to the DoubleLine Selective Credit Fund, please refer to the DoubleLine Selective Credit Fund’s separate annual report.
Each Fund is classified as a diversified fund under the 1940 Act, except the DoubleLine Global Bond Fund and the DoubleLine Emerging Markets Local Currency Bond Fund, which are classified as non-diversified funds. Currently under the 1940 Act, a diversified fund generally may not, with respect to 75% of its total assets, invest more than 5% of its total assets in the securities of any one issuer or own more than 10% of the outstanding voting securities of such issuer (except, in each case, U.S. Government securities, cash, cash items and the securities of other investment companies). The remaining 25% of a fund’s total assets is not subject to this limitation.
The Funds’ investment objectives and dates each share class commenced operations are as follows:
| | | | | | | | | | | | | | | | | | | | | | | | | | | |
| | | | |
| | | | | | | | | Commencement of Operations |
| | | | | | |
| Fund Name | | | | Investment Objective | | | | I Shares | | N Shares | | R6 Shares |
| | | | | | |
DoubleLine Total Return Bond Fund | | | | | | | Maximize total return | | | | | | | | | 4/6/2010 | | | | | 4/6/2010 | | | | | 7/31/2019 | |
| | | | | | |
DoubleLine Core Fixed Income Fund | | | | | | | Maximize current income and total return | | | | | | | | | 6/1/2010 | | | | | 6/1/2010 | | | | | 7/31/2019 | |
| | | | | | |
DoubleLine Emerging Markets Fixed Income Fund | | | | | | | Seek high total return from current income and capital appreciation | | | | | | | | | 4/6/2010 | | | | | 4/6/2010 | | | | | — | |
| | | | | | |
DoubleLine Low Duration Bond Fund | | | | | | | Seek current income | | | | | | | | | 9/30/2011 | | | | | 9/30/2011 | | | | | 7/31/2019 | |
| | | | | | |
DoubleLine Floating Rate Fund | | | | | | | Seek a high level of current income | | | | | | | | | 2/1/2013 | | | | | 2/1/2013 | | | | | — | |
| | | | | | |
DoubleLine Shiller Enhanced CAPE® | | | | | | | Seek total return which exceeds the total return of its benchmark index over a full market cycle | | | | | | | | | 10/31/2013 | | | | | 10/31/2013 | | | | | 7/31/2019 | |
| | | | | | |
DoubleLine Flexible Income Fund | | | | | | | Seek long-term total return while striving to generate current income | | | | | | | | | 4/7/2014 | | | | | 4/7/2014 | | | | | 7/31/2019 | |
| | | | | | |
DoubleLine Low Duration Emerging Markets Fixed Income Fund | | | | | | | Seek long-term total return | | | | | | | | | 4/7/2014 | | | | | 4/7/2014 | | | | | — | |
| | | | | | |
DoubleLine Long Duration Total Return Bond Fund | | | | | | | Seek long-term total return | | | | | | | | | 12/15/2014 | | | | | 12/15/2014 | | | | | — | |
| | | | | | |
DoubleLine Strategic Commodity Fund (Consolidated) | | | | | | | Seek long-term total return | | | | | | | | | 5/18/2015 | | | | | 5/18/2015 | | | | | — | |
| | | | | | |
DoubleLine Global Bond Fund | | | | | | | Seek long-term total return | | | | | | | | | 12/17/2015 | | | | | 12/17/2015 | | | | | — | |
| | | | | | |
DoubleLine Infrastructure Income Fund | | | | | | | Seek long-term total return while striving to generate current income | | | | | | | | | 4/1/2016 | | | | | 4/1/2016 | | | | | — | |
| | | | | | |
DoubleLine Shiller Enhanced International CAPE® | | | | | | | Seek total return which exceeds the total return of its benchmark index over a full market cycle | | | | | | | | | 12/23/2016 | | | | | 12/23/2016 | | | | | — | |
| | | | | | |
DoubleLine Emerging Markets Local Currency Bond Fund | | | | | | | Seek high total return from current income and capital appreciation | | | | | | | | | 6/28/2019 | | | | | 6/28/2019 | | | | | — | |
| | | | | | |
DoubleLine Income Fund | | | | | | | Maximize total return through investment principally in income-producing securities | | | | | | | | | 9/3/2019 | | | | | 9/3/2019 | | | | | — | |
| | | | | | |
DoubleLine Multi-Asset Trend Fund (Consolidated) | | | | | | | Seek total return (capital appreciation and current income) which exceeds the total return of its benchmark index over a full market cycle | | | | | | | | | 2/26/2021 | | | | | 2/26/2021 | | | | | — | |
The fiscal year end for the Funds is March 31, and the period covered by these financial statements is for the period ended March 31, 2024 (the “period end”).
| | | | | | | | | | |
| | | | Annual Report | | | | | March 31, 2024 | | 131 |
| | |
Notes to Financial Statements (Cont.) | | |
2. Significant Accounting Policies
Each Fund is an investment company that applies the accounting and reporting guidance issued in Topic 946, “Financial Services— Investment Companies”, by the Financial Accounting Standards Board (“FASB”). The following is a summary of the significant accounting policies of the Funds. These policies are in conformity with accounting principles generally accepted in the United States of America (“US GAAP”).
A. Security Valuation. The Funds have adopted US GAAP fair value accounting standards which establish a definition of fair value and set out a hierarchy for measuring fair value. These standards require additional disclosures about the various inputs and valuation techniques used to develop the measurements of fair value and a discussion of changes in valuation techniques and related inputs during the period. These inputs are summarized in the three broad levels listed below:
| | • | | Level 1—Unadjusted quoted market prices in active markets for identical securities |
| | • | | Level 2—Quoted prices for identical or similar assets in markets that are not active, or inputs derived from observable market data |
| | • | | Level 3—Significant unobservable inputs (including the reporting entity’s estimates and assumptions) |
Valuations for domestic and foreign fixed income securities are normally determined on the basis of evaluations provided by independent pricing services. Vendors typically value such securities based on one or more inputs described in the following table which is not intended to be a complete list. The table provides examples of inputs that are commonly relevant for valuing particular classes of fixed income securities in which the Funds are authorized to invest. However, these classifications are not exclusive, and any of the inputs may be used to value any other class of fixed-income securities. Securities that use similar valuation techniques and inputs as described in the following table are categorized as Level 2 of the fair value hierarchy. To the extent the significant inputs are unobservable, the values generally would be categorized as Level 3. Assets and liabilities may be transferred between levels.
| | | | | | |
| | |
| Fixed-income class | | | | | Examples of Inputs |
| | |
All | | | | | | Benchmark yields, transactions, bids, offers, quotations from dealers and trading systems, new issues, spreads and other relationships observed in the markets among comparable securities; and proprietary pricing models such as yield measures calculated using factors such as cash flows, financial or collateral performance and other reference data (collectively referred to as “standard inputs”) |
| | |
Corporate bonds and notes; convertible securities | | | | | | Standard inputs and underlying equity of the issuer |
| | |
US bonds and notes of government and government agencies | | | | | | Standard inputs |
| | |
Residential and commercial mortgage-backed obligations; asset-backed obligations (including collateralized loan obligations) | | | | | | Standard inputs and cash flows, prepayment information, default rates, delinquency and loss assumptions, collateral characteristics, credit enhancements and specific deal information, trustee reports |
| | |
Bank loans | | | | | | Standard inputs |
Investments in registered open-end management investment companies will be valued based upon the net asset value (“NAV”) of such investments and are categorized as Level 1 of the fair value hierarchy.
Common stocks, exchange-traded funds and financial derivative instruments, such as futures contracts or options contracts, that are traded on a national securities or commodities exchange, are typically valued at the last reported sales price, in the case of common stocks and exchange-traded funds, or, in the case of futures contracts or options contracts, the settlement price determined by the relevant exchange. To the extent these securities are actively traded and valuation adjustments are not applied, they are categorized as Level 1 of the fair value hierarchy.
Over-the-counter financial derivative instruments, such as forward currency exchange contracts, options contracts, or swap agreements, derive their values from underlying asset prices, indices, reference rates, other inputs or a combination of these factors. These instruments are normally valued on the basis of valuations obtained from counterparties, published index closing levels or evaluated prices supplied by independent pricing services, some or all of which may be based on market data from trading on exchanges that closed significantly before the time as of which a Fund calculates its NAV. Forward foreign currency contracts are generally valued based on rates provided by independent data providers. Exchange traded futures and options on futures are generally valued at the settlement price determined by the relevant exchange on which they principally trade, and exchange traded options are generally valued at the last trade price on the exchange on which they principally trade. A Fund does not normally take into account trading, clearances or settlements that take place after the close of the principal exchange or market on which such securities are traded. Depending on the instrument and the terms of the transaction, the value of the derivative instruments can be estimated by a pricing service provider using a series of techniques, such as simulation pricing models. The pricing models use issuer details and other inputs that are observed from actively quoted markets such as indices, spreads, interest
| | | | | | | | | | |
| 132 | | DoubleLine Funds Trust | | | | | | | | |
rates, curves, dividends and exchange rates. Derivatives that use similar valuation techniques and inputs as described above are normally categorized as Level 2 of the fair value hierarchy.
The Board of Trustees (the “Board”) has adopted a pricing and valuation policy for use by each Fund and its Valuation Designee (as defined below) in calculating each Fund’s NAV. Pursuant to Rule 2a-5 under the 1940 Act, each Fund has designated its primary investment adviser, either DoubleLine Capital LP (“DoubleLine Capital”) or DoubleLine Alternatives LP (“DoubleLine Alternatives”) (each, an “Adviser” and collectively, the “Advisers”), as applicable, as the “Valuation Designee” to perform all of the fair value determinations as well as to perform all of the responsibilities that may be performed by the Valuation Designee in accordance with Rule 2a-5. Each Adviser, as Valuation Designee, is authorized to make all necessary determinations of the fair values of portfolio securities and other assets for which market quotations are not readily available or if it is deemed that the prices obtained from brokers and dealers or independent pricing services are unreliable.
The following is a summary of the fair valuations according to the inputs used to value the Funds’ investments as of March 31, 2024:
| | | | | | | | | | | | | | | | | | | | | | | | | | | | | | | | | | | |
| | | | | | | |
| Category | | | | DoubleLine Total Return Bond Fund | | DoubleLine Core Fixed Income Fund | | DoubleLine Emerging Markets Fixed Income Fund | | DoubleLine Low Duration Bond Fund | | DoubleLine Floating Rate Fund | | DoubleLine Shiller Enhanced CAPE® |
| | | | | | | |
Investments in Securities | | | | | | | | | | | | | | | | | | | | | | | | | | | | | | | | | | | |
| | | | | | | |
Level 1 | | | | | | | | | | | | | | | | | | | | | | | | | | | | | | | | | | | |
| | | | | | | |
Short Term Investments | | | | | | | | $ | 633,460,140 | | | | $ | 155,989,824 | | | | $ | 3,929,291 | | | | $ | 166,985,268 | | | | $ | 22,119,033 | | | | $ | 123,710,118 | |
| | | | | | | |
Affiliated Mutual Funds | | | | | | | | | — | | | | | 445,384,751 | | | | | — | | | | | — | | | | | — | | | | | — | |
| | | | | | | |
Warrants | | | | | | | | | — | | | | | 5,881 | | | | | — | | | | | — | | | | | — | | | | | — | |
| | | | | | | |
Total Level 1 | | | | | | | | | 633,460,140 | | | | | 601,380,456 | | | | | 3,929,291 | | | | | 166,985,268 | | | | | 22,119,033 | | | | | 123,710,118 | |
| | | | | | | |
Level 2 | | | | | | | | | | | | | | | | | | | | | | | | | | | | | | | | | | | |
| | | | | | | |
US Government and Agency Mortgage Backed Obligations | | | | | | | | | 15,706,414,976 | | | | | 1,436,058,574 | | | | | — | | | | | 148,438,937 | | | | | — | | | | | 101,955,081 | |
| | | | | | | |
Non-Agency Residential Collateralized Mortgage Obligations | | | | | | | | | 7,852,786,685 | | | | | 758,805,812 | | | | | — | | | | | 733,718,377 | | | | | — | | | | | 425,871,039 | |
| | | | | | | |
Non-Agency Commercial Mortgage Backed Obligations | | | | | | | | | 2,267,472,860 | | | | | 368,566,209 | | | | | — | | | | | 805,312,133 | | | | | — | | | | | 480,357,115 | |
| | | | | | | |
US Government and Agency Obligations | | | | | | | | | 1,804,976,028 | | | | | 1,486,111,327 | | | | | — | | | | | 1,318,269,348 | | | | | — | | | | | 994,572,226 | |
| | | | | | | |
Asset Backed Obligations | | | | | | | | | 1,339,098,286 | | | | | 238,587,993 | | | | | — | | | | | 399,499,287 | | | | | — | | | | | 292,587,022 | |
| | | | | | | |
Collateralized Loan Obligations | | | | | | | | | 1,056,190,836 | | | | | 228,620,105 | | | | | — | | | | | 787,479,336 | | | | | 4,016,975 | | | | | 543,082,857 | |
| | | | | | | |
US Corporate Bonds | | | | | | | | | — | | | | | 1,050,592,366 | | | | | — | | | | | 395,516,698 | | | | | 6,893,465 | | | | | 262,815,736 | |
| | | | | | | |
Foreign Corporate Bonds | | | | | | | | | — | | | | | 426,881,852 | | | | | 390,897,594 | | | | | 490,705,581 | | | | | — | | | | | 214,735,867 | |
| | | | | | | |
Bank Loans | | | | | | | | | — | | | | | 221,121,496 | | | | | — | | | | | 195,414,169 | | | | | 153,757,081 | | | | | 206,500,952 | |
| | | | | | | |
Foreign Government Bonds, Foreign Agencies and Foreign Government Sponsored Corporations | | | | | | | | | — | | | | | 49,771,887 | | | | | 89,076,778 | | | | | 99,658,459 | | | | | — | | | | | 28,147,187 | |
| | | | | | | |
Short Term Investments | | | | | | | | | — | | | | | — | | | | | — | | | | | 56,031,716 | | | | | — | | | | | 116,377,063 | |
| | | | | | | |
Total Level 2 | | | | | | | | | 30,026,939,671 | | | | | 6,265,117,621 | | | | | 479,974,372 | | | | | 5,430,044,041 | | | | | 164,667,521 | | | | | 3,667,002,145 | |
| | | | | | | |
Level 3 | | | | | | | | | | | | | | | | | | | | | | | | | | | | | | | | | | | |
| | | | | | | |
Non-Agency Residential Collateralized Mortgage Obligations | | | | | | | | | 239,065,369 | | | | | 658,232 | | | | | — | | | | | 383,779 | | | | | — | | | | | 9,821,909 | |
| | | | | | | |
Asset Backed Obligations | | | | | | | | | 15,320,447 | | | | | 629,198 | | | | | — | | | | | 25,130,000 | | | | | — | | | | | — | |
| | | | | | | |
Collateralized Loan Obligations | | | | | | | | | 452,307 | | | | | 2,496,166 | | | | | — | | | | | — | | | | | — | | | | | 50,093 | |
| | | | | | | |
Common Stocks | | | | | | | | | — | | | | | 741,433 | | | | | — | | | | | — | | | | | 204,397 | | | | | 84,804 | |
| | | | | | | |
Bank Loans | | | | | | | | | — | | | | | 483,530 | | | | | — | | | | | — | | | | | 387,201 | | | | | — | |
| | | | | | | |
Foreign Corporate Bonds | | | | | | | | | — | | | | | 276,078 | | | | | 489,745 | | | | | 236,287 | | | | | — | | | | | 103,498 | |
| | | | | | | |
Non-Agency Commercial Mortgage Backed Obligations | | | | | | | | | — | | | | | — | | | | | — | | | | | — | | | | | — | | | | | 6,847,949 | |
| | | | | | | |
Total Level 3 | | | | | | | | | 254,838,123 | | | | | 5,284,637 | | | | | 489,745 | | | | | 25,750,066 | | | | | 591,598 | | | | | 16,908,253 | |
| | | | | | | |
Total | | | | | | | | $ | 30,915,237,934 | | | | $ | 6,871,782,714 | | | | $ | 484,393,408 | | | | $ | 5,622,779,375 | | | | $ | 187,378,152 | | | | $ | 3,807,620,516 | |
| | | | | | | |
Other Financial Instruments | | | | | | | | | | | | | | | | | | | | | | | | | | | | | | | | | | | |
| | | | | | | |
Level 1 | | | | | | | | | | | | | | | | | | | | | | | | | | | | | | | | | | | |
| | | | | | | |
Futures Contracts | | | | | | | | $ | (15,322,067 | ) | | | $ | (7,326,257 | ) | | | $ | — | | | | $ | — | | | | $ | — | | | | $ | — | |
| | | | | | | |
Total Level 1 | | | | | | | | | (15,322,067 | ) | | | | (7,326,257 | ) | | | | — | | | | | — | | | | | — | | | | | — | |
| | | | | | | |
Level 2 | | | | | | | | | | | | | | | | | | | | | | | | | | | | | | | | | | | |
| | | | | | | |
Excess Return Swaps | | | | | | | | | — | | | | | — | | | | | — | | | | | — | | | | | — | | | | | 404,068,626 | |
| | | | | | | |
Total Level 2 | | | | | | | | | — | | | | | — | | | | | — | | | | | — | | | | | — | | | | | 404,068,626 | |
| | | | | | | |
Level 3 | | | | | | | | | — | | | | | — | | | | | — | | | | | — | | | | | — | | | | | — | |
| | | | | | | |
Total | | | | | | | | $ | (15,322,067 | ) | | | $ | (7,326,257 | ) | | | $ | — | | | | $ | — | | | | $ | — | | | | $ | 404,068,626 | |
| | | | | | | | | | |
| | | | Annual Report | | | | | March 31, 2024 | | 133 |
| | |
Notes to Financial Statements (Cont.) | | |
| | | | | | | | | | | | | | | | | | | | | | | | | | | | | | | | | | | |
| | | | | | | |
| Category | | | | DoubleLine Flexible Income Fund | | DoubleLine Low Duration Emerging Markets Fixed Income Fund | | DoubleLine Long Duration Total Return Bond Fund | | DoubleLine Strategic Commodity Fund (Consolidated) | | DoubleLine Global Bond Fund | | DoubleLine Infrastructure Income Fund |
| | | | | | | |
Investments in Securities | | | | | | | | | | | | | | | | | | | | | | | | | | | | | | | | | | | |
| | | | | | | |
Level 1 | | | | | | | | | | | | | | | | | | | | | | | | | | | | | | | | | | | |
| | | | | | | |
Short Term Investments | | | | | | | | $ | 23,291,184 | | | | $ | 1,477,545 | | | | $ | 1,170,276 | | | | $ | 13,595,736 | | | | $ | 4,881,069 | | | | $ | 5,637,194 | |
| | | | | | | |
Warrants | | | | | | | | | 663 | | | | | — | | | | | — | | | | | — | | | | | — | | | | | — | |
| | | | | | | |
Total Level 1 | | | | | | | | | 23,291,847 | | | | | 1,477,545 | | | | | 1,170,276 | | | | | 13,595,736 | | | | | 4,881,069 | | | | | 5,637,194 | |
| | | | | | | |
Level 2 | | | | | | | | | | | | | | | | | | | | | | | | | | | | | | | | | | | |
| | | | | | | |
Non-Agency Residential Collateralized Mortgage Obligations | | | | | | | | | 167,085,797 | | | | | — | | | | | — | | | | | — | | | | | — | | | | | — | |
| | | | | | | |
Collateralized Loan Obligations | | | | | | | | | 162,498,800 | | | | | — | | | | | — | | | | | — | | | | | — | | | | | — | |
| | | | | | | |
Short Term Investments | | | | | | | | | 139,364,130 | | | | | — | | | | | — | | | | | 139,491,351 | | | | | 1,680,917 | | | | | — | |
| | | | | | | |
Non-Agency Commercial Mortgage Backed Obligations | | | | | | | | | 85,624,537 | | | | | — | | | | | — | | | | | — | | | | | — | | | | | — | |
| | | | | | | |
US Government and Agency Mortgage Backed Obligations | | | | | | | | | 83,908,353 | | | | | — | | | | | 46,266,779 | | | | | — | | | | | — | | | | | — | |
| | | | | | | |
Bank Loans | | | | | | | | | 83,898,589 | | | | | — | | | | | — | | | | | — | | | | | — | | | | | — | |
| | | | | | | |
US Government and Agency Obligations | | | | | | | | | 59,572,706 | | | | | — | | | | | 11,390,147 | | | | | — | | | | | 54,112,195 | | | | | 31,932,117 | |
| | | | | | | |
Foreign Corporate Bonds | | | | | | | | | 49,021,625 | | | | | 133,047,962 | | | | | — | | | | | — | | | | | — | | | | | 36,470,044 | |
| | | | | | | |
Asset Backed Obligations | | | | | | | | | 39,023,284 | | | | | — | | | | | — | | | | | — | | | | | — | | | | | 144,217,024 | |
| | | | | | | |
US Corporate Bonds | | | | | | | | | 36,688,390 | | | | | — | | | | | — | | | | | — | | | | | — | | | | | 137,159,409 | |
| | | | | | | |
Foreign Government Bonds, Foreign Agencies and Foreign Government Sponsored Corporations | | | | | | | | | 10,083,658 | | | | | 22,111,876 | | | | | — | | | | | — | | | | | 81,574,909 | | | | | 6,593,887 | |
| | | | | | | |
Total Level 2 | | | | | | | | | 916,769,869 | | | | | 155,159,838 | | | | | 57,656,926 | | | | | 139,491,351 | | | | | 137,368,021 | | | | | 356,372,481 | |
| | | | | | | |
Level 3 | | | | | | | | | | | | | | | | | | | | | | | | | | | | | | | | | | | |
| | | | | | | |
Non-Agency Residential Collateralized Mortgage Obligations | | | | | | | | | 6,848,140 | | | | | — | | | | | — | | | | | — | | | | | — | | | | | — | |
| | | | | | | |
Asset Backed Obligations | | | | | | | | | 6,010,661 | | | | | — | | | | | — | | | | | — | | | | | — | | | | | — | |
| | | | | | | |
Collateralized Loan Obligations | | | | | | | | | 4,736,284 | | | | | — | | | | | — | | | | | — | | | | | — | | | | | — | |
| | | | | | | |
Non-Agency Commercial Mortgage Backed Obligations | | | | | | | | | 2,098,353 | | | | | — | | | | | — | | | | | — | | | | | — | | | | | — | |
| | | | | | | |
Common Stocks | | | | | | | | | 180,092 | | | | | — | | | | | — | | | | | — | | | | | — | | | | | — | |
| | | | | | | |
Bank Loans | | | | | | | | | 105,726 | | | | | — | | | | | — | | | | | — | | | | | — | | | | | — | |
| | | | | | | |
Foreign Corporate Bonds | | | | | | | | | 71,015 | | | | | 69,494 | | | | | — | | | | | — | | | | | — | | | | | 1,969,965 | |
| | | | | | | |
Total Level 3 | | | | | | | | | 20,050,271 | | | | | 69,494 | | | | | — | | | | | — | | | | | — | | | | | 1,969,965 | |
| | | | | | | |
Total | | | | | | | | $ | 960,111,987 | | | | $ | 156,706,877 | | | | $ | 58,827,202 | | | | $ | 153,087,087 | | | | $ | 142,249,090 | | | | $ | 363,979,640 | |
| | | | | | | |
Other Financial Instruments | | | | | | | | | | | | | | | | | | | | | | | | | | | | | | | | | | | |
| | | | | | | |
Level 1 | | | | | | | | | | | | | | | | | | | | | | | | | | | | | | | | | | | |
| | | | | | | |
Futures Contracts | | | | | | | | $ | — | | | | $ | — | | | | $ | 234,656 | | | | $ | — | | | | $ | — | | | | $ | — | |
| | | | | | | |
Total Level 1 | | | | | | | | | — | | | | | — | | | | | 234,656 | | | | | — | | | | | — | | | | | — | |
| | | | | | | |
Level 2 | | | | | | | | | | | | | | | | | | | | | | | | | | | | | | | | | | | |
| | | | | | | |
Excess Return Swaps | | | | | | | | | — | | | | | — | | | | | — | | | | | 5,071,550 | | | | | — | | | | | — | |
| | | | | | | |
Total Level 2 | | | | | | | | | — | | | | | — | | | | | — | | | | | 5,071,550 | | | | | — | | | | | — | |
| | | | | | | |
Level 3 | | | | | | | | | — | | | | | — | | | | | — | | | | | — | | | | | — | | | | | — | |
| | | | | | | |
Total | | | | | | | | $ | — | | | | $ | — | | | | $ | 234,656 | | | | $ | 5,071,550 | | | | $ | — | | | | $ | — | |
| | | | | | | | | | |
| 134 | | DoubleLine Funds Trust | | | | | | | | |
| | | | | | | | | | | | | | | | | | | | | | | | | |
| | | | | |
| Category | | | | DoubleLine Shiller Enhanced International CAPE® | | Doubleline Emerging Markets Local
Currency Bond Fund | | Doubleline Income Fund | | DoubleLine Multi-Asset Trend Fund (Consolidated) |
| | | | | |
Investments in Securities | | | | | | | | | | | | | | | | | | | | | | | | | |
| | | | | |
Level 1 | | | | | | | | | | | | | | | | | | | | | | | | | |
| | | | | |
Affiliated Mutual Funds | | | | | | | | $ | 2,347,465 | | | | $ | — | | | | $ | — | | | | $ | 9,924,617 | |
| | | | | |
Short Term Investments | | | | | | | | | 458,358 | | | | | 275,668 | | | | | 16,223,046 | | | | | 1,423,452 | |
| | | | | |
Total Level 1 | | | | | | | | | 2,805,823 | | | | | 275,668 | | | | | 16,223,046 | | | | | 11,348,069 | |
| | | | | |
Level 2 | | | | | | | | | | | | | | | | | | | | | | | | | |
| | | | | |
US Government and Agency Obligations | | | | | | | | | 10,955,744 | | | | | — | | | | | — | | | | | 840,019 | |
| | | | | |
Collateralized Loan Obligations | | | | | | | | | 6,393,921 | | | | | — | | | | | 18,507,727 | | | | | — | |
| | | | | |
Non-Agency Residential Collateralized Mortgage Obligations | | | | | | | | | 5,917,198 | | | | | — | | | | | 21,108,208 | | | | | — | |
| | | | | |
Non-Agency Commercial Mortgage Backed Obligations | | | | | | | | | 5,449,003 | | | | | — | | | | | 14,181,746 | | | | | — | |
| | | | | |
Asset Backed Obligations | | | | | | | | | 3,356,283 | | | | | — | | | | | 4,589,264 | | | | | — | |
| | | | | |
US Corporate Bonds | | | | | | | | | 3,127,972 | | | | | — | | | | | — | | | | | — | |
| | | | | |
Foreign Corporate Bonds | | | | | | | | | 2,366,461 | | | | | 2,658,377 | | | | | — | | | | | — | |
| | | | | |
US Government and Agency Mortgage Backed Obligations | | | | | | | | | 1,434,204 | | | | | — | | | | | 6,514,882 | | | | | — | |
| | | | | |
Short Term Investments | | | | | | | | | 466,930 | | | | | — | | | | | 1,973,380 | | | | | — | |
| | | | | |
Foreign Government Bonds, Foreign Agencies and Foreign Government Sponsored Corporations | | | | | | | | | 363,575 | | | | | 9,480,583 | | | | | — | | | | | — | |
| | | | | |
Total Level 2 | | | | | | | | | 39,831,291 | | | | | 12,138,960 | | | | | 66,875,207 | | | | | 840,019 | |
| | | | | |
Level 3 | | | | | | | | | | | | | | | | | | | | | | | | | |
| | | | | |
Asset Backed Obligations | | | | | | | | | — | | | | | — | | | | | 3,107,719 | | | | | — | |
| | | | | |
Total Level 3 | | | | | | | | | — | | | | | — | | | | | 3,107,719 | | | | | — | |
| | | | | |
Total | | | | | | | | $ | 42,637,114 | | | | $ | 12,414,628 | | | | $ | 86,205,972 | | | | $ | 12,188,088 | |
| | | | | |
Other Financial Instruments | | | | | | | | | | | | | | | | | | | | | | | | | |
| | | | | |
Level 1 | | | | | | | | $ | — | | | | $ | — | | | | $ | — | | | | $ | — | |
| | | | | |
Level 2 | | | | | | | | | | | | | | | | | | | | | | | | | |
| | | | | |
Excess Return Swaps | | | | | | | | | 3,202,534 | | | | | — | | | | | — | | | | | (85,730 | ) |
| | | | | |
Forward Currency Exchange Contracts | | | | | | | | | 23,911 | | | | | — | | | | | — | | | | | — | |
| | | | | |
Total Level 2 | | | | | | | | | 3,226,445 | | | | | — | | | | | — | | | | | (85,730 | ) |
| | | | | |
Level 3 | | | | | | | | | — | | | | | — | | | | | — | | | | | — | |
| | | | | |
Total | | | | | | | | $ | 3,226,445 | | | | $ | — | | | | $ | — | | | | $ | (85,730 | ) |
See the Schedules of Investments for further disaggregation of investment categories.
| | | | | | | | | | |
| | | | Annual Report | | | | | March 31, 2024 | | 135 |
| | |
Notes to Financial Statements (Cont.) | | |
The following is a reconciliation of investments in which significant unobservable inputs (Level 3) were used in determining fair value:
| | | | | | | | | | | | | | | | | | | | | | | | | | | | | | | | | | | | | | | | | | | | | | | | | | |
| | | | | | | | | | |
DoubleLine Flexible
Income Fund | | Fair Value as of
March 31, 2023 | | Net Realized
Gain (Loss) | | Net Change in
Unrealized
Appreciation
(Depreciation)(c) | | Net Accretion
(Amortization) | | Purchases(a) | | Sales(b) | | Transfers Into Level 3(d) | | Transfers Out of Level 3(d) | | Fair Value as
of March 31, 2024 | | Net Change in
Unrealized
Appreciation
(Depreciation)
on securities
held at
March 31, 2024(c) |
Investments in Securities | | | | | | | | | | | | | | | | | | | | | | | | | | | | | | | | | | | | | | | | | | | | | | | | | | |
Non-Agency Residential Collateralized Mortgage Obligations | | | $ | 7,119,685 | | | | $ | 29,772 | | | | $ | 4,546 | | | | $ | 60,857 | | | | $ | — | | | | $ | (366,720 | ) | | | $ | — | | | | $ | — | | | | $ | 6,848,140 | | | | $ | 6,314 | |
Asset Backed Obligations | | | | 8,405,530 | | | | | (1,663,268 | ) | | | | (775,120 | ) | | | | — | | | | | 672,041 | | | | | (628,522 | ) | | | | — | | | | | — | | | | | 6,010,661 | | | | | (927,984 | ) |
Collateralized Loan Obligations | | | | 1,520,905 | | | | | — | | | | | 192,565 | | | | | 673 | | | | | 24,669 | | | | | — | | | | | 2,997,472 | | | | | — | | | | | 4,736,284 | | | | | 211,257 | |
Non-Agency Commercial Mortgage Backed Obligations | | | | 983,389 | | | | | 2,243 | | | | | 100,300 | | | | | 7,329 | | | | | — | | | | | (100,038 | ) | | | | 1,105,130 | | | | | — | | | | | 2,098,353 | | | | | 78,475 | |
Common Stocks | | | | 290,300 | | | | | (86,829 | ) | | | | 140,439 | | | | | — | | | | | 20,803 | | | | | (184,621 | ) | | | | — | | | | | — | | | | | 180,092 | | | | | (4,620 | ) |
Bank Loans | | | | 107,055 | | | | | 380 | | | | | (5,335 | ) | | | | 4,954 | | | | | — | | | | | (1,328 | ) | | | | — | | | | | — | | | | | 105,726 | | | | | (4,918 | ) |
Foreign Corporate Bonds | | | | — | | | | | (156,987 | ) | | | | (116,016 | ) | | | | — | | | | | 394,450 | | | | | (50,432 | ) | | | | — | | | | | — | | | | | 71,015 | | | | | — | |
Rights | | | | 6,138 | | | | | 6,966 | | | | | (6,138 | ) | | | | — | | | | | — | | | | | (6,966 | ) | | | | — | | | | | — | | | | | — | | | | | — | |
Escrow Notes | | | | — | | | | | — | | | | | — | | | | | — | | | | | — | | | | | — | | | | | — | | | | | — | | | | | — | | | | | — | |
Warrants | | | | — | | | | | — | | | | | — | | | | | — | | | | | — | | | | | — | | | | | — | | | | | — | | | | | — | | | | | — | |
Total | | | $ | 18,433,002 | | | | $ | (1,867,723 | ) | | | $ | (464,759 | ) | | | $ | 73,813 | | | | $ | 1,111,963 | | | | $ | (1,338,627 | ) | | | $ | 4,102,602 | | | | $ | — | | | | $ | 20,050,271 | | | | $ | (641,476 | ) |
| | | | | | | | | | | | | | | | | | | | | | | | | | | | | | | | | | | | | | | | | | | | | | | | | | | | | | | |
| | | | | | | | | | | |
| DoubleLine Income Fund | | | | Fair Value as of
March 31, 2023 | | Net Realized
Gain (Loss) | | Net Change in
Unrealized
Appreciation
(Depreciation)(c) | | Net Accretion
(Amortization) | | Purchases(a) | | Sales(b) | | Transfers Into
Level 3(d) | | Transfers Out
of Level 3(d) | | Fair Value as
of March 31, 2024 | | Net Change in
Unrealized
Appreciation
(Depreciation)
on securities held at
March 31, 2024(c) |
Investments in Securities | | | | | | | | | | | | | | | | | | | | | | | | | | | | | | | | | | | | | | | | | | | | | | | | | | | | | | | |
Asset Backed Obligations | | | | | | | | $ | 4,079,163 | | | | $ | (2,048,798 | ) | | | $ | 2,359,690 | | | | $ | 1,914 | | | | $ | 1,357,435 | | | | $ | (2,641,685 | ) | | | $ | — | | | | $ | — | | | | $ | 3,107,719 | | | | $ | (18,007 | ) |
| (a) | Purchases include all purchases of securities, payups and corporate actions. |
| (b) | Sales include all sales of securities, maturities, and paydowns. |
| (c) | Any difference between Net Change in Unrealized Appreciation (Depreciation) and Net Change in Unrealized Appreciation (Depreciation) on securities held at March 31, 2024 may be due to a security that was not held or categorized as Level 3 at either period end. |
| (d) | Transfers into or out of Level 3 can be attributed to changes in the availability of pricing sources and/or in the observability of significant inputs used to measure the fair value of those instruments. |
| | | | | | | | | | |
| 136 | | DoubleLine Funds Trust | | | | | | | | |
The following is a summary of quantitative information about Level 3 Fair Value Measurements:
| | | | | | | | | | | | | | | | | | | | | | | | | | | | | | | | | | | | | | | | | | | | |
| | | | | | |
| DoubleLine Flexible Income Fund | | Fair Value as of
March 31, 2024 | | Valuation
Techniques | | Unobservable
Input | | Unobservable Input Values
(Weighted Average)(e) | | Impact to valuation from an increase to input | | |
| | | | | | |
Non-Agency Residential Collateralized Mortgage Obligations | | | $ | 6,848,140 | | | Market Comparables | | Market
Quotes | | | | $92.78 ($92.78 | ) | | Significant changes in the market quotes would have resulted in direct and proportional changes in the fair value of the security | | |
| | | | | | |
Asset Backed Obligations | | | $ | 6,010,661 | | | Market Comparables | | Market
Quotes | | | | $4.71-$88.04 ($55.67 | ) | | Significant changes in the market quotes would have resulted in direct and proportional changes in the fair value of the security | | |
| | | | | | |
Collateralized Loan Obligations | | | $ | 4,736,284 | | | Market Comparables | | Market
Quotes | | | | $20.50-$94.27 ($88.26 | ) | | Significant changes in the market quotes would have resulted in direct and proportional changes in the fair value of the security | | |
| | | | | | |
Non-Agency Commercial Mortgage Backed Obligations | | | $ | 2,098,353 | | | Market Comparables | | Market
Quotes | | | | $10.29-$82.94 ($58.39 | ) | | Significant changes in the market quotes would have resulted in direct and proportional changes in the fair value of the security | | |
| | | | | | |
Common Stocks | | | $ | 180,092 | | | Market Comparables | | Market
Quotes | | | | $8.45-$26.50 ($17.91 | ) | | Significant changes in the market quotes would have resulted in direct and proportional changes in the fair value of the security | | |
| | | | | | |
Bank Loans | | | $ | 105,726 | | | Market Comparables | | Market
Quotes | | | | $100.00 ($100.00 | ) | | Significant changes in the market quotes would have resulted in direct and proportional changes in the fair value of the security | | |
| | | | | | |
Foreign Corporate Bonds | | | $ | 71,015 | | | Market Comparables | | Market
Quotes | | | | $0.00-$92.34 ($55.11 | ) | | Significant changes in the market quotes would have resulted in direct and proportional changes in the fair value of the security | | |
| | | | | | | | | | | | | | | | | | | | | | | |
| | | | | | |
| DoubleLine Income Fund | | Fair Value as of
March 31, 2024 | | Valuation
Techniques | | Unobservable
Input | | Unobservable Input Values
(Weighted Average)(e) | | Impact to valuation from an increase to input | | |
| | | | | | |
Asset Backed Obligations | | | $ | 3,107,719 | | | Market Comparables | | Market
Quotes | | | | $31.72-$4,914.18 ($802.19 | ) | | Significant changes in the market quotes would have resulted in direct and proportional changes in the fair value of the security | | |
| (e) | Unobservable inputs were weighted by the relative fair value of the instruments. |
B. Federal Income Taxes. Each Fund has elected to be taxed as a “regulated investment company” and intends to distribute substantially all of its taxable income to its shareholders and otherwise comply with the provisions of Subchapter M of the Internal Revenue Code of 1986, as amended (the “Internal Revenue Code”), applicable to regulated investment companies. Therefore, no provision for U.S. federal income taxes has been made.
The Funds may be subject to a nondeductible 4% excise tax calculated as a percentage of certain undistributed amounts of net investment income and net capital gains.
The Funds have adopted financial reporting rules that require the Funds to analyze all open tax years, as defined by the applicable statute of limitations, for all major jurisdictions. Open tax years 2021-2023 (Federal) and 2020-2023 (CA/DE/FL) for the Funds, are those that are open for exam by taxing authorities to the extent that each Fund operated within those respective tax years. As of March 31, 2024, the Funds have no examinations in progress.
Management has analyzed the Funds’ tax positions, and has concluded that no liability should be recorded related to uncertain tax positions expected to be taken on the tax return for the fiscal year ended March 31, 2024. The Funds identify their major tax jurisdictions as U.S. Federal, the State of Delaware and the State of Florida. The Funds are not aware of any tax positions for which it is reasonably possible that the total amounts of unrecognized tax benefits will significantly change in the next twelve months.
Each Fund’s tax returns are subject to examination by relevant tax authorities until expiration of the applicable statute of limitations, which is generally three years after the filing of the tax return but which can be extended to six years in certain circumstances.
C. Security Transactions, Investment Income. Investment securities transactions are accounted for on trade date. Gains and losses realized on sales of securities are determined on a specific identification basis. Interest income, including non-cash interest,
| | | | | | | | | | |
| | | | Annual Report | | | | | March 31, 2024 | | 137 |
| | |
Notes to Financial Statements (Cont.) | | |
is recorded on an accrual basis. Discounts/premiums on debt securities purchased, which may include residual and subordinate notes, are accreted/amortized over the life of the respective securities using the effective interest method except for certain deep discount bonds where management does not expect the par value above the bond’s cost to be fully realized. Dividend income and corporate action transactions, if any, are recorded on the ex-date. Non-cash dividends included in dividend income, if any, are recorded at the fair market value of securities received. Paydown gains and losses on mortgage-related and other asset-backed securities are recorded as components of interest income on the Statements of Operations. Estimated tax liabilities on certain foreign securities are recorded on an accrual basis and are reflected as components of interest income on the Statements of Operations.
D. Foreign Currency Translation. The Funds’ books and records are maintained in U.S. dollars. Investment securities and other assets and liabilities denominated in foreign currencies are translated into U.S. dollars based on the exchange rate of such currencies against U.S. dollars on the date of valuation. Investment securities transactions, income and expense items denominated in foreign currencies are translated into U.S. dollars at the exchange rate in effect on the transaction date. The Funds do not isolate changes in the exchange rates from the changes in the market prices of investments held or sold for financial reporting purposes. Accordingly, the effects of changes in exchange rates on investments are not segregated in the Statement of Operations from the effects of changes in market prices of those investments, but are included as a component of net realized and unrealized gain (loss) from investments.
E. Dividends and Distributions to Shareholders. With the exception of the DoubleLine Strategic Commodity Fund, the DoubleLine Global Bond Fund and the DoubleLine Emerging Markets Local Currency Bond Fund, dividends from net investment income will be declared and paid monthly. Dividends from the net investment income of the DoubleLine Global Bond Fund and the DoubleLine Emerging Markets Local Currency Bond Fund will be declared and paid quarterly. Dividends from the net investment income of the DoubleLine Strategic Commodity Fund will be declared and paid annually. The Funds will distribute any net realized long or short-term capital gains at least annually. Distributions are recorded on the ex-dividend date.
Income and capital gain distributions are determined in accordance with income tax regulations which may differ from US GAAP. Permanent book and tax basis differences relating to shareholder distributions will result in reclassifications between paid-in capital, undistributed (accumulated) net investment income (loss), and/or undistributed (accumulated) realized gain (loss). Undistributed (accumulated) net investment income or loss may include temporary book and tax basis differences which will reverse in a subsequent period. Any taxable income or capital gain remaining at fiscal year end is distributed in the following year.
Distributions from investment companies will be classified as investment income or realized gains in the Statements of Operations based on the U.S. income tax characteristics of the distribution if such information is available. In cases where the tax characteristics are not available, such distributions are generally classified as investment income.
F. Use of Estimates. The preparation of financial statements in conformity with US GAAP requires management to make estimates and assumptions that affect the reported amounts of assets and liabilities and disclosure of contingent assets and liabilities at the date of the financial statements, as well as the reported amounts of revenues and expenses during the period. Actual results could differ from those estimates.
G. Share Valuation. The NAV per share of a class of shares of a Fund is calculated by dividing the sum of the value of the securities held by the Fund, plus cash and other assets, attributable to that class, minus all liabilities (including estimated accrued expenses), attributable to that class by the total number of shares of that class outstanding, rounded to the nearest cent. The Funds’ NAV is typically calculated on days when the New York Stock Exchange opens for regular trading.
H. Unfunded Loan Commitments. The Funds may enter into certain credit agreements, of which all or a portion may be unfunded. The Funds are obligated to fund these commitments at the borrower’s discretion.
When unfunded loan commitments are outstanding at the end of the period, the Funds maintain with their custodian liquid investments having an aggregate value at least equal to the par value of their respective unfunded loan commitments and bridge loans.
As of March 31, 2024, there were no unfunded loan commitments outstanding by the Funds.
I. Guarantees and Indemnifications. Under the Trust’s organizational documents, each Trustee and officer of the Funds is indemnified, to the extent permitted by the 1940 Act, against certain liabilities that may arise out of performance of their duties to the Fund. Additionally, in the normal course of business, the Funds enter into contracts that contain a variety of indemnification
| | | | | | | | | | |
| 138 | | DoubleLine Funds Trust | | | | | | | | |
clauses. Each Fund’s maximum exposure under these arrangements is unknown as this would involve future claims that may be made against the Funds that have not yet occurred. However, the Funds have not had prior claims or losses pursuant to these contracts.
J. Basis for Consolidation. The DoubleLine Strategic Commodity Fund and the DoubleLine Multi-Asset Trend Fund may invest up to 25% of their total assets in the DoubleLine Strategic Commodity, Ltd. and the DoubleLine Multi-Asset Trend Fund, Ltd. (each, a
“Subsidiary” and, collectively, the “Subsidiaries”), respectively. The Subsidiaries, which are organized under the laws of the Cayman Islands, are wholly-owned and controlled by each respective Fund. Each Subsidiary invests in commodity-related investments and other investments. The consolidated financial statements include the accounts and balances of each Fund and its respective Subsidiary. Intercompany balances and transactions have been eliminated in consolidation.
As of March 31, 2024, the relationship of the Subsidiary to each respective Fund was as follows:
| | | | | | | | | | | | | | | |
| | | |
| | | | | DoubleLine
Strategic
Commodity
Fund
(Consolidated) | | DoubleLine
Multi-Asset
Trend Fund
(Consolidated) |
| | | |
Commencement of Operations | | | | | | | | | 5/18/2015 | | | | | 2/26/2021 | |
| | | |
Fund Net Assets | | | | | | | | $ | 149,148,395 | | | | $ | 13,222,055 | |
| | | |
Subsidiary % of Fund Net Assets | | | | | | | | | 21.49% | | | | | 10.73% | |
| | | |
Subsidiary Financial Statement Information | | | | | | | | | | | | | | | |
| | | |
Net Assets | | | | | | | | $ | 32,051,547 | | | | $ | 1,418,990 | |
| | | |
Total Income | | | | | | | | | 1,925,632 | | | | | 82,965 | |
| | | |
Net Realized Gain/(Loss) | | | | | | | | | (5,470,800 | ) | | | | (936,189 | ) |
K. Other. Each share class of a Fund is charged for those expenses that are directly attributable to that share class. Expenses that are not directly attributable to a Fund are allocated among all appropriate Funds in proportion to their respective net assets or in such a manner as the Funds’ Board may in its sole discretion consider fair and equitable to each Fund. Investment income, Fund expenses which are not class-specific, and realized and unrealized gains and losses are allocated directly to each class based upon the relative net assets of the classes.
3. Related and Other Party Transactions
The Advisers provide the Funds with investment management services under Investment Management Agreements (the “Agreements”). Under the Agreements, each Adviser manages the investment of the assets of the applicable Fund, places orders for the purchase and sale of its portfolio securities and is responsible for providing certain resources to assist with the day-to-day management of the Trust’s business affairs. As compensation for its services, each Adviser is entitled to a monthly fee at the annual rates of the average daily net assets of the Funds (the “Advisory Fee”) in the following table. Each Adviser has arrangements with DoubleLine Group LP to provide personnel and other resources to the Funds. On February 18, 2021, DoubleLine Alternatives, the investment adviser of the DoubleLine Multi-Asset Trend Fund, engaged DoubleLine Capital to serve as sub-adviser to the DoubleLine Multi-Asset Trend Fund to manage its investment in debt instruments. Effective as of July 29, 2022, DoubleLine Alternatives became the investment adviser to DoubleLine Shiller Enhanced CAPE® and DoubleLine Capital became the sub-adviser to the Fund. Prior to July 29, 2022, DoubleLine Capital was the sole investment adviser to DoubleLine Shiller Enhanced CAPE®.
Each Adviser has contractually agreed to limit certain of the Funds’ ordinary operating expenses so that its ratio of such expenses to average net assets will not exceed the following ratios (the “Expense Caps”). For the purposes of the expense limitation agreement between each Adviser and the applicable Funds, “ordinary operating expenses” excludes taxes, commissions, mark-ups, litigation expenses, indemnification expenses, interest expenses, acquired fund fees and expenses, and any extraordinary expenses. Each
| | | | | | | | | | |
| | | | Annual Report | | | | | March 31, 2024 | | 139 |
| | |
Notes to Financial Statements (Cont.) | | |
applicable Fund’s expense limitation is expected to apply until at least August 1, 2025. Each applicable expense limitation may be terminated during the term only by a majority vote of the disinterested Trustees of the Board.
| | | | | | | | | | | | | | | | | | | | | | | | | |
| | | |
| | | | | | | Expense Caps |
| | | | | |
| | | | | Advisory Fee | | I Shares | | N Shares | | R6 Shares |
| | | | | |
DoubleLine Total Return Bond Fund | | | | | | | | | 0.40% | | | | | N/A | | | | | N/A | | | | | N/A | |
| | | | | |
DoubleLine Core Fixed Income Fund | | | | | | | | | 0.40% | | | | | N/A | | | | | N/A | | | | | N/A | |
| | | | | |
DoubleLine Emerging Markets Fixed Income Fund | | | | | | | | | 0.75% | | | | | 0.95% | | | | | 1.20% | | | | | N/A | |
| | | | | |
DoubleLine Low Duration Bond Fund | | | | | | | | | 0.35% | | | | | 0.47% | | | | | 0.72% | | | | | 0.42% | |
| | | | | |
DoubleLine Floating Rate Fund | | | | | | | | | 0.50% | | | | | 0.75% | | | | | 1.00% | | | | | N/A | |
| | | | | |
DoubleLine Shiller Enhanced CAPE® | | | | | | | | | 0.45% | | | | | 0.65% | | | | | 0.90% | | | | | 0.60% | |
| | | | | |
DoubleLine Flexible Income Fund | | | | | | | | | 0.62% | | | | | 0.82% | | | | | 1.07% | | | | | 0.77% | |
| | | | | |
DoubleLine Low Duration Emerging Markets Fixed Income Fund | | | | | | | | | 0.50% | | | | | 0.59% | | | | | 0.84% | | | | | N/A | |
| | | | | |
DoubleLine Long Duration Total Return Bond Fund | | | | | | | | | 0.35% | | | | | 0.50% | | | | | 0.75% | | | | | N/A | |
| | | | | |
DoubleLine Strategic Commodity Fund (Consolidated) | | | | | | | | | 0.90% | | | | | 1.10% | | | | | 1.35% | | | | | N/A | |
| | | | | |
DoubleLine Global Bond Fund | | | | | | | | | 0.50% | | | | | 0.70% | | | | | 0.95% | | | | | N/A | |
| | | | | |
DoubleLine Infrastructure Income Fund | | | | | | | | | 0.50% | | | | | 0.65% | | | | | 0.90% | | | | | N/A | |
| | | | | |
DoubleLine Shiller Enhanced International CAPE® | | | | | | | | | 0.50% | | | | | 0.65% | | | | | 0.90% | | | | | N/A | |
| | | | | |
DoubleLine Emerging Markets Local Currency Bond Fund | | | | | | | | | 0.75% | | | | | 0.90% | | | | | 1.15% | | | | | N/A | |
| | | | | |
DoubleLine Income Fund | | | | | | | | | 0.50% | | | | | 0.65% | | | | | 0.90% | | | | | N/A | |
| | | | | |
DoubleLine Multi-Asset Trend Fund (Consolidated) | | | | | | | | | 0.50% | | | | | 0.65% | | | | | 0.90% | | | | | N/A | |
Other than as described above, to the extent that an Adviser waives its investment advisory fee and/or reimburses a Fund for other ordinary operating expenses, it may seek reimbursement of a portion or all of such amounts at any time within three fiscal years after the fiscal year in which such amounts were waived or reimbursed. Each Fund must pay its current ordinary operating expenses before each Adviser is entitled to any recoupment. Any such recoupment would be subject to review by the Board and will be subject to the Fund’s expense limitations in place when the fees were waived or the expenses were reimbursed.
Each Adviser, as applicable, contractually waived a portion of its fees or reimbursed certain operating expenses and may recapture a portion of the amounts no later than the dates as stated in the following table:
| | | | | | | | | | | | | | | | | | | | |
| | |
| | | | | March 31, |
| | | | |
| | | | | 2025 | | 2026 | | 2027 |
| | | | |
DoubleLine Emerging Markets Fixed Income Fund | | | | | | | | $ | — | | | | $ | — | | | | $ | 7,486 | |
| | | | |
DoubleLine Floating Rate Fund | | | | | | | | $ | — | | | | $ | — | | | | $ | 41 | |
| | | | |
DoubleLine Low Duration Emerging Markets Fixed Income Fund | | | | | | | | $ | 236,853 | | | | $ | 234,164 | | | | $ | 254,449 | |
| | | | |
DoubleLine Long Duration Total Return Bond Fund | | | | | | | | $ | 27,645 | | | | $ | 44,196 | | | | $ | 66,826 | |
| | | | |
DoubleLine Strategic Commodity Fund (Consolidated) | | | | | | | | $ | — | | | | $ | — | | | | $ | 18,057 | |
| | | | |
DoubleLine Shiller Enhanced International CAPE® | | | | | | | | $ | 120,695 | | | | $ | 170,757 | | | | $ | 132,622 | |
| | | | |
DoubleLine Emerging Markets Local Currency Fund | | | | | | | | $ | 182,623 | | | | $ | 137,372 | | | | $ | 171,745 | |
| | | | |
DoubleLine Income Fund | | | | | | | | $ | 100,221 | | | | $ | 129,356 | | | | $ | 120,118 | |
| | | | |
DoubleLine Multi-Asset Trend Fund (Consolidated) | | | | | | | | $ | 596,575 | | | | $ | 221,908 | | | | $ | 99,735 | |
For the year ended March 31, 2024, each Adviser recouped the amounts shown from the following Funds:
| | | | | | | | | | |
| | |
DoubleLine Global Bond Fund | | | | | | | | $ | 10,628 | |
| | | | | | | | | | |
| 140 | | DoubleLine Funds Trust | | | | | | | | |
If a Fund invested in other investment vehicles sponsored by an Adviser (“other DoubleLine Funds”) during the period, such Adviser waived its advisory fee to the Fund in an amount equal to the advisory fees paid to the Adviser by the other DoubleLine Funds in respect of Fund assets so invested. Accordingly, the Adviser waived the following fees for the year ended March 31, 2024:
| | | | | | | | | | |
| | |
DoubleLine Core Fixed Income Fund | | | | | | | | $ | 2,141,067 | |
| | |
DoubleLine Shiller Enhanced International CAPE® | | | | | | | | $ | 14,135 | |
| | |
DoubleLine Multi-Asset Trend Fund (Consolidated) | | | | | | | | $ | 39,275 | |
As of March 31, 2024, greater than 5% of the following DoubleLine Funds was held by other DoubleLine Funds as follows:
| | | | | | | | | | | | | | | |
| | | |
| Affiliated Fund Held | | | | % Owned | | Significant Owner |
| | | |
DoubleLine Long Duration Total Return Bond Fund | | | | | | | | | 55% | | | DoubleLine Core Fixed Income Fund | |
| | | |
DoubleLine Global Bond Fund | | | | | | | | | 75% | | | DoubleLine Core Fixed Income Fund | |
| | | |
DoubleLine Infrastructure Income Fund | | | | | | | | | 83% | | | DoubleLine Core Fixed Income Fund | |
DoubleLine Capital LP and certain DoubleLine affiliated advisers provide investment advisory, sub-advisory, or consulting services to a variety of investors, including investment program sponsors, separate accounts, and mutual funds sponsored by third parties
(collectively “third-party accounts”). Those services may result, directly or indirectly, in investments by the third-party accounts in one or more of the Funds. At times, the third-party accounts’ investments, individually or in the aggregate, may represent material interests in one or more of the Funds. The third-party accounts’ transaction activity in a Fund may cause a Fund to incur material transaction costs, to realize taxable gains distributable to shareholders, and/or to buy or sell assets at a time when the Fund might not otherwise do so, each of which may adversely affect a Fund’s performance. See the description of Large Shareholder Risk in the Principal Risks Note for more information. Records available to the Funds reflect that greater than 25% of the following Funds were held by third-party accounts as of March 31, 2024:
| | | | | | | | | | |
| | |
| | | | | % Owned |
| | |
DoubleLine Shiller Enhanced CAPE® | | | | | | | | | 51% | |
4. Distribution, Sales Charge and Redemption Fees
Class N shares of the Funds make payments under a distribution plan (the “Distribution Plan”) adopted pursuant to Rule 12b-1 under the 1940 Act. Pursuant to the Distribution Plan, each Fund compensates the Fund’s distributor for distribution and related services at an annual rate equal to 0.25% of the average daily net assets of the Fund attributable to its Class N shares. The fees may be used to pay the Fund’s distributor for distribution services and sales support services provided in connection with Class N shares.
The DoubleLine Floating Rate Fund imposes redemption fees. Redemption fees are paid to and retained by the Fund to limit the opportunity to market time the Fund and to help offset estimated portfolio transaction costs and other related costs incurred by the Fund as a result of short-term trading. Subject to the exceptions discussed in the Fund’s prospectus, the DoubleLine Floating Rate Fund will apply a redemption fee equal to 1% of the value of any shares redeemed within 90 calendar days of purchase.
| | | | | | | | | | |
| | | | Annual Report | | | | | March 31, 2024 | | 141 |
| | |
Notes to Financial Statements (Cont.) | | |
5. Purchases and Sales of Securities
Investment transactions (excluding short-term investments) for the period ended March 31, 2024 were as follows:
| | | | | | | | | | | | | | | | | | | | | | | | | |
| | | |
| | | | | All Other | | U.S. Government1 |
| | | | | |
| | | | | Purchases at
Cost | | Sales or
Maturity
Proceeds | | Purchases at
Cost | | Sales or
Maturity
Proceeds |
| | | | | |
DoubleLine Total Return Bond Fund | | | | | | | | $ | 5,907,198,613 | | | | $ | 6,900,493,241 | | | | $ | 5,353,208,984 | | | | $ | 6,032,532,422 | |
| | | | | |
DoubleLine Core Fixed Income Fund | | | | | | | | $ | 1,591,438,281 | | | | $ | 1,864,306,363 | | | | $ | 6,434,276,758 | | | | $ | 6,395,735,672 | |
| | | | | |
DoubleLine Emerging Markets Fixed Income Fund | | | | | | | | $ | 235,916,971 | | | | $ | 291,233,765 | | | | $ | — | | | | $ | — | |
| | | | | |
DoubleLine Low Duration Bond Fund | | | | | | | | $ | 1,362,576,530 | | | | $ | 1,863,911,903 | | | | $ | 2,754,995,742 | | | | $ | 2,577,225,160 | |
| | | | | |
DoubleLine Floating Rate Fund | | | | | | | | $ | 88,565,960 | | | | $ | 127,680,355 | | | | $ | — | | | | $ | — | |
| | | | | |
Doubleline Shiller Enhanced CAPE® | | | | | | | | $ | 604,304,406 | | | | $ | 1,159,242,768 | | | | $ | 2,089,249,223 | | | | $ | 1,870,045,094 | |
| | | | | |
DoubleLine Flexible Income Fund | | | | | | | | $ | 168,569,309 | | | | $ | 229,323,034 | | | | $ | 64,368,555 | | | | $ | 36,909,531 | |
| | | | | |
DoubleLine Low Duration Emerging Markets Fixed Income Fund | | | | | | | | $ | 48,841,370 | | | | $ | 89,184,774 | | | | $ | — | | | | $ | — | |
| | | | | |
DoubleLine Long Duration Total Return Bond Fund | | | | | | | | $ | 18,475,956 | | | | $ | 8,629,326 | | | | $ | 68,789,236 | | | | $ | 64,705,029 | |
| | | | | |
DoubleLine Strategic Commodity Fund (Consolidated) | | | | | | | | $ | — | | | | $ | — | | | | $ | — | | | | $ | — | |
| | | | | |
DoubleLine Global Bond Fund | | | | | | | | $ | 23,269,382 | | | | $ | 26,879,647 | | | | $ | 44,246,175 | | | | $ | 38,375,000 | |
| | | | | |
DoubleLine Infrastructure Income Fund | | | | | | | | $ | 119,820,046 | | | | $ | 130,923,852 | | | | $ | 53,474,859 | | | | $ | 36,364,408 | |
| | | | | |
Doubleline Shiller Enhanced International CAPE® | | | | | | | | $ | 9,606,385 | | | | $ | 15,052,171 | | | | $ | 26,908,073 | | | | $ | 24,592,060 | |
| | | | | |
DoubleLine Emerging Markets Local Currency Bond Fund | | | | | | | | $ | 6,347,228 | | | | $ | 3,410,849 | | | | $ | — | | | | $ | — | |
| | | | | |
DoubleLine Income Fund | | | | | | | | $ | 43,288,575 | | | | $ | 23,860,320 | | | | $ | 4,711,039 | | | | $ | 7,346,035 | |
| | | | | |
DoubleLine Multi-Asset Trend Fund (Consolidated) | | | | | | | | $ | — | | | | $ | — | | | | $ | 1,913,132 | | | | $ | 2,824,697 | |
| 1 | U.S. Government transactions are defined as those involving long-term U.S. Treasury bills, bonds and notes. |
6. Income Tax Information and Distributions to Shareholders
The tax character of distributions for the Funds were as follows:
| | | | | | | | | | | | | | | | | | | | | | | | | |
| | | |
| | | | | Year Ended March 31, 2024 | | Year Ended March 31, 2023 |
| | | | | |
| | | | | Ordinary Income | | Long Term
Capital Gain | | Ordinary Income | | Long Term
Capital Gain |
| | | | | |
DoubleLine Total Return Bond Fund | | | | | | | | $ | 1,461,181,260 | | | | $ | — | | | | $ | 1,359,051,998 | | | | $ | — | |
| | | | | |
DoubleLine Core Fixed Income Fund | | | | | | | | $ | 332,432,196 | | | | $ | — | | | | $ | 328,340,998 | | | | $ | — | |
| | | | | |
DoubleLine Emerging Markets Fixed Income Fund | | | | | | | | $ | 28,078,194 | | | | $ | — | | | | $ | 29,671,037 | | | | $ | — | |
| | | | | |
DoubleLine Low Duration Bond Fund | | | | | | | | $ | 270,810,785 | | | | $ | — | | | | $ | 197,485,763 | | | | $ | — | |
| | | | | |
DoubleLine Floating Rate Fund | | | | | | | | $ | 15,934,011 | | | | $ | — | | | | $ | 17,396,917 | | | | $ | — | |
| | | | | |
DoubleLine Shiller Enhanced CAPE® | | | | | | | | $ | 205,041,825 | | | | $ | — | | | | $ | 210,196,101 | | | | $ | 492,478,152 | |
| | | | | |
DoubleLine Flexible Income Fund | | | | | | | | $ | 54,700,592 | | | | $ | — | | | | $ | 49,922,749 | | | | $ | — | |
| | | | | |
DoubleLine Low Duration Emerging Markets Fixed Income Fund | | | | | | | | $ | 6,892,011 | | | | $ | — | | | | $ | 6,833,733 | | | | $ | — | |
| | | | | |
DoubleLine Long Duration Total Return Bond Fund | | | | | | | | $ | 2,039,170 | | | | $ | — | | | | $ | 1,444,233 | | | | $ | — | |
| | | | | |
DoubleLine Strategic Commodity Fund (Consolidated) | | | | | | | | $ | 4,557,572 | | | | $ | — | | | | $ | 65,540,372 | | | | $ | — | |
| | | | | |
DoubleLine Global Bond Fund | | | | | | | | $ | — | | | | $ | — | | | | $ | — | | | | $ | — | |
| | | | | |
DoubleLine Infrastructure Income Fund | | | | | | | | $ | 12,782,884 | | | | $ | — | | | | $ | 12,311,480 | | | | $ | 1,296,056 | |
| | | | | |
DoubleLine Shiller Enhanced International CAPE® | | | | | | | | $ | 2,762,090 | | | | $ | — | | | | $ | 2,763,952 | | | | $ | — | |
| | | | | |
DoubleLine Emerging Markets Local Currency Bond Fund | | | | | | | | $ | 425,812 | | | | $ | — | | | | $ | 184,950 | | | | $ | — | |
| | | | | |
DoubleLine Income Fund | | | | | | | | $ | 3,922,378 | | | | $ | — | | | | $ | 3,359,147 | | | | $ | — | |
| | | | | |
DoubleLine Multi-Asset Trend Fund (Consolidated) | | | | | | | | $ | 621,344 | | | | $ | — | | | | $ | 2,395,845 | | | | $ | — | |
| | | | | | | | | | |
| 142 | | DoubleLine Funds Trust | | | | | | | | |
The Funds designated as long-term capital gain dividend, pursuant to Internal Revenue Code Section 852(b)(3), the amount necessary to reduce the earnings and profits of the Funds related to net capital gain to zero.
The cost basis of investments for U.S. federal income tax purposes as of March 31, 2024, was as follows:
| | | | | | | | | | | | | | | | | | | | | | | | | | | | | | | | | | | |
| | | | | | | |
| | | | | DoubleLine Total Return Bond Fund | | DoubleLine Core Fixed
Income Fund | | DoubleLine
Emerging
Markets Fixed
Income Fund | | DoubleLine Low Duration
Bond Fund | | DoubleLine
Floating
Rate Fund | | DoubleLine
Shiller Enhanced
CAPE® |
| | | | | | | |
Tax Cost of Investments | | | | | | | | $ | 35,932,076,107 | | | | $ | 7,560,413,484 | | | | $ | 541,137,738 | | | | $ | 5,803,054,717 | | | | $ | 188,593,363 | | | | $ | 4,111,052,070 | |
| | | | | | | |
Gross Tax Unrealized Appreciation | | | | | | | | | 324,651,786 | | | | | 55,791,164 | | | | | 14,507,783 | | | | | 13,423,430 | | | | | 1,984,292 | | | | | 411,818,481 | |
| | | | | | | |
Gross Tax Unrealized Depreciation | | | | | | | | | (5,356,812,026 | ) | | | | (751,748,191 | ) | | | | (71,252,113 | ) | | | | (193,698,772 | ) | | | | (3,199,503 | ) | | | | (311,181,409 | ) |
| | | | | | | |
Net Tax Unrealized Appreciation (Depreciation) | | | | | | | | | (5,032,160,240 | ) | | | | (695,957,027 | ) | | | | (56,744,330 | ) | | | | (180,275,342 | ) | | | | (1,215,211 | ) | | | | 100,637,072 | |
| | | | | | | | | | | | | | | | | | | | | | | | | | | | | | | | | | | |
| | | | | | | |
| | | | | DoubleLine Flexible Income Fund | | DoubleLine Low Duration
Emerging
Markets Fixed
Income Fund | | DoubleLine
Long Duration
Total Return
Bond Fund | | DoubleLine
Strategic
Commodity Fund
(Consolidated) | | DoubleLine
Global Bond
Fund | | DoubleLine
Infrastructure
Income Fund |
| | | | | | | |
Tax Cost of Investments | | | | | | | | $ | 1,067,367,977 | | | | $ | 158,826,859 | | | | $ | 63,939,729 | | | | $ | 153,071,254 | | | | $ | 153,254,032 | | | | $ | 385,051,713 | |
| | | | | | | |
Gross Tax Unrealized Appreciation | | | | | | | | | 3,087,106 | | | | | 1,906,805 | | | | | 1,170,581 | | | | | 5,551,924 | | | | | 1,400,451 | | | | | 2,125,009 | |
| | | | | | | |
Gross Tax Unrealized Depreciation | | | | | | | | | (110,343,096 | ) | | | | (4,026,787 | ) | | | | (6,048,452 | ) | | | | (464,541 | ) | | | | (12,405,393 | ) | | | | (23,197,082 | ) |
| | | | | | | |
Net Tax Unrealized Appreciation (Depreciation) | | | | | | | | | (107,255,990 | ) | | | | (2,119,982 | ) | | | | (4,877,871 | ) | | | | 5,087,383 | | | | | (11,004,942 | ) | | | | (21,072,073 | ) |
| | | | | | | | | | | | | | | | | | | | | | | | | | | | | | | | | | | |
| | | | | | | |
| | | | | DoubleLine Shiller
Enhanced
International
CAPE® | | DoubleLine
Emerging
Markets Local
Currency Bond
Fund | | DoubleLine
Income Fund | | DoubleLine Multi-Asset Trend Fund (Consolidated) | | | | |
| | | | | | | |
Tax Cost of Investments | | | | | | | | $ | 45,640,909 | | | | $ | 13,395,160 | | | | $ | 92,146,182 | | | | $ | 12,579,920 | | | | | | | | | | | |
| | | | | | | |
Gross Tax Unrealized Appreciation | | | | | | | | | 3,543,065 | | | | | 184,941 | | | | | 873,633 | | | | | 652,144 | | | | | | | | | | | |
| | | | | | | |
Gross Tax Unrealized Depreciation | | | | | | | | | (3,320,415 | ) | | | | (1,165,473 | ) | | | | (6,813,843 | ) | | | | (1,129,706 | ) | | | | | | | | | | |
| | | | | | | |
Net Tax Unrealized Appreciation (Depreciation) | | | | | | | | | 222,650 | | | | | (980,532 | ) | | | | (5,940,210 | ) | | | | (477,562 | ) | | | | | | | | | | |
As of March 31, 2024, the components of accumulated earnings (losses) for income tax purposes were as follows:
| | | | | | | | | | | | | | | | | | | | | | | | | | | | | | | | | | | |
| | | | | | | |
| | | | | DoubleLine Total Return Bond Fund | | DoubleLine Core Fixed Income Fund | | DoubleLine
Emerging
Markets Fixed
Income Fund | | DoubleLine Low Duration
Bond Fund | | DoubleLine
Floating Rate Fund | | DoubleLine
Shiller Enhanced
CAPE® |
| | | | | | | |
Net Tax Unrealized Appreciation (Depreciation) | | | | | | | | $ | (5,032,160,240 | ) | | | $ | (695,957,027 | ) | | | $ | (56,744,330 | ) | | | $ | (180,275,342 | ) | | | $ | (1,215,211 | ) | | | $ | 100,637,072 | |
| | | | | | | |
Undistributed Ordinary Income | | | | | | | | | 57,868,222 | | | | | 13,747,954 | | | | | 1,807,898 | | | | | 7,813,955 | | | | | 794,062 | | | | | 11,887,581 | |
| | | | | | | |
Undistributed Long Term Capital Gains | | | | | | | | | — | | | | | — | | | | | — | | | | | — | | | | | — | | | | | — | |
| | | | | | | |
Total Distributable Earnings | | | | | | | | | 57,868,222 | | | | | 13,747,954 | | | | | 1,807,898 | | | | | 7,813,955 | | | | | 794,062 | | | | | 11,887,581 | |
| | | | | | | |
Other Accumulated Gains (Losses) | | | | | | | | | (6,194,064,707 | ) | | | | (998,787,845 | ) | | | | (167,306,594 | ) | | | | (268,873,917 | ) | | | | (57,789,121 | ) | | | | (779,962,686 | ) |
| | | | | | | |
Total Distributable Earnings (Loss) | | | | | | | | | (11,168,356,725 | ) | | | | (1,680,996,918 | ) | | | | (222,243,026 | ) | | | | (441,335,304 | ) | | | | (58,210,270 | ) | | | | (667,438,033 | ) |
| | | | | | | | | | | | | | | | | | | | | | | | | | | | | | | | | | | |
| | | | | | | |
| | | | | DoubleLine Flexible Income
Fund | | DoubleLine Low Duration
Emerging Markets Fixed
Income Fund | | DoubleLine Long Duration
Total Return
Bond Fund | | DoubleLine
Strategic
Commodity Fund
(Consolidated) | | DoubleLine
Global Bond
Fund | | DoubleLine
Infrastructure
Income Fund |
| | | | | | | |
Net Tax Unrealized Appreciation (Depreciation) | | | | | | | | $ | (107,255,990 | ) | | | $ | (2,119,982 | ) | | | $ | (4,877,871 | ) | | | $ | 5,087,383 | | | | $ | (11,004,942 | ) | | | $ | (21,072,073 | ) |
| | | | | | | |
Undistributed Ordinary Income | | | | | | | | | 1,737,080 | | | | | 147,935 | | | | | 156,766 | | | | | 1,083,146 | | | | | — | | | | | 1,266,368 | |
| | | | | | | |
Undistributed Long Term Capital Gains | | | | | | | | | — | | | | | — | | | | | — | | | | | — | | | | | — | | | | | — | |
| | | | | | | |
Total Distributable Earnings | | | | | | | | | 1,737,080 | | | | | 147,935 | | | | | 156,766 | | | | | 1,083,146 | | | | | — | | | | | 1,266,368 | |
| | | | | | | |
Other Accumulated Gains (Losses) | | | | | | | | | (98,816,254 | ) | | | | (15,474,084 | ) | | | | (17,969,746 | ) | | | | (457,947 | ) | | | | (30,713,627 | ) | | | | (30,200,538 | ) |
| | | | | | | |
Total Distributable Earnings (Loss) | | | | | | | | | (204,335,164 | ) | | | | (17,446,131 | ) | | | | (22,690,851 | ) | | | | 5,712,582 | | | | | (41,718,569 | ) | | | | (50,006,243 | ) |
| | | | | | | | | | |
| | | | Annual Report | | | | | March 31, 2024 | | 143 |
| | |
Notes to Financial Statements (Cont.) | | |
| | | | | | | | | | | | | | | | | | | | | | | | | | | | | | | | | | | |
| | | | | | | |
| | | | | DoubleLine Shiller Enhanced
International CAPE® | | DoubleLine
Emerging Markets Local
Currency Bond
Fund | | DoubleLine
Income Fund | | DoubleLine
Multi-Asset
Trend Fund (Consolidated) | | | | |
| | | | | | | |
Net Tax Unrealized Appreciation (Depreciation) | | | | | | | | $ | 222,650 | | | | $ | (980,532 | ) | | | $ | (5,940,210 | ) | | | $ | (477,562 | ) | | | | | | | | | | |
| | | | | | | |
Undistributed Ordinary Income | | | | | | | | | 39,135 | | | | | 14,192 | | | | | 106,151 | | | | | 1,217 | | | | | | | | | | | |
| | | | | | | |
Undistributed Long Term Capital Gains | | | | | | | | | — | | | | | — | | | | | — | | | | | — | | | | | | | | | | | |
| | | | | | | |
Total Distributable Earnings | | | | | | | | | 39,135 | | | | | 14,192 | | | | | 106,151 | | | | | 1,217 | | | | | | | | | | | |
| | | | | | | |
Other Accumulated Gains (Losses) | | | | | | | | | (15,777,552 | ) | | | | (358,998 | ) | | | | (16,881,843 | ) | | | | (1,754,461 | ) | | | | | | | | | | |
| | | | | | | |
Total Distributable Earnings (Loss) | | | | | | | | | (15,515,767 | ) | | | | (1,325,338 | ) | | | | (22,715,902 | ) | | | | (2,230,806 | ) | | | | | | | | | | |
Under the Regulated Investment Company Modernization Act of 2010, capital losses incurred by the Funds after January 1, 2011 will not be subject to expiration. In addition, such losses must be utilized prior to the losses incurred in the years preceding enactment.
As of March 31, 2024, the following capital loss carryforwards were available:
| | | | | | | | | | | | | | | |
| | | |
| | | | | Capital Loss
Carryforward | | Expires |
| | | |
DoubleLine Total Return Bond Fund | | | | | | | | $ | 6,161,460,441 | | | | | Indefinite | |
| | | |
DoubleLine Core Fixed Income Fund | | | | | | | | | 990,381,538 | | | | | Indefinite | |
| | | |
DoubleLine Emerging Markets Fixed Income Fund | | | | | | | | | 167,343,056 | | | | | Indefinite | |
| | | |
DoubleLine Low Duration Bond Fund | | | | | | | | | 263,662,018 | | | | | Indefinite | |
| | | |
DoubleLine Floating Rate Fund | | | | | | | | | 57,133,234 | | | | | Indefinite | |
| | | |
DoubleLine Shiller Enhanced CAPE® | | | | | | | | | 770,066,029 | | | | | Indefinite | |
| | | |
DoubleLine Flexible Income Fund | | | | | | | | | 97,646,971 | | | | | Indefinite | |
| | | |
DoubleLine Low Duration Emerging Markets Fixed Income Fund | | | | | | | | | 15,343,994 | | | | | Indefinite | |
| | | |
DoubleLine Long Duration Total Return Bond Fund | | | | | | | | | 17,836,535 | | | | | Indefinite | |
| | | |
DoubleLine Strategic Commodity Fund (Consolidated) | | | | | | | | | 453,221 | | | | | Indefinite | |
| | | |
DoubleLine Global Bond Fund | | | | | | | | | 30,242,526 | | | | | Indefinite | |
| | | |
DoubleLine Infrastructure Income Fund | | | | | | | | | 29,091,194 | | | | | Indefinite | |
| | | |
DoubleLine Shiller Enhanced International CAPE® | | | | | | | | | 15,765,120 | | | | | Indefinite | |
| | | |
DoubleLine Emerging Markets Local Currency Bond Fund | | | | | | | | | 355,936 | | | | | Indefinite | |
| | | |
DoubleLine Income Fund | | | | | | | | | 16,848,901 | | | | | Indefinite | |
| | | |
DoubleLine Multi-Asset Trend Fund (Consolidated) | | | | | | | | | 1,753,563 | | | | | Indefinite | |
As of March 31, 2024, the following funds deferred, on a tax basis, losses of:
| | | | | | | | | | | | | | | |
| | | |
| | | | | Post-October
Loss | | Late-Year
Loss |
| | | |
DoubleLine Global Bond Fund | | | | | | | | $ | — | | | | $ | 454,963 | |
| | | | | | | | | | |
| 144 | | DoubleLine Funds Trust | | | | | | | | |
Additionally, US GAAP requires that certain components of net assets relating to permanent differences be reclassified between financial and tax reporting. These reclassifications have no effect on net assets or NAV per share. The permanent differences primarily relate to paydown losses, accretion of discount on certain debt instruments, foreign currency gains (losses), consent fee income, prior period adjustments, net operating losses and deconsolidation of foreign subsidiaries. For the period ended March 31, 2024, the following table shows the reclassifications made:
| | | | | | | | | | | | | | | |
| | | |
| | | | | Paid-in
Capital | | Total Distributable
Earnings (Loss) |
| | | |
DoubleLine Total Return Bond Fund | | | | | | | | $ | — | | | | $ | — | |
| | | |
DoubleLine Core Fixed Income Fund | | | | | | | | | — | | | | | — | |
| | | |
DoubleLine Emerging Markets Fixed Income Fund | | | | | | | | | — | | | | | — | |
| | | |
DoubleLine Low Duration Bond Fund | | | | | | | | | — | | | | | — | |
| | | |
DoubleLine Floating Rate Fund | | | | | | | | | — | | | | | — | |
| | | |
DoubleLine Shiller Enhanced CAPE® | | | | | | | | | — | | | | | — | |
| | | |
DoubleLine Flexible Income Fund | | | | | | | | | — | | | | | — | |
| | | |
DoubleLine Low Duration Emerging Markets Fixed Income Fund | | | | | | | | | — | | | | | — | |
| | | |
DoubleLine Long Duration Total Return Bond Fund | | | | | | | | | — | | | | | — | |
| | | |
DoubleLine Strategic Commodity Fund (Consolidated) | | | | | | | | | (3,905,811 | ) | | | | 3,905,811 | |
| | | |
DoubleLine Global Bond Fund | | | | | | | | | — | | | | | — | |
| | | |
DoubleLine Infrastructure Income Fund | | | | | | | | | — | | | | | — | |
| | | |
DoubleLine Shiller Enhanced International CAPE® | | | | | | | | | — | | | | | — | |
| | | |
DoubleLine Emerging Markets Local Currency Bond Fund | | | | | | | | | — | | | | | — | |
| | | |
DoubleLine Income Fund | | | | | | | | | — | | | | | — | |
| | | |
DoubleLine Multi-Asset Trend Fund (Consolidated) | | | | | | | | | (881,220 | ) | | | | 881,220 | |
If a Fund estimates that a portion of its regular distributions to shareholders may be comprised of amounts from sources other than net investment income, as determined in accordance with such Fund’s policies and practices, the Fund will notify shareholders of the estimated composition of such distribution through a Section 19 Notice. For these purposes, each Fund estimates the source or sources from which a distribution is paid, to the close of the period as of which it is paid, in reference to its expected tax character. It is important to note that differences exist between a Fund’s daily internal accounting records and practices, the Fund’s financial statements presented in accordance with US GAAP, and recordkeeping practices under income tax regulations. It is possible that a Fund may not issue a Section 19 Notice in situations where such Fund’s financial statements prepared later and in accordance with US GAAP might later report that the sources of those distributions included capital gains and/or a return of capital. Please visit https://doubleline.com/mutual-funds/ for the most recent Section 19 Notice, if applicable. Information provided to you on a Section 19 notice is an estimate only and subject to change; final determination of a distribution’s tax character will be reported on Form 1099 DIV sent to shareholders for the calendar year.
| | | | | | | | | | |
| | | | Annual Report | | | | | March 31, 2024 | | 145 |
| | |
Notes to Financial Statements (Cont.) | | |
7. Share Transactions
Transactions in each Fund’s shares were as follows:
| | | | | | | | | | | | | | | | | | | | | | | | | | | | | | | | | | | | | | | | | | | | | | | | | | |
| | | | |
| | | | | DoubleLine Total Return Bond Fund | | | | DoubleLine Core Fixed Income Fund |
| | | | | | |
| | | | | Year Ended March 31, 2024 | | Year Ended March 31, 2023 | | | | Year Ended March 31, 2024 | | Year Ended March 31, 2023 |
| | | | | | | | | | |
| | | | | Shares | | Amount | | Shares | | Amount | | | | Shares | | Amount | | Shares | | Amount |
| | | | | | | | | | |
Shares Sold | | | | | | | | | | | | | | | | | | | | | | | | | | | | | | | | | | | | | | | | | | | | | | | | | | |
| | | | | | | | | | |
Class I | | | | | | | | | 1,037,192,466 | | | | $ | 8,994,148,707 | | | | | 1,171,725,790 | | | | $ | 10,693,301,956 | | | | | | | | | | 245,404,541 | | | | $ | 2,240,598,765 | | | | | 350,423,068 | | | | $ | 3,365,689,036 | |
| | | | | | | | | | |
Class N | | | | | | | | | 123,326,847 | | | | | 1,075,517,930 | | | | | 274,438,789 | | | | | 2,482,424,967 | | | | | | | | | | 8,254,813 | | | | | 75,388,589 | | | | | 15,128,315 | | | | | 145,162,360 | |
| | | | | | | | | | |
Class R6 | | | | | | | | | 103,288,915 | | | | | 895,978,547 | | | | | 53,181,967 | | | | | 486,371,241 | | | | | | | | | | 25,820,572 | | | | | 233,956,504 | | | | | 6,913,054 | | | | | 65,426,487 | |
| | | | | | | | | | |
Reinvested Dividends | | | | | | | | | | | | | | | | | | | | | | | | | | | | | | | | | | | | | | | | | | | | | | | | | | |
| | | | | | | | | | |
Class I | | | | | | | | | 99,792,522 | | | | | 866,710,755 | | | | | 92,280,941 | | | | | 838,310,245 | | | | | | | | | | 23,487,961 | | | | | 214,965,761 | | | | | 22,599,033 | | | | | 214,003,885 | |
| | | | | | | | | | |
Class N | | | | | | | | | 21,487,899 | | | | | 186,448,636 | | | | | 17,775,176 | | | | | 160,921,176 | | | | | | | | | | 1,153,080 | | | | | 10,539,919 | | | | | 1,355,076 | | | | | 12,839,905 | |
| | | | | | | | | | |
Class R6 | | | | | | | | | 3,590,608 | | | | | 31,162,719 | | | | | 3,637,242 | | | | | 33,036,800 | | | | | | | | | | 649,823 | | | | | 5,947,489 | | | | | 432,199 | | | | | 4,076,907 | |
| | | | | | | | | | |
Shares Redeemed | | | | | | | | | | | | | | | | | | | | | | | | | | | | | | | | | | | | | | | | | | | | | | | | | | |
| | | | | | | | | | |
Class I | | | | | | | | | (1,277,617,964 | ) | | | | (11,051,340,051 | ) | | | | (2,007,758,181 | ) | | | | (18,386,460,613 | ) | | | | | | | | | (311,845,251 | ) | | | | (2,851,993,023 | ) | | | | (593,397,316 | ) | | | | (5,708,094,146 | ) |
| | | | | | | | | | |
Class N | | | | | | | | | (224,846,520 | ) | | | | (1,943,044,471 | ) | | | | (228,946,594 | ) | | | | (2,086,753,887 | ) | | | | | | | | | (13,010,374 | ) | | | | (119,003,185 | ) | | | | (30,207,922 | ) | | | | (284,449,503 | ) |
| | | | | | | | | | |
Class R6 | | | | | | | | | (97,395,109 | ) | | | | (836,059,274 | ) | | | | (95,210,530 | ) | | | | (881,263,752 | ) | | | | | | | | | (3,967,611 | ) | | | | (35,949,878 | ) | | | | (3,782,783 | ) | | | | (35,150,784 | ) |
| | | | | | | | | | |
Increase (Decrease) in Net Assets Resulting from Net Share Transactions | | | | | | | | | (211,180,336 | ) | | | $ | (1,780,476,502 | ) | | | | (718,875,400 | ) | | | $ | (6,660,111,867 | ) | | | | | | | | | (24,052,446 | ) | | | $ | (225,549,059 | ) | | | | (230,537,276 | ) | | | $ | (2,220,495,853 | ) |
| | | | | | | | | | | | | | | | | | | | | | | | | | | | | | | | | | | | | | | | | | | | | | | | | | |
| | | | |
| | | | | DoubleLine Emerging Markets Fixed Income Fund | | | | DoubleLine Low Duration Bond Fund |
| | | | | | |
| | | | | Year Ended March 31, 2024 | | Year Ended March 31, 2023 | | | | Year Ended March 31, 2024 | | Year Ended March 31, 2023 |
| | | | | | | | | | |
| | | | | Shares | | Amount | | Shares | | Amount | | | | Shares | | Amount | | Shares | | Amount |
| | | | | | | | | | |
Shares Sold | | | | | | | | | | | | | | | | | | | | | | | | | | | | | | | | | | | | | | | | | | | | | | | | | | |
| | | | | | | | | | |
Class I | | | | | | | | | 20,761,731 | | | | $ | 179,367,709 | | | | | 35,747,836 | | | | $ | 308,847,991 | | | | | | | | | | 137,528,826 | | | | $ | 1,307,406,882 | | | | | 267,961,761 | | | | $ | 2,542,655,473 | |
| | | | | | | | | | |
Class N | | | | | | | | | 1,171,461 | | | | | 10,097,139 | | | | | 2,051,383 | | | | | 17,712,348 | | | | | | | | | | 9,090,846 | | | | | 86,309,602 | | | | | 10,474,023 | | | | | 99,179,098 | |
| | | | | | | | | | |
Class R6 | | | | | | | | | — | | | | | — | | | | | — | | | | | — | | | | | | | | | | 12,287,409 | | | | | 116,437,239 | | | | | 4,212,724 | | | | | 40,140,888 | |
| | | | | | | | | | |
Reinvested Dividends | | | | | | | | | | | | | | | | | | | | | | | | | | | | | | | | | | | | | | | | | | | | | | | | | | |
| | | | | | | | | | |
Class I | | | | | | | | | 2,203,881 | | | | | 18,820,578 | | | | | 2,241,448 | | | | | 19,193,620 | | | | | | | | | | 18,485,315 | | | | | 175,418,933 | | | | | 13,485,368 | | | | | 127,299,824 | |
| | | | | | | | | | |
Class N | | | | | | | | | 155,446 | | | | | 1,327,486 | | | | | 156,692 | | | | | 1,341,240 | | | | | | | | | | 3,057,460 | | | | | 28,987,196 | | | | | 2,246,787 | | | | | 21,198,187 | |
| | | | | | | | | | |
Class R6 | | | | | | | | | — | | | | | — | | | | | — | | | | | — | | | | | | | | | | 38,611 | | | | | 366,499 | | | | | 34,618 | | | | | 326,721 | |
| | | | | | | | | | |
Shares Redeemed | | | | | | | | | | | | | | | | | | | | | | | | | | | | | | | | | | | | | | | | | | | | | | | | | | |
| | | | | | | | | | |
Class I | | | | | | | | | (29,482,200 | ) | | | | (250,576,439 | ) | | | | (53,968,673 | ) | | | | (467,855,618 | ) | | | | | | | | | (211,875,833 | ) | | | | (2,010,789,940 | ) | | | | (369,014,298 | ) | | | | (3,497,914,542 | ) |
| | | | | | | | | | |
Class N | | | | | | | | | (2,028,171 | ) | | | | (17,404,882 | ) | | | | (2,924,590 | ) | | | | (25,382,042 | ) | | | | | | | | | (24,432,758 | ) | | | | (231,777,493 | ) | | | | (31,124,498 | ) | | | | (294,996,699 | ) |
| | | | | | | | | | |
Class R6 | | | | | | | | | — | | | | | — | | | | | — | | | | | — | | | | | | | | | | (4,696,617 | ) | | | | (44,649,753 | ) | | | | (2,808,821 | ) | | | | (26,690,987 | ) |
| | | | | | | | | | |
Increase (Decrease) in Net Assets Resulting from Net Share Transactions | | | | | | | | | (7,217,852 | ) | | | $ | (58,368,409 | ) | | | | (16,695,904 | ) | | | $ | (146,142,461 | ) | | | | | | | | | (60,516,741 | ) | | | $ | (572,290,835 | ) | | | | (104,532,336 | ) | | | $ | (988,802,037 | ) |
| | | | | | | | | | |
| 146 | | DoubleLine Funds Trust | | | | | | | | |
| | | | | | | | | | | | | | | | | | | | | | | | | | | | | | | | | | | | | | | | | | | | | | | | | | |
| | | | |
| | | | | DoubleLine Floating Rate Fund | | | | DoubleLine Shiller Enhanced CAPE® |
| | | | | | |
| | | | | Year Ended March 31, 2024 | | Year Ended March 31, 2023 | | | | Year Ended March 31, 2024 | | Year Ended March 31, 2023 |
| | | | | | | | | | |
| | | | | Shares | | Amount | | Shares | | Amount | | | | Shares | | Amount | | Shares | | Amount |
| | | | | | | | | | |
Shares Sold | | | | | | | | | | | | | | | | | | | | | | | | | | | | | | | | | | | | | | | | | | | | | | | | | | |
| | | | | | | | | | |
Class I | | | | | | | | | 3,838,600 | | | | $ | 34,614,125 | | | | | 6,795,806 | | | | $ | 61,845,213 | | | | | | | | | | 53,994,166 | | | | $ | 726,034,021 | | | | | 90,409,831 | | | | $ | 1,248,654,538 | |
| | | | | | | | | | |
Class N | | | | | | | | | 401,801 | | | | | 3,631,464 | | | | | 1,209,455 | | | | | 11,202,825 | | | | | | | | | | 3,431,972 | | | | | 46,521,811 | | | | | 7,902,683 | | | | | 105,974,145 | |
| | | | | | | | | | |
Class R6 | | | | | | | | | — | | | | | — | | | | | — | | | | | — | | | | | | | | | | 1,328,545 | | | | | 17,937,956 | | | | | 489,616 | | | | | 7,025,998 | |
| | | | | | | | | | |
Reinvested Dividends | | | | | | | | | | | | | | | | | | | | | | | | | | | | | | | | | | | | | | | | | | | | | | | | | | |
| | | | | | | | | | |
Class I | | | | | | | | | 581,726 | | | | | 5,221,458 | | | | | 679,023 | | | | | 6,105,332 | | | | | | | | | | 5,625,025 | | | | | 75,517,380 | | | | | 41,224,552 | | | | | 517,080,043 | |
| | | | | | | | | | |
Class N | | | | | | | | | 122,699 | | | | | 1,104,310 | | | | | 167,531 | | | | | 1,511,625 | | | | | | | | | | 880,354 | | | | | 11,839,010 | | | | | 3,451,900 | | | | | 43,469,224 | |
| | | | | | | | | | |
Class R6 | | | | | | | | | — | | | | | — | | | | | — | | | | | — | | | | | | | | | | 20,429 | | | | | 274,080 | | | | | 114,045 | | | | | 1,437,113 | |
| | | | | | | | | | |
Shares Redeemed | | | | | | | | | | | | | | | | | | | | | | | | | | | | | | | | | | | | | | | | | | | | | | | | | | |
| | | | | | | | | | |
Class I | | | | | | | | | (8,786,410 | ) | | | | (78,823,424 | )(a) | | | | (20,563,940 | ) | | | | (186,026,100 | )(b) | | | | | | | | | (111,715,045 | ) | | | | (1,501,299,524 | ) | | | | (282,818,689 | ) | | | | (3,932,553,381 | ) |
| | | | | | | | | | |
Class N | | | | | | | | | (932,201 | ) | | | | (8,391,360 | )(a) | | | | (3,891,989 | ) | | | | (35,340,904 | )(b) | | | | | | | | | (10,101,326 | ) | | | | (137,681,387 | ) | | | | (20,390,208 | ) | | | | (280,712,155 | ) |
| | | | | | | | | | |
Class R6 | | | | | | | | | — | | | | | — | | | | | — | | | | | — | | | | | | | | | | (737,905 | ) | | | | (9,976,567 | ) | | | | (880,743 | ) | | | | (12,163,698 | ) |
| | | | | | | | | | |
Increase (Decrease) in Net Assets Resulting from Net Share Transactions | | | | | | | | | (4,773,785 | ) | | | $ | (42,643,427 | ) | | | | (15,604,114 | ) | | | $ | (140,702,009 | ) | | | | | | | | | (57,273,785 | ) | | | $ | (770,833,220 | ) | | | | (160,497,013 | ) | | | $ | (2,301,788,173 | ) |
| (a) | Net of redemption fees of $213,270 and $21,308 for Class I and Class N, respectively. |
| (b) | Net of redemption fees of $91,678 and $10,897 for Class I and Class N, respectively. |
| | | | | | | | | | | | | | | | | | | | | | | | | | | | | | | | | | | | | | | | | | | | | | | | | | |
| | | | |
| | | | | DoubleLine Flexible Income Fund | | | | DoubleLine Low Duration Emerging Markets Fixed Income Fund |
| | | | | | |
| | | | | Year Ended March 31, 2024 | | Year Ended March 31, 2023 | | | | Year Ended March 31, 2024 | | Year Ended March 31, 2023 |
| | | | | | | | | | |
| | | | | Shares | | Amount | | Shares | | Amount | | | | Shares | | Amount | | Shares | | Amount |
| | | | | | | | | | |
Shares Sold | | | | | | | | | | | | | | | | | | | | | | | | | | | | | | | | | | | | | | | | | | | | | | | | | | |
| | | | | | | | | | |
Class I | | | | | | | | | 24,211,167 | | | | $ | 204,978,594 | | | | | 28,200,508 | | | | $ | 242,025,623 | | | | | | | | | | 3,187,104 | | | | $ | 29,295,766 | | | | | 13,406,902 | | | | $ | 122,332,808 | |
| | | | | | | | | | |
Class N | | | | | | | | | 2,122,918 | | | | | 17,942,241 | | | | | 6,847,879 | | | | | 58,591,923 | | | | | | | | | | 130,739 | | | | | 1,212,653 | | | | | 848,737 | | | | | 7,730,071 | |
| | | | | | | | | | |
Class R6 | | | | | | | | | 3,879,270 | | | | | 32,777,018 | | | | | 11,979,759 | | | | | 102,537,959 | | | | | | | | | | — | | | | | — | | | | | — | | | | | — | |
| | | | | | | | | | |
Reinvested Dividends | | | | | | | | | | | | | | | | | | | | | | | | | | | | | | | | | | | | | | | | | | | | | | | | | | |
| | | | | | | | | | |
Class I | | | | | | | | | 4,041,407 | | | | | 34,120,340 | | | | | 3,291,714 | | | | | 28,201,414 | | | | | | | | | | 586,515 | | | | | 5,388,614 | | | | | 590,385 | | | | | 5,332,023 | |
| | | | | | | | | | |
Class N | | | | | | | | | 438,563 | | | | | 3,698,045 | | | | | 523,761 | | | | | 4,489,741 | | | | | | | | | | 17,066 | | | | | 157,244 | | | | | 45,488 | | | | | 411,406 | |
| | | | | | | | | | |
Class R6 | | | | | | | | | 94,475 | | | | | 797,727 | | | | | 74,770 | | | | | 639,326 | | | | | | | | | | — | | | | | — | | | | | — | | | | | — | |
| | | | | | | | | | |
Shares Redeemed | | | | | | | | | | | | | | | | | | | | | | | | | | | | | | | | | | | | | | | | | | | | | | | | | | |
| | | | | | | | | | |
Class I | | | | | | | | | (21,145,407 | ) | | | | (178,499,964 | ) | | | | (50,737,988 | ) | | | | (439,003,812 | ) | | | | | | | | | (7,612,312 | ) | | | | (69,874,898 | ) | | | | (19,274,905 | ) | | | | (174,794,723 | ) |
| | | | | | | | | | |
Class N | | | | | | | | | (5,737,509 | ) | | | | (48,346,595 | ) | | | | (11,526,147 | ) | | | | (99,582,845 | ) | | | | | | | | | (242,720 | ) | | | | (2,223,082 | ) | | | | (2,696,281 | ) | | | | (24,519,261 | ) |
| | | | | | | | | | |
Class R6 | | | | | | | | | (9,600,207 | ) | | | | (80,774,249 | ) | | | | (9,372,890 | ) | | | | (79,765,162 | ) | | | | | | | | | — | | | | | — | | | | | — | | | | | — | |
| | | | | | | | | | |
Increase (Decrease) in Net Assets Resulting from Net Share Transactions | | | | | | | | | (1,695,323 | ) | | | $ | (13,306,843 | ) | | | | (20,718,634 | ) | | | $ | (181,865,833 | ) | | | | | | | | | (3,933,608 | ) | | | $ | (36,043,703 | ) | | | | (7,079,674 | ) | | | $ | (63,507,676 | ) |
| | | | | | | | | | | | | | | | | | | | | | | | | | | | | | | | | | | | | | | | | | | | | | | | | | |
| | | | |
| | | | | DoubleLine Long Duration Total Return Bond Fund | | | | DoubleLine Strategic Commodity Fund (Consolidated) |
| | | | | | |
| | | | | Year Ended March 31, 2024 | | Year Ended March 31, 2023 | | | | Year Ended March 31, 2024 | | Year Ended March 31, 2023 |
| | | | | | | | | | |
| | | | | Shares | | Amount | | Shares | | Amount | | | | Shares | | Amount | | Shares | | Amount |
| | | | | | | | | | |
Shares Sold | | | | | | | | | | | | | | | | | | | | | | | | | | | | | | | | | | | | | | | | | | | | | | | | | | |
| | | | | | | | | | |
Class I | | | | | | | | | 1,679,038 | | | | $ | 11,224,187 | | | | | 1,525,549 | | | | $ | 11,354,482 | | | | | | | | | | 5,878,965 | | | | $ | 44,977,021 | | | | | 6,122,585 | | | | $ | 64,461,145 | |
| | | | | | | | | | |
Class N | | | | | | | | | 1,763,411 | | | | | 11,423,332 | | | | | 159,325 | | | | | 1,189,184 | | | | | | | | | | 396,847 | | | | | 2,911,948 | | | | | 626,665 | | | | | 6,506,706 | |
| | | | | | | | | | |
Reinvested Dividends | | | | | | | | | | | | | | | | | | | | | | | | | | | | | | | | | | | | | | | | | | | | | | | | | | |
| | | | | | | | | | |
Class I | | | | | | | | | 75,736 | | | | | 496,534 | | | | | 38,917 | | | | | 284,611 | | | | | | | | | | 527,245 | | | | | 3,785,619 | | | | | 6,489,578 | | | | | 50,099,541 | |
| | | | | | | | | | |
Class N | | | | | | | | | 33,872 | | | | | 218,297 | | | | | 6,029 | | | | | 44,512 | | | | | | | | | | 54,765 | | | | | 388,281 | | | | | 759,847 | | | | | 5,790,033 | |
| | | | | | | | | | |
Shares Redeemed | | | | | | | | | | | | | | | | | | | | | | | | | | | | | | | | | | | | | | | | | | | | | | | | | | |
| | | | | | | | | | |
Class I | | | | | | | | | (1,311,052 | ) | | | | (8,802,995 | ) | | | | (941,886 | ) | | | | (7,141,404 | ) | | | | | | | | | (9,967,400 | ) | | | | (74,924,926 | ) | | | | (9,400,328 | ) | | | | (94,097,905 | ) |
| | | | | | | | | | |
Class N | | | | | | | | | (200,574 | ) | | | | (1,305,614 | ) | | | | (536,683 | ) | | | | (4,162,283 | ) | | | | | | | | | (1,003,822 | ) | | | | (7,499,401 | ) | | | | (1,058,352 | ) | | | | (10,800,412 | ) |
| | | | | | | | | | |
Increase (Decrease) in Net Assets Resulting from Net Share Transactions | | | | | | | | | 2,040,431 | | | | $ | 13,253,741 | | | | | 251,251 | | | | $ | 1,569,102 | | | | | | | | | | (4,113,400 | ) | | | $ | (30,361,458 | ) | | | | 3,539,995 | | | | $ | 21,959,108 | |
| | | | | | | | | | |
| | | | Annual Report | | | | | March 31, 2024 | | 147 |
| | |
Notes to Financial Statements (Cont.) | | |
| | | | | | | | | | | | | | | | | | | | | | | | | | | | | | | | | | | | | | | | | | | | | | | | | | |
| | | | |
| | | | | DoubleLine Global Bond Fund | | | | DoubleLine Infrastructure Income Fund |
| | | | | | |
| | | | | Year Ended March 31, 2024 | | Year Ended March 31, 2023 | | | | Year Ended March 31, 2024 | | Year Ended March 31, 2023 |
| | | | | | | | | | |
| | | | | Shares | | Amount | | Shares | | Amount | | | | Shares | | Amount | | Shares | | Amount |
| | | | | | | | | | |
Shares Sold | | | | | | | | | | | | | | | | | | | | | | | | | | | | | | | | | | | | | | | | | | | | | | | | | | |
| | | | | | | | | | |
Class I | | | | | | | | | 211,817 | | | | $ | 1,754,498 | | | | | 2,632,319 | | | | $ | 21,865,746 | | | | | | | | | | 1,728,130 | | | | $ | 15,854,950 | | | | | 1,004,157 | | | | $ | 9,359,697 | |
| | | | | | | | | | |
Class N | | | | | | | | | 619 | | | | | 5,118 | | | | | 696 | | | | | 5,907 | | | | | | | | | | 743,863 | | | | | 6,794,959 | | | | | 7,911 | | | | | 71,688 | |
| | | | | | | | | | |
Reinvested Dividends | | | | | | | | | | | | | | | | | | | | | | | | | | | | | | | | | | | | | | | | | | | | | | | | | | |
| | | | | | | | | | |
Class I | | | | | | | | | — | | | | | — | | | | | — | | | | | — | | | | | | | | | | 55,777 | | | | | 506,009 | | | | | 43,198 | | | | | 389,605 | |
| | | | | | | | | | |
Class N | | | | | | | | | — | | | | | — | | | | | — | | | | | — | | | | | | | | | | 9,623 | | | | | 88,475 | | | | | 1,836 | | | | | 16,614 | |
| | | | | | | | | | |
Shares Redeemed | | | | | | | | | | | | | | | | | | | | | | | | | | | | | | | | | | | | | | | | | | | | | | | | | | |
| | | | | | | | | | |
Class I | | | | | | | | | (121,452 | ) | | | | (1,003,458 | ) | | | | (15,407,720 | ) | | | | (141,495,414 | ) | | | | | | | | | (1,143,570 | ) | | | | (10,299,361 | ) | | | | (16,759,064 | ) | | | | (152,586,533 | ) |
| | | | | | | | | | |
Class N | | | | | | | | | (10,401 | ) | | | | (86,965 | ) | | | | (17,278 | ) | | | | (143,789 | ) | | | | | | | | | (64,951 | ) | | | | (596,573 | ) | | | | (128,821 | ) | | | | (1,212,811 | ) |
| | | | | | | | | | |
Increase (Decrease) in Net Assets Resulting from Net Share Transactions | | | | | | | | | 80,583 | | | | $ | 669,193 | | | | | (12,791,983 | ) | | | $ | (119,767,550 | ) | | | | | | | | | 1,328,872 | | | | $ | 12,348,459 | | | | | (15,830,783 | ) | | | $ | (143,961,740 | ) |
| | | | | | | | | | | | | | | | | | | | | | | | | | | | | | | | | | | | | | | | | | | | | | | | | | |
| | | | |
| | | | | DoubleLine Shiller Enhanced International CAPE® | | | | DoubleLine Emerging Markets Local Currency Bond Fund |
| | | | | | |
| | | | | Year Ended March 31, 2024 | | Year Ended March 31, 2023 | | | | Year Ended March 31, 2024 | | Year Ended March 31, 2023 |
| | | | | | | | | | |
| | | | | Shares | | Amount | | Shares | | Amount | | | | Shares | | Amount | | Shares | | Amount |
| | | | | | | | | | |
Shares Sold | | | | | | | | | | | | | | | | | | | | | | | | | | | | | | | | | | | | | | | | | | | | | | | | | | |
| | | | | | | | | | |
Class I | | | | | | | | | 674,695 | | | | $ | 7,965,916 | | | | | 1,560,171 | | | | $ | 18,010,356 | | | | | | | | | | 255,556 | | | | $ | 2,273,583 | | | | | 108,294 | | | | $ | 885,160 | |
| | | | | | | | | | |
Class N | | | | | | | | | 1,096,840 | | | | | 12,637,541 | | | | | 891,840 | | | | | 9,726,423 | | | | | | | | | | 197,806 | | | | | 1,722,919 | | | | | 11,352 | | | | | 92,808 | |
| | | | | | | | | | |
Reinvested Dividends | | | | | | | | | | | | | | | | | | | | | | | | | | | | | | | | | | | | | | | | | | | | | | | | | | |
| | | | | | | | | | |
Class I | | | | | | | | | 186,429 | | | | | 2,195,799 | | | | | 189,804 | | | | | 2,128,990 | | | | | | | | | | 44,702 | | | | | 386,979 | | | | | 23,004 | | | | | 182,403 | |
| | | | | | | | | | |
Class N | | | | | | | | | 36,834 | | | | | 437,958 | | | | | 27,127 | | | | | 306,449 | | | | | | | | | | 3,763 | | | | | 32,495 | | | | | 320 | | | | | 2,519 | |
| | | | | | | | | | |
Shares Redeemed | | | | | | | | | | | | | | | | | | | | | | | | | | | | | | | | | | | | | | | | | | | | | | | | | | |
| | | | | | | | | | |
Class I | | | | | | | | | (1,655,294 | ) | | | | (19,377,602 | ) | | | | (5,189,304 | ) | | | | (59,135,251 | ) | | | | | | | | | (60,037 | ) | | | | (533,979 | ) | | | | (65,807 | ) | | | | (543,498 | ) |
| | | | | | | | | | |
Class N | | | | | | | | | (1,154,437 | ) | | | | (13,502,679 | ) | | | | (620,058 | ) | | | | (7,223,427 | ) | | | | | | | | | (115,336 | ) | | | | (1,011,435 | ) | | | | (1,449 | ) | | | | (11,968 | ) |
| | | | | | | | | | |
Increase (Decrease) in Net Assets Resulting from Net Share Transactions | | | | | | | | | (814,933 | ) | | | $ | (9,643,067 | ) | | | | (3,140,420 | ) | | | $
|
(36,186,460 |
) | | | | | | | | | 326,454 | | | | $ | 2,870,562 | | | | | 75,714 | | | | $ | 607,424 | |
| | | | | | | | | | | | | | | | | | | | | | | | | | | | | | | | | | | | | | | | | | | | | | | | | | |
| | | | |
| | | | | DoubleLine Income Fund | | | | DoubleLine Multi Asset Trend Fund (Consolidated) |
| | | | | | |
| | | | | Year Ended March 31, 2024 | | Year Ended March 31, 2023 | | | | Year Ended March 31, 2024 | | Year Ended March 31, 2023 |
| | | | | | | | | | |
| | | | | Shares | | Amount | | Shares | | Amount | | | | Shares | | Amount | | Shares | | Amount |
| | | | | | | | | | |
Shares Sold | | | | | | | | | | | | | | | | | | | | | | | | | | | | | | | | | | | | | | | | | | | | | | | | | | |
| | | | | | | | | | |
Class I | | | | | | | | | 9,173,207 | | | | $ | 69,774,529 | | | | | 4,938,495 | | | | $ | 38,578,899 | | | | | | | | | | 35,616 | | | | $ | 280,900 | | | | | 242,165 | | | | $ | 2,332,953 | |
| | | | | | | | | | |
Class N | | | | | | | | | 240,101 | | | | | 1,828,558 | | | | | 764,876 | | | | | 6,331,745 | | | | | | | | | | 8,592 | | | | | 68,074 | | | | | 99,558 | | | | | 982,674 | |
| | | | | | | | | | |
Reinvested Dividends | | | | | | | | | | | | | | | | | | | | | | | | | | | | | | | | | | | | | | | | | | | | | | | | | | |
| | | | | | | | | | |
Class I | | | | | | | | | 445,731 | | | | | 3,369,022 | | | | | 303,925 | | | | | 2,392,781 | | | | | | | | | | 76,207 | | | | | 600,576 | | | | | 248,242 | | | | | 2,269,903 | |
| | | | | | | | | | |
Class N | | | | | | | | | 27,668 | | | | | 209,192 | | | | | 48,549 | | | | | 389,110 | | | | | | | | | | 1,431 | | | | | 11,294 | | | | | 9,202 | | | | | 84,198 | |
| | | | | | | | | | |
Shares Redeemed | | | | | | | | | | | | | | | | | | | | | | | | | | | | | | | | | | | | | | | | | | | | | | | | | | |
| | | | | | | | | | |
Class I | | | | | | | | | (6,126,281 | ) | | | | (45,725,779 | ) | | | | (8,917,631 | ) | | | | (71,151,983 | ) | | | | | | | | | (114,593 | ) | | | | (896,436 | ) | | | | (184,450 | ) | | | | (1,612,083 | ) |
| | | | | | | | | | |
Class N | | | | | | | | | (181,153 | ) | | | | (1,365,756 | ) | | | | (1,877,788 | ) | | | | (14,912,008 | ) | | | | | | | | | (27,805 | ) | | | | (219,760 | ) | | | | (82,483 | ) | | | | (736,330 | ) |
| | | | | | | | | | |
Increase (Decrease) in Net Assets Resulting from Net Share Transactions | | | | | | | | | 3,579,273 | | | | $ | 28,089,766 | | | | | (4,739,574 | ) | | | $ | (38,371,456 | ) | | | | | | | | | (20,552 | ) | | | $ | (155,352 | ) | | | | 332,234 | | | | $ | 3,321,315 | |
8. Trustees Fees
Trustees who are not affiliated with each Adviser and its affiliates receive fees from the Trust. These trustees may elect to defer the cash payment of part or all of their compensation. These deferred amounts, which remain as liabilities of the Funds, are treated as if invested in shares of Funds designated by each Trustee or other funds managed by each Adviser and its affiliates. These amounts represent general unsecured liabilities of each Fund and vary according to the total returns of the selected funds. Trustees Fees in the Statements of Operations include current fees (either paid in cash or deferred) and any increase (decrease) in the value of the deferred amounts. Certain trustees and officers of the Funds are also officers of each Adviser; such trustees and officers are not compensated by the Funds.
| | | | | | | | | | |
| 148 | | DoubleLine Funds Trust | | | | | | | | |
For the period ended March 31, 2024, the Trustees received as a group:
| | | | | | | | | | | | | | | | | | | | |
| | | | |
| | | | | Current Fees | | Increase/(Decrease) in
Value of Deferred
Amount | | Trustees Fees |
| | | | |
DoubleLine Total Return Bond Fund | | | | | | | | $ | 611,175 | | | | $ | 291,371 | | | | $ | 902,546 | |
| | | | |
DoubleLine Core Fixed Income Fund | | | | | | | | $ | 125,071 | | | | $ | 60,896 | | | | $ | 185,967 | |
| | | | |
DoubleLine Emerging Markets Fixed Income Fund | | | | | | | | $ | 8,587 | | | | $ | 4,504 | | | | $ | 13,091 | |
| | | | |
DoubleLine Low Duration Bond Fund | | | | | | | | $ | 112,034 | | | | $ | 50,601 | | | | $ | 162,635 | |
| | | | |
DoubleLine Floating Rate Fund | | | | | | | | $ | 3,329 | | | | $ | 1,657 | | | | $ | 4,986 | |
| | | | |
DoubleLine Shiller Enhanced CAPE® | | | | | | | | $ | 66,653 | | | | $ | 37,269 | | | | $ | 103,922 | |
| | | | |
DoubleLine Flexible Income Fund | | | | | | | | $ | 17,165 | | | | $ | 7,529 | | | | $ | 24,694 | |
| | | | |
DoubleLine Low Duration Emerging Markets Fixed Income Fund | | | | | | | | $ | 3,144 | | | | $ | 1,577 | | | | $ | 4,721 | |
| | | | |
DoubleLine Long Duration Total Return Bond Fund | | | | | | | | $ | 1,008 | | | | $ | 449 | | | | $ | 1,457 | |
| | | | |
DoubleLine Strategic Commodity Fund (Consolidated) | | | | | | | | $ | 2,217 | | | | $ | 1,495 | | | | $ | 3,712 | |
| | | | |
DoubleLine Global Bond Fund | | | | | | | | $ | 1,498 | | | | $ | 1,261 | | | | $ | 2,759 | |
| | | | |
DoubleLine Infrastructure Income Fund | | | | | | | | $ | 4,903 | | | | $ | 3,043 | | | | $ | 7,946 | |
| | | | |
DoubleLine Shiller Enhanced International CAPE® | | | | | | | | $ | 982 | | | | $ | 459 | | | | $ | 1,441 | |
| | | | |
DoubleLine Emerging Markets Local Currency Bond Fund | | | | | | | | $ | 76 | | | | $ | 114 | | | | $ | 190 | |
| | | | |
DoubleLine Income Fund | | | | | | | | $ | 932 | | | | $ | 421 | | | | $ | 1,353 | |
| | | | |
DoubleLine Multi-Asset Trend Fund (Consolidated) | | | | | | | | $ | 437 | | | | $ | 114 | | | | $ | 551 | |
9. Additional Disclosures about Derivative Instruments
The following disclosures provide information on the Funds’ use of derivatives and certain related risks. The location and fair value amounts of these instruments on the Statements of Assets and Liabilities and the realized gains and losses and changes in unrealized gains and losses on the Statements of Operations, each categorized by type of derivative contract, are included in the following tables.
The average volume of derivative activity for the period ended March 31, 2024, is as follows:
| | | | | | | | | | | | | | | | | | | | | | | | | | | | | | | | | | | | | | | | |
| | | | | | | | |
| | | | | DoubleLine
Total Return
Bond Fund | | DoubleLine
Core Fixed
Income Fund | | DoubleLine Shiller Enhanced
CAPE® | | DoubleLine
Long Duration
Total Return
Bond Fund | | DoubleLine
Strategic
Commodity
Fund
(Consolidated) | | DoubleLine
Shiller
Enhanced
International
CAPE® | | DoubleLine
Multi-Asset
Trend Fund
(Consolidated) |
| | | | | | | | |
Average Market Value | | | | | | | | | | | | | | | | | | | | | | | | | | | | | | | | | | | | | | | | |
| | | | | | | | |
Futures Contracts - Long | | | | | | | | $ | 36,814,865 | | | | $ | 1,557,800 | | | | $ | — | | | | $ | 451,159 | | | | $ | — | | | | $ | — | | | | $ | — | |
| | | | | | | | |
Futures Contracts - Short | | | | | | | | | (14,056,252 | ) | | | | (95,236 | ) | | | | — | | | | | (163,609 | ) | | | | — | | | | | — | | | | | — | |
| | | | | | | | |
Average Notional Balance | | | | | | | | | | | | | | | | | | | | | | | | | | | | | | | | | | | | | | | | |
| | | | | | | | |
Excess Return Swaps | | | | | | | | | — | | | | | — | | | | | 4,000,200,000 | | | | | — | | | | | 134,960,000 | | | | | 44,000,000 | | | | | 13,619,997 | |
| | | | | | | | |
Forward Currency Exchange Contracts | | | | | | | | | — | | | | | — | | | | | — | | | | | — | | | | | — | | | | | 76,818,947 | | | | | — | |
Options Contracts The Funds may purchase or sell put and call options. When a Fund purchases an option it pays a premium in return for the potential to profit from the change in value of an underlying investment or index during the term of the option. The option premium is included on the Funds’ Statements of Assets and Liabilities as an investment and marked-to-market to reflect the current value of the option. Premiums paid for purchasing options which expire are treated as realized losses and are recorded in net realized gain (loss) on investments on the Statements of Operations. Certain options may be purchased with premiums to be determined on a future date. The premiums for these options are based upon implied volatility parameters at specified terms. The risk associated with purchasing options is limited to the loss of the premium paid. Premiums paid for purchasing options which are exercised or closed are added to the amounts paid or offset against the proceeds on the underlying investment transaction to determine the realized gain or loss and are recorded in net realized gain (loss) on investments on the Statements of Operations. When a Fund writes (i.e., sells) an option it receives a premium in return for bearing the risk of the change in value of an underlying instrument during the term off the option. Writing put options tends to increase a Fund’s exposure to the risk that the value of the underlying instrument will depreciate. Writing call options tends to decrease a Fund’s ability to benefit from appreciation in the
| | | | | | | | | | |
| | | | Annual Report | | | | | March 31, 2024 | | 149 |
| | |
Notes to Financial Statements (Cont.) | | |
value in the underlying instrument. When a Fund writes a call or put, an amount equal to the premium received is recorded as a liability on the Fund’s Statement of Assets and Liabilities and marked-to-market to reflect the current value of the option written. Premiums received from writing options which expire are treated as realized gains and are recorded in net realized gain (loss) on written options on the Statements of Operations. Premiums received from writing options which are exercised or closed are added to the proceeds or offset against amounts paid on the underlying instrument to determine the realized gain or loss when the underlying instrument is sold and are recorded in net realized gain (loss) on written options on the Statements of Operations. A Fund as a writer of an option has no control over whether the underlying instrument may be sold (call) or purchased (put), and as a result bears the market risk of an unfavorable change in the price of the instrument underlying the written option. There is the risk that the market for options contracts may be illiquid and that a Fund may not be able to close out or sell an option at a particular time or at an anticipated price.
Futures Contracts Futures contracts typically involve a contractual commitment to buy or sell a particular instrument or index unit at a specified price on a future date. Risks associated with the use of futures contracts include the potential for imperfect correlation between the change in market value of the securities held by the Funds and the prices of futures contracts and the possibility of an illiquid market. Futures contracts are valued based upon their quoted daily settlement prices determined by the relevant exchange. Upon entering into a futures contract, a Fund is required to deposit with its futures broker an amount of cash in accordance with the initial margin requirements of the broker or exchange. Such collateral is recorded in deposit at broker for futures in the Statements of Assets and Liabilities. Futures contracts are marked-to-market daily and an appropriate payment reflecting the change in value (“variation margin”) is made or received by or for the accounts of the Funds. The variation margin is recorded on the Statements of Assets and Liabilities. The cumulative change in value of futures contracts is recorded in net unrealized appreciation (depreciation) on futures on the Statements of Assets and Liabilities. Gains or losses are recognized but not considered realized until the contracts expire or are closed and are recorded in net realized gain (loss) on futures on the Statements of Operations. Futures contracts involve, to varying degrees, risk of loss in excess of the variation margin disclosed on the Statements of Assets and Liabilities.
Forward Foreign Currency Contracts Forward foreign currency contracts are agreements between two parties to buy and sell a currency at a set exchange rate on a future date. Unless a Fund’s registration statement expressly states otherwise, each Fund may enter into forward foreign currency contracts for any investment purpose. The market value of a forward foreign currency contract fluctuates with the changes in foreign currency exchange rates. The contract is marked-to-market daily and the change in market value is recorded in net unrealized appreciation (depreciation) on forwards on the Statements of Assets and Liabilities. When the contract is closed, a Fund records a realized gain or loss equal to the difference between the value at the time it was opened and the value at the time it was closed on the Statements of Operations. The use of foreign currency exchange contracts involves the risk that the value of a foreign currency exchange contract changes unfavorably due to movements in the value of the referenced foreign currencies and the risk that a counterparty to the contract does not perform its obligations under the agreement.
Credit Default Swap Agreements Credit default swap agreements typically involve one party making a stream of payments (generally referred to as the buyer of protection) to another party (the seller of protection) in exchange for the right to receive a specified return in the event of a default or other credit event in respect of a referenced entity, obligation or index. As a seller of protection on credit default swap agreements, a Fund generally will receive from the buyer of protection a fixed rate of income throughout the term of the swap. As the seller, a Fund would effectively add leverage to its portfolio because, in addition to its total net assets, the Fund would be subject to investment exposure on the notional amount of the swap.
If a Fund is a seller of protection and a credit event occurs, as defined under the terms of that particular swap agreement, the Fund typically will either (i) pay to the buyer of protection an amount equal to the notional amount of the swap and take delivery of the referenced obligation, other deliverable obligations or the affected securities in the referenced index or (ii) pay a net settlement amount in the form of cash or securities equal to the notional amount of the swap less the recovery value of the referenced obligation or the affected securities in the referenced index. If a Fund is a buyer of protection and a credit event occurs, as defined under the terms of that particular swap agreement, the Fund typically will either (i) receive from the seller of protection an amount equal to the notional amount of the swap and deliver the referenced obligation, other deliverable obligations or the affected securities in the referenced index or (ii) receive a net settlement amount in the form of cash or securities equal to the notional amount of the swap less the recovery value of the referenced obligation or the affected securities in the referenced index. Recovery values are typically estimated by market makers considering either industry standard recovery rates or entity specific factors and considerations until a credit event occurs. An index credit default swap references all the names in the index, and if there is a default with respect to a single name in the index, the credit event is generally settled based on that name’s weight in the index.
Credit default swaps are considered to have credit risk related contingent features since they require payment by the protection seller to the protection buyer upon occurrence of a defined credit event. A Fund’s maximum risk of loss from counterparty risk, as
| | | | | | | | | | |
| 150 | | DoubleLine Funds Trust | | | | | | | | |
the protection buyer, is the fair value of the contract, which may be mitigated by the posting of collateral by the counterparty to a Fund to cover a Fund’s exposure to the counterparty. Upfront premiums (received) paid including accretion (amortization) less any collateral held at the counterparty are reflected in deposit at broker for swaps on the Statements of Assets and Liabilities. The marked-to-market value less a financing rate, if any, is included in net unrealized appreciation (depreciation) on swaps on the Statements of Assets and Liabilities. At termination or maturity of the swap, the cumulative marked-to-market on the value less a financing rate, if any, is recorded in realized gain (loss) on swaps on the Statements of Operations.
Interest Rate Swap Agreements The Funds may enter into interest rate swap agreements. Interest rate swap agreements involve an exchange with another party for their respective commitment to pay or receive interest on the notional amount of principal. Certain forms of interest rate swap agreements may include: (i) interest rate caps, under which, in return for a premium, one party agrees to make payments to the other to the extent that interest rates exceed a specified rate, or “cap”, (ii) interest rate floors, under which, in return for a premium, one party agrees to make payments to the other to the extent that interest rates fall below a specified rate, or “floor”, (iii) interest rate collars, under which a party sells a cap and purchases a floor or vice versa in an attempt to protect itself against interest rate movements exceeding given minimum or maximum levels, (iv) callable interest rate swaps, under which the buyer pays an upfront fee in consideration for the right to early terminate the swap transaction in whole, at zero cost and at a predetermined date and time prior to the maturity date, (v) spread locks, which allow the interest rate swap users to lock in the forward differential (or spread) between the interest rate swap rate and a specified benchmark, or (vi) basis swaps, under which two parties can exchange variable interest rates based on different segments of money markets. The value is marked-to-market and is recorded in net unrealized appreciation (depreciation) on swaps on the Statements of Assets and Liabilities. At termination or maturity date, the interest on the notional amount of principal is exchanged and is recorded in net realized gain (loss) on swaps on the Statements of Operations.
Excess Return Swap Agreements The Funds may enter into excess return swaps for investment purposes. Excess return swaps are agreements to exchange the return generated by one instrument for the return generated by another instrument. For example, the agreement to pay a predetermined or fixed interest rate in exchange for a market-linked return based on a notional amount. To the extent the total return of a referenced index or instrument exceeds the offsetting interest obligation, a Fund will receive a payment from the counterparty. To the extent it is less, a Fund will make a payment to the counterparty. The marked-to-market value less a financing rate, if any, is recorded in net unrealized appreciation (depreciation) on swaps on the Statements of Assets and Liabilities. At termination or maturity date, a net cash flow is exchanged where the total return is equivalent to the return of the underlying reference asset less a financing rate, if any, and is recorded in net realized gain (loss) on swaps on the Statements of Operations. To the extent the marked-to- market value of an excess return swap appreciates to the benefit of a Fund and exceeds certain contractual thresholds, a Fund’s counterparty may be contractually required to provide collateral. If the marked-to-market value of an excess return swap depreciates in value to the benefit of a counterparty and exceeds certain contractual thresholds, a Fund would generally be required to provide collateral for the benefit of its counterparty. Assets provided by the Funds as collateral are reflected as a component of investments in unaffiliated securities at value on the Statements of Assets and Liabilities and are noted on the Schedules of Investments. Assets provided to a Fund by a counterparty as collateral are not assets of the Fund and are not a component of a Fund’s NAV.
| | | | | | | | | | |
| | | | Annual Report | | | | | March 31, 2024 | | 151 |
| | |
Notes to Financial Statements (Cont.) | | |
The Funds’ derivative instrument holdings are summarized in the following tables.
The effect of derivative instruments on the Statements of Assets and Liabilities for the period ended March 31, 2024 was as follows:
| | | | | | | | | | | | | | | | | | | | | | | | | | | | | | | | |
| | | |
| | | | | | | Derivatives not accounted for as hedging instruments |
| | | | | | |
| Statements of Assets and Liabilities Location | | | | Commodity
Risk | | Equity Risk | | Foreign Exchange
Rate Risk | | Interest Rate
Risk | | Total |
| Net Unrealized Appreciation (Depreciation) on: | | | | | | | | | | | | | | | | | | | | | | | | | | | | | | |
Forwards | | | | | | | | | | | | | | | | | | | | | | | | | | | | | | |
DoubleLine Shiller Enhanced International CAPE® | | | | | | | | $ | — | | | | $ | — | | | | $ | 23,911 | | | | $ | — | | | | $ | 23,911 | |
Futures | | | | | | | | | | | | | | | | | | | | | | | | | | | | | | |
DoubleLine Total Return Bond Fund | | | | | | | | $ | — | | | | $ | — | | | | $ | — | | | | $ | (15,322,067 | ) | | | $ | (15,322,067 | ) |
DoubleLine Core Fixed Income Fund | | | | | | | | | — | | | | | — | | | | | — | | | | | (7,326,257 | ) | | | | (7,326,257 | ) |
DoubleLine Long Duration Total Return Bond Fund | | | | | | | | | — | | | | | — | | | | | — | | | | | 234,656 | | | | | 234,656 | |
Swaps | | | | | | | | | | | | | | | | | | | | | | | | | | | | | | |
DoubleLine Shiller Enhanced CAPE® | | | | | | | | $ | — | | | | $ | 404,068,626 | | | | $ | — | | | | $ | — | | | | $ | 404,068,626 | |
DoubleLine Strategic Commodity Fund (Consolidated) | | | | | | | | | 5,071,550 | | | | | — | | | | | — | | | | | — | | | | | 5,071,550 | |
DoubleLine Shiller Enhanced International CAPE® | | | | | | | | | — | | | | | 3,202,534 | | | | | — | | | | | — | | | | | 3,202,534 | |
DoubleLine Multi-Asset Trend Fund (Consolidated) | | | | | | | | | (737,874 | ) | | | | 652,144 | | | | | — | | | | | — | | | | | (85,730 | ) |
The effect of derivative instruments on the Statements of Operations for the period ended March 31, 2024 was as follows:
| | | | | | | | | | | | | | | | | | | | | | | | | | | | | | | | |
| | | |
| | | | | | | Derivatives not accounted for as hedging instruments |
| | | | | | |
| Statements of Operations Location | | | | Commodity
Risk | | Equity Risk | | Foreign Exchange
Rate Risk | | Interest Rate Risk | | Total |
| Net Realized Gain (Loss) on: | | | | | | | | | | | | | | | | | | | | | | | | | | | | | | |
Forwards | | | | | | | | | | | | | | | | | | | | | | | | | | | | | | |
DoubleLine Global Bond Fund | | | | | | | | $ | — | | | | $ | — | | | | $ | 57,081 | | | | $ | — | | | | $ | 57,081 | |
DoubleLine Shiller Enhanced International CAPE® | | | | | | | | | — | | | | | — | | | | | (2,946,571 | ) | | | | — | | | | | (2,946,571 | ) |
Futures | | | | | | | | | | | | | | | | | | | | | | | | | | | | | | |
DoubleLine Total Return Bond Fund | | | | | | | | $ | — | | | | $ | — | | | | $ | — | | | | $ | (255,921,521 | ) | | | $ | (255,921,521 | ) |
DoubleLine Core Fixed Income Fund | | | | | | | | | — | | | | | — | | | | | — | | | | | (42,991,361 | ) | | | | (42,991,361 | ) |
DoubleLine Long Duration Total Return Bond Fund | | | | | | | | | — | | | | | — | | | | | — | | | | | (1,151,402 | ) | | | | (1,151,402 | ) |
Swaps | | | | | | | | | | | | | | | | | | | | | | | | | | | | | | |
DoubleLine Shiller Enhanced CAPE® | | | | | | | | $ | — | | | | $ | 205,787,691 | | | | $ | — | | | | $ | — | | | | $ | 205,787,691 | |
DoubleLine Strategic Commodity Fund (Consolidated) | | | | | | | | | (5,463,047 | ) | | | | — | | | | | — | | | | | — | | | | | (5,463,047 | ) |
DoubleLine Shiller Enhanced International CAPE® | | | | | | | | | — | | | | | 1,398,491 | | | | | — | | | | | — | | | | | 1,398,491 | |
DoubleLine Multi-Asset Trend Fund (Consolidated) | | | | | | | | | (935,887 | ) | | | | (423,277 | ) | | | | — | | | | | — | | | | | (1,359,164 | ) |
| Net Change in Unrealized Appreciation (Depreciation) on: | | | | | | | | | | | | | | | | | | | | | | | | | | | | | | |
Forwards | | | | | | | | | | | | | | | | | | | | | | | | | | | | | | |
DoubleLine Shiller Enhanced International CAPE® | | | | | | | | $ | — | | | | $ | — | | | | $ | 1,635,110 | | | | $ | — | | | | $ | 1,635,110 | |
Futures | | | | | | | | | | | | | | | | | | | | | | | | | | | | | | |
DoubleLine Total Return Bond Fund | | | | | | | | $ | — | | | | $ | — | | | | $ | — | | | | $ | (136,401,869 | ) | | | $ | (136,401,869 | ) |
DoubleLine Core Fixed Income Fund | | | | | | | | | — | | | | | — | | | | | — | | | | | (25,912,923 | ) | | | | (25,912,923 | ) |
DoubleLine Long Duration Total Return Bond Fund | | | | | | | | | — | | | | | — | | | | | — | | | | | (446,892 | ) | | | | (446,892 | ) |
Swaps | | | | | | | | | | | | | | | | | | | | | | | | | | | | | | |
DoubleLine Shiller Enhanced CAPE® | | | | | | | | $ | — | | | | $ | 473,173,658 | | | | $ | — | | | | $ | — | | | | $ | 473,173,658 | |
DoubleLine Strategic Commodity Fund (Consolidated) | | | | | | | | | 7,442,550 | | | | | — | | | | | — | | | | | — | | | | | 7,442,550 | |
DoubleLine Shiller Enhanced International CAPE® | | | | | | | | | — | | | | | 999,098 | | | | | — | | | | | — | | | | | 999,098 | |
DoubleLine Multi-Asset Trend Fund (Consolidated) | | | | | | | | | 178,155 | | | | | 1,165,340 | | | | | — | | | | | — | | | | | 1,343,495 | |
| | | | | | | | | | |
| 152 | | DoubleLine Funds Trust | | | | | | | | |
10. Offsetting Assets and Liabilities
The Funds are subject to various Master Netting Arrangements, which govern the terms of certain transactions with select counterparties. The Master Netting Arrangements are intended to allow the Funds to close out and net their total exposure to a counterparty in the event of a default with respect to all the transactions governed under a single agreement with a counterparty. The Master Netting Arrangements also specify collateral posting arrangements at pre-arranged exposure levels. Under the Master Netting Arrangements, collateral is routinely transferred if the total net exposure to certain transactions (net of existing collateral already in place) governed under the relevant Master Netting Arrangement with a counterparty in a given account exceeds a specified threshold depending on the counterparty and the type of Master Netting Arrangement.
As of March 31, 2024, the Funds held the following derivative instruments that were subject to offsetting on the Statements of Assets and Liabilities:
DoubleLine Shiller Enhanced CAPE®
Assets:
| | | | | | | | | | | | | | | | | | | | | | | | |
| Description | | Gross
Amounts of
Recognized
Assets | | | Gross Amounts
Offset in the
Statement of
Assets and
Liabilities | | | Net Amounts
presented in the
Statement of
Assets and
Liabilities | | | Gross Amounts not offset in the
Statement of Assets and Liabilities | | | Net
Amount | |
| | Financial
Instruments | | | Cash
Collateral
Received | |
| | | | | | |
Swap Contracts | | $ | 404,068,626 | | | $ | — | | | $ | 404,068,626 | | | $ | 401,576,766 | | | $ | — | | | $ | 2,491,860 | |
DoubleLine Strategic Commodity Fund (Consolidated)
Assets:
| | | | | | | | | | | | | | | | | | | | | | | | |
| Description | | Gross
Amounts of
Recognized
Assets | | | Gross Amounts
Offset in the
Statement of
Assets and
Liabilities | | | Net Amounts
presented in the
Statement of
Assets and
Liabilities | | | Gross Amounts not offset in the
Statement of Assets and Liabilities | | | Net
Amount | |
| | Financial
Instruments | | | Cash
Collateral
Received | |
| | | | | | |
Swap Contracts | | $ | 5,510,675 | | | $ | (439,125 | ) | | $ | 5,071,550 | | | $ | 645,461 | | | $ | — | | | $ | 4,426,089 | |
Liabilities:
| | | | | | | | | | | | | | | | | | | | | | | | |
| Description | | Gross
Amounts of
Recognized
Liabilities | | | Gross Amounts
Offset in the
Statement of
Assets and
Liabilities | | | Net Amounts
presented in the
Statement of
Assets and
Liabilities | | | Gross Amounts not offset in the
Statement of Assets and Liabilities | | | Net
Amount | |
| | Financial
Instruments | | | Cash
Collateral
Pledged | |
| | | | | | |
Swap Contracts | | $ | 439,125 | | | $ | (439,125 | ) | | $ | — | | | $ | — | | | $ | — | | | $ | — | |
DoubleLine Shiller Enhanced International CAPE®
Assets:
| | | | | | | | | | | | | | | | | | | | | | | | |
| Description | | Gross
Amounts of
Recognized
Assets | | | Gross Amounts
Offset in the
Statement of
Assets and
Liabilities | | | Net Amounts
presented in the
Statement of
Assets and
Liabilities | | | Gross Amounts not offset in the
Statement of Assets and Liabilities | | | Net
Amount | |
| | Financial
Instruments | | | Cash
Collateral
Received | |
| | | | | | |
Forwards | | $ | 203,322 | | | $ | (90,247 | ) | | $ | 113,075 | | | $ | 36,993 | | | $ | 10,000 | | | $ | 66,082 | |
| | | | | | |
Swap Contracts | | | 3,202,534 | | | | — | | | | 3,202,534 | | | | 3,094,940 | | | | — | | | | 107,594 | |
| | | | | | |
| | $ | 3,405,856 | | | $ | (90,247 | ) | | $ | 3,315,609 | | | $ | 3,131,933 | | | $ | 10,000 | | | $ | 173,676 | |
Liabilities:
| | | | | | | | | | | | | | | | | | | | | | | | |
| Description | | Gross
Amounts of
Recognized
Liabilities | | | Gross Amounts
Offset in the
Statement of
Assets and
Liabilities | | | Net Amounts
presented in the
Statement of
Assets and
Liabilities | | | Gross Amounts not offset in the
Statement of Assets and Liabilities | | | Net
Amount | |
| | Financial
Instruments | | | Cash
Collateral
Pledged | |
| | | | | | |
Forwards | | $ | 179,411 | | | $ | (90,247 | ) | | $ | 89,164 | | | $ | — | | | $ | — | | | $ | 89,164 | |
| | | | | | | | | | |
| | | | Annual Report | | | | | March 31, 2024 | | 153 |
| | |
Notes to Financial Statements (Cont.) | | |
DoubleLine Multi-Asset Trend Fund (Consolidated)
Assets:
| | | | | | | | | | | | | | | | | | | | | | | | |
| Description | | Gross
Amounts of
Recognized
Assets | | | Gross Amounts
Offset in the
Statement of
Assets and
Liabilities | | | Net Amounts
presented in the
Statement of
Assets and
Liabilities | | | Gross Amounts not offset in the
Statement of Assets and Liabilities | | | Net
Amount | |
| | Financial
Instruments | | | Cash
Collateral
Received | |
| | | | | | |
Swap Contracts | | $ | 652,144 | | | $ | (652,144 | ) | | $ | — | | | $ | — | | | $ | — | | | $ | — | |
Liabilities:
| | | | | | | | | | | | | | | | | | | | | | | | |
| Description | | Gross
Amounts of
Recognized
Liabilities | | | Gross Amounts
Offset in the
Statement of
Assets and
Liabilities | | | Net Amounts
presented in the
Statement of
Assets and
Liabilities | | | Gross Amounts not offset in the
Statement of Assets and Liabilities | | | Net
Amount | |
| | Financial
Instruments | | | Cash
Collateral
Pledged | |
| | | | | | |
Swap Contracts | | $ | 737,874 | | | $ | (652,144 | ) | | $ | 85,730 | | | $ | 85,730 | | | $ | — | | | $ | — | |
11. Bank Loans
The Funds may make loans directly to borrowers and may acquire or invest in loans made by others (“loans”). The Funds may acquire a loan interest directly by acting as a member of the original lending syndicate. Alternatively, the Funds may acquire some or all of the interest of a bank or other lending institution in a loan to a particular borrower by means of a novation, an assignment or a participation. The loans in which the Funds may invest include those that pay fixed rates of interest and those that pay floating rates—i.e., rates that adjusted periodically by reference to a base lending rate, plus a spread. These base lending rates are primarily the Secured Overnight Financing Rate (SOFR) and secondarily, the prime rate offered by one or more United States banks (the Prime Rate). Base lending rates may be subject to a floor, or minimum rate. Rates for SOFR are generally 1 or 3 month tenors and may also be subject to a credit spread adjustment. The Funds may purchase and sell interests in bank loans on a when-issued and delayed delivery basis, with payment delivery scheduled for a future date.
Securities purchased on a delayed delivery basis are marked-to-market daily and no income accrues to the Funds prior to the date the Funds actually take delivery of such securities. These transactions are subject to market fluctuations and are subject, among other risks, to the risk that the value at delivery may be more or less than the trade purchase price.
12. Credit Facility
U.S. Bank, N.A. (the “Bank”) has made available to the Trust, excluding the DoubleLine Emerging Markets Local Currency Bond Fund, (the “DoubleLine Funds”) an uncommitted $500,000,000 credit facility for short term liquidity in connection with shareholder redemptions. Under the terms of the credit facility, borrowings for each DoubleLine Fund are limited to one-third of the total assets (including the amount borrowed) of such DoubleLine Fund. Fifty percent of the credit facility is available to all of the DoubleLine Funds, on a first come, first served basis. The remaining 50% of the credit facility is allocated among the DoubleLine Funds in accordance with procedures adopted by the Board. Borrowings under this credit facility bear interest at the greater of 0.00% or the Bank’s prime rate less 1.00%.
The Bank has also made available to the DoubleLine Floating Rate Fund a committed $50,000,000 credit facility. Borrowings under this credit facility bear interest at the greater of 0.00% or the Bank’s prime rate less 1.00%.
During the reporting period, State Street Bank and Trust Company made available to the DoubleLine Emerging Markets Local Currency Bond Fund an uncommitted $30,000,000 credit facility with an annual non-refundable facility fee of $50,000. Under the terms of the credit facility, borrowings are limited to 15% of the Fund’s total assets. Borrowings under this credit facility bore interest at 0.10% plus 1.25% plus the greater of the Federal Funds Rate or the Overnight Bank Funding Rate as in effect on that day. The credit facility was terminated effective as of December 14, 2023.
| | | | | | | | | | |
| 154 | | DoubleLine Funds Trust | | | | | | | | |
For the period ended March 31, 2024, the Funds’ credit facility activity is as follows:
| | | | | | | | | | | | | | | | | | | | | | | | | | | | | | |
| | | | | | |
| | | | | Average
Borrowings | | Maximum
Amount
Outstanding | | Interest
Expense | | Commitment
Fee | | Average
Interest
Rate |
| | | | | | |
DoubleLine Emerging Markets Fixed Income Fund | | | | | | | | $ | 2,020,954 | | | | $ | 22,740,000 | | | | $ | 27,285 | | | | $ | — | | | | | 7.47% | |
| | | | | | |
DoubleLine Floating Rate Fund | | | | | | | | $ | — | | | | $ | — | | | | $ | — | | | | $ | 61,000 | | | | | 0.00% | |
| | | | | | |
DoubleLine Low Duration Emerging Markets Fixed Income Fund | | | | | | | | $ | 395,919 | | | | $ | 2,863,000 | | | | $ | 6,065 | | | | $ | — | | | | | 7.42% | |
| | | | | | |
DoubleLine Long Duration Total Return Bond Fund | | | | | | | | $ | 1,609,000 | | | | $ | 1,609,000 | | | | $ | 324 | | | | $ | — | | | | | 7.25% | |
| | | | | | |
DoubleLine Infrastructure Income Fund | | | | | | | | $ | 783,400 | | | | $ | 1,941,000 | | | | $ | 789 | | | | $ | — | | | | | 7.25% | |
| | | | | | |
DoubleLine Shiller Enhanced International CAPE® | | | | | | | | $ | 99,500 | | | | $ | 129,000 | | | | $ | 83 | | | | $ | — | | | | | 7.50% | |
| | | | | | |
DoubleLine Income Fund | | | | | | | | $ | 5,697,500 | | | | $ | 8,433,000 | | | | $ | 2,374 | | | | $ | — | | | | | 7.50% | |
13. Significant Shareholder Holdings
As of March 31, 2024, shareholders affiliated with the Funds and/or Advisers (other than other DoubleLine Funds) owned shares of the Funds as follows:
| | | | | | | | | | | | | | | | | | | | |
| | | | |
| | | | | Shares | | % of Total Outstanding
Shares - Per Class | | % of Total Outstanding
Shares - Total Fund |
| | | | |
DoubleLine Emerging Markets Local Currency Bond Fund - Class I | | | | | | | | | 1,093,113 | | | | | 81% | | | | | 76% | |
| | | | |
DoubleLine Emerging Markets Local Currency Bond Fund - Class N | | | | | | | | | 10,931 | | | | | 10% | | | | | 76% | |
| | | | |
DoubleLine Multi-Asset Trend Fund (Consolidated) - Class I | | | | | | | | | 1,254,151 | | | | | 78% | | | | | 78% | |
| | | | |
DoubleLine Multi-Asset Trend Fund (Consolidated) - Class N | | | | | | | | | 12,572 | | | | | 45% | | | | | 78% | |
Investment activities of these shareholders could have a material effect on each Fund. See the description of Large Shareholder Risk in the following Principal Risks Note. For information on greater than 5% holders of certain Funds by other DoubleLine Funds, see Note 3 on Related and Other Party Transactions.
14. To-Be-Announced Securities
The Funds may invest in to-be-announced securities (“TBAs”). TBAs is a term that is generally used to describe forward-settling mortgage-backed securities. These TBAs are generally issued by U.S. Government Agencies or U.S. Government Sponsored Entities such as Freddie Mac, Fannie Mae and Ginnie Mae. The actual mortgage-backed security that will be delivered to the buyer at the time TBAs trades are entered is not known, however, the terms of the acceptable pools of loans that will comprise the mortgage- backed security are determined at the time the trade is entered into (coupon rate, maturity, credit quality, etc.). Investment in TBAs will generally increase the Fund’s exposure to interest rate risk and could also expose the Fund to counterparty default risk. In order to mitigate counterparty default risk, the Fund only enters TBAs with counterparties for which the risk of default is determined to be remote.
15. Principal Risks:
Below are summaries of some, but not all, of the principal risks of investing in one or more of the Funds, each of which could adversely affect a Fund’s NAV, yield and total return. Each risk listed below does not necessarily apply to each Fund, and you should read each Fund’s prospectus carefully for a description of the principal risks associated with investing in a particular Fund.
| | • | | active management risk: the risk that a Fund will fail to meet its investment objective and that the Fund’s investment performance will depend, at least in part, on how its assets are allocated and reallocated among asset classes, sectors, underlying funds and/or investments and that such allocation will focus on asset classes, sectors, underlying funds, and/or investments that perform poorly or underperform other asset classes, sectors, underlying funds, and/or available investments. Any given investment strategy may fail to produce the intended results, and Fund’s portfolio may underperform other comparable funds because of portfolio management decisions related to, among other things, the selection of investments, portfolio construction, risk assessments, and/or the outlook on market trends and opportunities. |
| | • | | asset-backed securities investment risk: the risk that borrowers may default on the obligations that underlie the asset-backed security and that, during periods of falling interest rates, asset-backed securities may be called or prepaid, which may |
| | | | | | | | | | |
| | | | Annual Report | | | | | March 31, 2024 | | 155 |
| | |
Notes to Financial Statements (Cont.) | | |
| | result in a Fund having to reinvest proceeds in other investments at a lower interest rate, and the risk that the impairment of the value of the collateral underlying a security in which a Fund invests (due, for example, to non-payment of loans) will result in a reduction in the value of the security. |
| | • | | cash position risk: the risk that to the extent that a Fund holds assets in cash, cash equivalents, and other short-term investments, the ability of the Fund to meet its objective may be limited. |
| | • | | collateralized debt obligations risk: the risks of an investment in a collateralized debt obligation (“CDO”) depend largely on the quality and type of the collateral and the tranche of the CDO in which a Fund invests. Normally, collateralized bond obligations (“CBOs”), collateralized loan obligations (“CLOs”) and other CDOs are privately offered and sold, and thus are not registered under the securities laws. As a result, investments in CDOs may be illiquid. In addition to the risks associated with debt instruments (e.g., interest rate risk and credit risk), CDOs carry additional risks including, but not limited to: (i) the possibility that distributions from collateral will not be adequate to make interest or other payments; (ii) the quality of the collateral may decline in value or default; (iii) the possibility that a Fund may invest in CDOs that are subordinate to other classes of the issuer’s securities; and (iv) the complex structure of the security may not be fully understood at the time of investment and may produce disputes with the issuer or unexpected investment results. |
| | • | | commodities risk: the risk that the value of a Fund’s shares may be affected by changes in the values of the Fund’s investment exposures to commodities or commodity-related instruments, which may be extremely volatile and difficult to value. The value of commodities and commodity-related instruments may be affected by, among other factors, market movements, commodity index volatility, changes in interest rates, or factors affecting supply, demand and/or other market fundamentals with respect to a particular sector, industry or commodity, such as drought, floods, weather, livestock disease, embargoes, tariffs and international economic, political and regulatory developments. A Fund will likely at times have significant exposure to particular sectors through its commodities-related investments, including, for example, the energy, industrial metals precious metals, and agricultural and livestock sectors and may be exposed to greater risk associated with events affecting those sectors. |
| | • | | confidential information access risk: the risk that the intentional or unintentional receipt of material, non-public information (“Confidential Information”) by the Adviser could limit a Fund’s ability to sell certain investments held by the Fund or pursue certain investment opportunities on behalf of the Fund, potentially for a substantial period of time. |
| | • | | counterparty risk: the risk that a Fund will be subject to credit risk with respect to the counterparties to the derivative contracts and other instruments entered into by the Fund; that the Fund’s counterparty will be unable or unwilling to perform its obligations; that the Fund will be unable to enforce contractual remedies if its counterparty defaults; that if a counterparty (or an affiliate of a counterparty) becomes bankrupt, the Fund may experience significant delays in obtaining any recovery or may obtain limited or no recovery in a bankruptcy or other insolvency proceeding. To the extent that a Fund enters into multiple transactions with a single or a small set of counterparties, it will be subject to increased counterparty risk. |
| | ° | | credit risk: the risk that an issuer, counterparty or other obligor to a Fund will fail to pay its obligations to the Fund when they are due, which may reduce the Fund’s income and/or reduce, in whole or in part, the value of the Fund’s investment. Actual or perceived changes in the financial condition of an obligor, changes in economic, social or political conditions that affect a particular type of security, instrument, or obligor, and changes in economic, social or political conditions generally can increase the risk of default by an obligor, which can affect a security’s or other instrument’s credit quality or value and an obligor’s ability to honor its obligations when due. The values of lower-quality debt securities (commonly known as “junk bonds”), including floating rate loans, tend to be particularly sensitive to these changes. The values of securities or instruments also may decline for a number of other reasons that relate directly to the obligor, such as management performance, financial leverage, and reduced demand for the obligor’s goods and services, as well as the historical and prospective earnings of the obligor and the value of its assets. |
| | ° | | extension risk: the risk that if interest rates rise, repayments of principal on certain debt securities, including, but not limited to, floating rate loans and mortgage-related securities, may occur at a slower rate than expected and the expected maturity of those securities could lengthen as a result. Securities that are subject to extension risk generally have a greater potential for loss when prevailing interest rates rise, which could cause their values to fall sharply. |
| | ° | | interest rate risk: the risk that debt instruments will change in value because of changes in interest rates. The value of an instrument with a longer duration (whether positive or negative) will be more sensitive to changes in interest rates than a similar instrument with a shorter duration. |
| | | | | | | | | | |
| 156 | | DoubleLine Funds Trust | | | | | | | | |
| | ° | | prepayment risk: the risk that the issuer of a debt security, including floating rate loans and mortgage-related securities, repays all or a portion of the principal prior to the security’s maturity. In times of declining interest rates, there is a greater likelihood that a Fund’s higher yielding securities will be pre-paid with the Fund being unable to reinvest the proceeds in an investment with as great a yield. Prepayments can therefore result in lower yields to shareholders of a Fund. |
| | • | | defaulted securities risk: the significant risk of the uncertainty of repayment of defaulted securities (e.g., a security on which a principal or interest payment is not made when due) and obligations of distressed issuers. |
| | • | | derivatives risk: the risk that an investment in derivatives will not perform as anticipated by an Adviser, may not be available at the time or price desired, cannot be closed out at a favorable time or price, will increase a Fund’s transaction costs, or will increase a Fund’s volatility; that derivatives may create investment leverage; that, when a derivative is used as a substitute for or alternative to a direct cash investment, the transaction may not provide a return that corresponds precisely or at all with that of the cash investment; that the positions may be improperly executed or constructed; that the Fund’s counterparty will be unable or unwilling to perform its obligations; or that, when used for hedging purposes, derivatives will not provide the anticipated protection, causing a Fund to lose money on both the derivatives transaction and the exposure the Fund sought to hedge. Recent changes in regulation relating to a Fund’s use of derivatives and related instruments could potentially limit or impact the Fund’s ability to invest in derivatives, limit the Fund’s ability to employ certain strategies that use derivatives and/or adversely affect the value of derivatives and the Fund’s performance. |
| | • | | emerging market country risk: the risk that investing in emerging markets, as compared to foreign developed markets, increases the likelihood that a Fund will lose money, due to more limited information about the issuer and/or the security; higher brokerage costs; different accounting, auditing and financial reporting standards; less developed legal systems; fewer investor protections; less regulatory oversight; thinner trading markets; the possibility of currency blockages or transfer restrictions; an emerging market country’s dependence on revenue from particular commodities or international aid; and expropriation, nationalization or other adverse political or economic developments. |
| | • | | equity issuer risk: the risk that the market price of common stocks and other equity securities may go up or down, sometimes rapidly or unpredictably, including due to factors affecting equity securities markets generally, particular industries represented in those markets, or the issuer itself. |
| | • | | financial services risk: the risk that an investment in issuers in the financial services sector or transactions with one or more counterparties in the financial services sector may be adversely affected by, among other things: (i) changes in governmental regulation, which may limit both the amounts and the types of loans and other financial commitments financial services companies can make, the interest rates and fees they can charge, the scope of their activities, the prices they can charge and the amount of capital they must maintain; (ii) fluctuations, including as a result of interest rate changes or increased competition, in the availability and cost of capital of funds on which the profitability of financial services companies is largely dependent; (iii) deterioration of the credit markets; (iv) credit losses resulting from financial difficulties of borrowers, especially when financial services companies are exposed to non-diversified or concentrated loan portfolios; (v) financial losses associated with investment activities, especially when financial services companies are exposed to financial leverage; (vi) the risk that any financial services company experiences substantial declines in the valuations of its assets, takes action to raise capital, or ceases operations; (vii) the risk that a market shock or other unexpected market, economic, political, regulatory, or other event might lead to a sudden decline in the values of most or all companies in the financial services sector; (viii) events leading to limited liquidity, defaults, non-performance or other adverse developments that affect financial institutions or the financial services industry generally, or concerns or rumors about any events of these kinds or other similar risks, leading to market-wide liquidity problems; and (ix) the interconnectedness or interdependence among financial services companies, including the risk that the financial distress or failure of one financial services company may materially and adversely affect a number of other financial services companies. |
| | • | | focused investment risk: the risk that a Fund that invests a substantial portion of its assets in a particular market, industry, sector, group of industries or sectors, country, region, group of countries or asset class is, relative to a Fund that invests in a more diverse investment portfolio, more susceptible to any single economic, market, political, regulatory or other occurrence. This is because, for example, issuers in a particular market, industry, region, sector or asset class may react similarly to specific economic, market, regulatory, political or other developments. The particular markets, industries, regions, sectors or asset classes in which the Fund may focus its investments may change over time and the Fund may alter its focus at inopportune times. |
| | • | | foreign currency risk: the risk that fluctuations in exchange rates may adversely affect the value of a Fund’s investments denominated in foreign currencies. |
| | | | | | | | | | |
| | | | Annual Report | | | | | March 31, 2024 | | 157 |
| | |
Notes to Financial Statements (Cont.) | | |
| | • | | foreign investing risk: the risk that investments in foreign securities or in issuers with significant exposure to foreign markets, as compared to investments in U.S. securities or in issuers with predominantly domestic market exposure, may be more vulnerable to economic, political, and social instability and subject to less government supervision, less protective custody practices, lack of transparency, inadequate regulatory and accounting standards, delayed or infrequent settlement of transactions, and foreign taxes. If a Fund buys securities denominated in a foreign currency, receives income in foreign currencies, or holds foreign currencies from time to time, the value of the Fund’s assets, as measured in U.S. dollars, can be affected unfavorably by changes in exchange rates relative to the U.S. dollar or other foreign currencies. Foreign markets are also subject to the risk that a foreign government could restrict foreign exchange transactions or otherwise implement unfavorable currency regulations. In addition, foreign securities may be subject to currency exchange rates or regulations, the imposition of economic sanctions, tariffs or other government restrictions, higher transaction and other costs, reduced liquidity, and delays in settlement. |
| | • | | high yield risk: the risk that debt instruments rated below investment grade or debt instruments that are unrated and of comparable or lesser quality are predominantly speculative. These instruments, commonly known as “junk bonds”, have a higher degree of default risk and may be less liquid than higher-rated bonds. These instruments may be subject to greater price volatility due to such factors as specific corporate developments, interest rate sensitivity, negative perceptions of high yield investments generally, and less secondary market liquidity. |
| | • | | index risk: the risk that the portion of a Fund invested in instruments based on an index or basket of commodities or that use an index or basket of commodities as the reference asset may not match or may underperform the return of the index or basket for a number of reasons, including, for example, (i) the performance of derivatives related to an index or basket in which a Fund invests may not correlate with the performance of the index or basket and/or may underperform the index or basket due to transaction costs, fees, or other aspects of the transaction’s pricing; (ii) the Fund may not be able to find counterparties willing to enter into derivative instruments whose returns are based on the return of the index or basket, or the Fund may be unable to find parties who are willing to do so at an acceptable cost or level of risk to the Fund; and (iii) errors may arise in carrying out an index’s methodology, or an index provider may incorrectly report information concerning the index. There can be no guarantee that any index, will be maintained indefinitely or that a Fund will be able to continue to utilize a specific index to implement the Fund’s principal investment strategies indefinitely. |
| | • | | inflation-indexed bond risk: the risk that such bonds will change in value in response to actual or anticipated changes in inflation rates in a manner unanticipated by a Fund’s portfolio management team or investors generally. Inflation-indexed bonds are subject to debt securities risks. |
| | • | | investment company and exchange-traded fund risk: the risk that an investment company or other pooled investment vehicle, including any exchange-traded funds (“ETFs”) or money market funds, in which a Fund invests will not achieve its investment objective or execute its investment strategies effectively or that significant purchase or redemption activity by shareholders of such an investment company might negatively affect the value of its shares. A Fund must pay its pro rata portion of an investment company’s fees and expenses. To the extent the Adviser determines to invest Fund assets in other investment companies, the Adviser will have an incentive to invest in other DoubleLine funds over investment companies sponsored or managed by others and to maintain such investments once made due to its own financial interest in those products and other business considerations. |
| | • | | large shareholder risk: the risk that certain account holders, including an Adviser or funds or accounts over which an Adviser (or related parties of an Adviser) has investment discretion, may from time to time own or control a significant percentage of a Fund’s shares. A Fund is subject to the risk that a redemption by those shareholders of all or a portion of their Fund shares, including as a result of an asset allocation decision made by an Adviser (or related parties of an Adviser), will adversely affect the Fund’s performance if it is forced to sell portfolio securities or invest cash when the Adviser would not otherwise choose to do so. Redemptions of a large number of shares may affect the liquidity of a Fund’s portfolio, increase a Fund’s transaction costs, and accelerate the realization of taxable income and/or gains to shareholders. |
| | • | | leveraging risk: the risk that certain investments by a Fund involving leverage may have the effect of increasing the volatility of value of the Fund’s portfolio, and the risk of loss in excess of invested capital. |
| | • | | limited operating history risk: the risk that a recently formed fund has a limited operating history to evaluate and may not attract sufficient assets to achieve or maximize investment and operational efficiencies and remain viable. If a recently formed fund fails to achieve sufficient scale, it may be liquidated. |
| | • | | liquidity risk: the risk that a Fund may be unable to sell a portfolio investment at a desirable time or at the value the Fund has placed on the investment. |
| | | | | | | | | | |
| 158 | | DoubleLine Funds Trust | | | | | | | | |
| | • | | loan risk: the risk that (i) if a Fund holds a loan through another financial institution, or relies on a financial institution to administer the loan, its receipt of principal and interest on the loan may be subject to the credit risk of that financial institution; (ii) any collateral securing a loan may be insufficient or unavailable to a Fund because, for example, the value of the collateral securing a loan can decline, be insufficient to meet the obligations of the borrower, or be difficult to liquidate, and the Fund’s rights to collateral may be limited by bankruptcy or insolvency laws; (iii) investments in highly leveraged loans or loans of stressed, distressed, or defaulted issuers may be subject to significant credit and liquidity risk; (iv) a bankruptcy or other court proceeding could delay or limit the ability of a Fund to collect the principal and interest payments on that borrower’s loans or adversely affect the Fund’s rights in collateral relating to a loan; (v) there may be limited public information available regarding the loan and the relevant borrower(s); (vi) the use of a particular interest rate benchmark may limit the Fund’s ability to achieve a net return to shareholders that consistently approximates the average published Prime Rate of U.S. banks; (vii) the prices of certain floating rate loans that include a feature that prevents their interest rates from adjusting if market interest rates are below a specified minimum level may appreciate less than other instruments in response to changes in interest rates should interest rates rise but remain below the applicable minimum level; (viii) if a borrower fails to comply with various restrictive covenants that may be found in loan agreements, the borrower may default in payment of the loan; (ix) if a Fund invests in loans that contain fewer or less restrictive constraints on the borrower than certain other types of loans (“covenant-lite” loans), it may have fewer rights against the borrowers of such loans, including fewer protections against the possibility of default and fewer remedies in the event of default; (x) the loan is unsecured; (xi) there is a limited secondary market; (xii) transactions in loans may settle on a delayed basis, and the Fund may not receive the proceeds from the sale of a loan for a substantial period of time after the sale, which may result in sale proceeds related to the sale of loans not being available to make additional investments or to meet a Fund’s redemption obligations until potentially a substantial period after the sale of the loans; and (xiii) loans may be difficult to value and may be illiquid, which may adversely affect an investment in the Fund. |
| | • | | market capitalization risk: the risk that investing substantially in issuers in one market capitalization category (large, medium or small) may adversely affect a Fund because of unfavorable market conditions particular to that category of issuers, such as larger, more established companies being unable to respond quickly to new competitive challenges or attain the high growth rates of successful smaller companies, or, conversely, stocks of smaller companies being more volatile than those of larger companies due to, among other things, narrower product lines, more limited financial resources, fewer experienced managers and there typically being less publicly available information about small capitalization companies. |
| | • | | market risk: the risk that markets will perform poorly or that the returns from the securities in which a Fund invests will underperform returns from the general securities markets or other types of investments. Markets may, in response to governmental actions or intervention or general market conditions, including real or perceived adverse, political, economic or market conditions, tariffs and trade disruptions, inflation, recession, changes in interest or currency rates, lack of liquidity in the bond markets or adverse investor sentiments, or other external factors, experience periods of high volatility and reduced liquidity. During those periods, the Fund may experience high levels of shareholder redemptions, and may have to sell securities at times when the Fund would otherwise not do so, and potentially at unfavorable prices. Certain securities may be difficult to value during such periods. Market risk involves the risk that the value of the Fund’s investment portfolio will change, potentially frequently and in large amounts, as the prices of its investments go up or down. During periods of severe market stress, it is possible that the market for some or all of a Fund’s investments may become highly illiquid. Recently, there have been inflationary price movements. As such, fixed income securities markets may experience heightened levels of interest rate volatility and liquidity risk. The U.S. Federal Reserve has raised interest rates from historically low levels and may continue to do so. Any additional interest rate increases in the future could cause the value of a Fund’s holdings to decrease. |
| | • | | mortgage-backed securities risk: the risk that borrowers may default on their mortgage obligations or the guarantees underlying the mortgage-backed securities will default or otherwise fail and that, during periods of falling interest rates, mortgage-backed securities will be called or prepaid, which may result in a Fund having to reinvest proceeds in other investments at a lower interest rate. During periods of rising interest rates, the average life of a mortgage-backed security may extend, which may lock in a below-market interest rate, increase the security’s duration, and reduce the value of the security. Enforcing rights against the underlying assets or collateral may be difficult, or the underlying assets or collateral may be insufficient if the issuer defaults. The values of certain types of mortgage-backed securities, such as inverse floaters and interest-only and principal-only securities, may be extremely sensitive to changes in interest rates and prepayment rates. A Fund may invest in mortgage-backed securities that are subordinate in their right to receive payment of interest and repayment of principal to other classes of the issuer’s securities. |
| | • | | operational and information security risks: an investment in a Fund, like any fund, can involve operational risks arising from factors such as processing errors, human errors, inadequate or failed internal or external processes, failures in systems |
| | | | | | | | | | |
| | | | Annual Report | | | | | March 31, 2024 | | 159 |
| | |
Notes to Financial Statements (Cont.) | | |
| | and technology, changes in personnel and errors caused by third-party service providers. The occurrence of any of these failures, errors or breaches could result in investment losses to a Fund, a loss of information, regulatory scrutiny, reputational damage or other events, any of which could have a material adverse effect on a Fund. While a Fund seeks to minimize such events through controls and oversight, there may still be failures that could cause losses to the Fund. |
| | • | | portfolio turnover risk: the risk that frequent purchases and sales of portfolio securities may result in higher Fund expenses and may result in larger distributions of taxable capital gains to investors as compared to a fund that trades less frequently. |
| | • | | real estate sector risk: the risk that real estate-related investments may decline in value as a result of factors affecting the real estate sector, such as the supply of real property in certain markets, changes in zoning laws, delays in completion of construction, changes in real estate values, changes in property taxes, levels of occupancy, and local, regional, and general market conditions. Along with the risks common to different types of real estate-related investments, real estate investment trusts (“REITs”), no matter the type, involve additional risk factors, including poor performance by the REIT’s manager, adverse changes to the tax laws, and the possible failure by the REIT to qualify for the favorable tax treatment available to REITs under the Internal Revenue Code, or the exemption from registration under the 1940 Act. REITs are not diversified and are heavily dependent on cash flow earned on the property interests they hold. |
| | • | | restricted securities risk: the risk that a Fund may be prevented or limited by law or the terms of an agreement from selling a security (a “restricted security”). To the extent that a Fund is permitted to sell a restricted security, there can be no assurance that a trading market will exist at any particular time and a Fund may be unable to dispose of the security promptly at reasonable prices or at all. A Fund may have to bear the expense of registering the securities for resale and the risk of substantial delays in effecting the registration. Also, restricted securities may be difficult to value because market quotations may not be readily available, and the values of restricted securities may have significant volatility. |
| | • | | securities or sector selection risk: the risk that the securities held by a Fund will underperform securities held in other funds investing in similar asset classes or comparable benchmarks because of the portfolio managers’ choice of securities or sectors for investment. To the extent a Fund allocates a higher percentage of its investment portfolio to a particular sector or related sectors, the Fund will be more susceptible to events or factors affecting companies in that sector or related sectors. |
| | • | | short position risk: the risk that an increase in the value of an instrument, index or interest rate with respect to which a Fund has established a short position will result in a loss to the Fund. |
| | • | | sovereign debt obligations risk: the risk that investments in debt obligations of sovereign governments may lose value due to the government entity’s unwillingness or inability to repay principal and interest when due in accordance with the terms of the debt or otherwise in a timely manner. |
| | • | | structured products and structured notes risk: the risk that an investment in a structured product, which includes, among other things, CDOs, mortgage-backed securities, other types of asset-backed securities and certain types of structured notes, may decline in value due to changes in the underlying instruments, indexes, interest rates or other factors on which the product is based (“reference measure”). Depending on the reference measure used and the use of multipliers or deflators (if any), changes in interest rates and movement of the reference measure may cause significant price and cash flow fluctuations. In addition to the general risks associated with fixed income securities discussed herein, structured products carry additional risks including, but not limited to: (i) the possibility that distributions from underlying investments will not be adequate to make interest or other payments; (ii) the quality of the underlying investments may decline in value or default; (iii) the possibility that the security may be subordinate to other classes of the issuer’s securities; (iv) the complex structure of the security may not be fully understood at the time of investment and may produce disputes with the issuer or unexpected investment results; and (v) because the structured products are generally privately offered and sold, they may be thinly traded or have a limited trading market, which may increase a Fund’s illiquidity and reduce the Fund’s income and the value of the investment, and the Fund may be unable to find qualified buyers for these securities. |
| | • | | tax risk: in order to qualify as a regulated investment company under the Internal Revenue Code, a Fund must meet requirements regarding, among other things, the source of its income. Certain investments in commodity-linked derivatives do not give rise to qualifying income for this purpose, and it is possible that certain investments in other commodity-linked instruments, ETFs and other investment pools will not give rise to qualifying income. Any income a Fund derives from investments in instruments that do not generate qualifying income must be limited to a maximum of 10% of a Fund’s annual gross income. If a Fund were to earn non-qualifying income in excess of 10% of its annual gross income, it could fail to qualify as a regulated investment company for that year. If a Fund were to fail to qualify as a regulated investment company, the Fund would be subject to tax and shareholders of the Fund would be subject to the risk of diminished returns. |
| | | | | | | | | | |
| 160 | | DoubleLine Funds Trust | | | | | | | | |
| | • | | U.S. Government securities risk: the risk that debt securities issued or guaranteed by certain U.S. Government agencies, instrumentalities, and sponsored enterprises are not supported by the full faith and credit of the U.S. Government, and so investments in their securities or obligations issued by them involve credit risk greater than investments in other types of U.S. Government securities. |
| | • | | valuation risk: the risk that a Fund will not value its investments in a manner that accurately reflects their market values or that the Fund will not be able to sell any investment at a price equal to the valuation ascribed to that investment for purposes of calculating the Fund’s NAV. The valuation of a Fund’s investments involves subjective judgment. Certain securities in which a Fund may invest may be more difficult to value accurately, especially during periods of market disruptions or extreme market volatility. Incorrect valuations of a Fund’s portfolio holdings could result in such Fund’s shareholder transactions being effected at an NAV that does not accurately reflect the underlying value of such Fund’s portfolio, resulting in the dilution of shareholder interests. |
16. Recently Issued Accounting Pronouncements and Other Regulatory Matters
In December 2022, the Financial Accounting Standards Board issued an Accounting Standards Update, ASU 2022-06, Reference Rate Reform (Topic 848) – Deferral of the Sunset Date of Topic 848 (“ASU 2022-06”). ASU 2022-06 is an amendment to ASU 2020-04, which provided optional guidance to ease the potential accounting burden due to the discontinuation of the London Interbank Offered Rate and other interbank-offered based reference rates and which was effective as of March 12, 2020 through December 31, 2022. ASU 2022-06 extends the effective period through December 31, 2024. Management did not adopt the optional guidance provided by ASU 2022-06 and does not intend to do so.
In October 2022, the Securities and Exchange Commission (the “SEC”) adopted a final rule relating to Tailored Shareholder Reports for Mutual Funds and Exchange-Traded Funds; Fee Information in Investment Company Advertisements. The rule and form amendments will, among other things, require the Fund to transmit concise and visually engaging shareholder reports that highlight key information. The amendments will require that funds tag information in a structured data format and that certain more in-depth information be made available online and available for delivery free of charge to investors on request. The amendments became effective January 24, 2023. There is an 18-month transition period after the effective date of the amendment. The implementation of this rule will not have any impact on the financial statements.
17. Subsequent Events
In preparing these financial statements, the Funds have evaluated events and transactions for potential recognition or disclosure through the date the financial statements were issued. The Funds have determined there are no subsequent events that would need to be disclosed in the Funds’ financial statements.
| | | | | | | | | | |
| | | | Annual Report | | | | | March 31, 2024 | | 161 |
| | |
Report of Independent Registered Public Accounting Firm | | |
To the Board of Trustees of DoubleLine Funds Trust and Shareholders of each of the sixteen funds indicated in the table below
Opinions on the Financial Statements
We have audited the accompanying financial statements and financial highlights of each of the funds indicated in the table below (sixteen of the funds constituting DoubleLine Funds Trust, hereafter collectively referred to as the “Funds”) as of the date indicated in the table below and for each of the periods indicated in the table below (collectively referred to as the “financial statements”). In our opinion, the financial statements present fairly, in all material respects, the financial position of each of the Funds as of the date indicated in the table below, the results of each of their operations, the changes in each of their net assets, and each of the financial highlights for each of the periods indicated in the table below, in conformity with accounting principles generally accepted in the United States of America.
|
DoubleLine Total Return Bond Fund (1) |
DoubleLine Core Fixed Income Fund (1) |
DoubleLine Emerging Markets Fixed Income Fund (2) |
DoubleLine Low Duration Bond Fund (2) |
DoubleLine Floating Rate Fund (2) |
DoubleLine Shiller Enhanced CAPE® (1) |
DoubleLine Flexible Income Fund (1) |
DoubleLine Low Duration Emerging Markets Fixed Income Fund (2) |
DoubleLine Long Duration Total Return Bond Fund (2) |
DoubleLine Strategic Commodity Fund and its subsidiary (3) |
DoubleLine Global Bond Fund (2) |
DoubleLine Infrastructure Income Fund (2) |
DoubleLine Shiller Enhanced International CAPE® (2) |
DoubleLine Emerging Markets Local Currency Bond Fund (2) |
DoubleLine Income Fund (2) |
DoubleLine Multi-Asset Trend Fund and its subsidiary (3) |
(1) The statement of assets and liabilities, including the schedule of investments – summary, as of March 31, 2024, the related statement of operations for the year then ended, the statement of changes in net assets for each of the two years in the period ended March 31, 2024, including the related notes, and the financial highlights for each of the periods indicated therein. |
(2) The statement of assets and liabilities, including the schedule of investments, as of March 31, 2024, the related statement of operations for the year then ended, the statement of changes in net assets for each of the two years in the period ended March 31, 2024, including the related notes, and the financial highlights for each of the periods indicated therein. |
(3) The consolidated statement of assets and liabilities, including the consolidated schedule of investments, as of March 31, 2024, the related consolidated statement of operations for the year then ended, the consolidated statement of changes in net assets for each of the two years in the period ended March 31, 2024, including the related notes, and the financial highlights for each of the periods indicated therein. |
Basis for Opinions
These financial statements are the responsibility of the Funds’ management. Our responsibility is to express an opinion on the Funds’ financial statements based on our audits. We are a public accounting firm registered with the Public Company Accounting Oversight Board (United States) (PCAOB) and are required to be independent with respect to the Funds in accordance with the U.S. federal securities laws and the applicable rules and regulations of the Securities and Exchange Commission and the PCAOB.
We conducted our audits of these financial statements in accordance with the standards of the PCAOB. Those standards require that we plan and perform the audit to obtain reasonable assurance about whether the financial statements are free of material misstatement, whether due to error or fraud.
Our audits included performing procedures to assess the risks of material misstatement of the financial statements, whether due to error or fraud, and performing procedures that respond to those risks. Such procedures included examining, on a test basis, evidence regarding the amounts and disclosures in the financial statements. Our audits also included evaluating the accounting principles used and significant estimates made by management, as well as evaluating the overall presentation of the financial statements. Our procedures included confirmation of securities owned as of March 31, 2024 by correspondence with the custodian and brokers; when replies were not received from brokers, we performed other auditing procedures. We believe that our audits provide a reasonable basis for our opinions.

Los Angeles, California
May 24, 2024
We have served as the auditor of one or more investment companies in the DoubleLine Investment Company Complex since 2010.
PricewaterhouseCoopers LLP, 601 South Figueroa Street, Los Angeles, California 90017
T: (213) 356 6000, www.pwc.com/us
| | | | | | | | | | |
| 162 | | DoubleLine Funds Trust | | | | | | | | |
| | |
Shareholder Expenses | | (Unaudited) March 31, 2024 |
Example
As a shareholder of the Funds, you incur two basic types of costs: (1) transaction costs, including sales charges (loads) on purchase payments, reinvested dividends, or other distributions; redemption fees; and exchange fees; and (2) ongoing costs, including management fees; distribution (12b-1) fees and other Fund expenses.
This Example is intended to help you understand your ongoing costs (in dollars) of investing in each Fund and to compare these costs with the ongoing costs of investing in other mutual funds. The Example is based on an investment of $1,000 invested at the beginning of the period and held for the entire period October 1, 2023 through March 31, 2024. Expenses paid during the period are equal to the net annualized expense ratio for the class, multiplied by the average account value over the period, multiplied by 183/366 (to reflect the one-half year period).
Actual Expenses
The actual return columns in the following table provide information about account values based on actual returns and actual expenses. You may use the information in these columns, together with the amount you invested, to estimate the expenses that you paid over the period. Simply divide your account value by $1,000 (for example, an $8,600 account value divided by $1,000 = 8.6), then multiply the result by the number in the respective line under the heading entitled “Expenses Paid During Period” to estimate the expenses you paid on your account during this period. In addition to the expenses shown below in the table, as a shareholder you will be assessed fees for outgoing wire transfers, returned checks and stop payment orders at prevailing rates charged by the funds’ transfer agent, U.S. Bancorp Fund Services, LLC (doing business as U.S. Bank Global Fund Services). Currently, if you request a redemption be made by wire, a $15.00 fee is charged by the Fund’s transfer agent. You will be charged a redemption fee equal to 1.00% of the net amount of the redemption if you redeem shares that have been held for 90 days or less in the DoubleLine Floating Rate Fund. An Individual Retirement Account (“IRA”) will be charged a $15.00 annual maintenance fee. The transfer agent charges a transaction fee of $25.00 on returned checks and stop payment orders. If you paid a transaction fee, you would add the fee amount to the expenses paid on your account this period to obtain your total expenses paid.
Hypothetical Example for Comparison Purposes
The hypothetical return columns in the following table provide information about hypothetical account values and hypothetical expenses based on a Fund’s actual expense ratio and an assumed rate of return of 5% per year before expenses, which is not a Fund’s actual return. The hypothetical account values and expenses may not be used to estimate the actual ending account balance or expenses you paid for the period. You may use this information to compare the ongoing costs of investing in a Fund and other funds. To do so, compare this 5% hypothetical example with the 5% hypothetical examples that appear in the shareholder reports of the other funds. Please note that the expenses shown in the table are meant to highlight your ongoing costs only and do not reflect the transaction fees discussed above. Therefore, those columns are useful in comparing ongoing costs only, and will not help you determine the relative total costs of owning different funds. In addition, if these transactional costs were included, your costs would have been higher.
| | | | | | | | | | | | | | | | | | | | | | | | | | | | | | |
| | | | | | |
| | | | | | | | | | | | | | Actual | | | Hypothetical
(5% return
before expenses) | |
| | | | | | | | |
| | | | | | | | Fund’s
Annualized
Expense Ratio(b) | | | Beginning
Account
Value | | | Ending
Account
Value at
3/31/24 | | | Expenses
Paid During
Period(a)(b) | | | Ending
Account
Value at
3/31/24 | | | Expenses
Paid During
Period(a)(b) | |
| | | | | | | | |
DoubleLine Total Return Bond Fund | | | | | | Class I | | | 0.50% | | | $ | 1,000 | | | $ | 1,062 | | | $ | 2.58 | | | $ | 1,023 | | | $ | 2.53 | |
| | | | | | | | |
| | | | | | Class N | | | 0.75% | | | $ | 1,000 | | | $ | 1,062 | | | $ | 3.87 | | | $ | 1,021 | | | $ | 3.79 | |
| | | | | | | | |
| | | | | | | Class R6 | | | 0.44% | | | $ | 1,000 | | | $ | 1,064 | | | $ | 2.27 | | | $ | 1,023 | | | $ | 2.23 | |
| | | | | | | | |
DoubleLine Core Fixed Income Fund | | | | | | Class I | | | 0.44% | | | $ | 1,000 | | | $ | 1,063 | | | $ | 2.27 | | | $ | 1,023 | | | $ | 2.23 | |
| | | | | | | | |
| | | | | | Class N | | | 0.69% | | | $ | 1,000 | | | $ | 1,063 | | | $ | 3.56 | | | $ | 1,022 | | | $ | 3.49 | |
| | | | | | | | |
| | | | | | | Class R6 | | | 0.41% | | | $ | 1,000 | | | $ | 1,063 | | | $ | 2.11 | | | $ | 1,023 | | | $ | 2.07 | |
| | | | | | | | |
DoubleLine Emerging Markets Fixed Income Fund | | | | | | Class I | | | 0.95% | | | $ | 1,000 | | | $ | 1,109 | | | $ | 5.01 | | | $ | 1,020 | | | $ | 4.80 | |
| | | | | | | | |
| | | | | | | Class N | | | 1.19% | | | $ | 1,000 | | | $ | 1,107 | | | $ | 6.27 | | | $ | 1,019 | | | $ | 6.01 | |
| | | | | | | | |
DoubleLine Low Duration Bond Fund | | | | | | Class I | | | 0.43% | | | $ | 1,000 | | | $ | 1,041 | | | $ | 2.19 | | | $ | 1,023 | | | $ | 2.17 | |
| | | | | | | | |
| | | | | | Class N | | | 0.68% | | | $ | 1,000 | | | $ | 1,039 | | | $ | 3.47 | | | $ | 1,022 | | | $ | 3.44 | |
| | | | | | | | |
| | | | | | | Class R6 | | | 0.39% | | | $ | 1,000 | | | $ | 1,040 | | | $ | 1.99 | | | $ | 1,023 | | | $ | 1.97 | |
| | | | | | | | |
DoubleLine Floating Rate Fund | | | | | | Class I | | | 0.80% | | | $ | 1,000 | | | $ | 1,047 | | | $ | 4.09 | | | $ | 1,021 | | | $ | 4.04 | |
| | | | | | | | |
| | | | | | | Class N | | | 1.05% | | | $ | 1,000 | | | $ | 1,047 | | | $ | 5.37 | | | $ | 1,020 | | | $ | 5.30 | |
| | | | | | | | | | |
| | | | Annual Report | | | | | March 31, 2024 | | 163 |
| | |
Shareholder Expenses (Cont.) | | |
| | | | | | | | | | | | | | | | | | | | | | | | | | | | | | |
| | | | | | |
| | | | | | | | | | | | | | Actual | | | Hypothetical
(5% return
before expenses) | |
| | | | | | | | |
| | | | | | | | Fund’s
Annualized
Expense Ratio(b) | | | Beginning
Account
Value | | | Ending
Account
Value at
3/31/24 | | | Expenses
Paid During
Period(a)(b) | | | Ending
Account
Value at
3/31/24 | | | Expenses
Paid During
Period(a)(b) | |
| | | | | | | | |
DoubleLine Shiller Enhanced CAPE® | | | | | | Class I | | | 0.53% | | | $ | 1,000 | | | $ | 1,191 | | | $ | 2.90 | | | $ | 1,022 | | | $ | 2.68 | |
| | | | | | | | |
| | | | | | Class N | | | 0.78% | | | $ | 1,000 | | | $ | 1,190 | | | $ | 4.27 | | | $ | 1,021 | | | $ | 3.94 | |
| | | | | | | | |
| | | | | | | Class R6 | | | 0.48% | | | $ | 1,000 | | | $ | 1,191 | | | $ | 2.63 | | | $ | 1,023 | | | $ | 2.43 | |
| | | | | | | | |
DoubleLine Flexible Income Fund | | | | | | Class I | | | 0.73% | | | $ | 1,000 | | | $ | 1,061 | | | $ | 3.76 | | | $ | 1,021 | | | $ | 3.69 | |
| | | | | | | | |
| | | | | | Class N | | | 0.98% | | | $ | 1,000 | | | $ | 1,061 | | | $ | 5.05 | | | $ | 1,020 | | | $ | 4.95 | |
| | | | | | | | |
| | | | | | | Class R6 | | | 0.69% | | | $ | 1,000 | | | $ | 1,063 | | | $ | 3.56 | | | $ | 1,022 | | | $ | 3.49 | |
| | | | | | | | |
DoubleLine Low Duration Emerging Markets Fixed Income Fund | | | | | | Class I | | | 0.59% | | | $ | 1,000 | | | $ | 1,059 | | | $ | 3.04 | | | $ | 1,022 | | | $ | 2.98 | |
| | | | | | | | |
| | | | | | | Class N | | | 0.84% | | | $ | 1,000 | | | $ | 1,059 | | | $ | 4.32 | | | $ | 1,021 | | | $ | 4.24 | |
| | | | | | | | |
DoubleLine Long Duration Total Return Bond Fund | | | | | | Class I | | | 0.50% | | | $ | 1,000 | | | $ | 1,097 | | | $ | 2.62 | | | $ | 1,023 | | | $ | 2.53 | |
| | | | | | | | |
| | | | | | | Class N | | | 0.75% | | | $ | 1,000 | | | $ | 1,095 | | | $ | 3.93 | | | $ | 1,021 | | | $ | 3.79 | |
| | | | | | | | |
DoubleLine Strategic Commodity Fund (Consolidated) | | | | | | Class I | | | 1.09% | | | $ | 1,000 | | | $ | 1,014 | | | $ | 5.49 | | | $ | 1,020 | | | $ | 5.50 | |
| | | | | | | | |
| | | | | | | Class N | | | 1.34% | | | $ | 1,000 | | | $ | 1,012 | | | $ | 6.74 | | | $ | 1,018 | | | $ | 6.76 | |
| | | | | | | | |
DoubleLine Global Bond Fund | | | | | | Class I | | | 0.62% | | | $ | 1,000 | | | $ | 1,049 | | | $ | 3.18 | | | $ | 1,022 | | | $ | 3.13 | |
| | | | | | | | |
| | | | | | | Class N | | | 0.89% | | | $ | 1,000 | | | $ | 1,047 | | | $ | 4.55 | | | $ | 1,021 | | | $ | 4.50 | |
| | | | | | | | |
DoubleLine Infrastructure Income Fund | | | | | | Class I | | | 0.58% | | | $ | 1,000 | | | $ | 1,068 | | | $ | 3.00 | | | $ | 1,022 | | | $ | 2.93 | |
| | | | | | | | |
| | | | | | | Class N | | | 0.84% | | | $ | 1,000 | | | $ | 1,067 | | | $ | 4.34 | | | $ | 1,021 | | | $ | 4.24 | |
| | | | | | | | |
DoubleLine Shiller Enhanced International CAPE® | | | | | | Class I | | | 0.61% | | | $ | 1,000 | | | $ | 1,150 | | | $ | 3.28 | | | $ | 1,022 | | | $ | 3.08 | |
| | | | | | | | |
| | | | | | | Class N | | | 0.87% | | | $ | 1,000 | | | $ | 1,148 | | | $ | 4.67 | | | $ | 1,021 | | | $ | 4.39 | |
| | | | | | | | |
DoubleLine Emerging Markets Local Currency Bond Fund | | | | | | Class I | | | 0.90% | | | $ | 1,000 | | | $ | 1,059 | | | $ | 4.63 | | | $ | 1,021 | | | $ | 4.55 | |
| | | | | | | | |
| | | | | | | Class N | | | 1.15% | | | $ | 1,000 | | | $ | 1,059 | | | $ | 5.92 | | | $ | 1,019 | | | $ | 5.81 | |
| | | | | | | | |
DoubleLine Income Fund | | | | | | Class I | | | 0.65% | | | $ | 1,000 | | | $ | 1,093 | | | $ | 3.40 | | | $ | 1,022 | | | $ | 3.29 | |
| | | | | | | | |
| | | | | | | Class N | | | 0.90% | | | $ | 1,000 | | | $ | 1,091 | | | $ | 4.71 | | | $ | 1,021 | | | $ | 4.55 | |
| | | | | | | | |
DoubleLine Multi-Asset Trend Fund (Consolidated) | | | | | | Class I | | | 0.34% | | | $ | 1,000 | | | $ | 1,061 | | | $ | 1.75 | | | $ | 1,023 | | | $ | 1.72 | |
| | | | | | | | |
| | | | | | | Class N | | | 0.59% | | | $ | 1,000 | | | $ | 1,059 | | | $ | 3.04 | | | $ | 1,022 | | | $ | 2.98 | |
(a) Expenses Paid During Period are equal to the net annualized expense ratio for the class, multiplied by the average account value over the period, multiplied by 183/366 (to reflect the one-half year period).
(b) Reflects fee waiver and expense limitation arrangements in effect during the period.
| | | | | | | | | | |
| 164 | | DoubleLine Funds Trust | | | | | | | | |
| | |
Evaluation of Advisory Agreement by the Board of Trustees | | (Unaudited) March 31, 2024 |
At a meeting held in February 2024 (the “February Meeting”), the Boards of Trustees (the “Board” or the “Trustees”) of the DoubleLine open-end mutual funds (“mutual funds”), exchange-traded funds (“ETFs”), and closed-end funds (“CEFs”) listed above (collectively, the “Funds”) approved the continuation of the investment advisory and sub-advisory agreements, as applicable (the “Advisory Agreements”), between DoubleLine and those Funds. That included approval by the Trustees who are not “interested persons” (as defined in the Investment Company Act of 1940, as amended (the “1940 Act”)) of the Funds (the “Independent Trustees”) voting separately. When used in this summary, “DoubleLine” or “Management” refers to DoubleLine Capital LP, DoubleLine ETF Adviser LP, and/or to DoubleLine Alternatives LP, as appropriate in the context.
The Trustees’ determination to approve the continuation of each Advisory Agreement was made on the basis of each Trustee’s business judgment after an evaluation of all of the relevant information provided to the Trustees, including information provided for their consideration at their February Meeting and at meetings held in preparation for the February Meeting with management and representatives of ISS Market Intelligence, an independent third-party provider of investment company data (“ISS MI”), and additional information requested by the Independent Trustees. The Independent Trustees also met with Independent Trustee counsel outside the presence of management prior to the February Meeting to consider the materials and information related to the proposed continuation of the Advisory Agreements.
The Trustees also meet regularly with investment advisory, compliance, risk management, operational, and other personnel from DoubleLine and regularly review detailed information, presented both orally and in writing, regarding the services performed by DoubleLine for the benefit of the Funds, DoubleLine’s investment program for each Fund, the performance of each Fund, the fees and expenses of each Fund, and the operations of each Fund. In considering whether to approve the continuation of the Advisory Agreements, the Trustees took into account information presented to them over the course of the past year and not just that which was provided specifically in relation to the proposed renewal of the Advisory Agreements.
This summary describes a number, but not necessarily all, of the most important factors considered by the Board and the Independent Trustees. Individual Trustees may have given different weights to certain factors and assigned various degrees of materiality to information received in connection with the approval process. No single factor was determined to be decisive or controlling. In all their deliberations, the Independent Trustees were advised by independent counsel.
The Trustees considered the nature, extent, and quality of the services, including the expertise and experience of investment personnel, provided and expected to be provided by DoubleLine to each Fund. In this regard, the Trustees considered that DoubleLine provides a full investment program for each Fund, with a strong emphasis on risk management for the Funds. The Board considered, where applicable, the difficulty of managing debt-related portfolios, noting that managing such portfolios requires a portfolio management team to balance a number of factors, which may include, among others, securities of varying maturities and durations, actual and anticipated interest rate changes and market volatility, prepayments, collateral management, counterparty management, pay-downs, credit events, workouts, and net new issuances. In their evaluation of the services provided by DoubleLine and the Funds’ contractual relationships with DoubleLine, the Trustees considered generally the long-term performance record of the firm’s portfolio management personnel, including, among others, Mr. Jeffrey Gundlach, and the strong historical investor interest in products managed by DoubleLine.
The Trustees reviewed reports prepared by ISS MI (the “ISS MI Reports”) that compared, among other information, each Fund’s net management fee rate and net total expense ratio (Class I shares with respect to the mutual funds) against the net management fee rate and net total expense ratio of a group of peers selected by ISS MI, and each Fund’s performance records (Class I shares with respect to the mutual funds) for the one-year, three-year (where applicable), five-year (where applicable), and ten-year (where applicable) periods ended October 31, 2023, against the performance records of those funds in each Fund’s Morningstar category and the performance of the Fund’s benchmark index. In preparation for the February Meeting, the Independent Trustees met with ISS MI representatives in January 2024 to review the comparative information set out in the ISS MI Reports, the methodologies used by ISS MI in compiling those reports and selecting the peer groups used within those reports, and the considerations for evaluating the comparative information presented in those reports. The Independent Trustees also considered the information ISS MI provided regarding the challenges ISS MI encountered in selecting or assembling peer groups for certain of the Funds due to, among other factors, the limited number of possible peer funds with substantially similar principal investment strategies or investment approaches. Where applicable, the Trustees also received information from DoubleLine, including regarding factors to consider in evaluating a Fund’s performance or management fees relative to its peer groups and factors that contributed to the relative underperformance of certain Funds relative to their benchmark indices or the median of their peer groups.
| | | | | | | | | | |
| | | | Annual Report | | | | | March 31, 2024 | | 165 |
| | |
Evaluation of Advisory Agreement by the Board of Trustees (Cont.) | | |
In respect of the mutual funds, the Trustees considered that a number of the mutual funds have achieved strong long-term performance relative to the median of their peers for the five-year and/or ten-year (where applicable) periods ended October 31, 2023, notwithstanding, in some cases, more recent periods of relative underperformance. Those Funds included DoubleLine Core Fixed Income Fund, DoubleLine Emerging Markets Fixed Income Fund, DoubleLine Floating Rate Fund, DoubleLine Flexible Income Fund, DoubleLine Infrastructure Income Fund, DoubleLine Low Duration Bond Fund, DoubleLine Low Duration Emerging Markets Fixed Income Fund, DoubleLine Shiller Enhanced CAPE® and DoubleLine Shiller Enhanced International CAPE®. The Trustees also considered that a number of the mutual funds had achieved strong relative performance more recently, such as over the one-year and/or three-year periods ended October 31, 2023, notwithstanding other periods of short-term or longer-term unfavorable relative performance. Those mutual funds included DoubleLine Long Duration Total Return Bond Fund, DoubleLine Emerging Markets Local Currency Bond Fund, DoubleLine Strategic Commodity Fund, DoubleLine Total Return Bond Fund, DoubleLine Income Fund and DoubleLine Selective Credit Fund. In each instance where a Fund exhibited relative underperformance over the one-year, three-year (as applicable), five-year (as applicable), or ten-year (as applicable) periods, the Trustees considered DoubleLine’s explanations for the periods of relative underperformance, including, in the cases of DoubleLine Long Duration Total Return Bond Fund, DoubleLine Global Bond Fund and DoubleLine Multi-Asset Trend Fund, differences in the Funds’ investment approach relative to their peer groups generally, as well as specifically in the case of DoubleLine Multi-Asset Trend Fund, that the Fund did not yet have three years of investment operations.
The Trustees considered the portion of the ISS MI Reports covering the Funds’ net management fees (where applicable) and net total expenses relative to their expense peer groups. The Trustees considered DoubleLine’s pricing policy for its advisory fees and that DoubleLine does not seek to be a low cost provider, nor does it have a policy to set its advisory fees below the median of a Fund’s peers, but rather seeks to set fees at a competitive level that reflects DoubleLine’s demonstrated significant expertise and experience in the investment strategies that if offers.
The Trustees also considered the relative net management fees and net total expenses of each of the mutual funds. They noted that all but five of the mutual funds had net management fees either below the median of their peer group or within five basis points of the median of their peer group. They noted that among those five mutual funds several, including DoubleLine Total Return Bond Fund, DoubleLine Emerging Markets Fixed Income Fund, DoubleLine Flexible Income Fund and DoubleLine Strategic Commodity Fund, had net total expense ratios either below or within five basis points of the median of their peer groups. In the case of DoubleLine Infrastructure Income Fund, the Trustees noted the very limited number of other mutual funds that invest principally in infrastructure-related debt as well as the information provided by ISS MI regarding challenges it encountered in constructing a peer group of funds with similar principal investment strategies. In all cases, the Trustees considered each Fund’s net management fees in light of that Fund’s historical performance net of expenses, that none of the mutual funds had the highest net management fee in its peer group, and that DoubleLine’s stated pricing philosophy for its advisory services did not include seeking to be a low-cost service provider. In light of all of the above and the other factors considered, The Trustees determined that neither the net management fees nor the net total expense ratios of any of the mutual funds appeared, on the basis of all of the information available to them, unreasonable or such as to call into question the continuation of the Funds’ Advisory Agreements.
In respect of the ETFs, the Trustees considered information in the ISS MI Reports regarding the ETFs’ performance records and net total expenses. The Trustees noted that DoubleLine Opportunistic Bond ETF and DoubleLine Shiller CAPE US Equities ETF commenced investment operations on March 31, 2022 and that DoubleLine Commercial Real Estate ETF and DoubleLine Mortgage ETF commenced investment operations on March 31, 2023. The Trustees noted that it was important to provide each Fund’s portfolio management team sufficient time to establish a more significant performance history. However, the Trustees considered that performance since inception for each ETF was within Management’s expectations and the Trustees considered Management’s explanation of any relative underperformance, including in respect of DoubleLine Opportunistic Bond ETF. In respect of DoubleLine Shiller CAPE Equities ETF, the Trustees noted that its performance was in line with, though below, its benchmark index. The Trustees noted also that its performance was shown relative to two peer groups and that the ETF compared more favorably against the peer group that was constructed using ISS MI’s more traditional approach. They noted that that ETF’s performance compared less favorably against the peer group that was constructed with just other active, non-transparent ETFs (the “ANT Group”). They noted that the ANT Group was comprised of ETFs with a broader spectrum of principal investment strategies and, consequently, with more dispersed performance records and they considered that in evaluating the ETF’s relative performance to date. On the basis of all of these factors, the Trustees determined that the performance records of the ETFs supported the continuance of the Advisory Agreement for each of the ETFs.
The Trustees considered the expenses of the ETFs. The Trustees noted that under the ETFs’ unitary fee structure, DoubleLine, in addition to providing investment management services, arranges for transfer agency, custody, fund administration and accounting, and other non-distribution related services necessary for the Funds to operate. The Trustees further noted that under the unitary
| | | | | | | | | | |
| 166 | | DoubleLine Funds Trust | | | | | | | | |
| | |
| | | (Unaudited) March 31, 2024 |
fee structure, DoubleLine pays substantially all of the operating expenses of the Funds, except for, among other things, the management fees, taxes and transaction costs, distribution fees or expenses, and any extraordinary expenses (such as litigation). The Trustees considered DoubleLine’s pricing policy for its advisory fees and that DoubleLine does not seek to be a lowest cost provider, nor does it have a policy to set its advisory fees below the median of an ETF’s peers, but rather seeks to set fees at a competitive level that reflects DoubleLine’s demonstrated significant expertise and experience in the investment strategies that if offers.
The Trustees noted that DoubleLine Shiller CAPE US Equities ETF and DoubleLine Opportunistic Bond ETF each had a net total expense ratio at or below the median of its peer group, though with DoubleLine Shiller CAPE US Equities ETF comparing less favorably again to the median of the ANT Group. In considering the net total expense ratios of DoubleLine Commercial Real Estate ETF and DoubleLine Mortgage ETF, the Trustees noted that while each Fund had a net total expense ratio that was above the median of its peer group, in each case, there were several peer funds with significantly higher net total expense ratios and that the ETFs’ net total expense ratios were within four or seven basis points of the median. The Trustees determined that none of the net total expense ratios of any of the ETFs appeared, on the basis of all of the information available to them, unreasonable or such as to call into question the continuation of the ETFs’ Advisory Agreements.
In respect of the CEFs, the Trustees considered the information in the ISS MI Reports regarding the Funds’ performance records and net management fees and net total expenses, based on each Fund’s net assets (excluding the principal amount of borrowings) and, separately, on each Fund’s total managed assets (including the principal amount of borrowings).
As to DoubleLine Income Solutions Fund (“DSL”), the Trustees noted that the Fund’s net management fees were in the third quartile of its peer group on both a net assets and total managed assets basis, though the Fund’s net total expenses (excluding investment related expenses) was either at or below the median of its expense peer group on those bases. The Trustees considered DoubleLine’s explanations for the Fund’s longer term relative underperformance with the Fund falling in the fourth quartile of its peers for the three-year, five-year and ten-year periods ended October 31, 2023 and noted the Fund’s stronger more recent performance, with the Fund performing in the second quartile of its peer group for the one-year period ended October 31, 2023, and the Fund outperforming its benchmark for the one- and three-year and ten-year periods ended October 31, 2023.
As to DoubleLine Opportunistic Credit Fund (“DBL”), the Trustees noted that DBL’s net management fees were in the third quartile of the Fund’s expense group on a net assets basis and in the fourth quartile of the expense group on a total managed assets basis. The Trustees also noted that DBL’s net total expense ratio was shown in the ISS MI Report to be in the third quartile of the Fund’s expense group on a net assets basis and in the fourth quartile of the expense group on a total managed assets basis. The Trustees considered that the Fund’s relative performance had improved recently, with the Fund performing in the second quartile of its peer group for the one-year period ended October 31, 2023, though the Fund had performed in the third quartile for the ten-year period ended October 31, 2023 and in the fourth quartile for the three- and five-year periods ended October 31, 2023. In considering the Fund’s performance, the Trustees noted also that the Fund had outperformed its benchmark index for the one-, three-, five- and ten-year periods shown in the ISS MI Report.
As to DoubleLine Yield Opportunities Fund (“DLY”), the Trustees considered that the Fund’s relative performance improved for the one-year period ended October 31, 2023, with the Fund performing in the first quartile of its peer group. They noted that the Fund performed in the fourth quartile for the three-year period ended October 31, 2023, though it had outperformed its benchmark index over one- and three-year periods ended October 31, 2023. In considering the fees and expenses of the Fund, the Trustees took into account DoubleLine’s statement that the Fund’s terms at its initial offering differed from many closed-end funds that came to market before it in that DoubleLine, as the Fund’s sponsor, bore all of the Fund’s initial organizational and offering expenses and that the Fund has a limited life, and that funds offered pursuant to such arrangements tend to pay higher advisory fees than funds whose sponsors do not bear those organizational and offering expenses and the related risks. The Trustees considered that ISS MI had developed an expense group comprising Funds with similar fee and expense arrangements, as ISS MI reported that it had done for a number of other fund families. The Trustees noted that the Fund’s net management fees and net total expenses, though above the medians of its peers on a total managed assets basis, was in the second quartile and slightly below the median of its peer group on a net assets basis.
The Trustees noted that each of DSL, DBL, and DLY had employed leverage during some or all of the periods shown in the ISS MI Reports, and considered information from DoubleLine that they receive quarterly regarding the estimated spread earned in respect of that leverage, after taking into account expenses related to the leverage, including incremental management fees.
For all of the Funds, Trustees considered that DoubleLine provides a variety of other services to the Funds in addition to investment advisory services, including, among others, a number of back-office services, valuation services, derivatives risk management
| | | | | | | | | | |
| | | | Annual Report | | | | | March 31, 2024 | | 167 |
| | |
Evaluation of Advisory Agreement by the Board of Trustees (Cont.) | | |
services, compliance services, liquidity monitoring services, certain forms of information technology services (such as internal reporting), assistance with accounting and distribution services, and supervision and monitoring of the Funds’ other service providers. The Trustees considered DoubleLine’s ongoing efforts to keep the Trustees informed about matters relevant to the Funds and their shareholders. The Trustees also considered the nature and structure of the Funds’ compliance program, including the policies and procedures of the Funds and their various service providers (including DoubleLine). The Trustees considered the quality of those non-investment advisory services and determined that their quality appeared to support the continuation of the Funds’ arrangements with DoubleLine.
The Trustees considered information provided by DoubleLine relating to its historical and continuing commitment to hire the necessary personnel and to invest in technology enhancements to support DoubleLine’s ability to provide services to the Funds. The Trustees concluded that it appeared that DoubleLine continued to have sufficient quality and depth of personnel, resources, and investment methods to continue to provide services of the same nature and quality as DoubleLine has historically provided to the Funds.
The Trustees considered materials relating to the fees charged by DoubleLine to non-Fund clients for which DoubleLine employs investment strategies substantially similar to one or more Funds’ investment strategies, including institutional separate accounts advised by DoubleLine and mutual funds for which DoubleLine serves as subadviser. The Trustees noted the information DoubleLine provided regarding certain institutional separate accounts advised by it and funds subadvised by it that are subject to fee schedules that differ from, and are in most cases lower than, the rates paid by a Fund with substantially similar investment strategies. The Trustees noted DoubleLine’s representations that administrative, compliance, operational, legal, and other burdens of providing investment advice to registered investment companies (mutual funds, ETFs and closed-end funds) exceed in many respects those required to provide advisory services to non-registered investment company clients, such as institutional accounts for retirement or pension plans, which may have differing contractual requirements. The Trustees noted DoubleLine’s representations that DoubleLine also bears substantially greater legal and other responsibilities and risks in managing and sponsoring registered investment companies than in managing private accounts or in sub-advising funds, including registered investment companies, sponsored by others, and that the services and resources required of DoubleLine when it sub-advises registered investment companies by others generally are less extensive than those required of DoubleLine to serve the Funds, because, where DoubleLine serves as a sub-adviser, many of the sponsorship, operational, and compliance responsibilities related to the advisory function are retained by the primary adviser. In respect of the ETFs, the Trustees also noted the substantial financial risks assumed by DoubleLine in respect of each ETF’s unitary fee and that DoubleLine would generally bear, with limited exceptions, any increase in each ETF’s ordinary operating expenses.
The Trustees reviewed information as to general estimates of DoubleLine’s profitability with respect to each Fund, taking into account, among other things, information about both the direct and the indirect benefits to DoubleLine from managing the Funds. The Trustees considered information provided by DoubleLine as to the methods it uses, and the assumptions it makes, in calculating its profitability. The Trustees considered representations from DoubleLine that its compensation program, which is comprised of several components, including base salary, discretionary bonus and potential equity participation in DoubleLine, enables DoubleLine to attract, retain, and motivate highly qualified and experienced employees. The Trustees noted that DoubleLine experienced significant profitability in respect of certain of the Funds, but noted that in those cases it would be appropriate to consider that profitability in light of various other considerations such as the nature, extent, and quality of the services provided by DoubleLine, the relative long-term performance of the relevant Funds, the consistency of the Funds’ investment operations over time, and the competitiveness of the management fees and total operating expenses of the Funds. The Trustees separately considered in this respect information provided by DoubleLine regarding its reinvestment in its business to accommodate changing regulatory requirements and to maintain its ability to provide high-quality services to the Funds.
In their evaluation of economies of scale, the Trustees considered, among other things, the pricing of the Funds and DoubleLine’s reported profitability, and that a number of the mutual funds had achieved significant size. They noted also that none of the Funds have breakpoints in their advisory fee schedules, though the Trustees considered management’s view that the fee schedules for the Funds remained consistent with DoubleLine’s original pricing philosophy of proposing an initial management fee rate that generally, when taking into account expense limitations (where applicable), reflects reasonably foreseeable economies of scale. In this regard, the Trustees noted also that the information provided by ISS MI supported the view that the net management fees of the largest mutual funds remained competitively priced. The Trustees separately noted that DoubleLine had agreed to continue in place the expense limitation arrangements (where applicable) for a number of the mutual funds at current levels for an additional one-year period, with the prospect of recouping any waived fees or reimbursed expenses at a later date. In evaluating economies of scale more generally, the Trustees also noted ongoing changes to the regulatory environment, which required DoubleLine to re-invest in its business and infrastructure. Based on these factors and others, the Trustees concluded that it was not necessary at
| | | | | | | | | | |
| 168 | | DoubleLine Funds Trust | | | | | | | | |
| | |
| | | (Unaudited) March 31, 2024 |
the present time to implement breakpoints for any of the Funds, although they would continue to consider the question periodically in the future.
With regard to DSL, DBL, and DLY, the Trustees noted that these Funds have not increased in assets significantly from their initial offerings due principally to their status as closed-end investment companies and that there were therefore no substantial increases in economies of scale realized with respect to these Funds since their inception. The Trustees noted DoubleLine’s view that the levels of its profitability in respect of DSL, DBL, and DLY are appropriate in light of the investment it has made in these Funds, the quality of the investment management and other teams provided by it, and its continued investments in its own business.
With regard to the ETFs, the Trustees noted that the ETFs have only recently begun operations and that none of the ETFs has achieved significant scale or scale that exceeded expectations for the ETFs at the time of their launch. The Trustees noted also the significant investment DoubleLine has made in the launch of the ETFs and that it has not yet achieved sustained significant profitability in respect of any of the ETFs.
On the basis of these considerations as well as others and in the exercise of their business judgment, the Trustees determined that they were satisfied with the nature, extent, and quality of the services provided to each Fund under its Advisory Agreement(s); that it appeared that the management fees paid by each Fund to DoubleLine were generally within the range of management fees paid by its peer funds, and generally reasonable in light of the services provided, the quality of the portfolio management teams, and each Fund’s performance to date; that the historical performance records of the Funds, and the factors cited by Management in respect of the underperforming Funds, were consistent with the continuance of the Advisory Agreement(s) for each of the Funds; that the fees paid by each Fund did not appear inappropriate in light of the fee schedules charged to DoubleLine’s other clients with substantially similar investment strategies (where applicable) in light of the differences in the services provided and the risks borne by DoubleLine; that the profitability of each Fund to DoubleLine did not appear excessive or such as to preclude continuation of the Fund’s Advisory Agreement(s); that absence of breakpoints in any Fund’s management fee did not render that Fund’s fee unreasonable or inappropriate under the circumstances, although the Trustees would continue to consider the topic over time; and that it would be appropriate to approve each Advisory Agreement for an additional one-year period.
| | | | | | | | | | |
| | | | Annual Report | | | | | March 31, 2024 | | 169 |
| | |
Statement Regarding the Fund’s Liquidity Risk Management Program | | (Unaudited) March 31, 2024 |
The Funds have adopted a liquidity risk management program. The program’s principal objectives include mitigating the risk that a Fund is unable to meet its redemption obligations timely and supporting each Fund’s compliance with its limits on investments in illiquid assets. For the calendar year ended December 31, 2023, the program administrator determined that the program supported each Fund’s ability to meet reasonably foreseeable redemption requests, reduced the risk of significant dilution from redemptions and supported the Adviser’s management of each Fund’s liquidity profile. The program includes a number of elements that support the assessment and management of liquidity risk, including the periodic classification and re-classification of a Fund’s investments into groupings based on the Adviser’s view of their liquidity. There can be no assurance that the program will achieve its objectives. Please refer to your Fund’s prospectus for more information regarding the Fund’s exposure to liquidity risk and other risks to which an investment in the Fund may be subject.
| | | | | | | | | | |
| 170 | | DoubleLine Funds Trust | | | | | | | | |
| | |
Federal Tax Information | | (Unaudited) March 31, 2024 |
For the fiscal year ended March 31, 2024, certain dividends paid by the Funds may be subject to a maximum tax rate of 15% (20% for taxpayers with taxable income greater than $492,300 for single individuals and $553,850 for married couples filing jointly), as provided for by the Jobs and Growth Tax Relief Reconciliation Act of 2003 and The Tax Cuts and Jobs Act of 2017. The percentage of dividends declared from ordinary income designated as qualified dividend income was as follows:
| | | | | | | | | | |
| | |
| Qualified Dividend Income | | | | |
| | |
DoubleLine Total Return Bond Fund | | | | | | | | | 0.00% | |
| | |
DoubleLine Core Fixed Income Fund | | | | | | | | | 0.01% | |
| | |
DoubleLine Emerging Markets Fixed Income Fund | | | | | | | | | 0.00% | |
| | |
DoubleLine Low Duration Bond Fund | | | | | | | | | 0.00% | |
| | |
DoubleLine Floating Rate Fund | | | | | | | | | 0.00% | |
| | |
DoubleLine Shiller Enhanced CAPE® | | | | | | | | | 0.00% | |
| | |
DoubleLine Flexible Income Fund | | | | | | | | | 0.01% | |
| | |
DoubleLine Low Duration Emerging Markets Fixed Income Fund | | | | | | | | | 0.00% | |
| | |
DoubleLine Long Duration Total Return Bond Fund | | | | | | | | | 0.00% | |
| | |
DoubleLine Strategic Commodity Fund (Consolidated) | | | | | | | | | 0.00% | |
| | |
DoubleLine Global Bond Fund | | | | | | | | | 0.00% | |
| | |
DoubleLine Infrastructure Income Fund | | | | | | | | | 0.00% | |
| | |
DoubleLine Shiller Enhanced International CAPE® | | | | | | | | | 0.00% | |
| | |
DoubleLine Emerging Markets Local Currency Bond Fund | | | | | | | | | 0.00% | |
| | |
DoubleLine Income Fund | | | | | | | | | 0.00% | |
| | |
DoubleLine Multi-Asset Trend Fund (Consolidated) | | | | | | | | | 0.00% | |
For corporate shareholders, the percent of ordinary income distributions qualifying for the corporate dividends received deduction for the fiscal year ended March 31, 2024 was as follows:
| | | | | | | | | | |
| | |
| Dividends Received Deduction | | | | |
| | |
DoubleLine Total Return Bond Fund | | | | | | | | | 0.00% | |
| | |
DoubleLine Core Fixed Income Fund | | | | | | | | | 0.01% | |
| | |
DoubleLine Emerging Markets Fixed Income Fund | | | | | | | | | 0.00% | |
| | |
DoubleLine Low Duration Bond Fund | | | | | | | | | 0.00% | |
| | |
DoubleLine Floating Rate Fund | | | | | | | | | 0.00% | |
| | |
DoubleLine Shiller Enhanced CAPE® | | | | | | | | | 0.00% | |
| | |
DoubleLine Flexible Income Fund | | | | | | | | | 0.01% | |
| | |
DoubleLine Low Duration Emerging Markets Fixed Income Fund | | | | | | | | | 0.00% | |
| | |
DoubleLine Long Duration Total Return Bond Fund | | | | | | | | | 0.00% | |
| | |
DoubleLine Strategic Commodity Fund (Consolidated) | | | | | | | | | 0.00% | |
| | |
DoubleLine Global Bond Fund | | | | | | | | | 0.00% | |
| | |
DoubleLine Infrastructure Income Fund | | | | | | | | | 0.00% | |
| | |
DoubleLine Shiller Enhanced International CAPE® | | | | | | | | | 0.00% | |
| | |
DoubleLine Emerging Markets Local Currency Bond Fund | | | | | | | | | 0.00% | |
| | |
DoubleLine Income Fund | | | | | | | | | 0.00% | |
| | |
DoubleLine Multi-Asset Trend Fund (Consolidated) | | | | | | | | | 0.00% | |
| | | | | | | | | | |
| | | | Annual Report | | | | | March 31, 2024 | | 171 |
| | |
Federal Tax Information (Cont.) | | |
The percentage of taxable ordinary income distributions that are designated as short-term capital gain distributions under Internal Revenue Code Section 871(k)(2)(c) for the fiscal year ended March 31, 2024 for each Fund was as follows:
| | | | | | | | | | |
| | |
| Qualified Short- Term Gains | | | | |
| | |
DoubleLine Total Return Bond Fund | | | | | | | | | 0.00% | |
| | |
DoubleLine Core Fixed Income Fund | | | | | | | | | 0.00% | |
| | |
DoubleLine Emerging Markets Fixed Income Fund | | | | | | | | | 0.00% | |
| | |
DoubleLine Low Duration Bond Fund | | | | | | | | | 0.00% | |
| | |
DoubleLine Floating Rate Fund | | | | | | | | | 0.00% | |
| | |
DoubleLine Shiller Enhanced CAPE® | | | | | | | | | 0.00% | |
| | |
DoubleLine Flexible Income Fund | | | | | | | | | 0.00% | |
| | |
DoubleLine Low Duration Emerging Markets Fixed Income Fund | | | | | | | | | 0.00% | |
| | |
DoubleLine Long Duration Total Return Bond Fund | | | | | | | | | 0.00% | |
| | |
DoubleLine Strategic Commodity Fund (Consolidated) | | | | | | | | | 0.00% | |
| | |
DoubleLine Global Bond Fund | | | | | | | | | 0.00% | |
| | |
DoubleLine Infrastructure Income Fund | | | | | | | | | 0.00% | |
| | |
DoubleLine Shiller Enhanced International CAPE® | | | | | | | | | 0.00% | |
| | |
DoubleLine Emerging Markets Local Currency Bond Fund | | | | | | | | | 0.00% | |
| | |
DoubleLine Income Fund | | | | | | | | | 0.00% | |
| | |
DoubleLine Multi-Asset Trend Fund (Consolidated) | | | | | | | | | 0.00% | |
The percentage of taxable ordinary income distributions that are designated as interest related dividends under Internal Revenue Code Section 871(k)(1)(c) for the fiscal year ended March 31, 2024 for each Fund was as follows:
| | | | | | | | | | |
| | |
| Qualified Interest Income | | | | |
| | |
DoubleLine Total Return Bond Fund | | | | | | | | | 98.66% | |
| | |
DoubleLine Core Fixed Income Fund | | | | | | | | | 86.30% | |
| | |
DoubleLine Emerging Markets Fixed Income Fund | | | | | | | | | 13.32% | |
| | |
DoubleLine Low Duration Bond Fund | | | | | | | | | 66.51% | |
| | |
DoubleLine Floating Rate Fund | | | | | | | | | 99.10% | |
| | |
DoubleLine Shiller Enhanced CAPE® | | | | | | | | | 73.16% | |
| | |
DoubleLine Flexible Income Fund | | | | | | | | | 66.42% | |
| | |
DoubleLine Low Duration Emerging Markets Fixed Income Fund | | | | | | | | | 18.48% | |
| | |
DoubleLine Long Duration Total Return Bond Fund | | | | | | | | | 100.00% | |
| | |
DoubleLine Strategic Commodity Fund (Consolidated) | | | | | | | | | 99.98% | |
| | |
DoubleLine Global Bond Fund | | | | | | | | | 0.00% | |
| | |
DoubleLine Infrastructure Income Fund | | | | | | | | | 58.29% | |
| | |
DoubleLine Shiller Enhanced International CAPE® | | | | | | | | | 64.03% | |
| | |
DoubleLine Emerging Markets Local Currency Bond Fund | | | | | | | | | 15.03% | |
| | |
DoubleLine Income Fund | | | | | | | | | 63.31% | |
| | |
DoubleLine Multi-Asset Trend Fund (Consolidated) | | | | | | | | | 10.02% | |
For the fiscal year ended March 31, 2024, each Fund earned foreign source income and paid foreign taxes, which each intend to pass through to its shareholders pursuant to Section 853 of the Internal Revenue Code as follows:
| | | | | | | | | | | | | | | |
| | | |
| | | | | Foreign Source
Income Earned | | Foreign
Taxes Paid |
| | | |
DoubleLine Emerging Markets Local Currency Bond Fund | | | | | | | | $ | 696,296 | | | | $ | 14,242 | |
Shareholders are advised to consult their own tax adviser with respect to the tax consequences of their investment in the Funds.
| | | | | | | | | | |
| 172 | | DoubleLine Funds Trust | | | | | | | | |
| | |
Trustees and Officers | | (Unaudited) March 31, 2024 |
The name, year of birth, and principal occupations for the past five years of the Trustees and officers of the Funds are listed below, along with the number of portfolios in the fund complex overseen and the other directorships held by each Trustee. The business address for each Trustee is c/o DoubleLine Funds Trust, 2002 North Tampa Street, Suite 200, Tampa, Florida 33602. Unless otherwise indicated, the information below is as of March 31, 2024.
| | | | | | | | | | |
| Name and Year of Birth | | Position with Trust | | Term of Office
and Length of
Time Served | | Principal Occupation(s) During Past 5 Years | | Number of
Portfolios in
Fund Complex
Overseen by
Trustee(1) | | Other Directorships
Held by Trustee
During Past 5 Years |
|
Independent Trustees |
| | | | | |
| Joseph J. Ciprari 1964 | | Trustee | | Indefinite/Since March 2010 | | Executive Vice President, Pointivo, Inc., a software development firm. President, Remo Consultants, a real estate financial consulting firm. Formerly, Managing Director, UBS AG. Formerly, Managing Director, Ally Securities LLC. | | 26 | | None. |
| | | | | |
| Yury Friedman 1956 | | Trustee | | Indefinite/Since September 2023 | | Retired. Formerly, Managing Director, Institutional Fixed Income, Citibank. | | 26 | | None. |
| | | | | |
| William A. Odell 1965 | | Trustee | | Indefinite/Since September 2023 | | Retired. Formerly, Vice President and Regional Sales Manager, Fidelity Investments. | | 26(2) | | None. |
| | | | | |
| John C. Salter 1957 | | Trustee | | Indefinite/Since March 2010 | | American Veterans Group, an investment bank and broker dealer specializing in financial services to American military veteran communities. Formerly, Partner, Stark Municipal Brokers. Formerly, Managing Director, Municipals, Tullet Prebon Financial Services LLC (d/b/a Chapdelaine). Formerly, Partner, Stark, Salter & Smith, a securities brokerage firm specializing in tax exempt bonds. | | 26 | | None. |
(1) The term ‘“Fund Complex” as used herein includes the Funds, DoubleLine Opportunistic Credit Fund, DoubleLine Income Solutions Fund, DoubleLine Yield Opportunities Fund and each series of DoubleLine ETF Trust
(2) Information as of May 14, 2024.
| | | | | | | | | | |
| | | | Annual Report | | | | | March 31, 2024 | | 173 |
| | |
Trustees and Officers (Cont.) | | |
Each of the following Trustees is an interested person of the Trust as defined in the 1940 Act because they are officers of affiliated entities or related parties of the Adviser and hold direct or indirect ownership interests in affiliated entities of the Adviser. Additionally, Mr. Redell is an officer of the Trust.
| | | | | | | | | | |
| Name and Year of Birth | | Position with Trust | | Term of Office
and Length of
Time Served | | Principal Occupation(s) During Past 5 Years | | Number of
Portfolios in
Fund Complex
Overseen by
Trustee(1) | | Other Directorships
Held by Trustee
During Past 5 Years |
|
Interested Trustees |
| | | | | |
| Jeffrey E. Gundlach 1959 | | Trustee | | Indefinite/Since January 2010 | | Chief Executive Officer and Chief Investment Officer, DoubleLine Capital LP (since December 2009). | | 23 | | None. |
(1) The term “Fund Complex” as used herein includes the Funds, DoubleLine Opportunistic Credit Fund, DoubleLine Income Solutions Fund, DoubleLine Yield Opportunities Fund and each series of DoubleLine ETF Trust
| | | | | | | | | | |
| 174 | | DoubleLine Funds Trust | | | | | | | | |
| | |
| | | (Unaudited) March 31, 2024 |
Officers
The officers of the Trust who are not also trustees of the Trust are included in the table below. The business address for each officer is c/o DoubleLine Funds, 2002 North Tampa Street, Suite 200, Tampa, Florida 33602.
| | | | | | |
| Name and Year of Birth | | Position(s)
Held with Trust | | Term of Office
and Length of
Time Served | | Principal Occupation(s) During Past 5 Years |
| | | |
| Ronald R. Redell, 1970 | | President | | Indefinite/Since Inception | | Trustee, Chairman, President and Chief Executive Officer, DoubleLine Yield Opportunities Fund (since November 2019); Trustee, Chairman, President and Chief Executive Officer, DoubleLine Income Solutions Fund (since January 2013); President, DoubleLine Group LP (since January 2019) and Executive (from January 2013 to January 2019); Trustee, Chairman, President and Chief Executive Officer, DoubleLine Opportunistic Credit Fund (since July 2011); Executive, DoubleLine Capital LP (since July 2010); President, DoubleLine Funds Trust (since January 2010). Formerly, Interested Trustee, DoubleLine Funds Trust (January 2019 to September 2023). |
| | | |
| Henry V. Chase, 1949 | | Treasurer and Principal Financial and Accounting Officer | | Indefinite/Since January 2020 | | Treasurer and Principal Financial and Accounting Officer, DoubleLine ETF Adviser LP (since December 2021); Treasurer and Principal Financial and Accounting Officer, DoubleLine Funds Trust (since January 2020); Treasurer and Principal Financial and Accounting Officer, DoubleLine Yield Opportunities Fund (since January 2020); Treasurer and Principal Financial and Accounting Officer, DoubleLine Income Solutions Fund (since January 2020); Treasurer and Principal Financial and Accounting Officer, DoubleLine Opportunistic Credit Fund (since January 2020); Chief Financial Officer, DoubleLine Capital LP (since January 2013). Formerly, Vice President, DoubleLine Yield Opportunities Fund (since Inception); Vice President, DoubleLine Income Solutions Fund (since May 2019); Vice President, DoubleLine Funds Trust (since May 2019); Vice President, DoubleLine Opportunistic Credit Fund (since May 2019). |
| | | |
| Youse Guia, 1972 | | Chief Compliance Officer | | Indefinite/Since March 2018 | | Chief Compliance Officer, DoubleLine ETF Adviser LP (since December 2021); Chief Compliance Officer, DoubleLine Yield Opportunities Fund (since November 2019); Chief Compliance Officer, DoubleLine Capital LP (since March 2018); Chief Compliance Officer, DoubleLine Funds Trust (since March 2018); Chief Compliance Officer, DoubleLine Opportunistic Credit Fund (since March 2018); Chief Compliance Officer, DoubleLine Income Solutions Fund (since March 2018). Formerly, Executive Vice President and Deputy Chief Compliance Officer, Pacific Investment Management Company LLC (“PIMCO”) (from April 2014 to February 2018); Chief Compliance Officer, PIMCO Managed Accounts Trust (from September 2014 to February 2018); Chief Compliance Officer, PIMCO-sponsored closed-end funds (from September 2014 to February 2018); Chief Compliance Officer, PIMCO Flexible Credit Income Fund (from February 2017 to February 2018). Formerly, Head of Compliance, Allianz Global Investors U.S. Holdings LLC (from October 2012 to March 2014); Chief Compliance Officer, Allianz Funds, Allianz Multi-Strategy Trust, Allianz Global Investors Sponsored Closed-End Funds, Premier Multi-Series VIT and The Korea Fund, Inc. (from October 2004 to December 2013). |
| | | |
| Winnie Han, 1988 | | Assistant Treasurer | | Indefinite/Since May 2017 | | Assistant Treasurer, DoubleLine Yield Opportunities Fund (since November 2019); Assistant Treasurer, DoubleLine Income Solutions Fund (since May 2017); Assistant Treasurer, DoubleLine Funds Trust (since May 2017); Assistant Treasurer, DoubleLine Opportunistic Credit Fund (since May 2017); Assistant Treasurer, DoubleLine Group LP (since March 2017); Formerly, Investment Accounting Supervisor, Alexandria Real Estate Equities, Inc. (June 2016 to March 2017); Formerly, Manager, PricewaterhouseCoopers (January 2011 to June 2016). |
| | | |
| Cris Santa Ana, 1965 | | Vice President and Secretary | | Indefinite/Vice President Since April 2011; Indefinite/Secretary Since July 2018 | | Vice President and Secretary, DoubleLine Yield Opportunities Fund (since November 2019); Secretary, DoubleLine Income Solutions Fund (since July 2018); Secretary, DoubleLine Opportunistic Credit Fund (since July 2018); Secretary, DoubleLine Funds Trust (since July 2018); Vice President, DoubleLine Income Solutions Fund (since January 2013); Vice President, DoubleLine Opportunistic Credit Fund (since July 2011); Vice President, DoubleLine Funds Trust (since April 2011); Chief Risk Officer, DoubleLine Group LP (since June 2010). Formerly, Chief Operating Officer, DoubleLine Capital (from December 2009 through May 2010). |
| | | | | | | | | | |
| | | | Annual Report | | | | | March 31, 2024 | | 175 |
| | |
Trustees and Officers (Cont.) | | |
| | | | | | |
| Name and Year of Birth | | Position(s)
Held with Trust | | Term of Office
and Length of
Time Served | | Principal Occupation(s) During Past 5 Years |
| | | |
| Earl A. Lariscy, 1966 | | Vice President | | Indefinite/Since May 2012 | | Vice President, DoubleLine Yield Opportunities Fund (since November 2019); Vice President and Assistant Secretary, DoubleLine Income Solutions Fund (since January 2013); Vice President, DoubleLine Funds Trust (since May 2012); Vice President and Assistant Secretary, DoubleLine Opportunistic Credit Fund (since May 2012 and inception, respectively); General Counsel, DoubleLine Group LP (since April 2010). |
| | | |
| David Kennedy, 1964 | | Vice President | | Indefinite/Since May 2012 | | Vice President, DoubleLine Yield Opportunities Fund (since November 2019); Vice President, DoubleLine Income Solutions Fund (since January 2013); Vice President, DoubleLine Funds Trust (since May 2012); Vice President, DoubleLine Opportunistic Credit Fund (since May 2012); Manager, Trading and Settlements, DoubleLine Group LP (since December 2009). |
| | | |
| Patrick A. Townzen, 1978 | | Vice President | | Indefinite/Since September 2012 | | Vice President, DoubleLine Yield Opportunities Fund (since November 2019); Vice President, DoubleLine Income Solutions Fund (since January 2013); Vice President, DoubleLine Funds Trust (since September 2012); Vice President, DoubleLine Opportunistic Credit Fund (since September 2012); Chief Operating Officer, DoubleLine Group LP (since March 2023). Formerly, Director of Operations, DoubleLine Group LP (since March 2018), Manager of Operations, DoubleLine Group LP (from September 2012 to March 2018). |
| | | |
| Brady J. Femling, 1987 | | Vice President | | Indefinite/Since May 2017 | | Vice President, DoubleLine Yield Opportunities Fund (since November 2019); Vice President, DoubleLine Income Solutions Fund (since May 2017); Vice President, DoubleLine Opportunistic Credit Fund (since May 2017); Vice President, DoubleLine Funds Trust (since May 2017); Senior Fund Accountant, DoubleLine Group LP (since April 2013). Formerly, Fund Accounting Supervisor, ALPS Fund Services (From October 2009 to April 2013). |
| | | |
| Neal L. Zalvan, 1973 | | Vice President | | Indefinite/Vice President Since May 2016 | | Vice President, DoubleLine Yield Opportunities Fund (since November 2019); Vice President, DoubleLine Opportunistic Credit Fund (since May 2017); Vice President, DoubleLine Funds Trust (since May 2016); Vice President, DoubleLine Income Solutions Fund (since May 2016); Legal/Compliance, DoubleLine Group LP (since January 2013); Formerly, Anti-Money Laundering Officer, DoubleLine Capital LP, DoubleLine Opportunistic credit Fund, DoubleLine Incomes Solutions Fund. |
| | | |
| Adam D. Rossetti, 1978 | | Vice President | | Indefinite/Since February 2019 | | Vice President, DoubleLine Yield Opportunities Fund (since November 2019); Vice President, DoubleLine Funds Trust (since February 2019); Vice President, DoubleLine Income Solutions Fund (since February 2019); Vice President, DoubleLine Opportunistic Credit Fund (since February 2019); Chief Compliance Officer, DoubleLine Alternatives LP (since June 2015); Legal/Compliance, DoubleLine Group LP (since April 2015). Formerly, Chief Compliance Officer, DoubleLine Capital LP (from August 2017 to March 2018); Chief Compliance Officer, DoubleLine Funds Trust (from August 2017 to March 2018); Chief Compliance Officer, DoubleLine Income Solutions Fund (from August 2017 to March 2018); Chief Compliance Officer, DoubleLine Opportunistic Credit Fund (from August 2017 to March 2018); Vice President and Counsel, PIMCO (from April 2012 to April 2015). |
| | | |
| Gheorghe Rotar, 1984 | | Vice President | | Indefinite/Since February 2019 | | Vice President, DoubleLine Funds Trust (since February 2019); U.S. Funds Operations Manager, DoubleLine Group LP (since January 2018). Formerly, Operations Specialist, DoubleLine Group LP (from April 2014 to December 2017); Fund Operations, PIMCO (from September 2007 to April 2014). |
| | | |
| Grace Walker, 1970 | | Assistant Treasurer | | Indefinite/Since January 2020 | | Assistant Treasurer, DoubleLine Funds Trust (since January 2020); Assistant Treasurer, DoubleLine Income Solutions Fund (since January 2020); Assistant Treasurer, DoubleLine Opportunistic Credit Fund (since January 2020); Assistant Treasurer, DoubleLine Yield Opportunities Fund (since January 2020); Treasurer, DoubleLine Funds (Luxembourg) and DoubleLine Cayman Unit Trust (since March 2017). Formerly, Assistant Treasurer, DoubleLine Income Solutions Fund (from January 2013 to May 2017); Assistant Treasurer, DoubleLine Opportunistic Credit Fund (from March 2012 to May 2017); Assistant Treasurer, DoubleLine Funds Trust (from March 2012 to May 2017). |
| | | | | | | | | | |
| 176 | | DoubleLine Funds Trust | | | | | | | | |
| | |
| | | (Unaudited) March 31, 2024 |
| | | | | | |
| Name and Year of Birth | | Position(s)
Held with Trust | | Term of Office
and Length of
Time Served | | Principal Occupation(s) During Past 5 Years |
| | | |
| Dawn Oswald, 1980 | | Vice President | | Indefinite/Since January 2020 | | Vice President, DoubleLine Funds Trust (since January 2020); Vice President, DoubleLine Yield Opportunities Fund (since January 2020); Vice President, DoubleLine Income Solutions Fund (since January 2020); Vice President, DoubleLine Opportunistic Credit Fund (since January 2020); Pricing Manager, DoubleLine Capital (since January 2018). Formerly, Operations Specialist, DoubleLine Capital (from July 2016 to January 2018). Global Securities Fixed Income Valuation Senior Analyst, Capital Group (from April 2015 to July 2016). Global Securities Fair Valuation Analyst, Capital Group (from January 2010 to April 2015). |
| | | |
| Lisa Chen, 1979 | | Anti-Money Laundering Compliance Officer | | Indefinite/Since September 2023 | | Anti-Money Laundering Compliance Officer, DoubleLine Funds Trust (since September 2023); Anti-Money Laundering Compliance Officer, DoubleLine ETF Trust (Since September 2023); Compliance Manager, DoubleLine Group LP (Since March 2022). Formerly, Vice President, Senior Compliance Officer, PIMCO (From April 2016 – February 2022). |
| | | | | | | | | | |
| | | | Annual Report | | | | | March 31, 2024 | | 177 |
| | |
Information About Proxy Voting | | (Unaudited) March 31, 2024 |
Information about how a Fund voted proxies relating to portfolio securities held during the most recent twelve month period ended June 30th is available no later than the following August 31st without charge, upon request, by calling 877-DLine11 (877-354-6311) and on the SEC’s website at www.sec.gov.
A description of the Funds’ proxy voting policies and procedures is available (i) without charge, upon request, by calling 877-DLine11 (877-354-6311); and (ii) on the SEC’s website at www.sec.gov.
Information About Portfolio Holdings
It is the policy of the Trust to provide certain unaudited information regarding the portfolio composition of the Funds as of each month-end to shareholders and others upon request to the Funds, beginning on the 15th calendar day after the end of the month (or, if not a business day, the next business day thereafter).
Shareholders and others who wish to obtain portfolio holdings for a particular month may make a request by contacting the Funds at no charge at 877-DLine11 (877-354-6311) between the hours of 7:00 a.m. and 5:00 p.m. Pacific time, Monday through Friday, beginning on the 15th day following the end of that month (or, if not a business day, the next business day thereafter). Requests for portfolio holdings may be made on a monthly basis pursuant to this procedure, or standing requests for portfolio holdings may be accepted.
The Trust is required to file its complete schedule of portfolio holdings with the SEC for its first and third fiscal quarters on Part F of Form N-PORT. When available, Part F of Form N-PORT is available on the SEC website at www.sec.gov.
This report includes summary Schedules of Investments for the DoubleLine Total Return Bond Fund, DoubleLine Core Fixed Income Fund, DoubleLine Shiller Enhanced CAPE® and DoubleLine Flexible Income Fund. A complete Schedule of Investments for each Fund may be obtained, without charge, upon request, by calling 877-DLine11 (877-354-6311) and on the SEC website at www.sec.gov.
Householding — Important Notice Regarding Delivery of Shareholder Documents
In an effort to conserve resources, the Funds intend to reduce the number of duplicate Prospectuses and Annual and Semi-Annual Reports you receive by sending only one copy of each to addresses where we reasonably believe two or more accounts are from the same family. If you would like to discontinue householding of your accounts, please call toll-free 877-DLine11 (877-354-6311) to request individual copies of these documents. We will begin sending individual copies thirty days after receiving your request to stop householding.
| | | | | | | | | | |
| 178 | | DoubleLine Funds Trust | | | | | | | | |
| | |
Privacy Policy | | (Unaudited) March 31, 2024 |
What Does DoubleLine Do With Your Personal Information?
This notice provides information about how DoubleLine (“we,” “our” and “us”) collects, discloses, and protects your personal information, and how you might choose to limit our ability to disclose certain information about you. Please read this notice carefully.
Why We Need Your Personal Information
All financial companies need to disclose customers’ personal information to run their everyday businesses, to appropriately tailor the services offered (where applicable), and to comply with our regulatory obligations. Accordingly, information, confidential and proprietary, plays an important role in the success of our business. However, we recognize that you have entrusted us with your personal and financial data, and we recognize our obligation to keep this information secure. Maintaining your privacy is important to us, and we hold ourselves to a high standard in its safekeeping and use. Most importantly, DoubleLine does not sell its customers’ non-public personal information to any third parties. DoubleLine uses its customers’ non-public personal information primarily to complete financial transactions that its customers request (where applicable), to make its customers aware of other financial products and services offered by a DoubleLine affiliated company, and to satisfy obligations we owe to regulatory bodies.
Information We May Collect
We may collect various types of personal data about you, including:
| | • | | Your personal identification information, which may include your name and passport information, your IP address, politically exposed person (“PEP”) status, and such other information as may be necessary for us to provide our services to you and to complete our customer due diligence process and discharge anti-money laundering obligations; |
| | • | | Your contact information, which may include postal address and e-mail address and your home and mobile telephone numbers; |
| | • | | Your family relationships, which may include your marital status, the identity of your spouse and the number of children that you have; |
| | • | | Your professional and employment information, which may include your level of education and professional qualifications, your employment, employer’s name and details of directorships and other offices which you may hold; and |
| | • | | Financial information, risk tolerance, sources of wealth and your assets, which may include details of shareholdings and beneficial interests in financial instruments, your bank details and your credit history. |
Where We Obtain Your Personal Information
| | • | | Information we receive about you on applications or other forms; |
| | • | | Information you may give us orally; |
| | • | | Information about your transactions with us or others; |
| | • | | Information you submit to us in correspondence, including emails or other electronic communications; and |
| | • | | Information about any bank account you use for transfers between your bank account and any DoubleLine investment account, including information provided when effecting wire transfers. |
Information Collected From Websites
Websites maintained by DoubleLine or its service providers may use a variety of technologies to collect information that help DoubleLine and its service providers understand how the website is used. Information collected from your web browser (including small files stored on your device that are commonly referred to as “cookies”) allow the websites to recognize your web browser and help to personalize and improve your user experience and enhance navigation of the website. You can change your cookie preferences by changing the setting on your web browser to delete or reject cookies. If you delete or reject cookies, some website pages may not function properly. Our websites may contain links that are maintained or controlled by third parties with privacy policies that may differ, in some cases significantly, from the privacy policies described in this notice. Please read the privacy policies of such third parties and understand that accessing their websites is at your own risk. Please contact your DoubleLine representative if you would like to receive more information about the privacy policies of third parties.
We also use web analytics services, which currently include but are not limited to Google Analytics and Adobe Analytics. Such web analytics services use cookies and similar technologies to evaluate visitor’s use of the domain, compile statistical reports on domain activity, and provide other services related to our websites. For more information about Google Analytics, or to opt out of Google Analytics, please go to https://tools.google.com/dlpage/gaoptout. For more information about Adobe Analytics, or to opt out of Adobe Analytics, please go to: http://www.adobe.com/privacy/opt-out.html.
| | | | | | | | | | |
| | | | Annual Report | | | | | March 31, 2024 | | 179 |
How And Why We May Disclose Your Information
DoubleLine does not disclose any non-public personal information about our customers or former customers without the customer’s authorization, except that we may disclose the information listed above, as follows:
| | • | | It may be necessary for DoubleLine to provide information to nonaffiliated third parties in connection with our performance of the services we have agreed to provide to you. For example, it might be necessary to do so in order to process transactions and maintain accounts. |
| | • | | DoubleLine will release any of the non-public information listed above about a customer if directed to do so by that customer or if DoubleLine is required or authorized by law to do so, such as for the purpose of compliance with regulatory requirements or in the case of a court order, legal investigation, or other properly executed governmental request. |
| | • | | In order to alert a customer to other financial products and services offered by an affiliate, DoubleLine may disclose information to an affiliate, including companies using the DoubleLine name. Such products and services may include, for example, other investment products offered by a DoubleLine company. If you prefer that we not disclose non-public personal information about you to our affiliates for this purpose, you may direct us not to make such disclosures (other than disclosures permitted by law) by contacting us at Privacy@DoubleLine.com or at 1 (800) 285-1545. If you limit this sharing and you have a joint account, your decision will be applied to all owners of the account. |
We will limit access to your personal account information to those agents and vendors who need to know that information to provide products and services to you. We do not share your information to nonaffiliated third parties for marketing purposes. We maintain physical, electronic, and procedural safeguards to guard your non-public personal information.
Notice Related To The California Consumer Privacy Act (CCPA) And To “Natural Persons” Residing In The State Of California
DoubleLine collects and uses information that identifies, describes, references, links or relates to, or is associated with, a particular consumer or device (“Personal Information”). Personal Information we collect from our customers and consumers is covered under the Gramm-Leach-Bliley Act (“GLBA”) and is therefore excluded from the scope of the California Consumer Privacy Act, as amended by the California Privacy Rights Act (together, “CCPA”).
However, for California residents who are not DoubleLine customers or consumers, as those terms are defined by GLBA, the personal information we collect about you is subject to the CCPA. As such, you have privacy rights with respect to your personal information. Please review the following applicable California privacy notice that is available at https://www.doubleline.com, or by contacting us at Privacy@DoubleLine.com or at 1 (800) 285-1545.
CA Privacy Notice for Website Visitors, Media Subscribers and Business Representatives CA Privacy Notice for Employees
Notice To “Natural Persons” Residing In The European Economic Area (The “EEA”)
If you reside in the EEA, we may transfer your personal information outside the EEA, and will ensure that it is protected and transferred in a manner consistent with legal requirements applicable to the information. This can be done in a number of different ways, for instance:
| | • | | the country to which we send the personal information may have been assessed by the European Commission as providing an “adequate” level of protection for personal data; or |
| | • | | the recipient may have signed a contract based on standard contractual clauses approved by the European Commission. |
In other circumstances, the law may permit us to otherwise transfer your personal information outside the EEA. In all cases, however, any transfer of your personal information will be compliant with applicable data protection law.
Notice To Investors In Cayman Islands Investment Funds
If you are a natural person, please review this notice as it applies to you directly. If you are a legal representative of a corporate or entity investor that provides us with any personal information about individuals (i.e., natural persons), you agree to furnish a copy of this notice to each such individual or otherwise advise them of its content.
Any international transfer of personal information will be compliant with the requirements of the Data Protection Act, 2017 of the Cayman Islands.
Privacy For Children
DoubleLine is concerned about the privacy of children. Our website and our services are not targeted at individuals under 18 years of age, and we do not knowingly collect any personal information from an individual under 18. If we learn that a child under the age of 13 (or such higher age as required by applicable law) has submitted personally identifiable information online without
| | | | | | | | | | |
| 180 | | DoubleLine Funds Trust | | | | | | | | |
| | |
| | | (Unaudited) March 31, 2024 |
parental consent, we will take all reasonable measures to delete such information from its databases and to not use such information for any purpose (except where necessary to protect the safety of the child or others as required or allowed by law). If you become aware of any personally identifiable information, we have collected from children under 13 (or such higher age as required by applicable law), please contact us at Privacy@DoubleLine.com or at 1 (800) 285-1545. We do not sell or share any personal information and have no actual knowledge about selling or sharing personal information of individuals under the age of 16.
Retention Of Personal Information And Security
Your personal information will be retained for as long as required:
| | • | | for the purposes for which the personal information was collected; |
| | • | | in order to establish or defend legal rights or obligations or to satisfy any reporting or accounting obligations; and/or |
| | • | | as required by data protection laws and any other applicable laws or regulatory requirements, including, but not limited to, U.S. laws and regulations applicable to our business. |
We will undertake commercially reasonable efforts to protect the personal information that we hold with appropriate security measures.
Access To And Control Of Your Personal Information
Depending on your country of domicile or applicable law, you may have the following rights in respect of the personal information about you that we process:
| | • | | the right to access and port personal information; |
| | • | | the right to rectify personal information; |
| | • | | the right to restrict the use of personal information; |
| | • | | the right to request that personal information is erased; and |
| | • | | the right to object to processing of personal information. |
Although you have the right to request that your personal information be deleted at any time, applicable laws or regulatory requirements may prohibit us from doing so. In addition, if you invest in a DoubleLine fund through a financial intermediary, DoubleLine may not have access to personal information about you.
If you wish to exercise any of the rights set out above, please contact us at Privacy@DoubleLine.com or at 1 (800) 285-1545.
Changes To DoubleLine’s Privacy Policy
DoubleLine reserves the right to modify its privacy policy at any time, but in the event that there is a change that affects the content of this notice materially, DoubleLine will promptly inform its customers of such changes in accordance with applicable law.
| | | | | | | | | | |
| | | | Annual Report | | | | | March 31, 2024 | | 181 |
Investment Advisers:
DoubleLine Capital LP and DoubleLine Alternatives LP
2002 North Tampa Street
Suite 200
Tampa, FL 33602
Distributor:
Quasar Distributors, LLC
615 East Michigan Street
Milwaukee, WI 53202
Administrator and Transfer Agent:
U.S. Bancorp Fund Services, LLC
P.O. Box 701
Milwaukee, WI 53201
Custodians:
U.S. Bank, N.A.
1555 North River Center Drive
Suite 302
Milwaukee, WI 53212
State Street Bank and Trust Company
Channel Center
1 Iron Street
Boston, MA 02210
Independent Registered Public Accounting Firm:
PricewaterhouseCoopers LLP
601 South Figueroa Street
Los Angeles, CA 90017
Legal Counsel:
Ropes & Gray LLP
1211 Avenue of the
Americas
New York, NY 10036
Contact Information:
doubleline.com
fundinfo@doubleline.com
(877) DLine11 or (877) 354-6311
DL-ANNUAL-DFT
DoubleLine || 2002 North Tampa Street, Suite 200 || Tampa, FL 33602 || (813) 791-7333
fundinfo@doubleline.com || www.doubleline.com
(b) Not applicable.
Item 2. Code of Ethics.
The Registrant has adopted a code of ethics that applies to the Registrant’s principal executive officer and principal financial officer. The Registrant has not made any substantive amendments to its code of ethics during the period covered by this report. The Registrant has not granted any waivers from any provisions of the code of ethics during the period covered by this report. A copy of the Registrant’s Code of Ethics is filed herewith.
Item 3. Audit Committee Financial Expert.
Mr. Raymond Woolson, a former Trustee and member of the Board’s Audit Committee was determined to qualify as an audit committee financial expert during his tenure on the Audit Committee. Since the date of Mr. Woolson’s retirement, the Registrant has not had an “audit committee financial expert,” as defined under instructions to Item 3(a), serving on its Audit Committee; however, the Registrant has retained Mr. Woolson to serve as a consultant to the Board of Trustees of the Registrant, including to the Independent Trustees who serve on the Registrant’s Audit Committee. In addition, the Registrant’s Audit Committee members have substantial financial expertise and include members with considerable professional experience in the financial markets, the securities markets, and the investment banking and investment management industries.
Item 4. Principal Accountant Fees and Services.
The Registrant has engaged its principal accountant to perform audit services, audit-related services, tax services and other services during the past two fiscal years. “Audit services” refer to performing an audit of the Registrant’s annual financial statements or services that are normally provided by the accountant in connection with statutory and regulatory filings or engagements for those fiscal years. “Audit-related services” refer to the assurance and related services by the principal accountant that are reasonably related to the performance of the audit. “Tax services” refer to professional services rendered by the principal accountant for tax compliance, tax advice, and tax planning. There were no “Other services” provided by the principal accountant. The following table details the aggregate fees billed or expected to be billed for each of the last two fiscal years for audit fees, audit-related fees, tax fees and other fees by the principal accountant.
| | | | | | | | |
| | | FYE 3/31/2024 | | | FYE 3/31/2023 | |
(a) Audit Fees | | $ | 1,130,636 | | | $ | 1,152,812 | |
(b) Audit-Related Fees | | | N/A | | | $ | 900 | |
(c) Tax Fees | | $ | 278,054 | | | $ | 267,824 | |
(d) All Other Fees | | | N/A | | | | N/A | |
(e)(1) The audit committee has adopted pre-approval policies and procedures that require the audit committee to pre-approve all audit and non-audit services of the Registrant, including services provided to any entity affiliated with the Registrant.
1
(e)(2) The percentage of fees billed by PricewaterhouseCoopers LLP applicable to non-audit services pursuant to waiver of pre-approval requirement were as follows:
| | | | | | | | |
| | | FYE 3/31/2024 | | | FYE 3/31/2023 | |
Audit-Related Fees | | | 0 | % | | | 0 | % |
Tax Fees | | | 0 | % | | | 0 | % |
All Other Fees | | | 0 | % | | | 0 | % |
(f) All of the principal accountant’s hours spent on auditing the Registrant’s financial statements were attributed to work performed by full-time permanent employees of the principal accountant.
(g) The following table indicates the non-audit fees billed or expected to be billed by the Registrant’s accountant for services to the Registrant and to the Registrant’s investment adviser (and any other controlling entity, etc.—not sub-adviser) for the last two years.
| | | | | | | | |
Non-Audit Related Fees | | FYE 3/31/2024 | | | FYE 3/31/2023 | |
| | | | | | | |
Registrant | | $ | 278,054 | | | $ | 267,824 | |
Registrant’s Investment Adviser | | $ | 365,847 | | | $ | 338,535 | |
(h) The audit committee of the board of trustees/directors has considered whether the provision of non-audit services that were rendered to the Registrant’s investment adviser is compatible with maintaining the principal accountant’s independence and has concluded that the provision of such non-audit services by the accountant has not compromised the accountant’s independence.
(i) The Registrant has not been identified by the U.S. Securities and Exchange Commission as having filed an annual report issued by a registered public accounting firm branch or office that is located in a foreign jurisdiction where the Public Company Accounting Oversight Board is unable to inspect or completely investigate because of a position taken by an authority in that jurisdiction.
(j) The Registrant is not a foreign issuer.
Item 5. Audit Committee of Listed Registrants.
Not applicable to Registrants who are not listed issuers (as defined in Rule 10A-3 under the Securities Exchange Act of 1934).
Item 6. Investments.
| | (a) | The information required by this Item 6 (except with respect to the DoubleLine Total Return Bond Fund, DoubleLine Core Fixed Income Fund, DoubleLine Shiller Enhanced CAPE, and DoubleLine Flexible Income Fund) is included as part of the annual report to shareholders filed under Item 1 of this Form N-CSR. |
Please note that the Registrant has included a summary schedule of portfolio securities of the DoubleLine Total Return Bond Fund, DoubleLine Core Fixed Income Fund,
2
DoubleLine Shiller Enhanced CAPE, and DoubleLine Flexible Income Fund in its annual report to shareholders, a copy of which is included under Item 1, for this reporting period. The DoubleLine Total Return Bond Fund’s, DoubleLine Core Fixed Income Fund’s, DoubleLine Shiller Enhanced CAPE’s, and DoubleLine Flexible Income Fund’s complete schedule of investments in securities of unaffiliated issuers as of the close of this period as set forth in Section 210.12-12 of Regulation S-X is set forth below:
[Insert full Schedule of Investments for DoubleLine Total Return Bond Fund, DoubleLine Core Fixed Income Fund, DoubleLine Shiller Enhanced CAPE, and DoubleLine Flexible Income Fund here]
[Insert N-CSR opinion letter here]
3
| | |
Schedule of Investments DoubleLine Total Return Bond Fund | | March 31, 2024 |
| | | | | | | | | | | | | | | | |
PRINCIPAL AMOUNT $ | | | SECURITY DESCRIPTION | | RATE | | | MATURITY | | | VALUE $ | |
| | ASSET BACKED OBLIGATIONS - 4.4% | |
| |
| | | | Affirm, Inc. | |
| | 26,635,000 | | | Series 2023-B-A | | | 6.82% | (a) | | | 09/15/2028 | | | | 27,048,048 | |
| |
| | | | Aligned Data Centers Issuer LLC | |
| | 12,950,000 | | | Series 2021-1A-A2 | | | 1.94% | (a) | | | 08/15/2046 | | | | 11,781,139 | |
| | 11,550,000 | | | Series 2021-1A-B | | | 2.48% | (a) | | | 08/15/2046 | | | | 10,336,346 | |
| |
| | | | Apollo Aviation Securitization Equity Trust | |
| | 3,596,243 | | | Series 2018-1A-B | | | 5.44% | (a)(b) | | | 01/16/2038 | | | | 721,047 | |
| | 10,731,073 | | | Series 2020-1A-A | | | 3.35% | (a) | | | 01/16/2040 | | | | 9,692,005 | |
| |
| | | | Aqua Finance Trust | |
| | 315,865 | | | Series 2017-A-A | | | 3.72% | (a) | | | 11/15/2035 | | | | 314,997 | |
| |
| | | | Bojangles Issuer LLC | |
| | 21,123,750 | | | Series 2020-1A-A2 | | | 3.83% | (a) | | | 10/20/2050 | | | | 19,949,515 | |
| |
| | | | Business Jet Securities LLC | |
| | 1,795,984 | | | Series 2020-1A-A | | | 2.98% | (a) | | | 11/15/2035 | | | | 1,736,249 | |
| |
| | | | CAI International, Inc. | |
| | 12,237,550 | | | Series 2020-1A-A | | | 2.22% | (a) | | | 09/25/2045 | | | | 11,094,108 | |
| |
| | | | Cajun Global LLC | |
| | 9,700,000 | | | Series 2021-1-A2 | | | 3.93% | (a) | | | 11/20/2051 | | | | 8,807,073 | |
| |
| | | | Carbon Level Mitigation Trust | |
| | 18,975,816 | | | Series 2021-3-CERT | | | 1.82% | (a)(c) | | | 09/08/2051 | | | | 11,681,360 | |
| | 28,975,623 | | | Series 2022-3-CERT | | | 0.23% | (a) | | | 11/21/2052 | | | | 19,682,474 | |
| |
| | | | Castlelake Aircraft Securitization Trust | |
| | 6,641,334 | | | Series 2017-1R-A | | | 2.74% | (a) | | | 08/15/2041 | | | | 6,157,254 | |
| |
| | | | Coinstar Funding LLC | |
| | 11,931,338 | | | Series 2017-1A-A2 | | | 5.22% | (a) | | | 04/25/2047 | | | | 10,708,225 | |
| |
| | | | Commonbond Student Loan Trust | |
| | 1,905,133 | | | Series 2016-A-A1 | | | 3.32% | (a) | | | 05/25/2040 | | | | 1,827,826 | |
| |
| | | | Compass Datacenters LLC | |
| | 14,000,000 | | | Series 2024-1A-A1 | | | 5.25% | (a) | | | 02/25/2049 | | | | 13,740,272 | |
| |
| | | | Container Leasing International LLC | |
| | 4,823,646 | | | Series 2020-1A-A | | | 2.08% | (a) | | | 09/18/2045 | | | | 4,347,921 | |
| |
| | | | Credit Suisse ABS Trust | |
| | 1,600,193 | | | Series 2020-AT1-A | | | 2.61% | (a) | | | 10/15/2026 | | | | 1,600,166 | |
| |
| | | | CyrusOne Data Centers Issuer I LLC | |
| | 18,200,000 | | | Series 2023-1A-A2 | | | 4.30% | (a) | | | 04/20/2048 | | | | 17,152,002 | |
| |
| | | | DataBank Issuer | |
| | 39,300,000 | | | Series 2021-1A-A2 | | | 2.06% | (a) | | | 02/27/2051 | | | | 36,048,816 | |
| | 31,000,000 | | | Series 2021-2A-A2 | | | 2.40% | (a) | | | 10/25/2051 | | | | 27,752,834 | |
| | 3,350,000 | | | Series 2021-2A-B | | | 2.79% | (a) | | | 10/25/2051 | | | | 2,891,905 | |
| |
| | | | DB Master Finance Parent LLC | |
| | 28,103,125 | | | Series 2021-1A-A23 | | | 2.79% | (a) | | | 11/20/2051 | | | | 23,590,952 | |
| |
| | | | Diamond Issuer | |
| | 6,000,000 | | | Series 2021-1A-B | | | 2.70% | (a) | | | 11/20/2051 | | | | 5,127,895 | |
| |
| | | | Dividend Solar Loans LLC | |
| | 15,498,573 | | | Series 2019-1-A | | | 3.67% | (a) | | | 08/22/2039 | | | | 13,941,235 | |
| |
| | | | ECAF Ltd. | |
| | 24,953,894 | | | Series 2015-1A-A2 | | | 4.95% | (a) | | | 06/15/2040 | | | | 16,469,820 | |
| |
| | | | Falcon Aerospace Ltd. | |
| | 1,270,058 | | | Series 2017-1-A | | | 4.58% | (a) | | | 02/15/2042 | | | | 1,234,134 | |
| |
| | | | Falko Regional Aircraft Ltd. | |
| | 31,539,012 | | | Series 2021-1A-A | | | 5.75% | | | | 04/15/2041 | | | | 29,078,843 | |
| |
| | | | Foundation Finance Trust | |
| | 355,914 | | | Series 2019-1A-A | | | 3.86% | (a) | | | 11/15/2034 | | | | 354,057 | |
| |
| | | | GAIA Aviation Ltd. | |
| | 9,353,166 | | | Series 2019-1-A | | | 3.97% | (a)(d) | | | 12/15/2044 | | | | 8,530,321 | |
| |
| | | | Global Sea Containers Two SRL | |
| | 20,338,529 | | | Series 2020-1A-A | | | 2.17% | (a) | | | 10/17/2040 | | | | 18,786,301 | |
| | | | | | | | |
| The accompanying notes are an integral part of these financial statements. | | Annual Report | | | | | March 31, 2024 | | 1 |
| | |
Schedule of Investments DoubleLine Total Return Bond Fund (Cont.) | | |
| | | | | | | | | | | | | | | | |
PRINCIPAL AMOUNT $ | | | SECURITY DESCRIPTION | | RATE | | | MATURITY | | | VALUE $ | |
| |
| | | | Helios Issuer LLC | |
| | 12,120,556 | | | Series 2018-1A-A | | | 4.87% | (a) | | | 07/20/2048 | | | | 11,485,221 | |
| | 11,256,935 | | | Series 2019-AA-A | | | 3.75% | (a) | | | 06/20/2046 | | | | 10,341,323 | |
| | 28,406,638 | | | Series 2020-2A-A | | | 2.73% | (a) | | | 11/01/2055 | | | | 21,608,438 | |
| | 12,218,111 | | | Series 2021-C-B | | | 2.33% | (a) | | | 10/20/2048 | | | | 10,280,770 | |
| |
| | | | HERO Funding Trust | |
| | 1,934,400 | | | Series 2016-3A-A2 | | | 3.91% | (a) | | | 09/20/2042 | | | | 1,755,544 | |
| | 5,120,324 | | | Series 2016-4A-A2 | | | 4.29% | (a) | | | 09/20/2047 | | | | 4,682,442 | |
| |
| | | | Horizon Aircraft Finance Ltd. | |
| | 12,445,645 | | | Series 2019-1-A | | | 3.72% | (a) | | | 07/15/2039 | | | | 11,067,339 | |
| |
| | | | Jack in the Box, Inc. | |
| | 36,860,000 | | | Series 2019-1A-A23 | | | 4.97% | (a) | | | 08/25/2049 | | | | 35,062,422 | |
| |
| | | | Jersey Mike’s Funding | |
| | 4,565,500 | | | Series 2019-1A-A2 | | | 4.43% | (a) | | | 02/15/2050 | | | | 4,375,360 | |
| |
| | | | Jimmy Johns LLC | |
| | 20,468,000 | | | Series 2017-1A-A2II | | | 4.85% | (a) | | | 07/30/2047 | | | | 19,709,282 | |
| |
| | | | JOL Air Ltd. | |
| | 7,852,022 | | | Series 2019-1-A | | | 3.97% | (a) | | | 04/15/2044 | | | | 7,262,815 | |
| |
| | | | Labrador Aviation Finance Ltd. | |
| | 52,067,997 | | | Series 2016-1A-A1 | | | 4.30% | (a) | | | 01/15/2042 | | | | 46,654,747 | |
| |
| | | | Loanpal Solar Loan Ltd. | |
| | 1,439,499 | | | Series 2021-1GS-B | | | 2.84% | (a) | | | 01/20/2048 | | | | 1,097,563 | |
| |
| | | | Lunar Aircraft Ltd. | |
| | 10,698,019 | | | Series 2020-1A-A | | | 3.38% | (a) | | | 02/15/2045 | | | | 9,534,042 | |
| |
| | | | Lunar Structured Aircraft Portfolio Notes | |
| | 1,043,348 | | | Series 2021-1-B | | | 3.43% | (a) | | | 10/15/2046 | | | | 914,254 | |
| |
| | | | ME Funding | |
| | 32,679,475 | | | Series 2019-1-A2 | | | 6.45% | (a) | | | 07/30/2049 | | | | 32,520,019 | |
| | 22,100,000 | | | Series 2024-1A-A2 | | | 8.10% | (a) | | | 04/30/2054 | | | | 21,262,609 | |
| |
| | | | Mosaic Solar Loans LLC | |
| | 11,665,788 | | | Series 2017-2A-A | | | 3.82% | (a) | | | 06/22/2043 | | | | 10,899,732 | |
| | 6,988,017 | | | Series 2018-1A-A | | | 4.01% | (a) | | | 06/22/2043 | | | | 6,547,844 | |
| | 9,159,871 | | | Series 2018-2GS-A | | | 4.20% | (a) | | | 02/22/2044 | | | | 8,527,400 | |
| | 1,495,600 | | | Series 2019-1A-A | | | 4.37% | (a) | | | 12/21/2043 | | | | 1,406,196 | |
| |
| | | | Navient Student Loan Trust | |
| | 21,622,892 | | | Series 2017-A-B | | | 3.91% | (a) | | | 12/16/2058 | | | | 20,887,722 | |
| | 11,000,000 | | | Series 2018-BA-B | | | 4.13% | (a) | | | 12/15/2059 | | | | 10,191,388 | |
| |
| | | | Navigator Aircraft ABS Ltd. | |
| | 10,939,733 | | | Series 2021-1-B | | | 3.57% | (a)(d) | | | 11/15/2046 | | | | 9,491,236 | |
| |
| | | | Neighborly Issuer | |
| | 14,344,375 | | | Series 2021-1A-A2 | | | 3.58% | (a) | | | 04/30/2051 | | | | 12,758,132 | |
| |
| | | | Pagaya AI Debt Selection Trust | |
| | 8,167,129 | | | Series 2023-5-A | | | 7.18% | (a) | | | 04/15/2031 | | | | 8,189,434 | |
| | 11,656,327 | | | Series 2023-6-A | | | 7.13% | (a) | | | 06/16/2031 | | | | 11,692,022 | |
| |
| | | | Pioneer Aircraft Finance Ltd. | |
| | 31,835,831 | | | Series 2019-1-A | | | 3.97% | (a) | | | 06/15/2044 | | | | 29,555,876 | |
| |
| | | | Primrose Holdings, Inc. | |
| | 12,529,125 | | | Series 2019-1A-A2 | | | 4.48% | (a) | | | 07/30/2049 | | | | 12,025,488 | |
| |
| | | | Project Silver | |
| | 25,146,701 | | | Series 2019-1-A | | | 3.97% | (a) | | | 07/15/2044 | | | | 21,835,358 | |
| |
| | | | Purewest Funding LLC | |
| | 20,270,817 | | | Series 2021-1-A1 | | | 4.09% | (a) | | | 12/22/2036 | | | | 19,633,360 | |
| |
| | | | Raptor Aircraft Finance | |
| | 13,022,339 | | | Series 2019-1-A | | | 4.21% | (a) | | | 08/23/2044 | | | | 10,789,229 | |
| |
| | | | Renew | |
| | 6,630,781 | | | Series 2017-2A-A | | | 3.22% | (a) | | | 09/22/2053 | | | | 5,792,696 | |
| |
| | | | Research-Driven Pagaya Motor Asset Trust | |
| | 22,870,727 | | | Series 2021-2A-A | | | 2.65% | (a) | | | 03/25/2030 | | | | 21,956,165 | |
| |
| | | | Sapphire Aviation Finance Ltd. | |
| | 32,052,328 | | | Series 2020-1A-A | | | 3.23% | (a) | | | 03/15/2040 | | | | 28,237,812 | |
| | 7,634,060 | | | Series 2020-1A-B | | | 4.34% | (a) | | | 03/15/2040 | | | | 5,794,740 | |
| |
| | | | SEB Funding LLC | |
| | 17,705,625 | | | Series 2021-1A-A2 | | | 4.97% | (a) | | | 01/30/2052 | | | | 16,726,706 | |
| |
| | | | ServiceMaster Funding LLC | |
| | 3,932,877 | | | Series 2020-1-A2II | | | 3.34% | (a) | | | 01/30/2051 | | | | 3,370,062 | |
| | | | |
| 2 | | DoubleLine Funds Trust | | The accompanying notes are an integral part of these financial statements. |
| | | | | | | | | | | | | | | | |
PRINCIPAL AMOUNT $ | | | SECURITY DESCRIPTION | | RATE | | | MATURITY | | | VALUE $ | |
| |
| | | | Shenton Aircraft Investment Ltd. | |
| | 17,324,397 | | | Series 2015-1A-A | | | 4.75% | (a) | | | 10/15/2042 | | | | 16,086,275 | |
| | | | |
| | | | Sierra Timeshare Conduit Receivables Funding LLC | | | | | | | | | | | | |
| | 1,558,731 | | | Series 2021-2A-C | | | 1.95% | (a) | | | 09/20/2038 | | | | 1,453,886 | |
| | 1,870,477 | | | Series 2021-2A-D | | | 3.23% | (a) | | | 09/20/2038 | | | | 1,725,648 | |
| |
| | | | SLM Student Loan Trust | |
| | 4,341,099 | | | Series 2006-A-A5 (CME Term SOFR 3 Month + 0.55%) | | | 5.88% | | | | 06/15/2039 | | | | 4,212,149 | |
| | 3,318,843 | | | Series 2006-B-A5 (CME Term SOFR 3 Month + 0.53%) | | | 5.86% | | | | 12/15/2039 | | | | 3,233,235 | |
| |
| | | | SOFI Alternative Trust | |
| | 5,609,753 | | | Series 2021-1-PT2 | | | 9.72% | (a)(c) | | | 05/25/2030 | | | | 5,554,565 | |
| | 22,091,640 | | | Series 2021-2-A | | | 1.25% | (a) | | | 08/15/2030 | | | | 21,428,824 | |
| | 500,000 | | | Series 2021-2-R1 | | | 0.00% | (a)(b)(e) | | | 08/15/2030 | | | | 4,194,652 | |
| | 24,993,932 | | | Series 2021-3-A | | | 1.50% | (a) | | | 11/15/2030 | | | | 24,148,637 | |
| | 950,000 | | | Series 2021-3-R1 | | | 0.00% | (a)(b)(e) | | | 11/15/2030 | | | | 10,404,748 | |
| |
| | | | SoFi Professional Loan Program LLC | |
| | 14,610,508 | | | Series 2017-E-B | | | 3.49% | (a) | | | 11/26/2040 | | | | 14,129,692 | |
| | 13,000,000 | | | Series 2017-E-C | | | 4.16% | (a) | | | 11/26/2040 | | | | 11,962,237 | |
| | 12,800,000 | | | Series 2018-A-B | | | 3.61% | (a) | | | 02/25/2042 | | | | 11,637,151 | |
| | 18,000,000 | | | Series 2018-B-BFX | | | 3.83% | (a) | | | 08/25/2047 | | | | 16,462,930 | |
| |
| | | | Sprite/KY | |
| | 18,237,165 | | | Series 2021-1-A | | | 3.75% | (a) | | | 11/15/2046 | | | | 17,042,741 | |
| |
| | | | Stack Infrastructure Issuer LLC | |
| | 5,750,000 | | | Series 2020-1A-A2 | | | 1.89% | (a) | | | 08/25/2045 | | | | 5,420,938 | |
| |
| | | | Start/Bermuda | |
| | 14,176,540 | | | Series 2018-1-A | | | 4.09% | (a) | | | 05/15/2043 | | | | 13,084,493 | |
| |
| | | | Stonepeak ABS | |
| | 2,631,835 | | | Series 2021-1A-A | | | 2.68% | (a) | | | 02/28/2033 | | | | 2,434,529 | |
| | 5,088,328 | | | Series 2021-1A-B | | | 3.82% | (a) | | | 02/28/2033 | | | | 4,474,966 | |
| |
| | | | Sunbird Engine Finance | |
| | 33,034,294 | | | Series 2020-1A-A | | | 3.67% | (a) | | | 02/15/2045 | | | | 28,898,466 | |
| |
| | | | Taco Bell Corp. | |
| | 7,417,875 | | | Series 2021-1A-A23 | | | 2.54% | (a) | | | 08/25/2051 | | | | 6,142,088 | |
| | 5,207,250 | | | Series 2021-1A-A2I | | | 1.95% | (a) | | | 08/25/2051 | | | | 4,717,495 | |
| |
| | | | TAL Advantage LLC | |
| | 12,650,000 | | | Series 2020-1A-A | | | 2.05% | (a) | | | 09/20/2045 | | | | 11,516,514 | |
| | 2,688,125 | | | Series 2020-1A-B | | | 3.29% | (a) | | | 09/20/2045 | | | | 2,443,690 | |
| |
| | | | Textainer Ltd. | |
| | 7,818,569 | | | Series 2020-1A-A | | | 2.73% | (a) | | | 08/21/2045 | | | | 7,317,859 | |
| | 2,313,607 | | | Series 2020-2A-B | | | 3.34% | (a) | | | 09/20/2045 | | | | 2,094,037 | |
| |
| | | | Upgrade Master Credit Pass-Thru Trust | |
| | 717,485 | | | Series 2021-PT1-A | | | 23.51% | (a)(c) | | | 08/15/2027 | | | | 583,167 | |
| |
| | | | Upgrade Master Pass-Thru Trust | |
| | 1,915,827 | | | Series 2021-PT1-A | | | 13.12% | (a)(c) | | | 04/15/2027 | | | | 1,705,728 | |
| | 2,149,665 | | | Series 2021-PT3-A | | | 13.84% | (a)(c) | | | 07/15/2027 | | | | 1,969,799 | |
| | 1,447,122 | | | Series 2021-PT4-A | | | 11.83% | (a)(c) | | | 08/15/2027 | | | | 1,248,027 | |
| | 3,987,813 | | | Series 2021-PT5-A | | | 16.50% | (a)(c) | | | 10/15/2027 | | | | 3,243,451 | |
| |
| | | | Upstart Pass-Through Trust Series | |
| | 2,816,314 | | | Series 2020-ST5-A | | | 3.00% | (a) | | | 12/20/2026 | | | | 2,795,956 | |
| | 2,418,567 | | | Series 2021-ST1-A | | | 2.75% | (a) | | | 02/20/2027 | | | | 2,390,223 | |
| |
| | | | Upstart Securitization Trust | |
| | 614,714 | | | Series 2020-2-A | | | 2.31% | (a) | | | 11/20/2030 | | | | 609,967 | |
| | 2,704,525 | | | Series 2021-3-B | | | 1.66% | (a) | | | 07/20/2031 | | | | 2,690,628 | |
| | 7,500,000 | | | Series 2021-3-C | | | 3.28% | (a) | | | 07/20/2031 | | | | 7,156,802 | |
| |
| | | | Vantage Data Centers Holding LLC | |
| | 32,425,000 | | | Series 2020-2A-A2 | | | 1.99% | (a) | | | 09/15/2045 | | | | 28,593,260 | |
| |
| | | | Vault DI Issuer LLC | |
| | 54,400,000 | | | Series 2021-1A-A2 | | | 2.80% | (a) | | | 07/15/2046 | | | | 47,617,815 | |
| |
| | | | Vivant Solar Financing V Parent LLC | |
| | 16,520,232 | | | Series 2018-1A-A | | | 4.73% | (a) | | | 04/30/2048 | | | | 15,427,116 | |
| |
| | | | VR Funding LLC | |
| | 14,864,490 | | | Series 2020-1A-A | | | 2.79% | (a) | | | 11/15/2050 | | | | 13,344,685 | |
| |
| | | | Waterfall Commercial Mortgage Trust | |
| | 5,899,650 | | | Series 2015-SBC5-A | | | 4.10% | (a)(c) | | | 04/14/2024 | | | | 5,696,621 | |
| |
| | | | Wendy’s SPV Guarantor LLC | |
| | 18,847,012 | | | Series 2019-1A-A2II | | | 4.08% | (a) | | | 06/15/2049 | | | | 17,729,343 | |
| | | | | | | | |
| The accompanying notes are an integral part of these financial statements. | | Annual Report | | | | | March 31, 2024 | | 3 |
| | |
Schedule of Investments DoubleLine Total Return Bond Fund (Cont.) | | |
| | | | | | | | | | | | | | | | |
PRINCIPAL AMOUNT $ | | | SECURITY DESCRIPTION | | RATE | | | MATURITY | | | VALUE $ | |
| | | | |
| | | | Willis Lease Finance Corp. | | | | | | | | | | | | |
| | 41,698,083 | | | Series 2020-A-A | | | 3.23% | (a) | | | 03/15/2045 | | | | 37,560,131 | |
| | | | |
| | | | Wingstop, Inc. | | | | | | | | | | | | |
| | 10,342,500 | | | Series 2020-1A-A2 | | | 2.84% | (a) | | | 12/05/2050 | | | | 9,404,647 | |
| | | | |
| | | | Zephyrus Capital Aviation Partners | | | | | | | | | | | | |
| | 4,740,453 | | | Series 2018-1-A | | | 4.61% | (a) | | | 10/15/2038 | | | | 4,320,994 | |
| | | | | | | | | | | | | | | | |
| | | | Total Asset Backed Obligations
(Cost $1,485,593,013) | | | | | | | | | | | 1,354,418,733 | |
| | | | | | | | | | | | | | | | |
| | COLLATERALIZED LOAN OBLIGATIONS - 3.4% | |
| | | | |
| | | | 37 Capital CLO | | | | | | | | | | | | |
| | 8,500,000 | | | Series 2023-2A-B (CME Term SOFR 3 Month + 2.75%, 2.75% Floor) | | | 8.12% | (a) | | | 01/15/2034 | | | | 8,544,668 | |
| | | | |
| | | | Anchorage Capital CLO Ltd. | | | | | | | | | | | | |
| | 2,000,000 | | | Series 2014-3RA-B (CME Term SOFR 3 Month + 1.76%) | | | 7.08% | (a) | | | 01/28/2031 | | | | 2,001,823 | |
| | | | |
| | | | Apidos CLO | | | | | | | | | | | | |
| | 3,000,000 | | | Series 2013-12A-CR (CME Term SOFR 3 Month + 2.06%) | | | 7.38% | (a) | | | 04/15/2031 | | | | 2,980,768 | |
| | | | |
| | | | ARES CLO | | | | | | | | | | | | |
| | 7,000,000 | | | Series 2017-44A-A3R1 (CME Term SOFR 3 Month + 1.91%, 1.65% Floor) | | | 7.23% | (a) | | | 04/15/2034 | | | | 7,007,985 | |
| | | | |
| | | | Battalion CLO Ltd. | | | | | | | | | | | | |
| | 3,000,000 | | | Series 2017-11A-BR (CME Term SOFR 3 Month + 1.98%, 1.72% Floor) | | | 7.30% | (a) | | | 04/24/2034 | | | | 2,986,142 | |
| | 1,000,000 | | | Series 2021-19A-B (CME Term SOFR 3 Month + 1.86%, 1.60% Floor) | | | 7.18% | (a) | | | 04/15/2034 | | | | 997,923 | |
| | | | |
| | | | BlueMountain CLO Ltd. | | | | | | | | | | | | |
| | 5,000,000 | | | Series 2018-2A-B (CME Term SOFR 3 Month + 1.96%, 1.70% Floor) | | | 7.27% | (a) | | | 08/15/2031 | | | | 5,006,234 | |
| | | | |
| | | | Bridge Street CLO Ltd. | | | | | | | | | | | | |
| | 20,000,000 | | | Series 2024-1A-A (CME Term SOFR 3 Month + 1.60%, 1.60% Floor) | | | 0.00% | (a) | | | 04/20/2037 | | | | 20,000,000 | |
| | | | |
| | | | Canyon Capital CLO Ltd. | | | | | | | | | | | | |
| | 20,000,000 | | | Series 2019-2A-BR (CME Term SOFR 3 Month + 1.96%, 1.70% Floor) | | | 7.28% | (a) | | | 10/15/2034 | | | | 19,905,694 | |
| | 2,500,000 | | | Series 2021-2A-B1 (CME Term SOFR 3 Month + 2.01%, 2.01% Floor) | | | 7.33% | (a) | | | 04/15/2034 | | | | 2,489,467 | |
| | | | |
| | | | Capital Four US CLO Ltd. | | | | | | | | | | | | |
| | 16,500,000 | | | Series 2021-1A-A (CME Term SOFR 3 Month + 1.47%, 1.21% Floor) | | | 6.77% | (a) | | | 01/18/2035 | | | | 16,528,482 | |
| | 18,000,000 | | | Series 2022-1A-BR (CME Term SOFR 3 Month + 2.65%, 2.65% Floor) | | | 8.45% | (a) | | | 01/20/2037 | | | | 18,094,993 | |
| | | | |
| | | | Carlyle Global Market Strategies | | | | | | | | | | | | |
| | 18,500,000 | | | Series 2022-2A-A2 (CME Term SOFR 3 Month + 2.00%, 2.00% Floor) | | | 7.32% | (a) | | | 04/20/2035 | | | | 18,568,554 | |
| | | | |
| | | | CarVal CLO | | | | | | | | | | | | |
| | 5,000,000 | | | Series 2024-1A-B (CME Term SOFR 3 Month + 2.10%, 2.10% Floor) | | | 7.42% | (a) | | | 04/20/2037 | | | | 5,005,604 | |
| | | | |
| | | | CBAM Ltd. | | | | | | | | | | | | |
| | 11,000,000 | | | Series 2017-2A-BR (CME Term SOFR 3 Month + 2.11%, 1.85% Floor) | | | 7.43% | (a) | | | 07/17/2034 | | | | 11,008,969 | |
| | | | |
| | | | Cedar Funding Ltd. | | | | | | | | | | | | |
| | 2,000,000 | | | Series 2022-15A-B (CME Term SOFR 3 Month + 1.80%, 1.80% Floor) | | | 7.12% | (a) | | | 04/20/2035 | | | | 1,997,617 | |
| | | | |
| | | | CIFC Funding Ltd. | | | | | | | | | | | | |
| | 11,500,000 | | | Series 2022-3A-B (CME Term SOFR 3 Month + 2.00%, 2.00% Floor) | | | 7.32% | (a) | | | 04/21/2035 | | | | 11,506,610 | |
| | | | |
| | | | Crown City CLO | | | | | | | | | | | | |
| | 2,750,000 | | | Series 2021-1A-A2 (CME Term SOFR 3 Month + 1.98%, 1.72% Floor) | | | 7.30% | (a) | | | 07/20/2034 | | | | 2,753,867 | |
| | | | |
| | | | Dryden Senior Loan Fund | | | | | | | | | | | | |
| | 3,500,000 | | | Series 2017-53A-B (CME Term SOFR 3 Month + 1.66%) | | | 6.98% | (a) | | | 01/15/2031 | | | | 3,501,285 | |
| | | | |
| | | | Empower CLO Ltd. | | | | | | | | | | | | |
| | 9,000,000 | | | Series 2023-3A-B (CME Term SOFR 3 Month + 2.55%, 2.55% Floor) | | | 7.89% | (a) | | | 01/20/2037 | | | | 9,054,407 | |
| | | | |
| 4 | | DoubleLine Funds Trust | | The accompanying notes are an integral part of these financial statements. |
| | | | | | | | | | | | | | | | |
PRINCIPAL AMOUNT $ | | | SECURITY DESCRIPTION | | RATE | | | MATURITY | | | VALUE $ | |
| |
| | | | Franklin Park Place CLO LLC | |
| | 13,000,000 | | | Series 2022-1A-A (CME Term SOFR 3 Month + 1.40%, 1.40% Floor) | | | 6.71% | (a) | | | 04/14/2035 | | | | 12,985,700 | |
| |
| | | | Generate CLO Ltd. | |
| | 5,800,000 | | | Series 3A-B2R (CME Term SOFR 3 Month + 2.60%, 2.60% Floor) | | | 7.90% | (a) | | | 10/20/2036 | | | | 5,830,319 | |
| |
| | | | Greywolf CLO Ltd. | |
| | 22,449,599 | | | Series 2018-1A-A1 (CME Term SOFR 3 Month + 1.29%) | | | 6.61% | (a) | | | 04/26/2031 | | | | 22,456,558 | |
| |
| | | | Halcyon Loan Advisors Funding Ltd. | |
| | 2,206,374 | | | Series 2014-2A-D (CME Term SOFR 3 Month + 5.26%) | | | 10.58% | (a)(b) | | | 04/28/2025 | | | | 452,307 | |
| |
| | | | Halsey Point CLO Ltd. | |
| | 13,000,000 | | | Series 2019-1A-B1 (CME Term SOFR 3 Month + 2.46%, 2.20% Floor) | | | 7.78% | (a) | | | 01/20/2033 | | | | 13,009,216 | |
| |
| | | | Harbourview CLO VII LLC | |
| | 22,719,068 | | | Series 7RA-A1 (CME Term SOFR 3 Month + 1.39%, 1.13% Floor) | | | 6.69% | (a) | | | 07/18/2031 | | | | 22,744,742 | |
| |
| | | | Harvest US CLO | |
| | 20,000,000 | | | Series 2023-1A-B (CME Term SOFR 3 Month + 2.60%, 2.60% Floor) | | | 7.91% | (a) | | | 01/15/2037 | | | | 20,102,730 | |
| |
| | | | Jackson Financial, Inc. | |
| | 9,500,000 | | | Series 2022-6RA-BR (CME Term SOFR 3 Month + 2.75%, 2.75% Floor) | | | 8.10% | (a) | | | 01/20/2037 | | | | 9,550,616 | |
| |
| | | | Jamestown CLO Ltd. | |
| | 6,000,000 | | | Series 2018-11A-A2 (CME Term SOFR 3 Month + 1.96%) | | | 7.28% | (a) | | | 07/14/2031 | | | | 6,005,532 | |
| | 40,825,344 | | | Series 2018-6RA-A1 (CME Term SOFR 3 Month + 1.41%, 1.15% Floor) | | | 6.74% | (a) | | | 04/25/2030 | | | | 40,892,253 | |
| | 5,000,000 | | | Series 2018-6RA-A2A (CME Term SOFR 3 Month + 2.04%, 1.78% Floor) | | | 7.37% | (a) | | | 04/25/2030 | | | | 5,015,405 | |
| |
| | | | Katayma CLO Ltd. | |
| | 25,000,000 | | | Series 2024-2A-A1 (CME Term SOFR 3 Month + 1.65%, 1.65% Floor) | | | 6.94% | (a) | | | 04/20/2037 | | | | 25,000,000 | |
| |
| | | | LCM LP | |
| | 14,305,304 | | | Series 17A-A2RR (CME Term SOFR 3 Month + 1.41%, 1.15% Floor) | | | 6.73% | (a) | | | 10/15/2031 | | | | 14,295,209 | |
| |
| | | | Marble Point CLO | |
| | 55,000,000 | | | Series 2021-2A-A (CME Term SOFR 3 Month + 1.46%, 1.20% Floor) | | | 6.79% | (a) | | | 07/25/2034 | | | | 54,986,332 | |
| | 50,000,000 | | | Series 2021-4A-A1 (CME Term SOFR 3 Month + 1.47%, 1.21% Floor) | | | 6.79% | (a) | | | 01/22/2035 | | | | 49,839,304 | |
| | 20,000,000 | | | Series 2022-2A-A1R (CME Term SOFR 3 Month + 1.93%, 1.93% Floor) | | | 7.28% | (a) | | | 10/20/2036 | | | | 20,105,000 | |
| | 11,400,000 | | | Series 2022-2A-BR (CME Term SOFR 3 Month + 2.85%, 2.85% Floor) | | | 8.20% | (a) | | | 10/20/2036 | | | | 11,472,267 | |
| |
| | | | MidOcean Credit CLO | |
| | 42,713,462 | | | Series 2018-9A-A1 (CME Term SOFR 3 Month + 1.41%, 1.15% Floor) | | | 6.73% | (a) | | | 07/20/2031 | | | | 42,562,385 | |
| |
| | | | MKS CLO Ltd. | |
| | 38,835,191 | | | Series 2017-1A-AR (CME Term SOFR 3 Month + 1.26%, 1.00% Floor) | | | 6.58% | (a) | | | 07/20/2030 | | | | 38,864,492 | |
| | 39,865,644 | | | Series 2017-2A-A (CME Term SOFR 3 Month + 1.45%, 1.19% Floor) | | | 6.77% | (a) | | | 01/20/2031 | | | | 39,892,601 | |
| |
| | | | MP CLO Ltd. | |
| | 25,181,658 | | | Series 2013-1A-AR (CME Term SOFR 3 Month + 1.51%) | | | 6.83% | (a) | | | 10/20/2030 | | | | 25,199,285 | |
| |
| | | | Nassau Global Credit LLC | |
| | 27,516,182 | | | Series 2018-IA-A (CME Term SOFR 3 Month + 1.41%) | | | 6.73% | (a) | | | 07/15/2031 | | | | 27,514,782 | |
| |
| | | | Ocean Trails CLO | |
| | 4,000,000 | | | Series 2019-7A-BR (CME Term SOFR 3 Month + 1.86%, 1.60% Floor) | | | 7.18% | (a) | | | 04/17/2030 | | | | 4,007,616 | |
| | 10,150,000 | | | Series 2020-10A-BR (CME Term SOFR 3 Month + 2.06%, 1.80% Floor) | | | 7.38% | (a) | | | 10/15/2034 | | | | 10,172,435 | |
| |
| | | | Octagon Investment Partners Ltd. | |
| | 1,500,000 | | | Series 2019-1A-BR (CME Term SOFR 3 Month + 1.85%, 1.85% Floor) | | | 7.16% | (a) | | | 04/15/2035 | | | | 1,487,851 | |
| |
| | | | OFSI Fund Ltd. | |
| | 46,162,102 | | | Series 2018-1A-A (CME Term SOFR 3 Month + 1.41%, 1.15% Floor) | | | 6.73% | (a) | | | 07/15/2031 | | | | 46,251,108 | |
| | | | | | | | |
| The accompanying notes are an integral part of these financial statements. | | Annual Report | | | | | March 31, 2024 | | 5 |
| | |
Schedule of Investments DoubleLine Total Return Bond Fund (Cont.) | | |
| | | | | | | | | | | | | | | | |
PRINCIPAL AMOUNT $ | | | SECURITY DESCRIPTION | | RATE | | | MATURITY | | | VALUE $ | |
| |
| | | | Park Blue CLO Ltd. | |
| | 7,400,000 | | | Series 2023-4A-B (CME Term SOFR 3 Month + 2.70%, 2.70% Floor) | | | 8.03% | (a) | | | 01/25/2037 | | | | 7,449,974 | |
| |
| | | | Regatta Funding Ltd. | |
| | 2,500,000 | | | Series 2018-1A-B (CME Term SOFR 3 Month + 1.91%) | | | 7.23% | (a) | | | 07/17/2031 | | | | 2,503,728 | |
| |
| | | | Rockford Tower CLO Ltd. | |
| | 2,525,000 | | | Series 2018-2A-B (CME Term SOFR 3 Month + 2.06%, 1.80% Floor) | | | 7.38% | (a) | | | 10/20/2031 | | | | 2,528,802 | |
| | 10,000,000 | | | Series 2024-1A-A1 (CME Term SOFR 3 Month + 1.61%, 1.61% Floor) | | | 0.00% | (a) | | | 04/20/2037 | | | | 10,000,000 | |
| |
| | | | Sound Point CLO Ltd. | |
| | 24,294,604 | | | Series 2013-3RA-A (CME Term SOFR 3 Month + 1.41%, 1.15% Floor) | | | 6.71% | (a) | | | 04/18/2031 | | | | 24,282,457 | |
| | 18,000,000 | | | Series 2018-2A-C (CME Term SOFR 3 Month + 2.21%) | | | 7.54% | (a) | | | 07/26/2031 | | | | 17,742,978 | |
| | 28,000,000 | | | Series 2018-3A-A1A (CME Term SOFR 3 Month + 1.44%, 1.18% Floor) | | | 6.77% | (a) | | | 10/26/2031 | | | | 28,061,418 | |
| | 7,025,000 | | | Series 2019-1A-BR (CME Term SOFR 3 Month + 1.96%, 1.70% Floor) | | | 7.28% | (a) | | | 01/20/2032 | | | | 6,993,635 | |
| | 25,250,000 | | | Series 2020-2A-AR (CME Term SOFR 3 Month + 1.44%, 1.18% Floor) | | | 6.77% | (a) | | | 10/25/2034 | | | | 25,251,278 | |
| | 10,000,000 | | | Series 2024-38A-A1 (CME Term SOFR 3 Month + 1.60%, 1.60% Floor) | | | 6.92% | (a) | | | 02/20/2037 | | | | 10,000,000 | |
| |
| | | | Steele Creek CLO Ltd. | |
| | 29,902,060 | | | Series 2016-1A-AR (CME Term SOFR 3 Month + 1.38%, 1.12% Floor) | | | 6.71% | (a) | | | 06/15/2031 | | | | 29,937,213 | |
| | 10,000,000 | | | Series 2019-1A-BR (CME Term SOFR 3 Month + 2.06%, 1.80% Floor) | | | 7.38% | (a) | | | 04/15/2032 | | | | 9,973,315 | |
| |
| | | | Symphony CLO Ltd. | |
| | 3,500,000 | | | Series 2020-22A-B (CME Term SOFR 3 Month + 1.96%, 1.70% Floor) | | | 7.26% | (a) | | | 04/18/2033 | | | | 3,500,207 | |
| |
| | | | Trimaran CAVU LLC | |
| | 20,000,000 | | | Series 2021-3A-A (CME Term SOFR 3 Month + 1.47%, 1.21% Floor) | | | 6.77% | (a) | | | 01/18/2035 | | | | 20,043,584 | |
| |
| | | | Unity-Peace Park CLO Ltd. | |
| | 15,000,000 | | | Series 2022-1A-B (CME Term SOFR 3 Month + 2.00%, 2.00% Floor) | | | 7.32% | (a) | | | 04/20/2035 | | | | 15,069,615 | |
| |
| | | | Vibrant Clo X Ltd. | |
| | 60,500,000 | | | Series 2018-10RA-A1 (CME Term SOFR 3 Month + 1.70%, 1.70% Floor) | | | 7.01% | (a) | | | 04/20/2036 | | | | 60,510,538 | |
| |
| | | | Wellfleet CLO Ltd. | |
| | 24,495,788 | | | Series 2018-2A-A1 (CME Term SOFR 3 Month + 1.46%, 1.20% Floor) | | | 6.78% | (a) | | | 10/20/2031 | | | | 24,500,687 | |
| |
| | | | Wind River CLO Ltd. | |
| | 4,000,000 | | | Series 2013-2A-CR (CME Term SOFR 3 Month + 2.26%) | | | 7.56% | (a) | | | 10/18/2030 | | | | 3,992,589 | |
| | 13,662,020 | | | Series 2014-2A-AR (CME Term SOFR 3 Month + 1.40%, 1.14% Floor) | | | 6.72% | (a) | | | 01/15/2031 | | | | 13,663,988 | |
| | | | | | | | | | | | | | | | |
| | | | Total Collateralized Loan Obligations
(Cost $1,054,721,412) | | | | | | | | | | | 1,056,643,143 | |
| | | | | | | | | | | | | | | | |
| | NON-AGENCY COMMERCIAL MORTGAGE BACKED OBLIGATIONS - 7.3% | |
| | | | |
| | | | 20 Times Square Trust | | | | | | | | | | | | |
| | 7,949,000 | | | Series 2018-20TS-F | | | 3.10% | (a)(c) | | | 05/15/2035 | | | | 6,067,926 | |
| | 5,856,000 | | | Series 2018-20TS-G | | | 3.10% | (a)(c) | | | 05/15/2035 | | | | 4,358,956 | |
| | | | |
| | | | Alen Mortgage Trust | | | | | | | | | | | | |
| | 11,551,000 | | | Series 2021-ACEN-E (CME Term SOFR 1 Month + 4.11%, 4.00% Floor) | | | 9.44% | (a) | | | 04/15/2034 | | | | 5,436,958 | |
| | | | |
| | | | Arbor Multifamily Mortgage Securities Trust | | | | | | | | | | | | |
| | 21,947,000 | | | Series 2021-MF3-XB | | | 0.49% | (a)(c)(f) | | | 10/15/2054 | | | | 707,929 | |
| | | | |
| | | | Arbor Realty Trust, Inc. | | | | | | | | | | | | |
| | 6,300,000 | | | Series 2021-FL1-B (CME Term SOFR 1 Month + 1.61%, 1.50% Floor) | | | 6.94% | (a) | | | 12/15/2035 | | | | 6,166,799 | |
| | | | |
| | | | Ares Commercial Real Estate Corp. | | | | | | | | | | | | |
| | 2,010,000 | | | Series 2021-FL4-B (CME Term SOFR 1 Month + 1.51%, 1.40% Floor) | | | 6.84% | (a) | | | 12/18/2037 | | | | 1,959,559 | |
| | | | |
| | | | Atrium Hotel Portfolio Trust | | | | | | | | | | | | |
| | 10,001,000 | | | Series 2018-ATRM-A (CME Term SOFR 1 Month + 1.25%, 0.95% Floor) | | | 6.57% | (a) | | | 06/15/2035 | | | | 9,955,784 | |
| | | | |
| 6 | | DoubleLine Funds Trust | | The accompanying notes are an integral part of these financial statements. |
| | | | | | | | | | | | | | | | |
PRINCIPAL AMOUNT $ | | | SECURITY DESCRIPTION | | RATE | | | MATURITY | | | VALUE $ | |
| | | |
| | | | Banc of America Merrill Lynch Commercial Mortgage, Inc. | | | | | | | | |
| | 43,281,895 | | | Series 2015-UBS7-XA | | | 0.74% | (c)(f) | | | 09/15/2048 | | | | 339,122 | |
| | 2,121,000 | | | Series 2016-UB10-C | | | 4.82% | (c) | | | 07/15/2049 | | | | 1,990,033 | |
| | | |
| | | | Banc of America Re-Remic Trust | | | | | | | | |
| | 35,435,000 | | | Series 2020-BOC-D | | | 3.18% | (a)(c) | | | 01/15/2032 | | | | 15,812,582 | |
| | 7,505,000 | | | Series 2020-BOC-E | | | 3.18% | (a)(c) | | | 01/15/2032 | | | | 2,973,795 | |
| | | |
| | | | BANK | | | | | | | | |
| | 3,554,000 | | | Series 2017-BNK4-C | | | 4.37% | (c) | | | 05/15/2050 | | | | 3,032,493 | |
| | 31,828,541 | | | Series 2017-BNK4-XA | | | 1.34% | (c)(f) | | | 05/15/2050 | | | | 1,005,238 | |
| | 4,916,000 | | | Series 2017-BNK5-B | | | 3.90% | (c) | | | 06/15/2060 | | | | 4,535,306 | |
| | 1,960,000 | | | Series 2017-BNK5-C | | | 4.19% | (c) | | | 06/15/2060 | | | | 1,788,191 | |
| | 72,040,036 | | | Series 2017-BNK5-XA | | | 0.94% | (c)(f) | | | 06/15/2060 | | | | 1,646,244 | |
| | 143,145,919 | | | Series 2018-BN10-XA | | | 0.69% | (c)(f) | | | 02/15/2061 | | | | 3,196,720 | |
| | 31,334,000 | | | Series 2018-BN10-XD | | | 1.72% | (a)(c)(f) | | | 02/15/2061 | | | | 1,830,889 | |
| | 90,109,309 | | | Series 2019-BN16-XA | | | 0.94% | (c)(f) | | | 02/15/2052 | | | | 3,268,805 | |
| | 13,119,665 | | | Series 2019-BN16-XD | | | 1.83% | (a)(c)(f) | | | 02/15/2052 | | | | 992,947 | |
| | 11,541,000 | | | Series 2019-BN17-XD | | | 1.59% | (a)(c)(f) | | | 04/15/2052 | | | | 774,401 | |
| | 43,097,000 | | | Series 2019-BN19-AS | | | 3.45% | | | | 08/15/2061 | | | | 37,677,177 | |
| | 17,013,666 | | | Series 2019-BN19-XD | | | 1.03% | (a)(c)(f) | | | 08/15/2061 | | | | 790,363 | |
| | 1,099,000 | | | Series 2019-BN20-AS | | | 3.24% | (c) | | | 09/15/2062 | | | | 950,233 | |
| | 5,000,000 | | | Series 2019-BN21-C | | | 3.52% | (c) | | | 10/17/2052 | | | | 3,725,225 | |
| | 26,932,000 | | | Series 2019-BN24-XD | | | 1.02% | (a)(c)(f) | | | 11/15/2062 | | | | 1,336,670 | |
| | 62,007,000 | | | Series 2020-BN30-XB | | | 0.72% | (c)(f) | | | 12/15/2053 | | | | 2,440,130 | |
| | 112,743,000 | | | Series 2021-BN35-XB | | | 0.59% | (c)(f) | | | 06/15/2064 | | | | 4,173,678 | |
| | 10,388,000 | | | Series 2021-BN38-XD | | | 0.72% | (a)(c)(f) | | | 12/15/2064 | | | | 468,110 | |
| | 7,663,000 | | | Series 2022-BNK40-XD | | | 0.89% | (a)(c)(f) | | | 03/15/2064 | | | | 431,684 | |
| | | |
| | | | BBCMS Trust | | | | | | | | |
| | 45,454,000 | | | Series 2018-CBM-A (CME Term SOFR 1 Month + 1.30%, 1.25% Floor) | | | 6.62% | (a) | | | 07/15/2037 | | | | 44,920,406 | |
| | 13,455,000 | | | Series 2018-CBM-E (CME Term SOFR 1 Month + 3.85%, 3.55% Floor) | | | 9.17% | (a) | | | 07/15/2037 | | | | 12,130,323 | |
| | 5,775,000 | | | Series 2018-TALL-F (CME Term SOFR 1 Month + 3.43%, 3.39% Floor) | | | 8.76% | (a) | | | 03/15/2037 | | | | 3,771,077 | |
| | 11,799,000 | | | Series 2020-C6-F5TB | | | 3.69% | (a)(c) | | | 02/15/2053 | | | | 8,251,614 | |
| | 12,497,250 | | | Series 2020-C6-F5TC | | | 3.69% | (a)(c) | | | 02/15/2053 | | | | 8,344,882 | |
| | 93,120,543 | | | Series 2020-C6-XA | | | 1.04% | (c)(f) | | | 02/15/2053 | | | | 4,221,322 | |
| | 7,424,000 | | | Series 2020-C6-XD | | | 1.20% | (a)(c)(f) | | | 02/15/2053 | | | | 445,477 | |
| | 34,040,000 | | | Series 2021-C11-XB | | | 0.96% | (c)(f) | | | 09/15/2054 | | | | 2,047,942 | |
| | 135,082,853 | | | Series 2021-C9-XA | | | 1.60% | (c)(f) | | | 02/15/2054 | | | | 10,880,829 | |
| | 68,467,000 | | | Series 2021-C9-XB | | | 0.99% | (c)(f) | | | 02/15/2054 | | | | 3,866,770 | |
| | | |
| | | | Benchmark Mortgage Trust | | | | | | | | |
| | 35,258,656 | | | Series 2018-B7-XA | | | 0.40% | (c)(f) | | | 05/15/2053 | | | | 498,832 | |
| | 27,627,784 | | | Series 2018-B8-XA | | | 0.62% | (c)(f) | | | 01/15/2052 | | | | 610,306 | |
| | 13,924,000 | | | Series 2019-B11-XD | | | 1.49% | (a)(c)(f) | | | 05/15/2052 | | | | 883,457 | |
| | 13,870,000 | | | Series 2019-B12-XD | | | 1.10% | (a)(c)(f) | | | 08/15/2052 | | | | 680,222 | |
| | 24,552,000 | | | Series 2019-B15-XD | | | 0.97% | (a)(c)(f) | | | 12/15/2072 | | | | 1,126,527 | |
| | 76,747,879 | | | Series 2019-B9-XA | | | 1.02% | (c)(f) | | | 03/15/2052 | | | | 2,885,897 | |
| | 74,845,135 | | | Series 2020-B16-XA | | | 1.04% | (c)(f) | | | 02/15/2053 | | | | 3,093,297 | |
| | 75,139,634 | | | Series 2020-B17-XA | | | 1.41% | (c)(f) | | | 03/15/2053 | | | | 3,620,243 | |
| | 13,462,000 | | | Series 2020-B18-AGND | | | 3.74% | (a) | | | 07/15/2053 | | | | 12,531,161 | |
| | 2,432,000 | | | Series 2020-B18-AGNE | | | 3.76% | (a) | | | 07/15/2053 | | | | 2,236,901 | |
| | 88,649,972 | | | Series 2020-B18-XA | | | 1.78% | (c)(f) | | | 07/15/2053 | | | | 5,536,678 | |
| | 235,975,384 | | | Series 2020-B19-XA | | | 1.76% | (c)(f) | | | 09/15/2053 | | | | 14,816,965 | |
| | 70,651,519 | | | Series 2020-B22-XA | | | 1.51% | (c)(f) | | | 01/15/2054 | | | | 5,450,609 | |
| | 275,367,278 | | | Series 2020-IG1-XA | | | 0.51% | (c)(f) | | | 09/15/2043 | | | | 5,869,729 | |
| | 232,245,848 | | | Series 2021-B24-XA | | | 1.15% | (c)(f) | | | 03/15/2054 | | | | 12,138,631 | |
| | 120,708,622 | | | Series 2021-B28-XA | | | 1.27% | (c)(f) | | | 08/15/2054 | | | | 7,749,457 | |
| | 59,609,000 | | | Series 2021-B28-XB | | | 0.95% | (c)(f) | | | 08/15/2054 | | | | 3,532,262 | |
| | 66,420,000 | | | Series 2021-B29-XB | | | 0.70% | (c)(f) | | | 09/15/2054 | | | | 2,904,374 | |
| | 363,472,249 | | | Series 2021-B30-XA | | | 0.81% | (c)(f) | | | 11/15/2054 | | | | 17,109,802 | |
| | 13,067,000 | | | Series 2022-B32-XD | | | 1.52% | (a)(c)(f) | | | 01/15/2055 | | | | 1,165,972 | |
| | 7,270,000 | | | Series 2022-B34-XD | | | 1.83% | (a)(c)(f) | | | 04/15/2055 | | | | 837,540 | |
| | | | | | | | |
| The accompanying notes are an integral part of these financial statements. | | Annual Report | | | | | March 31, 2024 | | 7 |
| | |
Schedule of Investments DoubleLine Total Return Bond Fund (Cont.) | | |
| | | | | | | | | | | | | | | | |
PRINCIPAL AMOUNT $ | | | SECURITY DESCRIPTION | | RATE | | | MATURITY | | | VALUE $ | |
| | | |
| | | | BHMS Mortgage Trust | | | | | | | | |
| | 14,537,000 | | | Series 2018-ATLS-A (CME Term SOFR 1 Month + 1.55%, 1.50% Floor) | | | 6.87% | (a) | | | 07/15/2035 | | | | 14,525,386 | |
| | | |
| | | | BPR Trust | | | | | | | | |
| | 10,166,000 | | | Series 2021-TY-A (CME Term SOFR 1 Month + 1.16%, 1.05% Floor) | | | 6.49% | (a) | | | 09/15/2038 | | | | 10,110,689 | |
| | | |
| | | | Braemar Hotels & Resorts Trust | | | | | | | | |
| | 598,840 | | | Series 2018-PRME-A (CME Term SOFR 1 Month + 0.99%, 0.95% Floor) | | | 6.32% | (a) | | | 06/15/2035 | | | | 598,121 | |
| | | |
| | | | BSPRT Co.-Issuer LLC | | | | | | | | |
| | 9,241,653 | | | Series 2021-FL6-A (CME Term SOFR 1 Month + 1.21%, 1.10% Floor) | | | 6.54% | (a) | | | 03/15/2036 | | | | 9,185,335 | |
| | | |
| | | | BX Trust | | | | | | | | |
| | 5,160,000 | | | Series 2019-IMC-F (CME Term SOFR 1 Month + 2.95%, 2.90% Floor) | | | 8.27% | (a) | | | 04/15/2034 | | | | 5,139,919 | |
| | 173,184,000 | | | Series 2019-OC11-E | | | 3.94% | (a)(c) | | | 12/09/2041 | | | | 149,938,082 | |
| | 326,679,000 | | | Series 2019-OC11-XB | | | 0.18% | (a)(c)(f) | | | 12/09/2041 | | | | 3,441,531 | |
| | 3,450,000 | | | Series 2021-VIEW-F (CME Term SOFR 1 Month + 4.04%, 3.93% Floor) | | | 9.37% | (a) | | | 06/15/2036 | | | | 3,067,908 | |
| | 55,807,000 | | | Series 2021-VOLT-E (CME Term SOFR 1 Month + 2.11%, 2.00% Floor) | | | 7.44% | (a) | | | 09/15/2036 | | | | 55,087,541 | |
| | 3,745,000 | | | Series 2021-VOLT-F (CME Term SOFR 1 Month + 2.51%, 2.40% Floor) | | | 7.84% | (a) | | | 09/15/2036 | | | | 3,713,503 | |
| | 3,926,071 | | | Series 2021-XL2-E (CME Term SOFR 1 Month + 1.96%, 1.85% Floor) | | | 7.28% | (a) | | | 10/15/2038 | | | | 3,892,105 | |
| | | |
| | | | California Housing Finance Agency | | | | | | | | |
| | 62,906,456 | | | Series 2021-2 | | | 0.82% | (c)(f) | | | 03/25/2035 | | | | 3,030,204 | |
| | | |
| | | | Cantor Commercial Real Estate Lending LP | | | | | | | | |
| | 10,105,250 | | | Series 2019-CF2-XD | | | 1.45% | (a)(c)(f) | | | 11/15/2052 | | | | 648,587 | |
| | 11,514,000 | | | Series 2019-CF3-XD | | | 1.10% | (a)(c)(f) | | | 01/15/2053 | | | | 618,827 | |
| | | |
| | | | CFCRE Commercial Mortgage Trust | | | | | | | | |
| | 7,155,000 | | | Series 2016-C4-C | | | 4.84% | (c) | | | 05/10/2058 | | | | 6,685,668 | |
| | 73,610,159 | | | Series 2016-C4-XA | | | 1.60% | (c)(f) | | | 05/10/2058 | | | | 1,665,776 | |
| | 5,000,000 | | | Series 2016-C6-C | | | 4.17% | (c) | | | 11/10/2049 | | | | 4,334,403 | |
| | | |
| | | | Citigroup Commercial Mortgage Trust | | | | | | | | |
| | 21,787,929 | | | Series 2014-GC21-XA | | | 1.00% | (c)(f) | | | 05/10/2047 | | | | 1,987 | |
| | 155,151,470 | | | Series 2014-GC25-XA | | | 0.94% | (c)(f) | | | 10/10/2047 | | | | 176,640 | |
| | 9,978,000 | | | Series 2015-GC27-C | | | 4.42% | (c) | | | 02/10/2048 | | | | 9,517,844 | |
| | 3,685,000 | | | Series 2015-GC27-D | | | 4.42% | (a)(c) | | | 02/10/2048 | | | | 3,323,295 | |
| | 161,119,844 | | | Series 2015-GC27-XA | | | 1.30% | (c)(f) | | | 02/10/2048 | | | | 1,083,579 | |
| | 14,310,000 | | | Series 2015-GC33-C | | | 4.57% | (c) | | | 09/10/2058 | | | | 11,887,739 | |
| | 151,772,439 | | | Series 2015-GC33-XA | | | 0.87% | (c)(f) | | | 09/10/2058 | | | | 1,456,105 | |
| | 93,581,983 | | | Series 2016-C1-XA | | | 1.82% | (c)(f) | | | 05/10/2049 | | | | 2,723,385 | |
| | 189,640,948 | | | Series 2016-GC36-XA | | | 1.21% | (c)(f) | | | 02/10/2049 | | | | 3,195,640 | |
| | 32,412,090 | | | Series 2016-GC37-XA | | | 1.65% | (c)(f) | | | 04/10/2049 | | | | 755,866 | |
| | 88,857,652 | | | Series 2016-P3-XA | | | 1.65% | (c)(f) | | | 04/15/2049 | | | | 1,800,700 | |
| | 51,823,526 | | | Series 2016-P4-XA | | | 1.88% | (c)(f) | | | 07/10/2049 | | | | 1,606,638 | |
| | 84,035,642 | | | Series 2016-P5-XA | | | 1.37% | (c)(f) | | | 10/10/2049 | | | | 2,119,404 | |
| | 219,467,257 | | | Series 2017-B1-XA | | | 0.73% | (c)(f) | | | 08/15/2050 | | | | 4,419,215 | |
| | 37,322,490 | | | Series 2017-P7-XA | | | 1.08% | (c)(f) | | | 04/14/2050 | | | | 940,672 | |
| | 3,625,000 | | | Series 2020-420K-D | | | 3.31% | (a)(c) | | | 11/10/2042 | | | | 3,016,221 | |
| | 7,800,000 | | | Series 2020-420K-E | | | 3.31% | (a)(c) | | | 11/10/2042 | | | | 6,278,293 | |
| | 23,804,000 | | | Series 2020-555-E | | | 3.50% | (a)(c) | | | 12/10/2041 | | | | 19,703,204 | |
| | 4,175,000 | | | Series 2020-555-F | | | 3.50% | (a)(c) | | | 12/10/2041 | | | | 3,193,882 | |
| | 2,853,000 | | | Series 2020-GC46-B | | | 3.15% | (c) | | | 02/15/2053 | | | | 2,430,587 | |
| | | |
| | | | Citigroup/Deutsche Bank Commercial Mortgage Trust | | | | | | | | |
| | 5,161,000 | | | Series 2016-C1-B | | | 4.20% | (c) | | | 05/10/2049 | | | | 4,693,860 | |
| | 102,585,958 | | | Series 2016-C1-XA | | | 1.36% | (c)(f) | | | 05/10/2049 | | | | 1,954,078 | |
| | 69,963,981 | | | Series 2017-CD4-XA | | | 1.22% | (c)(f) | | | 05/10/2050 | | | | 1,976,538 | |
| | 5,723,000 | | | Series 2017-CD6-B | | | 3.91% | (c) | | | 11/13/2050 | | | | 4,927,223 | |
| | 5,175,000 | | | Series 2017-CD6-C | | | 4.23% | (c) | | | 11/13/2050 | | | | 4,240,826 | |
| | 42,096,113 | | | Series 2017-CD6-XA | | | 0.87% | (c)(f) | | | 11/13/2050 | | | | 896,976 | |
| | 59,260,241 | | | Series 2020-C9-XA | | | 1.70% | (c)(f) | | | 09/15/2053 | | | | 3,204,930 | |
| | | | |
| 8 | | DoubleLine Funds Trust | | The accompanying notes are an integral part of these financial statements. |
| | | | | | | | | | | | | | | | |
PRINCIPAL AMOUNT $ | | | SECURITY DESCRIPTION | | RATE | | | MATURITY | | | VALUE $ | |
| |
| | | | CLNC Ltd. | |
| | 32,597,259 | | | Series 2019-FL1-AS (CME Term SOFR 1 Month + 1.66%, 1.55% Floor) | | | 6.99% | (a) | | | 08/20/2035 | | | | 32,248,599 | |
| | 29,797,989 | | | Series 2019-FL1-B (CME Term SOFR 1 Month + 2.01%, 1.90% Floor) | | | 7.34% | (a) | | | 08/20/2035 | | | | 29,132,838 | |
| |
| | | | Commercial Mortgage Pass Through Certificates | |
| | 18,283,950 | | | Series 2013-CR12-XA | | | 0.56% | (c)(f) | | | 10/10/2046 | | | | 1,190 | |
| | 297,659 | | | Series 2013-CR13-C | | | 4.92% | (c) | | | 11/10/2046 | | | | 283,305 | |
| | 4,345,000 | | | Series 2014-CR16-C | | | 4.90% | (c) | | | 04/10/2047 | | | | 4,058,969 | |
| | 8,187,000 | | | Series 2014-CR18-B | | | 4.46% | (c) | | | 07/15/2047 | | | | 8,048,952 | |
| | 7,635,000 | | | Series 2014-CR19-C | | | 4.62% | (c) | | | 08/10/2047 | | | | 7,138,382 | |
| | 25,400,000 | | | Series 2014-CR20-C | | | 4.45% | (c) | | | 11/10/2047 | | | | 24,731,571 | |
| | 10,585,000 | | | Series 2014-LC17-AM | | | 4.19% | (c) | | | 10/10/2047 | | | | 10,416,437 | |
| | 53,783,295 | | | Series 2014-UBS3-XA | | | 0.99% | (c)(f) | | | 06/10/2047 | | | | 4,701 | |
| | 833,000 | | | Series 2015-3BP-F | | | 3.24% | (a)(c) | | | 02/10/2035 | | | | 724,430 | |
| | 144,950,249 | | | Series 2015-CR22-XA | | | 0.81% | (c)(f) | | | 03/10/2048 | | | | 603,095 | |
| | 5,360,000 | | | Series 2015-CR23-C | | | 4.28% | (c) | | | 05/10/2048 | | | | 5,023,030 | |
| | 72,922,774 | | | Series 2015-CR26-XA | | | 0.89% | (c)(f) | | | 10/10/2048 | | | | 639,387 | |
| | 17,822,000 | | | Series 2015-DC1-C | | | 4.27% | (c) | | | 02/10/2048 | | | | 16,214,680 | |
| | 238,692,755 | | | Series 2015-DC1-XA | | | 0.93% | (c)(f) | | | 02/10/2048 | | | | 959,258 | |
| | 4,400,000 | | | Series 2015-PC1-A5 | | | 3.90% | | | | 07/10/2050 | | | | 4,311,716 | |
| | 1,403,000 | | | Series 2016-DC2-C | | | 4.66% | (c) | | | 02/10/2049 | | | | 1,293,192 | |
| | 5,524,000 | | | Series 2017-PANW-E | | | 3.81% | (a)(c) | | | 10/10/2029 | | | | 4,824,380 | |
| | 15,800,000 | | | Series 2018-COR3-XD | | | 1.75% | (a)(c)(f) | | | 05/10/2051 | | | | 937,265 | |
| | 18,570,000 | | | Series 2018-HCLV-A (CME Term SOFR 1 Month + 1.30%, 1.00% Floor) | | | 6.62% | (a) | | | 09/15/2033 | | | | 17,491,050 | |
| |
| | | | Computershare Corporate Trust | |
| | 2,233,970 | | | Series 2014-LC16-A5 | | | 3.82% | | | | 08/15/2050 | | | | 2,219,475 | |
| | 4,346,710 | | | Series 2014-LC18-B | | | 3.96% | | | | 12/15/2047 | | | | 4,236,720 | |
| | 11,460,000 | | | Series 2015-C26-C | | | 4.07% | (c) | | | 02/15/2048 | | | | 10,929,371 | |
| | 297,636,576 | | | Series 2015-C26-XA | | | 1.15% | (c)(f) | | | 02/15/2048 | | | | 1,707,511 | |
| | 3,187,500 | | | Series 2015-C27-C | | | 3.89% | | | | 02/15/2048 | | | | 2,785,197 | |
| | 167,525,473 | | | Series 2015-C27-XA | | | 0.81% | (c)(f) | | | 02/15/2048 | | | | 657,705 | |
| | 9,701,000 | | | Series 2015-C31-C | | | 4.59% | (c) | | | 11/15/2048 | | | | 9,010,718 | |
| | 116,496,220 | | | Series 2015-C31-XA | | | 0.95% | (c)(f) | | | 11/15/2048 | | | | 1,258,847 | |
| | 212,603,228 | | | Series 2015-LC20-XA | | | 1.27% | (c)(f) | | | 04/15/2050 | | | | 1,636,854 | |
| | 3,000,000 | | | Series 2015-LC22-C | | | 4.54% | (c) | | | 09/15/2058 | | | | 2,868,904 | |
| | 8,438,000 | | | Series 2015-NXS2-C | | | 4.27% | (c) | | | 07/15/2058 | | | | 7,401,819 | |
| | 81,184,276 | | | Series 2015-P2-XA | | | 0.92% | (c)(f) | | | 12/15/2048 | | | | 985,918 | |
| | 10,085,000 | | | Series 2016-C32-C | | | 4.73% | (c) | | | 01/15/2059 | | | | 9,489,620 | |
| | 4,250,000 | | | Series 2016-C34-B | | | 4.09% | | | | 06/15/2049 | | | | 3,946,285 | |
| | 5,888,000 | | | Series 2016-C34-C | | | 5.06% | (c) | | | 06/15/2049 | | | | 5,105,200 | |
| | 5,890,000 | | | Series 2016-LC24-C | | | 4.43% | (c) | | | 10/15/2049 | | | | 5,202,650 | |
| | 97,690,836 | | | Series 2016-NXS6-XA | | | 1.59% | (c)(f) | | | 11/15/2049 | | | | 2,585,691 | |
| | 183,582,507 | | | Series 2017-C39-XA | | | 1.09% | (c)(f) | | | 09/15/2050 | | | | 5,223,124 | |
| | 1,904,000 | | | Series 2017-C42-C | | | 4.30% | (c) | | | 12/15/2050 | | | | 1,603,232 | |
| | 48,249,872 | | | Series 2017-C42-XA | | | 0.86% | (c)(f) | | | 12/15/2050 | | | | 1,257,228 | |
| | 1,758,000 | | | Series 2017-RC1-C | | | 4.59% | | | | 01/15/2060 | | | | 1,607,844 | |
| | 139,829,841 | | | Series 2018-C43-XA | | | 0.58% | (c)(f) | | | 03/15/2051 | | | | 2,793,870 | |
| | 4,335,668 | | | Series 2019-C49-XD | | | 2.13% | (a)(c)(f) | | | 03/15/2052 | | | | 382,383 | |
| | 59,795,250 | | | Series 2019-C50-XA | | | 1.41% | (c)(f) | | | 05/15/2052 | | | | 3,060,799 | |
| | 3,193,000 | | | Series 2019-C51-B | | | 3.84% | (c) | | | 06/15/2052 | | | | 2,831,464 | |
| | 43,074,008 | | | Series 2019-C51-XA | | | 1.28% | (c)(f) | | | 06/15/2052 | | | | 2,279,007 | |
| | 24,972,000 | | | Series 2019-C52-AS | | | 3.14% | | | | 08/15/2052 | | | | 22,130,381 | |
| | 74,508,243 | | | Series 2019-C52-XA | | | 1.59% | (c)(f) | | | 08/15/2052 | | | | 4,459,505 | |
| | 5,000,000 | | | Series 2019-C53-C | | | 3.58% | (c) | | | 10/15/2052 | | | | 4,199,177 | |
| | 140,497,331 | | | Series 2019-C54-XA | | | 0.82% | (c)(f) | | | 12/15/2052 | | | | 5,125,062 | |
| | 28,088,000 | | | Series 2020-C55-AS | | | 2.94% | | | | 02/15/2053 | | | | 24,695,899 | |
| | 52,886,315 | | | Series 2020-C55-XB | | | 0.81% | (c)(f) | | | 02/15/2053 | | | | 2,112,549 | |
| | 158,989,258 | | | Series 2020-C56-XA | | | 1.39% | (c)(f) | | | 06/15/2053 | | | | 8,908,041 | |
| | 172,800,546 | | | Series 2021-C61-XA | | | 1.36% | (c)(f) | | | 11/15/2054 | | | | 11,442,023 | |
| | 1,780,000 | | | Series 2021-SAVE-C (CME Term SOFR 1 Month + 1.91%, 1.80% Floor) | | | 7.24% | (a) | | | 02/15/2040 | | | | 1,753,609 | |
| | 580,000 | | | Series 2021-SAVE-D (CME Term SOFR 1 Month + 2.61%, 2.50% Floor) | | | 7.94% | (a) | | | 02/15/2040 | | | | 570,329 | |
| | 1,460,000 | | | Series 2021-SAVE-E (CME Term SOFR 1 Month + 3.76%, 3.65% Floor) | | | 9.09% | (a) | | | 02/15/2040 | | | | 1,430,378 | |
| | | | | | | | |
| The accompanying notes are an integral part of these financial statements. | | Annual Report | | | | | March 31, 2024 | | 9 |
| | |
Schedule of Investments DoubleLine Total Return Bond Fund (Cont.) | | |
| | | | | | | | | | | | | | | | |
PRINCIPAL AMOUNT $ | | | SECURITY DESCRIPTION | | RATE | | | MATURITY | | | VALUE $ | |
| |
| | | | Credit Suisse Mortgage Capital Certificates | |
| | 147,561,481 | | | Series 2014-USA-X1 | | | 0.54% | (a)(c)(f) | | | 09/15/2037 | | | | 672,423 | |
| | 3,799,000 | | | Series 2017-CALI-E | | | 3.78% | (a)(c) | | | 11/10/2032 | | | | 937,961 | |
| | 6,050,000 | | | Series 2017-CALI-F | | | 3.78% | (a)(c) | | | 11/10/2032 | | | | 1,016,963 | |
| | 4,847,000 | | | Series 2017-TIME-A | | | 3.65% | (a) | | | 11/13/2039 | | | | 3,183,555 | |
| | 16,496,958 | | | Series 2019-ICE4-E (CME Term SOFR 1 Month + 2.20%, 2.15% Floor) | | | 7.52% | (a) | | | 05/15/2036 | | | | 16,485,710 | |
| | 31,304,939 | | | Series 2020-NET-A | | | 2.26% | (a) | | | 08/15/2037 | | | | 29,118,846 | |
| | 3,894,000 | | | Series 2020-NET-B | | | 2.82% | (a) | | | 08/15/2037 | | | | 3,619,590 | |
| | 138,591,707 | | | Series 2020-NET-X | | | 1.25% | (a)(c)(f) | | | 08/15/2037 | | | | 1,755,319 | |
| | 5,903,500 | | | Series 2021-B33-A1 | | | 3.05% | (a) | | | 10/10/2043 | | | | 5,377,461 | |
| | 18,815,500 | | | Series 2021-B33-A2 | | | 3.17% | (a) | | | 10/10/2043 | | | | 15,868,878 | |
| | 2,887,333 | | | Series 2021-B33-B | | | 3.64% | (a)(c) | | | 10/10/2043 | | | | 2,468,378 | |
| | 109,000,000 | | | Series 2021-B33-X | | | 0.50% | (a)(c)(f) | | | 10/10/2043 | | | | 3,028,761 | |
| |
| | | | Cross Harbor Capital Partners | |
| | 5,275,000 | | | Series 2021-FL1-B (CME Term SOFR 1 Month + 1.76%, 1.65% Floor) | | | 7.09% | (a) | | | 02/15/2038 | | | | 5,204,695 | |
| |
| | | | CSAIL Commercial Mortgage Trust | |
| | 4,606,000 | | | Series 2015-C1-C | | | 4.25% | (c) | | | 04/15/2050 | | | | 4,003,542 | |
| | 13,360,000 | | | Series 2015-C2-AS | | | 3.85% | (c) | | | 06/15/2057 | | | | 12,933,803 | |
| | 9,205,000 | | | Series 2015-C3-B | | | 4.10% | (c) | | | 08/15/2048 | | | | 8,514,973 | |
| | 2,299,000 | | | Series 2015-C4-C | | | 4.56% | (c) | | | 11/15/2048 | | | | 2,182,920 | |
| | 267,254,147 | | | Series 2015-C4-XA | | | 0.80% | (c)(f) | | | 11/15/2048 | | | | 2,331,338 | |
| | 9,425,000 | | | Series 2016-C5-C | | | 4.64% | (c) | | | 11/15/2048 | | | | 8,797,212 | |
| | 35,028,774 | | | Series 2016-C6-XA | | | 1.86% | (c)(f) | | | 01/15/2049 | | | | 943,640 | |
| | 11,020,000 | | | Series 2016-C7-B | | | 4.32% | (c) | | | 11/15/2049 | | | | 10,166,923 | |
| | 128,895,382 | | | Series 2017-C8-XA | | | 1.07% | (c)(f) | | | 06/15/2050 | | | | 3,408,355 | |
| | 4,399,000 | | | Series 2017-CX10-B | | | 3.89% | (c) | | | 11/15/2050 | | | | 3,855,279 | |
| | 3,356,000 | | | Series 2017-CX10-C | | | 4.17% | (c) | | | 11/15/2050 | | | | 2,671,323 | |
| | 77,073,471 | | | Series 2017-CX10-XA | | | 0.75% | (c)(f) | | | 11/15/2050 | | | | 1,482,053 | |
| | 1,886,000 | | | Series 2018-C14-C | | | 4.88% | (c) | | | 11/15/2051 | | | | 1,582,519 | |
| | 15,894,000 | | | Series 2019-C16-B | | | 3.88% | | | | 06/15/2052 | | | | 13,959,873 | |
| | 25,314,080 | | | Series 2019-C17-XA | | | 1.32% | (c)(f) | | | 09/15/2052 | | | | 1,304,604 | |
| | 7,924,000 | | | Series 2019-C18-B | | | 3.59% | | | | 12/15/2052 | | | | 6,878,214 | |
| | 224,065,663 | | | Series 2019-C18-XA | | | 1.00% | (c)(f) | | | 12/15/2052 | | | | 9,123,013 | |
| | 195,383,443 | | | Series 2020-C19-XA | | | 1.10% | (c)(f) | | | 03/15/2053 | | | | 9,574,981 | |
| | 81,465,000 | | | Series 2020-C19-XB | | | 0.08% | (c)(f) | | | 03/15/2053 | | | | 411,105 | |
| |
| | | | CSWF | |
| | 878,416 | | | Series 2018-TOP-G (CME Term SOFR 1 Month + 3.50%, 3.45% Floor) | | | 8.82% | (a) | | | 08/15/2035 | | | | 836,325 | |
| |
| | | | DBGS Mortgage Trust | |
| | 7,447,000 | | | Series 2018-5BP-D (CME Term SOFR 1 Month + 1.60%, 1.35% Floor) | | | 6.92% | (a) | | | 06/15/2033 | | | | 5,834,685 | |
| |
| | | | DOLP Trust | |
| | 5,750,000 | | | Series 2021-NYC-E | | | 3.70% | (a)(c) | | | 05/10/2041 | | | | 3,898,445 | |
| | 11,475,000 | | | Series 2021-NYC-F | | | 3.70% | (a)(c) | | | 05/10/2041 | | | | 7,250,293 | |
| |
| | | | Fontainebleau Miami Beach Trust | |
| | 6,520,000 | | | Series 2019-FBLU-G | | | 3.96% | (a)(c) | | | 12/10/2036 | | | | 6,275,015 | |
| |
| | | | FS Rialto | |
| | 778,656 | | | Series 2019-FL1-A (CME Term SOFR 1 Month + 1.31%, 1.20% Floor) | | | 6.64% | (a) | | | 12/16/2036 | | | | 775,121 | |
| |
| | | | Granite Point Mortgage Trust, Inc. | |
| | 18,404,952 | | | Series 2021-FL4-A (CME Term SOFR 1 Month + 1.46%, 1.35% Floor) | | | 6.79% | (a) | | | 12/15/2036 | | | | 18,035,970 | |
| |
| | | | Great Wolf Trust | |
| | 29,846,885 | | | Series 2019-WOLF-E (CME Term SOFR 1 Month + 3.05%, 2.93% Floor) | | | 8.37% | (a) | | | 12/15/2036 | | | | 29,789,018 | |
| | 21,137,929 | | | Series 2019-WOLF-F (CME Term SOFR 1 Month + 3.45%, 3.33% Floor) | | | 8.77% | (a) | | | 12/15/2036 | | | | 20,975,546 | |
| | 1,960,000 | | | Series 2024-WOLF-C (CME Term SOFR 1 Month + 2.39%, 2.39% Floor) | | | 7.69% | (a) | | | 03/15/2039 | | | | 1,967,246 | |
| | 6,240,000 | | | Series 2024-WOLF-E (CME Term SOFR 1 Month + 3.64%, 3.64% Floor) | | | 8.94% | (a) | | | 03/15/2039 | | | | 6,271,823 | |
| | | | |
| 10 | | DoubleLine Funds Trust | | The accompanying notes are an integral part of these financial statements. |
| | | | | | | | | | | | | | | | |
PRINCIPAL AMOUNT $ | | | SECURITY DESCRIPTION | | RATE | | | MATURITY | | | VALUE $ | |
| |
| | | | Greystone Commercial Real Estate Notes | |
| | 25,725,000 | | | Series 2019-FL2-B (CME Term SOFR 1 Month + 1.71%, 1.60% Floor) | | | 7.04% | (a) | | | 09/15/2037 | | | | 25,448,816 | |
| | 14,873,000 | | | Series 2019-FL2-C (CME Term SOFR 1 Month + 2.11%, 2.00% Floor) | | | 7.44% | (a) | | | 09/15/2037 | | | | 14,680,529 | |
| | 6,250,000 | | | Series 2021-FL3-B (CME Term SOFR 1 Month + 1.76%, 1.65% Floor) | | | 7.09% | (a) | | | 07/15/2039 | | | | 6,073,300 | |
| |
| | | | GS Mortgage Securities Corp. II | |
| | 4,000,000 | | | Series 2015-GC28-C | | | 4.31% | (c) | | | 02/10/2048 | | | | 3,746,623 | |
| | 191,142,229 | | | Series 2015-GC28-XA | | | 0.96% | (c)(f) | | | 02/10/2048 | | | | 728,367 | |
| | 189,365,508 | | | Series 2015-GC32-XA | | | 0.68% | (c)(f) | | | 07/10/2048 | | | | 1,253,770 | |
| | 141,774,595 | | | Series 2015-GC34-XA | | | 1.19% | (c)(f) | | | 10/10/2048 | | | | 1,916,140 | |
| | 62,974,352 | | | Series 2015-GS1-XA | | | 0.75% | (c)(f) | | | 11/10/2048 | | | | 600,788 | |
| | 39,521,394 | | | Series 2016-GS2-XA | | | 1.73% | (c)(f) | | | 05/10/2049 | | | | 1,017,913 | |
| | 253,664,900 | | | Series 2016-GS3-XA | | | 1.19% | (c)(f) | | | 10/10/2049 | | | | 5,566,727 | |
| | 47,426,269 | | | Series 2016-GS4-XA | | | 0.56% | (c)(f) | | | 11/10/2049 | | | | 547,271 | |
| | 179,481,393 | | | Series 2017-GS7-XA | | | 1.08% | (c)(f) | | | 08/10/2050 | | | | 4,830,616 | |
| | 98,700,000 | | | Series 2017-GS7-XB | | | 0.33% | (c)(f) | | | 08/10/2050 | | | | 1,005,161 | |
| | 3,443,000 | | | Series 2018-GS10-WLSA | | | 4.74% | (a)(c) | | | 03/10/2033 | | | | 3,222,030 | |
| | 6,834,000 | | | Series 2018-GS10-WLSB | | | 4.74% | (a)(c) | | | 03/10/2033 | | | | 6,257,307 | |
| | 9,287,000 | | | Series 2018-GS10-WLSC | | | 4.74% | (a)(c) | | | 03/10/2033 | | | | 8,324,105 | |
| | 8,990,000 | | | Series 2018-GS10-WLSD | | | 4.74% | (a)(c) | | | 03/10/2033 | | | | 7,863,111 | |
| | 11,236,750 | | | Series 2018-GS10-WLSE | | | 4.74% | (a)(c) | | | 03/10/2033 | | | | 9,615,514 | |
| | 191,943,310 | | | Series 2018-GS9-XA | | | 0.41% | (c)(f) | | | 03/10/2051 | | | | 2,708,263 | |
| | 12,875,000 | | | Series 2018-LUAU-A (CME Term SOFR 1 Month + 1.30%, 1.25% Floor) | | | 6.62% | (a) | | | 11/15/2032 | | | | 12,818,565 | |
| | 15,571,000 | | | Series 2018-TWR-A (CME Term SOFR 1 Month + 1.20%, 0.90% Floor) | | | 6.52% | (a) | | | 07/15/2031 | | | | 12,945,340 | |
| | 3,897,000 | | | Series 2018-TWR-D (CME Term SOFR 1 Month + 1.90%, 1.60% Floor) | | | 7.22% | (a) | | | 07/15/2031 | | | | 1,617,255 | |
| | 11,950,000 | | | Series 2018-TWR-E (CME Term SOFR 1 Month + 2.40%, 2.10% Floor) | | | 7.72% | (a) | | | 07/15/2031 | | | | 3,764,250 | |
| | 11,242,000 | | | Series 2018-TWR-F (CME Term SOFR 1 Month + 3.10%, 2.80% Floor) | | | 8.42% | (a) | | | 07/15/2031 | | | | 2,301,800 | |
| | 4,648,000 | | | Series 2018-TWR-G (CME Term SOFR 1 Month + 4.22%, 3.93% Floor) | | | 9.55% | (a) | | | 07/15/2031 | | | | 195,216 | |
| | 52,123,766 | | | Series 2019-GC38-XA | | | 1.01% | (c)(f) | | | 02/10/2052 | | | | 2,132,216 | |
| | 15,248,885 | | | Series 2019-GC39-XA | | | 1.14% | (c)(f) | | | 05/10/2052 | | | | 632,394 | |
| | 179,362,709 | | | Series 2020-GC45-XA | | | 0.66% | (c)(f) | | | 02/13/2053 | | | | 4,993,978 | |
| | 55,388,305 | | | Series 2020-GSA2-XA | | | 1.71% | (a)(c)(f) | | | 12/12/2053 | | | | 4,497,647 | |
| | 7,561,000 | | | Series 2020-UPTN-D | | | 3.25% | (a)(c) | | | 02/10/2037 | | | | 7,046,212 | |
| | 6,760,500 | | | Series 2020-UPTN-F | | | 3.25% | (a)(c) | | | 02/10/2037 | | | | 6,192,590 | |
| | 56,900,000 | | | Series 2021-1HTL-A (CME Term SOFR 1 Month + 3.59%, 3.48% Floor) | | | 8.91% | (a) | | | 10/09/2024 | | | | 56,477,403 | |
| | 3,280,000 | | | Series 2021-ARDN-E (CME Term SOFR 1 Month + 3.46%, 3.35% Floor) | | | 8.79% | (a) | | | 11/15/2036 | | | | 3,155,421 | |
| | 16,787,000 | | | Series 2021-ARDN-G (CME Term SOFR 1 Month + 5.11%, 5.00% Floor) | | | 10.44% | (a) | | | 11/15/2036 | | | | 15,764,678 | |
| |
| | | | Hilton USA Trust | |
| | 5,692,000 | | | Series 2016-SFP-A | | | 2.83% | (a) | | | 11/05/2035 | | | | 4,937,289 | |
| |
| | | | IMT Trust | |
| | 6,392,000 | | | Series 2017-APTS-AFX | | | 3.48% | (a) | | | 06/15/2034 | | | | 6,336,827 | |
| |
| | | | JP Morgan Chase Commercial Mortgage Securities | |
| | 606,900 | | | Series 2007-CB20-X1 | | | 0.00% | (a)(c)(f) | | | 02/12/2051 | | | | 1 | |
| | 4,990,324 | | | Series 2013-LC11-AS | | | 3.22% | | | | 04/15/2046 | | | | 4,621,001 | |
| | 9,535,000 | | | Series 2014-C20-B | | | 4.40% | (c) | | | 07/15/2047 | | | | 9,037,986 | |
| | 47,991,001 | | | Series 2015-JP1-XA | | | 0.88% | (c)(f) | | | 01/15/2049 | | | | 555,966 | |
| | 1,725,000 | | | Series 2017-JP5-C | | | 3.75% | (c) | | | 03/15/2050 | | | | 1,402,087 | |
| | 9,343,000 | | | Series 2018-MINN-E (CME Term SOFR 1 Month + 2.80%, 3.50% Floor) | | | 8.12% | (a) | | | 11/15/2035 | | | | 7,639,211 | |
| | | | | | | | |
| The accompanying notes are an integral part of these financial statements. | | Annual Report | | | | | March 31, 2024 | | 11 |
| | |
Schedule of Investments DoubleLine Total Return Bond Fund (Cont.) | | |
| | | | | | | | | | | | | | | | |
PRINCIPAL AMOUNT $ | | | SECURITY DESCRIPTION | | RATE | | | MATURITY | | | VALUE $ | |
| | 5,831,000 | | | Series 2018-WPT-EFX | | | 5.36% | (a)(c) | | | 07/05/2033 | | | | 4,334,795 | |
| | 6,097,000 | | | Series 2018-WPT-FFX | | | 5.36% | (a)(c) | | | 07/05/2033 | | | | 4,097,717 | |
| | 18,869,000 | | | Series 2019-COR4-XD | | | 2.01% | (a)(c)(f) | | | 03/10/2052 | | | | 1,564,008 | |
| | 87,709,676 | | | Series 2019-COR5-XA | | | 1.47% | (c)(f) | | | 06/13/2052 | | | | 4,608,073 | |
| | 7,366,000 | | | Series 2020-ACE-C | | | 3.69% | (a)(c) | | | 01/10/2037 | | | | 6,981,613 | |
| | 40,424,000 | | | Series 2020-NNN-EFX | | | 3.97% | (a) | | | 01/16/2037 | | | | 19,216,765 | |
| |
| | | | JPMBB Commercial Mortgage Securities Trust | |
| | 12,061,475 | | | Series 2014-C18-XA | | | 0.39% | (c)(f) | | | 02/15/2047 | | | | 514 | |
| | 4,787,000 | | | Series 2014-C21-C | | | 4.62% | (c) | | | 08/15/2047 | | | | 4,444,579 | |
| | 148,290,646 | | | Series 2014-C25-XA | | | 0.79% | (c)(f) | | | 11/15/2047 | | | | 256,484 | |
| | 153,179,196 | | | Series 2014-C26-XA | | | 0.91% | (c)(f) | | | 01/15/2048 | | | | 325,215 | |
| | 13,992,000 | | | Series 2015-C27-C | | | 4.30% | (c) | | | 02/15/2048 | | | | 11,325,596 | |
| | 10,425,000 | | | Series 2015-C27-D | | | 3.80% | (a)(c) | | | 02/15/2048 | | | | 5,592,750 | |
| | 10,663,088 | | | Series 2015-C28-C | | | 4.13% | (c) | | | 10/15/2048 | | | | 9,929,062 | |
| | 28,201,641 | | | Series 2015-C28-XA | | | 0.91% | (c)(f) | | | 10/15/2048 | | | | 149,988 | |
| | 27,445,443 | | | Series 2015-C29-XA | | | 0.54% | (c)(f) | | | 05/15/2048 | | | | 116,226 | |
| | 118,393,554 | | | Series 2015-C30-XA | | | 0.42% | (c)(f) | | | 07/15/2048 | | | | 490,019 | |
| | 17,628,000 | | | Series 2015-C32-C | | | 4.64% | (c) | | | 11/15/2048 | | | | 10,456,300 | |
| | 53,007,002 | | | Series 2015-C32-XA | | | 1.09% | (c)(f) | | | 11/15/2048 | | | | 458,420 | |
| | 7,394,000 | | | Series 2016-C1-C | | | 4.70% | (c) | | | 03/17/2049 | | | | 6,859,182 | |
| | 16,940,209 | | | Series 2016-C1-XA | | | 1.16% | (c)(f) | | | 03/17/2049 | | | | 273,229 | |
| |
| | | | JPMDB Commercial Mortgage Securities Trust | |
| | 103,446,056 | | | Series 2016-C2-XA | | | 1.48% | (c)(f) | | | 06/15/2049 | | | | 2,319,012 | |
| | 135,776,561 | | | Series 2017-C5-XA | | | 0.87% | (c)(f) | | | 03/15/2050 | | | | 2,482,932 | |
| | 178,448,925 | | | Series 2017-C7-XA | | | 0.83% | (c)(f) | | | 10/15/2050 | | | | 3,875,001 | |
| | 1,844,000 | | | Series 2018-C8-C | | | 4.76% | (c) | | | 06/15/2051 | | | | 1,593,952 | |
| | 13,604,000 | | | Series 2019-COR6-AS | | | 3.41% | (c) | | | 11/13/2052 | | | | 11,511,784 | |
| | 1,435,000 | | | Series 2020-COR7-B | | | 3.29% | (c) | | | 05/13/2053 | | | | 986,955 | |
| | 276,738,574 | | | Series 2020-COR7-XA | | | 1.64% | (c)(f) | | | 05/13/2053 | | | | 16,308,647 | |
| |
| | | | Ladder Capital Commercial Mortgage Securities LLC | |
| | 13,564,032 | | | Series 2021-FL3-A (CME Term SOFR 1 Month + 1.56%, 1.56% Floor) | | | 6.89% | (a) | | | 11/15/2038 | | | | 13,412,494 | |
| |
| | | | LFT CRE Ltd. | |
| | 10,800,000 | | | Series 2021-FL1-B (CME Term SOFR 1 Month + 1.86%, 1.86% Floor) | | | 7.19% | (a) | | | 06/15/2039 | | | | 10,597,198 | |
| |
| | | | LSTAR Commercial Mortgage Trust | |
| | 1,360,000 | | | Series 2015-3-D | | | 3.13% | (a)(c) | | | 04/20/2048 | | | | 1,299,510 | |
| | 15,322,042 | | | Series 2017-5-X | | | 0.83% | (a)(c)(f) | | | 03/10/2050 | | | | 229,038 | |
| |
| | | | M360 LLC | |
| | 21,336,722 | | | Series 2021-CRE3-A (CME Term SOFR 1 Month + 1.61%, 1.50% Floor) | | | 6.94% | (a) | | | 11/22/2038 | | | | 21,145,737 | |
| | 7,162,000 | | | Series 2021-CRE3-B (CME Term SOFR 1 Month + 2.36%, 2.25% Floor) | | | 7.69% | (a) | | | 11/22/2038 | | | | 6,941,539 | |
| |
| | | | Manhattan West | |
| | 5,731,000 | | | Series 2020-1MW-C | | | 2.33% | (a)(c) | | | 09/10/2039 | | | | 5,008,936 | |
| |
| | | | Med Trust | |
| | 6,070,865 | | | Series 2021-MDLN-A (CME Term SOFR 1 Month + 1.06%, 0.95% Floor) | | | 6.39% | (a) | | | 11/15/2038 | | | | 6,059,967 | |
| | 16,653,078 | | | Series 2021-MDLN-G (CME Term SOFR 1 Month + 5.36%, 5.25% Floor) | | | 10.69% | (a) | | | 11/15/2038 | | | | 16,671,187 | |
| |
| | | | MF1 Multifamily Housing Mortgage Loan Trust | |
| | 2,049,282 | | | Series 2021-FL5-A (CME Term SOFR 1 Month + 0.96%, 0.96% Floor) | | | 6.29% | (a) | | | 07/15/2036 | | | | 2,046,341 | |
| | 10,000,000 | | | Series 2021-FL5-AS (CME Term SOFR 1 Month + 1.31%, 1.31% Floor) | | | 6.64% | (a) | | | 07/15/2036 | | | | 9,874,160 | |
| |
| | | | MFT Trust | |
| | 9,417,000 | | | Series 2020-ABC-A | | | 3.36% | (a) | | | 02/10/2042 | | | | 6,493,157 | |
| | 4,317,000 | | | Series 2020-ABC-B | | | 3.48% | (a)(c) | | | 02/10/2042 | | | | 2,806,938 | |
| |
| | | | MHC Commercial Mortgage Trust | |
| | 3,540,060 | | | Series 2021-MHC-A (CME Term SOFR 1 Month + 0.92%, 0.80% Floor) | | | 6.24% | (a) | | | 04/15/2038 | | | | 3,526,117 | |
| |
| | | | Morgan Stanley ABS Capital I, Inc. | |
| | 4,353,603 | | | Series 2021-ILP-A (CME Term SOFR 1 Month + 0.89%, 0.78% Floor) | | | 6.22% | (a) | | | 11/15/2036 | | | | 4,324,088 | |
| | 17,326,703 | | | Series 2021-ILP-D (CME Term SOFR 1 Month + 1.69%, 1.58% Floor) | | | 7.02% | (a) | | | 11/15/2036 | | | | 17,153,724 | |
| | | | |
| 12 | | DoubleLine Funds Trust | | The accompanying notes are an integral part of these financial statements. |
| | | | | | | | | | | | | | | | |
PRINCIPAL AMOUNT $ | | | SECURITY DESCRIPTION | | RATE | | | MATURITY | | | VALUE $ | |
| |
| | | | Morgan Stanley Bank of America Merrill Lynch Trust | |
| | 10,468,141 | | | Series 2012-CKSV-CK | | | 4.17% | (a)(c) | | | 10/15/2030 | | | | 6,397,421 | |
| | 13,450,000 | | | Series 2014-C18-C | | | 4.46% | (c) | | | 10/15/2047 | | | | 12,988,778 | |
| | 6,693,500 | | | Series 2014-C19-C | | | 4.00% | | | | 12/15/2047 | | | | 6,359,232 | |
| | 5,457,500 | | | Series 2015-C20-C | | | 4.45% | (c) | | | 02/15/2048 | | | | 5,169,003 | |
| | 151,118,139 | | | Series 2015-C20-XA | | | 1.23% | (c)(f) | | | 02/15/2048 | | | | 499,521 | |
| | 14,422,000 | | | Series 2015-C27-C | | | 4.49% | (c) | | | 12/15/2047 | | | | 13,466,544 | |
| | 128,216,472 | | | Series 2016-C28-XA | | | 1.14% | (c)(f) | | | 01/15/2049 | | | | 1,852,331 | |
| | 7,564,000 | | | Series 2016-C31-C | | | 4.26% | (c) | | | 11/15/2049 | | | | 6,312,924 | |
| | 38,946,471 | | | Series 2017-C33-XA | | | 1.25% | (c)(f) | | | 05/15/2050 | | | | 1,062,608 | |
| |
| | | | Morgan Stanley Capital I, Inc. | |
| | 15,643,738 | | | Series 2006-HQ10-X1 | | | 0.21% | (a)(c)(f) | | | 11/12/2041 | | | | 204,766 | |
| | 7,137,000 | | | Series 2015-UBS8-B | | | 4.32% | (c) | | | 12/15/2048 | | | | 6,404,549 | |
| | 22,840,480 | | | Series 2015-UBS8-XA | | | 0.83% | (c)(f) | | | 12/15/2048 | | | | 226,911 | |
| | 132,113,306 | | | Series 2017-H1-XA | | | 1.30% | (c)(f) | | | 06/15/2050 | | | | 3,362,218 | |
| | 4,661,000 | | | Series 2017-HR2-C | | | 4.32% | (c) | | | 12/15/2050 | | | | 4,176,014 | |
| | 8,000,000 | | | Series 2018-MP-E | | | 4.28% | (a)(c) | | | 07/11/2040 | | | | 5,042,484 | |
| | 4,693,400 | | | Series 2019-H6-XD | | | 1.57% | (a)(c)(f) | | | 06/15/2052 | | | | 316,690 | |
| | 5,305,000 | | | Series 2019-H7-AS | | | 3.52% | | | | 07/15/2052 | | | | 4,803,539 | |
| | 76,829,349 | | | Series 2019-L2-XA | | | 1.00% | (c)(f) | | | 03/15/2052 | | | | 2,969,124 | |
| | 3,845,000 | | | Series 2019-L3-AS | | | 3.49% | | | | 11/15/2052 | | | | 3,404,546 | |
| | 147,339,960 | | | Series 2019-L3-XA | | | 0.61% | (c)(f) | | | 11/15/2052 | | | | 4,055,753 | |
| | 3,355,000 | | | Series 2019-NUGS-D (CME Term SOFR 1 Month + 1.91%, 3.30% Floor) | | | 7.24% | (a) | | | 12/15/2036 | | | | 986,553 | |
| | 1,315,000 | | | Series 2019-PLND-B (CME Term SOFR 1 Month + 1.41%, 1.30% Floor) | | | 6.74% | (a) | | | 05/15/2036 | | | | 1,170,771 | |
| | 6,002,000 | | | Series 2019-PLND-E (CME Term SOFR 1 Month + 2.26%, 2.15% Floor) | | | 7.59% | (a) | | | 05/15/2036 | | | | 4,197,389 | |
| | 2,200,000 | | | Series 2020-HR8-B | | | 2.70% | | | | 07/15/2053 | | | | 1,762,581 | |
| | 24,004,000 | | | Series 2020-L4-B | | | 3.08% | | | | 02/15/2053 | | | | 19,292,132 | |
| | 285,450,876 | | | Series 2020-L4-XA | | | 1.07% | (c)(f) | | | 02/15/2053 | | | | 14,407,419 | |
| | 13,625,665 | | | Series 2020-L4-XD | | | 1.17% | (a)(c)(f) | | | 02/15/2053 | | | | 785,417 | |
| | 10,779,000 | | | Series 2021-L6-C | | | 3.46% | (c) | | | 06/15/2054 | | | | 8,319,063 | |
| |
| | | | MRCD Mortgage Trust | |
| | 7,794,000 | | | Series 2019-PARK-F | | | 2.72% | (a) | | | 12/15/2036 | | | | 4,519,324 | |
| | 32,926,000 | | | Series 2019-PARK-G | | | 2.72% | (a) | | | 12/15/2036 | | | | 17,691,973 | |
| |
| | | | Natixis Commercial Mortgage Securities Trust | |
| | 2,258,309 | | | Series 2018-FL1-A (Prime Rate + 0.00%) | | | 8.50% | (a) | | | 06/15/2035 | | | | 2,091,151 | |
| | 13,188,800 | | | Series 2020-2PAC-D | | | 3.75% | (a) | | | 12/15/2038 | | | | 11,310,127 | |
| |
| | | | NYT Mortgage Trust | |
| | 25,000,000 | | | Series 2019-NYT-D (CME Term SOFR 1 Month + 2.30%, 2.00% Floor) | | | 7.62% | (a) | | | 12/15/2035 | | | | 21,037,983 | |
| |
| | | | OPG Trust | |
| | 7,067,421 | | | Series 2021-PORT-D (CME Term SOFR 1 Month + 1.25%, 1.13% Floor) | | | 6.57% | (a) | | | 10/15/2036 | | | | 6,938,813 | |
| |
| | | | SLG Office Trust | |
| | 37,079,000 | | | Series 2021-OVA-F | | | 2.85% | (a) | | | 07/15/2041 | | | | 27,182,975 | |
| |
| | | | SMR Mortgage Trust | |
| | 4,185,894 | | | Series 2022-IND-G (CME Term SOFR 1 Month + 7.50%, 7.50% Floor) | | | 12.83% | (a) | | | 02/15/2039 | | | | 3,528,659 | |
| |
| | | | Soho Trust | |
| | 2,985,000 | | | Series 2021-SOHO-B | | | 2.70% | (a)(c) | | | 08/10/2038 | | | | 1,913,087 | |
| |
| | | | SREIT Trust | |
| | 47,000,000 | | | Series 2021-IND-G (CME Term SOFR 1 Month + 3.38%, 3.27% Floor) | | | 8.71% | (a) | | | 10/15/2038 | | | | 44,040,269 | |
| | 5,071,373 | | | Series 2021-MFP-E (CME Term SOFR 1 Month + 2.14%, 2.03% Floor) | | | 7.47% | (a) | | | 11/15/2038 | | | | 5,034,372 | |
| |
| | | | TPG Real Estate Finance Issuer Ltd. | |
| | 13,076,662 | | | Series 2021-FL4-A (CME Term SOFR 1 Month + 1.31%, 1.20% Floor) | | | 6.64% | (a) | | | 03/15/2038 | | | | 12,964,700 | |
| | | | | | | | |
| The accompanying notes are an integral part of these financial statements. | | Annual Report | | | | | March 31, 2024 | | 13 |
| | |
Schedule of Investments DoubleLine Total Return Bond Fund (Cont.) | | |
| | | | | | | | | | | | | | | | |
PRINCIPAL AMOUNT $ | | | SECURITY DESCRIPTION | | RATE | | | MATURITY | | | VALUE $ | |
| |
| | | | UBS Commercial Mortgage Trust | |
| | 8,000,000 | | | Series 2017-C1-C | | | 4.44% | | | | 06/15/2050 | | | | 6,987,051 | |
| | 79,998,003 | | | Series 2017-C1-XA | | | 1.52% | (c)(f) | | | 06/15/2050 | | | | 2,856,561 | |
| | 1,124,000 | | | Series 2017-C2-C | | | 4.30% | (c) | | | 08/15/2050 | | | | 986,516 | |
| | 6,857,000 | | | Series 2017-C3-B | | | 4.09% | (c) | | | 08/15/2050 | | | | 6,326,272 | |
| | 10,297,005 | | | Series 2017-C3-XA | | | 1.11% | (c)(f) | | | 08/15/2050 | | | | 256,990 | |
| | 3,561,000 | | | Series 2017-C4-B | | | 4.24% | (c) | | | 10/15/2050 | | | | 3,271,287 | |
| | 2,886,000 | | | Series 2017-C6-C | | | 4.62% | (c) | | | 12/15/2050 | | | | 2,491,764 | |
| | 1,020,000 | | | Series 2018-C11-B | | | 4.71% | (c) | | | 06/15/2051 | | | | 890,451 | |
| | 1,500,000 | | | Series 2018-C9-C | | | 4.95% | (c) | | | 03/15/2051 | | | | 1,077,391 | |
| | 37,791,569 | | | Series 2018-C9-XA | | | 0.91% | (c)(f) | | | 03/15/2051 | | | | 1,145,239 | |
| | 8,350,000 | | | Series 2019-C17-AS | | | 3.20% | | | | 10/15/2052 | | | | 7,244,614 | |
| | 12,767,000 | | | Series 2019-C17-XD | | | 1.76% | (a)(c)(f) | | | 10/15/2052 | | | | 1,036,592 | |
| | 14,858,000 | | | Series 2019-C18-AS | | | 3.38% | (c) | | | 12/15/2052 | | | | 12,621,933 | |
| | 9,705,000 | | | Series 2019-C18-B | | | 3.68% | (c) | | | 12/15/2052 | | | | 7,966,382 | |
| | | |
| | | | UBS-Barclays Commercial Mortgage Trust | | | | | | | | |
| | 6,117,000 | | | Series 2019-C3-XD | | | 1.77% | (a)(c)(f) | | | 05/15/2052 | | | | 470,851 | |
| | 173,178,040 | | | Series 2019-C4-XA | | | 1.55% | (c)(f) | | | 08/15/2052 | | | | 10,469,755 | |
| | 13,091,000 | | | Series 2019-C4-XD | | | 1.15% | (a)(c)(f) | | | 08/15/2052 | | | | 679,047 | |
| | 70,679,910 | | | Series 2019-C5-XA | | | 0.87% | (c)(f) | | | 11/15/2052 | | | | 2,199,686 | |
| | | |
| | | | WF-RBS Commercial Mortgage Trust | | | | | | | | |
| | 10,000,000 | | | Series 2014-C21-B | | | 4.21% | (c) | | | 08/15/2047 | | | | 9,492,011 | |
| | 3,147,000 | | | Series 2014-C21-C | | | 4.23% | (c) | | | 08/15/2047 | | | | 2,887,811 | |
| | 156,103,301 | | | Series 2014-C25-XA | | | 0.78% | (c)(f) | | | 11/15/2047 | | | | 287,433 | |
| | | | | | | | | | | | | | | | |
| | | | Total Non-Agency Commercial Mortgage Backed Obligations
(Cost $3,087,645,564) | | | | 2,267,472,860 | |
| | | | | | | | | | | | | | | | |
| | | | | | | | | | | | | | | | |
| | NON-AGENCY RESIDENTIAL COLLATERALIZED MORTGAGE OBLIGATIONS - 26.1% | | | | | | | | |
| | | |
| | | | Accredited Mortgage Loan Trust | | | | | | | | |
| | 12,875,000 | | | Series 2006-1-M2 (CME Term SOFR 1 Month + 0.45%, 0.34% Floor) | | | 0.71% | | | | 04/25/2036 | | | | 9,437,996 | |
| | | |
| | | | ACE Securities Corp. | | | | | | | | |
| | 1,534,119 | | | Series 2007-ASP1-A2C (CME Term SOFR 1 Month + 0.63%, 0.52% Floor) | | | 5.96% | | | | 03/25/2037 | | | | 638,533 | |
| | 10,113,222 | | | Series 2007-HE1-A2B (CME Term SOFR 1 Month + 0.35%, 0.24% Floor) | | | 5.68% | | | | 01/25/2037 | | | | 6,046,440 | |
| | 2,356,619 | | | Series 2007-HE1-A2C (CME Term SOFR 1 Month + 0.45%, 0.34% Floor) | | | 5.78% | | | | 01/25/2037 | | | | 1,408,944 | |
| | 2,209,330 | | | Series 2007-HE1-A2D (CME Term SOFR 1 Month + 0.61%, 0.50% Floor) | | | 5.94% | | | | 01/25/2037 | | | | 1,320,855 | |
| | 71,036,986 | | | Series 2007-WM1-A1A (CME Term SOFR 1 Month + 0.39%, 0.28% Floor) | | | 5.72% | | | | 11/25/2036 | | | | 21,720,809 | |
| | 3,896,542 | | | Series 2007-WM1-A2A (CME Term SOFR 1 Month + 0.25%, 0.14% Floor) | | | 5.58% | | | | 11/25/2036 | | | | 1,621,416 | |
| | 4,212,464 | | | Series 2007-WM1-A2D (CME Term SOFR 1 Month + 0.55%, 0.44% Floor) | | | 5.88% | | | | 11/25/2036 | | | | 1,757,045 | |
| | 2,720,955 | | | Series 2007-WM2-A2C (CME Term SOFR 1 Month + 0.39%, 0.28% Floor) | | | 5.72% | | | | 02/25/2037 | | | | 1,150,655 | |
| | 2,385,354 | | | Series 2007-WM2-A2D (CME Term SOFR 1 Month + 0.48%, 0.37% Floor) | | | 5.81% | | | | 02/25/2037 | | | | 1,008,716 | |
| | | |
| | | | Adjustable Rate Mortgage Trust | | | | | | | | |
| | 2,555,977 | | | Series 2004-4-CB1 (CME Term SOFR 1 Month + 1.26%, 1.15% Floor, 10.00% Cap) | | | 6.59% | | | | 03/25/2035 | | | | 2,113,870 | |
| | 322,815 | | | Series 2005-10-3A31 | | | 4.10% | (c) | | | 01/25/2036 | | | | 303,548 | |
| | 17,960,372 | | | Series 2005-11-4A1 | | | 4.76% | (c) | | | 02/25/2036 | | | | 9,572,231 | |
| | 1,340,853 | | | Series 2005-4-2A1 | | | 6.06% | (c) | | | 08/25/2035 | | | | 1,269,932 | |
| | 128,954 | | | Series 2005-7-3A1 | | | 4.70% | (c) | | | 10/25/2035 | | | | 123,771 | |
| | 3,927,389 | | | Series 2005-8-3A21 | | | 4.52% | (c) | | | 11/25/2035 | | | | 2,768,831 | |
| | 10,790,844 | | | Series 2006-1-2A1 | | | 5.61% | (c) | | | 03/25/2036 | | | | 5,636,893 | |
| | 6,599,231 | | | Series 2006-2-3A1 | | | 5.86% | (c) | | | 05/25/2036 | | | | 5,931,509 | |
| | 9,923,581 | | | Series 2006-2-5A1 | | | 5.28% | (c) | | | 05/25/2036 | | | | 2,301,363 | |
| | 5,007,416 | | | Series 2007-1-3A1 | | | 5.27% | (c) | | | 03/25/2037 | | | | 4,406,785 | |
| | 857,259 | | | Series 2007-3-1A1 | | | 4.99% | (a)(c) | | | 11/25/2037 | | | | 825,356 | |
| | | | |
| 14 | | DoubleLine Funds Trust | | The accompanying notes are an integral part of these financial statements. |
| | | | | | | | | | | | | | | | |
PRINCIPAL AMOUNT $ | | | SECURITY DESCRIPTION | | RATE | | | MATURITY | | | VALUE $ | |
| | | | Aegis Asset Backed Securities Trust | | | | | | | | |
| | 191,819 | | | Series 2003-2-M2 (CME Term SOFR 1 Month + 2.66%, 2.55% Floor) | | | 7.99% | | | | 11/25/2033 | | | | 169,063 | |
| | 800,034 | | | Series 2004-1-M2 (CME Term SOFR 1 Month + 2.14%, 2.03% Floor) | | | 7.47% | | | | 04/25/2034 | | | | 761,981 | |
| | 617,792 | | | Series 2004-2-M2 (CME Term SOFR 1 Month + 2.06%, 1.95% Floor) | | | 7.39% | | | | 06/25/2034 | | | | 585,123 | |
| | 4,113,774 | | | Series 2004-6-M2 (CME Term SOFR 1 Month + 1.11%, 1.00% Floor, 15.00% Cap) | | | 6.44% | | | | 03/25/2035 | | | | 3,848,316 | |
| | 9,202,964 | | | Series 2006-1-A2 (CME Term SOFR 1 Month + 0.28%, 0.17% Floor, 12.00% Cap) | | | 5.61% | | | | 01/25/2037 | | | | 6,785,314 | |
| | | |
| | | | Ajax E Master Trust | | | | | | | | |
| | 32,123,193 | | | Series 2016-1-PC | | | 4.18% | (a)(c) | | | 01/01/2057 | | | | 24,928,870 | |
| | 32,496,259 | | | Series 2016-2-PC | | | 3.46% | (a)(b)(c) | | | 10/25/2056 | | | | 24,107,395 | |
| | 42,350,841 | | | Series 2017-1-PC | | | 3.87% | (a)(b)(c) | | | 06/25/2057 | | | | 32,890,489 | |
| | | |
| | | | AlphaFlow Transitional Mortgage Trust | | | | | | | | |
| | 7,354,132 | | | Series 2021-WL1-A1 | | | 3.28% | (a)(d) | | | 01/25/2026 | | | | 7,188,433 | |
| | | |
| | | | American Home Mortgage Assets LLC | | | | | | | | |
| | 2,768,145 | | | Series 2006-2-2A1 (CME Term SOFR 1 Month + 0.49%, 0.38% Floor) | | | 5.82% | | | | 09/25/2046 | | | | 2,450,378 | |
| | | |
| | | | American Home Mortgage Investment Trust | | | | | | | | |
| | 2,717,611 | | | Series 2005-4-3A1 (CME Term SOFR 1 Month + 0.71%, 0.60% Floor, 11.00% Cap) | | | 6.04% | | | | 11/25/2045 | | | | 1,882,682 | |
| | 12,128,332 | | | Series 2005-4-5A (CME Term SOFR 6 Month + 2.18%, 1.75% Floor, 11.00% Cap) | | | 7.47% | | | | 11/25/2045 | | | | 4,927,574 | |
| | 2,146,383 | | | Series 2006-2-3A4 | | | 7.10% | (d) | | | 06/25/2036 | | | | 321,903 | |
| | 7,248,123 | | | Series 2007-A-13A1 | | | 6.60% | (a)(d) | | | 01/25/2037 | | | | 1,106,870 | |
| | | |
| | | | Ameriquest Mortgage Securities, Inc. | | | | | | | | |
| | 4,794,197 | | | Series 2004-FR1-M1 | | | 3.84% | (d) | | | 05/25/2034 | | | | 4,688,939 | |
| | | |
| | | | Amortizing Residential Collateral Trust | | | | | | | | |
| | 4,762,600 | | | Series 2002-BC7-M1 (CME Term SOFR 1 Month + 1.31%, 1.20% Floor) | | | 6.64% | | | | 10/25/2032 | | | | 3,606,270 | |
| | | |
| | | | AMSR Trust | | | | | | | | |
| | 41,588,000 | | | Series 2019-SFR1-E | | | 3.47% | (a) | | | 01/19/2039 | | | | 38,725,556 | |
| | 30,156,000 | | | Series 2020-SFR4-G1 | | | 4.00% | (a) | | | 11/17/2037 | | | | 28,681,411 | |
| | 10,000,000 | | | Series 2020-SFR5-F | | | 2.69% | (a) | | | 11/17/2037 | | | | 9,410,832 | |
| | 6,500,000 | | | Series 2021-SFR3-E1 | | | 2.33% | (a) | | | 10/17/2038 | | | | 5,842,855 | |
| | 11,000,000 | | | Series 2021-SFR3-E2 | | | 2.43% | (a) | | | 10/17/2038 | | | | 9,871,557 | |
| | 18,500,000 | | | Series 2021-SFR3-F | | | 3.23% | (a) | | | 10/17/2038 | | | | 16,616,158 | |
| | 6,500,000 | | | Series 2021-SFR4-D | | | 2.77% | (a) | | | 12/17/2038 | | | | 5,883,364 | |
| | 10,500,000 | | | Series 2021-SFR4-E1 | | | 2.97% | (a) | | | 12/17/2038 | | | | 9,391,639 | |
| | | |
| | | | Angel Oak Mortgage Trust LLC | | | | | | | | |
| | 3,788,870 | | | Series 2019-2-M1 | | | 4.07% | (a)(c) | | | 03/25/2049 | | | | 3,753,538 | |
| | 9,121,000 | | | Series 2021-7-M1 | | | 3.26% | (a)(c) | | | 10/25/2066 | | | | 6,227,188 | |
| | | |
| | | | Argent Securities, Inc. Asset-Backed Pass-Through Certificates | | | | | | | | |
| | 9,652,851 | | | Series 2004-W11-M6 (CME Term SOFR 1 Month + 1.99%, 1.88% Floor) | | | 7.32% | | | | 11/25/2034 | | | | 7,885,023 | |
| | | |
| | | | Argent Securities, Inc. Asset-Backed Pass-Through Certificates Series 2003-W7 | | | | | | | | |
| | 103,496,385 | | | Series 2006-M3-A1 (CME Term SOFR 1 Month + 0.29%, 0.18% Floor) | | | 5.62% | | | | 10/25/2036 | | | | 57,098,500 | |
| | 11,800,432 | | | Series 2006-W5-A1A (CME Term SOFR 1 Month + 0.41%, 0.30% Floor) | | | 5.74% | | | | 06/25/2036 | | | | 7,588,660 | |
| | | |
| | | | Asset Backed Funding Certificates | | | | | | | | |
| | 84,432,605 | | | Series 2007-WMC1-A1A (CME Term SOFR 1 Month + 1.36%, 1.25% Floor) | | | 6.69% | | | | 06/25/2037 | | | | 57,763,520 | |
| | | |
| | | | Asset Backed Securities Corp. Home Equity | | | | | | | | |
| | 1,315,233 | | | Series 2004-HE3-M2 (CME Term SOFR 1 Month + 1.79%, 1.68% Floor) | | | 7.12% | | | | 06/25/2034 | | | | 1,287,424 | |
| | 18,087,004 | | | Series 2006-HE7-A1 (CME Term SOFR 1 Month + 0.38%, 0.27% Floor) | | | 4.03% | | | | 11/25/2036 | | | | 16,148,502 | |
| | | |
| | | | Banc of America Alternative Loan Trust | | | | | | | | |
| | 442,625 | | | Series 2005-10-4A1 | | | 5.75% | | | | 11/25/2035 | | | | 308,748 | |
| | 2,109,807 | | | Series 2005-11-2CB1 | | | 6.00% | | | | 12/25/2035 | | | | 1,876,633 | |
| | | | | | | | |
| The accompanying notes are an integral part of these financial statements. | | Annual Report | | | | | March 31, 2024 | | 15 |
| | |
Schedule of Investments DoubleLine Total Return Bond Fund (Cont.) | | |
| | | | | | | | | | | | | | | | |
PRINCIPAL AMOUNT $ | | | SECURITY DESCRIPTION | | RATE | | | MATURITY | | | VALUE $ | |
| | 1,329,297 | | | Series 2006-2-1CB1 | | | 6.00% | | | | 03/25/2036 | | | | 1,179,444 | |
| | 1,702,712 | | | Series 2006-2-3CB1 | | | 6.50% | | | | 03/25/2036 | | | | 1,482,702 | |
| | 450,438 | | | Series 2006-5-CB14 (CME Term SOFR 1 Month + 1.21%, 6.00% Floor, 6.00% Cap) | | | 6.00% | | | | 06/25/2046 | | | | 388,883 | |
| | 1,044,197 | | | Series 2006-6-CB3 | | | 6.00% | | | | 07/25/2046 | | | | 873,450 | |
| | 7,925,101 | | | Series 2006-7-A4 | | | 6.50% | (d) | | | 10/25/2036 | | | | 2,379,146 | |
| | 1,425,781 | | | Series 2006-8-1A1 (-1 x CME Term SOFR 1 Month + 6.39%, 6.50% Cap) | | | 1.06% | (f)(g) | | | 11/25/2036 | | | | 106,387 | |
| | 508,140 | | | Series 2006-8-1A2 (CME Term SOFR 1 Month + 0.56%, 0.45% Floor, 7.00% Cap) | | | 5.89% | | | | 11/25/2036 | | | | 395,628 | |
| | 2,423,699 | | | Series 2006-9-1CB1 | | | 6.00% | | | | 01/25/2037 | | | | 2,079,997 | |
| | 396,428 | | | Series 2007-2-2A1 | | | 6.00% | | | | 06/25/2037 | | | | 325,437 | |
| | | |
| | | | Banc of America Funding Corp. | | | | | | | | |
| | 2,304,270 | | | Series 2006-2-3A1 | | | 6.00% | | | | 03/25/2036 | | | | 1,891,516 | |
| | 68,102 | | | Series 2006-2-4A1 (-3 x CME Term SOFR 1 Month + 22.46%, 22.80% Cap) | | | 6.47% | (g) | | | 03/25/2036 | | | | 63,312 | |
| | 82,358 | | | Series 2006-2-6A2 | | | 5.50% | | | | 03/25/2036 | | | | 78,718 | |
| | 271,057 | | | Series 2006-3-1A1 | | | 6.00% | | | | 03/25/2036 | | | | 217,309 | |
| | 186,594 | | | Series 2006-3-6A1 | | | 6.37% | (c) | | | 03/25/2036 | | | | 184,676 | |
| | 1,257,708 | | | Series 2006-6-1A7 | | | 6.25% | | | | 08/25/2036 | | | | 1,056,905 | |
| | 470,999 | | | Series 2006-7-T2A5 | | | 6.54% | (d) | | | 10/25/2036 | | | | 399,486 | |
| | 2,219,967 | | | Series 2006-7-T2A8 | | | 6.41% | (d) | | | 10/25/2036 | | | | 1,883,108 | |
| | 548,637 | | | Series 2006-8T2-A8 | | | 6.60% | (d) | | | 10/25/2036 | | | | 463,984 | |
| | 229,658 | | | Series 2006-B-7A1 | | | 4.32% | (c) | | | 03/20/2036 | | | | 190,629 | |
| | 3,994,084 | | | Series 2006-D-6A1 | | | 3.90% | (c) | | | 05/20/2036 | | | | 3,237,115 | |
| | 102,830 | | | Series 2006-H-3A1 | | | 4.48% | (c) | | | 09/20/2046 | | | | 82,386 | |
| | 44,451,025 | | | Series 2006-H-5A1 (CME Term SOFR 1 Month + 0.47%, 0.36% Floor, 10.50% Cap) | | | 5.80% | | | | 10/20/2036 | | | | 13,869,298 | |
| | 466,986 | | | Series 2007-1-TA10 | | | 6.34% | (d) | | | 01/25/2037 | | | | 418,399 | |
| | 621,910 | | | Series 2007-3-TA1B | | | 5.83% | (c) | | | 04/25/2037 | | | | 518,960 | |
| | 1,122,388 | | | Series 2007-5-1A1 | | | 5.50% | | | | 07/25/2037 | | | | 876,883 | |
| | 685,269 | | | Series 2009-R14A-3A (-2 x CME Term SOFR 1 Month + 16.30%, 5.50% Floor, 16.57% Cap) | | | 5.50% | (a)(g) | | | 06/26/2035 | | | | 590,431 | |
| | 1,044,308 | | | Series 2009-R15A-4A2 | | | 5.75% | (a)(c) | | | 12/26/2036 | | | | 886,843 | |
| | 566,249 | | | Series 2010-R1-3A (-2 x CME Term SOFR 1 Month + 14.10%, 6.00% Floor, 14.28% Cap) | | | 6.00% | (a)(g) | | | 07/26/2036 | | | | 526,662 | |
| | 4,588,977 | | | Series 2014-R6-3A2 | | | 5.71% | (a)(b)(c)(h) | | | 10/26/2036 | | | | 4,079,700 | |
| | 11,702,849 | | | Series 2014-R8-A2 (CME Term SOFR 1 Month + 0.35%, 0.24% Floor) | | | 5.68% | (a) | | | 06/26/2036 | | | | 9,516,319 | |
| | 19,191,276 | | | Series 2015-R2-4A2 (CME Term SOFR 1 Month + 0.28%, 0.17% Floor) | | | 3.97% | (a)(b) | | | 09/29/2036 | | | | 14,219,375 | |
| | | |
| | | | Banc of America Mortgage Securities, Inc. | | | | | | | | |
| | 1,001,984 | | | Series 2006-1-A9 | | | 6.00% | | | | 05/25/2036 | | | | 833,520 | |
| | 153,531 | | | Series 2007-1-2A5 | | | 5.75% | | | | 01/25/2037 | | | | 125,283 | |
| | 3,248,725 | | | Series 2007-3-2A8 | | | 7.00% | | | | 09/25/2037 | | | | 2,669,375 | |
| | | |
| | | | BankUnited Trust | | | | | | | | |
| | 5,305,831 | | | Series 2005-1-2A1 | | | 4.97% | (c) | | | 09/25/2045 | | | | 4,705,205 | |
| | | |
| | | | Barclays PLC | | | | | | | | |
| | 6,401,243 | | | Series 2010-RR6-7A10 | | | 4.64% | (a)(c) | | | 02/26/2037 | | | | 2,605,073 | |
| | | |
| | | | Bayview Commercial Asset Trust | | | | | | | | |
| | 698,229 | | | Series 2007-3-A2 (CME Term SOFR 1 Month + 0.55%) | | | 5.88% | (a) | | | 07/25/2037 | | | | 644,905 | |
| | | |
| | | | Bayview Financial Acquisition Trust | | | | | | | | |
| | 2,394,778 | | | Series 2006-C-2A4 (CME Term SOFR 1 Month + 0.53%) | | | 5.86% | | | | 11/28/2036 | | | | 2,079,051 | |
| | | |
| | | | BCAP LLC Trust | | | | | | | | |
| | 21,249,557 | | | Series 2007-AA2-11A (CME Term SOFR 1 Month + 0.49%, 0.38% Floor) | | | 5.82% | (a) | | | 05/25/2047 | | | | 21,557,735 | |
| | 1,985,365 | | | Series 2007-AA2-2A7 | | | 6.00% | | | | 04/25/2037 | | | | 905,544 | |
| | 2,149,796 | | | Series 2007-AA2-2A8 | | | 5.75% | | | | 04/25/2037 | | | | 946,907 | |
| | 10,183,486 | | | Series 2008-RR3-A1B | | | 6.70% | (a)(c) | | | 10/25/2036 | | | | 2,919,853 | |
| | 1,449,557 | | | Series 2009-RR13-18A2 | | | 5.75% | (a)(c) | | | 07/26/2037 | | | | 705,709 | |
| | 2,565,661 | | | Series 2009-RR4-4A2 | | | 5.75% | (a)(c) | | | 02/26/2036 | | | | 1,170,015 | |
| | | |
| | | | Bear Stearns Adjustable Rate Mortgage Trust | | | | | | | | |
| | 514,789 | | | Series 2005-12-13A1 | | | 5.02% | (c) | | | 02/25/2036 | | | | 382,776 | |
| | 2,213,374 | | | Series 2006-4-4A1 | | | 4.69% | (c) | | | 10/25/2046 | | | | 1,844,675 | |
| | | | |
| 16 | | DoubleLine Funds Trust | | The accompanying notes are an integral part of these financial statements. |
| | | | | | | | | | | | | | | | |
PRINCIPAL AMOUNT $ | | | SECURITY DESCRIPTION | | RATE | | | MATURITY | | | VALUE $ | |
| | 2,661,520 | | | Series 2007-1-2A1 | | | 5.70% | (c) | | | 02/25/2047 | | | | 2,234,220 | |
| | 740,196 | | | Series 2007-1-3A1 | | | 4.48% | (c) | | | 02/25/2047 | | | | 695,176 | |
| | 8,596,789 | | | Series 2007-2-2A1 (CME Term SOFR 12 Month + 2.59%, 1.88% Floor, 11.15% Cap) | | | 8.06% | | | | 12/25/2046 | | | | 6,940,160 | |
| | | |
| | | | Bear Stearns Alt-A Trust | | | | | | | | |
| | 195,236 | | | Series 2004-11-2A3 | | | 5.48% | (c) | | | 11/25/2034 | | | | 192,715 | |
| | 3,410,057 | | | Series 2006-1-11A1 (CME Term SOFR 1 Month + 0.59%, 0.48% Floor, 11.50% Cap) | | | 5.92% | | | | 02/25/2036 | | | | 3,000,268 | |
| | 10,082,053 | | | Series 2006-3-21A1 | | | 4.47% | (c) | | | 05/25/2036 | | | | 7,315,361 | |
| | 3,774,553 | | | Series 2006-5-1A1 (CME Term SOFR 1 Month + 0.45%, 0.34% Floor, 11.50% Cap) | | | 5.78% | | | | 08/25/2036 | | | | 3,407,018 | |
| | 6,178,605 | | | Series 2006-6-2A1 | | | 4.20% | (c) | | | 11/25/2036 | | | | 2,831,058 | |
| | 3,074,043 | | | Series 2006-8-2A1 | | | 4.53% | (c) | | | 08/25/2046 | | | | 2,149,493 | |
| | 4,954,923 | | | Series 2007-1-1A1 (CME Term SOFR 1 Month + 0.43%, 0.32% Floor, 11.50% Cap) | | | 5.76% | | | | 01/25/2047 | | | | 3,977,239 | |
| | | |
| | | | Bear Stearns Asset Backed Securities Trust | | | | | | | | |
| | 2,392,374 | | | Series 2004-AC4-A2 | | | 5.50% | (d) | | | 08/25/2034 | | | | 2,311,690 | |
| | 5,510,072 | | | Series 2005-AC2-1A | | | 5.75% | (d) | | | 04/25/2035 | | | | 4,656,821 | |
| | 1,791,581 | | | Series 2005-AC2-2A1 | | | 5.75% | (d) | | | 04/25/2035 | | | | 1,655,653 | |
| | 22,396,797 | | | Series 2005-AC6-22A | | | 5.14% | (c) | | | 09/25/2035 | | | | 17,589,215 | |
| | 4,745,411 | | | Series 2005-AC7-A4 | | | 6.00% | (d) | | | 10/25/2035 | | | | 3,048,157 | |
| | 6,040,485 | | | Series 2006-AC1-1A1 | | | 6.25% | (d) | | | 02/25/2036 | | | | 2,858,089 | |
| | 912,086 | | | Series 2006-AC5-A1 | | | 6.75% | (d) | | | 12/25/2036 | | | | 893,315 | |
| | 873,946 | | | Series 2007-HE2-2A3 (CME Term SOFR 1 Month + 0.27%, 0.16% Floor) | | | 5.60% | | | | 02/25/2037 | | | | 869,516 | |
| | 21,653,115 | | | Series 2007-HE4-2A (CME Term SOFR 1 Month + 0.33%, 0.22% Floor) | | | 5.66% | | | | 05/25/2037 | | | | 19,381,015 | |
| | 11,789,999 | | | Series 2007-HE6-2A (CME Term SOFR 1 Month + 1.16%, 1.05% Floor) | | | 6.49% | | | | 08/25/2037 | | | | 10,297,541 | |
| | 967,152 | | | Series 2007-SD1-1A2A | | | 6.00% | | | | 10/25/2036 | | | | 395,941 | |
| | 1,320,163 | | | Series 2007-SD1-1A3A | | | 6.50% | | | | 10/25/2036 | | | | 551,275 | |
| | 1,315,799 | | | Series 2007-SD1-23A1 | | | 5.68% | (c) | | | 10/25/2036 | | | | 725,243 | |
| | | |
| | | | Bear Stearns Mortgage Funding Trust | | | | | | | | |
| | 6,137,899 | | | Series 2006-AR3-2A1 (CME Term SOFR 1 Month + 0.51%, 0.40% Floor, 10.50% Cap) | | | 5.84% | | | | 11/25/2036 | | | | 5,336,801 | |
| | 2,814,737 | | | Series 2006-AR4-A2 (CME Term SOFR 1 Month + 0.47%, 0.36% Floor, 10.50% Cap) | | | 5.80% | | | | 12/25/2037 | | | | 2,623,025 | |
| | 6,144,262 | | | Series 2007-AR3-22A1 (CME Term SOFR 1 Month + 0.43%, 0.32% Floor, 10.50% Cap) | | | 5.76% | | | | 04/25/2037 | | | | 6,045,924 | |
| | | |
| | | | BNC Mortgage Loan Trust | | | | | | | | |
| | 5,873,979 | | | Series 2006-2-A4 (CME Term SOFR 1 Month + 0.43%, 0.32% Floor) | | | 5.76% | | | | 11/25/2036 | | | | 5,630,843 | |
| | 5,078,067 | | | Series 2007-1-A4 (CME Term SOFR 1 Month + 0.27%, 0.16% Floor) | | | 5.60% | | | | 03/25/2037 | | | | 4,792,141 | |
| | 5,041,997 | | | Series 2007-4-A4 (CME Term SOFR 1 Month + 1.61%, 1.50% Floor) | | | 6.94% | | | | 11/25/2037 | | | | 4,050,738 | |
| | | |
| | | | BNP Paribas Mortgage Securities LLC | | | | | | | | |
| | 23,677,812 | | | Series 2009-1-B1 | | | 6.00% | (a) | | | 08/27/2037 | | | | 11,378,040 | |
| | | |
| | | | CAFL Issuer LLC | | | | | | | | |
| | 100,200,000 | | | Series 2021-RTL1-A1 | | | 2.24% | (a)(d) | | | 03/28/2029 | | | | 96,476,046 | |
| | 12,750,000 | | | Series 2021-RTL1-A2 | | | 3.10% | (a)(d) | | | 03/28/2029 | | | | 12,261,926 | |
| | | |
| | | | Carrington Mortgage Loan Trust | | | | | | | | |
| | 3,958,590 | | | Series 2006-FRE2-A2 (CME Term SOFR 1 Month + 0.23%, 0.12% Floor, 12.50% Cap) | | | 5.56% | | | | 10/25/2036 | | | | 3,115,107 | |
| | 19,087,827 | | | Series 2006-FRE2-A3 (CME Term SOFR 1 Month + 0.27%, 0.16% Floor, 12.50% Cap) | | | 5.60% | | | | 10/25/2036 | | | | 15,020,608 | |
| | 5,875,088 | | | Series 2006-FRE2-A4 (CME Term SOFR 1 Month + 0.36%, 0.25% Floor, 12.50% Cap) | | | 5.69% | | | | 10/25/2036 | | | | 4,623,194 | |
| | 3,919,632 | | | Series 2006-NC3-A3 (CME Term SOFR 1 Month + 0.26%, 0.15% Floor, 12.50% Cap) | | | 5.59% | | | | 08/25/2036 | | | | 3,734,744 | |
| | 32,812,407 | | | Series 2006-NC4-A3 (CME Term SOFR 1 Month + 0.27%, 0.16% Floor, 12.50% Cap) | | | 5.60% | | | | 10/25/2036 | | | | 31,842,606 | |
| | 22,777,902 | | | Series 2006-NC5-A3 (CME Term SOFR 1 Month + 0.26%, 0.15% Floor, 14.50% Cap) | | | 5.59% | | | | 01/25/2037 | | | | 19,732,262 | |
| | | | | | | | |
| The accompanying notes are an integral part of these financial statements. | | Annual Report | | | | | March 31, 2024 | | 17 |
| | |
Schedule of Investments DoubleLine Total Return Bond Fund (Cont.) | | |
| | | | | | | | | | | | | | | | |
PRINCIPAL AMOUNT $ | | | SECURITY DESCRIPTION | | RATE | | | MATURITY | | | VALUE $ | |
| | 11,509,783 | | | Series 2007-RFC1-A3 (CME Term SOFR 1 Month + 0.25%, 0.14% Floor, 14.50% Cap) | | | 5.58% | | | | 12/25/2036 | | | | 11,129,110 | |
| | | |
| | | | Cascade MH Asset Trust | | | | | | | | |
| | 15,707,006 | | | Series 2019-MH1-A | | | 4.00% | (a)(c) | | | 11/25/2044 | | | | 15,125,674 | |
| | | |
| | | | Centex Home Equity | | | | | | | | |
| | 2,750,000 | | | Series 2004-A-AF5 | | | 5.43% | (d) | | | 01/25/2034 | | | | 2,643,808 | |
| | | |
| | | | Chase Mortgage Finance Corp. | | | | | | | | |
| | 2,439,866 | | | Series 2005-A1-2A4 | | | 4.90% | (c) | | | 12/25/2035 | | | | 2,253,846 | |
| | 7,040,062 | | | Series 2006-S1-A5 | | | 6.50% | | | | 05/25/2036 | | | | 3,198,858 | |
| | 6,655,830 | | | Series 2006-S2-1A9 | | | 6.25% | | | | 10/25/2036 | | | | 2,673,912 | |
| | 4,617,039 | | | Series 2006-S3-1A2 | | | 6.00% | | | | 11/25/2036 | | | | 1,880,646 | |
| | 13,246,483 | | | Series 2006-S4-A8 | | | 6.00% | | | | 12/25/2036 | | | | 5,690,749 | |
| | 2,592,309 | | | Series 2007-A2-6A4 | | | 5.31% | (c) | | | 07/25/2037 | | | | 2,269,670 | |
| | 3,914,433 | | | Series 2007-S1-A7 | | | 6.00% | | | | 02/25/2037 | | | | 1,542,150 | |
| | 2,272,371 | | | Series 2007-S3-1A5 | | | 6.00% | | | | 05/25/2037 | | | | 1,013,027 | |
| | 1,061,910 | | | Series 2007-S3-2A1 | | | 5.50% | | | | 05/25/2037 | | | | 11 | |
| | 2,182,617 | | | Series 2007-S5-1A18 | | | 6.00% | | | | 07/25/2037 | | | | 984,643 | |
| | | |
| | | | Chaseflex Trust | | | | | | | | |
| | 1,081,324 | | | Series 2005-1-3A1 | | | 6.00% | | | | 02/25/2035 | | | | 882,602 | |
| | 92,439 | | | Series 2006-1-A5 | | | 6.16% | (c) | | | 06/25/2036 | | | | 85,262 | |
| | 2,134,962 | | | Series 2006-2-A2B (CME Term SOFR 1 Month + 0.31%, 0.20% Floor, 11.50% Cap) | | | 4.70% | | | | 09/25/2036 | | | | 1,742,398 | |
| | 3,197,061 | | | Series 2007-1-1A1 | | | 6.50% | | | | 02/25/2037 | | | | 1,149,261 | |
| | 4,808,689 | | | Series 2007-M1-2F4 | | | 4.23% | (d) | | | 08/25/2037 | | | | 3,737,377 | |
| | 5,001,464 | | | Series 2007-M1-2F5 | | | 4.23% | (d) | | | 08/25/2037 | | | | 3,886,832 | |
| | | |
| | | | Citicorp Mortgage Securities, Inc. | | | | | | | | |
| | 615,386 | | | Series 2006-7-1A1 | | | 6.00% | | | | 12/25/2036 | | | | 509,759 | |
| | | |
| | | | Citigroup Financial Products, Inc. | | | | | | | | |
| | 805,194 | | | Series 2005-5-2A2 | | | 5.75% | | | | 08/25/2035 | | | | 591,530 | |
| | 1,459,579 | | | Series 2007-AMC3-A2D (CME Term SOFR 1 Month + 0.46%, 0.35% Floor) | | | 5.79% | | | | 03/25/2037 | | | | 1,207,971 | |
| | | |
| | | | Citigroup Mortgage Loan Trust, Inc. | | | | | | | | |
| | 396,113 | | | Series 2005-9-21A1 | | | 5.50% | | | | 11/25/2035 | | | | 354,879 | |
| | 942,396 | | | Series 2006-4-2A1A | | | 6.00% | | | | 12/25/2035 | | | | 897,035 | |
| | 4,256,144 | | | Series 2006-AR3-1A1A | | | 4.81% | (c) | | | 06/25/2036 | | | | 3,750,305 | |
| | 2,190,230 | | | Series 2006-FX1-A6 | | | 7.35% | (d) | | | 10/25/2036 | | | | 1,232,026 | |
| | 8,792,526 | | | Series 2006-WF1-A2D | | | 4.57% | (d) | | | 03/25/2036 | | | | 7,011,249 | |
| | 8,871,237 | | | Series 2006-WF2-A2D | | | 6.66% | (d) | | | 05/25/2036 | | | | 3,330,354 | |
| | 1,540,698 | | | Series 2007-10-1A1A | | | 5.16% | (c) | | | 04/25/2037 | | | | 1,395,502 | |
| | 515,928 | | | Series 2007-12-2A1 | | | 6.50% | (a)(c) | | | 10/25/2036 | | | | 266,580 | |
| | 14,510,381 | | | Series 2007-9-1A1 | | | 5.75% | (a) | | | 04/25/2047 | | | | 7,811,906 | |
| | 656,838 | | | Series 2007-9-2A2 | | | 6.50% | (a)(c) | | | 05/25/2037 | | | | 588,190 | |
| | 38,458,341 | | | Series 2007-AMC2-A1 (CME Term SOFR 1 Month + 0.25%, 0.14% Floor) | | | 5.58% | (a) | | | 01/25/2037 | | | | 34,282,065 | |
| | 73,189 | | | Series 2007-AR5-1A3A | | | 5.13% | (c) | | | 04/25/2037 | | | | 73,674 | |
| | 1,818,092 | | | Series 2007-AR8-1A1A | | | 3.84% | (c) | | | 08/25/2047 | | | | 1,545,155 | |
| | 3,463,414 | | | Series 2007-OPX1-A2 (CME Term SOFR 1 Month + 0.31%, 0.20% Floor) | | | 5.64% | | | | 01/25/2037 | | | | 1,420,793 | |
| | 3,409,135 | | | Series 2007-OPX1-A3A | | | 5.97% | (d) | | | 01/25/2037 | | | | 1,387,120 | |
| | 7,514,959 | | | Series 2007-OPX1-A5A | | | 5.76% | (d) | | | 01/25/2037 | | | | 3,058,890 | |
| | 2,780,236 | | | Series 2010-7-9A4 | | | 6.00% | (a)(c) | | | 10/25/2037 | | | | 2,362,677 | |
| | 13,778,044 | | | Series 2010-8-7A4 | | | 6.00% | (a)(c) | | | 06/25/2037 | | | | 12,282,626 | |
| | 2,561,337 | | | Series 2014-8-3A2 | | | 6.00% | (a)(c) | | | 03/25/2037 | | | | 2,195,612 | |
| | 104,146,978 | | | Series 2019-A-PT1 | | | 3.92% | (a) | | | 10/25/2058 | | | | 85,918,340 | |
| | 161,032,680 | | | Series 2019-D-PT1 | | | 3.51% | (a)(c) | | | 04/25/2064 | | | | 133,470,647 | |
| | 200,104,707 | | | Series 2020-RP1-A1 | | | 1.50% | (a)(c) | | | 08/25/2064 | | | | 172,951,658 | |
| | 26,293,400 | | | Series 2020-RP1-M1 | | | 2.00% | (a)(c) | | | 08/25/2064 | | | | 19,371,034 | |
| | 22,116,950 | | | Series 2020-RP1-M2 | | | 2.50% | (a)(c) | | | 08/25/2064 | | | | 15,922,220 | |
| | 18,676,200 | | | Series 2020-RP1-M3 | | | 2.75% | (a)(c) | | | 08/25/2064 | | | | 13,156,744 | |
| | 49,012,437 | | | Series 2020-RP1-PT5 | | | 6.92% | (a)(c) | | | 08/25/2064 | | | | 40,342,725 | |
| | 15,108,854 | | | Series 2021-JL1-A | | | 2.75% | (a)(c) | | | 02/27/2062 | | | | 14,283,084 | |
| | 260,347,108 | | | Series 2021-RP2-A1 | | | 1.75% | (a)(c) | | | 03/25/2065 | | | | 229,306,286 | |
| | 34,186,100 | | | Series 2021-RP2-M1 | | | 3.25% | (a)(c) | | | 03/25/2065 | | | | 29,006,974 | |
| | | | |
| 18 | | DoubleLine Funds Trust | | The accompanying notes are an integral part of these financial statements. |
| | | | | | | | | | | | | | | | |
PRINCIPAL AMOUNT $ | | | SECURITY DESCRIPTION | | RATE | | | MATURITY | | | VALUE $ | |
| | 28,635,750 | | | Series 2021-RP2-M2 | | | 3.40% | (a)(c) | | | 03/25/2065 | | | | 23,302,742 | |
| | 26,589,300 | | | Series 2021-RP2-M3 | | | 3.40% | (a)(c) | | | 03/25/2065 | | | | 20,866,296 | |
| | 78,022,447 | | | Series 2021-RP2-PT1 | | | 5.88% | (a)(c) | | | 03/25/2065 | | | | 63,338,935 | |
| | | |
| | | | Citimortgage Alternative Loan Trust | | | | | | | | |
| | 1,417,988 | | | Series 2006-A1-1A5 | | | 5.50% | | | | 04/25/2036 | | | | 1,270,907 | |
| | 1,645,788 | | | Series 2006-A2-A2 | | | 6.00% | | | | 05/25/2036 | | | | 1,482,729 | |
| | 1,704,668 | | | Series 2006-A3-1A13 | | | 6.00% | | | | 07/25/2036 | | | | 1,504,848 | |
| | 1,332,333 | | | Series 2006-A4-1A8 | | | 6.00% | | | | 09/25/2036 | | | | 1,182,717 | |
| | 1,465,444 | | | Series 2006-A5-3A3 | | | 6.00% | | | | 10/25/2036 | | | | 1,154,248 | |
| | 3,944,283 | | | Series 2006-A6-1A2 (1 Month LIBOR USD + 0.50%, 6.00% Floor, 6.00% Cap) | | | 6.00% | (i) | | | 11/25/2036 | | | | 3,550,440 | |
| | 2,023,464 | | | Series 2007-A1-1A5 | | | 6.00% | | | | 01/25/2037 | | | | 1,773,674 | |
| | 986,573 | | | Series 2007-A1-1A7 | | | 6.00% | | | | 01/25/2037 | | | | 864,784 | |
| | 2,675,133 | | | Series 2007-A1-1A8 (CME Term SOFR 1 Month + 0.71%, 0.60% Floor, 6.00% Cap) | | | 6.00% | | | | 01/25/2037 | | | | 2,184,452 | |
| | 2,524,285 | | | Series 2007-A1-1A9 (-1 x CME Term SOFR 1 Month + 5.29%, 5.40% Cap) | | | 0.00% | (f)(g) | | | 01/25/2037 | | | | 127,110 | |
| | 2,143,103 | | | Series 2007-A3-1A1 | | | 6.00% | (j) | | | 03/25/2037 | | | | 1,915,836 | |
| | 4,931,966 | | | Series 2007-A3-1A3 (-1 x CME Term SOFR 1 Month + 5.29%, 5.40% Cap) | | | 0.00% | (f)(g) | | | 03/25/2037 | | | | 246,166 | |
| | 1,932,732 | | | Series 2007-A3-1A4 | | | 5.75% | | | | 03/25/2037 | | | | 1,717,107 | |
| | 3,368,167 | | | Series 2007-A4-1A3 (CME Term SOFR 1 Month + 0.44%, 0.33% Floor, 7.00% Cap) | | | 5.77% | | | | 04/25/2037 | | | | 2,833,984 | |
| | 3,368,167 | | | Series 2007-A4-1A4 (-1 x CME Term SOFR 1 Month + 6.56%, 6.67% Cap) | | | 1.23% | (f)(g) | | | 04/25/2037 | | | | 325,525 | |
| | 3,567,062 | | | Series 2007-A4-1A5 | | | 5.75% | | | | 04/25/2037 | | | | 3,249,372 | |
| | 468,692 | | | Series 2007-A5-1A11 | | | 6.00% | | | | 05/25/2037 | | | | 424,759 | |
| | 6,179,366 | | | Series 2007-A5-1A8 | | | 6.00% | | | | 05/25/2037 | | | | 5,600,145 | |
| | 196,224 | | | Series 2007-A8-A1 | | | 6.00% | | | | 10/25/2037 | | | | 171,904 | |
| | | |
| | | | CitiMortgage, Inc. | | | | | | | | |
| | 1,707,777 | | | Series 2005-1-1A4 | | | 5.50% | | | | 02/25/2035 | | | | 1,600,918 | |
| | | |
| | | | Colony American Finance Ltd. | | | | | | | | |
| | 9,000,000 | | | Series 2020-3-D | | | 2.95% | (a)(c) | | | 08/15/2053 | | | | 7,197,499 | |
| | | |
| | | | COLT Funding LLC | | | | | | | | |
| | 14,812,000 | | | Series 2021-5-M1 | | | 3.26% | (a)(c) | | | 11/26/2066 | | | | 10,536,882 | |
| | 4,294,000 | | | Series 2021-HX1-B1 | | | 3.11% | (a)(c) | | | 10/25/2066 | | | | 3,079,836 | |
| | 4,130,000 | | | Series 2021-HX1-B2 | | | 3.86% | (a)(c) | | | 10/25/2066 | | | | 3,074,003 | |
| | 6,000,000 | | | Series 2021-HX1-M1 | | | 2.36% | (a)(c) | | | 10/25/2066 | | | | 4,171,465 | |
| | 11,380,304 | | | Series 2022-4-A1 | | | 4.30% | (a)(c) | | | 03/25/2067 | | | | 11,104,364 | |
| | | |
| | | | Countrywide Alternative Loan Trust | | | | | | | | |
| | 24,311,262 | | | Series 2004-36CB-1A1 | | | 6.00% | | | | 02/25/2035 | | | | 17,572,987 | |
| | 5,113,987 | | | Series 2005-13CB-A1 (CME Term SOFR 1 Month + 0.61%, 0.50% Floor, 5.50% Cap) | | | 5.50% | | | | 05/25/2035 | | | | 4,194,653 | |
| | 2,335,865 | | | Series 2005-13CB-A3 | | | 5.50% | | | | 05/25/2035 | | | | 2,026,168 | |
| | 2,153,260 | | | Series 2005-20CB-2A1 (CME Term SOFR 1 Month + 0.61%, 0.50% Floor, 5.50% Cap) | | | 5.50% | | | | 07/25/2035 | | | | 1,298,716 | |
| | 4,396,239 | | | Series 2005-20CB-2A2 (-1 x CME Term SOFR 1 Month + 4.89%, 5.00% Cap) | | | 0.00% | (f)(g) | | | 07/25/2035 | | | | 180,545 | |
| | 1,349,435 | | | Series 2005-26CB-A11 (-2 x CME Term SOFR 1 Month + 12.84%, 13.05% Cap) | | | 3.18% | (g) | | | 07/25/2035 | | | | 924,413 | |
| | 1,843,787 | | | Series 2005-28CB-1A2 (CME Term SOFR 1 Month + 0.86%, 0.75% Floor, 5.50% Cap) | | | 5.50% | | | | 08/25/2035 | | | | 1,473,804 | |
| | 920,112 | | | Series 2005-28CB-3A6 | | | 6.00% | | | | 08/25/2035 | | | | 386,062 | |
| | 5,103,454 | | | Series 2005-32T1-A9 | | | 5.50% | | | | 08/25/2035 | | | | 2,895,942 | |
| | 1,977,596 | | | Series 2005-46CB-A14 | | | 5.50% | | | | 10/25/2035 | | | | 1,425,211 | |
| | 1,001,887 | | | Series 2005-46CB-A20 | | | 5.50% | | | | 10/25/2035 | | | | 722,039 | |
| | 3,655,770 | | | Series 2005-48T1-A2 | | | 5.50% | | | | 11/25/2035 | | | | 2,113,189 | |
| | 1,248,814 | | | Series 2005-54CB-3A4 | | | 5.50% | | | | 11/25/2035 | | | | 702,346 | |
| | 27,575,261 | | | Series 2005-55CB-1A1 | | | 5.50% | | | | 11/25/2035 | | | | 18,383,139 | |
| | 10,997,836 | | | Series 2005-57CB-1A1 | | | 5.50% | | | | 12/25/2035 | | | | 7,953,751 | |
| | 297,913 | | | Series 2005-60T1-A7 (-7 x CME Term SOFR 1 Month + 35.09%, 35.93% Cap) | | | 0.00% | (g) | | | 12/25/2035 | | | | 160,642 | |
| | 303,844 | | | Series 2005-64CB-1A14 | | | 5.50% | | | | 12/25/2035 | | | | 263,606 | |
| | 4,409,909 | | | Series 2005-64CB-1A4 | | | 5.50% | | | | 12/25/2035 | | | | 3,825,905 | |
| | | | | | | | |
| The accompanying notes are an integral part of these financial statements. | | Annual Report | | | | | March 31, 2024 | | 19 |
| | |
Schedule of Investments DoubleLine Total Return Bond Fund (Cont.) | | |
| | | | | | | | | | | | | | | | |
PRINCIPAL AMOUNT $ | | | SECURITY DESCRIPTION | | RATE | | | MATURITY | | | VALUE $ | |
| | 898,820 | | | Series 2005-73CB-1A5 (CME Term SOFR 1 Month + 0.91%, 0.80% Floor, 5.50% Cap) | | | 5.50% | | | | 01/25/2036 | | | | 813,984 | |
| | 2,261,246 | | | Series 2005-73CB-1A6 (-1 x CME Term SOFR 1 Month + 4.59%, 4.70% Cap) | | | 0.00% | (f)(g) | | | 01/25/2036 | | | | 65,587 | |
| | 29,540,861 | | | Series 2005-77T1-1A1 | | | 6.00% | | | | 02/25/2036 | | | | 14,720,905 | |
| | 416,385 | | | Series 2005-79CB-A5 | | | 5.50% | | | | 01/25/2036 | | | | 239,066 | |
| | 16,676,514 | | | Series 2005-80CB-4A1 | | | 6.00% | | | | 02/25/2036 | | | | 7,958,691 | |
| | 18,802,178 | | | Series 2005-85CB-1A1 | | | 6.00% | | | | 02/25/2036 | | | | 8,024,992 | |
| | 1,151,838 | | | Series 2005-85CB-2A6 (-4 x CME Term SOFR 1 Month + 21.21%, 21.63% Cap) | | | 1.67% | (g) | | | 02/25/2036 | | | | 852,851 | |
| | 822,529 | | | Series 2005-86CB-A5 | | | 5.50% | | | | 02/25/2036 | | | | 475,655 | |
| | 3,139,679 | | | Series 2005-J1-5A3 | | | 5.50% | | | | 02/25/2035 | | | | 2,946,308 | |
| | 13,650 | | | Series 2005-J1-7A1 | | | 5.50% | | | | 12/25/2024 | | | | 11,683 | |
| | 1,157,043 | | | Series 2005-J10-1A11 | | | 5.50% | | | | 10/25/2035 | | | | 791,224 | |
| | 263,316 | | | Series 2005-J10-1A13 (CME Term SOFR 1 Month + 0.81%, 0.70% Floor, 5.50% Cap) | | | 5.50% | | | | 10/25/2035 | | | | 161,823 | |
| | 123,349 | | | Series 2005-J10-1A15 | | | 5.50% | | | | 10/25/2035 | | | | 84,350 | |
| | 361,561 | | | Series 2005-J11-1A3 | | | 5.50% | | | | 11/25/2035 | | | | 204,969 | |
| | 73,863 | | | Series 2005-J11-6A1 | | | 6.50% | | | | 09/25/2032 | | | | 68,844 | |
| | 362,955 | | | Series 2005-J13-2A5 (CME Term SOFR 1 Month + 0.59%, 0.48% Floor, 5.50% Cap) | | | 5.50% | | | | 11/25/2035 | | | | 236,270 | |
| | 725,910 | | | Series 2005-J13-2A6 (-1 x CME Term SOFR 1 Month + 4.91%, 5.02% Cap) | | | 0.00% | (f)(g) | | | 11/25/2035 | | | | 30,359 | |
| | 431,937 | | | Series 2005-J2-1A5 (CME Term SOFR 1 Month + 0.61%, 0.50% Floor, 5.50% Cap) | | | 5.50% | | | | 04/25/2035 | | | | 334,317 | |
| | 1,329,037 | | | Series 2005-J2-1A6 (-1 x CME Term SOFR 1 Month + 4.89%, 5.00% Cap) | | | 0.00% | (f)(g) | | | 04/25/2035 | | | | 39,604 | |
| | 2,648,407 | | | Series 2005-J3-2A8 (CME Term SOFR 1 Month + 0.41%, 0.30% Floor, 5.50% Cap) | | | 5.50% | | | | 05/25/2035 | | | | 1,899,845 | |
| | 2,648,407 | | | Series 2005-J3-2A9 (-1 x CME Term SOFR 1 Month + 5.09%, 5.20% Cap) | | | 0.00% | (f)(g) | | | 05/25/2035 | | | | 114,055 | |
| | 2,507,644 | | | Series 2006-12CB-A3 (CME Term SOFR 1 Month + 5.75%, 5.75% Floor) | | | 5.75% | | | | 05/25/2036 | | | | 1,258,655 | |
| | 3,090,607 | | | Series 2006-12CB-A8 | | | 6.00% | | | | 05/25/2036 | | | | 1,610,875 | |
| | 10,739,144 | | | Series 2006-13T1-A1 | | | 6.00% | | | | 05/25/2036 | | | | 5,342,051 | |
| | 27,227,591 | | | Series 2006-15CB-A1 | | | 6.50% | | | | 06/25/2036 | | | | 12,754,653 | |
| | 2,584,040 | | | Series 2006-16CB-A7 | | | 6.00% | | | | 06/25/2036 | | | | 1,416,960 | |
| | 683,549 | | | Series 2006-18CB-A12 (CME Term SOFR 1 Month + 0.71%, 0.60% Floor, 6.00% Cap) | | | 6.00% | | | | 07/25/2036 | | | | 304,999 | |
| | 683,549 | | | Series 2006-18CB-A13 (-1 x CME Term SOFR 1 Month + 5.39%, 5.50% Cap) | | | 0.06% | (f)(g) | | | 07/25/2036 | | | | 49,800 | |
| | 3,337,922 | | | Series 2006-19CB-A12 (CME Term SOFR 1 Month + 0.51%, 0.40% Floor, 6.00% Cap) | | | 5.84% | | | | 08/25/2036 | | | | 1,585,661 | |
| | 4,526,423 | | | Series 2006-19CB-A13 (-1 x CME Term SOFR 1 Month + 5.49%, 5.60% Cap) | | | 0.16% | (f)(g) | | | 08/25/2036 | | | | 412,091 | |
| | 696,741 | | | Series 2006-19CB-A15 | | | 6.00% | | | | 08/25/2036 | | | | 402,898 | |
| | 4,099,493 | | | Series 2006-23CB-2A3 | | | 6.50% | | | | 08/25/2036 | | | | 1,288,289 | |
| | 1,261,078 | | | Series 2006-24CB-A11 | | | 5.75% | | | | 08/25/2036 | | | | 687,318 | |
| | 3,691,021 | | | Series 2006-24CB-A14 (-1 x CME Term SOFR 1 Month + 7.04%, 7.15% Cap) | | | 1.71% | (f)(g) | | | 08/25/2036 | | | | 591,602 | |
| | 2,959,718 | | | Series 2006-24CB-A22 | | | 6.00% | | | | 08/25/2036 | | | | 1,667,388 | |
| | 3,176,666 | | | Series 2006-24CB-A5 (CME Term SOFR 1 Month + 0.71%, 0.06% Floor, 6.00% Cap) | | | 6.00% | | | | 08/25/2036 | | | | 1,530,903 | |
| | 1,427,287 | | | Series 2006-26CB-A17 | | | 6.25% | | | | 09/25/2036 | | | | 719,404 | |
| | 1,832,044 | | | Series 2006-26CB-A9 | | | 6.50% | | | | 09/25/2036 | | | | 959,052 | |
| | 2,382,012 | | | Series 2006-29T1-1A2 | | | 6.25% | | | | 10/25/2036 | | | | 1,289,477 | |
| | 368,036 | | | Series 2006-29T1-2A12 (-7 x CME Term SOFR 1 Month + 45.41%, 46.15% Cap) | | | 10.76% | (g) | | | 10/25/2036 | | | | 477,785 | |
| | 225,430 | | | Series 2006-29T1-2A23 (-4 x CME Term SOFR 1 Month + 32.87%, 33.37% Cap) | | | 9.78% | (g) | | | 10/25/2036 | | | | 233,979 | |
| | 1,868,298 | | | Series 2006-2CB-A9 | | | 6.00% | | | | 03/25/2036 | | | | 826,105 | |
| | 2,425,276 | | | Series 2006-30T1-1A2 | | | 6.25% | | | | 11/25/2036 | | | | 1,811,443 | |
| | 1,993,613 | | | Series 2006-32CB-A1 (CME Term SOFR 1 Month + 0.78%, 0.67% Floor, 6.00% Cap) | | | 6.00% | | | | 11/25/2036 | | | | 999,282 | |
| | | | |
| 20 | | DoubleLine Funds Trust | | The accompanying notes are an integral part of these financial statements. |
| | | | | | | | | | | | | | | | |
PRINCIPAL AMOUNT $ | | | SECURITY DESCRIPTION | | RATE | | | MATURITY | | | VALUE $ | |
| | 3,325,346 | | | Series 2006-32CB-A2 (-1 x CME Term SOFR 1 Month + 5.22%, 5.33% Cap) | | | 0.00% | (f)(g) | | | 11/25/2036 | | | | 228,643 | |
| | 7,365,208 | | | Series 2006-36T2-2A1 | | | 6.25% | | | | 12/25/2036 | | | | 3,148,453 | |
| | 594,503 | | | Series 2006-36T2-2A4 | | | 6.25% | | | | 12/25/2036 | | | | 254,136 | |
| | 760,624 | | | Series 2006-39CB-1A10 | | | 6.00% | | | | 01/25/2037 | | | | 603,630 | |
| | 13,272,649 | | | Series 2006-39CB-2A2 (-1 x CME Term SOFR 1 Month + 6.44%, 6.55% Cap) | | | 1.11% | (f)(g) | | | 01/25/2037 | | | | 765,756 | |
| | 4,519,963 | | | Series 2006-39CB-2A4 (CME Term SOFR 1 Month + 0.56%, 0.45% Floor, 7.00% Cap) | | | 5.89% | | | | 01/25/2037 | | | | 569,866 | |
| | 1,135,207 | | | Series 2006-40T1-1A11 | | | 6.00% | | | | 01/25/2037 | | | | 683,738 | |
| | 1,932,229 | | | Series 2006-40T1-1A4 (-1 x CME Term SOFR 1 Month + 5.34%, 5.45% Cap) | | | 0.01% | (f)(g) | | | 01/25/2037 | | | | 132,585 | |
| | 2,755,178 | | | Series 2006-41CB-1A10 | | | 6.00% | | | | 01/25/2037 | | | | 1,450,417 | |
| | 6,738,266 | | | Series 2006-41CB-1A15 (-1 x CME Term SOFR 1 Month + 5.29%, 5.40% Cap) | | | 0.00% | (f)(g) | | | 01/25/2037 | | | | 614,202 | |
| | 6,738,266 | | | Series 2006-41CB-1A2 (CME Term SOFR 1 Month + 0.71%, 0.60% Floor, 6.00% Cap) | | | 6.00% | | | | 01/25/2037 | | | | 2,957,922 | |
| | 2,901,261 | | | Series 2006-41CB-1A9 | | | 6.00% | | | | 01/25/2037 | | | | 1,527,321 | |
| | 3,518,774 | | | Series 2006-42-1A1 (CME Term SOFR 1 Month + 0.71%, 0.60% Floor, 6.00% Cap) | | | 6.00% | | | | 01/25/2047 | | | | 1,536,215 | |
| | 3,518,774 | | | Series 2006-42-1A2 (-1 x CME Term SOFR 1 Month + 5.29%, 5.40% Cap) | | | 0.00% | (f)(g) | | | 01/25/2047 | | | | 320,699 | |
| | 2,343,320 | | | Series 2006-42-1A3 | | | 6.00% | | | | 01/25/2047 | | | | 1,231,024 | |
| | 2,634,036 | | | Series 2006-43CB-1A12 | | | 5.75% | | | | 02/25/2037 | | | | 1,397,427 | |
| | 9,113,358 | | | Series 2006-43CB-1A6 | | | 6.00% | | | | 02/25/2037 | | | | 5,009,250 | |
| | 9,706,694 | | | Series 2006-45T1-1A1 (CME Term SOFR 1 Month + 0.61%, 6.00% Floor, 6.00% Cap) | | | 6.00% | | | | 02/25/2037 | | | | 3,745,358 | |
| | 3,131,192 | | | Series 2006-45T1-1A4 (CME Term SOFR 1 Month + 0.71%, 0.60% Floor, 6.00% Cap) | | | 6.00% | | | | 02/25/2037 | | | | 898,946 | |
| | 3,131,192 | | | Series 2006-45T1-1A5 (-1 x CME Term SOFR 1 Month + 5.29%, 5.40% Cap) | | | 0.00% | (f)(g) | | | 02/25/2037 | | | | 221,260 | |
| | 1,334,103 | | | Series 2006-45T1-2A2 | | | 6.00% | | | | 02/25/2037 | | | | 722,932 | |
| | 5,334,846 | | | Series 2006-4CB-1A1 | | | 6.00% | | | | 04/25/2036 | | | | 2,653,921 | |
| | 580,838 | | | Series 2006-6CB-1A4 | | | 5.50% | | | | 05/25/2036 | | | | 471,907 | |
| | 4,123,700 | | | Series 2006-7CB-1A14 | | | 6.00% | | | | 05/25/2036 | | | | 2,235,600 | |
| | 7,190,989 | | | Series 2006-7CB-1A16 | | | 6.00% | | | | 05/25/2036 | | | | 3,898,483 | |
| | 2,203,319 | | | Series 2006-7CB-1A6 | | | 6.00% | | | | 05/25/2036 | | | | 1,210,195 | |
| | 2,231,547 | | | Series 2006-7CB-1A9 | | | 6.00% | | | | 05/25/2036 | | | | 1,209,799 | |
| | 812,226 | | | Series 2006-9T1-A11 | | | 6.00% | | | | 05/25/2036 | | | | 326,096 | |
| | 1,752,231 | | | Series 2006-J1-1A10 | | | 5.50% | | | | 02/25/2036 | | | | 1,208,377 | |
| | 3,555,210 | | | Series 2006-J1-1A3 | | | 5.50% | | | | 02/25/2036 | | | | 2,451,751 | |
| | 786,194 | | | Series 2006-J4-2A2 | | | 6.00% | | | | 07/25/2036 | | | | 448,469 | |
| | 1,017,190 | | | Series 2006-J7-1A1 | | | 6.25% | | | | 11/25/2036 | | | | 483,051 | |
| | 27,885,489 | | | Series 2006-OA21-A1 (CME Term SOFR 1 Month + 0.30%, 0.19% Floor) | | | 5.63% | | | | 03/20/2047 | | | | 22,529,676 | |
| | 2,437,904 | | | Series 2006-OA7-1A2 (12 Month US Treasury Average + 0.94%, 0.94% Floor) | | | 6.03% | | | | 06/25/2046 | | | | 2,055,084 | |
| | 586,779 | | | Series 2007-11T1-A24 (-6 x CME Term SOFR 1 Month + 39.21%, 39.90% Cap) | | | 7.24% | (g) | | | 05/25/2037 | | | | 541,159 | |
| | 9,193,259 | | | Series 2007-12T1-A11 | | | 6.00% | | | | 06/25/2037 | | | | 4,291,180 | |
| | 8,504,795 | | | Series 2007-15CB-A1 | | | 6.00% | | | | 07/25/2037 | | | | 5,153,054 | |
| | 5,072,612 | | | Series 2007-15CB-A2 | | | 5.75% | | | | 07/25/2037 | | | | 2,960,467 | |
| | 6,085,296 | | | Series 2007-15CB-A5 | | | 5.75% | | | | 07/25/2037 | | | | 3,551,489 | |
| | 7,233,503 | | | Series 2007-16CB-2A1 (CME Term SOFR 1 Month + 0.56%, 0.45% Floor, 7.00% Cap) | | | 5.89% | | | | 08/25/2037 | | | | 2,537,262 | |
| | 2,094,642 | | | Series 2007-16CB-2A2 (-8 x CME Term SOFR 1 Month + 53.63%, 54.58% Cap) | | | 9.22% | (g) | | | 08/25/2037 | | | | 2,705,322 | |
| | 2,459,786 | | | Series 2007-16CB-4A7 | | | 6.00% | | | | 08/25/2037 | | | | 1,810,105 | |
| | 4,738,873 | | | Series 2007-17CB-1A10 (-5 x CME Term SOFR 1 Month + 29.37%, 29.90% Cap) | | | 4.86% | (g) | | | 08/25/2037 | | | | 4,062,156 | |
| | 711,607 | | | Series 2007-18CB-2A25 | | | 6.00% | | | | 08/25/2037 | | | | 438,821 | |
| | 594,090 | | | Series 2007-19-1A10 (-6 x 1 Month LIBOR USD + 39.00%, 39.00% Cap) | | | 6.34% | (g)(i) | | | 08/25/2037 | | | | 602,134 | |
| | 10,647,848 | | | Series 2007-19-1A34 | | | 6.00% | | | | 08/25/2037 | | | | 5,207,934 | |
| | | | | | | | |
| The accompanying notes are an integral part of these financial statements. | | Annual Report | | | | | March 31, 2024 | | 21 |
| | |
Schedule of Investments DoubleLine Total Return Bond Fund (Cont.) | | |
| | | | | | | | | | | | | | | | |
PRINCIPAL AMOUNT $ | | | SECURITY DESCRIPTION | | RATE | | | MATURITY | | | VALUE $ | |
| | 8,731,857 | | | Series 2007-19-1A4 | | | 6.00% | | | | 08/25/2037 | | | | 4,270,810 | |
| | 27,035,329 | | | Series 2007-19-2A1 | | | 6.50% | | | | 08/25/2037 | | | | 11,354,160 | |
| | 2,683,128 | | | Series 2007-21CB-2A2 (-4 x CME Term SOFR 1 Month + 27.94%, 28.40% Cap) | | | 6.62% | (g) | | | 09/25/2037 | | | | 1,998,586 | |
| | 17,609,444 | | | Series 2007-22-2A16 | | | 6.50% | | | | 09/25/2037 | | | | 6,777,798 | |
| | 6,767,458 | | | Series 2007-23CB-A3 (CME Term SOFR 1 Month + 0.61%, 0.50% Floor, 7.00% Cap) | | | 5.94% | | | | 09/25/2037 | | | | 2,656,539 | |
| | 9,604,426 | | | Series 2007-23CB-A4 (-1 x CME Term SOFR 1 Month + 6.39%, 6.50% Cap) | | | 1.06% | (f)(g) | | | 09/25/2037 | | | | 1,254,855 | |
| | 971,785 | | | Series 2007-24-A2 (-6 x CME Term SOFR 1 Month + 41.01%, 41.70% Cap) | | | 9.04% | (g) | | | 10/25/2037 | | | | 866,568 | |
| | 1,943,160 | | | Series 2007-24-A3 (-1 x CME Term SOFR 1 Month + 6.84%, 6.95% Cap) | | | 1.51% | (f)(g) | | | 10/25/2037 | | | | 286,870 | |
| | 3,187,758 | | | Series 2007-24-A4 (CME Term SOFR 1 Month + 0.81%, 0.70% Floor, 7.00% Cap) | | | 6.14% | | | | 10/25/2037 | | | | 770,161 | |
| | 4,216,283 | | | Series 2007-24-A6 (CME Term SOFR 1 Month + 1.11%, 1.00% Floor, 7.00% Cap) | | | 6.44% | | | | 10/25/2037 | | | | 1,087,898 | |
| | 3,062,991 | | | Series 2007-2CB-1A4 (CME Term SOFR 1 Month + 1.11%, 5.75% Floor, 100.00% Cap) | | | 6.44% | | | | 03/25/2037 | | | | 1,647,811 | |
| | 14,795,333 | | | Series 2007-4CB-2A1 | | | 7.00% | | | | 03/25/2037 | | | | 1,387,404 | |
| | 3,492,635 | | | Series 2007-5CB-1A18 (-1 x CME Term SOFR 1 Month + 5.54%, 5.65% Cap) | | | 0.21% | (f)(g) | | | 04/25/2037 | | | | 345,814 | |
| | 3,492,635 | | | Series 2007-5CB-1A23 (CME Term SOFR 1 Month + 0.66%, 0.55% Floor, 6.00% Cap) | | | 5.99% | | | | 04/25/2037 | | | | 1,542,099 | |
| | 13,911,093 | | | Series 2007-5CB-1A31 | | | 5.50% | | | | 04/25/2037 | | | | 7,128,727 | |
| | 5,708,808 | | | Series 2007-5CB-2A1 | | | 6.00% | | | | 04/25/2037 | | | | 2,546,836 | |
| | 4,699,805 | | | Series 2007-6-A1 | | | 5.75% | | | | 04/25/2047 | | | | 2,556,161 | |
| | 5,153,374 | | | Series 2007-6-A4 | | | 5.75% | | | | 04/25/2047 | | | | 2,802,851 | |
| | 1,312,574 | | | Series 2007-7T2-A8 | | | 6.00% | | | | 04/25/2037 | | | | 593,625 | |
| | 232,638 | | | Series 2007-8CB-A12 (-6 x CME Term SOFR 1 Month + 39.51%, 40.20% Cap) | | | 7.54% | (g) | | | 05/25/2037 | | | | 236,724 | |
| | 248,337 | | | Series 2007-8CB-A8 (-6 x CME Term SOFR 1 Month + 39.39%, 40.08% Cap) | | | 7.42% | (g) | | | 05/25/2037 | | | | 250,989 | |
| | 386,009 | | | Series 2007-9T1-1A4 (CME Term SOFR 1 Month + 0.61%, 0.50% Floor, 6.00% Cap) | | | 5.94% | | | | 05/25/2037 | | | | 139,948 | |
| | 386,009 | | | Series 2007-9T1-1A5 (-1 x CME Term SOFR 1 Month + 5.39%, 5.50% Cap) | | | 0.06% | (f)(g) | | | 05/25/2037 | | | | 29,415 | |
| | 1,421,970 | | | Series 2007-9T1-2A1 | | | 6.00% | | | | 05/25/2037 | | | | 647,706 | |
| | 18,155,811 | | | Series 2007-HY2-1A | | | 4.95% | (c) | | | 03/25/2047 | | | | 16,000,902 | |
| | 15,746,098 | | | Series 2007-HY4-4A1 | | | 4.15% | (c) | | | 06/25/2037 | | | | 14,391,584 | |
| | | |
| | | | Countrywide Asset-Backed Certificates | | | | | | | | |
| | 17,544,000 | | | Series 2005-11-MF1 | | | 5.35% | (c) | | | 02/25/2036 | | | | 14,551,401 | |
| | 65,766 | | | Series 2005-4-AF5B | | | 5.65% | (d) | | | 10/25/2035 | | | | 65,447 | |
| | 18,774,012 | | | Series 2006-25-1A (CME Term SOFR 1 Month + 0.25%, 0.14% Floor) | | | 5.58% | | | | 06/25/2047 | | | | 17,189,940 | |
| | 5,360,527 | | | Series 2006-26-1A (CME Term SOFR 1 Month + 0.25%, 0.14% Floor) | | | 5.58% | | | | 06/25/2037 | | | | 4,961,585 | |
| | 21,331,069 | | | Series 2007-4-A5 | | | 4.42% | (d) | | | 04/25/2047 | | | | 15,398,342 | |
| | 10,202,347 | | | Series 2007-BC1-1A (CME Term SOFR 1 Month + 0.39%, 0.28% Floor) | | | 5.72% | | | | 05/25/2037 | | | | 9,331,039 | |
| | | |
| | | | Countrywide Home Loan Mortgage Pass Through Trust | | | | | | | | |
| | 422,459 | | | Series 2003-60-4A1 | | | 6.21% | (c) | | | 02/25/2034 | | | | 405,516 | |
| | 708,015 | | | Series 2004-R2-1AF1 (CME Term SOFR 1 Month + 0.53%, 0.42% Floor, 9.50% Cap) | | | 5.86% | (a) | | | 11/25/2034 | | | | 634,347 | |
| | 688,897 | | | Series 2004-R2-1AS | | | 0.68% | (a)(c)(f) | | | 11/25/2034 | | | | 30,088 | |
| | 11,666,638 | | | Series 2005-17-2A1 | | | 5.50% | | | | 09/25/2035 | | | | 5,710,900 | |
| | 2,453,470 | | | Series 2005-18-A1 | | | 5.50% | | | | 10/25/2035 | | | | 1,373,384 | |
| | 1,863,710 | | | Series 2005-20-A5 | | | 5.50% | | | | 10/25/2035 | | | | 1,143,922 | |
| | 1,366,101 | | | Series 2005-20-A8 | | | 5.25% | | | | 10/25/2035 | | | | 835,246 | |
| | 6,025,532 | | | Series 2005-23-A1 | | | 5.50% | | | | 11/25/2035 | | | | 3,249,268 | |
| | 1,328,083 | | | Series 2005-24-A8 | | | 5.50% | | | | 11/25/2035 | | | | 738,133 | |
| | 2,073,891 | | | Series 2005-26-1A12 | | | 5.50% | | | | 11/25/2035 | | | | 1,268,817 | |
| | 428,027 | | | Series 2005-27-2A1 | | | 5.50% | | | | 12/25/2035 | | | | 180,787 | |
| | 759,224 | | | Series 2005-28-A7 | | | 5.25% | | | | 01/25/2036 | | | | 400,032 | |
| | | | |
| 22 | | DoubleLine Funds Trust | | The accompanying notes are an integral part of these financial statements. |
| | | | | | | | | | | | | | | | |
PRINCIPAL AMOUNT $ | | | SECURITY DESCRIPTION | | RATE | | | MATURITY | | | VALUE $ | |
| | 6,316,194 | | | Series 2005-HYB1-4A1 | | | 4.80% | (c) | | | 03/25/2035 | | | | 5,724,810 | |
| | 240,455 | | | Series 2005-HYB8-1A1 | | | 4.57% | (c) | | | 12/20/2035 | | | | 218,131 | |
| | 6,349,136 | | | Series 2005-HYB8-4A1 | | | 4.55% | (c) | | | 12/20/2035 | | | | 5,544,878 | |
| | 616,472 | | | Series 2005-J3-2A4 | | | 4.50% | | | | 09/25/2035 | | | | 530,699 | |
| | 656,617 | | | Series 2005-J4-A5 | | | 5.50% | | | | 11/25/2035 | | | | 531,292 | |
| | 218,446 | | | Series 2005-R1-1AF1 (CME Term SOFR 1 Month + 0.47%, 0.36% Floor, 9.50% Cap) | | | 5.80% | (a) | | | 03/25/2035 | | | | 207,452 | |
| | 216,986 | | | Series 2005-R1-1AS | | | 0.80% | (a)(c)(f) | | | 03/25/2035 | | | | 8,792 | |
| | 6,528,554 | | | Series 2006-1-A2 | | | 6.00% | | | | 03/25/2036 | | | | 3,534,025 | |
| | 4,405,461 | | | Series 2006-14-A5 | | | 6.25% | | | | 09/25/2036 | | | | 1,934,144 | |
| | 3,124,493 | | | Series 2006-16-2A1 | | | 6.50% | | | | 11/25/2036 | | | | 1,060,482 | |
| | 1,340,175 | | | Series 2006-20-1A21 | | | 6.00% | | | | 02/25/2037 | | | | 667,702 | |
| | 15,643,083 | | | Series 2006-8-1A3 | | | 6.00% | | | | 05/25/2036 | | | | 9,914,303 | |
| | 181,372 | | | Series 2006-J3-A4 | | | 5.50% | | | | 05/25/2036 | | | | 176,180 | |
| | 3,821,143 | | | Series 2007-10-A7 | | | 6.00% | | | | 07/25/2037 | | | | 1,757,496 | |
| | 13,154,301 | | | Series 2007-11-A1 | | | 6.00% | | | | 08/25/2037 | | | | 5,725,728 | |
| | 6,481,626 | | | Series 2007-12-A9 | | | 5.75% | | | | 08/25/2037 | | | | 3,411,163 | |
| | 2,826,598 | | | Series 2007-13-A1 | | | 6.00% | | | | 08/25/2037 | | | | 1,437,883 | |
| | 4,631,536 | | | Series 2007-13-A10 | | | 6.00% | | | | 08/25/2037 | | | | 2,356,050 | |
| | 3,579,555 | | | Series 2007-15-1A1 | | | 6.25% | | | | 09/25/2037 | | | | 2,201,133 | |
| | 499,982 | | | Series 2007-15-1A16 | | | 6.25% | | | | 09/25/2037 | | | | 307,448 | |
| | 1,440,230 | | | Series 2007-15-1A2 | | | 6.25% | | | | 09/25/2037 | | | | 885,205 | |
| | 1,758,955 | | | Series 2007-15-1A29 | | | 6.25% | | | | 09/25/2037 | | | | 1,081,565 | |
| | 2,598,390 | | | Series 2007-17-1A2 | | | 6.00% | | | | 10/25/2037 | | | | 1,817,290 | |
| | 388,613 | | | Series 2007-18-1A1 | | | 6.00% | | | | 11/25/2037 | | | | 170,547 | |
| | 1,343,674 | | | Series 2007-2-A2 | | | 6.00% | | | | 03/25/2037 | | | | 574,359 | |
| | 36,822,567 | | | Series 2007-21-1A1 | | | 6.25% | | | | 02/25/2038 | | | | 17,769,868 | |
| | 3,495,729 | | | Series 2007-3-A1 | | | 6.00% | | | | 04/25/2037 | | | | 1,696,640 | |
| | 1,346,329 | | | Series 2007-3-A12 | | | 6.00% | | | | 04/25/2037 | | | | 653,436 | |
| | 3,149,200 | | | Series 2007-4-1A39 | | | 6.00% | | | | 05/25/2037 | | | | 1,379,295 | |
| | 1,154,730 | | | Series 2007-5-A2 | | | 5.75% | | | | 05/25/2037 | | | | 597,373 | |
| | 4,276,594 | | | Series 2007-7-A1 | | | 6.00% | | | | 06/25/2037 | | | | 2,184,567 | |
| | 1,921,958 | | | Series 2007-7-A11 | | | 5.50% | | | | 06/25/2037 | | | | 907,010 | |
| | 1,281,977 | | | Series 2007-7-A2 | | | 5.75% | | | | 06/25/2037 | | | | 629,945 | |
| | 4,302,757 | | | Series 2007-8-1A4 | | | 6.00% | | | | 01/25/2038 | | | | 1,929,752 | |
| | 2,258,071 | | | Series 2007-8-1A5 | | | 5.44% | | | | 01/25/2038 | | | | 940,598 | |
| | 3,659,845 | | | Series 2007-8-1A8 | | | 6.00% | | | | 01/25/2038 | | | | 1,641,411 | |
| | 5,242,766 | | | Series 2007-8-1A9 (CME Term SOFR 1 Month + 6.00%, 4.00% Floor, 6.00% Cap) | | | 6.00% | | | | 01/25/2038 | | | | 2,363,279 | |
| | 5,112,296 | | | Series 2007-9-A1 | | | 5.75% | | | | 07/25/2037 | | | | 2,583,424 | |
| | 672,818 | | | Series 2007-9-A11 | | | 5.75% | | | | 07/25/2037 | | | | 339,999 | |
| | 3,433,418 | | | Series 2007-HY1-1A1 | | | 4.54% | (c) | | | 04/25/2037 | | | | 3,117,483 | |
| | 7,902,126 | | | Series 2007-HYB1-2A1 | | | 4.05% | (c) | | | 03/25/2037 | | | | 6,223,113 | |
| | 15,659,671 | | | Series 2007-J1-2A1 | | | 6.00% | | | | 02/25/2037 | | | | 6,049,149 | |
| | 388,043 | | | Series 2007-J3-A1 (CME Term SOFR 1 Month + 0.61%, 0.50% Floor, 6.00% Cap) | | | 5.94% | | | | 07/25/2037 | | | | 121,971 | |
| | 1,940,213 | | | Series 2007-J3-A2 (-1 x CME Term SOFR 1 Month + 5.39%, 5.50% Cap) | | | 0.06% | (f)(g) | | | 07/25/2037 | | | | 163,783 | |
| | | |
| | | | Credit Suisse First Boston Mortgage Securities Corp. | | | | | | | | |
| | 1,804,969 | | | Series 2005-10-5A4 | | | 5.50% | | | | 11/25/2035 | | | | 1,317,345 | |
| | 380,003 | | | Series 2005-10-5A5 | | | 5.50% | | | | 11/25/2035 | | | | 277,389 | |
| | | |
| | | | Credit Suisse Management LLC | | | | | | | | |
| | 3,717,766 | | | Series 2005-11-2A1 | | | 6.00% | | | | 12/25/2035 | | | | 2,600,596 | |
| | 5,264,816 | | | Series 2005-12-5A1 | | | 5.25% | | | | 01/25/2036 | | | | 4,515,467 | |
| | 9,678,653 | | | Series 2005-12-7A1 | | | 7.00% | | | | 01/25/2036 | | | | 2,062,105 | |
| | 2,415,361 | | | Series 2005-8-3A10 | | | 5.50% | | | | 09/25/2035 | | | | 2,052,683 | |
| | 3,569,925 | | | Series 2005-8-7A1 | | | 7.00% | | | | 09/25/2035 | | | | 1,649,369 | |
| | | |
| | | | Credit Suisse Mortgage Capital Certificates | | | | | | | | |
| | 776,039 | | | Series 2005-1R-2A5 | | | 5.75% | (a) | | | 12/26/2035 | | | | 545,498 | |
| | 11,281,244 | | | Series 2006-1-2A1 | | | 6.00% | | | | 02/25/2036 | | | | 3,443,576 | |
| | 2,311,924 | | | Series 2006-2-5A1 (CME Term SOFR 1 Month + 0.81%, 0.70% Floor, 6.00% Cap) | | | 6.00% | | | | 03/25/2036 | | | | 786,961 | |
| | | | | | | | |
| The accompanying notes are an integral part of these financial statements. | | Annual Report | | | | | March 31, 2024 | | 23 |
| | |
Schedule of Investments DoubleLine Total Return Bond Fund (Cont.) | | |
| | | | | | | | | | | | | | | | |
PRINCIPAL AMOUNT $ | | | SECURITY DESCRIPTION | | RATE | | | MATURITY | | | VALUE $ | |
| | 12,922,594 | | | Series 2006-2-5A2 (-1 x CME Term SOFR 1 Month + 5.19%, 5.30% Cap) | | | 0.00% | (f)(g) | | | 03/25/2036 | | | | 900,222 | |
| | 2,691,758 | | | Series 2006-2-5A3 | | | 6.25% | | | | 03/25/2036 | | | | 1,178,848 | |
| | 7,284,975 | | | Series 2006-2-5A4 | | | 6.00% | | | | 03/25/2036 | | | | 3,069,979 | |
| | 1,083,916 | | | Series 2006-3-4A3 | | | 5.50% | | | | 04/25/2036 | | | | 769,492 | |
| | 655,255 | | | Series 2006-3-4A4 | | | 5.50% | | | | 04/25/2036 | | | | 465,178 | |
| | 2,415,566 | | | Series 2006-4-1A8 (CME Term SOFR 1 Month + 1.11%, 6.00% Floor, 6.00% Cap) | | | 6.00% | | | | 05/25/2036 | | | | 1,342,104 | |
| | 20,336,525 | | | Series 2006-4-4A1 | | | 7.00% | | | | 05/25/2036 | | | | 5,435,310 | |
| | 7,094,686 | | | Series 2006-4-6A1 | | | 6.00% | | | | 05/25/2036 | | | | 2,770,943 | |
| | 6,685,957 | | | Series 2006-6-1A4 | | | 6.00% | | | | 07/25/2036 | | | | 3,201,810 | |
| | 10,035,754 | | | Series 2006-6-3A1 | | | 7.00% | | | | 07/25/2036 | | | | 2,328,488 | |
| | 113,130 | | | Series 2006-7-3A11 | | | 6.00% | | | | 08/25/2036 | | | | 44,116 | |
| | 1,532,636 | | | Series 2006-7-7A5 | | | 6.00% | | | | 08/25/2036 | | | | 1,164,537 | |
| | 2,032,527 | | | Series 2006-9-2A1 | | | 5.50% | | | | 11/25/2036 | | | | 1,713,168 | |
| | 8,263,253 | | | Series 2006-9-3A1 | | | 6.00% | | | | 11/25/2036 | | | | 7,049,999 | |
| | 3,339,843 | | | Series 2006-9-4A1 | | | 6.00% | | | | 11/25/2036 | | | | 2,022,477 | |
| | 1,349,467 | | | Series 2006-9-6A14 | | | 6.00% | | | | 11/25/2036 | | | | 1,056,735 | |
| | 219,243 | | | Series 2006-9-6A15 (-6 x CME Term SOFR 1 Month + 39.21%, 39.90% Cap) | | | 7.29% | (g) | | | 11/25/2036 | | | | 253,847 | |
| | 8,235,786 | | | Series 2007-1-1A4 | | | 6.13% | (c) | | | 02/25/2037 | | | | 1,981,081 | |
| | 5,453,663 | | | Series 2007-1-3A1 | | | 6.00% | | | | 02/25/2057 | | | | 895,531 | |
| | 2,853,480 | | | Series 2007-1-5A14 | | | 6.00% | | | | 02/25/2037 | | | | 1,580,725 | |
| | 23,417 | | | Series 2007-2-2A1 | | | 5.00% | | | | 03/25/2037 | | | | 17,580 | |
| | 5,166,866 | | | Series 2007-3-2A10 | | | 6.00% | | | | 04/25/2037 | | | | 1,916,138 | |
| | 2,261,158 | | | Series 2007-5-2A5 | | | 5.00% | | | | 08/25/2037 | | | | 1,874,610 | |
| | 21,616,181 | | | Series 2007-5-3A19 | | | 6.00% | | | | 08/25/2037 | | | | 15,994,141 | |
| | 9,521,095 | | | Series 2007-5-3A9 | | | 6.00% | | | | 08/25/2037 | | | | 7,037,761 | |
| | 2,173,447 | | | Series 2008-2R-1A1 | | | 6.00% | (a)(b) | | | 07/25/2037 | | | | 1,719,092 | |
| | 8,302,114 | | | Series 2009-11R-4A1 | | | 7.00% | (a)(c) | | | 09/26/2037 | | | | 2,237,152 | |
| | 5,756,289 | | | Series 2009-12R-5A1 | | | 6.00% | (a)(b) | | | 06/27/2036 | | | | 2,845,384 | |
| | 1,312,250 | | | Series 2010-13R-1A2 | | | 5.50% | (a)(c) | | | 12/26/2035 | | | | 1,092,443 | |
| | 19,302,475 | | | Series 2010-17R-6A1 | | | 3.85% | (a)(b)(c) | | | 06/26/2037 | | | | 17,769,030 | |
| | 6,131,933 | | | Series 2010-4R-3A17 | | | 6.00% | (a)(b)(c) | | | 06/26/2037 | | | | 5,582,728 | |
| | 3,027,485 | | | Series 2010-4R-8A17 | | | 6.00% | (a)(b)(c) | | | 06/26/2037 | | | | 2,756,329 | |
| | 8,338,203 | | | Series 2010-7R-1A17 | | | 6.00% | (a)(c) | | | 01/26/2037 | | | | 4,582,649 | |
| | 7,096,789 | | | Series 2012-10R-4A2 | | | 4.53% | (a)(c) | | | 08/26/2046 | | | | 4,974,062 | |
| | 8,144,789 | | | Series 2013-9R-A1 | | | 3.00% | (a)(b)(c) | | | 05/27/2043 | | | | 7,014,621 | |
| | 171,649,437 | | | Series 2019-RPL6-PT1 | | | 4.14% | (a)(c) | | | 11/25/2058 | | | | 146,805,583 | |
| | 4,227,000 | | | Series 2020-AFC1-B1 | | | 3.45% | (a)(c) | | | 02/25/2050 | | | | 3,098,593 | |
| | 169,008,354 | | | Series 2020-RPL1-PT1 | | | 3.33% | (a)(c) | | | 10/25/2069 | | | | 132,435,012 | |
| | 11,402,980 | | | Series 2021-JR1-A1 | | | 2.47% | (a)(c) | | | 09/27/2066 | | | | 11,278,291 | |
| | 9,131,218 | | | Series 2021-JR2-A1 | | | 2.22% | (a)(c) | | | 11/25/2061 | | | | 8,924,088 | |
| | 7,469,850 | | | Series 2021-NQM1-B1 | | | 2.83% | (a)(c) | | | 05/25/2065 | | | | 4,812,608 | |
| | 6,225,825 | | | Series 2021-NQM5-M1 | | | 2.17% | (a)(c) | | | 05/25/2066 | | | | 3,629,866 | |
| | 3,180,040 | | | Series 2021-NQM6-B1 | | | 3.29% | (a)(c) | | | 07/25/2066 | | | | 2,109,230 | |
| | 7,445,317 | | | Series 2021-NQM6-M1 | | | 2.58% | (a)(c) | | | 07/25/2066 | | | | 4,985,538 | |
| | 27,354,096 | | | Series 2021-RPL9-A1 | | | 2.44% | (a)(c) | | | 02/25/2061 | | | | 26,505,462 | |
| | | |
| | | | Credit-Based Asset Servicing and Securitization LLC | | | | | | | | |
| | 7,942,246 | | | Series 2006-CB4-AV3 (CME Term SOFR 1 Month + 0.41%, 0.30% Floor) | | | 3.23% | | | | 05/25/2036 | | | | 5,179,731 | |
| | | |
| | | | CSAB Mortgage Backed Trust | | | | | | | | |
| | 3,892,946 | | | Series 2006-3-A4B | | | 6.61% | (d) | | | 11/25/2036 | | | | 604,197 | |
| | 2,218,252 | | | Series 2006-4-A6A | | | 6.18% | (d) | | | 12/25/2036 | | | | 400,783 | |
| | 8,123,030 | | | Series 2007-1-1A1A | | | 5.90% | (c) | | | 05/25/2037 | | | | 1,928,049 | |
| | | |
| | | | CSMCM Trust | | | | | | | | |
| | 7,218,796 | | | Series 2019-RPL6-CERT | | | 0.00% | (a)(c) | | | 11/25/2058 | | | | 5,907,822 | |
| | 8,895,752 | | | Series 2020-RPL1-CERT | | | 3.23% | (a)(c) | | | 01/25/2046 | | | | 6,807,088 | |
| | | |
| | | | DB US Financial Markets Holding Corp. | | | | | | | | |
| | 3,713,977 | | | Series 2014-RS1-3A2 (CME Term SOFR 1 Month + 0.51%, 0.40% Floor, 7.00% Cap) | | | 5.84% | (a)(b) | | | 10/27/2036 | | | | 2,785,406 | |
| | | |
| | | | Deutsche ALT-A Securities, Inc. | | | | | | | | |
| | 7,179,589 | | | Series 2005-4-A5 | | | 5.50% | (c) | | | 09/25/2035 | | | | 6,166,420 | |
| | | | |
| 24 | | DoubleLine Funds Trust | | The accompanying notes are an integral part of these financial statements. |
| | | | | | | | | | | | | | | | |
PRINCIPAL AMOUNT $ | | | SECURITY DESCRIPTION | | RATE | | | MATURITY | | | VALUE $ | |
| | 195,135 | | | Series 2005-5-1A6 (-7 x CME Term SOFR 1 Month + 35.09%, 35.93% Cap) | | | 0.00% | (g) | | | 11/25/2035 | | | | 261,571 | |
| | 471,187 | | | Series 2005-5-2A1 (CME Term SOFR 1 Month + 0.31%, 0.20% Floor, 5.50% Cap) | | | 5.50% | | | | 11/25/2035 | | | | 204,418 | |
| | 1,422,094 | | | Series 2005-5-2A2 (-1 x CME Term SOFR 1 Month + 5.19%, 5.30% Cap) | | | 0.00% | (f)(g) | | | 11/25/2035 | | | | 56,779 | |
| | 4,549,054 | | | Series 2005-6-2A1 | | | 5.50% | | | | 12/25/2035 | | | | 3,742,090 | |
| | 2,923,540 | | | Series 2006-AB1-A1C | | | 5.67% | (c) | | | 02/25/2036 | | | | 2,544,334 | |
| | 390,027 | | | Series 2006-AB2-A2 | | | 4.79% | (c) | | | 06/25/2036 | | | | 343,485 | |
| | 658,396 | | | Series 2006-AB4-A1A | | | 6.01% | (c) | | | 10/25/2036 | | | | 548,730 | |
| | 9,193,960 | | | Series 2006-AB4-A2 | | | 5.65% | (c) | | | 10/25/2036 | | | | 7,664,823 | |
| | 654,959 | | | Series 2006-AB4-A3 | | | 5.90% | (c) | | | 10/25/2036 | | | | 545,913 | |
| | 954,116 | | | Series 2006-AB4-A3A1 | | | 5.90% | (c) | | | 10/25/2036 | | | | 794,468 | |
| | 1,883,041 | | | Series 2006-AB4-A6A1 | | | 6.37% | (d) | | | 10/25/2036 | | | | 1,566,661 | |
| | 12,515,345 | | | Series 2007-2-2A1 (CME Term SOFR 1 Month + 0.41%, 0.30% Floor) | | | 5.74% | | | | 09/25/2047 | | | | 10,412,719 | |
| | 15,284,534 | | | Series 2007-OA3-A2 (CME Term SOFR 1 Month + 0.36%, 0.25% Floor) | | | 5.69% | | | | 07/25/2047 | | | | 12,981,819 | |
| | | |
| | | | Deutsche Mortgage Securities, Inc. | | | | | | | | |
| | 4,102,348 | | | Series 2006-PR1-3A1 (-1 x CME Term SOFR 1 Month + 11.96%, 12.12% Cap) | | | 4.51% | (a)(g) | | | 04/15/2036 | | | | 3,688,399 | |
| | 1,014,465 | | | Series 2006-PR1-4AI1 (-1 x CME Term SOFR 1 Month + 11.95%, 12.11% Cap) | | | 4.49% | (a)(g) | | | 04/15/2036 | | | | 910,751 | |
| | 1,653,652 | | | Series 2006-PR1-4AI2 (-2 x CME Term SOFR 1 Month + 14.39%, 14.61% Cap) | | | 4.22% | (a)(g) | | | 04/15/2036 | | | | 1,471,252 | |
| | 276,732 | | | Series 2006-PR1-5AI1 (-3 x CME Term SOFR 1 Month + 19.01%, 19.35% Cap) | | | 3.03% | (a)(g) | | | 04/15/2036 | | | | 238,874 | |
| | 2,434,940 | | | Series 2006-PR1-5AI3 (-1 x CME Term SOFR 1 Month + 12.41%, 12.57% Cap) | | | 4.95% | (a)(g) | | | 04/15/2036 | | | | 2,080,794 | |
| | 40,338,137 | | | Series 2006-PR1-5AI4 (-1 x CME Term SOFR 1 Month + 11.96%, 12.12% Cap) | | | 4.51% | (a)(g) | | | 04/15/2036 | | | | 34,417,782 | |
| | | |
| | | | Equifirst Loan Securitization Trust | | | | | | | | |
| | 8,925,805 | | | Series 2007-1-A2B (CME Term SOFR 1 Month + 0.30%, 0.19% Floor) | | | 5.63% | | | | 04/25/2037 | | | | 7,985,517 | |
| | | |
| | | | FBR Securitization Trust | | | | | | | | |
| | 22,750,000 | | | Series 2005-2-M4 (CME Term SOFR 1 Month + 1.04%, 0.93% Floor, 14.00% Cap) | | | 6.37% | | | | 09/25/2035 | | | | 19,613,050 | |
| | 5,500,000 | | | Series 2005-5-M3 (CME Term SOFR 1 Month + 0.85%, 0.74% Floor, 14.00% Cap) | | | 6.18% | | | | 11/25/2035 | | | | 4,970,373 | |
| | | |
| | | | Fieldstone Mortgage Investment Corp. | | | | | | | | |
| | 3,117,364 | | | Series 2007-1-2A2 (CME Term SOFR 1 Month + 0.38%, 0.27% Floor, 12.25% Cap) | | | 5.98% | | | | 04/25/2047 | | | | 2,243,029 | |
| | | |
| | | | Figure Line of Credit Trust | | | | | | | | |
| | 16,476,716 | | | Series 2020-1-A | | | 4.04% | (a)(c) | | | 09/25/2049 | | | | 15,747,936 | |
| | | |
| | | | First Franklin Mortgage Loan Asset Backed Certificates | | | | | | | | |
| | 7,487,220 | | | Series 2006-FF8-M1 (CME Term SOFR 1 Month + 0.49%, 0.38% Floor) | | | 5.82% | | | | 07/25/2036 | | | | 6,180,679 | |
| | 4,000,000 | | | Series 2006-FF9-2A4 (CME Term SOFR 1 Month + 0.61%, 0.50% Floor) | | | 5.94% | | | | 06/25/2036 | | | | 3,505,570 | |
| | 17,456,596 | | | Series 2007-FF2-A1 (CME Term SOFR 1 Month + 0.39%, 0.28% Floor) | | | 5.72% | | | | 03/25/2037 | | | | 9,132,050 | |
| | 20,767,556 | | | Series 2007-FF2-A2C (CME Term SOFR 1 Month + 0.41%, 0.30% Floor) | | | 5.74% | | | | 03/25/2037 | | | | 10,176,378 | |
| | | |
| | | | First Horizon Alternative Mortgage Securities | | | | | | | | |
| | 2,760,903 | | | Series 2005-AA4-1A1 | | | 5.41% | (c) | | | 05/25/2035 | | | | 1,345,530 | |
| | 3,341,316 | | | Series 2005-FA8-1A4 | | | 5.50% | | | | 11/25/2035 | | | | 1,640,121 | |
| | 249,056 | | | Series 2005-FA8-2A1 | | | 5.00% | | | | 02/25/2050 | | | | 245,997 | |
| | 947,303 | | | Series 2006-AA3-A1 | | | 5.80% | (c) | | | 06/25/2036 | | | | 733,657 | |
| | 1,876,406 | | | Series 2006-FA1-1A12 | | | 6.00% | | | | 04/25/2036 | | | | 877,432 | |
| | 6,296,510 | | | Series 2006-FA1-1A3 | | | 5.75% | | | | 04/25/2036 | | | | 2,829,459 | |
| | 1,204,844 | | | Series 2006-FA2-1A5 | | | 6.00% | | | | 05/25/2036 | | | | 507,291 | |
| | 1,920,111 | | | Series 2006-FA8-1A5 | | | 6.00% | | | | 02/25/2037 | | | | 776,223 | |
| | 2,714,123 | | | Series 2006-RE1-A1 | | | 5.50% | (c) | | | 05/25/2035 | | | | 1,776,057 | |
| | 10,551,180 | | | Series 2007-FA3-A3 | | | 6.00% | | | | 06/25/2037 | | | | 3,773,371 | |
| | 542,912 | | | Series 2007-FA3-A4 | | | 6.00% | | | | 06/25/2037 | | | | 194,159 | |
| | | | | | | | |
| The accompanying notes are an integral part of these financial statements. | | Annual Report | | | | | March 31, 2024 | | 25 |
| | |
Schedule of Investments DoubleLine Total Return Bond Fund (Cont.) | | |
| | | | | | | | | | | | | | | | |
PRINCIPAL AMOUNT $ | | | SECURITY DESCRIPTION | | RATE | | | MATURITY | | | VALUE $ | |
| | 600,848 | | | Series 2007-FA4-1A13 | | | 6.25% | | | | 08/25/2037 | | | | 243,646 | |
| | 1,854,864 | | | Series 2007-FA4-1A4 | | | 6.25% | | | | 08/25/2037 | | | | 752,153 | |
| | 1,054,603 | | | Series 2007-FA4-1A5 | | | 6.25% | | | | 08/25/2037 | | | | 427,645 | |
| | | |
| | | | First Horizon Asset Securities, Inc. | | | | | | | | |
| | 903,734 | | | Series 2006-1-1A2 | | | 6.00% | | | | 05/25/2036 | | | | 414,470 | |
| | 1,532,447 | | | Series 2007-4-1A1 | | | 6.00% | | | | 08/25/2037 | | | | 589,411 | |
| | | |
| | | | FirstKey Homes Trust | | | | | | | | |
| | 9,000,000 | | | Series 2020-SFR1-E | | | 2.79% | (a) | | | 08/17/2037 | | | | 8,527,712 | |
| | 18,000,000 | | | Series 2020-SFR2-D | | | 1.97% | (a) | | | 10/19/2037 | | | | 16,801,211 | |
| | 26,225,000 | | | Series 2020-SFR2-E | | | 2.67% | (a) | | | 10/19/2037 | | | | 24,769,625 | |
| | 16,350,000 | | | Series 2021-SFR1-E1 | | | 2.39% | (a) | | | 08/17/2038 | | | | 14,820,703 | |
| | 11,500,000 | | | Series 2021-SFR1-E2 | | | 2.49% | (a) | | | 08/17/2038 | | | | 10,354,687 | |
| | 8,000,000 | | | Series 2021-SFR2-D | | | 2.06% | (a) | | | 09/17/2038 | | | | 7,226,555 | |
| | 8,000,000 | | | Series 2021-SFR2-E1 | | | 2.26% | (a) | | | 09/17/2038 | | | | 7,197,929 | |
| | 8,000,000 | | | Series 2021-SFR2-E2 | | | 2.36% | (a) | | | 09/17/2038 | | | | 7,192,501 | |
| | 34,891,000 | | | Series 2021-SFR3-B | | | 2.44% | (a) | | | 12/17/2038 | | | | 32,088,370 | |
| | 29,584,000 | | | Series 2021-SFR3-C | | | 2.54% | (a) | | | 12/17/2038 | | | | 27,145,207 | |
| | 22,626,000 | | | Series 2021-SFR3-D | | | 2.79% | (a) | | | 12/17/2038 | | | | 20,713,675 | |
| | 45,314,000 | | | Series 2021-SFR3-E1 | | | 2.99% | (a) | | | 12/17/2038 | | | | 41,206,508 | |
| | 25,293,000 | | | Series 2021-SFR3-E2 | | | 3.08% | (a) | | | 12/17/2038 | | | | 23,004,606 | |
| | 10,174,000 | | | Series 2021-SFR3-F1 | | | 3.58% | (a) | | | 12/17/2038 | | | | 9,240,588 | |
| | | |
| | | | FMC GMSR Issuer Trust | | | | | | | | |
| | 62,350,000 | | | Series 2020-GT1-A | | | 4.45% | (a)(c) | | | 01/25/2026 | | | | 57,974,183 | |
| | 72,500,000 | | | Series 2021-GT1-A | | | 3.62% | (a)(c) | | | 07/25/2026 | | | | 63,956,361 | |
| | 64,820,000 | | | Series 2021-GT2-A | | | 3.85% | (a)(c) | | | 10/25/2026 | | | | 57,445,435 | |
| | | |
| | | | Freddie Mac Structured Agency Credit Risk Debt Notes | | | | | | | | |
| | 75,600,000 | | | Series 2022-DNA3-M1B (US 30 Day Average Secured Overnight Financing Rate + 2.90%) | | | 8.22% | (a) | | | 04/25/2042 | | | | 78,276,194 | |
| | | |
| | | | Fremont Home Loan Trust | | | | | | | | |
| | 111,763,618 | | | Series 2006-D-1A1 (CME Term SOFR 1 Month + 0.25%, 0.14% Floor) | | | 5.58% | | | | 11/25/2036 | | | | 64,952,544 | |
| | | |
| | | | FRTKL | | | | | | | | |
| | 7,750,000 | | | Series 2021-SFR1-E1 | | | 2.37% | (a) | | | 09/17/2038 | | | | 6,889,399 | |
| | 6,650,000 | | | Series 2021-SFR1-E2 | | | 2.52% | (a) | | | 09/17/2038 | | | | 5,900,258 | |
| | | |
| | | | GCAT | | | | | | | | |
| | 2,751,000 | | | Series 2019-NQM3-M1 | | | 3.45% | (a)(c) | | | 11/25/2059 | | | | 2,255,854 | |
| | 7,096,000 | | | Series 2021-NQM2-M1 | | | 2.54% | (a)(c) | | | 05/25/2066 | | | | 4,759,856 | |
| | 8,405,000 | | | Series 2021-NQM6-B1 | | | 4.42% | (a)(c) | | | 08/25/2066 | | | | 6,476,630 | |
| | | |
| | | | GE-WMC Mortgage Securities LLC | | | | | | | | |
| | 31,642,268 | | | Series 2006-1-A2B (CME Term SOFR 1 Month + 0.41%, 0.30% Floor) | | | 5.74% | | | | 08/25/2036 | | | | 13,392,558 | |
| | | |
| | | | GMAC Mortgage Corp. Loan Trust | | | | | | | | |
| | 1,661,094 | | | Series 2005-AR5-3A1 | | | 4.27% | (c) | | | 09/19/2035 | | | | 1,301,584 | |
| | | | Greenpoint Mortgage Funding Trust | | | | |
| | 20,852,716 | | | Series 2005-AR3-2A1 (CME Term SOFR 1 Month + 0.63%, 0.52% Floor, 10.50% Cap) | | | 5.96% | | | | 08/25/2045 | | | | 7,245,349 | |
| | 16,139,149 | | | Series 2007-AR2-1A3 (CME Term SOFR 1 Month + 0.59%, 0.48% Floor) | | | 5.92% | | | | 04/25/2047 | | | | 13,760,747 | |
| | | |
| | | | GS Mortgage Securities Corp. | | | | | | | | |
| | 886,125 | | | Series 2008-2R-1A1 | | | 3.35% | (a)(c) | | | 09/25/2036 | | | | 301,958 | |
| | 16,282,487 | | | Series 2014-3R-2B (CME Term SOFR 1 Month + 0.29%, 0.18% Floor) | | | 5.62% | (a) | | | 09/26/2036 | | | | 8,621,176 | |
| | | |
| | | | GS Mortgage-Backed Securities Trust | | | | | | | | |
| | 100,027,730 | | | Series 2020-RPL2-A1 | | | 1.75% | (a)(c) | | | 05/25/2060 | | | | 88,061,262 | |
| | 12,540,000 | | | Series 2020-RPL2-M1 | | | 2.25% | (a)(c) | | | 05/25/2060 | | | | 9,815,617 | |
| | 10,237,000 | | | Series 2020-RPL2-M2 | | | 2.75% | (a)(c) | | | 05/25/2060 | | | | 8,043,545 | |
| | 9,341,000 | | | Series 2020-RPL2-M3 | | | 3.00% | (a)(c) | | | 05/25/2060 | | | | 7,246,844 | |
| | 31,739,285 | | | Series 2020-RPL2-PT4 | | | 6.55% | (a)(j) | | | 05/25/2060 | | | | 27,448,547 | |
| | | |
| | | | GSAA Trust | | | | | | | | |
| | 105,154 | | | Series 2005-12-AF3 | | | 5.07% | (c) | | | 09/25/2035 | | | | 67,727 | |
| | 7,698,761 | | | Series 2006-10-AF3 | | | 5.98% | (c) | | | 06/25/2036 | | | | 2,001,264 | |
| | 5,510,135 | | | Series 2006-10-AF4 | | | 6.80% | (d) | | | 06/25/2036 | | | | 1,417,551 | |
| | 10,417,081 | | | Series 2006-15-AF4 | | | 6.46% | (d) | | | 09/25/2036 | | | | 2,656,314 | |
| | 1,632,898 | | | Series 2006-18-AF3A | | | 5.77% | (c) | | | 11/25/2036 | | | | 494,579 | |
| | | | |
| 26 | | DoubleLine Funds Trust | | The accompanying notes are an integral part of these financial statements. |
| | | | | | | | | | | | | | | | |
PRINCIPAL AMOUNT $ | | | SECURITY DESCRIPTION | | RATE | | | MATURITY | | | VALUE $ | |
| | 3,832,761 | | | Series 2006-18-AF6 | | | 6.18% | (d) | | | 11/25/2036 | | | | 962,185 | |
| | 7,226,352 | | | Series 2006-19-A1 (CME Term SOFR 1 Month + 0.29%, 0.18% Floor) | | | 5.62% | | | | 12/25/2036 | | | | 1,956,321 | |
| | 3,383,293 | | | Series 2007-10-A1A | | | 6.00% | | | | 11/25/2037 | | | | 1,947,095 | |
| | 2,508,874 | | | Series 2007-10-A2A | | | 6.50% | | | | 11/25/2037 | | | | 1,025,936 | |
| | 5,751,438 | | | Series 2007-7-A5 (CME Term SOFR 1 Month + 0.67%, 0.56% Floor) | | | 6.00% | | | | 07/25/2037 | | | | 2,915,977 | |
| | | |
| | | | GSAMP Trust | | | | | | | | |
| | 15,493,239 | | | Series 2006-HE6-A3 (CME Term SOFR 1 Month + 0.41%, 0.30% Floor) | | | 5.74% | | | | 08/25/2036 | | | | 12,153,332 | |
| | 6,436,597 | | | Series 2007-H1-A2B (CME Term SOFR 1 Month + 0.51%, 0.40% Floor) | | | 5.84% | | | | 01/25/2047 | | | | 3,377,593 | |
| | | |
| | | | GSMPS Mortgage Loan Trust | | | | | | | | |
| | 6,107,171 | | | Series 2005-RP2-1AF (CME Term SOFR 1 Month + 0.46%, 0.35% Floor) | | | 5.79% | (a) | | | 03/25/2035 | | | | 5,568,695 | |
| | 6,107,171 | | | Series 2005-RP2-1AS | | | 0.00% | (a)(c)(f) | | | 03/25/2035 | | | | 46,505 | |
| | 3,949,959 | | | Series 2005-RP3-1AF (CME Term SOFR 1 Month + 0.46%, 0.35% Floor, 9.50% Cap) | | | 5.79% | (a) | | | 09/25/2035 | | | | 3,335,958 | |
| | 3,949,959 | | | Series 2005-RP3-1AS | | | 0.00% | (a)(c)(f) | | | 09/25/2035 | | | | 22,185 | |
| | 14,832,507 | | | Series 2006-RP1-1AF1 (CME Term SOFR 1 Month + 0.46%, 0.35% Floor, 9.15% Cap) | | | 5.79% | (a) | | | 01/25/2036 | | | | 11,944,914 | |
| | 14,832,507 | | | Series 2006-RP1-1AS | | | 0.00% | (a)(c)(f) | | | 01/25/2036 | | | | 63,384 | |
| | | |
| | | | GSR Mortgage Loan Trust | | | | | | | | |
| | 692,459 | | | Series 2005-1F-1A2 | | | 5.50% | | | | 02/25/2035 | | | | 650,367 | |
| | 1,170,173 | | | Series 2005-1F-3A3 | | | 6.00% | | | | 01/25/2035 | | | | 1,033,435 | |
| | 177,657 | | | Series 2005-6F-3A5 | | | 6.00% | | | | 07/25/2035 | | | | 166,110 | |
| | 1,889,573 | | | Series 2005-6F-3A9 (-1 x CME Term SOFR 1 Month + 6.79%, 6.90% Cap) | | | 1.46% | (f)(g) | | | 07/25/2035 | | | | 145,381 | |
| | 116,130 | | | Series 2005-6F-4A1 (CME Term SOFR 1 Month + 0.61%, 0.50% Floor, 6.00% Cap) | | | 5.94% | | | | 07/25/2035 | | | | 111,907 | |
| | 97,048 | | | Series 2005-7F-3A1 (CME Term SOFR 1 Month + 0.61%, 0.50% Floor, 6.00% Cap) | | | 5.94% | | | | 09/25/2035 | | | | 95,038 | |
| | 6,947,506 | | | Series 2005-8F-3A5 | | | 6.00% | | | | 11/25/2035 | | | | 2,696,752 | |
| | 1,640,988 | | | Series 2005-8F-4A1 | | | 6.00% | | | | 11/25/2035 | | | | 636,113 | |
| | 150,605 | | | Series 2006-1F-1A2 | | | 5.50% | | | | 02/25/2036 | | | | 247,574 | |
| | 314,353 | | | Series 2006-2F-2A3 | | | 5.75% | | | | 02/25/2036 | | | | 257,402 | |
| | 1,517,245 | | | Series 2006-2F-3A3 | | | 6.00% | | | | 02/25/2036 | | | | 696,968 | |
| | 1,822,206 | | | Series 2006-2F-3A6 | | | 6.00% | | | | 02/25/2036 | | | | 837,002 | |
| | 16,944,922 | | | Series 2006-5F-3A1 | | | 6.50% | | | | 06/25/2036 | | | | 7,776,245 | |
| | 4,168,417 | | | Series 2006-6F-2A3 | | | 6.00% | | | | 07/25/2036 | | | | 2,376,291 | |
| | 3,640,302 | | | Series 2006-7F-3A4 | | | 6.25% | | | | 08/25/2036 | | | | 1,229,115 | |
| | 9,549,254 | | | Series 2006-9F-4A1 | | | 6.50% | | | | 10/25/2036 | | | | 4,063,276 | |
| | 28,008,092 | | | Series 2006-OA1-3A1 (Enterprise 11th District COFI Replacement Index + 1.50%, 1.50% Floor) | | | 4.65% | | | | 08/25/2046 | | | | 6,093,594 | |
| | 137,396 | | | Series 2007-1F-2A2 | | | 5.50% | | | | 01/25/2037 | | | | 340,385 | |
| | 466,221 | | | Series 2007-4F-1A1 | | | 5.00% | | | | 07/25/2037 | | | | 725,212 | |
| | 12,065,872 | | | Series 2007-4F-3A11 | | | 6.00% | | | | 07/25/2037 | | | | 7,848,765 | |
| | 40,283,421 | | | Series 2007-OA1-1A1 (CME Term SOFR 1 Month + 0.34%, 0.23% Floor) | | | 5.67% | | | | 05/25/2037 | | | | 19,608,237 | |
| | | |
| | | | Harborview Mortgage Loan Trust | | | | | | | | |
| | 246,148 | | | Series 2005-14-3A1A | | | 6.39% | (c) | | | 12/19/2035 | | | | 232,950 | |
| | 5,136,599 | | | Series 2005-2-1A (CME Term SOFR 1 Month + 0.63%, 0.52% Floor) | | | 5.96% | | | | 05/19/2035 | | | | 1,632,069 | |
| | 21,408,098 | | | Series 2005-8-1A1A (CME Term SOFR 1 Month + 0.73%, 0.62% Floor, 11.00% Cap) | | | 6.06% | | | | 09/19/2035 | | | | 11,161,829 | |
| | 40,114,335 | | | Series 2005-8-2A1A (12 Month US Treasury Average + 1.55%, 1.55% Floor) | | | 6.64% | | | | 09/19/2035 | | | | 17,397,266 | |
| | 3,402,782 | | | Series 2006-10-2A1A (CME Term SOFR 1 Month + 0.47%, 0.36% Floor) | | | 5.79% | | | | 11/19/2036 | | | | 2,941,827 | |
| | 3,564,988 | | | Series 2006-11-A1A (CME Term SOFR 1 Month + 0.45%, 0.34% Floor) | | | 5.78% | | | | 12/19/2036 | | | | 3,288,972 | |
| | 29,859,377 | | | Series 2006-14-1A1A (CME Term SOFR 1 Month + 0.47%, 0.36% Floor) | | | 5.80% | | | | 01/25/2047 | | | | 27,818,880 | |
| | 5,250,271 | | | Series 2006-4-1A2A (CME Term SOFR 1 Month + 0.49%, 0.38% Floor) | | | 5.82% | | | | 05/19/2046 | | | | 2,648,427 | |
| | | | | | | | |
| The accompanying notes are an integral part of these financial statements. | | Annual Report | | | | | March 31, 2024 | | 27 |
| | |
Schedule of Investments DoubleLine Total Return Bond Fund (Cont.) | | |
| | | | | | | | | | | | | | | | |
PRINCIPAL AMOUNT $ | | | SECURITY DESCRIPTION | | RATE | | | MATURITY | | | VALUE $ | |
| | 54,650,124 | | | Series 2006-8-1A1 (CME Term SOFR 1 Month + 0.51%) | | | 5.83% | | | | 07/21/2036 | | | | 26,468,394 | |
| | 6,114,518 | | | Series 2006-BU1-1A1A (CME Term SOFR 1 Month + 0.53%, 0.42% Floor, 10.50% Cap) | | | 5.86% | | | | 02/19/2046 | | | | 5,423,124 | |
| | 12,893,808 | | | Series 2007-7-1A1 | | | 6.44% | | | | 10/25/2037 | | | | 9,790,827 | |
| | | |
| | | | Home Equity Asset Trust | | | | | | | | |
| | 323,011 | | | Series 2003-3-M1 (CME Term SOFR 1 Month + 1.40%, 1.29% Floor) | | | 6.73% | | | | 08/25/2033 | | | | 315,283 | |
| | | |
| | | | Home Partners of America Trust | | | | | | | | |
| | 3,672,943 | | | Series 2019-2-C | | | 3.02% | (a) | | | 10/19/2039 | | | | 3,308,799 | |
| | 3,907,386 | | | Series 2019-2-D | | | 3.12% | (a) | | | 10/19/2039 | | | | 3,487,665 | |
| | 7,355,080 | | | Series 2019-2-E | | | 3.32% | (a) | | | 10/19/2039 | | | | 6,455,945 | |
| | | |
| | | | Homebanc Mortgage Trust | | | | | | | | |
| | 340,624 | | | Series 2005-1-M2 (CME Term SOFR 1 Month + 0.85%, 0.74% Floor, 11.50% Cap) | | | 6.18% | | | | 03/25/2035 | | | | 278,804 | |
| | 10,350,000 | | | Series 2005-3-M5 (CME Term SOFR 1 Month + 1.96%, 1.85% Floor, 11.50% Cap) | | | 7.29% | | | | 07/25/2035 | | | | 8,811,395 | |
| | | |
| | | | Homeward Opportunities Fund I Trust | | | | | | | | |
| | 13,161,000 | | | Series 2020-1-B1 | | | 5.74% | (a)(c) | | | 11/25/2059 | | | | 12,879,357 | |
| | 13,276,000 | | | Series 2020-1-B2 | | | 5.89% | (a)(c) | | | 11/25/2059 | | | | 13,268,272 | |
| | 28,994,000 | | | Series 2020-2-B2 | | | 5.47% | (a)(c) | | | 05/25/2065 | | | | 28,830,184 | |
| | | |
| | | | HSBC Asset Loan Obligation | | | | | | | | |
| | 17,917,892 | | | Series 2007-2-3A6 | | | 6.00% | | | | 09/25/2037 | | | | 5,524,061 | |
| | 13,592,818 | | | Series 2007-WF1-A3 | | | 4.49% | (d) | | | 12/25/2036 | | | | 4,631,783 | |
| | | |
| | | | HSI Asset Securitization Corp. | | | | | | | | |
| | 27,820,979 | | | Series 2006-HE1-1A1 (CME Term SOFR 1 Month + 0.39%, 0.28% Floor) | | | 5.72% | | | | 10/25/2036 | | | | 9,035,453 | |
| | 13,518,105 | | | Series 2007-NC1-A2 (CME Term SOFR 1 Month + 0.39%, 0.28% Floor) | | | 5.72% | | | | 04/25/2037 | | | | 9,014,156 | |
| | 58,605,316 | | | Series 2007-NC1-A3 (CME Term SOFR 1 Month + 0.47%, 0.36% Floor) | | | 5.80% | | | | 04/25/2037 | | | | 39,145,831 | |
| | | |
| | | | Impac CMB Trust | | | | | | | | |
| | 106,499 | | | Series 2002-9F-A1 | | | 5.22% | (d) | | | 12/25/2032 | | | | 104,512 | |
| | | |
| | | | Impac Secured Assets CMN Owner Trust | | | | | | | | |
| | 9,244,055 | | | Series 2007-3-A1B (CME Term SOFR 1 Month + 0.59%, 0.48% Floor, 11.50% Cap) | | | 5.92% | | | | 09/25/2037 | | | | 7,782,821 | |
| | | |
| | | | Imperial Fund Mortgage Trust | | | | | | | | |
| | 24,441,941 | | | Series 2021-NQM4-A1 | | | 2.09% | (a)(c) | | | 01/25/2057 | | | | 20,565,838 | |
| | 12,653,599 | | | Series 2021-NQM4-A2 | | | 2.30% | (a)(c) | | | 01/25/2057 | | | | 10,678,141 | |
| | 9,643,556 | | | Series 2021-NQM4-A3 | | | 2.45% | (a)(c) | | | 01/25/2057 | | | | 8,167,135 | |
| | | |
| | | | Indymac IMJA Mortgage Loan Trust | | | | | | | | |
| | 3,097,574 | | | Series 2007-A1-A1 | | | 6.00% | | | | 08/25/2037 | | | | 1,204,252 | |
| | 2,267,666 | | | Series 2007-A1-A7 | | | 6.00% | | | | 08/25/2037 | | | | 881,607 | |
| | 6,828,815 | | | Series 2007-A2-1A1 | | | 6.00% | | | | 10/25/2037 | | | | 3,027,237 | |
| | 11,175,462 | | | Series 2007-A2-2A3 | | | 6.50% | | | | 10/25/2037 | | | | 5,773,684 | |
| | 18,184,025 | | | Series 2007-A2-3A1 | | | 7.00% | | | | 10/25/2037 | | | | 5,303,625 | |
| | 15,467,716 | | | Series 2007-A3-A1 | | | 6.25% | | | | 11/25/2037 | | | | 6,862,608 | |
| | 12,712,283 | | | Series 2007-A4-A1 | | | 6.25% | | | | 02/25/2038 | | | | 4,006,901 | |
| | | |
| | | | Indymac IMSC Mortgage Loan Trust | | | | | | | | |
| | 29,132,971 | | | Series 2007-F1-2A1 | | | 6.50% | | | | 06/25/2037 | | | | 7,797,944 | |
| | 257,696 | | | Series 2007-F2-1A2 | | | 6.00% | | | | 07/25/2037 | | | | 180,047 | |
| | 25,241,038 | | | Series 2007-F2-2A1 | | | 6.50% | | | | 07/25/2037 | | | | 7,761,215 | |
| | 2,868,685 | | | Series 2007-HOA1-A11 (CME Term SOFR 1 Month + 0.47%, 0.36% Floor) | | | 5.80% | | | | 07/25/2047 | | | | 1,931,219 | |
| | | |
| | | | Indymac INDA Mortgage Loan Trust | | | | | | | | |
| | 752,797 | | | Series 2006-AR2-1A1 | | | 4.40% | (c) | | | 09/25/2036 | | | | 503,626 | |
| | 621,581 | | | Series 2006-AR2-4A1 | | | 4.11% | (c) | | | 09/25/2036 | | | | 541,467 | |
| | 7,557,999 | | | Series 2006-AR3-1A1 | | | 4.22% | (c) | | | 12/25/2036 | | | | 5,890,297 | |
| | 2,386,863 | | | Series 2007-AR1-3A1 | | | 3.04% | (c) | | | 03/25/2037 | | | | 1,930,293 | |
| | 2,245,391 | | | Series 2007-AR3-3A1 | | | 3.66% | (c) | | | 07/25/2037 | | | | 1,973,084 | |
| | | |
| | | | Indymac Index Mortgage Loan Trust | | | | | | | | |
| | 5,344,585 | | | Series 2005-AR15-A1 | | | 3.99% | (c) | | | 09/25/2035 | | | | 4,299,441 | |
| | 2,191,263 | | | Series 2006-AR7-3A1 | | | 3.87% | (c) | | | 05/25/2036 | | | | 1,875,042 | |
| | 1,867,633 | | | Series 2007-AR13-2A1 | | | 4.77% | (c) | | | 07/25/2037 | | | | 1,539,980 | |
| | 4,376,067 | | | Series 2007-AR21-8A1 | | | 4.52% | (c) | | | 09/25/2037 | | | | 4,269,972 | |
| | | | |
| 28 | | DoubleLine Funds Trust | | The accompanying notes are an integral part of these financial statements. |
| | | | | | | | | | | | | | | | |
PRINCIPAL AMOUNT $ | | | SECURITY DESCRIPTION | | RATE | | | MATURITY | | | VALUE $ | |
| | | | Indymac Residential Asset Backed Trust | | | | | | | | |
| | 12,182,000 | | | Series 2006-B-2A4 (CME Term SOFR 1 Month + 0.67%, 0.56% Floor) | | | 6.00% | | | | 06/25/2036 | | | | 10,604,163 | |
| | 8,528,139 | | | Series 2006-D-2A4 (CME Term SOFR 1 Month + 0.35%, 0.24% Floor) | | | 5.68% | | | | 11/25/2036 | | | | 6,631,082 | |
| | 7,741,205 | | | Series 2007-B-1A1 (CME Term SOFR 1 Month + 0.30%, 0.19% Floor) | | | 5.63% | | | | 07/25/2037 | | | | 3,162,556 | |
| | 7,741,205 | | | Series 2007-B-1A2 (CME Term SOFR 1 Month + 0.30%, 0.19% Floor) | | | 5.63% | | | | 07/25/2037 | | | | 3,162,556 | |
| | | |
| | | | JP Morgan Alternative Loan Trust | | | | | | | | |
| | 4,955,985 | | | Series 2005-S1-2A11 | | | 6.00% | | | | 12/25/2035 | | | | 3,323,253 | |
| | 1,588,783 | | | Series 2005-S1-2A9 | | | 6.00% | | | | 12/25/2035 | | | | 1,065,364 | |
| | 2,964,201 | | | Series 2006-A2-1A1 (CME Term SOFR 1 Month + 0.47%, 0.36% Floor, 11.50% Cap) | | | 5.80% | | | | 05/25/2036 | | | | 2,308,808 | |
| | 2,117,786 | | | Series 2006-S1-1A8 | | | 5.75% | | | | 03/25/2036 | | | | 1,111,226 | |
| | 1,243,877 | | | Series 2006-S2-A4 | | | 6.69% | (d) | | | 05/25/2036 | | | | 1,243,986 | |
| | | |
| | | | JP Morgan Mortgage Acquisition Corp. | | | | | | | | |
| | 2,179,200 | | | Series 2005-WMC1-M4 (CME Term SOFR 1 Month + 1.01%, 0.90% Floor) | | | 6.34% | | | | 09/25/2035 | | | | 1,978,529 | |
| | 5,416,148 | | | Series 2006-CH2-AF3 | | | 5.46% | (d) | | | 09/25/2029 | | | | 3,288,547 | |
| | 9,351,745 | | | Series 2006-HE3-A1 (CME Term SOFR 1 Month + 0.39%, 0.28% Floor) | | | 4.61% | | | | 11/25/2036 | | | | 8,497,270 | |
| | 22,043,602 | | | Series 2006-RM1-A3 (CME Term SOFR 1 Month + 0.35%, 0.24% Floor) | | | 5.68% | | | | 08/25/2036 | | | | 9,816,867 | |
| | 20,373,680 | | | Series 2006-RM1-A4 (CME Term SOFR 1 Month + 0.47%, 0.36% Floor) | | | 5.80% | | | | 08/25/2036 | | | | 9,092,058 | |
| | 2,880,635 | | | Series 2006-WF1-A5 | | | 6.91% | (d) | | | 07/25/2036 | | | | 826,418 | |
| | 4,131,374 | | | Series 2006-WMC4-A1A (CME Term SOFR 1 Month + 0.24%, 0.13% Floor) | | | 5.57% | | | | 12/25/2036 | | | | 2,529,587 | |
| | 35,550,679 | | | Series 2006-WMC4-A1B (CME Term SOFR 1 Month + 0.34%, 0.23% Floor) | | | 5.67% | | | | 12/25/2036 | | | | 4,876,021 | |
| | 13,274,167 | | | Series 2007-CH1-AF5 | | | 4.55% | (d) | | | 11/25/2036 | | | | 12,843,435 | |
| | 9,690,000 | | | Series 2007-CH3-M2 (CME Term SOFR 1 Month + 0.43%, 0.32% Floor) | | | 5.76% | | | | 03/25/2037 | | | | 8,418,761 | |
| | | |
| | | | JP Morgan Mortgage Trust | | | | | | | | |
| | 64,812 | | | Series 2005-A6-5A1 | | | 5.66% | (c) | | | 08/25/2035 | | | | 64,300 | |
| | 3,322,334 | | | Series 2005-S1-1A2 | | | 6.50% | | | | 01/25/2035 | | | | 3,315,121 | |
| | 339,364 | | | Series 2005-S2-2A13 | | | 5.50% | | | | 09/25/2035 | | | | 254,389 | |
| | 930,695 | | | Series 2006-S2-3A3 | | | 6.00% | | | | 07/25/2036 | | | | 312,474 | |
| | 3,400,001 | | | Series 2006-S2-3A5 | | | 6.25% | | | | 07/25/2036 | | | | 1,190,371 | |
| | 1,786,083 | | | Series 2006-S3-1A2 | | | 6.00% | | | | 08/25/2036 | | | | 532,514 | |
| | 7,213,983 | | | Series 2006-S3-1A21 (CME Term SOFR 1 Month + 0.49%, 0.38% Floor, 7.50% Cap) | | | 5.82% | | | | 08/25/2036 | | | | 1,552,939 | |
| | 7,213,983 | | | Series 2006-S3-1A22 (-1 x CME Term SOFR 1 Month + 7.01%, 7.12% Cap) | | | 1.68% | (f)(g) | | | 08/25/2036 | | | | 1,036,016 | |
| | 832,268 | | | Series 2006-S3-1A9 | | | 6.00% | | | | 08/25/2036 | | | | 248,138 | |
| | 5,703,391 | | | Series 2006-S4-A3 | | | 6.00% | | | | 01/25/2037 | | | | 2,269,269 | |
| | 2,375,277 | | | Series 2006-S4-A5 | | | 6.00% | | | | 01/25/2037 | | | | 948,884 | |
| | 5,571,164 | | | Series 2006-S4-A8 (CME Term SOFR 1 Month + 0.49%, 0.38% Floor, 7.00% Cap) | | | 5.82% | | | | 01/25/2037 | | | | 1,673,869 | |
| | 5,571,164 | | | Series 2006-S4-A9 (-1 x CME Term SOFR 1 Month + 6.51%, 6.62% Cap) | | | 1.18% | (f)(g) | | | 01/25/2037 | | | | 847,930 | |
| | 607,062 | | | Series 2007-A2-2A1 | | | 5.31% | (c) | | | 04/25/2037 | | | | 442,935 | |
| | 2,121,430 | | | Series 2007-A3-3A2M | | | 4.43% | (c) | | | 05/25/2037 | | | | 1,863,786 | |
| | 6,146,993 | | | Series 2007-S1-2A6 | | | 6.00% | | | | 03/25/2037 | | | | 2,491,236 | |
| | 1,725,816 | | | Series 2007-S3-1A1 | | | 5.50% | | | | 08/25/2037 | | | | 759,542 | |
| | 3,916,092 | | | Series 2007-S3-1A35 | | | 6.00% | | | | 08/25/2037 | | | | 1,881,393 | |
| | 1,691,984 | | | Series 2007-S3-1A64 | | | 7.50% | | | | 08/25/2037 | | | | 591,551 | |
| | 659,023 | | | Series 2007-S3-1A9 | | | 6.00% | | | | 08/25/2037 | | | | 315,033 | |
| | 3,610,824 | | | Series 2007-S3-1A96 | | | 6.00% | | | | 08/25/2037 | | | | 1,726,835 | |
| | 4,116,057 | | | Series 2007-S3-1A97 | | | 6.00% | | | | 08/25/2037 | | | | 1,968,567 | |
| | | |
| | | | JP Morgan Reremic | | | | | | | | |
| | 4,927,633 | | | Series 2009-4-3A2 | | | 6.00% | (a)(c) | | | 02/26/2037 | | | | 2,412,826 | |
| | 16,376,315 | | | Series 2009-7-7A1 | | | 7.00% | (a)(c) | | | 09/27/2037 | | | | 7,347,249 | |
| | | | | | | | |
| The accompanying notes are an integral part of these financial statements. | | Annual Report | | | | | March 31, 2024 | | 29 |
| | |
Schedule of Investments DoubleLine Total Return Bond Fund (Cont.) | | |
| | | | | | | | | | | | | | | | |
PRINCIPAL AMOUNT $ | | | SECURITY DESCRIPTION | | RATE | | | MATURITY | | | VALUE $ | |
| | 7,722,824 | | | Series 2010-1-1A4 | | | 6.00% | (a) | | | 02/26/2037 | | | | 3,530,495 | |
| | 5,125,471 | | | Series 2010-1-2A11 | | | 7.00% | (a)(c) | | | 01/26/2037 | | | | 2,323,363 | |
| | | |
| | | | Legacy Mortgage Asset Trust | | | | | | | | |
| | 117,230,912 | | | Series 2019-RPL3-PT1 | | | 0.00% | (a) | | | 06/25/2058 | | | | 98,383,861 | |
| | 28,844,714 | | | Series 2020-GS1-A2 | | | 8.00% | (a)(d)(h) | | | 10/25/2059 | | | | 28,902,586 | |
| | 28,151,733 | | | Series 2020-GS2-A2 | | | 8.00% | (a)(d)(h) | | | 03/25/2060 | | | | 28,208,214 | |
| | 24,000,000 | | | Series 2021-GS4-A2 | | | 3.55% | (a)(d) | | | 11/25/2060 | | | | 22,882,980 | |
| | | |
| | | | Lehman Brothers Holdings, Inc. | | | | | | | | |
| | 18,277,627 | | | Series 2007-1-1A1 (CME Term SOFR 1 Month + 0.32%, 0.21% Floor) | | | 5.65% | (a) | | | 06/25/2037 | | | | 12,925,225 | |
| | 5,603,322 | | | Series 2007-1-2A4 (CME Term SOFR 1 Month + 0.41%, 0.30% Floor) | | | 5.74% | (a) | | | 06/25/2037 | | | | 3,685,143 | |
| | | |
| | | | Lehman Mortgage Trust | | | | | | | | |
| | 1,478,018 | | | Series 2005-2-3A5 | | | 5.50% | | | | 12/25/2035 | | | | 768,617 | |
| | 1,005,738 | | | Series 2005-2-5A5 | | | 5.75% | | | | 12/25/2035 | | | | 686,606 | |
| | 1,741,874 | | | Series 2005-3-2A1 | | | 6.00% | | | | 01/25/2036 | | | | 1,436,406 | |
| | 148,188 | | | Series 2005-3-2A3 | | | 5.50% | | | | 01/25/2036 | | | | 116,612 | |
| | 796,092 | | | Series 2005-3-2A7 | | | 6.00% | | | | 01/25/2036 | | | | 656,423 | |
| | 921,577 | | | Series 2006-1-1A1 (CME Term SOFR 1 Month + 0.86%, 0.75% Floor, 5.50% Cap) | | | 5.50% | | | | 02/25/2036 | | | | 404,948 | |
| | 2,764,731 | | | Series 2006-1-1A2 (-1 x CME Term SOFR 1 Month + 4.64%, 4.75% Cap) | | | 0.00% | (f)(g) | | | 02/25/2036 | | | | 130,905 | |
| | 1,933,565 | | | Series 2006-1-3A1 (CME Term SOFR 1 Month + 0.86%, 0.75% Floor, 5.50% Cap) | | | 5.50% | | | | 02/25/2036 | | | | 1,217,914 | |
| | 1,933,565 | | | Series 2006-1-3A2 (-1 x CME Term SOFR 1 Month + 4.64%, 4.75% Cap) | | | 0.00% | (b)(f)(g) | | | 02/25/2036 | | | | 76,894 | |
| | 1,245,780 | | | Series 2006-1-3A4 | | | 5.50% | | | | 02/25/2036 | | | | 870,980 | |
| | 1,481,280 | | | Series 2006-4-1A3 (-1 x CME Term SOFR 1 Month + 5.29%, 5.40% Cap) | | | 0.00% | (f)(g) | | | 08/25/2036 | | | | 101,738 | |
| | 941,470 | | | Series 2006-4-1A4 | | | 6.00% | | | | 08/25/2036 | | | | 738,411 | |
| | 5,464,838 | | | Series 2006-5-2A1 (CME Term SOFR 1 Month + 0.46%, 0.35% Floor, 7.50% Cap) | | | 5.79% | | | | 09/25/2036 | | | | 778,509 | |
| | 11,383,198 | | | Series 2006-5-2A2 (-1 x CME Term SOFR 1 Month + 7.04%, 7.15% Cap) | | | 1.71% | (f)(g) | | | 09/25/2036 | | | | 1,092,869 | |
| | 5,650,361 | | | Series 2006-6-3A9 | | | 5.50% | | | | 10/25/2036 | | | | 3,792,423 | |
| | 158,763 | | | Series 2006-6-4A5 | | | 6.00% | | | | 12/25/2036 | | | | 149,915 | |
| | 2,766,145 | | | Series 2006-7-2A2 (CME Term SOFR 1 Month + 0.56%, 0.45% Floor, 7.00% Cap) | | | 5.89% | | | | 11/25/2036 | | | | 642,562 | |
| | 10,217,736 | | | Series 2006-7-2A5 (-1 x CME Term SOFR 1 Month + 6.44%, 6.55% Cap) | | | 1.11% | (f)(g) | | | 11/25/2036 | | | | 949,130 | |
| | 1,668,734 | | | Series 2006-9-1A19 (-5 x CME Term SOFR 1 Month + 30.16%, 30.68% Cap) | | | 5.64% | (g) | | | 01/25/2037 | | | | 1,472,654 | |
| | 1,812,600 | | | Series 2006-9-1A5 (CME Term SOFR 1 Month + 0.71%, 0.60% Floor, 5.75% Cap) | | | 5.75% | | | | 01/25/2037 | | | | 973,503 | |
| | 5,419,500 | | | Series 2006-9-1A6 (-1 x CME Term SOFR 1 Month + 5.04%, 5.15% Cap) | | | 0.00% | (f)(g) | | | 01/25/2037 | | | | 304,124 | |
| | 3,435,028 | | | Series 2006-9-2A1 (CME Term SOFR 1 Month + 0.49%, 0.38% Floor, 7.00% Cap) | | | 5.82% | | | | 01/25/2037 | | | | 721,018 | |
| | 6,196,517 | | | Series 2006-9-2A2 (-1 x CME Term SOFR 1 Month + 6.51%, 6.62% Cap) | | | 1.18% | (f)(g) | | | 01/25/2037 | | | | 531,331 | |
| | 5,822,380 | | | Series 2007-10-2A1 | | | 6.50% | | | | 01/25/2038 | | | | 1,628,214 | |
| | 1,410,944 | | | Series 2007-2-1A1 | | | 5.75% | | | | 02/25/2037 | | | | 947,455 | |
| | 2,404,747 | | | Series 2007-4-2A11 (CME Term SOFR 1 Month + 0.44%, 0.33% Floor, 7.00% Cap) | | | 5.77% | | | | 05/25/2037 | | | | 782,955 | |
| | 10,866,647 | | | Series 2007-4-2A8 (-1 x CME Term SOFR 1 Month + 6.56%, 6.67% Cap) | | | 1.23% | (f)(g) | | | 05/25/2037 | | | | 987,609 | |
| | 744,054 | | | Series 2007-4-2A9 (CME Term SOFR 1 Month + 0.44%, 0.33% Floor, 7.00% Cap) | | | 5.77% | | | | 05/25/2037 | | | | 183,693 | |
| | 6,435,089 | | | Series 2007-5-11A1 | | | 4.53% | (c) | | | 06/25/2037 | | | | 3,570,043 | |
| | 605,648 | | | Series 2007-5-4A3 (-6 x CME Term SOFR 1 Month + 39.39%, 40.08% Cap) | | | 7.42% | (g) | | | 08/25/2036 | | | | 678,561 | |
| | 601,977 | | | Series 2007-5-7A3 | | | 7.50% | | | | 10/25/2036 | | | | 230,792 | |
| | 64,515 | | | Series 2007-6-1A8 | | | 6.00% | | | | 07/25/2037 | | | | 57,432 | |
| | 5,740,551 | | | Series 2007-9-2A2 | | | 6.50% | | | | 10/25/2037 | | | | 1,520,716 | |
| | 3,212,717 | | | Series 2008-2-1A6 | | | 6.00% | | | | 03/25/2038 | | | | 1,013,354 | |
| | | | |
| 30 | | DoubleLine Funds Trust | | The accompanying notes are an integral part of these financial statements. |
| | | | | | | | | | | | | | | | |
PRINCIPAL AMOUNT $ | | | SECURITY DESCRIPTION | | RATE | | | MATURITY | | | VALUE $ | |
| | | | Lehman XS Trust | | | | | | | | | | | | |
| | 4,611,944 | | | Series 2005-2-2A3B | | | 5.94% | (d) | | | 08/25/2035 | | | | 4,076,372 | |
| | 78,351 | | | Series 2005-4-2A3A | | | 5.50% | (d) | | | 10/25/2035 | | | | 150,221 | |
| | 6,807,151 | | | Series 2005-9N-2A1 (12 Month US Treasury Average + 1.06%, 1.06% Floor) | | | 6.15% | | | | 02/25/2036 | | | | 5,831,174 | |
| | 5,337,317 | | | Series 2006-3-A3 (CME Term SOFR 1 Month + 0.71%, 0.60% Floor) | | | 6.04% | | | | 03/25/2036 | | | | 5,159,038 | |
| | 6,352,369 | | | Series 2006-5-1A1A (CME Term SOFR 1 Month + 0.53%, 0.42% Floor) | | | 5.86% | | | | 04/25/2036 | | | | 5,239,382 | |
| | 32,652 | | | Series 2006-5-2A4A | | | 6.39% | (d) | | | 04/25/2036 | | | | 38,876 | |
| | 7,638,726 | | | Series 2006-GP3-1A1 (CME Term SOFR 1 Month + 0.51%, 0.40% Floor) | | | 5.84% | | | | 06/25/2046 | | | | 6,866,952 | |
| | 4,311,098 | | | Series 2007-1-2A1 | | | 7.00% | (c) | | | 02/25/2037 | | | | 4,233,323 | |
| | 9,327,759 | | | Series 2007-12N-1A3A (CME Term SOFR 1 Month + 0.51%, 0.40% Floor) | | | 5.84% | | | | 07/25/2047 | | | | 8,941,242 | |
| | 9,157,581 | | | Series 2007-15N-4A1 (CME Term SOFR 1 Month + 1.01%, 0.90% Floor) | | | 6.34% | | | | 08/25/2047 | | | | 7,481,507 | |
| | | |
| | | | LHOME Mortgage Trust | | | | | | | | |
| | 16,073,208 | | | Series 2021-RTL2-A1 | | | 3.09% | (a)(d) | | | 06/25/2026 | | | | 16,047,391 | |
| | | |
| | | | Long Beach Mortgage Loan Trust | | | | | | | | |
| | 13,268,713 | | | Series 2006-2-2A4 (CME Term SOFR 1 Month + 0.69%, 0.58% Floor) | | | 6.02% | | | | 03/25/2046 | | | | 4,807,018 | |
| | 47,575,641 | | | Series 2006-3-2A3 (CME Term SOFR 1 Month + 0.47%, 0.36% Floor) | | | 5.80% | | | | 05/25/2046 | | | | 14,817,657 | |
| | 4,849,785 | | | Series 2006-3-2A4 (CME Term SOFR 1 Month + 0.65%, 0.54% Floor) | | | 5.98% | | | | 05/25/2046 | | | | 1,510,415 | |
| | 15,019,279 | | | Series 2006-5-2A4 (CME Term SOFR 1 Month + 0.59%, 0.48% Floor) | | | 5.92% | | | | 06/25/2036 | | | | 7,123,459 | |
| | 25,017,637 | | | Series 2006-6-1A (CME Term SOFR 1 Month + 0.40%, 0.29% Floor) | | | 5.73% | | | | 07/25/2036 | | | | 17,249,838 | |
| | 11,641,962 | | | Series 2006-WL1-M2 (CME Term SOFR 1 Month + 0.79%, 0.68% Floor) | | | 6.12% | | | | 01/25/2046 | | | | 10,746,146 | |
| | | |
| | | | Luminent Mortgage Trust | | | | | | | | |
| | 1,471,535 | | | Series 2005-1-A1 (CME Term SOFR 1 Month + 0.63%, 0.52% Floor, 11.50% Cap) | | | 5.96% | | | | 11/25/2035 | | | | 1,383,720 | |
| | | |
| | | | Master Resecuritization Trust | | | | | | | | |
| | 12,996,450 | | | Series 2008-1-A1 | | | 6.00% | (a)(b)(c) | | | 09/27/2037 | | | | 8,921,769 | |
| | 6,412,717 | | | Series 2008-4-A1 | | | 6.00% | (a)(c) | | | 06/27/2036 | | | | 4,941,565 | |
| | | |
| | | | Mastr Adjustable Rate Mortgages Trust | | | | | | | | |
| | 2,235,216 | | | Series 2005-2-2A1 | | | 3.86% | (c) | | | 03/25/2035 | | | | 1,907,935 | |
| | 721,435 | | | Series 2005-6-5A1 | | | 3.25% | (c) | | | 07/25/2035 | | | | 621,271 | |
| | 4,717,793 | | | Series 2007-1-2A1 | | | 4.62% | (c) | | | 11/25/2036 | | | | 2,529,444 | |
| | | |
| | | | MASTR Alternative Loans Trust | | | | | | | | |
| | 6,628,434 | | | Series 2004-9-M2 | | | 6.26% | (d) | | | 08/25/2034 | | | | 5,354,398 | |
| | 1,111,612 | | | Series 2005-2-3A1 | | | 6.00% | | | | 03/25/2035 | | | | 964,182 | |
| | 46,782 | | | Series 2005-5-2A3 | | | 5.50% | | | | 07/25/2025 | | | | 43,902 | |
| | 6,625,620 | | | Series 2005-5-3A1 | | | 5.75% | | | | 08/25/2035 | | | | 3,339,034 | |
| | 1,433,229 | | | Series 2005-6-1A5 | | | 5.50% | | | | 12/25/2035 | | | | 949,098 | |
| | 1,250,930 | | | Series 2006-3-1A2 | | | 6.25% | | | | 07/25/2036 | | | | 685,574 | |
| | 719,700 | | | Series 2007-1-1A5 | | | 5.75% | | | | 10/25/2036 | | | | 671,947 | |
| | 3,703,696 | | | Series 2007-1-2A7 | | | 6.00% | | | | 10/25/2036 | | | | 1,097,638 | |
| | | |
| | | | Mastr Asset Backed Securities Trust | | | | | | | | |
| | 1,948,466 | | | Series 2003-OPT1-M3 (CME Term SOFR 1 Month + 4.24%, 4.13% Floor) | | | 9.57% | | | | 12/25/2032 | | | | 1,856,121 | |
| | 6,026,698 | | | Series 2006-AM2-A3 (CME Term SOFR 1 Month + 0.45%, 0.34% Floor) | | | 5.78% | | | | 06/25/2036 | | | | 5,403,263 | |
| | 8,032,027 | | | Series 2007-HE1-A3 (CME Term SOFR 1 Month + 0.32%, 0.21% Floor) | | | 5.65% | | | | 05/25/2037 | | | | 7,663,612 | |
| | 13,101,948 | | | Series 2007-WMC1-A1 (CME Term SOFR 1 Month + 0.40%, 0.29% Floor) | | | 5.73% | | | | 01/25/2037 | | | | 3,619,370 | |
| | | |
| | | | MASTR Asset Securitization Trust | | | | | | | | |
| | 1,307,272 | | | Series 2006-1-1A4 | | | 5.75% | | | | 05/25/2036 | | | | 785,265 | |
| | 1,042,827 | | | Series 2006-2-1A11 (CME Term SOFR 1 Month + 6.00%, 6.00% Floor) | | | 6.00% | | | | 06/25/2036 | | | | 622,400 | |
| | 2,421,256 | | | Series 2007-1-1A3 | | | 6.25% | | | | 11/25/2037 | | | | 1,030,959 | |
| | | | | | | | |
| The accompanying notes are an integral part of these financial statements. | | Annual Report | | | | | March 31, 2024 | | 31 |
| | |
Schedule of Investments DoubleLine Total Return Bond Fund (Cont.) | | |
| | | | | | | | | | | | | | | | |
PRINCIPAL AMOUNT $ | | | SECURITY DESCRIPTION | | RATE | | | MATURITY | | | VALUE $ | |
| | | |
| | | | Mastr Seasoned Securities Trust | | | | | | | | |
| | 1,138,299 | | | Series 2005-2-1A4 | | | 6.00% | | | | 10/25/2032 | | | | 1,105,936 | |
| | 451,983 | | | Series 2005-2-2A1 (CME Term SOFR 1 Month + 0.51%, 0.40% Floor, 7.50% Cap) | | | 5.84% | | | | 10/25/2032 | | | | 411,788 | |
| | | |
| | | | Merrill Lynch Alternative Note Asset | | | | | | | | |
| | 19,809,731 | | | Series 2007-A3-A2A (CME Term SOFR 1 Month + 0.33%, 0.22% Floor) | | | 5.66% | | | | 04/25/2037 | | | | 7,214,520 | |
| | 10,158,808 | | | Series 2007-A3-A2B (CME Term SOFR 1 Month + 0.53%, 0.42% Floor) | | | 5.86% | | | | 04/25/2037 | | | | 3,699,504 | |
| | 14,080,227 | | | Series 2007-A3-A2C (CME Term SOFR 1 Month + 0.75%, 0.64% Floor) | | | 6.08% | | | | 04/25/2037 | | | | 5,131,933 | |
| | 12,927,876 | | | Series 2007-F1-2A4 (CME Term SOFR 1 Month + 0.43%, 0.32% Floor, 7.00% Cap) | | | 5.76% | | | | 03/25/2037 | | | | 3,694,647 | |
| | 12,927,876 | | | Series 2007-F1-2A5 (-1 x CME Term SOFR 1 Month + 6.57%, 6.68% Cap) | | | 1.24% | (f)(g) | | | 03/25/2037 | | | | 1,697,863 | |
| | 28,554,161 | | | Series 2007-OAR5-1A1 | | | 3.53% | (c) | | | 10/25/2047 | | | | 8,618,220 | |
| | | |
| | | | Merrill Lynch First Franklin Mortgage Loan Trust | | | | | | | | |
| | 2,078,927 | | | Series 2007-H1-1A2 (CME Term SOFR 1 Month + 3.61%, 3.50% Floor) | | | 8.94% | | | | 10/25/2037 | | | | 1,906,808 | |
| | | |
| | | | Merrill Lynch Mortgage Investors, Inc. | | | | | | | | |
| | 16,566,095 | | | Series 2005-AR1-M2 (CME Term SOFR 1 Month + 1.12%, 1.01% Floor) | | | 6.45% | | | | 06/25/2036 | | | | 12,871,591 | |
| | 7,856,820 | | | Series 2006-AR1-A2C (CME Term SOFR 1 Month + 0.43%, 0.32% Floor) | | | 5.76% | (a) | | | 03/25/2037 | | | | 2,219,344 | |
| | 694,491 | | | Series 2006-F1-1A2 | | | 6.00% | | | | 04/25/2036 | | | | 304,498 | |
| | 22,043,764 | | | Series 2006-FM1-A1 (CME Term SOFR 1 Month + 0.41%, 0.30% Floor) | | | 4.60% | | | | 04/25/2037 | | | | 12,889,233 | |
| | 10,277,127 | | | Series 2006-HE3-A4 (CME Term SOFR 1 Month + 0.61%, 0.50% Floor) | | | 5.94% | | | | 06/25/2037 | | | | 2,602,720 | |
| | 7,512,307 | | | Series 2006-HE4-A2B (CME Term SOFR 1 Month + 0.31%, 0.20% Floor) | | | 5.64% | | | | 07/25/2037 | | | | 1,767,498 | |
| | 74,695,349 | | | Series 2007-HE2-A1 (CME Term SOFR 1 Month + 0.61%, 0.50% Floor) | | | 5.94% | | | | 02/25/2037 | | | | 35,176,595 | |
| | 8,338,649 | | | Series 2007-HE3-A1 (CME Term SOFR 1 Month + 0.25%, 0.14% Floor) | | | 5.58% | | | | 04/25/2047 | | | | 3,412,471 | |
| | 7,114,136 | | | Series 2007-HE3-A3 (CME Term SOFR 1 Month + 0.49%, 0.38% Floor) | | | 5.82% | | | | 04/25/2047 | | | | 2,911,309 | |
| | 2,979,822 | | | Series 2007-HE3-A4 (CME Term SOFR 1 Month + 0.65%, 0.54% Floor) | | | 5.98% | | | | 04/25/2047 | | | | 1,219,429 | |
| | 48,290,416 | | | Series 2007-MLN1-A1 (CME Term SOFR 1 Month + 0.36%, 0.25% Floor) | | | 5.69% | | | | 03/25/2037 | | | | 35,819,431 | |
| | | |
| | | | MFRA Trust | | | | | | | | |
| | 13,500,028 | | | Series 2021-NPL1-A1 | | | 5.36% | (a)(d) | | | 03/25/2060 | | | | 13,382,305 | |
| | | |
| | | | Morgan Stanley ABS Capital I, Inc. | | | | | | | | |
| | 16,640,916 | | | Series 2006-HE7-A2C (CME Term SOFR 1 Month + 0.43%, 0.32% Floor) | | | 5.76% | | | | 09/25/2036 | | | | 7,170,562 | |
| | 22,081,958 | | | Series 2006-HE7-A2D (CME Term SOFR 1 Month + 0.57%, 0.46% Floor) | | | 5.90% | | | | 09/25/2036 | | | | 9,514,844 | |
| | 13,143,728 | | | Series 2006-NC2-M1 (CME Term SOFR 1 Month + 0.65%, 0.54% Floor) | | | 5.98% | | | | 02/25/2036 | | | | 11,975,602 | |
| | 5,687,975 | | | Series 2007-HE4-A1 (CME Term SOFR 1 Month + 0.24%, 0.13% Floor) | | | 5.57% | (a) | | | 02/25/2037 | | | | 2,490,695 | |
| | | |
| | | | Morgan Stanley Home Equity Loan Trust | | | | | | | | |
| | 24,787,425 | | | Series 2007-1-A4 (CME Term SOFR 1 Month + 0.33%, 0.22% Floor) | | | 5.66% | | | | 12/25/2036 | | | | 12,130,554 | |
| | | |
| | | | Morgan Stanley IXIS Real Estate Capital Trust | | | | | | | | |
| | 5,055,435 | | | Series 2006-2-AFPT (CME Term SOFR 1 Month + 0.18%, 0.07% Floor) | | | 5.51% | | | | 11/25/2036 | | | | 1,646,850 | |
| | | |
| | | | Morgan Stanley Mortgage Loan Trust | | | | | | | | |
| | 590,783 | | | Series 2005-10-1A1 (CME Term SOFR 1 Month + 0.81%, 0.70% Floor, 5.75% Cap) | | | 5.75% | | | | 12/25/2035 | | | | 355,149 | |
| | 1,480,187 | | | Series 2005-10-1A6 | | | 5.75% | | | | 12/25/2035 | | | | 987,361 | |
| | 1,809,760 | | | Series 2005-10-2A1 | | | 5.28% | (c) | | | 12/25/2035 | | | | 1,646,562 | |
| | 4,541,096 | | | Series 2006-11-1A6 | | | 6.73% | (d) | | | 08/25/2036 | | | | 855,550 | |
| | 6,631,957 | | | Series 2006-11-2A1 | | | 6.00% | | | | 08/25/2036 | | | | 2,800,860 | |
| | | | |
| 32 | | DoubleLine Funds Trust | | The accompanying notes are an integral part of these financial statements. |
| | | | | | | | | | | | | | | | |
PRINCIPAL AMOUNT $ | | | SECURITY DESCRIPTION | | RATE | | | MATURITY | | | VALUE $ | |
| | 6,608,790 | | | Series 2006-16AX-2A2 (CME Term SOFR 1 Month + 0.45%, 0.34% Floor) | | | 5.78% | | | | 11/25/2036 | | | | 1,903,871 | |
| | 5,171,467 | | | Series 2006-17XS-A3A | | | 6.15% | (d) | | | 10/25/2046 | | | | 1,540,163 | |
| | 1,782,258 | | | Series 2006-17XS-A6 | | | 6.08% | (d) | | | 10/25/2046 | | | | 435,594 | |
| | 1,705,951 | | | Series 2006-2-2A3 | | | 5.75% | | | | 02/25/2036 | | | | 1,533,150 | |
| | 14,655,303 | | | Series 2006-7-3A | | | 5.20% | (c) | | | 06/25/2036 | | | | 8,289,778 | |
| | 1,412,419 | | | Series 2006-7-4A4 | | | 6.00% | | | | 06/25/2036 | | | | 663,856 | |
| | 1,429,829 | | | Series 2006-7-4A7 | | | 6.00% | | | | 06/25/2036 | | | | 672,041 | |
| | 2,857,280 | | | Series 2007-13-6A1 | | | 6.00% | | | | 10/25/2037 | | | | 1,534,778 | |
| | 3,156,598 | | | Series 2007-14AR-2A3 | | | 3.66% | (c) | | | 10/25/2037 | | | | 1,799,120 | |
| | 2,849,666 | | | Series 2007-1XS-2A3 | | | 6.42% | (d) | | | 09/25/2046 | | | | 616,294 | |
| | 1,886,336 | | | Series 2007-1XS-2A4A | | | 6.58% | (d) | | | 09/25/2046 | | | | 495,801 | |
| | 242,115 | | | Series 2007-3XS-1A2A | | | 6.12% | (d) | | | 01/25/2047 | | | | 219,821 | |
| | 5,137,029 | | | Series 2007-3XS-2A3S | | | 6.36% | (d) | | | 01/25/2047 | | | | 1,864,145 | |
| | 3,004,678 | | | Series 2007-3XS-2A4S | | | 6.46% | (d) | | | 01/25/2047 | | | | 1,077,316 | |
| | | |
| | | | Morgan Stanley Reremic Trust | | | | | | | | |
| | 3,370,241 | | | Series 2010-R5-4B | | | 4.11% | (a)(d) | | | 06/26/2036 | | | | 3,168,545 | |
| | 5,804,254 | | | Series 2010-R5-5B | | | 3.35% | (a)(d) | | | 01/26/2037 | | | | 5,217,423 | |
| | 9,441,793 | | | Series 2010-R9-3C | | | 6.00% | (a)(b)(c) | | | 11/26/2036 | | | | 7,295,740 | |
| | 7,232,975 | | | Series 2012-R4-1B (CME Term SOFR 1 Month + 0.11%) | | | 3.34% | (a) | | | 08/26/2036 | | | | 5,307,837 | |
| | 6,057,449 | | | Series 2013-R2-1B | | | 3.98% | (a)(b)(c) | | | 10/26/2036 | | | | 5,052,849 | |
| | 1,273,065 | | | Series 2014-R7-B1 | | | 4.17% | (a)(c) | | | 01/26/2051 | | | | 1,258,710 | |
| | 5,018,402 | | | Series 2014-R7-B2 | | | 4.17% | (a)(c)(h) | | | 01/26/2051 | | | | 4,654,080 | |
| | | |
| | | | Morgan Stanley Residential Mortgage Loan Trust | | | | | | | | |
| | 18,961,848 | | | Series 2020-RPL1-A1 | | | 5.69% | (a)(c) | | | 10/25/2060 | | | | 18,789,924 | |
| | | |
| | | | New Century Alternative Mortgage Loan Trust | | | | | | | | |
| | 9,507,637 | | | Series 2006-ALT1-AF3 | | | 6.17% | (c) | | | 07/25/2036 | | | | 2,008,143 | |
| | 12,128,053 | | | Series 2006-ALT2-AF5 | | | 4.69% | (d) | | | 10/25/2036 | | | | 2,392,012 | |
| | | |
| | | | New Century Home Equity Loan Trust | | | | | | | | |
| | 17,829,000 | | | Series 2005-4-M5 (CME Term SOFR 1 Month + 1.13%, 1.02% Floor, 12.50% Cap) | | | 6.46% | | | | 09/25/2035 | | | | 16,535,365 | |
| | 12,500,000 | | | Series 2006-1-A2C (CME Term SOFR 1 Month + 0.67%, 0.56% Floor, 12.50% Cap) | | | 6.00% | | | | 05/25/2036 | | | | 11,217,569 | |
| | | |
| | | | New York Mortgage Trust, Inc. | | | | | | | | |
| | 219,832 | | | Series 2005-2-A (CME Term SOFR 1 Month + 0.77%, 0.66% Floor, 10.50% Cap) | | | 6.10% | | | | 08/25/2035 | | | | 197,454 | |
| | | |
| | | | Nomura Asset Acceptance Corp. | | | | | | | | |
| | 20,468 | | | Series 2005-AP1-2A5 | | | 5.36% | (d) | | | 02/25/2035 | | | | 19,954 | |
| | 12,688,021 | | | Series 2006-AF1-1A2 | | | 6.16% | (c) | | | 05/25/2036 | | | | 2,357,328 | |
| | 2,578,432 | | | Series 2006-AF1-1A3 | | | 6.41% | (c) | | | 05/25/2036 | | | | 478,568 | |
| | 14,099,024 | | | Series 2006-AP1-A2 | | | 5.52% | (c) | | | 01/25/2036 | | | | 4,278,817 | |
| | 2,383,032 | | | Series 2006-AP1-A3 | | | 5.65% | (c) | | | 01/25/2036 | | | | 722,961 | |
| | 1,116,073 | | | Series 2006-WF1-A2 | | | 5.76% | (c) | | | 06/25/2036 | | | | 293,968 | |
| | | |
| | | | Nomura Home Equity Loan, Inc. | | | | | | | | |
| | 14,713,946 | | | Series 2006-AF1-A2 | | | 6.30% | (d) | | | 10/25/2036 | | | | 3,206,850 | |
| | 2,521,275 | | | Series 2007-1-1A1 | | | 6.56% | (d) | | | 02/25/2037 | | | | 683,631 | |
| | 12,566,616 | | | Series 2007-1-1A3 | | | 6.49% | (d) | | | 02/25/2037 | | | | 3,407,995 | |
| | | |
| | | | Nomura Resecuritization Trust | | | | | | | | |
| | 2,789,985 | | | Series 2014-1R-6A7 | | | 6.36% | (a)(c) | | | 08/26/2036 | | | | 2,225,013 | |
| | 4,166,681 | | | Series 2014-2R-4A9 | | | 4.07% | (a)(d) | | | 07/26/2036 | | | | 3,643,487 | |
| | 7,451,981 | | | Series 2015-4R-5A2 (CME Term SOFR 1 Month + 0.54%, 0.43% Floor) | | | 3.04% | (a)(h) | | | 03/26/2036 | | | | 5,182,744 | |
| | | |
| | | | Novastar Home Equity Loan | | | | | | | | |
| | 14,340,514 | | | Series 2005-3-M4 (CME Term SOFR 1 Month + 1.00%, 0.89% Floor, 11.00% Cap) | | | 6.33% | | | | 01/25/2036 | | | | 11,777,496 | |
| | 7,412,253 | | | Series 2006-3-A2C (CME Term SOFR 1 Month + 0.43%, 0.32% Floor, 11.00% Cap) | | | 5.76% | | | | 10/25/2036 | | | | 3,902,359 | |
| | | |
| | | | NRZ Excess Spread-Collateralized Notes | | | | | | | | |
| | 37,277,614 | | | Series 2020-PLS1-A | | | 3.84% | (a) | | | 12/25/2025 | | | | 35,759,095 | |
| | 28,078,524 | | | Series 2021-FHT1-A | | | 3.10% | (a) | | | 07/25/2026 | | | | 26,212,810 | |
| | | |
| | | | Onslow Bay Mortgage Loan Trust | | | | | | | | |
| | 9,694,000 | | | Series 2021-NQM3-M1 | | | 2.33% | (a)(c) | | | 07/25/2061 | | | | 5,508,866 | |
| | | | | | | | |
| The accompanying notes are an integral part of these financial statements. | | Annual Report | | | | | March 31, 2024 | | 33 |
| | |
Schedule of Investments DoubleLine Total Return Bond Fund (Cont.) | | |
| | | | | | | | | | | | | | | | |
PRINCIPAL AMOUNT $ | | | SECURITY DESCRIPTION | | RATE | | | MATURITY | | | VALUE $ | |
| | | |
| | | | Option One Mortgage Loan Trust | | | | | | | | |
| | 721,028 | | | Series 2004-3-M3 (CME Term SOFR 1 Month + 1.09%, 0.98% Floor) | | | 6.42% | | | | 11/25/2034 | | | | 714,032 | |
| | 5,500,467 | | | Series 2007-1-2A3 (CME Term SOFR 1 Month + 0.25%, 0.14% Floor) | | | 5.58% | | | | 01/25/2037 | | | | 3,237,619 | |
| | 51,609,217 | | | Series 2007-6-1A1 (CME Term SOFR 1 Month + 0.30%, 0.19% Floor) | | | 5.63% | | | | 07/25/2037 | | | | 44,439,097 | |
| |
| | | | PennyMac Mortgage Investment Trust | |
| | 32,907,674 | | | Series 2019-2R-A (CME Term SOFR 1 Month + 3.86%, 2.75% Floor) | | | 9.20% | (a) | | | 05/30/2025 | | | | 32,956,779 | |
| | 8,206,318 | | | Series 2019-3R-A (US 30 Day Average Secured Overnight Financing Rate + 3.81%, 2.70% Floor) | | | 9.14% | (a) | | | 11/27/2031 | | | | 8,222,370 | |
| | 24,594,917 | | | Series 2020-1R-A (US 30 Day Average Secured Overnight Financing Rate + 3.46%, 2.35% Floor) | | | 8.79% | (a) | | | 02/25/2025 | | | | 24,524,536 | |
| | 67,663,000 | | | Series 2021-FT1-A (CME Term SOFR 1 Month + 3.11%, 3.12% Floor) | | | 8.44% | (a) | | | 03/25/2026 | | | | 68,514,708 | |
| |
| | | | People’s Choice Home Loan Securities Trust | |
| | 10,080,000 | | | Series 2005-1-M5 (CME Term SOFR 1 Month + 1.61%, 1.50% Floor, 15.00% Cap) | | | 6.94% | | | | 01/25/2035 | | | | 7,244,980 | |
| |
| | | | PHH Alternative Mortgage Trust | |
| | 2,827,736 | | | Series 2007-1-1A1 (CME Term SOFR 1 Month + 0.43%, 0.32% Floor, 10.10% Cap) | | | 5.76% | | | | 02/25/2037 | | | | 2,063,945 | |
| | 6,547,059 | | | Series 2007-2-2A1 | | | 6.00% | | | | 05/25/2037 | | | | 5,460,086 | |
| | 3,054,964 | | | Series 2007-2-2A2 | | | 6.00% | | | | 05/25/2037 | | | | 2,547,765 | |
| | 170,513 | | | Series 2007-2-3A1 | | | 6.00% | | | | 05/25/2037 | | | | 149,547 | |
| |
| | | | PR Mortgage Loan Trust | |
| | 108,539,570 | | | Series 2014-1-APT | | | 5.86% | (a)(c) | | | 10/25/2049 | | | | 100,352,885 | |
| |
| | | | Pretium Mortgage Credit Partners LLC | |
| | 41,137,130 | | | Series 2021-NPL1-A1 | | | 5.24% | (a)(d) | | | 09/27/2060 | | | | 40,704,742 | |
| | 23,400,798 | | | Series 2021-NPL5-A1 | | | 2.49% | (a)(d) | | | 10/25/2051 | | | | 22,947,705 | |
| | 14,674,089 | | | Series 2021-RN2-A1 | | | 1.74% | (a)(d) | | | 07/25/2051 | | | | 14,225,207 | |
| | 29,145,513 | | | Series 2021-RN4-A1 | | | 2.49% | (a)(c) | | | 10/25/2051 | | | | 28,558,032 | |
| |
| | | | Prime Mortgage Trust | |
| | 4,435,088 | | | Series 2006-DR1-2A1 | | | 5.50% | (a) | | | 05/25/2035 | | | | 4,036,596 | |
| | 2,495,811 | | | Series 2006-DR1-2A2 | | | 6.00% | (a) | | | 05/25/2035 | | | | 2,124,782 | |
| |
| | | | Progress Residential Trust | |
| | 56,990,150 | | | Series 2021-SFR10-E1 | | | 3.57% | (a) | | | 12/17/2040 | | | | 50,636,113 | |
| | 23,650,636 | | | Series 2021-SFR10-E2 | | | 3.67% | (a) | | | 12/17/2040 | | | | 20,936,326 | |
| | 12,810,761 | | | Series 2021-SFR10-F | | | 4.61% | (a) | | | 12/17/2040 | | | | 11,352,767 | |
| | 29,000,000 | | | Series 2021-SFR2-E1 | | | 2.55% | (a) | | | 04/19/2038 | | | | 26,652,467 | |
| | 20,000,000 | | | Series 2021-SFR2-E2 | | | 2.65% | (a) | | | 04/19/2038 | | | | 18,376,682 | |
| | 62,271,000 | | | Series 2021-SFR2-F | | | 3.40% | (a) | | | 04/19/2038 | | | | 56,977,853 | |
| | 7,000,000 | | | Series 2021-SFR5-E1 | | | 2.21% | (a) | | | 07/17/2038 | | | | 6,348,689 | |
| | 25,000,000 | | | Series 2021-SFR8-E1 | | | 2.38% | (a) | | | 10/17/2038 | | | | 22,477,808 | |
| | 23,900,000 | | | Series 2021-SFR8-E2 | | | 2.53% | (a) | | | 10/17/2038 | | | | 21,443,011 | |
| | 19,900,000 | | | Series 2021-SFR8-F | | | 3.18% | (a) | | | 10/17/2038 | | | | 17,840,251 | |
| |
| | | | PRPM LLC | |
| | 5,714,963 | | | Series 2020-4-A2 | | | 8.19% | (a)(d)(h) | | | 10/25/2025 | | | | 5,718,792 | |
| | 163,073,784 | | | Series 2021-10-A1 | | | 2.49% | (a)(d) | | | 10/25/2026 | | | | 160,714,757 | |
| | 79,221,114 | | | Series 2021-11-A1 | | | 2.49% | (a)(d) | | | 11/25/2026 | | | | 77,829,903 | |
| | 65,168,612 | | | Series 2021-2-A1 | | | 5.12% | (a)(c) | | | 03/25/2026 | | | | 64,600,674 | |
| | 7,100,000 | | | Series 2021-2-A2 | | | 6.77% | (a)(c) | | | 03/25/2026 | | | | 6,995,455 | |
| | 40,770,810 | | | Series 2021-6-A1 | | | 1.79% | (a)(d) | | | 07/25/2026 | | | | 39,687,476 | |
| | 36,598,387 | | | Series 2021-7-A1 | | | 1.87% | (a)(d) | | | 08/25/2026 | | | | 35,506,690 | |
| |
| | | | Racers | |
| | 13,085,000 | | | Series 2006-2-M2 (CME Term SOFR 1 Month + 0.40%, 0.29% Floor) | | | 5.73% | | | | 09/25/2036 | | | | 9,797,932 | |
| |
| | | | RALI Trust | |
| | 14,333,350 | | | Series 2005-QA11-4A1 | | | 5.37% | (c) | | | 10/25/2035 | | | | 10,465,916 | |
| | 7,554,442 | | | Series 2005-QA13-2A1 | | | 5.28% | (c) | | | 12/25/2035 | | | | 6,473,816 | |
| | 5,542,772 | | | Series 2005-QA3-CB1 | | | 4.29% | (c) | | | 03/25/2035 | | | | 2,295,987 | |
| | 175,300 | | | Series 2005-QS12-A11 (-11 x CME Term SOFR 1 Month + 49.89%, 51.15% Cap) | | | 0.00% | (g) | | | 08/25/2035 | | | | 143,592 | |
| | 716,453 | | | Series 2005-QS13-1A6 | | | 5.50% | | | | 09/25/2035 | | | | 581,777 | |
| | | | |
| 34 | | DoubleLine Funds Trust | | The accompanying notes are an integral part of these financial statements. |
| | | | | | | | | | | | | | | | |
PRINCIPAL AMOUNT $ | | | SECURITY DESCRIPTION | | RATE | | | MATURITY | | | VALUE $ | |
| | 1,468,662 | | | Series 2005-QS13-2A1 (CME Term SOFR 1 Month + 0.81%, 0.70% Floor, 5.75% Cap) | | | 5.75% | | | | 09/25/2035 | | | | 1,157,235 | |
| | 6,021,512 | | | Series 2005-QS13-2A2 (-1 x CME Term SOFR 1 Month + 4.94%, 5.05% Cap) | | | 0.00% | (f)(g) | | | 09/25/2035 | | | | 210,480 | |
| | 4,891,923 | | | Series 2005-QS14-2A1 | | | 6.00% | | | | 09/25/2035 | | | | 1,634,625 | |
| | 1,187,150 | | | Series 2005-QS15-2A | | | 6.00% | | | | 10/25/2035 | | | | 985,096 | |
| | 1,352,897 | | | Series 2005-QS15-3A | | | 6.00% | | | | 10/25/2035 | | | | 1,124,546 | |
| | 1,270,668 | | | Series 2005-QS16-A1 (CME Term SOFR 1 Month + 0.81%, 0.70% Floor, 5.50% Cap) | | | 5.50% | | | | 11/25/2035 | | | | 1,025,888 | |
| | 1,270,448 | | | Series 2005-QS16-A2 (-1 x CME Term SOFR 1 Month + 4.69%, 4.80% Cap) | | | 0.00% | (f)(g) | | | 11/25/2035 | | | | 26,629 | |
| | 722,047 | | | Series 2005-QS17-A1 | | | 6.00% | | | | 12/25/2035 | | | | 625,474 | |
| | 747,129 | | | Series 2005-QS17-A10 | | | 6.00% | | | | 12/25/2035 | | | | 647,201 | |
| | 2,092,644 | | | Series 2005-QS17-A11 | | | 6.00% | | | | 12/25/2035 | | | | 1,812,755 | |
| | 1,487,385 | | | Series 2005-QS17-A2 (CME Term SOFR 1 Month + 0.96%, 0.85% Floor, 6.00% Cap) | | | 6.00% | | | | 12/25/2035 | | | | 1,223,766 | |
| | 1,487,385 | | | Series 2005-QS17-A4 (-1 x CME Term SOFR 1 Month + 5.04%, 5.15% Cap) | | | 0.00% | (f)(g) | | | 12/25/2035 | | | | 50,939 | |
| | 1,196,796 | | | Series 2005-QS17-A6 | | | 6.00% | | | | 12/25/2035 | | | | 1,036,726 | |
| | 504,348 | | | Series 2005-QS5-A3 | | | 5.70% | | | | 04/25/2035 | | | | 491,774 | |
| | 576,083 | | | Series 2006-QS1-A6 (-8 x CME Term SOFR 1 Month + 41.98%, 42.86% Cap) | | | 1.12% | (g) | | | 01/25/2036 | | | | 496,997 | |
| | 1,875,432 | | | Series 2006-QS10-A1 | | | 6.00% | | | | 08/25/2036 | | | | 1,537,681 | |
| | 576,714 | | | Series 2006-QS10-A4 | | | 5.75% | | | | 08/25/2036 | | | | 466,332 | |
| | 4,307,718 | | | Series 2006-QS11-1A1 | | | 6.50% | | | | 08/25/2036 | | | | 3,462,073 | |
| | 1,081,121 | | | Series 2006-QS12-1A1 | | | 6.50% | | | | 09/25/2036 | | | | 483,747 | |
| | 1,683,102 | | | Series 2006-QS12-2A18 | | | 5.75% | | | | 09/25/2036 | | | | 1,345,221 | |
| | 2,625,461 | | | Series 2006-QS14-A18 | | | 6.25% | | | | 11/25/2036 | | | | 2,097,599 | |
| | 1,159,267 | | | Series 2006-QS15-A1 | | | 6.50% | | | | 10/25/2036 | | | | 971,884 | |
| | 487,759 | | | Series 2006-QS16-A10 | | | 6.00% | | | | 11/25/2036 | | | | 366,648 | |
| | 1,734,394 | | | Series 2006-QS16-A11 | | | 6.00% | | | | 11/25/2036 | | | | 1,303,915 | |
| | 1,382,476 | | | Series 2006-QS16-A7 | | | 6.00% | | | | 11/25/2036 | | | | 1,039,205 | |
| | 547,105 | | | Series 2006-QS16-A8 | | | 6.00% | | | | 11/25/2036 | | | | 411,258 | |
| | 216,500 | | | Series 2006-QS16-A9 | | | 6.00% | | | | 11/25/2036 | | | | 162,743 | |
| | 1,015,003 | | | Series 2006-QS17-A4 | | | 6.00% | | | | 12/25/2036 | | | | 820,929 | |
| | 5,638,916 | | | Series 2006-QS17-A5 | | | 6.00% | | | | 12/25/2036 | | | | 4,560,726 | |
| | 3,882,612 | | | Series 2006-QS3-1A11 | | | 6.00% | | | | 03/25/2036 | | | | 3,273,793 | |
| | 964,615 | | | Series 2006-QS4-A8 (-790 x CME Term SOFR 1 Month + 5,052.56%, 0.10% Floor, 8.00% Cap) | | | 8.00% | (g) | | | 04/25/2036 | | | | 810,626 | |
| | 3,815,268 | | | Series 2006-QS4-A9 | | | 6.00% | | | | 04/25/2036 | | | | 2,989,266 | |
| | 2,276,224 | | | Series 2006-QS5-A3 | | | 6.00% | | | | 05/25/2036 | | | | 1,827,312 | |
| | 6,784,004 | | | Series 2006-QS5-A4 | | | 6.00% | | | | 05/25/2036 | | | | 5,446,078 | |
| | 1,188,435 | | | Series 2006-QS6-1A16 | | | 6.00% | | | | 06/25/2036 | | | | 903,437 | |
| | 1,724,160 | | | Series 2006-QS6-1A2 | | | 6.00% | | | | 06/25/2036 | | | | 1,310,691 | |
| | 3,367,814 | | | Series 2006-QS8-A1 | | | 6.00% | | | | 08/25/2036 | | | | 2,724,319 | |
| | 5,840,282 | | | Series 2006-QS8-A5 (-1 x CME Term SOFR 1 Month + 5.44%, 5.55% Cap) | | | 0.11% | (f)(g) | | | 08/25/2036 | | | | 360,715 | |
| | 2,104,887 | | | Series 2006-QS9-1A6 (-1 x CME Term SOFR 1 Month + 5.19%, 5.30% Cap) | | | 0.00% | (f)(g) | | | 07/25/2036 | | | | 90,158 | |
| | 20,882,326 | | | Series 2007-QA5-1A1 | | | 6.04% | (c) | | | 09/25/2037 | | | | 13,303,846 | |
| | 24,439,844 | | | Series 2007-QH5-AII (CME Term SOFR 1 Month + 0.57%, 0.46% Floor) | | | 5.90% | | | | 06/25/2037 | | | | 10,295,534 | |
| | 9,453,675 | | | Series 2007-QH7-2A1 (CME Term SOFR 1 Month + 0.71%, 0.60% Floor) | | | 6.04% | | | | 08/25/2037 | | | | 8,434,031 | |
| | 7,238,529 | | | Series 2007-QS1-1A2 (-1 x CME Term SOFR 1 Month + 5.34%, 5.45% Cap) | | | 0.01% | (f)(g) | | | 01/25/2037 | | | | 332,815 | |
| | 728,635 | | | Series 2007-QS1-1A4 | | | 6.00% | | | | 01/25/2037 | | | | 557,690 | |
| | 1,757,620 | | | Series 2007-QS1-2A10 | | | 6.00% | | | | 01/25/2037 | | | | 1,322,721 | |
| | 21,137,375 | | | Series 2007-QS10-A1 | | | 6.50% | | | | 09/25/2037 | | | | 16,726,171 | |
| | 2,254,634 | | | Series 2007-QS11-A1 | | | 7.00% | | | | 10/25/2037 | | | | 1,739,114 | |
| | 2,336,424 | | | Series 2007-QS2-A6 | | | 6.25% | | | | 01/25/2037 | | | | 1,893,568 | |
| | 12,177,860 | | | Series 2007-QS3-A1 | | | 6.50% | | | | 02/25/2037 | | | | 9,803,015 | |
| | 1,941,836 | | | Series 2007-QS3-A4 | | | 6.25% | | | | 02/25/2037 | | | | 1,537,411 | |
| | 3,191,596 | | | Series 2007-QS4-3A3 | | | 6.00% | | | | 03/25/2037 | | | | 2,635,278 | |
| | | | | | | | |
| The accompanying notes are an integral part of these financial statements. | | Annual Report | | | | | March 31, 2024 | | 35 |
| | |
Schedule of Investments DoubleLine Total Return Bond Fund (Cont.) | | |
| | | | | | | | | | | | | | | | |
PRINCIPAL AMOUNT $ | | | SECURITY DESCRIPTION | | RATE | | | MATURITY | | | VALUE $ | |
| | 1,298,303 | | | Series 2007-QS5-A1 | | | 5.50% | | | | 03/25/2037 | | | | 997,631 | |
| | 535,603 | | | Series 2007-QS5-A5 (CME Term SOFR 1 Month + 0.41%, 0.30% Floor, 7.00% Cap) | | | 5.74% | | | | 03/25/2037 | | | | 386,551 | |
| | 1,778,860 | | | Series 2007-QS5-A8 (-1 x CME Term SOFR 1 Month + 6.59%, 6.70% Cap) | | | 1.26% | (f)(g) | | | 03/25/2037 | | | | 218,752 | |
| | 1,444,382 | | | Series 2007-QS6-A102 | | | 5.75% | | | | 04/25/2037 | | | | 1,126,028 | |
| | 464,411 | | | Series 2007-QS6-A13 (-8 x CME Term SOFR 1 Month + 54.05%, 55.00% Cap) | | | 9.63% | (g) | | | 04/25/2037 | | | | 529,461 | |
| | 2,068,242 | | | Series 2007-QS6-A45 | | | 5.75% | | | | 04/25/2037 | | | | 1,612,383 | |
| | 3,296,138 | | | Series 2007-QS6-A6 | | | 6.25% | | | | 04/25/2037 | | | | 2,647,213 | |
| | 227,654 | | | Series 2007-QS6-A77 (-8 x CME Term SOFR 1 Month + 54.88%, 55.83% Cap) | | | 10.47% | (g) | | | 04/25/2037 | | | | 267,101 | |
| | 5,336,233 | | | Series 2007-QS7-2A1 | | | 6.75% | | | | 06/25/2037 | | | | 2,252,795 | |
| | 12,443,453 | | | Series 2007-QS9-A33 | | | 6.50% | | | | 07/25/2037 | | | | 9,660,222 | |
| |
| | | | RAMP Trust | |
| | 1,428,485 | | | Series 2004-RS7-A3 | | | 5.53% | (c) | | | 07/25/2034 | | | | 1,224,832 | |
| | 6,359,025 | | | Series 2006-RS2-A3A (CME Term SOFR 1 Month + 0.41%, 0.30% Floor, 14.00% Cap) | | | 6.04% | | | | 03/25/2036 | | | | 6,193,042 | |
| | 12,278,236 | | | Series 2006-RS3-A4 (CME Term SOFR 1 Month + 0.41%, 0.30% Floor, 14.00% Cap) | | | 6.04% | | | | 05/25/2036 | | | | 10,221,522 | |
| | 12,410,749 | | | Series 2006-RS6-A4 (CME Term SOFR 1 Month + 0.65%, 0.54% Floor) | | | 5.98% | | | | 11/25/2036 | | | | 9,961,181 | |
| |
| | | | RASC Trust | |
| | 3,860,296 | | | Series 2005-KS4-M5 (CME Term SOFR 1 Month + 1.31%, 1.80% Floor) | | | 7.24% | | | | 05/25/2035 | | | | 3,782,943 | |
| | 5,643,386 | | | Series 2007-EMX1-A13 (CME Term SOFR 1 Month + 0.31%, 0.20% Floor, 14.00% Cap) | | | 5.64% | | | | 01/25/2037 | | | | 5,566,498 | |
| |
| | | | RBSGC Mortgage Pass Through Certificates | |
| | 11,377,557 | | | Series 2008-B-A1 | | | 6.00% | (a) | | | 06/25/2037 | | | | 9,788,512 | |
| |
| | | | RBSSP Resecuritization Trust | |
| | 1,318,178 | | | Series 2009-12-17A2 | | | 5.60% | (a)(c) | | | 10/25/2035 | | | | 1,292,116 | |
| | 13,715,643 | | | Series 2009-12-20A2 | | | 4.96% | (a)(b)(c) | | | 12/25/2035 | | | | 11,613,825 | |
| | 2,904,675 | | | Series 2010-4-7A2 | | | 6.00% | (a) | | | 07/26/2037 | | | | 1,442,880 | |
| |
| | | | Redwood Funding Trust | |
| | 53,821,878 | | | Series 2019-1-PT | | | 4.97% | (a)(d) | | | 09/27/2024 | | | | 53,861,400 | |
| | | | |
| | | | Redwood Trust, Inc. | | | | | | | | | | | | |
| | 37,936,601 | | | Series 2020-1-PT | | | 7.21% | (a)(d) | | | 02/17/2025 | | | | 36,438,560 | |
| | 55,526,022 | | | Series 2021-1-PT | | | 4.75% | (a)(d) | | | 06/19/2026 | | | | 52,742,780 | |
| | | | |
| | | | Regional Management Issuance Trust | | | | | | | | | | | | |
| | 66,658,473 | | | Series 2017-RPL2-CERT | | | 0.00% | (a)(b)(c) | | | 02/25/2056 | | | | 49,752,538 | |
| | | | |
| | | | Renaissance Home Equity Loan Trust | | | | | | | | | | | | |
| | 5,355,649 | | | Series 2006-1-AF6 | | | 5.75% | (d) | | | 05/25/2036 | | | | 2,556,774 | |
| | 2,062,139 | | | Series 2006-2-AF5 | | | 6.25% | (d) | | | 08/25/2036 | | | | 875,880 | |
| | 17,385,181 | | | Series 2006-3-AF3 | | | 5.59% | (d) | | | 11/25/2036 | | | | 5,914,159 | |
| | 18,049,871 | | | Series 2006-3-AF4 | | | 5.81% | (d) | | | 11/25/2036 | | | | 6,383,705 | |
| | 2,933,947 | | | Series 2006-3-AF5 | | | 6.12% | (d) | | | 11/25/2036 | | | | 1,091,794 | |
| | 8,192,822 | | | Series 2007-1-AF1 | | | 5.74% | (d) | | | 04/25/2037 | | | | 2,215,041 | |
| | 5,779,950 | | | Series 2007-1-AF1Z | | | 5.35% | (d) | | | 04/25/2037 | | | | 1,475,445 | |
| | 3,486,895 | | | Series 2007-1-AF2 | | | 5.51% | (d) | | | 04/25/2037 | | | | 904,915 | |
| | 5,072,268 | | | Series 2007-1-AF3 | | | 5.61% | (d) | | | 04/25/2037 | | | | 1,340,229 | |
| | 2,781,357 | | | Series 2007-1-AF4 | | | 5.76% | (d) | | | 04/25/2037 | | | | 754,477 | |
| | 8,232,817 | | | Series 2007-1-AF5 | | | 5.91% | (d) | | | 04/25/2037 | | | | 2,290,988 | |
| | | | |
| | | | Renaissance NIM Trust | | | | | | | | | | | | |
| | 10,257,172 | | | Series 2006-4-AF4 | | | 5.47% | (d) | | | 01/25/2037 | | | | 3,466,939 | |
| | 20,198,460 | | | Series 2006-4-AF5 | | | 5.69% | (d) | | | 01/25/2037 | | | | 7,093,087 | |
| | 17,696,892 | | | Series 2007-2-AF2 | | | 5.68% | (d) | | | 06/25/2037 | | | | 4,559,247 | |
| | 22,755,581 | | | Series 2007-2-AF5 | | | 6.20% | (d) | | | 06/25/2037 | | | | 6,502,441 | |
| | | | |
| | | | Residential Asset Securitization Trust | | | | | | | | | | | | |
| | 4,379,342 | | | Series 2005-A11-2A4 | | | 6.00% | | | | 10/25/2035 | | | | 1,916,744 | |
| | 1,109,448 | | | Series 2005-A12-A7 (-1 x CME Term SOFR 1 Month + 4.89%, 5.00% Cap) | | | 0.00% | (f)(g) | | | 11/25/2035 | | | | 69,692 | |
| | 1,405,296 | | | Series 2005-A12-A8 (CME Term SOFR 1 Month + 0.66%, 0.55% Floor, 5.50% Cap) | | | 5.50% | | | | 11/25/2035 | | | | 710,548 | |
| | 1,499,820 | | | Series 2005-A15-1A7 | | | 6.00% | | | | 02/25/2036 | | | | 1,400,481 | |
| | | | |
| 36 | | DoubleLine Funds Trust | | The accompanying notes are an integral part of these financial statements. |
| | | | | | | | | | | | | | | | |
PRINCIPAL AMOUNT $ | | | SECURITY DESCRIPTION | | RATE | | | MATURITY | | | VALUE $ | |
| | 6,927,257 | | | Series 2005-A15-5A3 | | | 5.75% | | | | 02/25/2036 | | | | 2,515,925 | |
| | 7,093,234 | | | Series 2005-A16-A1 | | | 5.00% | | | | 02/25/2036 | | | | 2,742,592 | |
| | 2,750,190 | | | Series 2005-A8CB-A11 | | | 6.00% | | | | 07/25/2035 | | | | 1,766,025 | |
| | 2,780,470 | | | Series 2005-A8CB-A2 (-1 x CME Term SOFR 1 Month + 4.89%, 5.00% Cap) | | | 0.00% | (f)(g) | | | 07/25/2035 | | | | 127,937 | |
| | 644,047 | | | Series 2006-A1-1A3 | | | 6.00% | | | | 04/25/2036 | | | | 278,244 | |
| | 10,250,699 | | | Series 2006-A1-3A2 | | | 6.00% | | | | 04/25/2036 | | | | 4,743,024 | |
| | 4,929,117 | | | Series 2006-A10-A5 | | | 6.50% | | | | 09/25/2036 | | | | 1,661,595 | |
| | 6,991,296 | | | Series 2006-A12-A1 | | | 6.25% | | | | 11/25/2036 | | | | 2,578,089 | |
| | 7,171,989 | | | Series 2006-A13-A1 | | | 6.25% | | | | 12/25/2036 | | | | 2,539,142 | |
| | 14,025,993 | | | Series 2006-A14C-2A6 (CME Term SOFR 1 Month + 0.56%, 0.45% Floor, 7.00% Cap) | | | 5.89% | | | | 12/25/2036 | | | | 3,096,499 | |
| | 30,953,262 | | | Series 2006-A14C-2A7 (-1 x CME Term SOFR 1 Month + 6.44%, 6.55% Cap) | | | 1.11% | (f)(g) | | | 12/25/2036 | | | | 3,710,717 | |
| | 5,471,283 | | | Series 2006-A2-A11 | | | 6.00% | | | | 01/25/2046 | | | | 2,253,777 | |
| | 3,812,659 | | | Series 2006-A2-A4 | | | 6.00% | | | | 01/25/2046 | | | | 1,563,259 | |
| | 3,168,681 | | | Series 2006-A2-A9 | | | 6.00% | | | | 01/25/2046 | | | | 1,299,217 | |
| | 2,250,431 | | | Series 2006-A8-1A1 | | | 6.00% | | | | 08/25/2036 | | | | 1,242,481 | |
| | 4,485,082 | | | Series 2006-R1-A1 (-4 x CME Term SOFR 1 Month + 27.94%, 28.40% Cap) | | | 6.62% | (b)(g) | | | 01/25/2046 | | | | 3,459,003 | |
| | 19,262,060 | | | Series 2007-A2-1A2 | | | 6.00% | | | | 04/25/2037 | | | | 10,225,319 | |
| | 716,817 | | | Series 2007-A3-1A2 (-8 x CME Term SOFR 1 Month + 45.51%, 46.38% Cap) | | | 4.65% | (g) | | | 04/25/2037 | | | | 774,810 | |
| | 22,895,372 | | | Series 2007-A5-1A4 (-1 x CME Term SOFR 1 Month + 5.99%, 6.10% Cap) | | | 0.66% | (f)(g) | | | 05/25/2037 | | | | 1,041,298 | |
| | 5,882,095 | | | Series 2007-A5-1A6 (CME Term SOFR 1 Month + 0.51%, 0.40% Floor, 6.50% Cap) | | | 5.84% | | | | 05/25/2037 | | | | 829,012 | |
| | 4,008,885 | | | Series 2007-A5-2A3 | | | 6.00% | | | | 05/25/2037 | | | | 2,041,627 | |
| | 1,756,890 | | | Series 2007-A5-2A5 | | | 6.00% | | | | 05/25/2037 | | | | 894,741 | |
| | 7,476,228 | | | Series 2007-A6-1A2 | | | 6.00% | | | | 06/25/2037 | | | | 3,836,998 | |
| | 7,757,643 | | | Series 2007-A7-A1 | | | 6.00% | | | | 07/25/2037 | | | | 2,959,091 | |
| | 34,123,095 | | | Series 2007-A7-A2 | | | 6.00% | | | | 07/25/2037 | | | | 13,015,985 | |
| | 15,119,223 | | | Series 2007-A7-A6 | | | 6.00% | | | | 07/25/2037 | | | | 5,767,108 | |
| |
| | | | Residential Mortgage Loan Trust | |
| | 6,300,000 | | | Series 2020-2-M1 | | | 3.57% | (a)(c) | | | 05/25/2060 | | | | 5,570,105 | |
| |
| | | | RFMSI Trust | |
| | 3,637,437 | | | Series 2006-S10-1A1 | | | 6.00% | | | | 10/25/2036 | | | | 2,733,551 | |
| | 1,062,347 | | | Series 2006-S5-A12 | | | 6.00% | | | | 06/25/2036 | | | | 872,809 | |
| | 72,733 | | | Series 2006-S5-A15 | | | 6.00% | | | | 06/25/2036 | | | | 59,756 | |
| | 2,224,915 | | | Series 2006-S9-A1 | | | 6.25% | | | | 09/25/2036 | | | | 1,716,247 | |
| | 2,593,752 | | | Series 2007-S1-A7 | | | 6.00% | | | | 01/25/2037 | | | | 1,944,327 | |
| | 1,356,093 | | | Series 2007-S2-A1 | | | 6.00% | | | | 02/25/2037 | | | | 1,033,002 | |
| | 1,527,788 | | | Series 2007-S2-A4 | | | 6.00% | | | | 02/25/2037 | | | | 1,163,791 | |
| | 2,852,206 | | | Series 2007-S2-A5 | | | 6.00% | | | | 02/25/2037 | | | | 2,172,664 | |
| | 445,705 | | | Series 2007-S2-A9 | | | 6.00% | | | | 02/25/2037 | | | | 339,515 | |
| | 1,457,663 | | | Series 2007-S3-1A4 | | | 6.00% | | | | 03/25/2037 | | | | 1,041,160 | |
| | 1,367,627 | | | Series 2007-S4-A1 | | | 6.00% | | | | 04/25/2037 | | | | 1,040,220 | |
| | 765,911 | | | Series 2007-S4-A2 | | | 6.00% | | | | 04/25/2037 | | | | 582,552 | |
| | 10,191,730 | | | Series 2007-S5-A1 | | | 6.00% | | | | 05/25/2037 | | | | 8,202,394 | |
| | 2,953,604 | | | Series 2007-S5-A8 | | | 6.00% | | | | 05/25/2037 | | | | 2,377,689 | |
| | 1,166,396 | | | Series 2007-S6-2A4 | | | 6.00% | | | | 06/25/2037 | | | | 857,789 | |
| | 7,794,177 | | | Series 2007-S7-A20 | | | 6.00% | | | | 07/25/2037 | | | | 5,950,885 | |
| | 3,940,901 | | | Series 2007-S8-1A1 | | | 6.00% | | | | 09/25/2037 | | | | 2,626,288 | |
| | 221,604 | | | Series 2007-SA1-4A | | | 4.55% | (c) | | | 02/25/2037 | | | | 202,461 | |
| | 2,635,424 | | | Series 2007-SA2-2A1 | | | 5.39% | (c) | | | 04/25/2037 | | | | 2,206,447 | |
| |
| | | | Rithm Capital Corp. | |
| | 62,504,400 | | | Series 2020-RPL1-M1 | | | 3.25% | (a)(c) | | | 11/25/2059 | | | | 54,011,840 | |
| | 16,345,550 | | | Series 2020-RPL1-M2 | | | 3.50% | (a)(c) | | | 11/25/2059 | | | | 13,982,408 | |
| |
| | | | Securitized Asset Backed Receivables LLC | |
| | 3,478,058 | | | Series 2006-NC3-A2B (CME Term SOFR 1 Month + 0.41%, 0.30% Floor) | | | 5.74% | | | | 09/25/2036 | | | | 1,215,107 | |
| | 5,365,070 | | | Series 2007-BR3-A2A (CME Term SOFR 1 Month + 0.25%, 0.14% Floor) | | | 5.58% | | | | 04/25/2037 | | | | 3,556,736 | |
| | 5,243,518 | | | Series 2007-BR3-A2B (CME Term SOFR 1 Month + 0.55%, 0.44% Floor) | | | 5.88% | | | | 04/25/2037 | | | | 3,476,024 | |
| | 14,336,405 | | | Series 2007-BR4-A2B (CME Term SOFR 1 Month + 0.31%, 0.20% Floor) | | | 5.64% | | | | 05/25/2037 | | | | 8,772,170 | |
| | | | | | | | |
| The accompanying notes are an integral part of these financial statements. | | Annual Report | | | | | March 31, 2024 | | 37 |
| | |
Schedule of Investments DoubleLine Total Return Bond Fund (Cont.) | | |
| | | | | | | | | | | | | | | | |
PRINCIPAL AMOUNT $ | | | SECURITY DESCRIPTION | | RATE | | | MATURITY | | | VALUE $ | |
| |
| | | | Securitized Mortgage Asset Loan Trust | |
| | 181,516,151 | | | Series 2015-1-PC | | | 2.41% | (a)(c) | | | 02/25/2054 | | | | 151,109,780 | |
| |
| | | | Sequoia Mortgage Trust | |
| | 49,834 | | | Series 2003-4-2A1 (CME Term SOFR 1 Month + 0.81%, 0.70% Floor, 11.50% Cap) | | | 6.14% | | | | 07/20/2033 | | | | 48,304 | |
| | | | |
| | | | SG Mortgage Securities Trust | | | | | | | | | | | | |
| | 3,331,635 | | | Series 2006-FRE1-A1A (CME Term SOFR 1 Month + 0.45%, 0.34% Floor) | | | 5.78% | | | | 02/25/2036 | | | | 3,218,728 | |
| | 2,435,282 | | | Series 2006-FRE1-A2C (CME Term SOFR 1 Month + 0.65%, 0.54% Floor) | | | 5.98% | | | | 02/25/2036 | | | | 1,235,934 | |
| | | | |
| | | | Soundview Home Equity Loan Trust | | | | | | | | | | | | |
| | 11,267,178 | | | Series 2007-NS1-M1 (CME Term SOFR 1 Month + 0.46%, 0.35% Floor) | | | 5.79% | | | | 01/25/2037 | | | | 10,311,324 | |
| | 3,206,370 | | | Series 2007-OPT1-2A2 (CME Term SOFR 1 Month + 0.26%, 0.15% Floor) | | | 5.59% | | | | 06/25/2037 | | | | 2,104,668 | |
| | 5,670,639 | | | Series 2007-OPT3-1A1 (CME Term SOFR 1 Month + 0.28%, 0.17% Floor) | | | 5.61% | | | | 08/25/2037 | | | | 4,743,775 | |
| | 18,112,838 | | | Series 2007-OPT4-1A1 (CME Term SOFR 1 Month + 1.11%, 1.00% Floor) | | | 6.44% | | | | 09/25/2037 | | | | 12,455,527 | |
| | 41,937,282 | | | Series 2007-WM1W-2A1 (CME Term SOFR 1 Month + 0.29%, 0.18% Floor) | | | 4.45% | (b) | | | 02/25/2037 | | | | 33,072,231 | |
| |
| | | | Specialty Underwriting & Residential Finance | |
| | 3,743,072 | | | Series 2006-BC2-A2B | | | 4.25% | (d) | | | 02/25/2037 | | | | 1,324,331 | |
| | 12,916,570 | | | Series 2007-AB1-A2C (CME Term SOFR 1 Month + 0.36%, 0.25% Floor) | | | 5.69% | | | | 03/25/2037 | | | | 7,079,586 | |
| |
| | | | Spruce Hill Mortgage Loan Trust | |
| | 9,309,606 | | | Series 2020-SH1-M1 | | | 3.22% | (a)(c) | | | 01/28/2050 | | | | 9,057,136 | |
| |
| | | | Starwood Mortgage Residential Trust | |
| | 6,329,000 | | | Series 2021-1-B2 | | | 4.52% | (a)(c) | | | 05/25/2065 | | | | 4,628,843 | |
| | 5,000,000 | | | Series 2021-2-B1 | | | 2.75% | (a)(c) | | | 05/25/2065 | | | | 3,814,892 | |
| | 7,110,000 | | | Series 2021-2-B2 | | | 3.00% | (a)(c) | | | 05/25/2065 | | | | 4,615,875 | |
| | 9,103,000 | | | Series 2021-5-M1 | | | 3.25% | (a)(c) | | | 09/25/2066 | | | | 6,382,985 | |
| |
| | | | Structured Adjustable Rate Mortgage Loan Trust | |
| | 1,094,890 | | | Series 2005-22-4A1 | | | 5.25% | (c) | | | 12/25/2035 | | | | 995,555 | |
| | 7,403,522 | | | Series 2006-1-8A1 | | | 5.34% | (c) | | | 02/25/2036 | | | | 4,315,826 | |
| | 2,197,577 | | | Series 2006-12-2A1 | | | 4.56% | (c) | | | 01/25/2037 | | | | 1,584,498 | |
| | 1,113,462 | | | Series 2006-8-4A4 | | | 4.76% | (c) | | | 09/25/2036 | | | | 991,139 | |
| | 6,524,066 | | | Series 2007-7-1A1 (CME Term SOFR 1 Month + 0.71%, 0.60% Floor) | | | 6.04% | | | | 08/25/2037 | | | | 5,608,949 | |
| |
| | | | Structured Asset Investment Loan Trust | |
| | 68,036,902 | | | Series 2006-3-A1 (CME Term SOFR 1 Month + 0.43%, 0.32% Floor) | | | 5.76% | | | | 06/25/2036 | | | | 42,529,330 | |
| | 7,952,922 | | | Series 2006-4-A1 (CME Term SOFR 1 Month + 0.29%, 0.17% Floor) | | | 5.62% | | | | 07/25/2036 | | | | 4,647,261 | |
| | 20,800,000 | | | Series 2006-4-A5 (CME Term SOFR 1 Month + 0.42%, 0.31% Floor) | | | 5.75% | | | | 07/25/2036 | | | | 6,984,596 | |
| |
| | | | Structured Asset Mortgage Investments, Inc. | |
| | 8,392,474 | | | Series 2006-AR3-12A2 (CME Term SOFR 1 Month + 0.51%, 0.40% Floor, 10.50% Cap) | | | 5.84% | | | | 05/25/2036 | | | | 6,541,359 | |
| |
| | | | Structured Asset Securities Corp. | |
| | 735,013 | | | Series 2003-24A-1A3 | | | 6.92% | (c) | | | 07/25/2033 | | | | 713,774 | |
| | 8,489,615 | | | Series 2005-5-3A1 | | | 6.00% | | | | 04/25/2035 | | | | 4,553,876 | |
| | 64,465,926 | | | Series 2006-BC4-A1 (CME Term SOFR 1 Month + 0.43%, 0.32% Floor) | | | 5.76% | | | | 12/25/2036 | | | | 37,618,047 | |
| | 10,108,551 | | | Series 2006-BC4-A4 (CME Term SOFR 1 Month + 0.45%, 0.34% Floor) | | | 5.78% | | | | 12/25/2036 | | | | 9,689,863 | |
| | 45,281,473 | | | Series 2007-4-1A3 (-1 x CME Term SOFR 1 Month + 6.14%, 6.25% Cap) | | | 0.81% | (a)(f)(g) | | | 03/28/2045 | | | | 2,367,397 | |
| | 20,127,500 | | | Series 2007-BC4-M1 (CME Term SOFR 1 Month + 0.61%, 0.50% Floor) | | | 5.94% | | | | 11/25/2037 | | | | 14,958,704 | |
| | 12,370,712 | | | Series 2007-MN1A-A4 (CME Term SOFR 1 Month + 0.35%, 0.24% Floor) | | | 5.68% | (a) | | | 01/25/2037 | | | | 7,568,957 | |
| | 14,607,692 | | | Series 2007-RF1-1A (CME Term SOFR 1 Month + 0.30%, 0.19% Floor) | | | 5.63% | (a) | | | 03/25/2037 | | | | 11,792,645 | |
| | | | |
| 38 | | DoubleLine Funds Trust | | The accompanying notes are an integral part of these financial statements. |
| | | | | | | | | | | | | | | | |
PRINCIPAL AMOUNT $ | | | SECURITY DESCRIPTION | | RATE | | | MATURITY | | | VALUE $ | |
| | | | |
| | | | Suntrust Adjustable Rate Mortgage Loan Trust | | | | | | | | | | | | |
| | 3,365,515 | | | Series 2007-2-1A1 | | | 6.06% | (c) | | | 04/25/2037 | | | | 1,335,181 | |
| | 1,347,095 | | | Series 2007-3-1A1 | | | 5.03% | (c) | | | 06/25/2037 | | | | 850,111 | |
| | | | |
| | | | Suntrust Alternative Loan Trust | | | | | | | | | | | | |
| | 191,588 | | | Series 2005-1F-2A3 | | | 5.75% | | | | 12/25/2035 | | | | 172,293 | |
| | 454,399 | | | Series 2006-1F-1A3 | | | 6.00% | | | | 04/25/2036 | | | | 171,708 | |
| | | | |
| | | | Terwin Mortgage Trust | | | | | | | | | | | | |
| | 10,628,142 | | | Series 2006-7-2A3 (CME Term SOFR 1 Month + 0.65%, 0.54% Floor) | | | 5.98% | (a) | | | 08/25/2037 | | | | 4,572,392 | |
| | | | |
| | | | Thornburg Mortgage Securities Trust | | | | | | | | | | | | |
| | 114,340 | | | Series 2003-6-A2 (CME Term SOFR 1 Month + 1.11%, 1.00% Floor, 11.50% Cap) | | | 6.44% | | | | 12/25/2033 | | | | 108,158 | |
| | 2,397,992 | | | Series 2004-4-5A | | | 3.05% | (c) | | | 12/25/2044 | | | | 2,067,968 | |
| | 4,219,897 | | | Series 2007-1-A1 (CME Term SOFR 12 Month + 2.02%, 0.11% Floor, 10.75% Cap) | | | 7.05% | | | | 03/25/2037 | | | | 3,575,920 | |
| | 1,396,924 | | | Series 2007-1-A2A (CME Term SOFR 12 Month + 2.02%, 0.11% Floor, 10.75% Cap) | | | 7.05% | | | | 03/25/2037 | | | | 1,050,246 | |
| | | | |
| | | | Toorak Mortgage Corp. | | | | | | | | | | | | |
| | 13,625,043 | | | Series 2021-1-A1 | | | 3.24% | (a)(d) | | | 06/25/2024 | | | | 13,495,243 | |
| | | | |
| | | | Tricon American Homes Trust | | | | | | | | | | | | |
| | 5,000,000 | | | Series 2019-SFR1-E | | | 3.40% | (a) | | | 03/17/2038 | | | | 4,735,670 | |
| | 8,900,000 | | | Series 2020-SFR1-D | | | 2.55% | (a) | | | 07/17/2038 | | | | 8,247,578 | |
| | 1,600,000 | | | Series 2020-SFR1-E | | | 3.54% | (a) | | | 07/17/2038 | | | | 1,513,024 | |
| | | | |
| | | | Tricon Residential Trust | | | | | | | | | | | | |
| | 16,000,000 | | | Series 2021-SFR1-B | | | 2.24% | (a) | | | 07/17/2038 | | | | 14,815,768 | |
| | 13,250,000 | | | Series 2021-SFR1-C | | | 2.34% | (a) | | | 07/17/2038 | | | | 12,234,825 | |
| | 5,250,000 | | | Series 2021-SFR1-D | | | 2.59% | (a) | | | 07/17/2038 | | | | 4,834,286 | |
| | 10,000,000 | | | Series 2021-SFR1-E2 | | | 2.89% | (a) | | | 07/17/2038 | | | | 9,125,726 | |
| | 11,300,000 | | | Series 2021-SFR1-F | | | 3.69% | (a) | | | 07/17/2038 | | | | 10,338,947 | |
| | | | |
| | | | VCAT Asset Securitization LLC | | | | | | | | | | | | |
| | 3,679,564 | | | Series 2021-NPL3-A1 | | | 1.74% | (a)(d) | | | 05/25/2051 | | | | 3,574,687 | |
| | 15,353,189 | | | Series 2021-NPL4-A1 | | | 1.87% | (a)(d) | | | 08/25/2051 | | | | 14,898,672 | |
| | 27,478,112 | | | Series 2021-NPL5-A1 | | | 1.87% | (a)(d) | | | 08/25/2051 | | | | 26,849,663 | |
| | 12,506,362 | | | Series 2021-NPL6-A1 | | | 1.92% | (a)(d) | | | 09/25/2051 | | | | 12,155,927 | |
| | | | |
| | | | Velocity Commercial Capital Loan Trust | | | | | | | | | | | | |
| | 5,673,551 | | | Series 2017-2-AFX | | | 3.07% | (a)(c) | | | 11/25/2047 | | | | 5,412,090 | |
| | 8,837,501 | | | Series 2018-2-A | | | 4.05% | (a)(c) | | | 10/26/2048 | | | | 8,334,163 | |
| | 21,707,471 | | | Series 2019-1-A | | | 3.76% | (a)(c) | | | 03/25/2049 | | | | 20,196,176 | |
| | 2,351,839 | | | Series 2019-1-M4 | | | 4.61% | (a)(c) | | | 03/25/2049 | | | | 1,967,785 | |
| | 7,979,537 | | | Series 2019-2-A | | | 3.13% | (a)(c) | | | 07/25/2049 | | | | 7,410,886 | |
| | 2,954,424 | | | Series 2019-2-M1 | | | 3.26% | (a)(c) | | | 07/25/2049 | | | | 2,590,387 | |
| | 1,999,174 | | | Series 2020-1-M4 | | | 3.54% | (a)(c) | | | 02/25/2050 | | | | 1,613,803 | |
| | | | |
| | | | Vericrest Opportunity Loan Transferee | | | | | | | | | | | | |
| | 12,861,136 | | | Series 2021-CF1-A1 | | | 1.99% | (a)(d) | | | 08/25/2051 | | | | 12,426,183 | |
| | 11,101,552 | | | Series 2021-CF2-A1 | | | 2.49% | (a)(d) | | | 11/27/2051 | | | | 10,710,728 | |
| | 13,637,346 | | | Series 2021-NPL1-A1 | | | 4.89% | (a)(d) | | | 02/27/2051 | | | | 13,332,442 | |
| | 4,857,920 | | | Series 2021-NPL2-A1 | | | 4.89% | (a)(d) | | | 02/27/2051 | | | | 4,727,443 | |
| | 41,238,033 | | | Series 2021-NPL3-A1 | | | 5.24% | (a)(d) | | | 02/27/2051 | | | | 40,381,915 | |
| | 5,359,043 | | | Series 2021-NPL5-A1 | | | 5.12% | (a)(d) | | | 03/27/2051 | | | | 5,253,922 | |
| | 18,729,337 | | | Series 2021-NPL6-A1 | | | 5.24% | (a)(d) | | | 04/25/2051 | | | | 18,460,348 | |
| | 1,539,741 | | | Series 2021-NPL9-A1 | | | 1.99% | (a)(d) | | | 05/25/2051 | | | | 1,488,477 | |
| | | | |
| | | | Verus Securitization Trust | | | | | | | | | | | | |
| | 6,100,000 | | | Series 2021-3-M1 | | | 2.40% | (a)(c) | | | 06/25/2066 | | | | 4,224,685 | |
| | 4,588,000 | | | Series 2021-4-B1 | | | 3.05% | (a)(c) | | | 07/25/2066 | | | | 2,874,133 | |
| | 2,300,000 | | | Series 2021-4-B2 | | | 3.81% | (a)(c) | | | 07/25/2066 | | | | 1,467,912 | |
| | 2,500,000 | | | Series 2021-4-M1 | | | 2.20% | (a)(c) | | | 07/25/2066 | | | | 1,605,032 | |
| | 6,651,000 | | | Series 2021-5-B1 | | | 3.04% | (a)(c) | | | 09/25/2066 | | | | 4,504,881 | |
| | 9,255,000 | | | Series 2021-5-M1 | | | 2.33% | (a)(c) | | | 09/25/2066 | | | | 6,352,690 | |
| | | | |
| | | | Voyager OPTONE Delaware Trust | | | | | | | | | | | | |
| | 6,019,965 | | | Series 2009-1-SAC3 | | | 6.19% | (a)(b)(c) | | | 02/25/2038 | | | | 4,050,971 | |
| | | | | | | | |
| The accompanying notes are an integral part of these financial statements. | | Annual Report | | | | | March 31, 2024 | | 39 |
| | |
Schedule of Investments DoubleLine Total Return Bond Fund (Cont.) | | |
| | | | | | | | | | | | | | | | |
PRINCIPAL AMOUNT $ | | | SECURITY DESCRIPTION | | RATE | | | MATURITY | | | VALUE $ | |
| |
| | | | WAMU Asset-Backed Certificates | |
| | 7,544,316 | | | Series 2007-HE1-2A2 (CME Term SOFR 1 Month + 0.22%, 0.22% Floor) | | | 5.55% | | | | 01/25/2037 | | | | 3,529,997 | |
| | 13,971,611 | | | Series 2007-HE4-1A (CME Term SOFR 1 Month + 0.28%, 0.28% Floor) | | | 5.61% | | | | 07/25/2047 | | | | 10,004,181 | |
| |
| | | | WaMu Mortgage Pass Through Certificates | |
| | 4,683,301 | | | Series 2005-AR19-B1 (CME Term SOFR 1 Month + 1.16%, 1.05% Floor, 10.50% Cap) | | | 6.49% | | | | 12/25/2045 | | | | 3,878,497 | |
| | 5,282,066 | | | Series 2006-AR10-1A1 | | | 4.44% | (c) | | | 09/25/2036 | | | | 4,344,413 | |
| | 5,496,117 | | | Series 2006-AR15-1A (12 Month US Treasury Average + 0.84%, 0.84% Floor) | | | 5.93% | | | | 11/25/2046 | | | | 4,632,384 | |
| | 3,278,437 | | | Series 2006-AR5-A12B (12 Month US Treasury Average + 0.98%, 0.98% Floor) | | | 6.07% | | | | 06/25/2046 | | | | 2,821,917 | |
| | 432,813 | | | Series 2006-AR6-2A3 | | | 4.71% | (c) | | | 08/25/2036 | | | | 370,854 | |
| | 4,604,584 | | | Series 2007-HY3-4A1 | | | 4.63% | (c) | | | 03/25/2037 | | | | 4,131,385 | |
| | 7,245,391 | | | Series 2007-HY5-1A1 | | | 3.69% | (c) | | | 05/25/2037 | | | | 6,168,567 | |
| |
| | | | Washington Mutual Alternative Mortgage Pass-Through Certificates | |
| | 3,545,056 | | | Series 2005-1-2A | | | 6.00% | | | | 03/25/2035 | | | | 2,914,924 | |
| | 877,264 | | | Series 2005-4-5A1 | | | 5.50% | | | | 06/25/2035 | | | | 719,207 | |
| | 367,055 | | | Series 2005-5-CB12 (-11 x CME Term SOFR 1 Month + 49.34%, 50.60% Cap) | | | 0.00% | (g) | | | 07/25/2035 | | | | 316,443 | |
| | 1,188,613 | | | Series 2005-5-CB6 (CME Term SOFR 1 Month + 0.71%, 0.60% Floor, 7.50% Cap) | | | 6.04% | | | | 07/25/2035 | | | | 1,015,071 | |
| | 297,543 | | | Series 2005-6-2A7 | | | 5.50% | | | | 08/25/2035 | | | | 251,037 | |
| | 3,448,962 | | | Series 2005-7-2CB6 (CME Term SOFR 1 Month + 1.56%, 1.45% Floor, 6.00% Cap) | | | 6.00% | | | | 08/25/2035 | | | | 3,270,282 | |
| | 313,542 | | | Series 2005-7-2CB7 (-11 x CME Term SOFR 1 Month + 48.79%, 50.05% Cap) | | | 0.00% | (g) | | | 08/25/2035 | | | | 250,501 | |
| | 2,158,328 | | | Series 2005-7-3CB | | | 6.50% | | | | 08/25/2035 | | | | 1,748,808 | |
| | 4,626,001 | | | Series 2005-8-1A2 | | | 5.50% | | | | 10/25/2035 | | | | 4,073,918 | |
| | 4,709,484 | | | Series 2005-9-2A2 | | | 5.50% | | | | 11/25/2035 | | | | 4,069,547 | |
| | 1,096,113 | | | Series 2005-9-CX | | | 5.50% | (f) | | | 11/25/2035 | | | | 191,882 | |
| | 4,139,085 | | | Series 2006-1-2CB1 | | | 7.00% | | | | 02/25/2036 | | | | 2,888,134 | |
| | 1,452,631 | | | Series 2006-1-3A1 | | | 5.75% | | | | 02/25/2036 | | | | 1,305,947 | |
| | 734,136 | | | Series 2006-1-3A2 | | | 5.75% | | | | 02/25/2036 | | | | 657,425 | |
| | 623,954 | | | Series 2006-1-3A7 | | | 5.75% | | | | 02/25/2036 | | | | 559,053 | |
| | 1,901,749 | | | Series 2006-3-3CB4 | | | 6.00% | | | | 04/25/2036 | | | | 1,570,080 | |
| | 1,050,944 | | | Series 2006-5-1A8 | | | 5.75% | | | | 07/25/2036 | | | | 783,083 | |
| | 2,433,584 | | | Series 2006-5-2CB1 | | | 6.00% | | | | 07/25/2036 | | | | 1,736,462 | |
| | 4,420,412 | | | Series 2006-5-2CB6 | | | 6.00% | | | | 07/25/2036 | | | | 3,154,146 | |
| | 12,892,756 | | | Series 2006-5-3A3 | | | 6.72% | (d) | | | 07/25/2036 | | | | 3,080,863 | |
| | 5,372,726 | | | Series 2006-5-3A5 | | | 6.95% | (d) | | | 07/25/2036 | | | | 1,282,949 | |
| | 7,643,639 | | | Series 2006-8-A4 | | | 4.15% | (d) | | | 10/25/2036 | | | | 2,647,146 | |
| | 2,832,740 | | | Series 2006-9-A7 | | | 4.28% | (d) | | | 10/25/2036 | | | | 895,692 | |
| | 3,648,135 | | | Series 2006-AR10-A1 (CME Term SOFR 1 Month + 0.31%, 0.20% Floor) | | | 5.64% | | | | 12/25/2036 | | | | 1,749,165 | |
| | 5,044,823 | | | Series 2006-AR4-2A (12 Month US Treasury Average + 0.95%, 0.95% Floor) | | | 3.79% | | | | 06/25/2046 | | | | 3,454,301 | |
| | 4,543,489 | | | Series 2006-AR5-4A (12 Month US Treasury Average + 0.99%, 0.99% Floor) | | | 6.08% | | | | 06/25/2046 | | | | 3,519,424 | |
| | 6,855,731 | | | Series 2007-2-1A6 | | | 6.00% | | | | 04/25/2037 | | | | 5,421,979 | |
| | 2,864,606 | | | Series 2007-3-A3 | | | 6.00% | | | | 04/25/2037 | | | | 2,464,384 | |
| | 2,181,085 | | | Series 2007-4-1A1 | | | 5.50% | | | | 06/25/2037 | | | | 2,029,929 | |
| | 157,585 | | | Series 2007-5-A11 (-6 x CME Term SOFR 1 Month + 38.79%, 39.48% Cap) | | | 6.82% | (g) | | | 06/25/2037 | | | | 162,438 | |
| | 3,939,629 | | | Series 2007-5-A6 | | | 6.00% | | | | 06/25/2037 | | | | 3,448,819 | |
| | 5,373,544 | | | Series 2007-OC1-A2 (CME Term SOFR 1 Month + 0.35%, 0.24% Floor) | | | 5.68% | | | | 01/25/2047 | | | | 4,842,069 | |
| |
| | | | Washington Mutual Asset-Backed Certificates | |
| | 1,111,002 | | | Series 2006-HE2-A4 (CME Term SOFR 1 Month + 0.59%, 0.48% Floor) | | | 5.92% | | | | 05/25/2036 | | | | 860,183 | |
| | 19,195,148 | | | Series 2007-HE2-2A2 (CME Term SOFR 1 Month + 0.33%, 0.22% Floor) | | | 5.66% | | | | 02/25/2037 | | | | 5,500,590 | |
| | | | |
| 40 | | DoubleLine Funds Trust | | The accompanying notes are an integral part of these financial statements. |
| | | | | | | | | | | | | | | | |
PRINCIPAL AMOUNT $ | | | SECURITY DESCRIPTION | | RATE | | | MATURITY | | | VALUE $ | |
| |
| | | | Wells Fargo Alternative Loan Trust | |
| | 474,026 | | | Series 2007-PA1-A10 | | | 6.00% | | | | 03/25/2037 | | | | 410,889 | |
| | 2,081,344 | | | Series 2007-PA1-A3 | | | 6.00% | | | | 03/25/2037 | | | | 1,804,122 | |
| | 1,794,573 | | | Series 2007-PA1-A5 | | | 6.00% | | | | 03/25/2037 | | | | 1,555,547 | |
| | 2,941,216 | | | Series 2007-PA1-A6 | | | 6.00% | | | | 03/25/2037 | | | | 2,549,464 | |
| | 11,473,754 | | | Series 2007-PA2-1A1 | | | 6.00% | | | | 06/25/2037 | | | | 10,320,548 | |
| | 1,961,885 | | | Series 2007-PA2-3A1 (CME Term SOFR 1 Month + 0.46%, 0.35% Floor, 7.00% Cap) | | | 5.79% | | | | 06/25/2037 | | | | 1,304,450 | |
| | 2,890,160 | | | Series 2007-PA2-3A2 (-1 x CME Term SOFR 1 Month + 6.54%, 6.65% Cap) | | | 1.21% | (f)(g) | | | 06/25/2037 | | | | 172,951 | |
| | 233,691 | | | Series 2007-PA3-1A4 | | | 5.75% | | | | 07/25/2037 | | | | 197,140 | |
| | 4,087,206 | | | Series 2007-PA3-2A1 | | | 6.00% | | | | 07/25/2037 | | | | 3,514,927 | |
| | 1,623,873 | | | Series 2007-PA3-2A4 | | | 6.00% | | | | 07/25/2037 | | | | 1,396,503 | |
| | 2,729,016 | | | Series 2007-PA3-3A1 | | | 6.25% | | | | 07/25/2037 | | | | 2,303,722 | |
| | 21,350,026 | | | Series 2007-PA5-1A1 | | | 6.25% | | | | 11/25/2037 | | | | 18,264,170 | |
| | 3,947,843 | | | Series 2007-PA6-A1 | | | 5.67% | (c) | | | 12/28/2037 | | | | 3,502,211 | |
| |
| | | | Wells Fargo Mortgage Backed Securities Trust | |
| | 1,415,953 | | | Series 2006-AR12-1A1 | | | 6.11% | (c) | | | 09/25/2036 | | | | 1,261,350 | |
| | 629,314 | | | Series 2006-AR13-A2 | | | 6.24% | (c) | | | 09/25/2036 | | | | 591,415 | |
| | 714,514 | | | Series 2006-AR4-2A1 | | | 6.18% | (c) | | | 04/25/2036 | | | | 668,114 | |
| | 1,094,872 | | | Series 2007-7-A1 | | | 6.00% | | | | 06/25/2037 | | | | 976,057 | |
| | 76,146 | | | Series 2007-7-A32 | | | 5.75% | | | | 06/25/2037 | | | | 67,072 | |
| | 2,465,572 | | | Series 2007-7-A34 | | | 6.00% | | | | 06/25/2037 | | | | 2,198,009 | |
| | 667,797 | | | Series 2007-7-A36 | | | 6.00% | | | | 06/25/2037 | | | | 595,311 | |
| | 227,107 | | | Series 2007-7-A43 (CME Term SOFR 1 Month + 0.61%, 0.50% Floor, 7.00% Cap) | | | 5.94% | | | | 06/25/2037 | | | | 193,099 | |
| | 620,452 | | | Series 2007-7-A49 | | | 6.00% | | | | 06/25/2037 | | | | 553,121 | |
| | 262,667 | | | Series 2007-7-A8 (CME Term SOFR 1 Month + 0.61%, 0.50% Floor, 7.00% Cap) | | | 5.94% | | | | 06/25/2037 | | | | 223,333 | |
| | 118,493 | | | Series 2007-7-A9 (-6 x CME Term SOFR 1 Month + 38.31%, 39.00% Cap) | | | 6.34% | (g) | | | 06/25/2037 | | | | 121,042 | |
| | 10,469,125 | | | Series 2007-AR9-A1 | | | 6.03% | (c) | | | 12/28/2037 | | | | 9,186,709 | |
| | | | | | | | | | | | | | | | |
| | | | Total Non-Agency Residential Collateralized Mortgage Obligations
(Cost $10,173,071,346) | | | | 8,091,852,054 | |
| | | | | | | | | | | | | | | | |
| | US GOVERNMENT AND AGENCY MORTGAGE BACKED OBLIGATIONS - 50.6% | | | | |
| |
| | | | Fannie Mae Whole Loan | |
| | 4,807,214 | | | Series 2003-W17-1A7 | | | 5.75% | | | | 08/25/2033 | | | | 4,781,571 | |
| | 1,442,014 | | | Series 2004-W10-A6 | | | 5.75% | | | | 08/25/2034 | | | | 1,455,444 | |
| |
| | | | Federal Home Loan Mortgage Corp. | |
| | 1,866,064 | | | Pool C03490 | | | 4.50% | | | | 08/01/2040 | | | | 1,833,106 | |
| | 12,583,263 | | | Pool C91388 | | | 3.50% | | | | 02/01/2032 | | | | 12,042,965 | |
| | 6,504,029 | | | Pool C91403 | | | 3.50% | | | | 03/01/2032 | | | | 6,224,070 | |
| | 6,535,148 | | | Pool C91413 | | | 3.50% | | | | 12/01/2031 | | | | 6,255,497 | |
| | 3,355,459 | | | Pool C91417 | | | 3.50% | | | | 01/01/2032 | | | | 3,210,710 | |
| | 13,470,849 | | | Pool C91447 | | | 3.50% | | | | 05/01/2032 | | | | 12,888,592 | |
| | 5,226,417 | | | Pool C91596 | | | 3.00% | | | | 02/01/2033 | | | | 4,901,381 | |
| | 2,489,492 | | | Pool D98901 | | | 3.50% | | | | 01/01/2032 | | | | 2,382,607 | |
| | 5,300,017 | | | Pool D98923 | | | 3.50% | | | | 01/01/2032 | | | | 5,073,036 | |
| | 6,555,699 | | | Pool D99724 | | | 3.00% | | | | 11/01/2032 | | | | 6,146,946 | |
| | 6,064,990 | | | Pool G01840 | | | 5.00% | | | | 07/01/2035 | | | | 6,106,820 | |
| | 1,269,310 | | | Pool G04817 | | | 5.00% | | | | 09/01/2038 | | | | 1,278,091 | |
| | 5,027,752 | | | Pool G07801 | | | 4.00% | | | | 10/01/2044 | | | | 4,771,523 | |
| | 10,712,841 | | | Pool G07862 | | | 4.00% | | | | 01/01/2044 | | | | 10,166,936 | |
| | 11,837,267 | | | Pool G07905 | | | 4.00% | | | | 01/01/2042 | | | | 11,234,468 | |
| | 23,827,471 | | | Pool G08534 | | | 3.00% | | | | 06/01/2043 | | | | 21,311,339 | |
| | 7,712,402 | | | Pool G08537 | | | 3.00% | | | | 07/01/2043 | | | | 6,897,980 | |
| | 14,131,983 | | | Pool G08614 | | | 3.00% | | | | 11/01/2044 | | | | 12,603,106 | |
| | 16,505,725 | | | Pool G08619 | | | 3.00% | | | | 12/01/2044 | | | | 14,699,494 | |
| | 21,102,066 | | | Pool G08622 | | | 3.00% | | | | 01/01/2045 | | | | 18,716,594 | |
| | | | | | | | |
| The accompanying notes are an integral part of these financial statements. | | Annual Report | | | | | March 31, 2024 | | 41 |
| | |
Schedule of Investments DoubleLine Total Return Bond Fund (Cont.) | | |
| | | | | | | | | | | | | | | | |
PRINCIPAL AMOUNT $ | | | SECURITY DESCRIPTION | | RATE | | | MATURITY | | | VALUE $ | |
| | 39,715,458 | | | Pool G08626 | | | 3.00% | | | | 02/01/2045 | | | | 35,371,442 | |
| | 20,286,482 | | | Pool G08631 | | | 3.00% | | | | 03/01/2045 | | | | 18,050,819 | |
| | 57,328,569 | | | Pool G08635 | | | 3.00% | | | | 04/01/2045 | | | | 50,986,962 | |
| | 17,509,498 | | | Pool G08653 | | | 3.00% | | | | 07/01/2045 | | | | 15,543,563 | |
| | 10,153,874 | | | Pool G08658 | | | 3.00% | | | | 08/01/2045 | | | | 9,009,589 | |
| | 11,516,070 | | | Pool G08670 | | | 3.00% | | | | 10/01/2045 | | | | 10,208,706 | |
| | 135,726,045 | | | Pool G08675 | | | 3.00% | | | | 11/01/2045 | | | | 120,317,853 | |
| | 55,961,194 | | | Pool G08680 | | | 3.00% | | | | 12/01/2045 | | | | 49,561,876 | |
| | 23,380,092 | | | Pool G08686 | | | 3.00% | | | | 01/01/2046 | | | | 20,707,364 | |
| | 52,006,024 | | | Pool G08692 | | | 3.00% | | | | 02/01/2046 | | | | 46,060,761 | |
| | 16,541,524 | | | Pool G08705 | | | 3.00% | | | | 05/01/2046 | | | | 14,609,439 | |
| | 19,186,792 | | | Pool G08715 | | | 3.00% | | | | 08/01/2046 | | | | 16,921,881 | |
| | 1,010,853 | | | Pool G08800 | | | 3.50% | | | | 02/01/2048 | | | | 923,208 | |
| | 9,718,300 | | | Pool G16072 | | | 3.00% | | | | 02/01/2032 | | | | 9,215,073 | |
| | 22,884,962 | | | Pool G60251 | | | 3.50% | | | | 10/01/2045 | | | | 20,919,272 | |
| | 59,008,824 | | | Pool G60393 | | | 3.50% | | | | 01/01/2046 | | | | 54,065,421 | |
| | 6,804,437 | | | Pool J22834 | | | 2.50% | | | | 03/01/2028 | | | | 6,521,440 | |
| | 20,913,651 | | | Pool Q13637 | | | 3.00% | | | | 11/01/2042 | | | | 18,716,517 | |
| | 21,063,454 | | | Pool Q13638 | | | 3.00% | | | | 11/01/2042 | | | | 18,839,668 | |
| | 36,137,587 | | | Pool Q16672 | | | 3.00% | | | | 03/01/2043 | | | | 32,321,664 | |
| | 2,360,300 | | | Pool Q23595 | | | 4.00% | | | | 12/01/2043 | | | | 2,255,576 | |
| | 2,681,632 | | | Pool Q24052 | | | 4.00% | | | | 01/01/2044 | | | | 2,562,657 | |
| | 2,223,844 | | | Pool Q24172 | | | 4.00% | | | | 01/01/2044 | | | | 2,125,172 | |
| | 2,477,275 | | | Pool Q24979 | | | 4.00% | | | | 02/01/2044 | | | | 2,360,417 | |
| | 9,280,618 | | | Pool Q31596 | | | 3.50% | | | | 02/01/2045 | | | | 8,493,055 | |
| | 4,077,254 | | | Pool Q32861 | | | 3.50% | | | | 04/01/2045 | | | | 3,725,979 | |
| | 9,725,461 | | | Pool Q32921 | | | 3.50% | | | | 04/01/2045 | | | | 8,885,030 | |
| | 10,894,247 | | | Pool Q39502 | | | 3.50% | | | | 03/01/2046 | | | | 9,979,794 | |
| | 23,573,272 | | | Pool Q44073 | | | 3.00% | | | | 09/01/2046 | | | | 20,775,785 | |
| | 25,092,444 | | | Pool QH2160 | | | 6.00% | | | | 10/01/2053 | | | | 25,731,476 | |
| | 14,954,870 | | | Pool QU7965 | | | 2.00% | | | | 09/01/2051 | | | | 11,519,909 | |
| | 14,090,706 | | | Pool QU7970 | | | 2.00% | | | | 09/01/2051 | | | | 10,854,089 | |
| | 16,076,261 | | | Pool RA2853 | | | 2.50% | | | | 06/01/2050 | | | | 13,398,331 | |
| | 48,248,537 | | | Pool RA3515 | | | 2.50% | | | | 09/01/2050 | | | | 40,004,570 | |
| | 20,318,125 | | | Pool RA4218 | | | 2.50% | | | | 12/01/2050 | | | | 17,059,321 | |
| | 15,557,145 | | | Pool RA4968 | | | 2.50% | | | | 04/01/2046 | | | | 13,228,270 | |
| | 58,475,224 | | | Pool RA5267 | | | 3.00% | | | | 05/01/2051 | | | | 50,817,529 | |
| | 8,871,940 | | | Pool RA7554 | | | 4.00% | | | | 06/01/2052 | | | | 8,232,705 | |
| | 89,059,981 | | | Pool RA7939 | | | 5.00% | | | | 09/01/2052 | | | | 87,053,037 | |
| | 73,092,318 | | | Pool RB5089 | | | 1.50% | | | | 12/01/2040 | | | | 60,106,192 | |
| | 8,071,894 | | | Pool RB5106 | | | 2.50% | | | | 03/01/2041 | | | | 7,039,450 | |
| | 83,684,600 | | | Pool RB5110 | | | 1.50% | | | | 05/01/2041 | | | | 68,616,556 | |
| | 15,426,562 | | | Pool SD0035 | | | 3.00% | | | | 04/01/2047 | | | | 13,644,993 | |
| | 31,951,822 | | | Pool SD0699 | | | 2.00% | | | | 11/01/2050 | | | | 25,938,302 | |
| | 44,826,947 | | | Pool SD0715 | | | 2.00% | | | | 09/01/2051 | | | | 36,609,794 | |
| | 63,842,560 | | | Pool SD2120 | | | 3.00% | | | | 10/01/2051 | | | | 55,445,339 | |
| | 38,585,525 | | | Pool SD2386 | | | 3.50% | | | | 06/01/2052 | | | | 34,747,824 | |
| | 56,796,995 | | | Pool SD2692 | | | 4.50% | | | | 04/01/2053 | | | | 54,126,734 | |
| | 23,435,075 | | | Pool SD2759 | | | 5.50% | | | | 05/01/2053 | | | | 23,517,298 | |
| | 28,561,442 | | | Pool SD2839 | | | 3.00% | | | | 08/01/2052 | | | | 24,752,397 | |
| | 17,539,897 | | | Pool SD2971 | | | 2.50% | | | | 03/01/2052 | | | | 14,751,147 | |
| | 14,715,279 | | | Pool SD3033 | | | 5.50% | | | | 05/01/2053 | | | | 15,002,024 | |
| | 69,540,615 | | | Pool SD3093 | | | 2.50% | | | | 03/01/2052 | | | | 58,084,433 | |
| | 54,366,191 | | | Pool SD3454 | | | 5.50% | | | | 08/01/2053 | | | | 54,541,827 | |
| | 29,431,093 | | | Pool SD4794 | | | 6.50% | | | | 01/01/2054 | | | | 30,564,536 | |
| | 26,377,334 | | | Pool SD4888 | | | 6.00% | | | | 02/01/2054 | | | | 26,914,711 | |
| | 194,462,606 | | | Pool SD7534 | | | 2.50% | | | | 02/01/2051 | | | | 164,456,510 | |
| | 23,834,426 | | | Pool SD7564 | | | 5.00% | | | | 06/01/2053 | | | | 23,617,001 | |
| | 81,610,929 | | | Pool SD8152 | | | 3.00% | | | | 06/01/2051 | | | | 70,568,950 | |
| | 3,130,366 | | | Pool SD8168 | | | 3.00% | | | | 09/01/2051 | | | | 2,704,227 | |
| | 8,758,065 | | | Pool SD8169 | | | 3.50% | | | | 09/01/2051 | | | | 7,865,834 | |
| | 40,842,279 | | | Pool SE9043 | | | 2.00% | | | | 09/01/2051 | | | | 31,461,159 | |
| | | | |
| 42 | | DoubleLine Funds Trust | | The accompanying notes are an integral part of these financial statements. |
| | | | | | | | | | | | | | | | |
PRINCIPAL AMOUNT $ | | | SECURITY DESCRIPTION | | RATE | | | MATURITY | | | VALUE $ | |
| | 958,051 | | | Pool T60392 | | | 4.00% | | | | 10/01/2041 | | | | 884,358 | |
| | 1,338,940 | | | Pool T60681 | | | 4.00% | | | | 05/01/2042 | | | | 1,261,491 | |
| | 5,407,023 | | | Pool T60782 | | | 3.50% | | | | 07/01/2042 | | | | 4,906,150 | |
| | 6,155,011 | | | Pool T60853 | | | 3.50% | | | | 09/01/2042 | | | | 5,588,450 | |
| | 6,205,927 | | | Pool T60854 | | | 3.50% | | | | 09/01/2042 | | | | 5,631,089 | |
| | 1,018,299 | | | Pool T65110 | | | 3.50% | | | | 10/01/2042 | | | | 923,994 | |
| | 6,803,220 | | | Pool T65492 | | | 3.00% | | | | 06/01/2048 | | | | 5,890,805 | |
| | 544,499 | | | Pool T69016 | | | 5.00% | | | | 06/01/2041 | | | | 531,446 | |
| | 10,386,813 | | | Pool T69050 | | | 3.50% | | | | 05/01/2046 | | | | 9,440,647 | |
| | 132,835 | | | Pool U60299 | | | 4.00% | | | | 11/01/2040 | | | | 126,554 | |
| | 146,362,699 | | | Pool U69911 | | | 4.00% | | | | 04/01/2045 | | | | 139,258,790 | |
| | 1,263,345 | | | Pool U99125 | | | 3.00% | | | | 01/01/2043 | | | | 1,124,658 | |
| | 48,218,471 | | | Pool V81821 | | | 3.00% | | | | 08/01/2045 | | | | 42,864,654 | |
| | 13,724,516 | | | Pool V82117 | | | 3.00% | | | | 12/01/2045 | | | | 12,166,452 | |
| | 11,447,681 | | | Pool V82209 | | | 3.50% | | | | 02/01/2046 | | | | 10,486,742 | |
| | 6,552,937 | | | Pool V82248 | | | 3.50% | | | | 03/01/2046 | | | | 5,985,001 | |
| | 10,500,000 | | | Pool WN1221 | | | 4.80% | | | | 12/01/2029 | | | | 10,467,924 | |
| | 19,180,000 | | | Pool WN1240 | | | 4.40% | | | | 12/01/2029 | | | | 18,723,527 | |
| | 40,000,000 | | | Pool WN2184 | | | 2.50% | | | | 04/01/2032 | | | | 34,050,591 | |
| | 23,230,000 | | | Pool WN2311 | | | 4.80% | | | | 01/01/2030 | | | | 23,170,370 | |
| | 16,361,000 | | | Pool WN2312 | | | 4.60% | | | | 01/01/2030 | | | | 16,206,093 | |
| | 14,700,000 | | | Pool WN2334 | | | 4.30% | | | | 01/01/2033 | | | | 14,130,331 | |
| | 45,015,000 | | | Pool WN2358 | | | 4.30% | | | | 01/01/2030 | | | | 43,923,430 | |
| | 21,615,000 | | | Pool WN2396 | | | 4.79% | | | | 03/01/2030 | | | | 21,527,603 | |
| | 15,225,000 | | | Pool WN2423 | | | 4.19% | | | | 06/01/2030 | | | | 14,769,319 | |
| | 76,699,505 | | | Pool Z40117 | | | 3.00% | | | | 04/01/2045 | | | | 68,520,277 | |
| | 67,611,113 | | | Pool Z40206 | | | 3.50% | | | | 02/01/2047 | | | | 61,757,380 | |
| | 84,862,774 | | | Pool Z40256 | | | 3.00% | | | | 12/01/2046 | | | | 75,655,966 | |
| | 12,391,264 | | | Pool ZS4706 | | | 3.00% | | | | 03/01/2047 | | | | 10,895,543 | |
| | 6,481,234 | | | Pool ZS4750 | | | 3.00% | | | | 01/01/2048 | | | | 5,685,365 | |
| | 11,698,944 | | | Pool ZS4778 | | | 4.00% | | | | 07/01/2048 | | | | 11,041,184 | |
| | 9,502,281 | | | Pool ZS4790 | | | 4.00% | | | | 09/01/2048 | | | | 8,950,353 | |
| | 14,151,392 | | | Pool ZT1827 | | | 3.00% | | | | 07/01/2047 | | | | 12,452,573 | |
| | 1,228,799 | | | Series 2021-MN1-M1 (US 30 Day Average Secured Overnight Financing Rate + 2.00%) | | | 7.32% | (a) | | | 01/25/2051 | | | | 1,204,523 | |
| | 1,250,000 | | | Series 2021-MN1-M2 (US 30 Day Average Secured Overnight Financing Rate + 3.75%) | | | 9.07% | (a) | | | 01/25/2051 | | | | 1,228,354 | |
| | 365,092 | | | Series 2519-ZD | | | 5.50% | | | | 11/15/2032 | | | | 360,371 | |
| | 194,211 | | | Series 2596-ZL | | | 5.00% | | | | 04/15/2033 | | | | 191,366 | |
| | 11,226,423 | | | Series 267-30 | | | 3.00% | | | | 08/15/2042 | | | | 10,106,879 | |
| | 137,245 | | | Series 2684-ZN | | | 4.00% | | | | 10/15/2033 | | | | 130,744 | |
| | 8,121,653 | | | Series 274-30 | | | 3.00% | | | | 08/15/2042 | | | | 7,234,706 | |
| | 826,694 | | | Series 2750-ZT | | | 5.00% | | | | 02/15/2034 | | | | 814,583 | |
| | 32,088,689 | | | Series 280-30 | | | 3.00% | | | | 09/15/2042 | | | | 28,745,094 | |
| | 2,440,052 | | | Series 2825-PZ | | | 5.50% | | | | 07/15/2034 | | | | 2,428,587 | |
| | 5,896,657 | | | Series 284-300 | | | 3.00% | | | | 10/15/2042 | | | | 5,365,702 | |
| | 1,427,994 | | | Series 2898-JZ | | | 5.00% | | | | 12/15/2034 | | | | 1,410,689 | |
| | 3,597,435 | | | Series 2899-AZ | | | 5.00% | | | | 12/15/2034 | | | | 3,555,960 | |
| | 1,981,843 | | | Series 2909-Z | | | 5.00% | | | | 12/15/2034 | | | | 1,959,137 | |
| | 3,994,282 | | | Series 2932-Z | | | 5.00% | | | | 02/15/2035 | | | | 3,950,640 | |
| | 1,530,912 | | | Series 3002-SN (-1 x US 30 Day Average Secured Overnight Financing Rate + 6.39%, 6.50% Cap) | | | 1.07% | (f)(g) | | | 07/15/2035 | | | | 100,447 | |
| | 949,291 | | | Series 3030-SL (-1 x US 30 Day Average Secured Overnight Financing Rate + 5.99%, 6.10% Cap) | | | 0.67% | (f)(g) | | | 09/15/2035 | | | | 59,157 | |
| | 343,449 | | | Series 3045-DI (-1 x US 30 Day Average Secured Overnight Financing Rate + 6.62%, 6.73% Cap) | | | 1.30% | (f)(g) | | | 10/15/2035 | | | | 26,835 | |
| | 2,533,860 | | | Series 3116-Z | | | 5.50% | | | | 02/15/2036 | | | | 2,521,804 | |
| | 384,801 | | | Series 3117-ZN | | | 4.50% | | | | 02/15/2036 | | | | 360,209 | |
| | 1,252,630 | | | Series 3174-PZ | | | 5.00% | | | | 01/15/2036 | | | | 1,240,280 | |
| | 314,573 | | | Series 3187-JZ | | | 5.00% | | | | 07/15/2036 | | | | 311,550 | |
| | 881,644 | | | Series 3188-ZK | | | 5.00% | | | | 07/15/2036 | | | | 871,998 | |
| | 1,379,567 | | | Series 3203-SE (-1 x US 30 Day Average Secured Overnight Financing Rate + 6.39%, 6.50% Cap) | | | 1.07% | (f)(g) | | | 08/15/2036 | | | | 101,904 | |
| | | | | | | | |
| The accompanying notes are an integral part of these financial statements. | | Annual Report | | | | | March 31, 2024 | | 43 |
| | |
Schedule of Investments DoubleLine Total Return Bond Fund (Cont.) | | |
| | | | | | | | | | | | | | | | |
PRINCIPAL AMOUNT $ | | | SECURITY DESCRIPTION | | RATE | | | MATURITY | | | VALUE $ | |
| | 1,770,045 | | | Series 3203-Z | | | 5.00% | | | | 07/15/2036 | | | | 1,730,896 | |
| | 2,804,649 | | | Series 3203-ZC | | | 5.00% | | | | 07/15/2036 | | | | 2,812,978 | |
| | 4,944,410 | | | Series 326-300Pool S0-7094 | | | 3.00% | | | | 03/15/2044 | | | | 4,445,555 | |
| | 10,443,686 | | | Series 326-F2Pool S0-7108 (US 30 Day Average Secured Overnight Financing Rate + 0.66%, 0.55% Floor, 6.50% Cap) | | | 5.98% | | | | 03/15/2044 | | | | 10,325,460 | |
| | 1,810,299 | | | Series 3261-SA (-1 x US 30 Day Average Secured Overnight Financing Rate + 6.32%, 6.43% Cap) | | | 1.00% | (f)(g) | | | 01/15/2037 | | | | 143,241 | |
| | 1,504,461 | | | Series 3275-SC (-1 x US 30 Day Average Secured Overnight Financing Rate + 5.97%, 6.08% Cap) | | | 0.65% | (f)(g) | | | 02/15/2037 | | | | 105,776 | |
| | 370,331 | | | Series 3315-HZ | | | 6.00% | | | | 05/15/2037 | | | | 384,660 | |
| | 1,276,885 | | | Series 3326-GS (-1 x US 30 Day Average Secured Overnight Financing Rate + 6.54%, 6.65% Cap) | | | 1.22% | (f)(g) | | | 06/15/2037 | | | | 102,653 | |
| | 325,877 | | | Series 3351-ZC | | | 5.50% | | | | 07/15/2037 | | | | 328,582 | |
| | 4,121,064 | | | Series 3355-BI (-1 x US 30 Day Average Secured Overnight Financing Rate + 5.94%, 6.05% Cap) | | | 0.62% | (f)(g) | | | 08/15/2037 | | | | 303,522 | |
| | 188,532 | | | Series 3369-Z | | | 6.00% | | | | 09/15/2037 | | | | 192,875 | |
| | 520,998 | | | Series 3405-ZG | | | 5.50% | | | | 01/15/2038 | | | | 508,762 | |
| | 236,114 | | | Series 3417-SI (-1 x US 30 Day Average Secured Overnight Financing Rate + 6.07%, 6.18% Cap) | | | 0.75% | (f)(g) | | | 02/15/2038 | | | | 14,716 | |
| | 791,348 | | | Series 3423-GS (-1 x US 30 Day Average Secured Overnight Financing Rate + 5.54%, 5.65% Cap) | | | 0.22% | (f)(g) | | | 03/15/2038 | | | | 40,141 | |
| | 129,948 | | | Series 3423-SG (-1 x US 30 Day Average Secured Overnight Financing Rate + 5.54%, 5.65% Cap) | | | 0.22% | (f)(g) | | | 03/15/2038 | | | | 6,396 | |
| | 156,066 | | | Series 3451-S (-1 x US 30 Day Average Secured Overnight Financing Rate + 5.92%, 6.03% Cap) | | | 0.60% | (f)(g) | | | 02/15/2037 | | | | 6,765 | |
| | 149,849 | | | Series 3455-SC (-1 x US 30 Day Average Secured Overnight Financing Rate + 5.95%, 6.06% Cap) | | | 0.63% | (f)(g) | | | 06/15/2038 | | | | 8,751 | |
| | 66,270 | | | Series 3473-SM (-1 x US 30 Day Average Secured Overnight Financing Rate + 5.96%, 6.07% Cap) | | | 0.64% | (f)(g) | | | 07/15/2038 | | | | 4,150 | |
| | 1,486,076 | | | Series 3484-SE (-1 x US 30 Day Average Secured Overnight Financing Rate + 5.74%, 5.85% Cap) | | | 0.42% | (f)(g) | | | 08/15/2038 | | | | 77,550 | |
| | 2,068,902 | | | Series 3519-SD (-1 x US 30 Day Average Secured Overnight Financing Rate + 5.44%, 5.55% Cap) | | | 0.12% | (f)(g) | | | 02/15/2038 | | | | 102,684 | |
| | 646,405 | | | Series 3524-LB | | | 3.16% | (c) | | | 06/15/2038 | | | | 603,393 | |
| | 59,862 | | | Series 3530-GZ | | | 4.50% | (h) | | | 05/15/2039 | | | | 54,992 | |
| | 1,912,786 | | | Series 3541-EI (-1 x US 30 Day Average Secured Overnight Financing Rate + 6.64%, 6.75% Cap) | | | 1.32% | (f)(g) | | | 06/15/2039 | | | | 173,330 | |
| | 135,188 | | | Series 3545-SA (-1 x US 30 Day Average Secured Overnight Financing Rate + 6.04%, 6.15% Cap) | | | 0.72% | (f)(g) | | | 06/15/2039 | | | | 8,828 | |
| | 56,238 | | | Series 3549-SA (-1 x US 30 Day Average Secured Overnight Financing Rate + 5.69%, 5.80% Cap) | | | 0.37% | (f)(g) | | | 07/15/2039 | | | | 3,545 | |
| | 33,932,485 | | | Series 357-200Pool S0-7745 | | | 2.00% | | | | 09/15/2047 | | | | 28,691,248 | |
| | 2,355,154 | | | Series 3577-LS (-1 x US 30 Day Average Secured Overnight Financing Rate + 7.09%, 7.20% Cap) | | | 1.77% | (f)(g) | | | 08/15/2035 | | | | 234,404 | |
| | 13,143,698 | | | Series 358-300Pool S0-7778 | | | 3.00% | | | | 10/15/2047 | | | | 11,776,978 | |
| | 792,077 | | | Series 3582-SA (-1 x US 30 Day Average Secured Overnight Financing Rate + 5.89%, 6.00% Cap) | | | 0.57% | (f)(g) | | | 10/15/2049 | | | | 59,031 | |
| | 732,335 | | | Series 3583-GB | | | 4.50% | | | | 10/15/2039 | | | | 721,765 | |
| | 1,225,721 | | | Series 3616-SG (-1 x US 30 Day Average Secured Overnight Financing Rate + 6.24%, 6.35% Cap) | | | 0.92% | (f)(g) | | | 03/15/2032 | | | | 51,612 | |
| | 2,128,881 | | | Series 3626-AZ | | | 5.50% | | | | 08/15/2036 | | | | 2,122,492 | |
| | 3,166,049 | | | Series 3641-Z | | | 5.50% | | | | 02/15/2036 | | | | 3,156,821 | |
| | 2,935,973 | | | Series 3654-ZB | | | 5.50% | | | | 11/15/2037 | | | | 2,927,279 | |
| | 6,897,509 | | | Series 3666-VZ | | | 5.50% | | | | 08/15/2036 | | | | 6,877,576 | |
| | 377,988 | | | Series 3667-SB (-1 x US 30 Day Average Secured Overnight Financing Rate + 6.34%, 6.45% Cap) | | | 1.02% | (f)(g) | | | 05/15/2040 | | | | 24,469 | |
| | 2,433,267 | | | Series 3702-SG (-1 x US 30 Day Average Secured Overnight Financing Rate + 5.94%, 6.05% Cap) | | | 0.62% | (f)(g) | | | 08/15/2032 | | | | 96,335 | |
| | 1,387,304 | | | Series 3704-EI | | | 5.00% | (f) | | | 12/15/2036 | | | | 188,987 | |
| | 1,216,453 | | | Series 3712-SG (-5 x US 30 Day Average Secured Overnight Financing Rate + 24.43%, 25.00% Cap) | | | 0.00% | (g) | | | 08/15/2040 | | | | 1,192,193 | |
| | 1,754,604 | | | Series 3724-CM | | | 5.50% | | | | 06/15/2037 | | | | 1,788,823 | |
| | 5,579,278 | | | Series 3726-SA (-1 x US 30 Day Average Secured Overnight Financing Rate + 5.94%, 6.05% Cap) | | | 0.62% | (f)(g) | | | 09/15/2040 | | | | 458,448 | |
| | | | |
| 44 | | DoubleLine Funds Trust | | The accompanying notes are an integral part of these financial statements. |
| | | | | | | | | | | | | | | | |
PRINCIPAL AMOUNT $ | | | SECURITY DESCRIPTION | | RATE | | | MATURITY | | | VALUE $ | |
| | 186,682 | | | Series 3741-SC (-2 x US 30 Day Average Secured Overnight Financing Rate + 9.77%, 10.00% Cap) | | | 0.00% | (g) | | | 10/15/2040 | | | | 134,221 | |
| | 4,674,509 | | | Series 3752-BS (-2 x US 30 Day Average Secured Overnight Financing Rate + 9.77%, 10.00% Cap) | | | 0.00% | (g) | | | 11/15/2040 | | | | 3,423,846 | |
| | 12,525,510 | | | Series 3768-ZX | | | 5.00% | | | | 12/15/2040 | | | | 12,413,171 | |
| | 1,608,450 | | | Series 3771-AL | | | 4.00% | | | | 12/15/2030 | | | | 1,572,148 | |
| | 4,169,547 | | | Series 3779-BY | | | 3.50% | | | | 12/15/2030 | | | | 4,018,440 | |
| | 13,278,386 | | | Series 3779-DZ | | | 4.50% | | | | 12/15/2040 | | | | 12,789,228 | |
| | 4,745,436 | | | Series 3779-LB | | | 4.00% | | | | 12/15/2030 | | | | 4,638,341 | |
| | 1,128,093 | | | Series 3779-YA | | | 3.50% | | | | 12/15/2030 | | | | 1,087,211 | |
| | 3,959,492 | | | Series 3783-AC | | | 4.00% | | | | 01/15/2031 | | | | 3,870,039 | |
| | 2,984,617 | | | Series 3786-SG (-2 x US 30 Day Average Secured Overnight Financing Rate + 9.27%, 9.50% Cap) | | | 0.00% | (g) | | | 01/15/2041 | | | | 2,125,177 | |
| | 3,294,787 | | | Series 3788-AY | | | 3.50% | | | | 01/15/2031 | | | | 3,174,114 | |
| | 464,192 | | | Series 3790-Z | | | 4.00% | | | | 01/15/2041 | | | | 433,944 | |
| | 9,964,500 | | | Series 3800-VZ | | | 4.50% | | | | 02/15/2041 | | | | 9,617,294 | |
| | 1,325,706 | | | Series 3803-ZM | | | 4.00% | | | | 02/15/2041 | | | | 1,252,117 | |
| | 14,341,533 | | | Series 3806-CZ | | | 5.50% | | | | 07/15/2034 | | | | 14,267,392 | |
| | 4,559,834 | | | Series 3808-DB | | | 3.50% | | | | 02/15/2031 | | | | 4,392,225 | |
| | 3,847,965 | | | Series 3812-EY | | | 3.50% | | | | 02/15/2031 | | | | 3,706,787 | |
| | 1,394,964 | | | Series 3818-CZ | | | 4.50% | | | | 03/15/2041 | | | | 1,346,741 | |
| | 3,124,176 | | | Series 3819-ZU | | | 5.50% | | | | 07/15/2034 | | | | 3,108,134 | |
| | 9,476,591 | | | Series 3824-EY | | | 3.50% | | | | 03/15/2031 | | | | 9,128,217 | |
| | 3,350,433 | | | Series 3828-SW (-3 x US 30 Day Average Secured Overnight Financing Rate + 12.86%, 13.20% Cap) | | | 0.00% | (g) | | | 02/15/2041 | | | | 2,418,759 | |
| | 4,053,514 | | | Series 3829-VZ | | | 4.00% | | | | 03/15/2041 | | | | 3,890,780 | |
| | 7,127,933 | | | Series 3843-PZ | | | 5.00% | | | | 04/15/2041 | | | | 7,121,421 | |
| | 10,032,746 | | | Series 3863-ZA | | | 5.50% | | | | 08/15/2034 | | | | 9,982,471 | |
| | 3,444,489 | | | Series 3870-PB | | | 4.50% | | | | 06/15/2041 | | | | 3,385,857 | |
| | 15,644,369 | | | Series 3871-LZ | | | 5.50% | | | | 06/15/2041 | | | | 15,629,081 | |
| | 4,707,768 | | | Series 3872-BA | | | 4.00% | | | | 06/15/2041 | | | | 4,530,467 | |
| | 2,475,990 | | | Series 3877-EY | | | 4.50% | | | | 06/15/2041 | | | | 2,401,642 | |
| | 863,403 | | | Series 3877-GY | | | 4.50% | | | | 06/15/2041 | | | | 846,175 | |
| | 7,136,864 | | | Series 3877-ZU | | | 4.50% | | | | 06/15/2041 | | | | 6,883,174 | |
| | 2,073,879 | | | Series 3900-SB (-1 x US 30 Day Average Secured Overnight Financing Rate + 5.86%, 5.97% Cap) | | | 0.54% | (f)(g) | | | 07/15/2041 | | | | 142,318 | |
| | 8,755,359 | | | Series 3901-VZ | | | 4.00% | | | | 07/15/2041 | | | | 8,407,420 | |
| | 14,437,078 | | | Series 3910-GZ | | | 5.00% | | | | 08/15/2041 | | | | 14,288,757 | |
| | 2,038,456 | | | Series 3910-ZE | | | 5.00% | | | | 10/15/2034 | | | | 2,014,636 | |
| | 3,175,202 | | | Series 3919-KL | | | 4.50% | | | | 09/15/2041 | | | | 3,111,162 | |
| | 10,638,199 | | | Series 3919-ZJ | | | 4.00% | | | | 09/15/2041 | | | | 10,021,797 | |
| | 574,563 | | | Series 3942-JZ | | | 4.00% | | | | 10/15/2041 | | | | 536,186 | |
| | 3,557,034 | | | Series 3944-AZ | | | 4.00% | | | | 10/15/2041 | | | | 3,355,161 | |
| | 1,454,946 | | | Series 3946-SM (-3 x US 30 Day Average Secured Overnight Financing Rate + 14.36%, 14.70% Cap) | | | 0.00% | (g) | | | 10/15/2041 | | | | 1,108,784 | |
| | 8,960,551 | | | Series 3969-AB | | | 4.00% | | | | 10/15/2033 | | | | 8,680,635 | |
| | 1,661,621 | | | Series 3982-AZ | | | 3.50% | | | | 01/15/2042 | | | | 1,491,658 | |
| | 41,523,923 | | | Series 3990-ZA | | | 3.50% | | | | 01/15/2042 | | | | 38,249,010 | |
| | 2,703,483 | | | Series 3999-EZ | | | 4.00% | | | | 02/15/2042 | | | | 2,549,428 | |
| | 347,607 | | | Series 4050-ND | | | 2.50% | | | | 09/15/2041 | | | | 337,130 | |
| | 39,952,999 | | | Series 4097-ZA | | | 3.50% | | | | 08/15/2042 | | | | 36,885,403 | |
| | 41,882,177 | | | Series 4109-GE | | | 4.50% | | | | 10/15/2041 | | | | 40,987,632 | |
| | 11,671,364 | | | Series 4116-AP | | | 1.35% | | | | 08/15/2042 | | | | 9,887,825 | |
| | 3,552,825 | | | Series 4121-AV | | | 3.00% | | | | 12/15/2035 | | | | 3,370,426 | |
| | 13,280,773 | | | Series 4160-HP | | | 2.50% | | | | 01/15/2033 | | | | 12,433,134 | |
| | 16,469,611 | | | Series 4162-ZJ | | | 3.00% | | | | 02/15/2033 | | | | 15,373,845 | |
| | 45,647,064 | | | Series 4174-Z | | | 3.50% | | | | 03/15/2043 | | | | 41,934,953 | |
| | 66,508,790 | | | Series 4179-AZ | | | 4.00% | | | | 01/15/2041 | | | | 63,782,222 | |
| | 9,720,159 | | | Series 4183-ZB | | | 3.00% | (h) | | | 03/15/2043 | | | | 7,535,204 | |
| | 3,462,185 | | | Series 4186-ZJ | | | 3.00% | (h) | | | 03/15/2033 | | | | 3,134,739 | |
| | 40,143,373 | | | Series 4212-US (-1 x US 30 Day Average Secured Overnight Financing Rate + 5.26%, 5.40% Cap) | | | 0.00% | (g) | | | 06/15/2043 | | | | 25,885,230 | |
| | | | | | | | |
| The accompanying notes are an integral part of these financial statements. | | Annual Report | | | | | March 31, 2024 | | 45 |
| | |
Schedule of Investments DoubleLine Total Return Bond Fund (Cont.) | | |
| | | | | | | | | | | | | | | | |
PRINCIPAL AMOUNT $ | | | SECURITY DESCRIPTION | | RATE | | | MATURITY | | | VALUE $ | |
| | 19,309,604 | | | Series 4223-US (-1 x US 30 Day Average Secured Overnight Financing Rate + 5.29%, 5.43% Cap) | | | 0.00% | (g) | | | 07/15/2043 | | | | 12,785,893 | |
| | 5,572,998 | | | Series 4229-TZ | | | 3.00% | | | | 06/15/2043 | | | | 5,078,014 | |
| | 8,852,526 | | | Series 4249-CS (-1 x US 30 Day Average Secured Overnight Financing Rate + 4.56%, 4.65% Cap) | | | 0.57% | (g) | | | 09/15/2043 | | | | 6,313,284 | |
| | 18,498,016 | | | Series 4250-BZ | | | 3.00% | | | | 09/15/2033 | | | | 17,399,883 | |
| | 8,948,853 | | | Series 4267-BZ | | | 4.00% | | | | 10/15/2040 | | | | 8,582,781 | |
| | 20,805,694 | | | Series 4283-ZL | | | 3.00% | | | | 08/15/2033 | | | | 19,557,186 | |
| | 11,010,181 | | | Series 4341-AZ | | | 3.00% | | | | 05/15/2044 | | | | 9,709,745 | |
| | 8,370,097 | | | Series 4341-ZA | | | 3.00% | | | | 05/15/2044 | | | | 7,465,416 | |
| | 17,990,267 | | | Series 4376-GZ | | | 3.00% | (h) | | | 08/15/2044 | | | | 15,551,241 | |
| | 57,195,410 | | | Series 4377-LZ | | | 3.00% | (h) | | | 08/15/2044 | | | | 49,754,830 | |
| | 1,406,527 | | | Series 4379-KA | | | 3.00% | | | | 08/15/2044 | | | | 1,295,522 | |
| | 31,263,960 | | | Series 4384-ZY | | | 3.00% | (h) | | | 09/15/2044 | | | | 27,336,575 | |
| | 158,451,269 | | | Series 4390-NZ | | | 3.00% | (h) | | | 09/15/2044 | | | | 137,728,932 | |
| | 11,629,449 | | | Series 4408-PB | | | 3.00% | | | | 04/15/2044 | | | | 10,739,852 | |
| | 12,141,430 | | | Series 4427-CE | | | 3.00% | | | | 02/15/2034 | | | | 11,746,081 | |
| | 6,570,541 | | | Series 4427-PS (-1 x US 30 Day Average Secured Overnight Financing Rate + 5.49%, 5.60% Cap) | | | 0.17% | (f)(g) | | | 07/15/2044 | | | | 349,814 | |
| | 5,777,548 | | | Series 4429-HA | | | 3.00% | | | | 04/15/2034 | | | | 5,562,932 | |
| | 985,460 | | | Series 4438-B | | | 3.00% | | | | 10/15/2043 | | | | 937,934 | |
| | 11,290,054 | | | Series 4441-VZ | | | 3.00% | (h) | | | 02/15/2045 | | | | 9,525,252 | |
| | 32,819,924 | | | Series 4444-CZ | | | 3.00% | (h) | | | 02/15/2045 | | | | 28,223,947 | |
| | 10,636,507 | | | Series 4471-BA | | | 3.00% | | | | 12/15/2041 | | | | 10,314,319 | |
| | 9,249,033 | | | Series 4471-BC | | | 3.00% | | | | 12/15/2041 | | | | 8,968,873 | |
| | 35,918,887 | | | Series 4471-GA | | | 3.00% | | | | 02/15/2044 | | | | 33,673,231 | |
| | 47,564,888 | | | Series 4483-CA | | | 3.00% | | | | 06/15/2044 | | | | 44,354,990 | |
| | 23,640,799 | | | Series 4483-PA | | | 2.50% | | | | 06/15/2045 | | | | 22,114,889 | |
| | 7,665,857 | | | Series 4492-GZ | | | 3.50% | | | | 07/15/2045 | | | | 7,030,644 | |
| | 198,933 | | | Series 4498-PD | | | 2.50% | | | | 08/15/2042 | | | | 197,827 | |
| | 5,420,518 | | | Series 4500-GO | | | 0.00% | (k) | | | 08/15/2045 | | | | 4,197,277 | |
| | 9,632,841 | | | Series 4504-CA | | | 3.00% | | | | 04/15/2044 | | | | 9,044,422 | |
| | 17,156,346 | | | Series 4527-GA | | | 3.00% | | | | 02/15/2044 | | | | 15,911,514 | |
| | 35,050,351 | | | Series 4533-AB | | | 3.00% | | | | 06/15/2044 | | | | 32,712,422 | |
| | 31,419,169 | | | Series 4543-HG | | | 2.70% | | | | 04/15/2044 | | | | 29,245,277 | |
| | 49,367,488 | | | Series 4573-CA | | | 3.00% | | | | 11/15/2044 | | | | 46,030,725 | |
| | 10,148,331 | | | Series 4573-DA | | | 3.00% | | | | 03/15/2045 | | | | 9,518,700 | |
| | 10,398,497 | | | Series 4588-DA | | | 3.00% | | | | 02/15/2044 | | | | 9,707,650 | |
| | 5,916,428 | | | Series 4629-KA | | | 3.00% | | | | 03/15/2045 | | | | 5,591,667 | |
| | 13,540,579 | | | Series 4632-MH | | | 4.00% | | | | 11/15/2056 | | | | 12,489,305 | |
| | 35,962,756 | | | Series 4636-DZ | | | 3.50% | | | | 12/15/2046 | | | | 32,772,176 | |
| | 58,609,301 | | | Series 4673-KZ | | | 3.50% | | | | 03/15/2047 | | | | 53,378,280 | |
| | 26,294,659 | | | Series 4679-VZ | | | 3.50% | | | | 02/15/2047 | | | | 23,945,988 | |
| | 5,555,266 | | | Series 4744-JA | | | 3.00% | | | | 09/15/2047 | | | | 4,973,238 | |
| | 5,407,171 | | | Series 4744-KA | | | 3.00% | | | | 08/15/2046 | | | | 5,075,350 | |
| | 21,534,000 | | | Series 4759-NL | | | 3.00% | | | | 02/15/2048 | | | | 18,109,907 | |
| | 8,060,795 | | | Series 4776-YP | | | 3.50% | | | | 02/15/2048 | | | | 7,220,064 | |
| | 25,414,838 | | | Series 4778-DZ | | | 4.00% | (h) | | | 04/15/2048 | | | | 23,648,748 | |
| | 5,436,555 | | | Series 4791-IO | | | 3.00% | (f) | | | 05/15/2048 | | | | 810,792 | |
| | 28,425,365 | | | Series 4791-JT | | | 3.00% | | | | 05/15/2048 | | | | 25,038,091 | |
| | 4,439,196 | | | Series 4791-LI | | | 3.00% | (f) | | | 05/15/2048 | | | | 771,261 | |
| | 4,439,196 | | | Series 4791-LO | | | 0.00% | (k) | | | 05/15/2048 | | | | 3,249,620 | |
| | 17,537,274 | | | Series 4791-PO | | | 0.00% | (k) | | | 05/15/2048 | | | | 13,450,798 | |
| | 12,075,559 | | | Series 4792-A | | | 3.00% | | | | 05/15/2048 | | | | 10,636,410 | |
| | 7,595,625 | | | Series 4793-C | | | 3.00% | | | | 06/15/2048 | | | | 6,647,236 | |
| | 7,255,978 | | | Series 4795-AO | | | 0.00% | (k) | | | 05/15/2048 | | | | 5,389,209 | |
| | 6,201,607 | | | Series 4801-OG | | | 0.00% | (k) | | | 06/15/2048 | | | | 4,755,743 | |
| | 25,080,044 | | | Series 4857-J | | | 3.40% | | | | 01/15/2049 | | | | 23,095,056 | |
| | 10,819,515 | | | Series 4901-BD | | | 3.00% | | | | 07/25/2049 | | | | 9,937,338 | |
| | 20,984,006 | | | Series 4924-ST (-1 x US 30 Day Average Secured Overnight Financing Rate + 5.89%, 6.00% Cap) | | | 0.57% | (f)(g) | | | 08/25/2048 | | | | 1,902,567 | |
| | 11,351,137 | | | Series 5004-LS (-1 x US 30 Day Average Secured Overnight Financing Rate + 6.04%, 6.15% Cap) | | | 0.72% | (f)(g) | | | 07/25/2050 | | | | 1,278,649 | |
| | | | |
| 46 | | DoubleLine Funds Trust | | The accompanying notes are an integral part of these financial statements. |
| | | | | | | | | | | | | | | | |
PRINCIPAL AMOUNT $ | | | SECURITY DESCRIPTION | | RATE | | | MATURITY | | | VALUE $ | |
| | 39,587,669 | | | Series 5007-IP | | | 3.00% | (f) | | | 07/25/2050 | | | | 6,368,512 | |
| | 17,550,777 | | | Series 5010-KI | | | 3.00% | (f) | | | 09/25/2050 | | | | 2,568,544 | |
| | 27,847,345 | | | Series 5017-VZ | | | 2.00% | (h) | | | 09/25/2050 | | | | 18,062,509 | |
| | 12,638,834 | | | Series 5023-YI | | | 3.00% | (f) | | | 10/25/2050 | | | | 1,900,708 | |
| | 58,823,485 | | | Series 5040-GI | | | 2.00% | (f) | | | 11/25/2050 | | | | 7,093,306 | |
| | 32,990,490 | | | Series 5050-BN | | | 3.00% | | | | 11/25/2050 | | | | 28,325,203 | |
| | 32,200,424 | | | Series 5053-AI | | | 3.00% | (f) | | | 11/25/2050 | | | | 5,297,710 | |
| | 10,733,474 | | | Series 5053-PI | | | 3.00% | (f) | | | 11/25/2050 | | | | 1,728,231 | |
| | 22,564,776 | | | Series 5059-HI | | | 3.00% | (f) | | | 09/25/2050 | | | | 3,605,899 | |
| | 26,013,031 | | | Series 5059-ID | | | 3.00% | (f) | | | 01/25/2051 | | | | 3,709,666 | |
| | 12,332,316 | | | Series 5060-LT | | | 2.00% | | | | 05/25/2050 | | | | 9,882,167 | |
| | 6,077,349 | | | Series 5062-PA | | | 1.25% | | | | 01/25/2051 | | | | 4,477,812 | |
| | 13,933,730 | | | Series 5071-FP (US 30 Day Average Secured Overnight Financing Rate + 0.70%, 0.70% Floor, 4.00% Cap) | | | 4.00% | | | | 02/25/2051 | | | | 10,555,277 | |
| | 30,853,466 | | | Series 5077-CI | | | 3.50% | (f) | | | 02/25/2051 | | | | 5,418,726 | |
| | 12,658,095 | | | Series 5081-MI | | | 2.50% | (f) | | | 03/25/2051 | | | | 1,880,180 | |
| | 11,613,055 | | | Series 5086-IB | | | 3.00% | (f) | | | 03/25/2051 | | | | 1,830,647 | |
| | 15,193,728 | | | Series 5086-IK | | | 3.00% | (f) | | | 03/25/2051 | | | | 2,393,655 | |
| | 7,835,291 | | | Series 5112-SC (-1 x US 30 Day Average Secured Overnight Financing Rate + 2.50%, 2.50% Cap) | | | 0.00% | (f)(g) | | | 06/25/2051 | | | | 49,035 | |
| | 17,879,148 | | | Series 5117-D | | | 2.00% | | | | 06/25/2051 | | | | 15,441,633 | |
| | 18,286,854 | | | Series 5118-PI | | | 3.00% | (f) | | | 03/25/2051 | | | | 2,981,973 | |
| | 38,666,559 | | | Series 5126-AH | | | 2.00% | | | | 02/25/2037 | | | | 34,209,020 | |
| | 107,125,666 | | | Series 5129-GI | | | 3.00% | (f) | | | 08/25/2050 | | | | 18,384,360 | |
| | 67,120,973 | | | Series 5130-IO | | | 3.50% | (f) | | | 08/25/2051 | | | | 13,066,849 | |
| | 34,211,255 | | | Series 5140-AI | | | 3.50% | (f) | | | 09/25/2051 | | | | 6,568,934 | |
| | 11,737,631 | | | Series 5140-B | | | 2.00% | | | | 05/25/2040 | | | | 10,123,158 | |
| | 26,079,496 | | | Series 5142-IP | | | 3.00% | (f) | | | 09/25/2051 | | | | 4,432,894 | |
| | 39,414,608 | | | Series 5145-SB (-1 x US 30 Day Average Secured Overnight Financing Rate + 2.60%, 2.60% Cap) | | | 0.00% | (f)(g) | | | 09/25/2051 | | | | 320,859 | |
| | 17,370,913 | | | Series 5149-CI | | | 3.00% | (f) | | | 12/25/2043 | | | | 2,390,121 | |
| | 21,709,576 | | | Series 5150-AB | | | 2.00% | | | | 04/25/2049 | | | | 17,587,722 | |
| | 44,527,358 | | | Series 5157-EI | | | 3.00% | (f) | | | 10/25/2051 | | | | 5,713,136 | |
| | 14,595,825 | | | Series 5157-P | | | 1.50% | | | | 10/25/2051 | | | | 11,508,154 | |
| | 10,441,311 | | | Series 5159-CD | | | 1.50% | | | | 07/25/2041 | | | | 8,858,283 | |
| | 17,701,323 | | | Series 5159-DI | | | 3.00% | (f) | | | 04/25/2048 | | | | 2,718,734 | |
| | 31,890,282 | | | Series 5159-UI | | | 3.50% | (f) | | | 08/25/2050 | | | | 6,136,513 | |
| | 43,434,265 | | | Series 5160-S (-1 x US 30 Day Average Secured Overnight Financing Rate + 3.74%, 3.74% Cap) | | | 0.00% | (f)(g) | | | 08/25/2050 | | | | 1,224,460 | |
| | 18,775,743 | | | Series 5160-ZY | | | 3.00% | (h) | | | 10/25/2050 | | | | 12,984,418 | |
| | 30,543,540 | | | Series 5171-GI | | | 3.00% | (f) | | | 12/25/2051 | | | | 4,925,815 | |
| | 26,500,099 | | | Series 5175-CZ | | | 2.50% | (h) | | | 09/25/2051 | | | | 14,765,111 | |
| | 30,349,703 | | | Series 5176-D | | | 2.50% | | | | 01/25/2051 | | | | 25,338,472 | |
| | 26,836,904 | | | Series 5181-IL | | | 3.00% | (f) | | | 01/25/2052 | | | | 4,231,538 | |
| | 16,756,097 | | | Series 5187-LA | | | 2.50% | | | | 10/25/2049 | | | | 14,581,523 | |
| | 22,056,787 | | | Series 5196-PE | | | 2.00% | | | | 02/25/2052 | | | | 18,784,248 | |
| | 37,655,284 | | | Series 5201-MA | | | 3.00% | | | | 10/25/2049 | | | | 33,982,892 | |
| | 27,355,406 | | | Series 5201-MN | | | 3.00% | | | | 04/25/2048 | | | | 25,076,343 | |
| | 16,730,125 | | | Series 5202-AK | | | 3.00% | | | | 10/25/2049 | | | | 15,088,913 | |
| | 23,492,064 | | | Series 5202-DB | | | 3.00% | | | | 05/25/2048 | | | | 20,814,648 | |
| | 19,440,886 | | | Series 5202-HA | | | 2.50% | | | | 09/25/2048 | | | | 16,923,523 | |
| | 63,000,929 | | | Series 5209-IO | | | 3.00% | (f) | | | 10/25/2051 | | | | 9,745,702 | |
| | 77,469,038 | | | Series 5223-GA | | | 3.00% | | | | 04/25/2049 | | | | 70,598,037 | |
| | 74,598,599 | | | Series 5279-IO | | | 3.00% | (f) | | | 03/25/2051 | | | | 11,639,716 | |
| | 21,499,663 | | | Series 5299-ZA | | | 3.00% | (h) | | | 03/25/2052 | | | | 15,441,086 | |
| | 18,988,086 | | | Series 5319-PO | | | 0.00% | (k) | | | 08/25/2050 | | | | 13,116,552 | |
| | 81,358,730 | | | Series 5321-PO | | | 0.00% | (k) | | | 08/25/2050 | | | | 56,693,180 | |
| | 14,210,035 | | | Series 5326-KO | | | 0.00% | (k) | | | 09/25/2050 | | | | 9,469,763 | |
| | 36,682,905 | | | Series 5326-MO | | | 0.00% | (k) | | | 09/25/2050 | | | | 25,056,471 | |
| | 17,285,376 | | | Series 5326-OP | | | 0.00% | (k) | | | 09/25/2050 | | | | 11,528,046 | |
| | 29,858,848 | | | Series 5326-UO | | | 0.00% | (k) | | | 10/25/2050 | | | | 20,101,577 | |
| | 27,706,645 | | | Series 5334-PO | | | 0.00% | (k) | | | 12/25/2050 | | | | 19,809,623 | |
| | 13,772,828 | | | Series 5352-LO | | | 0.00% | (k) | | | 10/15/2046 | | | | 10,111,447 | |
| | | | | | | | |
| The accompanying notes are an integral part of these financial statements. | | Annual Report | | | | | March 31, 2024 | | 47 |
| | |
Schedule of Investments DoubleLine Total Return Bond Fund (Cont.) | | |
| | | | | | | | | | | | | | | | |
PRINCIPAL AMOUNT $ | | | SECURITY DESCRIPTION | | RATE | | | MATURITY | | | VALUE $ | |
| | 21,861,034 | | | Series 5365-PO | | | 0.00% | (k) | | | 02/25/2037 | | | | 17,238,273 | |
| | 25,819,828 | | | Series 5385-ZA | | | 2.00% | (h) | | | 01/25/2051 | | | | 13,139,951 | |
| | 25,000,000 | | | Series 5400-FB (US 30 Day Average Secured Overnight Financing Rate + 1.10%, 1.10% Floor, 7.00% Cap) | | | 6.42% | | | | 04/25/2054 | | | | 25,026,367 | |
| | 21,405,428 | | | Series R003-ZA | | | 5.50% | | | | 10/15/2035 | | | | 21,069,305 | |
| |
| | | | Federal National Mortgage Association | |
| | 58,440,406 | | | Pool 310227 | | | 4.00% | | | | 01/01/2044 | | | | 55,606,549 | |
| | 16,101,485 | | | Pool 387898 | | | 3.71% | | | | 08/01/2030 | | | | 15,202,929 | |
| | 2,909,981 | | | Pool 555743 | | | 5.00% | | | | 09/01/2033 | | | | 2,926,335 | |
| | 2,154,634 | | | Pool 735382 | | | 5.00% | | | | 04/01/2035 | | | | 2,166,770 | |
| | 3,666,283 | | | Pool 735402 | | | 5.00% | | | | 04/01/2035 | | | | 3,686,934 | |
| | 2,430,294 | | | Pool 735484 | | | 5.00% | | | | 05/01/2035 | | | | 2,443,984 | |
| | 1,019,364 | | | Pool 735667 | | | 5.00% | | | | 07/01/2035 | | | | 1,025,100 | |
| | 830,407 | | | Pool 735893 | | | 5.00% | | | | 10/01/2035 | | | | 835,089 | |
| | 2,027,373 | | | Pool 745275 | | | 5.00% | | | | 02/01/2036 | | | | 2,038,813 | |
| | 84,000 | | | Pool 888695 | | | 5.00% | | | | 08/01/2037 | | | | 84,475 | |
| | 533,325 | | | Pool 888968 | | | 5.00% | | | | 08/01/2035 | | | | 536,329 | |
| | 4,032,888 | | | Pool 890549 | | | 4.00% | | | | 11/01/2043 | | | | 3,849,154 | |
| | 4,997,271 | | | Pool 890565 | | | 3.00% | | | | 11/01/2043 | | | | 4,464,526 | |
| | 275,213 | | | Pool 931104 | | | 5.00% | | | | 05/01/2039 | | | | 273,982 | |
| | 61,715 | | | Pool 975116 | | | 5.00% | | | | 05/01/2038 | | | | 62,063 | |
| | 892,085 | | | Pool 986864 | | | 6.50% | | | | 08/01/2038 | | | | 946,334 | |
| | 469,524 | | | Pool 987316 | | | 6.50% | | | | 09/01/2038 | | | | 493,503 | |
| | 3,978,005 | | | Pool 995203 | | | 5.00% | | | | 07/01/2035 | | | | 4,000,383 | |
| | 6,646,693 | | | Pool 995849 | | | 5.00% | | | | 08/01/2036 | | | | 6,684,104 | |
| | 5,204,489 | | | Pool AB2123 | | | 4.00% | | | | 01/01/2031 | | | | 5,065,883 | |
| | 110,738 | | | Pool AB2370 | | | 4.50% | | | | 09/01/2035 | | | | 108,411 | |
| | 376,901 | | | Pool AB3713 | | | 4.00% | | | | 10/01/2031 | | | | 364,803 | |
| | 2,808,396 | | | Pool AB3796 | | | 3.50% | | | | 11/01/2031 | | | | 2,687,461 | |
| | 688,517 | | | Pool AB3850 | | | 4.00% | | | | 11/01/2041 | | | | 645,368 | |
| | 528,634 | | | Pool AB3923 | | | 4.00% | | | | 11/01/2041 | | | | 486,348 | |
| | 10,093,204 | | | Pool AB4167 | | | 3.50% | | | | 01/01/2032 | | | | 9,645,413 | |
| | 8,292,942 | | | Pool AB4261 | | | 3.50% | | | | 01/01/2032 | | | | 7,925,018 | |
| | 1,427,648 | | | Pool AB5084 | | | 3.50% | | | | 05/01/2032 | | | | 1,364,152 | |
| | 3,668,284 | | | Pool AB5156 | | | 3.50% | | | | 05/01/2032 | | | | 3,502,902 | |
| | 5,426,686 | | | Pool AB5212 | | | 3.50% | | | | 05/01/2032 | | | | 5,186,065 | |
| | 3,172,767 | | | Pool AB5243 | | | 4.00% | | | | 05/01/2042 | | | | 2,918,935 | |
| | 7,260,150 | | | Pool AB5911 | | | 3.00% | | | | 08/01/2032 | | | | 6,823,511 | |
| | 2,970,812 | | | Pool AB6280 | | | 3.00% | | | | 09/01/2042 | | | | 2,641,366 | |
| | 3,795,406 | | | Pool AB6349 | | | 3.00% | | | | 10/01/2032 | | | | 3,559,808 | |
| | 10,482,863 | | | Pool AB6750 | | | 3.00% | | | | 10/01/2032 | | | | 9,821,359 | |
| | 5,434,806 | | | Pool AB6751 | | | 3.00% | | | | 10/01/2032 | | | | 5,091,080 | |
| | 30,601,068 | | | Pool AB6854 | | | 3.00% | | | | 11/01/2042 | | | | 27,335,147 | |
| | 23,257,848 | | | Pool AB7077 | | | 3.00% | | | | 11/01/2042 | | | | 20,775,660 | |
| | 10,153,682 | | | Pool AB7776 | | | 3.00% | | | | 02/01/2043 | | | | 9,027,412 | |
| | 11,050,797 | | | Pool AB7877 | | | 3.00% | | | | 02/01/2043 | | | | 9,825,020 | |
| | 4,811,896 | | | Pool AB8418 | | | 3.00% | | | | 02/01/2033 | | | | 4,503,030 | |
| | 7,597,709 | | | Pool AB8520 | | | 3.00% | | | | 02/01/2033 | | | | 7,105,041 | |
| | 9,592,561 | | | Pool AB8703 | | | 3.00% | | | | 03/01/2038 | | | | 8,675,025 | |
| | 3,684,798 | | | Pool AB8858 | | | 3.00% | | | | 04/01/2033 | | | | 3,447,920 | |
| | 8,136,088 | | | Pool AB9020 | | | 3.00% | | | | 04/01/2038 | | | | 7,356,790 | |
| | 6,019,917 | | | Pool AB9197 | | | 3.00% | | | | 05/01/2033 | | | | 5,622,088 | |
| | 3,491,306 | | | Pool AB9409 | | | 3.00% | | | | 05/01/2033 | | | | 3,261,169 | |
| | 129,747 | | | Pool AD2177 | | | 4.50% | | | | 06/01/2030 | | | | 127,347 | |
| | 292,198 | | | Pool AD6438 | | | 5.00% | | | | 06/01/2040 | | | | 291,690 | |
| | 185,230 | | | Pool AD7859 | | | 5.00% | | | | 06/01/2040 | | | | 184,889 | |
| | 2,425,804 | | | Pool AH0607 | | | 4.00% | | | | 12/01/2040 | | | | 2,299,610 | |
| | 126,266 | | | Pool AH1140 | | | 4.50% | | | | 12/01/2040 | | | | 121,031 | |
| | 1,763,302 | | | Pool AH4437 | | | 4.00% | | | | 01/01/2041 | | | | 1,652,816 | |
| | 560,831 | | | Pool AH7309 | | | 4.00% | | | | 02/01/2031 | | | | 544,920 | |
| | 632,700 | | | Pool AH9323 | | | 4.00% | | | | 04/01/2026 | | | | 621,958 | |
| | 773,086 | | | Pool AJ1265 | | | 4.00% | | | | 09/01/2041 | | | | 734,660 | |
| | | | |
| 48 | | DoubleLine Funds Trust | | The accompanying notes are an integral part of these financial statements. |
| | | | | | | | | | | | | | | | |
PRINCIPAL AMOUNT $ | | | SECURITY DESCRIPTION | | RATE | | | MATURITY | | | VALUE $ | |
| | 53,228 | | | Pool AJ1399 | | | 4.00% | | | | 09/01/2041 | | | | 49,891 | |
| | 1,481,304 | | | Pool AJ1467 | | | 4.00% | | | | 10/01/2041 | | | | 1,388,474 | |
| | 1,510,991 | | | Pool AJ3392 | | | 4.00% | | | | 10/01/2041 | | | | 1,416,286 | |
| | 1,066,736 | | | Pool AJ3854 | | | 4.00% | | | | 10/01/2041 | | | | 981,411 | |
| | 4,924,610 | | | Pool AJ4118 | | | 4.00% | | | | 11/01/2041 | | | | 4,616,025 | |
| | 1,283,650 | | | Pool AJ4131 | | | 4.00% | | | | 10/01/2041 | | | | 1,203,195 | |
| | 7,091,285 | | | Pool AJ5322 | | | 4.00% | | | | 11/01/2041 | | | | 6,721,584 | |
| | 1,803,678 | | | Pool AJ7677 | | | 3.50% | | | | 12/01/2041 | | | | 1,634,811 | |
| | 969,009 | | | Pool AJ8334 | | | 4.00% | | | | 12/01/2041 | | | | 891,481 | |
| | 7,975,203 | | | Pool AK0713 | | | 3.50% | | | | 01/01/2032 | | | | 7,638,710 | |
| | 1,408,404 | | | Pool AK4039 | | | 4.00% | | | | 02/01/2042 | | | | 1,295,737 | |
| | 2,624,015 | | | Pool AK4763 | | | 4.00% | | | | 02/01/2042 | | | | 2,459,627 | |
| | 1,093,294 | | | Pool AK9438 | | | 4.00% | | | | 03/01/2042 | | | | 1,024,770 | |
| | 1,684,025 | | | Pool AK9439 | | | 4.00% | | | | 03/01/2042 | | | | 1,578,486 | |
| | 473,681 | | | Pool AK9446 | | | 4.50% | | | | 03/01/2042 | | | | 462,528 | |
| | 44,361,361 | | | Pool AL3699 | | | 3.00% | | | | 06/01/2043 | | | | 39,440,224 | |
| | 24,215,696 | | | Pool AL3883 | | | 3.00% | | | | 07/01/2043 | | | | 21,529,839 | |
| | 258,750 | | | Pool AL4292 | | | 4.50% | | | | 04/01/2026 | | | | 255,718 | |
| | 3,883,035 | | | Pool AL4312 | | | 4.00% | | | | 10/01/2043 | | | | 3,706,084 | |
| | 8,724,938 | | | Pool AL6075 | | | 3.50% | | | | 09/01/2053 | | | | 7,725,572 | |
| | 16,806,271 | | | Pool AL6076 | | | 3.00% | | | | 06/01/2053 | | | | 14,509,048 | |
| | 22,343,344 | | | Pool AL6141 | | | 4.00% | | | | 04/01/2042 | | | | 21,185,618 | |
| | 20,932,449 | | | Pool AL6325 | | | 3.00% | | | | 10/01/2044 | | | | 18,700,417 | |
| | 6,790,965 | | | Pool AL6486 | | | 4.50% | | | | 02/01/2045 | | | | 6,629,052 | |
| | 20,454,903 | | | Pool AL6538 | | | 4.50% | | | | 06/01/2044 | | | | 20,068,637 | |
| | 20,167,630 | | | Pool AL8304 | | | 3.50% | | | | 03/01/2046 | | | | 18,403,025 | |
| | 10,138,664 | | | Pool AL9220 | | | 3.00% | | | | 06/01/2045 | | | | 9,057,638 | |
| | 14,765,764 | | | Pool AL9445 | | | 3.00% | | | | 07/01/2031 | | | | 14,059,591 | |
| | 24,437,329 | | | Pool AM8510 | | | 3.15% | | | | 05/01/2035 | | | | 21,732,928 | |
| | 27,179,170 | | | Pool AM8950 | | | 3.14% | | | | 06/01/2040 | | | | 24,077,576 | |
| | 4,404,934 | | | Pool AN5480 | | | 3.43% | | | | 06/01/2037 | | | | 4,091,300 | |
| | 217,500,000 | | | Pool AN6680 | | | 3.37% | | | | 11/01/2047 | | | | 169,271,053 | |
| | 5,500,000 | | | Pool AN7330 | | | 3.26% | | | | 12/01/2037 | | | | 4,649,554 | |
| | 23,357,107 | | | Pool AN7345 | | | 3.21% | | | | 11/01/2037 | | | | 20,277,253 | |
| | 10,026,000 | | | Pool AN7452 | | | 3.12% | | | | 11/01/2032 | | | | 8,985,234 | |
| | 20,655,203 | | | Pool AN8121 | | | 3.16% | | | | 01/01/2035 | | | | 18,141,585 | |
| | 3,783,150 | | | Pool AN9452 | | | 3.75% | | | | 06/01/2030 | | | | 3,521,527 | |
| | 3,630,404 | | | Pool AO2980 | | | 4.00% | | | | 05/01/2042 | | | | 3,402,848 | |
| | 12,979,953 | | | Pool AP4787 | | | 3.50% | | | | 09/01/2042 | | | | 11,764,625 | |
| | 10,215,635 | | | Pool AP4789 | | | 3.50% | | | | 09/01/2042 | | | | 9,259,089 | |
| | 6,136,503 | | | Pool AQ5541 | | | 3.00% | | | | 12/01/2042 | | | | 5,481,541 | |
| | 6,012,540 | | | Pool AR9856 | | | 3.00% | | | | 04/01/2043 | | | | 5,370,742 | |
| | 5,263,570 | | | Pool AS1927 | | | 4.50% | | | | 03/01/2044 | | | | 5,138,050 | |
| | 6,787,213 | | | Pool AS2038 | | | 4.50% | | | | 03/01/2044 | | | | 6,625,366 | |
| | 3,486,304 | | | Pool AS2517 | | | 4.50% | | | | 05/01/2044 | | | | 3,403,162 | |
| | 1,688,010 | | | Pool AS2551 | | | 4.50% | | | | 06/01/2044 | | | | 1,648,083 | |
| | 1,862,870 | | | Pool AS2765 | | | 4.50% | | | | 07/01/2044 | | | | 1,818,801 | |
| | 8,703,551 | | | Pool AS3201 | | | 3.00% | | | | 08/01/2034 | | | | 8,073,313 | |
| | 4,126,678 | | | Pool AS3456 | | | 3.00% | | | | 10/01/2034 | | | | 3,823,980 | |
| | 8,164,645 | | | Pool AS3666 | | | 3.00% | | | | 10/01/2034 | | | | 7,584,300 | |
| | 28,533,066 | | | Pool AS3961 | | | 3.00% | | | | 12/01/2044 | | | | 25,371,709 | |
| | 11,083,327 | | | Pool AS4154 | | | 3.00% | | | | 12/01/2044 | | | | 9,846,233 | |
| | 6,712,734 | | | Pool AS4212 | | | 3.00% | | | | 01/01/2035 | | | | 6,235,856 | |
| | 9,891,366 | | | Pool AS4281 | | | 3.00% | | | | 01/01/2035 | | | | 9,150,631 | |
| | 8,056,401 | | | Pool AS4345 | | | 3.50% | | | | 01/01/2045 | | | | 7,384,466 | |
| | 9,630,301 | | | Pool AS4360 | | | 3.00% | | | | 01/01/2035 | | | | 8,941,919 | |
| | 65,603,423 | | | Pool AS4625 | | | 3.00% | | | | 03/01/2045 | | | | 58,281,192 | |
| | 25,453,728 | | | Pool AS4645 | | | 3.00% | | | | 03/01/2045 | | | | 22,612,758 | |
| | 10,571,106 | | | Pool AS4779 | | | 3.00% | | | | 04/01/2035 | | | | 9,797,351 | |
| | 8,585,032 | | | Pool AS4780 | | | 3.00% | | | | 04/01/2035 | | | | 7,961,405 | |
| | 10,876,771 | | | Pool AS4840 | | | 3.00% | | | | 04/01/2035 | | | | 10,085,712 | |
| | 7,361,126 | | | Pool AS4881 | | | 3.00% | | | | 05/01/2035 | | | | 6,824,386 | |
| | | | | | | | |
| The accompanying notes are an integral part of these financial statements. | | Annual Report | | | | | March 31, 2024 | | 49 |
| | |
Schedule of Investments DoubleLine Total Return Bond Fund (Cont.) | | |
| | | | | | | | | | | | | | | | |
PRINCIPAL AMOUNT $ | | | SECURITY DESCRIPTION | | RATE | | | MATURITY | | | VALUE $ | |
| | 13,136,819 | | | Pool AS7473 | | | 3.00% | | | | 07/01/2046 | | | | 11,363,649 | |
| | 26,550,780 | | | Pool AS7661 | | | 3.00% | | | | 08/01/2046 | | | | 22,966,809 | |
| | 17,910,346 | | | Pool AS8056 | | | 3.00% | | | | 10/01/2046 | | | | 15,762,994 | |
| | 25,227,300 | | | Pool AS8111 | | | 3.00% | | | | 10/01/2041 | | | | 22,569,160 | |
| | 15,466,436 | | | Pool AS8269 | | | 3.00% | | | | 11/01/2046 | | | | 13,643,988 | |
| | 13,213,776 | | | Pool AS8306 | | | 3.00% | | | | 11/01/2041 | | | | 11,825,605 | |
| | 15,523,049 | | | Pool AS8356 | | | 3.00% | | | | 11/01/2046 | | | | 13,427,695 | |
| | 12,500,218 | | | Pool AX9696 | | | 3.00% | | | | 07/01/2045 | | | | 10,993,042 | |
| | 15,608,036 | | | Pool AY3974 | | | 3.00% | | | | 03/01/2045 | | | | 13,846,484 | |
| | 5,856,000 | | | Pool AY4295 | | | 3.00% | | | | 02/01/2045 | | | | 5,148,951 | |
| | 411,444 | | | Pool AY4296 | | | 3.00% | | | | 01/01/2045 | | | | 355,905 | |
| | 2,701,883 | | | Pool AY5471 | | | 3.00% | | | | 03/01/2045 | | | | 2,337,199 | |
| | 4,925,541 | | | Pool AZ0576 | | | 3.50% | | | | 04/01/2042 | | | | 4,496,936 | |
| | 8,014,249 | | | Pool BC0785 | | | 3.50% | | | | 04/01/2046 | | | | 7,310,787 | |
| | 14,928,022 | | | Pool BC9003 | | | 3.00% | | | | 11/01/2046 | | | | 13,141,343 | |
| | 7,600,954 | | | Pool BC9081 | | | 3.00% | | | | 12/01/2046 | | | | 6,692,819 | |
| | 73,022,141 | | | Pool BF0314 | | | 3.00% | | | | 01/01/2053 | | | | 63,831,826 | |
| | 62,759,854 | | | Pool BF0353 | | | 3.00% | | | | 05/01/2053 | | | | 54,860,367 | |
| | 32,865,961 | | | Pool BF0391 | | | 3.00% | | | | 09/01/2053 | | | | 28,729,401 | |
| | 20,281,759 | | | Pool BK8257 | | | 1.50% | | | | 12/01/2050 | | | | 15,105,880 | |
| | 16,944,805 | | | Pool BK8267 | | | 2.50% | | | | 12/01/2050 | | | | 14,261,701 | |
| | 9,000,000 | | | Pool BL0357 | | | 3.89% | | | | 10/01/2038 | | | | 8,231,490 | |
| | 43,897,283 | | | Pool BL0870 | | | 4.28% | | | | 12/01/2048 | | | | 38,642,280 | |
| | 5,000,000 | | | Pool BL2303 | | | 3.36% | | | | 05/01/2031 | | | | 4,631,057 | |
| | 8,860,000 | | | Pool BL4038 | | | 2.98% | | | | 09/01/2034 | | | | 7,635,739 | |
| | 8,190,000 | | | Pool BL5840 | | | 2.73% | | | | 02/01/2035 | | | | 6,726,487 | |
| | 6,410,306 | | | Pool BL6639 | | | 2.66% | | | | 05/01/2050 | | | | 4,899,644 | |
| | 16,589,434 | | | Pool BL6689 | | | 2.19% | | | | 05/01/2032 | | | | 13,953,220 | |
| | 28,785,015 | | | Pool BL6913 | | | 1.96% | | | | 05/01/2035 | | | | 22,474,697 | |
| | 36,488,000 | | | Pool BL7110 | | | 1.76% | | | | 07/01/2035 | | | | 27,794,758 | |
| | 3,568,101 | | | Pool BL7331 | | | 2.23% | | | | 07/01/2040 | | | | 2,555,872 | |
| | 20,400,000 | | | Pool BL7424 | | | 1.65% | | | | 08/01/2035 | | | | 15,134,711 | |
| | 40,000,000 | | | Pool BL8165 | | | 1.35% | | | | 09/01/2032 | | | | 31,143,201 | |
| | 32,000,000 | | | Pool BL8269 | | | 1.51% | | | | 09/01/2035 | | | | 23,883,813 | |
| | 17,000,000 | | | Pool BL8977 | | | 1.20% | | | | 11/01/2030 | | | | 13,643,566 | |
| | 10,712,297 | | | Pool BL9284 | | | 2.23% | | | | 12/01/2050 | | | | 7,467,448 | |
| | 53,000,000 | | | Pool BL9576 | | | 2.24% | | | | 12/01/2050 | | | | 35,396,420 | |
| | 17,415,150 | | | Pool BM5299 | | | 3.00% | | | | 12/01/2046 | | | | 15,330,783 | |
| | 27,046,330 | | | Pool BM5633 | | | 3.00% | | | | 07/01/2047 | | | | 23,797,810 | |
| | 4,012,562 | | | Pool BM5834 | | | 3.00% | | | | 04/01/2048 | | | | 3,470,844 | |
| | 47,072,696 | | | Pool BM6779 | | | 2.00% | | | | 08/01/2051 | | | | 36,274,347 | |
| | 170,877,863 | | | Pool BM6831 | | | 1.93% | (c) | | | 10/01/2033 | | | | 135,754,556 | |
| | 77,245,967 | | | Pool BM6857 | | | 1.83% | (c) | | | 12/01/2031 | | | | 63,496,472 | |
| | 21,383,052 | | | Pool BM7154 (US 30 Day Average Secured Overnight Financing Rate + 2.28%, 2.28% Floor, 9.73% Cap) | | | 4.74% | | | | 03/01/2053 | | | | 20,799,821 | |
| | 26,701,498 | | | Pool BM7164 (US 30 Day Average Secured Overnight Financing Rate + 2.28%, 2.28% Floor, 9.55% Cap) | | | 4.55% | | | | 03/01/2053 | | | | 25,808,829 | |
| | 8,147,279 | | | Pool BQ6432 | | | 2.00% | | | | 08/01/2051 | | | | 6,278,381 | |
| | 16,143,394 | | | Pool BQ6564 | | | 2.00% | | | | 09/01/2051 | | | | 12,440,138 | |
| | 15,596,758 | | | Pool BR2181 (US 30 Day Average Secured Overnight Financing Rate + 2.13%, 2.13% Floor, 7.15% Cap) | | | 2.14% | | | | 07/01/2051 | | | | 13,716,397 | |
| | 32,498,690 | | | Pool BR2290 (US 30 Day Average Secured Overnight Financing Rate + 2.12%, 2.12% Floor, 7.01% Cap) | | | 2.01% | | | | 08/01/2051 | | | | 28,400,390 | |
| | 48,883,000 | | | Pool BS2496 | | | 1.88% | | | | 09/01/2033 | | | | 38,566,609 | |
| | 5,592,000 | | | Pool BS2500 | | | 1.81% | | | | 06/01/2030 | | | | 4,734,526 | |
| | 14,906,452 | | | Pool BS2568 | | | 2.20% | | | | 09/01/2046 | | | | 11,357,912 | |
| | 3,000,000 | | | Pool BS2580 | | | 2.15% | | | | 08/01/2033 | | | | 2,426,334 | |
| | 22,000,000 | | | Pool BS2805 | | | 1.81% | | | | 09/01/2033 | | | | 17,443,518 | |
| | 9,975,000 | | | Pool BS2834 | | | 2.24% | | | | 08/01/2041 | | | | 7,006,702 | |
| | 39,850,000 | | | Pool BS3020 | | | 1.96% | | | | 09/01/2033 | | | | 31,494,464 | |
| | 34,043,000 | | | Pool BS3101 | | | 1.91% | | | | 09/01/2033 | | | | 27,100,985 | |
| | 2,595,000 | | | Pool BS3163 | | | 1.75% | | | | 08/01/2030 | | | | 2,183,571 | |
| | 19,880,000 | | | Pool BS3192 | | | 2.03% | | | | 09/01/2036 | | | | 14,703,705 | |
| | | | |
| 50 | | DoubleLine Funds Trust | | The accompanying notes are an integral part of these financial statements. |
| | | | | | | | | | | | | | | | |
PRINCIPAL AMOUNT $ | | | SECURITY DESCRIPTION | | RATE | | | MATURITY | | | VALUE $ | |
| | 16,125,000 | | | Pool BS3314 | | | 1.83% | | | | 10/01/2033 | | | | 12,775,736 | |
| | 21,000,000 | | | Pool BS3345 | | | 2.16% | | | | 10/01/2036 | | | | 16,217,506 | |
| | 25,042,000 | | | Pool BS3426 | | | 1.76% | | | | 11/01/2031 | | | | 20,236,374 | |
| | 12,048,000 | | | Pool BS3431 | | | 1.83% | | | | 11/01/2033 | | | | 9,489,468 | |
| | 6,536,000 | | | Pool BS3434 | | | 1.83% | | | | 11/01/2033 | | | | 5,148,005 | |
| | 32,694,000 | | | Pool BS3442 | | | 2.12% | | | | 10/01/2036 | | | | 24,618,710 | |
| | 11,900,000 | | | Pool BS3514 | | | 2.08% | | | | 10/01/2033 | | | | 9,452,324 | |
| | 7,339,000 | | | Pool BS3955 | | | 2.30% | | | | 12/01/2036 | | | | 5,613,907 | |
| | 46,000,000 | | | Pool BS3974 | | | 1.94% | | | | 01/01/2032 | | | | 37,778,478 | |
| | 21,200,000 | | | Pool BS4110 | | | 2.13% | | | | 01/01/2034 | | | | 17,167,871 | |
| | 48,972,000 | | | Pool BS4111 | | | 1.98% | | | | 01/01/2032 | | | | 40,606,031 | |
| | 46,000,000 | | | Pool BS4125 | | | 2.32% | | | | 12/01/2031 | | | | 39,044,552 | |
| | 20,931,784 | | | Pool BS4177 | | | 1.94% | | | | 12/01/2031 | | | | 17,493,192 | |
| | 12,500,000 | | | Pool BS4213 | | | 2.46% | | | | 12/01/2036 | | | | 9,909,763 | |
| | 18,199,000 | | | Pool BS4225 | | | 2.36% | | | | 01/01/2037 | | | | 14,120,258 | |
| | 20,000,000 | | | Pool BS4273 | | | 1.93% | | | | 12/01/2031 | | | | 16,647,135 | |
| | 33,675,000 | | | Pool BS4276 | | | 2.03% | | | | 01/01/2032 | | | | 28,102,056 | |
| | 51,025,000 | | | Pool BS4306 | | | 1.92% | | | | 01/01/2032 | | | | 41,595,405 | |
| | 27,223,552 | | | Pool BS4319 | | | 2.35% | | | | 01/01/2039 | | | | 20,778,625 | |
| | 19,170,000 | | | Pool BS4330 | | | 1.92% | | | | 01/01/2034 | | | | 15,107,542 | |
| | 30,761,000 | | | Pool BS4333 | | | 1.89% | | | | 01/01/2032 | | | | 25,180,022 | |
| | 12,000,000 | | | Pool BS4334 | | | 2.01% | | | | 01/01/2034 | | | | 9,471,515 | |
| | 18,191,357 | | | Pool BS4359 | | | 1.99% | | | | 01/01/2032 | | | | 15,277,406 | |
| | 21,800,000 | | | Pool BS4360 | | | 2.14% | | | | 01/01/2037 | | | | 16,306,388 | |
| | 53,950,000 | | | Pool BS4453 | | | 1.96% | | | | 01/01/2032 | | | | 44,398,925 | |
| | 51,688,000 | | | Pool BS4524 | | | 2.02% | | | | 01/01/2032 | | | | 42,631,682 | |
| | 41,850,000 | | | Pool BS4736 | | | 2.00% | | | | 02/01/2032 | | | | 34,136,858 | |
| | 24,500,000 | | | Pool BS4737 | | | 2.00% | | | | 02/01/2032 | | | | 19,984,540 | |
| | 20,155,000 | | | Pool BS4951 | | | 2.63% | | | | 04/01/2032 | | | | 17,235,965 | |
| | 11,091,839 | | | Pool BS5636 | | | 3.72% | | | | 06/01/2032 | | | | 10,330,863 | |
| | 6,814,923 | | | Pool BS5685 | | | 4.20% | | | | 05/01/2052 | | | | 6,022,692 | |
| | 8,665,000 | | | Pool BS6102 | | | 4.10% | | | | 08/01/2032 | | | | 8,265,930 | |
| | 4,200,000 | | | Pool BS6131 | | | 3.89% | | | | 07/01/2032 | | | | 3,942,723 | |
| | 3,600,000 | | | Pool BS6419 | | | 3.89% | | | | 09/01/2032 | | | | 3,383,792 | |
| | 24,762,678 | | | Pool BS6649 | | | 3.89% | | | | 10/01/2032 | | | | 23,225,039 | |
| | 159,468,000 | | | Pool BS6912 | | | 4.33% | | | | 12/01/2032 | | | | 153,764,993 | |
| | 4,131,000 | | | Pool BS7305 | | | 5.22% | | | | 01/01/2032 | | | | 4,252,741 | |
| | 39,897,392 | | | Pool BS7329 | | | 5.41% | | | | 12/01/2032 | | | | 40,477,210 | |
| | 7,863,000 | | | Pool BS7410 | | | 5.48% | | | | 01/01/2033 | | | | 8,017,721 | |
| | 3,260,000 | | | Pool BS7503 | | | 4.87% | | | | 04/01/2031 | | | | 3,267,812 | |
| | 3,315,320 | | | Pool BS7824 | | | 4.99% | | | | 11/01/2039 | | | | 3,310,522 | |
| | 10,467,000 | | | Pool BS8014 | | | 4.84% | | | | 03/01/2033 | | | | 10,450,886 | |
| | 8,333,000 | | | Pool BS8657 | | | 5.10% | | | | 06/01/2030 | | | | 8,439,143 | |
| | 5,590,980 | | | Pool BS8987 | | | 5.15% | | | | 07/01/2040 | | | | 5,657,631 | |
| | 18,443,561 | | | Pool BS9321 | | | 5.27% | | | | 08/01/2040 | | | | 19,019,039 | |
| | 1,571,716 | | | Pool BT6556 | | | 2.00% | | | | 07/01/2051 | | | | 1,211,154 | |
| | 11,092,947 | | | Pool BV8021 | | | 4.50% | | | | 08/01/2052 | | | | 10,574,577 | |
| | 10,550,000 | | | Pool BZ0079 | | | 5.21% | | | | 01/01/2034 | | | | 10,933,671 | |
| | 77,485,000 | | | Pool BZ0107 | | | 4.94% | | | | 12/01/2033 | | | | 78,839,841 | |
| | 27,755,000 | | | Pool BZ0115 | | | 5.27% | | | | 12/01/2033 | | | | 28,856,591 | |
| | 14,016,000 | | | Pool BZ0452 | | | 5.36% | | | | 02/01/2054 | | | | 14,482,075 | |
| | 7,638,421 | | | Pool CA0862 | | | 3.50% | | | | 09/01/2047 | | | | 6,967,847 | |
| | 5,095,666 | | | Pool CA3898 | | | 3.00% | | | | 07/01/2034 | | | | 4,793,830 | |
| | 4,198,658 | | | Pool CA4413 | | | 3.00% | | | | 10/01/2049 | | | | 3,603,072 | |
| | 36,200,411 | | | Pool CA7235 | | | 2.50% | | | | 10/01/2050 | | | | 30,344,198 | |
| | 11,836,726 | | | Pool CA7671 | | | 2.50% | | | | 11/01/2040 | | | | 10,323,619 | |
| | 20,922,627 | | | Pool CA7789 | | | 2.50% | | | | 11/01/2040 | | | | 18,248,621 | |
| | 16,012,268 | | | Pool CB0189 | | | 3.00% | | | | 04/01/2051 | | | | 13,921,167 | |
| | 14,145,151 | | | Pool CB1055 (US 30 Day Average Secured Overnight Financing Rate + 2.22%, 2.22% Floor, 6.87% Cap) | | | 1.87% | | | | 07/01/2051 | | | | 12,294,382 | |
| | 3,605,383 | | | Pool CB1648 | | | 2.00% | | | | 09/01/2051 | | | | 2,778,336 | |
| | 13,351,005 | | | Pool CB3332 | | | 3.50% | | | | 04/01/2052 | | | | 12,070,195 | |
| | | | | | | | |
| The accompanying notes are an integral part of these financial statements. | | Annual Report | | | | | March 31, 2024 | | 51 |
| | |
Schedule of Investments DoubleLine Total Return Bond Fund (Cont.) | | |
| | | | | | | | | | | | | | | | |
PRINCIPAL
AMOUNT $ | | | SECURITY DESCRIPTION | | RATE | | | MATURITY | | | VALUE $ | |
| | 92,967,678 | | | Pool CB4291 | | | 5.00% | | | | 08/01/2052 | | | | 90,874,342 | |
| | 49,532,304 | | | Pool CB4347 | | | 5.00% | | | | 08/01/2052 | | | | 49,211,927 | |
| | 55,637,769 | | | Pool CB4391 | | | 4.50% | | | | 08/01/2052 | | | | 53,053,314 | |
| | 66,015,877 | | | Pool CB5221 | | | 5.00% | | | | 12/01/2052 | | | | 64,529,322 | |
| | 19,438,419 | | | Pool CB6266 | | | 6.00% | | | | 05/01/2053 | | | | 19,740,446 | |
| | 39,636,320 | | | Pool CB7272 | | | 6.00% | | | | 10/01/2053 | | | | 40,266,541 | |
| | 31,430,971 | | | Pool CB7781 | | | 5.50% | | | | 01/01/2054 | | | | 31,319,938 | |
| | 44,917,016 | | | Pool FM1000 | | | 3.00% | | | | 04/01/2047 | | | | 39,531,620 | |
| | 23,380,563 | | | Pool FM4347 | | | 2.50% | | | | 09/01/2050 | | | | 19,567,116 | |
| | 42,004,688 | | | Pool FM4752 | | | 2.50% | | | | 11/01/2050 | | | | 35,390,807 | |
| | 47,236,845 | | | Pool FM4792 | | | 2.50% | | | | 11/01/2050 | | | | 39,595,264 | |
| | 26,439,783 | | | Pool FM4913 | | | 2.50% | | | | 11/01/2050 | | | | 22,170,722 | |
| | 33,545,541 | | | Pool FM5150 | | | 2.00% | | | | 12/01/2050 | | | | 26,901,508 | |
| | 4,995,863 | | | Pool FM6864 | | | 1.50% | | | | 04/01/2041 | | | | 4,106,103 | |
| | 62,531,480 | | | Pool FM7557 | | | 3.50% | | | | 03/01/2050 | | | | 57,112,859 | |
| | 27,681,261 | | | Pool FM8158 | | | 2.50% | | | | 07/01/2051 | | | | 23,500,500 | |
| | 62,886,599 | | | Pool FM8215 | | | 2.50% | | | | 03/01/2051 | | | | 52,957,333 | |
| | 46,052,284 | | | Pool FM8304 | | | 4.00% | | | | 07/01/2049 | | | | 43,265,875 | |
| | 60,991,302 | | | Pool FM8435 | | | 2.50% | | | | 09/01/2051 | | | | 51,354,923 | |
| | 110,255,210 | | | Pool FM8533 | | | 2.50% | | | | 03/01/2051 | | | | 93,144,737 | |
| | 68,631,362 | | | Pool FM8769 | | | 2.50% | | | | 09/01/2051 | | | | 57,757,921 | |
| | 35,913,403 | | | Pool FM8780 | | | 2.50% | | | | 09/01/2051 | | | | 30,067,260 | |
| | 10,185,360 | | | Pool FM9422 | | | 2.00% | | | | 01/01/2051 | | | | 8,128,641 | |
| | 29,204,182 | | | Pool FM9490 | | | 2.00% | | | | 11/01/2051 | | | | 23,535,138 | |
| | 37,796,525 | | | Pool FP0043 | | | 2.00% | | | | 10/01/2050 | | | | 30,158,145 | |
| | 31,832,343 | | | Pool FP0088 | | | 2.00% | | | | 10/01/2051 | | | | 25,334,880 | |
| | 34,076,651 | | | Pool FS0009 | | | 3.50% | | | | 11/01/2051 | | | | 30,649,530 | |
| | 52,946,897 | | | Pool FS1472 | | | 3.50% | | | | 11/01/2050 | | | | 48,132,882 | |
| | 84,633,207 | | | Pool FS2320 | | | 2.50% | | | | 04/01/2051 | | | | 70,216,981 | |
| | 16,549,782 | | | Pool FS2588 | | | 4.50% | | | | 08/01/2052 | | | | 15,781,009 | |
| | 15,720,290 | | | Pool FS2837 | | | 4.00% | | | | 09/01/2052 | | | | 14,586,685 | |
| | 16,102,890 | | | Pool FS5618 | | | 5.50% | | | | 08/01/2053 | | | | 16,427,780 | |
| | 50,997,514 | | | Pool FS5987 | | | 2.50% | | | | 04/01/2051 | | | | 43,083,712 | |
| | 37,140,883 | | | Pool FS6232 | | | 2.00% | | | | 03/01/2052 | | | | 29,981,197 | |
| | 24,610,015 | | | Pool FS6843 | | | 6.00% | | | | 01/01/2054 | | | | 25,145,471 | |
| | 49,366,484 | | | Pool FS7114 | | | 5.50% | | | | 02/01/2054 | | | | 49,632,701 | |
| | 601,666 | | | Pool MA0264 | | | 4.50% | | | | 12/01/2029 | | | | 592,390 | |
| | 2,134,099 | | | Pool MA0353 | | | 4.50% | | | | 03/01/2030 | | | | 2,100,720 | |
| | 438,431 | | | Pool MA0406 | | | 4.50% | | | | 05/01/2030 | | | | 431,528 | |
| | 35,634 | | | Pool MA0445 | | | 5.00% | | | | 06/01/2040 | | | | 34,636 | |
| | 68,571 | | | Pool MA0468 | | | 5.00% | | | | 07/01/2040 | | | | 66,494 | |
| | 666,698 | | | Pool MA0534 | | | 4.00% | | | | 10/01/2030 | | | | 648,860 | |
| | 153,220 | | | Pool MA0587 | | | 4.00% | | | | 12/01/2030 | | | | 149,038 | |
| | 3,974,950 | | | Pool MA0616 | | | 4.00% | | | | 01/01/2031 | | | | 3,864,745 | |
| | 1,001,926 | | | Pool MA0896 | | | 4.00% | | | | 11/01/2041 | | | | 939,761 | |
| | 13,242,606 | | | Pool MA0949 | | | 3.50% | | | | 01/01/2032 | | | | 12,657,480 | |
| | 7,888,934 | | | Pool MA1010 | | | 3.50% | | | | 03/01/2032 | | | | 7,539,895 | |
| | 1,695,237 | | | Pool MA1039 | | | 3.50% | | | | 04/01/2042 | | | | 1,537,258 | |
| | 10,538,831 | | | Pool MA1059 | | | 3.50% | | | | 05/01/2032 | | | | 10,070,503 | |
| | 1,083,488 | | | Pool MA1068 | | | 3.50% | | | | 05/01/2042 | | | | 982,051 | |
| | 3,123,623 | | | Pool MA1093 | | | 3.50% | | | | 06/01/2042 | | | | 2,831,128 | |
| | 1,908,544 | | | Pool MA1094 | | | 4.00% | | | | 06/01/2042 | | | | 1,788,916 | |
| | 14,385,949 | | | Pool MA1107 | | | 3.50% | | | | 07/01/2032 | | | | 13,743,160 | |
| | 26,591,345 | | | Pool MA1117 | | | 3.50% | | | | 07/01/2042 | | | | 24,100,411 | |
| | 28,266,566 | | | Pool MA1136 | | | 3.50% | | | | 08/01/2042 | | | | 25,624,045 | |
| | 9,966,985 | | | Pool MA1138 | | | 3.50% | | | | 08/01/2032 | | | | 9,503,822 | |
| | 8,352,673 | | | Pool MA1179 | | | 3.50% | | | | 09/01/2042 | | | | 7,570,121 | |
| | 1,926,196 | | | Pool MA1201 | | | 3.50% | | | | 10/01/2032 | | | | 1,839,648 | |
| | 14,013,578 | | | Pool MA1209 | | | 3.50% | | | | 10/01/2042 | | | | 12,632,055 | |
| | 12,905,233 | | | Pool MA1237 | | | 3.00% | | | | 11/01/2032 | | | | 12,098,410 | |
| | 1,290,569 | | | Pool MA1242 | | | 3.50% | | | | 11/01/2042 | | | | 1,163,337 | |
| | 7,388,054 | | | Pool MA1338 | | | 3.00% | | | | 02/01/2033 | | | | 6,919,388 | |
| | | | |
| 52 | | DoubleLine Funds Trust | | The accompanying notes are an integral part of these financial statements. |
| | | | | | | | | | | | | | | | |
PRINCIPAL
AMOUNT $ | | | SECURITY DESCRIPTION | | RATE | | | MATURITY | | | VALUE $ | |
| | 4,002,538 | | | Pool MA1490 | | | 3.00% | | | | 07/01/2033 | | | | 3,736,791 | |
| | 4,718,252 | | | Pool MA2114 | | | 3.50% | | | | 12/01/2044 | | | | 4,253,982 | |
| | 3,570,384 | | | Pool MA2151 | | | 3.50% | | | | 01/01/2045 | | | | 3,219,350 | |
| | 12,192,123 | | | Pool MA2164 | | | 3.50% | | | | 02/01/2035 | | | | 11,547,040 | |
| | 9,839,017 | | | Pool MA2166 | | | 3.50% | | | | 02/01/2045 | | | | 8,868,447 | |
| | 10,122,011 | | | Pool MA2248 | | | 3.00% | | | | 04/01/2045 | | | | 8,899,927 | |
| | 14,417,818 | | | Pool MA2270 | | | 3.00% | | | | 05/01/2045 | | | | 12,677,055 | |
| | 13,017,461 | | | Pool MA2621 | | | 3.50% | | | | 05/01/2046 | | | | 11,604,138 | |
| | 15,545,914 | | | Pool MA2649 | | | 3.00% | | | | 06/01/2046 | | | | 13,447,414 | |
| | 14,327,508 | | | Pool MA2650 | | | 3.50% | | | | 06/01/2046 | | | | 12,772,077 | |
| | 4,805,271 | | | Pool MA2673 | | | 3.00% | | | | 07/01/2046 | | | | 4,156,611 | |
| | 17,309,310 | | | Pool MA2711 | | | 3.00% | | | | 08/01/2046 | | | | 14,972,779 | |
| | 1,682,536 | | | Pool MA2743 | | | 3.00% | | | | 09/01/2046 | | | | 1,455,402 | |
| | 38,917,006 | | | Pool MA2806 | | | 3.00% | | | | 11/01/2046 | | | | 34,331,339 | |
| | 12,506,320 | | | Pool MA2833 | | | 3.00% | | | | 12/01/2046 | | | | 11,006,880 | |
| | 15,827,655 | | | Pool MA2895 | | | 3.00% | | | | 02/01/2047 | | | | 13,923,433 | |
| | 7,138,556 | | | Pool MA3357 | | | 4.00% | | | | 05/01/2048 | | | | 6,738,909 | |
| | 9,327,601 | | | Pool MA3614 | | | 3.50% | | | | 03/01/2049 | | | | 8,489,237 | |
| | 1,932,803 | | | Pool MA3894 | | | 4.00% | | | | 09/01/2031 | | | | 1,876,469 | |
| | 34,996,115 | | | Pool MA4100 | | | 2.00% | | | | 08/01/2050 | | | | 27,940,242 | |
| | 75,267,673 | | | Pool MA4191 | | | 2.00% | | | | 11/01/2050 | | | | 58,188,482 | |
| | 91,496,448 | | | Pool MA4306 | | | 2.50% | | | | 04/01/2051 | | | | 76,133,122 | |
| | 259,410 | | | Series 2002-70-QZ | | | 5.50% | | | | 11/25/2032 | | | | 259,109 | |
| | 381,847 | | | Series 2002-75-ZG | | | 5.50% | | | | 11/25/2032 | | | | 377,087 | |
| | 5,472,062 | | | Series 2003-129-ZT | | | 5.50% | | | | 01/25/2034 | | | | 5,449,170 | |
| | 927,950 | | | Series 2003-29-ZL | | | 5.00% | | | | 04/25/2033 | | | | 909,891 | |
| | 438,355 | | | Series 2003-64-ZG | | | 5.50% | | | | 07/25/2033 | | | | 432,880 | |
| | 3,605,609 | | | Series 2003-84-PZ | | | 5.00% | | | | 09/25/2033 | | | | 3,524,796 | |
| | 483,368 | | | Series 2004-46-PJ (-1 x US 30 Day Average Secured Overnight Financing Rate + 5.89%, 6.00% Cap) | | | 0.57% | (f)(g) | | | 03/25/2034 | | | | 5,501 | |
| | 1,080,361 | | | Series 2004-51-XP (-1 x US 30 Day Average Secured Overnight Financing Rate + 7.59%, 7.70% Cap) | | | 2.27% | (f)(g) | | | 07/25/2034 | | | | 101,812 | |
| | 20,311 | | | Series 2005-107-EG | | | 4.50% | | | | 01/25/2026 | | | | 20,077 | |
| | 205,709 | | | Series 2005-37-ZK | | | 4.50% | | | | 05/25/2035 | | | | 197,769 | |
| | 1,870,976 | | | Series 2005-87-SG (-1 x US 30 Day Average Secured Overnight Financing Rate + 6.59%, 6.70% Cap) | | | 1.27% | (f)(g) | | | 10/25/2035 | | | | 133,613 | |
| | 1,685,804 | | | Series 2006-101-SA (-1 x US 30 Day Average Secured Overnight Financing Rate + 6.47%, 6.58% Cap) | | | 1.15% | (f)(g) | | | 10/25/2036 | | | | 154,781 | |
| | 673,139 | | | Series 2006-123-LI (-1 x US 30 Day Average Secured Overnight Financing Rate + 6.21%, 6.32% Cap) | | | 0.89% | (f)(g) | | | 01/25/2037 | | | | 61,255 | |
| | 260,415 | | | Series 2006-16-HZ | | | 5.50% | | | | 03/25/2036 | | | | 255,632 | |
| | 2,619,880 | | | Series 2006-56-SM (-1 x US 30 Day Average Secured Overnight Financing Rate + 6.64%, 6.75% Cap) | | | 1.32% | (f)(g) | | | 07/25/2036 | | | | 194,126 | |
| | 243,498 | | | Series 2006-93-SN (-1 x US 30 Day Average Secured Overnight Financing Rate + 6.49%, 6.60% Cap) | | | 1.17% | (f)(g) | | | 10/25/2036 | | | | 16,275 | |
| | 3,525,529 | | | Series 2007-109-VZ | | | 5.00% | | | | 10/25/2035 | | | | 3,478,099 | |
| | 403,248 | | | Series 2007-116-BI (-1 x US 30 Day Average Secured Overnight Financing Rate + 6.14%, 6.25% Cap) | | | 0.82% | (f)(g) | | | 05/25/2037 | | | | 24,363 | |
| | 2,829,799 | | | Series 2007-14-PS (-1 x US 30 Day Average Secured Overnight Financing Rate + 6.70%, 6.81% Cap) | | | 1.38% | (f)(g) | | | 03/25/2037 | | | | 261,814 | |
| | 1,307,325 | | | Series 2007-30-OI (-1 x US 30 Day Average Secured Overnight Financing Rate + 6.33%, 6.44% Cap) | | | 1.01% | (f)(g) | | | 04/25/2037 | | | | 116,692 | |
| | 134,671 | | | Series 2007-30-SI (-1 x US 30 Day Average Secured Overnight Financing Rate + 6.00%, 6.11% Cap) | | | 0.68% | (f)(g) | | | 04/25/2037 | | | | 8,029 | |
| | 1,137,156 | | | Series 2007-32-SG (-1 x US 30 Day Average Secured Overnight Financing Rate + 5.99%, 6.10% Cap) | | | 0.67% | (f)(g) | | | 04/25/2037 | | | | 81,186 | |
| | 1,080,539 | | | Series 2007-57-SX (-1 x US 30 Day Average Secured Overnight Financing Rate + 6.51%, 6.62% Cap) | | | 1.19% | (f)(g) | | | 10/25/2036 | | | | 92,852 | |
| | 1,815,119 | | | Series 2007-60-VZ | | | 6.00% | | | | 07/25/2037 | | | | 1,872,663 | |
| | 1,119,370 | | | Series 2007-71-GZ | | | 6.00% | | | | 07/25/2047 | | | | 1,167,240 | |
| | 1,383,167 | | | Series 2007-75-ID (-1 x US 30 Day Average Secured Overnight Financing Rate + 5.76%, 5.87% Cap) | | | 0.44% | (f)(g) | | | 08/25/2037 | | | | 110,305 | |
| | 185,569 | | | Series 2007-9-SD (-1 x US 30 Day Average Secured Overnight Financing Rate + 6.54%, 6.65% Cap) | | | 1.22% | (f)(g) | | | 03/25/2037 | | | | 10,282 | |
| | | | | | | | |
| The accompanying notes are an integral part of these financial statements. | | Annual Report | | | | | March 31, 2024 | | 53 |
| | |
Schedule of Investments DoubleLine Total Return Bond Fund (Cont.) | | |
| | | | | | | | | | | | | | | | |
PRINCIPAL
AMOUNT $ | | | SECURITY DESCRIPTION | | RATE | | | MATURITY | | | VALUE $ | |
| | 1,403,772 | | | Series 2008-29-ZA | | | 4.50% | | | | 04/25/2038 | | | | 1,361,822 | |
| | 2,823,429 | | | Series 2008-48-BE | | | 5.00% | | | | 06/25/2034 | | | | 2,823,440 | |
| | 271,603 | | | Series 2008-48-SD (-1 x US 30 Day Average Secured Overnight Financing Rate + 5.89%, 6.00% Cap) | | | 0.57% | (f)(g) | | | 06/25/2037 | | | | 16,429 | |
| | 335,324 | | | Series 2008-5-MS (-1 x US 30 Day Average Secured Overnight Financing Rate + 6.14%, 6.25% Cap) | | | 0.82% | (f)(g) | | | 02/25/2038 | | | | 20,211 | |
| | 109,281 | | | Series 2008-53-LI (-1 x US 30 Day Average Secured Overnight Financing Rate + 6.04%, 6.15% Cap) | | | 0.72% | (f)(g) | | | 07/25/2038 | | | | 7,448 | |
| | 263,113 | | | Series 2008-57-SE (-1 x US 30 Day Average Secured Overnight Financing Rate + 5.89%, 6.00% Cap) | | | 0.57% | (f)(g) | | | 02/25/2037 | | | | 15,142 | |
| | 294,261 | | | Series 2008-61-SC (-1 x US 30 Day Average Secured Overnight Financing Rate + 5.89%, 6.00% Cap) | | | 0.57% | (f)(g) | | | 07/25/2038 | | | | 16,869 | |
| | 190,454 | | | Series 2008-62-SC (-1 x US 30 Day Average Secured Overnight Financing Rate + 5.89%, 6.00% Cap) | | | 0.57% | (f)(g) | | | 07/25/2038 | | | | 10,134 | |
| | 771,512 | | | Series 2008-65-SA (-1 x US 30 Day Average Secured Overnight Financing Rate + 5.89%, 6.00% Cap) | | | 0.57% | (f)(g) | | | 08/25/2038 | | | | 54,573 | |
| | 152,991 | | | Series 2008-81-LP | | | 5.50% | | | | 09/25/2038 | | | | 153,583 | |
| | 1,704,413 | | | Series 2009-106-EZ | | | 4.50% | | | | 01/25/2040 | | | | 1,629,220 | |
| | 240,293 | | | Series 2009-111-SE (-1 x US 30 Day Average Secured Overnight Financing Rate + 6.14%, 6.25% Cap) | | | 0.82% | (f)(g) | | | 01/25/2040 | | | | 22,649 | |
| | 165,790 | | | Series 2009-16-MZ | | | 5.00% | | | | 03/25/2029 | | | | 162,965 | |
| | 756,303 | | | Series 2009-42-SI (-1 x US 30 Day Average Secured Overnight Financing Rate + 5.89%, 6.00% Cap) | | | 0.57% | (f)(g) | | | 06/25/2039 | | | | 37,316 | |
| | 555,532 | | | Series 2009-42-SX (-1 x US 30 Day Average Secured Overnight Financing Rate + 5.89%, 6.00% Cap) | | | 0.57% | (f)(g) | | | 06/25/2039 | | | | 38,806 | |
| | 244,676 | | | Series 2009-47-SA (-1 x US 30 Day Average Secured Overnight Financing Rate + 5.99%, 6.10% Cap) | | | 0.67% | (f)(g) | | | 07/25/2039 | | | | 13,988 | |
| | 176,030 | | | Series 2009-48-WS (-1 x US 30 Day Average Secured Overnight Financing Rate + 5.84%, 5.95% Cap) | | | 0.52% | (f)(g) | | | 07/25/2039 | | | | 12,391 | |
| | 1,968,065 | | | Series 2009-49-S (-1 x US 30 Day Average Secured Overnight Financing Rate + 6.64%, 6.75% Cap) | | | 1.32% | (f)(g) | | | 07/25/2039 | | | | 156,085 | |
| | 212,720 | | | Series 2009-51-BZ | | | 4.50% | | | | 07/25/2039 | | | | 204,984 | |
| | 540,605 | | | Series 2009-54-EZ | | | 5.00% | | | | 07/25/2039 | | | | 525,060 | |
| | 216,443 | | | Series 2009-70-SA (-1 x US 30 Day Average Secured Overnight Financing Rate + 5.69%, 5.80% Cap) | | | 0.37% | (f)(g) | | | 09/25/2039 | | | | 18,318 | |
| | 1,172,193 | | | Series 2009-80-PM | | | 4.50% | | | | 10/25/2039 | | | | 1,147,715 | |
| | 1,089,132 | | | Series 2009-83-Z | | | 4.50% | | | | 10/25/2039 | | | | 1,041,426 | |
| | 4,507,321 | | | Series 2009-85-ES (-1 x US 30 Day Average Secured Overnight Financing Rate + 7.12%, 7.23% Cap) | | | 1.80% | (f)(g) | | | 01/25/2036 | | | | 349,652 | |
| | 7,462,222 | | | Series 2009-85-JS (-1 x US 30 Day Average Secured Overnight Financing Rate + 6.64%, 6.75% Cap) | | | 1.32% | (f)(g) | | | 10/25/2039 | | | | 781,254 | |
| | 407,691 | | | Series 2009-90-IB (-1 x US 30 Day Average Secured Overnight Financing Rate + 5.61%, 5.72% Cap) | | | 0.29% | (f)(g) | | | 04/25/2037 | | | | 19,671 | |
| | 230,303 | | | Series 2009-94-BC | | | 5.00% | | | | 11/25/2039 | | | | 229,569 | |
| | 1,812,784 | | | Series 2010-10-SA (-1 x US 30 Day Average Secured Overnight Financing Rate + 6.24%, 6.35% Cap) | | | 0.92% | (f)(g) | | | 02/25/2040 | | | | 149,544 | |
| | 592,071 | | | Series 2010-10-ZA | | | 4.50% | | | | 02/25/2040 | | | | 571,377 | |
| | 5,468,446 | | | Series 2010-101-SA (-1 x US 30 Day Average Secured Overnight Financing Rate + 4.37%, 4.48% Cap) | | | 0.00% | (f)(g) | | | 09/25/2040 | | | | 227,615 | |
| | 2,751,989 | | | Series 2010-101-ZC | | | 4.50% | | | | 09/25/2040 | | | | 2,651,514 | |
| | 5,545,365 | | | Series 2010-101-ZH | | | 4.50% | | | | 07/25/2040 | | | | 5,354,320 | |
| | 710,854 | | | Series 2010-111-S (-1 x US 30 Day Average Secured Overnight Financing Rate + 5.84%, 5.95% Cap) | | | 0.52% | (f)(g) | | | 10/25/2050 | | | | 59,492 | |
| | 961,881 | | | Series 2010-116-Z | | | 4.00% | | | | 10/25/2040 | | | | 908,083 | |
| | 224,265 | | | Series 2010-117-SA (-1 x US 30 Day Average Secured Overnight Financing Rate + 4.39%, 4.50% Cap) | | | 0.00% | (f)(g) | | | 10/25/2040 | | | | 6,278 | |
| | 707,796 | | | Series 2010-120-KD | | | 4.00% | | | | 10/25/2040 | | | | 674,297 | |
| | 6,124,082 | | | Series 2010-121-SD (-1 x US 30 Day Average Secured Overnight Financing Rate + 4.39%, 4.50% Cap) | | | 0.00% | (f)(g) | | | 10/25/2040 | | | | 233,611 | |
| | 242,685 | | | Series 2010-126-SU (-11 x US 30 Day Average Secured Overnight Financing Rate + 53.74%, 55.00% Cap) | | | 0.00% | (g) | | | 11/25/2040 | | | | 250,307 | |
| | 178,693 | | | Series 2010-126-SX (-3 x US 30 Day Average Secured Overnight Financing Rate + 14.66%, 15.00% Cap) | | | 0.00% | (g) | | | 11/25/2040 | | | | 145,670 | |
| | 1,073,261 | | | Series 2010-128-HZ | | | 4.00% | | | | 11/25/2040 | | | | 1,012,622 | |
| | 550,275 | | | Series 2010-132-Z | | | 4.50% | | | | 11/25/2040 | | | | 523,818 | |
| | | | |
| 54 | | DoubleLine Funds Trust | | The accompanying notes are an integral part of these financial statements. |
| | | | | | | | | | | | | | | | |
PRINCIPAL
AMOUNT $ | | | SECURITY DESCRIPTION | | RATE | | | MATURITY | | | VALUE $ | |
| | 83,252 | | | Series 2010-137-VS (-3 x US 30 Day Average Secured Overnight Financing Rate + 14.66%, 15.00% Cap) | | | 0.00% | (g) | | | 12/25/2040 | | | | 75,237 | |
| | 4,115,518 | | | Series 2010-142-AZ | | | 4.00% | | | | 12/25/2040 | | | | 3,893,809 | |
| | 743,832 | | | Series 2010-148-SA (-1 x US 30 Day Average Secured Overnight Financing Rate + 6.54%, 6.65% Cap) | | | 1.22% | (f)(g) | | | 01/25/2026 | | | | 7,174 | |
| | 7,108,622 | | | Series 2010-150-ZA | | | 4.00% | | | | 01/25/2041 | | | | 6,715,081 | |
| | 3,072,270 | | | Series 2010-16-SA (-1 x US 30 Day Average Secured Overnight Financing Rate + 5.34%, 5.45% Cap) | | | 0.02% | (f)(g) | | | 03/25/2040 | | | | 205,395 | |
| | 763,520 | | | Series 2010-2-MS (-1 x US 30 Day Average Secured Overnight Financing Rate + 6.14%, 6.25% Cap) | | | 0.82% | (f)(g) | | | 02/25/2050 | | | | 102,521 | |
| | 1,189,133 | | | Series 2010-21-DZ | | | 5.00% | | | | 03/25/2040 | | | | 1,175,427 | |
| | 528,784 | | | Series 2010-21-KS (-1 x US 30 Day Average Secured Overnight Financing Rate + 4.84%, 4.95% Cap) | | | 0.00% | (f)(g) | | | 03/25/2040 | | | | 11,062 | |
| | 610,771 | | | Series 2010-31-SA (-1 x US 30 Day Average Secured Overnight Financing Rate + 4.89%, 5.00% Cap) | | | 0.00% | (f)(g) | | | 04/25/2040 | | | | 21,645 | |
| | 645,219 | | | Series 2010-34-PS (-1 x US 30 Day Average Secured Overnight Financing Rate + 4.82%, 4.93% Cap) | | | 0.00% | (f)(g) | | | 04/25/2040 | | | | 17,603 | |
| | 176,720 | | | Series 2010-35-ES (-1 x US 30 Day Average Secured Overnight Financing Rate + 6.34%, 6.45% Cap) | | | 1.02% | (f)(g) | | | 04/25/2040 | | | | 5,162 | |
| | 77,471 | | | Series 2010-35-SV (-1 x US 30 Day Average Secured Overnight Financing Rate + 6.34%, 6.45% Cap) | | | 1.02% | (f)(g) | | | 04/25/2040 | | | | 1,447 | |
| | 802,993 | | | Series 2010-4-SK (-1 x US 30 Day Average Secured Overnight Financing Rate + 6.12%, 6.23% Cap) | | | 0.80% | (f)(g) | | | 02/25/2040 | | | | 48,177 | |
| | 526,579 | | | Series 2010-46-MS (-1 x US 30 Day Average Secured Overnight Financing Rate + 4.84%, 4.95% Cap) | | | 0.00% | (f)(g) | | | 05/25/2040 | | | | 19,694 | |
| | 3,505,001 | | | Series 2010-49-ZW | | | 4.50% | | | | 05/25/2040 | | | | 3,385,655 | |
| | 288,927 | | | Series 2010-58-ES (-3 x US 30 Day Average Secured Overnight Financing Rate + 12.18%, 12.47% Cap) | | | 0.00% | (g) | | | 06/25/2040 | | | | 255,394 | |
| | 2,334,177 | | | Series 2010-59-MS (-1 x US 30 Day Average Secured Overnight Financing Rate + 5.66%, 5.77% Cap) | | | 0.34% | (f)(g) | | | 06/25/2040 | | | | 150,476 | |
| | 2,762,426 | | | Series 2010-59-SC (-1 x US 30 Day Average Secured Overnight Financing Rate + 4.89%, 5.00% Cap) | | | 0.00% | (f)(g) | | | 01/25/2040 | | | | 78,091 | |
| | 176,122 | | | Series 2010-60-VZ | | | 5.00% | | | | 10/25/2039 | | | | 174,038 | |
| | 181,659 | | | Series 2010-61-EL | | | 4.50% | | | | 06/25/2040 | | | | 177,862 | |
| | 2,631,556 | | | Series 2010-64-EZ | | | 5.00% | | | | 06/25/2040 | | | | 2,600,531 | |
| | 6,343,806 | | | Series 2010-64-FC (US 30 Day Average Secured Overnight Financing Rate + 0.61%, 0.50% Floor, 7.00% Cap) | | | 5.93% | | | | 06/25/2040 | | | | 6,279,702 | |
| | 7,915,513 | | | Series 2010-76-ZK | | | 4.50% | | | | 07/25/2040 | | | | 7,648,225 | |
| | 1,815,446 | | | Series 2010-79-CZ | | | 4.00% | | | | 07/25/2040 | | | | 1,719,704 | |
| | 6,990,983 | | | Series 2010-79-VZ | | | 4.50% | | | | 07/25/2040 | | | | 6,748,347 | |
| | 874,818 | | | Series 2010-84-ZC | | | 4.50% | | | | 08/25/2040 | | | | 843,887 | |
| | 1,749,633 | | | Series 2010-84-ZD | | | 4.50% | | | | 08/25/2040 | | | | 1,687,771 | |
| | 2,264,213 | | | Series 2010-84-ZG | | | 4.50% | | | | 08/25/2040 | | | | 2,183,364 | |
| | 385,010 | | | Series 2010-9-DS (-1 x US 30 Day Average Secured Overnight Financing Rate + 5.19%, 0.50% Floor, 5.30% Cap) | | | 0.50% | (f)(g) | | | 02/25/2040 | | | | 17,449 | |
| | 183,196 | | | Series 2010-90-SA (-1 x US 30 Day Average Secured Overnight Financing Rate + 5.74%, 5.85% Cap) | | | 0.42% | (f)(g) | | | 08/25/2040 | | | | 10,865 | |
| | 694,304 | | | Series 2010-94-Z | | | 4.50% | | | | 08/25/2040 | | | | 670,058 | |
| | 3,414,631 | | | Series 2010-99-SG (-5 x US 30 Day Average Secured Overnight Financing Rate + 24.43%, 25.00% Cap) | | | 0.00% | (g) | | | 09/25/2040 | | | | 3,322,565 | |
| | 12,295,869 | | | Series 2011-106-LZ | | | 3.50% | | | | 10/25/2041 | | | | 11,488,279 | |
| | 520,021 | | | Series 2011-110-LS (-2 x US 30 Day Average Secured Overnight Financing Rate + 9.87%, 10.10% Cap) | | | 0.00% | (g) | | | 11/25/2041 | | | | 381,708 | |
| | 1,480,150 | | | Series 2011-111-CZ | | | 4.00% | | | | 11/25/2041 | | | | 1,395,345 | |
| | 3,826,136 | | | Series 2011-111-EZ | | | 5.00% | | | | 11/25/2041 | | | | 3,776,535 | |
| | 843,342 | | | Series 2011-111-VZ | | | 4.00% | | | | 11/25/2041 | | | | 794,664 | |
| | 26,622,057 | | | Series 2011-131-PB | | | 4.50% | | | | 12/25/2041 | | | | 26,196,253 | |
| | 7,213,220 | | | Series 2011-16-AL | | | 3.50% | | | | 03/25/2031 | | | | 6,940,252 | |
| | 15,004,798 | | | Series 2011-17-NY | | | 3.50% | | | | 03/25/2031 | | | | 14,435,929 | |
| | 332,169 | | | Series 2011-17-SA (-1 x US 30 Day Average Secured Overnight Financing Rate + 6.36%, 6.47% Cap) | | | 1.04% | (f)(g) | | | 03/25/2041 | | | | 18,050 | |
| | 2,895,644 | | | Series 2011-2-GZ | | | 4.00% | | | | 02/25/2041 | | | | 2,745,301 | |
| | 913,345 | | | Series 2011-25-KY | | | 3.00% | | | | 04/25/2026 | | | | 892,578 | |
| | | | | | | | |
| The accompanying notes are an integral part of these financial statements. | | Annual Report | | | | | March 31, 2024 | | 55 |
| | |
Schedule of Investments DoubleLine Total Return Bond Fund (Cont.) | | |
| | | | | | | | | | | | | | | | |
PRINCIPAL
AMOUNT $ | | | SECURITY DESCRIPTION | | RATE | | | MATURITY | | | VALUE $ | |
| | 1,445,302 | | | Series 2011-27-BS (-2 x US 30 Day Average Secured Overnight Financing Rate + 8.77%, 9.00% Cap) | | | 0.00% | (g) | | | 04/25/2041 | | | | 1,178,916 | |
| | 15,906,812 | | | Series 2011-29-AL | | | 3.50% | | | | 04/25/2031 | | | | 15,302,118 | |
| | 6,679,096 | | | Series 2011-32-ZG | | | 4.00% | | | | 04/25/2041 | | | | 6,306,626 | |
| | 1,195,006 | | | Series 2011-36-VZ | | | 4.50% | | | | 05/25/2041 | | | | 1,151,411 | |
| | 3,146,659 | | | Series 2011-37-Z | | | 4.50% | | | | 05/25/2041 | | | | 3,002,984 | |
| | 4,713,392 | | | Series 2011-38-BZ | | | 4.00% | | | | 05/25/2041 | | | | 4,546,047 | |
| | 842,089 | | | Series 2011-39-CB | | | 3.00% | | | | 05/25/2026 | | | | 822,097 | |
| | 3,529,936 | | | Series 2011-39-ZD | | | 4.00% | | | | 02/25/2041 | | | | 3,335,285 | |
| | 1,109,164 | | | Series 2011-40-LZ | | | 4.50% | | | | 05/25/2041 | | | | 1,068,266 | |
| | 1,297,569 | | | Series 2011-42-MZ | | | 4.50% | | | | 05/25/2041 | | | | 1,249,597 | |
| | 8,750,730 | | | Series 2011-45-ZA | | | 4.00% | | | | 05/25/2031 | | | | 8,519,199 | |
| | 2,712,385 | | | Series 2011-45-ZB | | | 4.50% | | | | 05/25/2041 | | | | 2,583,698 | |
| | 9,017,964 | | | Series 2011-51-FJ (US 30 Day Average Secured Overnight Financing Rate + 0.56%, 0.45% Floor, 7.00% Cap) | | | 5.88% | | | | 06/25/2041 | | | | 8,902,601 | |
| | 634,783 | | | Series 2011-59-MA | | | 4.50% | | | | 07/25/2041 | | | | 622,964 | |
| | 1,380,802 | | | Series 2011-60-EL | | | 3.00% | | | | 07/25/2026 | | | | 1,349,063 | |
| | 5,826,259 | | | Series 2011-64-DB | | | 4.00% | | | | 07/25/2041 | | | | 5,605,017 | |
| | 3,716,402 | | | Series 2011-77-Z | | | 3.50% | | | | 08/25/2041 | | | | 3,427,888 | |
| | 24,713,159 | | | Series 2011-99-CZ | | | 4.50% | | | | 10/25/2041 | | | | 23,853,693 | |
| | 13,607,620 | | | Series 2012-104-Z | | | 3.50% | | | | 09/25/2042 | | | | 12,505,632 | |
| | 1,933,593 | | | Series 2012-111-LB | | | 3.50% | | | | 05/25/2041 | | | | 1,813,766 | |
| | 13,808,654 | | | Series 2012-111-MJ | | | 4.00% | | | | 04/25/2042 | | | | 12,894,130 | |
| | 15,020,921 | | | Series 2012-122-DB | | | 3.00% | | | | 11/25/2042 | | | | 13,462,585 | |
| | 11,399,464 | | | Series 2012-132-KH | | | 1.75% | | | | 12/25/2032 | | | | 10,316,065 | |
| | 3,987,293 | | | Series 2012-14-BZ | | | 4.00% | | | | 03/25/2042 | | | | 3,755,839 | |
| | 11,811,755 | | | Series 2012-144-PT | | | 3.95% | (c) | | | 11/25/2049 | | | | 11,355,554 | |
| | 28,440,525 | | | Series 2012-15-PZ | | | 4.00% | (h) | | | 03/25/2042 | | | | 26,446,574 | |
| | 9,335,492 | | | Series 2012-20-ZT | | | 3.50% | | | | 03/25/2042 | | | | 8,675,937 | |
| | 17,281,478 | | | Series 2012-31-Z | | | 4.00% | | | | 04/25/2042 | | | | 16,232,267 | |
| | 7,301,448 | | | Series 2012-70-FY (US 30 Day Average Secured Overnight Financing Rate + 0.56%, 0.45% Floor, 7.00% Cap) | | | 5.88% | | | | 07/25/2042 | | | | 7,197,316 | |
| | 98,516 | | | Series 2012-80-EA | | | 2.00% | | | | 04/25/2042 | | | | 95,925 | |
| | 17,466,380 | | | Series 2012-86-ZC | | | 3.50% | | | | 08/25/2042 | | | | 16,112,123 | |
| | 30,310,450 | | | Series 2012-96-VZ | | | 3.50% | | | | 09/25/2042 | | | | 27,875,081 | |
| | 7,219,465 | | | Series 2012-98-BG | | | 4.50% | | | | 08/25/2040 | | | | 7,070,073 | |
| | 13,564,014 | | | Series 2012-99-QE | | | 3.00% | | | | 09/25/2042 | | | | 12,105,507 | |
| | 8,593,550 | | | Series 2013-100-PJ | | | 3.00% | | | | 03/25/2043 | | | | 7,954,479 | |
| | 19,802,556 | | | Series 2013-130-ZE | | | 3.00% | | | | 01/25/2044 | | | | 17,477,702 | |
| | 27,412,938 | | | Series 2013-133-ZT | | | 3.00% | (h) | | | 01/25/2039 | | | | 25,279,310 | |
| | 6,981,001 | | | Series 2013-41-ZH | | | 3.00% | (h) | | | 05/25/2033 | | | | 6,433,878 | |
| | 5,692,246 | | | Series 2013-51-HS (-1 x US 30 Day Average Secured Overnight Financing Rate + 5.26%, 5.40% Cap) | | | 0.00% | (g) | | | 04/25/2043 | | | | 3,867,415 | |
| | 994,109 | | | Series 2013-58-SC (-2 x US 30 Day Average Secured Overnight Financing Rate + 5.83%, 6.00% Cap) | | | 0.00% | (g) | | | 06/25/2043 | | | | 518,091 | |
| | 1,804,797 | | | Series 2013-81-ZQ | | | 3.00% | (h) | | | 08/25/2043 | | | | 1,241,037 | |
| | 5,826,407 | | | Series 2013-82-SH (-1 x US 30 Day Average Secured Overnight Financing Rate + 5.94%, 6.05% Cap) | | | 0.62% | (f)(g) | | | 12/25/2042 | | | | 415,589 | |
| | 21,963,555 | | | Series 2014-12-GZ | | | 3.50% | | | | 03/25/2044 | | | | 20,137,496 | |
| | 13,526,363 | | | Series 2014-21-GZ | | | 3.00% | | | | 04/25/2044 | | | | 11,938,701 | |
| | 34,044,653 | | | Series 2014-37-ZY | | | 2.50% | (h) | | | 07/25/2044 | | | | 28,674,177 | |
| | 21,454,889 | | | Series 2014-39-ZA | | | 3.00% | | | | 07/25/2044 | | | | 18,958,418 | |
| | 110,867 | | | Series 2014-46-NZ | | | 3.00% | (h) | | | 06/25/2043 | | | | 75,934 | |
| | 67,417,558 | | | Series 2014-60-EZ | | | 3.00% | (h) | | | 10/25/2044 | | | | 58,569,347 | |
| | 47,589,107 | | | Series 2014-61-ZV | | | 3.00% | (h) | | | 10/25/2044 | | | | 41,303,019 | |
| | 40,131,905 | | | Series 2014-64-NZ | | | 3.00% | (h) | | | 10/25/2044 | | | | 34,980,441 | |
| | 14,131,177 | | | Series 2014-67-DZ | | | 3.00% | (h) | | | 10/25/2044 | | | | 12,413,228 | |
| | 45,175,115 | | | Series 2014-68-MZ | | | 3.00% | (h) | | | 11/25/2044 | | | | 39,235,821 | |
| | 25,501,826 | | | Series 2014-77-VZ | | | 3.00% | (h) | | | 11/25/2044 | | | | 22,271,153 | |
| | 32,751,040 | | | Series 2014-84-KZ | | | 3.00% | (h) | | | 12/25/2044 | | | | 28,473,178 | |
| | 50,846,811 | | | Series 2014-M11-1A | | | 3.08% | (c) | | | 08/25/2024 | | | | 50,254,329 | |
| | | | |
| 56 | | DoubleLine Funds Trust | | The accompanying notes are an integral part of these financial statements. |
| | | | | | | | | | | | | | | | |
PRINCIPAL
AMOUNT $ | | | SECURITY DESCRIPTION | | RATE | | | MATURITY | | | VALUE $ | |
| | 4,672,494 | | | Series 2015-11-A | | | 3.00% | | | | 05/25/2034 | | | | 4,491,920 | |
| | 2,746,862 | | | Series 2015-21-G | | | 3.00% | | | | 02/25/2042 | | | | 2,711,594 | |
| | 4,561,150 | | | Series 2015-42-CA | | | 3.00% | | | | 03/25/2044 | | | | 4,257,280 | |
| | 19,370,486 | | | Series 2015-49-A | | | 3.00% | | | | 03/25/2044 | | | | 17,967,310 | |
| | 10,831,689 | | | Series 2015-52-GZ | | | 3.00% | (h) | | | 07/25/2045 | | | | 9,512,454 | |
| | 4,767,569 | | | Series 2015-88-AC | | | 3.00% | | | | 04/25/2043 | | | | 4,567,407 | |
| | 36,641,511 | | | Series 2015-88-BA | | | 3.00% | | | | 04/25/2044 | | | | 34,254,735 | |
| | 2,575,214 | | | Series 2015-94-MA | | | 3.00% | | | | 01/25/2046 | | | | 2,266,293 | |
| | 9,860,366 | | | Series 2016-2-JA | | | 2.50% | | | | 02/25/2046 | | | | 9,297,445 | |
| | 23,934,011 | | | Series 2016-32-LA | | | 3.00% | | | | 10/25/2044 | | | | 22,226,944 | |
| | 17,881,399 | | | Series 2016-72-PA | | | 3.00% | | | | 07/25/2046 | | | | 15,905,090 | |
| | 1,278,435 | | | Series 2016-74-PA | | | 3.00% | | | | 12/25/2044 | | | | 1,254,491 | |
| | 1,617,779 | | | Series 2016-79-EP | | | 3.00% | | | | 01/25/2044 | | | | 1,563,403 | |
| | 4,733,779 | | | Series 2016-81-PA | | | 3.00% | | | | 02/25/2044 | | | | 4,559,796 | |
| | 8,989,752 | | | Series 2016-95-AG | | | 2.50% | | | | 06/25/2037 | | | | 8,246,541 | |
| | 12,332,084 | | | Series 2017-57-BC | | | 3.00% | | | | 08/25/2057 | | | | 10,650,937 | |
| | 9,681,975 | | | Series 2018-21-IO | | | 3.00% | (f) | | | 04/25/2048 | | | | 1,454,638 | |
| | 15,991,372 | | | Series 2018-21-PO | | | 0.00% | (k) | | | 04/25/2048 | | | | 12,108,342 | |
| | 39,883,695 | | | Series 2018-27-AO | | | 0.00% | (k) | | | 05/25/2048 | | | | 29,988,319 | |
| | 11,656,844 | | | Series 2018-33-A | | | 3.00% | | | | 05/25/2048 | | | | 10,276,632 | |
| | 13,417,645 | | | Series 2018-38-JB | | | 3.00% | | | | 06/25/2048 | | | | 11,741,300 | |
| | 9,185,594 | | | Series 2018-65-DA | | | 3.00% | | | | 09/25/2048 | | | | 8,017,543 | |
| | 28,068,673 | | | Series 2018-7-CD | | | 3.00% | | | | 02/25/2048 | | | | 24,873,501 | |
| | 21,383,499 | | | Series 2018-85-PO | | | 0.00% | (k) | | | 12/25/2048 | | | | 15,875,022 | |
| | 5,059,381 | | | Series 2019-48-AZ | | | 3.50% | | | | 09/25/2049 | | | | 4,580,448 | |
| | 5,102,730 | | | Series 2019-64-D | | | 2.50% | | | | 11/25/2049 | | | | 4,362,988 | |
| | 14,630,360 | | | Series 2019-69-DS (-1 x US 30 Day Average Secured Overnight Financing Rate + 5.89%, 6.00% Cap) | | | 0.57% | (f)(g) | | | 12/25/2049 | | | | 1,783,698 | |
| | 41,735,679 | | | Series 2019-78-ZB | | | 3.00% | | | | 01/25/2050 | | | | 35,903,172 | |
| | 205,866,497 | | | Series 2019-M16-X | | | 1.18% | (c)(f) | | | 07/25/2031 | | | | 10,917,759 | |
| | 480,534,077 | | | Series 2019-M18-X | | | 0.71% | (c)(f) | | | 08/25/2029 | | | | 12,514,117 | |
| | 211,539,284 | | | Series 2019-M24-2XA | | | 1.14% | (c)(f) | | | 03/25/2031 | | | | 11,452,483 | |
| | 263,059,662 | | | Series 2019-M24-XA | | | 1.25% | (c)(f) | | | 03/25/2029 | | | | 12,335,473 | |
| | 162,492,626 | | | Series 2019-M7-X | | | 0.33% | (c)(f) | | | 04/25/2029 | | | | 2,247,013 | |
| | 32,487,413 | | | Series 2020-47-GL | | | 2.00% | | | | 05/25/2046 | | | | 28,001,870 | |
| | 9,101,097 | | | Series 2020-53-CG | | | 2.00% | | | | 08/25/2050 | | | | 7,551,680 | |
| | 50,244,347 | | | Series 2020-54-AB | | | 1.00% | | | | 08/25/2050 | | | | 38,263,899 | |
| | 11,147,211 | | | Series 2020-54-AS (-1 x US 30 Day Average Secured Overnight Financing Rate + 6.04%, 6.15% Cap) | | | 0.72% | (f)(g) | | | 08/25/2050 | | | | 1,426,250 | |
| | 12,985,214 | | | Series 2020-59-QZ | | | 3.00% | | | | 08/25/2040 | | | | 11,556,155 | |
| | 19,162,837 | | | Series 2020-61-AI | | | 3.00% | (f) | | | 09/25/2050 | | | | 2,759,565 | |
| | 8,998,323 | | | Series 2020-61-DC | | | 1.50% | | | | 09/25/2060 | | | | 6,737,552 | |
| | 34,104,430 | | | Series 2020-61-DI | | | 3.00% | (f) | | | 09/25/2060 | | | | 5,389,117 | |
| | 70,307,074 | | | Series 2020-62-JD | | | 1.25% | | | | 09/25/2050 | | | | 51,550,974 | |
| | 18,343,380 | | | Series 2020-86-JA | | | 2.00% | | | | 05/25/2041 | | | | 16,755,059 | |
| | 22,180,001 | | | Series 2020-97-EI | | | 2.00% | (f) | | | 01/25/2051 | | | | 2,843,452 | |
| | 25,863,864 | | | Series 2020-99-IQ | | | 3.00% | (f) | | | 01/25/2051 | | | | 4,579,231 | |
| | 349,885,595 | | | Series 2020-M10-X2 | | | 1.72% | (c)(f) | | | 12/25/2030 | | | | 24,055,824 | |
| | 186,084,843 | | | Series 2020-M10-X8 | | | 0.72% | (c)(f) | | | 12/25/2027 | | | | 3,072,037 | |
| | 75,483,145 | | | Series 2020-M13-X2 | | | 1.23% | (c)(f) | | | 09/25/2030 | | | | 3,349,074 | |
| | 479,334,600 | | | Series 2020-M15-X1 | | | 1.45% | (c)(f) | | | 09/25/2031 | | | | 30,114,724 | |
| | 17,943,918 | | | Series 2020-M17-X1 | | | 1.36% | (c)(f) | | | 01/25/2028 | | | | 588,857 | |
| | 116,354,962 | | | Series 2020-M27-X1 | | | 0.88% | (c)(f) | | | 03/25/2031 | | | | 4,200,845 | |
| | 160,148,957 | | | Series 2020-M54-X | | | 1.50% | (c)(f) | | | 12/25/2033 | | | | 11,044,096 | |
| | 52,980,215 | | | Series 2020-M7-X2 | | | 1.24% | (c)(f) | | | 03/25/2031 | | | | 2,982,828 | |
| | 11,315,826 | | | Series 2021-1-PA | | | 1.00% | | | | 11/25/2050 | | | | 8,429,507 | |
| | 16,980,670 | | | Series 2021-13-AK | | | 2.00% | | | | 01/25/2049 | | | | 14,548,418 | |
| | 13,313,270 | | | Series 2021-21-DK | | | 2.00% | | | | 07/25/2043 | | | | 11,363,612 | |
| | 5,638,975 | | | Series 2021-28-KF (US 30 Day Average Secured Overnight Financing Rate + 0.75%, 0.75% Floor, 4.00% Cap) | | | 4.00% | | | | 05/25/2051 | | | | 4,183,327 | |
| | 23,081,869 | | | Series 2021-28-LB | | | 2.00% | | | | 04/25/2051 | | | | 18,610,061 | |
| | 13,235,757 | | | Series 2021-29-BA | | | 1.25% | | | | 05/25/2041 | | | | 11,418,202 | |
| | | | | | | | |
| The accompanying notes are an integral part of these financial statements. | | Annual Report | | | | | March 31, 2024 | | 57 |
| | |
Schedule of Investments DoubleLine Total Return Bond Fund (Cont.) | | |
| | | | | | | | | | | | | | | | |
PRINCIPAL
AMOUNT $ | | | SECURITY DESCRIPTION | | RATE | | | MATURITY | | | VALUE $ | |
| | 41,849,498 | | | Series 2021-3-KI | | | 2.50% | (f) | | | 02/25/2051 | | | | 6,069,144 | |
| | 25,553,006 | | | Series 2021-40-BA | | | 3.00% | | | | 01/25/2051 | | | | 22,083,838 | |
| | 37,692,099 | | | Series 2021-43-EI | | | 3.00% | (f) | | | 07/25/2051 | | | | 6,209,883 | |
| | 73,669,132 | | | Series 2021-43-LI | | | 3.00% | (f) | | | 07/25/2051 | | | | 12,599,359 | |
| | 29,053,999 | | | Series 2021-58-SA (-1 x US 30 Day Average Secured Overnight Financing Rate + 2.65%, 2.65% Cap) | | | 0.00% | (f)(g) | | | 09/25/2051 | | | | 250,350 | |
| | 6,602,867 | | | Series 2021-61-KZ | | | 2.50% | (h) | | | 09/25/2051 | | | | 3,861,176 | |
| | 18,994,862 | | | Series 2021-63-G | | | 2.00% | | | | 06/25/2049 | | | | 15,404,899 | |
| | 86,142,027 | | | Series 2021-70-S (-1 x US 30 Day Average Secured Overnight Financing Rate + 3.75%, 3.75% Cap) | | | 0.00% | (f)(g) | | | 10/25/2049 | | | | 2,130,172 | |
| | 21,822,652 | | | Series 2021-73-JA | | | 2.50% | | | | 05/25/2049 | | | | 18,959,402 | |
| | 19,267,912 | | | Series 2021-85-C | | | 2.50% | | | | 03/25/2049 | | | | 16,752,295 | |
| | 23,121,494 | | | Series 2021-85-CJ | | | 2.50% | | | | 03/25/2049 | | | | 20,102,754 | |
| | 23,121,494 | | | Series 2021-85-CK | | | 2.50% | | | | 03/25/2049 | | | | 20,102,754 | |
| | 26,893,264 | | | Series 2021-85-DI | | | 3.00% | (f) | | | 12/25/2051 | | | | 4,335,396 | |
| | 52,408,393 | | | Series 2021-86-MA | | | 2.50% | | | | 11/25/2047 | | | | 46,381,784 | |
| | 25,045,113 | | | Series 2021-88-LB | | | 2.50% | | | | 03/25/2050 | | | | 21,228,260 | |
| | 32,985,612 | | | Series 2021-9-CA | | | 2.00% | | | | 03/25/2051 | | | | 26,876,390 | |
| | 24,410,534 | | | Series 2021-92-M | | | 2.50% | | | | 01/25/2049 | | | | 21,257,691 | |
| | 11,185,659 | | | Series 2021-M12-2A1 | | | 2.13% | (c) | | | 05/25/2033 | | | | 9,816,074 | |
| | 934,175,203 | | | Series 2021-M14-X | | | 0.98% | (c)(f) | | | 10/25/2031 | | | | 31,549,899 | |
| | 175,878,721 | | | Series 2021-M3-X2 | | | 0.93% | (c)(f) | | | 08/25/2033 | | | | 6,528,126 | |
| | 21,875,285 | | | Series 2021-M5-A1 | | | 1.46% | (c) | | | 01/25/2033 | | | | 19,521,319 | |
| | 21,120,857 | | | Series 2022-18-DK | | | 3.00% | | | | 07/25/2046 | | | | 19,441,327 | |
| | 36,721,521 | | | Series 2022-18-DZ | | | 3.50% | (h) | | | 04/25/2052 | | | | 27,944,666 | |
| | 24,999,960 | | | Series 2022-19-LA | | | 3.00% | | | | 02/25/2047 | | | | 22,846,414 | |
| | 146,422,881 | | | Series 2022-3-AB | | | 2.00% | | | | 11/25/2047 | | | | 126,542,328 | |
| | 2,568,728 | | | Series 2022-3-EV | | | 2.00% | | | | 08/25/2033 | | | | 2,258,507 | |
| | 85,431,210 | | | Series 2022-3-EZ | | | 2.00% | (h) | | | 01/25/2052 | | | | 47,305,653 | |
| | 58,034,973 | | | Series 2022-3-NZ | | | 2.00% | (h) | | | 02/25/2052 | | | | 32,155,263 | |
| | 84,326,662 | | | Series 2022-3-Z | | | 2.00% | (h) | | | 02/25/2052 | | | | 46,033,394 | |
| | 81,933,657 | | | Series 2022-4-EA | | | 2.50% | | | | 10/25/2047 | | | | 72,918,111 | |
| | 15,282,473 | | | Series 2022-4-LG | | | 3.00% | | | | 02/25/2052 | | | | 13,650,761 | |
| | 30,662,816 | | | Series 2022-6-M | | | 2.50% | | | | 06/25/2050 | | | | 26,585,247 | |
| | 21,641,561 | | | Series 2022-71-A | | | 3.00% | | | | 12/25/2051 | | | | 19,654,562 | |
| | 713,376,822 | | | Series 2022-M2-X | | | 0.39% | (c)(f) | | | 01/25/2032 | | | | 16,150,495 | |
| | 17,758,976 | | | Series 2022-M4-A1X | | | 2.46% | (c) | | | 05/25/2030 | | | | 16,103,184 | |
| | 117,524,186 | | | Series 2023-2-IO | | | 3.00% | (f) | | | 12/25/2051 | | | | 18,514,114 | |
| | 18,998,146 | | | Series 2023-29-DO | | | 0.00% | (k) | | | 11/25/2050 | | | | 12,539,626 | |
| | 14,119,619 | | | Series 2023-30-MO | | | 0.00% | (k) | | | 10/25/2050 | | | | 9,516,095 | |
| | 95,302,740 | | | Series 2023-39-IO | | | 3.00% | (f) | | | 10/25/2052 | | | | 16,143,989 | |
| | 7,324,368 | | | Series 2023-M1S-A1X | | | 4.51% | (c) | | | 07/25/2033 | | | | 7,259,792 | |
| | 18,569,490 | | | Series 2024-8-PO | | | 0.00% | (k) | | | 08/25/2050 | | | | 13,847,761 | |
| | 2,684,359 | | | Series 400-S4 (-1 x US 30 Day Average Secured Overnight Financing Rate + 5.34%, 5.45% Cap) | | | 0.02% | (f)(g) | | | 11/25/2039 | | | | 182,205 | |
| | 27,099,849 | | | Series 412-A3 | | | 3.00% | | | | 08/25/2042 | | | | 23,820,712 | |
| | 57,141,864 | | | Series 427-C69 | | | 3.00% | (f) | | | 03/25/2047 | | | | 8,830,875 | |
| | 33,346,295 | | | Series 428-C17 | | | 3.00% | (f) | | | 04/25/2050 | | | | 5,021,484 | |
| | 29,538,589 | | | Series 432-C11 | | | 3.00% | (f) | | | 08/25/2052 | | | | 4,943,168 | |
| | | | |
| | | | Freddie Mac Whole Loan Securities Trust | | | | | | | | | | | | |
| | 8,126,333 | | | Series 2015-SC02-1A | | | 3.00% | | | | 09/25/2045 | | | | 7,043,528 | |
| | 4,607,918 | | | Series 2016-SC01-1A | | | 3.00% | | | | 07/25/2046 | | | | 3,985,306 | |
| | | | |
| | | | FREMF Mortgage Trust | | | | | | | | | | | | |
| | 1,479,905 | | | Series 2017-KF34-B (US 30 Day Average Secured Overnight Financing Rate + 2.81%, 2.55% Floor) | | | 8.13% | (a) | | | 08/25/2024 | | | | 1,473,343 | |
| | | | |
| | | | Ginnie Mae II Pool | | | | | | | | | | | | |
| | 26,645,058 | | | Pool 785310 | | | 2.50% | | | | 02/20/2051 | | | | 22,611,211 | |
| | 41,241,435 | | | Pool 785346 | | | 2.00% | | | | 03/20/2051 | | | | 32,748,859 | |
| | 12,604,534 | | | Pool 785350 | | | 2.00% | | | | 01/20/2051 | | | | 9,987,594 | |
| | 24,020,904 | | | Pool 785374 | | | 2.50% | | | | 03/20/2051 | | | | 20,452,982 | |
| | 86,731,997 | | | Pool 785401 | | | 2.50% | | | | 10/20/2050 | | | | 72,126,606 | |
| | 120,870,350 | | | Pool 785412 | | | 2.50% | | | | 03/20/2051 | | | | 102,570,664 | |
| | 27,361,347 | | | Pool 785595 | | | 2.50% | | | | 03/20/2051 | | | | 23,288,464 | |
| | | | |
| 58 | | DoubleLine Funds Trust | | The accompanying notes are an integral part of these financial statements. |
| | | | | | | | | | | | | | | | |
PRINCIPAL
AMOUNT $ | | | SECURITY DESCRIPTION | | RATE | | | MATURITY | | | VALUE $ | |
| | 52,125,831 | | | Pool 785609 | | | 2.50% | | | | 08/20/2051 | | | | 44,304,791 | |
| | 13,409,972 | | | Pool 785638 | | | 2.50% | | | | 08/20/2051 | | | | 11,379,712 | |
| | 30,335,467 | | | Pool 785639 | | | 2.50% | | | | 08/20/2051 | | | | 25,742,731 | |
| | 12,730,493 | | | Pool 785680 | | | 2.50% | | | | 10/20/2051 | | | | 10,803,057 | |
| | 54,410,971 | | | Pool 785717 | | | 3.00% | | | | 11/20/2051 | | | | 47,732,700 | |
| | 9,672,968 | | | Pool CB2017 | | | 2.50% | | | | 03/20/2051 | | | | 8,208,710 | |
| | 9,264,231 | | | Pool CB4182 | | | 2.50% | | | | 03/20/2051 | | | | 7,861,683 | |
| | 2,520,322 | | | Pool CB5487 | | | 2.50% | | | | 03/20/2051 | | | | 2,084,918 | |
| | 8,064,017 | | | Pool CB9135 | | | 2.50% | | | | 04/20/2051 | | | | 6,902,971 | |
| | 7,784,673 | | | Pool CH0426 | | | 2.50% | | | | 02/20/2052 | | | | 6,440,259 | |
| | 6,278,820 | | | Pool CI0294 | | | 2.50% | | | | 01/20/2052 | | | | 5,163,489 | |
| | 26,995,735 | | | Pool CI6428 | | | 2.50% | | | | 01/20/2052 | | | | 22,333,720 | |
| | 558,737 | | | Pool MA2511 | | | 3.50% | | | | 01/20/2045 | | | | 504,875 | |
| | 16,820,543 | | | Pool MA5076 | | | 3.00% | | | | 03/20/2048 | | | | 15,015,968 | |
| | 10,397,921 | | | Pool MA7255 | | | 2.50% | | | | 03/20/2051 | | | | 8,874,111 | |
| | | | |
| | | | Government National Mortgage Association | | | | | | | | | | | | |
| | 23,695,592 | | | Pool 786510 | | | 3.00% | | | | 02/20/2052 | | | | 20,549,653 | |
| | 4,100,711 | | | Series 2003-67-SP (-1 x CME Term SOFR 1 Month + 6.99%, 7.10% Cap) | | | 1.66% | (f)(g) | | | 08/20/2033 | | | | 36,848 | |
| | 1,725,288 | | | Series 2003-86-ZK | | | 5.00% | | | | 10/20/2033 | | | | 1,713,777 | |
| | 1,057,266 | | | Series 2004-49-Z | | | 6.00% | | | | 06/20/2034 | | | | 1,070,664 | |
| | 1,918,918 | | | Series 2004-83-CS (-1 x CME Term SOFR 1 Month + 5.97%, 6.08% Cap) | | | 0.64% | (f)(g) | | | 10/20/2034 | | | | 88,681 | |
| | 498,133 | | | Series 2005-21-Z | | | 5.00% | | | | 03/20/2035 | | | | 497,176 | |
| | 5,270,832 | | | Series 2005-39-ZB | | | 5.00% | | | | 07/20/2034 | | | | 5,258,141 | |
| | 370,711 | | | Series 2006-24-CX (-7 x CME Term SOFR 1 Month + 39.13%, 39.97% Cap) | | | 0.05% | (g) | | | 05/20/2036 | | | | 394,375 | |
| | 1,874,385 | | | Series 2007-26-SJ (-1 x CME Term SOFR 1 Month + 4.58%, 4.69% Cap) | | | 0.00% | (f)(g) | | | 04/20/2037 | | | | 10,933 | |
| | 1,990,104 | | | Series 2008-2-SM (-1 x CME Term SOFR 1 Month + 6.39%, 6.50% Cap) | | | 1.06% | (f)(g) | | | 01/16/2038 | | | | 133,730 | |
| | 3,478,328 | | | Series 2008-42-AI (-1 x CME Term SOFR 1 Month + 7.58%, 7.69% Cap) | | | 2.25% | (f)(g) | | | 05/16/2038 | | | | 396,061 | |
| | 1,300,159 | | | Series 2008-43-SH (-1 x CME Term SOFR 1 Month + 6.22%, 6.34% Cap) | | | 0.89% | (f)(g) | | | 05/20/2038 | | | | 30,456 | |
| | 1,511,529 | | | Series 2008-51-SC (-1 x CME Term SOFR 1 Month + 6.14%, 6.25% Cap) | | | 0.81% | (f)(g) | | | 06/20/2038 | | | | 81,573 | |
| | 1,216,023 | | | Series 2008-51-SE (-1 x CME Term SOFR 1 Month + 6.14%, 6.25% Cap) | | | 0.81% | (f)(g) | | | 06/16/2038 | | | | 75,684 | |
| | 419,264 | | | Series 2008-82-SM (-1 x CME Term SOFR 1 Month + 5.94%, 6.05% Cap) | | | 0.61% | (f)(g) | | | 09/20/2038 | | | | 9,085 | |
| | 682,932 | | | Series 2008-83-SD (-1 x CME Term SOFR 1 Month + 6.45%, 6.56% Cap) | | | 1.12% | (f)(g) | | | 11/16/2036 | | | | 20,520 | |
| | 2,586,239 | | | Series 2009-10-NS (-1 x CME Term SOFR 1 Month + 6.54%, 6.65% Cap) | | | 1.21% | (f)(g) | | | 02/16/2039 | | | | 197,798 | |
| | 3,002,439 | | | Series 2009-106-VZ | | | 4.50% | | | | 11/20/2039 | | | | 2,940,559 | |
| | 500,940 | | | Series 2009-24-SN (-1 x CME Term SOFR 1 Month + 5.99%, 6.10% Cap) | | | 0.66% | (f)(g) | | | 09/20/2038 | | | | 12,387 | |
| | 1,744,255 | | | Series 2009-32-ZE | | | 4.50% | | | | 05/16/2039 | | | | 1,696,343 | |
| | 9,687,646 | | | Series 2009-35-DZ | | | 4.50% | | | | 05/20/2039 | | | | 9,366,143 | |
| | 9,499 | | | Series 2009-41-ZQ | | | 4.50% | (h) | | | 06/16/2039 | | | | 9,346 | |
| | 1,291,067 | | | Series 2009-48-Z | | | 5.00% | | | | 06/16/2039 | | | | 1,281,688 | |
| | 85,123 | | | Series 2009-50-KP | | | 4.50% | | | | 06/20/2039 | | | | 84,126 | |
| | 679,828 | | | Series 2009-69-TS (-1 x CME Term SOFR 1 Month + 6.09%, 6.20% Cap) | | | 0.76% | (f)(g) | | | 04/16/2039 | | | | 21,491 | |
| | 1,371,882 | | | Series 2009-75-GZ | | | 4.50% | | | | 09/20/2039 | | | | 1,343,681 | |
| | 200,110 | | | Series 2009-87-IG (-1 x CME Term SOFR 1 Month + 6.63%, 6.74% Cap) | | | 1.30% | (f)(g) | | | 03/20/2037 | | | | 999 | |
| | 2,782,901 | | | Series 2010-1-SA (-1 x CME Term SOFR 1 Month + 5.64%, 5.75% Cap) | | | 0.31% | (f)(g) | | | 01/16/2040 | | | | 162,950 | |
| | 5,783,619 | | | Series 2010-106-PS (-1 x CME Term SOFR 1 Month + 5.94%, 6.05% Cap) | | | 0.61% | (f)(g) | | | 03/20/2040 | | | | 168,900 | |
| | 2,543,620 | | | Series 2010-25-ZB | | | 4.50% | | | | 02/16/2040 | | | | 2,478,328 | |
| | | | | | | | |
| The accompanying notes are an integral part of these financial statements. | | Annual Report | | | | | March 31, 2024 | | 59 |
| | |
Schedule of Investments DoubleLine Total Return Bond Fund (Cont.) | | |
| | | | | | | | | | | | | | | | |
PRINCIPAL
AMOUNT $ | | | SECURITY DESCRIPTION | | RATE | | | MATURITY | | | VALUE $ | |
| | 20,341,664 | | | Series 2010-26-QS (-1 x CME Term SOFR 1 Month + 6.14%, 6.25% Cap) | | | 0.81% | (f)(g) | | | 02/20/2040 | | | | 1,848,366 | |
| | 1,731,982 | | | Series 2010-42-AY | | | 5.00% | | | | 11/20/2039 | | | | 1,734,952 | |
| | 1,676,141 | | | Series 2010-42-ES (-1 x CME Term SOFR 1 Month + 5.57%, 5.68% Cap) | | | 0.24% | (f)(g) | | | 04/20/2040 | | | | 122,425 | |
| | 474,213 | | | Series 2010-61-AS (-1 x CME Term SOFR 1 Month + 6.44%, 6.55% Cap) | | | 1.11% | (f)(g) | | | 09/20/2039 | | | | 22,459 | |
| | 5,276,772 | | | Series 2010-62-SB (-1 x CME Term SOFR 1 Month + 5.64%, 5.75% Cap) | | | 0.31% | (f)(g) | | | 05/20/2040 | | | | 396,967 | |
| | 6,156,657 | | | Series 2010-62-ZG | | | 5.50% | | | | 05/16/2040 | | | | 6,147,459 | |
| | 2,599,782 | | | Series 2011-18-SN (-2 x CME Term SOFR 1 Month + 9.27%, 9.50% Cap) | | | 0.00% | (g) | | | 12/20/2040 | | | | 2,113,413 | |
| | 2,603,623 | | | Series 2011-18-YS (-2 x CME Term SOFR 1 Month + 9.27%, 9.50% Cap) | | | 0.00% | (g) | | | 12/20/2040 | | | | 2,095,798 | |
| | 751,622 | | | Series 2011-69-OC | | | 0.00% | (k) | | | 05/20/2041 | | | | 576,600 | |
| | 7,451,767 | | | Series 2011-69-SB (-1 x CME Term SOFR 1 Month + 5.24%, 5.35% Cap) | | | 0.00% | (f)(g) | | | 05/20/2041 | | | | 531,950 | |
| | 11,882,196 | | | Series 2011-70-PO | | | 0.00% | (k) | | | 05/16/2041 | | | | 8,955,597 | |
| | 7,358,365 | | | Series 2011-71-ZA | | | 4.50% | | | | 02/20/2041 | | | | 7,192,294 | |
| | 2,815,543 | | | Series 2011-72-AS (-1 x CME Term SOFR 1 Month + 5.27%, 5.38% Cap) | | | 0.00% | (f)(g) | | | 05/20/2041 | | | | 197,336 | |
| | 2,157,865 | | | Series 2011-72-SK (-1 x CME Term SOFR 1 Month + 6.04%, 6.15% Cap) | | | 0.71% | (f)(g) | | | 05/20/2041 | | | | 147,333 | |
| | 7,406,426 | | | Series 2013-116-LS (-1 x CME Term SOFR 1 Month + 6.04%, 6.15% Cap) | | | 0.71% | (f)(g) | | | 08/20/2043 | | | | 700,296 | |
| | 10,381,329 | | | Series 2013-136-CS (-1 x CME Term SOFR 1 Month + 6.09%, 6.20% Cap) | | | 0.76% | (f)(g) | | | 09/16/2043 | | | | 789,946 | |
| | 17,388,572 | | | Series 2013-182-WZ | | | 2.50% | | | | 12/20/2043 | | | | 15,199,349 | |
| | 53,601,178 | | | Series 2013-182-ZW | | | 2.50% | | | | 12/20/2043 | | | | 47,377,111 | |
| | 3,710,950 | | | Series 2013-186-SG (-1 x CME Term SOFR 1 Month + 6.14%, 6.25% Cap) | | | 0.81% | (f)(g) | | | 02/16/2043 | | | | 214,357 | |
| | 5,092,495 | | | Series 2013-26-MS (-1 x CME Term SOFR 1 Month + 6.14%, 6.25% Cap) | | | 0.81% | (f)(g) | | | 02/20/2043 | | | | 470,127 | |
| | 2,558,979 | | | Series 2013-34-PL | | | 3.00% | | | | 03/20/2042 | | | | 2,480,034 | |
| | 8,792,674 | | | Series 2014-163-PS (-1 x CME Term SOFR 1 Month + 5.49%, 5.60% Cap) | | | 0.16% | (f)(g) | | | 11/20/2044 | | | | 701,665 | |
| | 9,491,747 | | | Series 2014-167-SA (-1 x CME Term SOFR 1 Month + 5.49%, 5.60% Cap) | | | 0.16% | (f)(g) | | | 11/20/2044 | | | | 779,142 | |
| | 16,135,846 | | | Series 2014-21-SE (-1 x CME Term SOFR 1 Month + 5.44%, 5.55% Cap) | | | 0.11% | (f)(g) | | | 02/20/2044 | | | | 1,189,811 | |
| | 10,151,423 | | | Series 2014-30-EA | | | 1.81% | (c) | | | 02/16/2044 | | | | 8,731,241 | |
| | 9,671,875 | | | Series 2014-39-SK (-1 x CME Term SOFR 1 Month + 6.09%, 6.20% Cap) | | | 0.76% | (f)(g) | | | 03/20/2044 | | | | 944,968 | |
| | 10,654,497 | | | Series 2014-59-DS (-1 x CME Term SOFR 1 Month + 6.14%, 6.25% Cap) | | | 0.81% | (f)(g) | | | 04/16/2044 | | | | 899,712 | |
| | 10,066,431 | | | Series 2016-108-SM (-1 x CME Term SOFR 1 Month + 5.99%, 6.10% Cap) | | | 0.66% | (f)(g) | | | 08/20/2046 | | | | 1,154,394 | |
| | 12,135,357 | | | Series 2018-40-AZ | | | 3.00% | (h) | | | 10/20/2047 | | | | 9,863,552 | |
| | 22,797,628 | | | Series 2019-122-IO | | | 1.00% | (c)(f) | | | 07/16/2061 | | | | 1,450,613 | |
| | 187,843,586 | | | Series 2019-147-IO | | | 0.40% | (c)(f) | | | 06/16/2061 | | | | 6,404,414 | |
| | 10,073,489 | | | Series 2019-153-GF (CME Term SOFR 1 Month + 0.56%, 0.45% Floor, 6.50% Cap) | | | 5.89% | | | | 12/20/2049 | | | | 9,901,278 | |
| | 19,018,691 | | | Series 2020-104-AI | | | 3.00% | (f) | | | 07/20/2050 | | | | 3,027,673 | |
| | 11,993,383 | | | Series 2020-104-EI | | | 3.00% | (f) | | | 07/20/2050 | | | | 1,910,288 | |
| | 10,380,716 | | | Series 2020-112-LS (-1 x US 30 Day Average Secured Overnight Financing Rate + 6.20%, 6.20% Cap) | | | 0.88% | (f)(g) | | | 08/20/2050 | | | | 1,477,843 | |
| | 41,203,874 | | | Series 2020-115-IG | | | 2.50% | (f) | | | 08/20/2050 | | | | 5,692,946 | |
| | 19,968,204 | | | Series 2020-138-IC | | | 3.50% | (f) | | | 08/20/2050 | | | | 3,607,661 | |
| | 146,058,650 | | | Series 2020-140-ES (-1 x CME Term SOFR 1 Month + 6.19%, 6.30% Cap) | | | 0.86% | (f)(g) | | | 09/20/2050 | | | | 18,446,638 | |
| | 37,367,436 | | | Series 2020-140-SG (-1 x CME Term SOFR 1 Month + 6.24%, 6.35% Cap) | | | 0.91% | (f)(g) | | | 09/20/2050 | | | | 4,596,856 | |
| | 47,873,852 | | | Series 2020-146-CI | | | 2.50% | (f) | | | 10/20/2050 | | | | 6,137,437 | |
| | 26,057,116 | | | Series 2020-146-KI | | | 2.50% | (f) | | | 10/20/2050 | | | | 3,433,627 | |
| | 42,006,561 | | | Series 2020-148-AI | | | 2.50% | (f) | | | 10/20/2050 | | | | 5,308,415 | |
| | | | |
| 60 | | DoubleLine Funds Trust | | The accompanying notes are an integral part of these financial statements. |
| | | | | | | | | | | | | | | | |
PRINCIPAL
AMOUNT $ | | | SECURITY DESCRIPTION | | RATE | | | MATURITY | | | VALUE $ | |
| | 36,367,385 | | | Series 2020-148-JL | | | 1.00% | | | | 10/20/2050 | | | | 26,544,663 | |
| | 149,435,433 | | | Series 2020-151-MI | | | 2.50% | (f) | | | 10/20/2050 | | | | 20,608,416 | |
| | 64,427,708 | | | Series 2020-152-IO | | | 0.58% | (c)(f) | | | 12/16/2062 | | | | 2,914,916 | |
| | 100,671,108 | | | Series 2020-153-EI | | | 2.50% | (f) | | | 10/20/2050 | | | | 13,160,482 | |
| | 44,645,021 | | | Series 2020-160-IA | | | 2.50% | (f) | | | 10/20/2050 | | | | 5,762,927 | |
| | 11,025,288 | | | Series 2020-160-IM | | | 2.50% | (f) | | | 10/20/2050 | | | | 1,506,697 | |
| | 35,782,988 | | | Series 2020-162-QS (-1 x CME Term SOFR 1 Month + 6.19%, 6.30% Cap) | | | 0.86% | (f)(g) | | | 10/20/2050 | | | | 4,550,415 | |
| | 50,806,634 | | | Series 2020-166-SM (-1 x CME Term SOFR 1 Month + 6.19%, 6.30% Cap) | | | 0.86% | (f)(g) | | | 11/20/2050 | | | | 6,333,596 | |
| | 70,718,568 | | | Series 2020-167-BI | | | 2.50% | (f) | | | 11/20/2050 | | | | 9,144,696 | |
| | 53,521,003 | | | Series 2020-167-DI | | | 2.50% | (f) | | | 11/20/2050 | | | | 6,699,358 | |
| | 33,509,137 | | | Series 2020-167-IA | | | 2.50% | (f) | | | 11/20/2050 | | | | 4,637,986 | |
| | 78,507,696 | | | Series 2020-167-JI | | | 2.50% | (f) | | | 11/20/2050 | | | | 10,607,434 | |
| | 14,427,996 | | | Series 2020-167-NS (-1 x CME Term SOFR 1 Month + 6.19%, 6.30% Cap) | | | 0.86% | (f)(g) | | | 11/20/2050 | | | | 1,959,573 | |
| | 27,886,229 | | | Series 2020-167-YK | | | 1.20% | | | | 11/20/2050 | | | | 20,741,454 | |
| | 127,377,773 | | | Series 2020-173-MI | | | 2.50% | (f) | | | 11/20/2050 | | | | 17,612,295 | |
| | 40,845,643 | | | Series 2020-175-MI | | | 2.50% | (f) | | | 11/20/2050 | | | | 5,259,685 | |
| | 38,069,970 | | | Series 2020-175-SC (-1 x CME Term SOFR 1 Month + 6.19%, 6.30% Cap) | | | 0.86% | (f)(g) | | | 11/20/2050 | | | | 4,852,996 | |
| | 81,765,907 | | | Series 2020-177-IO | | | 0.82% | (c)(f) | | | 06/16/2062 | | | | 4,895,586 | |
| | 28,396,367 | | | Series 2020-181-AI | | | 2.50% | (f) | | | 12/20/2050 | | | | 3,668,370 | |
| | 48,573,057 | | | Series 2020-181-BI | | | 2.50% | (f) | | | 12/20/2050 | | | | 6,474,128 | |
| | 30,209,664 | | | Series 2020-181-SA (-1 x CME Term SOFR 1 Month + 6.19%, 6.30% Cap) | | | 0.86% | (f)(g) | | | 12/20/2050 | | | | 3,859,828 | |
| | 28,174,016 | | | Series 2020-181-YM | | | 1.17% | | | | 12/20/2050 | | | | 20,905,551 | |
| | 65,575,247 | | | Series 2020-185-AI | | | 2.50% | (f) | | | 12/20/2050 | | | | 8,496,578 | |
| | 50,846,882 | | | Series 2020-185-KI | | | 2.50% | (f) | | | 12/20/2050 | | | | 6,197,737 | |
| | 41,303,123 | | | Series 2020-185-MI | | | 2.50% | (f) | | | 12/20/2050 | | | | 5,436,317 | |
| | 46,706,669 | | | Series 2020-187-AI | | | 2.50% | (f) | | | 12/20/2050 | | | | 5,995,553 | |
| | 5,424,291 | | | Series 2020-188-DI | | | 2.50% | (f) | | | 12/20/2050 | | | | 730,736 | |
| | 26,833,303 | | | Series 2020-188-GI | | | 2.00% | (f) | | | 12/20/2050 | | | | 2,857,768 | |
| | 40,232,807 | | | Series 2020-188-IQ | | | 3.00% | (f) | | | 10/20/2050 | | | | 6,392,450 | |
| | 90,160,905 | | | Series 2020-188-KI | | | 2.50% | (f) | | | 12/20/2050 | | | | 12,163,184 | |
| | 36,428,149 | | | Series 2020-188-NS (-1 x CME Term SOFR 1 Month + 6.19%, 6.30% Cap) | | | 0.86% | (f)(g) | | | 12/20/2050 | | | | 4,603,968 | |
| | 39,908,433 | | | Series 2020-195-IX | | | 1.13% | (c)(f) | | | 12/16/2062 | | | | 2,998,700 | |
| | 5,258,423 | | | Series 2020-4-H | | | 2.50% | | | | 10/20/2049 | | | | 4,492,759 | |
| | 35,400,085 | | | Series 2020-7-FM (CME Term SOFR 1 Month + 0.56%, 0.45% Floor, 6.50% Cap) | | | 5.89% | | | | 01/20/2050 | | | | 34,825,896 | |
| | 8,452,171 | | | Series 2020-79-KG | | | 1.30% | | | | 06/20/2050 | | | | 6,503,273 | |
| | 89,548,223 | | | Series 2020-89-IA | | | 1.16% | (c)(f) | | | 04/16/2062 | | | | 7,274,907 | |
| | 66,376,532 | | | Series 2020-94-IO | | | 0.97% | (c)(f) | | | 03/16/2062 | | | | 4,375,574 | |
| | 17,626,063 | | | Series 2020-98-SA (-1 x CME Term SOFR 1 Month + 6.04%, 6.15% Cap) | | | 0.71% | (f)(g) | | | 07/20/2050 | | | | 2,171,189 | |
| | 80,817,895 | | | Series 2021-1-EI | | | 2.00% | (f) | | | 01/20/2051 | | | | 6,555,180 | |
| | 34,700,189 | | | Series 2021-1-IA | | | 2.50% | (f) | | | 01/20/2051 | | | | 4,571,538 | |
| | 66,542,531 | | | Series 2021-10-IO | | | 0.99% | (c)(f) | | | 05/16/2063 | | | | 4,640,550 | |
| | 117,139,292 | | | Series 2021-100-IO | | | 0.97% | (c)(f) | | | 06/16/2063 | | | | 7,803,222 | |
| | 64,386,687 | | | Series 2021-107-QI | | | 2.50% | (f) | | | 06/20/2051 | | | | 8,673,795 | |
| | 130,351,011 | | | Series 2021-110-IO | | | 0.87% | (c)(f) | | | 11/16/2063 | | | | 8,546,686 | |
| | 24,630,310 | | | Series 2021-114-SB (-1 x CME Term SOFR 1 Month + 2.49%, 2.60% Cap) | | | 0.00% | (f)(g) | | | 06/20/2051 | | | | 246,059 | |
| | 44,822,175 | | | Series 2021-116-IA | | | 2.50% | (f) | | | 06/20/2051 | | | | 6,004,074 | |
| | 44,948,594 | | | Series 2021-116-XI | | | 3.50% | (f) | | | 03/20/2051 | | | | 8,041,744 | |
| | 21,369,581 | | | Series 2021-117-IJ | | | 3.50% | (f) | | | 06/20/2051 | | | | 2,750,086 | |
| | 16,542,157 | | | Series 2021-117-SH (-1 x CME Term SOFR 1 Month + 6.19%, 6.30% Cap) | | | 0.86% | (f)(g) | | | 07/20/2051 | | | | 1,606,983 | |
| | 238,706,366 | | | Series 2021-12-IO | | | 0.95% | (c)(f) | | | 03/16/2063 | | | | 15,830,672 | |
| | 115,161,852 | | | Series 2021-122-SA (-1 x US 30 Day Average Secured Overnight Financing Rate + 2.60%, 2.60% Cap) | | | 0.00% | (f)(g) | | | 07/20/2051 | | | | 1,077,305 | |
| | 25,773,591 | | | Series 2021-125-IO | | | 3.00% | (f) | | | 06/20/2051 | | | | 3,690,402 | |
| | | | | | | | |
| The accompanying notes are an integral part of these financial statements. | | Annual Report | | | | | March 31, 2024 | | 61 |
| | |
Schedule of Investments DoubleLine Total Return Bond Fund (Cont.) | | |
| | | | | | | | | | | | | | | | |
PRINCIPAL
AMOUNT $ | | | SECURITY DESCRIPTION | | RATE | | | MATURITY | | | VALUE $ | |
| | 61,496,908 | | | Series 2021-135-GI | | | 3.00% | (f) | | | 08/20/2051 | | | | 9,803,769 | |
| | 77,619,998 | | | Series 2021-135-SK (-1 x CME Term SOFR 1 Month + 6.19%, 6.30% Cap) | | | 0.86% | (f)(g) | | | 08/20/2051 | | | | 7,623,689 | |
| | 64,323,367 | | | Series 2021-136-EI | | | 3.00% | (f) | | | 08/20/2051 | | | | 10,255,390 | |
| | 39,823,001 | | | Series 2021-138-IL | | | 3.00% | (f) | | | 08/20/2051 | | | | 6,367,555 | |
| | 38,926,413 | | | Series 2021-138-KI | | | 3.00% | (f) | | | 08/20/2051 | | | | 6,256,638 | |
| | 58,968,798 | | | Series 2021-138-PS (-1 x US 30 Day Average Secured Overnight Financing Rate + 3.75%, 3.75% Cap) | | | 0.00% | (f)(g) | | | 08/20/2051 | | | | 961,799 | |
| | 15,358,356 | | | Series 2021-139-BI | | | 3.50% | (f) | | | 08/20/2051 | | | | 1,972,311 | |
| | 48,790,636 | | | Series 2021-140-IJ | | | 3.00% | (f) | | | 08/20/2051 | | | | 7,855,346 | |
| | 31,909,998 | | | Series 2021-142-IO | | | 3.00% | (f) | | | 08/20/2051 | | | | 5,132,621 | |
| | 119,404,837 | | | Series 2021-142-XI | | | 3.00% | (f) | | | 08/20/2051 | | | | 19,133,873 | |
| | 111,963,910 | | | Series 2021-143-IO | | | 0.97% | (c)(f) | | | 10/16/2063 | | | | 7,540,098 | |
| | 85,232,202 | | | Series 2021-144-IO | | | 0.83% | (c)(f) | | | 04/16/2063 | | | | 5,152,585 | |
| | 230,307,963 | | | Series 2021-15-BI | | | 2.50% | (f) | | | 01/20/2051 | | | | 30,238,583 | |
| | 89,337,489 | | | Series 2021-150-IO | | | 1.03% | (c)(f) | | | 11/16/2063 | | | | 5,967,280 | |
| | 68,492,543 | | | Series 2021-151-IO | | | 0.92% | (c)(f) | | | 04/16/2063 | | | | 4,659,342 | |
| | 28,832,444 | | | Series 2021-155-IE | | | 3.00% | (f) | | | 09/20/2051 | | | | 4,654,456 | |
| | 80,153,597 | | | Series 2021-155-KI | | | 4.00% | (f) | | | 09/20/2051 | | | | 10,762,993 | |
| | 38,716,158 | | | Series 2021-155-S (-1 x US 30 Day Average Secured Overnight Financing Rate + 3.20%, 3.20% Cap) | | | 0.00% | (f)(g) | | | 09/20/2051 | | | | 723,520 | |
| | 39,450,426 | | | Series 2021-155-SG (-1 x CME Term SOFR 1 Month + 6.19%, 6.30% Cap) | | | 0.86% | (f)(g) | | | 09/20/2051 | | | | 4,659,912 | |
| | 23,496,222 | | | Series 2021-157-IO | | | 0.89% | (c)(f) | | | 09/16/2063 | | | | 1,489,273 | |
| | 46,844,741 | | | Series 2021-158-IO | | | 3.00% | (f) | | | 09/20/2051 | | | | 7,448,979 | |
| | 64,209,082 | | | Series 2021-158-IV | | | 2.50% | (f) | | | 09/20/2051 | | | | 8,688,856 | |
| | 24,953,345 | | | Series 2021-160-IA | | | 3.00% | (f) | | | 09/20/2051 | | | | 3,978,741 | |
| | 80,137,473 | | | Series 2021-160-SQ (-1 x US 30 Day Average Secured Overnight Financing Rate + 2.65%, 3.00% Cap) | | | 0.00% | (f)(g) | | | 09/20/2051 | | | | 779,337 | |
| | 35,658,904 | | | Series 2021-160-WI | | | 2.50% | (f) | | | 09/20/2051 | | | | 4,427,545 | |
| | 42,338,688 | | | Series 2021-160-XI | | | 3.00% | (f) | | | 09/20/2051 | | | | 6,754,257 | |
| | 43,804,498 | | | Series 2021-161-KI | | | 3.50% | (f) | | | 09/20/2051 | | | | 7,076,639 | |
| | 81,817,923 | | | Series 2021-161-UI | | | 3.00% | (f) | | | 09/20/2051 | | | | 13,068,662 | |
| | 28,223,173 | | | Series 2021-162-DI | | | 3.00% | (f) | | | 09/20/2051 | | | | 4,504,946 | |
| | 15,168,580 | | | Series 2021-170-IO | | | 0.99% | (c)(f) | | | 05/16/2063 | | | | 1,081,403 | |
| | 40,523,941 | | | Series 2021-175-IM | | | 3.00% | (f) | | | 10/20/2051 | | | | 5,616,582 | |
| | 15,411,483 | | | Series 2021-175-IN | | | 2.50% | (f) | | | 07/20/2051 | | | | 2,045,184 | |
| | 52,620,299 | | | Series 2021-175-IU | | | 2.50% | (f) | | | 09/20/2051 | | | | 6,852,179 | |
| | 44,535,380 | | | Series 2021-176-TI | | | 4.00% | (f) | | | 10/20/2051 | | | | 5,829,423 | |
| | 118,898,546 | | | Series 2021-177-IA | | | 2.50% | (f) | | | 10/20/2051 | | | | 15,345,237 | |
| | 57,798,163 | | | Series 2021-180-IO | | | 0.91% | (c)(f) | | | 11/16/2063 | | | | 3,986,466 | |
| | 69,338,847 | | | Series 2021-184-IO | | | 0.88% | (c)(f) | | | 12/16/2061 | | | | 4,567,509 | |
| | 27,590,709 | | | Series 2021-188-IA | | | 3.00% | (f) | | | 10/20/2051 | | | | 4,396,317 | |
| | 48,523,664 | | | Series 2021-188-IN | | | 2.50% | (f) | | | 10/20/2051 | | | | 6,599,218 | |
| | 34,055,616 | | | Series 2021-188-IT | | | 2.50% | (f) | | | 10/20/2051 | | | | 4,454,703 | |
| | 23,092,502 | | | Series 2021-188-IW | | | 3.00% | (f) | | | 10/20/2051 | | | | 3,516,249 | |
| | 157,497,997 | | | Series 2021-189-IO | | | 0.88% | (c)(f) | | | 06/16/2061 | | | | 10,391,923 | |
| | 23,370,329 | | | Series 2021-191-BI | | | 2.50% | (f) | | | 10/20/2051 | | | | 3,158,026 | |
| | 46,944,030 | | | Series 2021-191-CI | | | 2.50% | (f) | | | 10/20/2051 | | | | 6,002,719 | |
| | 28,848,269 | | | Series 2021-192-AI | | | 3.00% | (f) | | | 10/20/2051 | | | | 4,650,520 | |
| | 59,700,877 | | | Series 2021-193-I | | | 3.00% | (f) | | | 06/20/2051 | | | | 9,081,315 | |
| | 4,347,525 | | | Series 2021-193-SW (-1 x US 30 Day Average Secured Overnight Financing Rate + 2.55%, 2.55% Cap) | | | 0.00% | (f)(g) | | | 11/20/2051 | | | | 45,456 | |
| | 70,708,209 | | | Series 2021-196-IO | | | 2.50% | (f) | | | 11/20/2051 | | | | 9,507,249 | |
| | 62,179,305 | | | Series 2021-2-IO | | | 0.88% | (c)(f) | | | 06/16/2063 | | | | 3,959,877 | |
| | 31,825,088 | | | Series 2021-20-IO | | | 1.15% | (c)(f) | | | 08/16/2062 | | | | 2,458,533 | |
| | 85,857,332 | | | Series 2021-200-IO | | | 0.88% | (c)(f) | | | 11/16/2063 | | | | 5,837,045 | |
| | 25,802,169 | | | Series 2021-205-DI | | | 2.50% | (f) | | | 11/20/2051 | | | | 3,380,876 | |
| | 180,241,565 | | | Series 2021-208-IO | | | 0.76% | (c)(f) | | | 06/16/2064 | | | | 9,848,255 | |
| | 182,298,095 | | | Series 2021-210-IO | | | 0.98% | (c)(f) | | | 05/16/2062 | | | | 12,955,415 | |
| | 52,200,744 | | | Series 2021-211-IO | | | 0.97% | (c)(f) | | | 01/16/2063 | | | | 3,621,990 | |
| | 33,380,974 | | | Series 2021-213-IH | | | 3.00% | (f) | | | 12/20/2051 | | | | 5,349,268 | |
| | 266,802,402 | | | Series 2021-22-IO | | | 0.98% | (c)(f) | | | 05/16/2063 | | | | 18,552,959 | |
| | | | |
| 62 | | DoubleLine Funds Trust | | The accompanying notes are an integral part of these financial statements. |
| | | | | | | | | | | | | | | | |
PRINCIPAL
AMOUNT $ | | | SECURITY DESCRIPTION | | RATE | | | MATURITY | | | VALUE $ | |
| | 9,350,489 | | | Series 2021-226-TI | | | 2.50% | (f) | | | 12/20/2051 | | | | 1,270,610 | |
| | 74,600,886 | | | Series 2021-24-XI | | | 2.00% | (f) | | | 02/20/2051 | | | | 7,456,650 | |
| | 32,637,194 | | | Series 2021-24-YD | | | 1.20% | | | | 02/20/2051 | | | | 24,962,108 | |
| | 11,275,911 | | | Series 2021-25-EI | | | 2.50% | (f) | | | 02/20/2051 | | | | 1,465,388 | |
| | 21,175,689 | | | Series 2021-30-IB | | | 2.50% | (f) | | | 02/20/2051 | | | | 2,882,140 | |
| | 25,876,459 | | | Series 2021-30-WI | | | 2.50% | (f) | | | 02/20/2051 | | | | 3,483,629 | |
| | 26,346,174 | | | Series 2021-35-IO | | | 1.03% | (c)(f) | | | 12/16/2062 | | | | 1,900,969 | |
| | 76,553,465 | | | Series 2021-35-IX | | | 1.20% | (c)(f) | | | 12/16/2062 | | | | 6,265,572 | |
| | 33,039,750 | | | Series 2021-40-IO | | | 0.82% | (c)(f) | | | 02/16/2063 | | | | 2,007,416 | |
| | 594,586,186 | | | Series 2021-45-IO | | | 0.81% | (c)(f) | | | 04/16/2063 | | | | 35,976,864 | |
| | 33,069,584 | | | Series 2021-49-NI | | | 2.50% | (f) | | | 03/20/2051 | | | | 3,953,925 | |
| | 46,757,911 | | | Series 2021-49-QI | | | 2.50% | (f) | | | 03/20/2049 | | | | 4,458,661 | |
| | 28,677,985 | | | Series 2021-52-IO | | | 0.72% | (c)(f) | | | 04/16/2063 | | | | 1,572,064 | |
| | 73,010,804 | | | Series 2021-57-JI | | | 3.00% | (f) | | | 03/20/2051 | | | | 11,571,570 | |
| | 8,170,904 | | | Series 2021-58-HP | | | 3.00% | | | | 08/20/2050 | | | | 7,125,501 | |
| | 101,177,085 | | | Series 2021-58-IE | | | 3.00% | (f) | | | 07/20/2050 | | | | 16,037,711 | |
| | 205,728,803 | | | Series 2021-60-IO | | | 0.83% | (c)(f) | | | 05/16/2063 | | | | 12,348,460 | |
| | 78,773,600 | | | Series 2021-64-IG | | | 3.00% | (f) | | | 04/20/2051 | | | | 12,490,728 | |
| | 236,444,657 | | | Series 2021-65-IO | | | 0.88% | (c)(f) | | | 08/16/2063 | | | | 15,268,319 | |
| | 40,606,931 | | | Series 2021-7-IP | | | 3.50% | (f) | | | 07/20/2050 | | | | 7,165,414 | |
| | 90,104,569 | | | Series 2021-7-KI | | | 2.50% | (f) | | | 01/20/2051 | | | | 12,113,730 | |
| | 53,156,103 | | | Series 2021-7-MI | | | 2.50% | (f) | | | 01/20/2051 | | | | 7,148,842 | |
| | 179,204,922 | | | Series 2021-70-IO | | | 0.71% | (c)(f) | | | 04/16/2063 | | | | 9,730,809 | |
| | 163,138,616 | | | Series 2021-71-IO | | | 0.87% | (c)(f) | | | 10/16/2062 | | | | 10,323,297 | |
| | 159,321,183 | | | Series 2021-72-IO | | | 0.57% | (c)(f) | | | 01/16/2061 | | | | 7,124,302 | |
| | 104,629,413 | | | Series 2021-74-CI | | | 3.00% | (f) | | | 12/20/2050 | | | | 16,520,315 | |
| | 100,596,676 | | | Series 2021-77-SJ (-1 x CME Term SOFR 1 Month + 3.64%, 3.75% Cap) | | | 0.00% | (f)(g) | | | 05/20/2051 | | | | 1,957,199 | |
| | 11,466,657 | | | Series 2021-78-IC | | | 4.00% | (f) | | | 05/20/2051 | | | | 2,138,682 | |
| | 59,100,211 | | | Series 2021-80-IO | | | 0.90% | (c)(f) | | | 12/16/2062 | | | | 4,018,525 | |
| | 311,684,974 | | | Series 2021-85-IO | | | 0.68% | (c)(f) | | | 03/16/2063 | | | | 16,422,744 | |
| | 47,022,086 | | | Series 2021-87-ET | | | 2.00% | | | | 05/20/2051 | | | | 38,171,833 | |
| | 59,302,600 | | | Series 2021-9-AI | | | 2.00% | (f) | | | 01/20/2051 | | | | 5,851,109 | |
| | 102,351,626 | | | Series 2021-9-MI | | | 2.50% | (f) | | | 01/20/2051 | | | | 13,744,196 | |
| | 44,356,971 | | | Series 2021-96-TS (-1 x US 30 Day Average Secured Overnight Financing Rate + 3.25%, 3.25% Cap) | | | 0.00% | (f)(g) | | | 06/20/2051 | | | | 853,419 | |
| | 41,842,524 | | | Series 2021-97-NI | | | 2.50% | (f) | | | 08/20/2049 | | | | 4,221,116 | |
| | 34,031,003 | | | Series 2021-97-SH (-1 x CME Term SOFR 1 Month + 3.64%, 3.75% Cap) | | | 0.00% | (f)(g) | | | 06/20/2051 | | | | 727,756 | |
| | 109,425,302 | | | Series 2021-98-IG | | | 3.00% | (f) | | | 06/20/2051 | | | | 17,605,185 | |
| | 25,010,768 | | | Series 2021-98-MI | | | 2.50% | (f) | | | 06/20/2051 | | | | 3,367,800 | |
| | 27,162,509 | | | Series 2021-98-SB (-1 x CME Term SOFR 1 Month + 6.19%, 6.30% Cap) | | | 0.86% | (f)(g) | | | 06/20/2051 | | | | 3,001,419 | |
| | 69,547,974 | | | Series 2021-98-ST (-1 x US 30 Day Average Secured Overnight Financing Rate + 2.73%, 2.73% Cap) | | | 0.00% | (f)(g) | | | 03/20/2051 | | | | 461,353 | |
| | 8,758,810 | | | Series 2021-98-SW (-1 x CME Term SOFR 1 Month + 6.19%, 6.30% Cap) | | | 0.86% | (f)(g) | | | 06/20/2051 | | | | 944,998 | |
| | 41,418,584 | | | Series 2021-99-IO | | | 0.59% | (c)(f) | | | 05/16/2061 | | | | 1,906,547 | |
| | 204,038,418 | | | Series 2022-102-IO | | | 0.48% | (c)(f) | | | 06/16/2064 | | | | 8,672,837 | |
| | 65,736,048 | | | Series 2022-137-DI | | | 2.50% | (f) | | | 02/20/2051 | | | | 8,376,554 | |
| | 66,757,448 | | | Series 2022-137-EI | | | 2.50% | (f) | | | 06/20/2051 | | | | 8,975,098 | |
| | 114,515,307 | | | Series 2022-14-IO | | | 0.66% | (c)(f) | | | 12/01/2061 | | | | 5,784,340 | |
| | 87,270,166 | | | Series 2022-141-IO | | | 0.78% | (c)(f) | | | 06/16/2064 | | | | 6,078,114 | |
| | 96,377,970 | | | Series 2022-158-IO | | | 0.88% | (c)(f) | | | 08/16/2064 | | | | 7,399,515 | |
| | 26,397,309 | | | Series 2022-160-ZD | | | 3.00% | (h) | | | 11/20/2047 | | | | 21,999,441 | |
| | 61,799,885 | | | Series 2022-167-IO | | | 0.82% | (c)(f) | | | 08/16/2065 | | | | 4,099,613 | |
| | 132,997,938 | | | Series 2022-169-IO | | | 0.89% | (c)(f) | | | 01/16/2062 | | | | 10,144,737 | |
| | 14,521,180 | | | Series 2022-183-B | | | 5.00% | | | | 04/20/2047 | | | | 14,409,518 | |
| | 85,327,304 | | | Series 2022-188-IO | | | 2.50% | (f) | | | 02/20/2051 | | | | 11,450,327 | |
| | 80,269,918 | | | Series 2022-202-IO | | | 0.72% | (c)(f) | | | 10/16/2063 | | | | 5,204,003 | |
| | 84,028,469 | | | Series 2022-207-EI | | | 3.50% | (f) | | | 02/20/2052 | | | | 15,273,225 | |
| | 88,339,051 | | | Series 2022-207-IO | | | 3.00% | (f) | | | 08/20/2051 | | | | 13,994,354 | |
| | 74,352,646 | | | Series 2022-21-IO | | | 0.78% | (c)(f) | | | 10/16/2063 | | | | 4,530,812 | |
| | | | | | | | |
| The accompanying notes are an integral part of these financial statements. | | Annual Report | | | | | March 31, 2024 | | 63 |
| | |
Schedule of Investments DoubleLine Total Return Bond Fund (Cont.) | | |
| | | | | | | | | | | | | | | | |
PRINCIPAL
AMOUNT $ | | | SECURITY DESCRIPTION | | RATE | | | MATURITY | | | VALUE $ | |
| | 55,516,325 | | | Series 2022-218-IO | | | 3.50% | (f) | | | 01/20/2052 | | | | 9,360,569 | |
| | 13,358,898 | | | Series 2022-23-BA | | | 3.00% | | | | 05/20/2049 | | | | 11,938,454 | |
| | 145,119,095 | | | Series 2022-27-IO | | | 0.75% | (c)(f) | | | 03/16/2064 | | | | 8,226,772 | |
| | 93,069,833 | | | Series 2022-35-IO | | | 0.55% | (c)(f) | | | 10/16/2063 | | | | 4,663,273 | |
| | 143,235,588 | | | Series 2022-38-IO | | | 0.72% | (c)(f) | | | 04/16/2064 | | | | 8,035,674 | |
| | 414,159,202 | | | Series 2022-39-IO | | | 0.62% | (c)(f) | | | 01/16/2064 | | | | 22,614,459 | |
| | 122,499,176 | | | Series 2022-42-IO | | | 0.67% | (c)(f) | | | 12/16/2063 | | | | 6,584,196 | |
| | 22,562,879 | | | Series 2022-44-TY | | | 2.00% | | | | 12/20/2051 | | | | 17,382,546 | |
| | 59,258,624 | | | Series 2022-48-IO | | | 0.70% | (c)(f) | | | 01/16/2064 | | | | 3,560,104 | |
| | 66,476,670 | | | Series 2022-49-IO | | | 0.76% | (c)(f) | | | 03/16/2064 | | | | 3,805,018 | |
| | 125,244,059 | | | Series 2022-54-IO | | | 0.59% | (c)(f) | | | 10/16/2063 | | | | 6,138,399 | |
| | 33,880,881 | | | Series 2022-56-HI | | | 2.50% | (f) | | | 01/20/2052 | | | | 4,522,694 | |
| | 78,661,751 | | | Series 2022-62-IO | | | 0.62% | (c)(f) | | | 06/16/2064 | | | | 4,093,974 | |
| | 207,188,873 | | | Series 2022-71-IO | | | 0.55% | (c)(f) | | | 06/16/2064 | | | | 9,201,506 | |
| | 275,169,449 | | | Series 2022-72-DI | | | 0.58% | (c)(f) | | | 06/16/2064 | | | | 13,206,620 | |
| | 97,526,541 | | | Series 2022-73-IO | | | 0.56% | (c)(f) | | | 07/16/2064 | | | | 5,080,762 | |
| | 5,944,000 | | | Series 2022-78-HW | | | 2.50% | | | | 04/20/2052 | | | | 4,518,332 | |
| | 191,173,550 | | | Series 2022-8-IO | | | 0.86% | (c)(f) | | | 09/16/2063 | | | | 12,362,276 | |
| | 131,272,337 | | | Series 2022-83-IO | | | 2.50% | (f) | | | 11/20/2051 | | | | 18,260,901 | |
| | 125,675,142 | | | Series 2022-86-IO | | | 0.53% | (c)(f) | | | 10/16/2063 | | | | 5,687,366 | |
| | 59,944,491 | | | Series 2022-9-EI | | | 3.00% | (f) | | | 01/20/2052 | | | | 8,377,273 | |
| | 97,392,392 | | | Series 2022-91-IO | | | 0.43% | (c)(f) | | | 07/16/2064 | | | | 4,284,174 | |
| | 474,306,647 | | | Series 2023-108-IO | | | 0.70% | (c)(f) | | | 08/16/2059 | | | | 16,388,528 | |
| | 51,055,703 | | | Series 2023-118-IO | | | 0.65% | (c)(f) | | | 05/16/2065 | | | | 2,766,438 | |
| | 10,983,076 | | | Series 2023-140-AS (-2 x US 30 Day Average Secured Overnight Financing Rate + 13.00%, 13.00% Cap) | | | 2.36% | (g) | | | 09/20/2053 | | | | 10,433,605 | |
| | 49,253,736 | | | Series 2023-16-IO | | | 0.90% | (c)(f) | | | 07/16/2063 | | | | 3,432,503 | |
| | 23,178,926 | | | Series 2023-164-BV | | | 3.00% | | | | 01/20/2052 | | | | 19,597,998 | |
| | 39,365,985 | | | Series 2023-173-GB | | | 3.50% | | | | 11/20/2053 | | | | 33,714,962 | |
| | 11,060,354 | | | Series 2023-187-ZP | | | 3.00% | (h) | | | 11/20/2051 | | | | 6,660,037 | |
| | 179,897,827 | | | Series 2023-19-IO | | | 2.50% | (f) | | | 02/20/2051 | | | | 24,445,740 | |
| | 23,875,421 | | | Series 2023-196-DZ | | | 4.50% | (h) | | | 12/20/2053 | | | | 21,039,847 | |
| | 32,401,481 | | | Series 2023-24-IH | | | 3.50% | (f) | | | 07/20/2051 | | | | 6,067,647 | |
| | 73,255,784 | | | Series 2023-50-IO | | | 0.86% | (c)(f) | | | 06/16/2064 | | | | 4,999,092 | |
| | 33,039,437 | | | Series 2023-58-IO | | | 2.50% | (f) | | | 10/20/2050 | | | | 4,249,850 | |
| | 36,838,199 | | | Series 2023-60-PT | | | 4.00% | | | | 10/20/2049 | | | | 34,061,328 | |
| | 55,227,783 | | | Series 2023-77-IO | | | 0.70% | (c)(f) | | | 04/16/2065 | | | | 3,289,527 | |
| | 49,938,770 | | | Series 2023-81-YD | | | 4.00% | | | | 06/20/2053 | | | | 44,229,485 | |
| | 31,927,906 | | | Series 2023-81-YJ | | | 3.50% | | | | 06/20/2053 | | | | 27,353,854 | |
| | 11,988,219 | | | Series 2023-88-IO | | | 0.92% | (c)(f) | | | 03/16/2065 | | | | 883,359 | |
| | 11,847,441 | | | Series 2024-1-CZ | | | 3.00% | (h) | | | 01/20/2050 | | | | 8,772,295 | |
| | 25,519,837 | | | Series 2024-19-EZ | | | 5.00% | (h) | | | 12/20/2063 | | | | 23,844,179 | |
| | 95,715,642 | | | Series 2024-20-LA | | | 2.50% | | | | 11/20/2051 | | | | 82,759,820 | |
| | 24,151,839 | | | Series 2024-20-LB | | | 2.50% | | | | 11/20/2051 | | | | 16,346,909 | |
| | 23,973,496 | | | Series 2024-20-LI | | | 2.50% | (f) | | | 11/20/2051 | | | | 3,259,451 | |
| | 53,464,814 | | | Series 2024-24-BI | | | 3.00% | (f) | | | 12/20/2051 | | | | 8,678,655 | |
| | 25,000,000 | | | Series 2024-40-FE (US 30 Day Average Secured Overnight Financing Rate + 1.00%, 1.00% Floor, 7.00% Cap) | | | 6.32% | | | | 03/20/2054 | | | | 24,995,117 | |
| | | |
| | | | Seasoned Credit Risk Transfer Trust | | | | | | | | |
| | 18,134,544 | | | Series 2018-3-HA | | | 3.00% | | | | 08/25/2057 | | | | 16,462,552 | |
| | 34,499,063 | | | Series 2020-1-MB | | | 2.50% | | | | 08/25/2059 | | | | 24,557,144 | |
| | 10,000,000 | | | Series 2020-2-MB | | | 2.00% | | | | 11/25/2059 | | | | 6,865,175 | |
| | 16,100,107 | | | Series 2020-2-MT | | | 2.00% | | | | 11/25/2059 | | | | 12,672,385 | |
| | 35,000,000 | | | Series 2022-2-MB | | | 3.00% | | | | 04/25/2062 | | | | 23,909,256 | |
| | | | | | | | | | | | | | | | |
| | | | Total US Government and Agency Mortgage Backed Obligations
(Cost $17,418,671,129) | | | | 15,706,414,976 | |
| | | | | | | | | | | | | | | | |
| | | | | | | | | | | | | | | | |
| | US GOVERNMENT AND AGENCY OBLIGATIONS - 5.8% | | | | | | | | | | | | |
| | | | |
| | 54,900,000 | | | Tennessee Valley Authority | | | 4.25% | | | | 09/15/2065 | | | | 48,221,341 | |
| | 780,000,000 | | | United States Treasury Note/Bond | | | 4.38% | | | | 08/15/2043 | | | | 770,981,250 | |
| | | | |
| | 950,000,000 | | | United States Treasury Note/Bond | | | 4.75% | | | | 11/15/2043 | | | | 985,773,437 | |
| | | | | | | | | | | | | | | | |
| | | | Total US Government and Agency Obligations
(Cost $1,728,792,504) | | | | 1,804,976,028 | |
| | | | | | | | | | | | | | | | |
| | | | |
| 64 | | DoubleLine Funds Trust | | The accompanying notes are an integral part of these financial statements. |
| | | | | | | | | | | | | | | | |
| SHARES | | | SECURITY DESCRIPTION | | RATE | | | MATURITY | | | VALUE $ | |
| | SHORT TERM INVESTMENTS - 2.0% | | | | |
| | | | |
| | 211,153,380 | | | First American Government Obligations Fund - U | | | 5.26% | (l) | | | | | | | 211,153,380 | |
| | 211,153,380 | | | JPMorgan US Government Money Market Fund - IM | | | 5.25% | (l) | | | | | | | 211,153,380 | |
| | 211,153,380 | | | MSILF Government Portfolio - Institutional | | | 5.22% | (l) | | | | | | | 211,153,380 | |
| | | | | | | | | | | | | | | | |
| | | | Total Short Term Investments
(Cost $633,460,140) | | | | 633,460,140 | |
| | | | | | | | | | | | | | | | |
| | | | Total Investments 99.6%
($35,581,955,108) | | | | 30,915,237,934 | |
| | | | Other Assets in Excess of Liabilities 0.4% | | | | | | | 120,173,498 | |
| | | | | | | | | | | | | | | | |
| | | | NET ASSETS 100% | | | | | | $ | 31,035,411,432 | |
| | | | | | | | | | | | | | | | |
| | | | | |
| SECURITY TYPE BREAKDOWN as a % of Net Assets: | | | | | |
US Government and Agency Mortgage Backed Obligations | | | | 50.6% | |
Non-Agency Residential Collateralized Mortgage Obligations | | | | 26.1% | |
Non-Agency Commercial Mortgage Backed Obligations | | | | 7.3% | |
US Government and Agency Obligations | | | | 5.8% | |
Asset Backed Obligations | | | | 4.4% | |
Collateralized Loan Obligations | | | | 3.4% | |
Short Term Investments | | | | 2.0% | |
Other Assets and Liabilities | | | | 0.4% | |
| | | | | |
Net Assets | | | | 100.0% | |
| | | | | |
| (a) | Security exempt from registration under Rule 144A of the Securities Act of 1933. These securities may be resold in transactions exempt from registration to qualified institutional buyers. |
| (b) | Value determined using significant unobservable inputs. |
| (c) | Coupon rate is variable based on the weighted average coupon of the underlying collateral. To the extent the weighted average coupon of the underlying assets which comprise the collateral increases or decreases, the coupon rate of this security will increase or decrease correspondingly. The rate disclosed is as of period end. |
| (d) | Step Bond; Coupon rate changes based on a predetermined schedule or event. The interest rate shown is the rate in effect as of period end. |
| (e) | Security pays interest at rates that represent residual cashflows available after more senior tranches have been paid. The interest rate disclosed reflects the estimated rate in effect as of period end. |
| (f) | Interest only security |
| (g) | Inverse floating rate security whose interest rate moves in the opposite direction of reference interest rates. Reference interest rates are typically based on a negative multiplier or slope. Interest rate may also be subject to a cap or floor. |
| (h) | This security accrues interest which is added to the outstanding principal balance. The interest payment will be deferred until all other tranches in the structure are paid off. The rate disclosed is as of period end. |
| (i) | Securities referencing LIBOR are expected to transition to an alternative reference rate by the security’s next scheduled coupon reset date. |
| (j) | Coupon rate is variable or floats based on components including but not limited to reference rate and spread. These securities may not indicate a reference rate and/or spread in their description. The rate disclosed is as of period end. |
| (k) | Principal only security |
| (l) | Seven-day yield as of period end. |
| | | | | | | | |
| The accompanying notes are an integral part of these financial statements. | | Annual Report | | | | | March 31, 2024 | | 65 |
| | |
Schedule of Investments DoubleLine Total Return Bond Fund (Cont.) | | |
Futures Contracts
| | | | | | | | | | | | | | | | | | | | | | | | | |
| Description | | Long/Short | | Contract Quantity | | Expiration Date | | Notional Amount(1) | | Unrealized Appreciation (Depreciation)/ Value |
U.S. Treasury Long Bonds | | Long | | | | 20,000 | | | | | 6/18/2024 | | | | $ | 2,408,750,000 | | | | $ | 34,869,762 | |
U.S. Treasury 5 Year Note | | Long | | | | 25,000 | | | | | 6/28/2024 | | | | | 2,675,390,625 | | | | | 3,267,313 | |
U.S. Treasury Ultra Bonds | | Long | | | | 1,925 | | | | | 6/18/2024 | | | | | 248,325,000 | | | | | 2,477,172 | |
10 Year U.S. Ultra Treasury Notes | | Short | | | | (30,000 | ) | | | | 6/18/2024 | | | | | (3,438,281,250 | ) | | | | (21,744,764 | ) |
U.S. Treasury 2 Year Notes | | Long | | | | 57,500 | | | | | 6/28/2024 | | | | | 11,757,851,620 | | | | | (34,191,550 | ) |
| | | | | | | | | | | | | | | | | | | | | | |
| | | | | | | | | | | | | | | | | | | | $ | (15,322,067 | ) |
| | | | | | | | | | | | | | | | | | | | | | |
| (1) | Notional Amount is determined based on the number of contracts multiplied by the contract size and the quoted daily settlement price in US dollars. |
| | | | |
| 66 | | DoubleLine Funds Trust | | The accompanying notes are an integral part of these financial statements. |
| | |
Schedule of Investments DoubleLine Core Fixed Income Fund | | March 31, 2024 |
| | | | | | | | | | | | | | | | |
PRINCIPAL AMOUNT $ | | | SECURITY DESCRIPTION | | RATE | | | MATURITY | | | VALUE $ | |
| | ASSET BACKED OBLIGATIONS - 3.5% | | | | | | | | | | | | |
| | | | |
| | | | Aaset Trust | | | | | | | | | | | | |
| | 2,798,325 | | | Series 2021-2A-B | | | 3.54% | (a) | | | 01/15/2047 | | | | 2,249,917 | |
| | | | |
| | | | American Airlines Group, Inc. | | | | | | | | | | | | |
| | 1,980,850 | | | Series B | | | 3.95% | | | | 07/11/2030 | | | | 1,822,382 | |
| | | | |
| | | | Business Jet Securities LLC | | | | | | | | | | | | |
| | 2,146,201 | | | Series 2020-1A-A | | | 2.98% | (a) | | | 11/15/2035 | | | | 2,074,818 | |
| | | | |
| | | | Carbon Level Mitigation Trust | | | | | | | | | | | | |
| | 19,647,558 | | | Series 2021-5-CERT | | | 0.61% | (a) | | | 10/13/2051 | | | | 12,161,937 | |
| | | | |
| | | | Castlelake Aircraft Securitization Trust | | | | | | | | | | | | |
| | 5,078,847 | | | Series 2021-1A-A | | | 3.47% | (a) | | | 01/15/2046 | | | | 4,759,886 | |
| | | | |
| | | | Compass Datacenters LLC | | | | | | | | | | | | |
| | 7,000,000 | | | Series 2024-1A-A1 | | | 5.25% | (a) | | | 02/25/2049 | | | | 6,870,136 | |
| | | | |
| | | | Diamond Infrastructure Funding LLC | | | | | | | | | | | | |
| | 3,000,000 | | | Series 2021-1A-C | | | 3.48% | (a) | | | 04/15/2049 | | | | 2,690,483 | |
| | | | |
| | | | Exeter Automobile Receivables Trust | | | | | | | | | | | | |
| | 5,704,175 | | | Series 2021-1A-D | | | 1.08% | | | | 11/16/2026 | | | | 5,563,598 | |
| | 8,500,000 | | | Series 2021-1A-E | | | 2.21% | (a) | | | 02/15/2028 | | | | 8,046,766 | |
| | | | |
| | | | Hardee’s Funding | | | | | | | | | | | | |
| | 3,500,000 | | | Series 2024-1A-A2 | | | 7.25% | (a) | | | 03/20/2054 | | | | 3,541,215 | |
| | | | |
| | | | Helios Issuer LLC | | | | | | | | | | | | |
| | 4,040,185 | | | Series 2018-1A-A | | | 4.87% | (a) | | | 07/20/2048 | | | | 3,828,407 | |
| | 4,814,256 | | | Series 2020-1A-A | | | 3.35% | (a) | | | 02/01/2055 | | | | 4,186,140 | |
| | | | |
| | | | HERO Funding Trust | | | | | | | | | | | | |
| | 1,230,534 | | | Series 2016-1A-A | | | 4.05% | (a) | | | 09/20/2041 | | | | 1,133,252 | |
| | | | |
| | | | Horizon Aircraft Finance Ltd. | | | | | | | | | | | | |
| | 1,660,106 | | | Series 2019-2-A | | | 3.43% | (a) | | | 11/15/2039 | | | | 1,333,797 | |
| | | | |
| | | | ITE Rail Fund LP | | | | | | | | | | | | |
| | 12,517,217 | | | Series 2021-1A-A | | | 2.25% | (a) | | | 02/28/2051 | | | | 11,141,755 | |
| | | | |
| | | | Lendingpoint Asset Securitization Trust | | | | | | | | | | | | |
| | 4,987,865 | | | Series 2021-A-C | | | 2.75% | (a) | | | 12/15/2028 | | | | 4,903,397 | |
| | | | |
| | | | MACH 1 Cayman Ltd. | | | | | | | | | | | | |
| | 9,330,285 | | | Series 2019-1-A | | | 3.47% | (a) | | | 10/15/2039 | | | | 8,216,211 | |
| | | | |
| | | | Mosaic Solar Loans LLC | | | | | | | | | | | | |
| | 892,087 | | | Series 2018-1A-A | | | 4.01% | (a) | | | 06/22/2043 | | | | 835,895 | |
| | 1,239,340 | | | Series 2019-2A-B | | | 3.28% | (a) | | | 09/20/2040 | | | | 1,101,748 | |
| | | | |
| | | | Navient Student Loan Trust | | | | | | | | | | | | |
| | 6,193,005 | | | Series 2018-A-B | | | 3.68% | (a) | | | 02/18/2042 | | | | 5,905,473 | |
| | | | |
| | | | NP Railcar Holdings LLC | | | | | | | | | | | | |
| | 3,549,377 | | | Series 2016-1A-A1 | | | 4.16% | (a) | | | 04/20/2046 | | | | 3,477,067 | |
| | 4,982,952 | | | Series 2019-1A-A2 | | | 3.24% | (a) | | | 09/20/2049 | | | | 4,651,722 | |
| | | | |
| | | | Pagaya AI Debt Selection Trust | | | | | | | | | | | | |
| | 3,859,463 | | | Series 2021-2-NOTE | | | 3.00% | (a) | | | 01/25/2029 | | | | 3,763,385 | |
| | | | |
| | | | Primrose Holdings, Inc. | | | | | | | | | | | | |
| | 19,350,000 | | | Series 2019-1A-A2 | | | 4.48% | (a) | | | 07/30/2049 | | | | 18,572,183 | |
| | | | |
| | | | Retained Vantage Data Centers Issuer LLC | | | | | | | | | | | | |
| | 6,500,000 | | | Series 2023-1A-A2A | | | 5.00% | (a) | | | 09/15/2048 | | | | 6,298,669 | |
| | | | |
| | | | Sapphire Aviation Finance Ltd. | | | | | | | | | | | | |
| | 2,856,148 | | | Series 2020-1A-A | | | 3.23% | (a) | | | 03/15/2040 | | | | 2,516,241 | |
| | | | |
| | | | SEB Funding LLC | | | | | | | | | | | | |
| | 4,987,500 | | | Series 2021-1A-A2 | | | 4.97% | (a) | | | 01/30/2052 | | | | 4,711,748 | |
| | | | |
| | | | SERVPRO Master Issuer LLC | | | | | | | | | | | | |
| | 957,500 | | | Series 2019-1A-A2 | | | 3.88% | (a) | | | 10/25/2049 | | | | 909,350 | |
| | | | |
| | | | Shenton Aircraft Investment Ltd. | | | | | | | | | | | | |
| | 961,487 | | | Series 2015-1A-A | | | 4.75% | (a) | | | 10/15/2042 | | | | 892,773 | |
| | | | |
| | | | SOFI Alternative Trust | | | | | | | | | | | | |
| | 2,362,638 | | | Series 2021-1-PT1 | | | 9.72% | (a)(b) | | | 05/25/2030 | | | | 2,339,394 | |
| | 3,248,771 | | | Series 2021-2-A | | | 1.25% | (a) | | | 08/15/2030 | | | | 3,151,298 | |
| | 75,000 | | | Series 2021-2-R1 | | | 0.00% | (a)(c)(d) | | | 08/15/2030 | | | | 629,198 | |
| | | | | | | | |
| The accompanying notes are an integral part of these financial statements. | | Annual Report | | | | | March 31, 2024 | | 1 |
| | |
Schedule of Investments DoubleLine Core Fixed Income Fund (Cont.) | | |
| | | | | | | | | | | | | | | | |
PRINCIPAL AMOUNT $ | | | SECURITY DESCRIPTION | | RATE | | | MATURITY | | | VALUE $ | |
| | | | |
| | | | SoFi Professional Loan Program LLC | | | | | | | | | | | | |
| | 2,000,000 | | | Series 2017-C-C | | | 4.21% | (a)(b) | | | 07/25/2040 | | | | 1,849,820 | |
| | | | |
| | | | Start Ltd./Bermuda | | | | | | | | | | | | |
| | 1,708,732 | | | Series 2019-1-A | | | 4.09% | (a) | | | 03/15/2044 | | | | 1,594,641 | |
| | | | |
| | | | Start/Bermuda | | | | | | | | | | | | |
| | 2,215,084 | | | Series 2018-1-A | | | 4.09% | (a) | | | 05/15/2043 | | | | 2,044,452 | |
| | | | |
| | | | Sunrun, Inc. | | | | | | | | | | | | |
| | 4,377,135 | | | Series 2019-2-A | | | 3.61% | (a) | | | 02/01/2055 | | | | 4,007,899 | |
| | 10,147,942 | | | Series 2020-1A-A | | | 2.21% | (a) | | | 07/31/2051 | | | | 8,377,153 | |
| | | | |
| | | | Upgrade Master Credit Pass-Thru Trust | | | | | | | | | | | | |
| | 172,846 | | | Series 2021-ST3-A | | | 2.50% | (a) | | | 07/15/2027 | | | | 172,376 | |
| | | | |
| | | | Upgrade Master Pass-Thru Trust | | | | | | | | | | | | |
| | 537,416 | | | Series 2021-PT3-A | | | 13.84% | (a)(b) | | | 07/15/2027 | | | | 492,450 | |
| | 2,523,801 | | | Series 2021-PT4-A | | | 11.83% | (a)(b) | | | 08/15/2027 | | | | 2,176,576 | |
| | | | |
| | | | Upstart Pass-Through Trust Series | | | | | | | | | | | | |
| | 1,230,130 | | | Series 2021-ST2-A | | | 2.50% | (a) | | | 04/20/2027 | | | | 1,202,267 | |
| | | | |
| | | | Upstart Securitization Trust | | | | | | | | | | | | |
| | 114,161 | | | Series 2020-2-A | | | 2.31% | (a) | | | 11/20/2030 | | | | 113,280 | |
| | 16,882,150 | | | Series 2021-2-C | | | 3.61% | (a) | | | 06/20/2031 | | | | 16,461,620 | |
| | 6,000,000 | | | Series 2021-3-C | | | 3.28% | (a) | | | 07/20/2031 | | | | 5,725,441 | |
| | 9,729,217 | | | Series 2021-4-B | | | 1.84% | (a) | | | 09/20/2031 | | | | 9,557,892 | |
| | 15,550,000 | | | Series 2021-4-C | | | 3.19% | (a) | | | 09/20/2031 | | | | 14,458,956 | |
| | 8,599,126 | | | Series 2023-3-A | | | 6.90% | (a) | | | 10/20/2033 | | | | 8,643,855 | |
| | | | |
| | | | USASF Receivables LLC | | | | | | | | | | | | |
| | 3,505,545 | | | Series 2021-1A-C | | | 2.20% | (a) | | | 05/15/2026 | | | | 3,219,941 | |
| | | | |
| | | | Vantage Data Centers Holding LLC | | | | | | | | | | | | |
| | 8,000,000 | | | Series 2020-2A-A2 | | | 1.99% | (a) | | | 09/15/2045 | | | | 7,054,621 | |
| | | | |
| | | | WAVE USA | | | | | | | | | | | | |
| | 9,297,235 | | | Series 2019-1-A | | | 3.60% | (a) | | | 09/15/2044 | | | | 7,783,710 | |
| | | | | | | | | | | | | | | | |
| | | | Total Asset Backed Obligations
(Cost $259,326,979) | | | | | | | | 239,217,191 | |
| | | | | | | | | | | | | | | | |
| | BANK LOANS - 3.2% | | | | | | | | | | | | |
| | | | |
| | | | AAdvantage Loyalty IP Ltd. | | | | | | | | | | | | |
| | 1,117,750 | | | Senior Secured First Lien Term Loan (3 Month US Secured Overnight Financing Rate + 5.01%, 0.75% Floor) | | | 10.33% | | | | 04/20/2028 | | | | 1,162,695 | |
| | | | |
| | | | Access CIG LLC | | | | | | | | | | | | |
| | 1,383,050 | | | Senior Secured First Lien Term Loan (1 Month US Secured Overnight Financing Rate + 5.00%, 0.50% Floor) | | | 10.33% | | | | 08/18/2028 | | | | 1,386,293 | |
| | | | |
| | | | Acrisure LLC | | | | | | | | | | | | |
| | 788,837 | | | Senior Secured First Lien Term Loan (1 Month Synthetic LIBOR + 3.50%) | | | 8.94% | (e) | | | 02/15/2027 | | | | 789,330 | |
| | 752,675 | | | Senior Secured First Lien Term Loan (1 Month Synthetic LIBOR + 4.25%, 0.50% Floor) | | | 9.69% | (e) | | | 02/15/2027 | | | | 755,968 | |
| | | | |
| | | | Acuris Finance US, Inc. | | | | | | | | | | | | |
| | 1,052,083 | | | Senior Secured First Lien Term Loan (3 Month US Secured Overnight Financing Rate + 4.10%, 0.50% Floor) | | | 9.50% | | | | 02/16/2028 | | | | 1,052,247 | |
| | | | |
| | | | ADMI Corp. | | | | | | | | | | | | |
| | 549,351 | | | Senior Secured First Lien Term Loan (1 Month US Secured Overnight Financing Rate + 3.86%, 0.50% Floor) | | | 9.19% | | | | 12/23/2027 | | | | 531,841 | |
| | 741,275 | | | Senior Secured First Lien Term Loan (1 Month US Secured Overnight Financing Rate + 5.75%) | | | 11.08% | | | | 12/23/2027 | | | | 742,898 | |
| | | | |
| | | | AI Aqua Merger Sub, Inc. | | | | | | | | | | | | |
| | 1,535,225 | | | Senior Secured First Lien Term Loan (1 Month US Secured Overnight Financing Rate + 3.75%, 0.50% Floor) | | | 9.07% | | | | 07/31/2028 | | | | 1,539,708 | |
| | | | |
| | | | Air Canada | | | | | | | | | | | | |
| | 435,000 | | | Senior Secured First Lien Term Loan (3 Month US Secured Overnight Financing Rate + 2.50%) | | | 7.83% | | | | 03/21/2031 | | | | 436,362 | |
| | | | |
| | | | Air Methods Corp. | | | | | | | | | | | | |
| | 16,170 | | | Senior Secured First Lien Term Loan (3 Month US Secured Overnight Financing Rate + 9.10%) | | | 14.41% | | | | 12/28/2028 | | | | 16,453 | |
| | | | |
| | | | AlixPartners LLP | | | | | | | | | | | | |
| | 1,404,695 | | | Senior Secured First Lien Term Loan (1 Month US Secured Overnight Financing Rate + 2.61%, 0.50% Floor) | | | 7.94% | | | | 02/04/2028 | | | | 1,408,032 | |
| | | | |
| 2 | | DoubleLine Funds Trust | | The accompanying notes are an integral part of these financial statements. |
| | | | | | | | | | | | | | | | |
PRINCIPAL AMOUNT $ | | | SECURITY DESCRIPTION | | RATE | | | MATURITY | | | VALUE $ | |
| | | | |
| | | | Alliant Holdings Intermediate LLC | | | | | | | | | | | | |
| | 1,120,636 | | | Senior Secured First Lien Term Loan (1 Month US Secured Overnight Financing Rate + 3.50%, 0.50% Floor) | | | 8.83% | | | | 11/06/2030 | | | | 1,126,480 | |
| | | | |
| | | | Allied Universal Holdco LLC | | | | | | | | | | | | |
| | 1,567,177 | | | Senior Secured First Lien Term Loan (1 Month US Secured Overnight Financing Rate + 3.85%, 0.50% Floor) | | | 9.18% | | | | 05/15/2028 | | | | 1,567,028 | |
| | | | |
| | | | Allspring Buyer LLC | | | | | | | | | | | | |
| | 1,021,492 | | | Senior Secured First Lien Term Loan (3 Month US Secured Overnight Financing Rate + 3.51%, 0.50% Floor) | | | 8.89% | | | | 11/01/2028 | | | | 1,022,054 | |
| | | | |
| | | | Alterra Mountain Co. | | | | | | | | | | | | |
| | 1,129,365 | | | Senior Secured First Lien Term Loan (1 Month US Secured Overnight Financing Rate + 3.61%, 0.50% Floor) | | | 8.94% | | | | 08/17/2028 | | | | 1,135,486 | |
| | 140,000 | | | Senior Secured Term Loan (CME Term SOFR 1 Month + 3.50%) | | | 8.83% | | | | 05/31/2030 | | | | 140,875 | |
| | 525,887 | | | Senior Secured First Lien Term Loan (1 Month US Secured Overnight Financing Rate + 3.85%) | | | 9.18% | | | | 05/31/2030 | | | | 529,173 | |
| | | | |
| | | | Altice France SA/France | | | | | | | | | | | | |
| | 989,600 | | | Senior Secured First Lien Term Loan (3 Month US Secured Overnight Financing Rate + 5.50%) | | | 10.81% | | | | 08/31/2028 | | | | 791,992 | |
| | | | |
| | | | AMC Entertainment Holdings, Inc. | | | | | | | | | | | | |
| | 262,472 | | | Senior Secured First Lien Term Loan (1 Month US Secured Overnight Financing Rate + 3.11%) | | | 8.44% | | | | 04/22/2026 | | | | 220,805 | |
| | | | |
| | | | American Airlines, Inc. | | | | | | | | | | | | |
| | 1,148,699 | | | Senior Secured First Lien Term Loan (6 Month US Secured Overnight Financing Rate + 3.50%) | | | 8.77% | | | | 06/04/2029 | | | | 1,153,725 | |
| | | | |
| | | | American Tire Distributors, Inc. | | | | | | | | | | | | |
| | 237,329 | | | Senior Secured First Lien Term Loan (3 Month US Secured Overnight Financing Rate + 6.51%, 0.75% Floor) | | | 11.83% | | | | 10/23/2028 | | | | 207,069 | |
| | | | |
| | | | Apple Bidco LLC | | | | | | | | | | | | |
| | 928,625 | | | Senior Secured First Lien Term Loan (1 Month US Secured Overnight Financing Rate + 2.86%, 0.50% Floor) | | | 8.19% | | | | 09/25/2028 | | | | 928,918 | |
| | | | |
| | | | Applied Systems, Inc. | | | | | | | | | | | | |
| | 330,000 | | | Senior Secured Second Lien Term Loan (3 Month US Secured Overnight Financing Rate + 5.25%) | | | 10.56% | | | | 02/23/2032 | | | | 342,273 | |
| | 905,000 | | | Senior Secured First Lien Term Loan (3 Month US Secured Overnight Financing Rate + 3.50%) | | | 8.81% | | | | 02/24/2031 | | | | 911,466 | |
| | | | |
| | | | APX Group, Inc. | | | | | | | | | | | | |
| | 1,050,107 | | | Senior Secured First Lien Term Loan (1 Month US Secured Overnight Financing Rate + 3.36%, 0.50% Floor) | | | 8.69% | | | | 07/10/2028 | | | | 1,053,924 | |
| | 2,893 | | | Senior Secured First Lien Term Loan (Prime Rate + 2.25%, 0.50% Floor) | | | 10.75% | | | | 07/10/2028 | | | | 2,903 | |
| | | | |
| | | | Artera Services LLC | | | | | | | | | | | | |
| | 915,000 | | | Senior Secured First Lien Term Loan (3 Month US Secured Overnight Financing Rate + 4.50%) | | | 9.81% | | | | 02/10/2031 | | | | 919,575 | |
| | | | |
| | | | Ascend Learning LLC | | | | | | | | | | | | |
| | 356,328 | | | Senior Secured Second Lien Term Loan (1 Month US Secured Overnight Financing Rate + 5.85%, 0.50% Floor) | | | 11.18% | | | | 12/10/2029 | | | | 352,877 | |
| | 579,842 | | | Senior Secured First Lien Term Loan (1 Month US Secured Overnight Financing Rate + 3.60%, 0.50% Floor) | | | 8.93% | | | | 12/10/2028 | | | | 577,380 | |
| | 598,650 | | | Senior Secured First Lien Term Loan (1 Month US Secured Overnight Financing Rate + 3.60%, 0.50% Floor) | | | 8.93% | | | | 12/10/2028 | | | | 596,109 | |
| | | | |
| | | | ASP LS Acquisition Corp. | | | | | | | | | | | | |
| | 760,500 | | | Senior Secured First Lien Term Loan (6 Month US Secured Overnight Financing Rate + 4.76%, 0.75% Floor) | | | 10.07% | | | | 05/07/2028 | | | | 710,497 | |
| | | | |
| | | | AssuredPartners, Inc. | | | | | | | | | | | | |
| | 80,000 | | | Senior Secured First Lien Term Loan (1 Month US Secured Overnight Financing Rate + 3.50%, 0.50% Floor) | | | 8.82% | | | | 02/14/2031 | | | | 80,200 | |
| | 69,624 | | | Senior Secured First Lien Term Loan (1 Month US Secured Overnight Financing Rate + 3.75%, 0.50% Floor) | | | 9.08% | | | | 02/12/2027 | | | | 69,784 | |
| | 583,100 | | | Senior Secured First Lien Term Loan (1 Month US Secured Overnight Financing Rate + 3.50%, 0.50% Floor) | | | 8.83% | | | | 02/12/2027 | | | | 584,287 | |
| | 944,526 | | | Senior Secured First Lien Term Loan (1 Month US Secured Overnight Financing Rate + 3.61%) | | | 8.94% | | | | 02/12/2027 | | | | 946,567 | |
| | | | |
| | | | Astra Acquisition Corp. | | | | | | | | | | | | |
| | 894,785 | | | Senior Secured Second Lien Term Loan (3 Month US Secured Overnight Financing Rate + 8.99%, 0.75% Floor) | | | 14.48% | | | | 10/25/2029 | | | | 276,824 | |
| | 870,992 | | | Senior Secured First Lien Term Loan (3 Month US Secured Overnight Financing Rate + 5.36%, 0.50% Floor) | | | 10.86% | | | | 10/25/2028 | | | | 369,083 | |
| | | | | | | | |
| The accompanying notes are an integral part of these financial statements. | | Annual Report | | | | | March 31, 2024 | | 3 |
| | |
Schedule of Investments DoubleLine Core Fixed Income Fund (Cont.) | | |
| | | | | | | | | | | | | | | | |
PRINCIPAL AMOUNT $ | | | SECURITY DESCRIPTION | | RATE | | | MATURITY | | | VALUE $ | |
| | | | |
| | | | Asurion LLC | | | | | | | | | | | | |
| | 555,703 | | | Senior Secured First Lien Term Loan (1 Month US Secured Overnight Financing Rate + 3.36%) | | | 8.69% | | | | 07/31/2027 | | | | 535,362 | |
| | 1,007,646 | | | Senior Secured First Lien Term Loan (1 Month US Secured Overnight Financing Rate + 3.36%) | | | 8.69% | | | | 12/23/2026 | | | | 989,650 | |
| | 295,000 | | | Senior Secured Second Lien Term Loan (1 Month US Secured Overnight Financing Rate + 5.36%) | | | 10.69% | | | | 02/03/2028 | | | | 267,528 | |
| | 124,098 | | | Senior Secured First Lien Term Loan (1 Month US Secured Overnight Financing Rate + 4.35%) | | | 9.68% | | | | 08/19/2028 | | | | 120,065 | |
| | 485,000 | | | Senior Secured Second Lien Term Loan (1 Month US Secured Overnight Financing Rate + 5.36%) | | | 10.69% | | | | 01/20/2029 | | | | 436,236 | |
| | | | |
| | | | AthenaHealth Group, Inc. | | | | | | | | | | | | |
| | 1,168,146 | | | Senior Secured First Lien Term Loan (1 Month US Secured Overnight Financing Rate + 3.25%, 0.50% Floor) | | | 8.58% | | | | 02/15/2029 | | | | 1,160,027 | |
| | | | |
| | | | Aveanna Healthcare LLC | | | | | | | | | | | | |
| | 385,415 | | | Senior Secured Second Lien Term Loan (3 Month US Secured Overnight Financing Rate + 7.15%, 0.50% Floor) | | | 12.49% | | | | 12/10/2029 | | | | 332,420 | |
| | 749,496 | | | Senior Secured First Lien Term Loan (3 Month US Secured Overnight Financing Rate + 3.85%, 0.50% Floor) | | | 9.19% | | | | 07/17/2028 | | | | 722,593 | |
| | | | |
| | | | Aventiv Technologies LLC | | | | | | | | | | | | |
| | 538,074 | | | First Lien Term Loan (CME Term SOFR 3 Month + 5.35%) | | | 10.70% | | | | 07/31/2025 | | | | 403,422 | |
| | | | |
| | | | Bally’s Corp. | | | | | | | | | | | | |
| | 853,507 | | | Senior Secured First Lien Term Loan (3 Month US Secured Overnight Financing Rate + 3.51%, 0.50% Floor) | | | 8.83% | | | | 10/02/2028 | | | | 803,539 | |
| | | | |
| | | | Bausch + Lomb Corp. | | | | | | | | | | | | |
| | 557,200 | | | Senior Secured First Lien Term Loan (1 Month US Secured Overnight Financing Rate + 4.00%) | | | 9.33% | | | | 09/29/2028 | | | | 557,899 | |
| | 1,569,489 | | | Senior Secured First Lien Term Loan (1 Month US Secured Overnight Financing Rate + 3.35%, 0.50% Floor) | | | 8.68% | | | | 05/10/2027 | | | | 1,554,971 | |
| | | | |
| | | | BCP Renaissance Parent LLC | | | | | | | | | | | | |
| | 1,012,094 | | | Senior Secured First Lien Term Loan (3 Month US Secured Overnight Financing Rate + 3.50%, 1.00% Floor) | | | 8.83% | | | | 10/31/2028 | | | | 1,016,208 | |
| | | | |
| | | | BCPE Empire Holdings, Inc. | | | | | | | | | | | | |
| | 1,366,361 | | | Senior Secured First Lien Term Loan (1 Month US Secured Overnight Financing Rate + 4.00%, 0.50% Floor) | | | 9.33% | | | | 12/25/2028 | | | | 1,369,435 | |
| | | | |
| | | | Boost Newco Borrower LLC | | | | | | | | | | | | |
| | 1,285,000 | | | Senior Secured First Lien Term Loan (3 Month US Secured Overnight Financing Rate + 3.00%) | | | 8.31% | | | | 01/31/2031 | | | | 1,291,162 | |
| | | | |
| | | | Boxer Parent Co., Inc. | | | | | | | | | | | | |
| | 1,762,306 | | | Senior Secured First Lien Term Loan (1 Month US Secured Overnight Financing Rate + 4.25%) | | | 9.58% | | | | 12/29/2028 | | | | 1,775,709 | |
| | | | |
| | | | Brand Industrial Services, Inc. | | | | | | | | | | | | |
| | 711,799 | | | Senior Secured First Lien Term Loan (3 Month US Secured Overnight Financing Rate + 5.50%, 0.50% Floor) | | | 10.81% | | | | 08/01/2030 | | | | 715,739 | |
| | | | |
| | | | Brown Group Holding LLC | | | | | | | | | | | | |
| | 1,184,112 | | | Senior Secured First Lien Term Loan (1 Month US Secured Overnight Financing Rate + 2.85%, 0.50% Floor) | | | 8.18% | | | | 06/07/2028 | | | | 1,184,650 | |
| | | | |
| | | | Buckeye Partners LP | | | | | | | | | | | | |
| | 575,000 | | | Senior Secured First Lien Term Loan (1 Month US Secured Overnight Financing Rate + 2.00%) | | | 7.33% | | | | 11/02/2026 | | | | 576,719 | |
| | | | |
| | | | Caesars Entertainment, Inc. | | | | | | | | | | | | |
| | 326,700 | | | Senior Secured First Lien Term Loan (3 Month US Secured Overnight Financing Rate + 3.35%, 0.50% Floor) | | | 8.66% | | | | 02/06/2030 | | | | 328,039 | |
| | 980,000 | | | Senior Secured First Lien Term Loan (3 Month US Secured Overnight Financing Rate + 2.75%, 0.50% Floor) | | | 8.04% | | | | 02/06/2031 | | | | 981,989 | |
| | | | |
| | | | Camelot US Acquisition LLC | | | | | | | | | | | | |
| | 19,530 | | | Senior Secured First Lien Term Loan (1 Month US Secured Overnight Financing Rate + 2.75%) | | | 8.08% | | | | 01/31/2031 | | | | 19,545 | |
| | 985,702 | | | Senior Secured First Lien Term Loan (1 Month US Secured Overnight Financing Rate + 2.75%) | | | 8.08% | | | | 01/31/2031 | | | | 986,442 | |
| | 229,767 | | | Senior Secured First Lien Term Loan (1 Month US Secured Overnight Financing Rate + 2.75%) | | | 8.08% | | | | 01/31/2031 | | | | 229,940 | |
| | | | |
| 4 | | DoubleLine Funds Trust | | The accompanying notes are an integral part of these financial statements. |
| | | | | | | | | | | | | | | | |
PRINCIPAL AMOUNT $ | | | SECURITY DESCRIPTION | | RATE | | | MATURITY | | | VALUE $ | |
| | | | |
| | | | Carnival Corp. | | | | | | | | | | | | |
| | 302,713 | | | Senior Secured First Lien Term Loan (1 Month US Secured Overnight Financing Rate + 3.00%, 0.75% Floor) | | | 8.32% | | | | 08/09/2027 | | | | 303,533 | |
| | 1,555,794 | | | Senior Secured First Lien Term Loan (1 Month US Secured Overnight Financing Rate + 3.36%, 0.75% Floor) | | | 8.69% | | | | 10/18/2028 | | | | 1,559,848 | |
| | | | |
| | | | Castle US Holding Corp. | | | | | | | | | | | | |
| | 331,289 | | | Senior Secured First Lien Term Loan (3 Month US Secured Overnight Financing Rate + 4.01%) | | | 9.35% | | | | 01/29/2027 | | | | 234,564 | |
| | | | |
| | | | Castlelake Aviation One DAC | | | | | | | | | | | | |
| | 1,270,252 | | | Senior Secured First Lien Term Loan (3 Month US Secured Overnight Financing Rate + 2.50%, 0.50% Floor) | | | 7.83% | | | | 10/22/2026 | | | | 1,271,916 | |
| | 662 | | | Senior Secured First Lien Term Loan (3 Month LIBOR USD + 2.50%, 0.50% Floor) | | | 7.83% | (e) | | | 10/22/2026 | | | | 663 | |
| | | | |
| | | | Catalent Pharma Solutions, Inc. | | | | | | | | | | | | |
| | 2,588,000 | | | Senior Secured First Lien Term Loan (1 Month US Secured Overnight Financing Rate + 2.11%, 0.50% Floor) | | | 7.44% | | | | 02/22/2028 | | | | 2,589,617 | |
| | | | |
| | | | Cengage Learning, Inc. | | | | | | | | | | | | |
| | 545,000 | | | Senior Secured First Lien Term Loan (1 Month US Secured Overnight Financing Rate + 4.25%, 1.00% Floor) | | | 9.58% | | | | 03/24/2031 | | | | 545,084 | |
| | | | |
| | | | Central Parent, Inc. | | | | | | | | | | | | |
| | 1,268,363 | | | Senior Secured First Lien Term Loan (3 Month US Secured Overnight Financing Rate + 4.00%) | | | 9.31% | | | | 07/06/2029 | | | | 1,273,575 | |
| | | | |
| | | | Century DE Buyer LLC | | | | | | | | | | | | |
| | 405,000 | | | Senior Secured First Lien Term Loan (3 Month US Secured Overnight Financing Rate + 4.00%) | | | 9.32% | | | | 10/30/2030 | | | | 406,974 | |
| | | | |
| | | | Chariot Buyer LLC | | | | | | | | | | | | |
| | 440,000 | | | Senior Secured First Lien Term Loan (1 Month US Secured Overnight Financing Rate + 3.75%, 0.50% Floor) | | | 9.08% | | | | 11/03/2028 | | | | 441,467 | |
| | | | |
| | | | Charter Communications Operating LLC | | | | | | | | | | | | |
| | 1,407,925 | | | Senior Secured First Lien Term Loan (3 Month US Secured Overnight Financing Rate + 2.00%) | | | 7.33% | | | | 12/09/2030 | | | | 1,395,501 | |
| | 3,538 | | | Senior Secured First Lien Term Loan (3 Month US Secured Overnight Financing Rate + 2.00%) | | | 7.32% | | | | 12/09/2030 | | | | 3,506 | |
| | | | |
| | | | Charter Next Generation, Inc. | | | | | | | | | | | | |
| | 954,316 | | | Senior Secured First Lien Term Loan (1 Month US Secured Overnight Financing Rate + 3.50%, 0.75% Floor) | | | 8.83% | | | | 12/01/2027 | | | | 957,136 | |
| | | | |
| | | | CHG Healthcare Services, Inc. | | | | | | | | | | | | |
| | 1,234,911 | | | Senior Secured First Lien Term Loan (1 Month US Secured Overnight Financing Rate + 3.36%, 0.50% Floor) | | | 8.69% | | | | 09/29/2028 | | | | 1,237,356 | |
| | | | |
| | | | CHG PPC Parent LLC | | | | | | | | | | | | |
| | 1,149,803 | | | Senior Secured First Lien Term Loan (1 Month US Secured Overnight Financing Rate + 3.11%, 0.50% Floor) | | | 8.44% | | | | 12/08/2028 | | | | 1,152,677 | |
| | | | |
| | | | Clarios Global LP | | | | | | | | | | | | |
| | 1,536,150 | | | Senior Secured First Lien Term Loan (1 Month US Secured Overnight Financing Rate + 3.00%) | | | 8.33% | | | | 05/06/2030 | | | | 1,541,911 | |
| | | | |
| | | | ClubCorp Holdings, Inc. | | | | | | | | | | | | |
| | 890,489 | | | Senior Secured First Lien Term Loan (3 Month US Secured Overnight Financing Rate + 5.26%) | | | 10.61% | | | | 09/18/2026 | | | | 893,356 | |
| | 32,080 | | | Senior Secured First Lien Term Loan (3 Month US Secured Overnight Financing Rate + 5.26%) | | | 10.61% | | | | 09/18/2026 | | | | 32,183 | |
| | | | |
| | | | Clydesdale Acquisition Holdings, Inc. | | | | | | | | | | | | |
| | 1,028,533 | | | Senior Secured First Lien Term Loan (1 Month US Secured Overnight Financing Rate + 3.78%, 0.50% Floor) | | | 9.11% | | | | 04/13/2029 | | | | 1,031,104 | |
| | | | |
| | | | CMG Media Corp. | | | | | | | | | | | | |
| | 773,229 | | | Senior Secured First Lien Term Loan (3 Month US Secured Overnight Financing Rate + 3.60%) | | | 8.91% | | | | 12/17/2026 | | | | 676,232 | |
| | | | |
| | | | CNT Holdings I Corp. | | | | | | | | | | | | |
| | 174,563 | | | Senior Secured First Lien Term Loan (3 Month US Secured Overnight Financing Rate + 3.50%, 0.75% Floor) | | | 8.82% | | | | 11/08/2027 | | | | 175,094 | |
| | | | |
| | | | Coherent Corp. T/L B (03/24) | | | | | | | | | | | | |
| | 175,000 | | | Senior Secured Term Loan | | | 7.83% | (f) | | | 07/02/2029 | | | | 175,000 | |
| | | | |
| | | | Columbus McKinnon Corp./NY | | | | | | | | | | | | |
| | 121,084 | | | Senior Secured First Lien Term Loan (3 Month US Secured Overnight Financing Rate + 2.50%) | | | 7.81% | | | | 05/15/2028 | | | | 121,538 | |
| | | | |
| | | | CommScope, Inc. | | | | | | | | | | | | |
| | 256,949 | | | Senior Secured First Lien Term Loan (1 Month US Secured Overnight Financing Rate + 3.36%) | | | 8.69% | | | | 04/06/2026 | | | | 233,823 | |
| | | | | | | | |
| The accompanying notes are an integral part of these financial statements. | | Annual Report | | | | | March 31, 2024 | | 5 |
| | |
Schedule of Investments DoubleLine Core Fixed Income Fund (Cont.) | | |
| | | | | | | | | | | | | | | | |
PRINCIPAL AMOUNT $ | | | SECURITY DESCRIPTION | | RATE | | | MATURITY | | | VALUE $ | |
| | | | |
| | | | Compass Power Generation LLC | | | | | | | | | | | | |
| | 1,227,043 | | | Senior Secured First Lien Term Loan (1 Month US Secured Overnight Financing Rate + 4.36%, 1.00% Floor) | | | 9.69% | | | | 04/14/2029 | | | | 1,236,075 | |
| | | | |
| | | | Connect Finco SARL | | | | | | | | | | | | |
| | 789,499 | | | Senior Secured First Lien Term Loan (1 Month US Secured Overnight Financing Rate + 3.50%, 1.00% Floor) | | | 8.83% | | | | 12/11/2026 | | | | 789,685 | |
| | | | |
| | | | Conservice Midco LLC | | | | | | | | | | | | |
| | 989,208 | | | Senior Secured First Lien Term Loan (1 Month US Secured Overnight Financing Rate + 4.00%) | | | 9.33% | | | | 05/13/2027 | | | | 993,704 | |
| | | | |
| | | | Constant Contact, Inc. | | | | | | | | | | | | |
| | 720,872 | | | Senior Secured First Lien Term Loan (3 Month US Secured Overnight Financing Rate + 4.26%, 0.75% Floor) | | | 9.59% | | | | 02/10/2028 | | | | 702,334 | |
| | | | |
| | | | CoreLogic, Inc. | | | | | | | | | | | | |
| | 1,131,274 | | | Senior Secured First Lien Term Loan (1 Month US Secured Overnight Financing Rate + 3.61%, 0.50% Floor) | | | 8.94% | | | | 06/02/2028 | | | | 1,108,914 | |
| | | | |
| | | | Cornerstone Building Brands, Inc. | | | | | | | | | | | | |
| | 559,235 | | | Senior Secured First Lien Term Loan (1 Month US Secured Overnight Financing Rate + 3.35%, 0.50% Floor) | | | 8.68% | | | | 04/12/2028 | | | | 557,330 | |
| | | | |
| | | | Cornerstone OnDemand, Inc. | | | | | | | | | | | | |
| | 712,339 | | | Senior Secured First Lien Term Loan (1 Month US Secured Overnight Financing Rate + 4.01%, 0.50% Floor) | | | 9.19% | | | | 10/16/2028 | | | | 700,172 | |
| | | | |
| | | | Cotiviti, Inc. | | | | | | | | | | | | |
| | 1,130,000 | | | Senior Secured Term Loan (CME Term SOFR 1 Month + 3.25%) | | | 8.58% | | | | 02/24/2031 | | | | 1,128,588 | |
| | | | |
| | | | CQP Holdco LP | | | | | | | | | | | | |
| | 972,987 | | | Senior Secured First Lien Term Loan (3 Month US Secured Overnight Financing Rate + 3.00%, 0.50% Floor) | | | 8.35% | | | | 12/31/2030 | | | | 977,088 | |
| | | | |
| | | | Crosby US Acquisition Corp. | | | | | | | | | | | | |
| | 309,225 | | | Senior Secured First Lien Term Loan (1 Month US Secured Overnight Financing Rate + 4.00%, 0.50% Floor) | | | 9.32% | | | | 08/16/2029 | | | | 311,318 | |
| | | | |
| | | | Cross Financial Corp. | | | | | | | | | | | | |
| | 722,040 | | | Senior Secured First Lien Term Loan (1 Month US Secured Overnight Financing Rate + 3.50%, 0.75% Floor) | | | 8.83% | | | | 09/15/2027 | | | | 722,943 | |
| | | | |
| | | | CSC Holdings LLC | | | | | | | | | | | | |
| | 969,948 | | | Senior Secured First Lien Term Loan (1 Month Synthetic LIBOR + 2.50%) | | | 7.94% | (e) | | | 04/15/2027 | | | | 879,534 | |
| | | | |
| | | | Curium Bidco SARL | | | | | | | | | | | | |
| | 144,991 | | | Senior Secured First Lien Term Loan (3 Month US Secured Overnight Financing Rate + 4.50%) | | | 9.81% | | | | 07/31/2029 | | | | 145,897 | |
| | 326,317 | | | Senior Secured First Lien Term Loan (3 Month US Secured Overnight Financing Rate + 4.50%) | | | 9.81% | | | | 07/31/2029 | | | | 328,357 | |
| | 496,503 | | | Senior Secured First Lien Term Loan (3 Month US Secured Overnight Financing Rate + 4.50%) | | | 9.81% | | | | 07/31/2029 | | | | 499,606 | |
| | | | |
| | | | Cyxtera DC Holdings, Inc. | | | | | | | | | | | | |
| | 448,915 | | | Senior Secured First Lien Term Loan (3 Month US Secured Overnight Financing Rate + 2.00%, 1.00% Floor) | | | 10.50% | (g) | | | 05/01/2024 | | | | 23,045 | |
| | | | |
| | | | Dcert Buyer, Inc. | | | | | | | | | | | | |
| | 979,607 | | | Senior Secured First Lien Term Loan (1 Month US Secured Overnight Financing Rate + 4.00%) | | | 9.33% | | | | 10/16/2026 | | | | 976,247 | |
| | 330,000 | | | Senior Secured Second Lien Term Loan (1 Month US Secured Overnight Financing Rate + 7.00%) | | | 12.33% | | | | 02/16/2029 | | | | 299,706 | |
| | | | |
| | | | Deerfield Dakota Holding LLC | | | | | | | | | | | | |
| | 1,220,490 | | | Senior Secured First Lien Term Loan (3 Month US Secured Overnight Financing Rate + 3.75%, 1.00% Floor) | | | 9.06% | | | | 04/09/2027 | | | | 1,215,999 | |
| | | | |
| | | | Dexko Global, Inc. | | | | | | | | | | | | |
| | 471,045 | | | Senior Secured First Lien Term Loan (3 Month US Secured Overnight Financing Rate + 4.01%, 0.50% Floor) | | | 9.32% | | | | 10/04/2028 | | | | 467,217 | |
| | | | |
| | | | DG Investment Intermediate Holdings 2, Inc. | | | | | | | | | | | | |
| | 250,000 | | | Senior Secured Second Lien Term Loan (1 Month US Secured Overnight Financing Rate + 6.86%, 0.75% Floor) | | | 12.19% | | | | 03/31/2029 | | | | 234,688 | |
| | 1,238,261 | | | Senior Secured First Lien Term Loan (1 Month US Secured Overnight Financing Rate + 3.86%, 0.75% Floor) | | | 9.19% | | | | 03/31/2028 | | | | 1,239,586 | |
| | | | |
| | | | Directv Financing LLC | | | | | | | | | | | | |
| | 574,948 | | | Senior Secured First Lien Term Loan (1 Month US Secured Overnight Financing Rate + 5.26%, 0.75% Floor) | | | 10.44% | | | | 08/02/2027 | | | | 576,385 | |
| | | | |
| 6 | | DoubleLine Funds Trust | | The accompanying notes are an integral part of these financial statements. |
| | | | | | | | | | | | | | | | |
PRINCIPAL AMOUNT $ | | | SECURITY DESCRIPTION | | RATE | | | MATURITY | | | VALUE $ | |
| | | | |
| | | | Dun & Bradstreet Corp. | | | | | | | | | | | | |
| | 773,088 | | | Senior Secured First Lien Term Loan (1 Month US Secured Overnight Financing Rate + 2.75%) | | | 8.08% | | | | 01/18/2029 | | | | 773,810 | |
| | | | |
| | | | Dynasty Acquisition Co., Inc. | | | | | | | | | | | | |
| | 1,142,980 | | | Senior Secured Term Loan (CME Term SOFR 1 Month + 3.50%) | | | 8.83% | | | | 08/24/2028 | | | | 1,145,947 | |
| | | | |
| | | | EAB Global, Inc. | | | | | | | | | | | | |
| | 1,032,081 | | | Senior Secured First Lien Term Loan (1 Month US Secured Overnight Financing Rate + 3.61%, 0.50% Floor) | | | 8.94% | | | | 08/16/2028 | | | | 1,033,887 | |
| | | | |
| | | | Echo Global Logistics, Inc. | | | | | | | | | | | | |
| | 518,262 | | | Senior Secured First Lien Term Loan (1 Month US Secured Overnight Financing Rate + 3.60%, 0.50% Floor) | | | 8.93% | | | | 11/23/2028 | | | | 512,154 | |
| | | | |
| | | | Ecovyst Catalyst Technologies LLC | | | | | | | | | | | | |
| | 656,636 | | | Senior Secured First Lien Term Loan (3 Month US Secured Overnight Financing Rate + 2.60%, 0.50% Floor) | | | 7.91% | | | | 06/09/2028 | | | | 657,148 | |
| | 252,552 | | | Senior Secured First Lien Term Loan (3 Month US Secured Overnight Financing Rate + 2.60%, 0.50% Floor) | | | 7.91% | | | | 06/09/2028 | | | | 252,749 | |
| | | | |
| | | | Edelman Financial Engines Center LLC/The | | | | | | | | | | | | |
| | 497,662 | | | Senior Secured Second Lien Term Loan (1 Month US Secured Overnight Financing Rate + 6.86%) | | | 12.19% | | | | 07/20/2026 | | | | 500,929 | |
| | 1,914,696 | | | Senior Secured First Lien Term Loan (1 Month US Secured Overnight Financing Rate + 3.61%, 0.75% Floor) | | | 8.94% | | | | 04/07/2028 | | | | 1,917,271 | |
| | | | |
| | | | EG America LLC | | | | | | | | | | | | |
| | 718,409 | | | Senior Secured First Lien Term Loan (Daily US Secured Overnight Financing Rate + 5.93%, 0.50% Floor) | | | 11.67% | | | | 02/07/2028 | | | | 716,613 | |
| | | | |
| | | | Eisner Advisory Group LLC | | | | | | | | | | | | |
| | 785,000 | | | Senior Secured First Lien Term Loan (1 Month US Secured Overnight Financing Rate + 4.00%, 0.50% Floor) | | | 9.33% | | | | 02/28/2031 | | | | 789,172 | |
| | | | |
| | | | Element Materials Technology Group US Holdings, Inc. | | | | | | | | | | | | |
| | 249,474 | | | Senior Secured First Lien Term Loan (3 Month US Secured Overnight Financing Rate + 4.35%, 0.50% Floor) | | | 9.66% | | | | 06/25/2029 | | | | 249,994 | |
| | 540,526 | | | Senior Secured First Lien Term Loan (3 Month US Secured Overnight Financing Rate + 4.35%, 0.50% Floor) | | | 9.66% | | | | 06/25/2029 | | | | 541,653 | |
| | | | |
| | | | Ellucian Holdings, Inc. | | | | | | | | | | | | |
| | 1,535,036 | | | Senior Secured First Lien Term Loan (1 Month US Secured Overnight Financing Rate + 3.60%, 0.50% Floor) | | | 8.93% | | | | 10/29/2029 | | | | 1,543,479 | |
| | | | |
| | | | Everi Holdings, Inc. | | | | | | | | | | | | |
| | 469,238 | | | Senior Secured First Lien Term Loan (1 Month US Secured Overnight Financing Rate + 2.61%, 0.50% Floor) | | | 7.94% | | | | 08/03/2028 | | | | 470,795 | |
| | | | |
| | | | Fertitta Entertainment LLC/NV | | | | | | | | | | | | |
| | 2,329,184 | | | Senior Secured First Lien Term Loan (1 Month US Secured Overnight Financing Rate + 3.75%, 0.50% Floor) | | | 9.08% | | | | 01/29/2029 | | | | 2,337,442 | |
| | | | |
| | | | FinThrive Software Intermediate Holdings, Inc. | | | | | | | | | | | | |
| | 427,821 | | | Senior Secured First Lien Term Loan (3 Month US Secured Overnight Financing Rate + 4.11%, 0.50% Floor) | | | 9.42% | | | | 12/18/2028 | | | | 361,109 | |
| | | | |
| | | | First Advantage Holdings LLC | | | | | | | | | | | | |
| | 1,127,777 | | | Senior Secured First Lien Term Loan (1 Month US Secured Overnight Financing Rate + 2.86%) | | | 8.19% | | | | 01/29/2027 | | | | 1,128,132 | |
| | | | |
| | | | Flame Newco LLC | | | | | | | | | | | | |
| | 441,954 | | | Senior Secured First Lien Term Loan (1 Month US Secured Overnight Financing Rate + 2.10%, 1.00% Floor) | | | 7.43% | | | | 06/30/2028 | | | | 416,541 | |
| | 13,606 | | | Senior Secured First Lien Term Loan (1 Month US Secured Overnight Financing Rate + 2.10%, 1.00% Floor) | | | 7.43% | | | | 06/30/2028 | | | | 12,824 | |
| | | | |
| | | | Flutter Financing BV | | | | | | | | | | | | |
| | 314,213 | | | Senior Secured First Lien Term Loan (3 Month US Secured Overnight Financing Rate + 2.25%, 0.50% Floor) | | | 7.56% | | | | 11/29/2030 | | | | 314,913 | |
| | | | |
| | | | Focus Financial Partners LLC | | | | | | | | | | | | |
| | 1,879,764 | | | Senior Secured First Lien Term Loan (1 Month US Secured Overnight Financing Rate + 2.75%, 0.50% Floor) | | | 8.08% | | | | 06/30/2028 | | | | 1,875,948 | |
| | | | |
| | | | Foresight Energy LLC | | | | | | | | | | | | |
| | 483,529 | | | Senior Secured First Lien Term Loan (3 Month US Secured Overnight Financing Rate + 8.10%, 1.50% Floor) | | | 13.41% | (d) | | | 06/30/2027 | | | | 483,530 | |
| | | | |
| | | | Fortrea Holdings, Inc. | | | | | | | | | | | | |
| | 193,538 | | | Senior Secured First Lien Term Loan (1 Month US Secured Overnight Financing Rate + 3.75%, 0.50% Floor) | | | 9.08% | | | | 07/01/2030 | | | | 194,344 | |
| | | | | | | | |
| The accompanying notes are an integral part of these financial statements. | | Annual Report | | | | | March 31, 2024 | | 7 |
| | |
Schedule of Investments DoubleLine Core Fixed Income Fund (Cont.) | | |
| | | | | | | | | | | | | | | | |
PRINCIPAL AMOUNT $ | | | SECURITY DESCRIPTION | | RATE | | | MATURITY | | | VALUE $ | |
| | | | |
| | | | Freeport LNG Investments LLLP | | | | | | | | | | | | |
| | 705,182 | | | Senior Secured First Lien Term Loan (3 Month US Secured Overnight Financing Rate + 3.76%, 0.50% Floor) | | | 9.08% | | | | 12/21/2028 | | | | 701,296 | |
| | | | |
| | | | Gainwell Acquisition Corp. | | | | | | | | | | | | |
| | 1,911,983 | | | Senior Secured First Lien Term Loan (3 Month US Secured Overnight Financing Rate + 4.10%, 0.75% Floor) | | | 9.41% | | | | 10/01/2027 | | | | 1,832,398 | |
| | | | |
| | | | Garda World Security Corp. | | | | | | | | | | | | |
| | 1,551,425 | | | Senior Secured First Lien Term Loan (3 Month US Secured Overnight Financing Rate + 4.35%) | | | 9.58% | | | | 02/01/2029 | | | | 1,556,281 | |
| | | | |
| | | | Gates Global LLC | | | | | | | | | | | | |
| | 329,975 | | | Senior Secured First Lien Term Loan (1 Month US Secured Overnight Financing Rate + 3.00%, 0.50% Floor) | | | 8.33% | | | | 11/16/2029 | | | | 331,448 | |
| | | | |
| | | | Genesys Cloud Services Holdings II T/L B | | | | | | | | | | | | |
| | 950,726 | | | Senior Secured Term Loan | | | 0.00% | | | | 12/01/2027 | | | | 932,294 | |
| | | | |
| | | | GIP II Blue Holding LP | | | | | | | | | | | | |
| | 446,589 | | | Senior Secured First Lien Term Loan (1 Month US Secured Overnight Financing Rate + 4.61%, 1.00% Floor) | | | 9.94% | | | | 09/29/2028 | | | | 448,612 | |
| | | | |
| | | | GIP Pilot Acquisition Partners LP | | | | | | | | | | | | |
| | 465,000 | | | Senior Secured First Lien Term Loan (3 Month US Secured Overnight Financing Rate + 3.00%) | | | 8.33% | | | | 10/04/2030 | | | | 467,093 | |
| | | | |
| | | | Gogo Intermediate Holdings LLC | | | | | | | | | | | | |
| | 1,170,802 | | | Senior Secured First Lien Term Loan (1 Month US Secured Overnight Financing Rate + 3.86%, 0.75% Floor) | | | 9.19% | | | | 04/28/2028 | | | | 1,170,480 | |
| | | | |
| | | | Graham Packaging Co., Inc. | | | | | | | | | | | | |
| | 1,276,341 | | | Senior Secured First Lien Term Loan (1 Month US Secured Overnight Financing Rate + 3.11%, 0.75% Floor) | | | 8.44% | | | | 08/04/2027 | | | | 1,277,540 | |
| | | | |
| | | | Great Outdoors Group LLC | | | | | | | | | | | | |
| | 1,279,991 | | | Senior Secured First Lien Term Loan (1 Month US Secured Overnight Financing Rate + 3.86%, 0.75% Floor) | | | 9.19% | | | | 03/05/2028 | | | | 1,282,302 | |
| | | | |
| | | | Greystone Select Financial LLC | | | | | | | | | | | | |
| | 375,600 | | | Senior Secured First Lien Term Loan (3 Month US Secured Overnight Financing Rate + 5.26%, 0.75% Floor) | | | 10.57% | | | | 06/17/2028 | | | | 375,600 | |
| | | | |
| | | | Grifols Worldwide Operations USA, Inc. | | | | | | | | | | | | |
| | 833,777 | | | Senior Secured First Lien Term Loan (3 Month US Secured Overnight Financing Rate + 2.15%) | | | 7.46% | | | | 11/15/2027 | | | | 809,126 | |
| | | | |
| | | | Helios Software Holdings, Inc. | | | | | | | | | | | | |
| | 791,491 | | | Senior Secured First Lien Term Loan (3 Month US Secured Overnight Financing Rate + 3.75%) | | | 9.07% | | | | 07/15/2030 | | | | 786,054 | |
| | | | |
| | | | Hexion Holdings Corp. | | | | | | | | | | | | |
| | 989,934 | | | Senior Secured First Lien Term Loan (3 Month US Secured Overnight Financing Rate + 4.50%, 0.50% Floor) | | | 9.98% | | | | 03/15/2029 | | | | 976,149 | |
| | | | |
| | | | H-Food Holdings LLC | | | | | | | | | | | | |
| | 302,888 | | | Senior Secured First Lien Term Loan (3 Month US Secured Overnight Financing Rate + 3.95%) | | | 9.29% | | | | 05/30/2025 | | | | 221,678 | |
| | | | |
| | | | Hightower Holding LLC | | | | | | | | | | | | |
| | 1,432,786 | | | Senior Secured First Lien Term Loan (3 Month US Secured Overnight Financing Rate + 4.26%, 0.75% Floor) | | | 9.59% | | | | 04/21/2028 | | | | 1,436,368 | |
| | | | |
| | | | Hilton Grand Vacations Borrower LLC | | | | | | | | | | | | |
| | 620,000 | | | Senior Secured First Lien Term Loan (1 Month US Secured Overnight Financing Rate + 2.75%) | | | 8.08% | | | | 01/17/2031 | | | | 621,841 | |
| | | | |
| | | | HomeServe USA Corp. | | | | | | | | | | | | |
| | 925,000 | | | Senior Secured First Lien Term Loan (1 Month US Secured Overnight Financing Rate + 3.00%) | | | 8.33% | | | | 10/21/2030 | | | | 928,353 | |
| | | | |
| | | | Hunter Douglas, Inc. | | | | | | | | | | | | |
| | 862,712 | | | Senior Secured First Lien Term Loan (3 Month US Secured Overnight Financing Rate + 3.50%, 0.50% Floor) | | | 8.82% | | | | 02/26/2029 | | | | 854,288 | |
| | 316,777 | | | Senior Secured First Lien Term Loan (3 Month US Secured Overnight Financing Rate + 3.50%, 0.50% Floor) | | | 8.82% | | | | 02/26/2029 | | | | 313,684 | |
| | | | |
| | | | iHeartCommunications, Inc. | | | | | | | | | | | | |
| | 431,279 | | | Senior Secured First Lien Term Loan (1 Month US Secured Overnight Financing Rate + 3.11%) | | | 8.44% | | | | 05/01/2026 | | | | 378,833 | |
| | | | |
| | | | INEOS US Finance LLC | | | | | | | | | | | | |
| | 300,000 | | | Senior Secured First Lien Term Loan (1 Month US Secured Overnight Financing Rate + 3.75%) | | | 9.08% | | | | 01/31/2031 | | | | 300,750 | |
| | 1,156,014 | | | Senior Secured First Lien Term Loan (1 Month US Secured Overnight Financing Rate + 3.60%) | | | 8.93% | | | | 02/19/2030 | | | | 1,157,459 | |
| | | | |
| 8 | | DoubleLine Funds Trust | | The accompanying notes are an integral part of these financial statements. |
| | | | | | | | | | | | | | | | |
PRINCIPAL AMOUNT $ | | | SECURITY DESCRIPTION | | RATE | | | MATURITY | | | VALUE $ | |
| | | | |
| | | | INEOS US Petrochem LLC | | | | | | | | | | | | |
| | 1,210,000 | | | Senior Secured Term Loan (CME Term SOFR 1 Month + 4.25%) | | | 9.68% | | | | 03/29/2029 | | | | 1,209,251 | |
| | | | |
| | | | Informatica LLC | | | | | | | | | | | | |
| | 1,827,700 | | | Senior Secured First Lien Term Loan (1 Month US Secured Overnight Financing Rate + 2.86%) | | | 8.19% | | | | 10/30/2028 | | | | 1,831,356 | |
| | | | |
| | | | ION Trading Finance Ltd. | | | | | | | | | | | | |
| | 477,303 | | | Senior Secured First Lien Term Loan (3 Month US Secured Overnight Financing Rate + 4.85%) | | | 10.20% | | | | 04/03/2028 | | | | 477,303 | |
| | | | |
| | | | Iron Mountain, Inc. | | | | | | | | | | | | |
| | 1,182,038 | | | Senior Secured First Lien Term Loan (1 Month US Secured Overnight Financing Rate + 2.25%) | | | 7.58% | | | | 01/31/2031 | | | | 1,175,141 | |
| | | | |
| | | | Ivanti Software, Inc. | | | | | | | | | | | | |
| | 371,844 | | | Senior Secured First Lien Term Loan (3 Month US Secured Overnight Financing Rate + 4.51%, 0.75% Floor) | | | 9.84% | | | | 12/01/2027 | | | | 349,068 | |
| | | | |
| | | | Jazz Financing Lux SARL | | | | | | | | | | | | |
| | 1,502,813 | | | Senior Secured First Lien Term Loan (1 Month US Secured Overnight Financing Rate + 3.11%, 0.50% Floor) | | | 8.44% | | | | 05/05/2028 | | | | 1,512,207 | |
| | | | |
| | | | Kenan Advantage Group, Inc. | | | | | | | | | | | | |
| | 835,000 | | | Senior Secured First Lien Term Loan (1 Month US Secured Overnight Financing Rate + 3.75%) | | | 9.08% | | | | 01/25/2029 | | | | 836,829 | |
| | | | |
| | | | Kloeckner Pentaplast of America, Inc. | | | | | | | | | | | | |
| | 364,062 | | | Senior Secured First Lien Term Loan (6 Month US Secured Overnight Financing Rate + 4.98%, 0.50% Floor) | | | 10.27% | | | | 02/09/2026 | | | | 343,583 | |
| | | | |
| | | | Kronos Acquisition Holdings, Inc. | | | | | | | | | | | | |
| | 278,363 | | | Senior Secured First Lien Term Loan (3 Month US Secured Overnight Financing Rate + 4.01%, 0.50% Floor) | | | 9.36% | | | | 12/22/2026 | | | | 279,043 | |
| | 652,964 | | | Senior Secured First Lien Term Loan (3 Month US Secured Overnight Financing Rate + 4.01%, 0.50% Floor) | | | 9.36% | | | | 12/22/2026 | | | | 654,557 | |
| | | | |
| | | | Lasership, Inc. | | | | | | | | | | | | |
| | 240,000 | | | Senior Secured Second Lien Term Loan (6 Month US Secured Overnight Financing Rate + 7.93%, 0.75% Floor) | | | 13.07% | | | | 05/07/2029 | | | | 198,720 | |
| | | | |
| | | | LBM Acquisition LLC | | | | | | | | | | | | |
| | 1,048,700 | | | Senior Secured First Lien Term Loan (1 Month US Secured Overnight Financing Rate + 3.85%, 0.75% Floor) | | | 9.18% | | | | 12/20/2027 | | | | 1,048,050 | |
| | | | |
| | | | Level 3 Financing, Inc. | | | | | | | | | | | | |
| | 182,946 | | | Senior Secured First Lien Term Loan (CME Term SOFR 1 Month + 6.67%) | | | 12.00% | | | | 04/15/2029 | | | | 181,860 | |
| | 182,946 | | | Senior Secured First Lien Term Loan (CME Term SOFR 1 Month + 6.67%) | | | 12.00% | | | | 04/15/2030 | | | | 181,860 | |
| | | | |
| | | | LifePoint Health, Inc. | | | | | | | | | | | | |
| | 1,521,188 | | | Senior Secured First Lien Term Loan (3 Month US Secured Overnight Financing Rate + 5.50%) | | | 11.09% | | | | 11/16/2028 | | | | 1,527,029 | |
| | | | |
| | | | Lummus Technology Holdings V LLC | | | | | | | | | | | | |
| | 1,416,978 | | | Senior Secured First Lien Term Loan (1 Month US Secured Overnight Financing Rate + 3.61%) | | | 8.94% | | | | 12/31/2029 | | | | 1,420,379 | |
| | | | |
| | | | Madison IAQ LLC | | | | | | | | | | | | |
| | 1,442,168 | | | Senior Secured First Lien Term Loan (1 Month US Secured Overnight Financing Rate + 3.36%, 0.50% Floor) | | | 8.69% | | | | 06/21/2028 | | | | 1,441,793 | |
| | | | |
| | | | Maravai Intermediate Holdings LLC | | | | | | | | | | | | |
| | 647,260 | | | Senior Secured First Lien Term Loan (3 Month US Secured Overnight Financing Rate + 3.00%, 0.50% Floor) | | | 8.31% | | | | 10/19/2027 | | | | 637,011 | |
| | | | |
| | | | Marriott Ownership Resorts, Inc. | | | | | | | | | | | | |
| | 875,821 | | | Senior Secured First Lien Term Loan (1 Month US Secured Overnight Financing Rate + 1.85%) | | | 7.18% | | | | 09/02/2025 | | | | 874,507 | |
| | | | |
| | | | Mavis Tire Express Services Topco Corp. | | | | | | | | | | | | |
| | 939,041 | | | Senior Secured First Lien Term Loan (1 Month US Secured Overnight Financing Rate + 3.75%, 0.75% Floor) | | | 9.08% | | | | 05/04/2028 | | | | 941,708 | |
| | | | |
| | | | McAfee Corp. | | | | | | | | | | | | |
| | 1,006,642 | | | Senior Secured First Lien Term Loan (1 Month US Secured Overnight Financing Rate + 3.85%, 0.50% Floor) | | | 9.18% | | | | 03/01/2029 | | | | 1,007,135 | |
| | | | |
| | | | Medline Borrower LP | | | | | | | | | | | | |
| | 1,160,719 | | | Senior Secured First Lien Term Loan (CME Term SOFR 1 Month + 2.86%) | | | 8.19% | | | | 10/23/2028 | | | | 1,164,543 | |
| | | | |
| | | | MIC Glen LLC | | | | | | | | | | | | |
| | 931,816 | | | Senior Secured First Lien Term Loan (1 Month US Secured Overnight Financing Rate + 3.36%, 0.50% Floor) | | | 8.69% | | | | 07/21/2028 | | | | 931,741 | |
| | | | | | | | |
| The accompanying notes are an integral part of these financial statements. | | Annual Report | | | | | March 31, 2024 | | 9 |
| | |
Schedule of Investments DoubleLine Core Fixed Income Fund (Cont.) | | |
| | | | | | | | | | | | | | | | |
PRINCIPAL AMOUNT $ | | | SECURITY DESCRIPTION | | RATE | | | MATURITY | | | VALUE $ | |
| | | | |
| | | | Michaels Cos., Inc. | | | | | | | | | | | | |
| | 887,110 | | | Senior Secured First Lien Term Loan (3 Month US Secured Overnight Financing Rate + 4.51%, 0.75% Floor) | | | 9.82% | | | | 04/15/2028 | | | | 798,199 | |
| | | | |
| | | | Mileage Plus Holdings LLC | | | | | | | | | | | | |
| | 705,250 | | | Senior Secured First Lien Term Loan (3 Month US Secured Overnight Financing Rate + 5.40%, 1.00% Floor) | | | 10.73% | | | | 06/21/2027 | | | | 727,127 | |
| | | | |
| | | | Minotaur Acquisition, Inc. | | | | | | | | | | | | |
| | 1,280,763 | | | Senior Secured First Lien Term Loan (1 Month US Secured Overnight Financing Rate + 4.85%) | | | 10.18% | | | | 03/30/2026 | | | | 1,283,644 | |
| | | | |
| | | | Mister Car Wash Holdings T/L (03/24) | | | | | | | | | | | | |
| | 220,000 | | | Senior Secured Term Loan | | | 8.33% | (f) | | | 03/21/2031 | | | | 220,780 | |
| | | | |
| | | | Mitchell International, Inc. | | | | | | | | | | | | |
| | 1,044,961 | | | Senior Secured First Lien Term Loan (1 Month US Secured Overnight Financing Rate + 3.86%, 0.50% Floor) | | | 9.19% | | | | 10/15/2028 | | | | 1,046,570 | |
| | 3,413 | | | Senior Secured First Lien Term Loan (3 Month LIBOR USD + 3.75%, 0.50% Floor) | | | 8.94% | (e) | | | 10/15/2028 | | | | 3,418 | |
| | 220,000 | | | Senior Secured Second Lien Term Loan (1 Month US Secured Overnight Financing Rate + 6.61%, 0.50% Floor) | | | 11.94% | | | | 10/15/2029 | | | | 220,138 | |
| | | | |
| | | | MIWD Holdco II LLC | | | | | | | | | | | | |
| | 220,000 | | | Senior Secured Term Loan (CME Term SOFR 1 Month + 3.50%) | | | 8.83% | | | | 03/28/2031 | | | | 221,307 | |
| | | | |
| | | | Monogram Food Solutions LLC | | | | | | | | | | | | |
| | 1,034,418 | | | Senior Secured First Lien Term Loan (1 Month US Secured Overnight Financing Rate + 4.11%, 0.50% Floor) | | | 9.44% | | | | 08/27/2028 | | | | 1,037,004 | |
| | | | |
| | | | Motion Finco SARL | | | | | | | | | | | | |
| | 1,395,000 | | | Senior Secured First Lien Term Loan (3 Month US Secured Overnight Financing Rate + 3.76%) | | | 9.07% | | | | 11/30/2029 | | | | 1,394,478 | |
| | | | |
| | | | Nascar Holdings LLC | | | | | | | | | | | | |
| | 222,015 | | | Senior Secured First Lien Term Loan (1 Month US Secured Overnight Financing Rate + 2.61%) | | | 7.94% | | | | 10/19/2026 | | | | 223,226 | |
| | | | |
| | | | NEP Group, Inc. | | | | | | | | | | | | |
| | 791,996 | | | Senior Secured First Lien Term Loan (1 Month US Secured Overnight Financing Rate + 3.36%) 1.50% PIK | | | 8.69% | | | | 08/19/2026 | | | | 757,100 | |
| | 15,271 | | | Senior Secured First Lien Term Loan (1 Month US Secured Overnight Financing Rate + 3.36%) 1.50% PIK | | | 8.69% | | | | 08/19/2026 | | | | 14,598 | |
| | | | |
| | | | Newfold Digital Holdings Group, Inc. | | | | | | | | | | | | |
| | 1,070,107 | | | Senior Secured First Lien Term Loan (6 Month US Secured Overnight Financing Rate + 3.93%, 0.75% Floor) | | | 9.42% | | | | 02/10/2028 | | | | 1,046,832 | |
| | | | |
| | | | Nouryon USA LLC | | | | | | | | | | | | |
| | 753,226 | | | Senior Secured First Lien Term Loan (3 Month US Secured Overnight Financing Rate + 4.10%) | | | 9.42% | | | | 04/03/2028 | | | | 756,521 | |
| | 195,519 | | | Senior Secured First Lien Term Loan (3 Month US Secured Overnight Financing Rate + 4.10%) | | | 9.42% | | | | 04/03/2028 | | | | 196,375 | |
| | | | |
| | | | NRG Energy T/L B (03/24) | | | | | | | | | | | | |
| | 580,000 | | | Senior Secured Term Loan | | | 7.33% | (f) | | | 03/27/2031 | | | | 579,640 | |
| | | | |
| | | | Olympus Water US Holding Corp. | | | | | | | | | | | | |
| | 933,052 | | | Senior Secured First Lien Term Loan (3 Month US Secured Overnight Financing Rate + 4.01%, 0.50% Floor) | | | 9.32% | | | | 11/09/2028 | | | | 934,746 | |
| | | | |
| | | | OMNIA Partners LLC | | | | | | | | | | | | |
| | 603,488 | | | Senior Secured First Lien Term Loan (3 Month US Secured Overnight Financing Rate + 3.75%) | | | 9.07% | | | | 07/25/2030 | | | | 606,976 | |
| | | | |
| | | | OneDigital Borrower LLC | | | | | | | | | | | | |
| | 1,564,275 | | | Senior Secured First Lien Term Loan (1 Month US Secured Overnight Financing Rate + 4.50%, 0.50% Floor) | | | 9.68% | | | | 11/16/2027 | | | | 1,566,230 | |
| | | | |
| | | | Ontario Gaming GTA LP | | | | | | | | | | | | |
| | 1,268,374 | | | Senior Secured First Lien Term Loan (3 Month US Secured Overnight Financing Rate + 4.25%, 0.50% Floor) | | | 9.56% | | | | 08/01/2030 | | | | 1,274,266 | |
| | | | |
| | | | Organon & Co. | | | | | | | | | | | | |
| | 951,818 | | | Senior Secured First Lien Term Loan (1 Month US Secured Overnight Financing Rate + 3.11%, 0.50% Floor) | | | 8.43% | | | | 06/02/2028 | | | | 956,382 | |
| | | | |
| | | | Oryx Midstream Services Permian Basin LLC | | | | | | | | | | | | |
| | 1,021,550 | | | Senior Secured First Lien Term Loan (1 Month US Secured Overnight Financing Rate + 3.11%, 0.50% Floor) | | | 8.44% | | | | 10/05/2028 | | | | 1,026,571 | |
| | | | |
| | | | Outcomes Group Holdings, Inc. | | | | | | | | | | | | |
| | 379,000 | | | Senior Secured First Lien Term Loan (1 Month US Secured Overnight Financing Rate + 3.51%) | | | 8.69% | | | | 10/24/2025 | | | | 379,531 | |
| | | | |
| 10 | | DoubleLine Funds Trust | | The accompanying notes are an integral part of these financial statements. |
| | | | | | | | | | | | | | | | |
PRINCIPAL AMOUNT $ | | | SECURITY DESCRIPTION | | RATE | | | MATURITY | | | VALUE $ | |
| | | | |
| | | | Pacific Dental Services T/L B (02/24) | | | | | | | | | | | | |
| | 880,000 | | | Senior Secured Term Loan | | | 8.58% | (f) | | | 03/07/2031 | | | | 881,285 | |
| | | | |
| | | | Packaging Coordinators Midco, Inc. | | | | | | | | | | | | |
| | 1,322,268 | | | Senior Secured First Lien Term Loan (3 Month US Secured Overnight Financing Rate + 3.76%, 0.75% Floor) | | | 9.07% | | | | 11/30/2027 | | | | 1,326,585 | |
| | | | |
| | | | Packers Holdings LLC | | | | | | | | | | | | |
| | 425,858 | | | Senior Secured First Lien Term Loan (1 Month US Secured Overnight Financing Rate + 3.35%, 0.75% Floor) | | | 8.68% | | | | 03/09/2028 | | | | 273,614 | |
| | | | |
| | | | Pactiv Evergreen Group Holdings, Inc. | | | | | | | | | | | | |
| | 509,393 | | | Senior Secured First Lien Term Loan (1 Month US Secured Overnight Financing Rate + 3.36%, 0.50% Floor) | | | 8.69% | | | | 09/25/2028 | | | | 511,748 | |
| | 64,944 | | | Senior Secured First Lien Term Loan (1 Month US Secured Overnight Financing Rate + 3.36%, 0.50% Floor) | | | 8.69% | | | | 09/25/2028 | | | | 65,244 | |
| | 112,143 | | | Senior Secured First Lien Term Loan (1 Month US Secured Overnight Financing Rate + 3.36%, 0.50% Floor) | | | 8.69% | | | | 09/25/2028 | | | | 112,662 | |
| | | | |
| | | | Par Petroleum LLC | | | | | | | | | | | | |
| | 272,250 | | | Senior Secured First Lien Term Loan (3 Month US Secured Overnight Financing Rate + 4.35%, 0.50% Floor) | | | 9.69% | | | | 02/28/2030 | | | | 273,015 | |
| | | | |
| | | | PECF USS Intermediate Holding III Corp. | | | | | | | | | | | | |
| | 656,803 | | | Senior Secured First Lien Term Loan (3 Month US Secured Overnight Financing Rate + 4.51%, 0.50% Floor) | | | 9.82% | | | | 12/15/2028 | | | | 503,278 | |
| | | | |
| | | | Peraton Corp. | | | | | | | | | | | | |
| | 926,735 | | | Senior Secured First Lien Term Loan (1 Month US Secured Overnight Financing Rate + 3.85%, 0.75% Floor) | | | 9.18% | | | | 02/01/2028 | | | | 927,680 | |
| | | | |
| | | | Perrigo Investments LLC | | | | | | | | | | | | |
| | 967,719 | | | Senior Secured First Lien Term Loan (1 Month US Secured Overnight Financing Rate + 2.35%, 0.50% Floor) | | | 7.68% | | | | 04/20/2029 | | | | 966,108 | |
| | | | |
| | | | PetSmart LLC | | | | | | | | | | | | |
| | 2,401,159 | | | Senior Secured First Lien Term Loan (1 Month US Secured Overnight Financing Rate + 3.85%, 0.75% Floor) | | | 9.18% | | | | 02/12/2028 | | | | 2,398,662 | |
| | | | |
| | | | PG&E Corp. | | | | | | | | | | | | |
| | 290,000 | | | Senior Secured First Lien Term Loan (1 Month US Secured Overnight Financing Rate + 2.50%, 0.50% Floor) | | | 7.83% | | | | 06/23/2027 | | | | 290,815 | |
| | | | |
| | | | Phoenix Newco, Inc. | | | | | | | | | | | | |
| | 1,386,463 | | | Senior Secured First Lien Term Loan (1 Month US Secured Overnight Financing Rate + 3.36%, 0.50% Floor) | | | 8.69% | | | | 11/15/2028 | | | | 1,391,191 | |
| | | | |
| | | | Playa Resorts Holding BV | | | | | | | | | | | | |
| | 1,270,574 | | | Senior Secured First Lien Term Loan (1 Month US Secured Overnight Financing Rate + 3.25%, 0.50% Floor) | | | 8.58% | | | | 01/05/2029 | | | | 1,275,777 | |
| | | | |
| | | | PointClickCare Technologies, Inc. | | | | | | | | | | | | |
| | 572,300 | | | Senior Secured First Lien Term Loan (3 Month US Secured Overnight Financing Rate + 3.26%, 0.75% Floor) | | | 8.57% | | | | 12/29/2027 | | | | 574,091 | |
| | | | |
| | | | Polar US Borrower LLC | | | | | | | | | | | | |
| | 174,912 | | | Senior Secured First Lien Term Loan (3 Month US Secured Overnight Financing Rate + 4.85%) | | | 10.16% | | | | 10/15/2025 | | | | 133,262 | |
| | 204,661 | | | Senior Secured First Lien Term Loan (3 Month US Secured Overnight Financing Rate + 4.85%) | | | 10.16% | | | | 10/15/2025 | | | | 155,927 | |
| | | | |
| | | | Polaris Newco LLC | | | | | | | | | | | | |
| | 566,664 | | | Senior Secured First Lien Term Loan (3 Month US Secured Overnight Financing Rate + 4.11%, 0.50% Floor) | | | 9.57% | | | | 06/05/2028 | | | | 561,839 | |
| | | | |
| | | | Pregis TopCo LLC | | | | | | | | | | | | |
| | 1,388,513 | | | Senior Secured First Lien Term Loan (1 Month US Secured Overnight Financing Rate + 3.75%) | | | 9.08% | | | | 07/31/2026 | | | | 1,392,228 | |
| | | | |
| | | | Pretium PKG Holdings, Inc. | | | | | | | | | | | | |
| | 275,000 | | | Senior Secured Second Lien Term Loan (3 Month US Secured Overnight Financing Rate + 7.01%, 0.50% Floor) | | | 12.33% | | | | 10/01/2029 | | | | 171,962 | |
| | 302,386 | | | Senior Secured First Lien Term Loan (3 Month US Secured Overnight Financing Rate + 2.50%, 1.00% Floor) 2.50% PIK | | | 7.81% | | | | 10/02/2028 | | | | 307,111 | |
| | 2,566 | | | Senior Secured First Lien Term Loan (3 Month US Secured Overnight Financing Rate + 2.50%, 1.00% Floor) 2.50% PIK | | | 7.81% | | | | 10/02/2028 | | | | 2,606 | |
| | 5,361 | | | Senior Secured First Lien Term Loan (3 Month US Secured Overnight Financing Rate + 3.20%, 1.00% Floor) 1.40% PIK | | | 8.50% | | | | 10/02/2028 | | | | 4,818 | |
| | 551,832 | | | Senior Secured First Lien Term Loan (3 Month US Secured Overnight Financing Rate + 3.20%, 1.00% Floor) 1.40% PIK | | | 8.50% | | | | 10/02/2028 | | | | 495,959 | |
| | | | | | | | |
| The accompanying notes are an integral part of these financial statements. | | Annual Report | | | | | March 31, 2024 | | 11 |
| | |
Schedule of Investments DoubleLine Core Fixed Income Fund (Cont.) | | |
| | | | | | | | | | | | | | | | |
PRINCIPAL AMOUNT $ | | | SECURITY DESCRIPTION | | RATE | | | MATURITY | | | VALUE $ | |
| | | | |
| | | | Proofpoint, Inc. | | | | | | | | | | | | |
| | 1,427,150 | | | Senior Secured First Lien Term Loan (1 Month US Secured Overnight Financing Rate + 3.36%, 0.50% Floor) | | | 8.69% | | | | 08/31/2028 | | | | 1,429,483 | |
| | | | |
| | | | Quikrete Holdings, Inc. | | | | | | | | | | | | |
| | 175,000 | | | Senior Secured Term Loan (CME Term SOFR 1 Month + 2.50%) | | | 7.94% | | | | 03/25/2031 | | | | 175,292 | |
| | 591,107 | | | Senior Secured First Lien Term Loan (1 Month US Secured Overnight Financing Rate + 2.86%) | | | 8.19% | | | | 03/19/2029 | | | | 592,083 | |
| | | | |
| | | | Radiology Partners T/L - TARGET | | | | | | | | | | | | |
| | 6,147 | | | Senior Secured First Lien Term Loan (3 Month US Secured Overnight Financing Rate + 3.50%) | | | 9.09% | | | | 01/31/2029 | | | | 5,954 | |
| | 596,582 | | | Senior Secured First Lien Term Loan (3 Month US Secured Overnight Financing Rate + 3.50%) | | | 9.09% | | | | 01/31/2029 | | | | 577,831 | |
| | | | |
| | | | RealPage, Inc. | | | | | | | | | | | | |
| | 1,433,444 | | | Senior Secured First Lien Term Loan (1 Month US Secured Overnight Financing Rate + 3.11%, 0.50% Floor) | | | 8.44% | | | | 04/24/2028 | | | | 1,396,511 | |
| | | | |
| | | | Restaurant Technologies, Inc. | | | | | | | | | | | | |
| | 90,054 | | | Senior Secured First Lien Term Loan (1 Month US Secured Overnight Financing Rate + 4.25%, 0.50% Floor) | | | 9.57% | | | | 04/02/2029 | | | | 89,407 | |
| | 954,434 | | | Senior Secured First Lien Term Loan (3 Month US Secured Overnight Financing Rate + 4.25%, 0.50% Floor) | | | 9.60% | | | | 04/02/2029 | | | | 947,576 | |
| | 90,054 | | | Senior Secured First Lien Term Loan (3 Month US Secured Overnight Financing Rate + 4.25%, 0.50% Floor) | | | 9.60% | | | | 04/02/2029 | | | | 89,407 | |
| | | | |
| | | | RH | | | | | | | | | | | | |
| | 512,433 | | | Senior Secured First Lien Term Loan (1 Month US Secured Overnight Financing Rate + 2.61%, 0.50% Floor) | | | 7.94% | | | | 10/20/2028 | | | | 500,783 | |
| | | | |
| | | | Scientific Games Holdings LP | | | | | | | | | | | | |
| | 1,031,920 | | | Senior Secured First Lien Term Loan (3 Month US Secured Overnight Financing Rate + 2.75%, 0.50% Floor) | | | 8.58% | | | | 04/04/2029 | | | | 1,032,916 | |
| | | | |
| | | | Sinclair Television Group, Inc. | | | | | | | | | | | | |
| | 432,118 | | | Senior Secured First Lien Term Loan (1 Month US Secured Overnight Financing Rate + 2.61%) | | | 7.94% | | | | 09/30/2026 | | | | 412,727 | |
| | | | |
| | | | SkyMiles IP Ltd. | | | | | | | | | | | | |
| | 678,750 | | | Senior Secured First Lien Term Loan (3 Month US Secured Overnight Financing Rate + 3.75%, 1.00% Floor) | | | 9.07% | | | | 10/20/2027 | | | | 700,881 | |
| | | | |
| | | | SMG US Midco 2, Inc. | | | | | | | | | | | | |
| | 1,009,755 | | | Senior Secured First Lien Term Loan (3 Month US Secured Overnight Financing Rate + 2.76%) | | | 8.07% | | | | 01/23/2025 | | | | 1,010,654 | |
| | 372,310 | | | Senior Secured First Lien Term Loan (3 Month US Secured Overnight Financing Rate + 2.76%) | | | 8.07% | | | | 01/23/2025 | | | | 372,642 | |
| | | | |
| | | | Sotera Health Holdings LLC | | | | | | | | | | | | |
| | 1,545,000 | | | Senior Secured First Lien Term Loan (1 Month US Secured Overnight Financing Rate + 2.86%) | | | 8.19% | | | | 12/11/2026 | | | | 1,542,420 | |
| | | | |
| | | | Southern Veterinary Partners LLC | | | | | | | | | | | | |
| | 1,795,615 | | | Senior Secured First Lien Term Loan (1 Month US Secured Overnight Financing Rate + 4.11%, 1.00% Floor) | | | 9.44% | | | | 10/05/2027 | | | | 1,799,655 | |
| | | | |
| | | | Spin Holdco, Inc. | | | | | | | | | | | | |
| | 410,479 | | | Senior Secured First Lien Term Loan (3 Month US Secured Overnight Financing Rate + 4.26%, 0.75% Floor) | | | 9.59% | | | | 03/06/2028 | | | | 381,201 | |
| | | | |
| | | | SRS Distribution, Inc. | | | | | | | | | | | | |
| | 1,535,393 | | | Senior Secured First Lien Term Loan (1 Month US Secured Overnight Financing Rate + 3.61%, 0.50% Floor) | | | 8.94% | | | | 06/05/2028 | | | | 1,547,745 | |
| | | | |
| | | | Standard Aero Ltd. | | | | | | | | | | | | |
| | 440,704 | | | Senior Secured First Lien Term Loan (1 Month US Secured Overnight Financing Rate + 3.50%) | | | 8.82% | | | | 08/24/2028 | | | | 441,847 | |
| | | | |
| | | | Starwood Property Mortgage LLC | | | | | | | | | | | | |
| | 377,099 | | | Senior Secured First Lien Term Loan (1 Month US Secured Overnight Financing Rate + 3.35%, 0.75% Floor) | | | 8.68% | | | | 07/27/2026 | | | | 378,513 | |
| | | | |
| | | | Station Casinos LLC | | | | | | | | | | | | |
| | 370,000 | | | Senior Secured First Lien Term Loan (CME Term SOFR 1 Month + 2.25%) | | | 7.82% | | | | 03/14/2031 | | | | 369,957 | |
| | | | |
| 12 | | DoubleLine Funds Trust | | The accompanying notes are an integral part of these financial statements. |
| | | | | | | | | | | | | | | | |
PRINCIPAL AMOUNT $ | | | SECURITY DESCRIPTION | | RATE | | | MATURITY | | | VALUE $ | |
| | | | |
| | | | StubHub Holdco Sub LLC | | | | | | | | | | | | |
| | 905,883 | | | Senior Secured First Lien Term Loan (1 Month US Secured Overnight Financing Rate + 4.75%) | | | 10.08% | | | | 03/12/2030 | | | | 908,334 | |
| | | | |
| | | | SWF Holdings I Corp. | | | | | | | | | | | | |
| | 1,057,988 | | | Senior Secured First Lien Term Loan (1 Month US Secured Overnight Financing Rate + 4.11%, 0.75% Floor) | | | 9.44% | | | | 10/06/2028 | | | | 976,432 | |
| | | | |
| | | | Tamko Building Products LLC | | | | | | | | | | | | |
| | 527,350 | | | Senior Secured First Lien Term Loan (3 Month US Secured Overnight Financing Rate + 3.50%) | | | 8.83% | | | | 09/20/2030 | | | | 528,009 | |
| | | | |
| | | | Team Health Holdings, Inc. | | | | | | | | | | | | |
| | 332,151 | | | Senior Secured First Lien Term Loan (3 Month US Secured Overnight Financing Rate + 5.25%, 1.00% Floor) | | | 10.56% | | | | 03/02/2027 | | | | 295,614 | |
| | | | |
| | | | Tecta America Corp. | | | | | | | | | | | | |
| | 807,175 | | | Senior Secured First Lien Term Loan (1 Month US Secured Overnight Financing Rate + 4.11%, 0.75% Floor) | | | 9.44% | | | | 04/10/2028 | | | | 810,266 | |
| | | | |
| | | | Telesat LLC | | | | | | | | | | | | |
| | 193,821 | | | Senior Secured First Lien Term Loan (3 Month US Secured Overnight Financing Rate + 2.86%) | | | 8.35% | | | | 12/07/2026 | | | | 117,928 | |
| | | | |
| | | | Tempo Acquisition LLC | | | | | | | | | | | | |
| | 845,351 | | | Senior Secured First Lien Term Loan (1 Month US Secured Overnight Financing Rate + 2.75%, 0.50% Floor) | | | 8.08% | | | | 08/31/2028 | | | | 848,982 | |
| | | | |
| | | | Tiger Acquisition LLC | | | | | | | | | | | | |
| | 671,148 | | | Senior Secured First Lien Term Loan (1 Month US Secured Overnight Financing Rate + 3.35%, 0.50% Floor) | | | 8.68% | | | | 06/01/2028 | | | | 666,353 | |
| | | | |
| | | | Titan Acquisition Ltd./Canada | | | | | | | | | | | | |
| | 1,214,700 | | | Senior Secured First Lien Term Loan (1 Month US Secured Overnight Financing Rate + 3.11%) | | | 8.44% | | | | 03/28/2025 | | | | 1,215,204 | |
| | 1,170,000 | | | Senior Secured Term Loan (CME Term SOFR 1 Month + 5.00%) | | | 10.33% | | | | 02/01/2029 | | | | 1,174,510 | |
| | | | |
| | | | TK Elevator US Newco, Inc. | | | | | | | | | | | | |
| | 1,575,000 | | | Senior Secured Term Loan (CME Term SOFR 1 Month + 3.50%) | | | 8.83% | | | | 04/15/2030 | | | | 1,582,112 | |
| | | | |
| | | | TransDigm, Inc. | | | | | | | | | | | | |
| | 1,546,313 | | | Senior Secured First Lien Term Loan (3 Month US Secured Overnight Financing Rate + 2.75%) | | | 8.06% | | | | 08/24/2028 | | | | 1,540,628 | |
| | 453,863 | | | Senior Secured First Lien Term Loan (3 Month US Secured Overnight Financing Rate + 3.25%) | | | 8.60% | | | | 02/28/2031 | | | | 456,597 | |
| | | | |
| | | | Travelport Finance Luxembourg SARL | | | | | | | | | | | | |
| | 445,364 | | | Senior Secured First Lien Term Loan (3 Month US Secured Overnight Financing Rate + 8.26%, 1.00% Floor) | | | 13.61% | | | | 09/29/2028 | | | | 417,030 | |
| | 135,346 | | | Senior Secured First Lien Term Loan (3 Month US Secured Overnight Financing Rate + 8.26%, 1.00% Floor) | | | 13.61% | | | | 09/29/2028 | | | | 126,735 | |
| | | | |
| | | | Traverse Midstream Partners LLC | | | | | | | | | | | | |
| | 282,070 | | | Senior Secured First Lien Term Loan (3 Month US Secured Overnight Financing Rate + 3.60%, 0.50% Floor) | | | 8.82% | | | | 02/16/2028 | | | | 283,128 | |
| | | | |
| | | | TricorBraun Holdings, Inc. | | | | | | | | | | | | |
| | 1,135,973 | | | Senior Secured First Lien Term Loan (1 Month US Secured Overnight Financing Rate + 3.36%, 0.50% Floor) | | | 8.69% | | | | 03/03/2028 | | | | 1,124,665 | |
| | | | |
| | | | Trident TPI Holdings, Inc. | | | | | | | | | | | | |
| | 1,044,943 | | | Senior Secured First Lien Term Loan (3 Month US Secured Overnight Financing Rate + 4.26%, 0.50% Floor) | | | 9.57% | | | | 09/18/2028 | | | | 1,046,610 | |
| | | | |
| | | | Triton Water Holdings, Inc. | | | | | | | | | | | | |
| | 1,568,825 | | | Senior Secured First Lien Term Loan (3 Month US Secured Overnight Financing Rate + 3.51%, 0.50% Floor) | | | 8.86% | | | | 03/31/2028 | | | | 1,554,321 | |
| | | | |
| | | | UFC Holdings LLC | | | | | | | | | | | | |
| | 929,411 | | | Senior Secured First Lien Term Loan (3 Month US Secured Overnight Financing Rate + 3.01%, 0.75% Floor) | | | 8.34% | | | | 04/29/2026 | | | | 931,865 | |
| | | | |
| | | | UKG, Inc. | | | | | | | | | | | | |
| | 1,205,000 | | | Senior Secured First Lien Term Loan (3 Month US Secured Overnight Financing Rate + 3.50%) | | | 8.81% | | | | 02/10/2031 | | | | 1,212,718 | |
| | 258,793 | | | Senior Secured Second Lien Term Loan (3 Month US Secured Overnight Financing Rate + 5.35%, 0.50% Floor) | | | 10.68% | | | | 05/03/2027 | | | | 261,543 | |
| | | | |
| | | | Ultra Clean Holdings T/L (03/24) | | | | | | | | | | | | |
| | 326,298 | | | Senior Secured Term Loan | | | 8.82% | (f) | | | 02/29/2028 | | | | 327,116 | |
| | | | |
| | | | Ultra Clean Holdings, Inc. | | | | | | | | | | | | |
| | 530,061 | | | Senior Secured First Lien Term Loan (1 Month US Secured Overnight Financing Rate + 3.86%) | | | 9.19% | | | | 08/27/2025 | | | | 531,389 | |
| | | | | | | | |
| The accompanying notes are an integral part of these financial statements. | | Annual Report | | | | | March 31, 2024 | | 13 |
| | |
Schedule of Investments DoubleLine Core Fixed Income Fund (Cont.) | | |
| | | | | | | | | | | | | | | | |
PRINCIPAL AMOUNT $ | | | SECURITY DESCRIPTION | | RATE | | | MATURITY | | | VALUE $ | |
| | | | |
| | | | United Airlines, Inc. | | | | | | | | | | | | |
| | 1,130,000 | | | Senior Secured First Lien Term Loan (3 Month US Secured Overnight Financing Rate + 2.75%) | | | 8.08% | | | | 02/24/2031 | | | | 1,133,175 | |
| | | | |
| | | | Univision Communications, Inc. | | | | | | | | | | | | |
| | 750,301 | | | Senior Secured First Lien Term Loan (3 Month US Secured Overnight Financing Rate + 4.25%, 0.50% Floor) | | | 9.56% | | | | 06/24/2029 | | | | 752,833 | |
| | | | |
| | | | Upbound Group, Inc. | | | | | | | | | | | | |
| | 664,093 | | | Senior Secured First Lien Term Loan (6 Month US Secured Overnight Financing Rate + 3.68%, 0.50% Floor) | | | 9.12% | | | | 02/17/2028 | | | | 665,059 | |
| | | | |
| | | | Vantage Specialty Chemicals, Inc. | | | | | | | | | | | | |
| | 128,375 | | | Senior Secured First Lien Term Loan (3 Month US Secured Overnight Financing Rate + 4.75%, 0.50% Floor) | | | 10.07% | | | | 10/26/2026 | | | | 127,171 | |
| | | | |
| | | | Verscend Holding Corp. | | | | | | | | | | | | |
| | 2,365,168 | | | Senior Secured First Lien Term Loan (1 Month US Secured Overnight Financing Rate + 4.11%) | | | 9.44% | | | | 08/27/2025 | | | | 2,368,125 | |
| | | | |
| | | | Vestis Corp. | | | | | | | | | | | | |
| | 375,000 | | | Senior Secured First Lien Term Loan (3 Month US Secured Overnight Financing Rate + 2.25%) | | | 7.58% | | | | 02/24/2031 | | | | 375,469 | |
| | | | |
| | | | Viad Corp. | | | | | | | | | | | | |
| | 734,193 | | | Senior Secured First Lien Term Loan (1 Month US Secured Overnight Financing Rate + 5.11%, 0.50% Floor) | | | 10.44% | | | | 07/31/2028 | | | | 737,177 | |
| | | | |
| | | | Vibrantz Technologies, Inc. | | | | | | | | | | | | |
| | 352,741 | | | Senior Secured First Lien Term Loan (3 Month US Secured Overnight Financing Rate + 4.40%, 0.50% Floor) | | | 9.72% | | | | 04/23/2029 | | | | 349,688 | |
| | | | |
| | | | Virgin Media Bristol LLC | | | | | | | | | | | | |
| | 1,485,000 | | | Senior Secured First Lien Term Loan (6 Month US Secured Overnight Financing Rate + 3.35%) | | | 8.79% | | | | 03/31/2031 | | | | 1,464,989 | |
| | | | |
| | | | Vistra Operations Co. LLC | | | | | | | | | | | | |
| | 254,363 | | | Senior Secured First Lien Term Loan (1 Month US Secured Overnight Financing Rate + 2.00%) | | | 7.33% | | | | 12/20/2030 | | | | 254,403 | |
| | | | |
| | | | Vistra Zero Operating Co. LLC | | | | | | | | | | | | |
| | 400,000 | | | Senior Secured Term Loan (CME Term SOFR 1 Month + 2.75%) | | | 8.07% | | | | 03/26/2031 | | | | 400,500 | |
| | | | |
| | | | VT Topco, Inc. | | | | | | | | | | | | |
| | 399,000 | | | Senior Secured First Lien Term Loan (1 Month US Secured Overnight Financing Rate + 4.25%, 0.50% Floor) | | | 9.58% | | | | 08/12/2030 | | | | 400,568 | |
| | | | |
| | | | Walker & Dunlop, Inc. | | | | | | | | | | | | |
| | 615,825 | | | Senior Secured First Lien Term Loan (1 Month US Secured Overnight Financing Rate + 2.50%, 0.50% Floor) | | | 7.68% | | | | 12/18/2028 | | | | 615,055 | |
| | | | |
| | | | Wand NewCo 3, Inc. | | | | | | | | | | | | |
| | 670,000 | | | Senior Secured First Lien Term Loan (1 Month US Secured Overnight Financing Rate + 3.75%) | | | 9.08% | | | | 01/30/2031 | | | | 672,670 | |
| | | | |
| | | | WaterBridge Midstream Operating LLC | | | | | | | | | | | | |
| | 110,026 | | | Senior Secured First Lien Term Loan (3 Month US Secured Overnight Financing Rate + 6.01%, 1.00% Floor) | | | 11.34% | | | | 06/21/2026 | | | | 110,284 | |
| | 655,858 | | | Senior Secured First Lien Term Loan (3 Month US Secured Overnight Financing Rate + 6.01%, 1.00% Floor) | | | 11.34% | | | | 06/21/2026 | | | | 657,396 | |
| | | | |
| | | | Wec US Holdings Ltd. | | | | | | | | | | | | |
| | 1,255,000 | | | Senior Secured First Lien Term Loan (1 Month US Secured Overnight Financing Rate + 2.75%) | | | 8.08% | | | | 01/27/2031 | | | | 1,255,000 | |
| | | | |
| | | | WestJet Airlines Ltd. | | | | | | | | | | | | |
| | 89,259 | | | Senior Secured First Lien Term Loan (1 Month US Secured Overnight Financing Rate + 3.10%, 1.00% Floor) | | | 8.43% | | | | 12/11/2026 | | | | 89,350 | |
| | | | |
| | | | WestJet Loyalty LP | | | | | | | | | | | | |
| | 1,375,000 | | | Senior Secured First Lien Term Loan (3 Month US Secured Overnight Financing Rate + 3.75%) | | | 9.08% | | | | 02/14/2031 | | | | 1,376,718 | |
| | | | |
| | | | Whatabrands LLC | | | | | | | | | | | | |
| | 1,351,045 | | | Senior Secured First Lien Term Loan (1 Month US Secured Overnight Financing Rate + 3.36%, 0.50% Floor) | | | 8.69% | | | | 08/03/2028 | | | | 1,353,416 | |
| | | | |
| | | | WhiteWater DBR HoldCo LLC | | | | | | | | | | | | |
| | 445,000 | | | Senior Secured First Lien Term Loan (1 Month US Secured Overnight Financing Rate + 2.75%) | | | 8.08% | | | | 03/03/2031 | | | | 446,297 | |
| | | | |
| | | | WWEX Uni Topco Holdings LLC | | | | | | | | | | | | |
| | 270,901 | | | Senior Secured First Lien Term Loan (3 Month US Secured Overnight Financing Rate + 4.26%, 0.75% Floor) | | | 9.57% | | | | 07/26/2028 | | | | 269,962 | |
| | | | |
| 14 | | DoubleLine Funds Trust | | The accompanying notes are an integral part of these financial statements. |
| | | | | | | | | | | | | | | | |
PRINCIPAL AMOUNT $ | | | SECURITY DESCRIPTION | | RATE | | | MATURITY | | | VALUE $ | |
| | | | |
| | | | Zayo Group Holdings, Inc. | | | | | | | | | | | | |
| | 1,257,145 | | | Senior Secured First Lien Term Loan (1 Month US Secured Overnight Financing Rate + 3.11%) | | | 8.44% | | | | 03/09/2027 | | | | 1,106,646 | |
| | | | |
| | | | Ziggo Financing Partnership | | | | | | | | | | | | |
| | 850,000 | | | Senior Secured First Lien Term Loan (1 Month US Secured Overnight Financing Rate + 2.61%) | | | 7.94% | | | | 04/30/2028 | | | | 838,844 | |
| | | | | | | | | | | | | | | | |
| | | | Total Bank Loans
(Cost $222,908,471) | | | | | | | | 221,605,026 | |
| | | | | | | | | | | | | |
| | COLLATERALIZED LOAN OBLIGATIONS - 3.3% | | | | | | | | | | | | |
| | | | |
| | | | Aimco CDO | | | | | | | | | | | | |
| | 1,000,000 | | | Series 2018-AA-D (CME Term SOFR 3 Month + 2.81%) | | | 8.13% | (a) | | | 04/17/2031 | | | | 996,536 | |
| | | | |
| | | | Anchorage Capital CLO Ltd. | | | | | | | | | | | | |
| | 5,000,000 | | | Series 2021-19A-A (CME Term SOFR 3 Month + 1.47%, 1.21% Floor) | | | 6.79% | (a) | | | 10/15/2034 | | | | 5,006,454 | |
| | | | |
| | | | Apidos CLO | | | | | | | | | | | | |
| | 1,000,000 | | | Series 2013-12A-DR (CME Term SOFR 3 Month + 2.86%) | | | 8.18% | (a) | | | 04/15/2031 | | | | 982,421 | |
| | | | |
| | | | Babson CLO Ltd./Cayman Islands | | | | | | | | | | | | |
| | 2,000,000 | | | Series 2018-1A-C (CME Term SOFR 3 Month + 2.86%) | | | 8.18% | (a) | | | 04/15/2031 | | | | 1,940,932 | |
| | | | |
| | | | Bain Capital Credit CLO | | | | | | | | | | | | |
| | 500,000 | | | Series 2017-2A-DR2 (CME Term SOFR 3 Month + 3.36%, 3.10% Floor) | | | 8.69% | (a) | | | 07/25/2034 | | | | 493,586 | |
| | | | |
| | | | Blackstone, Inc. | | | | | | | | | | | | |
| | 3,250,000 | | | Series 2018-1A-D (CME Term SOFR 3 Month + 2.86%) | | | 8.18% | (a) | | | 04/17/2030 | | | | 3,155,654 | |
| | | | |
| | | | BlueMountain CLO Ltd. | | | | | | | | | | | | |
| | 4,000,000 | | | Series 2015-3A-CR (CME Term SOFR 3 Month + 2.86%) | | | 8.18% | (a) | | | 04/20/2031 | | | | 3,852,780 | |
| | 2,000,000 | | | Series 2016-3A-DR (CME Term SOFR 3 Month + 3.36%, 3.10% Floor) | | | 8.67% | (a) | | | 11/15/2030 | | | | 1,943,000 | |
| | 2,400,000 | | | Series 2017-2A-C (CME Term SOFR 3 Month + 3.26%) | | | 8.58% | (a) | | | 10/20/2030 | | | | 2,346,137 | |
| | | | |
| | | | Buckhorn Park CLO Ltd. | | | | | | | | | | | | |
| | 1,000,000 | | | Series 2019-1A-DR (CME Term SOFR 3 Month + 3.36%, 3.10% Floor) | | | 8.66% | (a) | | | 07/18/2034 | | | | 997,788 | |
| | | | |
| | | | Canyon Capital CLO Ltd. | | | | | | | | | | | | |
| | 2,500,000 | | | Series 2012-1RA-D (CME Term SOFR 3 Month + 3.26%) | | | 8.58% | (a) | | | 07/15/2030 | | | | 2,496,840 | |
| | 2,750,000 | | | Series 2014-1A-CR (CME Term SOFR 3 Month + 3.01%, 2.75% Floor) | | | 8.33% | (a) | | | 01/30/2031 | | | | 2,628,720 | |
| | 3,000,000 | | | Series 2016-1A-DR (CME Term SOFR 3 Month + 3.06%) | | | 8.38% | (a) | | | 07/15/2031 | | | | 2,972,507 | |
| | 2,500,000 | | | Series 2021-1A-D (CME Term SOFR 3 Month + 3.36%, 3.10% Floor) | | | 8.68% | (a) | | | 04/15/2034 | | | | 2,457,809 | |
| | | | |
| | | | Canyon CLO | | | | | | | | | | | | |
| | 1,000,000 | | | Series 2021-3A-D (CME Term SOFR 3 Month + 3.31%, 3.05% Floor) | | | 8.63% | (a) | | | 07/15/2034 | | | | 974,723 | |
| | | | |
| | | | Carlyle Global Market Strategies | | | | | | | | | | | | |
| | 5,000,000 | | | Series 2016-3A-DRR (CME Term SOFR 3 Month + 3.56%, 3.30% Floor) | | | 8.88% | (a) | | | 07/20/2034 | | | | 5,007,516 | |
| | 9,000,000 | | | Series 2021-9A-D (CME Term SOFR 3 Month + 3.46%, 3.20% Floor) | | | 8.78% | (a) | | | 10/20/2034 | | | | 8,977,800 | |
| | | | |
| | | | Cathedral Lake CLO Ltd. | | | | | | | | | | | | |
| | 6,000,000 | | | Series 2021-8A-C (CME Term SOFR 3 Month + 2.88%, 2.62% Floor) | | | 8.20% | (a) | | | 01/20/2035 | | | | 6,075,767 | |
| | 5,000,000 | | | Series 2021-8A-D1 (CME Term SOFR 3 Month + 3.68%, 3.42% Floor) | | | 9.00% | (a) | | | 01/20/2035 | | | | 4,905,854 | |
| | | | |
| | | | Cent CLO | | | | | | | | | | | | |
| | 9,500,000 | | | Series 2018-27A-DR (CME Term SOFR 3 Month + 4.09%, 3.83% Floor) | | | 9.42% | (a) | | | 01/25/2035 | | | | 9,270,051 | |
| | | | |
| | | | Dryden Senior Loan Fund | | | | | | | | | | | | |
| | 3,000,000 | | | Series 2015-40A-DR (CME Term SOFR 3 Month + 3.36%, 3.10% Floor) | | | 8.67% | (a) | | | 08/15/2031 | | | | 2,961,134 | |
| | 2,006,000 | | | Series 2016-42A-DR (CME Term SOFR 3 Month + 3.19%) | | | 8.51% | (a) | | | 07/15/2030 | | | | 1,961,706 | |
| | 2,200,000 | | | Series 2016-43A-DR3 (CME Term SOFR 3 Month + 3.51%, 3.25% Floor) | | | 8.83% | (a) | | | 04/20/2034 | | | | 2,203,867 | |
| | 2,000,000 | | | Series 2018-57A-D (CME Term SOFR 3 Month + 2.81%, 2.55% Floor) | | | 8.12% | (a) | | | 05/15/2031 | | | | 1,927,805 | |
| | | | |
| | | | Gilbert Park CLO | | | | | | | | | | | | |
| | 4,000,000 | | | Series 2017-1A-E (CME Term SOFR 3 Month + 6.66%) | | | 11.98% | (a) | | | 10/15/2030 | | | | 3,982,850 | |
| | | | | | | | |
| The accompanying notes are an integral part of these financial statements. | | Annual Report | | | | | March 31, 2024 | | 15 |
| | |
Schedule of Investments DoubleLine Core Fixed Income Fund (Cont.) | | |
| | | | | | | | | | | | | | | | |
PRINCIPAL AMOUNT $ | | | SECURITY DESCRIPTION | | RATE | | | MATURITY | | | VALUE $ | |
| | | | |
| | | | Hayfin US | | | | | | | | | | | | |
| | 5,000,000 | | | Series 2018-9A-BR (CME Term SOFR 3 Month + 2.06%, 1.80% Floor) | | | 7.38% | (a) | | | 04/28/2031 | | | | 5,017,390 | |
| | | | |
| | | | ING Investment Management CLO Ltd. | | | | | | | | | | | | |
| | 3,000,000 | | | Series 2014-1A-CR2 (CME Term SOFR 3 Month + 3.06%) | | | 8.36% | (a) | | | 04/18/2031 | | | | 2,951,094 | |
| | | | |
| | | | LCM LP | | | | | | | | | | | | |
| | 2,000,000 | | | Series 25A-D (CME Term SOFR 3 Month + 3.71%) | | | 9.03% | (a) | | | 07/20/2030 | | | | 1,922,703 | |
| | 3,250,000 | | | Series 28A-D (CME Term SOFR 3 Month + 3.21%, 2.95% Floor) | | | 8.53% | (a) | | | 10/20/2030 | | | | 3,005,141 | |
| | 4,000,000 | | | Series 30A-DR (CME Term SOFR 3 Month + 3.26%, 3.00% Floor) | | | 8.58% | (a) | | | 04/20/2031 | | | | 3,782,173 | |
| | | | |
| | | | LCM XIII LP | | | | | | | | | | | | |
| | 4,000,000 | | | Series 14A-DR (CME Term SOFR 3 Month + 3.01%) | | | 8.33% | (a) | | | 07/20/2031 | | | | 3,751,616 | |
| | | | |
| | | | Magnetite CLO Ltd. | | | | | | | | | | | | |
| | 1,500,000 | | | Series 2016-18A-DR (CME Term SOFR 3 Month + 2.96%) | | | 8.27% | (a) | | | 11/15/2028 | | | | 1,488,078 | |
| | 2,000,000 | | | Series 2019-23A-DR (CME Term SOFR 3 Month + 3.31%, 3.05% Floor) | | | 8.64% | (a) | | | 01/25/2035 | | | | 1,995,573 | |
| | | | |
| | | | Neuberger Berman CLO Ltd. | | | | | | | | | | | | |
| | 2,000,000 | | | Series 2019-32A-DR (CME Term SOFR 3 Month + 2.96%, 2.70% Floor) | | | 8.27% | (a) | | | 01/20/2032 | | | | 1,986,484 | |
| | | | |
| | | | Octagon Investment Partners Ltd. | | | | | | | | | | | | |
| | 5,600,000 | | | Series 2012-1A-CRR (CME Term SOFR 3 Month + 4.16%, 3.90% Floor) | | | 9.48% | (a) | | | 07/15/2029 | | | | 5,621,123 | |
| | 2,000,000 | | | Series 2013-1A-DR (CME Term SOFR 3 Month + 3.26%, 3.00% Floor) | | | 8.58% | (a) | | | 07/17/2030 | | | | 1,950,251 | |
| | 2,000,000 | | | Series 2013-1A-DR2 (CME Term SOFR 3 Month + 2.76%) | | | 8.09% | (a) | | | 01/25/2031 | | | | 1,959,391 | |
| | 2,250,000 | | | Series 2014-1A-CR3 (CME Term SOFR 3 Month + 3.01%, 2.75% Floor) | | | 8.32% | (a) | | | 02/14/2031 | | | | 2,240,407 | |
| | 10,000,000 | | | Series 2016-1A-DR (CME Term SOFR 3 Month + 3.21%) | | | 8.53% | (a) | | | 07/15/2030 | | | | 9,760,057 | |
| | 5,460,000 | | | Series 2017-1A-CR (CME Term SOFR 3 Month + 3.56%) | | | 8.88% | (a) | | | 03/17/2030 | | | | 5,397,377 | |
| | 1,760,000 | | | Series 2017-1A-D (CME Term SOFR 3 Month + 6.46%) | | | 11.78% | (a)(d) | | | 03/17/2030 | | | | 1,659,068 | |
| | 1,500,000 | | | Series 2018-18A-C (CME Term SOFR 3 Month + 2.96%) | | | 8.28% | (a) | | | 04/16/2031 | | | | 1,455,466 | |
| | 2,500,000 | | | Series 2018-2A-C (CME Term SOFR 3 Month + 3.11%) | | | 8.44% | (a) | | | 07/25/2030 | | | | 2,430,247 | |
| | 3,500,000 | | | Series 2019-1A-DR (CME Term SOFR 3 Month + 3.61%, 3.35% Floor) | | | 8.93% | (a) | | | 01/20/2035 | | | | 3,490,103 | |
| | | | |
| | | | Octagon Investment Partners XXII LLC | | | | | | | | | | | | |
| | 2,500,000 | | | Series 2014-1A-ERR (CME Term SOFR 3 Month + 5.71%, 5.71% Floor) | | | 11.03% | (a) | | | 01/22/2030 | | | | 2,414,387 | |
| | | | |
| | | | Race Point CLO Ltd. | | | | | | | | | | | | |
| | 5,000,000 | | | Series 2013-8A-DR2 (CME Term SOFR 3 Month + 3.76%, 3.50% Floor) | | | 9.08% | (a) | | | 02/20/2030 | | | | 4,987,738 | |
| | | | |
| | | | Sound Point CLO Ltd. | | | | | | | | | | | | |
| | 3,500,000 | | | Series 2016-2A-DR (CME Term SOFR 3 Month + 4.11%, 3.85% Floor) | | | 9.43% | (a) | | | 10/20/2028 | | | | 3,498,418 | |
| | 1,000,000 | | | Series 2018-2A-C (CME Term SOFR 3 Month + 2.21%) | | | 7.54% | (a) | | | 07/26/2031 | | | | 985,721 | |
| | 7,000,000 | | | Series 2019-2A-DR (CME Term SOFR 3 Month + 3.56%, 3.30% Floor) | | | 8.88% | (a) | | | 07/15/2034 | | | | 6,638,196 | |
| | 7,000,000 | | | Series 2019-3A-DR (CME Term SOFR 3 Month + 3.76%, 3.76% Floor) | | | 9.09% | (a) | | | 10/25/2034 | | | | 6,606,593 | |
| | 2,000,000 | | | Series 2020-1A-DR (CME Term SOFR 3 Month + 3.61%, 3.61% Floor) | | | 8.93% | (a) | | | 07/20/2034 | | | | 1,901,465 | |
| | 4,000,000 | | | Series 2020-3A-D (CME Term SOFR 3 Month + 3.91%, 3.65% Floor) | | | 9.24% | (a) | | | 01/25/2032 | | | | 3,921,743 | |
| | 1,250,000 | | | Series 2021-3A-D (CME Term SOFR 3 Month + 3.51%, 3.25% Floor) | | | 8.84% | (a) | | | 10/25/2034 | | | | 1,214,948 | |
| | 1,000,000 | | | Series 2021-4A-D (CME Term SOFR 3 Month + 3.66%, 3.66% Floor) | | | 8.99% | (a) | | | 10/25/2034 | | | | 979,393 | |
| | | | |
| | | | Stewart Park CLO | | | | | | | | | | | | |
| | 10,000,000 | | | Series 2015-1A-DR (CME Term SOFR 3 Month + 2.86%, 2.60% Floor) | | | 8.18% | (a) | | | 01/15/2030 | | | | 9,815,754 | |
| | | | |
| | | | Symphony CLO Ltd. | | | | | | | | | | | | |
| | 3,000,000 | | | Series 2015-16A-DR (CME Term SOFR 3 Month + 3.31%, 3.05% Floor) | | | 8.63% | (a) | | | 10/15/2031 | | | | 2,944,595 | |
| | | | |
| 16 | | DoubleLine Funds Trust | | The accompanying notes are an integral part of these financial statements. |
| | | | | | | | | | | | | | | | |
PRINCIPAL AMOUNT $ | | | SECURITY DESCRIPTION | | RATE | | | MATURITY | | | VALUE $ | |
| | | | |
| | | | Trimaran CAVU LLC | | | | | | | | | | | | |
| | 10,000,000 | | | Series 2021-3A-D (CME Term SOFR 3 Month + 4.04%, 3.78% Floor) | | | 9.34% | (a) | | | 01/18/2035 | | | | 10,045,185 | |
| | | | |
| | | | Upland CLO | | | | | | | | | | | | |
| | 1,000,000 | | | Series 2016-1A-CR (CME Term SOFR 3 Month + 3.16%) | | | 8.48% | (a) | | | 04/20/2031 | | | | 981,742 | |
| | | | |
| | | | Voya CLO Ltd. | | | | | | | | | | | | |
| | 3,000,000 | | | Series 2017-3A-CR (CME Term SOFR 3 Month + 3.41%) | | | 8.73% | (a) | | | 04/20/2034 | | | | 3,004,817 | |
| | 4,000,000 | | | Series 2018-2A-D (CME Term SOFR 3 Month + 3.01%, 2.75% Floor) | | | 8.33% | (a) | | | 07/15/2031 | | | | 3,899,960 | |
| | | | |
| | | | Wellfleet CLO Ltd. | | | | | | | | | | | | |
| | 4,992,463 | | | Series 2019-XA-A1R (CME Term SOFR 3 Month + 1.43%) | | | 6.75% | (a) | | | 07/20/2032 | | | | 4,992,234 | |
| | | | |
| | | | Wind River CLO Ltd. | | | | | | | | | | | | |
| | 2,250,000 | | | Series 2014-1A-DRR (CME Term SOFR 3 Month + 3.26%, 3.00% Floor) | | | 8.56% | (a) | | | 07/18/2031 | | | | 2,113,793 | |
| | 1,000,000 | | | Series 2014-2A-ER (CME Term SOFR 3 Month + 6.01%, 5.75% Floor) | | | 11.33% | (a)(d) | | | 01/15/2031 | | | | 837,098 | |
| | 4,000,000 | | | Series 2014-3A-DR2 (CME Term SOFR 3 Month + 3.66%, 3.40% Floor) | | | 8.98% | (a) | | | 10/22/2031 | | | | 3,709,029 | |
| | 3,000,000 | | | Series 2017-1A-DR (CME Term SOFR 3 Month + 3.98%, 3.72% Floor) | | | 9.28% | (a) | | | 04/18/2036 | | | | 2,953,767 | |
| | 4,000,000 | | | Series 2017-3A-DR (CME Term SOFR 3 Month + 4.11%, 3.85% Floor) | | | 9.43% | (a) | | | 04/15/2035 | | | | 3,980,930 | |
| | 4,000,000 | | | Series 2018-1A-D (CME Term SOFR 3 Month + 3.16%) | | | 8.48% | (a) | | | 07/15/2030 | | | | 3,894,044 | |
| | 2,500,000 | | | Series 2018-2A-D (CME Term SOFR 3 Month + 3.26%) | | | 8.58% | (a) | | | 07/15/2030 | | | | 2,410,742 | |
| | | | | | | | | | | | | | | | |
| | | | Total Collateralized Loan Obligations
(Cost $235,243,052) | | | | | | | | 231,116,271 | |
| | | | | | | | | | | | | |
| | FOREIGN CORPORATE BONDS - 6.2% | | | | | | | | | | | | |
| | 263,000 | | | 1375209 BC Ltd. | | | 9.00% | (a) | | | 01/30/2028 | | | | 258,026 | |
| | 1,919,000 | | | Adani Electricity Mumbai Ltd. | | | 3.95% | | | | 02/12/2030 | | | | 1,633,286 | |
| | 1,100,000 | | | Adani Electricity Mumbai Ltd. | | | 3.87% | | | | 07/22/2031 | | | | 906,426 | |
| | 1,331,250 | | | Adani International Container Terminal Pvt Ltd. | | | 3.00% | (a) | | | 02/16/2031 | | | | 1,135,843 | |
| | 2,840,000 | | | Adani International Container Terminal Pvt Ltd. | | | 3.00% | | | | 02/16/2031 | | | | 2,423,132 | |
| | 1,000,000 | | | Adani Ports & Special Economic Zone Ltd. | | | 4.00% | | | | 07/30/2027 | | | | 918,608 | |
| | 1,614,000 | | | Adani Ports & Special Economic Zone Ltd. | | | 4.20% | | | | 08/04/2027 | | | | 1,492,319 | |
| | 1,700,000 | | | Adani Ports & Special Economic Zone Ltd. | | | 4.38% | | | | 07/03/2029 | | | | 1,517,331 | |
| | 700,000 | | | Adani Ports & Special Economic Zone Ltd. | | | 3.10% | | | | 02/02/2031 | | | | 558,080 | |
| | 1,000,000 | | | Adani Transmission Step-One Ltd. | | | 4.00% | | | | 08/03/2026 | | | | 940,685 | |
| | 1,169,650 | | | Adani Transmission Step-One Ltd. | | | 4.25% | | | | 05/21/2036 | | | | 993,006 | |
| | 900,000 | | | Adaro Indonesia PT | | | 4.25% | | | | 10/31/2024 | | | | 888,703 | |
| | 3,492,000 | | | AerCap Ireland Capital DAC / AerCap Global Aviation Trust | | | 5.10% | | | | 01/19/2029 | | | | 3,473,171 | |
| | 3,200,000 | | | AES Espana BV | | | 5.70% | (a) | | | 05/04/2028 | | | | 2,953,632 | |
| | 2,350,000 | | | Agrosuper SA | | | 4.60% | | | | 01/20/2032 | | | | 2,031,772 | |
| | 1,031,248 | | | AI Candelaria Spain SA | | | 7.50% | | | | 12/15/2028 | | | | 1,010,738 | |
| | 3,200,000 | | | AI Candelaria Spain SA | | | 5.75% | (a) | | | 06/15/2033 | | | | 2,599,549 | |
| | 1,650,000 | | | AI Candelaria Spain SA | | | 5.75% | | | | 06/15/2033 | | | | 1,340,392 | |
| | 6,560,000 | | | AIB Group PLC
(US Secured Overnight Financing Rate + 1.91%) | | | 5.87% | (a) | | | 03/28/2035 | | | | 6,581,019 | |
| | 800,000 | | | Altice Financing SA | | | 5.00% | (a) | | | 01/15/2028 | | | | 659,123 | |
| | 1,305,000 | | | Altice France Holding SA | | | 6.00% | (a) | | | 02/15/2028 | | | | 372,787 | |
| | 1,660,000 | | | Altice France SA/France | | | 5.50% | (a) | | | 10/15/2029 | | | | 1,128,448 | |
| | 200,000 | | | AngloGold Ashanti Holdings PLC | | | 3.75% | | | | 10/01/2030 | | | | 174,918 | |
| | 340,000 | | | ARD Finance SA
7.25% PIK | | | 6.50% | (a) | | | 06/30/2027 | | | | 114,134 | |
| | 1,305,000 | | | Ardonagh Finco Ltd. | | | 7.75% | (a) | | | 02/15/2031 | | | | 1,300,440 | |
| | 6,322,000 | | | Australia & New Zealand Banking Group Ltd.
(5 Year CMT Rate + 1.70%) | | | 2.57% | (a) | | | 11/25/2035 | | | | 5,188,224 | |
| | 1,093,425 | | | Avation Capital SA
9.00% PIK | | | 8.25% | (a) | | | 10/31/2026 | | | | 940,548 | |
| | 7,115,000 | | | Avolon Holdings Funding Ltd. | | | 5.75% | (a) | | | 03/01/2029 | | | | 7,085,502 | |
| | 2,400,000 | | | Banco Davivienda SA
(10 Year CMT Rate + 5.10%) | | | 6.65% | (a)(h) | | | 04/22/2031 | | | | 1,689,000 | |
| | 200,000 | | | Banco de Bogota SA | | | 6.25% | | | | 05/12/2026 | | | | 200,086 | |
| | 400,000 | | | Banco de Credito del Peru SA | | | 5.85% | (a) | | | 01/11/2029 | | | | 404,898 | |
| | | | | | | | |
| The accompanying notes are an integral part of these financial statements. | | Annual Report | | | | | March 31, 2024 | | 17 |
| | |
Schedule of Investments DoubleLine Core Fixed Income Fund (Cont.) | | |
| | | | | | | | | | | | | | | | |
PRINCIPAL AMOUNT $ | | | SECURITY DESCRIPTION | | RATE | | | MATURITY | | | VALUE $ | |
| | 500,000 | | | Banco de Credito del Peru SA
(5 Year CMT Rate + 3.00%) | | | 3.13% | (a) | | | 07/01/2030 | | | | 479,179 | |
| | 3,240,000 | | | Banco de Credito del Peru SA
(5 Year CMT Rate + 3.00%) | | | 3.13% | | | | 07/01/2030 | | | | 3,105,081 | |
| | 1,200,000 | | | Banco de Credito del Peru SA
(5 Year CMT Rate + 2.45%) | | | 3.25% | | | | 09/30/2031 | | | | 1,109,115 | |
| | 1,400,000 | | | Banco do Estado do Rio Grande do Sul SA
(5 Year CMT Rate + 4.93%) | | | 5.38% | | | | 01/28/2031 | | | | 1,353,997 | |
| | 250,000 | | | Banco GNB Sudameris SA
(5 Year CMT Rate + 4.56%) | | | 7.05% | | | | 04/03/2027 | | | | 249,952 | |
| | 2,050,000 | | | Banco Industrial SA/Guatemala
(5 Year CMT Rate + 4.44%) | | | 4.88% | | | | 01/29/2031 | | | | 1,965,417 | |
| | 4,555,000 | | | Banco Internacional del Peru SAA Interbank
(5 Year CMT Rate + 3.71%) | | | 4.00% | | | | 07/08/2030 | | | | 4,377,829 | |
| | 3,700,000 | | | Banco Mercantil del Norte SA/Grand Cayman
(10 Year CMT Rate + 5.35%) | | | 7.63% | (h) | | | 01/10/2028 | | | | 3,706,316 | |
| | 300,000 | | | Banco Mercantil del Norte SA/Grand Cayman
(10 Year CMT Rate + 5.47%) | | | 7.50% | (h) | | | 06/27/2029 | | | | 299,462 | |
| | 2,521,000 | | | Banco Mercantil del Norte SA/Grand Cayman
(10 Year CMT Rate + 5.47%) | | | 7.50% | (a)(h) | | | 06/27/2029 | | | | 2,516,476 | |
| | 700,000 | | | Banco Santander Mexico SA Institucion de Banca Multiple Grupo Financiero Santand
(5 Year CMT Rate + 3.00%) | | | 7.53% | | | | 10/01/2028 | | | | 728,558 | |
| | 4,600,000 | | | Bancolombia SA
(5 Year CMT Rate + 2.94%) | | | 4.63% | | | | 12/18/2029 | | | | 4,486,907 | |
| | 500,000 | | | Banistmo SA | | | 4.25% | | | | 07/31/2027 | | | | 466,675 | |
| | 7,656,000 | | | Bank of Montreal
(5 Year Swap Rate USD + 1.43%) | | | 3.80% | | | | 12/15/2032 | | | | 7,145,967 | |
| | 10,118,000 | | | Bank of Nova Scotia/The
(5 Year CMT Rate + 2.05%) | | | 4.59% | | | | 05/04/2037 | | | | 9,179,924 | |
| | 6,664,000 | | | BAT Capital Corp. | | | 4.54% | | | | 08/15/2047 | | | | 5,149,735 | |
| | 4,000,000 | | | BBVA Bancomer SA/Texas
(5 Year CMT Rate + 2.65%) | | | 5.13% | | | | 01/18/2033 | | | | 3,719,959 | |
| | 2,200,000 | | | BBVA Bancomer SA/Texas
(5 Year CMT Rate + 4.31%) | | | 5.88% | | | | 09/13/2034 | | | | 2,083,381 | |
| | 10,125,000 | | | BHP Billiton Finance USA Ltd. | | | 5.25% | | | | 09/08/2030 | | | | 10,301,695 | |
| | 1,040,000 | | | Bombardier, Inc. | | | 8.75% | (a) | | | 11/15/2030 | | | | 1,111,787 | |
| | 5,265,000 | | | BPCE SA | | | 1.00% | (a) | | | 01/20/2026 | | | | 4,882,458 | |
| | 1,400,000 | | | Braskem Idesa SAPI | | | 6.99% | | | | 02/20/2032 | | | | 1,087,675 | |
| | 300,000 | | | Braskem Netherlands Finance BV | | | 7.25% | | | | 02/13/2033 | | | | 288,765 | |
| | 2,500,000 | | | Braskem Netherlands Finance BV
(5 Year CMT Rate + 8.22%) | | | 8.50% | | | | 01/23/2081 | | | | 2,509,087 | |
| | 1,400,000 | | | Buffalo Energy Mexico Holdings / Buffalo Energy Infrastructure / Buffalo Energy | | | 7.88% | (a) | | | 02/15/2039 | | | | 1,516,642 | |
| | 2,800,000 | | | Canacol Energy Ltd. | | | 5.75% | | | | 11/24/2028 | | | | 1,241,434 | |
| | 2,100,000 | | | CAP SA | | | 3.90% | (a) | | | 04/27/2031 | | | | 1,650,945 | |
| | 2,900,000 | | | CAP SA | | | 3.90% | | | | 04/27/2031 | | | | 2,279,877 | |
| | 4,170,000 | | | CCL Industries, Inc. | | | 3.05% | (a) | | | 06/01/2030 | | | | 3,620,243 | |
| | 5,200,000 | | | Cemex SAB de CV
(5 Year CMT Rate + 4.53%) | | | 5.13% | (h) | | | 06/08/2026 | | | | 5,028,829 | |
| | 300,000 | | | Cemex SAB de CV
(5 Year CMT Rate + 5.16%) | | | 9.13% | (a)(h) | | | 03/14/2028 | | | | 326,094 | |
| | 4,951,411 | | | Chile Electricity PEC SpA | | | 0.00% | (a) | | | 01/25/2028 | | | | 3,894,284 | |
| | 4,325,000 | | | CI Financial Corp. | | | 4.10% | | | | 06/15/2051 | | | | 2,705,084 | |
| | 3,400,000 | | | Cia de Minas Buenaventura SAA | | | 5.50% | | | | 07/23/2026 | | | | 3,282,299 | |
| | 401,000 | | | Cometa Energia SAB de CV | | | 6.38% | | | | 04/24/2035 | | | | 404,515 | |
| | 4,356,000 | | | Commonwealth Bank of Australia | | | 4.32% | (a) | | | 01/10/2048 | | | | 3,552,003 | |
| | 200,000 | | | Cosan Luxembourg SA | | | 7.50% | (a) | | | 06/27/2030 | | | | 207,502 | |
| | 3,381,000 | | | Cosan Overseas Ltd. | | | 8.25% | (h) | | | 05/05/2024 | | | | 3,463,411 | |
| | 5,010,000 | | | Credit Agricole SA
(US Secured Overnight Financing Rate + 1.69%) | | | 5.34% | (a) | | | 01/10/2030 | | | | 4,997,259 | |
| | 5,400,000 | | | Credito Real SAB de CV SOFOM ER
(5 Year CMT Rate + 7.03%) | | | 9.13% | (g)(h) | | | 11/29/2027 | | | | 14,040 | |
| | 2,200,000 | | | CSN Resources SA | | | 5.88% | | | | 04/08/2032 | | | | 1,926,253 | |
| | 3,000,000 | | | CT Trust | | | 5.13% | | | | 02/03/2032 | | | | 2,661,788 | |
| | | | |
| 18 | | DoubleLine Funds Trust | | The accompanying notes are an integral part of these financial statements. |
| | | | | | | | | | | | | | | | |
PRINCIPAL AMOUNT $ | | | SECURITY DESCRIPTION | | RATE | | | MATURITY | | | VALUE $ | |
| | 2,500,000 | | | DBS Group Holdings Ltd.
(5 Year CMT Rate + 1.10%) | | | 1.82% | | | | 03/10/2031 | | | | 2,327,564 | |
| | 1,788,649 | | | Digicel Group Holdings Ltd. | | | 0.00% | (a)(d) | | | 12/31/2030 | | | | 20,540 | |
| | 710,927 | | | Digicel Group Holdings Ltd. | | | 0.00% | (a)(d) | | | 12/31/2030 | | | | 109,836 | |
| | 141,832 | | | Digicel Group Holdings Ltd. | | | 0.00% | (a)(d) | | | 12/31/2030 | | | | 130,972 | |
| | 18,236 | | | Digicel Group Holdings Ltd. | | | 0.00% | (a)(d) | | | 12/31/2030 | | | | 14,730 | |
| | 400,000 | | | eG Global Finance PLC | | | 12.00% | (a) | | | 11/30/2028 | | | | 425,509 | |
| | 4,846,000 | | | Element Fleet Management Corp. | | | 6.32% | (a) | | | 12/04/2028 | | | | 5,007,936 | |
| | 1,887,480 | | | Empresa Electrica Cochrane SpA | | | 5.50% | | | | 05/14/2027 | | | | 1,828,522 | |
| | 5,000,000 | | | Empresas Publicas de Medellin ESP | | | 4.25% | | | | 07/18/2029 | | | | 4,345,641 | |
| | 2,000,000 | | | Empresas Publicas de Medellin ESP | | | 4.38% | | | | 02/15/2031 | | | | 1,672,764 | |
| | 187,869 | | | Fermaca Enterprises S de RL de CV | | | 6.38% | | | | 03/30/2038 | | | | 183,916 | |
| | 773,370 | | | Fideicomiso PA Pacifico Tres | | | 8.25% | | | | 01/15/2035 | | | | 735,245 | |
| | 2,800,000 | | | Freeport Indonesia PT | | | 4.76% | | | | 04/14/2027 | | | | 2,740,872 | |
| | 1,000,000 | | | Freeport Indonesia PT | | | 5.32% | (a) | | | 04/14/2032 | | | | 979,188 | |
| | 2,300,000 | | | Freeport Indonesia PT | | | 5.32% | | | | 04/14/2032 | | | | 2,252,132 | |
| | 750,000 | | | Freeport-McMoRan, Inc. | | | 4.38% | | | | 08/01/2028 | | | | 721,460 | |
| | 300,000 | | | Freeport-McMoRan, Inc. | | | 5.25% | | | | 09/01/2029 | | | | 300,399 | |
| | 2,200,000 | | | Freeport-McMoRan, Inc. | | | 4.63% | | | | 08/01/2030 | | | | 2,115,434 | |
| | 1,031,000 | | | Frigorifico Concepcion SA | | | 7.70% | | | | 07/21/2028 | | | | 904,311 | |
| | 1,295,000 | | | Garda World Security Corp. | | | 4.63% | (a) | | | 02/15/2027 | | | | 1,241,792 | |
| | 930,000 | | | Garda World Security Corp. | | | 6.00% | (a) | | | 06/01/2029 | | | | 833,507 | |
| | 1,850,000 | | | Geopark Ltd. | | | 5.50% | | | | 01/17/2027 | | | | 1,681,742 | |
| | 1,040,000 | | | GGAM Finance Ltd. | | | 6.88% | (a) | | | 04/15/2029 | | | | 1,046,500 | |
| | 5,018,000 | | | Glencore Funding LLC | | | 1.63% | (a) | | | 04/27/2026 | | | | 4,654,548 | |
| | 11,090,000 | | | Glencore Funding LLC | | | 5.37% | (a) | | | 04/04/2029 | | | | 11,115,848 | |
| | 1,983,292 | | | Global Aircraft Leasing Co. Ltd.
7.25% PIK | | | 6.50% | (a) | | | 09/15/2024 | | | | 1,888,418 | |
| | 1,500,000 | | | Global Bank Corp.
(3 Month LIBOR USD + 3.30%) | | | 5.25% | (e) | | | 04/16/2029 | | | | 1,380,549 | |
| | 129,440 | | | GNL Quintero SA | | | 4.63% | | | | 07/31/2029 | | | | 126,719 | |
| | 800,000 | | | Gold Fields Orogen Holdings BVI Ltd. | | | 5.13% | | | | 05/15/2024 | | | | 797,502 | |
| | 4,150,000 | | | Gran Tierra Energy, Inc. | | | 9.50% | (a) | | | 10/15/2029 | | | | 3,881,259 | |
| | 1,060,000 | | | Grifols SA | | | 4.75% | (a) | | | 10/15/2028 | | | | 878,338 | |
| | 6,340,246 | | | Guara Norte SARL | | | 5.20% | | | | 06/15/2034 | | | | 5,789,721 | |
| | 10,805,000 | | | HSBC Holdings PLC
(CME Term SOFR 3 Month + 1.64%) | | | 6.96% | | | | 09/12/2026 | | | | 10,920,731 | |
| | 1,505,000 | | | Husky Injection Molding Systems Ltd. / Titan Co.-Borrower LLC | | | 9.00% | (a) | | | 02/15/2029 | | | | 1,558,229 | |
| | 1,300,000 | | | INEOS Finance PLC | | | 7.50% | (a) | | | 04/15/2029 | | | | 1,305,632 | |
| | 3,815,000 | | | ING Groep NV
(US Secured Overnight Financing Rate + 1.44%) | | | 5.34% | | | | 03/19/2030 | | | | 3,807,047 | |
| | 2,986,000 | | | Inkia Energy Ltd. | | | 5.88% | | | | 11/09/2027 | | | | 2,924,612 | |
| | 1,000,000 | | | InRetail Consumer | | | 3.25% | | | | 03/22/2028 | | | | 899,056 | |
| | 800,000 | | | InRetail Shopping Malls | | | 5.75% | | | | 04/03/2028 | | | | 781,141 | |
| | 885,000 | | | Intelsat Jackson Holdings SA | | | 6.50% | (a) | | | 03/15/2030 | | | | 824,440 | |
| | 300,000 | | | Intercorp Financial Services, Inc. | | | 4.13% | | | | 10/19/2027 | | | | 282,268 | |
| | 689,863 | | | Interoceanica IV Finance Ltd.
Series 2007 | | | 0.00% | | | | 11/30/2025 | | | | 651,058 | |
| | 1,192,690 | | | Invepar Holdings | | | 0.00% | (d)(g) | | | 12/30/2028 | | | | – | |
| | 500,000 | | | Inversiones La Construccion SA | | | 4.75% | | | | 02/07/2032 | | | | 427,500 | |
| | 2,300,000 | | | Itau Unibanco Holding SA/Cayman Island
(5 Year CMT Rate + 3.22%) | | | 4.63% | (h) | | | 02/27/2025 | | | | 2,165,766 | |
| | 500,000 | | | JBS USA LUX SA / JBS USA Food Co. / JBS USA Finance, Inc. | | | 3.75% | | | | 12/01/2031 | | | | 432,629 | |
| | 161,000 | | | JSW Hydro Energy Ltd. | | | 4.13% | | | | 05/18/2031 | | | | 142,834 | |
| | 1,046,500 | | | JSW Hydro Energy Ltd. | | | 4.13% | (a) | | | 05/18/2031 | | | | 928,420 | |
| | 1,500,000 | | | JSW Steel Ltd. | | | 5.05% | | | | 04/05/2032 | | | | 1,322,617 | |
| | 300,000 | | | Kallpa Generacion SA | | | 4.13% | | | | 08/16/2027 | | | | 285,405 | |
| | 865,000 | | | Kronos Acquisition Holdings, Inc. / KIK Custom Products, Inc. | | | 5.00% | (a) | | | 12/31/2026 | | | | 848,661 | |
| | 500,000 | | | KUO SAB De CV | | | 5.75% | | | | 07/07/2027 | | | | 471,743 | |
| | 5,574,240 | | | LLPL Capital Pte Ltd. | | | 6.88% | (a) | | | 02/04/2039 | | | | 5,581,261 | |
| | | | | | | | |
| The accompanying notes are an integral part of these financial statements. | | Annual Report | | | | | March 31, 2024 | | 19 |
| | |
Schedule of Investments DoubleLine Core Fixed Income Fund (Cont.) | | |
| | | | | | | | | | | | | | | | |
PRINCIPAL AMOUNT $ | | | SECURITY DESCRIPTION | | RATE | | | MATURITY | | | VALUE $ | |
| | 975,000 | | | Macquarie Airfinance Holdings Ltd. | | | 6.40% | (a) | | | 03/26/2029 | | | | 991,151 | |
| | 515,000 | | | Macquarie Airfinance Holdings Ltd. | | | 6.50% | (a) | | | 03/26/2031 | | | | 524,572 | |
| | 13,564,000 | | | Macquarie Group Ltd.
(US Secured Overnight Financing Rate + 1.53%) | | | 2.87% | (a) | | | 01/14/2033 | | | | 11,297,320 | |
| | 4,000,000 | | | MARB BondCo PLC | | | 3.95% | | | | 01/29/2031 | | | | 3,301,143 | |
| | 1,340,000 | | | Mattamy Group Corp. | | | 4.63% | (a) | | | 03/01/2030 | | | | 1,219,362 | |
| | 855,676 | | | MC Brazil Downstream Trading SARL | | | 7.25% | | | | 06/30/2031 | | | | 775,219 | |
| | 1,200,000 | | | Mercury Chile Holdco LLC | | | 6.50% | (a) | | | 01/24/2027 | | | | 1,164,072 | |
| | 200,000 | | | Mercury Chile Holdco LLC | | | 6.50% | | | | 01/24/2027 | | | | 194,012 | |
| | 2,095,000 | | | Merlin Entertainments Group US Holdings, Inc. | | | 7.38% | (a) | | | 02/15/2031 | | | | 2,112,638 | |
| | 2,550,000 | | | Mexarrend SAPI de CV | | | 10.25% | (a)(g) | | | 07/24/2024 | | | | 535,500 | |
| | 1,517,088 | | | Mexico Generadora de Energia S de RL | | | 5.50% | | | | 12/06/2032 | | | | 1,494,693 | |
| | 810,000 | | | Millicom International Cellular SA | | | 6.63% | | | | 10/15/2026 | | | | 807,007 | |
| | 900,000 | | | Millicom International Cellular SA | | | 5.13% | | | | 01/15/2028 | | | | 854,419 | |
| | 1,800,000 | | | Millicom International Cellular SA | | | 6.25% | | | | 03/25/2029 | | | | 1,759,080 | |
| | 7,000,000 | | | Minejesa Capital BV | | | 5.63% | | | | 08/10/2037 | | | | 6,373,946 | |
| | 3,200,000 | | | Minerva Luxembourg SA | | | 4.38% | | | | 03/18/2031 | | | | 2,677,344 | |
| | 800,000 | | | Minerva Luxembourg SA | | | 8.88% | | | | 09/13/2033 | | | | 842,224 | |
| | 1,100,000 | | | Minerva Luxembourg SA | | | 8.88% | (a) | | | 09/13/2033 | | | | 1,158,058 | |
| | 3,000,000 | | | Minsur SA | | | 4.50% | | | | 10/28/2031 | | | | 2,631,287 | |
| | 1,198,977 | | | Mong Duong Finance Holdings BV | | | 5.13% | | | | 05/07/2029 | | | | 1,147,152 | |
| | 972,000 | | | Multibank, Inc. | | | 7.75% | (a) | | | 02/03/2028 | | | | 981,771 | |
| | 3,129,483 | | | MV24 Capital BV | | | 6.75% | | | | 06/01/2034 | | | | 2,947,054 | |
| | 7,315,000 | | | National Australia Bank Ltd. | | | 2.99% | (a) | | | 05/21/2031 | | | | 6,169,813 | |
| | 5,084,000 | | | NatWest Markets PLC | | | 0.80% | (a) | | | 08/12/2024 | | | | 4,994,877 | |
| | 600,000 | | | NBM US Holdings, Inc. | | | 7.00% | | | | 05/14/2026 | | | | 602,771 | |
| | 4,314,000 | | | NBN Co. Ltd. | | | 1.45% | (a) | | | 05/05/2026 | | | | 3,994,729 | |
| | 2,150,000 | | | Network i2i Ltd.
(5 Year CMT Rate + 4.27%) | | | 5.65% | (h) | | | 01/15/2025 | | | | 2,137,389 | |
| | 500,000 | | | Network i2i Ltd.
(5 Year CMT Rate + 3.39%) | | | 3.98% | (h) | | | 03/03/2026 | | | | 477,248 | |
| | 1,000,000 | | | Nexa Resources SA | | | 5.38% | | | | 05/04/2027 | | | | 977,039 | |
| | 5,300,000 | | | NXP BV / NXP Funding LLC / NXP USA, Inc. | | | 3.88% | | | | 06/18/2026 | | | | 5,146,482 | |
| | 1,265,000 | | | Ontario Gaming GTA LP/OTG Co.-Issuer, Inc. | | | 8.00% | (a) | | | 08/01/2030 | | | | 1,303,921 | |
| | 1,028,000 | | | Orazul Energy Peru SA | | | 5.63% | | | | 04/28/2027 | | | | 974,380 | |
| | 4,000,000 | | | Oversea-Chinese Banking Corp. Ltd.
(5 Year CMT Rate + 1.58%) | | | 1.83% | | | | 09/10/2030 | | | | 3,782,193 | |
| | 500,000 | | | Oversea-Chinese Banking Corp. Ltd.
(5 Year CMT Rate + 1.58%) | | | 1.83% | (a) | | | 09/10/2030 | | | | 472,774 | |
| | 950,000 | | | Parkland Corp. | | | 4.63% | (a) | | | 05/01/2030 | | | | 876,644 | |
| | 1,030,000 | | | Primo Water Holdings, Inc. | | | 4.38% | (a) | | | 04/30/2029 | | | | 948,152 | |
| | 1,495,037 | | | Prumo Participacoes e Investimentos S/A | | | 7.50% | | | | 12/31/2031 | | | | 1,494,245 | |
| | 1,000,000 | | | Reliance Industries Ltd. | | | 3.67% | | | | 11/30/2027 | | | | 948,370 | |
| | 11,350,000 | | | Renesas Electronics Corp. | | | 2.17% | (a) | | | 11/25/2026 | | | | 10,388,575 | |
| | 2,615,000 | | | Royal Bank of Canada | | | 5.15% | | | | 02/01/2034 | | | | 2,618,722 | |
| | 450,000 | | | Rumo Luxembourg Sarl | | | 4.20% | | | | 01/18/2032 | | | | 382,684 | |
| | 4,470,833 | | | Rutas 2 & 7 Finance Ltd. | | | 0.00% | | | | 09/30/2036 | | | | 3,052,875 | |
| | 400,000 | | | Sasol Financing USA LLC | | | 4.38% | | | | 09/18/2026 | | | | 378,620 | |
| | 3,900,000 | | | Sasol Financing USA LLC | | | 5.50% | | | | 03/18/2031 | | | | 3,288,925 | |
| | 1,010,000 | | | Seaspan Corp. | | | 5.50% | (a) | | | 08/01/2029 | | | | 882,141 | |
| | 1,100,000 | | | Simpar Europe SA | | | 5.20% | | | | 01/26/2031 | | | | 962,485 | |
| | 5,475,000 | | | Smurfit Kappa Treasury ULC | | | 5.20% | (a) | | | 01/15/2030 | | | | 5,470,245 | |
| | 250,000 | | | Southern Copper Corp. | | | 3.88% | | | | 04/23/2025 | | | | 245,183 | |
| | 1,455,000 | | | Superior Plus LP / Superior General Partner, Inc. | | | 4.50% | (a) | | | 03/15/2029 | | | | 1,346,440 | |
| | 350,000 | | | Sydney Airport Finance Co. Pty Ltd. | | | 3.63% | (a) | | | 04/28/2026 | | | | 337,558 | |
| | 130,000 | | | Telesat Canada / Telesat LLC | | | 4.88% | (a) | | | 06/01/2027 | | | | 67,717 | |
| | 174,000 | | | Telesat Canada / Telesat LLC | | | 6.50% | (a) | | | 10/15/2027 | | | | 70,470 | |
| | 723,736 | | | Tierra Mojada Luxembourg II SARL | | | 5.75% | | | | 12/01/2040 | | | | 665,520 | |
| | 1,000,000 | | | Titan Acquisition Ltd. / Titan Co.-Borrower LLC | | | 7.75% | (a) | | | 04/15/2026 | | | | 999,655 | |
| | 800,000 | | | TK Elevator US Newco, Inc. | | | 5.25% | (a) | | | 07/15/2027 | | | | 773,780 | |
| | 500,000 | | | Transelec SA | | | 3.88% | | | | 01/12/2029 | | | | 473,244 | |
| | 2,095,000 | | | Triton Container International Ltd. | | | 1.15% | (a) | | | 06/07/2024 | | | | 2,076,378 | |
| | | | |
| 20 | | DoubleLine Funds Trust | | The accompanying notes are an integral part of these financial statements. |
| | | | | | | | | | | | | | | | |
PRINCIPAL AMOUNT $ | | | SECURITY DESCRIPTION | | RATE | | | MATURITY | | | VALUE $ | |
| | 3,986,000 | | | Triton Container International Ltd. / TAL International Container Corp. | | | 3.25% | | | | 03/15/2032 | | | | 3,241,364 | |
| | 6,716,000 | | | TSMC Global Ltd. | | | 1.25% | (a) | | | 04/23/2026 | | | | 6,220,138 | |
| | 6,640,000 | | | UBS Group AG
(1 Year CMT Rate + 1.52%) | | | 5.43% | (a) | | | 02/08/2030 | | | | 6,651,947 | |
| | 4,490,168 | | | UEP Penonome II SA | | | 6.50% | (a) | | | 10/01/2038 | | | | 3,513,557 | |
| | 880,425 | | | UEP Penonome II SA | | | 6.50% | | | | 10/01/2038 | | | | 688,933 | |
| | 9,700,000 | | | Unifin Financiera SAB de CV
(5 Year CMT Rate + 6.31%) | | | 8.88% | (g)(h) | | | 01/29/2025 | | | | 49,470 | |
| | 400,000 | | | Unigel Luxembourg SA | | | 8.75% | (g) | | | 10/01/2026 | | | | 124,680 | |
| | 3,100,000 | | | United Overseas Bank Ltd.
(5 Year CMT Rate + 1.52%) | | | 1.75% | | | | 03/16/2031 | | | | 2,878,636 | |
| | 1,500,000 | | | United Overseas Bank Ltd.
(5 Year CMT Rate + 1.23%) | | | 2.00% | | | | 10/14/2031 | | | | 1,374,723 | |
| | 300,000 | | | UPL Corp. Ltd. | | | 4.50% | | | | 03/08/2028 | | | | 257,968 | |
| | 3,350,000 | | | UPL Corp. Ltd. | | | 4.63% | | | | 06/16/2030 | | | | 2,698,747 | |
| | 4,000,000 | | | Vedanta Resources Finance II PLC | | | 9.25% | (a) | | | 04/23/2026 | | | | 3,267,895 | |
| | 2,914,000 | | | Vedanta Resources Ltd. | | | 13.88% | | | | 12/09/2028 | | | | 2,552,913 | |
| | 6,680,000 | | | Weir Group PLC/The | | | 2.20% | (a) | | | 05/13/2026 | | | | 6,202,572 | |
| | 6,295,000 | | | Westpac Banking Corp.
(5 Year CMT Rate + 1.53%) | | | 3.02% | | | | 11/18/2036 | | | | 5,176,930 | |
| | | | | | | | | | | | | | | | |
| | | | Total Foreign Corporate Bonds
(Cost $470,702,420) | | | | | | | | 427,157,930 | |
| | | | | | | | | | | | | | | | |
| | FOREIGN GOVERNMENT BONDS, FOREIGN AGENCIES AND FOREIGN GOVERNMENT SPONSORED CORPORATIONS - 0.7% | | | | | |
| | 3,800,000 | | | Banco do Brasil SA/Cayman
(10 Year CMT Rate + 4.40%) | | | 6.25% | (h) | | | 10/15/2024 | | | | 3,821,284 | |
| | 4,300,000 | | | Banco Nacional de Comercio Exterior SNC/Cayman Islands
(5 Year CMT Rate + 2.00%) | | | 2.72% | | | | 08/11/2031 | | | | 3,894,936 | |
| | 1,400,000 | | | Bank Negara Indonesia Persero Tbk PT | | | 3.75% | | | | 03/30/2026 | | | | 1,337,995 | |
| | 2,559,833 | | | Bioceanico Sovereign Certificate Ltd. | | | 0.00% | | | | 06/05/2034 | | | | 1,881,882 | |
| | 1,000,000 | | | Chile Government International Bond | | | 3.10% | | | | 01/22/2061 | | | | 633,283 | |
| | 10,700,000 | | | Colombia Government International Bond | | | 4.13% | | | | 05/15/2051 | | | | 6,667,136 | |
| | 200,000 | | | Comision Federal de Electricidad | | | 3.35% | | | | 02/09/2031 | | | | 167,485 | |
| | 2,400,000 | | | Corp. Financiera de Desarrollo SA
(3 Month LIBOR USD + 5.61%) | | | 5.25% | (e) | | | 07/15/2029 | | | | 2,398,008 | |
| | 9,000,000 | | | Ecopetrol SA | | | 5.88% | | | | 11/02/2051 | | | | 6,484,521 | |
| | 237,000 | | | Indonesia Asahan Aluminium PT / Mineral Industri Indonesia Persero PT | | | 5.45% | | | | 05/15/2030 | | | | 234,365 | |
| | 500,000 | | | Indonesia Asahan Aluminium PT / Mineral Industri Indonesia Persero PT | | | 4.75% | | | | 05/15/2025 | | | | 493,959 | |
| | 2,598,701 | | | Lima Metro Line 2 Finance Ltd. | | | 5.88% | | | | 07/05/2034 | | | | 2,580,099 | |
| | 7,000,000 | | | Mexico Government International Bond | | | 6.34% | | | | 05/04/2053 | | | | 6,923,683 | |
| | 2,800,000 | | | Mexico Government International Bond | | | 4.40% | | | | 02/12/2052 | | | | 2,145,970 | |
| | 5,800,000 | | | Panama Government International Bond | | | 3.87% | | | | 07/23/2060 | | | | 3,378,326 | |
| | 200,000 | | | Panama Government International Bond | | | 2.25% | | | | 09/29/2032 | | | | 143,290 | |
| | 200,000 | | | Panama Government International Bond | | | 4.30% | | | | 04/29/2053 | | | | 130,231 | |
| | 1,200,000 | | | Petroleos del Peru SA | | | 5.63% | | | | 06/19/2047 | | | | 807,192 | |
| | 2,691,000 | | | Petroleos del Peru SA | | | 4.75% | | | | 06/19/2032 | | | | 2,130,160 | |
| | 1,500,000 | | | Petroleos Mexicanos | | | 6.75% | | | | 09/21/2047 | | | | 998,670 | |
| | 2,800,000 | | | Republic of South Africa Government International Bond | | | 4.30% | | | | 10/12/2028 | | | | 2,519,412 | |
| | | | | | | | | | | | | | | | |
| | | | Total Foreign Government Bonds, Foreign Agencies and Foreign Government Sponsored Corporations
(Cost $59,093,612) | | | | | | | | 49,771,887 | |
| | | | | | | | | | | | | | | | |
| | NON-AGENCY COMMERCIAL MORTGAGE BACKED OBLIGATIONS - 5.3% | | | | | | | | | | | | |
| | | | |
| | | | Arbor Multifamily Mortgage Securities Trust | | | | | | | | | | | | |
| | 22,775,500 | | | Series 2021-MF2-XB | | | 0.75% | (a)(b)(i) | | | 06/15/2054 | | | | 1,064,121 | |
| | | | |
| | | | Banc of America Merrill Lynch Commercial Mortgage, Inc. | | | | | | | | | | | | |
| | 5,515,000 | | | Series 2015-UBS7-C | | | 4.34% | (b) | | | 09/15/2048 | | | | 4,766,170 | |
| | | | |
| | | | Banc of America Re-Remic Trust | | | | | | | | | | | | |
| | 2,638,666 | | | Series 2016-ISQ-C | | | 3.61% | (a)(b) | | | 08/14/2034 | | | | 1,213,157 | |
| | | | | | | | |
| The accompanying notes are an integral part of these financial statements. | | Annual Report | | | | | March 31, 2024 | | 21 |
| | |
Schedule of Investments DoubleLine Core Fixed Income Fund (Cont.) | | |
| | | | | | | | | | | | | | | | |
PRINCIPAL AMOUNT $ | | | SECURITY DESCRIPTION | | RATE | | | MATURITY | | | VALUE $ | |
| | | | |
| | | | BANK | | | | | | | | | | | | |
| | 4,077,601 | | | Series 2017-BNK8-XA | | | 0.71% | (b)(i) | | | 11/15/2050 | | | | 85,020 | |
| | 1,005,000 | | | Series 2020-BN28-AS | | | 2.14% | | | | 03/15/2063 | | | | 825,877 | |
| | 1,910,000 | | | Series 2021-BN32-A4 | | | 2.35% | | | | 04/15/2054 | | | | 1,636,085 | |
| | 4,009,000 | | | Series 2021-BN35-A5 | | | 2.29% | | | | 06/15/2064 | | | | 3,336,225 | |
| | 3,109,000 | | | Series 2021-BN37-C | | | 3.11% | (b) | | | 11/15/2064 | | | | 2,331,609 | |
| | 11,034,000 | | | Series 2022-BNK39-AS | | | 3.18% | | | | 02/15/2055 | | | | 9,451,273 | |
| | 2,682,000 | | | Series 2022-BNK39-E | | | 2.50% | (a) | | | 02/15/2055 | | | | 1,562,944 | |
| | | | |
| | | | BBCMS Trust | | | | | | | | | | | | |
| | 4,526,000 | | | Series 2021-C12-A5 | | | 2.69% | | | | 11/15/2054 | | | | 3,861,786 | |
| | 5,364,000 | | | Series 2022-C14-A5 | | | 2.95% | (b) | | | 02/15/2055 | | | | 4,621,900 | |
| | 5,785,000 | | | Series 2022-C16-A5 | | | 4.60% | (b) | | | 06/15/2055 | | | | 5,621,239 | |
| | | | |
| | | | Benchmark Mortgage Trust | | | | | | | | | | | | |
| | 4,598,000 | | | Series 2020-B18-AGNF | | | 4.14% | (a) | | | 07/15/2053 | | | | 4,186,937 | |
| | 4,549,000 | | | Series 2020-B19-AS | | | 2.15% | | | | 09/15/2053 | | | | 3,618,081 | |
| | 1,091,000 | | | Series 2020-B19-C | | | 3.21% | | | | 09/15/2053 | | | | 761,469 | |
| | 89,390,182 | | | Series 2021-B28-XA | | | 1.27% | (b)(i) | | | 08/15/2054 | | | | 5,738,823 | |
| | 10,350,000 | | | Series 2022-B32-AS | | | 3.41% | (b) | | | 01/15/2055 | | | | 8,464,492 | |
| | | | |
| | | | BMO Mortgage Trust | | | | | | | | | | | | |
| | 653,000 | | | Series 2024-5C3-AS | | | 6.29% | (b) | | | 02/15/2057 | | | | 669,723 | |
| | | | |
| | | | BX Trust | | | | | | | | | | | | |
| | 11,798,000 | | | Series 2019-OC11-E | | | 3.94% | (a)(b) | | | 12/09/2041 | | | | 10,214,393 | |
| | | | |
| | | | CFCRE Commercial Mortgage Trust | | | | | | | | | | | | |
| | 2,069,742 | | | Series 2016-C6-A2 | | | 2.95% | | | | 11/10/2049 | | | | 1,966,981 | |
| | 3,267,000 | | | Series 2017-C8-B | | | 4.20% | (b) | | | 06/15/2050 | | | | 2,971,676 | |
| | | | |
| | | | Citigroup Commercial Mortgage Trust | | | | | | | | | | | | |
| | 1,898,500 | | | Series 2015-GC27-D | | | 4.42% | (a)(b) | | | 02/10/2048 | | | | 1,712,151 | |
| | 3,075,094 | | | Series 2015-GC27-XA | | | 1.30% | (b)(i) | | | 02/10/2048 | | | | 20,681 | |
| | 4,470,000 | | | Series 2016-GC36-D | | | 2.85% | (a) | | | 02/10/2049 | | | | 1,864,331 | |
| | 35,671,556 | | | Series 2016-P3-XA | | | 1.65% | (b)(i) | | | 04/15/2049 | | | | 722,884 | |
| | 38,327,834 | | | Series 2016-P4-XA | | | 1.88% | (b)(i) | | | 07/10/2049 | | | | 1,188,243 | |
| | 65,485,909 | | | Series 2016-P5-XA | | | 1.37% | (b)(i) | | | 10/10/2049 | | | | 1,651,574 | |
| | 13,720,000 | | | Series 2017-C4-B | | | 4.10% | (b) | | | 10/12/2050 | | | | 12,501,523 | |
| | 4,534,000 | | | Series 2019-GC41-B | | | 3.20% | | | | 08/10/2056 | | | | 3,818,007 | |
| | 8,478,000 | | | Series 2020-555-F | | | 3.50% | (a)(b) | | | 12/10/2041 | | | | 6,485,684 | |
| | 7,003,000 | | | Series 2020-555-G | | | 3.50% | (a)(b) | | | 12/10/2041 | | | | 4,877,568 | |
| | 10,383,000 | | | Series 2022-GC48-A5 | | | 4.58% | (b) | | | 05/15/2054 | | | | 10,088,387 | |
| | | | |
| | | | Citigroup/Deutsche Bank Commercial Mortgage Trust | | | | | | | | | | | | |
| | 50,806,076 | | | Series 2016-C1-XA | | | 1.36% | (b)(i) | | | 05/10/2049 | | | | 967,764 | |
| | | | |
| | | | Commercial Mortgage Pass Through Certificates | | | | | | | | | | | | |
| | 1,815,000 | | | Series 2014-CR16-B | | | 4.58% | | | | 04/10/2047 | | | | 1,739,353 | |
| | 3,325,000 | | | Series 2015-CR25-B | | | 4.52% | (b) | | | 08/10/2048 | | | | 3,227,700 | |
| | 49,020,248 | | | Series 2015-CR26-XA | | | 0.89% | (b)(i) | | | 10/10/2048 | | | | 429,810 | |
| | 4,310,000 | | | Series 2015-LC21-C | | | 4.32% | (b) | | | 07/10/2048 | | | | 3,986,196 | |
| | 41,666,320 | | | Series 2016-DC2-XA | | | 0.91% | (b)(i) | | | 02/10/2049 | | | | 512,192 | |
| | | | |
| | | | Computershare Corporate Trust | | | | | | | | | | | | |
| | 4,891,000 | | | Series 2015-C31-C | | | 4.59% | (b) | | | 11/15/2048 | | | | 4,542,977 | |
| | 34,557,588 | | | Series 2015-NXS1-XA | | | 1.06% | (b)(i) | | | 05/15/2048 | | | | 184,410 | |
| | 48,829,063 | | | Series 2015-P2-XA | | | 0.92% | (b)(i) | | | 12/15/2048 | | | | 592,990 | |
| | 7,687,000 | | | Series 2016-C35-B | | | 3.44% | | | | 07/15/2048 | | | | 7,193,099 | |
| | 57,332,936 | | | Series 2016-NXS6-XA | | | 1.59% | (b)(i) | | | 11/15/2049 | | | | 1,517,494 | |
| | 2,638,000 | | | Series 2018-C45-C | | | 4.73% | | | | 06/15/2051 | | | | 2,472,310 | |
| | 7,228,000 | | | Series 2018-C46-C | | | 4.97% | (b) | | | 08/15/2051 | | | | 6,207,900 | |
| | 5,000,000 | | | Series 2018-C47-C | | | 4.92% | (b) | | | 09/15/2061 | | | | 4,626,742 | |
| | 6,546,000 | | | Series 2018-C48-C | | | 5.13% | (b) | | | 01/15/2052 | | | | 5,862,078 | |
| | 19,802,236 | | | Series 2019-C49-XA | | | 1.25% | (b)(i) | | | 03/15/2052 | | | | 921,515 | |
| | 10,776,000 | | | Series 2019-C50-C | | | 4.35% | | | | 05/15/2052 | | | | 9,424,988 | |
| | 2,705,000 | | | Series 2020-C55-B | | | 3.14% | | | | 02/15/2053 | | | | 2,238,784 | |
| | 1,018,000 | | | Series 2020-C58-A3 | | | 1.81% | | | | 07/15/2053 | | | | 859,137 | |
| | 5,510,000 | | | Series 2020-C58-B | | | 2.70% | | | | 07/15/2053 | | | | 4,351,470 | |
| | 118,002,997 | | | Series 2021-C59-XA | | | 1.52% | (b)(i) | | | 04/15/2054 | | | | 8,746,819 | |
| | 2,436,000 | | | Series 2021-C61-C | | | 3.31% | | | | 11/15/2054 | | | | 1,853,359 | |
| | | | |
| 22 | | DoubleLine Funds Trust | | The accompanying notes are an integral part of these financial statements. |
| | | | | | | | | | | | | | | | |
PRINCIPAL AMOUNT $ | | | SECURITY DESCRIPTION | | RATE | | | MATURITY | | | VALUE $ | |
| | | | |
| | | | Credit Suisse Mortgage Capital Certificates | | | | | | | | | | | | |
| | 6,269,000 | | | Series 2020-NET-C | | | 3.53% | (a) | | | 08/15/2037 | | | | 5,794,965 | |
| | 7,968,667 | | | Series 2021-B33-B | | | 3.64% | (a)(b) | | | 10/10/2043 | | | | 6,812,406 | |
| | 3,731,000 | | | Series 2021-B33-C | | | 3.64% | (a)(b) | | | 10/10/2043 | | | | 2,824,120 | |
| | | | |
| | | | CSAIL Commercial Mortgage Trust | | | | | | | | | | | | |
| | 3,461,000 | | | Series 2016-C6-D | | | 4.92% | (a)(b) | | | 01/15/2049 | | | | 2,416,950 | |
| | 35,092,895 | | | Series 2016-C6-XA | | | 1.86% | (b)(i) | | | 01/15/2049 | | | | 945,367 | |
| | 6,000,000 | | | Series 2018-C14-C | | | 4.88% | (b) | | | 11/15/2051 | | | | 5,034,526 | |
| | 400,000 | | | Series 2018-CX12-B | | | 4.61% | (b) | | | 08/15/2051 | | | | 366,933 | |
| | 9,269,000 | | | Series 2019-C16-B | | | 3.88% | | | | 06/15/2052 | | | | 8,141,064 | |
| | 62,287,672 | | | Series 2020-C19-XA | | | 1.10% | (b)(i) | | | 03/15/2053 | | | | 3,052,476 | |
| | | | |
| | | | DOLP Trust | | | | | | | | | | | | |
| | 4,550,000 | | | Series 2021-NYC-D | | | 3.70% | (a)(b) | | | 05/10/2041 | | | | 3,391,901 | |
| | 5,000,000 | | | Series 2021-NYC-E | | | 3.70% | (a)(b) | | | 05/10/2041 | | | | 3,389,953 | |
| | | | |
| | | | GS Mortgage Securities Corp. II | | | | | | | | | | | | |
| | 301,420 | | | Series 2011-GC5-XA | | | 0.00% | (a)(b)(i) | | | 08/10/2044 | | | | 2 | |
| | 6,484,000 | | | Series 2014-GC26-D | | | 4.51% | (a)(b) | | | 11/10/2047 | | | | 4,611,575 | |
| | 2,635,000 | | | Series 2015-GC32-B | | | 4.39% | (b) | | | 07/10/2048 | | | | 2,515,393 | |
| | 90,172,044 | | | Series 2015-GS1-XA | | | 0.75% | (b)(i) | | | 11/10/2048 | | | | 860,259 | |
| | 1,825,000 | | | Series 2016-GS2-C | | | 4.70% | (b) | | | 05/10/2049 | | | | 1,699,920 | |
| | 43,800,623 | | | Series 2016-GS2-XA | | | 1.73% | (b)(i) | | | 05/10/2049 | | | | 1,128,129 | |
| | 2,588,000 | | | Series 2018-RIVR-C (CME Term SOFR 1 Month + 1.55%, 1.50% Floor) | | | 6.87% | (a) | | | 07/15/2035 | | | | 1,490,625 | |
| | 1,070,000 | | | Series 2019-GC42-A3 | | | 2.75% | | | | 09/10/2052 | | | | 951,015 | |
| | | | |
| | | | JP Morgan Chase Commercial Mortgage Securities | | | | | | | | | | | | |
| | 47,448,217 | | | Series 2015-JP1-XA | | | 0.88% | (b)(i) | | | 01/15/2049 | | | | 549,678 | |
| | 1,000,000 | | | Series 2019-COR4-C | | | 4.94% | (b) | | | 03/10/2052 | | | | 832,076 | |
| | 7,958,000 | | | Series 2020-LOOP-E | | | 3.86% | (a)(b) | | | 12/05/2038 | | | | 2,075,232 | |
| | | | |
| | | | JPMBB Commercial Mortgage Securities Trust | | | | | | | | | | | | |
| | 6,593,973 | | | Series 2014-C18-XA | | | 0.39% | (b)(i) | | | 02/15/2047 | | | | 281 | |
| | 2,766,125 | | | Series 2014-C23-C | | | 4.48% | (b) | | | 09/15/2047 | | | | 2,670,200 | |
| | 8,204,658 | | | Series 2014-C23-D | | | 3.98% | (a)(b) | | | 09/15/2047 | | | | 7,362,734 | |
| | 39,076,477 | | | Series 2014-C25-XA | | | 0.79% | (b)(i) | | | 11/15/2047 | | | | 67,587 | |
| | 1,684,000 | | | Series 2015-C27-B | | | 3.90% | | | | 02/15/2048 | | | | 1,524,357 | |
| | 12,131,110 | | | Series 2015-C27-D | | | 3.80% | (a)(b) | | | 02/15/2048 | | | | 6,508,035 | |
| | 4,987,000 | | | Series 2015-C29-C | | | 4.19% | (b) | | | 05/15/2048 | | | | 4,528,957 | |
| | 45,744,250 | | | Series 2015-C30-XA | | | 0.42% | (b)(i) | | | 07/15/2048 | | | | 189,331 | |
| | 34,657,713 | | | Series 2015-C31-XA | | | 0.80% | (b)(i) | | | 08/15/2048 | | | | 291,797 | |
| | | | |
| | | | JPMDB Commercial Mortgage Securities Trust | | | | | | | | | | | | |
| | 7,675,000 | | | Series 2016-C2-AS | | | 3.48% | | | | 06/15/2049 | | | | 7,173,976 | |
| | 44,030,373 | | | Series 2016-C2-XA | | | 1.48% | (b)(i) | | | 06/15/2049 | | | | 987,055 | |
| | | | |
| | | | LSTAR Commercial Mortgage Trust | | | | | | | | | | | | |
| | 5,425,000 | | | Series 2016-4-C | | | 4.59% | (a)(b) | | | 03/10/2049 | | | | 4,564,606 | |
| | | | |
| | | | MF1 Multifamily Housing Mortgage Loan Trust | | | | | | | | | | | | |
| | 5,830,000 | | | Series 2024-FL14-A (CME Term SOFR 1 Month + 1.74%, 1.74% Floor) | | | 7.06% | (a) | | | 03/19/2039 | | | | 5,848,394 | |
| | | | |
| | | | Morgan Stanley Bank of America Merrill Lynch Trust | | | | | | | | | | | | |
| | 3,000,000 | | | Series 2014-C18-C | | | 4.46% | (b) | | | 10/15/2047 | | | | 2,897,125 | |
| | 23,924,133 | | | Series 2015-C20-XA | | | 1.23% | (b)(i) | | | 02/15/2048 | | | | 79,081 | |
| | 75,089,000 | | | Series 2015-C23-XB | | | 0.13% | (a)(b)(i) | | | 07/15/2050 | | | | 152,633 | |
| | 40,408,987 | | | Series 2016-C30-XA | | | 1.28% | (b)(i) | | | 09/15/2049 | | | | 887,559 | |
| | 6,364,000 | | | Series 2017-C33-B | | | 4.11% | | | | 05/15/2050 | | | | 5,877,697 | |
| | 3,943,000 | | | Series 2017-C34-D | | | 2.70% | (a) | | | 11/15/2052 | | | | 2,282,236 | |
| | | | |
| | | | Morgan Stanley Capital I, Inc. | | | | | | | | | | | | |
| | 23,551,995 | | | Series 2016-UB11-XA | | | 1.44% | (b)(i) | | | 08/15/2049 | | | | 620,298 | |
| | | | |
| | | | Natixis Commercial Mortgage Securities Trust | | | | | | | | | | | | |
| | 2,108,000 | | | Series 2018-FL1-C (Prime Rate + 0.00%) | | | 8.50% | (a) | | | 06/15/2035 | | | | 882,572 | |
| | | | |
| | | | NJ Trust | | | | | | | | | | | | |
| | 2,300,000 | | | Series 2023-GSP-A | | | 6.48% | (a)(b) | | | 01/06/2029 | | | | 2,406,489 | |
| | | | |
| | | | SG Commercial Mortgage Securities LLC | | | | | | | | | | | | |
| | 1,789,000 | | | Series 2016-C5-B | | | 3.93% | | | | 10/10/2048 | | | | 1,605,154 | |
| | 42,103,252 | | | Series 2016-C5-XA | | | 1.85% | (b)(i) | | | 10/10/2048 | | | | 1,188,781 | |
| | | | |
| | | | SLG Office Trust | | | | | | | | | | | | |
| | 10,336,000 | | | Series 2021-OVA-E | | | 2.85% | (a) | | | 07/15/2041 | | | | 7,883,165 | |
| | 9,660,000 | | | Series 2021-OVA-F | | | 2.85% | (a) | | | 07/15/2041 | | | | 7,081,840 | |
| | | | | | | | |
| The accompanying notes are an integral part of these financial statements. | | Annual Report | | | | | March 31, 2024 | | 23 |
| | |
Schedule of Investments DoubleLine Core Fixed Income Fund (Cont.) | | |
| | | | | | | | | | | | | | | | |
PRINCIPAL AMOUNT $ | | | SECURITY DESCRIPTION | | RATE | | | MATURITY | | | VALUE $ | |
| | | | |
| | | | UBS Commercial Mortgage Trust | | | | | | | | | | | | |
| | 8,911,000 | | | Series 2017-C1-B | | | 4.04% | | | | 06/15/2050 | | | | 8,010,125 | |
| | 2,491,000 | | | Series 2017-C6-B | | | 4.15% | (b) | | | 12/15/2050 | | | | 2,206,954 | |
| | 1,450,000 | | | Series 2017-C7-B | | | 4.29% | (b) | | | 12/15/2050 | | | | 1,328,484 | |
| | 6,958,000 | | | Series 2017-C7-C | | | 4.59% | (b) | | | 12/15/2050 | | | | 6,284,557 | |
| | 4,189,000 | | | Series 2018-C11-C | | | 4.88% | (b) | | | 06/15/2051 | | | | 3,442,702 | |
| | 2,896,000 | | | Series 2018-C12-C | | | 5.03% | (b) | | | 08/15/2051 | | | | 2,545,022 | |
| | | | |
| | | | UBS-Barclays Commercial Mortgage Trust | | | | | | | | | | | | |
| | 1,503,790 | | | Series 2013-C5-B | | | 3.65% | (a)(b) | | | 03/10/2046 | | | | 1,373,734 | |
| | 7,795,924 | | | Series 2013-C5-C | | | 3.69% | (a)(b) | | | 03/10/2046 | | | | 6,475,397 | |
| | 1,374,000 | | | Series 2013-C5-D | | | 3.69% | (a)(b) | | | 03/10/2046 | | | | 974,661 | |
| | | | |
| | | | Wachovia Bank Commercial Mortgage Trust | | | | | | | | | | | | |
| | 9,546 | | | Series 2006-C29-IO | | | 0.30% | (b)(i) | | | 11/15/2048 | | | | 32 | |
| | | | |
| | | | WB Commercial Mortgage Trust | | | | | | | | | | | | |
| | 5,000,000 | | | Series 2024-HQ-A | | | 6.13% | (a)(b) | | | 03/15/2040 | | | | 5,045,235 | |
| | | | |
| | | | WF-RBS Commercial Mortgage Trust | | | | | | | | | | | | |
| | 49,647,987 | | | Series 2014-C21-XA | | | 0.97% | (b)(i) | | | 08/15/2047 | | | | 27,505 | |
| | 38,310,216 | | | Series 2014-C22-XA | | | 0.76% | (b)(i) | | | 09/15/2057 | | | | 45,195 | |
| | | | | | | | | | | | | | | | |
| | | | Total Non-Agency Commercial Mortgage Backed Obligations
(Cost $505,557,469) | | | | | | | | 368,566,209 | |
| | | | | | | | | | | | | | | | |
| | NON-AGENCY RESIDENTIAL COLLATERALIZED MORTGAGE OBLIGATIONS - 11.0% | | | | | | | | | | | | |
| | | | |
| | | | Adjustable Rate Mortgage Trust | | | | | | | | | | | | |
| | 6,085,890 | | | Series 2007-1-4A1 | | | 5.67% | (b) | | | 03/25/2037 | | | | 3,886,170 | |
| | 19,276 | | | Series 2007-3-1A1 | | | 4.99% | (a)(b) | | | 11/25/2037 | | | | 18,559 | |
| | | | |
| | | | AlphaFlow Transitional Mortgage Trust | | | | | | | | | | | | |
| | 1,838,533 | | | Series 2021-WL1-A1 | | | 3.28% | (a)(j) | | | 01/25/2026 | | | | 1,797,108 | |
| | | | |
| | | | AMSR Trust | | | | | | | | | | | | |
| | 3,100,000 | | | Series 2019-SFR1-E | | | 3.47% | (a) | | | 01/19/2039 | | | | 2,886,631 | |
| | 10,000,000 | | | Series 2021-SFR1-F | | | 3.60% | (a) | | | 06/17/2038 | | | | 8,599,170 | |
| | 3,000,000 | | | Series 2021-SFR2-E1 | | | 2.48% | (a) | | | 08/17/2038 | | | | 2,715,179 | |
| | 2,500,000 | | | Series 2021-SFR2-E2 | | | 2.58% | (a) | | | 08/17/2038 | | | | 2,253,218 | |
| | 4,500,000 | | | Series 2021-SFR2-F1 | | | 3.28% | (a) | | | 08/17/2038 | | | | 4,073,549 | |
| | 2,000,000 | | | Series 2021-SFR2-F2 | | | 3.67% | (a) | | | 08/17/2038 | | | | 1,812,633 | |
| | 8,900,000 | | | Series 2023-SFR2-A | | | 3.95% | (a) | | | 06/17/2040 | | | | 8,465,231 | |
| | | | |
| | | | Argent Securities, Inc. Asset-Backed Pass-Through Certificates Series 2003-W7 | | | | | | | | | | | | |
| | 10,888,205 | | | Series 2006-M1-A2C (CME Term SOFR 1 Month + 0.41%, 0.30% Floor) | | | 5.74% | | | | 07/25/2036 | | | | 2,840,532 | |
| | 13,864,669 | | | Series 2006-M1-A2D (CME Term SOFR 1 Month + 0.59%, 0.48% Floor) | | | 5.92% | | | | 07/25/2036 | | | | 3,616,828 | |
| | | | |
| | | | Banc of America Funding Corp. | | | | | | | | | | | | |
| | 130,737 | | | Series 2005-G-A3 | | | 2.27% | (b) | | | 10/20/2035 | | | | 85,902 | |
| | 53,899 | | | Series 2006-2-6A2 | | | 5.50% | | | | 03/25/2036 | | | | 51,517 | |
| | 82,248 | | | Series 2006-6-1A2 | | | 6.25% | | | | 08/25/2036 | | | | 69,116 | |
| | | | |
| | | | Bear Stearns Asset Backed Securities Trust | | | | | | | | | | | | |
| | 255,515 | | | Series 2007-SD1-1A3A | | | 6.50% | | | | 10/25/2036 | | | | 106,698 | |
| | | | |
| | | | CAFL Issuer LLC | | | | | | | | | | | | |
| | 9,100,000 | | | Series 2021-RTL1-A1 | | | 2.24% | (a)(j) | | | 03/28/2029 | | | | 8,761,797 | |
| | | | |
| | | | Carrington Mortgage Loan Trust | | | | | | | | | | | | |
| | 5,458,217 | | | Series 2006-NC5-A3 (CME Term SOFR 1 Month + 0.26%, 0.15% Floor, 14.50% Cap) | | | 5.59% | | | | 01/25/2037 | | | | 4,728,397 | |
| | | | |
| | | | Chase Mortgage Finance Corp. | | | | | | | | | | | | |
| | 1,154,510 | | | Series 2007-A2-6A4 | | | 5.31% | (b) | | | 07/25/2037 | | | | 1,010,819 | |
| | 785,749 | | | Series 2007-S3-2A1 | | | 5.50% | | | | 05/25/2037 | | | | 8 | |
| | | | |
| | | | CIM Trust | | | | | | | | | | | | |
| | 6,953,000 | | | Series 2020-R2-M2 | | | 3.00% | (a)(b) | | | 10/25/2059 | | | | 5,445,811 | |
| | | | |
| | | | Citigroup Mortgage Loan Trust, Inc. | | | | | | | | | | | | |
| | 3,911,058 | | | Series 2007-OPX1-A1A (CME Term SOFR 1 Month + 0.18%, 0.07% Floor) | | | 5.51% | | | | 01/25/2037 | | | | 1,703,593 | |
| | 24,669,540 | | | Series 2019-A-PT1 | | | 3.92% | (a) | | | 10/25/2058 | | | | 20,351,680 | |
| | | | |
| 24 | | DoubleLine Funds Trust | | The accompanying notes are an integral part of these financial statements. |
| | | | | | | | | | | | | | | | |
PRINCIPAL AMOUNT $ | | | SECURITY DESCRIPTION | | RATE | | | MATURITY | | | VALUE $ | |
| | 43,209,655 | | | Series 2021-RP2-A1 | | | 1.75% | (a)(b) | | | 03/25/2065 | | | | 38,057,829 | |
| | 5,674,000 | | | Series 2021-RP2-M1 | | | 3.25% | (a)(b) | | | 03/25/2065 | | | | 4,814,400 | |
| | 4,752,000 | | | Series 2021-RP2-M2 | | | 3.40% | (a)(b) | | | 03/25/2065 | | | | 3,867,007 | |
| | 4,413,000 | | | Series 2021-RP2-M3 | | | 3.40% | (a)(b) | | | 03/25/2065 | | | | 3,463,159 | |
| | 12,949,496 | | | Series 2021-RP2-PT1 | | | 5.88% | (a)(b) | | | 03/25/2065 | | | | 10,512,452 | |
| | | | |
| | | | Citimortgage Alternative Loan Trust | | | | | | | | | | | | |
| | 53,900 | | | Series 2006-A2-A2 | | | 6.00% | | | | 05/25/2036 | | | | 48,559 | |
| | 33,266 | | | Series 2006-A5-3A3 | | | 6.00% | | | | 10/25/2036 | | | | 26,201 | |
| | 221,476 | | | Series 2007-A1-1A7 | | | 6.00% | | | | 01/25/2037 | | | | 194,135 | |
| | 6,749,652 | | | Series 2007-A2-1A5 | | | 6.00% | | | | 02/25/2037 | | | | 6,037,897 | |
| | 3,218,424 | | | Series 2007-A5-1A10 | | | 5.75% | | | | 05/25/2037 | | | | 2,841,712 | |
| | | | |
| | | | CitiMortgage, Inc. | | | | | | | | | | | | |
| | 20,632 | | | Series 2005-1-1A4 | | | 5.50% | | | | 02/25/2035 | | | | 19,341 | |
| | | | |
| | | | Colony American Finance Ltd. | | | | | | | | | | | | |
| | 1,000,000 | | | Series 2020-4-E | | | 3.38% | (a) | | | 12/15/2052 | | | | 783,175 | |
| | | | |
| | | | Countrywide Alternative Loan Trust | | | | | | | | | | | | |
| | 61,182 | | | Series 2005-20CB-1A1 | | | 5.50% | | | | 07/25/2035 | | | | 48,590 | |
| | 120,929 | | | Series 2005-28CB-3A6 | | | 6.00% | | | | 08/25/2035 | | | | 50,740 | |
| | 11,777,100 | | | Series 2005-37T1-A5 (CME Term SOFR 1 Month + 0.56%, 0.45% Floor, 5.50% Cap) | | | 5.50% | | | | 09/25/2035 | | | | 7,075,649 | |
| | 435,270 | | | Series 2005-46CB-A22 | | | 5.25% | | | | 10/25/2035 | | | | 307,541 | |
| | 6,908,884 | | | Series 2005-49CB-A2 | | | 5.50% | | | | 11/25/2035 | | | | 4,542,560 | |
| | 65,829 | | | Series 2005-J10-1A13 (CME Term SOFR 1 Month + 0.81%, 0.70% Floor, 5.50% Cap) | | | 5.50% | | | | 10/25/2035 | | | | 40,456 | |
| | 250,746 | | | Series 2006-26CB-A9 | | | 6.50% | | | | 09/25/2036 | | | | 131,262 | |
| | 5,953,683 | | | Series 2006-42-1A8 | | | 6.00% | | | | 01/25/2047 | | | | 3,127,669 | |
| | 938,025 | | | Series 2007-12T1-A1 | | | 6.00% | | | | 06/25/2037 | | | | 437,846 | |
| | 5,939,513 | | | Series 2007-12T1-A3 | | | 6.00% | | | | 06/25/2037 | | | | 2,772,414 | |
| | 1,009,326 | | | Series 2007-16CB-2A1 (CME Term SOFR 1 Month + 0.56%, 0.45% Floor, 7.00% Cap) | | | 5.89% | | | | 08/25/2037 | | | | 354,037 | |
| | 292,276 | | | Series 2007-16CB-2A2 (-8 x CME Term SOFR 1 Month + 53.63%, 54.58% Cap) | | | 9.22% | (k) | | | 08/25/2037 | | | | 377,487 | |
| | 53,851 | | | Series 2007-17CB-1A10 (-5 x CME Term SOFR 1 Month + 29.37%, 29.90% Cap) | | | 4.86% | (k) | | | 08/25/2037 | | | | 46,161 | |
| | 248,200 | | | Series 2007-18CB-2A17 | | | 6.00% | | | | 08/25/2037 | | | | 153,055 | |
| | 1,325,025 | | | Series 2007-23CB-A3 (CME Term SOFR 1 Month + 0.61%, 0.50% Floor, 7.00% Cap) | | | 5.94% | | | | 09/25/2037 | | | | 520,134 | |
| | 1,301,612 | | | Series 2007-23CB-A4 (-1 x CME Term SOFR 1 Month + 6.39%, 6.50% Cap) | | | 1.06% | (i)(k) | | | 09/25/2037 | | | | 170,061 | |
| | 692,763 | | | Series 2007-4CB-2A1 | | | 7.00% | | | | 03/25/2037 | | | | 64,963 | |
| | 5,713,068 | | | Series 2007-8CB-A1 | | | 5.50% | | | | 05/25/2037 | | | | 3,045,952 | |
| | 4,468,134 | | | Series 2007-OA8-2A1 (CME Term SOFR 1 Month + 0.47%, 0.36% Floor) | | | 5.80% | | | | 06/25/2047 | | | | 3,334,596 | |
| | | | |
| | | | Countrywide Home Loan Mortgage Pass Through Trust | | | | | | | | | | | | |
| | 143,597 | | | Series 2005-28-A7 | | | 5.25% | | | | 01/25/2036 | | | | 75,660 | |
| | 404,837 | | | Series 2007-10-A5 | | | 6.00% | | | | 07/25/2037 | | | | 186,201 | |
| | 163,810 | | | Series 2007-15-1A16 | | | 6.25% | | | | 09/25/2037 | | | | 100,730 | |
| | 420,602 | | | Series 2007-3-A17 | | | 6.00% | | | | 04/25/2037 | | | | 204,137 | |
| | | | |
| | | | Credit Suisse First Boston Mortgage Securities Corp. | | | | | | | | | | | | |
| | 51,598 | | | Series 2005-10-5A5 | | | 5.50% | | | | 11/25/2035 | | | | 37,665 | |
| | | | |
| | | | Credit Suisse Management LLC | | | | | | | | | | | | |
| | 557,657 | | | Series 2005-8-1A3 | | | 5.25% | | | | 09/25/2035 | | | | 439,128 | |
| | | | |
| | | | Credit Suisse Mortgage Capital Certificates | | | | | | | | | | | | |
| | 2,364,895 | | | Series 2006-4-6A1 | | | 6.00% | | | | 05/25/2036 | | | | 923,648 | |
| | 19,564 | | | Series 2006-4-7A1 | | | 5.50% | | | | 09/25/2056 | | | | 10,705 | |
| | 61,763 | | | Series 2007-1-3A1 | | | 6.00% | | | | 02/25/2057 | | | | 10,142 | |
| | 9,217 | | | Series 2007-2-2A1 | | | 5.00% | | | | 03/25/2037 | | | | 6,920 | |
| | 3,026,097 | | | Series 2009-3R-19A2 | | | 6.00% | (a) | | | 01/27/2038 | | | | 1,370,566 | |
| | 629,562 | | | Series 2010-4R-3A17 | | | 6.00% | (a)(b)(d) | | | 06/26/2037 | | | | 573,175 | |
| | 29,191,592 | | | Series 2020-RPL1-PT1 | | | 3.33% | (a)(b) | | | 10/25/2069 | | | | 22,874,543 | |
| | 9,035,400 | | | Series 2020-RPL4-M1 | | | 2.50% | (a) | | | 01/25/2060 | | | | 6,708,805 | |
| | 2,332,457 | | | Series 2021-JR1-A1 | | | 2.47% | (a)(b) | | | 09/27/2066 | | | | 2,306,952 | |
| | | | | | | | |
| The accompanying notes are an integral part of these financial statements. | | Annual Report | | | | | March 31, 2024 | | 25 |
| | |
Schedule of Investments DoubleLine Core Fixed Income Fund (Cont.) | | |
| | | | | | | | | | | | | | | | |
PRINCIPAL AMOUNT $ | | | SECURITY DESCRIPTION | | RATE | | | MATURITY | | | VALUE $ | |
| | | | |
| | | | Credit-Based Asset Servicing and Securitization LLC | | | | | | | | | | | | |
| | 6,547,058 | | | Series 2007-RP1-A (CME Term SOFR 1 Month + 0.42%, 0.31% Floor) | | | 5.75% | (a) | | | 05/25/2046 | | | | 5,416,714 | |
| | | | |
| | | | Deutsche ALT-A Securities, Inc. | | | | | | | | | | | | |
| | 4,278,543 | | | Series 2005-6-2A1 | | | 5.50% | | | | 12/25/2035 | | | | 3,519,566 | |
| | 4,146,856 | | | Series 2005-AR2-2A1 | | | 4.77% | (b) | | | 10/25/2035 | | | | 3,394,908 | |
| | 6,681,859 | | | Series 2007-OA1-A1 (CME Term SOFR 1 Month + 0.26%, 0.15% Floor) | | | 5.59% | | | | 02/25/2047 | | | | 3,759,424 | |
| | | | |
| | | | Deutsche Mortgage Securities, Inc. | | | | | | | | | | | | |
| | 379,021 | | | Series 2006-PR1-3A1 (-1 x CME Term SOFR 1 Month + 11.96%, 12.12% Cap) | | | 4.51% | (a)(k) | | | 04/15/2036 | | | | 340,776 | |
| | 28,795 | | | Series 2006-PR1-4AI2 (-2 x CME Term SOFR 1 Month + 14.39%, 14.61% Cap) | | | 4.22% | (a)(k) | | | 04/15/2036 | | | | 25,619 | |
| | 657,432 | | | Series 2006-PR1-5AI4 (-1 x CME Term SOFR 1 Month + 11.96%, 12.12% Cap) | | | 4.51% | (a)(k) | | | 04/15/2036 | | | | 560,942 | |
| | | | |
| | | | First Franklin Mortgage Loan Asset Backed Certificates | | | | | | | | | | | | |
| | 15,984,000 | | | Series 2006-FF15-A6 (CME Term SOFR 1 Month + 0.42%, 0.31% Floor) | | | 5.75% | | | | 11/25/2036 | | | | 12,800,770 | |
| | 10,456,021 | | | Series 2007-FF2-A1 (CME Term SOFR 1 Month + 0.39%, 0.28% Floor) | | | 5.72% | | | | 03/25/2037 | | | | 5,469,847 | |
| | | | |
| | | | First Horizon Alternative Mortgage Securities | | | | | | | | | | | | |
| | 196,390 | | | Series 2006-FA2-1A5 | | | 6.00% | | | | 05/25/2036 | | | | 82,688 | |
| | 2,626,772 | | | Series 2006-FA8-1A1 | | | 6.25% | | | | 02/25/2037 | | | | 1,099,747 | |
| | 34,776 | | | Series 2006-RE1-A1 | | | 5.50% | (b) | | | 05/25/2035 | | | | 22,756 | |
| | | | |
| | | | FMC GMSR Issuer Trust | | | | | | | | | | | | |
| | 16,440,000 | | | Series 2021-GT2-A | | | 3.85% | (a)(b) | | | 10/25/2026 | | | | 14,569,623 | |
| | | | |
| | | | GCAT | | | | | | | | | | | | |
| | 6,944,000 | | | Series 2021-NQM6-M1 | | | 3.41% | (a)(b) | | | 08/25/2066 | | | | 4,950,004 | |
| | | | |
| | | | GMAC Mortgage Corp. Loan Trust | | | | | | | | | | | | |
| | 1,276,973 | | | Series 2006-J1-A6 | | | 5.75% | | | | 04/25/2036 | | | | 1,090,435 | |
| | | | |
| | | | GS Mortgage-Backed Securities Trust | | | | | | | | | | | | |
| | 7,546,000 | | | Series 2020-NQM1-M1 | | | 3.29% | (a)(b) | | | 09/27/2060 | | | | 6,690,370 | |
| | | | |
| | | | GSAA Trust | | | | | | | | | | | | |
| | 4,964 | | | Series 2005-7-AF5 | | | 5.11% | (j) | | | 05/25/2035 | | | | 4,804 | |
| | 808,931 | | | Series 2007-10-A1A | | | 6.00% | | | | 11/25/2037 | | | | 465,542 | |
| | 942,300 | | | Series 2007-10-A2A | | | 6.50% | | | | 11/25/2037 | | | | 385,328 | |
| | | | |
| | | | GSR Mortgage Loan Trust | | | | | | | | | | | | |
| | 1,452,897 | | | Series 2006-3F-4A1 | | | 6.00% | | | | 03/25/2036 | | | | 1,129,860 | |
| | 22,702,102 | | | Series 2006-OA1-1A1 (CME Term SOFR 1 Month + 0.55%, 0.44% Floor) | | | 5.88% | | | | 08/25/2046 | | | | 5,313,738 | |
| | 57,019 | | | Series 2007-1F-2A2 | | | 5.50% | | | | 01/25/2037 | | | | 141,260 | |
| | | | |
| | | | Harborview Mortgage Loan Trust | | | | | | | | | | | | |
| | 10,219,206 | | | Series 2005-7-2A1 (CME Term SOFR 1 Month + 0.68%, 0.57% Floor, 11.00% Cap) | | | 6.01% | | | | 06/19/2045 | | | | 5,979,123 | |
| | | | |
| | | | Home Partners of America Trust | | | | | | | | | | | | |
| | 2,510,682 | | | Series 2021-1-D | | | 2.48% | (a) | | | 09/17/2041 | | | | 2,090,807 | |
| | 1,154,063 | | | Series 2021-1-E | | | 2.58% | (a) | | | 09/17/2041 | | | | 924,970 | |
| | 1,298,746 | | | Series 2021-1-F | | | 3.33% | (a) | | | 09/17/2041 | | | | 1,029,474 | |
| | | | |
| | | | Homeward Opportunities Fund I Trust | | | | | | | | | | | | |
| | 5,250,000 | | | Series 2020-2-M1 | | | 3.90% | (a)(b) | | | 05/25/2065 | | | | 4,900,127 | |
| | | | |
| | | | HSI Asset Securitization Corp. | | | | | | | | | | | | |
| | 22,256,783 | | | Series 2006-HE1-1A1 (CME Term SOFR 1 Month + 0.39%, 0.28% Floor) | | | 5.72% | | | | 10/25/2036 | | | | 7,228,362 | |
| | 9,549,711 | | | Series 2007-NC1-A3 (CME Term SOFR 1 Month + 0.47%, 0.36% Floor) | | | 5.80% | | | | 04/25/2037 | | | | 6,378,796 | |
| | | | |
| | | | Impac Secured Assets CMN Owner Trust | | | | | | | | | | | | |
| | 22,560,658 | | | Series 2006-5-1A1C (CME Term SOFR 1 Month + 0.65%, 0.54% Floor, 11.50% Cap) | | | 5.98% | | | | 02/25/2037 | | | | 20,122,503 | |
| | | | |
| | | | Imperial Fund Mortgage Trust | | | | | | | | | | | | |
| | 2,728,000 | | | Series 2021-NQM4-M1 | | | 3.45% | (a)(b) | | | 01/25/2057 | | | | 1,974,664 | |
| | | | |
| | | | Indymac IMSC Mortgage Loan Trust | | | | | | | | | | | | |
| | 1,392,754 | | | Series 2007-HOA1-A11 (CME Term SOFR 1 Month + 0.47%, 0.36% Floor) | | | 5.80% | | | | 07/25/2047 | | | | 937,612 | |
| | 1,385,004 | | | Series 2007-HOA1-A24 (CME Term SOFR 1 Month + 0.73%, 0.62% Floor) | | | 6.06% | | | | 07/25/2047 | | | | 993,020 | |
| | | | |
| 26 | | DoubleLine Funds Trust | | The accompanying notes are an integral part of these financial statements. |
| | | | | | | | | | | | | | | | |
PRINCIPAL AMOUNT $ | | | SECURITY DESCRIPTION | | RATE | | | MATURITY | | | VALUE $ | |
| | | | |
| | | | JP Morgan Alternative Loan Trust | | | | | | | | | | | | |
| | 2,618,081 | | | Series 2005-A2-1M1 (CME Term SOFR 1 Month + 0.80%, 0.69% Floor, 11.50% Cap) | | | 6.13% | | | | 01/25/2036 | | | | 2,500,313 | |
| | 31,894 | | | Series 2006-S2-A4 | | | 6.69% | (j) | | | 05/25/2036 | | | | 31,897 | |
| | 2,244,433 | | | Series 2006-S3-A4 | | | 6.81% | (j) | | | 08/25/2036 | | | | 2,109,948 | |
| | 26,779 | | | Series 2006-S3-A6 | | | 6.62% | (j) | | | 08/25/2036 | | | | 25,435 | |
| | 25,088 | | | Series 2006-S4-A6 | | | 6.21% | (j) | | | 12/25/2036 | | | | 24,485 | |
| | | | |
| | | | JP Morgan Mortgage Acquisition Corp. | | | | | | | | | | | | |
| | 13,470,641 | | | Series 2006-WMC2-A5 (CME Term SOFR 1 Month + 0.61%, 0.50% Floor) | | | 5.94% | | | | 07/25/2036 | | | | 5,846,269 | |
| | 15,451,526 | | | Series 2006-WMC3-A4 (CME Term SOFR 1 Month + 0.41%, 0.30% Floor) | | | 5.74% | | | | 08/25/2036 | | | | 11,141,124 | |
| | 12,765,808 | | | Series 2006-WMC4-A5 (CME Term SOFR 1 Month + 0.32%, 0.21% Floor) | | | 5.65% | | | | 12/25/2036 | | | | 6,821,799 | |
| | | | |
| | | | JP Morgan Mortgage Trust | | | | | | | | | | | | |
| | 2,036,011 | | | Series 2006-S1-2A9 | | | 6.50% | | | | 04/25/2036 | | | | 2,013,630 | |
| | 160,683 | | | Series 2007-S3-1A7 | | | 6.00% | | | | 08/25/2037 | | | | 76,811 | |
| | | | |
| | | | Legacy Mortgage Asset Trust | | | | | | | | | | | | |
| | 22,274,727 | | | Series 2019-RPL3-PT1 | | | 0.00% | (a) | | | 06/25/2058 | | | | 18,693,650 | |
| | 7,000,000 | | | Series 2021-GS3-A2 | | | 3.25% | (a)(j) | | | 07/25/2061 | | | | 6,490,383 | |
| | | | |
| | | | Lehman Mortgage Trust | | | | | | | | | | | | |
| | 367,637 | | | Series 2006-3-1A5 | | | 6.00% | | | | 07/25/2036 | | | | 186,413 | |
| | 25,236 | | | Series 2006-9-1A19 (-5 x CME Term SOFR 1 Month + 30.16%, 30.68% Cap) | | | 5.64% | (k) | | | 01/25/2037 | | | | 22,271 | |
| | 506,294 | | | Series 2007-10-2A1 | | | 6.50% | | | | 01/25/2038 | | | | 141,584 | |
| | 88,761 | | | Series 2007-2-1A1 | | | 5.75% | | | | 02/25/2037 | | | | 59,603 | |
| | | | |
| | | | Lehman XS Trust | | | | | | | | | | | | |
| | 3,199,186 | | | Series 2005-9N-1A1 (CME Term SOFR 1 Month + 0.38%, 0.27% Floor) | | | 5.71% | | | | 02/25/2036 | | | | 2,855,339 | |
| | 3,041,875 | | | Series 2007-1-1A2 (CME Term SOFR 1 Month + 0.43%, 0.32% Floor) | | | 5.76% | | | | 02/25/2037 | | | | 2,948,081 | |
| | 9,074,919 | | | Series 2007-15N-3A1 (CME Term SOFR 1 Month + 0.36%, 0.25% Floor) | | | 5.69% | | | | 08/25/2047 | | | | 7,600,541 | |
| | 8,458,526 | | | Series 2007-3-2A3 (CME Term SOFR 1 Month + 0.59%, 0.48% Floor) | | | 5.92% | | | | 03/25/2037 | | | | 7,756,348 | |
| | | | |
| | | | Long Beach Mortgage Loan Trust | | | | | | | | | | | | |
| | 34,223,350 | | | Series 2006-2-2A3 (CME Term SOFR 1 Month + 0.49%, 0.38% Floor) | | | 5.82% | | | | 03/25/2046 | | | | 12,396,265 | |
| | 13,348,293 | | | Series 2006-3-2A3 (CME Term SOFR 1 Month + 0.47%, 0.36% Floor) | | | 5.80% | | | | 05/25/2046 | | | | 4,157,389 | |
| | 15,434,013 | | | Series 2006-6-2A3 (CME Term SOFR 1 Month + 0.41%, 0.30% Floor) | | | 5.74% | | | | 07/25/2036 | | | | 6,004,083 | |
| | | | |
| | | | MASTR Alternative Loans Trust | | | | | | | | | | | | |
| | 73,761 | | | Series 2005-2-3A1 | | | 6.00% | | | | 03/25/2035 | | | | 63,978 | |
| | 4,460,753 | | | Series 2006-1-A5 | | | 6.00% | | | | 02/25/2036 | | | | 2,053,277 | |
| | 32,352 | | | Series 2007-1-2A7 | | | 6.00% | | | | 10/25/2036 | | | | 9,588 | |
| | | | |
| | | | Mastr Asset Backed Securities Trust | | | | | | | | | | | | |
| | 11,402,906 | | | Series 2005-NC2-A3 (CME Term SOFR 1 Month + 0.61%, 0.50% Floor) | | | 5.94% | | | | 11/25/2035 | | | | 6,596,401 | |
| | | | |
| | | | MASTR Asset Securitization Trust | | | | | | | | | | | | |
| | 731,809 | | | Series 2006-2-1A11 (CME Term SOFR 1 Month + 6.00%, 6.00% Floor) | | | 6.00% | | | | 06/25/2036 | | | | 436,772 | |
| | | | |
| | | | Merrill Lynch Alternative Note Asset | | | | | | | | | | | | |
| | 1,640,090 | | | Series 2007-F1-2A8 | | | 6.00% | | | | 03/25/2037 | | | | 588,138 | |
| | 8,328,893 | | | Series 2007-OAR4-A1 (CME Term SOFR 1 Month + 0.61%, 0.50% Floor) | | | 5.94% | | | | 08/25/2037 | | | | 7,133,444 | |
| | | | |
| | | | Merrill Lynch Mortgage Investors, Inc. | | | | | | | | | | | | |
| | 5,249,507 | | | Series 2007-MLN1-A1 (CME Term SOFR 1 Month + 0.36%, 0.25% Floor) | | | 5.69% | | | | 03/25/2037 | | | | 3,893,823 | |
| | | | |
| | | | MFRA Trust | | | | | | | | | | | | |
| | 2,026,841 | | | Series 2021-NPL1-A1 | | | 5.36% | (a)(j) | | | 03/25/2060 | | | | 2,009,167 | |
| | | | |
| | | | Morgan Stanley ABS Capital I, Inc. | | | | | | | | | | | | |
| | 7,444,041 | | | Series 2006-HE5-A2C (CME Term SOFR 1 Month + 0.39%, 0.28% Floor) | | | 5.72% | | | | 08/25/2036 | | | | 3,788,755 | |
| | | | | | | | |
| The accompanying notes are an integral part of these financial statements. | | Annual Report | | | | | March 31, 2024 | | 27 |
| | |
Schedule of Investments DoubleLine Core Fixed Income Fund (Cont.) | | |
| | | | | | | | | | | | | | | | |
PRINCIPAL AMOUNT $ | | | SECURITY DESCRIPTION | | RATE | | | MATURITY | | | VALUE $ | |
| | | | |
| | | | Morgan Stanley Mortgage Loan Trust | | | | | | | | | | | | |
| | 19,538 | | | Series 2004-1-1A1 | | | 5.00% | | | | 11/25/2033 | | | | 14,282 | |
| | 425,075 | | | Series 2005-7-7A4 | | | 5.50% | | | | 11/25/2035 | | | | 385,621 | |
| | 1,563,232 | | | Series 2006-7-3A | | | 5.20% | (b) | | | 06/25/2036 | | | | 884,243 | |
| | 25,658,557 | | | Series 2007-2AX-2A2 (CME Term SOFR 1 Month + 0.43%, 0.32% Floor) | | | 5.76% | | | | 12/25/2036 | | | | 8,718,731 | |
| | 7,707,893 | | | Series 2007-7AX-2A1 (CME Term SOFR 1 Month + 0.35%, 0.24% Floor) | | | 5.68% | | | | 04/25/2037 | | | | 2,113,327 | |
| | | | |
| | | | Morgan Stanley Reremic Trust | | | | | | | | | | | | |
| | 110,460 | | | Series 2010-R6-5C | | | 5.75% | (a)(b) | | | 05/26/2037 | | | | 101,834 | |
| | | | |
| | | | Morgan Stanley Residential Mortgage Loan Trust | | | | | | | | | | | | |
| | 1,957,101 | | | Series 2020-RPL1-A1 | | | 5.69% | (a)(b) | | | 10/25/2060 | | | | 1,939,356 | |
| | | | |
| | | | MortgageIT Trust | | | | | | | | | | | | |
| | 14,026,636 | | | Series 2007-1-2A11 (CME Term SOFR 1 Month + 0.55%, 0.44% Floor) | | | 5.88% | | | | 06/25/2047 | | | | 10,909,502 | |
| | | | |
| | | | New Century Home Equity Loan Trust | | | | | | | | | | | | |
| | 6,000,000 | | | Series 2005-B-M2 (CME Term SOFR 1 Month + 0.85%, 0.74% Floor) | | | 6.18% | | | | 10/25/2035 | | | | 5,052,458 | |
| | | | |
| | | | Nomura Asset Acceptance Corp. | | | | | | | | | | | | |
| | 162,439 | | | Series 2006-AP1-A2 | | | 5.52% | (b) | | | 01/25/2036 | | | | 49,297 | |
| | | | |
| | | | Nomura Home Equity Loan, Inc. | | | | | | | | | | | | |
| | 497,069 | | | Series 2006-AF1-A2 | | | 6.30% | (j) | | | 10/25/2036 | | | | 108,334 | |
| | 840,425 | | | Series 2007-1-1A1 | | | 6.56% | (j) | | | 02/25/2037 | | | | 227,877 | |
| | | | |
| | | | NRPL Trust | | | | | | | | | | | | |
| | 6,116,994 | | | Series 2019-3A-A1 | | | 7.00% | (a)(j) | | | 07/25/2059 | | | | 6,124,259 | |
| | | | |
| | | | NRZ Excess Spread-Collateralized Notes | | | | | | | | | | | | |
| | 2,948,320 | | | Series 2020-PLS1-A | | | 3.84% | (a) | | | 12/25/2025 | | | | 2,828,219 | |
| | | | |
| | | | Option One Mortgage Loan Trust | | | | | | | | | | | | |
| | 29,050 | | | Series 2004-3-M3 (CME Term SOFR 1 Month + 1.09%, 0.98% Floor) | | | 6.42% | | | | 11/25/2034 | | | | 28,768 | |
| | 16,950,695 | | | Series 2007-6-1A1 (CME Term SOFR 1 Month + 0.30%, 0.19% Floor) | | | 5.63% | | | | 07/25/2037 | | | | 14,595,718 | |
| | | | |
| | | | PennyMac Mortgage Investment Trust | | | | | | | | | | | | |
| | 1,609,937 | | | Series 2019-3R-A (US 30 Day Average Secured Overnight Financing Rate + 3.81%, 2.70% Floor) | | | 9.14% | (a) | | | 11/27/2031 | | | | 1,613,086 | |
| | 3,523,627 | | | Series 2020-1R-A (US 30 Day Average Secured Overnight Financing Rate + 3.46%, 2.35% Floor) | | | 8.79% | (a) | | | 02/25/2025 | | | | 3,513,544 | |
| | 15,000,000 | | | Series 2021-FT1-A (CME Term SOFR 1 Month + 3.11%, 3.12% Floor) | | | 8.44% | (a) | | | 03/25/2026 | | | | 15,188,813 | |
| | | | |
| | | | PR Mortgage Loan Trust | | | | | | | | | | | | |
| | 4,928,436 | | | Series 2014-1-APT | | | 5.86% | (a)(b) | | | 10/25/2049 | | | | 4,556,704 | |
| | | | |
| | | | Pretium Mortgage Credit Partners LLC | | | | | | | | | | | | |
| | 4,360,301 | | | Series 2021-RN2-A1 | | | 1.74% | (a)(j) | | | 07/25/2051 | | | | 4,226,919 | |
| | | | |
| | | | Progress Residential Trust | | | | | | | | | | | | |
| | 3,404,000 | | | Series 2021-SFR6-E2 | | | 2.53% | (a) | | | 07/17/2038 | | | | 3,077,050 | |
| | 4,666,000 | | | Series 2021-SFR6-F | | | 3.42% | (a) | | | 07/17/2038 | | | | 4,240,677 | |
| | 5,100,000 | | | Series 2021-SFR8-F | | | 3.18% | (a) | | | 10/17/2038 | | | | 4,572,125 | |
| | | | |
| | | | PRPM LLC | | | | | | | | | | | | |
| | 2,676,204 | | | Series 2021-3-A1 | | | 1.87% | (a)(j) | | | 04/25/2026 | | | | 2,634,203 | |
| | 2,871,566 | | | Series 2021-7-A1 | | | 1.87% | (a)(j) | | | 08/25/2026 | | | | 2,785,909 | |
| | 1,601,562 | | | Series 2021-9-A1 | | | 2.36% | (a)(j) | | | 10/25/2026 | | | | 1,564,472 | |
| | | | |
| | | | RALI Trust | | | | | | | | | | | | |
| | 117,959 | | | Series 2005-QS14-3A3 | | | 6.00% | | | | 09/25/2035 | | | | 96,680 | |
| | 152,435 | | | Series 2006-QS10-A4 | | | 5.75% | | | | 08/25/2036 | | | | 123,259 | |
| | 1,663,374 | | | Series 2006-QS10-A9 | | | 6.50% | | | | 08/25/2036 | | | | 1,401,425 | |
| | 1,700,156 | | | Series 2006-QS4-A10 | | | 6.00% | | | | 04/25/2036 | | | | 1,332,074 | |
| | 335,275 | | | Series 2006-QS6-1A15 | | | 6.00% | | | | 06/25/2036 | | | | 254,873 | |
| | 1,509 | | | Series 2006-QS6-2A1 | | | 6.00% | | | | 12/25/2024 | | | | – | |
| | 19,389,538 | | | Series 2007-QH5-AII (CME Term SOFR 1 Month + 0.57%, 0.46% Floor) | | | 5.90% | | | | 06/25/2037 | | | | 8,168,041 | |
| | 577,927 | | | Series 2007-QS3-A4 | | | 6.25% | | | | 02/25/2037 | | | | 457,563 | |
| | 2,091,337 | | | Series 2007-QS9-A33 | | | 6.50% | | | | 07/25/2037 | | | | 1,623,567 | |
| | | | |
| | | | RAMP Trust | | | | | | | | | | | | |
| | 11,500,000 | | | Series 2006-NC1-M2 (CME Term SOFR 1 Month + 0.51%, 0.40% Floor, 14.00% Cap) | | | 6.04% | | | | 01/25/2036 | | | | 9,627,291 | |
| | | | |
| 28 | | DoubleLine Funds Trust | | The accompanying notes are an integral part of these financial statements. |
| | | | | | | | | | | | | | | | |
PRINCIPAL AMOUNT $ | | | SECURITY DESCRIPTION | | RATE | | | MATURITY | | | VALUE $ | |
| | | | |
| | | | RBSGC Mortgage Pass Through Certificates | | | | | | | | | | | | |
| | 6,164,766 | | | Series 2005-A-3A | | | 6.00% | | | | 04/25/2035 | | | | 2,477,247 | |
| | | | |
| | | | Redwood Funding Trust | | | | | | | | | | | | |
| | 19,816,111 | | | Series 2019-1-PT | | | 4.97% | (a)(j) | | | 09/27/2024 | | | | 19,830,662 | |
| | | | |
| | | | Residential Asset Securitization Trust | | | | | | | | | | | | |
| | 154,629 | | | Series 2005-A10-A3 | | | 5.50% | | | | 09/25/2035 | | | | 75,637 | |
| | 218,967 | | | Series 2005-A11-2A4 | | | 6.00% | | | | 10/25/2035 | | | | 95,837 | |
| | 1,608,819 | | | Series 2006-A6-1A1 | | | 6.50% | | | | 07/25/2036 | | | | 489,990 | |
| | 110,289 | | | Series 2006-R1-A1 (-4 x CME Term SOFR 1 Month + 27.94%, 28.40% Cap) | | | 6.62% | (d)(k) | | | 01/25/2046 | | | | 85,057 | |
| | | | |
| | | | Residential Mortgage Loan Trust | | | | | | | | | | | | |
| | 5,154,000 | | | Series 2020-1-M1 | | | 3.24% | (a)(b) | | | 01/26/2060 | | | | 4,597,075 | |
| | | | |
| | | | RFMSI Trust | | | | | | | | | | | | |
| | 38,777 | | | Series 2006-S10-1A2 | | | 6.00% | | | | 10/25/2036 | | | | 29,141 | |
| | 381,947 | | | Series 2007-S2-A4 | | | 6.00% | | | | 02/25/2037 | | | | 290,948 | |
| | 291,533 | | | Series 2007-S3-1A4 | | | 6.00% | | | | 03/25/2037 | | | | 208,232 | |
| | | | |
| | | | Saxon Asset Securities Trust | | | | | | | | | | | | |
| | 7,695,758 | | | Series 2005-2-M4 (CME Term SOFR 1 Month + 1.06%, 0.95% Floor, 11.50% Cap) | | | 6.39% | | | | 10/25/2035 | | | | 4,998,411 | |
| | | | |
| | | | Securitized Asset Backed Receivables LLC | | | | | | | | | | | | |
| | 14,613,457 | | | Series 2007-BR3-A1 (CME Term SOFR 1 Month + 0.43%, 0.32% Floor, 100.00% Cap) | | | 5.76% | (a) | | | 04/25/2037 | | | | 9,480,517 | |
| | 18,648,005 | | | Series 2007-BR3-A2A (CME Term SOFR 1 Month + 0.25%, 0.14% Floor) | | | 5.58% | | | | 04/25/2037 | | | | 12,362,565 | |
| | 13,227,900 | | | Series 2007-BR3-A2B (CME Term SOFR 1 Month + 0.55%, 0.44% Floor) | | | 5.88% | | | | 04/25/2037 | | | | 8,769,016 | |
| | 2,379,477 | | | Series 2007-BR3-A2C (CME Term SOFR 1 Month + 0.67%, 0.56% Floor) | | | 6.00% | | | | 04/25/2037 | | | | 1,577,375 | |
| | 19,767,963 | | | Series 2007-HE1-A2C (CME Term SOFR 1 Month + 0.43%, 0.32% Floor) | | | 5.76% | | | | 12/25/2036 | | | | 4,542,682 | |
| | | | |
| | | | Securitized Mortgage Asset Loan Trust | | | | | | | | | | | | |
| | 22,764,250 | | | Series 2015-1-PC | | | 2.41% | (a)(b) | | | 02/25/2054 | | | | 18,950,935 | |
| | | | |
| | | | Sequoia Mortgage Trust | | | | | | | | | | | | |
| | 3,219,854 | | | Series 2007-3-2AA1 | | | 3.95% | (b) | | | 07/20/2037 | | | | 2,357,899 | |
| | | | |
| | | | Soundview Home Equity Loan Trust | | | | | | | | | | | | |
| | 6,404,930 | | | Series 2007-OPT4-1A1 (CME Term SOFR 1 Month + 1.11%, 1.00% Floor) | | | 6.44% | | | | 09/25/2037 | | | | 4,404,432 | |
| | | | |
| | | | Starwood Mortgage Residential Trust | | | | | | | | | | | | |
| | 5,910,000 | | | Series 2020-1-B1 | | | 3.73% | (a)(b) | | | 02/25/2050 | | | | 4,862,175 | |
| | | | |
| | | | Structured Asset Investment Loan Trust | | | | | | | | | | | | |
| | 10,438,923 | | | Series 2006-BNC3-A1 (CME Term SOFR 1 Month + 0.29%, 0.18% Floor) | | | 5.62% | | | | 09/25/2036 | | | | 6,385,524 | |
| | | | |
| | | | Structured Asset Securities Corp. | | | | | | | | | | | | |
| | 715,878 | | | Series 2005-RF1-A (CME Term SOFR 1 Month + 0.46%, 0.35% Floor) | | | 5.79% | (a) | | | 03/25/2035 | | | | 618,984 | |
| | 715,878 | | | Series 2005-RF1-AIO | | | 0.00% | (a)(b)(i) | | | 03/25/2035 | | | | 792 | |
| | | | |
| | | | VCAT Asset Securitization LLC | | | | | | | | | | | | |
| | 4,324,842 | | | Series 2021-NPL4-A1 | | | 1.87% | (a)(j) | | | 08/25/2051 | | | | 4,196,809 | |
| | 6,253,181 | | | Series 2021-NPL6-A1 | | | 1.92% | (a)(j) | | | 09/25/2051 | | | | 6,077,964 | |
| | | | |
| | | | Velocity Commercial Capital Loan Trust | | | | | | | | | | | | |
| | 920,215 | | | Series 2018-1-M1 | | | 3.91% | (a) | | | 04/25/2048 | | | | 830,128 | |
| | 503,741 | | | Series 2018-1-M2 | | | 4.26% | (a) | | | 04/25/2048 | | | | 444,993 | |
| | 310,595 | | | Series 2018-1-M3 | | | 4.41% | (a) | | | 04/25/2048 | | | | 269,590 | |
| | 1,592,498 | | | Series 2019-1-M1 | | | 3.94% | (a)(b) | | | 03/25/2049 | | | | 1,425,618 | |
| | 720,777 | | | Series 2019-1-M2 | | | 4.01% | (a)(b) | | | 03/25/2049 | | | | 633,064 | |
| | 645,882 | | | Series 2019-1-M3 | | | 4.12% | (a)(b) | | | 03/25/2049 | | | | 550,568 | |
| | | | |
| | | | Vericrest Opportunity Loan Transferee | | | | | | | | | | | | |
| | 2,572,227 | | | Series 2021-CF1-A1 | | | 1.99% | (a)(j) | | | 08/25/2051 | | | | 2,485,237 | |
| | 1,544,703 | | | Series 2021-CF2-A1 | | | 2.49% | (a)(j) | | | 11/27/2051 | | | | 1,490,323 | |
| | 5,802,593 | | | Series 2021-NP12-A1 | | | 2.73% | (a)(j) | | | 12/26/2051 | | | | 5,573,327 | |
| | 754,802 | | | Series 2021-NPL1-A1 | | | 4.89% | (a)(j) | | | 02/27/2051 | | | | 737,926 | |
| | 2,637,777 | | | Series 2021-NPL5-A1 | | | 5.12% | (a)(j) | | | 03/27/2051 | | | | 2,586,036 | |
| | 2,886,241 | | | Series 2021-NPL6-A1 | | | 5.24% | (a)(j) | | | 04/25/2051 | | | | 2,844,790 | |
| | | | | | | | |
| The accompanying notes are an integral part of these financial statements. | | Annual Report | | | | | March 31, 2024 | | 29 |
| | |
Schedule of Investments DoubleLine Core Fixed Income Fund (Cont.) | | |
| | | | | | | | | | | | | | | | |
PRINCIPAL AMOUNT $ | | | SECURITY DESCRIPTION | | RATE | | | MATURITY | | | VALUE $ | |
| | | | |
| | | | WaMu Mortgage Pass Through Certificates | | | | | | | | | | | | |
| | 4,288,563 | | | Series 2006-AR13-1A (12 Month US Treasury Average + 0.88%, 0.88% Floor) | | | 5.97% | | | | 10/25/2046 | | | | 3,558,802 | |
| | 1,380,586 | | | Series 2006-AR19-2A (12 Month US Treasury Average + 1.25%, 1.25% Floor) | | | 6.34% | | | | 01/25/2047 | | | | 1,213,579 | |
| | 4,269,873 | | | Series 2007-HY7-2A1 | | | 3.78% | (b) | | | 07/25/2037 | | | | 3,445,149 | |
| | | | |
| | | | Washington Mutual Alternative Mortgage Pass-Through Certificates | | | | | | | | | | | | |
| | 70,385 | | | Series 2005-1-2A | | | 6.00% | | | | 03/25/2035 | | | | 57,874 | |
| | 373,566 | | | Series 2006-1-3A1 | | | 5.75% | | | | 02/25/2036 | | | | 335,844 | |
| | 1,027,647 | | | Series 2006-2-4CB | | | 6.00% | | | | 03/25/2036 | | | | 966,277 | |
| | 7,092,949 | | | Series 2006-8-A5 | | | 4.15% | (j) | | | 10/25/2036 | | | | 2,455,760 | |
| | 3,152,170 | | | Series 2006-8-A6 | | | 4.15% | (j) | | | 10/25/2036 | | | | 1,092,211 | |
| | 6,696,620 | | | Series 2007-2-1A2 | | | 6.00% | | | | 04/25/2037 | | | | 5,295,529 | |
| | 4,696,602 | | | Series 2007-2-1A3 | | | 6.00% | | | | 04/25/2037 | | | | 3,713,962 | |
| | 607,386 | | | Series 2007-3-A6 | | | 6.00% | | | | 04/25/2037 | | | | 527,136 | |
| | 50,716 | | | Series 2007-5-A11 (-6 x CME Term SOFR 1 Month + 38.79%, 39.48% Cap) | | | 6.82% | (k) | | | 06/25/2037 | | | | 52,278 | |
| | 6,127,868 | | | Series 2007-5-A3 | | | 7.00% | | | | 06/25/2037 | | | | 4,691,436 | |
| | | | |
| | | | Wells Fargo Alternative Loan Trust | | | | | | | | | | | | |
| | 315,917 | | | Series 2007-PA5-1A1 | | | 6.25% | | | | 11/25/2037 | | | | 270,255 | |
| | | | |
| | | | Wells Fargo Mortgage Backed Securities Trust | | | | | | | | | | | | |
| | 7,886 | | | Series 2005-AR14-A6 | | | 5.95% | (b) | | | 08/25/2035 | | | | 7,561 | |
| | 395,299 | | | Series 2006-7-2A1 | | | 6.00% | | | | 06/25/2036 | | | | 339,470 | |
| | 17,911 | | | Series 2007-7-A1 | | | 6.00% | | | | 06/25/2037 | | | | 15,968 | |
| | | | | | | | | | | | | | | | |
| | | | Total Non-Agency Residential Collateralized Mortgage Obligations
(Cost $934,032,904) | | | | | | | | 759,464,044 | |
| | | | | | | | | | | | | | | | |
| | US CORPORATE BONDS - 15.2% | | | | | | | | | | | | |
| | 780,000 | | | AAR Escrow Issuer LLC | | | 6.75% | (a) | | | 03/15/2029 | | | | 786,976 | |
| | 5,404,000 | | | AbbVie, Inc. | | | 4.70% | | | | 05/14/2045 | | | | 5,057,323 | |
| | 2,845,000 | | | AbbVie, Inc. | | | 5.50% | | | | 03/15/2064 | | | | 2,928,227 | |
| | 1,295,000 | | | Academy Ltd. | | | 6.00% | (a) | | | 11/15/2027 | | | | 1,276,699 | |
| | 1,650,000 | | | Acuris Finance US, Inc. / Acuris Finance SARL | | | 5.00% | (a) | | | 05/01/2028 | | | | 1,500,817 | |
| | 620,000 | | | Acushnet Co. | | | 7.38% | (a) | | | 10/15/2028 | | | | 643,029 | |
| | 655,000 | | | AdaptHealth LLC | | | 5.13% | (a) | | | 03/01/2030 | | | | 571,819 | |
| | 1,235,000 | | | Advanced Drainage Systems, Inc. | | | 5.00% | (a) | | | 09/30/2027 | | | | 1,199,158 | |
| | 1,535,000 | | | Advanced Drainage Systems, Inc. | | | 6.38% | (a) | | | 06/15/2030 | | | | 1,544,371 | |
| | 882,000 | | | AEP Transmission Co. LLC | | | 5.40% | | | | 03/15/2053 | | | | 878,854 | |
| | 765,000 | | | Aethon United BR LP / Aethon United Finance Corp. | | | 8.25% | (a) | | | 02/15/2026 | | | | 774,523 | |
| | 1,810,000 | | | AGCO Corp. | | | 5.80% | | | | 03/21/2034 | | | | 1,833,432 | |
| | 2,492,000 | | | Agree LP | | | 2.60% | | | | 06/15/2033 | | | | 1,958,450 | |
| | 3,200,000 | | | Air Lease Corp. | | | 1.88% | | | | 08/15/2026 | | | | 2,951,257 | |
| | 4,870,000 | | | Alexandria Real Estate Equities, Inc. | | | 3.00% | | | | 05/18/2051 | | | | 3,094,771 | |
| | 984,000 | | | Alexandria Real Estate Equities, Inc. | | | 5.15% | | | | 04/15/2053 | | | | 906,892 | |
| | 1,125,000 | | | Alliant Holdings Intermediate LLC / Alliant Holdings Co.-Issuer | | | 6.75% | (a) | | | 10/15/2027 | | | | 1,109,299 | |
| | 520,000 | | | Alliant Holdings Intermediate LLC / Alliant Holdings Co.-Issuer | | | 7.00% | (a) | | | 01/15/2031 | | | | 525,602 | |
| | 1,220,000 | | | Allied Universal Holdco LLC | | | 7.88% | (a) | | | 02/15/2031 | | | | 1,237,137 | |
| | 460,000 | | | Allied Universal Holdco LLC / Allied Universal Finance Corp. | | | 6.63% | (a) | | | 07/15/2026 | | | | 460,084 | |
| | 615,000 | | | Allied Universal Holdco LLC / Allied Universal Finance Corp. | | | 6.00% | (a) | | | 06/01/2029 | | | | 529,859 | |
| | 355,000 | | | AMC Entertainment Holdings, Inc. | | | 7.50% | (a) | | | 02/15/2029 | | | | 237,421 | |
| | 1,290,000 | | | American Airlines, Inc. | | | 8.50% | (a) | | | 05/15/2029 | | | | 1,363,636 | |
| | 600,000 | | | American Axle & Manufacturing, Inc. | | | 5.00% | | | | 10/01/2029 | | | | 540,954 | |
| | 9,560,000 | | | American Express Co. | | | 3.95% | | | | 08/01/2025 | | | | 9,396,075 | |
| | 8,197,000 | | | American Homes 4 Rent LP | | | 5.50% | | | | 02/01/2034 | | | | 8,175,404 | |
| | 2,409,000 | | | American Tower Corp. | | | 5.55% | | | | 07/15/2033 | | | | 2,428,770 | |
| | 3,936,000 | | | Amgen, Inc. | | | 5.75% | | | | 03/02/2063 | | | | 4,017,658 | |
| | 1,040,000 | | | AmWINS Group, Inc. | | | 4.88% | (a) | | | 06/30/2029 | | | | 971,727 | |
| | 989,000 | | | Antero Midstream Partners LP / Antero Midstream Finance Corp. | | | 5.75% | (a) | | | 03/01/2027 | | | | 977,269 | |
| | | | |
| 30 | | DoubleLine Funds Trust | | The accompanying notes are an integral part of these financial statements. |
| | | | | | | | | | | | | | | | |
PRINCIPAL AMOUNT $ | | | SECURITY DESCRIPTION | | RATE | | | MATURITY | | | VALUE $ | |
| | 1,300,000 | | | Antero Midstream Partners LP / Antero Midstream Finance Corp. | | | 6.63% | (a) | | | 02/01/2032 | | | | 1,306,755 | |
| | 995,000 | | | Antero Resources Corp. | | | 5.38% | (a) | | | 03/01/2030 | | | | 956,454 | |
| | 685,000 | | | Ardagh Packaging Finance PLC / Ardagh Holdings USA, Inc. | | | 5.25% | (a) | | | 08/15/2027 | | | | 432,286 | |
| | 5,182,000 | | | Ares Capital Corp. | | | 3.25% | | | | 07/15/2025 | | | | 5,007,361 | |
| | 4,375,000 | | | Arrow Electronics, Inc. | | | 3.88% | | | | 01/12/2028 | | | | 4,148,477 | |
| | 375,000 | | | Arsenal AIC Parent LLC | | | 8.00% | (a) | | | 10/01/2030 | | | | 394,176 | |
| | 580,000 | | | Artera Services LLC | | | 8.50% | (a) | | | 02/15/2031 | | | | 595,064 | |
| | 845,000 | | | Ashton Woods USA LLC / Ashton Woods Finance Co. | | | 4.63% | (a) | | | 04/01/2030 | | | | 772,891 | |
| | 355,000 | | | ASP Unifrax Holdings, Inc. | | | 5.25% | (a) | | | 09/30/2028 | | | | 229,313 | |
| | 1,015,000 | | | AssuredPartners, Inc. | | | 5.63% | (a) | | | 01/15/2029 | | | | 936,135 | |
| | 14,735,000 | | | AT&T, Inc. | | | 3.50% | | | | 09/15/2053 | | | | 10,404,157 | |
| | 1,015,000 | | | AthenaHealth Group, Inc. | | | 6.50% | (a) | | | 02/15/2030 | | | | 929,389 | |
| | 4,973,000 | | | Athene Global Funding
(Secured Overnight Financing Rate + 0.56%) | | | 5.90% | (a) | | | 08/19/2024 | | | | 4,976,318 | |
| | 5,575,000 | | | Athene Holding Ltd. | | | 6.25% | | | | 04/01/2054 | | | | 5,664,663 | |
| | 7,710,000 | | | Aviation Capital Group LLC | | | 1.95% | (a) | | | 09/20/2026 | | | | 7,047,753 | |
| | 2,934,000 | | | Bank of America Corp.
(US Secured Overnight Financing Rate + 1.11%) | | | 3.84% | | | | 04/25/2025 | | | | 2,930,009 | |
| | 3,466,000 | | | Bank of America Corp.
(US Secured Overnight Financing Rate + 1.75%) | | | 4.83% | | | | 07/22/2026 | | | | 3,436,001 | |
| | 4,215,000 | | | Bank of America Corp.
(US Secured Overnight Financing Rate + 1.21%) | | | 2.57% | | | | 10/20/2032 | | | | 3,498,281 | |
| | 3,952,000 | | | Bank of America Corp.
(US Secured Overnight Financing Rate + 1.65%) | | | 5.47% | | | | 01/23/2035 | | | | 3,979,257 | |
| | 11,482,000 | | | Bank of America Corp.
(5 Year CMT Rate + 1.20%) | | | 2.48% | | | | 09/21/2036 | | | | 9,189,970 | |
| | 1,500,000 | | | Bausch + Lomb Corp. | | | 8.38% | (a) | | | 10/01/2028 | | | | 1,553,865 | |
| | 485,000 | | | Bausch Health Americas, Inc. | | | 8.50% | (a) | | | 01/31/2027 | | | | 285,548 | |
| | 1,080,000 | | | Bausch Health Cos., Inc. | | | 4.88% | (a) | | | 06/01/2028 | | | | 590,413 | |
| | 300,000 | | | Bausch Health Cos., Inc. | | | 5.25% | (a) | | | 01/30/2030 | | | | 126,324 | |
| | 93,000 | | | Bausch Health Cos., Inc. | | | 14.00% | (a) | | | 10/15/2030 | | | | 53,967 | |
| | 1,140,000 | | | BCPE Empire Holdings, Inc. | | | 7.63% | (a) | | | 05/01/2027 | | | | 1,114,151 | |
| | 1,135,000 | | | Beacon Roofing Supply, Inc. | | | 6.50% | (a) | | | 08/01/2030 | | | | 1,152,703 | |
| | 4,540,000 | | | Berkshire Hathaway Finance Corp. | | | 2.85% | | | | 10/15/2050 | | | | 3,067,674 | |
| | 2,427,000 | | | Berkshire Hathaway Finance Corp. | | | 3.85% | | | | 03/15/2052 | | | | 1,964,350 | |
| | 4,044,000 | | | Berry Global, Inc. | | | 4.88% | (a) | | | 07/15/2026 | | | | 3,966,088 | |
| | 2,930,000 | | | Berry Global, Inc. | | | 5.65% | (a) | | | 01/15/2034 | | | | 2,915,459 | |
| | 3,120,000 | | | BlackRock Funding, Inc. | | | 5.25% | | | | 03/14/2054 | | | | 3,138,276 | |
| | 9,211,000 | | | BlackRock, Inc. | | | 4.75% | | | | 05/25/2033 | | | | 9,166,716 | |
| | 400,000 | | | Boost Newco Borrower LLC | | | 7.50% | (a) | | | 01/15/2031 | | | | 419,031 | |
| | 125,000 | | | Boxer Parent Co., Inc. | | | 7.13% | (a) | | | 10/02/2025 | | | | 125,209 | |
| | 5,245,000 | | | BP Capital Markets America, Inc. | | | 4.89% | | | | 09/11/2033 | | | | 5,210,856 | |
| | 2,941,000 | | | BP Capital Markets America, Inc. | | | 2.94% | | | | 06/04/2051 | | | | 1,965,062 | |
| | 740,000 | | | Brand Industrial Services, Inc. | | | 10.38% | (a) | | | 08/01/2030 | | | | 802,096 | |
| | 1,911,000 | | | Brighthouse Financial Global Funding | | | 1.00% | (a) | | | 04/12/2024 | | | | 1,908,395 | |
| | 2,838,000 | | | Brighthouse Financial Global Funding | | | 2.00% | (a) | | | 06/28/2028 | | | | 2,450,858 | |
| | 1,880,000 | | | Bristol-Myers Squibb Co. | | | 5.50% | | | | 02/22/2044 | | | | 1,925,178 | |
| | 7,968,000 | | | Bristol-Myers Squibb Co. | | | 5.55% | | | | 02/22/2054 | | | | 8,201,237 | |
| | 6,670,000 | | | Brixmor Operating Partnership LP | | | 5.50% | | | | 02/15/2034 | | | | 6,589,460 | |
| | 8,836,000 | | | Broadcom, Inc. | | | 3.42% | (a) | | | 04/15/2033 | | | | 7,662,813 | |
| | 6,378,000 | | | Broadcom, Inc. | | | 3.19% | (a) | | | 11/15/2036 | | | | 5,078,456 | |
| | 1,270,000 | | | Builders FirstSource, Inc. | | | 4.25% | (a) | | | 02/01/2032 | | | | 1,139,850 | |
| | 1,295,000 | | | Builders FirstSource, Inc. | | | 6.38% | (a) | | | 06/15/2032 | | | | 1,315,294 | |
| | 1,595,000 | | | Builders FirstSource, Inc. | | | 6.38% | (a) | | | 03/01/2034 | | | | 1,603,578 | |
| | 3,506,000 | | | Burlington Northern Santa Fe LLC | | | 5.20% | | | | 04/15/2054 | | | | 3,478,054 | |
| | 570,000 | | | Caesars Entertainment, Inc. | | | 4.63% | (a) | | | 10/15/2029 | | | | 520,222 | |
| | 670,000 | | | Caesars Entertainment, Inc. | | | 6.50% | (a) | | | 02/15/2032 | | | | 676,319 | |
| | 1,100,000 | | | Callon Petroleum Co. | | | 7.50% | (a) | | | 06/15/2030 | | | | 1,166,666 | |
| | 890,000 | | | Calpine Corp. | | | 4.50% | (a) | | | 02/15/2028 | | | | 844,835 | |
| | 555,000 | | | Calpine Corp. | | | 5.13% | (a) | | | 03/15/2028 | | | | 533,127 | |
| | 600,000 | | | Calpine Corp. | | | 4.63% | (a) | | | 02/01/2029 | | | | 555,928 | |
| | 2,700,000 | | | Campbell Soup Co. | | | 5.40% | | | | 03/21/2034 | | | | 2,721,532 | |
| | | | | | | | |
| The accompanying notes are an integral part of these financial statements. | | Annual Report | | | | | March 31, 2024 | | 31 |
| | |
Schedule of Investments DoubleLine Core Fixed Income Fund (Cont.) | | |
| | | | | | | | | | | | | | | | |
PRINCIPAL AMOUNT $ | | | SECURITY DESCRIPTION | | RATE | | | MATURITY | | | VALUE $ | |
| | 2,418,000 | | | Cardinal Health, Inc. | | | 5.13% | | | | 02/15/2029 | | | | 2,423,774 | |
| | 1,915,000 | | | Carnival Corp. | | | 5.75% | (a) | | | 03/01/2027 | | | | 1,896,540 | |
| | 830,000 | | | Carnival Corp. | | | 7.00% | (a) | | | 08/15/2029 | | | | 866,350 | |
| | 975,000 | | | Carrier Global Corp. | | | 6.20% | | | | 03/15/2054 | | | | 1,074,411 | |
| | 224,000 | | | Castle US Holding Corp. | | | 9.50% | (a) | | | 02/15/2028 | | | | 111,728 | |
| | 305,000 | | | Catalent Pharma Solutions, Inc. | | | 3.50% | (a) | | | 04/01/2030 | | | | 290,747 | |
| | 2,520,000 | | | CCO Holdings LLC / CCO Holdings Capital Corp. | | | 4.75% | (a) | | | 03/01/2030 | | | | 2,165,350 | |
| | 1,275,000 | | | CCO Holdings LLC / CCO Holdings Capital Corp. | | | 4.50% | (a) | | | 08/15/2030 | | | | 1,069,307 | |
| | 1,200,000 | | | CCO Holdings LLC / CCO Holdings Capital Corp. | | | 4.75% | (a) | | | 02/01/2032 | | | | 980,506 | |
| | 1,830,000 | | | Cedar Fair LP | | | 5.25% | | | | 07/15/2029 | | | | 1,741,089 | |
| | 8,565,000 | | | Centene Corp. | | | 2.50% | | | | 03/01/2031 | | | | 7,052,272 | |
| | 910,000 | | | Central Parent LLC / CDK Global II LLC / CDK Financing Co., Inc. | | | 8.00% | (a) | | | 06/15/2029 | | | | 944,126 | |
| | 5,314,000 | | | CF Industries, Inc. | | | 5.38% | | | | 03/15/2044 | | | | 5,004,804 | |
| | 5,176,000 | | | Charter Communications Operating LLC / Charter Communications Operating Capital | | | 4.91% | | | | 07/23/2025 | | | | 5,114,408 | |
| | 5,350,000 | | | Cheniere Energy, Inc. | | | 4.63% | | | | 10/15/2028 | | | | 5,188,905 | |
| | 1,219,000 | | | Chesapeake Energy Corp. | | | 5.88% | (a) | | | 02/01/2029 | | | | 1,210,057 | |
| | 1,260,000 | | | Chord Energy Corp. | | | 6.38% | (a) | | | 06/01/2026 | | | | 1,266,188 | |
| | 805,000 | | | CHS/Community Health Systems, Inc. | | | 6.00% | (a) | | | 01/15/2029 | | | | 704,208 | |
| | 1,110,000 | | | CHS/Community Health Systems, Inc. | | | 4.75% | (a) | | | 02/15/2031 | | | | 857,644 | |
| | 1,790,000 | | | Citigroup, Inc.
(US Secured Overnight Financing Rate + 0.69%) | | | 2.01% | | | | 01/25/2026 | | | | 1,735,880 | |
| | 2,038,000 | | | Citigroup, Inc.
(US Secured Overnight Financing Rate + 1.28%) | | | 3.07% | | | | 02/24/2028 | | | | 1,917,466 | |
| | 770,000 | | | Civitas Resources, Inc. | | | 8.38% | (a) | | | 07/01/2028 | | | | 811,551 | |
| | 1,245,000 | | | Clarios Global LP / Clarios US Finance Co. | | | 6.75% | (a) | | | 05/15/2028 | | | | 1,262,969 | |
| | 565,000 | | | Clarivate Science Holdings Corp. | | | 4.88% | (a) | | | 07/01/2029 | | | | 523,301 | |
| | 460,000 | | | Clean Harbors, Inc. | | | 5.13% | (a) | | | 07/15/2029 | | | | 442,579 | |
| | 410,000 | | | Clear Channel Outdoor Holdings, Inc. | | | 9.00% | (a) | | | 09/15/2028 | | | | 427,431 | |
| | 465,000 | | | Clear Channel Outdoor Holdings, Inc. | | | 7.50% | (a) | | | 06/01/2029 | | | | 384,981 | |
| | 1,265,000 | | | Clearway Energy Operating LLC | | | 4.75% | (a) | | | 03/15/2028 | | | | 1,203,373 | |
| | 280,000 | | | Cloud Software Group, Inc. | | | 6.50% | (a) | | | 03/31/2029 | | | | 265,942 | |
| | 280,000 | | | Cloud Software Group, Inc. | | | 9.00% | (a) | | | 09/30/2029 | | | | 268,820 | |
| | 2,540,000 | | | CNH Industrial Capital LLC | | | 5.10% | | | | 04/20/2029 | | | | 2,533,933 | |
| | 1,185,000 | | | CNX Midstream Partners LP | | | 4.75% | (a) | | | 04/15/2030 | | | | 1,057,156 | |
| | 1,210,000 | | | CNX Resources Corp. | | | 6.00% | (a) | | | 01/15/2029 | | | | 1,185,860 | |
| | 565,000 | | | Coherent Corp. | | | 5.00% | (a) | | | 12/15/2029 | | | | 532,733 | |
| | 3,125,000 | | | Comcast Corp. | | | 3.95% | | | | 10/15/2025 | | | | 3,073,822 | |
| | 400,000 | | | CommScope Technologies LLC | | | 5.00% | (a) | | | 03/15/2027 | | | | 155,496 | |
| | 370,000 | | | CommScope, Inc. | | | 4.75% | (a) | | | 09/01/2029 | | | | 267,325 | |
| | 745,000 | | | Consolidated Communications, Inc. | | | 5.00% | (a) | | | 10/01/2028 | | | | 621,653 | |
| | 3,868,000 | | | COPT Defense Properties LP | | | 2.90% | | | | 12/01/2033 | | | | 3,035,384 | |
| | 763,000 | | | Cornerstone Building Brands, Inc. | | | 6.13% | (a) | | | 01/15/2029 | | | | 683,948 | |
| | 740,000 | | | Coty, Inc. | | | 6.50% | (a) | | | 04/15/2026 | | | | 741,686 | |
| | 1,240,000 | | | Coty, Inc. | | | 5.00% | (a) | | | 04/15/2026 | | | | 1,222,402 | |
| | 1,015,000 | | | Coty, Inc./HFC Prestige Products, Inc./HFC Prestige International US LLC | | | 6.63% | (a) | | | 07/15/2030 | | | | 1,031,535 | |
| | 3,085,000 | | | CQP Holdco LP / BIP-V Chinook Holdco LLC | | | 5.50% | (a) | | | 06/15/2031 | | | | 2,918,151 | |
| | 10,585,000 | | | Crown Castle, Inc. | | | 3.65% | | | | 09/01/2027 | | | | 10,037,596 | |
| | 1,185,000 | | | CSC Holdings LLC | | | 6.50% | (a) | | | 02/01/2029 | | | | 1,005,065 | |
| | 1,315,000 | | | CSC Holdings LLC | | | 5.75% | (a) | | | 01/15/2030 | | | | 697,171 | |
| | 1,050,000 | | | CSI Compressco LP / CSI Compressco Finance, Inc. | | | 7.50% | (a) | | | 04/01/2025 | | | | 1,050,000 | |
| | 12,807,000 | | | CSX Corp. | | | 3.80% | | | | 11/01/2046 | | | | 10,198,603 | |
| | 2,410,000 | | | Cummins, Inc. | | | 5.45% | | | | 02/20/2054 | | | | 2,465,707 | |
| | 680,000 | | | CVR Partners LP / CVR Nitrogen Finance Corp. | | | 6.13% | (a) | | | 06/15/2028 | | | | 654,187 | |
| | 5,205,000 | | | CVS Health Corp. | | | 5.30% | | | | 06/01/2033 | | | | 5,219,413 | |
| | 7,518,000 | | | CVS Health Corp. | | | 5.88% | | | | 06/01/2053 | | | | 7,653,448 | |
| | 410,000 | | | Dana, Inc. | | | 5.38% | | | | 11/15/2027 | | | | 401,409 | |
| | 965,000 | | | Dana, Inc. | | | 5.63% | | | | 06/15/2028 | | | | 942,711 | |
| | 285,000 | | | Dana, Inc. | | | 4.25% | | | | 09/01/2030 | | | | 252,082 | |
| | 547,000 | | | Dealer Tire LLC / DT Issuer LLC | | | 8.00% | (a) | | | 02/01/2028 | | | | 544,950 | |
| | 3,000,000 | | | Digital Realty Trust LP | | | 3.60% | | | | 07/01/2029 | | | | 2,765,925 | |
| | | | |
| 32 | | DoubleLine Funds Trust | | The accompanying notes are an integral part of these financial statements. |
| | | | | | | | | | | | | | | | |
PRINCIPAL AMOUNT $ | | | SECURITY DESCRIPTION | | RATE | | | MATURITY | | | VALUE $ | |
| | 1,390,000 | | | Directv Financing LLC / Directv Financing Co.-Obligor, Inc. | | | 5.88% | (a) | | | 08/15/2027 | | | | 1,315,859 | |
| | 1,275,000 | | | DISH DBS Corp. | | | 5.75% | (a) | | | 12/01/2028 | | | | 878,641 | |
| | 660,000 | | | DISH DBS Corp. | | | 5.13% | | | | 06/01/2029 | | | | 275,829 | |
| | 2,580,000 | | | Dollar General Corp. | | | 4.25% | | | | 09/20/2024 | | | | 2,561,717 | |
| | 9,413,000 | | | Dollar Tree, Inc. | | | 4.00% | | | | 05/15/2025 | | | | 9,256,457 | |
| | 905,000 | | | Dornoch Debt Merger Sub, Inc. | | | 6.63% | (a) | | | 10/15/2029 | | | | 805,330 | |
| | 8,114,000 | | | DTE Energy Co. | | | 5.10% | | | | 03/01/2029 | | | | 8,084,979 | |
| | 4,400,000 | | | DTE Energy Co. | | | 2.95% | | | | 03/01/2030 | | | | 3,888,889 | |
| | 1,433,000 | | | Duke Energy Corp. | | | 4.30% | | | | 03/15/2028 | | | | 1,400,615 | |
| | 6,595,000 | | | Duke Energy Corp. | | | 3.95% | | | | 08/15/2047 | | | | 5,124,363 | |
| | 1,700,000 | | | Duke Energy Corp. | | | 5.00% | | | | 08/15/2052 | | | | 1,540,469 | |
| | 2,075,000 | | | Dun & Bradstreet Corp. | | | 5.00% | (a) | | | 12/15/2029 | | | | 1,917,065 | |
| | 4,059,000 | | | Elevance Health, Inc. | | | 2.38% | | | | 01/15/2025 | | | | 3,960,301 | |
| | 1,435,000 | | | Elevance Health, Inc. | | | 4.55% | | | | 05/15/2052 | | | | 1,262,692 | |
| | 596,000 | | | Embarq Corp. | | | 8.00% | | | | 06/01/2036 | | | | 324,463 | |
| | 1,310,000 | | | EMRLD Borrower LP / Emerald Co.-Issuer, Inc. | | | 6.63% | (a) | | | 12/15/2030 | | | | 1,324,204 | |
| | 215,000 | | | Encompass Health Corp. | | | 4.75% | | | | 02/01/2030 | | | | 201,591 | |
| | 1,430,000 | | | Encompass Health Corp. | | | 4.63% | | | | 04/01/2031 | | | | 1,301,194 | |
| | 520,000 | | | Energizer Holdings, Inc. | | | 6.50% | (a) | | | 12/31/2027 | | | | 517,638 | |
| | 5,185,000 | | | Energy Transfer LP | | | 4.75% | | | | 01/15/2026 | | | | 5,133,377 | |
| | 3,180,000 | | | Energy Transfer LP | | | 4.40% | | | | 03/15/2027 | | | | 3,113,176 | |
| | 5,760,000 | | | Energy Transfer LP | | | 5.00% | | | | 05/15/2044 | | | | 5,098,470 | |
| | 2,660,000 | | | Entergy Corp. | | | 2.80% | | | | 06/15/2030 | | | | 2,326,621 | |
| | 1,235,000 | | | EQM Midstream Partners LP | | | 4.75% | (a) | | | 01/15/2031 | | | | 1,149,637 | |
| | 5,556,000 | | | Equinix, Inc. | | | 1.80% | | | | 07/15/2027 | | | | 4,984,423 | |
| | 5,205,000 | | | Essential Utilities, Inc. | | | 5.38% | | | | 01/15/2034 | | | | 5,181,060 | |
| | 830,000 | | | Everi Holdings, Inc. | | | 5.00% | (a) | | | 07/15/2029 | | | | 822,871 | |
| | 5,031,000 | | | Eversource Energy | | | 5.50% | | | | 01/01/2034 | | | | 5,034,959 | |
| | 2,575,000 | | | Expedia Group, Inc. | | | 5.00% | | | | 02/15/2026 | | | | 2,561,227 | |
| | 4,891,000 | | | Expedia Group, Inc. | | | 3.80% | | | | 02/15/2028 | | | | 4,654,357 | |
| | 1,409,000 | | | Expedia Group, Inc. | | | 3.25% | | | | 02/15/2030 | | | | 1,268,778 | |
| | 968,000 | | | Expedia Group, Inc. | | | 2.95% | | | | 03/15/2031 | | | | 845,532 | |
| | 5,069,000 | | | Extra Space Storage LP | | | 5.40% | | | | 02/01/2034 | | | | 5,048,610 | |
| | 4,971,000 | | | Exxon Mobil Corp. | | | 4.23% | | | | 03/19/2040 | | | | 4,531,321 | |
| | 990,000 | | | Ferrellgas LP / Ferrellgas Finance Corp. | | | 5.38% | (a) | | | 04/01/2026 | | | | 969,366 | |
| | 900,000 | | | Fertitta Entertainment LLC / Fertitta Entertainment Finance Co., Inc. | | | 6.75% | (a) | | | 01/15/2030 | | | | 808,859 | |
| | 5,135,000 | | | Fiserv, Inc. | | | 5.45% | | | | 03/15/2034 | | | | 5,202,760 | |
| | 6,088,000 | | | Ford Motor Co. | | | 3.25% | | | | 02/12/2032 | | | | 5,067,458 | |
| | 5,640,000 | | | Fortinet, Inc. | | | 1.00% | | | | 03/15/2026 | | | | 5,192,136 | |
| | 1,295,000 | | | Fortrea Holdings, Inc. | | | 7.50% | (a) | | | 07/01/2030 | | | | 1,338,427 | |
| | 1,555,000 | | | Fortress Transportation and Infrastructure Investors LLC | | | 7.88% | (a) | | | 12/01/2030 | | | | 1,634,541 | |
| | 390,000 | | | Frontier Communications Holdings LLC | | | 5.88% | (a) | | | 10/15/2027 | | | | 377,881 | |
| | 800,000 | | | Frontier Communications Holdings LLC | | | 5.00% | (a) | | | 05/01/2028 | | | | 743,150 | |
| | 515,392 | | | Frontier Communications Holdings LLC | | | 5.88% | | | | 11/01/2029 | | | | 436,053 | |
| | 690,000 | | | Full House Resorts, Inc. | | | 8.25% | (a) | | | 02/15/2028 | | | | 659,974 | |
| | 1,435,000 | | | Gap, Inc. | | | 3.88% | (a) | | | 10/01/2031 | | | | 1,215,338 | |
| | 5,679,000 | | | General Motors Financial Co., Inc. | | | 2.40% | | | | 10/15/2028 | | | | 5,028,521 | |
| | 5,965,000 | | | General Motors Financial Co., Inc. | | | 3.10% | | | | 01/12/2032 | | | | 5,054,860 | |
| | 5,400,000 | | | Georgia Power Co. | | | 2.20% | | | | 09/15/2024 | | | | 5,314,585 | |
| | 11,165,000 | | | Georgia Power Co. | | | 3.25% | | | | 03/15/2051 | | | | 7,847,858 | |
| | 640,000 | | | GFL Environmental, Inc. | | | 6.75% | (a) | | | 01/15/2031 | | | | 656,680 | |
| | 3,055,000 | | | Gilead Sciences, Inc. | | | 5.55% | | | | 10/15/2053 | | | | 3,164,479 | |
| | 5,205,000 | | | Global Payments, Inc. | | | 4.95% | | | | 08/15/2027 | | | | 5,166,368 | |
| | 11,303,000 | | | Goldman Sachs Group, Inc.
(CME Term SOFR 3 Month + 1.43%) | | | 6.74% | | | | 05/15/2026 | | | | 11,405,333 | |
| | 3,280,000 | | | Goldman Sachs Group, Inc.
(US Secured Overnight Financing Rate + 0.82%) | | | 6.17% | | | | 09/10/2027 | | | | 3,283,076 | |
| | 585,000 | | | Goodyear Tire & Rubber Co. | | | 5.25% | | | | 07/15/2031 | | | | 533,647 | |
| | 470,000 | | | GrafTech Finance, Inc. | | | 4.63% | (a) | | | 12/15/2028 | | | | 302,751 | |
| | 1,105,000 | | | Griffon Corp. | | | 5.75% | | | | 03/01/2028 | | | | 1,082,963 | |
| | 695,000 | | | Group 1 Automotive, Inc. | | | 4.00% | (a) | | | 08/15/2028 | | | | 641,113 | |
| | 635,971 | | | Gulfport Energy Corp. | | | 8.00% | (a) | | | 05/17/2026 | | | | 645,910 | |
| | | | | | | | |
| The accompanying notes are an integral part of these financial statements. | | Annual Report | | | | | March 31, 2024 | | 33 |
| | |
Schedule of Investments DoubleLine Core Fixed Income Fund (Cont.) | | |
| | | | | | | | | | | | | | | | |
PRINCIPAL AMOUNT $ | | | SECURITY DESCRIPTION | | RATE | | | MATURITY | | | VALUE $ | |
| | 1,534 | | | Gulfport Energy Corp. | | | 8.00% | | | | 05/17/2026 | | | | 1,558 | |
| | 2,160,000 | | | Halliburton Co. | | | 4.85% | | | | 11/15/2035 | | | | 2,102,137 | |
| | 7,720,000 | | | HCA, Inc. | | | 5.38% | | | | 02/01/2025 | | | | 7,699,499 | |
| | 11,273,000 | | | HCA, Inc. | | | 5.25% | | | | 06/15/2049 | | | | 10,297,275 | |
| | 1,180,000 | | | Helios Software Holdings, Inc. / ION Corporate Solutions Finance SARL | | | 4.63% | (a) | | | 05/01/2028 | | | | 1,059,982 | |
| | 1,075,000 | | | Hess Midstream Operations LP | | | 5.13% | (a) | | | 06/15/2028 | | | | 1,041,101 | |
| | 1,355,000 | | | Hess Midstream Operations LP | | | 5.50% | (a) | | | 10/15/2030 | | | | 1,314,092 | |
| | 4,065,000 | | | Hewlett Packard Enterprise Co. | | | 5.90% | | | | 10/01/2024 | | | | 4,071,750 | |
| | 760,000 | | | H-Food Holdings LLC / Hearthside Finance Co., Inc. | | | 8.50% | (a) | | | 06/01/2026 | | | | 57,000 | |
| | 975,000 | | | Hightower Holding LLC | | | 6.75% | (a) | | | 04/15/2029 | | | | 917,196 | |
| | 1,282,000 | | | Hilcorp Energy I LP / Hilcorp Finance Co. | | | 6.25% | (a) | | | 11/01/2028 | | | | 1,281,651 | |
| | 315,000 | | | Hilcorp Energy I LP / Hilcorp Finance Co. | | | 5.75% | (a) | | | 02/01/2029 | | | | 307,100 | |
| | 260,000 | | | Hilcorp Energy I LP / Hilcorp Finance Co. | | | 8.38% | (a) | | | 11/01/2033 | | | | 282,101 | |
| | 6,094,000 | | | Host Hotels & Resorts LP | | | 2.90% | | | | 12/15/2031 | | | | 5,068,303 | |
| | 1,245,000 | | | HUB International Ltd. | | | 7.25% | (a) | | | 06/15/2030 | | | | 1,280,367 | |
| | 10,119,000 | | | Hyundai Capital America | | | 5.30% | (a) | | | 01/08/2029 | | | | 10,136,865 | |
| | 1,045,000 | | | Icahn Enterprises LP / Icahn Enterprises Finance Corp. | | | 5.25% | | | | 05/15/2027 | | | | 945,135 | |
| | 960,000 | | | Illuminate Buyer LLC / Illuminate Holdings IV, Inc. | | | 9.00% | (a) | | | 07/01/2028 | | | | 948,204 | |
| | 1,435,000 | | | Installed Building Products, Inc. | | | 5.75% | (a) | | | 02/01/2028 | | | | 1,402,062 | |
| | 4,790,000 | | | Intuit, Inc. | | | 5.50% | | | | 09/15/2053 | | | | 4,975,985 | |
| | 3,510,000 | | | IQVIA, Inc. | | | 6.25% | | | | 02/01/2029 | | | | 3,647,399 | |
| | 1,175,000 | | | Iron Mountain, Inc. | | | 7.00% | (a) | | | 02/15/2029 | | | | 1,198,678 | |
| | 735,000 | | | Iron Mountain, Inc. | | | 4.50% | (a) | | | 02/15/2031 | | | | 663,891 | |
| | 3,430,000 | | | Jacobs Engineering Group, Inc. | | | 5.90% | | | | 03/01/2033 | | | | 3,475,127 | |
| | 1,380,000 | | | JELD-WEN, Inc. | | | 4.88% | (a) | | | 12/15/2027 | | | | 1,321,654 | |
| | 3,355,000 | | | JPMorgan Chase & Co.
(US Secured Overnight Financing Rate + 0.92%) | | | 2.60% | | | | 02/24/2026 | | | | 3,269,049 | |
| | 1,295,000 | | | JPMorgan Chase & Co.
(US Secured Overnight Financing Rate + 1.99%) | | | 4.85% | | | | 07/25/2028 | | | | 1,284,501 | |
| | 4,495,000 | | | JPMorgan Chase & Co.
(US Secured Overnight Financing Rate + 1.02%) | | | 2.07% | | | | 06/01/2029 | | | | 3,988,636 | |
| | 6,940,000 | | | JPMorgan Chase & Co.
(US Secured Overnight Financing Rate + 2.04%) | | | 2.52% | | | | 04/22/2031 | | | | 6,000,442 | |
| | 5,890,000 | | | JPMorgan Chase & Co.
(CME Term SOFR 3 Month + 1.25%) | | | 2.58% | | | | 04/22/2032 | | | | 4,981,371 | |
| | 5,830,000 | | | JPMorgan Chase & Co.
(US Secured Overnight Financing Rate + 1.26%) | | | 2.96% | | | | 01/25/2033 | | | | 4,979,510 | |
| | 8,367,000 | | | Kinder Morgan Energy Partners LP | | | 6.95% | | | | 01/15/2038 | | | | 9,164,319 | |
| | 1,285,000 | | | Kodiak Gas Services LLC | | | 7.25% | (a) | | | 02/15/2029 | | | | 1,309,740 | |
| | 5,090,000 | | | Kyndryl Holdings, Inc. | | | 6.35% | | | | 02/20/2034 | | | | 5,227,370 | |
| | 425,000 | | | LBM Acquisition LLC | | | 6.25% | (a) | | | 01/15/2029 | | | | 398,891 | |
| | 1,300,000 | | | Leeward Renewable Energy Operations LLC | | | 4.25% | (a) | | | 07/01/2029 | | | | 1,116,751 | |
| | 1,305,000 | | | Legacy LifePoint Health LLC | | | 4.38% | (a) | | | 02/15/2027 | | | | 1,244,618 | |
| | 1,015,000 | | | Legends Hospitality Holding Co. LLC / Legends Hospitality Co.-Issuer, Inc. | | | 5.00% | (a) | | | 02/01/2026 | | | | 1,006,191 | |
| | 530,000 | | | Level 3 Financing, Inc. | | | 3.75% | (a) | | | 07/15/2029 | | | | 238,500 | |
| | 420,000 | | | Level 3 Financing, Inc. | | | 4.50% | (a) | | | 04/01/2030 | | | | 262,500 | |
| | 799,000 | | | Level 3 Financing, Inc. | | | 10.50% | (a) | | | 05/15/2030 | | | | 820,973 | |
| | 870,000 | | | LFS Topco LLC | | | 5.88% | (a) | | | 10/15/2026 | | | | 812,488 | |
| | 375,000 | | | LifePoint Health, Inc. | | | 5.38% | (a) | | | 01/15/2029 | | | | 309,409 | |
| | 625,000 | | | Light & Wonder International, Inc. | | | 7.25% | (a) | | | 11/15/2029 | | | | 642,026 | |
| | 335,000 | | | Lions Gate Capital Holdings LLC | | | 5.50% | (a) | | | 04/15/2029 | | | | 256,565 | |
| | 620,000 | | | Live Nation Entertainment, Inc. | | | 6.50% | (a) | | | 05/15/2027 | | | | 627,188 | |
| | 5,625,000 | | | Lockheed Martin Corp. | | | 5.20% | | | | 02/15/2064 | | | | 5,566,590 | |
| | 3,100,000 | | | Lowe’s Cos., Inc. | | | 4.40% | | | | 09/08/2025 | | | | 3,062,978 | |
| | 2,922,000 | | | Lowe’s Cos., Inc. | | | 5.63% | | | | 04/15/2053 | | | | 2,954,429 | |
| | 975,000 | | | LSF9 Atlantis Holdings LLC / Victra Finance Corp. | | | 7.75% | (a) | | | 02/15/2026 | | | | 967,080 | |
| | 1,235,000 | | | M/I Homes, Inc. | | | 4.95% | | | | 02/01/2028 | | | | 1,179,053 | |
| | 805,000 | | | Macy’s Retail Holdings LLC | | | 5.88% | (a) | | | 04/01/2029 | | | | 790,524 | |
| | 1,030,000 | | | Madison IAQ LLC | | | 4.13% | (a) | | | 06/30/2028 | | | | 953,558 | |
| | 1,010,000 | | | Madison IAQ LLC | | | 5.88% | (a) | | | 06/30/2029 | | | | 925,054 | |
| | 4,089,000 | | | Marathon Petroleum Corp. | | | 5.13% | | | | 12/15/2026 | | | | 4,092,845 | |
| | | | |
| 34 | | DoubleLine Funds Trust | | The accompanying notes are an integral part of these financial statements. |
| | | | | | | | | | | | | | | | |
PRINCIPAL AMOUNT $ | | | SECURITY DESCRIPTION | | RATE | | | MATURITY | | | VALUE $ | |
| | 6,198,000 | | | Marriott International, Inc./MD | | | 2.75% | | | | 10/15/2033 | | | | 5,041,329 | |
| | 5,053,000 | | | Marriott International, Inc./MD | | | 5.30% | | | | 05/15/2034 | | | | 4,999,702 | |
| | 11,809,000 | | | Marvell Technology, Inc. | | | 2.95% | | | | 04/15/2031 | | | | 10,206,820 | |
| | 5,577,000 | | | Massachusetts Mutual Life Insurance Co. | | | 3.20% | (a) | | | 12/01/2061 | | | | 3,501,867 | |
| | 1,040,000 | | | Matador Resources Co. | | | 6.50% | (a) | | | 04/15/2032 | | | | 1,042,561 | |
| | 1,330,000 | | | Match Group Holdings II LLC | | | 5.00% | (a) | | | 12/15/2027 | | | | 1,275,606 | |
| | 1,315,000 | | | Mativ Holdings, Inc. | | | 6.88% | (a) | | | 10/01/2026 | | | | 1,310,033 | |
| | 1,130,000 | | | Mavis Tire Express Services Topco Corp. | | | 6.50% | (a) | | | 05/15/2029 | | | | 1,075,796 | |
| | 425,000 | | | McAfee Corp. | | | 7.38% | (a) | | | 02/15/2030 | | | | 390,210 | |
| | 5,804,000 | | | McDonald’s Corp. | | | 4.45% | | | | 03/01/2047 | | | | 5,060,365 | |
| | 1,085,000 | | | McGraw-Hill Education, Inc. | | | 5.75% | (a) | | | 08/01/2028 | | | | 1,024,156 | |
| | 1,700,000 | | | Medline Borrower LP | | | 5.25% | (a) | | | 10/01/2029 | | | | 1,608,087 | |
| | 565,000 | | | Medline Borrower LP/Medline Co.-Issuer, Inc. | | | 6.25% | (a) | | | 04/01/2029 | | | | 568,236 | |
| | 3,700,000 | | | Merck & Co., Inc. | | | 4.50% | | | | 05/17/2033 | | | | 3,620,031 | |
| | 5,555,000 | | | Meta Platforms, Inc. | | | 3.85% | | | | 08/15/2032 | | | | 5,208,065 | |
| | 5,710,000 | | | Meta Platforms, Inc. | | | 4.45% | | | | 08/15/2052 | | | | 5,080,367 | |
| | 5,096,000 | | | MetLife, Inc. | | | 5.25% | | | | 01/15/2054 | | | | 5,023,840 | |
| | 830,000 | | | Michaels Cos., Inc. | | | 5.25% | (a) | | | 05/01/2028 | | | | 707,981 | |
| | 660,000 | | | Michaels Cos., Inc. | | | 7.88% | (a) | | | 05/01/2029 | | | | 495,788 | |
| | 1,238,000 | | | Midwest Gaming Borrower LLC / Midwest Gaming Finance Corp. | | | 4.88% | (a) | | | 05/01/2029 | | | | 1,147,343 | |
| | 260,000 | | | Miter Brands Acquisition Holdco, Inc. / MIWD Borrower LLC | | | 6.75% | (a) | | | 04/01/2032 | | | | 261,051 | |
| | 860,000 | | | ModivCare Escrow Issuer, Inc. | | | 5.00% | (a) | | | 10/01/2029 | | | | 624,376 | |
| | 3,994,000 | | | Morgan Stanley
(US Secured Overnight Financing Rate + 1.67%) | | | 4.68% | | | | 07/17/2026 | | | | 3,952,389 | |
| | 4,078,000 | | | Morgan Stanley
(US Secured Overnight Financing Rate + 1.61%) | | | 4.21% | | | | 04/20/2028 | | | | 3,964,162 | |
| | 1,678,000 | | | Morgan Stanley
(US Secured Overnight Financing Rate + 1.29%) | | | 2.94% | | | | 01/21/2033 | | | | 1,426,654 | |
| | 11,572,000 | | | Morgan Stanley
(US Secured Overnight Financing Rate + 1.36%) | | | 2.48% | | | | 09/16/2036 | | | | 9,157,340 | |
| | 4,948,000 | | | Mosaic Co. | | | 5.38% | | | | 11/15/2028 | | | | 5,011,225 | |
| | 5,175,000 | | | Motorola Solutions, Inc. | | | 5.40% | | | | 04/15/2034 | | | | 5,166,757 | |
| | 940,000 | | | Murphy Oil USA, Inc. | | | 4.75% | | | | 09/15/2029 | | | | 892,255 | |
| | 395,000 | | | Nabors Industries Ltd. | | | 7.25% | (a) | | | 01/15/2026 | | | | 392,819 | |
| | 835,000 | | | Nabors Industries, Inc. | | | 9.13% | (a) | | | 01/31/2030 | | | | 868,815 | |
| | 1,460,000 | | | Nationstar Mortgage Holdings, Inc. | | | 5.75% | (a) | | | 11/15/2031 | | | | 1,348,027 | |
| | 955,000 | | | Navient Corp. | | | 5.00% | | | | 03/15/2027 | | | | 915,608 | |
| | 1,185,000 | | | NCL Corp. Ltd. | | | 5.88% | (a) | | | 03/15/2026 | | | | 1,170,556 | |
| | 830,000 | | | NCL Corp. Ltd. | | | 8.38% | (a) | | | 02/01/2028 | | | | 877,347 | |
| | 5,398,000 | | | NetApp, Inc. | | | 1.88% | | | | 06/22/2025 | | | | 5,164,668 | |
| | 2,570,000 | | | Netflix, Inc. | | | 4.88% | | | | 04/15/2028 | | | | 2,567,194 | |
| | 505,000 | | | News Corp. | | | 5.13% | (a) | | | 02/15/2032 | | | | 474,751 | |
| | 4,495,000 | | | NextEra Energy Capital Holdings, Inc. | | | 4.26% | | | | 09/01/2024 | | | | 4,465,543 | |
| | 3,155,000 | | | NextEra Energy Capital Holdings, Inc. | | | 5.55% | | | | 03/15/2054 | | | | 3,136,811 | |
| | 1,030,000 | | | NGL Energy Operating LLC / NGL Energy Finance Corp. | | | 8.13% | (a) | | | 02/15/2029 | | | | 1,055,582 | |
| | 410,000 | | | NGL Energy Partners LP / NGL Energy Finance Corp. | | | 7.50% | | | | 04/15/2026 | | | | 410,229 | |
| | 2,256,000 | | | NGPL PipeCo LLC | | | 3.25% | (a) | | | 07/15/2031 | | | | 1,928,771 | |
| | 5,175,000 | | | NiSource, Inc. | | | 5.35% | | | | 04/01/2034 | | | | 5,148,940 | |
| | 5,275,000 | | | Northrop Grumman Corp. | | | 5.20% | | | | 06/01/2054 | | | | 5,141,535 | |
| | 1,000,000 | | | Novelis Corp. | | | 4.75% | (a) | | | 01/30/2030 | | | | 923,458 | |
| | 3,136,000 | | | NRG Energy, Inc. | | | 2.00% | (a) | | | 12/02/2025 | | | | 2,944,931 | |
| | 915,000 | | | NRG Energy, Inc. | | | 3.63% | (a) | | | 02/15/2031 | | | | 790,531 | |
| | 1,650,000 | | | NuStar Logistics LP | | | 6.00% | | | | 06/01/2026 | | | | 1,643,757 | |
| | 4,910,000 | | | Occidental Petroleum Corp. | | | 6.63% | | | | 09/01/2030 | | | | 5,207,350 | |
| | 550,000 | | | Olympus Water US Holding Corp. | | | 6.25% | (a) | | | 10/01/2029 | | | | 503,980 | |
| | 850,000 | | | OneMain Finance Corp. | | | 6.88% | | | | 03/15/2025 | | | | 859,490 | |
| | 280,000 | | | OneMain Finance Corp. | | | 7.13% | | | | 03/15/2026 | | | | 285,270 | |
| | 825,000 | | | OneMain Finance Corp. | | | 5.38% | | | | 11/15/2029 | | | | 776,343 | |
| | 2,651,000 | | | ONEOK, Inc. | | | 3.40% | | | | 09/01/2029 | | | | 2,443,174 | |
| | 2,218,000 | | | ONEOK, Inc. | | | 6.63% | | | | 09/01/2053 | | | | 2,446,116 | |
| | 2,905,000 | | | Oracle Corp. | | | 6.25% | | | | 11/09/2032 | | | | 3,109,551 | |
| | 1,890,000 | | | Oracle Corp. | | | 3.80% | | | | 11/15/2037 | | | | 1,585,781 | |
| | | | | | | | |
| The accompanying notes are an integral part of these financial statements. | | Annual Report | | | | | March 31, 2024 | | 35 |
| | |
Schedule of Investments DoubleLine Core Fixed Income Fund (Cont.) | | |
| | | | | | | | | | | | | | | | |
PRINCIPAL AMOUNT $ | | | SECURITY DESCRIPTION | | RATE | | | MATURITY | | | VALUE $ | |
| | 2,515,000 | | | O’Reilly Automotive, Inc. | | | 5.75% | | | | 11/20/2026 | | | | 2,557,047 | |
| | 730,000 | | | Organon & Co. / Organon Foreign Debt Co.-Issuer BV | | | 5.13% | (a) | | | 04/30/2031 | | | | 649,581 | |
| | 1,220,000 | | | Outfront Media Capital LLC / Outfront Media Capital Corp. | | | 7.38% | (a) | | | 02/15/2031 | | | | 1,278,858 | |
| | 1,320,000 | | | Owens & Minor, Inc. | | | 6.63% | (a) | | | 04/01/2030 | | | | 1,311,234 | |
| | 6,063,000 | | | Pacific Gas and Electric Co. | | | 2.50% | | | | 02/01/2031 | | | | 5,046,394 | |
| | 4,588,000 | | | Pacific Gas and Electric Co. | | | 6.75% | | | | 01/15/2053 | | | | 5,004,464 | |
| | 5,457,000 | | | Packaging Corp. of America | | | 3.40% | | | | 12/15/2027 | | | | 5,190,802 | |
| | 1,015,000 | | | Pactiv Evergreen Group Issuer LLC / Pactiv Evergreen Group Issuer, Inc. | | | 4.38% | (a) | | | 10/15/2028 | | | | 947,945 | |
| | 1,035,000 | | | Panther Escrow Issuer LLC | | | 7.13% | (a) | | | 06/01/2031 | | | | 1,053,123 | |
| | 875,000 | | | Park Intermediate Holdings LLC / PK Domestic Property LLC / PK Finance Co.-Issuer | | | 4.88% | (a) | | | 05/15/2029 | | | | 814,364 | |
| | 525,000 | | | PBF Holding Co. LLC / PBF Finance Corp. | | | 6.00% | | | | 02/15/2028 | | | | 517,079 | |
| | 190,000 | | | PECF USS Intermediate Holding III Corp. | | | 8.00% | (a) | | | 11/15/2029 | | | | 100,312 | |
| | 470,000 | | | Penn Entertainment, Inc. | | | 4.13% | (a) | | | 07/01/2029 | | | | 404,517 | |
| | 690,000 | | | PennyMac Financial Services, Inc. | | | 4.25% | (a) | | | 02/15/2029 | | | | 631,415 | |
| | 775,000 | | | PennyMac Financial Services, Inc. | | | 7.88% | (a) | | | 12/15/2029 | | | | 797,045 | |
| | 3,580,000 | | | Penske Truck Leasing Co. LP / PTL Finance Corp. | | | 5.75% | (a) | | | 05/24/2026 | | | | 3,607,049 | |
| | 4,636,000 | | | Penske Truck Leasing Co. LP / PTL Finance Corp. | | | 4.20% | (a) | | | 04/01/2027 | | | | 4,505,236 | |
| | 1,175,000 | | | Performance Food Group, Inc. | | | 4.25% | (a) | | | 08/01/2029 | | | | 1,077,930 | |
| | 1,220,000 | | | Permian Resources Operating LLC | | | 7.00% | (a) | | | 01/15/2032 | | | | 1,266,469 | |
| | 1,345,000 | | | PetSmart, Inc. / PetSmart Finance Corp. | | | 7.75% | (a) | | | 02/15/2029 | | | | 1,310,477 | |
| | 4,205,000 | | | Pfizer Investment Enterprises Pte Ltd. | | | 4.75% | | | | 05/19/2033 | | | | 4,142,326 | |
| | 5,080,000 | | | Philip Morris International, Inc. | | | 5.25% | | | | 02/13/2034 | | | | 5,037,283 | |
| | 12,065,000 | | | Phillips 66 | | | 5.65% | | | | 06/15/2054 | | | | 12,252,086 | |
| | 1,200,000 | | | Pike Corp. | | | 5.50% | (a) | | | 09/01/2028 | | | | 1,149,846 | |
| | 655,000 | | | Pike Corp. | | | 8.63% | (a) | | | 01/31/2031 | | | | 696,866 | |
| | 430,000 | | | Post Holdings, Inc. | | | 5.50% | (a) | | | 12/15/2029 | | | | 415,892 | |
| | 375,000 | | | Premier Entertainment Sub LLC / Premier Entertainment Finance Corp. | | | 5.63% | (a) | | | 09/01/2029 | | | | 286,577 | |
| | 545,000 | | | Prime Security Services Borrower LLC / Prime Finance, Inc. | | | 6.25% | (a) | | | 01/15/2028 | | | | 534,293 | |
| | 3,070,000 | | | Qorvo, Inc. | | | 3.38% | (a) | | | 04/01/2031 | | | | 2,643,005 | |
| | 210,000 | | | Radiate Holdco LLC / Radiate Finance, Inc. | | | 4.50% | (a) | | | 09/15/2026 | | | | 167,161 | |
| | 304,781 | | | Radiology Partners, Inc.
(5.00% + 3.50% PIK) | | | 8.50% | (a) | | | 01/31/2029 | | | | 283,157 | |
| | 215,587 | | | Radiology Partners, Inc.
9.87% PIK | | | 9.78% | (a) | | | 02/15/2030 | | | | 173,817 | |
| | 725,000 | | | Realogy Group LLC / Realogy Co.-Issuer Corp. | | | 5.25% | (a) | | | 04/15/2030 | | | | 493,768 | |
| | 2,565,000 | | | Regal Rexnord Corp. | | | 6.05% | (a) | | | 02/15/2026 | | | | 2,579,600 | |
| | 530,000 | | | RegionalCare Hospital Partners Holdings, Inc. / LifePoint Health, Inc. | | | 9.75% | (a) | | | 12/01/2026 | | | | 531,119 | |
| | 985,000 | | | Roller Bearing Co. of America, Inc. | | | 4.38% | (a) | | | 10/15/2029 | | | | 903,116 | |
| | 1,475,000 | | | Royal Caribbean Cruises Ltd. | | | 5.50% | (a) | | | 08/31/2026 | | | | 1,462,949 | |
| | 205,000 | | | Royal Caribbean Cruises Ltd. | | | 7.25% | (a) | | | 01/15/2030 | | | | 213,136 | |
| | 775,000 | | | Royal Caribbean Cruises Ltd. | | | 6.25% | (a) | | | 03/15/2032 | | | | 781,661 | |
| | 6,254,000 | | | Royalty Pharma PLC | | | 2.15% | | | | 09/02/2031 | | | | 5,043,560 | |
| | 5,065,000 | | | Ryder System, Inc. | | | 5.65% | | | | 03/01/2028 | | | | 5,164,519 | |
| | 4,123,000 | | | Sabine Pass Liquefaction LLC | | | 5.00% | | | | 03/15/2027 | | | | 4,112,399 | |
| | 2,519,000 | | | Sabra Health Care LP | | | 3.20% | | | | 12/01/2031 | | | | 2,093,805 | |
| | 1,423,000 | | | San Diego Gas & Electric Co. | | | 5.35% | | | | 04/01/2053 | | | | 1,402,911 | |
| | 1,535,000 | | | Scientific Games Holdings LP/Scientific Games US FinCo, Inc. | | | 6.63% | (a) | | | 03/01/2030 | | | | 1,485,105 | |
| | 805,000 | | | Sealed Air Corp./Sealed Air Corp. US | | | 7.25% | (a) | | | 02/15/2031 | | | | 837,953 | |
| | 1,075,000 | | | Select Medical Corp. | | | 6.25% | (a) | | | 08/15/2026 | | | | 1,077,850 | |
| | 1,100,000 | | | Sirius XM Radio, Inc. | | | 5.50% | (a) | | | 07/01/2029 | | | | 1,048,482 | |
| | 690,000 | | | Sirius XM Radio, Inc. | | | 4.13% | (a) | | | 07/01/2030 | | | | 603,607 | |
| | 605,000 | | | Sitio Royalties Operating Partnership LP / Sitio Finance Corp. | | | 7.88% | (a) | | | 11/01/2028 | | | | 626,291 | |
| | 305,000 | | | SK Invictus Intermediate II SARL | | | 5.00% | (a) | | | 10/30/2029 | | | | 272,179 | |
| | 9,502,000 | | | Smithfield Foods, Inc. | | | 4.25% | (a) | | | 02/01/2027 | | | | 9,129,411 | |
| | 1,640,000 | | | Sonic Automotive, Inc. | | | 4.63% | (a) | | | 11/15/2029 | | | | 1,472,295 | |
| | 5,475,000 | | | Southern Co.
(5 Year CMT Rate + 2.92%) | | | 3.75% | | | | 09/15/2051 | | | | 5,125,317 | |
| | | | |
| 36 | | DoubleLine Funds Trust | | The accompanying notes are an integral part of these financial statements. |
| | | | | | | | | | | | | | | | |
PRINCIPAL AMOUNT $ | | | SECURITY DESCRIPTION | | RATE | | | MATURITY | | | VALUE $ | |
| | 3,724,000 | | | Southwestern Electric Power Co. | | | 3.25% | | | | 11/01/2051 | | | | 2,474,796 | |
| | 720,000 | | | Southwestern Energy Co. | | | 4.75% | | | | 02/01/2032 | | | | 663,381 | |
| | 1,230,000 | | | Spectrum Brands, Inc. | | | 5.00% | (a) | | | 10/01/2029 | | | | 1,206,428 | |
| | 790,000 | | | Spirit AeroSystems, Inc. | | | 9.75% | (a) | | | 11/15/2030 | | | | 884,655 | |
| | 975,000 | | | SRS Distribution, Inc. | | | 4.63% | (a) | | | 07/01/2028 | | | | 983,123 | |
| | 420,000 | | | SRS Distribution, Inc. | | | 6.13% | (a) | | | 07/01/2029 | | | | 428,745 | |
| | 1,480,000 | | | Standard Industries, Inc./NJ | | | 4.38% | (a) | | | 07/15/2030 | | | | 1,330,876 | |
| | 420,000 | | | Staples, Inc. | | | 7.50% | (a) | | | 04/15/2026 | | | | 410,313 | |
| | 305,000 | | | Staples, Inc. | | | 10.75% | (a) | | | 04/15/2027 | | | | 290,195 | |
| | 850,000 | | | Starwood Property Trust, Inc. | | | 7.25% | (a) | | | 04/01/2029 | | | | 857,828 | |
| | 950,000 | | | Station Casinos LLC | | | 4.63% | (a) | | | 12/01/2031 | | | | 854,758 | |
| | 1,320,000 | | | Station Casinos LLC | | | 6.63% | (a) | | | 03/15/2032 | | | | 1,334,412 | |
| | 1,135,000 | | | Suburban Propane Partners LP/Suburban Energy Finance Corp. | | | 5.00% | (a) | | | 06/01/2031 | | | | 1,035,612 | |
| | 6,130,000 | | | Sun Communities Operating LP | | | 2.70% | | | | 07/15/2031 | | | | 5,051,868 | |
| | 1,550,000 | | | SunCoke Energy, Inc. | | | 4.88% | (a) | | | 06/30/2029 | | | | 1,404,994 | |
| | 635,000 | | | Sunoco LP / Sunoco Finance Corp. | | | 6.00% | | | | 04/15/2027 | | | | 632,937 | |
| | 475,000 | | | Sunoco LP / Sunoco Finance Corp. | | | 4.50% | | | | 05/15/2029 | | | | 441,953 | |
| | 510,000 | | | SWF Escrow Issuer Corp. | | | 6.50% | (a) | | | 10/01/2029 | | | | 377,768 | |
| | 7,629,000 | | | Sysco Corp. | | | 6.00% | | | | 01/17/2034 | | | | 8,122,241 | |
| | 10,171,000 | | | Take-Two Interactive Software, Inc. | | | 4.95% | | | | 03/28/2028 | | | | 10,135,908 | |
| | 1,205,000 | | | Tallgrass Energy Partners LP / Tallgrass Energy Finance Corp. | | | 7.38% | (a) | | | 02/15/2029 | | | | 1,213,040 | |
| | 2,525,000 | | | Tapestry, Inc. | | | 7.05% | | | | 11/27/2025 | | | | 2,578,084 | |
| | 950,000 | | | Tenet Healthcare Corp. | | | 6.25% | | | | 02/01/2027 | | | | 950,364 | |
| | 835,000 | | | Tenet Healthcare Corp. | | | 6.13% | | | | 10/01/2028 | | | | 832,705 | |
| | 1,320,000 | | | Tenet Healthcare Corp. | | | 6.13% | | | | 06/15/2030 | | | | 1,318,622 | |
| | 1,600,000 | | | Texas Instruments, Inc. | | | 5.00% | | | | 03/14/2053 | | | | 1,570,982 | |
| | 5,056,000 | | | T-Mobile USA, Inc. | | | 5.15% | | | | 04/15/2034 | | | | 5,041,025 | |
| | 5,722,000 | | | T-Mobile USA, Inc. | | | 3.40% | | | | 10/15/2052 | | | | 4,062,180 | |
| | 945,000 | | | Townsquare Media, Inc. | | | 6.88% | (a) | | | 02/01/2026 | | | | 922,084 | |
| | 1,290,000 | | | TransDigm, Inc. | | | 5.50% | | | | 11/15/2027 | | | | 1,263,610 | |
| | 1,235,000 | | | TransDigm, Inc. | | | 6.88% | (a) | | | 12/15/2030 | | | | 1,260,311 | |
| | 668,250 | | | Transocean Poseidon Ltd. | | | 6.88% | (a) | | | 02/01/2027 | | | | 669,455 | |
| | 515,000 | | | Transocean, Inc. | | | 8.00% | (a) | | | 02/01/2027 | | | | 511,526 | |
| | 1,195,000 | | | Trident TPI Holdings, Inc. | | | 12.75% | (a) | | | 12/31/2028 | | | | 1,276,487 | |
| | 735,000 | | | Triton Water Holdings, Inc. | | | 6.25% | (a) | | | 04/01/2029 | | | | 670,151 | |
| | 655,000 | | | UKG, Inc. | | | 6.88% | (a) | | | 02/01/2031 | | | | 667,744 | |
| | 1,255,000 | | | United Airlines, Inc. | | | 4.63% | (a) | | | 04/15/2029 | | | | 1,168,549 | |
| | 770,000 | | | United Natural Foods, Inc. | | | 6.75% | (a) | | | 10/15/2028 | | | | 640,497 | |
| | 6,150,000 | | | UnitedHealth Group, Inc. | | | 5.05% | | | | 04/15/2053 | | | | 5,977,456 | |
| | 2,056,000 | | | UnitedHealth Group, Inc. | | | 4.95% | | | | 05/15/2062 | | | | 1,921,978 | |
| | 625,000 | | | Uniti Group LP / Uniti Group Finance, Inc. / CSL Capital LLC | | | 10.50% | (a) | | | 02/15/2028 | | | | 648,543 | |
| | 1,000,000 | | | Univision Communications, Inc. | | | 4.50% | (a) | | | 05/01/2029 | | | | 894,534 | |
| | 445,000 | | | Upbound Group, Inc. | | | 6.38% | (a) | | | 02/15/2029 | | | | 432,426 | |
| | 1,260,000 | | | US Foods, Inc. | | | 7.25% | (a) | | | 01/15/2032 | | | | 1,312,894 | |
| | 940,000 | | | Venture Global LNG, Inc. | | | 8.13% | (a) | | | 06/01/2028 | | | | 959,562 | |
| | 600,000 | | | Venture Global LNG, Inc. | | | 8.38% | (a) | | | 06/01/2031 | | | | 619,136 | |
| | 615,000 | | | Venture Global LNG, Inc. | | | 9.88% | (a) | | | 02/01/2032 | | | | 663,197 | |
| | 3,580,000 | | | Veralto Corp. | | | 5.35% | (a) | | | 09/18/2028 | | | | 3,628,530 | |
| | 1,836,000 | | | Verizon Communications, Inc. | | | 3.88% | | | | 03/01/2052 | | | | 1,444,689 | |
| | 8,662,000 | | | Verizon Communications, Inc. | | | 5.50% | | | | 02/23/2054 | | | | 8,761,861 | |
| | 3,260,000 | | | Viatris, Inc. | | | 1.65% | | | | 06/22/2025 | | | | 3,101,056 | |
| | 1,415,000 | | | Viking Cruises Ltd. | | | 5.88% | (a) | | | 09/15/2027 | | | | 1,389,268 | |
| | 1,210,000 | | | Viking Cruises Ltd. | | | 9.13% | (a) | | | 07/15/2031 | | | | 1,324,207 | |
| | 760,000 | | | Vistra Operations Co. LLC | | | 7.75% | (a) | | | 10/15/2031 | | | | 796,488 | |
| | 550,000 | | | Vital Energy, Inc. | | | 7.88% | (a) | | | 04/15/2032 | | | | 559,159 | |
| | 635,000 | | | VT Topco, Inc. | | | 8.50% | (a) | | | 08/15/2030 | | | | 670,903 | |
| | 790,000 | | | Wand NewCo 3, Inc. | | | 7.63% | (a) | | | 01/30/2032 | | | | 817,703 | |
| | 1,065,000 | | | WASH Multifamily Acquisition, Inc. | | | 5.75% | (a) | | | 04/15/2026 | | | | 1,041,823 | |
| | 478,000 | | | Weatherford International Ltd. | | | 6.50% | (a) | | | 09/15/2028 | | | | 493,395 | |
| | 1,090,000 | | | Weatherford International Ltd. | | | 8.63% | (a) | | | 04/30/2030 | | | | 1,138,825 | |
| | | | | | | | |
| The accompanying notes are an integral part of these financial statements. | | Annual Report | | | | | March 31, 2024 | | 37 |
| | |
Schedule of Investments DoubleLine Core Fixed Income Fund (Cont.) | | |
| | | | | | | | | | | | | | | | |
PRINCIPAL AMOUNT $ | | | SECURITY DESCRIPTION | | RATE | | | MATURITY | | | VALUE $ | |
| | 4,870,000 | | | Wells Fargo & Co.
(US Secured Overnight Financing Rate + 1.98%) | | | 4.81% | | | | 07/25/2028 | | | | 4,799,966 | |
| | 4,980,000 | | | Wells Fargo & Co.
(CME Term SOFR 3 Month + 1.43%) | | | 2.88% | | | | 10/30/2030 | | | | 4,403,918 | |
| | 7,465,000 | | | Wells Fargo & Co.
(US Secured Overnight Financing Rate + 2.06%) | | | 6.49% | | | | 10/23/2034 | | | | 8,010,293 | |
| | 179,000 | | | Wheel Pros, Inc. | | | 6.50% | (a) | | | 05/15/2029 | | | | 54,819 | |
| | 1,385,000 | | | Whirlpool Corp. | | | 5.75% | | | | 03/01/2034 | | | | 1,390,238 | |
| | 6,659,000 | | | Williams Cos., Inc. | | | 5.15% | | | | 03/15/2034 | | | | 6,602,005 | |
| | 9,231,000 | | | Willis North America, Inc. | | | 4.50% | | | | 09/15/2028 | | | | 9,001,879 | |
| | 5,500,000 | | | Workday, Inc. | | | 3.70% | | | | 04/01/2029 | | | | 5,188,540 | |
| | 1,020,000 | | | WR Grace Holdings LLC | | | 5.63% | (a) | | | 08/15/2029 | | | | 913,848 | |
| | 9,407,000 | | | WRKCo, Inc. | | | 3.75% | | | | 03/15/2025 | | | | 9,248,663 | |
| | 1,215,000 | | | Wyndham Hotels & Resorts, Inc. | | | 4.38% | (a) | | | 08/15/2028 | | | | 1,130,542 | |
| | 1,270,000 | | | XHR LP | | | 4.88% | (a) | | | 06/01/2029 | | | | 1,176,748 | |
| | 1,510,000 | | | XPO, Inc. | | | 7.13% | (a) | | | 06/01/2031 | | | | 1,550,391 | |
| | 2,935,000 | | | Zimmer Biomet Holdings, Inc. | | | 5.35% | | | | 12/01/2028 | | | | 2,978,759 | |
| | | | | | | | | | | | | | | | |
| | | | Total US Corporate Bonds
(Cost $1,107,461,242) | | | | | | | | 1,050,592,366 | |
| | | | | | | | | | | | | | | | |
| | US GOVERNMENT AND AGENCY MORTGAGE BACKED OBLIGATIONS - 20.8% | | | | | | | | | | | | |
| | | | |
| | | | Fannie Mae Whole Loan | | | | | | | | | | | | |
| | 123,262 | | | Series 2003-W17-1A7 | | | 5.75% | | | | 08/25/2033 | | | | 122,604 | |
| | | | |
| | | | Federal Home Loan Mortgage Corp. | | | | | | | | | | | | |
| | 227,064 | | | Pool G01840 | | | 5.00% | | | | 07/01/2035 | | | | 228,630 | |
| | 125,738 | | | Pool G04817 | | | 5.00% | | | | 09/01/2038 | | | | 126,608 | |
| | 5,073,949 | | | Pool G08537 | | | 3.00% | | | | 07/01/2043 | | | | 4,538,144 | |
| | 2,765,098 | | | Pool G08622 | | | 3.00% | | | | 01/01/2045 | | | | 2,452,519 | |
| | 2,661,149 | | | Pool G08686 | | | 3.00% | | | | 01/01/2046 | | | | 2,356,936 | |
| | 9,910,411 | | | Pool G08701 | | | 3.00% | | | | 04/01/2046 | | | | 8,733,330 | |
| | 652,893 | | | Pool G08737 | | | 3.00% | | | | 12/01/2046 | | | | 575,146 | |
| | 5,909,598 | | | Pool G61645 | | | 4.00% | | | | 10/01/2048 | | | | 5,556,951 | |
| | 870,308 | | | Pool N70081 | | | 5.50% | | | | 07/01/2038 | | | | 853,376 | |
| | 4,950,010 | | | Pool Q33789 | | | 3.50% | | | | 06/01/2045 | | | | 4,539,503 | |
| | 8,188,021 | | | Pool RA3722 | | | 2.50% | | | | 10/01/2050 | | | | 6,898,957 | |
| | 39,289,222 | | | Pool RA9843 | | | 5.50% | | | | 09/01/2053 | | | | 39,300,288 | |
| | 14,458,440 | | | Pool SD0035 | | | 3.00% | | | | 04/01/2047 | | | | 12,788,677 | |
| | 7,697,342 | | | Pool SD0699 | | | 2.00% | | | | 11/01/2050 | | | | 6,248,657 | |
| | 12,944,524 | | | Pool SD2759 | | | 5.50% | | | | 05/01/2053 | | | | 12,989,940 | |
| | 25,540,886 | | | Pool SD2912 | | | 5.00% | | | | 05/01/2053 | | | | 25,121,924 | |
| | 42,284,674 | | | Pool SD2969 | | | 2.50% | | | | 05/01/2052 | | | | 35,575,158 | |
| | 29,054,504 | | | Pool SD3721 | | | 5.00% | | | | 07/01/2053 | | | | 28,623,062 | |
| | 19,738,985 | | | Pool SD3892 | | | 5.50% | | | | 09/01/2053 | | | | 19,740,001 | |
| | 10,745,049 | | | Pool SD4400 | | | 2.00% | | | | 02/01/2051 | | | | 8,668,294 | |
| | 5,849,124 | | | Pool SD4658 | | | 5.00% | | | | 06/01/2053 | | | | 5,788,318 | |
| | 21,112,781 | | | Pool SD4888 | | | 6.00% | | | | 02/01/2054 | | | | 21,542,905 | |
| | 58,541,938 | | | Pool SD7538 | | | 2.00% | | | | 04/01/2051 | | | | 47,777,786 | |
| | 25,491,364 | | | Pool SD7564 | | | 5.00% | | | | 06/01/2053 | | | | 25,258,824 | |
| | 774,579 | | | Pool T60854 | | | 3.50% | | | | 09/01/2042 | | | | 702,832 | |
| | 136,660 | | | Pool U60299 | | | 4.00% | | | | 11/01/2040 | | | | 130,199 | |
| | 3,439,917 | | | Pool V83144 | | | 4.00% | | | | 04/01/2047 | | | | 3,257,558 | |
| | 10,613,544 | | | Pool ZT1827 | | | 3.00% | | | | 07/01/2047 | | | | 9,339,430 | |
| | 28,441 | | | Series 2692-SC (-2 x US 30 Day Average Secured Overnight Financing Rate + 13.06%, 13.29% Cap) | | | 2.42% | (k) | | | 07/15/2033 | | | | 27,863 | |
| | 742,890 | | | Series 2722-PS (-1 x US 30 Day Average Secured Overnight Financing Rate + 9.76%, 9.89% Cap) | | | 3.85% | (k) | | | 12/15/2033 | | | | 738,318 | |
| | 28,507 | | | Series 2750-ZT | | | 5.00% | | | | 02/15/2034 | | | | 28,089 | |
| | 69,587 | | | Series 3002-SN (-1 x US 30 Day Average Secured Overnight Financing Rate + 6.39%, 6.50% Cap) | | | 1.07% | (i)(k) | | | 07/15/2035 | | | | 4,566 | |
| | 33,744 | | | Series 3045-DI (-1 x US 30 Day Average Secured Overnight Financing Rate + 6.62%, 6.73% Cap) | | | 1.30% | (i)(k) | | | 10/15/2035 | | | | 2,637 | |
| | | | |
| 38 | | DoubleLine Funds Trust | | The accompanying notes are an integral part of these financial statements. |
| | | | | | | | | | | | | | | | |
PRINCIPAL AMOUNT $ | | | SECURITY DESCRIPTION | | RATE | | | MATURITY | | | VALUE $ | |
| | 114,024 | | | Series 3116-Z | | | 5.50% | | | | 02/15/2036 | | | | 113,481 | |
| | 8,279 | | | Series 3117-ZN | | | 4.50% | | | | 02/15/2036 | | | | 7,750 | |
| | 124,651 | | | Series 3203-ZC | | | 5.00% | | | | 07/15/2036 | | | | 125,021 | |
| | 30,703 | | | Series 3275-SC (-1 x US 30 Day Average Secured Overnight Financing Rate + 5.97%, 6.08% Cap) | | | 0.65% | (i)(k) | | | 02/15/2037 | | | | 2,159 | |
| | 84,159 | | | Series 3382-SB (-1 x US 30 Day Average Secured Overnight Financing Rate + 5.89%, 6.00% Cap) | | | 0.57% | (i)(k) | | | 11/15/2037 | | | | 4,656 | |
| | 104,061 | | | Series 3384-S (-1 x US 30 Day Average Secured Overnight Financing Rate + 6.28%, 6.39% Cap) | | | 0.96% | (i)(k) | | | 11/15/2037 | | | | 5,499 | |
| | 50,765 | | | Series 3417-SX (-1 x US 30 Day Average Secured Overnight Financing Rate + 6.07%, 6.18% Cap) | | | 0.75% | (i)(k) | | | 02/15/2038 | | | | 3,268 | |
| | 13,328 | | | Series 3423-GS (-1 x US 30 Day Average Secured Overnight Financing Rate + 5.54%, 5.65% Cap) | | | 0.22% | (i)(k) | | | 03/15/2038 | | | | 676 | |
| | 13,328 | | | Series 3423-SG (-1 x US 30 Day Average Secured Overnight Financing Rate + 5.54%, 5.65% Cap) | | | 0.22% | (i)(k) | | | 03/15/2038 | | | | 656 | |
| | 53,274 | | | Series 3524-LB | | | 3.16% | (b) | | | 06/15/2038 | | | | 49,729 | |
| | 32,001 | | | Series 3562-WS (-1 x US 30 Day Average Secured Overnight Financing Rate + 4.84%, 4.95% Cap) | | | 0.00% | (i)(k) | | | 08/15/2039 | | | | 1,194 | |
| | 103,314 | | | Series 3582-SA (-1 x US 30 Day Average Secured Overnight Financing Rate + 5.89%, 6.00% Cap) | | | 0.57% | (i)(k) | | | 10/15/2049 | | | | 7,700 | |
| | 74,853 | | | Series 3616-SG (-1 x US 30 Day Average Secured Overnight Financing Rate + 6.24%, 6.35% Cap) | | | 0.92% | (i)(k) | | | 03/15/2032 | | | | 3,152 | |
| | 383,199 | | | Series 3626-AZ | | | 5.50% | | | | 08/15/2036 | | | | 382,049 | |
| | 152,679 | | | Series 3666-SC (-1 x US 30 Day Average Secured Overnight Financing Rate + 5.66%, 5.77% Cap) | | | 0.34% | (i)(k) | | | 05/15/2040 | | | | 9,659 | |
| | 99,464 | | | Series 3666-VZ | | | 5.50% | | | | 08/15/2036 | | | | 99,177 | |
| | 1,193,511 | | | Series 3779-DZ | | | 4.50% | | | | 12/15/2040 | | | | 1,149,544 | |
| | 451,237 | | | Series 3779-YA | | | 3.50% | | | | 12/15/2030 | | | | 434,884 | |
| | 162,797 | | | Series 3786-SG (-2 x US 30 Day Average Secured Overnight Financing Rate + 9.27%, 9.50% Cap) | | | 0.00% | (k) | | | 01/15/2041 | | | | 115,919 | |
| | 101,340 | | | Series 3792-SE (-2 x US 30 Day Average Secured Overnight Financing Rate + 9.63%, 9.86% Cap) | | | 0.00% | (k) | | | 01/15/2041 | | | | 61,813 | |
| | 377,409 | | | Series 3806-CZ | | | 5.50% | | | | 07/15/2034 | | | | 375,458 | |
| | 293,004 | | | Series 3808-DB | | | 3.50% | | | | 02/15/2031 | | | | 282,233 | |
| | 507,260 | | | Series 3818-CZ | | | 4.50% | | | | 03/15/2041 | | | | 489,724 | |
| | 387,586 | | | Series 3819-ZU | | | 5.50% | | | | 07/15/2034 | | | | 385,596 | |
| | 997,520 | | | Series 3824-EY | | | 3.50% | | | | 03/15/2031 | | | | 960,850 | |
| | 251,282 | | | Series 3828-SW (-3 x US 30 Day Average Secured Overnight Financing Rate + 12.86%, 13.20% Cap) | | | 0.00% | (k) | | | 02/15/2041 | | | | 181,407 | |
| | 647,274 | | | Series 3863-ZA | | | 5.50% | | | | 08/15/2034 | | | | 644,030 | |
| | 1,902,804 | | | Series 3889-VZ | | | 4.00% | | | | 07/15/2041 | | | | 1,799,920 | |
| | 1,743,340 | | | Series 3910-GZ | | | 5.00% | | | | 08/15/2041 | | | | 1,725,429 | |
| | 720,905 | | | Series 3972-AZ | | | 3.50% | | | | 12/15/2041 | | | | 662,672 | |
| | 8,246,764 | | | Series 4165-ZT | | | 3.00% | (l) | | | 02/15/2043 | | | | 6,667,021 | |
| | 2,077,061 | | | Series 4291-MS (-1 x US 30 Day Average Secured Overnight Financing Rate + 5.79%, 5.90% Cap) | | | 0.47% | (i)(k) | | | 01/15/2054 | | | | 157,515 | |
| | 1,659,475 | | | Series 4471-BA | | | 3.00% | | | | 12/15/2041 | | | | 1,609,209 | |
| | 10,262,539 | | | Series 4471-GA | | | 3.00% | | | | 02/15/2044 | | | | 9,620,923 | |
| | 11,786,232 | | | Series 4542-AC | | | 2.70% | | | | 01/15/2045 | | | | 10,837,915 | |
| | 12,709,930 | | | Series 4717-GZ | | | 3.00% | (l) | | | 01/15/2047 | | | | 10,348,285 | |
| | 34,934,000 | | | Series 5138-HM | | | 2.00% | | | | 04/25/2051 | | | | 25,930,757 | |
| | 9,747,608 | | | Series 5148-BZ | | | 2.50% | (l) | | | 10/25/2051 | | | | 5,812,765 | |
| | 14,288,476 | | | Series 5195-ZN | | | 2.50% | (l) | | | 02/25/2052 | | | | 8,437,914 | |
| | 147,726 | | | Series R003-ZA | | | 5.50% | | | | 10/15/2035 | | | | 145,406 | |
| | | | |
| | | | Federal National Mortgage Association | | | | | | | | | | | | |
| | 42,668 | | | Pool 555743 | | | 5.00% | | | | 09/01/2033 | | | | 42,908 | |
| | 35,911 | | | Pool 735382 | | | 5.00% | | | | 04/01/2035 | | | | 36,113 | |
| | 304,062 | | | Pool 735383 | | | 5.00% | | | | 04/01/2035 | | | | 305,774 | |
| | 152,762 | | | Pool 735402 | | | 5.00% | | | | 04/01/2035 | | | | 153,622 | |
| | 206,816 | | | Pool 735484 | | | 5.00% | | | | 05/01/2035 | | | | 207,981 | |
| | 45,869 | | | Pool 931104 | | | 5.00% | | | | 05/01/2039 | | | | 45,664 | |
| | 255,293 | | | Pool 995203 | | | 5.00% | | | | 07/01/2035 | | | | 256,729 | |
| | 215,037 | | | Pool AB2123 | | | 4.00% | | | | 01/01/2031 | | | | 209,310 | |
| | 21,379 | | | Pool AB2370 | | | 4.50% | | | | 09/01/2035 | | | | 20,930 | |
| | | | | | | | |
| The accompanying notes are an integral part of these financial statements. | | Annual Report | | | | | March 31, 2024 | | 39 |
| | |
Schedule of Investments DoubleLine Core Fixed Income Fund (Cont.) | | |
| | | | | | | | | | | | | | | | |
PRINCIPAL AMOUNT $ | | | SECURITY DESCRIPTION | | RATE | | | MATURITY | | | VALUE $ | |
| | 3,664 | | | Pool AD2177 | | | 4.50% | | | | 06/01/2030 | | | | 3,597 | |
| | 336,499 | | | Pool AH7309 | | | 4.00% | | | | 02/01/2031 | | | | 326,952 | |
| | 4,062,428 | | | Pool AL9238 | | | 3.00% | | | | 10/01/2041 | | | | 3,654,570 | |
| | 888,033 | | | Pool AL9445 | | | 3.00% | | | | 07/01/2031 | | | | 845,563 | |
| | 5,962,664 | | | Pool AS4645 | | | 3.00% | | | | 03/01/2045 | | | | 5,297,152 | |
| | 7,288,692 | | | Pool AS7661 | | | 3.00% | | | | 08/01/2046 | | | | 6,304,824 | |
| | 3,438,941 | | | Pool AS7724 | | | 2.50% | | | | 08/01/2046 | | | | 2,931,907 | |
| | 10,842,538 | | | Pool BC9081 | | | 3.00% | | | | 12/01/2046 | | | | 9,547,109 | |
| | 7,768,128 | | | Pool BD8013 | | | 2.50% | | | | 09/01/2046 | | | | 6,639,663 | |
| | 17,450,500 | | | Pool BL2643 | | | 3.39% | | | | 07/01/2034 | | | | 15,440,778 | |
| | 28,707,000 | | | Pool BL4425 | | | 2.14% | | | | 10/01/2029 | | | | 25,317,202 | |
| | 32,930,000 | | | Pool BL4592 | | | 2.28% | | | | 11/01/2029 | | | | 29,045,266 | |
| | 18,090,000 | | | Pool BL5484 | | | 2.26% | | | | 01/01/2030 | | | | 15,883,691 | |
| | 4,793,631 | | | Pool BL9284 | | | 2.23% | | | | 12/01/2050 | | | | 3,341,598 | |
| | 1,861,685 | | | Pool BM4094 | | | 3.00% | | | | 03/01/2043 | | | | 1,671,879 | |
| | 10,825,984 | | | Pool BM6089 | | | 3.50% | | | | 12/01/2044 | | | | 9,918,652 | |
| | 45,476,877 | | | Pool BR2217 | | | 2.50% | | | | 08/01/2051 | | | | 38,228,736 | |
| | 36,599,790 | | | Pool BS4941 | | | 2.46% | | | | 04/01/2032 | | | | 31,078,816 | |
| | 25,824,171 | | | Pool CB3127 | | | 3.50% | | | | 03/01/2052 | | | | 23,346,984 | |
| | 11,914,369 | | | Pool CB4820 | | | 4.50% | | | | 10/01/2052 | | | | 11,352,169 | |
| | 24,274,416 | | | Pool CB6266 | | | 6.00% | | | | 05/01/2053 | | | | 24,651,583 | |
| | 37,828,363 | | | Pool CB7272 | | | 6.00% | | | | 10/01/2053 | | | | 38,429,836 | |
| | 10,170,434 | | | Pool FM1000 | | | 3.00% | | | | 04/01/2047 | | | | 8,951,034 | |
| | 16,184,665 | | | Pool FM4575 | | | 2.50% | | | | 10/01/2050 | | | | 13,672,231 | |
| | 10,268,794 | | | Pool FM6061 | | | 2.00% | | | | 02/01/2051 | | | | 8,289,148 | |
| | 27,849,189 | | | Pool FM8214 | | | 4.00% | | | | 05/01/2049 | | | | 26,265,215 | |
| | 6,709,257 | | | Pool FM8664 | | | 3.00% | | | | 10/01/2046 | | | | 5,913,164 | |
| | 21,989,497 | | | Pool FM8972 | | | 4.00% | | | | 06/01/2049 | | | | 20,773,359 | |
| | 5,704,538 | | | Pool FM9846 | | | 2.50% | | | | 12/01/2051 | | | | 4,732,843 | |
| | 38,327,270 | | | Pool FS1472 | | | 3.50% | | | | 11/01/2050 | | | | 34,842,494 | |
| | 10,209,774 | | | Pool FS3708 | | | 5.00% | | | | 01/01/2053 | | | | 9,978,559 | |
| | 30,427,870 | | | Pool FS5417 | | | 2.50% | | | | 04/01/2052 | | | | 25,386,344 | |
| | 31,750,618 | | | Pool FS5875 | | | 2.50% | | | | 04/01/2052 | | | | 26,481,305 | |
| | 2,333,705 | | | Pool FS6309 | | | 6.00% | | | | 12/01/2053 | | | | 2,383,408 | |
| | 6,691,482 | | | Pool FS6476 | | | 2.50% | | | | 11/01/2051 | | | | 5,629,731 | |
| | 144,400 | | | Pool MA0264 | | | 4.50% | | | | 12/01/2029 | | | | 142,174 | |
| | 96,948 | | | Pool MA0353 | | | 4.50% | | | | 03/01/2030 | | | | 95,431 | |
| | 4,389 | | | Pool MA0468 | | | 5.00% | | | | 07/01/2040 | | | | 4,256 | |
| | 2,042,023 | | | Pool MA2151 | | | 3.50% | | | | 01/01/2045 | | | | 1,841,255 | |
| | 1,012,201 | | | Pool MA2248 | | | 3.00% | | | | 04/01/2045 | | | | 889,993 | |
| | 1,626,781 | | | Pool MA2621 | | | 3.50% | | | | 05/01/2046 | | | | 1,450,160 | |
| | 3,779,387 | | | Pool MA2649 | | | 3.00% | | | | 06/01/2046 | | | | 3,269,217 | |
| | 1,505,015 | | | Pool MA2711 | | | 3.00% | | | | 08/01/2046 | | | | 1,301,857 | |
| | 9,752,282 | | | Pool MA2806 | | | 3.00% | | | | 11/01/2046 | | | | 8,603,152 | |
| | 13,262,712 | | | Pool MA4709 | | | 5.00% | | | | 07/01/2052 | | | | 12,956,914 | |
| | 17,302,793 | | | Pool MA5086 | | | 5.00% | | | | 07/01/2043 | | | | 17,151,559 | |
| | 779,213 | | | Series 2005-20-QH | | | 5.00% | | | | 03/25/2035 | | | | 779,894 | |
| | 140,576 | | | Series 2006-101-SA (-1 x US 30 Day Average Secured Overnight Financing Rate + 6.47%, 6.58% Cap) | | | 1.15% | (i)(k) | | | 10/25/2036 | | | | 12,907 | |
| | 55,940 | | | Series 2006-56-SM (-1 x US 30 Day Average Secured Overnight Financing Rate + 6.64%, 6.75% Cap) | | | 1.32% | (i)(k) | | | 07/25/2036 | | | | 4,145 | |
| | 43,425 | | | Series 2007-116-BI (-1 x US 30 Day Average Secured Overnight Financing Rate + 6.14%, 6.25% Cap) | | | 0.82% | (i)(k) | | | 05/25/2037 | | | | 2,624 | |
| | 576,373 | | | Series 2007-30-FS (-5 x US 30 Day Average Secured Overnight Financing Rate + 29.30%, 29.83% Cap) | | | 4.66% | (k) | | | 04/25/2037 | | | | 589,902 | |
| | 224,113 | | | Series 2007-30-OI (-1 x US 30 Day Average Secured Overnight Financing Rate + 6.33%, 6.44% Cap) | | | 1.01% | (i)(k) | | | 04/25/2037 | | | | 20,004 | |
| | 34,119 | | | Series 2008-29-ZA | | | 4.50% | | | | 04/25/2038 | | | | 33,100 | |
| | 12,697 | | | Series 2008-62-SC (-1 x US 30 Day Average Secured Overnight Financing Rate + 5.89%, 6.00% Cap) | | | 0.57% | (i)(k) | | | 07/25/2038 | | | | 676 | |
| | 144,401 | | | Series 2009-111-EZ | | | 5.00% | | | | 01/25/2040 | | | | 142,963 | |
| | 4,240 | | | Series 2009-111-SE (-1 x US 30 Day Average Secured Overnight Financing Rate + 6.14%, 6.25% Cap) | | | 0.82% | (i)(k) | | | 01/25/2040 | | | | 400 | |
| | | | |
| 40 | | DoubleLine Funds Trust | | The accompanying notes are an integral part of these financial statements. |
| | | | | | | | | | | | | | | | |
PRINCIPAL AMOUNT $ | | | SECURITY DESCRIPTION | | RATE | | | MATURITY | | | VALUE $ | |
| | 19,073 | | | Series 2009-16-MZ | | | 5.00% | | | | 03/25/2029 | | | | 18,748 | |
| | 20,709 | | | Series 2009-48-WS (-1 x US 30 Day Average Secured Overnight Financing Rate + 5.84%, 5.95% Cap) | | | 0.52% | (i)(k) | | | 07/25/2039 | | | | 1,458 | |
| | 43,450 | | | Series 2009-62-PS (-1 x US 30 Day Average Secured Overnight Financing Rate + 5.99%, 6.10% Cap) | | | 0.67% | (i)(k) | | | 08/25/2039 | | | | 1,133 | |
| | 394,164 | | | Series 2009-77-ZA | | | 4.50% | | | | 10/25/2039 | | | | 387,825 | |
| | 96,812 | | | Series 2009-83-Z | | | 4.50% | | | | 10/25/2039 | | | | 92,571 | |
| | 30,079 | | | Series 2010-101-ZH | | | 4.50% | | | | 07/25/2040 | | | | 29,043 | |
| | 125,103 | | | Series 2010-112-ZA | | | 4.00% | | | | 10/25/2040 | | | | 117,411 | |
| | 61,581 | | | Series 2010-121-SD (-1 x US 30 Day Average Secured Overnight Financing Rate + 4.39%, 4.50% Cap) | | | 0.00% | (i)(k) | | | 10/25/2040 | | | | 2,349 | |
| | 27,751 | | | Series 2010-137-VS (-3 x US 30 Day Average Secured Overnight Financing Rate + 14.66%, 15.00% Cap) | | | 0.00% | (k) | | | 12/25/2040 | | | | 25,079 | |
| | 17,964 | | | Series 2010-31-SA (-1 x US 30 Day Average Secured Overnight Financing Rate + 4.89%, 5.00% Cap) | | | 0.00% | (i)(k) | | | 04/25/2040 | | | | 637 | |
| | 12,488 | | | Series 2010-34-PS (-1 x US 30 Day Average Secured Overnight Financing Rate + 4.82%, 4.93% Cap) | | | 0.00% | (i)(k) | | | 04/25/2040 | | | | 341 | |
| | 70,340 | | | Series 2010-35-SP (-1 x US 30 Day Average Secured Overnight Financing Rate + 6.24%, 6.35% Cap) | | | 0.92% | (i)(k) | | | 04/25/2050 | | | | 5,738 | |
| | 3,568 | | | Series 2010-35-SV (-1 x US 30 Day Average Secured Overnight Financing Rate + 6.34%, 6.45% Cap) | | | 1.02% | (i)(k) | | | 04/25/2040 | | | | 67 | |
| | 496,800 | | | Series 2010-37-MY | | | 4.50% | | | | 04/25/2040 | | | | 486,834 | |
| | 92,699 | | | Series 2010-59-SC (-1 x US 30 Day Average Secured Overnight Financing Rate + 4.89%, 5.00% Cap) | | | 0.00% | (i)(k) | | | 01/25/2040 | | | | 2,621 | |
| | 157,453 | | | Series 2010-60-VZ | | | 5.00% | | | | 10/25/2039 | | | | 155,589 | |
| | 72,518 | | | Series 2010-64-EZ | | | 5.00% | | | | 06/25/2040 | | | | 71,663 | |
| | 118,303 | | | Series 2010-7-PE | | | 5.00% | | | | 02/25/2040 | | | | 118,678 | |
| | 35,018 | | | Series 2010-90-GS (-1 x US 30 Day Average Secured Overnight Financing Rate + 5.89%, 6.00% Cap) | | | 0.57% | (i)(k) | | | 08/25/2040 | | | | 2,381 | |
| | 22,764 | | | Series 2010-99-SG (-5 x US 30 Day Average Secured Overnight Financing Rate + 24.43%, 25.00% Cap) | | | 0.00% | (k) | | | 09/25/2040 | | | | 22,150 | |
| | 1,023,194 | | | Series 2011-141-PZ | | | 4.00% | | | | 01/25/2042 | | | | 964,828 | |
| | 127,363 | | | Series 2011-25-KY | | | 3.00% | | | | 04/25/2026 | | | | 124,467 | |
| | 284,050 | | | Series 2011-29-AL | | | 3.50% | | | | 04/25/2031 | | | | 273,252 | |
| | 440,263 | | | Series 2011-59-MA | | | 4.50% | | | | 07/25/2041 | | | | 432,066 | |
| | 5,822,019 | | | Series 2012-56-FK (US 30 Day Average Secured Overnight Financing Rate + 0.56%, 0.45% Floor, 6.50% Cap) | | | 5.88% | | | | 06/25/2042 | | | | 5,729,934 | |
| | 18,060,879 | | | Series 2013-6-ZB | | | 3.00% | | | | 02/25/2043 | | | | 15,900,063 | |
| | 2,794,977 | | | Series 2016-3-FB (US 30 Day Average Secured Overnight Financing Rate + 0.46%, 0.35% Floor, 6.00% Cap) | | | 5.78% | | | | 02/25/2046 | | | | 2,751,493 | |
| | 5,957,658 | | | Series 2017-46-ZL | | | 3.50% | (l) | | | 06/25/2057 | | | | 4,749,560 | |
| | 698,140 | | | Series 2017-86-MA | | | 3.00% | | | | 04/25/2046 | | | | 657,811 | |
| | 9,681,975 | | | Series 2018-21-IO | | | 3.00% | (i) | | | 04/25/2048 | | | | 1,454,638 | |
| | 15,232,967 | | | Series 2018-21-PO | | | 0.00% | (m) | | | 04/25/2048 | | | | 11,534,093 | |
| | 7,624,864 | | | Series 2018-35-IO | | | 3.00% | (i) | | | 05/25/2048 | | | | 1,325,702 | |
| | 29,250,926 | | | Series 2018-35-PO | | | 0.00% | (m) | | | 05/25/2048 | | | | 20,917,253 | |
| | 33,412,323 | | | Series 2020-49-ZD | | | 2.00% | (l) | | | 07/25/2050 | | | | 21,197,883 | |
| | 17,612,512 | | | Series 2021-48-NS (-1 x US 30 Day Average Secured Overnight Financing Rate + 3.65%, 3.65% Cap) | | | 0.00% | (i)(k) | | | 08/25/2051 | | | | 352,421 | |
| | 9,762,126 | | | Series 2022-12-MZ | | | 3.00% | (l) | | | 03/25/2052 | | | | 6,535,041 | |
| | 26,375,905 | | | Series 2022-28-Z | | | 2.50% | (l) | | | 02/25/2052 | | | | 18,466,639 | |
| | 68,251,692 | | | Series 2022-3-ZW | | | 2.00% | (l) | | | 02/25/2052 | | | | 39,274,343 | |
| | 15,431,428 | | | Series 2022-31-GZ | | | 2.00% | (l) | | | 03/25/2052 | | | | 10,767,149 | |
| | 23,516,684 | | | Series 2022-40-AZ | | | 2.00% | (l) | | | 08/25/2050 | | | | 15,337,179 | |
| | 91,512 | | | Series 400-S4 (-1 x US 30 Day Average Secured Overnight Financing Rate + 5.34%, 5.45% Cap) | | | 0.02% | (i)(k) | | | 11/25/2039 | | | | 6,212 | |
| | | | |
| | | | Ginnie Mae I Pool | | | | | | | | | | | | |
| | 27,779,371 | | | Pool 779384 | | | 3.50% | | | | 06/15/2042 | | | | 25,912,147 | |
| | | | |
| | | | Ginnie Mae II Pool | | | | | | | | | | | | |
| | 10,746,972 | | | Pool 784415 | | | 3.50% | | | | 04/20/2047 | | | | 9,937,089 | |
| | 26,215,508 | | | Pool 785713 | | | 2.50% | | | | 10/20/2051 | | | | 22,246,421 | |
| | 12,349,214 | | | Pool 785764 | | | 2.50% | | | | 11/20/2051 | | | | 10,479,481 | |
| | 31,897,248 | | | Pool 786009 | | | 3.00% | | | | 02/20/2052 | | | | 27,990,493 | |
| | | | | | | | |
| The accompanying notes are an integral part of these financial statements. | | Annual Report | | | | | March 31, 2024 | | 41 |
| | |
Schedule of Investments DoubleLine Core Fixed Income Fund (Cont.) | | |
| | | | | | | | | | | | | | | | |
PRINCIPAL AMOUNT $ | | | SECURITY DESCRIPTION | | RATE | | | MATURITY | | | VALUE $ | |
| | 10,083,258 | | | Pool 786227 | | | 3.00% | | | | 04/20/2052 | | | | 8,844,838 | |
| | 4,296,756 | | | Pool 786540 | | | 3.50% | | | | 02/20/2050 | | | | 3,979,736 | |
| | 11,199,892 | | | Pool 786718 | | | 3.50% | | | | 07/20/2051 | | | | 10,302,826 | |
| | 27,372,013 | | | Pool MA5076 | | | 3.00% | | | | 03/20/2048 | | | | 24,435,434 | |
| | 29,920,728 | | | Pool MA5191 | | | 3.50% | | | | 05/20/2048 | | | | 27,571,920 | |
| | | | |
| | | | Government National Mortgage Association | | | | | | | | | | | | |
| | 75,842 | | | Series 2003-67-SP (-1 x CME Term SOFR 1 Month + 6.99%, 7.10% Cap) | | | 1.66% | (i)(k) | | | 08/20/2033 | | | | 682 | |
| | 41,926 | | | Series 2008-82-SM (-1 x CME Term SOFR 1 Month + 5.94%, 6.05% Cap) | | | 0.61% | (i)(k) | | | 09/20/2038 | | | | 909 | |
| | 554,990 | | | Series 2009-32-ZE | | | 4.50% | | | | 05/16/2039 | | | | 539,746 | |
| | 616,487 | | | Series 2009-35-DZ | | | 4.50% | | | | 05/20/2039 | | | | 596,027 | |
| | 600,198 | | | Series 2009-75-GZ | | | 4.50% | | | | 09/20/2039 | | | | 587,860 | |
| | 788,827 | | | Series 2009-75-HZ | | | 5.00% | | | | 09/20/2039 | | | | 775,891 | |
| | 2,026,243 | | | Series 2010-113-SM (-1 x CME Term SOFR 1 Month + 5.94%, 6.05% Cap) | | | 0.61% | (i)(k) | | | 09/20/2040 | | | | 208,557 | |
| | 4,570,519 | | | Series 2010-115-AF (CME Term SOFR 1 Month + 0.56%, 0.45% Floor, 6.50% Cap) | | | 5.89% | | | | 09/20/2040 | | | | 4,519,770 | |
| | 87,930 | | | Series 2010-25-ZB | | | 4.50% | | | | 02/16/2040 | | | | 85,673 | |
| | 1,107,727 | | | Series 2011-45-GZ | | | 4.50% | | | | 03/20/2041 | | | | 1,084,809 | |
| | 7,458,686 | | | Series 2011-70-QF (CME Term SOFR 1 Month + 0.72%, 0.61% Floor, 6.50% Cap) | | | 6.05% | | | | 05/16/2041 | | | | 7,428,070 | |
| | 3,526,317 | | | Series 2011-71-ZA | | | 4.50% | | | | 02/20/2041 | | | | 3,446,732 | |
| | 2,040,023 | | | Series 2013-117-MS (-1 x CME Term SOFR 1 Month + 6.04%, 6.15% Cap) | | | 0.71% | (i)(k) | | | 02/20/2043 | | | | 93,809 | |
| | 1,855,515 | | | Series 2013-122-SB (-1 x CME Term SOFR 1 Month + 5.99%, 6.10% Cap) | | | 0.66% | (i)(k) | | | 08/16/2043 | | | | 182,913 | |
| | 6,750,100 | | | Series 2013-150-FT (CME Term SOFR 1 Month + 0.55%, 0.44% Floor, 6.50% Cap) | | | 5.88% | | | | 02/20/2040 | | | | 6,586,628 | |
| | 2,714,150 | | | Series 2014-102-TS (-1 x CME Term SOFR 1 Month + 5.49%, 5.60% Cap) | | | 0.16% | (i)(k) | | | 07/20/2044 | | | | 229,366 | |
| | 2,316,206 | | | Series 2014-118-PS (-1 x CME Term SOFR 1 Month + 6.09%, 6.20% Cap) | | | 0.76% | (i)(k) | | | 08/20/2044 | | | | 253,225 | |
| | 2,026,680 | | | Series 2014-118-SA (-1 x CME Term SOFR 1 Month + 6.09%, 6.20% Cap) | | | 0.76% | (i)(k) | | | 08/20/2044 | | | | 221,571 | |
| | 5,666,281 | | | Series 2017-52-FH (CME Term SOFR 1 Month + 0.46%, 0.35% Floor, 6.50% Cap) | | | 5.79% | | | | 04/20/2047 | | | | 5,542,649 | |
| | 12,411,956 | | | Series 2019-86-FE (CME Term SOFR 1 Month + 0.51%, 0.40% Floor, 6.50% Cap) | | | 5.84% | | | | 07/20/2049 | | | | 12,227,775 | |
| | 15,079,894 | | | Series 2020-61-IA | | | 3.00% | (i) | | | 05/20/2050 | | | | 2,344,074 | |
| | 20,029,595 | | | Series 2020-62-KF (CME Term SOFR 1 Month + 0.46%, 0.35% Floor, 6.50% Cap) | | | 5.79% | | | | 05/20/2050 | | | | 19,543,928 | |
| | 11,090,335 | | | Series 2021-117-ID | | | 3.50% | (i) | | | 06/20/2051 | | | | 1,910,068 | |
| | 23,443,254 | | | Series 2021-155-UI | | | 4.50% | (i) | | | 09/20/2051 | | | | 3,341,212 | |
| | 18,756,171 | | | Series 2021-214-IG | | | 2.50% | (i) | | | 12/20/2051 | | | | 2,540,452 | |
| | 17,826,043 | | | Series 2022-83-GZ | | | 3.00% | (l) | | | 05/20/2052 | | | | 13,701,237 | |
| | | | |
| | | | Seasoned Credit Risk Transfer Trust | | | | | | | | | | | | |
| | 7,498,952 | | | Series 2018-2-HV | | | 3.00% | (b) | | | 11/25/2057 | | | | 6,574,929 | |
| | 12,993,331 | | | Series 2019-4-M55D | | | 4.00% | | | | 02/25/2059 | | | | 12,075,263 | |
| | | | | | | | | | | | | | | | |
| | | | Total US Government and Agency Mortgage Backed Obligations
(Cost $1,579,751,186) | | | | | | | | 1,436,058,574 | |
| | | | | | | | | | | | | | | | |
| | | | |
| 42 | | DoubleLine Funds Trust | | The accompanying notes are an integral part of these financial statements. |
| | | | | | | | | | | | | | | | |
PRINCIPAL AMOUNT $/ SHARES | | | SECURITY DESCRIPTION | | RATE | | | MATURITY | | | VALUE $ | |
| | US GOVERNMENT AND AGENCY OBLIGATIONS - 21.6% | | | | | | | | | | | | |
| | | | |
| | 600,000,000 | | | United States Treasury Note/Bond | | | 4.75% | | | | 11/15/2043 | | | | 622,593,749 | |
| | 620,000,000 | | | United States Treasury Note/Bond | | | 4.00% | | | | 01/31/2029 | | | | 613,703,125 | |
| | 250,000,000 | | | United States Treasury Note/Bond | | | 4.63% | | | | 02/28/2026 | | | | 249,814,453 | |
| | | | | | | | | | | | | | | | |
| | | | Total US Government and Agency Obligations
(Cost $1,477,825,023) | | | | | | | | 1,486,111,327 | |
| | | | | | | | | | | | | | | | |
| | COMMON STOCKS - 0.0%(n) | | | | | | | | | | | | |
| | 37,440 | | | Flame Aggregator - Series R(d)(o) | | | | | | | | | | | 316,368 | |
| | 3,720 | | | Flame Aggregator - Series U(d)(o) | | | | | | | | | | | 31,434 | |
| | 14,854 | | | Intelsat Emergence SA(d)(o) | | | | | | | | | | | 393,631 | |
| | | | | | | | | | | | | | | | |
| | | | Total Common Stocks
(Cost $1,405,753) | | | | 741,433 | |
| | | | | | | | | | | | | | | | |
| | WARRANTS - 0.0%(n) | | | | | | | | |
| | 31,063 | | | Avation PLC, Expires 10/31/2026 at GBP 1.15(o) | | | | | | | 5,881 | |
| | | | | | | | | | | | | | | | |
| | | | Total Warrants
(Cost $–) | | | | 5,881 | |
| | | | | | | | | | | | | | | | |
| | AFFILIATED MUTUAL FUNDS - 6.4% | | | | | | | | |
| | 12,929,742 | | | DoubleLine Global Bond Fund - Class I(o) | | | | | | | 108,480,538 | |
| | 32,972,257 | | | DoubleLine Infrastructure Income Fund - Class I | | | | | | | 304,004,213 | |
| | 5,000,000 | | | DoubleLine Long Duration Total Return Bond Fund - Class I | | | | | | | 32,900,000 | |
| | | | | | | | | | | | | | | | |
| | | | Total Affiliated Mutual Funds
(Cost $504,557,903) | | | | 445,384,751 | |
| | | | | | | | | | | | | | | | |
| | SHORT TERM INVESTMENTS - 2.3% | | | | | | | | |
| | 51,996,608 | | | First American Government Obligations Fund - U | | | 5.26% | (p) | | | | | | | 51,996,608 | |
| | 51,996,608 | | | JPMorgan US Government Money Market Fund - IM | | | 5.25% | (p) | | | | | | | 51,996,608 | |
| | 51,996,608 | | | MSILF Government Portfolio - Institutional | | | 5.22% | (p) | | | | | | | 51,996,608 | |
| | | | | | | | | | | | | | | | |
| | | | Total Short Term Investments
(Cost $155,989,824) | | | | 155,989,824 | |
| | | | | | | | | | | | | | | | |
| | | | Total Investments 99.5%
($7,513,855,838) | | | | 6,871,782,714 | |
| | | | Other Assets in Excess of Liabilities 0.5% | | | | | | | 33,496,677 | |
| | | | | | | | | | | | | | | | |
| | | | NET ASSETS 100% | | | | | | $ | 6,905,279,391 | |
| | | | | | | | | | | | | | | | |
| | | | | | | | |
| The accompanying notes are an integral part of these financial statements. | | Annual Report | | | | | March 31, 2024 | | 43 |
| | |
Schedule of Investments DoubleLine Core Fixed Income Fund (Cont.) | | |
| | | | | |
| SECURITY TYPE BREAKDOWN as a % of Net Assets: | | | | | |
US Government and Agency Obligations | | | | 21.6% | |
US Government and Agency Mortgage Backed Obligations | | | | 20.8% | |
US Corporate Bonds | | | | 15.2% | |
Non-Agency Residential Collateralized Mortgage Obligations | | | | 11.0% | |
Affiliated Mutual Funds | | | | 6.4% | |
Foreign Corporate Bonds | | | | 6.2% | |
Non-Agency Commercial Mortgage Backed Obligations | | | | 5.3% | |
Asset Backed Obligations | | | | 3.5% | |
Collateralized Loan Obligations | | | | 3.3% | |
Bank Loans | | | | 3.2% | |
Short Term Investments | | | | 2.3% | |
Foreign Government Bonds, Foreign Agencies and Foreign Government Sponsored Corporations | | | | 0.7% | |
Common Stocks | | | | 0.0% | (n) |
Warrants | | | | 0.0% | (n) |
Other Assets and Liabilities | | | | 0.5% | |
| | | | | |
Net Assets | | | | 100.0% | |
| | | | | |
| | | | | |
| INVESTMENT BREAKDOWN as a % of Net Assets: | | | | | |
US Government and Agency Obligations | | | | 21.6% | |
US Government and Agency Mortgage Backed Obligations | | | | 20.8% | |
Non-Agency Residential Collateralized Mortgage Obligations | | | | 11.0% | |
Affiliated Mutual Funds | | | | 6.4% | |
Non-Agency Commercial Mortgage Backed Obligations | | | | 5.3% | |
Banking | | | | 3.9% | |
Asset Backed Obligations | | | | 3.5% | |
Collateralized Loan Obligations | | | | 3.3% | |
Energy | | | | 2.4% | |
Short Term Investments | | | | 2.3% | |
Utilities | | | | 1.9% | |
Technology | | | | 1.8% | |
| | | | | |
INVESTMENT BREAKDOWN as a % of Net Assets:
(Cont.) | |
Healthcare | | | | 1.5% | |
Transportation | | | | 1.1% | |
Finance | | | | 0.9% | |
Telecommunications | | | | 0.9% | |
Mining | | | | 0.8% | |
Media | | | | 0.8% | |
Insurance | | | | 0.7% | |
Real Estate | | | | 0.7% | |
Pharmaceuticals | | | | 0.7% | |
Retailers (other than Food/Drug) | | | | 0.6% | |
Hotels/Motels/Inns and Casinos | | | | 0.6% | |
Automotive | | | | 0.5% | |
Electronics/Electric | | | | 0.5% | |
Commercial Services | | | | 0.5% | |
Food Products | | | | 0.4% | |
Chemicals/Plastics | | | | 0.4% | |
Consumer Products | | | | 0.4% | |
Construction | | | | 0.4% | |
Foreign Government Bonds, Foreign Agencies and Foreign Government Sponsored Corporations | | | | 0.4% | |
Aerospace & Defense | | | | 0.3% | |
Industrial Equipment | | | | 0.3% | |
Containers and Glass Products | | | | 0.3% | |
Diversified Manufacturing | | | | 0.3% | |
Pulp & Paper | | | | 0.3% | |
Leisure | | | | 0.2% | |
Beverage and Tobacco | | | | 0.2% | |
Building and Development (including Steel/Metals) | | | | 0.2% | |
Business Equipment and Services | | | | 0.2% | |
Food Service | | | | 0.1% | |
Chemical Products | | | | 0.1% | |
Environmental Control | | | | 0.0% | (n) |
Financial Intermediaries | | | | 0.0% | (n) |
Conglomerates | | | | 0.0% | (n) |
Other Assets and Liabilities | | | | 0.5% | |
| | | | | |
Net Assets | | | | 100.0% | |
| | | | | |
| (a) | Security exempt from registration under Rule 144A of the Securities Act of 1933. These securities may be resold in transactions exempt from registration to qualified institutional buyers. |
| (b) | Coupon rate is variable based on the weighted average coupon of the underlying collateral. To the extent the weighted average coupon of the underlying assets which comprise the collateral increases or decreases, the coupon rate of this security will increase or decrease correspondingly. The rate disclosed is as of period end. |
| (c) | Security pays interest at rates that represent residual cashflows available after more senior tranches have been paid. The interest rate disclosed reflects the estimated rate in effect as of period end. |
| (d) | Value determined using significant unobservable inputs. |
| (e) | Securities referencing LIBOR are expected to transition to an alternative reference rate by the security’s next scheduled coupon reset date. |
| (f) | Coupon rate is variable or floats based on components including but not limited to reference rate and spread. These securities may not indicate a reference rate and/or spread in their description. The rate disclosed is as of period end. |
| (g) | Security is in default or has failed to make a scheduled payment. Income is not being accrued. |
| (h) | Perpetual maturity. The date disclosed is the next call date of the security. |
| (i) | Interest only security |
| (j) | Step Bond; Coupon rate changes based on a predetermined schedule or event. The interest rate shown is the rate in effect as of period end. |
| (k) | Inverse floating rate security whose interest rate moves in the opposite direction of reference interest rates. Reference interest rates are typically based on a negative multiplier or slope. Interest rate may also be subject to a cap or floor. |
| (l) | This security accrues interest which is added to the outstanding principal balance. The interest payment will be deferred until all other tranches in the structure are paid off. The rate disclosed is as of period end. |
| (m) | Principal only security |
| (n) | Represents less than 0.05% of net assets. |
| (o) | Non-income producing security. |
| (p) | Seven-day yield as of period end. |
| PIK | A payment-in-kind security in which the issuer may make interest or dividend payments in cash or additional securities. These additional securities generally have the same terms as the original holdings. |
| | | | |
| 44 | | DoubleLine Funds Trust | | The accompanying notes are an integral part of these financial statements. |
| | | | | | | | | | | | | | | | | | | | | | |
| |
| Futures Contracts | | |
| Description | | Long/Short | | Contract Quantity | | Expiration Date | | Notional Amount(1) | | Unrealized
Appreciation
(Depreciation)/ Value |
U.S. Treasury Ultra Bonds | | Short | | | | (1,025 | ) | | | | 6/18/2024 | | | | $ | (132,225,000 | ) | | | $ | 1,123,584 | |
10 Year U.S. Ultra Treasury Notes | | Short | | | | (500 | ) | | | | 6/18/2024 | | | | | (57,304,688 | ) | | | | (559,679 | ) |
U.S. Treasury 2 Year Notes | | Long | | | | 18,150 | | | | | 6/28/2024 | | | | | 3,711,391,424 | | | | | (7,890,162 | ) |
| | | | | | | | | | | | | | | | | | | | | | |
| | | | | | | | | | | | | | | | | | | | $ | (7,326,257 | ) |
| | | | | | | | | | | | | | | | | | | | | | |
| (1) | Notional Amount is determined based on the number of contracts multiplied by the contract size and the quoted daily settlement price in US dollars. |
A summary of the DoubleLine Core Fixed Income Fund’s investments in affiliated mutual funds for the period ended March 31, 2024 is as follows:
| | | | | | | | | | | | | | | | | | | | | | | | | | | | | | | | | | | | | | | | |
| Fund | | Value at
March 31,
2023 | | Gross
Purchases | | Gross
Sales | | Net Realized Gain (Loss) for the Period Ended
March 31, 2024 | | Change in
Unrealized for the
Period Ended
March 31, 2024 | | Value at
March 31,
2024 | | Shares Held at
March 31,
2024 | | Dividend Income
Earned for the
Period Ended
March 31, 2024 |
DoubleLine Infrastructure Income Fund (Class I) | | | $ | 298,398,929 | | | | $ | — | | | | $ | — | | | | $ | — | | | | $ | 5,605,284 | | | | $ | 304,004,213 | | | | | 32,972,257 | | | | $ | 10,926,500 | |
DoubleLine Global Bond Fund (Class I) | | | | 109,385,620 | | | | | — | | | | | — | | | | | — | | | | | (905,082 | ) | | | | 108,480,538 | | | | | 12,929,742 | | | | | — | |
DoubleLine Long Duration Total Return Bond Fund (Class I) | | | | 35,750,000 | | | | | — | | | | | — | | | | | — | | | | | (2,850,000 | ) | | | | 32,900,000 | | | | | 5,000,000 | | | | | 1,257,559 | |
| | | | | |
| | | $ | 443,534,549 | | | | $ | — | | | | $ | — | | | | $ | — | | | | $ | 1,850,202 | | | | $ | 445,384,751 | | | | | 50,901,999 | | | | $ | 12,184,059 | |
| | | | | |
| | | | | | | | |
| The accompanying notes are an integral part of these financial statements. | | Annual Report | | | | | March 31, 2024 | | 45 |
| | |
Schedule of Investments DoubleLine Shiller Enhanced CAPE® | | March 31, 2024 |
| | | | | | | | | | | | | | | | |
PRINCIPAL AMOUNT $ | | | SECURITY DESCRIPTION | | RATE | | | MATURITY | | | VALUE $ | |
| | ASSET BACKED OBLIGATIONS - 7.0% | |
| | | | |
| | | | Affirm, Inc. | | | | | | | | | | | | |
| | 9,155,335 | | | Series 2023-X1-A | | | 7.11 | %(a) | | | 11/15/2028 | | | | 9,199,999 | |
| | 3,750,000 | | | Series 2024-A-A | | | 5.61 | %(a) | | | 02/15/2029 | | | | 3,743,855 | |
| | | | |
| | | | Aligned Data Centers Issuer LLC | | | | | | | | | | | | |
| | 6,000,000 | | | Series 2021-1A-A2 | | | 1.94 | %(a) | | | 08/15/2046 | | | | 5,458,443 | |
| | | | |
| | | | Amur Equipment Finance Receivables LLC | | | | | | | | | | | | |
| | 4,000,000 | | | Series 2021-1A-D | | | 2.30 | %(a) | | | 11/22/2027 | | | | 3,885,514 | |
| | | | |
| | | | Arivo Acceptance Auto Loan Receivables Trust | | | | | | | | | | | | |
| | 417,966 | | | Series 2021-1A-A | | | 1.19 | %(a) | | | 01/15/2027 | | | | 414,007 | |
| | | | |
| | | | Bridgecrest Lending Auto Securitization Trust | | | | | | | | | | | | |
| | 9,500,000 | | | Series 2024-1-A2 | | | 5.82 | % | | | 09/15/2026 | | | | 9,498,478 | |
| | | | |
| | | | Business Jet Securities LLC | | | | | | | | | | | | |
| | 2,507,436 | | | Series 2021-1A-A | | | 2.16 | %(a) | | | 04/15/2036 | | | | 2,340,664 | |
| | | | |
| | | | CAI International, Inc. | | | | | | | | | | | | |
| | 5,093,125 | | | Series 2020-1A-A | | | 2.22 | %(a) | | | 09/25/2045 | | | | 4,617,238 | |
| | | | |
| | | | Castlelake Aircraft Securitization Trust | | | | | | | | | | | | |
| | 2,823,778 | | | Series 2019-1A-A | | | 3.97 | %(a) | | | 04/15/2039 | | | | 2,547,253 | |
| | | | |
| | | | College Avenue Student Loans LLC | | | | | | | | | | | | |
| | 699,838 | | | Series 2017-A-B | | | 4.50 | %(a) | | | 11/26/2046 | | | | 675,660 | |
| | | | |
| | | | Compass Datacenters LLC | | | | | | | | | | | | |
| | 10,000,000 | | | Series 2024-1A-A1 | | | 5.25 | %(a) | | | 02/25/2049 | | | | 9,814,480 | |
| | | | |
| | | | Credit Suisse ABS Trust | | | | | | | | | | | | |
| | 875,728 | | | Series 2020-AT1-A | | | 2.61 | %(a) | | | 10/15/2026 | | | | 875,713 | |
| | | | |
| | | | Diamond Resorts Owner Trust | | | | | | | | | | | | |
| | 1,447,261 | | | Series 2021-1A-C | | | 2.70 | %(a) | | | 11/21/2033 | | | | 1,376,683 | |
| | | | |
| | | | DRB Prime Student Loan Trust | | | | | | | | | | | | |
| | 575,810 | | | Series 2017-A-B | | | 3.10 | %(a)(b) | | | 05/27/2042 | | | | 571,056 | |
| | | | |
| | | | Exeter Automobile Receivables Trust | | | | | | | | | | | | |
| | 4,074,411 | | | Series 2021-1A-D | | | 1.08 | % | | | 11/16/2026 | | | | 3,973,999 | |
| | 10,000,000 | | | Series 2021-1A-E | | | 2.21 | %(a) | | | 02/15/2028 | | | | 9,466,784 | |
| | 9,567,790 | | | Series 2023-5A-A2 | | | 6.20 | % | | | 04/15/2026 | | | | 9,580,207 | |
| | | | |
| | | | ExteNet LLC | | | | | | | | | | | | |
| | 2,490,000 | | | Series 2019-1A-A2 | | | 3.20 | %(a) | | | 07/25/2049 | | | | 2,461,968 | |
| | | | |
| | | | Foundation Finance Trust | | | | | | | | | | | | |
| | 258,846 | | | Series 2019-1A-A | | | 3.86 | %(a) | | | 11/15/2034 | | | | 257,496 | |
| | | | |
| | | | Genesis Sales Finance Master Trust | | | | | | | | | | | | |
| | 10,000,000 | | | Series 2021-AA-C | | | 1.65 | %(a) | | | 12/21/2026 | | | | 9,324,698 | |
| | | | |
| | | | Global Sea Containers Two SRL | | | | | | | | | | | | |
| | 3,049,255 | | | Series 2020-1A-A | | | 2.17 | %(a) | | | 10/17/2040 | | | | 2,816,537 | |
| | | | |
| | | | GLS Auto Receivables Trust | | | | | | | | | | | | |
| | 11,500,000 | | | Series 2023-4A-A2 | | | 6.40 | %(a) | | | 12/15/2026 | | | | 11,537,439 | |
| | | | |
| | | | HERO Funding Trust | | | | | | | | | | | | |
| | 738,321 | | | Series 2016-1A-A | | | 4.05 | %(a) | | | 09/20/2041 | | | | 679,951 | |
| | | | |
| | | | Horizon Aircraft Finance Ltd. | | | | | | | | | | | | |
| | 15,771,008 | | | Series 2019-2-A | | | 3.43 | %(a) | | | 11/15/2039 | | | | 12,671,075 | |
| | | | |
| | | | Jack in the Box, Inc. | | | | | | | | | | | | |
| | 4,379,550 | | | Series 2019-1A-A2II | | | 4.48 | %(a) | | | 08/25/2049 | | | | 4,209,748 | |
| | | | |
| | | | Jimmy Johns LLC | | | | | | | | | | | | |
| | 11,334,750 | | | Series 2017-1A-A2II | | | 4.85 | %(a) | | | 07/30/2047 | | | | 10,914,588 | |
| | | | |
| | | | Laurel Road Prime Student Loan Trust | | | | | | | | | | | | |
| | 515,396 | | | Series 2017-B-CFX | | | 3.61 | %(a) | | | 08/25/2042 | | | | 484,517 | |
| | | | |
| | | | Lendbuzz Securitization Trust | | | | | | | | | | | | |
| | 3,693,647 | | | Series 2022-1A-A | | | 4.22 | %(a) | | | 05/17/2027 | | | | 3,632,722 | |
| | | | |
| | | | Loanpal Solar Loan Ltd. | | | | | | | | | | | | |
| | 6,593,666 | | | Series 2020-3GS-A | | | 2.47 | %(a) | | | 12/20/2047 | | | | 5,117,793 | |
| | 4,134,612 | | | Series 2021-1GS-A | | | 2.29 | %(a) | | | 01/20/2048 | | | | 3,326,643 | |
| | | | |
| | | | ME Funding | | | | | | | | | | | | |
| | 7,660,000 | | | Series 2019-1-A2 | | | 6.45 | %(a) | | | 07/30/2049 | | | | 7,622,624 | |
| | | | | | | | |
| The accompanying notes are an integral part of these financial statements. | | Annual Report | | | | | March 31, 2024 | | 1 |
| | |
Schedule of Investments DoubleLine Shiller Enhanced CAPE® (Cont.) | | |
| | | | | | | | | | | | | | | | |
PRINCIPAL AMOUNT $ | | | SECURITY DESCRIPTION | | RATE | | | MATURITY | | | VALUE $ | |
| | | | |
| | | | Mosaic Solar Loans LLC | | | | | | | | | | | | |
| | 610,475 | | | Series 2017-1A-A | | | 4.45 | %(a) | | | 06/20/2042 | | | | 586,915 | |
| | 4,888,473 | | | Series 2020-2A-B | | | 2.21 | %(a) | | | 08/20/2046 | | | | 3,950,910 | |
| | | | |
| | | | Navient Student Loan Trust | | | | | | | | | | | | |
| | 3,715,803 | | | Series 2018-A-B | | | 3.68 | %(a) | | | 02/18/2042 | | | | 3,543,284 | |
| | | | |
| | | | Pagaya AI Debt Selection Trust | | | | | | | | | | | | |
| | 2,596,035 | | | Series 2021-2-NOTE | | | 3.00 | %(a) | | | 01/25/2029 | | | | 2,531,409 | |
| | 6,412,856 | | | Series 2021-5-B | | | 2.63 | %(a) | | | 08/15/2029 | | | | 6,344,280 | |
| | 8,498,998 | | | Series 2021-5-C | | | 3.93 | %(a) | | | 08/15/2029 | | | | 7,670,584 | |
| | 16,647,798 | | | Series 2022-1-B | | | 3.34 | %(a) | | | 10/15/2029 | | | | 16,226,973 | |
| | 5,404,718 | | | Series 2023-5-A | | | 7.18 | %(a) | | | 04/15/2031 | | | | 5,419,478 | |
| | | | |
| | | | Purewest Funding LLC | | | | | | | | | | | | |
| | 6,081,245 | | | Series 2021-1-A1 | | | 4.09 | %(a) | | | 12/22/2036 | | | | 5,890,008 | |
| | | | |
| | | | Retained Vantage Data Centers Issuer LLC | | | | | | | | | | | | |
| | 5,000,000 | | | Series 2023-1A-A2A | | | 5.00 | %(a) | | | 09/15/2048 | | | | 4,845,130 | |
| | | | |
| | | | Santander Drive Auto Receivables LLC | | | | | | | | | | | | |
| | 3,767,195 | | | Series 2020-4-D | | | 1.48 | % | | | 01/15/2027 | | | | 3,701,787 | |
| | | | |
| | | | Sapphire Aviation Finance Ltd. | | | | | | | | | | | | |
| | 14,280,740 | | | Series 2020-1A-A | | | 3.23 | %(a) | | | 03/15/2040 | | | | 12,581,204 | |
| | | | |
| | | | Sierra Timeshare Conduit Receivables Funding LLC | | | | | | | | | | | | |
| | 1,246,985 | | | Series 2021-2A-C | | | 1.95 | %(a) | | | 09/20/2038 | | | | 1,163,109 | |
| | | | |
| | | | SOFI Alternative Trust | | | | | | | | | | | | |
| | 5,315,935 | | | Series 2021-1-PT1 | | | 9.72 | %(a)(b) | | | 05/25/2030 | | | | 5,263,636 | |
| | 6,944,247 | | | Series 2021-2-A | | | 1.25 | %(a) | | | 08/15/2030 | | | | 6,735,899 | |
| | 11,924,188 | | | Series 2021-3-A | | | 1.50 | %(a) | | | 11/15/2030 | | | | 11,520,912 | |
| | | | |
| | | | Start/Bermuda | | | | | | | | | | | | |
| | 2,215,084 | | | Series 2018-1-A | | | 4.09 | %(a) | | | 05/15/2043 | | | | 2,044,452 | |
| | | | |
| | | | Taco Bell Corp. | | | | | | | | | | | | |
| | 5,895,000 | | | Series 2021-1A-A2I | | | 1.95 | %(a) | | | 08/25/2051 | | | | 5,340,560 | |
| | | | |
| | | | TAL Advantage LLC | | | | | | | | | | | | |
| | 2,909,500 | | | Series 2020-1A-A | | | 2.05 | %(a) | | | 09/20/2045 | | | | 2,648,798 | |
| | | | |
| | | | Theorem Funding Trust | | | | | | | | | | | | |
| | 1,384,265 | | | Series 2021-1A-B | | | 1.84 | %(a) | | | 12/15/2027 | | | | 1,381,165 | |
| | | | |
| | | | Thunderbolt Aircraft Lease | | | | | | | | | | | | |
| | 8,682,292 | | | Series 2018-A-A | | | 4.15 | %(a)(c) | | | 09/15/2038 | | | | 7,361,672 | |
| | | | |
| | | | TIF Funding LLC | | | | | | | | | | | | |
| | 2,882,688 | | | Series 2021-1A-A | | | 1.65 | %(a) | | | 02/20/2046 | | | | 2,507,783 | |
| | | | |
| | | | Upgrade Master Pass-Thru Trust | | | | | | | | | | | | |
| | 1,343,541 | | | Series 2021-PT3-A | | | 13.84 | %(a)(b) | | | 07/15/2027 | | | | 1,231,124 | |
| | | | |
| | | | Upstart Pass-Through Trust Series | | | | | | | | | | | | |
| | 901,220 | | | Series 2020-ST5-A | | | 3.00 | %(a) | | | 12/20/2026 | | | | 894,706 | |
| | 1,650,625 | | | Series 2020-ST6-A | | | 3.00 | %(a) | | | 01/20/2027 | | | | 1,632,690 | |
| | 743,283 | | | Series 2021-ST3-A | | | 2.00 | %(a) | | | 05/20/2027 | | | | 724,706 | |
| | | | |
| | | | Upstart Securitization Trust | | | | | | | | | | | | |
| | 811,358 | | | Series 2021-3-B | | | 1.66 | %(a) | | | 07/20/2031 | | | | 807,189 | |
| | | | |
| | | | Westlake Automobile Receivables Trust | | | | | | | | | | | | |
| | 9,600,000 | | | Series 2023-4A-A2 | | | 6.23 | %(a) | | | 01/15/2027 | | | | 9,648,668 | |
| | | | |
| | | | Willis Lease Finance Corp. | | | | | | | | | | | | |
| | 5,872,969 | | | Series 2020-A-A | | | 3.23 | %(a) | | | 03/15/2045 | | | | 5,290,159 | |
| | | | | | | | | | | | | | | | |
| | | | Total Asset Backed Obligations
(Cost $310,458,849) | | | | 292,587,022 | |
| | | | | | | | | | | | | | | | |
| | BANK LOANS - 4.9% | |
| | | | |
| | | | 1011778 BC ULC | | | | | | | | | | | | |
| | 6,287,930 | | | Senior Secured First Lien Term Loan (1 Month US Secured Overnight Financing Rate + 2.25%) | | | 7.58 | % | | | 09/23/2030 | | | | 6,291,860 | |
| | | | |
| | | | Ali Group North America Corp. | | | | | | | | | | | | |
| | 6,843,998 | | | Senior Secured First Lien Term Loan (1 Month US Secured Overnight Financing Rate + 2.11%) | | | 7.44 | % | | | 07/23/2029 | | | | 6,853,648 | |
| | | | |
| | | | American Builders & Contractors Supply Co., Inc. | | | | | | | | | | | | |
| | 2,450,000 | | | Senior Secured First Lien Term Loan (1 Month US Secured Overnight Financing Rate + 2.00%) | | | 7.33 | % | | | 01/31/2031 | | | | 2,453,442 | |
| | | | |
| 2 | | DoubleLine Funds Trust | | The accompanying notes are an integral part of these financial statements. |
| | | | | | | | | | | | | | | | |
PRINCIPAL AMOUNT $ | | | SECURITY DESCRIPTION | | RATE | | | MATURITY | | | VALUE $ | |
| | | | |
| | | | APi Group DE, Inc. | | | | | | | | | | | | |
| | 3,515,000 | | | Senior Secured First Lien Term Loan (1 Month US Secured Overnight Financing Rate + 2.61%) | | | 7.94 | % | | | 01/03/2029 | | | | 3,526,723 | |
| | | | |
| | | | Aramark Services T/L B-8 (03/24)- Target 2 | | | | | | | | | | | | |
| | 383,075 | | | Senior Secured First Lien Term Loan (1 Month US Secured Overnight Financing Rate + 2.00%) | | | 7.33 | % | | | 06/24/2030 | | | | 379,244 | |
| | | | |
| | | | Aramark Services, Inc. | | | | | | | | | | | | |
| | 694,713 | | | Senior Secured First Lien Term Loan (1 Month US Secured Overnight Financing Rate + 1.86%) | | | 7.19 | % | | | 01/15/2027 | | | | 695,320 | |
| | | | |
| | | | Asplundh Tree Expert LLC | | | | | | | | | | | | |
| | 7,833,961 | | | Senior Secured First Lien Term Loan (1 Month US Secured Overnight Financing Rate + 1.85%) | | | 7.18 | % | | | 09/06/2027 | | | | 7,844,850 | |
| | | | |
| | | | Avantor Funding T/L (03/24) | | | | | | | | | | | | |
| | 3,924,480 | | | Senior Secured Term Loan | | | 7.43 | %(d) | | | 11/08/2027 | | | | 3,924,480 | |
| | | | |
| | | | Avantor Funding, Inc. | | | | | | | | | | | | |
| | 3,573,823 | | | Senior Secured First Lien Term Loan (1 Month US Secured Overnight Financing Rate + 2.35%, 0.50% Floor) | | | 7.68 | % | | | 11/08/2027 | | | | 3,583,365 | |
| | | | |
| | | | Axalta Coating Systems US Holdings, Inc. | | | | | | | | | | | | |
| | 4,191,399 | | | Senior Secured First Lien Term Loan (3 Month US Secured Overnight Financing Rate + 2.00%) | | | 7.33 | % | | | 12/20/2029 | | | | 4,202,610 | |
| | | | |
| | | | Beacon Roofing Supply, Inc. | | | | | | | | | | | | |
| | 2,805,000 | | | Senior Secured Term Loan (CME Term SOFR 1 Month + 2.00%) | | | 7.32 | % | | | 05/19/2028 | | | | 2,811,059 | |
| | | | |
| | | | Berry Global, Inc. | | | | | | | | | | | | |
| | 7,152,561 | | | Senior Secured First Lien Term Loan (1 Month US Secured Overnight Financing Rate + 1.86%) | | | 7.18 | % | | | 07/02/2029 | | | | 7,157,711 | |
| | | | |
| | | | Buckeye Partners LP | | | | | | | | | | | | |
| | 1,020,000 | | | Senior Secured First Lien Term Loan (1 Month US Secured Overnight Financing Rate + 2.00%) | | | 7.33 | % | | | 11/02/2026 | | | | 1,023,050 | |
| | | | |
| | | | Calpine Corp. | | | | | | | | | | | | |
| | 2,039,660 | | | Senior Secured First Lien Term Loan (1 Month US Secured Overnight Financing Rate + 2.00%) | | | 7.33 | % | | | 01/31/2031 | | | | 2,030,522 | |
| | 320,000 | | | Senior Secured Term Loan (CME Term SOFR 1 Month + 2.00%) | | | 7.33 | % | | | 01/31/2031 | | | | 318,416 | |
| | 4,458,840 | | | Senior Secured First Lien Term Loan (1 Month US Secured Overnight Financing Rate + 2.00%) | | | 7.33 | % | | | 12/16/2027 | | | | 4,459,732 | |
| | | | |
| | | | Catalent Pharma Solutions, Inc. | | | | | | | | | | | | |
| | 4,380,797 | | | Senior Secured First Lien Term Loan (1 Month US Secured Overnight Financing Rate + 2.11%, 0.50% Floor) | | | 7.44 | % | | | 02/22/2028 | | | | 4,383,535 | |
| | | | |
| | | | Clean Harbors, Inc. | | | | | | | | | | | | |
| | 1,890,000 | | | Senior Secured Term Loan (CME Term SOFR 1 Month + 1.75%) | | | 7.19 | % | | | 10/10/2028 | | | | 1,895,906 | |
| | | | |
| | | | Connect Finco SARL | | | | | | | | | | | | |
| | 428,313 | | | Senior Secured First Lien Term Loan (1 Month US Secured Overnight Financing Rate + 3.50%, 1.00% Floor) | | | 8.83 | % | | | 12/11/2026 | | | | 428,413 | |
| | | | |
| | | | Cyxtera DC Holdings, Inc. | | | | | | | | | | | | |
| | 401,916 | | | Senior Secured First Lien Term Loan (3 Month US Secured Overnight Financing Rate + 2.00%, 1.00% Floor) | | | 10.50 | %(e) | | | 05/01/2024 | | | | 20,632 | |
| | | | |
| | | | Element Solutions, Inc. | | | | | | | | | | | | |
| | 3,118,236 | | | Senior Secured First Lien Term Loan (1 Month US Secured Overnight Financing Rate + 2.00%) | | | 7.33 | % | | | 12/18/2030 | | | | 3,124,738 | |
| | | | |
| | | | Energizer Holdings, Inc. | | | | | | | | | | | | |
| | 4,325,697 | | | Senior Secured First Lien Term Loan (1 Month US Secured Overnight Financing Rate + 2.36%, 0.50% Floor) | | | 7.69 | % | | | 12/22/2027 | | | | 4,328,941 | |
| | | | |
| | | | Flame Newco LLC | | | | | | | | | | | | |
| | 107,762 | | | Senior Secured First Lien Term Loan (1 Month US Secured Overnight Financing Rate + 2.10%, 1.00% Floor) | | | 7.43 | % | | | 06/30/2028 | | | | 101,566 | |
| | 3,318 | | | Senior Secured First Lien Term Loan (1 Month US Secured Overnight Financing Rate + 2.10%, 1.00% Floor) | | | 7.43 | % | | | 06/30/2028 | | | | 3,127 | |
| | | | |
| | | | FleetCor Technologies Operating Co. LLC | | | | | | | | | | | | |
| | 7,250,129 | | | Senior Secured First Lien Term Loan (1 Month US Secured Overnight Financing Rate + 1.85%) | | | 7.18 | % | | | 05/01/2028 | | | | 7,252,631 | |
| | | | |
| | | | Flutter Financing BV | | | | | | | | | | | | |
| | 8,329,125 | | | Senior Secured First Lien Term Loan (3 Month US Secured Overnight Financing Rate + 2.25%, 0.50% Floor) | | | 7.56 | % | | | 11/29/2030 | | | | 8,347,699 | |
| | | | | | | | |
| The accompanying notes are an integral part of these financial statements. | | Annual Report | | | | | March 31, 2024 | | 3 |
| | |
Schedule of Investments DoubleLine Shiller Enhanced CAPE® (Cont.) | | |
| | | | | | | | | | | | | | | | |
PRINCIPAL AMOUNT $ | | | SECURITY DESCRIPTION | | RATE | | | MATURITY | | | VALUE $ | |
| | | | |
| | | | Focus Financial Partners LLC | | | | | | | | | | | | |
| | 3,732,753 | | | Senior Secured First Lien Term Loan (1 Month US Secured Overnight Financing Rate + 2.50%, 0.50% Floor) | | | 7.83 | % | | | 06/30/2028 | | | | 3,722,973 | |
| | | | |
| | | | Gen Digital, Inc. | | | | | | | | | | | | |
| | 5,527,146 | | | Senior Secured First Lien Term Loan (1 Month US Secured Overnight Financing Rate + 2.10%, 0.50% Floor) | | | 7.43 | % | | | 09/12/2029 | | | | 5,531,595 | |
| | | | |
| | | | Generac Power Systems, Inc. | | | | | | | | | | | | |
| | 383,133 | | | Senior Secured First Lien Term Loan (1 Month US Secured Overnight Financing Rate + 1.85%) | | | 7.18 | % | | | 12/14/2026 | | | | 383,313 | |
| | | | |
| | | | Go Daddy Operating Co. LLC | | | | | | | | | | | | |
| | 7,809,974 | | | Senior Secured First Lien Term Loan (1 Month US Secured Overnight Financing Rate + 2.00%) | | | 7.33 | % | | | 11/12/2029 | | | | 7,814,074 | |
| | | | |
| | | | Grifols Worldwide Operations USA, Inc. | | | | | | | | | | | | |
| | 4,740,247 | | | Senior Secured First Lien Term Loan (3 Month US Secured Overnight Financing Rate + 2.15%) | | | 7.46 | % | | | 11/15/2027 | | | | 4,600,101 | |
| | | | |
| | | | HB Fuller Co. | | | | | | | | | | | | |
| | 2,895,000 | | | Senior Secured First Lien Term Loan (1 Month US Secured Overnight Financing Rate + 2.00%, 0.50% Floor) | | | 7.33 | % | | | 02/15/2030 | | | | 2,905,133 | |
| | | | |
| | | | Hilton Domestic Operating Co., Inc. | | | | | | | | | | | | |
| | 2,035,000 | | | Senior Secured First Lien Term Loan (1 Month US Secured Overnight Financing Rate + 2.10%) | | | 7.43 | % | | | 11/08/2030 | | | | 2,041,532 | |
| | | | |
| | | | ICON Luxembourg SARL | | | | | | | | | | | | |
| | 1,201,703 | | | Senior Secured First Lien Term Loan (1 Month US Secured Overnight Financing Rate + 2.00%, 0.50% Floor) | | | 7.33 | % | | | 07/03/2028 | | | | 1,206,005 | |
| | 4,823,197 | | | Senior Secured First Lien Term Loan (1 Month US Secured Overnight Financing Rate + 2.00%, 0.50% Floor) | | | 7.33 | % | | | 07/03/2028 | | | | 4,840,464 | |
| | | | |
| | | | Installed Building Products T/L B (03/24) | | | | | | | | | | | | |
| | 920,000 | | | Senior Secured Term Loan | | | 7.33 | %(d) | | | 03/21/2031 | | | | 923,165 | |
| | | | |
| | | | IQVIA, Inc. | | | | | | | | | | | | |
| | 6,249,338 | | | Senior Secured First Lien Term Loan (3 Month US Secured Overnight Financing Rate + 2.00%) | | | 7.31 | % | | | 01/02/2031 | | | | 6,286,740 | |
| | | | |
| | | | Iron Mountain, Inc. | | | | | | | | | | | | |
| | 6,883,653 | | | Senior Secured First Lien Term Loan (1 Month US Secured Overnight Financing Rate + 1.86%) | | | 7.19 | % | | | 01/02/2026 | | | | 6,886,510 | |
| | | | |
| | | | KFC Holding Co. | | | | | | | | | | | | |
| | 4,586,929 | | | Senior Secured First Lien Term Loan (1 Month US Secured Overnight Financing Rate + 1.86%) | | | 7.19 | % | | | 03/15/2028 | | | | 4,590,003 | |
| | | | |
| | | | Lamar Media Corp. | | | | | | | | | | | | |
| | 4,879,350 | | | Senior Secured First Lien Term Loan (1 Month US Secured Overnight Financing Rate + 1.60%) | | | 6.93 | % | | | 02/08/2027 | | | | 4,879,350 | |
| | | | |
| | | | Lions Gate Capital Holdings LLC | | | | | | | | | | | | |
| | 420,532 | | | Senior Secured First Lien Term Loan (1 Month US Secured Overnight Financing Rate + 2.35%) | | | 7.68 | % | | | 03/24/2025 | | | | 420,664 | |
| | | | |
| | | | Maravai Intermediate Holdings LLC | | | | | | | | | | | | |
| | 261,449 | | | Senior Secured First Lien Term Loan (3 Month US Secured Overnight Financing Rate + 3.00%, 0.50% Floor) | | | 8.31 | % | | | 10/19/2027 | | | | 257,309 | |
| | | | |
| | | | Marriott Ownership Resorts, Inc. | | | | | | | | | | | | |
| | 4,770,000 | | | Senior Secured Term Loan (CME Term SOFR 1 Month + 2.25%) | | | 7.57 | % | | | 03/17/2031 | | | | 4,758,075 | |
| | 2,048,872 | | | Senior Secured First Lien Term Loan (1 Month US Secured Overnight Financing Rate + 1.85%) | | | 7.18 | % | | | 09/02/2025 | | | | 2,045,798 | |
| | | | |
| | | | Mileage Plus Holdings LLC | | | | | | | | | | | | |
| | 1,976,000 | | | Senior Secured First Lien Term Loan (3 Month US Secured Overnight Financing Rate + 5.40%, 1.00% Floor) | | | 10.73 | % | | | 06/21/2027 | | | | 2,037,295 | |
| | | | |
| | | | Nascar Holdings LLC | | | | | | | | | | | | |
| | 200,222 | | | Senior Secured First Lien Term Loan (1 Month US Secured Overnight Financing Rate + 2.61%) | | | 7.94 | % | | | 10/19/2026 | | | | 201,315 | |
| | | | |
| | | | NRG Energy T/L B (03/24) | | | | | | | | | | | | |
| | 5,045,000 | | | Senior Secured Term Loan | | | 7.33 | %(d) | | | 03/27/2031 | | | | 5,041,872 | |
| | | | |
| | | | Reynolds Consumer Products LLC | | | | | | | | | | | | |
| | 6,325,164 | | | Senior Secured First Lien Term Loan (1 Month US Secured Overnight Financing Rate + 1.85%) | | | 7.18 | % | | | 02/04/2027 | | | | 6,343,476 | |
| | | | |
| | | | Setanta Aircraft Leasing DAC | | | | | | | | | | | | |
| | 10,365,000 | | | Senior Secured First Lien Term Loan (3 Month US Secured Overnight Financing Rate + 2.26%) | | | 7.61 | % | | | 11/06/2028 | | | | 10,398,116 | |
| | | | |
| 4 | | DoubleLine Funds Trust | | The accompanying notes are an integral part of these financial statements. |
| | | | | | | | | | | | | | | | |
PRINCIPAL AMOUNT $ | | | SECURITY DESCRIPTION | | RATE | | | MATURITY | | | VALUE $ | |
| | | | |
| | | | SkyMiles IP Ltd. | | | | | | | | | | | | |
| | 483,750 | | | Senior Secured First Lien Term Loan (3 Month US Secured Overnight Financing Rate + 3.75%, 1.00% Floor) | | | 9.07 | % | | | 10/20/2027 | | | | 499,523 | |
| | | | |
| | | | SMG US Midco 2, Inc. | | | | | | | | | | | | |
| | 1,004,125 | | | Senior Secured First Lien Term Loan (3 Month US Secured Overnight Financing Rate + 2.76%) | | | 8.07 | % | | | 01/23/2025 | | | | 1,005,019 | |
| | 370,234 | | | Senior Secured First Lien Term Loan (3 Month US Secured Overnight Financing Rate + 2.76%) | | | 8.07 | % | | | 01/23/2025 | | | | 370,564 | |
| | | | |
| | | | Standard Industries, Inc./NJ | | | | | | | | | | | | |
| | 7,144,279 | | | Senior Secured First Lien Term Loan (1 Month US Secured Overnight Financing Rate + 2.36%, 0.50% Floor) | | | 7.69 | % | | | 09/22/2028 | | | | 7,155,602 | |
| | | | |
| | | | Trans Union LLC | | | | | | | | | | | | |
| | 2,604,940 | | | Senior Secured First Lien Term Loan (1 Month US Secured Overnight Financing Rate + 1.85%) | | | 7.18 | % | | | 11/16/2026 | | | | 2,606,868 | |
| | | | |
| | | | US Foods, Inc. | | | | | | | | | | | | |
| | 1,946,875 | | | Senior Secured First Lien Term Loan (1 Month US Secured Overnight Financing Rate + 2.11%) | | | 7.44 | % | | | 09/14/2026 | | | | 1,953,193 | |
| | | | |
| | | | Vestis Corp. | | | | | | | | | | | | |
| | 1,130,000 | | | Senior Secured First Lien Term Loan (3 Month US Secured Overnight Financing Rate + 2.25%) | | | 7.58 | % | | | 02/24/2031 | | | | 1,131,413 | |
| | | | |
| | | | Vistra Operations Co. LLC | | | | | | | | | | | | |
| | 6,295,170 | | | Senior Secured First Lien Term Loan (1 Month US Secured Overnight Financing Rate + 2.00%) | | | 7.33 | % | | | 12/20/2030 | | | | 6,296,177 | |
| | | | |
| | | | Walker & Dunlop, Inc. | | | | | | | | | | | | |
| | 2,160,275 | | | Senior Secured First Lien Term Loan (1 Month US Secured Overnight Financing Rate + 2.50%, 0.50% Floor) | | | 7.68 | % | | | 12/18/2028 | | | | 2,157,575 | |
| | | | |
| | | | WMG Acquisition Corp. | | | | | | | | | | | | |
| | 6,316,312 | | | Senior Secured First Lien Term Loan (1 Month US Secured Overnight Financing Rate + 2.00%) | | | 7.33 | % | | | 01/24/2031 | | | | 6,316,313 | |
| | | | |
| | | | Wyndham Hotels & Resorts, Inc. | | | | | | | | | | | | |
| | 1,213,003 | | | Senior Secured First Lien Term Loan (1 Month US Secured Overnight Financing Rate + 2.35%) | | | 7.68 | % | | | 05/28/2030 | | | | 1,218,691 | |
| | | | |
| | | | Ziggo Financing Partnership | | | | | | | | | | | | |
| | 235,000 | | | Senior Secured First Lien Term Loan (1 Month US Secured Overnight Financing Rate + 2.61%) | | | 7.94 | % | | | 04/30/2028 | | | | 231,916 | |
| | | | | | | | | | | | | | | | |
| | | | Total Bank Loans
(Cost $205,887,043) | | | | | | | | 206,500,952 | |
| | | | | | | | | | | | | |
| | COLLATERALIZED LOAN OBLIGATIONS - 12.9% | | | | | | | | | | | | |
| | | | |
| | | | 37 Capital CLO | | | | | | | | | | | | |
| | 27,000,000 | | | Series 2021-1A-A (CME Term SOFR 3 Month + 1.46%, 1.20% Floor) | | | 6.78 | %(a) | | | 10/15/2034 | | | | 27,005,400 | |
| | | | |
| | | | Anchorage Capital CLO Ltd. | | | | | | | | | | | | |
| | 23,000,000 | | | Series 2021-19A-A (CME Term SOFR 3 Month + 1.47%, 1.21% Floor) | | | 6.79 | %(a) | | | 10/15/2034 | | | | 23,029,688 | |
| | | | |
| | | | ArrowMark Colorado Holdings | | | | | | | | | | | | |
| | 18,223,916 | | | Series 2018-9A-A1 (CME Term SOFR 3 Month + 1.38%, 1.38% Floor) | | | 6.70 | %(a) | | | 07/15/2031 | | | | 18,254,671 | |
| | | | |
| | | | Atlas Senior Loan Fund Ltd. | | | | | | | | | | | | |
| | 2,000,000 | | | Series 2018-11A-B (CME Term SOFR 3 Month + 1.91%) | | | 7.24 | %(a) | | | 07/26/2031 | | | | 2,000,793 | |
| | | | |
| | | | Battalion CLO Ltd. | | | | | | | | | | | | |
| | 29,500,000 | | | Series 2017-11A-AR (CME Term SOFR 3 Month + 1.41%, 1.15% Floor) | | | 6.73 | %(a) | | | 04/24/2034 | | | | 29,579,585 | |
| | 10,000,000 | | | Series 2021-20A-A (CME Term SOFR 3 Month + 1.44%, 1.18% Floor) | | | 6.76 | %(a) | | | 07/15/2034 | | | | 10,004,250 | |
| | | | |
| | | | Bridge Street CLO Ltd. | | | | | | | | | | | | |
| | 10,500,000 | | | Series 2021-1A-A1A (CME Term SOFR 3 Month + 1.49%, 1.23% Floor) | | | 6.81 | %(a) | | | 07/20/2034 | | | | 10,509,976 | |
| | | | |
| | | | Cathedral Lake CLO Ltd. | | | | | | | | | | | | |
| | 9,850,000 | | | Series 2021-7RA-A (CME Term SOFR 3 Month + 1.57%, 1.31% Floor) | | | 6.89 | %(a) | | | 01/15/2032 | | | | 9,872,434 | |
| | | | |
| | | | CBAM Ltd. | | | | | | | | | | | | |
| | 4,500,000 | | | Series 2017-2A-AR (CME Term SOFR 3 Month + 1.45%, 1.19% Floor) | | | 6.77 | %(a) | | | 07/17/2034 | | | | 4,504,050 | |
| | | | | | | | |
| The accompanying notes are an integral part of these financial statements. | | Annual Report | | | | | March 31, 2024 | | 5 |
| | |
Schedule of Investments DoubleLine Shiller Enhanced CAPE® (Cont.) | | |
| | | | | | | | | | | | | | | | |
PRINCIPAL AMOUNT $ | | | SECURITY DESCRIPTION | | RATE | | | MATURITY | | | VALUE $ | |
| | | | |
| | | | CFIP CLO Ltd. | | | | | | | | | | | | |
| | 10,350,000 | | | Series 2017-1A-AR (CME Term SOFR 3 Month + 1.49%, 1.23% Floor) | | | 6.79% | (a) | | | 10/18/2034 | | | | 10,364,089 | |
| | | | |
| | | | CIFC Funding Ltd. | | | | | | | | | | | | |
| | 1,800,000 | | | Series 2014-5A-BR2 (CME Term SOFR 3 Month + 2.06%, 1.80% Floor) | | | 7.38% | (a) | | | 10/17/2031 | | | | 1,805,269 | |
| | | | |
| | | | CQS US CLO | | | | | | | | | | | | |
| | 25,000,000 | | | Series 2021-1A-A (CME Term SOFR 3 Month + 1.48%, 1.22% Floor) | | | 6.80% | (a) | | | 01/20/2035 | | | | 25,073,788 | |
| | 11,000,000 | | | Series 2021-1A-B (CME Term SOFR 3 Month + 2.14%, 1.88% Floor) | | | 7.46% | (a) | | | 01/20/2035 | | | | 10,983,742 | |
| | | | |
| | | | Dryden Senior Loan Fund | | | | | | | | | | | | |
| | 25,000,000 | | | Series 2020-85A-AR (CME Term SOFR 3 Month + 1.41%, 1.15% Floor) | | | 6.73% | (a) | | | 10/15/2035 | | | | 24,991,310 | |
| | | | |
| | | | Halcyon Loan Advisors Funding Ltd. | | | | | | | | | | | | |
| | 74,745 | | | Series 2013-2A-D (CME Term SOFR 3 Month + 4.06%) | | | 9.37% | (a)(f) | | | 08/01/2025 | | | | 50,093 | |
| | | | |
| | | | Hayfin US | | | | | | | | | | | | |
| | 8,315,232 | | | Series 2018-8A-A (CME Term SOFR 3 Month + 1.38%, 1.12% Floor) | | | 6.70% | (a) | | | 04/20/2031 | | | | 8,317,840 | |
| | 6,500,000 | | | Series 2018-8A-B (CME Term SOFR 3 Month + 1.74%, 1.48% Floor) | | | 7.06% | (a) | | | 04/20/2031 | | | | 6,503,520 | |
| | | | |
| | | | Jamestown CLO Ltd. | | | | | | | | | | | | |
| | 15,000,000 | | | Series 2016-9A-A1RR (CME Term SOFR 3 Month + 1.50%, 1.24% Floor) | | | 6.83% | (a) | | | 07/25/2034 | | | | 14,993,946 | |
| | | | |
| | | | LCM LP | | | | | | | | | | | | |
| | 9,536,869 | | | Series 17A-A2RR (CME Term SOFR 3 Month + 1.41%, 1.15% Floor) | | | 6.73% | (a) | | | 10/15/2031 | | | | 9,530,139 | |
| | | | |
| | | | Logan CLO | | | | | | | | | | | | |
| | 14,000,000 | | | Series 2022-1A-B (CME Term SOFR 3 Month + 2.05%, 2.05% Floor) | | | 7.37% | (a) | | | 04/21/2035 | | | | 14,033,909 | |
| | | | |
| | | | Madison Park Funding Ltd. | | | | | | | | | | | | |
| | 3,000,000 | | | Series 2017-26A-BR (CME Term SOFR 3 Month + 1.86%) | | | 7.18% | (a) | | | 07/29/2030 | | | | 3,002,499 | |
| | | | |
| | | | Marble Point CLO | | | | | | | | | | | | |
| | 29,500,000 | | | Series 2020-1A-A (CME Term SOFR 3 Month + 1.56%, 1.30% Floor) | | | 6.88% | (a) | | | 04/20/2033 | | | | 29,476,701 | |
| | 25,000,000 | | | Series 2021-2A-A (CME Term SOFR 3 Month + 1.46%, 1.20% Floor) | | | 6.79% | (a) | | | 07/25/2034 | | | | 24,993,788 | |
| | 23,000,000 | | | Series 2021-3A-A1 (CME Term SOFR 3 Month + 1.50%, 1.24% Floor) | | | 6.82% | (a) | | | 10/17/2034 | | | | 22,977,064 | |
| | | | |
| | | | MKS CLO Ltd. | | | | | | | | | | | | |
| | 9,089,087 | | | Series 2017-1A-AR (CME Term SOFR 3 Month + 1.26%, 1.00% Floor) | | | 6.58% | (a) | | | 07/20/2030 | | | | 9,095,945 | |
| | 4,230,640 | | | Series 2017-2A-A (CME Term SOFR 3 Month + 1.45%, 1.19% Floor) | | | 6.77% | (a) | | | 01/20/2031 | | | | 4,233,500 | |
| | | | |
| | | | MP CLO Ltd. | | | | | | | | | | | | |
| | 10,000,000 | | | Series 2015-2A-ARR (CME Term SOFR 3 Month + 1.46%, 1.20% Floor) | | | 6.78% | (a) | | | 04/28/2034 | | | | 10,015,101 | |
| | | | |
| | | | Nassau Global Credit LLC | | | | | | | | | | | | |
| | 20,728,857 | | | Series 2018-IA-A (CME Term SOFR 3 Month + 1.41%) | | | 6.73% | (a) | | | 07/15/2031 | | | | 20,727,802 | |
| | | | |
| | | | OFSI Fund Ltd. | | | | | | | | | | | | |
| | 9,232,420 | | | Series 2018-1A-A (CME Term SOFR 3 Month + 1.41%, 1.15% Floor) | | | 6.73% | (a) | | | 07/15/2031 | | | | 9,250,222 | |
| | | | |
| | | | Sandstone Peak Ltd. | | | | | | | | | | | | |
| | 14,000,000 | | | Series 2021-1A-A1 (CME Term SOFR 3 Month + 1.48%, 1.22% Floor) | | | 6.80% | (a) | | | 10/15/2034 | | | | 14,002,800 | |
| | | | |
| | | | Sound Point CLO Ltd. | | | | | | | | | | | | |
| | 25,000,000 | | | Series 2019-2A-AR (CME Term SOFR 3 Month + 1.43%, 1.17% Floor) | | | 6.75% | (a) | | | 07/15/2034 | | | | 24,941,640 | |
| | | | |
| | | | Steele Creek CLO Ltd. | | | | | | | | | | | | |
| | 11,000,000 | | | Series 2019-1A-BR (CME Term SOFR 3 Month + 2.06%, 1.80% Floor) | | | 7.38% | (a) | | | 04/15/2032 | | | | 10,970,647 | |
| | 18,000,000 | | | Series 2019-2A-AR (CME Term SOFR 3 Month + 1.43%, 1.17% Floor) | | | 6.75% | (a) | | | 07/15/2032 | | | | 18,035,915 | |
| | 9,000,000 | | | Series 2019-2A-BR (CME Term SOFR 3 Month + 2.11%, 1.85% Floor) | | | 7.43% | (a) | | | 07/15/2032 | | | | 9,003,725 | |
| | | | |
| 6 | | DoubleLine Funds Trust | | The accompanying notes are an integral part of these financial statements. |
| | | | | | | | | | | | | | | | |
PRINCIPAL AMOUNT $ | | | SECURITY DESCRIPTION | | RATE | | | MATURITY | | | VALUE $ | |
| | | | |
| | | | Trimaran CAVU LLC | | | | | | | | | | | | |
| | 20,000,000 | | | Series 2021-3A-A (CME Term SOFR 3 Month + 1.47%, 1.21% Floor) | | | 6.77% | (a) | | | 01/18/2035 | | | | 20,043,584 | |
| | | | |
| | | | Venture CDO Ltd. | | | | | | | | | | | | |
| | 9,973,743 | | | Series 2018-34A-A (CME Term SOFR 3 Month + 1.49%, 1.23% Floor) | | | 6.81% | (a) | | | 10/15/2031 | | | | 9,963,769 | |
| | | | |
| | | | Wellfleet CLO Ltd. | | | | | | | | | | | | |
| | 15,990,000 | | | Series 2020-2A-AR (CME Term SOFR 3 Month + 1.48%, 1.22% Floor) | | | 6.80% | (a) | | | 07/15/2034 | | | | 15,980,718 | |
| | | | |
| | | | Whitebox CLO Ltd. | | | | | | | | | | | | |
| | 25,000,000 | | | Series 2021-3A-A1 (CME Term SOFR 3 Month + 1.48%, 1.22% Floor) | | | 6.80% | (a) | | | 10/15/2034 | | | | 25,009,038 | |
| | | | | | | | | | | | | | | | |
| | | | Total Collateralized Loan Obligations
(Cost $542,563,286) | | | | | | | | 543,132,950 | |
| | | | | | | | | | | | | |
| | FOREIGN CORPORATE BONDS—5.1% | | | | | | | | | | | | |
| | 1,509,300 | | | Adani International Container Terminal Pvt Ltd. | | | 3.00% | | | | 02/16/2031 | | | | 1,287,758 | |
| | 324,000 | | | Adani Ports & Special Economic Zone Ltd. | | | 3.38% | | | | 07/24/2024 | | | | 320,860 | |
| | 3,300,000 | | | Adani Ports & Special Economic Zone Ltd. | | | 4.00% | | | | 07/30/2027 | | | | 3,031,406 | |
| | 1,600,000 | | | Adani Transmission Step-One Ltd. | | | 4.00% | | | | 08/03/2026 | | | | 1,505,095 | |
| | 2,100,000 | | | Adaro Indonesia PT | | | 4.25% | | | | 10/31/2024 | | | | 2,073,640 | |
| | 3,309,000 | | | AerCap Ireland Capital DAC / AerCap Global Aviation Trust | | | 6.45% | (a) | | | 04/15/2027 | | | | 3,398,805 | |
| | 3,877,494 | | | AI Candelaria Spain SA | | | 7.50% | | | | 12/15/2028 | | | | 3,800,375 | |
| | 535,000 | | | Algonquin Power & Utilities Corp. | | | 5.37% | (c) | | | 06/15/2026 | | | | 532,263 | |
| | 650,000 | | | AngloGold Ashanti Holdings PLC | | | 3.38% | | | | 11/01/2028 | | | | 585,479 | |
| | 3,585,000 | | | Avolon Holdings Funding Ltd. | | | 2.13% | (a) | | | 02/21/2026 | | | | 3,341,591 | |
| | 4,150,000 | | | BAE Systems PLC | | | 5.00% | (a) | | | 03/26/2027 | | | | 4,142,754 | |
| | 3,100,000 | | | Banco Bilbao Vizcaya Argentaria Colombia SA | | | 4.88% | | | | 04/21/2025 | | | | 3,047,362 | |
| | 1,850,000 | | | Banco Continental SAECA | | | 2.75% | (a) | | | 12/10/2025 | | | | 1,745,487 | |
| | 1,850,000 | | | Banco Continental SAECA | | | 2.75% | | | | 12/10/2025 | | | | 1,745,487 | |
| | 2,400,000 | | | Banco de Bogota SA | | | 6.25% | | | | 05/12/2026 | | | | 2,401,029 | |
| | 100,000 | | | Banco de Credito del Peru SA | | | 5.85% | (a) | | | 01/11/2029 | | | | 101,225 | |
| | 200,000 | | | Banco de Credito del Peru SA
(5 Year CMT Rate + 2.45%) | | | 3.25% | | | | 09/30/2031 | | | | 184,852 | |
| | 5,700,000 | | | Banco de Credito del Peru SA
(5 Year CMT Rate + 2.45%) | | | 3.25% | (a) | | | 09/30/2031 | | | | 5,268,295 | |
| | 1,200,000 | | | Banco Inbursa SA Institucion De Banca Multiple Grupo Financiero Inbursa | | | 4.38% | | | | 04/11/2027 | | | | 1,157,461 | |
| | 1,350,000 | | | Banco Industrial SA/Guatemala
(5 Year CMT Rate + 4.44%) | | | 4.88% | | | | 01/29/2031 | | | | 1,294,299 | |
| | 4,250,000 | | | Banco Internacional del Peru SAA Interbank
(5 Year CMT Rate + 3.71%) | | | 4.00% | | | | 07/08/2030 | | | | 4,084,693 | |
| | 1,700,000 | | | Banco Santander Mexico SA Institucion de Banca Multiple Grupo Financiero Santand
(5 Year CMT Rate + 3.00%) | | | 7.53% | | | | 10/01/2028 | | | | 1,769,355 | |
| | 1,800,000 | | | Bancolombia SA
(5 Year CMT Rate + 2.93%) | | | 6.91% | | | | 10/18/2027 | | | | 1,809,184 | |
| | 3,580,000 | | | Bancolombia SA
(5 Year CMT Rate + 2.94%) | | | 4.63% | | | | 12/18/2029 | | | | 3,491,984 | |
| | 1,805,000 | | | Bank of Montreal | | | 1.50% | | | | 01/10/2025 | | | | 1,751,943 | |
| | 1,715,000 | | | Bank of Nova Scotia/The | | | 4.75% | | | | 02/02/2026 | | | | 1,703,040 | |
| | 2,080,000 | | | BAT Capital Corp. | | | 2.79% | | | | 09/06/2024 | | | | 2,053,967 | |
| | 1,485,000 | | | BAT International Finance PLC | | | 1.67% | | | | 03/25/2026 | | | | 1,383,091 | |
| | 3,730,000 | | | BBVA Bancomer SA/Texas
(5 Year CMT Rate + 3.00%) | | | 5.35% | | | | 11/12/2029 | | | | 3,698,075 | |
| | 800,000 | | | BBVA Bancomer SA/Texas
(5 Year CMT Rate + 2.65%) | | | 5.13% | | | | 01/18/2033 | | | | 743,992 | |
| | 200,000 | | | Bharti Airtel Ltd. | | | 4.38% | | | | 06/10/2025 | | | | 196,789 | |
| | 2,715,000 | | | BHP Billiton Finance USA Ltd. | | | 5.25% | | | | 09/08/2026 | | | | 2,731,918 | |
| | 1,705,000 | | | BMW US Capital LLC
(Secured Overnight Financing Rate + 0.62%) | | | 5.96% | (a) | | | 08/11/2025 | | | | 1,711,885 | |
| | 3,505,000 | | | BPCE SA | | | 2.38% | (a) | | | 01/14/2025 | | | | 3,413,214 | |
| | 4,800,000 | | | Braskem Netherlands Finance BV
(5 Year CMT Rate + 8.22%) | | | 8.50% | | | | 01/23/2081 | | | | 4,817,449 | |
| | | | | | | | |
| The accompanying notes are an integral part of these financial statements. | | Annual Report | | | | | March 31, 2024 | | 7 |
| | |
Schedule of Investments DoubleLine Shiller Enhanced CAPE® (Cont.) | | |
| | | | | | | | | | | | | | | | |
PRINCIPAL AMOUNT $ | | | SECURITY DESCRIPTION | | RATE | | | MATURITY | | | VALUE $ | |
| | 600,000 | | | BRF GmbH | | | 4.35% | | | | 09/29/2026 | | | | 570,692 | |
| | 1,000,000 | | | Camposol SA | | | 6.00% | | | | 02/03/2027 | | | | 771,851 | |
| | 2,125,000 | | | Canadian Imperial Bank of Commerce | | | 3.95% | | | | 08/04/2025 | | | | 2,087,659 | |
| | 3,416,000 | | | Canadian Pacific Railway Co. | | | 1.35% | | | | 12/02/2024 | | | | 3,322,132 | |
| | 700,000 | | | Cencosud SA | | | 5.15% | | | | 02/12/2025 | | | | 695,949 | |
| | 5,545,580 | | | Chile Electricity PEC SpA | | | 0.00% | (a) | | | 01/25/2028 | | | | 4,361,600 | |
| | 400,000 | | | Cia de Minas Buenaventura SAA | | | 5.50% | | | | 07/23/2026 | | | | 386,153 | |
| | 3,307,000 | | | Commonwealth Bank of Australia
(US Secured Overnight Financing Rate + 0.40%) | | | 5.75% | (a) | | | 07/07/2025 | | | | 3,310,061 | |
| | 3,000,000 | | | Cosan Luxembourg SA | | | 7.00% | | | | 01/20/2027 | | | | 3,022,270 | |
| | 2,000,000 | | | Credicorp Ltd. | | | 2.75% | | | | 06/17/2025 | | | | 1,925,887 | |
| | 2,095,000 | | | Daimler Truck Finance North America LLC | | | 1.63% | (a) | | | 12/13/2024 | | | | 2,038,599 | |
| | 1,400,000 | | | Daimler Truck Finance North America LLC | | | 5.15% | (a) | | | 01/16/2026 | | | | 1,395,476 | |
| | 4,500,000 | | | DBS Group Holdings Ltd.
(5 Year CMT Rate + 1.10%) | | | 1.82% | | | | 03/10/2031 | | | | 4,189,614 | |
| | 199,263 | | | Digicel Group Holdings Ltd. | | | 0.00% | (a)(f) | | | 12/31/2030 | | | | 2,288 | |
| | 2,031 | | | Digicel Group Holdings Ltd. | | | 0.00% | (a)(f) | | | 12/31/2030 | | | | 1,641 | |
| | 58,645 | | | Digicel Group Holdings Ltd. | | | 0.00% | (a)(f) | | | 12/31/2030 | | | | 54,154 | |
| | 293,954 | | | Digicel Group Holdings Ltd. | | | 0.00% | (a)(f) | | | 12/31/2030 | | | | 45,415 | |
| | 1,055,902 | | | Empresa Electrica Angamos SA | | | 4.88% | | | | 05/25/2029 | | | | 956,990 | |
| | 1,782,620 | | | Empresa Electrica Cochrane SpA | | | 5.50% | | | | 05/14/2027 | | | | 1,726,937 | |
| | 3,406,000 | | | Enbridge, Inc. | | | 2.50% | | | | 02/14/2025 | | | | 3,318,287 | |
| | 2,202,941 | | | Fenix Power Peru SA | | | 4.32% | | | | 09/20/2027 | | | | 2,122,809 | |
| | 2,000,000 | | | Freeport Indonesia PT | | | 4.76% | | | | 04/14/2027 | | | | 1,957,766 | |
| | 950,000 | | | Freeport Indonesia PT | | | 4.76% | (a) | | | 04/14/2027 | | | | 929,939 | |
| | 4,500,000 | | | Freeport-McMoRan, Inc. | | | 4.13% | | | | 03/01/2028 | | | | 4,308,223 | |
| | 1,939,800 | | | Galaxy Pipeline Assets Bidco Ltd. | | | 1.75% | | | | 09/30/2027 | | | | 1,821,826 | |
| | 3,351,000 | | | Glencore Funding LLC | | | 4.00% | (a) | | | 04/16/2025 | | | | 3,297,573 | |
| | 110,000 | | | Glencore Funding LLC | | | 1.63% | (a) | | | 09/01/2025 | | | | 104,154 | |
| | 2,680,000 | | | Glencore Funding LLC
(Secured Overnight Financing Rate + 1.06%) | | | 6.41% | (a) | | | 04/04/2027 | | | | 2,681,641 | |
| | 1,500,000 | | | Global Bank Corp.
(3 Month LIBOR USD + 3.30%) | | | 5.25% | (g) | | | 04/16/2029 | | | | 1,380,549 | |
| | 2,375,000 | | | Gold Fields Orogen Holdings BVI Ltd. | | | 5.13% | | | | 05/15/2024 | | | | 2,367,585 | |
| | 2,000,000 | | | Grupo de Inversiones Suramericana SA | | | 5.50% | | | | 04/29/2026 | | | | 1,961,360 | |
| | 2,698,889 | | | Guara Norte SARL | | | 5.20% | | | | 06/15/2034 | | | | 2,464,544 | |
| | 316,000 | | | Hunt Oil Co. of Peru LLC Sucursal Del Peru | | | 6.38% | (a) | | | 06/01/2028 | | | | 313,049 | |
| | 1,000,000 | | | Industrias Penoles SAB de CV | | | 4.15% | | | | 09/12/2029 | | | | 935,839 | |
| | 2,836,000 | | | Inkia Energy Ltd. | | | 5.88% | | | | 11/09/2027 | | | | 2,777,696 | |
| | 295,655 | | | Interoceanica IV Finance Ltd.
Series 2007 | | | 0.00% | | | | 11/30/2025 | | | | 279,025 | |
| | 35,034 | | | Invepar Holdings | | | 0.00% | (e)(f) | | | 12/30/2028 | | | | — | |
| | 3,000,000 | | | Itau Unibanco Holding SA/Cayman Island
(5 Year CMT Rate + 3.45%) | | | 3.88% | | | | 04/15/2031 | | | | 2,868,080 | |
| | 1,012,000 | | | JBS USA LUX SA / JBS USA Food Co. / JBS USA Finance, Inc. | | | 3.00% | | | | 02/02/2029 | | | | 896,789 | |
| | 1,850,000 | | | JDE Peet’s NV | | | 0.80% | (a) | | | 09/24/2024 | | | | 1,804,404 | |
| | 644,000 | | | JSW Hydro Energy Ltd. | | | 4.13% | | | | 05/18/2031 | | | | 571,335 | |
| | 1,386,592 | | | LLPL Capital Pte Ltd. | | | 6.88% | | | | 02/04/2039 | | | | 1,388,339 | |
| | 1,690,000 | | | Macquarie Bank Ltd.
(US Secured Overnight Financing Rate + 1.20%) | | | 6.55% | (a) | | | 12/07/2026 | | | | 1,708,432 | |
| | 3,315,000 | | | Magna International, Inc. | | | 5.05% | | | | 03/14/2029 | | | | 3,315,828 | |
| | 400,000 | | | MEGlobal Canada ULC | | | 5.00% | | | | 05/18/2025 | | | | 395,466 | |
| | 4,400,000 | | | MEGlobal Canada ULC | | | 5.00% | (a) | | | 05/18/2025 | | | | 4,350,130 | |
| | 600,000 | | | Mercury Chile Holdco LLC | | | 6.50% | | | | 01/24/2027 | | | | 582,036 | |
| | 1,500,000 | | | Mercury Chile Holdco LLC | | | 6.50% | (a) | | | 01/24/2027 | | | | 1,455,091 | |
| | 1,453,876 | | | Mexico Generadora de Energia S de RL | | | 5.50% | | | | 12/06/2032 | | | | 1,432,414 | |
| | 810,000 | | | Millicom International Cellular SA | | | 6.63% | | | | 10/15/2026 | | | | 807,007 | |
| | 2,565,000 | | | Millicom International Cellular SA | | | 5.13% | | | | 01/15/2028 | | | | 2,435,092 | |
| | 4,370,060 | | | Minejesa Capital BV | | | 4.63% | | | | 08/10/2030 | | | | 4,158,455 | |
| | 1,227,000 | | | Minerva Luxembourg SA | | | 5.88% | | | | 01/19/2028 | | | | 1,187,908 | |
| | 4,245,000 | | | Mitsubishi UFJ Financial Group, Inc. | | | 3.78% | | | | 03/02/2025 | | | | 4,181,923 | |
| | | | |
| 8 | | DoubleLine Funds Trust | | The accompanying notes are an integral part of these financial statements. |
| | | | | | | | | | | | | | | | |
PRINCIPAL AMOUNT $ | | | SECURITY DESCRIPTION | | RATE | | | MATURITY | | | VALUE $ | |
| | 1,715,000 | | | Mizuho Financial Group, Inc.
(US Secured Overnight Financing Rate + 0.96%) | | | 6.30% | | | | 05/22/2026 | | | | 1,721,776 | |
| | 691,718 | | | Mong Duong Finance Holdings BV | | | 5.13% | | | | 05/07/2029 | | | | 661,818 | |
| | 800,000 | | | Multibank, Inc. | | | 7.75% | (a) | | | 02/03/2028 | | | | 808,042 | |
| | 2,580,352 | | | MV24 Capital BV | | | 6.75% | | | | 06/01/2034 | | | | 2,429,933 | |
| | 2,800,000 | | | NBM US Holdings, Inc. | | | 7.00% | | | | 05/14/2026 | | | | 2,812,930 | |
| | 2,750,000 | | | Nutrien Ltd. | | | 4.90% | | | | 03/27/2028 | | | | 2,736,948 | |
| | 1,750,000 | | | NXP BV / NXP Funding LLC / NXP USA, Inc. | | | 4.40% | | | | 06/01/2027 | | | | 1,716,536 | |
| | 1,993,000 | | | Orazul Energy Peru SA | | | 5.63% | | | | 04/28/2027 | | | | 1,889,045 | |
| | 200,000 | | | Oversea-Chinese Banking Corp. Ltd.
(5 Year CMT Rate + 1.58%) | | | 1.83% | (a) | | | 09/10/2030 | | | | 189,110 | |
| | 4,500,000 | | | Oversea-Chinese Banking Corp. Ltd.
(5 Year CMT Rate + 1.58%) | | | 1.83% | | | | 09/10/2030 | | | | 4,254,967 | |
| | 629,489 | | | Prumo Participacoes e Investimentos S/A | | | 7.50% | | | | 12/31/2031 | | | | 629,156 | |
| | 1,725,000 | | | Royal Bank of Canada
(Secured Overnight Financing Rate + 0.53%) | | | 5.87% | | | | 01/20/2026 | | | | 1,725,117 | |
| | 1,650,000 | | | Sasol Financing USA LLC | | | 4.38% | | | | 09/18/2026 | | | | 1,561,809 | |
| | 3,300,000 | | | Sociedad Quimica y Minera de Chile SA | | | 4.38% | | | | 01/28/2025 | | | | 3,260,611 | |
| | 700,000 | | | Southern Copper Corp. | | | 3.88% | | | | 04/23/2025 | | | | 686,513 | |
| | 1,200,000 | | | St Marys Cement, Inc. Canada | | | 5.75% | | | | 01/28/2027 | | | | 1,208,100 | |
| | 1,980,000 | | | Suzano International Finance BV | | | 4.00% | | | | 01/14/2025 | | | | 1,951,053 | |
| | 1,500,000 | | | Telefonica Celular del Paraguay SA | | | 5.88% | | | | 04/15/2027 | | | | 1,459,014 | |
| | 1,679,000 | | | Toronto-Dominion Bank/The | | | 0.70% | | | | 09/10/2024 | | | | 1,644,460 | |
| | 700,000 | | | Transportadora de Gas del Peru SA | | | 4.25% | | | | 04/30/2028 | | | | 681,261 | |
| | 4,700,000 | | | United Overseas Bank Ltd.
(5 Year CMT Rate + 1.52%) | | | 1.75% | | | | 03/16/2031 | | | | 4,364,382 | |
| | 188,000 | | | Vedanta Resources Ltd. | | | 13.88% | | | | 12/09/2028 | | | | 164,704 | |
| | 2,520,000 | | | Westpac Banking Corp.
(US Secured Overnight Financing Rate + 0.72%) | | | 6.06% | | | | 11/17/2025 | | | | 2,530,016 | |
| | | | | | | | | | | | | | | | |
| | | | Total Foreign Corporate Bonds
(Cost $218,136,408) | | | | 214,839,365 | |
| | | | | | | | | | | | | |
| | FOREIGN GOVERNMENT BONDS, FOREIGN AGENCIES AND FOREIGN GOVERNMENT SPONSORED CORPORATIONS—0.7% | |
| | | | |
| | 3,200,000 | | | Banco Nacional de Comercio Exterior SNC/Cayman Islands
(5 Year CMT Rate + 2.00%) | | | 2.72% | | | | 08/11/2031 | | | | 2,898,557 | |
| | 1,058,643 | | | Bioceanico Sovereign Certificate Ltd. | | | 0.00% | | | | 06/05/2034 | | | | 778,270 | |
| | 4,500,000 | | | Colombia Government International Bond | | | 4.50% | | | | 01/28/2026 | | | | 4,409,031 | |
| | 2,850,000 | | | Corp. Financiera de Desarrollo SA
(3 Month LIBOR USD + 5.61%) | | | 5.25% | (g) | | | 07/15/2029 | | | | 2,847,634 | |
| | 400,000 | | | Dominican Republic International Bond | | | 5.50% | | | | 01/27/2025 | | | | 398,000 | |
| | 2,200,000 | | | Indonesia Asahan Aluminium PT / Mineral Industri Indonesia Persero PT | | | 4.75% | | | | 05/15/2025 | | | | 2,173,420 | |
| | 2,000,000 | | | Korea Development Bank/The | | | 1.00% | | | | 09/09/2026 | | | | 1,821,125 | |
| | 300,000 | | | Korea Development Bank/The | | | 0.80% | | | | 04/27/2026 | | | | 275,980 | |
| | 2,300,000 | | | Korea Hydro & Nuclear Power Co. Ltd. | | | 1.25% | (a) | | | 04/27/2026 | | | | 2,121,727 | |
| | 1,000,000 | | | Korea Southern Power Co. Ltd. | | | 0.75% | (a) | | | 01/27/2026 | | | | 922,855 | |
| | 655,135 | | | Lima Metro Line 2 Finance Ltd. | | | 5.88% | | | | 07/05/2034 | | | | 650,445 | |
| | 700,000 | | | ONGC Videsh Vankorneft Pte Ltd. | | | 3.75% | | | | 07/27/2026 | | | | 674,689 | |
| | 200,000 | | | Paraguay Government International Bond | | | 4.70% | | | | 03/27/2027 | | | | 195,077 | |
| | 700,000 | | | Perusahaan Perseroan Persero PT Perusahaan Listrik Negara | | | 4.13% | | | | 05/15/2027 | | | | 674,845 | |
| | 1,500,000 | | | Petrobras Global Finance BV | | | 7.38% | | | | 01/17/2027 | | | | 1,560,358 | |
| | 1,500,000 | | | Republic of South Africa Government International Bond | | | 4.88% | | | | 04/14/2026 | | | | 1,462,641 | |
| | 4,500,000 | | | TNB Global Ventures Capital Bhd | | | 3.24% | | | | 10/19/2026 | | | | 4,282,533 | |
| | | | | | | | | | | | | | | | |
| | | | Total Foreign Government Bonds, Foreign Agencies and Foreign Government Sponsored Corporations
(Cost $29,176,564) | | | | 28,147,187 | |
| | | | | | | | | | | | | |
| | | | | | | | |
| The accompanying notes are an integral part of these financial statements. | | Annual Report | | | | | March 31, 2024 | | 9 |
| | |
Schedule of Investments DoubleLine Shiller Enhanced CAPE® (Cont.) | | |
| | | | | | | | | | | | | | | | |
PRINCIPAL AMOUNT $ | | | SECURITY DESCRIPTION | | RATE | | | MATURITY | | | VALUE $ | |
| | NON-AGENCY COMMERCIAL MORTGAGE BACKED OBLIGATIONS—11.6% | |
| | | | |
| | | | Alen Mortgage Trust | | | | | | | | | | | | |
| | 2,000,000 | | | Series 2021-ACEN-B (CME Term SOFR 1 Month + 1.76%, 1.65% Floor) | | | 7.09% | (a) | | | 04/15/2034 | | | | 1,701,221 | |
| | | | |
| | | | Arbor Multifamily Mortgage Securities Trust | | | | | | | | | | | | |
| | 112,582,199 | | | Series 2021-MF2-XA | | | 1.11% | (a)(b)(h) | | | 06/15/2054 | | | | 6,564,859 | |
| | | | |
| | | | Arbor Realty Trust, Inc. | | | | | | | | | | | | |
| | 40,902,000 | | | Series 2020-MF1-XD | | | 0.55% | (a)(b)(h) | | | 05/15/2053 | | | | 1,117,009 | |
| | 6,610,000 | | | Series 2021-FL3-A (CME Term SOFR 1 Month + 1.18%, 1.18% Floor) | | | 6.51% | (a) | | | 08/15/2034 | | | | 6,582,714 | |
| | | | |
| | | | AREIT Trust | | | | | | | | | | | | |
| | 12,000,000 | | | Series 2019-CRE3-C (CME Term SOFR 1 Month + 2.01%, 2.01% Floor) | | | 7.34% | (a) | | | 09/14/2036 | | | | 11,419,512 | |
| | 1,251,000 | | | Series 2019-CRE3-D (CME Term SOFR 1 Month + 2.76%, 2.76% Floor) | | | 8.09% | (a) | | | 09/14/2036 | | | | 1,167,286 | |
| | 2,878,921 | | | Series 2022-CRE6-A (US 30 Day Average Secured Overnight Financing Rate + 1.25%, 1.25% Floor) | | | 6.57% | (a) | | | 01/20/2037 | | | | 2,870,016 | |
| | | | |
| | | | BBCMS Trust | | | | | | | | | | | | |
| | 15,176,000 | | | Series 2018-TALL-F (CME Term SOFR 1 Month + 3.43%, 3.39% Floor) | | | 8.76% | (a) | | | 03/15/2037 | | | | 9,909,934 | |
| | 11,001,000 | | | Series 2019-BWAY-E (CME Term SOFR 1 Month + 2.96%, 2.85% Floor) | | | 8.29% | (a) | | | 11/15/2034 | | | | 1,039,479 | |
| | 29,456,500 | | | Series 2021-C10-XB | | | 1.02% | (b)(h) | | | 07/15/2054 | | | | 1,797,639 | |
| | 21,205,000 | | | Series 2021-C10-XD | | | 1.70% | (a)(b)(h) | | | 07/15/2054 | | | | 1,977,411 | |
| | | | |
| | | | BB-UBS Trust | | | | | | | | | | | | |
| | 6,312,892 | | | Series 2012-TFT-TE | | | 3.56% | (a)(b)(f) | | | 06/05/2030 | | | | 5,235,607 | |
| | | | |
| | | | BDS Ltd. | | | | | | | | | | | | |
| | 7,710,071 | | | Series 2021-FL10-A (CME Term SOFR 1 Month + 1.46%, 1.46% Floor) | | | 6.79% | (a) | | | 12/16/2036 | | | | 7,659,123 | |
| | 1,200,462 | | | Series 2021-FL8-A (CME Term SOFR 1 Month + 1.03%, 0.92% Floor) | | | 6.36% | (a) | | | 01/18/2036 | | | | 1,200,236 | |
| | 5,006,751 | | | Series 2021-FL9-A (CME Term SOFR 1 Month + 1.18%, 1.07% Floor) | | | 6.51% | (a) | | | 11/16/2038 | | | | 4,973,952 | |
| | | | |
| | | | Benchmark Mortgage Trust | | | | | | | | | | | | |
| | 157,277,074 | | | Series 2020-IG1-XA | | | 0.51% | (b)(h) | | | 09/15/2043 | | | | 3,352,518 | |
| | | | |
| | | | BHMS Mortgage Trust | | | | | | | | | | | | |
| | 165,041,500 | | | Series 2018-ATLS-XCP | | | 0.00% | (a)(b)(h) | | | 07/15/2035 | | | | 1,650 | |
| | | | |
| | | | BPR Trust | | | | | | | | | | | | |
| | 3,000,000 | | | Series 2021-TY-C (CME Term SOFR 1 Month + 1.81%, 1.70% Floor) | | | 7.14% | (a) | | | 09/15/2038 | | | | 2,967,008 | |
| | | | |
| | | | BRSP Ltd. | | | | | | | | | | | | |
| | 9,244,561 | | | Series 2021-FL1-A (CME Term SOFR 1 Month + 1.26%, 1.15% Floor) | | | 6.59% | (a) | | | 08/19/2038 | | | | 9,143,768 | |
| | 13,968,000 | | | Series 2021-FL1-AS (CME Term SOFR 1 Month + 1.71%, 1.60% Floor) | | | 7.04% | (a) | | | 08/19/2038 | | | | 13,663,888 | |
| | | | |
| | | | BSPRT Co.-Issuer LLC | | | | | | | | | | | | |
| | 1,939,358 | | | Series 2021-FL6-A (CME Term SOFR 1 Month + 1.21%, 1.10% Floor) | | | 6.54% | (a) | | | 03/15/2036 | | | | 1,927,540 | |
| | 8,926,265 | | | Series 2022-FL8-A (US 30 Day Average Secured Overnight Financing Rate + 1.50%, 1.50% Floor) | | | 6.82% | (a) | | | 02/15/2037 | | | | 8,893,334 | |
| | | | |
| | | | BX Trust | | | | | | | | | | | | |
| | 7,904,690 | | | Series 2020-VKNG-A (CME Term SOFR 1 Month + 1.04%, 0.93% Floor) | | | 6.37% | (a) | | | 10/15/2037 | | | | 7,895,654 | |
| | | | |
| | | | Carbon Capital VI Commercial Mortgage Trust | | | | | | | | | | | | |
| | 6,029,069 | | | Series 2019-FL2-B (CME Term SOFR 1 Month + 2.96%, 2.85% Floor) | | | 8.29% | (a) | | | 10/15/2035 | | | | 5,460,160 | |
| | | | |
| | | | CFCRE Commercial Mortgage Trust | | | | | | | | | | | | |
| | 18,611,212 | | | Series 2016-C4-XA | | | 1.60% | (b)(h) | | | 05/10/2058 | | | | 421,166 | |
| | 16,201,000 | | | Series 2017-C8-XB | | | 0.89% | (b)(h) | | | 06/15/2050 | | | | 393,673 | |
| | | | |
| | | | Citigroup Commercial Mortgage Trust | | | | | | | | | | | | |
| | 6,438,953 | | | Series 2014-GC25-XA | | | 0.94% | (b)(h) | | | 10/10/2047 | | | | 7,331 | |
| | 4,305,849 | | | Series 2015-GC27-XA | | | 1.30% | (b)(h) | | | 02/10/2048 | | | | 28,958 | |
| | 10,750,000 | | | Series 2015-GC31-C | | | 4.03% | (b) | | | 06/10/2048 | | | | 7,707,782 | |
| | 17,242,345 | | | Series 2016-GC36-XA | | | 1.21% | (b)(h) | | | 02/10/2049 | | | | 290,551 | |
| | 3,096,000 | | | Series 2016-P3-A4 | | | 3.33% | | | | 04/15/2049 | | | | 2,952,180 | |
| | 11,211,966 | | | Series 2016-P3-XA | | | 1.65% | (b)(h) | | | 04/15/2049 | | | | 227,210 | |
| | 2,519,000 | | | Series 2016-P4-B | | | 3.38% | | | | 07/10/2049 | | | | 2,299,681 | |
| | | | |
| 10 | | DoubleLine Funds Trust | | The accompanying notes are an integral part of these financial statements. |
| | | | | | | | | | | | | | | | |
PRINCIPAL AMOUNT $ | | | SECURITY DESCRIPTION | | RATE | | | MATURITY | | | VALUE $ | |
| | | | |
| | | | Citigroup Commercial Mortgage Trust (Cont.) | | | | | | | | | | | | |
| | 11,734,691 | | | Series 2016-P4-XA | | | 1.88% | (b)(h) | | | 07/10/2049 | | | | 363,800 | |
| | 10,900,406 | | | Series 2017-P7-XA | | | 1.08% | (b)(h) | | | 04/14/2050 | | | | 274,733 | |
| | | | |
| | | | Citigroup/Deutsche Bank Commercial Mortgage Trust | | | | | | | | | | | | |
| | 16,064,130 | | | Series 2016-C1-XA | | | 1.36% | (b)(h) | | | 05/10/2049 | | | | 305,993 | |
| | 43,948,038 | | | Series 2017-CD3-XA | | | 0.95% | (b)(h) | | | 02/10/2050 | | | | 884,841 | |
| | 52,382,313 | | | Series 2017-CD4-XA | | | 1.22% | (b)(h) | | | 05/10/2050 | | | | 1,479,842 | |
| | 2,950,000 | | | Series 2017-CD6-C | | | 4.23% | (b) | | | 11/13/2050 | | | | 2,417,475 | |
| | | | |
| | | | CLNC Ltd. | | | | | | | | | | | | |
| | 19,958,000 | | | Series 2019-FL1-D (CME Term SOFR 1 Month + 3.01%, 2.90% Floor) | | | 8.34% | (a) | | | 08/20/2035 | | | | 19,139,322 | |
| | | | |
| | | | Commercial Mortgage Pass Through Certificates | | | | | | | | | | | | |
| | 2,399,715 | | | Series 2013-CR12-XA | | | 0.56% | (b)(h) | | | 10/10/2046 | | | | 156 | |
| | 992,348 | | | Series 2014-CR17-XA | | | 0.77% | (b)(h) | | | 05/10/2047 | | | | 75 | |
| | 4,281,936 | | | Series 2014-UBS5-A3 | | | 3.57% | | | | 09/10/2047 | | | | 4,260,430 | |
| | 14,382,839 | | | Series 2015-CR22-XA | | | 0.81% | (b)(h) | | | 03/10/2048 | | | | 59,843 | |
| | 29,571,752 | | | Series 2015-CR25-XA | | | 0.79% | (b)(h) | | | 08/10/2048 | | | | 234,670 | |
| | 33,739,442 | | | Series 2015-CR27-XA | | | 0.90% | (b)(h) | | | 10/10/2048 | | | | 336,973 | |
| | 7,241,523 | | | Series 2015-DC1-XA | | | 0.93% | (b)(h) | | | 02/10/2048 | | | | 29,102 | |
| | 4,978,000 | | | Series 2015-LC21-B | | | 4.32% | (b) | | | 07/10/2048 | | | | 4,791,675 | |
| | 38,660,631 | | | Series 2015-LC21-XA | | | 0.62% | (b)(h) | | | 07/10/2048 | | | | 196,330 | |
| | 12,410,891 | | | Series 2016-DC2-XA | | | 0.91% | (b)(h) | | | 02/10/2049 | | | | 152,563 | |
| | 11,396,000 | | | Series 2018-HCLV-D (CME Term SOFR 1 Month + 2.47%, 2.18% Floor) | | | 7.80% | (a) | | | 09/15/2033 | | | | 7,981,981 | |
| | | | |
| | | | Computershare Corporate Trust | | | | | | | | | | | | |
| | 540,000 | | | Series 2014-LC18-B | | | 3.96% | | | | 12/15/2047 | | | | 526,336 | |
| | 8,728,684 | | | Series 2015-C27-XA | | | 0.81% | (b)(h) | | | 02/15/2048 | | | | 34,269 | |
| | 47,764,658 | | | Series 2015-C30-XA | | | 0.87% | (b)(h) | | | 09/15/2058 | | | | 420,917 | |
| | 22,413,468 | | | Series 2015-NXS2-XA | | | 0.58% | (b)(h) | | | 07/15/2058 | | | | 109,064 | |
| | 10,114,630 | | | Series 2016-C33-XA | | | 1.56% | (b)(h) | | | 03/15/2059 | | | | 230,380 | |
| | 20,592,624 | | | Series 2016-NXS6-XA | | | 1.59% | (b)(h) | | | 11/15/2049 | | | | 545,048 | |
| | 65,768,635 | | | Series 2017-C38-XA | | | 0.93% | (b)(h) | | | 07/15/2050 | | | | 1,493,316 | |
| | 21,665,889 | | | Series 2019-C52-XA | | | 1.59% | (b)(h) | | | 08/15/2052 | | | | 1,296,758 | |
| | 62,379,774 | | | Series 2021-C59-XA | | | 1.52% | (b)(h) | | | 04/15/2054 | | | | 4,623,820 | |
| | 5,250,000 | | | Series 2022-ONL-A | | | 3.86% | (a) | | | 12/15/2039 | | | | 4,904,459 | |
| | | | |
| | | | Credit Suisse Mortgage Capital Certificates | | | | | | | | | | | | |
| | 9,873,828 | | | Series 2014-USA-X1 | | | 0.54% | (a)(b)(h) | | | 09/15/2037 | | | | 44,994 | |
| | 2,274,342 | | | Series 2019-ICE4-A (CME Term SOFR 1 Month + 1.03%, 0.98% Floor) | | | 6.35% | (a) | | | 05/15/2036 | | | | 2,274,421 | |
| | 3,350,000 | | | Series 2021-ADV-C (CME Term SOFR 1 Month + 2.41%, 2.30% Floor) | | | 7.74% | (a) | | | 07/15/2038 | | | | 2,173,104 | |
| | | | |
| | | | Cross Harbor Capital Partners | | | | | | | | | | | | |
| | 3,000,000 | | | Series 2021-FL1-AS (CME Term SOFR 1 Month + 1.41%, 1.30% Floor) | | | 6.74% | (a) | | | 02/15/2038 | | | | 2,975,325 | |
| | | | |
| | | | CSAIL Commercial Mortgage Trust | | | | | | | | | | | | |
| | 24,861,974 | | | Series 2015-C1-XA | | | 0.80% | (b)(h) | | | 04/15/2050 | | | | 65,389 | |
| | 2,847,424 | | | Series 2016-C6-XA | | | 1.86% | (b)(h) | | | 01/15/2049 | | | | 76,707 | |
| | 122,348,900 | | | Series 2021-C20-XA | | | 0.99% | (b)(h) | | | 03/15/2054 | | | | 6,122,767 | |
| | | | |
| | | | FS Rialto | | | | | | | | | | | | |
| | 8,551,933 | | | Series 2021-FL2-A (CME Term SOFR 1 Month + 1.33%, 1.33% Floor) | | | 6.66% | (a) | | | 05/16/2038 | | | | 8,471,784 | |
| | 3,039,252 | | | Series 2021-FL3-A (CME Term SOFR 1 Month + 1.36%, 1.36% Floor) | | | 6.69% | (a) | | | 11/16/2036 | | | | 3,033,964 | |
| | | | |
| | | | Granite Point Mortgage Trust, Inc. | | | | | | | | | | | | |
| | 3,507,848 | | | Series 2021-FL3-A (CME Term SOFR 1 Month + 1.36%, 1.36% Floor) | | | 6.69% | (a) | | | 07/16/2035 | | | | 3,469,444 | |
| | 5,858,393 | | | Series 2021-FL4-A (CME Term SOFR 1 Month + 1.46%, 1.35% Floor) | | | 6.79% | (a) | | | 12/15/2036 | | | | 5,740,944 | |
| | | | |
| | | | Great Wolf Trust | | | | | | | | | | | | |
| | 8,770,000 | | | Series 2024-WOLF-A (CME Term SOFR 1 Month + 1.54%, 1.54% Floor) | | | 6.84% | (a) | | | 03/15/2039 | | | | 8,797,852 | |
| | | | |
| | | | Greystone Commercial Real Estate Notes | | | | | | | | | | | | |
| | 4,580,000 | | | Series 2021-FL3-A (CME Term SOFR 1 Month + 1.13%, 1.02% Floor) | | | 6.46% | (a) | | | 07/15/2039 | | | | 4,558,071 | |
| | 10,700,000 | | | Series 2021-FL3-C (CME Term SOFR 1 Month + 2.11%, 2.00% Floor) | | | 7.44% | (a) | | | 07/15/2039 | | | | 10,163,684 | |
| | | | | | | | |
| The accompanying notes are an integral part of these financial statements. | | Annual Report | | | | | March 31, 2024 | | 11 |
| | |
Schedule of Investments DoubleLine Shiller Enhanced CAPE® (Cont.) | | |
| | | | | | | | | | | | | | | | |
PRINCIPAL AMOUNT $ | | | SECURITY DESCRIPTION | | RATE | | | MATURITY | | | VALUE $ | |
| | | | |
| | | | GS Mortgage Securities Corp. II | | | | | | | | | | | | |
| | 3,032,659 | | | Series 2014-GC24-XA | | | 0.67% | (b)(h) | | | 09/10/2047 | | | | 1,854 | |
| | 28,002,402 | | | Series 2015-GC32-XA | | | 0.68% | (b)(h) | | | 07/10/2048 | | | | 185,401 | |
| | 8,340,914 | | | Series 2015-GS1-XA | | | 0.75% | (b)(h) | | | 11/10/2048 | | | | 79,574 | |
| | 14,009,246 | | | Series 2016-GS2-XA | | | 1.73% | (b)(h) | | | 05/10/2049 | | | | 360,822 | |
| | 24,247,487 | | | Series 2016-GS3-XA | | | 1.19% | (b)(h) | | | 10/10/2049 | | | | 532,116 | |
| | 2,314,000 | | | Series 2018-GS10-WLSD | | | 4.74% | (a)(b) | | | 03/10/2033 | | | | 2,023,942 | |
| | 2,893,000 | | | Series 2018-GS10-WLSE | | | 4.74% | (a)(b) | | | 03/10/2033 | | | | 2,475,599 | |
| | 5,000,000 | | | Series 2018-TWR-E (CME Term SOFR 1 Month + 2.40%, 2.10% Floor) | | | 7.72% | (a) | | | 07/15/2031 | | | | 1,575,000 | |
| | 5,000,000 | | | Series 2018-TWR-F (CME Term SOFR 1 Month + 3.10%, 2.80% Floor) | | | 8.42% | (a) | | | 07/15/2031 | | | | 1,023,750 | |
| | 5,000,000 | | | Series 2018-TWR-G (CME Term SOFR 1 Month + 4.22%, 3.93% Floor) | | | 9.55% | (a) | | | 07/15/2031 | | | | 210,000 | |
| | | | |
| | | | GSCG Trust | | | | | | | | | | | | |
| | 14,505,000 | | | Series 2019-600C-E | | | 3.99% | (a)(b)(f) | | | 09/06/2034 | | | | 1,492,855 | |
| | | | |
| | | | JP Morgan Chase Commercial Mortgage Securities | | | | | | | | | | | | |
| | 6,339,000 | | | Series 2014-C20-B | | | 4.40% | (b) | | | 07/15/2047 | | | | 6,008,578 | |
| | 13,689,427 | | | Series 2015-JP1-XA | | | 0.88% | (b)(h) | | | 01/15/2049 | | | | 158,589 | |
| | 30,749,302 | | | Series 2016-JP4-XA | | | 0.57% | (b)(h) | | | 12/15/2049 | | | | 355,831 | |
| | 336,000 | | | Series 2018-WPT-CFX | | | 4.95% | (a) | | | 07/05/2033 | | | | 273,902 | |
| | 4,216,000 | | | Series 2019-UES-C | | | 4.34% | (a) | | | 05/05/2032 | | | | 4,196,729 | |
| | 4,314,000 | | | Series 2019-UES-D | | | 4.45% | (a)(b) | | | 05/05/2032 | | | | 4,290,950 | |
| | 5,040,000 | | | Series 2019-UES-E | | | 4.45% | (a)(b) | | | 05/05/2032 | | | | 5,008,767 | |
| | 5,287,000 | | | Series 2019-UES-F | | | 4.45% | (a)(b) | | | 05/05/2032 | | | | 5,249,743 | |
| | 5,775,000 | | | Series 2019-UES-G | | | 4.45% | (a)(b) | | | 05/05/2032 | | | | 5,722,159 | |
| | 11,575,000 | | | Series 2020-NNN-EFX | | | 3.97% | (a) | | | 01/16/2037 | | | | 5,502,525 | |
| | 6,153,490 | | | Series 2022-NLP-A (CME Term SOFR 1 Month + 0.60%, 0.60% Floor) | | | 5.92% | (a) | | | 04/15/2037 | | | | 5,886,146 | |
| | | | |
| | | | JPMBB Commercial Mortgage Securities Trust | | | | | | | | | | | | |
| | 824,247 | | | Series 2014-C18-XA | | | 0.39% | (b)(h) | | | 02/15/2047 | | | | 35 | |
| | 500,000 | | | Series 2014-C23-C | | | 4.48% | (b) | | | 09/15/2047 | | | | 482,661 | |
| | 15,550,816 | | | Series 2014-C25-XA | | | 0.79% | (b)(h) | | | 11/15/2047 | | | | 26,897 | |
| | 5,287,890 | | | Series 2015-C27-D | | | 3.80% | (a)(b) | | | 02/15/2048 | | | | 2,836,820 | |
| | 12,593,504 | | | Series 2015-C29-XA | | | 0.54% | (b)(h) | | | 05/15/2048 | | | | 53,331 | |
| | 21,077,236 | | | Series 2015-C30-XA | | | 0.42% | (b)(h) | | | 07/15/2048 | | | | 87,237 | |
| | 8,737,239 | | | Series 2015-C31-XA | | | 0.80% | (b)(h) | | | 08/15/2048 | | | | 73,562 | |
| | 13,678,127 | | | Series 2015-C32-XA | | | 1.09% | (b)(h) | | | 11/15/2048 | | | | 118,293 | |
| | 5,380,000 | | | Series 2015-C33-AS | | | 4.02% | | | | 12/15/2048 | | | | 5,142,095 | |
| | | | |
| | | | KREF | | | | | | | | | | | | |
| | 6,730,000 | | | Series 2021-FL2-A (CME Term SOFR 1 Month + 1.18%, 1.07% Floor) | | | 6.51% | (a) | | | 02/15/2039 | | | | 6,628,559 | |
| | 7,942,000 | | | Series 2021-FL2-B (CME Term SOFR 1 Month + 1.76%, 1.65% Floor) | | | 7.09% | (a) | | | 02/15/2039 | | | | 7,561,848 | |
| | 3,506,000 | | | Series 2022-FL3-A (CME Term SOFR 1 Month + 1.45%, 1.45% Floor) | | | 6.78% | (a) | | | 02/17/2039 | | | | 3,489,567 | |
| | | | |
| | | | Ladder Capital Commercial Mortgage Securities LLC | | | | | | | | | | | | |
| | 10,000,000 | | | Series 2017-LC26-C | | | 4.71% | (a) | | | 07/12/2050 | | | | 8,599,501 | |
| | 6,367,000 | | | Series 2021-FL3-AS (CME Term SOFR 1 Month + 1.91%, 1.91% Floor) | | | 7.24% | (a) | | | 11/15/2038 | | | | 6,234,363 | |
| | 2,400,000 | | | Series 2021-FL3-B (CME Term SOFR 1 Month + 2.31%, 2.31% Floor) | | | 7.64% | (a) | | | 11/15/2038 | | | | 2,329,560 | |
| | | | |
| | | | LoanCore | | | | | | | | | | | | |
| | 5,236,693 | | | Series 2021-CRE5-A (CME Term SOFR 1 Month + 1.41%, 1.41% Floor) | | | 6.74% | (a) | | | 07/15/2036 | | | | 5,212,882 | |
| | 9,403,149 | | | Series 2021-CRE6-A (CME Term SOFR 1 Month + 1.41%, 1.30% Floor) | | | 6.74% | (a) | | | 11/15/2038 | | | | 9,356,838 | |
| | 5,734,201 | | | Series 2022-CRE7-A (US 30 Day Average Secured Overnight Financing Rate + 1.55%, 1.55% Floor) | | | 6.87% | (a) | | | 01/17/2037 | | | | 5,729,029 | |
| | | | |
| | | | LSTAR Commercial Mortgage Trust | | | | | | | | | | | | |
| | 6,031,719 | | | Series 2016-4-XA | | | 1.66% | (a)(b)(h) | | | 03/10/2049 | | | | 65,305 | |
| | 60,350,277 | | | Series 2017-5-X | | | 0.83% | (a)(b)(h) | | | 03/10/2050 | | | | 902,134 | |
| | | | |
| 12 | | DoubleLine Funds Trust | | The accompanying notes are an integral part of these financial statements. |
| | | | | | | | | | | | | | | | |
PRINCIPAL AMOUNT $ | | | SECURITY DESCRIPTION | | RATE | | | MATURITY | | | VALUE $ | |
| | | | |
| | | | Lument Finance Trust, Inc. | | | | | | | | | | | | |
| | 8,719,096 | | | Series 2021-FL1-A (CME Term SOFR 1 Month + 1.28%, 1.28% Floor) | | | 6.61% | (a) | | | 06/15/2039 | | | | 8,682,895 | |
| | | | |
| | | | MF1 Multifamily Housing Mortgage Loan Trust | | | | | | | | | | | | |
| | 1,480,750 | | | Series 2021-FL6-A (CME Term SOFR 1 Month + 1.21%, 1.10% Floor) | | | 6.54% | (a) | | | 07/16/2036 | | | | 1,473,937 | |
| | 3,016,982 | | | Series 2021-FL7-A (CME Term SOFR 1 Month + 1.19%, 1.08% Floor) | | | 6.52% | (a) | | | 10/16/2036 | | | | 3,002,374 | |
| | 3,780,327 | | | Series 2022-FL8-A (CME Term SOFR 1 Month + 1.35%, 1.35% Floor) | | | 6.68% | (a) | | | 02/19/2037 | | | | 3,758,710 | |
| | 12,550,000 | | | Series 2022-FL8-AS (CME Term SOFR 1 Month + 1.75%, 1.75% Floor) | | | 7.08% | (a) | | | 02/19/2037 | | | | 12,361,340 | |
| | | | |
| | | | MFT Trust | | | | | | | | | | | | |
| | 8,933,000 | | | Series 2020-ABC-D | | | 3.48% | (a)(b) | | | 02/10/2042 | | | | 4,746,625 | |
| | | | |
| | | | Morgan Stanley Bank of America Merrill Lynch Trust | | | | | | | | | | | | |
| | 9,732,681 | | | Series 2012-CKSV-CK | | | 4.17% | (a)(b) | | | 10/15/2030 | | | | 5,947,957 | |
| | 500,000 | | | Series 2014-C18-C | | | 4.46% | (b) | | | 10/15/2047 | | | | 482,854 | |
| | 7,513,000 | | | Series 2015-C23-AS | | | 4.00% | (b) | | | 07/15/2050 | | | | 7,288,425 | |
| | 15,880,411 | | | Series 2016-C28-XA-XA | | | 1.14% | (b)(h) | | | 01/15/2049 | | | | 229,423 | |
| | | | |
| | | | Morgan Stanley Capital I, Inc. | | | | | | | | | | | | |
| | 711,000 | | | Series 2019-NUGS-F (CME Term SOFR 1 Month + 2.96%, 4.34% Floor) | | | 8.28% | (a)(f) | | | 12/15/2036 | | | | 119,487 | |
| | 13,327,000 | | | Series 2019-PLND-E (CME Term SOFR 1 Month + 2.26%, 2.15% Floor) | | | 7.59% | (a) | | | 05/15/2036 | | | | 9,319,995 | |
| | 1,331,000 | | | Series 2019-PLND-F (CME Term SOFR 1 Month + 2.91%, 2.80% Floor) | | | 8.24% | (a) | | | 05/15/2036 | | | | 624,681 | |
| | | | |
| | | | Natixis Commercial Mortgage Securities Trust | | | | | | | | | | | | |
| | 9,940,000 | | | Series 2018-FL1-C (Prime Rate + 0.00%) | | | 8.50% | (a) | | | 06/15/2035 | | | | 4,161,652 | |
| | 8,191,000 | | | Series 2020-2PAC-AMZ1 | | | 3.50% | (a)(b) | | | 01/15/2037 | | | | 6,875,469 | |
| | 4,742,000 | | | Series 2020-2PAC-AMZ2 | | | 3.50% | (a)(b) | | | 01/15/2037 | | | | 3,698,139 | |
| | | | |
| | | | OPG Trust | | | | | | | | | | | | |
| | 4,937,649 | | | Series 2021-PORT-A (CME Term SOFR 1 Month + 0.60%, 0.48% Floor) | | | 5.92% | (a) | | | 10/15/2036 | | | | 4,876,136 | |
| | | | |
| | | | Ready Capital Corp. | | | | | | | | | | | | |
| | 3,436,996 | | | Series 2021-FL7-A (CME Term SOFR 1 Month + 1.31%, 1.20% Floor) | | | 6.64% | (a) | | | 11/25/2036 | | | | 3,431,988 | |
| | | | |
| | | | SFO Commercial Mortgage Trust | | | | | | | | | | | | |
| | 1,500,000 | | | Series 2021-555-C (CME Term SOFR 1 Month + 1.91%, 1.80% Floor) | | | 7.24% | (a) | | | 05/15/2038 | | | | 1,407,268 | |
| | | | |
| | | | SLG Office Trust | | | | | | | | | | | | |
| | 168,062,650 | | | Series 2021-OVA-X | | | 0.26% | (a)(b)(h) | | | 07/15/2041 | | | | 2,435,950 | |
| | | | |
| | | | Starwood Property Mortgage Trust | | | | | | | | | | | | |
| | 459,000 | | | Series 2019-FL1-C (CME Term SOFR 1 Month + 2.06%, 2.06% Floor) | | | 7.39% | (a) | | | 07/15/2038 | | | | 440,047 | |
| | 8,744,000 | | | Series 2019-FL1-D (CME Term SOFR 1 Month + 2.46%, 2.46% Floor) | | | 7.79% | (a) | | | 07/15/2038 | | | | 8,235,178 | |
| | 5,686,099 | | | Series 2021-FL2-A (CME Term SOFR 1 Month + 1.31%, 1.20% Floor) | | | 6.64% | (a) | | | 04/18/2038 | | | | 5,618,776 | |
| | | | |
| | | | TPG Real Estate Finance Issuer Ltd. | | | | | | | | | | | | |
| | 11,630,000 | | | Series 2022-FL5-A (US 30 Day Average Secured Overnight Financing Rate + 1.65%, 1.65% Floor) | | | 6.97% | (a) | | | 02/15/2039 | | | | 11,572,327 | |
| | | | |
| | | | UBS Commercial Mortgage Trust | | | | | | | | | | | | |
| | 1,500,000 | | | Series 2017-C4-C | | | 4.53% | (b) | | | 10/15/2050 | | | | 1,292,452 | |
| | 65,981,920 | | | Series 2018-C13-XA | | | 0.76% | (b)(h) | | | 10/15/2051 | | | | 1,774,095 | |
| | 6,009,000 | | | Series 2018-C8-C | | | 4.68% | (b) | | | 02/15/2051 | | | | 5,174,573 | |
| | 1,067,000 | | | Series 2018-C9-C | | | 4.95% | (b) | | | 03/15/2051 | | | | 766,384 | |
| | | | |
| | | | VMC Finance LLC | | | | | | | | | | | | |
| | 1,977,007 | | | Series 2022-FL5-A (US 30 Day Average Secured Overnight Financing Rate + 1.90%, 1.90% Floor) | | | 7.22% | (a) | | | 02/18/2039 | | | | 1,944,835 | |
| | | | |
| | | | WF-RBS Commercial Mortgage Trust | | | | | | | | | | | | |
| | 5,544,288 | | | Series 2014-C21-XA | | | 0.97% | (b)(h) | | | 08/15/2047 | | | | 3,072 | |
| | | | | | | | | | | | | | | | |
| | | | Total Non-Agency Commercial Mortgage Backed Obligations
(Cost $632,068,131) | | | | 487,205,064 | |
| | | | | | | | | | | | | |
| | | | | | | | |
| The accompanying notes are an integral part of these financial statements. | | Annual Report | | | | | March 31, 2024 | | 13 |
| | |
Schedule of Investments DoubleLine Shiller Enhanced CAPE® (Cont.) | | |
| | | | | | | | | | | | | | | | |
PRINCIPAL AMOUNT $ | | | SECURITY DESCRIPTION | | RATE | | | MATURITY | | | VALUE $ | |
| | NON-AGENCY RESIDENTIAL COLLATERALIZED MORTGAGE OBLIGATIONS—10.4% | | | | | | | | | | | | |
| | | | |
| | | | ACE Securities Corp. | | | | | | | | | | | | |
| | 4,659,832 | | | Series 2006-CW1-A2D (CME Term SOFR 1 Month + 0.63%, 0.52% Floor) | | | 5.96% | | | | 07/25/2036 | | | | 3,753,888 | |
| | 7,041,555 | | | Series 2007-WM1-A2B (CME Term SOFR 1 Month + 0.35%, 0.24% Floor) | | | 5.68% | | | | 11/25/2036 | | | | 2,933,917 | |
| | | | |
| | | | Adjustable Rate Mortgage Trust | | | | | | | | | | | | |
| | 4,569,992 | | | Series 2006-1-6A1 (CME Term SOFR 1 Month + 0.37%, 0.26% Floor) | | | 5.70% | | | | 03/25/2036 | | | | 2,630,262 | |
| | | | |
| | | | AJAX Mortgage Loan Trust | | | | | | | | | | | | |
| | 3,866,601 | | | Series 2021-C-A | | | 2.12% | (a)(c) | | | 01/25/2061 | | | | 3,760,472 | |
| | | | |
| | | | American Home Mortgage Investment Trust | | | | | | | | | | | | |
| | 2,110,989 | | | Series 2004-2-M1 (CME Term SOFR 1 Month + 1.01%, 0.90% Floor, 11.00% Cap) | | | 6.34% | | | | 02/25/2044 | | | | 1,928,864 | |
| | | | |
| | | | Angel Oak Mortgage Trust LLC | | | | | | | | | | | | |
| | 2,156,208 | | | Series 2020-2-A1A | | | 2.53% | (a)(b) | | | 01/26/2065 | | | | 1,999,940 | |
| | 395,909 | | | Series 2020-6-A3 | | | 1.78% | (a)(b) | | | 05/25/2065 | | | | 354,914 | |
| | 7,139,793 | | | Series 2021-7-A1 | | | 1.98% | (a)(b) | | | 10/25/2066 | | | | 5,994,714 | |
| | | | |
| | | | Arroyo Mortgage Trust | | | | | | | | | | | | |
| | 905,171 | | | Series 2019-1-A1 | | | 3.81% | (a)(b) | | | 01/25/2049 | | | | 862,863 | |
| | 496,576 | | | Series 2019-2-A2 | | | 3.50% | (a)(b) | | | 04/25/2049 | | | | 464,710 | |
| | 3,814,235 | | | Series 2019-3-A3 | | | 3.42% | (a)(b) | | | 10/25/2048 | | | | 3,543,287 | |
| | | | |
| | | | Banc of America Funding Corp. | | | | | | | | | | | | |
| | 977,462 | | | Series 2006-7-T2A1-T2A1 | | | 5.88% | (b) | | | 10/25/2036 | | | | 829,532 | |
| | 9,708,242 | | | Series 2015-R2-4A2 (CME Term SOFR 1 Month + 0.28%, 0.17% Floor) | | | 3.97% | (a)(f) | | | 09/29/2036 | | | | 7,193,119 | |
| | 1,947,375 | | | Series 2015-R2-9A2 | | | 4.83% | (a)(d) | | | 03/27/2036 | | | | 1,586,308 | |
| | | | |
| | | | Banc of America Mortgage Securities, Inc. | | | | | | | | | | | | |
| | 986,184 | | | Series 2005-I-2A5 | | | 4.68% | (b) | | | 10/25/2035 | | | | 906,054 | |
| | 2,274,920 | | | Series 2007-3-1A1 | | | 6.00% | | | | 09/25/2037 | | | | 1,830,505 | |
| | | | |
| | | | BCAP LLC Trust | | | | | | | | | | | | |
| | 6,711,985 | | | Series 2009-RR4-7A2 | | | 6.00% | (a)(b) | | | 03/26/2037 | | | | 2,477,557 | |
| | 1,285,134 | | | Series 2012-RR1-3A4 | | | 6.37% | (a)(b)(f) | | | 10/26/2035 | | | | 829,293 | |
| | | | |
| | | | BRAVO Residential Funding Trust | | | | | | | | | | | | |
| | 14,881,543 | | | Series 2021-B-A1 | | | 5.12% | (a)(c) | | | 04/01/2069 | | | | 14,701,956 | |
| | 2,173,870 | | | Series 2021-NQM2-A3 | | | 1.44% | (a)(b) | | | 03/25/2060 | | | | 2,017,139 | |
| | 8,122,862 | | | Series 2022-RPL1-A1 | | | 2.75% | (a)(b) | | | 09/25/2061 | | | | 7,330,882 | |
| | | | |
| | | | Citigroup Mortgage Loan Trust, Inc. | | | | | | | | | | | | |
| | 1,576,211 | | | Series 2020-EXP1-A1A | | | 1.80% | (a)(b) | | | 05/25/2060 | | | | 1,425,639 | |
| | | | |
| | | | Citimortgage Alternative Loan Trust | | | | | | | | | | | | |
| | 585,168 | | | Series 2007-A5-1A10 | | | 5.75% | | | | 05/25/2037 | | | | 516,675 | |
| | | | |
| | | | COLT Funding LLC | | | | | | | | | | | | |
| | 118,997 | | | Series 2020-3-A3 | | | 2.38% | (a)(b) | | | 04/27/2065 | | | | 113,750 | |
| | 2,774,166 | | | Series 2021-1R-A1 | | | 0.86% | (a)(b) | | | 05/25/2065 | | | | 2,361,308 | |
| | 4,891,687 | | | Series 2021-5-A1 | | | 1.73% | (a)(b) | | | 11/26/2066 | | | | 4,201,842 | |
| | 5,706,947 | | | Series 2022-2-A1 | | | 2.99% | (a)(c) | | | 02/25/2067 | | | | 5,185,288 | |
| | | | |
| | | | Countrywide Alternative Loan Trust | | | | | | | | | | | | |
| | 283,833 | | | Series 2005-23CB-A15 | | | 5.50% | | | | 07/25/2035 | | | | 229,152 | |
| | 979,781 | | | Series 2005-28CB-1A6-1A6 | | | 5.50% | | | | 08/25/2035 | | | | 829,582 | |
| | 3,936,466 | | | Series 2005-49CB-A6 | | | 5.50% | | | | 11/25/2035 | | | | 2,588,209 | |
| | 1,503,845 | | | Series 2005-61-1A2 (CME Term SOFR 1 Month + 0.85%, 0.74% Floor) | | | 5.81% | | | | 12/25/2035 | | | | 1,301,267 | |
| | 7,049,109 | | | Series 2005-62-1A1 (CME Term SOFR 1 Month + 0.71%, 0.60% Floor) | | | 6.04% | | | | 12/25/2035 | | | | 5,263,335 | |
| | 7,440,408 | | | Series 2006-16CB-A5 | | | 6.00% | | | | 06/25/2036 | | | | 4,079,954 | |
| | 1,443,843 | | | Series 2006-32CB-A21 | | | 5.50% | | | | 11/25/2036 | | | | 800,970 | |
| | 2,254,254 | | | Series 2006-34-A6 | | | 6.25% | | | | 11/25/2046 | | | | 1,096,217 | |
| | 5,640,643 | | | Series 2006-36T2-1A3 | | | 5.75% | | | | 12/25/2036 | | | | 2,184,917 | |
| | 1,354,540 | | | Series 2006-J4-2A9 | | | 6.00% | | | | 07/25/2036 | | | | 772,670 | |
| | 1,512,152 | | | Series 2006-J6-A5 | | | 6.00% | | | | 09/25/2036 | | | | 769,077 | |
| | 2,066,958 | | | Series 2006-OA12-A1B (CME Term SOFR 1 Month + 0.30%, 0.19% Floor) | | | 5.63% | | | | 09/20/2046 | | | | 2,097,145 | |
| | | | |
| 14 | | DoubleLine Funds Trust | | The accompanying notes are an integral part of these financial statements. |
| | | | | | | | | | | | | | | | |
PRINCIPAL AMOUNT $ | | | SECURITY DESCRIPTION | | RATE | | | MATURITY | | | VALUE $ | |
| | | | |
| | | | Countrywide Alternative Loan Trust (Cont.) | | | | | | | | | | | | |
| | 3,641,306 | | | Series 2006-OA21-A1 (CME Term SOFR 1 Month + 0.30%, 0.19% Floor) | | | 5.63% | | | | 03/20/2047 | | | | 2,941,940 | |
| | 10,903,028 | | | Series 2007-12T1-A11 | | | 6.00% | | | | 06/25/2037 | | | | 5,089,256 | |
| | 9,781,810 | | | Series 2007-12T1-A5 | | | 6.00% | | | | 06/25/2037 | | | | 4,565,900 | |
| | 288,951 | | | Series 2007-15CB-A7 | | | 6.00% | | | | 07/25/2037 | | | | 173,921 | |
| | 4,201,612 | | | Series 2007-8CB-A1 | | | 5.50% | | | | 05/25/2037 | | | | 2,240,111 | |
| | 10,573,310 | | | Series 2007-9T1-1A6 | | | 6.00% | | | | 05/25/2037 | | | | 5,154,015 | |
| | | | |
| | | | Countrywide Home Loan Mortgage Pass Through Trust | | | | | | | | | | | | |
| | 682,650 | | | Series 2005-10-A2 | | | 5.50% | | | | 05/25/2035 | | | | 551,317 | |
| | 9,775,639 | | | Series 2006-20-1A18 (CME Term SOFR 1 Month + 0.76%, 0.65% Floor, 6.00% Cap) | | | 6.00% | | | | 02/25/2037 | | | | 3,842,263 | |
| | 1,576,531 | | | Series 2006-21-A10 | | | 5.75% | | | | 02/25/2037 | | | | 700,060 | |
| | 542,671 | | | Series 2007-14-A15 | | | 6.50% | | | | 09/25/2037 | | | | 314,909 | |
| | | | |
| | | | Credit Suisse First Boston Mortgage Securities Corp. | | | | | | | | | | | | |
| | 2,452 | | | Series 2004-8-6A1 | | | 4.50% | | | | 11/25/2034 | | | | 2,009 | |
| | 445,970 | | | Series 2005-9-5A9 | | | 5.50% | | | | 10/25/2035 | | | | 237,138 | |
| | | | |
| | | | Credit Suisse Management LLC | | | | | | | | | | | | |
| | 1,017,333 | | | Series 2005-11-2A1 | | | 6.00% | | | | 12/25/2035 | | | | 711,629 | |
| | 51,034 | | | Series 2005-11-8A5 | | | 6.00% | | | | 12/25/2035 | | | | 39,103 | |
| | | | |
| | | | Credit Suisse Mortgage Capital Certificates | | | | | | | | | | | | |
| | 8,580,231 | | | Series 2009-8R-8A2 | | | 6.00% | (a)(b) | | | 03/26/2037 | | | | 3,365,845 | |
| | 402,843 | | | Series 2011-12R-3A5 | | | 5.27% | (a)(b) | | | 07/27/2036 | | | | 391,128 | |
| | 339,678 | | | Series 2021-JR1-A1 | | | 2.47% | (a)(b) | | | 09/27/2066 | | | | 335,964 | |
| | 17,138,319 | | | Series 2022-NQM1-A1 | | | 2.27% | (a)(b) | | | 11/25/2066 | | | | 15,026,825 | |
| | | | |
| | | | CSMCM Trust | | | | | | | | | | | | |
| | 20,624,355 | | | Series 2019-RP10-A1 | | | 3.14% | (a)(b) | | | 12/26/2059 | | | | 20,807,160 | |
| | | | |
| | | | DB US Financial Markets Holding Corp. | | | | | | | | | | | | |
| | 323,881 | | | Series 2014-RS1-1A2 | | | 6.50% | (a)(b) | | | 07/27/2037 | | | | 265,381 | |
| | | | |
| | | | Deutsche ALT-A Securities, Inc. | | | | | | | | | | | | |
| | 366,794 | | | Series 2006-AB4-A1A | | | 6.01% | (b) | | | 10/25/2036 | | | | 305,699 | |
| | 6,596,910 | | | Series 2006-AR4-A1 (CME Term SOFR 1 Month + 0.37%, 0.26% Floor) | | | 5.70% | | | | 12/25/2036 | | | | 2,201,381 | |
| | 4,377,459 | | | Series 2006-AR4-A2 (CME Term SOFR 1 Month + 0.49%, 0.38% Floor, 10.50% Cap) | | | 5.82% | | | | 12/25/2036 | | | | 1,412,554 | |
| | 190,446 | | | Series 2007-OA2-A1 (12 Month US Treasury Average + 0.77%, 0.77% Floor) | | | 5.86% | | | | 04/25/2047 | | | | 162,212 | |
| | | | |
| | | | Fannie Mae Connecticut Avenue Securities | | | | | | | | | | | | |
| | 5,304,170 | | | Series 2024-R01-1M1 (US 30 Day Average Secured Overnight Financing Rate + 1.05%, 1.05% Floor) | | | 6.37% | (a) | | | 01/25/2044 | | | | 5,308,160 | |
| | | | |
| | | | GCAT | | | | | | | | | | | | |
| | 3,063,001 | | | Series 2020-NQM2-A1 | | | 1.56% | (a)(c) | | | 04/25/2065 | | | | 2,830,807 | |
| | 6,728,502 | | | Series 2021-NQM4-A3 | | | 1.56% | (a)(b) | | | 08/25/2066 | | | | 5,422,692 | |
| | | | |
| | | | GSAA Trust | | | | | | | | | | | | |
| | 5,218,200 | | | Series 2006-19-A3A (CME Term SOFR 1 Month + 0.59%, 0.48% Floor) | | | 5.92% | | | | 12/25/2036 | | | | 1,854,657 | |
| | | | |
| | | | GSR Mortgage Loan Trust | | | | | | | | | | | | |
| | 323,240 | | | Series 2006-2F-3A4 | | | 6.00% | | | | 02/25/2036 | | | | 148,485 | |
| | | | |
| | | | Harborview Mortgage Loan Trust | | | | | | | | | | | | |
| | 2,219,813 | | | Series 2006-1-2A1A (CME Term SOFR 1 Month + 0.59%, 0.48% Floor) | | | 5.92% | | | | 03/19/2036 | | | | 2,034,217 | |
| | | | |
| | | | Impac Secured Assets CMN Owner Trust | | | | | | | | | | | | |
| | 694,174 | | | Series 2006-5-1A1C (CME Term SOFR 1 Month + 0.65%, 0.54% Floor, 11.50% Cap) | | | 5.98% | | | | 02/25/2037 | | | | 619,154 | |
| | | | |
| | | | Indymac Index Mortgage Loan Trust | | | | | | | | | | | | |
| | 638,647 | | | Series 2006-AR5-2A1 | | | 3.44% | (b) | | | 05/25/2036 | | | | 584,037 | |
| | | | |
| | | | JP Morgan Alternative Loan Trust | | | | | | | | | | | | |
| | 32,547,741 | | | Series 2005-S1-1A4 | | | 6.00% | | | | 12/25/2035 | | | | 11,876,140 | |
| | 3,343,653 | | | Series 2007-S1-A2 (CME Term SOFR 1 Month + 0.79%, 0.68% Floor, 11.50% Cap) | | | 6.12% | | | | 04/25/2047 | | | | 3,184,648 | |
| | | | |
| | | | JP Morgan Mortgage Acquisition Corp. | | | | | | | | | | | | |
| | 11,137,526 | | | Series 2006-WMC2-A5 (CME Term SOFR 1 Month + 0.61%, 0.50% Floor) | | | 5.94% | | | | 07/25/2036 | | | | 4,833,695 | |
| | | | |
| | | | JP Morgan Reremic | | | | | | | | | | | | |
| | 5,806,574 | | | Series 2014-4-1C | | | 0.00% | (a)(b)(f) | | | 01/26/2036 | | | | 1,799,497 | |
| | | | | | | | |
| The accompanying notes are an integral part of these financial statements. | | Annual Report | | | | | March 31, 2024 | | 15 |
| | |
Schedule of Investments DoubleLine Shiller Enhanced CAPE® (Cont.) | | |
| | | | | | | | | | | | | | | | |
PRINCIPAL AMOUNT $ | | | SECURITY DESCRIPTION | | RATE | | | MATURITY | | | VALUE $ | |
| | | | |
| | | | Legacy Mortgage Asset Trust | | | | | | | | | | | | |
| | 180,536 | | | Series 2020-SL1-A | | | 5.73% | (a)(c) | | | 01/25/2060 | | | | 180,625 | |
| | 2,593,229 | | | Series 2021-GS1-A1 | | | 4.89% | (a)(c) | | | 10/25/2066 | | | | 2,562,076 | |
| | | | |
| | | | Lehman Mortgage Trust | | | | | | | | | | | | |
| | 185,568 | | | Series 2006-1-1A3 | | | 5.50% | | | | 02/25/2036 | | | | 90,243 | |
| | | | |
| | | | Lehman XS Trust | | | | | | | | | | | | |
| | 8,893,084 | | | Series 2007-15N-3A1 (CME Term SOFR 1 Month + 0.36%, 0.25% Floor) | | | 5.69% | | | | 08/25/2047 | | | | 7,448,248 | |
| | | | |
| | | | Long Beach Mortgage Loan Trust | | | | | | | | | | | | |
| | 15,890,797 | | | Series 2006-11-2A2 (CME Term SOFR 1 Month + 0.31%, 0.20% Floor) | | | 5.64% | | | | 12/25/2036 | | | | 5,626,126 | |
| | 9,654,616 | | | Series 2006-2-2A3 (CME Term SOFR 1 Month + 0.49%, 0.38% Floor) | | | 5.82% | | | | 03/25/2046 | | | | 3,497,062 | |
| | | | |
| | | | Mastr Adjustable Rate Mortgages Trust | | | | | | | | | | | | |
| | 68,579 | | | Series 2006-2-2A1 | | | 6.17% | (b) | | | 04/25/2036 | | | | 36,455 | |
| | 1,411,448 | | | Series 2006-OA2-4A1A (12 Month US Treasury Average + 0.85%, 0.85% Floor) | | | 5.94% | | | | 12/25/2046 | | | | 1,301,304 | |
| | | | |
| | | | Merrill Lynch Alternative Note Asset | | | | | | | | | | | | |
| | 335,599 | | | Series 2007-F1-2A6 | | | 6.00% | | | | 03/25/2037 | | | | 120,346 | |
| | | | |
| | | | Merrill Lynch Mortgage Investors, Inc. | | | | | | | | | | | | |
| | 1,172,773 | | | Series 2006-AF1-AF2C | | | 6.25% | | | | 08/25/2036 | | | | 473,237 | |
| | 35,318,148 | | | Series 2006-RM2-A1A (CME Term SOFR 1 Month + 0.48%, 0.37% Floor) | | | 5.81% | | | | 05/25/2037 | | | | 9,819,367 | |
| | 4,372,048 | | | Series 2007-HE2-A2A (CME Term SOFR 1 Month + 0.35%, 0.24% Floor) | | | 5.68% | | | | 02/25/2037 | | | | 1,281,567 | |
| | 6,760,482 | | | Series 2007-HE2-A2B (CME Term SOFR 1 Month + 0.53%, 0.42% Floor) | | | 5.86% | | | | 02/25/2037 | | | | 1,981,740 | |
| | | | |
| | | | MFRA Trust | | | | | | | | | | | | |
| | 4,653,687 | | | Series 2021-NQM2-A3 | | | 1.47% | (a)(b) | | | 11/25/2064 | | | | 4,007,584 | |
| | | | |
| | | | Morgan Stanley Mortgage Loan Trust | | | | | | | | | | | | |
| | 223,305 | | | Series 2006-2-7A1 | | | 5.47% | (b) | | | 02/25/2036 | | | | 125,953 | |
| | | | |
| | | | Morgan Stanley Residential Mortgage Loan Trust | | | | | | | | | | | | |
| | 434,911 | | | Series 2020-RPL1-A1 | | | 5.69% | (a)(b) | | | 10/25/2060 | | | | 430,968 | |
| | | | |
| | | | Nomura Resecuritization Trust | | | | | | | | | | | | |
| | 3,894,927 | | | Series 2015-8R-4A4 | | | 4.51% | (a)(b) | | | 11/25/2047 | | | | 3,192,588 | |
| | | | |
| | | | Onslow Bay Mortgage Loan Trust | | | | | | | | | | | | |
| | 428,118 | | | Series 2020-EXP2-A3 | | | 2.50% | (a)(b) | | | 05/25/2060 | | | | 351,139 | |
| | 3,010,708 | | | Series 2021-NQM2-A3 | | | 1.56% | (a)(b) | | | 05/25/2061 | | | | 2,418,132 | |
| | 6,206,828 | | | Series 2022-NQM1-A1 | | | 2.31% | (a)(b) | | | 11/25/2061 | | | | 5,351,637 | |
| | | | |
| | | | Pretium Mortgage Credit Partners LLC | | | | | | | | | | | | |
| | 1,963,011 | | | Series 2021-NPL1-A1 | | | 5.24% | (a)(c) | | | 09/27/2060 | | | | 1,942,378 | |
| | 2,836,706 | | | Series 2021-NPL2-A1 | | | 1.99% | (a)(c) | | | 06/27/2060 | | | | 2,757,303 | |
| | 24,790,149 | | | Series 2021-NPL3-A1 | | | 1.87% | (a)(c) | | | 07/25/2051 | | | | 23,998,639 | |
| | 4,812,798 | | | Series 2021-RN1-A1 | | | 1.99% | (a)(c) | | | 02/25/2061 | | | | 4,704,453 | |
| | 4,791,539 | | | Series 2021-RN2-A1 | | | 1.74% | (a)(c) | | | 07/25/2051 | | | | 4,644,966 | |
| | | | |
| | | | PRPM LLC | | | | | | | | | | | | |
| | 4,680,603 | | | Series 2021-6-A1 | | | 1.79% | (a)(c) | | | 07/25/2026 | | | | 4,556,233 | |
| | | | |
| | | | RALI Trust | | | | | | | | | | | | |
| | 486,510 | | | Series 2006-QS12-2A3 | | | 6.00% | | | | 09/25/2036 | | | | 395,322 | |
| | 1,269,994 | | | Series 2007-QS4-3A4 | | | 6.00% | | | | 03/25/2037 | | | | 1,048,625 | |
| | 1,581,454 | | | Series 2007-QS4-3A9 | | | 6.00% | | | | 03/25/2037 | | | | 1,305,766 | |
| | 1,086,434 | | | Series 2007-QS8-A3 (CME Term SOFR 1 Month + 0.71%, 0.60% Floor, 6.00% Cap) | | | 6.00% | | | | 06/25/2037 | | | | 778,853 | |
| | 689,409 | | | Series 2007-QS9-A33 | | | 6.50% | | | | 07/25/2037 | | | | 535,209 | |
| | | | |
| | | | RASC Trust | | | | | | | | | | | | |
| | 4,181,979 | | | Series 2004-KS7-A2A (CME Term SOFR 1 Month + 0.69%, 0.58% Floor) | | | 6.02% | | | | 08/25/2034 | | | | 4,004,002 | |
| | | | |
| | | | RBSSP Resecuritization Trust | | | | | | | | | | | | |
| | 560,840 | | | Series 2009-2-3A2 (CME Term SOFR 1 Month + 0.61%, 0.50% Floor) | | | 5.09% | (a) | | | 04/26/2035 | | | | 516,924 | |
| | | | |
| | | | Residential Asset Securitization Trust | | | | | | | | | | | | |
| | 689,773 | | | Series 2006-A2-A11 | | | 6.00% | | | | 01/25/2046 | | | | 284,137 | |
| | 2,099,655 | | | Series 2006-A6-1A4 | | | 6.00% | | | | 07/25/2036 | | | | 608,099 | |
| | | | |
| | | | Residential Mortgage Loan Trust | | | | | | | | | | | | |
| | 5,394,000 | | | Series 2019-2-M1 | | | 3.86% | (a)(b) | | | 05/25/2059 | | | | 5,238,084 | |
| | | | |
| 16 | | DoubleLine Funds Trust | | The accompanying notes are an integral part of these financial statements. |
| | | | | | | | | | | | | | | | |
PRINCIPAL AMOUNT $ | | | SECURITY DESCRIPTION | | RATE | | | MATURITY | | | VALUE $ | |
| | | | |
| | | | RFMSI Trust | | | | | | | | | | | | |
| | 3,989,658 | | | Series 2007-S1-A1 (CME Term SOFR 1 Month + 0.71%, 0.60% Floor, 6.00% Cap) | | | 6.00% | | | | 01/25/2037 | | | | 2,847,313 | |
| | | | |
| | | | Securitized Asset Backed Receivables LLC | | | | | | | | | | | | |
| | 5,835,109 | | | Series 2006-WM3-A1 (CME Term SOFR 1 Month + 0.21%, 0.10% Floor) | | | 5.54% | | | | 10/25/2036 | | | | 1,989,168 | |
| | | | |
| | | | Soundview Home Equity Loan Trust | | | | | | | | | | | | |
| | 1,145,426 | | | Series 2007-OPT3-2A3 (CME Term SOFR 1 Month + 0.29%, 0.18% Floor) | | | 5.62% | | | | 08/25/2037 | | | | 1,111,720 | |
| | | | |
| | | | Starwood Mortgage Residential Trust | | | | | | | | | | | | |
| | 8,000,000 | | | Series 2020-2-M1E | | | 3.00% | (a) | | | 04/25/2060 | | | | 7,704,056 | |
| | | | |
| | | | Structured Adjustable Rate Mortgage Loan Trust | | | | | | | | | | | | |
| | 1,043,388 | | | Series 2005-22-4A1 | | | 5.25% | (b) | | | 12/25/2035 | | | | 948,726 | |
| | | | |
| | | | VCAT Asset Securitization LLC | | | | | | | | | | | | |
| | 8,649,684 | | | Series 2021-NPL4-A1 | | | 1.87% | (a)(c) | | | 08/25/2051 | | | | 8,393,618 | |
| | 5,152,146 | | | Series 2021-NPL5-A1 | | | 1.87% | (a)(c) | | | 08/25/2051 | | | | 5,034,312 | |
| | | | |
| | | | Velocity Commercial Capital Loan Trust | | | | | | | | | | | | |
| | 2,722,511 | | | Series 2020-1-M2 | | | 2.98% | (a)(b) | | | 02/25/2050 | | | | 2,270,774 | |
| | 2,372,947 | | | Series 2021-1-M2 | | | 2.26% | (a)(b) | | | 05/25/2051 | | | | 1,867,947 | |
| | 1,854,686 | | | Series 2021-2-M2 | | | 2.20% | (a)(b) | | | 08/25/2051 | | | | 1,524,139 | |
| | | | |
| | | | Vericrest Opportunity Loan Transferee | | | | | | | | | | | | |
| | 3,653,808 | | | Series 2021-NP10-A1 | | | 1.99% | (a)(c) | | | 05/25/2051 | | | | 3,523,029 | |
| | 5,301,857 | | | Series 2021-NP11-A1 | | | 1.87% | (a)(c) | | | 08/25/2051 | | | | 5,131,065 | |
| | 6,902,381 | | | Series 2021-NPL1-A1 | | | 4.89% | (a)(c) | | | 02/27/2051 | | | | 6,748,058 | |
| | 722,406 | | | Series 2021-NPL2-A1 | | | 4.89% | (a)(c) | | | 02/27/2051 | | | | 703,003 | |
| | 3,126,782 | | | Series 2021-NPL5-A1 | | | 5.12% | (a)(c) | | | 03/27/2051 | | | | 3,065,448 | |
| | 2,015,274 | | | Series 2021-NPL6-A1 | | | 5.24% | (a)(c) | | | 04/25/2051 | | | | 1,986,331 | |
| | 17,455,373 | | | Series 2021-NPL8-A1 | | | 5.12% | (a)(c) | | | 04/25/2051 | | | | 17,026,373 | |
| | | | |
| | | | Verus Securitization Trust | | | | | | | | | | | | |
| | 209,536 | | | Series 2020-4-A3 | | | 2.32% | (a)(c) | | | 05/25/2065 | | | | 200,365 | |
| | 1,500,000 | | | Series 2020-INV1-A2 | | | 3.04% | (a)(b) | | | 03/25/2060 | | | | 1,466,921 | |
| | 14,481,360 | | | Series 2021-7-A1 | | | 1.83% | (a)(b) | | | 10/25/2066 | | | | 12,596,440 | |
| | 1,885,853 | | | Series 2021-R1-A3 | | | 1.26% | (a)(b) | | | 10/25/2063 | | | | 1,721,552 | |
| | | | |
| | | | WAMU Asset-Backed Certificates | | | | | | | | | | | | |
| | 1,625,851 | | | Series 2007-HE4-2A3 (CME Term SOFR 1 Month + 0.28%, 0.28% Floor) | | | 5.61% | | | | 07/25/2047 | | | | 967,514 | |
| | | | |
| | | | WaMu Mortgage Pass Through Certificates | | | | | | | | | | | | |
| | 2,499,537 | | | Series 2005-AR4-A5 | | | 4.25% | (b) | | | 04/25/2035 | | | | 2,391,190 | |
| | 2,761,446 | | | Series 2006-AR10-2A1 | | | 4.17% | (b) | | | 09/25/2036 | | | | 2,342,980 | |
| | 10,121,115 | | | Series 2006-AR18-1A1 | | | 3.73% | (b) | | | 01/25/2037 | | | | 8,504,702 | |
| | | | |
| | | | Washington Mutual Alternative Mortgage Pass-Through Certificates | | | | | | | | | | | | |
| | 935,489 | | | Series 2005-8-2CB3 (CME Term SOFR 1 Month + 0.52%, 0.41% Floor, 5.50% Cap) | | | 5.50% | | | | 10/25/2035 | | | | 862,516 | |
| | | | |
| | | | Washington Mutual Asset-Backed Certificates | | | | | | | | | | | | |
| | 6,209,595 | | | Series 2006-HE5-2A2 (CME Term SOFR 1 Month + 0.47%, 0.36% Floor) | | | 4.48% | | | | 10/25/2036 | | | | 2,223,942 | |
| | 2,280,461 | | | Series 2006-HE5-2A3 (CME Term SOFR 1 Month + 0.57%, 0.46% Floor) | | | 4.48% | | | | 10/25/2036 | | | | 816,738 | |
| | | | |
| | | | Wells Fargo Alternative Loan Trust | | | | | | | | | | | | |
| | 479,007 | | | Series 2007-PA5-1A1 | | | 6.25% | | | | 11/25/2037 | | | | 409,773 | |
| | | | |
| | | | Wells Fargo Mortgage Backed Securities Trust | | | | | | | | | | | | |
| | 1,607,766 | | | Series 2007-15-A1 | | | 6.00% | | | | 11/25/2037 | | | | 1,425,590 | |
| | 5,700,522 | | | Series 2007-AR6-A2 | | | 6.01% | (b) | | | 10/25/2037 | | | | 5,191,173 | |
| | | | | | | | | | | | | | | | |
| | | | Total Non-Agency Residential Collateralized Mortgage Obligations
(Cost $530,592,042) | | | | | | | | 435,692,948 | |
| | | | | | | | | | | | | |
| | US CORPORATE BONDS—6.2% | | | | | | | | | | | | |
| | | | |
| | 1,635,000 | | | AbbVie, Inc. | | | 2.60% | | | | 11/21/2024 | | | | 1,605,864 | |
| | 795,000 | | | AGCO Corp. | | | 5.45% | | | | 03/21/2027 | | | | 798,899 | |
| | 960,000 | | | American Electric Power Co., Inc. | | | 5.20% | | | | 01/15/2029 | | | | 962,811 | |
| | | | | | | | |
| The accompanying notes are an integral part of these financial statements. | | Annual Report | | | | | March 31, 2024 | | 17 |
| | |
Schedule of Investments DoubleLine Shiller Enhanced CAPE® (Cont.) | | |
| | | | | | | | | | | | | | | | |
PRINCIPAL AMOUNT $ | | | SECURITY DESCRIPTION | | RATE | | | MATURITY | | | VALUE $ | |
| | 3,401,000 | | | American Express Co.
(Secured Overnight Financing Rate + 1.00%) | | | 6.34% | | | | 02/16/2028 | | | | 3,413,560 | |
| | 1,710,000 | | | Amgen, Inc. | | | 5.51% | | | | 03/02/2026 | | | | 1,708,412 | |
| | 1,710,000 | | | Arrow Electronics, Inc. | | | 6.13% | | | | 03/01/2026 | | | | 1,709,497 | |
| | 1,973,000 | | | AT&T, Inc. | | | 5.54% | | | | 02/20/2026 | | | | 1,971,990 | |
| | 5,185,000 | | | Athene Global Funding
(Secured Overnight Financing Rate + 0.70%) | | | 6.04% | (a) | | | 05/24/2024 | | | | 5,187,798 | |
| | 1,075,000 | | | Avery Dennison Corp. | | | 0.85% | | | | 08/15/2024 | | | | 1,054,586 | |
| | 2,715,000 | | | Aviation Capital Group LLC | | | 1.95% | (a) | | | 09/20/2026 | | | | 2,481,796 | |
| | 1,651,000 | | | Boeing Co. | | | 4.88% | | | | 05/01/2025 | | | | 1,632,914 | |
| | 3,427,000 | | | BP Capital Markets America, Inc. | | | 4.70% | | | | 04/10/2029 | | | | 3,420,013 | |
| | 1,885,000 | | | Bristol-Myers Squibb Co.
(US Secured Overnight Financing Rate + 0.49%) | | | 5.83% | | | | 02/20/2026 | | | | 1,891,762 | |
| | 1,470,000 | | | Broadcom Corp. / Broadcom Cayman Finance Ltd. | | | 3.88% | | | | 01/15/2027 | | | | 1,425,430 | |
| | 1,695,000 | | | Broadcom, Inc. | | | 3.15% | | | | 11/15/2025 | | | | 1,640,389 | |
| | 3,337,000 | | | Brown & Brown, Inc. | | | 4.20% | | | | 09/15/2024 | | | | 3,313,846 | |
| | 3,365,000 | | | Campbell Soup Co. | | | 3.95% | | | | 03/15/2025 | | | | 3,314,741 | |
| | 1,325,000 | | | Campbell Soup Co. | | | 5.20% | | | | 03/19/2027 | | | | 1,328,628 | |
| | 4,683,000 | | | Cardinal Health, Inc. | | | 3.08% | | | | 06/15/2024 | | | | 4,656,419 | |
| | 1,175,000 | | | Carrier Global Corp. | | | 5.80% | | | | 11/30/2025 | | | | 1,183,238 | |
| | 1,634,000 | | | Charles Schwab Corp.
(Secured Overnight Financing Rate + 1.05%) | | | 6.40% | | | | 03/03/2027 | | | | 1,639,502 | |
| | 1,010,000 | | | Charter Communications Operating LLC / Charter Communications Operating Capital | | | 6.15% | | | | 11/10/2026 | | | | 1,018,156 | |
| | 3,975,000 | | | Citigroup, Inc.
(CME Term SOFR 3 Month + 1.16%) | | | 3.35% | | | | 04/24/2025 | | | | 3,968,462 | |
| | 1,825,000 | | | Citigroup, Inc.
(US Secured Overnight Financing Rate + 1.53%) | | | 3.29% | | | | 03/17/2026 | | | | 1,783,935 | |
| | 1,750,000 | | | Constellation Brands, Inc. | | | 3.60% | | | | 05/09/2024 | | | | 1,745,885 | |
| | 1,755,000 | | | Crown Castle, Inc. | | | 4.80% | | | | 09/01/2028 | | | | 1,721,710 | |
| | 1,730,000 | | | CVS Health Corp. | | | 5.00% | | | | 02/20/2026 | | | | 1,724,755 | |
| | 1,762,000 | | | Dell International LLC / EMC Corp. | | | 4.00% | | | | 07/15/2024 | | | | 1,753,376 | |
| | 1,660,000 | | | Dell International LLC / EMC Corp. | | | 5.85% | | | | 07/15/2025 | | | | 1,668,784 | |
| | 1,630,000 | | | Dollar General Corp. | | | 4.15% | | | | 11/01/2025 | | | | 1,599,535 | |
| | 3,027,000 | | | Dollar Tree, Inc. | | | 4.00% | | | | 05/15/2025 | | | | 2,976,660 | |
| | 5,163,000 | | | Elevance Health, Inc. | | | 3.50% | | | | 08/15/2024 | | | | 5,122,027 | |
| | 1,925,000 | | | Eli Lilly & Co. | | | 5.00% | | | | 02/27/2026 | | | | 1,923,083 | |
| | 3,340,000 | | | Energy Transfer LP | | | 6.05% | | | | 12/01/2026 | | | | 3,407,986 | |
| | 3,550,000 | | | Entergy Corp. | | | 0.90% | | | | 09/15/2025 | | | | 3,329,034 | |
| | 3,515,000 | | | Equinix, Inc. | | | 1.25% | | | | 07/15/2025 | | | | 3,326,225 | |
| | 1,705,000 | | | Exelon Corp. | | | 5.15% | | | | 03/15/2029 | | | | 1,709,577 | |
| | 3,398,000 | | | Expedia Group, Inc. | | | 6.25% | (a) | | | 05/01/2025 | | | | 3,413,470 | |
| | 3,505,000 | | | Ford Motor Co. | | | 4.35% | | | | 12/08/2026 | | | | 3,413,512 | |
| | 1,740,000 | | | General Mills, Inc. | | | 4.00% | | | | 04/17/2025 | | | | 1,715,090 | |
| | 1,375,000 | | | General Mills, Inc. | | | 5.24% | | | | 11/18/2025 | | | | 1,371,214 | |
| | 3,315,000 | | | General Motors Financial Co., Inc. | | | 4.00% | | | | 01/15/2025 | | | | 3,271,847 | |
| | 3,420,000 | | | General Motors Financial Co., Inc. | | | 5.25% | | | | 03/01/2026 | | | | 3,410,990 | |
| | 1,680,000 | | | Georgia Power Co. | | | 5.00% | | | | 02/23/2027 | | | | 1,682,839 | |
| | 1,684,000 | | | Gilead Sciences, Inc. | | | 3.65% | | | | 03/01/2026 | | | | 1,641,538 | |
| | 2,215,000 | | | Goldman Sachs Bank USA/New York NY
(US Secured Overnight Financing Rate + 0.77%) | | | 6.12% | | | | 03/18/2027 | | | | 2,215,019 | |
| | 3,345,000 | | | HCA, Inc. | | | 5.38% | | | | 02/01/2025 | | | | 3,336,117 | |
| | 2,575,000 | | | Hewlett Packard Enterprise Co. | | | 5.90% | | | | 10/01/2024 | | | | 2,579,276 | |
| | 2,860,000 | | | Hyatt Hotels Corp. | | | 5.75% | | | | 01/30/2027 | | | | 2,905,464 | |
| | 3,415,000 | | | Hyundai Capital America | | | 1.00% | (a) | | | 09/17/2024 | | | | 3,341,374 | |
| | 1,660,000 | | | Hyundai Capital America | | | 5.30% | (a) | | | 03/19/2027 | | | | 1,660,727 | |
| | 1,700,000 | | | Intuit, Inc. | | | 5.25% | | | | 09/15/2026 | | | | 1,716,296 | |
| | 1,410,000 | | | JPMorgan Chase & Co.
(CME Term SOFR 3 Month + 0.54%) | | | 0.82% | | | | 06/01/2025 | | | | 1,397,842 | |
| | 1,105,000 | | | JPMorgan Chase & Co.
(CME Term SOFR 3 Month + 0.58%) | | | 0.97% | | | | 06/23/2025 | | | | 1,092,224 | |
| | 3,365,000 | | | JPMorgan Chase & Co. | | | 3.90% | | | | 07/15/2025 | | | | 3,310,607 | |
| | | | |
| 18 | | DoubleLine Funds Trust | | The accompanying notes are an integral part of these financial statements. |
| | | | | | | | | | | | | | | | |
PRINCIPAL AMOUNT $ | | | SECURITY DESCRIPTION | | RATE | | | MATURITY | | | VALUE $ | |
| | 2,910,000 | | | JPMorgan Chase & Co.
(US Secured Overnight Financing Rate + 0.49%) | | | 0.77% | | | | 08/09/2025 | | | | 2,855,307 | |
| | 1,730,000 | | | Kinder Morgan, Inc. | | | 4.30% | | | | 06/01/2025 | | | | 1,705,913 | |
| | 1,735,000 | | | Kinder Morgan, Inc. | | | 5.00% | | | | 02/01/2029 | | | | 1,728,939 | |
| | 1,035,000 | | | Lowe’s Cos., Inc. | | | 4.40% | | | | 09/08/2025 | | | | 1,022,639 | |
| | 3,319,000 | | | Marriott International, Inc./MD | | | 3.60% | | | | 04/15/2024 | | | | 3,315,885 | |
| | 1,735,000 | | | McDonald’s Corp. | | | 3.38% | | | | 05/26/2025 | | | | 1,698,604 | |
| | 1,712,000 | | | McDonald’s Corp. | | | 1.45% | | | | 09/01/2025 | | | | 1,625,226 | |
| | 1,730,000 | | | McKesson Corp. | | | 5.25% | | | | 02/15/2026 | | | | 1,725,896 | |
| | 905,000 | | | Meta Platforms, Inc. | | | 4.60% | | | | 05/15/2028 | | | | 904,926 | |
| | 3,055,000 | | | Microchip Technology, Inc. | | | 0.98% | | | | 09/01/2024 | | | | 2,993,328 | |
| | 460,000 | | | Microchip Technology, Inc. | | | 4.25% | | | | 09/01/2025 | | | | 452,617 | |
| | 665,000 | | | Microchip Technology, Inc. | | | 5.05% | | | | 03/15/2029 | | | | 665,374 | |
| | 3,355,000 | | | Morgan Stanley
(US Secured Overnight Financing Rate + 0.53%) | | | 0.79% | | | | 05/30/2025 | | | | 3,324,046 | |
| | 3,475,000 | | | Morgan Stanley | | | 3.88% | | | | 01/27/2026 | | | | 3,395,748 | |
| | 3,350,000 | | | Motorola Solutions, Inc. | | | 5.00% | | | | 04/15/2029 | | | | 3,334,850 | |
| | 1,755,000 | | | New York Life Global Funding | | | 3.60% | (a) | | | 08/05/2025 | | | | 1,718,589 | |
| | 1,050,000 | | | NextEra Energy Capital Holdings, Inc. | | | 4.20% | | | | 06/20/2024 | | | | 1,046,443 | |
| | 685,000 | | | NextEra Energy Capital Holdings, Inc. | | | 4.26% | | | | 09/01/2024 | | | | 680,511 | |
| | 1,690,000 | | | NiSource, Inc. | | | 5.25% | | | | 03/30/2028 | | | | 1,702,460 | |
| | 2,699,000 | | | Northrop Grumman Corp. | | | 2.93% | | | | 01/15/2025 | | | | 2,649,294 | |
| | 3,355,000 | | | NVIDIA Corp. | | | 0.58% | | | | 06/14/2024 | | | | 3,321,886 | |
| | 2,610,000 | | | Omnicom Group, Inc. / Omnicom Capital, Inc. | | | 3.65% | | | | 11/01/2024 | | | | 2,578,477 | |
| | 3,385,000 | | | Oracle Corp. | | | 5.80% | | | | 11/10/2025 | | | | 3,414,198 | |
| | 1,605,000 | | | O’Reilly Automotive, Inc. | | | 5.75% | | | | 11/20/2026 | | | | 1,631,833 | |
| | 2,800,000 | | | Pacific Gas and Electric Co. | | | 4.95% | | | | 06/08/2025 | | | | 2,778,073 | |
| | 710,000 | | | Pacific Gas and Electric Co. | | | 2.10% | | | | 08/01/2027 | | | | 639,558 | |
| | 1,240,000 | | | Packaging Corp. of America | | | 3.65% | | | | 09/15/2024 | | | | 1,227,873 | |
| | 3,330,000 | | | Parker-Hannifin Corp. | | | 3.65% | | | | 06/15/2024 | | | | 3,315,690 | |
| | 3,020,000 | | | Penske Truck Leasing Co. LP / PTL Finance Corp. | | | 4.00% | (a) | | | 07/15/2025 | | | | 2,958,568 | |
| | 3,506,000 | | | Penske Truck Leasing Co. LP / PTL Finance Corp. | | | 4.40% | (a) | | | 07/01/2027 | | | | 3,414,990 | |
| | 1,010,000 | | | PepsiCo, Inc.
(Secured Overnight Financing Rate + 0.40%) | | | 5.74% | | | | 11/12/2024 | | | | 1,011,354 | |
| | 710,000 | | | Pfizer Investment Enterprises Pte Ltd. | | | 4.65% | | | | 05/19/2025 | | | | 705,611 | |
| | 3,430,000 | | | Philip Morris International, Inc. | | | 4.88% | | | | 02/13/2026 | | | | 3,417,961 | |
| | 1,515,000 | | | Phillips 66 | | | 3.85% | | | | 04/09/2025 | | | | 1,492,377 | |
| | 142,000 | | | Phillips 66 | | | 1.30% | | | | 02/15/2026 | | | | 132,186 | |
| | 2,235,000 | | | PNC Financial Services Group, Inc.
(US Secured Overnight Financing Rate + 1.32%) | | | 5.81% | | | | 06/12/2026 | | | | 2,243,119 | |
| | 2,510,000 | | | Public Service Enterprise Group, Inc. | | | 5.85% | | | | 11/15/2027 | | | | 2,571,838 | |
| | 3,367,000 | | | Republic Services, Inc. | | | 2.50% | | | | 08/15/2024 | | | | 3,327,541 | |
| | 3,825,000 | | | Royalty Pharma PLC | | | 1.75% | | | | 09/02/2027 | | | | 3,416,985 | |
| | 3,395,000 | | | Ryder System, Inc. | | | 5.25% | | | | 06/01/2028 | | | | 3,412,271 | |
| | 1,595,000 | | | Sabine Pass Liquefaction LLC | | | 5.63% | | | | 03/01/2025 | | | | 1,594,013 | |
| | 2,692,000 | | | Simon Property Group LP | | | 2.00% | | | | 09/13/2024 | | | | 2,649,816 | |
| | 2,345,000 | | | Solventum Corp. | | | 5.45% | (a) | | | 02/25/2027 | | | | 2,353,681 | |
| | 1,235,000 | | | Southern California Edison Co.
(Secured Overnight Financing Rate + 0.83%) | | | 6.18% | | | | 04/01/2024 | | | | 1,235,000 | |
| | 1,175,000 | | | Southern California Edison Co. | | | 4.90% | | | | 06/01/2026 | | | | 1,169,497 | |
| | 1,685,000 | | | Southern Co. | | | 5.15% | | | | 10/06/2025 | | | | 1,682,771 | |
| | 2,370,000 | | | Stryker Corp. | | | 4.85% | | | | 12/08/2028 | | | | 2,371,891 | |
| | 3,360,000 | | | Synchrony Financial | | | 4.25% | | | | 08/15/2024 | | | | 3,338,698 | |
| | 3,425,000 | | | Take-Two Interactive Software, Inc. | | | 4.95% | | | | 03/28/2028 | | | | 3,413,184 | |
| | 1,753,000 | | | Truist Financial Corp.
(US Secured Overnight Financing Rate + 0.40%) | | | 5.75% | | | | 06/09/2025 | | | | 1,748,977 | |
| | 3,410,000 | | | Union Pacific Corp. | | | 4.75% | | | | 02/21/2026 | | | | 3,407,359 | |
| | 845,000 | | | UnitedHealth Group, Inc. | | | 0.55% | | | | 05/15/2024 | | | | 840,047 | |
| | 1,700,000 | | | Veralto Corp. | | | 5.50% | (a) | | | 09/18/2026 | | | | 1,707,252 | |
| | 1,724,000 | | | Viatris, Inc. | | | 1.65% | | | | 06/22/2025 | | | | 1,639,945 | |
| | 3,540,000 | | | VICI Properties LP / VICI Note Co., Inc. | | | 4.25% | (a) | | | 12/01/2026 | | | | 3,406,072 | |
| | 1,725,000 | | | WEC Energy Group, Inc. | | | 4.75% | | | | 01/09/2026 | | | | 1,709,822 | |
| | | | | | | | |
| The accompanying notes are an integral part of these financial statements. | | Annual Report | | | | | March 31, 2024 | | 19 |
| | |
Schedule of Investments DoubleLine Shiller Enhanced CAPE® (Cont.) | | |
| | | | | | | | | | | | | | | | |
PRINCIPAL AMOUNT $ | | | SECURITY DESCRIPTION | | RATE | | | MATURITY | | | VALUE $ | |
| | 6,265,000 | | | Wells Fargo & Co.
(CME Term SOFR 3 Month + 1.09%) | | | 2.41% | | | | 10/30/2025 | | | | 6,146,511 | |
| | 3,390,000 | | | Welltower OP LLC | | | 4.00% | | | | 06/01/2025 | | | | 3,333,353 | |
| | 1,660,000 | | | Workday, Inc. | | | 3.50% | | | | 04/01/2027 | | | | 1,589,960 | |
| | 3,413,000 | | | Zimmer Biomet Holdings, Inc. | | | 1.45% | | | | 11/22/2024 | | | | 3,322,172 | |
| | | | | | | | | | | | | | | | |
| | | | Total US Corporate Bonds
(Cost $264,305,520) | | | | | | | | 262,815,736 | |
| | | | | | | | | | | | | |
| | US GOVERNMENT AND AGENCY MORTGAGE BACKED OBLIGATIONS—2.4% | | | | | | | | | | | | |
| | | | |
| | | | Federal Home Loan Mortgage Corp. | | | | | | | | | | | | |
| | 446,763 | | | Pool G08626 | | | 3.00% | | | | 02/01/2045 | | | | 397,897 | |
| | 444,230 | | | Pool G08631 | | | 3.00% | | | | 03/01/2045 | | | | 395,273 | |
| | 813,549 | | | Series 2021-MN1-M1 (US 30 Day Average Secured Overnight Financing Rate + 2.00%) | | | 7.32% | (a) | | | 01/25/2051 | | | | 797,477 | |
| | 2,294,966 | | | Series 3072-FB (US 30 Day Average Secured Overnight Financing Rate + 0.66%, 0.55% Floor, 7.00% Cap) | | | 5.98% | | | | 11/15/2035 | | | | 2,283,371 | |
| | 239,278 | | | Series 3417-SM (-1 x US 30 Day Average Secured Overnight Financing Rate + 6.17%, 6.28% Cap) | | | 0.85% | (h)(i) | | | 02/15/2038 | | | | 21,181 | |
| | 571,900 | | | Series 4471-GA | | | 3.00% | | | | 02/15/2044 | | | | 536,144 | |
| | 3,857,661 | | | Series 4631-FA (US 30 Day Average Secured Overnight Financing Rate + 0.61%, 0.50% Floor, 6.50% Cap) | | | 5.93% | | | | 11/15/2046 | | | | 3,790,408 | |
| | 1,877,236 | | | Series 4917-FE (US 30 Day Average Secured Overnight Financing Rate + 0.56%, 0.45% Floor, 6.50% Cap) | | | 5.88% | | | | 10/25/2049 | | | | 1,838,379 | |
| | 7,670,208 | | | Series 5020-KA | | | 2.00% | | | | 04/25/2040 | | | | 7,149,692 | |
| | | | |
| | | | Federal National Mortgage Association | | | | | | | | | | | | |
| | 794,440 | | | Pool AL2987 (Refinitiv USD IBOR Consumer Cash Fallbacks Term 1 Year + 1.62%, 1.62% Floor, 7.31% Cap) | | | 5.87% | | | | 11/01/2042 | | | | 811,885 | |
| | 2,364,871 | | | Pool AP7870 (Refinitiv USD IBOR Consumer Cash Fallbacks Term 1 Year + 1.70%, 1.70% Floor, 7.53% Cap) | | | 5.95% | | | | 07/01/2042 | | | | 2,434,728 | |
| | 596,266 | | | Pool AS4645 | | | 3.00% | | | | 03/01/2045 | | | | 529,715 | |
| | 637,359 | | | Pool BM3520 (Refinitiv USD IBOR Consumer Cash Fallbacks Term 1 Year + 1.56%, 1.56% Floor, 7.00% Cap) | | | 5.51% | | | | 05/01/2045 | | | | 646,104 | |
| | 2,331,357 | | | Pool BM4513 (Refinitiv USD IBOR Consumer Cash Fallbacks Term 1 Year + 1.70%, 1.70% Floor, 7.84% Cap) | | | 6.38% | | | | 05/01/2044 | | | | 2,393,281 | |
| | 2,000,000 | | | Pool BS7662 | | | 4.90% | | | | 03/01/2028 | | | | 1,996,019 | |
| | 152,260 | | | Pool MA1200 | | | 3.00% | | | | 10/01/2032 | | | | 143,087 | |
| | 735,605 | | | Pool MA2270 | | | 3.00% | | | | 05/01/2045 | | | | 646,790 | |
| | 4,600,760 | | | Pool MA5086 | | | 5.00% | | | | 07/01/2043 | | | | 4,560,548 | |
| | 4,399,837 | | | Pool MA5112 | | | 5.00% | | | | 08/01/2043 | | | | 4,361,376 | |
| | 1,367,376 | | | Series 2016-72-PA | | | 3.00% | | | | 07/25/2046 | | | | 1,216,249 | |
| | 1,710,634 | | | Series 2016-8-FA (US 30 Day Average Secured Overnight Financing Rate + 0.56%, 0.45% Floor, 6.50% Cap) | | | 5.88% | | | | 03/25/2046 | | | | 1,681,656 | |
| | 6,551,076 | | | Series 2017-82-FG (US 30 Day Average Secured Overnight Financing Rate + 0.36%, 0.25% Floor, 6.50% Cap) | | | 5.68% | | | | 11/25/2032 | | | | 6,471,287 | |
| | 6,237,721 | | | Series 2019-25-SB (-1 x US 30 Day Average Secured Overnight Financing Rate + 5.94%, 6.05% Cap) | | | 0.62% | (h)(i) | | | 06/25/2049 | | | | 589,788 | |
| | 4,933,311 | | | Series 2019-43-FD (US 30 Day Average Secured Overnight Financing Rate + 0.51%, 0.40% Floor, 6.50% Cap) | | | 5.83% | | | | 08/25/2049 | | | | 4,839,260 | |
| | 2,840,526 | | | Series 2019-49-FB (US 30 Day Average Secured Overnight Financing Rate + 0.59%, 0.48% Floor, 6.50% Cap) | | | 5.91% | | | | 09/25/2049 | | | | 2,803,190 | |
| | 21,360,020 | | | Series 2020-M49-1A1 | | | 1.26% | (b) | | | 11/25/2030 | | | | 19,078,996 | |
| | 4,094,438 | | | Series 2021-21-HG | | | 2.00% | | | | 11/25/2047 | | | | 3,575,789 | |
| | 8,096,836 | | | Series 2022-M1S-A1 | | | 2.08% | (b) | | | 11/25/2031 | | | | 7,265,502 | |
| | 2,947,656 | | | Series 2023-M4-A1 | | | 3.77% | (b) | | | 06/25/2032 | | | | 2,864,007 | |
| | | | |
| | | | FREMF Mortgage Trust | | | | | | | | | | | | |
| | 2,433,468 | | | Series 2016-KF18-B (US 30 Day Average Secured Overnight Financing Rate + 5.61%, 5.50% Floor) | | | 10.93% | (a) | | | 05/25/2026 | | | | 2,356,020 | |
| | 124,762,277 | | | Series 2017-K67-X2B | | | 0.10% | (a)(h) | | | 09/25/2049 | | | | 359,902 | |
| | 1,401,628 | | | Series 2017-KF27-B (US 30 Day Average Secured Overnight Financing Rate + 4.46%, 4.35% Floor) | | | 9.78% | (a) | | | 12/25/2026 | | | | 1,389,980 | |
| | | | |
| 20 | | DoubleLine Funds Trust | | The accompanying notes are an integral part of these financial statements. |
| | | | | | | | | | | | | | | | |
PRINCIPAL AMOUNT $/
SHARES | | | SECURITY DESCRIPTION | | RATE | | | MATURITY | | | VALUE $ | |
| | | | |
| | | | FREMF Mortgage Trust (Cont.) | | | | | | | | | | | | |
| | 2,481,119 | | | Series 2017-KF30-B (US 30 Day Average Secured Overnight Financing Rate + 3.36%, 3.25% Floor) | | | 8.68% | (a) | | | 03/25/2027 | | | | 2,436,397 | |
| | 845,940 | | | Series 2018-KF44-B (US 30 Day Average Secured Overnight Financing Rate + 2.26%, 2.15% Floor) | | | 7.58% | (a) | | | 02/25/2025 | | | | 833,701 | |
| | 878,676 | | | Series 2019-KF69-B (US 30 Day Average Secured Overnight Financing Rate + 2.41%, 2.30% Floor) | | | 7.73% | (a) | | | 08/25/2029 | | | | 812,534 | |
| | | | |
| | | | Government National Mortgage Association | | | | | | | | | | | | |
| | 1,968,285 | | | Series 2016-121-JF (CME Term SOFR 1 Month + 0.51%, 0.40% Floor, 6.50% Cap) | | | 5.84% | | | | 09/20/2046 | | | | 1,932,346 | |
| | 2,904,236 | | | Series 2022-183-B | | | 5.00% | | | | 04/20/2047 | | | | 2,881,904 | |
| | 2,891,232 | | | Series 2024-25-AF (US 30 Day Average Secured Overnight Financing Rate + 0.51%, 0.51% Floor, 6.50% Cap) | | | 5.83% | | | | 02/20/2049 | | | | 2,833,218 | |
| | | | | | | | | | | | | | | | |
| | | | Total US Government and Agency Mortgage Backed Obligations
(Cost $106,974,498) | | | | | | | | 101,955,081 | |
| | | | | | | | | | | | | |
| | US GOVERNMENT AND AGENCY OBLIGATIONS—23.6% | | | | | | | | | | | | |
| | | | |
| | 125,100,000 | | | United States Treasury Note/Bond | | | 4.25% | | | | 01/31/2026 | | | | 124,127,543 | |
| | 40,500,000 | | | United States Treasury Note/Bond | | | 4.63% | | | | 11/15/2026 | | | | 40,637,637 | |
| | 132,800,000 | | | United States Treasury Note/Bond | | | 4.88% | | | | 11/30/2025 | | | | 133,012,687 | |
| | 93,400,000 | | | United States Treasury Note/Bond | | | 4.00% | | | | 01/15/2027 | | | | 92,294,523 | |
| | 145,500,000 | | | United States Treasury Note/Bond | | | 4.25% | | | | 12/31/2025 | | | | 144,317,813 | |
| | 84,500,000 | | | United States Treasury Note/Bond | | | 4.13% | | | | 02/15/2027 | | | | 83,796,934 | |
| | 103,600,000 | | | United States Treasury Note/Bond | | | 4.25% | | | | 05/31/2025 | | | | 102,768,368 | |
| | 81,800,000 | | | United States Treasury Note/Bond | | | 4.38% | | | | 12/15/2026 | | | | 81,611,476 | |
| | 55,600,000 | | | United States Treasury Note/Bond | | | 4.63% | | | | 06/30/2025 | | | | 55,406,703 | |
| | 136,700,000 | | | United States Treasury Note/Bond | | | 4.63% | | | | 02/28/2026 | | | | 136,598,542 | |
| | | | | | | | | | | | | | | | |
| | | | Total US Government and Agency Obligations
(Cost $999,238,965) | | | | | | | | 994,572,226 | |
| | | | | | | | | | | | | |
| | COMMON STOCKS—0.0%(j) | | | | | | | | | | | | |
| | | | |
| | 9,129 | | | Flame Aggregator - Series R(f)(k) | | | | | | | | | | | 77,140 | |
| | 907 | | | Flame Aggregator - Series U(f)(k) | | | | | | | | | | | 7,664 | |
| | | | | | | | | | | | | | | | |
| | | | Total Common Stocks
(Cost $20,580) | | | | | | | | 84,804 | |
| | | | | | | | | | | | | |
| | SHORT TERM INVESTMENTS—5.7% | | | | | | | | | | | | |
| | | | |
| | 41,236,706 | | | First American Government Obligations Fund - U | | | 5.26% | (l) | | | | | | | 41,236,706 | |
| | 41,236,706 | | | JPMorgan US Government Money Market Fund - IM | | | 5.25% | (l) | | | | | | | 41,236,706 | |
| | 41,236,706 | | | MSILF Government Portfolio - Institutional | | | 5.22% | (l) | | | | | | | 41,236,706 | |
| | 42,600,000 | | | United States Treasury Bill | | | 0.00% | | | | 05/16/2024 | | | | 42,321,829 | |
| | 75,000,000 | | | United States Treasury Bill | | | 0.00% | | | | 06/27/2024 | | | | 74,055,234 | |
| | | | | | | | | | | | | | | | |
| | | | Total Short Term Investments
(Cost $240,097,484) | | | | | | | | 240,087,181 | |
| | | | | | | | | | | | | |
| | | | Total Investments 90.5%
($4,079,519,370) | | | | | | | | 3,807,620,516 | |
| | | | Other Assets in Excess of Liabilities 9.5% | | | | | | | | | | | 397,681,224 | |
| | | | | | | | | | | | | | | | |
| | | | NET ASSETS 100% | | | | | | | | | | $ | 4,205,301,740 | |
| | | | | | | | | | | | | | | | |
| | | | | | | | |
| The accompanying notes are an integral part of these financial statements. | | Annual Report | | | | | March 31, 2024 | | 21 |
| | |
Schedule of Investments DoubleLine Shiller Enhanced CAPE® (Cont.) | | |
| | | | | |
| SECURITY TYPE BREAKDOWN as a % of Net Assets: | | | | | |
US Government and Agency Obligations | | | | 23.6% | |
Collateralized Loan Obligations | | | | 12.9% | |
Non-Agency Commercial Mortgage Backed Obligations | | | | 11.6% | |
Non-Agency Residential Collateralized Mortgage Obligations | | | | 10.4% | |
Asset Backed Obligations | | | | 7.0% | |
US Corporate Bonds | | | | 6.2% | |
Short Term Investments | | | | 5.7% | |
Foreign Corporate Bonds | | | | 5.1% | |
Bank Loans | | | | 4.9% | |
US Government and Agency Mortgage Backed Obligations | | | | 2.4% | |
Foreign Government Bonds, Foreign Agencies and Foreign Government Sponsored Corporations | | | | 0.7% | |
Common Stocks | | | | 0.0% | (j) |
Other Assets and Liabilities | | | | 9.5% | |
| | | | | |
Net Assets | | | | 100.0% | |
| | | | | |
| | | | | |
| INVESTMENT BREAKDOWN as a % of Net Assets: | | | | | |
US Government and Agency Obligations | | | | 23.6% | |
Collateralized Loan Obligations | | | | 12.9% | |
Non-Agency Commercial Mortgage Backed Obligations | | | | 11.6% | |
Non-Agency Residential Collateralized Mortgage Obligations | | | | 10.4% | |
Asset Backed Obligations | | | | 7.0% | |
Short Term Investments | | | | 5.7% | |
Banking | | | | 2.9% | |
US Government and Agency Mortgage Backed Obligations | | | | 2.4% | |
Utilities | | | | 1.5% | |
Healthcare | | | | 1.2% | |
Hotels/Motels/Inns and Casinos | | | | 1.0% | |
Energy | | | | 0.9% | |
Technology | | | | 0.8% | |
Transportation | | | | 0.8% | |
Mining | | | | 0.6% | |
Automotive | | | | 0.6% | |
Industrial Equipment | | | | 0.5% | |
Electronics/Electric | | | | 0.5% | |
Pharmaceuticals | | | | 0.5% | |
Media | | | | 0.5% | |
Finance | | | | 0.4% | |
Chemicals/Plastics | | | | 0.4% | |
Commercial Services | | | | 0.4% | |
Containers and Glass Products | | | | 0.4% | |
Food Products | | | | 0.3% | |
Consumer Products | | | | 0.3% | |
Real Estate | | | | 0.2% | |
Insurance | | | | 0.2% | |
Telecommunications | | | | 0.2% | |
Chemical Products | | | | 0.2% | |
Aerospace & Defense | | | | 0.2% | |
Building and Development (including Steel/Metals) | | | | 0.2% | |
Retailers (other than Food/Drug) | | | | 0.2% | |
Beverage and Tobacco | | | | 0.2% | |
Diversified Manufacturing | | | | 0.1% | |
Foreign Government Bonds, Foreign Agencies and Foreign Government Sponsored Corporations | | | | 0.1% | |
Food Service | | | | 0.1% | |
Construction | | | | 0.1% | |
Environmental Control | | | | 0.1% | |
Pulp & Paper | | | | 0.1% | |
Business Equipment and Services | | | | 0.1% | |
Financial Intermediaries | | | | 0.1% | |
Other Assets and Liabilities | | | | 9.5% | |
| | | | | |
Net Assets | | | | 100.0% | |
| | | | | |
| | | | |
| 22 | | DoubleLine Funds Trust | | The accompanying notes are an integral part of these financial statements. |
| (a) | Security exempt from registration under Rule 144A of the Securities Act of 1933. These securities may be resold in transactions exempt from registration to qualified institutional buyers. |
| (b) | Coupon rate is variable based on the weighted average coupon of the underlying collateral. To the extent the weighted average coupon of the underlying assets which comprise the collateral increases or decreases, the coupon rate of this security will increase or decrease correspondingly. The rate disclosed is as of period end. |
| (c) | Step Bond; Coupon rate changes based on a predetermined schedule or event. The interest rate shown is the rate in effect as of period end. |
| (d) | Coupon rate is variable or floats based on components including but not limited to reference rate and spread. These securities may not indicate a reference rate and/or spread in their description. The rate disclosed is as of period end. |
| (e) | Security is in default or has failed to make a scheduled payment. Income is not being accrued. |
| (f) | Value determined using significant unobservable inputs. |
| (g) | Securities referencing LIBOR are expected to transition to an alternative reference rate by the security’s next scheduled coupon reset date. |
| (h) | Interest only security |
| (i) | Inverse floating rate security whose interest rate moves in the opposite direction of reference interest rates. Reference interest rates are typically based on a negative multiplier or slope. Interest rate may also be subject to a cap or floor. |
| (j) | Represents less than 0.05% of net assets. |
| (k) | Non-income producing security. |
| (l) | Seven-day yield as of period end. |
| | | | | | | | | | | | | | | | | | | | | | | | | | | | | | | | | | | | | | | | | | |
| | | | | | |
| Excess Return Swaps | | | | | | | | | | | | |
| Reference Entity | | Counterparty | | Long/Short | | Financing
Rate | | Payment
Frequency | | Termination
Date | | Notional
Amount | | Value | | Upfront
Premiums
Paid/
(Received) | | Unrealized
Appreciation
(Depreciation) |
Shiller Barclays CAPE® US Sector II ER USD Index(1) | | Barclays Capital, Inc. | | | | Long | | | | | 0.40% | | | | | Termination | | | | | 06/13/2024 | | | | | 100,000,000 | | | | $ | 18,069,097 | | | | $ | — | | | | $ | 18,069,097 | |
Shiller Barclays CAPE® US Sector II ER USD Index(1) | | BNP Paribas Securities Corp. | | | | Long | | | | | 0.39% | | | | | Termination | | | | | 05/01/2024 | | | | | 80,000,000 | | | | | 17,245,235 | | | | | — | | | | | 17,245,235 | |
Shiller Barclays CAPE® US Sector II ER USD Index(1) | | Barclays Capital, Inc. | | | | Long | | | | | 0.40% | | | | | Termination | | | | | 05/09/2024 | | | | | 70,000,000 | | | | | 15,090,852 | | | | | — | | | | | 15,090,852 | |
Shiller Barclays CAPE® US Sector II ER USD Index(1) | | Canadian Imperial Bank Of Commerce | | | | Long | | | | | 0.40% | | | | | Termination | | | | | 05/21/2024 | | | | | 69,000,000 | | | | | 13,795,726 | | | | | — | | | | | 13,795,726 | |
Shiller Barclays CAPE® US Sector II ER USD Index(1) | | Barclays Capital, Inc. | | | | Long | | | | | 0.40% | | | | | Termination | | | | | 10/17/2024 | | | | | 85,000,000 | | | | | 13,196,826 | | | | | — | | | | | 13,196,826 | |
Shiller Barclays CAPE® US Sector II ER USD Index(1) | | BNP Paribas Securities Corp. | | | | Long | | | | | 0.39% | | | | | Termination | | | | | 06/05/2024 | | | | | 65,000,000 | | | | | 12,866,764 | | | | | — | | | | | 12,866,764 | |
Shiller Barclays CAPE® US Sector II ER USD Index(1) | | Canadian Imperial Bank Of Commerce | | | | Long | | | | | 0.40% | | | | | Termination | | | | | 04/23/2024 | | | | | 75,000,000 | | | | | 12,749,539 | | | | | — | | | | | 12,749,539 | |
Shiller Barclays CAPE® US Sector II ER USD Index(1) | | Barclays Capital, Inc. | | | | Long | | | | | 0.40% | | | | | Termination | | | | | 06/27/2024 | | | | | 86,000,000 | | | | | 12,343,935 | | | | | — | | | | | 12,343,935 | |
| | | | | | | | |
| The accompanying notes are an integral part of these financial statements. | | Annual Report | | | | | March 31, 2024 | | 23 |
| | |
Schedule of Investments DoubleLine Shiller Enhanced CAPE® (Cont.) | | |
| | | | | | | | | | | | | | | | | | | | | | | | | | | | | | | | | | | | | | | | | | |
| Reference Entity | | Counterparty | | Long/Short | | Financing
Rate | | Payment
Frequency | | Termination
Date | | Notional
Amount | | Value | | Upfront
Premiums
Paid/
(Received) | | Unrealized
Appreciation
(Depreciation) |
Shiller Barclays CAPE® US Sector II ER USD Index(1) | | Barclays Capital, Inc. | | | | Long | | | | | 0.40% | | | | | Termination | | | | | 12/05/2024 | | | | | 80,000,000 | | | | $ | 12,304,821 | | | | $ | — | | | | $ | 12,304,821 | |
Shiller Barclays CAPE® US Sector II ER USD Index(1) | | Bank of America Securities, Inc. | | | | Long | | | | | 0.38% | | | | | Termination | | | | | 04/16/2024 | | | | | 64,000,000 | | | | | 11,964,636 | | | | | — | | | | | 11,964,636 | |
Shiller Barclays CAPE® US Sector II ER USD Index(1) | | Bank of America Securities, Inc. | | | | Long | | | | | 0.38% | | | | | Termination | | | | | 06/18/2024 | | | | | 80,000,000 | | | | | 11,749,744 | | | | | — | | | | | 11,749,744 | |
Shiller Barclays CAPE® US Sector II ER USD Index(1) | | Canadian Imperial Bank Of Commerce | | | | Long | | | | | 0.40% | | | | | Termination | | | | | 05/28/2024 | | | | | 62,000,000 | | | | | 11,665,158 | | | | | — | | | | | 11,665,158 | |
Shiller Barclays CAPE® US Sector II ER USD Index(1) | | BNP Paribas Securities Corp. | | | | Long | | | | | 0.39% | | | | | Termination | | | | | 10/09/2024 | | | | | 75,000,000 | | | | | 11,660,288 | | | | | — | | | | | 11,660,288 | |
Shiller Barclays CAPE® US Sector II ER USD Index(1) | | Bank of America Securities, Inc. | | | | Long | | | | | 0.38% | | | | | Termination | | | | | 11/19/2024 | | | | | 75,000,000 | | | | | 10,769,052 | | | | | — | | | | | 10,769,052 | |
Shiller Barclays CAPE® US Sector II ER USD Index(1) | | Barclays Capital, Inc. | | | | Long | | | | | 0.40% | | | | | Termination | | | | | 11/14/2024 | | | | | 55,000,000 | | | | | 10,666,821 | | | | | — | | | | | 10,666,821 | |
Shiller Barclays CAPE® US Sector II ER USD Index(1) | | Bank of America Securities, Inc. | | | | Long | | | | | 0.38% | | | | | Termination | | | | | 10/22/2024 | | | | | 72,000,000 | | | | | 10,360,560 | | | | | — | | | | | 10,360,560 | |
Shiller Barclays CAPE® US Sector II ER USD Index(1) | | Canadian Imperial Bank Of Commerce | | | | Long | | | | | 0.40% | | | | | Termination | | | | | 11/07/2024 | | | | | 60,000,000 | | | | | 10,212,266 | | | | | — | | | | | 10,212,266 | |
Shiller Barclays CAPE® US Sector II ER USD Index(1) | | BNP Paribas Securities Corp. | | | | Long | | | | | 0.39% | | | | | Termination | | | | | 10/30/2024 | | | | | 65,000,000 | | | | | 10,035,515 | | | | | — | | | | | 10,035,515 | |
Shiller Barclays CAPE® US Sector II ER USD Index(1) | | Bank of America Securities, Inc. | | | | Long | | | | | 0.38% | | | | | Termination | | | | | 12/10/2024 | | | | | 100,000,000 | | | | | 9,971,262 | | | | | — | | | | | 9,971,262 | |
Shiller Barclays CAPE® US Sector II ER USD Index(1) | | Barclays Capital, Inc. | | | | Long | | | | | 0.40% | | | | | Termination | | | | | 07/11/2024 | | | | | 88,000,000 | | | | | 9,895,971 | | | | | — | | | | | 9,895,971 | |
Shiller Barclays CAPE® US Sector II ER USD Index(1) | | Canadian Imperial Bank Of Commerce | | | | Long | | | | | 0.40% | | | | | Termination | | | | | 07/16/2024 | | | | | 96,000,000 | | | | | 9,828,593 | | | | | — | | | | | 9,828,593 | |
Shiller Barclays CAPE® US Sector II ER USD Index(1) | | Barclays Capital, Inc. | | | | Long | | | | | 0.40% | | | | | Termination | | | | | 09/12/2024 | | | | | 100,000,000 | | | | | 9,801,542 | | | | | — | | | | | 9,801,542 | |
Shiller Barclays CAPE® US Sector II ER USD Index(1) | | BNP Paribas Securities Corp. | | | | Long | | | | | 0.39% | | | | | Termination | | | | | 10/02/2024 | | | | | 80,000,000 | | | | | 8,940,236 | | | | | — | | | | | 8,940,236 | |
Shiller Barclays CAPE® US Sector II ER USD Index(1) | | Canadian Imperial Bank Of Commerce | | | | Long | | | | | 0.40% | | | | | Termination | | | | | 09/19/2024 | | | | | 88,000,000 | | | | | 8,860,191 | | | | | — | | | | | 8,860,191 | |
Shiller Barclays CAPE® US Sector II ER USD Index(1) | | BNP Paribas Securities Corp. | | | | Long | | | | | 0.39% | | | | | Termination | | | | | 12/18/2024 | | | | | 83,000,000 | | | | | 7,850,222 | | | | | — | | | | | 7,850,222 | |
Shiller Barclays CAPE® US Sector II ER USD Index(1) | | BNP Paribas Securities Corp. | | | | Long | | | | | 0.39% | | | | | Termination | | | | | 08/14/2024 | | | | | 95,000,000 | | | | | 7,766,310 | | | | | — | | | | | 7,766,310 | |
Shiller Barclays CAPE® US Sector II ER USD Index(1) | | Bank of America Securities, Inc. | | | | Long | | | | | 0.38% | | | | | Termination | | | | | 11/26/2024 | | | | | 65,000,000 | | | | | 7,268,213 | | | | | — | | | | | 7,268,213 | |
Shiller Barclays CAPE® US Sector II ER USD Index(1) | | Barclays Capital, Inc. | | | | Long | | | | | 0.40% | | | | | Termination | | | | | 08/08/2024 | | | | | 95,000,000 | | | | | 7,227,053 | | | | | — | | | | | 7,227,053 | |
Shiller Barclays CAPE® US Sector II ER USD Index(1) | | Barclays Capital, Inc. | | | | Long | | | | | 0.40% | | | | | Termination | | | | | 08/22/2024 | | | | | 65,000,000 | | | | | 6,964,274 | | | | | — | | | | | 6,964,274 | |
Shiller Barclays CAPE® US Sector II ER USD Index(1) | | Barclays Capital, Inc. | | | | Long | | | | | 0.40% | | | | | Termination | | | | | 09/26/2024 | | | | | 77,000,000 | | | | | 6,652,296 | | | | | — | | | | | 6,652,296 | |
Shiller Barclays CAPE® US Sector II ER USD Index(1) | | BNP Paribas Securities Corp. | | | | Long | | | | | 0.39% | | | | | Termination | | | | | 07/24/2024 | | | | | 80,000,000 | | | | | 6,418,678 | | | | | — | | | | | 6,418,678 | |
Shiller Barclays CAPE® US Sector II ER USD Index(1) | | Bank of America Securities, Inc. | | | | Long | | | | | 0.38% | | | | | Termination | | | | | 09/03/2024 | | | | | 55,000,000 | | | | | 6,284,773 | | | | | — | | | | | 6,284,773 | |
Shiller Barclays CAPE® US Sector II ER USD Index(1) | | Bank of America Securities, Inc. | | | | Long | | | | | 0.38% | | | | | Termination | | | | | 07/30/2024 | | | | | 80,000,000 | | | | | 6,088,122 | | | | | — | | | | | 6,088,122 | |
| | | | |
| 24 | | DoubleLine Funds Trust | | The accompanying notes are an integral part of these financial statements. |
| | | | | | | | | | | | | | | | | | | | | | | | | | | | | | | | | | | | | | | | | | |
| Reference Entity | | Counterparty | | Long/Short | | Financing
Rate | | Payment
Frequency | | Termination
Date | | Notional
Amount | | Value | | Upfront
Premiums
Paid/
(Received) | | Unrealized
Appreciation
(Depreciation) |
Shiller Barclays CAPE® US Sector II ER USD Index(1) | | Bank of America Securities, Inc. | | | | Long | | | | | 0.38% | | | | | Termination | | | | | 08/13/2024 | | | | | 85,000,000 | | | | $ | 5,823,829 | | | | $ | — | | | | $ | 5,823,829 | |
Shiller Barclays CAPE® US Sector II ER USD Index(1) | | Canadian Imperial Bank Of Commerce | | | | Long | | | | | 0.40% | | | | | Termination | | | | | 02/18/2025 | | | | | 85,000,000 | | | | | 5,206,277 | | | | | — | | | | | 5,206,277 | |
Shiller Barclays CAPE® US Sector II ER USD Index(1) | | BNP Paribas Securities Corp. | | | | Long | | | | | 0.39% | | | | | Termination | | | | | 01/08/2025 | | | | | 100,000,000 | | | | | 5,178,196 | | | | | — | | | | | 5,178,196 | |
Shiller Barclays CAPE® US Sector II ER USD Index(1) | | BNP Paribas Securities Corp. | | | | Long | | | | | 0.39% | | | | | Termination | | | | | 08/28/2024 | | | | | 50,000,000 | | | | | 4,889,887 | | | | | — | | | | | 4,889,887 | |
Shiller Barclays CAPE® US Sector II ER USD Index(1) | | BNP Paribas Securities Corp. | | | | Long | | | | | 0.39% | | | | | Termination | | | | | 02/12/2025 | | | | | 86,000,000 | | | | | 4,278,962 | | | | | — | | | | | 4,278,962 | |
Shiller Barclays CAPE® US Sector II ER USD Index(1) | | Morgan Stanley | | | | Long | | | | | 0.36% | | | | | Termination | | | | | 01/07/2025 | | | | | 54,000,000 | | | | | 4,263,947 | | | | | — | | | | | 4,263,947 | |
Shiller Barclays CAPE® US Sector II ER USD Index(1) | | Morgan Stanley | | | | Long | | | | | 0.36% | | | | | Termination | | | | | 03/04/2025 | | | | | 78,000,000 | | | | | 4,210,285 | | | | | — | | | | | 4,210,285 | |
Shiller Barclays CAPE® US Sector II ER USD Index(1) | | Bank of America Securities, Inc. | | | | Long | | | | | 0.38% | | | | | Termination | | | | | 02/25/2025 | | | | | 80,000,000 | | | | | 4,113,706 | | | | | — | | | | | 4,113,706 | |
Shiller Barclays CAPE® US Sector II ER USD Index(1) | | Canadian Imperial Bank Of Commerce | | | | Long | | | | | 0.40% | | | | | Termination | | | | | 01/09/2025 | | | | | 97,000,000 | | | | | 3,959,411 | | | | | — | | | | | 3,959,411 | |
Shiller Barclays CAPE® US Sector II ER USD Index(1) | | Canadian Imperial Bank Of Commerce | | | | Long | | | | | 0.40% | | | | | Termination | | | | | 03/11/2025 | | | | | 75,000,000 | | | | | 2,862,792 | | | | | — | | | | | 2,862,792 | |
Shiller Barclays CAPE® US Sector II ER USD Index(1) | | Morgan Stanley | | | | Long | | | | | 0.36% | | | | | Termination | | | | | 02/04/2025 | | | | | 47,000,000 | | | | | 2,701,762 | | | | | — | | | | | 2,701,762 | |
Shiller Barclays CAPE® US Sector II ER USD Index(1) | | Canadian Imperial Bank Of Commerce | | | | Long | | | | | 0.40% | | | | | Termination | | | | | 03/20/2025 | | | | | 65,000,000 | | | | | 2,274,129 | | | | | — | | | | | 2,274,129 | |
Shiller Barclays CAPE® US Sector II ER USD Index(1) | | BNP Paribas Securities Corp. | | | | Long | | | | | 0.39% | | | | | Termination | | | | | 01/29/2025 | | | | | 64,000,000 | | | | | 2,206,275 | | | | | — | | | | | 2,206,275 | |
Shiller Barclays CAPE® US Sector II ER USD Index(1) | | Morgan Stanley | | | | Long | | | | | 0.36% | | | | | Termination | | | | | 01/14/2025 | | | | | 50,000,000 | | | | | 1,727,556 | | | | | — | | | | | 1,727,556 | |
Shiller Barclays CAPE® US Sector II ER USD Index(1) | | Bank of America Securities, Inc. | | | | Long | | | | | 0.38% | | | | | Termination | | | | | 04/08/2025 | | | | | 91,000,000 | | | | | 1,470,335 | | | | | — | | | | | 1,470,335 | |
Shiller Barclays CAPE® US Sector II ER USD Index(1) | | Canadian Imperial Bank Of Commerce | | | | Long | | | | | 0.40% | | | | | Termination | | | | | 04/01/2025 | | | | | 93,000,000 | | | | | 1,449,460 | | | | | — | | | | | 1,449,460 | |
Shiller Barclays CAPE® US Sector II ER USD Index(1) | | Bank of America Securities, Inc. | | | | Long | | | | | 0.38% | | | | | Termination | | | | | 03/25/2025 | | | | | 62,000,000 | | | | | 887,246 | | | | | — | | | | | 887,246 | |
| | | | | | | | | | | | | | | | | | | | | | | | | | | | | | | | |
| | | | | | | | | | | | | | | | | | | | | | | | | | | | | | $ | 404,068,626 | | | | $ | — | | | | $ | 404,068,626 | |
| | | | | | | | | | | | | | | | | | | | | | | | | | | | | | | | |
| (1) | Shiller Barclays CAPE® US Sector II ER USD Index aims to provide notional long exposure to the top four United States equity sectors that are relatively undervalued, as defined by a modified version of the classic CAPE® Ratio (the “Relative CAPE® Indicator”) and that possess relatively strong price momentum over the prior twelve months. Each U.S. equity sector is represented by an index of equity securities of companies in the relevant sector. Information on the sector constituents as of March 31, 2024, is available on the Barclays Capital, Inc. website at https://indices.cib.barclays/IM/12/en/indices/details.app;ticker=BXIICS2E. |
| | | | | | | | |
| The accompanying notes are an integral part of these financial statements. | | Annual Report | | | | | March 31, 2024 | | 25 |
| | |
Schedule of Investments DoubleLine Flexible Income Fund | | March 31, 2024 |
| | | | | | | | | | | | | | | | |
PRINCIPAL
AMOUNT $ | | | SECURITY DESCRIPTION | | RATE | | | MATURITY | | | VALUE $ | |
| | ASSET BACKED OBLIGATIONS - 4.7% | | | | | | | | | | | | |
| | | | |
| | | | Amur Equipment Finance Receivables LLC | | | | | | | | | | | | |
| | 650,000 | | | Series 2021-1A-E | | | 4.13% | (a) | | | 03/20/2028 | | | | 634,541 | |
| | | | |
| | | | Arivo Acceptance Auto Loan Receivables Trust | | | | | | | | | | | | |
| | 513,000 | | | Series 2021-1A-C | | | 3.77% | (a) | | | 03/15/2027 | | | | 499,017 | |
| | | | |
| | | | CAI International, Inc. | | | | | | | | | | | | |
| | 702,500 | | | Series 2020-1A-B | | | 3.50% | (a) | | | 09/25/2045 | | | | 633,043 | |
| | | | |
| | | | Castlelake Aircraft Securitization Trust | | | | | | | | | | | | |
| | 2,468,915 | | | Series 2018-1-B | | | 5.30% | (a) | | | 06/15/2043 | | | | 1,965,328 | |
| | | | |
| | | | Compass Datacenters LLC | | | | | | | | | | | | |
| | 1,500,000 | | | Series 2024-1A-B | | | 7.00% | (a) | | | 02/25/2049 | | | | 1,501,593 | |
| | | | |
| | | | Diamond Resorts Owner Trust | | | | | | | | | | | | |
| | 629,244 | | | Series 2021-1A-D | | | 3.83% | (a) | | | 11/21/2033 | | | | 578,102 | |
| | | | |
| | | | ExteNet LLC | | | | | | | | | | | | |
| | 6,250,000 | | | Series 2019-1A-C | | | 5.22% | (a) | | | 07/25/2049 | | | | 6,184,799 | |
| | | | |
| | | | Falko Regional Aircraft Ltd. | | | | | | | | | | | | |
| | 3,583,979 | | | Series 2021-1A-A | | | 5.75% | | | | 04/15/2041 | | | | 3,304,414 | |
| | | | |
| | | | Jersey Mike’s Funding | | | | | | | | | | | | |
| | 1,855,212 | | | Series 2019-1A-A2 | | | 4.43% | (a) | | | 02/15/2050 | | | | 1,777,947 | |
| | | | |
| | | | JOL Air Ltd. | | | | | | | | | | | | |
| | 1,015,322 | | | Series 2019-1-B | | | 4.95% | (a) | | | 04/15/2044 | | | | 874,110 | |
| | | | |
| | | | Lendingpoint Asset Securitization Trust | | | | | | | | | | | | |
| | 1,750,000 | | | Series 2022-C-B | | | 7.46% | (a) | | | 02/15/2030 | | | | 1,746,205 | |
| | | | |
| | | | Loanpal Solar Loan Ltd. | | | | | | | | | | | | |
| | 1,041,713 | | | Series 2021-1GS-C | | | 3.50% | (a) | | | 01/20/2048 | | | | 654,861 | |
| | | | |
| | | | Lunar Structured Aircraft Portfolio Notes | | | | | | | | | | | | |
| | 2,937,402 | | | Series 2021-1-C | | | 5.68% | (a)(b) | | | 10/15/2046 | | | | 2,586,171 | |
| | | | |
| | | | Mosaic Solar Loans LLC | | | | | | | | | | | | |
| | 612,999 | | | Series 2018-1A-C | | | 0.00% | (a)(c) | | | 06/22/2043 | | | | 568,777 | |
| | | | |
| | | | Pagaya AI Debt Selection Trust | | | | | | | | | | | | |
| | 5,499,701 | | | Series 2021-3-C | | | 3.27% | (a) | | | 05/15/2029 | | | | 4,790,280 | |
| | 1,350,000 | | | Series 2021-5-CERT | | | 0.00% | (a)(b)(d) | | | 08/15/2029 | | | | 63,624 | |
| | 2,050,000 | | | Series 2024-1-A | | | 6.66% | (a) | | | 07/15/2031 | | | | 2,057,692 | |
| | | | |
| | | | Retained Vantage Data Centers Issuer LLC | | | | | | | | | | | | |
| | 2,000,000 | | | Series 2023-1A-B | | | 5.75% | (a) | | | 09/15/2048 | | | | 1,878,240 | |
| | | | |
| | | | Switch ABS Issuer LLC | | | | | | | | | | | | |
| | 1,500,000 | | | Series 2024-1A-B | | | 6.50% | (a) | | | 03/25/2054 | | | | 1,458,687 | |
| | | | |
| | | | Upstart Securitization Trust | | | | | | | | | | | | |
| | 1,750,000 | | | Series 2021-3-C | | | 3.28% | (a) | | | 07/20/2031 | | | | 1,669,920 | |
| | | | |
| | | | Vivant Solar Financing V Parent LLC | | | | | | | | | | | | |
| | 4,405,395 | | | Series 2018-1A-A | | | 4.73% | (a) | | | 04/30/2048 | | | | 4,113,898 | |
| | | | |
| | | | WAVE USA | | | | | | | | | | | | |
| | 10,593,979 | | | Series 2019-1-C | | | 6.41% | (a)(b) | | | 09/15/2044 | | | | 3,360,866 | |
| | | | |
| | | | Willis Lease Finance Corp. | | | | | | | | | | | | |
| | 984,771 | | | Series 2018-A-A | | | 4.75% | (a)(e) | | | 09/15/2043 | | | | 943,557 | |
| | | | |
| | | | Zephyrus Capital Aviation Partners | | | | | | | | | | | | |
| | 1,303,625 | | | Series 2018-1-A | | | 4.61% | (a) | | | 10/15/2038 | | | | 1,188,273 | |
| | | | | | | | | | | | | | | | |
| | | | Total Asset Backed Obligations (Cost $55,337,606) | | | | | | | | 45,033,945 | |
| | | | | | | | | | | | | |
| | | | | | | | |
| The accompanying notes are an integral part of these financial statements. | | Annual Report | | | | | March 31, 2024 | | 1 |
| | |
Schedule of Investments DoubleLine Flexible Income Fund (Cont.) | | |
| | | | | | | | | | | | | | | | |
PRINCIPAL
AMOUNT $ | | | SECURITY DESCRIPTION | | RATE | | | MATURITY | | | VALUE $ | |
| | BANK LOANS - 8.8% | | | | | | | | | | | | |
| | | | |
| | | | AAdvantage Loyalty IP Ltd. | | | | | | | | | | | | |
| | 191,250 | | | Senior Secured First Lien Term Loan (3 Month US Secured Overnight Financing Rate + 5.01%, 0.75% Floor) | | | 10.33% | | | | 04/20/2028 | | | | 198,940 | |
| | | | |
| | | | Access CIG LLC | | | | | | | | | | | | |
| | 527,761 | | | Senior Secured First Lien Term Loan (1 Month US Secured Overnight Financing Rate + 5.00%, 0.50% Floor) | | | 10.33% | | | | 08/18/2028 | | | | 528,999 | |
| | | | |
| | | | Acrisure LLC | | | | | | | | | | | | |
| | 664,806 | | | Senior Secured First Lien Term Loan (1 Month Synthetic LIBOR + 3.50%) | | | 8.94% | (f) | | | 02/15/2027 | | | | 665,222 | |
| | 185,725 | | | Senior Secured First Lien Term Loan (1 Month Synthetic LIBOR + 4.25%, 0.50% Floor) | | | 9.69% | (f) | | | 02/15/2027 | | | | 186,538 | |
| | | | |
| | | | Acuris Finance US, Inc. | | | | | | | | | | | | |
| | 415,104 | | | Senior Secured First Lien Term Loan (3 Month US Secured Overnight Financing Rate + 4.10%, 0.50% Floor) | | | 9.50% | | | | 02/16/2028 | | | | 415,169 | |
| | | | |
| | | | ADMI Corp. | | | | | | | | | | | | |
| | 183,779 | | | Senior Secured First Lien Term Loan (1 Month US Secured Overnight Financing Rate + 3.86%, 0.50% Floor) | | | 9.19% | | | | 12/23/2027 | | | | 177,921 | |
| | 273,625 | | | Senior Secured First Lien Term Loan (1 Month US Secured Overnight Financing Rate + 5.75%) | | | 11.08% | | | | 12/23/2027 | | | | 274,224 | |
| | | | |
| | | | AI Aqua Merger Sub, Inc. | | | | | | | | | | | | |
| | 874,834 | | | Senior Secured First Lien Term Loan (1 Month US Secured Overnight Financing Rate + 3.75%, 0.50% Floor) | | | 9.07% | | | | 07/31/2028 | | | | 877,388 | |
| | | | |
| | | | Air Canada | | | | | | | | | | | | |
| | 175,000 | | | Senior Secured First Lien Term Loan (3 Month US Secured Overnight Financing Rate + 2.50%) | | | 7.83% | | | | 03/21/2031 | | | | 175,548 | |
| | | | |
| | | | Air Methods Corp. | | | | | | | | | | | | |
| | 4,768 | | | Senior Secured First Lien Term Loan (3 Month US Secured Overnight Financing Rate + 9.10%) | | | 14.41% | | | | 12/28/2028 | | | | 4,852 | |
| | | | |
| | | | AlixPartners LLP | | | | | | | | | | | | |
| | 382,738 | | | Senior Secured First Lien Term Loan (1 Month US Secured Overnight Financing Rate + 2.61%, 0.50% Floor) | | | 7.94% | | | | 02/04/2028 | | | | 383,647 | |
| | | | |
| | | | Alliant Holdings Intermediate LLC | | | | | | | | | | | | |
| | 412,925 | | | Senior Secured First Lien Term Loan (1 Month US Secured Overnight Financing Rate + 3.50%, 0.50% Floor) | | | 8.83% | | | | 11/06/2030 | | | | 415,078 | |
| | | | |
| | | | Allied Universal Holdco LLC | | | | | | | | | | | | |
| | 520,672 | | | Senior Secured First Lien Term Loan (1 Month US Secured Overnight Financing Rate + 3.85%, 0.50% Floor) | | | 9.18% | | | | 05/15/2028 | | | | 520,624 | |
| | | | |
| | | | Allspring Buyer LLC | | | | | | | | | | | | |
| | 266,706 | | | Senior Secured First Lien Term Loan (3 Month US Secured Overnight Financing Rate + 3.51%, 0.50% Floor) | | | 8.89% | | | | 11/01/2028 | | | | 266,853 | |
| | | | |
| | | | Alterra Mountain Co. | | | | | | | | | | | | |
| | 159,213 | | | Senior Secured First Lien Term Loan (1 Month US Secured Overnight Financing Rate + 3.85%) | | | 9.18% | | | | 05/31/2030 | | | | 160,208 | |
| | 55,000 | | | Senior Secured Term Loan (CME Term SOFR 1 Month + 3.50%) | | | 8.83% | | | | 05/31/2030 | | | | 55,344 | |
| | 336,963 | | | Senior Secured First Lien Term Loan (1 Month US Secured Overnight Financing Rate + 3.61%, 0.50% Floor) | | | 8.94% | | | | 08/17/2028 | | | | 338,789 | |
| | | | |
| | | | Altice France SA/France | | | | | | | | | | | | |
| | 393,575 | | | Senior Secured First Lien Term Loan (3 Month US Secured Overnight Financing Rate + 5.50%) | | | 10.81% | | | | 08/31/2028 | | | | 314,984 | |
| | | | |
| | | | AMC Entertainment Holdings, Inc. | | | | | | | | | | | | |
| | 81,577 | | | Senior Secured First Lien Term Loan (1 Month US Secured Overnight Financing Rate + 3.11%) | | | 8.44% | | | | 04/22/2026 | | | | 68,627 | |
| | | | |
| | | | American Airlines, Inc. | | | | | | | | | | | | |
| | 434,547 | | | Senior Secured First Lien Term Loan (6 Month US Secured Overnight Financing Rate + 3.50%) | | | 8.77% | | | | 06/04/2029 | | | | 436,448 | |
| | | | |
| | | | American Tire Distributors, Inc. | | | | | | | | | | | | |
| | 95,323 | | | Senior Secured First Lien Term Loan (3 Month US Secured Overnight Financing Rate + 6.51%, 0.75% Floor) | | | 11.83% | | | | 10/23/2028 | | | | 83,169 | |
| | | | |
| | | | Apple Bidco LLC | | | | | | | | | | | | |
| | 122,188 | | | Senior Secured First Lien Term Loan (1 Month US Secured Overnight Financing Rate + 2.86%, 0.50% Floor) | | | 8.19% | | | | 09/25/2028 | | | | 122,226 | |
| | | | |
| | | | Applied Systems, Inc. | | | | | | | | | | | | |
| | 125,000 | | | Senior Secured Second Lien Term Loan (3 Month US Secured Overnight Financing Rate + 5.25%) | | | 10.56% | | | | 02/23/2032 | | | | 129,649 | |
| | 345,000 | | | Senior Secured First Lien Term Loan (3 Month US Secured Overnight Financing Rate + 3.50%) | | | 8.81% | | | | 02/24/2031 | | | | 347,465 | |
| | | | |
| | | | APX Group, Inc. | | | | | | | | | | | | |
| | 160,433 | | | Senior Secured First Lien Term Loan (1 Month US Secured Overnight Financing Rate + 3.36%, 0.50% Floor) | | | 8.69% | | | | 07/10/2028 | | | | 161,016 | |
| | 442 | | | Senior Secured First Lien Term Loan (Prime Rate + 2.25%, 0.50% Floor) | | | 10.75% | | | | 07/10/2028 | | | | 444 | |
| | | | |
| 2 | | DoubleLine Funds Trust | | The accompanying notes are an integral part of these financial statements. |
| | | | | | | | | | | | | | | | |
PRINCIPAL
AMOUNT $ | | | SECURITY DESCRIPTION | | RATE | | | MATURITY | | | VALUE $ | |
| | | | |
| | | | Artera Services LLC | | | | | | | | | | | | |
| | 360,000 | | | Senior Secured First Lien Term Loan (3 Month US Secured Overnight Financing Rate + 4.50%) | | | 9.81% | | | | 02/10/2031 | | | | 361,800 | |
| | | | |
| | | | Ascend Learning LLC | | | | | | | | | | | | |
| | 214,249 | | | Senior Secured First Lien Term Loan (1 Month US Secured Overnight Financing Rate + 3.60%, 0.50% Floor) | | | 8.93% | | | | 12/10/2028 | | | | 213,340 | |
| | 118,216 | | | Senior Secured Second Lien Term Loan (1 Month US Secured Overnight Financing Rate + 5.85%, 0.50% Floor) | | | 11.18% | | | | 12/10/2029 | | | | 117,071 | |
| | 207,518 | | | Senior Secured First Lien Term Loan (1 Month US Secured Overnight Financing Rate + 3.60%, 0.50% Floor) | | | 8.93% | | | | 12/10/2028 | | | | 206,637 | |
| | | | |
| | | | ASP LS Acquisition Corp. | | | | | | | | | | | | |
| | 148,855 | | | Senior Secured First Lien Term Loan (6 Month US Secured Overnight Financing Rate + 4.76%, 0.75% Floor) | | | 10.07% | | | | 05/07/2028 | | | | 139,068 | |
| | | | |
| | | | AssuredPartners, Inc. | | | | | | | | | | | | |
| | 142,100 | | | Senior Secured First Lien Term Loan (1 Month US Secured Overnight Financing Rate + 3.50%, 0.50% Floor) | | | 8.83% | | | | 02/12/2027 | | | | 142,389 | |
| | 24,866 | | | Senior Secured First Lien Term Loan (1 Month US Secured Overnight Financing Rate + 3.75%, 0.50% Floor) | | | 9.08% | | | | 02/12/2027 | | | | 24,923 | |
| | 925,000 | | | Senior Secured First Lien Term Loan (1 Month US Secured Overnight Financing Rate + 3.50%, 0.50% Floor) | | | 8.82% | | | | 02/14/2031 | | | | 927,312 | |
| | 276,253 | | | Senior Secured First Lien Term Loan (1 Month US Secured Overnight Financing Rate + 3.61%) | | | 8.94% | | | | 02/12/2027 | | | | 276,850 | |
| | | | |
| | | | Astra Acquisition Corp. | | | | | | | | | | | | |
| | 234,126 | | | Senior Secured First Lien Term Loan (3 Month US Secured Overnight Financing Rate + 5.36%, 0.50% Floor) | | | 10.86% | | | | 10/25/2028 | | | | 99,211 | |
| | | | |
| | | | Asurion LLC | | | | | | | | | | | | |
| | 50,000 | | | Senior Secured Second Lien Term Loan (1 Month US Secured Overnight Financing Rate + 5.36%) | | | 10.69% | | | | 02/03/2028 | | | | 45,344 | |
| | 274,774 | | | Senior Secured First Lien Term Loan (1 Month US Secured Overnight Financing Rate + 4.35%) | | | 9.68% | | | | 08/19/2028 | | | | 265,844 | |
| | 143,533 | | | Senior Secured First Lien Term Loan (1 Month US Secured Overnight Financing Rate + 3.36%) | | | 8.69% | | | | 12/23/2026 | | | | 140,969 | |
| | 165,000 | | | Senior Secured Second Lien Term Loan (1 Month US Secured Overnight Financing Rate + 5.36%) | | | 10.69% | | | | 01/20/2029 | | | | 148,410 | |
| | 262,396 | | | Senior Secured First Lien Term Loan (1 Month US Secured Overnight Financing Rate + 3.36%) | | | 8.69% | | | | 07/31/2027 | | | | 252,791 | |
| | | | |
| | | | AthenaHealth Group, Inc. | | | | | | | | | | | | |
| | 857,700 | | | Senior Secured First Lien Term Loan (1 Month US Secured Overnight Financing Rate + 3.25%, 0.50% Floor) | | | 8.58% | | | | 02/15/2029 | | | | 851,739 | |
| | | | |
| | | | Aveanna Healthcare LLC | | | | | | | | | | | | |
| | 277,459 | | | Senior Secured First Lien Term Loan (3 Month US Secured Overnight Financing Rate + 3.85%, 0.50% Floor) | | | 9.19% | | | | 07/17/2028 | | | | 267,499 | |
| | 118,610 | | | Senior Secured Second Lien Term Loan (3 Month US Secured Overnight Financing Rate + 7.15%, 0.50% Floor) | | | 12.49% | | | | 12/10/2029 | | | | 102,301 | |
| | | | |
| | | | Aventiv Technologies LLC | | | | | | | | | | | | |
| | 159,344 | | | First Lien Term Loan (CME Term SOFR 3 Month + 5.35%) | | | 10.70% | | | | 07/31/2025 | | | | 119,469 | |
| | | | |
| | | | Bally’s Corp. | | | | | | | | | | | | |
| | 348,645 | | | Senior Secured First Lien Term Loan (3 Month US Secured Overnight Financing Rate + 3.51%, 0.50% Floor) | | | 8.83% | | | | 10/02/2028 | | | | 328,234 | |
| | | | |
| | | | Bausch + Lomb Corp. | | | | | | | | | | | | |
| | 601,731 | | | Senior Secured First Lien Term Loan (1 Month US Secured Overnight Financing Rate + 3.35%, 0.50% Floor) | | | 8.68% | | | | 05/10/2027 | | | | 596,165 | |
| | 184,075 | | | Senior Secured First Lien Term Loan (1 Month US Secured Overnight Financing Rate + 4.00%) | | | 9.33% | | | | 09/29/2028 | | | | 184,306 | |
| | | | |
| | | | BCP Renaissance Parent LLC | | | | | | | | | | | | |
| | 269,758 | | | Senior Secured First Lien Term Loan (3 Month US Secured Overnight Financing Rate + 3.50%, 1.00% Floor) | | | 8.83% | | | | 10/31/2028 | | | | 270,855 | |
| | | | |
| | | | BCPE Empire Holdings, Inc. | | | | | | | | | | | | |
| | 487,753 | | | Senior Secured First Lien Term Loan (1 Month US Secured Overnight Financing Rate + 4.00%, 0.50% Floor) | | | 9.33% | | | | 12/25/2028 | | | | 488,850 | |
| | | | |
| | | | Boost Newco Borrower LLC | | | | | | | | | | | | |
| | 430,000 | | | Senior Secured First Lien Term Loan (3 Month US Secured Overnight Financing Rate + 3.00%) | | | 8.31% | | | | 01/31/2031 | | | | 432,062 | |
| | | | |
| | | | Boxer Parent Co., Inc. | | | | | | | | | | | | |
| | 653,063 | | | Senior Secured First Lien Term Loan (1 Month US Secured Overnight Financing Rate + 4.25%) | | | 9.58% | | | | 12/29/2028 | | | | 658,029 | |
| | | | | | | | |
| The accompanying notes are an integral part of these financial statements. | | Annual Report | | | | | March 31, 2024 | | 3 |
| | |
Schedule of Investments DoubleLine Flexible Income Fund (Cont.) | | |
| | | | | | | | | | | | | | | | |
PRINCIPAL
AMOUNT $ | | | SECURITY DESCRIPTION | | RATE | | | MATURITY | | | VALUE $ | |
| | | | |
| | | | Brand Industrial Services, Inc. | | | | | | | | | | | | |
| | 273,949 | | | Senior Secured First Lien Term Loan (3 Month US Secured Overnight Financing Rate + 5.50%, 0.50% Floor) | | | 10.81% | | | | 08/01/2030 | | | | 275,466 | |
| | | | |
| | | | Brown Group Holding LLC | | | | | | | | | | | | |
| | 469,906 | | | Senior Secured First Lien Term Loan (1 Month US Secured Overnight Financing Rate + 2.85%, 0.50% Floor) | | | 8.18% | | | | 06/07/2028 | | | | 470,120 | |
| | | | |
| | | | Buckeye Partners LP | | | | | | | | | | | | |
| | 215,000 | | | Senior Secured First Lien Term Loan (1 Month US Secured Overnight Financing Rate + 2.00%) | | | 7.33% | | | | 11/02/2026 | | | | 215,643 | |
| | | | |
| | | | Caesars Entertainment, Inc. | | | | | | | | | | | | |
| | 365,000 | | | Senior Secured First Lien Term Loan (3 Month US Secured Overnight Financing Rate + 2.75%, 0.50% Floor) | | | 8.04% | | | | 02/06/2031 | | | | 365,741 | |
| | 99,000 | | | Senior Secured First Lien Term Loan (3 Month US Secured Overnight Financing Rate + 3.35%, 0.50% Floor) | | | 8.66% | | | | 02/06/2030 | | | | 99,406 | |
| | | | |
| | | | Camelot US Acquisition LLC | | | | | | | | | | | | |
| | 363,153 | | | Senior Secured First Lien Term Loan (1 Month US Secured Overnight Financing Rate + 2.75%) | | | 8.08% | | | | 01/31/2031 | | | | 363,426 | |
| | 7,195 | | | Senior Secured First Lien Term Loan (1 Month US Secured Overnight Financing Rate + 2.75%) | | | 8.08% | | | | 01/31/2031 | | | | 7,201 | |
| | 84,651 | | | Senior Secured First Lien Term Loan (1 Month US Secured Overnight Financing Rate + 2.75%) | | | 8.08% | | | | 01/31/2031 | | | | 84,715 | |
| | | | |
| | | | Carnival Corp. | | | | | | | | | | | | |
| | 79,400 | | | Senior Secured First Lien Term Loan (1 Month US Secured Overnight Financing Rate + 3.00%, 0.75% Floor) | | | 8.32% | | | | 08/09/2027 | | | | 79,615 | |
| | 475,407 | | | Senior Secured First Lien Term Loan (1 Month US Secured Overnight Financing Rate + 3.36%, 0.75% Floor) | | | 8.69% | | | | 10/18/2028 | | | | 476,646 | |
| | | | |
| | | | Castle US Holding Corp. | | | | | | | | | | | | |
| | 131,197 | | | Senior Secured First Lien Term Loan (3 Month US Secured Overnight Financing Rate + 4.01%) | | | 9.35% | | | | 01/29/2027 | | | | 92,892 | |
| | | | |
| | | | Castlelake Aviation One DAC | | | | | | | | | | | | |
| | 387,662 | | | Senior Secured First Lien Term Loan (3 Month US Secured Overnight Financing Rate + 2.50%, 0.50% Floor) | | | 7.83% | | | | 10/22/2026 | | | | 388,169 | |
| | | | |
| | | | Catalent Pharma Solutions, Inc. | | | | | | | | | | | | |
| | 862,806 | | | Senior Secured First Lien Term Loan (1 Month US Secured Overnight Financing Rate + 2.11%, 0.50% Floor) | | | 7.44% | | | | 02/22/2028 | | | | 863,344 | |
| | | | |
| | | | Cengage Learning, Inc. | | | | | | | | | | | | |
| | 215,000 | | | Senior Secured First Lien Term Loan (1 Month US Secured Overnight Financing Rate + 4.25%, 1.00% Floor) | | | 9.58% | | | | 03/24/2031 | | | | 215,033 | |
| | | | |
| | | | Central Parent, Inc. | | | | | | | | | | | | |
| | 428,238 | | | Senior Secured First Lien Term Loan (3 Month US Secured Overnight Financing Rate + 4.00%) | | | 9.31% | | | | 07/06/2029 | | | | 429,998 | |
| | | | |
| | | | Century DE Buyer LLC | | | | | | | | | | | | |
| | 135,000 | | | Senior Secured First Lien Term Loan (3 Month US Secured Overnight Financing Rate + 4.00%) | | | 9.32% | | | | 10/30/2030 | | | | 135,658 | |
| | | | |
| | | | Chariot Buyer LLC | | | | | | | | | | | | |
| | 262,982 | | | Senior Secured First Lien Term Loan (1 Month US Secured Overnight Financing Rate + 3.35%, 0.50% Floor) | | | 8.68% | | | | 11/03/2028 | | | | 262,934 | |
| | | | |
| | | | Charter Communications Operating LLC | | | | | | | | | | | | |
| | 472,625 | | | Senior Secured First Lien Term Loan (3 Month US Secured Overnight Financing Rate + 2.00%) | | | 7.33% | | | | 12/09/2030 | | | | 468,454 | |
| | 1,188 | | | Senior Secured First Lien Term Loan (3 Month US Secured Overnight Financing Rate + 2.00%) | | | 7.32% | | | | 12/09/2030 | | | | 1,177 | |
| | | | |
| | | | Charter Next Generation, Inc. | | | | | | | | | | | | |
| | 350,000 | | | Senior Secured First Lien Term Loan (1 Month US Secured Overnight Financing Rate + 3.50%, 0.75% Floor) | | | 8.83% | | | | 12/01/2027 | | | | 351,034 | |
| | | | |
| | | | CHG Healthcare Services, Inc. | | | | | | | | | | | | |
| | 1,707,732 | | | Senior Secured First Lien Term Loan (1 Month US Secured Overnight Financing Rate + 3.36%, 0.50% Floor) | | | 8.69% | | | | 09/29/2028 | | | | 1,711,113 | |
| | | | |
| | | | CHG PPC Parent LLC | | | | | | | | | | | | |
| | 332,422 | | | Senior Secured First Lien Term Loan (1 Month US Secured Overnight Financing Rate + 3.11%, 0.50% Floor) | | | 8.44% | | | | 12/08/2028 | | | | 333,253 | |
| | | | |
| | | | Clarios Global LP | | | | | | | | | | | | |
| | 513,713 | | | Senior Secured First Lien Term Loan (1 Month US Secured Overnight Financing Rate + 3.00%) | | | 8.33% | | | | 05/06/2030 | | | | 515,639 | |
| | | | |
| 4 | | DoubleLine Funds Trust | | The accompanying notes are an integral part of these financial statements. |
| | | | | | | | | | | | | | | | |
PRINCIPAL
AMOUNT $ | | | SECURITY DESCRIPTION | | RATE | | | MATURITY | | | VALUE $ | |
| | | | |
| | | | ClubCorp Holdings, Inc. | | | | | | | | | | | | |
| | 352,696 | | | Senior Secured First Lien Term Loan (3 Month US Secured Overnight Financing Rate + 5.26%) | | | 10.61% | | | | 09/18/2026 | | | | 353,832 | |
| | 12,705 | | | Senior Secured First Lien Term Loan (3 Month US Secured Overnight Financing Rate + 5.26%) | | | 10.61% | | | | 09/18/2026 | | | | 12,746 | |
| | | | |
| | | | Clydesdale Acquisition Holdings, Inc. | | | | | | | | | | | | |
| | 379,036 | | | Senior Secured First Lien Term Loan (1 Month US Secured Overnight Financing Rate + 3.78%, 0.50% Floor) | | | 9.11% | | | | 04/13/2029 | | | | 379,983 | |
| | | | |
| | | | CMG Media Corp. | | | | | | | | | | | | |
| | 239,485 | | | Senior Secured First Lien Term Loan (3 Month US Secured Overnight Financing Rate + 3.60%) | | | 8.91% | | | | 12/17/2026 | | | | 209,443 | |
| | | | |
| | | | CNT Holdings I Corp. | | | | | | | | | | | | |
| | 341,593 | | | Senior Secured First Lien Term Loan (3 Month US Secured Overnight Financing Rate + 3.50%, 0.75% Floor) | | | 8.82% | | | | 11/08/2027 | | | | 342,633 | |
| | | | |
| | | | Coherent Corp. T/L B (03/24) | | | | | | | | | | | | |
| | 70,000 | | | Senior Secured Term Loan | | | 7.83% | (g) | | | 07/02/2029 | | | | 70,000 | |
| | | | |
| | | | Columbus McKinnon Corp./NY | | | | | | | | | | | | |
| | 19,530 | | | Senior Secured First Lien Term Loan (3 Month US Secured Overnight Financing Rate + 2.50%) | | | 7.81% | | | | 05/15/2028 | | | | 19,603 | |
| | | | |
| | | | CommScope, Inc. | | | | | | | | | | | | |
| | 99,026 | | | Senior Secured First Lien Term Loan (1 Month US Secured Overnight Financing Rate + 3.36%) | | | 8.69% | | | | 04/06/2026 | | | | 90,113 | |
| | | | |
| | | | Compass Power Generation LLC | | | | | | | | | | | | |
| | 330,358 | | | Senior Secured First Lien Term Loan (1 Month US Secured Overnight Financing Rate + 4.36%, 1.00% Floor) | | | 9.69% | | | | 04/14/2029 | | | | 332,789 | |
| | | | |
| | | | Connect Finco SARL | | | | | | | | | | | | |
| | 261,133 | | | Senior Secured First Lien Term Loan (1 Month US Secured Overnight Financing Rate + 3.50%, 1.00% Floor) | | | 8.83% | | | | 12/11/2026 | | | | 261,194 | |
| | | | |
| | | | Conservice Midco LLC | | | | | | | | | | | | |
| | 259,799 | | | Senior Secured First Lien Term Loan (1 Month US Secured Overnight Financing Rate + 4.00%) | | | 9.33% | | | | 05/13/2027 | | | | 260,980 | |
| | | | |
| | | | Constant Contact, Inc. | | | | | | | | | | | | |
| | 267,507 | | | Senior Secured First Lien Term Loan (3 Month US Secured Overnight Financing Rate + 4.26%, 0.75% Floor) | | | 9.59% | | | | 02/10/2028 | | | | 260,629 | |
| | | | |
| | | | CoreLogic, Inc. | | | | | | | | | | | | |
| | 454,175 | | | Senior Secured First Lien Term Loan (1 Month US Secured Overnight Financing Rate + 3.61%, 0.50% Floor) | | | 8.94% | | | | 06/02/2028 | | | | 445,198 | |
| | | | |
| | | | Cornerstone Building Brands, Inc. | | | | | | | | | | | | |
| | 148,469 | | | Senior Secured First Lien Term Loan (1 Month US Secured Overnight Financing Rate + 3.35%, 0.50% Floor) | | | 8.68% | | | | 04/12/2028 | | | | 147,964 | |
| | | | |
| | | | Cornerstone OnDemand, Inc. | | | | | | | | | | | | |
| | 278,771 | | | Senior Secured First Lien Term Loan (1 Month US Secured Overnight Financing Rate + 4.01%, 0.50% Floor) | | | 9.19% | | | | 10/16/2028 | | | | 274,010 | |
| | | | |
| | | | Cotiviti, Inc. | | | | | | | | | | | | |
| | 435,000 | | | Senior Secured Term Loan (CME Term SOFR 1 Month + 3.25%) | | | 8.58% | | | | 02/24/2031 | | | | 434,456 | |
| | | | |
| | | | CQP Holdco LP | | | | | | | | | | | | |
| | 359,100 | | | Senior Secured First Lien Term Loan (3 Month US Secured Overnight Financing Rate + 3.00%, 0.50% Floor) | | | 8.35% | | | | 12/31/2030 | | | | 360,613 | |
| | | | |
| | | | Crosby US Acquisition Corp. | | | | | | | | | | | | |
| | 119,700 | | | Senior Secured First Lien Term Loan (1 Month US Secured Overnight Financing Rate + 4.00%, 0.50% Floor) | | | 9.32% | | | | 08/16/2029 | | | | 120,510 | |
| | | | |
| | | | Cross Financial Corp. | | | | | | | | | | | | |
| | 189,031 | | | Senior Secured First Lien Term Loan (1 Month US Secured Overnight Financing Rate + 3.50%, 0.75% Floor) | | | 8.83% | | | | 09/15/2027 | | | | 189,267 | |
| | | | |
| | | | CSC Holdings LLC | | | | | | | | | | | | |
| | 318,342 | | | Senior Secured First Lien Term Loan (1 Month Synthetic LIBOR + 2.50%) | | | 7.94% | (f) | | | 04/15/2027 | | | | 288,668 | |
| | | | |
| | | | Curium Bidco SARL | | | | | | | | | | | | |
| | 37,916 | | | Senior Secured First Lien Term Loan (3 Month US Secured Overnight Financing Rate + 4.50%) | | | 9.81% | | | | 07/31/2029 | | | | 38,153 | |
| | 85,334 | | | Senior Secured First Lien Term Loan (3 Month US Secured Overnight Financing Rate + 4.50%) | | | 9.81% | | | | 07/31/2029 | | | | 85,867 | |
| | 129,838 | | | Senior Secured First Lien Term Loan (3 Month US Secured Overnight Financing Rate + 4.50%) | | | 9.81% | | | | 07/31/2029 | | | | 130,649 | |
| | | | | | | | |
| The accompanying notes are an integral part of these financial statements. | | Annual Report | | | | | March 31, 2024 | | 5 |
| | |
Schedule of Investments DoubleLine Flexible Income Fund (Cont.) | | |
| | | | | | | | | | | | | | | | |
PRINCIPAL
AMOUNT $ | | | SECURITY DESCRIPTION | | RATE | | | MATURITY | | | VALUE $ | |
| | | | |
| | | | Cyxtera DC Holdings, Inc. | | | | | | | | | | | | |
| | 123,869 | | | Senior Secured First Lien Term Loan (3 Month US Secured Overnight Financing Rate + 2.00%, 1.00% Floor) | | | 10.50% | (h) | | | 05/01/2024 | | | | 6,359 | |
| | | | |
| | | | Dcert Buyer, Inc. | | | | | | | | | | | | |
| | 95,000 | | | Senior Secured Second Lien Term Loan (1 Month US Secured Overnight Financing Rate + 7.00%) | | | 12.33% | | | | 02/16/2029 | | | | 86,279 | |
| | 370,892 | | | Senior Secured First Lien Term Loan (1 Month US Secured Overnight Financing Rate + 4.00%) | | | 9.33% | | | | 10/16/2026 | | | | 369,620 | |
| | | | |
| | | | Deerfield Dakota Holding LLC | | | | | | | | | | | | |
| | 927,558 | | | Senior Secured First Lien Term Loan (3 Month US Secured Overnight Financing Rate + 3.75%, 1.00% Floor) | | | 9.06% | | | | 04/09/2027 | | | | 924,144 | |
| | | | |
| | | | Dexko Global, Inc. | | | | | | | | | | | | |
| | 187,435 | | | Senior Secured First Lien Term Loan (3 Month US Secured Overnight Financing Rate + 4.01%, 0.50% Floor) | | | 9.32% | | | | 10/04/2028 | | | | 185,912 | |
| | | | |
| | | | DG Investment Intermediate Holdings 2, Inc. | | | | | | | | | | | | |
| | 45,000 | | | Senior Secured Second Lien Term Loan (1 Month US Secured Overnight Financing Rate + 6.86%, 0.75% Floor) | | | 12.19% | | | | 03/31/2029 | | | | 42,244 | |
| | 383,623 | | | Senior Secured First Lien Term Loan (1 Month US Secured Overnight Financing Rate + 3.86%, 0.75% Floor) | | | 9.19% | | | | 03/31/2028 | | | | 384,034 | |
| | | | |
| | | | Directv Financing LLC | | | | | | | | | | | | |
| | 167,472 | | | Senior Secured First Lien Term Loan (1 Month US Secured Overnight Financing Rate + 5.26%, 0.75% Floor) | | | 10.44% | | | | 08/02/2027 | | | | 167,891 | |
| | | | |
| | | | Dun & Bradstreet Corp. | | | | | | | | | | | | |
| | 238,338 | | | Senior Secured First Lien Term Loan (1 Month US Secured Overnight Financing Rate + 2.75%) | | | 8.08% | | | | 01/18/2029 | | | | 238,560 | |
| | | | |
| | | | Dynasty Acquisition Co., Inc. | | | | | | | | | | | | |
| | 391,705 | | | Senior Secured Term Loan (CME Term SOFR 1 Month + 3.50%) | | | 8.83% | | | | 08/24/2028 | | | | 392,723 | |
| | | | |
| | | | EAB Global, Inc. | | | | | | | | | | | | |
| | 267,944 | | | Senior Secured First Lien Term Loan (1 Month US Secured Overnight Financing Rate + 3.61%, 0.50% Floor) | | | 8.94% | | | | 08/16/2028 | | | | 268,413 | |
| | | | |
| | | | Echo Global Logistics, Inc. | | | | | | | | | | | | |
| | 135,814 | | | Senior Secured First Lien Term Loan (1 Month US Secured Overnight Financing Rate + 3.60%, 0.50% Floor) | | | 8.93% | | | | 11/23/2028 | | | | 134,214 | |
| | | | |
| | | | Ecovyst Catalyst Technologies LLC | | | | | | | | | | | | |
| | 253,286 | | | Senior Secured First Lien Term Loan (3 Month US Secured Overnight Financing Rate + 2.60%, 0.50% Floor) | | | 7.91% | | | | 06/09/2028 | | | | 253,483 | |
| | 658,542 | | | Senior Secured First Lien Term Loan (3 Month US Secured Overnight Financing Rate + 2.60%, 0.50% Floor) | | | 7.91% | | | | 06/09/2028 | | | | 659,057 | |
| | | | |
| | | | Edelman Financial Engines Center LLC/The | | | | | | | | | | | | |
| | 154,180 | | | Senior Secured Second Lien Term Loan (1 Month US Secured Overnight Financing Rate + 6.86%) | | | 12.19% | | | | 07/20/2026 | | | | 155,192 | |
| | 733,409 | | | Senior Secured First Lien Term Loan (1 Month US Secured Overnight Financing Rate + 3.61%, 0.75% Floor) | | | 8.94% | | | | 04/07/2028 | | | | 734,396 | |
| | | | |
| | | | EG America LLC | | | | | | | | | | | | |
| | 278,991 | | | Senior Secured First Lien Term Loan (Daily US Secured Overnight Financing Rate + 5.93%, 0.50% Floor) | | | 11.67% | | | | 02/07/2028 | | | | 278,294 | |
| | | | |
| | | | Eisner Advisory Group LLC | | | | | | | | | | | | |
| | 300,000 | | | Senior Secured First Lien Term Loan (1 Month US Secured Overnight Financing Rate + 4.00%, 0.50% Floor) | | | 9.33% | | | | 02/28/2031 | | | | 301,595 | |
| | | | |
| | | | Element Materials Technology Group US Holdings, Inc. | | | | | | | | | | | | |
| | 67,046 | | | Senior Secured First Lien Term Loan (3 Month US Secured Overnight Financing Rate + 4.35%, 0.50% Floor) | | | 9.66% | | | | 06/25/2029 | | | | 67,186 | |
| | 145,266 | | | Senior Secured First Lien Term Loan (3 Month US Secured Overnight Financing Rate + 4.35%, 0.50% Floor) | | | 9.66% | | | | 06/25/2029 | | | | 145,569 | |
| | | | |
| | | | Ellucian Holdings, Inc. | | | | | | | | | | | | |
| | 516,902 | | | Senior Secured First Lien Term Loan (1 Month US Secured Overnight Financing Rate + 3.60%, 0.50% Floor) | | | 8.93% | | | | 10/29/2029 | | | | 519,745 | |
| | | | |
| | | | Energizer Holdings, Inc. | | | | | | | | | | | | |
| | 139,332 | | | Senior Secured First Lien Term Loan (1 Month US Secured Overnight Financing Rate + 2.36%, 0.50% Floor) | | | 7.69% | | | | 12/22/2027 | | | | 139,437 | |
| | | | |
| | | | Everi Holdings, Inc. | | | | | | | | | | | | |
| | 130,613 | | | Senior Secured First Lien Term Loan (1 Month US Secured Overnight Financing Rate + 2.61%, 0.50% Floor) | | | 7.94% | | | | 08/03/2028 | | | | 131,046 | |
| | | | |
| | | | Fertitta Entertainment LLC/NV | | | | | | | | | | | | |
| | 1,713,705 | | | Senior Secured First Lien Term Loan (1 Month US Secured Overnight Financing Rate + 3.75%, 0.50% Floor) | | | 9.08% | | | | 01/29/2029 | | | | 1,719,779 | |
| | | | |
| 6 | | DoubleLine Funds Trust | | The accompanying notes are an integral part of these financial statements. |
| | | | | | | | | | | | | | | | |
PRINCIPAL
AMOUNT $ | | | SECURITY DESCRIPTION | | RATE | | | MATURITY | | | VALUE $ | |
| | | | |
| | | | FinThrive Software Intermediate Holdings, Inc. | | | | | | | | | | | | |
| | 164,418 | | | Senior Secured First Lien Term Loan (3 Month US Secured Overnight Financing Rate + 4.11%, 0.50% Floor) | | | 9.42% | | | | 12/18/2028 | | | | 138,780 | |
| | | | |
| | | | First Advantage Holdings LLC | | | | | | | | | | | | |
| | 187,311 | | | Senior Secured First Lien Term Loan (1 Month US Secured Overnight Financing Rate + 2.86%) | | | 8.19% | | | | 01/29/2027 | | | | 187,370 | |
| | | | |
| | | | Flame Newco LLC | | | | | | | | | | | | |
| | 3,353 | | | Senior Secured First Lien Term Loan (1 Month US Secured Overnight Financing Rate + 2.10%, 1.00% Floor) | | | 7.43% | | | | 06/30/2028 | | | | 3,161 | |
| | 108,927 | | | Senior Secured First Lien Term Loan (1 Month US Secured Overnight Financing Rate + 2.10%, 1.00% Floor) | | | 7.43% | | | | 06/30/2028 | | | | 102,663 | |
| | | | |
| | | | Flutter Financing BV | | | | | | | | | | | | |
| | 124,688 | | | Senior Secured First Lien Term Loan (3 Month US Secured Overnight Financing Rate + 2.25%, 0.50% Floor) | | | 7.56% | | | | 11/29/2030 | | | | 124,966 | |
| | | | |
| | | | Focus Financial Partners LLC | | | | | | | | | | | | |
| | 738,000 | | | Senior Secured First Lien Term Loan (1 Month US Secured Overnight Financing Rate + 2.75%, 0.50% Floor) | | | 8.08% | | | | 06/30/2028 | | | | 736,502 | |
| | | | |
| | | | Foresight Energy LLC | | | | | | | | | | | | |
| | 105,726 | | | Senior Secured First Lien Term Loan (3 Month US Secured Overnight Financing Rate + 8.10%, 1.50% Floor) | | | 13.41% | (b) | | | 06/30/2027 | | | | 105,726 | |
| | | | |
| | | | Fortrea Holdings, Inc. | | | | | | | | | | | | |
| | 49,625 | | | Senior Secured First Lien Term Loan (1 Month US Secured Overnight Financing Rate + 3.75%, 0.50% Floor) | | | 9.08% | | | | 07/01/2030 | | | | 49,832 | |
| | | | |
| | | | Freeport LNG Investments LLLP | | | | | | | | | | | | |
| | 279,170 | | | Senior Secured First Lien Term Loan (3 Month US Secured Overnight Financing Rate + 3.76%, 0.50% Floor) | | | 9.08% | | | | 12/21/2028 | | | | 277,632 | |
| | | | |
| | | | Gainwell Acquisition Corp. | | | | | | | | | | | | |
| | 766,250 | | | Senior Secured First Lien Term Loan (3 Month US Secured Overnight Financing Rate + 4.10%, 0.75% Floor) | | | 9.41% | | | | 10/01/2027 | | | | 734,354 | |
| | | | |
| | | | Garda World Security Corp. | | | | | | | | | | | | |
| | 466,625 | | | Senior Secured First Lien Term Loan (3 Month US Secured Overnight Financing Rate + 4.35%) | | | 9.58% | | | | 02/01/2029 | | | | 468,086 | |
| | | | |
| | | | Gates Global LLC | | | | | | | | | | | | |
| | 93,575 | | | Senior Secured First Lien Term Loan (1 Month US Secured Overnight Financing Rate + 3.00%, 0.50% Floor) | | | 8.33% | | | | 11/16/2029 | | | | 93,993 | |
| | | | |
| | | | Genesys Cloud Services Holdings II T/L B | | | | | | | | | | | | |
| | 365,086 | | | Senior Secured Term Loan | | | 0.00% | | | | 12/01/2027 | | | | 365,715 | |
| | | | |
| | | | GIP II Blue Holding LP | | | | | | | | | | | | |
| | 110,269 | | | Senior Secured First Lien Term Loan (1 Month US Secured Overnight Financing Rate + 4.61%, 1.00% Floor) | | | 9.94% | | | | 09/29/2028 | | | | 110,768 | |
| | | | |
| | | | GIP Pilot Acquisition Partners LP | | | | | | | | | | | | |
| | 155,000 | | | Senior Secured First Lien Term Loan (3 Month US Secured Overnight Financing Rate + 3.00%) | | | 8.33% | | | | 10/04/2030 | | | | 155,698 | |
| | | | |
| | | | Gogo Intermediate Holdings LLC | | | | | | | | | | | | |
| | 502,703 | | | Senior Secured First Lien Term Loan (1 Month US Secured Overnight Financing Rate + 3.86%, 0.75% Floor) | | | 9.19% | | | | 04/28/2028 | | | | 502,564 | |
| | | | |
| | | | Graham Packaging Co., Inc. | | | | | | | | | | | | |
| | 520,137 | | | Senior Secured First Lien Term Loan (1 Month US Secured Overnight Financing Rate + 3.11%, 0.75% Floor) | | | 8.44% | | | | 08/04/2027 | | | | 520,626 | |
| | | | |
| | | | Great Outdoors Group LLC | | | | | | | | | | | | |
| | 497,963 | | | Senior Secured First Lien Term Loan (1 Month US Secured Overnight Financing Rate + 3.86%, 0.75% Floor) | | | 9.19% | | | | 03/05/2028 | | | | 498,862 | |
| | | | |
| | | | Greystone Select Financial LLC | | | | | | | | | | | | |
| | 67,415 | | | Senior Secured First Lien Term Loan (3 Month US Secured Overnight Financing Rate + 5.26%, 0.75% Floor) | | | 10.57% | | | | 06/17/2028 | | | | 67,415 | |
| | | | |
| | | | Grifols Worldwide Operations USA, Inc. | | | | | | | | | | | | |
| | 330,463 | | | Senior Secured First Lien Term Loan (3 Month US Secured Overnight Financing Rate + 2.15%) | | | 7.46% | | | | 11/15/2027 | | | | 320,693 | |
| | | | |
| | | | Harbor Freight Tools USA, Inc. | | | | | | | | | | | | |
| | 165,788 | | | Senior Secured First Lien Term Loan (1 Month US Secured Overnight Financing Rate + 2.86%, 0.50% Floor) | | | 8.19% | | | | 10/19/2027 | | | | 165,872 | |
| | | | |
| | | | Helios Software Holdings, Inc. | | | | | | | | | | | | |
| | 229,026 | | | Senior Secured First Lien Term Loan (3 Month US Secured Overnight Financing Rate + 3.75%) | | | 9.07% | | | | 07/15/2030 | | | | 227,453 | |
| | | | | | | | |
| The accompanying notes are an integral part of these financial statements. | | Annual Report | | | | | March 31, 2024 | | 7 |
| | |
Schedule of Investments DoubleLine Flexible Income Fund (Cont.) | | |
| | | | | | | | | | | | | | | | |
PRINCIPAL
AMOUNT $ | | | SECURITY DESCRIPTION | | RATE | | | MATURITY | | | VALUE $ | |
| | | | |
| | | | Hexion Holdings Corp. | | | | | | | | | | | | |
| | 363,256 | | | Senior Secured First Lien Term Loan (3 Month US Secured Overnight Financing Rate + 4.50%, 0.50% Floor) | | | 9.98% | | | | 03/15/2029 | | | | 358,197 | |
| | | | |
| | | | H-Food Holdings LLC | | | | | | | | | | | | |
| | 109,088 | | | Senior Secured First Lien Term Loan (3 Month US Secured Overnight Financing Rate + 3.95%) | | | 9.29% | | | | 05/30/2025 | | | | 79,839 | |
| | | | |
| | | | Hightower Holding LLC | | | | | | | | | | | | |
| | 417,884 | | | Senior Secured First Lien Term Loan (3 Month US Secured Overnight Financing Rate + 4.26%, 0.75% Floor) | | | 9.59% | | | | 04/21/2028 | | | | 418,928 | |
| | | | |
| | | | Hilton Grand Vacations Borrower LLC | | | | | | | | | | | | |
| | 230,000 | | | Senior Secured First Lien Term Loan (1 Month US Secured Overnight Financing Rate + 2.75%) | | | 8.08% | | | | 01/17/2031 | | | | 230,683 | |
| | | | |
| | | | HomeServe USA Corp. | | | | | | | | | | | | |
| | 305,000 | | | Senior Secured First Lien Term Loan (1 Month US Secured Overnight Financing Rate + 3.00%) | | | 8.33% | | | | 10/21/2030 | | | | 306,106 | |
| | | | |
| | | | Hunter Douglas, Inc. | | | | | | | | | | | | |
| | 319,411 | | | Senior Secured First Lien Term Loan (3 Month US Secured Overnight Financing Rate + 3.50%, 0.50% Floor) | | | 8.82% | | | | 02/26/2029 | | | | 316,291 | |
| | 117,284 | | | Senior Secured First Lien Term Loan (3 Month US Secured Overnight Financing Rate + 3.50%, 0.50% Floor) | | | 8.82% | | | | 02/26/2029 | | | | 116,138 | |
| | | | |
| | | | iHeartCommunications, Inc. | | | | | | | | | | | | |
| | 160,836 | | | Senior Secured First Lien Term Loan (1 Month US Secured Overnight Financing Rate + 3.11%) | | | 8.44% | | | | 05/01/2026 | | | | 141,277 | |
| | | | |
| | | | INEOS US Finance LLC | | | | | | | | | | | | |
| | 110,000 | | | Senior Secured First Lien Term Loan (1 Month US Secured Overnight Financing Rate + 3.75%) | | | 9.08% | | | | 01/31/2031 | | | | 110,275 | |
| | 322,563 | | | Senior Secured First Lien Term Loan (1 Month US Secured Overnight Financing Rate + 3.60%) | | | 8.93% | | | | 02/19/2030 | | | | 322,966 | |
| | | | |
| | | | INEOS US Petrochem LLC | | | | | | | | | | | | |
| | 480,000 | | | Senior Secured Term Loan (CME Term SOFR 1 Month + 4.25%) | | | 9.68% | | | | 03/29/2029 | | | | 479,702 | |
| | | | |
| | | | ION Trading Finance Ltd. | | | | | | | | | | | | |
| | 183,827 | | | Senior Secured First Lien Term Loan (3 Month US Secured Overnight Financing Rate + 4.85%) | | | 10.20% | | | | 04/03/2028 | | | | 183,827 | |
| | | | |
| | | | Iron Mountain, Inc. | | | | | | | | | | | | |
| | 438,900 | | | Senior Secured First Lien Term Loan (1 Month US Secured Overnight Financing Rate + 2.25%) | | | 7.58% | | | | 01/31/2031 | | | | 436,339 | |
| | | | |
| | | | Ivanti Software, Inc. | | | | | | | | | | | | |
| | 115,341 | | | Senior Secured First Lien Term Loan (3 Month US Secured Overnight Financing Rate + 4.51%, 0.75% Floor) | | | 9.84% | | | | 12/01/2027 | | | | 108,277 | |
| | | | |
| | | | Jazz Financing Lux SARL | | | | | | | | | | | | |
| | 387,365 | | | Senior Secured First Lien Term Loan (1 Month US Secured Overnight Financing Rate + 3.11%, 0.50% Floor) | | | 8.44% | | | | 05/05/2028 | | | | 389,787 | |
| | | | |
| | | | Kenan Advantage Group, Inc. | | | | | | | | | | | | |
| | 310,000 | | | Senior Secured First Lien Term Loan (1 Month US Secured Overnight Financing Rate + 3.75%) | | | 9.08% | | | | 01/25/2029 | | | | 310,679 | |
| | | | |
| | | | Kloeckner Pentaplast of America, Inc. | | | | | | | | | | | | |
| | 144,015 | | | Senior Secured First Lien Term Loan (6 Month US Secured Overnight Financing Rate + 4.98%, 0.50% Floor) | | | 10.27% | | | | 02/09/2026 | | | | 135,914 | |
| | | | |
| | | | Kronos Acquisition Holdings, Inc. | | | | | | | | | | | | |
| | 243,234 | | | Senior Secured First Lien Term Loan (3 Month US Secured Overnight Financing Rate + 4.01%, 0.50% Floor) | | | 9.36% | | | | 12/22/2026 | | | | 243,827 | |
| | 103,692 | | | Senior Secured First Lien Term Loan (3 Month US Secured Overnight Financing Rate + 4.01%, 0.50% Floor) | | | 9.36% | | | | 12/22/2026 | | | | 103,945 | |
| | | | |
| | | | LBM Acquisition LLC | | | | | | | | | | | | |
| | 275,039 | | | Senior Secured First Lien Term Loan (1 Month US Secured Overnight Financing Rate + 3.85%, 0.75% Floor) | | | 9.18% | | | | 12/20/2027 | | | | 274,868 | |
| | | | |
| | | | Level 3 Financing, Inc. | | | | | | | | | | | | |
| | 68,130 | | | Senior Secured First Lien Term Loan (CME Term SOFR 1 Month + 6.67%) | | | 12.00% | | | | 04/15/2029 | | | | 67,725 | |
| | 68,130 | | | Senior Secured First Lien Term Loan (CME Term SOFR 1 Month + 6.67%) | | | 12.00% | | | | 04/15/2030 | | | | 67,725 | |
| | | | |
| | | | LifePoint Health, Inc. | | | | | | | | | | | | |
| | 523,725 | | | Senior Secured First Lien Term Loan (3 Month US Secured Overnight Financing Rate + 5.50%) | | | 11.09% | | | | 11/16/2028 | | | | 525,736 | |
| | | | |
| 8 | | DoubleLine Funds Trust | | The accompanying notes are an integral part of these financial statements. |
| | | | | | | | | | | | | | | | |
PRINCIPAL
AMOUNT $ | | | SECURITY DESCRIPTION | | RATE | | | MATURITY | | | VALUE $ | |
| | | | |
| | | | Light & Wonder International, Inc. | | | | | | | | | | | | |
| | 231,475 | | | Senior Secured First Lien Term Loan (1 Month US Secured Overnight Financing Rate + 2.75%, 0.50% Floor) | | | 8.08% | | | | 04/16/2029 | | | | 232,262 | |
| | | | |
| | | | Lummus Technology Holdings V LLC | | | | | | | | | | | | |
| | 546,810 | | | Senior Secured First Lien Term Loan (1 Month US Secured Overnight Financing Rate + 3.61%) | | | 8.94% | | | | 12/31/2029 | | | | 548,122 | |
| | | | |
| | | | Madison IAQ LLC | | | | | | | | | | | | |
| | 560,100 | | | Senior Secured First Lien Term Loan (1 Month US Secured Overnight Financing Rate + 3.36%, 0.50% Floor) | | | 8.69% | | | | 06/21/2028 | | | | 559,954 | |
| | | | |
| | | | Maravai Intermediate Holdings LLC | | | | | | | | | | | | |
| | 166,770 | | | Senior Secured First Lien Term Loan (3 Month US Secured Overnight Financing Rate + 3.00%, 0.50% Floor) | | | 8.31% | | | | 10/19/2027 | | | | 164,129 | |
| | | | |
| | | | Mavis Tire Express Services Topco Corp. | | | | | | | | | | | | |
| | 364,716 | | | Senior Secured First Lien Term Loan (1 Month US Secured Overnight Financing Rate + 3.75%, 0.75% Floor) | | | 9.08% | | | | 05/04/2028 | | | | 365,751 | |
| | | | |
| | | | McAfee Corp. | | | | | | | | | | | | |
| | 339,539 | | | Senior Secured First Lien Term Loan (1 Month US Secured Overnight Financing Rate + 3.85%, 0.50% Floor) | | | 9.18% | | | | 03/01/2029 | | | | 339,705 | |
| | | | |
| | | | Medline Borrower LP | | | | | | | | | | | | |
| | 444,018 | | | Senior Secured First Lien Term Loan (CME Term SOFR 1 Month + 2.86%) | | | 8.19% | | | | 10/23/2028 | | | | 445,482 | |
| | | | |
| | | | MIC Glen LLC | | | | | | | | | | | | |
| | 381,052 | | | Senior Secured First Lien Term Loan (1 Month US Secured Overnight Financing Rate + 3.36%, 0.50% Floor) | | | 8.69% | | | | 07/21/2028 | | | | 381,022 | |
| | | | |
| | | | Michaels Cos., Inc. | | | | | | | | | | | | |
| | 322,624 | | | Senior Secured First Lien Term Loan (3 Month US Secured Overnight Financing Rate + 4.51%, 0.75% Floor) | | | 9.82% | | | | 04/15/2028 | | | | 290,289 | |
| | | | |
| | | | Mileage Plus Holdings LLC | | | | | | | | | | | | |
| | 97,500 | | | Senior Secured First Lien Term Loan (3 Month US Secured Overnight Financing Rate + 5.40%, 1.00% Floor) | | | 10.73% | | | | 06/21/2027 | | | | 100,524 | |
| | | | |
| | | | Minotaur Acquisition, Inc. | | | | | | | | | | | | |
| | 377,141 | | | Senior Secured First Lien Term Loan (1 Month US Secured Overnight Financing Rate + 4.85%) | | | 10.18% | | | | 03/30/2026 | | | | 377,989 | |
| | | | |
| | | | Mirion Technologies US, Inc. | | | | | | | | | | | | |
| | 280,361 | | | Senior Secured First Lien Term Loan (3 Month US Secured Overnight Financing Rate + 3.01%, 0.50% Floor) | | | 8.36% | | | | 10/20/2028 | | | | 281,412 | |
| | | | |
| | | | Mister Car Wash Holdings T/L (03/24) | | | | | | | | | | | | |
| | 85,000 | | | Senior Secured Term Loan | | | 8.33% | (g) | | | 03/21/2031 | | | | 85,301 | |
| | | | |
| | | | Mitchell International, Inc. | | | | | | | | | | | | |
| | 390,809 | | | Senior Secured First Lien Term Loan (1 Month US Secured Overnight Financing Rate + 3.86%, 0.50% Floor) | | | 9.19% | | | | 10/15/2028 | | | | 391,411 | |
| | 55,000 | | | Senior Secured Second Lien Term Loan (1 Month US Secured Overnight Financing Rate + 6.61%, 0.50% Floor) | | | 11.94% | | | | 10/15/2029 | | | | 55,034 | |
| | | | |
| | | | MIWD Holdco II LLC | | | | | | | | | | | | |
| | 90,000 | | | Senior Secured Term Loan (CME Term SOFR 1 Month + 3.50%) | | | 8.83% | | | | 03/28/2031 | | | | 90,535 | |
| | | | |
| | | | Monogram Food Solutions LLC | | | | | | | | | | | | |
| | 347,013 | | | Senior Secured First Lien Term Loan (1 Month US Secured Overnight Financing Rate + 4.11%, 0.50% Floor) | | | 9.44% | | | | 08/27/2028 | | | | 347,881 | |
| | | | |
| | | | Motion Finco SARL | | | | | | | | | | | | |
| | 555,000 | | | Senior Secured First Lien Term Loan (3 Month US Secured Overnight Financing Rate + 3.76%) | | | 9.07% | | | | 11/30/2029 | | | | 554,792 | |
| | | | |
| | | | Nascar Holdings LLC | | | | | | | | | | | | |
| | 49,034 | | | Senior Secured First Lien Term Loan (1 Month US Secured Overnight Financing Rate + 2.61%) | | | 7.94% | | | | 10/19/2026 | | | | 49,301 | |
| | | | |
| | | | NEP Group, Inc. | | | | | | | | | | | | |
| | 234,120 | | | Senior Secured First Lien Term Loan (1 Month US Secured Overnight Financing Rate + 3.36%) 1.50% PIK | | | 8.69% | | | | 08/19/2026 | | | | 223,805 | |
| | 33,885 | | | Senior Secured First Lien Term Loan (1 Month US Secured Overnight Financing Rate + 3.36%) 1.50% PIK | | | 8.69% | | | | 08/19/2026 | | | | 32,392 | |
| | | | |
| | | | Newfold Digital Holdings Group, Inc. | | | | | | | | | | | | |
| | 279,609 | | | Senior Secured First Lien Term Loan (6 Month US Secured Overnight Financing Rate + 3.93%, 0.75% Floor) | | | 9.42% | | | | 02/10/2028 | | | | 273,528 | |
| | | | |
| | | | Nouryon USA LLC | | | | | | | | | | | | |
| | 288,180 | | | Senior Secured First Lien Term Loan (3 Month US Secured Overnight Financing Rate + 4.10%) | | | 9.42% | | | | 04/03/2028 | | | | 289,441 | |
| | 74,805 | | | Senior Secured First Lien Term Loan (3 Month US Secured Overnight Financing Rate + 4.10%) | | | 9.42% | | | | 04/03/2028 | | | | 75,132 | |
| | | | | | | | |
| The accompanying notes are an integral part of these financial statements. | | Annual Report | | | | | March 31, 2024 | | 9 |
| | |
Schedule of Investments DoubleLine Flexible Income Fund (Cont.) | | |
| | | | | | | | | | | | | | | | |
PRINCIPAL
AMOUNT $ | | | SECURITY DESCRIPTION | | RATE | | | MATURITY | | | VALUE $ | |
| | | | |
| | | | NRG Energy T/L B (03/24) | | | | | | | | | | | | |
| | 230,000 | | | Senior Secured Term Loan | | | 7.33% | (g) | | | 03/27/2031 | | | | 229,857 | |
| | | | |
| | | | Olympus Water US Holding Corp. | | | | | | | | | | | | |
| | 344,672 | | | Senior Secured First Lien Term Loan (3 Month US Secured Overnight Financing Rate + 4.01%, 0.50% Floor) | | | 9.32% | | | | 11/09/2028 | | | | 345,298 | |
| | | | |
| | | | OMNIA Partners LLC | | | | | | | | | | | | |
| | 154,613 | | | Senior Secured First Lien Term Loan (3 Month US Secured Overnight Financing Rate + 3.75%) | | | 9.07% | | | | 07/25/2030 | | | | 155,506 | |
| | | | |
| | | | OneDigital Borrower LLC | | | | | | | | | | | | |
| | 495,437 | | | Senior Secured First Lien Term Loan (1 Month US Secured Overnight Financing Rate + 4.50%, 0.50% Floor) | | | 9.68% | | | | 11/16/2027 | | | | 496,056 | |
| | | | |
| | | | Ontario Gaming GTA LP | | | | | | | | | | | | |
| | 428,943 | | | Senior Secured First Lien Term Loan (3 Month US Secured Overnight Financing Rate + 4.25%, 0.50% Floor) | | | 9.56% | | | | 08/01/2030 | | | | 430,935 | |
| | | | |
| | | | Organon & Co. | | | | | | | | | | | | |
| | 365,505 | | | Senior Secured First Lien Term Loan (1 Month US Secured Overnight Financing Rate + 3.11%, 0.50% Floor) | | | 8.43% | | | | 06/02/2028 | | | | 367,258 | |
| | | | |
| | | | Oryx Midstream Services Permian Basin LLC | | | | | | | | | | | | |
| | 374,063 | | | Senior Secured First Lien Term Loan (1 Month US Secured Overnight Financing Rate + 3.11%, 0.50% Floor) | | | 8.44% | | | | 10/05/2028 | | | | 375,901 | |
| | | | |
| | | | Outcomes Group Holdings, Inc. | | | | | | | | | | | | |
| | 94,750 | | | Senior Secured First Lien Term Loan (1 Month US Secured Overnight Financing Rate + 3.51%) | | | 8.69% | | | | 10/24/2025 | | | | 94,883 | |
| | | | |
| | | | Pacific Dental Services T/L B (02/24) | | | | | | | | | | | | |
| | 350,000 | | | Senior Secured Term Loan | | | 8.58% | (g) | | | 03/07/2031 | | | | 350,511 | |
| | | | |
| | | | Packaging Coordinators Midco, Inc. | | | | | | | | | | | | |
| | 505,350 | | | Senior Secured First Lien Term Loan (3 Month US Secured Overnight Financing Rate + 3.76%, 0.75% Floor) | | | 9.07% | | | | 11/30/2027 | | | | 507,000 | |
| | | | |
| | | | Packers Holdings LLC | | | | | | | | | | | | |
| | 143,255 | | | Senior Secured First Lien Term Loan (1 Month US Secured Overnight Financing Rate + 3.35%, 0.75% Floor) | | | 8.68% | | | | 03/09/2028 | | | | 92,041 | |
| | | | |
| | | | Pactiv Evergreen Group Holdings, Inc. | | | | | | | | | | | | |
| | 23,941 | | | Senior Secured First Lien Term Loan (1 Month US Secured Overnight Financing Rate + 3.36%, 0.50% Floor) | | | 8.69% | | | | 09/25/2028 | | | | 24,052 | |
| | 187,784 | | | Senior Secured First Lien Term Loan (1 Month US Secured Overnight Financing Rate + 3.36%, 0.50% Floor) | | | 8.69% | | | | 09/25/2028 | | | | 188,653 | |
| | 41,341 | | | Senior Secured First Lien Term Loan (1 Month US Secured Overnight Financing Rate + 3.36%, 0.50% Floor) | | | 8.69% | | | | 09/25/2028 | | | | 41,532 | |
| | | | |
| | | | Par Petroleum LLC | | | | | | | | | | | | |
| | 84,150 | | | Senior Secured First Lien Term Loan (3 Month US Secured Overnight Financing Rate + 4.35%, 0.50% Floor) | | | 9.69% | | | | 02/28/2030 | | | | 84,386 | |
| | | | |
| | | | PECF USS Intermediate Holding III Corp. | | | | | | | | | | | | |
| | 176,054 | | | Senior Secured First Lien Term Loan (3 Month US Secured Overnight Financing Rate + 4.51%, 0.50% Floor) | | | 9.82% | | | | 12/15/2028 | | | | 134,902 | |
| | | | |
| | | | Penn Entertainment, Inc. | | | | | | | | | | | | |
| | 390,092 | | | Senior Secured First Lien Term Loan (1 Month US Secured Overnight Financing Rate + 2.85%, 0.50% Floor) | | | 8.18% | | | | 05/03/2029 | | | | 390,946 | |
| | | | |
| | | | Peraton Corp. | | | | | | | | | | | | |
| | 372,581 | | | Senior Secured First Lien Term Loan (1 Month US Secured Overnight Financing Rate + 3.85%, 0.75% Floor) | | | 9.18% | | | | 02/01/2028 | | | | 372,961 | |
| | | | |
| | | | Perrigo Investments LLC | | | | | | | | | | | | |
| | 251,770 | | | Senior Secured First Lien Term Loan (1 Month US Secured Overnight Financing Rate + 2.35%, 0.50% Floor) | | | 7.68% | | | | 04/20/2029 | | | | 251,351 | |
| | | | |
| | | | PetSmart LLC | | | | | | | | | | | | |
| | 846,459 | | | Senior Secured First Lien Term Loan (1 Month US Secured Overnight Financing Rate + 3.85%, 0.75% Floor) | | | 9.18% | | | | 02/12/2028 | | | | 845,579 | |
| | | | |
| | | | PG&E Corp. | | | | | | | | | | | | |
| | 95,000 | | | Senior Secured First Lien Term Loan (1 Month US Secured Overnight Financing Rate + 2.50%, 0.50% Floor) | | | 7.83% | | | | 06/23/2027 | | | | 95,267 | |
| | | | |
| | | | Phoenix Newco, Inc. | | | | | | | | | | | | |
| | 843,544 | | | Senior Secured First Lien Term Loan (1 Month US Secured Overnight Financing Rate + 3.36%, 0.50% Floor) | | | 8.69% | | | | 11/15/2028 | | | | 846,421 | |
| | | | |
| 10 | | DoubleLine Funds Trust | | The accompanying notes are an integral part of these financial statements. |
| | | | | | | | | | | | | | | | |
PRINCIPAL
AMOUNT $ | | | SECURITY DESCRIPTION | | RATE | | | MATURITY | | | VALUE $ | |
| | | | |
| | | | Playa Resorts Holding BV | | | | | | | | | | | | |
| | 326,222 | | | Senior Secured First Lien Term Loan (1 Month US Secured Overnight Financing Rate + 3.25%, 0.50% Floor) | | | 8.58% | | | | 01/05/2029 | | | | 327,558 | |
| | | | |
| | | | PointClickCare Technologies, Inc. | | | | | | | | | | | | |
| | 97,099 | | | Senior Secured First Lien Term Loan (3 Month US Secured Overnight Financing Rate + 3.26%, 0.75% Floor) | | | 8.57% | | | | 12/29/2027 | | | | 97,403 | |
| | | | |
| | | | Polar US Borrower LLC | | | | | | | | | | | | |
| | 76,389 | | | Senior Secured First Lien Term Loan (3 Month US Secured Overnight Financing Rate + 4.85%) | | | 10.16% | | | | 10/15/2025 | | | | 58,199 | |
| | 65,285 | | | Senior Secured First Lien Term Loan (3 Month US Secured Overnight Financing Rate + 4.85%) | | | 10.16% | | | | 10/15/2025 | | | | 49,739 | |
| | | | |
| | | | Polaris Newco LLC | | | | | | | | | | | | |
| | 258,383 | | | Senior Secured First Lien Term Loan (3 Month US Secured Overnight Financing Rate + 4.11%, 0.50% Floor) | | | 9.57% | | | | 06/05/2028 | | | | 256,183 | |
| | | | |
| | | | Pregis TopCo LLC | | | | | | | | | | | | |
| | 516,820 | | | Senior Secured First Lien Term Loan (1 Month US Secured Overnight Financing Rate + 3.75%) | | | 9.08% | | | | 07/31/2026 | | | | 518,203 | |
| | | | |
| | | | Pretium PKG Holdings, Inc. | | | | | | | | | | | | |
| | 1,313 | | | Senior Secured First Lien Term Loan (3 Month US Secured Overnight Financing Rate + 3.20%, 1.00% Floor) 1.40% PIK | | | 8.50% | | | | 10/02/2028 | | | | 1,180 | |
| | 628 | | | Senior Secured First Lien Term Loan (3 Month US Secured Overnight Financing Rate + 2.50%, 1.00% Floor) 2.50% PIK | | | 7.81% | | | | 10/02/2028 | | | | 638 | |
| | 213,154 | | | Senior Secured First Lien Term Loan (3 Month US Secured Overnight Financing Rate + 3.20%, 1.00% Floor) 1.40% PIK | | | 8.50% | | | | 10/02/2028 | | | | 191,572 | |
| | 65,000 | | | Senior Secured Second Lien Term Loan (3 Month US Secured Overnight Financing Rate + 7.01%, 0.50% Floor) | | | 12.33% | | | | 10/01/2029 | | | | 40,645 | |
| | 74,054 | | | Senior Secured First Lien Term Loan (3 Month US Secured Overnight Financing Rate + 2.50%, 1.00% Floor) 2.50% PIK | | | 7.81% | | | | 10/02/2028 | | | | 75,211 | |
| | | | |
| | | | Proofpoint, Inc. | | | | | | | | | | | | |
| | 1,719,772 | | | Senior Secured First Lien Term Loan (1 Month US Secured Overnight Financing Rate + 3.36%, 0.50% Floor) | | | 8.69% | | | | 08/31/2028 | | | | 1,722,582 | |
| | | | |
| | | | Quikrete Holdings, Inc. | | | | | | | | | | | | |
| | 153,823 | | | Senior Secured First Lien Term Loan (1 Month US Secured Overnight Financing Rate + 2.86%) | | | 8.19% | | | | 03/19/2029 | | | | 154,077 | |
| | 70,000 | | | Senior Secured Term Loan (CME Term SOFR 1 Month + 2.50%) | | | 7.94% | | | | 03/25/2031 | | | | 70,117 | |
| | | | |
| | | | Radiology Partners T/L - TARGET | | | | | | | | | | | | |
| | 168,006 | | | Senior Secured First Lien Term Loan (3 Month US Secured Overnight Financing Rate + 3.50%) | | | 9.09% | | | | 01/31/2029 | | | | 162,725 | |
| | | | |
| | | | RealPage, Inc. | | | | | | | | | | | | |
| | 854,360 | | | Senior Secured First Lien Term Loan (1 Month US Secured Overnight Financing Rate + 3.11%, 0.50% Floor) | | | 8.44% | | | | 04/24/2028 | | | | 832,346 | |
| | | | |
| | | | Restaurant Technologies, Inc. | | | | | | | | | | | | |
| | 35,705 | | | Senior Secured First Lien Term Loan (3 Month US Secured Overnight Financing Rate + 4.25%, 0.50% Floor) | | | 9.60% | | | | 04/02/2029 | | | | 35,448 | |
| | 378,413 | | | Senior Secured First Lien Term Loan (3 Month US Secured Overnight Financing Rate + 4.25%, 0.50% Floor) | | | 9.60% | | | | 04/02/2029 | | | | 375,694 | |
| | 35,705 | | | Senior Secured First Lien Term Loan (1 Month US Secured Overnight Financing Rate + 4.25%, 0.50% Floor) | | | 9.57% | | | | 04/02/2029 | | | | 35,448 | |
| | | | |
| | | | RH | | | | | | | | | | | | |
| | 223,282 | | | Senior Secured First Lien Term Loan (1 Month US Secured Overnight Financing Rate + 2.61%, 0.50% Floor) | | | 7.94% | | | | 10/20/2028 | | | | 218,206 | |
| | | | |
| | | | Scientific Games Holdings LP | | | | | | | | | | | | |
| | 311,834 | | | Senior Secured First Lien Term Loan (3 Month US Secured Overnight Financing Rate + 2.75%, 0.50% Floor) | | | 8.58% | | | | 04/04/2029 | | | | 312,135 | |
| | | | |
| | | | Sinclair Television Group, Inc. | | | | | | | | | | | | |
| | 112,012 | | | Senior Secured First Lien Term Loan (1 Month US Secured Overnight Financing Rate + 2.61%) | | | 7.94% | | | | 09/30/2026 | | | | 106,986 | |
| | | | |
| | | | SkyMiles IP Ltd. | | | | | | | | | | | | |
| | 108,750 | | | Senior Secured First Lien Term Loan (3 Month US Secured Overnight Financing Rate + 3.75%, 1.00% Floor) | | | 9.07% | | | | 10/20/2027 | | | | 112,296 | |
| | | | | | | | |
| The accompanying notes are an integral part of these financial statements. | | Annual Report | | | | | March 31, 2024 | | 11 |
| | |
Schedule of Investments DoubleLine Flexible Income Fund (Cont.) | | |
| | | | | | | | | | | | | | | | |
PRINCIPAL
AMOUNT $ | | | SECURITY DESCRIPTION | | RATE | | | MATURITY | | | VALUE $ | |
| | | | |
| | | | SMG US Midco 2, Inc. | | | | | | | | | | | | |
| | 219,986 | | | Senior Secured First Lien Term Loan (3 Month US Secured Overnight Financing Rate + 2.76%) | | | 8.07% | | | | 01/23/2025 | | | | 220,182 | |
| | 81,112 | | | Senior Secured First Lien Term Loan (3 Month US Secured Overnight Financing Rate + 2.76%) | | | 8.07% | | | | 01/23/2025 | | | | 81,184 | |
| | | | |
| | | | Sotera Health Holdings LLC | | | | | | | | | | | | |
| | 395,000 | | | Senior Secured First Lien Term Loan (1 Month US Secured Overnight Financing Rate + 2.86%) | | | 8.19% | | | | 12/11/2026 | | | | 394,340 | |
| | | | |
| | | | Southern Veterinary Partners LLC | | | | | | | | | | | | |
| | 578,866 | | | Senior Secured First Lien Term Loan (1 Month US Secured Overnight Financing Rate + 4.11%, 1.00% Floor) | | | 9.44% | | | | 10/05/2027 | | | | 580,169 | |
| | | | |
| | | | Spin Holdco, Inc. | | | | | | | | | | | | |
| | 152,885 | | | Senior Secured First Lien Term Loan (3 Month US Secured Overnight Financing Rate + 4.26%, 0.75% Floor) | | | 9.59% | | | | 03/06/2028 | | | | 141,981 | |
| | | | |
| | | | SRS Distribution, Inc. | | | | | | | | | | | | |
| | 1,737,659 | | | Senior Secured First Lien Term Loan (1 Month US Secured Overnight Financing Rate + 3.61%, 0.50% Floor) | | | 8.94% | | | | 06/05/2028 | | | | 1,751,639 | |
| | | | |
| | | | Standard Aero Ltd. | | | | | | | | | | | | |
| | 151,031 | | | Senior Secured First Lien Term Loan (1 Month US Secured Overnight Financing Rate + 3.50%) | | | 8.82% | | | | 08/24/2028 | | | | 151,423 | |
| | | | |
| | | | Starwood Property Mortgage LLC | | | | | | | | | | | | |
| | 99,237 | | | Senior Secured First Lien Term Loan (1 Month US Secured Overnight Financing Rate + 3.35%, 0.75% Floor) | | | 8.68% | | | | 07/27/2026 | | | | 99,609 | |
| | | | |
| | | | Station Casinos LLC | | | | | | | | | | | | |
| | 145,000 | | | Senior Secured First Lien Term Loan (CME Term SOFR 1 Month + 2.25%) | | | 7.82% | | | | 03/14/2031 | | | | 144,983 | |
| | | | |
| | | | StubHub Holdco Sub LLC | | | | | | | | | | | | |
| | 360,000 | | | Senior Secured First Lien Term Loan (1 Month US Secured Overnight Financing Rate + 4.75%) | | | 10.08% | | | | 03/12/2030 | | | | 360,974 | |
| | | | |
| | | | SWF Holdings I Corp. | | | | | | | | | | | | |
| | 354,431 | | | Senior Secured First Lien Term Loan (1 Month US Secured Overnight Financing Rate + 4.11%, 0.75% Floor) | | | 9.44% | | | | 10/06/2028 | | | | 327,111 | |
| | | | |
| | | | Tamko Building Products LLC | | | | | | | | | | | | |
| | 417,900 | | | Senior Secured First Lien Term Loan (3 Month US Secured Overnight Financing Rate + 3.50%) | | | 8.83% | | | | 09/20/2030 | | | | 418,422 | |
| | | | |
| | | | Team Health Holdings, Inc. | | | | | | | | | | | | |
| | 109,064 | | | Senior Secured First Lien Term Loan (3 Month US Secured Overnight Financing Rate + 5.25%, 1.00% Floor) | | | 10.56% | | | | 03/02/2027 | | | | 97,067 | |
| | | | |
| | | | Tecta America Corp. | | | | | | | | | | | | |
| | 195,366 | | | Senior Secured First Lien Term Loan (1 Month US Secured Overnight Financing Rate + 4.11%, 0.75% Floor) | | | 9.44% | | | | 04/10/2028 | | | | 196,114 | |
| | | | |
| | | | Telesat LLC | | | | | | | | | | | | |
| | 70,676 | | | Senior Secured First Lien Term Loan (3 Month US Secured Overnight Financing Rate + 2.86%) | | | 8.35% | | | | 12/07/2026 | | | | 43,002 | |
| | | | |
| | | | Tempo Acquisition LLC | | | | | | | | | | | | |
| | 205,299 | | | Senior Secured First Lien Term Loan (1 Month US Secured Overnight Financing Rate + 2.75%, 0.50% Floor) | | | 8.08% | | | | 08/31/2028 | | | | 206,180 | |
| | | | |
| | | | Tiger Acquisition LLC | | | | | | | | | | | | |
| | 198,752 | | | Senior Secured First Lien Term Loan (1 Month US Secured Overnight Financing Rate + 3.35%, 0.50% Floor) | | | 8.68% | | | | 06/01/2028 | | | | 197,333 | |
| | | | |
| | | | Titan Acquisition Ltd./Canada | | | | | | | | | | | | |
| | 506,474 | | | Senior Secured First Lien Term Loan (1 Month US Secured Overnight Financing Rate + 3.11%) | | | 8.44% | | | | 03/28/2025 | | | | 506,684 | |
| | 465,000 | | | Senior Secured Term Loan (CME Term SOFR 1 Month + 5.00%) | | | 10.33% | | | | 02/01/2029 | | | | 466,793 | |
| | | | |
| | | | TK Elevator US Newco, Inc. | | | | | | | | | | | | |
| | 625,000 | | | Senior Secured Term Loan (CME Term SOFR 1 Month + 3.50%) | | | 8.83% | | | | 04/15/2030 | | | | 627,822 | |
| | | | |
| | | | TransDigm, Inc. | | | | | | | | | | | | |
| | 507,023 | | | Senior Secured First Lien Term Loan (3 Month US Secured Overnight Financing Rate + 2.75%) | | | 8.06% | | | | 08/24/2028 | | | | 506,177 | |
| | 149,625 | | | Senior Secured First Lien Term Loan (3 Month US Secured Overnight Financing Rate + 3.25%) | | | 8.60% | | | | 02/28/2031 | | | | 150,526 | |
| | | | |
| | | | Travelport Finance Luxembourg SARL | | | | | | | | | | | | |
| | 150,713 | | | Senior Secured First Lien Term Loan (3 Month US Secured Overnight Financing Rate + 8.26%, 1.00% Floor) | | | 13.61% | | | | 09/29/2028 | | | | 141,125 | |
| | 42,996 | | | Senior Secured First Lien Term Loan (3 Month US Secured Overnight Financing Rate + 8.26%, 1.00% Floor) | | | 13.61% | | | | 09/29/2028 | | | | 40,261 | |
| | | | |
| 12 | | DoubleLine Funds Trust | | The accompanying notes are an integral part of these financial statements. |
| | | | | | | | | | | | | | | | |
PRINCIPAL
AMOUNT $ | | | SECURITY DESCRIPTION | | RATE | | | MATURITY | | | VALUE $ | |
| | | | |
| | | | Traverse Midstream Partners LLC | | | | | | | | | | | | |
| | 87,539 | | | Senior Secured First Lien Term Loan (3 Month US Secured Overnight Financing Rate + 3.60%, 0.50% Floor) | | | 8.82% | | | | 02/16/2028 | | | | 87,867 | |
| | | | |
| | | | TricorBraun Holdings, Inc. | | | | | | | | | | | | |
| | 340,329 | | | Senior Secured First Lien Term Loan (1 Month US Secured Overnight Financing Rate + 3.36%, 0.50% Floor) | | | 8.69% | | | | 03/03/2028 | | | | 336,941 | |
| | | | |
| | | | Trident TPI Holdings, Inc. | | | | | | | | | | | | |
| | 499,295 | | | Senior Secured First Lien Term Loan (3 Month US Secured Overnight Financing Rate + 4.26%, 0.50% Floor) | | | 9.57% | | | | 09/18/2028 | | | | 500,091 | |
| | | | |
| | | | Triton Water Holdings, Inc. | | | | | | | | | | | | |
| | 513,566 | | | Senior Secured First Lien Term Loan (3 Month US Secured Overnight Financing Rate + 3.51%, 0.50% Floor) | | | 8.86% | | | | 03/31/2028 | | | | 508,818 | |
| | | | |
| | | | Uber Technologies, Inc. | | | | | | | | | | | | |
| | 173,443 | | | Senior Secured First Lien Term Loan (3 Month US Secured Overnight Financing Rate + 2.75%) | | | 8.08% | | | | 03/04/2030 | | | | 174,389 | |
| | | | |
| | | | UFC Holdings LLC | | | | | | | | | | | | |
| | 378,932 | | | Senior Secured First Lien Term Loan (3 Month US Secured Overnight Financing Rate + 3.01%, 0.75% Floor) | | | 8.34% | | | | 04/29/2026 | | | | 379,932 | |
| | | | |
| | | | UKG, Inc. | | | | | | | | | | | | |
| | 445,000 | | | Senior Secured First Lien Term Loan (3 Month US Secured Overnight Financing Rate + 3.50%) | | | 8.81% | | | | 02/10/2031 | | | | 447,850 | |
| | 62,241 | | | Senior Secured Second Lien Term Loan (3 Month US Secured Overnight Financing Rate + 5.35%, 0.50% Floor) | | | 10.68% | | | | 05/03/2027 | | | | 62,903 | |
| | | | |
| | | | Ultra Clean Holdings T/L (03/24) | | | | | | | | | | | | |
| | 130,000 | | | Senior Secured Term Loan | | | 8.82% | (g) | | | 02/29/2028 | | | | 130,325 | |
| | | | |
| | | | Ultra Clean Holdings, Inc. | | | | | | | | | | | | |
| | 90,868 | | | Senior Secured First Lien Term Loan (1 Month US Secured Overnight Financing Rate + 3.86%) | | | 9.19% | | | | 08/27/2025 | | | | 91,095 | |
| | | | |
| | | | United Airlines, Inc. | | | | | | | | | | | | |
| | 435,000 | | | Senior Secured First Lien Term Loan (3 Month US Secured Overnight Financing Rate + 2.75%) | | | 8.08% | | | | 02/24/2031 | | | | 436,222 | |
| | | | |
| | | | Univision Communications, Inc. | | | | | | | | | | | | |
| | 197,428 | | | Senior Secured First Lien Term Loan (3 Month US Secured Overnight Financing Rate + 4.25%, 0.50% Floor) | | | 9.56% | | | | 06/24/2029 | | | | 198,094 | |
| | | | |
| | | | Upbound Group, Inc. | | | | | | | | | | | | |
| | 130,133 | | | Senior Secured First Lien Term Loan (6 Month US Secured Overnight Financing Rate + 3.68%, 0.50% Floor) | | | 9.12% | | | | 02/17/2028 | | | | 130,323 | |
| | | | |
| | | | Vantage Specialty Chemicals, Inc. | | | | | | | | | | | | |
| | 39,500 | | | Senior Secured First Lien Term Loan (3 Month US Secured Overnight Financing Rate + 4.75%, 0.50% Floor) | | | 10.07% | | | | 10/26/2026 | | | | 39,130 | |
| | | | |
| | | | Verscend Holding Corp. | | | | | | | | | | | | |
| | 456,912 | | | Senior Secured First Lien Term Loan (1 Month US Secured Overnight Financing Rate + 4.11%) | | | 9.44% | | | | 08/27/2025 | | | | 457,484 | |
| | | | |
| | | | Vestis Corp. | | | | | | | | | | | | |
| | 145,000 | | | Senior Secured First Lien Term Loan (3 Month US Secured Overnight Financing Rate + 2.25%) | | | 7.58% | | | | 02/24/2031 | | | | 145,181 | |
| | | | |
| | | | Viad Corp. | | | | | | | | | | | | |
| | 192,426 | | | Senior Secured First Lien Term Loan (1 Month US Secured Overnight Financing Rate + 5.11%, 0.50% Floor) | | | 10.44% | | | | 07/31/2028 | | | | 193,209 | |
| | | | |
| | | | Vibrantz Technologies, Inc. | | | | | | | | | | | | |
| | 138,781 | | | Senior Secured First Lien Term Loan (3 Month US Secured Overnight Financing Rate + 4.40%, 0.50% Floor) | | | 9.72% | | | | 04/23/2029 | | | | 137,580 | |
| | | | |
| | | | Virgin Media Bristol LLC | | | | | | | | | | | | |
| | 500,000 | | | Senior Secured First Lien Term Loan (6 Month US Secured Overnight Financing Rate + 3.35%) | | | 8.79% | | | | 03/31/2031 | | | | 493,263 | |
| | | | |
| | | | Vistra Operations Co. LLC | | | | | | | | | | | | |
| | 94,763 | | | Senior Secured First Lien Term Loan (1 Month US Secured Overnight Financing Rate + 2.00%) | | | 7.33% | | | | 12/20/2030 | | | | 94,778 | |
| | | | |
| | | | Vistra Zero Operating Co. LLC | | | | | | | | | | | | |
| | 160,000 | | | Senior Secured Term Loan (CME Term SOFR 1 Month + 2.75%) | | | 8.07% | | | | 03/26/2031 | | | | 160,200 | |
| | | | |
| | | | VT Topco, Inc. | | | | | | | | | | | | |
| | 104,738 | | | Senior Secured First Lien Term Loan (1 Month US Secured Overnight Financing Rate + 4.25%, 0.50% Floor) | | | 9.58% | | | | 08/12/2030 | | | | 105,149 | |
| | | | | | | | |
| The accompanying notes are an integral part of these financial statements. | | Annual Report | | | | | March 31, 2024 | | 13 |
| | |
Schedule of Investments DoubleLine Flexible Income Fund (Cont.) | | |
| | | | | | | | | | | | | | | | |
PRINCIPAL
AMOUNT $ | | | SECURITY DESCRIPTION | | RATE | | | MATURITY | | | VALUE $ | |
| | | | |
| | | | Wand NewCo 3, Inc. | | | | | | | | | | | | |
| | 250,000 | | | Senior Secured First Lien Term Loan (1 Month US Secured Overnight Financing Rate + 3.75%) | | | 9.08% | | | | 01/30/2031 | | | | 250,996 | |
| | | | |
| | | | WaterBridge Midstream Operating LLC | | | | | | | | | | | | |
| | 20,930 | | | Senior Secured First Lien Term Loan (3 Month US Secured Overnight Financing Rate + 6.01%, 1.00% Floor) | | | 11.34% | | | | 06/21/2026 | | | | 20,979 | |
| | 124,761 | | | Senior Secured First Lien Term Loan (3 Month US Secured Overnight Financing Rate + 6.01%, 1.00% Floor) | | | 11.34% | | | | 06/21/2026 | | | | 125,054 | |
| | | | |
| | | | Wec US Holdings Ltd. | | | | | | | | | | | | |
| | 465,000 | | | Senior Secured First Lien Term Loan (1 Month US Secured Overnight Financing Rate + 2.75%) | | | 8.08% | | | | 01/27/2031 | | | | 465,000 | |
| | | | |
| | | | WestJet Airlines Ltd. | | | | | | | | | | | | |
| | 23,350 | | | Senior Secured First Lien Term Loan (1 Month US Secured Overnight Financing Rate + 3.10%, 1.00% Floor) | | | 8.43% | | | | 12/11/2026 | | | | 23,374 | |
| | | | |
| | | | WestJet Loyalty LP | | | | | | | | | | | | |
| | 925,000 | | | Senior Secured First Lien Term Loan (3 Month US Secured Overnight Financing Rate + 3.75%) | | | 9.08% | | | | 02/14/2031 | | | | 926,156 | |
| | | | |
| | | | Whatabrands LLC | | | | | | | | | | | | |
| | 873,180 | | | Senior Secured First Lien Term Loan (1 Month US Secured Overnight Financing Rate + 3.36%, 0.50% Floor) | | | 8.69% | | | | 08/03/2028 | | | | 874,712 | |
| | | | |
| | | | WhiteWater DBR HoldCo LLC | | | | | | | | | | | | |
| | 170,000 | | | Senior Secured First Lien Term Loan (1 Month US Secured Overnight Financing Rate + 2.75%) | | | 8.08% | | | | 03/03/2031 | | | | 170,496 | |
| | | | |
| | | | WWEX Uni Topco Holdings LLC | | | | | | | | | | | | |
| | 72,483 | | | Senior Secured First Lien Term Loan (3 Month US Secured Overnight Financing Rate + 4.26%, 0.75% Floor) | | | 9.57% | | | | 07/26/2028 | | | | 72,232 | |
| | | | |
| | | | Zayo Group Holdings, Inc. | | | | | | | | | | | | |
| | 421,026 | | | Senior Secured First Lien Term Loan (1 Month US Secured Overnight Financing Rate + 3.11%) | | | 8.44% | | | | 03/09/2027 | | | | 370,623 | |
| | | | |
| | | | Ziggo Financing Partnership | | | | | | | | | | | | |
| | 235,000 | | | Senior Secured First Lien Term Loan (1 Month US Secured Overnight Financing Rate + 2.61%) | | | 7.94% | | | | 04/30/2028 | | | | 231,916 | |
| | | | | | | | | | | | | | | | |
| | | | Total Bank Loans
(Cost $84,182,300) | | | | | | | | | | | 84,004,315 | |
| | | | | | | | | | | | | | | | |
| | COLLATERALIZED LOAN OBLIGATIONS - 17.6% | | | | | | | | | | | | |
| | | | |
| | | | Aimco CDO | | | | | | | | | | | | |
| | 2,000,000 | | | Series 2021-15A-D (CME Term SOFR 3 Month + 3.16%, 2.90% Floor) | | | 8.48% | (a) | | | 10/17/2034 | | | | 1,994,332 | |
| | | | |
| | | | Apidos CLO | | | | | | | | | | | | |
| | 2,000,000 | | | Series 2013-12A-DR (CME Term SOFR 3 Month + 2.86%) | | | 8.18% | (a) | | | 04/15/2031 | | | | 1,964,842 | |
| | | | |
| | | | Babson CLO Ltd./Cayman Islands | | | | | | | | | | | | |
| | 1,737,500 | | | Series 2015-2A-ER (CME Term SOFR 3 Month + 6.71%) | | | 12.03% | (a) | | | 10/20/2030 | | | | 1,726,592 | |
| | | | |
| | | | Bain Capital Credit CLO | | | | | | | | | | | | |
| | 500,000 | | | Series 2017-2A-DR2 (CME Term SOFR 3 Month + 3.36%, 3.10% Floor) | | | 8.69% | (a) | | | 07/25/2034 | | | | 493,586 | |
| | 1,250,000 | | | Series 2021-7A-D (CME Term SOFR 3 Month + 3.51%, 3.25% Floor) | | | 8.83% | (a) | | | 01/22/2035 | | | | 1,224,648 | |
| | | | |
| | | | Blackstone, Inc. | | | | | | | | | | | | |
| | 1,500,000 | | | Series 2018-1A-D (CME Term SOFR 3 Month + 2.76%) | | | 8.08% | (a) | | | 04/15/2031 | | | | 1,480,780 | |
| | | | |
| | | | BlueMountain CLO Ltd. | | | | | | | | | | | | |
| | 3,770,000 | | | Series 2013-2A-DR (CME Term SOFR 3 Month + 3.16%) | | | 8.48% | (a) | | | 10/22/2030 | | | | 3,704,186 | |
| | 500,000 | | | Series 2015-3A-CR (CME Term SOFR 3 Month + 2.86%) | | | 8.18% | (a) | | | 04/20/2031 | | | | 481,597 | |
| | 1,000,000 | | | Series 2016-3A-DR (CME Term SOFR 3 Month + 3.36%, 3.10% Floor) | | | 8.67% | (a) | | | 11/15/2030 | | | | 971,500 | |
| | 1,000,000 | | | Series 2017-2A-C (CME Term SOFR 3 Month + 3.26%) | | | 8.58% | (a) | | | 10/20/2030 | | | | 977,557 | |
| | | | |
| | | | Canyon Capital CLO Ltd. | | | | | | | | | | | | |
| | 1,000,000 | | | Series 2012-1RA-D (CME Term SOFR 3 Month + 3.26%) | | | 8.58% | (a) | | | 07/15/2030 | | | | 998,736 | |
| | 2,000,000 | | | Series 2014-1A-CR (CME Term SOFR 3 Month + 3.01%, 2.75% Floor) | | | 8.33% | (a) | | | 01/30/2031 | | | | 1,911,797 | |
| | | | |
| | | | Canyon CLO | | | | | | | | | | | | |
| | 3,000,000 | | | Series 2020-2A-DR (CME Term SOFR 3 Month + 3.41%, 3.15% Floor) | | | 8.73% | (a) | | | 10/15/2034 | | | | 2,929,534 | |
| | 1,000,000 | | | Series 2021-4A-B (CME Term SOFR 3 Month + 1.96%, 1.70% Floor) | | | 7.28% | (a) | | | 10/15/2034 | | | | 999,797 | |
| | | | |
| 14 | | DoubleLine Funds Trust | | The accompanying notes are an integral part of these financial statements. |
| | | | | | | | | | | | | | | | |
PRINCIPAL
AMOUNT $ | | | SECURITY DESCRIPTION | | RATE | | | MATURITY | | | VALUE $ | |
| | 2,500,000 | | | Series 2021-4A-D (CME Term SOFR 3 Month + 3.31%, 3.05% Floor) | | | 8.63% | (a) | | | 10/15/2034 | | | | 2,444,238 | |
| | 1,000,000 | | | Series 2021-4A-E (CME Term SOFR 3 Month + 6.56%, 6.30% Floor) | | | 11.88% | (a) | | | 10/15/2034 | | | | 990,580 | |
| | | | |
| | | | Carlyle Global Market Strategies | | | | | | | | | | | | |
| | 500,000 | | | Series 2020-2A-CR (CME Term SOFR 3 Month + 3.46%, 3.20% Floor) | | | 8.79% | (a) | | | 01/25/2035 | | | | 498,252 | |
| | 1,000,000 | | | Series 2024-2A-D (CME Term SOFR 3 Month + 3.85%, 3.85% Floor) | | | 0.00% | (a) | | | 04/25/2037 | | | | 1,000,000 | |
| | | | |
| | | | Cathedral Lake CLO Ltd. | | | | | | | | | | | | |
| | 3,500,000 | | | Series 2021-8A-C (CME Term SOFR 3 Month + 2.88%, 2.62% Floor) | | | 8.20% | (a) | | | 01/20/2035 | | | | 3,544,197 | |
| | 3,500,000 | | | Series 2021-8A-D1 (CME Term SOFR 3 Month + 3.68%, 3.42% Floor) | | | 9.00% | (a) | | | 01/20/2035 | | | | 3,434,097 | |
| | | | |
| | | | Chenango Park CLO | | | | | | | | | | | | |
| | 1,500,000 | | | Series 2018-1A-C (CME Term SOFR 3 Month + 3.26%, 3.00% Floor) | | | 8.58% | (a) | | | 04/15/2030 | | | | 1,472,533 | |
| | | | |
| | | | CIFC Funding Ltd. | | | | | | | | | | | | |
| | 1,000,000 | | | Series 2019-3A-CR (CME Term SOFR 3 Month + 3.31%, 3.05% Floor) | | | 8.63% | (a) | | | 10/16/2034 | | | | 1,010,729 | |
| | | | |
| | | | Dryden Senior Loan Fund | | | | | | | | | | | | |
| | 2,500,000 | | | Series 2013-28A-B1LR (CME Term SOFR 3 Month + 3.41%) | | | 8.72% | (a) | | | 08/15/2030 | | | | 2,500,635 | |
| | 3,000,000 | | | Series 2015-37A-DR (CME Term SOFR 3 Month + 2.76%, 2.50% Floor) | | | 8.08% | (a) | | | 01/15/2031 | | | | 2,918,057 | |
| | 1,000,000 | | | Series 2016-45A-DR (CME Term SOFR 3 Month + 3.41%, 3.15% Floor) | | | 8.73% | (a) | | | 10/15/2030 | | | | 988,519 | |
| | 1,000,000 | | | Series 2017-50A-D (CME Term SOFR 3 Month + 3.51%, 3.25% Floor) | | | 8.83% | (a) | | | 07/15/2030 | | | | 993,522 | |
| | 1,000,000 | | | Series 2019-68A-DR (CME Term SOFR 3 Month + 3.61%, 3.35% Floor) | | | 8.93% | (a) | | | 07/15/2035 | | | | 1,001,090 | |
| | 900,000 | | | Series 2020-77A-DR (CME Term SOFR 3 Month + 3.26%, 3.26% Floor) | | | 8.58% | (a) | | | 05/20/2034 | | | | 900,132 | |
| | | | |
| | | | Halcyon Loan Advisors Funding Ltd. | | | | | | | | | | | | |
| | 315,196 | | | Series 2014-2A-D (CME Term SOFR 3 Month + 5.26%) | | | 10.58% | (a)(b) | | | 04/28/2025 | | | | 64,615 | |
| | 500,000 | | | Series 2018-1A-A2 (CME Term SOFR 3 Month + 2.06%, 1.80% Floor) | | | 7.38% | (a) | | | 07/21/2031 | | | | 500,965 | |
| | | | |
| | | | Hayfin US | | | | | | | | | | | | |
| | 2,000,000 | | | Series 2018-8A-B (CME Term SOFR 3 Month + 1.74%, 1.48% Floor) | | | 7.06% | (a) | | | 04/20/2031 | | | | 2,001,083 | |
| | | | |
| | | | Highbridge Loan Management Ltd. | | | | | | | | | | | | |
| | 1,500,000 | | | Series 13A-18-D (CME Term SOFR 3 Month + 3.26%, 3.00% Floor) | | | 8.58% | (a) | | | 10/15/2030 | | | | 1,477,932 | |
| | 2,000,000 | | | Series 2013-2A-CR (CME Term SOFR 3 Month + 3.16%, 2.90% Floor) | | | 8.48% | (a) | | | 10/20/2029 | | | | 1,995,622 | |
| | | | |
| | | | ING Investment Management CLO Ltd. | | | | | | | | | | | | |
| | 3,900,000 | | | Series 2013-1A-CR (CME Term SOFR 3 Month + 3.21%) | | | 8.53% | (a) | | | 10/15/2030 | | | | 3,810,414 | |
| | | | |
| | | | LCM LP | | | | | | | | | | | | |
| | 56,442 | | | Series 19A-E2 (CME Term SOFR 3 Month + 5.96%, 5.70% Floor) | | | 11.28% | (a) | | | 07/15/2027 | | | | 56,438 | |
| | 5,000,000 | | | Series 26A-D (CME Term SOFR 3 Month + 2.76%, 2.50% Floor) | | | 8.08% | (a) | | | 01/20/2031 | | | | 4,682,638 | |
| | 1,500,000 | | | Series 27A-D (CME Term SOFR 3 Month + 3.21%) | | | 8.53% | (a) | | | 07/16/2031 | | | | 1,410,189 | |
| | | | |
| | | | LCM XIII LP | | | | | | | | | | | | |
| | 3,175,000 | | | Series 14A-DR (CME Term SOFR 3 Month + 3.01%) | | | 8.33% | (a) | | | 07/20/2031 | | | | 2,977,846 | |
| | | | |
| | | | Madison Park Funding Ltd. | | | | | | | | | | | | |
| | 4,500,000 | | | Series 2015-18A-BR (CME Term SOFR 3 Month + 1.86%) | | | 7.18% | (a) | | | 10/21/2030 | | | | 4,503,055 | |
| | | | |
| | | | Magnetite CLO Ltd. | | | | | | | | | | | | |
| | 3,500,000 | | | Series 2018-20A-D (CME Term SOFR 3 Month + 2.76%) | | | 8.08% | (a) | | | 04/20/2031 | | | | 3,486,984 | |
| | 1,750,000 | | | Series 2019-23A-DR (CME Term SOFR 3 Month + 3.31%, 3.05% Floor) | | | 8.64% | (a) | | | 01/25/2035 | | | | 1,746,127 | |
| | | | |
| | | | Marble Point CLO | | | | | | | | | | | | |
| | 3,500,000 | | | Series 2021-3A-D1 (CME Term SOFR 3 Month + 3.76%, 3.50% Floor) | | | 9.08% | (a) | | | 10/17/2034 | | | | 3,483,464 | |
| | | | | | | | |
| The accompanying notes are an integral part of these financial statements. | | Annual Report | | | | | March 31, 2024 | | 15 |
| | |
Schedule of Investments DoubleLine Flexible Income Fund (Cont.) | | |
| | | | | | | | | | | | | | | | |
PRINCIPAL
AMOUNT $ | | | SECURITY DESCRIPTION | | RATE | | | MATURITY | | | VALUE $ | |
| | | | |
| | | | Myers Park CLO | | | | | | | | | | | | |
| | 1,000,000 | | | Series 2018-1A-D (CME Term SOFR 3 Month + 3.31%, 3.05% Floor) | | | 8.63% | (a) | | | 10/20/2030 | | | | 997,265 | |
| | | | |
| | | | Neuberger Berman CLO Ltd. | | | | | | | | | | | | |
| | 1,000,000 | | | Series 2016-21A-DR2 (CME Term SOFR 3 Month + 3.56%, 3.30% Floor) | | | 8.88% | (a) | | | 04/20/2034 | | | | 1,002,013 | |
| | 4,000,000 | | | Series 2017-16SA-DR (CME Term SOFR 3 Month + 3.16%, 2.90% Floor) | | | 8.48% | (a) | | | 04/15/2034 | | | | 3,991,812 | |
| | 1,500,000 | | | Series 2017-25A-DR (CME Term SOFR 3 Month + 3.11%, 2.85% Floor) | | | 8.41% | (a) | | | 10/18/2029 | | | | 1,503,816 | |
| | 1,000,000 | | | Series 2017-26A-D (CME Term SOFR 3 Month + 2.91%, 2.65% Floor) | | | 8.21% | (a) | | | 10/18/2030 | | | | 1,002,010 | |
| | 1,500,000 | | | Series 2018-28A-D (CME Term SOFR 3 Month + 3.11%) | | | 8.43% | (a) | | | 04/20/2030 | | | | 1,503,861 | |
| | 1,000,000 | | | Series 2020-38A-DR (CME Term SOFR 3 Month + 3.26%, 3.00% Floor) | | | 8.58% | (a) | | | 10/20/2035 | | | | 1,000,946 | |
| | | | |
| | | | Oak Hill Credit Partners | | | | | | | | | | | | |
| | 2,500,000 | | | Series 2021-16A-E (CME Term SOFR 3 Month + 6.36%, 6.10% Floor) | | | 11.66% | (a) | | | 10/18/2034 | | | | 2,520,640 | |
| | | | |
| | | | Octagon Investment Partners Ltd. | | | | | | | | | | | | |
| | 4,500,000 | | | Series 2012-1A-CRR (CME Term SOFR 3 Month + 4.16%, 3.90% Floor) | | | 9.48% | (a) | | | 07/15/2029 | | | | 4,516,974 | |
| | 500,000 | | | Series 2014-1A-CR3 (CME Term SOFR 3 Month + 3.01%, 2.75% Floor) | | | 8.32% | (a) | | | 02/14/2031 | | | | 497,868 | |
| | 1,250,000 | | | Series 2017-1A-D (CME Term SOFR 3 Month + 6.46%) | | | 11.78% | (a)(b) | | | 03/17/2030 | | | | 1,178,316 | |
| | 4,000,000 | | | Series 2018-1A-C (CME Term SOFR 3 Month + 2.86%, 2.60% Floor) | | | 8.18% | (a) | | | 01/20/2031 | | | | 3,848,878 | |
| | 3,000,000 | | | Series 2018-2A-C (CME Term SOFR 3 Month + 3.11%) | | | 8.44% | (a) | | | 07/25/2030 | | | | 2,916,297 | |
| | 500,000 | | | Series 2019-1A-ER (CME Term SOFR 3 Month + 7.26%, 7.00% Floor) | | | 12.58% | (a) | | | 01/20/2035 | | | | 481,715 | |
| | 1,000,000 | | | Series 2020-2A-DR (CME Term SOFR 3 Month + 3.56%, 3.30% Floor) | | | 8.88% | (a) | | | 07/15/2036 | | | | 998,967 | |
| | | | |
| | | | Park Avenue Institutional Advisers CLO Ltd. | | | | | | | | | | | | |
| | 500,000 | | | Series 2021-2A-D (CME Term SOFR 3 Month + 3.66%, 3.40% Floor) | | | 8.98% | (a) | | | 07/15/2034 | | | | 492,813 | |
| | | | |
| | | | RR Ltd./Cayman Islands | | | | | | | | | | | | |
| | 4,000,000 | | | Series 2018-4A-C (CME Term SOFR 3 Month + 3.21%, 0.26% Floor) | | | 8.53% | (a) | | | 04/15/2030 | | | | 3,972,471 | |
| | | | |
| | | | Sound Point CLO Ltd. | | | | | | | | | | | | |
| | 2,000,000 | | | Series 2015-2A-DRRR (CME Term SOFR 3 Month + 4.76%, 4.50% Floor) | | | 10.08% | (a) | | | 07/20/2032 | | | | 1,905,500 | |
| | 6,000,000 | | | Series 2019-2A-DR (CME Term SOFR 3 Month + 3.56%, 3.30% Floor) | | | 8.88% | (a) | | | 07/15/2034 | | | | 5,689,881 | |
| | 1,000,000 | | | Series 2020-1A-DR (CME Term SOFR 3 Month + 3.61%, 3.61% Floor) | | | 8.93% | (a) | | | 07/20/2034 | | | | 950,732 | |
| | 5,000,000 | | | Series 2020-2A-DR (CME Term SOFR 3 Month + 3.61%, 3.35% Floor) | | | 8.94% | (a) | | | 10/25/2034 | | | | 4,750,979 | |
| | 3,375,000 | | | Series 2021-4A-D (CME Term SOFR 3 Month + 3.66%, 3.66% Floor) | | | 8.99% | (a) | | | 10/25/2034 | | | | 3,305,452 | |
| | | | |
| | | | Steele Creek CLO Ltd. | | | | | | | | | | | | |
| | 5,000,000 | | | Series 2019-2A-BR (CME Term SOFR 3 Month + 2.11%, 1.85% Floor) | | | 7.43% | (a) | | | 07/15/2032 | | | | 5,002,069 | |
| | | | |
| | | | Stewart Park CLO | | | | | | | | | | | | |
| | 3,500,000 | | | Series 2015-1A-DR (CME Term SOFR 3 Month + 2.86%, 2.60% Floor) | | | 8.18% | (a) | | | 01/15/2030 | | | | 3,435,514 | |
| | | | |
| | | | Symphony CLO Ltd. | | | | | | | | | | | | |
| | 1,500,000 | | | Series 2015-16A-DR (CME Term SOFR 3 Month + 3.31%, 3.05% Floor) | | | 8.63% | (a) | | | 10/15/2031 | | | | 1,472,297 | |
| | | | |
| | | | TIAA CLO Ltd. | | | | | | | | | | | | |
| | 1,500,000 | | | Series 2017-2A-B (CME Term SOFR 3 Month + 1.76%) | | | 7.08% | (a) | | | 01/16/2031 | | | | 1,501,526 | |
| | | | |
| | | | Trimaran CAVU LLC | | | | | | | | | | | | |
| | 6,000,000 | | | Series 2019-1A-B (CME Term SOFR 3 Month + 2.46%, 2.20% Floor) | | | 7.78% | (a) | | | 07/20/2032 | | | | 6,004,896 | |
| | | | |
| | | | Upland CLO | | | | | | | | | | | | |
| | 500,000 | | | Series 2016-1A-CR (CME Term SOFR 3 Month + 3.16%) | | | 8.48% | (a) | | | 04/20/2031 | | | | 490,871 | |
| | | | |
| | | | Vibrant CLO Ltd. | | | | | | | | | | | | |
| | 500,000 | | | Series 2015-3A-A2RR (CME Term SOFR 3 Month + 2.11%, 0.26% Floor) | | | 7.43% | (a) | | | 10/20/2031 | | | | 501,301 | |
| | | | |
| 16 | | DoubleLine Funds Trust | | The accompanying notes are an integral part of these financial statements. |
| | | | | | | | | | | | | | | | |
PRINCIPAL
AMOUNT $ | | | SECURITY DESCRIPTION | | RATE | | | MATURITY | | | VALUE $ | |
| | | | |
| | | | Voya CLO Ltd. | | | | | | | | | | | | |
| | 1,500,000 | | | Series 2017-3A-CR (CME Term SOFR 3 Month + 3.41%) | | | 8.73% | (a) | | | 04/20/2034 | | | | 1,502,408 | |
| | | | |
| | | | Wind River CLO Ltd. | | | | | | | | | | | | |
| | 2,000,000 | | | Series 2013-2A-E1R (CME Term SOFR 3 Month + 7.01%) | | | 12.31% | (a)(b) | | | 10/18/2030 | | | | 1,819,156 | |
| | 2,000,000 | | | Series 2014-1A-DRR (CME Term SOFR 3 Month + 3.26%, 3.00% Floor) | | | 8.56% | (a) | | | 07/18/2031 | | | | 1,878,927 | |
| | 4,000,000 | | | Series 2014-2A-DR (CME Term SOFR 3 Month + 3.16%, 2.90% Floor) | | | 8.48% | (a) | | | 01/15/2031 | | | | 3,874,644 | |
| | 2,000,000 | | | Series 2014-2A-ER (CME Term SOFR 3 Month + 6.01%, 5.75% Floor) | | | 11.33% | (a)(b) | | | 01/15/2031 | | | | 1,674,197 | |
| | 1,500,000 | | | Series 2014-3A-DR2 (CME Term SOFR 3 Month + 3.66%, 3.40% Floor) | | | 8.98% | (a) | | | 10/22/2031 | | | | 1,390,886 | |
| | 2,000,000 | | | Series 2017-1A-DR (CME Term SOFR 3 Month + 3.98%, 3.72% Floor) | | | 9.28% | (a) | | | 04/18/2036 | | | | 1,969,178 | |
| | 1,750,000 | | | Series 2017-1A-ER (CME Term SOFR 3 Month + 7.32%, 7.06% Floor) | | | 12.62% | (a) | | | 04/18/2036 | | | | 1,645,127 | |
| | 1,500,000 | | | Series 2018-1A-D (CME Term SOFR 3 Month + 3.16%) | | | 8.48% | (a) | | | 07/15/2030 | | | | 1,460,266 | |
| | 3,500,000 | | | Series 2018-2A-D (CME Term SOFR 3 Month + 3.26%) | | | 8.58% | (a) | | | 07/15/2030 | | | | 3,375,038 | |
| | 500,000 | | | Series 2021-3A-D (CME Term SOFR 3 Month + 3.61%, 3.35% Floor) | | | 8.93% | (a) | | | 07/20/2033 | | | | 487,067 | |
| | 1,000,000 | | | Series 2021-4A-D (CME Term SOFR 3 Month + 3.46%, 3.20% Floor) | | | 8.78% | (a) | | | 01/20/2035 | | | | 967,073 | |
| | | | | | | | | | | | | | | | |
| | | | Total Collateralized Loan Obligations
(Cost $170,880,163) | | | | | | | | 167,235,084 | |
| | | | | | | | | | | | | |
| | FOREIGN CORPORATE BONDS - 5.2% | | | | | | | | | | | | |
| | 44,000 | | | 1375209 BC Ltd. | | | 9.00% | (a) | | | 01/30/2028 | | | | 43,168 | |
| | 349,000 | | | Adani Electricity Mumbai Ltd. | | | 3.95% | | | | 02/12/2030 | | | | 297,039 | |
| | 1,136,000 | | | Adani International Container Terminal Pvt Ltd. | | | 3.00% | | | | 02/16/2031 | | | | 969,252 | |
| | 200,000 | | | Adani Ports & Special Economic Zone Ltd. | | | 4.00% | | | | 07/30/2027 | | | | 183,722 | |
| | 200,000 | | | Adani Ports & Special Economic Zone Ltd. | | | 4.20% | | | | 08/04/2027 | | | | 184,922 | |
| | 600,000 | | | Adani Ports & Special Economic Zone Ltd. | | | 4.38% | | | | 07/03/2029 | | | | 535,529 | |
| | 400,000 | | | Adani Ports & Special Economic Zone Ltd. | | | 3.10% | | | | 02/02/2031 | | | | 318,903 | |
| | 400,000 | | | Adani Transmission Step-One Ltd. | | | 4.00% | | | | 08/03/2026 | | | | 376,274 | |
| | 250,000 | | | Adaro Indonesia PT | | | 4.25% | | | | 10/31/2024 | | | | 246,862 | |
| | 600,000 | | | AES Andes SA
(5 Year Swap Rate USD + 4.64%) | | | 7.13% | (a) | | | 03/26/2079 | | | | 594,489 | |
| | 200,000 | | | Agrosuper SA | | | 4.60% | | | | 01/20/2032 | | | | 172,917 | |
| | 412,499 | | | AI Candelaria Spain SA | | | 7.50% | | | | 12/15/2028 | | | | 404,295 | |
| | 500,000 | | | AI Candelaria Spain SA | | | 5.75% | (a) | | | 06/15/2033 | | | | 406,180 | |
| | 500,000 | | | AI Candelaria Spain SA | | | 5.75% | | | | 06/15/2033 | | | | 406,180 | |
| | 200,000 | | | Altice Financing SA | | | 5.00% | (a) | | | 01/15/2028 | | | | 164,781 | |
| | 200,000 | | | Altice France Holding SA | | | 6.00% | (a) | | | 02/15/2028 | | | | 57,132 | |
| | 255,000 | | | Altice France SA/France | | | 5.50% | (a) | | | 10/15/2029 | | | | 173,346 | |
| | 200,000 | | | ARD Finance SA
7.25% PIK | | | 6.50% | (a) | | | 06/30/2027 | | | | 67,138 | |
| | 215,000 | | | Ardonagh Finco Ltd. | | | 7.75% | (a) | | | 02/15/2031 | | | | 214,249 | |
| | 210,918 | | | Avation Capital SA
9.00% PIK | | | 8.25% | (a) | | | 10/31/2026 | | | | 181,428 | |
| | 600,000 | | | Banco Davivienda SA
(10 Year CMT Rate + 5.10%) | | | 6.65% | (a)(i) | | | 04/22/2031 | | | | 422,250 | |
| | 300,000 | | | Banco de Credito del Peru SA | | | 5.85% | (a) | | | 01/11/2029 | | | | 303,674 | |
| | 600,000 | | | Banco de Credito del Peru SA
(5 Year CMT Rate + 3.00%) | | | 3.13% | | | | 07/01/2030 | | | | 575,015 | |
| | 140,000 | | | Banco de Credito del Peru SA
(5 Year CMT Rate + 2.45%) | | | 3.25% | | | | 09/30/2031 | | | | 129,397 | |
| | 100,000 | | | Banco GNB Sudameris SA
(5 Year CMT Rate + 4.56%) | | | 7.05% | | | | 04/03/2027 | | | | 99,981 | |
| | 300,000 | | | Banco GNB Sudameris SA
(5 Year CMT Rate + 6.66%) | | | 7.50% | | | | 04/16/2031 | | | | 261,624 | |
| | 300,000 | | | Banco Industrial SA/Guatemala
(5 Year CMT Rate + 4.44%) | | | 4.88% | | | | 01/29/2031 | | | | 287,622 | |
| | 1,200,000 | | | Banco Internacional del Peru SAA Interbank
(5 Year CMT Rate + 3.71%) | | | 4.00% | | | | 07/08/2030 | | | | 1,153,324 | |
| | | | | | | | |
| The accompanying notes are an integral part of these financial statements. | | Annual Report | | | | | March 31, 2024 | | 17 |
| | |
Schedule of Investments DoubleLine Flexible Income Fund (Cont.) | | |
| | | | | | | | | | | | | | | | |
PRINCIPAL
AMOUNT $ | | | SECURITY DESCRIPTION | | RATE | | | MATURITY | | | VALUE $ | |
| | 800,000 | | | Banco Mercantil del Norte SA/Grand Cayman
(10 Year CMT Rate + 5.35%) | | | 7.63% | (i) | | | 01/10/2028 | | | | 801,366 | |
| | 200,000 | | | Banco Mercantil del Norte SA/Grand Cayman
(10 Year CMT Rate + 5.47%) | | | 7.50% | (i) | | | 06/27/2029 | | | | 199,641 | |
| | 200,000 | | | Banco Mercantil del Norte SA/Grand Cayman
(10 Year CMT Rate + 5.47%) | | | 7.50% | (a)(i) | | | 06/27/2029 | | | | 199,641 | |
| | 500,000 | | | Bancolombia SA
(5 Year CMT Rate + 2.94%) | | | 4.63% | | | | 12/18/2029 | | | | 487,707 | |
| | 1,300,000 | | | BBVA Bancomer SA/Texas
(5 Year CMT Rate + 2.65%) | | | 5.13% | | | | 01/18/2033 | | | | 1,208,986 | |
| | 200,000 | | | BBVA Bancomer SA/Texas
(5 Year CMT Rate + 4.31%) | | | 5.88% | | | | 09/13/2034 | | | | 189,398 | |
| | 170,000 | | | Bombardier, Inc. | | | 7.88% | (a) | | | 04/15/2027 | | | | 170,225 | |
| | 165,000 | | | Bombardier, Inc. | | | 8.75% | (a) | | | 11/15/2030 | | | | 176,389 | |
| | 200,000 | | | Braskem Idesa SAPI | | | 6.99% | | | | 02/20/2032 | | | | 155,382 | |
| | 1,000,000 | | | Braskem Netherlands Finance BV
(5 Year CMT Rate + 8.22%) | | | 8.50% | | | | 01/23/2081 | | | | 1,003,635 | |
| | 400,000 | | | Buffalo Energy Mexico Holdings / Buffalo Energy Infrastructure / Buffalo Energy | | | 7.88% | (a) | | | 02/15/2039 | | | | 433,326 | |
| | 600,000 | | | Canacol Energy Ltd. | | | 5.75% | | | | 11/24/2028 | | | | 266,022 | |
| | 900,000 | | | CAP SA | | | 3.90% | | | | 04/27/2031 | | | | 707,548 | |
| | 600,000 | | | CAP SA | | | 3.90% | (a) | | | 04/27/2031 | | | | 471,699 | |
| | 900,000 | | | Cemex SAB de CV
(5 Year CMT Rate + 4.53%) | | | 5.13% | (i) | | | 06/08/2026 | | | | 870,374 | |
| | 1,980,564 | | | Chile Electricity PEC SpA | | | 0.00% | (a) | | | 01/25/2028 | | | | 1,557,713 | |
| | 600,000 | | | Cia de Minas Buenaventura SAA | | | 5.50% | | | | 07/23/2026 | | | | 579,229 | |
| | 160,400 | | | Cometa Energia SAB de CV | | | 6.38% | | | | 04/24/2035 | | | | 161,806 | |
| | 800,000 | | | Cosan Overseas Ltd. | | | 8.25% | (i) | | | 05/05/2024 | | | | 819,499 | |
| | 600,000 | | | Credito Real SAB de CV SOFOM ER
(5 Year CMT Rate + 7.03%) | | | 9.13% | (h)(i) | | | 11/29/2027 | | | | 1,560 | |
| | 600,000 | | | CSN Resources SA | | | 5.88% | | | | 04/08/2032 | | | | 525,342 | |
| | 600,000 | | | CT Trust | | | 5.13% | | | | 02/03/2032 | | | | 532,358 | |
| | 600,000 | | | DBS Group Holdings Ltd.
(5 Year CMT Rate + 1.10%) | | | 1.82% | | | | 03/10/2031 | | | | 558,615 | |
| | 189,821 | | | Digicel Group Holdings Ltd. | | | 0.00% | (a)(b) | | | 12/31/2030 | | | | 29,327 | |
| | 37,870 | | | Digicel Group Holdings Ltd. | | | 0.00% | (a)(b) | | | 12/31/2030 | | | | 34,970 | |
| | 340,696 | | | Digicel Group Holdings Ltd. | | | 0.00% | (a)(b) | | | 12/31/2030 | | | | 3,912 | |
| | 3,474 | | | Digicel Group Holdings Ltd. | | | 0.00% | (a)(b) | | | 12/31/2030 | | | | 2,806 | |
| | 525,800 | | | Empresa Electrica Angamos SA | | | 4.88% | | | | 05/25/2029 | | | | 476,546 | |
| | 629,160 | | | Empresa Electrica Cochrane SpA | | | 5.50% | | | | 05/14/2027 | | | | 609,507 | |
| | 400,000 | | | Empresas Publicas de Medellin ESP | | | 4.38% | | | | 02/15/2031 | | | | 334,553 | |
| | 187,869 | | | Fermaca Enterprises S de RL de CV | | | 6.38% | | | | 03/30/2038 | | | | 183,916 | |
| | 343,720 | | | Fideicomiso PA Pacifico Tres | | | 8.25% | | | | 01/15/2035 | | | | 326,776 | |
| | 400,000 | | | Freeport Indonesia PT | | | 4.76% | | | | 04/14/2027 | | | | 391,553 | |
| | 400,000 | | | Freeport Indonesia PT | | | 5.32% | | | | 04/14/2032 | | | | 391,675 | |
| | 400,000 | | | Freeport Indonesia PT | | | 5.32% | (a) | | | 04/14/2032 | | | | 391,675 | |
| | 200,000 | | | Freeport-McMoRan, Inc. | | | 4.63% | | | | 08/01/2030 | | | | 192,312 | |
| | 400,000 | | | Frigorifico Concepcion SA | | | 7.70% | | | | 07/21/2028 | | | | 350,848 | |
| | 230,000 | | | Garda World Security Corp. | | | 4.63% | (a) | | | 02/15/2027 | | | | 220,550 | |
| | 180,000 | | | Garda World Security Corp. | | | 6.00% | (a) | | | 06/01/2029 | | | | 161,324 | |
| | 700,000 | | | Geopark Ltd. | | | 5.50% | | | | 01/17/2027 | | | | 636,335 | |
| | 180,000 | | | GGAM Finance Ltd. | | | 6.88% | (a) | | | 04/15/2029 | | | | 181,125 | |
| | 255,580 | | | Global Aircraft Leasing Co. Ltd.
7.25% PIK | | | 6.50% | (a) | | | 09/15/2024 | | | | 243,354 | |
| | 200,000 | | | Gold Fields Orogen Holdings BVI Ltd. | | | 5.13% | | | | 05/15/2024 | | | | 199,376 | |
| | 300,000 | | | Gran Tierra Energy, Inc. | | | 9.50% | (a) | | | 10/15/2029 | | | | 280,573 | |
| | 856,790 | | | Guara Norte SARL | | | 5.20% | | | | 06/15/2034 | | | | 782,395 | |
| | 320,000 | | | Husky Injection Molding Systems Ltd. / Titan Co.-Borrower LLC | | | 9.00% | (a) | | | 02/15/2029 | | | | 331,318 | |
| | 210,000 | | | INEOS Finance PLC | | | 7.50% | (a) | | | 04/15/2029 | | | | 210,910 | |
| | 600,000 | | | Inkia Energy Ltd. | | | 5.88% | | | | 11/09/2027 | | | | 587,665 | |
| | 200,000 | | | InRetail Consumer | | | 3.25% | | | | 03/22/2028 | | | | 179,811 | |
| | 100,000 | | | InRetail Shopping Malls | | | 5.75% | | | | 04/03/2028 | | | | 97,643 | |
| | 150,000 | | | Intelsat Jackson Holdings SA | | | 6.50% | (a) | | | 03/15/2030 | | | | 139,735 | |
| | | | |
| 18 | | DoubleLine Funds Trust | | The accompanying notes are an integral part of these financial statements. |
| | | | | | | | | | | | | | | | |
PRINCIPAL
AMOUNT $ | | | SECURITY DESCRIPTION | | RATE | | | MATURITY | | | VALUE $ | |
| | 35,079 | | | Invepar Holdings | | | 0.00% | (b)(h) | | | 12/30/2028 | | | | – | |
| | 400,000 | | | Itau Unibanco Holding SA/Cayman Island
(5 Year CMT Rate + 3.22%) | | | 4.63% | (i) | | | 02/27/2025 | | | | 376,655 | |
| | 241,500 | | | JSW Hydro Energy Ltd. | | | 4.13% | | | | 05/18/2031 | | | | 214,251 | |
| | 200,000 | | | Kallpa Generacion SA | | | 4.13% | | | | 08/16/2027 | | | | 190,270 | |
| | 160,000 | | | Kronos Acquisition Holdings, Inc. / KIK Custom Products, Inc. | | | 5.00% | (a) | | | 12/31/2026 | | | | 156,978 | |
| | 200,000 | | | KUO SAB De CV | | | 5.75% | | | | 07/07/2027 | | | | 188,697 | |
| | 774,200 | | | LLPL Capital Pte Ltd. | | | 6.88% | | | | 02/04/2039 | | | | 775,175 | |
| | 851,620 | | | LLPL Capital Pte Ltd. | | | 6.88% | (a) | | | 02/04/2039 | | | | 852,693 | |
| | 85,000 | | | Macquarie Airfinance Holdings Ltd. | | | 6.50% | (a) | | | 03/26/2031 | | | | 86,580 | |
| | 800,000 | | | MARB BondCo PLC | | | 3.95% | | | | 01/29/2031 | | | | 660,229 | |
| | 330,000 | | | Mattamy Group Corp. | | | 4.63% | (a) | | | 03/01/2030 | | | | 300,291 | |
| | 200,000 | | | Mercury Chile Holdco LLC | | | 6.50% | | | | 01/24/2027 | | | | 194,012 | |
| | 335,000 | | | Merlin Entertainments Group US Holdings, Inc. | | | 7.38% | (a) | | | 02/15/2031 | | | | 337,820 | |
| | 600,000 | | | Mexarrend SAPI de CV | | | 10.25% | (a)(h) | | | 07/24/2024 | | | | 126,000 | |
| | 442,484 | | | Mexico Generadora de Energia S de RL | | | 5.50% | | | | 12/06/2032 | | | | 435,952 | |
| | 360,000 | | | Millicom International Cellular SA | | | 6.63% | | | | 10/15/2026 | | | | 358,670 | |
| | 720,000 | | | Millicom International Cellular SA | | | 6.25% | | | | 03/25/2029 | | | | 703,631 | |
| | 1,500,000 | | | Minejesa Capital BV | | | 5.63% | | | | 08/10/2037 | | | | 1,365,845 | |
| | 600,000 | | | Minerva Luxembourg SA | | | 4.38% | | | | 03/18/2031 | | | | 502,002 | |
| | 400,000 | | | Minerva Luxembourg SA | | | 8.88% | | | | 09/13/2033 | | | | 421,112 | |
| | 600,000 | | | Minsur SA | | | 4.50% | | | | 10/28/2031 | | | | 526,257 | |
| | 461,145 | | | Mong Duong Finance Holdings BV | | | 5.13% | | | | 05/07/2029 | | | | 441,212 | |
| | 886,996 | | | MV24 Capital BV | | | 6.75% | | | | 06/01/2034 | | | | 835,289 | |
| | 400,000 | | | Network i2i Ltd.
(5 Year CMT Rate + 4.27%) | | | 5.65% | (i) | | | 01/15/2025 | | | | 397,654 | |
| | 400,000 | | | Nexa Resources SA | | | 5.38% | | | | 05/04/2027 | | | | 390,816 | |
| | 135,000 | | | Ontario Gaming GTA LP/OTG Co.-Issuer, Inc. | | | 8.00% | (a) | | | 08/01/2030 | | | | 139,154 | |
| | 252,000 | | | Orazul Energy Peru SA | | | 5.63% | | | | 04/28/2027 | | | | 238,856 | |
| | 800,000 | | | Oversea-Chinese Banking Corp. Ltd.
(5 Year CMT Rate + 1.58%) | | | 1.83% | | | | 09/10/2030 | | | | 756,439 | |
| | 340,000 | | | Parkland Corp. | | | 4.63% | (a) | | | 05/01/2030 | | | | 313,746 | |
| | 160,000 | | | Primo Water Holdings, Inc. | | | 4.38% | (a) | | | 04/30/2029 | | | | 147,286 | |
| | 629,489 | | | Prumo Participacoes e Investimentos S/A | | | 7.50% | | | | 12/31/2031 | | | | 629,156 | |
| | 500,000 | | | Reliance Industries Ltd. | | | 3.67% | | | | 11/30/2027 | | | | 474,185 | |
| | 200,000 | | | Rumo Luxembourg Sarl | | | 4.20% | | | | 01/18/2032 | | | | 170,082 | |
| | 1,040,000 | | | Rutas 2 & 7 Finance Ltd. | | | 0.00% | | | | 09/30/2036 | | | | 710,155 | |
| | 1,000,000 | | | Sasol Financing USA LLC | | | 5.50% | | | | 03/18/2031 | | | | 843,314 | |
| | 155,000 | | | Seaspan Corp. | | | 5.50% | (a) | | | 08/01/2029 | | | | 135,378 | |
| | 200,000 | | | Simpar Europe SA | | | 5.20% | | | | 01/26/2031 | | | | 174,997 | |
| | 200,000 | | | Southern Copper Corp. | | | 3.88% | | | | 04/23/2025 | | | | 196,147 | |
| | 250,000 | | | Superior Plus LP / Superior General Partner, Inc. | | | 4.50% | (a) | | | 03/15/2029 | | | | 231,347 | |
| | 25,000 | | | Telesat Canada / Telesat LLC | | | 4.88% | (a) | | | 06/01/2027 | | | | 13,023 | |
| | 180,934 | | | Tierra Mojada Luxembourg II SARL | | | 5.75% | | | | 12/01/2040 | | | | 166,380 | |
| | 165,000 | | | Titan Acquisition Ltd. / Titan Co.-Borrower LLC | | | 7.75% | (a) | | | 04/15/2026 | | | | 164,943 | |
| | 528,255 | | | UEP Penonome II SA | | | 6.50% | (a) | | | 10/01/2038 | | | | 413,360 | |
| | 704,340 | | | UEP Penonome II SA | | | 6.50% | | | | 10/01/2038 | | | | 551,146 | |
| | 2,800,000 | | | Unifin Financiera SAB de CV
(5 Year CMT Rate + 6.31%) | | | 8.88% | (h)(i) | | | 01/29/2025 | | | | 14,280 | |
| | 400,000 | | | Unigel Luxembourg SA | | | 8.75% | (h) | | | 10/01/2026 | | | | 124,680 | |
| | 400,000 | | | United Overseas Bank Ltd.
(5 Year CMT Rate + 1.52%) | | | 1.75% | | | | 03/16/2031 | | | | 371,437 | |
| | 800,000 | | | UPL Corp. Ltd. | | | 4.63% | | | | 06/16/2030 | | | | 644,477 | |
| | 1,222,000 | | | Vedanta Resources Ltd. | | | 13.88% | | | | 12/09/2028 | | | | 1,070,576 | |
| | 325,000 | | | VZ Secured Financing BV | | | 5.00% | (a) | | | 01/15/2032 | | | | 279,361 | |
| | | | | | | | | | | | | | | | |
| | | | Total Foreign Corporate Bonds
(Cost $54,911,347) | | | | 49,092,640 | |
| | | | | | | | | | | | | |
| | | | | | | | |
| The accompanying notes are an integral part of these financial statements. | | Annual Report | | | | | March 31, 2024 | | 19 |
| | |
Schedule of Investments DoubleLine Flexible Income Fund (Cont.) | | |
| | | | | | | | | | | | | | | | |
PRINCIPAL
AMOUNT $ | | | SECURITY DESCRIPTION | | RATE | | | MATURITY | | | VALUE $ | |
| | FOREIGN GOVERNMENT BONDS, FOREIGN AGENCIES AND FOREIGN GOVERNMENT SPONSORED CORPORATIONS - 1.1% | | | | | |
| | 600,000 | | | Banco do Brasil SA/Cayman
(10 Year CMT Rate + 4.40%) | | | 6.25% | (i) | | | 10/15/2024 | | | | 603,361 | |
| | 800,000 | | | Banco Nacional de Comercio Exterior SNC/Cayman Islands
(5 Year CMT Rate + 2.00%) | | | 2.72% | | | | 08/11/2031 | | | | 724,639 | |
| | 200,000 | | | Bank Negara Indonesia Persero Tbk PT | | | 3.75% | | | | 03/30/2026 | | | | 191,142 | |
| | 564,031 | | | Bioceanico Sovereign Certificate Ltd. | | | 0.00% | | | | 06/05/2034 | | | | 414,652 | |
| | 2,000,000 | | | Colombia Government International Bond | | | 4.13% | | | | 05/15/2051 | | | | 1,246,194 | |
| | 600,000 | | | Corp. Financiera de Desarrollo SA
(3 Month LIBOR USD + 5.61%) | | | 5.25% | (f) | | | 07/15/2029 | | | | 599,502 | |
| | 1,500,000 | | | Ecopetrol SA | | | 5.88% | | | | 11/02/2051 | | | | 1,080,754 | |
| | 200,000 | | | Indonesia Asahan Aluminium PT / Mineral Industri Indonesia Persero PT | | | 4.75% | | | | 05/15/2025 | | | | 197,584 | |
| | 300,000 | | | Indonesia Asahan Aluminium PT / Mineral Industri Indonesia Persero PT | | | 5.45% | | | | 05/15/2030 | | | | 296,664 | |
| | 262,054 | | | Lima Metro Line 2 Finance Ltd. | | | 5.88% | | | | 07/05/2034 | | | | 260,178 | |
| | 1,400,000 | | | Mexico Government International Bond | | | 6.34% | | | | 05/04/2053 | | | | 1,384,736 | |
| | 1,500,000 | | | Panama Government International Bond | | | 3.87% | | | | 07/23/2060 | | | | 873,705 | |
| | 900,000 | | | Petroleos del Peru SA | | | 4.75% | | | | 06/19/2032 | | | | 712,428 | |
| | 400,000 | | | Petroleos del Peru SA | | | 5.63% | | | | 06/19/2047 | | | | 269,064 | |
| | 900,000 | | | Petroleos Mexicanos | | | 6.75% | | | | 09/21/2047 | | | | 599,202 | |
| | 700,000 | | | Republic of South Africa Government International Bond | | | 4.30% | | | | 10/12/2028 | | | | 629,853 | |
| | | | | | | | | | | | | | | | |
| | | | Total Foreign Government Bonds, Foreign Agencies and Foreign Government Sponsored Corporations (Cost $12,110,775) | | | | | | | | 10,083,658 | |
| | | | | | | | | | | | | | | | |
| | NON-AGENCY COMMERCIAL MORTGAGE BACKED OBLIGATIONS - 9.2% | | | | | | | | | | | | |
| |
| | | | Arbor Multifamily Mortgage Securities Trust | |
| | 10,194,000 | | | Series 2021-MF3-XD | | | 1.18% | (a)(j)(k) | | | 10/15/2054 | | | | 727,946 | |
| |
| | | | Arbor Realty Trust, Inc. | |
| | 15,206,956 | | | Series 2020-MF1-XA | | | 0.95% | (a)(j)(k) | | | 05/15/2053 | | | | 666,112 | |
| |
| | | | AREIT Trust | |
| | 1,017,000 | | | Series 2019-CRE3-D (CME Term SOFR 1 Month + 2.76%, 2.76% Floor) | | | 8.09% | (a) | | | 09/14/2036 | | | | 948,944 | |
| |
| | | | Banc of America Re-Remic Trust | |
| | 1,500,000 | | | Series 2018-DSNY-C (CME Term SOFR 1 Month + 1.65%, 1.60% Floor) | | | 6.97% | (a) | | | 09/15/2034 | | | | 1,492,950 | |
| |
| | | | BANK | |
| | 9,610,389 | | | Series 2017-BNK5-XA | | | 0.94% | (j)(k) | | | 06/15/2060 | | | | 219,615 | |
| | 58,287,168 | | | Series 2018-BN11-XA | | | 0.45% | (j)(k) | | | 03/15/2061 | | | | 950,973 | |
| |
| | | | BBCMS Trust | |
| | 1,675,000 | | | Series 2019-BWAY-E (CME Term SOFR 1 Month + 2.96%, 2.85% Floor) | | | 8.29% | (a) | | | 11/15/2034 | | | | 158,270 | |
| |
| | | | BB-UBS Trust | |
| | 1,197,590 | | | Series 2012-TFT-TE | | | 3.56% | (a)(b)(j) | | | 06/05/2030 | | | | 993,223 | |
| |
| | | | BDS Ltd. | |
| | 875,093 | | | Series 2021-FL10-A (CME Term SOFR 1 Month + 1.46%, 1.46% Floor) | | | 6.79% | (a) | | | 12/16/2036 | | | | 869,310 | |
| |
| | | | Benchmark Mortgage Trust | |
| | 56,222,725 | | | Series 2022-B32-XA | | | 0.46% | (a)(j)(k) | | | 01/15/2055 | | | | 1,106,424 | |
| |
| | | | BLP Commercial Mortgage Trust | |
| | 750,000 | | | Series 2024-IND2-D (CME Term SOFR 1 Month + 2.59%, 2.59% Floor) | | | 7.92% | (a) | | | 03/15/2041 | | | | 752,579 | |
| |
| | | | BPR Trust | |
| | 2,866,000 | | | Series 2021-TY-D (CME Term SOFR 1 Month + 2.46%, 2.35% Floor) | | | 7.79% | (a) | | | 09/15/2038 | | | | 2,829,546 | |
| |
| | | | BX Trust | |
| | 1,575,000 | | | Series 2019-CALM-E (CME Term SOFR 1 Month + 2.11%, 2.00% Floor) | | | 7.44% | (a) | | | 11/15/2032 | | | | 1,566,359 | |
| | 1,800,000 | | | Series 2019-IMC-D (CME Term SOFR 1 Month + 1.95%, 1.90% Floor) | | | 7.27% | (a) | | | 04/15/2034 | | | | 1,796,169 | |
| | 1,484,812 | | | Series 2021-21M-A (CME Term SOFR 1 Month + 0.84%, 0.73% Floor) | | | 6.17% | (a) | | | 10/15/2036 | | | | 1,473,774 | |
| | 1,028,000 | | | Series 2021-CIP-B (CME Term SOFR 1 Month + 1.39%, 1.27% Floor) | | | 6.71% | (a) | | | 12/15/2038 | | | | 1,016,332 | |
| | | | |
| 20 | | DoubleLine Funds Trust | | The accompanying notes are an integral part of these financial statements. |
| | | | | | | | | | | | | | | | |
PRINCIPAL
AMOUNT $ | | | SECURITY DESCRIPTION | | RATE | | | MATURITY | | | VALUE $ | |
| |
| | | | Carbon Capital VI Commercial Mortgage Trust | |
| | 1,119,631 | | | Series 2019-FL2-B (CME Term SOFR 1 Month + 2.96%, 2.85% Floor) | | | 8.29% | (a) | | | 10/15/2035 | | | | 1,013,982 | |
| | | | |
| | | | CFCRE Commercial Mortgage Trust | | | | | | | | | | | | |
| | 3,649,890 | | | Series 2016-C4-XA | | | 1.60% | (j)(k) | | | 05/10/2058 | | | | 82,596 | |
| | | | |
| | | | Citigroup Commercial Mortgage Trust | | | | | | | | | | | | |
| | 1,463,627 | | | Series 2014-GC25-XA | | | 0.94% | (j)(k) | | | 10/10/2047 | | | | 1,666 | |
| | 6,268,224 | | | Series 2016-C1-XA | | | 1.82% | (j)(k) | | | 05/10/2049 | | | | 182,415 | |
| | 2,170,166 | | | Series 2016-P4-XA | | | 1.88% | (j)(k) | | | 07/10/2049 | | | | 67,280 | |
| | | | |
| | | | Citigroup/Deutsche Bank Commercial Mortgage Trust | | | | | | | | | | | | |
| | 8,522,621 | | | Series 2017-CD3-XA | | | 0.95% | (j)(k) | | | 02/10/2050 | | | | 171,593 | |
| | 1,670,650 | | | Series 2020-C9-A2 | | | 1.90% | | | | 08/15/2053 | | | | 1,583,475 | |
| | | | |
| | | | CLNC Ltd. | | | | | | | | | | | | |
| | 1,216,000 | | | Series 2019-FL1-B (CME Term SOFR 1 Month + 2.01%, 1.90% Floor) | | | 7.34% | (a) | | | 08/20/2035 | | | | 1,188,856 | |
| | | | |
| | | | Commercial Mortgage Pass Through Certificates | | | | | | | | | | | | |
| | 412,206 | | | Series 2014-CR17-XA | | | 0.77% | (j)(k) | | | 05/10/2047 | | | | 31 | |
| | 10,318,286 | | | Series 2015-CR25-XA | | | 0.79% | (j)(k) | | | 08/10/2048 | | | | 81,882 | |
| | 6,437,044 | | | Series 2015-CR27-XA | | | 0.90% | (j)(k) | | | 10/10/2048 | | | | 64,290 | |
| | 1,227,000 | | | Series 2015-DC1-C | | | 4.27% | (j) | | | 02/10/2048 | | | | 1,116,340 | |
| | 1,448,305 | | | Series 2015-DC1-XA | | | 0.93% | (j)(k) | | | 02/10/2048 | | | | 5,820 | |
| | 8,662,773 | | | Series 2015-LC21-XA | | | 0.62% | (j)(k) | | | 07/10/2048 | | | | 43,992 | |
| | 2,525,399 | | | Series 2016-DC2-XA | | | 0.91% | (j)(k) | | | 02/10/2049 | | | | 31,044 | |
| | 2,228,000 | | | Series 2018-HCLV-D (CME Term SOFR 1 Month + 2.47%, 2.18% Floor) | | | 7.80% | (a) | | | 09/15/2033 | | | | 1,560,535 | |
| | | | |
| | | | Computershare Corporate Trust | | | | | | | | | | | | |
| | 100,000 | | | Series 2015-C27-C | | | 3.89% | | | | 02/15/2048 | | | | 87,379 | |
| | 400,000 | | | Series 2015-C28-C | | | 4.08% | (j) | | | 05/15/2048 | | | | 363,359 | |
| | 9,170,396 | | | Series 2015-C30-XA | | | 0.87% | (j)(k) | | | 09/15/2058 | | | | 80,812 | |
| | 4,802,100 | | | Series 2015-C31-XA | | | 0.95% | (j)(k) | | | 11/15/2048 | | | | 51,891 | |
| | 1,681,458 | | | Series 2015-NXS1-XA | | | 1.06% | (j)(k) | | | 05/15/2048 | | | | 8,973 | |
| | 6,112,764 | | | Series 2015-NXS2-XA | | | 0.58% | (j)(k) | | | 07/15/2058 | | | | 29,745 | |
| | 1,834,536 | | | Series 2016-C33-XA | | | 1.56% | (j)(k) | | | 03/15/2059 | | | | 41,785 | |
| | 3,523,044 | | | Series 2016-NXS6-XA | | | 1.59% | (j)(k) | | | 11/15/2049 | | | | 93,248 | |
| | 13,275,479 | | | Series 2017-C38-XA | | | 0.93% | (j)(k) | | | 07/15/2050 | | | | 301,428 | |
| | 1,886,831 | | | Series 2017-RC1-XA | | | 1.38% | (j)(k) | | | 01/15/2060 | | | | 61,887 | |
| | 2,267,000 | | | Series 2018-C47-C | | | 4.92% | (j) | | | 09/15/2061 | | | | 2,097,765 | |
| | 1,000,000 | | | Series 2021-SAVE-D (CME Term SOFR 1 Month + 2.61%, 2.50% Floor) | | | 7.94% | (a) | | | 02/15/2040 | | | | 983,325 | |
| | 1,000,000 | | | Series 2021-SAVE-E (CME Term SOFR 1 Month + 3.76%, 3.65% Floor) | | | 9.09% | (a) | | | 02/15/2040 | | | | 979,711 | |
| | | | |
| | | | Credit Suisse Mortgage Capital Certificates | | | | | | | | | | | | |
| | 1,974,822 | | | Series 2014-USA-X1 | | | 0.54% | (a)(j)(k) | | | 09/15/2037 | | | | 8,999 | |
| | 1,396,526 | | | Series 2019-ICE4-D (CME Term SOFR 1 Month + 1.65%, 1.60% Floor) | | | 6.97% | (a) | | | 05/15/2036 | | | | 1,396,004 | |
| | | | |
| | | | CSAIL Commercial Mortgage Trust | | | | | | | | | | | | |
| | 2,202,585 | | | Series 2015-C1-XA | | | 0.80% | (j)(k) | | | 04/15/2050 | | | | 5,793 | |
| | 39,185,686 | | | Series 2018-CX12-XA | | | 0.54% | (j)(k) | | | 08/15/2051 | | | | 797,609 | |
| | 31,829,133 | | | Series 2021-C20-XA | | | 0.99% | (j)(k) | | | 03/15/2054 | | | | 1,592,841 | |
| | 18,269,000 | | | Series 2021-C20-XD | | | 1.46% | (a)(j)(k) | | | 03/15/2054 | | | | 1,490,169 | |
| | | | |
| | | | ELP Commercial Mortgage Trust | | | | | | | | | | | | |
| | 1,765,944 | | | Series 2021-ELP-C (CME Term SOFR 1 Month + 1.43%, 1.32% Floor) | | | 6.76% | (a) | | | 11/15/2038 | | | | 1,749,142 | |
| | | | |
| | | | Fontainebleau Miami Beach Trust | | | | | | | | | | | | |
| | 2,264,000 | | | Series 2019-FBLU-G | | | 3.96% | (a)(j) | | | 12/10/2036 | | | | 2,178,932 | |
| | | | |
| | | | FS Rialto | | | | | | | | | | | | |
| | 1,168,212 | | | Series 2021-FL3-A (CME Term SOFR 1 Month + 1.36%, 1.36% Floor) | | | 6.69% | (a) | | | 11/16/2036 | | | | 1,166,180 | |
| | 1,450,000 | | | Series 2022-FL4-AS (US 30 Day Average Secured Overnight Financing Rate + 2.40%, 2.40% Floor) | | | 7.72% | (a) | | | 01/19/2039 | | | | 1,430,496 | |
| | | | Granite Point Mortgage Trust, Inc. | | | | | | | | | | | | |
| | 1,000,000 | | | Series 2021-FL4-B (CME Term SOFR 1 Month + 2.06%, 1.95% Floor) | | | 7.39% | (a) | | | 12/15/2036 | | | | 935,520 | |
| | | | | | | | |
| The accompanying notes are an integral part of these financial statements. | | Annual Report | | | | | March 31, 2024 | | 21 |
| | |
Schedule of Investments DoubleLine Flexible Income Fund (Cont.) | | |
| | | | | | | | | | | | | | | | |
PRINCIPAL
AMOUNT $ | | | SECURITY DESCRIPTION | | RATE | | | MATURITY | | | VALUE $ | |
| | | | |
| | | | Great Wolf Trust | | | | | | | | | | | | |
| | 1,450,000 | | | Series 2024-WOLF-A (CME Term SOFR 1 Month + 1.54%, 1.54% Floor) | | | 6.84% | (a) | | | 03/15/2039 | | | | 1,454,605 | |
| | | | |
| | | | GS Mortgage Securities Corp. II | | | | | | | | | | | | |
| | 6,240,176 | | | Series 2014-GC24-XA | | | 0.67% | (j)(k) | | | 09/10/2047 | | | | 3,814 | |
| | 6,762,903 | | | Series 2015-GS1-XA | | | 0.75% | (j)(k) | | | 11/10/2048 | | | | 64,519 | |
| | 5,245,871 | | | Series 2016-GS2-XA | | | 1.73% | (j)(k) | | | 05/10/2049 | | | | 135,113 | |
| | 442,000 | | | Series 2018-GS10-WLSD | | | 4.74% | (a)(j) | | | 03/10/2033 | | | | 386,596 | |
| | 553,000 | | | Series 2018-GS10-WLSE | | | 4.74% | (a)(j) | | | 03/10/2033 | | | | 473,213 | |
| | 1,509,000 | | | Series 2018-RIVR-E (CME Term SOFR 1 Month + 1.85%, 1.80% Floor) | | | 7.17% | (a) | | | 07/15/2035 | | | | 396,112 | |
| | 850,000 | | | Series 2018-TWR-E (CME Term SOFR 1 Month + 2.40%, 2.10% Floor) | | | 7.72% | (a) | | | 07/15/2031 | | | | 267,750 | |
| | 850,000 | | | Series 2018-TWR-F (CME Term SOFR 1 Month + 3.10%, 2.80% Floor) | | | 8.42% | (a) | | | 07/15/2031 | | | | 174,038 | |
| | 850,000 | | | Series 2018-TWR-G (CME Term SOFR 1 Month + 4.22%, 3.93% Floor) | | | 9.55% | (a) | | | 07/15/2031 | | | | 35,700 | |
| | | | |
| | | | GSCG Trust | | | | | | | | | | | | |
| | 2,377,000 | | | Series 2019-600C-E | | | 3.99% | (a)(b)(j) | | | 09/06/2034 | | | | 244,641 | |
| | | | |
| | | | IMT Trust | | | | | | | | | | | | |
| | 2,271,000 | | | Series 2017-APTS-CFX | | | 3.50% | (a)(j) | | | 06/15/2034 | | | | 2,245,959 | |
| | | | |
| | | | JP Morgan Chase Commercial Mortgage Securities | | | | | | | | | | | | |
| | 1,376,000 | | | Series 2014-C20-C | | | 4.48% | (j) | | | 07/15/2047 | | | | 1,103,537 | |
| | 4,940,842 | | | Series 2016-JP4-XA | | | 0.57% | (j)(k) | | | 12/15/2049 | | | | 57,175 | |
| | 1,957,000 | | | Series 2018-WPT-EFX | | | 5.36% | (a)(j) | | | 07/05/2033 | | | | 1,454,844 | |
| | 766,000 | | | Series 2019-UES-C | | | 4.34% | (a) | | | 05/05/2032 | | | | 762,499 | |
| | 784,000 | | | Series 2019-UES-D | | | 4.45% | (a)(j) | | | 05/05/2032 | | | | 779,811 | |
| | 915,000 | | | Series 2019-UES-E | | | 4.45% | (a)(j) | | | 05/05/2032 | | | | 909,330 | |
| | 960,000 | | | Series 2019-UES-F | | | 4.45% | (a)(j) | | | 05/05/2032 | | | | 953,235 | |
| | 1,049,000 | | | Series 2019-UES-G | | | 4.45% | (a)(j) | | | 05/05/2032 | | | | 1,039,402 | |
| | 1,685,000 | | | Series 2020-NNN-EFX | | | 3.97% | (a) | | | 01/16/2037 | | | | 801,015 | |
| | | | |
| | | | JPMBB Commercial Mortgage Securities Trust | | | | | | | | | | | | |
| | 247,274 | | | Series 2014-C18-XA | | | 0.39% | (j)(k) | | | 02/15/2047 | | | | 11 | |
| | 2,973,000 | | | Series 2014-C21-C | | | 4.62% | (j) | | | 08/15/2047 | | | | 2,760,337 | |
| | 100,000 | | | Series 2014-C23-C | | | 4.48% | (j) | | | 09/15/2047 | | | | 96,532 | |
| | 1,115,000 | | | Series 2015-C29-C | | | 4.19% | (j) | | | 05/15/2048 | | | | 1,012,590 | |
| | 2,938,484 | | | Series 2015-C29-XA | | | 0.54% | (j)(k) | | | 05/15/2048 | | | | 12,444 | |
| | 3,834,677 | | | Series 2015-C31-XA | | | 0.80% | (j)(k) | | | 08/15/2048 | | | | 32,286 | |
| | 470,000 | | | Series 2015-C33-C | | | 4.64% | (j) | | | 12/15/2048 | | | | 418,400 | |
| | | | |
| | | | KREF | | | | | | | | | | | | |
| | 1,780,000 | | | Series 2021-FL2-A (CME Term SOFR 1 Month + 1.18%, 1.07% Floor) | | | 6.51% | (a) | | | 02/15/2039 | | | | 1,753,170 | |
| | | | |
| | | | Ladder Capital Commercial Mortgage Securities LLC | | | | | | | | | | | | |
| | 2,532,000 | | | Series 2017-LC26-C | | | 4.71% | (a) | | | 07/12/2050 | | | | 2,177,394 | |
| | | | |
| | | | LFT CRE Ltd. | | | | | | | | | | | | |
| | 1,470,000 | | | Series 2021-FL1-B (CME Term SOFR 1 Month + 1.86%, 1.86% Floor) | | | 7.19% | (a) | | | 06/15/2039 | | | | 1,442,396 | |
| | | | |
| | | | LSTAR Commercial Mortgage Trust | | | | | | | | | | | | |
| | 2,344,427 | | | Series 2016-4-XA | | | 1.66% | (a)(j)(k) | | | 03/10/2049 | | | | 25,383 | |
| | 11,382,859 | | | Series 2017-5-X | | | 0.83% | (a)(j)(k) | | | 03/10/2050 | | | | 170,154 | |
| | | | |
| | | | Lument Finance Trust, Inc. | | | | | | | | | | | | |
| | 1,828,692 | | | Series 2021-FL1-A (CME Term SOFR 1 Month + 1.28%, 1.28% Floor) | | | 6.61% | (a) | | | 06/15/2039 | | | | 1,821,099 | |
| | | | |
| | | | Merit 2020 | | | | | | | | | | | | |
| | 670,000 | | | Series 2021-STOR-C (CME Term SOFR 1 Month + 1.16%, 1.05% Floor) | | | 6.49% | (a) | | | 07/15/2038 | | | | 662,645 | |
| | | | |
| | | | MF1 Multifamily Housing Mortgage Loan Trust | | | | | | | | | | | | |
| | 2,200,000 | | | Series 2021-FL7-C (CME Term SOFR 1 Month + 2.16%, 2.05% Floor) | | | 7.49% | (a) | | | 10/16/2036 | | | | 2,118,268 | |
| | 1,380,000 | | | Series 2024-FL14-A (CME Term SOFR 1 Month + 1.74%, 1.74% Floor) | | | 7.06% | (a) | | | 03/19/2039 | | | | 1,384,354 | |
| | | | |
| | | | MFT Trust | | | | | | | | | | | | |
| | 2,538,000 | | | Series 2020-ABC-D | | | 3.48% | (a)(j) | | | 02/10/2042 | | | | 1,348,588 | |
| | | | |
| 22 | | DoubleLine Funds Trust | | The accompanying notes are an integral part of these financial statements. |
| | | | | | | | | | | | | | | | |
PRINCIPAL
AMOUNT $ | | | SECURITY DESCRIPTION | | RATE | | | MATURITY | | | VALUE $ | |
| | | | |
| | | | Morgan Stanley Bank of America Merrill Lynch Trust | | | | | | | | | | | | |
| | 100,000 | | | Series 2014-C18-C | | | 4.46% | (j) | | | 10/15/2047 | | | | 96,571 | |
| | 274,000 | | | Series 2015-C27-C | | | 4.49% | (j) | | | 12/15/2047 | | | | 255,848 | |
| | | | |
| | | | Morgan Stanley Capital I, Inc. | | | | | | | | | | | | |
| | 2,489,000 | | | Series 2019-NUGS-F (CME Term SOFR 1 Month + 2.96%, 4.34% Floor) | | | 8.28% | (a)(b) | | | 12/15/2036 | | | | 418,288 | |
| | | | |
| | | | Natixis Commercial Mortgage Securities Trust | | | | | | | | | | | | |
| | 1,919,000 | | | Series 2018-FL1-C (Prime Rate + 0.00%) | | | 8.50% | (a) | | | 06/15/2035 | | | | 803,442 | |
| | 1,183,000 | | | Series 2020-2PAC-AMZ1 | | | 3.50% | (a)(j) | | | 01/15/2037 | | | | 993,002 | |
| | 685,000 | | | Series 2020-2PAC-AMZ2 | | | 3.50% | (a)(j) | | | 01/15/2037 | | | | 534,210 | |
| | 639,000 | | | Series 2020-2PAC-AMZ3 | | | 3.50% | (a)(b)(j) | | | 01/15/2037 | | | | 442,201 | |
| | | | |
| | | | One New York Plaza Trust | | | | | | | | | | | | |
| | 1,500,000 | | | Series 2020-1NYP-C (CME Term SOFR 1 Month + 2.31%, 2.20% Floor) | | | 7.64% | (a) | | | 01/15/2036 | | | | 1,384,268 | |
| | | | |
| | | | RLGH Trust | | | | | | | | | | | | |
| | 2,750,000 | | | Series 2021-TROT-D (CME Term SOFR 1 Month + 1.83%, 1.71% Floor) | | | 7.15% | (a) | | | 04/15/2036 | | | | 2,698,067 | |
| | | | |
| | | | Soho Trust | | | | | | | | | | | | |
| | 2,874,000 | | | Series 2021-SOHO-B | | | 2.70% | (a)(j) | | | 08/10/2038 | | | | 1,841,947 | |
| | | | |
| | | | Starwood Property Mortgage Trust | | | | | | | | | | | | |
| | 961,000 | | | Series 2019-FL1-D (CME Term SOFR 1 Month + 2.46%, 2.46% Floor) | | | 7.79% | (a) | | | 07/15/2038 | | | | 905,078 | |
| | | | |
| | | | TPG Real Estate Finance Issuer Ltd. | | | | | | | | | | | | |
| | 1,160,000 | | | Series 2021-FL4-B (CME Term SOFR 1 Month + 1.96%, 1.85% Floor) | | | 7.29% | (a) | | | 03/15/2038 | | | | 1,101,381 | |
| | | | |
| | | | UBS Commercial Mortgage Trust | | | | | | | | | | | | |
| | 1,097,000 | | | Series 2018-C8-C | | | 4.68% | (j) | | | 02/15/2051 | | | | 944,667 | |
| | 12,629,950 | | | Series 2018-C8-XA | | | 0.81% | (j)(k) | | | 02/15/2051 | | | | 338,101 | |
| | | | |
| | | | VMC Finance LLC | | | | | | | | | | | | |
| | 1,321,442 | | | Series 2019-FL3-D (CME Term SOFR 1 Month + 2.76%, 2.65% Floor) | | | 8.09% | (a) | | | 09/15/2036 | | | | 1,288,239 | |
| | | | |
| | | | WF-RBS Commercial Mortgage Trust | | | | | | | | | | | | |
| | 2,356,322 | | | Series 2014-C21-XA | | | 0.97% | (j)(k) | | | 08/15/2047 | | | | 1,305 | |
| | | | | | | | | | | | | | | | |
| | | | Total Non-Agency Commercial Mortgage Backed Obligations (Cost $116,446,593) | | | | 87,722,890 | |
| | | | | | | | | | | | | | | | |
| | NON-AGENCY RESIDENTIAL COLLATERALIZED MORTGAGE OBLIGATIONS - 18.2% | |
| | | | |
| | | | ACE Securities Corp. | | | | | | | | | | | | |
| | 2,721,565 | | | Series 2007-HE1-A2A (CME Term SOFR 1 Month + 0.29%, 0.18% Floor) | | | 5.62% | | | | 01/25/2037 | | | | 1,627,169 | |
| | 1,104,665 | | | Series 2007-HE1-A2D (CME Term SOFR 1 Month + 0.61%, 0.50% Floor) | | | 5.94% | | | | 01/25/2037 | | | | 660,428 | |
| | | | |
| | | | AMSR Trust | | | | | | | | | | | | |
| | 1,000,000 | | | Series 2020-SFR4-E1 | | | 2.21% | (a) | | | 11/17/2037 | | | | 934,144 | |
| | 5,122,000 | | | Series 2021-SFR3-G | | | 3.80% | (a) | | | 10/17/2038 | | | | 4,564,472 | |
| | | | |
| | | | APS Resecuritization Trust | | | | | | | | | | | | |
| | 7,765,840 | | | Series 2015-3-1MZ (12 Month US Treasury Average + 0.96%, 0.96% Floor) | | | 4.47% | (a) | | | 10/27/2046 | | | | 6,633,234 | |
| | | | |
| | | | Asset Backed Securities Corp. Home Equity | | | | | | | | | | | | |
| | 1,561,905 | | | Series 2007-HE2-A4 (CME Term SOFR 1 Month + 0.34%, 0.23% Floor) | | | 5.67% | | | | 05/25/2037 | | | | 1,089,713 | |
| | | | |
| | | | Bear Stearns Adjustable Rate Mortgage Trust | | | | | | | | | | | | |
| | 939,610 | | | Series 2006-2-2A1 | | | 4.19% | (j) | | | 07/25/2036 | | | | 792,866 | |
| | | | |
| | | | Bear Stearns Alt-A Trust | | | | | | | | | | | | |
| | 681,658 | | | Series 2006-4-22A1 | | | 4.16% | (j) | | | 08/25/2036 | | | | 492,402 | |
| | | | |
| | | | Chase Mortgage Finance Corp. | | | | | | | | | | | | |
| | 1,961,983 | | | Series 2007-S4-A4 (CME Term SOFR 1 Month + 0.71%, 0.60% Floor, 6.00% Cap) | | | 6.00% | | | | 06/25/2037 | | | | 641,831 | |
| | | | |
| | | | Citimortgage Alternative Loan Trust | | | | | | | | | | | | |
| | 585,168 | | | Series 2007-A5-1A10 | | | 5.75% | | | | 05/25/2037 | | | | 516,675 | |
| | | | |
| | | | Countrywide Alternative Loan Trust | | | | | | | | | | | | |
| | 223,929 | | | Series 2005-75CB-A3 | | | 5.50% | | | | 01/25/2036 | | | | 154,699 | |
| | 526,386 | | | Series 2006-23CB-2A2 | | | 6.50% | | | | 08/25/2036 | | | | 165,420 | |
| | 3,295,554 | | | Series 2006-6CB-2A10 | | | 6.00% | | | | 05/25/2036 | | | | 1,367,990 | |
| | 1,937,072 | | | Series 2006-OA6-1A1A (CME Term SOFR 1 Month + 0.53%, 0.42% Floor) | | | 5.86% | | | | 07/25/2046 | | | | 1,705,696 | |
| | 288,951 | | | Series 2007-15CB-A7 | | | 6.00% | | | | 07/25/2037 | | | | 173,921 | |
| | 474,001 | | | Series 2008-1R-2A3 | | | 6.00% | | | | 08/25/2037 | | | | 247,327 | |
| | | | | | | | |
| The accompanying notes are an integral part of these financial statements. | | Annual Report | | | | | March 31, 2024 | | 23 |
| | |
Schedule of Investments DoubleLine Flexible Income Fund (Cont.) | | |
| | | | | | | | | | | | | | | | |
PRINCIPAL
AMOUNT $ | | | SECURITY DESCRIPTION | | RATE | | | MATURITY | | | VALUE $ | |
| | | | |
| | | | Countrywide Home Loan Mortgage Pass Through Trust | | | | | | | | | | | | |
| | 114,364 | | | Series 2005-HYB9-3A2A (CME Term SOFR 12 Month + 2.47%, 1.75% Floor, 11.00% Cap) | | | 7.88% | | | | 02/20/2036 | | | | 96,371 | |
| | 248,078 | | | Series 2007-14-A15 | | | 6.50% | | | | 09/25/2037 | | | | 143,958 | |
| | 4,858,100 | | | Series 2007-14-A19 | | | 6.00% | | | | 09/25/2037 | | | | 2,619,867 | |
| | 2,983,437 | | | Series 2007-9-A13 | | | 5.75% | | | | 07/25/2037 | | | | 1,507,637 | |
| | 351,795 | | | Series 2007-HY1-1A1 | | | 4.54% | (j) | | | 04/25/2037 | | | | 319,423 | |
| | | | |
| | | | Credit Suisse First Boston Mortgage Securities Corp. | | | | | | | | | | | | |
| | 387,999 | | | Series 2005-10-6A9 | | | 5.50% | | | | 11/25/2035 | | | | 143,884 | |
| | 160,231 | | | Series 2005-9-5A9 | | | 5.50% | | | | 10/25/2035 | | | | 85,200 | |
| | | | |
| | | | Credit Suisse Mortgage Capital Certificates | | | | | | | | | | | | |
| | 604,264 | | | Series 2011-12R-3A5 | | | 5.27% | (a)(j) | | | 07/27/2036 | | | | 586,692 | |
| | 7,700,000 | | | Series 2020-RPL6-A2 | | | 3.40% | (a)(j) | | | 03/25/2059 | | | | 7,088,264 | |
| | 1,500,000 | | | Series 2021-NQM6-B1 | | | 3.29% | (a)(j) | | | 07/25/2066 | | | | 994,907 | |
| | | | |
| | | | CSAB Mortgage Backed Trust | | | | | | | | | | | | |
| | 265,891 | | | Series 2006-2-A5A | | | 6.58% | (e) | | | 09/25/2036 | | | | 79,736 | |
| | | | |
| | | | DB US Financial Markets Holding Corp. | | | | | | | | | | | | |
| | 99,147 | | | Series 2014-RS1-1A2 | | | 6.50% | (a)(j) | | | 07/27/2037 | | | | 81,239 | |
| | | | |
| | | | Deutsche ALT-A Securities, Inc. | | | | | | | | | | | | |
| | 170,348 | | | Series 2006-AB4-A1A | | | 6.01% | (j) | | | 10/25/2036 | | | | 141,974 | |
| | | | |
| | | | Fannie Mae Connecticut Avenue Securities | | | | | | | | | | | | |
| | 6,200,000 | | | Series 2024-R01-1M2 (US 30 Day Average Secured Overnight Financing Rate + 1.80%, 1.80% Floor) | | | 7.12% | (a) | | | 01/25/2044 | | | | 6,241,917 | |
| | | | |
| | | | FirstKey Homes Trust | | | | | | | | | | | | |
| | 6,452,000 | | | Series 2021-SFR1-F1 | | | 3.24% | (a) | | | 08/17/2038 | | | | 5,822,276 | |
| | | | |
| | | | FMC GMSR Issuer Trust | | | | | | | | | | | | |
| | 8,000,000 | | | Series 2021-GT1-A | | | 3.62% | (a)(j) | | | 07/25/2026 | | | | 7,057,253 | |
| | | | |
| | | | Freddie Mac Structured Agency Credit Risk Debt Notes | | | | | | | | | | | | |
| | 4,300,000 | | | Series 2024-DNA1-M2 (US 30 Day Average Secured Overnight Financing Rate + 1.95%) | | | 7.27% | (a) | | | 02/25/2044 | | | | 4,318,757 | |
| | 9,000,000 | | | Series 2024-HQA1-M2 (US 30 Day Average Secured Overnight Financing Rate + 2.00%) | | | 7.32% | (a) | | | 03/25/2044 | | | | 9,024,646 | |
| | | | |
| | | | GCAT | | | | | | | | | | | | |
| | 500,000 | | | Series 2019-NQM3-B1 | | | 3.95% | (a)(j) | | | 11/25/2059 | | | | 391,196 | |
| | | | |
| | | | Home Partners of America Trust | | | | | | | | | | | | |
| | 6,435,698 | | | Series 2019-2-F | | | 3.87% | (a) | | | 10/19/2039 | | | | 5,668,209 | |
| | | | |
| | | | Impac Secured Assets CMN Owner Trust | | | | | | | | | | | | |
| | 694,174 | | | Series 2006-5-1A1C (CME Term SOFR 1 Month + 0.65%, 0.54% Floor, 11.50% Cap) | | | 5.98% | | | | 02/25/2037 | | | | 619,154 | |
| | | | |
| | | | Indymac Index Mortgage Loan Trust | | | | | | | | | | | | |
| | 3,456,866 | | | Series 2006-AR19-2A1 | | | 3.73% | (j) | | | 08/25/2036 | | | | 3,110,422 | |
| | | | |
| | | | JP Morgan Mortgage Trust | | | | | | | | | | | | |
| | 404,992 | | | Series 2005-S3-1A2 | | | 5.75% | | | | 01/25/2036 | | | | 184,555 | |
| | 291,283 | | | Series 2007-A2-4A1M | | | 4.46% | (j) | | | 04/25/2037 | | | | 230,466 | |
| | | | |
| | | | Legacy Mortgage Asset Trust | | | | | | | | | | | | |
| | 3,337,749 | | | Series 2021-GS1-A2 | | | 6.84% | (a)(e) | | | 10/25/2066 | | | | 3,343,170 | |
| | | | |
| | | | Lehman Mortgage Trust | | | | | | | | | | | | |
| | 106,039 | | | Series 2006-1-1A3 | | | 5.50% | | | | 02/25/2036 | | | | 51,567 | |
| | | | |
| | | | LoanDepot GMSR Master Trust | | | | | | | | | | | | |
| | 3,000,000 | | | Series 2018-GT1-A (CME Term SOFR 1 Month + 3.66%, 2.80% Floor) | | | 8.99% | (a) | | | 10/16/2025 | | | | 2,926,267 | |
| | | | |
| | | | Mastr Adjustable Rate Mortgages Trust | | | | | | | | | | | | |
| | 68,579 | | | Series 2006-2-2A1 | | | 6.17% | (j) | | | 04/25/2036 | | | | 36,455 | |
| | | | |
| | | | Merrill Lynch Alternative Note Asset | | | | | | | | | | | | |
| | 261,697 | | | Series 2007-F1-2A7 | | | 6.00% | | | | 03/25/2037 | | | | 93,845 | |
| | | | |
| | | | Merrill Lynch Mortgage Investors, Inc. | | | | | | | | | | | | |
| | 539,620 | | | Series 2006-AF1-AF2C | | | 6.25% | | | | 08/25/2036 | | | | 217,747 | |
| | | | |
| | | | Morgan Stanley Mortgage Loan Trust | | | | | | | | | | | | |
| | 4,489,702 | | | Series 2005-7-3A1 | | | 4.67% | (j) | | | 11/25/2035 | | | | 2,582,785 | |
| | 71,361 | | | Series 2005-7-4A1 | | | 5.50% | | | | 11/25/2035 | | | | 44,076 | |
| | 279,132 | | | Series 2006-2-7A1 | | | 5.47% | (j) | | | 02/25/2036 | | | | 157,441 | |
| | 434,634 | | | Series 2007-8XS-A1 | | | 5.75% | (j) | | | 04/25/2037 | | | | 209,220 | |
| | | | |
| 24 | | DoubleLine Funds Trust | | The accompanying notes are an integral part of these financial statements. |
| | | | | | | | | | | | | | | | |
PRINCIPAL
AMOUNT $ | | | SECURITY DESCRIPTION | | RATE | | | MATURITY | | | VALUE $ | |
| | | | |
| | | | Morgan Stanley Resecuritization Trust | | | | | | | | | | | | |
| | 7,380,795 | | | Series 2013-R7-8B (12 Month US Treasury Average + 0.96%, 0.96% Floor) | | | 6.04% | (a)(b) | | | 12/26/2046 | | | | 6,848,140 | |
| | | | |
| | | | New Century Home Equity Loan Trust | | | | | | | | | | | | |
| | 1,099,894 | | | Series 2006-1-A2B (CME Term SOFR 1 Month + 0.47%, 0.36% Floor, 12.50% Cap) | | | 5.80% | | | | 05/25/2036 | | | | 1,082,130 | |
| | | | |
| | | | New York Mortgage Trust, Inc. | | | | | | | | | | | | |
| | 1,457,149 | | | Series 2021-BPL1-A2 | | | 2.98% | (a)(e) | | | 05/25/2026 | | | | 1,438,849 | |
| | | | |
| | | | Novastar Home Equity Loan | | | | | | | | | | | | |
| | 9,679,231 | | | Series 2006-3-A2C (CME Term SOFR 1 Month + 0.43%, 0.32% Floor, 11.00% Cap) | | | 5.76% | | | | 10/25/2036 | | | | 5,095,863 | |
| | | | |
| | | | PennyMac Mortgage Investment Trust | | | | | | | | | | | | |
| | 368,547 | | | Series 2019-3R-A (US 30 Day Average Secured Overnight Financing Rate + 3.81%, 2.70% Floor) | | | 9.14% | (a) | | | 11/27/2031 | | | | 369,268 | |
| | 500,000 | | | Series 2021-FT1-A (CME Term SOFR 1 Month + 3.11%, 3.12% Floor) | | | 8.44% | (a) | | | 03/25/2026 | | | | 506,294 | |
| | | | |
| | | | Progress Residential Trust | | | | | | | | | | | | |
| | 1,100,000 | | | Series 2021-SFR1-G | | | 3.86% | (a) | | | 04/17/2038 | | | | 1,003,318 | |
| | 7,500,000 | | | Series 2021-SFR2-F | | | 3.40% | (a) | | | 04/19/2038 | | | | 6,862,486 | |
| | 8,100,000 | | | Series 2021-SFR3-F | | | 3.44% | (a) | | | 05/17/2026 | | | | 7,423,958 | |
| | | | |
| | | | PRPM LLC | | | | | | | | | | | | |
| | 3,000,000 | | | Series 2021-2-A2 | | | 6.77% | (a)(j) | | | 03/25/2026 | | | | 2,955,826 | |
| | | | |
| | | | RALI Trust | | | | | | | | | | | | |
| | 261,054 | | | Series 2006-QS12-2A3 | | | 6.00% | | | | 09/25/2036 | | | | 212,124 | |
| | | | |
| | | | Residential Asset Securitization Trust | | | | | | | | | | | | |
| | 1,488,826 | | | Series 2005-A15-5A2 | | | 5.75% | | | | 02/25/2036 | | | | 540,730 | |
| | 344,887 | | | Series 2006-A2-A11 | | | 6.00% | | | | 01/25/2046 | | | | 142,069 | |
| | | | |
| | | | Residential Mortgage Loan Trust | | | | | | | | | | | | |
| | 5,750,000 | | | Series 2020-1-B1 | | | 3.95% | (a)(j) | | | 01/26/2060 | | | | 4,908,327 | |
| | | | |
| | | | RFMSI Trust | | | | | | | | | | | | |
| | 2,511,079 | | | Series 2006-S8-A10 | | | 6.00% | | | | 09/25/2036 | | | | 1,837,065 | |
| | | | |
| | | | Soundview Home Equity Loan Trust | | | | | | | | | | | | |
| | 4,366,567 | | | Series 2007-OPT1-2A2 (CME Term SOFR 1 Month + 0.26%, 0.15% Floor) | | | 5.59% | | | | 06/25/2037 | | | | 2,866,223 | |
| | | | |
| | | | Starwood Mortgage Residential Trust | | | | | | | | | | | | |
| | 1,116,000 | | | Series 2019-INV1-B1 | | | 3.66% | (a)(j) | | | 09/27/2049 | | | | 996,134 | |
| | | | |
| | | | Structured Adjustable Rate Mortgage Loan Trust | | | | | | | | | | | | |
| | 514,738 | | | Series 2005-22-4A1 | | | 5.25% | (j) | | | 12/25/2035 | | | | 468,038 | |
| | | | |
| | | | Structured Asset Securities Corp. | | | | | | | | | | | | |
| | 7,454,445 | | | Series 2007-OSI-A4 (CME Term SOFR 1 Month + 0.31%, 0.20% Floor) | | | 5.64% | | | | 06/25/2037 | | | | 4,809,154 | |
| | 5,092,983 | | | Series 2007-RF1-1A (CME Term SOFR 1 Month + 0.30%, 0.19% Floor) | | | 5.63% | (a) | | | 03/25/2037 | | | | 4,111,514 | |
| | | | |
| | | | TBW Mortgage Backed Pass Through Certificates | | | | | | | | | | | | |
| | 13,354,142 | | | Series 2006-3-4A1 (CME Term SOFR 1 Month + 0.51%, 0.40% Floor, 7.50% Cap) | | | 5.84% | | | | 07/25/2036 | | | | 1,218,707 | |
| | 13,354,229 | | | Series 2006-3-4A3 (-1 x CME Term SOFR 1 Month + 6.99%, 7.10% Cap) | | | 1.66% | (k)(l) | | | 07/25/2036 | | | | 622,722 | |
| | | | |
| | | | Toorak Mortgage Corp. | | | | | | | | | | | | |
| | 6,600,000 | | | Series 2021-1-A2 | | | 5.10% | (a)(e) | | | 06/25/2024 | | | | 6,430,118 | |
| | | | |
| | | | Tricon American Homes Trust | | | | | | | | | | | | |
| | 5,000,000 | | | Series 2019-SFR1-F | | | 3.75% | (a) | | | 03/17/2038 | | | | 4,732,995 | |
| | | | |
| | | | Velocity Commercial Capital Loan Trust | | | | | | | | | | | | |
| | 1,272,726 | | | Series 2018-2-M2 | | | 4.51% | (a)(j) | | | 10/26/2048 | | | | 1,108,040 | |
| | 323,342 | | | Series 2018-2-M3 | | | 4.72% | (a)(j) | | | 10/26/2048 | | | | 273,364 | |
| | 1,030,325 | | | Series 2019-1-M5 | | | 5.70% | (a)(j) | | | 03/25/2049 | | | | 880,588 | |
| | 1,411,970 | | | Series 2019-2-M4 | | | 3.99% | (a)(j) | | | 07/25/2049 | | | | 1,210,111 | |
| | | | |
| | | | Verus Securitization Trust | | | | | | | | | | | | |
| | 3,100,000 | | | Series 2019-INV3-B1 | | | 3.73% | (a)(j) | | | 11/25/2059 | | | | 2,715,221 | |
| | 2,600,000 | | | Series 2021-3-B1 | | | 3.20% | (a)(j) | | | 06/25/2066 | | | | 1,799,922 | |
| | 5,000,000 | | | Series 2021-7-B1 | | | 4.14% | (a)(j) | | | 10/25/2066 | | | | 3,794,417 | |
| | 3,000,000 | | | Series 2021-R2-B1 | | | 3.25% | (a)(j) | | | 02/25/2064 | | | | 2,227,392 | |
| | | | | | | | |
| The accompanying notes are an integral part of these financial statements. | | Annual Report | | | | | March 31, 2024 | | 25 |
| | |
Schedule of Investments DoubleLine Flexible Income Fund (Cont.) | | |
| | | | | | | | | | | | | | | | |
PRINCIPAL
AMOUNT $ | | | SECURITY DESCRIPTION | | RATE | | | MATURITY | | | VALUE $ | |
| | | | |
| | | | WaMu Mortgage Pass Through Certificates | | | | | | | | | | | | |
| | 734,975 | | | Series 2007-HY6-2A2 | | | 3.69% | (j) | | | 06/25/2037 | | | | 628,823 | |
| | | | |
| | | | Washington Mutual Alternative Mortgage Pass-Through Certificates | | | | | | | | | | | | |
| | 467,112 | | | Series 2006-2-4CB | | | 6.00% | | | | 03/25/2036 | | | | 439,217 | |
| | | | |
| | | | Wells Fargo Alternative Loan Trust | | | | | | | | | | | | |
| | 228,099 | | | Series 2007-PA5-1A1 | | | 6.25% | | | | 11/25/2037 | | | | 195,130 | |
| | | | |
| | | | Wells Fargo Home Equity Trust | | | | | | | | | | | | |
| | 4,534,286 | | | Series 2007-2-A4 (CME Term SOFR 1 Month + 0.71%, 0.60% Floor) | | | 6.04% | | | | 04/25/2037 | | | | 3,191,097 | |
| | | | | | | | | | | | | | | | |
| | | | Total Non-Agency Residential Collateralized Mortgage Obligations
(Cost $208,214,860) | | | | | | | | 173,933,937 | |
| | | | | | | | | | | | | |
| | US CORPORATE BONDS - 3.9% | | | | | | | | | | | | |
| | 215,000 | | | AAR Escrow Issuer LLC | | | 6.75% | (a) | | | 03/15/2029 | | | | 216,923 | |
| | 425,000 | | | Academy Ltd. | | | 6.00% | (a) | | | 11/15/2027 | | | | 418,995 | |
| | 275,000 | | | Acuris Finance US, Inc. / Acuris Finance SARL | | | 5.00% | (a) | | | 05/01/2028 | | | | 250,136 | |
| | 90,000 | | | Acushnet Co. | | | 7.38% | (a) | | | 10/15/2028 | | | | 93,343 | |
| | 110,000 | | | AdaptHealth LLC | | | 5.13% | (a) | | | 03/01/2030 | | | | 96,031 | |
| | 255,000 | | | Advanced Drainage Systems, Inc. | | | 6.38% | (a) | | | 06/15/2030 | | | | 256,557 | |
| | 130,000 | | | Aethon United BR LP / Aethon United Finance Corp. | | | 8.25% | (a) | | | 02/15/2026 | | | | 131,618 | |
| | 185,000 | | | Alliant Holdings Intermediate LLC / Alliant Holdings Co.-Issuer | | | 6.75% | (a) | | | 10/15/2027 | | | | 182,418 | |
| | 80,000 | | | Alliant Holdings Intermediate LLC / Alliant Holdings Co.-Issuer | | | 7.00% | (a) | | | 01/15/2031 | | | | 80,862 | |
| | 200,000 | | | Allied Universal Holdco LLC | | | 7.88% | (a) | | | 02/15/2031 | | | | 202,809 | |
| | 70,000 | | | Allied Universal Holdco LLC / Allied Universal Finance Corp. | | | 6.63% | (a) | | | 07/15/2026 | | | | 70,013 | |
| | 200,000 | | | Allied Universal Holdco LLC / Allied Universal Finance Corp. | | | 6.00% | (a) | | | 06/01/2029 | | | | 172,312 | |
| | 60,000 | | | AMC Entertainment Holdings, Inc. | | | 7.50% | (a) | | | 02/15/2029 | | | | 40,127 | |
| | 205,000 | | | American Airlines, Inc. | | | 8.50% | (a) | | | 05/15/2029 | | | | 216,702 | |
| | 215,000 | | | American Airlines, Inc./AAdvantage Loyalty IP Ltd. | | | 5.75% | (a) | | | 04/20/2029 | | | | 211,506 | |
| | 100,000 | | | American Axle & Manufacturing, Inc. | | | 5.00% | | | | 10/01/2029 | | | | 90,159 | |
| | 185,000 | | | AmWINS Group, Inc. | | | 4.88% | (a) | | | 06/30/2029 | | | | 172,855 | |
| | 239,000 | | | Antero Midstream Partners LP / Antero Midstream Finance Corp. | | | 5.75% | (a) | | | 03/01/2027 | | | | 236,165 | |
| | 205,000 | | | Antero Midstream Partners LP / Antero Midstream Finance Corp. | | | 6.63% | (a) | | | 02/01/2032 | | | | 206,065 | |
| | 230,000 | | | Antero Resources Corp. | | | 5.38% | (a) | | | 03/01/2030 | | | | 221,090 | |
| | 60,000 | | | Arsenal AIC Parent LLC | | | 8.00% | (a) | | | 10/01/2030 | | | | 63,068 | |
| | 95,000 | | | Artera Services LLC | | | 8.50% | (a) | | | 02/15/2031 | | | | 97,467 | |
| | 145,000 | | | Ashton Woods USA LLC / Ashton Woods Finance Co. | | | 4.63% | (a) | | | 04/01/2030 | | | | 132,626 | |
| | 60,000 | | | ASP Unifrax Holdings, Inc. | | | 5.25% | (a) | | | 09/30/2028 | | | | 38,757 | |
| | 170,000 | | | AssuredPartners, Inc. | | | 5.63% | (a) | | | 01/15/2029 | | | | 156,791 | |
| | 165,000 | | | AthenaHealth Group, Inc. | | | 6.50% | (a) | | | 02/15/2030 | | | | 151,083 | |
| | 230,000 | | | Bausch + Lomb Corp. | | | 8.38% | (a) | | | 10/01/2028 | | | | 238,259 | |
| | 75,000 | | | Bausch Health Americas, Inc. | | | 8.50% | (a) | | | 01/31/2027 | | | | 44,157 | |
| | 175,000 | | | Bausch Health Cos., Inc. | | | 4.88% | (a) | | | 06/01/2028 | | | | 95,669 | |
| | 50,000 | | | Bausch Health Cos., Inc. | | | 5.25% | (a) | | | 01/30/2030 | | | | 21,054 | |
| | 15,000 | | | Bausch Health Cos., Inc. | | | 14.00% | (a) | | | 10/15/2030 | | | | 8,704 | |
| | 250,000 | | | BCPE Empire Holdings, Inc. | | | 7.63% | (a) | | | 05/01/2027 | | | | 244,330 | |
| | 180,000 | | | Beacon Roofing Supply, Inc. | | | 6.50% | (a) | | | 08/01/2030 | | | | 182,807 | |
| | 25,000 | | | Boxer Parent Co., Inc. | | | 7.13% | (a) | | | 10/02/2025 | | | | 25,042 | |
| | 115,000 | | | Brand Industrial Services, Inc. | | | 10.38% | (a) | | | 08/01/2030 | | | | 124,650 | |
| | 195,000 | | | Builders FirstSource, Inc. | | | 4.25% | (a) | | | 02/01/2032 | | | | 175,016 | |
| | 200,000 | | | Builders FirstSource, Inc. | | | 6.38% | (a) | | | 06/15/2032 | | | | 203,134 | |
| | 265,000 | | | Builders FirstSource, Inc. | | | 6.38% | (a) | | | 03/01/2034 | | | | 266,426 | |
| | 95,000 | | | Caesars Entertainment, Inc. | | | 4.63% | (a) | | | 10/15/2029 | | | | 86,704 | |
| | 210,000 | | | Caesars Entertainment, Inc. | | | 6.50% | (a) | | | 02/15/2032 | | | | 211,981 | |
| | 210,000 | | | Calpine Corp. | | | 4.50% | (a) | | | 02/15/2028 | | | | 199,343 | |
| | 210,000 | | | Calpine Corp. | | | 4.63% | (a) | | | 02/01/2029 | | | | 194,575 | |
| | 340,000 | | | Carnival Corp. | | | 5.75% | (a) | | | 03/01/2027 | | | | 336,724 | |
| | 130,000 | | | Carnival Corp. | | | 7.00% | (a) | | | 08/15/2029 | | | | 135,693 | |
| | | | |
| 26 | | DoubleLine Funds Trust | | The accompanying notes are an integral part of these financial statements. |
| | | | | | | | | | | | | | | | |
PRINCIPAL
AMOUNT $ | | | SECURITY DESCRIPTION | | RATE | | | MATURITY | | | VALUE $ | |
| | 40,000 | | | Castle US Holding Corp. | | | 9.50% | (a) | | | 02/15/2028 | | | | 19,951 | |
| | 50,000 | | | Catalent Pharma Solutions, Inc. | | | 3.50% | (a) | | | 04/01/2030 | | | | 47,663 | |
| | 355,000 | | | CCO Holdings LLC / CCO Holdings Capital Corp. | | | 4.75% | (a) | | | 03/01/2030 | | | | 305,040 | |
| | 295,000 | | | CCO Holdings LLC / CCO Holdings Capital Corp. | | | 4.50% | (a) | | | 08/15/2030 | | | | 247,408 | |
| | 200,000 | | | CCO Holdings LLC / CCO Holdings Capital Corp. | | | 4.75% | (a) | | | 02/01/2032 | | | | 163,418 | |
| | 235,000 | | | Cedar Fair LP | | | 5.25% | | | | 07/15/2029 | | | | 223,582 | |
| | 145,000 | | | Central Parent LLC / CDK Global II LLC / CDK Financing Co., Inc. | | | 8.00% | (a) | | | 06/15/2029 | | | | 150,438 | |
| | 270,000 | | | Chesapeake Energy Corp. | | | 5.88% | (a) | | | 02/01/2029 | | | | 268,019 | |
| | 160,000 | | | Chord Energy Corp. | | | 6.38% | (a) | | | 06/01/2026 | | | | 160,786 | |
| | 140,000 | | | CHS/Community Health Systems, Inc. | | | 6.00% | (a) | | | 01/15/2029 | | | | 122,471 | |
| | 200,000 | | | CHS/Community Health Systems, Inc. | | | 4.75% | (a) | | | 02/15/2031 | | | | 154,530 | |
| | 125,000 | | | Civitas Resources, Inc. | | | 8.38% | (a) | | | 07/01/2028 | | | | 131,745 | |
| | 140,000 | | | Clarios Global LP / Clarios US Finance Co. | | | 6.75% | (a) | | | 05/15/2028 | | | | 142,021 | |
| | 90,000 | | | Clarivate Science Holdings Corp. | | | 4.88% | (a) | | | 07/01/2029 | | | | 83,358 | |
| | 110,000 | | | Clean Harbors, Inc. | | | 5.13% | (a) | | | 07/15/2029 | | | | 105,834 | |
| | 60,000 | | | Clear Channel Outdoor Holdings, Inc. | | | 9.00% | (a) | | | 09/15/2028 | | | | 62,551 | |
| | 95,000 | | | Clear Channel Outdoor Holdings, Inc. | | | 7.50% | (a) | | | 06/01/2029 | | | | 78,652 | |
| | 305,000 | | | Clearway Energy Operating LLC | | | 4.75% | (a) | | | 03/15/2028 | | | | 290,142 | |
| | 45,000 | | | Cloud Software Group, Inc. | | | 6.50% | (a) | | | 03/31/2029 | | | | 42,741 | |
| | 45,000 | | | Cloud Software Group, Inc. | | | 9.00% | (a) | | | 09/30/2029 | | | | 43,203 | |
| | 205,000 | | | CNX Midstream Partners LP | | | 4.75% | (a) | | | 04/15/2030 | | | | 182,884 | |
| | 185,000 | | | CNX Resources Corp. | | | 6.00% | (a) | | | 01/15/2029 | | | | 181,309 | |
| | 90,000 | | | Coherent Corp. | | | 5.00% | (a) | | | 12/15/2029 | | | | 84,860 | |
| | 65,000 | | | CommScope Technologies LLC | | | 5.00% | (a) | | | 03/15/2027 | | | | 25,268 | |
| | 65,000 | | | CommScope, Inc. | | | 4.75% | (a) | | | 09/01/2029 | | | | 46,963 | |
| | 140,000 | | | Consolidated Communications, Inc. | | | 5.00% | (a) | | | 10/01/2028 | | | | 116,821 | |
| | 120,000 | | | Cornerstone Building Brands, Inc. | | | 6.13% | (a) | | | 01/15/2029 | | | | 107,567 | |
| | 285,000 | | | Coty, Inc. | | | 5.00% | (a) | | | 04/15/2026 | | | | 280,955 | |
| | 195,000 | | | Coty, Inc./HFC Prestige Products, Inc./HFC Prestige International US LLC | | | 6.63% | (a) | | | 07/15/2030 | | | | 198,177 | |
| | 470,000 | | | CQP Holdco LP / BIP-V Chinook Holdco LLC | | | 5.50% | (a) | | | 06/15/2031 | | | | 444,580 | |
| | 230,000 | | | CSC Holdings LLC | | | 6.50% | (a) | | | 02/01/2029 | | | | 195,076 | |
| | 245,000 | | | CSC Holdings LLC | | | 5.75% | (a) | | | 01/15/2030 | | | | 129,891 | |
| | 180,000 | | | CSI Compressco LP / CSI Compressco Finance, Inc. | | | 7.50% | (a) | | | 04/01/2025 | | | | 180,000 | |
| | 115,000 | | | CVR Partners LP / CVR Nitrogen Finance Corp. | | | 6.13% | (a) | | | 06/15/2028 | | | | 110,635 | |
| | 100,000 | | | Dana, Inc. | | | 5.38% | | | | 11/15/2027 | | | | 97,905 | |
| | 65,000 | | | Dana, Inc. | | | 4.25% | | | | 09/01/2030 | | | | 57,492 | |
| | 85,000 | | | Dealer Tire LLC / DT Issuer LLC | | | 8.00% | (a) | | | 02/01/2028 | | | | 84,681 | |
| | 220,000 | | | Directv Financing LLC / Directv Financing Co.-Obligor, Inc. | | | 5.88% | (a) | | | 08/15/2027 | | | | 208,265 | |
| | 200,000 | | | DISH DBS Corp. | | | 5.75% | (a) | | | 12/01/2028 | | | | 137,826 | |
| | 110,000 | | | DISH DBS Corp. | | | 5.13% | | | | 06/01/2029 | | | | 45,972 | |
| | 140,000 | | | Dornoch Debt Merger Sub, Inc. | | | 6.63% | (a) | | | 10/15/2029 | | | | 124,581 | |
| | 250,000 | | | Dun & Bradstreet Corp. | | | 5.00% | (a) | | | 12/15/2029 | | | | 230,972 | |
| | 115,000 | | | Embarq Corp. | | | 8.00% | | | | 06/01/2036 | | | | 62,606 | |
| | 320,000 | | | EMRLD Borrower LP / Emerald Co.-Issuer, Inc. | | | 6.63% | (a) | | | 12/15/2030 | | | | 323,470 | |
| | 85,000 | | | Energizer Holdings, Inc. | | | 6.50% | (a) | | | 12/31/2027 | | | | 84,614 | |
| | 155,000 | | | EQM Midstream Partners LP | | | 4.75% | (a) | | | 01/15/2031 | | | | 144,286 | |
| | 320,000 | | | Everi Holdings, Inc. | | | 5.00% | (a) | | | 07/15/2029 | | | | 317,250 | |
| | 180,000 | | | Ferrellgas LP / Ferrellgas Finance Corp. | | | 5.38% | (a) | | | 04/01/2026 | | | | 176,248 | |
| | 145,000 | | | Fertitta Entertainment LLC / Fertitta Entertainment Finance Co., Inc. | | | 6.75% | (a) | | | 01/15/2030 | | | | 130,316 | |
| | 375,000 | | | Ford Motor Co. | | | 3.25% | | | | 02/12/2032 | | | | 312,138 | |
| | 200,000 | | | Fortrea Holdings, Inc. | | | 7.50% | (a) | | | 07/01/2030 | | | | 206,707 | |
| | 245,000 | | | Fortress Transportation and Infrastructure Investors LLC | | | 7.88% | (a) | | | 12/01/2030 | | | | 257,533 | |
| | 165,000 | | | Frontier Communications Holdings LLC | | | 5.00% | (a) | | | 05/01/2028 | | | | 153,275 | |
| | 83,218 | | | Frontier Communications Holdings LLC | | | 5.88% | | | | 11/01/2029 | | | | 70,407 | |
| | 115,000 | | | Full House Resorts, Inc. | | | 8.25% | (a) | | | 02/15/2028 | | | | 109,996 | |
| | 240,000 | | | Gap, Inc. | | | 3.88% | (a) | | | 10/01/2031 | | | | 203,262 | |
| | 105,000 | | | GFL Environmental, Inc. | | | 6.75% | (a) | | | 01/15/2031 | | | | 107,737 | |
| | 95,000 | | | Goodyear Tire & Rubber Co. | | | 5.25% | | | | 07/15/2031 | | | | 86,661 | |
| | 80,000 | | | GrafTech Finance, Inc. | | | 4.63% | (a) | | | 12/15/2028 | | | | 51,532 | |
| | 210,000 | | | Griffon Corp. | | | 5.75% | | | | 03/01/2028 | | | | 205,812 | |
| | | | | | | | |
| The accompanying notes are an integral part of these financial statements. | | Annual Report | | | | | March 31, 2024 | | 27 |
| | |
Schedule of Investments DoubleLine Flexible Income Fund (Cont.) | | |
| | | | | | | | | | | | | | | | |
PRINCIPAL
AMOUNT $ | | | SECURITY DESCRIPTION | | RATE | | | MATURITY | | | VALUE $ | |
| | 112,043 | | | Gulfport Energy Corp. | | | 8.00% | (a) | | | 05/17/2026 | | | | 113,794 | |
| | 362 | | | Gulfport Energy Corp. | | | 8.00% | | | | 05/17/2026 | | | | 368 | |
| | 315,000 | | | Helios Software Holdings, Inc. / ION Corporate Solutions Finance SARL | | | 4.63% | (a) | | | 05/01/2028 | | | | 282,961 | |
| | 450,000 | | | Hess Midstream Operations LP | | | 5.50% | (a) | | | 10/15/2030 | | | | 436,414 | |
| | 130,000 | | | H-Food Holdings LLC / Hearthside Finance Co., Inc. | | | 8.50% | (a) | | | 06/01/2026 | | | | 9,750 | |
| | 110,000 | | | Hightower Holding LLC | | | 6.75% | (a) | | | 04/15/2029 | | | | 103,479 | |
| | 195,000 | | | Hilcorp Energy I LP / Hilcorp Finance Co. | | | 6.25% | (a) | | | 11/01/2028 | | | | 194,947 | |
| | 40,000 | | | Hilcorp Energy I LP / Hilcorp Finance Co. | | | 8.38% | (a) | | | 11/01/2033 | | | | 43,400 | |
| | 195,000 | | | HUB International Ltd. | | | 7.25% | (a) | | | 06/15/2030 | | | | 200,539 | |
| | 180,000 | | | Icahn Enterprises LP / Icahn Enterprises Finance Corp. | | | 5.25% | | | | 05/15/2027 | | | | 162,798 | |
| | 165,000 | | | Illuminate Buyer LLC / Illuminate Holdings IV, Inc. | | | 9.00% | (a) | | | 07/01/2028 | | | | 162,973 | |
| | 335,000 | | | Installed Building Products, Inc. | | | 5.75% | (a) | | | 02/01/2028 | | | | 327,311 | |
| | 195,000 | | | Iron Mountain, Inc. | | | 7.00% | (a) | | | 02/15/2029 | | | | 198,930 | |
| | 115,000 | | | Iron Mountain, Inc. | | | 4.50% | (a) | | | 02/15/2031 | | | | 103,874 | |
| | 225,000 | | | JELD-WEN, Inc. | | | 4.88% | (a) | | | 12/15/2027 | | | | 215,487 | |
| | 320,000 | | | Kodiak Gas Services LLC | | | 7.25% | (a) | | | 02/15/2029 | | | | 326,161 | |
| | 70,000 | | | LBM Acquisition LLC | | | 6.25% | (a) | | | 01/15/2029 | | | | 65,700 | |
| | 200,000 | | | Leeward Renewable Energy Operations LLC | | | 4.25% | (a) | | | 07/01/2029 | | | | 171,808 | |
| | 215,000 | | | Legacy LifePoint Health LLC | | | 4.38% | (a) | | | 02/15/2027 | | | | 205,052 | |
| | 220,000 | | | Legends Hospitality Holding Co. LLC / Legends Hospitality Co.-Issuer, Inc. | | | 5.00% | (a) | | | 02/01/2026 | | | | 218,091 | |
| | 115,000 | | | Level 3 Financing, Inc. | | | 3.75% | (a) | | | 07/15/2029 | | | | 51,750 | |
| | 75,000 | | | Level 3 Financing, Inc. | | | 4.50% | (a) | | | 04/01/2030 | | | | 46,875 | |
| | 135,000 | | | Level 3 Financing, Inc. | | | 10.50% | (a) | | | 05/15/2030 | | | | 138,713 | |
| | 150,000 | | | LFS Topco LLC | | | 5.88% | (a) | | | 10/15/2026 | | | | 140,084 | |
| | 75,000 | | | LifePoint Health, Inc. | | | 5.38% | (a) | | | 01/15/2029 | | | | 61,882 | |
| | 220,000 | | | Light & Wonder International, Inc. | | | 7.25% | (a) | | | 11/15/2029 | | | | 225,993 | |
| | 55,000 | | | Lions Gate Capital Holdings LLC | | | 5.50% | (a) | | | 04/15/2029 | | | | 42,123 | |
| | 95,000 | | | Live Nation Entertainment, Inc. | | | 6.50% | (a) | | | 05/15/2027 | | | | 96,101 | |
| | 195,000 | | | LSF9 Atlantis Holdings LLC / Victra Finance Corp. | | | 7.75% | (a) | | | 02/15/2026 | | | | 193,416 | |
| | 285,000 | | | M/I Homes, Inc. | | | 4.95% | | | | 02/01/2028 | | | | 272,090 | |
| | 135,000 | | | Macy’s Retail Holdings LLC | | | 5.88% | (a) | | | 04/01/2029 | | | | 132,572 | |
| | 160,000 | | | Madison IAQ LLC | | | 4.13% | (a) | | | 06/30/2028 | | | | 148,126 | |
| | 160,000 | | | Madison IAQ LLC | | | 5.88% | (a) | | | 06/30/2029 | | | | 146,543 | |
| | 180,000 | | | Matador Resources Co. | | | 6.50% | (a) | | | 04/15/2032 | | | | 180,443 | |
| | 210,000 | | | Match Group Holdings II LLC | | | 5.00% | (a) | | | 12/15/2027 | | | | 201,412 | |
| | 220,000 | | | Mativ Holdings, Inc. | | | 6.88% | (a) | | | 10/01/2026 | | | | 219,169 | |
| | 190,000 | | | Mavis Tire Express Services Topco Corp. | | | 6.50% | (a) | | | 05/15/2029 | | | | 180,886 | |
| | 70,000 | | | McAfee Corp. | | | 7.38% | (a) | | | 02/15/2030 | | | | 64,270 | |
| | 200,000 | | | McGraw-Hill Education, Inc. | | | 5.75% | (a) | | | 08/01/2028 | | | | 188,784 | |
| | 345,000 | | | Medline Borrower LP | | | 5.25% | (a) | | | 10/01/2029 | | | | 326,347 | |
| | 95,000 | | | Medline Borrower LP/Medline Co.-Issuer, Inc. | | | 6.25% | (a) | | | 04/01/2029 | | | | 95,544 | |
| | 150,000 | | | Michaels Cos., Inc. | | | 5.25% | (a) | | | 05/01/2028 | | | | 127,948 | |
| | 130,000 | | | Michaels Cos., Inc. | | | 7.88% | (a) | | | 05/01/2029 | | | | 97,655 | |
| | 160,000 | | | Midwest Gaming Borrower LLC / Midwest Gaming Finance Corp. | | | 4.88% | (a) | | | 05/01/2029 | | | | 148,283 | |
| | 45,000 | | | Miter Brands Acquisition Holdco, Inc. / MIWD Borrower LLC | | | 6.75% | (a) | | | 04/01/2032 | | | | 45,182 | |
| | 150,000 | | | ModivCare Escrow Issuer, Inc. | | | 5.00% | (a) | | | 10/01/2029 | | | | 108,903 | |
| | 225,000 | | | Murphy Oil USA, Inc. | | | 4.75% | | | | 09/15/2029 | | | | 213,572 | |
| | 65,000 | | | Nabors Industries Ltd. | | | 7.25% | (a) | | | 01/15/2026 | | | | 64,641 | |
| | 130,000 | | | Nabors Industries, Inc. | | | 9.13% | (a) | | | 01/31/2030 | | | | 135,265 | |
| | 275,000 | | | Nationstar Mortgage Holdings, Inc. | | | 5.75% | (a) | | | 11/15/2031 | | | | 253,909 | |
| | 150,000 | | | Navient Corp. | | | 5.00% | | | | 03/15/2027 | | | | 143,813 | |
| | 255,000 | | | NCL Corp. Ltd. | | | 5.88% | (a) | | | 03/15/2026 | | | | 251,892 | |
| | 155,000 | | | NCL Corp. Ltd. | | | 8.38% | (a) | | | 02/01/2028 | | | | 163,842 | |
| | 85,000 | | | News Corp. | | | 5.13% | (a) | | | 02/15/2032 | | | | 79,909 | |
| | 165,000 | | | NGL Energy Operating LLC / NGL Energy Finance Corp. | | | 8.13% | (a) | | | 02/15/2029 | | | | 169,098 | |
| | 70,000 | | | NGL Energy Partners LP / NGL Energy Finance Corp. | | | 7.50% | | | | 04/15/2026 | | | | 70,039 | |
| | 300,000 | | | NRG Energy, Inc. | | | 3.63% | (a) | | | 02/15/2031 | | | | 259,190 | |
| | 200,000 | | | Olympus Water US Holding Corp. | | | 9.75% | (a) | | | 11/15/2028 | | | | 213,293 | |
| | 60,000 | | | OneMain Finance Corp. | | | 7.13% | | | | 03/15/2026 | | | | 61,129 | |
| | 220,000 | | | OneMain Finance Corp. | | | 6.63% | | | | 01/15/2028 | | | | 220,871 | |
| | | | |
| 28 | | DoubleLine Funds Trust | | The accompanying notes are an integral part of these financial statements. |
| | | | | | | | | | | | | | | | |
PRINCIPAL
AMOUNT $ | | | SECURITY DESCRIPTION | | RATE | | | MATURITY | | | VALUE $ | |
| | 190,000 | | | Outfront Media Capital LLC / Outfront Media Capital Corp. | | | 7.38% | (a) | | | 02/15/2031 | | | | 199,166 | |
| | 225,000 | | | Owens & Minor, Inc. | | | 6.63% | (a) | | | 04/01/2030 | | | | 223,506 | |
| | 170,000 | | | Pactiv Evergreen Group Issuer LLC / Pactiv Evergreen Group Issuer, Inc. | | | 4.38% | (a) | | | 10/15/2028 | | | | 158,769 | |
| | 170,000 | | | Panther Escrow Issuer LLC | | | 7.13% | (a) | | | 06/01/2031 | | | | 172,977 | |
| | 200,000 | | | Park Intermediate Holdings LLC / PK Domestic Property LLC / PK Finance Co.-Issuer | | | 4.88% | (a) | | | 05/15/2029 | | | | 186,140 | |
| | 80,000 | | | PBF Holding Co. LLC / PBF Finance Corp. | | | 6.00% | | | | 02/15/2028 | | | | 78,793 | |
| | 35,000 | | | PECF USS Intermediate Holding III Corp. | | | 8.00% | (a) | | | 11/15/2029 | | | | 18,478 | |
| | 75,000 | | | Penn Entertainment, Inc. | | | 4.13% | (a) | | | 07/01/2029 | | | | 64,551 | |
| | 110,000 | | | PennyMac Financial Services, Inc. | | | 4.25% | (a) | | | 02/15/2029 | | | | 100,660 | |
| | 120,000 | | | PennyMac Financial Services, Inc. | | | 7.88% | (a) | | | 12/15/2029 | | | | 123,413 | |
| | 180,000 | | | Performance Food Group, Inc. | | | 4.25% | (a) | | | 08/01/2029 | | | | 165,130 | |
| | 190,000 | | | Permian Resources Operating LLC | | | 7.00% | (a) | | | 01/15/2032 | | | | 197,237 | |
| | 250,000 | | | PetSmart, Inc. / PetSmart Finance Corp. | | | 7.75% | (a) | | | 02/15/2029 | | | | 243,583 | |
| | 175,000 | | | Pike Corp. | | | 5.50% | (a) | | | 09/01/2028 | | | | 167,686 | |
| | 100,000 | | | Pike Corp. | | | 8.63% | (a) | | | 01/31/2031 | | | | 106,392 | |
| | 105,000 | | | Post Holdings, Inc. | | | 5.50% | (a) | | | 12/15/2029 | | | | 101,555 | |
| | 60,000 | | | Premier Entertainment Sub LLC / Premier Entertainment Finance Corp. | | | 5.63% | (a) | | | 09/01/2029 | | | | 45,852 | |
| | 95,000 | | | Prime Security Services Borrower LLC / Prime Finance, Inc. | | | 6.25% | (a) | | | 01/15/2028 | | | | 93,134 | |
| | 35,000 | | | Radiate Holdco LLC / Radiate Finance, Inc. | | | 4.50% | (a) | | | 09/15/2026 | | | | 27,860 | |
| | 49,302 | | | Radiology Partners, Inc.
(5.00% + 3.50% PIK) | | | 8.50% | (a) | | | 01/31/2029 | | | | 45,804 | |
| | 36,807 | | | Radiology Partners, Inc.
9.87% PIK | | | 9.78% | (a) | | | 02/15/2030 | | | | 29,676 | |
| | 125,000 | | | Realogy Group LLC / Realogy Co.-Issuer Corp. | | | 5.25% | (a) | | | 04/15/2030 | | | | 85,132 | |
| | 100,000 | | | RegionalCare Hospital Partners Holdings, Inc. / LifePoint Health, Inc. | | | 9.75% | (a) | | | 12/01/2026 | | | | 100,211 | |
| | 165,000 | | | Roller Bearing Co. of America, Inc. | | | 4.38% | (a) | | | 10/15/2029 | | | | 151,283 | |
| | 255,000 | | | Royal Caribbean Cruises Ltd. | | | 5.50% | (a) | | | 08/31/2026 | | | | 252,918 | |
| | 40,000 | | | Royal Caribbean Cruises Ltd. | | | 7.25% | (a) | | | 01/15/2030 | | | | 41,587 | |
| | 130,000 | | | Royal Caribbean Cruises Ltd. | | | 6.25% | (a) | | | 03/15/2032 | | | | 131,117 | |
| | 220,000 | | | Scientific Games Holdings LP/Scientific Games US FinCo, Inc. | | | 6.63% | (a) | | | 03/01/2030 | | | | 212,849 | |
| | 125,000 | | | Sealed Air Corp./Sealed Air Corp. US | | | 7.25% | (a) | | | 02/15/2031 | | | | 130,117 | |
| | 105,000 | | | Sirius XM Radio, Inc. | | | 5.50% | (a) | | | 07/01/2029 | | | | 100,082 | |
| | 90,000 | | | Sitio Royalties Operating Partnership LP / Sitio Finance Corp. | | | 7.88% | (a) | | | 11/01/2028 | | | | 93,167 | |
| | 55,000 | | | SK Invictus Intermediate II SARL | | | 5.00% | (a) | | | 10/30/2029 | | | | 49,081 | |
| | 120,000 | | | Southwestern Energy Co. | | | 4.75% | | | | 02/01/2032 | | | | 110,564 | |
| | 175,000 | | | Spectrum Brands, Inc. | | | 5.00% | (a) | | | 10/01/2029 | | | | 171,646 | |
| | 125,000 | | | Spirit AeroSystems, Inc. | | | 9.75% | (a) | | | 11/15/2030 | | | | 139,977 | |
| | 110,000 | | | SRS Distribution, Inc. | | | 4.63% | (a) | | | 07/01/2028 | | | | 110,916 | |
| | 250,000 | | | Standard Industries, Inc./NJ | | | 4.38% | (a) | | | 07/15/2030 | | | | 224,810 | |
| | 70,000 | | | Staples, Inc. | | | 7.50% | (a) | | | 04/15/2026 | | | | 68,386 | |
| | 50,000 | | | Staples, Inc. | | | 10.75% | (a) | | | 04/15/2027 | | | | 47,573 | |
| | 140,000 | | | Starwood Property Trust, Inc. | | | 7.25% | (a) | | | 04/01/2029 | | | | 141,289 | |
| | 145,000 | | | Station Casinos LLC | | | 4.63% | (a) | | | 12/01/2031 | | | | 130,463 | |
| | 220,000 | | | Station Casinos LLC | | | 6.63% | (a) | | | 03/15/2032 | | | | 222,402 | |
| | 195,000 | | | Suburban Propane Partners LP/Suburban Energy Finance Corp. | | | 5.00% | (a) | | | 06/01/2031 | | | | 177,925 | |
| | 240,000 | | | SunCoke Energy, Inc. | | | 4.88% | (a) | | | 06/30/2029 | | | | 217,548 | |
| | 115,000 | | | Sunoco LP / Sunoco Finance Corp. | | | 6.00% | | | | 04/15/2027 | | | | 114,626 | |
| | 100,000 | | | Sunoco LP / Sunoco Finance Corp. | | | 4.50% | | | | 05/15/2029 | | | | 93,043 | |
| | 90,000 | | | SWF Escrow Issuer Corp. | | | 6.50% | (a) | | | 10/01/2029 | | | | 66,665 | |
| | 190,000 | | | Tallgrass Energy Partners LP / Tallgrass Energy Finance Corp. | | | 7.38% | (a) | | | 02/15/2029 | | | | 191,268 | |
| | 80,000 | | | Tenet Healthcare Corp. | | | 6.25% | | | | 02/01/2027 | | | | 80,031 | |
| | 85,000 | | | Tenet Healthcare Corp. | | | 6.13% | | | | 10/01/2028 | | | | 84,766 | |
| | 220,000 | | | Tenet Healthcare Corp. | | | 6.13% | | | | 06/15/2030 | | | | 219,770 | |
| | 275,000 | | | Townsquare Media, Inc. | | | 6.88% | (a) | | | 02/01/2026 | | | | 268,332 | |
| | 205,000 | | | TransDigm, Inc. | | | 5.50% | | | | 11/15/2027 | | | | 200,806 | |
| | | | | | | | |
| The accompanying notes are an integral part of these financial statements. | | Annual Report | | | | | March 31, 2024 | | 29 |
| | |
Schedule of Investments DoubleLine Flexible Income Fund (Cont.) | | |
| | | | | | | | | | | | | | | | |
PRINCIPAL
AMOUNT $ | | | SECURITY DESCRIPTION | | RATE | | | MATURITY | | | VALUE $ | |
| | 104,625 | | | Transocean Poseidon Ltd. | | | 6.88% | (a) | | | 02/01/2027 | | | | 104,814 | |
| | 80,000 | | | Transocean, Inc. | | | 8.00% | (a) | | | 02/01/2027 | | | | 79,460 | |
| | 200,000 | | | Trident TPI Holdings, Inc. | | | 12.75% | (a) | | | 12/31/2028 | | | | 213,638 | |
| | 115,000 | | | Triton Water Holdings, Inc. | | | 6.25% | (a) | | | 04/01/2029 | | | | 104,854 | |
| | 210,000 | | | UKG, Inc. | | | 6.88% | (a) | | | 02/01/2031 | | | | 214,086 | |
| | 225,000 | | | United Airlines, Inc. | | | 4.63% | (a) | | | 04/15/2029 | | | | 209,501 | |
| | 140,000 | | | United Natural Foods, Inc. | | | 6.75% | (a) | | | 10/15/2028 | | | | 116,454 | |
| | 95,000 | | | Uniti Group LP / Uniti Group Finance, Inc. / CSL Capital LLC | | | 10.50% | (a) | | | 02/15/2028 | | | | 98,578 | |
| | 160,000 | | | Univision Communications, Inc. | | | 4.50% | (a) | | | 05/01/2029 | | | | 143,125 | |
| | 90,000 | | | Upbound Group, Inc. | | | 6.38% | (a) | | | 02/15/2029 | | | | 87,457 | |
| | 195,000 | | | US Foods, Inc. | | | 7.25% | (a) | | | 01/15/2032 | | | | 203,185 | |
| | 155,000 | | | Venture Global LNG, Inc. | | | 8.13% | (a) | | | 06/01/2028 | | | | 158,226 | |
| | 100,000 | | | Venture Global LNG, Inc. | | | 8.38% | (a) | | | 06/01/2031 | | | | 103,189 | |
| | 90,000 | | | Venture Global LNG, Inc. | | | 9.88% | (a) | | | 02/01/2032 | | | | 97,053 | |
| | 230,000 | | | Viking Cruises Ltd. | | | 5.88% | (a) | | | 09/15/2027 | | | | 225,817 | |
| | 195,000 | | | Viking Cruises Ltd. | | | 9.13% | (a) | | | 07/15/2031 | | | | 213,405 | |
| | 115,000 | | | Vistra Operations Co. LLC | | | 7.75% | (a) | | | 10/15/2031 | | | | 120,521 | |
| | 90,000 | | | Vital Energy, Inc. | | | 7.88% | (a) | | | 04/15/2032 | | | | 91,499 | |
| | 100,000 | | | VT Topco, Inc. | | | 8.50% | (a) | | | 08/15/2030 | | | | 105,654 | |
| | 120,000 | | | Wand NewCo 3, Inc. | | | 7.63% | (a) | | | 01/30/2032 | | | | 124,208 | |
| | 170,000 | | | WASH Multifamily Acquisition, Inc. | | | 5.75% | (a) | | | 04/15/2026 | | | | 166,300 | |
| | 75,000 | | | Weatherford International Ltd. | | | 6.50% | (a) | | | 09/15/2028 | | | | 77,416 | |
| | 240,000 | | | Weatherford International Ltd. | | | 8.63% | (a) | | | 04/30/2030 | | | | 250,751 | |
| | 30,000 | | | Wheel Pros, Inc. | | | 6.50% | (a) | | | 05/15/2029 | | | | 9,188 | |
| | 190,000 | | | WR Grace Holdings LLC | | | 5.63% | (a) | | | 08/15/2029 | | | | 170,227 | |
| | 380,000 | | | XHR LP | | | 4.88% | (a) | | | 06/01/2029 | | | | 352,098 | |
| | 215,000 | | | XPO, Inc. | | | 7.13% | (a) | | | 06/01/2031 | | | | 220,751 | |
| | | | | | | | | | | | | | | | |
| | | | Total US Corporate Bonds (Cost $38,461,245) | | | | | | | | 36,688,390 | |
| | | | | | | | | | | | | |
| | US GOVERNMENT AND AGENCY MORTGAGE BACKED OBLIGATIONS - 8.8% | | | | | | | | | | | | |
| | | | |
| | | | Federal Home Loan Mortgage Corp. | | | | | | | | | | | | |
| | 552,085 | | | Series 3926-HS (-1 x US 30 Day Average Secured Overnight Financing Rate + 6.34%, 6.45% Cap) | | | 1.02% | (k)(l) | | | 09/15/2041 | | | | 59,850 | |
| | 205,251 | | | Series 4471-GA | | | 3.00% | | | | 02/15/2044 | | | | 192,418 | |
| | 2,294,757 | | | Series 4631-FA (US 30 Day Average Secured Overnight Financing Rate + 0.61%, 0.50% Floor, 6.50% Cap) | | | 5.93% | | | | 11/15/2046 | | | | 2,254,751 | |
| | 13,164,956 | | | Series 4851-PF (US 30 Day Average Secured Overnight Financing Rate + 0.51%, 0.40% Floor, 6.50% Cap) | | | 5.83% | | | | 08/15/2057 | | | | 12,756,786 | |
| | 1,875,302 | | | Series 4942-FB (US 30 Day Average Secured Overnight Financing Rate + 0.61%, 0.50% Floor, 6.00% Cap) | | | 5.93% | | | | 04/15/2040 | | | | 1,817,555 | |
| | 10,948,609 | | | Series 4944-F (US 30 Day Average Secured Overnight Financing Rate + 0.56%, 0.45% Floor, 6.50% Cap) | | | 5.88% | | | | 01/25/2050 | | | | 10,806,690 | |
| | 1,420,762 | | | Series 4981-GF (US 30 Day Average Secured Overnight Financing Rate + 0.51%, 0.40% Floor, 6.50% Cap) | | | 5.83% | | | | 06/25/2050 | | | | 1,391,217 | |
| | 10,481,022 | | | Series 5142-QI | | | 3.00% | (k) | | | 09/25/2051 | | | | 1,705,713 | |
| | 7,450,128 | | | Series KF89-AS (US 30 Day Average Secured Overnight Financing Rate + 0.37%) | | | 5.69% | | | | 09/25/2030 | | | | 7,376,978 | |
| | | | |
| | | | Federal National Mortgage Association | | | | | | | | | | | | |
| | 6,014,737 | | | Series 2013-12-FT (US 30 Day Average Secured Overnight Financing Rate + 0.46%, 0.35% Floor, 6.50% Cap) | | | 5.78% | | | | 02/25/2043 | | | | 5,888,144 | |
| | 7,947,597 | | | Series 2017-11-SK (-1 x US 30 Day Average Secured Overnight Financing Rate + 5.94%, 6.05% Cap) | | | 0.62% | (k)(l) | | | 03/25/2047 | | | | 907,714 | |
| | 3,988,130 | | | Series 2018-86-MF (US 30 Day Average Secured Overnight Financing Rate + 0.41%, 0.30% Floor, 6.50% Cap) | | | 5.73% | | | | 12/25/2048 | | | | 3,924,196 | |
| | 21,015,540 | | | Series 2019-M7-X | | | 0.33% | (j)(k) | | | 04/25/2029 | | | | 290,611 | |
| | 7,591,418 | | | Series 2020-54-AS (-1 x US 30 Day Average Secured Overnight Financing Rate + 6.04%, 6.15% Cap) | | | 0.72% | (k)(l) | | | 08/25/2050 | | | | 971,298 | |
| | 8,899,433 | | | Series 2021-32-AI | | | 3.00% | (k) | | | 05/25/2046 | | | | 1,048,542 | |
| | 21,947,240 | | | Series 2021-M8-X | | | 0.25% | (j)(k) | | | 11/25/2035 | | | | 434,222 | |
| | 5,207,911 | | | Series 2022-43-FA (US 30 Day Average Secured Overnight Financing Rate + 0.55%, 0.55% Floor, 6.00% Cap) | | | 5.87% | | | | 07/25/2052 | | | | 4,917,245 | |
| | | | |
| 30 | | DoubleLine Funds Trust | | The accompanying notes are an integral part of these financial statements. |
| | | | | | | | | | | | | | | | |
PRINCIPAL
AMOUNT $/ SHARES | | | SECURITY DESCRIPTION | | RATE | | | MATURITY | | | VALUE $ | |
| | | | |
| | | | FREMF Mortgage Trust | | | | | | | | | | | | |
| | 639,609 | | | Series 2016-KF18-B (US 30 Day Average Secured Overnight Financing Rate + 5.61%, 5.50% Floor) | | | 10.93% | (a) | | | 05/25/2026 | | | | 619,253 | |
| | 372,621 | | | Series 2017-KF27-B (US 30 Day Average Secured Overnight Financing Rate + 4.46%, 4.35% Floor) | | | 9.78% | (a) | | | 12/25/2026 | | | | 369,524 | |
| | 700,066 | | | Series 2017-KF30-B (US 30 Day Average Secured Overnight Financing Rate + 3.36%, 3.25% Floor) | | | 8.68% | (a) | | | 03/25/2027 | | | | 687,447 | |
| | 1,479,905 | | | Series 2017-KF34-B (US 30 Day Average Secured Overnight Financing Rate + 2.81%, 2.55% Floor) | | | 8.13% | (a) | | | 08/25/2024 | | | | 1,473,343 | |
| | 392,798 | | | Series 2018-KF44-B (US 30 Day Average Secured Overnight Financing Rate + 2.26%, 2.15% Floor) | | | 7.58% | (a) | | | 02/25/2025 | | | | 387,116 | |
| | 2,245,874 | | | Series 2019-KF71-C (US 30 Day Average Secured Overnight Financing Rate + 6.11%, 6.00% Floor) | | | 11.43% | (a) | | | 10/25/2029 | | | | 2,153,460 | |
| | | | |
| | | | Government National Mortgage Association | | | | | | | | | | | | |
| | 19,396,213 | | | Series 2013-155-IB | | | 0.18% | (j)(k) | | | 09/16/2053 | | | | 123,823 | |
| | 7,559,046 | | | Series 2019-128-KS (-1 x CME Term SOFR 1 Month + 2.74%, 2.85% Cap) | | | 0.00% | (k)(l) | | | 10/20/2049 | | | | 78,576 | |
| | 6,641,350 | | | Series 2020-104-SB (-1 x CME Term SOFR 1 Month + 6.04%, 6.15% Cap) | | | 0.71% | (k)(l) | | | 07/20/2050 | | | | 813,813 | |
| | 14,342,774 | | | Series 2020-115-YS (-1 x CME Term SOFR 1 Month + 4.09%, 4.20% Cap) | | | 0.00% | (k)(l) | | | 08/20/2050 | | | | 421,844 | |
| | 28,483,592 | | | Series 2020-129-SA (-1 x CME Term SOFR 1 Month + 3.64%, 3.75% Cap) | | | 0.00% | (k)(l) | | | 09/20/2050 | | | | 544,715 | |
| | 35,285,790 | | | Series 2020-146-IJ | | | 2.50% | (k) | | | 10/20/2050 | | | | 4,169,390 | |
| | 14,131,187 | | | Series 2020-189-SU (-1 x CME Term SOFR 1 Month + 6.19%, 6.30% Cap) | | | 0.86% | (k)(l) | | | 12/20/2050 | | | | 1,858,922 | |
| | 7,930,791 | | | Series 2021-1-SH (-1 x CME Term SOFR 1 Month + 6.19%, 6.30% Cap) | | | 0.86% | (k)(l) | | | 01/20/2051 | | | | 1,012,046 | |
| | 11,649,456 | | | Series 2021-193-DS (-1 x US 30 Day Average Secured Overnight Financing Rate + 2.60%, 2.60% Cap) | | | 0.00% | (k)(l) | | | 11/20/2051 | | | | 86,731 | |
| | 27,280,731 | | | Series 2021-35-IO | | | 1.03% | (j)(k) | | | 12/16/2062 | | | | 1,968,400 | |
| | 47,072,886 | | | Series 2022-192-IO | | | 0.67% | (j)(k) | | | 09/16/2064 | | | | 2,853,794 | |
| | 24,575,893 | | | Series 2023-15-IO | | | 0.92% | (j)(k) | | | 08/16/2064 | | | | 1,834,586 | |
| | 47,072,940 | | | Series 2024-15-BI | | | 0.74% | (j)(k) | | | 10/16/2065 | | | | 2,853,797 | |
| | 42,674,285 | | | Series 2024-35-IB | | | 0.80% | (j)(k) | | | 07/16/2065 | | | | 2,853,843 | |
| | | | | | | | | | | | | | | | |
| | | | Total US Government and Agency Mortgage Backed Obligations
(Cost $92,446,027) | | | | | | | | 83,908,353 | |
| | | | | | | | | | | | | |
| | US GOVERNMENT AND AGENCY OBLIGATIONS - 6.3% | | | | | | | | | | | | |
| | 10,000,000 | | | United States Treasury Note/Bond | | | 3.13% | | | | 08/15/2025 | | | | 9,773,633 | |
| | 50,000,000 | | | United States Treasury Note/Bond | | | 4.63% | | | | 02/28/2025 | | | | 49,799,073 | |
| | | | | | | | | | | | | | | | |
| | | | Total US Government and Agency Obligations (Cost $59,641,079) | | | | | | | | 59,572,706 | |
| | | | | | | | | | | | | |
| | COMMON STOCKS - 0.0%(m) | | | | | | | | | | | | |
| | 9,228 | | | Flame Aggregator - Series R(b)(n) | | | | | | | | | | | 77,976 | |
| | 917 | | | Flame Aggregator - Series U(b)(n) | | | | | | | | | | | 7,749 | |
| | 3,561 | | | Intelsat Emergence SA(b)(n) | | | | | | | | | | | 94,367 | |
| | | | | | | | | | | | | | | | |
| | | | Total Common Stocks (Cost $341,010) | | | | | | | | 180,092 | |
| | | | | | | | | | | | | |
| | WARRANTS - 0.0%(m) | | | | | | | | | | | | |
| | 3,500 | | | Avation PLC, Expires 10/31/2026 at GBP 1.15(n) | | | | | | | | | | | 663 | |
| | | | | | | | | | | | | | | | |
| | | | Total Warrants (Cost $—) | | | | | | | | 663 | |
| | | | | | | | | | | | | | | | |
| | SHORT TERM INVESTMENTS - 17.0% | | | | | | | | | | | | |
| | 7,763,728 | | | First American Government Obligations Fund - U | | | 5.26% | (o) | | | | | | | 7,763,728 | |
| | 7,763,728 | | | JPMorgan US Government Money Market Fund - IM | | | 5.25% | (o) | | | | | | | 7,763,728 | |
| | 7,763,728 | | | MSILF Government Portfolio - Institutional | | | 5.22% | (o) | | | | | | | 7,763,728 | |
| | 140,000,000 | | | United States Treasury Bill | | | 0.00% | | | | 05/02/2024 | | | | 139,364,130 | |
| | | | | | | | | | | | | | | | |
| | | | Total Short Term Investments
(Cost $162,658,736) | | | | 162,655,314 | |
| | | | | | | | | | | | | | | | |
| | | | Total Investments 100.8%
($1,055,631,741) | | | | 960,111,987 | |
| | | | Other Liabilities in Excess of Assets (0.8)% | | | | (7,747,596 | ) |
| | | | | | | | | | | | | | | | |
| | | | NET ASSETS 100% | | | | | | | | | | $ | 952,364,391 | |
| | | | | | | | | | | | | | | | |
| | | | | | | | |
| The accompanying notes are an integral part of these financial statements. | | Annual Report | | | | | March 31, 2024 | | 31 |
| | |
Schedule of Investments DoubleLine Flexible Income Fund (Cont.) | | |
| | | | | |
| SECURITY TYPE BREAKDOWN as a % of Net Assets: | | | | | |
Non-Agency Residential Collateralized Mortgage Obligations | | | | 18.2% | |
Collateralized Loan Obligations | | | | 17.6% | |
Short Term Investments | | | | 17.0% | |
Non-Agency Commercial Mortgage Backed Obligations | | | | 9.2% | |
Bank Loans | | | | 8.8% | |
US Government and Agency Mortgage Backed Obligations | | | | 8.8% | |
US Government and Agency Obligations | | | | 6.3% | |
Foreign Corporate Bonds | | | | 5.2% | |
Asset Backed Obligations | | | | 4.7% | |
US Corporate Bonds | | | | 3.9% | |
Foreign Government Bonds, Foreign Agencies and Foreign Government Sponsored Corporations | | | | 1.1% | |
Common Stocks | | | | 0.0% | (m) |
Warrants | | | | 0.0% | (m) |
Other Assets and Liabilities | | | | (0.8)% | |
| | | | | |
Net Assets | | | | 100.0% | |
| | | | | |
| | | | | |
| INVESTMENT BREAKDOWN as a % of Net Assets: | | | | | |
Non-Agency Residential Collateralized Mortgage Obligations | | | | 18.2% | |
Collateralized Loan Obligations | | | | 17.6% | |
Short Term Investments | | | | 17.0% | |
Non-Agency Commercial Mortgage Backed Obligations | | | | 9.2% | |
US Government and Agency Mortgage Backed Obligations | | | | 8.8% | |
US Government and Agency Obligations | | | | 6.3% | |
Asset Backed Obligations | | | | 4.7% | |
Energy | | | | 1.6% | |
Utilities | | | | 1.4% | |
Electronics/Electric | | | | 1.4% | |
Healthcare | | | | 1.4% | |
Transportation | | | | 1.1% | |
Banking | | | | 1.1% | |
Hotels/Motels/Inns and Casinos | | | | 1.0% | |
Industrial Equipment | | | | 0.8% | |
| | | | | |
INVESTMENT BREAKDOWN as a % of Net Assets:
(Cont.) | |
Mining | | | | 0.7% | |
Media | | | | 0.6% | |
Chemicals/Plastics | | | | 0.6% | |
Retailers (other than Food/Drug) | | | | 0.6% | |
Consumer Products | | | | 0.6% | |
Telecommunications | | | | 0.6% | |
Commercial Services | | | | 0.6% | |
Finance | | | | 0.6% | |
Insurance | | | | 0.5% | |
Foreign Government Bonds, Foreign Agencies and Foreign Government Sponsored Corporations | | | | 0.5% | |
Construction | | | | 0.4% | |
Business Equipment and Services | | | | 0.4% | |
Containers and Glass Products | | | | 0.3% | |
Aerospace & Defense | | | | 0.3% | |
Technology | | | | 0.3% | |
Leisure | | | | 0.3% | |
Building and Development (including Steel/Metals) | | | | 0.2% | |
Automotive | | | | 0.2% | |
Pharmaceuticals | | | | 0.2% | |
Food Products | | | | 0.2% | |
Diversified Manufacturing | | | | 0.2% | |
Chemical Products | | | | 0.1% | |
Real Estate | | | | 0.1% | |
Beverage and Tobacco | | | | 0.1% | |
Pulp & Paper | | | | 0.0% | (m) |
Environmental Control | | | | 0.0% | (m) |
Conglomerates | | | | 0.0% | (m) |
Food Service | | | | 0.0% | (m) |
Financial Intermediaries | | | | 0.0% | (m) |
Other Assets and Liabilities | | | | (0.8)% | |
| | | | | |
Net Assets | | | | 100.0% | |
| | | | | |
| (a) | Security exempt from registration under Rule 144A of the Securities Act of 1933. These securities may be resold in transactions exempt from registration to qualified institutional buyers. |
| (b) | Value determined using significant unobservable inputs. |
| (c) | Principal only security |
| (d) | Security pays interest at rates that represent residual cashflows available after more senior tranches have been paid. The interest rate disclosed reflects the estimated rate in effect as of period end. |
| (e) | Step Bond; Coupon rate changes based on a predetermined schedule or event. The interest rate shown is the rate in effect as of period end. |
| (f) | Securities referencing LIBOR are expected to transition to an alternative reference rate by the security’s next scheduled coupon reset date. |
| (g) | Coupon rate is variable or floats based on components including but not limited to reference rate and spread. These securities may not indicate a reference rate and/or spread in their description. The rate disclosed is as of period end. |
| (h) | Security is in default or has failed to make a scheduled payment. Income is not being accrued. |
| (i) | Perpetual maturity. The date disclosed is the next call date of the security. |
| (j) | Coupon rate is variable based on the weighted average coupon of the underlying collateral. To the extent the weighted average coupon of the underlying assets which comprise the collateral increases or decreases, the coupon rate of this security will increase or decrease correspondingly. The rate disclosed is as of period end. |
| (k) | Interest only security |
| (l) | Inverse floating rate security whose interest rate moves in the opposite direction of reference interest rates. Reference interest rates are typically based on a negative multiplier or slope. Interest rate may also be subject to a cap or floor. |
| (m) | Represents less than 0.05% of net assets. |
| (n) | Non-income producing security. |
| (o) | Seven-day yield as of period end. |
| PIK | A payment-in-kind security in which the issuer may make interest or dividend payments in cash or additional securities. These additional securities generally have the same terms as the original holdings. |
| | | | |
| 32 | | DoubleLine Funds Trust | | The accompanying notes are an integral part of these financial statements. |

Report of Independent Registered Public Accounting Firm
To the Board of Trustees of DoubleLine Funds Trust and Shareholders of DoubleLine Total Return Bond Fund, DoubleLine Core Fixed Income Fund, DoubleLine Shiller Enhanced CAPE®, and DoubleLine Flexible Income Fund
Opinions on the Financial Statements
We have audited the accompanying statements of assets and liabilities, including the schedules of investments – summary, of DoubleLine Total Return Bond Fund, DoubleLine Core Fixed Income Fund, DoubleLine Shiller Enhanced CAPE®, and DoubleLine Flexible Income Fund (four of the funds constituting DoubleLine Funds Trust, hereafter collectively referred to as the “Funds”) as of March 31, 2024, the related statements of operations for the year ended March 31, 2024, the statements of changes in net assets for each of the two years in the period ended March 31, 2024, including the related notes, and the financial highlights for each of the periods indicated therein (included in Item 1 of this Form N-CSR) and the schedule of investments (included in Item 6 of this Form N-CSR) as of March 31, 2024 (collectively referred to as the “financial statements”). In our opinion, the financial statements present fairly, in all material respects, the financial position of each of the Funds as of March 31, 2024, the results of each of their operations for the year then ended, the changes in each of their net assets for each of the two years in the period ended March 31, 2024 and each of the financial highlights for each of the periods indicated therein in conformity with accounting principles generally accepted in the United States of America.
Basis for Opinions
These financial statements are the responsibility of the Funds’ management. Our responsibility is to express an opinion on the Funds’ financial statements based on our audits. We are a public accounting firm registered with the Public Company Accounting Oversight Board (United States) (PCAOB) and are required to be independent with respect to the Funds in accordance with the U.S. federal securities laws and the applicable rules and regulations of the Securities and Exchange Commission and the PCAOB.
We conducted our audits of these financial statements in accordance with the standards of the PCAOB. Those standards require that we plan and perform the audit to obtain reasonable assurance about whether the financial statements are free of material misstatement, whether due to error or fraud.
Our audits included performing procedures to assess the risks of material misstatement of the financial statements, whether due to error or fraud, and performing procedures that respond to those risks. Such procedures included examining, on a test basis, evidence regarding the amounts and disclosures in the financial statements. Our audits also included evaluating the accounting principles used and significant estimates made by management, as well as evaluating the overall presentation of the financial statements. Our procedures included confirmation of securities owned as of March 31, 2024 by correspondence with the custodian and brokers; when replies were not received from brokers, we performed other auditing procedures. We believe that our audits provide a reasonable basis for our opinions.
Los Angeles, California
May 24, 2024
We have served as the auditor of one or more investment companies in the DoubleLine Investment Company Complex since 2010.
PricewaterhouseCoopers LLP, 601 South Figueroa Street, Los Angeles, California 90017
T: (213) 356 6000, www.pwc.com/us
(b) Not applicable.
Item 7. Disclosure of Proxy Voting Policies and Procedures for Closed-End Management Investment Companies.
Not applicable to open-end investment companies.
Item 8. Portfolio Managers of Closed-End Management Investment Companies.
Not applicable to open-end investment companies.
Item 9. Purchases of Equity Securities by Closed-End Management Investment Company and Affiliated Purchasers.
Not applicable to open-end investment companies.
Item 10. Submission of Matters to a Vote of Security Holders.
There have been no material changes to the procedures by which shareholders may recommend nominees to the Registrant’s board of trustees.
Item 11. Controls and Procedures.
| (a) | The Registrant’s principal executive and principal financial officers have reviewed the Registrant’s disclosure controls and procedures (as defined in Rule 30a-3(c) under the Investment Company Act of 1940 (the “Act”)) as of a date within 90 days of the filing of this report, as required by Rule 30a-3(b) under the Act and Rules 13a-15(b) or 15d-15(b) under the Securities Exchange Act of 1934. Based on their review, such officers have concluded that the disclosure controls and procedures are effective in ensuring that information required to be disclosed in this report is appropriately recorded, processed, summarized and reported and made known to them by others within the Registrant and by the Registrant’s service provider. |
| (b) | There were no changes in the Registrant’s internal control over financial reporting (as defined in Rule 30a-3(d) under the Act) that occurred during the period covered by this report that has materially affected, or is reasonably likely to materially affect, the Registrant’s internal control over financial reporting. |
1
Item 12. Disclosure of Securities Lending Activities for Closed-End Management Investment Companies
Not applicable to open-end investment companies.
Item 13. Exhibits.
(2) A separate certification for each principal executive and principal financial officer pursuant to Section 302 of the Sarbanes-Oxley Act of 2002. Filed herewith.
(3) Any written solicitation to purchase securities under Rule 23c-1 under the Act sent or given during the period covered by the report by or on behalf of the Registrant to 10 or more persons. Not applicable to open-end investment companies.
(4) Change in the Registrant’s independent public accountant. There was no change in the Registrant’s independent public accountant for the period covered by this report.
2
SIGNATURES
Pursuant to the requirements of the Securities Exchange Act of 1934 and the Investment Company Act of 1940, the Registrant has duly caused this report to be signed on its behalf by the undersigned, thereunto duly authorized.
| | |
(Registrant) | | DoubleLine Funds Trust |
| | |
| |
By (Signature and Title) | | /s/ Ronald Redell |
| | Ronald R. Redell, President |
Pursuant to the requirements of the Securities Exchange Act of 1934 and the Investment Company Act of 1940, this report has been signed below by the following persons on behalf of the Registrant and in the capacities and on the dates indicated.
| | |
By (Signature and Title) | | /s/ Ronald Redell |
| | Ronald R. Redell, President |
| | |
| |
By (Signature and Title) | | /s/ Henry V. Chase |
| | Henry V. Chase, Treasurer and |
| | Principal Financial and Accounting Officer |
3