
Ryerson Quarterly Release Presentation Q3 2022 Exhibit 99.2
31 Important Information About Ryerson Holding Corporation These materials do not constitute an offer or solicitation to purchase or sell securities of Ryerson Holding Corporation (“Ryerson” or “the Company”) or its subsidiaries and no investment decision should be made based upon the information provided herein. Ryerson strongly urges you to review its filings with the Securities and Exchange Commission, which can be found at https://ir.ryerson.com/financials/sec-filings/default.aspx. This site also provides additional information about Ryerson. Safe Harbor Provision Certain statements made in this presentation and other written or oral statements made by or on behalf of the Company constitute "forward-looking statements" within the meaning of the federal securities laws, including statements regarding our future performance, as well as management's expectations, beliefs, intentions, plans, estimates, objectives, or projections relating to the future. Such statements can be identified by the use of forward-looking terminology such as “objectives,” “goals,” “preliminary,” “range,” "believes," "expects," "may," "estimates," "will," "should," "plans," or "anticipates" or the negative thereof or other variations thereon or comparable terminology, or by discussions of strategy. The Company cautions that any such forward-looking statements are not guarantees of future performance and may involve significant risks and uncertainties, and that actual results may vary materially from those in the forward-looking statements as a result of various factors. Among the factors that significantly impact our business are: the cyclicality of our business; the highly competitive, volatile, and fragmented metals industry in which we operate; the impact of geopolitical events, including Russia's invasion of Ukraine and global trade sanctions; fluctuating metal prices; our indebtedness and the covenants in instruments governing such indebtedness; the integration of acquired operations; regulatory and other operational risks associated with our operations located inside and outside of the United States; impacts and implications of adverse health events, including the COVID-19 pandemic; work stoppages; obligations under certain employee retirement benefit plans; the ownership of a majority of our equity securities by a single investor group; currency fluctuations; and consolidation in the metals industry. Forward-looking statements should, therefore, be considered in light of various factors, including those set forth above and those set forth under "Risk Factors" in our annual report on Form 10-K for the year ended December 31, 2021, our quarterly report on Form 10-Q for the quarter ended September 30, 2022, and in our other filings with the Securities and Exchange Commission. Moreover, we caution against placing undue reliance on these statements, which speak only as of the date they were made. The Company does not undertake any obligation to publicly update or revise any forward-looking statements to reflect future events or circumstances, new information or otherwise. Non-GAAP Measures Certain measures contained in these slides or the related presentation are not measures calculated in accordance with generally accepted accounting principles (“GAAP”). They should not be considered a replacement for GAAP results. Non-GAAP financial measures appearing in these slides are identified in the footnotes. �A reconciliation of these non-GAAP measures to the most directly comparable GAAP financial measures is included in the Appendix.
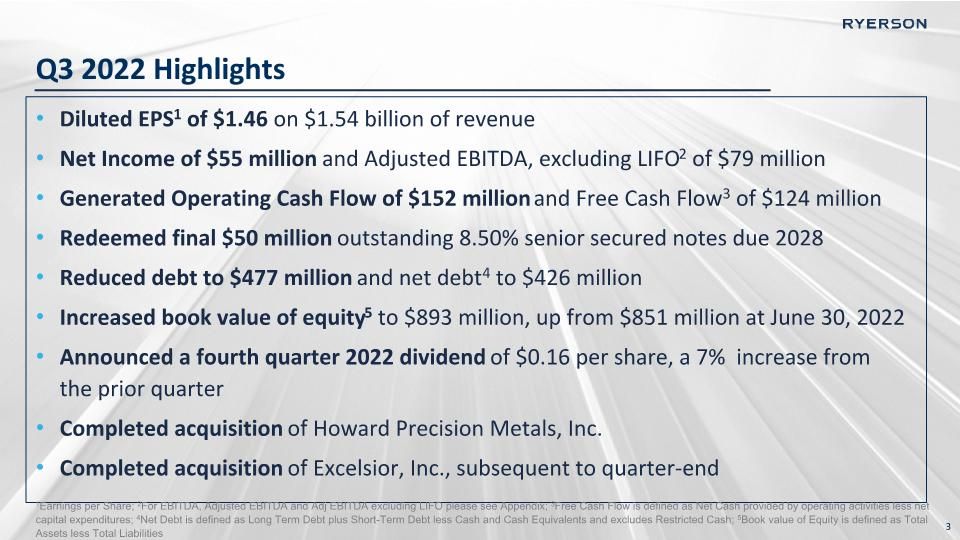
Q3 2022 Highlights Diluted EPS1 of $1.46 on $1.54 billion of revenue Net Income of $55 million and Adjusted EBITDA, excluding LIFO2 of $79 million Generated Operating Cash Flow of $152 million and Free Cash Flow3 of $124 million Redeemed final $50 million outstanding 8.50% senior secured notes due 2028 Reduced debt to $477 million and net debt4 to $426 million Increased book value of equity5 to $893 million, up from $851 million at June 30, 2022 Announced a fourth quarter 2022 dividend of $0.16 per share, a 7% increase from the prior quarter Completed acquisition of Howard Precision Metals, Inc. Completed acquisition of Excelsior, Inc., subsequent to quarter-end 1Earnings per Share; 2For EBITDA, Adjusted EBITDA and Adj EBITDA excluding LIFO please see Appendix; 3Free Cash Flow is defined as Net Cash provided by operating activities less net capital expenditures; 4Net Debt is defined as Long Term Debt plus Short-Term Debt less Cash and Cash Equivalents and excludes Restricted Cash; 5Book value of Equity is defined as Total Assets less Total Liabilities
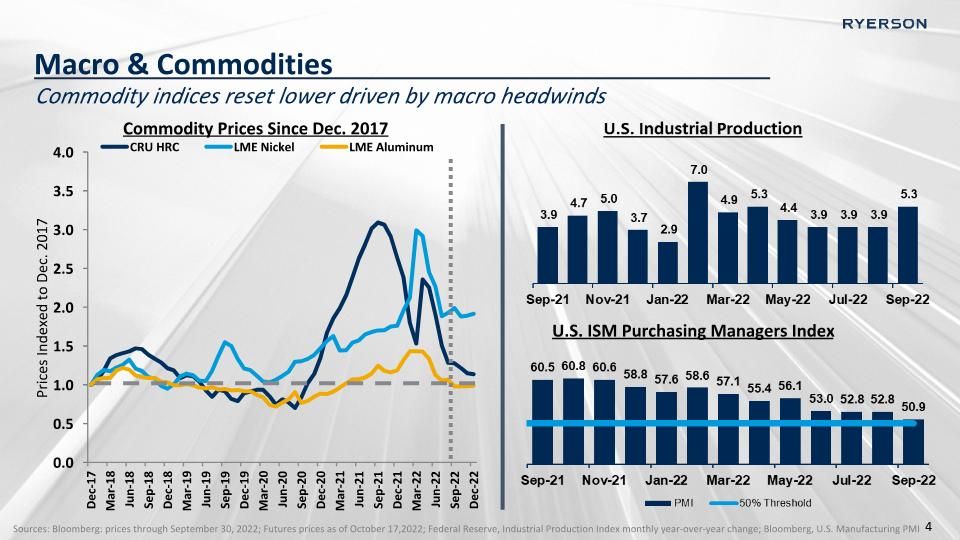
Macro & Commodities Commodity indices reset lower driven by macro headwinds Sources: Bloomberg: prices through September 30, 2022; Futures prices as of October 17,2022; Federal Reserve, Industrial Production Index monthly year-over-year change; Bloomberg, U.S. Manufacturing PMI Commodity Prices Since Dec. 2017 U.S. ISM Purchasing Managers Index
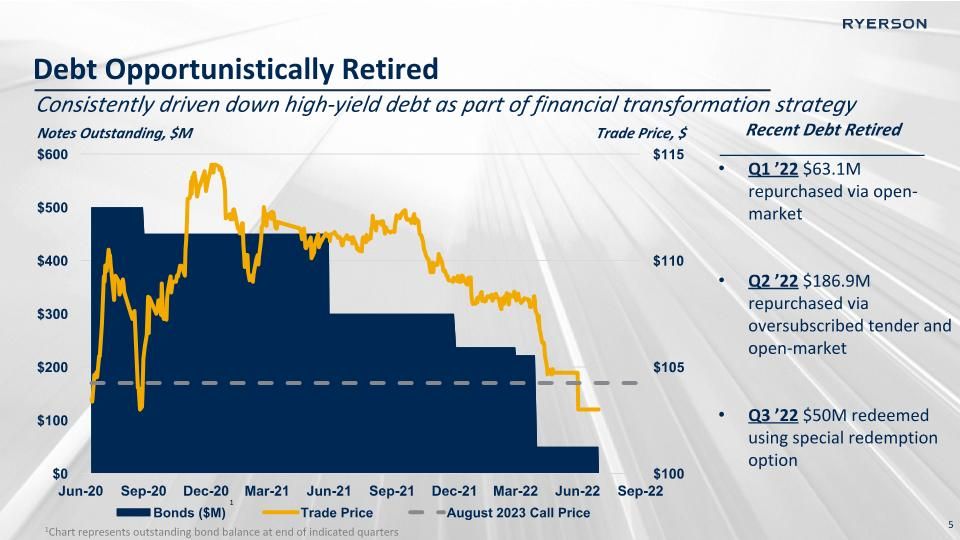
Debt Opportunistically Retired Consistently driven down high-yield debt as part of financial transformation strategy Q1 ’22 $63.1M repurchased via open-market Q2 ’22 $186.9M repurchased via oversubscribed tender and open-market Q3 ’22 $50M redeemed using special redemption option 1Chart represents outstanding bond balance at end of indicated quarters 1 Notes Outstanding, $M Trade Price, $ Recent Debt Retired
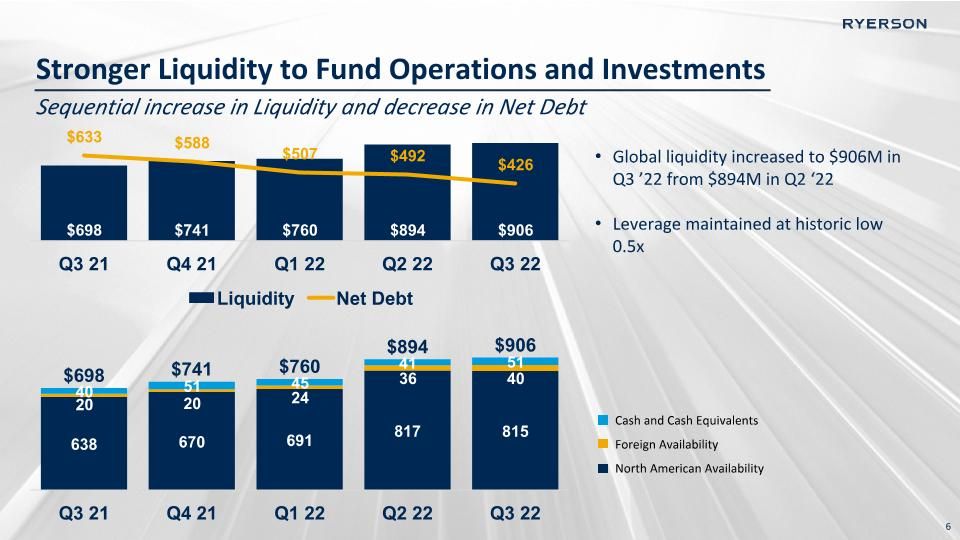
Sequential increase in Liquidity and decrease in Net Debt Global liquidity increased to $906M in Q3 ’22 from $894M in Q2 ‘22 Leverage maintained at historic low 0.5x Stronger Liquidity to Fund Operations and Investments Cash and Cash Equivalents Foreign Availability North American Availability
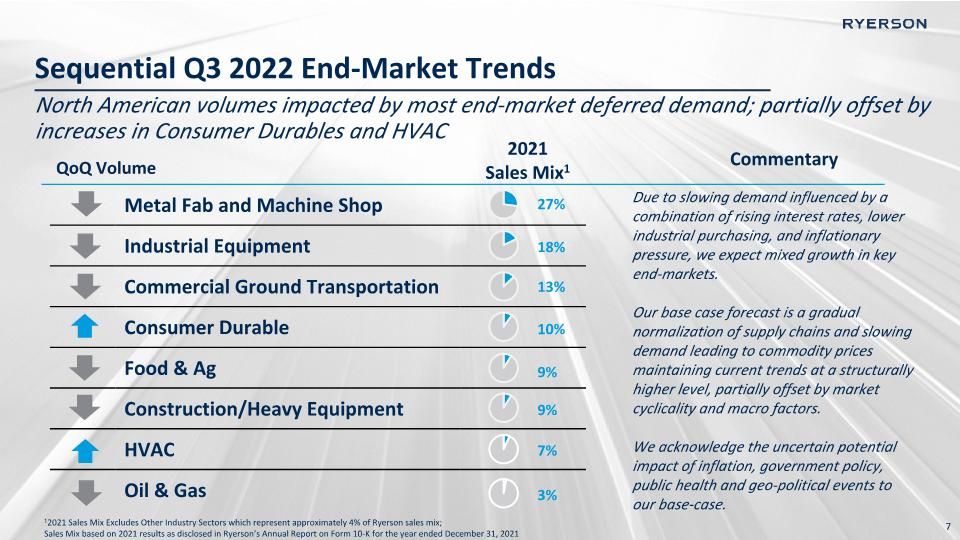
Sequential Q3 2022 End-Market Trends North American volumes impacted by most end-market deferred demand; partially offset by increases in Consumer Durables and HVAC 12021 Sales Mix Excludes Other Industry Sectors which represent approximately 4% of Ryerson sales mix;�Sales Mix based on 2021 results as disclosed in Ryerson’s Annual Report on Form 10-K for the year ended December 31, 2021 Metal Fab and Machine Shop Industrial Equipment Commercial Ground Transportation Consumer Durable Food & Ag Construction/Heavy Equipment HVAC Oil & Gas 2021 Sales Mix1 Commentary QoQ Volume 27% 18% 13% 10% 9% 9% 7% 3% Due to slowing demand influenced by a combination of rising interest rates, lower industrial purchasing, and inflationary pressure, we expect mixed growth in key end-markets. Our base case forecast is a gradual normalization of supply chains and slowing demand leading to commodity prices maintaining current trends at a structurally higher level, partially offset by market cyclicality and macro factors. We acknowledge the uncertain potential impact of inflation, government policy, public health and geo-political events to our base-case.
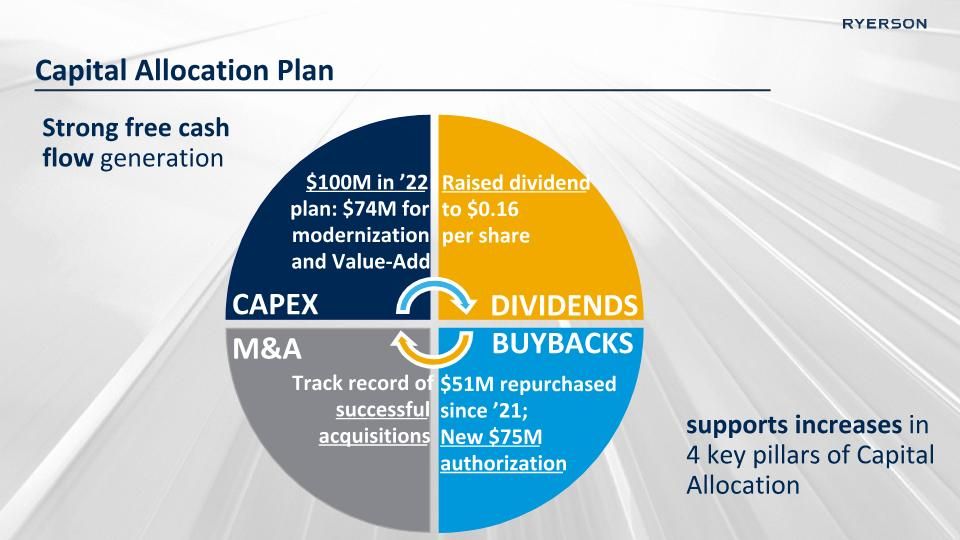
Capital Allocation Plan Strong free cash flow generation $100M in ’22 plan: $74M for modernization and Value-Add Raised dividend�to $0.16 per share Track record of successful acquisitions $51M repurchased since ’21; �New $75M authorization CAPEX DIVIDENDS BUYBACKS M&A supports increases in 4 key pillars of Capital Allocation
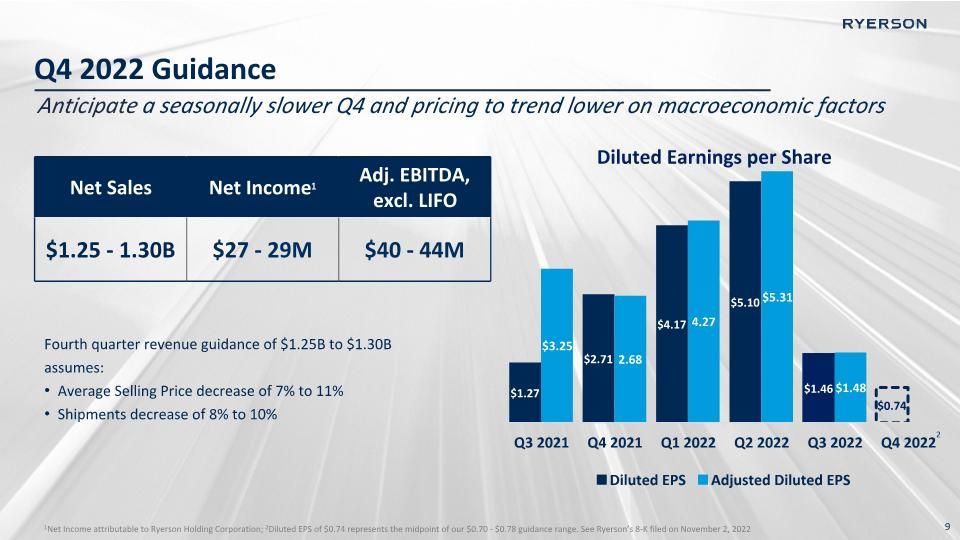
Q4 2022 Guidance Anticipate a seasonally slower Q4 and pricing to trend lower on macroeconomic factors Net Sales Net Income1 Adj. EBITDA, excl. LIFO $1.25 - 1.30B $27 - 29M $40 - 44M Fourth quarter revenue guidance of $1.25B to $1.30B assumes: Average Selling Price decrease of 7% to 11% Shipments decrease of 8% to 10% Diluted Earnings per Share 1Net Income attributable to Ryerson Holding Corporation; 2Diluted EPS of $0.74 represents the midpoint of our $0.70 - $0.78 guidance range. See Ryerson’s 8-K filed on November 2, 2022 2
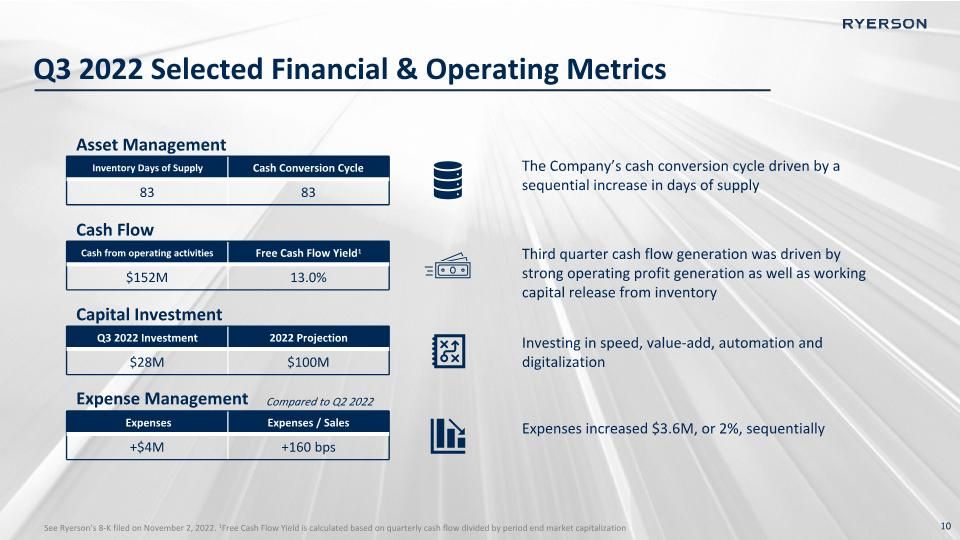
Q3 2022 Selected Financial & Operating Metrics See Ryerson’s 8-K filed on November 2, 2022. 1Free Cash Flow Yield is calculated based on quarterly cash flow divided by period end market capitalization Q3 2022 Investment 2022 Projection $28M $100M Capital Investment Expenses Expenses / Sales +$4M +160 bps Expense Management Compared to Q2 2022 Inventory Days of Supply Cash Conversion Cycle 83 83 Asset Management Cash from operating activities Free Cash Flow Yield1 $152M 13.0% Cash Flow Investing in speed, value-add, automation and digitalization Expenses increased $3.6M, or 2%, sequentially Third quarter cash flow generation was driven by strong operating profit generation as well as working capital release from inventory The Company’s cash conversion cycle driven by a sequential increase in days of supply
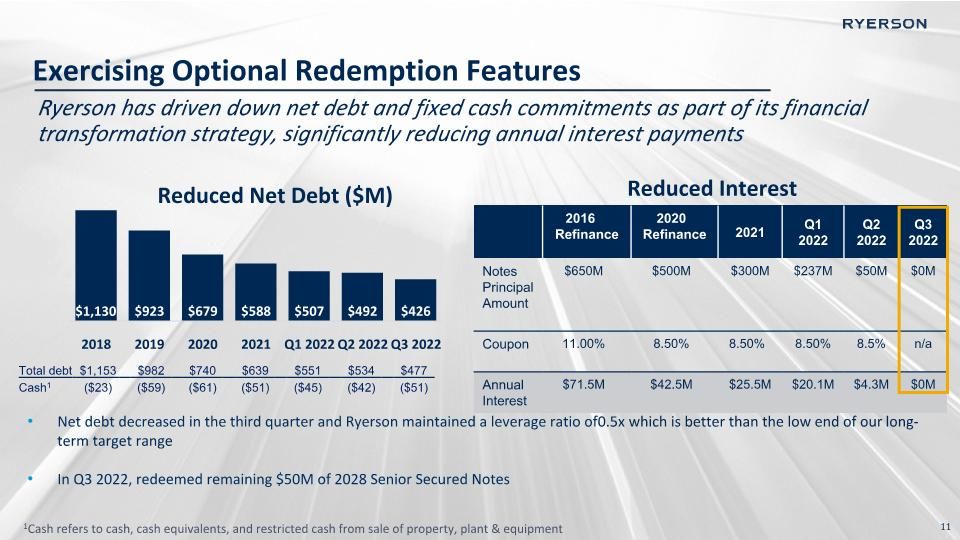
Ryerson has driven down net debt and fixed cash commitments as part of its financial transformation strategy, significantly reducing annual interest payments 2016 Refinance 2020 Refinance 2021 Q1 2022 Q2 2022 Q3 2022 Notes�Principal Amount $650M $500M $300M $237M $50M $0M Coupon 11.00% 8.50% 8.50% 8.50% 8.5% n/a Annual Interest $71.5M $42.5M $25.5M $20.1M $4.3M $0M Net debt decreased in the third quarter and Ryerson maintained a leverage ratio of 0.5x which is better than the low end of our long-term target range In Q3 2022, redeemed remaining $50M of 2028 Senior Secured Notes Reduced Net Debt ($M) Reduced Interest Exercising Optional Redemption Features 1Cash refers to cash, cash equivalents, and restricted cash from sale of property, plant & equipment Total debt $1,153 $982 $740 $639 $551 $534 $477 Cash1 ($23) ($59) ($61) ($51) ($45) ($42) ($51)
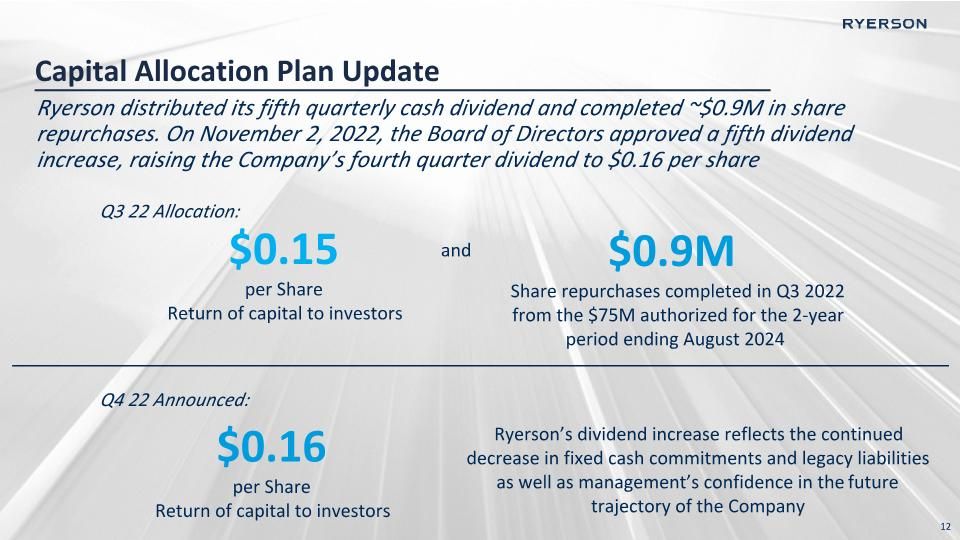
Ryerson distributed its fifth quarterly cash dividend and completed ~$0.9M in share repurchases. On November 2, 2022, the Board of Directors approved a fifth dividend increase, raising the Company’s fourth quarter dividend to $0.16 per share $0.15 per Share Return of capital to investors and $0.9M Share repurchases completed in Q3 2022 from the $75M authorized for the 2-year period ending August 2024 Q3 22 Allocation: $0.16 per Share Return of capital to investors Q4 22 Announced: Ryerson’s dividend increase reflects the continued decrease in fixed cash commitments and legacy liabilities as well as management’s confidence in the future trajectory of the Company Capital Allocation Plan Update
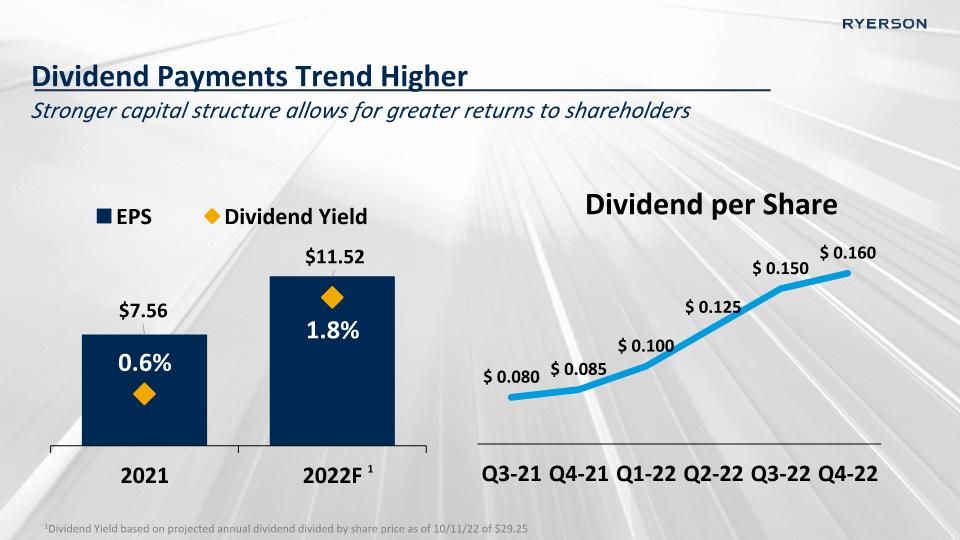
Dividend Payments Trend Higher Stronger capital structure allows for greater returns to shareholders 1Dividend Yield based on projected annual dividend divided by share price as of 10/11/22 of $29.25 1
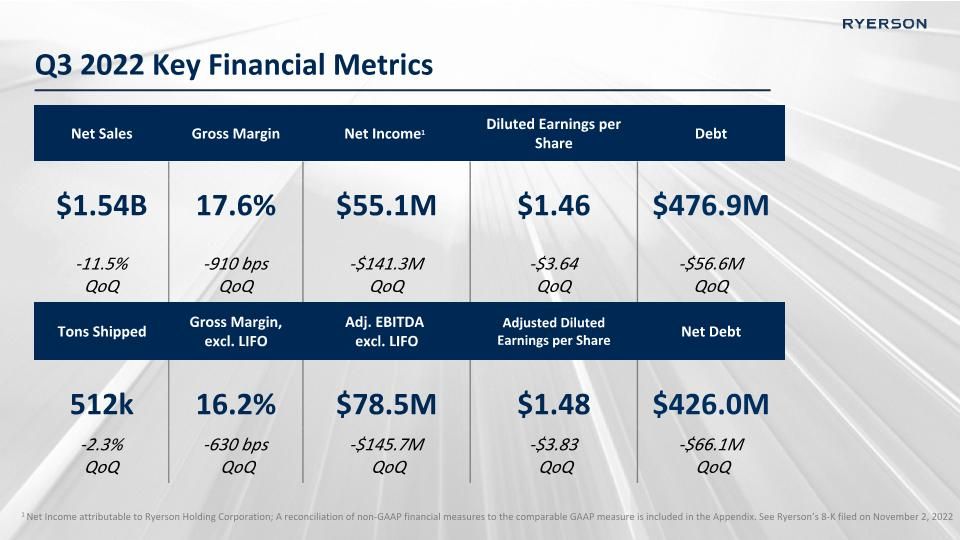
1 Net Income attributable to Ryerson Holding Corporation; A reconciliation of non-GAAP financial measures to the comparable GAAP measure is included in the Appendix. See Ryerson’s 8-K filed on November 2, 2022 Q3 2022 Key Financial Metrics Net Sales Gross Margin Net Income1 Diluted Earnings per Share Debt $1.54B 17.6% $55.1M $1.46 $476.9M -11.5% �QoQ -910 bps �QoQ -$141.3M �QoQ -$3.64 �QoQ -$56.6M �QoQ Tons Shipped Gross Margin, excl. LIFO Adj. EBITDA excl. LIFO Adjusted Diluted Earnings per Share Net Debt 512k 16.2% $78.5M $1.48 $426.0M -2.3% �QoQ -630 bps� QoQ -$145.7M� QoQ -$3.83� QoQ -$66.1M� QoQ
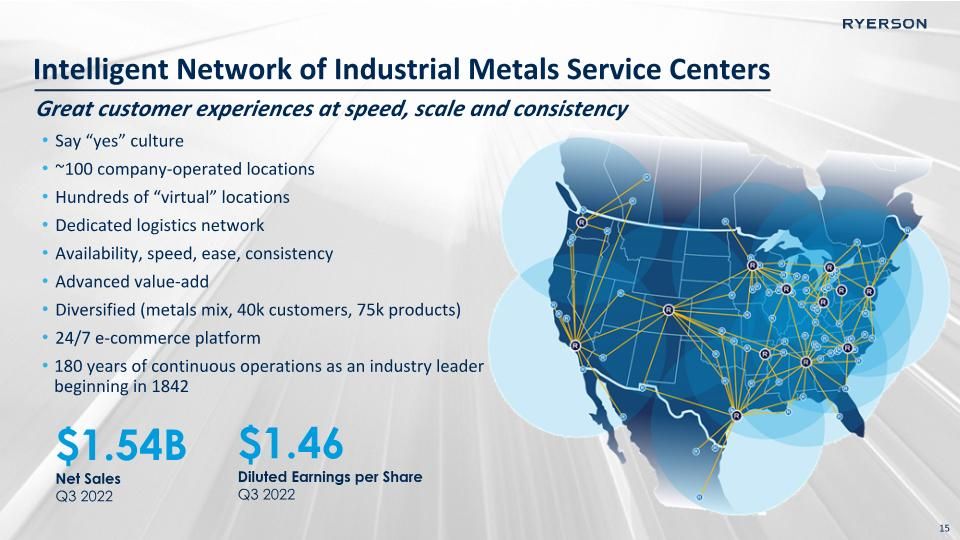
Intelligent Network of Industrial Metals Service Centers Say “yes” culture ~100 company-operated locations Hundreds of “virtual” locations Dedicated logistics network Availability, speed, ease, consistency Advanced value-add Diversified (metals mix, 40k customers, 75k products) 24/7 e-commerce platform 180 years of continuous operations as an industry leader beginning in 1842 Great customer experiences at speed, scale and consistency $1.54B Net Sales Q3 2022 $1.46 Diluted Earnings per Share Q3 2022
Appendix
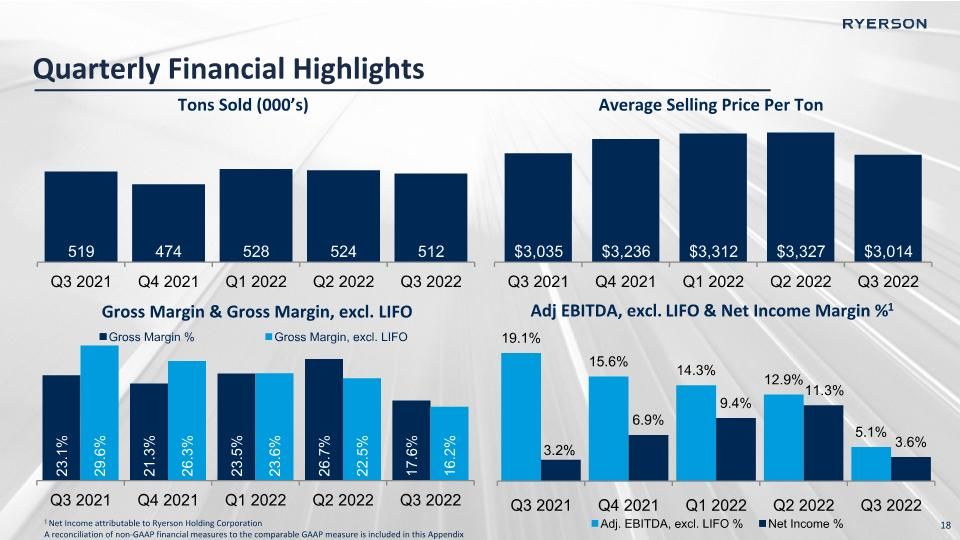
Tons Sold (000’s) Quarterly Financial Highlights 1 Net Income attributable to Ryerson Holding Corporation A reconciliation of non-GAAP financial measures to the comparable GAAP measure is included in this Appendix Average Selling Price Per Ton Gross Margin & Gross Margin, excl. LIFO Adj EBITDA, excl. LIFO & Net Income Margin %1
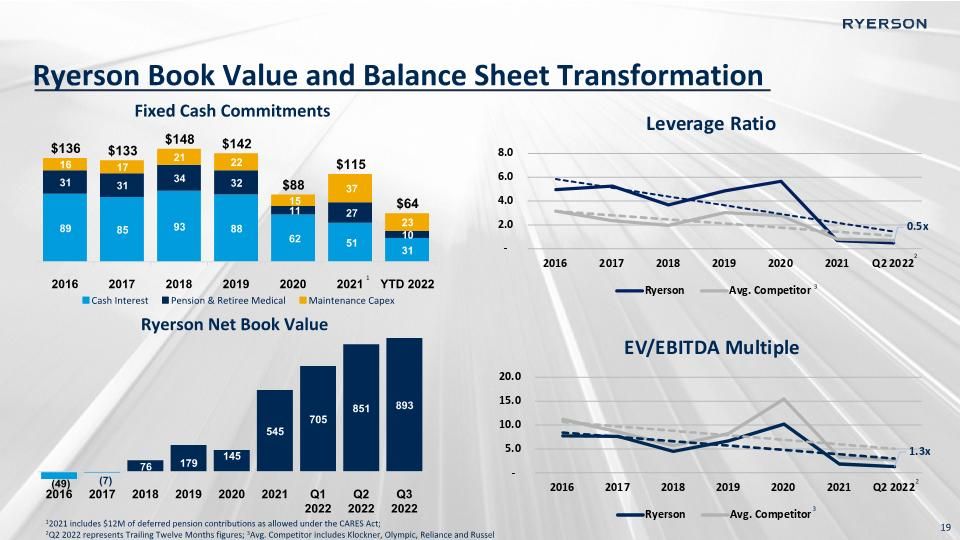
Ryerson Book Value and Balance Sheet Transformation 12021 includes $12M of deferred pension contributions as allowed under the CARES Act; �2Q2 2022 represents Trailing Twelve Months figures; 3Avg. Competitor includes Klockner, Olympic, Reliance and Russel Fixed Cash Commitments 2 2 3 3 1

Non-GAAP Reconciliation: Quarterly Adjusted EBITDA, excl. LIFO 20
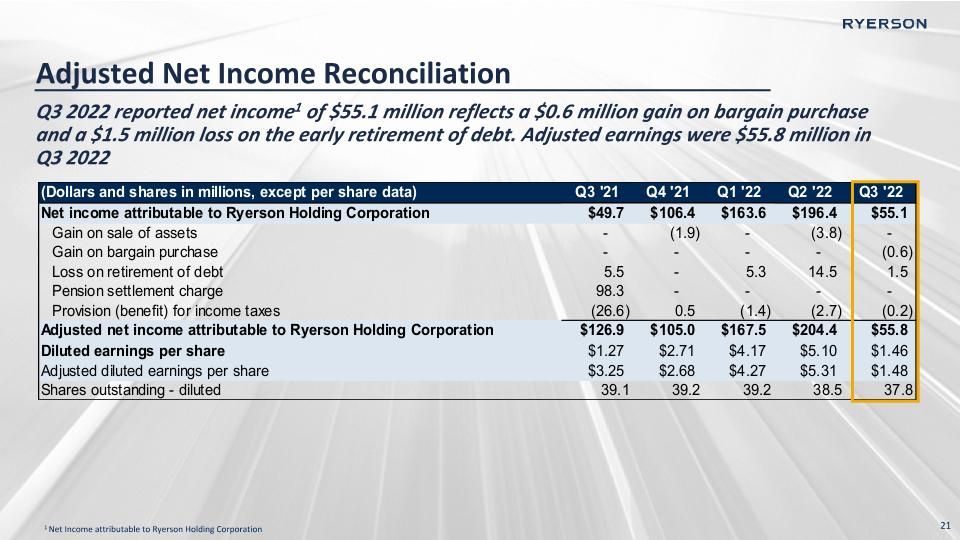
Adjusted Net Income Reconciliation Q3 2022 reported net income1 of $55.1 million reflects a $0.6 million gain on bargain purchase and a $1.5 million loss on the early retirement of debt. Adjusted earnings were $55.8 million in Q3 2022 1 Net Income attributable to Ryerson Holding Corporation
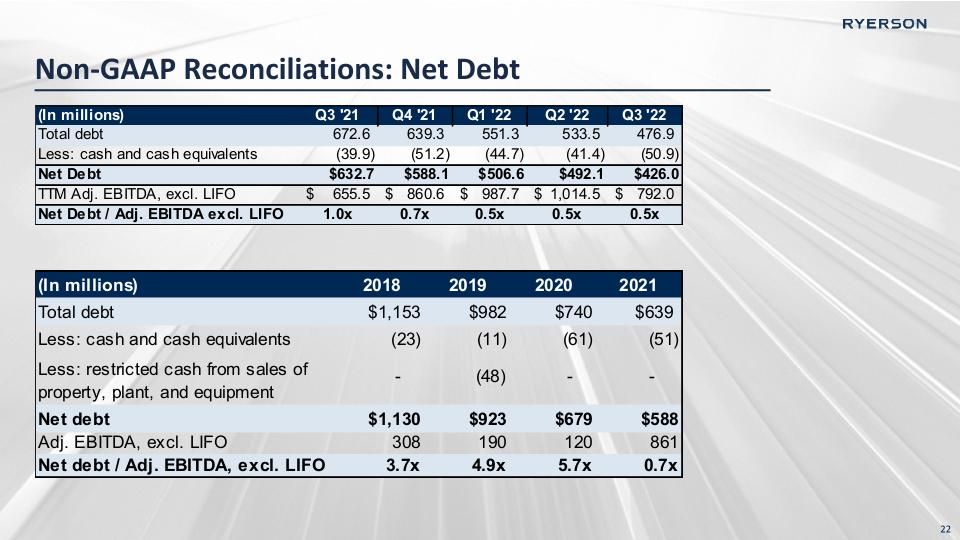
Non-GAAP Reconciliations: Net Debt
31 Note: EBITDA represents net income before interest and other expense on debt, provision for income taxes, depreciation, and amortization. Adjusted EBITDA gives further effect to, among other things, reorganization expenses, gain on bargain purchase, gain on sale of assets, loss on retirement of debt, loss on pension settlement, and foreign currency transaction gains and losses. We believe that the presentation of EBITDA, Adjusted EBITDA, and Adjusted EBITDA, excluding LIFO expense (income), provides useful information to investors regarding our operational performance because they enhance an investor’s overall understanding of our core financial performance and provide a basis of comparison of results between current, past, and future periods. We also disclose the metric Adjusted EBITDA, excluding LIFO expense (income), to provide a means of comparison amongst our competitors who may not use the same basis of accounting for inventories. EBITDA, Adjusted EBITDA, and Adjusted EBITDA, excluding LIFO expense (income), are three of the primary metrics management uses for planning and forecasting in future periods, including trending and analyzing the core operating performance of our business without the effect of U.S. generally accepted accounting principles, or GAAP, expenses, revenues, and gains (losses) that are unrelated to the day to day performance of our business. We also establish compensation programs for our executive management and regional employees that are based upon the achievement of pre-established EBITDA, Adjusted EBITDA, and Adjusted EBITDA, excluding LIFO expense (income), targets. We also use EBITDA, Adjusted EBITDA, and Adjusted EBITDA, excluding LIFO expense (income), to benchmark our operating performance to that of our competitors. EBITDA, Adjusted EBITDA, and Adjusted EBITDA, excluding LIFO expense (income), do not represent, and should not be used as a substitute for, net income or cash flows from operations as determined in accordance with generally accepted accounting principles, and neither EBITDA, Adjusted EBITDA, and Adjusted EBITDA, excluding LIFO expense (income), is necessarily an indication of whether cash flow will be sufficient to fund our cash requirements. This release also presents gross margin, excluding LIFO expense (income), which is calculated as gross profit minus LIFO expense (income), divided by net sales. We have excluded LIFO expense (income) from gross margin and Adjusted EBITDA as a percentage of net sales metrics in order to provide a means of comparison amongst our competitors who may not use the same basis of accounting for inventories as we do. Our definitions of EBITDA, Adjusted EBITDA, Adjusted EBITDA, excluding LIFO expense (income), gross margin, excluding LIFO expense (income), and Adjusted EBITDA, excluding LIFO expense (income), as a percentage of sales may differ from that of other companies. Adjusted Net income and Adjusted Earnings per share is presented to provide a means of comparison with periods that do not include similar adjustments. Non-GAAP Reconciliation 23
