Q2 2019 Ryerson Quarterly Release Presentation Exhibit 99.2
31 Important Information About Ryerson Holding Corporation These materials do not constitute an offer or solicitation to purchase or sell securities of Ryerson Holding Corporation (“Ryerson” or “the Company”) and no investment decision should be made based upon the information provided herein. Ryerson strongly urges you to review its filings with the Securities and Exchange Commission, which can be found at https://ir.ryerson.com/Docs. This site also provides additional information about Ryerson. Safe Harbor Provision Certain statements made in this presentation and other written or oral statements made by or on behalf of the Company constitute "forward-looking statements" within the meaning of the federal securities laws, including statements regarding our future performance, as well as management's expectations, beliefs, intentions, plans, estimates, objectives, or projections relating to the future. Such statements can be identified by the use of forward-looking terminology such as “objectives,” “goals,” “preliminary,” “range,” "believes," "expects," "may," "estimates," "will," "should," "plans," or "anticipates" or the negative thereof or other variations thereon or comparable terminology, or by discussions of strategy. The Company cautions that any such forward-looking statements are not guarantees of future performance and may involve significant risks and uncertainties, and that actual results may vary materially from those in the forward-looking statements as a result of various factors. Among the factors that significantly impact the metals distribution industry and our business are: the cyclicality of our business; the highly competitive, volatile, and fragmented market in which we operate; fluctuating metal prices; our substantial indebtedness and the covenants in instruments governing such indebtedness; the integration of acquired operations; regulatory and other operational risks associated with our operations located inside and outside of the United States; work stoppages; obligations under certain employee retirement benefit plans; the ownership of a majority of our equity securities by a single investor group; currency fluctuations; and consolidation in the metals producer industry. Forward-looking statements should, therefore, be considered in light of various factors, including those set forth above and those set forth under "Risk Factors" in our annual report on Form 10-K for the year ended December 31, 2018, and in our other filings with the Securities and Exchange Commission. Moreover, we caution against placing undue reliance on these statements, which speak only as of the date they were made. The Company does not undertake any obligation to publicly update or revise any forward-looking statements to reflect future events or circumstances, new information or otherwise. Non-GAAP Measures Certain measures contained in these slides or the related presentation are not measures calculated in accordance with generally accepted accounting principles (“GAAP”). They should not be considered a replacement for GAAP results. Non-GAAP financial measures appearing in these slides are identified in the footnotes. A reconciliation of these non-GAAP measures to the most directly comparable GAAP financial measures is included in the Appendix.
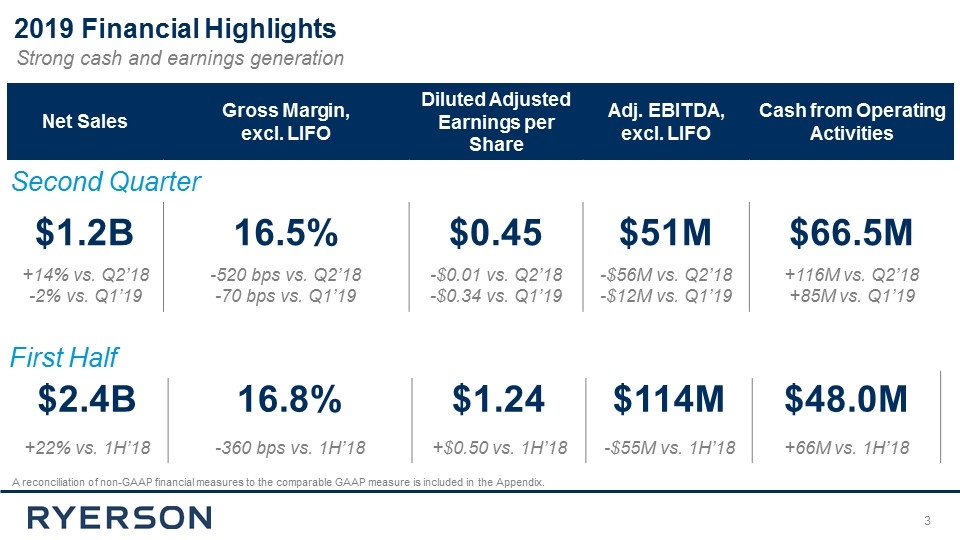
2019 Financial Highlights A reconciliation of non-GAAP financial measures to the comparable GAAP measure is included in the Appendix. Strong cash and earnings generation Net Sales Gross Margin, excl. LIFO Diluted Adjusted Earnings per Share Adj. EBITDA, excl. LIFO Cash from Operating Activities $1.2B 16.5% $0.45 $51M $66.5M +14% vs. Q2’18 -2% vs. Q1’19 -520 bps vs. Q2’18 -70 bps vs. Q1’19 -$0.01 vs. Q2’18 -$0.34 vs. Q1’19 -$56M vs. Q2’18 -$12M vs. Q1’19 +116M vs. Q2’18 +85M vs. Q1’19 $2.4B 16.8% $1.24 $114M $48.0M +22% vs. 1H’18 -360 bps vs. 1H’18 +$0.50 vs. 1H’18 -$55M vs. 1H’18 +66M vs. 1H’18 Second Quarter First Half
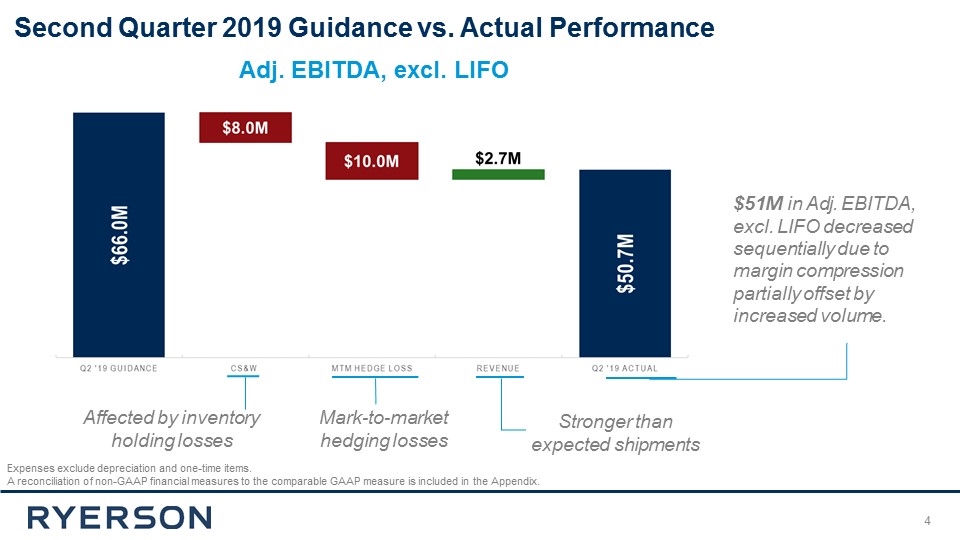
Second Quarter 2019 Guidance vs. Actual Performance Affected by inventory holding losses Stronger than expected shipments Expenses exclude depreciation and one-time items. A reconciliation of non-GAAP financial measures to the comparable GAAP measure is included in the Appendix. $51M in Adj. EBITDA, excl. LIFO decreased sequentially due to margin compression partially offset by increased volume. Adj. EBITDA, excl. LIFO Mark-to-market hedging losses
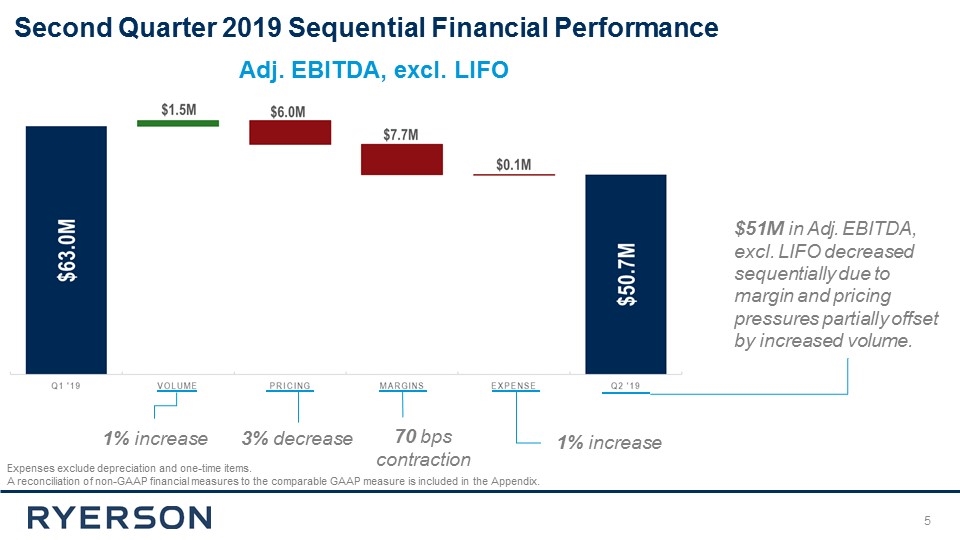
Second Quarter 2019 Sequential Financial Performance 1% increase 3% decrease 1% increase Expenses exclude depreciation and one-time items. A reconciliation of non-GAAP financial measures to the comparable GAAP measure is included in the Appendix. $51M in Adj. EBITDA, excl. LIFO decreased sequentially due to margin and pricing pressures partially offset by increased volume. Adj. EBITDA, excl. LIFO 70 bps contraction
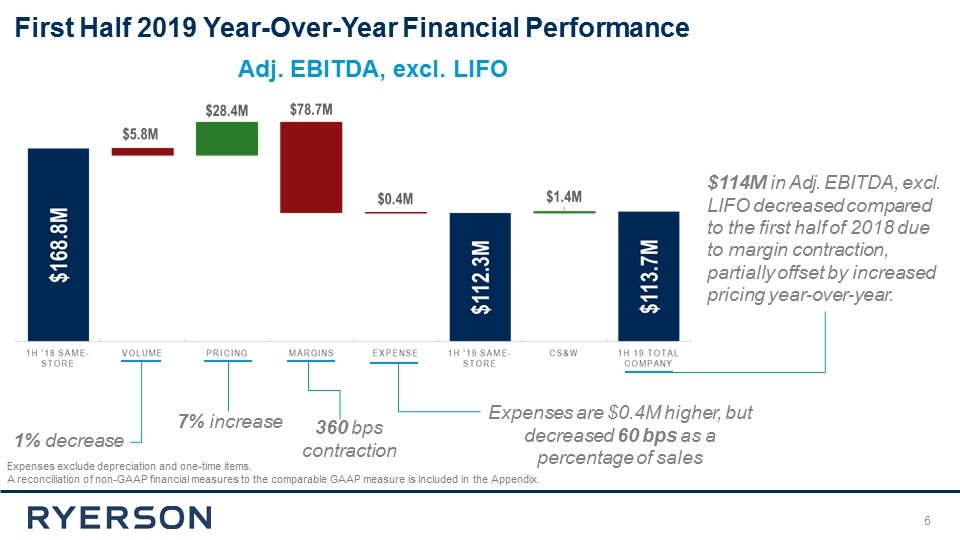
First Half 2019 Year-Over-Year Financial Performance 1% decrease 7% increase 360 bps contraction Expenses are $0.4M higher, but decreased 60 bps as a percentage of sales Expenses exclude depreciation and one-time items. A reconciliation of non-GAAP financial measures to the comparable GAAP measure is included in the Appendix. $114M in Adj. EBITDA, excl. LIFO decreased compared to the first half of 2018 due to margin contraction, partially offset by increased pricing year-over-year. Adj. EBITDA, excl. LIFO
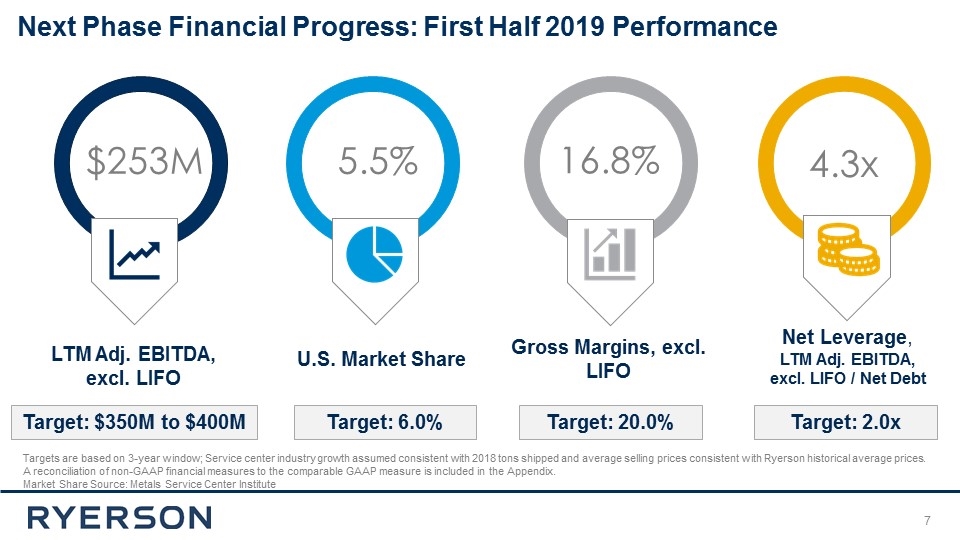
Next Phase Financial Progress: First Half 2019 Performance 16.8% Gross Margins, excl. LIFO Target: 20.0% 5.5% U.S. Market Share Target: 6.0% Targets are based on 3-year window; Service center industry growth assumed consistent with 2018 tons shipped and average selling prices consistent with Ryerson historical average prices. A reconciliation of non-GAAP financial measures to the comparable GAAP measure is included in the Appendix. Market Share Source: Metals Service Center Institute $253M LTM Adj. EBITDA, excl. LIFO Target: $350M to $400M 4.3x Net Leverage, LTM Adj. EBITDA, excl. LIFO / Net Debt Target: 2.0x
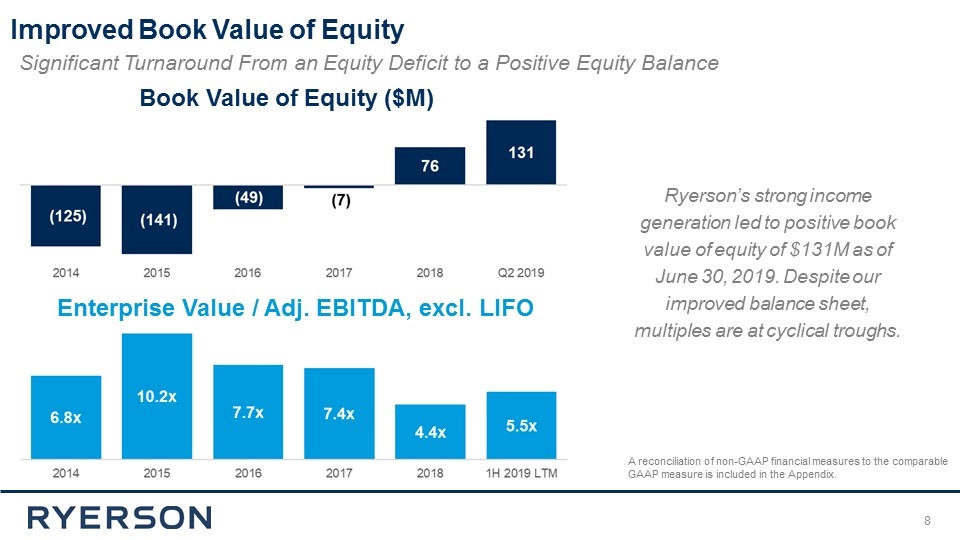
Improved Book Value of Equity Book Value of Equity ($M) Ryerson’s strong income generation led to positive book value of equity of $131M as of June 30, 2019. Despite our improved balance sheet, multiples are at cyclical troughs. Enterprise Value / Adj. EBITDA, excl. LIFO Significant Turnaround From an Equity Deficit to a Positive Equity Balance A reconciliation of non-GAAP financial measures to the comparable GAAP measure is included in the Appendix.
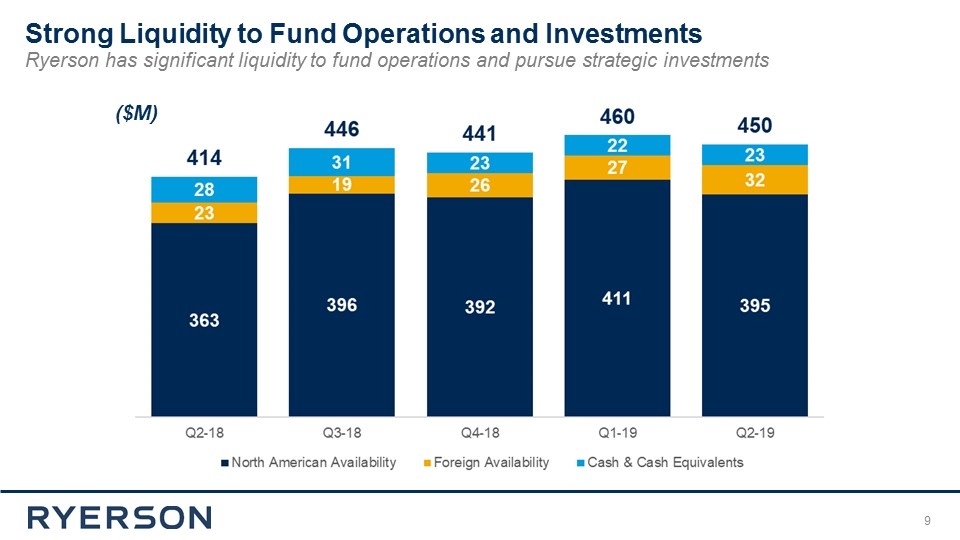
Strong Liquidity to Fund Operations and Investments Ryerson has significant liquidity to fund operations and pursue strategic investments ($M)
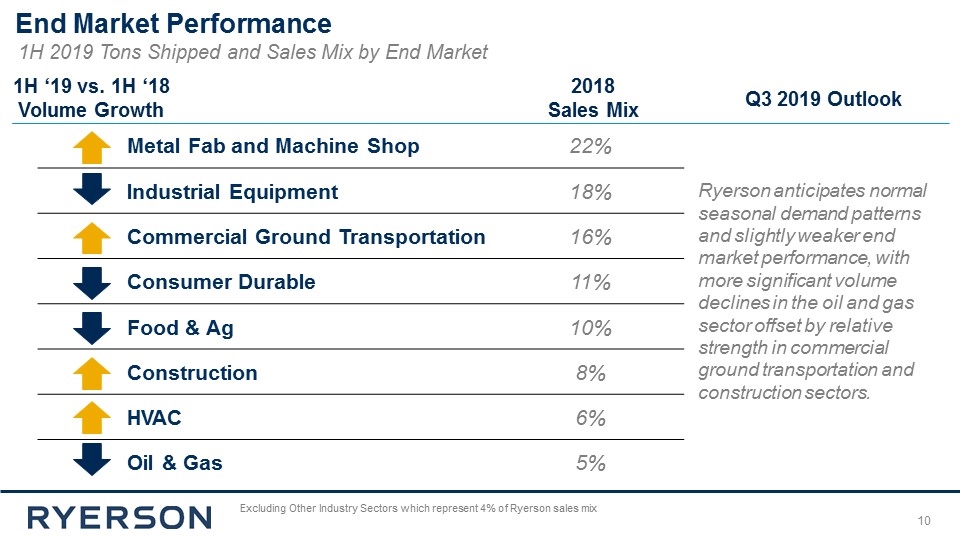
End Market Performance 1H 2019 Tons Shipped and Sales Mix by End Market Metal Fab and Machine Shop 22% Industrial Equipment 18% Commercial Ground Transportation 16% Consumer Durable 11% Food & Ag 10% Construction 8% HVAC 6% Oil & Gas 5% Excluding Other Industry Sectors which represent 4% of Ryerson sales mix Ryerson anticipates normal seasonal demand patterns and slightly weaker end market performance, with more significant volume declines in the oil and gas sector offset by relative strength in commercial ground transportation and construction sectors. 2018 Sales Mix Q3 2019 Outlook 1H ‘19 vs. 1H ‘18 Volume Growth
Appendix
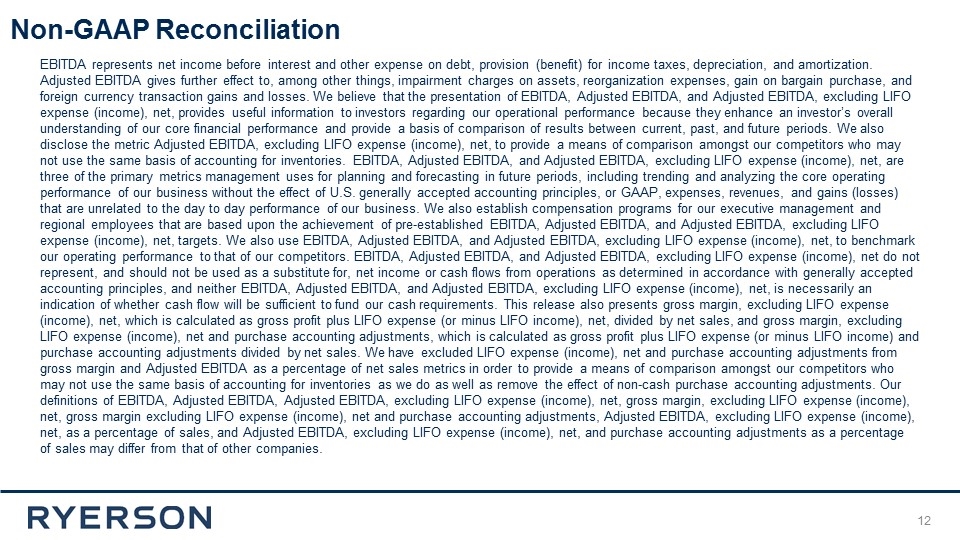
31 EBITDA represents net income before interest and other expense on debt, provision (benefit) for income taxes, depreciation, and amortization. Adjusted EBITDA gives further effect to, among other things, impairment charges on assets, reorganization expenses, gain on bargain purchase, and foreign currency transaction gains and losses. We believe that the presentation of EBITDA, Adjusted EBITDA, and Adjusted EBITDA, excluding LIFO expense (income), net, provides useful information to investors regarding our operational performance because they enhance an investor’s overall understanding of our core financial performance and provide a basis of comparison of results between current, past, and future periods. We also disclose the metric Adjusted EBITDA, excluding LIFO expense (income), net, to provide a means of comparison amongst our competitors who may not use the same basis of accounting for inventories. EBITDA, Adjusted EBITDA, and Adjusted EBITDA, excluding LIFO expense (income), net, are three of the primary metrics management uses for planning and forecasting in future periods, including trending and analyzing the core operating performance of our business without the effect of U.S. generally accepted accounting principles, or GAAP, expenses, revenues, and gains (losses) that are unrelated to the day to day performance of our business. We also establish compensation programs for our executive management and regional employees that are based upon the achievement of pre-established EBITDA, Adjusted EBITDA, and Adjusted EBITDA, excluding LIFO expense (income), net, targets. We also use EBITDA, Adjusted EBITDA, and Adjusted EBITDA, excluding LIFO expense (income), net, to benchmark our operating performance to that of our competitors. EBITDA, Adjusted EBITDA, and Adjusted EBITDA, excluding LIFO expense (income), net do not represent, and should not be used as a substitute for, net income or cash flows from operations as determined in accordance with generally accepted accounting principles, and neither EBITDA, Adjusted EBITDA, and Adjusted EBITDA, excluding LIFO expense (income), net, is necessarily an indication of whether cash flow will be sufficient to fund our cash requirements. This release also presents gross margin, excluding LIFO expense (income), net, which is calculated as gross profit plus LIFO expense (or minus LIFO income), net, divided by net sales, and gross margin, excluding LIFO expense (income), net and purchase accounting adjustments, which is calculated as gross profit plus LIFO expense (or minus LIFO income) and purchase accounting adjustments divided by net sales. We have excluded LIFO expense (income), net and purchase accounting adjustments from gross margin and Adjusted EBITDA as a percentage of net sales metrics in order to provide a means of comparison amongst our competitors who may not use the same basis of accounting for inventories as we do as well as remove the effect of non-cash purchase accounting adjustments. Our definitions of EBITDA, Adjusted EBITDA, Adjusted EBITDA, excluding LIFO expense (income), net, gross margin, excluding LIFO expense (income), net, gross margin excluding LIFO expense (income), net and purchase accounting adjustments, Adjusted EBITDA, excluding LIFO expense (income), net, as a percentage of sales, and Adjusted EBITDA, excluding LIFO expense (income), net, and purchase accounting adjustments as a percentage of sales may differ from that of other companies. Non-GAAP Reconciliation
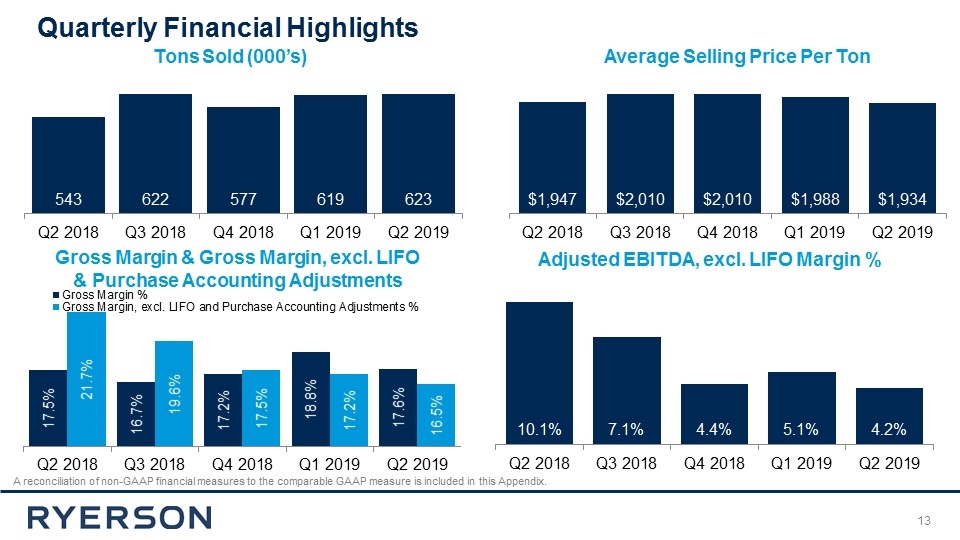
Quarterly Financial Highlights A reconciliation of non-GAAP financial measures to the comparable GAAP measure is included in this Appendix. Tons Sold (000’s) Average Selling Price Per Ton Adjusted EBITDA, excl. LIFO Margin % Gross Margin & Gross Margin, excl. LIFO & Purchase Accounting Adjustments
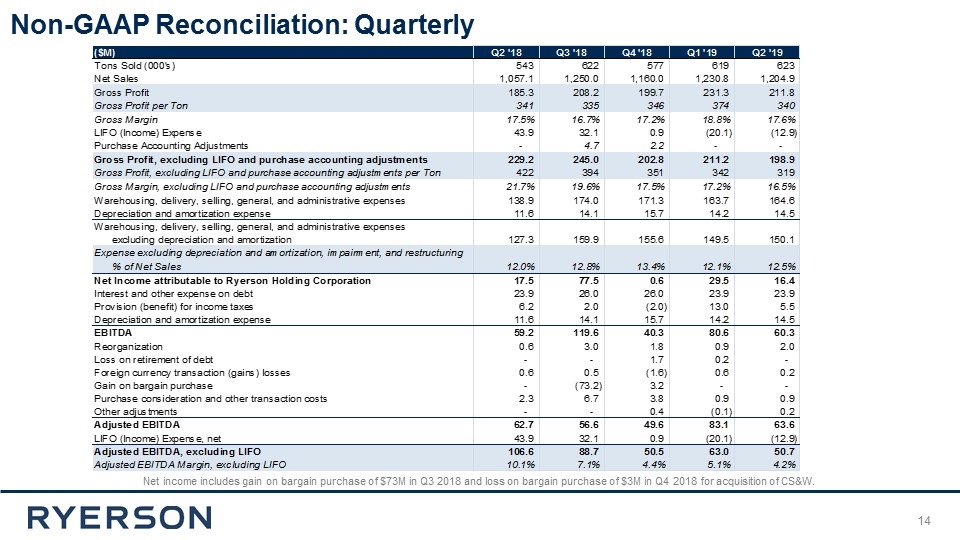
Non-GAAP Reconciliation: Quarterly Net income includes gain on bargain purchase of $73M in Q3 2018 and loss on bargain purchase of $3M in Q4 2018 for acquisition of CS&W.


