
Q1 2020 Ryerson Quarterly Release Presentation Exhibit 99.1

31 Important Information About Ryerson Holding Corporation These materials do not constitute an offer or solicitation to purchase or sell securities of Ryerson Holding Corporation (“Ryerson” or “the Company”) and no investment decision should be made based upon the information provided herein. Ryerson strongly urges you to review its filings with the Securities and Exchange Commission, which can be found at https://ir.ryerson.com/financials/sec-filings/default.aspx. This site also provides additional information about Ryerson. Safe Harbor Provision Certain statements made in this presentation and other written or oral statements made by or on behalf of the Company constitute "forward-looking statements" within the meaning of the federal securities laws, including statements regarding our future performance, as well as management's expectations, beliefs, intentions, plans, estimates, objectives, or projections relating to the future. Such statements can be identified by the use of forward-looking terminology such as “objectives,” “goals,” “preliminary,” “range,” "believes," "expects," "may," "estimates," "will," "should," "plans," or "anticipates" or the negative thereof or other variations thereon or comparable terminology, or by discussions of strategy. The Company cautions that any such forward-looking statements are not guarantees of future performance and may involve significant risks and uncertainties, and that actual results may vary materially from those in the forward-looking statements as a result of various factors. Among the factors that significantly impact our business are: the cyclicality of our business; the highly competitive, volatile, and fragmented metals industry in which we operate; fluctuating metal prices; our substantial indebtedness and the covenants in instruments governing such indebtedness; the integration of acquired operations; regulatory and other operational risks associated with our operations located inside and outside of the United States; impacts and implications of adverse health events, including the COVID-19 pandemic; work stoppages; obligations under certain employee retirement benefit plans; the ownership of a majority of our equity securities by a single investor group; currency fluctuations; and consolidation in the metals industry. Forward-looking statements should, therefore, be considered in light of various factors, including those set forth above and those set forth under "Risk Factors" in our annual report on Form 10-K for the year ended December 31, 2019, and in our other filings with the Securities and Exchange Commission. Moreover, we caution against placing undue reliance on these statements, which speak only as of the date they were made. The Company does not undertake any obligation to publicly update or revise any forward-looking statements to reflect future events or circumstances, new information or otherwise. Non-GAAP Measures Certain measures contained in these slides or the related presentation are not measures calculated in accordance with generally accepted accounting principles (“GAAP”). They should not be considered a replacement for GAAP results. Non-GAAP financial measures appearing in these slides are identified in the footnotes. A reconciliation of these non-GAAP measures to the most directly comparable GAAP financial measures is included in the Appendix.
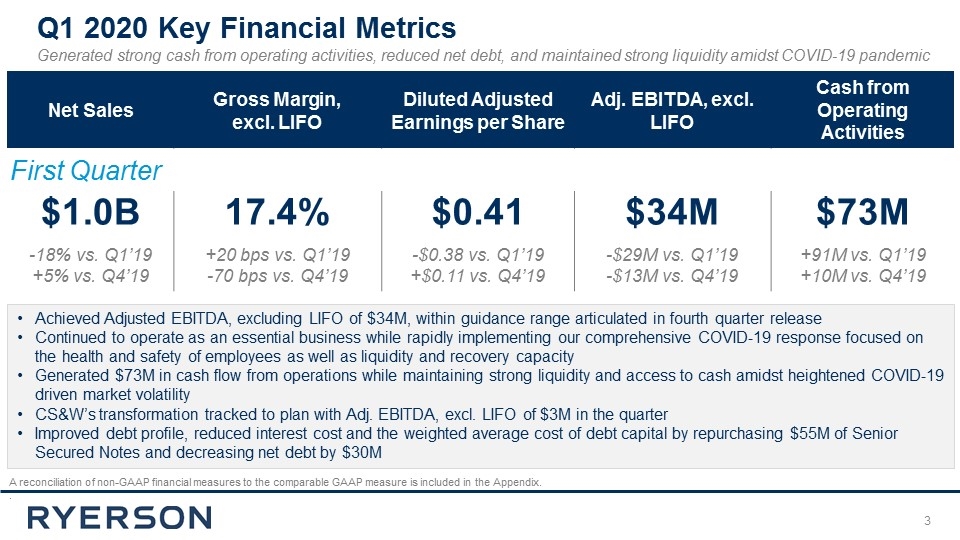
A reconciliation of non-GAAP financial measures to the comparable GAAP measure is included in the Appendix. . Net Sales Gross Margin, excl. LIFO Diluted Adjusted Earnings per Share Adj. EBITDA, excl. LIFO Cash from Operating Activities $1.0B 17.4% $0.41 $34M $73M -18% vs. Q1’19 +5% vs. Q4’19 +20 bps vs. Q1’19 -70 bps vs. Q4’19 -$0.38 vs. Q1’19 +$0.11 vs. Q4’19 -$29M vs. Q1’19 -$13M vs. Q4’19 +91M vs. Q1’19 +10M vs. Q4’19 First Quarter Achieved Adjusted EBITDA, excluding LIFO of $34M, within guidance range articulated in fourth quarter release Continued to operate as an essential business while rapidly implementing our comprehensive COVID-19 response focused on the health and safety of employees as well as liquidity and recovery capacity Generated $73M in cash flow from operations while maintaining strong liquidity and access to cash amidst heightened COVID-19 driven market volatility CS&W’s transformation tracked to plan with Adj. EBITDA, excl. LIFO of $3M in the quarter Improved debt profile, reduced interest cost and the weighted average cost of debt capital by repurchasing $55M of Senior Secured Notes and decreasing net debt by $30M Q1 2020 Key Financial Metrics Generated strong cash from operating activities, reduced net debt, and maintained strong liquidity amidst COVID-19 pandemic
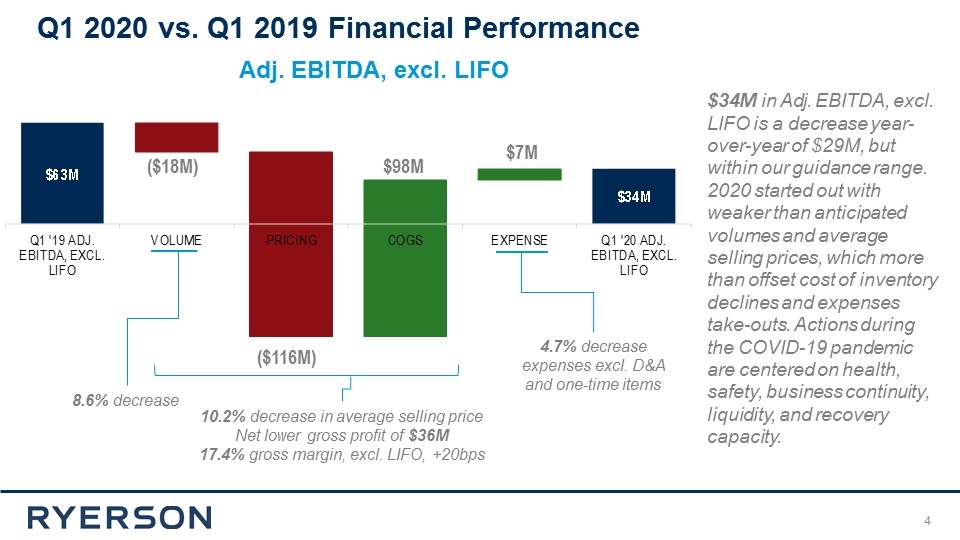
($18M) ($116M) $98M $7M 10.2% decrease in average selling price Net lower gross profit of $36M 17.4% gross margin, excl. LIFO, +20bps Adj. EBITDA, excl. LIFO 8.6% decrease 4.7% decrease expenses excl. D&A and one-time items $34M in Adj. EBITDA, excl. LIFO is a decrease year-over-year of $29M, but within our guidance range. 2020 started out with weaker than anticipated volumes and average selling prices, which more than offset cost of inventory declines and expenses take-outs. Actions during the COVID-19 pandemic are centered on health, safety, business continuity, liquidity, and recovery capacity. Q1 2020 vs. Q1 2019 Financial Performance
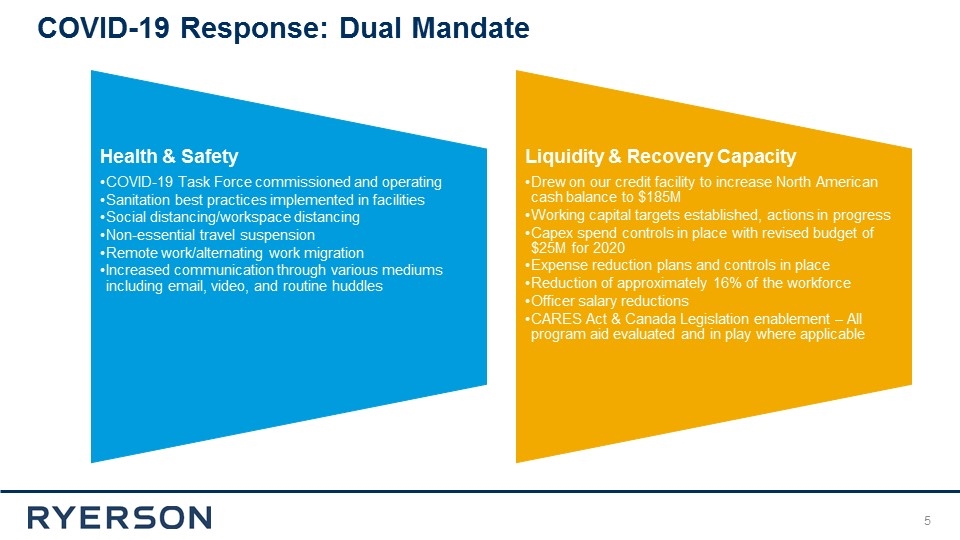
COVID-19 Response: Dual Mandate Health & Safety Sanitation best practices implemented in facilities Liquidity & Recovery Capacity Drew on our credit facility to increase North American cash balance to $185M Social distancing/workspace distancing Non-essential travel suspension Remote work/alternating work migration Increased communication through various mediums including email, video, and routine huddles Capex spend controls in place with revised budget of $25M for 2020 Expense reduction plans and controls in place Reduction of approximately 16% of the workforce CARES Act & Canada Legislation enablement – All program aid evaluated and in play where applicable Working capital targets established, actions in progress COVID-19 Task Force commissioned and operating Officer salary reductions
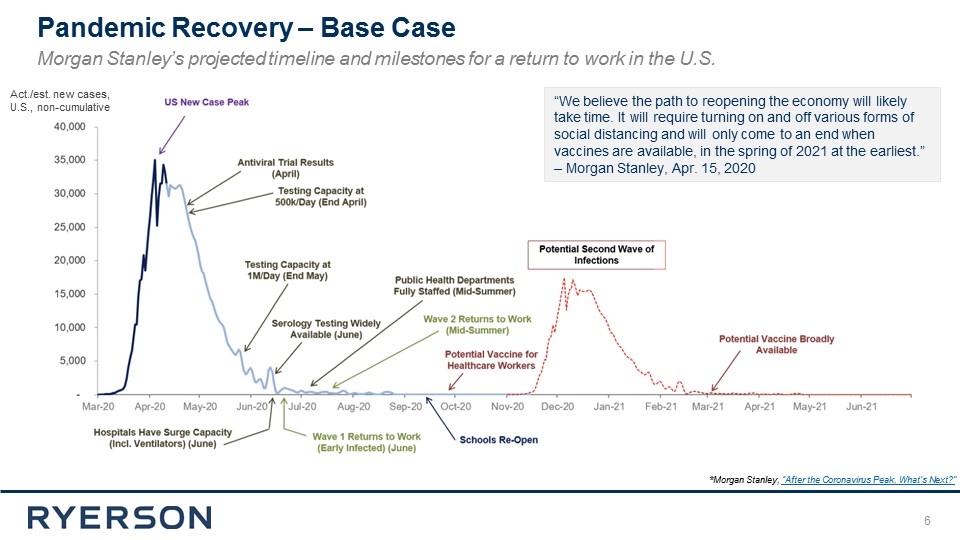
“We believe the path to reopening the economy will likely take time. It will require turning on and off various forms of social distancing and will only come to an end when vaccines are available, in the spring of 2021 at the earliest.” – Morgan Stanley, Apr. 15, 2020 *Morgan Stanley, “After the Coronavirus Peak, What’s Next?” Act./est. new cases, U.S., non-cumulative Pandemic Recovery – Base Case Morgan Stanley’s projected timeline and milestones for a return to work in the U.S.
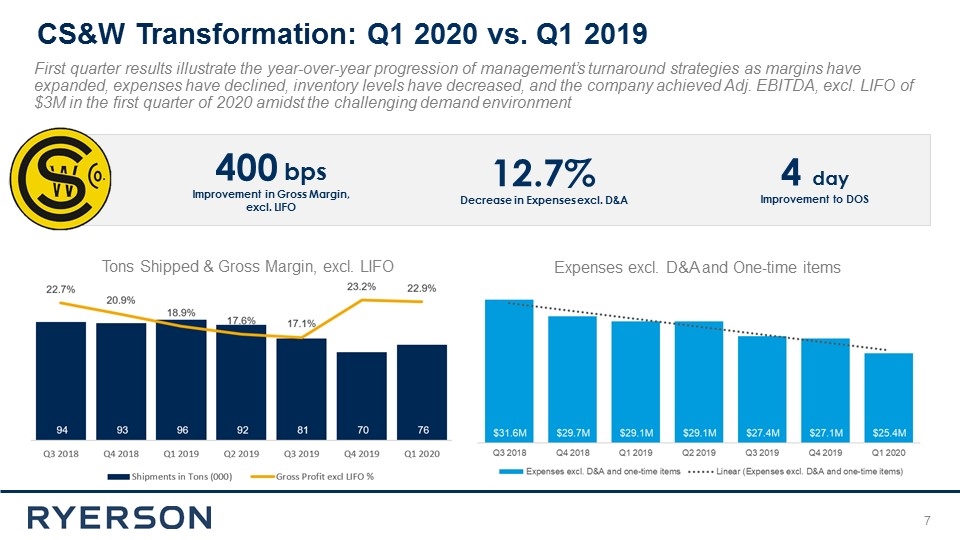
CS&W Transformation: Q1 2020 vs. Q1 2019 First quarter results illustrate the year-over-year progression of management’s turnaround strategies as margins have expanded, expenses have declined, inventory levels have decreased, and the company achieved Adj. EBITDA, excl. LIFO of $3M in the first quarter of 2020 amidst the challenging demand environment 400 bps Improvement in Gross Margin, excl. LIFO 12.7% Decrease in Expenses excl. D&A 4 day Improvement to DOS Tons Shipped & Gross Margin, excl. LIFO Expenses excl. D&A and One-time items
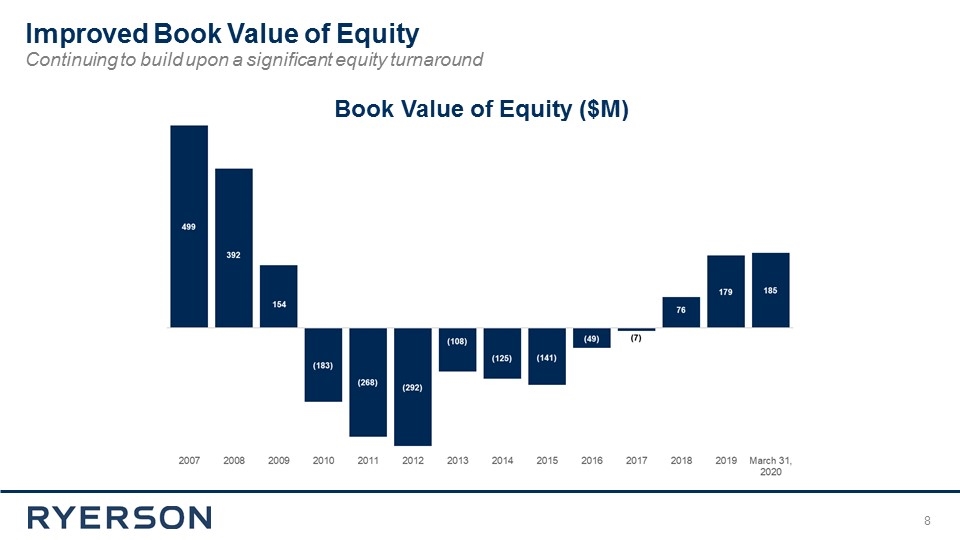
Improved Book Value of Equity Continuing to build upon a significant equity turnaround Book Value of Equity ($M)
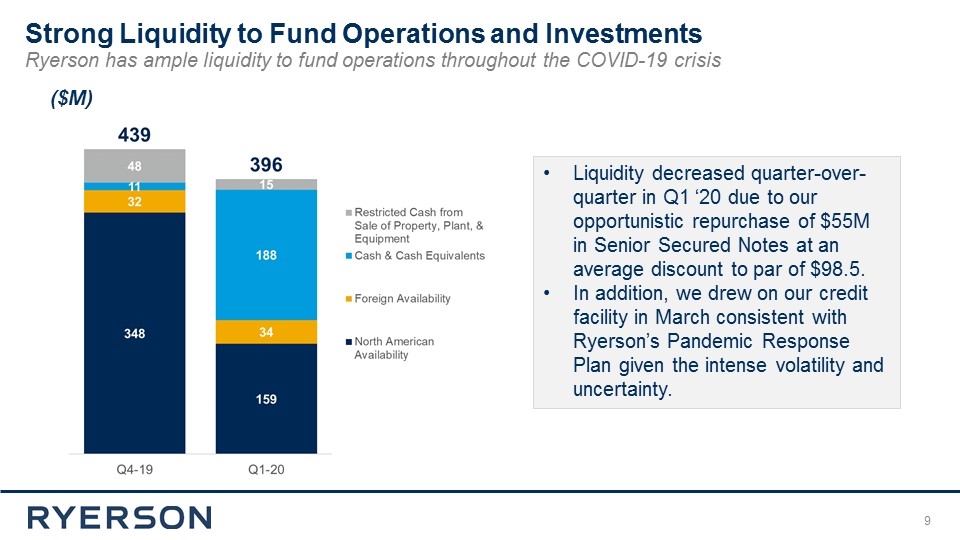
Strong Liquidity to Fund Operations and Investments Ryerson has ample liquidity to fund operations throughout the COVID-19 crisis ($M) Liquidity decreased quarter-over-quarter in Q1 ‘20 due to our opportunistic repurchase of $55M in Senior Secured Notes at an average discount to par of $98.5. In addition, we drew on our credit facility in March consistent with Ryerson’s Pandemic Response Plan given the intense volatility and uncertainty.
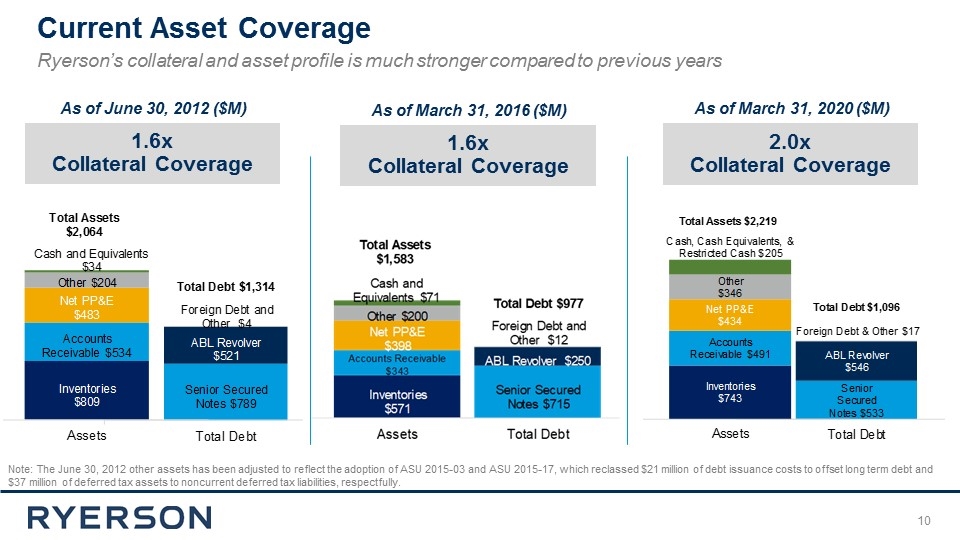
Ryerson’s collateral and asset profile is much stronger compared to previous years Current Asset Coverage 2.0x Collateral Coverage As of March 31, 2020 ($M) 1.6x Collateral Coverage As of June 30, 2012 ($M) 1.6x Collateral Coverage As of March 31, 2016 ($M) Note: The June 30, 2012 other assets has been adjusted to reflect the adoption of ASU 2015-03 and ASU 2015-17, which reclassed $21 million of debt issuance costs to offset long term debt and $37 million of deferred tax assets to noncurrent deferred tax liabilities, respectfully.
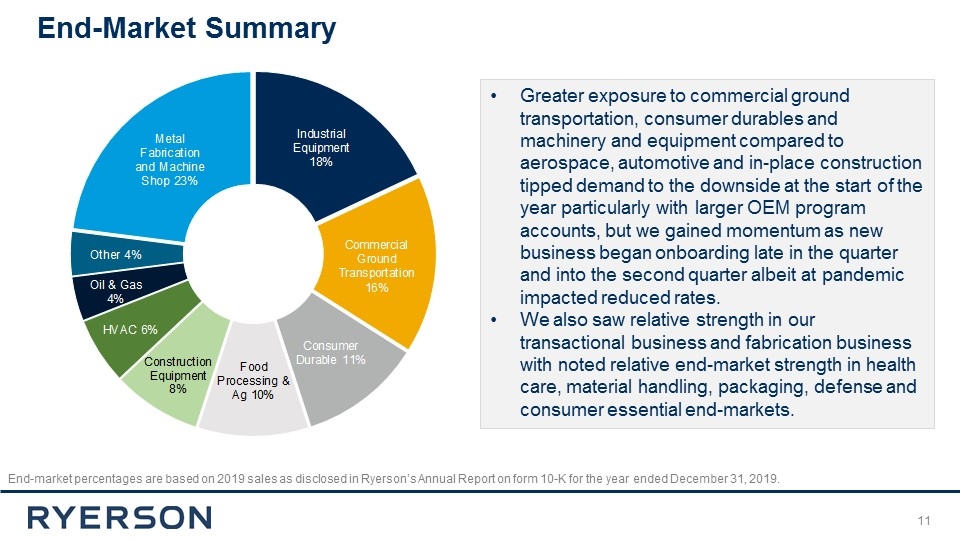
Greater exposure to commercial ground transportation, consumer durables and machinery and equipment compared to aerospace, automotive and in-place construction tipped demand to the downside at the start of the year particularly with larger OEM program accounts, but we gained momentum as new business began onboarding late in the quarter and into the second quarter albeit at pandemic impacted reduced rates. We also saw relative strength in our transactional business and fabrication business with noted relative end-market strength in health care, material handling, packaging, defense and consumer essential end-markets. End-market percentages are based on 2019 sales as disclosed in Ryerson’s Annual Report on form 10-K for the year ended December 31, 2019. End-Market Summary

100+ Locations 178 Years 40,000Customers 70,000 Products Focused on creating great customer experiences with Speed, Scale, & Growth
Appendix
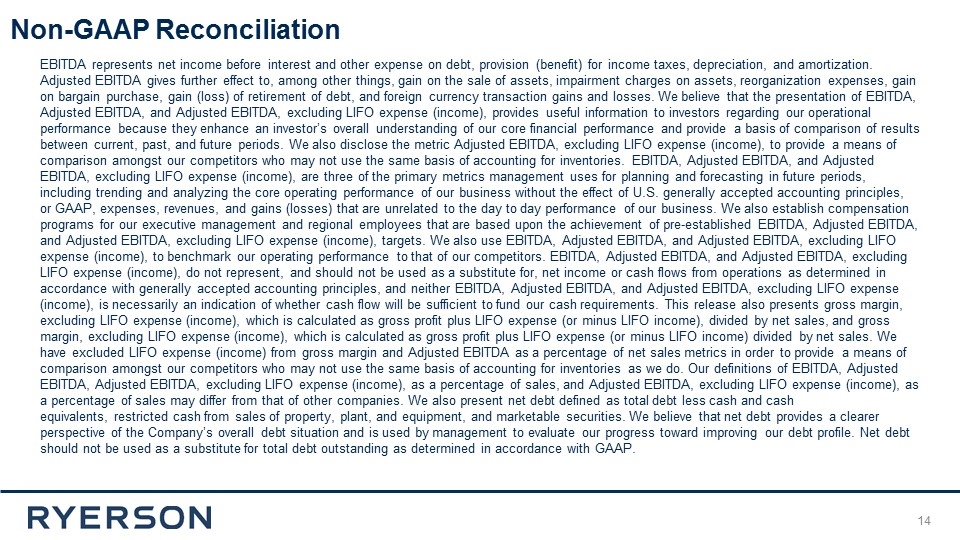
31 EBITDA represents net income before interest and other expense on debt, provision (benefit) for income taxes, depreciation, and amortization. Adjusted EBITDA gives further effect to, among other things, gain on the sale of assets, impairment charges on assets, reorganization expenses, gain on bargain purchase, gain (loss) of retirement of debt, and foreign currency transaction gains and losses. We believe that the presentation of EBITDA, Adjusted EBITDA, and Adjusted EBITDA, excluding LIFO expense (income), provides useful information to investors regarding our operational performance because they enhance an investor’s overall understanding of our core financial performance and provide a basis of comparison of results between current, past, and future periods. We also disclose the metric Adjusted EBITDA, excluding LIFO expense (income), to provide a means of comparison amongst our competitors who may not use the same basis of accounting for inventories. EBITDA, Adjusted EBITDA, and Adjusted EBITDA, excluding LIFO expense (income), are three of the primary metrics management uses for planning and forecasting in future periods, including trending and analyzing the core operating performance of our business without the effect of U.S. generally accepted accounting principles, or GAAP, expenses, revenues, and gains (losses) that are unrelated to the day to day performance of our business. We also establish compensation programs for our executive management and regional employees that are based upon the achievement of pre-established EBITDA, Adjusted EBITDA, and Adjusted EBITDA, excluding LIFO expense (income), targets. We also use EBITDA, Adjusted EBITDA, and Adjusted EBITDA, excluding LIFO expense (income), to benchmark our operating performance to that of our competitors. EBITDA, Adjusted EBITDA, and Adjusted EBITDA, excluding LIFO expense (income), do not represent, and should not be used as a substitute for, net income or cash flows from operations as determined in accordance with generally accepted accounting principles, and neither EBITDA, Adjusted EBITDA, and Adjusted EBITDA, excluding LIFO expense (income), is necessarily an indication of whether cash flow will be sufficient to fund our cash requirements. This release also presents gross margin, excluding LIFO expense (income), which is calculated as gross profit plus LIFO expense (or minus LIFO income), divided by net sales, and gross margin, excluding LIFO expense (income), which is calculated as gross profit plus LIFO expense (or minus LIFO income) divided by net sales. We have excluded LIFO expense (income) from gross margin and Adjusted EBITDA as a percentage of net sales metrics in order to provide a means of comparison amongst our competitors who may not use the same basis of accounting for inventories as we do. Our definitions of EBITDA, Adjusted EBITDA, Adjusted EBITDA, excluding LIFO expense (income), as a percentage of sales, and Adjusted EBITDA, excluding LIFO expense (income), as a percentage of sales may differ from that of other companies. We also present net debt defined as total debt less cash and cash equivalents, restricted cash from sales of property, plant, and equipment, and marketable securities. We believe that net debt provides a clearer perspective of the Company’s overall debt situation and is used by management to evaluate our progress toward improving our debt profile. Net debt should not be used as a substitute for total debt outstanding as determined in accordance with GAAP. Non-GAAP Reconciliation
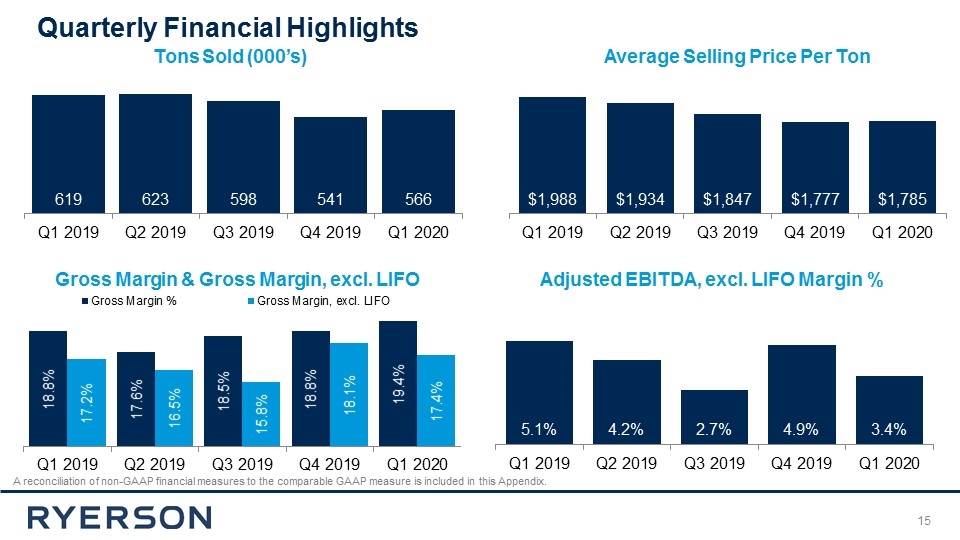
Quarterly Financial Highlights A reconciliation of non-GAAP financial measures to the comparable GAAP measure is included in this Appendix. Tons Sold (000’s) Average Selling Price Per Ton Adjusted EBITDA, excl. LIFO Margin % Gross Margin & Gross Margin, excl. LIFO
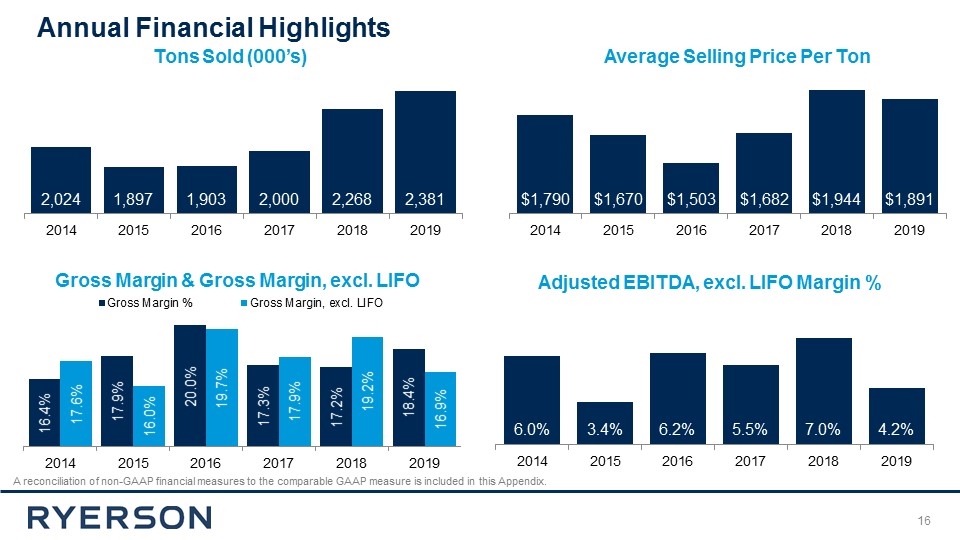
Annual Financial Highlights A reconciliation of non-GAAP financial measures to the comparable GAAP measure is included in this Appendix. Tons Sold (000’s) Average Selling Price Per Ton Gross Margin & Gross Margin, excl. LIFO Adjusted EBITDA, excl. LIFO Margin %
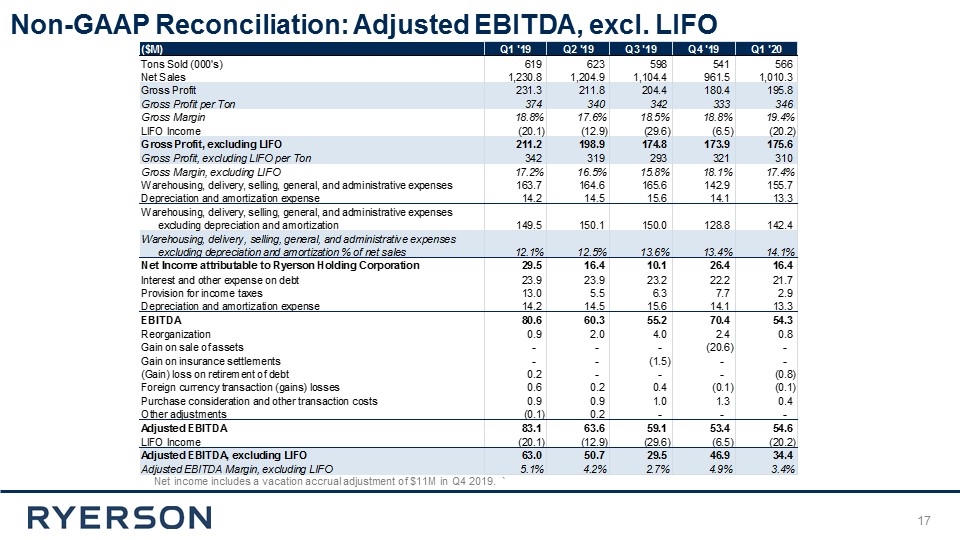
Non-GAAP Reconciliation: Adjusted EBITDA, excl. LIFO Net income includes a vacation accrual adjustment of $11M in Q4 2019. `
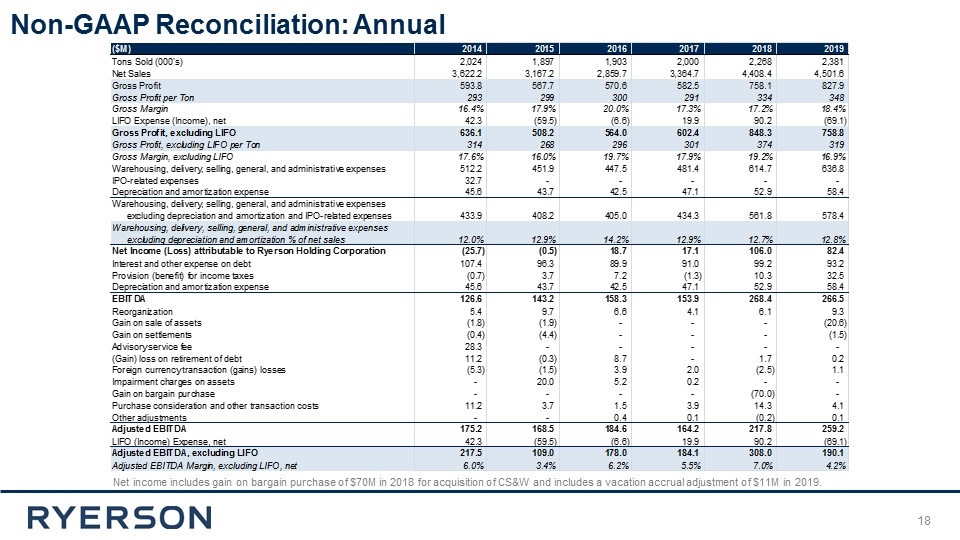
Non-GAAP Reconciliation: Annual Net income includes gain on bargain purchase of $70M in 2018 for acquisition of CS&W and includes a vacation accrual adjustment of $11M in 2019.
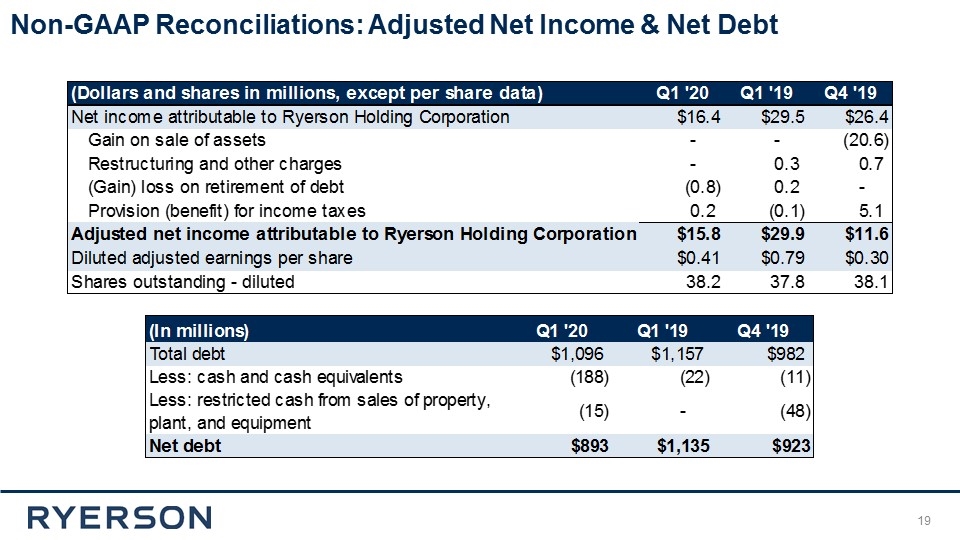
Non-GAAP Reconciliations: Adjusted Net Income & Net Debt
