Exhibit 99.2 Valuation Update Meeting December 12, 2019
The information contained herein should be read in conjunction with, and is qualified by, the information in KBS Real Estate Investment Trust III’s (the “Company” or “KBS REIT III”) Annual Report on Form 10-K for the year ended December 31, 2018 (the “Annual Report”), in the Company’s Quarterly Reports on Form 10-Q for the periods ended June 30, 2019 and September 30, 2019 (the “Quarterly Reports”) and in the Company’s preliminary proxy statement filed with the SEC on December 12, 2019, including the “Risk Factors” contained therein. For a full description of the Important limitations, methodologies and assumptions used to value the Company’s assets and liabilities in connection with the calculation of the Company’s estimated value per share, see the Company’s Current Report on Form 8-K, filed with the SEC on December 12, 2019 (the “Valuation 8-K”). Disclosures Forward-Looking Statements Certain statements contained herein may be deemed to be forward-looking statements within the meaning of the Federal Private Securities Litigation Reform Act of 1995. The Company intends that such forward-looking statements be subject to the safe harbors created by Section 27A of the Securities Act of 1933, as amended, and Section 21E of the Securities Exchange Act of 1934, as amended. These statements include statements regarding the intent, belief or current expectations of the Company and members of its management team, as well as the assumptions on which such statements are based, and generally are identified by the use of words such as “may,” “will,” “seeks,” “anticipates,” “believes,” “estimates,” “expects,” “plans,” “intends,” “should” or similar expressions. Readers are cautioned not to place undue reliance on these forward-looking statements, which speak only as of the date they are made. The Company undertakes no obligation to update or revise forward-looking statements to reflect changed assumptions, the occurrence of unanticipated events or changes to future operating results over time, unless required by law. Such statements are subject to known and unknown risks and uncertainties which could cause actual results to differ materially from those contemplated by such forward-looking statements. The Company makes no representation or warranty (express or implied) about the accuracy of any such forward-looking statements. These statements are based on a number of assumptions involving the judgment of management. The Company may fund distributions from any source including, without limitation, from offering proceeds or borrowings. Distributions paid through September 30, 2019 have been funded with cash flow from operating activities, debt financing and proceeds from asset sales. There are no guarantees that the Company will continue to pay distributions or that distributions at the current rate are sustainable. No assurances can be given with respect to distributions. Actual events may cause the value and returns on the Company’s investments to be less than that used for purposes of the Company’s estimated NAV per share. With respect to the estimated NAV per share, the appraisal methodology used for the appraised properties assumes the properties realize the projected net operating income and expected exit cap rates and that investors would be willing to invest in such properties at yields equal to the expected discount rates. The valuation for the Company’s investment in units of Prime US REIT assumes a discount for the holding period risk attributable to transfer restrictions and blockage due to the quantity of units held by the Company and such discount is driven by trading volume in Prime US REIT’s units in the public market and expected future volatility. Though the appraisals of the appraised properties and the valuation of the Company’s investment in units of Prime US REIT, with respect to Duff & Phelps, and the valuation estimates used in calculating the estimated value per share, with respect to Duff & Phelps, the Company’s advisor and the Company, are the respective party’s best estimates as of September 30, 2019, December 3, 2019 and December 4, 2019, as applicable, the Company can give no assurance in this regard. Even small changes to these assumptions could result in significant differences in the appraised values of the appraised properties, the valuation of the Company’s investment in units of Prime US REIT and the estimated value per share. Further, the Company can make no assurances with respect to the future value appreciation of its properties and ultimate returns to investors. Stockholders may have to hold their shares for an indefinite period of time. The Company can give no assurance that it will be able to provide additional liquidity to stockholders. The Company’s conflicts committee, which is composed of all of its independent directors, has approved the pursuit of the Company’s conversion to a perpetual-life NAV REIT, which includes submitting to stockholders for their approval two proposals related to the Company’s conversion to an NAV REIT. However, even if these proposals are approved by the Company’s stockholders, implementation of these proposals and the Company’s conversion to an NAV REIT remain subject to further approval of the conflicts committee and board of directors, and regulatory, market or business considerations may influence the Company to delay the implementation of the NAV REIT conversion or abandon the Company’s conversion to an NAV REIT. Even if the Company converts to an NAV REIT, there is no assurance that the Company will successfully implement its strategy. The statements herein also depend on factors such as: future economic, competitive and market conditions; the Company’s ability to maintain and/or improve occupancy levels and rental rates at its real estate properties; and other risks identified in Part I, Item IA of the Company’s Annual Report, in Part II, Item IA of the Company’s Quarterly Reports and in the Company’s preliminary proxy statement filed with the SEC on December 12, 2019. WWW. KBS.COM 2
IMPORTANT On December 12, 2019, the Company filed a preliminary proxy statement and the Company plans to file a definitive proxy statement for its INFORMATION FOR Annual Meeting of Stockholders with the SEC. The definitive proxy statement will be sent or given to the Company’s stockholders and will STOCKHOLDERS contain information about the proposals to be voted on by the Company’s stockholders at the Annual Meeting of Stockholders, including ADDITIONAL INFORMATION AND information relating to two proposals related to the Company’s conversion to an NAV REIT: the amendment of the Company’s charter and WHERE TO FIND IT the acceleration of the payment of incentive compensation to KBS Capital Advisors LLC (the “Advisor”). This presentation does not constitute a solicitation of any vote or proxy from any stockholder of the Company. STOCKHOLDERS ARE URGED TO READ THE DEFINITIVE PROXY STATEMENT CAREFULLY AND IN ITS ENTIRETY WHEN IT IS AVAILABLE AND ANY OTHER RELEVANT DOCUMENTS OR MATERIALS FILED OR TO BE FILED WITH THE SEC OR INCORPORATED BY REFERENCE IN THE DEFINITIVE PROXY STATEMENT, BECAUSE THEY WILL CONTAIN IMPORTANT INFORMATION ABOUT THE PROPOSALS TO BE VOTED ON BY THE COMPANY’S STOCKHOLDERS AT THE ANNUAL MEETING OF STOCKHOLDERS. Stockholders will be able to obtain a copy of the definitive proxy statement and other relevant documents, including the Company’s Annual Report on Form 10-K for the year ended December 31, 2018 (which will be sent or given to the Company’s stockholders with the definitive proxy statement), free of charge at the SEC’s website, www.sec.gov, on the Investor Information page of the Company’s website at www.kbsreitiii.com, or by directing a request by mail to KBS Capital Markets Group Investor Relations, 800 Newport Center Drive, Suite 700, Newport Beach, CA 92660, or by calling the Broadridge proxy help line at 855-643-7458. PARTICIPATION IN THIS SOLICITATION The Company, its directors and executive officers, the Advisor and the Advisor’s officers and employees may be deemed to be participants in the solicitation of proxies from the Company’s stockholders with respect to the proposals to be voted on at the Annual Meeting of Stockholders, including the amendment of the Company’s charter and the acceleration of the payment of incentive compensation to the Advisor. Information regarding the Company, its directors and executive officers and the Advisor, including detailed information regarding the interests of such entities or persons in the solicitation, is included in the Company’s preliminary proxy statement and will be included in the definitive proxy statement in connection with the Annual Meeting of Stockholders. Stockholders may obtain the definitive proxy statement and other relevant documents free of charge as described above. WWW. KBS.COM 3
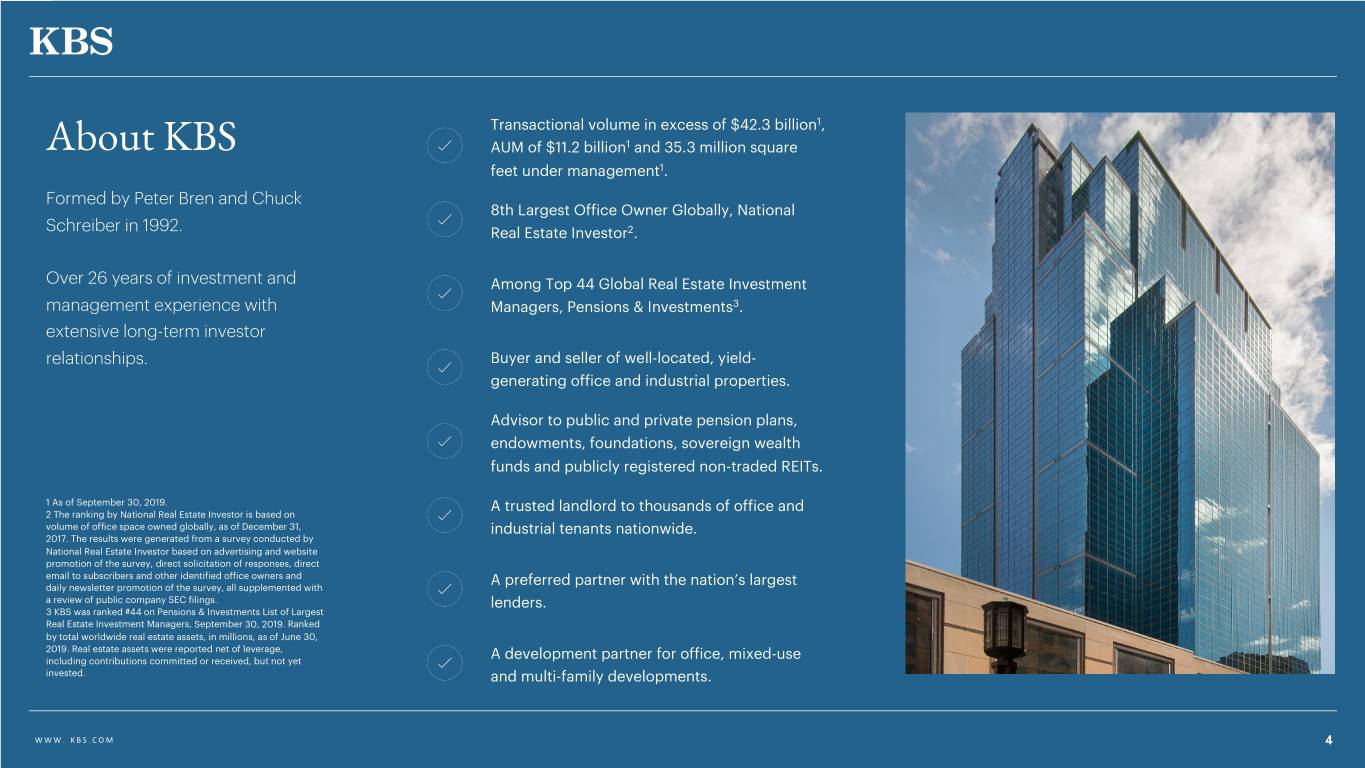
Transactional volume in excess of $42.3 billion1, About KBS AUM of $11.2 billion1 and 35.3 million square feet under management1. Formed by Peter Bren and Chuck 8th Largest Office Owner Globally, National Schreiber in 1992. Real Estate Investor2. Over 26 years of investment and Among Top 44 Global Real Estate Investment management experience with Managers, Pensions & Investments3. extensive long-term investor relationships. Buyer and seller of well-located, yield- generating office and industrial properties. Advisor to public and private pension plans, endowments, foundations, sovereign wealth funds and publicly registered non-traded REITs. 1 As of September 30, 2019. A trusted landlord to thousands of office and 2 The ranking by National Real Estate Investor is based on volume of office space owned globally, as of December 31, industrial tenants nationwide. 2017. The results were generated from a survey conducted by National Real Estate Investor based on advertising and website promotion of the survey, direct solicitation of responses, direct email to subscribers and other identified office owners and A preferred partner with the nation’s largest daily newsletter promotion of the survey, all supplemented with a review of public company SEC filings. lenders. 3 KBS was ranked #44 on Pensions & Investments List of Largest Real Estate Investment Managers, September 30, 2019. Ranked by total worldwide real estate assets, in millions, as of June 30, 2019. Real estate assets were reported net of leverage, including contributions committed or received, but not yet A development partner for office, mixed-use invested. and multi-family developments. WWW. KBS.COM 4
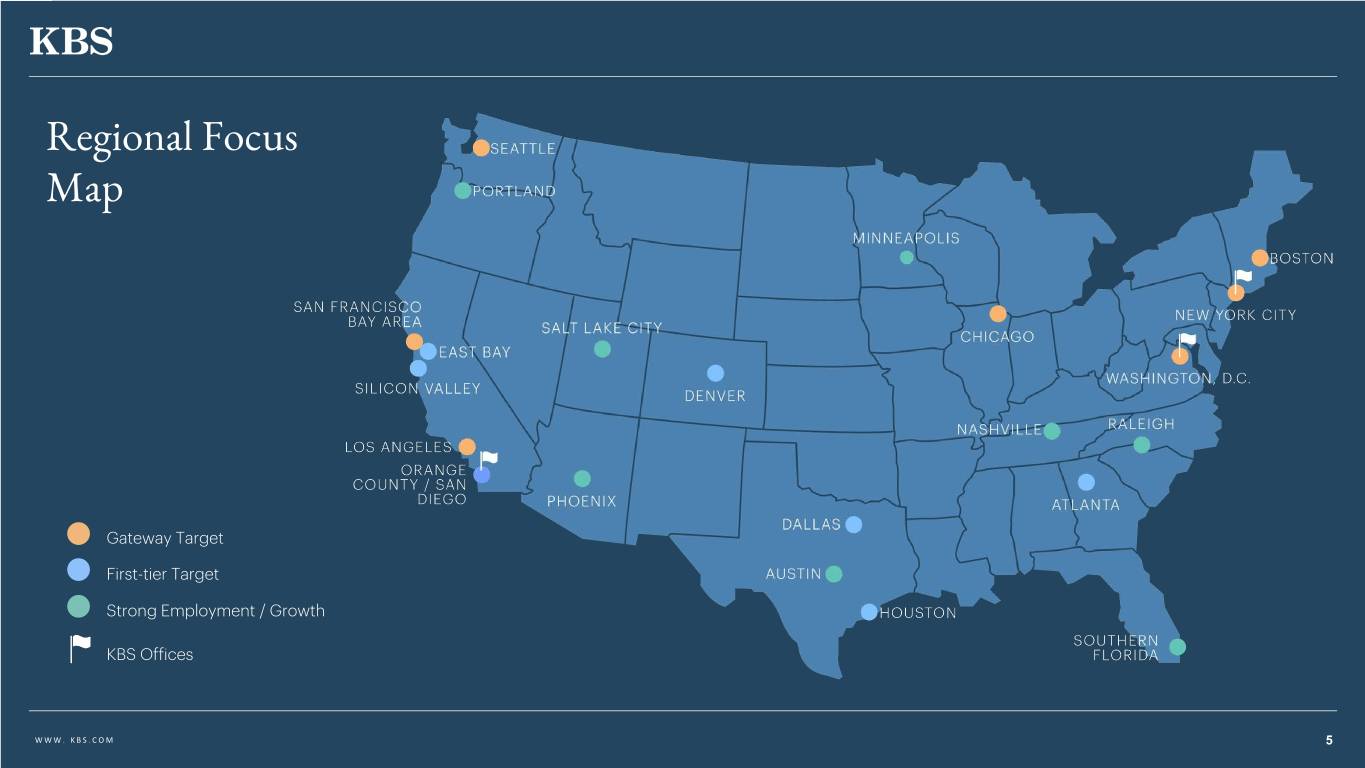
Regional Focus Map Gateway Target First-tier Target Strong Employment / Growth KBS Offices WWW. KBS.COM 5
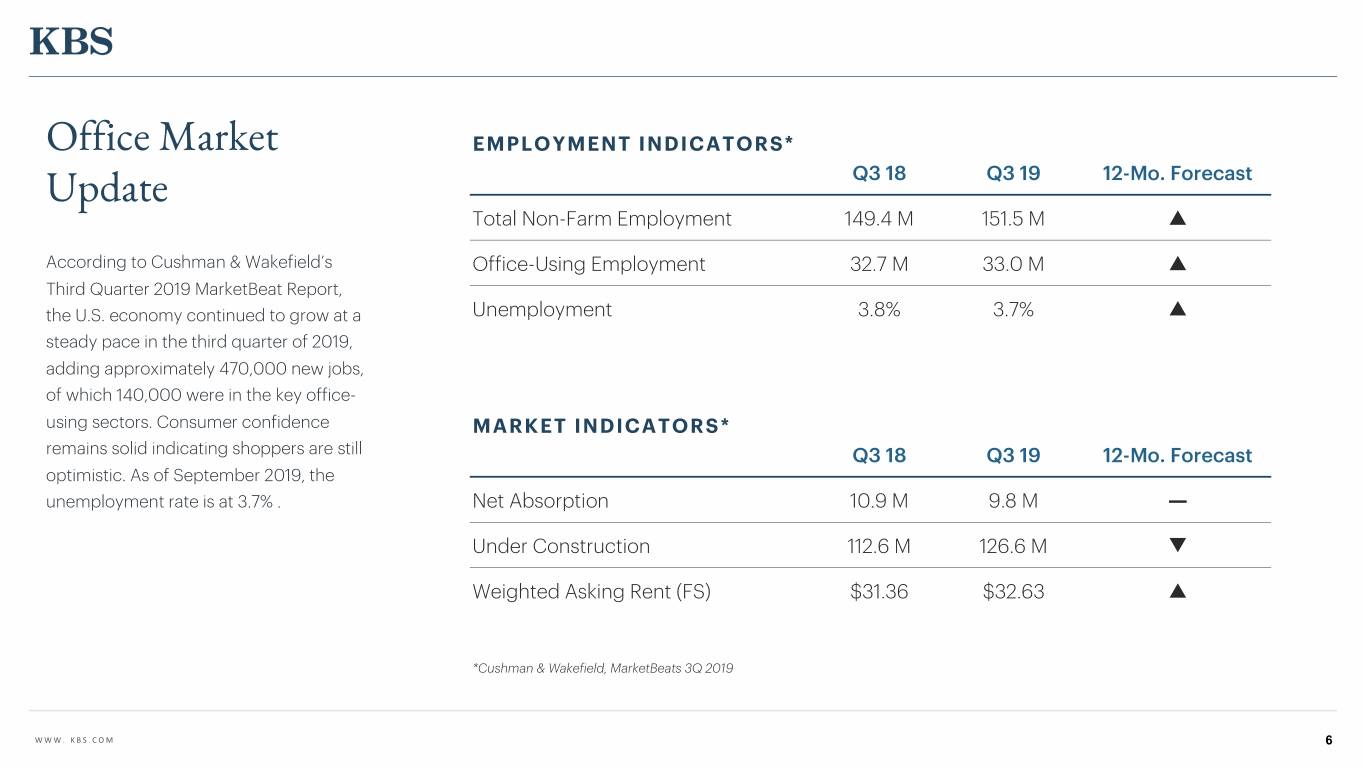
Office Market EMPLOYMENT INDICATORS* Update Q3 18 Q3 19 12-Mo. Forecast Total Non-Farm Employment 149.4 M 151.5 M p According to Cushman & Wakefield’s Office-Using Employment 32.7 M 33.0 M p Third Quarter 2019 MarketBeat Report, the U.S. economy continued to grow at a Unemployment 3.8% 3.7% p steady pace in the third quarter of 2019, adding approximately 470,000 new jobs, of which 140,000 were in the key office- using sectors. Consumer confidence MARKET INDICATORS* remains solid indicating shoppers are still Q3 18 Q3 19 12-Mo. Forecast optimistic. As of September 2019, the unemployment rate is at 3.7% . Net Absorption 10.9 M 9.8 M — Under Construction 112.6 M 126.6 M q Weighted Asking Rent (FS) $31.36 $32.63 p *Cushman & Wakefield, MarketBeats 3Q 2019 WWW. KBS.COM 6

Fund and Portfolio FUND PORTFOLIO Primary Offering Broke Escrow December 2019 Estimated Value of Overview May 24, 2011 Current Portfolio of Properties1 $3.3 billion Primary Offering Closed Current Cost Basis of Current Portfolio of As of September 30, 2019, unless July 28, 2015 Properties2 otherwise noted. Capital Raised in Primary Offering $2.9 billion 1 Current portfolio of properties as of September 30, 2019, value based solely on the $1.7 billion appraised values as of September 30, 2019 as reflected in the December 2019 estimated share value. The appraised values do not take into account estimated Current Value of Investment in units of disposition costs and fees. 7 3 2 Represents cost basis of portfolio, which includes acquisition price (excluding closing Additional Capital Raised from DRIP PRIME US REIT costs) plus subsequent capital expenditures as of September 30, 2019 for the current portfolio of properties. $320.1 million 3 December 3, 2019 estimated value of REIT III's investment in Prime US REIT units $257.8 million was based on the closing price of the units on the SGX of $0.97 per unit as of December 3, 2019, offset by an 8.2% discount due to the lack of marketability from 8 4 lock-up provisions and low trading volumes in Singapore. Current Distribution Rate, on Cost Current Rentable Square Feet 4 Rentable square feet includes a multi-family apartment development project consisting of 463,956 SF, which was under construction as of September 30, 2019. 6.50% 5 Includes future leases that had been executed but had not yet commenced as 8.3 million September 30, 2019 and excludes a multi-family apartment development project consisting of 453 units, which was under construction as of September 30, 2019. 5 6 Calculated as total debt as of September 30, 2019, divided by the December 2019 Cumulative Distributions Per Share (includes Total Leased Occupancy estimated value of the current portfolio of properties and current value of investment in cash and stock) PRIME US REIT. 91.3% 7 DRIP refers to dividend reinvestment plan. 9 8 Rate is annualized and assumes a $10 per share purchase price. (life-to-date as of December 2019) 9 Assumed early investor (invested at escrow break on March 24, 2011) and all 6 distributions have been taken in cash. Cumulative distributions includes a Special $6.29 Total Leverage (Loan-to-Value) Dividend of $0.80 per share that will be paid on December 12, 2019 and assumes the shareholder receives 35% of the Special Dividend in cash and 65% in stock. See slides 19-23 for more information on stockholder performance. 39.2% WWW. KBS.COM 7
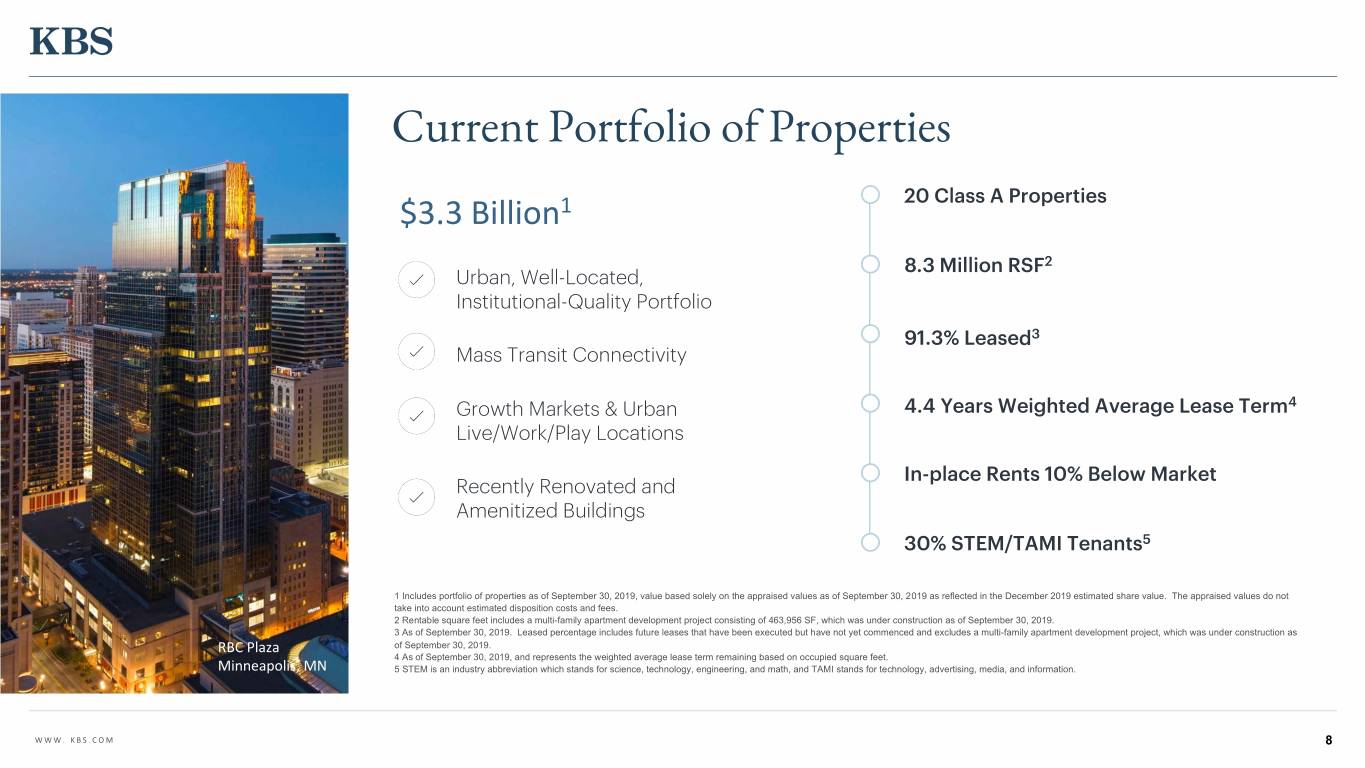
Current Portfolio of Properties 20 Class A Properties $3.3 Billion1 8.3 Million RSF2 Urban, Well-Located, Institutional-Quality Portfolio 91.3% Leased3 Mass Transit Connectivity Growth Markets & Urban 4.4 Years Weighted Average Lease Term4 Live/Work/Play Locations In-place Rents 10% Below Market Recently Renovated and Amenitized Buildings 30% STEM/TAMI Tenants5 1 Includes portfolio of properties as of September 30, 2019, value based solely on the appraised values as of September 30, 2019 as reflected in the December 2019 estimated share value. The appraised values do not take into account estimated disposition costs and fees. 2 Rentable square feet includes a multi-family apartment development project consisting of 463,956 SF, which was under construction as of September 30, 2019. 3 As of September 30, 2019. Leased percentage includes future leases that have been executed but have not yet commenced and excludes a multi-family apartment development project, which was under construction as RBC Plaza of September 30, 2019. 4 As of September 30, 2019, and represents the weighted average lease term remaining based on occupied square feet. Minneapolis, MN 5 STEM is an industry abbreviation which stands for science, technology, engineering, and math, and TAMI stands for technology, advertising, media, and information. WWW. KBS.COM 8

The Current Portfolio of Properties Building Classification Leased Occupancy Mass Transit Leased Occupancy Property Metro City Class Sq. Ft. (CBD, Urban, at September 30, Availability at Acquisition ( A,B or C) Suburban) 20191 WEST Anchor Centre Phoenix A 333,014 Suburban Metro 78% 96% Gateway Tech Center Salt Lake City A 210,256 CBD Metro/Light Rail 92% 84% Hardware Village Salt Lake City Apartment 478,596 CBD Metro/Light Rail N/A N/A 201 Spear San Francisco Bay Area A 252,591 CBD Subway/Metro/Light Rail 84% 97% Ten Almaden San Francisco Bay Area A 309,255 CBD Metro/Light Rail 89% 97% The Almaden San Francisco Bay Area A 416,126 CBD Metro/Light Rail 95% 97% Towers II & III at Emeryville San Francisco Bay Area A 592,811 Urban Metro/Light Rail/Shuttle 85% 82% CENTRAL Legacy Tower Center Dallas A 522,043 Urban None 89% 96% Preston Commons Dallas A 427,799 Urban None 88% 94% Sterling Plaza Dallas A 313,609 Urban None 87% 98% RBC Plaza Minneapolis A 710,332 CBD Metro/Light Rail 86% 97% Domain Gateway Austin A 183,911 Urban Metro/Light Rail 100% 100% 515 Congress Austin A 263,058 CBD Metro/Light Rail 95% 94% EAST Park Place Village Kansas City A 483,984 Suburban None 95% 94% Accenture Tower Chicago A 1,457,724 Urban Subway/Metro 93% 81% Carillon Charlotte A 488,277 Urban Metro/Light Rail 92% 92% 201 17th Street Atlanta A 355,870 Urban Shuttle 93% 93% 3001 Washington Washington, D.C. A 94,837 Urban Metro 31% 98% 3003 Washington Washington, D.C. A 210,804 Urban Metro 96% 99% McEwen Building Nashville A 175,262 Suburban None 97% 79% 1 Includes future leases that had been executed but had not yet commenced as September 30, 2019. WWW. KBS.COM 9
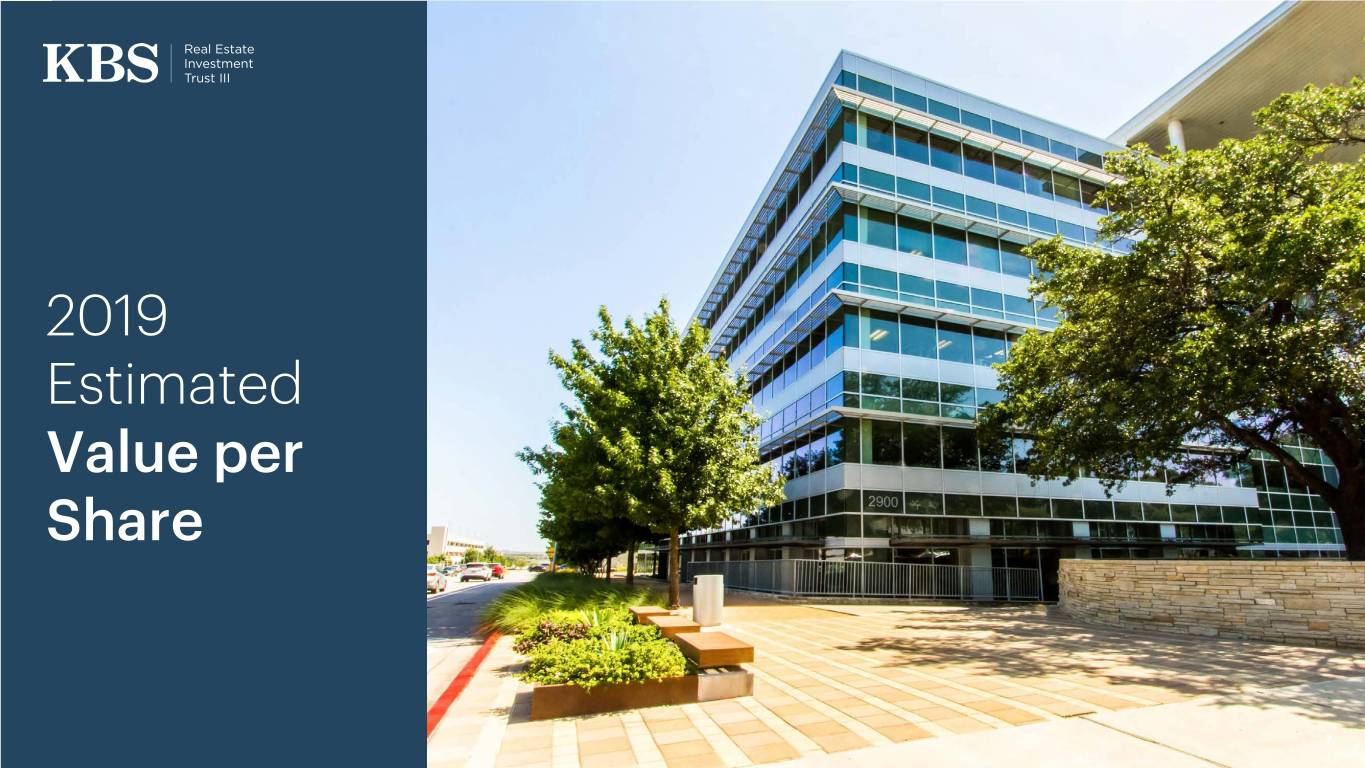
2019 Estimated Value per Share 107

KBS REIT III’s estimated value per share was determined in accordance with the Institute for Portfolio Alternatives’ (formerly known as the Investment Program Association) Practice Guideline 2013-01, Valuations of Publicly Valuation Registered Non-Listed REITs. Duff & Phelps, an independent, third-party real estate valuation firm, was engaged to provide a calculation of the 1 range in estimated value per share of common stock as of December 4, 2019. Duff & Phelps based the range in Information estimated value per share upon: o Appraisals of 20 of KBS REIT III’s real estate properties owned as of September 30, 2019 and an estimated value for the investment in units of PRIME US REIT (SGX Ticker: OXMU) as of December 3, 2019, performed by Duff & Phelps. o Valuations performed by the Advisor of KBS REIT III’s other assets and liabilities as of September 30, 2019. The estimated value of the mortgage debt is equal to the GAAP fair value as disclosed in the footnotes to the Quarterly Report, and the estimated values of cash and a majority of other assets and other liabilities are equal to their carrying values; and o Adjustments to KBS REIT III’s net asset value to give effect to the October 23, 2019 authorization of a special dividend of $0.80 per share on the outstanding shares of common stock of KBS REIT III to the stockholders of record as of the close of business on November 4, 2019, (the “Special Dividend); and o The estimated value per share did not include an enterprise (portfolio) premium or discount. Consideration was given to any potential subordinated participation in cash flows that would be due to the Advisor in a hypothetical liquidation if the required stockholder return thresholds are met. The Advisor estimated the fair value of this liability to be $29.8 million or $0.17 per share as of the valuation date, and included the impact of this liability in its calculation of the estimated value per share. KBS REIT III’s board of directors approved $11.65 as the estimated value per share of KBS REIT III’s common stock, which approximates the mid-range value of the range in estimated value per share calculated by Duff & Phelps, and which estimated value per share was recommended by the Advisor and KBS REIT III’s conflicts committee. Both the 1 For more information, see the Valuation 8-K filed with the SEC on December range in estimated value per share and the estimated value per share were based on Duff & Phelps appraisals, Duff 12, 2019. and Phelps valuation of KBS REIT III’s investment in units of Prime US REIT and the Advisor’s valuations. Excluding the impact of the Special Dividend, the estimated value per share of common stock would be $12.45. WWW. KBS.COM 11

December 20191 December 20182 Valuation Estimated Value Estimated Value Real estate properties $3,340.8 Million (90.8%) $4,145.7 Million (96.1%) Summary Investment in PRIME US REIT units $257.8 Million (7.0%) - Investment in unconsolidated joint venture - $34.7 Million (0.8%) Cash $64.1 Million (1.7%) $78.2 Million (1.8%) Other assets3 $15.9 Million (0.5%) $54.1 Million (1.3%) Total Assets: $3,678.6 Million $4,312.7 Million Mortgage debt $1,415.3 Million $2,084.3 Million Advisor participation fee potential liability $29.8 Million $17.6 Million Non-controlling Interest $6.4 Million $5.0 Million Other liabilities4 $79.7 Million $85.4 Million Total Liabilities: $1,531.2 Million $2,192.3 Million Net equity at estimated value before impact 1 Based on the estimated value of KBS REIT III’s assets less the $2,147.4 Million $2,120.4 Million estimated value of KBS REIT III’s liabilities, divided by the number of of 2019 Special Dividend shares outstanding, all as of September 30, 2019, except for certain items discussed in the Valuation 8-K for which estimated values were adjusted subsequent to September 30, 2019. December 2019 Special Dividend $(137.9 Million) - 2 Based on data as of September 30, 2018, except for certain items discussed in the 2018 Valuation 8-K for which estimated values were adjusted subsequent to September 30, 2018. The valuation 8-K was filed Net equity at estimated value after impact of with the SEC on December 6, 2018. $2,009.5 Million $2,120.4 Million 3 Includes rents and other receivables, due from affiliates, deposits and 2019 Special Dividend prepaid expenses as applicable. 4 Includes accounts payable, accrued liabilities, due to affiliates and distributions payable. WWW. KBS.COM 12
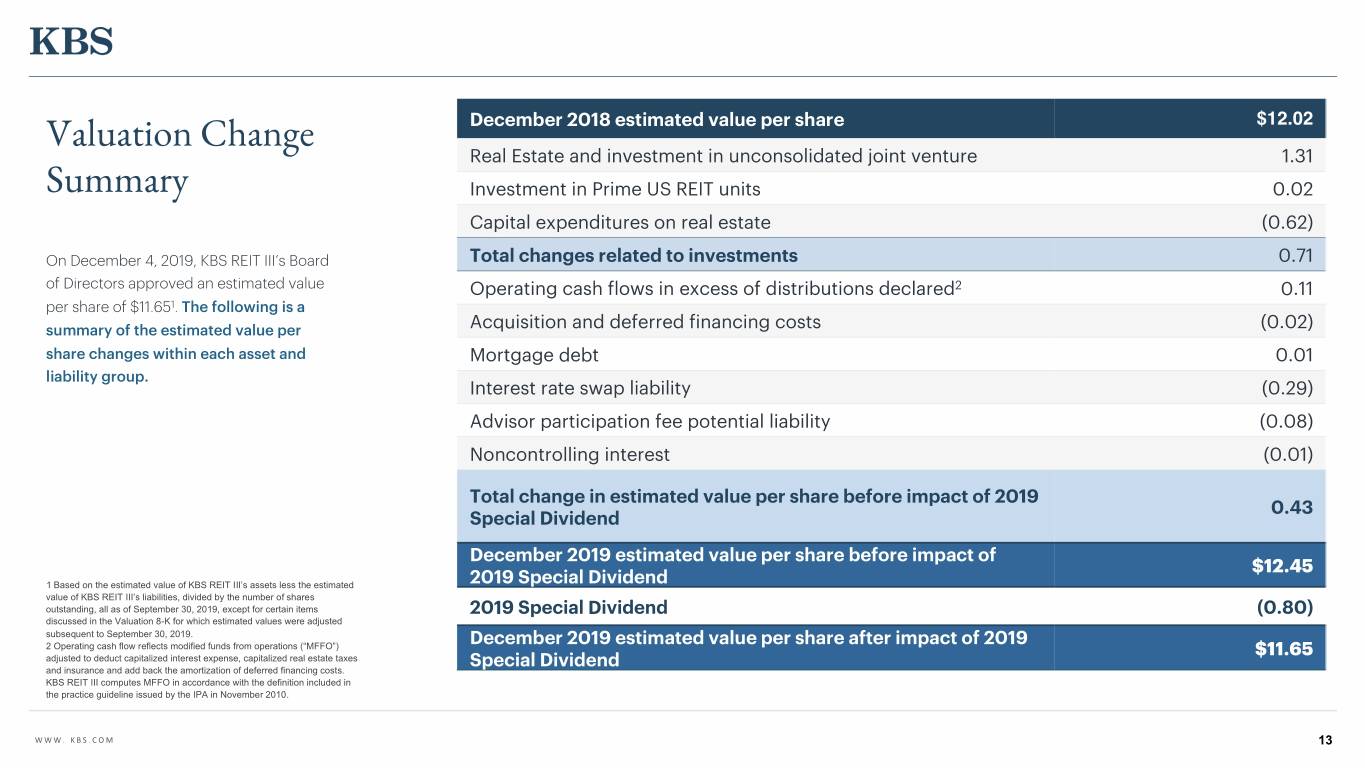
December 2018 estimated value per share $12.02 Valuation Change Real Estate and investment in unconsolidated joint venture 1.31 Summary Investment in Prime US REIT units 0.02 Capital expenditures on real estate (0.62) On December 4, 2019, KBS REIT III’s Board Total changes related to investments 0.71 of Directors approved an estimated value Operating cash flows in excess of distributions declared2 0.11 per share of $11.651. The following is a summary of the estimated value per Acquisition and deferred financing costs (0.02) share changes within each asset and Mortgage debt 0.01 liability group. Interest rate swap liability (0.29) Advisor participation fee potential liability (0.08) Noncontrolling interest (0.01) Total change in estimated value per share before impact of 2019 0.43 Special Dividend December 2019 estimated value per share before impact of $12.45 1 Based on the estimated value of KBS REIT III’s assets less the estimated 2019 Special Dividend value of KBS REIT III’s liabilities, divided by the number of shares outstanding, all as of September 30, 2019, except for certain items 2019 Special Dividend (0.80) discussed in the Valuation 8-K for which estimated values were adjusted subsequent to September 30, 2019. December 2019 estimated value per share after impact of 2019 2 Operating cash flow reflects modified funds from operations (“MFFO”) $11.65 adjusted to deduct capitalized interest expense, capitalized real estate taxes Special Dividend and insurance and add back the amortization of deferred financing costs. KBS REIT III computes MFFO in accordance with the definition included in the practice guideline issued by the IPA in November 2010. WWW. KBS.COM 13

Hardware Village Significant Real The appraised value increased $31.9 million, or 22.9%, compared to prior year appraised value plus capital expenditures due to the following: Estate Changes • The prior year appraisal assumed an additional $26 million of capital spend to complete construction on the East building, whereas the property is now substantially completed. • Due to the timing of construction completion, the current appraisal assumes an end of year 1 stabilization vs. the prior year appraisal assuming a mid-to-end of year 2 stabilization. • Increase of approximately 3.9% to the year 1 rental rates in the current appraisal (which is in line with leases being signed) vs. the prior appraisal. • Discount rate used in the appraisal improved 150 bps from the prior year to account for the stabilization timing following construction. As of September 30, 2019, the West Building was 65% leased. Domain Gateway Hardware Village The appraised value increased $27.7 million, or 34.8%, compared to prior year appraised value plus capital expenditures due to the following: • Since the last appraisal, KBS has signed a lease with Indeed Inc. to lease the entire building on a 13 year lease term with minimal downtime between leases. In-place rents increased from approximately $22.35/sf NNN to $35.00/sf NNN. • Investor appetite for office product in Austin remains strong as Austin is among the most sought after and healthiest office markets in the country. This is evidenced by record shattering price per foot sale numbers across the market including valuations approaching $850 per square foot in the CBD. • The increased term resulting from Indeed’s lease has contributed to a significant decrease in the cap rate and discount rate applied to the property; this is further supported by a decreasing interest rate environment and a Domain Gateway national demand for long-term credit tenancy. WWW. KBS.COM 14
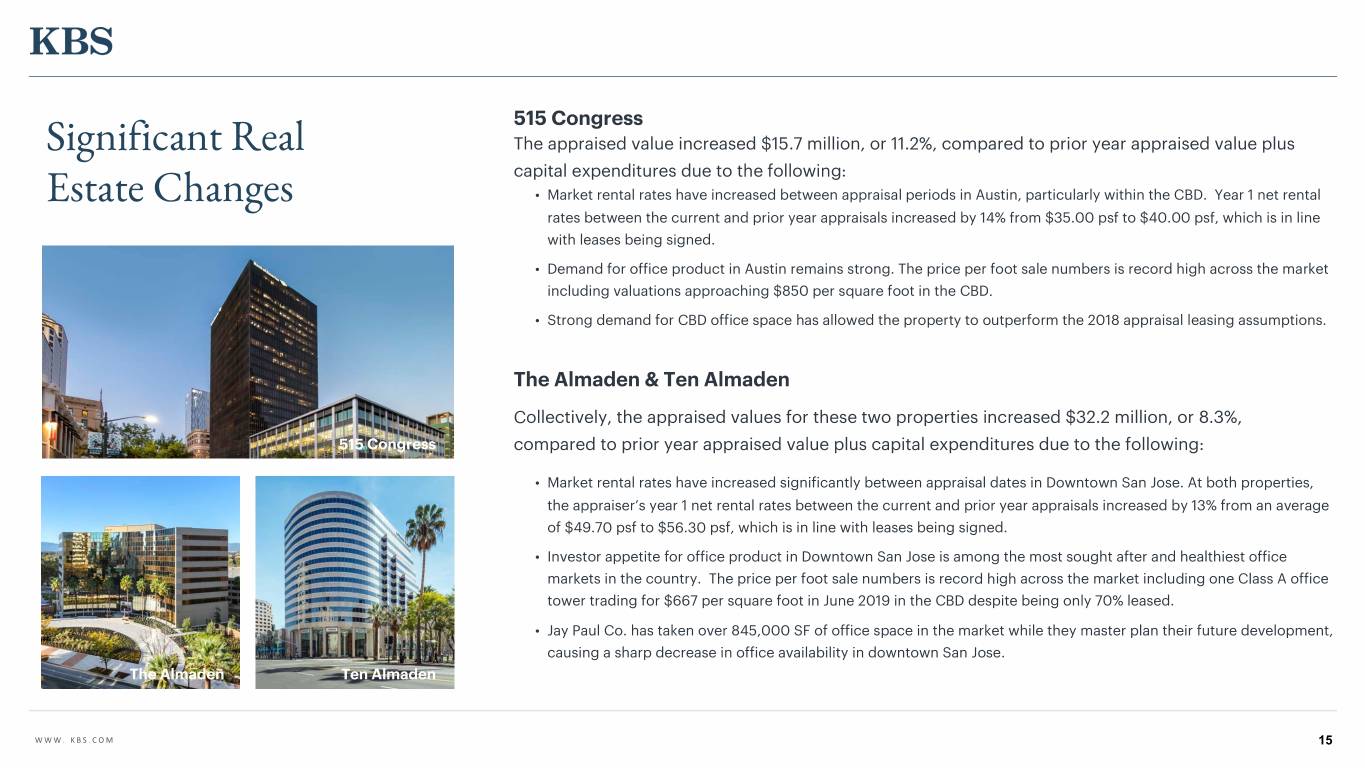
515 Congress Significant Real The appraised value increased $15.7 million, or 11.2%, compared to prior year appraised value plus capital expenditures due to the following: Estate Changes • Market rental rates have increased between appraisal periods in Austin, particularly within the CBD. Year 1 net rental rates between the current and prior year appraisals increased by 14% from $35.00 psf to $40.00 psf, which is in line with leases being signed. • Demand for office product in Austin remains strong. The price per foot sale numbers is record high across the market including valuations approaching $850 per square foot in the CBD. • Strong demand for CBD office space has allowed the property to outperform the 2018 appraisal leasing assumptions. The Almaden & Ten Almaden Collectively, the appraised values for these two properties increased $32.2 million, or 8.3%, 515 Congress compared to prior year appraised value plus capital expenditures due to the following: • Market rental rates have increased significantly between appraisal dates in Downtown San Jose. At both properties, the appraiser’s year 1 net rental rates between the current and prior year appraisals increased by 13% from an average of $49.70 psf to $56.30 psf, which is in line with leases being signed. • Investor appetite for office product in Downtown San Jose is among the most sought after and healthiest office markets in the country. The price per foot sale numbers is record high across the market including one Class A office tower trading for $667 per square foot in June 2019 in the CBD despite being only 70% leased. • Jay Paul Co. has taken over 845,000 SF of office space in the market while they master plan their future development, causing a sharp decrease in office availability in downtown San Jose. The Almaden Ten Almaden WWW. KBS.COM 15
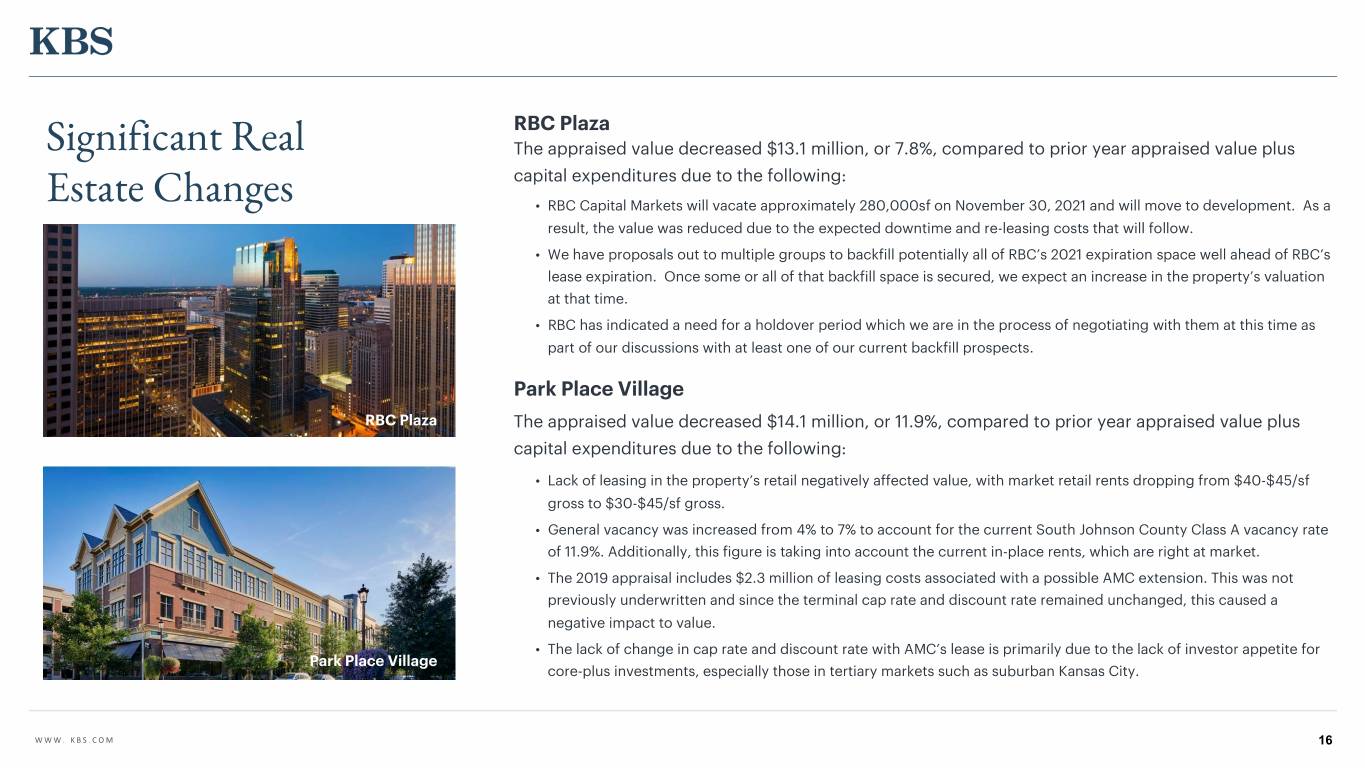
RBC Plaza Significant Real The appraised value decreased $13.1 million, or 7.8%, compared to prior year appraised value plus capital expenditures due to the following: Estate Changes • RBC Capital Markets will vacate approximately 280,000sf on November 30, 2021 and will move to development. As a result, the value was reduced due to the expected downtime and re-leasing costs that will follow. • We have proposals out to multiple groups to backfill potentially all of RBC’s 2021 expiration space well ahead of RBC’s lease expiration. Once some or all of that backfill space is secured, we expect an increase in the property’s valuation at that time. • RBC has indicated a need for a holdover period which we are in the process of negotiating with them at this time as part of our discussions with at least one of our current backfill prospects. Park Place Village RBC Plaza The appraised value decreased $14.1 million, or 11.9%, compared to prior year appraised value plus capital expenditures due to the following: • Lack of leasing in the property’s retail negatively affected value, with market retail rents dropping from $40-$45/sf gross to $30-$45/sf gross. • General vacancy was increased from 4% to 7% to account for the current South Johnson County Class A vacancy rate of 11.9%. Additionally, this figure is taking into account the current in-place rents, which are right at market. • The 2019 appraisal includes $2.3 million of leasing costs associated with a possible AMC extension. This was not previously underwritten and since the terminal cap rate and discount rate remained unchanged, this caused a negative impact to value. • The lack of change in cap rate and discount rate with AMC’s lease is primarily due to the lack of investor appetite for Park Place Village core-plus investments, especially those in tertiary markets such as suburban Kansas City. WWW. KBS.COM 16
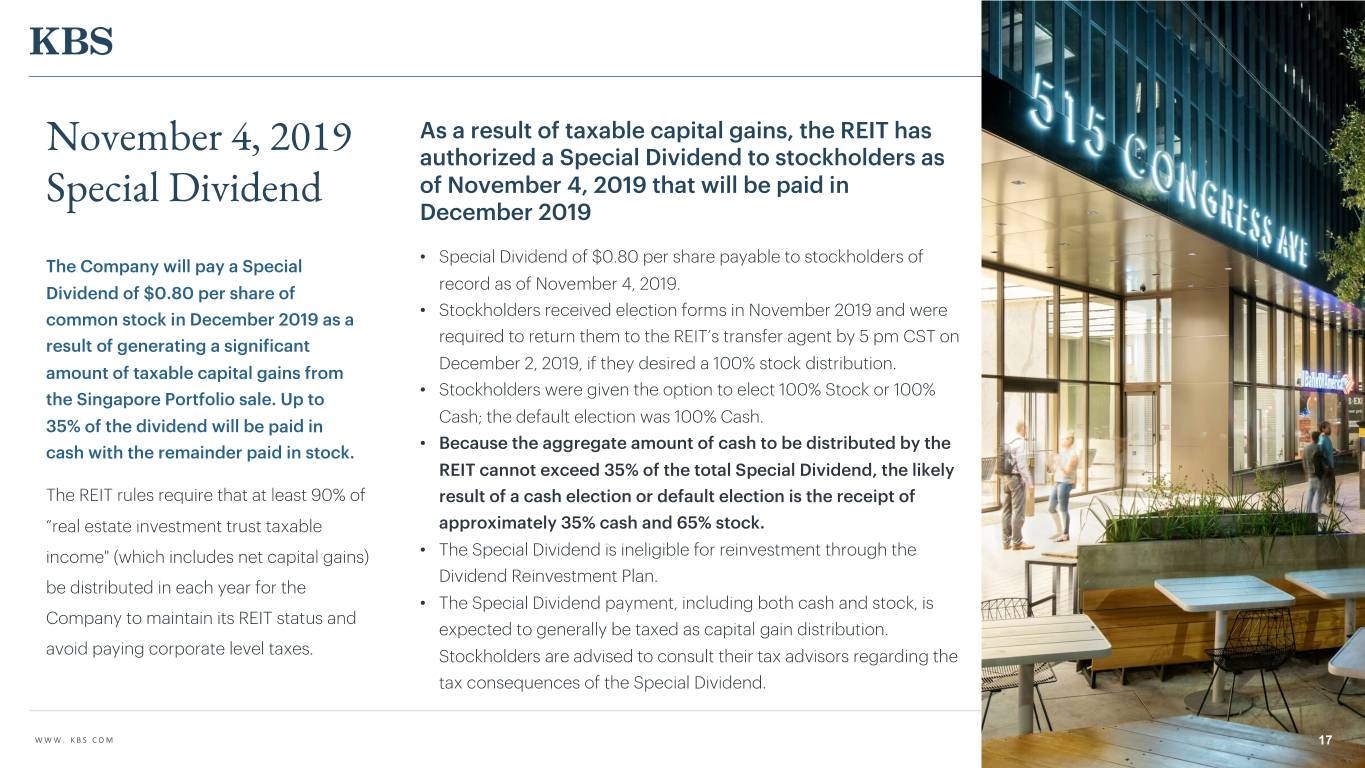
As a result of taxable capital gains, the REIT has November 4, 2019 authorized a Special Dividend to stockholders as of November 4, 2019 that will be paid in Special Dividend December 2019 • Special Dividend of $0.80 per share payable to stockholders of The Company will pay a Special record as of November 4, 2019. Dividend of $0.80 per share of • Stockholders received election forms in November 2019 and were common stock in December 2019 as a required to return them to the REIT’s transfer agent by 5 pm CST on result of generating a significant December 2, 2019, if they desired a 100% stock distribution. amount of taxable capital gains from • Stockholders were given the option to elect 100% Stock or 100% the Singapore Portfolio sale. Up to Cash; the default election was 100% Cash. 35% of the dividend will be paid in • Because the aggregate amount of cash to be distributed by the cash with the remainder paid in stock. REIT cannot exceed 35% of the total Special Dividend, the likely The REIT rules require that at least 90% of result of a cash election or default election is the receipt of “real estate investment trust taxable approximately 35% cash and 65% stock. income" (which includes net capital gains) • The Special Dividend is ineligible for reinvestment through the Dividend Reinvestment Plan. be distributed in each year for the • The Special Dividend payment, including both cash and stock, is Company to maintain its REIT status and expected to generally be taxed as capital gain distribution. avoid paying corporate level taxes. Stockholders are advised to consult their tax advisors regarding the tax consequences of the Special Dividend. WWW. KBS.COM 17

Special Dividend Special Dividend on Stockholder Account: Record Date November 4, 2019 Total Estimated Total Account Cash The estimated value per share would Value Per Total Shares Account Value and Distributions be $12.45 before the Special Share Value Cash Distributions Dividend, and is $11.65 after the Special Dividend paid in December December 4, 2019 before 2019. $12.45 1.00000 $12.45 - $12.45 Special Dividend Only the cash portion of the Special Special Dividend1 Dividend ultimately impacts the value of Cash Distribution ($0.28) - - $0.28 - shares held in a client’s account, as the stock distribution increases the number Stock Distribution Value2 ($0.52) 0.04464 - - - of shares owned and decreases the value of each share but does not impact December 4, 2019 after Special $11.65 1.04464 $12.17 $0.28 $12.45 the total account value. The following Dividend illustrates the approximate pre- and post-special distribution value of an account originally holding one share for which a cash election is made for the 1 Assumes the stockholder receives 35% of the Special Dividend in cash and 65% in stock. If a significant number of investors elect all stock, a Special Dividend. stockholder making a cash election or default election may receive more than 35% of the special dividend in cash. 2 Assumes stockholder receives 0.04464 shares per share of common stock outstanding from the Special Dividend. WWW. KBS.COM 121818
Stockholder The December 2019 estimated value per share was performed in accordance with the provisions of and also to comply with the IPA Valuation Guidelines. As with any valuation methodology, the methodologies used Performance are based upon a number of estimates and assumptions that may not be accurate or complete. Different parties with different assumptions and estimates could derive a different estimated value per share of KBS REIT III’s common stock, and this difference could be significant. The estimated value per share is not KBS REIT III provides its estimated value audited and does not represent the fair value of KBS REIT III’s assets less the fair value of KBS REIT III’s per share to assist broker dealers that liabilities according to GAAP. KBS REIT III can give no assurance that: participated in KBS REIT III’s now- terminated initial public offering in • a stockholder would be able to resell his or her • another independent third-party appraiser or meeting their customer account shares at KBS REIT III’s estimated value per share; third-party valuation firm would agree with KBS statement reporting obligations. • a stockholder would ultimately realize REIT III’s estimated value per share; or distributions per share equal to KBS REIT III’s • the methodology used to determine KBS REIT estimated value per share upon liquidation of III’s estimated value per share would be KBS REIT III’s assets and settlement of its acceptable to FINRA or for compliance with liabilities or a sale of KBS REIT III; ERISA reporting requirements. • KBS REIT III’s shares of common stock would trade at the estimated value per share on a national securities exchange; WWW. KBS.COM 19
Further, the estimated value per share is based on the estimated value of KBS REIT III’s assets less the estimated Stockholder value of KBS REIT III’s liabilities, divided by the number of shares outstanding, all as of September 30, 2019, with the exception of adjustments to the Company’s net asset value to give effect to (i) the October 23, 2019 authorization Performance of a Special Dividend of $0.80 per share on the outstanding shares of common stock of the Company to the stockholders of record as of the close of business on November 4, 2019 and (ii) the change in the estimated value of KBS REIT III’s investment in units of Prime US REIT (SGX Ticker: OXMU) as of December 3, 2019. KBS REIT III did not make any other adjustments to the estimated value per share subsequent to September 30, 2019, including any KBS REIT III provides its estimated value adjustments relating to the following, among others: (i) the issuance of common stock and the payment of related per share to assist broker dealers that offering costs related to KBS REIT III’s dividend reinvestment plan offering; (ii) net operating income earned and participated in KBS REIT III’s now- distributions declared; and (iii) the redemption of shares. The value of KBS REIT III’s shares will fluctuate over time in terminated initial public offering in response to developments related to future investments, the performance of individual assets in KBS REIT III’s portfolio and the management of those assets, the real estate and finance markets and due to other factors. KBS meeting their customer account REIT III’s estimated value per share does not reflect a discount for the fact that KBS REIT III is externally managed, statement reporting obligations. nor does it reflect a real estate portfolio premium/discount versus the sum of the individual property values. KBS REIT III’s estimated value per share does not take into account estimated disposition costs and fees for real estate properties which were not under contract to sell as of December 4, 2019, debt prepayment penalties that could apply upon the prepayment of certain of KBS REIT III’s debt obligations, the impact of restrictions on the assumption of debt or swap breakage fees that may be incurred upon the termination of certain of KBS REIT III’s swaps prior to expiration. The Company has generally incurred disposition costs and fees related to the sale of each real estate property since inception of 0.8% to 2.9% of the gross sales price less concessions and credits, with the weighted average being approximately 1.5%. The estimated value per share does not take into consideration acquisition-related costs and financing costs related to any future acquisitions subsequent to December 4, 2019. KBS REIT III currently expects to utilize an independent valuation firm to update its estimated value per share no later than December 2020. WWW. KBS.COM 20
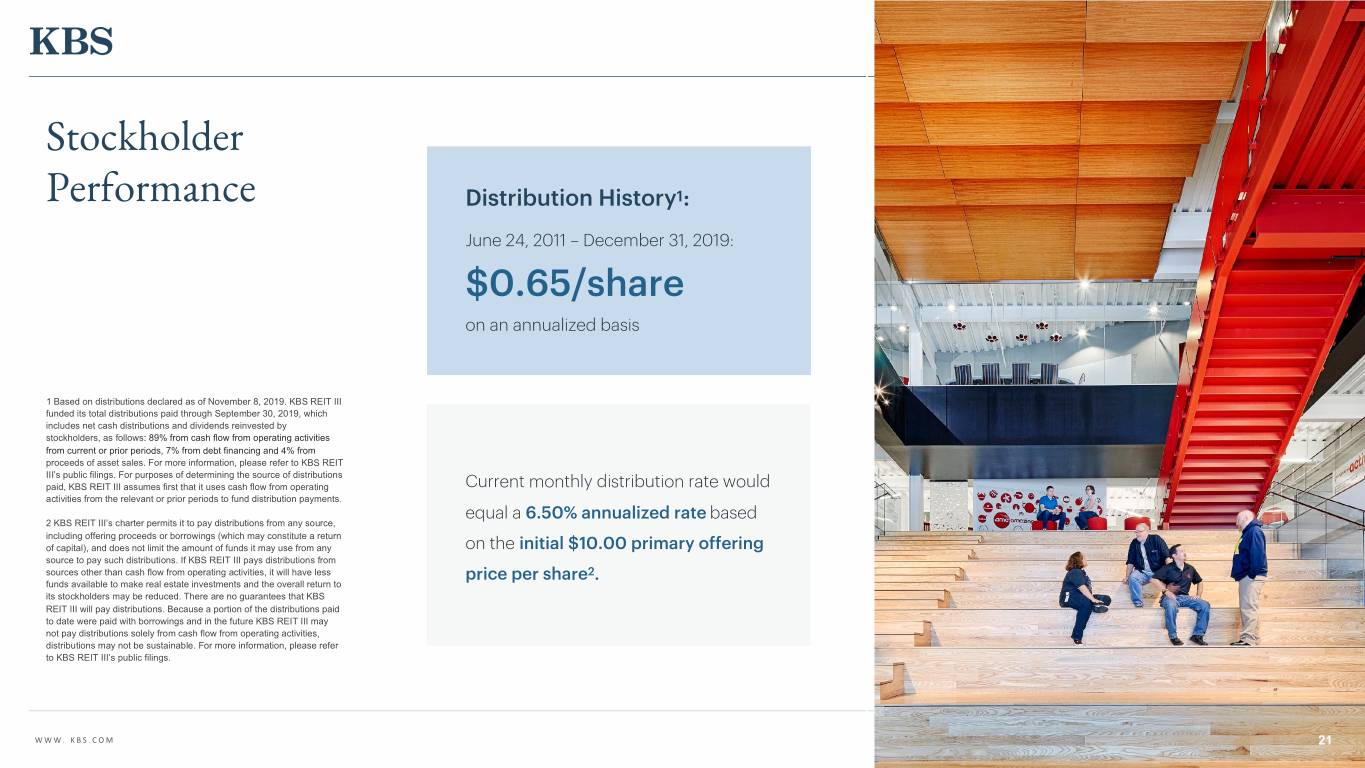
Stockholder Performance Distribution History1: June 24, 2011 – December 31, 2019: $0.65/share on an annualized basis 1 Based on distributions declared as of November 8, 2019. KBS REIT III funded its total distributions paid through September 30, 2019, which includes net cash distributions and dividends reinvested by stockholders, as follows: 89% from cash flow from operating activities from current or prior periods, 7% from debt financing and 4% from proceeds of asset sales. For more information, please refer to KBS REIT III’s public filings. For purposes of determining the source of distributions paid, KBS REIT III assumes first that it uses cash flow from operating Current monthly distribution rate would activities from the relevant or prior periods to fund distribution payments. equal a 6.50% annualized rate based 2 KBS REIT III’s charter permits it to pay distributions from any source, including offering proceeds or borrowings (which may constitute a return of capital), and does not limit the amount of funds it may use from any on the initial $10.00 primary offering source to pay such distributions. If KBS REIT III pays distributions from sources other than cash flow from operating activities, it will have less price per share2. funds available to make real estate investments and the overall return to its stockholders may be reduced. There are no guarantees that KBS REIT III will pay distributions. Because a portion of the distributions paid to date were paid with borrowings and in the future KBS REIT III may not pay distributions solely from cash flow from operating activities, distributions may not be sustainable. For more information, please refer to KBS REIT III’s public filings. WWW. KBS.COM 21

Stockholder Hypothetical Performance of Early and Late Investors Hypothetical Assumes all distributions have been taken in cash other than the Special Dividend shares and stockholder Performance has held shares since the dates below: Sum of Estimated Value Per Cumulative Cash Share, Cumulative Cash Estimated Value Distributions and Stock Distributions and Stock Per Share as of Dividends Received Dividends Received December 4, 2019 Per Share as of Per Share as of December 20191 December 20191,2 First Investor (Invested at Escrow Break on March 24, 2011): $11.65 $6.29 $17.94 Last Investor (Invested at Close of Public Offering on July 28, 2015): 1 Cumulative distributions includes a Special Dividend of $0.80 per share that will be paid on December 12, 2019 and assumes the shareholder receives 35% of the Special Dividend in cash and 65% in stock. $11.65 $3.62 $15.27 2 The values in this column would change to $19.26 and $15.81 for an early and late investor, respectively, who fully participated in KBS REIT III’s dividend reinvestment plan for the life of the investment and did not make any redemptions. WWW. KBS.COM 222231
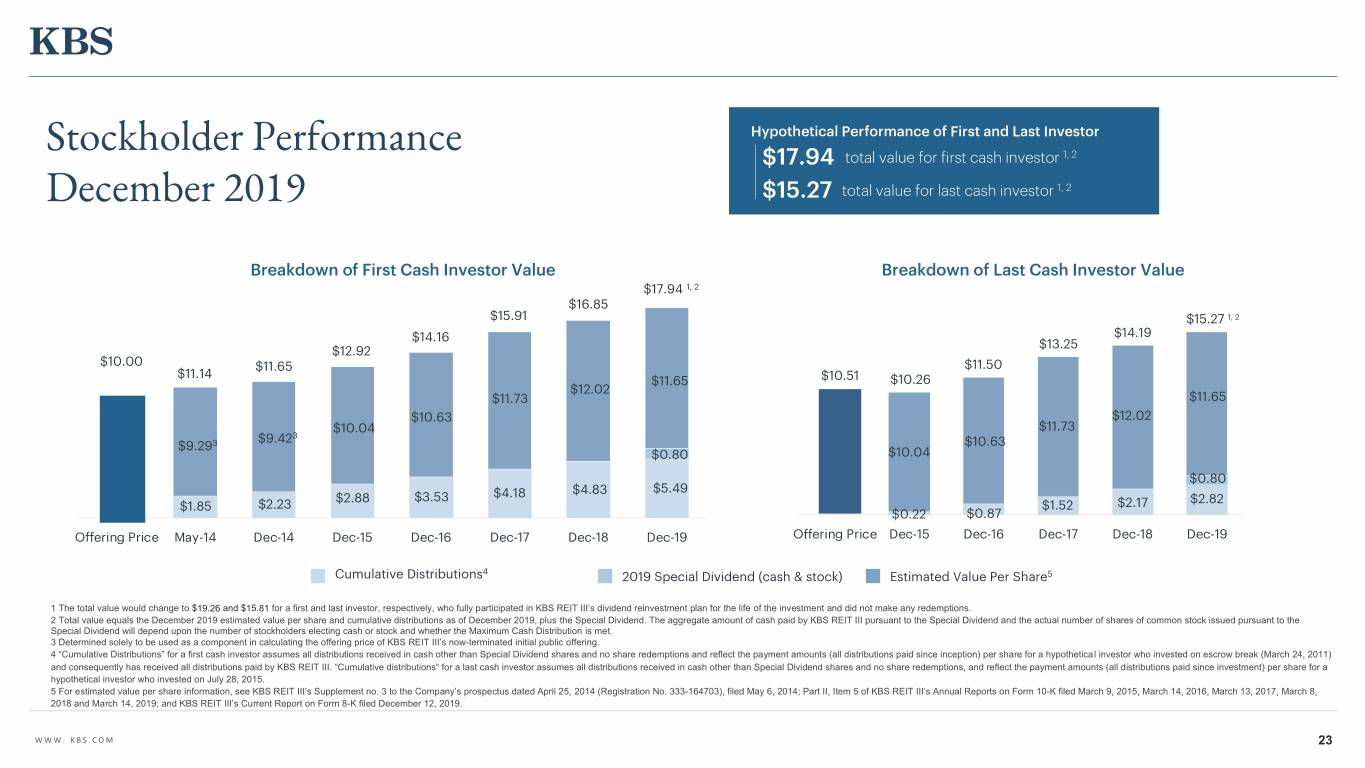
Hypothetical Performance of First and Last Investor Stockholder Performance $17.94 total value for first cash investor 1, 2 December 2019 $15.27 total value for last cash investor 1, 2 Breakdown of First Cash Investor Value Breakdown of Last Cash Investor Value $17.94 1, 2 $16.85 $15.91 $15.27 1, 2 $14.16 $14.19 $13.25 $12.92 $10.00 $11.65 $11.50 $11.14 $11.65 $10.51 $10.26 $12.02 $11.73 $11.65 $10.63 $12.02 $10.04 $11.73 $9.423 $9.293 $10.63 $0.80 $10.04 $0.80 $4.83 $5.49 $2.88 $3.53 $4.18 $2.82 $1.85 $2.23 $1.52 $2.17 $0.22 $0.87 Offering Price May-14 Dec-14 Dec-15 Dec-16 Dec-17 Dec-18 Dec-19 Offering Price Dec-15 Dec-16 Dec-17 Dec-18 Dec-19 Cumulative Distributions4 2019 Special Dividend (cash & stock) Estimated Value Per Share5 1 The total value would change to $19.26 and $15.81 for a first and last investor, respectively, who fully participated in KBS REIT III’s dividend reinvestment plan for the life of the investment and did not make any redemptions. 2 Total value equals the December 2019 estimated value per share and cumulative distributions as of December 2019, plus the Special Dividend. The aggregate amount of cash paid by KBS REIT III pursuant to the Special Dividend and the actual number of shares of common stock issued pursuant to the Special Dividend will depend upon the number of stockholders electing cash or stock and whether the Maximum Cash Distribution is met. 3 Determined solely to be used as a component in calculating the offering price of KBS REIT III’s now-terminated initial public offering. 4 “Cumulative Distributions” for a first cash investor assumes all distributions received in cash other than Special Dividend shares and no share redemptions and reflect the payment amounts (all distributions paid since inception) per share for a hypothetical investor who invested on escrow break (March 24, 2011) and consequently has received all distributions paid by KBS REIT III. “Cumulative distributions” for a last cash investor assumes all distributions received in cash other than Special Dividend shares and no share redemptions, and reflect the payment amounts (all distributions paid since investment) per share for a hypothetical investor who invested on July 28, 2015. 5 For estimated value per share information, see KBS REIT III’s Supplement no. 3 to the Company’s prospectus dated April 25, 2014 (Registration No. 333-164703), filed May 6, 2014; Part II, Item 5 of KBS REIT III’s Annual Reports on Form 10-K filed March 9, 2015, March 14, 2016, March 13, 2017, March 8, 2018 and March 14, 2019; and KBS REIT III’s Current Report on Form 8-K filed December 12, 2019. WWW. KBS.COM 23
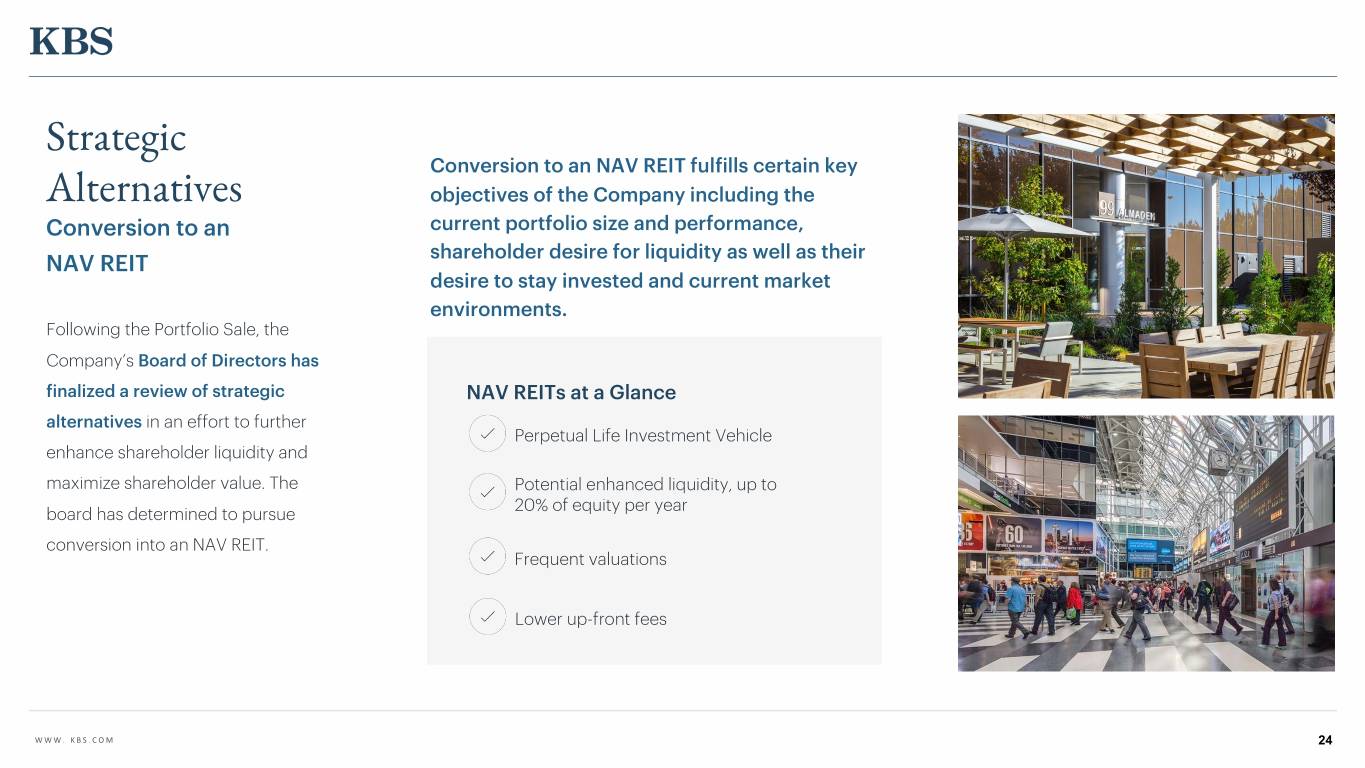
Strategic Conversion to an NAV REIT fulfills certain key Alternatives objectives of the Company including the Conversion to an current portfolio size and performance, shareholder desire for liquidity as well as their NAV REIT desire to stay invested and current market environments. Following the Portfolio Sale, the Company’s Board of Directors has finalized a review of strategic NAV REITs at a Glance alternatives in an effort to further Perpetual Life Investment Vehicle enhance shareholder liquidity and maximize shareholder value. The Potential enhanced liquidity, up to 20% of equity per year board has determined to pursue conversion into an NAV REIT. Frequent valuations Lower up-front fees WWW. KBS.COM 24
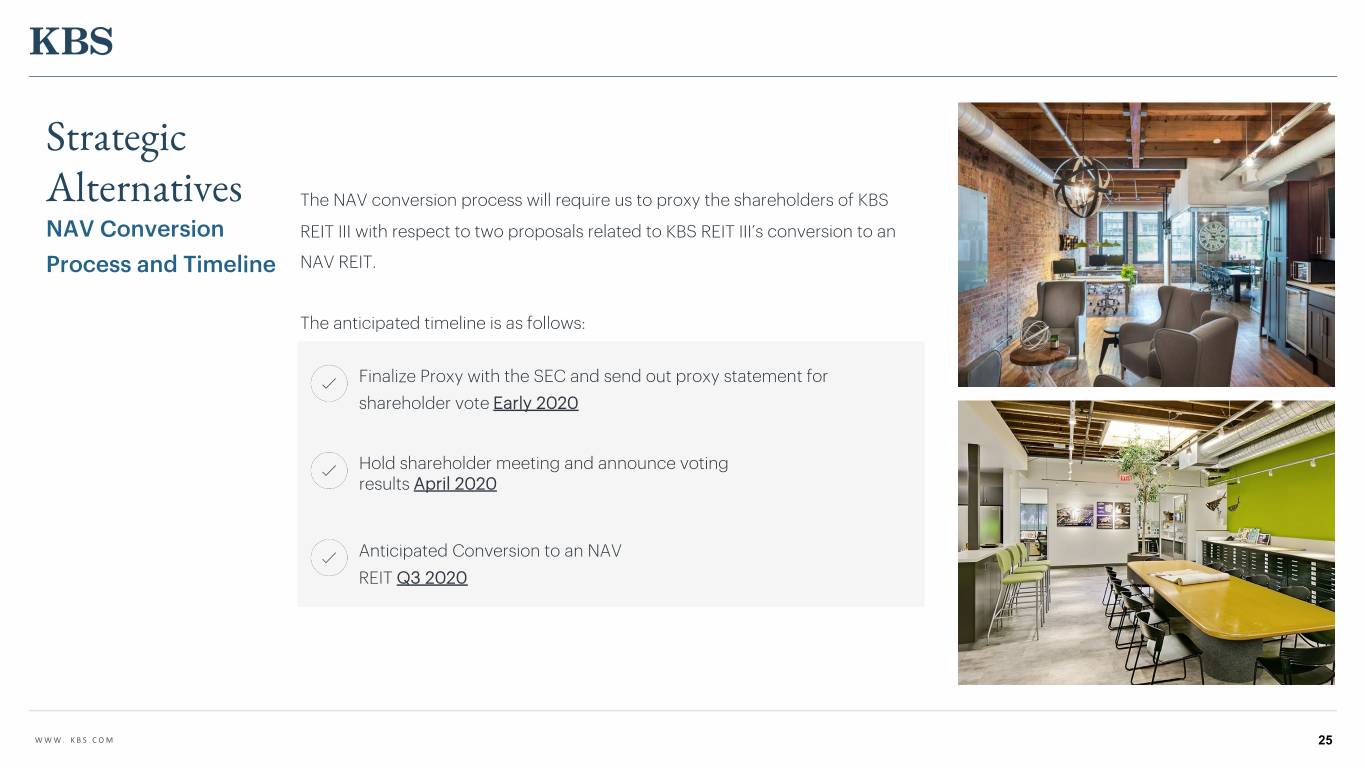
Strategic Alternatives The NAV conversion process will require us to proxy the shareholders of KBS NAV Conversion REIT III with respect to two proposals related to KBS REIT III’s conversion to an Process and Timeline NAV REIT. The anticipated timeline is as follows: Finalize Proxy with the SEC and send out proxy statement for shareholder vote Early 2020 Hold shareholder meeting and announce voting results April 2020 Anticipated Conversion to an NAV REIT Q3 2020 WWW. KBS.COM 25
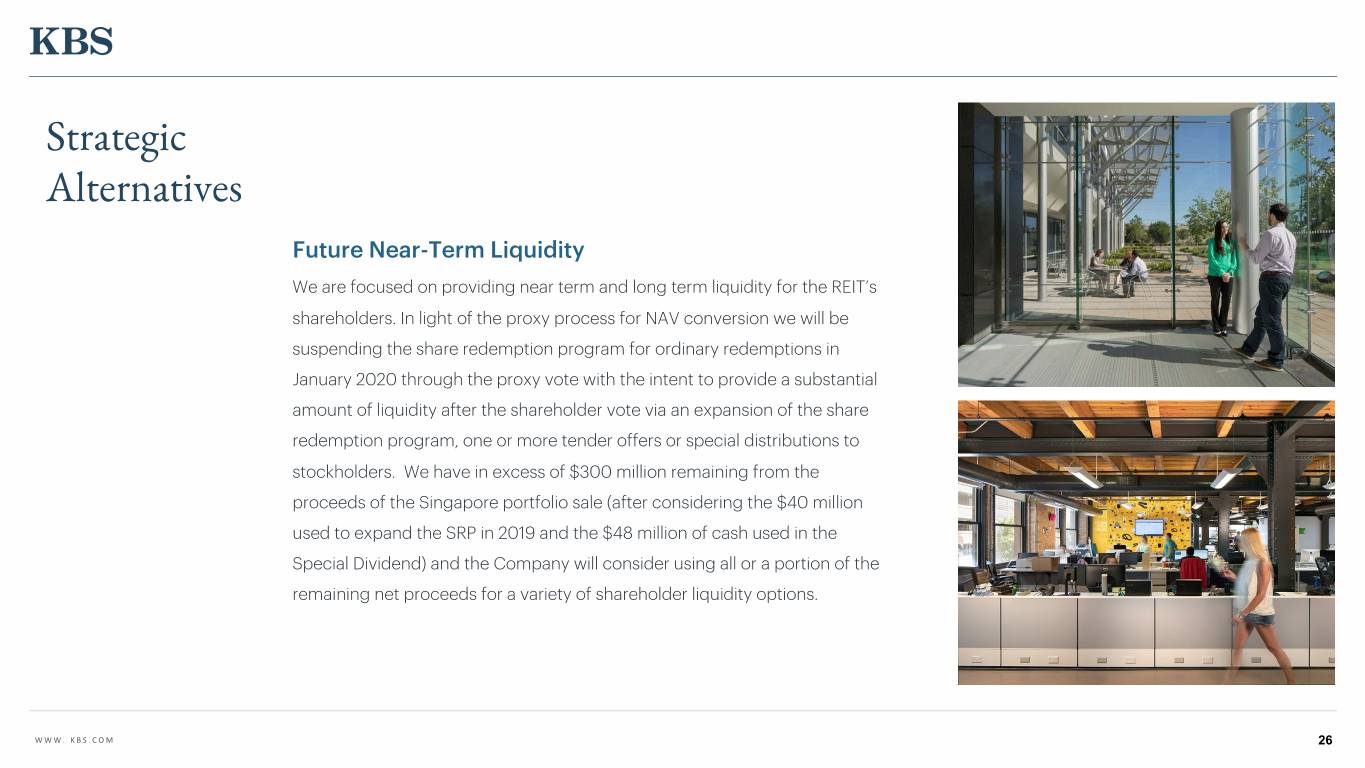
Strategic Alternatives Future Near-Term Liquidity We are focused on providing near term and long term liquidity for the REIT’s shareholders. In light of the proxy process for NAV conversion we will be suspending the share redemption program for ordinary redemptions in January 2020 through the proxy vote with the intent to provide a substantial amount of liquidity after the shareholder vote via an expansion of the share redemption program, one or more tender offers or special distributions to stockholders. We have in excess of $300 million remaining from the proceeds of the Singapore portfolio sale (after considering the $40 million used to expand the SRP in 2019 and the $48 million of cash used in the Special Dividend) and the Company will consider using all or a portion of the remaining net proceeds for a variety of shareholder liquidity options. WWW. KBS.COM 26

REIT III Goals & Objectives Provide enhanced shareholder liquidity Pursue NAV REIT Conversion Complete major capital projects, such as renovations or amenity enhancements, with the goal of attracting quality tenants Complete construction of Hardware Village property and continue to lease-up Lease-up and stabilize all properties in the portfolio with an emphasis in capital investments leading to stabilized occupancy at increased market rental rates Distribute operating cash flows to stockholders Continue to monitor the properties in the portfolio for beneficial sale opportunities in order to maximize value WWW. KBS.COM 27
Q&A For additional questions, contact KBS Capital Markets Group Investor Relations (866) 527-4264 28


