Portfolio Update Webcast March 30, 2021 Exhibit 99.1
W W W . K B S . C O M The information contained herein should be read in conjunction with, and is qualified by, the information in KBS Real Estate Investment Trust III’s (the “Company” or “KBS REIT III”) Annual Report on Form 10-K for the year ended December 31, 2020 (the “Annual Report”), including the “Risk Factors” contained therein. For a full description of the limitations, methodologies and assumptions used to value the Company’s assets and liabilities in connection with the calculation of the Company’s estimated value per share, see the Company’s Current Report on Form 8-K, dated December 7, 2020 (the “Valuation 8-K”). Important Disclosures Certain statements contained herein may be deemed to be forward-looking statements within the meaning of the Federal Private Securities Litigation Reform Act of 1995. The Company intends that such forward-looking statements be subject to the safe harbors created by Section 27A of the Securities Act of 1933, as amended, and Section 21E of the Securities Exchange Act of 1934, as amended. These statements include statements regarding the intent, belief or current expectations of the Company and members of its management team, as well as the assumptions on which such statements are based, and generally are identified by the use of words such as “may,” “will,” “seeks,” “anticipates,” “believes,” “estimates,” “expects,” “plans,” “intends,” “should” or similar expressions. Readers are cautioned not to place undue reliance on these forward-looking statements, which speak only as of the date they are made. The Company undertakes no obligation to update or revise forward-looking statements to reflect changed assumptions, the occurrence of unanticipated events or changes to future operating results over time, unless required by law. Such statements are subject to known and unknown risks and uncertainties which could cause actual results to differ materially from those contemplated by such forward-looking statements. The Company makes no representation or warranty (express or implied) about the accuracy of any such forward-looking statements. These statements are based on a number of assumptions involving the judgment of management. You should interpret many of the risks identified in this presentation and in our Annual Report as being heightened as a result of the ongoing and numerous adverse impacts of the COVID-19 pandemic. The COVID-19 pandemic, together with the resulting measures imposed to help control the spread of the virus, including quarantines, “shelter in place” and “stay at home” orders, travel restrictions, restrictions on businesses and school closures, has had a negative impact on the economy and business activity globally. The COVID-19 pandemic is negatively impacting almost every industry, including the U.S. office real estate industry and the industries of the Company’s tenants, directly or indirectly. The extent to which the COVID-19 pandemic impacts the Company’s operations and those of its tenants and the Company’s investment in Prime US REIT depends on future developments, which are highly uncertain and cannot be predicted with confidence, including the scope, severity and duration of the pandemic, the actions taken to contain the pandemic or mitigate its impact, and the direct and indirect economic effects of the pandemic and containment measures, among others. If tenants default on their rent and vacate, the ability to re-lease this space is likely to be more difficult if the economic slowdown continues and any long term impact of this situation, even after an economic rebound, remains unclear. Further, significant reductions in rental revenue in the future related to the impact of the COVID-19 pandemic may limit our ability to draw on our revolving credit facilities or exercise our extension options due to covenants described in our loan agreements. Forward-Looking Statements 2
W W W . K B S . C O M Important Disclosures (cont.) The Company may fund distributions from any source including, without limitation, from offering proceeds or borrowings. Distributions paid through December 31, 2020 have been funded with cash flow from operating activities, debt financing and proceeds from asset sales. There are no guarantees that the Company will continue to pay distributions or that distributions at the current rate are sustainable. No assurances can be given with respect to distributions. Actual events may cause the value and returns on the Company’s investments to be less than that used for purposes of the Company’s estimated NAV per share. With respect to the estimated NAV per share, the appraisal methodology used for the appraised properties assumed the properties realize the projected net operating income and expected exit cap rates and that investors would be willing to invest in such properties at yields equal to the expected discount rates. The valuation for the Company’s investment in units of Prime US REIT assumed a discount for the holding period risk attributable to blockage due to the quantity of units held by the Company and such discount is driven by trading volume in Prime US REIT’s units in the public market and expected future volatility. Though the appraisals of the appraised properties and the valuation of the Company’s investment in units of Prime US REIT, with respect to Duff & Phelps, and the valuation estimates used in calculating the estimated value per share, with respect to Duff & Phelps, the Company’s advisor and the Company, were the respective party’s best estimates as of September 30, 2020, December 1, 2020 or December 7, 2020, as applicable, the Company can give no assurance in this regard. Even small changes to these assumptions could result in significant differences in the appraised values of the appraised properties, the valuation of the Company’s investment in units of Prime US REIT and the estimated value per share. Further, the Company can make no assurances with respect to the future value appreciation of its properties and ultimate returns to investors. Stockholders may have to hold their shares for an indefinite period of time. The Company can give no assurance that it will be able to provide additional liquidity to stockholders. As the global impact of the COVID-19 pandemic continues to evolve, the Company’s conflicts committee and board of directors continue to evaluate whether the proposed NAV REIT conversion remains in the best interest of the Company’s stockholders. Accordingly, the Company can give no assurance that it will continue to pursue a conversion to an NAV REIT. Even if the Company converts to an NAV REIT, there is no assurance that the Company will successfully implement its strategy. The statements herein also depend on factors such as: future economic, competitive and market conditions; the Company’s ability to maintain and/or improve occupancy levels and rental rates at its real estate properties; and other risks identified in Part I, Item 1A of the Company’s Annual Report. Forward-Looking Statements 3
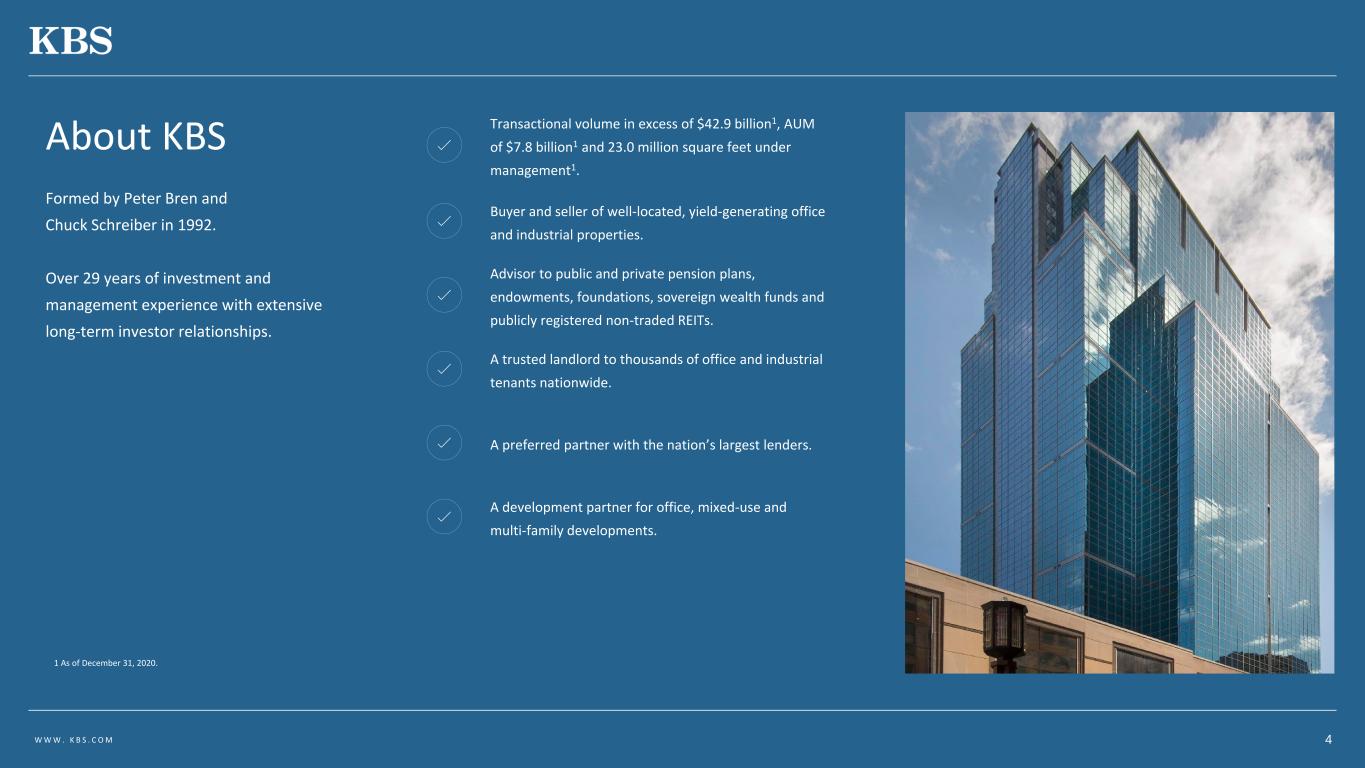
W W W . K B S . C O M Formed by Peter Bren and Chuck Schreiber in 1992. Over 29 years of investment and management experience with extensive long-term investor relationships. 1 As of December 31, 2020. About KBS 4 Transactional volume in excess of $42.9 billion1, AUM of $7.8 billion1 and 23.0 million square feet under management1. Buyer and seller of well-located, yield-generating office and industrial properties. Advisor to public and private pension plans, endowments, foundations, sovereign wealth funds and publicly registered non-traded REITs. A trusted landlord to thousands of office and industrial tenants nationwide. A preferred partner with the nation’s largest lenders. A development partner for office, mixed-use and multi-family developments.
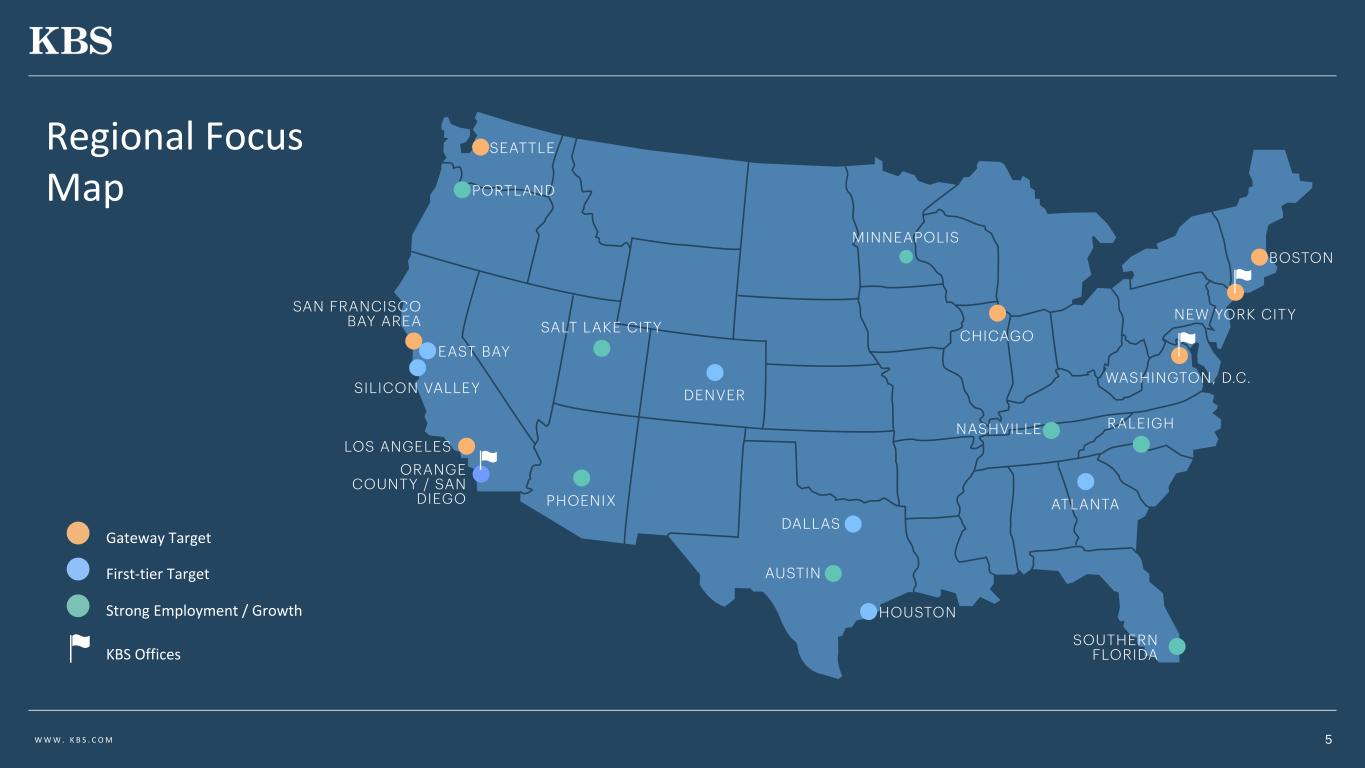
W W W . K B S . C O M Gateway Target First-tier Target Strong Employment / Growth KBS Offices Regional Focus Map 5
W W W . K B S . C O M The Impact of COVID-19 on Capital Markets and US Real Estate Investments 6
W W W . K B S . C O M • The Organization for Economic Cooperation and Development said the American economy is projected to expand 6.5% this year, up from the previous forecast of 3.2% in December 2020 due to the recent stimulus plan and rapid vaccine rollout.1 • According to the Department of Labor, total U.S. nonfarm payroll employment rose by 379,000 in February 2021 with most of the job gains occurring in leisure and hospitality, and the unemployment rate was little changed at 6.2%.2 Rents: • National 2020 asking rents declined by an average of 1.2% year-over-year, according to CoStar data.3 • Asking rents have remained more stable than originally predicted because of how fast the recession hit and landlords are willing to wait it out, rather than cut rates, however, landlords have been willing to offer record-breaking concessions.3 Vacancy: • The national average vacancy rate was 15.0%, an increase of 160 bps over the last year.4 • According to a Cushman & Wakefield September 2020 study, it expects vacancies to trend downward starting Q1 2022.3 COVID-19: The Economy and Office Market Fundamentals 1 “U.S. Growth Could Surge on Stimulus and Vaccine Rollout”. New York Times, March 9, 2021. 2 “The Employment Situation – February 2021”. Bureau of Labor Statistics, February 2021. 3 “CBD Office Values Show Little Sign of Distress”. WealthManagement.com, Feb. 18, 2021. 4 “CommercialEdge National Office Report March 2021”. CommercialEdge, Mar. 18, 2021. 7

W W W . K B S . C O M COVID-19: Recovering Markets • By comparison, major CBD office markets (i.e. New York City, NY and San Francisco, CA) will continue to struggle, while secondary and suburban markets will prove to be more resilient, according to JLL.1 • Austin, TX ranks third in metros that have lost the least amount of jobs during the pandemic. 5,600 jobs were added in December 2020, narrowing pandemic-related job losses to 7,400.2 • In Raleigh, NC, more than 10,600 jobs openings - primarily in tech - were posted in January 2021, a 22.5% increase year-over-year, according to the North Carolina Technology Association.3 8 1 “Office Occupancy Losses Were Unprecedented in 2020”. GlobeSt.com, Jan. 21, 2021. 2 “Job Growth & Unemployment”. Austin Chamber of Commerce, Jan. 26, 2021. 3 “Tech jobs market in Raleigh is red hot, up more than 20% from 2020”. WRAL TechWire, Feb. 16, 2021.
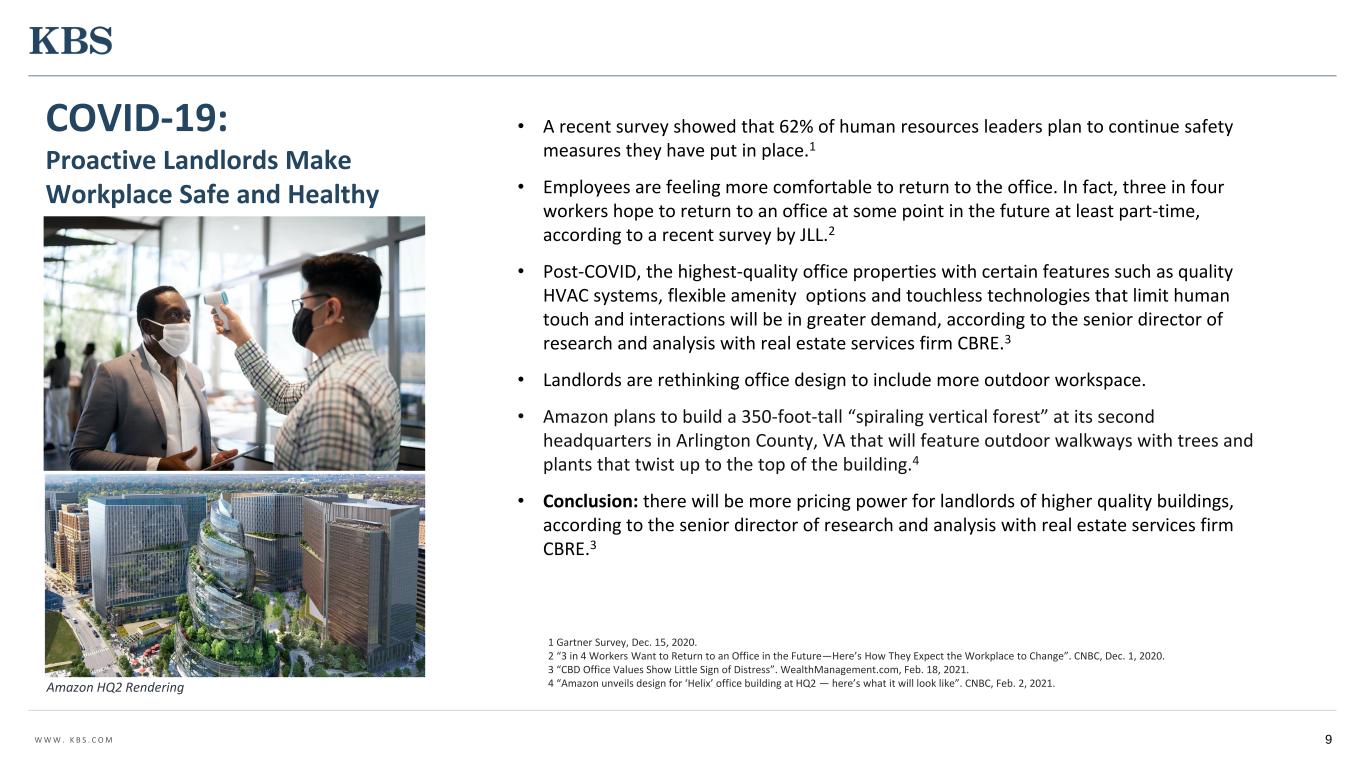
W W W . K B S . C O M • A recent survey showed that 62% of human resources leaders plan to continue safety measures they have put in place.1 • Employees are feeling more comfortable to return to the office. In fact, three in four workers hope to return to an office at some point in the future at least part-time, according to a recent survey by JLL.2 • Post-COVID, the highest-quality office properties with certain features such as quality HVAC systems, flexible amenity options and touchless technologies that limit human touch and interactions will be in greater demand, according to the senior director of research and analysis with real estate services firm CBRE.3 • Landlords are rethinking office design to include more outdoor workspace. • Amazon plans to build a 350-foot-tall “spiraling vertical forest” at its second headquarters in Arlington County, VA that will feature outdoor walkways with trees and plants that twist up to the top of the building.4 • Conclusion: there will be more pricing power for landlords of higher quality buildings, according to the senior director of research and analysis with real estate services firm CBRE.3 9 COVID-19: Proactive Landlords Make Workplace Safe and Healthy 1 Gartner Survey, Dec. 15, 2020. 2 “3 in 4 Workers Want to Return to an Office in the Future—Here’s How They Expect the Workplace to Change”. CNBC, Dec. 1, 2020. 3 “CBD Office Values Show Little Sign of Distress”. WealthManagement.com, Feb. 18, 2021. 4 “Amazon unveils design for ‘Helix’ office building at HQ2 — here’s what it will look like”. CNBC, Feb. 2, 2021.Amazon HQ2 Rendering

W W W . K B S . C O M COVID-19: Rent Collections Since April 1, 2020, a number of tenants have requested rent relief, most in the form of rent deferrals or abatement. Depending upon the duration of the various measures imposed to help control the spread of the virus and the corresponding economic slowdown, these tenants or additional tenants may seek rent deferrals or abatements in future periods or become unable to pay their rent. Through March 17, 2021, rent collections are as follows: The Company has received short-term rent relief requests from tenants who have been directly impacted by the COVID-19 pandemic. The Company evaluates each request on an individual basis. From the start of the COVID-19 crisis through March 2021, the Company has provided temporary deferrals of approximately 1.2% of total billings that primarily will be paid back over a range of 12 to 24 months. In addition, the Company has given short-term rent abatements to a number of tenants within the portfolio’s minor population of retail and restaurant tenants. In most cases, it is in the Company’s best interest to help its tenants remain in business and reopen when mandated closures or other restrictions are lifted. Rent relief requests to date may not be indicative of collections or requests in any future period. 10 Period of Rent Collected % of Rent Collected Q2 2020 97% Q3 2020 94% Q4 2020 96% January 2021 98% February 2021 98%
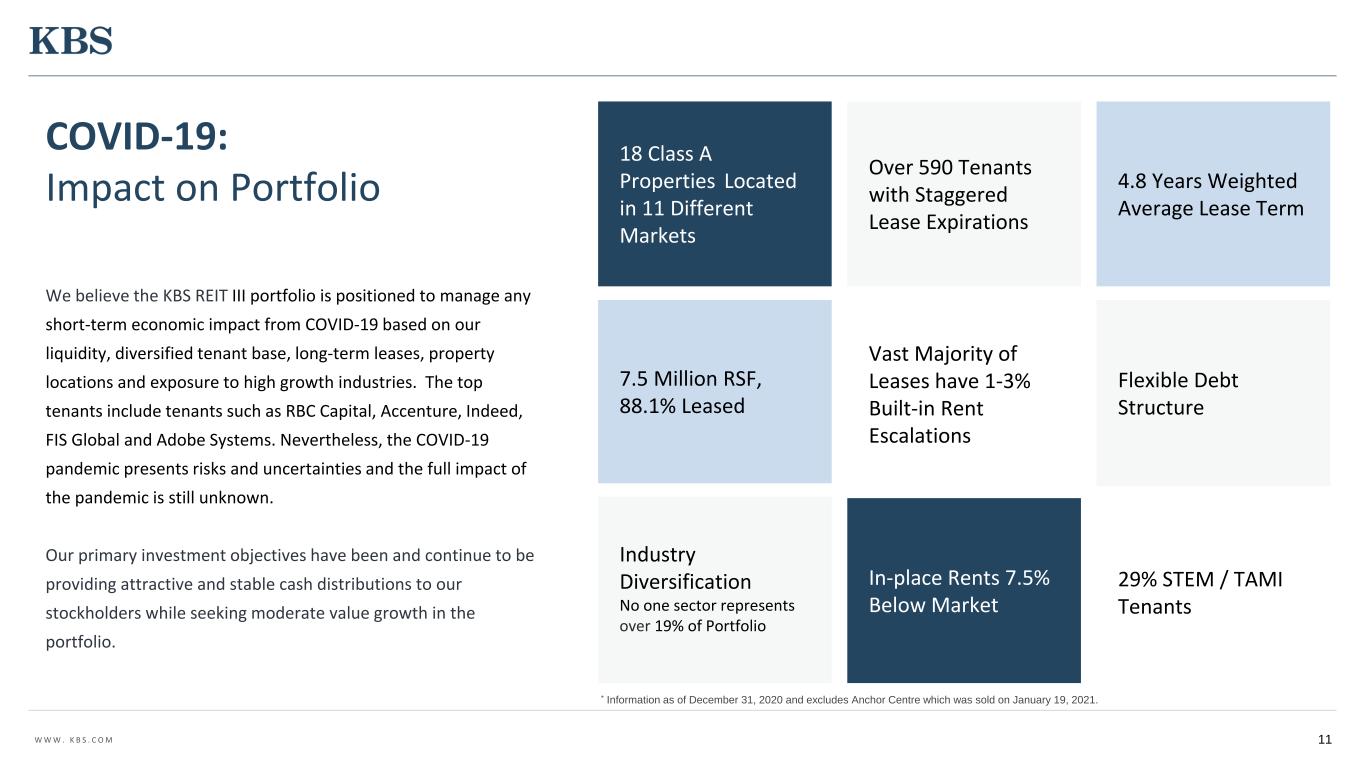
W W W . K B S . C O M We believe the KBS REIT III portfolio is positioned to manage any short-term economic impact from COVID-19 based on our liquidity, diversified tenant base, long-term leases, property locations and exposure to high growth industries. The top tenants include tenants such as RBC Capital, Accenture, Indeed, FIS Global and Adobe Systems. Nevertheless, the COVID-19 pandemic presents risks and uncertainties and the full impact of the pandemic is still unknown. Our primary investment objectives have been and continue to be providing attractive and stable cash distributions to our stockholders while seeking moderate value growth in the portfolio. 18 Class A Properties Located in 11 Different Markets Over 590 Tenants with Staggered Lease Expirations 4.8 Years Weighted Average Lease Term 7.5 Million RSF, 88.1% Leased Industry Diversification No one sector represents over 19% of Portfolio Flexible Debt Structure In-place Rents 7.5% Below Market 29% STEM / TAMI Tenants Vast Majority of Leases have 1-3% Built-in Rent Escalations 11 COVID-19: Impact on Portfolio * Information as of December 31, 2020 and excludes Anchor Centre which was sold on January 19, 2021.
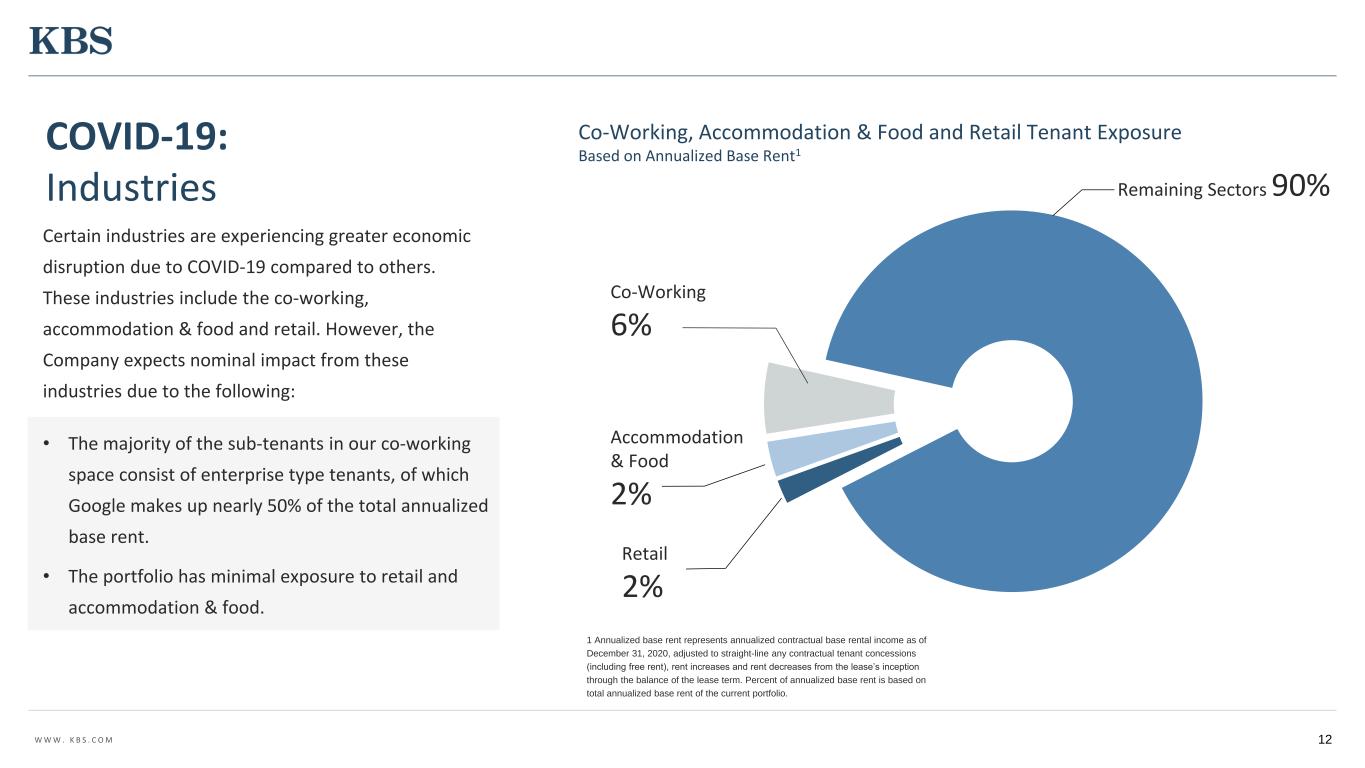
W W W . K B S . C O M Certain industries are experiencing greater economic disruption due to COVID-19 compared to others. These industries include the co-working, accommodation & food and retail. However, the Company expects nominal impact from these industries due to the following: • The majority of the sub-tenants in our co-working space consist of enterprise type tenants, of which Google makes up nearly 50% of the total annualized base rent. • The portfolio has minimal exposure to retail and accommodation & food. 12 Industry Comparison1 Accommodation & Food 2% Co-Working 6% Remaining Sectors 90% 1 Annualized base rent represents annualized contractual base rental income as of December 31, 2020, adjusted to straight-line any contractual tenant concessions (including free rent), rent increases and rent decreases from the lease’s inception through the balance of the lease term. Percent of annualized base rent is based on total annualized base rent of the current portfolio. Co-Working, Accommodation & Food and Retail Tenant Exposure Based on Annualized Base Rent1 Retail 2% COVID-19: Industries
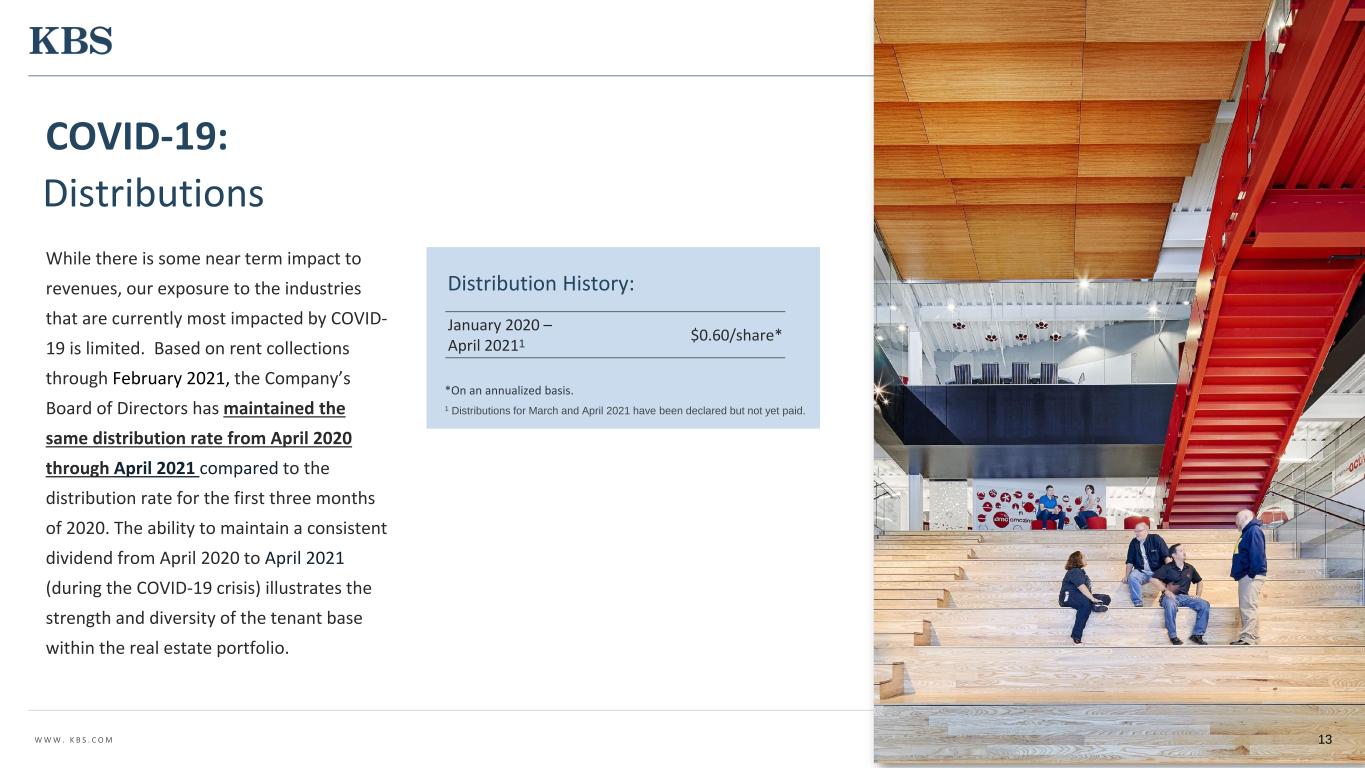
W W W . K B S . C O M 13 Distribution History: 1 Distributions for March and April 2021 have been declared but not yet paid. *On an annualized basis. January 2020 – April 20211 $0.60/share* Distributions While there is some near term impact to revenues, our exposure to the industries that are currently most impacted by COVID- 19 is limited. Based on rent collections through February 2021, the Company’s Board of Directors has maintained the same distribution rate from April 2020 through April 2021 compared to the distribution rate for the first three months of 2020. The ability to maintain a consistent dividend from April 2020 to April 2021 (during the COVID-19 crisis) illustrates the strength and diversity of the tenant base within the real estate portfolio. COVID-19:
Fund and Portfolio Overview 14
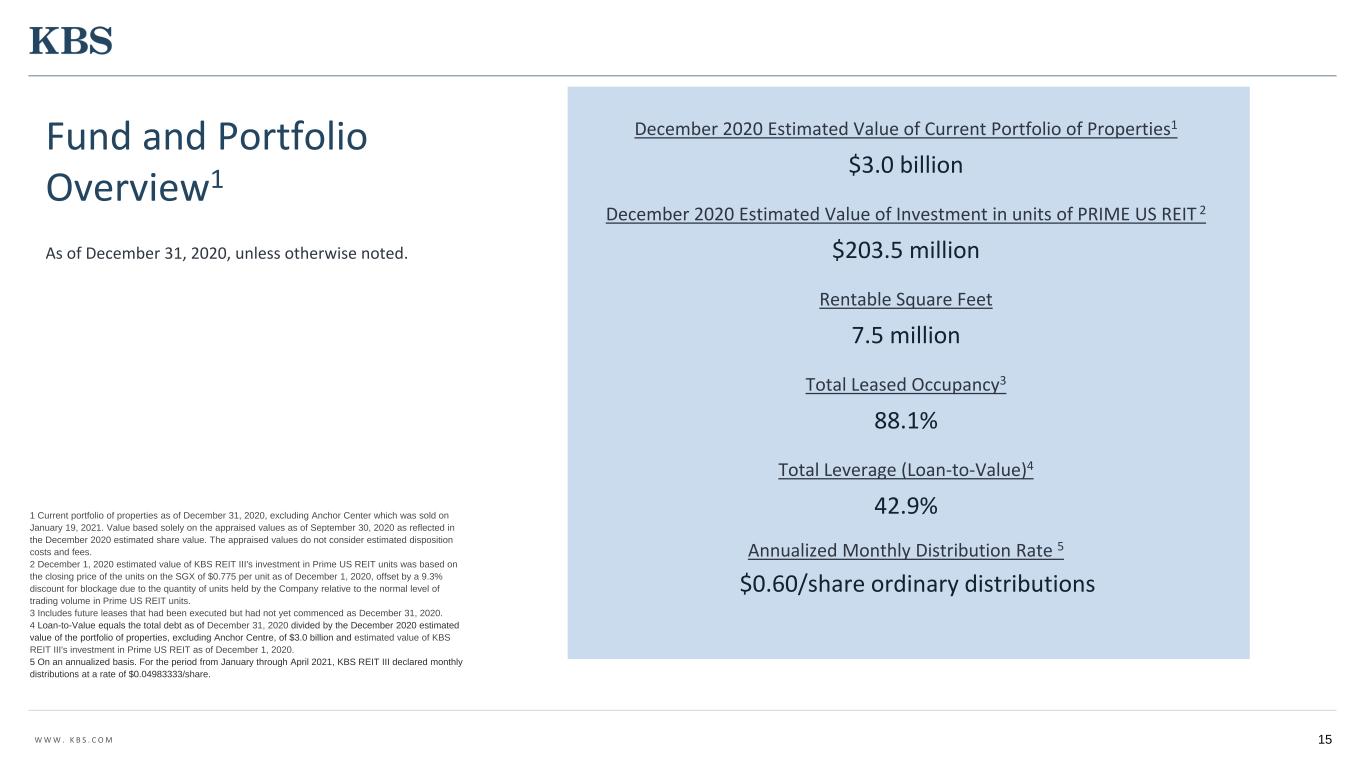
W W W . K B S . C O M 1 Current portfolio of properties as of December 31, 2020, excluding Anchor Center which was sold on January 19, 2021. Value based solely on the appraised values as of September 30, 2020 as reflected in the December 2020 estimated share value. The appraised values do not consider estimated disposition costs and fees. 2 December 1, 2020 estimated value of KBS REIT III's investment in Prime US REIT units was based on the closing price of the units on the SGX of $0.775 per unit as of December 1, 2020, offset by a 9.3% discount for blockage due to the quantity of units held by the Company relative to the normal level of trading volume in Prime US REIT units. 3 Includes future leases that had been executed but had not yet commenced as December 31, 2020. 4 Loan-to-Value equals the total debt as of December 31, 2020 divided by the December 2020 estimated value of the portfolio of properties, excluding Anchor Centre, of $3.0 billion and estimated value of KBS REIT III's investment in Prime US REIT as of December 1, 2020. 5 On an annualized basis. For the period from January through April 2021, KBS REIT III declared monthly distributions at a rate of $0.04983333/share. December 2020 Estimated Value of Current Portfolio of Properties1 $3.0 billion December 2020 Estimated Value of Investment in units of PRIME US REIT 2 $203.5 million Rentable Square Feet 7.5 million Total Leased Occupancy3 88.1% Total Leverage (Loan-to-Value)4 42.9% Annualized Monthly Distribution Rate 5 $0.60/share ordinary distributions 15 Fund and Portfolio Overview1 As of December 31, 2020, unless otherwise noted.
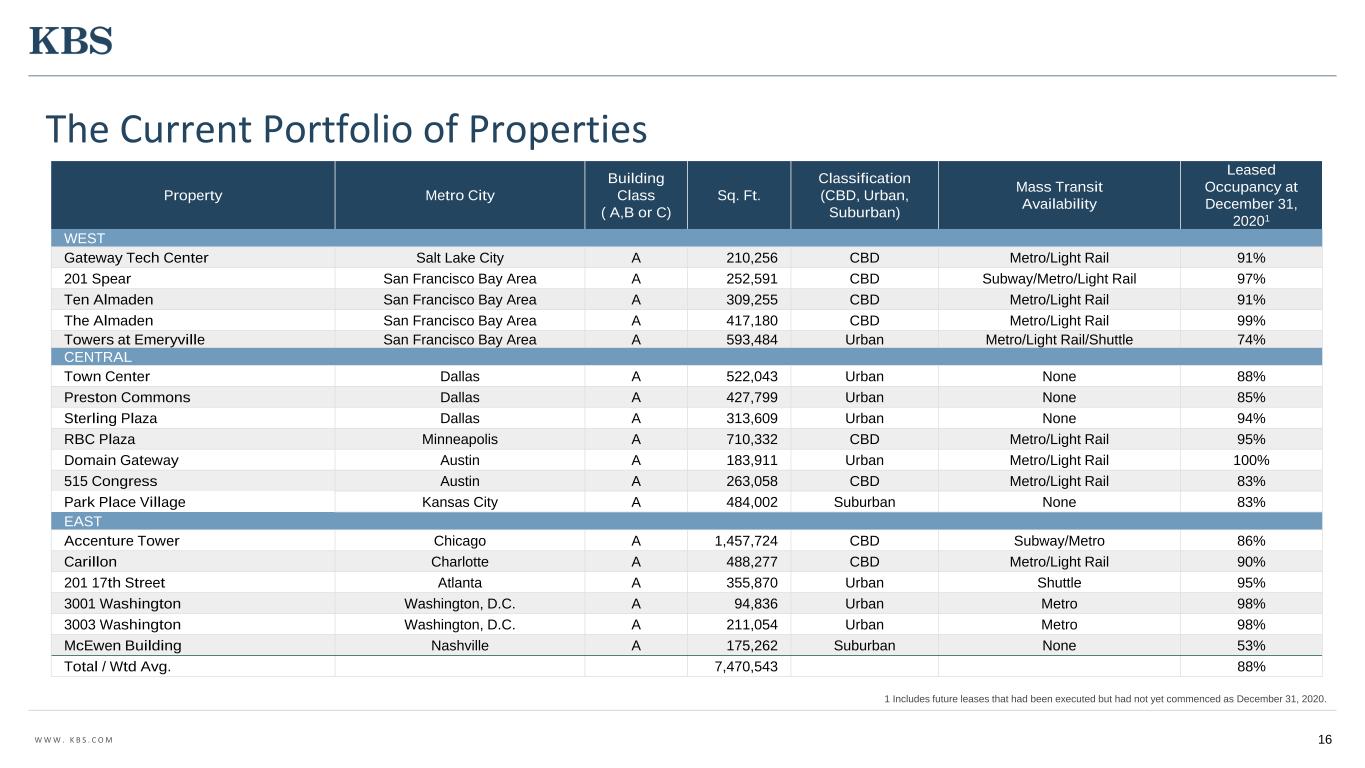
W W W . K B S . C O M 16 1 Includes future leases that had been executed but had not yet commenced as December 31, 2020. Property Metro City Building Class ( A,B or C) Sq. Ft. Classification (CBD, Urban, Suburban) Mass Transit Availability Leased Occupancy at December 31, 20201 WEST Gateway Tech Center Salt Lake City A 210,256 CBD Metro/Light Rail 91% 201 Spear San Francisco Bay Area A 252,591 CBD Subway/Metro/Light Rail 97% Ten Almaden San Francisco Bay Area A 309,255 CBD Metro/Light Rail 91% The Almaden San Francisco Bay Area A 417,180 CBD Metro/Light Rail 99% Towers at Emeryville San Francisco Bay Area A 593,484 Urban Metro/Light Rail/Shuttle 74% CENTRAL Town Center Dallas A 522,043 Urban None 88% Preston Commons Dallas A 427,799 Urban None 85% Sterling Plaza Dallas A 313,609 Urban None 94% RBC Plaza Minneapolis A 710,332 CBD Metro/Light Rail 95% Domain Gateway Austin A 183,911 Urban Metro/Light Rail 100% 515 Congress Austin A 263,058 CBD Metro/Light Rail 83% Park Place Village Kansas City A 484,002 Suburban None 83% EAST Accenture Tower Chicago A 1,457,724 CBD Subway/Metro 86% Carillon Charlotte A 488,277 CBD Metro/Light Rail 90% 201 17th Street Atlanta A 355,870 Urban Shuttle 95% 3001 Washington Washington, D.C. A 94,836 Urban Metro 98% 3003 Washington Washington, D.C. A 211,054 Urban Metro 98% McEwen Building Nashville A 175,262 Suburban None 53% Total / Wtd Avg. 7,470,543 88% The Current Portfolio of Properties
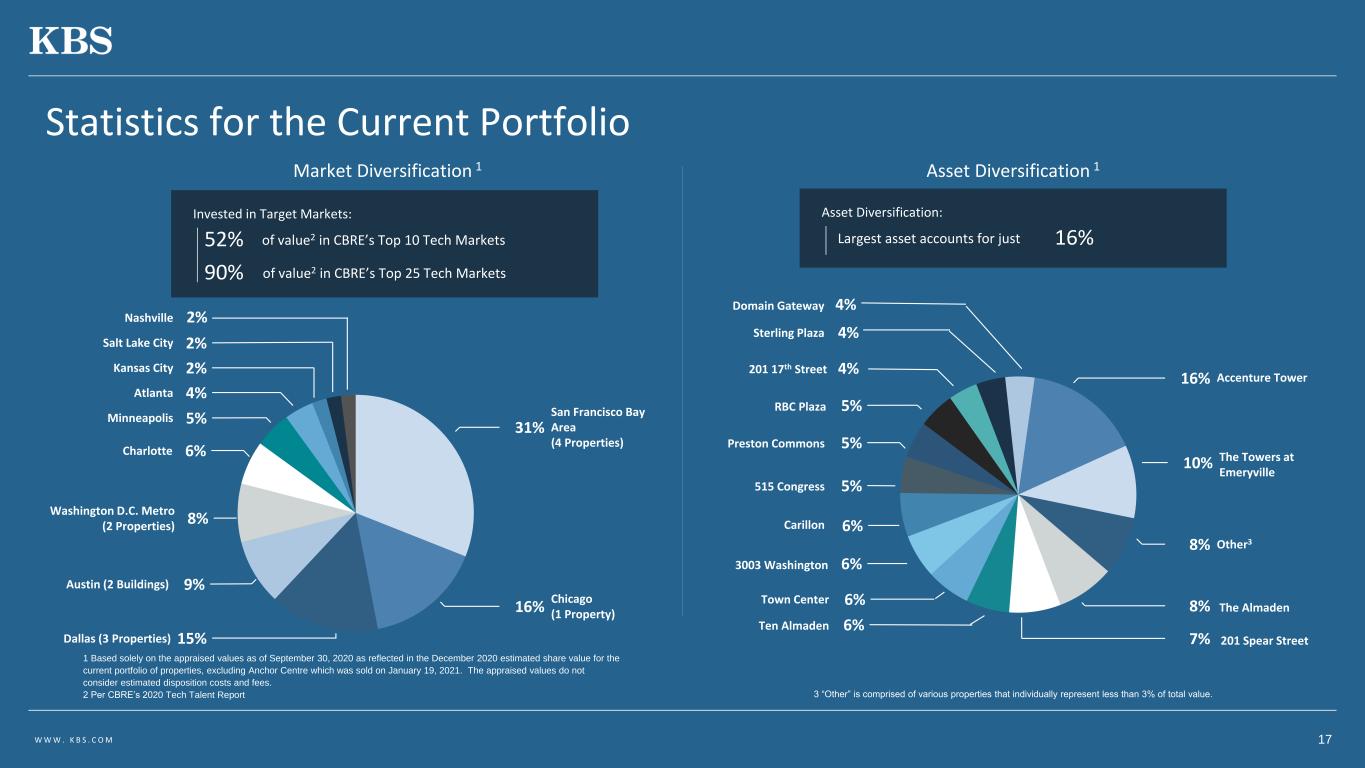
W W W . K B S . C O M Nashville Salt Lake City Kansas City Atlanta Minneapolis Charlotte Washington D.C. Metro (2 Properties) Austin (2 Buildings) Dallas (3 Properties) 2% 4% 2% 5% 6% 8% 9% 15% San Francisco Bay Area (4 Properties) 31% Chicago (1 Property) 16% Statistics for the Current Portfolio 1 Based solely on the appraised values as of September 30, 2020 as reflected in the December 2020 estimated share value for the current portfolio of properties, excluding Anchor Centre which was sold on January 19, 2021. The appraised values do not consider estimated disposition costs and fees. 2 Per CBRE’s 2020 Tech Talent Report Asset Diversification 1 3 “Other” is comprised of various properties that individually represent less than 3% of total value. Market Diversification 1 17 Invested in Target Markets: of value2 in CBRE’s Top 10 Tech Markets52% 90% of value2 in CBRE’s Top 25 Tech Markets Asset Diversification: Largest asset accounts for just 16% 2% 201 17th Street Carillon Preston Commons 4% 5% 5% 515 Congress 5% Town Center 6% RBC Plaza 6%3003 Washington Ten Almaden 6% 6% The Almaden 201 Spear Street Other3 The Towers at Emeryville Accenture Tower 10% 16% 8% 8% 7% Sterling Plaza 4% Domain Gateway 4%

W W W . K B S . C O M Communications Equipment Manufacturing Scientific Research & Development Healthcare & Social Assistance Computer Systems Design & Related Services Information Professional, Scientific, & Technical Services Insurance Carriers & Related Activities Management Consulting Services 19% Finance 1% 1% 4% 6% 7% 10% 3% 4% 6% 19% Other3 Real Estate & Rental & Leasing 11% 9% Legal Services STEM/TAMI2 29% Statistics for the Current Portfolio • Industry diversification provides downside protection from any single industry. No one sector represents over 19% of the total portfolio. • STEM/TAMI2, the fastest growing sector, represents 29% of the total portfolio. 1 Annualized base rent represents annualized contractual base rental income as of December 31, 2020, excluding Anchor Centre which was sold on January 19, 2021, adjusted to straight-line any contractual tenant concessions (including free rent), rent increases and rent decreases from the lease’s inception through the balance of the lease term. Percent of annualized base rent is based on total annualized base rent of the current portfolio. 2 STEM is an industry abbreviation which stands for science, technology, engineering, and math and TAMI stands for technology, advertising, media, and information. 3 “Other” is comprised of various industries that individually represent less than 3.0% of total annualized base rent, excluding STEM industries. 18 Over 590 Tenants with Staggered Lease Expirations and Industry Diversification Tenant Industries 1 $0 $10000 $20000 $30000 $40000 A n n u a li ze d B a se R e n t ($ 0 0 0 ) 10.8% 16.1% 11.7% 9.3% 8.1% 7.3% 6.4% 4.4% 9.5% 6.9% 9.5% Lease Expirations 1 Transportation & Warehousing
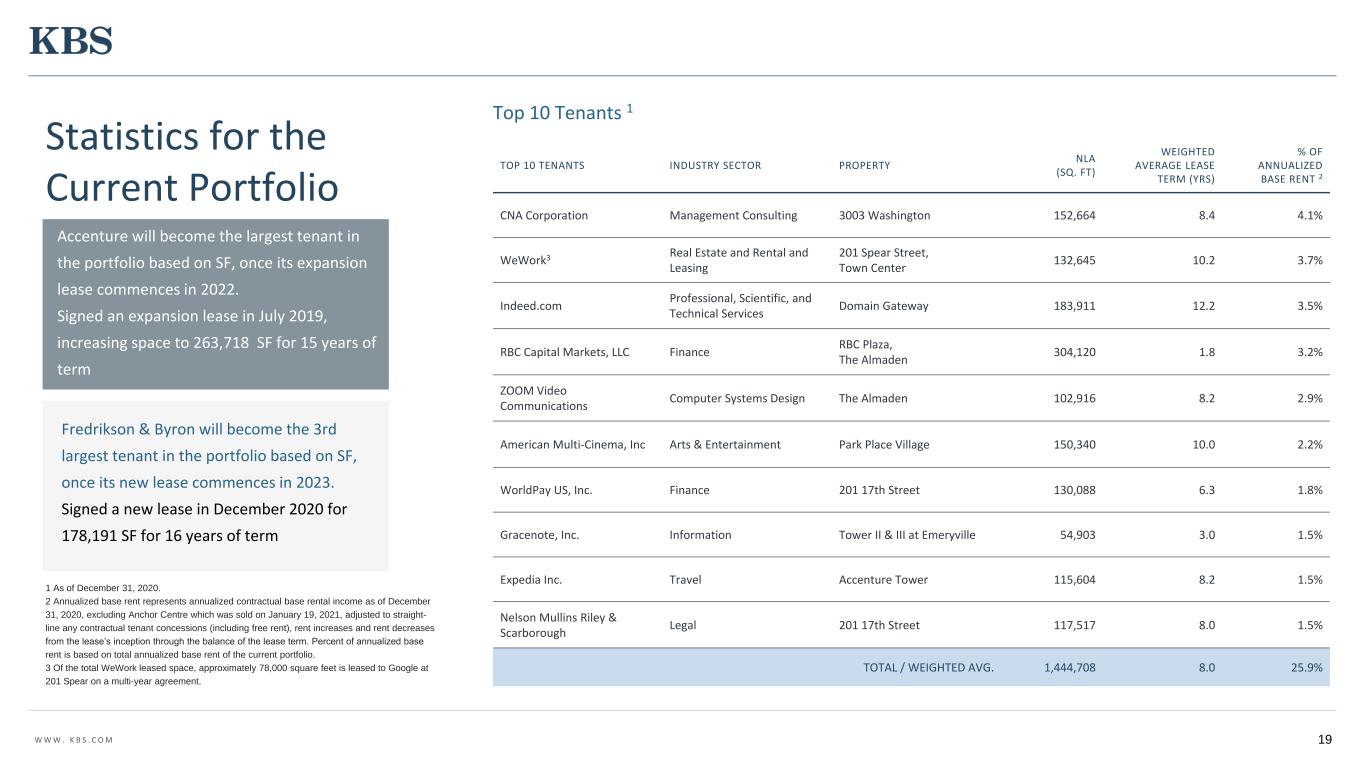
W W W . K B S . C O M Top 10 Tenants 1 TOP 10 TENANTS INDUSTRY SECTOR PROPERTY NLA (SQ. FT) WEIGHTED AVERAGE LEASE TERM (YRS) % OF ANNUALIZED BASE RENT 2 CNA Corporation Management Consulting 3003 Washington 152,664 8.4 4.1% WeWork3 Real Estate and Rental and Leasing 201 Spear Street, Town Center 132,645 10.2 3.7% Indeed.com Professional, Scientific, and Technical Services Domain Gateway 183,911 12.2 3.5% RBC Capital Markets, LLC Finance RBC Plaza, The Almaden 304,120 1.8 3.2% ZOOM Video Communications Computer Systems Design The Almaden 102,916 8.2 2.9% American Multi-Cinema, Inc Arts & Entertainment Park Place Village 150,340 10.0 2.2% WorldPay US, Inc. Finance 201 17th Street 130,088 6.3 1.8% Gracenote, Inc. Information Tower II & III at Emeryville 54,903 3.0 1.5% Expedia Inc. Travel Accenture Tower 115,604 8.2 1.5% Nelson Mullins Riley & Scarborough Legal 201 17th Street 117,517 8.0 1.5% TOTAL / WEIGHTED AVG. 1,444,708 8.0 25.9% Accenture will become the largest tenant in the portfolio based on SF, once its expansion lease commences in 2022. Signed an expansion lease in July 2019, increasing space to 263,718 SF for 15 years of term 19 Statistics for the Current Portfolio 1 As of December 31, 2020. 2 Annualized base rent represents annualized contractual base rental income as of December 31, 2020, excluding Anchor Centre which was sold on January 19, 2021, adjusted to straight- line any contractual tenant concessions (including free rent), rent increases and rent decreases from the lease’s inception through the balance of the lease term. Percent of annualized base rent is based on total annualized base rent of the current portfolio. 3 Of the total WeWork leased space, approximately 78,000 square feet is leased to Google at 201 Spear on a multi-year agreement. Fredrikson & Byron will become the 3rd largest tenant in the portfolio based on SF, once its new lease commences in 2023. Signed a new lease in December 2020 for 178,191 SF for 16 years of term
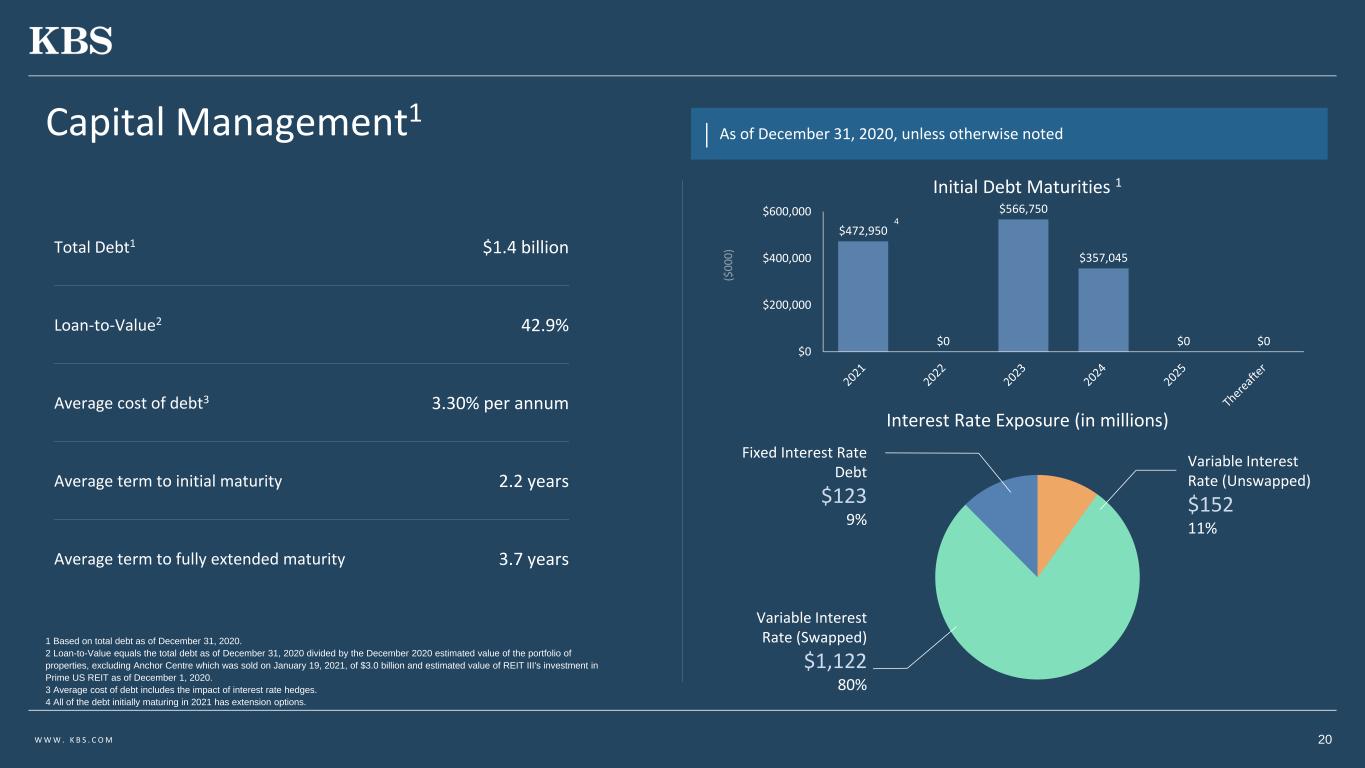
W W W . K B S . C O M Capital Management1 As of December 31, 2020, unless otherwise noted Initial Debt Maturities 1 1 Based on total debt as of December 31, 2020. 2 Loan-to-Value equals the total debt as of December 31, 2020 divided by the December 2020 estimated value of the portfolio of properties, excluding Anchor Centre which was sold on January 19, 2021, of $3.0 billion and estimated value of REIT III's investment in Prime US REIT as of December 1, 2020. 3 Average cost of debt includes the impact of interest rate hedges. 4 All of the debt initially maturing in 2021 has extension options. Total Debt1 $1.4 billion Loan-to-Value2 42.9% Average cost of debt3 3.30% per annum Average term to initial maturity 2.2 years Average term to fully extended maturity 3.7 years $472,950 $0 $566,750 $357,045 $0 $0 $0 $200,000 $400,000 $600,000 4 Variable Interest Rate (Unswapped) $152 11% Variable Interest Rate (Swapped) $1,122 80% Fixed Interest Rate Debt $123 9% Interest Rate Exposure (in millions) 20
21 Portfolio Updates
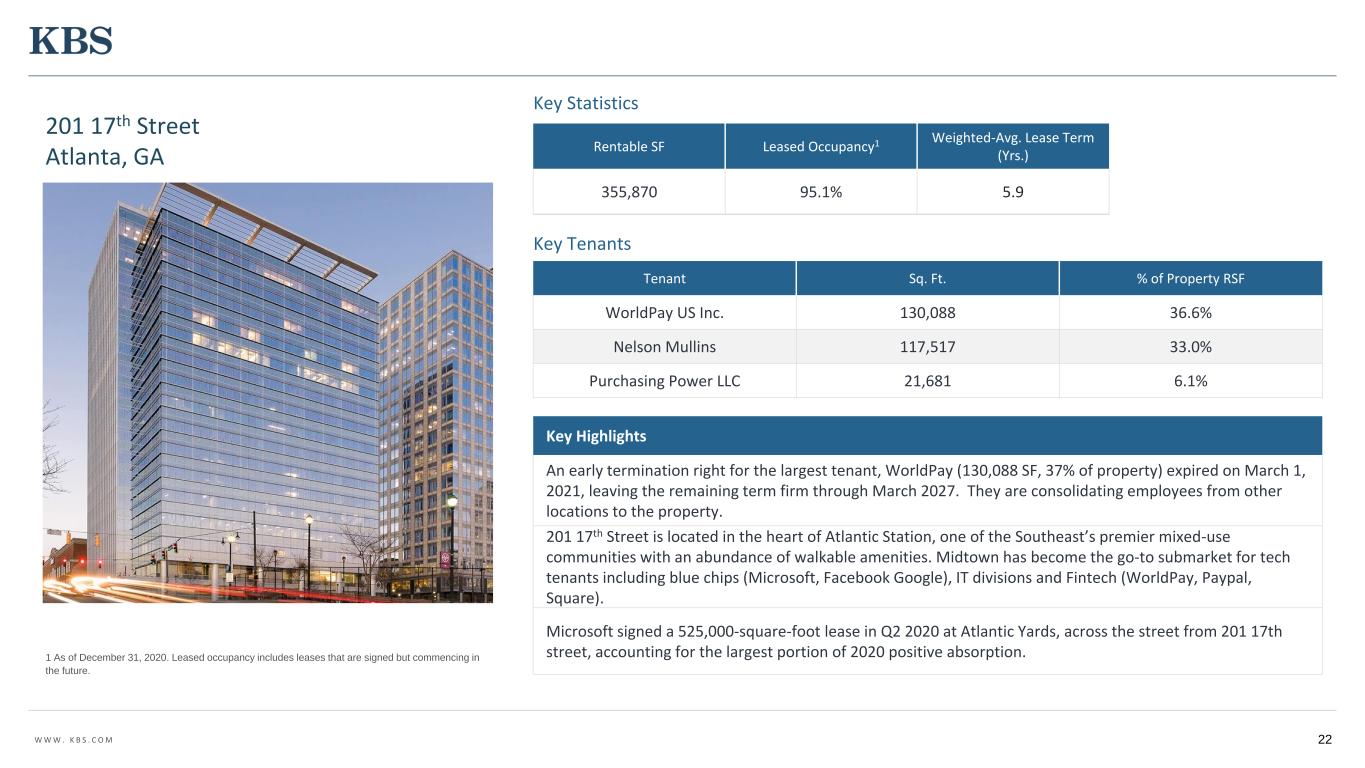
W W W . K B S . C O M 22 Key Highlights An early termination right for the largest tenant, WorldPay (130,088 SF, 37% of property) expired on March 1, 2021, leaving the remaining term firm through March 2027. They are consolidating employees from other locations to the property. 201 17th Street is located in the heart of Atlantic Station, one of the Southeast’s premier mixed-use communities with an abundance of walkable amenities. Midtown has become the go-to submarket for tech tenants including blue chips (Microsoft, Facebook Google), IT divisions and Fintech (WorldPay, Paypal, Square). Microsoft signed a 525,000-square-foot lease in Q2 2020 at Atlantic Yards, across the street from 201 17th street, accounting for the largest portion of 2020 positive absorption. Rentable SF Leased Occupancy1 Weighted-Avg. Lease Term (Yrs.) 355,870 95.1% 5.9 Tenant Sq. Ft. % of Property RSF WorldPay US Inc. 130,088 36.6% Nelson Mullins 117,517 33.0% Purchasing Power LLC 21,681 6.1% 201 17th Street Atlanta, GA Key Statistics Key Tenants 1 As of December 31, 2020. Leased occupancy includes leases that are signed but commencing in the future.
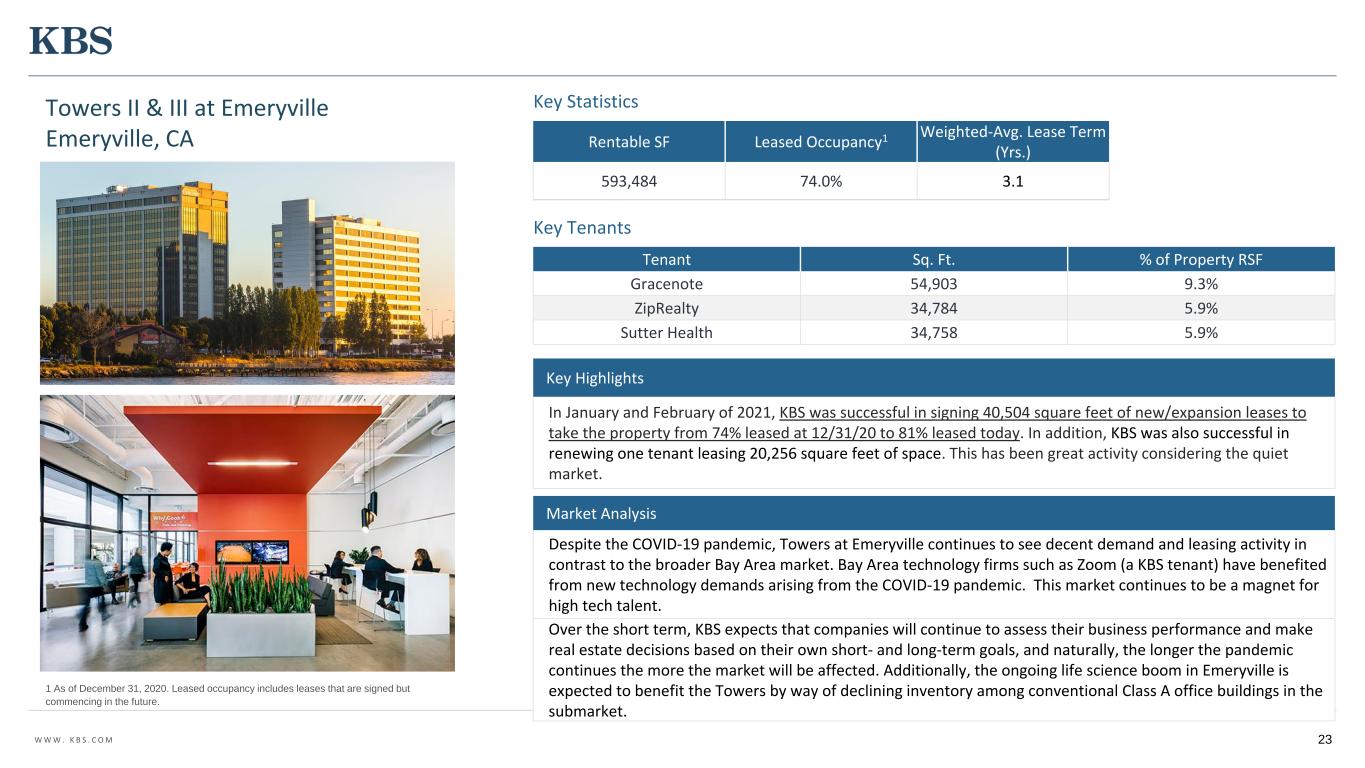
W W W . K B S . C O M 23 Key Highlights In January and February of 2021, KBS was successful in signing 40,504 square feet of new/expansion leases to take the property from 74% leased at 12/31/20 to 81% leased today. In addition, KBS was also successful in renewing one tenant leasing 20,256 square feet of space. This has been great activity considering the quiet market. Rentable SF Leased Occupancy1 Weighted-Avg. Lease Term (Yrs.) 593,484 74.0% 3.1 Tenant Sq. Ft. % of Property RSF Gracenote 54,903 9.3% ZipRealty 34,784 5.9% Sutter Health 34,758 5.9% Towers II & III at Emeryville Emeryville, CA Key Statistics Key Tenants 1 As of December 31, 2020. Leased occupancy includes leases that are signed but commencing in the future. Market Analysis Despite the COVID-19 pandemic, Towers at Emeryville continues to see decent demand and leasing activity in contrast to the broader Bay Area market. Bay Area technology firms such as Zoom (a KBS tenant) have benefited from new technology demands arising from the COVID-19 pandemic. This market continues to be a magnet for high tech talent. Over the short term, KBS expects that companies will continue to assess their business performance and make real estate decisions based on their own short- and long-term goals, and naturally, the longer the pandemic continues the more the market will be affected. Additionally, the ongoing life science boom in Emeryville is expected to benefit the Towers by way of declining inventory among conventional Class A office buildings in the submarket.
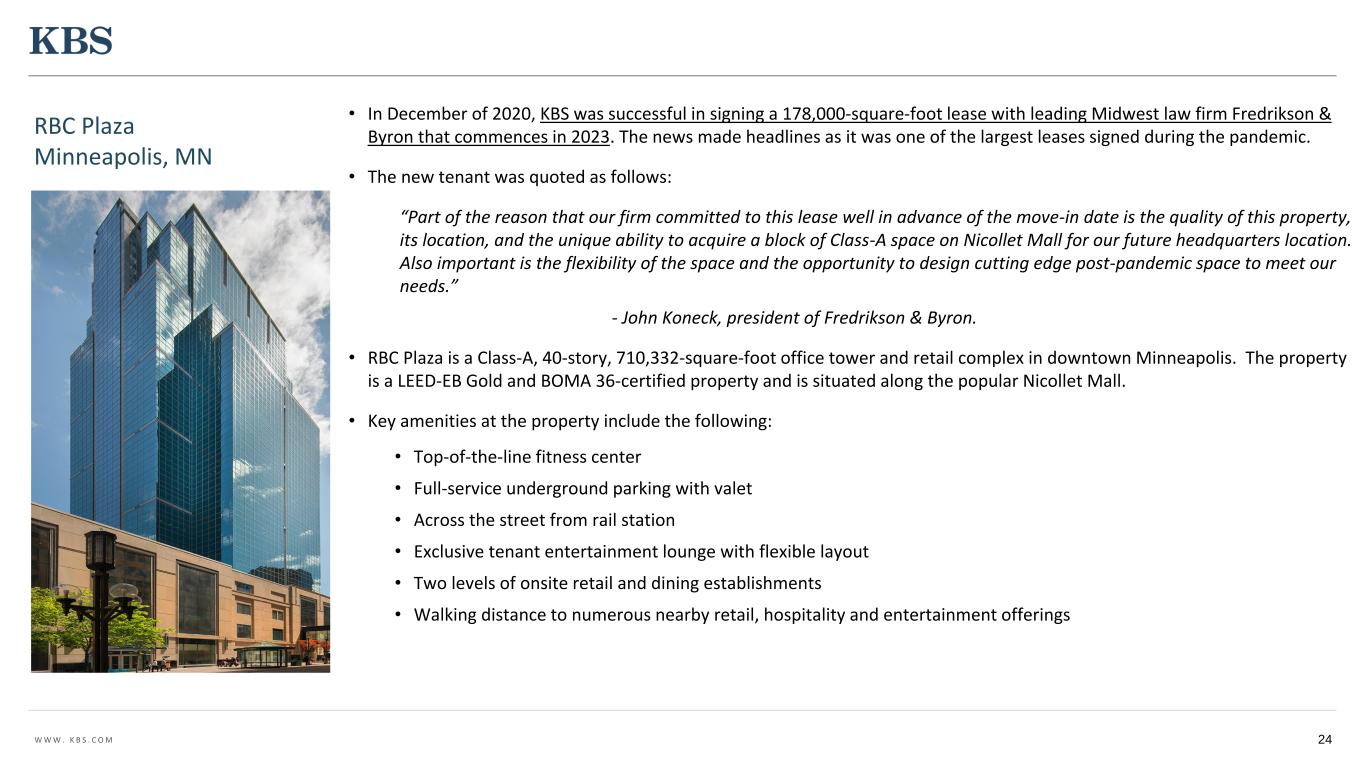
W W W . K B S . C O M RBC Plaza Minneapolis, MN 24 • In December of 2020, KBS was successful in signing a 178,000-square-foot lease with leading Midwest law firm Fredrikson & Byron that commences in 2023. The news made headlines as it was one of the largest leases signed during the pandemic. • The new tenant was quoted as follows: “Part of the reason that our firm committed to this lease well in advance of the move-in date is the quality of this property, its location, and the unique ability to acquire a block of Class-A space on Nicollet Mall for our future headquarters location. Also important is the flexibility of the space and the opportunity to design cutting edge post-pandemic space to meet our needs.” - John Koneck, president of Fredrikson & Byron. • RBC Plaza is a Class-A, 40-story, 710,332-square-foot office tower and retail complex in downtown Minneapolis. The property is a LEED-EB Gold and BOMA 36-certified property and is situated along the popular Nicollet Mall. • Key amenities at the property include the following: • Top-of-the-line fitness center • Full-service underground parking with valet • Across the street from rail station • Exclusive tenant entertainment lounge with flexible layout • Two levels of onsite retail and dining establishments • Walking distance to numerous nearby retail, hospitality and entertainment offerings

W W W . K B S . C O M 25 RBC Plaza Minneapolis, MN Improvements
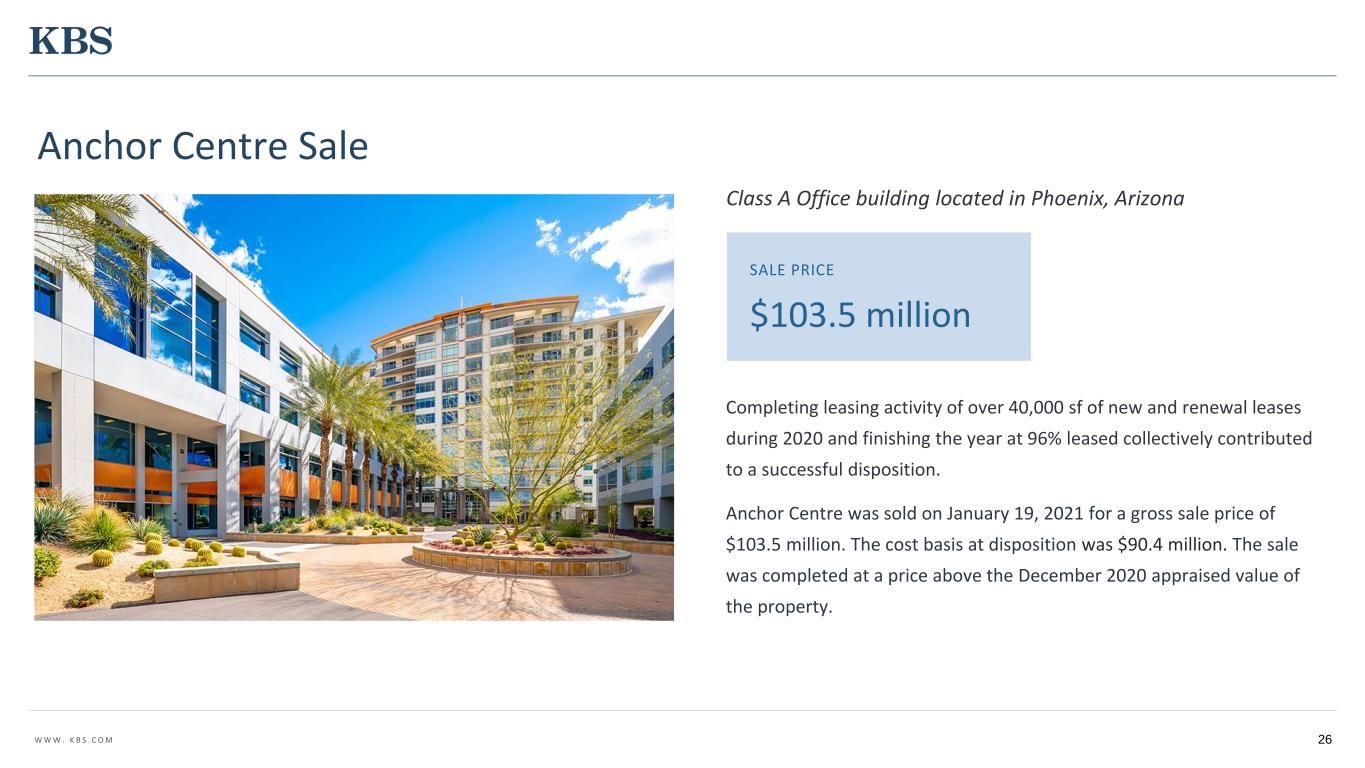
W W W . K B S . C O M Anchor Centre Sale Completing leasing activity of over 40,000 sf of new and renewal leases during 2020 and finishing the year at 96% leased collectively contributed to a successful disposition. Anchor Centre was sold on January 19, 2021 for a gross sale price of $103.5 million. The cost basis at disposition was $90.4 million. The sale was completed at a price above the December 2020 appraised value of the property. SALE PRICE $103.5 million Class A Office building located in Phoenix, Arizona 26
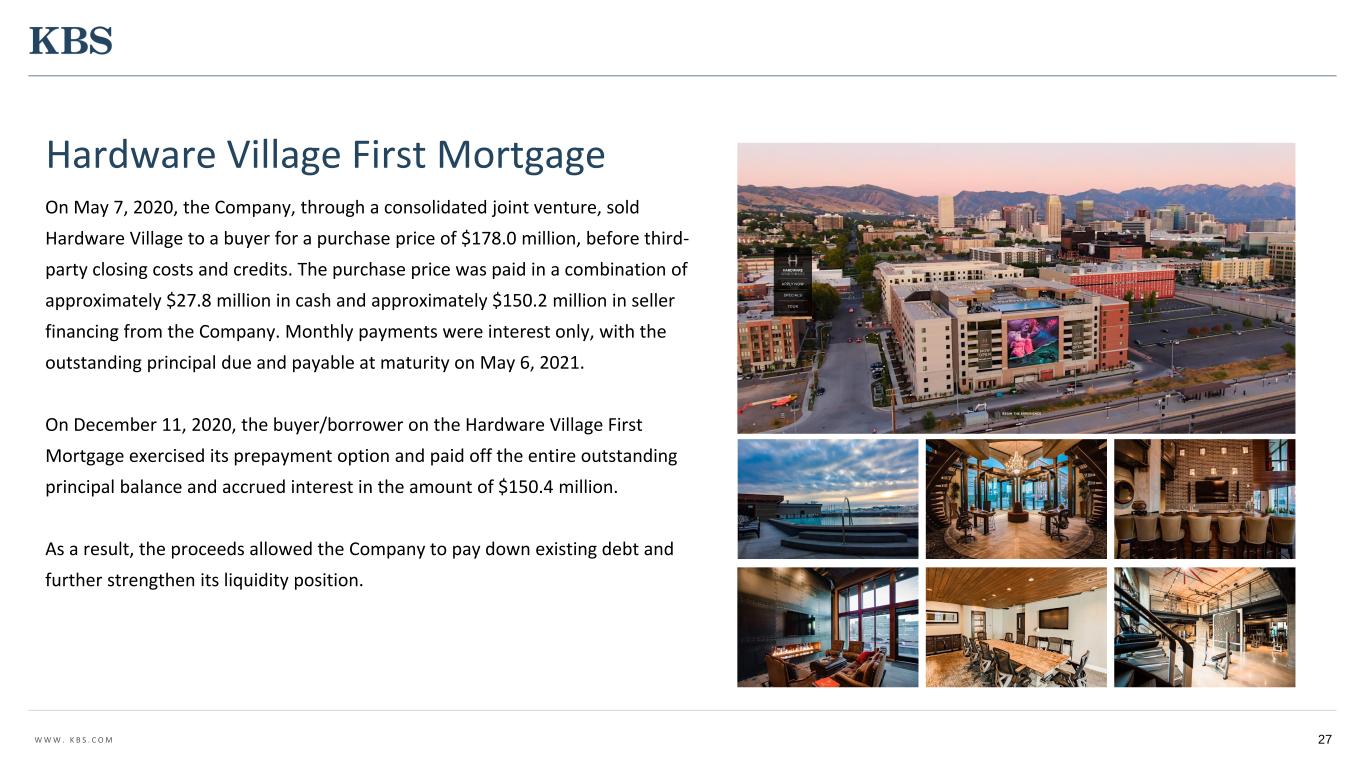
W W W . K B S . C O M Hardware Village First Mortgage On May 7, 2020, the Company, through a consolidated joint venture, sold Hardware Village to a buyer for a purchase price of $178.0 million, before third- party closing costs and credits. The purchase price was paid in a combination of approximately $27.8 million in cash and approximately $150.2 million in seller financing from the Company. Monthly payments were interest only, with the outstanding principal due and payable at maturity on May 6, 2021. On December 11, 2020, the buyer/borrower on the Hardware Village First Mortgage exercised its prepayment option and paid off the entire outstanding principal balance and accrued interest in the amount of $150.4 million. As a result, the proceeds allowed the Company to pay down existing debt and further strengthen its liquidity position. 27
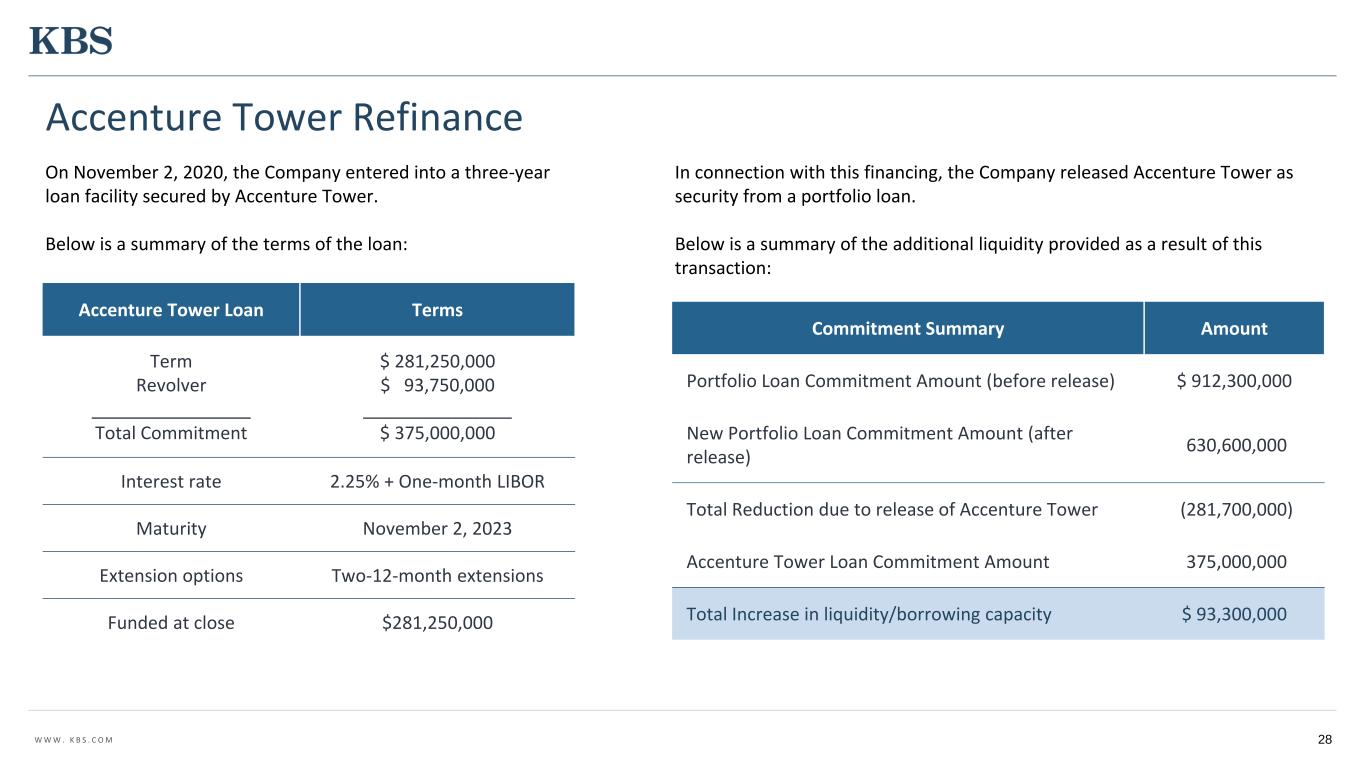
W W W . K B S . C O M Accenture Tower Refinance On November 2, 2020, the Company entered into a three-year loan facility secured by Accenture Tower. Below is a summary of the terms of the loan: 28 In connection with this financing, the Company released Accenture Tower as security from a portfolio loan. Below is a summary of the additional liquidity provided as a result of this transaction: Accenture Tower Loan Terms Term Revolver ________________ Total Commitment $ 281,250,000 $ 93,750,000 _______________ $ 375,000,000 Interest rate 2.25% + One-month LIBOR Maturity November 2, 2023 Extension options Two-12-month extensions Funded at close $281,250,000 Commitment Summary Amount Portfolio Loan Commitment Amount (before release) $ 912,300,000 New Portfolio Loan Commitment Amount (after release) 630,600,000 Total Reduction due to release of Accenture Tower (281,700,000) Accenture Tower Loan Commitment Amount 375,000,000 Total Increase in liquidity/borrowing capacity $ 93,300,000
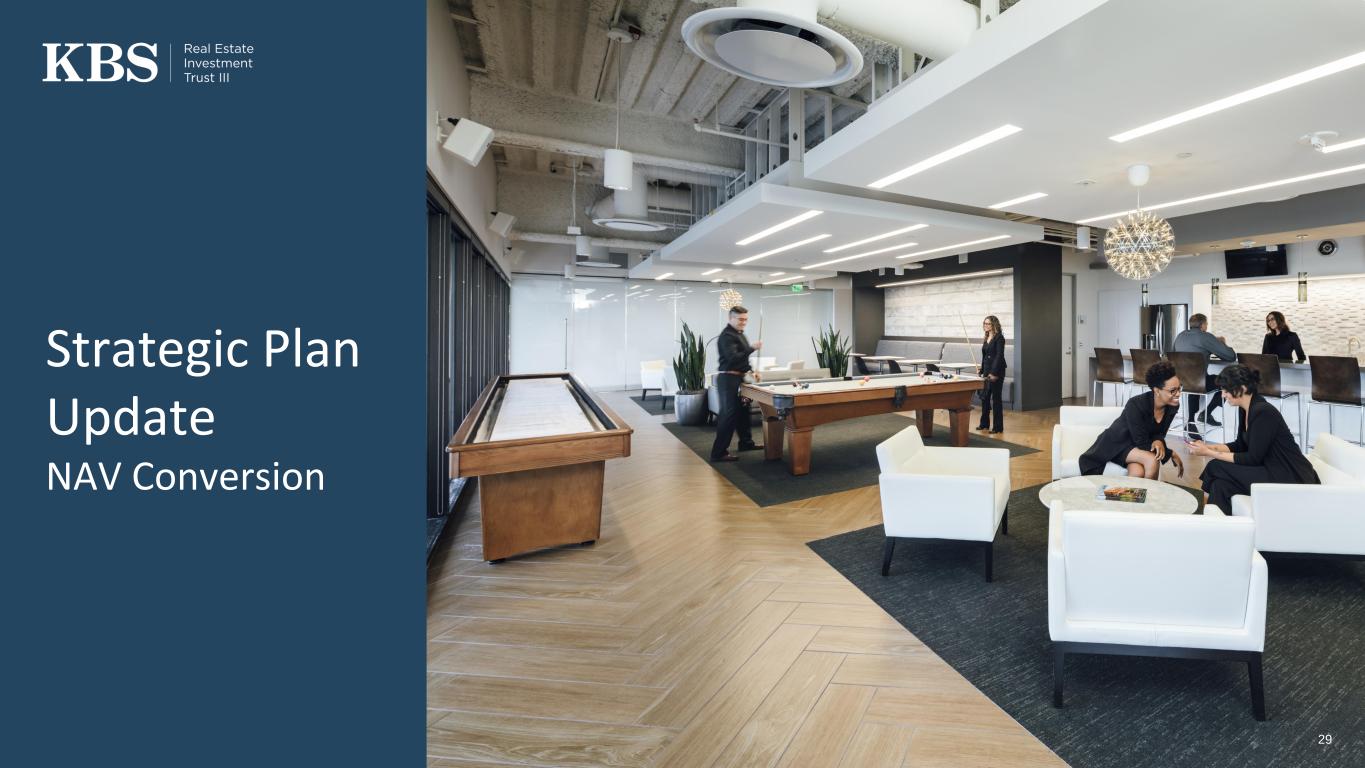
29 Strategic Plan Update NAV Conversion
W W W . K B S . C O M 30 Conversion to an NAV REIT fulfills certain key objectives of the Company including balancing shareholder desire for liquidity as well as their desire to stay invested. Potential NAV Conversion NAV REITs at a Glance Perpetual Life Investment Vehicle Potential enhanced liquidity, up to 20% of equity per year Frequent valuations Lower up-front fees
W W W . K B S . C O M 31 The impact of COVID-19 has altered the landscape of the real estate market in its entirety. The disruption has reduced cashflows and halted leasing activity resulting in reductions of real estate values. Specific to the KBS REIT III portfolio, our rent collections have remained very strong and we have only granted short-term rent relief on a small portion of the portfolio, mostly in the form of rent deferrals or abatements. The COVID-19 crisis caused us to delay certain asset sales and refinancing plans which then delayed the timing of the REIT providing additional liquidity to stockholders. However, we have recently seen increased lending activity in the credit markets and were able to refinance a few loans in the portfolio, collect proceeds from the repayment of the Hardware Village First Mortgage, as well as close on the sale of an office building slightly above the 2020 appraised value in Jan 2021. The recent transactions have further increased the strength of the REIT’s liquidity position. We are working on one additional loan financing, and thereafter, intend to move forward with providing a substantial amount of increased liquidity to stockholders. While we continue to believe our portfolio is well-positioned for future success, including navigating issues caused by the pandemic, the impact of the COVID-19 pandemic on the capital and financial markets, including the U.S. real estate office market, has caused our conflicts committee and board of directors to further consider the timing and likelihood of success of the proposed NAV REIT conversion and whether this conversion continues to be in the best interest of our shareholders. Potential NAV Conversion
W W W . K B S . C O M REIT III 2021 Goals & Objectives 32 Distribute operating cash flows to stockholders Carefully evaluate all tenant rent deferral requests to make sure we are providing rent relief where it is necessary, while being repaid on such deferrals either over time or through a longer term lease extension Constantly review the liquidity needs of the portfolio in order to retain capital to enhance asset values and provide stockholder liquidity Continue to monitor the properties in the portfolio for any beneficial sale opportunities in order to maximize value Finalize decision on NAV REIT Conversion Efficiently manage the real estate portfolio throughout the COVID-19 crisis in order to maximize the long-term portfolio value to stockholders
33 Q&A For additional questions, contact KBS Capital Markets Group Investor Relations (866) 527-4264


