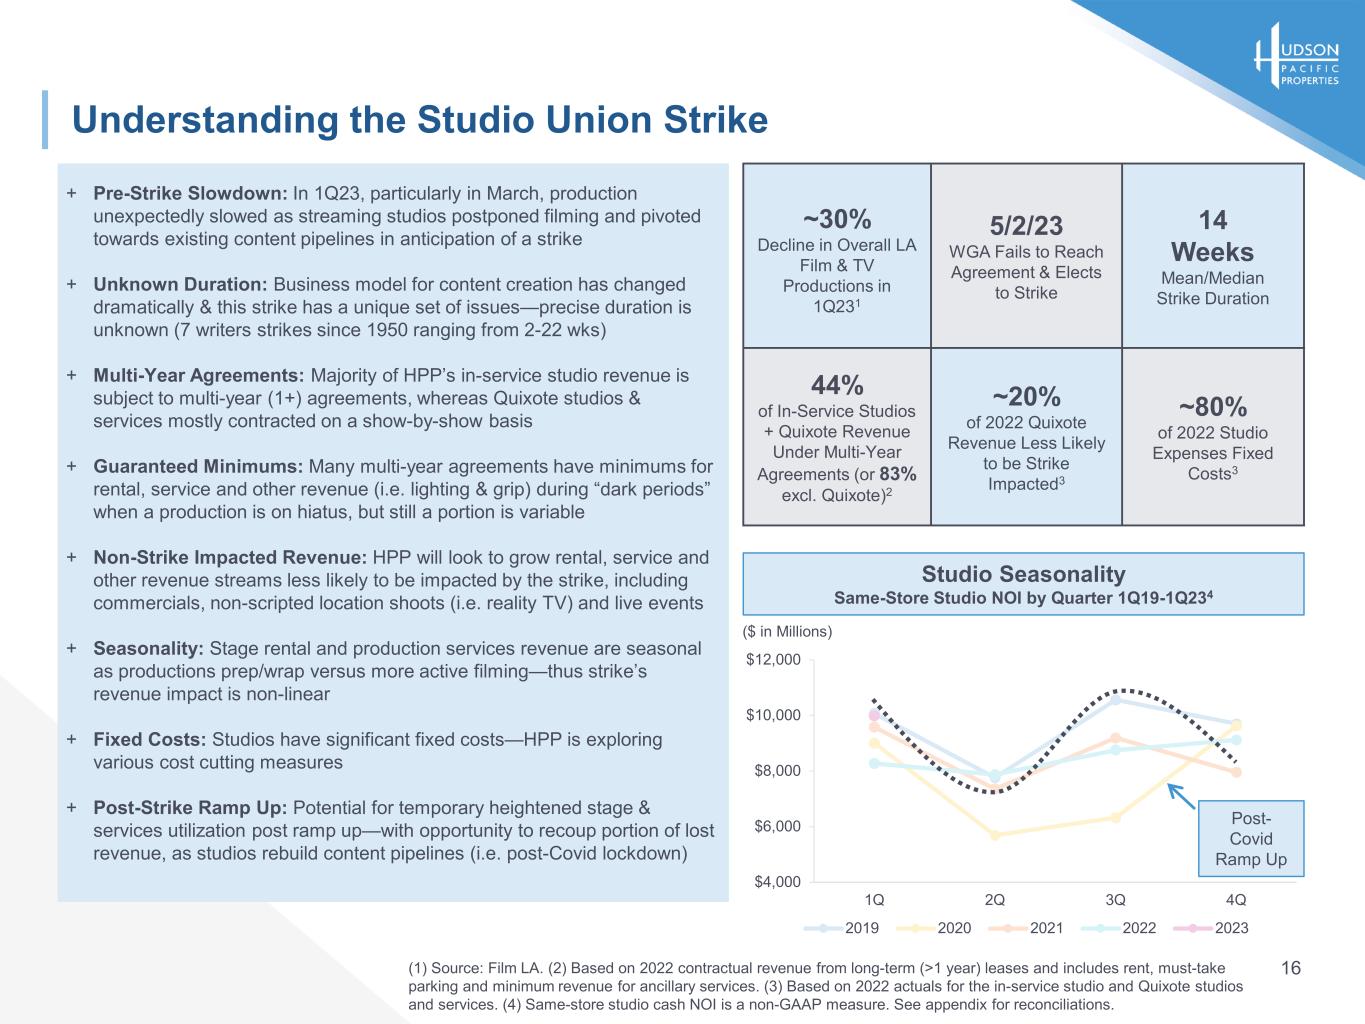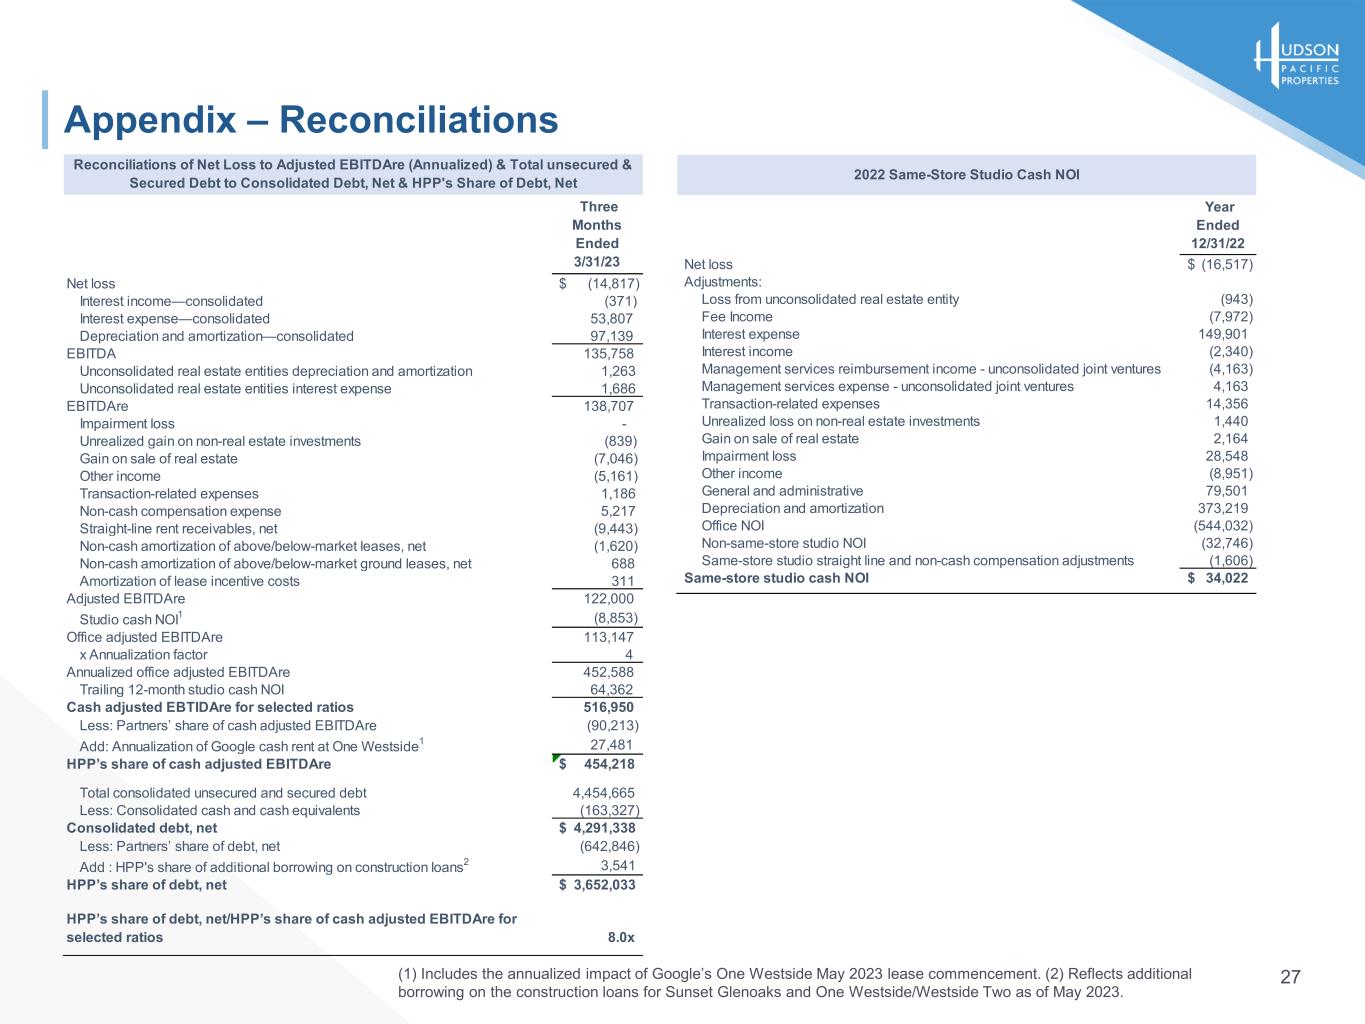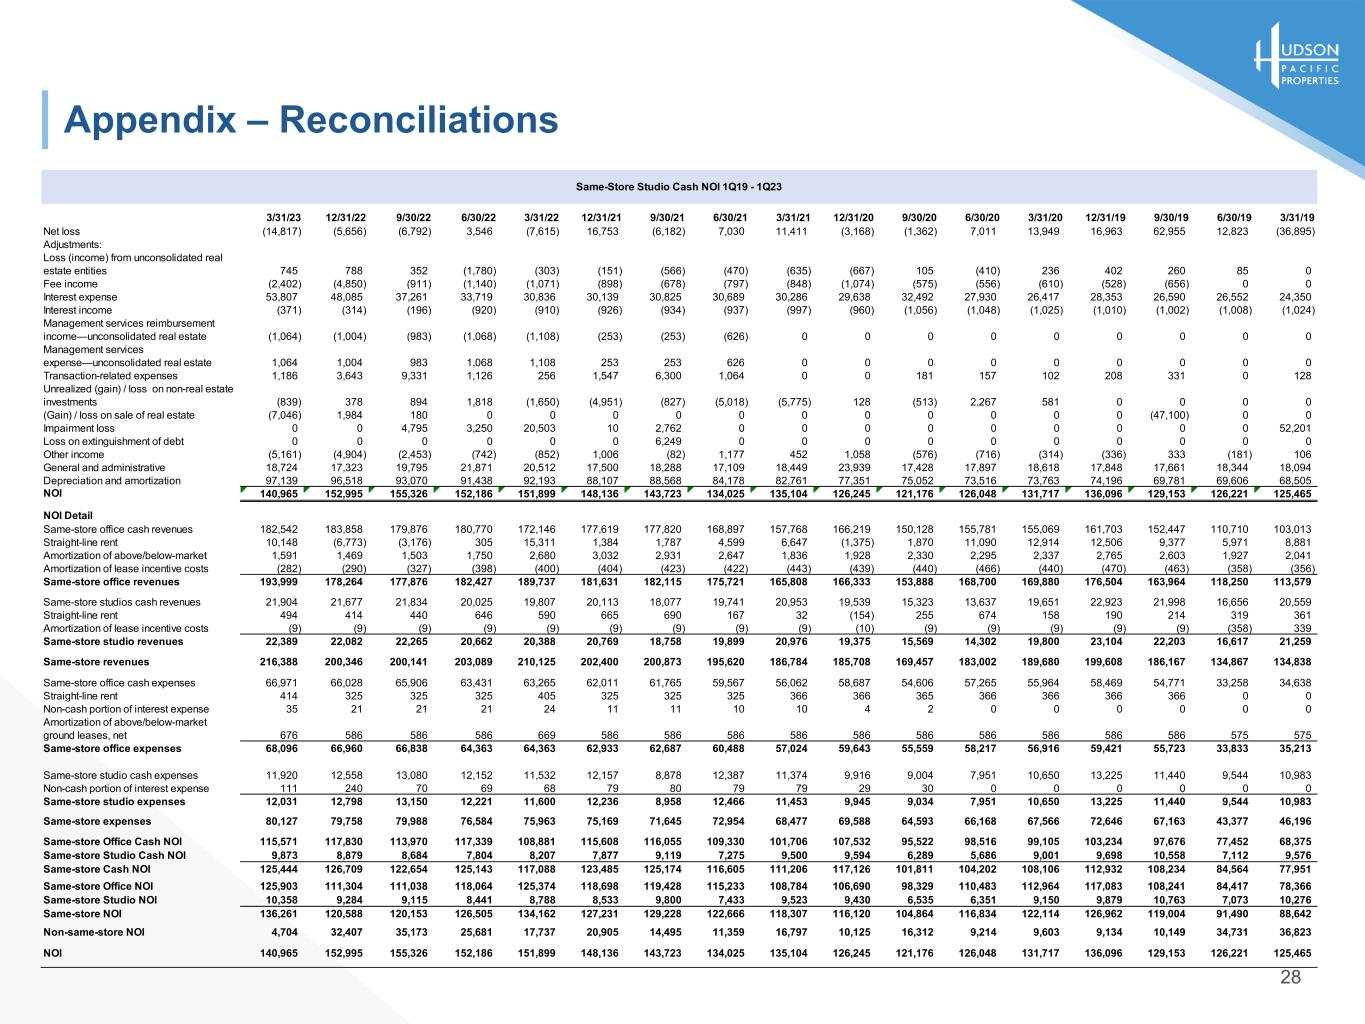
28 Appendix – Reconciliations 3/31/23 12/31/22 9/30/22 6/30/22 3/31/22 12/31/21 9/30/21 6/30/21 3/31/21 12/31/20 9/30/20 6/30/20 3/31/20 12/31/19 9/30/19 6/30/19 3/31/19 Net loss (14,817) (5,656) (6,792) 3,546 (7,615) 16,753 (6,182) 7,030 11,411 (3,168) (1,362) 7,011 13,949 16,963 62,955 12,823 (36,895) Adjustments: Loss (income) from unconsolidated real estate entities 745 788 352 (1,780) (303) (151) (566) (470) (635) (667) 105 (410) 236 402 260 85 0 Fee income (2,402) (4,850) (911) (1,140) (1,071) (898) (678) (797) (848) (1,074) (575) (556) (610) (528) (656) 0 0 Interest expense 53,807 48,085 37,261 33,719 30,836 30,139 30,825 30,689 30,286 29,638 32,492 27,930 26,417 28,353 26,590 26,552 24,350 Interest income (371) (314) (196) (920) (910) (926) (934) (937) (997) (960) (1,056) (1,048) (1,025) (1,010) (1,002) (1,008) (1,024) Management services reimbursement income—unconsolidated real estate (1,064) (1,004) (983) (1,068) (1,108) (253) (253) (626) 0 0 0 0 0 0 0 0 0 Management services expense—unconsolidated real estate 1,064 1,004 983 1,068 1,108 253 253 626 0 0 0 0 0 0 0 0 0 Transaction-related expenses 1,186 3,643 9,331 1,126 256 1,547 6,300 1,064 0 0 181 157 102 208 331 0 128 Unrealized (gain) / loss on non-real estate investments (839) 378 894 1,818 (1,650) (4,951) (827) (5,018) (5,775) 128 (513) 2,267 581 0 0 0 0 (Gain) / loss on sale of real estate (7,046) 1,984 180 0 0 0 0 0 0 0 0 0 0 0 (47,100) 0 0 Impairment loss 0 0 4,795 3,250 20,503 10 2,762 0 0 0 0 0 0 0 0 0 52,201 Loss on extinguishment of debt 0 0 0 0 0 0 6,249 0 0 0 0 0 0 0 0 0 0 Other income (5,161) (4,904) (2,453) (742) (852) 1,006 (82) 1,177 452 1,058 (576) (716) (314) (336) 333 (181) 106 General and administrative 18,724 17,323 19,795 21,871 20,512 17,500 18,288 17,109 18,449 23,939 17,428 17,897 18,618 17,848 17,661 18,344 18,094 Depreciation and amortization 97,139 96,518 93,070 91,438 92,193 88,107 88,568 84,178 82,761 77,351 75,052 73,516 73,763 74,196 69,781 69,606 68,505 NOI 140,965 152,995 155,326 152,186 151,899 148,136 143,723 134,025 135,104 126,245 121,176 126,048 131,717 136,096 129,153 126,221 125,465 NOI Detail Same-store office cash revenues 182,542 183,858 179,876 180,770 172,146 177,619 177,820 168,897 157,768 166,219 150,128 155,781 155,069 161,703 152,447 110,710 103,013 Straight-line rent 10,148 (6,773) (3,176) 305 15,311 1,384 1,787 4,599 6,647 (1,375) 1,870 11,090 12,914 12,506 9,377 5,971 8,881 Amortization of above/below-market 1,591 1,469 1,503 1,750 2,680 3,032 2,931 2,647 1,836 1,928 2,330 2,295 2,337 2,765 2,603 1,927 2,041 Amortization of lease incentive costs (282) (290) (327) (398) (400) (404) (423) (422) (443) (439) (440) (466) (440) (470) (463) (358) (356) Same-store office revenues 193,999 178,264 177,876 182,427 189,737 181,631 182,115 175,721 165,808 166,333 153,888 168,700 169,880 176,504 163,964 118,250 113,579 Same-store studios cash revenues 21,904 21,677 21,834 20,025 19,807 20,113 18,077 19,741 20,953 19,539 15,323 13,637 19,651 22,923 21,998 16,656 20,559 Straight-line rent 494 414 440 646 590 665 690 167 32 (154) 255 674 158 190 214 319 361 Amortization of lease incentive costs (9) (9) (9) (9) (9) (9) (9) (9) (9) (10) (9) (9) (9) (9) (9) (358) 339 Same-store studio revenues 22,389 22,082 22,265 20,662 20,388 20,769 18,758 19,899 20,976 19,375 15,569 14,302 19,800 23,104 22,203 16,617 21,259 Same-store revenues 216,388 200,346 200,141 203,089 210,125 202,400 200,873 195,620 186,784 185,708 169,457 183,002 189,680 199,608 186,167 134,867 134,838 Same-store office cash expenses 66,971 66,028 65,906 63,431 63,265 62,011 61,765 59,567 56,062 58,687 54,606 57,265 55,964 58,469 54,771 33,258 34,638 Straight-line rent 414 325 325 325 405 325 325 325 366 366 365 366 366 366 366 0 0 Non-cash portion of interest expense 35 21 21 21 24 11 11 10 10 4 2 0 0 0 0 0 0 Amortization of above/below-market ground leases, net 676 586 586 586 669 586 586 586 586 586 586 586 586 586 586 575 575 Same-store office expenses 68,096 66,960 66,838 64,363 64,363 62,933 62,687 60,488 57,024 59,643 55,559 58,217 56,916 59,421 55,723 33,833 35,213 Same-store studio cash expenses 11,920 12,558 13,080 12,152 11,532 12,157 8,878 12,387 11,374 9,916 9,004 7,951 10,650 13,225 11,440 9,544 10,983 Non-cash portion of interest expense 111 240 70 69 68 79 80 79 79 29 30 0 0 0 0 0 0 Same-store studio expenses 12,031 12,798 13,150 12,221 11,600 12,236 8,958 12,466 11,453 9,945 9,034 7,951 10,650 13,225 11,440 9,544 10,983 Same-store expenses 80,127 79,758 79,988 76,584 75,963 75,169 71,645 72,954 68,477 69,588 64,593 66,168 67,566 72,646 67,163 43,377 46,196 Same-store Office Cash NOI 115,571 117,830 113,970 117,339 108,881 115,608 116,055 109,330 101,706 107,532 95,522 98,516 99,105 103,234 97,676 77,452 68,375 Same-store Studio Cash NOI 9,873 8,879 8,684 7,804 8,207 7,877 9,119 7,275 9,500 9,594 6,289 5,686 9,001 9,698 10,558 7,112 9,576 Same-store Cash NOI 125,444 126,709 122,654 125,143 117,088 123,485 125,174 116,605 111,206 117,126 101,811 104,202 108,106 112,932 108,234 84,564 77,951 Same-store Office NOI 125,903 111,304 111,038 118,064 125,374 118,698 119,428 115,233 108,784 106,690 98,329 110,483 112,964 117,083 108,241 84,417 78,366 Same-store Studio NOI 10,358 9,284 9,115 8,441 8,788 8,533 9,800 7,433 9,523 9,430 6,535 6,351 9,150 9,879 10,763 7,073 10,276 Same-store NOI 136,261 120,588 120,153 126,505 134,162 127,231 129,228 122,666 118,307 116,120 104,864 116,834 122,114 126,962 119,004 91,490 88,642 Non-same-store NOI 4,704 32,407 35,173 25,681 17,737 20,905 14,495 11,359 16,797 10,125 16,312 9,214 9,603 9,134 10,149 34,731 36,823 NOI 140,965 152,995 155,326 152,186 151,899 148,136 143,723 134,025 135,104 126,245 121,176 126,048 131,717 136,096 129,153 126,221 125,465 Same-Store Studio Cash NOI 1Q19 - 1Q23
