Table of Contents
Exhibit 99.1
Part II
| ITEM 7. | Management’s Discussion and Analysis of Financial Condition and Results of Operations |
Unless the context otherwise requires, references in this report to the “Partnership,” “we,” “our,” “us” or like terms, when used in a historical context, refer to the financial results of Chesapeake Midstream Partners, L.L.C. through the closing date of our initial public offering (“IPO”) on August 3, 2010 and to Access Midstream Partners, L.P. (NYSE: ACMP) and its subsidiaries thereafter. The “GIP I Entities” refers to, collectively, GIP-A Holding (CHK), L.P., GIP-B Holding (CHK), L.P. and GIP-C Holding (CHK), L.P., the “GIP II Entities” refers to certain entities affiliated with Global Infrastructure Investors II, LLC, and “GIP” refers to the GIP I Entities and their affiliates and the GIP II Entities, collectively. “Williams” refers to The Williams Companies, Inc. (NYSE: WMB). “Chesapeake” refers to Chesapeake Energy Corporation (NYSE: CHK). “Total,” when discussing the upstream joint venture with Chesapeake, refers to Total E&P USA, Inc., a wholly owned subsidiary of Total S.A. (NYSE: TOT, FP: FP), and when discussing our gas gathering agreement and related matters, refers to Total E&P USA, Inc. and Total Gas & Power North America, Inc., a wholly owned subsidiary of Total S.A.
Overview
We are a growth-oriented publicly traded Delaware limited partnership formed in 2010 to own, operate, develop and acquire natural gas, natural gas liquids (“NGLs”) and oil gathering systems and other midstream energy assets. We are principally focused on natural gas and NGL gathering, the first segment of midstream energy infrastructure that connects natural gas and NGLs produced at the wellhead to third-party takeaway pipelines.
We provide our midstream services to Chesapeake, Total, Mitsui & Co. (“Mitsui”), Anadarko Petroleum Corporation (“Anadarko”), Statoil ASA (“Statoil”) and other leading producers under long-term, fixed-fee contracts. We operate assets in our Barnett Shale region in north-central Texas; our Eagle Ford Shale region in South Texas; our Haynesville Shale region in northwest Louisiana; our Marcellus Shale region primarily in Pennsylvania and West Virginia; our Niobrara Shale region in eastern Wyoming; our Utica Shale region in eastern Ohio; and our Mid-Continent region which includes the Anadarko, Arkoma, Delaware and Permian Basins.
Acquisitions
Our CMO Acquisition and Williams’ Acquisition of 50 Percent of Our General Partner
On December 20, 2012, we acquired from Chesapeake Midstream Development, L.P. (“CMD”), a wholly owned subsidiary of Chesapeake, and certain of CMD’s affiliates, 100 percent of the issued and outstanding equity interests in Chesapeake Midstream Operating, L.L.C. (“CMO”) for total consideration of $2.16 billion (the “CMO Acquisition”). As a result of the CMO Acquisition, the Partnership now owns certain midstream assets in the Eagle Ford, Utica and Niobrara regions. The CMO Acquisition also extended our assets and operations in the Haynesville, Marcellus and Mid-Continent regions. The acquired assets included, in the aggregate, approximately 1,675 miles of pipeline and 4.3 million (gross) dedicated acres as of the date of the acquisition. We also assumed various gas gathering and processing agreements associated with the assets that have terms ranging from 10 to 20 years and that, in certain cases, include cost of service or fee redetermination mechanisms.
The results of operations presented and discussed in this annual report include results of operations from the CMO assets for the twelve-day period from closing of the CMO Acquisition on December 20, 2012 through December 31, 2012.
Concurrently with the CMO Acquisition, the GIP I Entities sold to Williams 34,538,061 of our subordinated units and 50 percent of the outstanding equity interests in Access Midstream Ventures, L.L.C., the sole member of our general partner (“Access Midstream Ventures”), for cash consideration of approximately $1.82 billion (the “Williams Acquisition”). As a result of the closing of the Williams Acquisition, the GIP II Entities and Williams together own and control our general partner and the GIP I Entities no longer have any ownership interest in the Partnership or our general partner.
Our Marcellus Acquisition
On December 29, 2011, we acquired from CMD all of the issued and outstanding common units of Appalachia Midstream Services, L.L.C. (“Appalachia Midstream”) for total consideration of $879.3 million, consisting of 9,791,605 common units and $600.0 million in cash. Through Appalachia Midstream, we currently operate 100 percent of and own an approximate average 47 percent interest in 10 gas gathering systems that consist of approximately 549 miles
Table of Contents
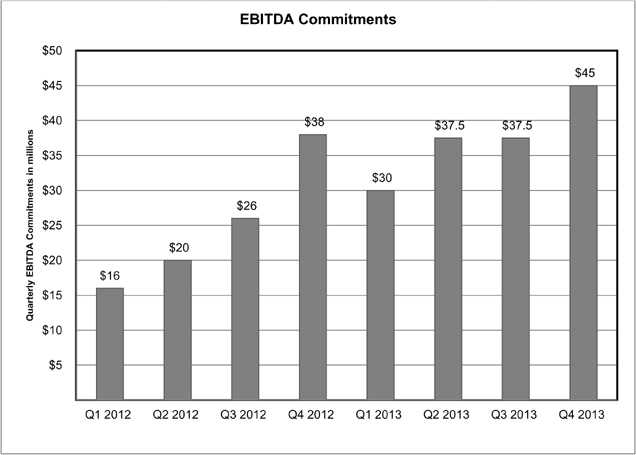
of gas gathering pipeline in the Marcellus Shale. The remaining 53 percent interest in these assets is owned primarily by Statoil, Anadarko and Mitsui. Appalachia Midstream operates the assets under 15-year, 100 percent fixed fee gathering agreements that include significant acreage dedications and cost of service mechanisms. In addition, CMD committed to pay us quarterly for any shortfall between the actual EBITDA generated by these gas gathering systems and specified quarterly targets totaling $100 million in 2012 and $150 million in 2013. EBITDA generated by these gas gathering systems exceeded the specified EBITDA commitment in 2012.
The results of operations presented and discussed in this annual report include results of operations from Appalachia Midstream for the full year of operations in 2012 and the two-day period from closing of the acquisition on December 29, 2011, through December 31, 2011.
We acquired additional assets in the Marcellus Shale region through the acquisition of CMO in December 2012.
Our Haynesville Springridge Acquisition
On December 21, 2010, we acquired the Springridge gathering system and related facilities located in Caddo and De Soto Parishes, Louisiana from CMD for $500.0 million. In connection with the acquisition, we entered into a 10-year, 100 percent fixed-fee gas gathering agreement with Chesapeake that includes a significant acreage dedication, an annual fee redetermination and a three-year minimum volume commitment.
Our Operations
We operate assets in the Barnett Shale region in north-central Texas, the Eagle Ford Shale region in southwest Texas, the Haynesville Shale region in northwest Louisiana, the Marcellus Shale region primarily in Pennsylvania and West Virginia, the Niobrara Shale region in Wyoming, the Utica Shale region in northeast Ohio, and our Mid-Continent region, which includes the Anadarko, Arkoma, Delaware and Permian Basins.
We generated approximately 54 percent of our fees from our gathering systems in the Barnett Shale region, approximately 19 percent of our fees from our gathering systems in the Marcellus Shale region, approximately 18 percent of our fees from our gathering systems in our Mid-Continent region and approximately 9 percent of our fees from our gathering systems in the Haynesville Shale region for the year ended December 31, 2012. The CMO assets contributed to our income during the 12-day period from closing of the acquisition to December 31, 2012, but the impact was immaterial to our results.
The results of our operations are primarily driven by the volumes of natural gas and liquids we gather, treat, compress and process across our gathering systems. We currently provide all of our midstream services pursuant to fixed fee contracts, which limit our direct commodity price exposure, and we generally do not take title to the natural gas or NGLs we gather. We have entered into long-term gas gathering and processing agreements with Chesapeake, Total, Statoil, Anadarko, Mitsui, and other producers. Pursuant to our commercial agreements, our producer customers have agreed to dedicate extensive acreage in our operating regions.
Our Commercial Agreements with Producers
We generate substantially all of our revenues through long-term, fixed-fee natural gas gathering, treating and compression contracts, and increasingly through processing contracts, all of which limit our direct commodity price exposure.
Future revenues under our commercial agreements with producers will be derived pursuant to terms that will vary depending on the applicable operating region. The following outlines the key economic provisions of our commercial agreements by region.
Barnett Shale Region.Under our gas gathering agreements with Chesapeake and Total, we have agreed to provide the following services in our Barnett Shale region for the fees and obligations outlined below:
| • | Gathering, Treating and Compression Services. We gather, treat and compress natural gas for Chesapeake and Total within the Barnett Shale region in exchange for specified fees per thousand cubic feet (“Mcf”) for natural gas gathered on our gathering systems that are based on the pressure at the various points where our gathering systems received our customers’ natural gas. We refer to these fees collectively as the Barnett Shale fee. Our Barnett Shale fee is subject to an annual rate escalation of two percent at the beginning of each year. |
2
Table of Contents
| • | Acreage Dedication. Pursuant to our gas gathering agreements, subject to certain exceptions, each of Chesapeake and Total has agreed to dedicate all of the natural gas owned or controlled by it and produced from or attributable to existing and future wells located on natural gas and oil leases covering lands within an acreage dedication in our Barnett Shale region. |
| • | Minimum Volume Commitments. Pursuant to our gas gathering agreements, Chesapeake and Total have agreed to minimum volume commitments for each year through December 31, 2018 and for the six-month period ending June 30, 2019. Approximately 75 percent of the aggregate minimum volume commitment is attributed to Chesapeake, and approximately 25 percent is attributed to Total. The minimum volume commitments increase, on average, approximately 3 percent per year. The following table outlines the approximate aggregate minimum volume commitments for each year during the minimum volume commitment period: |
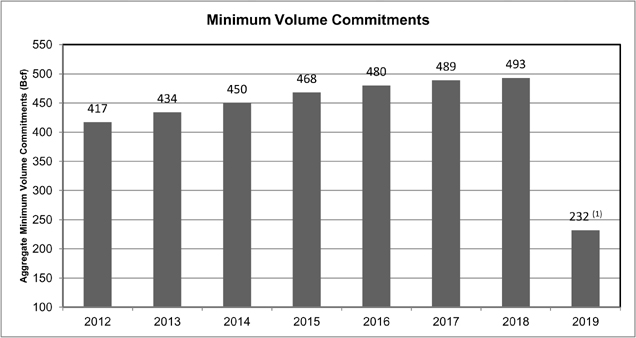
| (1) | Indicated volumes relate to the six months ending June 30, 2019. |
If either Chesapeake or Total does not meet its minimum volume commitment to us, as adjusted in certain instances, for any annual period (or six-month period in the case of the six months ending June 30, 2019) during the minimum volume commitment period, Chesapeake or Total, as applicable, will be obligated to pay us a fee equal to the Barnett Shale fee for each Mcf by which the applicable party’s minimum volume commitment for the year (or six-month period) exceeds the actual volumes gathered on our systems attributable to the applicable party’s production. To the extent natural gas gathered on our systems from Chesapeake or Total, as applicable, during any annual period (or six-month period) exceeds such party’s minimum volume commitment for the period, Chesapeake or Total, as applicable, will be obligated to pay us the Barnett Shale fee for all volumes gathered, and the excess volumes will be credited first against the minimum volume commitments for the six months ending June 30, 2019, and then against the minimum volume commitments of each preceding year. If the minimum volume commitment for any period is credited in full, the minimum volume commitment period will be shortened to end on the final day of the immediately preceding period.
| • | Fee Redetermination.In May 2012, we entered into an agreement with Chesapeake and Total relating to the initial redetermination period. The agreement called for an upward adjustment of the Barnett Shale fee and was effective July 1, 2012. We and each of Chesapeake and Total, as applicable, have the right to request an additional redetermination of the Barnett Shale fee during a two-year period beginning on September 30, 2014. The fee redetermination mechanism is intended to support a return on our invested capital. If a fee redetermination is requested, we will determine an adjustment (upward or downward) to our Barnett Shale fee with Chesapeake and Total based on the factors specified in our gas gathering agreements, including, but not limited to: (i) differences between our actual capital expenditures, compression expenses and revenues as of the redetermination date and the scheduled estimates of these amounts for the minimum volume commitment period made as of September 30, 2009 and (ii) differences between the revised estimates of our capital expenditures, compression expenses and revenues for the remainder of the minimum volume commitment period forecast as of the redetermination date and |
3
Table of Contents
scheduled estimates thereof for the minimum volume commitment period made as of September 30, 2009. The cumulative upward or downward adjustment for the Barnett Shale region is capped at 27.5 percent of the initial weighted average Barnett Shale fee (as escalated) as specified in the gas gathering agreement. If we and Chesapeake or Total, as applicable, do not agree upon a redetermination of the Barnett Shale fee within 30 days of receipt of the request for the redetermination, an industry expert will be selected to determine adjustments to the Barnett Shale fee. |
| • | Well Connection Requirement. Subject to required notice by Chesapeake and Total and certain exceptions, we have generally agreed to connect new operated drilling pads and new operated wells within our Barnett Shale region acreage dedications as requested by Chesapeake and Total during the minimum volume commitment period. During the minimum volume period, if we fail to complete a connection in the acreage dedication by the required date, Chesapeake and Total, as their sole remedy for such delayed connection, are entitled to a delay in the minimum volume obligations for gas volumes that would have been produced from the delayed connection. |
| • | Fuel and Lost and Unaccounted For Gas. We have agreed with Chesapeake and Total on caps on fuel and lost and unaccounted for gas on our systems, both on an individual basis and an aggregate basis, with respect to Chesapeake’s and Total’s volumes. These caps do not apply to certain of our gathering systems due to their historic performance relative to the caps. These systems will be reviewed annually to determine whether changes have occurred that would make them suitable for inclusion. If we exceed a permitted cap in any covered period, we may incur significant expenses to replace the natural gas used as fuel and lost or unaccounted for in excess of such cap based on then current natural gas prices. Accordingly, this replacement obligation will subject us to direct commodity price risk. |
Eagle Ford Shale Region. Under our gas gathering agreement that we entered into with our producer customer, as part of the CMO Acquisition, we have agreed to provide the following services in our Eagle Ford Shale region for the fees and obligations outlined below:
| • | Gathering, Compression, Dehydration and Treating Services. We will gather, compress, dehydrate and treat natural gas and liquids for the producers within the Eagle Ford Shale region in exchange for a cost of service based fee for natural gas and liquids gathered and treated on our gathering systems. The cost of service components will include revenue, compression expense, deemed general and administrative expense, capital expenditures, fixed and variable operating expenses and other metrics. We refer to these fees collectively as the Eagle Ford fee. |
| • | Acreage Dedication. Subject to certain exceptions, our producer customer has agreed to dedicate all of the natural gas and liquids owned or controlled by it and produced from the Eagle Ford Shale formation through existing and future wells with a surface location within the dedicated area in the Eagle Ford Shale region. |
| • | Fee Redetermination. During 2013 and 2014, the Eagle Ford fee is determined by a fee tiering mechanism that calculates the Eagle Ford fee on a monthly basis according to the quantity of gas delivered to us by our producer customer relative to its scheduled deliveries. Effective on January 1, 2015 and January 1 of each year thereafter for a period of 20 years from July 1, 2012, the Eagle Ford fee will be redetermined based on a cost of service calculation that targets a specified pre-income tax rate of return on invested capital. There is no cap on these adjustments. |
| • | Well Connection Requirement. Subject to required notice by our producer customer, we will have the option to connect new operated wells within our Eagle Ford Shale region acreage dedications as requested by the producer customer. If we elect not to connect a new operated well, the producer will be provided alternative forms of release. Subject to certain conditions specified in the applicable gas gathering agreement, if we elect to connect a new well to our gathering systems, we are generally required to connect the new wells within specified timelines subject to penalties for delayed connections, up to a specified cap, and the potential for a well pad release from the producer customer’s acreage dedication in certain circumstances. |
| • | Fuel and Lost and Unaccounted For Gas. We have agreed with the producer customer to a cap on fuel and lost and unaccounted for gas on our systems with respect to the producer customer’s volumes. The cap is based on a percentage per deemed compression stage and a percentage for lost and unaccounted for gas. If we exceed a permitted cap in any covered period and do not respond in a timely manner with a proposed solution, we may incur significant expenses to replace the natural gas used as fuel or lost and unaccounted for in excess of such cap based on then-current natural gas prices. Accordingly, this replacement obligation may subject us to direct commodity price risk. |
4
Table of Contents
Haynesville Shale Region.Under our gas gathering agreement that we entered into with our producer customer, we have agreed to provide the following services in our Haynesville Shale region for the fees and obligations outlined below:
Springridge Gathering System
| • | Gathering, Treating and Compression Services.We gather, treat and compress natural gas in exchange for fees per Mcf for natural gas gathered and per Mcf for natural gas compressed, which we refer to as the Springridge fees. The Springridge fees for these systems are subject to an annual specified rate escalation at the beginning of each year. |
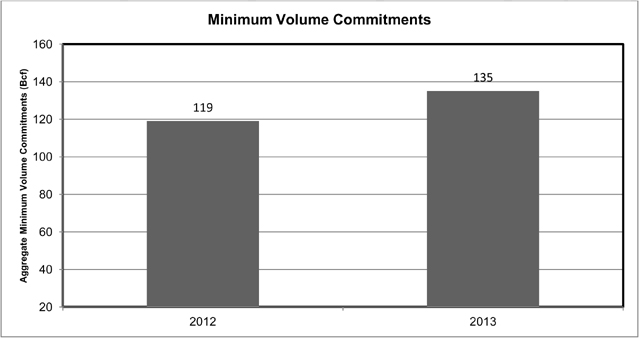
| • | Minimum Volume Commitments. Pursuant to our gas gathering agreement, our producer customer has agreed to minimum volume commitments for each year through December 31, 2013. In the event our producer customer does not meet its minimum volume commitment to us, as adjusted in certain instances, for any annual period during the minimum volume commitment period, it will be obligated to pay us a fee equal to the Springridge fee for each Mcf by which the minimum volume commitment for the year exceeds the actual volumes gathered on our systems attributable to its production. To the extent natural gas gathered on our systems from our producer customer during any annual period exceeds its minimum volume commitment for the period, it will be obligated to pay us the Springridge fee for all volumes gathered, and the excess volumes will be credited first against the minimum volume commitments for the year 2013, and then against the minimum volume commitments of each preceding year. In the event that the minimum volume commitment for any period is credited in full, the minimum volume commitment period will be shortened to end on the final day of the immediately preceding period. |
| • | Acreage Dedication. Pursuant to our gas gathering agreement, subject to certain exceptions, our producer customer has agreed to dedicate all of the natural gas owned or controlled by them and produced from or attributable to existing and future wells located on oil, natural gas and mineral leases within the Springridge acreage dedication. |
| • | Fee Redetermination. The Springridge fees are subject to a redetermination mechanism. The first redetermination period will extend from December 1, 2010 through December 31, 2012, and subsequent redetermination periods will be the calendar years 2013 through 2020. We will determine an adjustment to fees for the gathering systems in the region with our producer customer based on the factors specified in the gas gathering agreement, including, but not limited to, differences between our actual capital expenditures, compression expenses and revenues as of the redetermination date and the scheduled estimates of these amounts for the period ending December 31, 2020, referred to as the redetermination period, made as of November 30, 2010. The annual upward or downward fee adjustment for the Springridge region is capped at 15 percent of the then-current fees at the time of redetermination. |
5
Table of Contents
| • | Well Connection Requirement. We have certain connection obligations for new operated drilling pads and operated wells of our producer customer in the acreage dedications. Our producer customer is required to provide us notice of new drilling pads and wells operated by our producer customer in the acreage dedications. Subject to certain conditions specified in the gas gathering agreement, we are generally required to connect new operated drilling pads in the acreage dedication by the later of 30 days after the date the wells commence production and six months after the date of the connection notice. During the minimum volume period, if we fail to complete a connection in the Springridge acreage dedication by the required date, our producer customer, as its sole remedy for such delayed connection, is entitled to a delay in the minimum volume obligations for gas volumes that would have been produced from the delayed connection. After the minimum volume period, we are subject to a daily penalty for such delayed connections, up to a specified cap per delayed connection. Our producer customer also is required to notify us of its wells drilled in the acreage dedications that are operated by other parties and we have the option, but not the obligation, to connect non-operated wells to our gathering systems. If we decline to make a connection to a non-operated well, our producer customer has certain rights to have the well released from the dedication under the gas gathering agreement. |
| • | Fuel and Lost and Unaccounted For Gas.We have agreed with our producer customer on caps on fuel and lost and unaccounted for gas on our systems with respect to our producer customer’s volumes. These caps do not apply to one of our compressor stations due to its historical performance relative to the caps. This station will be reviewed periodically to determine whether changes have occurred that would make it suitable for inclusion. If we exceed a permitted cap in any covered period, we may incur significant expenses to replace the natural gas used as fuel or lost and unaccounted for in excess of such cap based on then current natural gas prices. Accordingly, this replacement obligation may subject us to direct commodity price risk. |
Mansfield Gathering System
| • | Gathering, Dehydration, Compression and Treating Services. We will gather, dehydrate, compress and to the extent provided, treat natural gas in exchange for a fixed fee per MMBtu for natural gas gathered. We refer to this fee as the Mansfield fee. The Mansfield fee is subject to an annual 2.5 percent rate escalation at the beginning of each year. |
| • | Acreage Dedication. Subject to certain exceptions, our producer customer has agreed to dedicate all of the natural gas owned or controlled by it and produced from the Bossier and Haynesville formations through existing and future wells with a surface location within the dedicated area in the Mansfield acreage dedication. |
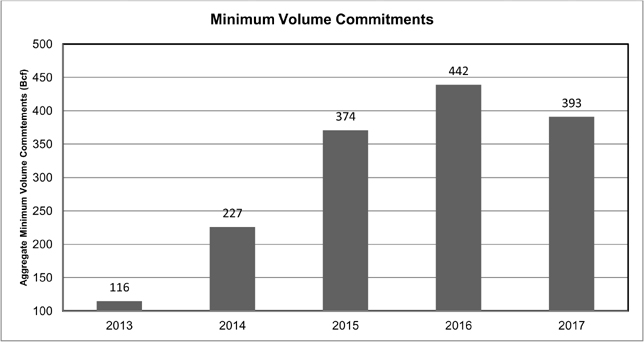
| • | Minimum Volume Commitments. Pursuant to our gas gathering agreement, our producer customer has agreed to minimum volume commitments for each year through December 31, 2017. If our producer customer does not meet its minimum volume commitments to us, as adjusted in certain instances, for any annual period during the minimum volume commitment period, it will be obligated to pay us the difference between the minimum volume commitment and the volume of gas delivered from its wells. |
6
Table of Contents
| • | Fixed Fee/Tiered Fees. During the minimum volume commitment period, the Mansfield fee is a fixed fee on all monthly volumes. Subsequent to that period, our producer customer will pay a tiered fee that calculates the Mansfield fee on a monthly basis according to the quantity of gas delivered to us from our producer customer’s wells relative to its scheduled deliveries. |
| • | Well Connection Requirement. We have certain connection obligations for new operated wells of our producer customer in the acreage dedications. Our producer customer is required to provide us notice of new wells that it operates in the acreage dedications. Subject to certain conditions specified in the applicable gas gathering agreement, we are generally required to connect new wells within specified timelines subject to minimum volume commitment delays for volumes that would have been received from the new wells during the minimum volume commitment period and penalties up to a specified cap after the minimum volume commitment period. |
| • | Fuel and Lost and Unaccounted For Gas. We have agreed with our producer customer on percentage-based caps on fuel and lost and unaccounted for gas on our systems with respect to our producer customer’s volumes. If we exceed a permitted cap in any covered period, we may incur significant expenses to replace the natural gas used as fuel or lost and unaccounted for in excess of such cap based on then current natural gas prices. Accordingly, this replacement obligation may subject us to direct commodity price risk. |
Marcellus Shale Region.Under our gas gathering agreements with certain subsidiaries of Chesapeake, Statoil, Anadarko, Epsilon, Mitsui and Chief, we have agreed to provide the following services in our Marcellus Shale region for our proportionate share (based on our ownership interest in the applicable systems) of the fees and obligations outlined below:
| • | Gathering and Compression Services.In systems operated by Appalachia Midstream, we gather and compress natural gas in exchange for fees per million British thermal units (“MMBtu”) of natural gas gathered and per MMBtu of natural gas compressed. The gathering fees are redetermined annually based on a cost of service mechanism, as described below. The compression fees escalate on January 1 of each year based on the consumer price index. In addition, CMD has committed to pay us quarterly any shortfall between the actual EBITDA generated by these assets and specified quarterly targets totaling $100 million in 2012 and $150 million in 2013. EBITDA generated by these assets exceeded the $100 million target for 2012 and no additional revenue related to the commitment was recognized. The target for 2013 represents the minimum amount of EBITDA we will recognize with the potential that throughput for these systems will generate EBITDA in excess of the guaranteed amounts. The following table below outlines the EBITDA commitments for each quarter during the commitment period. In the systems acquired as part of the CMO Acquisition, we gather and compress natural gas in exchange for a gathering fee per MMBtu, which is redetermined annually based on a cost of service mechanism. |
7
Table of Contents
| • | Acreage Dedication.Pursuant to our gas gathering agreements, subject to certain exceptions, the shippers and producers have agreed to dedicate all of the natural gas owned or controlled by them and produced from or attributable to existing and future wells with a surface location within the designated dedicated areas. |
| • | Fee Redetermination.Each January 1, gathering fees for each gathering system under the gas gathering agreements with Chesapeake, Statoil, Anadarko, Epsilon and Mitsui will be redetermined based on a cost of service calculation that targets a specified pre-income tax rate of return on invested capital. There is no cap on these fee adjustments. Each January 1, gathering fees for each gathering system under the gas gathering agreement with Chief are adjusted based on the applicable producer price index. The change in the amount of the gathering fees under the Chief agreement is not to exceed 3 percent in any one year. |
| • | Well Connections.We have the option to connect to new wells within the dedicated acreage. If we elect not to connect to any new well within the dedicated acreage, the shipper for such well may elect to have such well, and any subsequent wells within a two-mile radius (in the case of Chesapeake, Statoil, Anadarko, Epsilon and Mitsui) or a one-mile radius (in the case of Chief) of the surface location of such well, permanently released from the dedication area, or the shipper may elect to construct, at the shipper’s expense, a gathering system to connect to such well (and wells within a one-mile radius of such well in the case of Chesapeake, Statoil, Anadarko, Epsilon and Mitsui), in which case the shipper would pay us a reduced gathering fee for natural gas we receive through the shipper-installed asset. Alternatively, the shipper may require us to enter into an agreement pursuant to which we would construct the gathering system to connect to the well in exchange for a reimbursement by the shipper of the costs we incur in connection therewith. The shipper may elect to connect wells outside the dedicated area at its sole expense and pay us a reduced gathering fee for natural gas we receive from such wells, but gas from such outside wells will not be afforded the same priority as gas produced from wells located within the dedicated area. In the systems acquired as part of the CMO Acquisition, subject to certain conditions specified in the applicable gas gathering agreement, if we elect to connect a new well to our gathering systems, we are generally required to connect the new wells within specified timelines subject to penalties for delayed connections, up to a specified cap, and the potential for a well pad release from the producer’s acreage dedication in certain circumstances. |
8
Table of Contents
| • | Fuel and Lost and Unaccounted For Gas. Under our gas gathering agreements with Chesapeake, Statoil, Anadarko, Epsilon and Mitsui, we have agreed on caps on fuel and lost and unaccounted for gas on the systems. If we exceed the permitted cap, we must provide a cost estimate for a remedy that is reasonably expected to prevent exceeding the permitted cap in the future. At the election of the shippers we may pay such costs (which costs would then be included in the gathering fee redetermination) or the shippers may pay the costs. If we exceed the permitted cap and do not provide a proposal to the shippers to prevent exceeding the cap in the future within the required time period, we may incur our proportionate share (based on our ownership interest in the applicable system) of significant expenses in connection with the natural gas used as fuel or lost and unaccounted for in excess of such cap based on then current natural gas prices. Accordingly, this may subject us to direct commodity price risk. |
Under gas gathering agreements between Appalachia Midstream and certain subsidiaries of Chief, the shipper on each system is to furnish to us, at the shipper’s sole cost and expense, all necessary fuel gas to operate the system. Gas volumes lost solely due to our actions or inactions constituting gross negligence or willful misconduct are our sole responsibility. Additionally, we will bear the cost of natural gas lost in excess of one percent due to our failure to maintain adequate corrosion protection. If we lose natural gas due to our gross negligence or willful misconduct or our failure to maintain an adequate corrosion protection system, we may incur significant expenses in connection with the cost of the lost natural gas. Our responsibility for the cost of the lost gas may subject us to direct commodity price risk.
Niobrara Shale Region. Under our gas gathering and processing agreement that we entered into with our producer customer, as part of the CMO Acquisition, we have agreed to provide the following services in our Niobrara Shale region for the fees and obligations outlined below:
| • | Gathering, Compression, Dehydration and Processing Services. We will gather, compress, dehydrate and process natural gas and liquids within the Niobrara region in exchange for a cost of service based fee for natural gas and liquids gathered on our gathering systems and for natural gas and liquids processed at our proposed processing facility. The cost of service components will include revenues, compression expense, deemed general and administrative expense, capital expenditures, fixed and variable operating expenses and other metrics. We refer to these fees collectively as the Niobrara fee. |
| • | Acreage Dedication. Subject to certain exceptions, our producer customer has agreed to dedicate all of the natural gas and liquids owned or controlled by them and produced from the Frontier Sand and the Niobrara Shale through existing and future wells with a surface location within the dedicated areas in the Niobrara Shale region. |
| • | Fee Redetermination. Effective on January 1, 2014 and January 1st of each year thereafter for a period of 20 years from July 1, 2012, the Niobrara fee will be redetermined based on a cost of service calculation that targets a specified pre-income tax rate of return on invested capital. There is no cap on these fee adjustments. |
| • | Well Connections. Subject to required notice by our producer customer, we will have the option to connect new operated wells within our Niobrara region acreage dedications as requested by such producer customer. If we elect not to connect a new operated well, the producer customer will be provided alternative forms of release. Subject to certain conditions specified in the gas gathering agreement, if we elect to connect a new well to our gathering systems, we are generally required to connect the new wells within specified timelines subject to penalties for delayed connections up to a specified cap, and the potential for a well pad release from the producer customer’s acreage dedication in certain circumstances. |
| • | Fuel and Lost and Unaccounted For Gas. We have agreed with our producer customer to a cap on fuel and lost and unaccounted for gas on our systems with respect to the producer customer’s volumes. The cap is based on a percentage per deemed compression stage and a percentage for lost and unaccounted for gas. If we exceed a permitted cap in any covered period and do not respond in a timely manner with a proposed solution, we may incur significant expenses to replace the natural gas used as fuel or lost and unaccounted for in excess of such cap based on then current natural gas prices. Accordingly, this replacement obligation may subject us to direct commodity price risk. |
Utica Shale Region. Under our commercial agreements that we entered into with Chesapeake, Total and Enervest, acquired as part of the CMO Acquisition, we have agreed to provide the following services in our Utica Shale region to our producer customers for the fees and obligations of our producer customers outlined below:
| • | Gathering, Compression, Dehydration, Processing and Fractionation Services. We will gather, compress and dehydrate natural gas and liquids in exchange for a cost of service based fee for natural gas and liquids gathered on our gathering systems. The cost of service components (i) for our 66 percent operating interest in a joint venture that owns five wet gas gathering systems (the “Cardinal JV”), and (ii) in the area covered |
9
Table of Contents
by our 100 percent ownership interest in four dry gas gathering systems (the “Utica Dry”) will include revenues, compression expense (in the case of the Utica Dry only), deemed general and administrative expense, capital expenditures, fixed and variable operating expenses and other metrics. We also will process and fractionate natural gas and liquids through our 49 percent non-operating interest in a joint venture that is currently constructing four 200 MMcf/d processing trains, a 120,000 barrel per day fractionation facility, approximately 870,000 barrels of NGL storage capacity and other ancillary assets (the “UEO JV”) for a fixed fee that escalates annually within a specified range. The Partnership refers to these fees collectively as the Utica fee. |
| • | Acreage Dedication. Subject to certain exceptions, our producer customers have agreed to dedicate all of the natural gas and liquids owned or controlled by them and produced from the Utica Shale formation through existing and future wells with a surface location within the dedicated areas in the Utica Shale region. The UEO JV has a processing and fractionation dedication with a designated dedication area from Chesapeake, Total and Enervest for 800 MMcf/d. |
| • | Fee Redetermination. Beginning on October 1, 2013 for the Cardinal JV and January 1, 2014 for Utica Dry and annually thereafter, for a period of 20.75 years from January 1, 2012 (Cardinal JV) and 15 years from July 1, 2012 (Utica Dry), the gathering fee portion of the Utica fee will be redetermined based on a cost of service calculation that targets a specified pre-income tax rate of return on invested capital. There is no cap on these fee adjustments. |
| • | Well Connections. In the Cardinal JV, we are generally required to connect new wells within specified timelines subject to penalties for delayed connections in the form of a temporary reduction in the gathering fee for the new well. In Utica Dry, subject to required notice by the producer customer, we will have the option to connect new operated wells within our dedicated acreage as requested by the producer customer. If we elect not to connect a new operated well, the producer customer will be provided alternative forms of release. Subject to certain conditions specified in the gas gathering agreement, if we elect to connect a new well to our gathering systems, we are generally required to connect the new wells within specified timelines subject to penalties for delayed connections, up to a specified cap, and the potential for a well pad release from the producer’s acreage dedication in certain circumstances. |
| • | Processing and Fractionation Performance Standards. We have agreed with our producer customers to certain performance standards for the UEO JV, including guaranteed in-service dates, minimum facility run-time standards, minimum propane recovery standards, and fuel caps. If the UEO JV fails to achieve any of these performance standards as specified, the fees associated with these services will be temporarily reduced. |
| • | Fuel and Lost and Unaccounted For Gas. We have agreed with the producer customers to a cap on fuel and lost and unaccounted for gas on our systems with respect to each producer’s volumes. The cap is based on a percentage per deemed compression stage and a percentage for lost and unaccounted for gas. If we exceed a permitted cap in any covered period, we may incur significant expenses to replace the natural gas used as fuel or lost and unaccounted for in excess of such cap based on then current natural gas prices. Accordingly, this replacement obligation may subject us to direct commodity price risk. In Utica Dry, exceeding the permitted cap does not result in a reimbursement to the Utica producers if we respond in a timely manner with a proposed solution. |
Mid-Continent Region.Under our gas gathering agreement with producer customers, we have agreed to provide the following services in our Mid-Continent region to our producer customers for the fees and obligations of our producer customers outlined below:
| • | Gathering, Treating and Compression and Processing Services.We gather, treat, compress and process natural gas and NGLs in exchange for system-based services fees per Mcf for natural gas gathered and per Mcf for natural gas compressed. We refer to the fees collectively as the Mid-Continent fee. The Mid-Continent fees for these systems are subject to an annual two and a half percent rate escalation at the beginning of each year. |
| • | Acreage Dedication.Pursuant to our gas gathering agreement, subject to certain exceptions, our producer customers have agreed to dedicate all of the natural gas and liquids owned or controlled by them and produced from or attributable to existing and future wells located on oil, natural gas and mineral leases covering lands within the acreage dedication. |
10
Table of Contents
| • | Fee Redetermination. The Mid-Continent fees are redetermined at the beginning of each year through 2019. We and our producer customers will determine an adjustment to fees for the gathering systems in the region with our producer customers based on the factors specified in the gas gathering agreement, including, but not limited to, differences between our actual capital expenditures, compression expenses and revenues as of the redetermination date and the scheduled estimates of these amounts for the period ending June 30, 2019, referred to as the redetermination period, made as of September 30, 2009. The annual upward or downward fee adjustment for the Mid-Continent region is capped at 15 percent of the then current fees at the time of redetermination. |
| • | Well Connection Requirement.Subject to required notice by our producer customers and certain exceptions, we have generally agreed to use our commercially reasonable efforts to connect new operated drilling pads and new operated wells in our Mid-Continent region acreage dedications as requested by our producer customers through June 30, 2019. |
| • | Fuel and Lost and Unaccounted For Gas.We have agreed with our producer customers on caps on fuel and lost and unaccounted for gas on our systems, both on an individual basis and an aggregate basis, with respect to our producer customers volumes. These caps do not apply to certain of our gathering systems due to their historic performance relative to the caps. These systems will be reviewed annually to determine whether changes have occurred that would make them suitable for inclusion. If we exceed a permitted cap in any covered period, we may incur significant expenses to replace the natural gas used as fuel or lost or unaccounted for in excess of such cap based on then current natural gas prices. Accordingly, this replacement obligation will subject us to direct commodity price risk. |
As part of the CMO Acquisition, we acquired a 33% equity interest in Ranch Westex JV, LLC, which we own jointly with Regency Energy Partners, LP and Anadarko Pecos Midstream LLC. Under a gas processing agreement with Chesapeake and Anadarko, Ranch Westex JV, LLC provides gas processing services under a cost of service fee arrangement.
All Regions. If one of the counterparties to the gas gathering agreements sells, transfers or otherwise disposes of to a third party properties within the our acreage dedications, it does so subject to the terms of the gas gathering agreement, including our dedication, and it will be required to cause the third party to acknowledge and take assignment of the counterparty’s obligations under the existing gas gathering agreement with the Partnership, subject to our consent. Our producer customers’ dedication of the gas produced from applicable properties under our gas gathering agreements will run with the land in order to bind successors to the producer customers’ interest, as well as any interests in the dedicated properties subsequently acquired by the producer customer.
Other Arrangements
Services Arrangements.Under our services agreement with Chesapeake, Chesapeake has agreed to provide us with certain general and administrative services and any additional services we may request. We reimburse Chesapeake for such general and administrative services in any given month subject to a cap equal to $0.0310 per Mcf multiplied by the volume (measured in Mcf) of natural gas and liquids that we gather, treat or compress. The fee is calculated as the lesser of $0.0310 per Mcf gathered or actual corporate overhead costs, excluding those overhead costs that are billed directly to the Partnership. The $0.0310 per Mcf cap is subject to an annual upward adjustment on October 1 of each year equal to 50 percent of any increase in the Consumer Price Index, and, subject to receipt of requisite approvals, such cap may be further adjusted to reflect changes in general and administrative services provided by Chesapeake relating to new laws or accounting rules that are implemented. The cap contained in the services agreement does not apply to our direct general and administrative expenses.
Additionally, pursuant to an employee secondment agreement, specified employees of Chesapeake were seconded to our general partner to provide operating, routine maintenance and other services with respect to our business under the direction, supervision and control of our general partner. Our general partner, subject to specified exceptions and limitations, reimbursed Chesapeake on a monthly basis for substantially all costs and expenses it incurred relating to such seconded employees.
On June 15, 2012, in connection with the closing of the first portion of the acquisition by the GIP II Entities of Chesapeake’s ownership interest in the Partnership (the “GIP Acquisition”), we entered into a letter agreement with Chesapeake regarding the terms on which Chesapeake will provide certain transition services to the Partnership and our general partner following the GIP Acquisition by the GIP II Entities. Among other things, the letter agreement provides for the continuation of our services agreement and secondment agreement with Chesapeake until December 31, 2013. On June 29, 2012, we entered into an amendment to the letter agreement amending certain terms relating to the insurance coverage to be provided under our services agreement and altering the workers’ compensation insurance endorsements for our general partner under our secondment agreement. On December 20, 2012 in connection with the CMO Acquisition, we entered into another amendment to the letter agreement amending certain terms relating primarily to the extension of transition services for technology related services through March 2014 and through June 2014 for certain field communication support services. The secondment agreement and employee transfer agreement each terminated on January 1, 2013.
11
Table of Contents
How We Evaluate Our Operations
Our management relies on certain financial and operational metrics to analyze our performance. These metrics are significant factors in assessing our operating results and profitability and include (i) throughput volumes, (ii) revenues, (iii) operating expenses, (iv) Adjusted EBITDA, (v) distributable cash flow and (vi) segment operating income.
Throughput Volumes
Our management analyzes our performance based on the aggregate amount of throughput volumes on our gathering systems in our operating regions in order to maintain or increase throughput volumes on our gathering systems as a whole. Our success in connecting additional wells is impacted by successful drilling activity on the acreage dedicated to our systems, our ability to secure volumes from new wells drilled on non-dedicated acreage, our ability to attract natural gas and liquids volumes currently gathered by our competitors and our ability to cost-effectively construct new infrastructure to connect new wells.
Revenues
Our revenues are driven primarily by our contractual terms with our customers and the actual volumes of natural gas we gather, treat and compress, and increasingly by the actual volumes of natural gas we process. Our revenues will be supported by the minimum volume commitments contained in our gas gathering agreements with Chesapeake and Total in the case of our Barnett Shale and Chesapeake in the case of our Haynesville Shale as well as fee redetermination and cost of service provisions in our other regions. We contract with producers to gather natural gas or liquids from individual wells located near our gathering systems. We connect wells to gathering pipelines through which natural gas is compressed and may be delivered to a treating facility, processing plant or an intrastate or interstate pipeline for delivery to market. We treat natural gas and liquids that we gather to the extent necessary to meet required specifications of third-party takeaway pipelines. For the years ended December 31, 2012, 2011 and 2010, Chesapeake accounted for approximately 81 percent, 84 percent and 81 percent, respectively, of the natural gas volumes on our gathering systems and 81 percent, 83 percent and 82 percent, respectively, of our revenues. Across all operating regions, we earned approximately 75.3 percent of our fees from Chesapeake and 24.7 percent from other producer customers for the year ended December 31, 2012.
Our revenues are also impacted by other aspects of our contractual agreements, including rate redetermination, cost of service and other contractual provisions and our management constantly evaluates capital spending and its impact on future revenue generation.
Operating Expenses
Our management seeks to maximize the profitability of our operations by minimizing operating expenses without compromising environmental protection and employee safety. Operating expenses are comprised primarily of field operating costs (which include labor, treating and chemicals, and measurements services among other items), compression expense, ad valorem and taxes and other operating costs, some of which are independent of the volumes that flow through our systems but fluctuate depending on the scale of our operations during a specific period.
Adjusted EBITDA and Distributable Cash Flow
We define Adjusted EBITDA as net income (loss) before income tax expense (benefit), interest expense, depreciation and amortization expense and certain other items management believes effect the comparability of operating results.
We define distributable cash flow as Adjusted EBITDA, plus interest income, less cash paid for interest expense, maintenance capital expenditures and income taxes. Distributable cash flow does not reflect changes in working capital balances. Distributable cash flow and Adjusted EBITDA are not presentations made in accordance with generally accepted accounting principles (“GAAP”).
We did not utilize a distributable cash flow measure prior to becoming a publicly traded partnership in 2010 and, as such, did not differentiate between maintenance and capital expenditures prior to 2010 and do not report distributable cash flow for periods prior to 2010.
12
Table of Contents
Adjusted EBITDA and distributable cash flow are non-GAAP supplemental financial measures that management and external users of our consolidated financial statements, such as industry analysts, investors, lenders and rating agencies, may use to assess:
| • | our operating performance as compared to other publicly traded partnerships in the midstream energy industry, without regard to historical cost basis, or in the case of Adjusted EBITDA, financing methods; |
| • | our ability to incur and service debt and fund capital expenditures; |
| • | the ability of our assets to generate sufficient cash flow to make distributions to our unitholders; and |
| • | the viability of acquisitions and other capital expenditure projects and the returns on investment of various investment opportunities. |
Segment Operating Income
Prior to the CMO Acquisition, our operations were organized into a single business segment. As a result of the CMO Acquisition, we added assets in three new operating regions. Effective January 1, 2013, our chief operating decision maker began to analyze and make operating decisions based on geographic segments. Our operations are divided into eight operating segments: Barnett Shale, Eagle Ford Shale, Haynesville Shale, Marcellus Shale, Niobrara Shale, Utica Shale, Mid-Continent region and Corporate.
Reconciliation to GAAP measures
We believe that the presentation of Adjusted EBITDA and distributable cash flow provides useful information to investors in assessing our financial condition and results of operations. Adjusted EBITDA and distributable cash flow are presented because they are helpful to management, industry analysts, investors, lenders and rating agencies and may be used to assess the financial performance and operating results of our fundamental business activities. The GAAP measures most directly comparable to Adjusted EBITDA and distributable cash flow are net income and net cash provided by operating activities. Our non-GAAP financial measures of Adjusted EBITDA and distributable cash flow should not be considered as an alternative to GAAP net income or net cash provided by operating activities. Each of Adjusted EBITDA and distributable cash flow has important limitations as an analytical tool because it excludes some but not all items that affect net income and net cash provided by operating activities. You should not consider either Adjusted EBITDA or distributable cash flow in isolation or as a substitute for analysis of our results as reported under GAAP. Because Adjusted EBITDA and distributable cash flow may be defined differently by other companies in our industry, our definitions of Adjusted EBITDA and distributable cash flow may not be comparable to similarly titled measures of other companies, thereby diminishing their utility.
The following table presents a reconciliation of the non-GAAP financial measures of Adjusted EBITDA and distributable cash flow to the GAAP financial measures of net income and net cash provided by operating activities:
| Year Ended December 31, 2012 | Year Ended December 31, 2011 | Year Ended December 31, 2010 | ||||||||||
| ($ in thousands) | ||||||||||||
Reconciliation of Adjusted EBITDA and Distributable cash flow to net income: | ||||||||||||
Net income attributable to Access Midstream Partners, L.P. | $ | 178,455 | $ | 194,337 | $ | 195,227 | ||||||
Interest expense | 64,739 | 14,884 | 7,426 | |||||||||
Income tax expense | 3,214 | 3,289 | 2,431 | |||||||||
Depreciation and amortization expense | 165,517 | 136,169 | 88,601 | |||||||||
Other | (820 | ) | 739 | 285 | ||||||||
Income from unconsolidated affiliates | (67,542 | ) | (433 | ) | — | |||||||
EBITDA from unconsolidated affiliates | 116,887 | 488 | — | |||||||||
Acquisition transaction costs | 17,432 | — | — | |||||||||
|
|
|
|
|
| |||||||
Adjusted EBITDA | $ | 477,882 | $ | 349,473 | $ | 293,970 | ||||||
|
|
|
|
|
| |||||||
Maintenance capital expenditures | (75,184 | ) | (74,000 | ) | (70,000 | ) | ||||||
Cash portion of interest expense | (59,411 | ) | (10,224 | ) | (2,550 | ) | ||||||
Income tax expense | (3,214 | ) | (3,289 | ) | (2,431 | ) | ||||||
|
|
|
|
|
| |||||||
Distributable cash flow | $ | 340,073 | $ | 261,960 | $ | 218,989 | ||||||
|
|
|
|
|
| |||||||
13
Table of Contents
| Year Ended December 31, 2012 | Year Ended December 31, 2011 | Year Ended December 31, 2010 | ||||||||||
| ($ in thousands) | ||||||||||||
Reconciliation of Adjusted EBITDA and Distributable cash flow to net cash provided by operating activities: | ||||||||||||
Net cash provided by operating activities | $ | 318,130 | $ | 399,016 | $ | 317,091 | ||||||
Changes in assets and liabilities | (33,472 | ) | (62,457 | ) | (28,002 | ) | ||||||
Interest expense | 64,739 | 14,884 | 7,426 | |||||||||
Current income tax expense | 3,214 | 3,289 | 2,431 | |||||||||
Other non-cash items | (9,048 | ) | (5,747 | ) | (4,976 | ) | ||||||
Acquisition transaction costs | 17,432 | — | — | |||||||||
EBITDA from unconsolidated affiliates | 116,887 | 488 | — | |||||||||
|
|
|
|
|
| |||||||
Adjusted EBITDA | $ | 477,882 | $ | 349,473 | $ | 293,970 | ||||||
|
|
|
|
|
| |||||||
Maintenance capital expenditures | (75,184 | ) | (74,000 | ) | (70,000 | ) | ||||||
Cash portion of interest expense | (59,411 | ) | (10,224 | ) | (2,550 | ) | ||||||
Income tax expense | (3,214 | ) | (3,289 | ) | (2,431 | ) | ||||||
|
|
|
|
|
| |||||||
Distributable cash flow | $ | 340,073 | 261,960 | 218,989 | ||||||||
|
|
|
|
|
| |||||||
Results of Operations
We have provided a detailed comparison for the years ended December 31, 2012, 2011 and 2010 in the chart and discussion below. The following table and discussion present a summary of our financial results of operations for the periods described above:
| Year Ended December 31, 2012 | Year Ended December 31, 2011 | Year Ended December 31, 2010 | ||||||||||
| ($ in thousands, except per unit data) | ||||||||||||
Revenues, including revenue from Affiliates(1) | $ | 608,447 | $ | 565,929 | $ | 459,153 | ||||||
Operating expenses, including expenses from affiliates | 197,639 | 176,851 | 133,293 | |||||||||
Depreciation and amortization expense | 165,517 | 136,169 | 88,601 | |||||||||
General and administrative expense, including expenses from affiliates | 67,579 | 40,380 | 31,992 | |||||||||
Other operating (income) expense | (766 | ) | 739 | 285 | ||||||||
|
|
|
|
|
| |||||||
Total operating expenses | 429,969 | 354,139 | 254,171 | |||||||||
|
|
|
|
|
| |||||||
Operating income | 178,478 | 211,790 | 204,982 | |||||||||
Income from unconsolidated affiliates | 67,542 | 433 | — | |||||||||
Interest expense | (64,739 | ) | (14,884 | ) | (7,426 | ) | ||||||
Other income | 320 | 287 | 102 | |||||||||
|
|
|
|
|
| |||||||
Income before income tax expense | 181,601 | 197,626 | 197,658 | |||||||||
Income tax expense | 3,214 | 3,289 | 2,431 | |||||||||
|
|
|
|
|
| |||||||
Net income | 178,387 | 194,337 | 195,227 | |||||||||
Net loss attributable to noncontrolling interest | (68 | ) | — | — | ||||||||
|
|
|
|
|
| |||||||
Net income attributable to Access Midstream Partners, L.P. | $ | 178,455 | $ | 194,337 | $ | 195,227 | ||||||
|
|
|
|
|
| |||||||
Operating Data: | ||||||||||||
Throughput, Bcf/d(2) | 2.819 | 2.176 | 1.595 | |||||||||
| (1) | If either Chesapeake or Total does not meet its minimum volume commitment to the Partnership in the Barnett Shale region or Chesapeake does not meet its minimum volume commitment in the Haynesville Shale region under the applicable gas gathering agreement for specified annual periods, Chesapeake or Total is obligated to pay the Partnership a fee equal to the applicable fee for each Mcf by which the applicable party’s minimum volume commitment for the year exceeds the actual volumes gathered on the Partnership’s systems. The Partnership recognizes any associated revenue in the fourth quarter. For the years ended December 31, 2011 and 2010, we recognized revenue related to volume shortfall of $17.4 million and $56.8 million, respectively, because throughput in our Barnett Shale region was below contractual minimum volume commitment levels. |
| (2) | Excludes production from CMO assets acquired on December 20, 2012. |
Segment Reporting
We present information in this Management’s Discussion and Analysis of Financial Condition and Results of Operations by segment. The segment information appearing in Note 14 of the accompanying Notes to the Condensed Consolidated Financial Statements is presented on a basis consistent with our internal management reporting. Beginning on January 1, 2013, we conduct our operations in the following segments: Barnett Shale, Eagle Ford Shale, Haynesville Shale, Marcellus Shale, Niobrara Shale, Utica Shale, Mid-Continent region and Corporate.
14
Table of Contents
Year Ended December 31, 2012 vs. Year Ended December 31, 2011
The following tables reflect the Partnership’s revenues, throughput, operating expenses and operating expenses per Mcf of throughput by segment for the years ended December 31, 2012 and 2011 (please note that revenue, throughput and operating expenses related to our equity investments (primarily in the Marcellus Shale) are excluded from the tables below as the financial results for our equity investments are reported separately. Please read “Income from Unconsolidated Affiliates” in this Results of Operations section of Management’s Discussion and Analysis of Financial Condition and Results of Operations):
| Years Ended December 31, | ||||||||||||||
| 2012 | 2011 | % Change(1) | ||||||||||||
| (In thousands, except percentages and throughput data) | ||||||||||||||
Revenue: | ||||||||||||||
Barnett Shale | $ | 395,467 | $ | 361,843 | 9.3 | % | ||||||||
Eagle Ford Shale(2) | 7,232 | — | N.M. | |||||||||||
Haynesville Shale(2) | 68,184 | 93,107 | (26.8 | ) | ||||||||||
Marcellus Shale(2) | 783 | — | N.M. | |||||||||||
Niobrara Shale(2) | 116 | — | N.M. | |||||||||||
Utica Shale(2) | 353 | — | N.M. | |||||||||||
Mid-Continent | 136,312 | 110,979 | 22.8 | |||||||||||
|
|
|
| |||||||||||
| $ | 608,447 | $ | 565,929 | 7.5 | % | |||||||||
|
|
|
| |||||||||||
Throughput (Bcf): | ||||||||||||||
Barnett Shale | 437.3 | 395.4 | 10.6 | % | ||||||||||
Eagle Ford Shale | 2.2 | — | N.M. | |||||||||||
Haynesville Shale | 138.4 | 197.5 | (30.0 | ) | ||||||||||
Marcellus Shale | 0.3 | — | N.M. | |||||||||||
Niobrara Shale | 0.1 | — | N.M. | |||||||||||
Utica Shale | 0.8 | — | N.M. | |||||||||||
Mid-Continent | 206.5 | 201.4 | 2.5 | |||||||||||
|
|
|
| |||||||||||
| 785.6 | 794.3 | (1.1 | )% | |||||||||||
|
|
|
| |||||||||||
| (1) | N.M.—not meaningful |
| (2) | Reflective of revenue after completion of the CMO Acquisition on December 20, 2012. |
| Years Ended December 31, | ||||||||||||
| 2012 | 2011 | % Change(1) | ||||||||||
| (In thousands, except percentages and per Mcf data) | ||||||||||||
Operating Expenses: | ||||||||||||
Barnett Shale | $ | 101,703 | $ | 94,009 | 8.2 | % | ||||||
Eagle Ford Shale(2) | 1,604 | — | N.M. | |||||||||
Haynesville Shale(2) | 15,642 | 18,057 | (13.4 | ) | ||||||||
Marcellus Shale(2) | 188 | — | N.M. | |||||||||
Niobrara Shale(2) | 85 | — | N.M. | |||||||||
Utica Shale(2) | 159 | — | N.M. | |||||||||
Mid-Continent | 52,979 | 47,749 | 11.0 | |||||||||
Corporate | 25,279 | 17,036 | 48.4 | |||||||||
|
|
|
| |||||||||
| $ | 197,639 | $ | 176,851 | 11.8 | % | |||||||
|
|
|
| |||||||||
Expenses ($ per Mcf): | ||||||||||||
Barnett Shale | $ | 0.23 | $ | 0.24 | (4.2 | )% | ||||||
Eagle Ford Shale | 0.73 | — | N.M. | |||||||||
Haynesville Shale | 0.11 | 0.09 | 22.2 | |||||||||
Marcellus Shale | 0.63 | — | N.M. | |||||||||
Niobrara Shale | 0.85 | — | N.M. | |||||||||
Utica Shale | 0.20 | — | N.M. | |||||||||
Mid-Continent | 0.26 | 0.24 | 8.3 | |||||||||
|
|
|
| |||||||||
| $ | 0.25 | $ | 0.22 | 13.6 | % | |||||||
|
|
|
| |||||||||
| (1) | N.M.—not meaningful |
| (2) | Reflective of operating expenses after completion of the CMO Acquisition on December 20, 2012. |
15
Table of Contents
Barnett Shale
Revenues. For the years ended December 31, 2012 and 2011, revenues were $395.5 million and $361.8 million, respectively. The increase was primarily the result of increased throughput of 10.6 percent due to additional wells connected in 2011 and the first half of 2012. Additionally, the Barnett Shale fees increased five cents per mcf effective July 1, 2012, as a result of fee redetermination.
We have contractual minimum volume commitments from Chesapeake and Total in the Barnett Shale. Throughput in the Barnett Shale during the current year was above the minimum volume commitment level. Because throughput in the Barnett Shale during 2011 was below contractual minimum volume commitment levels, we recognized revenue related to the volume shortfall of $17.4 million for the year ended December 31, 2011.
Operating Expenses. For the years ended December 31, 2012 and 2011, operating expenses were $101.7 million and $94.0 million, respectively. As throughput increased, operating expenses have increased in order to support the additional throughput. Operating expenses per Mcf decreased slightly from 2011 to 2012.
Depreciation and Amortization Expenses. For the years ended December 31, 2012 and 2011, depreciation expenses were $93.3 million and $77.0 million. The increase was due to capital expenditures made in this region during 2011 and 2012.
Eagle Ford Shale
We acquired the Eagle Ford Shale assets in December 2012. For the twelve-day period from closing the CMO Acquisition on December 20, 2012 through December 31, 2012, revenues and operating expenses were $7.2 million and $1.6 million, respectively.
Haynesville Shale
Revenues. For the years ended December 31, 2012 and 2011, revenues were $68.2 million and $93.1 million, respectively. Revenues were down 26.8 percent due to a volume decrease on the Springridge gathering system, offset partially by a 2.5 percent annual fee escalation and additional production from the Mansfield gathering system acquired in December 2012. Additionally, we have contractual minimum volume commitment from Chesapeake in the Haynesville Shale. Throughput during the current year was above the minimum volume commitment levels.
Operating Expenses. For the years ended December 31, 2012 and 2011, operating expenses were $15.6 million and $18.1 million, respectively. We have reduced operating expense in the Haynesville Shale in response to the reduction in throughput in this region; however, in the first half of 2012 we had fixed costs in this area which caused the expense per Mcf to increase temporarily.
Marcellus Shale
Revenues and expenses in the Marcellus Shale reflect only the results of the Marcellus gathering systems acquired in December 2012. For the twelve-day period from closing the CMO Acquisition on December 20, 2012 through December 31, 2012, revenues and expenses were $0.8 million and $0.2 million, respectively. The majority of our assets in the Marcellus Shale are accounted for as equity investments and included in Income from Unconsolidated Affiliates. See further discussion below under “Income from Unconsolidated Affiliates” in this section of Marcellus Shale results of operations.
16
Table of Contents
Income from unconsolidated affiliates.On December 29, 2011, we acquired all of the issued and outstanding common units of Appalachia Midstream, which owns an approximate average 47 percent interest in 10 gas gathering systems in the Marcellus Shale in Pennsylvania and West Virginia. The remaining 53 percent interest in these assets are owned primarily by Statoil, Anadarko, Epsilon and Mitsui. Income from unconsolidated affiliates was $67.6 million and $0.4 million reflecting activity for the year ended December 31, 2012 and the last two days of December 2011, respectively. The following table summarizes the results of the Appalachia Midstream assets (net to our interest) for the year ended December 31, 2012.
| Year Ended December 31, 2012 | ||||
Revenues ($ in thousands) | $ | 140,541 | ||
Throughput (Bcf) | 256.7 | |||
Operating expenses ($ in thousands) | $ | 15,782 | ||
Expenses ($ per Mcf) | 0.06 | |||
Niobrara Shale
We acquired 50 percent of the Niobrara Shale assets in December 2012. Because we operate the assets and have contractual discretion to make operating decisions for the assets, we are deemed to control the assets and thus, we consolidated 100 percent of the assets and results of operation in our financial results. We present the noncontrolling interest for these assets in Noncontrolling Interests on the condensed consolidated balance sheet and in Net Income Attributable to Noncontrolling Interests on the condensed consolidated statement of operations. For the twelve-day period from closing the CMO Acquisition on December 20, 2012 through December 31, 2012, revenues and operating expenses in the Niobrara Shale were $0.1 million and $0.1 million, respectively.
Utica Shale
In the CMO Acquisition, we acquired a 100 percent ownership interest in four natural gas gathering systems, a 66 percent operating interest in the Cardinal Joint Venture and a 49 percent interest in the UEO Joint Venture. Because we operate the four wholly-owned natural gas gathering systems and Cardinal Joint Venture and have contractual discretion to make operating decisions for the Cardinal Joint Venture, we are deemed to control the assets and thus, we consolidated 100 percent of the assets and results of operations in our financial results and reflect the ownership of the other interest owners through a noncontrolling interest in the income and equity of the investment. The UEO Joint Venture is accounted for as an equity investment because the power to direct the activities which are most significant to the UEO Joint Venture’s economic performance is shared between us and the other equity holders. For the twelve-day period from closing the CMO Acquisition on December 20, 2012 through December 31, 2012, revenues and operating expenses in the Utica Shale were $0.4 million and $0.2 million, respectively.
Mid-Continent
Revenues. For the years ended December 31, 2012 and 2011, revenues were $136.3 million and $111.0 million, respectively. This increase was due to increased throughput of 2.5 percent as drilling activity increased in this liquids-rich region, a 2.5 percent annual fee escalation and a 15 percent fee increase due to annual contractual fee redetermination.
Operating Expenses. For the years ended December 31, 2012 and 2011, operating expenses were $53.0 million and $47.7 million, respectively. Operating expenses increased due to added compression to support additional throughput.
Corporate
Operating Expenses. For the years ended December 31, 2012 and 2011, operating expenses were $25.3 million and $17.0 million, respectively. The increase in operating expenses resulted from additional technical resources to support the assets acquired in 2011.
General and Administrative Expense.For the years ended December 31, 2012 and 2011, general and administrative expenses were $67.6 million and $40.4 million, respectively, representing an increase of 67.3 percent. This increase is primarily attributable to additional overhead expenses resulting from the increased scale of the Partnership’s operations, additional expense from equity-based, long-term incentive compensation influenced by the recent increase in the Partnership’s unit price, one-time transition costs as the Partnership develops an independent back office infrastructure and $15.0 million of transaction costs related to the CMO Acquisition.
17
Table of Contents
Interest Expense.Interest expense for the year ended December 31, 2012 was $64.7 million, which was net of $14.6 million of capitalized interest. Interest expense was $14.9 million for the year ended December 31, 2011, which was net of $9.5 million of capitalized interest. The increase is related to interest expense on the $750 million of senior notes issued in January 2012 and $1.4 billion of senior notes issued in December 2012. We incurred interest expenses on borrowings under our revolving credit facility and our senior notes issued in April 2011. Interest expense also includes commitment fees on the unused portion of our credit facility and amortization of debt issuance costs.
Income Tax Expense.Income tax expense for the years ended December 31, 2012 and 2011 was $3.2 million and $3.3 million, respectively, and was attributable to franchise taxes in the state of Texas. The Partnership and its subsidiaries are pass-through entities for federal income tax purposes. For these entities, all income, expenses, gains, losses and tax credits generated flow through to their owners and, accordingly, do not result in a provision for income taxes in the financial statements, other than Texas Franchise Tax.
Year Ended December 31, 2011 vs. Year Ended December 31, 2010
The following tables reflect the Partnership’s revenues, throughput, operating expenses and operating expenses per Mcf of throughput by segment for the years ended December 31, 2011 and 2010 (please note that revenue, throughput and operating expenses related to our equity investments (primarily in the Marcellus Shale) are excluded from the tables below as the financial results for our equity investments are reported separately. Please read “Income from Unconsolidated Affiliates” in this Results of Operations section of Management’s Discussion and Analysis of Financial Condition and Results of Operations):
| Years Ended December 31, | ||||||||||||
| 2011 | 2010 | % Change(1) | ||||||||||
| (In thousands, except percentages and throughput data) | ||||||||||||
Revenue: | ||||||||||||
Barnett Shale | $ | 361,843 | $ | 358,821 | 0.8 | % | ||||||
Haynesville Shale – Springridge gathering system | 93,107 | 2,082 | N.M. | |||||||||
Mid-Continent | 110,979 | 98,250 | 13.0 | |||||||||
|
|
|
| |||||||||
| $ | 565,929 | $ | 459,153 | 23.3 | % | |||||||
|
|
|
| |||||||||
Throughput (Bcf): | ||||||||||||
Barnett Shale | 395.4 | 374.0 | 5.7 | % | ||||||||
Haynesville Shale – Springridge gathering system | 197.5 | 4.9 | N.M. | |||||||||
Mid-Continent | 201.4 | 203.4 | (1.0 | ) | ||||||||
|
|
|
| |||||||||
| 794.3 | 582.3 | 36.4 | % | |||||||||
|
|
|
| |||||||||
| (1) | N.M.—not meaningful |
| Years Ended December 31, | ||||||||||||
| 2011 | 2010 | % Change(1) | ||||||||||
| (In thousands, except percentages and per Mcf data) | ||||||||||||
Operating Expenses: | ||||||||||||
Barnett Shale | $ | 94,009 | $ | 81,304 | 15.6 | % | ||||||
Haynesville Shale – Springridge gathering system | 18,057 | 508 | N.M. | |||||||||
Mid-Continent | 47,749 | 42,521 | 12.3 | |||||||||
Corporate | 17,036 | 8,960 | 90.1 | |||||||||
|
|
|
| |||||||||
| $ | 176,851 | $ | 133,293 | 32.7 | % | |||||||
|
|
|
| |||||||||
Expenses ($ per Mcf): | ||||||||||||
Barnett Shale | $ | 0.24 | $ | 0.22 | 9.1 | % | ||||||
Haynesville Shale – Springridge gathering system | 0.09 | 0.10 | (10.0 | ) | ||||||||
Mid-Continent | 0.24 | 0.21 | 14.3 | |||||||||
|
|
|
| |||||||||
| $ | 0.22 | $ | 0.23 | (4.3 | )% | |||||||
|
|
|
| |||||||||
| (1) | N.M.—not meaningful |
Barnett
Revenues. For the years ended December 31, 2011 and 2010, Barnett Shale throughput was 1.1 Bcf per day and 1.0 Bcf per day, respectively. Revenues were $361.8 million and $358.8 million, respectively, an increase of 0.8 percent. Gathering rates increased two percent as a result of annual contractual rate increases. We also benefited from added compression revenues during 2011.
18
Table of Contents
Because throughput in the Barnett Shale during 2011 and 2010 was below contractual minimum volume commitment levels, we recognized revenue related to volume shortfall of $17.4 million and $56.8 million for the years ended December 31, 2011 and 2010, respectively. The amount recognized in 2010 included a one-time carry forward from 2009 of $17.2 million. The minimum volume commitment is measured annually and recognized in the fourth quarter of each year.
Operating Expenses. Operating expenses were $0.24 per Mcf for the year ended December 31, 2011 compared to $0.22 per Mcf for the year ended December 31, 2010. The increase in the Barnett Shale region was due to additional compression expense to support increased throughput. We have also incurred increased expenses for additional field personnel and other personnel related costs resulting from Partnership growth.
Depreciation and Amortization Expense. For the years ended December 31, 2011 and 2010, depreciation and amortization expense was $77.0 million and 62.6 million, respectively. The increase in depreciation and amortization is a result of capital expenditures made in 2010 and early 2011.
Haynesville Shale
Revenues. For the years ended December 31, 2011 and 2010, revenues totaled $93.1 million and $2.1 million, respectively. The increase in our revenue was due to the acquisition of the Springridge gathering system at the end of 2010.
Operating Expenses. Operating expenses were $18.1 million for the year ended December 31, 2011 compared to $0.5 million for the year ended December 31, 2010. The increase in operating expenses resulted from the acquisition of the Springridge gathering system at the end of 2010.
Depreciation and Amortization Expense. Depreciation and amortization expense for the year ended December 31, 2011 and 2010 was $29.1 million from $0.4 million, respectively. The increase in depreciation and amortization is a result of the acquisition of the Springridge gathering system at the end of 2010.
Marcellus Shale
Income from unconsolidated affiliates.On December 29, 2011, we acquired all of the issued and outstanding common units of Appalachia Midstream, which owns an approximate average 47 percent interest in 10 gas gathering systems in the Marcellus Shale in Pennsylvania and West Virginia. The remaining 53 percent interest in these assets is owned primarily by Statoil, Anadarko, Epsilon and Mitsui. Income from unconsolidated affiliates was $0.4 million reflecting activity for the last two days of 2011.
Mid-Continent
Revenues. For the years ended December 31, 2011 and 2010, Mid-Continent throughput was 0.6 Bcf per day. Revenues were $111.0 million and $98.3 million, respectively, an increase of 13.0 percent. Revenues were positively impacted by the redetermination of Mid-Continent gathering rates that occurred on January 1, 2011, increasing gathering rates in that region by approximately 15 percent, plus a 2.5 percent annual contractual rate increase.
Operating Expenses. Operating expenses were $0.24 per Mcf for the year ended December 31, 2011 compared to $0.21 per Mcf for the year ended December 31, 2010. The increase in operating expenses in the Mid-Continent region was primarily due to additional compression expense in expectation of future increased throughput. We have also incurred increased expenses for additional field personnel and other personnel related costs resulting from Partnership growth.
Corporate
Operating Expenses. Operating expenses were $17.0 million and $9.0 million, respectively for the years ended December 31, 2011 and 2010. The increase in operating expenses resulted from additional technical resources to support assets acquired in 2010.
General and Administrative Expense.For the years ended December 31, 2011 and 2010, general and administrative expenses were $40.4 million and $32.0 million, respectively, representing an increase of 26.2 percent. The increase is primarily attributable to additional expenses resulting from the acquisition of the Springridge gathering system in the Haynesville Shale.
19
Table of Contents
Interest Expense.Interest expense for the year ended December 31, 2011 was $14.9 million, which was net of $9.5 million of capitalized interest. Interest expense was $7.4 million for the year ended December 31, 2010, which was net of $2.6 million of capitalized interest. The increase is related to interest expense on the senior notes issued in April 2011. We incur interest expense on our senior notes, borrowings under our revolving credit facility and commitment fees on the unused portion of the credit facility. Interest expense also includes amortization of previously capitalized debt issuance costs.
Income Tax Expense.Income tax expense for the years ended December 31, 2011 and 2010 was $3.3 million and $2.4 million, respectively, and was attributable to franchise taxes in the state of Texas. The Partnership and its subsidiaries are pass-through entities for federal income tax purposes. For these entities, all income, expenses, gains, losses and tax credits generated flow through to their owners and, accordingly, do not result in a provision for income taxes in the financial statements, other than Texas Franchise Tax.
Liquidity and Capital Resources
Our ability to finance operations and fund capital expenditures will largely depend on our ability to generate sufficient cash flow to cover these expenses as well as the availability of borrowings under our revolving credit facility and our access to the capital markets. Our ability to generate cash flow is subject to a number of factors, some of which are beyond our control. SeeRisk Factorsin Item 1A of this annual report.
Historically, our sources of liquidity included cash generated from operations and borrowings under our revolving credit facility.
Working Capital (Deficit). Working capital, defined as the amount by which current assets exceed current liabilities, is an indication of liquidity and the potential need for short-term funding. As of December 31, 2012 and 2011, we had working capital deficits of $44.0 million and $54.9 million, respectively, due to our capital intensive business that requires significant investment in new midstream operating assets and to maintain and improve existing facilities.
Cash Flows.Net cash provided by (used in) operating activities, investing activities and financing activities of the Partnership for the year ended December 31, 2012 and 2011 were as follows:
| Years Ended December 31, | ||||||||
| 2012 | 2011 | |||||||
| ($ in thousands) | ||||||||
Cash Flow Data: | ||||||||
Net cash provided by (used in): | ||||||||
Operating activities | $ | 318,130 | $ | 399,016 | ||||
Investing activities | (2,685,965 | ) | (1,017,104 | ) | ||||
Financing activities | 2,432,807 | 600,294 | ||||||
Operating Activities. Net cash provided by operating activities was $318.1 million for the year ended December 31, 2012 compared to $399.0 million for the year ended December 31, 2011. Changes in cash flow from operations are largely due to the same factors that affect our net income, excluding various non-cash items such as depreciation, amortization and gains or losses on sales of fixed assets. See additional discussion in the Results of Operations section above in the Management’s Discussion and Analysis. The changes in cash flow are also impacted by timing impacts on working capital accounts.
Investing Activities. Net cash used in investing activities for the year ended December 31, 2012 increased $1.7 billion compared to the prior year. Approximately $2.7 billion of cash was used in investing activities during 2012. This amount included approximately $2.16 billion of cash paid as part of the CMO Acquisition and approximately $350.5 million in additions to property, plant, and equipment. It also includes $185.0 million of additional investment in our unconsolidated affiliate in the Marcellus Shale.
Financing Activities. Net cash provided by financing activities was $2.4 billion for the year ended December 31, 2012 compared to $600.3 million for the year ended December 31, 2011. This increase was primarily attributable to the proceeds from the issuance of debt and equity in 2012.
Sources of Liquidity.At December 31, 2012, our sources of liquidity included:
| • | cash on hand; |
| • | cash generated from operations; |
| • | borrowings under our revolving credit facility; and |
| • | capital raised through debt and equity markets. |
20
Table of Contents
We believe that cash generated from these sources will be sufficient to meet our short-term working capital requirements and long-term capital expenditure requirements and to fund our quarterly cash distributions to unitholders.
Credit Facility.On December 12, 2012, we amended our Amended and Restated Credit Agreement to, among other things, allow for the CMO Acquisition, increase our Consolidated Leverage Ratio covenant from 5.0 to 5.5, waive the Consolidated Leverage Ratio test for the fourth quarter 2012, allow the Partnership to enter into a secured bridge loan facility, and allow inclusion of Material Project EBITDA in the definition of Consolidated EBITDA. Additionally, for the three quarters following the CMO Acquisition, Consolidated EBITDA is measured as year-to-date EBITDA annualized.
On December 20, 2011, we exercised the accordion option feature under our Amended and Restated Credit Agreement to increase the total revolving commitments from $800 million to $1 billion. Additionally, we amended our Amended and Restated Credit Agreement to, among other things, permit us to make certain investments in Joint Ventures (as defined in the amendment), which Joint Ventures, unless otherwise agreed to by us, will not be subject to the provisions of the revolving credit facility and will not be required to become guarantors under the revolving credit facility. The amendment also provides that we may from time to time request increases in the total revolving commitments under the credit facility up to $1.25 billion, subject to the satisfaction of certain conditions, including the identification of lenders or proposed lenders that agree to satisfy the increased commitment amounts under the facility. Our revolving credit facility matures in June 2016. As of December 31, 2012 we had no borrowings outstanding under our revolving credit facility.
Borrowings under our revolving credit facility are available to fund working capital, finance capital expenditures and acquisitions, provide for the issuance of letters of credit and for general partnership purposes. Our revolving credit facility is secured by all of our assets, and loans thereunder (other than swing line loans) bear interest at our option at either (i) the greater of (a) the reference rate of Wells Fargo Bank, NA, (b) the federal funds effective rate plus 0.50 percent or (c) the Eurodollar rate which is based on the London Interbank Offered Rate (LIBOR), plus 1.00 percent, each of which is subject to a margin that varies from 0.625 percent to 1.50 percent per annum, according to the Partnership’s leverage ratio (as defined in the agreement), or (ii) the Eurodollar rate plus a margin that varies from 1.625 percent to 2.50 percent per annum, according to the Partnership’s leverage ratio. If we reach investment grade status, we will have the option to release the security under the credit facility and amounts borrowed will bear interest under a specified ratings-based pricing grid. The unused portion of the credit facility is subject to commitment fees of (a) 0.25 percent to 0.40 percent per annum while we are subject to the leverage-based pricing grid, according to the Partnership’s leverage ratio and (b) 0.20 percent to 0.35 percent per annum while we are subject to the ratings-based pricing grid, according to our senior unsecured long-term debt ratings.
Additionally, our revolving credit facility contains various covenants and restrictive provisions which limit our and our subsidiaries’ ability to incur additional indebtedness, guarantees and/or liens; consolidate, merge or transfer all or substantially all of our assets; make certain investments, acquisitions or other restricted payments; engage in certain types of transactions with affiliates; dispose of assets; and prepay certain indebtedness. If we fail to perform our obligations under these and other covenants, the revolving credit commitment could be terminated and any outstanding borrowings, together with accrued interest, under the revolving credit facility could be declared immediately due and payable. Our revolving credit facility also has cross default provisions that apply to any other indebtedness we may have with an outstanding principal amount in excess of $15 million.
The revolving credit facility agreement contains certain negative covenants that (i) limit our ability, as well as the ability of certain of our subsidiaries, among other things, to enter into hedging arrangements and create liens and (ii) require us to maintain a consolidated leverage ratio, and an EBITDA to interest expense ratio, in each case as described in the credit facility agreement. The revolving credit facility agreement also provides for the discontinuance of the requirement for the Partnership to maintain the EBITDA to interest expense ratio and allows for the Partnership to release all collateral securing the revolving credit facility if we reach investment grade status. The revolving credit facility agreement requires us to maintain a consolidated leverage ratio of 5.5 to 1.0 (or 5.0 to 1.0 after we have released all collateral upon achieving investment grade status). We were in compliance with all covenants under the agreement at December 31, 2012.
Senior Notes.On December 19, 2012, we and ACMP Finance Corp., a wholly owned subsidiary of Access MLP Operating, L.L.C., completed a public offering of $1.4 billion in aggregate principal amount of 4.875 percent senior notes due 2023 (the “2023 Notes”). We used a portion of the net proceeds to fund a portion of the purchase price for the CMO Acquisition, and the balance to repay borrowings outstanding under our revolving credit facility. Debt issuance costs of $25.8 million are being amortized over the life of the 2023 Notes.
21
Table of Contents
The 2023 Notes will mature on May 15, 2023 and interest is payable on May 15 and November 15 of each year. We have the option to redeem all or a portion of the 2023 Notes at any time on or after December 15, 2017, at the redemption price specified in the indenture relating to the 2023 Notes, plus accrued and unpaid interest. We may also redeem the 2023 Notes, in whole or in part, at a “make-whole” redemption price specified in the indenture, plus accrued and unpaid interest, at any time prior to December 15, 2017. In addition, we may redeem up to 35 percent of the 2023 Notes prior to December 15, 2015 under certain circumstances with the net cash proceeds from certain equity offerings.
On January 11, 2012, we and ACMP Finance Corp., a wholly owned subsidiary of Access MLP Operating, L.L.C., completed a private placement of $750.0 million in aggregate principal amount of 6.125 percent senior notes due 2022 (the “2022 Notes”). We used a portion of the net proceeds to repay all borrowings outstanding under our revolving credit facility and used the balance for general partnership purposes. Debt issuance costs of $12.4 million are being amortized over the life of the 2022 Notes.
The 2022 Notes will mature on July 15, 2022 and interest is payable on January 15 and July 15 of each year. We have the option to redeem all or a portion of the 2022 Notes at any time on or after January 15, 2017, at the redemption price specified in the indenture relating to the 2022 Notes, plus accrued and unpaid interest. We may also redeem the 2022 Notes, in whole or in part, at a “make-whole” redemption price specified in the indenture, plus accrued and unpaid interest, at any time prior to January 15, 2017. In addition, we may redeem up to 35 percent of the 2022 Notes prior to January 15, 2015 under certain circumstances with the net cash proceeds from certain equity offerings.
On April 19, 2011, we and ACMP Finance Corp., a wholly owned subsidiary of Access MLP Operating, L.L.C., completed a private placement of $350.0 million in aggregate principal amount of 5.875 percent senior notes due 2021 ( the “2021 Notes”). We used a portion of the net proceeds to repay borrowings outstanding under our revolving credit facility and used the balance for general partnership purposes. Debt issuance costs of $7.8 million are being amortized over the life of the 2021 Notes.
The 2021 Notes will mature on April 15, 2021 and interest is payable on April 15 and October 15 of each year. We have the option to redeem all or a portion of the 2021 Notes at any time on or after April 15, 2015, at the redemption price specified in the indenture relating to the 2021 Notes, plus accrued and unpaid interest. We may also redeem the 2021 Notes, in whole or in part, at a “make-whole” redemption price specified in the indenture, plus accrued and unpaid interest, at any time prior to April 15, 2015. In addition, we may redeem up to 35 percent of the 2021 Notes prior to April 15, 2014 under certain circumstances with the net cash proceeds from certain equity offerings.
The 2023 Notes, 2022 Notes and the 2021 Notes indentures contain covenants that, among other things, limit our ability and the ability of certain of our subsidiaries to: (1) sell assets including equity interests in its subsidiaries; (2) pay distributions on, redeem or purchase our units, or redeem or purchase our subordinated debt; (3) make investments; (4) incur or guarantee additional indebtedness or issue preferred units; (5) create or incur certain liens; (6) enter into agreements that restrict distributions or other payments from certain subsidiaries to us; (7) consolidate, merge or transfer all or substantially all of our or certain of our subsidiaries’ assets; (8) engage in transactions with affiliates; and (9) create unrestricted subsidiaries. These covenants are subject to important exceptions and qualifications. If the 2023 Notes, 2022 Notes or the 2021 Notes achieve an investment grade rating from either of Moody’s Investors Service, Inc. or Standard & Poor’s Ratings Services and no default, as defined in the indenture, has occurred or is continuing, many of these covenants will terminate.
Equity Issuance. On December 18, 2012, we completed an equity offering of 18.4 million common units (such amount includes 2.4 million common units issued pursuant to the exercise of the underwriters’ over-allotment option) representing limited partner interest in the Partnership, at a price of $32.15 per common unit.
We received gross offering proceeds (net of underwriting discounts, commissions and offering expenses) from the equity offering of approximately $569.3 million, including the exercise of the option to purchase additional units. We used the net proceeds to pay a portion of the purchase price for the CMO Acquisition.
Subscription Agreement. On December 20, 2012, we sold 5.9 million Class B units to each of the GIP II Entities and Williams and 5.6 million Class C units to each of the GIP II Entities and Williams, in each case pursuant to the subscription agreement. We received aggregate proceeds of approximately $712.1 million in exchange for the sale of Class B units and Class C units, inclusive of the capital contribution made by our general partner to maintain its 2.0 percent interest in the Partnership following the issuance of common, Class B and Class C units.
22
Table of Contents
Capital Requirements.Our business is capital-intensive, requiring significant investment to grow our business as well as to maintain and improve existing assets. We categorize capital expenditures as either:
| • | maintenance capital expenditures, which include those expenditures required to maintain our long-term operating capacity and/or operating income and service capability of our assets, including the replacement of system components and equipment that have suffered significant wear and tear, become obsolete or approached the end of their useful lives, those expenditures necessary to remain in compliance with regulatory legal requirements or those expenditures necessary to complete additional well connections to maintain existing system volumes and related cash flows; or |
| • | expansion capital expenditures, which include those expenditures incurred in order to acquire additional assets to grow our business, expand and upgrade our systems and facilities, extend the useful lives of our assets, increase gathering, treating and compression throughput from current levels and reduce costs or increase revenues. |
For the years ended December 31, 2012 and 2011, expansion capital expenditures totaled $659.7 million and $344.8 million, respectively. The 2012 amount includes $384.4 million of capital expenditures made as part of our unconsolidated affiliates that are accounted for as equity investments. The Maintenance capital expenditures totaled $75.2 million and $74.0 million for the years ended December 31, 2012 and 2011, respectively, an increase of 1.6 percent. Our future capital expenditures may vary significantly from budgeted amounts and from period to period based on the investment opportunities that become available to us.
We continually review opportunities for both organic growth projects and acquisitions that will enhance our financial performance. Because our partnership agreement requires us to distribute most of the cash generated from operations to our unitholders and our general partner, we expect to fund future capital expenditures from cash and cash equivalents on hand, cash flow generated from our operations that is not distributed to our unitholders and general partner, borrowings under our revolving credit facility and future issuances of equity and debt securities.
Distributions. We intend to pay a minimum quarterly distribution of $0.3375 per unit per quarter. We do not have a legal obligation to pay this distribution.
The following table represents a summary of our quarterly distributions for the years ended December 31, 2012 and 2011:
| Declaration Date | Record Date | Distribution Date | Distribution Declared | |||||||||||||
2012 | ||||||||||||||||
Fourth quarter | January 25, 2013 | February 6, 2013 | February 13, 2013 | $ | 0.4500 | |||||||||||
Third quarter | October 25, 2012 | November 7, 2012 | November 14, 2012 | 0.4350 | ||||||||||||
Second quarter | July 27, 2012 | August 7, 2012 | August 14, 2012 | 0.4200 | ||||||||||||
First quarter | April 27, 2012 | May 8, 2012 | May 15, 2012 | 0.4050 | ||||||||||||
2011 | ||||||||||||||||
Fourth quarter | January 27, 2012 | February 7, 2012 | February 14, 2012 | $ | 0.3900 | |||||||||||
Third quarter | October 28, 2011 | November 7, 2011 | November 14, 2011 | 0.3750 | ||||||||||||
Second quarter | July 26, 2011 | August 5, 2011 | August 12, 2011 | 0.3625 | ||||||||||||
First quarter | April 26, 2011 | May 6, 2011 | May 13, 2011 | 0.3500 | ||||||||||||
Contractual Obligations. At December 31, 2012, our contractual obligations included:
| Payments Due By Period | ||||||||||||||||||||
| Total | Less than 1 year | 1-3 years | 3-5 years | More than 5 years | ||||||||||||||||
| (in thousands) | ||||||||||||||||||||
Long-term debt (including interest)(1) | $ | 3,784,967 | $ | 138,750 | $ | 277,500 | $ | 271,500 | $ | 3,097,217 | ||||||||||
Operating leases(2) | 172,178 | 54,034 | 76,236 | 26,019 | 15,889 | |||||||||||||||
|
|
|
|
|
|
|
|
|
| |||||||||||
Total | $ | 3,957,145 | $ | 192,784 | $ | 353,736 | $ | 297,519 | $ | 3,113,106 | ||||||||||
|
|
|
|
|
|
|
|
|
| |||||||||||
| (1) | Assumes a commitment fee of 0.40 percent on the unused portion of the credit facility. |
| (2) | Includes our contractual obligations related to the CMO assets we acquired on December 20, 2012. |
23
Table of Contents
Application of Critical Accounting Policies
Readers of this report and users of the information contained in it should be aware of how certain events may impact our financial results based on the accounting policies in place. The policies we consider to be the most significant are discussed below. The Partnership’s management has discussed each critical accounting policy with the Audit Committee of the Partnership’s general partner’s board of directors.
The selection and application of accounting policies are an important process that changes as our business changes and as accounting rules are developed. Accounting rules generally do not involve a selection among alternatives, but involve an implementation and interpretation of existing rules and the use of judgment to the specific set of circumstances existing in our business.
Revenue and cost of sales recognition
We estimate certain revenue and expenses since actual amounts are not confirmed until after the financial closing process due to the standard settlement dates in the gas industry. We calculate estimated revenues using actual pricing and measured volumes. In the second month after production, we reverse the accrual and record the actual results. Prior to the settlement date, we record actual operating data to the extent available, such as actual operating and maintenance and other expenses. We do not expect actual results to differ materially from our estimates.
Depreciation and amortization
Depreciation associated with our property, plant and equipment and other assets is calculated using the straight-line method, based on the estimated useful lives of our assets. These estimates are based on various factors including age (in the case of acquired assets), manufacturing specifications, technological advances and historical data concerning useful lives of similar assets. Uncertainties that impact these estimates include changes in laws and regulations relating to restoration and abandonment requirements, economic conditions and supply and demand in the area. When assets are put into service, we and our predecessor make estimates with respect to useful lives and salvage values that we believe and our predecessor believes, respectively, are reasonable. However, subsequent events could cause us to change our estimates, thus impacting the future calculation of depreciation. The estimated service lives of our functional asset groups are as follows:
Asset Group | Estimated Useful Lives (In years) | |||
Gathering systems | 20 | |||
Other fixed assets | 2 to 39 | |||
Intangible assets are generally amortized on a straight-line basis over their estimated useful lives, unless the assets’ economic benefits are consumed on an other than straight-line basis. The estimated useful life is the period over which the assets are expected to contribute directly or indirectly to the Partnership’s future cash flows.
Impairment of long-lived assets
Long-lived assets with recorded values that are not expected to be recovered through future cash flows are written down to estimated fair value. Assets are tested for impairment when events or circumstances indicate that the carrying value may not be recoverable. The carrying value of a long-lived asset is not recoverable if it exceeds the sum of the undiscounted cash flows expected to result from the use and eventual disposition of the asset. If the carrying value exceeds the sum of the undiscounted cash flows, an impairment loss equal to the amount that the carrying value exceeds the fair value of the asset is recognized. Fair value is determined using an income approach whereby the expected future cash flows are discounted using a rate management believes a market participant would assume is reflective of the risks associated with achieving the underlying cash flows.
Variable Interest Entities (VIEs)
An entity is referred to as a VIE pursuant to accounting guidance for consolidation if it possesses one of the following criteria: (i) it is thinly capitalized, (ii) the residual equity holders do not control the entity, (iii) the equity holders are shielded from the economic losses, (iv) the equity holders do not participate fully in the entity’s residual economics, or (v) the entity was established with non-substantive voting interests. We consolidate a VIE when we have both the power to direct the activities that most significantly impact the activities of the VIE and the right to receive benefits or the obligation to absorb losses of the entity that could be potentially significant to the VIE. We continually monitor both consolidated and unconsolidated VIEs to determine if any events have occurred that could cause the primary beneficiary to change.
24
Table of Contents
Recently Issued Accounting Standards
The Financial Accounting Standards Board (“FASB”) recently issued the following standard which we reviewed to determine the potential impact on our financial statements upon adoption.
On July 27, 2012, the FASB issued authoritative guidance related to the testing of indefinite-lived intangible assets for impairment. The guidance provides with the option to first assess qualitative factors to determine whether the existence of events or circumstances leads to a determination that it is more-likely-than-not that the indefinite-lived asset is impaired. If, after assessing the total events or circumstances, we determine that it is not more likely than not that the indefinite-lived asset is impaired, then we are not required to take further action. However, if we conclude otherwise, then we are required to determine the fair value of the indefinite-lived intangible asset and perform the quantitative impairment test by comparing the fair value with the carrying amount. The guidance also gives us the option to bypass the qualitative assessment for any period and proceed directly to performing the quantitative impairment test and resume performing the qualitative assessment in any subsequent period. This guidance will be effective for us beginning January 1, 2013 and will not have a material impact on our consolidated financial statements.
Forward-Looking Statements
Certain statements and information in this annual report may constitute forward-looking statements. The words “believe,” “expect,” “anticipate,” “plan,” “intend,” “foresee,” “should,” “would,” “could” or other similar expressions are intended to identify forward-looking statements, which are generally not historical in nature. These forward-looking statements are based on our current expectations and beliefs concerning future developments and their potential effect on us. While management believes that these forward-looking statements are reasonable as and when made, there can be no assurance that future developments affecting us will be those that we anticipate. All comments concerning our expectations for future revenues and operating results are based on our forecasts for our existing operations and do not include the potential impact of any future acquisitions. Our forward-looking statements involve significant risks and uncertainties (some of which are beyond our control) and assumptions that could cause actual results to differ materially from our historical experience and our present expectations or projections. Important factors that could cause actual results to differ materially from those in the forward-looking statements include, but are not limited to, those summarized below:
| • | our dependence on Chesapeake, Total, Mitsui, Anadarko Petroleum Corporation and Statoil for a majority of our revenues; |
| • | the impact on our growth strategy and ability to increase cash distributions if producers do not increase the volume of natural gas they provide to our gathering systems; |
| • | oil and natural gas realized prices; |
| • | the termination of our gas gathering agreements; |
| • | the availability, terms and effects of acquisitions; |
| • | our potential inability to maintain existing distribution amounts or pay the minimum quarterly distribution to our unitholders; |
| • | the limitations that our level of indebtedness may have on our financial flexibility; |
| • | our ability to obtain new sources of natural gas, which is dependent on factors largely beyond our control; |
| • | the availability of capital resources to fund capital expenditures and other contractual obligations, and our ability to access those resources through the debt or equity capital markets; |
| • | competitive conditions; |
| • | the unavailability of third-party pipelines interconnected to our gathering systems or the potential that the volumes we gather do not meet the quality requirement of such pipelines; |
| • | new asset construction may not result in revenue increases and will be subject to regulatory, environmental, political, legal and economic risks; |
| • | our exposure to direct commodity price risk may increase in the future; |
| • | our ability to maintain and/or obtain rights to operate our assets on land owned by third parties; |
| • | hazards and operational risks that may not be fully covered by insurance; |
25
Table of Contents
| • | our dependence on Chesapeake for substantially all of our compression capacity; |
| • | our lack of industry diversification; and |
| • | legislative or regulatory changes, including changes in environmental regulations, environmental risks, regulations by the Federal Energy Regulatory Commission and liability under federal and state environmental laws and regulations. |
Other factors that could cause our actual results to differ from our projected results are described under the caption “Risk Factors” and in our reports filed from time to time with the SEC.
Readers are cautioned not to place undue reliance on forward-looking statements, which speak only as of the date hereof. We undertake no obligation to publicly update or revise any forward-looking statements after the date they are made, whether as a result of new information, future events or otherwise.
26
Table of Contents
| ITEM 8. | Financial Statements and Supplementary Data |
ACCESS MIDSTREAM PARTNERS, L.P.
| Page | ||||
Management’s Report on Internal Control Over Financial Reporting | 28 | |||
Consolidated Financial Statements: | ||||
| 29 | ||||
| 30 | ||||
Consolidated Statements of Operations for the Years Ended December 31, 2012, 2011 and 2010 | 31 | |||
Consolidated Statements of Cash Flows for the Years Ended December 31, 2012, 2011 and 2010 | 32 | |||
| 33 | ||||
| 34 | ||||
27
Table of Contents
MANAGEMENT’S REPORT ON INTERNAL CONTROL OVER FINANCIAL REPORTING
It is the responsibility of the management of Access Midstream Partners, L.P. to establish and maintain adequate internal control over financial reporting (as defined in Rule 13a-15(f) under the Securities Exchange Act of 1934). Management has assessed the effectiveness of the Partnership’s internal control over financial reporting as of December 31, 2012, utilizing the Committee of Sponsoring Organizations of the Treadway Commission’sInternal Control—Integrated Framework(COSO framework).
Based on this evaluation, management has determined the Partnership’s internal control over financial reporting was effective as of December 31, 2012.
The effectiveness of the Partnership’s internal control over financial reporting as of December 31, 2012 has been audited by PricewaterhouseCoopers LLP, an independent registered public accounting firm, as stated in its report which appears herein.
| /s/ J. MIKE STICE |
| J. Mike Stice |
| Chief Executive Officer |
| /s/ DAVID C. SHIELS |
| David C. Shiels |
| Chief Financial Officer |
28
Table of Contents
REPORT OF INDEPENDENT REGISTERED PUBLIC ACCOUNTING FIRM
To the Board of Directors of Access Midstream Partners GP, L.L.C., as General Partner of Access Midstream Partners, L.P. and the Unitholders:
In our opinion, the accompanying consolidated balance sheets and the related consolidated statements of operations, of changes in partners’ capital and of cash flows present fairly, in all material respects, the financial position of Access Midstream Partners, L.P. and its subsidiaries (the “Partnership”) at December 31, 2012 and 2011, and the results of their operations and their cash flows for each of the three years in the period ended December 31, 2012 in conformity with accounting principles generally accepted in the United States of America. Also in our opinion, the Partnership maintained, in all material respects, effective internal control over financial reporting as of December 31, 2012, based on criteria established inInternal Control—Integrated Framework issued by the Committee of Sponsoring Organizations of the Treadway Commission (COSO). The Partnership’s management is responsible for these financial statements, for maintaining effective internal control over financial reporting and for its assessment of the effectiveness of internal control over financial reporting, included in the accompanying Management’s Report on Internal Control over Financial Reporting. Our responsibility is to express opinions on these financial statements and on the Partnership’s internal control over financial reporting based on our audits (which was an integrated audit in 2012 and 2011). We conducted our audits in accordance with the standards of the Public Company Accounting Oversight Board (United States). Those standards require that we plan and perform the audit to obtain reasonable assurance about whether the financial statements are free of material misstatement and whether effective internal control over financial reporting was maintained in all material respects. Our audits of the financial statements included examining, on a test basis, evidence supporting the amounts and disclosures in the financial statements, assessing the accounting principles used and significant estimates made by management, and evaluating the overall financial statement presentation. Our audit of internal control over financial reporting included obtaining an understanding of internal control over financial reporting, assessing the risk that a material weakness exists, and testing and evaluating the design and operating effectiveness of internal control based on the assessed risk. Our audits also included performing such other procedures as we considered necessary in the circumstances. We believe that our audits provide a reasonable basis for our opinions.
As discussed in Notes 5 and 6 to the accompanying consolidated financial statements, Access Midstream Partners, L.P. earned substantially all of its revenues and has other significant transactions with affiliated entities.
A company’s internal control over financial reporting is a process designed to provide reasonable assurance regarding the reliability of financial reporting and the preparation of financial statements for external purposes in accordance with generally accepted accounting principles. A company’s internal control over financial reporting includes those policies and procedures that (i) pertain to the maintenance of records that, in reasonable detail, accurately and fairly reflect the transactions and dispositions of the assets of the company; (ii) provide reasonable assurance that transactions are recorded as necessary to permit preparation of financial statements in accordance with generally accepted accounting principles, and that receipts and expenditures of the company are being made only in accordance with authorizations of management and directors of the company; and (iii) provide reasonable assurance regarding prevention or timely detection of unauthorized acquisition, use, or disposition of the company’s assets that could have a material effect on the financial statements.
Because of its inherent limitations, internal control over financial reporting may not prevent or detect misstatements. Also, projections of any evaluation of effectiveness to future periods are subject to the risk that controls may become inadequate because of changes in conditions, or that the degree of compliance with the policies or procedures may deteriorate.
/s/ PricewaterhouseCoopers LLP
Tulsa, Oklahoma
February 25, 2013, except for the change in segments discussed in Note 14 to the consolidated financial statements, as to which date is as of July 15, 2013
29
Table of Contents
ACCESS MIDSTREAM PARTNERS, L.P.
| December 31, 2012 | December 31, 2011 | |||||||
| ($ in thousands) | ||||||||
| ASSETS | ||||||||
Current assets: | ||||||||
Cash and cash equivalents | $ | 64,994 | $ | 22 | ||||
Accounts receivable, including $80,038 and $61,030 from affiliates at December 31, 2012 and 2011, respectively | 133,543 | 81,297 | ||||||
Other current assets | 16,720 | 6,869 | ||||||
|
|
|
| |||||
Total current assets | 215,257 | 88,188 | ||||||
|
|
|
| |||||
Property, plant and equipment: | ||||||||
Gathering systems | 5,130,255 | 2,954,868 | ||||||
Other fixed assets | 96,916 | 53,611 | ||||||
Less: Accumulated depreciation | (590,614 | ) | (480,555 | ) | ||||
|
|
|
| |||||
Total property, plant and equipment, net | 4,636,557 | 2,527,924 | ||||||
|
|
|
| |||||
Investment in unconsolidated affiliates | 1,297,811 | 886,558 | ||||||
Intangible customer relationships, net | 355,217 | 158,621 | ||||||
Deferred loan costs, net | 56,258 | 21,947 | ||||||
|
|
|
| |||||
Total assets | $ | 6,561,100 | $ | 3,683,238 | ||||
|
|
|
| |||||
| LIABILITIES AND PARTNERS’ CAPITAL | ||||||||
Current liabilities: | ||||||||
Accounts payable | $ | 47,987 | $ | 57,546 | ||||
Accrued liabilities, including $12,648 and $62,823 to affiliates at December 31, 2012 and 2011, respectively | 211,274 | 85,548 | ||||||
|
|
|
| |||||
Total current liabilities | 259,261 | 143,094 | ||||||
|
|
|
| |||||
Long-term liabilities: | ||||||||
Long-term debt | 2,500,000 | 1,062,900 | ||||||
Other liabilities | 5,333 | 4,099 | ||||||
|
|
|
| |||||
Total long-term liabilities | 2,505,333 | 1,066,999 | ||||||
|
|
|
| |||||
Commitments and contingencies (Note 12) | ||||||||
Partners’ capital: | ||||||||
Common units (97,324,453 and 78,876,643 issued and outstanding at December 31, 2012 and 2011, respectively) | 2,188,241 | 1,561,504 | ||||||
Subordinated units (69,076,122 issued and outstanding at December 31, 2012 and 2011) | 834,001 | 869,241 | ||||||
Class B units (11,858,050 issued and outstanding at December 31, 2012) | 273,858 | — | ||||||
Class C units (11,199,268 issued and outstanding at December 31, 2012) | 295,551 | — | ||||||
General partner interest | 93,182 | 42,400 | ||||||
|
|
|
| |||||
Total partners’ capital attributable to Access Midstream Partners, L.P. | 3,684,833 | 2,473,145 | ||||||
Noncontrolling interest | 111,673 | — | ||||||
|
|
|
| |||||
Total partners’ capital | 3,796,506 | 2,473,145 | ||||||
|
|
|
| |||||
Total liabilities and partners’ capital | $ | 6,561,100 | $ | 3,683,238 | ||||
|
|
|
| |||||
The accompanying notes are an integral part of the consolidated financial statements.
30
Table of Contents
ACCESS MIDSTREAM PARTNERS, L.P.
CONSOLIDATED STATEMENTS OF OPERATIONS
| Year Ended December 31, 2012 | Year Ended December 31, 2011 | Year Ended December 31, 2010 | ||||||||||
| ($ in thousands, except per unit data) | ||||||||||||
Revenues, including revenue from affiliates (Notes 5 and 6) | $ | 608,447 | $ | 565,929 | $ | 459,153 | ||||||
Operating expenses | ||||||||||||
Operating expenses, including expenses from affiliates (Note 5) | 197,639 | 176,851 | 133,293 | |||||||||
Depreciation and amortization expense | 165,517 | 136,169 | 88,601 | |||||||||
General and administrative expense, including expenses from affiliates (Note 5) | 67,579 | 40,380 | 31,992 | |||||||||
Other operating (income) expense | (766 | ) | 739 | 285 | ||||||||
|
|
|
|
|
| |||||||
Total operating expenses | 429,969 | 354,139 | 254,171 | |||||||||
|
|
|
|
|
| |||||||
Operating income | 178,478 | 211,790 | 204,982 | |||||||||
Other income (expense) | ||||||||||||
Income from unconsolidated affiliates | 67,542 | 433 | — | |||||||||
Interest expense (Note 11) | (64,739 | ) | (14,884 | ) | (7,426 | ) | ||||||
Other income | 320 | 287 | 102 | |||||||||
|
|
|
|
|
| |||||||
Income before income tax expense | 181,601 | 197,626 | 197,658 | |||||||||
Income tax expense | 3,214 | 3,289 | 2,431 | |||||||||
|
|
|
|
|
| |||||||
Net income | 178,387 | 194,337 | 195,227 | |||||||||
Net loss attributable to noncontrolling interests | (68 | ) | — | — | ||||||||
|
|
|
|
|
| |||||||
Net income attributable to Access Midstream Partners, L.P. | $ | 178,455 | $ | 194,337 | $ | 195,227 | ||||||
|
|
|
|
|
| |||||||
Limited partner interest in net income | ||||||||||||
Net income attributable to Access Midstream Partners, L.P.(1) | $ | 178,455 | $ | 194,337 | $ | 109,396 | ||||||
Less general partner interest in net income | (8,481 | ) | (5,070 | ) | (2,188 | ) | ||||||
|
|
|
|
|
| |||||||
Limited partner interest in net income | $ | 169,974 | $ | 189,267 | $ | 107,208 | ||||||
|
|
|
|
|
| |||||||
Net income per limited partner unit – basic and diluted | ||||||||||||
Common units | $ | 1.11 | $ | 1.37 | $ | 0.78 | ||||||
Subordinated units | $ | 1.14 | $ | 1.37 | $ | 0.78 | ||||||
| (1) | Reflective of general and limited partner interest in net income attributable to Access Midstream Partners, L.P. since closing the Partnership’s IPO on August 3, 2010. See Note 4 to the consolidated financial statements. |
The accompanying notes are an integral part of the consolidated financial statements.
31
Table of Contents
ACCESS MIDSTREAM PARTNERS, L.P.
CONSOLIDATED STATEMENTS OF CASH FLOWS
| Year Ended December 31, 2012 | Year Ended December 31, 2011 | Year Ended December 31, 2010 | ||||||||||
| ($ in thousands) | ||||||||||||
Cash flows from operating activities: | ||||||||||||
Net income | $ | 178,387 | $ | 194,337 | $ | 195,227 | ||||||
Adjustments to reconcile net income to net cash provided by operating activities: | ||||||||||||
Depreciation and amortization | 165,517 | 136,169 | 88,601 | |||||||||
Income from unconsolidated affiliates | (67,542 | ) | (433 | ) | — | |||||||
Other non-cash items | 8,296 | 6,486 | 5,261 | |||||||||
Changes in assets and liabilities: | ||||||||||||
Decrease in accounts receivable | 18,484 | 31,501 | 58,172 | |||||||||
Increase in other assets | (9,925 | ) | (292 | ) | (4,833 | ) | ||||||
Increase in accounts payable | 8,800 | 11,258 | 7,474 | |||||||||
Increase (decrease) in accrued liabilities | 16,113 | 19,990 | (32,811 | ) | ||||||||
|
|
|
|
|
| |||||||
Net cash provided by operating activities | 318,130 | 399,016 | 317,091 | |||||||||
|
|
|
|
|
| |||||||
Cash flows from investing activities: | ||||||||||||
Additions to property, plant and equipment | (350,500 | ) | (418,834 | ) | (216,303 | ) | ||||||
Acquisition of gathering system assets | (2,160,000 | ) | — | (500,000 | ) | |||||||
Investment in unconsolidated affiliates | (185,039 | ) | (600,000 | ) | — | |||||||
Proceeds from sale of assets | 9,574 | 1,730 | 4,823 | |||||||||
|
|
|
|
|
| |||||||
Net cash used in investing activities | (2,685,965 | ) | (1,017,104 | ) | (711,480 | ) | ||||||
|
|
|
|
|
| |||||||
Cash flows from financing activities: | ||||||||||||
Proceeds from long-term debt borrowings | 1,387,800 | 1,576,700 | 529,300 | |||||||||
Payments on long-term debt borrowings | (2,100,700 | ) | (1,112,900 | ) | (324,300 | ) | ||||||
Proceeds from issuance of common units | 569,255 | — | 474,579 | |||||||||
Proceeds from issuance of Class B units | 343,000 | — | — | |||||||||
Proceeds from issuance of Class C units | 343,000 | — | — | |||||||||
Proceeds from issuance of senior notes | 2,150,000 | 350,000 | (30,522 | ) | ||||||||
Distributions to unit holders | (251,720 | ) | (200,897 | ) | — | |||||||
Distributions to partners | — | — | (231,919 | ) | ||||||||
Contribution from predecessor | — | — | 177 | |||||||||
Debt issuance cost | (39,626 | ) | (11,332 | ) | (5,113 | ) | ||||||
Initial public offering costs | — | (1,280 | ) | — | ||||||||
Other adjustments | 31,798 | 3 | — | |||||||||
|
|
|
|
|
| |||||||
Net cash provided by financing activities | 2,432,807 | 600,294 | 412,202 | |||||||||
|
|
|
|
|
| |||||||
Net increase (decrease) in cash and cash equivalents | 64,972 | (17,794 | ) | 17,813 | ||||||||
Cash and cash equivalents, beginning of period | 22 | 17,816 | 3 | |||||||||
|
|
|
|
|
| |||||||
Cash and cash equivalents, end of period | $ | 64,994 | $ | 22 | $ | 17,816 | ||||||
|
|
|
|
|
| |||||||
Supplemental disclosure of non-cash investing activities: | ||||||||||||
Changes in accounts payable and other liabilities related to purchases of property, plant and equipment | $ | 60,427 | $ | 8,589 | $ | 12,633 | ||||||
Changes in other liabilities related to asset retirement obligations | $ | (133 | ) | $ | 324 | $ | 28 | |||||
Contributions of property, plant and equipment to Chesapeake | $ | — | $ | — | $ | 11,705 | ||||||
Supplemental disclosure of non-cash financing activities: | ||||||||||||
Issuance of 9,791,605 units to Chesapeake for acquisition of Appalachia Midstream | $ | — | $ | 279,257 | $ | — | ||||||
Issuance of general partner interests | $ | — | $ | 5,702 | $ | — | ||||||
Supplemental disclosure of cash payments for interest | $ | 30,292 | $ | 16,957 | $ | 3,607 | ||||||
Supplemental disclosure of cash payments for taxes | $ | 2,900 | $ | 2,830 | $ | 645 | ||||||
The accompanying notes are an integral part of the consolidated financial statements.
32
Table of Contents
ACCESS MIDSTREAM PARTNERS, L.P.
CONSOLIDATED STATEMENTS OF CHANGES IN PARTNERS’ CAPITAL
| Partners’ Equity | ||||||||||||||||||||||||||||||||
| Limited Partners | ||||||||||||||||||||||||||||||||
| Members’ Equity | Common | Subordinated | Class B | Class C | General Partner | Non controlling Interest | Total | |||||||||||||||||||||||||
Balance at December 31, 2009 | $ | 1,793,627 | $ | — | $ | — | $ | — | $ | — | $ | — | $ | — | $ | 1,793,627 | ||||||||||||||||
Distributions to predecessor, net | (6,574 | ) | — | — | — | — | — | — | (6,574 | ) | ||||||||||||||||||||||
Distributions to members | (169,500 | ) | — | — | — | — | — | — | (169,500 | ) | ||||||||||||||||||||||
Net income attributable to the period from January 1, 2010 through August 2, 2010 | 85,831 | — | — | — | — | — | — | 85,831 | ||||||||||||||||||||||||
Contribution of net assets to Chesapeake Midstream Partners, L.P. | (1,703,384 | ) | 834,658 | 834,658 | — | — | 34,068 | — | — | |||||||||||||||||||||||
Issuance of common units to public, net of offering and other costs | — | 474,579 | — | — | — | — | — | 474,579 | ||||||||||||||||||||||||
Distribution of proceeds to partner from exercise of over-allotment option | — | (62,419 | ) | — | — | — | — | — | (62,419 | ) | ||||||||||||||||||||||
Non-cash equity based compensation | — | 150 | — | — | — | — | — | 150 | ||||||||||||||||||||||||
Distributions to unitholders | — | (14,956 | ) | (14,955 | ) | — | — | (611 | ) | — | (30,522 | ) | ||||||||||||||||||||
Net income attributable to the period from August 3, 2010 through December 31, 2010 | — | 53,607 | 53,601 | — | — | 2,188 | — | 109,396 | ||||||||||||||||||||||||
|
|
|
|
|
|
|
|
|
|
|
|
|
|
|
| |||||||||||||||||
Balance at December 31, 2010 | $ | — | $ | 1,285,619 | $ | 873,304 | $ | — | $ | — | $ | 35,645 | $ | — | $ | 2,194,568 | ||||||||||||||||
Net income | — | 94,896 | 94,371 | — | — | 5,070 | — | 194,337 | ||||||||||||||||||||||||
Distribution to unitholders | — | (98,446 | ) | (98,434 | ) | — | — | (4,017 | ) | — | (200,897 | ) | ||||||||||||||||||||
Initial public offering costs | — | (1,280 | ) | — | — | — | — | — | (1,280 | ) | ||||||||||||||||||||||
Non-cash equity based compensation | — | 1,458 | — | — | — | — | — | 1,458 | ||||||||||||||||||||||||
Issuance of common units | — | 279,257 | — | — | — | — | — | 279,257 | ||||||||||||||||||||||||
Issuance of general partner interests | — | — | — | — | — | 5,702 | — | 5,702 | ||||||||||||||||||||||||
|
|
|
|
|
|
|
|
|
|
|
|
|
|
|
| |||||||||||||||||
Balance at December 31, 2011 | $ | — | $ | 1,561,504 | $ | 869,241 | $ | — | $ | — | $ | 42,400 | $ | — | $ | 2,473,145 | ||||||||||||||||
Net income | — | 90,822 | 78,736 | 214 | 202 | 8,481 | (68 | ) | 178,387 | |||||||||||||||||||||||
Distribution to unitholders | — | (130,204 | ) | (113,976 | ) | — | — | (7,540 | ) | — | (251,720 | ) | ||||||||||||||||||||
Contributions from noncontrolling interest owners | — | — | — | — | — | — | 111,741 | 111,741 | ||||||||||||||||||||||||
Non-cash equity based compensation | — | 3,695 | — | — | — | — | — | 3,695 | ||||||||||||||||||||||||
Issuance of common units | — | 569,255 | — | — | — | — | — | 569,255 | ||||||||||||||||||||||||
Issuance of Class B units | — | — | — | 331,148 | — | — | — | 331,148 | ||||||||||||||||||||||||
Issuance of Class C units | — | — | — | — | 331,115 | — | — | 331,115 | ||||||||||||||||||||||||
Issuance of general partner interests | — | — | — | — | — | 49,841 | — | 49,841 | ||||||||||||||||||||||||
Beneficial conversion feature of Class B and Class C units | — | 95,073 | — | (58,328 | ) | (36,745 | ) | — | — | — | ||||||||||||||||||||||
Amortization of beneficial conversion feature of Class B and Class C units | — | (1,803 | ) | — | 824 | 979 | — | — | — | |||||||||||||||||||||||
Other adjustments | — | (101 | ) | — | — | — | — | — | (101 | ) | ||||||||||||||||||||||
|
|
|
|
|
|
|
|
|
|
|
|
|
|
|
| |||||||||||||||||
Balance at December 31, 2012 | $ | — | $ | 2,188,241 | $ | 834,001 | $ | 273,858 | $ | 295,551 | $ | 93,182 | $ | 111,673 | $ | 3,796,506 | ||||||||||||||||
|
|
|
|
|
|
|
|
|
|
|
|
|
|
|
| |||||||||||||||||
33
Table of Contents
1. Description of Business and Basis of Presentation
Basis of presentation. Access Midstream Partners, L.P., (the “Partnership”) a Delaware limited partnership formed in January 2010, is principally focused on natural gas gathering, the first segment of midstream energy infrastructure that connects natural gas produced at the wellhead to third-party takeaway pipelines. The Partnership is the industry’s largest gathering and processing master limited partnership as measured by throughput volume. The Partnership’s assets are located in Arkansas, Kansas, Louisiana, Maryland, New York, Ohio, Oklahoma, Pennsylvania, Texas, Virginia, West Virginia and Wyoming. The Partnership provides gathering, treating and compression services to Chesapeake Energy Corporation, Total Gas and Power North America, Inc., Statoil ASA, Anadarko Petroleum Corporation, Mitsui & Co., Ltd. and other producers under long-term, fixed-fee contracts.
For purposes of these financial statements, the “Partnership,” when used in a historical context, refers to the financial results of Chesapeake Midstream Partners, L.L.C. through the closing date of our initial public offering (“IPO”) on August 3, 2010 and to Access Midstream Partners, L.P. (NYSE: ACMP) and its subsidiaries thereafter. The “GIP I Entities” refers to, collectively, GIP-A Holding (CHK), L.P., GIP-B Holding (CHK), L.P. and GIP-C Holding (CHK), L.P., the “GIP II Entities” refers to certain entities affiliated with Global Infrastructure Investors II, LLC, and “GIP” refers to the GIP I Entities and their affiliates and the GIP II Entities, collectively. “Williams” refers to The Williams Companies, Inc. (NYSE: WMB). “Chesapeake” refers to Chesapeake Energy Corporation (NYSE: CHK). “Total”, when discussing the upstream joint venture with Chesapeake, refers to Total E&P USA, Inc., a wholly owned subsidiary of Total S.A. (NYSE: TOT, FP: FP), and when discussing our gas gathering agreement and related matters, refers to Total E&P USA, Inc. and Total Gas & Power North America, Inc., a wholly owned subsidiary of Total S.A.
The accompanying consolidated financial statements of the Partnership have been prepared in accordance with accounting principles generally accepted in the United States (“GAAP”). To conform to these accounting principles, management makes estimates and assumptions that affect the amounts reported in the consolidated financial statements and the notes thereto. These estimates are evaluated on an ongoing basis, utilizing historical experience and other methods considered reasonable under the particular circumstances. Although these estimates are based on management’s best available knowledge at the time, changes in facts and circumstances or discovery of new facts or circumstances may result in revised estimates and actual results may differ from these estimates. Effects on the Partnership’s business, financial position and results of operations resulting from revisions to estimates are recognized when the facts that give rise to the revision become known.
Offerings and acquisitions.
IPO. On August 3, 2010, the Partnership completed its initial public offering (“IPO”) of 24,437,500 common units (including 3,187,500 common units issued pursuant to the exercise of the underwriters’ over-allotment option on August 3, 2010) at a price of $21.00 per unit. The Partnership’s common units are listed on the New York Stock Exchange (the “NYSE”) under the symbol “ACMP”.
The Partnership received gross offering proceeds in the IPO of approximately $513.2 million less approximately $38.6 million for underwriting discounts and commissions, structuring fees and offering expenses. Pursuant to the terms of the contribution agreement, the Partnership distributed the approximate $62.4 million of net proceeds from the exercise of the over-allotment option to the GIP I Entities on August 3, 2010. Upon completion of the IPO, Chesapeake and the GIP I Entities conveyed to the Partnership a 100 percent membership interest in Chesapeake MLP Operating, L.L.C., which owned all of its assets since September 2009.
During the second quarter of 2012, the GIP II Entities acquired Chesapeake’s 50 percent interest in the Partnership’s general partner and all of the common units and subordinated units in the Partnership that were previously held by Chesapeake. The remaining 50 percent interest in the Partnership’s general partner continued to be owned by the GIP I Entities.
Haynesville Springridge acquisition. On December 21, 2010, the Partnership acquired the Springridge gathering system and related facilities from CMD for $500.0 million. The acquisition was financed with a draw on the Partnership’s revolving credit facility of approximately $234.0 million plus approximately $266.0 million of cash on hand. The Springridge gathering system is primarily located in Caddo and De Soto Parishes, Louisiana. In connection with the acquisition, the Partnership entered into a 10-year, 100 percent fixed-fee gas gathering agreement with Chesapeake which includes a significant acreage dedication, annual fee redetermination and a minimum volume commitment. These assets are referred to collectively as the “Springridge assets” and the acquisition is referred to as the “Springridge acquisition.”
34
Table of Contents
Marcellus acquisition. On December 29, 2011, the Partnership acquired from CMD, all of the issued and outstanding common units of Appalachia Midstream Services, L.L.C. (“Appalachia Midstream”) for total consideration of $879.3 million, consisting of 9,791,605 common units and $600.0 million in cash that was financed with a draw on the Partnership’s revolving credit facility. Through the acquisition of Appalachia Midstream, the Partnership operates 100 percent of and owns an approximate average 47 percent interest in 10 gas gathering systems that consist of approximately 549 miles of gas gathering pipeline in the Marcellus Shale. The remaining 53 percent interest in these assets is owned primarily by Statoil ASA (“Statoil”), Anadarko Petroleum Corporation (“Anadarko”), Epsilon Energy Ltd. (“Epsilon”), Mitsui & Co., Ltd. (“Mitsui”). Appalachia Midstream operates the assets under 15-year fixed fee gathering agreements. The gathering agreements include significant acreage dedications and cost of service mechanisms. EBITDA exceeded the $100 million target in 2012 and no additional revenue related to the commitment was recognized. The target for 2013 represents the minimum amount of EBITDA we will recognize with the potential that throughput for these systems will generate EBITDA in excess of the guaranteed amounts.
CMO acquisition. On December 20, 2012, we acquired from Chesapeake Midstream Development, L.P. (“CMD”), a wholly owned subsidiary of Chesapeake, and certain of CMD’s affiliates, 100 percent of the issued and outstanding equity interests in Chesapeake Midstream Operating, L.L.C. (“CMO”) for total consideration of $2.16 billion (the “CMO Acquisition”). As a result of the CMO Acquisition, the Partnership now owns certain midstream assets in the Eagle Ford, Utica and Niobrara regions. The CMO Acquisition also extended our assets and operations in the Haynesville, Marcellus and Mid-Continent regions. The acquired assets included, in the aggregate, approximately 1,675 miles of pipeline and 4.3 million (gross) dedicated acres as of the date of the acquisition. We also assumed various gas gathering and processing agreements associated with the assets that have terms ranging from 10 to 20 years and that, in certain cases, include cost of service or fee redetermination mechanisms.
Equity Issuance. On December 18, 2012, we completed an equity offering of 18.4 million common units (such amount includes 2.4 million common units issued pursuant to the exercise of the underwriters’ over-allotment option) representing limited partner interest in the Partnership, at a price of $32.15 per common unit.
We received gross offering proceeds (net of underwriting discounts, commissions and offering expenses) from the equity offering of approximately $569.3 million, including the exercise of the option to purchase additional units. We used the net proceeds to pay a portion of the purchase price for the CMO Acquisition.
Subscription Agreement. On December 20, 2012, we sold 5.9 million Class B units to each of the GIP II Entities and Williams and 5.6 million Class C units to each of the GIP II Entities and Williams, in each case pursuant to the subscription agreement. We received aggregate proceeds of approximately $712.1 million in exchange for the sale of Class B units and Class C units, inclusive of the capital contribution made by our general partner to maintain its 2.0 percent interest in the Partnership following the issuance of common, Class B and Class C units.
The results of operations presented and discussed in this annual report include results of operations from CMO for the twelve-day period from closing of the CMO Acquisition on December 20, 2012 through December 31, 2012.
Williams acquisition. Concurrently with the CMO Acquisition, the GIP I Entities sold to Williams 34,538,061 of our subordinated units and 50% of the outstanding equity interests in Access Midstream Ventures, L.L.C., the sole member of our general partner (“Access Midstream Ventures”), for cash consideration of approximately $1.8 billion (the “Williams Acquisition”). The Partnership did not receive any cash proceeds from the Williams Acquisition. As a result of the closing of the Williams Acquisition, the GIP II Entities and Williams together own and control our general partner and the GIP I Entities no longer have any ownership interest in us or our general partner.
35
Table of Contents
Limited partner and general partner units. The following table summarizes common, subordinated, Class B, Class C and general partner units issued during the years ended December 31, 2012, 2011 and 2010:
| Limited Partner Units | ||||||||||||||||||||||||
| Common | Subordinated | Convertible Class B | Subordinated Class C | General Partner Interests | Total | |||||||||||||||||||
Balance at December 31, 2009 | — | — | — | — | — | — | ||||||||||||||||||
Initial public offering and contribution of assets | 69,076,122 | 69,076,122 | — | — | 2,819,434 | 140,971,678 | ||||||||||||||||||
Long-term incentive plan awards | 7,143 | — | — | — | — | 7,143 | ||||||||||||||||||
|
|
|
|
|
|
|
|
|
|
|
| |||||||||||||
Balance at December 31, 2010 | 69,083,265 | 69,076,122 | — | — | 2,819,434 | 140,978,821 | ||||||||||||||||||
Long-term incentive plan awards | 1,773 | — | — | — | 172 | 1,945 | ||||||||||||||||||
December 2011 equity issuance | 9,791,605 | — | — | — | 199,838 | 9,991,443 | ||||||||||||||||||
|
|
|
|
|
|
|
|
|
|
|
| |||||||||||||
Balance at December 31, 2011 | 78,876,643 | 69,076,122 | — | — | 3,019,444 | 150,972,209 | ||||||||||||||||||
Long-term incentive plan awards | 47,810 | — | — | — | 976 | 48,786 | ||||||||||||||||||
December 2012 equity issuance | 18,400,000 | — | 11,858,050 | 11,199,268 | 846,068 | 42,303,386 | ||||||||||||||||||
|
|
|
|
|
|
|
|
|
|
|
| |||||||||||||
Balance at December 31, 2012 | 97,324,453 | 69,076,122 | 11,858,050 | 11,199,268 | 3,866,488 | 193,324,381 | ||||||||||||||||||
|
|
|
|
|
|
|
|
|
|
|
| |||||||||||||
Holdings of partnership equity. At December 31, 2012, the GIP II Entities held 1,933,244 notional general partner units representing a 1.0 percent general partner interest in the Partnership, 50 percent of the Partnership’s incentive distribution rights, 33,704,666 common units, 34,538,061 subordinated units, 5,929,025 Class B units and 5,599,634 Class C units. The GIP II Entities’ ownership represents an aggregate 41.3 percent limited partner interest in the Partnership. Williams held 1,933,244 notional general partner units representing a 1.0 percent general partner interest in the Partnership, 50.0 percent of the Partnership’s incentive distribution rights, 34,538,061 subordinated units, 5,929,025 Class B units and 5,599,634 Class C units. Williams ownership represents an aggregate 23.8 percent limited partner interest in the Partnership. The public held 63,619,787 common units, representing a 32.9 percent limited partner interest in the Partnership.
2. Summary of Significant Accounting Policies
Use of estimates.The preparation of financial statements in conformity with accounting principles generally accepted in the United States of America requires management to make estimates and assumptions that affect the reported amounts and disclosure of contingencies. Significant estimates include: (1) estimated useful lives of assets, which impacts depreciation and amortization; (2) accruals related to revenues, expenses and capital costs; (3) liability and contingency accruals; and (4) cost allocations as described in Note 5. Although management believes these estimates are reasonable, actual results could differ from the Partnership’s estimates.
Cash and cash equivalents. For purposes of the consolidated financial statements, investments in all highly liquid instruments with original maturities of three months or less at date of purchase are considered to be cash equivalents. The Partnership had approximately $65.0 million and $22.0 thousand of cash and cash equivalents as of December 31, 2012 and 2011, respectively. Book overdrafts are checks that have been issued before the end of the period, but not presented to the bank for payment before the end of the period. At December 31, 2012 and 2011, book overdrafts of $30.0 million and $8.5 million, respectively, were included in accounts payable.
Accounts receivable.The majority of accounts receivable relate to gathering and treating activities. Accounts receivable included in the balance sheets are reflected net of an allowance for doubtful accounts, if warranted. At December 31, 2012, the Partnership had no allowance for doubtful accounts. At December 31, 2011, the Partnership had an allowance for doubtful accounts of $0.4 million.
Property, plant and equipment. Property, plant and equipment are recorded at cost. Expenditures for maintenance and repairs that do not add capacity or extend the useful life of an asset are expensed as incurred. The carrying value of the assets is based on estimates, assumptions and judgments relative to useful lives and salvage values. As assets are disposed of, the cost and related accumulated depreciation are removed from the accounts, and any resulting gain or loss is included in operating expenses in the statements of operations.
Certain of the gathering systems of the Partnership are subject to an agreement with a subsidiary of Chesapeake that provides the Partnership rights and obligations equivalent to a capital lease. Under the terms of the agreement, the Partnership has rights to the associated capital assets for as long as the assets are in operation. Specifically, the Partnership will pay all costs associated with the related gathering systems, including all capital
36
Table of Contents
costs, operating costs and direct and indirect overhead costs. In exchange for paying such costs and for the services it provides pursuant to the agreement, the Partnership receives revenues derived from operation of the gathering systems. At December 31, 2012 and 2011, approximately $125.6 million and $124.5 million ($99.8 million and $105.0 million net of accumulated depreciation), respectively, of the Partnership’s gathering system assets were held under such agreement. Payments for capital costs under the agreement are made as the associated capital assets are constructed and, accordingly, as of December 31, 2012, the Partnership had no capital lease obligation liability associated with the assets held under the agreement.
Depreciation is calculated using the straight-line method, based on the assets’ estimated useful lives. These estimates are based on various factors including age (in the case of acquired assets), manufacturing specifications, technological advances and historical data concerning useful lives of similar assets.
Impairment of long-lived assets.Long-lived assets with recorded values that are not expected to be recovered through future cash flows are written down to estimated fair value. Assets are tested for impairment when events or circumstances indicate that the carrying value may not be recoverable. The carrying value of a long-lived asset is not recoverable if it exceeds the sum of the undiscounted cash flows expected to result from the use and eventual disposition of the asset. If the carrying value exceeds the sum of the undiscounted cash flows, an impairment loss equal to the amount that the carrying value exceeds the fair value of the asset is recognized. Fair value is determined using an income approach whereby the expected future cash flows are discounted using a rate management believes a market participant would assume is reflective of the risks associated with achieving the underlying cash flows.
Equity Method Investments.The equity method of accounting is used to account for the Partnership’s interest in Utica East Ohio Midstream LLC and Ranch Westex JV, LLC, which the Partnership acquired as part of the CMO Acquisition. The equity method is also used to account for the Partnership’s various ownership interests in 10 gas gathering systems in the Marcellus Shale. See Note 1 – Description of Business and Basis of Presentation for more information on the acquisitions.
Asset retirement obligations. Management recognizes a liability based on the estimated costs of retiring tangible long-lived assets. The liability is recognized at the Partnership’s fair value measured using expected discounted future cash outflows of the asset retirement obligation when the obligation originates, which generally is when an asset is acquired or constructed. The carrying amount of the associated asset is increased commensurate with the liability recognized. Accretion expense is recognized over time as the discounted liability is accreted to the Partnership’s expected settlement value. Subsequent to the initial recognition, the liability is adjusted for any changes in the expected value of the retirement obligation (with a corresponding adjustment to property, plant and equipment) and for accretion of the liability due to the passage of time, until the obligation is settled. If the fair value of the estimated asset retirement obligation changes, an adjustment is recorded for both the asset retirement obligation and the associated asset carrying amount. Revisions in estimated asset retirement obligations may result from changes in estimated inflation rates, discount rates, retirement costs and the estimated timing of settling asset retirement obligations.
Fair value. The fair-value-measurement standard defines fair value as the price that would be received to sell an asset or paid to transfer a liability in an orderly transaction between market participants at the measurement date. The standard characterizes inputs used in determining fair value according to a hierarchy that prioritizes those inputs based upon the degree to which they are observable. The three levels of the fair value hierarchy are as follows:
Level 1 — inputs represent quoted prices in active markets for identical assets or liabilities.
Level 2 — inputs other than quoted prices included within Level 1 that are observable for the asset or liability, either directly or indirectly (for example, quoted market prices for similar assets or liabilities in active markets or quoted market prices for identical assets or liabilities in markets not considered to be active, inputs other than quoted prices that are observable for the asset or liability, or market-corroborated inputs).
Level 3 — inputs that are not observable from objective sources, such as management’s internally developed assumptions used in pricing an asset or liability (for example, an estimate of future cash flows used in management’s internally developed present value of future cash flows model that underlies the fair value measurement).
Nonfinancial assets and liabilities initially measured at fair value include third-party business combinations, impaired long-lived assets (asset groups), and initial recognition of asset retirement obligations.
37
Table of Contents
The fair value of debt is the estimated amount the Partnership would have to pay to repurchase its debt, including any premium or discount attributable to the difference between the stated interest rate and market rate of interest at the balance sheet date. Fair values are based on quoted market prices or average valuations of similar debt instruments at the balance sheet date for those debt instruments for which quoted market prices are not available. See Note 11 — Debt and Interest Expense for disclosures regarding the fair value of debt.
| December 31, 2012 | December 31, 2011 | |||||||||||||||
| Carrying amount | Fair Value (Level 2) | Carrying amount | Fair Value (Level 2) | |||||||||||||
| ($ in thousands) | ||||||||||||||||
Financial liabilities | ||||||||||||||||
Revolving credit facility | $ | — | $ | — | $ | 712,900 | $ | 712,900 | ||||||||
2021 Notes | 350,000 | 370,125 | 350,000 | 350,221 | ||||||||||||
2022 Notes | 750,000 | 810,000 | — | — | ||||||||||||
2023 Notes | 1,400,000 | 1,428,882 | — | — | ||||||||||||
The carrying amount of cash and cash equivalents, accounts receivable and accounts payable reported on the balance sheet approximates fair value.
Segments. Prior to the CMO Acquisition, the Partnership’s operations were organized into a single business segment. As a result of the CMO Acquisition, the Partnership added assets in three new operating regions. Effective January 1, 2013, the Partnership’s chief operating decision maker began to analyze and make operating decisions based on geographic segments. The Partnership’s operations are divided into eight operating segments: Barnett Shale, Eagle Ford Shale, Haynesville Shale, Marcellus Shale, Niobrara Shale, Utica Shale, Mid-Continent region and Corporate.
Revenue Recognition. In 2012, the Partnership derived the majority of its revenues through gas gathering agreements with Chesapeake and Total. Pursuant to their respective applicable gas gathering agreements, Chesapeake and Total have agreed to minimum volume commitments covering production in the Barnett Shale region for each year through December 31, 2018 and for the six month period ending June 30, 2019, and, solely with respect to Chesapeake, in the Haynesville Shale region for each year through December 31, 2013 and December 31, 2017 for the Springridge and Mansfield systems, respectively. In the event either Chesapeake or Total does not meet its minimum volume commitment to the Partnership in the Barnett Shale region or Chesapeake does not meet its minimum volume commitment to the Partnership in the Haynesville Shale region, for any annual period (or six month period with respect to the six months ending June 30, 2019 in the Barnett Shale region) during the minimum volume commitment period, Chesapeake and Total will be obligated to pay a fee equal to the applicable fee for each Mcf by which the applicable party’s minimum volume commitment for such year (or six month period with respect to the six months ending June 30, 2019) exceeds the actual volumes gathered from such party’s production. The revenue associated with such shortfall fees is recognized in the fourth quarter of each year.
Revenues consist of fees recognized for the gathering, treating, compression and processing of natural gas. Revenues are recognized when the service is performed and is based upon non-regulated rates and the related gathering, treating, compression and processing volumes.
Deferred Loan Costs.External costs incurred in connection with closing the revolving bank credit facilities are capitalized as deferred loan costs and amortized over the life of the related agreement. Amortization is included in interest expense in the statement of operations.
Environmental Expenditures.Liabilities for loss contingencies, including environmental remediation costs, arising from claims, assessments, litigation, fines, and penalties and other sources are charged to expense when it is probable that a liability has been incurred and the amount of the assessment and/or remediation can be reasonably estimated. There are no liabilities reflected in the accompanying financial statements at December 31, 2012 and 2011.
Equity Based Compensation. Through December 31, 2012, certain employees of Chesapeake were seconded to the Partnership and provided operating, routine maintenance and other services with respect to the business under the direction, supervision and control of the Partnership’s general partner. A number of these employees received equity-based compensation through Chesapeake’s stock-based compensation programs, which consist of restricted stock issued to employees.
38
Table of Contents
The fair value of the awards issued was determined based on the fair market value of the shares on the date of grant. However, the Partnership’s expense was allocated based on the lesser of the value at grant date or vest date. This value is amortized over the vesting period, which is generally four or five years from the date of grant. To the extent compensation cost relates to employee activities directly involved in gathering or treating operations, such amounts were charged to the Partnership and its predecessor and were reflected as operating expenses. Included in operating expenses is stock-based compensation of $9.0 million, $3.8 million and $2.1 million for the Partnership during the years ended December 31, 2012, 2011 and 2010, respectively. To the extent compensation cost relates to employees indirectly involved in gathering or treating operations, such amounts are charged to the Partnership and its predecessor through an overhead allocation and are reflected as general and administrative expenses.
The Access Midstream Long-Term Incentive Plan (“LTIP”) provides for an aggregate of 3,500,000 common units to be awarded to employees, directors and consultants of the Partnership’s general partner and its affiliates through various award types, including unit awards, restricted units, phantom units, unit options, unit appreciation rights and other unit-based awards. The LTIP has been designed to promote the interests of the Partnership and its unitholders by strengthening its ability to attract, retain and motivate qualified individuals to serve as employees, directors and consultants. As of December 31, 2012, there was $11.5 million of unrecognized compensation expense attributable to the LTIP, of which $10.7 million is expected to be recognized over a weighted average period of four years.
The following table summarizes LTIP award activity for the year ended December 31, 2012:
| Units | Value per Unit | |||||||
Restricted units unvested at beginning of period | 273,258 | $ | 28.50 | |||||
Granted | 332,868 | 28.57 | ||||||
Vested | (47,810 | ) | 28.53 | |||||
Forfeited | (47,139 | ) | 28.45 | |||||
|
| |||||||
Restricted units unvested at end of period | 511,177 | $ | 28.55 | |||||
|
| |||||||
Intangible Assets.Intangible assets are generally amortized on a straight-line basis over their estimated useful lives, unless the assets economic benefits are consumed on an other than straight-line basis. The estimated useful life is the period over which the assets are expected to contribute directly or indirectly to the Partnership’s future cash flows. The estimated useful life of the customer relationship acquired with the Springridge gathering system and Appalachia Midstream is 15 years and 20 years for the CMO Acquisition. Amortization expense was $11.3 million and $11.3 million for the years ended December 31, 2012 and 2011, respectively, for the Partnership. No amortization expense was recognized for the year ended December 31, 2010.
The Partnership assesses long-lived assets, including property, plant and equipment and intangible assets, for impairment whenever events or changes in circumstances indicate that the carrying amount of an asset may not be recoverable. Recoverability is assessed by comparing the carrying amount of an asset to undiscounted future net cash flows expected to be generated by the asset. If such assets are considered to be impaired, the impairment to be recognized is measured as the amount by which the carrying amounts exceed the fair value of the assets.
Business Combinations.The Partnership makes various assumptions in developing models for determining the fair values of assets and liabilities associated with business acquisitions. These fair value models, developed with the assistance of outside consultants, apply discounted cash flow approaches to expected future operating results, considering expected growth rates, development opportunities, and future pricing assumptions to arrive at an economic value for the business acquired. The Partnership then determines the fair value of the tangible assets based on estimates of replacement costs less obsolescence. Identifiable intangible assets acquired consist primarily of customer contracts, customer relationships, trade names, and licenses and permits. The Partnership values customer relationships using a discounted cash flow model.
Income taxes. As a master limited partnership, the Partnership is a pass-through entity and also not subject to federal income taxes and most state income taxes with the exception of Texas Franchise Tax. For federal and state income tax purposes, all income, expenses, gains, losses and tax credits generate flow through to the owners, and accordingly, do not result in a provision for income taxes.
39
Table of Contents
Variable Interest Entities (VIEs).An entity is referred to as a VIE pursuant to accounting guidance for consolidation if it possesses one of the following criteria: (i) it is thinly capitalized, (ii) the residual equity holders do not control the entity, (iii) the equity holders are shielded from the economic losses, (iv) the equity holders do not participate fully in the entity’s residual economics, or (v) the entity was established with non-substantive voting interests. We consolidate a VIE when we have both the power to direct the activities that most significantly impact the activities of the VIE and the right to receive benefits or the obligation to absorb losses of the entity that could be potentially significant to the VIE. We continually monitor both consolidated and unconsolidated VIEs to determine if any events have occurred that could cause the primary beneficiary to change.
3. Partnership Distributions
The partnership agreement requires that, within 45 days subsequent to the end of each quarter, beginning with the quarter ended September 30, 2010, the Partnership distributes all of its available cash (as defined in the partnership agreement) to unitholders of record on the applicable record date. During the years ended December 31, 2012 and 2011, the Partnership paid cash distributions to its unitholders of approximately $251.7 million and $200.9 million, respectively, representing the four distributions in 2012 and four distributions in 2011. See also Note 15 — Subsequent Events concerning distributions approved in January 2013 for the quarter ended December 31, 2012.
Available cash. The amount of available cash (as defined in the partnership agreement) generally is all cash on hand at the end of the quarter less the amount of cash reserves established by the Partnership’s general partner to provide for the proper conduct of its business, including reserves to fund future capital expenditures, to comply with applicable laws, or its debt instruments and other agreements, or to provide funds for distributions to its unitholders and to its general partner for any one or more of the next four quarters. Working capital borrowings generally include borrowings made under a credit facility or similar financing arrangement.
Minimum Quarterly Distribution.The partnership agreement provides that, during the subordination period, the common units are entitled to distributions of available cash each quarter in an amount equal to the minimum quarterly distribution, which is $0.3375 per common unit for a full fiscal quarter, plus any arrearages in the payment of the minimum quarterly distribution on the common units from prior quarters, before any distributions of available cash are permitted on the subordinated units. Furthermore, arrearages do not apply to and therefore will not be paid on the subordinated units. The effect of the subordinated units is to increase the likelihood that, during the subordination period, available cash is sufficient to fully fund cash distributions on the common units in an amount equal to or greater than the minimum quarterly distribution.
The subordination period will lapse at such time when the Partnership has earned and paid at least the quarterly minimum distribution per quarter on each common unit, subordinated unit and general partner unit for any three consecutive, non-overlapping four-quarter periods ending on or after June 30, 2013. Also, if the Partnership has earned and paid at least 150 percent of the minimum quarterly distribution on each outstanding common unit, subordinated unit and general partner unit for each calendar quarter in a four-quarter period, the subordination period will terminate automatically. The subordination period will also terminate automatically if the general partner is removed without cause and the units held by the general partner and its affiliates are not voted in favor of removal. When the subordination period lapses or otherwise terminates, all remaining subordinated units will convert into common units on a one-for-one basis and the common units will no longer be entitled to arrearages. All subordinated units are held indirectly by affiliates of the Partnership’s general partner.
Class B Units
The Class B units are not entitled to cash distributions. Instead, prior to conversion into common units, the Class B units will receive quarterly distributions of additional paid-in-kind Class B units. The amount of each quarterly distribution per Class B unit will be the quotient of the quarterly distribution paid to our common units by the volume-weighted average price of the common units for the 30-day period prior to the declaration of the quarterly distribution to common units. Effective on the business day after the record date for the distribution on common units for the fiscal quarter ending December 31, 2014, each Class B unit will become convertible at the election of either the holder of such Class B unit or us into a common unit on a one-for-one basis. In the event of our liquidation, the holder of Class B units will be entitled to receive out of our assets available for distribution to the partners the positive balance in each such holder’s capital account in respect of such Class B units, determined after allocating our net
40
Table of Contents
income or net loss among the partners. All Class B units are held indirectly by affiliates of the Partnership’s general partner. The Class B units were issued at a discount to the market price of the common units which they are convertible. This discount totaling $58.3 million represents a beneficial conversion feature and is reflected as an increase in common unitholders’ capital and a decrease in Class B units capital to reflect the fair value of the Class B units at issuance on the Partnership’s consolidated statement of changes in partners’ capital for the twelve months ended December 31, 2012. The beneficial conversion feature is considered a non-cash distribution recognized ratably from the issuance date of December 20, 2012, through the conversion date, resulting in an increase in Class B units capital and a decrease in common unitholders’ capital.
Class C Units
The Class C units are entitled to quarterly cash distributions after the common units have received the minimum quarterly distribution, plus any arrearages from prior quarters. The Class C units will participate pro rata thereafter with all outstanding subordinated units until the subordinated units and Class C units receive the minimum quarterly distribution, after which the Class C units will participate in further cash distributions pro rata with our common units. Effective on the business day after the record date for the distribution on common units for the fiscal quarter ending December 31, 2013, each Class C unit will become convertible at the election of either the holder of such Class C unit or us into a common unit on a one-for-one basis. In the event of our liquidation, the holder of Class C units will be entitled to receive out of our assets available for distribution to the our partners the positive balance in each such holder’s capital account in respect of such Class C units, determined after allocating our net income or net loss among the Partners. All Class C units are held indirectly by affiliates of the Partnership’s general partner. The Class C units were issued at a discount to the market price of the common units which they are convertible. This discount totaling $36.7 million represents a beneficial conversion feature and is reflected as an increase in common unitholders’ capital and a decrease in Class C units capital to reflect the fair value of the Class C units at issuance on the Partnership’s consolidated statement of changes in partners’ capital for the twelve months ended December 31, 2012. The beneficial conversion feature is considered a non-cash distribution recognized ratably from the issuance date of December 20, 2012, through the conversion date, resulting in an increase in Class C units capital and a decrease in common unitholders’ capital.
General Partner Interest and Incentive Distribution Rights. The Partnership’s general partner is entitled to two percent of all quarterly distributions that the Partnership makes prior to its liquidation. The general partner has the right, but not the obligation, to contribute a proportionate amount of capital to the Partnership to maintain its current general partner interest. The general partner’s initial two percent interest in the Partnership’s distributions may be reduced if the Partnership issues additional limited partner units in the future (other than the issuance of common units upon conversion of outstanding subordinated, Class B or Class C units or the issuance of common units upon a reset of the incentive distribution rights) and its general partner does not contribute a proportionate amount of capital to the Partnership to maintain its two percent general partner interest. After distributing amounts equal to the minimum quarterly distribution to common, subordinated and Class C unitholders (and Class B unitholders, upon conversion of Class B units to common units) and distributing amounts to eliminate any arrearages to common unitholders, the Partnership’s general partner is entitled to incentive distributions if the amount the Partnership distributes with respect to any quarter exceeds specified target levels shown below:
| Total quarterly distribution per unit | Unitholders | General partner | ||||||||||
Minimum Quarterly Distribution | $0.3375 | 98.0 | % | 2.0 | % | |||||||
First Target Distribution | up to $0.388125 | 98.0 | % | 2.0 | % | |||||||
Second Target Distribution | above $0.388125 up to $0.421875 | 85.0 | % | 15.0 | % | |||||||
Third Target Distribution | above $0.421875 up to $0.50625 | 75.0 | % | 25.0 | % | |||||||
Thereafter | above $0.50625 | 50.0 | % | 50.0 | % | |||||||
The table above assumes that the Partnership’s general partner maintains its two percent general partner interest, that there are no arrearages on common units and the general partner continues to own the incentive distribution rights. The maximum distribution sharing percentage of 50.0 percent includes distributions paid to the general partner on its two percent general partner interest and does not include any distributions that the general partner may receive on limited partner units that it owns or may acquire.
41
Table of Contents
4. Net Income per Limited Partner Unit
The Partnership’s net income attributable to the Partnership’s assets for periods including and subsequent to the Partnership’s acquisitions of the Partnership’s assets is allocated to the general partner and the limited partners, including any subordinated, Class B and Class C unitholders, in accordance with their respective ownership percentages, and when applicable, giving effect to unvested units granted under the LTIP and incentive distributions allocable to the general partner. The allocation of undistributed earnings, or net income in excess of distributions, to the incentive distribution rights is limited to available cash (as defined by the partnership agreement) for the period. The Partnership’s net income allocable to the limited partners is allocated between the common, subordinated, Class B and Class C unitholders by applying the provisions of the partnership agreement that govern actual cash distributions as if all earnings for the period had been distributed. Accordingly, if current net income allocable to the limited partners is less than the minimum quarterly distribution, or if cumulative net income allocable to the limited partners since August 3, 2010 is less than the cumulative minimum quarterly distributions, more income is allocated to the common unitholders than the subordinated, Class B and Class C unitholders for that quarterly period.
Basic and diluted net income per limited partner unit is calculated by dividing the limited partners’ interest in net income by the weighted average number of limited partner units outstanding during the period. The common units issued during the period are included on a weighted-average basis for the days in which they were outstanding.
The following table illustrates the Partnership’s calculation of net income per unit for common and subordinated limited partner units (in thousands, except per-unit information):
| Years Ended | ||||||||
| December 31, 2012 | December 31, 2011 | |||||||
Net income attributable to Access Midstream Partners, L.P. | $ | 178,455 | $ | 194,337 | ||||
Less general partner interest in net income | (8,481 | ) | (5,070 | ) | ||||
|
|
|
| |||||
Limited partner interest in net income | $ | 169,974 | $ | 189,267 | ||||
|
|
|
| |||||
Net income allocable to common units(1) | $ | 89,019 | $ | 94,896 | ||||
Net income allocable to subordinated units | 78,736 | 94,371 | ||||||
Net income allocable to convertible class B units(1) | 1,038 | — | ||||||
Net income allocable to subordinated class C units(1) | 1,181 | — | ||||||
|
|
|
| |||||
Limited partner interest in net income | $ | 169,974 | $ | 189,267 | ||||
|
|
|
| |||||
Net income per limited partner unit – basic and diluted | ||||||||
Common units | $ | 1.11 | $ | 1.37 | ||||
Subordinated units | 1.14 | 1.37 | ||||||
Weighted average limited partner units outstanding – basic and diluted | ||||||||
Common units | 80,058,682 | 69,371,194 | ||||||
Subordinated units | 69,076,122 | 69,076,122 | ||||||
|
|
|
| |||||
Total | 149,134,804 | 138,447,316 | ||||||
|
|
|
| |||||
| (1) | Adjusted to reflect amortization for the beneficial conversion feature. |
5. Related Party Transactions
In June 2012, Chesapeake sold all of its ownership interests in us and in our general partner; however, Mr. Dell’Osso, Executive Vice President and Chief Financial Officer of Chesapeake, remained on our board of directors. Effective with the closing of the CMO Acquisition on December 20, 2012, the Partnership does not expect to complete additional significant transactions with Chesapeake. While Mr. Dell’Osso remains on our board, we no longer consider Chesapeake to be an affiliate of Access Midstream Partners. Because Chesapeake was our affiliate for a portion of 2012, we set forth below a description of our transactions with Chesapeake.
42
Table of Contents
Affiliate transactions.In the normal course of business, natural gas gathering, treating and other midstream services are provided to Chesapeake and its affiliates. Revenues are derived almost exclusively from Chesapeake, which includes volumes attributable to third-party interest owners that participate in Chesapeake’s operated wells.
Omnibus Agreement.The Partnership has entered into an omnibus agreement with Access Midstream Ventures and Chesapeake Midstream Holdings that addresses the Partnership’s right to indemnification for certain liabilities and its obligation to indemnify Access Midstream Ventures and affiliated parties for certain liabilities.
General and Administrative Services and Reimbursement. Pursuant to a services agreement, Chesapeake and its affiliates provide certain services including legal, accounting, treasury, human resources, information technology and administration. The employees supporting these operations are employees of Chesapeake Energy Marketing Inc. (“CEMI”) or Chesapeake. The consolidated financial statements for the Partnership and the predecessor include costs allocated from Chesapeake and CEMI for centralized general and administrative services, as well as depreciation of assets utilized by Chesapeake’s centralized general and administrative functions. Effective October 1, 2009, the Partnership was charged a general and administrative fee from Chesapeake based on the terms of the joint venture agreement. The established terms indicate corporate overhead costs are charged to the Partnership based on actual cost of the services provided, subject to a fee per Mcf cap based on volumes of natural gas gathered. The fee is calculated as the lesser of $0.0310/Mcf gathered or actual corporate overhead costs. General and administrative charges were $22.3 million, $23.7 million and $17.0 million for the years ended December 31, 2012, 2011 and 2010 for the Partnership.
Additional Services and Reimbursement. At the Partnership’s request, Chesapeake also provides the Partnership with certain additional services under the services agreement, including engineering, construction, procurement, business analysis, commercial, cartographic and other similar services to the extent they are not already provided by the seconded employees. In return for such additional services, the general partner reimburses Chesapeake on a monthly basis an amount equal to the time and materials actually spent in performing the additional services. The reimbursement for additional services is not subject to the general and administrative services reimbursement cap.
Chesapeake has agreed to perform all services under the relevant provisions of the services agreement using at least the same level of care, quality, timeliness and skill as it does for itself and its affiliates and with no less than the same degree of care, quality, timeliness and skill as its past practice in performing the services for itself and the Partnership’s business during the one year period prior to September 30, 2009. In any event, Chesapeake has agreed to perform such services using no less than a reasonable level of care in accordance with industry standards.
In connection with the services arrangement, the Partnership reimburses GIP for certain costs incurred by GIP in connection with assisting the Partnership in the operation of its business. For the years ended December 31, 2012 and 2011, the cost was $1.7 million and $0.6 million, respectively, for these support services.
Employee Secondment Agreement. Chesapeake, certain of its affiliates and the Partnership’s general partner have entered into an amended and restated employee secondment agreement pursuant to which specified employees of Chesapeake are seconded to the general partner to provide operating, routine maintenance and other services with respect to the Partnership’s business under the direction, supervision and control of the general partner. Additionally, all of the Partnership’s executive officers other than its chief executive officer, Mr. Stice, are seconded to the general partner pursuant to this agreement. The general partner, subject to specified exceptions and limitations, reimburses Chesapeake on a monthly basis for substantially all costs and expenses Chesapeake incurs relating to such seconded employees, including the cost of their salaries, bonuses and employee benefits, including 401(k), restricted stock grants and health insurance and certain severance benefits. Charges to the Partnership for the services rendered by such seconded employees were $49.4 million and $42.1 million for the years ended December 31, 2012 and 2011, respectively. These charges include $37.7 million and $37.7 million in operating expenses and $11.7 million and $4.4 million in general and administrative expenses for the years end December 31, 2012 and 2011, respectively, in the accompanying consolidated statements of operations.
The initial term of the employee secondment agreement extends through September 30, 2014. The term will automatically extend for additional twelve month periods unless any party provides 90 days’ prior written notice otherwise prior to the expiration of the initial term or the applicable twelve month period. The Partnership’s general partner may terminate the agreement at any time upon 90 days’ prior written notice.
43
Table of Contents
Shared Services Agreement.In return for the services of Mr. Stice as the chief executive officer of the Partnership’s general partner, its general partner has entered into a shared services agreement with Chesapeake pursuant to which its general partner reimburses certain of the costs and expenses incurred by Chesapeake in connection with Mr. Stice’s employment. The general partner is generally expected, subject to certain exceptions, to reimburse Chesapeake for 50 percent of the costs and expenses of the amounts provided to Mr. Stice in his employment agreement; however, the ultimate reimbursement obligation is determined based on the amount of time Mr. Stice actually spends working for the Partnership. The reimbursement obligations of its general partner will continue for so long as Mr. Stice is employed by both the general partner and Chesapeake.
Gas Compressor Master Rental and Servicing Agreement. The Partnership has entered into a gas compressor master rental and servicing agreement with MidCon Compression, L.L.C., (“MidCon Compression”) a wholly owned indirect subsidiary of Chesapeake, pursuant to which MidCon Compression agreed to provide the Partnership certain compression equipment that the Partnership uses to compress gas gathered on its gathering systems outside the Marcellus Shale and provide certain related services. In return for providing such equipment, the Partnership pays specified monthly rates per specified compression units, subject to an annual escalator to be applied on October 1st of each year and a redetermination of such specified monthly rates to market rates effective no later than October 1, 2016. Under the compression agreement, the Partnership granted MidCon Compression the exclusive right to provide compression equipment to the Partnership in the acreage dedications through September 30, 2016. Thereafter, the Partnership will have the right to continue receiving such equipment through September 30, 2019 at market rates to be agreed upon between the parties or to receive compression equipment from unaffiliated third parties. MidCon Compression guarantees to the Partnership that the compressors will meet specified run time and throughput performance guarantees. The monthly rates are reduced for any equipment that does not meet these guarantees. The Partnership receives substantially all of the compression capacity for its existing gathering systems in the Marcellus Shale from MidCon Compression under a long-term contract expiring on January 31, 2021 pursuant to which the Partnership has agreed to pay specified monthly rates under a fixed-fee structure subject to an annual escalator. This agreement is not subject to an exclusivity provision. Compressor charges from affiliates were $65.3 million, $57.6 million and $47.8 million for the years ended December 31, 2012, 2011 and 2010, respectively. These charges are included in operating expenses in the accompanying consolidated statements of operations.
The Partnership is obligated to maintain general liability and property insurance, including machinery breakdown insurance with respect to the equipment. In addition, MidCon Compression has agreed to provide the Partnership with emission testing and other related services at monthly rates. The Partnership or MidCon Compression may terminate these services upon not less than six months notice.
The compression agreement expires on September 30, 2019 but will continue from year to year thereafter, unless terminated by the Partnership no less than 60 days prior to the end of the term or any year thereafter. Additionally, either party may terminate in specified circumstances, including upon the other party’s failure to perform material obligations under the compression agreement if such failure is not cured within 60 days after notice thereof.
Inventory Purchase Agreement. Upon completion of the IPO, the Partnership entered into an inventory purchase agreement pursuant to which the Partnership agreed beginning as of September 30, 2009 to purchase from Chesapeake, in each case on terms and conditions to be mutually agreed upon by Chesapeake and the Partnership, its first $60.0 million of requirements of pipes that are useful in the conduct of the natural gas gathering, compression, dehydrating, treating and transportation business at a specified price per ton. For the years ended December 31, 2011 and 2010, the Partnership purchased approximately $23.4 million and $36.6 million, respectively, of inventory pursuant to this inventory purchase agreement and incorporated in the Partnership’s property, plant and equipment, thus satisfying the terms of this agreement.
Gas Gathering Agreements.The Partnership operates under gas gathering agreements that range from 10 to 20 years.
Future revenues under the Partnership’s gas gathering agreements will be derived pursuant to terms that will differ between the Partnership’s operating regions.
If one of the counterparties to the gas gathering agreements sells, transfers or otherwise disposes of to a third party properties within the Partnership’s acreage dedications, it does so subject to the terms of the gas gathering agreement, including our dedication, and it will be required to cause the third party to acknowledge and take assignment of the counterparty’s obligations under the existing gas gathering agreement with the Partnership, subject to our consent. Our producer customers’ dedication of the gas produced from applicable properties under our gas gathering agreements will run with the land in order to bind successors to the producer customers’ interest, as well as any interests in the dedicated properties subsequently acquired by the producer customer.
44
Table of Contents
6. Concentration of Credit Risk
Chesapeake and Total are the only customers from whom revenues exceeded 10 percent of consolidated revenues for the years ended December 31, 2012, 2011, and 2010, for the Partnership. The percentage of revenues from Chesapeake, Total and other customers are as follows:
| Years Ended December 31, | ||||||||||||
| 2012 | 2011 | 2010 | ||||||||||
Chesapeake | 80.7 | % | 82.9 | % | 82.2 | % | ||||||
Total | 14.1 | 14.0 | 14.8 | |||||||||
Other | 5.2 | 3.1 | 3.0 | |||||||||
|
|
|
|
|
| |||||||
Total(a) | 100 | % | 100 | % | 100 | % | ||||||
|
|
|
|
|
| |||||||
| (a) | Revenues from Appalachia Midstream are accounted for as part of our equity method investment. |
Financial instruments that potentially subject the Partnership and its predecessor to concentrations of credit risk consist principally of cash and cash equivalents and trade receivables. On December 31, 2012 and 2011, respectively, cash and cash equivalents were invested in a non-interest bearing account and money market funds with investment grade ratings.
7. Property, Plant and Equipment
A summary of the historical cost of the Partnership’s property, plant and equipment is as follows:
| Estimated Useful Lives (Years) | December 31, 2012 | December 31, 2011 | ||||||||||
| ($ in thousands) | ||||||||||||
Gathering systems | 20 | $ | 5,130,255 | $ | 2,954,868 | |||||||
Other fixed assets | 2 through 39 | 96,916 | 53,611 | |||||||||
|
|
|
| |||||||||
Total property, plant and equipment | 5,227,171 | 3,008,479 | ||||||||||
Accumulated depreciation | (590,614 | ) | (480,555 | ) | ||||||||
|
|
|
| |||||||||
Total net, property, plant and equipment | $ | 4,636,557 | $ | 2,527,924 | ||||||||
|
|
|
| |||||||||
Included in gathering systems is $455.4 million and $122.6 million at December 31, 2012 and 2011, respectively, that is not subject to depreciation as the systems were under construction and had not been put into service.
Depreciation expense was $153.8 million, $124.7 million and $88.6 million for the years ended December 31, 2012, 2011 and 2010, respectively, for the Partnership.
8. Business Combinations
CMO. On December 20, 2012, the Partnership acquired from CMD, 100 percent of the issued and outstanding equity interests in Chesapeake Midstream Operating, L.L.C. (“CMO”) for total consideration of $2.16 billion. Through the acquisition of CMO, the Partnership owns certain midstream assets in the Eagle Ford, Utica, Niobrara, Haynesville, Marcellus and Mid-Continent regions. These assets include, in aggregate, approximately 1,675 miles of pipeline and 4.3 million dedicated acres. See Note 1 to the consolidated financial statements for additional information.
The results of operations presented and discussed in this annual report include results of operations from the CMO acquisition for the twelve-day period from closing of the acquisition on December 20, 2012 through December 31, 2012. For this period, income attributable to CMO operations was $3.0 million. The purchase price in excess of the value underlying the gas gathering system assets and working capital is approximately $207.9 million and is attributable to customer relationships acquired. This intangible asset will be amortized over a 20 year period on a straight-line basis.
45
Table of Contents
The table below reflects the final allocation of the purchase price to the assets acquired and the liabilities assumed in the CMO Acquisition (in thousands).
Property, plant and equipment | $ | 1,960,826 | ||
Intangible asset | 207,891 | |||
Other | (8,717 | ) | ||
|
| |||
Total purchase price | $ | 2,160,000 | ||
|
|
The purchase price allocation is based on an assessment of the fair value of the assets acquired and liabilities assumed in the CMO Acquisition. The fair values of the gathering assets, related equipment, and intangible assets acquired were based on the market, cost and income approaches. All fair-value measurements of assets acquired and liabilities assumed are based on inputs that are not observable in the market and thus represent Level 3 inputs.
Marcellus. On December 29, 2011, the Partnership acquired from CMD all of the issued and outstanding common units of Appalachia Midstream for total consideration of $879.3 million, consisting of 9,791,605 common units and $600.0 million in cash that was financed with a draw on the Partnership’s revolving credit facility. The base purchase price of $879.3 million was increased by $7.3 million due to initial working capital adjustments through December 31, 2011. Through the acquisition of Appalachia Midstream, the Partnership operates 100 percent of and owns an approximate average 47 percent interest in 10 gas gathering systems that consist of approximately 549 miles of gas gathering pipeline in the Marcellus Shale.
The results of operations presented and discussed in this annual report include results of operations from the Appalachia Midstream for the full year of operations in 2012 and the two-day period from closing of the acquisition on December 29, 2011, through December 31, 2011. The Partnership’s interest in the gas gathering systems is accounted for as an equity investment and is included in income from unconsolidated affiliate. For this period, income from unconsolidated affiliate attributable to Marcellus operations was $0.4 million. The purchase price in excess of the value underlying the gas gathering system assets and working capital is approximately $461.2 million and is attributable to customer relationships acquired. This intangible asset will be amortized over a 15 year period on a straight-line basis.
Haynesville Springridge.On December 21, 2010, the Partnership completed the Springridge acquisition for $500.0 million in cash that was funded with a draw on the Partnership’s revolving credit facility of approximately $234.0 million plus approximately $266.0 million of cash on hand. The Springridge gathering system is primarily located in Caddo and De Soto Parishes, Louisiana.
The results of operations presented and discussed in this annual report include results of operations from the Springridge gathering system for the 10-day period from closing of the acquisition on December 21, 2010, through December 31, 2010 and all of 2011 and 2012. The total purchase price of the Springridge acquisition was allocated as follows: gas gathering system assets of $327.5 million and a customer relationship with a value of $172.5 million. The useful life of the customer relationship acquired is estimated to be 15 years and is amortized on a straight-line basis.
46
Table of Contents
The following table presents the pro forma condensed financial information of the Partnership as if the CMO Acquisition occurred on January 1, 2011, and as if the Springridge and Appalachia Midstream Acquisitions occurred on January 1, 2010. The pro forma adjustments reflected in the pro forma condensed consolidated financial statements are based upon currently available information and certain assumptions and estimates; therefore, the actual effects of these transactions will differ from the pro forma adjustments. However, the Partnership’s management considers the applied estimates and assumptions to provide a reasonable basis for the presentation of the significant effects of certain transactions that are expected to have a continuing impact on the Partnership. In addition, the Partnership’s management considers the pro forma adjustments to be factually supportable and to appropriately represent the expected impact of items that are directly attributable to the transfer of CMO, the Springridge assets and Appalachia Midstream to the Partnership.
| Year Ended December 31, | Year Ended December 31, | Year Ended December 31, | ||||||||||
| 2012 | 2011 | 2010 | ||||||||||
| (in thousands) | ||||||||||||
Revenues, including revenue from affiliates | $ | 670,702 | $ | 689,840 | $ | 512,745 | ||||||
Net income | 117,334 | 69,390 | 144,789 | |||||||||
Net income attributable to Access Midstream Partners, L.P. | 117,861 | 69,390 | 144,789 | |||||||||
Net income per common unit – basic and diluted | 0.72 | 0.49 | 0.96 | |||||||||
Net income per subordinated unit – basic and diluted | 0.74 | 0.49 | 0.96 | |||||||||
9. Unconsolidated Affiliates
At December 31, 2012 and 2011, the Partnership had the following investments:
| Net Ownership Interest | December 31, 2012 | December 31, 2011 | ||||||||||
| ($ in thousands) | ||||||||||||
Liberty gas gathering system | 33.75 | % | $ | 264,625 | $ | 200,145 | ||||||
Victory gas gathering system | 67.50 | 178,011 | 189,402 | |||||||||
Rome gas gathering system | 33.75 | 160,087 | 127,348 | |||||||||
Panhandle gas gathering system | 67.50 | 149,654 | 59,858 | |||||||||
Utica East Ohio Midstream LLC | 49.00 | 125,416 | — | |||||||||
Overfield gas gathering system | 67.50 | 101,339 | 75,797 | |||||||||
Smithfield gas gathering system | 67.50 | 82,347 | 67,134 | |||||||||
Selbyville gas gathering system | 67.50 | 65,354 | 76,251 | |||||||||
Ranch Westex JV, LLC | 33.33 | 35,012 | — | |||||||||
Other gas gathering systems | various | 135,966 | 90,623 | |||||||||
|
|
|
| |||||||||
Total investments in unconsolidated affiliates | $ | 1,297,811 | $ | 886,558 | ||||||||
|
|
|
| |||||||||
Marcellus. On December 29, 2011, the Partnership acquired from CMD, a wholly owned subsidiary of Chesapeake, and certain of its affiliates, all of the issued and outstanding common units of Appalachia Midstream for approximately $879.3 million. Through the acquisition of Appalachia Midstream, the Partnership will operate 100 percent of and own an approximate average 47 percent interest in 10 gas gathering systems that consist of approximately 549 miles of gas gathering pipeline in the Marcellus Shale in Pennsylvania and West Virginia. These 10 gathering systems consist of the Liberty, Victory, Rome and Selbyville gas gathering systems and six other smaller gas gathering systems. The remaining 53 percent interest in these assets is owned primarily by Statoil, Anadarko, Epsilon and Mitsui. Appalachia Midstream operates the assets under 15-year fixed fee gathering agreements. The 10 gathering systems are separate investments with varying ownership percentages and each gathering system is accounted for as an equity investment because all capital expenditures and other operating decisions must be approved by a supermajority vote of the gathering system’s owners.
Utica East Ohio Midstream, LLC. In March 2012, CMO entered into an agreement to form Utica East Ohio Midstream LLC (“UEOM”) with M3 Midstream, L.L.C. and EV Energy Partners, L.P. to develop necessary infrastructure for the gathering and processing of natural gas and NGL in the Utica Shale play in Eastern Ohio. The infrastructure complex will consist of natural gas gathering and compression facilities constructed and operated by CMO, as well as processing, NGL fractionation, loading and terminal facilities constructed and operated by M3
47
Table of Contents
Midstream, L.L.C. The Partnership owns a 49 percent interest and UEOM is accounted for as an equity investment because the power to direct the activities which are most significant to UEOM’s economic performance is shared between the Partnership and the other equity holders. The Partnership acquired UEOM as part of the CMO Acquisition in December 2012.
Ranch Westex JV, LLC. On December 1, 2011, CMO entered into a joint venture to form Ranch Westex JV, LLC. (“Ranch Westex”) with Regency Energy Partners, LP and Anadarko Pecos Midstream LLC to build a processing facility in Ward County, Texas, to process natural gas delivered from the liquids-rich Bone Springs and Avalon Shale formations. The Partnership owns a 33 percent interest and Ranch Westex is accounted for as an equity method investment because the power to direct the activities that are most significant to Ranch Westex’s economic performance is shared among the three equity holders. The project will consist of the construction of two plants, a refrigeration plant and a cryogenic processing plant. The Partnership acquired Ranch Westex as part of the CMO Acquisition in December 2012.
Unconsolidated Affiliates Financial Information. The following tables sets forth summarized financial information of 100 percent of the 10 Marcellus gas gathering system investments in which the Partnership acquired an interest in December 2012 and 2011, as follows:
| December 31, 2012 | December 31, 2011 | |||||||
| ($ in thousands) | ||||||||
Balance Sheet | ||||||||
Current assets | $ | 70,234 | $ | 38,709 | ||||
Property, plant, and equipment | 1,528,894 | 745,061 | ||||||
Other assets | 301 | 213 | ||||||
|
|
|
| |||||
Total assets | $ | 1,599,429 | $ | 783,983 | ||||
|
|
|
| |||||
Current liabilities | $ | 23,424 | $ | 13,137 | ||||
Other liabilities | 111,718 | 90,067 | ||||||
Partner’s capital | 1,464,287 | 680,779 | ||||||
|
|
|
| |||||
Total liabilities and partner’s capital | $ | 1,599,429 | $ | 783,983 | ||||
|
|
|
| |||||
| December 31, 2012 | December 31, 2011 | |||||||
| ($ in thousands) | ||||||||
Income Statement | ||||||||
Revenue | $ | 308,845 | $ | 1,150 | ||||
Operating Expenses | $ | 97,594 | $ | 195 | ||||
Net Income | $ | 211,361 | $ | 955 | ||||
10. Asset Retirement Obligations
The following table provides a summary of changes in asset retirement obligations, which are included in other liabilities in the accompanying consolidated balance sheets. Revisions in estimates for the periods presented relate primarily to revisions of current cost estimates, inflation rates and/or discount rates.
| Years Ended December 31, | ||||||||||||
| 2012 | 2011 | 2010 | ||||||||||
| (in thousands) | ||||||||||||
Asset retirement obligations, beginning of period | $ | 3,409 | $ | 2,878 | $ | 2,850 | ||||||
Additions(1) | 1,816 | 131 | 229 | |||||||||
Revisions | (133 | ) | 193 | — | ||||||||
Accretion expense | 243 | 207 | 211 | |||||||||
Deletions | — | — | (412 | ) | ||||||||
|
|
|
|
|
| |||||||
Asset retirement obligations, end of period | $ | 5,335 | $ | 3,409 | $ | 2,878 | ||||||
|
|
|
|
|
| |||||||
| (1) | Includes asset retirement obligation acquired as part the CMO Acquisition. |
48
Table of Contents
11. Long-Term Debt and Interest Expense
The following table presents the Partnership’s outstanding debt as of December 31, 2012 and 2011 (in thousands):
| December 31, 2012 | December 31, 2011 | |||||||
Revolving credit facility | $ | — | $ | 712,900 | ||||
5.875% Senior Notes due April 2021 | 350,000 | 350,000 | ||||||
6.125% Senior Notes due July 2022 | 750,000 | — | ||||||
4.875% Senior Notes due May 2023 | 1,400,000 | — | ||||||
|
|
|
| |||||
Total long-term debt | $ | 2,500,000 | $ | 1,062,900 | ||||
|
|
|
| |||||
Revolving Bank Credit Facility.On August 2, 2010, June 10, 2011 and December 20, 2011 the Partnership amended its $500 million joint venture senior secured credit facility. The amendments extended the revolving credit facility’s maturity date and increased the revolving credit facility’s borrowing capacity, including the sub-limit for same-day swing line advances, as well as the revolving credit facility’s accordion feature that allowed the Partnership to increase the available borrowing capacity under the facility subject to the satisfaction of certain closing conditions.
On December 12, 2012, the Partnership further amended its senior secured revolving credit facility. The amended revolving credit facility matures in June 2016 and provides up to $1 billion of borrowing capacity, including a sub-limit of $50 million for same-day swing line advances and a sub-limit of $50 million for letters of credit. In addition, the revolving credit facility’s accordion feature allows the Partnership to increase the available borrowing capacity under the facility up to $1.25 billion, subject to the satisfaction of certain conditions, including the identification of lenders or proposed lenders that agree to satisfy the increased commitment amounts under the revolving credit facility. As of December 31, 2012 the Partnership had no borrowings outstanding under its revolving credit facility.
Borrowings under the revolving credit facility are available to fund working capital, finance capital expenditures and acquisitions, provide for the issuance of letters of credit and for general partnership purposes. The revolving credit facility is secured by all of the Partnership’s assets, and loans thereunder (other than swing line loans) bear interest at the Partnership’s option at either (i) the greater of (a) the reference rate of Wells Fargo Bank, NA, (b) the federal funds effective rate plus 0.50 percent or (c) the Eurodollar rate which is based on the London Interbank Offered Rate (LIBOR), plus 1.00 percent, each of which is subject to a margin that varies from 0.625 percent to 1.50 percent per annum, according to the Partnership’s leverage ratio (as defined in the agreement), or (ii) the Eurodollar rate plus a margin that varies from 1.625 percent to 2.50 percent per annum, according to the Partnership’s leverage ratio. If the Partnership reaches investment grade status, the Partnership will have the option to release the security under the credit facility and amounts borrowed will bear interest under a specified ratings-based pricing grid. The unused portion of the credit facility is subject to commitment fees of (a) 0.25 percent to 0.40 percent per annum while the Partnership is subject to the leverage-based pricing grid, according to the Partnership’s leverage ratio and (b) 0.20 percent to 0.35 percent per annum while the Partnership is subject to the ratings-based pricing grid, according to its senior unsecured long-term debt ratings.
Additionally, the revolving credit facility contains various covenants and restrictive provisions which limit the Partnership and its subsidiaries’ ability to incur additional indebtedness, guarantees and/or liens; consolidate, merge or transfer all or substantially all of the Partnership’s assets; make certain investments, acquisitions or other restricted payments; modify certain material agreements; engage in certain types of transactions with affiliates; dispose of assets; and prepay certain indebtedness. If the Partnership fails to perform its obligations under these and other covenants, the revolving credit commitment could be terminated and any outstanding borrowings, together with accrued interest, under the revolving credit facility could be declared immediately due and payable. The revolving credit facility also has cross default provisions that apply to any other indebtedness the Partnership may have with an outstanding principal amount in excess of $15 million.
The revolving credit facility agreement contains certain negative covenants that (i) limit the Partnership’s ability, as well as the ability of certain of its subsidiaries, among other things, to enter into hedging arrangements and create liens and (ii) require the Partnership to maintain a consolidated leverage ratio, and an EBITDA to interest expense ratio, in each case as described in the credit facility agreement. The revolving credit facility agreement also provides for the discontinuance of the requirement for the Partnership to maintain the EBITDA to interest expense ratio and
49
Table of Contents
allows for the Partnership to release all collateral securing the revolving credit facility if the Partnership reaches investment grade status. The revolving credit facility agreement also requires the Partnership to maintain a consolidated leverage ratio of 5.5 to 1.0 (or 5.0 to 1.0 after we have released all collateral upon achieving investment grade status). The Partnership was in compliance with all covenants under the agreement at December 31, 2012.
Senior Notes.On April 19, 2011, the Partnership and ACMP Finance Corp., a wholly owned subsidiary of Access MLP Operating, L.L.C., completed a private placement of $350.0 million in aggregate principal amount of 5.875 percent senior notes due 2021 (the “2021 Notes”). The Partnership used a portion of the net proceeds to repay borrowings outstanding under its revolving credit facility and used the balance for general partnership purposes. Debt issuance costs of $7.8 million are being amortized over the life of the 2021 Notes.
The 2021 Notes will mature on April 15, 2021 and interest is payable on the 2021 Notes on April 15 and October 15 of each year, beginning on October 15, 2011. The Partnership has the option to redeem all or a portion of the 2021 Notes at any time on or after April 15, 2015, at the redemption price specified in the indenture, plus accrued and unpaid interest. The Partnership may also redeem the 2021 Notes, in whole or in part, at a “make-whole” redemption price specified in the indenture, plus accrued and unpaid interest, at any time prior to April 15, 2015. In addition, the Partnership may redeem up to 35 percent of the 2021 Notes prior to April 15, 2014 under certain circumstances with the net cash proceeds from certain equity offerings.
On January 11, 2012, the Partnership and ACMP Finance Corp., a wholly owned subsidiary of Access MLP Operating, L.L.C., completed a private placement of $750.0 million in aggregate principal amount of 6.125 percent senior notes due 2022 (the “2022 Notes”). The Partnership used a portion of the net proceeds to repay all borrowings outstanding under its revolving credit facility and used the balance for general partnership purposes. Debt issuance costs of $13.8 million are being amortized over the life of the 2022 Notes.
The 2022 Notes will mature on July 15, 2022 and interest is payable on January 15 and July 15 of each year. The Partnership has the option to redeem all or a portion of the 2022 Notes at any time on or after January 15, 2017, at the redemption price specified in the indenture relating to the 2022 Notes, plus accrued and unpaid interest. The Partnership may also redeem the 2022 Notes, in whole or in part, at a “make-whole” redemption price specified in the indenture, plus accrued and unpaid interest, at any time prior to January 15, 2017. In addition, the Partnership may redeem up to 35 percent of the 2022 Notes prior to January 15, 2015 under certain circumstances with the net cash proceeds from certain equity offerings.
In connection with the issuances and sales of the 2021 Notes and the 2022 Notes, we entered into registration rights agreements with the initial purchasers of the 2021 Notes and the 2022 Notes obligating us, among other things, to use our commercially reasonable best efforts to file exchange registration statements with the SEC so that holders of the 2021 Notes and the 2022 Notes could offer to exchange such notes for registered notes having substantially the same terms as the 2021 Notes and the 2022 Notes and evidencing the same indebtedness as the 2021 Notes and the 2022 Notes, respectively. On February 10, 2012, we filed an exchange offer registration statement for the 2021 Notes and the 2022 Notes with the SEC, which was were declared effective on March 14, 2012. The exchange offer was completed in April 2012, thereby fulfilling all of the requirements of the 2011 Notes and 2022 Notes registration rights agreements.
On December 19, 2012, the Partnership and ACMP Finance Corp., a wholly owned subsidiary of Access MLP Operating, L.L.C., completed a public offering of $1.4 billion in aggregate principal amount of 4.875 percent senior notes due 2023 (the “2023 Notes”). We used a portion of the net proceeds to fund a portion of the purchase price for the CMO Acquisition, and the balance to repay borrowings outstanding under our revolving credit facility. Debt issuance costs of $25.8 million are being amortized over the life of the 2023 Notes.
The 2023 Notes will mature on May 15, 2023, and interest is payable on May 15 and November 15 of each year. We have the option to redeem all or a portion of the 2023 Notes at any time on or after December 15, 2017, at the redemption price specified in the indenture relating to the 2023 Notes, plus accrued and unpaid interest. We may also redeem the 2023 Notes, in whole or in part, at a “make-whole” redemption price specified in the indenture, plus accrued and unpaid interest, at any time prior to December 15, 2017. In addition, we may redeem up to 35 percent of the 2023 Notes prior to December 15, 2015 under certain circumstances with the net cash proceeds from certain equity offerings.
The 2023 Notes, 2022 Notes and the 2021 Notes indentures contain covenants that, among other things, limit the Partnership’s ability and the ability of certain of the Partnership’s subsidiaries to: (1) sell assets including equity interests in its subsidiaries; (2) pay distributions on, redeem or purchase the Partnership’s units, or redeem or
50
Table of Contents
purchase the Partnership’s subordinated debt; (3) make investments; (4) incur or guarantee additional indebtedness or issue preferred units; (5) create or incur certain liens; (6) enter into agreements that restrict distributions or other payments from certain subsidiaries to the Partnership; (7) consolidate, merge or transfer all or substantially all of the Partnership’s or certain of the Partnership’s subsidiaries’ assets; (8) engage in transactions with affiliates; and (9) create unrestricted subsidiaries. These covenants are subject to important exceptions and qualifications. If the 2023 Notes, 2022 Notes or the 2021 Notes achieve an investment grade rating from either of Moody’s Investors Service, Inc. or Standard & Poor’s Ratings Services and no default, as defined in the indentures, has occurred or is continuing, many of these covenants will terminate.
The Partnership, as the parent company, has no independent assets or operations. The Partnership’s operations are conducted by its subsidiaries through its operating company subsidiary, Access MLP Operating, L.L.C. Each of Access MLP Operating, L.L.C. and the Partnership’s other subsidiaries is a guarantor, other than ACMP Finance Corp., an indirect 100 percent owned subsidiary of the Partnership whose sole purpose is to act as co-issuer of any debt securities. Each guarantor is a 100 percent owned subsidiary of the Partnership. The guarantees registered under the registration statement are full and unconditional and joint and several, subject to certain automatic customary releases, including sale, disposition, or transfer of the capital stock or substantially all of the assets of a subsidiary guarantor, exercise of legal defeasance option or covenant defeasance option, and designation of a subsidiary guarantor as unrestricted in accordance with the Indenture. There are no significant restrictions on the ability of the Partnership or any guarantor to obtain funds from its subsidiaries by dividend or loan. None of the assets of the Partnership or a guarantor represent restricted net assets pursuant to Rule 4-08(e)(3) of Regulation S-X under the Securities Act.
Capitalized Interest.Interest expense was net of capitalized interest of $14.6 million, $9.5 million, and $2.6 million for the years ended December 31, 2012, 2011 and 2010, respectively, for the Partnership.
12. Commitments and Contingencies
Environmental obligations.The Partnership is subject to various environmental-remediation and reclamation obligations arising from federal, state and local regulations regarding air and water quality, hazardous and solid waste disposal and other environmental matters. Management believes there are currently no such matters that will have a material effect on the Partnership’s results of operations, cash flows or financial position and has not recorded any liability in these financial statements.
Litigation and legal proceedings.From time to time, the Partnership is involved in legal, tax, regulatory and other proceedings in various forums regarding performance, contracts and other matters that arise in the ordinary course of business. Management is not aware of any such proceedings for which a final disposition could have a material effect on the Partnership’s results of operations, cash flows or financial position. There was not an accrual for legal contingencies as of December 31, 2012 or 2011.
Lease commitments. Certain property, equipment and operating facilities are leased under various operating leases. Costs are also incurred associated with leased land, rights-of-way, permits and regulatory fees, the contracts for which generally extend beyond one year but can be cancelled at any time should they not be required for operations.
Rental expense related to leases was $81.1 million, $60.7 million, $50.1 million for the years ended December 31, 2012, 2011 and 2010, respectively, for the Partnership. The Partnership’s remaining contractual lease obligations as of December 31, 2012 include obligations with an affiliate of Chesapeake for compression equipment as compression services are needed to support pipeline that is being placed in service in future periods. Contractual lease obligations also include remaining payments for the Partnership’s headquarter buildings and other lease agreements.
51
Table of Contents
Future minimum rental payments due under operating leases as of December 31, 2012 are as follows:
| (in thousands) | ||||||||
2013 | $ | 54,034 | ||||||
2014 | 45,461 | |||||||
2015 | 30,775 | |||||||
2016 | 18,038 | |||||||
2017 | 7,981 | |||||||
Thereafter | 15,889 | |||||||
|
| |||||||
Future minimum lease payments(1) | $ | 172,178 | ||||||
|
| |||||||
| (1) | Includes the Partnership’s minimum rental payments for CMO acquired on December 20, 2012. |
13. Recently Issued Accounting Standards
The Financial Accounting Standards Board (“FASB”) recently issued the following standard which the Partnership reviewed to determine the potential impact on its financial statements upon adoption.
On July 27, 2012, the FASB issued authoritative guidance related to the testing of indefinite-lived intangible assets for impairment. The guidance provides with the option to first assess qualitative factors to determine whether the existence of events or circumstances leads to a determination that it is more-likely-than-not that the indefinite-lived asset is impaired. If, after assessing the total events or circumstances, we determine that it is not more likely than not that the indefinite-lived asset is impaired, then we are not required to take further action. However, if we conclude otherwise, then we are required to determine the fair value of the indefinite-lived intangible asset and perform the quantitative impairment test by comparing the fair value with the carrying amount. The guidance also gives us the option to bypass the qualitative assessment for any period and proceed directly to performing the quantitative impairment test and resume performing the qualitative assessment in any subsequent period. This guidance will be effective for us beginning January 1, 2013 and will not have a material impact on our consolidated financial statements.
52
Table of Contents
14. Segment Information
Prior to the CMO Acquisition, the Partnership’s operations were organized into a single business segment. As a result of the CMO Acquisition, the Partnership added assets in three new operating regions. Effective January 1, 2013, the Partnership’s chief operating decision maker began to analyze and make operating decisions based on geographic segments. The Partnership’s operations are divided into eight operating segments: Barnett Shale, Eagle Ford Shale, Haynesville Shale, Marcellus Shale, Niobrara Shale, Utica Shale, Mid-Continent region and Corporate. Summarized financial information for the reportable segments is shown in the following tables, presented in thousands.
For the year ended December 31, 2012
| Barnett | Eagle Ford | Haynesville | Marcellus | Niobrara | ||||||||||||||||
Revenues | $ | 395,467 | $ | 7,232 | $ | 68,184 | $ | 783 | $ | 116 | ||||||||||
Operating expenses | 101,703 | 1,604 | 15,642 | 188 | 85 | |||||||||||||||
Depreciation and amortization expense | 93,343 | 968 | 33,210 | 6 | 79 | |||||||||||||||
General and administrative expense | — | — | — | — | — | |||||||||||||||
Other operating expense | — | — | — | — | — | |||||||||||||||
|
|
|
|
|
|
|
|
|
| |||||||||||
Operating income (loss) | $ | 200,421 | $ | 4,660 | $ | 19,332 | $ | 589 | $ | (48 | ) | |||||||||
|
|
|
|
|
|
|
|
|
| |||||||||||
Income (loss) from unconsolidated affiliates | $ | — | $ | — | $ | — | $ | 67,592 | $ | — | ||||||||||
Capital expenditures | $ | 98,507 | $ | 11,796 | $ | 23,578 | $ | — | (1) | $ | 1,967 | |||||||||
Total assets | $ | 1,573,789 | $ | 925,694 | $ | 1,324,599 | $ | 1,142,550 | $ | 91,236 | ||||||||||
| Utica | Mid-Continent | Corporate | Consolidated | |||||||||||||
Revenues | $ | 353 | $ | 136,312 | $ | — | $ | 608,447 | ||||||||
Operating expenses | 159 | 52,979 | 25,279 | 197,639 | ||||||||||||
Depreciation and amortization expense | 48 | 32,042 | 5,821 | 165,517 | ||||||||||||
General and administrative expense | — | — | 67,579 | 67,579 | ||||||||||||
Other operating expense | — | — | (766 | ) | (766 | ) | ||||||||||
|
|
|
|
|
|
|
| |||||||||
Operating income (loss) | $ | 146 | $ | 51,291 | $ | (97,913 | ) | $ | 178,478 | |||||||
|
|
|
|
|
|
|
| |||||||||
Income (loss) from unconsolidated affiliates | $ | (38 | ) | $ | (12 | ) | $ | — | $ | 67,542 | ||||||
Capital expenditures | $ | 126 | $ | 184,285 | $ | 30,241 | $ | 350,500 | ||||||||
Total assets | $ | 356,662 | $ | 714,510 | $ | 432,060 | $ | 6,561,100 | ||||||||
| (1) | Amount excludes $384.4 million for the Partnership’s share of capital expenditures included in investments in unconsolidated affiliates. |
53
Table of Contents
For the year ended December 31, 2011
| Barnett | Eagle Ford | Haynesville | Marcellus | Niobrara | ||||||||||||||||
Revenues | $ | 361,843 | $ | — | $ | 93,107 | $ | — | — | |||||||||||
Operating expenses | 94,009 | — | 18,057 | — | — | |||||||||||||||
Depreciation and amortization expense | 76,979 | — | 29,051 | — | — | |||||||||||||||
General and administrative expense | — | — | — | — | — | |||||||||||||||
Other operating expense | — | — | — | — | — | |||||||||||||||
|
|
|
|
|
|
|
|
|
| |||||||||||
Operating income | $ | 190,855 | $ | — | $ | 45,999 | $ | — | $ | — | ||||||||||
|
|
|
|
|
|
|
|
|
| |||||||||||
Income from unconsolidated affiliates | $ | — | $ | — | $ | — | $ | 433 | $ | — | ||||||||||
Capital expenditures | $ | 253,126 | $ | — | $ | 56,087 | $ | — | $ | — | ||||||||||
Total Assets | $ | 1,584,207 | $ | — | $ | 527,527 | $ | 886,558 | $ | — | ||||||||||
| Utica | Mid-Continent | Corporate | Consolidated | |||||||||||||
Revenues | $ | — | $ | 110,979 | $ | — | $ | 565,929 | ||||||||
Operating expenses | — | 47,749 | 17,036 | 176,851 | ||||||||||||
Depreciation and amortization expense | — | 28,014 | 2,125 | 136,169 | ||||||||||||
General and administrative expense | — | — | 40,380 | 40,380 | ||||||||||||
Other operating expense | — | — | 739 | 739 | ||||||||||||
|
|
|
|
|
|
|
| |||||||||
Operating income | $ | — | $ | 35,216 | $ | (60,280 | ) | $ | 211,790 | |||||||
|
|
|
|
|
|
|
| |||||||||
Income from unconsolidated affiliates | $ | — | $ | — | $ | — | $ | 433 | ||||||||
Capital expenditures | $ | — | $ | 88,259 | $ | 21,362 | $ | 418,834 | ||||||||
Total Assets | $ | — | $ | 531,410 | $ | 153,536 | $ | 3,683,238 | ||||||||
For the year ended December 31, 2010
| Barnett | Eagle Ford | Haynesville | Marcellus | Niobrara | ||||||||||||||||
Revenues | $ | 358,821 | $ | — | $ | 2,082 | $ | — | — | |||||||||||
Operating expenses | 81,304 | — | 508 | — | — | |||||||||||||||
Depreciation and amortization expense | 62,559 | — | 422 | — | — | |||||||||||||||
General and administrative expense | — | — | — | — | — | |||||||||||||||
Other operating expense | — | — | — | — | — | |||||||||||||||
|
|
|
|
|
|
|
|
|
| |||||||||||
Operating income | $ | 214,958 | $ | — | $ | 1,152 | $ | — | $ | — | ||||||||||
|
|
|
|
|
|
|
|
|
| |||||||||||
Income from unconsolidated affiliates | $ | — | $ | — | $ | — | $ | — | $ | — | ||||||||||
Capital expenditures | $ | 156,430 | $ | — | $ | — | $ | — | $ | — | ||||||||||
Total Assets | $ | 1,405,002 | $ | — | $ | 504,780 | $ | — | $ | — | ||||||||||
| Utica | Mid-Continent | Corporate | Consolidated | |||||||||||||
Revenues | $ | — | $ | 98,250 | $ | — | $ | 459,153 | ||||||||
Operating expenses | — | 42,521 | 8,960 | 133,293 | ||||||||||||
Depreciation and amortization expense | — | 23,709 | 1,911 | 88,601 | ||||||||||||
General and administrative expense | — | — | 31,992 | 31,992 | ||||||||||||
Other operating expense | — | — | 285 | 285 | ||||||||||||
|
|
|
|
|
|
|
| |||||||||
Operating income | $ | — | $ | 32,020 | $ | (43,148 | ) | $ | 204,982 | |||||||
|
|
|
|
|
|
|
| |||||||||
Income from unconsolidated affiliates | $ | — | $ | — | $ | — | $ | — | ||||||||
Capital expenditures | $ | — | $ | 49,015 | $ | 10,858 | $ | 216,303 | ||||||||
Total Assets | $ | — | $ | 464,250 | $ | 171,884 | $ | 2,545,916 | ||||||||
54
Table of Contents
15. Subsequent Events
On January 25, 2013, the board of directors of the Partnership’s general partner declared a cash distribution to the Partnership’s unitholders of $0.45 per unit, or $84.1 million in aggregate. The cash distribution was paid on February 13, 2013 to unitholders of record at the close of business on February 6, 2013.
16. Quarterly Financial Data (Unaudited)
Summarized unaudited quarterly financial data for 2012 and 2011 are as follows ($ in thousands except per share data):
| Quarters Ended | ||||||||||||||||
| March 31, 2012 | June 30, 2012 | September 30, 2012 | December 31, 2012 | |||||||||||||
Total revenues | $ | 154,674 | $ | 149,332 | $ | 156,092 | $ | 148,349 | ||||||||
Gross profit(a) | 105,992 | 104,601 | 106,287 | 93,928 | ||||||||||||
Net income | 52,366 | 51,606 | 50,228 | 24,187 | ||||||||||||
Net income attributable to Access Midstream Partners, L.P. | 52,366 | 51,606 | 50,228 | 24,255 | ||||||||||||
Net income per common units | $ | 0.34 | $ | 0.34 | $ | 0.32 | $ | 0.11 | ||||||||
Net income per subordinated units | $ | 0.34 | $ | 0.34 | $ | 0.32 | $ | 0.14 | ||||||||
| Quarters Ended | ||||||||||||||||
| March 31, 2011 | June 30, 2011 | September 30, 2011 | December 31, 2011 | |||||||||||||
Total revenues | $ | 123,529 | $ | 133,217 | $ | 140,105 | $ | 169,078 | ||||||||
Gross profit(a) | 80,968 | 88,933 | 96,872 | 122,305 | ||||||||||||
Net income | 38,776 | 41,083 | 48,173 | 66,305 | ||||||||||||
Net income attributable to Access Midstream Partners, L.P. | 38,776 | 41,083 | 48,173 | 66,305 | ||||||||||||
Net income per limited partner unit | $ | 0.27 | $ | 0.29 | $ | 0.34 | $ | 0.46 | ||||||||
| (a) | Total revenue less operating costs. |
55