Table of Contents
The information in this preliminary prospectus supplement is not complete and may be changed. A registration statement relating to these securities has been filed with the Securities and Exchange Commission. This preliminary prospectus supplement and the accompanying prospectus is not an offer to sell these securities and we are not soliciting an offer to buy these securities in any state where the offer or sale is not permitted.
Filed Pursuant to Rule 424(b)(5)
Registration No. 333-170866
SUBJECT TO COMPLETION, DATED NOVEMBER 8, 2011
PRELIMINARY PROSPECTUS SUPPLEMENT
(To Prospectus Dated July 1, 2011)

Korea Finance Corporation
US$ % Notes due 20
Our US$ aggregate principal amount of notes due 20 (the “Notes”) will bear interest at a rate of % per annum. Interest on the Notes is payable semi-annually in arrears on and of each year, beginning on , 2012. The Notes will mature on , 20 .
The Notes will be issued in minimum denominations of US$200,000 principal amount and integral multiples of US$1,000 in excess thereof. The Notes will be represented by one or more global notes registered in the name of a nominee of The Depository Trust Company, as depositary.
Neither the Securities and Exchange Commission nor any state securities commission has approved or disapproved of these securities or determined if this prospectus supplement or the accompanying prospectus is truthful or complete. Any representation to the contrary is a criminal offense.
| Per Note | Total | |||||||
Public offering price | % | US$ | ||||||
Underwriting discount | % | US$ | ||||||
Proceeds to us (before deduction of expenses) | % | US$ | ||||||
In addition to the initial public offering price, you will have to pay for accrued interest, if any, from and including , 2011.
Approval in-principle has been received from the Singapore Exchange Securities Trading Limited (the “SGX-ST”) for the listing of the Notes. The SGX-ST assumes no responsibility for the correctness of any statements made, opinions expressed or reports contained in this prospectus supplement or the accompanying prospectus. Approval in-principle from, and admission of the Notes to the Official List of, the SGX-ST are not to be taken as an indication of the merits of the issuer or the Notes. Currently, there is no public market for the Notes.
The Notes are expected to be delivered to investors through the book-entry facilities of The Depository Trust Company on or about , 2011.
Joint Bookrunners & Lead Managers
BofA Merrill Lynch Credit Suisse HSBC The Royal Bank of Scotland Daewoo Securities
Prospectus Supplement dated , 2011
Table of Contents
You should rely only on the information contained in or incorporated by reference in this prospectus supplement and the accompanying prospectus. We have not authorized anyone to provide you with different information. We are not making an offer to sell these securities in any state or jurisdiction where the offer or sale is not permitted.
Prospectus Supplement
| S-6 | ||||
| S-8 | ||||
| S-9 | ||||
| S-177 | ||||
| S-180 | ||||
| S-183 | ||||
| S-184 | ||||
| S-188 | ||||
| S-188 | ||||
| S-188 |
Prospectus
| 1 | ||||
| 2 | ||||
| 3 | ||||
| 3 | ||||
| 5 | ||||
| 5 | ||||
| 8 | ||||
| 15 | ||||
| 22 | ||||
| 24 | ||||
| 26 | ||||
| 27 | ||||
| 28 | ||||
| 30 | ||||
| 36 | ||||
| 111 | ||||
| 111 | ||||
| 112 | ||||
| 116 | ||||
| 123 | ||||
| 128 | ||||
| 133 | ||||
| 137 | ||||
| 144 | ||||
| 147 | ||||
| 148 | ||||
| 153 | ||||
| 153 | ||||
| 160 | ||||
| 161 |
S-2
Table of Contents
Limitations on Issuance of Bearer Debt Securities and Bearer Warrants | 162 | |||
| 163 | ||||
| 163 | ||||
| 164 | ||||
| 171 | ||||
| 172 | ||||
| 172 | ||||
| 172 | ||||
| 172 | ||||
| 173 | ||||
| 174 |
S-3
Table of Contents
Certain Defined Terms
All references to “Korea” or the “Republic” contained in this prospectus supplement and the accompanying prospectus mean The Republic of Korea. All references to the “Government” mean the government of Korea.
Unless the context otherwise requires or otherwise indicates, references to “we”, “us” or “our” mean Korea Finance Corporation and its consolidated subsidiaries, and references to “KoFC” or the “Issuer” mean Korea Finance Corporation, excluding its subsidiaries. Terms used but not defined in this prospectus supplement shall have the same meaning given to them in the accompanying prospectus.
In this prospectus supplement and the accompanying prospectus, where information has been prepared in thousands, millions or billions of units, amounts may have been rounded up or down. Accordingly, actual numbers may differ from those contained herein due to rounding. All discrepancies in any table between totals and the sums of the amounts listed are due to rounding.
Additional Information
The information in this prospectus supplement is in addition to the information contained in our prospectus dated July 1, 2011. The accompanying prospectus contains information regarding ourselves and Korea, as well as a description of some terms of the Notes. You can find further information regarding us, Korea, and the Notes in registration statement no. 333-170866, as amended, relating to our debt securities, with or without warrants, which is on file with the U.S. Securities and Exchange Commission.
We are Responsible for the Accuracy of the Information in this Document
We are responsible for the accuracy of the information in this document and confirm that to the best of our knowledge we have included all facts that should be included so as not to mislead potential investors. The statement made in the preceding sentence is not intended to be a disclaimer or limitation of liability under the federal securities laws.
The SGX-ST assumes no responsibility for the correctness of any statements made or opinions expressed or reports contained in this prospectus supplement and the accompanying prospectus. Approval in-principle from, and admission of the Notes to the Official List of, the SGX-ST are not to be taken as an indication of the merits of the issuer or the Notes.
Not an Offer if Prohibited by Law
The distribution of this prospectus supplement and the accompanying prospectus, and the offer of the Notes, may be legally restricted in some countries. If you wish to distribute this prospectus supplement or the accompanying prospectus, you should observe any restrictions. This prospectus supplement and the accompanying prospectus should not be considered an offer and should not be used to make an offer, in any state or country which prohibits the offering.
The Notes may not be offered or sold in Korea, directly or indirectly, or to any resident of Korea, except as permitted by Korean law. For more information, see “Underwriting—Foreign Selling Restrictions”.
S-4
Table of Contents
Information Presented Accurate as of Date of Document
This prospectus supplement and the accompanying prospectus are the only documents on which you should rely for information about the offering. We have authorized no one to provide you with different information. You should not assume that the information in this prospectus supplement or the accompanying prospectus is accurate as of any date other than the date on the front of each document.
S-5
Table of Contents
This summary highlights selected information from this prospectus supplement and the accompanying prospectus and may not contain all of the information that is important to you. To understand the terms of our Notes, you should carefully read this prospectus supplement and the accompanying prospectus.
Issuer | Korea Finance Corporation |
Notes offered | US$ % Notes due 20 |
Maturity | , 20 |
Issue Price | % |
Interest Payment Dates | and of each year, commencing , 2012 |
Redemption at Maturity | Unless previously redeemed for tax reasons as provided below, we may not redeem the Notes prior to maturity. |
Redemption for Tax Reasons | We may, at our option, redeem the Notes, in whole but not in part, at their principal amount plus accrued interest to the date fixed for redemption, if we have or would become obligated to pay additional amounts in respect of certain Korean taxes imposed in respect of payments of principal of or interest on the Notes. See “Description of the Securities—Description of the Debt Securities—Redemption for Tax Reasons” in the accompanying prospectus. |
Ranking of the Notes | The Notes will constitute our direct, unconditional, unsecured and unsubordinated obligations, rank at least equally in right of payment among themselves, regardless of when issued, and rank at least equally in right of payment with all of our other unsecured and unsubordinated obligations, subject to certain statutory exceptions under Korean law. |
Denomination; Form | The Notes will be denominated in principal amounts of US$200,000 and integral multiples of US$1,000 in excess thereof. The Notes will be represented by one or more fully registered global notes registered in the name of a nominee of The Depository Trust Company (“DTC”), as depositary. |
Negative Pledge Covenant | If any Notes are outstanding, we will not create or permit any security interest on the whole or any part of our assets, present or future, to secure for the benefit of the holders of any International Investment Securities (as defined in “Description of the Securities—Description of the Debt Securities—Negative Pledge Covenant” in the accompanying prospectus) (i) payment of any sum due in respect of any such securities, (ii) any payment under any guarantee of any such securities or (iii) any payment under any indemnity or other like obligation relating to any such securities, without in any such case at the same time according to the Notes the same security as is granted |
S-6
Table of Contents
to or is outstanding in respect of such International Investment Securities, guarantee, indemnity or other like obligation. See “Description of the Securities—Description of the Debt Securities—Negative Pledge Covenant” in the accompanying prospectus. |
Events of Default | The Notes will contain certain events of default, the occurrence of which may permit holders of the Notes to accelerate our obligations under the Notes prior to maturity. See “Description of the Securities—Description of the Debt Securities—Events of Default” in the accompanying prospectus. |
Listing and Trading | Approval in-principle has been received from the SGX-ST for the listing of the Notes. Settlement of the Notes is not conditioned on obtaining the listing. The Notes will be traded on the SGX-ST in a minimum board lot size of S$200,000 for so long as the Notes are listed on the SGX-ST and the rules of the SGX-ST so require. |
Further Issues | We may from time to time, without the consent of the holders of the Notes, create and issue additional debt securities with the same terms and conditions as the Notes in all respects (except for the amount of the first interest payment and for the interest paid on the Notes prior to the issuance of the additional debt securities). We may consolidate such additional debt securities with the outstanding Notes to form a single series. We will not issue any such additional debt securities unless such additional securities have no more thana de minimisamount of original issue discount or such issuance would constitute a “qualified reopening” for U.S. federal income tax purposes. |
Delivery of the Notes | We expect to make delivery of the Notes, against payment in same-day funds on or about , 2011, which will be the fifth business day following the date of this prospectus supplement, referred to as “T+5.” You should note that initial trading of the Notes may be affected by the T+5 settlement. See “Underwriting—Delivery of the Notes.” |
Underwriting | Daewoo Securities Co., Ltd., one of the underwriters, is our affiliate and has agreed to offer and sell the Notes only outside the United States to non-U.S. persons. See “Underwriting—Relationship with the Underwriters”. |
S-7
Table of Contents
The net proceeds from the issue of the Notes, after deducting the underwriting discount but not estimated expenses, will be US$ . We will use the net proceeds from the sale of the Notes for our general operations, including extending foreign currency loans.
S-8
Table of Contents
This section provides information that supplements the information about us and the Republic included under the headings corresponding to the headings below in the accompanying prospectus dated July 1, 2011. Defined terms used in this section have the meanings given to them in the accompanying prospectus. If the information in this section differs from the information in the accompanying prospectus, you should rely on the information in this section.
KOREA FINANCE CORPORATION
KoFC’s non-consolidated financial information as of June 30, 2011 and December 31, 2010 and for the six months ended June 30, 2011 and 2010 in this prospectus supplement has been prepared in accordance with generally accepted accounting principles in Korea (“Korean GAAP” or “K-GAAP”). KDB’s consolidated financial information as of June 30, 2011 and December 31, 2010 and for the six months ended June 30, 2011 and 2010 in this prospectus supplement has been prepared under International Financial Reporting Standards as adopted in Korea (“Korean IFRS” or “K-IFRS”). Commencing in 2011, KDB prepares its financial statements in accordance with Korean IFRS, which differs in certain significant respects from Korean GAAP. As a result, KDB’s interim consolidated K-IFRS financial statements included in this prospectus supplement are not comparable with our non-consolidated K-GAAP financial statements included in this prospectus supplement or our consolidated K-GAAP financial statements included in the accompanying prospectus. Note 52 of the notes to KDB’s interim consolidated financial statements as of December 31, 2010 and June 30, 2011 and for the six month periods ended June 30, 2010 and 2011 included in this prospectus supplement provides a description of the effects of the conversion from Korean GAAP to Korean IFRS.
Selected Financial Statement Data
Balance Sheet Data
The following table presents unaudited non-consolidated balance sheet data of KoFC as of June 30, 2011 and December 31, 2010, which have been derived from KoFC’s unaudited non-consolidated balance sheets as of June 30, 2011 and December 31, 2010 prepared in accordance with Korean GAAP and included in this prospectus supplement. You should read the following balance sheet data together with KoFC’s non-consolidated balance sheets and notes included in this prospectus supplement:
KoFC Non-Consolidated K-GAAP Balance Sheet Data
| As of June 30, 2011 | As of December 31, 2010 | |||||||
| (unaudited) | (audited) | |||||||
(non-consolidated) (billions of Won) | ||||||||
Balance Sheet Data | ||||||||
Total Loans(1) | 15,987.6 | 12,436.9 | ||||||
Total Borrowings(2) | 35,482.0 | 32,095.8 | ||||||
Total Assets | 61,821.0 | 52,343.7 | ||||||
Total Liabilities | 38,375.4 | 33,618.9 | ||||||
Equity | 23,445.6 | 18,724.8 | ||||||
| (1) | Gross amount without adjusting for allowance for loan losses, present value discounts and deferred loan fees. |
| (2) | Total Borrowings include borrowings and policy finance bonds. |
S-9
Table of Contents
The following table presents selected consolidated balance sheet data of KDB, KDBFG’s principal subsidiary, as of June 30, 2011 and December 31, 2010, which have been derived from KDB’s unaudited consolidated balance sheets as of June 30, 2011 and December 31, 2010 prepared in accordance with Korean IFRS and included in this prospectus supplement. You should read the following balance sheet data together with KDB’s consolidated balance sheets and notes included in this prospectus supplement:
KDB Consolidated K-IFRS Balance Sheet Data
| As of June 30, 2011 | As of December 31, 2010 | |||||||
(consolidated) (unaudited) (billions of Won) | ||||||||
Balance Sheet Data | ||||||||
Total Loans(1) | 76,715.1 | 75,218.9 | ||||||
Total Borrowings(2) | 96,623.1 | 88,939.2 | ||||||
Total Assets | 143,615.8 | 125,859.2 | ||||||
Total Liabilities | 123,288.1 | 108,866.0 | ||||||
Equity | 20,327.7 | 16,993.2 | ||||||
| (1) | Gross amount, which includes equipment capital loans, working capital loans and other loans (including call loans, domestic usance, bills of exchange bought, debentures accepted by private subscription, bonds purchased, inter-bank loans, local letters of credit negotiation, loan-type suspense accounts pursuant to the applicable guidelines and other loans) without adjusting for allowance for loan losses, present value discounts and deferred loan fees. |
| (2) | Total Borrowings include deposits, call money, borrowings, bonds sold under repurchase agreements, bills sold and industrial finance bonds. |
Income Statement Data
The following table presents unaudited non-consolidated income statement data of KoFC for the six months ended June 30, 2011 and 2010, which have been derived from KoFC’s unaudited non-consolidated income statements for the six months ended June 30, 2011 and 2010 prepared in accordance with Korean GAAP and included in this prospectus supplement. You should read the following income statement data together with KoFC’s non-consolidated income statements and notes included in this prospectus supplement:
KoFC Non-Consolidated K-GAAP Income Statement Data
| Six Months Ended June 30, | ||||||||
| 2011 | 2010 | |||||||
| (non-consolidated) (unaudited) (billions of Won) | ||||||||
Income Statement Data | ||||||||
Total Interest Income | 396.2 | 183.6 | ||||||
Total Interest Expenses | 679.7 | 540.3 | ||||||
Net Interest Income (Loss) | (283.5 | ) | (356.7 | ) | ||||
Operating Revenues | 1,492.7 | 217.4 | ||||||
Operating Expenses | 831.6 | 562.8 | ||||||
Net Income (Loss) | 947.5 | (219.1 | ) | |||||
For the six months ended June 30, 2011, KoFC had non-consolidated net income of (Won)947.5 billion compared to non-consolidated net loss of (Won)219.1 billion for the six months ended June 30, 2010.
Principal factors for the net income in the six months ended June 30, 2011 as compared to the net loss in the six months ended June 30, 2010 included:
| • | an increase in gain on disposal of available-for-sale securities to (Won)920.2 billion in the six months ended June 30, 2011 from (Won)0.4 billion in the corresponding period of 2010, primarily due to a gain from the sale of our equity interest in Hyundai Engineering & Construction Co., Ltd.; |
S-10
Table of Contents
| • | an increase in net valuation gain on equity method investments to (Won)580.2 billion in the six months ended June 30, 2011 from (Won)67.1 billion in the corresponding period of 2010, primarily due to a gain on valuation of equity method investments on KDBFG shares; |
| • | a decrease in net interest loss to (Won)283.5 billion in the six months ended June 30, 2011 from (Won)356.7 billion in the corresponding period of 2010, primarily due to an increase in interest income derived from loans and debt securities; and |
| • | an increase in dividend income to (Won)45.7 billion in the six months ended June 30, 2011 from (Won)27.4 billion in the corresponding period of 2010, primarily due to an increase in dividend income from KDBFG shares. |
The above factors were partially offset by income tax expenses of (Won)294.1 billion in the six months ended June 30, 2011 compared to income tax benefit of (Won)58.6 billion in the corresponding period of 2010, primarily due to the net income before income tax in the six months ended June 30, 2011 as compared to the net loss before income tax in the six months ended June 30, 2010.
The following table presents selected consolidated income statement data of KDB, KDBFG’s principal subsidiary, for the six months ended June 30, 2011 and 2010, which have been derived from KDB’s unaudited consolidated income statements for the six months ended June 30, 2011 and 2010 prepared in accordance with Korean IFRS and included in this prospectus supplement. You should read the following income statement data together with KDB’s consolidated income statements and notes included in this prospectus supplement:
KDB Consolidated K-IFRS Income Statement Data
| Six Months Ended June 30, | ||||||||
| 2011 | 2010 | |||||||
(consolidated) (unaudited) (billions of Won) | ||||||||
Income Statement Data | ||||||||
Total Interest Income | 2,395.5 | 2,471.7 | ||||||
Total Interest Expenses | 1,478.9 | 1,488.1 | ||||||
Net Interest Income | 916.7 | 983.6 | ||||||
Operating Income | 1,342.5 | 597.0 | ||||||
Net Income | 1,005.6 | 392.6 | ||||||
For the six months ended June 30, 2011, KDB had net income of (Won)1,005.6 billion compared to net income of (Won)392.6 billion for the six months ended June 30, 2010, on a consolidated basis.
Principal factors for the increase in net income for the six months ended June 30, 2011 compared to the six months ended June 30, 2010 included:
| • | a decrease in credit loss expense to (Won)89.8 billion in the six months ended June 30, 2011 from (Won)568.7 billion in the corresponding period of 2010, primarily due to a decrease in non-performing loans; and |
| • | an increase in net gain from foreign currency transactions and derivative financial instruments to (Won)592.5 billion in the six months ended June 30, 2011 from (Won)81.9 billion in the corresponding period of 2010, primarily due to a valuation gain on Kumho Petrochemical convertible bonds; commencing in 2011, embedded derivative instruments (such as conversion rights) were treated as separate derivatives and recorded at fair value under Korean IFRS. |
The above factors were partially offset by a decrease in net gain from financial assets available-for-sale to (Won)74.9 billion in the six months ended June 30, 2011 from (Won)272.6 billion in the corresponding period of 2010, primarily due to a decrease in sales of available-for-sale securities.
S-11
Table of Contents
Financial Statements and the Auditors
Our consolidated financial statements included in the accompanying prospectus and our interim non-consolidated financial statements as of June 30, 2011 and December 31, 2010 and for the six months ended June 30, 2011 and 2010 appearing in this prospectus supplement were prepared in conformity with Korean GAAP. KDB’s interim consolidated financial statements as of June 30, 2011 and December 31, 2010 and for the six months ended June 30, 2011 and 2010 appearing in this prospectus supplement were prepared in conformity with Korean IFRS, as summarized in note 3 of the notes to KDB’s interim consolidated financial statements of June 30, 2011 and 2010 included in this prospectus supplement. Korean IFRS differs in significant respects from Korean GAAP, particularly with respect to accounting for cash and due from banks and loans (including establishment of loan loss allowances and provisions). As a result, KDB’s financial statements prepared in accordance with Korean IFRS are not comparable with our financial statements prepared in accordance with Korean GAAP, and the levels of cash and due from banks and loans (including allowance and provision levels), as well as certain other balance sheet and income statement items, reflected in KDB’s financial statements prepared in accordance with Korean IFRS may differ substantially from those reflected in our financial statements prepared in accordance with Korean GAAP. See note 52 of the notes to KDB’s interim consolidated financial statements of June 30, 2011 and 2010 included in this prospectus supplement.
S-12
Table of Contents
Korea Finance Corporation
Interim non-consolidated statements of financial position
As of June 30, 2011 and December 31, 2010
(Korean won) | Unaudited June 30, 2011 | Audited December 31, 2010 | ||||||
Assets | ||||||||
Cash and due from banks (Notes 3 and 13) | (Won) | 643,237,481,613 | (Won) | 1,008,236,609,334 | ||||
Securities (Notes 4 and 13): | ||||||||
Available-for-sale securities | 12,191,752,966,089 | 12,103,099,601,774 | ||||||
Held-to-maturity securities | 1,281,737,150,347 | 1,157,236,283,559 | ||||||
Equity method investments | 31,572,559,846,404 | 25,503,106,225,965 | ||||||
|
|
|
| |||||
| 45,046,049,962,840 | 38,763,442,111,298 | |||||||
Loans receivable, less allowance for possible loan losses of (Won)26,676,290,520 at June 30, 2011 ((Won)16,402,029,771 at December 31, 2010), less deferred loan fees of (Won)10,045,787,856 at June 30, 2011 ((Won)9,111,661,162 at December 31, 2010), and less net present value discount of (Won)5,193,729,052 at June 30, 2011 ((Won)10,501,296,908 at December 31, 2010) (Notes 5, 13 and 19) | 15,945,687,493,732 | 12,400,887,337,009 | ||||||
Property and equipment (Note 6) | 83,740,522,523 | 82,033,190,117 | ||||||
Other assets (Notes 7 and 15): | ||||||||
Intangible assets | 3,814,950,761 | 4,059,714,882 | ||||||
Guarantee deposits | — | 273,000,000 | ||||||
Accounts receivable | 28,105,471,216 | 21,001,759,562 | ||||||
Accrued income | 57,404,608,567 | 42,655,411,567 | ||||||
Prepaid expenses | 1,582,652,602 | 17,275,888 | ||||||
Derivatives assets | 10,376,777,059 | — | ||||||
Miscellaneous assets | 980,476,252 | 21,127,516,590 | ||||||
|
|
|
| |||||
| 102,264,936,457 | 89,134,678,489 | |||||||
|
|
|
| |||||
Total assets | (Won) | 61,820,980,397,165 | (Won) | 52,343,733,926,247 | ||||
|
|
|
| |||||
(Continued)
See accompanying notes.
S-13
Table of Contents
Korea Finance Corporation
Interim non-consolidated statements of financial position
As of June 30, 2011 and December 31, 2010
(Korean won) | Unaudited June 30, 2011 | Audited December 31, 2010 | ||||||
Liabilities and equity | ||||||||
Liabilities: | ||||||||
Borrowing liabilities (Notes 8, 13, 15 and 19): | ||||||||
Borrowings in Korean won | (Won) | 1,993,600,000,000 | (Won) | 2,793,600,000,000 | ||||
Borrowings in foreign currencies | 1,194,510,437,202 | 1,201,106,074,214 | ||||||
Bonds sold under repurchase agreements | 459,400,000,000 | 500,000,000,000 | ||||||
Bills sold | 755,922,650,000 | — | ||||||
Call money | 299,879,500,000 | 68,334,000,000 | ||||||
Debentures in Korean won | 29,286,414,161,459 | 26,252,210,802,559 | ||||||
Debentures in foreign currencies | 1,492,277,604,949 | 1,280,579,176,688 | ||||||
|
|
|
| |||||
| 35,482,004,353,610 | 32,095,830,053,461 | |||||||
Other liabilities: | ||||||||
Severance and retirement benefits (Note 9) | 1,719,639,580 | 684,893,808 | ||||||
Allowance for possible losses on acceptances and guarantees (Notes 10, 13) | 4,048,991,614 | 1,118,005,311 | ||||||
Allowance for possible losses on unused loan commitments (Notes 11, 13 and 14) | 4,025,757,650 | 4,462,764,687 | ||||||
Accounts payables | 1,698,278,267 | 168,354,840 | ||||||
Accrued expenses | 136,332,225,664 | 134,077,189,486 | ||||||
Unearned revenues | 3,978,276,873 | 2,572,655,091 | ||||||
Deposits for letter of guarantees | 9,187,160,000 | 9,187,160,000 | ||||||
Deferred income tax liabilities (Note 18) | 2,635,965,117,571 | 1,330,917,332,522 | ||||||
Derivatives liabilities (Note 15) | 1,170,364,325 | 18,359,720,220 | ||||||
Miscellaneous liabilities (Note 12) | 95,278,845,212 | 21,544,041,100 | ||||||
|
|
|
| |||||
| 2,893,404,656,756 | 1,523,092,117,065 | |||||||
|
|
|
| |||||
Total liabilities | (Won) | 38,375,409,010,366 | (Won) | 33,618,922,170,526 | ||||
|
|
|
| |||||
Equity: | ||||||||
Paid-in capital (Note 16) | (Won) | 14,999,999,967,089 | (Won) | 14,999,999,967,089 | ||||
Capital surplus | — | 3,367,206,320 | ||||||
Capital adjustment | (164,789,032,232 | ) | (186,047,925,366 | ) | ||||
Accumulated other comprehensive income (Notes 4 and 20) | 1,035,242,109,604 | 1,573,466,776,761 | ||||||
Retained earnings (Note 16): | ||||||||
Legal reserve | 2,267,239,731,067 | 1,912,963,278,390 | ||||||
Unappropriated retained earnings | 5,307,878,611,271 | 421,062,452,527 | ||||||
|
|
|
| |||||
| 7,575,118,342,338 | 2,334,025,730,917 | |||||||
|
|
|
| |||||
Total equity | 23,445,571,386,799 | 18,724,811,755,721 | ||||||
|
|
|
| |||||
Total liabilities and equity | (Won) | 61,820,980,397,165 | (Won) | 52,343,733,926,247 | ||||
|
|
|
| |||||
See accompanying notes.
S-14
Table of Contents
Korea Finance Corporation
Interim non-consolidated statements of operations
For the three months and six months ended June 30, 2011 and 2010
| Unaudited 2011 | Unaudited 2010 | |||||||||||||||
(Korean won) | Three months ended June 30 | Six months ended June 30 | Three months ended June 30 | Six months ended June 30 | ||||||||||||
Operating revenue: | ||||||||||||||||
Interest income (Note 19): | ||||||||||||||||
Interest on due from banks | (Won) | 3,844,133,820 | (Won) | 7,659,545,598 | (Won) | 7,997,323,291 | (Won) | 14,267,142,884 | ||||||||
Interest on available-for-sale securities | 33,401,595,226 | 65,255,294,060 | 22,326,349,259 | 47,767,671,963 | ||||||||||||
Interest on held-to-maturity securities | 20,401,656,136 | 31,924,403,647 | — | — | ||||||||||||
Interest on loans receivable | 155,216,005,169 | 291,010,084,331 | 69,031,275,027 | 121,600,254,684 | ||||||||||||
Others | 315,468,954 | 327,685,146 | — | — | ||||||||||||
|
|
|
|
|
|
|
| |||||||||
| 213,178,859,305 | 396,177,012,782 | 99,354,947,577 | 183,635,069,531 | |||||||||||||
Gain on valuation and disposal of securities: | ||||||||||||||||
Gain on disposal of available-for-sale securities | 920,237,995,366 | 920,238,177,461 | 378,760,870 | 378,760,870 | ||||||||||||
Gain on disposal of equity method investments | 25,408,375,629 | 25,408,375,629 | — | — | ||||||||||||
|
|
|
|
|
|
|
| |||||||||
| 945,646,370,995 | 945,646,553,090 | 378,760,870 | 378,760,870 | |||||||||||||
Gain on foreign currency transactions | 31,794,238,740 | 70,005,222,040 | 4,901,537,427 | 4,901,537,427 | ||||||||||||
Fees and commission income | 2,686,446,253 | 5,554,803,054 | 943,526,956 | 1,072,337,179 | ||||||||||||
Dividends income | 1,728,082,434 | 45,683,185,152 | 85,388,748 | 27,433,454,626 | ||||||||||||
Other operating income (Note 11 and 15): | ||||||||||||||||
Reversal of allowance for unused loan commitments | 1,065,140,429 | 437,007,037 | — | — | ||||||||||||
Gain on derivatives transactions | 713,422,419 | 2,223,189,058 | — | — | ||||||||||||
Gain on derivatives valuation | 27,719,726,247 | 26,603,917,426 | — | — | ||||||||||||
Gain on valuation of hedged items | — | 320,157,787 | — | — | ||||||||||||
|
|
|
|
|
|
|
| |||||||||
| 29,498,289,095 | 29,584,271,308 | — | — | |||||||||||||
|
|
|
|
|
|
|
| |||||||||
Total operating revenue | 1,224,532,286,822 | 1,492,651,047,426 | 105,664,161,578 | 217,421,159,633 | ||||||||||||
Operating expenses: | ||||||||||||||||
Interest expense (Note 19): | ||||||||||||||||
Interest on borrowings | 46,366,753,472 | 98,191,774,244 | 45,657,431,379 | 83,160,047,790 | ||||||||||||
Interest on debentures | 299,531,171,584 | 581,478,979,044 | 228,337,094,583 | 456,987,745,250 | ||||||||||||
Others | — | — | — | 197,965,807 | ||||||||||||
|
|
|
|
|
|
|
| |||||||||
| 345,897,925,056 | 679,670,753,288 | 273,994,525,962 | 540,345,758,847 | |||||||||||||
Loss from valuation and disposal of securities: | ||||||||||||||||
Loss from disposal of available-for-sale securities | 8,966,269,156 | 8,966,269,156 | — | — | ||||||||||||
Loss from disposal of equity method investments | 5,193,990,012 | 5,193,990,012 | — | — | ||||||||||||
|
|
|
|
|
|
|
| |||||||||
| 14,160,259,168 | 14,160,259,168 | — | — | |||||||||||||
Loss from valuation and disposal of loans receivable: | ||||||||||||||||
Provision for possible loan losses (Note 5) | 2,687,382,288 | 10,274,260,749 | 2,503,507,043 | 2,869,083,043 | ||||||||||||
Loss on foreign currency transactions | 35,794,540,563 | 76,322,808,406 | 4,798,992,254 | 4,799,208,259 | ||||||||||||
Fees and commission expenses | 460,375,149 | 882,432,715 | 71,969,051 | 86,209,867 | ||||||||||||
Other operating expenses: | ||||||||||||||||
Provision for possible losses on acceptances and guarantees (Note 10) | 1,461,746,113 | 2,937,596,912 | 61,161,000 | 98,006,000 | ||||||||||||
Provision for unused loan commitments (Note 11) | — | — | 900,000,000 | 900,000,000 | ||||||||||||
Loss on derivatives transactions | 755,430,902 | 1,485,679,253 | — | — | ||||||||||||
Loss on derivatives valuation (Note 15) | — | 1,045,095,961 | — | — | ||||||||||||
Loss on valuation of hedged items | 24,712,167,194 | 22,113,085,653 | — | — | ||||||||||||
Others | 124,092,151 | 124,092,151 | — | 319,677,070 | ||||||||||||
|
|
|
|
|
|
|
| |||||||||
| 27,053,436,360 | 27,705,549,930 | 961,161,000 | 1,317,683,070 | |||||||||||||
General and administrative expenses (Note 17) | 12,716,346,707 | 22,591,686,627 | 7,359,094,962 | 13,416,052,297 | ||||||||||||
|
|
|
|
|
|
|
| |||||||||
Total operating expenses | 438,770,265,291 | 831,607,750,883 | 289,689,250,272 | 562,833,995,383 | ||||||||||||
|
|
|
|
|
|
|
| |||||||||
Operating income (loss) | 785,762,021,531 | 661,043,296,543 | (184,025,088,694 | ) | (345,412,835,750 | ) | ||||||||||
Non-operating income (expenses): | ||||||||||||||||
Rental income | 224,677,527 | 449,355,054 | 274,348,737 | 563,363,291 | ||||||||||||
Gain on valuation of equity method investments (Note 4) | 472,958,750,780 | 958,859,739,125 | — | 208,198,492,966 | ||||||||||||
Loss on valuation of equity method investments (Note 4) | (272,970,288,923 | ) | (378,624,832,760 | ) | (150,406,419,063 | ) | (141,071,880,190 | ) | ||||||||
Others, net | (30,838,500 | ) | (54,639,933 | ) | (888,030 | ) | 28,875,760 | |||||||||
|
|
|
|
|
|
|
| |||||||||
| 200,182,300,884 | 580,629,621,486 | (150,132,958,356 | ) | 67,718,851,827 | ||||||||||||
|
|
|
|
|
|
|
| |||||||||
Income (loss) before income taxes | 985,944,322,415 | 1,241,672,918,029 | (334,158,047,050 | ) | (277,693,983,923 | ) | ||||||||||
Income tax expense (benefit) (Note 18) | 293,537,132,939 | 294,135,115,969 | (66,990,656,774 | ) | (58,635,763,557 | ) | ||||||||||
|
|
|
|
|
|
|
| |||||||||
Net income (loss) | (Won) | 692,407,189,476 | (Won) | 947,537,802,060 | (Won) | (267,167,390,276 | ) | (Won) | (219,058,220,366 | ) | ||||||
|
|
|
|
|
|
|
| |||||||||
See accompanying notes.
S-15
Table of Contents
Korea Finance Corporation
Interim non-consolidated statements of changes in equity
For the six months ended June 30, 2011 and 2010
(Korean won) | Paid-in capital | Capital surplus | Capital adjustment | Accumulated other comprehensive income | Retained earnings | Total | ||||||||||||||||||
As of January 1, 2010 | (Won) | 14,999,999,967,089 | (Won) | — | (Won) | (3,696,550,840 | ) | (Won) | 1,211,202,571,592 | (Won) | 1,912,963,278,390 | (Won) | 18,120,469,266,231 | |||||||||||
Net loss | — | — | — | — | (219,058,220,366 | ) | (219,058,220,366 | ) | ||||||||||||||||
Unrealized gain on available- for-sale securities | — | — | — | (7,439,872,232 | ) | — | (7,439,872,232 | ) | ||||||||||||||||
Changes in retained earnings on valuation of equity method investments | — | — | — | — | 18,696,326,777 | 18,696,326,777 | ||||||||||||||||||
Changes in capital surplus of equity method investments | — | 292,366,035 | — | — | — | 292,366,035 | ||||||||||||||||||
Changes in capital adjustment of equity method investments | — | — | (166,754,996,926 | ) | — | — | (166,754,996,926 | ) | ||||||||||||||||
Changes in unrealized gain on valuation of equity method investments | — | — | — | 161,999,799,331 | — | 161,999,799,331 | ||||||||||||||||||
Changes in unrealized loss on valuation of equity method investments | — | — | — | (6,958,066,744 | ) | — | (6,958,066,744 | ) | ||||||||||||||||
|
|
|
|
|
|
|
|
|
|
|
| |||||||||||||
As of June 30, 2010 (unaudited) | (Won) | 14,999,999,967,089 | (Won) | 292,366,035 | (Won)(170,451,547,766 | ) | (Won) | 1,358,804,431,947 | (Won) | 1,712,601,384,801 | (Won) | 17,901,246,602,106 | ||||||||||||
|
|
|
|
|
|
|
|
|
|
|
| |||||||||||||
As of January 1, 2011 | (Won) | 14,999,999,967,089 | (Won) | 3,367,206,320 | (Won) | (186,047,925,366 | ) | (Won) | 1,573,466,776,761 | (Won) | 2,334,025,730,917 | (Won) | 18,724,811,755,721 | |||||||||||
Cash dividends | — | — | — | — | (66,785,999,850 | ) | (66,785,999,850 | ) | ||||||||||||||||
Net income | — | — | — | — | 947,537,802,060 | 947,537,802,060 | ||||||||||||||||||
Unrealized gain on available- for-sale securities | — | — | — | (254,266,908,600 | ) | — | (254,266,908,600 | ) | ||||||||||||||||
Changes in retained earnings of equity method investments | — | — | — | — | 4,360,340,809,211 | 4,360,340,809,211 | ||||||||||||||||||
Changes in capital surplus of equity method investments | — | (3,367,206,320 | ) | — | — | — | (3,367,206,320 | ) | ||||||||||||||||
Changes in capital adjustment of equity method investments | — | — | 21,258,893,134 | — | — | 21,258,893,134 | ||||||||||||||||||
Changes in unrealized gain on valuation of equity method investments | — | — | — | (22,479,662,871 | ) | — | (22,479,662,871 | ) | ||||||||||||||||
Changes in unrealized loss on valuation of equity method investments | — | — | — | (261,478,095,686 | ) | — | (261,478,095,686 | ) | ||||||||||||||||
|
|
|
|
|
|
|
|
|
|
|
| |||||||||||||
As of June 30, 2011 (unaudited) | (Won) | 14,999,999,967,089 | (Won) | — | (Won) | (164,789,032,232 | ) | (Won) | 1,035,242,109,604 | (Won) | 7,575,118,342,338 | (Won) | 23,445,571,386,799 | |||||||||||
|
|
|
|
|
|
|
|
|
|
|
| |||||||||||||
See accompanying notes.
S-16
Table of Contents
Korea Finance Corporation
Interim non-consolidated statements of cash flows
For the six months ended June 30, 2011 and 2010
(Korean won) | Unaudited Six months ended June 30, 2011 | Unaudited Six months ended June 30, 2010 | ||||||
Cash flows from operating activities: | ||||||||
Net income (loss) | (Won) | 947,537,802,060 | (Won) | (219,058,220,366 | ) | |||
Adjustments to reconcile net income (loss) to net cash used in operating activities: | ||||||||
Gain on valuation of equity method investments, net | (580,234,906,365 | ) | (67,126,612,776 | ) | ||||
Provision for possible loan losses | 10,274,260,749 | 2,869,083,043 | ||||||
Depreciation | 1,583,270,436 | 1,263,207,011 | ||||||
Amortization of intangible assets | 604,353,494 | 334,937,972 | ||||||
Amortization of discount on debentures | 82,018,624,566 | 27,644,572,186 | ||||||
Provision for possible losses on acceptances and guarantees | 2,937,596,912 | 98,006,000 | ||||||
Provision (reversal of allowance) for unused loan commitments | (437,007,037 | ) | 900,000,000 | |||||
Gain on derivatives valuation, net | (25,558,821,465 | ) | — | |||||
Loss (gain) on foreign currency translations, net | 4,281,232,095 | (337,657,250 | ) | |||||
Provision of severance and retirement benefits | 1,041,079,105 | — | ||||||
Loss from valuation of hedged items, net | 21,792,927,866 | — | ||||||
Gain on disposal of equity method investments | (20,214,385,617 | ) | — | |||||
Others, net | 6,914,266,909 | (569,455,040 | ) | |||||
Changes in operating assets and liabilities: | ||||||||
Due from banks | (67,381,250,000 | ) | — | |||||
Available-for-sale securities | (418,161,750,418 | ) | 125,490,165,765 | |||||
Held-to-maturity securities | (126,168,235,000 | ) | — | |||||
Loans receivable | (3,678,597,125,312 | ) | (1,585,763,077,711 | ) | ||||
Accounts receivable | (919,939,860 | ) | 4,246,162,385 | |||||
Accrued income | (15,160,951,580 | ) | (5,836,495,104 | ) | ||||
Prepaid expenses | (1,565,376,714 | ) | (646,719,751 | ) | ||||
Derivatives assets | 16,227,140,367 | — | ||||||
Account payables | 1,624,422,916 | (244,182,078 | ) | |||||
Accrued expenses | 2,566,215,499 | (4,915,569,832 | ) | |||||
Unearned revenues | 1,405,621,782 | 394,838,709 | ||||||
Deferred income tax liabilities | 197,156,274,190 | (58,635,763,557 | ) | |||||
Derivatives liabilities | (18,234,451,856 | ) | — | |||||
Payments for severance and retirement benefits | (6,333,333 | ) | — | |||||
Dividends | 236,979,107,053 | 25,004,169,850 | ||||||
Others, net | 88,389,212,656 | 13,198,271,714 | ||||||
|
|
|
| |||||
Total adjustments | (3,781,847,419,610 | ) | (1,487,708,199,610 | ) | ||||
|
|
|
| |||||
Net cash used in operating activities | (3,329,307,125,902 | ) | (1,741,690,338,830 | ) | ||||
Cash flows from investing activities: | ||||||||
Decrease in guarantee deposits | 273,000,000 | — | ||||||
Increase in guarantee deposits | — | (273,000,000 | ) | |||||
Acquisition of equity method investments | (431,213,259,267 | ) | (19,128,000,000 | ) | ||||
Purchase of property and equipment | (3,558,126,353 | ) | (1,703,366,380 | ) | ||||
Purchase of intangible assets | (359,589,373 | ) | (432,378,725 | ) | ||||
Purchase of miscellaneous assets | (351,500,000 | ) | — | |||||
Decrease in deposit for letter of guarantees | — | (116,509,600 | ) | |||||
|
|
|
| |||||
Net cash used in investing activities | (435,209,474,993 | ) | (21,653,254,705 | ) | ||||
Cash flows from financing activities: | ||||||||
Repayment of borrowings, net | (781,786,782,902 | ) | (112,580,200,000 | ) | ||||
Proceeds from debentures, net | 3,184,455,862,415 | 1,348,226,798,688 | ||||||
Proceeds from bills sold, net | 756,856,990,000 | 150,000,000,000 | ||||||
Increase in call money | 239,128,630,000 | — | ||||||
Increase in government subsidy | 267,523,511 | — | ||||||
Dividends paid | (66,785,999,850 | ) | — | |||||
|
|
|
| |||||
Net cash provided by financing activities | 3,332,136,223,174 | 1,385,646,598,688 | ||||||
|
|
|
| |||||
Net decrease in cash and cash equivalents | (432,380,377,721 | ) | (377,696,994,847 | ) | ||||
Cash and cash equivalents at the beginning of the period | 1,008,236,609,334 | 1,395,609,274,745 | ||||||
|
|
|
| |||||
Cash and cash equivalents at the end of the period | (Won) | 575,856,231,613 | (Won) | 1,017,912,279,898 | ||||
|
|
|
| |||||
See accompanying notes.
S-17
Table of Contents
Korea Finance Corporation
Notes to interim non-consolidated financial statements
June 30, 2011 and 2010
1. General information
Corporate information
Pursuant to the Korea Finance Corporation Act (the “Act”), Korea Finance Corporation (“KoFC”) was established on October 28, 2009, as a result of the spinoff of certain assets and liabilities of Korea Development Bank (“KDB”). The purpose of the Act is to contribute to the creation of jobs by strengthening national competitiveness and amplifying growth potential; and to the sound growth of the finance industry and national economy by utilizing functions of financial institutions for money brokerage to assist small and medium enterprises to raise funds easily and by supplying and managing funds required for the growth of national economy. KoFC’s business activities include loans, equity investment, guarantees, and securitization of credit risk, all of which are aimed at the support of small and medium enterprises, the development of new growth engine industries, the development of regions, the extension of social infrastructure, the stabilization of financial markets, and the facilitation of sustainable growth. KoFC’s head office is located at 16 Yeouido-dong, Yeongdeungpo-gu, Seoul. As of June 30, 2011, KoFC’s total paid-in capital amounts to approximately (Won)15 trillion, and the government of the Republic of Korea (the “Government”) has 100% ownership of KoFC.
Spin-off from KDB and non-cash capital contribution of KDB Financial Group shares
In accordance with the resolution passed at KDB’s extraordinary shareholder’s general meeting on September 23, 2009, KDB’s policy-based financing businesses were spun off to create KoFC on October 28, 2009 (“spin-off date”), while KDB’s subsidiaries businesses were spun off to create KDB Financial Group Inc. (“KDBFG”). The spin-off was carried out through the distribution of subscription certificates issued by KoFC to the shareholder of KDB in proportion to the percentage of shares held by the shareholder of KDB. With regards to the liabilities held by KDB before the spin-off, KoFC shall be held liable jointly with KDB and KDBFG.
Pursuant to the draft on non-cash capital contribution of state property to KoFC (“non-cash capital contribution draft”), which was provisionally authorized on December 29, 2009, the Government made a non-cash capital contribution of KDBFG shares to KoFC on December 30, 2009, increasing KoFC’s capital to approximately (Won)15 trillion.
In accordance with the non-cash capital contribution draft, the valuation of KDBFG shares was completed on June 23, 2010 and as a result, additional settlements were made by KoFC returning to the Government KDBFG shares equivalent to the difference between the finalized per share value and the original value at the time of the capital contribution.
2. Summary of significant accounting policies
Basis of financial statement preparation
The accompanying interim non-consolidated financial statements do not disclose all information and disclosures required in the annual financial statements, and should be read in conjunction with the annual non-consolidated financial statements as of December, 31, 2010.
KoFC maintains its official accounting records in Korean won and prepares financial statements in the Korean language in conformity with accounting principles generally accepted in the Republic of Korea (“Korean GAAP”) and related regulations including the Act. Certain accounting principles applied by KoFC that conform with financial accounting standards and accounting principles in the Republic of Korea may not conform with generally accepted accounting principles in other countries. Accordingly, these financial statements are intended for use by those who are informed about Korean accounting principles and practices. In the event of any differences in interpreting the interim non-consolidated financial statements or the independent accountants’
S-18
Table of Contents
Korea Finance Corporation
Notes to interim non-consolidated financial statements—(Continued)
June 30, 2011 and 2010
review report thereon, the Korean version, which is used for regulatory reporting purposes, shall prevail. The accompanying interim non-consolidated financial statements have been condensed, restructured and translated into English (with certain expanded descriptions) from the Korean language financial statements.
The significant accounting policies, except for changes in accounting policies explained below, adopted in the preparation of the accompanying interim non-consolidated financial statements, which are consistent with those followed in the preparation of the annual non-consolidated financial statements for the year ended December 31, 2011, are summarized below.
Changes in accounting policy
(a) Changes in accounting policy of KoFC
Pursuant to the revised Supervisory Regulations of the Act (the “Supervisory Regulations”), KoFC will adopt Korea International Financial Reporting Standards (“K-IFRS”) from January 1, 2013. Before the adoption of K-IFRS, KoFC will prepare financial statements in accordance with the Supervisory Regulations.
Significant differences between revised Supervisory Regulations and Korean GAAP effective until December 31, 2010 (the “Previous Korean GAAP) are as follows:
Previous Korean GAAP | Revised Supervisory Regulations | |||||
| Scope of consolidation | Related standards | Article 1-3 of the Enforcement Decree of the Act on External Audit of Stock Companies | K-IFRS 1027, 2012 | |||
| Difference | Subsidiaries less than certain amount of assets, liabilities or number of and employees are excluded from in-scope of consolidation. | Subsidiaries controlled by KoFC are included in-scope of consolidation regardless of the scale of the subsidiaries. | ||||
‚ Largest shareholder which holds more than 30% of shares of a subsidiary includes the subsidiary in-scope of consolidation. | ‚ Shareholder which holds more than 50% of shares of a subsidiary includes the subsidiary in-scope of consolidation. | |||||
ƒ There’s no standard for consolidation of SPCs. | ƒ There’s standards for consolidation of SPCs under risk and reward standards. | |||||
Derecognition of financial instruments | Related standards | Interpretation of Korea Financial Accounting standards 52-14 | K-IFRS 1039, 1107 | |||
| Difference | There’s no standard for considering whether the derecognition is appropriate.
‚ Asset securitization in accordance with Asset-Backed Securitization Act is regard as true-sale. | There’s Standard for considering whether the derecognition is appropriate.
‚ There’s no exception that allows asset securitization to be regarded as true-sale. | ||||
Other | There is no difference. | |||||
S-19
Table of Contents
Korea Finance Corporation
Notes to interim non-consolidated financial statements—(Continued)
June 30, 2011 and 2010
The changes in accounting policy have no effect on the financial position, the results of financial performance and cash flows of KoFC.
(b) Adoption of K-IFRS of equity method investees
KDBFG, Korea Electric Power Co. and other investees have prepared their financial statements in accordance with K-IFRS starting January 1, 2011. The date of transition to IFRS of those equity method investees is January 1, 2010.
In accordance with the Supervisory Regulations, KoFC applied equity method of accounting without modification of the investees’ financial statements to conform to KoFC’s accounting policy.
Recognition of interest income
Interest income on loans and investments is recognized on an accrual basis. However, interest income on loans overdue or dishonored is recognized on a cash basis except for those secured and guaranteed by financial institutions for which the interest is recognized on an accrual basis.
Securities
Securities are classified as either trading, held-to-maturity or available-for-sale securities, as appropriate, and are initially measured at cost, including incidental expenses. KoFC determines the classification of its investments after initial recognition, and, where allowed and appropriate, re-evaluates this designation at the end of each reporting period.
Securities that are acquired and held principally for the purpose of selling them in the near term are classified as trading securities. Debt securities which carry fixed or determinable principal payments and a fixed maturity are classified as held-to-maturity, if KoFC has the positive intention and ability to hold to maturity. Securities that are not classified as either trading or held-to-maturity are classified as available-for-sale securities.
When held-to-maturity securities are reclassified to available-for-sale, those securities are accounted for at fair value on the reclassification date and the difference between the fair value and book value is reported in other comprehensive income as a gain or loss on valuation of available-for sale securities. When available-for-sale securities are reclassified to held-to-maturity, gains or losses on valuation of these available-for-sale securities, which had been recorded until the reclassification date, continue to be included in other comprehensive income and are amortized using the effective interest rate method. Such amortization amount is charged to interest income until maturity. Once the reclassification is made, trading securities cannot be reclassified to available-for-sale securities or held-to-maturity securities and vice versa except in rare circumstances only. In addition, when certain trading securities become non-marketable, such securities are reclassified to available-for-sale at fair value as of the reclassification date.
After initial measurement, available-for-sale securities are measured at fair value with unrealized gains or losses being recognized as other comprehensive income in equity. Likewise, trading securities are also measured at fair value after initial measurement, but with unrealized gains or losses reported as part of net income. Held-to-maturity securities are measured at amortized cost after initial measurement. The cost is computed as the amount initially recognized minus principal repayments, plus or minus the cumulative amortization using the effective interest method, of any difference between the initially recognized amount and the maturity amount.
S-20
Table of Contents
Korea Finance Corporation
Notes to interim non-consolidated financial statements—(Continued)
June 30, 2011 and 2010
The fair value of trading and available-for-sale securities that are traded actively in the open market (marketable securities) is measured at the closing price of those securities at the reporting date. Non-marketable equity securities are carried at a value announced by a public independent credit rating agency. If application of such measurement method is not feasible, non-marketable equity securities are measured at cost less impairment, if any, subsequent to initial recognition. Non-marketable debt securities are carried at the present value of their future cash flows discounted using an appropriate interest rate which reflects the issuer’s credit rating, as announced by a public independent credit rating agency.
If the recoverable amount of a held-to-maturity security and available-for-sale security is less than acquisition cost or carrying value, and such decline is deemed other than temporary, such security is adjusted to its recoverable amount with an impairment loss charged to the statement of operations after eliminating any gains and losses previously recorded in accumulated other comprehensive income for temporary changes. A subsequent recovery is also recorded in the statement of operations to the extent of the previously recorded impairment losses if such recovery is attributable to an event occurring subsequent to the recognition of the impairment losses.
Equity method investments
Investments in entities over which KoFC has control or significant influence are accounted for using the equity method. KoFC deems to have a significant influence on an investee if it holds more than 15% of voting shares of the investee.
Under the equity method of accounting, KoFC’s initial investment in an investee is recorded at acquisition cost. Subsequently, the carrying amount of the investment is adjusted to reflect KoFC’s share of income or loss of the investee in the statement of operations and share of changes in equity that have been recognized directly in the equity of the investee in the related equity account of KoFC on the statement of financial position. If KoFC’s share of losses of the investee equals or exceeds its interest in the investee, it suspends recognizing its share of further losses. However, if KoFC has other long-term interests in the investee, it continues recognizing its share of further losses to the extent of the carrying amount of such long-term interests. KoFC resumes the application of the equity method if KoFC’s share of income or change in equity of an investee exceeds KoFC’s share of losses accumulated during the period of suspension of the equity method of accounting.
At the date of acquisition, the difference between the acquisition cost of the investee and KoFC’s share of the net fair value of the investee’s identifiable assets and liabilities is accounted for as goodwill or negative goodwill. Goodwill is amortized over its useful life of five years using the straight-line method and the amortization expense is included as part of valuation gain or loss on equity method investments in the statement of operations. Negative goodwill is amortized based on the investee’s accounting treatments on the related assets and liabilities and charged or credited to valuation gain or loss on equity method investments in the statement of operations.
KoFC’s share in the investee’s unrealized profits and losses resulting from transactions between KoFC and its investee are eliminated to the extent of the interest in the investee.
S-21
Table of Contents
Korea Finance Corporation
Notes to interim non-consolidated financial statements—(Continued)
June 30, 2011 and 2010
Allowance for possible loan losses
KoFC provides an allowance for possible loan losses based on the borrowers’ future debt servicing ability (forward looking criteria) as determined by a credit rating model developed by KoFC. This credit rating model includes financial and non-financial factors of borrowers and classifies the borrowers’ credit risk. Allowances are determined by applying the following minimum percentages to the various credit risk ratings:
Loan classifications | Minimum provision percentages (%) | |||
Normal | 0.5 | |||
Precautionary | 3.5 | |||
Substandard | 20.0 | |||
Doubtful | 50.0 | |||
Estimated loss | 100.0 | |||
Troubled debt restructuring
If the present value of a loan is different from its book value due to a rescheduling of terms as agreed by the related parties (as in the case of court receivership, court mediation or workout), the difference in present value of the restructured loan payments and book value of the loan is recorded as an allowance for possible loan losses. The difference recorded as an allowance is amortized to current earnings over the related period using the effective interest rate method. The amortization is recorded as interest income.
Deferred loan fees and expenses
KoFC defers and amortizes certain fees received from borrowers and expenses paid to third parties associated with originating certain loans. Such fees and expenses are amortized over the life of the associated loan using the effective interest rate method.
Valuation of long-term receivables (payables) at present value
Receivables or payables arising from long-term installment transactions are stated at present value. The difference between the carrying amount of these receivables or payables and their present value is amortized using the effective interest rate method and credited or charged to the statement of operations over the installment period.
Property and equipment
Property and equipment are stated at cost, less accumulated depreciation. Maintenance and repairs are expensed in the year in which they are incurred. Expenditures which enhance the value or extend the useful lives of the related assets are capitalized as additions to property and equipment.
Depreciation of property and equipment is provided using the straight-line method over the following estimated useful life of assets:
| Years | ||
Buildings | 20 ~ 50 | |
Structures | 10 ~ 40 | |
Machinery and equipment | 4 | |
Others | 4 |
S-22
Table of Contents
Korea Finance Corporation
Notes to interim non-consolidated financial statements—(Continued)
June 30, 2011 and 2010
Government subsidy
Government subsidy with no repayment obligation, which is used for the acquisition of certain assets, is accounted for as a deduction from the acquisition cost of the acquired assets. Such subsidy amount is offset against the depreciation or amortization of the acquired assets during such assets’ useful life.
Intangible assets
Intangible assets of KoFC consist of development costs and software, which are stated at cost, less accumulated amortization. Intangible assets are amortized using the straight-line method over a period of four to five years.
Impairment of assets
When the recoverable amount of an asset is less than its carrying amount, the decline in value, if material, is deducted from the carrying amount and recognized as an asset impairment loss in the current period.
Bond purchased under resale agreement and bonds sold under repurchase agreements
Bond purchased or sold under resale or repurchase agreements are included in loans and borrowings, respectively. The difference between the selling and repurchase price is treated as interest and is accrued evenly over the period covered by the agreements.
Debenture issuance costs
Debenture issuance costs are amortized as an interest expense over the redemption term using the effective interest rate method.
Severance and retirement benefits
In accordance with the Employee Retirement Benefit Security Act and the KoFC’s regulations, employees and directors terminating their employment with at least one year of service are entitled to severance and retirement benefits, based on the rates of payment in effect at the time of termination, years of service and certain other factors. The provision is determined based on the amount that would be payable assuming all employees and directors were to terminate their employment as of the reporting date.
Provisions and contingent liabilities
Provisions are recognized when KoFC has a present obligation (legal or constructive) as a result of a past event, it is probable that an outflow of resources embodying economic benefits will be required to settle the obligation and a reliable estimate can be made on the amount of the obligation. The provision is used only for expenditures for which the provision was originally recognized. If the effect of the time value of money is material, provisions are stated at present value.
Confirmed acceptances and guarantees are not recognized on the statement of financial position, but are disclosed as off-statement of financial position items in the notes to the financial statements. KoFC provides a provision for such off-statement of financial position items, applying a Credit Conversion Factor (“CCF”) and provision rates, and records the provision as an allowance for possible losses on acceptances and guarantees. KoFC provides a provision for certain portions of unused loan commitments applying the CCF and provision rates, and records the provision as an allowance for possible losses on unused loan commitments.
S-23
Table of Contents
Korea Finance Corporation
Notes to interim non-consolidated financial statements—(Continued)
June 30, 2011 and 2010
KoFC carries out on-lending loan businesses utilizing commercial financial institutions as financial intermediaries in order to support the growth of small and medium enterprises (SMEs). As part of the on-lending program, KoFC shares up to a certain portion of credit risks of SMEs selected by the financial intermediaries upon receiving request from the intermediary institutions. The sharing of SMEs credit risks is seen as repayment guarantees and thus recognized as provisions which are computed pursuant to the allowance ratio of possible losses on loans, applying CCF.
Income taxes
Current tax assets and liabilities for the current period are measured at the amount expected to be recovered from, or paid to, the tax authorities. Deferred income taxes are provided using the liability method for the tax effect of temporary differences between the tax bases of assets and liabilities and their reported amounts in the accompanying financial statements. Deferred tax assets and liabilities are measured using the enacted tax rates and laws that will be in effect when the differences are expected to reverse. In addition, current tax and deferred tax are charged or credited directly to equity if the tax relates to items that are charged or credited directly to equity.
Translation of foreign currency
Transactions involving foreign currencies are recorded at the exchange rates prevailing at the time the transactions are made. Assets and liabilities denominated in foreign currencies are translated into Korean won using the exchange rates provided by Seoul Money Brokerage Service, Ltd., which are in effect on the reporting date. The resulting translation gains or losses are credited or charged to current operations.
Derivative financial instruments
Derivative financial instruments are presented as assets or liabilities valued principally at the fair value of the rights or obligations associated with the derivative contracts. The unrealized gain or loss from a derivative transaction with the purpose of hedging the exposure to changes in the fair value of a recognized asset or liability or unrecognized firm commitment is recognized in current operations. For a derivative instrument with the purpose of hedging the exposure to the variability of cash flows of a recognized asset or liability or a forecasted transaction, the hedge-effective portion of the derivative instrument’s gain or loss is deferred as other comprehensive income in equity. The ineffective portion of the gain or loss is charged or credited to current operations. Derivative instruments that do not meet the criteria for hedge accounting, or contracts for which the KoFC has not elected hedge accounting are measured at fair value with unrealized gains or losses reported in current operations.
Significant judgments and accounting estimates
The preparation of financial statements in accordance with Korean GAAP and related regulations including the Act, requires management to make judgments, estimates and assumptions that affect the reported amounts of assets and liabilities and disclosure of contingent assets and liabilities at the reporting date, and the reported amounts of revenues and expenses during the reporting period. Actual results could differ from those estimates.
S-24
Table of Contents
Korea Finance Corporation
Notes to interim non-consolidated financial statements—(Continued)
June 30, 2011 and 2010
3. Cash and due from banks
Cash and due from banks at June 30, 2011 and December 31, 2010 are as follows (Korean won in millions):
| June 30, 2011 (Unaudited) | December 31, 2010 (Audited) | |||||||
Cash and cash equivalents: | ||||||||
Due from banks in Korean won | (Won) | 224,642 | (Won) | 1,004,916 | ||||
Due from banks in Foreign currency | 351,214 | 3,321 | ||||||
|
|
|
| |||||
| 575,856 | 1,008,237 | |||||||
Due from banks: | ||||||||
Due from banks in Foreign currency | 67,381 | — | ||||||
|
|
|
| |||||
| (Won) | 643,237 | (Won) | 1,008,237 | |||||
|
|
|
| |||||
Due from banks in Korean won at June 30, 2011 and December 31, 2010 is as follows (Korean won in millions):
Counterparty | Account | Annual interest rate (%) | June 30, 2011 (Unaudited) | December 31, 2010 (Audited) | ||||||||
KDB | Other deposits | 2.25 | (Won) | 174,642 | (Won) | 234,916 | ||||||
Others | Other deposits | 2.51 ~ 2.64 | 50,000 | 770,000 | ||||||||
|
|
|
| |||||||||
| (Won) | 224,642 | (Won) | 1,004,916 | |||||||||
|
|
|
| |||||||||
Due from banks in foreign currency at June 30, 2011 and December 31, 2010 is as follows (Korean won in millions):
Counterparty | Account | Annual interest rate (%) | June 30, 2011 (Unaudited) | December 31, 2010 (Audited) | ||||||||
Others | Other deposits | 0 ~ 1.18 | (Won) | 417,737 | (Won) | 2,392 | ||||||
Off-shore deposits | — | 858 | 929 | |||||||||
|
|
|
| |||||||||
| (Won) | 418,595 | (Won) | 3,321 | |||||||||
|
|
|
| |||||||||
The maturities of due from banks outstanding as of June 30, 2011 and December 31, 2010 are as follows (Korean won in millions):
| June 30, 2011 (Unaudited) | ||||||||||||
Maturities | Korean won | Foreign currencies | Total | |||||||||
Within 6 months | (Won) | 224,642 | (Won) | 418,595 | (Won) | 643,237 | ||||||
|
|
|
|
|
| |||||||
| December 31, 2010 (Audited) | ||||||||||||
Maturities | Korean won | Foreign currencies | Total | |||||||||
Within 6 months | (Won) | 1,004,916 | (Won) | 3,321 | (Won) | 1,008,237 | ||||||
|
|
|
|
|
| |||||||
S-25
Table of Contents
Korea Finance Corporation
Notes to interim non-consolidated financial statements—(Continued)
June 30, 2011 and 2010
Due from banks by financial institution at June 30, 2011 and December 31, 2010 is as follows (Korean won in millions):
| June 30, 2011 (Unaudited) | ||||||||||||
Counterparty | Korean won | Foreign currency | Total | |||||||||
Banks | (Won) | 174,642 | (Won) | 416,571 | (Won) | 591,213 | ||||||
Others | 50,000 | 2,024 | 52,024 | |||||||||
|
|
|
|
|
| |||||||
| (Won) | 224,642 | (Won) | 418,595 | (Won) | 643,237 | |||||||
|
|
|
|
|
| |||||||
| December 31, 2010 (Audited) | ||||||||||||
Counterparty | Korean won | Foreign currencies | Total | |||||||||
Banks | (Won) | 344,916 | (Won) | 1,603 | (Won) | 346,519 | ||||||
Others | 660,000 | 1,718 | 661,718 | |||||||||
|
|
|
|
|
| |||||||
| (Won) | 1,004,916 | (Won) | 3,321 | (Won) | 1,008,237 | |||||||
|
|
|
|
|
| |||||||
4. Securities
Available-for-sale securities at June 30, 2011 and December 31, 2010 consist of the following (Korean won in millions):
| Annual interest rate (%) | June 30, 2011 (Unaudited) | December 31, 2010 (Audited) | ||||||||
Securities denominated in Korean won: | ||||||||||
Equity securities: | ||||||||||
Marketable equity securities | — | (Won) | 1,446,045 | (Won) | 1,945,269 | |||||
Non-marketable equity securities | — | 6,551,246 | 6,580,827 | |||||||
|
|
|
| |||||||
| 7,997,291 | 8,526,096 | |||||||||
Debt securities: | ||||||||||
Government and public bonds | 4.00 | 29,981 | — | |||||||
Finance bonds | 3.62 ~ 3.81 | 500,031 | 100,676 | |||||||
Corporate bonds | 3.72 ~ 9.20 | 2,284,914 | 2,271,141 | |||||||
|
|
|
| |||||||
| 2,814,926 | 2,371,817 | |||||||||
Beneficiary certificates | — | 1,260,246 | 1,153,988 | |||||||
|
|
|
| |||||||
| 12,072,463 | 12,051,901 | |||||||||
Securities denominated in foreign currency: | ||||||||||
Non-marketable equity securities | — | — | 479 | |||||||
Debt securities | 0.28 ~ 6.50 | 119,290 | 50,720 | |||||||
|
|
|
| |||||||
| 119,290 | 51,199 | |||||||||
|
|
|
| |||||||
| (Won) | 12,191,753 | (Won) | 12,103,100 | |||||||
|
|
|
| |||||||
S-26
Table of Contents
Korea Finance Corporation
Notes to interim non-consolidated financial statements—(Continued)
June 30, 2011 and 2010
Details of marketable equity securities at June 30, 2011 and December 31, 2010 consist of the following (number of shares in thousands and Korean won in millions):
| June 30, 2011 (Unaudited) | December 31, 2010 (Audited) | |||||||||||||||||||||||
Company | Number of shares | Ownership (%) | Book value before valuation | Current period valuation gain (loss) | Fair value (Book value) | Fair value (Book value) | ||||||||||||||||||
Hyndai E&C Co., Ltd. | 3,655 | 3.28 | (Won) | 264,254 | (Won) | 50,440 | (Won) | 314,694 | (Won) | 823,770 | ||||||||||||||
Hynix Semiconductor Inc. | 32,413 | 5.47 | 758,626 | 41,399 | 800,025 | 758,626 | ||||||||||||||||||
SK Networks Co., Ltd. | 12,448 | 5.02 | 166,185 | (30,498 | ) | 135,687 | 166,185 | |||||||||||||||||
Industrial Bank of Korea | 10,490 | 1.92 | 196,688 | (1,049 | ) | 195,639 | 196,688 | |||||||||||||||||
|
|
|
|
|
|
|
| |||||||||||||||||
| (Won) | 1,385,753 | (Won) | 60,292 | (Won) | 1,446,045 | (Won) | 1,945,269 | |||||||||||||||||
|
|
|
|
|
|
|
| |||||||||||||||||
Details of non-marketable equity securities (including non-marketable equity securities denominated in foreign currencies) at June 30, 2011 and December 31, 2010 consist of the following (number of shares in thousands and Korean won in millions):
| June 30, 2011 (Unaudited) | December 31, 2010 (Audited) | |||||||||||||||||||||||
Company | Number of shares | Ownership (%) | Book value before valuation | Current period valuation gain (loss) | Fair value (Book value) | Fair value (Book value) | ||||||||||||||||||
Korea Express Way Co. | 92,629 | 3.95 | (Won) | 926,326 | (Won) | — | (Won) | 926,326 | (Won) | 1,930,184 | ||||||||||||||
Industrial Bank of Korea (Preferred stock) | 46,915 | 47.89 | 791,695 | (4,223 | ) | 787,472 | 791,695 | |||||||||||||||||
Korea Asset Management Co. | 14,000 | 8.14 | 146,240 | — | 146,240 | 146,240 | ||||||||||||||||||
The Seoul Shinmun | 2 | 0.02 | 33 | — | 33 | 33 | ||||||||||||||||||
Korea Land & Housing Co. | (* | ) | 13.93 | 2,491,947 | — | 2,491,947 | 2,491,947 | |||||||||||||||||
Korea Water Resources Co. | (* | ) | 9.01 | 976,307 | — | 976,307 | 976,307 | |||||||||||||||||
The Export-Import Bank of Korea | (* | ) | 18.58 | 1,200,000 | — | 1,200,000 | 200,000 | |||||||||||||||||
Korea Resources Corp. | (* | ) | 0.34 | 3,220 | — | 3,220 | 3,220 | |||||||||||||||||
Bank Recapitalization SPV | (* | ) | 10.00 | 1 | — | 1 | 1 | |||||||||||||||||
KoFC-HVIC Pioneer Champ 2010-11 Investment Fund | (* | ) | 50.00 | 4,000 | — | 4,000 | 4,000 | |||||||||||||||||
KoFC-Kiwoom Pioneer Champ 2010-12 Investment Fund | (* | ) | 70.00 | 7,000 | — | 7,000 | 2,800 | |||||||||||||||||
KoFC-BK Pioneer Champ 2010-13 Investment Fund | (* | ) | 61.03 | 2,600 | — | 2,600 | 2,600 | |||||||||||||||||
KoFC-Ione Pioneer Champ 2010-15 Investment Fund | (* | ) | 70.00 | 2,800 | — | 2,800 | 2,800 | |||||||||||||||||
KoFC-UTC Pioneer Champ 2010-19 Investment Fund | (* | ) | 70.00 | 2,800 | — | 2,800 | 2,800 | |||||||||||||||||
NAU Japan Technology Investment Fund 1 | (* | ) | 16.67 | 500 | — | 500 | 500 | |||||||||||||||||
Others | — | — | — | 26,179 | ||||||||||||||||||||
|
|
|
|
|
|
|
| |||||||||||||||||
| (Won) | 6,555,469 | (Won) | (4,223 | ) | (Won) | 6,551,246 | (Won) | 6,581,306 | ||||||||||||||||
|
|
|
|
|
|
|
| |||||||||||||||||
S-27
Table of Contents
Korea Finance Corporation
Notes to interim non-consolidated financial statements—(Continued)
June 30, 2011 and 2010
| (*) | The numbers of shares are not disclosed for investee entities whose paid-in capitals are not shares but are investment certificates. |
Non-marketable equity securities, except for Industrial Bank of Korea, are measured at cost less impairment, because the fair value of those securities cannot be measured reliably.
Available-for-sale securities that are restricted as to disposal at June 30, 2011 are summarized as follows (number of shares in thousands and Korean won in millions):
| June 30, 2011 (Unaudited) | ||||||||||
| Number of shares | Book value | Disposal restriction | ||||||||
Hynix Semiconductor Inc. | 15,281 | (Won) | 370,870 | Until the completion of M&A | ||||||
Marketable equity securities that are restricted as to disposal are carried at a value provided by a public independent credit rating agency.
Debt securities (including debt securities dominated in foreign currency) at June 30, 2011 and December 31, 2010 are summarized as follows (Korean won in millions):
| June 30, 2011 (Unaudited) | ||||||||||||||||
| Par value | Acquisition cost | Amortized cost | Fair value (Book value) | |||||||||||||
Government and public bonds | (Won) | 30,000 | (Won) | 30,248 | (Won) | 30,245 | (Won) | 29,981 | ||||||||
Finance bonds | 500,000 | 500,639 | 500,454 | 500,031 | ||||||||||||
Corporate bonds | 2,265,000 | 2,264,947 | 2,264,992 | 2,284,914 | ||||||||||||
Debt securities in foreign currency | 118,352 | 119,116 | 119,008 | 119,290 | ||||||||||||
|
|
|
|
|
|
|
| |||||||||
| (Won) | 2,913,352 | (Won) | 2,914,950 | (Won) | 2,914,699 | (Won) | 2,934,216 | |||||||||
|
|
|
|
|
|
|
| |||||||||
| December 31, 2010 (Audited) | ||||||||||||||||
| Par value | Acquisition cost | Amortized cost | Fair value (Book value) | |||||||||||||
Finance bonds | (Won) | 100,000 | (Won) | 100,329 | (Won) | 100,274 | (Won) | 100,676 | ||||||||
Corporate bonds | 2,245,000 | 2,244,419 | 2,244,945 | 2,271,141 | ||||||||||||
Debt securities in foreign currency | 50,720 | 50,720 | 50,720 | 50,720 | ||||||||||||
|
|
|
|
|
|
|
| |||||||||
| (Won) | 2,395,720 | (Won) | 2,395,468 | (Won) | 2,395,939 | (Won) | 2,422,537 | |||||||||
|
|
|
|
|
|
|
| |||||||||
Debt securities in Korean won are measured based on the lower of the valuation provided by KIS Pricing Inc. or the Korea Asset Pricing Co. and debt securities denominated in foreign currency are measured based on the lower of the valuation provided by NICE Pricing Services Inc. or the Korea Asset Pricing Co.
KoFC provides available-for-sale securities in the amount of (Won)499,984 million ((Won)550,708 million as of December 31 2010) to Bank of Korea and other parties as collateral as of June 30, 2011.
S-28
Table of Contents
Korea Finance Corporation
Notes to interim non-consolidated financial statements—(Continued)
June 30, 2011 and 2010
Beneficiary certificates at June 30, 2011 and December 31, 2010 are summarized as follows (Korean won in millions):
| June 30, 2011 (Unaudited) | ||||||||||||||||
| Acquisition cost | Book value before valuation | Other comprehensive income | Fair value (book value) | |||||||||||||
Beneficiary certificates in Korean won: | ||||||||||||||||
Blended type | (Won) | 1,232,105 | (Won) | 1,243,641 | (Won) | 16,605 | (Won) | 1,260,246 | ||||||||
|
|
|
|
|
|
|
| |||||||||
| December 31, 2010 (Audited) | ||||||||||||||||
| Acquisition cost | Book value before valuation | Other comprehensive income | Fair value (book value) | |||||||||||||
Beneficiary certificates in Korean won: | ||||||||||||||||
Blended type | (Won) | 1,142,452 | (Won) | 1,142,452 | (Won) | 11,536 | (Won) | 1,153,988 | ||||||||
|
|
|
|
|
|
|
| |||||||||
Held-to-maturity securities at June 30, 2011 and December 31, 2010 are summarized as follows (Korean won in millions):
| June 30, 2011 (Unaudited) | ||||||||||||||||
| Par value | Acquisition cost | Amortized cost | Book value | |||||||||||||
Government and public bonds | (Won) | 1,282,160 | (Won) | 1,282,135 | (Won) | 1,281,737 | (Won) | 1,281,737 | ||||||||
|
|
|
|
|
|
|
| |||||||||
| December 31, 2010 (Audited) | ||||||||||||||||
| Par value | Acquisition cost | Amortized cost | Book value | |||||||||||||
Government and public bonds | (Won) | 1,155,992 | (Won) | 1,157,553 | (Won) | 1,157,236 | (Won) | 1,157,236 | ||||||||
|
|
|
|
|
|
|
| |||||||||
The maturities of debt securities included in available-for-sale securities at June 30, 2011 and December 31, 2010 are as follows (Korean won in millions):
| June 30, 2011 (Unaudited) | ||||||||||||||||||||
| Government and public bonds | Finance bonds | Corporate bonds | Debt securities in foreign currency | Total | ||||||||||||||||
Available-for-sale securities: | ||||||||||||||||||||
Within 6 months | (Won) | — | (Won) | — | (Won) | 165,268 | (Won) | — | (Won) | 165,268 | ||||||||||
After 6 months but no later than 1 year | — | 399,937 | 413,065 | 14,605 | 827,607 | |||||||||||||||
After 1 year but no later than 3 years | — | 100,094 | 1,301,839 | 99,077 | 1,501,010 | |||||||||||||||
After 3 years but no later than 5 years | 29,981 | — | 404,742 | 5,608 | 440,331 | |||||||||||||||
|
|
|
|
|
|
|
|
|
| |||||||||||
| (Won) | 29,981 | (Won) | 500,031 | (Won) | 2,284,914 | (Won) | 119,290 | (Won) | 2,934,216 | |||||||||||
|
|
|
|
|
|
|
|
|
| |||||||||||
S-29
Table of Contents
Korea Finance Corporation
Notes to interim non-consolidated financial statements—(Continued)
June 30, 2011 and 2010
| December 31, 2010 (Audited) | ||||||||||||||||
| Finance bonds | Corporate bonds | Debt securities in foreign currency | Total | |||||||||||||
Available-for-sale securities: | ||||||||||||||||
Within 6 months | (Won) | — | (Won) | 382,953 | (Won) | — | (Won) | 382,953 | ||||||||
After 6 months but no later than 1 year | — | 165,802 | — | 165,802 | ||||||||||||
After 1 year but no later than 3 years | 100,676 | 1,529,990 | 50,720 | 1,681,386 | ||||||||||||
After 3 years but no later than 5 years | — | 192,396 | — | 192,396 | ||||||||||||
|
|
|
|
|
|
|
| |||||||||
| (Won) | 100,676 | (Won) | 2,271,141 | (Won) | 50,720 | (Won) | 2,422,537 | |||||||||
|
|
|
|
|
|
|
| |||||||||
The maturities of held-to-maturity securities at June 30, 2011 and December 31, 2010 are as follows (Korean won in millions):
| June 30, 2011 (Unaudited) | December 31, 2010 (Audited) | |||||||
Held-to-maturity securities: | ||||||||
Within 6 months | (Won) | 150,411 | (Won) | 321,132 | ||||
After 6 months but no later than 1 year | 11,400 | 229,336 | ||||||
After 1 year but no later than 3 years | 1,119,926 | 606,768 | ||||||
|
|
|
| |||||
| (Won) | 1,281,737 | (Won) | 1,157,236 | |||||
|
|
|
| |||||
Information of securities (except for equity method investments) by country of issuance or origination at June 30, 2011 and December 31, 2010 is summarized as follows (Korean won in millions):
June 30, 2011 (Unaudited) | ||||||||||
Country | Book value | Ratio (%) | ||||||||
Available-for-sale securities | Korea | (Won) | 12,191,753 | 100.00 | ||||||
Held-to-maturity securities | Korea | 1,281,737 | 100.00 | |||||||
|
| |||||||||
| (Won) | 13,473,490 | |||||||||
|
| |||||||||
December 31, 2010 (Audited) | ||||||||||
Country | Book value | Ratio (%) | ||||||||
Available-for-sale securities | Korea | (Won) | 12,103,100 | 100.00 | ||||||
Held-to-maturity securities | Korea | 1,157,236 | 100.00 | |||||||
|
| |||||||||
| (Won) | 13,260,336 | |||||||||
|
| |||||||||
S-30
Table of Contents
Korea Finance Corporation
Notes to interim non-consolidated financial statements—(Continued)
June 30, 2011 and 2010
Information of securities (except for equity method investments) by industry at June 30, 2011 and December 31, 2010 is summarized as follows (Korean won in millions):
June 30, 2011 (Unaudited) | ||||||||||
Industry | Book value | Ratio (%) | ||||||||
Available-for-sale securities | Financial services | (Won) | 4,523,841 | 37.10 | ||||||
| Manufacturing | 3,209,208 | 26.32 | ||||||||
| Construction | 3,753,254 | 30.79 | ||||||||
| Transportation | 415,615 | 3.41 | ||||||||
| Wholesale and retail | 165,938 | 1.36 | ||||||||
| Other | 123,897 | 1.02 | ||||||||
|
|
|
| |||||||
| 12,191,753 | 100.00 | |||||||||
Held-to-maturity securities | Real estate renting and business services | 690,000 | 53.83 | |||||||
| Construction | 529,011 | 41.28 | ||||||||
| Transportation | 62,726 | 4.89 | ||||||||
|
|
|
| |||||||
| 1,281,737 | 100.00 | |||||||||
|
| |||||||||
| (Won) | 13,473,490 | |||||||||
|
| |||||||||
December 31, 2010 (Audited) | ||||||||||
Industry | Book value | Ratio (%) | ||||||||
Available-for-sale securities | Financial services | (Won) | 3,160,809 | 26.11 | ||||||
| Manufacturing | 2,144,213 | 17.72 | ||||||||
| Construction | 2,774,462 | 22.92 | ||||||||
| Electricity, gas and water supply | 976,307 | 8.06 | ||||||||
| Wholesale and retail | 196,701 | 1.63 | ||||||||
| Other | 2,850,608 | 23.56 | ||||||||
|
|
|
| |||||||
| 12,103,100 | 100.00 | |||||||||
Held-to-maturity securities | Real estate renting and business services | 591,615 | 51.12 | |||||||
| Construction | 444,733 | 38.43 | ||||||||
| Transportation | 120,888 | 10.45 | ||||||||
|
|
|
| |||||||
| 1,157,236 | 100.00 | |||||||||
|
| |||||||||
| (Won) | 13,260,336 | |||||||||
|
| |||||||||
S-31
Table of Contents
Korea Finance Corporation
Notes to interim non-consolidated financial statements—(Continued)
June 30, 2011 and 2010
Information of securities (except for equity method investments) by type of instrument at June 30, 2011 and December 31, 2010 is summarized as follows (Korean won in millions):
June 30, 2011 (Unaudited) | ||||||||||
Type | Book value | Ratio (%) | ||||||||
Available-for-sale securities | Equity securities | (Won) | 3,306,116 | 27.12 | ||||||
| Investment certificates | 4,691,175 | 38.48 | ||||||||
| Floating rate bonds | 7,468 | 0.06 | ||||||||
| Fixed rate bonds | 2,926,748 | 24.00 | ||||||||
| Beneficiary certificates | 1,260,246 | 10.34 | ||||||||
|
|
|
| |||||||
| 12,191,753 | 100.00 | |||||||||
Held-to-maturity securities | Fixed rate bonds | 1,281,737 | 100.00 | |||||||
|
| |||||||||
| (Won) | 13,473,490 | |||||||||
|
| |||||||||
December 31, 2010 (Audited) | ||||||||||
Type | Book value | Ratio (%) | ||||||||
Available-for-sale securities | Equity securities | (Won) | 4,813,421 | 39.77 | ||||||
| Investment certificates | 3,713,154 | 30.68 | ||||||||
| Fixed rate bonds | 2,422,537 | 20.01 | ||||||||
| Beneficiary certificates | 1,153,988 | 9.54 | ||||||||
|
|
|
| |||||||
| 12,103,100 | 100.00 | |||||||||
Held-to-maturity securities | Fixed rate bonds | 1,157,236 | 100.00 | |||||||
|
| |||||||||
| (Won) | 13,260,336 | |||||||||
|
| |||||||||
S-32
Table of Contents
Korea Finance Corporation
Notes to interim non-consolidated financial statements—(Continued)
June 30, 2011 and 2010
Equity method investments at June 30, 2011 and December 31, 2010 are summarized as follows (Korean won in millions):
| June 30, 2011 (Unaudited) | December 31, 2010 (Audited) | |||||||||||||||||||||||||||||||||||||||||||||||||||||||
| Equity method valuation | ||||||||||||||||||||||||||||||||||||||||||||||||||||||||
| Retained earnings | Changes in equity | |||||||||||||||||||||||||||||||||||||||||||||||||||||||
| Owner -ship (%) | Beginning balance | Increase (Decrease) | Dividend | Book value before valuation | Gain (loss) | GAAP difference (*3) | Other | GAAP difference (*3) | Other | Book value | Proportionate net asset value | Book value | Proportionate net asset value | |||||||||||||||||||||||||||||||||||||||||||
Securities: | ||||||||||||||||||||||||||||||||||||||||||||||||||||||||
KDBFG(*1) | 90.26 | (Won) | 15,504,815 | (Won) | — | (Won) | (217,305 | ) | (Won) | 15,287,510 | (Won) | 946,854 | (Won) | 547,732 | (Won) | 89,988 | (Won) | 9,637 | (Won) | (26,444 | ) | (Won) | 16,855,277 | (Won) | 16,936,303 | (Won) | 15,504,815 | (Won) | 15,588,097 | |||||||||||||||||||||||||||
Korea Electric Power Co.(*1) | 29.93 | 9,282,329 | (5,194 | ) | — | 9,277,135 | (362,390 | ) | 8,763,329 | (3,803,540 | ) | (4,030,938 | ) | 3,701,992 | 13,545,588 | 16,428,086 | 9,282,329 | 12,294,287 | ||||||||||||||||||||||||||||||||||||||
Korea Tourism Organization (*1) | 43.58 | 309,727 | — | (16,633 | ) | 293,094 | 2,670 | — | (8,558 | ) | — | 11,056 | 298,262 | 298,262 | 309,727 | 309,727 | ||||||||||||||||||||||||||||||||||||||||
Korea Aerospace Industries, Ltd. (*1) | 26.41 | 188,232 | 25,408 | (2,872 | ) | 210,768 | 7,386 | — | 58 | — | (131 | ) | 218,081 | 217,839 | 188,232 | 184,746 | ||||||||||||||||||||||||||||||||||||||||
Korea Appraisal Board (*1) | 30.60 | 13,308 | — | (168 | ) | 13,140 | 1,950 | — | 1,172 | — | — | 16,262 | 16,262 | 13,308 | 13,308 | |||||||||||||||||||||||||||||||||||||||||
|
|
|
|
|
|
|
|
|
|
|
|
|
|
|
|
|
|
|
|
|
|
|
|
|
| |||||||||||||||||||||||||||||||
| 25,298,411 | 20,214 | (236,978 | ) | 25,081,647 | 596,470 | 9,311,061 | (3,720,880 | ) | (4,021,301 | ) | 3,686,473 | 30,933,470 | 33,896,752 | 25,298,411 | 28,390,165 | |||||||||||||||||||||||||||||||||||||||||
Other investments: | ||||||||||||||||||||||||||||||||||||||||||||||||||||||||
KoFC KDB Material and Component Investment Fund No.1 (*2) | 50.00 | 12,400 | 12,500 | — | 24,900 | (77 | ) | — | — | — | — | 24,823 | 24,823 | 12,400 | 12,400 | |||||||||||||||||||||||||||||||||||||||||
KoFC-TongYang Pioneer Champ 2010-5 Investment Fund (*2) | 56.76 | 8,228 | 4,200 | — | 12,428 | (195 | ) | — | — | — | — | 12,233 | 12,233 | 8,228 | 8,228 | |||||||||||||||||||||||||||||||||||||||||
KoFC-Aju Pioneer Champ 2010-9 Investment Fund (*2) | 60.00 | 7,580 | 7,200 | — | 14,780 | (392 | ) | — | — | — | — | 14,388 | 14,388 | 7,580 | 7,580 | |||||||||||||||||||||||||||||||||||||||||
KoFC-LB Pioneer Champ 2010-10 Investment Fund (*2) | 63.64 | 8,202 | 8,400 | — | 16,602 | (167 | ) | — | — | — | — | 16,435 | 16,435 | 8,202 | 8,202 | |||||||||||||||||||||||||||||||||||||||||
KoFC-IMM Pioneer Champ 2010-17 Investment Fund (*2) | 60.87 | 9,283 | 4,620 | — | 13,903 | (135 | ) | — | — | — | — | 13,768 | 13,768 | 9,283 | 9,283 | |||||||||||||||||||||||||||||||||||||||||
KoFC-KVIC Job Creation Fund (*2) | 83.33 | 23,688 | 8,000 | — | 31,688 | (624 | ) | — | — | — | — | 31,064 | 31,064 | 23,688 | 23,688 | |||||||||||||||||||||||||||||||||||||||||
KoFC KDBC-JKL Frontier Champ 2010-1 PEF(*2) | 62.50 | 41,095 | 32,000 | — | 73,095 | (516 | ) | — | — | — | — | 72,579 | 72,579 | 41,095 | 41,095 | |||||||||||||||||||||||||||||||||||||||||
S-33
Table of Contents
Korea Finance Corporation
Notes to interim non-consolidated financial statements—(Continued)
June 30, 2011 and 2010
| June 30, 2011 (Unaudited) | December 31, 2010 (Audited) | |||||||||||||||||||||||||||||||||||||||||||||||||||||||
| Equity method valuation | ||||||||||||||||||||||||||||||||||||||||||||||||||||||||
| Gain (loss) | Retained earnings | Changes in equity | ||||||||||||||||||||||||||||||||||||||||||||||||||||||
| Owner -ship (%) | Beginning balance | Increase (Decrease) | Dividend | Book value before valuation | GAAP difference (*3) | Other | GAAP difference (*3) | Other | Book value | Proportionate net asset value | Book value | Proportionate net asset value | ||||||||||||||||||||||||||||||||||||||||||||
KoFC QCP IBKC Frontier Champ 2010-2 PEF(*2) | 44.91 | 11,837 | 13,875 | — | 25,712 | (793 | ) | — | — | — | (6,283 | ) | 18,636 | 18,636 | 11,837 | 11,837 | ||||||||||||||||||||||||||||||||||||||||
KoFC Skylake Growth Champ 2010-5 PEF (*2) | 64.66 | 16,859 | 23,955 | — | 40,814 | (3,929 | ) | — | — | — | — | 36,885 | 36,885 | 16,859 | 16,859 | |||||||||||||||||||||||||||||||||||||||||
KoFC Macquarie Growth Champ 2010-1 PEF(*2) | 44.94 | 19,468 | 25,840 | — | 45,308 | (235 | ) | — | — | — | — | 45,073 | 45,073 | 19,468 | 19,468 | |||||||||||||||||||||||||||||||||||||||||
Job Creation PEF (*2) | 50.00 | 9,863 | 2,900 | — | 12,763 | (200 | ) | — | — | — | — | 12,563 | 12,563 | 9,863 | 9,863 | |||||||||||||||||||||||||||||||||||||||||
KoFC Mirae Asset Growth Champ 2010-4 PEF(*2) | 39.86 | — | 43,500 | — | 43,500 | (764 | ) | — | — | — | — | 42,736 | 42,736 | — | — | |||||||||||||||||||||||||||||||||||||||||
KoFC STIC Growth Champ 2010-2 PEF (*2) | 39.59 | — | 36,800 | — | 36,800 | (984 | ) | — | — | — | — | 35,816 | 35,816 | — | — | |||||||||||||||||||||||||||||||||||||||||
KoFC KTB Frontier Champ 2010-3 PEF (*2) | 58.12 | — | 65,100 | — | 65,100 | (682 | ) | — | — | — | — | 64,418 | 64,418 | — | — | |||||||||||||||||||||||||||||||||||||||||
Blue Ocean PEF 1 (*2) | 50.83 | — | 61,500 | — | 61,500 | (117 | ) | — | — | — | — | 61,383 | 61,383 | — | — | |||||||||||||||||||||||||||||||||||||||||
Others | 36,192 | 106,523 | — | 142,715 | (6,425 | ) | — | — | — | — | 136,290 | 136,290 | 36,192 | 36,192 | ||||||||||||||||||||||||||||||||||||||||||
|
|
|
|
|
|
|
|
|
|
|
|
|
|
|
|
|
|
|
|
|
|
|
|
|
| |||||||||||||||||||||||||||||||
| 204,695 | 456,913 | — | 661,608 | (16,235 | ) | — | — | — | (6,283 | ) | 639,090 | 639,090 | 204,695 | 204,695 | ||||||||||||||||||||||||||||||||||||||||||
|
|
|
|
|
|
|
|
|
|
|
|
|
|
|
|
|
|
|
|
|
|
|
|
|
| |||||||||||||||||||||||||||||||
| (Won) | 25,503,106 | (Won) | 477,127 | (Won) | (236,978 | ) | (Won) | 25,743,255 | (Won) | 580,235 | (Won) | 9,311,061 | (Won) | (3,720,880 | ) | (Won) | (4,021,301 | ) | (Won) | 3,680,190 | (Won) | 31,572,560 | (Won) | 34,535,842 | (Won) | 25,503,106 | (Won) | 28,594,860 | ||||||||||||||||||||||||||||
|
|
|
|
|
|
|
|
|
|
|
|
|
|
|
|
|
|
|
|
|
|
|
|
|
| |||||||||||||||||||||||||||||||
| (*1) | KoFC obtained reviewed interim financial statements of the investees. |
| (*2) | KoFC obtained unreviewed interim financial statements signed by the investees’ management. KoFC confirmed that the investees’ unreviewed financial statements reflected significant transactions or resolution of accounting issues which KoFC identified. |
S-34
Table of Contents
Korea Finance Corporation
Notes to interim non-consolidated financial statements—(Continued)
June 30, 2011 and 2010
| (*3) | Differences between K-IFRS which are adopted by the investees and Korean GAAP at December 31, 2010 are as follows: |
| KDBFG | Korea Electric Power Co. | |||||||||||||||||||||||||||||||
| Previous K-GAAP | K-IFRS | GAAP differences | Share of KoFC | Previous K-GAAP | K-IFRS | GAAP differences | Share of KoFC | |||||||||||||||||||||||||
Controlling interests: | ||||||||||||||||||||||||||||||||
Paid-in capital | (Won) | 1,813,292 | (Won) | 1,813,292 | (Won) | — | (Won) | — | (Won) | 3,207,839 | (Won) | 3,207,839 | (Won) | — | (Won) | — | ||||||||||||||||
Capital surplus | 13,617,012 | 13,599,978 | (17,034 | ) | (15,375 | ) | 14,764,631 | 1,404,672 | (13,359,959 | ) | (4,001,525 | ) | ||||||||||||||||||||
Capital adjustment | (39,908 | ) | (1,779 | ) | 38,129 | 34,415 | (741,587 | ) | (741,489 | ) | 98 | 30 | ||||||||||||||||||||
Accumulated other comprehensive income | 83,403 | 72,984 | (10,419 | ) | (9,403 | ) | 453,928 | 355,626 | (98,302 | ) | (29,443 | ) | ||||||||||||||||||||
Retained earnings | 1,796,779 | 2,403,630 | 606,851 | 547,732 | 23,333,052 | 52,591,330 | 29,258,278 | 8,763,329 | ||||||||||||||||||||||||
|
|
|
|
|
|
|
|
|
|
|
|
|
|
|
| |||||||||||||||||
| 17,270,578 | 17,888,105 | 617,527 | (Won) | 557,369 | 41,017,863 | 56,817,978 | 15,800,115 | (Won) | 4,732,391 | |||||||||||||||||||||||
Non-controlling interests | 5,350,055 | 1,830,791 | (3,519,264 | ) | 470,738 | 458,559 | (12,179 | ) | ||||||||||||||||||||||||
|
|
|
|
|
|
|
|
|
|
|
| |||||||||||||||||||||
Total equity | (Won) | 22,620,633 | (Won) | 19,718,896 | (Won) | (2,901,737 | ) | (Won) | 41,488,601 | (Won) | 57,276,537 | (Won) | 15,787,936 | |||||||||||||||||||
|
|
|
|
|
|
|
|
|
|
|
| |||||||||||||||||||||
S-35
Table of Contents
Korea Finance Corporation
Notes to interim non-consolidated financial statements—(Continued)
June 30, 2011 and 2010
The unamortized difference between cost of investments and KoFC’s portion of the investee’s net asset value at the acquisition date representing goodwill (negative goodwill) is summarized as follows (Korean won in millions):
| Six months ended June 30, 2011 (Unaudited) | ||||||||||||
| Beginning balance | Amortization | Ending balance | ||||||||||
Korea Electric Power Co. | (Won) | (3,011,958 | ) | (Won) | 129,460 | (Won) | (2,882,498 | ) | ||||
Korea Aerospace Industries, Ltd. | 818 | (576 | ) | 242 | ||||||||
|
|
|
|
|
| |||||||
| (Won) | (3,011,140 | ) | (Won) | 128,884 | (Won) | (2,882,256 | ) | |||||
|
|
|
|
|
| |||||||
| Year ended December 31, 2010 (Audited) | ||||||||||||
| Beginning balance | Amortization | Ending balance | ||||||||||
Korea Electric Power Co. | (Won) | (3,269,431 | ) | (Won) | 257,473 | (Won) | (3,011,958 | ) | ||||
Korea Aerospace Industries, Ltd. | 1,908 | (1,090 | ) | 818 | ||||||||
|
|
|
|
|
| |||||||
| (Won) | (3,267,523 | ) | (Won) | 256,383 | (Won) | (3,011,140 | ) | |||||
|
|
|
|
|
| |||||||
The elimination of unrealized gains (losses) arising from inter-company transactions for the six months ended June 30, 2011 and year ended December 31, 2010 is as follows (Korean won in millions):
| Six months ended June 30, 2011 (Unaudited) | ||||||||||||||||
| Beginning balance | Increase | Decrease | Ending balance | |||||||||||||
KDBFG | (Won) | (83,282 | ) | (Won) | (9,741 | ) | (Won) | 11,997 | (Won) | (81,026 | ) | |||||
Korea Aerospace Industries, Ltd. | 2,668 | — | (2,668 | ) | — | |||||||||||
|
|
|
|
|
|
|
| |||||||||
| (Won) | (80,614 | ) | (Won) | (9,741 | ) | (Won) | 9,329 | (Won) | (81,026 | ) | ||||||
|
|
|
|
|
|
|
| |||||||||
| Year ended December 31, 2010 (Audited) | ||||||||||||||||
| Beginning balance | Increase | Decrease | Ending balance | |||||||||||||
KDBFG | (Won) | — | (Won) | (83,282 | ) | (Won) | — | (Won) | (83,282 | ) | ||||||
Korea Aerospace Industries, Ltd. | 1,973 | 695 | — | 2,668 | ||||||||||||
|
|
|
|
|
|
|
| |||||||||
| (Won) | 1,973 | (Won) | (82,587 | ) | (Won) | — | (Won) | (80,614 | ) | |||||||
|
|
|
|
|
|
|
| |||||||||
S-36
Table of Contents
Korea Finance Corporation
Notes to interim non-consolidated financial statements—(Continued)
June 30, 2011 and 2010
The condensed financial position as of June 30, 2011 and December 31, 2010 and the results of financial performance of KoFC’s equity method investees for the six months ended June 30, 2011 and the year ended December 31, 2010 are summarized as follows (Korean won in millions):
| June 30, 2011 (Unaudited) | ||||||||||||||||
| Assets | Liabilities | Operating revenue | Net income (loss) | |||||||||||||
Securities: | ||||||||||||||||
KDBFG | (Won) | 165,792,997 | (Won) | 142,675,402 | (Won) | 15,114,828 | (Won) | 1,046,553 | ||||||||
Korea Electric Power Co. | 131,374,781 | 76,052,647 | 19,915,884 | (1,636,216 | ) | |||||||||||
Korea Tourism Organization | 1,353,128 | 590,378 | 423,138 | 6,125 | ||||||||||||
Korea Aerospace Industries, Ltd. | 1,625,660 | 800,913 | 664,985 | 35,217 | ||||||||||||
Korea Appraisal Board | 540,442 | 487,292 | 44,801 | 6,374 | ||||||||||||
Other investments: | ||||||||||||||||
KoFC-KDB Material and Component Investment Fund No.1 | 49,646 | — | 354 | (155 | ) | |||||||||||
KoFC-TongYang Pioneer Champ 2010-5 Investment Fund | 21,875 | 321 | 58 | (343 | ) | |||||||||||
KoFC-Aju Pioneer Champ 2010-9 Investment Fund | 24,153 | 173 | 156 | (653 | ) | |||||||||||
KoFC-LB Pioneer Champ 2010-10 Investment Fund | 25,827 | — | 88 | (262 | ) | |||||||||||
KoFC-IMM Pioneer Champ 2010-17 Investment Fund | 22,618 | — | 13 | (224 | ) | |||||||||||
KoFC-KVIC Job Creation Fund | 37,281 | 3 | 12 | (748 | ) | |||||||||||
KoFC KDBC-JKL Frontier Champ 2010-1 PEF | 116,550 | 424 | 27 | (825 | ) | |||||||||||
KoFC QCP IBKC Frontier Champ 2010-2 PEF | 42,380 | 883 | 155 | (1,765 | ) | |||||||||||
KoFC Skylake Growth Champ 2010-5 PEF | 57,739 | 690 | 7 | (6,006 | ) | |||||||||||
KoFC Macquarie Growth Champ 2010-1 PEF | 100,761 | 475 | 5 | (523 | ) | |||||||||||
Job Creation PEF | 25,621 | 496 | 101 | (400 | ) | |||||||||||
KoFC Mirae Asset Growth Champ 2010-4 PEF | 108,149 | 940 | 1 | (1,887 | ) | |||||||||||
KoFC STIC Growth Champ 2010-2 PEF | 91,786 | 1,314 | 225 | (2,485 | ) | |||||||||||
KoFC KTB Frontier Champ 2010-3 PEF | 111,486 | 643 | 2 | (1,173 | ) | |||||||||||
Blue Ocean PEF 1 | 120,908 | 139 | 411 | (231 | ) | |||||||||||
S-37
Table of Contents
Korea Finance Corporation
Notes to interim non-consolidated financial statements—(Continued)
June 30, 2011 and 2010
| December 31, 2010 (Audited) | ||||||||||||||||
| Assets | Liabilities | Operating revenue | Net income (loss) | |||||||||||||
Securities: | ||||||||||||||||
KDBFG | (Won) | 17,918,378 | (Won) | 647,801 | (Won) | 1,094,682 | (Won) | 908,527 | ||||||||
Korea Electric Power Co. | 74,398,204 | 33,351,057 | 39,189,661 | (61,421 | ) | |||||||||||
Korea Tourism Organization | 1,012,503 | 301,868 | 414,104 | 177,490 | ||||||||||||
Korea Aerospace Industries, Ltd. | 1,498,431 | 884,273 | 1,266,710 | 78,841 | ||||||||||||
Korea Appraisal Board | 385,496 | 342,003 | 104,665 | 2,887 | ||||||||||||
Other investments: | ||||||||||||||||
KDB-Tstone PEF | 40,659 | 400 | 148 | (1,499 | ) | |||||||||||
KoFC-KDB Material and Component Investment Fund No.1 | 24,801 | — | 303 | (199 | ) | |||||||||||
KoFC-Hantoo Pioneer Champ 2010-1 Investment Fund | 11,477 | — | 112 | (523 | ) | |||||||||||
KoFC-KDBC Pioneer Champ 2010-4 Investment Fund | 17,576 | — | 65 | (424 | ) | |||||||||||
KoFC-TongYang Pioneer Champ 2010-5 Investment Fund | 14,497 | — | 50 | (303 | ) | |||||||||||
KoFC-Neoplux Pioneer Champ 2010-7 Investment Fund | 12,102 | — | 109 | (498 | ) | |||||||||||
KoFC-Aju Pioneer Champ 2010-9 Investment Fund | 12,806 | 173 | 965 | 633 | ||||||||||||
KoFC-LB Pioneer Champ 2010-10 Investment Fund | 12,891 | 2 | 26 | (311 | ) | |||||||||||
KoFC-IMM Pioneer Champ 2010-17 Investment Fund | 15,253 | 3 | 245 | (160 | ) | |||||||||||
KoFC-KVIC Job Creation Fund | 28,431 | 5 | 14 | (373 | ) | |||||||||||
KoFC KDBC-JKL Frontier Champ 2010-1 PEF | 66,139 | 388 | 4 | (249 | ) | |||||||||||
KoFC QCP IBKC Frontier Champ 2010-2 PEF | 30,062 | 3,705 | — | (363 | ) | |||||||||||
KoFC Skylake Growth Champ 2010-5 PEF | 26,303 | 227 | 2 | (258 | ) | |||||||||||
KoFC KBIC Frontier Champ 2010-5 PEF | 20,991 | 53 | — | (63 | ) | |||||||||||
KoFC Macquarie Growth Champ 2010-1 PEF | 43,316 | — | — | (205 | ) | |||||||||||
Job Creation PEF | 20,229 | 504 | 39 | (515 | ) | |||||||||||
S-38
Table of Contents
Korea Finance Corporation
Notes to interim non-consolidated financial statements—(Continued)
June 30, 2011 and 2010
Investees that are not accounted for using the equity method of accounting, while KoFC holds more than 15% of voting shares as of June 30 2011 and December 31, 2010 are as follows (Korean won in millions):
| June 30, 2011 (Unaudited) | ||||||||||||||||||
| Ratio (%) | Acquisition cost | Book value | Net asset value or fair value | Reason | ||||||||||||||
The Export-Import Bank of Korea |
| 18.58 |
| (Won) | 1,200,000 |
| (Won) | 1,200,000 |
| (Won) | 1,211,952 |
| The Government owns over two third of voting shares | |||||
KoFC-HVIC Pioneer Champ 2010-11 Investment Fund |
| 50.00 |
|
| 4,000 |
|
| 4,000 |
|
| 4,000 |
| Korea Financial Accounting Standards 15, Paragraph No.2 (*1) | |||||
KoFC-Kiwoom Pioneer Champ 2010-12 Investment Fund | 70.00 | 7,000 | 7,000 | 7,000 | ” | |||||||||||||
KoFC-BK Pioneer Champ 2010-13 Investment Fund | 61.00 | 2,600 | 2,600 | 2,600 | ” | |||||||||||||
KoFC-Ione Pioneer Champ 2010-15 Investment Fund | 70.00 | 2,800 | 2,800 | 2,800 | ” | |||||||||||||
KoFC-UTC Pioneer Champ 2010-19 Investment Fund | 70.00 | 2,800 | 2,800 | 2,800 | ” | |||||||||||||
|
|
|
|
|
| |||||||||||||
| (Won) | 1,219,200 | (Won) | 1,219,200 | (Won) | 1,231,152 | |||||||||||||
|
|
|
|
|
| |||||||||||||
| (*1) | KoFC does not apply equity method on investees which have less than (Won)10 billion of total assets because those investees are not significant. |
S-39
Table of Contents
Korea Finance Corporation
Notes to interim non-consolidated financial statements—(Continued)
June 30, 2011 and 2010
| December 31, 2010 (Audited) | ||||||||||||||||||
| Ratio (%) | Acquisition cost | Book value | Net asset value or fair value | Reason | ||||||||||||||
Troica Resources Investment PEF (*2) | 9.10 | (Won) | 479 | (Won) | 479 | (Won) | 479 | Korea Financial Accounting Standards 15, Paragraph No.2(*1) | ||||||||||
KoFC-Daesung Pioneer Champ 2010-2 Venture Investment Fund | 45.00 | 3,600 | 3,600 | 3,600 | ” | |||||||||||||
KoFC-Bokwang Pioneer Champ 2010-3 Investment Fund | 42.86 | 3,000 | 3,000 | 3,000 | ” | |||||||||||||
KoFC-WIP Pioneer Champ 2010-6 Investment Fund | 70.00 | 4,200 | 4,200 | 4,200 | ” | |||||||||||||
KoFC-KB Pioneer Champ 2010-8 Investment Fund | 50.00 | 3,000 | 3,000 | 3,000 | ” | |||||||||||||
KoFC-HVIC Pioneer Champ 2010-11 Investment Fund | 50.00 | 4,000 | 4,000 | 4,000 | ” | |||||||||||||
KoFC-Kiwoom Pioneer Champ 2010-12 Investment Fund | 70.00 | 2,800 | 2,800 | 2,800 | ” | |||||||||||||
KoFC-BK Pioneer Champ 2010-13 Investment Fund | 61.00 | 2,600 | 2,600 | 2,600 | ” | |||||||||||||
KoFC-Hanwha Pioneer Champ 2010-14 Investment Fund | 70.00 | 6,300 | 6,300 | 6,300 | ” | |||||||||||||
KoFC-Ione Pioneer Champ 2010-15 Investment Fund | 70.00 | 2,800 | 2,800 | 2,800 | ” | |||||||||||||
KoFC-Atinum Pioneer Champ 2010-16 Investment Fund | 70.00 | 2,800 | 2,800 | 2,800 | ” | |||||||||||||
KoFC-Daekyung Pioneer Champ 2010-18 Investment Fund | 46.67 | 2,800 | 2,800 | 2,800 | ” | |||||||||||||
KoFC-UTC Pioneer Champ 2010-19 Investment Fund | 70.00 | 2,800 | 2,800 | 2,800 | ” | |||||||||||||
NAU Japan Technology Investment Fund 1 | 16.67 | 500 | 500 | 500 | ” | |||||||||||||
|
|
|
|
|
| |||||||||||||
| (Won) | 41,679 | (Won) | 41,679 | (Won) | 41,679 | |||||||||||||
|
|
|
|
|
| |||||||||||||
| (*1) | KoFC does not apply equity method on investees which have less than (Won)10 billion of total assets because those investees are not significant. |
| (*2) | The sum of ownership together with KDB is more than 15%. |
S-40
Table of Contents
Korea Finance Corporation
Notes to interim non-consolidated financial statements—(Continued)
June 30, 2011 and 2010
The market value of listed equity method investees at June 30, 2011 and December 31, 2010 is as follows (Korean won in millions):
| June 30, 2011 (Unaudited) | December 31, 2010 (Audited) | |||||||||||||||
| Market value | Book value | Market value | Book value | |||||||||||||
Korea Electric Power Co. | (Won) | 5,447,734 | (Won) | 13,545,588 | (Won) | 5,803,230 | (Won) | 9,282,329 | ||||||||
Korea Aerospace Industries, Ltd. | 570,273 | 218,081 | — | — | ||||||||||||
|
|
|
|
|
|
|
| |||||||||
| (Won) | 6,018,007 | (Won) | 13,763,669 | (Won) | 5,803,230 | (Won) | 9,282,329 | |||||||||
|
|
|
|
|
|
|
| |||||||||
5. Loans receivable
Total loans receivable at June 30, 2011 and December 31, 2010 consist of the following (Korean won in millions):
| June 30, 2011 (Unaudited) | December 31, 2010 (Audited) | |||||||
Loans in Korean won: | ||||||||
Loans for working capital: | ||||||||
Government fund loans | (Won) | 2,795,635 | (Won) | 3,492,635 | ||||
On-lending working capital loans | 2,642,784 | 1,631,633 | ||||||
Credit risk-shared on-lending working capital loans | 94,531 | 67,764 | ||||||
|
|
|
| |||||
| 5,532,950 | 5,192,032 | |||||||
Loans for facility developments: | ||||||||
Government fund loans | 3,436,579 | 2,825,413 | ||||||
On-lending equipment loans | 3,015,039 | 1,671,527 | ||||||
Credit risk-shared on-lending equipment loans | 19,798 | 10,178 | ||||||
|
|
|
| |||||
| 6,471,416 | 4,507,118 | |||||||
|
|
|
| |||||
| 12,004,366 | 9,699,150 | |||||||
Loans in foreign currency: | ||||||||
Loans for working capital | 54,435 | 103,994 | ||||||
Loans for facility developments | 2,483,930 | 2,320,395 | ||||||
|
|
|
| |||||
| 2,538,365 | 2,424,389 | |||||||
Others: | ||||||||
Call loan in foreign currency | 101,341 | 77,445 | ||||||
Loans to banks in foreign currency | 228,557 | 43,278 | ||||||
Privately placed bonds | 1,113,333 | 191,667 | ||||||
Guarantee payments | 348 | — | ||||||
Other | 1,293 | 974 | ||||||
|
|
|
| |||||
| 1,444,872 | 313,364 | |||||||
|
|
|
| |||||
| (Won) | 15,987,603 | (Won) | 12,436,903 | |||||
|
|
|
| |||||
S-41
Table of Contents
Korea Finance Corporation
Notes to interim non-consolidated financial statements—(Continued)
June 30, 2011 and 2010
Concentrations of loans in Korean won and loans in foreign currency by country at June 30, 2011 and December 31, 2010 are summarized as follows (Korean won in millions):
| June 30, 2011 (Unaudited) | December 31, 2010 (Audited) | |||||||||||||||
| Amount | Ratio (%) | Amount | Ratio (%) | |||||||||||||
Korea | (Won) | 13,995,979 | 96.24 | (Won) | 11,654,215 | 96.13 | ||||||||||
Marshall Islands | 146,393 | 1.01 | 159,446 | 1.32 | ||||||||||||
Australia | 149,037 | 1.03 | 157,442 | 1.30 | ||||||||||||
Indonesia | 39,890 | 0.27 | 7,972 | 0.06 | ||||||||||||
Canada | 53,905 | 0.37 | 56,945 | 0.47 | ||||||||||||
Other | 157,527 | 1.08 | 87,519 | 0.72 | ||||||||||||
|
|
|
|
|
|
|
| |||||||||
| (Won) | 14,542,731 | 100.00 | (Won) | 12,123,539 | 100.00 | |||||||||||
|
|
|
|
|
|
|
| |||||||||
Concentrations of loans in Korean won and in foreign currency by industry at June 30, 2011 and December 31, 2010 are summarized as follows (Korean won in millions):
| June 30, 2011 (Unaudited) | December 31, 2010 (Audited) | |||||||||||||||
| Amount | Ratio (%) | Amount | Ratio (%) | |||||||||||||
Financial services | (Won) | 9,263,429 | 63.70 | (Won) | 7,820,352 | 64.52 | ||||||||||
Manufacturing | 1,815,774 | 12.49 | 1,194,628 | 9.85 | ||||||||||||
Construction | 193,435 | 1.33 | 867,222 | 7.15 | ||||||||||||
Public administration | 467,487 | 3.21 | 567,481 | 4.68 | ||||||||||||
Others | 2,802,606 | 19.27 | 1,673,856 | 13.80 | ||||||||||||
|
|
|
|
|
|
|
| |||||||||
| (Won) | 14,542,731 | 100.00 | (Won) | 12,123,539 | 100.00 | |||||||||||
|
|
|
|
|
|
|
| |||||||||
The maturities of loans in Korean won and in foreign currency at June 30, 2011 and December 31, 2010 are summarized as follows (Korean won in millions):
| June 30, 2011 (Unaudited) | ||||||||||||
Maturity | Korean won | Foreign currency | Total | |||||||||
Within 6 months | (Won) | 814,057 | (Won) | 765,270 | (Won) | 1,579,327 | ||||||
After 6 months but no later than 1 year | 4,145,289 | 481,629 | 4,626,918 | |||||||||
After 1 year but no later than 3 years | 3,567,671 | 1,030,483 | 4,598,154 | |||||||||
After 3 years but no later than 5 years | 2,381,618 | 97,735 | 2,479,353 | |||||||||
After 5 years | 1,095,731 | 163,248 | 1,258,979 | |||||||||
|
|
|
|
|
| |||||||
| (Won) | 12,004,366 | (Won) | 2,538,365 | (Won) | 14,542,731 | |||||||
|
|
|
|
|
| |||||||
| December 31, 2010 (Audited) | ||||||||||||
Maturity | Korean won | Foreign currency | Total | |||||||||
Within 6 months | (Won) | 3,487,849 | (Won) | 463,336 | (Won) | 3,951,185 | ||||||
After 6 months but no later than 1 year | 804,314 | 802,087 | 1,606,401 | |||||||||
After 1 year but no later than 3 years | 2,750,172 | 1,075,447 | 3,825,619 | |||||||||
After 3 years but no later than 5 years | 1,724,366 | 69,283 | 1,793,649 | |||||||||
After 5 years | 932,449 | 14,236 | 946,685 | |||||||||
|
|
|
|
|
| |||||||
| (Won) | 9,699,150 | (Won) | 2,424,389 | (Won) | 12,123,539 | |||||||
|
|
|
|
|
| |||||||
S-42
Table of Contents
Korea Finance Corporation
Notes to interim non-consolidated financial statements—(Continued)
June 30, 2011 and 2010
Details of changes in the allowance for possible loan losses for the six months ended June 30, 2011 and 2010 are as follows (Korean won in millions):
| Six months ended June 30, 2011 (Unaudited) | Six months ended June 30, 2010 (Unaudited) | |||||||
Beginning balance | (Won) | 16,402 | (Won) | 4,112 | ||||
Provision of allowance for possible loan losses | 10,274 | 2,869 | ||||||
|
|
|
| |||||
Ending balance | (Won) | 26,676 | (Won) | 6,981 | ||||
|
|
|
| |||||
Details on the allowance for possible loan losses at June 30, 2011 and December 31, 2010 are as follows (Korean won in millions):
| June 30, 2011 (Unaudited) | December 31, 2010 (Audited) | |||||||
Loans receivable: | ||||||||
Loans for working capital in Korean won | (Won) | 4,900 | (Won) | 2,988 | ||||
Loans for facility developments in Korean won | 14,410 | 9,479 | ||||||
Loans for facility developments in foreign currency | 2,881 | 2,451 | ||||||
Others | 4,485 | 1,484 | ||||||
|
|
|
| |||||
| (Won) | 26,676 | (Won) | 16,402 | |||||
|
|
|
| |||||
Details on the classification of loans receivable and the allowance for possible loan losses at June 30, 2011 and December 31, 2010 are as follows (Korean won in millions):
| June 30, 2011 (Unaudited) | ||||||||||||
| Loans receivable | Allowance for possible loan losses | Ratio (%) | ||||||||||
Normal | (Won) | 4,250,704 | (Won) | 21,253 | 0.50 | |||||||
Precautionary | 7,889 | 276 | 3.50 | |||||||||
Substandard | — | — | — | |||||||||
Doubtful | — | — | — | |||||||||
Estimated loss | 5,147 | 5,147 | 100.00 | |||||||||
|
|
|
|
|
| |||||||
| (Won) | 4,263,740 | (Won) | 26,676 | 0.63 | ||||||||
|
|
|
|
|
| |||||||
| December 31, 2010 (Audited) | ||||||||||||
| Loans receivable | Allowance for possible loan losses | Ratio (%) | ||||||||||
Normal | (Won) | 3,280,478 | (Won) | 16,402 | 0.50 | |||||||
Precautionary | — | — | — | |||||||||
Substandard | — | — | — | |||||||||
Doubtful | — | — | — | |||||||||
Estimated loss | — | — | — | |||||||||
|
|
|
|
|
| |||||||
| (Won) | 3,280,478 | (Won) | 16,402 | 0.50 | ||||||||
|
|
|
|
|
| |||||||
S-43
Table of Contents
Korea Finance Corporation
Notes to interim non-consolidated financial statements—(Continued)
June 30, 2011 and 2010
Details of the adjustments to loans receivable for the purpose of determination of the allowance for possible loan losses at June 30, 2011 and December 31, 2010 are as follows (Korean won in millions):
| June 30, 2011 (Unaudited) | December 31, 2010 (Audited) | |||||||
Loans receivable | (Won) | 15,987,603 | (Won) | 12,436,903 | ||||
Loans to banks | (6,051,513 | ) | (3,501,192 | ) | ||||
Call loan | (101,341 | ) | (77,445 | ) | ||||
Loans to the Government and others(*1) | (5,565,815 | ) | (5,567,358 | ) | ||||
Others(*2) | (5,194 | ) | (10,430 | ) | ||||
|
|
|
| |||||
Loans subject to allowance for possible loan losses | (Won) | 4,263,740 | (Won) | 3,280,478 | ||||
|
|
|
| |||||
| (*1) | Loans to the Government and others are guaranteed by the Korea Credit Guarantee Fund and others. |
| (*2) | Other represents present value discount not subject to the allowance for possible loan losses. |
Changes in deferred loan fees, net of expenses, for the six months ended June 30, 2011 and the year ended December 31, 2010 are summarized as follows (Korean won in millions):
| Six months ended June 30, 2011 (Unaudited) | ||||||||||||||||
| Beginning | Increase | Decrease | Ending | |||||||||||||
Deferred loan fees, net of expenses | (Won) | 9,112 | (Won) | 2,631 | (Won) | (1,697 | ) | (Won) | 10,046 | |||||||
|
|
|
|
|
|
|
| |||||||||
| Year ended December 31, 2010 (Audited) | ||||||||||||||||
| Beginning | Increase | Decrease | Ending | |||||||||||||
Deferred loan fees, net of expenses | (Won) | 1,196 | (Won) | 10,494 | (Won) | (2,578 | ) | (Won) | 9,112 | |||||||
|
|
|
|
|
|
|
| |||||||||
S-44
Table of Contents
Korea Finance Corporation
Notes to interim non-consolidated financial statements—(Continued)
June 30, 2011 and 2010
6. Property and equipment
Changes in property and equipment for the six months ended June 30, 2011 and the year ended December 31, 2010 are as follows (Korean won in millions):
| Six months ended June 30, 2011 (Unaudited) | ||||||||||||||||||||
| Beginning balance | Increase | Decrease | Transfer in (out) | Ending balance | ||||||||||||||||
Acquisition cost: | ||||||||||||||||||||
Land | (Won) | 38,958 | (Won) | — | (Won) | — | (Won) | — | (Won) | 38,958 | ||||||||||
Buildings | 53,293 | 541 | — | 1,573 | 55,407 | |||||||||||||||
(Government subsidy) | — | (268 | ) | — | — | (268 | ) | |||||||||||||
Structures | 2,824 | — | — | — | 2,824 | |||||||||||||||
Machinery and equipment | 4,880 | 168 | — | 382 | 5,430 | |||||||||||||||
Office equipment | 290 | 35 | — | 62 | 387 | |||||||||||||||
Tools and furniture | 1,225 | 319 | — | 13 | 1,557 | |||||||||||||||
Assets under construction | — | 2,496 | — | (2,030 | ) | 466 | ||||||||||||||
|
|
|
|
|
|
|
|
|
| |||||||||||
| 101,470 | 3,291 | — | — | 104,761 | ||||||||||||||||
Accumulated depreciation: | ||||||||||||||||||||
Buildings | (16,775 | ) | (762 | ) | — | — | (17,537 | ) | ||||||||||||
Structures | (754 | ) | (40 | ) | — | — | (794 | ) | ||||||||||||
Machinery and equipment | (1,566 | ) | (573 | ) | — | — | (2,139 | ) | ||||||||||||
Office equipment | (64 | ) | (41 | ) | — | — | (105 | ) | ||||||||||||
Tools and furniture | (278 | ) | (167 | ) | — | — | (445 | ) | ||||||||||||
|
|
|
|
|
|
|
|
|
| |||||||||||
| (19,437 | ) | (1,583 | ) | — | — | (21,020 | ) | |||||||||||||
|
|
|
|
|
|
|
|
|
| |||||||||||
| (Won) | 82,033 | (Won) | 1,708 | (Won) | — | (Won) | — | (Won) | 83,741 | |||||||||||
|
|
|
|
|
|
|
|
|
| |||||||||||
S-45
Table of Contents
Korea Finance Corporation
Notes to interim non-consolidated financial statements—(Continued)
June 30, 2011 and 2010
| Year ended December 31, 2010 (Audited) | ||||||||||||||||
| Beginning balance | Increase | Decrease | Ending balance | |||||||||||||
Acquisition cost: | ||||||||||||||||
Land | (Won) | 38,958 | (Won) | — | (Won) | — | (Won) | 38,958 | ||||||||
Buildings | 52,960 | 333 | — | 53,293 | ||||||||||||
Structures | 2,816 | 8 | — | 2,824 | ||||||||||||
Machinery and equipment | 2,814 | 2,066 | — | 4,880 | ||||||||||||
Office equipment | 809 | 416 | — | 1,225 | ||||||||||||
Tools and furniture | 97 | 193 | — | 290 | ||||||||||||
|
|
|
|
|
|
|
| |||||||||
| 98,454 | 3,016 | — | 101,470 | |||||||||||||
Accumulated depreciation: | ||||||||||||||||
Buildings | (15,290 | ) | (1,485 | ) | — | (16,775 | ) | |||||||||
Structures | (675 | ) | (79 | ) | — | (754 | ) | |||||||||
Machinery and equipment | (739 | ) | (827 | ) | — | (1,566 | ) | |||||||||
Office equipment | (42 | ) | (236 | ) | — | (278 | ) | |||||||||
Tools and furniture | (24 | ) | (40 | ) | — | (64 | ) | |||||||||
|
|
|
|
|
|
|
| |||||||||
| (16,770 | ) | (2,667 | ) | — | (19,437 | ) | ||||||||||
|
|
|
|
|
|
|
| |||||||||
| (Won) | 81,684 | (Won) | 349 | (Won) | — | (Won) | 82,033 | |||||||||
|
|
|
|
|
|
|
| |||||||||
The value of KoFC’s land, as determined by the Government for tax administration purposes as of June 30, 2011 and December 31, 2010 amounted to (Won)63,273 million and (Won)62,536 million, respectively.
Insured property and equipment at June 30, 2011 are summarized as follows (Korean won in millions):
| June 30, 2011 (Unaudited) | ||||||||
| Insured amount | Insurance period | |||||||
Building and equipment | (Won) | 44,463 | 2010/12/1 ~ 2011/11/30 | |||||
Machinery and equipment | 1,000 | 2010/12/1 ~ 2011/11/30 | ||||||
|
| |||||||
| 45,463 | ||||||||
|
| |||||||
7. Other assets
Changes in intangible assets for the six months ended June 30, 2011 and the year ended December 31, 2010 are as follows (Korean won in millions):
| Six months ended June 30, 2011 (Unaudited) | ||||||||||||||||
| Beginning balance | Acquisition | Amortization | Ending balance | |||||||||||||
Intangible assets | (Won) | 4,060 | (Won) | 359 | (Won) | (604) | (Won) | 3,815 | ||||||||
|
|
|
|
|
|
|
| |||||||||
| Year ended December 31, 2010 (Audited) | ||||||||||||||||
| Beginning balance | Acquisition | Amortization | Ending balance | |||||||||||||
Intangible assets | (Won) | 2,474 | (Won) | 2,523 | (Won) | (937 | ) | (Won) | 4,060 | |||||||
|
|
|
|
|
|
|
| |||||||||
S-46
Table of Contents
Korea Finance Corporation
Notes to interim non-consolidated financial statements—(Continued)
June 30, 2011 and 2010
Details of miscellaneous assets at June 30, 2011 and December 31, 2010 are as follows (Korean won in millions):
| June 30, 2011 (Unaudited) | December 31, 2010 (Audited) | |||||||
Prepaid income tax payment | — | 20,484 | ||||||
Other deposits provided | 17 | 612 | ||||||
Prepaid value added tax | 963 | 32 | ||||||
|
|
|
| |||||
| (Won) | 980 | (Won) | 21,128 | |||||
|
|
|
| |||||
8. Borrowing liabilities
Borrowing liabilities at June 30, 2011 and December 31, 2010 consist of the following (Korean won in millions):
| June 30, 2011 (Unaudited) | December 31, 2010 (Audited) | |||||||
Borrowings: | ||||||||
Korean won | (Won) | 1,993,600 | (Won) | 2,793,600 | ||||
Foreign currency | 1,194,510 | 1,201,106 | ||||||
|
|
|
| |||||
| 3,188,110 | 3,994,706 | |||||||
Debentures: | ||||||||
Korean won | 29,286,414 | 26,252,211 | ||||||
Foreign currency | 1,492,277 | 1,280,579 | ||||||
|
|
|
| |||||
| 30,778,691 | 27,532,790 | |||||||
Other borrowings: | ||||||||
Bonds sold under repurchase agreements | 459,400 | 500,000 | ||||||
Bills sold | 755,923 | — | ||||||
Call money | 299,880 | 68,334 | ||||||
|
|
|
| |||||
| 1,515,203 | 568,334 | |||||||
|
|
|
| |||||
| (Won) | 35,482,004 | (Won) | 32,095,830 | |||||
|
|
|
| |||||
Borrowings in Korean won at June 30, 2011 and December 31, 2010 consist of the following (Korean won in millions):
Counterparty | Classification | Annual interest rate (%) | June 30, 2011 (Unaudited) | December 31, 2010 (Audited) | ||||||||||
Bank of Korea | Bank Recapitalization Fund | 5.71 | (Won) | 1,993,600 | (Won) | 2,793,600 | ||||||||
|
|
|
| |||||||||||
S-47
Table of Contents
Korea Finance Corporation
Notes to interim non-consolidated financial statements—(Continued)
June 30, 2011 and 2010
Borrowings in foreign currency at June 30, 2011 and December 31, 2010 consist of the following (Korean won in millions):
Counterparty | Classification | Rate (%) | June 30, 2011 (Unaudited) | December 31, 2010 (Audited) | ||||||||
KDB | Short-term borrowings in foreign currency | 0.60 ~ 0.94 | (Won) | 429,476 | (Won) | — | ||||||
Long-term borrowings in foreign currency | 3M Libor + 0.60 ~ 6M Libor + 0.75 | 53,905 | 225,916 | |||||||||
Government | Borrowings from IBRD (*) | 6M Libor + 0.75 | 721,094 | 989,541 | ||||||||
|
|
|
| |||||||||
| 1,204,475 | 1,215,457 | |||||||||||
Present value discount | (9,298 | ) | (14,351 | ) | ||||||||
Deferred borrowing fees | (667 | ) | — | |||||||||
|
|
|
| |||||||||
| (Won) | 1,194,510 | (Won) | 1,201,106 | |||||||||
|
|
|
| |||||||||
| (*) | Subordinated borrowings from the Government |
Bonds sold under repurchase agreements at June 30, 2011 and December 31, 2010 consist of the following (Korean won in millions):
Counterparty | Rate (%) | June 30, 2011 (Unaudited) | December 31, 2010 (Audited) | |||||||
WOORI Investment & Securities Co., Ltd. | 3.37 | (Won) | 459,400 | (Won) | 500,000 | |||||
|
|
|
| |||||||
Bills sold at June 30, 2011 consist of the following (Korean won in millions)
Counterparty | Rate (%) | June 30, 2011 (unaudited) | ||||
Bills sold in Korean won: | ||||||
KTB Investment & Securities Co., Ltd. | 3.43 | (Won) | 100,000 | |||
Woori Bank | 3.37 | 50,000 | ||||
Korea Investment & Securities Co., Ltd. | 3.43 | 100,000 | ||||
|
| |||||
| 250,000 | ||||||
Bills sold in foreign currency: | ||||||
Barclays Bank, London | 0.32 ~ 1.62 | 42,558 | ||||
BOA, London | 0.32 ~ 1.25 | 249,670 | ||||
CITI Bank, London | 0.28 ~ 0.64 | 33,421 | ||||
ING Bank, Amsterdam | 0.30 ~ 1.36 | 180,274 | ||||
|
| |||||
| 505,923 | ||||||
|
| |||||
| (Won) | 755,923 | |||||
|
| |||||
S-48
Table of Contents
Korea Finance Corporation
Notes to interim non-consolidated financial statements—(Continued)
June 30, 2011 and 2010
Call money at June 30, 2011 and December 31, 2010 consists of the following (Korean won in millions):
Counterparty | Rate (%) | June 30, 2011 (Unaudited) | December 31, 2010 (Audited) | |||||||
Call money in Korean won: | ||||||||||
UBS Hana Asset Management | 3.01 | (Won) | 50,000 | (Won) | — | |||||
NH-CA Asset Management | 2.93 | 50,000 | — | |||||||
|
|
|
| |||||||
| 100,000 | — | |||||||||
Call money in foreign currency: | ||||||||||
BOA Seoul | — | — | 34,167 | |||||||
KfW Frankfurt | 0.36 ~ 1.22 | 199,880 | 34,167 | |||||||
|
|
|
| |||||||
| 199,880 | 68,334 | |||||||||
|
|
|
| |||||||
| (Won) | 299,880 | (Won) | 68,334 | |||||||
|
|
|
| |||||||
Debentures in Korean won at June 30, 2011 and December 31, 2010 are as follows (Korean won in millions):
Classifications | Rate (%) | June 30, 2011 (Unaudited) | December 31, 2010 (Audited) | |||||||
Industrial finance bonds in Korean won | 3.61 ~ 6.85 | (Won) | 3,880,000 | (Won) | 6,810,000 | |||||
Policy banking bonds in Korean won | 2.65 ~ 5.45 | 25,470,000 | 19,500,000 | |||||||
|
|
|
| |||||||
| 29,350,000 | 26,310,000 | |||||||||
Premium on debentures | 155 | 193 | ||||||||
Discount on debentures | (63,741 | ) | (57,982 | ) | ||||||
|
|
|
| |||||||
| (Won) | 29,286,414 | (Won) | 26,252,211 | |||||||
|
|
|
| |||||||
Debentures in foreign currency at June 30, 2011 and December 31, 2010 are as follows (Korean won in millions):
Classifications | Rate (%) | June 30, 2011 (Unaudited) | December 31, 2010 (Audited) | |||||||
Policy banking bonds in foreign currency | 3m Libor + 0.70 ~ 0.95 | (Won) | 1,185,116 | (Won) | 1,025,010 | |||||
Discount on debentures | (2,646 | ) | (3,044 | ) | ||||||
Adjustment from hedge accounting | (641 | ) | (18,351 | ) | ||||||
|
|
|
| |||||||
| 1,181,829 | 1,003,615 | |||||||||
Off-shore policy banking bond in foreign currency | 3m Libor + 0.70 ~ 0.95 | 312,649 | 284,725 | |||||||
Discount on debentures | (947 | ) | (1,088 | ) | ||||||
Adjustment from hedge accounting | (1,254 | ) | (6,673 | ) | ||||||
|
|
|
| |||||||
| 310,448 | 276,964 | |||||||||
|
|
|
| |||||||
Total | (Won) | 1,492,277 | (Won) | 1,280,579 | ||||||
|
|
|
| |||||||
S-49
Table of Contents
Korea Finance Corporation
Notes to interim non-consolidated financial statements—(Continued)
June 30, 2011 and 2010
Pursuant to the Korea Development Bank Act, KDB has the sole right to issue the Industrial Finance Bonds (“IFBs”) and as of the end of the reporting period, the book value of IFBs was succeeded by KoFC from KDB, as a result of the spin-off.
According to the Act, KoFC has the sole right to issue the Policy Banking Bonds (“PBBs”) and the outstanding amount of PBBs cannot exceed thirty times the sum of the paid-in capital and reserves of KoFC. KoFC may issue PBBs in excess of the amount stated above on a temporary basis for refinancing PBBs but KoFC must repay old PBBs amounting to the face value of the bonds issued within one month after issuance. The Government does not guarantee any repayment of the principal of and interest on the aforementioned PBBs.
Maturities of borrowing liabilities at June 30, 2011 and December 31, 2010 are as follows (Korean won in millions):
| June 30, 2011 (Unaudited) | ||||||||||||||||
Maturities | Borrowings | Debentures | Others | Total | ||||||||||||
Within 6 months | (Won) | 53,905 | (Won) | 7,230,000 | (Won) | 1,515,203 | (Won) | 8,799,108 | ||||||||
After 6 months but no later than 1 year | 2,025,943 | 7,270,934 | — | 9,296,877 | ||||||||||||
After 1 year but no later than 3 years | 1,118,227 | 13,177,335 | — | 14,295,562 | ||||||||||||
After 3 years but no later than 5 years | — | 2,307,167 | — | 2,307,167 | ||||||||||||
After 5 years | — | 862,329 | — | 862,329 | ||||||||||||
|
|
|
|
|
|
|
| |||||||||
| (Won) | 3,198,075 | (Won) | 30,847,765 | (Won) | 1,515,203 | (Won) | 35,561,043 | |||||||||
|
|
|
|
|
|
|
| |||||||||
| December 31, 2010 (Audited) | ||||||||||||||||
Maturities | Borrowings | Debentures | Others | Total | ||||||||||||
Within 6 months | (Won) | 3,078,325 | (Won) | 6,830,000 | (Won) | 568,334 | (Won) | 10,476,659 | ||||||||
After 6 months but no later than 1 year | 227,780 | 5,153,890 | — | 5,381,670 | ||||||||||||
After 1 year but no later than 3 years | 702,952 | 12,841,670 | — | 13,544,622 | ||||||||||||
After 3 years but no later than 5 years | — | 2,794,175 | — | 2,794,175 | ||||||||||||
|
|
|
|
|
|
|
| |||||||||
| (Won) | 4,009,057 | (Won) | 27,619,735 | (Won) | 568,334 | (Won) | 32,197,126 | |||||||||
|
|
|
|
|
|
|
| |||||||||
9. Severance and retirement benefits
Change in severance and retirement benefits for the six months ended June 30, 2011 and the year ended December 31, 2010 are as follows (Korean won in millions):
| Six months ended June 30, 2011 (Unaudited) | Year ended December 31, 2010 (Audited) | |||||||
Beginning balance | (Won) | 685 | (Won) | — | ||||
Provision of severance and retirement benefits | 1,041 | 685 | ||||||
Payments for severance and retirement benefits | (6 | ) | — | |||||
|
|
|
| |||||
| (Won) | 1,720 | (Won) | 685 | |||||
|
|
|
| |||||
S-50
Table of Contents
Korea Finance Corporation
Notes to interim non-consolidated financial statements—(Continued)
June 30, 2011 and 2010
10. Acceptances and guarantees
Acceptances and guarantees and allowance for possible losses on acceptances and guarantees at June 30, 2011 and December 31, 2010 are as follows (Korean won in millions):
| June 30, 2011 (Unaudited) | ||||||||
| Acceptances and guarantees | Allowance for possible losses | |||||||
Settled guarantees and commitments: | ||||||||
Loan guarantees for credit risk sharing | (Won) | 114,383 | (Won) | 1,408 | ||||
Other acceptances and guarantees | 799,099 | 1,928 | ||||||
|
|
|
| |||||
| 913,482 | 3,336 | |||||||
Unsettled guarantees and commitments: | ||||||||
Other acceptances and guarantees | 724,202 | 713 | ||||||
|
|
|
| |||||
| (Won) | 1,637,684 | (Won) | 4,049 | |||||
|
|
|
| |||||
| December 31, 2010 (Audited) | ||||||||
| Acceptances and guarantees | Allowance for possible losses | |||||||
Settled guarantees and commitments: | ||||||||
Loan guarantees for credit risk sharing | (Won) | 77,910 | (Won) | 451 | ||||
Other acceptances and guarantees | 28,606 | 62 | ||||||
|
|
|
| |||||
| 106,516 | 513 | |||||||
Unsettled guarantees and commitments: | ||||||||
Other acceptances and guarantees | 642,474 | 605 | ||||||
|
|
|
| |||||
| (Won) | 748,990 | (Won) | 1,118 | |||||
|
|
|
| |||||
Details of classification of acceptances and guarantees and allowance for possible losses on acceptances and guarantees at June 30, 2011 and December 31, 2010 are summarized as follows (Korean won in millions):
| June 30, 2011 (Unaudited) | ||||||||||||
| Outstanding amount | Allowance for possible losses | Ratio (%) | ||||||||||
Normal | (Won) | 1,636,441 | (Won) | 2,806 | 0.17 | |||||||
Precautionary | — | — | — | |||||||||
Substandard | — | — | — | |||||||||
Doubtful | — | — | — | |||||||||
Estimated loss | 1,243 | 1,243 | 100.00 | |||||||||
|
|
|
|
|
| |||||||
| (Won) | 1,637,684 | (Won) | 4,049 | 0.25 | ||||||||
|
|
|
|
|
| |||||||
S-51
Table of Contents
Korea Finance Corporation
Notes to interim non-consolidated financial statements—(Continued)
June 30, 2011 and 2010
| December 31, 2010 (Audited) | ||||||||||||
| Outstanding amount | Allowance for possible losses | Ratio (%) | ||||||||||
Normal | (Won) | 748,928 | (Won) | 1,056 | 0.14 | |||||||
Precautionary | — | — | — | |||||||||
Substandard | — | — | — | |||||||||
Doubtful | — | — | — | |||||||||
Estimated loss | 62 | 62 | 100.00 | |||||||||
|
|
|
|
|
| |||||||
| (Won) | 748,990 | (Won) | 1,118 | 0.15 | ||||||||
|
|
|
|
|
| |||||||
| (*) | No allowance was provided for the acceptances and guarantees with the Korea Resources Corporation amounting to (Won)38,918 million as of June 30, 2011 pursuant to the supervisory measures for KoFC prescribed by the Financial Services Commission. |
11. Allowances for unused commitments
Unused loan commitments and the related allowances for possible losses as of June 30, 2011 and December 31, 2010 are as follows (Korean won in millions):
| June 30, 2011 (Unaudited) | December 31, 2010 (Audited) | |||||||||||||||
| Unused loan commitment | Allowance for possible losses | Unused loan commitment | Allowance for possible losses | |||||||||||||
Commitments on loan in Korean won(*) | (Won) | 524,800 | (Won) | 900 | (Won) | 524,800 | (Won) | 900 | ||||||||
Commitments on loan in foreign currency(*) | 2,779,145 | 3,126 | 3,124,707 | 3,563 | ||||||||||||
|
|
|
|
|
|
|
| |||||||||
| (Won) | 3,303,945 | (Won) | 4,026 | (Won) | 3,649,507 | (Won) | 4,463 | |||||||||
|
|
|
|
|
|
|
| |||||||||
| (*) | No allowance was provided for the loan commitments with the Korea Asset Management Corporation and the Korea Resources Corporation amounting to (Won)164,800 million as of June 30, 2011 ((Won)164,800 million as of December 31, 2010) and (Won)61,308 million as of December 31, 2010, respectively, pursuant to the supervisory measures for KoFC prescribed by the Financial Services Commission. |
12. Miscellaneous liabilities
Miscellaneous liabilities at June 30, 2011 and December 31, 2010 consist of the following (Korean won in millions):
| June 30, 2011 (Unaudited) | December 31, 2010 (Audited) | |||||||
Withholding taxes | (Won) | 12,479 | (Won) | 882 | ||||
Withholding agent fee | 114 | 67 | ||||||
Deposits received VAT | 42 | 173 | ||||||
Suspense receipts | 4 | 1 | ||||||
Income tax payable | 56,374 | — | ||||||
Others | 26,266 | 20,421 | ||||||
|
|
|
| |||||
| (Won) | 95,279 | (Won) | 21,544 | |||||
|
|
|
| |||||
S-52
Table of Contents
Korea Finance Corporation
Notes to interim non-consolidated financial statements—(Continued)
June 30, 2011 and 2010
13. Assets and liabilities denominated in foreign currencies
Significant assets and liabilities denominated in foreign currencies at June 30, 2011 and December 31, 2010 are as follows (Korean won in millions or U.S. dollar in thousands):
| June 30, 2011 (Unaudited) | December 31, 2010 (Audited) | |||||||||||||||
Account | USD equivalent | Korean won equivalent | USD equivalent | Korean won equivalent | ||||||||||||
Assets: | ||||||||||||||||
Due from banks | $ | 388,271 | (Won) | 418,595 | $ | 2,916 | (Won) | 3,321 | ||||||||
Available-for-sale securities | 110,648 | 119,290 | 44,954 | 51,199 | ||||||||||||
Loans receivable | 2,354,480 | 2,538,365 | 2,128,711 | 2,424,389 | ||||||||||||
Call loans | 94,000 | 101,341 | 68,000 | 77,445 | ||||||||||||
Loans to banks | 212,000 | 228,557 | 38,000 | 43,278 | ||||||||||||
|
|
|
|
|
|
|
| |||||||||
| $ | 3,159,399 | (Won) | 3,406,148 | $ | 2,282,581 | (Won) | 2,599,632 | |||||||||
|
|
|
|
|
|
|
| |||||||||
Liabilities: | ||||||||||||||||
Borrowings | $ | 1,117,220 | (Won) | 1,204,475 | $ | 1,067,220 | (Won) | 1,215,457 | ||||||||
Bills sold | 469,273 | 505,923 | — | — | ||||||||||||
Call money | 185,400 | 199,880 | 60,000 | 68,334 | ||||||||||||
Debentures | 1,099,264 | 1,185,116 | 900,000 | 1,025,010 | ||||||||||||
Off-shore debentures | 290,000 | 312,649 | 250,000 | 284,725 | ||||||||||||
Allowance for possible losses on acceptances and guarantees | 2,450 | 2,641 | 586 | 667 | ||||||||||||
Allowance for possible losses on unused loan commitments | 2,899 | 3,126 | 3,128 | 3,563 | ||||||||||||
Accrued expenses | 11,177 | 12,050 | 11,243 | 12,805 | ||||||||||||
|
|
|
|
|
|
|
| |||||||||
| $ | 3,177,683 | (Won) | 3,425,860 | $ | 2,292,177 | (Won) | 2,610,561 | |||||||||
|
|
|
|
|
|
|
| |||||||||
14. Commitments and Contingencies
Unsettled commitments provided by KoFC at June 30, 2011 and December 31, 2010 are as follows (Korean won in millions):
| June 30, 2011 (Unaudited) | December 31, 2010 (Audited) | |||||||
Unsettled commitments: | ||||||||
Commitments on loans in Korean won | (Won) | 524,800 | (Won) | 524,800 | ||||
Commitments on loans in foreign currency | 2,779,145 | 3,124,707 | ||||||
|
|
|
| |||||
| (Won) | 3,303,945 | (Won) | 3,649,507 | |||||
|
|
|
| |||||
KoFC has entered into agreements to provide certain syndicated loans with other financial institutions. The total amounts available under such loans are (Won)1,906,633 million as of June 30, 2011 ((Won)1,704,702 million as of December 31, 2010), and (Won)605,388 million as of June 30, 2011 ((Won)1,093,527 million as of December 31, 2010) have not been withdrawn by borrowers.
S-53
Table of Contents
Korea Finance Corporation
Notes to interim non-consolidated financial statements—(Continued)
June 30, 2011 and 2010
KoFC provides a promissory note to a financial institution as collateral for borrowing in Korean won as of June 30, 2011. Detail of collateral in summarized as follows (Korean won in millions):
Counterparty | Borrowing date | Maximum pledge amount | Amount | |||||||||
Bank of Korea | 2011.03.31 | (Won) | 1,993,600 | (Won) | 1,993,600 | |||||||
|
|
|
|
|
| |||||||
15. Derivative instruments
KoFC’s derivative instruments consist of trading derivatives and hedge derivatives, based on the nature of each transaction. KoFC enters into hedge transactions mainly for the purpose of hedging the fair value risk related to changes in fair value of the underlying assets and liabilities.
The notional amounts outstanding for derivatives contracts as of June 30, 2011 and December 31, 2010 and the related valuation gains (losses) for the six months ended June 30, 2011 and the year ended December 31, 2010 are summarized as follows (Korean won in millions):
| June 30, 2011 (Unaudited) | ||||||||||||||||||||||||||||
| Notional amounts | Valuation gain (loss) | Derivative asset (liability) | ||||||||||||||||||||||||||
| Trading purpose | Hedging purpose | Total | Trading purpose | Hedging purpose | Total | |||||||||||||||||||||||
Currency: | ||||||||||||||||||||||||||||
Forward | (Won) | 274,572 | (Won) | — | (Won) | 274,572 | (Won) | 1,597 | (Won) | — | (Won) | 1,597 | (Won) | 1,598 | ||||||||||||||
Swap | 226,315 | 117,482 | 343,797 | (511 | ) | 5,225 | 4,714 | 5,114 | ||||||||||||||||||||
|
|
|
|
|
|
|
|
|
|
|
|
|
| |||||||||||||||
| 500,887 | 117,482 | 618,369 | 1,086 | 5,225 | 6,311 | 6,712 | ||||||||||||||||||||||
Interest: | ||||||||||||||||||||||||||||
Swap | 5,390 | 848,646 | 854,036 | (172 | ) | 19,420 | 19,248 | 2,494 | ||||||||||||||||||||
|
|
|
|
|
|
|
|
|
|
|
|
|
| |||||||||||||||
| (Won) | 506,277 | (Won) | 966,128 | (Won) | 1,472,405 | (Won) | 914 | (Won) | 24,645 | (Won) | 25,559 | (Won) | 9,206 | |||||||||||||||
|
|
|
|
|
|
|
|
|
|
|
|
|
| |||||||||||||||
| December 31, 2010 (Audited) | ||||||||||||||||||||||||||||
| Notional amounts | Valuation loss | Derivative asset (liability) | ||||||||||||||||||||||||||
| Trading purpose | Hedging purpose | Total | Trading purpose | Hedging purpose | Total | |||||||||||||||||||||||
Currency: | ||||||||||||||||||||||||||||
Forward | (Won) | 31,434 | (Won) | — | (Won) | 31,434 | (Won) | (818 | ) | (Won) | — | (Won) | (818) | (Won) | (818) | |||||||||||||
|
|
|
|
|
|
|
|
|
|
|
|
|
| |||||||||||||||
Interest: | ||||||||||||||||||||||||||||
Swap | — | 854,175 | 854,175 | — | (25,032 | ) | (25,032 | ) | (17,542 | ) | ||||||||||||||||||
|
|
|
|
|
|
|
|
|
|
|
|
|
| |||||||||||||||
| (Won) | 31,434 | (Won) | 854,175 | (Won) | 885,609 | (Won) | (818 | ) | (Won) | (25,032 | ) | (Won) | (25,850 | ) | (Won) | (18,360 | ) | |||||||||||
|
|
|
|
|
|
|
|
|
|
|
|
|
| |||||||||||||||
Unrealized gain and loss from fair value hedge items by type of the underlying assets or liabilities for the six months ended June 30, 2011 are as follows (Korean won in millions):
| Gain | Loss | |||||||
Policy banking bonds in foreign currency | (Won) | 320 | (Won) | 17,050 | ||||
Off-shore policy banking bonds in foreign currency | — | 5,063 | ||||||
|
|
|
| |||||
| (Won) | 320 | (Won) | 22,113 | |||||
|
|
|
| |||||
S-54
Table of Contents
Korea Finance Corporation
Notes to interim non-consolidated financial statements—(Continued)
June 30, 2011 and 2010
16. Equity
Paid-in capital
The Government is the sole equity owner of KoFC and is responsible for maintaining for the entire paid-in capital in accordance with the Act. KoFC’s authorized capital amounts to approximately (Won)15 trillion as of June 30, 2011 and December 31, 2010.
KoFC’s initial paid-in capital at the time of its incorporation was (Won)100 billion. After the Government’s non-cash capital contribution of (Won)14.9 trillion in KDBFG shares, KoFC’s capital as of the end of the reporting period amounts to approximately (Won)15 trillion.
Retained earnings
KoFC’s surplus reserve represents the legal reserve transferred from KDB as a result of the spin-off. In accordance with the Act, KoFC must appropriate 20% or more of net income for legal reserve until the reserve reaches the total amount of paid-in capital. The reserve is restricted for use other than for offsetting a deficit or transferring to capital.
In accordance with the Act, KoFC may offset accumulated deficit with reserves. If reserves are insufficient to offset the accumulated deficit, the Korean government may be responsible for the deficit.
17. General and administrative expenses
General and administrative expenses for the six months ended June 30, 2011 and 2010 are as follows (Korean won in millions):
| Six months ended June 30, 2011 (Unaudited) | Six months ended June 30, 2010 (Unaudited) | |||||||
Salaries(*) | (Won) | 10,319 | (Won) | 5,234 | ||||
Provision of severance and retirement benefits(*) | 1,041 | — | ||||||
Other employee benefits(*) | 1,525 | 932 | ||||||
Rent(*) | 95 | 61 | ||||||
Depreciation(*) | 1,583 | 1,263 | ||||||
Amortization(*) | 604 | 335 | ||||||
Taxes and dues(*) | 422 | 268 | ||||||
Printing | 290 | 115 | ||||||
Travel | 121 | 36 | ||||||
Commission | 1,393 | 1,685 | ||||||
Electronic data processing | 2,413 | 1,929 | ||||||
Training | 432 | 222 | ||||||
Others | 2,354 | 1,336 | ||||||
|
|
|
| |||||
| (Won) | 22,592 | (Won) | 13,416 | |||||
|
|
|
| |||||
| (*) | These accounts in aggregate amounting to (Won)15,589 million for the six months ended June 30, 2011 ((Won)8,093 million for the six months ended June 30, 2010) are related to the “added value” disclosure items of KoFC’s operations as required by Statements of Korea Accounting Standards 21. |
S-55
Table of Contents
Korea Finance Corporation
Notes to interim non-consolidated financial statements—(Continued)
June 30, 2011 and 2010
18. Income tax
Income tax expense (benefit) for the six months ended June 30, 2011 and 2010 is as follows (Korean won in millions):
| Six months ended June 30, 2011 (Unaudited) | Six months ended June 30, 2010 (Unaudited) | |||||||
Current income taxes | (Won) | 71,278 | (Won) | — | ||||
Change in deferred income tax due to temporary difference | 1,194,218 | 11,299 | ||||||
Tax effect of tax loss carry forwards and others | 110,830 | (75,254 | ) | |||||
| 1,376,326 | (63,955 | ) | ||||||
Deferred income taxes recognized directly to equity | (1,082,191 | ) | 5,320 | |||||
|
|
|
| |||||
Income tax expense (benefit) | (Won) | 294,135 | (Won) | (58,635 | ) | |||
|
|
|
| |||||
Reconciliations of income tax expense (benefit) applicable to income (loss) before income taxes at the Korea statutory tax rate to income tax expense (benefit) at the effective income tax rate of KoFC are as follows (Korean won in millions):
| Six months ended June 30, 2011 (Unaudited) | Six months ended June 30, 2010 (Unaudited) | |||||||
Income (loss) before income taxes (A) | (Won) | 1,241,673 | (Won) | (277,694 | ) | |||
Tax at the statutory income tax rate | 273,168 | (61,093 | ) | |||||
Adjustments: | ||||||||
Non-deductible expenses (income), net | 1,145,818 | (1,696 | ) | |||||
Deferred income tax liability not recognized | (1,124,761 | ) | 4,153 | |||||
Others | (90 | ) | 1 | |||||
|
|
|
| |||||
Income tax expense (benefit) (B) | (Won) | 294,135 | (Won) | (58,635 | ) | |||
|
|
|
| |||||
Effective income tax rate (%) (B)/(A) | 23.69 | 21.11 | ||||||
Deferred income tax assets (liabilities) recognized in the statement of financial position at June 30, 2011 and December 31, 2010 are as follows (Korean won in millions):
| June 30, 2011 (Unaudited) | December 31, 2010 (Audited) | |||||||
Cumulative net taxable temporary differences | (Won) | (11,201,084 | ) | (Won) | (5,579,315 | ) | ||
Tax rate (%) | (*1 | ) | (*1 | ) | ||||
|
|
|
| |||||
Tax effects arising from cumulative net taxable temporary differences | (2,464,238 | ) | (1,227,450 | ) | ||||
Tax effect of tax loss carry forwards | — | 110,830 | ||||||
Unrealizable deferred income tax liabilities(*2) | 1,323,883 | 199,122 | ||||||
Tax effect of tax credit carry forwards | 6 | 6 | ||||||
|
|
|
| |||||
Deferred income tax liabilities arising from cumulative net taxable temporary differences | (1,140,349 | ) | (917,492 | ) | ||||
Deferred income tax recognized directly to equity | (1,495,616 | ) | (413,425 | ) | ||||
|
|
|
| |||||
Net deferred income tax liabilities | (Won) | (2,635,965 | ) | (Won) | (1,330,917 | ) | ||
|
|
|
| |||||
S-56
Table of Contents
Korea Finance Corporation
Notes to interim non-consolidated financial statements—(Continued)
June 30, 2011 and 2010
| (*1) | Deferred income tax assets and liabilities are measured using the enacted tax rates and laws that will be in effect when the differences are expected to reverse (the income tax rate of 24.2% and 22% is applied for calculation until 2011 and after 2012, respectively). |
| (*2) | Deferred income liabilities arising from taxable temporary differences on the valuation of equity method investments are recognized only to the extent of portion that is expected to be realized through the estimated future dividend income, after adjustment to the amount which is non-taxable due to double taxation under the tax law. |
Deferred income taxes reflect the net tax effects of temporary differences between the carrying amounts of assets and liabilities for financial reporting purposes and the amounts used for corporate income tax reporting purposes. Significant changes in cumulative temporary differences and deferred income tax assets and liabilities for the six months ended June 30, 2011 and for the year ended December 31, 2010 are as follows (Korean won in millions):
| Six months ended June 30, 2011 (Unaudited) | ||||||||||||||||
| Beginning | Net changes | Ending | Deferred income tax assets (liabilities) | |||||||||||||
Reclassification to trading securities | (Won) | (60,812 | ) | (Won) | — | (Won) | (60,812 | ) | (Won) | (13,379 | ) | |||||
Equity method valuation | (5,734,635 | ) | (5,612,540 | ) | (11,347,175 | ) | (2,496,378 | ) | ||||||||
Equity method valuation of the past | (78,695 | ) | — | (78,695 | ) | (17,313 | ) | |||||||||
Fictitious dividends | 425,355 | (20,852 | ) | 404,503 | 88,991 | |||||||||||
Advanced depreciation provision | (425,355 | ) | 20,852 | (404,503 | ) | (88,991 | ) | |||||||||
Stock dividends | 757 | — | 757 | 167 | ||||||||||||
Bonus stock | 252,741 | — | 252,741 | 55,603 | ||||||||||||
Amortization of discounts on securities | (470 | ) | 611 | 141 | 31 | |||||||||||
Allowance for bad debt | 12,999 | — | 12,999 | 2,860 | ||||||||||||
Allowance for possible losses on acceptances and guarantees | 1,118 | 2,931 | 4,049 | 890 | ||||||||||||
Allowance for possible losses on unused loan commitments | 4,463 | (437 | ) | 4,026 | 885 | |||||||||||
Deferred loan fees and expenses | 9,112 | 1,601 | 10,713 | 2,356 | ||||||||||||
Accrued income | (17,556 | ) | (8,049 | ) | (25,605 | ) | (5,633 | ) | ||||||||
Loss (gain) on valuation of derivatives instruments, net | 18,360 | (27,566 | ) | (9,206 | ) | (2,025 | ) | |||||||||
Severance and retirement benefits | 479 | 810 | 1,289 | 284 | ||||||||||||
Net gain on valuation of fair value hedge | (25,023 | ) | 23,129 | (1,894 | ) | (417 | ) | |||||||||
Accounts receivable | (567 | ) | 567 | — | — | |||||||||||
Donation payable | 10 | 13 | 23 | 5 | ||||||||||||
Net loss on foreign currency translations of hedged items | 17,665 | (2,917 | ) | 14,748 | 3,245 | |||||||||||
Amortization of discounts on held-to- maturity securities | 317 | 81 | 398 | 88 | ||||||||||||
Other | 20,422 | — | 20,422 | 4,493 | ||||||||||||
|
|
|
|
|
|
|
| |||||||||
| (5,579,315 | ) | (5,621,766 | ) | (11,201,081 | ) | (2,464,238 | ) | |||||||||
[Temporary differences not recognized] : | ||||||||||||||||
Equity method investments | (905,100 | ) | (5,112,551 | ) | (6,017,651 | ) | (1,323,883 | ) | ||||||||
[Tax credit carry forwards] : | ||||||||||||||||
Tax credit for investment on safety equipment | 26 | — | 26 | 6 | ||||||||||||
|
|
|
|
|
|
|
| |||||||||
Total | (Won) | (4,674,189 | ) | (Won) | (509,215 | ) | (Won) | (5,183,404 | ) | (Won) | (1,140,349 | ) | ||||
|
|
|
|
|
|
|
| |||||||||
S-57
Table of Contents
Korea Finance Corporation
Notes to interim non-consolidated financial statements—(Continued)
June 30, 2011 and 2010
| Year ended December 31, 2010 (Audited) | ||||||||||||||||
| Beginning | Net changes | Ending | Deferred income tax assets (liabilities) | |||||||||||||
Reclassification to trading securities | (Won) | (60,812) | (Won) | — | (Won) | (60,812) | (Won) | (13,379) | ||||||||
Equity method valuation | (4,805,342 | ) | (929,293 | ) | (5,734,635 | ) | (1,261,620 | ) | ||||||||
Equity method valuation of the past | (78,695 | ) | — | (78,695 | ) | (17,313 | ) | |||||||||
Fictitious dividends | 425,355 | — | 425,355 | 93,578 | ||||||||||||
Advanced depreciation provision | (425,355 | ) | — | (425,355 | ) | (93,578 | ) | |||||||||
Stock dividends | 757 | — | 757 | 167 | ||||||||||||
Bonus stock | 252,741 | — | 252,741 | 55,603 | ||||||||||||
Amortization of discounts on securities | (4,137 | ) | 3,667 | (470 | ) | (103 | ) | |||||||||
Allowance for bad debt | 12,999 | — | 12,999 | 2,860 | ||||||||||||
Allowance for possible losses on acceptances and guarantees | 370 | 748 | 1,118 | 246 | ||||||||||||
Allowance for possible losses on unused loan commitments | — | 4,463 | 4,463 | 982 | ||||||||||||
Deferred loan fees and expenses | 1,196 | 7,916 | 9,112 | 2,005 | ||||||||||||
Accrued income | — | (17,556 | ) | (17,556 | ) | (3,862 | ) | |||||||||
Loss on valuation of derivatives instruments, net | — | 18,360 | 18,360 | 4,039 | ||||||||||||
Severance and retirement benefits | — | 479 | 479 | 105 | ||||||||||||
Net gain on valuation of fair value hedge | — | (25,023 | ) | (25,023 | ) | (5,505 | ) | |||||||||
Accounts receivable | — | (567 | ) | (567 | ) | (125 | ) | |||||||||
Donation payable | — | 10 | 10 | 2 | ||||||||||||
Net loss on foreign currency translations of hedged items | — | 17,665 | 17,665 | 3,886 | ||||||||||||
Amortization of discounts on held-to- maturity securities | — | 317 | 317 | 69 | ||||||||||||
Other | — | 20,422 | 20,422 | 4,493 | ||||||||||||
|
|
|
|
|
|
|
| |||||||||
| (4,680,923 | ) | (898,392 | ) | (5,579,315 | ) | (1,227,450 | ) | |||||||||
[Temporary differences not recognized] : | ||||||||||||||||
Equity method investments | (675,640 | ) | (229,460 | ) | (905,100 | ) | (199,122 | ) | ||||||||
[Tax credit carry forwards] : | ||||||||||||||||
Tax credit for investment on safety equipment | — | 26 | 26 | 6 | ||||||||||||
|
|
|
|
|
|
|
| |||||||||
Total | (Won) | (4,005,283 | ) | (Won) | (668,906 | ) | (Won) | (4,674,189 | ) | (Won) | (1,028,322 | ) | ||||
|
|
|
|
|
|
|
| |||||||||
S-58
Table of Contents
Korea Finance Corporation
Notes to interim non-consolidated financial statements—(Continued)
June 30, 2011 and 2010
Details of deferred income taxes charged directly to equity for the six months ended June 30, 2011 and for the year ended December 31, 2010 are as follows (Korean won in millions):
| Six months ended June 30, 2011 (Unaudited) | ||||||||||||||||
| Beginning | Net changes | Ending | Deferred income tax assets (liabilities) | |||||||||||||
Gain on valuation of available-for-sale securities | (Won) | (1,790,320 | ) | (Won) | 292,368 | (Won) | (1,497,952 | ) | (Won) | (341,768 | ) | |||||
Loss on valuation of available-for-sale securities | 5,247 | 34,503 | 39,750 | 8,745 | ||||||||||||
Gain on valuation of equity method investments | (251,395 | ) | 28,820 | (222,575 | ) | (48,967 | ) | |||||||||
Loss on valuation of equity method investments | 2,651 | 335,228 | 337,879 | 74,334 | ||||||||||||
Capital surplus | (4,317 | ) | 4,317 | — | — | |||||||||||
Capital adjustments | 238,523 | (27,255 | ) | 211,268 | 46,479 | |||||||||||
Changes in retained earnings of equity method investments | (20,906 | ) | (5,590,181 | ) | (5,611,087 | ) | (1,234,439 | ) | ||||||||
|
|
|
|
|
|
|
| |||||||||
| (Won) | (1,820,517 | ) | (Won) | (4,922,200 | ) | (Won) | (6,742,717 | ) | (Won) | (1,495,616 | ) | |||||
|
|
|
|
|
|
|
| |||||||||
| Year ended December 31, 2010 (Audited) | ||||||||||||||||
| Beginning | Net changes | Ending | Deferred income tax assets (liabilities) | |||||||||||||
Gain on valuation of available-for-sale securities | (Won) | (1,567,118 | ) | (Won) | (223,202 | ) | (Won) | (1,790,320 | ) | (Won) | (406,781 | ) | ||||
Loss on valuation of available-for-sale securities | 6,798 | (1,551 | ) | 5,247 | 1,154 | |||||||||||
Gain on valuation of equity method investments | (1,429 | ) | (249,966 | ) | (251,395 | ) | (55,307 | ) | ||||||||
Loss on valuation of equity method investments | 8,924 | (6,273 | ) | 2,651 | 583 | |||||||||||
Capital surplus | — | (4,317 | ) | (4,317 | ) | (950 | ) | |||||||||
Capital adjustments | 4,739 | 233,784 | 238,523 | 52,475 | ||||||||||||
Changes in retained earnings of equity method investments | — | (20,906 | ) | (20,906 | ) | (4,599 | ) | |||||||||
|
|
|
|
|
|
|
| |||||||||
| (Won) | (1,548,086 | ) | (Won) | (272,431 | ) | (Won) | (1,820,517 | ) | (Won) | (413,425 | ) | |||||
|
|
|
|
|
|
|
| |||||||||
S-59
Table of Contents
Korea Finance Corporation
Notes to interim non-consolidated financial statements—(Continued)
June 30, 2011 and 2010
Tax loss carry forwards as of June 30, 2011 are as follows (Korean won in millions):
Year | Term of deduction | Amount | ||||
2009 | 2019 | (Won) | 110,779 | |||
2010 | 2020 | 393,343 | ||||
|
| |||||
| (Won) | 504,122 | |||||
|
| |||||
19. Related party transactions
The subsidiaries and equity-method investees of KoFC at June 30, 2011 and December 31, 2010 are as follows (Korean won in millions):
| June 30, 2011 (Unaudited) | December 31, 2010 (Audited) | |||||||||||||||||
Investor | Investee | Number of shares | Owner- ship (%) | Number of shares | Owner- ship (%) | |||||||||||||
KoFC | KDBFG | 327,328,647 | 90.26 | 327,328,647 | 90.26 | |||||||||||||
KDBFG | KDB | 1,848,622,235 | 100.00 | 1,848,622,235 | 100.00 | |||||||||||||
The significant transactions which occurred in the normal course of business with related parties for the six months ended June 30, 2011 and 2010 and the related account balances at June 31, 2011 and December 31, 2010 are as follows (Korean won in millions):
| Six months ended June 30, 2011 (Unaudited) | ||||||||||
Related parties | Classification | Interest income | Interest expense | |||||||
KDB | On-lending equipment loans | (Won) | 4,553 | (Won) | — | |||||
On-lending working capital loans | 5,971 | — | ||||||||
Credit risk-shared on-lending equipment loans | 30 | — | ||||||||
Credit risk-shared on-lending working capital loans | 30 | — | ||||||||
Loans for working capital in foreign currency | 595 | — | ||||||||
Borrowing in foreign currency | — | 594 | ||||||||
|
|
|
| |||||||
| 11,179 | 594 | |||||||||
Korea Electric Power Co. | Government fund loans | 10,262 | — | |||||||
Privately placed bonds in Korean won | 2,689 | — | ||||||||
|
|
|
| |||||||
| 12,951 | — | |||||||||
|
|
|
| |||||||
| (Won) | 24,130 | (Won) | 594 | |||||||
|
|
|
| |||||||
| Six months ended June 30, 2010 (Unaudited) | ||||||
Investee | Classification | Interest income | ||||
KDB | On-lending equipment loans | (Won) | 244 | |||
| On-lending working capital loans | 531 | |||||
Credit risk-shared on-lending working capital | 12 | |||||
|
| |||||
| (Won) | 787 | |||||
|
| |||||
S-60
Table of Contents
Korea Finance Corporation
Notes to interim non-consolidated financial statements—(Continued)
June 30, 2011 and 2010
| June 30, 2011 (Unaudited) | ||||||||||||||||||
Related parties | Classification | Loans receivable | Accrued income | Liability | Accrued expenses | |||||||||||||
KDB | On-lending equipment loans | (Won) | 389,648 | (Won) | 578 | (Won) | — | (Won) | — | |||||||||
On-lending working capital loans | 358,526 | 603 | — | — | ||||||||||||||
Credit risk-shared on-lending equipment loans | 1,440 | 2 | — | — | ||||||||||||||
Credit risk-shared on-lending working capital loans | 45 | 1 | — | — | ||||||||||||||
Loans for working capital in foreign currency | 54,436 | 81 | — | — | ||||||||||||||
Borrowing in foreign currency | — | — | 181,513 | 327 | ||||||||||||||
|
|
|
|
|
|
|
| |||||||||||
| 804,095 | 1,265 | 181,513 | 327 | |||||||||||||||
Korea Electric Power Co. | Government fund loans | 485,555 | 647 | — | — | |||||||||||||
Private placed bonds in Korean won | 83,333 | 487 | — | — | ||||||||||||||
|
|
|
|
|
|
|
| |||||||||||
| 568,888 | 1,134 | — | — | |||||||||||||||
|
|
|
|
|
|
|
| |||||||||||
| (Won) | 1,372,983 | (Won) | 2,399 | (Won) | 181,513 | (Won) | 327 | |||||||||||
|
|
|
|
|
|
|
| |||||||||||
| December 31, 2010 (Audited) | ||||||||||||||||||
Related parties | Classification | Loans receivable | Accrued income | Liability | Accrued expenses | |||||||||||||
KDB | On-lending equipment loans | (Won) | 196,825 | (Won) | 291 | (Won) | — | (Won) | — | |||||||||
On-lending working capital loans | 266,538 | 400 | — | — | ||||||||||||||
Credit risk-shared on-lending equipment loans | 1,440 | 3 | — | — | ||||||||||||||
Credit risk-shared on-lending working capital loans | 1,710 | 3 | — | — | ||||||||||||||
Loans for working capital in foreign currency | 103,993 | 143 | — | — | ||||||||||||||
Policy banking bonds | — | — | 2,820,000 | 4,180 | ||||||||||||||
Borrowing in foreign currency | — | — | 135,172 | 210 | ||||||||||||||
|
|
|
|
|
|
|
| |||||||||||
| 570,506 | 840 | 2,955,172 | 4,390 | |||||||||||||||
Korea Electric Power Co. | Government fund loans | 675,555 | 864 | — | — | |||||||||||||
Private placed bonds in Korean won | 191,667 | 1,108 | — | — | ||||||||||||||
|
|
|
|
|
|
|
| |||||||||||
| 867,222 | 1,972 | — | — | |||||||||||||||
|
|
|
|
|
|
|
| |||||||||||
| (Won) | 1,437,728 | (Won) | 2,812 | (Won) | 2,955,172 | (Won) | 4,390 | |||||||||||
|
|
|
|
|
|
|
| |||||||||||
S-61
Table of Contents
Korea Finance Corporation
Notes to interim non-consolidated financial statements—(Continued)
June 30, 2011 and 2010
20. Comprehensive income
Comprehensive income for the six months ended June 30, 2011 and 2010 is as follows (Korean won in millions):
| Six months ended June 30, 2011 (Unaudited) | Six months ended June 30, 2010 (Unaudited) | |||||||
Net income (loss) | (Won) | 947,538 | (Won) | (219,058) | ||||
Other comprehensive income: | ||||||||
Gain on valuation of available-for-sale securities, net (Income taxes effect: (Won)72,604 million and (Won)2,098 million for the six months ended June 30, 2011 and 2010, respectively) | (254,267 | ) | (7,440 | ) | ||||
Changes in unrealized gain on valuation of equity method investments (Income taxes effect: (Won)6,340 million and (Won)(-)45,692 million for the six months ended June 30, 2011 and 2010, respectively) | (22,480 | ) | 162,000 | |||||
Changes in unrealized loss on valuation of equity method investments (Income taxes effect: (Won)73,750 million and (Won)1,963 million for the six months ended June 30, 2011 and 2010, respectively) | (261,478 | ) | (6,958 | ) | ||||
|
|
|
| |||||
Comprehensive income (loss) | (Won) | 409,313 | (Won) | (71,456 | ) | |||
|
|
|
| |||||
21. Cash flow information
Significant non-cash transactions for the six months ended June 30, 2011 and 2010 are as follows (Korean won in millions):
| Six months ended June 30, 2011 (Unaudited) | Six months ended June 30, 2010 (Unaudited) | |||||||
Changes in unrealized gain on valuation of equity method investments | (Won) | (22,480 | ) | (Won) | 162,000 | |||
Changes in unrealized loss on valuation of equity method investments | (261,478 | ) | (6,958 | ) | ||||
Unrealized gain on available for-sale securities | (254,267 | ) | (7,440 | ) | ||||
Changes in retained earnings on valuation of equity method investments | 4,360,341 | 18,696 | ||||||
Changes in capital adjustment of equity method investments | 21,259 | (166,755 | ) | |||||
|
|
|
| |||||
| (Won) | 3,843,375 | (Won) | (457 | ) | ||||
|
|
|
| |||||
S-62
Table of Contents
Interim consolidated statements of financial position
As of June 30, 2011, December 31, 2010 and January 1, 2010
(Korean won in millions) | Notes | June 30, 2011 | December 31, 2010 | January 1, 2010 | ||||||||||
Assets | ||||||||||||||
Cash and due from banks | 18, 48 | (Won) | 3,017,844 | (Won) | 1,372,645 | (Won) | 1,835,800 | |||||||
Financial assets held-for-trading | 19, 47, 48, 51 | 4,742,393 | 6,171,488 | 3,357,957 | ||||||||||
Financial assets designated at FVTPL | 20, 47, 48 | 55,380 | 33,935 | 89,973 | ||||||||||
Financial assets available-for-sale | 21, 47, 48 | 29,095,728 | 26,408,883 | 29,137,099 | ||||||||||
Financial assets held-to-maturity | 22, 48 | 1,121,148 | 1,152,432 | 378,836 | ||||||||||
Loans | 23, 48, 51 | 75,169,687 | 73,650,602 | 76,669,750 | ||||||||||
Derivative financial assets | 24, 47, 48 | 5,940,255 | 6,063,248 | 7,618,716 | ||||||||||
Investments in associates | 5, 25 | 1,887,126 | 2,480,970 | 1,099,687 | ||||||||||
Property and equipment | 5, 26 | 1,249,548 | 580,492 | 577,178 | ||||||||||
Investment properties | 5, 27 | 444,059 | 157,700 | 89,251 | ||||||||||
Intangible assets | 5, 28 | 3,349,854 | 429,981 | 69,709 | ||||||||||
Deferred tax assets | 29 | 453,823 | 111 | 1,246 | ||||||||||
Other assets | 30 | 14,705,032 | 6,318,153 | 4,997,036 | ||||||||||
Non-current assets held-for-sale | 49 | 2,383,919 | 1,038,528 | 1,042,398 | ||||||||||
|
|
|
|
|
| |||||||||
Total assets | (Won) | 143,615,796 | (Won) | 125,859,168 | (Won) | 126,964,636 | ||||||||
|
|
|
|
|
| |||||||||
Liabilities | ||||||||||||||
Financial liabilities designated at FVTPL | 31, 47, 48 | (Won) | 968,705 | (Won) | 951,752 | (Won) | 1,308,299 | |||||||
Due to customers | 32, 48 | 24,114,764 | 19,640,762 | 14,756,525 | ||||||||||
Borrowings | 33, 48 | 25,479,802 | 23,541,415 | 31,267,111 | ||||||||||
Debt issued | 34, 48 | 46,059,829 | 44,805,248 | 50,945,645 | ||||||||||
Derivative financial liabilities | 24, 47 | 4,170,853 | 4,695,123 | 6,648,656 | ||||||||||
Policy reserve | 35 | 7,669,981 | 7,303,669 | — | ||||||||||
Severance and retirement benefits | 36 | 202,574 | 82,812 | 74,115 | ||||||||||
Provisions | 37 | 346,707 | 181,362 | 233,228 | ||||||||||
Deferred tax liabilities | 29 | 992,703 | 331,551 | 282,420 | ||||||||||
Current tax liabilities | 116,079 | 191,818 | 11,333 | |||||||||||
Other liabilities | 38 | 13,166,099 | 7,140,468 | 5,759,492 | ||||||||||
|
|
|
|
|
| |||||||||
Total liabilities | 123,288,096 | 108,865,980 | 111,286,824 | |||||||||||
|
|
|
|
|
| |||||||||
Equity | ||||||||||||||
Controlling interest: | ||||||||||||||
Issued capital | 39 | 9,251,861 | 9,251,861 | 9,241,861 | ||||||||||
Capital surplus | 39 | 51,774 | 51,596 | 52,162 | ||||||||||
Capital adjustments | 1,210 | (3,025 | ) | (1,229 | ) | |||||||||
Accumulated other comprehensive income | 800,284 | 791,517 | 796,976 | |||||||||||
Retained earnings | 39 | 7,579,514 | 6,801,763 | 5,564,895 | ||||||||||
|
|
|
|
|
| |||||||||
(Planned regulatory reserve for possible loan losses (Won)669,340 million at June 30, 2011 (Won)822,032 million at December 31, 2010) | 17,684,643 | 16,893,712 | 15,654,665 | |||||||||||
Non-controlling interest | 2,643,057 | 99,476 | 23,147 | |||||||||||
|
|
|
|
|
| |||||||||
Total equity | 20,327,700 | 16,993,188 | 15,677,812 | |||||||||||
|
|
|
|
|
| |||||||||
Total liabilities and equity | (Won) | 143,615,796 | (Won) | 125,859,168 | (Won) | 126,964,636 | ||||||||
|
|
|
|
|
| |||||||||
See accompanying notes.
S-63
Table of Contents
Interim consolidated statements of comprehensive income
For the six-months periods ended June 30, 2011 and 2010
| 2011 | 2010 | |||||||||||||||||
(Korean won in millions, except per share amounts) | Notes | three-months period | six-months period | three-months period | six-months period | |||||||||||||
Net interest income | ||||||||||||||||||
Interest income | 5, 6 | (Won) | 1,201,658 | (Won) | 2,395,526 | (Won) | 1,222,918 | (Won) | 2,471,673 | |||||||||
Interest expense | 5, 6 | (761,870 | ) | (1,478,876 | ) | (695,718 | ) | (1,488,096 | ) | |||||||||
|
|
|
|
|
|
|
| |||||||||||
| 439,788 | 916,650 | 527,200 | 983,577 | |||||||||||||||
Net non-interest income | ||||||||||||||||||
Net fees and commission income | 5, 7 | 144,025 | 222,961 | 125,220 | 214,254 | |||||||||||||
Dividend income | 5, 8 | 35,807 | 93,869 | 29,822 | 73,645 | |||||||||||||
Net gain from financial assets and liabilities held-for-trading | 5, 9 | 21,497 | 43,478 | 8,989 | 35,804 | |||||||||||||
Net loss from financial assets and liabilities designated at FVTPL | 5, 10 | (18,140 | ) | (17,946 | ) | 17,154 | (45,253 | ) | ||||||||||
Net gain from financial assets available-for-sale | 5, 11 | 102,631 | 74,903 | 233,901 | 272,612 | |||||||||||||
Net gain from foreign currency transactions and derivative financial instruments | 5, 12 | 310,595 | 592,494 | 40,082 | 81,889 | |||||||||||||
Other operating loss, net | 13 | 41,082 | 77,854 | (200,104 | ) | (169,295 | ) | |||||||||||
|
|
|
|
|
|
|
| |||||||||||
| 637,497 | 1,087,613 | 255,064 | 463,656 | |||||||||||||||
Credit loss expense | 5, 23 | 59,459 | 89,792 | 253,636 | 568,702 | |||||||||||||
General administrative expenses | 14 | 324,318 | 571,980 | 168,093 | 281,545 | |||||||||||||
|
|
|
|
|
|
|
| |||||||||||
Operating income | 693,508 | 1,342,491 | 360,535 | 596,986 | ||||||||||||||
Non-operating income (expense) | ||||||||||||||||||
Equity in earnings of investments in associates | 25 | 17,470 | 26,229 | 3,942 | 8,116 | |||||||||||||
Other non-operating income | 15 | 31,783 | 59,557 | 1,504 | 6,111 | |||||||||||||
Other non-operating expense | 15 | (104,268 | ) | (172,746 | ) | (20,356 | ) | (23,674 | ) | |||||||||
|
|
|
|
|
|
|
| |||||||||||
| (55,015 | ) | (86,960 | ) | (14,910 | ) | (9,447 | ) | |||||||||||
|
|
|
|
|
|
|
| |||||||||||
Net income before income tax | 638,493 | 1,255,531 | 345,625 | 587,539 | ||||||||||||||
|
|
|
|
|
|
|
| |||||||||||
Income tax expenses | 16 | 128,482 | 249,921 | 127,705 | 194,964 | |||||||||||||
|
|
|
|
|
|
|
| |||||||||||
Net income | 510,011 | 1,005,610 | 217,920 | 392,575 | ||||||||||||||
(Net income after adjusting regulatory reserve for possible loan losses: (Won)1,158,303 million at June 30, 2011) | ||||||||||||||||||
Other comprehensive income | ||||||||||||||||||
Gains on valuation of financial assets available-for-sale | 16 | (88,061 | ) | 78,928 | (188,548 | ) | 292,763 | |||||||||||
Exchange differences on translation of foreign operations | 16, 43 | (31,490 | ) | (18,323 | ) | 60,099 | 19,512 | |||||||||||
Net gain on cash flow hedges | 16 | — | — | 1,800 | 2,441 | |||||||||||||
Equity adjustments from equity method valuation | 16 | 8,093 | 17,288 | 328 | (291 | ) | ||||||||||||
Other comprehensive income | 16 | 1,383 | 2,368 | 2,813 | 6,299 | |||||||||||||
Tax effect | 16 | 15,711 | (7,781 | ) | 48,755 | (61,106 | ) | |||||||||||
|
|
|
|
|
|
|
| |||||||||||
| (94,364 | ) | 72,480 | (74,753 | ) | 259,618 | |||||||||||||
|
|
|
|
|
|
|
| |||||||||||
Total comprehensive income | (Won) | 415,647 | (Won) | 1,078,090 | (Won) | 143,167 | (Won) | 652,193 | ||||||||||
|
|
|
|
|
|
|
| |||||||||||
Profit attributable to: | ||||||||||||||||||
Equity holders of the Bank | (Won) | 476,011 | (Won) | 975,446 | (Won) | 225,157 | (Won) | 399,019 | ||||||||||
Non-controlling interests | 34,000 | 30,164 | (7,237 | ) | (6,444 | ) | ||||||||||||
Total comprehensive income | ||||||||||||||||||
Equity holders of the Bank | (Won) | 399,797 | (Won) | 984,213 | (Won) | 151,789 | (Won) | 643,771 | ||||||||||
Non-controlling interests | 15,850 | 93,877 | (8,622 | ) | 8,422 | |||||||||||||
Earning per share | ||||||||||||||||||
Basic and diluted | 17 | (Won) | 257 | (Won) | 527 | (Won) | 122 | (Won) | 216 | |||||||||
See accompanying notes.
S-64
Table of Contents
Interim consolidated statement of changes in equity
For the six-months periods ended June 31, 2011 and 2010
| Controlling interest | ||||||||||||||||||||||||||||||||
(Korean won in millions) | Issued capital | Capital surplus | Capital adjustments | Accumulated other comprehensive income | Retained earnings | Total | Non- controlling interest | Total equity | ||||||||||||||||||||||||
As of January 1, 2011 | (Won) | 9,251,861 | (Won) | 51,596 | (Won) | (3,025 | ) | (Won) | 791,517 | (Won) | 6,801,763 | (Won) | 16,893,712 | (Won) | 99,476 | (Won) | 16,993,188 | |||||||||||||||
Dividends | — | — | — | — | (297,910 | ) | (297,910 | ) | — | (297,910 | ) | |||||||||||||||||||||
Appropriations of retained earnings | — | — | 4,261 | — | (51 | ) | 4,210 | — | 4,210 | |||||||||||||||||||||||
|
|
|
|
|
|
|
|
|
|
|
|
|
|
|
| |||||||||||||||||
| 9,251,861 | 51,596 | 1,236 | 791,517 | 6,503,802 | 16,600,012 | 99,476 | 16,699,488 | |||||||||||||||||||||||||
Changes in retained earnings from equity method valuation | — | — | — | — | 100,266 | 100,266 | — | 100,266 | ||||||||||||||||||||||||
Changes in consolidated subsidiaries and others | — | 178 | (26 | ) | — | — | 152 | 2,449,704 | 2,449,856 | |||||||||||||||||||||||
|
|
|
|
|
|
|
|
|
|
|
|
|
|
|
| |||||||||||||||||
| 9,251,861 | 51,774 | 1,210 | 791,517 | 6,604,068 | 16,700,430 | 2,549,180 | 19,249,610 | |||||||||||||||||||||||||
Net income for the period | — | — | — | — | 975,446 | 975,446 | 30,164 | 1,005,610 | ||||||||||||||||||||||||
Changes in unrealized gain on financial assets available-for-sale | — | — | — | 60,144 | — | 60,144 | 18,784 | 78,928 | ||||||||||||||||||||||||
Changes in equity from equity method valuation | — | — | — | 6,048 | — | 6,048 | 11,240 | 17,288 | ||||||||||||||||||||||||
Exchange differences on translation of foreign operations | — | — | — | (49,710 | ) | — | (49,710 | ) | 31,387 | (18,323 | ) | |||||||||||||||||||||
Other comprehensive income | — | — | — | 66 | — | 66 | 2,302 | 2,368 | ||||||||||||||||||||||||
Tax effect | — | — | — | (7,781 | ) | — | (7,781 | ) | — | (7,781 | ) | |||||||||||||||||||||
|
|
|
|
|
|
|
|
|
|
|
|
|
|
|
| |||||||||||||||||
Total comprehensive income | — | — | — | 8,767 | 975,446 | 984,213 | 93,877 | 1,078,090 | ||||||||||||||||||||||||
|
|
|
|
|
|
|
|
|
|
|
|
|
|
|
| |||||||||||||||||
As of June 30, 2011 | (Won) | 9,251,861 | (Won) | 51,774 | (Won) | 1,210 | (Won) | 800,284 | (Won) | 7,579,514 | (Won) | 17,684,643 | (Won) | 2,643,057 | (Won) | 20,327,700 | ||||||||||||||||
|
|
|
|
|
|
|
|
|
|
|
|
|
|
|
| |||||||||||||||||
(Continued)
See accompanying notes.
S-65
Table of Contents
Korea Development Bank
Interim consolidated statement of changes in equity
For the six-months periods ended June 31, 2011 and 2010
| Controlling interest | ||||||||||||||||||||||||||||||||
(Korean won in millions) | Issued capital | Capital surplus | Capital adjustments | Accumulated other comprehensive income | Retained earnings | Total | Non- controlling interest | Total equity | ||||||||||||||||||||||||
As of January 1, 2010 (the date of transition) | (Won) | 9,241,861 | (Won) | 52,162 | (Won) | (1,229 | ) | (Won) | 796,976 | (Won) | 5,564,895 | (Won) | 15,654,665 | (Won) | 23,147 | (Won) | 15,677,812 | |||||||||||||||
Capital injection | 10,000 | — | (51 | ) | — | — | 9,949 | — | 9,949 | |||||||||||||||||||||||
Changes in retained earnings from equity method valuation | — | — | — | — | (679 | ) | (679 | ) | — | (679 | ) | |||||||||||||||||||||
Changes in consolidated subsidiaries and others | — | 3,629 | — | — | — | 3,629 | 46,140 | 49,769 | ||||||||||||||||||||||||
|
|
|
|
|
|
|
|
|
|
|
|
|
|
|
| |||||||||||||||||
| 9,251,861 | 55,791 | (1,280 | ) | 796,976 | 5,564,216 | 15,667,564 | 69,287 | 15,736,851 | ||||||||||||||||||||||||
Net income for the period | — | — | — | — | 399,019 | 399,019 | (6,444 | ) | 392,575 | |||||||||||||||||||||||
Changes in unrealized gain on financial assets available-for-sale | — | — | — | 285,598 | — | 285,598 | 7,165 | 292,763 | ||||||||||||||||||||||||
Exchange differences on translation of foreign operations | — | — | — | 19,684 | — | 19,684 | (172 | ) | 19,512 | |||||||||||||||||||||||
Changes in gain on cash flow hedges | — | — | — | 2,441 | — | 2,441 | — | 2,441 | ||||||||||||||||||||||||
Changes in equity from equity method valuation | — | — | — | (291 | ) | — | (291 | ) | — | (291 | ) | |||||||||||||||||||||
Other comprehensive income | — | — | — | (1,574 | ) | — | (1,574 | ) | 7,873 | 6,299 | ||||||||||||||||||||||
Tax effect | — | — | — | (61,106 | ) | — | (61,106 | ) | — | (61,106 | ) | |||||||||||||||||||||
|
|
|
|
|
|
|
|
|
|
|
|
|
|
|
| |||||||||||||||||
Total comprehensive income | — | — | — | 244,752 | 399,019 | 643,771 | 8,422 | 652,193 | ||||||||||||||||||||||||
|
|
|
|
|
|
|
|
|
|
|
|
|
|
|
| |||||||||||||||||
As of June 30, 2010 | (Won) | 9,251,861 | (Won) | 55,791 | (Won) | (1,280) | (Won) | 1,041,728 | (Won) | 5,963,235 | (Won) | 16,311,335 | (Won) | 77,709 | (Won) | 16,389,044 | ||||||||||||||||
|
|
|
|
|
|
|
|
|
|
|
|
|
|
|
| |||||||||||||||||
See accompanying notes.
S-66
Table of Contents
Interim consolidated statement of cash flows
For the six-months periods ended June 30, 2011 and 2010
| For the six-months periods ended June 30 | ||||||||||
(Korean won in millions) | Notes | 2011 | 2010 | |||||||
Cash flows from operating activities | ||||||||||
Net income before income tax | (Won) | 1,255,531 | (Won) | 587,539 | ||||||
Non-cash items included in profit before income tax and gain (loss) from non-operating activities: | ||||||||||
Gain (loss) from hedge accounting, net | (146,365 | ) | 213,526 | |||||||
Gain from financial assets available-for-sale | (76,132 | ) | (790,023 | ) | ||||||
Gain (loss) from financial assets held-to-maturity | 15,583 | (21,227 | ) | |||||||
Equity in earnings of investments in associates | (26,229 | ) | (8,116 | ) | ||||||
Gain on disposal of investments in associates | (554 | ) | (7,135 | ) | ||||||
Depreciation of property and equipment | 26 | 56,056 | 21,499 | |||||||
Gain (loss) on disposal of property and equipment | 359 | (945 | ) | |||||||
Depreciation of investment properties | 27 | 1,381 | 907 | |||||||
Amortization of intangible assets | 28 | 117,368 | 7,759 | |||||||
Gain on disposal of tangible assets | (176 | ) | — | |||||||
Gain on disposal of Non-current assets held-for-sale | (4,652 | ) | — | |||||||
Loss on redemption of debt issued, net | 1,302 | (2,083 | ) | |||||||
|
|
|
| |||||||
| (62,059 | ) | (585,838 | ) | |||||||
Changes in operating assets and liabilities: | ||||||||||
Financial assets held-for-trading | 2,033,205 | (2,782,050 | ) | |||||||
Financial assets designated at FVTPL | (21,445 | ) | 114,179 | |||||||
Loans | (2,655,449 | ) | (1,768,298 | ) | ||||||
Derivative financial assets and liabilities | (601,543 | ) | 219,392 | |||||||
Other assets | (2,993,304 | ) | (2,175,522 | ) | ||||||
Financial liabilities designated at FVTPL | 16,953 | (142,099 | ) | |||||||
Due to customers | 4,474,002 | 1,690,749 | ||||||||
Policy reserve | 366,312 | 178,709 | ||||||||
Severance and retirement benefits | (10,049 | ) | 10,978 | |||||||
Provisions | 64,436 | 135,767 | ||||||||
Other liabilities | 2,491,022 | 1,257,783 | ||||||||
|
|
|
| |||||||
| 3,164,140 | (3,260,412 | ) | ||||||||
Income tax paid | (172,344 | ) | (112,333 | ) | ||||||
|
|
|
| |||||||
Net cash flows provided by (used in) operating activities | 4,185,268 | (3,371,044 | ) | |||||||
Cash flows from Investing activities | ||||||||||
Withdrawal of deposits | 391,536 | 1,174,092 | ||||||||
Increase of deposits | (1,689,906 | ) | (569,276 | ) | ||||||
Disposal of financial assets available-for-sale | 12,779,748 | 11,586,698 | ||||||||
Acquisition of financial assets available-for-sale | (14,977,711 | ) | (5,359,473 | ) | ||||||
Disposal of financial assets held-to-maturity | 33,915 | 81,919 | ||||||||
Acquisition of financial assets held-to-maturity | (28,912 | ) | (109,785 | ) | ||||||
(Continued)
See accompanying notes.
S-67
Table of Contents
Korea Development Bank
Interim consolidated statement of cash flows
For the six-months periods ended June 30, 2011 and 2010
| For the six-months periods ended June 30 | ||||||||||
(Korean won in millions) | Notes | 2011 | 2010 | |||||||
Disposal of investment in associates | 37,167 | 331,363 | ||||||||
Acquisition of investment in associates | (12,782 | ) | (144,559 | ) | ||||||
Acquisition of investment in subsidiaries | (1,538,815 | ) | (166,491 | ) | ||||||
Disposal of property and equipment | 20,825 | 26,374 | ||||||||
Acquisition of property and equipment | 26 | (71,386 | ) | (29,606 | ) | |||||
Disposal of investment property | 27 | 61,457 | — | |||||||
Acquisition of investment property | 27 | (277 | ) | — | ||||||
Disposal of intangible assets | 1,344 | — | ||||||||
Acquisition of intangible assets | 28 | (41,625 | ) | (7,826 | ) | |||||
Disposal of non-current assets held-for-sale | 26,238 | 3,870 | ||||||||
|
|
|
| |||||||
Net cash flows provided by (used in) investing activities | (5,009,184 | ) | 6,817,300 | |||||||
Cash flows from financing activities | ||||||||||
Proceeds from borrowings | 6,241,916 | 6,926,259 | ||||||||
Repayment of borrowings | (4,556,367 | ) | (8,639,211 | ) | ||||||
Repayment from other borrowings | (749,978 | ) | (2,478,656 | ) | ||||||
Proceeds from bonds | 3,783,702 | 10,385,634 | ||||||||
Repayment of bonds | (3,946,724 | ) | (10,293,983 | ) | ||||||
Capital injection | — | 9,949 | ||||||||
Dividends paid | (297,910 | ) | — | |||||||
|
|
|
| |||||||
Net cash flow provided by (used in) financing activities | 474,639 | (4,090,008 | ) | |||||||
|
|
|
| |||||||
Net decrease in cash and cash equivalents | (349,277 | ) | (643,752 | ) | ||||||
Cash and cash equivalents at the beginning of the period | 50 | 3,240,599 | 1,852,559 | |||||||
|
|
|
| |||||||
Cash and cash equivalents at the end of the period | 50 | (Won) | 2,891,322 | (Won) | 1,208,807 | |||||
|
|
|
| |||||||
See accompanying notes.
S-68
Table of Contents
Notes to the interim consolidated financial statements
June 30, 2011 and 2010
1. Company information
The accompanying consolidated financial statements include Korea Development Bank (“KDB” or the “Bank”) and its subsidiaries (collectively, the “Company”). General information describing the Company is described below.
Korea Development Bank was established on April 1, 1954, in accordance with the Korea Development Bank Act of the Republic of Korea to finance and manage major industrial projects in order to expedite industrial development and enhance the national economy. The Bank is primarily engaged in the banking industry under the Korea Development Bank Act and other applicable statutes and in the fiduciary service in accordance with the Financial Investment Services and Capital Markets Act.
The Bank is a fully-owned subsidiary of the KDB Financial Group Inc. (“KDBFG”), and its capital stock amounts to (Won)9,251,861 million as of June 30, 2011. The joint shareholders of KDBFG are the Korean government and the Korea Finance Corporation (“KoFC”).
The Bank’s head office is located in Yeouido-dong, Yeongdeungpo-gu, Seoul and its service network is as follows:
| Domestic | Overseas | |||||||||||||||||||||||
| Head office | Branches | Branches | Subsidiaries | Representative offices | Total | |||||||||||||||||||
KDB | 1 | 51 | 7 | 5 | 2 | 66 | ||||||||||||||||||
|
|
|
|
|
|
|
|
|
|
|
| |||||||||||||
2. Scope of consolidated financial statements
The Company’s subsidiaries
The Company’s equity ownership in its consolidated wholly owned and indirect subsidiaries as of June 30, 2011 is summarized as follows (Korean won in millions, US dollar, Brazilian reais, Hungarian forint in millions):
Investor | Investee | Acquisition value | Equity ownership at June 30, 2011 (%) | |||||||||||
| June 30, 2011 | December 31, 2010 | |||||||||||||
| Domestic subsidiaries: | ||||||||||||||
KDB | Korea Infrastructure Fund | (Won) | 30,543 | (Won) | 31,418 | 85.00 | ||||||||
” | KDB Value Private Equity Fund I | — | — | 77.02 | ||||||||||
” | KDB Value Private Equity Fund II | — | — | 51.93 | ||||||||||
” | KDB Value Private Equity Fund III | 62,640 | 62,640 | 70.69 | ||||||||||
” | KDB Value Private Equity Fund VI | 2,194,040 | 1,003,870 | 99.84 | ||||||||||
” | KDB Venture M&A Private Equity Fund | — | 14,240 | 57.56 | ||||||||||
” | KDB Turn Around Private Equity Fund | 56,130 | 53,880 | 95.15 | ||||||||||
” | KDB Consus Value Private Equity Fund(*1) | 253,845 | 253,845 | 40.52 | ||||||||||
” | Materials & Components M&A | 63,525 | 53,566 | 83.33 | ||||||||||
” | KoFC-KDB Materials and Components Investment Fund No.1 | 25,000 | 12,500 | 50.00 | ||||||||||
” | Certain trust accounts of KDB | — | — | 100.00 | ||||||||||
S-69
Table of Contents
Korea Development Bank
Notes to the interim consolidated financial statements—(Continued)
June 30, 2011 and 2010
Investor | Investee | Acquisition value | Equity ownership at June 30, 2011 (%) | |||||||||||
| June 30, 2011 | December 31, 2010 | |||||||||||||
” | KDB 1st SPC and 15 SPCs | 31 | 31 | |||||||||||
” | KDB Shipping Private Fund KL 1st and 38 funds | 1,426,613 | 1,267,887 | Over 50 | % | |||||||||
KDB Turn Around PEF | SunStar Co., Ltd. | (Won) | 56,848 | (Won) | 56,848 | 100.00 | ||||||||
KDB Consus Value PEF | KDB Life Insurance Co., Ltd. | 852,255 | 852,255 | 85.05 | ||||||||||
KDB Value Private Equity Fund VI | Daewoo Engineering & Construction Co., Ltd. (*2) | 3,178,493 | — | 50.75 | ||||||||||
|
|
|
| |||||||||||
| (Won) | 8,199,963 | (Won) | 3,662,980 | |||||||||||
|
|
|
| |||||||||||
| Overseas subsidiaries: | ||||||||||||||
KDB | KDB Asia Ltd. | USD | 140,000 | USD | 140,000 | 100.00 | ||||||||
” | KDB Ireland Co., Ltd. | USD | 20,000 | USD | 20,000 | 100.00 | ||||||||
” | KDB Hungary Ltd. | HUF | 21,296 | HUF | 21,296 | 100.00 | ||||||||
” | Banco KDB Do Brasil S.A | BRL | 328,396 | BRL | 178,366 | 100.00 | ||||||||
” | KDB Uzbekistan, Ltd. | USD | 8,949 | USD | 8,949 | 61.11 | ||||||||
|
|
|
| |||||||||||
| USD | 168,949 | USD | 168,949 | |||||||||||
| HUF | 21,296 | HUF | 21,296 | |||||||||||
| BRL | 328,396 | BRL | 178,366 | |||||||||||
|
|
|
| |||||||||||
| (*1) | The entities have been fully consolidated even though the bank’s ownership is less than 50%, as the bank maintains defacto control to dominate the entities’ financial or operational policies. |
| (*2) | This entity has been fully consolidated from accounting period beginning after January 1, 2011. |
Korea Infrastructure Fund
Korea Infrastructure Fund (“KIF”) was established on December 15, 1999 in accordance with the Financial Investment Services and Capital Markets Act (“FSCMA”) and the Private Participation in Infrastructure Act (“PPIA”). KIF is classified as a special purpose vehicle that was established to invest in certain entities that have entered into long-term construction agreements with the national, provincial and municipal governments in Korea. Korea Infrastructure Investment Asset Management Co., Ltd. is KIF’s asset manager. Issued capital of KIF amounts to (Won)39,806 million as of June 30, 2011 because of (Won)1,029 million capital reduction in current year.
KDB Value Private Equity Fund I
KDB Value Private Equity Fund I (“KDB Value PEF I”) was established on March 29, 2005 in accordance with the FSCMA to engage in investing in securities. Issued capital of KDB Value PEF I amounts to nil as of June 30, 2011 as KDB Value PEF I is under liquidation procedures.
S-70
Table of Contents
Korea Development Bank
Notes to the interim consolidated financial statements—(Continued)
June 30, 2011 and 2010
KDB Value Private Equity Fund II
KDB Value Private Equity Fund II (“KDB Value PEF II”) was established on September 27, 2006 in accordance with the FSCMA to engage in investing in securities. Issued capital of KDB Value PEF II amounts to nil as of June 30, 2011 as KDB Value PEF II is under liquidation procedures.
KDB Value Private Equity Fund III
KDB Value Private Equity Fund III (“KDB Value PEF III”) was established on September 16, 2008 in accordance with the FSCMA to engage in investing in securities. Issued capital of KDB Value PEF III amounts to (Won)89,780 million as of June 30, 2011 because of (Won)1,908 million capital reduction in current year.
KDB Value Private Equity Fund VI
KDB Value Private Equity Fund VI (“KDB Value PEF VI”) was established on July 9, 2009 in accordance with the FSCMA to engage in investing in securities. Issued capital of KDB Value PEF VI amounts to (Won)2,197,597 million as of June 30, 2011 because of (Won)1,192,077 million capital increase in current year.
KDB Venture M&A Private Equity Fund
KDB Venture M&A Private Equity Fund (“KDB Venture M&A”) was established on May 2, 2007 in accordance with the FSCMA to engage in investing in securities. Issued capital of KDB Venture M&A is nil as of June 30, 2011 because KDB Venture M&A fully repaid its paid-in capital amounts to (Won)24,740 million during the current year.
KDB Turn Around Private Equity Fund
KDB Turn Around Private Equity Fund (“KDB Turn Around”) was established on April 8, 2009 in accordance with the FSCMA to engage in providing private equity financial services. Issued capital of KDB Turn Around amounts to (Won)58,990 million as of June 30, 2011 because of (Won)2,350 million capital increase in current year.
KDB Consus Value PEF
KDB Consus Value PEF (“KDB Consus Value”) was established on February 22, 2010 in accordance with the FSCMA to engage in providing private equity financial services. The Bank acquired 40.52% equity ownership in KDB Consus Value during 2010 and became subject to consolidation. Issued capital of KDB Consus Value amounts to (Won)626,500 million as of June 30, 2011.
Components and Materials M&A PEF
Components and Materials M&A PEF (“Components and Materials M&A”) was established on January 28, 2010 in accordance with the FSCMA to engage in providing private equity financial services. The Bank acquired 83.33% equity ownership of Components and Materials M&A during 2010 and became subject to consolidation. Issued capital of Components and Materials M&A amounts to (Won)76,231 million as of June 30, 2011 because of (Won)11,951 million capital increase in current year.
S-71
Table of Contents
Korea Development Bank
Notes to the interim consolidated financial statements—(Continued)
June 30, 2011 and 2010
KoFC-KDB Materials and Components Investment Fund No.1
KoFC-KDB Materials and Components Investment Fund No.1 (“KoFC-KDB Materials and Components Investment”) was established on June 29, 2010 in accordance with the Act on Special Measures for the Promotion of Specialized Enterprises and other applicable statutes to engage in providing private equity financial services. On December 31, 2010, the Bank acquired 50.00% equity ownership in KoFC-KDB Materials and Components Investment Fund No.1 and became subject to consolidation. Issued capital of KoFC-KDB Materials and Components Investment amounts to (Won)50,000 million as of June 30, 2011 because of (Won)25,000 million capital increase in current year.
Trust accounts
In accordance with K-IFRS, trusts held for development projects, private annuities trusts and pension annuities trusts embedded with credit protection that guarantees a return of principal and interest amounts, which in turn, exposes the bank to a majority of the residual or ownership risks related to these trusts are included in scope of consolidation. Conversely, unearmarked funds in trusts, new private annuities trusts, pension trusts and new retirement annuities trusts without these productive provisions are excluded from consolidation.
KDB 1st Securitization and 15 other SPCs
KDB 1st Securitization and 15 other SPCs, which exposes the Company to the majority of the residual or ownership risks related to the SPC or its assets, are included in scope of consolidation.
KDB Shipping Private Fund KL 1st and 38 other funds
KDB Shipping Private Fund KL 1st and 38 other funds, that take half of the remained risks and rewards, are included in the scope of consolidation.
KDB Asia Ltd.
KDB Asia, Ltd. was incorporated on January 23, 1986 in Hong Kong and is engaged in providing financing services to Korean companies and investment securities. Issued capital of KDB Asia Ltd. amounts to USD140,000 thousand as of June 30, 2011.
KDB Ireland Ltd.
KDB Ireland Ltd. was incorporated on June 18, 1997 in the Republic of Ireland. KDB Ireland Ltd. is engaged in providing financing services to Korean companies and investing in securities. Issued capital of KDB Ireland Ltd. amounts to USD25,000 thousand as of June 30, 2011.
KDB Hungary Ltd.
KDB Hungary Ltd. was incorporated on February 1, 1990 to engage in commercial banking. On December 30, 2002, the Bank wholly assumed the shares of KDB Hungary Ltd. from Daewoo Securities Co., Ltd. Issued capital of KDB Hungary Ltd. amounts to HUF15,341 million as of June 30, 2011.
S-72
Table of Contents
Korea Development Bank
Notes to the interim consolidated financial statements—(Continued)
June 30, 2011 and 2010
Banco KDB Do Brasil S.A.
Banco KDB Do Brasil S.A. was incorporated on October 25, 2005 to engage in providing financing services, investment securities and investment banking. Issued capital of Banco KDB Do Brasil S.A. amounts to BRL324,969 thousand as of June 30, 2011.
KDB Uzbekistan, Ltd.
KDB Uzbekistan, Ltd. was incorporated on March 1, 1997 to engage in providing financing services, investment securities and investment banking. On February 10, 2006, the Bank wholly assumed the shares of KDB Uzbekistan, Ltd. from Daewoo Securities Co., Ltd. Issued capital of KDB Uzbekistan, Ltd. amounts to UZS25,136 million as of June 30, 2011 because of UZS15,522 million capital increase in current year.
KDB Life Insurance Co., Ltd.
KDB Life Insurance Co., Ltd. (“KDB Life Insurance”) was established on April 1, 1988 in accordance with the Korea Insurance Business Act to offer insurance policies and generate revenue from applicable premiums and other related sources. Issued capital of KDB Life Insurance amounts to (Won)613,122 million as of June 30, 2011.
Daewoo Engineering & Construction Co., Ltd.
Daewoo Engineering & Construction Co., Ltd. (Daewoo E&C) was established on December 27, 2000 through spin-off from Daewoo Corporation and is engaged in civil engineering, construction, housing and plant business. Issued capital of Daewoo E&C amounts to (Won)2,078,113 million as of June 30, 2011.
3. Summary of significant accounting policies
Basis of financial statement preparation
The consolidated financial statements of the Company have been prepared under Korea International Financial Reporting Standards (“K-IFRS”) in accordance with the Act of External Audit of Stock Companies, Article 13(1)(1).
The Company has prepared its interim consolidated financial statements in accordance with K-IFRS, including K-IFRS 1034 Interim Financial Reporting, and its interpretations expected to be effective, and the accounting policies expected to be adopted, when management prepares its first complete set of K-IFRS financial statements as of December 31, 2011. There is a possibility that interim consolidated financial statements may require adjustment before constituting the K-IFRS first time adoption annual financial statement as of December 31, 2011.
The significant accounting policies followed by the Company in preparation of the K-IFRS interim separate financial statements are summarized below. These policies are applied to the consolidated financial statements as of December 31, 2010 and January 1, 2010, which are presented for comparative purposes, unless separately mentioned.
Basis of consolidation
(i) Subsidiaries
A subsidiary is an entity, including an unincorporated entity such as a partnership, which is controlled by another entity (known as the parent). Generally, the parent owns more than half of the voting rights of an entity
S-73
Table of Contents
Korea Development Bank
Notes to the interim consolidated financial statements—(Continued)
June 30, 2011 and 2010
to govern the financial and operating policies of an entity so as to obtain benefits from its activities. An entity considers the existence and effect of potential voting rights that are currently exercisable or convertible, including potential voting rights held by another entity, when assessing whether an entity has the power to govern the financial and operating policies of another entity. Subsidiaries are fully consolidated from the date on which control is transferred to the Company. Subsidiaries are no longer consolidated from the date in which the Company loses control.
Business combinations are accounted for using the acquisition method. The cost of an acquisition is measured as the aggregate of the consideration transferred, measured at acquisition date fair value and the amount of any non-controlling interest in the acquiree. For each business combination, the acquirer measures the non-controlling interest in the acquiree either at fair value or at the proportionate share of the acquiree’s identifiable net assets. Acquisition costs incurred are expensed.
The excess of the cost of acquisition over the fair value of the acquiree’s share of the identifiable net assets acquired is recorded as goodwill. Any goodwill arising from initial consolidation is tested for impairment at least once a year and whenever events or changes in circumstances indicate the need for impairment. If the cost of acquisition is less than the fair value of the acquiree’s share of the net assets acquired, the difference is recognized directly in the consolidated statement of income.
All intra-company balances, income and expenses, bonds and liabilities resulting from intra-company transactions are eliminated in full. Where necessary, adjustments are made to bring the accounting policies of subsidiaries in line with those of the Company.
A change in the ownership interest of a subsidiary, without a change of control, is accounted for as an equity transaction. If the Company loses control over a subsidiary, it recognizes the fair value of any investment retained and any surplus or deficit in profit or loss.
(ii) Investment in an associate
Associates are all entities over which the Company has significant influence but not control, generally accompanying a shareholding of between 20% and 50% of the voting rights. Investments in associates are accounted for by the equity method of accounting and are initially recognized at cost. The Company’s investment in associates includes goodwill (net of any accumulated impairment loss) identified on acquisition. When the investor’s share on the fair value of the associate’s identifiable assets and liabilities exceeds acquisition cost of the associate’s interest, the exceeding is recognized as the current profit for the year of acquisition.
The Company’s share of its associates’ post-acquisition profits or losses is recognized in the statement of income, and its share of post-acquisition movements in reserves is recognized in reserves. The cumulative post-acquisition movements are adjusted against the carrying amount of the investment. When the investor’s share of losses in an associate equals or exceeds its interest in the associate, including any other unsecured receivables, the Company does not recognize further losses. The carrying amount of equity method investments and the long term interest, which partially consists of investors’ net investment, are included in interest in the associate
Unrealized gains on transactions between the Company and its associates are eliminated to the extent of the Company’s interest in the associates. Unrealized losses are also eliminated unless the transaction provides evidence of an impairment of the asset transferred. Accounting policies of associates have been changed where necessary to ensure consistency with the policies adopted by the Company.
S-74
Table of Contents
Korea Development Bank
Notes to the interim consolidated financial statements—(Continued)
June 30, 2011 and 2010
Interest income and interest expense
The Company recognizes interest income and interest expense using the effective interest rate (EIR) method on an accrual basis. When a financial instrument bearing interest is impaired, the Company reduces the carrying amount to its recoverable amount, being the estimated future cash flows discounted at its original effective interest rate of the instrument, and continues unwinding the discount as interest income.
Fee and commission income
Fee and commission are generally recognized on an accrual basis when the service has been provided. The revenue recognition of financial service fee is various based on the nature of service and the purpose of charge, and categorized as follows:
| • | Fees earned for the rendering of services over a period of time are accrued over that period using the straight line method. |
| • | Fees arising from providing significant transaction services for a third party are recognized on completion of the transaction services. |
| • | Fees which are regarded as the part of the interest of financial instruments are recognized using the EIR. |
Dividend income
Dividend income is recognized when the Company’s right to receive the payment is established.
Cash and cash equivalents
Cash and cash equivalents comprise of cash on hand, due from banks on demand and short-term highly liquid investments with an original maturity of three months or less.
Financial assets
The Company’s management determines the category of its financial assets at initial recognition and initially measures financial assets at their fair value on the date of recognition. The Company classifies its financial assets in the following categories: financial assets at Fair Value through Profit or Loss (FVTPL), financial assets available-for-sale, financial assets held-to-maturity, loans and receivables, and derivative financial instruments.
The Company recognizes conventional dealing, which is bought or sold within generally expected period in accordance with related market regulations, on the date of trading.
(i) Financial assets at FVTPL
Financial assets at FVTPL include financial assets held-for-trading and financial assets designated at FVTPL upon initial recognition. Financial assets are classified as held-for-trading if they are acquired for the purpose of selling in the near term. Derivative financial assets presented in the statement of financial position include derivative contracts that are designated as hedging instruments in hedge relationships and separately disclosed in Note 24. The Company’s management may only designate a financial asset at FVTPL upon initial recognition when they determine that such classification provides more useful information. Gain or loss from financial assets at FVTPL are credited or charged to current operation results.
S-75
Table of Contents
Korea Development Bank
Notes to the interim consolidated financial statements—(Continued)
June 30, 2011 and 2010
(ii) Financial assets available-for-sale
Financial assets available-for-sale are non-derivative financial instruments designated at available-for-sale item, and are not classified as loans and receivables, financial assets held-to-maturity or financial assets at FVTPL. They are measured at fair value and their valuation gains and losses are recognized in equity as other comprehensive income. The equity ownership, whose active market values are not available and fair values cannot be reliably measured, are valued at acquisition cost. Accumulated other comprehensive income previously recognized in equity is recognized in the income statement when the investment is disposed of or impairment loss for the investment is recognized. Dividends earned whilst holding financial assets available-for-sale are recognized in the income statement when the right of the payment has been established.
(iii) Financial assets held-to-maturity
Financial assets held-to-maturity are non-derivative financial instruments with fixed or determinable payments and fixed maturities, which the Company has the positive intention and ability to hold to maturity. When the financial assets meet the definition of loans and receivables or are designated at FVTPL, or financial investments available-for-sale, they will not be classified as financial assets held-to-maturity. After initial measurement, financial assets held-to-maturity are subsequently measured at amortized cost using the effective interest rate (“EIR”). Also, interest income on financial assets held-to-maturity is recognized using the EIR method.
(iv) Loans and receivables
Loans and receivables are non-derivative financial instruments with fixed or determinable payments and are not traded in an active market. Loans and receivables (excluding short-term loan) are subsequently measured at amortized cost using the EIR, less allowance for impairment. The amortization is included in interest income in the income statement.
Impairment of financial assets
(i) Impairment of financial assets available-for-sale
The Company assesses at each statement of financial position date whether there is objective evidence that an investment is impaired. If any such evidence exists, the amount recorded for impairment is the cumulative loss measured as the difference between the acquisition cost (or amortized cost for debt instrument) and current fair value, less any impairment loss on that investment previously recognized in the income statement. Impairment losses on equity ownership are not reversed through the income statement. If, in a subsequent period, the fair value of a debt instrument increases and the increase can be objectively related to an event occurring after the impairment loss was recognized in, the impairment loss is reversed through the income statement.
The impairment loss is reduced from the carrying amount of the asset directly.
(ii) Impairment of financial assets held-to-maturity
The Company assesses individually at each statement of financial position date whether there is objective evidence that a financial assets held-to-maturity is impaired. If any such evidence exists, the amount of loss is measured as the difference between the carrying amount and the present value of estimated future cash flows, which is discounted using the initial effective interest rate. The amount of the loss is recognized in the income statement. If, in a subsequent period, the fair value of a financial assets held-to-maturity increases and the
S-76
Table of Contents
Korea Development Bank
Notes to the interim consolidated financial statements—(Continued)
June 30, 2011 and 2010
increase can be objectively related to an event occurring after the impairment was recognized, the impairment loss is reversed through the income statement. The impairment loss is reduced from the carrying amount of the asset directly.
(iii) Impairment of loans and receivables
The Company assesses at each statement of financial position date whether there is objective evidence that loans and receivables are impaired. If there is objective evidence that an impairment loss has been incurred, the amount of the loss is measured as the difference between the carrying amount and the present value of estimated future cash flows, which is discounted using the initial effective interest rate. The carrying amount of the asset is reduced through the use of an allowance account and the amount of the loss is recognized in the income statement.
The Company first assesses whether objective evidence of impairment exists for individual loans and receivables that are significant (“individual assessment”). If the Company determines that no objective evidence of impairment exists for an individually assessed loans and receivables, the Company includes the loan in a group of loans and receivables with similar credit risk characteristics and collectively assesses them for impairment (“collective assessment”).
When an individual loans and receivables are impaired, the amount of the loss is measured as the difference between the carrying amount and the present value of estimated future cash flows (including estimated future cash flows from its collateral). In collective assessments, the amount of the loss is statistically evaluated using the Company’s historical loss data.
The present value of estimated future cash flows is measured using the loan’s initial effective interest rate. If the loans anf receivables have a floating interest rate, the Company uses the current effective interest rate for the measurement. Future cash flows from collateral are estimated at net cash flow from disposal of collateral (deducting transaction cost).
For the purpose of a collective evaluation of impairment, loans and reveivables are grouped on the basis of the Company’s internal credit grading system, that considers credit risk characteristics such as asset type, industry, geographical location, collateral type, past-due status and other relevant factors.
Future cash flows on a group of loans and receivables collectively assessed are estimated on the basis of historical loss experience for loans with similar credit risk characteristics. Historical loss experience is adjusted on the basis of current observable data to reflect the effects of current conditions on which the historical loss experience is based and to remove the effects of conditions in the historical period that no longer exists. Estimates of changes in future cash flows reflect, and are directionally consistent with, changes in related observable data from year to year (such as changes in unemployment rates, property prices, commodity prices, payment status, or other factors that are indicative of incurred losses in the group and their magnitude). The methodology and assumptions used for estimating future cash flows are reviewed regularly to reduce any differences between loss estimates and actual loss experience.
(iv) The evidence of impairment
Objective evidence that a financial asset is impaired includes following loss events:
| (a) | significant financial difficulty of the issuer or obligor |
| (b) | a breach of contract, such as a default or delinquency in interest or principal payments |
S-77
Table of Contents
Korea Development Bank
Notes to the interim consolidated financial statements—(Continued)
June 30, 2011 and 2010
| (c) | the lender, for economic or legal reasons relating to the borrower’s financial difficulty, granting to the borrower a concession that the lender would not otherwise consider |
| (d) | it becoming probable that the borrower will enter bankruptcy or other financial reorganization |
| (e) | the disappearance of an active market for that financial asset because of financial difficulties |
| (f) | observable data indicating that there is a measurable decrease in the estimated future cash flows from a group of financial assets since the initial recognition of those assets, although the decrease cannot yet be identified with the individual financial assets in the group |
Financial liabilities
The Company classifies its financial liabilities in the following categories: financial liabilities at FVTPL (financial liabilities held-for-trading and financial liabilities designated at FVTPL), financial liabilities carried at amortized cost (due to customers, borrowings and debt issued, etc.) and derivative financial liabilities. All financial liabilities are recognized at their fair value on the date of initial recognition.
(i) Financial liabilities at FVTPL
Financial liabilities at FVTPL in the current year include financial liabilities held-for-trading and financial liabilities designated at FVTPL upon initial recognition. Financial liabilities and derivatives are classified as held-for-trading if they are acquired for the purpose of repurchasing in the near term. Derivative financial liabilities presented in the statement of financial position include derivative financial contracts that are designated as hedging instruments in hedge relationships and separately disclosed in Note 24.
The Company’s management may only designate a financial asset at FVTPL upon initial recognition when they judge that such classification provides more useful information. Gain or loss from financial assets at FVTPL are credited or charged to current operation results.
(ii) Financial liabilities carried at amortized cost
Financial liabilities carried at amortized cost are recognized initially at fair value, net of transaction costs incurred. Such financial liabilities are subsequently carried at amortized cost. Any difference between the proceeds (net of transaction costs) and the redemption value is recognized in the statement of income over the period of the financial liability using the EIR method.
Fees paid on the establishment of credit facilities are recognized as transaction costs of the financial liabilities to the extent that it is highly likely that some or all of the facility will be borrowed. In this case, the fee is deferred until the borrowing occurs. If there is no evidence that the probability that some or all of the facility will be borrowed is high, then the fee is capitalized as a pre-payment for liquidity services and amortized over the period of the facility to which it relates.
Financial guarantees
Financial guarantee contracts (consisting of letter of credit, guarantees and acceptances) are contracts that require the issuer to make specified payments to reimburse the holder for a loss it incurs because a specified debtor has failed to make payments when due, in accordance with the terms of contracts. Financial guarantees are
S-78
Table of Contents
Korea Development Bank
Notes to the interim consolidated financial statements—(Continued)
June 30, 2011 and 2010
initially recognized as financial guarantee liabilities in the statement of financial position at fair value on the date the guarantee was given. Subsequent to initial recognition, the Company’s liabilities under such guarantees are measured at the higher of the amount determined in accordance with K-IFRS 1037Provisions, Contingent Liabilities, and Contingent Assets and the initial amount less cumulative amortization of fees recognized in accordance with K-IFRS 1018Revenues.
Repurchase and reverse repurchase agreements
Securities purchased under agreements to resell at a specified future date (“reverse repos”) are recorded in the statement of financial position as bonds purchased under repurchase agreements in the other loans. Conversely, securities sold under agreements to repurchase at a specified future date (“repos”) are recorded in the statement of financial position as bonds sold under repurchase agreements in the other borrowings. Interest income and expense incurred from reverse repo and repo transactions are recorded in the statement of income as interest income on loan and interest expense on borrowings, respectively.
Derivatives instruments and hedge accounting
Derivatives instruments are initially recognized at fair value on the contract date and are subsequently revalued at their fair value. Derivative instruments are accounted differently depending on whether hedge accounting is applied, and therefore, are classified into trading purpose derivatives and hedging purpose derivatives. In a hedge relationship, when a hedge item is any asset, liability or unrecognized fixed contract, which is exposed at the possibility that its some or entire fair value is fluctuated by the specified risks, fair value hedge accounting is applied. In other way, when a hedge item is any asset, liability or expected highly-probable transaction, which is exposed at the possibility that its cash flow is fluctuated by the specified risk, cash flow hedge accounting is applied. For trading purpose derivatives transaction, changes in the fair value of derivatives are recognized in net income.
At inception of the hedge relationship, the Company formally documents the relationship between the hedged item and the hedging instrument, including the nature of the risk, the objective and strategy for undertaking the hedge and the method that will be used to assess the effectiveness of the hedging relationship. Also, at the inception of the hedge relationship, a formal assessment is undertaken to ensure the hedging instrument is expected to be highly effective in offsetting the designated risk in the hedged item and actual result was so.
(i) Fair value hedges
For designated and qualifying fair value hedges, the change in the fair value of a hedging derivative is recognized in the income statement. Meanwhile, the change in the fair value of the hedged item attributable to the risk hedged is recorded as part of the carrying value of the hedged item and is also recognized in the income statement. When the hedge no longer meets the criteria for hedge accounting, the hedge relationship is terminated. For hedged item recorded at amortized cost, the difference between the carrying value of the hedged item on termination and the face value is amortized over the remaining term of the original hedge using the EIR.
(ii) Cash flow hedges
For designated and qualifying cash flow hedges, the effective portion of the gain or loss on the hedging instruments is initially recognized directly in equity. The ineffective portion of the gain or loss on the hedging instrument is recognized immediately in the income statement. When the hedged cash flow affects the income
S-79
Table of Contents
Korea Development Bank
Notes to the interim consolidated financial statements—(Continued)
June 30, 2011 and 2010
statement, the gain or loss on the hedging instrument is recorded in the corresponding income or expense line of the income statement. When a hedge no longer meets the criteria for hedge accounting, any cumulative gain or loss existing in equity at that time remains in equity and is recognized when the hedged forecast transaction is ultimately recognized in the income statement. When a forecast transaction is no longer expected to occur, the cumulative gain and loss that was reported in equity is immediately transferred to the income statement.
Embedded derivative instruments
Derivatives embedded in other financial instruments are treated as separate derivatives and recorded at fair value if their economic characteristics and risks are not closely related to those of the host contract and the host contract is not itself held-for-trading or designated at FVTPL. Unless the Company aggregately designates the host contract and embedded derivative as financial instrument at FVTPL. These embedded derivatives separated from the host contract are carried at fair value and changes in their fair value are recognized in the income statement.
Fair value of financial instruments
The fair value of financial instruments that are traded in active markets is determined by referencing quoted market prices at each reporting date. For financial instruments not traded in an active market, the fair value is determined using appropriate valuation techniques. Such techniques may include discounted cash flow analysis or other valuation methods.
The Company’s standards for measuring fair value of financial instruments are as follows:
| • | Loans |
The fair value of loans is estimated future cash flows reflecting premature redemption ratio, using the market discounted interest rate, which is adjusted by credit spread considering the probability of default. For the loans with credit line facilities, short-term loans with three-month maturity or less, and impaired loans, the Company regards their carrying amount as fair value.
| • | Financial assets held-to-maturity |
The Company uses the fair value measured by appraisal agencies for financial assets held-to-maturity.
| • | Due to customer |
The fair value of due to customer is estimated using discounted cash flow method. However, for deposits, whose cash flows cannot be estimated reasonably, the Company considered their carrying amount as fair value.
| • | Borrowings |
The fair value of borrowings in Korean won is estimated using discounted cash flow method. On the other hand the fair value of borrowings denominated foreign currency is measured by appraisal agencies.
| • | Debt issued |
The fair value of industrial financial debts in Korean won (except structured debts) is estimated using discounted cash flow method. For industrial financial debts in foreign currency and structured debts, the Company use the fair value measured by appraisal agencies.
S-80
Table of Contents
Korea Development Bank
Notes to the interim consolidated financial statements—(Continued)
June 30, 2011 and 2010
The Company defines quoted market prices in active markets into Level 1, the fair value determined using appropriate valuation techniques with observable market data into Level 2 and the fair value determined using valuation techniques with unobservable market data into Level 3.
Day 1 profit or loss recognition
In cases where fair value is determined using data, which is not observable in the market, the difference between the transaction price and initial value is amortized in the statement of income by using straight line method over time on an appropriate basis.
Derecognition of financial instruments
(i) Derecognition of financial assets
Financial assets are derecognized when the contractual rights to receive the cash flows from these assets have ceased to exist or the assets have been transferred and substantial risks and rewards of ownership of the assets are also transferred. If the Company has neither transferred nor retained substantial risks and rewards of the asset, but has transferred control of the asset, the asset is recognized to the extent of the Company’s continuing involvement in the asset in the financial statement. If the Company still retains substantial risks and rewards of the transferred asset, the Company continuously recognizes the financial assets, and recognizes disposal proceeds as borrowings with collaterals.
(ii) Derecognition of financial liabilities
A financial liability is derecognized when the obligation under the liability is discharged or cancelled or expires. Where an existing financial liability is replaced by another from the same lender on substantially different terms, or the terms of an existing liability are substantially modified, such an exchange or modification, the liability is treated as a derecognition of the original liability and the recognition of a new liability. The difference between the carrying value of the original financial liability and the consideration paid is recognized in the income statement.
Property and equipment
Land and buildings comprise mainly of the Company’s head office and some local branches. Plant and equipment is stated at cost, net of accumulated depreciation and/or accumulated impairment losses, if any. Such cost includes the cost of replacing part of the plant and equipment and borrowing costs for long-term construction projects if the recognition criteria are met. When significant parts of property, plant and equipment are required to be replaced in intervals, the Company recognizes such parts as individual assets with specific useful lives and depreciation, respectively. Likewise, when a major inspection is performed, its cost is recognized in the carrying amount of the plant and equipment as a replacement if the recognition criteria are satisfied. All other repair and maintenance costs are recognized in the statements of comprehensive income as incurred.
The present value of the expected cost for the decommissioning of the asset after its use is included in the cost of the respective asset if the recognition criteria for a provision are met.
Land and buildings are measured at fair value less accumulated depreciation on buildings and impairment losses recognized after the date of the revaluation. Valuations are performed frequently to ensure that the fair value of a revalued asset does not differ materially from its carrying amount.
S-81
Table of Contents
Korea Development Bank
Notes to the interim consolidated financial statements—(Continued)
June 30, 2011 and 2010
Depreciation is calculated on a straight-line basis over the estimated useful life of the asset as follows:
| Useful life (in years) | ||
Building | 20 ~ 50 | |
Structures | 10 ~ 40 | |
Leasehold improvements | 4 | |
Furniture and equipment for operation | 4 |
Property and equipment is impaired when its carrying amount exceeds the recoverable amount. The Company assesses residual value and economic life of its assets at each reporting date and makes adjustments to its useful life when necessary. Any gain or loss arising from the disposal of the asset (calculated as the difference between the net disposal proceeds and the carrying amount of the asset) is recognized in ‘non-operating income (expense)’ in the income statement.
Investment properties
Investment properties are measured initially at cost, including transaction costs. Subsequent to initial recognition, investment properties are stated at fair value, which reflects market conditions at the reporting date.
Investment properties are derecognized when either they have been disposed of or when the investment property is permanently withdrawn from use and no future economic benefit is expected from its disposal. The difference between the net disposal proceeds and the carrying amount of the asset is recognized in the statements of comprehensive income in the period of derecognition. Transfers are made to or from investment property only when there is a change in use.
Depreciation is calculated on a straight-line basis over the estimated useful life of the asset as follows:
| Useful life (in years) | ||
Building | 20 ~ 50 | |
Structures | 10 ~ 40 |
Intangible assets
Intangible assets acquired separately are measured on initial recognition at cost. Following initial recognition, intangible assets are carried at cost less any accumulated amortization and any accumulated impairment losses.
Intangible assets with finite lives are amortized over the useful economic life and assessed for impairment whenever there is an indication that the intangible asset may be impaired. The amortization period and the amortization method for an intangible asset with a finite useful life is reviewed at least at each financial year end. Changes in the expected useful life or the expected pattern of consumption of future economic benefits embodied in the asset is accounted for by changing the amortization period or method, as appropriate, and are treated as changes in accounting estimates.
Intangible assets with indefinite useful lives are not amortized, but are tested for impairment annually, either individually or at the cash generating unit level. The assessment of indefinite life is reviewed annually to determine whether the indefinite life continues to be supportable. If not, the change in useful life from indefinite to finite is made on a prospective basis.
S-82
Table of Contents
Korea Development Bank
Notes to the interim consolidated financial statements—(Continued)
June 30, 2011 and 2010
Non-current assets (or disposal groups) held-for-sale
Non-current assets and disposal groups classified as held-for-sale are measured at the lower of carrying amount and fair value less costs to sell. Non-current assets and disposal groups are classified as held-for-sale if their carrying amounts will be recovered through a sale transaction rather than through continuing use. This condition is regarded as met only when the sale is highly probable and the asset or disposal group is available for immediate sale in its present condition.
Policy reserves
In accordance with the Insurance Business Act (“IBA”) and the Related Insurance Standard (“RIS”), the Company is required to maintain policy reserves, which consist of a premium reserve, unearned premium reserve, guaranteed benefit reserve, reserve for outstanding claims, reserve for participating policyholders’ dividends and excess participating policyholders’ dividend reserve as a liability which is measured in accordance with the “Manual for Calculation of Premium and Policy Reserves” issued by the Financial Supervisory Commission. Details are as follows:
(i) Premium reserve
Premium reserves represent an amount calculated based on a net premium valuation, which is the greater of an amount calculated by using the standard interest rate and standard risk rate issued by the FSS, and an amount calculated using an internally generated rate derived by the Company. If the reserve is at zero or less, the amount is to be recorded at nil.
(ii) Unearned premium reserve
Unearned premium reserves represent an amount allocated for certain premiums whose initial payment date falls within the current reporting period and future payments, if any, fall subsequent to the end of the reporting period.
(iii) Guaranteed benefit reserve
Guaranteed benefit reserve guarantees a certain level of the insurance claims considering expected losses in the future. Details are as follows:
| • | Minimum annuity reserve guarantee |
Reserve for guaranteeing pensions by the contracted limit
| • | Minimum death benefit guarantee |
Reserve for guaranteeing the death benefit by the contracted limit
| • | Minimum withdrawal guarantee |
Reserve for guaranteeing the contracted drawings for the withdrawal period
| • | Minimum life withdrawal guarantee |
Reserve for guaranteeing the contracted drawings for the life period
| • | Other guaranteed benefit reserve |
Reserve for guaranteeing the insurance benefit in excess of the normal level
S-83
Table of Contents
Korea Development Bank
Notes to the interim consolidated financial statements—(Continued)
June 30, 2011 and 2010
(iv) Reserve for outstanding claims
Reserve for outstanding claims represents a reserve calculated by an estimate of losses for insured events prior to the reporting date but for which actual amounts cannot be determined. Details are as follows:
| • | Individual estimated amount |
Expenses to be incurred in the course of settlement of the insured event, such as potential losses arising from a lawsuit or arbitration (if partial amount is paid, the remainder is recognized.)
| • | IBNR (Incurred But Not Reported) |
Estimated amounts using a reliable and reasonable actuarial techniques statistical method considering the Company’s experience rate.
| • | Reserve for ineffective contracts |
Reserve for ineffective contracts due to default in the payment of premium payment (Partial amount of surrender value)
| • | Unpaid claims |
The amount of claims, surrender value and dividends to be paid have been determined but not yet paid.
(v) Reserve for participating policyholders’ dividends
The reserve for participating policyholders’ dividends is classified into an interest dividend reserve, a mortality dividend reserve, an interest rate difference guarantee reserve and a long-term duration dividend reserve.
(vi) Excess participating policyholders’ dividend reserve
Pursuant to relevant laws and contracts, the Company may provide an excess participating policyholder dividend reserve based on the operating results of related insurance products. The reserve may be used to pay participating policyholder dividends or additional dividends.
Lease
The determination of whether an arrangement is, or contains, a lease is based on the substance of the arrangement at inception date: whether fulfillment of the arrangement is dependent on the use of a specific asset or assets or the arrangement conveys a right to use the asset.
(i) Finance lease
Finance leases, which transfer to the Company substantially all the risks and benefits incidental to ownership of the leased item, are capitalized at the commencement of the lease at the fair value of the leased property or, if lower, at the present value of the minimum lease payments. Lease payments are apportioned between finance charges and reduction of the lease liability so as to achieve a constant rate of interest on the remaining balance of the liability. Finance charges are recognized in the statements of comprehensive income.
(ii) Operating lease
Leases where the Company does not transfer substantially all the risks and benefits of ownership of the asset are classified as operating leases. Initial direct costs incurred in negotiating an operating lease are added to the carrying amount of the leased asset and recognized over the lease term on the same bases as rental income.
S-84
Table of Contents
Korea Development Bank
Notes to the interim consolidated financial statements—(Continued)
June 30, 2011 and 2010
Contingent rents are recognized as revenue in the period in which they are earned. Operating lease payments are recognized as an expense in the statements of comprehensive income on a straight line basis over the lease term.
Impairment of non-financial assets
The Company assesses at each reporting date whether there is an indication that an asset may be impaired. If any indication exists, or when annual impairment testing for an asset is required, the Company estimates the asset’s recoverable amount. An asset’s recoverable amount is the higher of an asset’s or cash-generating unit’s (CGU) fair value less costs to sell and its value in use and is determined for an individual asset, unless the asset does not generate cash inflows that are largely independent of those from other assets or groups of assets. Where the carrying amount of an asset or CGU exceeds its recoverable amount, the asset is considered impaired and is written down to its recoverable amount.
Impairment losses of continuing operations are recognized in the statements of comprehensive income in those expense categories consistent with the function of the impaired asset, except for property previously revalued where the revaluation was taken to other comprehensive income. In this case, the impairment is also recognized in other comprehensive income up to the amount of any previous revaluation.
Pension benefits
The Company operates both defined benefit pension plan and defined contribution pension plan. All pensions are classified as defined benefit plans except for defined contributions. A defined contribution plan is a pension plan under which the Company pays fixed contributions into a separate entity. A defined benefit plan defines an amount of pension benefit that an employee will receive on retirement and is usually dependent on one or more factors such as years of service and compensation.
Under a defined contribution pansion plan, the company has no further payment obligations once the contributions have been paid. The contributions are recognized as an employee benefit expense when they are due. Prepaid contributions are recognized as an asset to the extent that a cash refund or a reduction in the future payments is available.
The liability recognized in the statement of financial position in respect to the defined benefit pension plans is the present value of the defined benefit obligation at the date of the statement of financial position less the fair value of plan assets, together with adjustments for unrecognized actuarial gains or losses and past service costs. The defined benefit obligation is calculated annually by independent actuaries using the projected unit credit method. The present value of the defined benefit obligation is determined by discounting the estimated future cash outflows using interest rates of high-quality corporate bonds that are denominated in the currency in which the benefits will be paid, and that have terms to maturity similar to the terms of the related pension liability.
Actuarial gains and losses arising from adjustments and changes in actuarial assumptions and actual results are recognized as income or expense in current year.
Contingent liabilities
A contingent liability is a possible obligation that arises from past events and is recognized when it is probable that an outflow of resources embodying economic benefits will be required to settle the obligation, or the amount of the obligation can be measured with sufficient reliability.
S-85
Table of Contents
Korea Development Bank
Notes to the interim consolidated financial statements—(Continued)
June 30, 2011 and 2010
Income tax expense and deferred tax assets and liabilities
The income tax expense for the period comprises of current (including additional income taxes for the prior period and refund of prior years’ income taxes) and deferred taxes in accordance with the Corporation Tax Act.
Current income tax assets and liabilities for the current and prior periods are measured at the amount expected to be recovered from or paid to the taxation authorities. The tax rates and tax laws used to compute the amount are those that are enacted or substantively enacted, by the reporting date, in the countries where the Company operates and generates taxable income.
Current income tax relating to items recognized directly in equity is recognized in equity and not in the statements of comprehensive income. Management periodically evaluates positions taken in the tax returns with respect to situations in which applicable tax regulations are subject to interpretation and establishes provisions where appropriate.
Deferred tax assets are recognized for all deductible temporary differences, carry forward of unused tax credits and unused tax losses, to the extent that it is probable that taxable profit will be available against which the deductible temporary differences, and the carry forward of unused tax credits and unused tax losses can be utilized.
Deferred tax assets and deferred tax liabilities are offset, if a legally enforceable right exists to set off current tax assets against current income tax liabilities and the deferred taxes relate to the same taxable entity and the same taxation authority.
Foreign currency transactions
(i)Functional currency and presentation currency
The Company’s consolidated financial statements are presented in Korean won, which is also the parent company’s functional currency. Each entity in the Company determines its own functional currency and items included in the financial statements of each entity are measured using that functional currency.
(ii) Recognition to functional currency and foreign currency translation
In preparing the Company’s financial statements, Transactions in foreign currencies are initially recorded by the Company at their respective functional currency rates prevailing at the date of the transaction.
Monetary assets and liabilities in foreign currencies are retranslated at the functional currency spot rate of exchange ruling at the reporting date. Non-monetary items that are measured in terms of historical cost in a foreign currency are translated using the exchange rates as at the dates of the initial transactions. Non-monetary items measured at fair value in a foreign currency are translated using the exchange rates at the date when the fair value is determined.
All foreign exchange gains and losses recognized in the statement of income are presented net in the statement of income and the foreign exchange gains and losses on other comprehensive income items are presented in other comprehensive income. Non-monetary assets and liabilities which are not measured at fair value, the exchange difference would not occur since the exchange rate is applied at initial recognition.
In case the monetary assets and liabilities resulting from the transactions with overseas branches or overseas subsidiaries which are not intended to pay or not expected to be paid, such amount of assets and liabilities are
S-86
Table of Contents
Korea Development Bank
Notes to the interim consolidated financial statements—(Continued)
June 30, 2011 and 2010
regarded as net investments. Any foreign exchange differences which have been incurred from these monetary assets and liabilities are presented in other comprehensive income and will be reclassified to the net income when they are sold.
(iii) Translation tothe presentation currency
The assets and liabilities of foreign operations are translated into Korean won at the rate of exchange prevailing at the reporting date and their statements of comprehensive income are translated at average exchange rates during the year. The exchange differences arising on the translation are recognized in other comprehensive income.
Accounting for the trust accounts
Assets held in an agency or trust management capacities are not included in the consolidated financial statement in accordance with the Capital Market and Financial Investment Business Act, as they are not owned by the Company. The Company recognizes trust fees earned from the trust accounts as income from trust operations.
When a loss is incurred arising from trust accounts where the Company provided a guarantee of principal or principal and interest repayment, the loss is recognized as a loss from trust operations.
Dividends
Dividends are recognized as liabilities in the period in which they are approved by the Company’s shareholders.
Regulatory reserve for possible loan losses
In the case that the total sum of allowance for possible loan losses does not meet the amount prescribed in the Regulations on Supervision of Bank Business 29(1), the Bank is required to compensate the difference, if any, at the reporting date as a regulatory reserve for possible loan losses.
In the case that the amount of existing regulatory reserve for possible loan losses exceeds the amount needed to be laid aside as at the current period, the difference, if any, shall be reversed. If there is indisposed deficit, the Bank can accumulate reserves for possible loan losses after disposing deficit.
Net income after subtracting (adding) the transferred (reversed) amount of regulatory reserve for possible loan losses during the reporting period and adjusted earnings per share are disclosed in Note 39.
Significant accounting estimates and judgments
The preparation of the Company’s consolidated financial statements requires management to make judgments, estimates and assumptions that affect the reported amounts of revenues, expenses, assets and liabilities, and the disclosure of contingent liabilities, at the end of the reporting period. However, uncertainty about these assumptions and estimates could result in outcomes that require a material adjustment to the carrying amount of the asset or liability affected in future periods.
S-87
Table of Contents
Korea Development Bank
Notes to the interim consolidated financial statements—(Continued)
June 30, 2011 and 2010
Significant assumption and uncertainty, which may be adjusted during the upcoming period, are as follows:
(i) Fair value of financial assets
If the observable market price doesn’t exist, the Company need to use valuation techniques to determine the fair value of the financial asset. When the financial asset is not traded frequently and the price of the asset is not reliable, the Company should make extensive judgment to evaluate liquidity, market uncertainties, valuation assumptions and other valuation risks
The Company uses various valuation techniques with many variables and assumptions to determine the fair value of the financial asset.
(ii) Allowances for credit loss (allowance for possible loan losses, provision for payment guarantees and unused commitments)
The Company assesses whether impairment exists for loans and provides allowance for possible loan losses. In addition, the Company records a provision for payment guarantees and unused commitments after evaluating the possibilities of credit loss. The accuracy of such allowances depends on the expected cash flows of individual loans for individual assessment, and assumptions and variables applied in collective assessment and calculation of provision for payment guarantees and provision for unused commitments.
(iii) Defined benefit obligation measurement
The defined benefit obligation is calculated annually by actuaries using the projected unit method and depends on actuarial assumptions and variables such as pay increase rate, retirement rate and discount rate.
4. Transition to K-IFRS
Transition to K-IFRS
The Company’s opening K-IFRS statement of financial position was prepared as of January 1, 2010, the Company’s date of transition to K-IFRS. In addition, the date of adoption of the K-IFRS is January 1, 2011.
K-IFRS 1101First-Time Adoption of Korean International Financial Reporting Standards allows the Company, as a first-time adopter, certain exemptions from the retrospective application of certain K-IFRS.
Optional exemptions from other K-IFRS
Optional exemptions other than provided by K-IFRS 1101 are detailed as follows:
Section | Contents | |
Business combinations | The retrospective application of K-IFRS 1103Business Combinations is exempted for past business combinations (business combinations that occurred before the date of transition) | |
Cumulative translation differences | The cumulative translation differences for all foreign operations are deemed to be nil at the date of transition. | |
Designation of previously recognized financial instruments | A financial product (provided it meets certain criteria) is designated as a financial instruments at FVTPL or financial assets available-for-sale. | |
S-88
Table of Contents
Korea Development Bank
Notes to the interim consolidated financial statements—(Continued)
June 30, 2011 and 2010
Mandatory exceptions to the retrospective application
Mandatory exceptions to the retrospective application that the Company has applied are as follows:
Section | Contents | |
Derecognition under K-IFRS 1039Financial Instruments: Recognition and Measurement | K-IFRS 1039 has been applied only for the transactions entered into on or after January 1, 2010. | |
Exceptions to hedge accounting | Hedge accounting was applied only for the qualified transactions in accordance with K-IFRS 1039 at the date of transition. | |
Non-controlling interests | The Company shall apply the following requirements of K-IFRS 1027 (28, 30, 31, 34 ~ 37) and K-IFRS 1105 prospectively, from the date of transition. | |
Financial estimates
When preparing the Company’s statement of financial position as of January 1, 2010, estimates were made consistently with the estimates made for the preparation of statutory financial statements in conformity with accounting principles generally accepted in the Republic of Korea (“Korean GAAP”) on the same date.
Reconciliation of Korean GAAP to K-IFRS
Significant adjustments made by the Company in changing its consolidated statement of financial position from Korean GAAP to K-IFRS as of January 1, 2010 are summarized in Note 52.
S-89
Table of Contents
Korea Development Bank
Notes to the interim consolidated financial statements—(Continued)
June 30, 2011 and 2010
5. Operating segment information
Operating segment information for the six months ended June 30, 2011 and 2010 are as follows (Korean won in millions):
| Six months ended June 30, 2011 | ||||||||||||||||||||||||||||
| KDB(*) | Overseas subsidiaries | KDB Life Insurance | Daewoo E&C | Others | Adjustments | Total | ||||||||||||||||||||||
Net interest income: | (Won) | 800,414 | (Won) | 28,112 | (Won) | 165,704 | (Won) | — | (Won) | (77,580 | ) | (Won) | — | (Won) | 916,650 | |||||||||||||
Interest income | 2,203,538 | 67,045 | 171,929 | — | 59,881 | (106,867 | ) | 2,395,526 | ||||||||||||||||||||
Interest expense | (1,403,124 | ) | (38,933 | ) | (6,225 | ) | — | (137,461 | ) | 106,867 | (1,478,876 | ) | ||||||||||||||||
Net non-interest income: | 757,124 | 21,688 | (216,386 | ) | 481,649 | 79,364 | (35,826 | ) | 1,087,613 | |||||||||||||||||||
Net fee and commission income | 233,007 | 9,276 | 21,676 | — | (40,762 | ) | (236 | ) | 222,961 | |||||||||||||||||||
Dividend income | 94,678 | 52 | 21,160 | 796 | 11,780 | (34,597 | ) | 93,869 | ||||||||||||||||||||
Net gain (loss) from financial assets and liabilities held-for-trading | 47,984 | 593 | 5,464 | — | (10,563 | ) | — | 43,478 | ||||||||||||||||||||
Net gain (loss) from financial assets and liabilities designated at FVTPL | (13,670 | ) | (1,289 | ) | 461 | — | (3,448 | ) | — | (17,946 | ) | |||||||||||||||||
Net gain (loss) from financial assets available-for-sale | 64,072 | 15,450 | (38,375 | ) | 73,299 | 19,104 | (58,647 | ) | 74,903 | |||||||||||||||||||
Net gain (loss) from foreign currency transactions and derivative financial instruments | 558,636 | 452 | (11,870 | ) | 33,804 | 805 | 10,667 | 592,494 | ||||||||||||||||||||
Other operating income (expense) | (227,583 | ) | (2,846 | ) | (214,902 | ) | 373,750 | 102,448 | 46,987 | 77,854 | ||||||||||||||||||
Credit loss expense (reversal) | (72,567 | ) | (6,515 | ) | (14,502 | ) | — | 1,074 | 2,718 | (89,792 | ) | |||||||||||||||||
General administrative expenses (except depreciation and amortization)) | (209,867 | ) | (18,617 | ) | — | (163,333 | ) | (45,866 | ) | — | (437,683 | ) | ||||||||||||||||
|
|
|
|
|
|
|
|
|
|
|
|
|
| |||||||||||||||
Operating income (loss) (except depreciation and amortization)) | 1,275,104 | 24,668 | (65,184 | ) | 318,316 | (43,008 | ) | (33,108 | ) | 1,476,788 | ||||||||||||||||||
Depreciation and amortization | (16,327 | ) | (920 | ) | (3,167 | ) | (7,703 | ) | (106,180 | ) | — | (134,297 | ) | |||||||||||||||
|
|
|
|
|
|
|
|
|
|
|
|
|
| |||||||||||||||
Operating income (loss) | 1,258,777 | 23,748 | (68,351 | ) | 310,613 | (149,188 | ) | (33,108 | ) | 1,342,491 | ||||||||||||||||||
Equity in earnings of investments in associates | 31,509 | — | — | (8,026 | ) | 2,746 | — | 26,229 | ||||||||||||||||||||
Other non-operating income (expense) | (6,102 | ) | (380 | ) | (63 | ) | (97,918 | ) | (7,323 | ) | (1,403 | ) | (113,189 | ) | ||||||||||||||
|
|
|
|
|
|
|
|
|
|
|
|
|
| |||||||||||||||
Income (loss) before income tax | 1,284,184 | 23,368 | (68,414 | ) | 204,669 | (153,765 | ) | (34,511 | ) | 1,255,531 | ||||||||||||||||||
Income tax expense | (243,289 | ) | (4,509 | ) | 6,910 | (51,809 | ) | 24,367 | 18,409 | (249,921 | ) | |||||||||||||||||
|
|
|
|
|
|
|
|
|
|
|
|
|
| |||||||||||||||
Net income (loss) for the period | (Won) | 1,040,895 | (Won) | 18,859 | (Won) | (61,504 | ) | (Won) | 152,860 | (Won) | (129,398 | ) | (Won) | (16,102 | ) | (Won) | 1,005,610 | |||||||||||
|
|
|
|
|
|
|
|
|
|
|
|
|
| |||||||||||||||
Total assets | ||||||||||||||||||||||||||||
January 1, 2010 | (Won) | 122,801,863 | (Won) | 2,799,019 | (Won) | — | (Won) | — | (Won) | 6,470,562 | (Won) | (5,106,808 | ) | (Won) | 126,964,636 | |||||||||||||
December 31, 2010 | (Won) | 113,949,883 | (Won) | 2,708,036 | (Won) | 9,037,959 | (Won) | — | (Won) | 6,160,508 | (Won) | (5,997,218 | ) | (Won) | 125,859,168 | |||||||||||||
June 30, 2011 | (Won) | 122,786,774 | (Won) | 2,631,624 | (Won) | 9,338,062 | (Won) | 10,114,531 | (Won) | 7,361,989 | (Won) | (8,617,184 | ) | (Won) | 143,615,796 | |||||||||||||
|
|
|
|
|
|
|
|
|
|
|
|
|
| |||||||||||||||
S-90
Table of Contents
Korea Development Bank
Notes to the interim consolidated financial statements—(Continued)
June 30, 2011 and 2010
| Six months ended June 30, 2010 | ||||||||||||||||||||||||
| KDB (1) | Overseas subsidiaries | KDB Life Insurance | Others | Adjustments | Total | |||||||||||||||||||
Net interest income: | (Won) | 855,200 | (Won) | 32,204 | (Won) | 78,952 | (Won) | 12,454 | (Won) | 4,767 | (Won) | 983,577 | ||||||||||||
Interest income | 2,307,831 | 65,028 | 82,789 | 99,922 | (83,897 | ) | 2,471,673 | |||||||||||||||||
Interest expense | (1,452,631 | ) | (32,824 | ) | (3,837 | ) | (87,468 | ) | 88,664 | (1,488,096 | ) | |||||||||||||
Net non-interest income: | 530,210 | (17,264 | ) | (33,846 | ) | 36,577 | (52,021 | ) | 463,656 | |||||||||||||||
Net fee and commission income | 240,094 | 5,952 | 10,234 | (39,441 | ) | (2,585 | ) | 214,254 | ||||||||||||||||
Dividend income | 92,479 | 2 | 10,837 | 5,811 | (35,484 | ) | 73,645 | |||||||||||||||||
Net gains from financial assets and liabilities held-for-trading | 28,188 | 14 | 838 | 981 | 5,783 | 35,804 | ||||||||||||||||||
Net gain (loss) from financial assets and liabilities designated at FVTPL | (46,270 | ) | 325 | 663 | 29 | — | (45,253 | ) | ||||||||||||||||
Net gain (loss) from financial assets available-for-sale | 281,034 | (13,132 | ) | (2,222 | ) | 49,552 | (42,620 | ) | 272,612 | |||||||||||||||
Net gain (loss) from foreign currency transaction and derivative financial instruments | 74,160 | (9,978 | ) | (70 | ) | 496 | 17,281 | 81,889 | ||||||||||||||||
Other operating income (expense) | (139,475 | ) | (447 | ) | (54,126 | ) | 19,149 | 5,604 | (169,295 | ) | ||||||||||||||
Credit loss expense (reversal) | (547,239 | ) | (951 | ) | (27,336 | ) | 5,952 | 872 | (568,702 | ) | ||||||||||||||
General administrative expenses (except depreciation and amortization)) | (193,159 | ) | (19,086 | ) | (37,373 | ) | (11,646 | ) | 1 | (261,263 | ) | |||||||||||||
|
|
|
|
|
|
|
|
|
|
|
| |||||||||||||
Operating income (loss) (except depreciation and amortization)) | 645,012 | (5,097 | ) | (19,603 | ) | 43,337 | (46,381 | ) | 617,268 | |||||||||||||||
Depreciation and amortization) | (14,134 | ) | (1,411 | ) | (3,634 | ) | (1,102 | ) | (1 | ) | (20,282 | ) | ||||||||||||
|
|
|
|
|
|
|
|
|
|
|
| |||||||||||||
Operating income (loss) | 630,878 | (6,508 | ) | (23,237 | ) | 42,235 | (46,382 | ) | 596,986 | |||||||||||||||
Equity in earnings of investments in associates | (18,242 | ) | — | — | — | 26,358 | 8,116 | |||||||||||||||||
Other non-operating income (expense) | (1,151 | ) | (18 | ) | (145 | ) | (18,457 | ) | 2,208 | (17,563 | ) | |||||||||||||
|
|
|
|
|
|
|
|
|
|
|
| |||||||||||||
Profit (loss) before income tax | 611,485 | (6,526 | ) | (23,382 | ) | 23,778 | (17,816 | ) | 587,539 | |||||||||||||||
Income tax expense | (186,024 | ) | (2,373 | ) | — | 57 | (6,624 | ) | (194,964 | ) | ||||||||||||||
|
|
|
|
|
|
|
|
|
|
|
| |||||||||||||
Net profit (loss) for the period | (Won) | 425,461 | (Won) | (8,899 | ) | (Won) | (23,382 | ) | (Won) | 23,835 | (Won) | (24,440 | ) | (Won) | 392,575 | |||||||||
|
|
|
|
|
|
|
|
|
|
|
| |||||||||||||
Total assets | ||||||||||||||||||||||||
January 1, 2010 | (Won) | 122,801,863 | (Won) | 2,799,019 | (Won) | — | (Won) | 6,470,562 | (Won) | (5,106,808 | ) | (Won) | 126,964,636 | |||||||||||
June 30, 2011 | (Won) | 123,425,802 | (Won) | 2,702,065 | (Won) | 8,482,811 | (Won) | 5,713,349 | (Won) | (5,016,412 | ) | (Won) | 135,307,615 | |||||||||||
|
|
|
|
|
|
|
|
|
|
|
| |||||||||||||
| (*) | As of June 30, 2011 and 2010, the difference between separate consolidated financial statements represents equity method valuation adjustments. This adjustments consists of dividends from associates amounting to (Won)27,440 million and (Won)17,106 million for the six-months periods ended June 30, 2011 and 2010, respectively and equity in earnings of investments in associate amounting to (Won)33,061 million and (Won)12,547 million for the six-months periods ended June 30, 2011 and 2010, respectively. |
S-91
Table of Contents
Korea Development Bank
Notes to the interim consolidated financial statements—(Continued)
June 30, 2011 and 2010
Geographical segment information as of and for the six-months periods ended June 30, 2011 and 2010 are as follows (Korean won in millions):
| Income | Non-current assets(*1) | |||||||||||||||||||
| Six months ended June 30, 2011 | Six months ended June 30, 2010 | June 30, 2011 | June 30, 2010 | January 1, 2010 | ||||||||||||||||
Domestic | (Won) | 12,762,009 | (Won) | 11,289,630 | (Won) | 6,917,985 | (Won) | 2,144,653 | (Won) | 1,823,010 | ||||||||||
International(*2) | 632,127 | 304,701 | 12,602 | 11,581 | 12,815 | |||||||||||||||
|
|
|
|
|
|
|
|
|
| |||||||||||
| (Won) | 13,394,136 | (Won) | 11,594,331 | (Won) | 6,930,587 | (Won) | 2,156,234 | (Won) | 1,835,825 | |||||||||||
|
|
|
|
|
|
|
|
|
| |||||||||||
| (*1) | Non-current assets comprises investments in associates, property and equipment, investment properties and intangible assets. |
| (*2) | International operation includes overseas subsidiaries’ and branches’ operations. |
6. Net interest income
The details of net interest income for the six months ended June 30, 2011 and 2010 are as follows (Korean won in millions):
| Six months ended June 30, 2011 | Six months ended June 30, 2010 | |||||||
Interest income: | ||||||||
Interest income from due from banks | (Won) | 20,293 | (Won) | 19,864 | ||||
Interest income from financial assets held-for-trading | 32,762 | 42,604 | ||||||
Interest income from financial assets available-for-sale | 524,252 | 517,410 | ||||||
Interest income from financial assets held-to-maturity | 34,236 | 27,393 | ||||||
Interest income from loans | 1,783,983 | 1,864,402 | ||||||
|
|
|
| |||||
| 2,395,526 | 2,471,673 | |||||||
Interest expense: | ||||||||
Interest expense on financial liabilities designated at FVTPL | 27,578 | 35,091 | ||||||
Interest expense on due to customers | 356,977 | 216,586 | ||||||
Interest expense on borrowings | 239,890 | 309,903 | ||||||
Interest expense on debt issued | 854,431 | 926,516 | ||||||
|
|
|
| |||||
| 1,478,876 | 1,488,096 | |||||||
|
|
|
| |||||
| (Won) | 916,650 | (Won) | 983,577 | |||||
|
|
|
| |||||
S-92
Table of Contents
Korea Development Bank
Notes to the interim consolidated financial statements—(Continued)
June 30, 2011 and 2010
7. Net fee and commission income
The details of net fee and commission income for the six months ended June 30, 2011 and 2010 are as follows (Korean won in millions):
| Six months ended June 30, 2011 | Six months ended June 30, 2010 | |||||||
Commission income: | ||||||||
Loan handling fee | (Won) | 106,574 | (Won) | 99,529 | ||||
Underwriting and investment financing commissions | 97,237 | 111,657 | ||||||
Brokerage and agency commissions | 7,010 | 3,627 | ||||||
Trust and retirement pension commissions | 12,285 | 10,422 | ||||||
Asset management fee | 592 | 407 | ||||||
Other commissions | 16,414 | 30,230 | ||||||
|
|
|
| |||||
| 240,112 | 255,872 | |||||||
Fee expense: | ||||||||
Brokerage and agency fee | 4,320 | 8,936 | ||||||
Other fee | 12,831 | 32,682 | ||||||
|
|
|
| |||||
| 17,151 | 41,618 | |||||||
|
|
|
| |||||
| (Won) | 222,961 | (Won) | 214,254 | |||||
|
|
|
| |||||
8. Dividend income
The details of dividend income for the six months ended June 30, 2011 and 2010 are as follows (Korean won in millions):
| Six months ended June 30, 2011 | Six months ended June 30, 2010 | |||||||
Financial assets held-for-trading | (Won) | 1,237 | (Won) | 904 | ||||
Financial assets available-for-sale | 62,719 | 42,828 | ||||||
Non-current assets held-for-sale | 29,913 | 29,913 | ||||||
|
|
|
| |||||
| (Won) | 93,869 | (Won) | 73,645 | |||||
|
|
|
| |||||
S-93
Table of Contents
Korea Development Bank
Notes to the interim consolidated financial statements—(Continued)
June 30, 2011 and 2010
9. Gain (loss) from financial assets and liabilities held-for-trading
Gain (loss) from financial assets and liabilities held-for-trading for the six months ended June 30, 2011 and 2010 are as follows (Korean won in millions):
| Six months ended June 30, 2011 | Six months ended June 30, 2010 | |||||||
Gain from financial assets and liabilities held-for-trading: | ||||||||
Gain on redemption | (Won) | 50 | (Won) | 2,102 | ||||
Gain on sale | 69,873 | 36,242 | ||||||
Gain on valuation | 35,768 | 35,173 | ||||||
|
|
|
| |||||
| 105,691 | 73,517 | |||||||
Loss from financial assets and liabilities held-for-trading: | ||||||||
Loss on redemption | 415 | 5,536 | ||||||
Loss on sale | 35,799 | 16,149 | ||||||
Loss on valuation | 25,759 | 15,911 | ||||||
Trading expense | 240 | 117 | ||||||
|
|
|
| |||||
| 62,213 | 37,713 | |||||||
|
|
|
| |||||
| (Won) | 43,478 | (Won) | 35,804 | |||||
|
|
|
| |||||
10. Gain (loss) from financial assets and liabilities designated at FVTPL
Gain (loss) from financial assets and liabilities designated at FVTPL for the six months ended June 30, 2011 and 2010 are as follows (Korean won in millions):
| Six months ended June 30, 2011 | Six months ended June 30, 2010 | |||||||
Gain from financial assets and liabilities designated at FVTPL: | ||||||||
Gain on redemption | (Won) | 52 | (Won) | 3,839 | ||||
Gain on sale | 62 | 675 | ||||||
Gain on valuation | 4,742 | 1,775 | ||||||
|
|
|
| |||||
| 4,856 | 6,289 | |||||||
Loss from financial assets and liabilities designated at FVTPL: | ||||||||
Loss on redemption | 47 | 8,564 | ||||||
Loss on sale | — | 113 | ||||||
Loss on valuation | 22,755 | 42,865 | ||||||
|
|
|
| |||||
| 22,802 | 51,542 | |||||||
|
|
|
| |||||
| (Won) | (17,946 | ) | (Won) | (42,253 | ) | |||
|
|
|
| |||||
S-94
Table of Contents
Korea Development Bank
Notes to the interim consolidated financial statements—(Continued)
June 30, 2011 and 2010
11. Gain (loss) from financial assets available-for-sale
Gain (loss) from financial assets available-for-sale for the six months ended June 30, 2011 and 2010 are as follows (Korean won in millions):
| Six months ended June 30, 2011 | Six months ended June 30, 2010 | |||||||
Gain from financial assets available-for-sale: | ||||||||
Gain on redemption | (Won) | 1,567 | (Won) | 1,049 | ||||
Gain on sale | 197,622 | 414,413 | ||||||
Reversal of impairment losses | 13,589 | 4,000 | ||||||
|
|
|
| |||||
| 212,778 | 419,462 | |||||||
Loss from financial assets available-for-sale: | ||||||||
Loss on redemption | 1,339 | 420 | ||||||
Loss on sale | 8,149 | 23,820 | ||||||
Impairment losses | 128,387 | 122,610 | ||||||
|
|
|
| |||||
| 137,875 | 146,850 | |||||||
|
|
|
| |||||
| (Won) | 74,903 | (Won) | 272,612 | |||||
|
|
|
| |||||
12. Gain (loss) from foreign currency transactions and derivative financial instruments
Gain (loss) from foreign currency transactions and derivative financial instruments for the six months ended June 30, 2011 and 2010 are as follows (Korean won in millions):
| Six months ended June 30, 2011 | Six months ended June 30, 2010 | |||||||
Gain (loss) on foreign currency trading: | ||||||||
Gain on foreign currency trading | (Won) | 292,096 | (Won) | 576,094 | ||||
Loss on foreign currency trading | (298,673 | ) | (618,768 | ) | ||||
|
|
|
| |||||
| (6,577 | ) | (42,674 | ) | |||||
Gain (loss) on foreign exchange translation: | ||||||||
Gain on foreign exchange translation | 97,729 | 317,551 | ||||||
Loss on foreign exchange translation | (342,618 | ) | (122,040 | ) | ||||
|
|
|
| |||||
| (244,889 | ) | 195,511 | ||||||
Gain (loss) from trading purpose of derivatives: | ||||||||
Gain from trading purpose of derivatives: | ||||||||
Interest related derivatives | 1,055,257 | 1,567,498 | ||||||
Currency related derivatives | 2,984,383 | 4,067,295 | ||||||
Stock related derivatives | 37,422 | 52,536 | ||||||
Commodity related derivatives | 43,332 | 101,419 | ||||||
Embedded derivatives | 517,353 | 75,518 | ||||||
Gain on adjustment of derivatives | 10,298 | 14,642 | ||||||
|
|
|
| |||||
| 4,648,045 | 5,878,908 | |||||||
S-95
Table of Contents
Korea Development Bank
Notes to the interim consolidated financial statements—(Continued)
June 30, 2011 and 2010
| Six months ended June 30, 2011 | Six months ended June 30, 2010 | |||||||
Loss from trading purpose of derivatives: | ||||||||
Interest related derivatives | 1,075,222 | 1,628,954 | ||||||
Currency related derivatives | 2,783,784 | 3,895,394 | ||||||
Stock related derivatives | 36,990 | 50,954 | ||||||
Commodity related derivatives | 39,167 | 101,440 | ||||||
Embedded derivatives | 11,101 | 13,778 | ||||||
Loss on adjustment of derivatives | 7,528 | 44,596 | ||||||
|
|
|
| |||||
| 3,953,792 | 5,735,116 | |||||||
|
|
|
| |||||
| 694,253 | 143,792 | |||||||
Gain (loss) from hedging purpose derivatives: | ||||||||
Gain from hedging purpose of derivatives: | ||||||||
Interest related derivatives | 71,257 | 248,583 | ||||||
Currency related derivatives | 139,532 | 96,575 | ||||||
Commodity related derivatives | — | 18 | ||||||
Gain on adjustment of derivatives | 4,825 | 5,274 | ||||||
|
|
|
| |||||
| 215,614 | 350,450 | |||||||
Loss from hedging purpose derivatives: | ||||||||
Interest related derivatives | 57,816 | 60,555 | ||||||
Currency related derivatives | 40,647 | 319,595 | ||||||
Loss on adjustment of derivatives | 2,387 | 2,807 | ||||||
|
|
|
| |||||
| 100,850 | 382,957 | |||||||
|
|
|
| |||||
| 114,764 | (32,507 | ) | ||||||
Gain (loss) from fair value hedge instrument: | ||||||||
Gain from fair value hedge instrument: | ||||||||
Gain on valuation | 216,193 | 287,952 | ||||||
Gain on redemption | 21,656 | 15,503 | ||||||
|
|
|
| |||||
| 237,849 | 303,455 | |||||||
Loss from fair value hedge instrument: | ||||||||
Loss on valuation | 159,540 | 452,711 | ||||||
Loss on redemption | 43,366 | 32,977 | ||||||
|
|
|
| |||||
| 202,906 | 485,688 | |||||||
|
|
|
| |||||
| 34,943 | (182,233 | ) | ||||||
|
|
|
| |||||
| (Won) | 592,494 | (Won) | 81,889 | |||||
|
|
|
| |||||
S-96
Table of Contents
Korea Development Bank
Notes to the interim consolidated financial statements—(Continued)
June 30, 2011 and 2010
13. Other operating income (expense)
Other operating income (expense) for the six months ended June 30, 2011 and 2010 is as follows (Korean won in millions):
| Six months ended June 30, 2011 | Six months ended June 30, 2010 | |||||||
Other operating income: | ||||||||
Insurance premium | (Won) | 1,075,978 | (Won) | 555,259 | ||||
Reversal of other allowances | 35,511 | 62,120 | ||||||
Gain on sale of loans | 9,025 | 9,218 | ||||||
Gain on disposal of investment in associates | 5,182 | 10,495 | ||||||
Others | 3,533,588 | 129,751 | ||||||
|
|
|
| |||||
| 4,659,284 | 766,843 | |||||||
Other operating expense: | ||||||||
Insurance expense | 1,312,548 | 611,124 | ||||||
Provision for other allowances | 104,571 | 143,523 | ||||||
Impairment loss of held-to-maturity investments | 16,396 | 5,998 | ||||||
Loss on sale of loans | 457 | 2,579 | ||||||
Loss on disposal of investments in associates | 4,628 | 3,360 | ||||||
Others | 3,142,830 | 169,554 | ||||||
|
|
|
| |||||
| 4,581,430 | 936,138 | |||||||
|
|
|
| |||||
| (Won) | 77,854 | (Won) | (169,295 | ) | ||||
|
|
|
| |||||
14. General administrative expenses
General administrative expenses for the six months ended June 30, 2011 and 2010 are as follows (Korean won in millions):
| Six months ended June 30, 2011 | Six months ended June 30, 2010 | |||||||
Payroll costs: | ||||||||
Short-term salary | (Won) | 206,545 | (Won) | 145,194 | ||||
Early retirement compensation (voluntary) | 796 | 1,599 | ||||||
Severance pay | 19,028 | 15,939 | ||||||
|
|
|
| |||||
| 226,369 | 162,732 | |||||||
Employee welfare | 33,774 | 11,399 | ||||||
Depreciation of property and equipment | 16,930 | 12,523 | ||||||
Amortization of intangible assets | 117,368 | 7,759 | ||||||
Other: | ||||||||
Rental fee | 25,358 | 16,246 | ||||||
Taxes and dues | 10,412 | 12,661 | ||||||
Advertising expenses | 21,289 | 4,243 | ||||||
Others | 120,480 | 53,982 | ||||||
|
|
|
| |||||
| 177,539 | 87,132 | |||||||
|
|
|
| |||||
| (Won) | 571,980 | (Won) | 281,545 | |||||
|
|
|
| |||||
S-97
Table of Contents
Korea Development Bank
Notes to the interim consolidated financial statements—(Continued)
June 30, 2011 and 2010
15. Other non-operating income (expense)
The details of other non-operating income (expense) for the six months ended June 30, 2011 and 2010 are as follows (Korean won in millions):
| Six months ended June 30, 2011 | Six months ended June 30, 2010 | |||||||
Other non-operating income: | ||||||||
Interest income from non-financial industry | (Won) | 32,430 | (Won) | — | ||||
Gain on disposal of non-current assets held-for-sale | 7,214 | 179 | ||||||
Gain on disposal of property and equipment | 1,678 | 1,136 | ||||||
Rental income | 2,932 | 1,321 | ||||||
Others | 15,303 | 3,475 | ||||||
|
|
|
| |||||
| (Won) | 59,557 | (Won) | 6,111 | |||||
|
|
|
| |||||
Other non-operating expense: | ||||||||
Interest expense for non-financial industry | (Won) | 91,502 | (Won) | — | ||||
Loss on disposal of non-current assets held-for-sale | 2,562 | 179 | ||||||
Loss on disposal of property & equipment | 2,037 | 191 | ||||||
Depreciation for investment properties | 1,381 | 907 | ||||||
Donations | 6,466 | 308 | ||||||
Others | 68,798 | 22,280 | ||||||
|
|
|
| |||||
| (Won) | 172,746 | (Won) | 23,674 | |||||
|
|
|
| |||||
16. Income tax expense
The major components of income tax expense for the six months ended June 30, 2011 and 2010 are as follows (Korean won in millions):
| Six months ended June 30, 2011 | Six months ended June 30, 2010 | |||||||
Current income tax(*) | (Won) | 127,432 | (Won) | 254,087 | ||||
Change in deferred income tax due to temporary differences | 207,440 | 7,722 | ||||||
Deferred income tax recognized directly to equity | (7,781 | ) | (61,106 | ) | ||||
Change in income tax due to consolidated tax return | (33 | ) | — | |||||
Others | (77,137 | ) | (5,739 | ) | ||||
|
|
|
| |||||
Income tax expense | (Won) | 249,921 | (Won) | 194,964 | ||||
|
|
|
| |||||
Deferred income tax assets and liabilities are measured using the enacted tax rates and laws that will be in effect when the differences are expected to reverse (the income tax rate of 24.2% and 22% is applied 2011 and 2012 and thereafter, respectively.
S-98
Table of Contents
Korea Development Bank
Notes to the interim consolidated financial statements—(Continued)
June 30, 2011 and 2010
Tax effect related to comprehensive income is summarized as follows (Korean won in millions):
| Six months ended June 30, 2011 | Six months ended June 30, 2010 | |||||||
Gain on valuation of financial assets available-for-sale | (Won) | 78,928 | (Won) | 292,763 | ||||
Accumulated amount of exchange differences on translation of foreign operations | (18,323 | ) | 19,512 | |||||
Gain on valuation of cash flow hedge | — | 2,441 | ||||||
Changes in equity adjustments from equity method valuation | 17,288 | (291 | ) | |||||
Others | 2,368 | 6,299 | ||||||
|
|
|
| |||||
| 80,261 | 320,724 | |||||||
Income taxes expense | (7,781 | ) | (61,106 | ) | ||||
|
|
|
| |||||
| (Won) | 72,480 | (Won) | 259,618 | |||||
|
|
|
| |||||
17. Earnings per share
The Company represents its diluted and basic earnings per ordinary share in separate comprehensive statement of income. Basic earnings per share amounts are calculated by dividing net profit for the period attributable to ordinary share holders of the Company by the weighted average number of ordinary shares outstanding during the period. Diluted earnings per share amounts are calculated by adjusting net profit attributable to ordinary shareholders of the Company for basic earnings considered potential ordinary shares with dilution effect and weighted average number of ordinary shares outstanding.
Basic earnings per share computations are as follows (Korean won and share in units):
| Three months ended June 30, 2011 | Six months ended June 30, 2011 | |||||||
Net profit attributable to ordinary shareholders of the bank | (Won) | 476,010,671,817 | (Won) | 975,445,702,282 | ||||
Weighted average number of ordinary shares outstanding | 1,850,372,235 | 1,850,372,235 | ||||||
|
|
|
| |||||
Basic earnings per share | (Won) | 257 | (Won) | 527 | ||||
|
|
|
| |||||
| Three months ended June 30, 2010 | Six months ended June 30, 2010 | |||||||
Net profit attributable to ordinary shareholders of the Bank | (Won) | 225,156,903,771 | (Won) | 399,019,151,159 | ||||
Weighted average number of ordinary shares outstanding | 1,850,372,235 | 1,849,377,760 | ||||||
|
|
|
| |||||
Basic earnings per share | (Won) | 122 | (Won) | 216 | ||||
|
|
|
| |||||
S-99
Table of Contents
Korea Development Bank
Notes to the interim consolidated financial statements—(Continued)
June 30, 2011 and 2010
Weighted-average number of ordinary shares outstanding for the six months ended June 30, 2011 and 2010 are calculated as follows (share and day in units):
Six months ended June 30, 2011 | ||||||||||||
Number of shares outstanding | Days | Cumulative shares | Weighted number of shares outstanding | |||||||||
1,850,372,235 | 181 | 334,917,374,535 | 1,850,372,235 | |||||||||
|
|
|
|
|
| |||||||
Six months ended June 30, 2010 | ||||||||||||||||
| Number of shares outstanding | Days | Cumulative shares | Weighted number of shares outstanding | |||||||||||||
January 1, 2010 | 1,848,372,235 | 181 | 334,555,374,535 | 1,848,372,235 | ||||||||||||
Capital injection | 2,000,000 | 91 | 182,000,000 | 1,005,525 | ||||||||||||
|
|
|
|
|
| |||||||||||
June 30, 2010 | 1,850,372,235 | 334,737,374,535 | 1,849,377,760 | |||||||||||||
|
|
|
|
|
| |||||||||||
Diluted and basic earnings per share for the six months ended June 30, 2011 and 2010 are identical as the Company did not issue any potentially diluted common shares.
18. Cash and due from banks
Cash and due from banks in Korean won as of June 30, 2011, December 31, 2010 and January 1, 2010 are as follows (Korean won in millions):
| June 30, 2011 | December 31, 2010 | January 1, 2010 | ||||||||||
Cash | (Won) | 168,373 | (Won) | 175,032 | (Won) | 129,225 | ||||||
Due from banks in Korean won: | ||||||||||||
Due from Bank of Korea (“BOK”) | 1,009,861 | 88,165 | 646,172 | |||||||||
Due from Other banks | 720,754 | 463,862 | 413,182 | |||||||||
Due from Korea Securities Finance Corporation (“KSFC”) | — | — | 166 | |||||||||
Due from banks in foreign currency/off-shores | 1,118,856 | 645,586 | 647,055 | |||||||||
|
|
|
|
|
| |||||||
| (Won) | 3,017,844 | (Won) | 1,372,645 | (Won) | 1,835,800 | |||||||
|
|
|
|
|
| |||||||
Restricted due from banks as of June 30, 2011, December 31, 2010 and January 1, 2010 are summarized as follows (Korean won in millions):
| June 30, 2011 | December 31, 2010 | January 1, 2010 | ||||||||||
Deposits with BOK | (Won) | 1,091,299 | (Won) | 180,728 | (Won) | 705,876 | ||||||
Reserve for payment of principal on behalf of SPC | 114,802 | 157,209 | 141,905 | |||||||||
Others | 61,971 | 64,567 | 46,689 | |||||||||
|
|
|
|
|
| |||||||
| (Won) | 1,268,072 | (Won) | 402,504 | (Won) | 894,470 | |||||||
|
|
|
|
|
| |||||||
S-100
Table of Contents
Korea Development Bank
Notes to the interim consolidated financial statements—(Continued)
June 30, 2011 and 2010
19. Financial assets held-for-trading
The details of financial assets held-for-trading as of June 30, 2011, December 31, 2010 and January 1, 2010 are as follows (Korean won in millions):
| June 30, 2011 | December 31, 2010 | January 1, 2010 | ||||||||||
Held-for-trading in Korean won: | ||||||||||||
Equity securities | (Won) | 140,111 | (Won) | 77,413 | (Won) | 3,650 | ||||||
Debt securities: | ||||||||||||
Government and municipal bonds | 679,438 | 1,006,899 | 300,383 | |||||||||
Financial bonds | 1,115,000 | 1,195,301 | 1,149,854 | |||||||||
Corporate bonds | 215,938 | 181,748 | 623,511 | |||||||||
Commercial paper | 304,761 | 186,320 | 167,098 | |||||||||
|
|
|
|
|
| |||||||
| 2,315,137 | 2,570,628 | 2,240,846 | ||||||||||
Beneficiary certificates | 1,794,761 | 3,273,051 | 995,255 | |||||||||
Others | 2,031 | 194,963 | 44,566 | |||||||||
|
|
|
|
|
| |||||||
| 4,252,040 | 6,115,695 | 3,284,317 | ||||||||||
Held-for-trading in foreign currency and off-shores investments: | ||||||||||||
Equity securities | 13,932 | 17,217 | — | |||||||||
Debt securities | 79,323 | 3,640 | 73,640 | |||||||||
Others | 42,942 | 34,936 | — | |||||||||
|
|
|
|
|
| |||||||
| 136,197 | 55,793 | 73,640 | ||||||||||
Held-for-trading lended | 354,156 | — | — | |||||||||
|
|
|
|
|
| |||||||
| (Won) | 4,742,393 | (Won) | 6,171,488 | (Won) | 3,357,957 | |||||||
|
|
|
|
|
| |||||||
The details of debt securities in financial assets held-for-trading as of June 30, 2011, December 31, 2010 and January 1, 2010 are as follows (Korean won in millions):
| June 30, 2011 | ||||||||||||
| Par value | Acquisition cost | Fair value (carrying amount) | ||||||||||
Government and municipal bonds | (Won) | 691,068 | (Won) | 691,717 | (Won) | 679,438 | ||||||
Financial bonds | 1,125,067 | 1,117,474 | 1,115,000 | |||||||||
Corporate bonds | 203,367 | 205,203 | 215,938 | |||||||||
Commercial papers | 311,000 | 304,754 | 304,761 | |||||||||
Debt securities in foreign currency | 84,662 | 80,552 | 79,323 | |||||||||
Debt securities lended | 360,000 | 355,745 | 354,156 | |||||||||
|
|
|
|
|
| |||||||
| (Won) | 2,775,164 | (Won) | 2,755,445 | (Won) | 2,748,616 | |||||||
|
|
|
|
|
| |||||||
S-101
Table of Contents
Korea Development Bank
Notes to the interim consolidated financial statements—(Continued)
June 30, 2011 and 2010
| December 31, 2010 | ||||||||||||
| Par value | Acquisition cost | Fair value (carrying amount) | ||||||||||
Government and municipal bonds | (Won) | 999,847 | (Won) | 1,030,431 | (Won) | 1,006,899 | ||||||
Financial bonds | 1,195,301 | 1,196,041 | 1,195,301 | |||||||||
Corporate bonds | 178,645 | 180,851 | 181,748 | |||||||||
Commercial papers | 188,500 | 186,254 | 186,320 | |||||||||
Debt securities in foreign currency | 3,898 | 3,667 | 3,640 | |||||||||
|
|
|
|
|
| |||||||
| (Won) | 2,566,191 | (Won) | 2,597,244 | (Won) | 2,573,908 | |||||||
|
|
|
|
|
| |||||||
| January 1, 2010 | ||||||||||||
| Par value | Acquisition cost | Fair value (Carrying amount) | ||||||||||
Government and municipal bonds | (Won) | 300,132 | (Won) | 301,419 | (Won) | 300,383 | ||||||
Financial bonds | 1,150,364 | 1,150,432 | 1,149,854 | |||||||||
Corporate bonds | 626,535 | 626,291 | 623,511 | |||||||||
Commercial papers | 170,000 | 167,023 | 167,098 | |||||||||
Debt securities in foreign currency | 75,110 | 72,468 | 73,640 | |||||||||
|
|
|
|
|
| |||||||
| (Won) | 2,322,141 | (Won) | 2,317,633 | (Won) | 2,314,486 | |||||||
|
|
|
|
|
| |||||||
Debt securities in Korean won are measured at the lower of fair values provided by KIS Bonds Pricing Inc. and Korea Asset Pricing Co. Debt securities in foreign currency are measured at the lower of fair values provided by NICE Bonds Pricing Services Inc. and Korea Asset Pricing Co.
20. Financial assets designated at FVTPL
The financial assets designated at FVTPL as of June 30, 2011, December 31, 2010 and January 1, 2010 are as follows (Korean won in millions):
| June 30, 2011 | December 31, 2010 | January 1, 2010 | ||||||||||
Securities in Korean won | (Won) | 55,380 | (Won) | 32,438 | (Won) | — | ||||||
Securities in foreign currency | — | 1,497 | 470 | |||||||||
Loans in Korean won | — | — | 89,503 | |||||||||
|
|
|
|
|
| |||||||
| (Won) | 55,380 | (Won) | 33,935 | (Won) | 89,973 | |||||||
|
|
|
|
|
| |||||||
The above financial assets designated at FVTPL represent equity index linked securities, which are not separated from host contracts, and the entire financial asset is designated at FVTPL.
S-102
Table of Contents
Korea Development Bank
Notes to the interim consolidated financial statements—(Continued)
June 30, 2011 and 2010
21. Financial assets available-for-sale
The details of financial assets available-for-sale as of June 30, 2011, December 31, 2010 and January 1, 2010 are as follows (Korean won in millions):
| June 30, 2011 | December 31, 2010 | January 1, 2010 | ||||||||||
Available-for-sale in Korean won: | ||||||||||||
Equity securities | (Won) | 2,989,748 | (Won) | 2,537,248 | (Won) | 2,986,700 | ||||||
Debt securities: | ||||||||||||
Government and public bonds | 2,769,787 | 2,469,545 | 1,082,033 | |||||||||
Financial bonds | 5,290,832 | 4,969,775 | 3,922,907 | |||||||||
Corporate bonds | 11,265,741 | 10,510,287 | 14,974,652 | |||||||||
|
|
|
|
|
| |||||||
| 19,326,360 | 17,949,607 | 19,979,592 | ||||||||||
Beneficiary certificates | 462,612 | 408,385 | 1,042,348 | |||||||||
Others | 546,033 | 559,836 | — | |||||||||
|
|
|
|
|
| |||||||
| 23,324,753 | 21,455,076 | 24,008,640 | ||||||||||
Available-for-sale in foreign currency and off-shore investments: | ||||||||||||
Equity securities | 14,938 | 15,548 | 25,482 | |||||||||
Debt securities | 4,774,285 | 4,568,224 | 4,703,985 | |||||||||
Others | 613,566 | 370,035 | 398,992 | |||||||||
|
|
|
|
|
| |||||||
| 5,402,789 | 4,953,807 | 5,128,459 | ||||||||||
Financial assets available-for-sale lended | 368,186 | — | — | |||||||||
|
|
|
|
|
| |||||||
| (Won) | 29,095,728 | (Won) | 26,408,883 | (Won) | 29,137,099 | |||||||
|
|
|
|
|
| |||||||
Changes in financial assets available-for-sale for the six months ended June 30, 2011 and 2010 are as follows (Korean won in millions):
| Six months ended June 30, 2011 | Six months ended June 30, 2010 | |||||||
Beginning balance | (Won) | 26,408,883 | (Won) | 29,137,099 | ||||
Acquisition | 14,977,711 | 5,359,473 | ||||||
Disposal and redemption | (12,590,047 | ) | (11,280,699 | ) | ||||
Changes due to amortization | 1,229 | (9,060 | ) | |||||
Changes in fair value | (42,040 | ) | 292,763 | |||||
Impairment loss | (128,387 | ) | (122,610 | ) | ||||
Reversal of impairment loss | 13,589 | 4,000 | ||||||
Reclassification | (77,025 | ) | 288,369 | |||||
Foreign exchange differences | (197,193 | ) | 26,036 | |||||
Acquisition of subsidiary | 729,008 | 2,116,778 | ||||||
Others | — | 111,000 | ||||||
|
|
|
| |||||
Ending balance | (Won) | 29,095,728 | (Won) | 25,923,149 | ||||
|
|
|
| |||||
S-103
Table of Contents
Korea Development Bank
Notes to the interim consolidated financial statements—(Continued)
June 30, 2011 and 2010
The details of marketable financial assets available-for-sale (including equity securities in foreign currency) as of June 30, 2011, December 31, 2010 and January 1, 2010 consist of the following (Korean won in millions):
| June 30, 2011 | December 31, 2010 | January 1, 2010 | ||||||||||||||
Company | Ownership (%) | Fair value (carrying amount) | Fair value (carrying amount) | Fair value (carrying amount) | ||||||||||||
STX Pan Ocean Co., Ltd. | 14.99 | (Won) | 230,833 | (Won) | 353,347 | (Won) | 348,718 | |||||||||
KUMHO Tire Co., Inc.(*) | 13.73 | 133,222 | 74,771 | — | ||||||||||||
Asiana Airlines Inc. | 6.81 | 120,414 | 117,852 | 44,469 | ||||||||||||
Sungjin Geotec Co., Ltd. | 17.50 | 99,464 | — | — | ||||||||||||
Doosan Heavy Industries and Construction Co., Ltd. | 1.27 | 76,100 | 115,565 | 610,889 | ||||||||||||
Ssangyong Cement Industry Co., Ltd.(*) | 13.81 | 71,891 | 69,140 | 94,738 | ||||||||||||
ILJIN Materials Co., Ltd. | 6.63 | 65,390 | 10,026 | — | ||||||||||||
STX Corporation | 4.74 | 64,060 | 68,494 | 40,375 | ||||||||||||
KUMHO Industrial Co., Ltd.(*) | 7.80 | 47,541 | 94,993 | — | ||||||||||||
IS Dongseo Co., Ltd. | 8.19 | 39,517 | — | — | ||||||||||||
Taesan LCD Co., Ltd.(*) | 6.57 | 10,562 | 17,808 | 9,995 | ||||||||||||
SIMPAC Inc. | 5.24 | 10,134 | 6,202 | 3,480 | ||||||||||||
KOCREF15CR-REIT | 15.00 | 9,356 | 9,374 | 9,300 | ||||||||||||
Sewon Corporation | 16.62 | 8,161 | 10,299 | — | ||||||||||||
Jusung Engeneering Co., Ltd. | 1.10 | 5,643 | 7,600 | — | ||||||||||||
Others | 166,601 | 225,638 | 183,731 | |||||||||||||
|
|
|
|
|
| |||||||||||
| (Won) | 1,158,889 | (Won) | 1,181,109 | (Won) | 1,345,695 | |||||||||||
|
|
|
|
|
| |||||||||||
| (*) | Listed shares with disposal restrictions are measured at fair value provided by independent appraisal agencies. |
The details of non-marketable financial assets available-for-sale (including equity securities in foreign currency) as of June 30, 2011, December 31, 2010 and January 1, 2010 consist of the following (Korean won in millions):
| June 30, 2011 | December 31, 2010 | January 1, 2010 | ||||||||||||||
Company | Ownership (%) | Fair value (carrying amount) | Fair value (carrying amount | Fair value (carrying amount) | ||||||||||||
Consumer Credit Assistant Fund Co., Ltd. | 4.67 | (Won) | 102,198 | (Won) | 102,198 | (Won) | 102,198 | |||||||||
Pantech Co., Ltd.(*) | 15.10 | 100,519 | 101,268 | 103,762 | ||||||||||||
Hyundai Engineering Co., Ltd. | 7.42 | 59,618 | 56,242 | 5,740 | ||||||||||||
Samsung Total Petrochemicals Co., Ltd. | 19.44 | 46,314 | 43,328 | 38,391 | ||||||||||||
Korea Securities Finance Corporation | 5.19 | 37,693 | 34,523 | 29,397 | ||||||||||||
Hwan Young Steel Ind. Co., Ltd. | 14.28 | 32,906 | 32,541 | 32,983 | ||||||||||||
Shinbundang Railroad Co., Ltd. | 10.28 | 31,669 | 28,881 | 23,790 | ||||||||||||
Nonperforming Asset Management Fund | 10.47 | 25,593 | 30,901 | 48,880 | ||||||||||||
Alpha dome City Co., Ltd. | 14.00 | 23,996 | 19,668 | 11,800 | ||||||||||||
Econhill Development Co., Ltd. | 4.32 | 19,668 | 17,013 | 17,013 | ||||||||||||
Kangnam Beltway | 13.46 | 15,547 | 15,420 | 13,973 | ||||||||||||
Korea Integrated Freight Terminal Co., Ltd. | 6.85 | 15,316 | 14,965 | 14,523 | ||||||||||||
Seoullitetower. Ltd. | 6.19 | 14,989 | 9,460 | — | ||||||||||||
Others | 1,319,771 | 865,279 | 1,224,037 | |||||||||||||
|
|
|
|
|
| |||||||||||
| (Won) | 1,845,797 | (Won) | 1,371,687 | (Won) | 1,666,487 | |||||||||||
|
|
|
|
|
| |||||||||||
S-104
Table of Contents
Korea Development Bank
Notes to the interim consolidated financial statements—(Continued)
June 30, 2011 and 2010
| (*) | Listed shares with disposal restrictions are measured at fair value provided by independent appraisal agencies. |
Equity investments available-for-sale with disposal restrictions as of June 30, 2011, December 31, 2010 and January 1, 2010 are summarized as follows (Korean won in millions and share in unit):
| June 30, 2011 | ||||||||||
Company | Number of shares | Carrying amount | Restricted term | |||||||
Pantech Co., Ltd. | 249,427,382 | (Won) | 100,519 | Until December 31, 2011 | ||||||
KUMHO Tire Co., Inc. | 13,161,600 | 133,222 | Until December 31, 2014 | |||||||
Ssangyong Cement Industry Co., Ltd. | 11,090,842 | 71,891 | Not defined | |||||||
Taesan LCD Co., Ltd. | 7,027,574 | 10,562 | Until December 31, 2013 | |||||||
KUMHO Industrial Co., Ltd. | 7,413,201 | 47,541 | Until December 31, 2014 | |||||||
Hanchang Paper Co., Ltd. | 6,409,200 | 3,166 | Until December 31, 2012 | |||||||
Jaeyoung Solutec Co., Ltd. | 1,962,000 | 1,399 | Until December 31, 2012 | |||||||
MB CORP Co., Ltd. | 1,220,975 | 810 | (*) | |||||||
Hanil Engineering & Construction Co., Ltd. | 909,600 | 2,199 | Until December 31, 2014 | |||||||
Young Gwang Stainless Co., Ltd. | 413,000 | 772 | Until December 31, 2012 | |||||||
Daehan Shipbuilding Co., Ltd. | 309,500 | 2,419 | Until December 31, 2013 | |||||||
21ST CENTURY SHIPBUILDING Co., Ltd. | 210,400 | — | Until December 31, 2012 | |||||||
Enertech INC | 207,600 | — | Until December 31, 2012 | |||||||
Daewoo Electronics Corp. | 12,063 | 1,835 | Until March 31, 2012 | |||||||
|
| |||||||||
| (Won) | 376,335 | |||||||||
|
| |||||||||
| (*) | 30%, 30% and 40% of shares are expected to be released from disposal restrictions in July 2011, October 2011 and January 2012, respectively. |
| December 31, 2010 | ||||||||||
Company | Number of shares | Carrying amount | Restricted term | |||||||
Pantech Co., Ltd. | 249,427,382 | (Won) | 101,268 | Until December 31, 2011 | ||||||
KUMHO Tire Co., Inc. | 13,161,600 | 74,771 | Until December 31, 2014 | |||||||
Ssangyong Cement Industry Co., Ltd. | 11,090,842 | 69,140 | Not defined | |||||||
Taesan LCD Co., Ltd. | 7,027,574 | 17,808 | Until December 31, 2013 | |||||||
KUMHO Industrial Co., Ltd. | 7,413,201 | 94,993 | Until December 31, 2014 | |||||||
Hanchang Paper Co., Ltd. | 6,409,200 | 3,230 | Until December 31, 2012 | |||||||
Daewoo Electronics Corporation | 2,412,662 | 2,085 | Until March 31, 2011 | |||||||
Daehan Shipbuilding Co., Ltd. | 309,500 | 2,238 | Until December 31, 2013 | |||||||
Young Gwang Stainless Co., Ltd. | 413,000 | 772 | Until December 31, 2012 | |||||||
|
| |||||||||
| (Won) | 366,305 | |||||||||
|
| |||||||||
S-105
Table of Contents
Korea Development Bank
Notes to the interim consolidated financial statements—(Continued)
June 30, 2011 and 2010
| January 1, 2010 | ||||||||||
Company | Number of shares | Carrying amount | Restricted term | |||||||
Ssangyong Cement Industry Co., Ltd. | 11,092,842 | (Won) | 94,738 | Not defined | ||||||
Hanchang Paper Co., Ltd. | 9,156,000 | 4,779 | Until August 8, 2010 | |||||||
Daehan Eunpakgy Co., Ltd. | 2,815,093 | 2,846 | Until March 27, 2010 | |||||||
Daewoo Electronics Corporation | 2,412,662 | 1,884 | Until March 31, 2011 | |||||||
|
| |||||||||
| (Won) | 104,247 | |||||||||
|
| |||||||||
The details of debt securities available-for-sale as of June 30, 2011, December 31, 2010 and January 1, 2010 are summarized as follows (Korean won in millions):
| June 30, 2011 | ||||||||||||
| Par value | Acquisition cost | Fair value (carrying amount) | ||||||||||
Government and public bonds | (Won) | 2,704,438 | (Won) | 2,742,483 | (Won) | 2,769,787 | ||||||
Finance bonds | 5,255,200 | 5,279,154 | 5,290,832 | |||||||||
Corporate bonds | 11,484,647 | 11,459,110 | 11,265,741 | |||||||||
Bonds in foreign currency | 4,986,577 | 5,240,634 | 4,826,363 | |||||||||
Available-for-sale bonds lended | 370,000 | 372,747 | 368,186 | |||||||||
|
|
|
|
|
| |||||||
| (Won) | 24,800,862 | (Won) | 25,094,128 | (Won) | 24,520,909 | |||||||
|
|
|
|
|
| |||||||
| December 31, 2010 | ||||||||||||
| Par value | Acquisition cost | Fair value (carrying amount) | ||||||||||
Government and public bonds | (Won) | 2,398,426 | (Won) | 2,474,529 | (Won) | 2,469,545 | ||||||
Finance bonds | 4,937,938 | 4,953,711 | 4,969,775 | |||||||||
Corporate bonds | 11,709,168 | 11,665,837 | 10,510,287 | |||||||||
Bonds in foreign currency | 4,693,929 | 4,693,392 | 4,568,224 | |||||||||
|
|
|
|
|
| |||||||
| (Won) | 23,739,461 | (Won) | 23,787,469 | (Won) | 22,517,831 | |||||||
|
|
|
|
|
| |||||||
| January 1, 2010 | ||||||||||||
| Par value | Acquisition cost | Fair value (carrying amount) | ||||||||||
Government and public bonds | (Won) | 1,075,000 | (Won) | 1,131,286 | (Won) | 1,082,033 | ||||||
Finance bonds | 3,940,000 | 3,951,579 | 3,922,907 | |||||||||
Corporate bonds | 15,254,239 | 15,199,575 | 14,974,652 | |||||||||
Bonds in foreign currency | 4,893,743 | 4,886,773 | 4,703,985 | |||||||||
|
|
|
|
|
| |||||||
| (Won) | 25,162,982 | (Won) | 25,169,213 | (Won) | 24,683,577 | |||||||
|
|
|
|
|
| |||||||
Debt securities in Korean won are measured at the lower of fair values provided by KIS Bonds Pricing Inc. and Korea Asset Pricing Co. Debt securities in foreign currency are measured at the lower of fair values provided by NICE Bonds Pricing Services Inc. and the Korea Asset Pricing Co.
S-106
Table of Contents
Korea Development Bank
Notes to the interim consolidated financial statements—(Continued)
June 30, 2011 and 2010
22. Financial assets held-to-maturity
The details of financial assets held-to-maturity as of June 30, 2011, December 31, 2010 and January 1, 2010 are as follows (Korean won in millions):
| Amortized cost | Fair value | |||||||||||||||||||||||
| June 30, 2011 | December 31, 2010 | January 1, 2010 | June 30, 2011 | December 31, 2010 | January 1, 2010 | |||||||||||||||||||
Financial assets held-to-maturity in Korean won: | ||||||||||||||||||||||||
Government and public bonds | (Won) | 198,434 | (Won) | 198,069 | (Won) | 16,661 | (Won) | 163,055 | (Won) | 206,843 | (Won) | 15,317 | ||||||||||||
Financial bonds | 373,610 | 394,228 | — | 379,246 | 397,987 | — | ||||||||||||||||||
Corporate bonds | 264,554 | 279,714 | 318,072 | 265,674 | 282,010 | 319,013 | ||||||||||||||||||
Others | 1,031 | 847 | 859 | 1,031 | 847 | 859 | ||||||||||||||||||
|
|
|
|
|
|
|
|
|
|
|
| |||||||||||||
| 837,629 | 872,858 | 335,592 | 809,006 | 887,687 | 335,189 | |||||||||||||||||||
Financial assets held-to-maturity in foreign currency: | ||||||||||||||||||||||||
Debt securities | 283,519 | 279,574 | 5,996 | 303,563 | 298,187 | 5,996 | ||||||||||||||||||
Others | — | — | 37,248 | — | — | 37,248 | ||||||||||||||||||
|
|
|
|
|
|
|
|
|
|
|
| |||||||||||||
| 283,519 | 279,574 | 43,244 | 303,563 | 298,187 | 43,244 | |||||||||||||||||||
|
|
|
|
|
|
|
|
|
|
|
| |||||||||||||
| (Won) | 1,121,148 | (Won) | 1,152,432 | (Won) | 378,836 | (Won) | 1,112,569 | (Won) | 1,185,874 | (Won) | 378,433 | |||||||||||||
|
|
|
|
|
|
|
|
|
|
|
| |||||||||||||
Changes in carrying value of financial assets held-to-maturity for the year six months ended June 30, 2011 and 2010 are as follows (Korean won in millions):
| Six months ended June 30, 2011 | Six months ended June 30, 2010 | |||||||
Beginning balance | (Won) | 1,152,432 | (Won) | 378,836 | ||||
Acquisition | 28,912 | 109,785 | ||||||
Disposal and redemption | (34,243 | ) | (62,536 | ) | ||||
Changes due to amortization | 1,286 | (691 | ) | |||||
Impairment loss | (16,396 | ) | (5,998 | ) | ||||
Foreign exchange differences | (10,698 | ) | 8,533 | |||||
Acquisition of subsidiary | — | 960,148 | ||||||
Others | (145 | ) | — | |||||
|
|
|
| |||||
Ending balance | (Won) | 1,121,148 | (Won) | 1,388,077 | ||||
|
|
|
| |||||
S-107
Table of Contents
Korea Development Bank
Notes to the interim consolidated financial statements—(Continued)
June 30, 2011 and 2010
23. Loans and allowance for possible loan losses
The details of loans as of June 30, 2011, December 31, 2010 and January 1, 2010 are as follows (Korean won in millions):
| Amortized cost | Fair value | |||||||||||||||||||||||
| June 30, 2011 | December 31, 2010 | January 1, 2010 | June 30, 2011 | December 31, 2010 | January 1, 2010 | |||||||||||||||||||
Loans in Korean won: | ||||||||||||||||||||||||
Loans for facility development | (Won) | 25,961,671 | (Won) | 24,420,548 | (Won) | 24,799,268 | (Won) | 26,114,693 | (Won) | 24,463,655 | (Won) | 24,571,094 | ||||||||||||
Loans for working capital | 17,088,250 | 14,714,314 | 12,293,214 | 16,625,866 | 14,230,157 | 12,012,440 | ||||||||||||||||||
Private loans | 1,002,988 | 968,011 | 47,989 | 986,217 | 936,557 | 47,046 | ||||||||||||||||||
Inter-bank loans | 536,994 | 513,262 | 437,358 | 524,527 | 485,267 | 404,101 | ||||||||||||||||||
|
|
|
|
|
|
|
|
|
|
|
| |||||||||||||
| 44,589,903 | 40,616,135 | 37,577,829 | 44,251,303 | 40,115,636 | 37,034,681 | |||||||||||||||||||
Loans in foreign currency: | ||||||||||||||||||||||||
Loans | 12,897,172 | 13,471,026 | 14,139,806 | 12,827,530 | 13,457,509 | 14,026,735 | ||||||||||||||||||
Off-shore loans receivables | 3,360,837 | 3,513,242 | 3,360,834 | 3,375,716 | 3,440,303 | 3,301,327 | ||||||||||||||||||
Inter-bank loans | 1,780,067 | 780,390 | 756,413 | 1,783,626 | 780,614 | 755,987 | ||||||||||||||||||
Loans borrowed from overseas financial institutions | 316,643 | 343,067 | 1,575,954 | 321,525 | 345,759 | 1,646,663 | ||||||||||||||||||
|
|
|
|
|
|
|
|
|
|
|
| |||||||||||||
| 18,354,719 | 18,107,725 | 19,833,007 | 18,308,397 | 18,024,185 | 19,730,712 | |||||||||||||||||||
Other loans: | ||||||||||||||||||||||||
Private-placed corporate bonds | 6,676,772 | 7,325,960 | 12,302,478 | 6,510,184 | 7,160,075 | 12,285,162 | ||||||||||||||||||
Bills bought in foreign currency | 1,653,216 | 1,726,482 | 2,302,486 | 1,649,307 | 1,720,338 | 2,285,842 | ||||||||||||||||||
Advance payments on acceptances and guarantees | 83,641 | 162,247 | 121,367 | 71,720 | 74,990 | 92,480 | ||||||||||||||||||
Others | 5,356,821 | 7,280,391 | 5,682,627 | 5,361,192 | 7,264,656 | 5,094,242 | ||||||||||||||||||
|
|
|
|
|
|
|
|
|
|
|
| |||||||||||||
| 13,770,450 | 16,495,080 | 20,408,958 | 13,592,403 | 16,220,059 | 19,757,726 | |||||||||||||||||||
|
|
|
|
|
|
|
|
|
|
|
| |||||||||||||
| (Won) | 76,715,072 | (Won) | 75,218,940 | (Won) | 77,819,794 | (Won) | 76,152,103 | (Won) | 74,359,880 | (Won) | 76,523,119 | |||||||||||||
|
|
|
|
|
|
|
|
|
|
|
| |||||||||||||
Less: | ||||||||||||||||||||||||
Allowance for possible loan losses | (1,419,004 | ) | (1,423,122 | ) | (1,043,548 | ) | ||||||||||||||||||
Present value discount | (90,124 | ) | (116,218 | ) | (90,216 | ) | ||||||||||||||||||
Deferred loan origination fees | (36,257 | ) | (28,998 | ) | (16,280 | ) | ||||||||||||||||||
|
|
|
|
|
| |||||||||||||||||||
| (Won) | 75,169,687 | (Won) | 73,650,602 | (Won) | 76,669,750 | |||||||||||||||||||
|
|
|
|
|
| |||||||||||||||||||
S-108
Table of Contents
Korea Development Bank
Notes to the interim consolidated financial statements—(Continued)
June 30, 2011 and 2010
Changes in allowance for possible loan losses for the six months ended June 30, 2011 and 2010 are as follows (Korean won in millions):
| Six months ended June 30, 2011 | ||||||||||||||||||||||||||||
| Loans in Korean won | Other loans | |||||||||||||||||||||||||||
| Loans for working capital | Loans for facility development | Others | Loans in foreign currency | Private- placed corporate bonds | Others | Total | ||||||||||||||||||||||
Beginning balance | (Won) | 598,270 | (Won) | 172,844 | (Won) | 383 | (Won) | 264,696 | (Won) | 247,687 | (Won) | 139,242 | (Won) | 1,423,122 | ||||||||||||||
Net increase (decrease) in allowance for possible loan losses | 58,660 | 38,925 | (22 | ) | 37,011 | 15,451 | (60,233 | ) | 89,792 | |||||||||||||||||||
Write-off | (81,999 | ) | — | — | — | — | — | (81,999 | ) | |||||||||||||||||||
Foreign exchange differences | — | — | — | (2,690 | ) | — | (10 | ) | (2,700 | ) | ||||||||||||||||||
Others | (1,821 | ) | (2,766 | ) | (1 | ) | 11,694 | (4,654 | ) | (11,663 | ) | (9,211 | ) | |||||||||||||||
|
|
|
|
|
|
|
|
|
|
|
|
|
| |||||||||||||||
Ending balance | (Won) | 573,110 | (Won) | 209,003 | (Won) | 360 | (Won) | 310,711 | (Won) | 258,484 | (Won) | 67,336 | (Won) | 1,419,004 | ||||||||||||||
|
|
|
|
|
|
|
|
|
|
|
|
|
| |||||||||||||||
| Six months ended June 30, 2010 | ||||||||||||||||||||||||||||
| Loans in Korean won | Other loans | |||||||||||||||||||||||||||
| Loans for working capital | Loans for facility development | Others | Loans in foreign currency | Privately- placed corporate bonds | Others | Total | ||||||||||||||||||||||
Beginning balance | (Won) | 425,059 | (Won) | 198,199 | (Won) | 352 | (Won) | 242,957 | (Won) | 78,722 | (Won) | 98,259 | (Won) | 1,043,548 | ||||||||||||||
Net increase (decrease) in allowance for possible loan losses | 315,908 | (10,660 | ) | — | 69,645 | 108,207 | 85,602 | 568,702 | ||||||||||||||||||||
Write-off | (217,285 | ) | (35,941 | ) | — | (51,716 | ) | (47,287 | ) | (12,765 | ) | (364,994 | ) | |||||||||||||||
Foreign exchange differences | 190,258 | — | — | — | — | — | 190,258 | |||||||||||||||||||||
Others | (84,726 | ) | 45,826 | 85 | 607 | (958 | ) | (9,898 | ) | (49,064 | ) | |||||||||||||||||
|
|
|
|
|
|
|
|
|
|
|
|
|
| |||||||||||||||
Ending balance | (Won) | 629,214 | (Won) | 197,424 | (Won) | 437 | (Won) | 261,493 | (Won) | 138,684 | (Won) | 161,198 | (Won) | 1,388,450 | ||||||||||||||
|
|
|
|
|
|
|
|
|
|
|
|
|
| |||||||||||||||
Gain (loss) from loans for the six months ended June 30, 2011 and 2010 are as follows (Korean won in millions):
| Six months ended June 30, 2011 | Six months ended June 30, 2010 | |||||||
Credit loss expense | (Won) | (89,792 | ) | (Won) | (568,702 | ) | ||
Net gain on sale of loans | 8,568 | 6,639 | ||||||
|
|
|
| |||||
| (Won) | (81,224 | ) | (Won) | (562,063 | ) | |||
|
|
|
| |||||
S-109
Table of Contents
Korea Development Bank
Notes to the interim consolidated financial statements—(Continued)
June 30, 2011 and 2010
24. Derivative financial instruments
The Company’s derivative financial instruments consist of derivatives held-for-trading and derivatives used as fair value hedge, depending on the nature of each transaction. The Company enters into derivatives used as fair value hedge transactions mainly for the purpose of hedging fair value risk related to changes in fair value of the underlying assets and liabilities.
The Company enters into derivatives held-for-trading transactions such as futures, forwards, swaps and options for arbitrage transactions by speculating on the future value of the underlying asset. Derivatives held-for-trading transactions include contracts with the Company’s customers and its liquidation position.
For the purpose of hedging the exposure to the variability of fair values of funds in Korean won by changes in interest rate, the Company mainly uses interest swaps or currency swaps. The main counterparties are financial institutions and local banks. To hedge against the exposure to the variability of fair values of bonds on foreign currency by changes in interest or currency rates, the Company primarily relies on its interest swaps or currency swaps.
The notional amounts outstanding for derivatives contracts and the fair values of the derivative instruments held as of June 30, 2011, December 31, 2010 and January 1, 2010 are as follows (Korean won in millions):
| June 30, 2011 | ||||||||||||||||
| Notional amounts | Fair value | |||||||||||||||
| Bought | Sold | Asset | Liability | |||||||||||||
Trading derivative instruments: | ||||||||||||||||
Interest | (Won) | 145,852,241 | (Won) | 146,466,652 | (Won) | 1,204,206 | (Won) | 1,295,073 | ||||||||
Currency | 45,954,582 | 44,748,170 | 2,890,232 | 2,527,448 | ||||||||||||
Equity | 1,250,606 | 775,231 | 16,386 | 188,098 | ||||||||||||
Commodities | 542,056 | 542,060 | 16,039 | 16,035 | ||||||||||||
Embedded derivatives | 475,722 | 59 | 705,884 | 59 | ||||||||||||
Valuation and other adjustments | — | — | (15,729 | ) | 10,311 | |||||||||||
|
|
|
|
|
|
|
| |||||||||
| 194,075,207 | 192,532,172 | 4,817,018 | 4,037,024 | |||||||||||||
Hedging derivative instruments: | ||||||||||||||||
Interest | 11,841,217 | 11,834,662 | 597,658 | 59,813 | ||||||||||||
Currency | 4,096,049 | 4,161,256 | 512,137 | 62,515 | ||||||||||||
Valuation and other adjustments | — | — | 13,442 | 11,501 | ||||||||||||
|
|
|
|
|
|
|
| |||||||||
| 15,937,266 | 15,995,918 | 1,123,237 | 133,829 | |||||||||||||
|
|
|
|
|
|
|
| |||||||||
| (Won) | 210,012,473 | (Won) | 208,528,090 | (Won) | 5,940,255 | (Won) | 4,170,853 | |||||||||
|
|
|
|
|
|
|
| |||||||||
S-110
Table of Contents
Korea Development Bank
Notes to the interim consolidated financial statements—(Continued)
June 30, 2011 and 2010
| December 31, 2010 | ||||||||||||||||
| Notional amounts | Fair value | |||||||||||||||
| Bought | Sold | Asset | Liability | |||||||||||||
Trading derivative instruments: | ||||||||||||||||
Interest | (Won) | 175,932,894 | (Won) | 162,882,010 | (Won) | 1,380,119 | (Won) | 1,660,692 | ||||||||
Currency | 52,005,665 | 50,968,294 | 3,214,672 | 2,782,386 | ||||||||||||
Equity | 461,463 | 412,718 | 26,161 | 25,765 | ||||||||||||
Commodities | 220,755 | 220,755 | 12,576 | 12,393 | ||||||||||||
Embedded derivatives | 548,950 | — | 233,770 | — | ||||||||||||
Valuation and other adjustments | — | — | (39,955 | ) | 2,982 | |||||||||||
|
|
|
|
|
|
|
| |||||||||
| 229,169,727 | 214,483,777 | 4,827,343 | 4,484,218 | |||||||||||||
Hedging derivative instruments: | ||||||||||||||||
Interest | 12,944,107 | 12,964,927 | 594,631 | 73,055 | ||||||||||||
Currency | 5,406,094 | 5,426,858 | 628,640 | 123,377 | ||||||||||||
Valuation and other adjustments | — | — | 12,634 | 14,473 | ||||||||||||
|
|
|
|
|
|
|
| |||||||||
| 18,350,201 | 18,391,785 | 1,235,905 | 210,905 | |||||||||||||
|
|
|
|
|
|
|
| |||||||||
| (Won) | 247,519,928 | (Won) | 232,875,562 | (Won) | 6,063,248 | (Won) | 4,695,123 | |||||||||
|
|
|
|
|
|
|
| |||||||||
| January 1, 2010 | ||||||||||||||||
| Notional amounts | Fair value | |||||||||||||||
| Bought | Sold | Asset | Liability | |||||||||||||
Trading derivative instruments: | ||||||||||||||||
Interest | (Won) | 161,221,309 | (Won) | 159,724,796 | (Won) | 1,424,660 | (Won) | 1,846,240 | ||||||||
Currency | 56,350,899 | 53,850,122 | 5,213,654 | 4,442,833 | ||||||||||||
Equity | 159,387 | 203,523 | 1,022 | 29,426 | ||||||||||||
Commodities | 397,922 | 397,954 | 87,448 | 84,968 | ||||||||||||
Embedded derivatives | 356,725 | — | 68,248 | — | ||||||||||||
Valuation and other adjustments | — | — | (51,847 | ) | 2,201 | |||||||||||
|
|
|
|
|
|
|
| |||||||||
| 218,486,242 | 214,176,395 | 6,743,185 | 6,405,668 | |||||||||||||
Hedging derivative instruments: | ||||||||||||||||
Interest | 10,137,751 | 10,288,655 | 330,282 | 174,599 | ||||||||||||
Currency | 5,425,028 | 4,981,724 | 552,550 | 79,212 | ||||||||||||
Valuation and other adjustment | — | — | (7,301 | ) | (10,823 | ) | ||||||||||
|
|
|
|
|
|
|
| |||||||||
| 15,562,779 | 15,270,379 | 875,531 | 242,988 | |||||||||||||
|
|
|
|
|
|
|
| |||||||||
| (Won) | 234,049,021 | (Won) | 229,446,774 | (Won) | 7,618,716 | (Won) | 6,648,656 | |||||||||
|
|
|
|
|
|
|
| |||||||||
S-111
Table of Contents
Korea Development Bank
Notes to the interim consolidated financial statements—(Continued)
June 30, 2011 and 2010
25. Investments in associates
Investments in associates as of June 30, 2011, December 31, 2010 are summarized as follows (Korean won in millions):
| June 30, 2011 | December 31, 2010 | January 1, 2010 | ||||||||||
Daewoo Engineering & Construction Co., Ltd | (Won) | — | (Won) | 1,000,010 | (Won) | — | ||||||
GM Korea Company | 666,704 | 470,335 | — | |||||||||
Korea BTL Fund I | 240,929 | 222,309 | 173,994 | |||||||||
KDB electronic power PEF | 150,724 | 150,915 | 126,150 | |||||||||
Korea Infrastructure Fund II | 124,783 | 114,998 | 96,795 | |||||||||
Korea Education Fund | 83,258 | 83,604 | 74,210 | |||||||||
Korea Railroad Fund I | 160,574 | 133,382 | 73,479 | |||||||||
Sungjin Geotec Co., Ltd | — | — | 60,542 | |||||||||
Others | 460,154 | 305,417 | 494,517 | |||||||||
|
|
|
|
|
| |||||||
| (Won) | 1,887,126 | (Won) | 2,480,970 | (Won) | 1,099,687 | |||||||
|
|
|
|
|
| |||||||
S-112
Table of Contents
Korea Development Bank
Notes to the interim consolidated financial statements—(Continued)
June 30, 2011 and 2010
Changes in investments in associates, which were valued using equity method, for the six months ended June 30, 2011 and 2010 are as follows (Korean won in millions):
| Six-months ended June 30, 2011 | ||||||||||||||||||||||||||||||||||||||||
| January 1, 2011 | Acquisition/ Transfer | Disposal | Equity in earnings of investments in associates | Changes in equity adjustments from equity method valuation | Dividend | Impairment loss | Acquisition of subsidiary | Others | June 30, 2011 | |||||||||||||||||||||||||||||||
Daewoo E&C (*) | (Won) | 1,000,010 | (Won) | — | (Won) | — | (Won) | — | (Won) | — | (Won) | — | (Won) | — | (Won) | — | (Won) | (1,000,010 | ) | (Won) | — | |||||||||||||||||||
GM Korea Company | 470,335 | — | — | 19,480 | 13,591 | — | — | 163,298 | 666,704 | |||||||||||||||||||||||||||||||
Korea BTL Fund I | 222,309 | 20,417 | (2,498 | ) | 5,762 | — | (5,061 | ) | — | — | — | 240,929 | ||||||||||||||||||||||||||||
KDB electronic power PEF | 150,915 | — | 3,942 | — | (4,132 | ) | — | — | — | 150,725 | ||||||||||||||||||||||||||||||
Korea Infrastructure Fund II | 114,998 | 9,866 | (612 | ) | 3,020 | — | (2,489 | ) | — | — | — | 124,783 | ||||||||||||||||||||||||||||
Korea Education Fund | 83,604 | 1,000 | (1,348 | ) | 2,074 | — | (2,072 | ) | — | — | — | 83,258 | ||||||||||||||||||||||||||||
Korea Railroad Fund I | 133,382 | 26,501 | — | 3,569 | — | (2,878 | ) | — | — | — | 160,574 | |||||||||||||||||||||||||||||
Others | 305,417 | 32,025 | (4,715 | ) | 3,162 | 3,697 | (10,808 | ) | (14,780 | ) | 155,162 | (9,007 | ) | 460,153 | ||||||||||||||||||||||||||
|
|
|
|
|
|
|
|
|
|
|
|
|
|
|
|
|
|
|
| |||||||||||||||||||||
| (Won) | 2,480,970 | (Won) | 89,809 | (Won) | (9,173 | ) | (Won) | 41,009 | (Won) | 17,288 | (Won) | (27,440 | ) | (Won) | (14,780 | ) | (Won) | 155,162 | (Won) | (845,719 | ) | (Won) | 1,887,126 | |||||||||||||||||
|
|
|
|
|
|
|
|
|
|
|
|
|
|
|
|
|
|
|
| |||||||||||||||||||||
| (*) | This Company was fully consolidated from the beginning of current year on which control was transfered to the Company by acquisition of equity ownership. |
| Six-months ended June 30,2010 | ||||||||||||||||||||||||||||||||
| January 1, 2010 | Acquisition/ Transfer | Disposal | Equity in earnings of investments in associates | Changes in equity adjustments from equity method valuation | Dividend | Impairment loss | June 30, 2010 | |||||||||||||||||||||||||
Korea BTL Fund I | (Won) | 173,994 | (Won) | 25,000 | (Won) | (1,157 | ) | (Won) | 4,578 | (Won) | — | (Won) | (3,621 | ) | (Won) | — | (Won) | 198,794 | ||||||||||||||
KDB electronic power PEF | 126,150 | 24,020 | (312 | ) | 4,005 | — | (3,389 | ) | — | 150,474 | ||||||||||||||||||||||
Korea Infrastructure Fund II | 96,795 | 6,133 | (1,820 | ) | 1,981 | — | (2,654 | ) | — | 100,435 | ||||||||||||||||||||||
Korea Education Fund | 74,210 | 10,000 | (877 | ) | 2,099 | — | (1,814 | ) | — | 83,618 | ||||||||||||||||||||||
Korea Railroad Fund I | 73,479 | 24,501 | — | 2,126 | — | (1,477 | ) | — | 98,629 | |||||||||||||||||||||||
Sungjin Geotec Co., Ltd. | 60,542 | — | (60,542 | ) | — | — | — | — | — | |||||||||||||||||||||||
Others | 494,517 | 54,906 | (242,414 | ) | (2,242 | ) | (218 | ) | (4,151 | ) | (4,431 | ) | 295,967 | |||||||||||||||||||
|
|
|
|
|
|
|
|
|
|
|
|
|
|
|
| |||||||||||||||||
| (Won) | 1,099,687 | (Won) | 144,560 | (Won) | (307,122 | ) | (Won) | 12,547 | (Won) | (218 | ) | (Won) | (17,106 | ) | (Won) | (4,431 | ) | (Won) | 927,917 | |||||||||||||
|
|
|
|
|
|
|
|
|
|
|
|
|
|
|
| |||||||||||||||||
S-113
Table of Contents
Korea Development Bank
Notes to the interim consolidated financial statements—(Continued)
June 30, 2011 and 2010
The details of financial information of important associates valued using equity method and ownership ratios as of June 30, 2011, December 31, 2010 and January 1, 2010 are as follows (Korean won in millions):
| June 30, 2011 | ||||||||||||||||||||||||||||
| Country | Industry | Assets | Liabilities | Equity | Operating revenue | Net income (loss) | Ownership ratio (%) | |||||||||||||||||||||
GM Korea Company | Korea | Manufacturing | (Won) | 9,365,849 | (Won) | 5,445,946 | (Won) | 3,919,903 | (Won) | 7,336,787 | (Won) | 114,520 | 17.02 | |||||||||||||||
Korea BTL Fund I | Korea | Financial investment | 578,617 | 380 | 578,237 | 14,657 | 13,830 | 41.67 | ||||||||||||||||||||
KDB electronic power PEF | Korea | Financial investment | 299,347 | 49 | 299,298 | 8,270 | 7,884 | 50.00 | ||||||||||||||||||||
Korea Infrastructure Fund II | Korea | Financial investment | 582,118 | 114,179 | 467,939 | 16,939 | 11,324 | 26.67 | ||||||||||||||||||||
Korea Education Fund | Korea | Financial investment | 166,524 | 8 | 166,516 | 4,364 | 4,147 | 50.00 | ||||||||||||||||||||
Korea Railroad Fund I | Korea | Financial investment | (Won) | 321,163 | (Won) | 15 | (Won) | 321,148 | (Won) | 7,921 | (Won) | 7,138 | 50.00 | |||||||||||||||
| December 31, 2010 | ||||||||||||||||||||||||||||
| Country | Industry | Assets | Liabilities | Equity | Operating revenue | Net Income (loss) | Ownership ratio (%) | |||||||||||||||||||||
Daewoo E&C | Korea | Construction | (Won) | 9,558,441 | (Won) | 6,155,702 | (Won) | 3,402,739 | (Won) | 6,780,478 | (Won) | (362,241 | ) | 21.63 | ||||||||||||||
GM Korea Company | Korea | Manufacturing | 7,827,531 | 5,061,596 | 2,765,935 | 13,791,424 | 585,551 | 17.02 | ||||||||||||||||||||
Korea BTL Fund I | Korea | Financial investment | 451,505 | 278 | 451,227 | 5,419 | 5,103 | 41.67 | ||||||||||||||||||||
KDB electronic power PEF | Korea | Financial investment | 282,373 | 323 | 282,050 | 4,043 | 3,852 | 50.00 | ||||||||||||||||||||
Korea Infrastructure Fund II | Korea | Financial investment | 454,027 | 96,226 | 357,801 | 5,965 | 3,598 | 26.67 | ||||||||||||||||||||
Korea Education Fund | Korea | Financial investment | 165,074 | 7 | 165,067 | 2,129 | 2,029 | 50.00 | ||||||||||||||||||||
Korea Railroad Fund I | Korea | Financial investment | (Won) | 165,998 | (Won) | 10 | (Won) | 165,988 | (Won) | 2,194 | (Won) | 1,983 | 50.00 | |||||||||||||||
| January 1, 2010 | ||||||||||||||||||||||
| Country | Industry | Assets | Liabilities | Equity | Ownership ratio (%) | |||||||||||||||||
Korea BTL Fund I | Korea | Financial investment | (Won) | 417,854 | (Won) | 263 | (Won) | 417,591 | 41.67 | |||||||||||||
KDB electronic power PEF | Korea | Financial investment | 250,819 | 43 | 250,776 | 50.00 | ||||||||||||||||
Korea Infrastructure Fund II | Korea | Financial investment | 456,259 | 93,278 | 362,981 | 26.67 | ||||||||||||||||
Korea Education Fund | Korea | Financial investment | 148,427 | 8 | 148,419 | 50.00 | ||||||||||||||||
Korea Railroad Fund I | Korea | Financial investment | 146,967 | 9 | 146,958 | 50.00 | ||||||||||||||||
Sungjin Geotec Co., Ltd. | Korea | Manufacturing | (Won) | 588,858 | (Won) | 554,493 | (Won) | 34,365 | 29.51 | |||||||||||||
S-114
Table of Contents
Korea Development Bank
Notes to the interim consolidated financial statements—(Continued)
June 30, 2011 and 2010
26. Property and equipment
Changes in carrying value of property and equipment for the six months ended June 30, 2011 and 2010 are as follows (Korean won in millions):
| Six months ended June 30, 2011 | ||||||||||||||||||||||||||||
| January 1, 2011 | Acquisition/ depreciation | Disposal/ write-off | Reclassi- fication | Foreign exchange differences | Acquisition of subsidiary | June 30, 2011 | ||||||||||||||||||||||
Acquisition cost: | ||||||||||||||||||||||||||||
Land | (Won) | 265,191 | (Won) | 210 | (Won) | (1,623 | ) | (Won) | 5,467 | (Won) | (15 | ) | (Won) | 135,598 | (Won) | 404,828 | ||||||||||||
Buildings and structures | 356,865 | 2,623 | (320 | ) | 6,787 | (541 | ) | 274,225 | 639,639 | |||||||||||||||||||
Leasehold improvements | 24,201 | 1,754 | (3,872 | ) | — | (268 | ) | — | 21,815 | |||||||||||||||||||
Vehicles | 4,406 | 4,852 | (18,477 | ) | — | (7 | ) | 113,189 | 103,963 | |||||||||||||||||||
Equipment | 118,866 | 26,876 | (39,562 | ) | — | (100 | ) | 98,220 | 204,300 | |||||||||||||||||||
Construction in-progress | — | 8,920 | — | — | — | 168,265 | 177,185 | |||||||||||||||||||||
Others | 108,638 | 26,151 | (19,594 | ) | — | 200 | 362,872 | 478,267 | ||||||||||||||||||||
|
|
|
|
|
|
|
|
|
|
|
|
|
| |||||||||||||||
| 878,167 | 71,386 | (83,448 | ) | 12,254 | (731 | ) | 1,152,369 | 2,029,997 | ||||||||||||||||||||
Accumulated depreciation: | ||||||||||||||||||||||||||||
Buildings and structures | 111,405 | 7,740 | (276 | ) | 2,029 | (131 | ) | 57,268 | 178,035 | |||||||||||||||||||
Leasehold improvements | 14,865 | 1,369 | (2,374 | ) | — | (201 | ) | — | 13,659 | |||||||||||||||||||
Vehicles | 2,683 | 4,430 | (18,776 | ) | — | 25 | 93,177 | 81,539 | ||||||||||||||||||||
Equipment | 91,633 | 8,124 | (36,423 | ) | — | 63 | 69,063 | 132,460 | ||||||||||||||||||||
Others | 71,705 | 34,393 | (4,415 | ) | — | 20 | 267,669 | 369,372 | ||||||||||||||||||||
|
|
|
|
|
|
|
|
|
|
|
|
|
| |||||||||||||||
| 292,291 | 56,056 | (62,264 | ) | 2,029 | (224 | ) | 487,177 | 775,065 | ||||||||||||||||||||
Accumulated impairment loss: | ||||||||||||||||||||||||||||
Land | 3,023 | — | — | — | — | — | 3,023 | |||||||||||||||||||||
Buildings and structures | 2,361 | — | — | — | — | — | 2,361 | |||||||||||||||||||||
|
|
|
|
|
|
|
|
|
|
|
|
|
| |||||||||||||||
| 5,384 | — | — | — | — | — | 5,384 | ||||||||||||||||||||||
|
|
|
|
|
|
|
|
|
|
|
|
|
| |||||||||||||||
| (Won) | 580,492 | (Won) | 15,530 | (Won) | (21,184 | ) | (Won) | 10,225 | (Won) | (507 | ) | (Won) | 665,192 | (Won) | 1,249,548 | |||||||||||||
|
|
|
|
|
|
|
|
|
|
|
|
|
| |||||||||||||||
S-115
Table of Contents
Korea Development Bank
Notes to the interim consolidated financial statements—(Continued)
June 30, 2011 and 2010
| Six months ended June 30, 2010 | ||||||||||||||||||||||||||||
| January 1, 2010 | Acquisition/ depreciation | Disposal/ write-off | Reclassi- fication | Foreign exchange differences | Acquisition of subsidiary | June 30, 2010 | ||||||||||||||||||||||
Acquisition cost: | ||||||||||||||||||||||||||||
Land | (Won) | 283,815 | (Won) | 17 | (Won) | (8,144 | ) | (Won) | (3,819 | ) | (Won) | 24 | (Won) | 2,940 | (Won) | 274,833 | ||||||||||||
Buildings and structures | 344,508 | 989 | (11,979 | ) | (2,462 | ) | 93 | 35,818 | 366,967 | |||||||||||||||||||
Leasehold improvements | 13,383 | 1,185 | (149 | ) | — | (69 | ) | 7,036 | 21,386 | |||||||||||||||||||
Vehicles | 3,655 | 1,144 | (177 | ) | — | (110 | ) | 18 | 4,530 | |||||||||||||||||||
Equipment | 58,047 | 2,840 | (4,260 | ) | — | (836 | ) | 65,063 | 120,854 | |||||||||||||||||||
Construction in-progress | 13 | 16 | — | — | — | — | 29 | |||||||||||||||||||||
Others | 79,543 | 23,415 | (1,361 | ) | — | (542 | ) | 524 | 101,579 | |||||||||||||||||||
|
|
|
|
|
|
|
|
|
|
|
|
|
| |||||||||||||||
| 782,964 | 29,606 | (26,070 | ) | (6,281 | ) | (1,440 | ) | 111,399 | 890,178 | |||||||||||||||||||
Accumulated depreciation: | ||||||||||||||||||||||||||||
Buildings and structures | 79,124 | 11,449 | (17 | ) | (670 | ) | 260 | 10,065 | 100,211 | |||||||||||||||||||
Leasehold improvements | 9,999 | 1,017 | (95 | ) | — | (119 | ) | 3,018 | 13,820 | |||||||||||||||||||
Vehicles | 3,305 | 197 | (160 | ) | — | (117 | ) | 18 | 3,243 | |||||||||||||||||||
Equipment | 43,434 | 4,636 | (369 | ) | — | (685 | ) | 48,598 | 95,614 | |||||||||||||||||||
Others | 64,540 | 4,200 | — | — | (371 | ) | — | 68,369 | ||||||||||||||||||||
|
|
|
|
|
|
|
|
|
|
|
|
|
| |||||||||||||||
| 200,402 | 21,499 | (641 | ) | (670 | ) | (1,032 | ) | 61,699 | 281,257 | |||||||||||||||||||
Accumulated impairment loss: | ||||||||||||||||||||||||||||
Land | 3,023 | — | — | — | — | — | 3,023 | |||||||||||||||||||||
Buildings and structures | 2,361 | — | — | — | — | — | 2,361 | |||||||||||||||||||||
|
|
|
|
|
|
|
|
|
|
|
|
|
| |||||||||||||||
| 5,384 | — | — | — | — | — | 5,384 | ||||||||||||||||||||||
|
|
|
|
|
|
|
|
|
|
|
|
|
| |||||||||||||||
| (Won) | 577,178 | (Won) | 8,107 | (Won) | (25,429 | ) | (Won) | (5,611 | ) | (Won) | (408 | ) | (Won) | 49,700 | (Won) | 603,537 | ||||||||||||
|
|
|
|
|
|
|
|
|
|
|
|
|
| |||||||||||||||
27. Investment properties
Changes in carrying value of investment properties for the six months ended June 30, 2011 and 2010 are as follows (Korean won in millions):
| Six months ended June 30, 2011 | ||||||||||||||||||||||||
| January 1, 2011 | Acquisition/ depreciation | Disposal/ write-off | Reclassi- fication | Acquisition of subsidiary | June 30, 2011 | |||||||||||||||||||
Acquisition cost: | ||||||||||||||||||||||||
Land | (Won) | 74,703 | (Won) | 277 | (Won) | (50,545 | ) | (Won) | (5,467 | ) | (Won) | 282,138 | (Won) | 301,106 | ||||||||||
Buildings and structures | 129,426 | — | (39,256 | ) | (6,787 | ) | 135,710 | 219,093 | ||||||||||||||||
|
|
|
|
|
|
|
|
|
|
|
| |||||||||||||
| 204,129 | 277 | (89,801 | ) | (12,254 | ) | 417,848 | 520,199 | |||||||||||||||||
Accumulated depreciation: | ||||||||||||||||||||||||
Buildings and structures | 36,280 | 1,381 | (17,145 | ) | (2,028 | ) | 42,380 | 60,868 | ||||||||||||||||
|
|
|
|
|
|
|
|
|
|
|
| |||||||||||||
| 36,280 | 1,381 | (17,145 | ) | (2,028 | ) | 42,380 | 60,868 | |||||||||||||||||
Accumulated impairment loss: | ||||||||||||||||||||||||
Land | 8,371 | — | (11,200 | ) | — | 14,502 | 11,673 | |||||||||||||||||
Buildings and structures | 1,778 | — | — | — | 1,821 | 3,599 | ||||||||||||||||||
|
|
|
|
|
|
|
|
|
|
|
| |||||||||||||
| 10,149 | — | (11,200 | ) | — | 16,323 | 15,272 | ||||||||||||||||||
|
|
|
|
|
|
|
|
|
|
|
| |||||||||||||
| (Won) | 157,700 | (Won) | (1,104 | ) | (Won) | (61,456 | ) | (Won) | (10,226 | ) | (Won) | 359,145 | (Won) | 444,059 | ||||||||||
|
|
|
|
|
|
|
|
|
|
|
| |||||||||||||
S-116
Table of Contents
Korea Development Bank
Notes to the interim consolidated financial statements—(Continued)
June 30, 2011 and 2010
| Six months ended June 30, 2010 | ||||||||||||||||||||
| January 1, 2010 | Acquisition/ depreciation | Reclassification | Acquisition of subsidiary | June 30, 2010 | ||||||||||||||||
Acquisition cost: | ||||||||||||||||||||
Land | (Won) | 61,770 | — | (Won) | 3,819 | (Won) | 6,564 | (Won) | 72,153 | |||||||||||
Buildings and structures | 40,832 | — | 2,462 | 79,276 | 122,570 | |||||||||||||||
|
|
|
|
|
|
|
|
|
| |||||||||||
| 102,602 | — | 6,281 | 85,840 | 194,723 | ||||||||||||||||
Accumulated depreciation: | ||||||||||||||||||||
Buildings and structures | 10,376 | 907 | 670 | 21,133 | 33,086 | |||||||||||||||
Accumulated impairment loss: | ||||||||||||||||||||
Land | 1,197 | — | — | — | 1,197 | |||||||||||||||
Buildings and structures | 1,778 | — | — | — | 1,778 | |||||||||||||||
|
|
|
|
|
|
|
|
|
| |||||||||||
| 2,975 | — | — | — | 2,975 | ||||||||||||||||
|
|
|
|
|
|
|
|
|
| |||||||||||
| (Won) | 89,251 | (Won) | (907 | ) | (Won) | 5,611 | (Won) | 64,707 | (Won) | 158,662 | ||||||||||
|
|
|
|
|
|
|
|
|
| |||||||||||
The fair value of the Company’s investment properties, which was determined on the basis of a valuation by an independent appraisal agency, amounted to (Won)471,146 million as of June 30, 2011, ((Won)173,950 million as of December 31, 2010 and (Won)95,557 million as of January 1, 2010).
28. Intangible assets
Changes in carrying value of intangible assets for the six months ended June 30, 2011 and 2010 are as follows (Korean won in millions):
| Six months ended June 30, 2011 | ||||||||||||||||||||||||||||||||
| January 1, 2011 | Acquisition | Disposal | Amortization | Foreign exchange differences | Acquisition of subsidiary | Others | June 30, 2011 | |||||||||||||||||||||||||
Good will | (Won) | 331,768 | (Won) | 610,209 | (Won) | — | (Won) | — | (Won) | — | (Won) | — | (Won) | 2,534 | (Won) | 944,511 | ||||||||||||||||
Intangible assets related customers | 17,414 | — | — | (48,341 | ) | — | 931,631 | — | 900,704 | |||||||||||||||||||||||
Others | 80,799 | 39,091 | (1,168 | ) | (69,027 | ) | (101 | ) | 1,455,045 | — | 1,504,639 | |||||||||||||||||||||
|
|
|
|
|
|
|
|
|
|
|
|
|
|
|
| |||||||||||||||||
| (Won) | 429,981 | (Won) | 649,300 | (Won) | (1,168 | ) | (Won) | (117,368 | ) | (Won) | (101 | ) | (Won) | 2,386,676 | (Won) | 2,534 | (Won) | 3,349,854 | ||||||||||||||
|
|
|
|
|
|
|
|
|
|
|
|
|
|
|
| |||||||||||||||||
| Six months ended June 30, 2010 | ||||||||||||||||||||||||||||
| January 1, 2010 | Acquisition | Amortization | Foreign exchange differences | Acquisition of subsidiary | Others | June 30, 2010 | ||||||||||||||||||||||
Good will | (Won) | 11,630 | (Won) | 331,079 | (Won) | — | (Won) | — | (Won) | — | (Won) | 35,247 | (Won) | 377,956 | ||||||||||||||
Intangible assets related customers | — | — | (149 | ) | — | 17,861 | — | 17,712 | ||||||||||||||||||||
Others | 58,079 | 7,826 | (7,610 | ) | (335 | ) | 12,459 | 31 | 70,450 | |||||||||||||||||||
|
|
|
|
|
|
|
|
|
|
|
|
|
| |||||||||||||||
| (Won) | 69,709 | (Won) | 338,905 | (Won) | (7,759 | ) | (Won) | (335 | ) | (Won) | 30,320 | (Won) | 35,278 | (Won) | 466,118 | |||||||||||||
|
|
|
|
|
|
|
|
|
|
|
|
|
| |||||||||||||||
S-117
Table of Contents
Korea Development Bank
Notes to the interim consolidated financial statements—(Continued)
June 30, 2011 and 2010
29. Deferred tax assets and liabilities
The temporary differences which comprise of deferred tax assets and liabilities as of June 30, 2011, December 31, 2010 and January 1, 2010 are as follows (Korean won in millions):
| June 30, 2011 | ||||||||
| Temporary differences | Deferred tax liabilities (assets) | |||||||
Gain on valuation of financial assets available-for-sale | (Won) | 831,211 | (Won) | 200,048 | ||||
Loss on valuation of hedged items | (759,627 | ) | (167,118 | ) | ||||
Impairment loss on debt investments | (491,136 | ) | (108,050 | ) | ||||
Impairment loss on equity investments | (575,116 | ) | (126,525 | ) | ||||
Derivative financial liabilities | 1,989,745 | 437,744 | ||||||
Investments in associates | 835,008 | 161,825 | ||||||
Others | 640,715 | 140,956 | ||||||
|
|
|
| |||||
| (Won) | 2,470,800 | (Won) | 538,880 | |||||
|
|
|
| |||||
Deferred tax assets | (Won) | 453,823 | ||||||
|
| |||||||
Deferred tax liabilities | (Won) | 992,703 | ||||||
|
| |||||||
| December 31, 2010 | ||||||||
| Temporary differences | Deferred tax liabilities (assets) | |||||||
Gain on valuation of financial assets available-for-sale | (Won) | 771,068 | (Won) | 180,304 | ||||
Loss on valuation of hedged items | (1,158,118 | ) | (254,786 | ) | ||||
Impairment loss on debt investments | (527,176 | ) | (115,979 | ) | ||||
Impairment loss on equity investments | (437,743 | ) | (96,303 | ) | ||||
Derivative financial liabilities | 1,167,505 | 256,851 | ||||||
Investments in associates | 1,103,600 | 288,321 | ||||||
Others | 331,964 | 73,032 | ||||||
|
|
|
| |||||
| (Won) | 1,251,100 | (Won) | 331,440 | |||||
|
|
|
| |||||
Deferred tax assets | (Won) | 111 | ||||||
|
| |||||||
Deferred tax liabilities | (Won) | 331,551 | ||||||
|
| |||||||
| January 1, 2010 | ||||||||
| Temporary differences | Deferred tax assets (liabilities) | |||||||
Gain on valuation of financial investments available-for-sale | (Won) | 738,977 | (Won) | 169,400 | ||||
Loss on valuation of hedged items | (1,029,850 | ) | (226,567 | ) | ||||
Impairment loss on debt investments | (512,118 | ) | (112,666 | ) | ||||
Reversal of impairment loss on equity investments | 268,702 | 59,115 | ||||||
Credit loss expense | (17,336 | ) | (3,814 | ) | ||||
Derivative financial instruments | 880,036 | 193,608 | ||||||
Investments in associates | 991,741 | 218,183 | ||||||
Others | (41,318 | ) | (16,085 | ) | ||||
|
|
|
| |||||
| (Won) | 1,278,834 | (Won) | 281,174 | |||||
|
|
|
| |||||
Deferred tax assets | (Won) | 1,246 | ||||||
|
| |||||||
Deferred tax liabilities | (Won) | 282,420 | ||||||
|
| |||||||
S-118
Table of Contents
Korea Development Bank
Notes to the interim consolidated financial statements—(Continued)
June 30, 2011 and 2010
The deferred tax assets on the statement of financial position amounting to (Won)453,823 million as of June 30, 2011 ((Won)111 million as of December 31, 2010 and (Won) 1,246 million as of January 1, 2010) were originated from foreign subsidiaries and were not offset against deferred income tax liabilities due to different tax jurisdictions.
Deferred income taxes are calculated on all temporary differences under the liability method using an enacted tax rate of 24.2% (22% from 2012 and thereafter). Deferred tax assets recognized to the extent that it is probable that taxable profit will be available against which the deductible temporary difference and unused tax loss, if any.
30. Other assets
The details of other assets as of June 30, 2011, December 31, 2010 and January 1, 2010 are as follows (Korean won in millions):
| June 30, 2011 | December 31, 2010 | January 1, 2010 | ||||||||||
Accounts receivable | (Won) | 5,874,111 | (Won) | 2,678,587 | (Won) | 2,772,762 | ||||||
Unsettled domestic exchange receivables | 1,825,757 | 933,161 | 1,152,906 | |||||||||
Accrued income | 444,409 | 374,000 | 475,077 | |||||||||
Guarantee deposits | 283,277 | 185,374 | 130,774 | |||||||||
Trade accounts receivables | 3,068,743 | 114,267 | 115,433 | |||||||||
Inventories | 806,998 | 63,251 | 39,356 | |||||||||
Prepaid expenses | 434,687 | 51,765 | 65,522 | |||||||||
Advance payments | 462,786 | 26,399 | 3,128 | |||||||||
Others | 1,620,114 | 1,976,668 | 262,409 | |||||||||
|
|
|
|
|
| |||||||
| 14,820,882 | 6,403,472 | 5,017,367 | ||||||||||
Allowance for possible losses | (109,861 | ) | (78,537 | ) | (14,290 | ) | ||||||
Present value discount | (5,989 | ) | (6,782 | ) | (6,041 | ) | ||||||
|
|
|
|
|
| |||||||
| (Won) | 14,705,032 | (Won) | 6,318,153 | (Won) | 4,997,036 | |||||||
|
|
|
|
|
| |||||||
The carrying amount of financial assets included in other assets above amounted to (Won)7,160,487 million as of June 30, 2011, ((Won)4,070,003 million as of December 31, 2010 and (Won)4,550,341 million as of January 1, 2010) and its fair value amounted to (Won)7,169,241 million as of June 30, 2011, ((Won)4,142,731 million as of December 31, 2010 and (Won)4,552,602 million as of January 1, 2010).
S-119
Table of Contents
Korea Development Bank
Notes to the interim consolidated financial statements—(Continued)
June 30, 2011 and 2010
31. Financial liabilities designated at FVTPL
The financial liabilities designated at FVTPL as of June 30, 2011, December 31, 2010 and January 1, 2010 are as follows (Korean won in millions):
| June 30, 2011 | December 31, 2010 | January 1, 2010 | ||||||||||
Borrowings | (Won) | 7,232 | (Won) | 4,093 | (Won) | 139,749 | ||||||
Debt issued | 961,473 | 947,659 | 1,168,550 | |||||||||
|
|
|
|
|
| |||||||
| (Won) | 968,705 | (Won) | 951,752 | (Won) | 1,308,299 | |||||||
|
|
|
|
|
| |||||||
The Company utilized derivatives to hedge the risk that the fair value of debt issued fluctuates. The Company designates debt issued as at FVTPL, and recognizes the changes in the fair value of such financial liabilities in the statement of comprehensive income.
The difference between carrying amount and maturity amount of financial liabilities designated at FVTPL as of June 30, 2011, December 31, 2010 and January 1, 2010 are as follows (Korean won in millions):
| June 30, 2011 | December 31, 2010 | January 1, 2010 | ||||||||||
Carrying amount | (Won) | 968,705 | (Won) | 951,752 | (Won) | 1,308,299 | ||||||
Principal and interest at maturity | 898,481 | 895,121 | 1,354,224 | |||||||||
|
|
|
|
|
| |||||||
Difference | (Won) | 70,224 | (Won) | 56,631 | (Won) | (45,925 | ) | |||||
|
|
|
|
|
| |||||||
32. Due to customers
The details of due to customers as of June 30, 2011, December 31, 2010 and January 1, 2010 are as follows (Korean won in millions):
| Amortized cost | Fair value | |||||||||||||||||||||||
| June 30, 2011 | December 31, 2010 | January 1, 2010 | June 30, 2011 | December 31, 2010 | January 1, 2010 | |||||||||||||||||||
Deposits in Korean won: | ||||||||||||||||||||||||
Demand deposits | (Won) | 336,213 | (Won) | 308,041 | (Won) | 223,110 | (Won) | 336,213 | (Won) | 307,948 | (Won) | 223,110 | ||||||||||||
Time and saving deposits | 21,275,053 | 16,424,254 | 8,692,703 | 21,424,819 | 16,252,543 | 8,578,108 | ||||||||||||||||||
Certificate of deposits | 100,690 | 835,938 | 3,428,842 | 104,177 | 829,565 | 3,401,477 | ||||||||||||||||||
| 21,711,956 | 17,568,233 | 12,344,655 | 21,865,209 | 17,390,056 | 12,202,695 | |||||||||||||||||||
Deposits in foreign currency: | ||||||||||||||||||||||||
Demand deposits | 709,852 | 656,030 | 463,739 | 709,852 | 656,030 | 463,739 | ||||||||||||||||||
Time and saving deposits | 1,449,929 | 1,159,290 | 1,792,187 | 1,452,008 | 1,158,178 | 1,920,449 | ||||||||||||||||||
Certificate of deposits | 243,027 | 257,209 | 155,944 | 243,714 | 257,240 | 155,973 | ||||||||||||||||||
|
|
|
|
|
|
|
|
|
|
|
| |||||||||||||
| 2,402,808 | 2,072,529 | 2,411,870 | 2,405,574 | 2,071,448 | 2,540,161 | |||||||||||||||||||
|
|
|
|
|
|
|
|
|
|
|
| |||||||||||||
| (Won) | 24,114,764 | (Won) | 19,640,762 | (Won) | 14,756,525 | (Won) | 24,270,783 | (Won) | 19,461,504 | (Won) | 14,742,856 | |||||||||||||
|
|
|
|
|
|
|
|
|
|
|
| |||||||||||||
S-120
Table of Contents
Korea Development Bank
Notes to the interim consolidated financial statements—(Continued)
June 30, 2011 and 2010
33. Borrowings
The details of borrowings as of June 30, 2011, December 31, 2010 and January 1, 2010 are as follows (Korean won in millions):
| June 30, 2011 | ||||||||||||||||
| Minimum interest rate (%) | Maximum interest rate (%) | Amortized cost | Fair value | |||||||||||||
Borrowings in Korean won | 0.04 | 8.00 | (Won) | 6,696,789 | (Won) | 6,700,324 | ||||||||||
Borrowings in foreign currency | 0.44 | 7.43 | 12,061,284 | 12,213,748 | ||||||||||||
Off-shore borrowings in foreign currency | 0.26 | 4.27 | 977,064 | 980,581 | ||||||||||||
Callable preferred stock | 404,553 | 404,553 | ||||||||||||||
Others | 0.83 | 7.75 | 5,365,231 | 5,397,316 | ||||||||||||
|
|
|
| |||||||||||||
| (Won) | 25,504,921 | (Won) | 25,696,522 | |||||||||||||
|
|
|
| |||||||||||||
Present value discount | (18,882 | ) | ||||||||||||||
Deferred borrowing costs | (6,237 | ) | ||||||||||||||
|
| |||||||||||||||
| (Won) | 25,479,802 | |||||||||||||||
|
| |||||||||||||||
| December 31, 2010 | ||||||||||||||||
| Minimum interest rate (%) | Maximum interest rate (%) | Amortized cost | Fair value | |||||||||||||
Borrowings in Korean won | 0.50 | 6.00 | (Won) | 5,349,829 | (Won) | 5,353,477 | ||||||||||
Borrowings in foreign currency | 0.80 | 5.20 | 10,445,066 | 10,469,648 | ||||||||||||
Off-shore borrowings in foreign currency | 0.20 | 4.70 | 1,283,671 | 1,285,947 | ||||||||||||
Callable preferred stock | 455,627 | 455,627 | ||||||||||||||
Others | 2.14 | 7.75 | 6,013,043 | 5,986,361 | ||||||||||||
|
|
|
| |||||||||||||
| (Won) | 23,547,236 | (Won) | 23,551,060 | |||||||||||||
|
|
|
| |||||||||||||
Deferred borrowing costs | (5,821 | ) | ||||||||||||||
|
| |||||||||||||||
| (Won) | 23,541,415 | |||||||||||||||
|
| |||||||||||||||
| January 1, 2010 | ||||||||||||||||
| Minimum interest rate (%) | Maximum interest rate (%) | Amortized cost | Fair value | |||||||||||||
Borrowings in Korean won | 0.45 | 6.79 | (Won) | 7,346,686 | (Won) | 7,340,339 | ||||||||||
Borrowings in foreign currency | 9.75 | 11.00 | 12,155,485 | 12,082,275 | ||||||||||||
Off-shore borrowings in foreign currency | 0.28 | 0.65 | 1,087,890 | 1,090,868 | ||||||||||||
Callable preferred stock | 186,062 | 186,062 | ||||||||||||||
Others | 0.45 | 7.75 | 10,497,465 | 10,409,504 | ||||||||||||
|
|
|
| |||||||||||||
| (Won) | 31,273,588 | (Won) | 31,109,048 | |||||||||||||
|
|
|
| |||||||||||||
Present value discount | (2,181 | ) | ||||||||||||||
Deferred borrowing costs | (4,296 | ) | ||||||||||||||
|
| |||||||||||||||
| (Won) | 31,267,111 | |||||||||||||||
|
| |||||||||||||||
S-121
Table of Contents
Korea Development Bank
Notes to the interim consolidated financial statements—(Continued)
June 30, 2011 and 2010
Borrowings in Korean won as of June 30, 2011, December 31, 2010 and January 1, 2010 consist of the following (Korean won in millions):
Lender | Classification | Annual interest rate (%) | June 30, 2011 | December 31, 2010 | January 1, 2010 | |||||||||||||
Ministry of Strategy and Finance | Borrowings from government fund (*) | 2.75 ~ 5.00 | (Won) | 748,196 | (Won) | 803,068 | (Won) | 848,647 | ||||||||||
Industrial Bank of Korea | Borrowings from industrial technique fund | 0.97 ~ 3.49 | 74,213 | 90,732 | 144,713 | |||||||||||||
Small & Medium Business Corp. | Borrowings from local small and medium company promotion fund | 2.06 ~ 3.79 | 484,895 | 506,138 | 557,702 | |||||||||||||
Ministry of Culture and Tourism | Borrowings from tourism promotion fund | 0.97 ~ 4.00 | 1,146,443 | 1,154,203 | 1,150,502 | |||||||||||||
Korea Energy Management Corporation | Borrowings from fund for rational use of energy | 0.50 ~ 4.25 | 1,057,126 | 1,022,210 | 923,453 | |||||||||||||
Local governments | Borrowings from local small and medium company promotion fund | — | — | — | 135,381 | |||||||||||||
Others | Borrowings from environment improvement support fund | 0.00 ~ 6.00 | 3,185,916 | 1,773,478 | 3,586,288 | |||||||||||||
|
|
|
|
|
| |||||||||||||
| (Won) | 6,696,789 | (Won) | 5,349,829 | (Won) | 7,346,686 | |||||||||||||
|
|
|
|
|
| |||||||||||||
| (*) | Borrowing from government fund are subordinated borrowings |
S-122
Table of Contents
Korea Development Bank
Notes to the interim consolidated financial statements—(Continued)
June 30, 2011 and 2010
Borrowings in foreign currency as of June 30, 2011, December 31, 2010 and January 1, 2010 consist of the following (Korean won in millions):
Lender | Classification | Annual interest rate (%) | June 30, 2011 | December 31, 2010 | January 1, 2010 | |||||||||||
Japan Bank for International Cooperation (“JBIC”) | Borrowings from JBIC | 1.4 ~ 6M Libor+0.8 | (Won) | 326,140 | (Won) | 353,001 | (Won) | 167,147 | ||||||||
International Bank for Reconstruction and Development (“IBRD”) | Borrowings from IBRD(*) | — | — | — | 1,480,890 | |||||||||||
Mizuho and others | Borrowings from overseas banks | 3M Libor+0.5 ~ 1.8 | 2,139,339 | 1,803,873 | 1,655,870 | |||||||||||
| 6M Libor+0.3 ~ 1.0 | 146,721 | 347,946 | 316,887 | |||||||||||||
| — | 138,059 | 166,942 | ||||||||||||||
|
|
|
|
|
| |||||||||||
| 2,286,060 | 2,289,878 | 2,139,699 | ||||||||||||||
DBS Bank and others | Off-shore short- term borrowings | 0.26 ~ 1.33 | 111,514 | 124,577 | 194,766 | |||||||||||
| — | — | 56,945 | 122,598 | |||||||||||||
| 6M Libor+0.5 ~ 0.7 | 312,649 | 261,947 | 36,932 | |||||||||||||
| — | — | — | 93,408 | |||||||||||||
|
|
|
|
|
| |||||||||||
| 424,163 | 443,469 | 447,704 | ||||||||||||||
Nippon Life Insurance Company and others | Off-shore long-term borrowings | 3M+0.5 ~ 3.8 | 315,614 | 473,241 | 306,615 | |||||||||||
| — | 45,556 | 216,286 | ||||||||||||||
| 6M EULibor+0.6 | 163,388 | 212,052 | 198,492 | |||||||||||||
|
|
|
|
|
| |||||||||||
| 479,002 | 730,849 | 721,393 | ||||||||||||||
JBIC | Off-shore borrowings from JBIC | 4.3 ~ 6M Libor 1.2 | 58,517 | 65,070 | — | |||||||||||
Others | Others short-term borrowings | 0.25 ~ 1.98 | 7,907,484 | 6,123,094 | 6,405,850 | |||||||||||
| 6M Libor+0.4 ~ 0.85 | 221,011 | 22,778 | 72,913 | |||||||||||||
| — | — | 148,057 | 188,720 | |||||||||||||
| 3M Libor+0.85 | 32,343 | — | 151,788 | |||||||||||||
|
|
|
|
|
| |||||||||||
| 8,160,838 | 6,293,929 | 6,819,271 | ||||||||||||||
|
|
|
|
|
| |||||||||||
Others long-term borrowings | 1,303,628 | 1,552,541 | 1,467,271 | |||||||||||||
|
|
|
|
|
| |||||||||||
| (Won) | 13,038,348 | (Won) | 11,728,737 | (Won) | 13,243,375 | |||||||||||
|
|
|
|
|
| |||||||||||
| (*) | Borrowing from IBRD are subordinated borrowing |
S-123
Table of Contents
Korea Development Bank
Notes to the interim consolidated financial statements—(Continued)
June 30, 2011 and 2010
34. Debt issued
The details of debt issued as of June 30, 2011, December 31, 2010 and January 1, 2010 are as follows (Korean won in millions):
| June 30, 2011 | ||||||||||||||||
| Minimum interest rate (%) | Maximum interest rate (%) | Amortized cost | Fair value | |||||||||||||
Debenture in Korean won: | ||||||||||||||||
Bonds | 2.67 | 14.09 | (Won) | 31,031,621 | (Won) | 31,379,225 | ||||||||||
Discount on bonds | (94,450 | ) | — | |||||||||||||
Premium on bonds | 356 | — | ||||||||||||||
Valuation adjustments for hedge | 56,457 | — | ||||||||||||||
|
|
|
| |||||||||||||
| 30,993,984 | 31,379,225 | |||||||||||||||
Debenture in foreign currency | ||||||||||||||||
Bonds | 0.43 | 8.00 | 10,108,321 | 10,795,845 | ||||||||||||
Discount on bonds | (29,844 | ) | — | |||||||||||||
Premium on bonds | 929 | — | ||||||||||||||
Valuation adjustments for hedge | 511,082 | — | ||||||||||||||
|
|
|
| |||||||||||||
| 10,590,488 | 10,795,845 | |||||||||||||||
Off-shore debenture: | ||||||||||||||||
Bonds | 0.65 | 11.72 | 4,158,389 | 4,571,915 | ||||||||||||
Discount on bonds | (5,172 | ) | — | |||||||||||||
Premium on bonds | 299 | — | ||||||||||||||
Valuation adjustments for hedge | 321,841 | — | ||||||||||||||
|
|
|
| |||||||||||||
| 4,475,357 | 4,571,915 | |||||||||||||||
|
|
|
| |||||||||||||
| (Won) | 46,059,829 | (Won) | 46,746,985 | |||||||||||||
|
|
|
| |||||||||||||
| December 31, 2010 | ||||||||||||||||
| Minimum interest rate (%) | Maximum interest rate (%) | Amortized cost | Fair value | |||||||||||||
Debenture in Korean won: | ||||||||||||||||
Bonds | 2.53 | 12.00 | (Won) | 28,732,818 | (Won) | 29,253,273 | ||||||||||
Discount on bonds | (17,179 | ) | ||||||||||||||
Premium on bonds | 526 | |||||||||||||||
Valuation adjustments for hedge | 53,933 | |||||||||||||||
|
|
|
| |||||||||||||
| 28,770,098 | 29,253,273 | |||||||||||||||
Debenture in foreign currency: | ||||||||||||||||
Bonds | 0.20 | 8.00 | 11,165,811 | 12,122,697 | ||||||||||||
Discount on bonds | (28,710 | ) | ||||||||||||||
Premium on bonds | 1,242 | |||||||||||||||
Valuation adjustments for hedge | 820,804 | |||||||||||||||
|
|
|
| |||||||||||||
| 11,959,147 | 12,122,697 | |||||||||||||||
Off-shore debenture: | ||||||||||||||||
Bonds | 0.48 | 9.50 | 3,690,600 | 4,128,591 | ||||||||||||
Discount on bonds | (6,057 | ) | ||||||||||||||
Premium on bonds | 371 | |||||||||||||||
Valuation adjustments for hedge | 391,089 | |||||||||||||||
|
|
|
| |||||||||||||
| 4,076,003 | 4,128,591 | |||||||||||||||
|
|
|
| |||||||||||||
| (Won) | 44,805,248 | (Won) | 45,504,561 | |||||||||||||
|
|
|
| |||||||||||||
S-124
Table of Contents
Korea Development Bank
Notes to the interim consolidated financial statements—(Continued)
June 30, 2011 and 2010
| January 1, 2010 | ||||||||||||||||
| Minimum interest rate (%) | Maximum interest rate (%) | Amortized cost | Fair value | |||||||||||||
Debenture in Korean won: | ||||||||||||||||
Bonds | 2.28 | 9.76 | (Won) | 34,104,557 | (Won) | 34,177,175 | ||||||||||
Discount on bonds | (76,766 | ) | ||||||||||||||
Premium on bonds | 856 | |||||||||||||||
Valuation adjustments for hedge | (59,169 | ) | ||||||||||||||
|
|
|
| |||||||||||||
| 33,969,478 | 34,177,175 | |||||||||||||||
Debenture in foreign currency: | ||||||||||||||||
Bonds | 0.87 | 8.00 | 12,385,664 | 13,472,360 | ||||||||||||
Discount on bonds | (28,530 | ) | ||||||||||||||
Premium on bonds | 2,318 | |||||||||||||||
Valuation adjustments for hedge | 914,966 | |||||||||||||||
|
|
|
| |||||||||||||
| 13,274,418 | 13,472,360 | |||||||||||||||
Off-shore debenture: | ||||||||||||||||
Bonds | 1.56 | 8.00 | 3,403,006 | 3,749,138 | ||||||||||||
Discount on bonds | (5,645 | ) | ||||||||||||||
Premium on bonds | 525 | |||||||||||||||
Valuation adjustments for hedge | 303,863 | |||||||||||||||
|
|
|
| |||||||||||||
| 3,701,749 | 3,749,138 | |||||||||||||||
|
|
|
| |||||||||||||
| (Won) | 50,945,645 | (Won) | 51,398,673 | |||||||||||||
|
|
|
| |||||||||||||
S-125
Table of Contents
Korea Development Bank
Notes to the interim consolidated financial statements—(Continued)
June 30, 2011 and 2010
35. Policy reserve
The details of policy reserve categorized by insurance type as of June 30, 2011 and December 31, 2010 are as follows (Korean won in millions):
| June 30, 2011 | December 31, 2010 | |||||||||
Premium reserve | Pure endowment | (Won) | 2,169,342 | (Won) | 2,055,683 | |||||
| Death | 2,939,143 | 2,833,174 | ||||||||
| Endowment | 2,121,785 | 1,995,355 | ||||||||
| Group | 33,494 | 33,255 | ||||||||
|
|
|
| |||||||
| 7,263,764 | 6,917,467 | |||||||||
Unearned premium reserve | Pure endowment | 10 | 8 | |||||||
| Death | 480 | 614 | ||||||||
| Endowment | 10 | 13 | ||||||||
| Group | 2,245 | 1,198 | ||||||||
|
|
|
| |||||||
| 2,745 | 1,833 | |||||||||
Reserve for outstanding claims | Pure endowment | 51,465 | 49,793 | |||||||
| Death | 231,898 | 219,204 | ||||||||
| Endowment | 60,597 | 54,737 | ||||||||
| Group | 9,157 | 9,605 | ||||||||
|
|
|
| |||||||
| 353,117 | 333,339 | |||||||||
Reserve for participating policyholders’ dividends | Pure endowment | 14,701 | 13,492 | |||||||
| Death | 11,321 | 8,494 | ||||||||
| Endowment | 3,462 | 3,145 | ||||||||
| Group | 120 | 79 | ||||||||
|
|
|
| |||||||
| 29,604 | 25,210 | |||||||||
Excess participating policyholder dividend reserve | 154 | 5,782 | ||||||||
Guaranteed benefit reserve | 20,597 | 20,038 | ||||||||
|
|
|
| |||||||
| (Won) | 7,669,981 | (Won) | 7,303,669 | |||||||
|
|
|
| |||||||
S-126
Table of Contents
Korea Development Bank
Notes to the interim consolidated financial statements—(Continued)
June 30, 2011 and 2010
36. Severance and retirement benefits
The details of severance and retirement benefits as of June 30, 2011, December 31, 2010 and January 1, 2010 and defined benefit pension for the six months ended June 30, 2011 and 2010 are as follows (Korean won in millions):
| June 30, 2011 | December 31, 2010 | January 1, 2010 | ||||||||||
Severance and retirement benefits | (Won) | 202,574 | (Won) | 82,812 | (Won) | 74,115 | ||||||
Defined benefit pension | (Won) | 36,808 | (Won) | 26,065 | (Won) | — | ||||||
The details of severance and retirement benefits June 30, 2011, and January 1, 2010 are as follows (Korean won in millions):
| June 30, 2011 | December 31, 2010 | January 1, 2010 | ||||||||||
Present value of defined benefit obligation | (Won) | 368,975 | (Won) | 186,434 | (Won) | 117,996 | ||||||
Fair value of plan assets | (166,401 | ) | (103,622 | ) | (43,881 | ) | ||||||
|
|
|
|
|
| |||||||
| (Won) | 202,574 | (Won) | 82,812 | (Won) | 74,115 | |||||||
|
|
|
|
|
| |||||||
Changes in defined benefit obligation for the six months ended June 30, 2011 and 2010 are as follows (Korean won in millions):
| Six months ended June 30, 2011 | Six months ended June 30, 2010 | |||||||
Beginning balance | (Won) | 186,434 | (Won) | 117,996 | ||||
Current service cost | 27,858 | 12,430 | ||||||
Interest cost on benefit obligation | 11,105 | 4,509 | ||||||
Actuarial gain on obligation | 55 | (19 | ) | |||||
Benefits paid | (82,028 | ) | (3,135 | ) | ||||
Acquisition of subsidiary | 225,555 | 47,419 | ||||||
Others | (4 | ) | 4 | |||||
|
|
|
| |||||
Ending balance | (Won) | 368,975 | (Won) | 179,204 | ||||
|
|
|
| |||||
The details of plan assets as of June 30, 2011, December 31, 2010 and January 1, 2010 are as follows (Korean won in millions):
| June 30, 2011 | December 31, 2010 | January 1, 2010 | ||||||||||||||||||||||
| Amounts | Rate (%) | Amounts | Rate (%) | Amounts | Rate (%) | |||||||||||||||||||
Debt instruments | (Won) | 149,898 | 90.08 | (Won) | 73,994 | 71.41 | (Won) | — | — | |||||||||||||||
Due from banks, and others | 16,503 | 9.92 | 29,628 | 28.59 | 43,881 | 100.00 | ||||||||||||||||||
|
|
|
|
|
|
|
|
|
|
|
| |||||||||||||
| (Won) | 166,401 | 100.00 | (Won) | 103,622 | 100.00 | (Won) | 43,881 | 100.00 | ||||||||||||||||
|
|
|
|
|
|
|
|
|
|
|
| |||||||||||||
S-127
Table of Contents
Korea Development Bank
Notes to the interim consolidated financial statements—(Continued)
June 30, 2011 and 2010
Changes in the fair value of plan assets are for the six months ended June 30, 2011 and 2010 as follows (Korean won in millions):
| Six months ended June 30, 2011 | Six months ended June 30, 2010 | |||||||
Beginning balance | (Won) | 103,622 | (Won) | 43,881 | ||||
Expected return on plan assets | 3,032 | 982 | ||||||
Actuarial gain on obligation | 202 | 19 | ||||||
Contributions by employer | (822 | ) | — | |||||
Benefits paid | (34,826 | ) | 400 | |||||
Acquisition of subsidiary | 95,744 | 24,725 | ||||||
Others | (551 | ) | 2,209 | |||||
|
|
|
| |||||
Ending balance | (Won) | 166,401 | (Won) | 72,216 | ||||
|
|
|
| |||||
Changes in severance and retirement benefits for the six months ended June 30, 2011 and 2010 are as follows (Korean won in millions):
| Six months ended June 30, 2011 | Six months ended June 30, 2010 | |||||||
Current service cost | (Won) | 27,858 | (Won) | 12,430 | ||||
Interest cost on benefit obligation | 11,105 | 4,509 | ||||||
Expected return on plan assets | (3,032 | ) | (982 | ) | ||||
Actuarial gain on obligation | 877 | (19 | ) | |||||
|
|
|
| |||||
| (Won) | 36,808 | (Won) | 15,938 | |||||
|
|
|
| |||||
The principal actuarial assumptions are as follows (Unit: %):
| June 30, 2011 | December 31, 2010 | January 1, 2010 | ||||||||||
Discount rate | 4.95 | 4.95 | 5.77 | |||||||||
Expected return on plan assets | 3.50 | 3.50 | 3.50 | |||||||||
Future salary increase rate | 6.89 | 6.89 | 8.01 | |||||||||
S-128
Table of Contents
Korea Development Bank
Notes to the interim consolidated financial statements—(Continued)
June 30, 2011 and 2010
37. Provisions
Changes of provisions for the six months ended June 30, 2011 and 2010 are as follows (Korean won in millions):
| Six months ended June 30, 2011 | ||||||||||||||||||||||||
| Payment guarantees | Unused commitments | Lawsuit | Asset retirement obligation | Other | Total | |||||||||||||||||||
Beginning balance | (Won) | 89,642 | (Won) | 80,718 | (Won) | 2,216 | (Won) | 3,023 | (Won) | 5,763 | (Won) | 181,362 | ||||||||||||
Net increase (decrease) | (6,506 | ) | 70,432 | (9 | ) | (76 | ) | 11,751 | 75,592 | |||||||||||||||
Provision used | — | — | — | (382 | ) | (18,656 | ) | (19,038 | ) | |||||||||||||||
Capitalized restoration expense | — | — | — | 477 | — | 477 | ||||||||||||||||||
Foreign exchange differences | — | — | 8 | — | — | 8 | ||||||||||||||||||
Acquisition of subsidiary | — | — | — | — | 100,909 | 100,909 | ||||||||||||||||||
Others | (57 | ) | (200 | ) | — | — | 7,654 | 7,397 | ||||||||||||||||
|
|
|
|
|
|
|
|
|
|
|
| |||||||||||||
Ending balance | (Won) | 83,079 | (Won) | 150,950 | (Won) | 2,215 | (Won) | 3,042 | (Won) | 107,421 | (Won) | 346,707 | ||||||||||||
|
|
|
|
|
|
|
|
|
|
|
| |||||||||||||
| Six months ended June 30, 2010 | ||||||||||||||||||||||||
| Payment guarantees | Unused commitments | Lawsuit | Asset retirement obligation | Other | Total | |||||||||||||||||||
Beginning balance | (Won) | 150,896 | (Won) | 78,051 | (Won) | 3,249 | (Won) | — | (Won) | 1,032 | (Won) | 233,228 | ||||||||||||
Net increase (decrease) | 49,981 | 80,048 | (1,354 | ) | (68 | ) | — | 128,607 | ||||||||||||||||
Provision used | — | (110 | ) | — | (165 | ) | — | (275 | ) | |||||||||||||||
Capitalized restoration expense | — | — | — | 154 | — | 154 | ||||||||||||||||||
Foreign exchange differences | — | (4 | ) | — | — | — | (4 | ) | ||||||||||||||||
Acquisition of subsidiary | — | — | — | 2,851 | — | 2,851 | ||||||||||||||||||
Others | 77 | 450 | 250 | 91 | 6,417 | 7,285 | ||||||||||||||||||
|
|
|
|
|
|
|
|
|
|
|
| |||||||||||||
Ending balance | (Won) | 200,954 | (Won) | 158,435 | (Won) | 2,145 | (Won) | 2,863 | (Won) | 7,449 | (Won) | 371,846 | ||||||||||||
|
|
|
|
|
|
|
|
|
|
|
| |||||||||||||
Provision for payment guarantees
Confirmed acceptances and guarantees, unconfirmed acceptances and guarantees and bills endorsed are not recognized on the statement of financial position, but are disclosed as off-statement of financial position items in the notes to the financial statements. The Company provides a provision for such off-statement of financial position items, applying a Credit Conversion Factor (“CCF”) and provision rates, and records the provision as a reserve for possible losses on acceptances and guarantees.
Provision for unused commitments
The Company records a provision for a certain portion of unused credit lines which are calculated using a CCF as provision for unused commitments applying provision rates.
Provision for possible losses from lawsuits
As of June 30, 2011, the Company is involved in 125 lawsuits as a plaintiff and 264 lawsuits as a defendant. The aggregate amount of claims as a plaintiff and a defendant amounted to (Won)3,933,485 million and \623,463 million, respectively. The Company provided a provision against contingent loss from pending lawsuits as of June 30, 2011.
S-129
Table of Contents
Korea Development Bank
Notes to the interim consolidated financial statements—(Continued)
June 30, 2011 and 2010
The financial institution creditors of Renault Samsung Motors (including KDB) filed a lawsuit against Kun-hee Lee and 28 Samsung affiliates (including Samsung Electronics), claiming compensation for delays in payment of liquidated damages and contract bills of (Won)2,450 billion based on the agreement signed on August 24, 1999. In connection to the litigation, the financial institution creditors partially won the second trial at the Seoul High Court, but both parties filed an appeal to the Supreme Court judgment and are waiting for the final decision as of June 30, 2011.
Other provision
The Company has recognized other possible losses.
38. Other liabilities
The details of other liabilities as of June 30, 2011, December 31, 2010 and January 1, 2010 are as follows (Korean won in millions):
| June 30, 2011 | December 31, 2010 | January 1, 2010 | ||||||||||
Accounts payables | (Won) | 5,298,737 | (Won) | 2,633,740 | (Won) | 2,874,357 | ||||||
Accrued expense | 1,249,365 | 955,384 | 980,833 | |||||||||
Domestic exchange obligation payables | 1,172,745 | 930,878 | 641,067 | |||||||||
Borrowing from trust accounts | 395,885 | 532,839 | 453,896 | |||||||||
Advance receipts | 1,806,713 | 55,462 | 283,125 | |||||||||
Guarantee money received | 868,906 | 561,547 | 106,185 | |||||||||
Trades payable | 692,191 | 102,887 | 79,615 | |||||||||
Income in advance | 79,955 | 77,603 | 48,954 | |||||||||
Deposits withholding tax | 39,190 | 19,104 | 10,814 | |||||||||
Foreign bills payables | 133,888 | 88,187 | 11,188 | |||||||||
Separate account liabilities | 876,950 | 951,013 | — | |||||||||
Others | 552,115 | 232,467 | 270,503 | |||||||||
|
|
|
|
|
| |||||||
| 13,166,640 | 7,141,111 | 5,760,537 | ||||||||||
Present value discount account | (541 | ) | (643 | ) | (1,045 | ) | ||||||
|
|
|
|
|
| |||||||
| (Won) | 13,166,099 | (Won) | 7,140,468 | (Won) | 5,759,492 | |||||||
|
|
|
|
|
| |||||||
The carrying amount of financial liabilities included in other liabilities amounted to (Won)8,403,800 million as of June 30, 2011, ((Won)6,254,916 million as of December 31, 2010 and (Won)5,194,809 million as of January 1, 2010), and its fair value amounted to (Won)8,403,834 million as of June 30, 2011, ((Won)6,255,034 million as of December 31, 2010 and (Won)5,349,903 million as of January 1, 2010).
39. Equity
Capital stock
The Company is authorized to issue 3,000 million shares of common stock and has 1,850,372,235 shares issued and outstanding. Total par value of outstanding shares amounts (Won)9,251,861 million as of June 30, 2011.
S-130
Table of Contents
Korea Development Bank
Notes to the interim consolidated financial statements—(Continued)
June 30, 2011 and 2010
Capital surplus
The Company reduced (Won)5,178,600 million of its issued capital in 1998 and 2000 to offset its accumulated deficit amounting to (Won)5,134,227 million. As the result of the capital reduction, (Won)44,373 million of surplus exceeding accumulated deficit was recorded in capital surplus in equity. Including (Won)44,373 million, the outstanding balance of capital surplus as of June 30, 2011 amounts to (Won)51,774 million.
Retained earnings
The Korea Development Bank Act requires the Bank to appropriate at least 40% of net income as a legal reserve. This reserve can be transferred to paid-in capital or offset accumulated deficit.
In accordance with the Korea Development Bank Act, the Bank offsets accumulated deficit with reserves. If reserve is insufficient to offset the accumulated deficit, the Korean government is supposed to be responsible for the deficit.
The details of reserves of retained earnings as of June 30, 2011, December 31, 2010 and January 1, 2010 are as follows. (Korean won in millions):
| June 30, 2011 | December 31, 2010 | January 1, 2010 | ||||||||||
Legal reserves | (Won) | 5,076,391 | (Won) | 4,658,028 | (Won) | 4,353,489 | ||||||
Unappropriated retained earnings | 2,503,123 | 2,143,735 | 1,211,406 | |||||||||
|
|
|
|
|
| |||||||
| (Won) | 7,579,514 | (Won) | 6,801,763 | (Won) | 5,564,895 | |||||||
|
|
|
|
|
| |||||||
Changes in legal reserves for the six months ended June 30, 2011 and 2010 are as follows (Korean won in millions):
| Six months ended June 30, 2011 | Six months ended June 30, 2010 | |||||||
Beginning balance | (Won) | 4,658,028 | (Won) | 4,353,489 | ||||
Transferred from retained earnings | 418,363 | 304,539 | ||||||
|
|
|
| |||||
Ending balance | (Won) | 5,076,391 | (Won) | 4,658,028 | ||||
|
|
|
| |||||
Changes in inappropriate retained earnings for the six months ended June 30, 2011 and 2010 are as follows (Korean won in millions):
| Six months ended June 30, 2011 | Six months ended June 30, 2010 | |||||||
Beginning balance | (Won) | 2,143,735 | (Won) | 1,211,406 | ||||
Net income | 975,446 | 399,019 | ||||||
Contribution to legal reserves | (418,363 | ) | (304,539 | ) | ||||
Dividend | (297,910 | ) | — | |||||
Offset with discount on stock issuance | (51 | ) | — | |||||
Special retention in trust account | 14,527 | 569 | ||||||
Changes in retained earnings | 85,739 | (1,248 | ) | |||||
|
|
|
| |||||
Ending balance | (Won) | 2,503,123 | (Won) | 1,305,207 | ||||
|
|
|
| |||||
S-131
Table of Contents
Korea Development Bank
Notes to the interim consolidated financial statements—(Continued)
June 30, 2011 and 2010
The Company is required to provide reserve for possible loan losses in accordance with Regulations on Supervision of Bank Business 29(1), and (2), and details are as follows (Korean won in millions):
The balance of regulatory reserve for possible loan losses as of June 30, 2011 and December 31, 2010 are as follows (Korean won in millions):
| June 30, 2011 | December 31, 2010 | |||||||
Beginning balance | (Won) | — | (Won) | — | ||||
Planned reserve for possible loan losses | 669,340 | 822,032 | ||||||
|
|
|
| |||||
| (Won) | 669,340 | (Won) | 822,032 | |||||
|
|
|
| |||||
Changes in regulatory credit loss and adjusted profit reflecting the provisions for possible loan losses reserve for the six months ended June 30, 2011 are as follows (Korean won in millions except per share amount)):
| Six months ended June 30, 2011 | ||||
Net income | (Won) | 1,005,610 | ||
Reversal of regulatory reserve for possible loan losses | 152,693 | |||
|
| |||
Net income after adjusting regulatory reserve for possible loan losses | 1,158,303 | |||
|
| |||
Earnings per share after adjusting regulatory reserve for possible loan losses | (Won) | 626 | ||
|
| |||
40. Collateral
The details of assets pledged by the Company as of June 30, 2011, December 31, 2010 and January 1, 2010 are as follows (Korean won in millions):
| June 30, 2011 | December 31, 2010 | January 1, 2010 | ||||||||||||||||||||||
| Pledged assets | Related liabilities | Pledged assets | Related liabilities | Pledged assets | Related liabilities | |||||||||||||||||||
Cash and due from banks(*1) | (Won) | 206,019 | (Won) | — | (Won) | — | (Won) | — | (Won) | — | (Won) | — | ||||||||||||
Financial assets available-for-sale (*2) | 7,827,994 | 3,683,875 | 8,314,982 | 4,289,467 | 13,175,516 | 8,344,587 | ||||||||||||||||||
Others(*3) | 585,880 | 158,201 | 101,000 | 158,201 | — | — | ||||||||||||||||||
|
|
|
|
|
|
|
|
|
|
|
| |||||||||||||
| (Won) | 8,619,893 | (Won) | 3,842,076 | (Won) | 8,415,982 | (Won) | 4,447,668 | (Won) | 13,175,516 | (Won) | 8,344,587 | |||||||||||||
|
|
|
|
|
|
|
|
|
|
|
| |||||||||||||
| (*1) | These are collaterals for the business projects. |
| (*2) | These are collaterals for reverse repo transactions etc. |
| (*3) | These are collaterals for mortgage borrowings and D/A. |
S-132
Table of Contents
Korea Development Bank
Notes to the interim consolidated financial statements—(Continued)
June 30, 2011 and 2010
41. Guarantees and Commitments
Guarantees and commitments provided by the Company as of June 30, 2011, December 31, 2010 and January 1, 2010 are as follows (Korean won in millions):
| June 30, 2011 | December 31, 2010 | January 1, 2010 | ||||||||||
Confirmed acceptances and guarantees: | ||||||||||||
Acceptances in foreign currency | (Won) | 4,744 | (Won) | 1,010,386 | (Won) | 1,225,215 | ||||||
Guarantees for bond issuance | 1,049 | 102,620 | (Won) | 1,210 | ||||||||
Guarantees for loans | 47,504 | 124,900 | 154,870 | |||||||||
Acceptances for L/G | 45,711 | 39,383 | 75,034 | |||||||||
Others | 17,189,256 | 11,774,904 | 12,919,230 | |||||||||
|
|
|
|
|
| |||||||
| (Won) | 17,288,264 | (Won) | 13,052,193 | (Won) | 14,375,559 | |||||||
|
|
|
|
|
| |||||||
Unconfirmed acceptances and guarantees: | ||||||||||||
Letter of credit | (Won) | 3,003,459 | (Won) | 3,148,215 | (Won) | 3,053,920 | ||||||
Others | 5,709,343 | 6,531,007 | 7,258,188 | |||||||||
|
|
|
|
|
| |||||||
| (Won) | 8,712,802 | (Won) | 9,679,222 | (Won) | 10,312,108 | |||||||
|
|
|
|
|
| |||||||
Commitments: | ||||||||||||
Commitments on loans | (Won) | 10,086,874 | (Won) | 10,499,591 | (Won) | 12,316,031 | ||||||
Commitments on purchase of securities | 32,536 | 719 | 1,000,000 | |||||||||
Others | 144,450 | 81,979 | 3,469 | |||||||||
|
|
|
|
|
| |||||||
| (Won) | 10,263,860 | (Won) | 10,582,289 | (Won) | 13,319,500 | |||||||
|
|
|
|
|
| |||||||
Bills endorsed | (Won) | 702 | (Won) | — | (Won) | — | ||||||
|
|
|
|
|
| |||||||
| (Won) | 36,265,628 | (Won) | 34,405,320 | (Won) | 37,731,069 | |||||||
|
|
|
|
|
| |||||||
42. Leases
The Company entered into lease contracts to utilize ships, vehicles and other equipment. The general lease conditions are summarized below:
The lease contracts are non-cancellable, and a lessee can return or purchase the asset at the contracted price at the end of the lease term or renew the contract. The Company has ownership of the asset over the entire lease term. In addition, the lease assets are insured with fire insurance and comprehensive insurance which are paid by the lessee. The acquisition cost is determined at the date of the lease contract, and is declared in Korean won and foreign currency. The Company calculates its minimum lease payments by applying criteria rate of interest with a certain rate of margin added.
S-133
Table of Contents
Korea Development Bank
Notes to the interim consolidated financial statements—(Continued)
June 30, 2011 and 2010
Finance lease
The details of the leaser under a finance lease as of June 30, 2011, December 31, 2010 and January 1, 2010 are as follow (Korean won in millions):
| June 30, 2011 | December 31, 2010 | January 1, 2010 | ||||||||||
Over 1 year through 5 years | (Won) | — | (Won) | — | (Won) | 9,226 | ||||||
|
|
|
|
|
| |||||||
Net investment in the lease | (Won) | — | (Won) | — | (Won) | 9,226 | ||||||
|
|
|
|
|
| |||||||
43. Effects of changes in foreign exchange rates
The effects of changes in foreign exchange rates for the six months ended June 30, 2011 and 2010 are as follows (Korean won in millions):
| Six months ended June 30, 2011 | Six months ended June 30, 2010 | |||||||
Recognized in current income: | ||||||||
Gain (loss) from foreign currency transaction: | ||||||||
Realized gain | (Won) | 292,096 | (Won) | 576,094 | ||||
Realized loss | 298,673 | 618,768 | ||||||
|
|
|
| |||||
| (6,577 | ) | (42,674 | ) | |||||
Gain (loss) from foreign currency transaction: | ||||||||
Unrealized gain | 97,729 | 317,551 | ||||||
Unrealized loss | 342,618 | 122,040 | ||||||
|
|
|
| |||||
| (244,889 | ) | 195,511 | ||||||
|
|
|
| |||||
| (251,466 | ) | 152,837 | ||||||
|
|
|
| |||||
Recognized in other comprehensive income: | ||||||||
Beginning balance | (35,502 | ) | — | |||||
Changes during the period | (18,323 | ) | 19,512 | |||||
|
|
|
| |||||
Ending balance | (Won) | (53,825 | ) | (Won) | 19,512 | |||
|
|
|
| |||||
44. Day 1 profit or loss recognition
Changes in Day 1 profit or loss for the six months ended June 30, 2011 and 2010 are as follows (Korean won in millions):
| Six months ended June 30, 2011 | Six months ended June 30, 2010 | |||||||
Beginning balance | (Won) | (12,237 | ) | (Won) | 516 | |||
Difference between the transaction price and fair value at initial valuation (*) | (3,975 | ) | (9,402 | ) | ||||
Amortization | 4,643 | 1,963 | ||||||
Transactions terminated and others | 2,232 | (298 | ) | |||||
|
|
|
| |||||
Ending balance | (Won) | (9,337 | ) | (Won) | (7,221 | ) | ||
|
|
|
| |||||
| (*) | Day 1 profit or loss arose from derivatives financial instruments, whose fair values are classified as level 3. |
S-134
Table of Contents
Korea Development Bank
Notes to the interim consolidated financial statements—(Continued)
June 30, 2011 and 2010
45. Related-party disclosures
Detail relationship between the Bank and its subsidiaries and the details of investments in associates are disclosed in Note 2 and 25, respectively.
Outstanding balances with related parties as of June 30, 2011, December 31, 2010 and January 1, 2010 are as follows (Korean won in millions):
| June 30, 2011 | ||||||||||||||||||||
| Controlling entities | Subsidiaries | Associates | Entities under same control | Total | ||||||||||||||||
Assets: | ||||||||||||||||||||
Cash and due from banks | (Won) | — | (Won) | 352,801 | (Won) | — | (Won) | — | (Won) | 352,801 | ||||||||||
Financial assets available -for-sale | 1,976,392 | 481,804 | 447,224 | — | 2,905,420 | |||||||||||||||
Loans | 181,513 | 2,079,436 | 222,452 | — | 2,483,401 | |||||||||||||||
(Allowance for possible loan losses) | — | (5,088 | ) | (3 | ) | — | (5,091 | ) | ||||||||||||
Derivative financial assets | 1,681 | 48,750 | 1,146 | 4,902 | 56,479 | |||||||||||||||
Others | 324 | 185,173 | 14,449 | 8,035 | 207,981 | |||||||||||||||
(Allowance for possible other asset losses) | — | (42 | ) | — | — | (42 | ) | |||||||||||||
|
|
|
|
|
|
|
|
|
| |||||||||||
| (Won) | 2,159,910 | (Won) | 3,142,834 | (Won) | 685,268 | (Won) | 12,937 | (Won) | 6,000,949 | |||||||||||
|
|
|
|
|
|
|
|
|
| |||||||||||
Liabilities: | ||||||||||||||||||||
Due to customers | (Won) | 449,560 | (Won) | 282,120 | (Won) | 43,924 | (Won) | 1,336 | (Won) | 776,940 | ||||||||||
Borrowings | 32,343 | 916,509 | 3,951 | 291,667 | 1,244,470 | |||||||||||||||
Derivative financial liabilities | 742 | 18,595 | 6,143 | 15,833 | 41,313 | |||||||||||||||
Other liabilities | 315 | 3,715 | 1,215 | 48,729 | 53,974 | |||||||||||||||
Other provisions | — | 2 | 138 | — | 140 | |||||||||||||||
|
|
|
|
|
| �� |
|
|
|
| ||||||||||
| (Won) | 482,960 | (Won) | 1,220,941 | (Won) | 55,371 | (Won) | 357,565 | (Won) | 2,116,837 | |||||||||||
|
|
|
|
|
|
|
|
|
| |||||||||||
S-135
Table of Contents
Korea Development Bank
Notes to the interim consolidated financial statements—(Continued)
June 30, 2011 and 2010
| December 31, 2010 | ||||||||||||||||||||||||
| Controlling entities | Subsidiaries | Associates | Entities under same control | Key management | Total | |||||||||||||||||||
Assets: | ||||||||||||||||||||||||
Cash and due from banks | (Won) | — | (Won) | 372,069 | (Won) | — | (Won) | — | (Won) | — | (Won) | 372,069 | ||||||||||||
Financial assets available -for-sale | 2,789,173 | 493,187 | 557 | 12,432 | — | 3,295,259 | ||||||||||||||||||
Loans | 134,805 | 985,733 | 192,135 | 220,981 | 97 | 1,533,751 | ||||||||||||||||||
(Allowance for possible loan losses) | — | (2,370 | ) | (5,721 | ) | — | (3 | ) | (8,094 | ) | ||||||||||||||
Derivative financial assets | 3,476 | 51,618 | — | 70,986 | — | 126,080 | ||||||||||||||||||
Others | 848 | 117,043 | 431 | 13,336 | — | 131,658 | ||||||||||||||||||
(Allowance for possible other asset losses) | — | (10 | ) | (160 | ) | — | — | (170 | ) | |||||||||||||||
|
|
|
|
|
|
|
|
|
|
|
| |||||||||||||
| (Won) | 2,928,302 | (Won) | 2,017,270 | (Won) | 187,242 | (Won) | 317,645 | (Won) | 94 | (Won) | 5,450,553 | |||||||||||||
|
|
|
|
|
|
|
|
|
|
|
| |||||||||||||
Liabilities: | ||||||||||||||||||||||||
Due to customers | (Won) | 235,152 | (Won) | 261,774 | (Won) | 21,988 | (Won) | 125,305 | (Won) | — | (Won) | 644,219 | ||||||||||||
Borrowings | 1 | 526,409 | 3,423 | 90,860 | — | 620,693 | ||||||||||||||||||
Derivative financial liabilities | — | 6,188 | — | 45,724 | — | 51,912 | ||||||||||||||||||
Other liabilities | 151,792 | 6,515 | 250 | 12,004 | — | 170,561 | ||||||||||||||||||
Other provisions | — | 4 | 147 | — | — | 151 | ||||||||||||||||||
|
|
|
|
|
|
|
|
|
|
|
| |||||||||||||
| (Won) | 386,945 | (Won) | 800,890 | (Won) | 25,808 | (Won) | 273,893 | (Won) | — | (Won) | 1,487,536 | |||||||||||||
|
|
|
|
|
|
|
|
|
|
|
| |||||||||||||
S-136
Table of Contents
Korea Development Bank
Notes to the interim consolidated financial statements—(Continued)
June 30, 2011 and 2010
| January 1, 2010 | ||||||||||||||||||||||||
| Controlling entities | Subsidiaries | Associates | Entities under same control | Key management | Total | |||||||||||||||||||
Assets: | ||||||||||||||||||||||||
Cash and due from banks | (Won) | — | (Won) | 500,872 | (Won) | — | (Won) | — | (Won) | — | (Won) | 500,872 | ||||||||||||
Financial assets available-for-sale | — | 284,233 | — | 12,650 | — | 296,883 | ||||||||||||||||||
Loans | — | 895,087 | 1,583,776 | 177,651 | 115 | 2,656,629 | ||||||||||||||||||
(Allowance for possible loan losses) | — | (209 | ) | (123,958 | ) | (180 | ) | (3 | ) | (124,350 | ) | |||||||||||||
Derivative financial assets | — | 49,608 | 176,936 | 60,017 | — | 286,561 | ||||||||||||||||||
Others | — | 102,364 | 11,591 | 3,910 | — | 117,865 | ||||||||||||||||||
(Allowance for possible other asset losses) | — | (1 | ) | (789 | ) | — | — | (790 | ) | |||||||||||||||
|
|
|
|
|
|
|
|
|
|
|
| |||||||||||||
| (Won) | — | (Won) | 1,831,954 | (Won) | 1,647,556 | (Won) | 254,048 | (Won) | 112 | (Won) | 3,733,670 | |||||||||||||
|
|
|
|
|
|
|
|
|
|
|
| |||||||||||||
Liabilities: | ||||||||||||||||||||||||
Financial liabilities designated at FVTPL | (Won) | — | (Won) | — | (Won) | — | (Won) | 14,262 | (Won) | — | (Won) | 14,262 | ||||||||||||
Due to customers | 1,868 | 111,462 | 138,389 | 171,460 | — | 423,179 | ||||||||||||||||||
Borrowings | — | 446,452 | 23,945 | 8,800 | — | 479,197 | ||||||||||||||||||
Debt issued | — | — | 3,000 | — | — | 3,000 | ||||||||||||||||||
Derivative financial liabilities | — | 3,313 | 76 | 29,710 | — | 33,099 | ||||||||||||||||||
Other liabilities | 5,705 | 979 | 2,815 | 4,473 | — | 13,972 | ||||||||||||||||||
Other provisions | — | 480 | 108 | — | — | 588 | ||||||||||||||||||
|
|
|
|
|
|
|
|
|
|
|
| |||||||||||||
| (Won) | 7,573 | (Won) | 562,686 | (Won) | 168,333 | (Won) | 228,705 | (Won) | — | (Won) | 967,297 | |||||||||||||
|
|
|
|
|
|
|
|
|
|
|
| |||||||||||||
Transactions with related-parties for the six months ended June 30, 2011 and 2010 are summarized as follows (Korean won in millions):
| Six months ended June 30, 2011 | ||||||||||||||||||||||||
| Controlling entities | Subsidiaries | Associates | Entities under same control | Key management | Total | |||||||||||||||||||
Income: | ||||||||||||||||||||||||
Interest income | (Won) | 1,596 | (Won) | 51,062 | (Won) | 8,002 | (Won) | 58 | (Won) | — | (Won) | 60,718 | ||||||||||||
Reversal of allowance for possible loan losses | 63 | 3,933 | 4,938 | — | — | 8,934 | ||||||||||||||||||
Commission income and others | 71,771 | 141,707 | 67,845 | 22,633 | — | 303,956 | ||||||||||||||||||
|
|
|
|
|
|
|
|
|
|
|
| |||||||||||||
| (Won) | 73,430 | (Won) | 196,702 | (Won) | 80,785 | (Won) | 22,691 | (Won) | — | (Won) | 373,608 | |||||||||||||
|
|
|
|
|
|
|
|
|
|
|
| |||||||||||||
Expense: | ||||||||||||||||||||||||
Interest expense | (Won) | 17,958 | (Won) | 769 | (Won) | 1,934 | (Won) | 359 | (Won) | — | (Won) | 21,020 | ||||||||||||
Credit loss expense | — | 10,923 | — | — | — | 10,923 | ||||||||||||||||||
Administration expense | — | — | — | — | 1,125 | 1,125 | ||||||||||||||||||
Other operating loss | 7,869 | 31,505 | 10,692 | 20,981 | — | 71,047 | ||||||||||||||||||
|
|
|
|
|
|
|
|
|
|
|
| |||||||||||||
| (Won) | 25,827 | (Won) | 43,197 | (Won) | 12,626 | (Won) | 21,340 | (Won) | 1,125 | (Won) | 104,115 | |||||||||||||
|
|
|
|
|
|
|
|
|
|
|
| |||||||||||||
S-137
Table of Contents
Korea Development Bank
Notes to the interim consolidated financial statements—(Continued)
June 30, 2011 and 2010
| Six months ended June 30, 2010 | ||||||||||||||||||||||||
| Controlling entities | Subsidiaries | Associates | Entities under same control | Key management | Total | |||||||||||||||||||
Income: | ||||||||||||||||||||||||
Interest income | (Won) | 4 | (Won) | 75,743 | (Won) | 5,756 | (Won) | 4,902 | (Won) | — | (Won) | 86,405 | ||||||||||||
Commission income and others | 50 | 35,722 | 4,438 | 72,671 | — | 112,881 | ||||||||||||||||||
|
|
|
|
|
|
|
|
|
|
|
| |||||||||||||
| (Won) | 54 | (Won) | 111,465 | (Won) | 10,194 | (Won) | 77,573 | (Won) | — | (Won) | 199,286 | |||||||||||||
|
|
|
|
|
|
|
|
|
|
|
| |||||||||||||
Expense: | ||||||||||||||||||||||||
Interest expense | (Won) | 2,727 | (Won) | 10,856 | (Won) | 433 | (Won) | 260 | (Won) | — | (Won) | 14,276 | ||||||||||||
Credit loss expense | — | 872 | 3,592 | 526 | — | 4,990 | ||||||||||||||||||
Administration expense | — | — | — | 83 | 377 | 460 | ||||||||||||||||||
Other operating loss | 395 | 22,446 | 4,405 | 53,864 | — | 81,110 | ||||||||||||||||||
|
|
|
|
|
|
|
|
|
|
|
| |||||||||||||
| (Won) | 3,122 | (Won) | 34,174 | (Won) | 8,430 | (Won) | 54,733 | (Won) | 377 | (Won) | 100,836 | |||||||||||||
|
|
|
|
|
|
|
|
|
|
|
| |||||||||||||
The Company provided various commitments amounting to (Won)925,155 million and payments guarantees amounting to (Won)35,729 million in the transactions with related party.
46. Scope of consolidation
Changes in scope of consolidation for the six months ended June 30, 2011 are as follows (Korean won in millions):
Newly included in scope of consolidation (28): |
Daewoo Engineering & Construction Co., Ltd, KIAMCO KDB Shipping PR-4 Private Fund, |
KIAMCO KDB Shipping PR-5 Private Fund, KDB DB-6 Private Fund, KDB DB-7 Private Fund, |
KB Evergreen 41 Private Fund, KB Evergreen 42 Private Fund, |
Samsung Focus 23 Private Fund, Samsung Focus 24 Private Fund, |
Kyobo Axa Tomorrow 3M L-1 Private Fund, IBK Panorama 39 Private Fund, |
IBK Panorama 40 Private Fund, Kyobo Axa Tomorrow 6M L-8 Private Fund, |
Hanwha Smart 44 Private Fund, Hanwha Smart 45 Private Fund, |
Yurie New Athenae 9 Private Fund, Yurie Select 28 Private Fund, |
Woori Frontier 7 Private Fund, Woori Frontier 8 Private Fund, |
Dongbu Together 49 Private Fund, Dongbu Together 50 Private Fund, |
U-Best the 2nd Securitization Specialty Co., Ltd.,HI Dream Private Securities Investment Trust 1, |
HI Dream Private Securities Investment Trust 2, Eugene Jarang Private 22 Bond, |
Eugene Jarang Private 23 Bond, Midas Private Securities Trust KD-1, |
Midas Private Securities Trust KD-2 |
Excluded from scope of consolidation (23): |
KB Evergreen 30 Private Fund, Samsung Focus 20 Private Fund, |
Shinhan BNPP 13 Private Fund, Hi 6-4 Private Fund, |
Kyobo Axa Tomorrow 6M L-7 Private Fund, KDB DB-5 Private Fund, |
Hanwha Smart 37 Private Fund, Yurie New Athenae 5 Private Fund, |
Woori Frontier 9 Private Fund, NH-CA 6-1 Private Fund, |
Korea Investment Basic 28 Private Fund, Dongbu Together 35 Private Fund, |
IBK Panorama 28 Private Fund, KB Evergreen 20 Private Fund, |
Hanwha Smart 31 Private Fund, Hana UBS 20 Private Fund, |
Yurie New Athenae 3 Private Fund, Woori Frontier 6 Private Fund, |
Shinhan BNPP 11 Private Fund, Samsung Focus 17 Private Fund, |
KDB DB-4 Private Fund,Kyobo Axa Tomorrow 6M L-6 Private Fund, |
KDB 1st Securitization |
S-138
Table of Contents
Korea Development Bank
Notes to the interim consolidated financial statements—(Continued)
June 30, 2011 and 2010
47. Fair value of financial assets and liabilities
The details of the fair value of financial instruments as of June 30, 2011, December 31, 2010 and January 1, 2010 are as follows (Korean won in millions):
| June 30, 2011 | ||||||||||||||||
| Level 1 | Level 2 | Level 3 | Total | |||||||||||||
Financial assets: | ||||||||||||||||
Financial assets held-for-trading | (Won) | 979,391 | (Won) | 3,762,636 | (Won) | 366 | (Won) | 4,742,393 | ||||||||
Financial assets designated at FVTPL | — | 55,380 | — | 55,380 | ||||||||||||
Financial assets available-for-sale | 3,122,499 | 23,093,953 | 2,879,276 | 29,095,728 | ||||||||||||
Derivative financial assets | 2,419 | 5,139,873 | 797,963 | 5,940,255 | ||||||||||||
|
|
|
|
|
|
|
| |||||||||
| (Won) | 4,104,309 | (Won) | 32,051,842 | (Won) | 3,677,605 | (Won) | 39,833,756 | |||||||||
|
|
|
|
|
|
|
| |||||||||
Financial liabilities: | ||||||||||||||||
Financial liabilities designated at FVTPL | — | 961,473 | 7,232 | 968,705 | ||||||||||||
Derivative financial liabilities | 53,126 | 4,020,798 | 96,929 | 4,170,853 | ||||||||||||
|
|
|
|
|
|
|
| |||||||||
| (Won) | 53,126 | (Won) | 4,982,271 | (Won) | 104,161 | (Won) | 5,139,558 | |||||||||
|
|
|
|
|
|
|
| |||||||||
| December 31, 2010 | ||||||||||||||||
| Level 1 | Level 2 | Level 3 | Total | |||||||||||||
Financial assets: | ||||||||||||||||
Financial assets held-for-trading | (Won) | 989,682 | (Won) | 5,166,246 | (Won) | 15,560 | (Won) | 6,171,488 | ||||||||
Financial assets designated at FVTPL | — | 33,935 | — | 33,935 | ||||||||||||
Financial assets available-for-sale | 3,822,145 | 21,672,997 | 913,741 | 26,408,883 | ||||||||||||
Derivative financial assets | — | 5,751,322 | 311,926 | 6,063,248 | ||||||||||||
|
|
|
|
|
|
|
| |||||||||
| (Won) | 4,811,827 | (Won) | 32,624,500 | (Won) | 1,241,227 | (Won) | 38,677,554 | |||||||||
|
|
|
|
|
|
|
| |||||||||
Financial liabilities: | ||||||||||||||||
Financial liabilities designated at FVTPL | — | 947,659 | 4,093 | 951,752 | ||||||||||||
Derivative financial liabilities | — | 4,612,560 | 82,563 | 4,695,123 | ||||||||||||
|
|
|
|
|
|
|
| |||||||||
| (Won) | — | (Won) | 5,560,219 | (Won) | 86,656 | (Won) | 5,646,875 | |||||||||
|
|
|
|
|
|
|
| |||||||||
| January 1, 2010 | ||||||||||||||||
| Level 1 | Level 2 | Level 3 | Total | |||||||||||||
Financial assets: | ||||||||||||||||
Financial assets held-for-trading | (Won) | 336,571 | (Won) | 3,021,386 | (Won) | — | (Won) | 3,357,957 | ||||||||
Financial assets designated at FVTPL | 470 | — | 89,503 | 89,973 | ||||||||||||
Financial assets available-for-sale | 2,607,470 | 22,984,357 | 3,545,272 | 29,137,099 | ||||||||||||
Derivative financial assets | 7,379 | 7,507,118 | 104,219 | 7,618,716 | ||||||||||||
|
|
|
|
|
|
|
| |||||||||
| (Won) | 2,951,890 | (Won) | 33,512,861 | (Won) | 3,738,994 | (Won) | 40,203,745 | |||||||||
|
|
|
|
|
|
|
| |||||||||
Financial liabilities: | ||||||||||||||||
Financial liabilities designated at FVTPL | — | 1,168,550 | 139,749 | 1,308,299 | ||||||||||||
Derivative financial liabilities | — | 6,521,130 | 127,526 | 6,648,656 | ||||||||||||
|
|
|
|
|
|
|
| |||||||||
| (Won) | — | (Won) | 7,689,680 | (Won) | 267,275 | (Won) | 7,956,955 | |||||||||
|
|
|
|
|
|
|
| |||||||||
S-139
Table of Contents
Korea Development Bank
Notes to the interim consolidated financial statements—(Continued)
June 30, 2011 and 2010
Changes in carrying value of level 3 financial instruments, whose fair value is categorized as level 3, for the six months ended June 30, 2011 and 2010 are as follows (Korean won in millions):
| Six-months ended June 30, 2011 | ||||||||||||||||||||||||||||||||||||
| Beginning balance | Current profit or loss | Other comprehensive income | Purchase | Disposal | Settlement | Level transfers | Foreign exchange differences | Ending balance | ||||||||||||||||||||||||||||
Assets: | ||||||||||||||||||||||||||||||||||||
Financial assets held-for-trading | (Won) | 15,560 | (Won) | — | (Won) | — | (Won) | 366 | (Won) | (15,560 | ) | (Won) | — | (Won) | — | (Won) | — | (Won) | 366 | |||||||||||||||||
Financial assets available -for-sale | 913,741 | 39,075 | 11,099 | 2,028,862 | (490,354 | ) | — | (11,269 | ) | 388,122 | 2,879,276 | |||||||||||||||||||||||||
Derivative financial assets | 311,926 | 437,447 | — | 56,946 | — | (8,356 | ) | — | — | 797,963 | ||||||||||||||||||||||||||
|
|
|
|
|
|
|
|
|
|
|
|
|
|
|
|
|
| |||||||||||||||||||
| (Won) | 1,241,227 | (Won) | 476,522 | (Won) | 11,099 | (Won) | 2,086,174 | (Won) | (505,914) | (Won) | (8,356 | ) | (Won) | (11,269) | (Won) | 388,122 | (Won) | 3,677,605 | ||||||||||||||||||
|
|
|
|
|
|
|
|
|
|
|
|
|
|
|
|
|
| |||||||||||||||||||
Liability: | ||||||||||||||||||||||||||||||||||||
Financial liabilities designated FVTPL | (Won) | 4,093 | (Won) | 141 | (Won) | — | (Won) | — | (Won) | — | (Won) | 2,998 | (Won) | — | (Won) | — | (Won) | 7,232 | ||||||||||||||||||
Derivative financial liabilities | 82,563 | (45,356 | ) | — | 52,434 | — | 7,288 | — | — | 96,929 | ||||||||||||||||||||||||||
|
|
|
|
|
|
|
|
|
|
|
|
|
|
|
|
|
| |||||||||||||||||||
| (Won) | 86,656 | (Won) | (45,215) | (Won) | — | (Won) | 52,434 | (Won) | — | (Won) | 10,286 | (Won) | — | (Won) | — | (Won) | 104,161 | |||||||||||||||||||
|
|
|
|
|
|
|
|
|
|
|
|
|
|
|
|
|
| |||||||||||||||||||
| Six-months ended June 30, 2010 | ||||||||||||||||||||||||||||||||||||
| Beginning balance | Current profit or loss | Other comprehensive income | Purchase | Disposal | Settlement | Level transfers | Foreign exchange differences | Beginning balance | ||||||||||||||||||||||||||||
Assets: | ||||||||||||||||||||||||||||||||||||
Financial assets held-for-trading | (Won) | — | (Won) | — | (Won) | — | (Won) | 88,825 | (Won) | (36,736 | ) | (Won) | — | (Won) | — | (Won) | 299 | (Won) | 52,388 | |||||||||||||||||
Financial assets designated at FVTPL | 89,503 | — | — | — | — | (89,503 | ) | — | — | — | ||||||||||||||||||||||||||
Financial assets available-for-sale | 3,545,272 | 91,480 | 4,962 | 1,886,257 | (95,316 | ) | (751,473 | ) | (275,542 | ) | (417,100 | ) | 3,988,540 | |||||||||||||||||||||||
Derivative financial assets | 104,219 | 28,695 | — | 9,133 | — | 59,610 | — | — | 201,657 | |||||||||||||||||||||||||||
|
|
|
|
|
|
|
|
|
|
|
|
|
|
|
|
|
| |||||||||||||||||||
| (Won) | 3,738,994 | (Won) | 120,175 | (Won) | 4,962 | (Won) | 1,984,215 | (Won) | (132,052 | ) | (Won) | (781,366 | ) | (Won) | (275,542 | ) | (Won) | (416,801 | ) | (Won) | 4,242,585 | |||||||||||||||
|
|
|
|
|
|
|
|
|
|
|
|
|
|
|
|
|
| |||||||||||||||||||
Liability: | ||||||||||||||||||||||||||||||||||||
Financial liabilities designated FVTPL | (Won) | 139,749 | (Won) | (77 | ) | (Won) | — | (Won) | — | (Won) | — | (Won) | (134,236 | ) | (Won) | — | (Won) | — | (Won) | 5,436 | ||||||||||||||||
Derivative financial liabilities | 127,526 | (43,821 | ) | (1,237 | ) | (42,374 | ) | — | (25,649 | ) | (Won) | — | (Won) | — | 14,445 | |||||||||||||||||||||
|
|
|
|
|
|
|
|
|
|
|
|
|
|
|
|
|
| |||||||||||||||||||
| (Won) | 267,275 | (Won) | (43,898 | ) | (Won) | (1,237 | ) | (Won) | (42,374 | ) | (Won) | — | (Won) | (159,885 | ) | (Won) | — | (Won) | — | (Won) | 19,881 | |||||||||||||||
|
|
|
|
|
|
|
|
|
|
|
|
|
|
|
|
|
| |||||||||||||||||||
S-140
Table of Contents
Korea Development Bank
Notes to the interim consolidated financial statements—(Continued)
June 30, 2011 and 2010
48. Categories of financial assets and liabilities
Categorization of the Company’s financial assets and liabilities as of June 30, 2011, December 31, 2010 and January 1, 2010 are as follows (Korean won in millions):
| June 30, 2011 | ||||||||||||||||||||||||||||||||||||
| Cash and cash equivalents | Financial instruments held-for-trading | Financial instruments designated at FVTPL | Available- for-sale financial instruments | Held-to-maturity financial instruments | Loan and receivables | Financial liabilities carrying at amortized cost | Derivative financial instruments utilized in fair value hedging | Total | ||||||||||||||||||||||||||||
Financial assets: | ||||||||||||||||||||||||||||||||||||
Cash and due from banks | (Won) | 1,331,426 | (Won) | — | (Won) | — | (Won) | — | (Won) | — | (Won) | 1,686,418 | (Won) | — | (Won) | — | (Won) | 3,017,844 | ||||||||||||||||||
Financial assets held-for-trading | 1,002 | 4,741,391 | — | — | — | — | — | — | 4,742,393 | |||||||||||||||||||||||||||
Financial assets designated at FVTPL | — | — | 55,380 | — | — | — | — | — | 55,380 | |||||||||||||||||||||||||||
Financial assets available-for-sale | 598,458 | — | — | 28,497,270 | — | — | — | — | 29,095,728 | |||||||||||||||||||||||||||
Financial assets held-to-maturity | — | — | — | — | 1,121,148 | — | — | — | 1,121,148 | |||||||||||||||||||||||||||
Loans | 960,436 | — | — | — | — | 74,209,251 | — | — | 75,169,687 | |||||||||||||||||||||||||||
Derivative financial assets | — | 4,817,018 | — | — | — | — | — | 1,123,237 | 5,940,255 | |||||||||||||||||||||||||||
Others | — | — | — | — | — | 7,160,487 | — | — | 7,160,487 | |||||||||||||||||||||||||||
|
|
|
|
|
|
|
|
|
|
|
|
|
|
|
|
|
| |||||||||||||||||||
| (Won) | 2,891,322 | (Won) | 9,558,409 | (Won) | 55,380 | (Won) | 28,497,270 | (Won) | 1,121,148 | (Won) | 83,056,156 | (Won) | — | (Won) | 1,123,237 | (Won) | 126,302,922 | |||||||||||||||||||
|
|
|
|
|
|
|
|
|
|
|
|
|
|
|
|
|
| |||||||||||||||||||
Financial liabilities: | ||||||||||||||||||||||||||||||||||||
Financial liabilities designated at FVTPL | (Won) | — | (Won) | — | (Won) | 968,705 | (Won) | — | (Won) | — | (Won) | — | (Won) | — | (Won) | — | (Won) | 968,705 | ||||||||||||||||||
Due to customers | — | — | — | — | — | — | 24,114,764 | — | 24,114,764 | |||||||||||||||||||||||||||
Borrowings | — | — | — | — | — | — | 25,479,802 | — | 25,479,802 | |||||||||||||||||||||||||||
Debt issued | — | — | — | — | — | — | 46,059,829 | — | 46,059,829 | |||||||||||||||||||||||||||
Derivative financial liabilities | — | 4,037,024 | — | — | — | — | — | 133,829 | 4,170,853 | |||||||||||||||||||||||||||
Others | — | — | — | — | — | — | 8,403,800 | — | 8,403,800 | |||||||||||||||||||||||||||
|
|
|
|
|
|
|
|
|
|
|
|
|
|
|
|
|
| |||||||||||||||||||
| (Won) | — | (Won) | 4,037,024 | (Won) | 968,705 | (Won) | — | (Won) | — | (Won) | — | (Won) | 104,058,195 | (Won) | 133,829 | (Won) | 109,197,753 | |||||||||||||||||||
|
|
|
|
|
|
|
|
|
|
|
|
|
|
|
|
|
| |||||||||||||||||||
S-141
Table of Contents
Korea Development Bank
Notes to the interim consolidated financial statements—(Continued)
June 30, 2011 and 2010
| December 31, 2010 | ||||||||||||||||||||||||||||||||||||
| Cash and cash equivalents | Financial instruments held-for-trading | Financial instruments designated at FVTPL | Available-for-sale financial instruments | Held-to-maturity financial instruments | Loan and receivables | Financial liabilities carrying at amortized cost | Derivative financial instruments utilized in fair value hedging | Total | ||||||||||||||||||||||||||||
Financial assets: | ||||||||||||||||||||||||||||||||||||
Cash and due from banks | (Won) | 984,597 | (Won) | — | (Won) | — | (Won) | — | (Won) | — | (Won) | 388,048 | (Won) | — | (Won) | — | (Won) | 1,372,645 | ||||||||||||||||||
Financial assets held-for-trading | — | 6,171,488 | — | — | — | — | — | — | 6,171,488 | |||||||||||||||||||||||||||
Financial assets designated at FVTPL | — | — | 33,935 | — | — | — | — | — | 33,935 | |||||||||||||||||||||||||||
Financial assets available-for-sale | — | — | — | 26,408,883 | — | — | — | — | 26,408,883 | |||||||||||||||||||||||||||
Financial assets held-to-maturity | — | — | — | — | 1,152,432 | — | — | — | 1,152,432 | |||||||||||||||||||||||||||
Loans | 2,256,002 | — | — | — | — | 71,394,600 | — | — | 73,650,602 | |||||||||||||||||||||||||||
Derivative financial assets | — | 4,827,343 | — | — | — | — | — | 1,235,905 | 6,063,248 | |||||||||||||||||||||||||||
Others | — | — | — | — | — | 4,070,003 | — | — | 4,070,003 | |||||||||||||||||||||||||||
|
|
|
|
|
|
|
|
|
|
|
|
|
|
|
|
|
| |||||||||||||||||||
| (Won) | 3,240,599 | (Won) | 10,998,831 | (Won) | 33,935 | (Won) | 26,408,883 | (Won) | 1,152,432 | (Won) | 75,852,651 | (Won) | — | (Won) | 1,235,905 | (Won) | 118,923,236 | |||||||||||||||||||
|
|
|
|
|
|
|
|
|
|
|
|
|
|
|
|
|
| |||||||||||||||||||
Financial liabilities: | ||||||||||||||||||||||||||||||||||||
Financial liabilities designated at FVTPL | (Won) | — | (Won) | — | (Won) | 951,752 | (Won) | — | (Won) | — | (Won) | — | (Won) | — | (Won) | — | (Won) | 951,752 | ||||||||||||||||||
Due to customers | — | — | — | — | — | — | 19,640,762 | — | 19,640,762 | |||||||||||||||||||||||||||
Borrowings | — | — | — | — | — | — | 23,541,415 | — | 23,541,415 | |||||||||||||||||||||||||||
Debt issued | — | — | — | — | — | — | 44,805,248 | — | 44,805,248 | |||||||||||||||||||||||||||
Derivative financial liabilities | — | 4,484,218 | — | — | — | — | — | 210,905 | 4,695,123 | |||||||||||||||||||||||||||
Others | — | — | — | — | — | — | 6,254,916 | — | 6,254,916 | |||||||||||||||||||||||||||
|
|
|
|
|
|
|
|
|
|
|
|
|
|
|
|
|
| |||||||||||||||||||
| (Won) | — | (Won) | 4,484,218 | (Won) | 951,752 | (Won) | — | (Won) | — | (Won) | — | (Won) | 94,242,341 | (Won) | 210,905 | (Won) | 99,889,216 | |||||||||||||||||||
|
|
|
|
|
|
|
|
|
|
|
|
|
|
|
|
|
| |||||||||||||||||||
S-142
Table of Contents
Korea Development Bank
Notes to the interim consolidated financial statements—(Continued)
June 30, 2011 and 2010
| January 1, 2010 | ||||||||||||||||||||||||||||||||||||
| Cash and cash equivalents | Financial instruments held-for-trading | Financial instruments designated at FVTPL | Available-for-sale financial instruments | Held-to-maturity financial instruments | Loan and receivables | Financial liabilities carrying at amortized cost | Derivative financial instruments utilized in fair value hedging | Total | ||||||||||||||||||||||||||||
Financial assets: | ||||||||||||||||||||||||||||||||||||
Cash and due from banks | (Won) | 725,407 | (Won) | — | (Won) | — | (Won) | — | (Won) | — | (Won) | 1,110,393 | (Won) | — | (Won) | — | (Won) | 1,835,800 | ||||||||||||||||||
Financial assets held-for-trading | — | 3,357,957 | — | — | — | — | — | — | 3,357,957 | |||||||||||||||||||||||||||
Financial assets designated at FVTPL | — | — | 89,973 | — | — | — | — | — | 89,973 | |||||||||||||||||||||||||||
Financial assets available-for-sale | — | — | — | 29,137,099 | — | — | — | — | 29,137,099 | |||||||||||||||||||||||||||
Financial assets held-to-maturity | — | — | — | — | 378,836 | — | — | — | 378,836 | |||||||||||||||||||||||||||
Loans | 1,127,152 | — | — | — | — | 75,542,598 | — | — | 76,669,750 | |||||||||||||||||||||||||||
Derivative financial assets | — | 6,743,185 | — | — | — | — | — | 875,531 | 7,618,716 | |||||||||||||||||||||||||||
Others | — | — | — | — | — | 4,550,341 | — | — | 4,550,341 | |||||||||||||||||||||||||||
|
|
|
|
|
|
|
|
|
|
|
|
|
|
|
|
|
| |||||||||||||||||||
| (Won) | 1,852,559 | (Won) | 10,101,142 | (Won) | 89,973 | (Won) | 29,137,099 | (Won) | 378,836 | (Won) | 81,203,332 | (Won) | — | (Won) | 875,531 | (Won) | 123,638,472 | |||||||||||||||||||
|
|
|
|
|
|
|
|
|
|
|
|
|
|
|
|
|
| |||||||||||||||||||
Financial liabilities: | ||||||||||||||||||||||||||||||||||||
Financial liabilities designated at FVTPL | (Won) | — | (Won) | — | (Won) | 1,308,299 | (Won) | — | (Won) | — | (Won) | — | (Won) | — | (Won) | — | (Won) | 1,308,299 | ||||||||||||||||||
Due to customers | — | — | — | — | — | — | 14,756,525 | — | 14,756,525 | |||||||||||||||||||||||||||
Borrowings | — | — | — | — | — | — | 31,267,111 | — | 31,267,111 | |||||||||||||||||||||||||||
Debt issued | — | — | — | — | — | — | 50,945,645 | — | 50,945,645 | |||||||||||||||||||||||||||
Derivative financial liabilities | — | 6,405,668 | — | — | — | — | — | 242,988 | 6,648,656 | |||||||||||||||||||||||||||
Others | — | — | — | — | — | — | 5,194,809 | — | 5,194,809 | |||||||||||||||||||||||||||
|
|
|
|
|
|
|
|
|
|
|
|
|
|
|
|
|
| |||||||||||||||||||
| (Won) | — | (Won) | 6,405,668 | (Won) | 1,308,299 | (Won) | — | (Won) | — | (Won) | — | (Won) | 102,164,090 | (Won) | 242,988 | (Won) | 110,121,045 | |||||||||||||||||||
|
|
|
|
|
|
|
|
|
|
|
|
|
|
|
|
|
| |||||||||||||||||||
S-143
Table of Contents
Korea Development Bank
Notes to the interim consolidated financial statements—(Continued)
June 30, 2011 and 2010
49. Non-current assets held-for-sale
The details of non-current assets held-for-sale as of June 30, 2011, December 31, 2010 and January 1, 2010 are as follows (Korean won in millions):
| June 30, 2011 | December 31, 2010 | January 1, 2010 | ||||||||||
Non-current assets held-for-sale: | ||||||||||||
Investments in associates(*1) | (Won) | 1,926,417 | (Won) | 1,038,528 | (Won) | 1,038,528 | ||||||
Property and equipment(*2) | 457,502 | — | 3,870 | |||||||||
|
|
|
|
|
| |||||||
| (Won) | 2,383,919 | (Won) | 1,038,528 | (Won) | 1,042,398 | |||||||
|
|
|
| |||||||||
Equity related to non-current assets held-for-sale: | ||||||||||||
Unrealized gain on valuation of associates | 302,186 | 302,186 | 302,186 | |||||||||
Income tax effect | (66,481 | ) | (66,481 | ) | (66,481 | ) | ||||||
|
|
|
|
|
| |||||||
| (Won) | 235,705 | (Won) | 235,705 | (Won) | 235,705 | |||||||
|
|
|
|
|
| |||||||
| (*1) | The Company has been in progress of selling Daewoo shipbuilding & Marine Engineering Co., Ltd (Number of shares : 59,825,596 shares) and Korea Express Inc., (Number of shares : 1,215,291 shares) and will complete the procedures soon. |
| (*2) | Property and equipment is owned by Daewoo E&C Co., Ltd and it will be sold soon. |
The details of income and loss related non-current assets held-for-sale as of June 30, 2011, December 31, 2010 and January 1, 2010 are as follows (Korean won in millions):
| June 30, 2011 | December 31, 2010 | |||||||
Gain on disposal of non-current assets held-for-sale | (Won) | 7,214 | (Won) | 179 | ||||
Loss on disposal of non-current assets held-for-sale | (Won) | (2,562 | ) | (Won) | (179 | ) | ||
S-144
Table of Contents
Korea Development Bank
Notes to the interim consolidated financial statements—(Continued)
June 30, 2011 and 2010
50. Additional cash flows information
Cash and cash equivalents in the statement of cash flows as of June 30, 2011, December 31, 2010 and January 1, 2010 are as follows (Korean won in millions):
| June 30, 2011 | December 31, 2010 | January 1, 2010 | ||||||||||
Cash and due from banks: | ||||||||||||
Cash | (Won) | 168,373 | (Won) | 175,032 | (Won) | 129,225 | ||||||
Deposits | 1,163,053 | 809,565 | 596,182 | |||||||||
|
|
|
|
|
| |||||||
| 1,331,426 | 984,597 | 725,407 | ||||||||||
Financial assets held-for-trading: | ||||||||||||
Government bonds | 1,002 | — | — | |||||||||
Financial assets available-for-sale: | ||||||||||||
Government bonds | 598,458 | — | — | |||||||||
Loans: | ||||||||||||
Call loans | 790,098 | 2,167,031 | 1,032,998 | |||||||||
Loans to banks | 170,338 | 88,971 | 94,154 | |||||||||
|
|
|
|
|
| |||||||
| (Won) | 960,436 | (Won) | 2,256,002 | (Won) | 1,127,152 | |||||||
|
|
|
|
|
| |||||||
| (Won) | 2,891,322 | (Won) | 3,240,599 | (Won) | 1,852,559 | |||||||
|
|
|
|
|
| |||||||
Total interest and dividend that received or paid for six months ended June 30, 2011 and 2010 are as follows (Korean won in millions):
| Six months ended June 30, 2011 | Six months ended June 30, 2010 | |||||||
Total interest received | (Won) | 2,615,514 | (Won) | 3,379,119 | ||||
Total interest paid | (Won) | 1,336,002 | (Won) | 1,585,314 | ||||
Total dividend received | (Won) | 93,869 | (Won) | 73,645 | ||||
51. Business combinations
Acquisition of Daewoo E&C
On January 6, 2011, the Company additionally acquired 29.12% of voting shares of Daewoo E&C. So, the Company secured 50.75% ownership. The acquisition date was deemed on January 1, 2011. The Company accounted for the acquisition using the purchase method.
S-145
Table of Contents
Korea Development Bank
Notes to the interim consolidated financial statements—(Continued)
June 30, 2011 and 2010
The details of identifiable assets and liabilities of Daewoo E&C at the acquisition date are as follows (Korean won in millions):
| Carrying amount | Fair value (*1) | |||||||
Assets: | ||||||||
Cash and due from banks | (Won) | 639,668 | (Won) | 639,668 | ||||
Financial assets held-for-trading | 4,650 | 4,650 | ||||||
Financial assets available-for-sale | 729,008 | 729,008 | ||||||
Derivative financial assets | 406 | 406 | ||||||
Investments in associates | 155,162 | 155,162 | ||||||
Property and equipment | 665,194 | 665,192 | ||||||
Investment properties | 359,145 | 359,145 | ||||||
Intangible assets(*2) | 75,816 | 2,386,676 | ||||||
Deferred tax assets | 480,635 | 480,635 | ||||||
Others | 5,463,574 | 5,461,742 | ||||||
Non-current assets held-for-sale | 1,377,955 | 1,281,928 | ||||||
|
|
|
| |||||
| (Won) | 9,951,213 | (Won) | 12,164,212 | |||||
|
|
|
| |||||
Liabilities: | ||||||||
Borrowings | (Won) | 1,002,816 | (Won) | 1,002,816 | ||||
Debt issued | 1,579,751 | 1,598,258 | ||||||
Derivative financial liabilities | 165,080 | 165,080 | ||||||
Severance and retirement benefits | 129,811 | 129,811 | ||||||
Other allowances | 100,909 | 100,909 | ||||||
Deferred income tax liabilities | 16,258 | 501,336 | ||||||
Current tax liabilities | 8,758 | 8,758 | ||||||
Policy reserve and others | 3,520,082 | 3,520,082 | ||||||
|
|
|
| |||||
| (Won) | 6,523,465 | (Won) | 7,027,050 | |||||
|
|
|
| |||||
Identifiable net assets | (Won) | 3,427,748 | 5,137,162 | |||||
|
| |||||||
Non-controlling interest(*3) | (2,564,720 | ) | ||||||
Goodwill(*4) | 606,051 | |||||||
|
| |||||||
Net assets acquired | (Won) | 3,178,493 | ||||||
|
| |||||||
| (*1) | Fair value of acquired assets and liabilities was measured using the discounted future cash flow method. |
| (*2) | Intangible assets consists of identifiable assets amounting to (Won)2,310,860 millions such as trade-mark right, patent and orders on hand. |
| (*3) | Non-controlling interest was measured in proportion to identifiable net assets. |
| (*4) | Goodwill consists of synergies to be created through business combination and specifically unidentifiable assets. Goodwill will not be included when calculating net assets acquired for tax purposes. |
S-146
Table of Contents
Korea Development Bank
Notes to the interim consolidated financial statements—(Continued)
June 30, 2011 and 2010
The summary of cash flows from the acquisition is as follows (Korean won in millions):
| Amounts | ||||
Acquisition cost paid in cash(*) | (Won) | 3,178,493 | ||
Cash and cash equivalents owned by the acquiree | (639,668 | ) | ||
|
| |||
Cash outflows from the acquisition | (Won) | 2,538,825 | ||
|
| |||
| (*) | Acquisition cost paid in cash includes prior year’s common share acquisition amounting to (Won)1,000,010 million. |
After the acquisition of Daewoo E&C, operating income and net income is amounted to (Won)3,559,785 million and (Won)152,929 million, respectively.
52. Explanation of transition to K-IFRS
The details of reconciliation from Korea GAAP to K-IFRS key financial figures as of December 31, 2010, June 30,2010 and January 1, 2010 are as follows (Korean won in millions):
| December 31, 2010 | ||||||||||||||||||||
| Total assets | Total liabilities | Total equity | Net income | Comprehensive income | ||||||||||||||||
Korean-GAAP | (Won) | 138,083,425 | (Won) | 118,692,230 | (Won) | 19,391,195 | (Won) | 1,506,847 | (Won) | 1,571,530 | ||||||||||
Adjustments: | ||||||||||||||||||||
Changes in calculation of allowance for possible loan losses(*1) | 632,380 | (160,112 | ) | 792,492 | 219,105 | 219,105 | ||||||||||||||
Financial guarantees | — | (112,135 | ) | 112,135 | (70,521 | ) | (70,521 | ) | ||||||||||||
Changes in measurement of severance and retirement benefits | 63,916 | 90,518 | (26,602 | ) | 32,707 | 32,707 | ||||||||||||||
Deferred income tax effect | (84,073 | ) | (106,980 | ) | 22,907 | 101,707 | 101,707 | |||||||||||||
Changes in scope of consolidation | (12,645,185 | ) | (10,699,611 | ) | (1,945,574 | ) | 63,662 | 63,662 | ||||||||||||
Others(*2) | (191,295 | ) | 1,162,070 | (1,353,365 | ) | (625,802 | ) | (689,252 | ) | |||||||||||
|
|
|
|
|
|
|
|
|
| |||||||||||
Total adjustments | (12,224,257 | ) | (9,826,250 | ) | (2,398,007 | ) | (279,142 | ) | (342,592 | ) | ||||||||||
|
|
|
|
|
|
|
|
|
| |||||||||||
K-IFRS | (Won) | 125,859,168 | (Won) | 108,865,980 | (Won) | 16,993,188 | (Won) | 1,227,705 | (Won) | 1,228,938 | ||||||||||
|
|
|
|
|
|
|
|
|
| |||||||||||
S-147
Table of Contents
Korea Development Bank
Notes to the interim consolidated financial statements—(Continued)
June 30, 2011 and 2010
| June 30, 2010 | ||||||||||||||||||||
| Total assets | Total liabilities | Total equity | Net income | Comprehensive income | ||||||||||||||||
Korean-GAAP | (Won) | 146,983,527 | (Won) | 128,593,883 | (Won) | 18,389,644 | (Won) | 329,232 | (Won) | 658,795 | ||||||||||
Adjustments: | ||||||||||||||||||||
Changes in calculation of allowance for possible loan losses(*1) | 624,362 | (87,999 | ) | 712,361 | 138,974 | 138,974 | ||||||||||||||
Financial guarantees | 66,953 | 73,821 | (6,868 | ) | 59,703 | 59,703 | ||||||||||||||
Changes in measurement of severance and retirement benefits | — | (125,342 | ) | 125,342 | (57,314 | ) | (57,314 | ) | ||||||||||||
Deferred income tax effect | (79,848 | ) | 14,414 | (94,262 | ) | (15,462 | ) | (15,462 | ) | |||||||||||
Changes in scope of consolidation | (13,094,407 | ) | (10,863,995 | ) | (2,230,412 | ) | (221,176 | ) | (221,176 | ) | ||||||||||
Others(*2) | 807,028 | 1,313,789 | (506,761 | ) | 158,618 | 88,673 | ||||||||||||||
|
|
|
|
|
|
|
|
|
| |||||||||||
Total adjustments | (11,675,912 | ) | (9,675,312 | ) | (2,000,600 | ) | 63,343 | (6,602 | ) | |||||||||||
|
|
|
|
|
|
|
|
|
| |||||||||||
K-IFRS | (Won) | 135,307,615 | (Won) | 118,918,571 | (Won) | 16,389,044 | (Won) | 392,575 | (Won) | 652,193 | ||||||||||
|
|
|
|
|
|
|
|
|
| |||||||||||
| January 1, 2010 | ||||||||||||
| Total assets | Total liabilities | Total equity | ||||||||||
Korean-GAAP | (Won) | 139,149,240 | (Won) | 121,837,616 | (Won) | 17,311,624 | ||||||
Adjustments: | ||||||||||||
Changes in calculation of allowance for possible loan losses(*1) | 358,833 | (214,554 | ) | 573,387 | ||||||||
Financial guarantees | 72,576 | 140,902 | (68,366 | ) | ||||||||
Changes in measurement of severance and retirement benefits | — | (182,656 | ) | 182,656 | ||||||||
Deferred income tax effect | (137,955 | ) | (59,155 | ) | (78,800 | ) | ||||||
Changes in-scope of consolidation | (15,602,132 | ) | (13,592,896 | ) | (2,009,236 | ) | ||||||
Others(*2) | 3,124,074 | 3,357,567 | (233,453 | ) | ||||||||
|
|
|
|
|
| |||||||
Total adjustments | (12,184,604 | ) | (10,550,792 | ) | (1,633,812 | ) | ||||||
|
|
|
|
|
| |||||||
K-IFRS | (Won) | 126,964,636 | (Won) | 111,286,824 | (Won) | 15,677,812 | ||||||
|
|
|
|
|
| |||||||
| (*1) | Under K-IFRS, allowance for possible loan losses is estimated using the incurred loss model. |
| (*2) | Other items represent the separation of embedded derivatives, recognition of accrued interest on overdue loans, financial instruments designated at FVTPL and others. |
The Company did not disclose comprehensive income for the three months ended June 30, 2010 in accordance with Korean-GAAP. Accordingly, reconciliation of comprehensive income for the three months ended June 30, 2010 is not disclosed.
S-148
Table of Contents
Korea Development Bank
Notes to the interim consolidated financial statements—(Continued)
June 30, 2011 and 2010
Financial instruments designated at FVTPL at first-time adoption
| Fair value at the transition date | Carrying amount under previous GAAP | |||||||
Financial assets designated at FVTPL(*1) | (Won) | 89,973 | (Won) | 89,973 | ||||
Financial Liabilities designated at FVTPL(*2) | 1,308,299 | 1,330,748 | ||||||
|
|
|
| |||||
| (Won) | 1,398,272 | (Won) | 1,420,721 | |||||
|
|
|
| |||||
| (*1) | Financial assets designated at FVTPL are comprised of securities amounted to (Won)470 million of securities, (Won)92,526 million of loans and (Won)3,023 million of derivatives liabilities as of December 31, 2009 of GAAP. |
| (*2) | Financial liabilities designated at FVTPL are comprised of (Won)163,224 million of borrowings, (Won)1,191,000 million of debt issued and (Won) 23,476 million of derivatives assets as of December 31, 2009 of GAAP. |
K-IFRS cash flow differences adjustment
Income tax payment is represented separately in the statement of cash flows in accordance with K-IFRS, which was not separately shown in the statement of cash flows under Korean-GAAP. The transaction related with certain securities are reclassified as investing activities from operating activities. There is no significant differences in the statement of cash flows prepared under K-IFRS and Korean-GAAP except the items mentioned above.
53. Risk management
Introduction
Objectives and policies
The Bank’s risk management aims to maintain financial soundness and effectively manage various risks pertinent to the nature of the Bank’s business. In addition, the Bank has improved the risk management process to reflect the changes in the financial environment. The Bank has set up and fulfilled policies to manage risks timely and effectively. Pursuant to the policies, the Bank’s risks shall be
| • | managed comprehensively and independently. |
| • | recognized timely, evaluated exactly and managed effectively. |
| • | maintained to the extent that the risks balance with profit. |
| • | diversified appropriately to avoid concentration on specific segments. |
| • | managed to prevent from being excessively exposed by setting up and managing the tolerance limit and the guidelines. |
Risk management strategy and process
The Bank measures risks in a way so as to monitor and manage. The Bank’s risk management is at the level that the information generated in the risk management process is integrated and applied strategically to the Bank’s business. In the circumstance that risk management is recognized as the key function in the banking operations, the Bank reestablishes risk management from an adaptive and limited role to a leading and comprehensive role.
In addition, the Bank has focused on regular communications among the various departments to form a consensus on the strategy and process of risk management.
S-149
Table of Contents
Korea Development Bank
Notes to the interim consolidated financial statements—(Continued)
June 30, 2011 and 2010
Risk management governance
Risk Management Committee
The Bank’s Risk Management Committee (the “Committee”) is comprised of the chief commissioner, the president of the Bank, and four commissioners including outside directors. The Committee’s function is to establish the policies of risk management; to evaluate the capital adequacy of the Bank; to discuss material issues relating to risk management; and to present its preliminary decisions on material issues to the board of directors.
The president of the Bank and the head of Risk Management Department
The president abides by risk management policies and manages and monitors whether the Bank’s risk management and internal controls are effectively operated. The head of the Risk Management Department is responsible for supervising overall administration of risk management and providing the risk-related information to members of the board of directors and the Bank’s top management.
Risk Management Practice Committee
The Bank’s Risk Management Practice Committee supports the head of Risk Management Department in performing review at an operational level. The Risk Management Practice Committee is divided into each risk type (i.e. credit risk, market risk, interest rate risk, liquidity risk and operational risk). The Risk Management Practice Committee consists of the leaders of business segments.
Performance of Risk Management Committee
The Risk Management Committee performs comprehensive review of all the affairs related to risk management and deliberating the decisions of the board of directors. For the six months ended June 30, 2011, the key activities of the Risk Management Committee are as follows:
| • | Major deliberation |
| • | Regulating and amendment due to reorganization of risk management committee |
| • | Risk management committee set-up |
| • | Major reporting |
| • | Monthly results of risk management |
| • | Foundation and alteration on evaluation and approval criteria of private loan |
| • | Distribution of inner capital limit and control standard of inner capital for the year |
| • | Integrated analysis on crisis situation and capital adequacy |
| • | Status for management of IT Operating Risk |
| • | Provision of regulatory reserve for possible loan losses under K-IFRS and expansion of individual assessment (mainly focusing PF loans) |
Improvement of risk management system
For continuous improvement of risk management, financial soundness and capital adequacy, the Bank performs the following:
| • | Improvement of risk management system under Basel II |
S-150
Table of Contents
Korea Development Bank
Notes to the interim consolidated financial statements—(Continued)
June 30, 2011 and 2010
| • | In 2008, the Korean Financial Supervisory (“FSS”) provided a detail guideline on the capital adequacy and, in turn, the Bank improved the internal capital adequacy assessment process for more effective capital adequacy management. Pursuant to Roll-Out Plan, the Bank plans to improve the model for Low Default Portfolio (“LDP”). |
| • | The Bank elaborated the risk measuring criteria (including credit risk parameter and measuring logic) to enhance the practical uses of risk management system under Basel II. |
| • | The Advanced Measurement Approach (“AMA”) was preliminarily operated for calculating the operational risk. |
| • | Set-up of the risk management infrastructure |
| • | The Bank completed the development of RAPM system in order to reflect risks to the Bank’s business and enhance decision-making support function. Using the RAPM, the Bank evaluates the performances of each branch from 2010. |
| • | The Bank enforced the risk management related to irregular compound derivatives and as part of the enforcement, the Bank validated the derivative pricing model that the Bank’s front office had developed. |
Risk management reporting and measuring system
The Bank tries consistently to measure and manage objectively and rationally all of significant risk types with reference to the characteristics of operational areas, assets, and risks. In relation to reporting and measurement, the Bank has developed the application systems which are listed as follows:
Application system | Approach | Completion | Major function | |||
Corporate Credit Rating System | Logit Model | Jun. 2004 Mar. 2008 Mar. 2010 | Calculate corporate credit rating | |||
Credit Risk Measurement System | CreditRisk+ Credit Metrics | Jul. 2003 Nov. 2007 | Summarize exposures, manage exposure limit and calculate Credit VaR | |||
Market Risk Management System | RiskWatch | Jun. 2002 | Summarize position, manage exposure limit and calculate Market VaR | |||
Interest/Liquidity Risk Management System | OFSA | Feb. 2006 | Calculate repricing gap, duration gap, VaR and EaR | |||
Operational Risk Management System | Standardized Approach AMA | May 2006 May 2009 | Manage the process and calculate CSA, KRI, OP and VaR Calculate Op VaR |
Response and Plan for Basel II
The Korean authority implemented Basel II in January 2008 and adopted the Standardized Approach and the Foundation Internal Rating-Based Approach. The Advanced Approaches were later adopted in 2009.
S-151
Table of Contents
Korea Development Bank
Notes to the interim consolidated financial statements—(Continued)
June 30, 2011 and 2010
In conformity with the implementation roadmap of Basel II, the Bank obtained the approval to use the Foundation Internal Rating-Based Approach in the credit risk from the FSS in July 2008 and has applied the approach since June 2008. The Bank has applied Standardized Approach in the market risk and operational risk.
The Bank plans to adopt the Advanced Approaches (Credit risk: Advanced Internal Rating-Based Approach, Operational risk: Advanced Measurement Approach etc) to enhance reliability and financial soundness for the future. In preparing the adoption, the Bank also plans to improve the related systems and policies.
Internal capital adequacy assessment process
Internal capital adequacy assessment process is defined as the process that the Bank aggregates significant risks, calculates its internal capital, compares the internal capital with the available capital and assesses its internal capital adequacy.
| • | Internal capital adequacy assessment |
For the purpose of the internal capital adequacy assessment, the Bank calculates its aggregated internal capital and available capital by evaluating all significant risks and taking into account the quality and components of capital and then assesses the internal capital adequacy by comparing the aggregated internal capital with the available capital.
| • | Goal setting in the internal capital management |
The Bank sets up on an annual basis a basic plan of risk management for the maintenance of the internal capital adequacy within the limits of available capital. The Risk Management Committee deliberates on the plan and the board of directors approves the plan. The Bank sets up the goal of the BIS capital adequacy ratio in consideration of the risk appetite, prior year’s internal capital, financial environment, operation’s direction and scale.
| • | Allocation of internal capital |
The Bank’s entire internal capital is allocated to each headquarter and department reflecting the amount of the available risk and the business scale after the Risk Management Committee’s deliberation and the board of directors’ approval. The allocated internal capital is monitored regularly and managed using various management methods. The results of monitoring and managing the allocated internal capital are reported to the Risk Management Committee and others. In case of any material changes in the Bank’s business plan or risk operation strategy, the Bank adjusts the allocation.
| • | Composition of internal capital |
Internal capital is composed of quantifiable and non-quantifiable risks. The quantifiable risk is composed of credit risk, market risk, interest rate risk, operational risk and credit concentration risk. The quantifiable risk is measured quantitatively by applying reasonable methodology using objective data. Non-quantifiable risk is comprised of strategy risk, reputation risk, residual risk on asset securitization and others. Non-quantifiable risks not measured quantitatively because appropriate measuring methodology and related data do not exist to rate its risk level.
Credit Risk
Concept
Credit risk is defined as potential losses resulting from counterparty’s default or refusal to perform obligations.
S-152
Table of Contents
Korea Development Bank
Notes to the interim consolidated financial statements—(Continued)
June 30, 2011 and 2010
Approach to credit risk management
Summary of credit risk management
The Bank regards credit risk as the most important risk area in its business operations, and accordingly, closely monitors its credit risk exposure. The Bank manages both credit risk at portfolio level and at individual credit level. At portfolio level, the Bank reduces credit concentration and restructures the portfolio in such a way to maximize profitability considering the risk level. To avoid credit concentration on a particular sector, the Bank manages credit limits by client, group, and industry. The Bank also resets exposure management directives for each industry by conducting an industry credit evaluation twice a year.
At the individual credit level, relationship manager (“RM”), credit officer (“CO”) and the Credit Review Committee manage each borrower’s credit risk.
Post management and insolvent borrower management
The Bank consistently monitors the borrower’s credit rating from the date of the loan to the date of final collection of debt and inspects the borrower’s status regularly and frequently in order to prevent bad debts generated from newer accounts and to stabilize the number of debt recoveries.
In addition, the early warning system is operated timely to find out borrowers that are likely to be highly insolvent. Early warning system provides financial information, financial transaction information, public information and market information of the borrower. Using the information, the relationship officer and the credit officer consistently watch out for the changes in the borrower’s credit rating.
Under the early warning system, the borrower that is highly likely to be insolvent is classified as early warning borrower or precautionary borrower. The Bank sets up a specific and practical stabilization plan on the borrower considering the borrower’s characteristics and constantly manages whether the borrower complies with the plan. The borrower classified as substandard borrower doubtful borrower or estimated loss is managed by the Bank’s department which is exclusively responsible for insolvent borrowers. The department takes legal proceedings, disposals or corporate turnaround with the borrower.
Classification of asset soundness and allowance for bad debts provision
Classification of asset soundness is fulfilled by the analysis and assessment of credit risk. The classification is used in order to prevent further occurrence of insolvent asset and promote the normalization of existing insolvent asset and enhance the stabilization of operational asset.
Based on the Regulation on Supervision of Banking Business, the Bank established guidelines on classification of asset soundness according to Forward Looking Criteria (“FLC”) by which asset soundness is classified reflecting not only the past record of repayment but debt repayment capacity
In conformity with the guidelines, the Bank’s assets are classified as normal, precautionary, substandard, doubtful or estimated loss by credit rating and the Bank provides allowance for bad debts for each level of classification.
S-153
Table of Contents
Korea Development Bank
Notes to the interim consolidated financial statements—(Continued)
June 30, 2011 and 2010
Loans
The details of loans as of June 30, 2011, December 31, 2010 and January 1, 2010 are as follows (Korean won in millions):
| June 30, 2011 | December 31, 2010 | January 1, 2010 | ||||||||||
Neither past due nor impaired | (Won) | 73,778,410 | (Won) | 72,102,809 | (Won) | 75,849,816 | ||||||
Past due but not impaired | 270,080 | 298,136 | 207,564 | |||||||||
Impaired | 2,666,582 | 2,817,995 | 1,762,414 | |||||||||
|
|
|
|
|
| |||||||
Total | 76,715,072 | 75,218,940 | 77,819,794 | |||||||||
Allowance for possible loan losses | (1,419,004 | ) | (1,423,122 | ) | (1,043,548 | ) | ||||||
Present value discount | (90,124 | ) | (116,218 | ) | (90,216 | ) | ||||||
Deferred loan handling fees | (36,257 | ) | (28,998 | ) | (16,280 | ) | ||||||
|
|
|
|
|
| |||||||
Net amount | (Won) | 75,169,687 | (Won) | 73,650,602 | (Won) | 76,669,750 | ||||||
|
|
|
|
|
| |||||||
Ratio of allowance for possible loan losses to total loans (%) | 1.85 | 1.89 | 1.34 | |||||||||
|
|
|
|
|
| |||||||
Loans that are neither past due nor impaired
Loans that are neither past due nor impaired as of June 30, 2011, December 31, 2010 and January 1, 2010 consist of the followings (Korean won in millions):
| June 30, 2011 | ||||||||||||||||||||||||||||
| Loans in Korean won | Other loans | |||||||||||||||||||||||||||
| Loans for working capital | Loans for facility development | Others | Loans in foreign currency | Private placed corporate bonds | Others | Total | ||||||||||||||||||||||
AAA ~ B (Normal) | (Won) | 14,447,849 | (Won) | 25,149,423 | (Won) | 1,370,141 | (Won) | 17,073,195 | (Won) | 5,884,923 | (Won) | 6,597,719 | (Won) | 70,523,250 | ||||||||||||||
CCC (Precautionary) | 1,173,786 | 377,533 | — | 736,397 | 292,528 | 349,916 | 2,930,160 | |||||||||||||||||||||
CC (Substandard) | 58,986 | 50,780 | — | 86,356 | 7,923 | 18,353 | 222,398 | |||||||||||||||||||||
C (Doubtful) | 242 | 208 | — | — | — | — | 450 | |||||||||||||||||||||
D (Estimated Loss) | 2,335 | — | 99,774 | — | — | 43 | 102,152 | |||||||||||||||||||||
|
|
|
|
|
|
|
|
|
|
|
|
|
| |||||||||||||||
| (Won) | 15,683,198 | (Won) | 25,577,944 | (Won) | 1,469,915 | (Won) | 17,895,948 | (Won) | 6,185,374 | (Won) | 6,966,031 | (Won) | 73,778,410 | |||||||||||||||
|
|
|
|
|
|
|
|
|
|
|
|
|
| |||||||||||||||
| December 31, 2010 | ||||||||||||||||||||||||||||
| Loans in Korean won | Other loans | |||||||||||||||||||||||||||
| Loans for working capital | Loans for facility development | Others | Loans in foreign currency | Private placed corporate bonds | Others | Total | ||||||||||||||||||||||
AAA ~ B (Normal) | (Won) | 12,051,472 | (Won) | 23,608,477 | (Won) | 1,392,064 | (Won) | 17,468,184 | (Won) | 6,622,206 | (Won) | 8,366,003 | (Won) | 69,508,406 | ||||||||||||||
CCC (Precautionary) | 1,171,775 | 378,170 | — | 306,288 | 249,307 | 300,813 | 2,406,353 | |||||||||||||||||||||
CC (Substandard) | 122,837 | 31,418 | — | 3,562 | 11,923 | 15,857 | 185,597 | |||||||||||||||||||||
C (Doubtful) | — | — | 17 | — | — | — | 17 | |||||||||||||||||||||
D (Estimated Loss) | — | 2,436 | — | — | — | — | 2,436 | |||||||||||||||||||||
|
|
|
|
|
|
|
|
|
|
|
|
|
| |||||||||||||||
| (Won) | 13,346,084 | (Won) | 24,020,501 | (Won) | 1,392,081 | (Won) | 17,778,034 | (Won) | 6,883,436 | (Won) | 8,682,673 | (Won) | 72,102,809 | |||||||||||||||
|
|
|
|
|
|
|
|
|
|
|
|
|
| |||||||||||||||
S-154
Table of Contents
Korea Development Bank
Notes to the interim consolidated financial statements—(Continued)
June 30, 2011 and 2010
| January 1, 2010 | ||||||||||||||||||||||||||||
| Loans in Korean won | Other loans | |||||||||||||||||||||||||||
| Loans for working capital | Loans for facility development | Others | Loans in foreign currency | Private placed corporate bonds | Others | Total | ||||||||||||||||||||||
AAA ~ B (Normal) | (Won) | 10,799,823 | (Won) | 23,994,787 | (Won) | 485,348 | (Won) | 19,098,950 | (Won) | 12,075,934 | (Won) | 7,713,519 | (Won) | 74,168,361 | ||||||||||||||
CCC (Precautionary) | 218,673 | 244,391 | — | 391,003 | 88,939 | 40,642 | 983,648 | |||||||||||||||||||||
CC (Substandard) | 246,924 | 170,975 | — | 103,304 | 7,923 | 144,689 | 673,815 | |||||||||||||||||||||
C (Doubtful) | — | — | — | 6,013 | — | — | 6,013 | |||||||||||||||||||||
D (Estimated Loss) | 589 | — | — | 17,390 | — | — | 17,979 | |||||||||||||||||||||
|
|
|
|
|
|
|
|
|
|
|
|
|
| |||||||||||||||
| (Won) | 11,266,009 | (Won) | 24,410,153 | (Won) | 485,348 | (Won) | 19,616,660 | (Won) | 12,172,796 | (Won) | 7,898,850 | (Won) | 75,849,816 | |||||||||||||||
|
|
|
|
|
|
|
|
|
|
|
|
|
| |||||||||||||||
Loans that are past due but not impaired as of June 30, 2011, December 31, 2010 and January 1, 2010 consist of the followings (Korean won in millions):
| June 30, 2011 | ||||||||||||||||||||||||||||
| Loans in Korean won | Other loans | |||||||||||||||||||||||||||
| Loans for working capital | Loans for facility development | Others | Loans in foreign currency | Private placed corporate bonds | Others | Total | ||||||||||||||||||||||
Less 30 days | (Won) | 73,041 | (Won) | 37,635 | (Won) | 39,181 | (Won) | 61,220 | (Won) | 1,800 | (Won) | 10,542 | (Won) | 223,419 | ||||||||||||||
Less 30 ~ 60 days | 17,839 | — | 9,355 | — | — | — | 27,194 | |||||||||||||||||||||
Less 60 ~ 90 days | 1,562 | — | 17,905 | — | — | — | 19,467 | |||||||||||||||||||||
|
|
|
|
|
|
|
|
|
|
|
|
|
| |||||||||||||||
| (Won) | 92,442 | (Won) | 37,635 | (Won) | 66,441 | (Won) | 61,220 | (Won) | 1,800 | (Won) | 10,542 | (Won) | 270,080 | |||||||||||||||
|
|
|
|
|
|
|
|
|
|
|
|
|
| |||||||||||||||
| December 31, 2010 | ||||||||||||||||||||||||||||
| Loans in Korean won | Other loans | |||||||||||||||||||||||||||
| Loans for working capital | Loans for facility development | Others | Loans in foreign currency | Private placed corporate bonds | Others | Total | ||||||||||||||||||||||
Less 30 days | (Won) | 50,782 | (Won) | 103,602 | (Won) | 29,689 | (Won) | 61,311 | (Won) | 10,700 | (Won) | 8,708 | (Won) | 264,792 | ||||||||||||||
Less 30 ~ 60 days | 2,010 | — | 10,002 | — | — | — | 12,012 | |||||||||||||||||||||
Less 60 ~ 90 days | 495 | — | 20,837 | — | — | — | 21,332 | |||||||||||||||||||||
|
|
|
|
|
|
|
|
|
|
|
|
|
| |||||||||||||||
| (Won) | 53,287 | (Won) | 103,602 | (Won) | 60,528 | (Won) | 61,311 | (Won) | 10,700 | (Won) | 8,708 | (Won) | 298,136 | |||||||||||||||
|
|
|
|
|
|
|
|
|
|
|
|
|
| |||||||||||||||
| January 1, 2010 | ||||||||||||||||||||||||||||
| Loans in Korean won | Other loans | |||||||||||||||||||||||||||
| Loans for working capital | Loans for facility development | Others | Loans in foreign currency | Private placed corporate bonds | Others | Total | ||||||||||||||||||||||
Less 30 days | (Won) | 116,494 | (Won) | 19,147 | (Won) | — | (Won) | 13,016 | (Won) | 2,900 | (Won) | 8,143 | (Won) | 159,700 | ||||||||||||||
Less 30 ~ 60 days | 19,455 | 17,976 | — | 3,054 | — | — | 40,485 | |||||||||||||||||||||
Less 60 ~ 90 days | 650 | — | — | 5,729 | 1,000 | — | 7,379 | |||||||||||||||||||||
|
|
|
|
|
|
|
|
|
|
|
|
|
| |||||||||||||||
| (Won) | 136,599 | (Won) | 37,123 | (Won) | — | (Won) | 21,799 | (Won) | 3,900 | (Won) | 8,143 | (Won) | 207,564 | |||||||||||||||
|
|
|
|
|
|
|
|
|
|
|
|
|
| |||||||||||||||
S-155
Table of Contents
Korea Development Bank
Notes to the interim consolidated financial statements—(Continued)
June 30, 2011 and 2010
Impaired loans
Impaired loans as of June 30, 2011, December 31, 2010 and January 1, 2010 consist of the followings (Korean won in millions):
| June 30, 2011 | ||||||||||||||||||||||||||||
| Loans in Korean won | Other loans | |||||||||||||||||||||||||||
| Loans for working capital | Loans for facility development | Others | Loans in foreign currency | Private placed corporate bonds | Others | Total | ||||||||||||||||||||||
Individually assessed loans | (Won) | 1,210,768 | (Won) | 260,440 | (Won) | 3,626 | (Won) | 251,420 | (Won) | 479,139 | (Won) | 106,439 | (Won) | 2,311,832 | ||||||||||||||
Collectively assessed loans | 101,841 | 85,652 | — | 146,132 | 10,460 | 10,665 | 354,750 | |||||||||||||||||||||
|
|
|
|
|
|
|
|
|
|
|
|
|
| |||||||||||||||
| (Won) | 1,312,609 | (Won) | 346,092 | (Won) | 3,626 | (Won) | 397,552 | (Won) | 489,599 | (Won) | 117,104 | (Won) | 2,666,582 | |||||||||||||||
|
|
|
|
|
|
|
|
|
|
|
|
|
| |||||||||||||||
| December 31, 2010 | ||||||||||||||||||||||||||||
| Loans in Korean won | Other loans | |||||||||||||||||||||||||||
| Loans for working capital | Loans for facility development | Others | Loans in foreign currency | Private placed corporate bonds | Others | Total | ||||||||||||||||||||||
Individually assessed loans | (Won) | 1,239,885 | (Won) | 209,578 | (Won) | — | (Won) | 152,947 | (Won) | 422,364 | (Won) | 465,651 | (Won) | 2,490,425 | ||||||||||||||
Collectively assessed loans | 75,058 | 86,868 | 28,663 | 115,433 | 9,460 | 12,088 | 327,570 | |||||||||||||||||||||
|
|
|
|
|
|
|
|
|
|
|
|
|
| |||||||||||||||
| (Won) | 1,314,943 | (Won) | 296,446 | (Won) | 28,663 | (Won) | 268,380 | (Won) | 431,824 | (Won) | 477,739 | (Won) | 2,817,995 | |||||||||||||||
|
|
|
|
|
|
|
|
|
|
|
|
|
| |||||||||||||||
| January 1, 2010 | ||||||||||||||||||||||||||||
| Loans in Korean won | Other loans | |||||||||||||||||||||||||||
| Loans for working capital | Loans for facility development | Others | Loans in foreign currency | Private placed corporate bonds | Others | Total | ||||||||||||||||||||||
Individually assessed loans | (Won) | 843,398 | (Won) | 315,154 | (Won) | — | (Won) | 120,918 | (Won) | 119,422 | (Won) | 170,724 | (Won) | 1,569,616 | ||||||||||||||
Collectively assessed loans | 47,208 | 36,839 | — | 73,629 | 6,360 | 28,762 | 192,798 | |||||||||||||||||||||
|
|
|
|
|
|
|
|
|
|
|
|
|
| |||||||||||||||
| (Won) | 890,606 | (Won) | 351,993 | (Won) | — | (Won) | 194,547 | (Won) | 125,782 | (Won) | 199,486 | (Won) | 1,762,414 | |||||||||||||||
|
|
|
|
|
|
|
|
|
|
|
|
|
| |||||||||||||||
Measurement methodology of credit risk
Pursuant to Basel II, the Bank selects the measurement methodology of credit risk considering the difficulty of measurement, measurement factors, estimating methods and others. Measurement approaches are divided into Standardized Approach and Internal Rating-Based Approach.
S-156
Table of Contents
Korea Development Bank
Notes to the interim consolidated financial statements—(Continued)
June 30, 2011 and 2010
(1) Standardized Approach (“SA”)
In the case of the Standardized Approach, the risk weights are applied according to the credit rating assessed by External Credit Assessment Institution (“ECAI”).
Risk weights in each credit rating are as follows:
Credit rating (*) | Corporate | Country | Bank | Asset securitization | ||||
AAA ~ AA- | 20.0% | 0.0% | 20.0% | 20.0% | ||||
A+ ~ A- | 50.0% | 20.0% | 50.0% | 50.0% | ||||
BBB+ ~ BBB- | 100.0% | 50.0% | 100.0% | 100.0% | ||||
BB+ ~ BB- | 100.0% | 100.0% | 100.0% | 350.0% | ||||
B+ ~ B- | 150.0% | 100.0% | 100.0% | Deducted from equity capital (1,250%) | ||||
Below B- | 150.0% | 150.0% | 150.0% | ” | ||||
Unrated | 100.0% | 100.0% | 100.0% | ” |
| (*) | Credit rating is referenced that of global credit rating agencies such as S&P or Moody’s |
The OECD, S&P, Moody’s and Fitch are designated as foreign ECAI and Korea Investors Service Co., Ltd., NICE Investors Services Co., Ltd. and the Korea Ratings Co., Ltd. are designated as domestic ECAI.
The Bank assesses the credit rating based on the same borrower’s unsecured and senior loans. In the case where the borrower’s risk weight is higher than the unrated exposure’s risk weight (100%), the higher weight is applied. In the case where the borrower has more than one rating, the higher weight of the two lowest weights (second best criteria) is applied.
(2) Internal Rating-Based Approach (“IRB”)
The Bank should be approved by the FSS and also should meet the requirement pre-set by the FSS to use the Internal Rating-Based Approach.
In July 2008, the Bank was approved by the FSS to use the Foundation Internal Rating-Based Approach. The Bank has calculated credit risk weighted asset using the approach since July 2008.
(3) Measurement method of credit risk weighted asset
The Bank has calculated credit risk weighted asset of corporate exposures and asset securitization exposures using the Foundation Internal Rating-Based Approach since December 2009.
The Standardized Approach is permanently applied to country exposures, public institution exposures and bank exposures according to the interpretation of the FSS and the Standardized Approach is applied to overseas subsidiary and the Bank’s branch pursuant to the prior consultation with the FSS.
Some of the phased exposures are using the present Standard Approach (as of December 2010). The Bank plans to complete the implementation of the Internal Rating-Based Approach by 2011 through carrying out additional improvements.
S-157
Table of Contents
Korea Development Bank
Notes to the interim consolidated financial statements—(Continued)
June 30, 2011 and 2010
<Approved measurement method> | ||||
| Measurement method | Exposure | |||
Standardized Approach | Permanent SA(*1) | — Country, public institution and bank | ||
SA(*2) | — Oversea subsidiaries and branches, and other assets | |||
Foundation Internal Rating-Based Approach | — Corporate and small and medium enterprises and asset securitization (at each credit level) | |||
Phased application | — Special lending, nonresidence, non-bank financial institution | |||
| (*1) | Pursuant to the interpretation of the FSS, the Standardized Approach is applied to the exposures of governments and banks including public institutions. |
| (*2) | The Standardized Approach is applied in the case where the credit risk weighted assets of a specific business segment is less than 15% of the entire credit risk weighted assets with the consultation of the FSS. |
The mitigated effect of credit risk reflects the related policies which considers eligible collateral and guarantees. The Bank calculates the credit risk-weighted assets using the capital adequacy ratio.
When calculating credit risk-weighted assets for derivatives, the Bank calculates exposure considering a legally enforceable right to set off the exposures.
Exposures at default by the asset type as of June 30, 2011, December 31, 2010 are follows (Korean won in millions):
| June 30, 2011 | ||||||||||||
| Exposure | Credit risk mitigation | Exposure less credit risk mitigation | ||||||||||
Government | (Won) | 9,459,952 | (Won) | — | (Won) | 9,459,952 | ||||||
Bank | 4,991,816 | — | 4,991,816 | |||||||||
Corporate | 89,401,776 | 20,006 | 89,381,770 | |||||||||
Securities | 4,155,830 | — | 4,155,830 | |||||||||
Indirect investment | 220,392 | — | 220,392 | |||||||||
Asset securitization | 8,446,263 | — | 8,446,263 | |||||||||
Over-the-counter derivatives | 8,485,560 | 3,328,077 | 5,157,483 | |||||||||
Others | 27,119,535 | 162,293 | 26,957,242 | |||||||||
|
|
|
|
|
| |||||||
| (Won) | 152,281,124 | (Won) | 3,510,376 | (Won) | 148,770,748 | |||||||
|
|
|
|
|
| |||||||
| December 31, 2010 | ||||||||||||
| Exposure | Credit risk mitigation | Exposure less credit risk mitigation | ||||||||||
Government | (Won) | 9,403,633 | (Won) | — | (Won) | 9,403,633 | ||||||
Bank | 6,598,854 | — | 6,598,854 | |||||||||
Corporate | 84,669,468 | 73,978 | 84,595,490 | |||||||||
Securities | 4,110,671 | — | 4,110,671 | |||||||||
Indirect investment | 200,515 | — | 200,515 | |||||||||
Asset securitization | 8,514,778 | — | 8,514,778 | |||||||||
Over-the-counter derivatives | 8,848,064 | 3,863,319 | 4,984,745 | |||||||||
Others | 22,215,893 | 134,468 | 22,081,425 | |||||||||
|
|
|
|
|
| |||||||
| (Won) | 144,561,876 | (Won) | 4,071,765 | (Won) | 140,490,111 | |||||||
|
|
|
|
|
| |||||||
S-158
Table of Contents
Korea Development Bank
Notes to the interim consolidated financial statements—(Continued)
June 30, 2011 and 2010
(4) Credit rating model
The results of credit rating are presented as grades through an assessment of the debt repayment capacity that the principal and interest of debt securities or loans are redeemed while complying with contractual redemption schedule.
Using the Bank’s internal credit rating model, the Bank classifies debtors’ credit rating into 10 grades (AAA~D). Plus sign (+) and minus sign (-) are attached to the grades (AA ~ B) to distinguish the difference between credits in the identical grade. As a result, the Bank’s credit rating model uses 20 grades.
The Bank’s regular credit rating process is carried out once a year and in the case of the change of debtor’s credit condition, the credit rating is frequently adjusted as necessary to retain the adequacy of credit rating.
The results of credit rating is applied to various areas such as discrimination of loan processes, loan limit, loan interest rate, post loan management standard process, credit risk measurement, and allowance for bad debts assessment.
(5) Credit process control structure
According to the Principle of Checks and Balances, the Bank has established the credit process control structure by which the credit rating system operates appropriately.
| • | Independent assessment of credit rating: The Bank’s business segment (RM) and credit rating assessment segment (CO) are independently operated. |
| • | Independent control of credit rating system: The control of credit rating system including the development of credit rating model is independently implemented by the Bank’s risk management department. |
| • | Independent verification of credit rating system: Credit rating system is independently verified by the validation team of the Risk Management Department. |
| • | Internal audit of credit rating process: Credit rating process is audited by the Bank’s internal audit department. |
| • | Role of the board of directors and the Bank’s management: Major issues relating to credit process are approved by the board of directors and are regularly monitored by the Bank’s top management. |
The Bank reviews the loan collectability based on credit analysis of the borrower. As a result, the Bank may secure additional collateral and/or repayment guarantee, increase the interest rate for loan or perform appropriate actions to cover credit risk, if necessary,
The Bank evaluates the value of the collateral, performance ability of the guarantee and legal validity of the guarantee when those are provided. The Bank re-evaluates the provided collateral and guarantees regularly.
For guarantees, the Bank requires a corresponding written guarantee according to the loan handling standards and evaluates the guarantor’s credit rate in accordance with the credit rating endowment standards.
S-159
Table of Contents
Korea Development Bank
Notes to the interim consolidated financial statements—(Continued)
June 30, 2011 and 2010
Credit exposure
| (1) | Geographical information as of June 30, 2011, December 31, 2010 are as follows (Korean won in millions): |
| June 30, 2011 | ||||||||||||||||||||
| Korea | England | U.S. | Others | Total | ||||||||||||||||
Due from banks (excluding due from the BOK) | (Won) | 1,269,577 | (Won) | 3,579 | (Won) | 15,544 | (Won) | 550,705 | (Won) | 1,839,405 | ||||||||||
Financial assets designated at FVTPL: | ||||||||||||||||||||
Bonds (excluding government bonds) | — | — | — | — | — | |||||||||||||||
Financial assets available-for-sale: | ||||||||||||||||||||
Bonds (excluding government bonds) | 12,933,790 | 653,748 | 557,984 | 808,472 | 14,953,994 | |||||||||||||||
Financial assets held-to-maturity: | ||||||||||||||||||||
Bonds (excluding government bonds) | 860,193 | — | — | 61,995 | 922,188 | |||||||||||||||
Loans | 93,088,174 | 369,174 | 724,690 | 4,993,433 | 99,175,471 | |||||||||||||||
Derivative financial assets | 1,099,504 | 171 | — | 23,562 | 1,123,237 | |||||||||||||||
Other assets | 11,161,505 | 91,511 | 24,203 | 41,198 | 11,318,417 | |||||||||||||||
|
|
|
|
|
|
|
|
|
| |||||||||||
| 120,412,743 | 1,118,183 | 1,322,421 | 6,479,365 | 129,332,712 | ||||||||||||||||
|
|
|
|
|
|
|
|
|
| |||||||||||
Financial guarantees | 54,801,635 | — | 112 | 792,119 | 55,593,866 | |||||||||||||||
Credit related commitment (Commitments on loans and others) | 10,223,837 | — | — | 306,024 | 10,529,861 | |||||||||||||||
|
|
|
|
|
|
|
|
|
| |||||||||||
| 65,025,472 | — | 112 | 1,098,143 | 66,123,727 | ||||||||||||||||
|
|
|
|
|
|
|
|
|
| |||||||||||
| (Won) | 185,438,215 | (Won) | 1,118,183 | (Won) | 1,322,533 | (Won) | 7,577,508 | (Won) | 195,456,439 | |||||||||||
|
|
|
|
|
|
|
|
|
| |||||||||||
| December 31, 2010 | ||||||||||||||||||||
| Korea | England | U.S. | Others | Total | ||||||||||||||||
Due from banks (excluding due from the BOK) | (Won) | 628,440 | (Won) | 3,775 | (Won) | 9,768 | (Won) | 469,728 | (Won) | 1,111,711 | ||||||||||
Financial assets designated at FVTPL: | ||||||||||||||||||||
Bonds (excluding government bonds) | 110,310 | — | — | — | 110,310 | |||||||||||||||
Financial assets available-for-sale: | ||||||||||||||||||||
Bonds (excluding government bonds) | 11,062,010 | 651,866 | 539,022 | 1,275,344 | 13,528,242 | |||||||||||||||
Financial assets held-to-maturity: | ||||||||||||||||||||
Bonds (excluding government bonds) | 868,242 | — | — | 68,472 | 936,714 | |||||||||||||||
Loans | 89,929,419 | 394,348 | 630,109 | 4,254,036 | 95,207,912 | |||||||||||||||
Derivative financial assets | 1,443,521 | 558 | — | — | 1,444,079 | |||||||||||||||
Other assets | 5,891,215 | 2,486 | 9,094 | 24,272 | 5,927,067 | |||||||||||||||
|
|
|
|
|
|
|
|
|
| |||||||||||
| 109,933,157 | 1,053,033 | 1,187,993 | 6,091,852 | 118,266,035 | ||||||||||||||||
|
|
|
|
|
|
|
|
|
| |||||||||||
Financial guarantees | 59,096,110 | — | 1,327 | 840,690 | 59,938,127 | |||||||||||||||
Credit related commitment (Commitments on loans and others) | 10,994,386 | — | — | 208,503 | 11,202,889 | |||||||||||||||
|
|
|
|
|
|
|
|
|
| |||||||||||
| 70,090,496 | — | 1,327 | 1,049,193 | 71,141,016 | ||||||||||||||||
|
|
|
|
|
|
|
|
|
| |||||||||||
| (Won) | 180,023,653 | (Won) | 1,053,033 | (Won) | 1,189,320 | (Won) | 7,141,045 | (Won) | 189,407,051 | |||||||||||
|
|
|
|
|
|
|
|
|
| |||||||||||
S-160
Table of Contents
Korea Development Bank
Notes to the interim consolidated financial statements—(Continued)
June 30, 2011 and 2010
| (2) | Industry information as of June 30, 2011, December 31, 2010 is as follows (Korean won in millions): |
| June 30, 2011 | ||||||||||||||||
| Manufacturing | Service | Others | Total | |||||||||||||
Due from banks (excluding due from the BOK) | (Won) | 1,871 | (Won) | 871,621 | (Won) | 965,913 | (Won) | 1,839,405 | ||||||||
Financial assets designated at FVTPL: | ||||||||||||||||
Bonds (excluding government bonds) | — | — | — | — | ||||||||||||
Financial assets available-for-sale: | ||||||||||||||||
Bonds (excluding government bonds) | 3,428,954 | 9,036,727 | 2,488,313 | 14,953,994 | ||||||||||||
Financial assets held-to-maturity: | ||||||||||||||||
Bonds (excluding government bonds) | 65,869 | 789,222 | 67,097 | 922,188 | ||||||||||||
Loans | 53,501,502 | 35,791,923 | 9,882,046 | 99,175,471 | ||||||||||||
Derivative financial assets | — | 1,089,859 | 33,378 | 1,123,237 | ||||||||||||
Other assets | 12,799 | 62,740 | 11,242,878 | 11,318,417 | ||||||||||||
|
|
|
|
|
|
|
| |||||||||
| 57,010,995 | 47,642,092 | 24,679,625 | 129,332,712 | |||||||||||||
|
|
|
|
|
|
|
| |||||||||
Financial guarantees | 44,415,325 | 3,825,175 | 7,353,366 | 55,593,866 | ||||||||||||
Credit related commitment (Commitments on loans and others) | 36,815 | 9,799,841 | 693,205 | 10,529,861 | ||||||||||||
|
|
|
|
|
|
|
| |||||||||
| 44,452,140 | 13,625,016 | 8,046,571 | 66,123,727 | |||||||||||||
|
|
|
|
|
|
|
| |||||||||
| (Won) | 101,463,135 | (Won) | 61,267,108 | (Won) | 32,726,197 | (Won) | 195,456,440 | |||||||||
|
|
|
|
|
|
|
| |||||||||
| December 31, 2010 | ||||||||||||||||
| Manufacturing | Service | Others | Total | |||||||||||||
Due from banks (excluding due from the BOK) | (Won) | — | (Won) | 763,172 | (Won) | 348,539 | (Won) | 1,111,711 | ||||||||
Financial assets designated at FVTPL: | ||||||||||||||||
Bonds (excluding government bonds) | — | — | 110,310 | 110,310 | ||||||||||||
Financial assets available-for-sale: | ||||||||||||||||
Bonds (excluding government bonds) | 2,739,481 | 8,118,594 | 2,670,167 | 13,528,242 | ||||||||||||
Financial assets held-to-maturity: | ||||||||||||||||
Bonds (excluding government bonds) | 68,297 | 790,633 | 77,784 | 936,714 | ||||||||||||
Loans | 50,699,677 | 35,768,023 | 8,740,212 | 95,207,912 | ||||||||||||
Derivative financial assets | 220,962 | 1,212,628 | 10,489 | 1,444,079 | ||||||||||||
Other assets | 1,540 | 69,424 | 5,856,103 | 5,927,067 | ||||||||||||
|
|
|
|
|
|
|
| |||||||||
| 53,729,957 | 46,722,474 | 17,813,604 | 118,266,035 | |||||||||||||
|
|
|
|
|
|
|
| |||||||||
Financial guarantees | 48,787,801 | 3,042,748 | 8,107,578 | 59,938,127 | ||||||||||||
Credit related commitment (Commitments on loans and others) | 22,162 | 10,800,623 | 380,104 | 11,202,889 | ||||||||||||
|
|
|
|
|
|
|
| |||||||||
| 48,809,963 | 13,843,371 | 8,487,682 | 71,141,016 | |||||||||||||
|
|
|
|
|
|
|
| |||||||||
| (Won) | 102,539,920 | (Won) | 60,565,845 | (Won) | 26,301,286 | (Won) | 189,407,051 | |||||||||
|
|
|
|
|
|
|
| |||||||||
S-161
Table of Contents
Korea Development Bank
Notes to the interim consolidated financial statements—(Continued)
June 30, 2011 and 2010
| (3) | Rating information as of June 30, 2011, December 31, 2010 is as follows (Korean won in millions): |
| June 30, 2011 | ||||||||||||||||
| Due from banks | Financial assets available-for-sale | Financial assets held-to-maturity | Total | |||||||||||||
AAA~AA- | (Won) | 1,310,414 | (Won) | 4,528,097 | (Won) | 502,514 | (Won) | 6,341,025 | ||||||||
A+~A- | 21,500 | 1,466,629 | 166,961 | 1,655,090 | ||||||||||||
BBB+~BB- | 48,642 | 4,242,521 | 167,634 | 4,458,797 | ||||||||||||
Below BB- | 55,219 | 319,700 | — | 374,919 | ||||||||||||
Unrated | 403,630 | 4,397,047 | 85,079 | 4,885,756 | ||||||||||||
|
|
|
|
|
|
|
| |||||||||
| (Won) | 1,839,405 | (Won) | 14,953,994 | (Won) | 922,188 | (Won) | 17,715,587 | |||||||||
|
|
|
|
|
|
|
| |||||||||
| December 31, 2010 | ||||||||||||||||
| Due from banks | Financial assets available-for-sale | Financial assets held-to-maturity | Total | |||||||||||||
AAA~AA- | (Won) | 408,867 | (Won) | 4,263,056, | (Won) | 526,471 | (Won) | 5,198,394 | ||||||||
A+~A- | 34,268 | 1,400,192 | 191,335 | 1,625,795 | ||||||||||||
BBB+~BB- | 52,589 | 3,836,299 | 150,464 | 4,039,352 | ||||||||||||
Below BB- | 331,423 | 331,423 | ||||||||||||||
Unrated | 615,987 | 3,697,272 | 68,443 | 4,381,702 | ||||||||||||
|
|
|
|
|
|
|
| |||||||||
| (Won) | 1,111,711 | (Won) | 13,528,242 | (Won) | 936,713 | (Won) | 15,576,666 | |||||||||
|
|
|
|
|
|
|
| |||||||||
The Bank reviews debt serviceability based on credit analysis when handling loans. Depending on the results, credit loan preservation is adjusted as necessary using such methods as interest rate preservation due to credit risk.
The Bank evaluates the value of the collateral, performing ability and legal validity of the guarantee at the initial acquisition. The Bank re-evaluates the provided collateral and guarantees regularly for them to be reasonably preserved.
For guarantees, the Bank demands a corresponding written guarantee according to loan handling standards and the guarantor’s credit rating is independently calculated when in conformance with the credit rating endowment method
Capital management activities
Capital adequacy
The FSS approved the Bank’s use of the Foundation Internal Rating-Based Approach in July 2008. The Bank has been using the same approach when calculating credit risk weighted assets since the end of June 2008. The equity capital ratio and equity capital according to the standards of the Bank for International Settlements are calculated for the purpose of such disclosure. The equity capital ratio and equity capital are calculated on a consolidated basis.
S-162
Table of Contents
Korea Development Bank
Notes to the interim consolidated financial statements—(Continued)
June 30, 2011 and 2010
| (1) | BIS capital adequacy ratio |
(unit: Korean won in millions) | June 30, 2011 | December 31, 2010 | January 1, 2010 | |||||||||
Equity capital based on BIS (A): | (Won) | 16,478,932 | (Won) | 15,724,982 | (Won) | 15,399,399 | ||||||
Tier 1 capital | 15,478,335 | 14,642,375 | 13,867,302 | |||||||||
Tier 2 capital | 1,000,597 | 1,082,607 | 1,532,097 | |||||||||
|
|
|
|
|
| |||||||
Risk-weighted assets (B): | (Won) | 96,015,243 | (Won) | 90,078,941 | (Won) | 94,052,684 | ||||||
Credit risk-weighted assets | 87,794,139 | 85,730,427 | 90,594,757 | |||||||||
Market risk-weighted assets | 3,867,275 | 909,729 | 637,859 | |||||||||
Operational risk-weighted assets | 4,353,829 | 3,438,785 | 2,820,068 | |||||||||
|
|
|
|
|
| |||||||
BIS capital adequacy ratio (A/B): | 17.16 | 17.46 | 16.37 | |||||||||
Tier 1 capital ratio | 16.12 | 16.26 | 14.74 | |||||||||
Tier 2 capital ratio | 1.04 | 1.20 | 1.63 | |||||||||
|
|
|
|
|
| |||||||
| (2) | Equity capital based on BIS |
(unit: Korean won in millions) | June 30, 2011 | December 31, 2010 | January 1, 2010 | |||||||||
Equity capital (A+B) | (Won) | 16,477,578 | (Won) | 15,724,982 | (Won) | 15,399,399 | ||||||
|
|
|
|
|
| |||||||
Tier 1 capital (A): | (Won) | 15,478,335 | (Won) | 14,642,375 | 13,867,302 | |||||||
Capital stock | 9,251,861 | 9,251,861 | 9,241,861 | |||||||||
Capital surplus | 39,273 | 39,288 | 52,168 | |||||||||
Retained earnings | 7,580,524 | 6,804,113 | 5,086,984 | |||||||||
Non-controlling interest | 19,375 | 19,614 | 211,976 | |||||||||
Deductions | (1,412,498 | ) | (1,472,501 | ) | (Won) | (725,687 | ) | |||||
|
|
|
|
|
| |||||||
Tier 2 capital (B): | (Won) | 1,000,597 | (Won) | 1,082,607 | (Won) | 1,532,097 | ||||||
45% of unrealized gain on financial assets available-for-sale | 282,618 | 172,925 | 372,140 | |||||||||
Term subordinated liabilities | 532,014 | 576,526 | 973,551 | |||||||||
Others | 621,157 | 725,865 | 446,767 | |||||||||
Deductions | (Won) | (435,192 | ) | (Won) | (392,709 | ) | (Won) | (260,361 | ) | |||
|
|
|
|
|
| |||||||
Market risk
Concept
Market risk is defined as the possibility of potential loss on a trading position resulting from unexpected fluctuations in interest rates, foreign exchange rates and the price of stocks and derivatives.
Approach to market risk management
Market risk is managed using VaR limit and loss limit. VaR limit is calculated in the view of entire bank and the calculated VaR limit is distributed into each department and each type (price of a stock, interest rates, foreign exchange rates and option). The trading department regulates and operates terms of stop loss and investment limits.
S-163
Table of Contents
Korea Development Bank
Notes to the interim consolidated financial statements—(Continued)
June 30, 2011 and 2010
Using the Standardized Approach and internal model of VaR, the Bank’s VaR is measured daily and the measured VaR is used at risk monitoring and limit management. In the estimation of VaR, the historical simulation and two other supplemental procedures are used: variance-covariance matrix and Monte Carlo simulation. Through the stress test and back test, the estimation of VaR is validated daily.
In estimating of market risk, the Standardized Approach and the internal model are used. The Standardized Approach is used in order to calculate the required capital from market risk and the internal model is used in order to manage risks internally.
Since July 2007 the Bank has measured one-day 99% VaR through the historical simulation method using the time series data of past 250 days under 99% confidence level. The calculated VaR is monitored on a daily basis.
In the implementation of the stress test, the Bank applied three scenarios based on the fluctuation of market index occurred at the time of the historical event that resulted in the significant shock. The stress test is implemented by the system daily in order to provide for crisis occurrence. Furthermore, the Bank is conducting a contingency plan for market risk management. The plan distinguishes the crisis condition into three stages—precautious stage, precrisis stage and crisis stage—through the measurement of the market volatility.
For the validation of the market risk measurement methodology, the Bank daily implements the backtesting that compares the simulated loss, the actual loss and the previous day’s VaR. In addition, the Bank enforces the market risk management relating to irregular compound derivatives through the validation of the derivative pricing model developed by the Bank’s Front Office.
Trading VaR
The Bank’s trading VaRs as of June 30, 2011, December 31, 2010 and January 1, 2010 are as follows (Korean won in millions):
KDB stand-alone
| June 30, 2011 | ||||||||||||||||
| Average | Max | Min | June 30, 2011 | |||||||||||||
Interest rates | (Won) | 4,223 | (Won) | 5,356 | (Won) | 3,470 | (Won) | 4,206 | ||||||||
Price of a stock | 1,589 | 2,600 | 31 | 456 | ||||||||||||
Foreign exchange rates | 1,398 | 3,866 | 350 | 848 | ||||||||||||
Options | 250 | 412 | 69 | 123 | ||||||||||||
Total | 4,652 | 7,155 | 3,480 | 4,202 | ||||||||||||
| December 31, 2010 | ||||||||||||||||
| Average | Max | Min | December 31, 2010 | |||||||||||||
Interest rates | (Won) | 3,786 | (Won) | 4,972 | (Won) | 3,134 | (Won) | 3,790 | ||||||||
Price of a stock | 1,130 | 1,502 | 616 | 1,502 | ||||||||||||
Foreign exchange rates | 1,202 | 3,049 | 434 | 514 | ||||||||||||
Options | 151 | 182 | 23 | 182 | ||||||||||||
Total | 4,128 | 7,912 | 2,645 | 3,530 | ||||||||||||
S-164
Table of Contents
Korea Development Bank
Notes to the interim consolidated financial statements—(Continued)
June 30, 2011 and 2010
KDB Subsidiaries
| June 30, 2011 | ||||||||||||||||
| Average | Max | Min | June 30, 2011 | |||||||||||||
Interest rates | (Won) | 14,056 | (Won) | 17,230 | (Won) | 10,881 | (Won) | 17,230 | ||||||||
Price of a stock | 14,666 | 17,000 | 12,332 | 17,000 | ||||||||||||
Foreign exchange rates | 12,432 | 13,848 | 11,015 | 13,848 | ||||||||||||
Total | 41,153 | 48,078 | 34,228 | 48,078 | ||||||||||||
| December 31, 2010 | ||||||||||||||||
| Average | Max | Min | December 31, 2010 | |||||||||||||
Interest rates | (Won) | 17 | (Won) | 117 | (Won) | — | (Won) | 67 | ||||||||
Price of a stock | — | — | — | — | ||||||||||||
Foreign exchange rates | 107 | 373 | 17 | 219 | ||||||||||||
Total | 109 | 381 | 8 | 231 | ||||||||||||
Interest rate risk
Interest rate risk is defined as the likely loss resulting from the unfavorable fluctuation of interest rate in the Bank’s financial condition and is measured by interest rate VaR and interest rate EaR.
Interest rate VaR is the maximum amount of a decrease in net asset value resulting from the unfavorable fluctuation of interest rate. Interest rate EaR is the maximum amount of decrease in net interest income resulting from the unfavorable fluctuation of interest rate for a year.
The Bank’s interest rate VaR and interest rate EaR are measured through the simulation of conclusive interest rate scenario with the Oracle Financial Services Application (OFSA) and are reported on a monthly basis to the Risk Management Committee. The Management’s target of interest rate VaR and interest rate EaR are approved at the beginning of the year. Additionally, the interest rate VaR and interest rate EaR on a consolidated basis are calculated using the Standardized Approach in order to retain the consistency in the methods used by the Bank and its subsidiaries.
(1) Interest rate EaR/VaR
(unit: Korean won in millions) | June 30, 2011 | |||
Interest rate shock | Interest rate VaR | Interest rate EaR | ||
2.00% | (Won)828,374 | (Won)25,430 | ||
(Korean won in millions) | December 31, 2010 | |||
Interest rate shock | Interest rate VaR | Interest rate EaR | ||
2.00% | (Won)128,529 | (Won)126,280 | ||
S-165
Table of Contents
Korea Development Bank
Notes to the interim consolidated financial statements—(Continued)
June 30, 2011 and 2010
(2) Cash flows by maturity of interest bearing assets and liabilities
Cash flows by maturity of interest bearing assets and liabilities as of June 30, 2011, December 31, 2010 are as follows (Korean won in millions):
| June 30, 2011 | ||||||||||||||||||||||||
| Less 1 month | 1~3months | 3~12months | Less 1~5 years | Over 5 years | Total | |||||||||||||||||||
Assets: | ||||||||||||||||||||||||
Cash and due from banks | (Won) | 1,294,907 | (Won) | 309,339 | (Won) | 242,990 | (Won) | 21,681 | (Won) | — | (Won) | 1,868,917 | ||||||||||||
Financial assets designated at FVTPL | — | — | 1,122 | 3,153 | — | 4,275 | ||||||||||||||||||
Financial assets available-for-sale | 1,751,224 | 2,940,105 | 6,514,391 | 13,025,864 | 3,690,008 | 27,921,592 | ||||||||||||||||||
Financial assets held-to- maturity | 29,560 | 71,623 | 55,984 | 388,832 | 533,104 | 1,079,103 | ||||||||||||||||||
Loans | 12,953,453 | 26,734,647 | 23,632,699 | 14,164,775 | 4,864,144 | 82,349,718 | ||||||||||||||||||
Others | 28,949 | 12,299 | 3,646 | 26 | — | 44,920 | ||||||||||||||||||
|
|
|
|
|
|
|
|
|
|
|
| |||||||||||||
| (Won) | 16,058,093 | (Won) | 30,068,013 | (Won) | 30,450,832 | (Won) | 27,604,331 | (Won) | 9,087,256 | (Won) | 113,268,525 | |||||||||||||
|
|
|
|
|
|
|
|
|
|
|
| |||||||||||||
Liabilities: | ||||||||||||||||||||||||
Financial liabilities designated at FVTPL | (Won) | 4,003 | (Won) | 4,770 | (Won) | 16,291 | (Won) | 248,372 | (Won) | 1,329,861 | (Won) | 1,603,297 | ||||||||||||
Due to customer | 5,955,908 | 6,742,177 | 7,356,451 | 4,310,139 | 205,388 | 24,570,063 | ||||||||||||||||||
Borrowings | 6,573,787 | 8,159,018 | 6,166,083 | 3,876,147 | 1,742,852 | 26,517,887 | ||||||||||||||||||
Debt issued | 3,480,937 | 5,434,836 | 12,067,912 | 25,436,049 | 4,951,254 | 51,370,988 | ||||||||||||||||||
Others | 429,024 | 4,139 | — | 11,511 | — | 444,674 | ||||||||||||||||||
|
|
|
|
|
|
|
|
|
|
|
| |||||||||||||
| (Won) | 16,443,659 | (Won) | 20,344,940 | (Won) | 25,606,737 | (Won) | 33,882,218 | (Won) | 8,229,355 | (Won) | 104,506,909 | |||||||||||||
|
|
|
|
|
|
|
|
|
|
|
| |||||||||||||
| December 31, 2010 | ||||||||||||||||||||||||
| Less 1 month | 1~3months | 3~12months | Less 1~5 years | Over 5 years | Total | |||||||||||||||||||
Assets: | ||||||||||||||||||||||||
Cash and due from banks | (Won) | 791,192 | (Won) | 250,353 | (Won) | 362,754 | (Won) | 5,674 | (Won) | — | (Won) | 1,409,973 | ||||||||||||
Financial assets- available-for-sale | 1,591,861 | 3,648,762 | 5,312,247 | 11,176,216 | 3,368,237 | 25,097,323 | ||||||||||||||||||
Financial assets held-to- maturity | 22,943 | 51,016 | 45,805 | 466,188 | 530,822 | 1,116,774 | ||||||||||||||||||
Loans | 16,597,278 | 26,556,772 | 20,837,455 | 10,034,980 | 4,873,804 | 78,900,289 | ||||||||||||||||||
Others | 30,446 | 14,370 | 3,509 | — | — | 48,325 | ||||||||||||||||||
|
|
|
|
|
|
|
|
|
|
|
| |||||||||||||
| (Won) | 19,033,720 | (Won) | 30,521,273 | (Won) | 26,561,770 | (Won) | 21,683,058 | (Won) | 8,772,863 | (Won) | 106,572,684 | |||||||||||||
|
|
|
|
|
|
|
|
|
|
|
| |||||||||||||
Liabilities: | ||||||||||||||||||||||||
Financial liabilities designated at FVTPL | (Won) | 4,093 | (Won) | 5,400 | (Won) | 17,626 | (Won) | 249,703 | (Won) | 1,308,004 | (Won) | 1,584,826 | ||||||||||||
Due to customer | 3,419,789 | 6,301,544 | 5,898,194 | 3,946,611 | 202,796 | 19,768,934 | ||||||||||||||||||
Borrowings | 6,551,555 | 6,205,629 | 6,006,520 | 3,589,327 | 1,762,885 | 24,115,916 | ||||||||||||||||||
Debt issued | 3,488,794 | 5,311,998 | 11,814,656 | 23,996,206 | 5,214,025 | 49,825,679 | ||||||||||||||||||
Others | 535,165 | 13,449 | — | 515 | — | 549,129 | ||||||||||||||||||
|
|
|
|
|
|
|
|
|
|
|
| |||||||||||||
| (Won) | 13,999,396 | (Won) | 17,838,020 | (Won) | 23,736,996 | (Won) | 31,782,362 | (Won) | 8,487,710 | (Won) | 95,844,484 | |||||||||||||
|
|
|
|
|
|
|
|
|
|
|
| |||||||||||||
S-166
Table of Contents
Korea Development Bank
Notes to the interim consolidated financial statements—(Continued)
June 30, 2011 and 2010
Foreign currency risk
Outstanding balances by currency with significant exposure as of June 30, 2011, December 31, 2010 and January 1, 2010 are as follows (Korean won in millions):
| June 30, 2011 | ||||||||||||||||||||||||||||
| KRW | USD | EUR | JPY | GBP | Others | Total | ||||||||||||||||||||||
Assets: | ||||||||||||||||||||||||||||
Cash and due from banks | (Won) | 1,581,344 | (Won) | 699,995 | (Won) | 79,821 | (Won) | 86,350 | (Won) | 1,253 | (Won) | 569,081 | (Won) | 3,017,844 | ||||||||||||||
Financial assets held-for-trading | 4,606,196 | 78,918 | — | — | 17,258 | 40,021 | 4,742,393 | |||||||||||||||||||||
Financial assets designated at FVTPL | 55,380 | — | — | — | — | — | 55,380 | |||||||||||||||||||||
Financial assets available-for-sale | 23,692,938 | 4,230,747 | 169,744 | 642,131 | — | 360,168 | 29,095,728 | |||||||||||||||||||||
Financial assets held-to-maturity | 837,628 | 221,524 | — | — | — | 61,996 | 1,121,148 | |||||||||||||||||||||
Loans | 50,462,681 | 19,626,989 | 872,077 | 3,721,401 | 4,384 | 482,155 | 75,169,687 | |||||||||||||||||||||
Derivative financial assets | 4,376,818 | 1,482,435 | 52,235 | 26,008 | 431 | 2,328 | 5,940,255 | |||||||||||||||||||||
Other assets | 4,429,983 | 2,456,827 | 124,128 | 133,649 | — | 15,900 | 7,160,487 | |||||||||||||||||||||
|
|
|
|
|
|
|
|
|
|
|
|
|
| |||||||||||||||
Total financial assets | 90,042,968 | 28,797,435 | 1,298,005 | 4,609,539 | 23,326 | 1,531,649 | 126,302,922 | |||||||||||||||||||||
Liabilities: | ||||||||||||||||||||||||||||
Financial liabilities designated at FVTPL | 968,705 | — | — | — | — | — | 968,705 | |||||||||||||||||||||
Due to customers | 21,658,052 | 1,789,480 | 220,492 | 75,339 | 881 | 370,520 | 24,114,764 | |||||||||||||||||||||
Borrowings | 10,477,744 | 10,678,672 | 1,834,719 | 2,355,283 | — | 133,384 | 25,479,802 | |||||||||||||||||||||
Debt issued | 31,543,428 | 9,999,387 | 390,225 | 2,167,154 | — | 1,959,635 | 46,059,829 | |||||||||||||||||||||
Derivative financial liabilities | 2,568,495 | 1,502,763 | 25,699 | 27,328 | — | 46,568 | 4,170,853 | |||||||||||||||||||||
Other liabilities | 4,718,100 | 3,319,953 | 171,504 | 164,195 | 173 | 29,875 | 8,403,780 | |||||||||||||||||||||
|
|
|
|
|
|
|
|
|
|
|
|
|
| |||||||||||||||
Total financial liabilities | 71,934,524 | 27,290,255 | 2,642,639 | 4,789,299 | 1,054 | 2,539,987 | 109,197,753 | |||||||||||||||||||||
|
|
|
|
|
|
|
|
|
|
|
|
|
| |||||||||||||||
Net financial position | (Won) | 18,108,444 | (Won) | 1,507,180 | (Won) | (1,344,634 | ) | (Won) | (179,760 | ) | (Won) | 22,272 | (Won) | (1,008,330 | ) | (Won) | 17,105,169 | |||||||||||
|
|
|
|
|
|
|
|
|
|
|
|
|
| |||||||||||||||
S-167
Table of Contents
Korea Development Bank
Notes to the interim consolidated financial statements—(Continued)
June 30, 2011 and 2010
| December 31, 2010 | ||||||||||||||||||||||||||||
| KRW | USD | EUR | JPY | GBP | Others | Total | ||||||||||||||||||||||
Assets: | ||||||||||||||||||||||||||||
Cash and due from banks | (Won) | 601,925 | (Won) | 541,744 | (Won) | 27,105 | (Won) | 11,198 | (Won) | 1,307 | (Won) | 189,366 | (Won) | 1,372,645 | ||||||||||||||
Financial assets held-for-trading | 5,921,098 | 198,237 | — | — | 17,192 | 34,961 | 6,171,488 | |||||||||||||||||||||
Financial assets designated at FVTPL | 32,438 | 1,441 | — | 56 | — | — | 33,935 | |||||||||||||||||||||
Financial assets available-for-sale | 21,456,102 | 3,894,620 | 175,374 | 513,403 | — | 369,384 | 26,408,883 | |||||||||||||||||||||
Financial assets held-to-maturity | 889,877 | 218,785 | — | — | — | 43,770 | 1,152,432 | |||||||||||||||||||||
Loans | 48,728,989 | 19,771,570 | 811,011 | 3,757,340 | 20,451 | 561,241 | 73,650,602 | |||||||||||||||||||||
Derivative financial assets | 4,479,229 | 1,478,594 | 49,783 | 50,654 | 1,277 | 3,711 | 6,063,248 | |||||||||||||||||||||
Other assets | 2,503,926 | 1,188,457 | 17,121 | 351,321 | 1 | 9,177 | 4,070,003 | |||||||||||||||||||||
|
|
|
|
|
|
|
|
|
|
|
|
|
| |||||||||||||||
Total financial assets | 84,613,584 | 27,293,448 | 1,080,394 | 4,683,972 | 40,228 | 1,211,610 | 118,923,236 | |||||||||||||||||||||
Liabilities: | ||||||||||||||||||||||||||||
Financial liabilities designated at FVTPL | 951,752 | — | — | — | — | — | 951,752 | |||||||||||||||||||||
Due to customers | 17,568,232 | 1,408,849 | 130,961 | 59,936 | 837 | 471,947 | 19,640,762 | |||||||||||||||||||||
Borrowings | 10,288,066 | 9,710,951 | 1,355,173 | 2,089,709 | 1,714 | 95,802 | 23,541,415 | |||||||||||||||||||||
Debt issued | 29,717,131 | 9,202,134 | 968,395 | 2,628,406 | 253,437 | 2,035,745 | 44,805,248 | |||||||||||||||||||||
Derivative financial liabilities | 3,095,179 | 1,524,926 | 30,867 | 34,930 | — | 9,221 | 4,695,123 | |||||||||||||||||||||
Other liabilities | 3,832,783 | 2,270,292 | 53,211 | 55,315 | 3,591 | 39,724 | 6,254,916 | |||||||||||||||||||||
|
|
|
|
|
|
|
|
|
|
|
|
|
| |||||||||||||||
Total financial liabilities | 65,453,143 | 24,117,152 | 2,538,607 | 4,868,296 | 259,579 | 2,652,439 | 99,889,216 | |||||||||||||||||||||
|
|
|
|
|
|
|
|
|
|
|
|
|
| |||||||||||||||
Net financial position | (Won) | 19,160,441 | (Won) | 3,176,296 | (Won) | (1,458,213 | ) | (Won) | (184,324 | ) | (Won) | (219,351 | ) | (Won) | (1,440,829 | ) | (Won) | 19,034,020 | ||||||||||
|
|
|
|
|
|
|
|
|
|
|
|
|
| |||||||||||||||
S-168
Table of Contents
Korea Development Bank
Notes to the interim consolidated financial statements—(Continued)
June 30, 2011 and 2010
| January 1, 2010 | ||||||||||||||||||||||||||||
| KRW | USD | EUR | JPY | GBP | Others | Total | ||||||||||||||||||||||
Assets: | ||||||||||||||||||||||||||||
Cash and due from banks | (Won) | 1,070,427 | (Won) | 516,608 | (Won) | 7,045 | (Won) | 25,348 | (Won) | 103,512 | (Won) | 112,860 | (Won) | 1,835,800 | ||||||||||||||
Financial assets held-for-trading | 3,239,763 | 96,590 | 3,300 | 17,617 | — | 687 | 3,357,957 | |||||||||||||||||||||
Financial assets designated at FVTPL | 89,503 | 431 | — | 39 | — | — | 89,973 | |||||||||||||||||||||
Financial assets available-for-sale | 24,011,787 | 3,074,900 | 354,053 | 538,861 | 660,426 | 497,072 | 29,137,099 | |||||||||||||||||||||
Financial assets held-to-maturity | 335,592 | — | — | — | — | 43,244 | 378,836 | |||||||||||||||||||||
Loans | 50,197,159 | 20,943,849 | 1,241,794 | 3,355,872 | 370,909 | 560,167 | 76,669,750 | |||||||||||||||||||||
Derivative financial assets | 5,777,340 | 1,363,777 | 168,374 | 66,083 | 243,142 | — | 7,618,716 | |||||||||||||||||||||
Other assets | 2,699,900 | 1,494,034 | 111,695 | 122,000 | 122,712 | — | 4,550,341 | |||||||||||||||||||||
|
|
|
|
|
|
|
|
|
|
|
|
|
| |||||||||||||||
Total financial assets | 87,421,471 | 27,490,189 | 1,886,261 | 4,125,820 | 1,500,701 | 1,214,030 | 123,638,472 | |||||||||||||||||||||
Liabilities: | ||||||||||||||||||||||||||||
Financial liabilities designated at FVTPL | 1,308,299 | — | — | — | — | — | 1,308,299 | |||||||||||||||||||||
Due to customers | 12,275,795 | 1,646,516 | 226,523 | 102,285 | 141,802 | 363,604 | 14,756,525 | |||||||||||||||||||||
Borrowings | 16,663,924 | 9,751,085 | 1,690,730 | 1,679,365 | 1,255,483 | 226,524 | 31,267,111 | |||||||||||||||||||||
Debt issued | 35,006,447 | 9,174,311 | 1,790,631 | 3,069,181 | 253,436 | 1,651,639 | 50,945,645 | |||||||||||||||||||||
Derivative financial liabilities | 4,572,283 | 1,535,611 | 212,507 | 46,090 | 282,165 | — | 6,648,656 | |||||||||||||||||||||
Other liabilities | 3,348,884 | 1,608,305 | 13,374 | 106,885 | 117,361 | — | 5,194,809 | |||||||||||||||||||||
|
|
|
|
|
|
|
|
|
|
|
|
|
| |||||||||||||||
Total financial liabilities | 73,175,632 | 23,715,828 | 3,933,765 | 5,003,806 | 2,050,247 | 2,241,767 | 110,121,045 | |||||||||||||||||||||
|
|
|
|
|
|
|
|
|
|
|
|
|
| |||||||||||||||
Net financial position | (Won) | 14,245,839 | (Won) | 3,774,361 | (Won) | (2,047,504 | ) | (Won) | (877,986 | ) | (Won) | (549,546 | ) | (Won) | (1,027,737 | ) | (Won) | 13,517,427 | ||||||||||
|
|
|
|
|
|
|
|
|
|
|
|
|
| |||||||||||||||
S-169
Table of Contents
Korea Development Bank
Notes to the interim consolidated financial statements—(Continued)
June 30, 2011 and 2010
Liquidity risk management
Concept
Liquidity risk is defined as the possibility of potential loss due to a temporary shortage in funds caused by a maturity mismatch or an unexpected capital outlay. Liquidity risk soars when funding rates rise, assets are sold below a normal price, or a good investment opportunity is missed.
Approach to liquidity risk management
Since the methodology to quantifiably measure liquidity risk does not formally exist, the Bank manages its liquidity risks as follows:
(1) Allowable limit for liquidity risk
The allowable limit for liquidity risk sets liquidity ratio and remaining maturity gap. The management standards with regards to the allowable limit for liquidity risk should be set using separate and stringent set ratios in accordance with the FSS guidelines.
<Measurement Methodology>
- Liquidity ratio : (Maturing liquidity asset in the interval / Maturing liquidity liability in the interval) X 100
- Remaining maturity gap : (Maturing liquidity asset in the interval - Maturing liquidity liability in the interval) / total assets X 100
(2) Early Warning Indicator
In order to identify prematurely and cope with worsening liquidity risk trends, the Bank has set up 13 indexes such as the “Foreign Exchange Stabilization Bond CDS Premium,” and measures the trend monthly, weekly and daily as a means for establishing the allowable liquidity risk limit complementary measures.
(3) Stress-Test analysis and contingency plan
The Bank evaluates the effects on the liquidity risk and identifies the inherent flaws. In the case where an unpredictable and significant liquidity crisis occurs, the Bank executes risk situation analysis quarterly based on crises specific to the Bank, market risk, and complex emergency, and reports to the Risk Management Committee for the purpose of the Bank’s solvency securitization.
S-170
Table of Contents
Korea Development Bank
Notes to the interim consolidated financial statements—(Continued)
June 30, 2011 and 2010
Remaining maturity gap
| (1) | Liquidity risks of non-derivative financial instruments as of June 30, 2011, December 31, 2010 are as follows (Korean won in millions): |
| June 30, 2011 | ||||||||||||||||||||||||
| Less 1 month | 1~ 3 months | 3~12 months | Less 1~5 years | Over 5 years | Total | |||||||||||||||||||
Assets: | ||||||||||||||||||||||||
Cash and due from banks | (Won) | 2,425,932 | (Won) | 225,055 | (Won) | 287,240 | (Won) | 172,812 | (Won) | 190 | (Won) | 3,111,229 | ||||||||||||
Financial assets held-for-trading | 2,848,662 | 73,388 | 1,117,393 | 633,260 | 106,264 | 4,778,967 | ||||||||||||||||||
Financial assets designated at FVTPL | 5,730 | 19,372 | 52,818 | 129,398 | 16,990 | 224,308 | ||||||||||||||||||
Financial assets available-for-sale | 894,071 | 1,818,039 | 7,228,057 | 15,184,800 | 7,090,207 | 32,215,174 | ||||||||||||||||||
Financial assets held-to-maturity | 65,905 | 20,907 | 61,812 | 384,951 | 603,625 | 1,137,200 | ||||||||||||||||||
Loans | 4,404,573 | 9,009,040 | 27,753,920 | 34,827,931 | 7,957,498 | 83,952,962 | ||||||||||||||||||
Others | 7,327,324 | 69,097 | 462,496 | 5,456,404 | 3,627,162 | 16,942,483 | ||||||||||||||||||
|
|
|
|
|
|
|
|
|
|
|
| |||||||||||||
| (Won) | 17,972,197 | (Won) | 11,234,898 | (Won) | 36,963,736 | (Won) | 56,789,556 | (Won) | 19,401,936 | (Won) | 142,362,323 | |||||||||||||
|
|
|
|
|
|
|
|
|
|
|
| |||||||||||||
Liabilities: | ||||||||||||||||||||||||
Financial liabilities designated at FVTPL | (Won) | 4,008 | (Won) | 4,770 | (Won) | 16,291 | (Won) | 248,372 | (Won) | 1,329,861 | (Won) | 1,603,302 | ||||||||||||
Due to customers | 11,621,987 | 6,299,005 | 6,097,455 | 1,426,310 | 208,094 | 25,652,851 | ||||||||||||||||||
Borrowings | 5,453,851 | 5,829,909 | 7,817,423 | 5,715,103 | 1,721,279 | 26,537,565 | ||||||||||||||||||
Debt issued | 2,549,502 | 3,842,140 | 12,725,827 | 27,500,357 | 6,382,702 | 53,000,528 | ||||||||||||||||||
Others | 6,190,063 | 44,143 | 500,913 | 717,740 | 3,295,093 | 10,747,952 | ||||||||||||||||||
|
|
|
|
|
|
|
|
|
|
|
| |||||||||||||
| (Won) | 25,819,411 | (Won) | 16,019,967 | (Won) | 27,157,909 | (Won) | 35,607,882 | (Won) | 12,937,029 | (Won) | 117,542,198 | |||||||||||||
|
|
|
|
|
|
|
|
|
|
|
| |||||||||||||
S-171
Table of Contents
Korea Development Bank
Notes to the interim consolidated financial statements—(Continued)
June 30, 2011 and 2010
| December 31, 2010 | ||||||||||||||||||||||||
| Less 1 month | 1~ 3 months | 3~12 months | Less 1~5 years | Over 5 years | Total | |||||||||||||||||||
Assets: | ||||||||||||||||||||||||
Cash and due from banks | (Won) | 1,001,058 | (Won) | 89,687 | (Won) | 357,425 | (Won) | 294,056 | (Won) | 75 | (Won) | 1,742,301 | ||||||||||||
Financial assets held-for-trading | 4,510,712 | 789,881 | 271,339 | 287,614 | 257,152 | 6,116,698 | ||||||||||||||||||
Financial assets designated at FVTPL | — | — | 31,243 | 1,497 | — | 32,740 | ||||||||||||||||||
Financial assets available-for-sale | 2,099,982 | 2,293,597 | 5,404,927 | 12,952,077 | 6,761,355 | 29,511,938 | ||||||||||||||||||
Financial assets held-to-maturity | 41,018 | 300 | 45,805 | 471,341 | 601,756 | 1,160,220 | ||||||||||||||||||
Loans | 7,297,388 | 7,938,664 | 24,926,000 | 32,716,792 | 7,999,988 | 80,878,832 | ||||||||||||||||||
Others | 3,511,755 | 69,361 | 397,925 | 449,842 | 6,062,074 | 10,490,957 | ||||||||||||||||||
|
|
|
|
|
|
|
|
|
|
|
| |||||||||||||
| (Won) | 18,461,913 | (Won) | 11,181,490 | (Won) | 31,434,664 | (Won) | 47,173,219 | (Won) | 21,682,400 | (Won) | 129,933,686 | |||||||||||||
|
|
|
|
|
|
|
|
|
|
|
| |||||||||||||
Liabilities: | ||||||||||||||||||||||||
Financial liabilities designated at FVTPL | (Won) | 4,093 | (Won) | 5,400 | (Won) | 17,626 | (Won) | 249,703 | (Won) | 1,308,004 | (Won) | 1,584,826 | ||||||||||||
Due to customers | 7,766,769 | 5,807,193 | 4,891,623 | 1,690,022 | 218,522 | 20,374,129 | ||||||||||||||||||
Borrowings | 5,310,473 | 4,357,061 | 7,816,397 | 4,945,672 | 1,854,033 | 24,283,636 | ||||||||||||||||||
Debt issued | 2,006,337 | 3,017,780 | 13,419,683 | 26,377,220 | 7,222,919 | 52,043,939 | ||||||||||||||||||
Others | 4,106,317 | 120,601 | 425,712 | 481,324 | 4,048,374 | 9,182,328 | ||||||||||||||||||
|
|
|
|
|
|
|
|
|
|
|
| |||||||||||||
| (Won) | 19,193,989 | (Won) | 13,308,035 | (Won) | 26,571,041 | (Won) | 33,743,941 | (Won) | 14,651,852 | (Won) | 107,468,858 | |||||||||||||
|
|
|
|
|
|
|
|
|
|
|
| |||||||||||||
| (2) | Liquidity risks of derivatives instruments as of June 30, 2011, December 31, 2010 are as follows (Korean won in millions): |
| (A) | Net-settled derivatives |
| June 30, 2011 | ||||||||||||||||||||||||
| Less 1 month | 1~3 months | 3~12 months | Less 1~5 years | Over 5 years | Total | |||||||||||||||||||
Derivatives for trading: | ||||||||||||||||||||||||
Currency | (Won) | (38,584 | ) | (Won) | (184,105 | ) | (Won) | (3,363 | ) | (Won) | 4 | (Won) | — | (Won) | (226,048 | ) | ||||||||
Interest | 100,011 | 293,766 | (24,981 | ) | 46,524 | 1,271,011 | 1,686,331 | |||||||||||||||||
Stock | (1,429 | ) | (37,639 | ) | (10,038 | ) | 5,801 | — | (43,305 | ) | ||||||||||||||
Commodity | 647 | — | — | — | — | 647 | ||||||||||||||||||
Derivatives for hedging: | ||||||||||||||||||||||||
Interest | 32,982 | (483,972 | ) | (67,633 | ) | (675,555 | ) | (67,386 | ) | (1,261,564 | ) | |||||||||||||
Stock | — | (8,713 | ) | — | — | — | (8,713 | ) | ||||||||||||||||
|
|
|
|
|
|
|
|
|
|
|
| |||||||||||||
| (Won) | 93,627 | (Won) | (420,663 | ) | (Won) | (106,015 | ) | (Won) | (623,226 | ) | (Won) | 1,203,625 | (Won) | 147,348 | ||||||||||
|
|
|
|
|
|
|
|
|
|
|
| |||||||||||||
S-172
Table of Contents
Korea Development Bank
Notes to the interim consolidated financial statements—(Continued)
June 30, 2011 and 2010
| December 31, 2010 | ||||||||||||||||||||||||
| Less 1 month | 1~3 months | 3~12 months | Less 1~5 years | Over 5 years | Total | |||||||||||||||||||
Derivatives for trading: | ||||||||||||||||||||||||
Currency | (Won) | (179,404 | ) | (Won) | (80,678 | ) | (Won) | 23 | (Won) | 383 | (Won) | — | (Won) | (259,676 | ) | |||||||||
Interest | (6,283 | ) | 132,541 | (556,409 | ) | (83,374 | ) | 1,092,543 | 579,018 | |||||||||||||||
Stock | — | (42,829 | ) | (49,971 | ) | (35,949 | ) | — | (128,749 | ) | ||||||||||||||
Commodity | — | 1 | 6 | 18 | — | 25 | ||||||||||||||||||
Interest | — | (737,774 | ) | (60,162 | ) | (649,115 | ) | (134,764 | ) | (1,581,815 | ) | |||||||||||||
Stock | — | (14,659 | ) | — | — | — | (14,659 | ) | ||||||||||||||||
|
|
|
|
|
|
|
|
|
|
|
| |||||||||||||
| (Won) | (185,687 | ) | (Won) | (743,398 | ) | (Won) | (666,513 | ) | (Won) | (768,037 | ) | (Won) | 957,779 | (Won) | (1,405,856 | ) | ||||||||
|
|
|
|
|
|
|
|
|
|
|
| |||||||||||||
| (B) | Gross settled derivatives |
| June 30, 2011 | ||||||||||||||||||||||||
| Less 1 month | 1~3 months | 3~12 months | Less 1~5 years | Over 5 years | Total | |||||||||||||||||||
Derivatives for trading: | ||||||||||||||||||||||||
Currency: | ||||||||||||||||||||||||
Inflow | (Won) | 14,725,131 | (Won) | 11,224,694 | (Won) | 12,521,185 | (Won) | 6,256,836 | (Won) | 317,708 | (Won) | 45,045,554 | ||||||||||||
Outflow | 14,680,582 | 11,135,262 | 12,441,081 | 6,475,039 | 308,523 | 45,040,487 | ||||||||||||||||||
Interest: | ||||||||||||||||||||||||
Inflow | 43,133 | 35,456 | — | 78,089 | — | 156,678 | ||||||||||||||||||
Outflow | 61,077 | — | — | — | — | 61,077 | ||||||||||||||||||
Inflow | — | — | 9,197 | — | — | 9,197 | ||||||||||||||||||
Outflow | — | — | 9,188 | — | — | 9,188 | ||||||||||||||||||
Derivatives for hedging: | ||||||||||||||||||||||||
Currency: | ||||||||||||||||||||||||
Inflow | — | — | 7,921 | 6,869 | 4,858 | 19,648 | ||||||||||||||||||
Outflow | 271 | — | — | 2,015 | — | 2,286 | ||||||||||||||||||
Interest: | ||||||||||||||||||||||||
Outflow | 61,077 | — | — | — | — | 61,077 | ||||||||||||||||||
|
|
|
|
|
|
|
|
|
|
|
| |||||||||||||
Total inflow | (Won) | 14,768,264 | (Won) | 11,260,150 | (Won) | 12,538,303 | (Won) | 6,341,794 | (Won) | 322,566 | (Won) | 45,231,077 | ||||||||||||
|
|
|
|
|
|
|
|
|
|
|
| |||||||||||||
Total outflow | (Won) | 14,803,007 | (Won) | 11,135,262 | (Won) | 12,450,269 | (Won) | 6,477,054 | (Won) | 308,523 | (Won) | 45,174,115 | ||||||||||||
|
|
|
|
|
|
|
|
|
|
|
| |||||||||||||
S-173
Table of Contents
Korea Development Bank
Notes to the interim consolidated financial statements—(Continued)
June 30, 2011 and 2010
| December 31, 2010 | ||||||||||||||||||||||||
| Less 1 month | 1~3 months | 3~12 months | Less 1~5 years | Over 5 years | Total | |||||||||||||||||||
Derivatives for trading: | ||||||||||||||||||||||||
Currency: | ||||||||||||||||||||||||
Inflow | (Won) | 5,848,831 | (Won) | 15,179,884 | (Won) | 13,568,150 | (Won) | 5,859,167 | (Won) | 266,644 | (Won) | 40,722,676 | ||||||||||||
Outflow | 5,803,601 | 15,063,515 | 13,197,367 | 5,839,089 | 253,661 | 40,157,233 | ||||||||||||||||||
Interest: | ||||||||||||||||||||||||
Inflow | 77,918 | — | — | 102,289 | — | 180,207 | ||||||||||||||||||
Outflow | 84,051 | — | — | 103,518 | — | 187,569 | ||||||||||||||||||
Derivatives for hedging: | ||||||||||||||||||||||||
Currency: | ||||||||||||||||||||||||
Inflow | 175 | 1,179 | 743 | 2,891 | 1,436 | 6,424 | ||||||||||||||||||
Outflow | 474 | 3,184 | 14 | 3,819 | — | 7,491 | ||||||||||||||||||
|
|
|
|
|
|
|
|
|
|
|
| |||||||||||||
Total inflow | (Won) | 5,926,924 | (Won) | 15,181,063 | (Won) | 13,568,893 | (Won) | 5,964,347 | (Won) | 268,080 | (Won) | 40,909,307 | ||||||||||||
|
|
|
|
|
|
|
|
|
|
|
| |||||||||||||
Total outflow | (Won) | 5,888,126 | (Won) | 15,066,699 | (Won) | 13,197,381 | (Won) | 5,946,426 | (Won) | 253,661 | (Won) | 40,352,293 | ||||||||||||
|
|
|
|
|
|
|
|
|
|
|
| |||||||||||||
| (3) | Liquidity risks of guarantees and commitments as of June 30, 2011, December 31, 2010 are as follows (Korean won in millions): |
| June 30, 2011 | ||||||||||||||||||||||||
| Less 1 month | 1~3 months | 3~12 months | Less 1~5 years | Over 5 years | Total | |||||||||||||||||||
Guarantees | (Won) | 1,891,747 | (Won) | 2,018,480 | (Won) | 5,853,082 | (Won) | 6,664,960 | (Won) | 9,627,539 | (Won) | 26,055,808 | ||||||||||||
Commitments | 193,493 | 540,391 | 3,840,335 | 6,125,219 | 450,809 | 11,150,247 | ||||||||||||||||||
|
|
|
|
|
|
|
|
|
|
|
| |||||||||||||
| (Won) | 2,085,240 | (Won) | 2,558,871 | (Won) | 9,693,417 | (Won) | 12,790,179 | (Won) | 10,078,348 | (Won) | 37,206,055 | |||||||||||||
|
|
|
|
|
|
|
|
|
|
|
| |||||||||||||
| December 31, 2010 | ||||||||||||||||||||||||
| Less 1 month | 1~3 months | 3~12 months | Less 1~5 years | Over 5 years | Total | |||||||||||||||||||
Guarantees | (Won) | 1,578,619 | (Won) | 1,251,925 | (Won) | 3,967,968 | (Won) | 5,486,312 | (Won) | 10,528,187 | (Won) | 22,813,011 | ||||||||||||
Commitments | 172,985 | 79,163 | 3,480,445 | 7,789,244 | 82,183 | 11,604,020 | ||||||||||||||||||
|
|
|
|
|
|
|
|
|
|
|
| |||||||||||||
| (Won) | 1,751,604 | (Won) | 1,331,088 | (Won) | 7,448,413 | (Won) | 13,275,556 | (Won) | 10,610,370 | (Won) | 34,417,031 | |||||||||||||
|
|
|
|
|
|
|
|
|
|
|
| |||||||||||||
S-174
Table of Contents
THE REPUBLIC OF KOREA
The Economy
Current Worldwide Economic and Financial Difficulties
The global financial markets have experienced significant volatility in recent months as a result of, among other things, the downgrading by Standard & Poor’s Rating Services of the long-term sovereign credit rating of the United States to “AA+” from “AAA” in August 2011, as well as the continuing financial difficulties and resulting ratings downgrades experienced by the governments of Greece and other countries in Europe. Any future deterioration of the global economy could adversely affect the Korean economy and financial markets and our financial condition and results of operations.
There have been increased volatility and substantial declines in the Korea Composite Stock Index recently, due to adverse global financial and economic conditions. See “—The Financial System—Securities Markets”. There is no guarantee that the stock prices of Korean companies will not decline again in the future. Future declines in the index and large amounts of sales of Korean securities by foreign investors and subsequent repatriation of the proceeds of such sales may continue to adversely affect the value of the Won, the foreign currency reserves held by financial institutions in Korea, and the ability of Korean companies and banks (including us) to raise capital.
Gross Domestic Product
Based on preliminary data, GDP growth in the first half of 2011 was 3.8% at chained 2005 year prices, as aggregate private and general government consumption expenditures increased by 2.6% and exports of goods and services increased by 13.0%, which more than offset a 1.6% decrease in gross domestic fixed capital formation, each compared with the corresponding period of 2010. Based on preliminary data, GDP growth in the third quarter of 2011 was 3.4% at chained 2005 year prices, as aggregate private and general government consumption expenditures increased by 2.5% and exports of goods and services increased by 9.4%, which more than offset a 1.6% decrease in gross domestic fixed capital formation, each compared with the corresponding period of 2010.
Prices, Wages and Employment
The inflation rate, on an annualized basis, was 4.5% in the first quarter of 2011, 4.2% in the second quarter of 2011 and 4.8% in the third quarter of 2011. The unemployment rate was 4.2% in the first quarter of 2011, 3.4% in the second quarter of 2011 and 3.1% in the third quarter of 2011.
The Financial System
Securities Markets
The Korea Composite Stock Price Index was 2,100.7 on June 30, 2011, 2,133.2 on July 29, 2011, 1,880.1 on August 31, 2011, 1,769.7 on September 30, 2011, 1,909.0 on October 31, 2011 and 1,919.1 on November 7, 2011.
Monetary Policy
Foreign Exchange
The market average exchange rate between the Won and the U.S. Dollar (in Won per one U.S. Dollar) as announced by the Seoul Money Brokerage Service Ltd. was Won 1,078.1 to US$1.00 on June 30, 2011, Won 1,052.6 to US$1.00 on July 29, 2011, Won 1,071.7 to US$1.00 on August 31, 2011, Won 1,179.5 to US$1.00 on September 30, 2011, Won 1,104.5 to US$1.00 on October 31, 2011 and Won 1,112.6 to US$1.00 on November 7, 2011.
S-175
Table of Contents
Balance of Payments and Foreign Trade
Balance of Payments
Based on preliminary data, the Republic recorded a current account surplus of approximately US$15.3 billion in the first nine months of 2011. The current account surplus in the first nine months of 2011 decreased from the current account surplus of US$19.1 billion in the corresponding period of 2010, primarily due to a decrease in surplus from the goods account.
Trade Balance
Based on preliminary data, the Republic recorded a trade surplus of US$22.2 billion in the first nine months of 2011. Exports increased by 23.0% to US$415.3 billion and imports increased by 27.0% to US$393.1 billion from US$337.6 billion of exports and US$309.5 billion of imports, respectively, in the corresponding period of 2010.
Foreign Currency Reserves
The amount of the Government’s foreign currency reserves was US$311.0 billion as of October 31, 2011.
S-176
Table of Contents
The following is a description of some of the terms of the Noteswe are offering. Since it is only a summary,we urge you to read thefiscal agency agreement described below and the form of global note before deciding whether to invest in the Notes.We have filed a copy of these documents with the United States Securities and Exchange Commissionas exhibits to the registration statement no.333-170866.
The general terms of our Notes are described in the accompanying prospectus. The description in this prospectus supplement further adds to that description or, to the extent inconsistent with that description, replaces it.
Governed by Fiscal Agency Agreement
The Notes will be issued under the fiscal agency agreement, dated as of September 20, 2010, between us and Citibank, N.A., as fiscal agent (the “Fiscal Agent”). The Fiscal Agent will maintain a register for the Notes.
Payment of Principal and Interest
The Notes are initially limited to US$ aggregate principal amount and will mature on , 20 (the “Maturity Date”). The Notes will bear interest at the rate of % per annum, payable semi-annually in arrears on and of each year (each, an “Interest Payment Date”), beginning on , 2012. Interest on the Notes will accrue from , 2011. If any Interest Payment Date or the Maturity Date shall be a day on which banking institutions in The City of New York or Seoul are authorized or obligated by law to close, then such payment will not be made on such date but will be made on the next succeeding day which is not a day on which banking institutions in The City of New York or Seoul are authorized or obligated by law to close, with the same force and effect as if made on the date for such payment, and no interest shall be payable in respect of any such delay. We will pay interest to the person who is registered as the owner of a Note at the close of business on the fifteenth day (whether or not a business day) preceding such Interest Payment Date. Interest on the Notes will be computed on the basis of a 360-day year consisting of twelve 30-day months. We will make principal and interest payments on the Notes in immediately available funds in U.S. dollars.
Denomination
The Notes will be issued in minimum denominations of US$200,000 principal amount and integral multiples of US$1,000 in excess thereof.
Redemption at Maturity
Unless previously redeemed for tax reasons as provided in the accompanying prospectus, we may not redeem the Notes prior to maturity. At maturity, we will redeem the Notes at par.
Form and Registration
The Notes will be issued in the form of one or more fully registered global notes, registered in the name of a nominee of and deposited with the custodian for DTC. DTC, or its nominee, will therefore be considered the sole owner or holder of the Notes represented by each global note for all purposes under the Note and the fiscal agency agreement. Except as specified below, beneficial owners:
| • | will not be entitled to have any of the Notes represented by the global note registered in their names; |
| • | will not receive physical delivery of any Notes in definitive form; |
S-177
Table of Contents
| • | will not be considered the owners or holders of the Notes; |
| • | must rely on the procedures of DTC and, if applicable, any participants (institutions that have accounts with DTC or its nominee, such as securities brokers and dealers) to exercise any rights of a holder; and |
| • | will receive payments of principal and interest from DTC or its participants rather than directly from us. |
We understand that, under existing industry practice, DTC and its participants will allow beneficial owners to take all actions required of, and exercise all rights granted to, the registered holders of the Notes. Financial institutions, acting as direct and indirect participants in DTC, will represent your beneficial interests in the global notes. These financial institutions will record the ownership and transfer of your beneficial interest through book-entry accounts. You may hold your beneficial interests in the Notes through Euroclear or Clearstream if you are a participant in such systems, or indirectly through organizations that are participants in such systems. Any secondary market trading of book-entry interests in the Notes will take place through DTC participants, including Euroclear and Clearstream. See “Clearance and Settlement—Transfers Within and Between DTC, Euroclear and Clearstream”.
We will register the Notes in the name of a person other than DTC or its nominee only if:
| • | DTC is unwilling or unable to continue as depositary; or |
| • | we determine, in our sole discretion, not to have the Notes represented by a global note. |
In either such instance, an owner of a beneficial interest in a global note will be entitled to registration of a principal amount of Notes equal to its beneficial interest in its name and to physical delivery of the Notes in definitive form.
Only participants, and persons that may hold beneficial interests through participants, can own a beneficial interest in the global note. DTC keeps records of the ownership and transfer of beneficial interests in the global note by its participants. In turn, participants keep records of the ownership and transfer of beneficial interests in the global note by other persons (such as their customers). No other records of the ownership and transfer of beneficial interests in the global security will be kept.
All payments on a global note will be made to DTC or its nominee. When DTC receives payment of principal or interest on the global note, we expect DTC to credit its participants’ accounts with amounts that correspond to their respective beneficial interests in the global note. We also expect that, after the participants’ accounts are credited, the participants will credit the accounts of the owners of beneficial interests in the global note with amounts that correspond to the owners’ respective beneficial interests in the global note.
DTC and its participants establish policies and procedures governing payments, transfers, exchanges and other important matters that affect owners of beneficial interests in a global note. DTC and its participants may change these policies and procedures from time to time. We have no responsibility or liability for the records of ownership of beneficial interests in the global note, or for payments made or not made to owners of such beneficial interests. We also have no responsibility or liability for any aspect of the relationship between DTC and its participants or for any aspect of the relationship between participants and owners of beneficial interests in the global note.
The Fiscal Agent will not charge you any fees for the Notes, other than reasonable fees for the replacement of lost, stolen, mutilated or destroyed Notes. However, you may incur fees for the maintenance and operation of the book-entry accounts with the clearing systems in which your beneficial interests are held.
S-178
Table of Contents
Paying Agent; Transfer Agent; Registrar
The Fiscal Agent will serve as the initial paying agent, transfer agent and registrar.
For so long as the Notes are listed on the SGX-ST and the rules of the SGX-ST so require, we will appoint and maintain a paying and transfer agent in Singapore, where the certificates representing the Notes may be presented or surrendered for payment or redemption (if required), in the event that we issue the Notes in definitive form in the limited circumstances set forth above. In addition, an announcement of such issue will be made through the SGX-ST. Such announcement will include all material information with respect to the delivery of the definitive Notes, including details of the paying and transfer agent in Singapore.
Notices
All notices or communications to a registered holder of the Notes shall be sufficient if given in writing in the English language and delivered by depositing such notice or communication by first class mail (air mail in the case of holders whose addresses appearing in the register are in a country other than the United States of America), postage prepaid, addressed to such registered holder at its address as it then appears in the register. All notices regarding the Notes will be published in London in theFinancial Times and in New York inThe Wall Street Journal (U.S. Edition). If we cannot, for any reason, publish notice in any of those newspapers, we will choose an appropriate alternate English language newspaper of general circulation in London or New York, respectively, and notice in that newspaper will be considered valid notice. Notice will be considered made on the first date of its publication.
S-179
Table of Contents
DTC, Euroclear and Clearstream are under no obligation to perform or continue to perform the procedures described below, and they may modify or discontinue them at any time. Neither we nor the registrar will be responsible for DTC’s, Euroclear’s or Clearstream’s performance of their obligations under their rules and procedures. Nor will we or the registrar be responsible for the performance by direct or indirect participants of their obligations under their rules and procedures.
Introduction
The Depository Trust Company
DTC is:
| • | a limited-purpose trust company organized under the New York Banking Law; |
| • | a “banking organization” under the New York Banking Law; |
| • | a member of the Federal Reserve System; |
| • | a “clearing corporation” under the New York Uniform Commercial Code; and |
| • | a “clearing agency” registered under Section 17A of the Securities Exchange Act of 1934. |
DTC was created to hold securities for its participants and facilitate the clearance and settlement of securities transactions between its participants. It does this through electronic book-entry changes in the accounts of its direct participants, eliminating the need for physical movement of securities certificates. DTC is owned by a number of its direct participants and by the New York Stock Exchange Inc., the American Stock Exchange, Inc. and the National Association of Securities Dealers Inc.
Euroclear and Clearstream
Like DTC, Euroclear and Clearstream hold securities for their participants and facilitate the clearance and settlement of securities transactions between their participants through electronic book-entry changes in their accounts. Euroclear and Clearstream provide various services to their participants, including the safekeeping, administration, clearance and settlement and lending and borrowing of internationally traded securities. Participants in Euroclear and Clearstream are financial institutions such as underwriters, securities brokers and dealers, banks and trust companies. Some of the underwriters participating in this offering are participants in Euroclear or Clearstream. Other banks, brokers, dealers and trust companies have indirect access to Euroclear or Clearstream by clearing through or maintaining a custodial relationship with a Euroclear or Clearstream participant.
Ownership of the Notes through DTC, Euroclear and Clearstream
We will issue the Notes in the form of one or more fully registered global notes, registered in the name of a nominee of DTC. Financial institutions, acting as direct and indirect participants in DTC, will represent your beneficial interests in the Notes. These financial institutions will record the ownership and transfer of your beneficial interests through book-entry accounts. You may also hold your beneficial interests in the Notes through Euroclear or Clearstream, if you are a participant in such systems, or indirectly through organizations that are participants in such systems. Euroclear and Clearstream will hold their participants’ beneficial interests in the global notes in their customers’ securities accounts with their depositaries. These depositaries of Euroclear and Clearstream in turn will hold such interests in their customers’ securities accounts with DTC.
We and the fiscal agent generally will treat the registered holder of the Notes, initially Cede & Co., as the absolute owner of the Notes for all purposes. Once we and the fiscal agent make payments to the registered
S-180
Table of Contents
holder, we and the fiscal agent will no longer be liable on the Notes for the amounts so paid. Accordingly, if you own a beneficial interest in the global notes, you must rely on the procedures of the institutions through which you hold your interests in the Notes, including DTC, Euroclear, Clearstream and their respective participants, to exercise any of the rights granted to holders of the Notes. Under existing industry practice, if you desire to take any action that Cede & Co., as the holder of the global notes, is entitled to take, then Cede & Co. would authorize the DTC participant through which you own your beneficial interest to take such action. The participant would then either authorize you to take the action or act for you on your instructions.
DTC may grant proxies or authorize its participants, or persons holding beneficial interests in the Notes through such participants, to exercise any rights of a holder or take any actions that a holder is entitled to take under the fiscal agency agreement or the Notes. Euroclear’s or Clearstream’s ability to take actions as holder under the Notes or the fiscal agency agreement will be limited by the ability of their respective depositaries to carry out such actions for them through DTC. Euroclear and Clearstream will take such actions only in accordance with their respective rules and procedures.
Transfers Within and Between DTC, Euroclear and Clearstream
Trading Between DTC Purchasers and Sellers
DTC participants will transfer interests in the Notes among themselves in the ordinary way according to DTC rules. Participants will pay for such transfers by wire transfer. The laws of some states require certain purchasers of securities to take physical delivery of the securities in definitive form. These laws may impair your ability to transfer beneficial interests in the global notes to such purchasers. DTC can act only on behalf of its direct participants, who in turn act on behalf of indirect participants and certain banks. Thus, your ability to pledge a beneficial interest in the global notes to persons that do not participate in the DTC system, and to take other actions, may be limited because you will not possess a physical certificate that represents your interest.
Trading Between Euroclear and/or Clearstream Participants
Participants in Euroclear and Clearstream will transfer interests in the Notes among themselves according to the rules and operating procedures of Euroclear and Clearstream.
Trading Between a DTC Seller and a Euroclear or Clearstream Purchaser
When the Notes are to be transferred from the account of a DTC participant to the account of a Euroclear or Clearstream participant, the purchaser must first send instructions to Euroclear or Clearstream through a participant at least one business day prior to the settlement date. Euroclear or Clearstream will then instruct its depositary to receive the Notes and make payment for them. On the settlement date, the depositary will make payment to the DTC participant’s account, and the Notes will be credited to the depositary’s account. After settlement has been completed, DTC will credit the Notes to Euroclear or Clearstream, Euroclear or Clearstream will credit the Notes, in accordance with its usual procedures, to the participant’s account, and the participant will then credit the purchaser’s account. These securities credits will appear the next day (European time) after the settlement date. The cash debit from the account of Euroclear or Clearstream will be back-valued to the value date, which will be the preceding day if settlement occurs in New York. If settlement is not completed on the intended value date (i.e., the trade fails), the cash debit will instead be valued at the actual settlement date.
Participants in Euroclear and Clearstream will need to make funds available to Euroclear or Clearstream to pay for the Notes by wire transfer on the value date. The most direct way of doing this is to pre-position funds (i.e., have funds in place at Euroclear or Clearstream before the value date), either from cash on hand or existing lines of credit. Under this approach, however, participants may take on credit exposure to Euroclear and Clearstream until the Notes are credited to their accounts one day later.
S-181
Table of Contents
As an alternative, if Euroclear or Clearstream has extended a line of credit to a participant, the participant may decide not to pre-position funds, but to allow Euroclear or Clearstream to draw on the line of credit to finance settlement for the Notes. Under this procedure, Euroclear or Clearstream would charge the participant overdraft charges for one day, assuming that the overdraft would be cleared when the Notes were credited to the participant’s account. However, interest on the Notes would accrue from the value date. Therefore, in many cases the interest income on the Notes which the participant earns during that one-day period will substantially reduce or offset the amount of the participant’s overdraft charges. Of course, this result will depend on the cost of funds (i.e., the interest rate that Euroclear or Clearstream charges) to each participant.
Since the settlement will occur during New York business hours, a DTC participant selling an interest in the Notes can use its usual procedures for transferring global securities to the depositories of Euroclear or Clearstream for the benefit of Euroclear or Clearstream participants. The DTC seller will receive the sale proceeds on the settlement date. Thus, to the DTC seller, a cross-market sale will settle no differently than a trade between two DTC participants.
Finally, day traders who use Euroclear or Clearstream and who purchase Notes from DTC participants for credit to Euroclear participants or Clearstream participants should note that these trades will automatically fail unless one of three steps is taken:
| • | borrowing through Euroclear or Clearstream for one day, until the purchase side of the day trade is reflected in the day trader’s Euroclear or Clearstream account, in accordance with the clearing system’s customary procedures; |
| • | borrowing the Notes in the United States from DTC participants no later than one day prior to settlement, which would allow sufficient time for the Notes to be reflected in the Euroclear or Clearstream account in order to settle the sale side of the trade; or |
| • | staggering the value dates for the buy and sell sides of the trade so that the value date for the purchase from the DTC participant is at least one day prior to the value date for the sale to the Euroclear or Clearstream participant. |
Trading Between a Euroclear or Clearstream Seller and a DTC Purchaser
Due to time-zone differences in their favor, Euroclear and Clearstream participants can use their usual procedures to transfer Notes through their depositaries to a DTC participant. The seller must first send instructions to Euroclear or Clearstream through a participant at least one business day prior to the settlement date. Euroclear or Clearstream will then instruct its depositary to credit the Notes to the DTC participant’s account and receive payment. The payment will be credited in the account of the Euroclear or Clearstream participant on the following day, but the receipt of the cash proceeds will be back-valued to the value date, which will be the preceding day if settlement occurs in New York. If settlement is not completed on the intended value date (i.e., the trade fails), the receipt of the cash proceeds will instead be valued at the actual settlement date.
If the Euroclear or Clearstream participant selling the Notes has a line of credit with Euroclear or Clearstream and elects to be in debit for the Notes until it receives the sale proceeds in its account, then the back-valuation may substantially reduce or offset any overdraft charges that the participant incurs over that period.
Settlement in other currencies between DTC and Euroclear and Clearstream is possible using free-of-payment transfers to move the Notes, but funds movement will take place separately.
S-182
Table of Contents
Korean Taxation
For a discussion of certain Korean tax considerations that may be relevant to you if you invest in the Notes, see “Taxation—Korean Taxation” in the accompanying prospectus.
United States Tax Considerations
Stated interest on the Notes will be treated as qualified stated interest for U.S. federal income tax purposes. Under certain circumstances as described under “Taxation—Korean Taxation” in the accompanying prospectus, a U.S. holder may be subject to Korean withholding tax upon the sale or other disposition of Notes. A U.S. holder eligible for benefits of the Korea-U.S. tax treaty, which exempts capital gains from tax in Korea, would not be eligible to credit against its U.S. federal income tax liability any such Korean tax withheld. U.S. holders should consult their own tax advisers with respect to their eligibility for benefits under the Korea-U.S. tax treaty and, in the case of U.S. holders that are not eligible for treaty benefits, their ability to credit any Korean tax withheld upon sale of the Notes against their U.S. federal income tax liability. For a discussion of additional U.S. federal income tax considerations that may be relevant to you if you invest in the Notes and are a U.S. holder, see “Taxation—United States Tax Considerations” in the accompanying prospectus.
S-183
Table of Contents
Relationship with the Underwriters
We and the underwriters named below (the “Underwriters”) have entered into a Terms Agreement dated , 2011 (the “Terms Agreement”) with respect to the Notes relating to the Underwriting Agreement—Standard Terms (together with the Terms Agreement, the “Underwriting Agreement”) filed as an exhibit to the registration statement. Subject to the terms and conditions set forth in the Underwriting Agreement, we have agreed to sell to each of the Underwriters, severally and not jointly, and each of the Underwriters has severally and not jointly agreed to purchase, the following principal amount of the Notes set out opposite its name below:
Name of Underwriters | Principal Amount of the Notes | |||
Credit Suisse Securities (USA) LLC | US$ | |||
The Hongkong and Shanghai Banking Corporation Limited | ||||
Merrill Lynch, Pierce, Fenner & Smith Incorporated | ||||
The Royal Bank of Scotland plc | ||||
Daewoo Securities Co., Ltd. | ||||
|
| |||
Total | US$ | |||
|
| |||
Daewoo Securities Co., Ltd., one of the Underwriters, is our affiliate and has agreed to offer and sell the Notes only outside the United States to non-U.S. persons. Under the terms and conditions of the Underwriting Agreement, if the Underwriters take any of the Notes, then the Underwriters are obligated to take and pay for all of the Notes.
The Underwriters, or certain of their respective affiliates acting as selling agents, initially propose to offer the Notes directly to the public at the offering price described on the cover page of this prospectus supplement. Any Underwriter may allow, and any such dealer may reallow, a concession to certain other dealers. After the initial offering of the Notes, the Underwriters may from time to time vary the offering price and other selling terms.
The Notes are a new class of securities with no established trading market. Approval in-principle has been received from the SGX-ST for the listing of the Notes. The Underwriters have advised us that they intend to make a market in the Notes. However, they are not obligated to do so and they may discontinue any market making activities with respect to the Notes at any time without notice. Accordingly, we cannot assure you as to the liquidity of any trading market for the Notes.
We have agreed to indemnify the Underwriters against certain liabilities, including liabilities under the Securities Act of 1933, as amended, or to contribute to payments which the Underwriters may be required to make in respect of any such liabilities.
The amount of net proceeds is US$ after deducting the underwriting discounts but not estimated expenses. Expenses associated with this offering are estimated to be approximately US$ . The Underwriters have agreed to pay certain of our expenses incurred in connection with the offering of the Notes.
In the ordinary course of their respective businesses, some of the Underwriters and their affiliates have engaged, and may in the future engage, in commercial banking and/or investment banking transactions and other related services with us and our affiliates for which the Underwriters and/or their affiliates have received or may receive customary fees and reimbursement of out-of-pocket expenses.
S-184
Table of Contents
Delivery of the Notes
We expect to make delivery of the Notes, against payment in same-day funds on or about , 2011, which we expect will be the fifth business day following the date of this prospectus supplement. Under Rule 15c6-1 promulgated under the Securities Exchange Act of 1934, as amended, U.S. purchasers are generally required to settle trades in the secondary market in three business days, unless they and the other parties to any such trade expressly agree otherwise. Accordingly, if you wish to trade in the Notes on the date of this prospectus supplement or the succeeding business day, because the Notes will initially settle in T+5, you may be required to specify an alternate settlement cycle at the time of your trade to prevent a failed settlement. Purchasers in other countries should consult with their own advisors.
Foreign Selling Restrictions
Each Underwriter has agreed, severally and not jointly, to the following selling restrictions in connection with the offering with respect to the following jurisdictions:
Korea
Each Underwriter has severally represented and agreed that:
| • | it has not offered, sold or delivered and will not offer, sell or deliver, directly or indirectly, any Notes in Korea, or to, or for the account or benefit of, any resident of Korea, except as otherwise permitted by applicable Korean laws and regulations; and |
| • | any securities dealer to whom the Underwriters may sell the Notes will agree that it will not offer any Notes, directly or indirectly, in Korea, or to any resident of Korea, except as permitted by applicable Korean laws and regulations, or to any other dealer who does not so represent and agree. |
United Kingdom
Each Underwriter has severally represented and agreed that:
| • | it has only communicated or caused to be communicated and will only communicate or cause to be communicated any invitation or inducement to engage in investment activity (within the meaning of Section 21 of the Financial Services and Markets Act of 2000 (the “FSMA”)) received by it in connection with the issue or sale of any of the Notes in circumstances in which section 21(1) of the FSMA does not apply to us; and |
| • | it has complied, and will comply with, all applicable provisions of the FSMA with respect to anything done by it in relation to the Notes, from or otherwise involving the United Kingdom. |
Japan
Each Underwriter has severally represented and agreed that the Notes have not been and will not be registered under the Financial Instruments and Exchange Law of Japan (Law No. 25 of 1948, as amended); it has not offered or sold, and it will not offer or sell, directly or indirectly, any of the Notes in Japan or to, or for the account or benefit of, any resident of Japan or to, or for the account or benefit of, any resident for reoffering or resale, directly or indirectly, in Japan or to, or for the account or benefit of, any resident of Japan except (i) pursuant to an exemption from the registration requirements of, or otherwise in compliance with, the Financial Instruments and Exchange Law of Japan and (ii) in compliance with the other relevant laws of Japan.
Hong Kong
Each Underwriter has severally represented and agreed that:
| • | it has not offered or sold and will not offer or sell in Hong Kong, by means of any document, any Notes other than (i) to “professional investors” as defined in the Securities and Futures Ordinance (Cap. 571) |
S-185
Table of Contents
of Hong Kong and any rules made under that Ordinance or (ii) in circumstances which do not result in the document being a “prospectus” as defined in the Companies Ordinance (Cap. 32) of Hong Kong or which do not constitute an offer to the public within the meaning of that Ordinance; and |
| • | it has not issued, or had in its possession for the purposes of issue, and will not issue or have in its possession for the purposes of issue, any advertisement, invitation or document relating to the Notes, whether in Hong Kong or elsewhere, which is directed at, or the contents of which are or are likely to be accessed or read by, the public in Hong Kong (except if permitted to do so under the securities laws of Hong Kong) other than with respect to Notes which are or are intended to be disposed of to persons outside Hong Kong or only to “professional investors” within the meaning of the Securities and Futures Ordinance (Cap. 571) of the laws of Hong Kong and any rules made thereunder. |
Singapore
Each Underwriter has severally represented and agreed that neither the preliminary prospectus nor the prospectus have been or will be registered as a prospectus with the Monetary Authority of Singapore under the Securities and Futures Act (Chapter 289 of Singapore) (the “SFA”). Accordingly, each Underwriter has severally represented, warranted and agreed that it has not offered or sold any Notes or caused the Notes to be made the subject of an invitation for subscription or purchase and will not offer or sell any Notes or cause the Notes to be made the subject of an invitation for subscription or purchase, and has not circulated or distributed, nor will it circulate or distribute, the preliminary prospectus or the prospectus or any other document or material in connection with the offer or sale, or invitation for subscription or purchase, of the Notes, whether directly or indirectly, to any person in Singapore other than under exemptions provided in the SFA for offers made (i) to an institutional investor (as defined in Section 4A of the SFA) under Section 274 of the SFA, (ii) to a relevant person pursuant to Section 275(1) of the SFA, or any person pursuant to Section 275(1A) of the SFA, and in accordance with the conditions, specified in Section 275 of the SFA or (iii) otherwise pursuant to, and in accordance with the conditions of, any other applicable provision of the SFA.
Where the Notes are subscribed or purchased under Section 275 of the SFA by a relevant person which is:
| (a) | a corporation (which is not an accredited investor (as defined in Section 4A of the SFA)) the sole business of which is to hold investments and the entire share capital of which is owned by one or more individuals, each of whom is an accredited investor; or |
| (b) | a trust (where the trustee is not an accredited investor) whose sole purpose is to hold investments and each beneficiary of the trust is an individual who is an accredited investor, |
securities (as defined in Section 239(1) of the SFA) of that corporation or the beneficiaries’ rights and interest (howsoever described) in that trust shall not be transferred within 6 months after that corporation or that trust has acquired the Notes pursuant to an offer made under Section 275 of the SFA except:
| (1) | to an institutional investor (under Section 274 of the SFA) or to a relevant person defined in Section 275(2) of the SFA or (in the case of such corporation) where the transfer arises from an offer referred to in Section 276(3)(i)(B) of the SFA, or (in the case of such trust), where the transfer arises from an offer referred to in Section 276(4)(i)(B) of the SFA; |
| (2) | where no consideration is or will be given for the transfer; |
| (3) | where the transfer is by operation of law; or |
| (4) | pursuant to Section 276(7) of the SFA. |
Price Stabilization and Short Position
In connection with this offering, Merrill Lynch, Pierce, Fenner & Smith Incorporated (the “Stabilizing Manager”) or any person acting for it, on behalf of the Underwriters, may purchase and sell the Notes in the open
S-186
Table of Contents
market. These transactions may include over-allotment, covering transactions, penalty bids and stabilizing transactions. Over-allotment involves sales of the Notes in excess of the principal amount of Notes to be purchased by the Underwriters in this offering, which creates a short position for the Underwriters. Covering transactions involve purchases of the Notes in the open market after the distribution has been completed in order to cover short positions. Penalty bid occurs when a particular Underwriter repays to the Underwriters a portion of the underwriting discount received by it because the Underwriters or the Stabilizing Manager has repurchased Notes sold by or for the account of such Underwriter in stabilizing or short covering transactions. Stabilizing transactions consist of certain bids or purchases of Notes in the open market for the purpose of preventing or retarding a decline in the market price of the Notes while the offering is in progress. Any of these activities may have the effect of preventing or retarding a decline in the market price of the Notes. They may also cause the price of the Notes to be higher than the price that otherwise would exist in the open market in the absence of these transactions. The Stabilizing Manager may conduct these transactions in the over-the-counter market or otherwise. If the Stabilizing Manager commences any of these transactions, it may discontinue them at any time, and must discontinue them after a limited period.
S-187
Table of Contents
The validity of the Notes is being passed upon for us by Cleary Gottlieb Steen & Hamilton LLP, New York, New York, and by Kim & Chang, Seoul, Korea. Certain legal matters will also be passed upon for the Underwriters by Davis Polk & Wardwell LLP, New York, New York. In giving their opinions, Cleary Gottlieb Steen & Hamilton LLP and Davis Polk & Wardwell LLP may rely as to matters of Korean law upon the opinions of Kim & Chang, and Kim & Chang may rely as to matters of New York law upon the opinions of Cleary Gottlieb Steen & Hamilton LLP.
OFFICIAL STATEMENTS AND DOCUMENTS
Our President, in his official capacity, has supplied the information set forth in this prospectus supplement under “Recent Developments—Korea Finance Corporation.” Such information is stated on his authority. The documents identified in the portion of this prospectus supplement captioned “Recent Developments—The Republic of Korea” as the sources of financial or statistical data are derived from official public documents of the Republic and of its agencies and instrumentalities.
We were established in 2009 as a government-owned policy finance institution pursuant to the Korea Finance Corporation Act. The address of our registered office is 16 Yeouido-dong, Youngdeungpo-gu, Seoul, The Republic of Korea.
The issue of the Notes has been authorized by a decision of our President dated May 13, 2011. On May 16, 2011, we filed our reports on the proposed issuance of the Notes with the Ministry of Strategy and Finance of Korea.
The registration statement with respect to us and the Notes has been filed with the U.S. Securities and Exchange Commission in Washington, D.C. under the Securities Act of 1933, as amended. Additional information concerning us and the Notes is contained in the registration statement and post-effective amendments to such registration statement, including their various exhibits, which may be inspected at the public reference facilities maintained by the Securities and Exchange Commission at Room 1580, 100 F Street N.E., Washington, D.C. 20549, United States.
The Notes have been accepted for clearance through DTC, Euroclear and Clearstream:
| ISIN | CUSIP | Common Code | ||||||||||
| Notes | US50065TAC71 | 50065T AC7 | 063294322 | |||||||||
S-188
Table of Contents
PROSPECTUS
Korea Finance Corporation
$5,000,000,000
Debt Securities
Warrants to Purchase Debt Securities
We will provide the specific terms of these securities in supplements to this prospectus. You should read this prospectus and any prospectus supplement carefully before you invest.
Neither the Securities and Exchange Commission nor any state securities commission has approved or disapproved of these securities or determined if this prospectus is truthful or complete. Any representation to the contrary is a criminal offense.
This prospectus is dated July 1, 2011
Table of Contents
| Page | ||||
| 1 | ||||
| 2 | ||||
| 3 | ||||
| 3 | ||||
| 5 | ||||
| 5 | ||||
| 8 | ||||
| 15 | ||||
| 22 | ||||
| 24 | ||||
| 26 | ||||
| 27 | ||||
| 28 | ||||
| 30 | ||||
| 36 | ||||
| 111 | ||||
| 111 | ||||
| 112 | ||||
| 116 | ||||
| 123 | ||||
| 128 | ||||
| 133 | ||||
| 137 | ||||
| 144 | ||||
| 147 | ||||
| 148 | ||||
| 153 | ||||
| 153 | ||||
| 160 | ||||
| 161 | ||||
Limitations on Issuance of Bearer Debt Securities and Bearer Warrants | 162 | |||
| 163 | ||||
| 163 | ||||
| 164 | ||||
| 171 | ||||
| 172 | ||||
| 172 | ||||
| 172 | ||||
| 172 | ||||
| 173 | ||||
| 174 | ||||
i
Table of Contents
CERTAIN DEFINED TERMS AND CONVENTIONS
All references to “Korea” or the “Republic” contained in this prospectus mean The Republic of Korea. All references to the “Government” mean the government of Korea.
Unless the context otherwise requires or otherwise indicates, references to “we”, “us” or “our” mean Korea Finance Corporation and its consolidated subsidiaries, and references to “KoFC” or the “Issuer” mean Korea Finance Corporation, excluding its subsidiaries.
Unless otherwise indicated, all references to “KRW”, “Won”, “won” or “(Won)” are to the currency of Korea, references to “$”, “U.S.$”, “US$”, “U.S. Dollars”, “USD” or “U.S. dollar” are to the currency of the United States of America, references to “GBP”, “£” or “sterling” are to the currency of the United Kingdom, references to “Yen”, “JPY” or “¥” are to the currency of Japan, references to “Swiss franc” or “CHF” are to the currency of Switzerland, references to “Hong Kong dollar” or “HKD” are to the currency of Hong Kong, S.A.R., references to “Singapore dollar” or “SGD” are to the currency of Singapore, references to “Brazilian Real” or “BRL” are to the currency of Federative Republic of Brazil, references to “Thai Baht” or “THB” are to the currency of Thailand, references to “Australian dollar” or “AUD” are to the currency of Australia and references to “euro”, “EUR” or “€” are to the currency introduced at the start of the third stage of European economic and monetary union pursuant to the Treaty establishing the European Community, as amended.
In this prospectus, where information has been prepared in thousands, millions or billions of units, amounts may have been rounded up or down. Accordingly, actual numbers may differ from those contained herein due to rounding. All discrepancies in any table between totals and the sums of the amounts listed are due to rounding.
We maintain our accounts in Won. For convenience, Won amounts in this prospectus as of December 31, 2010 have been translated into U.S. dollars at the market average exchange rate, announced by Seoul Money Brokerage Services, Ltd. in Seoul, between Won and U.S. dollars, in effect on December 31, 2010, which was (Won)1,138.9 to U.S.$1.00. However, such translations should not be construed as representations that the Won amounts have been, could have been or could in the future be converted into U.S. dollars at this or any other rate.
Our financial statements included in this prospectus have been prepared in accordance with generally accepted accounting principles in Korea (“Korean GAAP”).
1
Table of Contents
Unless otherwise specified in the applicable prospectus supplement, we will use the net proceeds from the sale of the securities for our general operations, including extending foreign currency loans.
2
Table of Contents
KoFC was established on October 28, 2009 as a policy finance institution pursuant to the Korea Finance Corporation Act (the “KoFC Act”) in order to strengthen national competitiveness, to promote job growth in the Republic, and to contribute to the sound growth of the financial markets and the national economy of the Republic. The Government owns all of KoFC’s paid-in capital. KoFC’s registered office is located at 16 Yeouido-dong, Youngdeungpo-gu, Seoul, Korea.
KoFC was established to succeed to the policy bank role of KDB, a Government-owned financial institution established in 1954, which has been the leading bank in the Republic with respect to the provision of long-term financing for projects designed to assist the nation’s economic growth and development. Pursuant to the Government’s plan for the privatization of KDB and the transfer of the national policy and development bank role from KDB to KoFC, the Government in October 2009 established KoFC and KDBFG, a financial holding company, by spinning off a portion of KDB’s assets, liabilities and equity. In the spin-off, KDB’s interests in Daewoo Securities, KDB Capital, KDB Asset Management and KIAMCO were transferred to KDBFG, and KDB’s equity holdings in government-controlled companies, including Korea Electric Power Corporation (“KEPCO”), and equity holdings in certain private sector companies acquired during previous restructuring programs, including Hyundai Engineering & Construction Co., Ltd., were transferred to KoFC.
The Government transferred its ownership interest in KDB to KDBFG in exchange for all of KDBFG’s share capital on November 24, 2009 and initially contributed 94.27% of KDBFG’s shares to KoFC as a capital contribution on December 30, 2009 based on preliminary valuation of KDBFG shares as of December 30, 2009. In March 2010, the Government made a capital contribution of (Won)10 billion in cash to KDBFG. In July 2010, KDBFG’s valuation as of December 30, 2009 was finalized and the Government’s initial contribution was adjusted to reflect an increase in the value of the KDBFG shares. As KoFC’s authorized capital is (Won)15,000.0 billion, KoFC is permitted to hold only that percentage of KDBFG shares of which the aggregate value (together with cash contributed by the Government) does not exceed (Won)15,000.0 billion. Accordingly, as of the date of this prospectus, KoFC owns 90.26% of KDBFG’s share capital and the Government directly owns 9.74% of KDBFG’s share capital.
Under the Government’s plan for the privatization of KDB and the KDB Act, as amended, the sale of KDBFG’s shares to unrelated third parties is to commence by May 2014. The implementation of the Government’s privatization plan may be delayed or changed depending on a variety of factors, such as domestic and international economic conditions. There can be no assurance that such privatization plan will be implemented as contemplated or that the contemplated privatization will be implemented at all.
The following diagram provides an overview of our structure.
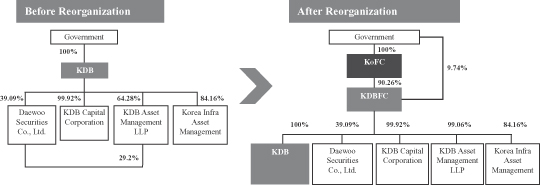
3
Table of Contents
We engage in a broad range of financial businesses, including policy banking, development banking, corporate and investment banking, brokerage and asset management, directly or through our consolidated subsidiary, KDBFG, and its subsidiaries. KoFC provides loans to industrial enterprises, either directly or indirectly through intermediary financial institutions, and purchases debt and equity securities issued by such enterprises in order to achieve its statutory purpose of providing financing for the growth of small and medium- sized enterprises (“SMEs”), development of national and regional infrastructure and promotion of new growth engine industries in the Republic. KDBFG, through its principal subsidiary, KDB, provides financing to major industries for equipment, capital investment and the development of high technology, as well as for working capital. KDBFG also provides corporate and investment banking, brokerage and asset management services through its subsidiaries.
As of December 31, 2010, we had (Won)85,362.4 billion of loans outstanding (including on-lending and direct loans, call loans, domestic usance, bills of exchange bought, local letters of credit negotiation, loan-type suspense accounts, inter-bank loans, advance payments, bonds purchased, factoring receivables, credit card receivables, private placement bonds and other loans, net of provision for loan losses, present value discounts and deferred loan fees pursuant to the applicable guidelines), total assets of (Won)192,183.1 billion and total equity of (Won)26,127.7 billion, as compared to (Won)82,792.2 billion of loans outstanding (including on-lending and direct loans, call loans, domestic usance, bills of exchange bought, local letters of credit negotiation, loan-type suspense accounts, inter-bank loans, advance payments, bonds purchased, factoring receivables, credit card receivables, private placement bonds and other loans, net of provision for loan losses and deferred loan fees pursuant to the applicable guidelines), total assets of (Won)182,888.7 billion and total equity of (Won)23,285.7 billion as of December 31, 2009. In 2010, we recorded interest income of (Won)6,078.7 billion, interest expense of (Won)4,608.8 billion and net income of (Won)1,247.8 billion. See “—Selected Financial Statement Data”.
The Government owns all of KoFC’s paid-in capital, as required by the KoFC Act. In addition to contributions to KoFC’s capital, the Government provides direct financial support, including extension of loans and guarantees, for KoFC’s financing activities. The Government’s determination each fiscal year regarding the amount of financial support to extend to us plays an important role in determining our lending capacity. Under the KoFC Act, the Government appoints KoFC’s President, all of its Directors, its Auditor and all members of its Steering Committee. Pursuant to the KoFC Act, the Financial Services Commission (the “FSC”), the governmental agency responsible for the overall supervision of the Korean banking industry, has supervisory power and authority over matters relating to KoFC’s general business including, but not limited to, capital adequacy and managerial soundness.
The Government supports KoFC’s operations pursuant to Article 31 of the KoFC Act. Article 31 of the KoFC Act provides that “the annual net losses of Korea Finance Corporation shall be offset each fiscal year by the reserve, and if the reserve be insufficient, the deficit shall be replenished by the Government.” As a result of Article 31, the Government is generally responsible for KoFC’s operations and is legally obligated to replenish any deficit that arises if its reserve, consisting of its surplus and capital surplus items, is insufficient to cover its annual net losses. In light of the above, if KoFC had insufficient funds to make any payment under any of its obligations, including the debt securities covered by this prospectus, the Government would be required by the KoFC Act to take appropriate steps, such as by making a capital contribution, by allocating funds or by taking other action, to enable KoFC to make such payment when due. The provisions of Article 31 do not, however, constitute a direct guarantee by the Government of KoFC’s obligations under the debt securities, and the provisions of the KoFC Act, including Article 31, may be amended at any time by action of the National Assembly. The Government can directly support KoFC’s financing activities under the KoFC Act by lending it funds, allowing it to borrow from the Bank of Korea, and guaranteeing, subject to approval by the National Assembly, its overseas borrowings and debt securities.
4
Table of Contents
As of December 31, 2010, KoFC’s authorized capital was (Won)15,000.0 billion and KDBFG’s authorized capital was (Won)5,000.0 billion. Our capitalization as of December 31, 2010 was as follows:
| As of December 31, 2010 (1) | ||||
| (consolidated) | ||||
| (billions of won) | ||||
Long-term debt (2) (3): | ||||
Borrowings | (Won) | 8,351.0 | ||
Debentures | 43,332.5 | |||
Total long-term debt | 51,683.5 | |||
Capital: | ||||
Paid-in capital | 15,000.0 | |||
Additional paid-in capital | 3.4 | |||
Capital adjustments | (186.1 | ) | ||
Retained earnings | 2,334.0 | |||
Accumulated other comprehensive income | 1,573.5 | |||
Minority interests | 7,402.9 | |||
Total capital | 26,127.7 | |||
Total capitalization | (Won) | 77,811.2 | ||
| (1) | Except as disclosed in this prospectus, there has been no material adverse change in our capitalization since December 31, 2010. |
| (2) | We have translated borrowings in foreign currencies into Won at the rate of (Won)1,138.9 to US$1.00, which was the market average exchange rate, as announced by the Seoul Monetary Brokerage Services Ltd., on December 31, 2010. |
| (3) | As of December 31, 2010, we had contingent liabilities totaling (Won)13,184.5 billion under outstanding guarantees issued on behalf of our clients. |
Purpose and Authority
KoFC’s primary purpose, as stated in Article 1 of the KoFC Act, is to “strengthen national competitiveness, amplify growth potential and job growth, and contribute to the sound growth of the financial markets and the national economy, by facilitating financing for SMEs, and supplying and managing funds required for the growth of the national economy, including provision of funds for local development and infrastructure projects, new growth engine industries, stabilization of financial markets and facilitation of sustainable growth.” Since KoFC serves a public policy role, it strives to maintain a level of profitability to strengthen its equity base and support growth in the volume of its business, rather than placing emphasis on profit maximization, as is the case with commercial financial institutions. The KoFC Act and the Enforcement Decree of the Korea Finance Corporation Act (the “KoFC Decree”) set forth the powers, privileges, government supervision and operating guidelines for KoFC.
Under the KoFC Act, KoFC provides funds for the following purposes to accomplish its statutory purpose:
| • | facilitation of the growth of SMEs; |
| • | development of national and regional infrastructure; |
| • | urgent financial support necessary for the stabilization of financial markets in the Republic; |
| • | activities for the management, operation and financial support of the financial stabilizing fund for the structural improvement of the financial industry in the Republic, named the Financial Market Stabilization Fund; and |
| • | development of new growth engine industries and facilitation of sustainable growth. |
5
Table of Contents
Under the KoFC Act, KoFC may engage in the following activities to provide funds for the purposes described above and procure funding for such activities:
| • | providing loans; |
| • | investing in securities; |
| • | guaranteeing indebtedness; |
| • | securitization of credit risk; |
| • | borrowing from the Government, the Bank of Korea and other financial institutions; |
| • | borrowing from overseas; |
| • | issuance of policy finance bonds and other securities; |
| • | provision of funds pursuant to the Act on the Structural Improvement of the Financial Industry; |
| • | research regarding industrial and policy financing; |
| • | businesses entrusted by the Government; |
| • | businesses incidental to the foregoing; and |
| • | other businesses approved by the FSC as necessary to achieve KoFC’s statutory purpose. |
Government Support and Supervision
The Government owns all of KoFC’s paid-in capital, as required by the KoFC Act. KoFC’s authorized capital under the KoFC Act is (Won)15,000.0 billion. At the time of KoFC’s establishment in October 2009, it had (Won)100.0 billion of paid-in capital transferred from KDB’s paid-in capital in the spin-off described above. Subsequently, the Government contributed 94.27% of KDBFG’s shares, valued at approximately (Won)14,900.0 billion, to KoFC on December 30, 2009. Taking into account these capital contributions, as of December 31, 2010, KoFC’s total paid-in capital was (Won)15,000.0 billion.
In addition to making capital contributions, the Government can directly support KoFC’s financing activities under the KoFC Act by:
| • | lending it funds; |
| • | allowing it to borrow from the Bank of Korea; and |
| • | guaranteeing, subject to approval by the National Assembly, its overseas borrowings and debt securities. |
KDB’s borrowing of (Won)3,296.6 billion from the Bank of Korea, which had been used to finance the Bank Recapitalization Fund in the wake of the global financial crisis in 2008, was transferred to KoFC as part of the KDB spin-off. In addition, government loans of (Won)1,124.3 billion were transferred from KDB to KoFC on August 23, 2010 as part of an additional transfer of KDB’s policy-related assets and liabilities.
The Government also supports KoFC’s operations pursuant to Articles 30 and 31 of the KoFC Act. Article 30 provides that “20% or more of the annual net profit of Korea Finance Corporation shall be transferred to reserve, after compensating for any accumulated losses pursuant to Article 31, until the reserve amounts equal the total amount of paid-in capital” and that accumulated amounts in reserve may be capitalized in accordance with the provisions of the KoFC Decree. Article 31 of the KoFC Act provides that “the annual net losses of Korea Finance Corporation shall be offset each fiscal year by the reserve, and if the reserve be insufficient, the deficit shall be replenished by the Government.”
6
Table of Contents
As a result of the KoFC Act, the Government is generally responsible for KoFC’s operations and is legally obligated to replenish any deficit that arises if its reserve, consisting of its surplus and capital surplus items, is insufficient to cover its annual net losses. In light of the above, if KoFC had insufficient funds to make any payment under any of its obligations, including the debt securities covered by this prospectus, the Government would be required by the KoFC Act to take appropriate steps, such as by making a capital contribution, by allocating funds or by taking other action, to enable KoFC to make such payment when due. The provisions of Article 31 do not, however, constitute a direct guarantee by the Government of KoFC’s obligations under the debt securities, and the provisions of the KoFC Act, including Article 31, may be amended at any time by action of the National Assembly.
Under the KoFC Act, the Government appoints KoFC’s President, all of its Directors, its Auditor and all members of its Steering Committee. The President of the Republic appoints KoFC’s President and Chairman of the Board of Directors upon the recommendation of the Chairman of the FSC. The FSC appoints all of KoFC’s Directors upon the recommendation of KoFC’s President. The FSC appoints KoFC’s Auditor after consultation with the Minister of Strategy and Finance. KoFC’s Board of Directors, composed of its President and Directors, adopts resolutions on important matters concerning its business affairs.
Under the KoFC Act, KoFC’s Steering Committee deliberates and adopts resolutions on its important policies, including the amendment of its Articles of Incorporation, amendment of its operating manual, determination of its annual business plan and annual budget, settlement of accounts and deployment of reserves to increase capital or decrease accumulated losses. The Steering Committee determines KoFC’s fundamental policies and ensures that they are consistent with the policy objectives of the Government, while KoFC’s Board of Directors guides its operations to appropriately carry out the policies mandated by the Steering Committee and the Government. Four members of the Steering Committee are appointed from among public officials – one is appointed by each of the Minister of Strategy and Finance, the Minister of Knowledge Economy, the Chairman of the FSC, and the Administrator of Small and Medium Business Administration from among their respective senior ranking officials. KoFC’s President serves as the Chairman of the Steering Committee and three other non-governmental members are appointed by the FSC from among experts with knowledge and experience in policy financing or other related areas.
KoFC is subject to extensive oversight and supervision by the Government on an ongoing basis. Under the KoFC Act, the KoFC Decree and the FSC’s Supervisory Regulations on Korea Finance Corporation (the “KoFC Supervisory Regulations” and, together with the KoFC Act and the KoFC Decree, the “KoFC Regulations”), KoFC’s activities are supervised and regulated by the Government, primarily by the FSC, as follows:
| • | one month prior to the beginning of each fiscal year, KoFC must submit its proposed business plan and annual budget for the fiscal year to the FSC for its approval; |
| • | within three months after the end of each fiscal year, KoFC must submit its financial statements for the fiscal year to the Minister of Strategy and Finance for his/her approval and further examination by the Board of Audit and Inspection of Korea; |
| • | the FSC must approve KoFC’s operating manual, which among other things sets out the guidelines for all principal operating matters, including the method and maximum amount of lending, interest rate, maturity and terms of loans, and the method and maximum amount of investment and guarantees; |
| • | the FSC has broad authority to require reports from KoFC on any matter and to examine its books, records and other documents. On the basis of the reports and examinations, the FSC may issue any orders deemed necessary to enforce the KoFC Act; |
| • | the FSC may supervise KoFC’s operations to ensure managerial soundness based upon the criteria set forth in the KoFC Regulations, which includes (i) restrictions on lending to a single borrower, (ii) restrictions on equity investments, (iii) restrictions on investment in securities and other assets, (iv) regulations on capital adequacy ratios and liquidity ratios, (v) regulations on foreign currency assets |
7
Table of Contents
and liabilities, (vi) standards for the provisions for possible loan losses and (vii) applicable accounting principles and the authority to issue orders deemed necessary for such supervision; |
| • | the Minister of Strategy and Finance may make a request to the FSC as necessary for the supervision of KoFC’s operations and may request the FSC to require reports from KoFC or examine its books, records and other documents; and |
| • | KoFC may amend its Articles of Incorporation only with the approval of the FSC. |
Selected Financial Statement Data
You should read the following financial statement data together with the financial statements and notes included in this prospectus.
Balance Sheet Data
Our balance sheet data included in the following table have been derived from our audited consolidated financial statements as of December 31, 2009 and 2010 included elsewhere in this prospectus.
| As of December 31, | ||||||||
| 2009 | 2010 | |||||||
| (consolidated) (billions of won) (audited) | ||||||||
Balance Sheet Data | ||||||||
Securities | 62,567.2 | 66,174.6 | ||||||
Total Loans(1) | 84,556.3 | 87,696.2 | ||||||
Total Borrowings (2) | 117,160.1 | 112,882.5 | ||||||
Total Assets | 182,888.7 | 192,183.1 | ||||||
Total Liabilities | 159,602.9 | 166,055.4 | ||||||
Equity | 23,285.7 | 26,127.7 | ||||||
| (1) | Gross amount without adjusting for allowance for loan losses, present value discounts and deferred loan fees. |
| (2) | Total Borrowings include borrowings, industrial finance bonds and policy finance bonds. |
The following table presents audited non-consolidated balance sheet data of KDB, KDBFG’s principal subsidiary, as of December 31, 2009 and 2010:
| As of December 31, | ||||||||
| 2009 | 2010 | |||||||
| (non-consolidated) (billions of won) (audited) | ||||||||
Balance Sheet Data | ||||||||
Securities | 31,664.2 | 28,200.9 | ||||||
Total Loans (1) | 76,211.4 | 71,863.2 | ||||||
Total Borrowings (2) | 94,623.7 | 85,738.0 | ||||||
Total Assets | 122,333.4 | 113,205.5 | ||||||
Total Liabilities | 107,222.7 | 96,977.1 | ||||||
Equity | 15,110.7 | 16,228.3 | ||||||
| (1) | Gross amount, which includes loans, call loans, domestic usance, bills of exchange bought, local letters of credit negotiation and loan-type suspense accounts pursuant to the applicable guidelines without adjusting for allowance for loan losses, present value discounts and deferred loan fees. |
| (2) | Total Borrowings include deposits, call money, borrowings and industrial finance bonds. |
8
Table of Contents
In October 2009, the Government established KoFC and KDBFG by spinning off a portion of KDB’s assets, liabilities and equity as described above under the heading “Overview.”
The following balance sheet data show (i) KDB’s assets, liabilities and equity as of October 27, 2009 before and after the spin-off, (ii) assets, liabilities and equity transferred to KoFC and KDBFG from KDB and (iii) KoFC’s assets, liabilities and equity as of December 31, 2009, on a non-consolidated basis as well as on a consolidated basis, reflecting the transfer of KDBFG’s shares to KoFC. KDB’s and KDBFG’s balance sheet data as of October 27, 2009 included in the following table have been derived from KDB’s financial statements as of October 27, 2009 included in KDB’s prospectus supplement dated February 3, 2009 as filed with the SEC on February 5, 2010. KoFC’s non-consolidated data included in the following table have been derived from its audited non-consolidated financial statements as of December 31, 2009 not included in this prospectus and KoFC’s consolidated data included in the following table have been derived from its audited consolidated financial statements as of December 31, 2009 included elsewhere in this prospectus.
| KDB Before Spin-off | KDB After Spin-off | KDBFG | KoFC | |||||||||||||||||||||
| As of October 27, 2009 | As of October 27, 2009 | As of October 27, 2009 | As of October 27, 2009 | As of December 31, 2009 | As of December 31, 2009 | |||||||||||||||||||
| (non-consolidated) | (non-consolidated) | (consolidated) | ||||||||||||||||||||||
| (unaudited) | (audited) | (audited) | ||||||||||||||||||||||
| (billions of won) | ||||||||||||||||||||||||
Balance Sheet Data | ||||||||||||||||||||||||
Assets | ||||||||||||||||||||||||
Cash and due from banks | 1,778.3 | 1,200.6 | 72.8 | 504.9 | 1,395.6 | 7,590.0 | ||||||||||||||||||
Securities(1) | 54,556.8 | 33,791.4 | 1,579.6 | 19,185.8 | 34,628.4 | 62,567.2 | ||||||||||||||||||
Loans receivable (net of provision for possible loan losses and deferred loan fees) | 79,328.0 | 75,315.7 | — | 4,012.4 | 4,344.2 | 82,792.2 | ||||||||||||||||||
Property and equipment | 625.5 | 547.5 | 0.3 | 77.7 | 81.7 | 6,262.8 | ||||||||||||||||||
Other assets | 15,446.8 | 15,399.3 | 14.4 | 33.1 | 58.7 | 23,676.4 | ||||||||||||||||||
Total assets | 151,735.4 | 126,254.4 | 1,667.1 | 23,813.9 | 40,508.7 | 182,888.7 | ||||||||||||||||||
Liabilities and Equity | ||||||||||||||||||||||||
Liabilities | ||||||||||||||||||||||||
Deposits | 14,073.8 | 14,073.8 | — | — | — | 16,673.2 | ||||||||||||||||||
Borrowings(2) | 102,380.6 | 82,289.7 | 450.0 | 19,640.9 | 21,050.9 | 117,160.1 | ||||||||||||||||||
Other liabilities | 16,464.8 | 15,224.7 | 67.1 | 1,173.0 | 1,337.4 | 25,769.6 | ||||||||||||||||||
Total liabilities | 132,919.2 | 111,588.2 | 517.1 | 20,813.9 | 22,388.2 | 159,603.0 | ||||||||||||||||||
Equity | ||||||||||||||||||||||||
Paid-in capital | 9,641.9 | 9,241.9 | 300.0 | 100.0 | 15,000.0 | 15,000.0 | ||||||||||||||||||
Capital surplus | 60.7 | 47.1 | 13.6 | — | — | — | ||||||||||||||||||
Capital adjustments | (38.5 | ) | (34.6 | ) | (0.2 | ) | (3.7 | ) | (3.7 | ) | (3.7 | ) | ||||||||||||
Accumulated other comprehensive income (loss) | 1,101.3 | 185.6 | (14.6 | ) | 930.3 | 1,211.2 | 1,211.2 | |||||||||||||||||
Retained Earnings | 8,050.9 | 5,226.3 | 851.2 | 1,973.4 | 1,913.0 | 1,913.0 | ||||||||||||||||||
Minority Interests | — | — | — | — | — | 5,165.3 | ||||||||||||||||||
Total equity | 18,816.2 | 14,666.2 | 1,150.0 | 3,000.0 | 18,120.5 | 23,285.7 | ||||||||||||||||||
Total liabilities and equity | 151,735.4 | 126,254.4 | 1,667.1 | 23,813.9 | 40,508.7 | 182,888.7 | ||||||||||||||||||
| (1) | Includes equity securities and debt securities. The following table shows details of equity securities that have been transferred to KDBFG and KoFC in the spin-off. In addition, the Government contributed 94.27% of KDBFG’s shares, valued at approximately (Won)14,900.0 billion, to KoFC on December 30, 2009. |
9
Table of Contents
| (a) | Equity securities transferred to KDBFG from KDB |
| As of October 27, 2009 | ||||||||
Classification | Ownership | Book value | ||||||
| (billions of won, except percentage) | ||||||||
Daewoo Securities Co., Ltd. | 39.1 | % | 1,043.0 | |||||
KDB Capital Corporation | 99.9 | % | 485.3 | |||||
KDB Asset Management LLP | 64.3 | % | 42.4 | |||||
Korea Infra Asset Management | 84.2 | % | 8.9 | |||||
Total | 1,579.6 | |||||||
| (b) | Equity securities transferred to KoFC from KDB |
| As of October 27, 2009 | ||||||||
Classification | Ownership | Book value | ||||||
| (billions of won, except percentage) | ||||||||
KEPCO | 29.9 | % | 8,981.7 | |||||
Korea Expressway Corporation | 8.8 | % | 1,930.2 | |||||
Korea Land & Housing Corporation | 15.3 | % | 2,491.9 | |||||
Korea Water Resources Corporation | 9.3 | % | 976.3 | |||||
The Export-Import Bank of Korea | 3.1 | % | 200.0 | |||||
Korea Tourism Organization | 43.6 | % | 166.0 | |||||
Korea Asset Management Corporation | 8.1 | % | 146.2 | |||||
Korea Appraisal Board | 30.6 | % | 13.9 | |||||
Korea Resources Corporation | 0.4 | % | 3.2 | |||||
Seoul Newspaper Co., Ltd. | 0.02 | % | 0.03 | |||||
Industrial Bank of Korea | 9.7 | % | 620.2 | |||||
Hyundai Engineering & Construction Co., Ltd.* | 11.1 | % | 744.4 | |||||
Hynix Semiconductor Inc. | 5.5 | % | 587.0 | |||||
Korea Aerospace Industries, Ltd. | 30.1 | % | 171.9 | |||||
SK Networks Co., Ltd. | 8.0 | % | 246.1 | |||||
Daewoo International Corporation | 5.3 | % | 153.0 | |||||
Total | 17,432.1 | |||||||
| * | In April 2011, the creditors of Hyundai Engineering & Construction (including us) sold 34.9% of outstanding common stock (including 7.8% held by us) of Hyundai Engineering & Construction to Hyundai Motor Group, and we currently own 3.3% shares of common stock of Hyundai Engineering & Construction. |
| (2) | Borrowings include borrowings and industrial finance bonds. Industrial finance bonds amounting to (Won)16,255.0 billion have been transferred to KoFC from KDB in the spin-off. |
In August 2010, KoFC acquired from KDB additional policy-driven loans (including loans to Government-controlled enterprises and companies operating in Gaesung Industrial Complex) of (Won)4,068.0 billion and KDB’s North Korea research function was transferred to KoFC, in order to support KoFC’s policy roles. In addition, in September 2010, KoFC acquired KDB’s (Won)1,091.4 billion participation in the Bond Market Stabilization Fund, which was established in December 2008 by the Government and Korean financial institutions in order to provide liquidity to the economy by purchasing financial and corporate bonds.
Income Statement Data
Our income statement data included in the following table have been derived from our audited consolidated financial statements for the year ended December 31, 2010 included elsewhere in this prospectus.
10
Table of Contents
KoFC Consolidated Income Statement Data
| Year ended December 31, 2010 (1) | ||||
(consolidated) (billions of won) (audited) | ||||
Total Interest Income | 6,078.7 | |||
Total Interest Expenses | 4,608.8 | |||
Net Interest Income | 1,469.9 | |||
Operating Revenues | 40,629.5 | |||
Operating Expenses | 38,697.0 | |||
Net Income | 1,247.8 | |||
| (1) | KoFC was newly established in October 2009. Accordingly, income statement data for the full year 2009 are not available. |
In 2010, we recorded net income of (Won)1,247.8 billion, primarily due to (i) net gain on sales of available-for-sale securities of (Won)1,816.3 billion, primarily due to gain from the sale of our equity interest in Doosan Heavy Industries & Construction and (ii) net interest income of (Won)1,469.9 billion, primarily due to interest income derived from loans and debt securities, which were partially offset by (i) provision for possible loan losses of (Won)1,500.7 billion, primarily due to loan loss provision for our real-estate project financing exposures and (ii) net impairment loss on available-for-sale securities of (Won)514.4 billion, primarily due to impairment loss relating to our exposure to Ssangyong Cement Co., Ltd.
The following table presents audited non-consolidated income statement data of KDB, KDBFG’s principal subsidiary, for the years ended December 31, 2009 and 2010:
KDB Non-Consolidated Income Statement Data
| Year Ended December 31, | ||||||||
| 2009 | 2010 | |||||||
| (non-consolidated) (billions of won) (audited) | ||||||||
Total Interest Income | 5,374.5 | 4,409.1 | ||||||
Total Interest Expenses | 4,476.9 | 2,804.0 | ||||||
Net Interest Income | 897.6 | 1,605.1 | ||||||
Operating Revenues | 27,682.3 | 17,507.7 | ||||||
Operating Expenses | 27,676.5 | 16,218.1 | ||||||
Net Income | 761.1 | 1,045.7 | ||||||
KDB had non-consolidated net income of (Won)1,045.7 billion in 2010 compared to non-consolidated net income of (Won)761.1 billion in 2009.
Principal factors for the increase in non-consolidated net income in 2010 compared to 2009 included:
| • | an increase in net interest income to (Won)1,605.1 billion in 2010 from (Won)897.6 billion in 2009, primarily due to a decrease in interest expenses resulting from the transfer of interest-bearing liabilities, including Won-denominated industrial finance bonds, to KoFC in connection with the spin-off in October 2009; and |
| • | an increase in net gain on sales of available-for-sale securities to (Won)1,299.2 billion in 2010 from (Won)649.6 billion in 2009, primarily due to gain from the sale of its equity interest in Doosan Heavy Industries & Construction. |
11
Table of Contents
The above factors were partially offset by (i) a decrease in net valuation gain on equity method investments to (Won)187.9 billion in 2010 from (Won)619.9 billion in 2009, primarily due to the transfer of equity securities, including KEPCO, to KoFC in the spin-off and (ii) a decrease in dividend income to (Won)55.1 billion in 2010 from (Won)431.7 billion in 2009, primarily due to a decrease in dividend income from KDB 3rd Securitization Specialty Co.
Provisions for Possible Loan Losses and Loans in Arrears
We establish provisions for possible losses from problem loans, including guarantees and other extensions of credit, based on the length of the delinquent periods and the nature of the loans, including guarantees and other extensions of credit. As of December 31, 2010, we established provisions of (Won)2,273.4 billion for possible loan losses and bad debt securities, 32.1% higher than the provisions of (Won)1,720.9 billion as of December 31, 2009, and (Won)112.7 billion for possible losses on guarantees and other assets, 55.8% lower than the provisions of (Won)254.8 billion as of December 31, 2009.
Certain of our customers have restructured loans with their creditor banks. As of December 31, 2010, we have provided loans and guarantees of (Won)5,122.8 billion for companies under workout, court receivership, court mediation and other restructuring procedures. In addition, as of such date, we held equity securities of such companies in the amount of (Won)309.5 billion following debt-equity swaps. As of December 31, 2010, we had established provisions of (Won)1,043.9 billion for our exposure to such companies. We cannot assure you that actual results of the credit loss from the loans to these customers will not exceed the provisions reserved.
KoFC Supervisory Regulations and FSC guidelines classify our loans into five categories; provisions are made in accordance with ratios applicable to each category. Under the FSC’s definitions for loan categories, loans are categorized as follows:
Normal | Credits extended to customers which, in consideration of their business and operations, financial conditions and future cash flows, do not raise concerns regarding their ability to repay the credits. 0.5% or more reserves required for KoFC and 0.85% (0.9% for companies in certain industries) or more reserves required for our consolidated subsidiaries. | |
Precautionary | Credits extended to customers (1) which, in consideration of their business and operations, financial conditions and future cash flows, are judged to have potential risks with respect to their ability to repay the credits in the future, although there have not occurred any immediate risks of default in repayment; or (2) which are in arrears for one month or more but less than three months. 3.5% or more reserves required for KoFC and 7.0% or more reserves required for our consolidated subsidiaries. | |
Substandard | (1) Credits extended to customers, which in consideration of their business and operations, financial conditions and future cash flows, are judged to have incurred considerable risks for default in repayment as the customers’ ability to repay has deteriorated; or (2) that portion which is expected to be collected of total credits (a) extended to customers which have been in arrears for three months or more, (b) extended to customers which are judged to have incurred serious risks due to the occurrence of final refusal to pay their promissory notes, liquidation or bankruptcy proceedings, or closure of their businesses or (c) of “Doubtful Customers” or “Expected-loss Customers” (each as defined below). 20.0% or more reserves required. | |
12
Table of Contents
Doubtful | That portion of credits in excess of the amount expected to be collected of total credits extended to (1) customers (“Doubtful Customers”) which, in consideration of their business and operations, financial conditions and future cash flows, are judged to have incurred serious risks of default in repayment due to noticeable deterioration in their ability to repay; or (2) customers which have been in arrears for three months or more but less than twelve months. 50.0% or more reserves required. | |
Expected Loss | That portion of credits in excess of the amount expected to be collected of total credits extended to (1) customers (“Expected-loss Customers”), which, in consideration of their business and operations, financial conditions and future cash flows, are judged to have to be accounted as a loss as the inability to repay became certain due to serious deterioration in their ability to repay; (2) customers which have been in arrears for twelve months or more; or (3) customers which are judged to have incurred serious risks of default in repayment due to the occurrence of final refusal to pay their promissory notes, liquidation or bankruptcy proceedings, or closure of their businesses. 100.0% reserves required. | |
The following table provides information on KoFC’s loan loss provisions.
| KoFC As of December 31, 2009 | KoFC As of December 31, 2010 | |||||||||||||||||||||||
| Loan Amount (1) | Minimum Provisioning Ratio | Loan Loss Provisions | Loan Amount (1) | Minimum Provisioning Ratio | Loan Loss Provisions | |||||||||||||||||||
(non-consolidated) (in billions of won, except percentages) | ||||||||||||||||||||||||
Normal | (Won) | 822.3 | 0.5 | % | (Won) | 4.1 | (Won) | 3,280.5 | 0.5 | % | (Won) | 16.4 | ||||||||||||
Precautionary | — | 3.5 | % | — | — | 3.5 | % | — | ||||||||||||||||
Substandard | — | 20.0 | % | — | — | 20.0 | % | — | ||||||||||||||||
Doubtful | — | 50.0 | % | — | — | 50.0 | % | — | ||||||||||||||||
Expected Loss | — | 100.0 | % | — | — | 100.0 | % | — | ||||||||||||||||
Others(2) | 3,527.2 | — | — | 9,156.4 | — | — | ||||||||||||||||||
Total | (Won) | 4,349.6 | (Won) | 4.1 | (Won) | 12,436.9 | (Won) | 16.4 | ||||||||||||||||
| (1) | These figures include loans (including direct loans) and present value discount pursuant to the applicable guidelines. |
| (2) | Includes loans to banks (including on-lending), loans guaranteed by the Korea Credit Guarantee Fund and loans to government-related entities. |
Non-performing loans are defined as (a) loans classified as doubtful and estimated loss, (b) loans in delinquency of repayment of principal or interest for more than 3 months or (c) loans exempted from interest payments due to restructuring or rescheduling. As of December 31, 2010, KoFC did not have any non-performing loans. On December 31, 2010, KoFC’s legal reserve was (Won)1,913.0 billion, representing 15.4% of its outstanding loans as of such date.
13
Table of Contents
The following table provides information on KDB’s loan loss provisions.
| KDB As of December 31, 2009 | KDB As of December 31, 2010 | |||||||||||||||||||||||
| Loan Amount (1) | Minimum Provisioning Ratio | Loan Loss Provisions | Loan Amount (1) | Minimum Provisioning Ratio | Loan Loss Provisions | |||||||||||||||||||
(non-consolidated) (in billions of won, except percentages) | ||||||||||||||||||||||||
Normal | (Won) | 66,797.0 | 0.85-0.9 | % | (Won) | 719.6 | (Won) | 61,836.8 | 0.85-0.9 | % | (Won) | 773.2 | ||||||||||||
Precautionary | 1,343.2 | 7.0 | % | 190.2 | 2,404.4 | 7.0 | % | 448.9 | ||||||||||||||||
Substandard | 1,580.4 | 20.0 | % | 418.9 | 1,403.4 | 20.0 | % | 499.7 | ||||||||||||||||
Doubtful | 37.6 | 50.0 | % | 22.8 | 49.7 | 50.0 | % | 41.7 | ||||||||||||||||
Expected Loss | 42.0 | 100.0 | % | 42.0 | 165.4 | 100.0 | % | 165.4 | ||||||||||||||||
Others(2) | 6,411.2 | — | — | 6,003.5 | — | — | ||||||||||||||||||
Total | (Won) | 76,211.4 | (Won) | 1,393.5 | (Won) | 71,863.2 | (Won) | 1,928.8 | ||||||||||||||||
| (1) | These figures include loans, domestic usance, bills of exchange bought, local letters of credit negotiation, loan-type suspense accounts, inter-bank loans, factoring receivables, credit card receivables, private placement bonds, other loans and present value discounts. |
| (2) | Includes loans to or loans guaranteed by the Government, call loans, bond purchased under repurchase agreements and inter bank loan classified as “normal”. |
As of December 31, 2010, KDB’s non-performing loans totaled (Won)1,660.4 billion, representing 2.3% of its outstanding loans as of such date. On December 31, 2010, KDB’s legal reserve was (Won)4,658.0 billion, representing 6.5% of its outstanding loans as of such date.
Loans to Financially Troubled Companies
We have credit exposure (including loans, guarantees and equity investments) to a number of financially troubled Korean companies including Kumho Tire Co., Inc., Daehan Shipbuilding Co., Ltd., Daewoo Motor Sales, Kumho Industrial and Ssangyong Motor Company. As of December 31, 2010, our credit extended to these companies totaled (Won)2,496.4 billion, accounting for 1.3% of our total assets as of such date.
As of December 31, 2010, our exposure (including loans classified as substandard or below and equity investment classified as estimated loss or below) to Kumho Tires increased to (Won)994.2 billion from (Won)584.6 billion as of December 31, 2009, primarily due to extension of new loans to Kumho Tires. We upgraded the classification of our exposure to Kumho Tires from substandard to precautionary in 2010. As of December 31, 2010, our exposure to Daehan Shipbuilding was (Won)586.9 billion, a decrease from (Won)752.0 billion as of December 31, 2009, primarily due to a decrease in our guarantee exposure to Daehan Shipbuilding. As of December 31, 2010, our exposure to Daewoo Motor Sales increased to (Won)351.7 billion from (Won)247.8 billion as of December 31, 2009, primarily due to extension of additional loans. As of December 31, 2010, our exposure to Kumho Industrial increased to (Won)314.7 billion from (Won)141.0 billion as of December 31, 2009, primarily due to extension of additional loans. As of December 31, 2010, our exposure to Ssangyong Motor Company decreased to (Won)248.9 billion from (Won)318.2 billion as of December 31, 2009, primarily due to repayment of loans. Following such changes in Ssangyong Motor Company exposure, we upgraded the classification of our exposure to Ssangyong Motor Company from estimated loss to precautionary.
As of December 31, 2010, we established provisions of (Won)201.1 billion for our exposure to Kumho Tires, (Won)62.3 billion for Daehan Shipbuilding, (Won)172.3 billion for Daewoo Motor Sales, (Won)69.0 billion for Kumho Industrial and (Won)47.4 billion for Ssangyong Motor Company.
In January 2010, Kumho Tires Co., Inc. and Kumho Industrial Co., Ltd. agreed with their creditors, including KDB, to begin an out-of-court debt restructuring program under the Corporate Restructuring Promotion Act. In March and May 2010, the creditors of these companies agreed on work-out plans, which
14
Table of Contents
included debt-to-equity swaps and extensions of additional credit. In connection with these work-out plans, KDB provided emergency loans of (Won)100.0 billion and (Won)280.0 billion to Kumho Tires and Kumho Industrial, respectively. KDB and other creditors of Kumho Tires and Kumho Industrial decided to freeze the repayment of both companies’ debt until December 31, 2014. In addition, KDB and other creditors of Kumho Petrochemical Co., Ltd. and Asiana Airlines decided to freeze the repayment of both companies’ debt until December 31, 2011. These four companies are members of Kumho Asiana Group, which has been undergoing financial difficulties resulting from its heavily leveraged purchase of Daewoo Engineering & Construction Co., Ltd. (“Daewoo E&C”) in 2006. KDB, a main creditor of Kumho Asiana Group, has acquired 50.75% of Daewoo E&C by participating in a (Won)1,000.0 billion rights issue in December 2010 and by acquiring (Won)2,178.5 billion of additional equity shares through its private equity arm in January 2011.
As of December 31, 2010, our exposure to Kumho Tires, Kumho Industrial, Kumho Petrochemical and Asiana Airlines was (Won)994.2 billion, (Won)314.7 billion, (Won)1,065.8 billion and (Won)949.7 billion, respectively. As of December 31, 2010, we established provisions of (Won)201.1 billion, (Won)69.0 billion, (Won)65.3 billion and (Won)51.7 billion for our exposure to Kumho Tires, Kumho Industrial, Kumho Petrochemical and Asiana Airlines, respectively.
In 2010, KDB sold non-performing loans of (Won)689.0 billion to the Korea Asset Management Corporation, or KAMCO. In 2010, KoFC did not sell any non-performing loans to KAMCO.
We engage in a broad range of financial businesses, including policy banking, development banking, corporate and investment banking, brokerage and asset management, directly or through our consolidated subsidiary, KDBFG, and its subsidiaries. KoFC provides loans to industrial enterprises, either directly or indirectly through intermediary financial institutions, and purchases debt and equity securities issued by such enterprises in order to achieve its statutory purpose of providing financing for the growth of SMEs, development of national and regional infrastructure and promotion of new growth engine industries, such as high-tech industries and new or renewable energy industries, in the Republic. KDBFG, through its principal subsidiary KDB, provides financing to major industries for equipment, capital investment and the development of high technology, as well as for working capital. KDBFG also provides corporate and investment banking, brokerage and asset management services through its subsidiaries.
Loan Operations
We mainly provide equipment loans, project loans and working capital loans to private and public Korean enterprises either directly or indirectly through on-lending. Equipment loans generally refer to loans made to industrial borrowers to finance the acquisition of specific items of machinery and equipment. Equipment loans include loans to major industries for development of high technology and for acquisition, improvement or repair of machinery and equipment. Equipment loans are secured by the financed equipment asset and usually mature within five to ten years. Project loans generally refer to loans made to public and private enterprises for large-scale infrastructure or industrial projects. Project loans are generally secured by the financed construction projects and usually mature within 10 to 20 years. We also provide working capital loans to industrial borrowers, particularly in the manufacturing industry, to facilitate job growth. Working capital loans usually mature within two years.
Before approving a loan, we consider:
| • | the economic benefits of the project to the Republic; |
| • | the extent to which the project serves priorities established by the Government’s industrial policy; |
| • | the project’s operational feasibility; |
| • | the loan’s and the project’s profitability; and |
| • | the quality of the borrower’s management. |
15
Table of Contents
We generally obtain collateral valued in excess of the original loan from large companies and up to the value of the loan from SMEs. Depending on the type of borrower and loan, the collateral may be equipment purchased with the loan proceeds, industrial plants, real estate and marketable securities. We appraise the value of our collateral at least once a year.
The following table sets out, by category of loan, our total outstanding loans:
Loans (1)
| As of December 31, | ||||||||
| 2009 | 2010 | |||||||
| (consolidated) (billions of won) | ||||||||
Direct Loans: | ||||||||
Equipment Loans | (Won) | 41,619.1 | (Won) | 18,687.9 | ||||
Working Capital Loans | 20,225.0 | 39,295.1 | ||||||
Other Loans | — | 7,687.6 | ||||||
Sub-total | 61,844.1 | 65,670.6 | ||||||
On-Lending: | ||||||||
Equipment Loans | 133.2 | 1,681.7 | ||||||
Working Capital Loans | 97.4 | 1,699.4 | ||||||
Sub-total | 230.6 | 3,381.1 | ||||||
Total | (Won) | 62,074.7 | (Won) | 69,051.7 | ||||
| (1) | Includes loans extended to affiliates but excludes domestic usance, bills of exchange bought, local letters of credit negotiation, loan-type suspense accounts, inter-bank loans, advance payments, bonds purchased, factoring receivables, credit card receivables, private placement bonds and other loans. |
Direct Loans
Direct loans refer to loans made directly to particular industrial concerns without the involvement of an intermediary financial institution. Under the KoFC Act, KoFC is not allowed to compete against other financial institutions in carrying out its business. Due to this restriction, KoFC provides direct loans primarily in the following areas, in which adequate financing from commercial financial institutions is difficult to obtain:
| • | financing for new growth engine industries to support long-term research projects and investment in facilities; |
| • | financing for the construction of national and regional infrastructure projects, such as roads, railroads and harbors; and |
| • | financing for development of natural resources in and outside of the Republic. |
In 2010, KoFC provided (Won)8,742.4 billion of direct loans.
Our consolidated subsidiaries, including KDB, are not subject to this restriction under the KoFC Act. Most of KDB’s loans are provided directly to industrial borrowers.
On-Lending
On-lending is a form of indirect financing that involves intermediary financial institutions which on-lend the funds provided by us to industrial borrowers and are responsible for repayment to us. KoFC started on-lending as one of its main methods of policy banking after its establishment in October 2009. Most of the funds provided by KoFC through on-lending are ultimately lent to SMEs for their equipment purchases and working capital. KDB, Industrial Bank of Korea, and commercial banks and regional banks in Korea serve as intermediary financial institutions through which the funds are on-lent.
16
Table of Contents
KoFC explicitly set detailed guidelines (including scope of borrowers, maturity and interest rates) for intermediary financial institutions to be followed when on-lending to the ultimate borrowers. KoFC monitors its exposure to, and the credit standing of, each financial institution to which it lends. Borrowers do not apply directly to KoFC and may only apply for KoFC’s on-lending loans through their regular bank or another bank of their choice. The intermediary bank appraises the financial and business situation of the applicant and assumes liability for repayment to KoFC. Although the processing of individual loans requires two formally separate loan approvals for each borrower, first by the intermediary bank and then by KoFC, the ultimate borrower need only apply to the intermediary bank for approval.
By lending to the intermediary financial institutions, KoFC, in principle, insulates itself from credit exposure to the ultimate borrower and gains the benefit of the intermediary financial institutions’ knowledge of their customers as well as their administrative and servicing expertise. Under certain circumstances, if on-lending financial institutions request, KoFC may share with such financial institutions a certain proportion of the credit risk of the loans made to industrial borrowers (up to 50% or, for regional SMEs and SMEs in new growth, green or job creation industries, up to 60%) and receive a fee from them for sharing the credit risk. Equipment loans made by intermediary banks whose credit risk is shared with KoFC are normally collateralized by real property or other assets.
The following table sets out the amount of loans provided by KoFC through on-lending, categorized by loan type:
On-Lending
| As of December 31, | ||||||||
| 2009 | 2010 | |||||||
| (consolidated) | ||||||||
| (billions of won) | ||||||||
Equipment Loans: | ||||||||
Credit risk borne by the intermediary financial institutions | (Won) | 130.1 | (Won) | 1,671.5 | ||||
Credit risk shared with KoFC | 3.1 | 10.2 | ||||||
Sub-total | 133.2 | 1,681.7 | ||||||
Working Capital Loans: | ||||||||
Credit risk borne by the intermediary financial institutions | 86.1 | 1,631.6 | ||||||
Credit risk shared with KoFC | 11.2 | 67.8 | ||||||
Sub-total | 97.4 | 1,699.4 | ||||||
Total | (Won) | 230.6 | (Won) | 3,381.1 | ||||
Maturities of Outstanding Loans
The following table categorizes our outstanding loans by their remaining maturities:
Outstanding Loans by Remaining Maturities (1)
| As of December 31, | As % of December 31, 2010 Total | |||||||||||
| 2009 | 2010 | |||||||||||
| (consolidated) | ||||||||||||
| (billions of won, except percentages) | ||||||||||||
Loans with Remaining Maturities of Less Than One Year | (Won) | 24,232.9 | (Won) | 28,333.8 | 41.0 | % | ||||||
Loans with Remaining Maturities of One Year or More | 37,841.8 | 40,717.9 | 59.0 | % | ||||||||
Total | (Won) | 62,074.7 | (Won) | 69,051.7 | 100.0 | % | ||||||
| (1) | Includes loans extended to affiliates but excludes domestic usance, bills of exchange bought, local letters of credit negotiation, loan-type suspense accounts, inter-bank loans, advance payments, bonds purchased, factoring receivables, credit card receivables, private placement bonds and others. |
17
Table of Contents
Loans by Industrial Sector
The following table sets out the total amount of KoFC’s outstanding loans, categorized by industry sector:
KoFC’s Outstanding Loans by Industry Sector (1)
| As of December 31, | As % of December 31, 2010 Total | |||||||||||
| 2009 | 2010 | |||||||||||
| (non-consolidated) | ||||||||||||
| (billions of won, except percentages) | ||||||||||||
Banking, Insurance and Financial Services | (Won) | 4,236.6 | (Won) | 7,820.4 | 64.5 | % | ||||||
Manufacturing | 32.0 | 1,194.6 | 9.9 | % | ||||||||
Construction | 51.0 | 867.2 | 7.2 | % | ||||||||
Publication and Media | — | 783.8 | 6.5 | % | ||||||||
Others | 30.0 | 1,457.5 | 12.0 | % | ||||||||
Total | (Won) | 4,349.6 | (Won) | 12,123.5 | 100.0 | % | ||||||
| (1) | Includes loans extended to affiliates but does reflect provision for loan losses and deferred loan fees. |
As of December 31, 2010, the banking, insurance and financial services sector accounted for 64.5% of KoFC’s outstanding loans, among which (Won)3,381.1 billion, or 27.9% of KoFC’s total outstanding loans as of such date, were on-lent to non-financial borrowers. Among loans on-lent to non-financial borrowers, the manufacturing sector accounted for 86.1% of KoFC’s outstanding loans as of December 31, 2010. As of December 31, 2010, Bank Recapitalization Fund SPV was KoFC’s single largest borrower, accounting for 23.0% of its outstanding loans. As of December 31, 2010, KoFC’s five largest borrowers accounted for 52.1% of its outstanding loans.
The following table sets out the total amount of KDB’s outstanding loans, categorized by industry sector:
KDB’s Outstanding Loans by Industry Sector (1)
| As of December 31, | As % of December 31, 2010 Total | |||||||||||
| 2009 | 2010 | |||||||||||
| (non-consolidated) | ||||||||||||
| (billions of won, except percentages) | ||||||||||||
Manufacturing | (Won) | 32,172.2 | (Won) | 32,162.4 | 59.4 | % | ||||||
Transportation and Communication | 5,567.7 | 5,596.2 | 10.3 | % | ||||||||
Banking, Insurance and Financial Services (Direct-loans) | 3,331.5 | 4,280.4 | 7.9 | % | ||||||||
Electricity, Gas and Water Supply | 2,983.6 | 2,044.9 | 3.8 | % | ||||||||
Wholesale and Retail | 1,649.1 | 1,387.2 | 2.6 | % | ||||||||
Public Administration and National Defense | 1,629.7 | 740.5 | 1.4 | % | ||||||||
Others | 7,430.8 | 7,958.7 | 14.7 | % | ||||||||
Total | (Won) | 54,764.6 | (Won) | 54,170.2 | 100.0 | % | ||||||
| (1) | Includes loans extended to affiliates but excludes domestic usance, bills of exchange bought, local letters of credit negotiation, loan-type suspense accounts, inter-bank loans, private placement bonds and others. |
18
Table of Contents
As of December 31, 2010, the manufacturing sector accounted for 59.4% of KDB’s total outstanding loans. As of December 31, 2010, Korean Air was KDB’s single largest borrower accounting for 1.6% of its outstanding loans. As of December 31, 2010, KDB’s five largest borrowers accounted for 6.8% of its outstanding loans and the 20 largest borrowers for 18.4%.
Guarantee Operations
We extend guarantees to our clients to facilitate their other borrowings and to finance major industrial projects. We guarantee Won-denominated corporate debentures, local currency loans, and other Won liabilities and foreign currency loans from domestic and overseas Korean financial institutions and from foreign institutions.
We generally obtain collateral valued in excess of the original guarantee. We appraise the value of our collateral at least once a year. Depending on the borrower, the collateral may be industrial plants, real estate and marketable securities.
The following table shows our outstanding guarantees:
Guarantees Outstanding
| As of December 31, | ||||||||
| 2009 | 2010 | |||||||
| (consolidated) | ||||||||
| (billions of won) | ||||||||
Acceptances | (Won) | 1,234.9 | (Won) | 1,016.8 | ||||
Guarantees on local borrowing | 431.3 | 975.1 | ||||||
Guarantees on foreign borrowing | 12,810.1 | 11,153.3 | ||||||
Letter of guarantee for importers | 40.3 | 39.4 | ||||||
Total | (Won) | 14,516.6 | (Won) | 13,184.6 | ||||
On November 13, 2002, KDB entered into a guarantee agreement with KEPCO with respect to certain of KEPCO’s debt securities in connection with KEPCO’s restructuring and privatization. Pursuant to the guarantee agreement, KDB issued in February 2003 its guarantee to holders of KEPCO’s Yankee and Global debt securities with final maturities ranging from 2003 to 2096 (although KDB’s guarantee obligations only run through 2016) in an aggregate principal amount of approximately (Won)3.3 trillion, based on exchange rates prevailing on the guarantee issuance date, February 25, 2003. The guarantees described above constitute full, irrevocable and unconditional guarantees, on an unsecured and unsubordinated basis, in respect of the principal, interest and other payments due with respect to those debt obligations. KEPCO paid and will continue to pay KDB an annual guarantee fee of 0.05% of (i) the aggregate outstanding principal amount of all issues of debt securities that will be covered by the KDB guarantee and (ii) the sum of all interest payments due on such debt securities from the date of calculation until the earlier of their maturity or their stated redemption date.
KoFC currently owns approximately 29.95% of the outstanding shares of common stock of KEPCO, and the Government, which owns all of KoFC’s paid-in capital, owns an additional 21.12% of such shares.
19
Table of Contents
The following table provides information on KoFC’s allowance for possible losses on guarantees as of December 31, 2009 and 2010:
| As of December 31, 2009 | As of December 31, 2010 | |||||||||||||||
| Guarantee Amount | Allowance for possible losses on guarantees | Guarantee Amount | Allowance for possible losses on guarantees | |||||||||||||
| (billions of won) | ||||||||||||||||
Normal | (Won) | 14.0 | (Won) | 0.1 | (Won) | 748.9 | (Won) | 1.0 | ||||||||
Precautionary | — | — | — | — | ||||||||||||
Substandard | — | — | — | — | ||||||||||||
Doubtful | — | — | — | — | ||||||||||||
Estimated Loss | 0.3 | 0.3 | 0.1 | 0.1 | ||||||||||||
| (Won) | 14.3 | (Won) | 0.4 | (Won) | 749.0 | (Won) | 1.1 | |||||||||
The following table provides information on KDB’s allowance for possible losses on guarantees as of December 31, 2009 and 2010:
| As of December 31, 2009 | As of December 31, 2010 | |||||||||||||||
| Guarantee Amount | Allowance for possible losses on guarantees | Guarantee Amount | Allowance for possible losses on guarantees | |||||||||||||
| (billions of won) | ||||||||||||||||
Normal | (Won) | 23,490.8 | (Won) | 79.2 | (Won) | 22,260.8 | (Won) | 83.4 | ||||||||
Precautionary | 565.7 | 33.1 | 282.5 | 8.0 | ||||||||||||
Substandard | 436.1 | 131.3 | 52.5 | 12.0 | ||||||||||||
Doubtful | — | — | — | — | ||||||||||||
Estimated Loss | 0.0 | 0.0 | 16.5 | 6.4 | ||||||||||||
| (Won) | 24,492.6 | (Won) | 243.6 | (Won) | 22,612.3 | (Won) | 109.8 | |||||||||
Investments
As of December 31, 2010, our total investment in securities amounted to (Won)66,174.6 billion, representing 34.4% of our total assets. Our total investment in securities increased by 5.8% to (Won)66,174.6 billion as of December 31, 2010 from (Won)62,567.2 billion as of December 31, 2009. Under the KoFC Decree, KoFC is not allowed to invest in equity securities or securities with maturities of more than three years in an aggregate amount exceeding 60% of its capital, subject to the following exceptions: (i) securities purchased by KoFC to pursue its policy objectives, (ii) debt securities issued by the Government, local governments and other public entities, (iii) monetary stabilization securities issued by the Bank of Korea, (iv) debt securities issued by public funds, (v) securities received from the Government or transferred from KDB and (vi) securities the purchase of which was approved by the FSC. As of December 31, 2010, KoFC held (Won)184.3 billion of securities subject to the restriction under the KoFC Decree, equal to 1.8% of the maximum permitted amount.
20
Table of Contents
The following table sets out the total amount of securities held by KoFC and KDB, on a book value basis, categorized by industry sector:
Securities
| KoFC | KDB | |||||||||||||||||||||||
| As of December 31, | As % of December 31, 2010 Total | As of December 31, | As % of December 31, 2010 Total | |||||||||||||||||||||
| 2009 | 2010 | 2009 | 2010 | |||||||||||||||||||||
| (non-consolidated) | (non-consolidated) | |||||||||||||||||||||||
| (billions of won, except percentages) | (billions of won, except percentages) | |||||||||||||||||||||||
Manufacturing | (Won) | 1,415.2 | (Won) | 2,332.4 | 6.0 | % | (Won) | 6,502.4 | (Won) | 5,353.5 | 19.0 | % | ||||||||||||
Banking, Insurance and Financial Services | 16,894.2 | (1) | 18,665.6 | (1) | 48.2 | 15,265.6 | 15,758.3 | 55.9 | ||||||||||||||||
Construction | 2,758.7 | 3,219.2 | 8.3 | 3,430.8 | 1,222.2 | 4.3 | ||||||||||||||||||
Public Administration and National Defense | 248.1 | 309.7 | 0.8 | 2,094.7 | 1,040.4 | 3.7 | ||||||||||||||||||
Electricity, Gas and Water Supply | 10,013.3 | 10,258.6 | 26.5 | 207.2 | 215.5 | 0.8 | ||||||||||||||||||
Others | 3,298.9 | 3,977.8 | 10.3 | 4,113.5 | 4,611.0 | 16.4 | ||||||||||||||||||
Total | (Won) | 34,628.4 | (Won) | 38,763.4 | 100.0 | % | (Won) | 31,664.2 | (Won) | 28,200.9 | 100.0 | % | ||||||||||||
| (1) | Includes KDBFG shares of (Won)15,504.8 billion under the equity method of accounting. |
Debt Securities
We purchase debt securities either directly from the issuer or indirectly in the secondary market for investment, financing and trading purposes. In particular, KoFC purchases debt securities issued by SMEs, companies involved in new growth engine industries, including high-tech industries and new or renewable energy industries, or in infrastructure construction, either directly or indirectly through capital markets. Many of these debt securities are similar to loans in nature as KoFC expects to hold most of the debt securities to maturity and does not expect to trade these debt securities in the secondary market. KoFC also acquires debt securities issued by securitization vehicles based on securities issued by SMEs in order to help provide funds to SMEs that do not have ready access to the capital markets. As of December 31, 2010, we held debt securities amounting to (Won)35,903.4 billion, an increase of 2.2% from (Won)35,139.0 billion as of December 31, 2009.
Equity Securities
We invest in a range of Korean private and Government-owned enterprises but we will not take a controlling interest in a company unless the Government specifically instructs us to do so. Although generally a long-term investor, we may sell investments from time to time. As of December 31, 2010, our equity investments (including investments in beneficiary certificates) amounted to (Won)25,280.6 billion, a decrease of 7.8% from (Won)27,428.2 billion as of December 31, 2009.
A substantial portion of our equity investments consists of equity holdings in Government-controlled companies, including KEPCO, and equity holdings in private sector companies acquired during previous restructuring programs. In addition, KoFC makes indirect investments through venture capital funds and collective investment vehicles to provide financing to SMEs, start-up companies and enterprises in new growth engine industries. Some of KoFC’s equity investments are used to purchase equity portions of project finance vehicles to help finance the construction of national and regional infrastructure projects. Our consolidated
21
Table of Contents
subsidiaries, including KDB, also invest in equity securities, including shares of promising SMEs. When possible, we use the prevailing market price of a security to determine the value of our investments. However, if no readily ascertainable market value exists for our holdings, we record these investments at the cost of acquisition.
Pursuant to the KoFC Decree, KoFC may not acquire equity securities of a single company in excess of 15% of its voting shares. The 15% limit, however, does not apply to certain investments, including equity securities received from the Government or transferred from KDB. For a discussion of Korean accounting principles relating to our equity investments, see “—Financial Statements and the Auditors”.
As of December 31, 2010, KoFC held total equity investments, on a book value basis, of (Won)10,417.0 billion in four of its five largest borrowers and (Won)11,175.6 billion in five of its 20 largest borrowers. KoFC has not established a policy with respect to loans to enterprises in which it holds equity interests or equity interests in enterprises to which it has extended loans.
As of December 31, 2010, KDB held total equity investments, on a book value basis, of (Won)74.9 billion in two of its five largest borrowers and (Won)1,476.1 billion in seven of its 20 largest borrowers. KDB has not established a policy addressing loans to enterprises in which it holds equity interests or equity interests in enterprises to which it has extended loans.
Other Activities
KoFC engages in a range of activities as a policy finance institution in addition to the activities described above, including:
| • | provision of urgent financial support to stabilize financial markets at times of national financial instability; |
| • | facilitation of corporate restructuring and creditor work-out programs in the Republic; and |
| • | research regarding industrial and policy financing. |
In addition to our capital and reserves, we fund our lending operations primarily from:
| • | issuances of bonds in the domestic and international capital markets; |
| • | borrowings from the Government and the Bank of Korea; and |
| • | borrowings from foreign financial institutions. |
In addition, KDB is permitted to take deposits from the general public. All of our borrowings are unsecured.
Domestic and International Capital Markets
KoFC issues debt securities in the domestic capital markets in the form of policy finance bonds, which are accorded a special legal status under the KoFC Act, as well as in the international capital markets. KDB also issues industrial finance bonds under the KDB Act both in Korea and abroad. We generally issue domestic bonds at fixed interest rates with original maturities of one to ten years.
22
Table of Contents
The following table sets out the outstanding balance of KoFC’s policy finance bonds and industrial finance bonds and KDB’s industrial finance bonds as of December 31, 2010:
| KoFC | KDB | |||||||
Outstanding Balance | As of December 31, 2010 | As of December 31, 2010 | ||||||
| (non-consolidated) | (non-consolidated) | |||||||
| (billions of won) | (billions of won) | |||||||
Policy Finance Bonds: | ||||||||
Denominated in Won | (Won) | 19,500.0 | (Won) | — | ||||
Denominated in Other Currencies | 1,309.7 | — | ||||||
Sub-total | 20,809.7 | — | ||||||
Industrial Finance Bonds: | ||||||||
Denominated in Won | 6,810.0 | 28,061.8 | ||||||
Denominated in Other Currencies | — | 16,117.0 | ||||||
Sub-total | 6,810.0 | 44,178.8 | ||||||
Total | (Won) | 27,619.7 | (Won) | 44,178.8 | ||||
The KoFC Act provides that the aggregate outstanding principal amount of KoFC’s policy finance bonds may not exceed 30 times the sum of its paid-in capital and its reserve from profit. As of December 31, 2010, the aggregate amount of KoFC’s policy finance bonds was (Won)20,809.7 billion, equal to 4.0% of its authorized amount under the KoFC Act, which was (Won)520,020.8 billion. Industrial finance bonds amounting to (Won)16,255.0 billion have been transferred to KoFC from KDB in the spin off on October 27, 2009, among which (Won)6,810.0 billion remains outstanding as of December 31, 2010.
The KDB Act provides that the aggregate outstanding principal amount of KDB’s industrial finance bonds, other than those directly guaranteed or purchased by the Government, plus the aggregate outstanding amount of its on-balance sheet and off-balance sheet guarantee obligations, other than those excepted by statute, may not exceed 30 times the sum of its paid-in capital and its reserve from profit. As of December 31, 2010, the aggregate amount of KDB’s industrial finance bonds and guarantee obligations (including guarantee obligations relating to loans that had not been borrowed as of December 31, 2010) was (Won)57,132.1 billion, equal to 12.4% of its authorized amount under the KDB Act, which was (Won)461,391.4 billion.
Borrowings from the Government
We borrow from the Government’s general purpose funds and its special purpose funds. General purpose loans generally are in Won and have fixed interest rates and maturities ranging from five to twenty years. We incur special purpose loans, principally from the Petroleum Business Fund, the Tourism Promotion Fund and the Special Industry Supporting Fund, in connection with specific projects we finance. The Government links the interest rate and maturity of each special purpose borrowing to the terms of the financing we provide for the specific project.
The following table sets out our Government borrowings as of December 31, 2010:
Type of Funds Borrowed | As of December 31, 2010 | |||
| (consolidated) (billions of won) | ||||
General Purpose | (Won) | 803.1 | ||
Special Purpose (1) | 4,975.0 | |||
Total | (Won) | 5,778.1 | ||
| (1) | Includes borrowings from the government denominated in foreign currencies. |
23
Table of Contents
Foreign Currency Borrowings
We borrow money from institutions, principally syndicates of commercial banks, outside the Republic in foreign currencies. We frequently enter into related interest rate and currency swap transactions. The loans generally have original maturities of five to ten years. KDB also borrows from the World Bank, the Asian Development Bank and other similar supranational institutions to fund special projects, with terms linked to the related loans it extends. As of December 31, 2010, the outstanding amount of our foreign currency borrowings was (Won)14,108.9 billion.
Deposits
KDB takes demand deposits and time and savings deposits from the general public. Time and savings deposits generally have maturities shorter than three years and bear interest at fixed rates. As of December 31, 2010, demand deposits held by us totaled (Won)926.7 billion and time and savings deposits held by us totaled (Won)18,294.2 billion. KoFC is not permitted to accept deposits.
Debt Repayment Schedule
The following table sets out KoFC’s and KDB’s principal repayment schedule as of December 31, 2010:
Debt Principal Repayment Schedule
| KoFC | KDB(3) | |||||||||||||||||||||||||||||||||||||||
| Maturing on or before December 31, | Maturing on or before December 31, | |||||||||||||||||||||||||||||||||||||||
Currency (1) (2) | 2011 | 2012 | 2013 | 2014 | Thereafter | 2011 | 2012 | 2013 | 2014 | Thereafter | ||||||||||||||||||||||||||||||
(non-consolidated) (billions of won) | (non-consolidated) (billions of won) | |||||||||||||||||||||||||||||||||||||||
Won | 14,773.6 | 6,370.0 | 6,020.0 | 1,520.0 | 420.0 | 18,052.6 | 7,368.3 | 3,501.6 | 2,826.3 | 5,863.1 | ||||||||||||||||||||||||||||||
Foreign | 170.8 | 318.9 | 1,181.3 | — | 854.2 | 14,930.9 | 4,708.9 | 3,527.3 | 3,438.3 | 2,644.9 | ||||||||||||||||||||||||||||||
Total Won Equivalent | 14,944.4 | 6,688.9 | 7,201.3 | 1,520.0 | 1,274.2 | 32,983.5 | 12,077.1 | 7,028.9 | 6,264.6 | 8,508.0 | ||||||||||||||||||||||||||||||
| (1) | Borrowings in foreign currencies have been translated into Won at the market average exchange rates on December 31, 2010, as announced by the Seoul Money Brokerage Services Ltd. |
| (2) | We categorize debt with respect to which we have entered into currency swap agreements by our repayment currency under such agreements. |
| (3) | Excludes debt valuation adjustment. |
Internal and External Debt of KoFC
The following table shows the outstanding direct internal debt of KoFC as of December 31 of the years indicated:
Direct Internal Debt of KoFC
| (billions of Won) | ||||
2009 | 21,051.6 | |||
2010 | 29,603.6 | |||
24
Table of Contents
The following table sets out, by currency and the equivalent amount in U.S. Dollars, the outstanding direct external debt of KoFC as of December 31, 2010:
Direct External Debt of KoFC
| Amount in Original Currency | Equivalent Amount in U.S. Dollars (1) | |||||||
| (billions) | ||||||||
US$ | US$ | 2.3 | US$ | 2.3 | ||||
Total | US$ | 2.3 | ||||||
| (1) | Amounts expressed in currencies other than US$ are converted to US$ at the exchange rate announced by the Seoul Money Brokerage Services, Ltd. in effect on December 31, 2010. |
The following table summarizes, as of December 31 of the years indicated, the outstanding direct external debt of KoFC:
Direct External Debt of KoFC
| (billions of Won) | ||||
2009 | — | |||
2010 | 2,593.5 | |||
For further information on the outstanding debt of KoFC, see “—Tables and Supplementary Information.”
Internal and External Debt of KDB
The following table summarizes, as of December 31 of the years indicated, the outstanding direct internal debt of KDB:
Direct Internal Debt of KDB
| (billions of Won) | ||||
2006 | 47,054.7 | |||
2007 | 48,419.6 | |||
2008 | 62,956.7 | |||
2009 | 49,035.8 | |||
2010 | 37,551.8 | |||
25
Table of Contents
The following table summarizes, as of December 31 of the years indicated, the outstanding direct external debt of KDB:
Direct External Debt of KDB
| (billions of Won) | ||||
2006 | 24,198.7 | |||
2007 | 35,951.3 | |||
2008 | 37,556.4 | |||
2009 | 29,869.0 | |||
2010 | 27,334.7 | |||
The following table sets out, by currency and the equivalent amount in U.S. Dollars, the outstanding external bonds of KDB as of December 31, 2010:
External Bonds of KDB
| Amount in Original Currency | Equivalent Amount in U.S. Dollars (1) | |||||||
| (millions) | ||||||||
US$ | US$ | 7,922.0 | US$ | 7,922.0 | ||||
Japanese yen (¥) | ¥ | 212,000.0 | 2,600.6 | |||||
Euro (EUR) | EUR | 810.0 | 1,076.5 | |||||
Singapore dollar (SGD) | SGD | 442.0 | 343.1 | |||||
Hong Kong dollar (HKD) | HKD | 3,238.0 | 416.1 | |||||
Pound sterling (GBP) | GBP | 150.0 | 231.5 | |||||
Swiss franc (CHF) | CHF | 850.0 | 909.0 | |||||
Brazilian real (BRL) | BRL | 260.0 | 156.7 | |||||
Australian dollar (AUD) | AUD | 82.0 | 83.4 | |||||
Thai Baht (THB) | THB | 3,000.0 | 99.5 | |||||
Total | US$ | 13,838.4 | ||||||
| (1) | Amounts expressed in currencies other than US$ are converted to US$ at the exchange rate announced by the Seoul Money Brokerage Services, Ltd. in effect on December 31, 2010. |
For further information on the outstanding indebtedness of KDB, see “—Tables and Supplementary Information.”
Debt Record
We have never defaulted in the payment of principal or interest on any of our obligations.
KoFC’s head office is located at 16 Yeouido-dong, Youngdeungpo-gu, Seoul, Korea, a 35,996 square meter building completed in 1995 and owned by KoFC. The following table presents information regarding certain of our properties:
Type of Facility / Building | Location | Area (Square Meters) | ||||
Headquarters of KoFC and KDB Capital | 16 Yeouido-dong, Youngdeungpo-gu, Seoul | 35,996 | ||||
Headquarters of KDBFG and KDB | 16-3 Youido-dong, Youngdeungpo-gu, Seoul | 99,839 | ||||
Headquarters of Daewoo Securities | 34-3 Youido-dong, Youngdeungpo-gu, Seoul | 38,530 | ||||
26
Table of Contents
Directors and Management; Employees
KoFC’s Board of Directors, composed of its President and Directors, adopts resolutions on important matters concerning its business affairs. KoFC’s Steering Committee deliberates and adopts resolutions on its important policies, including the amendment of its Articles of Incorporation, amendment of its operating manual, determination of its annual business plan and annual budget, settlement of accounts and deployment of reserves to increase capital or decrease accumulated losses. The Steering Committee determines KoFC’s fundamental policies and ensures that they are consistent with the policy objectives of the Government, while KoFC’s Board of Directors guides its operations to appropriately carry out the policies mandated by the Steering Committee and the Government.
Under the KoFC Act, the Government appoints KoFC’s President, all of its Directors, its Auditor and all members of its Steering Committee. The President of the Republic appoints KoFC’s President and Chairman of the Board of Directors upon the recommendation of the Chairman of the FSC. The FSC appoints all of KoFC’s Directors upon the recommendation of KoFC’s President. The FSC appoints KoFC’s Auditor after consultation with the Minister of Strategy and Finance. Four members of the Steering Committee are appointed from among public officials—one is appointed by each of the Minister of Strategy and Finance, the Minister of Knowledge Economy, the Chairman of the FSC, and the Administrator of Small and Medium Business Administration from among their respective senior ranking officials. KoFC’s President serves as the Chairman of the Steering Committee and three other non-governmental members are appointed by the FSC from among experts with knowledge and experience in policy financing or other related areas. KoFC’s Directors serve for three-year terms and may be re-appointed.
The following tables show the members of KoFC’s Board of Directors and Steering Committee:
Board of Directors
Position | Name | Expiration of Term | ||
President and Chairman of the Board of Directors: | Jae-Han Ryu | October 27, 2012 | ||
Executive Directors: | Bong Sik Choi | June 8, 2013 | ||
| Dong Choon Lee | June 8, 2013 | |||
Steering Committee
Position | Name | Expiration of Term | ||
President and Chairman of the Steering Committee: | Jae-Han Ryu | October 27, 2012 | ||
Government Members: | Joo Hyeon Kim | Not applicable (1) | ||
| Jong Won Yoon | Not applicable (1) | |||
| Kyung Won Kim | Not applicable (1) | |||
| Yeong Tae Jeong | Not applicable (1) | |||
Non-governmental Members: | Sung Uk Hong | November 2, 2011 | ||
| Dae Keun Park | November 2, 2011 | |||
| (1) | Government members serve as members of our Steering Committee during their terms at the relevant government position. |
As of December 31, 2010, KoFC employed 180 persons and KDB, KDBFG’s principal subsidiary, employed 2,533 persons.
27
Table of Contents
The following table sets forth certain information relating to KoFC’s directly owned consolidated subsidiaries as of December 31, 2010:
Consolidated Subsidiaries | Primary Business | Ownership Percentage (%) | Location | |||||||
KDBFG | Holding company | 90.26 | Korea | |||||||
Korea Aerospace Industries, Ltd. | Manufacturing & sales of aircrafts and other components | 30.11 | Korea | |||||||
KDBFG
KDBFG is a financial holding company established on October 28, 2009 in connection with the Government’s plan for the privatization of KDB. The Government transferred its ownership interest in KDB to KDBFG in exchange for all of KDBFG’s share capital on November 24, 2009 and contributed 94.27% of KDBFG’s shares to KoFC as a capital contribution on December 30, 2009. The Government has made a further capital contribution of (Won)10 billion in cash to KDBFG on March 31, 2010. As a result, as of the date of this prospectus, KoFC owns 90.26% of KDBFG’s share capital and the Government directly owns the remaining 9.74% of KDBFG’s share capital. Under the Government’s plan for the privatization of KDB and the revised KDB Act, the sale by KoFC of KDBFG’s shares to unrelated third parties is to commence by May 2014.
On a consolidated basis, KDBFG had total assets of (Won)159,460.6 billion, total liabilities of (Won)136,840.0 billion and total equity of (Won)22,620.6 billion as of December 31, 2010, as compared to total assets of (Won)157,162.8 billion, total liabilities of (Won)137,012.4 billion and total equity of (Won)20,150.4 billion as of December 31, 2009. In 2010, KDBFG recorded revenue of (Won)38,570.8 billion, operating income of (Won)2,337.0 billion and net income of (Won)1,607.5 billion on a consolidated basis.
KDB
KDB was established in 1954 as a Government-owned financial institution pursuant to the KDB Act. Since its establishment, KDB has been the leading bank in the Republic with respect to the provision of long-term financing for projects designed to assist the nation’s economic growth and development. KDB’s primary purpose under the KDB Act is to “furnish funds for the expansion of the national economy.” KDB makes loans available to major industries for equipment, capital investment and the development of high technology, as well as for working capital.
Under the KDB Act, KDB may:
| • | provide loans or discount notes; |
| • | subscribe to, underwrite or invest in securities; |
| • | guarantee or assume indebtedness; |
| • | raise funds by accepting demand deposits and time and savings deposits from the general public, issuing securities, borrowing from the Government, The Bank of Korea or other financial institutions, and borrowing from overseas; |
| • | execute foreign exchange transactions; |
| • | carry out activities necessary to accomplish the expansion of the national economy, subject to the approval of the FSC; |
| • | provide planning, management, research and other support services at the request of the Government, public bodies, financial institutions or enterprises; and |
| • | carry out other businesses incidental to the foregoing, subject to the approval of the FSC. |
28
Table of Contents
As of December 31, 2010, on a non-consolidated basis, KDB had (Won)69,892.9 billion of loans outstanding (including loans, call loans, domestic usance, bills of exchange bought, local letters of credit negotiation and loan-type suspense accounts pursuant to the applicable guidelines), total assets of (Won)113,205.5 billion, total liabilities of (Won)96,977.1 billion and total equity of (Won)16,228.3 billion, as compared to (Won)74,785.5 billion of loans outstanding, (Won)122,333.4 billion of total assets, (Won)107,222.7 billion of total liabilities and (Won)15,110.7 billion of total equity as of December 31, 2009. In 2010, on a non-consolidated basis, KDB recorded interest income of (Won)4,409.1 billion, interest expense of (Won)2,804.0 billion and net income of (Won)1,045.7 billion, as compared to (Won)5,374.5 billion of interest income, (Won)4,476.9 billion of interest expense and (Won)761.1 billion of net income for 2009.
Daewoo Securities
KDBFG currently owns 39.1% of the outstanding shares of Daewoo Securities. Daewoo Securities is a major securities company in the Republic established in 1970 providing brokerage and investment banking services, among others. Daewoo Securities operates its business under three units: brokerage unit, providing offline/online securities trading and brokerage services; investment banking unit, which underwrites equity, debt and asset-backed securities, and wealth management unit, providing cash management account and wrap account products and services.
As of December 31, 2010, on a non-consolidated basis, Daewoo Securities had total assets of (Won)18,056.3 billion, total liabilities of (Won)15,200.5 billion and total equity of (Won)2,855.8 billion, as compared to (Won)15,333.7 billion of total assets, (Won)12,614.7 billion of total liabilities and (Won)2,719.0 billion of total equity as of December 31, 2009. For the nine months ended December 31, 2010, on a non-consolidated basis, Daewoo Securities recorded revenue of (Won)2,740.9 billion, operating income of (Won)269.5 billion and net income of (Won)193.5 billion, as compared to (Won)3,704.1 billion of revenue, (Won)257.8 billion of operating income and (Won)201.2 billion of net income for the corresponding period of 2009.
KDB Capital
KDBFG currently owns 99.9% of the outstanding shares of KDB Capital. KDB Capital provides equipment leasing, venture capital, factoring, corporate restructuring, corporate credit card and other lending services.
As of December 31, 2010, on a non-consolidated basis, KDB Capital had total assets of (Won)3,026.7 billion, total liabilities of (Won)2,677.3 billion and total equity of (Won)349.3 billion, as compared to (Won)3,512.9 billion of total assets, (Won)3,044.7 billion of total liabilities and (Won)468.2 billion of total equity as of December 31, 2009. For the nine months ended December 31, 2010, on a non-consolidated basis, KDB Capital recorded revenue of (Won)236.0 billion, operating loss of (Won)180.7 billion and net loss of (Won)165.8 billion, as compared to (Won)378.4 billion of revenue, (Won)6.4 billion of operating income and (Won)3.0 billion of net income for the corresponding period of 2009.
KDB Asset Management and KIAMCO
KDBFG currently owns 99.1% and 84.2% of the outstanding shares of KDB Asset Management and KIAMCO, respectively. KDB Asset Management and KIAMCO provide asset management and investment advisory services.
29
Table of Contents
Tables and Supplementary Information
I. KoFC
A. External Debt of KoFC
(1) External Bonds of KoFC as of December 31, 2010
Currency | Original Principal Amount | Interest Rate (%) | Issue Date | Maturity Date | Principal Amount Outstanding as of December 31, 2010 | |||||||||||
USD | 50,000,000 | 3M USD Libor + 0.70 | June 14, 2010 | June 14, 2012 | 50,000,000 | |||||||||||
USD | 50,000,000 | 3M USD Libor + 0.70 | June 14, 2010 | June 14, 2012 | 50,000,000 | |||||||||||
USD | 50,000,000 | 3M USD Libor + 0.95 | July 26, 2010 | July 26, 2012 | 50,000,000 | |||||||||||
USD | 50,000,000 | 3M USD Libor + 0.95 | September 2, 2010 | September 2, 2012 | 50,000,000 | |||||||||||
USD | 750,000,000 | 3.25 | September 20, 2010 | September 20, 2016 | 750,000,000 | |||||||||||
USD | 50,000,000 | 3M USD Libor + 0.95 | September 7, 2010 | September 7, 2012 | 50,000,000 | |||||||||||
USD | 100,000,000 | 3M USD Libor + 0.80 | December 10, 2010 | December 10, 2011 | 100,000,000 | |||||||||||
USD | 50,000,000 | 3M USD Libor + 1.07 | December 13, 2010 | December 13, 2013 | 50,000,000 | |||||||||||
Subtotal in Original Currency | USD 1,150,000,000 | |||||||||||||||
Subtotal in Equivalent Amount of Won | (Won) | 1,309,735,000,000 | ||||||||||||||
Total External Bonds of KoFC in Equivalent Amount of Won | (Won) | 1,309,735,000,000 | ||||||||||||||
(2) External Borrowings of KoFC as of December 31, 2010
Lender | Classifications | Range of Interest Rates | Range of Years of Issue | Range of Years of Maturity | Principal Amount Outstanding as of December 31, 2010 | |||||||||||||
| (millions of Won) | ||||||||||||||||||
International Bank for Reconstruction and Development (“IBRD”) | Borrowings from IBRD | 6M Libor + 0.75 | 1998 | 2013 | 1,124,345 | |||||||||||||
Others | Offshore long-term borrowings | 3M Libor + 0.6~0.7 | 2010 | 2011~2012 | 91,112 | |||||||||||||
Others | Offshore short-term borrowings | 0.75~0.82 | 2010 | 2011 | 68,334 | |||||||||||||
Total External Borrowings of KoFC |
| 1,283,792 | ||||||||||||||||
30
Table of Contents
B. Internal Debt of KoFC
Title | Range of Interest Rates | Range of Years of Issue | Range of Years of Original Maturity | Principal Amounts Outstanding as of December 31, 2010 | ||||||||||||||||
| (%) | (millions of Won) | |||||||||||||||||||
1. Bonds | ||||||||||||||||||||
Short-term Industrial Finance Bonds | (Won) | — | ||||||||||||||||||
Long-term Industrial Finance Bonds | 3.61~6.85 | 2006~2009 | 2011~2014 | 6,810,000 | ||||||||||||||||
Short-term Policy Banking Bonds | — | |||||||||||||||||||
Long-term Policy Banking Bonds | 2.65~5.45 | 2009~2010 | 2011~2015 | 19,500,000 | ||||||||||||||||
Total Bonds | 26,310,000 | |||||||||||||||||||
2. Borrowings | ||||||||||||||||||||
Borrowings from the Bank of Korea | 5.71 | 2010 | 2011 | (Won) | 2,793,600 | |||||||||||||||
Total Borrowings (1) |
| 2,793,600 | ||||||||||||||||||
3. Other Debt (2) | 2.54 | 2010 | 2011 | 500,000 | ||||||||||||||||
Total Internal Floating Debt(3) |
| 500.000 | ||||||||||||||||||
Total Internal Funded Debt(4) |
| 29,103,600 | ||||||||||||||||||
Total Internal Debt |
| 29,603,600 | ||||||||||||||||||
| (1) | KoFC does not have any short-term borrowings outstanding as of December 31, 2010. |
| (2) | Includes bonds sold under repurchase agreements. |
| (3) | Floating debt is debt that has a maturity at issuance of less than one year. |
| (4) | Funded debt is debt that has a maturity at issuance of one year or more. |
31
Table of Contents
II. KDB
A. External Debt of KDB
(1) External Bonds of KDB
Currency | Original | Interest Rate (%) | Issue Date | Maturity Date | Principal Amount Outstanding as of December 31, 2010 | |||||||||
USD | 450,000,000 | 5.5 | November 13, 2002 | November 13, 2012 | 450,000,000 | |||||||||
USD | 150,000,000 | 5.5 | January 30, 2003 | November 13, 2012 | 150,000,000 | |||||||||
USD | 750,000,000 | 5.75 | September 10, 2003 | September 10, 2013 | 750,000,000 | |||||||||
USD | 500,000,000 | 3M USD Libor + 0.28 | November 22, 2005 | November 22, 2012 | 500,000,000 | |||||||||
USD | 300,000,000 | 3M USD Libor + 0.2 | September 12, 2006 | September 12, 2011 | 300,000,000 | |||||||||
USD | 1,000,000,000 | 5.3 | January 17, 2008 | January 17, 2013 | 1,000,000,000 | |||||||||
USD | 1,700,000,000 | 8 | January 23, 2009 | January 23, 2014 | 1,700,000,000 | |||||||||
USD | 19,000,000 | 5.7 | May 12, 2009 | April 9, 2012 | 19,000,000 | |||||||||
USD | 15,000,000 | 5.46 | May 15, 2009 | April 9, 2012 | 15,000,000 | |||||||||
USD | 50,000,000 | 3M USD Libor + 1.3 | October 30, 2009 | October 30, 2011 | 50,000,000 | |||||||||
USD | 10,000,000 | 3M USD Libor + 1.3 | November 9, 2009 | October 30, 2011 | 10,000,000 | |||||||||
USD | 20,000,000 | 3M USD Libor + 0.65 | January 27, 2010 | January 27, 2011 | 20,000,000 | |||||||||
USD | 550,000,000 | 4.375 | February 10, 2010 | August 10, 2015 | 550,000,000 | |||||||||
USD | 30,000,000 | 1.650 | June 8, 2010 | June 8, 2011 | 30,000,000 | |||||||||
USD | 20,000,000 | 2.120 | July 2, 2010 | July 2, 2012 | 20,000,000 | |||||||||
USD | 450,000,000 | 3.250 | September 9, 2010 | March 9, 2016 | 450,000,000 | |||||||||
USD | 250,000,000 | 3.250 | September 9, 2010 | March 9, 2016 | 250,000,000 | |||||||||
USD | 15,000,000 | 1.220 | October 20, 2010 | October 20, 2011 | 15,000,000 | |||||||||
USD | 50,000,000 | 3M USD Libor + 1.15 | October 28, 2010 | October 28, 2013 | 50,000,000 | |||||||||
USD | 300,000,000 | 6M USD Libor + 0.35 | October 4, 2007 | October 4, 2012 | 300,000,000 | |||||||||
USD | 150,000,000 | 3M USD Libor + 0.7 | February 27, 2008 | February 27, 2011 | 150,000,000 | |||||||||
USD | 300,000,000 | 8 | January 23, 2009 | January 23, 2014 | 300,000,000 | |||||||||
USD | 200,000,000 | 5.75 | May 13, 2009 | May 13, 2012 | 200,000,000 | |||||||||
USD | 50,000,000 | 3M USD Libor + 4.3 | May 13, 2009 | May 13, 2016 | 50,000,000 | |||||||||
USD | 20,000,000 | 4.53 | May 20, 2009 | May 18, 2011 | 20,000,000 | |||||||||
USD | 20,000,000 | 3M USD Libor + 0.65 | January 25, 2010 | January 25, 2011 | 20,000,000 | |||||||||
USD | 20,000,000 | 3M USD Libor + 0.65 | January 25, 2010 | January 25, 2011 | 20,000,000 | |||||||||
USD | 20,000,000 | 3M USD Libor + 0.78 | January 27, 2010 | July 27, 2012 | 20,000,000 | |||||||||
USD | 200,000,000 | 4.375 | February 10, 2010 | August 10, 2015 | 200,000,000 | |||||||||
USD | 13,000,000 | 1.610 | July 13, 2010 | July 13, 2011 | 13,000,000 | |||||||||
USD | 200,000,000 | 3.250 | September 9, 2010 | March 9, 2016 | 200,000,000 | |||||||||
USD | 100,000,000 | 6M USD Libor + 0.80 | November 19, 2010 | November 19, 2011 | 100,000,000 | |||||||||
Subtotal in Original Currency | USD | 7,922,000,000 | ||||||||||||
Subtotal in Equivalent Amount of Won (1) | (Won) | 9,022,365,800,000 | ||||||||||||
THB | 3,000,000,000 | 2.940 | November 24, 2010 | November 24, 2013 | 3,000,000,000 | |||||||||
Subtotal in Original Currency | THB | 3,000,000,000 | ||||||||||||
Subtotal in Equivalent Amount of Won(2) | (Won) | 113,400,000,000 | ||||||||||||
SGD | 50,000,000 | 5.2 | April 29, 2009 | April 29, 2011 | 50,000,000 | |||||||||
SGD | 30,000,000 | 5.65 | May 18, 2009 | May 18, 2014 | 30,000,000 | |||||||||
SGD | 40,000,000 | 5.65 | May 18, 2009 | May 18, 2014 | 40,000,000 | |||||||||
SGD | 15,000,000 | 5.02 | May 29, 2009 | May 29, 2014 | 15,000,000 | |||||||||
SGD | 53,000,000 | 1.18 | May 19, 2010 | May 19, 2011 | 53,000,000 | |||||||||
SGD | 50,000,000 | 1.53 | November 4, 2010 | November 5, 2012 | 50,000,000 | |||||||||
SGD | 68,000,000 | 2.44 | November 25, 2009 | May 25, 2012 | 68,000,000 | |||||||||
SGD | 30,000,000 | 1.36 | July 26, 2010 | January 26, 2012 | 30,000,000 | |||||||||
SGD | 52,000,000 | 1.15 | August 16, 2010 | August 16, 2011 | 52,000,000 | |||||||||
SGD | 28,000,000 | 1.91 | August 19, 2010 | August 19, 2013 | 28,000,000 | |||||||||
SGD | 26,000,000 | 1.30 | December 23, 2010 | December 23, 2011 | 26,000,000 | |||||||||
Subtotal in Original Currency | SGD | 442,000,000 | ||||||||||||
Subtotal in Equivalent Amount of Won (3) | (Won) | 390,728,000,000 | ||||||||||||
32
Table of Contents
Currency | Original | Interest Rate (%) | Issue Date | Maturity Date | Principal Amount Outstanding as of December 31, 2010 | |||||||||
JPY | 30,000,000,000 | 1.74 | June 7, 2006 | June 7, 2011 | 30,000,000,000 | |||||||||
JPY | 30,000,000,000 | 1.64 | June 1, 2007 | June 1, 2012 | 30,000,000,000 | |||||||||
JPY | 20,000,000,000 | 6M ¥ Libor + 0.18 | June 1, 2007 | June 1, 2012 | 20,000,000,000 | |||||||||
JPY | 5,000,000,000 | 3M ¥ Libor + 0.23 | September 20, 2007 | September 20, 2012 | 5,000,000,000 | |||||||||
JPY | 5,000,000,000 | 3M ¥ Libor + 0.45 | November 1, 2007 | November 1, 2012 | 5,000,000,000 | |||||||||
JPY | 5,000,000,000 | 3M ¥ Libor + 0.6 | December 21, 2007 | December 21, 2012 | 5,000,000,000 | |||||||||
JPY | 15,000,000,000 | 3.22 | May 30, 2008 | May 30, 2018 | 15,000,000,000 | |||||||||
JPY | 22,600,000,000 | 1.480 | July 1, 2010 | June 29, 2012 | 22,600,000,000 | |||||||||
JPY | 4,400,000,000 | 1.560 | July 1, 2010 | June 28, 2013 | 4,400,000,000 | |||||||||
JPY | 1,000,000,000 | 0.650 | October 28, 2010 | October 28, 2011 | 1,000,000,000 | |||||||||
JPY | 1,000,000,000 | 0.600 | November 4, 2010 | November 4, 2011 | 1,000,000,000 | |||||||||
JPY | 33,000,000,000 | 1.94 | October 12, 2007 | October 12, 2012 | 33,000,000,000 | |||||||||
JPY | 5,000,000,000 | 3M ¥ Libor + 0.45 | November 15, 2007 | November 15, 2012 | 5,000,000,000 | |||||||||
JPY | 3,000,000,000 | 2.07 | April 8, 2008 | April 8, 2013 | 3,000,000,000 | |||||||||
JPY | 12,100,000,000 | 2.51 | September 14, 2009 | September 14, 2011 | 12,100,000,000 | |||||||||
JPY | 10,900,000,000 | 2.67 | September 14, 2009 | September 14, 2012 | 10,900,000,000 | |||||||||
JPY | 7,000,000,000 | 2.97 | September 14, 2009 | September 12, 2014 | 7,000,000,000 | |||||||||
JPY | 2,000,000,000 | 0.92 | August 19, 2010 | August 20, 2012 | 2,000,000,000 | |||||||||
Subtotal in Original Currency | JPY | 212,000,000,000 | ||||||||||||
Subtotal in Equivalent Amount of Won (4) | (Won) | 2,961,852,000,000 | ||||||||||||
HKD | 150,000,000 | 5 | November 20, 2007 | November 20, 2017 | 150,000,000 | |||||||||
HKD | 80,000,000 | 4.77 | November 21, 2007 | November 21, 2012 | 80,000,000 | |||||||||
HKD | 80,000,000 | 4.71 | December 18, 2007 | December 18, 2017 | 80,000,000 | |||||||||
HKD | 100,000,000 | 5.28 | April 27, 2009 | April 27, 2011 | 100,000,000 | |||||||||
HKD | 170,000,000 | 0.88 | January 28, 2010 | January 28, 2011 | 170,000,000 | |||||||||
HKD | 155,000,000 | 1.20 | June 8, 2010 | June 8, 2011 | 155,000,000 | |||||||||
HKD | 124,000,000 | 1.00 | October 21, 2010 | October 21, 2011 | 124,000,000 | |||||||||
HKD | 150,000,000 | 3M Hibor + 0.22 | May 30, 2006 | May 30, 2011 | 150,000,000 | |||||||||
HKD | 150,000,000 | 3.075 | January 23, 2008 | January 24, 2011 | 150,000,000 | |||||||||
HKD | 150,000,000 | 3.2 | August 19, 2009 | August 19, 2011 | 150,000,000 | |||||||||
HKD | 240,000,000 | 3M Hibor + 1.03 | November 16, 2009 | November 16, 2011 | 240,000,000 | |||||||||
HKD | 230,000,000 | 2.28 | May 13, 2010 | May 13, 2013 | 230,000,000 | |||||||||
HKD | 300,000,000 | 3.25 | July 20, 2010 | July 20, 2015 | 300,000,000 | |||||||||
HKD | 101,000,000 | 3M Hibor + 0.74 | July 26, 2010 | July 26, 2011 | 101,000,000 | |||||||||
HKD | 308,000,000 | 2.15 | August 6, 2010 | August 6, 2013 | 308,000,000 | |||||||||
HKD | 465,000,000 | 1.05 | August 18, 2010 | August 18, 2011 | 465,000,000 | |||||||||
HKD | 285,000,000 | 1.72 | December 20, 2010 | December 20, 2012 | 285,000,000 | |||||||||
Subtotal in Original Currency | HKD | 3,238,000,000 | ||||||||||||
Subtotal in Equivalent Amount of Won (5) | (Won) | 474,043,200,000 | ||||||||||||
GBP | 150,000,000 | 3M £ Libor + 0.2 | April 26, 2006 | April 26, 2011 | 150,000,000 | |||||||||
Subtotal in Original Currency | GBP | 150,000,000 | ||||||||||||
Subtotal in Equivalent Amount of Won (6) | (Won) | 263,655,000,000 | ||||||||||||
EUR | 500,000,000 | 3M Euribor + 0.2 | March 9, 2006 | March 9, 2011 | 500,000,000 | |||||||||
EUR | 300,000,000 | 3M Euribor + 0.24 | April 3, 2007 | April 3, 2014 | 300,000,000 | |||||||||
EUR | 10,000,000 | 6M Euribor + 0.755 | June 21, 2010 | June 21, 2013 | 10,000,000 | |||||||||
Subtotal in Original Currency | EUR | 810,000,000 | ||||||||||||
Subtotal in Equivalent Amount of Won (7) | (Won) | 1,226,016,000,000 | ||||||||||||
CHF | 250,000,000 | 3 | June 23, 2006 | June 23, 2011 | 250,000,000 | |||||||||
CHF | 50,000,000 | 3 | December 28, 2007 | June 23, 2011 | 50,000,000 | |||||||||
CHF | 50,000,000 | 4.125 | May 16, 2008 | May 16, 2013 | 50,000,000 | |||||||||
CHF | 200,000,000 | 1.750 | October 1, 2010 | October 1, 2014 | 200,000,000 | |||||||||
CHF | 200,000,000 | 4.204 | May 16, 2008 | May 16, 2013 | 200,000,000 | |||||||||
CHF | 100,000,000 | 4.198 | May 16, 2008 | May 16, 2013 | 100,000,000 | |||||||||
Subtotal in Original Currency | CHF | 850,000,000 | ||||||||||||
Subtotal in Equivalent Amount of Won (8) | (Won) | 1,035,300,000,000 | ||||||||||||
33
Table of Contents
Currency | Original | Interest Rate (%) | Issue Date | Maturity Date | Principal Amount Outstanding as of December 31, 2010 | |||||||||
BRL | 260,000,000 | CDI | *98% | February 1, 2010 | February 1, 2011 | 260,000,000 | ||||||||
Subtotal in Original Currency | BRL | 260,000,000 | ||||||||||||
Subtotal in Equivalent Amount of Won (9) | (Won) | 178,438,000,000 | ||||||||||||
AUD | 32,000,000 | 6.000 | January 25, 2010 | January 25, 2012 | 32,000,000 | |||||||||
AUD | 50,000,000 | 6.000 | February 1, 2010 | February 1, 2012 | 50,000,000 | |||||||||
Subtotal in Original Currency | AUD | 82,000,000 | ||||||||||||
Subtotal in Equivalent Amount of Won(10) | (Won) | 94,947,800,000 | ||||||||||||
Total External Bonds of KDB in Equivalent Amount of Won | (Won) | 15,760,745,800,000 | ||||||||||||
| (1) | U.S. dollar amounts are converted to Won amounts at the rate of US$1.00 to Won 1,138.9, the market average exchange rate in effect on December 31, 2010, as announced by Seoul Money Brokerage Services, Ltd. |
| (2) | Thai baht amounts are converted to Won amounts at the rate of THB 1.00 to Won 37.8, the market average exchange rate in effect on December 31, 2010, as announced by Seoul Money Brokerage Services, Ltd. |
| (3) | Singapore dollar amounts are converted to Won amounts at the rate of SGD 1.00 to Won 884.0, the market average exchange rate in effect on December 31, 2010, as announced by Seoul Money Brokerage Services, Ltd. |
| (4) | Japanese yen amounts are converted to Won amounts at the rate of JPY 100.00 to Won 1,397.1, the market average exchange rate in effect on December 31, 2010, as announced by Seoul Money Brokerage Services, Ltd. |
| (5) | Hong Kong dollar amounts are converted to Won amounts at the rate of HKD 1.00 to Won 146.4, the market average exchange rate in effect on December 31, 2010, as announced by Seoul Money Brokerage Services, Ltd. |
| (6) | Pound sterling amounts are converted to Won amounts at the rate of GBP 1.00 to Won 1,757.7, the market average exchange rate in effect on December 31, 2010, as announced by Seoul Money Brokerage Services, Ltd. |
| (7) | Euro amounts are converted to Won amounts at the rate of EUR 1.00 to Won 1,513.6, the market average exchange rate in effect on December 31, 2010, as announced by Seoul Money Brokerage Services, Ltd. |
| (8) | Swiss franc amounts are converted to Won amounts at the rate of CHF 1.00 to Won 1,218.0, the market average exchange rate in effect on December 31, 2010, as announced by Seoul Money Brokerage Services, Ltd. |
| (9) | Brazilian real amounts are converted to Won amounts at the rate of BRL 1.00 to Won 686.3, the prevailing market rate on December 31, 2010. |
| (10) | Australian dollar amounts are converted to Won amounts at the rate of AUD 1.00 to Won 1,157.9, the market average exchange rate in effect on December 31, 2010, as announced by Seoul Money Brokerage Services, Ltd. |
34
Table of Contents
(2) External Borrowings of KDB
Lender | Classifications | Range of Interest Rates | Range of Years of Issue | Range of Years of Maturity | Principal Amount Outstanding as of December 31, 2010 (1) | |||||||||||||
| (%) | (millions of Won) | |||||||||||||||||
JBIC | Borrowings from JBIC | 1.4~6M Libor + 0.8 | 2009~2010 | 2011~2023 | (Won) | 353,001 | ||||||||||||
Mizuho and others | Borrowings from foreign banks |
| 3M~6M Libor/6M Euribor + 0.3~1.8 |
| 2006~2010 | 2011~2014 | 2,289,878 | |||||||||||
DBS Bank and others | Off-shore short-term borrowings | 0.2~1.0 | 2010 | 2011 | 124,577 | |||||||||||||
| 3M ~6M Libor + 2.0~3.5 | 2010 | 2011 | 56,945 | |||||||||||||||
| 6M Libor + 0.6~1.3 | 2010 | 2011 | 261,947 | |||||||||||||||
Nippon Life Insurance Company and others | Off-shore long-term borrowings | | 3M~6M Libor/ 6M Euribor + 0.6~9.1 | | 2008~2010 | 2011~2012 | 730,849 | |||||||||||
JBIC | Off-shore borrowings from JBIC | 4.3~6M Libor + 1.2 | 2010 | 2011~2020 | 65,070 | |||||||||||||
Others | Short-term borrowings in foreign currency | | 0.0~5.2/6M ~1Y Libor 0.6~4.0 | | 2009~2010 | 2010~2011 | 6,293,929 | |||||||||||
Long-term borrowings in foreign currency | 0.0~4.7 | 2007~2010 | 2011~2013 | 1,397,724 | ||||||||||||||
Total External Borrowings of KDB |
| (Won) | 11,573,920 | |||||||||||||||
| (1) | Converted to Won amounts at the relevant market average exchange rates in effect on December 31, 2010 as announced by Seoul Money Brokerage Services, Ltd. |
35
Table of Contents
B. Internal Debt of KDB
Title | Range of Interest Rates | Range of Years of Issue | Range of Years of Original Maturity | Principal Amounts Outstanding as of December 31, 2010 | ||||||||||||
| (%) | (millions of Won) | |||||||||||||||
1. Bonds | ||||||||||||||||
Short-term Industrial Finance Bonds | 2.53~5.49 | 2010 | 2011 | (Won) | 1,019,740 | |||||||||||
Long-term Industrial Finance Bonds | 3.09~12.0 | 2001~2010 | 2006~2030 | 27,042,032 | ||||||||||||
Total Bonds | 2.53~12.0 | 2001~2010 | 2006~2030 | 28,061,772 | ||||||||||||
2. Borrowings | ||||||||||||||||
Borrowings from the Ministry of Strategy and Finance | 2.5~6.0 | 1990~2010 | 2010~2030 | (Won) | 803,068 | |||||||||||
Borrowings from Industrial Bank of Korea | 1.4~3.8 | 2002~2010 | 2010~2023 | 90,732 | ||||||||||||
Borrowings from Small Business Corp. | 2.0~4.0 | 2001~2010 | 2010~2020 | 506,138 | ||||||||||||
Borrowings from the Ministry of Culture and Tourism | 1.3~4.0 | 2001~2010 | 2010~2020 | 1,154,203 | ||||||||||||
Borrowings from Korea Energy Management Corporation | 0.5~4.5 | 1993~2010 | 2010~2025 | 1,022,210 | ||||||||||||
Others | 0.0~6.0 | 2000~2010 | 2010~2019 | 1,258,157 | ||||||||||||
Total Borrowings (1) |
| 4,834,508 | ||||||||||||||
3. Other Debt (2) |
| 4,655,528 | ||||||||||||||
Total Internal Floating Debt(3) |
| 6,152,408 | ||||||||||||||
Total Internal Funded Debt(4) |
| 31,399,400 | ||||||||||||||
Total Internal Debt |
| 37,551,808 | ||||||||||||||
| (1) | Consist of short term borrowings in the amount of (Won)477,140 million and long term borrowings in the amount of (Won)4,357,368 million. |
| (2) | Other debt includes bonds sold under repurchase agreements and call money. |
| (3) | Floating debt is debt that has a maturity at issuance of less than one year. |
| (4) | Funded debt is debt that has a maturity at issuance of one year or more. |
Financial Statements and the Auditors
The FSC appoints KoFC’s Auditor, who is responsible for examining KoFC’s financial operations and auditing KoFC’s financial statements and records. The present Auditor is Nak Gyun Jeong, who was appointed for a three-year term on June 8, 2010.
We prepare our financial statements annually for submission to the FSC, accompanied by an opinion of the Auditor. Although we are not legally required to have financial statements audited by external independent auditors, an independent public accounting firm audits our non-consolidated and consolidated financial statements. As of the date of this prospectus, our external independent auditors are Ernst & Young Han Young, located at Taeyoung Bldg., #10-2, Yeouido-dong, Yeongdeungpo-gu, Seoul, Korea. Ernst & Young Han Young have audited our consolidated financial statements as of December 31, 2009 and 2010 and for the year ended December 31, 2010 included in this prospectus.
Our consolidated financial statements appearing in this prospectus were prepared in conformity with generally accepted accounting principles in the Republic, summarized in “—Notes to Consolidated Financial Statements of December 31, 2010—Note 2”. These principles and procedures differ in certain material respects from generally accepted accounting principles in the United States (“US GAAP”).
36
Table of Contents
We recognize interest income on loans and debt securities on an accrual basis. However, interest income on delinquent and dishonored loans and debt securities, other than those collateralized with security deposits or guaranteed by financial institutions, is recognized on a cash basis.
We classify securities that are acquired and held principally for the purpose of selling them in the near future as trading securities. We classify debt securities with fixed or determinable payments and fixed maturities, and which we intend to hold to maturity, as held-to-maturity securities. We classify investments that are categorized as neither trading securities nor held-to-maturity securities as available-for-sale securities. We record our trading and available-for-sale securities, except for non-marketable securities, at market value. We record non-marketable equity securities at a value announced by a public independent credit rating agency. If application of such measurement method is not feasible, we record non-marketable equity securities at the cost of acquisition. We record held-to-maturity debt securities at the present value of their future cash flows discounted using an appropriate interest rate which reflects our credit rating, as announced by a public independent credit rating agency. We record held-to-maturity securities at amortized cost. We recognize impairment losses on securities in current operations when the recoverable amounts are less than the acquisition cost of equity securities or amortized cost of debt securities.
We record our equity investments in companies in which we exercise significant control or influence by using the equity method, pursuant to which we account for adjustment in the value of our investments resulting from changes to the investee’s net asset value.
We record debenture issuance costs as discounts on debentures and amortize them over the redemption period of the debentures using the effective interest rate method.
We record the value of our property, plant and equipment at cost. Maintenance and repairs are expensed in the year in which they are incurred. Expenditures which enhance the value or extend the useful lives of the related assets are capitalized as additions to property, plant and equipment.
37
Table of Contents
Independent auditors’ report
The Steering Committee
Korea Finance Corporation
We have audited the accompanying consolidated statements of financial position of Korea Finance Corporation (“KoFC”) and its subsidiaries (collectively, the “Corporation”) as of December 31, 2010 and 2009, and the related consolidated statements of operations, changes in equity and cash flows for the year ended December 31, 2010 and the period from October 28, 2009 (inception) to December 31, 2009. These consolidated financial statements are the responsibility of the Corporation’s management. Our responsibility is to express an opinion on these consolidated financial statements based on our audits. We did not audit the financial statements of the equity method investees which represent 5.6% and 4.9% of the Corporation’s consolidated total assets as of December 31, 2010 and 2009, respectively, and 55.6% and 34.7% of the Corporation’s income (loss) before income tax expenses for the year ended December 31, 2010 and the period from October 28, 2009 to December 31, 2009, respectively. The financial statements of those investees were audited by other auditors whose reports have been furnished to us, and our opinion, insofar as it related to the amounts included for the investees, is based solely on the reports of other auditors.
We conducted our audits in accordance with auditing standards generally accepted in the Republic of Korea. Those standards require that we plan and perform the audit to obtain reasonable assurance about whether the consolidated financial statements are free of material misstatement. An audit includes examining, on a test basis, evidence supporting the amounts and disclosures in the consolidated financial statements. An audit also includes assessing the accounting principles used and significant estimates made by management, as well as evaluating the overall consolidated financial statement presentation. We believe that our audit and the reports of other auditors provide a reasonable basis for our opinion.
In our opinion, based on our audits and the reports of other auditors, the consolidated financial statements referred to above present fairly, in all material respects, the consolidated financial position of KoFC and its subsidiaries as of December 31, 2010 and 2009, and the results of their financial performances and their cash flows for the year ended December 31, 2010 and the period from October 28, 2009 to December 31, 2009 in conformity with accounting principles generally accepted in the Republic of Korea.
Accounting principles and auditing standards and their application in practice vary among countries. The accompanying consolidated financial statements are not intended to present the consolidated financial position, results of financial performances, and cash flows in accordance with accounting principles and practices generally accepted in countries other than the Republic of Korea. In addition, the procedures and practices utilized in the Republic of Korea to audit such consolidated financial statements may differ from those generally accepted and applied in other countries. Accordingly, this report and the accompanying consolidated financial statements are for use by those who are knowledgeable about Korean accounting principles and auditing standards and their application in practice.
/s/ Ernst & Young Han Young
March 29, 2011
38
Table of Contents
Korea Finance Corporation
Consolidated statements of financial position
As of December 31, 2010 and 2009
(Korean won) | 2010 | 2009 | ||||||
Assets | ||||||||
Cash and due from banks (Notes 3, 15, 27 and 28): | ||||||||
Cash and cash equivalents in Korean won | (Won) | 53,707,199,881 | (Won) | 69,697,222,094 | ||||
Cash and cash equivalents in foreign currency | 144,420,870,867 | 86,270,138,402 | ||||||
Due from banks in Korean won | 8,577,261,815,429 | 6,640,764,879,475 | ||||||
Due from banks in foreign currency | 956,781,624,318 | 793,297,241,640 | ||||||
| 9,732,171,510,495 | 7,590,029,481,611 | |||||||
Securities (Notes 4, 15 and 28): | ||||||||
Trading securities | 9,698,847,145,045 | 8,659,237,755,658 | ||||||
Available-for-sale securities | 41,192,146,343,367 | 41,754,448,971,244 | ||||||
Held-to-maturity securities | 2,374,523,705,133 | 1,853,599,960,347 | ||||||
Equity method investments | 12,909,072,371,724 | 10,299,917,398,059 | ||||||
| 66,174,589,565,269 | 62,567,204,085,308 | |||||||
Loans receivable, less allowance for possible loan losses of (Won)2,293,307,406,419 at December 31, 2010 ((Won)1,745,269,574,161 at December 31, 2009), less deferred loan fees of (Won)38,109,449,524 at December 31, 2010 ((Won)18,818,008,141 at December 31, 2009), and less net present value discount of (Won)2,486,042,243 at December 31, 2010 | 85,362,361,428,749 | 82,792,212,387,025 | ||||||
Property and equipment (Notes 6 and 28) | 6,924,544,394,330 | 6,262,843,341,141 | ||||||
Other assets (Notes 6, 7, 15, 17, 24 and 28): | ||||||||
Allowance for possible losses for other assets | (90,320,472,299 | ) | (340,453,959,890 | ) | ||||
Intangible assets | 356,696,708,944 | 270,594,651,859 | ||||||
Goodwill | 382,250,369,053 | 73,200,665,984 | ||||||
Negative goodwill | (7,603,135,463 | ) | (470,039,890,568 | ) | ||||
Guarantee deposits | 329,703,028,557 | 263,277,528,549 | ||||||
Accounts receivable | 749,629,566,355 | 831,354,007,431 | ||||||
Accrued income | 731,084,232,880 | 664,941,265,157 | ||||||
Advance payments | 1,317,887,003,742 | 1,683,599,091,212 | ||||||
Prepaid expenses | 87,414,595,510 | 139,883,437,530 | ||||||
Deferred income tax asset | 174,448,624,316 | 207,787,704,327 | ||||||
Property under operating lease | 25,339,523,064 | 39,533,868,927 | ||||||
Derivatives assets | 6,781,741,328,925 | 9,363,716,386,170 | ||||||
Foreign exchange receivable | 933,160,891,148 | 1,152,905,892,979 | ||||||
Account receivable of unsettled spot exchange | 2,483,537,069,971 | 2,686,966,614,115 | ||||||
Miscellaneous assets | 1,890,735,154,885 | 424,970,356,162 | ||||||
| 16,145,704,489,588 | 16,992,237,619,944 | |||||||
Other manufacturing assets: | ||||||||
Trade receivables, less allowance for other manufacturing assets of (Won)45,200,427,910 at December 31, 2010 ((Won)18,518,063,075 at December 31, 2009) | 6,815,054,673,700 | 5,214,325,540,326 | ||||||
Inventories | 1,028,702,382,722 | 1,469,810,876,853 | ||||||
| 7,843,757,056,422 | 6,684,136,417,179 | |||||||
Total assets | (Won) | 192,183,128,444,853 | (Won) | 182,888,663,332,208 | ||||
(Continued)
See accompanying notes.
39
Table of Contents
Korea Finance Corporation
Consolidated statements of financial position
As of December 31, 2010 and 2009
(Korean won) | 2010 | 2009 | ||||||
Liabilities and equity | ||||||||
Liabilities: | ||||||||
Deposits (Notes 8, 15 and 28) | (Won) | 22,256,054,012,589 | (Won) | 16,673,188,967,374 | ||||
Borrowing liabilities (Notes 6, 9, 15, 16 and 28) | 112,882,507,201,833 | 117,160,104,447,263 | ||||||
Other liabilities: (Notes 6, 10, 11, 12, 13, 14, 15, 17, 18, 24 and 28) | ||||||||
Severance and retirement benefits, less contribution to national pension plan of (Won)1,971,732,417 at December 31, 2010 ((Won)1,871,016,977 at December 31, 2009), less deposits for severance and retirement of (Won)276,720,015,620 at December 31, 2010 ((Won)121,911,297,574 at December 31, 2009), and less other assets for severance and retirement of (Won)498,943,485 at December 31, 2010 | 414,885,528,096 | 446,218,687,651 | ||||||
Allowance for possible losses on acceptances and guarantees | 112,705,206,094 | 254,816,545,339 | ||||||
Allowance for possible losses on unused loan commitments | 225,691,507,632 | 189,048,466,511 | ||||||
Other allowances | 118,431,234,012 | 100,968,118,775 | ||||||
Due to trust accounts | 495,114,235,616 | 353,277,302,401 | ||||||
Foreign exchange payable | 88,186,503,770 | 11,188,490,409 | ||||||
Accounts payable | 1,134,764,434,264 | 671,700,850,793 | ||||||
Account payable of unsettled spot exchange | 2,489,477,646,627 | 2,685,304,395,958 | ||||||
Accrued expenses | 2,026,476,680,010 | 1,574,048,457,208 | ||||||
Advance received | 5,054,368,350,296 | 6,354,012,677,528 | ||||||
Unearned revenue | 78,225,100,701 | 90,772,504,554 | ||||||
Deposits for letter of guarantees and others | 631,852,800,165 | 209,505,279,692 | ||||||
Derivatives liabilities | 5,591,138,932,999 | 8,912,331,441,338 | ||||||
Insurance policy reserves | 7,283,656,742,841 | — | ||||||
Deferred income tax liabilities | 1,823,890,750,216 | 1,604,028,803,897 | ||||||
Miscellaneous liabilities | 1,969,569,922,196 | 1,028,609,589,454 | ||||||
| 29,538,435,575,535 | 24,485,831,611,508 | |||||||
Other manufacturing liabilities: | ||||||||
Trade accounts payable | 1,262,167,565,273 | 1,158,038,700,858 | ||||||
Allowance for other manufacturing liabilities | 116,227,434,165 | 125,756,256,687 | ||||||
| 1,378,394,999,438 | 1,283,794,957,545 | |||||||
Total liabilities | 166,055,391,789,395 | 159,602,919,983,690 | ||||||
Equity: | ||||||||
Equity attributable to equity holder of the parent: | ||||||||
Paid-in capital (Note 19) | 14,999,999,967,089 | 14,999,999,967,089 | ||||||
Capital surplus | 3,367,206,320 | — | ||||||
Capital adjustments | (186,047,925,366 | ) | (3,696,550,840 | ) | ||||
Accumulated other comprehensive income (Notes 4 and 19): | ||||||||
Unrealized gain on valuation of available-for-sale securities, net | 1,771,027,396,789 | 1,218,203,677,941 | ||||||
Equity adjustments in equity method | (200,074,822,985 | ) | (7,001,106,349 | ) | ||||
Foreign currency translation adjustments for overseas operations, net | (1,042,052,434 | ) | — | |||||
Unrealized gain on valuation of cash flow hedge, net | 3,556,255,391 | — | ||||||
| 1,573,466,776,761 | 1,211,202,571,592 | |||||||
Retained earnings (Note 19): | ||||||||
Legal reserve | 1,912,963,278,390 | 1,973,436,654,761 | ||||||
Other consolidated retained earnings | 16,306,797,553 | — | ||||||
Unappropriated retained earnings (undisposed accumulated deficit) | 404,755,654,974 | (60,473,376,371 | ) | |||||
| 2,334,025,730,917 | 1,912,963,278,390 | |||||||
| 18,724,811,755,721 | 18,120,469,266,231 | |||||||
Minority interests | 7,402,924,899,737 | 5,165,274,082,287 | ||||||
Total equity | 26,127,736,655,458 | 23,285,743,348,518 | ||||||
Total liabilities and equity | (Won) | 192,183,128,444,853 | (Won) | 182,888,663,332,208 | ||||
See accompanying notes.
40
Table of Contents
Korea Finance Corporation
Consolidated statements of operations
For the year ended December 31, 2010 and the period from October 28, 2009 (inception) to December 31,2009
(Korean won) | Year ended Dec. 31, 2010 | From Oct. 28, 2009 to Dec. 31, 2009 | ||||||
Operating revenue (Note 28): | ||||||||
Interest income: | ||||||||
Interest on due from banks | (Won) | 204,281,927,905 | (Won) | 2,951,240,159 | ||||
Interest on securities | 1,694,487,831,025 | 17,301,465,060 | ||||||
Interest on loans receivable | 4,179,928,203,737 | 33,491,350,299 | ||||||
| 6,078,697,962,667 | 53,744,055,518 | |||||||
Gain from valuation and disposal of investment securities | ||||||||
Gain on valuation of trading securities | 154,869,507,375 | — | ||||||
Gain on disposal of trading securities | 986,185,486,145 | — | ||||||
Reversal of impairment loss on available-for-sale securities | 25,043,705,193 | — | ||||||
Gain on disposal of available-for-sale securities | 1,887,812,004,182 | — | ||||||
Gain on disposal of held-to-maturity securities | 3,999,628,237 | — | ||||||
Gain on disposal of equity method investments | 20,534,464,180 | — | ||||||
| 3,078,444,795,312 | — | |||||||
Reversal of allowance for possible loan losses (Note 5) | — | 29,468,462,648 | ||||||
Gain on disposal of loans receivable | 161,468,769,765 | — | ||||||
Gain on foreign currency transactions | 1,747,961,348,292 | — | ||||||
Fees and commissions income | 1,131,535,325,430 | 42,421,720 | ||||||
Fees and commissions from trust accounts | 36,297,195,646 | — | ||||||
Dividends income | 223,308,409,688 | — | ||||||
Insurance Income | 1,669,798,479,005 | — | ||||||
Other operating income: | ||||||||
Gain on derivatives transactions | 11,422,224,744,788 | — | ||||||
Gain on valuation of hedged items (Note 17) | 355,788,504,862 | — | ||||||
Reversal of allowance for possible losses on acceptances and guarantees | 130,889,911,219 | — | ||||||
Reversal of allowance for unused commitments | — | 706,383,000 | ||||||
Reversal of other liabilities | 37,444,101,582 | — | ||||||
Reversal of negative goodwill | 1,517,082,125 | — | ||||||
Others (Note 23) | 14,554,099,598,373 | 189,792,335,931 | ||||||
| 26,501,963,942,949 | 190,498,718,931 | |||||||
Total operating revenue | 40,629,476,228,754 | 273,753,658,817 | ||||||
Operating expenses (Note 28): | ||||||||
Interest expense: | ||||||||
Interest on deposits | 532,835,865,832 | — | ||||||
Interest on borrowings | 1,102,656,605,664 | 25,657,276,834 | ||||||
Interest on debentures | 2,973,316,713,439 | 164,461,355,534 | ||||||
| 4,608,809,184,935 | 190,118,632,368 | |||||||
Loss on valuation and disposal of securities: | ||||||||
Loss on valuation of trading securities | 250,386,605,444 | — | ||||||
Loss on disposal of trading securities | 986,163,920,581 | — | ||||||
Impairment loss on available-for-sale securities | 539,473,234,684 | — | ||||||
Loss on disposal of available-for-sale securities | 71,540,057,413 | — | ||||||
Loss on disposal of held-to-maturity securities | 2,230,760,643 | — | ||||||
Loss on disposal of equity method investments | 8,757,257,269 | — | ||||||
| 1,858,551,836,034 | — | |||||||
Loss on valuation and disposal of loans receivable: | ||||||||
Provision for possible loan losses (Note 5) | 1,500,672,929,333 | — | ||||||
Loss on disposal of loans receivable | 521,357,076,111 | — | ||||||
| 2,022,030,005,444 | — | |||||||
(Continued)
See accompanying notes.
41
Table of Contents
Korea Finance Corporation
Consolidated statements of operations
For the year ended December 31, 2010 and the period from October 28, 2009 (inception) to December 31,2009
(Korean won) | Year ended Dec. 31, 2010 | From Oct. 28, 2009 to Dec. 31, 2009 | ||||||
Loss on foreign currency transactions | (Won) | 1,972,267,831,317 | (Won) | — | ||||
Fees and commissions expense | 112,446,907,337 | 4,206,750 | ||||||
Insurance expense | 1,824,959,719,478 | — | ||||||
Other operating expenses: | ||||||||
Loss from derivative transactions | 10,810,786,187,065 | — | ||||||
Loss on valuation of hedged items (Note 17) | 621,192,257,783 | — | ||||||
Provision for possible losses on acceptances and guarantees | — | 306,788,000 | ||||||
Provision for unused loan commitments | 36,337,037,479 | — | ||||||
Provision for other liabilities | 24,446,317,592 | — | ||||||
Others (Note 23) | 12,857,798,040,990 | 235,967,666,799 | ||||||
| 24,350,559,840,909 | 236,274,454,799 | |||||||
General and administrative expenses (Note 22) | 1,947,374,490,213 | 21,295,049,781 | ||||||
Total operating expenses | 38,696,999,815,667 | 447,692,343,698 | ||||||
Operating income (loss) | 1,932,476,413,087 | (173,938,684,881 | ) | |||||
Non-operating income (expense): | ||||||||
Gain (loss) on disposal of property and equipment, net | 655,469,642 | (28,168,568 | ) | |||||
Rental income | 11,503,723,291 | 198,113,818 | ||||||
Equity in earnings of equity method investments, net (Note 4) | 193,803,031,712 | 36,704,722,878 | ||||||
Loss on disposal of intangible assets | (10,022,248,870 | ) | — | |||||
Donations | (27,250,201,584 | ) | (180,685,750 | ) | ||||
Others, net | (1,335,145,244 | ) | 7,930,577,548 | |||||
| 167,354,628,947 | 44,624,559,926 | |||||||
Income (loss) before income tax expense (benefit) | 2,099,831,042,034 | (129,314,124,955 | ) | |||||
Income tax expense (benefit) (Note 24) | 857,442,627,494 | (61,182,574,970 | ) | |||||
Net loss of subsidiary before acquisition | (5,423,520,786 | ) | — | |||||
Net income (loss) (Notes 25 and 28) | (Won) | 1,247,811,935,326 | (Won) | (68,131,549,985 | ) | |||
Attributable to: | ||||||||
Equity holder of the parent | (Won) | 404,755,654,974 | (Won) | (60,473,376,371 | ) | |||
Minority interests | 843,056,280,352 | (7,658,173,614 | ) | |||||
| (Won) | 1,247,811,935,326 | (Won) | (68,131,549,985 | ) | ||||
See accompanying notes.
42
Table of Contents
Korea Finance Corporation
Consolidated statements of changes in equity
For the year ended December 31, 2010 and the period from October 28, 2009 (inception) and December 31, 2009
(Korean won) | Paid-in capital | Capital surplus | Capital adjustments | Accumulated other comprehensive income (loss) | Retained earnings | Minority interests | Total | |||||||||||||||||||||
As of October 28, 2009 | (Won) | 100,000,000,000 | (Won) | — | (Won) | (3,696,550,840 | ) | (Won) | 930,259,896,079 | (Won) | 1,973,436,654,761 | (Won) | 390,004,547,745 | (Won) | 3,390,004,547,745 | |||||||||||||
Increase in paid-in capital via investment in-kind | 14,899,999,967,089 | — | — | — | — | — | 14,899,999,967,089 | |||||||||||||||||||||
Net loss | — | — | — | — | (60,473,376,371 | ) | (7,658,173,614 | ) | (68,131,549,985 | ) | ||||||||||||||||||
Changes in unrealized gain on available-for-sale securities, net | — | — | — | 202,072,484,501 | — | 2,678,859,713 | 204,751,344,214 | |||||||||||||||||||||
Changes in equity adjustments in equity method | — | — | — | 1,114,325,086 | — | (684,255,617 | ) | 430,069,469 | ||||||||||||||||||||
Changes in equity adjustments in equity method-debit | — | — | — | 77,755,865,926 | — | — | 77,755,865,926 | |||||||||||||||||||||
Changes in equity interests of consolidated subsidiaries | — | — | — | — | — | 4,780,933,104,060 | 4,780,933,104,060 | |||||||||||||||||||||
As of December 31, 2009 | (Won) | 14,999,999,967,089 | (Won) | — | (Won) | (3,696,550,840 | ) | (Won) | 1,211,202,571,592 | (Won) | 1,912,963,278,390 | (Won) | 5,165,274,082,287 | (Won) | 23,285,743,348,518 | |||||||||||||
As of January 1, 2010 (Audited) | (Won) | 14,999,999,967,089 | (Won) | — | (Won) | (3,696,550,840 | ) | (Won) | 1,211,202,571,592 | (Won) | 1,912,963,278,390 | (Won) | 5,165,274,082,287 | (Won) | 23,285,743,348,518 | |||||||||||||
Cash dividends of subsidiaries | — | — | — | — | — | (73,168,906,527 | ) | (73,168,906,527 | ) | |||||||||||||||||||
Net income | — | — | — | — | 404,755,654,974 | 843,056,280,352 | 1,247,811,935,326 | |||||||||||||||||||||
Changes in unrealized gain on available-for-sale securities, net | — | — | — | 552,823,718,848 | — | 60,723,094,564 | 613,546,813,412 | |||||||||||||||||||||
Changes in capital surplus in equity method | — | 3,367,206,320 | — | — | — | (446,044,468 | ) | 2,921,161,852 | ||||||||||||||||||||
Changes in capital adjustments in equity method | — | — | (182,351,374,526 | ) | — | — | (3,808,465,173 | ) | (186,159,839,699 | ) | ||||||||||||||||||
Changes in retained earning in equity method | — | — | — | — | 16,306,797,553 | 2,234,422,415 | 18,541,219,968 | |||||||||||||||||||||
Changes in equity adjustments in equity method | — | — | — | 573,703,011,843 | — | 58,885,856,522 | 632,588,868,365 | |||||||||||||||||||||
Changes in equity adjustments in equity method-debit | — | — | — | (766,776,728,479 | ) | — | (81,035,304,892 | ) | (847,812,033,371 | ) | ||||||||||||||||||
Foreign currency translation adjustments for overseas operations | — | — | — | (1,042,052,434 | ) | — | (10,882,112,600 | ) | (11,924,165,034 | ) | ||||||||||||||||||
Changes in unrealized gain on valuation of cash flow hedge | — | — | — | 3,556,255,391 | — | 387,070,668 | 3,943,326,059 | |||||||||||||||||||||
Increase in treasury stock by subsidiaries | — | — | — | — | — | (63,346,305,452 | ) | (63,346,305,452 | ) | |||||||||||||||||||
Changes in equity interests of consolidated subsidiaries | — | — | — | — | — | 772,784,914,846 | 772,784,914,846 | |||||||||||||||||||||
Others | — | — | — | — | — | 732,266,317,194 | 732,266,317,194 | |||||||||||||||||||||
As of December 31, 2010 | (Won) | 14,999,999,967,089 | (Won) | 3,367,206,320 | (Won) | (186,047,925,366 | ) | (Won) | 1,573,466,776,761 | (Won) | 2,334,025,730,917 | (Won) | 7,402,924,899,737 | (Won) | 26,127,736,655,458 | |||||||||||||
See accompanying notes.
43
Table of Contents
Korea Finance Corporation
Consolidated statements of cash flows
For the year ended December 31, 2010 and the period from October 28, 2009 (inception)
and December 31, 2009
(Korean won) | Year ended Dec. 31, 2010 | From Oct. 28, 2009 to Dec. 31, 2009 | ||||||
Cash flows from operating activities: | ||||||||
Net income (loss) | (Won) | 404,755,654,974 | (Won) | (68,131,549,985 | ) | |||
Adjustments to reconcile net income (loss) to net cash provided by (used in) operating activities: | ||||||||
Loss on valuation of trading securities, net | 95,517,098,069 | — | ||||||
Impairment loss on available-for-sale securities, net | 514,429,529,491 | — | ||||||
Provision (reversal of) for possible loan losses | 1,500,672,929,333 | (29,468,462,648 | ) | |||||
Loss on foreign currency translation, net | 144,675,373,442 | — | ||||||
Gain on valuation of derivative instruments, net | (340,226,181,066 | ) | — | |||||
Provision (reversal of) for possible losses on acceptances and guarantees | (130,889,911,219 | ) | 306,788,000 | |||||
Provision (reversal of) for other liabilities, net | (12,997,783,990 | ) | — | |||||
Provision (reversal of) for unused loan commitments | 36,337,037,479 | (698,671,644 | ) | |||||
Amortization of discount on debentures | 68,140,248,082 | 121,542,605 | ||||||
Depreciation | 1,407,784,164,045 | 945,690,833 | ||||||
Amortization of intangible assets | 171,875,000,000 | 1,196,549,269 | ||||||
Loss (gain) on disposal of property and equipment, net | (655,469,642 | ) | 28,168,568 | |||||
Loss on disposal of intangible assets | 10,019,248,870 | — | ||||||
Equity in earnings of equity method investments, net | (193,803,031,712 | ) | (36,704,722,878 | ) | ||||
Provision for severance and retirement benefits | 149,141,893,808 | — | ||||||
Reversal of negative goodwill | (1,517,082,125 | ) | — | |||||
Others, net | (4,753,263,510 | ) | — | |||||
Changes in operating assets and liabilities: | ||||||||
Trading securities | (959,857,000,000 | ) | — | |||||
Available-for-sale securities | 1,320,319,201,816 | (203,342,788,511 | ) | |||||
Held-to-maturity securities | 403,508,716,441 | 22,673,672,870 | ||||||
Dividends from equity method investments | 78,939,000,000 | (23,177,958,762 | ) | |||||
Loans receivable | (3,205,573,858,851 | ) | (162,283,645,454 | ) | ||||
Guarantee deposits | 431,964,000,000 | 7,140,488,810 | ||||||
Accounts receivable | 214,189,007,906 | 140,717,885,378 | ||||||
Accrued income | (25,988,028,857 | ) | 12,448,525,723 | |||||
Advance payments | 308,378,000,000 | (120,085,262,175 | ) | |||||
Prepaid expenses | 7,536,848,229 | (887,953,959 | ) | |||||
Deferred income tax assets and liabilities, net | 158,958,657,709 | 15,116,730,245 | ||||||
Derivative instruments, net | (406,149,535,821 | ) | — | |||||
Foreign exchange receivable | 219,745,000,000 | — | ||||||
Miscellaneous assets | 89,686,483,738 | (30,437,041,918 | ) | |||||
Trade accounts receivable | (1,381,721,000,000 | ) | (148,383,200,333 | ) | ||||
Inventories | 448,885,000,000 | 63,570,114,555 | ||||||
Payment of severance and retirement benefits | (87,728,000,000 | ) | — | |||||
Decrease in deposit for national pension services | 207,000,000 | — | ||||||
Deposits for severance and retirement | (131,210,000,000 | ) | — | |||||
(Continued)
See accompanying notes.
44
Table of Contents
Korea Finance Corporation
Consolidated statements of cash flows
For the year ended December 31, 2010 and the period from October 28, 2009 (inception)
and December 31, 2009
(Korean won) | Year ended Dec. 31, 2010 | From Oct. 28, 2009 to Dec. 31, 2009 | ||||||
Allowance for possible losses on acceptances and guarantees | (11,221,694,813 | ) | — | |||||
Allowance for possible losses on unused loan commitments | 306,000,000 | — | ||||||
Allowance for other liabilities | 35,505,000,000 | 61,065,526,820 | ||||||
Accounts payable | 350,983,209,967 | 3,841,551,604 | ||||||
Account receivable of unsettled spot exchange | 203,430,000,000 | — | ||||||
Accrued expenses | 386,537,617,018 | (1,237,617,784 | ) | |||||
Advance received | (1,199,582,000,000 | ) | (58,241,097,392 | ) | ||||
Unearned revenue | (14,615,704,909 | ) | 3,627,392 | |||||
Deposits for letters of guarantees and others | (16,436,669,600 | ) | (82,372,892,408 | ) | ||||
Insurance policy reserves | (940,000,000 | ) | — | |||||
Miscellaneous liabilities | (21,676,984,613 | ) | 80,358,730,017 | |||||
Trade accounts payable | 145,341,000,000 | 32,436,869,475 | ||||||
Allowance for other manufacturing liabilities | (9,529,000,000 | ) | — | |||||
Total adjustments | 745,940,064,715 | (455,348,853,702 | ) | |||||
Net cash provided by (used in) operating activities | 1,150,695,719,689 | (523,480,403,687 | ) | |||||
Cash flows from investing activities: | ||||||||
Proceeds from disposal of property and equipment | (Won) | 302,718,000,000 | (Won) | — | ||||
Acquisition of property and equipment | (2,241,115,871,537 | ) | (7,234,699,978 | ) | ||||
Acquisition of intangible assets | (163,444,027,767 | ) | (3,912,536,781 | ) | ||||
Proceeds from disposal of equity method investments | 124,843,000,000 | — | ||||||
Acquisition of equity method investments | (2,798,672,000,000 | ) | — | |||||
Decrease in property under operating lease | 14,194,000,000 | — | ||||||
Increase in due from banks | (2,365,361,000,000 | ) | (20,743,053,811 | ) | ||||
Net cash used in investing activities | (7,126,837,899,304 | ) | (31,890,290,570 | ) | ||||
Cash flows from financing activities: | ||||||||
Increase in debentures, net | 3,205,225,257,252 | 1,489,850,000,000 | ||||||
Repayment of borrowings, net | (134,516,329,683 | ) | (107,869,601,000 | ) | ||||
Decrease in call money, net | (279,331,440,000 | ) | — | |||||
Decrease in bonds sold under repurchase agreements | (2,375,991,000,000 | ) | — | |||||
Decrease in bills sold | (9,029,000,000 | ) | — | |||||
Increase in deposits, net | 5,552,702,000,000 | — | ||||||
Increase in paid-in capital | 9,982,000,000 | — | ||||||
Decrease in other borrowings, net | (212,614,000,000 | ) | — | |||||
Cash dividends | (67,512,000,000 | ) | — | |||||
Net cash provided by financing activities | 5,688,915,487,569 | 1,381,980,399,000 | ||||||
Effect of changes in the scope of consolidation | 304,303,000,000 | (209,641,914,249 | ) | |||||
Net increase in cash and cash equivalents | 17,076,307,954 | 616,967,790,494 | ||||||
Cash and cash equivalents at the beginning of the period | 1,185,967,360,496 | 568,999,570,002 | ||||||
Cash and cash equivalents at the end of the period (Note 24) | (Won) | 1,203,043,668,450 | (Won) | 1,185,967,360,496 | ||||
See accompanying notes.
45
Table of Contents
Korea Finance Corporation
Notes to consolidated financial statements
December 31, 2010 and 2009
1. Corporate information
The accompanying consolidated financial statements include the Korea Finance Corporation (“KoFC”) and its subsidiaries (collectively, the “Corporation”). The general information describing the Corporation is provided below.
KoFC
Pursuant to the Korea Finance Corporation Act (the “KoFC Act”), KoFC was established on October 28, 2009 as a result of the spin-off of certain assets and liabilities of Korea Development Bank (“KDB”). The purpose of the KoFC Act is to contribute to the creation of jobs by strengthening national competitiveness and amplifying growth potential; and to the sound growth of the finance industry and national economy by utilizing functions of financial institutions for money brokerage to assist small and medium enterprises to raise funds easily and by supplying and managing funds required for the growth of national economy. KoFC’s business activities include loans, equity investment, guarantees, and securitization of credit risk, all of which are aimed at the support of small and medium enterprises, the development of new growth engine industries, the development of regions, the extension of social infrastructure, the stabilization of financial markets, and the facilitation of sustainable growth. KoFC’s head office is located at 16 Yeouido-dong, Yeongdeungpo-gu, Seoul. As of December 31, 2010, KoFC’s total paid-in capital amounts to approximately (Won)15 trillion and the government of the Republic of Korea (the “Government”) has 100% ownership of KoFC.
Non-cash capital contribution of KDB Financial Group shares
Pursuant to the draft on non-cash capital contribution of state property to KoFC (“Non-Cash Capital Contribution Draft”), which was provisionally authorized on December 29, 2009, the Government made a Non-Cash Capital Contribution of KDB Financial Group (“KDBFG”) shares to KoFC on December 30, 2009, increasing KoFC’s capital to approximately (Won)15 trillion.
In accordance with the Non-Cash Capital Contribution Draft, the valuation of KDBFG shares was completed on June 23, 2010 and as a result, additional settlements were made by KoFC returning to the Government KDBFG shares equivalent to the difference between the finalized per share value and the original value at the time of the capital contribution.
Consolidated subsidiaries
Ownership percentages of the Corporation in its subsidiaries as of December 31, 2010 and 2009 are summarized as follows:
Investor | Subsidiaries | Number of shares | Ownership (%) | |||||||||||
| 2010 | 2009 | |||||||||||||
| Direct subsidiaries: | ||||||||||||||
KoFC | KDBFG | 327,328,647 | 90.26 | 94.27 | ||||||||||
Korea Aerospace Industries, Co., Ltd. | 25,889,572 | 30.11 | 30.11 | |||||||||||
KDB-Tstone PEF(*1)(*2) | — | 62.54 | — | |||||||||||
KoFC-KDB Material and Components Investment Fund | — | 95.13 | — | |||||||||||
KoFC-KDBC Pioneer Champ 2010-4 Venture Investment | — | 95.08 | — | |||||||||||
KoFC KDBC-JKL Frontier Champ 2010-1 PEF(*2)(*3) | — | 78.57 | — | |||||||||||
46
Table of Contents
Korea Finance Corporation
Notes to consolidated financial statements—(Continued)
December 31, 2010 and 2009
Investor | Subsidiaries | Number of shares | Ownership (%) | |||||||||||
| 2010 | 2009 | |||||||||||||
| Indirect subsidiaries: | ||||||||||||||
KDBFG | KDB | 1,850,372,235 | 100.00 | 100.00 | ||||||||||
KDB Capital Corp. | 62,124,521 | 99.92 | 99.92 | |||||||||||
Daewoo Securities Co., Ltd. | 74,309,252 | 39.09 | 39.09 | |||||||||||
KDB Asset Management Co., Ltd. | 7,706,104 | 99.06 | 64.28 | |||||||||||
Korea Infrastructure Investment Asset Management | 1,683,200 | 84.16 | 84.16 | |||||||||||
| (*1) | Represent the subsidiaries of KoFC and KDB. |
| (*2) | Refers to newly acquired entities included as in-scope consolidated subsidiaries |
| (*3) | Represent the subsidiaries of KoFC and KDB Capital Corp. |
KDBFG
KDBFG was incorporated resulting from the spin-off of KDB and by KDBFG issuing common stock amounting to (Won)300,000 million to the shareholder (the Government) on October 28, 2009. KDBFG was established to engage in management of its financial subsidiaries, which operate in the financial services industry, and its head office is located in 16-3 Yeouido-dong, Yeongdeungpo-gu, Seoul. On November 24, 2009, KDBFG acquired 100% ownership of KDB through a stock swap transaction based on the exchange ratio of 0.1636 KDBFG share for every 1 share of KDB. Total number of the KDBFG’s issued and outstanding common shares amounts to 363 million shares with the aggregate par value of (Won)1,813,392 million as of December 31, 2010 and 2009.
Korea Aerospace Industries Co., Ltd.
Korea Aerospace Industries Co., Ltd. (“KAI”) was established on October 11, 1999 and is engaged in the manufacturing and selling of aircraft parts and finished aircraft. The head office and manufacturing plant of KAI are located in Sacheon-si, Gyeongsangnam-do. KAI’s common stock and preferred stock issued amount to (Won)397,190 million and (Won)32,690 million, respectively, as of December 31, 2010.
KDB-Tstone Private Equity Fund
KDB-Tstone Private Equity Fund (“KDB-Tstone”) was established on January 29, 2010 in accordance with the Capital Market and Financial Investment Business Act (“CMFIBA”) to engage in private equity financial services. Paid-in capital of KDB-Tstone is (Won)41,758 million as of December 31, 2010.
KoFC-KDB Material and Components Investment Fund No.1
KoFC-KDB Materials and Components Investment Fund No.1 was established on June 29, 2010 in accordance with the Act on Special Measures for the Promotion of Specialized Enterprises, etc. for Components and Materials to engage in private equity financial service. Paid-in capital of KoFC-KDB Materials and Components Investment Fund No.1 is (Won)25,000 million as of December 31, 2010.
47
Table of Contents
Korea Finance Corporation
Notes to consolidated financial statements—(Continued)
December 31, 2010 and 2009
KoFC-KDBC Pioneer Champ 2010-4 Venture Investment Fund
KoFC-KDBC Pioneer Champ 2010-4 Venture Investment Fund was established on July 14, 2010 in accordance with the Credit Financial Service Act to make investments in the small and medium enterprises which are related to green and new growth engine industries. Paid-in capital of KoFC-KDBC Pioneer Champ 2010-4 Venture Investment Fund is (Won)18,000 million as of December 31, 2010.
KoFC KDBC-JKL Frontier Champ 2010-1 PEF
KoFC KDBC-JKL Frontier Champ 2010-1 PEF was established on August 31, 2010 in accordance with CMFIBA to engage in private equity financial services. Paid-in capital of KoFC KDBC-JKL Frontier Champ 2010-1 PEF is (Won)66,000 million as of December 31, 2010.
Condensed information of indirect subsidiaries
The Corporation’s consolidated indirect subsidiaries as of December 31, 2010 are as follows (Korean won in millions):
Investor | Investee | Net assets | Industry | |||||
KDBFG | KDB | 16,228,350 | Banking | |||||
| Daewoo Securities Co., Ltd. | 2,855,754 | Financial service | ||||||
” | KDB Capital Corp. | 349,317 | Credit financing | |||||
” | KDB Asset Management Co., Ltd. | 66,972 | Financial asset management | |||||
” | Korea Infrastructure Investment Asset | 12,542 | Financial asset management | |||||
2. Summary of significant accounting policies
Basis of financial statement preparation
The Corporation maintains its official accounting records in Korean won and prepares non-consolidated and consolidated financial statements in the Korean language in conformity with accounting principles generally accepted in the Republic of Korea (“Korean GAAP”) and related regulations including the KoFC Act. Certain accounting principles applied by the Corporation that conform with financial accounting standards and accounting principles in the Republic of Korea may not conform with generally accepted accounting principles in other countries. Accordingly, these financial statements are intended for use by those who are informed about Korean accounting principles and practices.
The consolidated financial statements of the Corporation have been prepared in accordance with Korean GAAP, including the Statements of Korea Accounting Standards (“SKAS”) 1 to 25, and related regulations including the KoFC Act. The significant accounting policies followed by the Corporation in preparing the accompanying consolidated financial statements are summarized below.
48
Table of Contents
Korea Finance Corporation
Notes to consolidated financial statements—(Continued)
December 31, 2010 and 2009
Recognition of interest income
Interest income on loans and investments is recognized on an accrual basis. However, interest income on loans overdue or dishonored is recognized on a cash basis except for those secured and guaranteed by financial institutions for which the interest is recognized on an accrual basis.
The Corporation recognizes fees and commissions as well as realized gains and losses from the sale of securities on a trade date basis.
Securities
Securities are classified as either trading, held-to-maturity or available-for-sale securities, as appropriate, and are initially measured at cost, including incidental expenses, with cost being determined using the moving average method for equity securities (but specific identification for equity investment) and specific identification for debt securities. The Company determines the classification of its investments after initial recognition, and, where allowed and appropriate, re-evaluates this designation at each financial year end.
Securities that are acquired and held principally for the purpose of selling them in the near term are classified as trading securities. Debt securities which carry fixed or determinable principal payment and a fixed maturity are classified as held-to-maturity, if the Corporation has the positive intention and ability to hold to maturity. Securities that are not classified as either trading or held-to-maturity are classified as available-for-sale securities.
When held-to-maturity securities are reclassified to available-for-sale, those securities are accounted for at fair value on the reclassification date and the difference between the fair value and book value is reported in other comprehensive income as a gain or loss on valuation of available-for sale securities. When available-for-sale securities are reclassified to held-to-maturity, gains or losses on valuation of these available-for-sale securities, which had been recorded until the reclassification date, continue to be included in accumulated other comprehensive income and are amortized using the effective interest rate method. Such amortization amount is charged to interest income until maturity. Once the reclassification is made, trading securities cannot be reclassified to available-for-sale securities or held-to-maturity securities and vice versa, except in rare circumstances only. In addition, when certain trading securities become non-marketable, such securities are reclassified to available-for-sale at fair value as of the reclassification date.
After initial measurement, available-for-sale securities are measured at fair value with unrealized gains or losses being recognized as other comprehensive income in equity. Likewise, trading securities are also measured at fair value after initial measurement, but with unrealized gains or losses reported as part of net income. Held-to-maturity securities are measured at amortized cost after initial measurement. The cost is computed as the amount initially recognized minus principal repayments, plus or minus the cumulative amortization using the effective interest method, of any difference between the initially recognized amount and the maturity amount.
The fair value of trading and available-for-sale securities that are traded actively in the open market (marketable securities) is measured at the closing price of those securities at the reporting date. Non-marketable equity securities are carried at a value announced by a public independent credit rating agency. If application of such measurement method is not feasible, non-marketable equity securities are measured at cost less impairment, if any, subsequent to initial recognition. Non-marketable debt securities are carried at the present value of their future cash flows discounted using an appropriate interest rate which reflects the issuer’s credit rating, as announced by a public independent credit rating agency.
49
Table of Contents
Korea Finance Corporation
Notes to consolidated financial statements—(Continued)
December 31, 2010 and 2009
If the recoverable amount of a held-to-maturity security and available-for-sale security is less than acquisition cost or carrying value, and such decline is deemed other than temporary, such security is adjusted to its recoverable amount with an impairment loss charged to the statement of operations after eliminating any gains and losses previously recorded in other comprehensive income for temporary changes. A subsequent recovery is also recorded in the statement of operations to the extent of the previously recorded impairment losses if such recovery is attributable to an event occurring subsequent to the recognition of the impairment losses.
Equity method investments
Investments in entities over which the Corporation has significant influence are accounted for using the equity method.
Under the equity method of accounting, the Corporation’s initial investment in an investee is recorded at acquisition cost. Subsequently, the carrying amount of the investment is adjusted to reflect the Corporation’s share of income or loss of the investee in the statement of operations and share of changes in equity that have been recognized directly in the equity of the investee in the related equity account of the Corporation on the statement of financial position. If the Corporation’s share of losses of the investee equals or exceeds its interest in the investee, it suspends recognizing its share of further losses. However, if the Corporation has other long-term interests in the investee, it continues recognizing its share of further losses to the extent of the carrying amount of such long-term interests. The Corporation resumes the application of the equity method if the Corporation’s shares of income or changes in equity of an investee exceed the Corporation’s share of losses accumulated during the period of discontinuance of the equity method of accounting.
At the date of acquisition, the difference between the acquisition cost of the investee and the Corporation’s share of the net fair value of the investee’s identifiable assets and liabilities is accounted for as goodwill or negative goodwill. Goodwill is amortized over its useful life of five years using the straight-line method and the amortization expense is included in the statement of operations. Negative goodwill is amortized based on the investee’s accounting treatments on the related assets and liabilities and charged or credited to the statement of operations.
The Corporation’s share in the investee’s unrealized profits and losses resulting from transactions between the Corporation and its investee are eliminated to the extent of the Corporation’s interest in the investee.
Allowance for possible loan losses
The Corporation provides an allowance for possible loan losses based on the borrowers’ future debt servicing ability (forward looking criteria) as determined by a credit rating model developed by the Corporation. This credit rating model includes financial and non-financial factors of borrowers and classifies the borrowers’ credit risk. Allowances are determined by applying the following minimum percentages to the various credit risk ratings:
Loan classifications | Minimum provision percentages (%) | |||
Normal | 0.5 | |||
Precautionary | 3.5 | |||
Substandard | 20.0 | |||
Doubtful | 50.0 | |||
Estimated loss | 100.0 | |||
50
Table of Contents
Korea Finance Corporation
Notes to consolidated financial statements—(Continued)
December 31, 2010 and 2009
KDB, KDB Capital Corp. and Daewoo Securities Co., Ltd. provide an allowance for possible loan losses based on Regulations on Supervision of Banking Business, Credit Finance Business and Financial Investment Business, respectively.
Troubled debt restructuring
If the present value of a loan is different from its book value due to a rescheduling of terms as agreed by the related parties (as in the case of court receivership, court mediation or workout), the difference in present value of the restructured loan payments and book value of the loan is recorded as an allowance for possible loan losses. The difference recorded as an allowance is amortized to current earnings over the related period using the effective interest rate method. The amortization is recorded as interest income.
Deferred loan fees and expenses
The Corporation defers and amortizes certain fees received from borrowers and expenses paid to third parties associated with originating certain loans. Such fees and expenses are amortized over the life of the associated loan using the straight-line method.
Valuation of long-term receivables (payables) at present value
Receivables or payables arising from long-term installment transactions are stated at present value. The difference between the carrying amount of these receivables or payables and their present value is amortized using the effective interest rate method and credited or charged to the statement of operations over the installment period.
Property and equipment
Property and equipment are stated at cost, less accumulated depreciation. Maintenance and repairs are expensed in the year in which they are incurred. Expenditures which enhance the value or extend the useful lives of the related assets are capitalized as additions to property, plant and equipment.
Depreciation of property and equipment is provided using the straight-line method over the following estimated useful life of assets:
| Years | ||||
Buildings | 20 ~ 50 | |||
Structures | 3 ~ 50 | |||
Machinery | 3 ~ 12 | |||
Others | 3 ~ 10 | |||
Intangible assets
Intangible assets of the Corporation consist of goodwill, trademarks, development costs, software and other intangible assets which are stated at cost less accumulated amortization. Intangible assets are amortized using the straight-line method over a period of 4 to 40 years.
51
Table of Contents
Korea Finance Corporation
Notes to consolidated financial statements—(Continued)
December 31, 2010 and 2009
Impairment of assets
When the recoverable amount of an asset is less than its carrying amount, the decline in value, if material, is deducted from the carrying amount and recognized as an asset impairment loss in the current period.
Bond purchased under resale agreement and bonds sold under repurchase agreements
Bond purchased or sold under resale or repurchase agreements are included in loans and borrowings, respectively. The difference between the selling and repurchase price is treated as interest and is accrued evenly over the period covered by the agreements.
Debenture issuance costs
Debenture issuance costs are amortized as interest expense over the redemption term using the effective interest rate method.
Severance and retirement benefits
In accordance with the Employee Retirement Benefit Security Act and the Corporation’s regulations, employees and directors with at least one year of service are entitled to receive a lump-sum payment upon termination of their employment with the Corporation, based on their length of service and rate of pay at the time of termination. Accrued severance benefits represent the amount which would be payable assuming all eligible employees and directors were to terminate their employment as of the reporting date.
The Corporation has deposited a portion of its severance and retirement benefits obligation with insurance companies such as Samsung Life Insurance Co., Ltd. Those amounts have been offset against the Corporation’s liability for severance and retirement benefits as of such dates.
In accordance with the Korean National Pension Law prior to revision, the Corporation had prepaid a portion of its severance and retirement benefits obligation to the Korean National Pension Corporation (“KNPC”). Such prepayments have been offset against the Corporation’s liability for severance and retirement benefits.
Provisions and contingent liabilities
Provisions are recognized when the Corporation has a present obligation (legal or constructive) as a result of a past event, it is probable that an outflow of resources embodying economic benefits will be required to settle the obligation and a reliable estimate can be made on the amount of the obligation. The provision is used only for expenditures for which the provision was originally recognized. If the effect of the time value of money is material, provisions are stated at present value.
Confirmed acceptances and guarantees, unconfirmed acceptances and guarantees and bills endorsed do not appear on the statements of financial position, but are presented as off-financial position items in the notes to the financial statements. The Corporation provides a provision for such off-financial position items, applying a Credit Conversion Factor (“CCF”) and provision rates, and records the provision as an allowance for possible losses on acceptances and guarantees. KoFC provides a provision for certain portions of unused loan commitments applying the CCF and provision rates, and records the provision as an allowance for possible losses on unused loan commitments.
52
Table of Contents
Korea Finance Corporation
Notes to consolidated financial statements—(Continued)
December 31, 2010 and 2009
The Corporation carries out on-lending loan businesses utilizing commercial financial institutions as financial intermediaries in order to support the growth of small and medium enterprises (SMEs). As part of the on-lending program, The Corporation shares up to a certain portion of credit risks of SMEs selected by the financial intermediaries upon receiving request from the intermediary institutions. The sharing of SMEs credit risks is seen as repayment guarantees and thus recognized as provisions which are computed pursuant to the allowance ratio of possible losses on loans applied by the Corporation.
Income taxes
Current tax assets and liabilities for the current and prior periods are measured at the amount expected to be recovered from, or paid to, the tax authorities. Deferred income taxes are provided using the liability method for the tax effect of temporary differences between the tax bases of assets and liabilities and their reported amounts in the accompanying financial statements. Deferred tax assets and liabilities are measured using the enacted tax rates and laws that will be in effect when the differences are expected to reverse. In addition, current tax and deferred tax are charged or credited directly to equity if the tax relates to items that are charged or credited directly to equity.
Translation of foreign currency and financial statements of overseas branches
Assets and liabilities denominated in foreign currencies are translated into Korean won at the foreign exchange rates as announced by Seoul Money Brokerage Service, Ltd. which are in effect on the reporting date. The resulting translation gains or losses are credited or charged to current income.
Derivative financial instruments
Derivative financial instruments are presented as assets or liabilities valued principally at the fair value of the rights or obligations associated with the derivative contracts. The unrealized gain or loss from a derivative transaction with the purpose of hedging the exposure to changes in the fair value of a recognized asset or liability or unrecognized firm commitment is recognized in current operations. For a derivative instrument with the purpose of hedging the exposure to the variability of cash flows of a recognized asset or liability or a forecasted transaction, the hedge-effective portion of the derivative instrument’s gain or loss is deferred as other comprehensive income in equity. The ineffective portion of the gain or loss is charged or credited to current operations. Derivative instruments that do not meet the criteria for hedge accounting, or contracts for which the Corporation has not elected hedge accounting are measured at fair value with unrealized gains or losses reported in current operations.
Insurance policy reserves
In accordance with the Insurance Business Act (“IBA”) and the Regulation on Supervision of Insurance Business, the Corporation is required to maintain policy reserves as a liability which are measured in accordance with the manual for calculation of premium and policy reserve issued by the Financial Supervisory Commission.
Accounting for trust accounts
The Corporation recognizes, in accordance with the CMFIBA, trust fees earned from trust accounts as income from trust operations. If a loss is incurred on trust accounts that have a guarantee of principal repayment, losses are recognized as a loss from trust operations.
53
Table of Contents
Korea Finance Corporation
Notes to consolidated financial statements—(Continued)
December 31, 2010 and 2009
Significant judgments and accounting estimates
The preparation of financial statements in accordance with Korean GAAP requires management to make judgments, estimates and assumptions that affect the reported amounts of assets and liabilities and disclosure of contingent assets and liabilities at the reporting date, and the reported amounts of revenues and expenses during the reporting period. Actual results could differ from those estimates.
Principles of consolidation
The investment accounts of the parent company and the corresponding equity accounts of the subsidiaries are eliminated in consolidation. The consolidated financial statements reflect only the share of the consolidated subsidiaries post-acquisition earnings and other equity changes after acquiring or gaining control of the subsidiaries.
The difference between the cost of investment and the Corporation’s share of fair value of identifiable net assets of the subsidiaries at the date of acquisition is presented as goodwill or negative goodwill.
When the Company acquires an additional interest in a subsidiary after control is obtained, the difference between the additional cost of investment and the share of additional interest of the subsidiary’s net fair value of assets and liabilities is accounted for as a capital surplus.
All significant inter-company transactions and account balances among consolidated companies are eliminated on consolidation. Unrealized gains or losses included in loans and borrowings arising from transactions between consolidated companies are eliminated on consolidation. The related accounts receivable and payable are also eliminated on consolidation.
Accounts of foreign subsidiaries are maintained in the currency of the country in which they conduct their operations. In translating the foreign currency financial statements into Korean won, the financial statements are translated at the exchange rate prevailing on the reporting date.
The post-acquisition retained earnings and changes in equity of a subsidiary are included in the consolidated financial statements from the date of acquisition or the date when the Corporation obtains control of a subsidiary.
Minority interests are presented as a separate component of equity in the consolidated statement of financial position. Losses in excess of minority interests are treated as a reduction to equity. If there is a subsequent recovery from the losses in excess of the minority interests, a reversal of the previous charge to equity is made up to the extent of the original amount charged to equity.
The Corporation consolidates the financial statements using the parent company’s financial statements reporting period which is coterminous with the reporting period of the consolidated subsidiaries.
54
Table of Contents
Korea Finance Corporation
Notes to consolidated financial statements—(Continued)
December 31, 2010 and 2009
3. Cash and due from banks
The following table summarizes the details of due from banks in Korean won at December 31, 2010 and 2009 (Korean won in millions):
Account | Annual interest rate (%) | 2010 | 2009 | |||||||||||
Bank of Korea (“BOK”) | Reserve deposits with BOK | — | (Won) | 88,165 | (Won) | 646,172 | ||||||||
Korea Exchange Bank | Other deposits | 0.0 ~ 3.8 | 2,150 | 57,635 | ||||||||||
Kookmin Bank | Other deposits | 3.1 ~ 3.3 | 119,404 | 165,304 | ||||||||||
Others | Other deposits | 0.1 ~ 5.0 | 8,367,543 | 5,771,654 | ||||||||||
| (Won) | 8,577,262 | (Won) | 6,640,765 | |||||||||||
The following table summarizes the details of due from banks in foreign currencies at December 31, 2010 and 2009 (Korean won in millions):
Account | Annual interest rate (%) | 2010 | 2009 | |||||||||||
BOK | Reserve deposits with BOK | — | (Won) | 75,648 | (Won) | 59,704 | ||||||||
Shinhan Bank | Other deposits | 0.8 ~ 2.4 | 5,564 | 28,377 | ||||||||||
Hana Bank | Other deposits | 0.5 ~ 1.6 | 51 | 3,381 | ||||||||||
Korea Exchange Bank | Other deposits | 0.4 ~ 1.5 | 8,199 | 78,001 | ||||||||||
Woori Bank | Other deposits | 0.4 ~ 2.1 | 12,057 | 132,838 | ||||||||||
Others | Other deposits | 0.0 ~ 4.1 | 855,263 | 490,996 | ||||||||||
| (Won) | 956,782 | (Won) | 793,297 | |||||||||||
The following table summarizes the details of restricted due from banks at December 31, 2010 and 2009 (Korean won in millions):
| 2010 | 2009 | Restriction | ||||||||
BOK | (Won) | 163,813 | (Won) | 705,876 | Reserve for payment of deposit | |||||
Kokmin Bank | 117,466 | 106,585 | Reserve for payment of principal onbehalf of special purpose entities | |||||||
Shinhan Bank | 79,752 | 65,592 | (*1) | |||||||
ICBC Shanghai and others | 82,086 | 46,689 | Reserve for payment of deposit under local regulation | |||||||
Other | 1,845,845 | 1,577,334 | (*2) | |||||||
| (Won) | 2,288,962 | (Won) | 2,502,076 | |||||||
| (*1) | Reserve for payment of principal on behalf of special purpose entities, maintaining checking account and others |
| (*2) | Customers’ deposits, maintaining checking account, collateral and others |
55
Table of Contents
Korea Finance Corporation
Notes to consolidated financial statements—(Continued)
December 31, 2010 and 2009
The maturities of due from banks outstanding as of December 31, 2010 and 2009 are as follows (Korean won in millions):
| 2010 | ||||||||||||
Maturities | Korean won | Foreign currencies | Total | |||||||||
Within 3 month | (Won) | 7,715,204 | (Won) | 348,883 | (Won) | 8,064,087 | ||||||
After 3 months but no later than 6 months | 163,635 | 217,295 | 380,930 | |||||||||
After 6 months but no later than 1 year | 688,962 | 109,841 | 798,803 | |||||||||
After 1 year but no later than 3 years | 9,461 | 280,149 | 289,610 | |||||||||
After 3 years but no later than 5 years | — | — | — | |||||||||
Later than 5 years | — | 614 | 614 | |||||||||
| (Won) | 8,577,262 | (Won) | 956,782 | (Won) | 9,534,044 | |||||||
| 2009 | ||||||||||||
Maturities | Korean won | Foreign currencies | Total | |||||||||
Within 3 month | (Won) | 4,836,923 | (Won) | 465,890 | (Won) | 5,302,813 | ||||||
After 3 months but no later than 6 months | 413,975 | 45,551 | 459,526 | |||||||||
After 6 months but no later than 1 year | 431,526 | 190,523 | 622,049 | |||||||||
After 1 year but no later than 3 years | 4,000 | 54,004 | 58,004 | |||||||||
After 3 years but no later than 5 years | 33 | — | 33 | |||||||||
Later than 5 years | 954,308 | 37,329 | 991,637 | |||||||||
| (Won) | 6,640,765 | (Won) | 793,297 | (Won) | 7,434,062 | |||||||
Due from banks by financial institution at December 31, 2010 and 2009 are as follows (Korean won in millions):
| 2010 | ||||||||||||
Counterparty | Korean won | Foreign currencies | Total | |||||||||
BOK | (Won) | 88,165 | (Won) | 75,648 | (Won) | 163,813 | ||||||
Other banks | 2,146,229 | 791,625 | 2,937,854 | |||||||||
Others | 6,342,868 | 89,509 | 6,432,377 | |||||||||
| (Won) | 8,577,262 | (Won) | 956,782 | (Won) | 9,534,044 | |||||||
| 2009 | ||||||||||||
Counterparty | Korean won | Foreign currencies | Total | |||||||||
BOK | (Won) | 646,172 | (Won) | 59,704 | (Won) | 705,876 | ||||||
Other banks | 896,667 | 678,360 | 1,575,027 | |||||||||
Others | 5,097,926 | 55,233 | 5,153,159 | |||||||||
| (Won) | 6,640,765 | (Won) | 793,297 | (Won) | 7,434,062 | |||||||
56
Table of Contents
Korea Finance Corporation
Notes to consolidated financial statements—(Continued)
December 31, 2010 and 2009
4. Securities
Trading securities at December 31, 2010 and 2009 consist of the following (Korean won in millions):
| Annual interest rate (%) | 2010 | 2009 | ||||||||||
Trading securities denominated in Korean won: | ||||||||||||
Equity securities | — | (Won) | 266,775 | (Won) | 348,106 | |||||||
Debt securities: | ||||||||||||
Government and public bonds | 2. ~ 5.8 | 2,748,993 | 1,854,088 | |||||||||
Finance bonds | 2.5 ~ 7.1 | 3,300,309 | 2,136,714 | |||||||||
Corporate bonds | 2.9 ~ 9.3 | 2,086,999 | 2,806,250 | |||||||||
| 8,136,301 | 6,797,052 | |||||||||||
Commercial paper | — | 687,853 | 447,143 | |||||||||
Beneficiary certificates: | ||||||||||||
Bond type | — | 111,236 | 107,052 | |||||||||
Hybrid securities | — | 93,432 | 36,366 | |||||||||
Others | — | 140,213 | — | |||||||||
| 344,881 | 143,418 | |||||||||||
Others | — | 98,054 | 721,218 | |||||||||
| 9,533,864 | 8,456,937 | |||||||||||
Trading securities denominated in foreign currency: | ||||||||||||
Equity securities | — | 18,603 | 24,047 | |||||||||
Debt securities | 0.5 ~ 9.1 | 145,186 | 178,254 | |||||||||
Others | — | 1,194 | — | |||||||||
| 164,983 | 202,301 | |||||||||||
| (Won) | 9,698,847 | (Won) | 8,659,238 | |||||||||
The following table summarizes the details of debt securities classified as trading securities at December 31, 2010 and 2009 consist of the following (Korean won in millions):
| 2010 | ||||||||||||
| Par value | Acquisition Cost | Fair value (Book value) | ||||||||||
Government and public bonds | (Won) | 2,712,895 | (Won) | 2,790,788 | (Won) | 2,748,993 | ||||||
Finance bonds | 3,420,489 | 3,329,307 | 3,300,309 | |||||||||
Corporate bonds | 2,064,499 | 2,107,823 | 2,086,999 | |||||||||
Securities denominated in foreign currency | 142,916 | 147,106 | 145,186 | |||||||||
| (Won) | 8,340,799 | (Won) | 8,375,024 | (Won) | 8,281,487 | |||||||
57
Table of Contents
Korea Finance Corporation
Notes to consolidated financial statements—(Continued)
December 31, 2010 and 2009
| 2009 | ||||||||||||
| Par value | Acquisition cost | Fair value (Book value) | ||||||||||
Government and public bonds | (Won) | 1,873,265 | (Won) | 1,829,969 | (Won) | 1,854,088 | ||||||
Finance bonds | 2,138,126 | 2,119,494 | 2,136,714 | |||||||||
Corporate bonds | 2,807,412 | 2,792,826 | 2,806,250 | |||||||||
Securities denominated in foreign currency | 183,631 | 182,734 | 178,254 | |||||||||
| (Won) | 7,002,434 | (Won) | 6,925,023 | (Won) | 6,975,306 | |||||||
The fair value for trading debt securities in Korean won is determined based on the lower of the valuation provided by KIS Pricing, Inc. or the Korea Asset Pricing Co. and the fair value for trading debt securities in foreign currency is determined based on the lower of the valuation provided by NICE Pricing Services, Inc. or the Korea Asset Pricing Co.
Available-for-sale securities at December 31, 2010 and 2009 consist of the following (Korean won in millions):
| Annual interest rate (%) | 2010 | 2009 | ||||||||||
Available-for-sale securities denominated in Korean won: | ||||||||||||
Equity securities: | ||||||||||||
Marketable equity securities | — | (Won) | 3,356,952 | (Won) | 3,570,912 | |||||||
Non-marketable equity securities | — | 8,628,229 | 8,860,905 | |||||||||
| 11,985,181 | 12,431,817 | |||||||||||
Debt securities: | ||||||||||||
Government and public bonds | 2.1 ~ 5.8 | 5,705,088 | 1,134,726 | |||||||||
Finance bonds | 2.9 ~ 7.0 | 5,947,077 | 4,893,602 | |||||||||
Corporate bonds | 2.0 ~ 20.7 | 11,680,043 | 15,190,777 | |||||||||
| 23,332,208 | 21,219,105 | |||||||||||
Beneficiary certificates | — | 3,107,975 | 2,831,543 | |||||||||
Others | — | 192,336 | — | |||||||||
| 38,617,700 | 36,482,465 | |||||||||||
Available-for-sale securities denominated in foreign currency: | ||||||||||||
Non-marketable equity securities | — | 101,006 | 164,294 | |||||||||
Debt securities | 0.4 ~ 12.4 | 1,915,184 | 5,054,652 | |||||||||
Beneficiary certificates | — | 358,335 | 42,333 | |||||||||
Others | — | 199,921 | 10,705 | |||||||||
| 2,574,446 | 5,271,984 | |||||||||||
| (Won) | 41,192,146 | (Won) | 41,754,449 | |||||||||
58
Table of Contents
Korea Finance Corporation
Notes to consolidated financial statements—(Continued)
December 31, 2010 and 2009
The following table summarizes the details of marketable equity securities classified as available-for-sales securities at December 31, 2010 and 2009 are as follows (Korean won in millions):
| 2010 | ||||||
Company | Ownership (%) | Fair value (book value) | ||||
Hyundai E&C Co., Ltd. | 11.1 | (Won) | 823,770 | |||
Hynix Semiconductor Inc. | 5.9 | 811,498 | ||||
STX Pan Ocean Co., Ltd. | 14.9 | 353,347 | ||||
Kumho Industrial Co., Ltd. | 12.1 | 178,066 | ||||
Industrial Bank of Korea | 1.9 | 196,688 | ||||
SK Networks Co., Ltd. | 6.5 | 166,185 | ||||
Asiana Airlines Inc. | 7.0 | 117,852 | ||||
Doosan Heavy Industries & Construction Co., Ltd. | 1.3 | 115,565 | ||||
Kumho Tire Co., Inc. | 14.2 | 74,771 | ||||
Ssangyong Cement Industry Co., Ltd. | 13.8 | 69,140 | ||||
STX Corporation | 4.8 | 68,494 | ||||
S&T Daewoo Co., Ltd. | 8.4 | 38,550 | ||||
Taesan LCD Co., Ltd. | 6.6 | 17,808 | ||||
KOCREF 15CR-REIT | 15.0 | 9,374 | ||||
KPF | 14.1 | 9,025 | ||||
Others | — | 306,819 | ||||
| (Won) | 3,356,952 | |||||
| 2009 | ||||||||
Company | Ownership (%) | Fair value (book value) | ||||||
Hyundai E&C Co., Ltd. | 11.1 | (Won) | 828,554 | |||||
Hynix Semiconductor Inc. | 5.5 | 686,330 | ||||||
SK Networks Co., Ltd. | 8.2 | 209,143 | ||||||
Daewoo International Corp. | 5.3 | 148,192 | ||||||
Industrial Bank of Korea | 1.9 | 146,860 | ||||||
Doosan Heavy Industries & Construction Co., Ltd. | 7.1 | 610,889 | ||||||
STX Pan Ocean Co., Ltd. | 14.9 | 348,718 | ||||||
Ssangyong Cement Industry Co., Ltd. | 13.8 | 94,738 | ||||||
Hyundai Corp. | 9.8 | 46,238 | ||||||
Asiana Airlines Inc. | 7.0 | 44,469 | ||||||
STX Corporation | 4.8 | 40,375 | ||||||
S&T Daewoo Co., Ltd. | 8.4 | 36,470 | ||||||
Sajodaerim Co. | 19.9 | 21,825 | ||||||
Neosemitech Corp. | 2.3 | 13,892 | ||||||
Taesan LCD Co., Ltd. | 6.6 | 9,995 | ||||||
Others | — | 284,224 | ||||||
| (Won) | 3,570,912 | |||||||
59
Table of Contents
Korea Finance Corporation
Notes to consolidated financial statements—(Continued)
December 31, 2010 and 2009
The following table summarizes the details of non-marketable equity securities (including non-marketable equity securities denominated in foreign currencies) classified as available-for-sale securities at December 31, 2010 and 2009 are as follows (Korean won in millions):
| 2010 | ||||||||
Company | Ownership (%) | Fair value (book value) | ||||||
Korea Land & Housing Co.(*) | 14.3 | (Won) | 2,491,947 | |||||
Korea Express Way Co.(*) | 8.2 | 1,930,184 | ||||||
Korea Water Resources Corp.(*) | 9.1 | 976,307 | ||||||
Industrial Bank of Korea (Preferred stock) | 47.9 | 791,695 | ||||||
Export-Import Bank of Korea(*) | 3.0 | 200,000 | ||||||
Korea Asset Management Co.(*) | 8.1 | 146,240 | ||||||
Pantech Co., Ltd. | 15.1 | 103,950 | ||||||
Consumer Credit Assistant Fund Co., Ltd.(*) | 4.7 | 102,198 | ||||||
Sung Jin Geotec Co., Ltd. | 16.6 | 97,484 | ||||||
Daewoo Capital CRV | 24.0 | 92,392 | ||||||
Korea Exchange Ltd. | 3.2 | 90,410 | ||||||
Hyundai Engineering Co., Ltd. | 7.4 | 56,242 | ||||||
Samsung Total Petrochemicals Co., Ltd. | 3.2 | 43,328 | ||||||
CJ GLS Corporation | 14.5 | 35,140 | ||||||
Korea Securities Finance Corp. | 5.2 | 34,523 | ||||||
Others | — | 1,537,195 | ||||||
| (Won) | 8,729,235 | |||||||
| 2009 | ||||||||
Company | Ownership (%) | Fair value (book value) | ||||||
Korea Land & Housing Co.(*) | 15.3 | (Won) | 2,491,947 | |||||
Korea Express Way Co.(*) | 8.6 | 1,930,184 | ||||||
Korea Water Resources Corp.(*) | 9.3 | 976,307 | ||||||
Industrial Bank of Korea (Preferred stock) | 47.9 | 591,132 | ||||||
GM Daewoo Auto & Technology Co. | 17.0 | 206,574 | ||||||
Export-Import Bank of Korea(*) | 3.1 | 200,000 | ||||||
Korea Asset Management Co.(*) | 8.2 | 146,240 | ||||||
Samsung Life Insurance Co., Ltd.(*) | 1.9 | 132,248 | ||||||
Korea Exchange Ltd. | 3.2 | 79,917 | ||||||
Korea Securities Finance Corp. | 9.2 | 57,080 | ||||||
Daewoo Capital CRV | 24.0 | 55,341 | ||||||
Hyundai Merchant Marine Co., Ltd. | 2.0 | 45,334 | ||||||
Samsung Total Petrochemicals Co., Ltd. | 3.2 | 38,391 | ||||||
Hwan Young Steel Ind. Co., Ltd. | 13.7 | 32,983 | ||||||
Shinhan Financial Group Co., Ltd. (Preferred stock) | 2.0 | 30,576 | ||||||
Other | — | 2,010,945 | ||||||
| (Won) | 9,025,199 | |||||||
| (*) | Non-marketable equity securities are measured at cost, because the fair value of those securities cannot be measured reliably. |
60
Table of Contents
Korea Finance Corporation
Notes to consolidated financial statements—(Continued)
December 31, 2010 and 2009
Available-for-sale securities that are restricted for sales at December 31, 2010 and 2009 are summarized as follows (number of shares in thousands and Korean won in millions):
| 2010 | ||||||||
Company | Number of shares | Book value | ||||||
Hyundai E&C Co., Ltd. | 8,739 | (Won) | 559,514 | |||||
Hynix Semiconductor Inc. | 17,234 | 394,331 | ||||||
Pantech Co., Ltd. | 249,427 | 101,268 | ||||||
Kumho Industrial Co., Ltd. | 13,179 | 178,066 | ||||||
Kumho Tire Co., Inc. | 13,161 | 74,771 | ||||||
Ssangyong Cement Industry Co. Ltd. | 11,091 | 69,140 | ||||||
Taesan LCD Co., Ltd. | 7,028 | 17,808 | ||||||
Hanchang Paper Co., Ltd. | 6,409 | 3,230 | ||||||
Daehan Shipbuilding Co., Ltd. | 310 | 2,238 | ||||||
Daewoo Electronics Corp. | 2,413 | 2,085 | ||||||
Young Gwang Stainless Co., Ltd. | 413 | 772 | ||||||
| (Won) | 1,403,223 | |||||||
| 2009 | ||||||||
Company | Number of shares | Book value | ||||||
Hynix Semiconductor Inc. | 32,224 | (Won) | 681,956 | |||||
Hyundai E&C Co., Ltd. | 8,739 | 569,459 | ||||||
Daewoo International Corp. | 5,047 | 143,180 | ||||||
Ssangyong Cement Industry Co., Ltd. | 11,091 | 94,738 | ||||||
Hanchang Paper Co., Ltd. | 9,156 | 4,779 | ||||||
Daihan Eunpakgy Co., Ltd. | 2,815 | 2,846 | ||||||
Daewoo Electronics Corp. | 2,413 | 1,884 | ||||||
| (Won) | 1,498,842 | |||||||
Marketable equity securities that are restricted as to disposal are carried at a value provided by a public independent credit rating agency.
The following table summarizes the details of debt securities classified as available-for-sale securities (including debt securities denominated in foreign currencies) at December 31, 2010 and 2009. (Korean won in millions):
| 2010 | ||||||||||||
| Par value | Acquisition cost | Fair value (Book value) | ||||||||||
Government and public bonds | (Won) | 5,665,791 | (Won) | 5,707,476 | (Won) | 5,705,088 | ||||||
Finance bonds | 5,986,451 | 5,995,771 | 5,947,077 | |||||||||
Corporate bonds | 11,749,137 | 11,828,339 | 11,680,043 | |||||||||
Bonds denominated in foreign currency | 1,844,049 | 1,872,917 | 1,915,184 | |||||||||
| (Won) | 25,245,428 | (Won) | 25,404,503 | (Won) | 25,247,392 | |||||||
61
Table of Contents
Korea Finance Corporation
Notes to consolidated financial statements—(Continued)
December 31, 2010 and 2009
| 2009 | ||||||||||||
| Par value | Acquisition cost | Fair value (Book value) | ||||||||||
Government and public bonds | (Won) | 1,126,718 | (Won) | 1,184,477 | (Won) | 1,134,726 | ||||||
Finance bonds | 4,913,505 | 4,924,715 | 4,893,602 | |||||||||
Corporate bonds | 15,380,011 | 15,247,537 | 15,190,777 | |||||||||
Bonds denominated in foreign currency | 5,244,860 | 5,243,299 | 5,054,652 | |||||||||
| (Won) | 26,665,094 | (Won) | 26,600,028 | (Won) | 26,273,757 | |||||||
The following table summarizes the details of beneficiary certificates classified as available-for-sale securities (including beneficiary certificates denominated in foreign currency) at December 31, 2010 and 2009. (Korean won in millions):
| 2010 | ||||||||||||||||
| Acquisition cost | Book value before valuation | Current period valuation gain (loss) | Book value | |||||||||||||
Beneficiary certificates in Korean won: | ||||||||||||||||
Bond type | (Won) | 1,502,907 | (Won) | 1,484,910 | (Won) | 34,034 | (Won) | 1,518,944 | ||||||||
Equity type | 1,142,768 | 1,142,600 | 22,510 | 1,165,110 | ||||||||||||
Other type | 599,262 | 585,978 | (162,057 | ) | 423,921 | |||||||||||
| 3,244,937 | 3,213,488 | (105,513 | ) | 3,107,975 | ||||||||||||
Beneficiary certificates in foreign currencies | 511,854 | 487,666 | (129,331 | ) | 358,335 | |||||||||||
| (Won) | 3,756,791 | (Won) | 3,701,154 | (Won) | (234,844 | ) | (Won) | 3,466,310 | ||||||||
| 2009 | ||||||||||||||||
| Acquisition cost | Book value before valuation | Current period valuation gain (loss) | Book value | |||||||||||||
Beneficiary certificates in Korean won: | ||||||||||||||||
Bond type | (Won) | 1,664,453 | (Won) | 1,664,453 | (Won) | 25,604 | (Won) | 1,690,057 | ||||||||
Equity type | 82,383 | 79,340 | (1,259 | ) | 78,081 | |||||||||||
Other type | 1,034,057 | 1,022,297 | 41,108 | 1,063,405 | ||||||||||||
| 2,780,893 | 2,766,090 | 65,453 | 2,831,543 | |||||||||||||
Beneficiary certificates in foreign currencies | 41,883 | 41,883 | 450 | 42,333 | ||||||||||||
| (Won) | 2,822,776 | (Won) | 2,807,973 | (Won) | 65,903 | (Won) | 2,873,876 | |||||||||
62
Table of Contents
Korea Finance Corporation
Notes to consolidated financial statements—(Continued)
December 31, 2010 and 2009
Held-to-maturity securities at December 31, 2010 and 2009 consist of the following (Korean won in millions):
| 2010 | ||||||||||||
| Par value | Acquisition cost | Book value | ||||||||||
Government and public bonds | (Won) | 1,478,659 | (Won) | 1,484,669 | (Won) | 1,488,902 | ||||||
Finance bonds | 150,009 | 149,976 | 150,005 | |||||||||
Corporate bonds | 470,191 | 472,460 | 473,044 | |||||||||
Others | 568 | 568 | 568 | |||||||||
Bonds denominated in foreign currency | 262,552 | 262,005 | 262,005 | |||||||||
| (Won) | 2,361,979 | (Won) | 2,369,678 | (Won) | 2,374,524 | |||||||
| 2009 | ||||||||||||
| Par value | Acquisition cost | Book value | ||||||||||
Government and public bonds | (Won) | 1,729,662 | (Won) | 1,723,080 | (Won) | 1,729,378 | ||||||
Finance bonds | 5,611 | 5,611 | 5,611 | |||||||||
Corporate bonds | 74,878 | 75,672 | 75,804 | |||||||||
Bonds denominated in foreign currency | 43,419 | 42,807 | 42,807 | |||||||||
| (Won) | 1,853,570 | (Won) | 1,847,170 | (Won) | 1,853,600 | |||||||
The following table summarizes the details of structured securities classified as available-for-sale securities at December 31, 2010 and 2009. (U.S. dollar ($) in thousands, JPY (¥) in millions, GBP (£) in thousands, CNY in thousands):
| 2010 | ||||||||||||||||||||
Type | Issuer | Par value | Issued date | Maturity | Fair value | Risk | ||||||||||||||
<Available-for-sale Securities> | ||||||||||||||||||||
Stock: | ||||||||||||||||||||
Convertible bonds (JPY) | Heiwa Real Estate Co., Ltd. | ¥ | 50 | 2007.06.15 | 2012.06.22 | ¥ | 49 | Stock index | ||||||||||||
” | Mitsubishi Chemical Holdings Corp. | 100 | 2007.10.09 | 2013.10.22 | 97 | ” | ||||||||||||||
” | Sharp Corp. | 200 | 2007.09.07 | 2013.09.30 | 196 | ” | ||||||||||||||
” | STX Pan Ocean Co., Ltd. | 163 | 2009.11.17 | 2014.11.20 | 175 | ” | ||||||||||||||
” | Toray Industries, Inc. | 200 | 2007.03.06 | 2014.03.12 | 195 | ” | ||||||||||||||
” | Yamada Denki Co., Ltd. | 100 | 2008.06.24 | 2015.03.31 | 95 | ” | ||||||||||||||
” | Yamada Denki Co., Ltd. | 100 | 2008.06.26 | 2015.03.31 | 95 | ” | ||||||||||||||
Exchangeable bonds (USD) | Zeus (Cayman) Pohang | $ | 3,688 | 2009.05.21 | 2011.08.19 | $ | 3,700 | ” | ||||||||||||
Convertible bonds (CNY) | Industrial and Commercial Bank Of China | CNY 1,317 | 2010.08.31 | 2016.08.31 | CNY 1,557 | ” | ||||||||||||||
JPY Total | ¥ | 913 | ¥ | 902 | ||||||||||||||||
USD Total | $ | 3,688 | $ | 3,700 | ||||||||||||||||
CNY Total | CNY 1,317 | CNY 1,557 | ||||||||||||||||||
63
Table of Contents
Korea Finance Corporation
Notes to consolidated financial statements—(Continued)
December 31, 2010 and 2009
| 2009 | ||||||||||||||||||||||
Type | Issuer | Par value | Issued date | Maturity | Fair value | Risk | ||||||||||||||||
<Available-for-sale Securities> | ||||||||||||||||||||||
Stock: | ||||||||||||||||||||||
Convertible bonds (JPY) | Toray Industries Inc. | ¥ | 200 | 2007.03.06 | 2014.03.12 | ¥ | 190 | Stock index | ||||||||||||||
” | Heiwa Real Estate Co., Ltd. | 50 | 2007.06.15 | 2012.06.22 | 48 | ” | ||||||||||||||||
” | Sharp Co., Ltd. | 200 | 2007.09.07 | 2013.09.30 | 190 | ” | ||||||||||||||||
” | LG Display Co., Ltd. | 921 | 2007.10.01 | 2012.04.18 | 1,002 | ” | ||||||||||||||||
” | Mitsubishi Chemical Holdings Co., Ltd. | 100 | 2007.10.09 | 2013.10.22 | 90 | ” | ||||||||||||||||
” | Hynix Semiconductor Inc. | 184 | 2007.12.12 | 2012.12.14 | 183 | ” | ||||||||||||||||
” | Yamada Denki Co., Ltd. | 100 | 2008.06.24 | 2015.03.31 | 91 | ” | ||||||||||||||||
” | Yamada Denki Co., Ltd. | 100 | 2008.06.26 | 2015.03.31 | 91 | ” | ||||||||||||||||
” | KCC Corporation | 461 | 2008.07.03 | 2012.10.30 | 480 | ” | ||||||||||||||||
” | KCC Corporation | 184 | 2008.07.03 | 2012.10.30 | 186 | ” | ||||||||||||||||
” | KCC Corporation | 92 | 2008.07.04 | 2012.10.30 | 93 | ” | ||||||||||||||||
” | KCC Corporation | 92 | 2008.07.16 | 2012.10.30 | 93 | ” | ||||||||||||||||
” | KCC Corporation | 92 | 2008.07.17 | 2012.10.30 | 93 | ” | ||||||||||||||||
” | LG Display Co., Ltd. | 276 | 2008.09.05 | 2012.04.18 | 301 | ” | ||||||||||||||||
” | LG Display Co., Ltd. | 184 | 2008.09.05 | 2012.04.18 | 200 | ” | ||||||||||||||||
” | STX Pan Ocean Co., Ltd. | 184 | 2009.11.17 | 2014.11.20 | 179 | ” | ||||||||||||||||
Exchangeable bonds (JPY) | Donga Pharmaceutical Co., Ltd. | 442 | 2007.08.03 | 2012.07.05 | 468 | ” | ||||||||||||||||
” | Donga Pharmaceutical Co., Ltd. | 479 | 2007.08.03 | 2017.07.05 | 507 | ” | ||||||||||||||||
Convertible bonds (USD) | KCC Corporation | $ | 1,500 | 2008.07.02 | 2012.10.30 | $ | 1,563 | ” | ||||||||||||||
” | Hynix Semiconductor Inc. | 1,000 | 2009.03.17 | 2012.12.14 | 994 | ” | ||||||||||||||||
” | Hynix Semiconductor Inc. | 1,000 | 2009.04.03 | 2012.12.14 | 994 | ” | ||||||||||||||||
” | Hynix Semiconductor Inc. | 1,000 | 2009.04.03 | 2012.12.14 | 994 | ” | ||||||||||||||||
” | Hynix Semiconductor Inc. | 1,000 | 2009.04.17 | 2012.12.14 | 994 | ” | ||||||||||||||||
” | Hynix Semiconductor Inc. | 2,000 | 2009.06.10 | 2012.04.18 | 2,176 | ” | ||||||||||||||||
” | Hynix Semiconductor Inc. | 1,000 | 2009.07.21 | 2012.12.14 | 994 | ” | ||||||||||||||||
” | Hynix Semiconductor Inc. | 2,000 | 2009.07.21 | 2012.12.14 | 1,987 | ” | ||||||||||||||||
” | Hynix Semiconductor Inc. | 1,000 | 2009.07.23 | 2012.12.14 | 994 | ” | ||||||||||||||||
” | Hynix Semiconductor Inc. | 1,000 | 2009.07.23 | 2012.12.14 | 994 | ” | ||||||||||||||||
” | LG Display Co., Ltd. | 276 | 2008.09.05 | 2012.04.18 | 301 | ” | ||||||||||||||||
” | LG Display Co., Ltd. | 184 | 2008.09.05 | 2012.04.18 | 200 | ” | ||||||||||||||||
” | Hynix Semiconductor Inc. | 1,000 | 2009.07.23 | 2012.12.14 | 994 | ” | ||||||||||||||||
Exchangeable bonds (GBP) | Daechang Co., Ltd. | £ | — | 2009.04.09 | 2012.08.09 | £ | 110 | ” | ||||||||||||||
” | Zeus(Cayman) Pohang | 2,015 | 2009.05.21 | 2011.08.19 | 1,966 | ” | ||||||||||||||||
Convertible bonds (GBP) | Hynix Semiconductor Inc. | 1,241 | 2007.12.10 | 2010.06.14 | 1,233 | ” | ||||||||||||||||
JPY Total | ¥ | 4,341 | ¥ | 4,485 | ||||||||||||||||||
USD Total | $ | 13,960 | $ | 14,179 | ||||||||||||||||||
GBP Total | £ | 3,256 | £ | 3,309 | ||||||||||||||||||
64
Table of Contents
Korea Finance Corporation
Notes to consolidated financial statements—(Continued)
December 31, 2010 and 2009
The following table sets forth the Corporation’s available-for-sale and held-to-maturity debt securities at December 31, 2010 and 2009 by contractual maturity date (Korean won in millions):
| 2010 | ||||||||||||||||||||||||
| Government and public bonds | Finance bonds | Corporate bonds | Bonds denominated in foreign currencies | Others | Total | |||||||||||||||||||
Available-for-sale securities: | ||||||||||||||||||||||||
Within 1 year | (Won) | 1,629,241 | (Won) | 2,685,215 | (Won) | 2,907,515 | (Won) | 583,776 | (Won) | — | (Won) | 7,805,747 | ||||||||||||
After 1 year but no later than | 2,727,294 | 3,232,489 | 8,112,057 | 153,936 | — | 14,225,776 | ||||||||||||||||||
After 5 years but no later than | 1,242,935 | 29,373 | 660,471 | 488,786 | — | 2,421,565 | ||||||||||||||||||
Later than 10 years | 105,618 | — | — | 688,686 | — | 794,304 | ||||||||||||||||||
| (Won) | 5,705,088 | (Won) | 5,947,077 | (Won) | 11,680,043 | (Won) | 1,915,184 | (Won) | — | (Won) | 25,247,392 | |||||||||||||
Held-to-maturity securities: | ||||||||||||||||||||||||
Within 1 year | (Won) | 551,547 | (Won) | 10,005 | (Won) | 33,563 | (Won) | 46,032 | (Won) | 568 | (Won) | 641,715 | ||||||||||||
After 1 year but no later than 5 years | 757,172 | 20,000 | 307,589 | 78,456 | — | 1,163,217 | ||||||||||||||||||
After 5 years but no later than 10 years | 25,142 | 70,000 | 10,770 | 61,891 | — | 167,803 | ||||||||||||||||||
Later than 10 years | 155,041 | 50,000 | 121,122 | 75,626 | — | 401,789 | ||||||||||||||||||
| (Won) | 1,488,902 | (Won) | 150,005 | (Won) | 473,044 | (Won) | 262,005 | (Won) | 568 | (Won) | 2,374,524 | |||||||||||||
| 2009 | ||||||||||||||||||||
| Government and public bonds | Finance bonds | Corporate bonds | Bonds denominated in foreign currencies | Total | ||||||||||||||||
Available-for-sale securities: | ||||||||||||||||||||
Within 1 year | (Won) | 225,567 | (Won) | 1,176,282 | (Won) | 5,059,140 | (Won) | 1,480,039 | (Won) | 7,941,028 | ||||||||||
After 1 year but no later than | 519,416 | 3,717,320 | 9,823,693 | 1,911,282 | 15,971,711 | |||||||||||||||
After 5 years but no later than | 304,839 | — | 293,768 | 1,506,182 | 2,104,789 | |||||||||||||||
Later than 10 years | 84,904 | — | 14,176 | 157,149 | 256,229 | |||||||||||||||
| (Won) | 1,134,726 | (Won) | 4,893,602 | (Won) | 15,190,777 | (Won) | 5,054,652 | (Won) | 26,273,757 | |||||||||||
Held-to-maturity securities: | ||||||||||||||||||||
Within 1 year | (Won) | 884,620 | (Won) | 5,211 | (Won) | 1,592 | (Won) | 37,160 | (Won) | 928,583 | ||||||||||
After 1 year but no later than | 752,016 | 400 | 61,150 | 5,647 | 819,213 | |||||||||||||||
After 5 years but no later than | 92,742 | — | 9,785 | — | 102,527 | |||||||||||||||
Later than 10 years | — | — | 3,277 | — | 3,277 | |||||||||||||||
| (Won) | 1,729,378 | (Won) | 5,611 | (Won) | 75,804 | (Won) | 42,807 | (Won) | 1,853,600 | |||||||||||
65
Table of Contents
Korea Finance Corporation
Notes to consolidated financial statements—(Continued)
December 31, 2010 and 2009
Information of securities (except for equity method investments) by country of issuance or origination at December 31, 2010 and 2009 is summarized as follows (Korean won in millions):
2010 | ||||||||||
Country | Book value | Ratio (%) | ||||||||
Trading securities | Korea | (Won) | 9,650,131 | 99.50 | ||||||
| China | 17,486 | 0.18 | ||||||||
| US | 6,857 | 0.07 | ||||||||
| U.K | 2,281 | 0.02 | ||||||||
| Cayman | 2,247 | 0.02 | ||||||||
| Others | 19,845 | 0.21 | ||||||||
| 9,698,847 | 100.00 | |||||||||
Available-for-sale securities | Korea | 39,026,888 | 94.74 | |||||||
| US | 552,552 | 1.34 | ||||||||
| Indonesia | 150,786 | 0.37 | ||||||||
| Japan | 108,282 | 0.26 | ||||||||
| U.K | 103,551 | 0.25 | ||||||||
| Others | 1,250,087 | 3.04 | ||||||||
| 41,192,146 | 100.00 | |||||||||
Held-to-maturity securities | Korea | 2,258,697 | 95.12 | |||||||
| Malaysia | 53,356 | 2.25 | ||||||||
| US | 19,252 | 0.81 | ||||||||
| Hungary | 43,219 | 1.82 | ||||||||
| 2,374,524 | 100.00 | |||||||||
| (Won) | 53,265,517 | |||||||||
2009 | ||||||||||
Country | Book value | Ratio (%) | ||||||||
Trading securities | Korea | (Won) | 8,456,937 | 97.66 | ||||||
| Poland | 7,604 | 0.09 | ||||||||
| U.K | 2,148 | 0.02 | ||||||||
| Indonesia | 1,752 | 0.02 | ||||||||
| Hungary | 822 | 0.01 | ||||||||
| Singapore | 444 | 0.01 | ||||||||
| Others | 189,531 | 2.19 | ||||||||
| 8,659,238 | 100.00 | |||||||||
Available-for-sale securities | Korea | 36,493,170 | 87.40 | |||||||
| US | 559,289 | 1.34 | ||||||||
| India | 191,440 | 0.46 | ||||||||
| Russia | 147,279 | 0.35 | ||||||||
| U.K | 113,567 | 0.27 | ||||||||
| UAE | 95,457 | 0.23 | ||||||||
| Japan | 73,878 | 0.18 | ||||||||
| Vietnam | 7,029 | 0.02 | ||||||||
| Others | 4,073,340 | 9.75 | ||||||||
| 41,754,449 | 100.00 | |||||||||
Held-to-maturity securities | Korea | 1,810,793 | 97.69 | |||||||
| Hungary | 42,807 | 2.31 | ||||||||
| 1,853,600 | 100.00 | |||||||||
| (Won) | 52,267,287 | |||||||||
66
Table of Contents
Korea Finance Corporation
Notes to consolidated financial statements—(Continued)
December 31, 2010 and 2009
Information of securities (except for equity method investments) by industry at December 31, 2010 and 2009 is summarized as follows (Korean won in millions):
2010 | ||||||||||
Industry | Book value | Ratio (%) | ||||||||
Trading securities | Public sector | (Won) | 3,934,769 | 40.57 | ||||||
| Financial services | 3,008,946 | 31.02 | ||||||||
| Others | 2,755,132 | 28.41 | ||||||||
| 9,698,847 | 100.00 | |||||||||
Available-for-sale securities | Financial services | 19,255,217 | 46.74 | |||||||
| Manufacturing | 5,402,939 | 13.12 | ||||||||
| Public sector | 4,128,433 | 10.02 | ||||||||
| Construction | 3,374,509 | 8.19 | ||||||||
| Electricity, gas and water supply | 2,283,345 | 5.54 | ||||||||
| Others | 6,747,703 | 16.39 | ||||||||
| 41,192,146 | 100.00 | |||||||||
Held-to-maturity securities | Real estate renting and business services | 591,615 | 24.92 | |||||||
| Construction | 467,003 | 19.67 | ||||||||
| Electricity, gas and water supply | 462,001 | 19.46 | ||||||||
| Public sector | 428,364 | 18.04 | ||||||||
| Others | 425,541 | 17.91 | ||||||||
| 2,374,524 | 100.00 | |||||||||
| (Won) | 53,265,517 | |||||||||
2009 | ||||||||||
Industry | Book value | Ratio (%) | ||||||||
Trading securities | Financial services | (Won) | 3,943,276 | 45.54 | ||||||
Public sector | 1,639,941 | 18.94 | ||||||||
Others | 3,076,021 | 35.52 | ||||||||
| 8,659,238 | 100.00 | |||||||||
Available-for-sale securities | Financial services | 18,576,485 | 44.49 | |||||||
Manufacturing | 1,246,053 | 2.98 | ||||||||
Public sector | 2,176,488 | 5.21 | ||||||||
Construction | 2,758,738 | 6.61 | ||||||||
Electricity, gas and water supply | 976,307 | 2.34 | ||||||||
Others | 16,020,378 | 38.37 | ||||||||
| 41,754,449 | 100.00 | |||||||||
Held-to-maturity securities | Public sector | 119,177 | 4.75 | |||||||
Financial services | 88,029 | 6.43 | ||||||||
Others | 1,646,394 | 88.82 | ||||||||
| 1,853,600 | 100.00 | |||||||||
| (Won) | 52,267,287 | |||||||||
67
Table of Contents
Korea Finance Corporation
Notes to consolidated financial statements—(Continued)
December 31, 2010 and 2009
Information of securities (except for equity method investments) by type of instrument at December 31, 2010 and 2009 is summarized as follows (Korean won in millions):
2010 | ||||||||||
Type | Book value | Ratio (%) | ||||||||
Trading securities | Equity securities | (Won) | 285,378 | 2.94 | ||||||
| Fixed rate bonds | 8,278,863 | 85.36 | ||||||||
| Floating rate bonds | 2,624 | 0.03 | ||||||||
| Beneficiary certificates | 346,075 | 3.57 | ||||||||
| Others | 785,907 | 8.10 | ||||||||
| 9,698,847 | 100.00 | |||||||||
Available-for-sale securities | Equity securities | 8,002,400 | 19.43 | |||||||
| Investments in partnerships | 4,083,787 | 9.91 | ||||||||
| Fixed rate bonds | 22,523,486 | 54.68 | ||||||||
| Floating rate bonds | 2,641,449 | 6.41 | ||||||||
| Beneficiary certificates | 3,548,768 | 8.62 | ||||||||
| Others | 392,256 | 0.95 | ||||||||
| 41,192,146 | 100.00 | |||||||||
Held-to-maturity securities | Fixed rate bonds | 2,235,272 | 94.14 | |||||||
| Floating rate bonds | 139,252 | 5.86 | ||||||||
| 2,374,524 | 100.00 | |||||||||
| (Won) | 53,265,517 | |||||||||
2009 | ||||||||||
Type | Book value | Ratio (%) | ||||||||
Trading securities | Equity securities | (Won) | 372,153 | 4.30 | ||||||
| Fixed rate bonds | 6,808,777 | 78.63 | ||||||||
| Floating rate bonds | 202,830 | 2.34 | ||||||||
| Beneficiary certificates | 143,418 | 1.66 | ||||||||
| Others | 1,132,060 | 13.07 | ||||||||
| 8,659,238 | 100.00 | |||||||||
Available-for-sale securities | Equity securities | 8,600,543 | 20.60 | |||||||
| Investments in partnerships | 3,995,568 | 9.57 | ||||||||
| Fixed rate bonds | 25,079,464 | 60.06 | ||||||||
| Floating rate bonds | 1,194,293 | 2.86 | ||||||||
| Beneficiary certificates | 2,873,876 | 6.88 | ||||||||
| Others | 10,705 | 0.03 | ||||||||
| 41,754,449 | 100.00 | |||||||||
Held-to-maturity securities | Fixed rate bonds | 1,853,600 | 100.00 | |||||||
| (Won) | 52,267,287 | |||||||||
68
Table of Contents
Korea Finance Corporation
Notes to consolidated financial statements—(Continued)
December 31, 2010 and 2009
The following table summarizes the details of equity method investments and their changes in carrying value for the year ended December 31, 2010 and the period from October 28, 2009 to December 31, 2009 (Korean won in millions):
| Year ended Dec. 31, 2010 | ||||||||||||||||||||||||||||||||||||||||||||
| Equity method valuation | ||||||||||||||||||||||||||||||||||||||||||||
| Owner-ship (%) | Beginning balance | Acquisition (disposal) | Dividend | Others | Book value before valuation | Gain (loss) | Other comprehensive income | Changes in retained earnings | Book value | Proportionate net asset value | ||||||||||||||||||||||||||||||||||
Korea Electric Power Co. (*1) | 29.95 | (Won) | 9,037,049 | (Won) | — | (Won) | — | (Won) | — | (Won) | 9,037,049 | (Won) | 239,077 | (Won) | 6,203 | (Won) | — | (Won) | 9,282,329 | (Won) | 12,294,287 | |||||||||||||||||||||||
Daewoo E&C Co., Ltd. (*2) | 22.41 | — | 1,041,774 | — | — | 1,041,774 | — | — | — | 1,041,774 | 588,245 | |||||||||||||||||||||||||||||||||
GM Daewoo Auto & | 17.02 | — | 751,122 | — | — | 751,122 | — | — | — | 751,122 | 470,766 | |||||||||||||||||||||||||||||||||
Korea Tourism Organization (*1) | 43.58 | 248,051 | — | (15,726 | ) | — | 232,325 | (91,053 | ) | 168,455 | — | 309,727 | 309,727 | |||||||||||||||||||||||||||||||
Korea VTL Fund I (*2) | 41.67 | 172,377 | 46,875 | (8,199 | ) | — | 211,053 | 10,043 | — | — | 221,096 | 222,308 | ||||||||||||||||||||||||||||||||
Tong Yang Cement Corp. (*2) | 36.00 | — | 202,419 | — | — | 202,419 | (3,600 | ) | 8,258 | — | 207,077 | 207,077 | ||||||||||||||||||||||||||||||||
KDB Electronic Private Special Asset Investment (*2) | 50.00 | 126,150 | 23,709 | (7,394 | ) | — | 142,465 | 7,947 | — | — | 150,412 | 149,840 | ||||||||||||||||||||||||||||||||
Korea Railroad Fund I (*2) | 50.00 | 73,176 | 58,502 | (3,603 | ) | — | 128,075 | 5,080 | — | — | 133,155 | 133,382 | ||||||||||||||||||||||||||||||||
Korea Infrastructure Fund II (*2) | 26.67 | 96,795 | 18,369 | (4,635 | ) | — | 110,529 | 4,468 | — | — | 114,997 | 114,997 | ||||||||||||||||||||||||||||||||
Starkist Co., Ltd. (*2) | 30.00 | 100,022 | — | (3,742 | ) | — | 96,280 | 12,176 | (2,970 | ) | — | 105,486 | 105,486 | |||||||||||||||||||||||||||||||
Korea Education Fund II (*2) | 50.00 | 73,312 | 9,137 | (3,913 | ) | — | 78,536 | 4,395 | — | — | 82,931 | 83,604 | ||||||||||||||||||||||||||||||||
DK Maritime S.A. (*2) | 50.00 | 69,795 | — | — | — | 69,795 | (2,093 | ) | (1,672 | ) | — | 66,030 | 66,030 | |||||||||||||||||||||||||||||||
KLDS Maritime S.A. (*2) | 50.00 | 27,361 | — | — | — | 27,361 | (1,012 | ) | (529 | ) | — | 25,820 | 25,820 | |||||||||||||||||||||||||||||||
Poongan-KDBC Corporation Restructuring Limited | 56.79 | 45,929 | 946 | — | (20,995 | ) | 25,880 | (665 | ) | — | — | 25,215 | 25,215 | |||||||||||||||||||||||||||||||
KoFC-KVIC Job Creation | 83.33 | — | 24,000 | — | — | 24,000 | (312 | ) | — | — | 23,688 | 23,688 | ||||||||||||||||||||||||||||||||
Cofeedcn Co., Ltd. (*2) | 42.13 | — | 18,000 | — | — | 18,000 | 1,891 | — | — | 19,891 | 11,196 | |||||||||||||||||||||||||||||||||
KoFC Macquarie Growth Champ 2010-1 PEF (*2) | 44.94 | — | 19,560 | — | — | 19,560 | (92 | ) | — | — | 19,468 | 19,468 | ||||||||||||||||||||||||||||||||
KoFC Skylake Growth Champ 2010-5 PEF (*2) | 64.66 | — | 17,026 | — | — | 17,026 | (167 | ) | — | — | 16,859 | 16,859 | ||||||||||||||||||||||||||||||||
Sewon Co., Ltd. (*2) | 16.62 | 12,011 | — | (69 | ) | — | 11,942 | 4,181 | — | — | 16,123 | 16,123 | ||||||||||||||||||||||||||||||||
PTE Trading Securities (*2) | 38.35 | 6,752 | 5,702 | — | — | 12,454 | 1,065 | 126 | — | 13,645 | 10,675 | |||||||||||||||||||||||||||||||||
Korea Appraisal Board (*2) | 30.60 | 12,648 | — | (224 | ) | — | 12,424 | 884 | — | — | 13,308 | 13,308 | ||||||||||||||||||||||||||||||||
Others | — | 198,489 | 561,531 | (31,434 | ) | (21,617 | ) | 706,969 | 1,590 | (445,708 | ) | 6,068 | 268,919 | |||||||||||||||||||||||||||||||
| (Won) | 10,299,917 | (Won) | 2,798,672 | (Won) | (78,939 | ) | (Won) | (42,612 | ) | (Won) | 12,977,038 | (Won) | 193,803 | (Won) | (267,837 | ) | (Won) | 6,068 | (Won) | 12,909,072 | ||||||||||||||||||||||||
| (*1) | The Corporation obtained audited financial statements of the investees. |
| (*2) | The Corporation obtained unaudited financial statements signed by the investees’ management. The Corporation confirmed that the investees’ unaudited financial statements reflected significant transactions or resolution of accounting issues which the Corporation identified. |
69
Table of Contents
Korea Finance Corporation
Notes to consolidated financial statements—(Continued)
December 31, 2010 and 2009
| From Oct. 28, 2009 to Dec. 31, 2009 | ||||||||||||||||||||||||||||||||
| Equity method valuation | ||||||||||||||||||||||||||||||||
| Ownership (%) | Beginning balance | Addition of subsidiaries | Book value before valuaion | Gain (loss) | Other comprehensive income | Book value | Proportionate net asset value | |||||||||||||||||||||||||
Korea Electric Power Co. | 29.9 | (Won) | 8,981,659 | (Won) | — | (Won) | 8,981,659 | (Won) | (44,840 | ) | (Won) | 100,230 | (Won) | 9,037,049 | (Won) | 12,306,480 | ||||||||||||||||
Korea Tourism Organization | 43.6 | 165,978 | — | 165,978 | 82,046 | 27 | 248,051 | 248,051 | ||||||||||||||||||||||||
Korea VTL Fund I | 41.7 | — | 172,377 | — | — | — | 172,377 | 173,994 | ||||||||||||||||||||||||
KDB Electronic Private Special Asset Investment | 50.0 | — | 126,150 | — | — | — | 126,150 | 125,388 | ||||||||||||||||||||||||
Korea Infrastructure Fund II | 26.7 | — | 96,795 | — | — | — | 96,795 | 96,795 | ||||||||||||||||||||||||
Korea Railroad Fund I | 50.0 | — | 73,176 | — | — | — | 73,176 | 73,479 | ||||||||||||||||||||||||
Korea Education Fund II | 50.0 | — | 73,312 | — | — | — | 73,312 | 70,037 | ||||||||||||||||||||||||
DK Maritime S.A. | 50.0 | — | 69,795 | — | — | — | 69,795 | 69,795 | ||||||||||||||||||||||||
Moorim P&P Co., Ltd. | 18.3 | — | 29,628 | — | — | — | 29,628 | 64,016 | ||||||||||||||||||||||||
Poongan-KDBC Corporation Restructuring Limited Partnership | 68.5 | — | 45,929 | — | — | — | 45,929 | 45,929 | ||||||||||||||||||||||||
KLDS Maritime S.A. | 50.0 | — | 27,361 | — | — | — | 27,361 | 27,361 | ||||||||||||||||||||||||
Renaissance 12 | 16.6 | — | 19,119 | — | — | — | 19,119 | 19,119 | ||||||||||||||||||||||||
National Pension Service 06-7 KDBC Restructuring Investment | 37.6 | — | 14,563 | — | — | — | 14,563 | 14,563 | ||||||||||||||||||||||||
Leaders PEF | 6.5 | — | 13,168 | — | — | — | 13,168 | 13,168 | ||||||||||||||||||||||||
Korea Appraisal Board | 30.6 | 13,924 | — | 13,924 | (1,276 | ) | — | 12,648 | 12,648 | |||||||||||||||||||||||
Sewon Co., Ltd. | 16.6 | — | 12,011 | — | — | — | 12,011 | 12,011 | ||||||||||||||||||||||||
Hanmifine Chemical Co., Ltd. | 25.0 | — | 11,357 | — | — | — | 11,357 | 11,357 | ||||||||||||||||||||||||
KDBC-JKL Private Equity Fund | 22.2 | — | 8,822 | — | — | — | 8,822 | 8,822 | ||||||||||||||||||||||||
S&K Co., Ltd. | 29.4 | 528 | — | 528 | 152 | 1,843 | 2,523 | 2,523 | ||||||||||||||||||||||||
Korea Aerospace F.W., Inc. | 100.0 | 1 | — | 1 | 604 | — | 605 | 605 | ||||||||||||||||||||||||
KAI Image Inc. | 50.0 | — | — | 18 | — | 18 | 18 | |||||||||||||||||||||||||
Other | — | — | 205,460 | — | — | — | 205,460 | |||||||||||||||||||||||||
| (Won) | 9,162,090 | (Won) | 999,023 | (Won) | 9,162,090 | (Won) | 36,704 | (Won) | 102,100 | (Won) | 10,299,917 | |||||||||||||||||||||
70
Table of Contents
Korea Finance Corporation
Notes to consolidated financial statements—(Continued)
December 31, 2010 and 2009
For the year ended December 31, 2010 and the period from October 28, 2009 to December 31, 2009, the unamortized difference between cost of investments and the Corporation’s portion of the investee’s net asset value at the acquisition date representing goodwill (negative goodwill) is summarized as follows (Korean won in millions):
| Year ended Dec. 31, 2010 | ||||||||||||||||
| Beginning balance | Addition of subsidiaries | Amortization (recovery) | Ending balance | |||||||||||||
Korea Electric Power Co. | (Won) | (3,269,431 | ) | (Won) | — | (Won) | 257,473 | (Won) | (3,011,958 | ) | ||||||
Korea VTL Fund I | (1,617 | ) | — | 405 | (1,212 | ) | ||||||||||
KDB Electronic Private Special Asset Investment | 762 | — | (190 | ) | 572 | |||||||||||
Korea Railroad Fund I | (303 | ) | — | 76 | (227 | ) | ||||||||||
Korea Education Fund II | (897 | ) | — | 224 | (673 | ) | ||||||||||
Daewoo E&C Co., Ltd. | — | 453,529 | — | 453,529 | ||||||||||||
Cofeedcn Co., Ltd. | — | 8,695 | — | 8,695 | ||||||||||||
PTE Trading Securities | 714 | 2,829 | (573 | ) | 2,970 | |||||||||||
GM Daewoo Auto & Technology | — | 280,356 | — | 280,356 | ||||||||||||
| From Oct. 28, 2009 to Dec. 31, 2009 | ||||||||||||||||
| Beginning balance | Addition of subsidiaries | Amortization | Ending balance | |||||||||||||
Korea Electric Power Co. | (Won) | (3,334,328 | ) | (Won) | — | (Won) | 64,897 | (Won) | (3,269,431 | ) | ||||||
Moorim P&P Co., Ltd. | — | (34,388 | ) | — | (34,388 | ) | ||||||||||
Korea VTL Fund I | — | (1,617 | ) | — | (1,617 | ) | ||||||||||
Korea Railroad Fund I | — | (303 | ) | — | (303 | ) | ||||||||||
KDB Electronic Private Special Asset Investment | — | 762 | — | 762 | ||||||||||||
Korea Education Fund II | — | (897 | ) | — | (897 | ) | ||||||||||
The market values of listed equity method investments at December 31, 2010 and 2009 are as follows (Korean won in millions):
| 2010 | ||||||||
| Market value | Book value | |||||||
Korea Electric Power Co. | (Won) | 5,803,230 | (Won) | 9,282,329 | ||||
Tong Yang Cement Corp. | 90,646 | 207,077 | ||||||
Daewoo E&C Co., Ltd. | 1,155,108 | 1,041,774 | ||||||
Sewon Co., Ltd. | 10,368 | 16,123 | ||||||
| (Won) | 7,059,352 | (Won) | 10,547,303 | |||||
| 2009 | ||||||||
| Market value | Book value | |||||||
Korea Electric Power Co. | (Won) | 6,696,774 | (Won) | 9,037,049 | ||||
Moorim P&P Co., Ltd. | 31,462 | 29,628 | ||||||
Sewon Co., Ltd. | 8,050 | 12,011 | ||||||
| (Won) | 6,736,286 | (Won) | 9,078,688 | |||||
71
Table of Contents
Korea Finance Corporation
Notes to consolidated financial statements—(Continued)
December 31, 2010 and 2009
Investees that are not accounted for using the equity method of accounting, while the Corporation holds more than 15% of voting shares at December 31, 2010 and 2009, are as follows (Korean won in millions):
| 2010 | ||||||||||||||||||
| Ownership (%) | Acquisition cost | Book value | Net asset value or fair value | Reason | ||||||||||||||
Troica Resources Investment PEF | 45.79 | (Won) | 2,429 | (Won) | 2,429 | (Won) | 2,429 | Korea Financial Accounting Standards 15, Paragraph No.2 (*1) | ||||||||||
KoFC-Daesung Pioneer Champ 2010-2 Venture Investment Fund |
| 45.00 |
|
| 3,600 |
|
| 3,600 |
|
| 3,600 |
| ” | |||||
KoFC-Bokwang Pioneer Champ 2010-3 Investment Fund |
| 42.86 |
|
| 3,000 |
|
| 3,000 |
|
| 3,000 |
| ” | |||||
KoFC-WIP Pioneer Champ 2010-6 Investment Fund |
| 70.00 |
|
| 4,200 |
|
| 4,200 |
|
| 4,200 |
| ” | |||||
KoFC-KB Pioneer Champ 2010-8 Investment Fund |
| 50.00 |
|
| 3,000 |
|
| 3,000 |
|
| 3,000 |
| ” | |||||
KoFC-HVIC Pioneer Champ 2010-11 Investment Fund |
| 50.00 |
|
| 4,000 |
|
| 4,000 |
|
| 4,000 |
| ” | |||||
KoFC-Kiwoom Pioneer Champ 2010-12 Investment Fund |
| 70.00 |
|
| 2,800 |
|
| 2,800 |
|
| 2,800 |
| ” | |||||
KoFC-BK Pioneer Champ 2010-13 Investment Fund |
| 61.00 |
|
| 2,600 |
|
| 2,600 |
|
| 2,600 |
| ” | |||||
KoFC-Hanwha Pioneer Champ 2010-14 Investment Fund |
| 70.00 |
|
| 6,300 |
|
| 6,300 |
|
| 6,300 |
| ” | |||||
KoFC-Ione Pioneer Champ 2010-15 Investment Fund |
| 70.00 |
|
| 2,800 |
|
| 2,800 |
|
| b |
| Korea Financial Accounting Standards 15, Paragraph No.2(*1) | |||||
KoFC-Atinum Pioneer Champ 2010-16 Investment Fund |
| 70.00 |
|
| 2,800 |
|
| 2,800 |
|
| 2,800 |
| ” | |||||
KoFC-Daekyung Pioneer Champ 2010-18 Investment Fund |
| 46.67 |
|
| 2,800 |
|
| 2,800 |
|
| 2,800 |
| ” | |||||
KoFC-UTC Pioneer Champ 2010-19 Investment Fund |
| 70.00 |
|
| 2,800 |
|
| 2,800 |
|
| 2,800 |
| ” | |||||
NANAU Japan Technology Investment |
| 16.67 |
|
| 500 |
|
| 500 |
|
| 500 |
| ” | |||||
Sung Jin Geotech Co., Ltd. | | 16.61 | | | 30,000 | | | 97,484 | | | — | | Non-voting preferred stock | |||||
Ajin P&P Inc. | | 25.90 | | | 4,855 | | | 9,600 | | | — | | Corporate Restructuring Promotion Act. | |||||
Hae Dong Engineering Co., Ltd. | 100.00 | 100 | 100 | 100 | ” | |||||||||||||
DSME Oman Llc. | 70.00 | 924 | 924 | — | ” | |||||||||||||
DSME Far East | 100.00 | — | — | — | ” | |||||||||||||
SBM Ship Yard Ltd. | 33.33 | 7 | 7 | — | ” | |||||||||||||
DSME E&R Trading PTE Ltd. | 51.00 | 52 | 52 | — | ” | |||||||||||||
Dewind Engineering | 100.00 | 3,963 | 3,963 | 368 | ” | |||||||||||||
Daewoo Capital CRV | 23.97 | 28,628 | 92,392 | 92,392 | ” | |||||||||||||
| (Won) | 110,208 | (Won) | 246,201 | (Won) | 134,539 | |||||||||||||
72
Table of Contents
Korea Finance Corporation
Notes to consolidated financial statements—(Continued)
December 31, 2010 and 2009
| (*1) | The Corporation does not apply equity method on investees which have less than (Won)10 billion of total assets because those investees are not significant. |
| 2009 | ||||||||||||||||||
| Ownership (%) | Acquisition cost | Book value | Net asset value or fair value | Reason | ||||||||||||||
Korea Land & Housing Co. | 15.29 | 2,462,522 | 2,491,947 | 2,491,947 | The Government owns over two third of voting shares. | |||||||||||||
Restricted securities at December 31, 2010 and 2009 are summarized as follows (Korean won in millions):
| 2010 | ||||||
| Book value | Restriction | |||||
BOK | (Won) | 1,660,336 | Collateral for overdrafts and others | |||
Korea Securities Depository | 6,992,111 | Collateral relating to repurchase transactions and others | ||||
Korea Exchange Ltd. | 184,067 | Collateral relating to futures-option trading | ||||
Other | 7,546,694 | Collateral relating to futures trading | ||||
| (Won) | 16,383,208 | |||||
| 2009 | ||||||
| Book value | Restriction | |||||
BOK | (Won) | 1,974,873 | Collateral for overdrafts and others | |||
Korea Securities Depository | 10,312,766 | Collateral relating to repurchase transactions and others | ||||
Korea Exchange Ltd. | 246,993 | Collateral relating to futures-option trading | ||||
Other | 3,314,007 | Collateral relating to futures trading | ||||
| (Won) | 15,848,639 | |||||
73
Table of Contents
Korea Finance Corporation
Notes to consolidated financial statements—(Continued)
December 31, 2010 and 2009
5. Loans receivable
Total loans receivable at December 31, 2010 and 2009 consist of the following (Korean won in millions):
| 2010 | 2009 | |||||||
Loans in Korean won | (Won) | 49,495,235 | (Won) | 42,853,289 | ||||
Loans in foreign currencies | 19,556,454 | 19,221,421 | ||||||
Bills bought in foreign currencies | 1,725,333 | 2,316,385 | ||||||
Domestic import usance | 3,075,089 | 3,458,112 | ||||||
Bonds purchased under resale agreements | 1,143,211 | 1,039,831 | ||||||
Call loans | 2,578,885 | 1,150,240 | ||||||
Privately-placed corporate bonds | 7,004,926 | 11,413,019 | ||||||
Others | 3,117,041 | 3,104,003 | ||||||
| 87,696,173 | 84,556,300 | |||||||
Less allowance for possible loan losses | (2,293,307 | ) | (1,745,270 | ) | ||||
Less deferred loan fees | (38,019 | ) | (18,818 | ) | ||||
Present value discount, net | (2,486 | ) | — | |||||
| (Won) | 85,362,361 | (Won) | 82,792,212 | |||||
Loans in Korean won and foreign currencies at December 31, 2010 and 2009 consist of the following (Korean won in millions):
| 2010 | 2009 | |||||||
Loans receivable in Korean won: | ||||||||
Loans for working capital | (Won) | 17,712,923 | (Won) | 15,113,427 | ||||
Loans for facility developments | 25,166,056 | 22,418,691 | ||||||
Loans for households | 961,246 | 35,507 | ||||||
Loans for public sector and others | 5,655,010 | 5,285,664 | ||||||
| 49,495,235 | 42,853,289 | |||||||
Loans receivable in foreign currencies: | ||||||||
Loans in foreign currencies | 14,936,031 | 14,499,430 | ||||||
Loans to international bank for reconstruction and development | 1,020,352 | 1,417,786 | ||||||
Off-shore loans in foreign currencies | 3,600,071 | 3,304,205 | ||||||
| 19,556,454 | 19,221,421 | |||||||
Others | 18,644,485 | 22,481,590 | ||||||
| (Won) | 87,696,174 | (Won) | 84,556,300 | |||||
74
Table of Contents
Korea Finance Corporation
Notes to consolidated financial statements—(Continued)
December 31, 2010 and 2009
Concentrations of loans in Korean won and foreign currency by country at December 31, 2009 and 2010 are summarized as follows (Korean won in millions):
| 2010 | ||||||||
| Amount | Ratio (%) | |||||||
Korea | (Won) | 59,576,843 | 86.28 | |||||
China | 1,856,045 | 2.69 | ||||||
Ireland | 704,781 | 1.02 | ||||||
US | 410,841 | 0.59 | ||||||
Marshall Islands | 159,446 | 0.23 | ||||||
Others | 6,343,733 | 9.19 | ||||||
| (Won) | 69,051,689 | 100.00 | ||||||
| 2009 | ||||||||
| Amount | Ratio (%) | |||||||
Korea | (Won) | 54,016,088 | 87.02 | |||||
China | 1,676,750 | 2.70 | ||||||
Ireland | 869,487 | 1.40 | ||||||
US | 449,672 | 0.72 | ||||||
Indonesia | 209,101 | 0.34 | ||||||
Others | 4,853,612 | 7.82 | ||||||
| (Won) | 62,074,710 | 100.00 | ||||||
Concentrations of loans in Korean won and loans in foreign currencies by industry at December 31, 2010 and 2009 are listed as follows (Korean won in millions):
| 2010 | ||||||||
| Amount | Ratio (%) | |||||||
Manufacturing | (Won) | 33,576,596 | 48.63 | |||||
Financial services | 10,209,219 | 14.78 | ||||||
Transportation services | 5,833,557 | 8.45 | ||||||
Electricity, gas and water supply | 2,135,396 | 3.09 | ||||||
Wholesale and retail | 1,452,037 | 2.10 | ||||||
Construction | 867,222 | 1.26 | ||||||
Others | 14,977,662 | 21.69 | ||||||
| (Won) | 69,051,689 | 100.00 | ||||||
| 2009 | ||||||||
| Amount | Ratio (%) | |||||||
Manufacturing | (Won) | 34,044,015 | 54.84 | |||||
Financial services | 7,809,179 | 12.58 | ||||||
Transportation services | 5,673,191 | 9.14 | ||||||
Electricity, gas and water supply | 3,029,352 | 4.88 | ||||||
Wholesale and retail | 1,668,268 | 2.69 | ||||||
Public sector | 1,647,950 | 2.65 | ||||||
Others | 8,202,755 | 13.22 | ||||||
| (Won) | 62,074,710 | 100.00 | ||||||
75
Table of Contents
Korea Finance Corporation
Notes to consolidated financial statements—(Continued)
December 31, 2010 and 2009
The maturity of loans in Korean won and loans in foreign currencies at December 31, 2010 and 2009 is summarized as follows (Korean won in millions):
| 2010 | ||||||||||||
| Korean won | Foreign currencies | Total | ||||||||||
Within 6 months | (Won) | 12,893,383 | (Won) | 3,844,812 | (Won) | 16,738,195 | ||||||
After 6 months but no later than 1 year | 8,271,092 | 3,324,512 | 11,595,604 | |||||||||
After 1 year but no later than 3 years | 13,449,785 | 7,645,497 | 21,095,282 | |||||||||
After 3 years but no later than 5 years | 7,937,132 | 2,661,117 | 10,598,249 | |||||||||
Later than 5 years | 6,943,843 | 2,080,516 | 9,024,359 | |||||||||
| (Won) | 49,495,235 | (Won) | 19,556,454 | (Won) | 69,051,689 | |||||||
| 2009 | ||||||||||||
| Korean won | Foreign currencies | Total | ||||||||||
Within 6 months | (Won) | 11,965,404 | (Won) | 3,401,472 | (Won) | 15,366,876 | ||||||
After 6 months but no later than 1 year | 5,964,101 | 2,901,928 | 8,866,029 | |||||||||
After 1 year but no later than 3 years | 12,807,522 | 7,417,155 | 20,224,677 | |||||||||
After 3 years but no later than 5 years | 5,847,466 | 3,442,489 | 9,289,955 | |||||||||
Later than 5 years | 6,268,796 | 2,058,377 | 8,327,173 | |||||||||
| (Won) | 42,853,289 | (Won) | 19,221,421 | (Won) | 62,074,710 | |||||||
Details of changes in the allowance for possible loan losses for the year ended December 31, 2010 and the period from October 28, 2009 to December 31, 2009 are as follows (Korean won in millions):
| Year ended Dec. 31, 2010 | ||||||||||||
| Loans(*1) | Others | Total | ||||||||||
Beginning balance | (Won) | 1,720,868 | (Won) | 318,934 | (Won) | 2,039,802 | ||||||
Foreign currency adjustments for overseas branches | 154,444 | — | 154,444 | |||||||||
Provision for repurchased loans | 13,227 | — | 13,227 | |||||||||
Transfer to allowance for other guarantees | (49,428 | ) | (176,555 | ) | (225,983 | ) | ||||||
Disposal of non-performing loans | (255,603 | ) | (30,913 | ) | (286,516 | ) | ||||||
Provision for restructured loans due to early repayments | 758 | — | 758 | |||||||||
Write-offs | (811,574 | ) | — | (811,574 | ) | |||||||
Provision (reversal of) for possible loan losses | 1,500,673 | (21,146 | ) | 1,479,527 | ||||||||
Ending balance | (Won) | 2,273,365 | (Won) | 90,320 | (Won) | 2,363,685 | ||||||
| (*1) | The difference between the above allowance for possible loan losses of (Won)2,273,365 million and the amount per the statement of financial position of (Won)2,293,307 million represents present value discount of loans under restructuring agreements. |
76
Table of Contents
Korea Finance Corporation
Notes to consolidated financial statements—(Continued)
December 31, 2010 and 2009
| From Oct. 28, 2009 to Dec. 31, 2009 | ||||||||||||
Loans(*1) |
Others (*2) | Total | ||||||||||
Beginning balance | (Won) | 33,626 | (Won) | 16,884 | (Won) | 50,510 | ||||||
Increase in allowance relating to addition of subsidiaries | 1,717,941 | 303,257 | 2,021,198 | |||||||||
Write-offs | — | (1,207 | ) | (1,207 | ) | |||||||
Reversal of allowance for possible loan losses | (29,514 | ) | — | (29,514 | ) | |||||||
Change due to the consolidation adjustments | (1,185 | ) | — | (1,185 | ) | |||||||
Ending balance | (Won) | 1,720,868 | (Won) | 318,934 | (Won) | 2,039,802 | ||||||
| (*1) | The difference between the above allowance for possible loan losses of (Won)1,720,868 million and the amount per the statement of financial position of (Won)1,745,269 million represents present value discount of loans under restructuring agreements. |
| (*2) | The difference between the above allowance for others of (Won)318,934 million and the amount per the statement of financial position of (Won)340,454 million represents present value discount of loans under restructuring agreements. |
Details of an allocation of the allowance for possible loan losses as of December 31, 2010 and 2009 are as follows (Korean won in millions):
| 2010 | 2009 | |||||||
Loans receivable: | ||||||||
Loans | (Won) | 1,687,562 | (Won) | 1,265,620 | ||||
Bills bought in foreign currencies | 46,712 | 49,462 | ||||||
Advances payments on acceptances and guarantees | 53,675 | 127,404 | ||||||
Credit card accounts | 2,005 | 67,459 | ||||||
Privately-placed bonds | 343,050 | 164,917 | ||||||
Others | 140,361 | 46,006 | ||||||
| 2,273,365 | 1,720,868 | |||||||
Other assets | 90,320 | 318,934 | ||||||
| (Won) | 2,363,685 | (Won) | 2,039,802 | |||||
Details on the classification of loans receivable and the allowance for possible loan losses as of December 31, 2010 and 2009 are as follows (Korean won in millions):
| 2010 | ||||||||||||
| Loans receivable | Allowance for possible loan losses | Ratio (%) | ||||||||||
Normal | (Won) | 69,508,561 | (Won) | 723,913 | 1.04 | |||||||
Precautionary | 3,107,673 | 524,820 | 16.89 | |||||||||
Substandard | 1,728,015 | 624,178 | 36.12 | |||||||||
Doubtful | 230,936 | 168,711 | 73.06 | |||||||||
Estimated loss | 231,743 | 231,743 | 100.00 | |||||||||
| (Won) | 74,806,928 | (Won) | 2,273,365 | 3.04 | ||||||||
77
Table of Contents
Korea Finance Corporation
Notes to consolidated financial statements—(Continued)
December 31, 2010 and 2009
| 2009 | ||||||||||||
| Loans receivable | Allowance for possible loan losses | Ratio (%) | ||||||||||
Normal | (Won) | 71,083,449 | (Won) | 723,002 | 1.02 | |||||||
Precautionary | 1,800,361 | 236,247 | 13.12 | |||||||||
Substandard | 1,788,728 | 486,471 | 27.20 | |||||||||
Doubtful | 102,766 | 66,032 | 64.25 | |||||||||
Estimated loss | 209,116 | 209,116 | 100.00 | |||||||||
| (Won) | 74,984,420 | (Won) | 1,720,868 | 2.29 | ||||||||
Details of adjustments to loans receivable for purpose of the determination of the allowance for possible loan losses as of December 31, 2010 and 2009 are as follows (Korean won in millions):
| 2010 | 2009 | |||||||
Loans receivable | (Won) | 87,696,173 | (Won) | 84,556,300 | ||||
Loans to banks(*1) | (2,930,686 | ) | (230,557 | ) | ||||
Prepayments regarded as loans | — | 1,908 | ||||||
Call loans | (2,578,885 | ) | (1,150,240 | ) | ||||
Inter-bank loans | (1,271,803 | ) | (1,166,797 | ) | ||||
Bonds purchased under resale agreements | (1,143,211 | ) | (1,039,831 | ) | ||||
Loans to the Government and others(*2) | (4,934,290 | ) | (5,961,962 | ) | ||||
Others(*3) | (30,371 | ) | (24,401 | ) | ||||
| (Won) | 74,806,927 | (Won) | 74,984,420 | |||||
| (*1) | Loans relating to on-lending businesses were classified as loans to banks. |
| (*2) | Loans to the Government and others, and loans guaranteed by the Korea Credit Guarantee Fund and others |
| (*3) | Others represent present value discount related to restructured debts and loans. |
Details of restructured loans for the year ended December 31, 2010 and the period from October 28, 2009 to December 31, 2009 are as follows (Korean won in millions):
| Year ended Dec. 31, 2010 | From Oct. 28, 2009 to Dec. 31, 2009 | |||||||
Debt for equity swap | (Won) | 223,714 | (Won) | 83,654 | ||||
The following table summarizes the details of restructured loans at December 31, 2010 and 2009 that are present valued due to changes in their contractual terms (Korean won in millions):
| 2010 | ||||||||||||
Type of restructured loan | Amount before restructuring | Present value discount | Value after restructuring | |||||||||
Loans receivable restructured | (Won) | 89,469 | (Won) | 15,995 | (Won) | 73,474 | ||||||
Financial lease assets | 1,619 | 4 | 1,615 | |||||||||
Loans receivable in Korean won | 9,000 | 3,943 | 5,057 | |||||||||
| (Won) | 100,088 | (Won) | 19,942 | (Won) | 80,146 | |||||||
78
Table of Contents
Korea Finance Corporation
Notes to consolidated financial statements—(Continued)
December 31, 2010 and 2009
| 2009 | ||||||||||||
Type of restructured loan | Amount before restructuring | Present value discount | Value after restructuring | |||||||||
Loans receivable restructured | (Won) | 97,918 | (Won) | 19,854 | (Won) | 78,064 | ||||||
Financial lease assets | 1,619 | 124 | 1,495 | |||||||||
Loans in Korean won | 9,000 | 4,423 | 4,577 | |||||||||
| (Won) | 108,537 | (Won) | 24,401 | (Won) | 84,136 | |||||||
Changes in present value discounts of the above restructured loans for the year ended December 31, 2010 and the period from October 28, 2009 to December 31, 2009 are as follows (Korean won in millions):
| Year ended Dec. 31, 2010 | From Oct. 28, 2009 to Dec. 31, 2009 | |||||||
Beginning balance | (Won) | 24,401 | (Won) | 22,408 | ||||
Increase | 224 | 7,258 | ||||||
Amortization (interest income) | (4,683 | ) | (5,265 | ) | ||||
Ending balance | (Won) | 19,942 | (Won) | 24,401 | ||||
Changes in deferred loan fees, net of expenses for the year ended December 31, 2010 and the period from October 28, 2009 to December 31, 2009 are summarized as follows (Korean won in millions):
| Year ended Dec. 31, 2010 | ||||||||||||||||||||
| Beginning balance | Increase | Addition of subsidiaries | Decrease | Ending balance | ||||||||||||||||
Deferred loan fees, net of expenses | (Won) | 18,818 | (Won) | 33,876 | (Won) | — | (Won) | 14,675 | (Won) | 38,019 | ||||||||||
| From Oct. 28, 2009 to Dec. 31, 2009 | ||||||||||||||||||||
| Beginning balance | Increase | Addition of subsidiaries | Decrease | Ending balance | ||||||||||||||||
Deferred loan fees, net of expenses | (Won) | — | (Won) | 1,197 | (Won) | 17,622 | (Won) | 1 | (Won) | 18,818 | ||||||||||
6. Property and equipment
Details of property and equipment at December 31, 2010 and 2009 are as follows (Korean won in millions):
| Acquisition cost | Accumulated depreciation (*) | Book value | ||||||||||||||||||||||
| 2010 | 2009 | 2010 | 2009 | 2010 | 2009 | |||||||||||||||||||
Land | (Won) | 2,649,526 | (Won) | 2,373,118 | (Won) | 11,394 | (Won) | — | (Won) | 2,638,132 | (Won) | 2,373,118 | ||||||||||||
Buildings | 2,095,885 | 1,753,375 | 521,138 | 399,176 | 1,574,747 | 1,354,199 | ||||||||||||||||||
Structures | 1,166,787 | 1,154,695 | 223,442 | 206,437 | 943,345 | 948,258 | ||||||||||||||||||
Vehicles | 223,994 | 938 | 92,498 | 639 | 131,496 | 299 | ||||||||||||||||||
Construction in-progress | 602,962 | 18,744 | — | — | 602,962 | 18,744 | ||||||||||||||||||
Others | 2,313,275 | 2,849,220 | 1,279,413 | 1,280,995 | 1,033,862 | 1,568,225 | ||||||||||||||||||
| (Won) | 9,052,429 | (Won) | 8,150,090 | (Won) | 2,127,885 | (Won) | 1,887,247 | (Won) | 6,924,544 | (Won) | 6,262,843 | |||||||||||||
| (*) | Accumulated depreciation includes accumulated impairment loss and amortization of government subsidies. |
79
Table of Contents
Korea Finance Corporation
Notes to consolidated financial statements—(Continued)
December 31, 2010 and 2009
The value of the Corporation’s land, as determined by the Government for tax administration purposes at December 31, 2010 amounted to (Won)1,453,059 million.
Insured property and equipment as of December 31, 2010 are summarized as follows (Korean won in millions):
| 2010 | 2009 | |||||||||
| Type of insurance | Insured amount | Insured amount | ||||||||
Buildings and structures | Package insurance, etc. | (Won) | 573,328 | (Won) | 707,568 | |||||
Machinery and equipment | ” | 20,399 | 16,492 | |||||||
Ship and others | Hull insurance, etc | 15,801,304 | 13,883,147 | |||||||
| (Won) | 16,395,031 | (Won) | 14,607,207 | |||||||
Directors and officers of the Corporation are insured for security or other claim loss and business indemnity.
Future minimum rentals payable under operating leases at December 31, 2010 and 2009 are summarized as follows (Korean won in millions):
| 2010 | 2009 | |||||||
Within 1 year | (Won) | 1,139 | (Won) | 12,478 | ||||
over 1 year through 5 years | 537 | 7,863 | ||||||
| (Won) | 1,676 | (Won) | 20,341 | |||||
Assets under operating leases at December 31, 2010 and 2009 are summarized as follows (Korean won in millions):
| 2010 | 2009 | |||||||
Transportation machinery | (Won) | 30,805 | (Won) | 44,298 | ||||
General equipment | 2,324 | 4,505 | ||||||
Initial direct costs | 137 | 218 | ||||||
| 33,266 | 49,021 | |||||||
Accumulated depreciation | (7,926 | ) | (9,487 | ) | ||||
| (Won) | 25,340 | (Won) | 39,534 | |||||
Future minimum lease payments together with the present value of the minimum lease payments of capital leases as of December 31, 2010 and 2009 are summarized as follows (Korean won in millions):
| 2010 | 2009 | |||||||
Within 1 year | (Won) | 26,926 | (Won) | 88,621 | ||||
After 1 year but no later than 5 years | 4,646 | 9,706 | ||||||
| 31,572 | 98,327 | |||||||
Less finance changes | (477 | ) | (5,153 | ) | ||||
Present value of minimum lease payments (*) | (Won) | 31,095 | (Won) | 93,174 | ||||
| (*) | The Corporation’s capital lease obligations are classified as other borrowings within borrowing liabilities. |
80
Table of Contents
Korea Finance Corporation
Notes to consolidated financial statements—(Continued)
December 31, 2010 and 2009
7. Other assets
Changes in goodwill (negative goodwill) for the year ended December 31, 2010 and the period from October 28, 2009 to December 31, 2009 are summarized as follows (Korean won in millions):
| Year ended Dec. 31, 2010 | ||||||||||||||||||||
Subsidiary | Beginning balance | Addition of subsidiaries | Amortization | Other (*) | Ending balance | |||||||||||||||
KDBFG | (Won) | (469,468 | ) | (Won) | — | (Won) | — | (Won) | 469,468 | (Won) | — | |||||||||
KAI | 1,908 | — | (1,092 | ) | — | 816 | ||||||||||||||
Korea Infrastructure Investment Asset Management | (572 | ) | — | 191 | — | (381 | ) | |||||||||||||
KDB Turn Around PEF | 10,069 | (6,318 | ) | (38 | ) | — | 3,713 | |||||||||||||
Daewoo Shipbuilding & Marine Engineering Co., Ltd. | 61,224 | — | (20,461 | ) | — | 40,763 | ||||||||||||||
KDB Consus Value | — | 328,676 | (49,301 | ) | — | 279,375 | ||||||||||||||
Korea Rental Corporation | — | (8,548 | ) | 1,326 | — | (7,222 | ) | |||||||||||||
TAPEX | — | 13,200 | — | — | 13,200 | |||||||||||||||
Hankook Jungsoo Industries Co., Ltd. | — | 44,383 | — | — | 44,383 | |||||||||||||||
| (Won) | (396,839 | ) | (Won) | 371,393 | (Won) | (69,375 | ) | (Won) | 469,468 | (Won) | 374,647 | |||||||||
| (*) | Other represents the difference which had been adjusted as a result of the additional settlements of non-cash capital contribution between KoFC and the Government at June 13, 2010. |
| From Oct. 28, 2009 to Dec. 31, 2009 | ||||||||||||||||
Subsidiary | Beginning balance | Addition of subsidiaries | Amortization | Ending balance | ||||||||||||
KDBFG | (Won) | — | (Won) | (469,468 | ) | (Won) | — | (Won) | (469,468 | ) | ||||||
KAI | 2,183 | — | 275 | 1,908 | ||||||||||||
Korea Infrastructure Investment Asset Management | (620 | ) | 48 | (572 | ) | |||||||||||
KDB Turn Around PEF | — | 10,069 | — | 10,069 | ||||||||||||
Daewoo Shipbuilding & Marine Engineering Co., Ltd. | — | 61,224 | — | 61,224 | ||||||||||||
| (Won) | 1,563 | (Won) | (398,175 | ) | (Won) | 323 | (Won) | (396,839 | ) | |||||||
Changes in intangible assets (except for goodwill and negative goodwill) for the year ended December 31, 2010 and the period from October 28, 2009 to December 31, 2009 are as follows (Korean won in millions):
| Year ended Dec. 31, 2010 | ||||||||||||||||||||||||
| Beginning balance | Additions | Amortization | Other changes (*) | Addition of subsidiaries | Ending balance | |||||||||||||||||||
Development cost | (Won) | 161,585 | (Won) | 103,339 | (Won) | 46,617 | (Won) | (8,779 | ) | (Won) | — | (Won) | 209,528 | |||||||||||
Others | 109,010 | 86,644 | 64,141 | 15,656 | — | 147,169 | ||||||||||||||||||
| (Won) | 270,595 | (Won) | 189,983 | (Won) | 110,758 | (Won) | 6,877 | (Won) | — | (Won) | 356,697 | |||||||||||||
81
Table of Contents
Korea Finance Corporation
Notes to consolidated financial statements—(Continued)
December 31, 2010 and 2009
| From Oct. 28, 2009 to Dec. 31, 2009 | ||||||||||||||||||||||||
| Beginning balance | Additions | Amortization | Other changes (*) | Addition of subsidiaries | Ending balance | |||||||||||||||||||
Development cost | 67,902 | 50,958 | 3,513 | (25,559 | ) | 71,797 | 161,585 | |||||||||||||||||
Others | 18,352 | 12,205 | 2,257 | — | 80,710 | 109,010 | ||||||||||||||||||
| (Won) | 86,254 | (Won) | 63,163 | (Won) | 5,770 | (Won) | (25,559 | ) | (Won) | 152,507 | (Won) | 270,595 | ||||||||||||
| (*) | Other includes the effect of foreign exchange translation. |
Details of miscellaneous assets at December 31, 2010 and 2009 are as follows (Korean won in millions):
| 2010 | 2009 | |||||||
Deferred acquisition cost | (Won) | 627,922 | (Won) | — | ||||
Special account assets | 940,478 | — | ||||||
Other lease assets | 94,346 | 177,977 | ||||||
Other | 227,989 | 246,993 | ||||||
| (Won) | 1,890,735 | (Won) | 424,970 | |||||
8. Deposits
Deposits at December 31, 2010 and 2009 consist of the following (Korean won in millions):
| 2010 | 2009 | |||||||
Demand deposits: | ||||||||
Korean won | (Won) | 301,022 | (Won) | 179,909 | ||||
Foreign currency | 625,658 | 533,799 | ||||||
| 926,680 | 713,708 | |||||||
Time and savings deposits: | ||||||||
Korean won | 17,106,518 | 9,291,481 | ||||||
Foreign currency | 1,187,632 | 1,681,600 | ||||||
| 18,294,150 | 10,973,081 | |||||||
Certificates of deposits | 1,136,947 | 3,586,126 | ||||||
Others | 1,898,277 | 1,400,274 | ||||||
| (Won) | 22,256,054 | (Won) | 16,673,189 | |||||
82
Table of Contents
Korea Finance Corporation
Notes to consolidated financial statements—(Continued)
December 31, 2010 and 2009
Maturities of deposits at December 31, 2010 and 2009 are summarized as follows (Korean won in millions):
| 2010 | ||||||||||||||||||||
| Demand deposits (*) | Time and saving deposits | Certificates of deposits | Others | Total | ||||||||||||||||
Within 3 months | (Won) | 926,680 | (Won) | 11,646,449 | (Won) | 840,844 | (Won) | — | (Won) | 13,413,973 | ||||||||||
After 3 months but no later than | — | 2,077,519 | 246,556 | 1,898,277 | 4,222,352 | |||||||||||||||
After 6 months but no later than | — | 1,635,763 | 16,564 | — | 1,652,327 | |||||||||||||||
After 1 year but no later than | — | 1,594,935 | 32,813 | — | 1,627,748 | |||||||||||||||
After 3 years but no later than | — | 33,332 | 170 | — | 33,502 | |||||||||||||||
Later than 5 years | — | 1,306,152 | — | — | 1,306,152 | |||||||||||||||
| (Won) | 926,680 | (Won) | 18,294,150 | (Won) | 1,136,947 | (Won) | 1,898,277 | (Won) | 22,256,054 | |||||||||||
| 2009 | ||||||||||||||||||||
| Demand deposits (*) | Time and saving deposits | Certificates of deposits | Others | Total | ||||||||||||||||
Within 3 months | (Won) | 713,708 | (Won) | 6,616,887 | (Won) | 2,063,495 | (Won) | — | (Won) | 9,394,090 | ||||||||||
After 3 months but no later than | — | 1,441,879 | 1,470,305 | 1,400,274 | 4,312,458 | |||||||||||||||
After 6 months but no later than | — | 1,064,993 | 25,034 | — | 1,090,027 | |||||||||||||||
After 1 year but no later than | — | 590,636 | 27,228 | — | 617,864 | |||||||||||||||
After 3 years but no later than | — | 18,573 | 64 | — | 18,637 | |||||||||||||||
Later than 5 years | — | 1,240,113 | — | — | 1,240,113 | |||||||||||||||
| (Won) | 713,708 | (Won) | 10,973,081 | (Won) | 3,586,126 | (Won) | 1,400,274 | (Won) | 16,673,189 | |||||||||||
| (*) | The Corporation classifies ordinary deposits and current deposits into demand deposits, which are paid unconditionally at customer’s requests. |
83
Table of Contents
Korea Finance Corporation
Notes to consolidated financial statements—(Continued)
December 31, 2010 and 2009
9. Borrowing liabilities
Borrowing liabilities at December 31, 2010 and 2009 consist of the following (Korean won in millions):
| 2010 | 2009 | |||||||
Borrowings: | ||||||||
Korean won | (Won) | 8,620,538 | (Won) | 10,004,888 | ||||
Foreign currencies | 14,104,391 | 14,766,957 | ||||||
| 22,724,929 | 24,771,845 | |||||||
Debentures: | ||||||||
Korean won | 57,114,850 | 54,870,945 | ||||||
Foreign currencies | 15,028,979 | 17,124,822 | ||||||
| 72,143,829 | 71,995,767 | |||||||
Other borrowings: | ||||||||
Bonds sold under repurchase agreements | 12,190,876 | 14,066,867 | ||||||
Bills sold | 270 | 9,298 | ||||||
Call money | 2,096,103 | 2,375,687 | ||||||
Others | 3,732,323 | 3,944,938 | ||||||
| 18,019,572 | 20,396,790 | |||||||
| 112,888,330 | 117,164,402 | |||||||
Deferred borrowing fees | (5,822 | ) | (4,296 | ) | ||||
| (Won) | 112,882,508 | (Won) | 117,160,106 | |||||
Borrowings in Korean won at December 31, 2010 and 2009 consist of the following (Korean won in millions):
| Annual interest rate (%) | 2010 | 2009 | ||||||||
Borrowings from the Government | 1.50 ~ 6.00 | (Won) | 2,145,642 | (Won) | 1,999,149 | |||||
BOK | 5.71 | 2,793,600 | 3,296,600 | |||||||
Others | 0.10 ~7.50 | 3,681,296 | 4,709,139 | |||||||
| (Won) | 8,620,538 | (Won) | 10,004,888 | |||||||
84
Table of Contents
Korea Finance Corporation
Notes to consolidated financial statements—(Continued)
December 31, 2010 and 2009
Borrowings in foreign currencies at December 31, 2010 and 2009 consist of the following (Korean won in millions):
| Annual interest rate (%) | 2010 | 2009 | ||||||||
Borrowings from the Government (*) | 3M Libor + 0.2 ~ 3.8, 6M Libor + 0.75 | (Won) | 3,632,420 | (Won) | 3,811,649 | |||||
Off-shore borrowings | 3M Libor + 0.6 ~ 3.5 | 1,290,974 | 1,178,762 | |||||||
Others | 3M Libor + 0.6 ~ 6M Libor + 0.75, 2.2 ~ 5.2 | 9,185,474 | 9,776,546 | |||||||
| 14,108,868 | 14,766,957 | |||||||||
Present value discount | (4,477 | ) | — | |||||||
| (Won) | 14,104,391 | (Won) | 14,766,957 | |||||||
| (*) | Subordinated borrowings from the Government of (Won)225,916 million are included. |
Debentures in Korean won at December 31, 2010 and 2009 are as follows (Korean won in millions):
| Annual interest rate (%) | 2010 | 2009 | ||||||||||
Industrial finance bonds in Korean won | 2.9 ~ 8.0 | (Won) | 35,360,374 | (Won) | 51,222,435 | |||||||
Policy banking bonds in Korean won | 2.7 ~ 5.5 | 19,169,145 | 1,500,000 | |||||||||
Others | 3.5 ~ 7.4 | 2,661,402 | 2,229,180 | |||||||||
| 57,190,921 | 54,951,615 | |||||||||||
Premium on debentures | 719 | 856 | ||||||||||
Discount on debentures | (76,790 | ) | (81,526 | ) | ||||||||
| (Won) | 57,114,850 | (Won) | 54,870,945 | |||||||||
85
Table of Contents
Korea Finance Corporation
Notes to consolidated financial statements—(Continued)
December 31, 2010 and 2009
Debentures in foreign currencies at December 31, 2010 and 2009 are as follows (Korean won in millions):
| Annual interest rate (%) | 2010 | 2009 | ||||||||
Debentures in foreign currencies: | ||||||||||
Industrial finance bonds in foreign currencies | 3M Libor + 0.7 ~ 1.0, 0.2 ~ 1.0 | (Won) | 10,706,379 | (Won) | 13,449,363 | |||||
Premium on debentures | 1,435 | 2,319 | ||||||||
Discount on debentures | (31,802 | ) | (28,608 | ) | ||||||
| 10,676,012 | 13,423,074 | |||||||||
Off-shore debentures in foreign currencies: | ||||||||||
Off-shore bonds in foreign currencies | 3M Libor + 1.0, 0.1 ~ 9.5 | 4,359,741 | 3,706,868 | |||||||
Premium on debentures | 371 | 525 | ||||||||
Discount on debentures | (7,145 | ) | (5,645 | ) | ||||||
| 4,352,967 | 3,701,748 | |||||||||
| (Won) | 15,028,979 | (Won) | 17,124,822 | |||||||
Other borrowings at December 31, 2010 and 2009 are as follows (Korean won in millions):
| 2010 | 2009 | |||||||
Bonds sold under repurchase agreements | (Won) | 12,190,876 | (Won) | 14,066,867 | ||||
Bills sold | 270 | 9,298 | ||||||
Call money | 2,096,103 | 2,375,687 | ||||||
Others | 3,732,323 | 3,944,938 | ||||||
| (Won) | 18,019,572 | (Won) | 20,396,790 | |||||
Maturities of borrowing liabilities at December 31, 2010 and 2009 are as follows (Korean won in millions):
| 2010 | ||||||||||||||||
| Borrowings | Debentures | Other borrowings | Total | |||||||||||||
Within 6 months | (Won) | 9,201,698 | (Won) | 14,490,605 | (Won) | 17,441,424 | (Won) | 41,133,727 | ||||||||
After 6 months but no later than 1 year | 5,176,722 | 14,433,928 | 508,588 | 20,119,238 | ||||||||||||
After 1 year but no later than 3 years | 4,354,348 | 27,602,760 | 69,560 | 32,026,668 | ||||||||||||
After 3 years but no later than 5 years | 1,859,453 | 11,046,894 | — | 12,906,347 | ||||||||||||
Later than 5 years | 2,137,185 | 4,682,854 | — | 6,820,039 | ||||||||||||
| (Won) | 22,729,406 | (Won) | 72,257,041 | (Won) | 18,019,572 | (Won) | 113,006,019 | |||||||||
86
Table of Contents
Korea Finance Corporation
Notes to consolidated financial statements—(Continued)
December 31, 2010 and 2009
| 2009 | ||||||||||||||||
| Borrowings | Debentures | Other borrowings | Total | |||||||||||||
Within 6 months | (Won) | 12,513,279 | (Won) | 15,370,760 | (Won) | 19,181,164 | (Won) | 49,065,202 | ||||||||
After 6 months but no later than 1 year | 4,088,287 | 14,385,689 | 1,165,083 | 19,639,059 | ||||||||||||
After 1 year but no later than 3 years | 5,175,962 | 27,057,514 | 41,246 | 32,274,722 | ||||||||||||
After 3 years but no later than 5 years | 1,428,529 | 11,312,716 | — | 12,741,245 | ||||||||||||
Later than 5 years | 1,565,788 | 3,868,088 | 9,298 | 5,444,174 | ||||||||||||
| (Won) | 24,771,845 | (Won) | 71,995,767 | (Won) | 20,396,791 | (Won) | 117,164,402 | |||||||||
10. Severance and retirement benefits
Changes in severance and retirement benefits for the year ended December 31, 2010 and the period from October 28, 2009 to December 31, 2009 are as follows (Korean won in millions):
| Year ended Dec. 31, 2010 | From Oct. 28, 2009 to Dec. 31, 2009 | |||||||
Beginning balance | (Won) | 570,001 | (Won) | 83,507 | ||||
Payments during the period | (87,728 | ) | (7,833 | ) | ||||
Addition of subsidiaries | 34,757 | 479,971 | ||||||
Provision for severance and retirement benefits | 175,279 | 14,356 | ||||||
Others(*) | 1,457 | — | ||||||
Transfer from related party | 310 | — | ||||||
Ending balance | (Won) | 694,076 | (Won) | 570,001 | ||||
| (*) | Others include the effect of foreign exchange translation. |
11. Acceptances and guarantees
Acceptances and guarantees and allowance for possible losses on acceptances and guarantees at December 31, 2010 and 2009 are as follows (Korean won in millions):
| Acceptances and guarantees | Allowance for possible losses | |||||||||||||||
| 2010 | 2009 | 2010 | 2009 | |||||||||||||
Settled guarantees and commitments: | ||||||||||||||||
Acceptance on letters of credit | (Won) | 1,011,714 | (Won) | 1,228,163 | (Won) | 10,250 | (Won) | 8,471 | ||||||||
Collateral for loans | 641,004 | 261,027 | 7,741 | 13,434 | ||||||||||||
Debt guarantees | 124,900 | 169,062 | 1,617 | 1,883 | ||||||||||||
Debt guarantees for credit risk sharing | 77,910 | — | 451 | — | ||||||||||||
Corporate debentures | 102,620 | 1,210 | 1,939 | 10 | ||||||||||||
Foreign banks borrowing | 5,087 | 6,704 | 43 | 57 | ||||||||||||
Other acceptances and guarantees in foreign currencies(*) | 11,153,309 | 12,810,053 | 63,491 | 203,517 | ||||||||||||
Other acceptance and guarantees | 28,606 | — | 62 | — | ||||||||||||
Acceptances for letters of guarantees for importers | 39,383 | 40,332 | 2,060 | 319 | ||||||||||||
| 13,184,533 | 14,516,551 | 87,654 | 227,691 | |||||||||||||
Unsettled guarantees and commitments: | ||||||||||||||||
Local letters of credit | 3,148,063 | 2,913,744 | 9,256 | 5,672 | ||||||||||||
Others | 7,219,144 | 7,266,415 | 15,795 | 21,454 | ||||||||||||
| 10,367,207 | 10,180,159 | 25,051 | 27,126 | |||||||||||||
| (Won) | 23,551,740 | (Won) | 24,696,710 | (Won) | 112,705 | (Won) | 254,817 | |||||||||
| (*) | Other acceptances and guarantees in foreign currencies consist of acceptances and guarantees for the return of advances related to export, overseas bidding and contractual obligations. |
87
Table of Contents
Korea Finance Corporation
Notes to consolidated financial statements—(Continued)
December 31, 2010 and 2009
Details of classification of acceptances and guarantees and allowance for possible losses on acceptances and guarantees at December 31, 2010 and 2009 are summarized as follows (Korean won in millions):
| 2010 | ||||||||||||||||||||||||||||
| Confirmed | Unconfirmed | Total | Ratio (%) | |||||||||||||||||||||||||
| Outstanding amount | Allowance | Outstanding amount | Allowance | Outstanding amount | Allowance | |||||||||||||||||||||||
Normal | (Won) | 13,074,932 | (Won) | 67,618 | (Won) | 10,093,603 | (Won) | 16,855 | (Won) | 23,168,535 | (Won) | 84,473 | 0.36 | |||||||||||||||
Precautionary | 49,727 | 4,742 | 244,729 | 5,015 | 294,456 | 9,757 | 3.31 | |||||||||||||||||||||
Substandard | 55,981 | 11,401 | 16,199 | 646 | 72,180 | 12,047 | 16.69 | |||||||||||||||||||||
Doubtful | — | — | — | — | — | — | — | |||||||||||||||||||||
Estimated loss | 3,893 | 3,893 | 12,676 | 2,535 | 16,569 | 6,428 | 38.80 | |||||||||||||||||||||
| (Won) | 13,184,533 | (Won) | 87,654 | (Won) | 10,367,207 | (Won) | 25,051 | (Won) | 23,551,740 | (Won) | 112,705 | 0.48 | ||||||||||||||||
| 2009 | ||||||||||||||||||||||||||||
| Korean won | Foreign currencies | Total | Ratio (%) | |||||||||||||||||||||||||
| Outstanding amount | Allowance | Outstanding amount | Allowance | Outstanding amount | Allowance | |||||||||||||||||||||||
Normal | (Won) | 297,044 | (Won) | 1,180 | (Won) | 23,397,545 | (Won) | 78,071 | (Won) | 23,694,589 | (Won) | 79,251 | (Won) | 0.33 | ||||||||||||||
Precautionary | — | — | 565,709 | 33,081 | 565,709 | 33,081 | 5.85 | |||||||||||||||||||||
Substandard | 8,300 | 12,545 | 427,779 | 129,633 | 436,079 | 142,178 | 32.60 | |||||||||||||||||||||
Doubtful | — | — | — | — | — | — | — | |||||||||||||||||||||
Estimated loss | 300 | 300 | 33 | 7 | 333 | 307 | 92.19 | |||||||||||||||||||||
| (Won) | 305,644 | (Won) | 14,025 | (Won) | 24,391,066 | (Won) | 240,792 | (Won) | 24,696,710 | (Won) | 254,817 | 1.03 | ||||||||||||||||
12. Allowances for unused commitments
Unused loan commitments and the related allowances for possible losses at December 31, 2010 and 2009 are as follows (Korean won in millions):
| 2010 | 2009 | |||||||||||||||
| Unused loan commitments | Allowance for possible losses | Unused loan commitments | Allowance for possible losses | |||||||||||||
Commitments on loans receivable | (Won) | 4,550,214 | (Won) | 30,002 | (Won) | 4,192,444 | (Won) | 22,586 | ||||||||
Commitments on guarantees and acceptances | 14,254,129 | 57,557 | 16,560,056 | 63,977 | ||||||||||||
Commitments on loan | 15,766,988 | 138,133 | 12,480,852 | 102,486 | ||||||||||||
| (Won) | 34,571,331 | (Won) | 225,692 | (Won) | 33,233,352 | (Won) | 189,049 | |||||||||
88
Table of Contents
Korea Finance Corporation
Notes to consolidated financial statements—(Continued)
December 31, 2010 and 2009
13. Allowances for other liabilities
Changes in allowances for other liability for the year ended December 31, 2010 and the period from October 28, 2009 to December 31, 2009 are as follows (Korean won in millions):
| Year ended Dec. 31, 2010 | ||||||||||||
| Beginning balance | Addition of subsidiaries | Ending balance | ||||||||||
Allowance for litigation | (Won) | 26,710 | (Won) | (1,059 | ) | (Won) | 25,651 | |||||
Allowance for loss | 61,065 | (5,044 | ) | 56,021 | ||||||||
Other | 13,193 | 23,566 | 36,759 | |||||||||
| (Won) | 100,968 | (Won) | 17,463 | (Won) | 118,431 | |||||||
| From Oct. 28, 2009 and Dec. 31, 2009 | ||||||||||||
| Beginning balance | Addition of subsidiaries | Ending balance | ||||||||||
Allowance for litigation | (Won) | — | (Won) | 26,710 | (Won) | 26,710 | ||||||
Allowance for loss | — | 61,065 | 61,065 | |||||||||
Other | — | 13,193 | 13,193 | |||||||||
| (Won) | — | (Won) | 100,968 | (Won) | 100,968 | |||||||
14. Miscellaneous liabilities
Miscellaneous liabilities at December 31, 2010 and 2009 consist of the following (Korean won in millions):
| 2010 | 2009 | |||||||
Accounts payable related to foreign exchanges | 930,878 | 641,067 | ||||||
Allowance of financial Insurance | 68 | 92,076 | ||||||
Others | 1,038,624 | 295,467 | ||||||
| (Won) | 1,969,570 | (Won) | 1,028,610 | |||||
89
Table of Contents
Korea Finance Corporation
Notes to consolidated financial statements—(Continued)
December 31, 2010 and 2009
15. Assets and liabilities denominated in foreign currencies
Significant assets and liabilities denominated in foreign currencies at December 31, 2010 and 2009 are as follows (Korean won in millions or U.S. dollar in thousands):
| US$ equivalent(*) | Korean won equivalent | |||||||||||||||
| 2010 | 2009 | 2010 | 2009 | |||||||||||||
Assets: | ||||||||||||||||
Cash on hand | $ | 126,807 | $ | 73,887 | (Won) | 144,421 | (Won) | 86,270 | ||||||||
Due from banks | 840,092 | 679,426 | 956,782 | 793,297 | ||||||||||||
Trading securities | 144,861 | 173,261 | 164,983 | 202,301 | ||||||||||||
Available-for-sale securities | 2,260,467 | 4,506,063 | 2,574,446 | 5,261,279 | ||||||||||||
Held-to-maturity securities | 230,051 | 36,662 | 262,005 | 42,807 | ||||||||||||
Equity method investments | 188,260 | — | 214,409 | |||||||||||||
Bills purchased | 1,514,912 | 1,983,886 | 1,725,333 | 2,316,385 | ||||||||||||
Call loans | 2,220,463 | 654,947 | 2,528,885 | 764,716 | ||||||||||||
Loans receivable | 17,171,353 | 16,462,335 | 19,556,454 | 19,221,421 | ||||||||||||
Inter-bank loans | 38,000 | — | 43,278 | — | ||||||||||||
Domestic import usance | 2,700,052 | 2,961,727 | 3,075,089 | 3,458,112 | ||||||||||||
Accounts receivable | 1,434,246 | 1,633,460 | — | |||||||||||||
Investment in financial lease | 473,825 | — | 539,639 | — | ||||||||||||
Advance for financial release assets | 2,945 | — | 3,354 | — | ||||||||||||
Other assets | 8,931,289 | 4,870,354 | 10,171,882 | 5,686,625 | ||||||||||||
| $ | 38,277,623 | $ | 32,402,548 | (Won) | 43,594,420 | (Won) | 37,833,213 | |||||||||
Liabilities: | ||||||||||||||||
Deposit | $ | 1,606,260 | $ | 1,897,396 | (Won) | 1,829,376 | (Won) | 2,215,399 | ||||||||
Borrowings | 12,388,153 | 12,649,231 | 14,108,868 | 14,766.956 | ||||||||||||
Bonds sold under repurchase agreements | 4,391,250 | 968,826 | 5,001,195 | 1,131,201 | ||||||||||||
Call money | 446,059 | 498,492 | 508,016 | 582,040 | ||||||||||||
Debentures | 9,378,968 | 11,496,295 | 10,676,012 | 13,423,073 | ||||||||||||
Offshore debentures | 3,822,080 | 3,170,390 | 4,352,967 | 3,701,748 | ||||||||||||
Allowance for possible losses on acceptances and guarantees | 586 | — | 667 | — | ||||||||||||
Accrued expense | 11,243 | — | 12,805 | — | ||||||||||||
Allowance for possible losses on unused loan commitments | 3,128 | — | 3,563 | — | ||||||||||||
Others | 6,166,023 | 2,805,823 | 7,022,483 | 3,276,079 | ||||||||||||
| $ | 38,213,750 | $ | 33,486,453 | (Won) | 43,515,952 | (Won) | 39,096,496 | |||||||||
| (*) | All foreign currencies other than the US dollar are expressed in the equivalent of US dollars at the reporting date. |
90
Table of Contents
Korea Finance Corporation
Notes to consolidated financial statements—(Continued)
December 31, 2010 and 2009
16. Commitments and contingencies
Unsettled commitments provided by the Corporation at December 31, 2010 and 2009 are as follows (Korean won in millions):
| 2010 | 2009 | |||||||
Commitments: | ||||||||
Commitments on loans in Korean won | (Won) | 11,773,627 | (Won) | 11,855,099 | ||||
Commitments on loans in foreign currencies | 3,993,361 | 622,036 | ||||||
Commitments on purchase of securities | 720 | 1,000,000 | ||||||
Others | — | 3,717 | ||||||
| 15,767,708 | 13,480,852 | |||||||
Bonds sold under repurchase agreements | 751,269 | 750,570 | ||||||
| (Won) | 16,518,977 | (Won) | 14,231,422 | |||||
Loans sold at December 31, 2010 and 2009 are as follows (Korean won in millions):
| 2010 | ||||||||||||||||||||
Counterparty | Disposal date | Book value | Sales price | Subordinated debt securities held by the Corporation | Pledged assets(*) | |||||||||||||||
KDB First SPC | 2000.06.08 | (Won) | 950,627 | (Won) | 600,000 | (Won) | 114,314 | (Won) | 120,266 | |||||||||||
KDB Second SPC | 2000.11.20 | 914,764 | 423,600 | 13,000 | 80,049 | |||||||||||||||
KDB Third SPC | 2001.09.12 | 1,793,546 | 949,900 | — | — | |||||||||||||||
KDB Fifth SPC | 2001.12.04 | 765,358 | 528,400 | 74,200 | 100,101 | |||||||||||||||
KDB Sixth SPC | 2009.11.26 | 420,631 | 330,000 | 117,800 | — | |||||||||||||||
KDB Capital Third SPC | 2001.03.17 | 54,252 | 53,604 | 1,200 | — | |||||||||||||||
KDB Capital Fourth SPC | 2009.03.29 | 78,998 | 81,965 | 13,900 | — | |||||||||||||||
KDB Champ First SPC | 2009.03.31 | 999,583 | 1,004,493 | — | — | |||||||||||||||
KDB Champ Second SPC | 2009.05.29 | 791,941 | 793,722 | — | — | |||||||||||||||
KDB Champ Third SPC | 2009.11.10 | 669,646 | 669,833 | — | — | |||||||||||||||
KDB Champ Fourth SPC | 2009.12.09 | 448,734 | 449,589 | — | — | |||||||||||||||
KDB Green Growth | 2010.06.22 | 208,725 | 210,000 | — | — | |||||||||||||||
Songsan 2nd Industrial Complex SPC | 2010.02.25 | 198,380 | 200,000 | — | — | |||||||||||||||
KAMCO 8th JV SPC | 2010.12.30 | 689,043 | 272,500 | — | — | |||||||||||||||
| (Won) | 8,984,228 | (Won) | 6,567,606 | (Won) | 334,414 | (Won) | 300,416 | |||||||||||||
91
Table of Contents
Korea Finance Corporation
Notes to consolidated financial statements—(Continued)
December 31, 2010 and 2009
| 2009 | ||||||||||||||||||||
Counterparty | Disposal date | Book value | Sales price | Subordinated debt securities held by the Company | Pledged assets(*) | |||||||||||||||
KDB First SPC | 2000.06.08 | (Won) | 950,627 | (Won) | 600,000 | (Won) | 201,800 | (Won) | 120,000 | |||||||||||
KDB Second SPC | 2000.11.08 | 914,764 | 423,600 | 93,600 | 80,000 | |||||||||||||||
KDB Third SPC | 2000.09.20 | 1,793,546 | 949,900 | — | — | |||||||||||||||
KDB Fifth SPC | 2000.12.13 | 765,358 | 528,400 | 98,400 | 100,000 | |||||||||||||||
KDB Sixth SPC | 2009.09.30 | 420,631 | 330,000 | 160,000 | — | |||||||||||||||
KDB capital Third SPC | 2001.03.17 | 54,252 | 53,604 | 1,200 | — | |||||||||||||||
KDB capital Fourth SPC | 2009.03.29 | 78,998 | 81,965 | 43,900 | — | |||||||||||||||
KDB Champ First SPC | 2009.03.31 | 999,583 | 1,004,493 | — | — | |||||||||||||||
KDB Champ Second SPC | 2009.05.29 | 791,941 | 793,722 | — | — | |||||||||||||||
KDB Champ Third SPC | 2009.11.10 | 669,646 | 669,833 | — | — | |||||||||||||||
KDB Champ Fourth SPC | 2009.12.09 | 448,734 | 449,589 | — | — | |||||||||||||||
| (Won) | 7,888,080 | (Won) | 5,885,106 | (Won) | 598,900 | (Won) | 300,000 | |||||||||||||
| (*) | Investment securities are pledged as collateral. |
According to the contracts with the counterparties for the above loans sold with a recourse provision, the Corporation is liable to the counterparties’ claims of up to 30% of the sales price when the principal or the interest is not repaid according to the payment schedules.
The Corporation’s loans and receivables written-off, for which the contractual rights to cash flows have not expired, amount to (Won)2,085,053 million and (Won)1,931,415 million as of December 31, 2010 and 2009, respectively.
The Corporation has outstanding loans receivable and investment securities from companies under workout, court receivership, court mediation or other restructuring process. The following table summarizes the details of these loans receivable (including acceptance and guarantees) and investment securities as of December 31, 2010 and 2009 (Korean won in millions):
| 2010 | 2009 | |||||||
Loans receivable | (Won) | 5,122,750 | (Won) | 3,232,237 | ||||
Allowance for possible loan losses | 1,043,927 | 575,338 | ||||||
Investment securities | 386,517 | 191,164 | ||||||
The Corporation has entered into agreements to provide certain syndicated loans with other financial institutions. The total amount available under such loans is (Won)1,704,702 million ((Won)361,921 million as of December 31, 2009) and (Won)1,093,527 million ((Won)278,921 million as of December 31, 2009) has not been withdrawn by borrowers as of December 31, 2010.
92
Table of Contents
Korea Finance Corporation
Notes to consolidated financial statements—(Continued)
December 31, 2010 and 2009
As of December 31, 2010, the Corporation has 67 lawsuits as a plaintiff and 127 lawsuits as a defendant. The aggregate amount of claims as a plaintiff and a defendant is approximately (Won)3,798,151 million and (Won)461,669 million, respectively. A significant lawsuit in which the Corporation is involved as a defendant is as follows (Korean won in millions):
Court ruling | ||||||||||||
Plaintiff | Amount | First trial | Second trial | Final trial | Description (*) | |||||||
Kyobo Life Insurance Co., Ltd. and 2 others | (Won) | 11,781 |
| In favor of plaintiff | In favor of plaintiff | In-progress | Redemption beneficiary certificates | |||||
Korea Coal Corp. | | 2,320 | | In favor of plaintiff | In-progress | — | Redemption beneficiary certificates | |||||
| (*) | The Corporation recorded an allowance for loss on its financial statements for lawsuits which have met the provision for contingent loss. (See note 13). |
The Corporation provides a promissory note to a financial institution as collateral for borrowing in Korean won as of December 31, 2010. Detail of collateral is summarized as follows (Korean won in millions):
Counterparty | Borrowing date | Maximum pledge amount | Borrowing amount | |||||||||
BOK | 2010.03.31 | 2,793,600 | 2,793,600 | |||||||||
93
Table of Contents
Korea Finance Corporation
Notes to consolidated financial statements—(Continued)
December 31, 2010 and 2009
17. Derivative financial instruments and related contracts
The Corporation’s derivatives instruments are divided into trading derivatives and hedging derivatives, based on the nature of the transaction. The Corporation enters into hedge transactions mainly for the purpose of hedging the fair value risk related to changes in fair values of the underlying assets and liabilities.
The notional amounts outstanding for derivatives contracts and the related valuation gains (losses) as of and for the year ended December 31, 2010 and the period from October 28, 2009 to December 31, 2009, respectively, are summarized as follows (Korean won in millions):
| Year ended Dec. 31 , 2010 | ||||||||||||||||||||||||||||
| Unsettled notional amount | Valuation gain (loss) | Derivative asset (liability) | ||||||||||||||||||||||||||
| Trading purpose | Hedging purpose | Total | Trading purpose | Hedging purpose | Total | |||||||||||||||||||||||
Commodity: | ||||||||||||||||||||||||||||
Swap | (Won) | 37,964 | (Won) | — | (Won) | 37,964 | (Won) | (2,025 | ) | (Won) | — | (Won) | (2,025 | ) | (Won) | 182 | ||||||||||||
Option bought | 201,773 | 26,016 | 227,789 | 1,388 | 67,172 | 68,560 | 9,812 | |||||||||||||||||||||
Option sold | 201,773 | — | 201,773 | — | — | — | (7,754 | ) | ||||||||||||||||||||
| 441,510 | 26,016 | 467,526 | (637 | ) | 67,172 | 66,535 | 2,240 | |||||||||||||||||||||
Interest rate: | ||||||||||||||||||||||||||||
Forward | 17,084 | 24,837 | 41,921 | — | 2,614 | 2,598 | (413 | ) | ||||||||||||||||||||
Futures | 1,118,528 | — | 1,118,528 | (16 | ) | — | — | — | ||||||||||||||||||||
Swap | 302,282,785 | 57,399,316 | 359,682,101 | 26,902 | 126,117 | 153,019 | 193,730 | |||||||||||||||||||||
Option bought | 1,734,000 | — | 1,734,000 | 1,403 | (993 | ) | 410 | 28,097 | ||||||||||||||||||||
Option sold | 2,860,000 | 270,000 | 3,130,000 | — | 1,293 | 1,293 | (40,236 | ) | ||||||||||||||||||||
| 308,012,397 | 57,694,153 | 365,706,550 | 28,289 | 129,031 | 157,320 | 181,178 | ||||||||||||||||||||||
Currency: | ||||||||||||||||||||||||||||
Forward | 43,865,986 | 12,761,080 | 56,627,066 | (103,464 | ) | 3,898 | (99,566 | ) | 575,481 | |||||||||||||||||||
Futures | 264,101 | 96,222 | 360,323 | 2,180 | 43 | 2,223 | 2,254 | |||||||||||||||||||||
Swap | 47,099,672 | 10,873,893 | 57,973,565 | 288,813 | 138,746 | 427,559 | 350,159 | |||||||||||||||||||||
Option bought | 888,922 | 7,890 | 896,812 | (1,306 | ) | (33 | ) | (1,339 | ) | 27,807 | ||||||||||||||||||
Option sold | 614,831 | 14,000 | 628,831 | — | (124 | ) | (124 | ) | (27,659 | ) | ||||||||||||||||||
| 92,733,512 | 23,753,085 | 116,486,597 | 186,223 | 142,530 | 328,753 | 928,042 | ||||||||||||||||||||||
Stock: | ||||||||||||||||||||||||||||
Index futures bought | 256,398 | — | 256,398 | 21,203 | — | 21,203 | — | |||||||||||||||||||||
Index futures sold | 1,233 | — | 1,233 | — | — | — | — | |||||||||||||||||||||
Futures bought | 94 | — | 94 | 5 | — | 5 | — | |||||||||||||||||||||
Futures sold | 9,823 | — | 9,823 | (494 | ) | — | (494 | ) | — | |||||||||||||||||||
Foreign index futures bought | — | 891 | 891 | — | 10 | 10 | — | |||||||||||||||||||||
Foreign index futures sold | — | 99,350 | 99,350 | — | 1,259 | 1,259 | — | |||||||||||||||||||||
Swap bought | — | 13,939 | 13,939 | — | 1 | 1 | — | |||||||||||||||||||||
Index option bought | 788,674 | — | 788,674 | 41 | 4,476 | 4,517 | 22,742 | |||||||||||||||||||||
Index option sold | 1,178,031 | — | 1,178,031 | (2,862 | ) | — | (2,862 | ) | (36,022 | ) | ||||||||||||||||||
Option bought | 318,680 | 237,029 | 555,709 | (141 | ) | (18,096 | ) | (18,237 | ) | 17,535 | ||||||||||||||||||
Option sold | 4,121 | 98,774 | 102,895 | — | 2,226 | 2,226 | (8,535 | ) | ||||||||||||||||||||
Others | — | 1,334,711 | 1,334,711 | 70,073 | 14,355 | 84,428 | 81,993 | |||||||||||||||||||||
| 2,557,054 | 1,784,694 | 4,341,748 | 87,825 | 4,231 | 92,056 | 77,713 | ||||||||||||||||||||||
Credit: | ||||||||||||||||||||||||||||
Credit default swap bought | — | 16,979 | 16,979 | — | 427 | 427 | (153 | ) | ||||||||||||||||||||
Credit default swap sold | — | 58,117 | 58,117 | — | (79 | ) | (79 | ) | 1,582 | |||||||||||||||||||
| — | 75,096 | 75,096 | 348 | 348 | 1,429 | |||||||||||||||||||||||
| (Won) | 403,744,473 | (Won) | 83,333,044 | (Won) | 487,077,517 | (Won) | 301,700 | (Won) | 343,312 | (Won) | 645,012 | (Won) | 1,190,602 | |||||||||||||||
94
Table of Contents
Korea Finance Corporation
Notes to consolidated financial statements—(Continued)
December 31, 2010 and 2009
| From Oct. 28, 2009 to Dec.31, 2009 | ||||||||||||||||||||||||||||
| Unsettled notional amount | Valuation gain (loss) | Derivative asset (liability) | ||||||||||||||||||||||||||
| Trading purpose | Hedging purpose | Total | Trading purpose | Hedging purpose | Total | |||||||||||||||||||||||
Commodity: | ||||||||||||||||||||||||||||
Forward | (Won) | 33,003 | (Won) | — | (Won) | 33,003 | (Won) | — | (Won) | — | (Won) | — | (Won) | 33 | ||||||||||||||
Swap | 508,101 | — | 508,101 | — | — | — | 2,447 | |||||||||||||||||||||
Other swap | — | 773,963 | 773,963 | — | (121,324 | ) | (121,324 | ) | (12,458 | ) | ||||||||||||||||||
Option bought | 130,951 | 159 | 131,110 | (594 | ) | (1 | ) | (595 | ) | 31,794 | ||||||||||||||||||
Option sold | 119,329 | — | 119,329 | — | — | — | (31,109 | ) | ||||||||||||||||||||
| 791,384 | 774,122 | 1,565,506 | (594 | ) | (121,325 | ) | (121,919 | ) | (9,293 | ) | ||||||||||||||||||
Interest rate: | ||||||||||||||||||||||||||||
Futures | 3,708,545 | 408,085 | 4,116,630 | 1,785 | — | 1,785 | — | |||||||||||||||||||||
Swap | 294,668,493 | 16,273,133 | 310,941,626 | — | 3,182 | 3,182 | (253,498 | ) | ||||||||||||||||||||
Option bought | 1,355,816 | — | 1,355,816 | — | — | — | 26,350 | |||||||||||||||||||||
Option sold | 3,161,816 | 270,000 | 3,431,816 | — | — | — | (44,307 | ) | ||||||||||||||||||||
| 302,894,670 | 16,951,218 | 319,845,888 | 1,785 | 3,182 | 4,967 | (271,455 | ) | |||||||||||||||||||||
Currency: | ||||||||||||||||||||||||||||
Forward | 61,572,968 | 801,075 | 62,374,043 | — | (4,455 | ) | (4,455 | ) | 1,337,808 | |||||||||||||||||||
Futures | 481,086 | 7,806 | 488,892 | — | (126 | ) | (126 | ) | — | |||||||||||||||||||
Swap | 104,350,060 | 10,716,933 | 115,066,993 | 10,996 | (26,514 | ) | (15,518 | ) | (756,388 | ) | ||||||||||||||||||
Option bought | 3,292,918 | 7,446 | 3,300,364 | — | (36 | ) | (36 | ) | 256,875 | |||||||||||||||||||
Option sold | 2,042,024 | — | 2,042,024 | — | — | — | (102,182 | ) | ||||||||||||||||||||
| 171,739,056 | 11,533,260 | 183,272,316 | 10,996 | (31,131 | ) | (20,135 | ) | 736,113 | ||||||||||||||||||||
Stock: | ||||||||||||||||||||||||||||
Index futures bought | 164,886 | 21,657 | 186,543 | (1,737 | ) | 1,001 | (736 | ) | — | |||||||||||||||||||
Index futures sold | — | 10,479 | 10,479 | — | (668 | ) | (668 | ) | — | |||||||||||||||||||
Futures bought | 841 | — | 841 | — | — | — | — | |||||||||||||||||||||
Futures sold | 8,699 | — | 8,699 | (324 | ) | — | (324 | ) | — | |||||||||||||||||||
Swap bought | — | 15,356 | 15,356 | — | (810 | ) | (810 | ) | — | |||||||||||||||||||
Index option bought | 288,213 | — | 288,213 | 84 | — | 84 | 633 | |||||||||||||||||||||
Index option sold | 808,023 | — | 808,023 | (1,542 | ) | — | (1,542 | ) | (14,267 | ) | ||||||||||||||||||
Option bought | 102,630 | 413,561 | 516,191 | — | 32,869 | 32,869 | 32,129 | |||||||||||||||||||||
Option sold | 114,261 | — | 114,261 | — | — | — | (24,108 | ) | ||||||||||||||||||||
| 1,487,553 | 461,053 | 1,948,606 | (3,519 | ) | 32,392 | 28,873 | (5,613 | ) | ||||||||||||||||||||
Credit: | ||||||||||||||||||||||||||||
Credit default swap bought | 66,838 | — | 66,838 | 2,431 | — | 2,431 | (663 | ) | ||||||||||||||||||||
Credit default swap sold | 66,692 | 70,797 | 137,489 | (2,038 | ) | (327 | ) | (2,365 | ) | 2,296 | ||||||||||||||||||
| 133,530 | 70,797 | 204,327 | 393 | (327 | ) | 66 | 1,633 | |||||||||||||||||||||
| (Won) | 477,046,193 | (Won) | 29,790,450 | (Won) | 506,836,643 | (Won) | 9,061 | (Won) | (117,209) | (Won) | (108,148) | (Won) | 451,385 | |||||||||||||||
95
Table of Contents
Korea Finance Corporation
Notes to consolidated financial statements—(Continued)
December 31, 2010 and 2009
Unrealized gains and losses from fair value hedge items by type of the underlying assets or liabilities for the year ended December 31, 2010 are as follows (Korean won in millions):
| Year ended Dec. 31, 2010 | ||||||||
| Gain | Loss | |||||||
Available-for-sale securities | (Won) | 17,870 | (Won) | 26,728 | ||||
Borrowings | 45,226 | 38,145 | ||||||
Finance bonds | 267,670 | 556,319 | ||||||
Policy banking bonds in foreign currency | 18,350 | — | ||||||
Off-shore policy banking bonds in foreign currency | 6,673 | — | ||||||
| (Won) | 355,789 | (Won) | 621,192 | |||||
Unrealized gains (losses) recorded in accumulated other comprehensive income resulting from the application of cash flow hedge accounting at December 31, 2010 and 2009 are as follows (Korean won in millions):
| 2010 | 2009 | |||||||
Borrowing in foreign currencies | (Won) | 3,214 | (Won) | 1,891 | ||||
Income tax effect | (707 | ) | (458 | ) | ||||
| (Won) | 2,507 | (Won) | 1,433 | |||||
Outstanding credit derivatives issued by the Corporation at December 31, 2010 and 2009 are as follows (Korean won in millions):
| 2010 | ||||||||||||
Type | Counterparty | Notional amount | Transaction type | Reference entity (*) | ||||||||
Credit default Swap buy | Hana Daetoo Securities Co., Ltd. | (Won) | (153) | CDS | Exchangeable bonds of Hyundai Motor Company | |||||||
Credit default swap sell | BNP Paribas and others | (Won) | 1,582 | CDS | Exchangeable bonds of KCC, Debentures of Hyundai Motor Company and Hyundai Heavy Industries Co., Ltd | |||||||
| 2009 | ||||||||||||
Type | Counterparty | Notional amount | Transaction type | Reference entity (*) | ||||||||
Credit default swap buy | Hana Daetoo Securities Co., Ltd. | (Won) | (663 | ) | CDS | 137th CB of Taihan electric Wire Co., Ltd., Exchangeable bonds of KCC and Hyundai Motor Company | ||||||
Credit default swap sell | BNP Paribas and others | (Won) | 2,295 | CDS | 137th CB of Taihan electric Wire Co., Ltd., Exchangeable bonds of KCC and Hyundai Motor Company, Debentures of Hyundai Heavy Industries Co., Ltd. | |||||||
| (*) | Upon certain credit events of the reference entity before the maturity of the credit derivatives, the Corporation is required to pay (receive) to (from) the counterparty amount of losses (gains) incurred (generated) related to the credit events according to the nature of the transaction |
96
Table of Contents
Korea Finance Corporation
Notes to consolidated financial statements—(Continued)
December 31, 2010 and 2009
18. Insurance policy reserves
In accordance with the Insurance Business Act (“IBA”) and the Regulation on Supervision of Insurance Business (“RSIB”), the Corporation is required to maintain the policy reserve as a liability. Details of insurance policy reserve by insurance contracts at December 31, 2010 are as follows (Korean won in millions):
| 2010 | ||||
Premium reserve | (Won) | 6,917,467 | ||
Unearned premium reserve | 1,833 | |||
Reserve for outstanding claims | 333,339 | |||
Reserve for participating policyholders’ dividends | 25,211 | |||
Excess participating policyholder dividend reserve | 5,782 | |||
Reserve adjustment account for reinsurance ceded | (20,012 | ) | ||
Guaranteed benefit reserve | 20,037 | |||
| (Won) | 7,283,657 | |||
19. Capital stock and capital surplus
Paid-in capital
The Government is the sole equity owner of KoFC and is responsible for maintaining the entire paid-in capital in accordance with the KoFC Act. KoFC’s paid-in capital amounts to approximately (Won)15 trillion as of December 31, 2010 and 2009.
KoFC’s initial paid-in capital at the time of its incorporation was (Won)100 billion. After the Government’s non-cash capital contribution of (Won)14.9 trillion in KDBFG shares, KoFC’s capital at the reporting date amounts to approximately (Won)15 trillion.
Accumulated other comprehensive income
Accumulated other comprehensive income at December 31, 2010 and 2009 is as follows (Korean won in millions):
| 2010 | 2009 | |||||||
Unrealized gain on available-for-sale securities | (Won) | 1,771,027 | (Won) | 1,218,203 | ||||
Equity adjustments in equity method | 573,703 | — | ||||||
Equity adjustments in equity method-debit | (773,778 | ) | (7,001 | ) | ||||
Foreign currency translation adjustments for overseas operations | (1,042 | ) | — | |||||
Loss on valuation of cash flow hedge | 3,556 | — | ||||||
| (Won) | 1,573,466 | (Won) | 1,211,202 | |||||
97
Table of Contents
Korea Finance Corporation
Notes to consolidated financial statements—(Continued)
December 31, 2010 and 2009
Retained earnings
KoFC’s surplus reserve represents the legal reserve transferred from KDB as a result of the spin-off. In accordance with the KoFC Act, KoFC must appropriate 20% or more of net income for legal reserve until the reserve reaches the total amount of paid-in capital. The reserve is restricted for use other than for offsetting a deficit or transferring to capital.
In accordance with the KoFC Act, KoFC may utilize its legal reserve to offset its accumulated deficit as stated above. If the legal reserve is insufficient to offset the undisposed accumulated deficit, the Korean government is responsible to dispose of the remaining deficit.
20. Other comprehensive income
Comprehensive income for the year ended December 31, 2010 and the period from October 28, 2009 to December 31, 2009 consists of the following (Korean won in millions):
| Year ended Dec. 31 2010 | From Oct. 28, 2009 to Dec. 31, 2009 | |||||||
Net income (loss) | (Won) | 1,247,812 | (Won) | (68,132 | ) | |||
Other comprehensive income: | ||||||||
Changes in unrealized gain on valuation of available-for-sale securities, net | 613,547 | 204,751 | ||||||
Equity adjustments in equity method | 632,589 | 430 | ||||||
Equity adjustments in equity method-debit | (847,812 | ) | 77,756 | |||||
Foreign currency translation adjustments for overseas operations | (11,924 | ) | — | |||||
Changes in unrealized gain on valuation for cash flow hedge | 3,943 | — | ||||||
Comprehensive income | (Won) | 1,638,155 | (Won) | 214,805 | ||||
Attributable to: | ||||||||
Equity holder of parent | 767,020 | 220,469 | ||||||
Minority interests | 871,135 | (5,664 | ) | |||||
| (Won) | 1,638,155 | (Won) | 214,805 | |||||
21. Dividends
Details of dividends declared for KoFC for the year ended December 31, 2010 and the period from October 28, 2009 to December 31, 2009 are as follows (Korean won in million):
| Year ended Dec. 31, 2010 | From Oct. 28, 2009 To Dec. 31, 2009 | |||||||
Paid-in capital | (Won) | 15,000,000 | (Won) | 15,000,000 | ||||
Dividends | (Won) | 66,786 | (Won) | — | ||||
Dividend rate (%) | 0.45 | — | ||||||
98
Table of Contents
Korea Finance Corporation
Notes to consolidated financial statements—(Continued)
December 31, 2010 and 2009
The dividend payout ratios for KoFC for the year ended December 31, 2010 and the period from October 28, 2009 to December 31, 2009 are as follows (Korean won in millions):
| Year ended Dec. 31, 2010 | From Oct. 28, 2009 To Dec. 31, 2009 | |||||||
Cash dividends (A) | (Won) | 66,786 | (Won) | — | ||||
Net income (loss) (B) | (Won) | 404,756 | (Won) | (60,473 | ) | |||
Dividend payout ratio (%) (A)/(B) | 16.50 | — | ||||||
22. General and administrative expenses
General and administrative expenses for the year ended December 31, 2010 and the period from October 28, 2009 to December 31, 2009 are as follows (Korean won in millions):
| Year ended Dec. 31, 2010 | From Oct. 28, 2009 to Dec. 31, 2009 | |||||||
Salaries(*) | (Won) | 694,739 | (Won) | 5,263 | ||||
Other employee benefits(*) | 283,352 | 1,168 | ||||||
Rent(*) | 64,186 | 164 | ||||||
Depreciation(*) | 66,669 | 945 | ||||||
Amortization(*) | 107,238 | 1,196 | ||||||
Taxes and dues(*) | 78,487 | 1,576 | ||||||
Advertizing expense | 59,241 | 1,856 | ||||||
Others | 593,462 | 9,127 | ||||||
| (Won) | 1,947,374 | (Won) | 21,295 | |||||
| (*) | These accounts in aggregate amounting to (Won)1,294,671 million and (Won)10,312 million for the year ended December 31, 2010 and the period from October 28, 2009 to December 31, 2009 are related to the “added value” disclosure items of the Corporation’s operations as required by Statements of Korea Accounting Standards 21. |
23. Other operating income and other operating expenses
Details of others included in other operating income for the year ended December 31, 2010 and the period from October 28, 2009 to December 31, 2009 consist of the following (Korean won in millions):
| Year ended Dec. 31, 2010 | From Oct. 28, 2009 to Dec. 31, 2009 | |||||||
Sales of non-financial subsidiaries | (Won) | 14,363,928 | (Won) | 189,792 | ||||
Other | 190,172 | — | ||||||
| (Won) | 14,554,100 | (Won) | 189,792 | |||||
99
Table of Contents
Korea Finance Corporation
Notes to consolidated financial statements—(Continued)
December 31, 2010 and 2009
Details of others included in other operating expenses for the year ended December 31, 2010 and the period from October 28, 2009 to December 31, 2009 consist of the following (Korean won in millions):
| Year ended Dec. 31, 2010 | From Oct. 28, 2009 to Dec. 31, 2009 | |||||||
Cost of goods sold of non-financial subsidiaries | (Won) | 12,543,304 | (Won) | 235,968 | ||||
Other | 314,494 | — | ||||||
| (Won) | 12,857,798 | (Won) | 235,968 | |||||
24.Income tax
Income tax expense (benefit) for the year ended December 31, 2010 and the period from October 28, 2009 to December 31, 2009 is as follows (Korean won in millions):
| Year ended Dec. 31, 2010 | From Oct. 28, 2009 to Dec. 31, 2009 | |||||||
Income taxes of KoFC: | ||||||||
Current income taxes | (Won) | — | (Won) | — | ||||
Tax effect of temporary differences | 220,005 | 84,319 | ||||||
Tax effect of tax loss carry forwards and others | (86,266 | ) | (24,562 | ) | ||||
| 133,739 | 59,757 | |||||||
Deferred income taxes recognized directly to equity | (72,846 | ) | (79,240 | ) | ||||
| 60,893 | (19,483 | ) | ||||||
Income taxes of the subsidiaries: | ||||||||
Current income taxes | 783,399 | 2,563 | ||||||
Tax effect of temporary differences | 120,758 | (44,262 | ) | |||||
Tax effect of the judgment on propriety before tax levying | 19,983 | — | ||||||
Tax effect of tax loss carry forwards and others | (21,275 | ) | — | |||||
Deferred income taxes recognized directly to equity | (104,682 | ) | — | |||||
Income tax attributable to consolidated tax return | (1,633 | ) | — | |||||
| 796,550 | (41,699 | ) | ||||||
Income tax expense (benefit) | (Won) | 857,443 | (Won) | (61,182 | ) | |||
Deferred income tax assets and liabilities at December 31, 2010 and 2009 consist of the following (Korean won in millions):
| 2010 | 2009 | |||||||||||||||
| Deferred income tax assets | Deferred income tax liabilities | Deferred income tax assets | Deferred income tax liabilities | |||||||||||||
KoFC | (Won) | — | (Won) | 1,330,918 | (Won) | — | (Won) | 1,197,179 | ||||||||
KDBFG | 130,803 | 492,973 | 163,147 | 406,850 | ||||||||||||
KAI | 43,646 | — | 44,640 | — | ||||||||||||
| (Won) | 174,449 | (Won) | 1,823,891 | (Won) | 207,787 | (Won) | 1,604,029 | |||||||||
100
Table of Contents
Korea Finance Corporation
Notes to consolidated financial statements—(Continued)
December 31, 2010 and 2009
25. Net income (loss) attributable to equity holder of the parent and minority interests
Net income (loss) attributable to equity holder of the parent and minority interests for the year ended December 31, 2010 is as follows (Korean won in millions):
| Year ended Dec. 31, 2010 | ||||||||||||||||
| Attributable to | ||||||||||||||||
| Ownership (%) | Net income (loss) | Equity holder of the parent | Minority interests | |||||||||||||
KoFC | — | (Won) | 404,756 | (Won) | 404,756 | (Won) | — | |||||||||
KDBFG | 90.26 | 1,607,536 | 1,450,930 | 156,606 | ||||||||||||
KAI | 30.11 | 78,841 | 23,739 | 55,102 | ||||||||||||
KDB-Tstone PEF | 62.54 | (5,997 | ) | (3,750 | ) | (2,247 | ) | |||||||||
KoFC-KDB Material and Components Investment Fund No.1 | 95.13 | (199 | ) | (189 | ) | (10 | ) | |||||||||
KoFC-KDBC Pioneer Champ 2010-4 Venture Investment Fund | 95.08 | (424 | ) | (403 | ) | (21 | ) | |||||||||
KoFC KDBC-JKL Frontier Champ 2010-1PEF | 78.57 | (249 | ) | (196 | ) | (53 | ) | |||||||||
| 2,084,264 | 1,874,887 | 209,377 | ||||||||||||||
Inter-company transaction | (79,442 | ) | (79,442 | ) | — | |||||||||||
Consolidation adjustments | (757,010 | ) | (1,390,689 | ) | 633,679 | |||||||||||
| (Won) | 1,247,812 | (Won) | 404,756 | (Won) | 843,056 | |||||||||||
26. Related party transactions
Transactions with related parties (including transactions between subsidiaries which have been eliminated in consolidation) for the year ended December 31, 2010 and the period from October 28, 2009 to December 31, 2009 are summarized as follows (Korean won in millions):
| Year ended Dec. 31, 2010 | ||||||||||||||||||||||
Revenue | Expense | Interest on deposit | Interest on securities | Interest on loans | Others | Total | ||||||||||||||||
KoFC | KDB | (Won) | — | (Won) | — | (Won) | 4,739 | (Won) | — | (Won) | 4,739 | |||||||||||
” | Daewoo Securities Co., Ltd. | 201 | — | — | — | 201 | ||||||||||||||||
” | Korea Electric Power Co. | — | — | 13,946 | — | 13,946 | ||||||||||||||||
KDB | KoFC | — | 32,365 | 431 | — | 32,796 | ||||||||||||||||
” | KDBFG | — | — | — | 3,645 | 3,645 | ||||||||||||||||
” | Daewoo Securities Co., Ltd. | — | 22,616 | — | 165 | 22,781 | ||||||||||||||||
” | KDB Capital | — | 363 | 1,606 | 201 | 2,170 | ||||||||||||||||
” | KoFC-KDBC Pioneer Champ 2010-4 Venture Investment Fund | 66 | — | — | — | 66 | ||||||||||||||||
Daewoo Securities Co., Ltd. | KDBFG | — | 308 | — | 1,102 | 1,410 | ||||||||||||||||
” | KDB | — | 27,665 | — | 335 | 28,000 | ||||||||||||||||
KDB Capital | KDBFG | — | — | — | 91 | 91 | ||||||||||||||||
” | KDB | 82 | — | — | 136 | 218 | ||||||||||||||||
” | Daewoo Securities Co., Ltd. | — | — | — | 415 | 415 | ||||||||||||||||
” | KDB Asset Management Co., Ltd. | — | — | — | 50 | 50 | ||||||||||||||||
101
Table of Contents
Korea Finance Corporation
Notes to consolidated financial statements—(Continued)
December 31, 2010 and 2009
| Year ended Dec. 31, 2010 | ||||||||||||||||||||||
Revenue | Expense | Interest on deposit | Interest on securities | Interest on loans | Others | Total | ||||||||||||||||
“ | Korea Infrastructure Investment Assets Management Co., Ltd. | — | — | — | 14 | 14 | ||||||||||||||||
KDB Asset Management Co., Ltd. | KDBFG | — | — | — | 208 | 208 | ||||||||||||||||
Korea Infrastructure Investment Assets Management Co., Ltd. | KDB | 257 | — | — | 323 | 580 | ||||||||||||||||
Daewoo Securities (HK) Ltd. | Daewoo Securities Co., Ltd. | — | — | — | 6,938 | 6,938 | ||||||||||||||||
Daewoo Securities (Europe) Ltd. | Daewoo Securities Co., Ltd. | — | — | — | 1,417 | 1,417 | ||||||||||||||||
Daewoo Securities (America) Inc. | Daewoo Securities Co., Ltd. | — | — | — | 1,962 | 1,962 | ||||||||||||||||
Trust Account | KDB | 3,588 | — | 857 | — | 4,445 | ||||||||||||||||
Daewoo Shipbuilding & Marine Engineering Co., Ltd. | KDB | 1,052 | 84,441 | 11,728 | 7,844 | 105,065 | ||||||||||||||||
Korea Infrastructure Investment Asset Management Co., Ltd. | KDB | 14 | — | 156 | 55 | 225 | ||||||||||||||||
KDB Value PEF II | KDB | 28 | — | 20 | 417 | 465 | ||||||||||||||||
KDB Value PEF III | KDB | 205 | — | 169 | 971 | 1,345 | ||||||||||||||||
KDB Value PEF VI | KDB | — | — | — | 5,086 | 5,086 | ||||||||||||||||
KDB Venture M&A | KDB | 2 | — | — | 492 | 494 | ||||||||||||||||
KDB Turnaround PEF | KDB | 7 | — | 6 | 1,419 | 1,432 | ||||||||||||||||
KDB Asia (HK) Ltd. | KDB | 3,422 | 7,327 | 5,459 | 47 | 16,255 | ||||||||||||||||
KDB Ireland Co., Ltd. | KDB | — | — | 3,462 | — | 3,462 | ||||||||||||||||
KDB Bank (Hungary) Ltd. | KDB | 1,626 | 27,928 | 1,720 | 48 | 31,322 | ||||||||||||||||
Banco KDB Do Brasil S.A | KDB | 1,569 | — | 27,055 | 22 | 28,646 | ||||||||||||||||
KDB Consus Value | KDB | 119 | 1,465 | — | 2,058 | 3,642 | ||||||||||||||||
Materials and Components M&A PEF | KDB | 20 | — | 9 | 3,133 | 3,162 | ||||||||||||||||
KDB-Tstone PEF | KDB | 39 | — | 12 | 585 | 636 | ||||||||||||||||
KoFC-KDBC Pioneer Champ 2010-4 Venture Investment Fund No.1 | KDB | 66 | — | — | 490 | 556 | ||||||||||||||||
| (Won) | 12,363 | (Won) | 204,478 | (Won) | 71,375 | (Won) | 39,669 | (Won) | 327,885 | |||||||||||||
| From Oct. 28, 2009 to Dec. 31, 2009 | ||||||||||||||||||||||
Revenue | Expense | Interest on deposit | Interest on securities | Interest on loan | Others | Total | ||||||||||||||||
KDBFG | Daewoo Securities Co., Ltd. | (Won) | 249 | (Won) | — | (Won) | — | (Won) | — | (Won) | 249 | |||||||||||
Daewoo Securities Co., Ltd. | KDBFG | — | 663 | — | — | 663 | ||||||||||||||||
“ | KDB Capital | — | — | 219 | — | 219 | ||||||||||||||||
“ | KDB Asset Management | — | — | — | 151 | 151 | ||||||||||||||||
102
Table of Contents
Korea Finance Corporation
Notes to consolidated financial statements—(Continued)
December 31, 2010 and 2009
| From Oct. 28, 2009 to Dec. 31, 2009 | ||||||||||||||||||||||
Revenue | Expense | Interest on deposit | Interest on securities | Interest on loan | Others | Total | ||||||||||||||||
KDB Capital | Daewoo Securities Co., Ltd. | 428 | — | — | 148 | 576 | ||||||||||||||||
“ | KDB Asset Management Co., Ltd. | — | — | — | 14 | 14 | ||||||||||||||||
Daewoo Securities (Europe) Ltd. | Daewoo Securities Co., Ltd. | — | — | — | 318 | 318 | ||||||||||||||||
Daewoo Securities (America) Inc. | Daewoo Securities Co., Ltd. | — | — | — | 759 | 759 | ||||||||||||||||
Daewoo Securities (HK) Ltd. | Daewoo Securities Co., Ltd. | — | — | — | 504 | 504 | ||||||||||||||||
| (Won) | 677 | (Won) | 633 | (Won) | 219 | (Won) | 1,894 | (Won) | 3,423 | |||||||||||||
Outstanding balances with related parties (including balances between subsidiaries which have been eliminated in consolidation) arising from the above transactions as of December 31, 2010 and 2009 are summarized as follows (Korean won in millions):
| 2010 | ||||||||||||||||||||||
| Receivable | Payable | Due from banks | Securities | Loans | Others | Total | ||||||||||||||||
KoFC | KDB | (Won) | 234,916 | (Won) | — | (Won) | 570,506 | (Won) | 840 | (Won) | 806,262 | |||||||||||
” | Korea Electric Power Co. | — | — | 867,222 | 1,972 | 869,194 | ||||||||||||||||
KDBFG | KDB | 236 | — | — | 151,704 | 151,940 | ||||||||||||||||
KDB | KoFC | — | 2,955,172 | — | 4,390 | 2,959,562 | ||||||||||||||||
” | KDBFG | 236 | — | — | 151,704 | 151,940 | ||||||||||||||||
” | Daewoo Securities Co., Ltd. | — | — | — | 643 | 643 | ||||||||||||||||
” | KDB Capital | — | 53,986 | — | 4,366 | 58,352 | ||||||||||||||||
” | KAI | — | — | 220,292 | — | 220,292 | ||||||||||||||||
Daewoo Securities Co., Ltd” | KDB | 5,589 | 279,063 | — | 2,621 | 287,273 | ||||||||||||||||
” | KDBFG | — | 19,999 | — | 336 | 20,335 | ||||||||||||||||
KDB Capital | KDBFG | — | — | — | 18 | 18 | ||||||||||||||||
” | KDB | 37,612 | — | — | 508 | 38,120 | ||||||||||||||||
” | Daewoo Securities Co., Ltd. | — | — | — | 30 | 30 | ||||||||||||||||
KDB Asset Management Co., Ltd. | KDBFG | — | — | — | 39 | 39 | ||||||||||||||||
Daewoo Securities Co., Ltd. | — | — | — | 731 | 731 | |||||||||||||||||
Korea Infrastructure Investment Asset Management Co., Ltd. | KDB | 10,330 | — | — | 52 | 10,382 | ||||||||||||||||
KoFC-KDBC Pioneer Champ 2010-4 Venture Investment Fund | KDB | 10,531 | — | — | 5 | 10,536 | ||||||||||||||||
Daewoo Securities (Europe) Ltd. | Daewoo Securities Co., Ltd. | 2 | — | — | 408 | 410 | ||||||||||||||||
Daewoo Securities (America) Inc. | Daewoo Securities Co., Ltd. | 8 | — | — | 193 | 201 | ||||||||||||||||
Daewoo Securities (HK) Ltd. | Daewoo Securities Co., Ltd. | 52 | — | — | 154 | 206 | ||||||||||||||||
Trust Account | KDB | 85,965 | — | 37,725 | — | 123,690 | ||||||||||||||||
103
Table of Contents
Korea Finance Corporation
Notes to consolidated financial statements—(Continued)
December 31, 2010 and 2009
| 2010 | ||||||||||||||||||||||
| Receivable | Payable | Due from banks | Securities | Loans | Others | Total | ||||||||||||||||
Daewoo Shipbuilding & Marine Engineering Co., Ltd. | KDB | 143,452 | 204,465 | 730,786 | 699 | 1,079,402 | ||||||||||||||||
Korea Infrastructure Fund | KDB | 2,726 | — | — | — | 2,726 | ||||||||||||||||
KDB Value PEF II | KDB | 15,962 | — | 1,093 | 70 | 17,125 | ||||||||||||||||
KDB Value PEF III | KDB | 5,838 | — | — | 90 | 5,928 | ||||||||||||||||
KDB Value PEF VI | KDB | 424 | — | — | — | 424 | ||||||||||||||||
KDB Venture M&A PEF | KDB | 43 | — | — | — | 43 | ||||||||||||||||
KDB Turn Around PEF | KDB | 425 | — | — | 1 | 426 | ||||||||||||||||
KDB Asia (HK) Ltd. | KDB | 195,129 | — | 149,728 | 925 | 345,782 | ||||||||||||||||
KDB Ireland Co., Ltd. | KDB | 7,719 | — | 319,866 | 972 | 328,557 | ||||||||||||||||
KDB Bank (Hungary) Ltd. | KDB | 170,835 | — | 104,734 | 673 | 276,242 | ||||||||||||||||
Banco KDB Do Brasil S.A | KDB | — | — | 430,554 | 2,998 | 433,552 | ||||||||||||||||
KDB Consus Value | KDB | 12,246 | — | 16,996 | — | 29,242 | ||||||||||||||||
Materials & Components M&A PEF | KDB | 1,377 | — | — | 6 | 1,383 | ||||||||||||||||
KoFC-KDB Materials and Components Investment Fund No.1 | KDB | 17,793 | — | — | 7 | 17,800 | ||||||||||||||||
KDB-Tstone PEF | KDB | 1,800 | — | —�� | 10 | 1,810 | ||||||||||||||||
| (Won) | 961,246 | (Won) | 3,512,685 | (Won) | 3,449,502 | (Won) | 327,165 | (Won) | 8,250,598 | |||||||||||||
| 2009 | ||||||||||||||||||||||
| Receivable | Payable | Due from banks | Securities | Loans | Others | Total | ||||||||||||||||
KoFC | KDB | (Won) | 265,609 | (Won) | — | (Won) | — | (Won) | — | (Won) | 265,609 | |||||||||||
” | Daewoo Securities Co., Ltd. | 100,000 | — | — | — | 100,000 | ||||||||||||||||
KAI | KDB | — | — | 139,331 | — | 139,331 | ||||||||||||||||
KDBFG | KDB | 1,865 | — | — | 6,192 | 8,057 | ||||||||||||||||
” | Daewoo Securities Co., Ltd. | 60,200 | — | — | 249 | 60,449 | ||||||||||||||||
KDB | KAI | — | — | 139,331 | — | 139,331 | ||||||||||||||||
” | Daewoo Securities Co., Ltd. | — | 1,302 | — | 38,602 | 39,904 | ||||||||||||||||
” | KDB Capital | — | 20,043 | 165,990 | 24,735 | 210,768 | ||||||||||||||||
” | Korea Infrastructure Investment Asset Management Co., Ltd. | — | — | — | 3 | 3 | ||||||||||||||||
” | Daewoo Shipbuilding & Marine Engineering Co., Ltd. | 99,846 | 50,820 | 353,285 | 516,220 | 1,020,171 | ||||||||||||||||
” | KDB Asia (HK) Ltd. | 180,978 | 11,686 | 103,415 | — | 296,079 | ||||||||||||||||
” | KDB Ireland Co., Ltd. | 54,227 | — | 311,986 | 8,157 | 374,370 | ||||||||||||||||
” | KDB Bank (Hungary) Ltd. | 175,140 | — | 86,799 | 16,937 | 278,876 | ||||||||||||||||
” | Banco KDB Do Brasil S.A | 144,808 | — | 368,305 | 1,656 | 514,769 | ||||||||||||||||
” | UzKDB Bank | — | — | 9,107 | 103 | 9,210 | ||||||||||||||||
Daewoo Securities Co., Ltd | KDBFG | — | 49,995 | — | 28,645 | 78,640 | ||||||||||||||||
” | KDB | 5,393 | 273,178 | — | 3,538 | 282,109 | ||||||||||||||||
” | KDB Capital | — | — | 10,000 | — | 10,000 | ||||||||||||||||
104
Table of Contents
Korea Finance Corporation
Notes to consolidated financial statements—(Continued)
December 31, 2010 and 2009
| 2009 | ||||||||||||||||||||||
| Receivable | Payable | Due from banks | Securities | Loans | Others | Total | ||||||||||||||||
KDB Capital | KDB | 28,153 | — | — | 485 | 28,638 | ||||||||||||||||
” | Daewoo Securities Co., Ltd. | 95,000 | — | — | 95 | 95,095 | ||||||||||||||||
” | Korea Infrastructure Investment Asset Management Co. Ltd. | — | — | — | 28 | 28 | ||||||||||||||||
KDB Asset Management Co., Ltd. | KDBFG | — | — | — | 2 | 2 | ||||||||||||||||
” | Daewoo Securities Co., Ltd. | — | — | — | 731 | 731 | ||||||||||||||||
Korea Infrastructure Investment Asset Management Co., Ltd. | KDB | 8,999 | — | — | 8 | 9,007 | ||||||||||||||||
” | KDB Capital | — | — | — | 13 | 13 | ||||||||||||||||
KDB Trust | KDB | — | — | — | 102,146 | 102,146 | ||||||||||||||||
KDB Asia (HK) Ltd. | KDB | 171 | 1,248 | 1,797 | 32,128 | 35,344 | ||||||||||||||||
KDB Ireland Co., Ltd. | KDB | — | 28,461 | — | 1,010 | 29,471 | ||||||||||||||||
KDB Bank (Hungary) Ltd. | KDB | — | — | — | 1,102 | 1,102 | ||||||||||||||||
UzKDB | KDB | — | — | 5,291 | — | 5,291 | ||||||||||||||||
Daewoo Shipbuilding & Marine Engineering Co., Ltd. | KDB | 136,474 | — | — | 142,509 | 278,983 | ||||||||||||||||
Korea Infrastructure | KDB | 278 | — | — | 34,713 | 34,991 | ||||||||||||||||
KDB Value PEF I | KDB | 1,595 | — | — | — | 1,595 | ||||||||||||||||
KDB Value PEF II | KDB | 1,109 | — | — | — | 1,109 | ||||||||||||||||
KDB Value PEF III | KDB | 3,254 | 3,903 | — | 130 | 7,287 | ||||||||||||||||
KDB Venture M&A | KDB | 318 | — | — | — | 318 | ||||||||||||||||
KDB Turn Around PEF | KDB | 288 | 500 | — | — | 788 | ||||||||||||||||
Daewoo Securities (Europe) Ltd. | Daewoo Securities Co., Ltd. | — | — | — | 84 | 84 | ||||||||||||||||
Daewoo Securities (America) Inc. | Daewoo Securities Co., Ltd. | — | — | — | 566 | 566 | ||||||||||||||||
Daewoo Securities (HK) Ltd. | Daewoo Securities Co., Ltd. | — | — | — | 171 | 171 | ||||||||||||||||
| (Won) | 1,363,705 | (Won) | 451,136 | (Won) | 1,555,306 | (Won) | 968,366 | (Won) | 4,338,513 | |||||||||||||
105
Table of Contents
Korea Finance Corporation
Notes to consolidated financial statements—(Continued)
December 31, 2010 and 2009
Guarantees or collateral provided between related parties at December 31, 2010 and 2009 are summarized as follows (Korean won in millions):
Provider | Beneficiary | Guarantee/collateral | 2010 | 2009 | ||||||||
KDB | Daewoo Shipbuilding & Marine Engineering Co., Ltd. | Acceptance and guarantees in foreign currencies | (Won) | 562,893 | (Won) | 2,690,143 | ||||||
KDB Asia (HK) Ltd. | Acceptance and guarantees in foreign currencies | 143,513 | 58,380 | |||||||||
KAI | Acceptance and guarantees in foreign currencies | 220,292 | 185,340 | |||||||||
KDB Capital | KDB | Collateral loans for shipping finance | 147,583 | 103,991 | ||||||||
| (Won) | 1,074,281 | (Won) | 3,037,854 | |||||||||
KoFC received assets and liabilities related to policy banking from KDB for the purpose of transfer of policy banking. Significant assets and liabilities which were transferred from KDB to KoFC for the year ended December 31, 2010 are as follows (Korean won in millions):
Related party | Classification | Received assets and liabilities | ||||||||
| Asset | Liability | |||||||||
KDB | Loans for working capital in foreign currency | (Won) | 155,278 | (Won) | — | |||||
Loans for facility development in foreign currency | 4,176 | — | ||||||||
Privately placed bonds in Korean won | 302,430 | — | ||||||||
Beneficiary certificates in Korean won | 1,091,358 | — | ||||||||
Held-to-maturity securities in Korean won | 986,904 | — | ||||||||
Government fund loans for facility developments in Korean won | 1,501,451 | — | ||||||||
Government fund loans for working capital | 3,156 | — | ||||||||
IBRD foreign capital loans | 1,114,652 | — | ||||||||
Borrowings from IBRD | — | 135,559 | ||||||||
Other borrowings in foreign currency | — | 1,130,465 | ||||||||
| (Won) | 5,159,405 | (Won) | 1,266,024 | |||||||
Related party | Classification | Transferred assets and issued liability | ||||||||
| Asset | Liability | |||||||||
KDB | Due from bank in Korean won | (Won) | 1,107,797 | (Won) | — | |||||
Policy banking bonds in Korean won | — | 2,785,584 | ||||||||
| (Won) | 1,107,797 | (Won) | 2,785,584 | |||||||
106
Table of Contents
Korea Finance Corporation
Notes to consolidated financial statements—(Continued)
December 31, 2010 and 2009
27. Supplementary cash flow information
Significant non-cash transactions for the year ended December 31, 2010 and the period from October 29, 2009 to December 31, 2009 are as follows (Korean won in millions):
| Year ended Dec. 31, 2010 | From Oct. 28, 2009 to Dec. 31, 2009 | |||||||
Investment in-kind | (Won) | — | (Won) | 14,900,000 | ||||
Unrealized gain on valuation of available-for-sale securities | 162,397 | 202,072 | ||||||
Changes in equity adjustments in equity method | 194,974 | 1,114 | ||||||
Changes in equity adjustments in equity method-debit | 4,893 | 77,756 | ||||||
| (Won) | 362,264 | (Won) | 15,180,942 | |||||
Cash and cash equivalents recorded in the statement of cash flow at December 31, 2010 and 2009 are as follows (Korean won in millions):
| 2010 | 2009 | |||||||
Cash and cash equivalents in Korean won | (Won) | 53,707 | (Won) | 69,697 | ||||
Cash and cash equivalents in foreign currency | 144,421 | 86,270 | ||||||
Due from banks in Korean won possessed by KoFC | 1,004,916 | 1,030,000 | ||||||
| (Won) | 1,203,044 | (Won) | 1,185,967 | |||||
28. Segment financial information
The Corporation’s business segments are reported based on financial and non-financial services. The allocation of the Corporation’s condensed consolidated statement of financial position by business segments at December 31, 2010 and 2009 is as follows (Korean won in millions):
| 2010 | ||||||||||||||||
| Financial services | Non-financial services | Consolidation adjustments | Total | |||||||||||||
Assets: | ||||||||||||||||
Cash and due from banks | (Won) | 9,903,035 | (Won) | 741,116 | (Won) | (911,979 | ) | (Won) | 9,732,172 | |||||||
Securities | 107,094,228 | 976,546 | (41,896,184 | ) | 66,174,590 | |||||||||||
Loans receivable | 88,619,284 | 456,163 | (3,713,086 | ) | 85,362,361 | |||||||||||
Derivatives | 6,172,652 | 976,423 | (367,334 | ) | 6,781,741 | |||||||||||
Property and equipment, net | 1,180,915 | 5,846,042 | (102,413 | ) | 6,924,544 | |||||||||||
Others | 7,628,518 | 10,156,060 | (576,858 | ) | 17,207,720 | |||||||||||
| (Won) | 220,598,632 | (Won) | 19,152,350 | (Won) | (47,567,854 | ) | (Won) | 192,183,128 | ||||||||
Liabilities: | ||||||||||||||||
Deposits | (Won) | 22,930,786 | (Won) | — | (Won) | (674,732 | ) | (Won) | 22,256,054 | |||||||
Borrowings and debentures | 116,187,364 | 4,254,300 | (7,559,157 | ) | 112,882,507 | |||||||||||
Derivatives | 4,940,920 | 1,017,104 | (366,885 | ) | 5,591,139 | |||||||||||
Other | 17,592,147 | 8,850,236 | (1,116,692 | ) | 25,325,691 | |||||||||||
| (Won) | 161,651,217 | (Won) | 14,121,640 | (Won) | (9,717,466 | ) | (Won) | 166,055,391 | ||||||||
107
Table of Contents
Korea Finance Corporation
Notes to consolidated financial statements—(Continued)
December 31, 2010 and 2009
| 2010 | ||||||||||||||||
| Financial services | Non-financial services | Consolidation adjustments | Total | |||||||||||||
Equity: | ||||||||||||||||
Paid-in capital | (Won) | 30,993,611 | (Won) | 1,870,733 | (Won) | (17,864,344 | ) | (Won) | 15,000,000 | |||||||
Capital surplus | 14,453,134 | 175,314 | (14,625,081 | ) | 3,367 | |||||||||||
Capital adjustment | (397,636 | ) | (44,885 | ) | 256,473 | (186,048 | ) | |||||||||
Accumulated other comprehensive income | 2,783,306 | 1,069,418 | (2,279,257 | ) | 1,573,467 | |||||||||||
Retained earnings | 11,115,000 | 1,960,130 | (10,741,104 | ) | 2,334,026 | |||||||||||
Minority interests | — | — | 7,402,925 | 7,402,925 | ||||||||||||
| (Won) | 58,947,415 | (Won) | 5,030,710 | (Won) | (37,850,388 | ) | (Won) | 26,127,737 | ||||||||
| 2009 | ||||||||||||||||
| Financial services | Non-financial services | Consolidation adjustments | Total | |||||||||||||
Assets: | ||||||||||||||||
Cash and due from banks | (Won) | 7,800,290 | (Won) | 1,102,847 | (Won) | (1,313,108 | ) | (Won) | 7,590,029 | |||||||
Securities | 96,684,564 | 729,103 | (34,846,463 | ) | 62,567,204 | |||||||||||
Loans receivable | 84,155,170 | 261,328 | (1,624,286 | ) | 82,792,212 | |||||||||||
Derivatives | 7,862,617 | 2,128,977 | (627,878 | ) | 9,363,716 | |||||||||||
Property and equipment, net | 1,062,820 | 5,320,347 | (120,324 | ) | 6,262,843 | |||||||||||
Others | 5,736,169 | 9,543,354 | (966,864 | ) | 14,312,659 | |||||||||||
| (Won) | 203,301,630 | (Won) | 19,085,956 | (Won) | (39,498,923 | ) | (Won) | 182,888,663 | ||||||||
Liabilities: | ||||||||||||||||
Deposits | (Won) | 17,533,310 | (Won) | 364 | (Won) | (860,458 | ) | (Won) | 16,673,189 | |||||||
Borrowings and debentures | 116,729,243 | 3,195,482 | (2,764,621 | ) | 117,160,104 | |||||||||||
Others | 6,882,014 | 2,658,195 | (627,878 | ) | 8,912,331 | |||||||||||
Other manufacturing liability | 8,245,351 | 9,272,688 | (660,743 | ) | 16,857,296 | |||||||||||
| (Won) | 149,389,918 | (Won) | 15,126,729 | (Won) | (4,913,727 | ) | (Won) | 159,602,920 | ||||||||
Equity: | ||||||||||||||||
Paid-in capital | (Won) | 28,357,156 | (Won) | 1,755,852 | (Won) | (15,113,008 | ) | (Won) | 15,000,000 | |||||||
Capital surplus | 13,903,339 | 165,907 | (14,069,246 | ) | — | |||||||||||
Capital adjustment | (38,276 | ) | (48,818 | ) | 83,397 | (3,697 | ) | |||||||||
Accumulated other comprehensive income | 2,118,879 | 921,835 | (1,829,511 | ) | 1,211,203 | |||||||||||
Retained earnings | 9,570,614 | 1,164,451 | (8,822,102 | ) | 1,912,963 | |||||||||||
Minority interests | — | — | 5,165,274 | 5,165,274 | ||||||||||||
| (Won) | 53,911,712 | (Won) | 3,959,227 | (Won) | (34,585,196 | ) | (Won) | 23,285,743 | ||||||||
108
Table of Contents
Korea Finance Corporation
Notes to consolidated financial statements—(Continued)
December 31, 2010 and 2009
The allocation of the Corporation’s condensed consolidated statements of operations by business segments for the year ended December 31, 2010 and the period from October 28, 2009 to December 31, 2009 is as follows:
| Year ended Dec. 31, 2010 | ||||||||||||||||
| Financial services | Non-financial services | Consolidation adjustments | Total | |||||||||||||
Operating revenue | (Won) | 25,470,585 | (Won) | 16,994,876 | (Won) | (1,835,985 | ) | (Won) | 40,629,476 | |||||||
Operating expense | 24,507,152 | 15,864,732 | (1,674,884 | ) | 38,697,000 | |||||||||||
Operating income | 963,433 | 1,130,144 | (161,101 | ) | 1,932,476 | |||||||||||
Non-operating income | 2,592,397 | 159,529 | (2,240,784 | ) | 511,142 | |||||||||||
Non-operating expense | 714,841 | 163,489 | (534,543 | ) | 343,787 | |||||||||||
Income before income tax | 2,840,989 | 1,126,184 | (1,867,342 | ) | 2,099,831 | |||||||||||
Income tax expense | 560,858 | 285,590 | 10,995 | 857,443 | ||||||||||||
Net loss before acquiring subsidiary | — | — | — | (5,424 | ) | |||||||||||
Net income | (Won) | 2,280,131 | (Won) | 840,594 | (Won) | (1,872,913 | ) | (Won) | 1,247,812 | |||||||
Attributable to: | ||||||||||||||||
Equity holder of parent | (Won) | 2,280,131 | (Won) | 840,594 | (Won) | (2,715,969 | ) | (Won) | 404,756 | |||||||
Minority interests | — | — | 843,056 | 843,056 | ||||||||||||
| (Won) | 2,280,131 | (Won) | 840,594 | (Won) | (1,872,913 | ) | (Won) | 1,247,812 | ||||||||
| From Oct. 28, 2009 to Dec. 31, 2009 | ||||||||||||||||
| Financial services | Non-financial services | Consolidation adjustments | Total | |||||||||||||
Operating revenue | (Won) | 84,007 | (Won) | 189,793 | (Won) | (46 | ) | (Won) | 273,754 | |||||||
Operating expense: | 195,784 | 251,633 | 276 | 447,693 | ||||||||||||
Operating loss | (111,777 | ) | (61,840 | ) | (322 | ) | (173,939 | ) | ||||||||
Non-operating income | 82,244 | 14,525 | — | 96,769 | ||||||||||||
Non-operating expense | 50,424 | 5,342 | (3,622 | ) | 52,144 | |||||||||||
Loss before income tax | (79,957 | ) | (52,657 | ) | 3,300 | (129,314 | ) | |||||||||
Income tax benefit | (19,483 | ) | (41,700 | ) | — | (61,183 | ) | |||||||||
Net loss | (Won) | (60,474 | ) | (Won) | (10,957 | ) | (Won) | 3,300 | (Won) | (68,131 | ) | |||||
Attributable to: | ||||||||||||||||
Equity holder of parent | (Won) | (60,474 | ) | (Won) | (10,957 | ) | (Won) | 10,958 | (Won) | (60,473 | ) | |||||
Minority interests | — | — | (7,658 | ) | (7,658 | ) | ||||||||||
| (Won) | (60,474 | ) | (Won) | (10,957 | ) | (Won) | 3,300 | (Won) | (68,131 | ) | ||||||
109
Table of Contents
Korea Finance Corporation
Notes to consolidated financial statements—(Continued)
December 31, 2010 and 2009
29. Financial information of the consolidated subsidiaries
The condensed statements of financial position of consolidated subsidiaries at December 31, 2010 and 2009 is summarized as follows (Korean won in millions):
| 2010 | ||||||||||||
| Assets | Liabilities | Equity | ||||||||||
KDBFG | (Won) | 159,460,622 | (Won) | 136,839,989 | (Won) | 22,620,633 | ||||||
KAI | 1,498,431 | 884,273 | 614,158 | |||||||||
KDB-Tstone PEF | 36,161 | 400 | 35,761 | |||||||||
KoFC-KDB Materials and Components Investment Fund No.1 | 24,801 | — | 24,801 | |||||||||
KoFC-KDBC Pioneer Champ 2010-4 Venture Investment Fund | 17,576 | — | 17,576 | |||||||||
KoFC KDBC-JKL Frontier Champ 2010-1 PEF | 66,139 | 388 | 65,751 | |||||||||
| (Won) | 161,103,730 | (Won) | 137,725,050 | (Won) | 23,378,680 | |||||||
| 2009 | ||||||||||||
| Assets | Liabilities | Equity | ||||||||||
KDBFG | (Won) | 157,162,817 | (Won) | 137,012,416 | (Won) | 20,150,401 | ||||||
KAI | 1,274,962 | 725,401 | 549,561 | |||||||||
| (Won) | 158,437,779 | (Won) | 137,737,817 | (Won) | 20,699,962 | |||||||
The condensed statements of operations of consolidated subsidiaries for the year ended December 31, 2010 and the period from October 28, 2009 to December 31, 2009 are summarized as follows (Korean won in millions):
| Year ended Dec. 31, 2010 | ||||||||||||||||
| Operating revenue | Operating expense | Operating income (loss) | Net income (loss) | |||||||||||||
KDBFG | (Won) | 38,570,795 | (Won) | 36,233,812 | (Won) | 2,336,983 | (Won) | 1,607,536 | ||||||||
KAI | 1,266,711 | 1,145,704 | 121,007 | 78,841 | ||||||||||||
KDB-Tstone PEF | 587 | 6,584 | (5,997 | ) | (5,997 | ) | ||||||||||
KoFC-KDB Materials and Components Investment Fund No.1 | 303 | 503 | (200 | ) | (199 | ) | ||||||||||
KoFC-KDBC Pioneer Champ 2010-4 Venture Investment Fund | 66 | 490 | (424 | ) | (424 | ) | ||||||||||
KoFC KDBC-JKL Frontier Champ 2010-1 PEF | 5 | 253 | (248 | ) | (249 | ) | ||||||||||
| (Won) | 39,838,467 | (Won) | 37,378,346 | (Won) | 2,451,121 | (Won) | 1,679,508 | |||||||||
| From Oct. 28, 2009 to Dec. 31, 2009 | ||||||||||||||||
| Operating revenue | Operating expense | Operating income (loss) | Net income (loss) | |||||||||||||
KDBFG | (Won) | 1,441,533 | (Won) | 1,440,749 | (Won) | 784 | (Won) | 19,220 | ||||||||
KAI | 189,792 | 251,663 | (61,871 | ) | 78,841 | |||||||||||
| (Won) | 1,631,325 | (Won) | 1,692,412 | (Won) | (61,087 | ) | (Won) | 1,679,508 | ||||||||
110
Table of Contents
Territory and Population
Located generally south of the 38th parallel on the Korean peninsula, The Republic of Korea covers about 38,000 square miles, approximately one-fourth of which is arable. The Republic has a population of approximately 48 million people. The country’s largest city and capital, Seoul, has a population of about 11 million people.
Map of the Republic of Korea
Political History
Dr. Rhee Seungman, who was elected President in each of 1948, 1952, 1956 and 1960, dominated the years after the Republic’s founding in 1948. Shortly after President Rhee’s resignation in 1960 in response to student-led demonstrations, a group of military leaders headed by Park Chung Hee assumed power by coup. The military leaders established a civilian government, and the country elected Mr. Park as President in October 1963. President Park served as President until his assassination in 1979 following a period of increasing strife between the Government and its critics. The Government declared martial law and formed an interim
111
Table of Contents
government under Prime Minister Choi Kyu Hah, who became the next President. After clashes between the Government and its critics, President Choi resigned, and General Chun Doo Hwan, who took control of the Korean army, became President in 1980.
In late 1980, the country approved, by national referendum, a new Constitution, providing for indirect election of the President by an electoral college and for certain democratic reforms, and shortly thereafter, in early 1981, re-elected President Chun.
Responding to public demonstrations in 1987, the legislature revised the Constitution to provide for direct election of the President. In December 1987, Roh Tae Woo won the Presidency by a narrow plurality, after opposition parties led by Kim Young Sam and Kim Dae Jung failed to unite behind a single candidate. In February 1990, two opposition political parties, including the one led by Kim Young Sam, merged into President Roh’s ruling Democratic Liberal Party.
In December 1992, the country elected Kim Young Sam as President. The election of a civilian and former opposition party leader considerably lessened the controversy concerning the legitimacy of the political regime. President Kim’s administration reformed the political sector and deregulated and internationalized the Korean economy.
In December 1997, the country elected Kim Dae Jung as President. President Kim’s party, the Millennium Democratic Party (formerly known as the National Congress for New Politics), formed a coalition with the United Liberal Democrats led by Kim Jong Pil, with Kim Jong Pil becoming the first prime minister in President Kim’s administration. The coalition, which temporarily ended before the election held in April 2000, continued with the appointment of Lee Han Dong of the United Liberal Democrats as the Prime Minister in June 2000. The coalition again ended in September 2001.
In December 2002, the country elected Roh Moo Hyun as President. President Roh and his supporters left the Millennium Democratic Party in 2003 and formed a new party, the Uri Party, in November 2003. On August 15, 2007, 85 members of the National Assembly, previously belonging to the Uri Party, or the Democratic Party, formed the United New Democratic Party (the “UNDP”). The Uri Party merged into the UNDP in August 20, 2007.
In December 2007, the country elected Lee Myung-Bak as President. He commenced his term on February 25, 2008. The Lee administration’s key policy priorities include:
| • | pursuing a lively market economy through deregulation, free trade and the attraction of foreign investment; |
| • | establishing an efficient government by reorganizing government functions and privatizing state-owned enterprises; |
| • | taking initiatives on the denuclearization of North Korea; |
| • | seeking a productive welfare system based on customized welfare benefits and job training; and |
| • | strengthening the competitiveness of Korea’s education system. |
Government and Administrative Structure
Governmental authority in the Republic is centralized and concentrated in a strong Presidency. The President is elected by popular vote and can only serve one term of five years. The President chairs the State Council, which consists of the prime minister, the deputy prime ministers, the respective heads of Government
112
Table of Contents
ministries and the ministers of state. The President can select the members of the State Council and appoint or remove all other Government officials, except for elected local officials.
The President can veto new legislation and take emergency measures in cases of natural disaster, serious fiscal or economic crisis, state of war or other similar circumstances. The President must promptly seek the concurrence of the National Assembly for any emergency measures taken and failing to do so automatically invalidates the emergency measures. In the case of martial law, the President may declare martial law without the consent of the National Assembly; provided, however, that the National Assembly may request the President to rescind such martial law.
The National Assembly exercises the country’s legislative power. The Constitution and the Election for Public Offices Act provide for the direct election of about 82% of the members of the National Assembly and the distribution of the remaining seats proportionately among parties winning more than 5 seats in the direct election or receiving over 3% of the popular vote. National Assembly members serve four-year terms. The National Assembly enacts laws, ratifies treaties and approves the national budget. The executive branch drafts most legislation and submits it to the National Assembly for approval.
The country’s judicial branch comprises the Supreme Court, the Constitutional Court and lower courts of various levels. The President appoints the Chief Justice of the Supreme Court and appoints the other Justices of the Supreme Court upon the recommendation of the Chief Justice. All appointments to the Supreme Court require the consent of the National Assembly. The Chief Justice, with the consent of the conference of Supreme Court Justices, appoints all the other judges in Korea. Supreme Court Justices serve for six years and all other judges serve for ten years. Other than the Chief Justice, justices and judges may be reappointed to successive terms.
The President formally appoints all nine judges of the Constitutional Court, but three judges must be designated by the National Assembly and three by the Chief Justice of the Supreme Court. Constitutional Court judges serve for six years and may be reappointed to successive terms.
Administratively, the Republic comprises nine provinces and seven cities with provincial status: Seoul, Busan, Daegu, Incheon, Gwangju, Daejon and Ulsan. From 1961 to 1995, the national government controlled the provinces and the President appointed provincial officials. Local autonomy, including the election of provincial officials, was reintroduced in June 1995.
Political Organizations
Currently, there are two major political parties, the Grand National Party, or GNP, and the Democratic Party, or DP. The 18th legislative general election was held on April 9, 2008 and the term of the National Assembly members elected in the 18th legislative general election commenced on May 30, 2008.
As of June 17, 2011, the parties control the following number of seats in the National Assembly:
| GNP | DP | Others | Total | |||||||||||||
Number of Seats | 169 | 87 | 41 | 297 | ||||||||||||
Relations with North Korea
Relations between the Republic and North Korea have been tense over most of the Republic’s history. The Korean War, which took place between 1950 and 1953 began with the invasion of the Republic by communist forces from North Korea and, following a military stalemate, an armistice was reached establishing a demilitarized zone monitored by the United Nations in the vicinity of the 38th parallel.
113
Table of Contents
North Korea maintains a regular military force estimated at more than 1,000,000 troops, mostly concentrated near the northern border of the demilitarized zone. The Republic’s military forces, composed of approximately 650,000 regular troops and almost 3.0 million reserves, maintain a state of military preparedness along the southern border of the demilitarized zone. In addition, the United States has historically maintained its military presence in the Republic. In October 2004, the United States and the Republic agreed to a three-phase withdrawal of approximately one-third of the 37,500 troops stationed in the Republic by the end of 2008. By the end of 2004, 5,000 U.S. troops departed the Republic in the first phase of such withdrawal and in the plan’s second phase, the United States removed 5,000 troops by the end of 2006. In the final phase, another 2,500 U.S. troops were scheduled to depart by the end of 2008. In April 2008, however, the United States and the Republic decided not to proceed with the final phase of withdrawal and agreed to maintain 28,500 U.S. troops in the Republic. In February 2007, the United States and the Republic agreed to dissolve their joint command structure by 2012, which would allow the Republic to assume the command of its own armed forces in the event of war on the Korean peninsula.
The level of tension between the two Koreas has fluctuated and may increase abruptly as a result of current and future events. In recent years, there have been heightened security concerns stemming from North Korea’s nuclear weapons and long-range missile programs and increased uncertainty regarding North Korea’s actions and possible responses from the international community. In December 2002, North Korea removed the seals and surveillance equipment from its Yongbyon nuclear power plant and evicted inspectors from the United Nations International Atomic Energy Agency. In January 2003, North Korea renounced its obligations under the Nuclear Non-Proliferation Treaty. Since the renouncement, the Republic, the United States, North Korea, China, Japan and Russia have held numerous rounds of six party multi-lateral talks in an effort to resolve issues relating to North Korea’s nuclear weapons program.
In addition to conducting test flights of long-range missiles, North Korea announced in October 2006 that it had successfully conducted a nuclear test, which increased tensions in the region and elicited strong objections worldwide. In response, the United Nations Security Council passed a resolution that prohibits any United Nations member state from conducting transactions with North Korea in connection with any large scale arms and material or technology related to missile development or weapons of mass destruction and from providing luxury goods to North Korea, imposes an asset freeze and travel ban on persons associated with North Korea’s weapons program, and calls upon all United Nations member states to take cooperative action, including thorough inspection of cargo to or from North Korea. In response, North Korea agreed in February 2007 at the six-party talks to shut down and seal the Yongbyon nuclear facility, including the reprocessing facility, and readmit international inspectors to conduct all necessary monitoring and verifications.
In April 2009, North Korea launched a long-range rocket over the Pacific Ocean. The Republic, Japan and the United States responded that the launch poses a threat to neighboring nations and that it was in violation of the United Nations Security Council resolution adopted in 2006 against nuclear tests by North Korea, and the United Nations Security Council unanimously passed a presidential statement that condemned North Korea for the launch and decided to tighten sanctions against North Korea. Subsequently, North Korea announced that it would permanently pull out of the six-party talks and restart its nuclear program, and the International Atomic Energy Agency reported that its inspectors had been ordered to remove surveillance devices and other equipment at the Yongbyon nuclear power plant and to leave North Korea. In May 2009, North Korea announced that it had successfully conducted a second nuclear test and test-fired three short-range, surface-to-air missiles. In response, the United Nations Security Council unanimously passed a resolution that condemned North Korea for the nuclear test and decided to expand and tighten sanctions against North Korea. In March 2010, a Korean warship was destroyed by an underwater explosion, killing many of the crewmen on board. The Government formally accused North Korea of causing the sinking in May 2010. North Korea has denied responsibility for the sinking and has threatened retaliation for any attempt to punish it for the act. On November 23, 2010, North Korean forces fired more than one hundred artillery shells targeting Yeonpyeong Island located near the maritime border between the Republic and North Korea on the west coast of the Korean peninsula, killing two Korean soldiers
114
Table of Contents
and two civilians as well as causing substantial property damage. The Republic responded by firing approximately 80 artillery shells and putting the military on its highest alert level. The Government condemned North Korea for the act and vowed stern retaliation should there be further provocation.
There recently has been increased uncertainty with respect to the future of North Korea’s political leadership and concern regarding its implications for economic and political stability in the region. In June 2009, U.S. and Korean officials announced that Kim Jong-il, the North Korean ruler who reportedly suffered a stroke in August 2008, designated his third son, Kim Jong-eun, who is reportedly in his twenties, to become his successor. In September 2010, Kim Jong-eun was made a general in the North Korean army, named the vice chairman of the Central Military Commission and appointed to the Central Committee of the Workers’ Party in a series of measures widely believed to be part of the succession plan. In addition, North Korea’s economy faces severe challenges. For example, in November 2009, the North Korean government redenominated its currency at a ratio of 100 to 1 as part of a currency reform undertaken in an attempt to control inflation and reduce income gaps. In tandem with the currency redenomination, the North Korean government banned the use or possession of foreign currency by its residents and closed down privately run markets, which led to severe inflation and food shortages. Such developments may further aggravate social and political tensions within North Korea.
There can be no assurance that the level of tension on the Korean peninsula will not escalate in the future or that such escalation will not have a material adverse impact on the Republic’s economy or its ability to obtain future funding. Any further increase in tension, which may occur, for example, if North Korea experiences a leadership crisis, high-level contacts between the Republic and North Korea break down or military hostilities occur, could have a material adverse effect on the Republic’s economy.
Over the longer term, reunification of the two Koreas could occur. Reunification may entail a significant economic commitment by the Republic. In President Lee’s national address on August 15, 2010, he suggested the possible adoption of a reunification tax as a potential means of alleviating the potential long-term economic burden associated with reunification. Such discussions on reunification are very preliminary, and it has not been decided whether or when such a reunification tax would be implemented. If a reunification tax is implemented, depending on how it is structured, it may lead to a decrease in domestic consumption, which in turn may have a material adverse effect on the Republic’s economy.
Foreign Relations and International Organizations
The Republic maintains diplomatic relations with most nations of the world, most importantly with the United States with which it entered into a mutual defense treaty and several economic agreements. The Republic also has important relationships with Japan and China, its largest trading partners together with the United States.
The Republic belongs to a number of supranational organizations, including:
| • | the International Monetary Fund, or the IMF; |
| • | the World Bank; |
| • | the Asian Development Bank, or ADB; |
| • | the Multilateral Investment Guarantee Agency; |
| • | the International Finance Corporation; |
| • | the International Development Association; |
| • | the African Development Bank; |
| • | the European Bank for Reconstruction and Development; |
| • | the Bank for International Settlements; |
115
Table of Contents
| • | the World Trade Organization, or WTO; and |
| • | the Inter-American Development Bank, or IDB. |
In September 1991, the Republic and North Korea became members of the United Nations. During the 1996 and 1997 sessions, the Republic served as a non-permanent member of the United Nations Security Council.
In March 1995, the Republic applied for admission to the Organization for Economic Cooperation and Development, or the OECD, which the Republic officially joined as the twenty-ninth regular member in December 1996.
Current Worldwide Economic and Financial Difficulties
Recent difficulties affecting the U.S. and global financial sectors, adverse conditions and volatility in the U.S. and worldwide credit and financial markets, fluctuations in oil and commodity prices and the general weakness of the U.S. and global economy during the second half of 2008 and first half of 2009 increased the uncertainty of global economic prospects in general and adversely affected, and may continue to adversely affect, the Korean economy. During the second and third quarter of 2007, credit markets in the United States started to experience difficult conditions and volatility that in turn have affected worldwide financial markets. In particular, in late July and early August 2007, market uncertainty in the U.S. sub-prime mortgage sector increased dramatically and further expanded to other markets such as those for leveraged finance, collateralized debt obligations and other structured products. In September and October 2008, liquidity and credit concerns and volatility in the global credit and financial markets increased significantly with the bankruptcy or acquisition of, and government assistance to, several major U.S. and European financial institutions. These developments resulted in reduced liquidity, greater volatility, widening of credit spreads and a lack of price transparency in the United States and global credit and financial markets.
As liquidity and credit concerns and volatility in the global financial markets increased significantly since September 2008, the value of the Won relative to the U.S. dollar depreciated at an accelerated rate during the fourth quarter of 2008 and first half of 2009. See “Monetary Policy—Foreign Exchange.” Such depreciation of the Won increased the cost of imported goods and services and the Won revenue needed by Korean companies to service foreign currency-denominated debt. Furthermore, as a result of adverse global and Korean economic conditions, there was a significant overall decline and continuing volatility in the stock prices of Korean companies. The Korea Composite Stock Price Index declined by 27.8% from 1,852.0 on May 30, 2008 to 1,336.7 on April 16, 2009. See “The Financial System—Securities Markets”. Further declines in the Korea Composite Stock Price Index and large amounts of sales of Korean securities by foreign investors and subsequent repatriation of the proceeds of such sales may continue to adversely affect the value of the Won, the foreign currency reserves held by financial institutions in Korea, and the ability of Korean companies to raise capital. In addition, increases in credit spreads, as well as limitations on the availability of credit resulting from heightened concerns about the stability of the markets generally and the strength of counterparties specifically that led many lenders and institutional investors to reduce or cease funding to borrowers, adversely affected Korean banks’ ability to borrow, particularly with respect to foreign currency funding, during the fourth quarter of 2008 and first half of 2009. Moreover, GDP in the first quarter of 2009 contracted by 4.3% at chained 2005 year prices compared with the same period in 2008, and exports in the first quarter of 2009 decreased by 24.8% to US$74.7 billion from US$99.4 billion in the same period in 2008. In the event that such difficult conditions in the global credit markets continue or the global economy deteriorates in the future, the Korean economy could be adversely affected and Korean banks, including us, may be forced to fund their operations at a higher cost or may be unable to raise as much funding as they need to support their lending and other activities.
In response to these developments, legislators and financial regulators in the United States and other jurisdictions, including Korea, implemented a number of policy measures designed to add stability to the
116
Table of Contents
financial markets, including the provision of direct and indirect assistance to distressed financial institutions. In particular, the Government has implemented or announced, among other things, the following measures during the fourth quarter of 2008 and in 2009:
| • | in October 2008, the Government implemented a guarantee program to guarantee foreign currency- denominated debt incurred by Korean banks and their overseas branches between October 20, 2008 and June 30, 2009 (subsequently extended to December 31, 2009), up to an aggregate amount of US$100 billion, for a period of three years (subsequently extended to five years) from the date such debt was incurred; |
| • | in October 2008, The Bank of Korea established a temporary reciprocal currency swap arrangement with the Federal Reserve Board of the United States for up to US$30 billion, effective until April 30, 2009 (subsequently extended to October 30, 2009). The Bank of Korea provided U.S. dollar liquidity, through competitive auction facilities, to financial institutions established in Korea, using funds from the swap line; |
| • | in December 2008, a (Won)10 trillion bond market stabilization fund was established to purchase financial and corporate bonds and debentures in order to provide liquidity to companies and financial institutions; |
| • | in December 2008, The Bank of Korea agreed with the People’s Bank of China to establish a bilateral currency swap arrangement for up to (Won)38 trillion, effective for three years, and agreed with the Bank of Japan to increase the maximum amount of their bilateral swap arrangement from US$3 billion to US$20 billion, effective until April 30, 2009; |
| • | in December 2008 and March 2009, the Government, through Korea Asset Management Corporation, purchased non-performing loans held by savings banks in the amount of approximately (Won)1.7 trillion; |
| • | in February 2009, the Government announced its plan to contribute capital to Korean banks through a (Won)20 trillion bank recapitalization fund and received applications from 14 banks; |
| • | during the first quarter of 2009, the Government, through the Bank of Korea and the Korea Development Bank, purchased from Korean banks hybrid securities and subordinated bonds in the amount of approximately (Won)4 trillion; |
| • | during the fourth quarter of 2008 and the first quarter of 2009, The Bank of Korea decreased the policy rate by a total of 3.25% points to 2.00% in order to address financial market instability and to help combat the slowdown of the domestic economy; |
| • | in April 2009, the National Assembly authorized the expansion of the 2009 national budget by (Won)28.4 trillion to provide stimulus for the Korean economy. The stimulus plan includes (Won)17.2 trillion to be used for cash handouts, low-interest loans, infrastructure spending and job training, as well as (Won)11.2 trillion in various tax incentives; and |
| • | in December 2009, the Government, together with the member countries of the Association of Southeast Asian Nations, China and Japan, signed the Chiang Mai Initiative Multilateralization Agreement to address balance-of-payments and short-term liquidity difficulties in the region and to supplement the existing international financial arrangements. |
However, the overall impact of these legislative and regulatory efforts on the financial markets is uncertain, and they may not have the intended stabilizing effects.
While the rate of deterioration of the global economy slowed in the second half of 2009 and into 2010, with some signs of stabilization and possible improvement, the overall prospects for the Korean and global economy in 2010 and beyond remain uncertain. For example, in November 2009, the Dubai government announced a moratorium on the outstanding debt of Dubai World, a government-affiliated investment company.
117
Table of Contents
In addition, many governments in Europe are showing increasing signs of fiscal stress and may experience difficulties in meeting their debt service requirements. For example, in November 2008, the Icelandic government, facing mounting debt problems, reached an agreement with the IMF to receive loans in the amount of US$2.1 billion over a two-year period. In addition, in May 2010, the Greek government reached an agreement with the IMF and the European Union to receive loans in the amount of Euro 115 billion over a three-year period. Any of these or other developments could potentially trigger another financial and economic crisis, which could have a material adverse effect on the Korean economy and financial markets (including depreciation of the value of the Won, decline and volatility in the stock prices of Korean companies, increases in credit spreads and funding costs and decreases in exports) and our financial conditions and results of operations.
Furthermore, while many governments worldwide are considering or are in the process of implementing “exit strategies”, in the form of reduced government spending, higher interest rates or otherwise, with respect to the economic stimulus measures adopted in response to the global financial crisis, such strategies may, for reasons related to timing, magnitude or other factors, have the unintended consequence of prolonging or worsening global economic and financial difficulties.
Moreover, the catastrophic earthquake and tsunami that struck Japan in March 2011 and the nuclear crisis that resulted may adversely affect the Korean economy by causing a decline in exports to Japan and a decrease in foreign direct investment in the Republic, reducing demand in the retail and tourism industry and disrupting supplies to certain manufacturers that depend on components made in Japan, which in turn may have a material adverse effect on our financial condition and results of operations. In addition, the price of oil has increased recently due to, among others, political unrest and military conflict in North Africa and Middle East, which could have a material adverse effect on the global and Korean economies.
In light of the high level of interdependence of the global economy, any of the foregoing developments could have a material adverse effect on the Korean economy and financial markets.
Gross Domestic Product
Gross domestic product, or GDP, measures the market value of all final goods and services produced within a country for a given period and reveals whether a country’s productive output rises or falls over time. Economists present GDP in both current market prices and “real” or “inflation-adjusted” terms. In March 2009, the Republic adopted a method known as the “chain-linked” measure of GDP, replacing the previous fixed-base, or “constant” measure of GDP, to show the real growth of the aggregate economic activity, as recommended by the System of National Accounts 1993. GDP at current market prices values a country’s output using the actual prices of each year, whereas the “chain-linked” measure of GDP is compiled by using “chained indices” linking volume growth between consecutive time periods.
118
Table of Contents
The following table sets out the composition of the Republic’s GDP at current and chained 2005 year prices and the annual average increase in the Republic’s GDP.
Gross Domestic Product
| 2006 | 2007 | 2008 | 2009 | 2010(1) | As % of GDP 2010(1) | |||||||||||||||||||
| (billions of Won) | ||||||||||||||||||||||||
Gross Domestic Product at Current Market Prices: | ||||||||||||||||||||||||
Private | 494,917.6 | 530,264.1 | 561,627.5 | 575,970.2 | 615,406.9 | 52.5 | ||||||||||||||||||
Government | 131,900.7 | 143,262.2 | 156,944.1 | 170,324.7 | 180,053.8 | 15.4 | ||||||||||||||||||
Gross Capital Formation | 269,187.8 | 286,917.6 | 320,368.8 | 279,858.1 | 341,902.8 | 29.2 | ||||||||||||||||||
Exports of Goods and Services | 360,625.3 | 408,754.1 | 544,110.7 | 529,645.1 | 614,451.0 | 52.4 | ||||||||||||||||||
Less Imports of Goods and Services | (348,022.9 | ) | (394,026.2 | ) | (556,197.9 | ) | (490,188.3 | ) | (581,735.8 | ) | (49.6 | ) | ||||||||||||
Statistical Discrepancy | 135.3 | (158.9 | ) | (401.4 | ) | (573.0 | ) | 2,724.6 | 0.2 | |||||||||||||||
Expenditures on Gross Domestic Product | 908,743.8 | 975,013.0 | 1,026,451.8 | 1,065,036.8 | 1,172,803.4 | 100.0 | ||||||||||||||||||
Net Factor Income from the Rest of the World | 1,390.3 | 1,800.9 | 7,663.6 | 4,746.2 | 320.0 | 0.0 | ||||||||||||||||||
Gross National Income(2) | 910,134.2 | 976,813.9 | 1,034,115.4 | 1,069,783.1 | 1,173,123.4 | 100.0 | ||||||||||||||||||
Gross Domestic Product at Chained 2005 Year Prices: | ||||||||||||||||||||||||
Private | 487,439.0 | 512,094.8 | 518,820.8 | 518,776.0 | 540,254.7 | 51.8 | ||||||||||||||||||
Government | 127,908.9 | 134,806.9 | 140,633.6 | 148,471.7 | 152,948.6 | 14.7 | ||||||||||||||||||
Gross Capital Formation | 268,215.8 | 277,729.0 | 277,772.8 | 240,411.7 | 277,460.4 | 26.6 | ||||||||||||||||||
Exports of Goods and Services | 378,374.7 | 426,070.6 | 454,248.9 | �� | 448,813.8 | 514,032.7 | 49.3 | |||||||||||||||||
Less Imports of Goods and Services | (352,087.7 | ) | (393,207.1 | ) | (410,567.7 | ) | (377,795.8 | ) | (441,692.8 | ) | (42.4 | ) | ||||||||||||
Statistical Discrepancy | 198.3 | 91.3 | (323.6 | ) | (528.1 | ) | (1,028.7 | ) | (0.1 | ) | ||||||||||||||
Expenditures on Gross Domestic Product(3) | 910,048.9 | 956,514.5 | 978,498.8 | 981,625.1 | 1,042,111.3 | 100.0 | ||||||||||||||||||
Net Factor Income from the Rest of the World in the Terms of Trade | 1,341.6 | 1,622.9 | 6,776.2 | 4,055.5 | 114.9 | 0.0 | ||||||||||||||||||
Trading Gains and Losses from Changes in the Terms of Trade | (13,196.4 | ) | (16,827.8 | ) | (50,031.9 | ) | (35,622.1 | ) | (39,741.5 | ) | (3.8 | ) | ||||||||||||
Gross National Income(4) | 898,194.2 | 941,317.3 | 935,248.8 | 950,041.1 | 1,002,473.2 | 96.2 | ||||||||||||||||||
Percentage Increase (Decrease) of GDP over Previous Year At Current Prices | 5.0 | 7.3 | 5.3 | 3.8 | 10.1 | — | ||||||||||||||||||
At Chained 2005 Year Prices | 5.2 | 5.1 | 2.3 | 0.3 | 6.2 | — | ||||||||||||||||||
| (1) | Preliminary. |
| (2) | GDP plus net factor income from the rest of the world is equal to the Republic’s gross national product. |
| (3) | Under the “chain-linked” measure of GDP, the components of GDP will not necessarily add to the total GDP. |
| (4) | Under the “chain-linked” measure of Gross National Income, the components of Gross National Income will not necessarily add to the total Gross National Income. |
Source: The Bank of Korea.
119
Table of Contents
The following table sets out the Republic’s GDP by economic sector at current prices:
Gross Domestic Product by Economic Sector
(at current market prices)
| 2006 | 2007 | 2008 | 2009 | 2010(1) | As % of GDP 2010 (1) | |||||||||||||||||||
| (billions of Won) | ||||||||||||||||||||||||
Industrial Sectors: | ||||||||||||||||||||||||
Agriculture, Forestry and Fisheries | 25,751.2 | 25,208.8 | 24,686.0 | 26,615.0 | 27,018.7 | 2.3 | ||||||||||||||||||
Mining and Manufacturing | 222,865.9 | 240,612.1 | 258,545.4 | 268,798.7 | 325,287.2 | 27.7 | ||||||||||||||||||
Mining and Quarrying | 1,925.8 | 2,001.2 | 2,336.0 | 2,220.5 | 2,237.3 | 0.2 | ||||||||||||||||||
Manufacturing | 220,940.1 | 238,610.9 | 256,209.4 | 266,578.2 | 323,049.9 | 27.6 | ||||||||||||||||||
Electricity, Gas and Water | 18,546.9 | 19,155.3 | 12,298.6 | 17,258.2 | 21,044.6 | 1.8 | ||||||||||||||||||
Construction | 61,359.3 | 64,979.0 | 64,612.2 | 66,576.6 | 68,800.8 | 5.9 | ||||||||||||||||||
Services: | 486,162.9 | 524,826.9 | 559,545.8 | 579,587.5 | 614,860.2 | 52.4 | ||||||||||||||||||
Wholesale and Retail Trade, Restaurants and Hotels | 87,320.8 | 93,405.5 | 100,419.3 | 103,994.8 | 114,245.4 | 9.7 | ||||||||||||||||||
Transportation, Storage and Communication | 36,424.2 | 40,070.5 | 41,613.1 | 40,162.5 | 42,909.6 | 3.7 | ||||||||||||||||||
Financial Intermediation | 55,234.7 | 61,114.0 | 65,132.2 | 65,035.5 | 72,476.6 | 6.2 | ||||||||||||||||||
Real Estate, Renting and Business Activities | 65,534.7 | 69,435.7 | 71,886.2 | 74,361.1 | 74,773.1 | 6.4 | ||||||||||||||||||
Information, Communication | 37,969.9 | 39,198.1 | 39,666.8 | 41,225.0 | 43,159.5 | 3.7 | ||||||||||||||||||
Business Activities | 41,292.3 | 45,056.0 | 49,905.7 | 51,001.9 | 53,956.6 | 4.6 | ||||||||||||||||||
Public Administration and Defense; Compulsory Social Security | 52,262.6 | 55,515.9 | 59,396.8 | 63,706.6 | 66,031.0 | 5.6 | ||||||||||||||||||
Education | 51,036.7 | 55,554.4 | 60,940.1 | 63,448.7 | 65,139.4 | 5.6 | ||||||||||||||||||
Health and Social Work | 31,617.7 | 35,451.6 | 38,452.1 | 43,092.1 | 47,332.0 | 4.0 | ||||||||||||||||||
Recreational, Cultural and Sporting | 10,859.2 | 12,209.1 | 13,048.9 | 13,693.8 | 14,056.9 | 1.2 | ||||||||||||||||||
Other Service Activities | 16,610.1 | 17,816.1 | 19,084.6 | 19,865.5 | 20,780.1 | 1.8 | ||||||||||||||||||
Taxes less subsidies on products | 94,057.8 | 100,231.0 | 106,763.8 | 106,200.8 | 115,791.6 | 9.9 | ||||||||||||||||||
Gross Domestic Product at Current Prices | 908,743.8 | 975,013.0 | 1,026,451.8 | 1,065,036.8 | 1,172,803.4 | 100.0 | ||||||||||||||||||
Net Factor Income from the Rest of the World | 1,390.3 | 1,800.9 | 7,663.6 | 4,746.2 | 320.0 | 0.0 | ||||||||||||||||||
Gross National Income at Current Price | 910,134.2 | 976,813.9 | 1,034,115.4 | 1,069,783.1 | 1,173,123.4 | 100.0 | ||||||||||||||||||
| (1) | Preliminary. |
Source: The Bank of Korea.
120
Table of Contents
The following table sets out the Republic’s GDP per capita:
Gross Domestic Product per capita
(at current market prices)
| 2006 | 2007 | 2008 | 2009 | 2010 (1) | ||||||||||||||||
GDP per capita (thousands of Won) | 18,820 | 20,120 | 21,120 | 21,848 | 23,996 | |||||||||||||||
GDP per capita (U.S. dollar) | 19,692 | 21,655 | 19,153 | 17,117 | 20,753 | |||||||||||||||
Average Exchange Rate (in Won per U.S. dollar) | 955.5 | 929.2 | 1,102.6 | 1,276.4 | 1,156.3 | |||||||||||||||
| (1) | Preliminary. |
Source : The Bank of Korea.
The following table sets out the Republic’s Gross National Income, or GNI, per capita:
Gross National Income per capita
(at current market prices)
| 2006 | 2007 | 2008 | 2009 | 2010 (1) | ||||||||||||||||
GNI per capita (thousands of Won) | 18,840 | 20,160 | 21,280 | 21,946 | 24,003 | |||||||||||||||
GNI per capita (U.S. dollar) | 19,772 | 21,695 | 19,296 | 17,193 | 20,759 | |||||||||||||||
Average Exchange Rate (in Won per U.S. dollar) | 955.5 | 929.2 | 1,102.6 | 1,276.4 | 1,156.3 | |||||||||||||||
| (1) | Preliminary. |
Source : The Bank of Korea.
121
Table of Contents
The following table sets out the Republic’s GDP by economic sector at chained 2005 year prices:
Gross Domestic Product by Economic Sector
(at chained 2005 year prices)
| 2006 | 2007 | 2008 | 2009 | 2010(1) | As % of GDP 2010(1) | |||||||||||||||||||
| (billions of Won) | ||||||||||||||||||||||||
Industrial Sectors: | ||||||||||||||||||||||||
Agriculture, Forestry and Fisheries | 26,240.2 | 27,294.0 | 28,826.9 | 29,759.2 | 28,475.4 | 2.7 | ||||||||||||||||||
Mining and Manufacturing | 232,884.5 | 249,317.9 | 254,658.8 | 252,473.7 | 289,358.3 | 27.8 | ||||||||||||||||||
Mining and Quarrying | 1,991.9 | 1,909.8 | 1,922.1 | 1,906.0 | 1,758.2 | 0.2 | ||||||||||||||||||
Manufacturing | 230,892.6 | 247,408.1 | 254,466.7 | 250,567.7 | 287,600.1 | 27.6 | ||||||||||||||||||
Electricity, Gas and Water | 18,332.9 | 19,026.2 | 20,199.0 | 21,023.6 | 22,020.4 | 2.1 | ||||||||||||||||||
Construction | 60,564.4 | 62,134.9 | 60,611.1 | 61,716.0 | 61,681.6 | 5.9 | ||||||||||||||||||
Services: | 477,658.0 | 502,050.0 | 515,983.6 | 521,915.10 | 540,293.60 | 51.9 | ||||||||||||||||||
Wholesale and Retail Trade, Restaurants and Hotels | 85,792.6 | 90,291.3 | 91,512.4 | 90,725.7 | 96,878.5 | 9.3 | ||||||||||||||||||
Transportation and Storage | 37,082.6 | 39,136.8 | 41,033.4 | 38,666.2 | 42,367.1 | 4.1 | ||||||||||||||||||
Financial Intermediation | 55,611.7 | 61,614.4 | 64,612.2 | 67,425.2 | 69,080.2 | 6.6 | ||||||||||||||||||
Real Estate, Renting and Business Activities | 64,603.9 | 65,524.8 | 66,491.6 | 66,368.7 | 66,570.8 | 6.4 | ||||||||||||||||||
Information and Communication | 38,238.7 | 39,664.7 | 41,024.7 | 41,933.8 | 43,473.1 | 4.2 | ||||||||||||||||||
Business Activities | 39,720.8 | 41,800.2 | 42,990.6 | 42,727.5 | 43,211.9 | 4.2 | ||||||||||||||||||
Public Administration and Defense: Compulsory Social Security | 50,520.8 | 52,183.9 | 52,903.0 | 54,887.7 | 55,821.1 | 5.4 | ||||||||||||||||||
Education | 48,532.9 | 49,971.2 | 51,619.6 | 52,135.1 | 52,658.8 | 5.1 | ||||||||||||||||||
Health and Social Work | 30,389.3 | 32,905.8 | 34,197.6 | 36,897.6 | 39,509.6 | 3.8 | ||||||||||||||||||
Culture and Entertainment Services | 10,744.2 | 11,781.1 | 12,175.8 | 12,477.2 | 12,562.3 | 1.2 | ||||||||||||||||||
Other Service Activities | 16,420.5 | 17,175.8 | 17,422.7 | 17,670.4 | 18,160.2 | 1.7 | ||||||||||||||||||
Taxes less subsidies on products | 94,368.8 | 96,992.4 | 97,090.1 | 95,514.0 | 101,396.0 | 9.7 | ||||||||||||||||||
Gross Domestic Product at Market Prices(2) | 910,048.9 | 956,514.5 | 978,498.8 | 981,625.1 | 1,042,111.3 | 100.0 | ||||||||||||||||||
| (1) | Preliminary. |
| (2) | Under the “chain-linked” measure of GDP, the components of GDP will not necessarily add to the total GDP. |
Source : The Bank of Korea.
GDP growth in 2006 was 5.2% at chained 2005 year prices, as aggregate private and general government consumption expenditures increased by 5.1% and gross domestic fixed capital formation increased by 3.4%, each compared with 2005.
GDP growth in 2007 was 5.1% at chained 2005 year prices, as aggregate private and general government consumption expenditures increased by 5.1% and gross domestic fixed capital formation increased by 4.2%, each compared with 2006.
GDP growth in 2008 was 2.3% at chained 2005 year prices, as aggregate private and general government consumption expenditures increased by 2.0% and gross domestic fixed capital formation decreased by 1.9%, each compared with 2007.
122
Table of Contents
GDP growth in 2009 was 0.3% at chained 2005 year prices, as aggregate private and general government consumption expenditures increased by 1.2% but gross domestic fixed capital formation decreased by 1.0%, each compared with 2008.
Based on preliminary data, GDP growth in 2010 was 6.2% at chained 2005 year prices, as aggregate private and general government consumption expenditures increased by 3.9% and gross domestic fixed capital formation increased by 7.0%, each compared with 2009.
Based on preliminary data, GDP growth in the first quarter of 2011 was 4.2% at chained 2005 year prices, as aggregate private and general government consumption expenditures increased by 2.7% and exports of goods and services increased by 16.8%, which more than offset a 2.2% decrease in gross domestic fixed capital formation, each compared with the corresponding period of 2010.
Principal Sectors of the Economy
Industrial Sectors
The following table sets out production indices for the principal industrial products of the Republic and their relative contribution to total industrial production:
Industrial Production
(2005 = 100)
| Index Weight (1) | 2006 | 2007 | 2008 | 2009 | 2010 (2) | |||||||||||||||||||
All Industries | 10,000.0 | 108.4 | 115.9 | 119.4 | 119.0 | 138.7 | ||||||||||||||||||
Mining and Manufacturing | 9,458.5 | 108.6 | 116.3 | 119.7 | 119.1 | 139.4 | ||||||||||||||||||
Mining | 36.5 | 95.8 | 91.5 | 8-0.9 | 87.0 | 80.6 | ||||||||||||||||||
Petroleum, Crude Petroleum and Natural Gas | 8.7 | 93.4 | 82.1 | 65.7 | 89.1 | 87.3 | ||||||||||||||||||
Metal Ores | 0.5 | 113.2 | 171.0 | 154.8 | 122.2 | 221.5 | ||||||||||||||||||
Non-metallic Minerals | 27.3 | 96.3 | 93.0 | 84.4 | 85.6 | 75.9 | ||||||||||||||||||
Manufacturing | 9,422.0 | 108.7 | 116.4 | 119.9 | 119.2 | 139.6 | ||||||||||||||||||
Food Products | 479.2 | 101.7 | 101.8 | 100.5 | 99.1 | 104.0 | ||||||||||||||||||
Beverage Products | 159.0 | 99.4 | 101.7 | 104.7 | 99.7 | 104.1 | ||||||||||||||||||
Tobacco Products | 55.1 | 111.9 | 116.2 | 120.8 | 120.3 | 116.2 | ||||||||||||||||||
Textiles | 226.0 | 100.2 | 98.9 | 91.2 | 85.5 | 95.1 | ||||||||||||||||||
Wearing Apparel, Clothing Accessories and Fur Articles | 174.6 | 109.6 | 116.3 | 117.2 | 112.5 | 116.7 | ||||||||||||||||||
Tanning and Dressing of Leather, Luggage and Footwear | 47.9 | 102.5 | 100.5 | 95.7 | 86.0 | 83.0 | ||||||||||||||||||
Wood and Products of Wood and Cork (Except Furniture) | 46.7 | 109.6 | 107.1 | 100.0 | 87.2 | 88.2 | ||||||||||||||||||
Pulp, Paper and Paper Products | 145.0 | 102.1 | 104.8 | 103.3 | 100.2 | 106.6 | ||||||||||||||||||
Printing and Reproduction of Recorded Media | 77.0 | 102.0 | 101.8 | 110.6 | 100.1 | 114.1 | ||||||||||||||||||
Coke, hard-coal and lignite fuel briquettes and Refined Petroleum Products | 315.2 | 101.3 | 102.5 | 103.2 | 102.0 | 105.4 | ||||||||||||||||||
Chemicals and Chemical Products | 772.2 | 102.5 | 109.6 | 110.4 | 116.3 | 123.3 | ||||||||||||||||||
Pharmaceuticals, Medicinal Chemicals and Botanical Products | 187.1 | 111.2 | 120.6 | 130.3 | 134.7 | 140.8 | ||||||||||||||||||
Rubber and Plastic Products | 434.2 | 106.8 | 113.0 | 109.2 | 100.5 | 112.7 | ||||||||||||||||||
Non-metallic Minerals | 309.9 | 106.1 | 112.2 | 113.4 | 111.4 | 116.1 | ||||||||||||||||||
Basic Metals | 753.2 | 103.7 | 108.4 | 109.1 | 100.3 | 120.4 | ||||||||||||||||||
Fabricated Metal Products | 490.8 | 106.3 | 112.0 | 116.0 | 106.5 | 115.9 | ||||||||||||||||||
Electronic Components, Computer, Radio, Television and Communication Equipment and Apparatuses | 1,970.4 | 122.3 | 138.9 | 152.0 | 163.5 | 204.1 | ||||||||||||||||||
Medical, Precision and Optical Instruments, Watches and Clocks | 102.8 | 107.3 | 112.5 | 116.9 | 118.5 | 135.9 | ||||||||||||||||||
Electrical Equipment | 449.5 | 100.3 | 104.8 | 111.5 | 114.4 | 130.3 | ||||||||||||||||||
Other Machinery and Equipment | 737.5 | 109.5 | 120.4 | 119.8 | 107.3 | 151.4 | ||||||||||||||||||
Motor Vehicles, Trailers and Semitrailers | 1,101.2 | 108.0 | 114.8 | 110.6 | 103.4 | 131.7 | ||||||||||||||||||
Other Transport Equipment | 254.3 | 108.3 | 115.9 | 145.1 | 160.3 | 148.7 | ||||||||||||||||||
Furniture | 79.0 | 101.4 | 100.6 | 96.6 | 91.7 | 95.9 | ||||||||||||||||||
Other Products | 54.2 | 94.8 | 93.9 | 78.3 | 74.7 | 84.4 | ||||||||||||||||||
Electricity, Gas | 541.5 | 104.1 | 108.8 | 114.6 | 116.4 | 126.9 | ||||||||||||||||||
Publishing activities | 109.3 | 101.2 | 96.0 | 94.8 | 91.2 | 91.6 | ||||||||||||||||||
Total Index (including Publishing Activities) | 10,109.3 | 108.3 | 115.7 | 119.2 | 118.7 | 138.2 | ||||||||||||||||||
123
Table of Contents
| (1) | Index weights were established on the basis of an industrial census in 2005 and reflect the average annual value added by production in each of the classifications shown, expressed as a percentage of total value added in the mining, manufacturing and electricity and gas industries in that year. |
| (2) | Preliminary |
Source: The Bank of Korea; Korea National Statistical Office.
Industrial production increased by 8.4% in 2006, primarily due to increased exports and domestic consumption. Industrial production increased by 6.9% in 2007, primarily due to solid export growth and domestic consumption. Industrial production growth was only 3.4% in 2008, primarily due to a slowdown in growth of exports and domestic consumption as a result of adverse global and Korean economic conditions beginning in the second half of 2008. Industrial production decreased by 0.8% in 2009, primarily due to decreased exports as a result of adverse global economic conditions. Based on preliminary data, industrial production increased by 16.7% in 2010, primarily due to increased exports and domestic consumption.
Manufacturing
The manufacturing sector increased production by 6.3% in 2005, 8.7% in 2006, 7.1% in 2007 and 2.9% in 2008. In 2009, the manufacturing sector decreased production by 1.5%. Based on preliminary data, in 2010, the manufacturing sector increased production by 14.8%.
Automobiles. In 2006, automobile production increased by 3.8%, domestic sales volume recorded an increase of 1.9% and export sales volume recorded an increase of 2.4%, compared with 2005. In 2006, export sales of automobiles constituted approximately 9.4% of the Republic’s total exports. In 2007, automobile production increased by 6.4%, domestic sales volume recorded an increase of 4.7% and export sales volume recorded an increase of 7.5%, compared with 2006. In 2007, export sales of automobiles constituted approximately 9.3% of the Republic’s total exports. In 2008, automobile production decreased by 6.4%, domestic sales volume recorded a decrease of 5.3% and export sales volume recorded a decrease of 5.7%, compared with 2007, primarily due to a decrease in the domestic and global demand for automobiles as a result of adverse global and Korean economic conditions. In 2008, export sales of automobiles constituted approximately 7.4% of the Republic’s total exports. In 2009, automobile production decreased by 8.2%, domestic sales volume recorded an increase of 20.7% and export sales volume recorded a decrease of 19.9%, compared with 2008, primarily due to the continued decrease in global demand for automobiles. In 2009, export sales of automobiles constituted approximately 6.2% of the Republic’s total exports. The automobile stimulus programs of a number of governments, including those in the United States and Europe, encouraged demand for automobiles in the relevant countries for the first nine months of 2009, the effect of which partially offset the decrease in global demand for Korean automobiles during the duration of such stimulus programs. In the fourth quarter of 2009, export sales of automobiles increased compared to previous quarters of 2009, primarily due to the recovery of global demand for automobiles, the effect of which more than offset the negative impact of termination of most of such governments’ automobile stimulus programs in the second half of 2009. Based on preliminary data, in 2010, automobile production increased by 21.6%, domestic sales volume recorded an increase of 5.1% and export sales volume recorded an increase of 29.0%, compared with 2009.
Electronics. In 2006, electronics production increased by 22.3% and exports increased by 18.6%, each compared with 2005. In 2006, export sales of semiconductor memory chips constituted approximately 11.5% of the Republic’s total exports. In 2007, electronics production increased by 13.6% and exports increased by 13.7%, each compared with 2006. In 2007, export sales of semiconductor memory chips constituted approximately 10.5% of the Republic’s total exports. In 2008, electronics production increased by 9.4% and exports increased by 8.9%, each compared with 2007. In 2008, export sales of semiconductor memory chips constituted approximately 7.8% of the Republic’s total exports. In 2009, electronics production increased by 0.8% and exports increased by 5.5%, each compared with 2008. In 2009, export sales of semiconductor memory chips constituted approximately 8.5% of the Republic’s total exports.
124
Table of Contents
Iron and Steel. In 2006, crude steel production totaled 48.5 million tons, an increase of 1.3% from 2005. Domestic sales volume increased by 5.7% and export sales volume increased by 11.9%. In 2007, crude steel production totaled 51.5 million tons, an increase of 6.3% from 2006. Domestic sales volume increased by 10.8% and export sales volume increased by 5.2%. In 2008, crude steel production totaled 53.3 million tons, an increase of 3.8% from 2007. Domestic sales volume increased by 6.2% and export sales volume increased by 8.6%. In 2009, crude steel production totaled 48.6 million tons, a decrease of 8.9% from 2008. Domestic sales volume and export sales volume decreased by 22.5% and 1.2%, respectively. Based on preliminary data, in 2010, crude steel production totaled 58.4 million tons, an increase of 20.2% from 2009. Domestic sales volume and export sales volume increased by 14.3% and 21.1%, respectively.
Shipbuilding. In 2006, the Republic’s shipbuilding orders amounted to 20.6 million compensated gross tons, an increase of 68.9% compared to 2005. In 2007, the Republic’s shipbuilding orders amounted to 33.0 million compensated gross tons, an increase of 60.2% compared to 2006. In 2008, the Republic’s shipbuilding orders amounted to 14.0 million compensated gross tons, a decrease of 57.6% compared to 2007. In 2009, the Republic’s shipbuilding orders amounted to 1.9 million compensated gross tons, a decrease of 86.4% compared to 2008 as a result of a decrease in ship orders due to adverse global economic conditions. In the first nine months of 2010, the Republic’s ship building orders amounted to 7.0 million compensated gross tons.
Agriculture, Forestry and Fisheries
The Government’s agricultural policy has traditionally focused on:
| • | grain production; |
| • | development of irrigation systems; |
| • | land consolidation and reclamation; |
| • | seed improvement; |
| • | mechanization measures to combat drought and flood damage; and |
| • | increasing agricultural incomes. |
Recently, however, the Government has increased emphasis on cultivating profitable crops and strengthening international competitiveness in anticipation of opening the domestic agricultural market.
In 2006, rice production decreased 2.1% from 2005 to 4.7 million tons. In 2007, rice production decreased 6.4% from 2006 to 4.4 million tons. In 2008, rice production increased 9.1% from 2007 to 4.8 million tons. Based on preliminary data, in 2009, rice production increased 2.1% from 2008 to 4.9 million tons. Based on preliminary data, in 2010, rice production decreased 12.6% from 2009 to 4.3 million tons. Due to limited crop yields resulting from geographical and physical constraints, the Republic depends on imports for certain basic foodstuffs.
The Government is seeking to develop the fishing industry by encouraging the building of large fishing vessels and modernizing fishing equipment, marketing techniques and distribution outlets.
In 2006, the agriculture, forestry and fisheries industry increased by 1.5% compared to 2005 primarily due to an increase in the cultivation and livestock industry. In 2007, the agriculture, forestry and fisheries industry increased by 4.0% compared to 2006 primarily due to an increase in fishing catch which offset a decrease in the production of rice. In 2008, the agriculture, forestry and fisheries industry increased by 5.6% compared to 2007. In 2009, the agriculture, forestry and fisheries industry increased by 3.2% compared to 2008. Based on preliminary data, in 2010, the agriculture, forestry and fisheries industry decreased by 4.3% compared to 2009.
125
Table of Contents
Construction
In 2006, the construction industry increased by 2.2% compared to 2005 primarily due to an increase in the construction of residential and commercial buildings. In 2007, the construction industry increased by 2.6% compared to 2006 primarily due to an increase in the construction of commercial buildings which offset a slight decrease in the construction of residential buildings. In 2008, the construction industry decreased by 2.4% compared to 2007 primarily due to a significant decrease in the construction of commercial and residential buildings. In 2009, the construction industry increased by 1.8% compared to 2008. Based on preliminary data, in 2010, the construction industry decreased by 0.1% compared to 2009. The construction industry has experienced a significant downturn since the second half of 2009, due to excessive investment in recent years in residential property development projects, stagnation of real property prices and reduced demand for residential property, especially in areas outside of Seoul, as a result of deteriorating conditions in the Korean economy in the second half of 2009 and into 2010. The Government has taken measures to support the Korean construction industry, including a (Won)5 trillion program to buy unsold housing units and land from construction companies. However, the effect of these measures is uncertain and the construction industry may continue to experience adverse conditions.
Electricity and Gas
The following table sets out the Republic’s dependence on imports for energy consumption:
Dependence on Imports for Energy Consumption
| Total Energy Consumption | Imports | Imports Dependence Ratio | ||||||||||
| (millions of tons of oil equivalents, except ratios) | ||||||||||||
2006 | 233.4 | 225.2 | 96.5 | |||||||||
2007 | 236.5 | 228.3 | 96.5 | |||||||||
2008 | 240.8 | 232.2 | 96.4 | |||||||||
2009 | 243.3 | 234.7 | 96.5 | |||||||||
2010(1) | 260.5 | 251.2 | 96.4 | |||||||||
| (1) | Preliminary |
Source: Korea Energy Economics Institute.
Korea has almost no domestic oil or gas production and depends on imported oil and gas to meet its energy requirements. Accordingly, the international prices of oil and gas significantly affect the Korean economy. Any significant long-term increase in the prices of oil and gas will increase inflationary pressures in Korea and adversely affect the Republic’s balance of trade.
To reduce its dependence on oil and gas imports, the Government has encouraged energy conservation and energy source diversification emphasizing nuclear energy. The following table sets out the principal primary sources of energy consumed in the Republic, expressed in oil equivalents and as a percentage of total energy consumption.
Consumption of Energy by Source
| Coal | Petroleum | Nuclear | Others(1) | Total | ||||||||||||||||||||||||||||||||||||
| Quantity | % | Quantity | % | Quantity | % | Quantity | % | Quantity | % | |||||||||||||||||||||||||||||||
2006 | 56.7 | 24.3 | 101.8 | 43.6 | 37.2 | 15.9 | 37.7 | 16.2 | 233.4 | 100.0 | ||||||||||||||||||||||||||||||
2007 | 59.7 | 25.2 | 105.5 | 44.6 | 30.7 | 13.0 | 40.6 | 17.2 | 236.5 | 100.0 | ||||||||||||||||||||||||||||||
2008 | 66.1 | 27.5 | 100.2 | 41.6 | 32.5 | 13.5 | 42.0 | 17.4 | 240.8 | 100.0 | ||||||||||||||||||||||||||||||
2009 | 68.6 | 28.2 | 102.3 | 42.1 | 31.8 | 13.1 | 40.6 | 16.7 | 243.3 | 100.0 | ||||||||||||||||||||||||||||||
2010(2) | 76.0 | 29.2 | 104.3 | 40.1 | 31.7 | 12.3 | 48.4 | 18.6 | 260.5 | 100.0 | ||||||||||||||||||||||||||||||
| (1) | Includes natural gas, hydroelectric power and renewable energy. |
| (2) | Preliminary |
Source: Korea Energy Economics Institute.
126
Table of Contents
The Republic’s first nuclear power plant went into full operation in 1978 with a rated generating capacity of 587 megawatts. Construction of an additional 18 nuclear power plants was completed by July 2004, adding 16,129 megawatts of generating capacity. The Republic’s total nuclear power generating capacity is estimated to be 17,716 megawatts as of December 31, 2008.
Services Sector
In 2006, the transportation and storage sector increased by 5.1%, the financial intermediation sector increased by 4.2% and the real estate, renting and business activities sector increased by 2.2%, each compared with 2005. In 2007, the transportation and storage sector increased by 5.5%, the financial intermediation sector increased by 10.8% and the real estate, renting and business activities sector increased by 1.4%, each compared with 2006. In 2008, the transportation and storage sector increased by 4.8%, the financial intermediation sector increased by 4.9% and the real estate, renting and business service sector increased by 1.5%, each compared with 2007. In 2009, the transportation and storage sector decreased by 5.8%, the financial intermediation sector increased by 4.4% and the real estate, renting and business activities sector decreased by 0.2%, each compared with 2008. Based on preliminary data, in 2010, the transportation and storage sector increased by 9.6%, the financial intermediation sector increased by 2.5% and the real estate, renting and business activities sector increased by 0.3%, each compared with 2009.
Prices, Wages and Employment
The following table shows selected price and wage indices and unemployment rates:
| Producer Price Index (1) | Increase Over Previous Year | Consumer Price Index (1) | Increase Over Previous Year | Wage Index (1) (2) | Increase Over Previous Year | Unemployment Rate (1) (3) | ||||||||||||||||||||||
| (2005=100) | (%) | (2005=100) | (%) | (2005=100) | (%) | (%) | ||||||||||||||||||||||
2006 | 100.9 | 0.9 | 102.2 | 2.2 | 105.7 | 5.7 | 3.5 | |||||||||||||||||||||
2007 | 102.3 | 1.4 | 104.8 | 2.5 | 106.5 | 0.7 | 3.2 | |||||||||||||||||||||
2008 | 111.1 | 8.6 | 109.7 | 4.7 | 109.9 | 3.1 | 3.2 | |||||||||||||||||||||
2009 | 110.9 | (0.2 | ) | 112.8 | 2.8 | 109.1 | (0.7 | ) | 3.6 | |||||||||||||||||||
2010 | 115.1 | 3.8 | 116.1 | 2.9 | N/A | (4) | N/A | (4) | 3.7 | |||||||||||||||||||
| (1) | Average for year. |
| (2) | Nominal wage index of earnings in all industries. |
| (3) | Expressed as a percentage of the economically active population. |
| (4) | Not available. |
Source: The Bank of Korea; Korea National Statistical Office.
The inflation rate, on an annualized basis, was 2.2% in 2006, 2.5% in 2007, 4.7% in 2008, 2.8% in 2009 and 2.9% in 2010. The inflation rate was 4.5% in the first quarter of 2011, compared to the same period of 2010.
The unemployment rate was 3.5% in 2006, 3.2% in 2007, 3.2% in 2008, 3.6% in 2009 and 3.7% in 2010. The unemployment rate was 4.2% in the first quarter of 2011.
From 1992 to 2009, the economically active population of the Republic increased by approximately 24.8% to 24.3 million, while the number of employees increased by approximately 23.7% to 23.5 million. The economically active population over 15 years old as a percentage of the total over-15 population has remained between 60% and 63% over the past decade. Literacy among workers under 50 is almost universal. As of December 31, 2010, the economically active population of the Republic was 24.8 million and the number of employees was 23.8 million.
127
Table of Contents
As of July 1, 2004, the Republic adopted a five-day workweek for large corporations with over 1,000 employees, publicly-owned (state-run) companies, banks and insurance companies, reducing working hours from 44 to 40 hours a week. The adoption of the five-day workweek has been extended to companies with over 300 employees and to government employees as of July 1, 2005 and to companies with over 100 employees as of July 1, 2006. Companies with more than 50 employees adopted the five-day workweek as of July 1, 2007 and those with over 20 adopted the five-day workweek as of July 1, 2008. Companies with less than 20 employees are also scheduled to adopt the five-day workweek by July 1, 2011.
Approximately 10.5% of the Republic’s workers were unionized as of December 31, 2008. In the early 2000s, the labor unions of several of the Republic’s largest commercial banks, including Kookmin Bank, Chohung Bank (which was later acquired by Shinhan Bank) and Citibank Korea Inc. (formerly KorAm Bank), staged strikes in response to consolidation in the banking industry. In addition, in the summer of 2004 and 2005, respectively, unionized workers of GS Caltex Corporation and Asiana Airlines staged strikes demanding better compensation and working conditions. In the fall of 2005, unionized workers at Hyundai Motor Company and Kia Motors Corp. went on strikes during annual contract talks. In December 2005, Korean Air’s unionized pilots also staged strikes demanding a higher wage increase. In the summer of 2006, unionized workers of Hyundai Motor Company and Kia Motors Corp. went on partial strikes demanding better compensation and working conditions, and unionized workers of Ssangyong Motor Company went on strike in response to the company’s proposed layoff plans. In July 2006, unionized workers of POSCO’s subcontractors initiated a sit-in strike at POSCO’s headquarters in Pohang demanding better wages and working conditions, disrupting POSCO’s operations for nine days. In June 2007, unionized workers of Hyundai Motor Company went on partial strikes demanding a higher bonus increase. Also, in May 2009, unionized workers of Ssangyong Motor Company went on full-scale strike and illegally occupied the company’s factory premises in Pyungtaek opposing the company’s reorganization plan. Actions such as these by labor unions may hinder implementation of the labor reform measures and disrupt the Government’s plans to create a more flexible labor market. Although much effort is being expended to resolve labor disputes in a peaceful manner, there can be no assurance that further labor unrest will not occur in the future. Continued labor unrest in key industries of the Republic may have an adverse effect on the economy.
In 1997, the Korean Confederation of Trade Unions organized a political alliance, which led to the formation of the Democratic Labor Party in January 2000. The Democratic Labor Party, which seeks to represent the interests of workers, controls five seats in the National Assembly from May 30, 2008 as a result of the 18th legislative general election held on April 9, 2008.
Structure of the Financial Sector
The Republic’s financial sector includes the following categories of financial institutions:
| • | The Bank of Korea; |
| • | banking institutions; |
| • | non-bank financial institutions; and |
| • | other financial entities, including: |
| • | financial investment companies; |
| • | credit guarantee institutions; |
| • | venture capital companies; and |
| • | miscellaneous others. |
128
Table of Contents
To increase transparency in financial transactions and enhance the integrity and efficiency of the financial markets, Korean law requires that financial institutions confirm that their clients use their real names when transacting business. To ease the liquidity crisis, the Government altered the real-name financial transactions system during 1998, to allow the sale or deposit of foreign currencies through domestic financial institutions and the purchase of certain bonds, including Government bonds, without identification. The Government also strengthened confidentiality protection for private financial transactions.
In July 2007, the Korean National Assembly passed the Financial Investment Services and Capital Markets Act or FSCMA, under which various industry-based capital markets regulatory systems currently were consolidated into a single regulatory system. The FSCMA, which became effective in February 2009, expands the scope of permitted investment-related financial products and activities through expansive definitions of financial instruments and function-based regulations that allow financial investment companies to offer a wider range of financial services, as well as strengthening investor protection and disclosure requirements. The Enforcement Decree of the FSCMA classifies the financial investment companies into a total of 77 categories depending on the types of (i) financial investment services, (ii) financial investment products, and (iii) investors.
Prior to the effective date of the Financial Investment Services and Capital Markets Act, separate laws regulated various types of financial institutions depending on the type of the financial institution (for example, securities companies, futures companies, trust business companies and asset management companies) and subjected financial institutions to different licensing and ongoing regulatory requirements (for example, under the Securities and Exchange Act, the Futures Business Act and the Indirect Investment Asset Management Business Act). By applying one uniform set of rules to financial businesses having the same economic function, the Financial Investment Services and Capital Markets Act attempts to improve and address issues caused by the previous regulatory system under which the same economic function relating to capital markets-related business were governed by multiple regulations. To this end, the Financial Investment Services and Capital Markets Act categorizes capital markets-related businesses into six different functions, as follows:
| • | investment dealing (trading and underwriting of financial investment products); |
| • | investment brokerage (brokerage of financial investment products); |
| • | collective investment (establishment of collective investment schemes and the management thereof); |
| • | investment advice; |
| • | discretionary investment management; and |
| • | trusts (together with the five businesses set forth above, “Financial Investment Businesses”). |
Accordingly, all financial businesses relating to financial investment products are reclassified as one or more of the Financial Investment Businesses described above, and financial institutions are subject to the regulations applicable to their relevant Financial Investment Businesses, irrespective of what type of financial institution it is. For example, under the Financial Investment Services and Capital Markets Act, derivative businesses conducted by securities companies and future companies will be subject to the same regulations under the Financial Investment Services and Capital Markets Act, at least in principle.
The banking business and the insurance business are not subject to the Financial Investment Services and Capital Markets Act and will continue to be regulated under separate laws; provided, however, that they are subject to the Financial Investment Services and Capital Markets Act if their activities involve any Financial Investment Businesses requiring a license based on the Financial Investment Services and Capital Markets Act.
Banking Industry
The banking industry comprises commercial banks and specialized banks. Commercial banks serve the general public and corporate sectors. They include nationwide banks, regional banks and branches of foreign
129
Table of Contents
banks. Regional banks provide services similar to nationwide banks, but operate in a geographically restricted region. Branches of foreign banks have operated in the Republic since 1967 but provide a relatively small proportion of the country’s banking services. As of December 31, 2010, commercial banks consisted of seven nationwide banks, all of which have branch networks throughout the Republic, six regional banks and 53 branches of 37 foreign banks operating in the country. Nationwide and regional banks had, in the aggregate, 5,531 domestic branches and offices, 41 overseas branches, 17 overseas representative offices and 32 overseas subsidiaries as of December 31, 2010.
Specialized banks meet the needs of specific sectors of the economy in accordance with Government policy; they are organized under, or chartered by, special laws. Specialized banks include:
| • | The Korea Development Bank; |
| • | The Export-Import Bank of Korea; |
| • | The Industrial Bank of Korea; |
| • | National Agricultural Cooperative Federation (which merged with the National Livestock Cooperative Federation in July 2000); and |
| • | National Federation of Fisheries Cooperatives. |
The economic difficulties in 1997 and 1998 caused an increase in Korean banks’ non-performing assets and a decline in capital adequacy ratios of Korean banks. From 1998 through 2002, the Financial Services Commission amended banking regulations several times to adopt more stringent criteria for non-performing loans that more closely followed international standards. The new criteria increased the level of non-performing loans held by banks and other financial institutions. The following table sets out the total loans and discounts and non-performing assets of the banking sector.
| Total Loans | Non-Performing Assets(1) | Percentage of Total | ||||||||||
| (trillions of won) | (percentage) | |||||||||||
December 31, 2006 | 930.2 | 7.8 | 0.8 | |||||||||
December 31, 2007 | 1,073.8 | 7.7 | 0.7 | |||||||||
December 31, 2008 | 1,288.1 | 14.7 | 1.1 | |||||||||
December 31, 2009 | 1,285.8 | 16.0 | 1.2 | |||||||||
December 31, 2010 | 1,308.9 | 24.6 | 1.9 | |||||||||
| (1) | Assets classified as substandard, doubtful and estimated loss in accordance with the Republic’s banking regulations. |
Source : Financial Supervisory Service.
Most of the growth in total loans since the end of 2002 has been attributable to loans to the retail sector, accounting for 38.1% of total loans as of December 31, 2010, compared to 34.3% as of December 31, 1999.
In 2006, a group of the Republic’s banks, including seven nationwide commercial banks, six regional commercial banks and five special banks, posted an aggregate net profit of (Won)13.6 trillion. In 2007, these banks posted an aggregate net profit of (Won)15.0 trillion. In 2008, these banks posted an aggregate net profit of (Won)7.7 trillion, compared to an aggregate net profit of (Won)15.0 trillion in 2007, primarily due to increased loan loss provisions. In 2009, these banks posted an aggregate net profit of (Won)6.9 trillion, compared to an aggregate net profit of (Won)7.7 trillion in 2008, primarily due to increased non-performing loans. Based on preliminary data, in 2010, these banks posted an aggregate net profit of (Won)9.4 trillion, compared to an aggregate net profit of (Won)6.9 trillion, primarily due to increased net interest income.
130
Table of Contents
Non-Bank Financial Institutions
Non-bank financial institutions include:
| • | savings institutions, including trust accounts of banks, mutual savings banks, credit unions, mutual credit facilities, community credit cooperatives and postal savings; |
| • | life insurance institutions; and |
| • | credit card companies. |
The country had 105 mutual savings banks as of December 31, 2010, with assets totaling (Won)86.9 trillion.
As of December 31, 2010, 13 domestic life insurance institutions, two joint venture life insurance institutions and nine wholly-owned subsidiaries of foreign life insurance companies, with assets totaling approximately (Won)408.5 trillion as of December 31, 2010, were operating in the Republic.
As of December 31, 2010, six credit card companies operated in the country with loans totaling approximately (Won)54.5 trillion.
Money Markets
In the Republic, the money markets consist of the call market and markets for a wide range of other short- term financial instruments, including treasury bills, monetary stabilization bonds, negotiable certificates of deposits, repurchase agreements and commercial paper.
Securities Markets
On January 27, 2005, the Korea Exchange was established pursuant to the now repealed Korea Securities and Futures Exchange Act by consolidating the Korea Stock Exchange, the Korea Futures Exchange, the KOSDAQ Stock Market, Inc., or the KOSDAQ, and the KOSDAQ Committee of the Korea Securities Dealers Association, which had formerly managed the KOSDAQ. There are three different markets operated by the Korea Exchange: the KRX KOSPI Market, the KRX KOSDAQ Market, and the KRX Derivatives Market. The Korea Exchange has two trading floors located in Seoul, one for the KRX KOSPI Market and one for the KRX KOSDAQ Market, and one trading floor in Busan for the KRX Derivatives Market. The Korea Exchange is a limited liability company, the shares of which are held by (i) financial investment companies that were formerly members of the Korea Futures Exchange or the Korea Stock Exchange and (ii) the stockholders of the KOSDAQ. Currently, the Korea Exchange is the only stock exchange in Korea and is operated by membership, having as its members Korean financial investment companies and some Korean branches of foreign financial investment companies.
The Korea Exchange publishes the Korea Composite Stock Price Index every ten seconds, which is an index of all equity securities listed on the Korea Exchange. The Korea Composite Stock Price Index is computed using the aggregate value method, whereby the market capitalizations of all listed companies are aggregated, subject to certain adjustments, and this aggregate is expressed as a percentage of the aggregate market capitalization of all listed companies as of the base date, January 4, 1980.
131
Table of Contents
The following table shows the value of the Korea Composite Stock Price Index as of the dates indicated:
December 29, 2005 | 1,379.4 | |||
January 31, 2006 | 1,399.8 | |||
February 28, 2006 | 1,371.6 | |||
March 31, 2006 | 1,359.6 | |||
April 28, 2006 | 1,419.7 | |||
May 30, 2006 | 1,317.7 | |||
June 30, 2006 | 1,295.2 | |||
July 31, 2006 | 1,297.8 | |||
August 31, 2006 | 1,352.7 | |||
September 29, 2006 | 1,371.4 | |||
October 31, 2006 | 1,364.6 | |||
November 30, 2006 | 1,432.2 | |||
December 28, 2006 | 1,434.5 | |||
January 31, 2007 | 1,360.2 | |||
February 28, 2007 | 1,417.3 | |||
March 31, 2007 | 1,452.6 | |||
April 30, 2007 | 1,542.2 | |||
May 31, 2007 | 1,700.9 | |||
June 30, 2007 | 1,743.6 | |||
July 31, 2007 | 1,933.3 | |||
August 31, 2007 | 1,873.2 | |||
September 28, 2007 | 1,946.5 | |||
October 31, 2007 | 2,064.9 | |||
November 30, 2007 | 1,906.0 | |||
December 28, 2007 | 1,897.1 | |||
January 31, 2008 | 1,624.7 | |||
February 29, 2008 | 1,711.6 | |||
March 31, 2008 | 1,704.0 | |||
April 30, 2008 | 1,825.5 | |||
May 30, 2008 | 1,852.0 | |||
June 30, 2008 | 1,674.9 | |||
July 31, 2008 | 1,594.7 | |||
August 29, 2008 | 1,474.2 |
September 30, 2008 | 1,448.1 | |||
October 31, 2008 | 1,113.1 | |||
November 28, 2008 | 1,076.1 | |||
December 31, 2008 | 1,124.5 | |||
January 30, 2009 | 1,162.1 | |||
February 27, 2009 | 1,063.0 | |||
March 31, 2009 | 1,206.3 | |||
April 30, 2009 | 1,369.4 | |||
May 29, 2009 | 1,395.9 | |||
June 30, 2009 | 1,390.1 | |||
July 31, 2009 | 1,557.3 | |||
August 31, 2009 | 1,591.9 | |||
September 30, 2009 | 1,673.1 | |||
October 31, 2009 | 1,580.7 | |||
November 30, 2009 | 1,555.6 | |||
December 31, 2009 | 1,682.8 | |||
January 29, 2010 | 1,602.4 | |||
February 26, 2010 | 1,594.6 | |||
March 31, 2010 | 1,692.9 | |||
April 30, 2010 | 1,741.6 | |||
May 31, 2010 | 1,641.3 | |||
June 30, 2010 | 1,698.3 | |||
July 30, 2010 | 1,759.3 | |||
August 31, 2010 | 1,742.8 | |||
September 30, 2010 | 1,872.8 | |||
October 29, 2010 | 1,883.0 | |||
November 30, 2010 | 1,904.6 | |||
December 31, 2010 | 2,051.0 | |||
January 31, 2011 | 2,069.7 | |||
February 28, 2011 | 1,939.3 | |||
March 31, 2011 | 2,106.7 | |||
April 30, 2011 | 2,192.4 | |||
May 31, 2011 | 2,142.5 |
On December 27, 1997, the last day of trading in 1997, the index stood at 376.3, a sharp decline from 647.1 on September 30, 1997. The fall resulted from growing concerns about the Republic’s weakening financial and corporate sectors, the Republic’s falling foreign currency reserves, the sharp depreciation of the Won against the U.S. Dollar and other external factors, such as a sharp decline in stock prices in Hong Kong on October 24, 1997 and financial turmoil in Southeast Asian countries. The Korea Composite Stock Price Index recovered to reach a high of 2,064.9 in late 2007 but since then the index declined. As liquidity and credit concerns and volatility in the global financial markets increased significantly since September 2008, there was a significant overall decline and continuing volatility in the stock prices of Korean companies during the fourth quarter of 2008 and first half of 2009. The index was 2,094.4 on June 29, 2011.
Supervision System
The Office of Bank Supervision, the Securities Supervisory Board, the Insurance Supervisory Board and all other financial sector regulatory bodies merged in January 1999 to form the Financial Services Commission. The Financial Services Commission acts as the executive body over the Financial Supervisory Service. The Financial Services Commission reports to, but operates independently of, the Prime Minister’s office.
132
Table of Contents
The Ministry of Strategy and Finance (formerly the Ministry of Finance and Economy) focuses on financial policy and foreign currency regulations. The Bank of Korea manages monetary policy focusing on price stabilization.
Deposit Insurance System
The Republic’s deposit insurance system insures amounts on deposit with banks, non-bank financial institutions, securities companies and life insurance companies.
Since January 2001, deposits at any single financial institution are insured only up to (Won)50 million regardless of the amount deposited.
The Government recently excluded certain deposits, such as repurchase agreements, from the insurance scheme, expanded the definition of unsound financial institutions to which the insurance scheme would apply and increased the insurance premiums payable by insured financial institutions.
The Bank of Korea
The Bank of Korea was established in 1950 as Korea’s central bank and the country’s sole currency issuing bank. A seven-member Monetary Policy Committee, chaired by the Governor of The Bank of Korea, formulates and controls monetary and credit policies.
Inflation targeting is the basic system of operation for Korean monetary policy. The consumer price index is used as The Bank of Korea’s target indicator. To achieve its established inflation target, the Monetary Policy Committee of The Bank of Korea determines and announces the “Bank of Korea Base Rate,” the reference rate applied in transactions such as repurchase agreements between The Bank of Korea and its financial institution counterparts. The Bank of Korea uses open market operations as its primary instrument to keep the call rate in line with the Monetary Policy Committee’s target rate. In addition, The Bank of Korea is able to establish policies regarding its lending to banks in Korea and their reserve requirements.
Interest Rates
On October 11, 2005, The Bank of Korea raised the policy rate from 3.25% to 3.5%, which was further raised to 3.75% on December 8, 2005, to 4.0% on February 9, 2006, to 4.25% on June 8, 2006 and to 4.50% on August 10, 2006, in response to the increasing side-effects of a low interest rate environment including inflationary pressures coupled with signs of recovery of the real economy. On July 12, 2007, The Bank of Korea raised the policy rate to 4.75% from 4.5%, and raised it further to 5.0% on August 9, 2007. The rationale for this change was the concern that the ample market liquidity might put upside pressure on inflation in the medium to long term as the economic upswing continued. On August 7, 2008, The Bank of Korea raised the policy rate to 5.25% from 5.0%, taking the view that inflation in consumer prices had picked up its pace, due to the direct and indirect effects of high oil prices, at a time when domestic economic activity had slackened. On October 9, 2008, The Bank of Korea cut its policy rate to 5.0% from 5.25%, and continued to lower it further to 4.25% on October 27, 2008, 4.0% on November 7, 2008, 3.0% on December 11, 2008, 2.5% on January 9, 2009 and 2.0% on February 12, 2009, in order to address financial market instability and to help combat the slowdown of the domestic economy. On July 9, 2010, The Bank of Korea raised the policy rate to 2.25% from 2.0%, which was further raised to 2.5% on November 16, 2010, in response to signs of inflationary pressures and the continued growth of domestic economy. On January 13, 2011, The Bank of Korea raised the policy rate to 2.75%, which was further raised to 3.0% on March 10, 2011 and 3.25% on June 10, 2011, in response to inflationary pressures driven mainly by rises in the prices of petroleum products and farm products.
133
Table of Contents
With the deregulation of interest rates on banks’ demand deposits on February 2, 2004, The Bank of Korea completed the interest rate deregulation based upon the “Four-Stage Interest Rate Liberalization Plan” announced in 1991. The prohibition on the payment of interest on ordinary checking accounts was, however, maintained.
Money Supply
The following table shows the volume of the Republic’s money supply:
| December 31, | ||||||||||||||||||||
| 2006 | 2007 | 2008 | 2009 | 2010 | ||||||||||||||||
| (billions of Won) | ||||||||||||||||||||
Money Supply (M1)(1) | 371,087.6 | 316,382.7 | 330,623.7 | 389,394.5 | 427,791.6 | |||||||||||||||
Quasi-money(2) | 778,174.5 | 957,229.2 | 1,095,263.8 | 1,177,455.5 | 1,232,738.4 | |||||||||||||||
Money Supply (M2)(3) | 1,149,262.1 | 1,273,611.9 | 1,425,887.5 | 1,566,850.0 | 1,660,530.0 | |||||||||||||||
Percentage Increase Over Previous Year | 12.5 | % | 10.8 | % | 12.0 | % | 9.9 | % | 6.0 | % | ||||||||||
| (1) | Consists of currency in circulation and demand and instant access savings deposits at financial institutions. |
| (2) | Includes time and installment savings deposits, marketable instruments, yield-based dividend instruments and financial debentures, excluding financial instruments with a maturity of more than two years. |
| (3) | Money Supply (M2) is the sum of Money Supply (M1) and quasi-money. |
Source: The Bank of Korea.
Exchange Controls
Authorized foreign exchange banks, as registered with the Ministry of Strategy and Finance, handle foreign exchange transactions. The ministry has designated other types of financial institutions to handle foreign exchange transactions on a limited basis.
Korean laws and regulations generally require a report to either the Ministry of Strategy and Finance, The Bank of Korea or authorized foreign exchange banks, as applicable, for issuances of international bonds and other instruments, overseas investments and certain other transactions involving foreign exchange payments.
In 1994 and 1995, the Government relaxed regulations of foreign exchange position ceilings and foreign exchange transaction documentation and created free Won accounts which may be opened by non-residents at Korean foreign exchange banks. The Won funds deposited into the free Won accounts may be converted into foreign currencies and remitted outside Korea without any governmental approval. In December 1996, after joining the OECD, the Republic freed the repatriation of investment funds, dividends and profits, as well as loan repayments and interest payments. The Government continues to reduce exchange controls in response to changes in the world economy, including the new trade regime under the WTO, anticipating that such foreign exchange reform will improve the Republic’s competitiveness and encourage strategic alliances between domestic and foreign entities.
In September 1998, the National Assembly passed the Foreign Exchange Transactions Act, which became effective in April 1999 and was subsequently amended in October 2000, December 2000, December 2005, October 2006, January 2007, August 2007, February 2008, January 2009 and April 2009. In principle, most currency and capital transactions, including, among others, the following transactions, have been liberalized:
| • | the investment in real property located overseas by Korean companies and financial institutions; |
| • | the establishment of overseas branches and subsidiaries by Korean companies and financial institutions; |
134
Table of Contents
| • | the investment by non-residents in deposits and trust products having more than one year maturities; and |
| • | the issuance of debentures by non-residents in the Korean market. |
To minimize the adverse effects from further opening of the Korean capital markets, the Ministry of Strategy and Finance is authorized to introduce a variable deposit requirement system to restrict the influx of short-term speculative funds.
The Government has also embarked on a second set of liberalization initiatives starting in January 2001, under which ceilings on international payments for Korean residents have been eliminated, including overseas travel expenses, overseas inheritance remittances and emigration expenses. Overseas deposits, trusts, acquisitions of foreign securities and other foreign capital transactions made by residents and the making of deposits in Korean currency by non-residents have also been liberalized. In line with the foregoing liberalization, measures will also be adopted to curb illegal foreign exchange transactions and to stabilize the foreign exchange market.
Effective as of January 1, 2006, the Government liberalized the regulations governing “capital transactions.” The regulations provide that no regulatory approvals are required for any capital transactions. The capital transactions previously subject to approval requirements are now subject only to reporting requirements.
In January 2010, the Financial Supervisory Services releasedFX Derivative Transactions Risk Management Guideline to prevent over-hedging of foreign exchange risk by corporate investors. According to the guideline, if a corporate investor, other than a financial institution or a public enterprise, wishes to enter into a foreign exchange forward, option or swap agreement with a bank, the bank is required to verify whether the corporate investor’s assets, liabilities or contracts face foreign exchange risks that could be mitigated by a foreign exchange forward, option or swap agreement. In addition, the bank is required to ensure that the corporate investor’s risk hedge ratio, which is the ratio of the aggregate notional amount to the aggregate amount of risk, does not exceed 100%.
135
Table of Contents
Foreign Exchange
The following table shows the exchange rate between the Won and the U.S. Dollar (in Won per U.S. Dollar) as announced by the Seoul Money Brokerage Services, Ltd. as of the dates indicated:
Exchange Rates
| Won/U.S. Dollar Exchange Rate | ||||
December 30, 2005 | 1,013.0 | |||
January 31, 2006 | 971.0 | |||
February 28, 2006 | 969.0 | |||
March 31, 2006 | 975.9 | |||
April 28, 2006 | 945.7 | |||
May 30, 2006 | 947.4 | |||
June 30, 2006 | 960.3 | |||
July 31, 2006 | 953.1 | |||
August 31, 2006 | 959.6 | |||
September 29, 2006 | 945.2 | |||
October 31, 2006 | 944.2 | |||
November 30, 2006 | 929.9 | |||
December 29, 2006 | 929.6 | |||
January 31, 2007 | 940.9 | |||
February 28, 2007 | 938.3 | |||
March 31, 2007 | 940.3 | |||
April 30, 2007 | 929.4 | |||
May 31, 2007 | 929.9 | |||
June 30, 2007 | 926.8 | |||
July 31, 2007 | 923.2 | |||
August 31, 2007 | 939.9 | |||
September 28, 2007 | 920.7 | |||
October 31, 2007 | 907.4 | |||
November 30, 2007 | 929.6 | |||
December 31, 2007 | 938.2 | |||
January 31, 2008 | 943.9 | |||
February 29, 2008 | 937.3 | |||
March 31, 2008 | 991.7 | |||
April 30, 2008 | 999.7 | |||
May 31, 2008 | 1,031.4 | |||
June 30, 2008 | 1,043.4 | |||
July 31, 2008 | 1,008.5 | |||
August 29, 2008 | 1,081.8 | |||
| Won/U.S. Dollar Exchange Rate | ||||
September 30, 2008 | 1,187.7 | |||
October 31, 2008 | 1,291.4 | |||
November 28, 2008 | 1,482.7 | |||
December 31, 2008 | 1,257.5 | |||
January 31, 2009 | 1,368.5 | |||
February 27, 2009 | 1,516.4 | |||
March 31, 2009 | 1,377.1 | |||
April 30, 2009 | 1,348.0 | |||
May 29, 2009 | 1,272.9 | |||
June 30, 2009 | 1,284.7 | |||
July 31, 2009 | 1,240.5 | |||
August 31, 2009 | 1,244.9 | |||
September 30, 2009 | 1,188.7 | |||
October 31, 2009 | 1,200.6 | |||
November 30, 2009 | 1,167.4 | |||
December 31, 2009 | 1,167.6 | |||
January 29, 2010 | 1,156.5 | |||
February 26, 2010 | 1,158.4 | |||
March 31, 2010 | 1,130.8 | |||
April 30, 2010 | 1,115.5 | |||
May 31, 2010 | 1,200.2 | |||
June 30, 2010 | 1,210.3 | |||
July 30, 2010 | 1,187.2 | |||
August 31, 2010 | 1,189.1 | |||
September 30, 2010 | 1,142.0 | |||
October 29, 2010 | 1,126.6 | |||
November 30, 2010 | 1,157.3 | |||
December 31, 2010 | 1,138.9 | |||
January 31, 2011 | 1,114.3 | |||
February 28, 2011 | 1,127.9 | |||
March 31, 2011 | 1,107.2 | |||
April 30, 2011 | 1,072.3 | |||
May 31, 2011 | 1,080.6 | |||
Prior to November 1997, the Government permitted exchange rates to float within a daily range of 2.25%. In response to the substantial downward pressures on the Won caused by the Republic’s economic difficulties in late 1997, in November 1997, the Government expanded the range of permitted daily exchange rate fluctuations to 10%. The Government eliminated the daily exchange rate band in December 1997, and the Won now floats according to market forces. The value of the Won relative to the U.S. dollar depreciated from (Won)888.1 to US$1.00 on June 30, 1997 to (Won)1,964.8 to US$1.00 on December 24, 1997. Due to improved economic conditions and increases in trade surplus, the Won has generally appreciated against the U.S. dollar, although the trend reversed in March 2008. During the period from January 2, 2008 through April 16, 2009, the value of the Won relative to the U.S. dollar declined by approximately 29.9%, due primarily to adverse economic conditions
136
Table of Contents
resulting from liquidity and credit concerns and volatility in the global credit and financial markets and repatriations by foreign investors of their investments in the Korean stock market. The market average exchange rate was (Won)1,081.8 to US$1.00 on June 29, 2011.
Balance of Payments and Foreign Trade
Balance of Payments
Balance of payments figures measure the relative flow of goods, services and capital into and out of the country as represented in the current balance and the capital balance. The current balance tracks a country’s trade in goods and services and transfer payments and measures whether a country is living within its income from trading and investments. The capital balance covers all transactions involving the transfer of capital into and out of the country, including loans and investments. The overall balance represents the sum of the current and capital balances. An overall balance surplus indicates a net inflow of foreign currencies, thereby increasing demand for and strengthening the local currency. An overall balance deficit indicates a net outflow of foreign currencies, thereby decreasing demand for and weakening the local currency. The financial account mirrors the overall balance. If the overall balance is positive, the surplus, which represents the nation’s savings, finances the overall deficit of the country’s trading partners. Accordingly, the financial account will indicate cash outflows equal to the overall surplus. If, however, the overall balance is negative, the nation has an international deficit which must be financed. Accordingly, the financial account will indicate cash inflows equal to the overall deficit.
The following table sets out certain information with respect to the Republic’s balance of payments:
Balance of Payments(1)
Classification | 2006 | 2007 | 2008 | 2009 | 2010(4) | |||||||||||||||
| (millions of dollars) | ||||||||||||||||||||
Current Account | 14,083.2 | 21,769.7 | 3,197.5 | 32,790.5 | 28,213.6 | |||||||||||||||
Goods | 31,433.4 | 37,129.1 | 5,170.1 | 37,866.0 | 41,904.0 | |||||||||||||||
Exports(2) | 336,494.4 | 389,568.5 | 434,651.5 | 358,189.7 | 464,286.9 | |||||||||||||||
Imports(2) | 305,061.0 | 352,439.4 | 429,481.4 | 320,323.7 | 422,383.1 | |||||||||||||||
Services | (13,331.8 | ) | (11,967.3 | ) | (5,734.1 | ) | (6,640.5 | ) | (11,229.4 | ) | ||||||||||
Income | 74.5 | 135.0 | 4,435.4 | 2,276.7 | 768.4 | |||||||||||||||
Current Transfers | (4,092.9 | ) | (3,527.1 | ) | (673.9 | ) | (711.7 | ) | (3,229.4 | ) | ||||||||||
Capital and Financial Account | (14,151.4 | ) | (23,876.6 | ) | (1,154.0 | ) | (34,651.2 | ) | (25,331.5 | ) | ||||||||||
Financial Account(3) | (3,126.1 | ) | (2,387.5 | ) | 109.3 | 289.6 | (174.2 | ) | ||||||||||||
Capital Account | (11,025.3 | ) | (21,489.1 | ) | (1,263.3 | ) | (34,940.7 | ) | (25,157.3 | ) | ||||||||||
Net Errors and Omissions | 68.2 | 2,106.9 | (2,043.5 | ) | 1,860.7 | (2,882.1 | ) | |||||||||||||
| (1) | Figures are prepared based on the sixth edition of Balance of Payment Manual, or BPM6, published by International Monetary Fund in December 2008 and implemented by the Government in December 2010. |
| (2) | These entries are derived from trade statistics and are valued on a free on board basis, meaning that the insurance and freight costs are not included. |
| (3) | Includes borrowings from the IMF, syndicated bank loans and short-term borrowings. |
| (4) | Preliminary. |
Source: The Bank of Korea.
The Republic recorded a current account surplus of approximately US$32.8 billion in 2009 compared with a current account surplus of US$3.2 billion in 2008, primarily due to a significant increase in surplus from the goods account.
Based on preliminary data, the Republic recorded a current account surplus of approximately US$28.2 billion in 2010. The current account surplus in 2010 decreased from the current account surplus of US$32.8
137
Table of Contents
billion in 2009, primarily due to an increase in deficit from the services account which more than offset an increase in surplus from the goods account.
Based on preliminary data, the Republic recorded a current account surplus of approximately US$2.7 billion in the first quarter of 2011. The current account surplus in the first quarter of 2011 increased from the current account surplus of US$0.3 billion in the corresponding period of 2010, primarily due to a decrease in deficit from the services account and an increase in surplus from the goods account.
Foreign Direct Investment
Since 1960, the Government has adopted a broad range of related laws, administrative rules and regulations, providing a framework for the conduct and regulation of foreign investment activities. In September 1998, the Government promulgated the Foreign Investment Promotion Act (the “FIPA”), which replaced previous foreign direct investment related laws, rules and regulations, to promote inbound foreign investments by providing incentives to, and facilitating investment activities in the Republic by, foreign nationals. The FIPA prescribes, among others, procedural requirements for inbound foreign investments, incentives for foreign investments such as tax reductions, and requirements relating to designation and development of foreign investment target regions. The Government believes that providing a stable and receptive environment for foreign direct investment will accelerate the inflow of foreign capital, technology and management techniques.
The following table sets forth information regarding annual foreign direct investment in the Republic for the periods indicated.
Foreign Direct Investment
| 2006 | 2007 | 2008 | 2009 | 2010 | ||||||||||||||||
| (billions of dollars) | ||||||||||||||||||||
Contracted and Reported Investment | ||||||||||||||||||||
Greenfield Investment (1) | 6.9 | 8.0 | 7.3 | 8.1 | 11.1 | |||||||||||||||
Merger & Acquisition | 4.3 | 2.5 | 4.4 | 3.4 | 2.0 | |||||||||||||||
Total | 11.2 | 10.5 | 11.7 | 11.5 | 13.1 | |||||||||||||||
Actual Investment | 9.1 | 7.8 | 8.4 | 6.7 | 5.3 | |||||||||||||||
| (1) | Includes building new factories and operational facilities. |
Source: Ministry of Knowledge Economy
In 2010, the contracted and reported amount of foreign direct investment in the Republic increased to US$13.1 billion from US$11.5 billion in 2009, primarily due to an increase in foreign investment in the manufacturing sector to US$6.7 billion in 2010 from US$3.7 billion in 2009, which was partially offset by a decrease in foreign investment in the service sector to US$6.3 billion in 2010 from US$7.6 billion in 2009.
138
Table of Contents
The following table sets forth information regarding the source of foreign direct investment by region and country for the periods indicated:
Foreign Direct Investment by Region and Country
| 2006 | 2007 | 2008 | 2009 | 2010 | ||||||||||||||||
| (billions of dollars) | ||||||||||||||||||||
North America | ||||||||||||||||||||
U.S.A | 1.7 | 2.3 | 1.3 | 1.5 | 2.0 | |||||||||||||||
Others | 0.2 | 0.9 | 0.6 | 0.7 | 0.7 | |||||||||||||||
| 1.9 | 3.2 | 1.9 | 2.2 | 2.7 | ||||||||||||||||
Asia | ||||||||||||||||||||
Japan | 2.1 | 1.0 | 1.4 | 1.9 | 2.1 | |||||||||||||||
Hong Kong | 0.2 | 0.1 | 0.2 | 0.8 | 0.1 | |||||||||||||||
Singapore | 0.6 | 0.5 | 0.9 | 0.4 | 0.8 | |||||||||||||||
China | 0.0 | 0.4 | 0.4 | 0.2 | 0.4 | |||||||||||||||
Others | 1.1 | 0.3 | 0.4 | 0.4 | 3.5 | |||||||||||||||
| 4.0 | 2.3 | 3.3 | 3.7 | 6.9 | ||||||||||||||||
European Union | ||||||||||||||||||||
England | 0.7 | 0.3 | 1.2 | 2.0 | 0.6 | |||||||||||||||
Netherlands | 0.8 | 2.0 | 1.2 | 1.9 | 1.2 | |||||||||||||||
Germany | 0.5 | 0.4 | 0.7 | 0.6 | 0.3 | |||||||||||||||
France | 1.2 | 0.4 | 0.5 | 0.1 | 0.2 | |||||||||||||||
Others | 1.8 | 1.2 | 2.7 | 0.7 | 1.0 | |||||||||||||||
| 5.0 | 4.3 | 6.3 | 5.3 | 3.3 | ||||||||||||||||
Others regions and countries | 0.3 | 0.7 | 0.2 | 0.3 | 0.2 | |||||||||||||||
Total | 11.2 | 10.5 | 11.7 | 11.5 | 13.1 | |||||||||||||||
Source:Ministry of Knowledge Economy
Trade Balance
Trade balance figures measure the difference between a country’s exports and imports. If exports exceed imports the country has a trade balance surplus while if imports exceed exports the country has a deficit. A deficit, indicating that a country’s receipts from abroad fall short of its payments to foreigners, must be financed, rendering the country a debtor nation. A surplus, indicating that a country’s receipts exceed its payments to foreigners, allows the country to finance its trading partners’ net deficit to the extent of the surplus, rendering the country a creditor nation.
139
Table of Contents
The following table summarizes the Republic’s trade balance for the periods indicated:
Trade Balance
| Exports(1) | Imports(2) | Balance of Trade | Exports as % of Imports | |||||||||||||
| (millions of dollars, except percentages) | ||||||||||||||||
2006 | 325,464.9 | 309,382.7 | 16,082.2 | 105.2 | ||||||||||||
2007 | 371,489.0 | 356,845.7 | 14,643.3 | 104.1 | ||||||||||||
2008 | 422,007.3 | 435,274.7 | (13,267.4 | ) | 97.0 | |||||||||||
2009 | 363,533.6 | 323,084.5 | 40,449.1 | 112.5 | ||||||||||||
2010(3) | 466,383.8 | 425,212.2 | 41,171.6 | 109.7 | ||||||||||||
| (1) | These entries are derived from trade statistics and are valued on a free on board basis, meaning that the insurance and freight costs are not included. |
| (2) | These entries are derived from customs clearance statistics on a C.I.F. basis, meaning that the price of goods include insurance and freight cost. |
| (3) | Preliminary. |
Source: The Bank of Korea.
Overall exports increased during the period from 2005 to 2008 primarily due to the continued increase in global demand (including strong demand in China) for electronics products (including semiconductors and information technology products), iron and steel products and machinery and precision equipment. Overall exports decreased in 2009 compared to 2008 due to the effects of the global financial crisis on global demand for goods in general.
The Republic, due to its lack of natural resources, relies on extensive trading activity for growth. The country meets virtually all domestic requirements for petroleum, wood and rubber with imports, as well as much of its coal and iron needs. Exports consistently represent a high percentage of GDP and, accordingly, the international economic environment is of crucial importance to the Republic’s economy.
140
Table of Contents
The following tables give information regarding the Republic’s exports and imports by major commodity groups:
Exports by Major Commodity Groups (F.O.B.)(1)
| 2006 | As % of Total | 2007 | As % of Total | 2008 | As % of Total | 2009 | As % of Total | 2010(2) | As % of Total(2) | |||||||||||||||||||||||||||||||
| (billions of dollars, except percentages) | ||||||||||||||||||||||||||||||||||||||||
Foods & Consumer Goods | 3.2 | 1.0 | 3.5 | 1.0 | 4.1 | 1.0 | 4.3 | 1.2 | 5.4 | 1.2 | ||||||||||||||||||||||||||||||
Raw Materials and Fuels | 25.1 | 7.7 | 29.4 | 7.9 | 44.1 | 10.5 | 27.9 | 7.7 | 38.5 | 8.3 | ||||||||||||||||||||||||||||||
Petroleum & Derivatives | 20.6 | 6.3 | 24.2 | 6.5 | 37.8 | 9.0 | 23.2 | 6.4 | 31.9 | 6.8 | ||||||||||||||||||||||||||||||
Light Industrial Products | 26.9 | 8.3 | 27.5 | 7.4 | 29.4 | 7.0 | 27.5 | 7.6 | 32.7 | 7.0 | ||||||||||||||||||||||||||||||
Heavy & Chemical Industrial Products | 270.4 | 83.1 | 311.0 | 83.7 | 344.4 | 81.6 | 303.9 | 83.6 | 389.9 | 83.6 | ||||||||||||||||||||||||||||||
Electronic & Electronic Products | 115.7 | 35.6 | 126.9 | 34.2 | 127.2 | 30.0 | 121.2 | 33.3 | 154.2 | 33.1 | ||||||||||||||||||||||||||||||
Chemicals & Chemical Products | 31.2 | 9.6 | 36.8 | 9.9 | 41.9 | 9.9 | 36.6 | 10.1 | 47.5 | 10.2 | ||||||||||||||||||||||||||||||
Metal Goods | 27.2 | 8.3 | 31.6 | 8.5 | 38.1 | 9.0 | 29.9 | 8.2 | 37.7 | 8.1 | ||||||||||||||||||||||||||||||
Machinery & Precision Equipment | 29.0 | 8.9 | 36.2 | 9.7 | 42.9 | 10.3 | 32.8 | 9.0 | 44.0 | 9.4 | ||||||||||||||||||||||||||||||
Passenger Cars | 30.5 | 9.4 | 34.5 | 9.3 | 31.3 | 7.4 | 22.4 | 6.2 | 31.8 | 6.8 | ||||||||||||||||||||||||||||||
Ship & Boat | 21.7 | 6.7 | 26.9 | 7.2 | 41.3 | 9.8 | 42.8 | 11.8 | 47.1 | 10.1 | ||||||||||||||||||||||||||||||
Total | 325.5 | 100.0 | 371.5 | 100.0 | 422.0 | 100.0 | 363.5 | 100.0 | 466.4 | 100.0 | ||||||||||||||||||||||||||||||
| (1) | These entries are derived from trade statistics and are valued on a free on board basis, meaning that the insurance and freight costs are not included. |
| (2) | Preliminary |
Source: The Bank of Korea.
Imports by Major Commodity Groups (C.I.F.) (1)
| 2006 | As % of Total | 2007 | As % of Total | 2008 | As % of Total | 2009 | As % of Total | 2010(2) | As % of Total(2) | |||||||||||||||||||||||||||||||
| (billions of dollars, except percentages) | ||||||||||||||||||||||||||||||||||||||||
Industrial Materials and Fuels | 173.9 | 56.2 | 201.7 | 56.5 | 269.0 | 61.8 | 184.4 | 57.1 | 247.2 | 58.1 | ||||||||||||||||||||||||||||||
Crude Petroleum | 55.9 | 18.1 | 60.3 | 16.9 | 85.9 | 19.7 | 50.8 | 15.7 | 68.7 | 16.2 | ||||||||||||||||||||||||||||||
Mineral | 13.0 | 4.2 | 16.0 | 4.5 | 19.6 | 4.5 | 13.7 | 4.2 | 21.4 | 5.0 | ||||||||||||||||||||||||||||||
Chemicals | 25.2 | 8.1 | 29.2 | 8.8 | 33.1 | 7.6 | 28.7 | 8.9 | 37.7 | 8.9 | ||||||||||||||||||||||||||||||
Iron & Steel Products | 17.7 | 5.7 | 24.1 | 6.7 | 37.1 | 8.5 | 21.6 | 6.7 | 27.3 | 6.4 | ||||||||||||||||||||||||||||||
Non-ferrous Metal | 12.3 | 4.0 | 14.3 | 4.0 | 13.4 | 3.1 | 9.1 | 2.8 | 12.6 | 0.0 | ||||||||||||||||||||||||||||||
Capital Goods | 105.1 | 34.0 | 118.1 | 33.1 | 124.1 | 28.5 | 104.5 | 32.4 | 135.7 | 31.9 | ||||||||||||||||||||||||||||||
Machinery & Precision Equipment | 35.4 | 11.5 | 39.3 | 11.0 | 40.0 | 9.2 | 33.6 | 10.4 | 47.7 | 11.2 | ||||||||||||||||||||||||||||||
Electric & Electronic Machines | 60.1 | 19.4 | 67.0 | 18.7 | 70.4 | 16.2 | 59.8 | 18.5 | 73.3 | 17.2 | ||||||||||||||||||||||||||||||
Transport Equipment | 8.0 | 2.6 | 10.0 | 2.8 | 11.7 | 2.7 | 9.5 | 3.0 | 12.9 | 3.0 | ||||||||||||||||||||||||||||||
Consumer Goods | 30.4 | 9.8 | 37.0 | 10.4 | 42.1 | 9.7 | 34.1 | 10.6 | 42.3 | 9.9 | ||||||||||||||||||||||||||||||
Cereals | 3.5 | 1.1 | 4.7 | 1.3 | 7.4 | 1.7 | 5.3 | 1.6 | 5.9 | 1.4 | ||||||||||||||||||||||||||||||
Goods for Direct Consumption | 8.3 | 2.7 | 9.7 | 2.7 | 10.2 | 2.3 | 8.9 | 2.7 | 11.0 | 2.6 | ||||||||||||||||||||||||||||||
Consumer Durable Goods | 11.8 | 3.8 | 14.6 | 4.1 | 16.4 | 3.8 | 12.9 | 4.0 | 16.2 | 3.8 | ||||||||||||||||||||||||||||||
Consumer Nondurable Goods | 6.8 | 2.2 | 8.0 | 2.2 | 8.2 | 1.9 | 7.1 | 2.2 | 9.2 | 2.2 | ||||||||||||||||||||||||||||||
Total | 309.4 | 100.0 | 356.8 | 100.0 | 435.3 | 100.0 | 323.1 | 100.0 | 425.2 | 100.0 | ||||||||||||||||||||||||||||||
| (1) | These entries are derived from customs clearance statistics. C.I.F. means that the price of goods includes insurance and freight costs. |
| (2) | Preliminary |
Source: The Bank of Korea.
141
Table of Contents
In 2005, the Republic recorded a trade surplus of US$23.2 billion. Exports increased by 12.0% to US$284.4 billion and imports increased by 16.4% to US$261.2 billion from US$253.8 billion of exports and US$224.5 billion of imports, respectively, in 2004.
In 2006, the Republic recorded a trade surplus of US$16.1 billion. Exports increased by 14.5% to US$325.5 billion and imports increased by 18.5% to US$309.4 billion from US$284.4 billion of exports and US$261.2 billion of imports, respectively, in 2005.
In 2007, the Republic recorded a trade surplus of US$14.6 billion. Exports increased by 14.1% to US$371.5 billion and imports increased by 15.3% to US$356.8 billion from US$325.5 billion of exports and US$309.4 billion of imports, respectively, in 2006.
In 2008, the Republic recorded a trade deficit of US$13.3 billion. Exports increased by 13.6% to US$422.0 billion and imports increased by 22.0% to US$435.3 billion from US$371.5 billion of exports and US$356.8 billion of imports, respectively, in 2007.
In 2009, the Republic recorded a trade surplus of US$40.4 billion. Exports decreased by 13.9% to US$363.5 billion and imports decreased by 25.8% to US$323.1 billion from US$422.0 billion of exports and US$435.3 billion of imports, respectively, in 2008.
Based on preliminary data, the Republic recorded a trade surplus of US$41.2 billion in 2010. Exports increased by 28.3% to US$466.4 billion and imports increased by 31.6% to US$425.2 billion from US$363.5 billion of exports and US$323.1 billion of imports, respectively, in 2009.
Based on preliminary data, the Republic recorded a trade surplus of US$8.0 billion in the first quarter of 2011. Exports increased by 29.9% to US$131.3 billion and imports increased by 25.6% to US$123.3 billion from US$101.1 billion of exports and US$98.2 billion of imports, respectively, in the corresponding period of 2010.
On October 6, 2010, the Republic and the EU signed a FTA, which is expected to come into effect on July 1, 2011.
The following table sets forth the Republic’s exports trading partners:
Exports
| 2006 | As % of 2006 Total | 2007 | As % of 2007 Total | 2008 | As % of 2008 Total | 2009 | As % of 2009 Total | 2010(1) | As % of 2010 Total (1) | |||||||||||||||||||||||||||||||
| (millions of dollars, except percentages) | ||||||||||||||||||||||||||||||||||||||||
China | 69,459.2 | 21.3 | 81,985.2 | 22.1 | 91,388.9 | 21.7 | 86,703.2 | 23.9 | 116,837.8 | 32.1 | ||||||||||||||||||||||||||||||
United States | 43,183.5 | 13.3 | 45,766.1 | 12.3 | 46,376.6 | 11.0 | 37,649.9 | 10.4 | 49,816.1 | 13.7 | ||||||||||||||||||||||||||||||
Japan | 26,534.0 | 8.2 | 26,370.2 | 7.1 | 28,252.5 | 6.7 | 21,770.8 | 6.0 | 28,176.3 | 7.8 | ||||||||||||||||||||||||||||||
Hong Kong | 18,978.9 | 5.8 | 18,654.5 | 5.0 | 19,771.9 | 4.7 | 19,661.1 | 5.4 | 25,294.3 | 7.0 | ||||||||||||||||||||||||||||||
Singapore | 9,489.3 | 2.9 | 11,949.5 | 3.2 | 16,293.0 | 3.9 | 13,617.0 | 3.7 | 15,244.2 | 4.2 | ||||||||||||||||||||||||||||||
Taiwan | 12,995.7 | 4.0 | 13,027.1 | 3.5 | 11,462.0 | 2.7 | 9,501.1 | 2.6 | 14,830.5 | 4.1 | ||||||||||||||||||||||||||||||
Germany | 10,056.2 | 3.1 | 11,542.5 | 3.1 | 10,522.7 | 2.5 | 8,820.9 | 2.4 | 10,702.2 | 2.9 | ||||||||||||||||||||||||||||||
India | 5,532.8 | 1.7 | 6,600.0 | 1.8 | 8,977.1 | 2.1 | 8,013.3 | 2.2 | 11,434.6 | 3.2 | ||||||||||||||||||||||||||||||
Russia | 5,179.2 | 1.6 | 8,087.7 | 2.2 | 9,748.0 | 2.3 | 4,194.1 | 1.2 | 7,759.8 | 2.1 | ||||||||||||||||||||||||||||||
Indonesia | 4,873.5 | 1.5 | 5,770.6 | 1.6 | 7,933.6 | 1.9 | 5,999.9 | 1.7 | 8,897.3 | 2.5 | ||||||||||||||||||||||||||||||
Others(2) | 119,182.5 | 36.6 | 141,735.7 | 38.2 | 171,281.0 | 40.6 | 147,602.3 | 40.6 | 74,540.5 | 20.4 | ||||||||||||||||||||||||||||||
Total | 325,464.8 | 100.0 | 371,489.1 | 100.0 | 422,007.3 | 100.0 | 363,533.6 | 100.0 | 363,533.6 | 100.0 | ||||||||||||||||||||||||||||||
| (1) | Preliminary |
| (2) | Includes more than 200 countries and regions with lower exports levels than those shown above. |
Source : The Bank of Korea.
142
Table of Contents
The following table sets forth the Republic’s imports trading partners:
Imports
| 2006 | As % of 2006 Total | 2007 | As % of 2007 Total | 2008 | As % of 2008 Total | 2009 | As % of 2009 Total | 2010(1) | As % of 2010 Total (1) | |||||||||||||||||||||||||||||||
| (millions of dollars, except percentages) | ||||||||||||||||||||||||||||||||||||||||
China | 48,556.7 | 15.7 | 63,027.8 | 17.7 | 76,930.3 | 17.7 | 54,246.1 | 16.8 | 71,573.6 | 16.8 | ||||||||||||||||||||||||||||||
Japan | 51,926.3 | 16.8 | 56,250.1 | 15.8 | 60,956.4 | 14.0 | 49,427.5 | 15.3 | 64,296.1 | 15.1 | ||||||||||||||||||||||||||||||
United States | 33,654.2 | 10.9 | 37,219.3 | 10.4 | 38,364.8 | 8.8 | 29,039.5 | 9.0 | 40,402.7 | 9.5 | ||||||||||||||||||||||||||||||
Saudi Arabia | 20,552.1 | 6.6 | 21,163.5 | 5.9 | 33,781.5 | 7.8 | 19,736.8 | 6.1 | 26,820.0 | 6.3 | ||||||||||||||||||||||||||||||
Australia | 11,309.4 | 3.7 | 13,232.5 | 3.7 | 18,000.3 | 4.1 | 14,756.1 | 4.6 | 20,456.2 | 4.8 | ||||||||||||||||||||||||||||||
Germany | 11,364.6 | 3.7 | 13,534.3 | 3.8 | 14,769.1 | 3.4 | 12,298.5 | 3.8 | 14,304.9 | 3.4 | ||||||||||||||||||||||||||||||
Taiwan | 9,287.5 | 3.0 | 9,966.5 | 2.8 | 10,642.9 | 2.4 | 9,851.4 | 3.0 | 13,647.1 | 3.2 | ||||||||||||||||||||||||||||||
United Arab Emirates | 12,930.9 | 4.2 | 12,656.2 | 3.5 | 19,248.5 | 4.4 | 9,310.0 | 2.9 | 12,170.1 | 2.9 | ||||||||||||||||||||||||||||||
Indonesia | 8,848.6 | 2.9 | 9,113.8 | 2.6 | 11,320.3 | 2.6 | 9,264.1 | 2.9 | 13,985.8 | 3.3 | ||||||||||||||||||||||||||||||
Malaysia | 7,242.5 | 2.3 | 8,442.2 | 2.4 | 9,909.1 | 2.3 | 7,574.1 | 2.3 | 9,531.0 | 2.2 | ||||||||||||||||||||||||||||||
Others(2) | 93,709.9 | 30.3 | 112,239.5 | 31.4 | 141,351.5 | 32.5 | 107,580.4 | 33.3 | 138,024.7 | 32.5 | ||||||||||||||||||||||||||||||
Total | 309,382.7 | 100.0 | 356,845.7 | 100.0 | 435,274.7 | 100.0 | 323,084.5 | 100.0 | 425,212.2 | 100.0 | ||||||||||||||||||||||||||||||
| (1) | Preliminary |
| (2) | Includes more than 200 countries and regions with lower imports levels than those shown above. |
Source : The Bank of Korea.
In 2003, the outbreak of severe acute respiratory syndrome, or SARS, and the avian influenza in Asia (including China) and other parts of the world increased uncertainty about prospects for international trade and economic growth for affected countries, as well as world economic prospects in general. The avian influenza carried by migrating wild birds spread to several Asian countries, Russia, Romania and Turkey. In response to these outbreaks of avian influenza, the Government issued an advisory on disease prevention as of October 14, 2005 and conducted special monitoring of poultry farms. In addition, the Government continued to cooperate with regional and international efforts to develop and implement additional measures to contain and prevent SARS, the avian influenza and other diseases. Another outbreak of SARS, the avian influenza or similar incidents in the future may have an adverse effect on Korean and world economies and on international trade.
In April 2007, the Republic and the United States reached an agreement on a bilateral free trade agreement, or FTA, which was subsequently renegotiated and signed by both nations in December 2010. As of April 6, 2011, the FTA has not been ratified by the Korean National Assembly nor the U.S. Congress.
Non-Commodities Trade Balance
The non-commodities trade deficit was US$17.4 billion in 2006, US$15.4 billion in 2007, US$2.0 billion in 2008, US$5.8 billion in 2009 and US$13.7 billion in 2010.
143
Table of Contents
Foreign Currency Reserves
The following table shows the Republic’s total official foreign currency reserves:
Total Official Reserves
| December 31, | ||||||||||||||||||||
| 2006 | 2007 | 2008 | 2009 | 2010 | ||||||||||||||||
| (millions of dollars) | ||||||||||||||||||||
Gold (1) | $ | 74.2 | $ | 74.3 | $ | 75.7 | $ | 79.0 | $ | 79.6 | ||||||||||
Foreign Exchange | 238,387.9 | 261,770.7 | 200,479.1 | 265,202.3 | 286,926.4 | |||||||||||||||
Total Gold and Foreign Exchange | 238,462.1 | 261,845.0 | 200,554.8 | 265,281.3 | 287,006.0 | |||||||||||||||
Reserve Position at IMF | 440.0 | 310.5 | 582.6 | 981.6 | 1,024.7 | |||||||||||||||
Special Drawing Rights | 54.0 | 68.6 | 86.0 | 3,731.8 | 3,539.9 | |||||||||||||||
Total Official Reserves | $ | 238,956.1 | $ | 262,224.1 | $ | 201,223.4 | $ | 269,994.7 | $ | 291,570.7 | ||||||||||
| (1) | For this purpose, domestically-owned gold is valued at US$42.22 per troy ounce (31.1035 grams) and gold deposited overseas is calculated at cost of purchase. |
Source: The Bank of Korea.
The Government’s foreign currency reserves increased to US$262.2 billion as of December 31, 2007 from US$8.9 billion as of December 31, 1997, primarily due to continued balance of trade surpluses and capital inflows. In 2008, the Government’s foreign currency reserves decreased, falling to US$201.2 billion as of December 31, 2008, partially as a result of the Government’s use of the foreign currency reserve to provide foreign currency liquidity to Korean financial institutions and to defend the value of the Won against depreciation. The Government’s foreign currency reserves increased in 2009 and 2010, due among others to the retrieval of the foreign currency reserve previously used to provide foreign currency liquidity to Korean financial institutions, as well as gains on investment. The amount of the Government’s foreign currency reserve was US$305.1 billion as of May 31, 2011.
The Ministry of Strategy and Finance prepares the Government budget and administers the Government’s finances.
The Government’s fiscal year commences on January 1. The Government must submit the budget, which is drafted by the Minister of Strategy and Finance and approved by the President of the Republic, to the National Assembly not later than 90 days prior to the start of the fiscal year and may submit supplementary budgets revising the original budget at any time during the fiscal year.
144
Table of Contents
The following table shows consolidated Government revenues and expenditures:
Consolidated Central Government Revenues and Expenditures
| December 31, | ||||||||||||||||||||||||
| 2004 | 2005 | 2006 | 2007 | 2008 | 2009 (1) | |||||||||||||||||||
| (billions of Won) | ||||||||||||||||||||||||
Total Revenues | 178,784 | 191,446 | 209,573 | 243,633 | 250,713 | 255,252 | ||||||||||||||||||
Current Revenues | 177,453 | 190,165 | 208,091 | 241,693 | 248,809 | 252,720 | ||||||||||||||||||
Total Tax Revenues | 117,796 | 127,466 | 138,044 | 161,459 | 167,306 | 164,542 | ||||||||||||||||||
Income Profits and Capital Gains | 48,112 | 54,456 | 60,367 | 74,273 | 75,510 | 69,675 | ||||||||||||||||||
Tax on Property | 2,996 | 4,683 | 6,281 | 8,725 | 7,694 | 7,171 | ||||||||||||||||||
Tax on Goods and Services | 51,800 | 53,401 | 54,996 | 59,835 | 63,060 | 63,496 | ||||||||||||||||||
Customs Duties | 6,796 | 6,318 | 6,858 | 7,411 | 8,776 | 9,169 | ||||||||||||||||||
Others | 8,090 | 8,608 | 9,542 | 11,216 | 12,267 | 15,031 | ||||||||||||||||||
Social Security Contribution | 22,848 | 24,905 | 27,315 | 29,739 | 32,896 | 33,896 | ||||||||||||||||||
Non-Tax Revenues | 36,788 | 37,795 | 42,733 | 50,495 | 48,607 | 54,283 | ||||||||||||||||||
Capital Revenues | 1,331 | 1,281 | 1,482 | 1,940 | 1,904 | 2,532 | ||||||||||||||||||
Total Expenditures and Net Lending | 173,538 | 187,946 | 205,928 | 209,810 | 238,834 | 272,873 | ||||||||||||||||||
Total Expenditures | 172,140 | 184,922 | 200,181 | 202,703 | 233,354 | 254,823 | ||||||||||||||||||
Current Expenditures | 144,148 | 160,274 | 173,688 | 169,658 | 196,879 | 209,689 | ||||||||||||||||||
Goods and Services | 33,869 | 36,165 | 38,987 | 34,496 | 37,375 | N/A | (2) | |||||||||||||||||
Interest Payments | 8,710 | 10,094 | 12,150 | 13,444 | 14,356 | N/A | (2) | |||||||||||||||||
Subsidies and Other Transfers (3) | 99,537 | 111,448 | 119,997 | 119,565 | 142,782 | N/A | (2) | |||||||||||||||||
Subsidies | 748 | 724 | 764 | 680 | 730 | N/A | (2) | |||||||||||||||||
Other Transfers(3) | 98,789 | 110,724 | 119,233 | 118,885 | 142,052 | N/A | (2) | |||||||||||||||||
Non-Financial Public Enterprises Expenditures | 3,031 | 2,566 | 2,554 | 2,153 | 2,366 | N/A | (2) | |||||||||||||||||
Capital Expenditures | 26,992 | 24,648 | 26,493 | 33,045 | 36,475 | 45,134 | ||||||||||||||||||
Net Lending | 1,398 | 3,024 | 5,746 | 7,107 | 5,480 | 18,049 | ||||||||||||||||||
| (1) | Preliminary. |
| (2) | Not available. |
| (3) | Includes transfers to local governments, non-profit institutions, households and abroad. |
Source: Ministry of Strategy and Finance; Korea National Statistical Office.
The consolidated Government account consists of a General Account, Special Accounts (including a non-financial public enterprise special account) and Public Funds. The Government segregates the accounts of certain functions of the Government into Special Accounts and Public Funds for more effective administration and fiscal control. The Special Accounts and Public Funds relate to business type activities, such as economic development, road and railway construction and maintenance, monopolies, and communications developments and the administration of loans received from official international financial organizations and foreign governments.
Revenues derive mainly from national taxes and non-tax revenues. Taxes in Korea can be roughly classified into the following types:
| • | income tax and capital gains tax, |
| • | property tax, |
145
Table of Contents
| • | value-added tax, |
| • | customs duty tax, and |
| • | other taxes. |
Income tax and capital gains tax are imposed on income derived from labor, business operation and ownership of assets and profits derived from capital appreciation. Income tax and capital gains tax, depending on the type of taxpayer, can be further classified into corporate income tax and individual income tax. Property tax is imposed on exchange or ownership of property and includes inheritance tax and gift tax. Value-added tax is imposed on value added to goods and services. Customs duty tax is imposed on imported goods. Other taxes include tax on certain securities transactions and a stamp tax for certain documents.
Expenditures include general administration, national defense, community service, education, health, social security, certain annuities and pensions and local finance, which involves the transfer of tax revenues to local governments.
For 2005, revenues increased by approximately 7.1%, which represented 23.6% of the Republic’s GDP, principally due to higher tax revenues. Tax revenues increased principally as a result of the country’s export growth and the accompanying increase in corporate income. The Republic had a fiscal surplus of (Won)3.5 trillion in 2005.
For 2006, revenues increased by approximately 9.5%, which represented 24.7% of the Republic’s GDP, principally due to higher tax revenues. Tax revenues increased principally as a result of the country’s export growth and the accompanying increase in corporate income. The Republic had a fiscal surplus of (Won)3.6 trillion in 2006.
For 2007, revenues increased by approximately 16.3%, which represented 27.0% of the Republic’s GDP, principally due to higher tax revenues. Tax revenues increased principally as a result of the country’s export growth and the accompanying increase in corporate income. The Republic had a fiscal surplus of (Won)33.8 trillion in 2007.
For 2008, revenues increased by approximately 2.9% principally due to higher tax revenues. Tax revenues increased principally as a result of the country’s export growth and the accompanying increase in corporate income. The Republic had a fiscal surplus of (Won)11.9 trillion in 2008.
Based on preliminary data, the Republic recorded total revenues of (Won)255.3 trillion and total expenditures and net lending of (Won)272.9 trillion in 2009. The Republic had a fiscal deficit of (Won)17.6 trillion in 2009.
Based on preliminary data, the Republic recorded total revenues of (Won)232.1 trillion and total expenditures and net lending of (Won)216.6 trillion in the first ten months of 2010. The Republic had a fiscal surplus of (Won)15.5 trillion in the first ten months of 2010.
146
Table of Contents
The Government estimates that the total outstanding debt of the Government (including guarantees by the Government) as of December 31, 2010 amounted to approximately (Won)405.5 trillion, an increase of 8.8% over the previous year.
External and Internal Debt of the Government
The following table sets out, by currency and the equivalent amount in U.S. Dollars, the estimated outstanding direct external debt of the Government as of December 31, 2010:
Direct External Debt of the Government
| Amount in Original Currency | Equivalent Amount in U.S. Dollars (1) | |||||||
| (millions) | ||||||||
US$ | US$ | 7,401.7 | US$ | 7,401.7 | ||||
Japanese Yen (¥) | ¥ | 10,963.1 | 134.5 | |||||
Euro (EUR) | EUR | 876.6 | 1,165.0 | |||||
Total | US$ | 8,701.2 | ||||||
| (1) | Amounts expressed in currencies other than US$ are converted to US$ at the arbitrage rate announced by the Seoul Money Brokerage Services, Ltd. in effect on December 31, 2010. |
The following table summarizes, as of December 31 of the years indicated, the outstanding direct internal debt of the Republic:
Direct Internal Debt of the Government
| (billions of Won) | ||||
2006 | 262,380.6 | |||
2007 | 278,800.8 | |||
2008 | 288,719.8 | |||
2009 | 331,904.1 | |||
2010 | 360,804.5 | |||
The following table sets out all outstanding guarantees by the Government of indebtedness of others:
Guarantees by the Government
| December 31, | ||||||||||||||||||||
| 2006 | 2007 | 2008 | 2009 | 2010 | ||||||||||||||||
| (billions of Won) | ||||||||||||||||||||
Domestic | 36,436.6 | 33,031.1 | 28,112.8 | 28,292.4 | 33,291.7 | |||||||||||||||
External(1) | 73.4 | 31.8 | — | 1,508.4 | 1,508.3 | |||||||||||||||
Total | 36,510.1 | 33,062.9 | 28,112.8 | 29,800.8 | 34,800.0 | |||||||||||||||
| (1) | Converted to Won at foreign exchange banks’ telegraphed transfer selling rates to customers or the market average exchange rates in effect on December 31 of each year. |
For further information on the outstanding indebtedness, including guarantees, of the Republic, see “—Tables and Supplementary Information”.
147
Table of Contents
External Debt
The following tables set out certain information regarding the Republic’s external debt calculated under the criteria based on the sixth edition of Balance of Payment Manual, or BPM6, published by the International Monetary Fund in December 2008 and implemented by the Government in December 2010. Under BPM6, in particular, prepayments received in connection with the construction of ships are excluded from external debt.
| December 31, | ||||||||||||||||||||
| 2006 | 2007 | 2008 | 2009 | 2010 | ||||||||||||||||
| (billions of dollars) | ||||||||||||||||||||
Long-term Debt | 111.5 | 173.2 | 167.5 | 196.2 | 225.0 | |||||||||||||||
General Government | 10.3 | 31.7 | 21.1 | 27.8 | 44.2 | |||||||||||||||
Monetary Authorities | 5.7 | 12.3 | 13.1 | 28.3 | 25.3 | |||||||||||||||
Banks | 40.4 | 58.9 | 59.0 | 64.6 | 72.4 | |||||||||||||||
Other Sectors | 55.0 | 70.2 | 74.2 | 75.5 | 83.1 | |||||||||||||||
Short-term Debt | 113.7 | 160.2 | 149.9 | 149.2 | 135.0 | |||||||||||||||
Monetary Authorities | 3.9 | 9.6 | 18.3 | 11.7 | 10.3 | |||||||||||||||
Banks | 96.1 | 134.0 | 110.4 | 115.7 | 101.3 | |||||||||||||||
Other Sectors | 13.7 | 16.7 | 21.2 | 21.8 | 23.4 | |||||||||||||||
Total External Liabilities | 225.2 | 333.4 | 317.4 | 345.4 | 360.0 | |||||||||||||||
Debt Record
The Government has always paid when due the full amount of principal of, interest on, and amortization of sinking fund requirements of, all of its indebtedness.
Tables and Supplementary Information
A. External Debt of the Government
(1) External Bonds of the Government
Series | Issue Date | Maturity Date | Interest Rate (%) | Currency | Original Principal Amount | Principal Amount Outstanding as of December 31, 2010 | ||||||||||||||
2003-001 | June 3, 2003 | June 1, 2013 | 4.25 | USD | 1,000,000,000 | 1,000,000,000 | ||||||||||||||
2004-001 | September 22, 2004 | September 22, 2014 | 4.875 | USD | 1,000,000,000 | 1,000,000,000 | ||||||||||||||
2005-001 | November 2, 2005 | November 3, 2025 | 5.625 | USD | 400,000,000 | 400,000,000 | ||||||||||||||
2005-002 | November 2, 2005 | November 2, 2015 | 3.625 | EUR | 500,000,000 | 500,000,000 | ||||||||||||||
2006-001 | December 7, 2006 | December 7, 2016 | 5.125 | USD | 500,000,000 | 500,000,000 | ||||||||||||||
2006-002 | December 7, 2006 | December 7, 2021 | 4.25 | EUR | 375,000,000 | 375,000,000 | ||||||||||||||
2009-001 | April 16, 2009 | April 16, 2014 | 5.75 | USD | 1,500,000,000 | 1,500,000,000 | ||||||||||||||
2009-002 | April 16, 2009 | April 16, 2019 | 7.125 | USD | 1,500,000,000 | 1,500,000,000 | ||||||||||||||
Total External Bonds in Original Currencies |
| USD 5,900,000,000 | ||||||||||||||||||
| EUR 875,000,000 | ||||||||||||||||||||
Total External Bonds in Equivalent Amount of Won(1) |
| (Won) | 8,043,910,000,000 | |||||||||||||||||
| (1) | U.S. dollar amounts are converted to Won amounts at the rate of US$1.00 to (Won)1,138.9, the market average exchange rate in effect on December 31, 2010, as announced by Seoul Money Brokerage Services, Ltd. Euro amounts are converted to Won amounts at the rate of EUR1.00 to (Won)1,513.6, the market average exchange rate in effect on December 31, 2010, as announced by Seoul Money Brokerage Services, Ltd. |
148
Table of Contents
(2) External Borrowings of the Government
a. Borrowings in U.S. Dollars
Date of Borrowing | Original Maturity (Years) | Interest Rate (%) | Original Principal Amount (USD) | Principal Amount Outstanding as of December 31, 2010 (USD) | ||||||||||||
February 26, 1969 | 42 | 3 | 5,000,000 | 132,538 | ||||||||||||
March 20, 1970 | 40 | 3 | 4,000,000 | 119,629 | ||||||||||||
June 3, 1970 | 41 | 3 | 10,000,000 | 214,773 | ||||||||||||
January 29, 1971 | 40 | 3 | 29,300,000 | 943,903 | ||||||||||||
January 29, 1971 | 41 | 3 | 29,200,000 | 1,878,810 | ||||||||||||
March 6, 1971 | 40 | 3 | 35,000,000 | 788,451 | ||||||||||||
April 12, 1971 | 40 | 3 | 29,600,000 | 895,449 | ||||||||||||
April 12, 1971 | 30 | 3 | 400,000 | 21,777 | ||||||||||||
June 24, 1971 | 40 | 3 | 14,000,000 | 1,024,817 | ||||||||||||
August 31, 1971 | 41 | 3 | 6,000,000 | 433,064 | ||||||||||||
January 20, 1972 | 41 | 3 | 2,000,000 | 264,311 | ||||||||||||
February 14, 1972 | 41 | 3 | 40,000,000 | 3,460,416 | ||||||||||||
February 14, 1972 | 40 | 3 | 162,200,000 | 10,064,083 | ||||||||||||
March 16, 1972 | 41 | 3 | 17,000,000 | 2,043,685 | ||||||||||||
June 27, 1972 | 40 | 3 | 5,000,000 | 467,668 | ||||||||||||
September 13, 1972 | 41 | 3 | 2,500,000 | 286,646 | ||||||||||||
February 28, 1973 | 40 | 3 | 25,000,000 | 3,458,373 | ||||||||||||
April 12, 1973 | 42 | 3 | 96,300,000 | 15,042,830 | ||||||||||||
April 12, 1973 | 43 | 3 | 5,300,000 | 991,249 | ||||||||||||
April 12, 1973 | 40 | 3 | 25,200,000 | 2,367,574 | ||||||||||||
January 28, 1974 | 40 | 3 | 5,000,000 | 649,508 | ||||||||||||
April 19, 1974 | 40 | 3 | 2,800,000 | 473,686 | ||||||||||||
September 11, 1974 | 41 | 3 | 25,700,000 | 5,400,863 | ||||||||||||
September 13, 1975 | 41 | 3 | 5,000,000 | 982,945 | ||||||||||||
September 13, 1975 | 41 | 3 | 5,000,000 | 981,867 | ||||||||||||
September 13, 1975 | 41 | 3 | 5,000,000 | 1,358,594 | ||||||||||||
February 18, 1976 | 40 | 3 | 11,900,000 | 1,862,543 | ||||||||||||
February 18, 1976 | 40 | 3 | 27,900,000 | 4,644,194 | ||||||||||||
February 18, 1976 | 40 | 3 | 23,400,000 | 5,829,298 | ||||||||||||
February 18, 1976 | 40 | 3 | 90,800,000 | 16,528,863 | ||||||||||||
July 21, 1977 | 41 | 3 | 59,500,000 | 14,349,380 | ||||||||||||
July 21, 1977 | 40 | 3 | 43,800,000 | 9,268,853 | ||||||||||||
June 7, 1979 | 30 | 3 | 40,000,000 | 10,882,277 | ||||||||||||
January 25, 1980 | 40 | 3 | 30,000,000 | 9,068,823 | ||||||||||||
May 18, 1981 | 40 | 3 | 27,000,000 | 8,789,239 | ||||||||||||
October 12, 1994 | 20 | 6.25 | 1,640,370,000 | 489,108,316 | ||||||||||||
March 27, 1998 | 15 | LIBOR+0.75 | 2,000,000,000 | 268,856,448 | ||||||||||||
September 14, 1998 | 16 | LIBOR+0.5 | 48,000,000 | 7,813,369 | ||||||||||||
October 23, 1998 | 15 | LIBOR+0.75 | 2,000,000,000 | 600,000,000 | ||||||||||||
Subtotal in Original Currency |
| USD 1,501,749,112 | ||||||||||||||
Subtotal in Equivalent Amount of Won (1) |
| (Won) | 1,710,342,064,040 | |||||||||||||
| (1) | U.S. dollar amounts are converted to Won amounts at the rate of US$1.00 to (Won)1,138.9, the market average exchange rate in effect on December 31, 2010, as announced by Seoul Money Brokerage Services, Ltd. |
149
Table of Contents
b. Borrowings in Euro
Date of Borrowing | Original Maturity (Years) | Interest Rate (%) | Original Principal Amount (EUR) | Principal Amount Outstanding as of December 31, 2010 (EUR) | ||||||||||
April 19, 1982 | 39 | 2 | 7,029,215 | 957,624 | ||||||||||
March 27, 1985 | 30 | 2 | 2,039,087 | 658,088 | ||||||||||
Subtotal in Original Currency |
| EUR 1,615,712 | ||||||||||||
Subtotal in Equivalent Amount of Won(1) |
| (Won) | 2,445,541,350 | |||||||||||
| (1) | Euro amounts are converted to Won amounts at the rate of EUR1.00 to (Won)1,513.6, the market average exchange rate in effect on December 31, 2010, as announced by Seoul Money Brokerage Services, Ltd. |
c. Borrowings in Japanese Yen
Date of Borrowing | Original Maturity (Years) | Interest Rate (%) | Original Principal Amount (JPY) | Principal Amount Outstanding as of December 31, 2010 (JPY) | ||||||||||
August 18, 1987 | 25 | 4.25 | 7,750,000,000 | 837,836,000 | ||||||||||
August 18, 1987 | 25 | 4.25 | 12,911,000,000 | 1,307,244,000 | ||||||||||
May 24, 1988 | 24 | Floating | 7,567,732,075 | 694,717,775 | ||||||||||
June 22, 1988 | 25 | 4.25 | 2,679,000,000 | 357,325,000 | ||||||||||
June 22, 1988 | 25 | 4.25 | 5,920,000,000 | 777,375,000 | ||||||||||
June 22, 1988 | 25 | 4.25 | 5,254,000,000 | 518,585,000 | ||||||||||
June 22, 1988 | 25 | 4.25 | 4,440,000,000 | 599,125,000 | ||||||||||
December 13, 1989 | 25 | Floating | 8,745,658,966 | 3,562,106,766 | ||||||||||
October 31, 1990 | 25 | 4 | 4,320,000,000 | 1,126,610,000 | ||||||||||
October 31, 1990 | 25 | 4 | 5,414,000,000 | 598,740,000 | ||||||||||
October 31, 1990 | 25 | 4 | 2,160,000,000 | 583,390,000 | ||||||||||
Subtotal in Original Currency |
| JPY 10,963,054,541 | ||||||||||||
Subtotal in Equivalent Amount of Won(1) |
| (Won) | 153,162,642,380 | |||||||||||
Total ExternalBorrowings in Equivalent Amount of Won |
| (Won) | 1,865,950,247,770 | |||||||||||
| (1) | Japanese yen amounts are converted to Won amounts at the rate of JPY100.00 to (Won)1,397.08, the market average exchange rate in effect on December 31, 2010, as announced by Seoul Money Brokerage Services, Ltd. |
150
Table of Contents
B. External Guaranteed Debt of the Government
Borrower | Issue Date | Maturity Date | Interest Rate (%) | Currency | Original Principal Amount | Principal Amount Outstanding as of December 31, 2010 | ||||||||||||||||||
Hana Bank | April 9, 2009 | April 9, 2012 | 6.5 | USD | 1,000,000,000 | 1,000,000,000 | ||||||||||||||||||
Hana Bank | June 30, 2009 | December 30, 2011 | 4.8 | MYR | 710,000,000 | 710,000,000 | ||||||||||||||||||
Hana Bank | June 30, 2009 | June 29, 2012 | 4.85 | MYR | 290,000,000 | 290,000,000 | ||||||||||||||||||
Total External Guaranteed Debt in Original Currencies |
| USD 1,000,000,000 | ||||||||||||||||||||||
| MYR 1,000,000,000 | ||||||||||||||||||||||||
Total External Guaranteed Debt in Equivalent Amount of Won(1) |
| (Won) | 1,508,250,000,000 | |||||||||||||||||||||
| (1) | U.S. dollar amounts are converted to Won amounts at the rate of US$1.00 to (Won)1,138.9, the market average exchange rate in effect on December 31, 2010, as announced by Seoul Money Brokerage Services, Ltd. Malaysian ringgit amounts are converted to Won amounts at the rate of MYR1.00 to (Won)369.35, the market average exchange rate in effect on December 31, 2010, as announced by Seoul Money Brokerage Services, Ltd. |
C. Internal Debt of the Government
Title | Range of Interest Rates | Range of Years of Issue | Range of Years of Original Maturity | Principal Amounts Outstanding as of December 31, 2010 | ||||||||||||
| (%) | (billions of Won) | |||||||||||||||
1. Bonds | ||||||||||||||||
Interest-Bearing Treasury Bond for Treasury Bond Management Fund | 2.75-7.65 | 2001-2010 | 2011-2030 | 310,076.7 | ||||||||||||
Interest-Bearing Treasury Bond for National Housing I | 3.0 | 2001-2010 | 2006-2015 | 44,067.0 | ||||||||||||
Interest-Bearing Treasury Bond for National Housing II | 0.0-3.0 | 1986-2010 | 2006-2030 | 4,383.1 | ||||||||||||
Interest-Bearing Treasury Bond for National Housing III | 0 | 2005 | 2015 | 594.2 | ||||||||||||
Non-interest-Bearing Treasury Bond for Contribution to International Organizations (1) | — | 1967-1985 | — | 11.3 | ||||||||||||
Total Bonds | 359,132.3 | |||||||||||||||
2. Borrowings | ||||||||||||||||
Borrowings from The Bank of Korea | 2.24 | 2010 | 2011 | 1,117.2 | ||||||||||||
Borrowings from the Sports Promotion Fund | 3.64-5.0 | 2009-2010 | 2012-2015 | 400.0 | ||||||||||||
Borrowings from the Private School Teachers’ Pension Fund | 5.17-5.27 | 2006 | 2011 | 65.0 | ||||||||||||
Borrowings from the Korea Foundation Fund | 4.31 | 2009 | 2012 | 30.0 | ||||||||||||
Borrowings from the Government Employees’ Pension Fund | 2.8 | 2009 | 2012 | 10.0 | ||||||||||||
Borrowings from the Film Industry Development Fund | 3.04-3.85 | 2010 | 2013 | 30.0 | ||||||||||||
Borrowings from the Culture and Arts Promotion Fund | 3.29 | 2010 | 2013 | 20.0 | ||||||||||||
Total Borrowings | 1,672.2 | |||||||||||||||
Total Internal Funded Debt | 360,804.5 | |||||||||||||||
151
Table of Contents
| (1) | Interest Rates and Years of Maturity not applicable. |
D. Internal Guaranteed Debt of the Government
Title | Range of Interest Rates | Range of Years of Issue | Range of Years of Original Maturity | Principal Amounts Outstanding as of December 31, 2010 | ||||||||||||
| (%) | (billions of Won) | |||||||||||||||
1. Bonds of Government-Affiliated Corporations | ||||||||||||||||
Korea Deposit Insurance Corporation | 4.09-6.32 | 2006-2010 | 2011-2015 | 26,690.0 | ||||||||||||
KAMCO | Floating-5.27 | 2009-2010 | 2012-2014 | 3,969.1 | ||||||||||||
Korea Student Aid Foundation | Floating-5.26 | 2010 | 2012-2020 | 2,510.0 | ||||||||||||
Total Bonds | 33,169.1 | |||||||||||||||
2. Borrowings of Government-Affiliated Corporations | ||||||||||||||||
Rural Development Corporation and Federation of Farmland | 5.5 | 1989 | 2023 | 122.6 | ||||||||||||
Total Borrowings | 122.6 | |||||||||||||||
Total Internal Guaranteed Debt | 33,291.7 | |||||||||||||||
152
Table of Contents
Description of Debt Securities
We will issue debt securities under a fiscal agency agreement or agreements. The description below summarizes the material provisions of the debt securities and the fiscal agency agreement. Since it is only a summary, the description may not contain all of the information that may be important to you as a potential investor in the debt securities. Therefore, we urge you to read the fiscal agency agreement and the form of global debt security before deciding whether to invest in the debt securities. We have filed a copy of these documents with the Securities and Exchange Commission as exhibits to the registration statement of which this prospectus is a part. You should refer to such exhibits for more complete information.
The financial terms and other specific terms of your debt securities will be described in the prospectus supplement relating to your debt securities. The description in the prospectus supplement will supplement this description or, to the extent inconsistent with this description, replace it.
We will appoint a fiscal agent or agents in connection with debt securities whose duties will be governed by the fiscal agency agreement. We may replace the fiscal agent or appoint different fiscal agents for different series of debt securities.
General Terms of the Debt Securities
We may issue debt securities in separate series at various times. The prospectus supplement that relates to your debt securities will specify some or all of the following terms:
| • | the aggregate principal amount; |
| • | the currency of denomination and payment; |
| • | any limitation on principal amount and authorized denominations; |
| • | the percentage of their principal amount at which the debt securities will be issued; |
| • | the maturity date or dates; |
| • | the interest rate for the debt securities and, if variable, the method by which the interest rate will be calculated; |
| • | whether any amount payable in respect of the debt securities will be determined based on an index or formula, and how any such amount will be determined; |
| • | the dates from which interest, if any, will accrue for payment of interest and the record dates for any such interest payments; |
| • | where and how we will pay principal and interest; |
| • | whether and in what circumstances the debt securities may be redeemed before maturity; |
| • | any sinking fund or similar provision; |
| • | whether any part or all of the debt securities will be in the form of a global security and the circumstances in which a global security is exchangeable for certificated securities; |
| • | if issued in certificated form, whether the debt securities will be in bearer form with interest coupons, if any, or in registered form without interest coupons, or both forms, and any restrictions on exchanges from one form to the other; |
| • | whether any of the terms set out herein will differ for the debt securities; and |
| • | other specific provisions. |
153
Table of Contents
Depending on the terms of the debt securities we issue, the prospectus supplement relating to the debt securities may also describe applicable U.S. federal income tax and other considerations additional to the disclosure in this prospectus.
Unless otherwise specified in the applicable prospectus supplement, we will maintain at an office in the Borough of Manhattan, The City of New York, a register for the registration of transfers of debt securities issued in registered form.
Payments of Principal, Premium and Interest
On every payment date specified in the relevant prospectus supplement, we will pay the principal, premium and/or interest due on that date to the registered holder of the relevant debt security at the close of business on the related record date. We will make all payments at the place and in the currency set out in the prospectus supplement. Unless otherwise specified in the relevant prospectus supplement or the debt securities, we will make payments in U.S. dollars at the New York office of the fiscal agent or, outside the United States, at the office of any paying agent. Unless otherwise specified in the applicable prospectus supplement or debt securities, we will pay interest by check, payable to the registered holder.
We will make any payments on debt securities in bearer form at the offices and agencies of the fiscal agent or any other paying agent outside the United States as we may designate. At the option of the holder of the bearer debt securities, we will make such payments by check or by transfer to an account maintained by the holder with a bank located outside of the United States. We will not make payments on bearer debt securities at the corporate trust office of the fiscal agent in the United States or at any other paying agency in the United States. In addition, we will not make any payment by mail to an address in the United States or by transfer to an account maintained by a holder of bearer debt securities with a bank in the United States. Nevertheless, we will make payments on a bearer debt security denominated and payable in U.S. dollars at an office or agency in the United States if:
| • | payment outside the United States is illegal or effectively precluded by exchange controls or other similar restrictions; and |
| • | the payment is then permitted under United States law, without material adverse consequences to us. |
If we issue bearer debt securities, we will designate the offices of at least one paying agent outside the United States as the location for payment.
Redemption for Tax Reasons
Unless otherwise specified in the applicable prospectus supplement, the debt securities may be redeemed at our option, in whole, but not in part, upon not less than 30 nor more than 60 days’ notice, at any time at a redemption price equal to the principal amount thereof plus accrued interest to (but excluding) the date fixed for redemption if:
| • | on the occasion of the next payment due under a series of debt securities we have or will become obliged to pay additional amounts as described under “—Additional Amounts” as a result of any change in, or amendment to, the laws or regulations of Korea or any political subdivision or any authority thereof or therein having power to tax, or any change in the application or official interpretation of such laws or regulations, which change or amendment becomes effective on or after the issue date of such series of debt securities; and |
| • | such obligation cannot be avoided by our taking reasonable measures available to us, |
provided that no such notice of redemption shall be given earlier than 90 days prior to the earliest date on which we would be obliged to pay such additional amounts in respect of such series of debt securities. Before giving
154
Table of Contents
any notice of such redemption, we shall deliver to the fiscal agent a certificate stating that we are entitled to effect such redemption and setting forth a statement of facts showing that the conditions precedent to our right so to redeem have occurred, and an opinion of independent legal advisers of recognized standing to the effect that we have or will become obliged to pay such additional amounts as a result of such change or amendment.
Repayment of Funds; Prescription
If no one claims money paid by us to the fiscal agent for the payment of principal or interest in respect of any series of debt securities for two years after the payment was due and payable, the fiscal agent or paying agent will repay the money to us. After such repayment, the fiscal agent or paying agent will not be liable with respect to the amounts so repaid, and you may look only to us for any payment under the debt securities.
Under Korean law, you will not be permitted to file a claim against us for payment of principal or interest on any series of debt securities unless you do so within five years, in the case of principal, and three years, in the case of interest, from the date on which payment was due.
Global Securities
The prospectus supplement relating to a series of debt securities will indicate whether any of that series of debt securities will be represented by a global security. The prospectus supplement will also describe any unique specific terms of the depositary arrangement with respect to that series. Unless otherwise specified in the prospectus supplement, we anticipate that the following provisions will apply to depositary arrangements.
Registered Ownership of the Global Security
The global security will be registered in the name of a depositary identified in the prospectus supplement, or its nominee, and will be deposited with the depositary, its nominee or a custodian. The depositary, or its nominee, will therefore be considered the sole owner or holder of debt securities represented by the global security for all purposes under the fiscal agency agreement. Except as specified below or in the applicable prospectus supplement, beneficial owners:
| • | will not be entitled to have any of the debt securities represented by the global security registered in their names; |
| • | will not receive physical delivery of any debt securities in definitive form; |
| • | will not be considered the owners or holders of the debt securities; |
| • | must rely on the procedures of the depositary and, if applicable, any participants (institutions that have accounts with the depositary or a nominee of the depositary, such as securities brokers and dealers) to exercise any rights of a holder; and |
| • | will receive payments of principal and interest from the depositary or its participants rather than directly from us. |
We understand that, under existing industry practice, the depositary and participants will allow beneficial owners to take all actions required of, and exercise all rights granted to, the registered holders of the debt securities.
We will register debt securities in the name of a person other than the depositary or its nominee only if:
| • | the depositary for a series of debt securities is unwilling or unable to continue as depositary; or |
| • | we determine, in our sole discretion, not to have a series of debt securities represented by a global security. |
155
Table of Contents
In either such instance, an owner of a beneficial interest in a global security will be entitled to registration of a principal amount of debt securities equal to its beneficial interest in its name and to physical delivery of the debt securities in definitive form.
Beneficial Interests in and Payments on a Global Security
Only participants, and persons that may hold beneficial interests through participants, can own a beneficial interest in the global security. The depositary keeps records of the ownership and transfer of beneficial interests in the global security by its participants. In turn, participants keep records of the ownership and transfer of beneficial interests in the global security by other persons (such as their customers). No other records of the ownership and transfer of beneficial interests in the global security will be kept.
All payments on a global security will be made to the depositary or its nominee. When the depositary receives payment of principal or interest on the global security, we expect the depositary to credit its participants’ accounts with amounts that correspond to their respective beneficial interests in the global security. We also expect that, after the participants’ accounts are credited, the participants will credit the accounts of the owners of beneficial interests in the global security with amounts that correspond to the owners’ respective beneficial interests in the global security.
The depositary and its participants establish policies and procedures governing payments, transfers, exchanges and other important matters that affect owners of beneficial interests in a global security. The depositary and its participants may change these policies and procedures from time to time. We have no responsibility or liability for the records of ownership of beneficial interests in the global security, or for payments made or not made to owners of such beneficial interests. We also have no responsibility or liability for any aspect of the relationship between the depositary and its participants or for any aspect of the relationship between participants and owners of beneficial interests in the global security.
Bearer Securities
We may issue debt securities in a series in the form of one or more bearer global debt securities deposited with a common depositary for the Euroclear and Clearstream, or with a nominee identified in the applicable prospectus supplement. The specific terms and procedures, including the specific terms of the depositary arrangement, with respect to any portion of a series of debt securities to be represented by a global security will be described in the applicable prospectus supplement.
Additional Amounts
We will make all payments of principal of, and premium and interest, if any, on the debt securities without withholding or deducting any present or future taxes imposed by the Republic or any of its political subdivisions, unless required by law. If Korean law requires us to deduct or withhold taxes, we will pay additional amounts as necessary to ensure that you receive the same amount as you would have received without such withholding or deduction.
We will not pay, however, any additional amounts if you are liable for Korean tax because:
| • | you are connected with the Republic (or any political subdivision thereof) other than by merely owning the debt securities or receiving income or payments on the debt securities; |
| • | you failed to complete and submit a declaration of your status as a non-resident of the Republic after we or the relevant tax authority requested you to do so; |
| • | you failed to present your debt securities for payment (where presentation is required) within 30 days of when the payment is due or, if the fiscal agent did not receive the money prior to the due date, the date |
156
Table of Contents
notice is given to holders that the fiscal agent has received the full amount due to holders. Nevertheless, we will pay additional amounts to the extent you would have been entitled to such amounts had you presented your debt securities for payment on the last day of the 30-day period; |
| • | you are a fiduciary or partnership or a person other than the sole beneficial owner of any such payment, to the extent that a beneficiary or settler with respect to such fiduciary, a member of such a partnership or the beneficial owner of the payment would not have been entitled to the additional amounts had the beneficiary, settler, member or beneficial owner been the holder of the debt securities; or |
| • | you would have been able to avoid the withholding or deduction by the presentation (where presentation is required) of the relevant debt securities to, or otherwise accepting payment from, another paying agent. |
We will not pay any additional amounts for taxes on the debt securities except for taxes payable through deduction or withholding from payments of principal, premium or interest. Examples of the types of taxes for which we will not pay additional amounts include the following: estate or inheritance taxes, gift taxes, sales or transfer taxes, personal property or related taxes, assessments or other governmental charges. We will pay stamp or other similar taxes that may be imposed by the Republic, the United States or any political subdivision or taxing authority in one of those two countries on the fiscal agency agreement or be payable in connection with the issuance of the debt securities.
References to principal, premium or interest in respect of the debt securities shall be deemed also to refer to any additional amounts which may be payable as set forth in the debt securities.
Status of Debt Securities
The debt securities will:
| • | constitute our direct, unconditional, unsecured and unsubordinated obligations; |
| • | rank at least equally in right of payment among themselves, regardless of when issued or currency of payment; and |
| • | rank at least equally in right of payment with all of our other unsecured and unsubordinated obligations, subject to certain statutory exceptions under Korean law. |
Negative Pledge Covenant
If any debt securities covered by this prospectus are outstanding, we will not create or permit any security interest on the whole or any part of our assets, present or future, to secure for the benefit of the holders of any International Investment Securities (as defined below) (i) payment of any sum due in respect of any such International Investment Securities, (ii) any payment under any guarantee of any such International Investment Securities or (iii) any payment under any indemnity or other like obligation relating to any such International Investment Securities, without in any such case at the same time according to the debt securities covered by this prospectus the same security as is granted to or is outstanding in respect of such International Investment Securities, guarantee, indemnity or other like obligation.
“International Investment Securities” means notes, debentures, bonds or investment securities which:
| • | either are by their terms payable, or confer a right to receive payment, in any currency other than Won or are denominated in Won and more than 50% of the aggregate principal amount thereof is initially distributed outside Korea by or with our authorization; and |
| • | are for the time being, or are intended to be, quoted, listed, ordinarily dealt in or traded on any stock exchange or over-the-counter or other securities market outside Korea. |
157
Table of Contents
Events of Default
Each of the following constitutes an event of default with respect to any series of debt securities:
| 1. | Non-Payment: we do not pay principal or interest or premium, if any, on any debt securities of such series when due and such failure to pay continues for 30 days. |
| 2. | Breach of Other Obligations: we fail to observe or perform any of the covenants in such series of debt securities (other than non-payment) for 60 days after written notice of the default is delivered to us at the corporate trust office of the fiscal agent in New York City by holders representing at least 10% of the aggregate principal amount of the debt securities of such series. |
| 3. | Cross Default and Cross Acceleration: |
| • | we default on any External Indebtedness, and, as a result, become obligated to pay an amount equal to or greater than US$10,000,000 in aggregate principal amount prior to its due date; or |
| • | we fail to pay when due, including any grace period, any of our External Indebtedness in aggregate principal amount equal to or greater than US$10,000,000 or we fail to pay when requested and required by the terms thereof any guarantee for External Indebtedness of another person equal to or greater than US$10,000,000 in aggregate principal amount. |
| 4. | Moratorium/Default: |
| • | the Republic declares a general moratorium on the payment of its External Indebtedness, including obligations under guarantees; |
| • | the Republic becomes liable to repay prior to maturity any amount of External Indebtedness, including obligations under guarantees, as a result of a default under such External Indebtedness or obligations; or |
| • | the international monetary reserves of the Republic become subject to a security interest or segregation or other preferential arrangement for the benefit of any creditors. |
| 5. | Bankruptcy: |
| • | we are declared bankrupt or insolvent by any court or administrative agency with jurisdiction over us; |
| • | we pass a resolution to apply for bankruptcy or to request the appointment of a receiver or trustee or similar official in insolvency; |
| • | a substantial part of our assets is liquidated; or |
| • | we cease to carry on the whole or substantially the whole of our business. |
| 6. | Failure of Support: the Republic fails to provide financial support for us as required under Article 31 of the KoFC Act as of the issue date of the debt securities of such series. |
| 7. | Government Control: the Republic ceases to control (directly or indirectly) us. |
| 8. | IMF Membership/World Bank Membership: the Republic ceases to be a member of the IMF or the International Bank for Reconstruction and Development (World Bank). |
For purposes of the foregoing, “External Indebtedness” means any obligation for the payment or repayment of money borrowed that is denominated in a currency other than the currency of the Republic.
As used in subparagraph 6 above, “control” means the acquisition or control of a majority of our voting share capital or the right to appoint and/or remove all or the majority of the members of our board of directors or other governing body, whether obtained directly or indirectly, and whether obtained by ownership of share capital, the possession of voting rights, contract or otherwise.
158
Table of Contents
If an event of default occurs, any holder may declare the principal amount of debt securities that it holds to be immediately due and payable by written notice to us and the fiscal agent.
You should note that:
| • | despite the procedure described above, no debt securities may be declared due and payable if we cure the applicable event of default before we receive the written notice from the holder of the debt securities; |
| • | we are not required to provide periodic evidence of the absence of defaults; and |
| • | the fiscal agency agreement does not require us to notify holders of the debt securities of an event of default or grant any holder of the debt securities a right to examine the security register. |
Modifications and Amendments; Debt Securityholders’ Meetings
Each holder of a series of debt securities must consent to any amendment or modification of the terms of such series of debt securities or the fiscal agency agreement that would, among other things:
| • | change the stated maturity of the principal of the debt securities of such series or any installment of interest; |
| • | reduce the principal amount of the debt securities of such series or the portion of the principal amount payable upon acceleration of such debt securities; |
| • | reduce the interest rate or premium, if any, payable on the debt securities of such series; |
| • | change the currency of payment of principal of, interest or premium, if any, on the debt securities of such series; |
| • | amend either the procedures provided for a redemption event or the definition of a redemption event; |
| • | shorten the period during which we are not allowed to redeem the debt securities of such series or grant us a right to redeem the debt securities of such series which we previously did not have; or |
| • | reduce the percentage of the outstanding principal amount needed to modify or amend the fiscal agency agreement or the terms of the debt securities of such series. |
We may, with the exception of the above changes, with the consent of the holders of at least 66 2/3% in principal amount of the debt securities of a series that are outstanding, modify and amend other terms of such series of debt securities.
We may at any time call a meeting of the holders of a series of debt securities to seek such holders’ approval of the modification, or amendment, or obtain a waiver, of any applicable provision of such series of debt securities. The meeting will be held at the time and place in the Borough of Manhattan in New York City as determined by the fiscal agent. The notice calling the meeting must be given at least 30 days and not more than 60 days prior to the meeting.
While an event of default with respect to a series of debt securities is continuing, holders of at least 10% of the aggregate principal amount of such series of debt securities may compel the fiscal agent to call a meeting of all holders of debt securities of such series.
Holders of debt securities of a series who hold, in the aggregate, a majority in principal amount of the debt securities of such series that are outstanding at the time will constitute a quorum at a meeting. At the reconvening of any meeting adjourned for a lack of a quorum, the persons entitled to vote 25% in principal amount of the debt securities of such series that are outstanding at the time will constitute a quorum for taking any action set out in the original notice. To vote at a meeting, a person must either hold outstanding debt securities of the relevant series or be duly appointed as a proxy for a debt securityholder. The fiscal agent will make all rules governing the conduct of any meeting.
159
Table of Contents
The fiscal agency agreement and any series of debt securities may be modified or amended, without the consent of the holders of the debt securities, to:
| • | add covenants made by us that benefit holders of the debt securities; |
| • | surrender any right or power given to us; |
| • | secure the debt securities; and |
| • | cure any ambiguity or correct or supplement any defective provision in the fiscal agency agreement or the debt securities, without materially and adversely affecting the interests of the holders of the debt securities. |
Fiscal Agent
The fiscal agency agreement governs the duties of the fiscal agent. We may maintain bank accounts and a banking relationship with the fiscal agent or its affiliates. The fiscal agent is our agent and does not act as a trustee for the holders of the debt securities.
Further Issues of Debt Securities
We may, without the consent of the holders of the debt securities, create and issue additional debt securities with the same terms and conditions as any series of debt securities (or that are the same except for the amount of the first interest payment and for the interest paid on such series of debt securities prior to the issuance of the additional debt securities). We may consolidate such additional debt securities with the outstanding debt securities to form a single series. We will not issue any such additional debt securities unless such additional debt securities have no more than ade minimis amount of original issue discount or such issuance would constitute a “qualified reopening” for U.S. federal income tax purposes.
The description below summarizes some of the provisions of warrants for the purchase of debt securities that we may issue from time to time and of the warrant agreement. Copies of the forms of warrants and the warrant agreement are or will be filed as exhibits to the registration statement of which this prospectus is a part. Since it is only a summary, the description may not contain all of the information that is important to you as a potential investor in the warrants.
The description of the warrants that will be contained in the prospectus supplement will supplement this description and, to the extent inconsistent with this description, replace it.
General Terms of the Warrants
Each series of warrants will be issued under a warrant agreement to be entered into between us and a bank or trust company, as warrant agent. The prospectus supplement relating to the series of warrants will describe:
| • | the terms of the debt securities purchasable upon exercise of the warrants, as described above under “—Description of Debt Securities—General Terms of the Debt Securities”; |
| • | the principal amount of debt securities purchasable upon exercise of one warrant and the exercise price; |
| • | the procedures and conditions for the exercise of the warrants; |
| • | the dates on which the right to exercise the warrants begins and expires; |
| • | whether and under what conditions the warrants may be terminated or canceled by us; |
| • | whether and under what conditions the warrants and any debt securities issued with the warrants will be separately transferable; |
160
Table of Contents
| • | whether the warrants will be issued in bearer or registered form; |
| • | whether the warrants will be exchangeable between registered and bearer form, and, if issued in registered form, where they may be transferred and registered; and |
| • | other specific provisions. |
Terms Applicable to Debt Securities and Warrants
Governing Law
The fiscal agency agreement, any warrant agreement and the debt securities and any warrants will be governed by the laws of the State of New York without regard to any principles of New York law requiring the application of the laws of another jurisdiction. Nevertheless, all matters governing our authorization, execution and delivery of the debt securities and the fiscal agency agreement and any warrants and warrant agreement by us will be governed by the laws of the Republic.
Jurisdiction and Consent to Service
We are owned by a foreign sovereign government and all of our directors and executive officers and some of the experts named in this prospectus are residents of Korea. In addition, all or most of our assets and the assets of the people named in the preceding sentence are located outside of the United States. For that reason, you may have difficulty serving process on us or the individuals described above in the United States or enforcing a U.S.-court judgment based on the U.S. federal securities laws. Our Korean counsel, Kim & Chang, has informed us that there would be certain conditions to be met under Korean law regarding the enforceability in Korea, either in original actions or in actions for the enforcement of U.S.-court judgments, of civil liabilities based on the U.S. federal securities laws.
We have appointed the General Manager of KDB’s New York Branch, Mr. In Joo Kim and the Senior Deputy General Manager of KDB’s New York Branch, Mr. Joo Yung Sung, and each of their successors in the future, as our authorized agents to receive service of process in any suit which a holder of any series of debt securities or warrants may bring in any state or federal court in the Borough of Manhattan, the City of New York, New York and we have accepted the jurisdiction of those courts for those actions and waived the defense of an inconvenient forum to the maintenance of those actions brought in those courts. KDB’s New York Branch is located at 320 Park Avenue, 32nd Floor, New York, New York 10022. These appointments are irrevocable as long as any amounts of principal, premium or interest remain payable by us to the fiscal agent under any series of debt securities or any warrants have not expired or otherwise terminated under their terms. If for any reason either of these two men ceases to act as our authorized agent or ceases to have an address in the Borough of Manhattan, the City of New York, New York, we shall appoint a replacement. We may also be sued in courts having jurisdiction over us located in the Republic.
We will irrevocably consent to any relief and process in connection with a suit against us in relation to the debt securities or warrants, including the enforcement or execution of any order or judgment of the court. To the extent permitted by law, we will waive irrevocably any immunity from jurisdiction to which we might otherwise be entitled in any suit based on any series of debt securities or warrants.
Foreign Exchange Controls
We are required to file a report to the Minister of Strategy and Finance of Korea before we may issue debt securities outside the Republic. After issuance of debt securities outside the Republic, we are required to file a report to the Minister of Strategy and Finance again with respect to such issuance. No further approval or authorization is required for us to pay principal of or interest on the debt securities.
161
Table of Contents
LIMITATIONS ON ISSUANCE OF BEARER DEBT SECURITIES
AND BEARER WARRANTS
Bearer securities will not be offered, sold or delivered in the United States or its possessions or to a United States person; except in certain circumstances permitted by United States tax regulations. Bearer securities will initially be represented by temporary global securities, without interest coupons, deposited with a common depositary in London for Euroclear and Clearstream for credit to designated accounts. Unless otherwise indicated in the prospectus supplement:
| • | each temporary global security will be exchangeable for definitive bearer securities on or after the date that is 40 days after issuance only upon receipt of certification of non-United States beneficial ownership of the temporary global security as provided for in United States tax regulations, provided that no bearer security will be mailed or otherwise delivered to any location in the United States in connection with the exchange; and |
| • | any interest payable on any portion of a temporary global security with respect to any interest payment date occurring prior to the issuance of definitive bearer securities will be paid only upon receipt of certification of non-United States beneficial ownership of the temporary global security as provided for in United States tax regulations. |
Bearer securities, other than temporary global debt securities, and any related coupons will bear the following legend: “Any United States person who holds this obligation will be subject to limitations under the United States federal income tax laws, including the limitations provided in Section 165(j) and 1287(a) of the Internal Revenue Code.” The sections referred to in the legend provide that, with certain exceptions, a United States person who holds a bearer security or coupon will not be allowed to deduct any loss realized on the disposition of the bearer security, and any gain, which might otherwise be characterized as capital gain, recognized on the disposition will be treated as ordinary income.
For purposes of this section, “United States person” means:
| • | a citizen or resident of the United States; |
| • | a corporation, partnership or other entity created or organized in or under the laws of the United States of any political subdivision thereof; or |
| • | an estate or trust the income of which is subject to United States federal income taxation regardless of its source. |
For purposes of this section, “United States” means the United States of America, including each state and the District of Columbia, its territories, possessions and other areas subject to its jurisdiction.
162
Table of Contents
The following discussion summarizes certain Korean and U.S. federal income tax considerations that may be relevant to you if you invest in debt securities. This summary is based on laws, regulations, rulings and decisions as of the date of this prospectus. These laws, regulations, rulings and/or decisions may change; any such change could apply retroactively and could affect the continued validity of this summary.
This summary does not describe all of the tax considerations that may be relevant to you or your situation, particularly if you are subject to special tax rules. You should consult your tax adviser about the tax consequences of holding the debt securities, including the relevance to your particular situation of the considerations discussed below, as well as of state, local or other tax laws.
The following summary of Korean tax consideration applies to you so long as you are not:
| • | a citizen of Korea; |
| • | a resident of Korea; |
| • | a corporation organized under Korean law; |
| • | a corporation of which the place of management is located in Korea; or |
| • | maintaining a permanent establishment or a fixed base in Korea for business, trade or otherwise. |
Tax on Interest Payments
Under current Korean tax laws, when we make payments of interest to you on the debt securities, no amount will be withheld from such payments for, or on account of, taxes of any kind imposed, levied, withheld or assessed by Korea or any political subdivision or taxing authority thereof or therein.
Tax on Capital Gains
You will not be subject to any Korean income or withholding taxes in connection with the sale, exchange or other disposition of the debt securities, as long as such debt securities are denominated in a currency other than Won, provided that the disposition does not involve a transfer of such debt securities within Korea or the disposition does not involve a transfer of such debt securities to a resident of Korea or a Korean corporation (or the Korean permanent establishment of a non-resident or a non-Korean corporation). If you sell or otherwise dispose of such debt securities to a Korean resident or a Korean corporation (or the Korean permanent establishment of a non-resident or a non-Korean corporation) and such disposition or sale is made within Korea, any gain realized on the transaction will be taxable at ordinary Korean withholding tax rates (the lesser of 22% of net gain or 11% of gross sale proceeds with respect to transactions), unless an exemption is available under an applicable income tax treaty. For example, if you are a resident of the United States for the purposes of the income tax treaty currently in force between Korea and the United States, you are generally entitled to an exemption from Korean taxation in respect of any gain realized on a disposition of the debt securities, regardless of whether the disposition is to a Korean resident. For more information regarding tax treaties, please refer to the heading “—Tax Treaties” below.
Inheritance Tax and Gift Tax
If you die while you are the holder of any debt securities, the subsequent transfer of the debt securities by way of succession will be subject to Korean inheritance tax. Similarly, if you transfer the debt securities as a gift, the donee will be subject to Korean gift tax and you may be required to pay the gift tax if the donee fails to do so or the donee is a non-resident.
163
Table of Contents
Stamp Duty
You will not be subject to any Korean transfer tax, stamp duty, registration duty or similar documentary tax in respect of or in connection with a transfer of any debt securities or in connection with the exercise of exchange rights or conversion rights that may be acquired with the debt securities.
Tax Treaties
At the date of this prospectus, Korea has tax treaties with, among others, Australia, Austria, Bangladesh, Belgium, Brazil, Bulgaria, Canada, China, Czech Republic, Denmark, Egypt, Finland, France, Germany, Hungary, India, Indonesia, Ireland, Italy, Japan, Luxembourg, Malaysia, Mexico, Mongolia, the Netherlands, New Zealand, Norway, Pakistan, Philippines, Poland, Republic of Fiji, Romania, Singapore, Spain, Sri Lanka, Sweden, Switzerland, Thailand, Tunisia, Turkey, the United Kingdom, the United States of America and Vietnam under which the rate of withholding tax on interest and dividends is reduced, generally to between 5% and 15%, and the tax on capital gains is often eliminated.
With respect to any gains subject to Korean withholding tax, as described under “—Tax on Capital Gains” above, you should inquire for yourself whether you are entitled to the benefit of a tax treaty with Korea. It will be your responsibility to claim the benefits of any tax treaty that may exist between your country and Korea in respect of capital gains, and to provide to the purchaser of the debt securities, or the relevant securities company handling the debt securities, as applicable, a certificate as to your country of residence. In the absence of sufficient proof, the purchaser, or the relevant securities company, as the case may be, must withhold tax at the normal rates.
At present, Korea has not entered into tax treaties regarding inheritance or gift tax.
United States Tax Considerations
Any U.S. federal tax advice included in this communication was not intended or written to be used, and cannot be used, for the purpose of avoiding U.S. federal tax penalties.
The following discussion summarizes certain U.S. federal income tax considerations that may be relevant to you if you invest in debt securities and are a U.S. holder. You will be a U.S. holder if you are an individual who is a citizen or resident of the United States, a U.S. domestic corporation, or any other person that is subject to U.S. federal income tax on a net income basis in respect of its investment in a debt security. This summary deals only with U.S. holders that hold debt securities as capital assets for tax purposes. This summary does not apply to you if you are an investor that is subject to special tax rules, such as:
| • | a bank or thrift; |
| • | a real estate investment trust; |
| • | a regulated investment company; |
| • | an insurance company; |
| • | a dealer in securities or currencies; |
| • | a trader in securities or commodities that elects mark-to-market treatment; |
| • | a person that will hold debt securities as a hedge against currency risk or as a position in a straddle or conversion transaction for tax purposes; |
| • | a tax exempt organization; or |
| • | a person whose functional currency for tax purposes is not the U.S. dollar. |
164
Table of Contents
This summary is based on the Internal Revenue Code of 1986, as amended (the “Code”), its legislative history, existing and proposed regulations promulgated thereunder, and published rulings and court decisions, all as currently in effect. These laws are subject to change, possibly on a retroactive basis.
Any special U.S. federal income tax considerations relevant to a particular issuance of debt securities will be discussed in the applicable prospectus supplement. You should consult your tax adviser about the tax consequences of holding debt securities, including the relevance to your particular situation of the considerations discussed below, as well as of state, local or other tax laws.
Payments or Accruals of Interest
Payments or accruals of “qualified stated interest” (as defined below) on a debt security will be taxable to you as ordinary interest income at the time that you receive or accrue such amounts, in accordance with your regular method of tax accounting. If you use the cash method of tax accounting and you receive payments of interest pursuant to the terms of a debt security in a currency other than U.S. dollars, a “foreign currency”, the amount of interest income you will realize will be the U.S. dollar value of the foreign currency payment based on the exchange rate in effect on the date you receive the payment regardless of whether you convert the payment into U.S. dollars. If you are an accrual-basis U.S. holder, the amount of interest income you will realize will be based on the average exchange rate in effect during the interest accrual period or, with respect to an interest accrual period that spans two taxable years, at the average exchange rate for the partial period within the taxable year. Alternatively, as an accrual-basis U.S. holder you may elect to translate all interest income on foreign currency-denominated debt securities at the spot rate on the last day of the accrual period (or the last day of the taxable year, in the case of an accrual period that spans more than one taxable year), or on the date that you receive the interest payment if that date is within five business days of the end of the accrual period. If you make this election you must apply it consistently to all debt instruments from year to year and you cannot change the election without the consent of the Internal Revenue Service. If you use the accrual method of accounting for tax purposes you will recognize foreign currency gain or loss on the receipt of a foreign currency interest payment if the exchange rate in effect on the date the payment is received differs from the rate applicable to a previous accrual of that interest income. This foreign currency gain or loss will be treated as ordinary income or loss, but generally will not be treated as an adjustment to interest income received on the debt security.
Purchase, Sale and Retirement of Notes
Initially, your tax basis in a debt security generally will equal the cost of the debt security to you. Your basis will increase by any amounts that you are required to include in income under the rules governing original issue discount and market discount, and will decrease by the amount of any amortized premium and any payments other than qualified stated interest made on the debt security. The rules for determining these amounts are discussed below. If you purchase a debt security that is denominated in a foreign currency, the cost to you, and therefore generally your initial tax basis, will be the U.S. dollar value of the foreign currency purchase price on the date of purchase calculated at the exchange rate in effect on that date. If the foreign currency-denominated debt security is traded on an established securities market and you are a cash-basis taxpayer, or if you are an accrual-basis taxpayer that makes a special election, then you will determine the U.S. dollar value of the cost of the debt security by translating the amount of the foreign currency that you paid for the debt security at the spot rate of exchange on the settlement date of your purchase. The amount of any subsequent adjustments to your tax basis in a foreign currency-denominated debt security in respect of original issue discount, market discount and premium will be determined in the manner described below. If you convert U.S. dollars into a foreign currency and then immediately use that foreign currency to purchase a debt security, you generally will not have any taxable gain or loss as a result of the purchase.
When you sell or exchange a debt security, or if a debt security is retired, you generally will recognize gain or loss equal to the difference between the amount you realize on the transaction, less any accrued qualified stated interest, which will be subject to tax in the manner described above, and your tax basis in the debt security.
165
Table of Contents
If you sell or exchange a debt security for a foreign currency, or receive foreign currency on the retirement of a debt security, the amount you will realize for U.S. tax purposes generally will be the dollar value of the foreign currency that you receive calculated at the exchange rate in effect on the date the foreign currency debt security is disposed of or retired. If you dispose of a foreign currency debt security that is traded on an established securities market and you are a cash-basis U.S. holder, or if you are an accrual-basis holder that makes a special election, then you will determine the U.S. dollar value of the amount realized by translating the amount at the spot rate of exchange on the settlement date of the sale, exchange or retirement.
The special election available to you if you are an accrual-basis taxpayer in respect of the purchase and sale of foreign currency debt securities traded on an established securities market, which is discussed in the two preceding paragraphs, must be applied consistently to all debt instruments from year to year and cannot be changed without the consent of the Internal Revenue Service.
Except as discussed below with respect to market discount, short-term debt securities and foreign currency gain or loss, the gain or loss that you recognize on the sale, exchange or retirement of a debt security generally will be long-term capital gain or loss if you have held the debt security for more than one year. The Code provides preferential treatment under certain circumstances for net long-term capital gains recognized by individual investors. Long-term capital gains recognized by individual U.S. holders generally are subject to tax at a lower rate than short-term capital gains or ordinary income. The ability of U.S. holders to offset capital losses against ordinary income is limited.
The gain or loss that you recognize on the sale, exchange or retirement of a foreign currency debt security generally will be treated as ordinary income or loss to the extent that the gain or loss is attributable to changes in exchange rates during the period in which you held the debt security. This foreign currency gain or loss will not be treated as an adjustment to interest income that you receive on the debt security.
Original Issue Discount
If we issue debt securities at a discount from their stated redemption price at maturity, and the discount is equal to or more than the product of one-fourth of one percent (0.25%) of the stated redemption price at maturity of the debt securities multiplied by the number of whole years to their maturity, the debt securities will be “Original Issue Discount Debt Securities”. The difference between the issue price and their stated redemption price at maturity will be the “original issue discount”. The “issue price” of the debt securities will be the first price at which a substantial amount of the debt securities are sold to the public (i.e., excluding sales of debt securities to underwriters, placement agents, wholesalers, or similar persons). The “stated redemption price at maturity” will include all payments under the debt securities other than payments of qualified stated interest. The term “qualified stated interest” generally means stated interest that is unconditionally payable in cash or property, other than debt instruments issued by us, at least annually during the entire term of a debt security at a single fixed interest rate or, subject to certain conditions, based on one or more interest indices.
If you invest in Original Issue Discount Debt Securities you generally will be subject to the special tax accounting rules for original issue discount obligations provided by the Internal Revenue Code and certain Treasury regulations (the “OID regulations”). You should be aware that, as described in greater detail below, if you invest in an Original Issue Discount Debt Security you generally will be required to include original issue discount in ordinary gross income for U.S. federal income tax purposes as it accrues, before you receive the cash attributable to that income.
In general, and regardless of whether you use the cash or the accrual method of tax accounting, if you are the holder of an Original Issue Discount Debt Security with a maturity greater than one year, you will be required to include in ordinary gross income the sum of the “daily portions” of original issue discount on that debt security for all days during the taxable year that you own the debt security. The daily portions of original issue discount on an Original Issue Discount Debt Security are determined by allocating to each day in any accrual
166
Table of Contents
period a ratable portion of the original issue discount allocable to that period. Accrual periods may be any length and may vary in length over the term of an Original Issue Discount Debt Security, so long as no accrual period is longer than one year and each scheduled payment of principal or interest occurs on the first or last day of an accrual period. If you are the initial holder of the debt security, the amount of original issue discount on an Original Issue Discount Debt Security allocable to each accrual period is determined by:
| (i) | multiplying the “adjusted issue price” (as defined below) of the debt security at the beginning of the accrual period by a fraction, the numerator of which is the annual yield to maturity of the debt security and the denominator of which is the number of accrual periods in a year; and |
| (ii) | subtracting from that product the amount, if any, payable as qualified stated interest allocable to that accrual period. |
In the case of an Original Issue Discount Debt Security that is a floating rate debt security, both the “annual yield to maturity” and the qualified stated interest will be determined for these purposes as though the debt security had borne interest in all periods at a fixed rate generally equal to the rate that would be applicable to interest payments on the debt security on its date of issue or, in the case of some floating rate debt securities, the rate that reflects the yield that is reasonably expected for the debt security. Additional rules may apply if interest on a floating rate debt security is based on more than one interest index. The “adjusted issue price” of an Original Issue Discount Debt Security at the beginning of any accrual period will generally be the sum of its issue price, including any accrued interest, and the amount of original issue discount allocable to all prior accrual periods, reduced by the amount of all payments other than any qualified stated interest payments on the debt security in all prior accrual periods. All payments on an Original Issue Discount Debt Security, other than qualified stated interest, will generally be viewed first as payments of previously accrued original issue discount, to the extent of the previously accrued discount, with payments considered made from the earliest accrual periods first, and then as a payment of principal. The “annual yield to maturity” of a debt security is the discount rate, appropriately adjusted to reflect the length of accrual periods, that causes the present value on the issue date of all payments on the debt security to equal the issue price. As a result of this “constant yield” method of including original issue discount income, the amounts you will be required to include in your gross income if you invest in an Original Issue Discount Debt Security denominated in U.S. dollars will generally be less in the early years and greater in the later years than amounts that would be includible on a straight-line basis.
You generally may make an irrevocable election to include in income your entire return on a debt security (i.e., the excess of all remaining payments to be received on the debt security, including payments of qualified stated interest, over the amount you paid for the debt security) under the constant yield method described above. For debt securities purchased at a premium or bearing market discount in your hands, if you make this election you will also be deemed to have made the election (discussed below under “Premium and Market Discount”) to amortize premium or to accrue market discount in income currently on a constant yield basis.
In the case of an Original Issue Discount Debt Security that is also a foreign currency-denominated debt security, you should determine the U.S. dollar amount includible as original issue discount for each accrual period by (i) calculating the amount of original issue discount allocable to each accrual period in the foreign currency using the constant yield method, and (ii) translating the foreign currency amount so determined at the average exchange rate in effect during that accrual period (or, with respect to an interest accrual period that spans two taxable years, at the average exchange rate for each partial period). Alternatively, you may translate the foreign currency amount so determined at the spot rate of exchange on the last day of the accrual period (or the last day of the taxable year, for an accrual period that spans two taxable years), or at the spot rate of exchange on the date of receipt, if that date is within five business days of the last day of the accrual period, provided that you have made the election described under “—Payments or Accruals of Interest” above. Because exchange rates may fluctuate, if you are the holder of an Original Issue Discount Debt Security that is also a foreign currency debt security you may recognize a different amount of original issue discount income in each accrual period than would be the case if you were the holder of an otherwise similar Original Issue Discount Debt Security denominated in U.S. dollars. Upon the receipt of an amount attributable to original issue discount, whether in connection with a payment of an amount that is not qualified stated interest or the sale or retirement of the
167
Table of Contents
Original Issue Discount Debt Security, you will recognize ordinary income or loss measured by the difference between the amount received, translated into U.S. dollars at the exchange rate in effect on the date of receipt or on the date of disposition of the Original Issue Discount Debt Security, as the case may be, and the amount accrued, using the exchange rate applicable to such previous accrual.
If you purchase an Original Issue Discount Debt Security outside of the initial offering at a cost less than its “remaining redemption amount”, or if you purchase an Original Issue Discount Debt Security in the initial offering at a price other than the debt security’s issue price, you will also generally be required to include in gross income the daily portions of original issue discount, calculated as described above. However, if you acquire an Original Issue Discount Debt Security at a price greater than its adjusted issue price, you will be entitled to reduce your periodic inclusions of original issue discount to reflect the premium paid over the adjusted issue price. The remaining redemption amount for an Original Issue Discount Debt Security is the total of all future payments to be made on the debt security other than qualified stated interest.
Floating rate debt securities generally will be treated as “variable rate debt instruments” under the OID regulations. Accordingly, the stated interest on a floating rate debt security generally will be treated as qualified stated interest, and such a debt security will not have original issue discount solely as a result of the fact that it provides for interest at a variable rate. A floating rate debt security that does not qualify as a variable rate debt instrument will be subject to special rules (the “contingent payment regulations”) that govern the tax treatment of debt obligations that provide for contingent payments (“contingent debt obligations”). A detailed description of the tax considerations relevant to U.S. holders of any such debt securities will be provided in the applicable prospectus supplement.
Certain debt securities may be redeemed prior to maturity, either at our option or at the option of the holder, or may have special repayment or interest rate reset features as indicated in the prospectus supplement. Original Issue Discount Debt Securities containing these features may be subject to rules that differ from the general rules discussed above. If you purchase Original Issue Discount Debt Securities with these features, you should carefully examine the prospectus supplement and consult your tax adviser about their treatment since the tax consequences with respect to original issue discount will depend, in part, on the particular terms and features of the debt securities.
Short-Term Debt Securities
The rules described above will also generally apply to Original Issue Discount Debt Securities with maturities of one year or less (“short-term debt securities”), but with some modifications.
First, the original issue discount rules treat none of the interest on a short-term debt security as qualified stated interest, but treat a short-term debt security as having original issue discount. Thus, all short-term debt securities will be Original Issue Discount Debt Securities. Except as noted below, if you are a cash-basis holder of a short-term debt security and you do not identify the short-term debt security as part of a hedging transaction you will generally not be required to accrue original issue discount currently, but you will be required to treat any gain realized on a sale, exchange or retirement of the debt security as ordinary income to the extent such gain does not exceed the original issue discount accrued with respect to the debt security during the period you held the debt security. You may not be allowed to deduct all of the interest paid or accrued on any indebtedness incurred or maintained to purchase or carry a short-term debt security until the maturity of the debt security or its earlier disposition in a taxable transaction. Notwithstanding the foregoing, if you are a cash-basis U.S. holder of a short-term debt security you may elect to accrue original issue discount on a current basis, in which case the limitation on the deductibility of interest described above will not apply. A U.S. holder using the accrual method of tax accounting and some cash method holders, including banks, securities dealers, regulated investment companies and certain trust funds, generally will be required to include original issue discount on a short-term debt security in gross income on a current basis. Original issue discount will be treated as accruing for these purposes on a ratable basis or, at the election of the holder, on a constant yield basis based on daily compounding.
168
Table of Contents
Second, regardless of whether you are a cash- or accrual-basis holder, if you are the holder of a short-term debt security you can elect to accrue any “acquisition discount” with respect to the debt security on a current basis. Acquisition discount is the excess of the remaining redemption amount of the debt security at the time of acquisition over the purchase price. Acquisition discount will be treated as accruing ratably or, at the election of the holder, under a constant yield method based on daily compounding. If you elect to accrue acquisition discount, the original issue discount rules will not apply.
Finally, the market discount rules described below will not apply to short-term debt securities.
As described above, certain of the debt securities may be subject to special redemption features. These features may affect the determination of whether a debt security has a maturity of one year or less and thus is a short-term debt security. If you purchase debt securities with these features, you should carefully examine the prospectus supplement and consult your tax adviser about these features.
Premium and Market Discount
If you purchase a debt security at a cost greater than the debt security’s remaining redemption amount, you will be considered to have purchased the debt security at a premium, and you may elect to amortize the premium as an offset to interest income, using a constant yield method, over the remaining term of the debt security. If you make this election, it generally will apply to all debt instruments that you hold at the time of the election, as well as any debt instruments that you subsequently acquire. In addition, you may not revoke the election without the consent of the Internal Revenue Service. If you elect to amortize the premium you will be required to reduce your tax basis in the debt security by the amount of the premium amortized during your holding period. Original Issue Discount Debt Securities purchased at a premium will not be subject to the original issue discount rules described above. In the case of premium on a foreign currency debt security, you should calculate the amortization of the premium in the foreign currency. Amortization deductions attributable to a period reduce interest payments in respect of that period, and therefore are translated into U.S. dollars at the rate that you use for those interest payments. Exchange gain or loss will be realized with respect to amortized premium on a foreign currency debt security based on the difference between the exchange rate computed on the date or dates the premium is amortized against interest payments on the debt security and the exchange rate on the date when the holder acquired the debt security. For a U.S. holder that does not elect to amortize premium, the amount of premium will be included in your tax basis when the debt security matures or is disposed of. Therefore, if you do not elect to amortize premium and you hold the debt security to maturity, you generally will be required to treat the premium as capital loss when the debt security matures.
If you purchase a debt security at a price that is lower than the debt security’s remaining redemption amount, or in the case of an Original Issue Discount Debt Security, the debt security’s adjusted issue price, by 0.25% or more of the remaining redemption amount, or adjusted issue price, multiplied by the number of remaining whole years to maturity, the debt security will be considered to bear “market discount” in your hands. In this case, any gain that you realize on the disposition of the debt security generally will be treated as ordinary interest income to the extent of the market discount that accrued on the debt security during your holding period. In addition, you could be required to defer the deduction of a portion of the interest paid on any indebtedness that you incurred or continued to purchase or carry the debt security. In general, market discount will be treated as accruing ratably over the term of the debt security, or, at your election, under a constant yield method. You must accrue market discount on a foreign currency debt security in the specified currency. The amount that you will be required to include in income in respect of accrued market discount will be the U.S. dollar value of the accrued amount, generally calculated at the exchange rate in effect on the date that you dispose of the debt security.
You may elect to include market discount in gross income currently as it accrues (on either a ratable or constant yield basis), in lieu of treating a portion of any gain realized on a sale of the debt security as ordinary income. If you elect to include market discount on a current basis, the interest deduction deferral rule described above will not apply. If you do make such an election, it will apply to all market discount debt instruments that
169
Table of Contents
you acquire on or after the first day of the first taxable year to which the election applies. The election may not be revoked without the consent of the Internal Revenue Service. Any accrued market discount on a foreign currency debt security that is currently includible in income will be translated into U.S. dollars at the average exchange rate for the accrual period (or portion thereof within the holder’s taxable year).
Warrants
A description of the tax consequences of an investment in warrants will be provided in the applicable prospectus supplement.
Indexed Notes and Other Notes Providing for Contingent Payments
The contingent payment regulations generally require accrual of interest income on a constant yield basis in respect of contingent debt obligations at a yield determined at the time of issuance of the obligation, and may require adjustments to these accruals when any contingent payments are made. In addition, special rules may apply to floating rate debt securities if the interest payable on the debt securities is based on more than one interest index. We will provide a detailed description of the tax considerations relevant to U.S. holders of any debt securities that are subject to the special rules discussed in this paragraph in the relevant prospectus supplement.
Information Reporting and Backup Withholding
The paying agent must file information returns with the United States Internal Revenue Service in connection with debt security payments made to certain United States persons. If you are a United States person, you generally will not be subject to United States backup withholding tax on such payments if you provide your taxpayer identification number to the paying agent. You may also be subject to information reporting and backup withholding tax requirements with respect to the proceeds from a sale of the debt securities. If you are not a United States person, in order to avoid information reporting and backup withholding tax requirements you may have to comply with certification procedures to establish that you are not a United States person.
170
Table of Contents
We may sell or issue the debt securities or warrants in any of three ways:
| • | through underwriters or dealers; |
| • | directly to one or more purchasers; or |
| • | through agents. |
The prospectus supplement relating to a particular series of debt securities or warrants will state:
| • | the names of any underwriters; |
| • | the purchase price of the securities; |
| • | the proceeds to us from the sale; |
| • | any underwriting discounts and other compensation; |
| • | the initial public offering price; |
| • | any discounts or concessions allowed or paid to dealers; and |
| • | any securities exchanges on which the securities will be listed. |
Any underwriter involved in the sale of securities will acquire the securities for its own account. The underwriters may resell the securities from time to time in one or more transactions, including negotiated transactions, at a fixed public offering price or at varying prices to be determined at the time of sale. The securities may be offered to the public either by underwriting syndicates represented by managing underwriters or by underwriters without a syndicate. Unless the prospectus supplement states otherwise, certain conditions must be satisfied before the underwriters become obligated to purchase securities from us, and they will be obligated to purchase all of the securities if any are purchased. The underwriters may change any initial public offering price and any discounts or concessions allowed or reallowed or paid to dealers.
If we sell any securities through agents, the prospectus supplement will identify the agent and indicate any commissions payable by us. Unless the prospectus supplement states otherwise, all agents will act on a best efforts basis and will not acquire the securities for their own account.
We may authorize agents, underwriters or dealers to solicit offers by certain specified entities to purchase the securities from us at the public offering price set forth in a prospectus supplement pursuant to delayed delivery contracts. The prospectus supplement will set out the conditions of the delayed delivery contracts and the commission receivable by the agents, underwriters or dealers for soliciting the contracts.
We may offer debt securities as consideration for the purchase of other of our debt securities, either in connection with a publicly announced tender offer or in privately negotiated transactions. The offer may be in addition to or in lieu of sales of debt securities directly or through underwriters or agents.
Agents and underwriters may be entitled to indemnification by us against certain liabilities, including liabilities under the Securities Act of 1933, as amended, or to contribution from us with respect to certain payments which the agents or underwriters may be required to make. Agents and underwriters may be customers of, engage in transactions with, or perform services (including commercial and investment banking services) for, us in the ordinary course of business.
171
Table of Contents
The validity of any particular series of debt securities or warrants issued with debt securities will be passed upon for us and any underwriters or agents by United States and Korean counsel identified in the related prospectus supplement.
AUTHORIZED REPRESENTATIVES IN THE UNITED STATES
Our authorized agents in the United States are Mr. In Joo Kim, General Manager of KDB’s New York Branch, and Mr. Joo Yung Sung, Senior Deputy General Manager of KDB’s New York Branch. The address of our authorized agents in the United States is 320 Park Avenue, 32nd Floor, New York, New York 10022. The authorized representative of the Republic in the United States is Mr. Byeong Sun Song, Financial Attache, Korean Consulate General in New York, located at 335 East 45th Street, New York, New York 10017.
OFFICIAL STATEMENTS AND DOCUMENTS
Our President, in his official capacity, has supplied the information set forth under “Korea Finance Corporation” (except for the information set out under “Korea Finance Corporation—Business—Government Support and Supervision”). Such information is stated on his authority.
The Minister of Strategy and Finance of The Republic of Korea, in his official capacity, has supplied the information set out under “Korea Finance Corporation—Business—Government Support and Supervision” and “The Republic of Korea”. Such information is stated on his authority. The documents identified in the portion of this prospectus captioned “The Republic of Korea” as the sources of financial or statistical data are official public documents of the Republic or its agencies and instrumentalities.
Our consolidated financial statements as of December 31, 2009 and 2010 and for the year ended December 31, 2010, appearing in this prospectus, have been audited by Ernst & Young Han Young, independent auditors, as set forth in their report thereon appearing elsewhere herein, and are included in reliance upon such report given on the authority of such firm as experts in accounting and auditing.
172
Table of Contents
This prospectus includes future expectations, projections or “forward-looking statements”, as defined in Section 27A of the Securities Act of 1933, as amended, and Section 21E of the Securities Exchange Act of 1934, as amended. The words “believe”, “expect”, “anticipate”, “estimate”, “project” and similar words identify forward-looking statements. In addition, all statements other than statements of historical facts included in this prospectus are forward-looking statements. Although we believe that the expectations reflected in the forward-looking statements are reasonable, we can give no assurance that such expectations will prove correct. This prospectus discloses important factors that could cause actual results to differ materially from our expectations (“Cautionary Statements”). All subsequent written and oral forward-looking statements attributable to us or persons acting on our behalf are expressly qualified in their entirety by the Cautionary Statements.
Factors that could adversely affect the future performance of the Korean economy include:
| • | continuing difficulties in the housing and financial sectors in the United States and elsewhere and the resulting adverse effects on the global financial markets; |
| • | adverse changes or volatility in foreign currency reserve levels, commodity prices (including oil prices), exchange rates (including fluctuation of the U.S. dollar or Japanese yen exchange rates or revaluation of the Chinese renminbi), interest rates and stock markets; |
| • | adverse developments in the economies of countries that are important export markets for the Republic, such as the United States, Japan and China, or in emerging market economies in Asia or elsewhere; |
| • | substantial decreases in the market prices of Korean real estate; |
| • | increasing delinquencies and credit defaults by consumer and SME borrowers; |
| • | declines in consumer confidence and a slowdown in consumer spending; |
| • | the continued emergence of the Chinese economy, to the extent its benefits (such as increased exports to China) are outweighed by its costs (such as competition in export markets or for foreign investment and the relocation of the manufacturing base from the Republic to China); |
| • | social and labor unrest; |
| • | a decrease in tax revenues and a substantial increase in the Government’s expenditures for fiscal stimulus measures, unemployment compensation and other economic and social programs that, together, would lead to an increased government budget deficit; |
| • | financial problems or lack of progress in the restructuring of Korean conglomerates, other large troubled companies, their suppliers or the financial sector; |
| • | loss of investor confidence arising from corporate accounting irregularities and corporate governance issues at certain Korean conglomerates; |
| • | the economic impact of any pending or future free trade agreements; |
| • | geo-political uncertainty and risk of further attacks by terrorist groups around the world; |
| • | the recurrence of severe acute respiratory syndrome, or SARS, or an outbreak of swine or avian flu in Asia and other parts of the world; |
| • | deterioration in economic or diplomatic relations between the Republic and its trading partners or allies, including deterioration resulting from trade disputes or disagreements in foreign policy; |
| • | political uncertainty or increasing strife among or within political parties in the Republic; |
| • | hostilities involving oil producing countries in the Middle East and any material disruption in the supply of oil or increase in the price of oil; and |
| • | an increase in the level of tension or an outbreak of hostilities between North Korea and the Republic or the United States. |
173
Table of Contents
We filed a registration statement with respect to the securities covered by this prospectus with the Securities and Exchange Commission under the Securities Act of 1933, as amended, and its related rules and regulations. You can find additional information concerning ourselves and such securities in the registration statement and any pre- or post-effective amendment, including its various exhibits, which may be inspected at the public reference facilities maintained by the Securities and Exchange Commission at 100 F Street, N.E., Washington, D.C. 20549. These filings are also available to the public from the Securities and Exchange Commission’s website at http://www.sec.gov.
174
Table of Contents
HEAD OFFICE OF KoFC
16 Youido-dong,
Youngdeungpo-gu, Seoul 150-873
The Republic of Korea
FISCAL AGENT AND PRINCIPAL PAYING AGENT
Citibank, N.A.
21st Floor
Citigroup Centre
Canada Square
Canary Wharf
London E14 5LB
United Kingdom
LEGAL ADVISORS TO KoFC
| as to Korean law | as to U.S. law | |
Kim & Chang Seyang Building 223 Naeja-dong, Jongno-gu Seoul 110-720 The Republic of Korea | Cleary Gottlieb Steen & Hamilton LLP c/o 39th Floor Bank of China Tower One Garden Road Hong Kong | |
LEGAL ADVISOR TO THE UNDERWRITERS
| as to U.S. law |
Davis Polk & Wardwell LLP c/o 18th Floor The Hong Kong Club Building 3A Chater Road Hong Kong |
AUDITOR OF KoFC
Ernst & Young
3rd to 8th Floor, Taeyoung Building
10-2 Youido-dong
Youngdeungpo-gu, Seoul 150-777
The Republic of Korea
SINGAPORE LISTING AGENT
Shook Lin & Bok LLP
1 Robinson Road
#18-00 AIA Tower
Singapore 048542
Table of Contents