| | | | |
| | 300 North LaSalle Chicago, Illinois 60654 | | |
Robert M. Hayward, P.C. To Call Writer Directly:
(312) 862-2133
robert.hayward@kirkland.com | | (312) 862-2000 www.kirkland.com | | Facsimile: (312) 862-2200 |
April 30, 2010
Via EDGAR Submission and Overnight Delivery
Securities and Exchange Commission
100 F Street, N.E.
Washington, D.C. 20549
| | | Amendment No. 5 to Registration Statement on Form S-1 |
| | | (SEC File No. 333-164906), filed April 30, 2010 |
Gentlemen:
Express Parent LLC, a Delaware limited liability company (the “Company”), has today filed with the Securities and Exchange Commission, pursuant to the requirements of the Securities Act of 1933, as amended, and Regulation S-T thereunder, an Amendment No. 5 to its Registration Statement on Form S-1 (“Amendment No. 5”).
On behalf of the Company, we are writing to respond to the comments raised in the letter to the Company, dated April 28, 2010, from the staff of the Securities and Exchange Commission (the “Staff”). The Company’s responses below correspond to the captions and numbers of those comments (which are reproduced below in italics). For your convenience, copies of Amendment No. 5 are enclosed, and have been marked to show changes from Amendment No. 4 to the Registration Statement on Form S-1 filed on April 23, 2010. Where applicable, we have referenced in the Company’s responses the appropriate page number of Amendment No. 5. Capitalized terms used in this letter but not otherwise defined have the meanings assigned to them in Amendment No. 5.
Unaudited Pro Forma Condensed Consolidated Financial Data, page 39 and Note 13- Pro Forma Information (unaudited), page F-37
| 1. | We note your response to our prior comment four that any reclassification of the accumulated deficit would result in negative additional paid in capital. Since there has |
Hong Kong London Los Angeles Munich New York Palo Alto San Francisco Shanghai Washington, D.C.

Securities and Exchange Commission
April 30, 2010
Page 2
been an excess distribution of earnings and losses, such distributions which would be deemed as return of capital to the members. Accordingly, it appears to us any remaining undistributed losses (accumulated deficit) of the previously unincorporated entities should be reclassified in to additional paid in capital upon conversion to C Corp in accordance with SAB Topic 4B, regardless of the ending negative additional paid in capital position . Please revise or advise.
Response:In response to the Staff’s comment, the Company has revised the unaudited pro forma condensed consolidated balance sheet on page 41 of Amendment No. 5 to add a pro forma adjustment to reclassify the accumulated deficit to additional paid-in capital due to the Reorganization in accordance with SAB Topic 4B.
Business, page 74
| 2. | We note your response to prior comment six from our letter dated April 22, 2010. However the revised disclosure is unclear as to whether the majority of fees paid to MAST relate to “the cost of merchandise, which MAST then remits to the vendor,” as you indicate in your response. Please revise to clarify in approximate quantitative disclosure the amount of fees paid to MAST representing product sourcing costs apart from agency fees. |
Response:In response to the Staff’s comment, the Company has revised page 79 of Amendment No. 5 to provide approximate quantitative disclosure regarding the amount of fees paid to MAST, which represent product sourcing costs.
Note 11 - Equity Units and Share-Based Compensation
Successor, F-35
| 3. | We note your correspondence dated April 19, 2010 relating to the proposed preliminary range of offering price and estimated offering price of $19 per share. Considering the significant difference between the offering price of $19 per share and your valuation of the recent equity awards at $0.63 per unit, please quantify and discuss the impact on the fair value on each of the factors that occurred between the date the equity units were granted and the date the registration statement filed. Also, indicate when discussions were initiated with your underwriter(s). |
Response:In response to the Staff’s comment, the Company respectfully advises the Staff that comparing the $0.69 per unit grant date fair value of its Class C Units granted in 2009 to the estimated $19 per share initial public offering price is not a meaningful comparison. When the Company converts to a corporation, each of its units will be converted into a fraction of a share, and therefore each full share received in respect of
Securities and Exchange Commission
April 30, 2010
Page 3
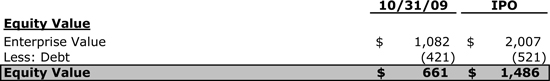
the Class C Units will have a per share basis that is substantially higher than $0.69. As a result, when determining the difference between the grant date fair value of the Class C Units and the estimated initial public offering price, the Staff should compare the $0.69 per unit at the time of the October 31, 2009 valuation to the value per unit of $8.40 that is implied by the initial public offering enterprise value. The $8.40 per unit value was calculated assuming that the Company would have an enterprise value of $2.01 billion if the initial public offering of its common stock prices at the midpoint of the range set forth on the cover of the prospectus, which is $19. With a $2.01 billion enterprise value, if the Company was liquidated for cash today and all of that cash was distributed pursuant to the waterfall set forth in the Company’s limited liability company agreement, the Class C Units would receive $8.40 per unit.
The increase in the value of the Class C Units from the $0.69 per unit calculated as of October 31, 2009 to the $8.40 per unit implied by the midpoint of the initial public offering range is driven by two factors:
| | A. | An increase in the Company’s enterprise value; and |
| | B. | The economics of the Company’s incentive equity units have a compounding effect on unit value as enterprise value increases due to financial leverage and the option-like nature of the equity units. |
The following is a discussion of each of these factors in more detail:
A. Company Valuation
The enterprise value of the Company increased by $920 million, from $1.08 billion as of October 31, 2009 to $2.01 billion, as implied by the midpoint of the offering range of $19 per share. The $920 million increase in enterprise value was driven by three factors:
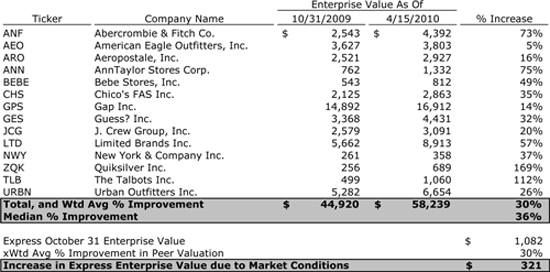
| | • | | Improved market conditions: Improved market conditions for specialty retailers accounted for approximately $321 million of the increase in valuation. Between October 31, 2009 and April 15, 2010, the enterprise values of the Company’s peer group increased 30% on average (see table below). This is the same peer group Duff & Phelps used for their October 31, 2009 valuation of the Company. The Company believes this increase in valuation was driven by improved operating performance and outlook for the peer group which would also be applicable to the Company. Applying this 30% increase to the Company’s previous $1.08 billion enterprise value would result in a $321 million increase in enterprise value. |
Securities and Exchange Commission
April 30, 2010
Page 4
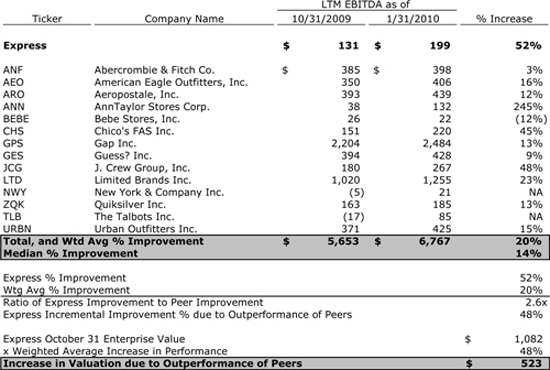
| | • | | Relative performance:The Company’s relative performance to the peer group accounted for another approximately $523 million increase in valuation. Express’ EBITDA improved 52% from twelve months ended October 31, 2009 compared to the twelve months ended January 30, 2010. EBITDA for the Company’s peer group improved an average of 20% during this same time period. The Company believes its over-performance relative to the peer group supports a further increase in valuation of $523 million (see table below). |
Securities and Exchange Commission
April 30, 2010
Page 5
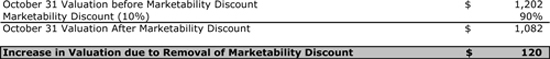
| | • | | Improved marketability/liquidity:Finally, the elimination of the 10% marketability discount as a result of establishing liquidity for the Company’s stock accounts for $120 million of the increase in valuation. |
Collectively, these three components suggest enterprise value for the Company should have increased by approximately $964 million which is roughly equivalent to the $920 million increase between the October 31, 2009 valuation of $1.08 billion and the proposed offering valuation of $2.01 billion.
B. C Unit Economics
This 1.9x increase in enterprise value resulted in a 12x increase in the value of the awarded Class C Units due to the compounding effects of leverage and their option-like economics. First, the 1.9x increase in enterprise value increased equity value by 2.2x due to financial leverage.
Securities and Exchange Commission
April 30, 2010
Page 6
As the equity value has increased, the value of the Class C Units has increased even faster due to their option-like nature. The Company’s Class C Units have a strike price or participation threshold similar to stock options. This participation threshold is tied to the cost basis for the equity value paid at the time of the Golden Gate Acquisition. As seen in the table below, this participation threshold compounds the increase in value of the Class C Units. In addition, the participation threshold was reduced beginning October 31, 2009 and through today due to dividends that reduced the remaining cost basis for the Company’s equity value. Because the equity value at October 31, 2009 was below the strike price, the Class C Units would have received no value at this date had the Company been sold at the $1.08 billion valuation; however, a fair value of $0.69 per unit was assigned to the Class C Units granted at this date based on the Black Scholes Pricing Model.
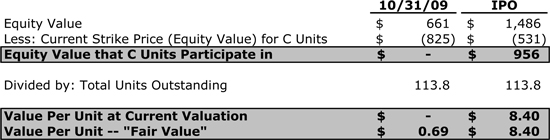
As mentioned above, $8.40 per unit is equivalent in value to $19 per share after the Company’s conversion to a C-corporation. As a result, the Company believes that the $0.69 grant date fair market value of its Class C Units is correct and is consistent with a $19 per share offering price in its initial public offering.
The Company has also evaluated the hypothetical accounting impact of applying a higher valuation to its recent equity awards. Even if the Company were to apply the proposed offering valuation of $2.01 billion to the grants made in 2009, the resulting impact on the Company’s financial statements would be quantitatively and qualitatively immaterial. Using the hypothesized valuation of $2.01 billion as of October 31, 2009, the impact on
Securities and Exchange Commission
April 30, 2010
Page 7
2009 would be a non-cash compensation charge of slightly less than $400,000 which would be 0.5% of net income and 0.2% of EBITDA. The Company believes this amount is not material to its 2009 financial statements and that no adjustment is required to its historical financial statements. Again, this increase reflects the most extreme potential change in valuation of applying the proposed offering valuation, which the Company respectfully believes would not be appropriate for the reasons outlined above.
Finally, in response to the Staff’s last question in this comment, the Company did not have an initial organizational meeting with its underwriters until December 2009. Conversations with the underwriters did not include discussions of valuations until April of 2010.
| 4. | We reviewed your response to our prior comment 11. Your response did not address our comment in its entirety, thus the comment will be partially reissued. For each period presented, provide us with your calculations of marketability discount. Your current response simply provided a reference to Mr. Finnerty’s paper and not the underlying calculations you used to determine the marketability discount amounts disclosed here along with a detailed explanation of the assumptions used and your basis for selecting this model. |
Response:The Company acknowledges the Staff’s comments, and advises the Staff that it is providing its calculation for marketability discount in Exhibit A attached to this letter. Additionally, below is a discussion of the basis on which the Company selected the Finnerty model.
The Finnerty Model was selected to calculate the marketability discount. Finnerty isolated the effect of marketability through a regression analysis that included variables that factor in information and ownership concentration effects. He attributed the remaining differences in prices of privately held companies to the effects of the lack of marketability and found that those differences were consistent with the levels produced by his average-price put option model.
| | • | | Put option models require estimates of volatility, which are subject to some degree of judgment, but the model and its implementation are relatively objective. What distinguishes the Finnerty model is that Finnerty tested and validated its theoretical results against observed discounts. Finnerty observed: |
| | • | | The stock market generally reacts favorably to the announcement of a common stock private placement. |
| | • | | The announcement conveys valuable information. |
Securities and Exchange Commission
April 30, 2010
Page 8
| | • | | The issuance of common stock involves equity ownership concentration effects, too. |
| | • | | More than just lack of free marketability is responsible for the private placement discounts we observe. |
The fact that the impact of observable evidence and theoretical outcomes is considered makes the Finnerty model a desirable tool to estimate discounts for lack of marketability.
Other models evaluated by the Company include the Chaffe Model and the Longstaff Model. Chaffe used the standard Black-Scholes model to price the put option. The value of the put option, expressed as a percentage of the market price of the shares, approximates the discount. The Company believes that the Chaffe Model does not provide the valuable insight that Finnerty produces because it lacks the link between the observable outcomes and theoretical results.
Longstaff (1995) proposed that the owner of non-marketable shares has in effect given up a “look-back” put option. A look-back put option conveys the right to sell at the highest price attained by the subject shares during the life of the option. Longstaff’s model gives much larger discounts than Chaffe’s approach when the length of the restriction is longer than a few months. The Company believes the Longstaff model is used rarely, if at all, because the assumption of market timing is unrealistic in most circumstances.
As noted earlier, in addition to choosing a specific put option model, the Company must also estimate the volatility to serve as an input to that model. To accomplish this, the Company selects a set of comparable businesses and uses the same set over time when estimating volatility. It is sometimes necessary for the Company to deviate from this approach if data for a particular comparable company is not available (e.g., if it is acquired by another company). Also, if something unusual/non-recurring occurs to a comparable business rendering it inappropriate for comparison, the Company would eliminate it. That might occur, for example, if unusual information events that caused price changes that the Company concluded were unrepresentative of what might reasonably be expected in the future. However, the Company advises the Staff that it has not eliminated any comparable businesses in this sample due to unusual/non-recurring events.
The Company also attempts to match as closely as possible in the volatility analysis the comparable companies in other parts of the analysis (i.e., equity pricing and/or cost of capital). The Company does not do that if it deems other factors more important in picking its sample sets. For example, if a market analysis using a profit ratio and earnings for a sample company were negative, that might disqualify that company from the
Securities and Exchange Commission
April 30, 2010
Page 9
earnings analysis sample but not from the volatility sample. Also, if the historical or projected profitability and growth of a comparable business did not match the profitability and growth of the subject company being valued, the multiples may not be appropriate to use in a pricing analysis but may still be appropriate for a volatility analysis.
| 5. | Please provide us with the October 31, 2009 valuation report provided by Duff and Phelps and any additional guidance used by management to conclude the fair value of the Class C units was $0.63. In addition, tell us specifically when valuations were performed in prior years. We may have further comments upon review of such information. |
Response: As requested, the Company has provided to the Staff under separate confidential cover the October 31, 2009 valuation report of Duff & Phelps. The Company further notes that prior valuations were performed in December 2007 and October 2008.
Exhibits
Exhibit 10.12
| 6. | Your Master Sublease makes reference to an Exhibit A in its recitals; however, this exhibit does not appear to have been filed. Please revise to file this agreement in its entirety. |
Response:In response to the Staff’s comment, the Company has re-filed Exhibit 10.12, to include the omitted exhibit A.
* * * *
Finally, the Company will furnish a letter at the time it requests acceleration of the effective date of the Registration Statement acknowledging the statements set forth in the Staff’s comment letter.
We hope that the foregoing has been responsive to the Staff’s comments. Should you have any questions relating to any of the foregoing, please feel free to contact the undersigned at (312) 862-2133.
Securities and Exchange Commission
April 30, 2010
Page 10
|
| Sincerely, |
|
| /s/ Robert M. Hayward, P.C. |
|
| Robert M. Hayward, P.C. |
Express Parent LLC
William R. Burke
Kirkland & Ellis LLP
Marc D. Jaffe
Latham & Watkins LLP
Securities and Exchange Commission
April 30, 2010
Page 11
Exhibit A
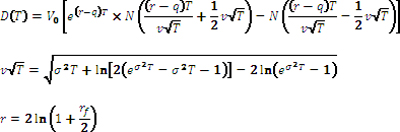
2009 Marketability Discount Rate Calculation
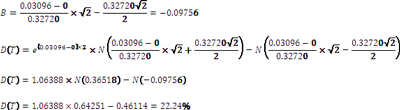
Formulas
| | |
rf = risk-free rate  = equity volatility of the stock function = equity volatility of the stock function
q = dividend yield (constant) | | T = length of the restriction period N(·) = standard normal cumulative distribution V0 = current share price |
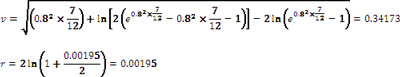
Assumptions
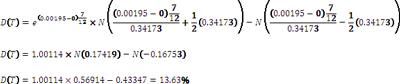
rf= 0.195% US Constant Maturity Treasury (CMT) from 10/31/2009 to estimated liquidity date (7 months)
T= 7 months Estimated time to expected liquidity as of 10/31/2009
= 80% Estimated based on historical weekly returns from comparable companies as of 10/31/2009
q = 0 Assumes no regular go-forward dividends
V0 =1 Assumed stock price equal 1 to estimate marketability discount percentage (D(T)) as opposed to stock price
Calculations
Securities and Exchange Commission
April 30, 2010
Page 12
Securities and Exchange Commission
April 30, 2010
Page 13
2008 Marketability Discount Rate Calculation
Formulas1
| | |
rf = risk-free rate = equity volatility of the stock function q = dividend yield (constant) | | T = length of the restriction period N(·) = standard normal cumulative distribution V0 = current share price |
Assumptions
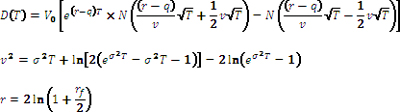
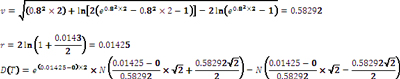
rf= 1.43% US Constant Maturity Treasury (CMT) from 10/6/2008 to estimated liquidity date (2 years)
T= 2 Years Estimated time to expected liquidity as of 10/6/2008
= 80% Estimated based on historical weekly returns from comparable companies as of 10/6/2008
q = 0 Assumes no regular go-forward dividends
V0 = 1 Assumed stock price equal to 1 to estimate marketability discount percentage (D(T)) as opposed to stock price
Calculations
Securities and Exchange Commission
April 30, 2010
Page 14
Securities and Exchange Commission
April 30, 2010
Page 15
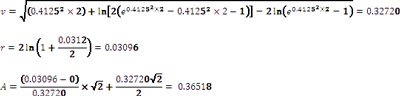
2007 Marketability Discount Rate Calculation
Formulas1

| | |
rf = risk-free rate = equity volatility of the stock function q = dividend yield (constant) | | T = length of the restriction period N(·) = standard normal cumulative distribution V0 = current share price |
Assumptions
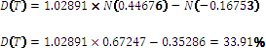
rf= 3.12% US Constant Maturity Treasury (CMT) from 12/7/2007 to estimated liquidity date (2 years)
T= 2 Years Estimated time to expected liquidity as of 12/7/2007
= 41.25% Estimated based on historical weekly returns from comparable companies as of 12/7/2007
q = 0 Assumes no regular go-forward dividends
V0 = 1 Assumed stock price equal to 1 to estimate marketability discount percentage (D(T)) as opposed to stock price
Calculations
Securities and Exchange Commission
April 30, 2010
Page 16