
Exhibit 99.2 Express, Inc. (EXPR) First Quarter 2023 Earnings Presentation
FIRST QUARTER 2023 EARNINGS Cautionary Statement REGARDING FORWARD-LOOKING STATEMENTS Certain statements are “forward-looking statements” made pursuant to the safe harbor provisions of the Private Securities Litigation Reform Act of 1995. Forward-looking statements include any statement that does not directly relate to any historical or current fact and include, but are not limited to (1) guidance and expectations, including statements regarding expected operating margins, comparable sales, effective tax rates, interest income, net income, diluted earnings per share, cash tax refunds, liquidity, EBITDA, free cash flow, eCommerce demand, and capital expenditures, (2) statements regarding expected store openings, store closures, store conversions, and gross square footage, (3) statements regarding the Company's strategy, plans, and initiatives, including, but not limited to, results expected from such strategy, plans, and initiatives, and (4) the anticipated benefits or effects of the Bonobos acquisition, including statements regarding operating results, financial efficiencies, operational synergies, and our plans, objectives, expectations and intentions related to the acquired assets. You can identify these forward-looking statements by the use of words in the future tense and statements accompanied by words such as “outlook,” “indicator,” “believes,” “expects,” “potential,” “continues,” “may,” “will,” “should,” “seeks,” “approximately,” “predicts,” “intends,” “plans,” “scheduled,” “estimates,” “anticipates,” “opportunity,” “leads” or the negative version of these words or other comparable words. Forward-looking statements are based on our current expectations and assumptions, which may not prove to be accurate. These statements are not guarantees and are subject to risks, uncertainties, and changes in circumstances that are difficult to predict, and significant contingencies, many of which are beyond the Company's control. Many factors could cause actual results to differ materially and adversely from these forward-looking statements. Among these factors are (1) changes in consumer spending and general economic conditions; (2) the COVID-19 pandemic and any future impact on our business operations, financial condition, liquidity and cash flow; (3) geopolitical risks, including impacts from the ongoing conflict between Russia and Ukraine and increased tensions between China and Taiwan; (4) our ability to operate our business efficiently, manage capital expenditures and costs, and obtain financing when required; (5) our ability to identify and respond to new and changing fashion trends, customer preferences, and other related factors including selling through inventory at an appropriate price; (6) fluctuations in our sales, results of operations, and cash levels on a seasonal basis and due to a variety of other factors, including our product offerings relative to customer demand, the mix of merchandise we sell, promotions, inventory levels, and sales mix between stores and eCommerce; (7) customer traffic at malls, shopping centers, and at our stores; (8) competition from other retailers; (9) our dependence on a strong brand image; (10) our ability to adapt to changing consumer behavior and develop and maintain a relevant and reliable omni-channel experience for our customers, including our efforts to optimize our omni-channel platform through our partnership with WHP Global; (11) the failure or breach of information systems upon which we rely; (12) our ability to protect customer data from fraud and theft; (13) our dependence upon third parties to manufacture all of our merchandise; (14) changes in the cost of raw materials, labor, and freight; (15) labor shortages and supply chain disruption; (16) our dependence upon key executive management; (17) our ability to execute our growth strategy, EXPRESSway Forward, including, but not limited to, engaging our customers and acquiring new ones, executing with precision to accelerate sales and profitability, creating great product and reinvigorating our brand; (18) our substantial lease obligations; (19) our reliance on third parties to provide us with certain key services for our business; (20) impairment charges on long-lived assets; (21) claims made against us resulting in litigation or changes in laws and regulations applicable to our business; (22) our inability to protect our trademarks or other intellectual property rights which may preclude the use of our trademarks or other intellectual property around the world; (23) restrictions imposed on us under the terms of our current credit facility, including asset based requirements related to inventory levels, ability to make additional borrowings, and restrictions on the ability to effect share repurchases; (24) changes in tax requirements, results of tax audits, and other factors including timing of tax refund receipts, that may cause fluctuations in our effective tax rate; (25) changes in tariff rates; (26) natural disasters, extreme weather, public health issues, including pandemics, fire, acts of terrorism or war and other events that cause business interruption, (27) risks related to our strategic partnership with WHP Global; (28) our ability to realize the expected strategic and financial benefits of the Bonobos acquisition; and (29) our failure to regain compliance with the continued listing requirements of the New York Stock Exchange, or any future failure to meet those requirements. These factors should not be construed as exhaustive and should be read in conjunction with the additional information concerning these and other factors in Express, Inc.'s filings with the Securities and Exchange Commission. We undertake no obligation to publicly update or revise any forward-looking statement as a result of new information, future events, or otherwise, except as required by law. 2

Express, Inc. (EXPR) Timeline
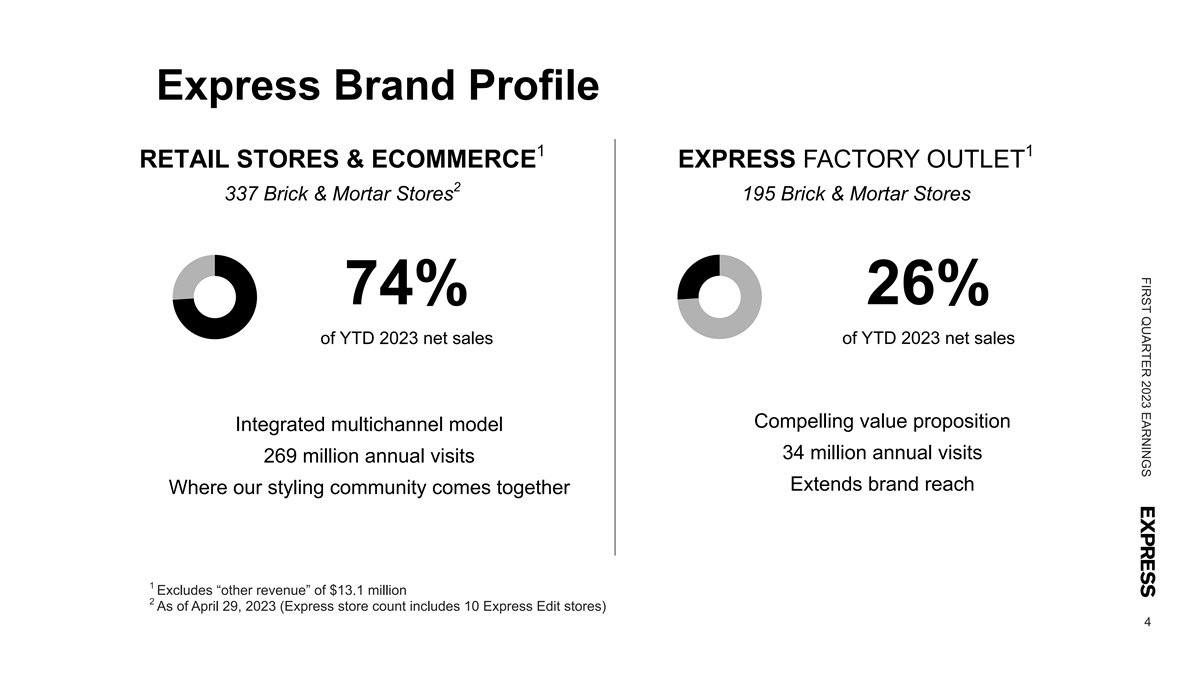
FIRST QUARTER 2023 EARNINGS Express Brand Profile 1 1 RETAIL STORES & ECOMMERCE EXPRESS FACTORY OUTLET 2 337 Brick & Mortar Stores 195 Brick & Mortar Stores 74% 26% of YTD 2023 net sales of YTD 2023 net sales Compelling value proposition Integrated multichannel model 34 million annual visits 269 million annual visits Extends brand reach Where our styling community comes together 1 Excludes “other revenue” of $13.1 million 2 As of April 29, 2023 (Express store count includes 10 Express Edit stores) 4
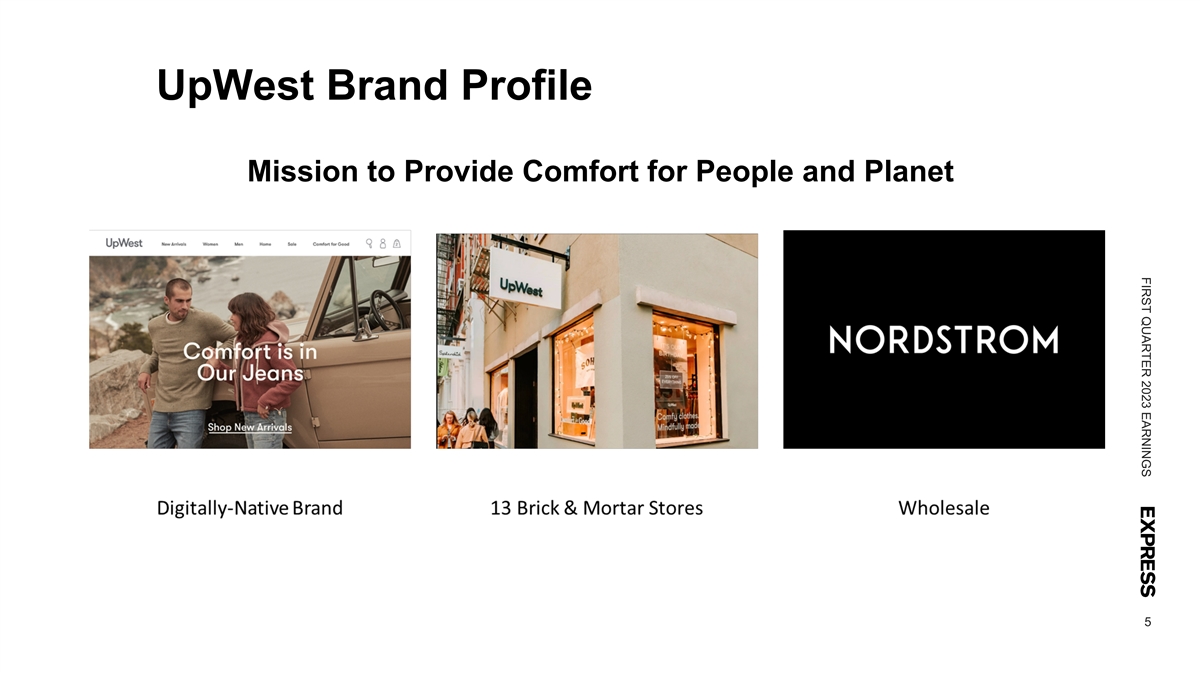
FIRST QUARTER 2023 EARNINGS UpWest Brand Profile Mission to Provide Comfort for People and Planet 5

Financial Results FIRST QUARTER 2023

FIRST QUARTER 2023 EARNINGS Q1 2023 Summary First quarter comparable sales were negative 14% due to a combination of external factors and challenges in our product assortments. The reduced consumer spending, increased price sensitivity in discretionary categories and aggressive promotional activity across the industry that began in 2022 continued into the first quarter of this year and negatively impacted our performance. • First Quarter 2023 ◦ Net sales decreased 15%; consolidated comparable sales declined 14% ◦ Gross margin decreased 1,260 basis points, including 320 basis points of royalty expense related to the joint venture with WHP Global ◦ SG&A expenses as a percent of net sales delevered 510 basis points ◦ Net loss per diluted share of $0.99 1 ◦ EBITDA of negative $56 million ◦ Inventory decrease of 7%; down from a 2% increase in the fourth quarter of 2022 • Expense Reduction Initiative • The Company is taking aggressive action to reduce expenses and improve the operating efficiency of its business • In January, the Company disclosed $40 million in annualized expense savings versus 2022 prior to the impact of inflation and since that time, it has already identified and implemented an additional $25 million to be realized in 2023 • The Company is committed to finding significant additional expense savings which are expected to benefit the back half of 2023 and full year 2024, and has engaged external advisors to assist in analyzing and identifying both potential margin expansion and further expense reduction opportunities • Completed the Joint acquisition of Bonobos with Strategic Partner WHP Global 7 1. EBITDA is a non-GAAP financial measure. Refer to pages 23-24 for information about this non-GAAP financial measure and a reconciliation to the most directly comparable GAAP financial measure.
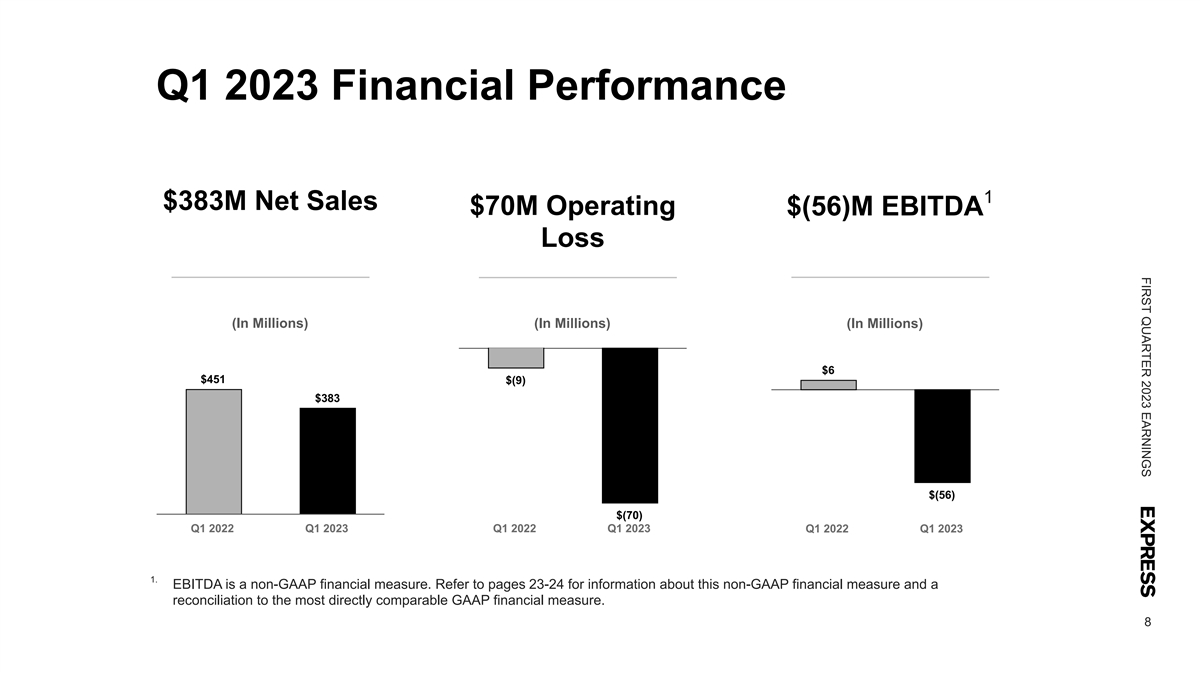
FIRST QUARTER 2023 EARNINGS Q1 2023 Financial Performance 1 $383M Net Sales $70M Operating $(56)M EBITDA Loss (In Millions) (In Millions) (In Millions) $6 $451 $(9) $383 $(56) $(70) Q1 2022 Q1 2023 Q1 2022 Q1 2023 Q1 2022 Q1 2023 1. EBITDA is a non-GAAP financial measure. Refer to pages 23-24 for information about this non-GAAP financial measure and a reconciliation to the most directly comparable GAAP financial measure. 8

FIRST QUARTER 2023 EARNINGS Inventory and Operating Cash Flow Inventory Operating Cash Flow (In Millions) (In Millions) $371 $347 $(76) $(81) Q1 2022 Q1 2023 2022 YTD 2023 YTD 9

EXPR Acquires Bonobos in Partnership with WHP Global

FIRST QUARTER 2023 EARNINGS Transforming EXPR to Create Shareholder Value 11
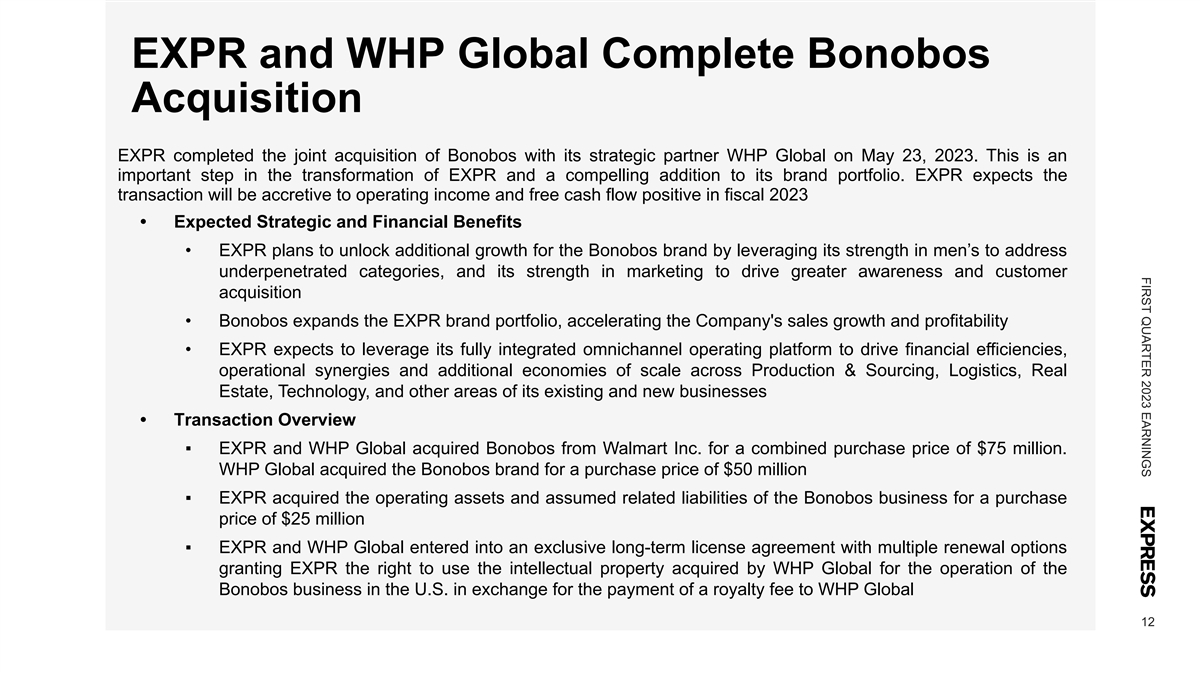
FIRST QUARTER 2023 EARNINGS EXPR and WHP Global Complete Bonobos Acquisition EXPR completed the joint acquisition of Bonobos with its strategic partner WHP Global on May 23, 2023. This is an important step in the transformation of EXPR and a compelling addition to its brand portfolio. EXPR expects the transaction will be accretive to operating income and free cash flow positive in fiscal 2023 • Expected Strategic and Financial Benefits • EXPR plans to unlock additional growth for the Bonobos brand by leveraging its strength in men’s to address underpenetrated categories, and its strength in marketing to drive greater awareness and customer acquisition • Bonobos expands the EXPR brand portfolio, accelerating the Company's sales growth and profitability • EXPR expects to leverage its fully integrated omnichannel operating platform to drive financial efficiencies, operational synergies and additional economies of scale across Production & Sourcing, Logistics, Real Estate, Technology, and other areas of its existing and new businesses • Transaction Overview ▪ EXPR and WHP Global acquired Bonobos from Walmart Inc. for a combined purchase price of $75 million. WHP Global acquired the Bonobos brand for a purchase price of $50 million ▪ EXPR acquired the operating assets and assumed related liabilities of the Bonobos business for a purchase price of $25 million ▪ EXPR and WHP Global entered into an exclusive long-term license agreement with multiple renewal options granting EXPR the right to use the intellectual property acquired by WHP Global for the operation of the Bonobos business in the U.S. in exchange for the payment of a royalty fee to WHP Global 12

FIRST QUARTER 2023 EARNINGS Bonobos is a Key Milestone in the EXPR Transformation 13
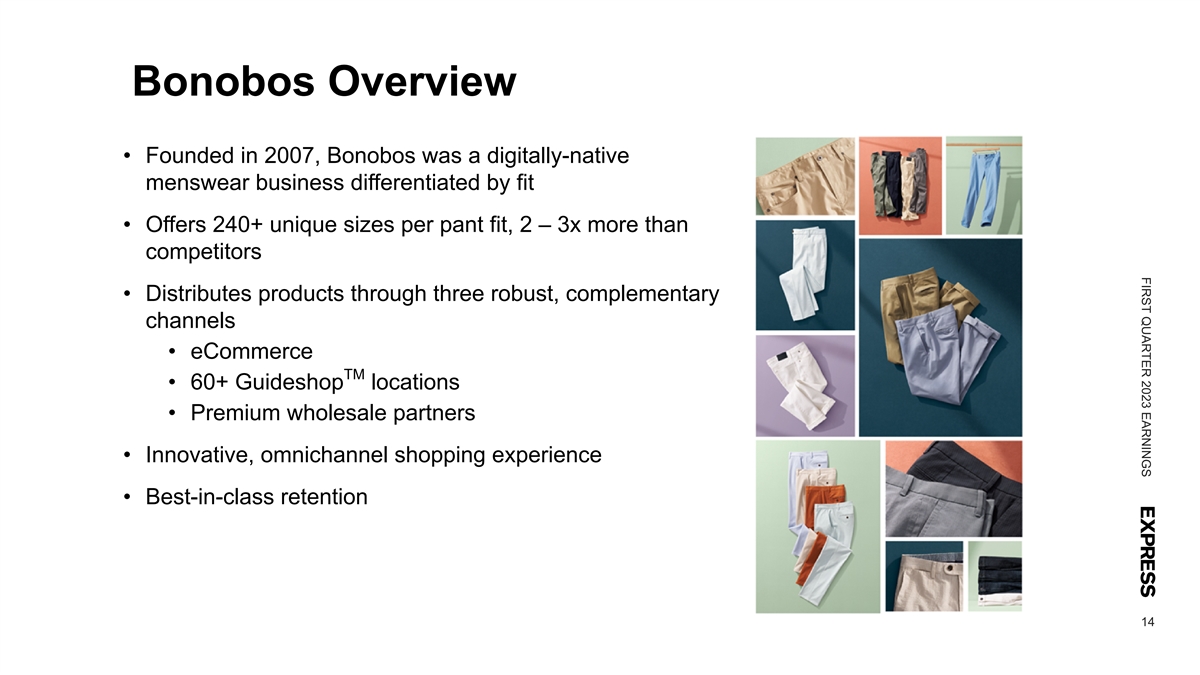
FIRST QUARTER 2023 EARNINGS Bonobos Overview • Founded in 2007, Bonobos was a digitally-native menswear business differentiated by fit • Offers 240+ unique sizes per pant fit, 2 – 3x more than competitors • Distributes products through three robust, complementary channels • eCommerce TM • 60+ Guideshop locations • Premium wholesale partners • Innovative, omnichannel shopping experience • Best-in-class retention 14

FIRST QUARTER 2023 EARNINGS Bonobos at a Glance 15

FIRST QUARTER 2023 EARNINGS Bonobos Transaction Aligns with EXPR M&A Strategic Priorities 16
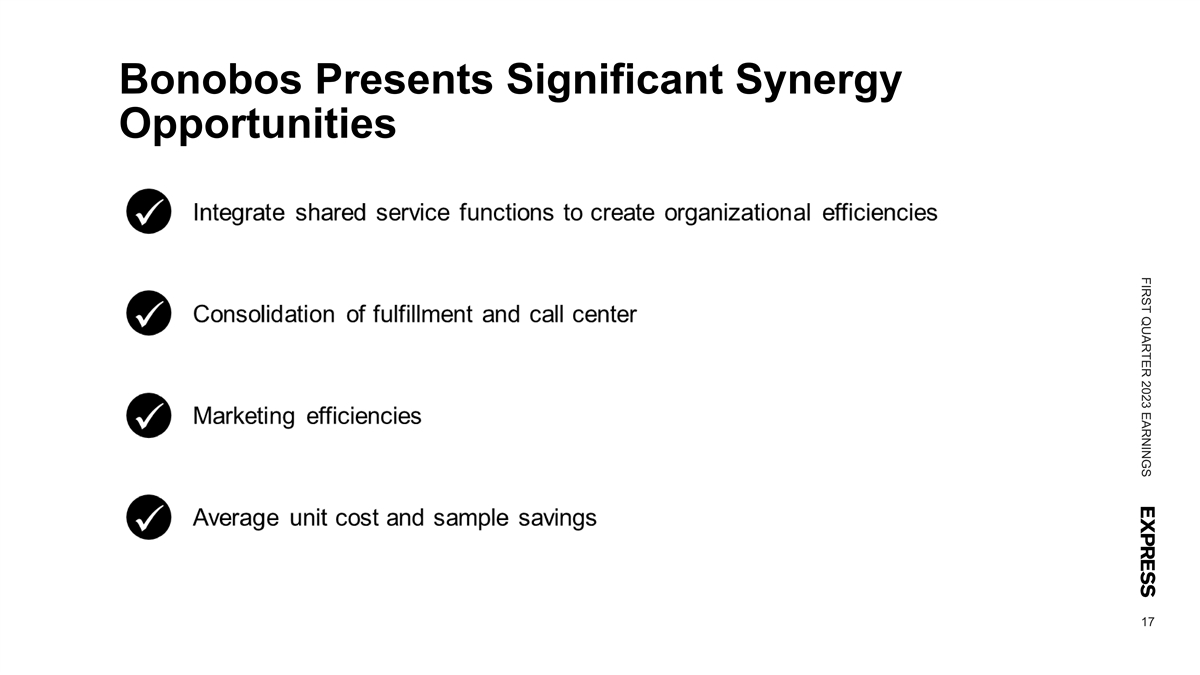
FIRST QUARTER 2023 EARNINGS Bonobos Presents Significant Synergy Opportunities 17

FIRST QUARTER 2023 EARNINGS Pro Forma Organizational Chart 18

2023 OUTLOOK

FIRST QUARTER 2023 EARNINGS 2023 Outlook This outlook is based on our first quarter of 2023 performance and the advancements we have made in each of the four foundational pillars of our EXPRESSway Forward strategy (Product, Brand, Customer, Execution), balanced against the persistently challenging macroeconomic and retail apparel environments. 1 Second Quarter 2023 • Net sales of approximately $400 million to $450 million, including approximately $30 million in Bonobos sales • Gross margin rate to decrease approximately 800 basis points, including approximately 300 basis points of royalty expense related to the joint venture with WHP, and a positive 200 basis point impact from Bonobos • SG&A expenses as a percent of net sales to deleverage approximately 300 basis points, including approximately 100 basis point impact from Bonobos • Net interest expense of $3 million • Effective tax rate of essentially zero percent • Diluted loss per share of $0.50 to $0.60 • Consolidated inventory to increase by approximately 10% to 15% with the addition of Bonobos 2 Full Year 2023 • Net sales of approximately $1.9 billion to $2.0 billion, including approximately $125 million to $150 million in Bonobos sales • Net interest expense of $15 million • Effective tax rate of essentially zero percent • Diluted loss per share of $1.50 to $1.70 • Capital expenditures of approximately $30 million, a $25 million reduction compared to our previous outlook of $55 million as we prioritized capital deployment for the Bonobos transaction 20 1. Second quarter 2023 compared to the second quarter of 2022 2. Full year 2023 compared to the full year 2022
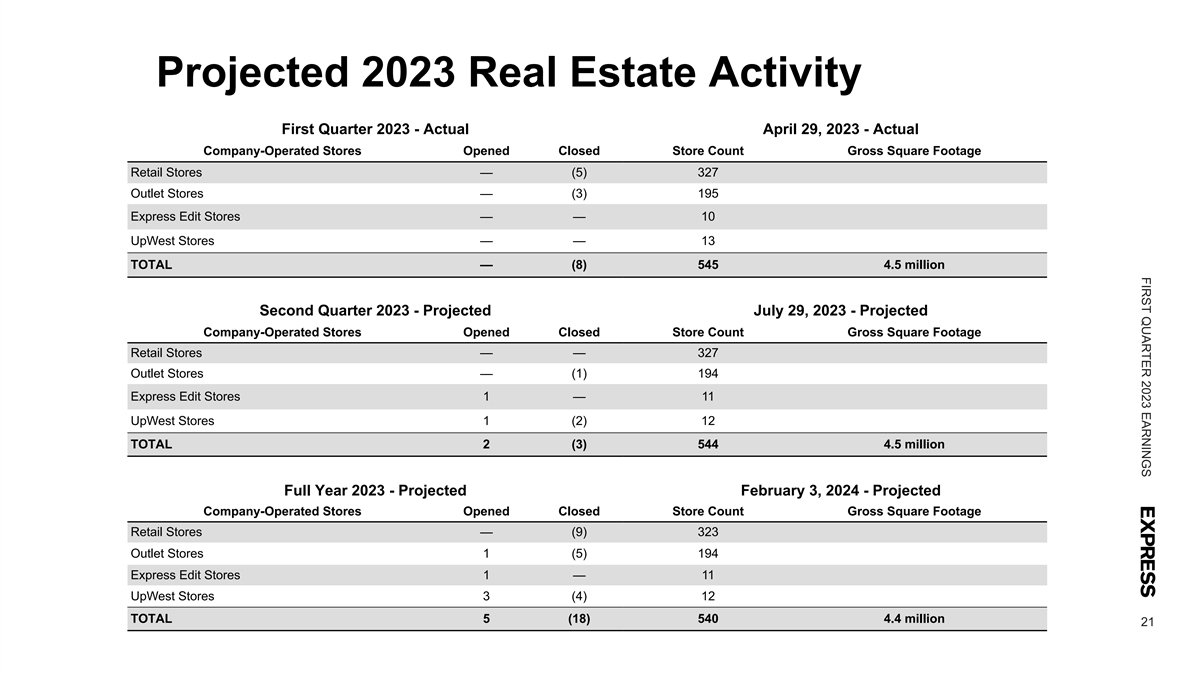
FIRST QUARTER 2023 EARNINGS Projected 2023 Real Estate Activity First Quarter 2023 - Actual April 29, 2023 - Actual Company-Operated Stores Opened Closed Store Count Gross Square Footage Retail Stores — (5) 327 Outlet Stores — (3) 195 Express Edit Stores — — 10 UpWest Stores — — 13 TOTAL — (8) 545 4.5 million Second Quarter 2023 - Projected July 29, 2023 - Projected Company-Operated Stores Opened Closed Store Count Gross Square Footage Retail Stores — — 327 Outlet Stores — (1) 194 Express Edit Stores 1 — 11 UpWest Stores 1 (2) 12 TOTAL 2 (3) 544 4.5 million Full Year 2023 - Projected February 3, 2024 - Projected Company-Operated Stores Opened Closed Store Count Gross Square Footage Retail Stores — (9) 323 Outlet Stores 1 (5) 194 Express Edit Stores 1 — 11 UpWest Stores 3 (4) 12 TOTAL 5 (18) 540 4.4 million 21

NON-GAAP RECONCILIATIONS FIRST QUARTER 2023

FIRST QUARTER 2023 EARNINGS Cautionary Statement REGARDING NON-GAAP FINANCIAL MEASURES This presentation contains references to Earnings before interest, taxes, and depreciation and amortization (EBITDA) which is a non-GAAP financial measure. This measure should be considered supplemental to and not a substitute for financial information prepared in accordance with generally accepted accounting principles (GAAP) included in Express, Inc.’s filings with the Securities and Exchange Commission and may differ from similarly titled measures used by others. Please refer to slide 24 in this presentation for additional information and a reconciliation of EBITDA to the most directly comparable financial measure calculated in accordance with GAAP. EBITDA is used as a performance measure in our long-term executive compensation program for purposes of determining the number of equity awards that are ultimately earned. EBITDA is also a metric used in our short-term cash incentive compensation plan. This non-GAAP financial measure reflects an additional way of viewing the Company's operations that, when viewed with the GAAP results and the following reconciliation to the corresponding GAAP financial measure, provides a more complete understanding of our business. Management strongly encourages investors and stockholders to review our financial statements and publicly-filed reports in their entirety and not to rely on any single financial measure. 23
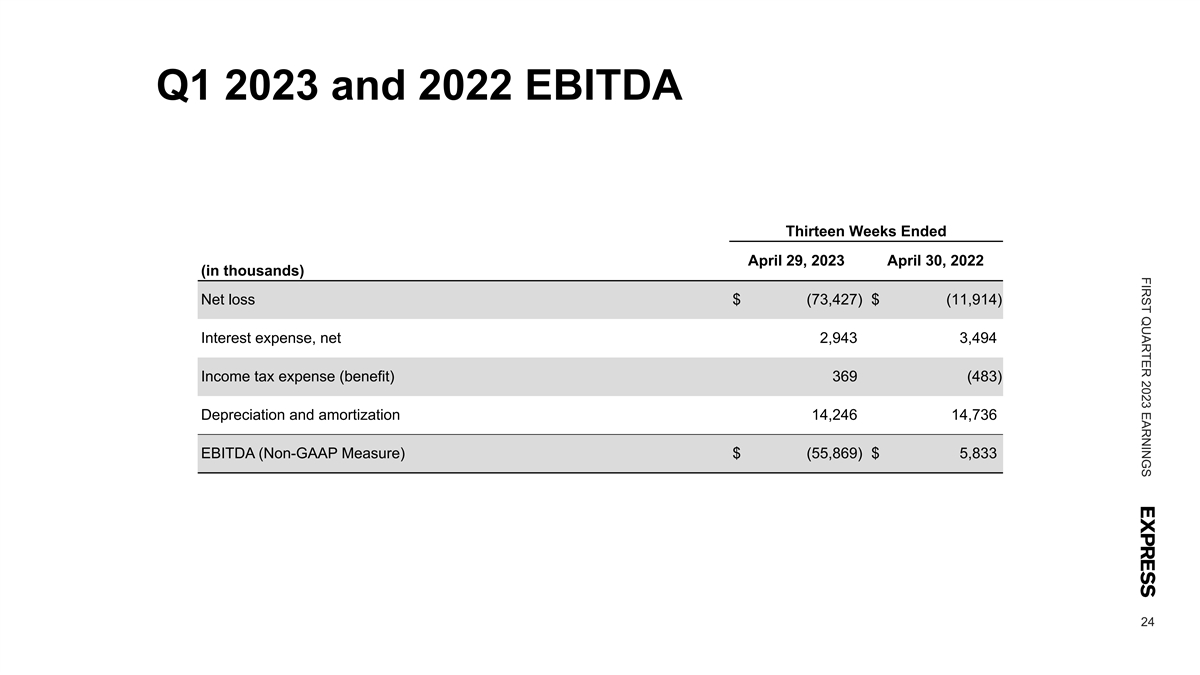
FIRST QUARTER 2023 EARNINGS Q1 2023 and 2022 EBITDA Thirteen Weeks Ended April 29, 2023 April 30, 2022 (in thousands) Net loss $ (73,427) $ (11,914) Interest expense, net 2,943 3,494 Income tax expense (benefit) 369 (483) Depreciation and amortization 14,246 14,736 EBITDA (Non-GAAP Measure) $ (55,869) $ 5,833 24

INVESTOR CONTACT Greg Johnson VP, Investor Relations (614) 474-4890