Use these links to rapidly review the document
TABLE OF CONTENTS
TABLE OF CONTENTS 2
Table of Contents
UNITED STATES
SECURITIES AND EXCHANGE COMMISSION
WASHINGTON, D.C. 20549
Form 10-K
| | |
ý |
|
Annual Report Pursuant to Section 13 or 15(d) of the Securities Exchange Act of 1934 |
For the fiscal year ended March 31, 2013 |
OR |
o |
|
Transition Report Pursuant to Section 13 or 15(d) of the Securities Exchange Act of 1934 |
For the transition period from to
|
Commission file number: 001-34733
Niska Gas Storage Partners LLC
(Exact name of registrant as specified in its charter)
| | |
Delaware
(State or other
jurisdiction or organization) | | 27-1855740
(I.R.S. Employer
Identification No.) |
1001 Fannin Street, Suite 2500 |
|
|
Houston, Texas
(Address of principal executive offices) | | 77002
(Zip Code) |
(281) 404-1890
(Registrant's telephone number, including area code)
None
(Former name, former address and former fiscal year, if changed since last report)
Securities registered pursuant to Section 12(b) of the Act:
| | |
| Title of Each Class | | Name of Exchange on which Registered |
|---|
| Common Units Representing Limited Liability | | New York Stock Exchange |
| Company Interests | | |
Securities registered pursuant to section 12(g) of the Act:
Indicate by check mark if the registrant is a well-known seasoned issuer, as defined in Rule 405 of the Securities Act. Yes o No ý
Indicate by check mark if the registrant is not required to file reports pursuant to Section 13 or Section 15(d) of the Act. Yes o No ý
Indicate by check mark whether the registrant (1) has filed all reports required to be filed by Section 13 or 15(d) of the Securities Exchange Act of 1934 during the preceding 12 months (or for such shorter period that the registrant was required to file such reports), and (2) has been subject to such filing requirements for the past 90 days. Yes ý No o
Indicate by check mark whether the registrant has submitted electronically and posted on its corporate Web site, if any, every Interactive Data File required to be submitted and posted pursuant to Rule 405 of Regulation S-T (§ 232.405 of this chapter) during the preceding 12 months (or for such shorter period that the registrant was required to submit and post such files). Yes ý No o
Indicate by check mark if disclosure of delinquent filers pursuant to Item 405 of Regulation S-K (§ 229.405 of this chapter) is not contained herein, and will not be contained, to the best of registrant's knowledge, in definitive proxy or information statements incorporated by reference in Part III of this Form 10-K or any amendment to this Form 10-K. ý
Indicate by check mark whether the registrant is a large accelerated filer, an accelerated filer, a non-accelerated filer, or a smaller reporting company. See the definitions of "large accelerated filer," "accelerated filer" and "smaller reporting company" in Rule 12b-2 of the Exchange Act.
| | | | | | |
| Large accelerated filer o | | Accelerated filer ý | | Non-accelerated filer o
(Do not check if a
smaller reporting company) | | Smaller reporting company o |
Indicate by check mark whether the registrant is a shell company (as defined in Rule 12b-2 of the Act). Yes o No ý
As of September 30, 2012, the aggregate market value of the registrant's common units held by non-affiliates was $219,450,000 based on a unit price of $12.54. This calculation of such market value should not be construed as an admission or conclusion by the registrant that any person is in fact an affiliate of the registrant.
As of June 6, 2013, the registrant had 34,492,245 common units outstanding.
DOCUMENTS INCORPORATED BY REFERENCE: None
Table of Contents
TABLE OF CONTENTS
| | | | | | |
| |
| | Page | |
|---|
| | PART I
| | | | |
Item 1. | | Business | | | 1 | |
Item 1A. | | Risk Factors | | | 16 | |
Item 1B. | | Unresolved Staff Comments | | | 36 | |
Item 2. | | Properties | | | 36 | |
Item 3. | | Legal Proceedings | | | 36 | |
Item 4. | | Mine Safety Disclosures | | | 36 | |
| | PART II | | | | |
Item 5. | | Market for Registrant's Common Equity, Related Shareholder Matters and Issuer Purchases of Equity Securities | | | 37 | |
Item 6. | | Selected Financial Data | | | 39 | |
Item 7. | | Management's Discussion and Analysis of Financial Condition and Results of Operations | | | 41 | |
Item 7A. | | Quantitative and Qualitative Disclosures About Market Risks | | | 64 | |
Item 8. | | Financial Statements and Supplementary Data | | | 67 | |
Item 9. | | Changes in and Disagreements with Accountants on Accounting and Financial Disclosure | | | 67 | |
Item 9A. | | Controls and Procedures | | | 67 | |
Item 9B. | | Other Information | | | 68 | |
| | PART III | | | | |
Item 10. | | Directors, Executive Officers and Corporate Governance | | | 68 | |
Item 11. | | Executive Compensation | | | 76 | |
Item 12. | | Security Ownership of Certain Beneficial Owners and Management | | | 93 | |
Item 13. | | Certain Relationships and Related Transactions, and Director Independence | | | 94 | |
Item 14. | | Principal Accounting Fees and Services | | | 96 | |
| | PART IV | | | | |
Item 15. | | Exhibits, Financial Statement Schedules | | | 96 | |
| | FINANCIAL STATEMENTS
| | | | |
Niska Gas Storage Partners LLC Index to Financial Statements | | | F-1 | |
i
Table of Contents
GLOSSARY OF KEY TERMS
As used generally in the energy industry and in this report, the following terms have the meanings indicated below.
| | |
| Basin | | A geological province on land or offshore where hydrocarbons are generated and trapped. |
Bcf |
|
One billion cubic feet of natural gas. A standard volume measure of natural gas products. |
Cap-and -Trade |
|
A market-based approach used to control pollution by providing economic incentives for achieving reductions in the emissions of pollutants. A central authority (usually a governmental body) sets a limit or cap on the amount of a pollutant that may be emitted. The limit or cap is allocated or sold to firms in the form of emissions permits which represent the right to emit or discharge a specific volume of the specified pollutant. |
Contracted Capacity |
|
The amount of working gas capacity reserved by third parties. Typically subject to fixed demand charges. May involve short-term contracts, typically less than one year, or long-term contracts, with terms longer than one year. |
CPUC |
|
California Public Utilities Commission. A regulatory agency that monitors privately owned public utilities in the state of California, including natural gas companies. |
Cushion Gas |
|
A quantity of natural gas held within the confines of the natural gas storage facility and used for pressure support and to maintain a minimum facility pressure. May consist of injected cushion gas or native cushion gas. |
Cycle |
|
A complete withdrawal and injection of working gas. |
Effective Working Gas Capacity |
|
The maximum volume of natural gas that can be cost-effectively injected into a storage reservoir and extracted during the normal operation of the storage facility. Effective working gas capacity excludes cushion gas and non-cycling working gas. |
GAAP |
|
Generally accepted accounting principles in the United States of America. |
Gas storage capacity |
|
See Effective Working Gas Capacity. |
Holdco |
|
Niska Sponsor Holdings Coöperatief U.A. |
Hub |
|
Geographic location of a natural gas storage facility and multiple pipeline interconnections. |
Independent Storage |
|
Natural gas storage facilities owned and operated independently from the pipeline and distribution facilities to which they are interconnected. |
Inventory |
|
An amount of Working Gas held within the natural gas storage facility. It may relate to third-party customer volumes or to owner/operator volumes of working gas. |
ii
Table of Contents
| | |
| Injection Rate | | The rate at which a customer is permitted to inject natural gas into a natural gas storage facility. |
LTF Contracts |
|
Long term firm reserved storage contracts. |
Manager |
|
Niska Gas Storage Management LLC. Also referred to as "our manager". |
Mcf |
|
Thousand cubic feet of natural gas. |
MMcf |
|
Million cubic feet of natural gas. |
Natural Gas |
|
Several hydrocarbons that occur naturally underground in a gaseous state. Natural gas is normally mostly methane, but other components also include ethane, propane, and butane. |
Natural Gas Act |
|
Federal law enacted in 1938 that established the Federal Energy Regulatory Commission's authority to regulate interstate pipelines. |
NGPL |
|
Natural Gas Pipeline Company of America. |
Niska Canada |
|
Niska Gas Storage Canada ULC, our wholly-owned subsidiary. |
Niska Holdings |
|
Niska Holdings L.P. (formerly Niska GS Holdings Canada, L.P.). |
Niska Predecessor |
|
When used in a historical context, Niska Predecessor refers to Niska GS Holdings I, L.P. and Niska GS Holdings II, L.P. which were contributed to Niska Gas Storage Partners LLC in connection with our initial public offering ("IPO"). When used in the present tense or prospectively, Niska Predecessor refers to Niska Gas Storage Partners LLC. |
Niska US |
|
Niska Gas Storage U.S., LLC, our wholly-owned subsidiary. |
Optimization |
|
The purchase, storage and sale of natural gas by the storage owner for its own account in order to utilize storage capacity that is (1) not contracted to customers, (2) contracted to customers but underutilized by them or (3) available only on a short term basis. |
Reservoir |
|
A naturally occurring underground formation that originally contained crude oil or natural gas, or both. |
STF Contracts |
|
Short term firm storage contracts. |
Withdrawal Capacity |
|
The amount of gas that is or can be removed from a natural gas storage facility. Usually stated in MMcf per day, Bcf per day or Mcf per day. Typically stated as maximum or peak daily withdrawal capacity. |
Withdrawal Rate |
|
The rate at which a customer is permitted to withdraw gas from a natural gas storage facility. |
Working Gas |
|
Natural gas in a storage facility in excess of Cushion Gas. |
Working Gas Capacity |
|
See Effective Working Gas Capacity. |
iii
Table of Contents
CAUTIONARY STATEMENT REGARDING FORWARD-LOOKING STATEMENTS
Certain statements and information in this Annual Report on Form 10-K may constitute "forward-looking statements". Forward-looking statements are based on management's current expectations, contain projections of results of operations or of financial condition, or forecasts of future events. Words such as "may," "assume," "forecast," "position," "predict," "strategy," "expect," "intend," "plan," "estimate," "anticipate," "believe," "project," "budget," "potential," or "continue," and similar expressions are used to identify forward-looking statements. They can be affected by assumptions used or by known or unknown risks or uncertainties, some of which are beyond our control. Consequently, no forward-looking statements can be guaranteed. When considering these forward-looking statements, you should keep in mind the risk factors and other cautionary statements in this document. Actual results may vary materially. You are cautioned not to place undue reliance on any forward-looking statements. You should also understand that it is not possible to predict or identify all such factors and should not consider the following list to be a complete statement of all potential risks and uncertainties. Known material factors that could cause our actual results to differ from those forward-looking statements are those described in Part I, Item 1A, "Risk Factors".
Readers are cautioned not to place undue reliance on forward-looking statements, which speak only as of the date hereof. We undertake no obligation to publicly update or revise any forward-looking statements after the date they are made, whether as a result of new information, future events or otherwise.
iv
Table of Contents
PART I
Item 1. Business.
We are a Delaware limited liability company formed in 2006 to own and operate natural gas storage assets. We own or contract for approximately 225.5 billion cubic feet, or Bcf, of total natural gas storage capacity. Our assets are located in key North American natural gas producing and consuming regions and are connected at strategic points on the natural gas transmission network, providing access to multiple end-use markets. Our locations provide us and our customers with substantial liquidity, meaning access to multiple counterparties for transactions to buy and sell natural gas. Since our inception in 2006, we have added 81.3 Bcf of new storage capacity through low cost organic expansions, an increase of approximately 56%, bringing our total working gas capacity to 225.5 Bcf at the end of March 31, 2013.
Because the supply of natural gas remains relatively stable over the course of a year compared to the demand for natural gas, which fluctuates seasonally, natural gas storage facilities are needed to reallocate excess natural gas supply from periods of low demand to periods of high demand. We capitalize on the imbalance between supply of and demand for natural gas by providing our customers and ourselves with the ability to store natural gas for resale or use in a higher value period. Our natural gas storage facilities allow us to offer our customers "multi-cycle" gas contracts, which permit them to inject and withdraw their natural gas multiple times in one year, providing more flexibility to capture market opportunities. Since our inception, our storage contracts have provided cyclability rates ranging from 1.0 to 6.0 times per year.
Our common units are listed on the New York Stock Exchange, or the NYSE, under the symbol "NKA." You may find more information about us on our website at http://www.niskapartners.com. Our headquarters is located in Houston, TX, and our operations center is located in Calgary, Alberta, Canada.
Recent Developments
On April 2, 2013, we completed an equity restructuring with affiliates of Carlyle/Riverstone Global Energy and Power Fund II, L.P. and Carlyle/Riverstone Global Energy and Power Fund III, L.P. (collectively the "Carlyle/Riverstone Funds"). In the restructuring, all of our 33.8 million subordinated units and previous incentive distribution rights (all of which were owned by the Carlyle/Riverstone Funds) were combined into and restructured as a new class of incentive distribution rights ("new IDRs"). The equity restructuring, which did not require any further consents or approvals, was effective as of the same day. The transaction was unanimously approved by our board of directors, on the unanimous approval and recommendation of its Conflicts Committee, which is composed solely of independent directors.
The restructuring permanently eliminated our subordinated units and previous incentive distribution rights in return for the new IDRs. Prior to completion of the restructuring, we would have been required to pay the full minimum quarterly distribution of $0.35 per unit on the subordinated units (requiring additional distributions of approximately $12 million per quarter) prior to increasing the quarterly distribution on our common units. Quarterly distributions on the subordinated units had not been paid since the quarter ended September 30, 2011.
The new IDRs entitle the Carlyle/Riverstone Funds to receive 48% of any quarterly cash distributions after our common unit holders have received the full minimum quarterly distribution ($0.35 per unit) for each quarter plus any arrearages from prior quarters (of which there are currently none). The previous incentive distribution rights entitled the Carlyle/Riverstone Funds to receive increasing percentages (ranging from 13% to 48%) of incremental cash distributions after our unit holders (both common and subordinated) exceeded quarterly distributions ranging from $0.4025 per unit to $0.5250 per unit. In addition, for a period of five years, and provided that the Carlyle/Riverstone Funds continue to own a majority of both our managing member and the new IDRs, the
Table of Contents
Carlyle Riverstone Funds will be deemed to own 33.8 million "Notional Subordinated Units" in connection with votes to remove and replace our managing member. These Notional Subordinated Units are not entitled to distributions, but merely preserve the Carlyle/Riverstone Fund's voting rights with respect to removal of the managing member. Tables summarizing the changes in incentive distributions are provided below.
Previous structure
| | | | | | | | | | | | |
| |
| | Marginal Percentage Interest in Cash Distributions | |
|---|
| | Total Quarterly
Distribution per Unit
Target Amount | | Common and
Subordinated | | Managing
Member | | IDR Holder | |
|---|
Minimum Quarterly Distribution | | $0.35 | | | 98.02 | % | | 1.98 | % | | — | |
First Target Distribution | | above $0.35 up to $0.4025 | | | 98.02 | % | | 1.98 | % | | — | |
Second Target Distribution | | above $0.4025 up to $0.4375 | | | 85.02 | % | | 1.98 | % | | 13.00 | % |
Third Target Distribution | | above $0.4375 up to $0.5250 | | | 75.02 | % | | 1.98 | % | | 23.00 | % |
Thereafter | | above $0.5250 | | | 50.02 | % | | 1.98 | % | | 48.00 | % |
New structure
| | | | | | | | | | | | |
| |
| | Marginal Percentage Interest in Cash
Distributions | |
|---|
| | Total Quarterly
Distribution per Unit
Target Amount | | Common Unitholders | | Managing
Member | | IDR Holder | |
|---|
Minimum Quarterly Distribution | | $0.35 | | | 98.02 | % | | 1.98 | % | | — | |
Thereafter | | above $0.35 | | | 50.02 | % | | 1.98 | % | | 48.00 | % |
After completion of the restructuring, we had 34.5 million common units issued and outstanding, of which 17.5 million were owned by the public and 17.0 million were owned by the Carlyle/Riverstone Funds. The Carlyle/Riverstone Funds also owned a 1.98% managing member interest in us. As a result of the restructuring, the percentage ownership owned by the Carlyle/Riverstone Funds (excluding the previous incentive distribution rights and the new IDRs, which are a variable interest) has decreased from approximately 74.9% to approximately 50.3%.
2
Table of Contents
Organizational Structure
The following diagram depicts our simplified organizational and ownership structure after the completion of the equity restructuring:
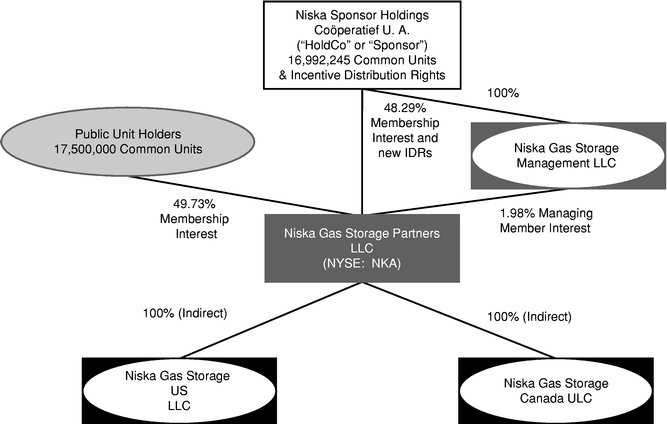
Our Relationship with Holdco
Niska Sponsor Holdings Coöperatief U.A., or Holdco, owns our manager, approximately 49.3% of our outstanding common units and 100% of our new IDRs.
Over 95% of the equity in Holdco is owned by the Carlyle/Riverstone Funds and affiliated entities with the balance owned by our current and former officers and employees. The Carlyle/Riverstone Funds are affiliated with Riverstone Holdings LLC, or Riverstone. Riverstone conducts buyout and growth capital investments in the midstream, exploration and production, oilfield services, power and renewable sectors of the energy industry. Riverstone's management has substantial experience in identifying, evaluating, negotiating and financing acquisitions and investments.
Management
Niska Gas Storage Management LLC, or "our manager", has a 1.98% managing member interest in us. Our manager has sole responsibility for conducting our business and for managing our operations. Pursuant to our Operating Agreement, our manager has delegated the power to conduct our business and manage our operations to our board of directors, all of the members of which are appointed by our manager. References to our board refer to the board of directors of Niska Gas Storage Partners LLC as long as the delegation is in effect (or to the board of directors of our manager if such delegation is not in effect). Our board directs the management of our business and presently consists of nine members. Our manager appoints all members to our board, and three of our directors
3
Table of Contents
are independent as defined under the independence standards established by the NYSE. For more information about our directors, see "Directors, Executive Officers and Corporate Governance."
Our Operations
We store natural gas for a broad range of customers, including financial institutions, marketers, pipelines, power generators, utilities and producers of natural gas. Fee based revenue consists of longer term contracts for storage fees that are generated when we lease storage capacity on a monthly basis and shorter term fees associated with park and loan activities.
We provide multi-year, multi-cycle storage services to our customers under long-term firm, or LTF contracts. Under our LTF contracts our customers are obligated to pay us monthly reservation fees in exchange for the right to inject, store and withdraw volumes of natural gas on days and for periods selected by them at injection or withdrawal rates up to maximums specified in the contract. The reservation fees are fixed charges owed to us regardless of the actual amount of storage capacity utilized by customers. When customers utilize the capacity that is reserved under these contracts we also collect variable fees based upon the actual volumes of natural gas injected or withdrawn. These variable fees are designed to allow us to recover our variable operating costs and make up a small percentage of the total fees we receive under our LTF contracts.
Under LTF contracts, the customer has the right, but not the obligation, to store natural gas in the facility during the term of the contract, up to a specified volume or "inventory capacity." In addition to the total amount of inventory capacity, LTF contracts specify a customer's daily withdrawal and injection rights which increase or decrease as the customer's inventory changes. The maximum injection rate that a customer is typically entitled to is highest when that customer's inventory capacity is empty, reducing as that customer's inventory increases. When a customer's contracted inventory capacity is full, it has no further injection rights. A customer's maximum withdrawal rate is typically highest when its inventory is full, declining incrementally to zero when the customer's inventory is empty. LTF contracts provide the customer with the flexibility to use all, a portion, or none of its capacity and the freedom to inject or withdraw natural gas up to its daily injection or withdrawal rate, but obligate the customer to remove any injected natural gas by the end of the contract term.
Reservation fees comprise over 90% of the revenue received from LTF storage customers, and thus represent a steady and predictable baseline cash flow stream.
We also provide short-term storage services for customers under short-term firm, or STF contracts. STF contracts typically have terms of less than one year; however can extend up to two years. Under an STF contract, a customer pays a fixed fee to inject a specified quantity of natural gas on a specified date or dates and to store that gas in our storage facilities until withdrawal on a specified future date or dates. One half of the fees are earned at the time of injection by a customer and one half of the fees are earned at the time of withdrawal by a customer. An STF contract differs from an LTF contract in that the customer is obligated to inject and withdraw specified quantities of natural gas on specified dates rather than entitled to utilize injection and withdrawal capacity at its option. Because STF contracts set forth specified future injection and withdrawal dates, we can enter into offsetting transactions to lock in incremental fees as spot and future natural gas prices fluctuate prior to that activity date.
4
Table of Contents
Under STF contracts the customer is obligated to perform the injection and withdrawal activities as specified in the contract, thus enabling us to enter into offsetting transactions to capture incremental opportunities as spot and future natural gas prices fluctuate prior to the specified withdrawal date. For example, if, after a customer enters into an STF contract to inject natural gas in July and to withdraw that gas in January, natural gas futures prices for January fall below February prices, we might enter into an offsetting STF transaction for the same quantities, with the same or another customer, to inject in January and withdraw in February for a fee based on the January to February spread. The result in January would be that the second transaction offsets the first transaction resulting in no net flow obligation on our storage facility during January, and therefore, a fuel savings. By entering into offsetting transactions, we are able to capture additional opportunities as they are created throughout the year by volatile natural gas futures prices.
Our portfolio of third-party customers consists of a mix of customer types, each of which tends to have a storage usage pattern that is different from those of other customers at the facility. This means that even though the withdrawal or injection capability of a facility may be fully contracted, it will generally not be fully utilized on any given day. We purchase, store and sell natural gas for our own account in order to utilize, or optimize, storage capacity and injection and withdrawal capacity that is: (1) not contracted to customers; (2) contracted to customers, but underutilized by them; or (3) available only on a short-term basis. We have a stringent risk policy that limits, among other things, our exposure to commodity price fluctuations by requiring us to promptly enter into a forward sale contract or other hedging transaction whenever we enter into a proprietary purchase contract. Therefore, inventory purchases are matched with forward sales or are otherwise economically hedged so that a margin is effectively locked in promptly after we enter into the purchase. As a result, there are no speculative positions beyond the minimal operational tolerances specified in our risk policy. We purchase natural gas for our own account, inject it and subsequently withdraw and sell the gas. The flexibility arising from purchasing and selling natural gas for our own account allows us to generate incremental value through our proprietary optimization strategy by capturing spot and intraday opportunities. Unlike STF and LTF storage transactions, proprietary optimization requires us to fund the carrying cost of the inventory with our own working capital.
Risk management techniques, adapted to the unique aspects of natural gas storage, enable us to match the capacity at our facilities with the portfolio of long-term and short-term contracts and proprietary optimization transactions at those facilities in order to utilize the maximum amount of capacity available. We utilize New York Mercantile Exchange Inc., or NYMEX, and Intercontinental Exchange, Inc., or ICE, which are regulated exchanges for the purchase and sale of energy products, to hedge our commodity risk with respect to the pricing of natural gas. This helps us reduce potential credit, delivery and supply risks. Generally these are financial swaps and are settled without the requirement for physical delivery. In the case of NYMEX futures, we can enter an EFS (exchange for swaps) to avoid the requirement for delivery.
Our gas storage customers include a broad mix of natural gas market participants, including financial institutions, producers, marketers, power generators, pipelines and municipalities. Approximately 90% of the counterparties under our natural gas storage contracts and proprietary storage optimization transactions either have an investment grade credit rating, provide us with another form of financial assurance, such as a letter of credit or other collateral, or are governmental entities. Our investment grade counterparties account for approximately 94% of our credit exposures as of March 31, 2013.
5
Table of Contents
Although during certain reporting periods a large portion of our gross revenues can be attributed to one or two counterparties, these gross revenues reflect the full commodity value of natural gas sales under our optimization strategy and overstate the counterparties' contribution to our net margin (after cost of goods sold) that is more correlated with our net earnings and operating cash flow.
We analyze the financial condition of our counterparties prior to entering into an agreement. Our exposure to the volume of business transacted with a natural gas clearing and settlement facility is mitigated by the facility's requirement to post margin deposits to reduce the risk of default. In the event of any default, the exchange would absorb losses by other clearing members. Because every member posts an initial margin, the exchange can protect the exchange members if or when a clearing member defaults.
Our Assets
Our owned and operated natural gas storage facilities consist of AECO Hub™ (comprised of two facilities in Alberta, Canada), our Wild Goose storage facility in California and our Salt Plains storage facility in Oklahoma. Our natural gas storage assets are modern, well-maintained, automated facilities with low maintenance costs, long useful lives and comparatively high injection and withdrawal, or "cycling," capabilities. Our facilities require low amounts of cushion gas, meaning that a relatively small amount of natural gas is required to remain inside our facilities in order to maintain a minimum facility pressure supporting the working gas. The size and flexibility of our facilities, together with the application of advanced skills in reservoir engineering, drilling, geology and geophysics, enable us to support individual high-cycle contracts in excess of the average physical cycling capabilities of our facilities. In addition to the facilities we own and operate, we also contract for 8.5 Bcf of natural gas storage capacity on a long-term basis from Natural Gas Pipeline Company of America LLC, or NGPL, on its pipeline system in the mid-continent (Texas and Oklahoma) at cost-of-service based rates that we believe are currently below market rates. The following table highlights certain important design information about our assets:
March 31, 2013:
| | | | | | | | | | | | | | | | | | | |
| | AECO Hub™ | |
| |
| |
| |
| |
|---|
| | Suffield | | Countess | | Wild Goose | | Salt Plains | | NGPL | |
| |
|---|
Name | | Alberta | | Alberta | | California | | Oklahoma | | Midcon/Texok | | Total | |
|---|
Location | |
|---|
Gas Storage Capacity (Bcf) | | | 83.5 | | | 70.5 | | | 50 | | | 13 | | | 8.5 | | | 225.5 | |
Peak Withdrawal (MMcf per day) | | | 1,800 | | | 1,250 | | | 950 | | | 150 | | | 114 | | | 4,264 | |
Peak Injection (MMcf per day) | | | 1,600 | | | 1,150 | | | 525 | | | 115 | | | 57 | | | 3,447 | |
Reservoirs | | | 5 | | | 2 | | | 3 | | | 1 | | | N/A | | | 11 | |
Storage Wells | | | 60 | | | 29 | | | 17 | | | 30 | | | N/A | | | 136 | |
Compression (horsepower) | | | 36,000 | | | 34,500 | | | 27,900 | | | 10,000 | | | N/A | | | 108,400 | |
In Service Date | | | 1988 | | | 2003 | | | 1999 | | | 1995 | | | N/A | | | 1988 - 2003 | |
AECO Hub™, our largest operation, is comprised of two facilities in Alberta, Suffield and Countess, which are 75 miles apart but operate as one hub. Due to its high injection and withdrawal capacity (2.8 Bcf per day and 3.1 Bcf per day, respectively), AECO Hub™ supports high cycling customer contracts. AECO Hub™ is the largest natural gas storage provider in western Canada and the largest independent storage hub in North America, based on our analysis of working gas capacity owned by other storage owners, adjusted according to each such owner's percentage ownership of its
6
Table of Contents
respective storage facilities. Its location on TransCanada Pipeline's Alberta System with direct access to abundant western Canadian natural gas supply and pipeline connections to most major U.S. and Canadian natural gas markets provides us and our customers with significant flexibility and liquidity.
AECO Hub™ is located in the Western Canadian Sedimentary Basin, or the WCSB, which is the major hydrocarbon basin in Canada and one of the most important natural gas producing regions in North America. The WCSB accounts for a majority of annual Canadian natural gas production and a significant amount of annual North American natural gas production according to the Canadian National Energy Board, or NEB. Although WCSB production has leveled off in recent years, we have seen stronger levels of natural gas production in fiscal 2013 compared to production in the prior 2 years. Further, we expect that Canadian natural gas production will grow in future years in response to a growing demand for LNG exports to serve Asian Markets. New production to support these projects will be provided by large new shale and tight gas plays in northeast British Columbia and western Alberta, a large remaining conventional natural gas resource base.
AECO Hub™ is connected to the extensive Alberta System. Most of the natural gas produced in Alberta flows into the Alberta System, which transports that natural gas from the well or gas plant to industrial consumers and gas utilities in Alberta and to export pipelines at the Alberta border.
AECO Hub™ has been a central part of the Alberta System since the early 1990s, when the Suffield facility began providing title transfers as a hub service before that service was available on the pipeline. Many transactions were being transacted by storage customers and others at the Suffield facility and a new price index, known as the "AECO Hub™ Price Index," was developed to facilitate price discovery. AECO Hub™ is the most commonly referenced pricing point for Canadian natural gas, and the price of natural gas in Alberta is often referred to as the "AECO Price."
AECO Suffield and AECO Countess, the two facilities that make up the AECO Hub™, are geographically separated, but the toll design of the Alberta System means that they are both commercially located at the same point. This enables us to operate the two facilities as one integrated commercial operation without customers incurring incremental transportation costs. Customers nominate injections or withdrawals at Suffield's interconnect with the Alberta System, and AECO Hub™ allocates the nominations between its Suffield and Countess facilities based on its reservoir management strategy.
Our rights to use the reservoirs at Suffield and Countess are held pursuant to a series of natural gas storage agreements, trust arrangements and similar instruments entered into with the holders of subsurface mineral interests of the land where the reservoirs are situated. Rights to access, occupy and use the lands for facilities including the well sites and pipelines are derived from access agreements, right-of-ways, easements, leases and other similar land use agreements with the surface owners of such land.
Suffield Storage Facility. AECO Suffield is located in southeastern Alberta. It is near the Alberta System's "eastern gate," the largest natural gas delivery point in Canada, where gas is delivered into TransCanada's mainline pipeline system (transporting natural gas to eastern Canada and the northeastern U.S.) and the Foothills/Northern Border pipeline system (transporting natural gas to Chicago and the Midwestern U.S.). AECO Suffield consists of 60 storage wells and five storage reservoirs with aggregate effective working capacity of approximately 83.5 Bcf. The storage reservoirs are connected to a central processing and compression facility by a system of five pipelines. Compression is provided by natural gas powered engines that have a total of more than 36,000 horsepower.
7
Table of Contents
All of the processing and compression facilities and substantially all of the well sites for the storage reservoirs are located on the Canadian Forces Base, Suffield military training range, or CFB Suffield. CFB Suffield is open prairie land, which provides relatively low costs for seismic surveys, drilling and pipelining. While the military restricts access to the well sites on a limited basis from time-to-time (i.e., during military exercises), AECO Suffield has not experienced any operational issues due to the location since its inception in 1988.
Countess Storage Facility. AECO Countess is located in south central Alberta, approximately 60 miles east of Calgary. Countess is connected to a large diameter pipe of the Alberta System. This modern natural gas storage project consists of 29 storage wells and two high performance gas storage reservoirs that are connected to a central processing and compression facility. The two storage reservoirs each have their own gathering pipeline system. Compression is electrically powered and totals approximately 34,500 horsepower. The two reservoirs have total effective working capacity of approximately 70.5 Bcf.
AECO Hub™'s customers consist of a mix of natural gas market participants, including financial institutions, producers, marketers, power generators, and pipelines, resulting in a portfolio of customers with diverse usage patterns and varying contract expiration dates. This allows more opportunity for AECO Hub™ to optimize underutilized capacity.
Most of AECO's LTF contracts have capacity of 1.0 Bcf or greater and an average of 3.0 Bcf. LTF contract terms have been chosen so that a manageable amount of contracts expire each year, avoiding exposure to a large contract turnover volume. The weighted average contract life of our LTF storage contracts at AECO Hub™ is 2.2 years but most of our current customers have consistently entered into new contracts when their existing contracts expire. The largest contract we have at AECO Hub™ is in the ninth year of an initial term of 10 years. This contract for 40.0 Bcf continues for a full 25 year term unless either party pays a significant cancellation fee upon the expiration of the initial term or after subsequent five year term periods.
AECO Hub™ is subject to provincial regulatory jurisdiction. Operations are subject to the regulation of the Alberta Energy Resources Conservation Board, or the Alberta ERCB, which must also approve proposed expansions of storage capacity. AECO Hub™ is not subject to active market regulation. While the Alberta Utilities Commission, or the AUC, does have overriding jurisdiction to set natural gas storage prices when authorized to do so by the Alberta Government, it is not currently Alberta Government policy to apply such rate regulation. As such, there is no cost-of-service or other utility-type regulation of storage rates or other commercial terms of storage contracts that apply to AECO Hub™. Therefore, AECO Hub™ can charge customers negotiated market-based rates as well as store purchased natural gas for its own account.
Both AECO Hub™ facilities are subject to federal and provincial environmental laws and regulations, including oversight by Alberta's Department of Environment and the Alberta ERCB. We are not aware of any material environmental liabilities relating to the AECO Hub™ facilities.
8
Table of Contents
Our Wild Goose storage facility is located 55 miles north of Sacramento, California. Wild Goose is a high deliverability, multi-cycle, or HDMC storage facility. This HDMC capability is made possible by the rock quality of the Wild Goose reservoirs and the extensive use of horizontal well technology.
Wild Goose is strategically located in a highly-liquid hub market and is one of only four independent operating storage facilities in northern California. Wild Goose provides natural gas receipt and delivery services at Pacific Gas & Electric Company (PG&E), or PG&E Citygate, a liquid trading point where natural gas supply from multiple upstream basins meets the volatile California end-use gas demands that create a dependence on natural gas storage. This location provides customers with the opportunity to take advantage of PG&E Citygate pricing, liquidity and arbitrage opportunities.
Facility
Wild Goose operates 17 natural gas storage wells that are completed in three depleted natural gas reservoirs with an effective working capacity of 50.0 Bcf and a gas generated compression of 27,900 horsepower. The Wild Goose reservoirs are located in high quality rock formations. In addition, the reservoirs have a strong water drive mechanism, which helps maintain reservoir pressure and well deliverability. Rights to use the reservoirs at Wild Goose for natural gas storage are held pursuant to a series of natural gas storage leases with the surface owners of the lands where the reservoirs are situated as well as mineral owner agreements and similar instruments entered into with the holders of subsurface mineral interests in such lands. Rights for the lands used for the pipelines are derived from right-of-ways, easements, leases, and other similar land-use agreements.
Wild Goose's customers include a mix of natural gas market participants, including financial institutions, producers, marketers, power generators, pipelines and municipalities, resulting in a portfolio of customers with diverse usage patterns and different contract expiration dates. This allows us to optimize underutilized capacity.
Wild Goose has contracts for terms of one year or longer. The weighted average contract life of our LTF storage contracts at Wild Goose is 1.6 years, but many of our current customers have consistently entered into new contracts when their existing contracts expire.
Wild Goose is regulated as a state utility by the CPUC and is certified to serve the California intra-state market. Wild Goose has regulatory authority to negotiate market based rates for third-party storage contracts and buys and sells natural gas for its own account to optimize its operations. In addition, as an independent storage provider Wild Goose is exempt from the provisions of California's affiliate conduct rules and has the right to coordinate its operation with our other facilities. It is however, restricted from contracting for natural gas storage services with its affiliates.
We are not aware of any material environmental liabilities relating to the Wild Goose facility.
In constructing and expanding the Wild Goose facility, we have experienced no significant environmental-related delays or unexpected costs by initially bringing forward development plans that mitigate any environmental impacts to the satisfaction of all responsible agencies and stakeholders.
9
Table of Contents
Our Salt Plains storage facility is located 110 miles north of Oklahoma City, Oklahoma, in a region of growing demand for natural gas as a fuel for heating and power generation. Salt Plains provides intrastate services in Oklahoma through its connection to pipelines operated by ONEOK Gas Transportation Pipelines, L.L.C., or ONEOK, and intrastate and interstate services through its interconnect with pipelines operated by Southern Star Central Gas Pipeline, Inc., or Southern Star.
Salt Plains is in a strategic mid-continent location with interconnects to pipelines owned by Southern Star and ONEOK, which serve both regional and mid-continent natural gas markets. This provides customers the benefits of liquidity, supply, and arbitrage opportunities. In addition, natural gas produced in the Rocky Mountains that is delivered to the mid-continent region gets redistributed to various pipelines such as Southern Star that have access to Salt Plains.
Salt Plains operates 30 gas storage wells and a gas generated compression of 10,000 horsepower that are completed in a depleted natural gas storage reservoir characterized by high-quality rock. The wells are connected to a central plant facility by seven miles of pipeline. Rights to use the reservoir at Salt Plains for natural gas storage are held pursuant to a series of gas storage agreements with the mineral rights owners of the lands where the reservoir is situated. Rights for the lands used for the pipelines are derived under these gas storage agreements as well as from right-of-way grants from other land owners.
Salt Plains' customers include a mix of natural gas market participants, including financial institutions, producers, and marketers. The weighted average contract life of our LTF storage contracts at Salt Plains is 1.0 years, but most of our current customers have consistently entered into new contracts when their existing contracts expire.
Our Salt Plains intrastate operations are subject to regulation by the Oklahoma Corporation Commission, or the OCC. Salt Plains is also authorized to provide interstate storage service under the Natural Gas Policy Act of 1978 and the Federal Energy Regulatory Commission, or FERC, regulations and policies that allow intrastate pipeline and storage companies to engage in interstate commerce (commonly known as NGPA section 311 services). Salt Plains provides these NGPA section 311 services, which are not subject to FERC's broader jurisdiction under the Natural Gas Act, pursuant to a Statement of Operating Conditions which is on file with FERC. The OCC's regulatory policies are generally less stringent than those of FERC. Currently, Salt Plains is authorized to charge market based rates in both intrastate and interstate service and has no restrictions on affiliate interactions.
We are not aware of any material environmental liabilities relating to the Salt Plains facility.
NGPL Contracted Capacity
Overview
Since 2001, our subsidiary has contracted for 8.5 Bcf of gas storage capacity on the MidCon leg and the TexOk leg of the NGPL pipeline system in the mid-continent. The NGPL system connects and
10
Table of Contents
balances Gulf Coast and mid-continent supply basins with Chicago and other Midwestern U.S. end-use markets. NGPL has a number of different storage facilities on its pipeline system and manages its storage capacity as pools on separate legs of the pipeline. Under NGPL's FERC-approved tariff, NGPL is limited to charging cost-of-service rates for its transportation and storage services. We currently have multiple LTF storage contracts with NGPL that expire on various dates through 2017. We have a tariff-based right of first refusal to renew these contracts, effectively making this capacity a long-term asset without any invested capital, with an option to exit either temporarily or permanently, should the rate be above market value.
As a customer of the NGPL capacity, and not the operator, we use our optimization strategy to generate revenue from our use of the capacity, and we do not remarket services.
We have a small but growing natural gas marketing business in Eastern Canada, British Columbia and Alberta serving commercial, industrial and retail customers. This is also a margin business where supply is locked in to serve customers at committed prices. In Eastern Canada, we also provide fee-based agency services to natural gas end-users. The Access marketing business is an extension of the Company's proprietary optimization activities.
Regulation
Our operations are subject to extensive laws and regulations that have the potential to have a significant impact on our business. We may incur substantial costs in order to conduct our operations in compliance with these laws and regulations. We are subject to regulatory oversight by federal, state, provincial and local regulatory agencies, many of which implement rules and regulations that are binding on the natural gas storage and pipeline industry, related businesses and individual participants. The failure to comply with such laws and regulations can result in substantial penalties. The cost of regulatory compliance on our operations increases our costs of doing business and, consequently, affects our profitability. However, we do not believe that we are affected in a significantly different manner by these laws and regulations than are our competitors.
Our historical and projected operating costs reflect the recurring costs resulting from compliance with these regulations, and we do not anticipate material expenditures in excess of these amounts in the absence of future acquisitions or changes in regulation, or discovery of existing but unknown compliance issues. The following is a summary of the kinds of regulation that may impact our operations. However, such discussion should not be considered an exhaustive review of all regulatory considerations affecting our operations.
Our natural gas storage operations are subject to stringent and complex federal, state, provincial and local laws and regulations governing environmental protection, including air emissions, water quality, wastewater discharges, and solid waste management. Such laws and regulations generally require us to obtain and comply with a wide variety of environmental registrations, licenses, permits and other approvals. These laws and regulations impose numerous obligations that are applicable to our operations, including the acquisition of permits to conduct certain activities under statutes such as the Clean Water Act, or CWA, the Clean Air Act, or CAA, the Safe Drinking Water Act, or SDWA and comparable legislation in Canada, limiting or preventing the release of materials from our facilities, managing wastes generated by our operations, the installation of pollution control equipment, responding to releases of process materials or wastes from our operations, and the risk of substantial liabilities for pollution resulting from our operations. The Occupational Safety and Health Act, or OSHA, comparable state statutes that regulate the protection of the health and safety of workers, as
11
Table of Contents
well as the Occupational Health and Safety Act in the Province of Alberta, and comparable federal legislation in Canada also apply to our operations. Failure to comply with these laws and regulations may trigger a variety of administrative, civil, and criminal enforcement measures, including the assessment of monetary penalties, the imposition of remedial obligations and the issuance of injunctions limiting or preventing some or all of our operations. We believe that we are in substantial compliance with existing environmental laws and regulations and that such laws and regulations will not have a material adverse effect on our business, financial position or results of operations. Nevertheless, the trend in environmental regulation is to place more restrictions and limitations on activities that may affect the environment. For example, on April 17, 2012, the U.S. Environmental Protection Agency (EPA) finalized rules that establish new air emission controls for oil and natural gas production and natural gas processing operations. Specifically, the EPA's rule package includes New Source Performance Standards to address emissions of sulfur dioxide and volatile organic compounds, or VOC's, and a separate set of emission standards to address hazardous air pollutants frequently associated with oil and natural gas production and processing activities. The rules establish specific new requirements regarding emissions from compressors and controllers of natural gas processing plants, dehydrators, storage tanks and other production equipment. These rules may require a number of modifications to our operations including the installation of new equipment to control emissions. As a result, there can be no assurance of the amount or timing of future expenditures for environmental compliance or remediation, and actual future expenditures may be different from the amounts that we currently anticipate.
The workplaces in the U.S. associated with the storage facilities we operate are subject to the requirements of the Federal Occupational Safety and Health Act, or OSHA, as amended, as well as comparable state statutes that regulate the protection of the health and safety of workers. Workplaces in Canada associated with our operations are subject to the requirements of the Occupational Health and Safety Act in the Province of Alberta and comparable federal legislation. Failure to comply with OSHA requirements, or comparable requirements in Canada, including general industry standards, recordkeeping requirements and monitoring of occupational exposure to regulated substances, could subject us to fines or significant compliance costs.
There is increasing attention in the United States and worldwide concerning the issue of climate change and the effect of greenhouse gases (GHGs). Future regulation of GHGs in the United States could occur pursuant to future U.S. treaty commitments, new domestic legislation that may impose a carbon emissions tax or establish a cap-and-trade program or regulation by the EPA. The Obama Administration has indicated its support for a mandatory cap-and-trade program to reduce GHG emissions, and it is possible that federal legislation could be adopted in the future. Similarly, the outcomes of ongoing international negotiations since the 2011 Durban Climate Change Conference make it possible that a new, legally-binding international instrument to control GHGs will be adopted in the future.
While a new federal or international program seems unlikely in the near future, we may have to comply with state or regional programs to limit GHG emissions. State and regional programs that may impact our operations include the Western Climate Initiative (WCI) and the Regional Greenhouse Gas Initiative (RGGI). The future status of RGGI, and agreement between the states in the Northeastern U.S. is uncertain. We do not believe that RGGI will impact our business because we do not currently have operations in RGGI member states. The WCI is an agreement that was originally between the states of California, Oregon, Washington, New Mexico, Arizona, Utah and Montana, and the Canadian provinces of British Columbia, Manitoba, Ontario, and Quebec to create a regional cap-and-trade
12
Table of Contents
scheme for GHG emissions. However, in 2011, all states except California withdrew from the WCI. Still though, it is likely that regional efforts to curb GHG emissions will continue. Depending on the scope of any regional programs that we must comply with, we could be required to obtain and surrender allowances for GHG emissions statutorily attributed to our operations (e.g., emissions from compressor stations or the injection and withdrawal of natural gas). Although we would not be impacted to any greater degree than other similarly situated natural gas storage companies, a stringent GHG control program could have an adverse effect on our cost of doing business and reduce demand for the natural gas storage services we provide.
In 2006, California adopted AB 32, the Global Warming Solutions Act of 2006, with a goal of reaching (i) 1990 GHG emissions levels by the year 2020, (ii) 80% of 1990 levels by 2050, and (iii) establishing a mandatory emissions reporting program. AB 32 directed the California Air Resources Board, or CARB, to begin developing discrete early actions to reduce GHGs while also preparing a scoping plan to identify how best to reach the 2020 limit. Since the passage of AB 32, the CARB approved in December 2010 a GHG cap-and-trade program, which is scheduled to take effect in 2012. However, various legal challenges threaten to delay California's cap-and-trade program. No final determination has been made with regard to the potential applicability of the AB 32 cap-and-trade program to our operations. We are therefore not in a position to quantify any potential costs associated with compliance under the program as proposed. However, any limitation a finalized program places on GHG emissions from our equipment and operations could require us to incur costs to reduce the GHG emissions associated with our operations.
Even in the absence of new federal legislation the U.S. Environmental Protection Agency, or EPA, has begun to regulate GHG emissions using its authority under the federal Clean Air Act (CAA) as articulated by the April 2007 United States Supreme Court ruling inMassachusetts, et al. v. EPA that the EPA has authority to regulate carbon dioxide emissions. The GHG regulations that EPA has issued following exercising the authority affirmed byMassachusetts , et al. v. EPA include: (1) the December 2009 "endangerment finding" determining that air pollution from six GHGs endangers public health and welfare, and that mobile sources cause or contribute to that air pollution; (2) the May 2010 "Tailpipe Rule," issued jointly with the National Highway Traffic Safety Administration setting GHG emission and fuel economy standards for new light-duty vehicles; (3) the April 2010 "Timing Rule," concluding that stationary source regulation under Titles I and V of the CAA (involving Prevention of Significant Deterioration regulations and operating permits, respectively) must regulate GHG emissions beginning when such emissions are subject to controls under the mobile source provisions of the Act; (4) the June 2010 "Tailoring Rule," exempting small stationary sources from PSD and Title V requirements through regulations modifying the Act's emissions thresholds; and (5) the December 2010 "SIP Call" rule, finding thirteen state Implementation Plans ("SIPs") inadequate because they did not regulate GHGs from stationary sources, and directing those states to correct the inadequacies or face federalization of their permitting programs. All of these regulations are subject to legal challenges but the D.C. Circuit has refused to stay the rules while the challenges are pending.
In addition to the above rules, on March 27, 2012 the EPA proposed GHG emissions standards for power plants. The EPA also plans to propose new GHG emission standards for refineries. The new standard for power plants along with the current EPA's GHG regulations could affect the demand for natural gas.
Pursuant to a Congressional mandate in the FY2008 Consolidated Appropriations Act, EPA has promulgated regulations requiring the measuring and reporting of GHG emissions from a variety of industrial sources. Finalized in October 2009, the Mandatory Reporting of Greenhouse Gas Emissions Rule (Mandatory Reporting Rule or MRR) sets out general provisions applicable to all entities with MRR compliance obligations, as well as a series of subparts covering particular industrial sectors. For most sectors, MRR obligations are triggered when the facility's emissions exceed 25,000 metric tons of carbon dioxide equivalent in a year, however, some facilities will be covered regardless of their
13
Table of Contents
emissions levels. Since the initial MRR was finalized, the EPA has gone on to finalize additional subparts, bringing new sectors within the scope of the rule. Finalized in June 2010, Subpart W of the MRR applies to owners and operators of petroleum and natural gas systems, which are defined to include onshore oil and natural gas production, offshore oil and natural gas production, onshore natural gas process, onshore natural gas transmission and compression, underground natural gas storage, LNG storage, and LNG import and export activities be subject to the MRR's requirements if they emit more than 25,000 metric tons of carbon dioxide equivalent per year. Because our primary business involves underground natural gas storage, we are potentially subject to Subpart W of the MRR.
British Columbia has been in the process of implementing a cap-and-trade system consistent with the requirements of the WCI. The province has created a Climate Action Secretariat that is responsible for developing cap-and-trade rules. Ontario, another province participating in the WCI, has committed to a phase out of coal fired power by 2014.
Alberta regulates GHG emissions under the Climate Change and Emissions Management Act, the Specified Gas Reporting Regulation (the "SGRR"), which imposes GHG emissions reporting requirements, and the Specified Gas Emitters Regulation (the "SGER"), which imposes GHG emissions limits. A facility subject to the SGRR must report if it has GHG emissions of 50,000 metric tonnes or more in any year. Under the SGER, GHG emission limits apply once a facility has direct GHG emissions in a year of 100,000 metric tonnes or more. Under the SGER, subject facilities are required to reduce their emission intensities (e.g., metric ton of GHGs emitted per unit of production) by 12% in the case of facilities operating prior to 2000 and by 2% per year beginning in the fourth year of commercial operations for facilities commencing operations in 2000 and after up to a maximum of 12%. A facility subject to the SGER may meet the applicable emission limits by making emissions intensity improvements, offsetting GHG emissions by purchasing offset credits or emission performance credits in the open market, or acquiring "fund credits" by making payments of CDN$15 per metric tonne to the Alberta Climate Change and Management Fund. The direct and indirect costs of these regulations may adversely affect our operations and financial results.
Rates
Commercial arrangements at our facilities in the U.S. are subject to the jurisdiction of regulators, including FERC, the OCC and the CPUC. With authorization of the Alberta Government, commercial arrangements at our facility in Alberta, Canada, could be regulated by the AUC, but it is not currently Alberta Government policy to apply any such rate regulation. Each of our facilities currently has the ability to negotiate and charge rates based upon market prices, and are not limited to charging cost-of-service rates which are capped at recovery of costs plus a reasonable rate of return. The exemptions we receive under the regulatory regimes applicable to us enable us to buy, sell and store natural gas for our own account at our existing storage assets. The ability to charge market-based rates enables us to charge greater prices than many other storage providers which are required to charge cost-of-service based rates and our ability to buy, sell and store natural gas for our own account enables us to optimize our working gas capacity. In addition, we are permitted to consolidate management, marketing, and administrative functions for efficiencies in matters that some competing operators are prohibited from due to affiliate rules to which they are subject.
Employees
As of March 31, 2013, we had 133 employees. Our executive officers are currently employed by Niska Partners Management ULC and subsidiaries of Niska Gas Storage Partners LLC.
14
Table of Contents
Competition
The natural gas storage business is competitive. The principal elements of competition among storage facilities are rates, terms of service, types of service, access to supply sources, access to demand markets and flexibility and reliability of service. Because our facilities are strategically located in key North American natural gas producing and consuming regions, we face competition from existing competitors who also operate in those markets. Our competitors include natural gas storage companies, major integrated energy companies, pipeline operators and natural gas marketers of varying sizes, financial resources and experience. Competitors of the AECO Hub™ currently include TransCanada (Edson, CrossAlta), Atco (Carbon) and Enstor (Alberta Hub). Competitors of our Wild Goose facility currently include Buckeye Partners (Lodi), PG&E, NW Natural (Gill Ranch), Central Valley Gas and a number of proposed projects in northern California. Competitors of our Salt Plains facility currently include Southern Star. Given the key location of our facilities, additional competition in the markets we serve could arise from new developments or expanded operations from existing competitors. We anticipate that growing demand for natural gas storage in the markets we serve will be met with increasing storage capacity, either through the expansion of existing facilities or the construction of new storage facilities.
Seasonality
Our cash expenditures related to our optimization activities are highest during summer months, and our cash receipts from our optimization activities are highest during winter months. Consequently, our results of operations for the summer are generally lower than for the winter.
Geographic Data; Financial Information about Segments
See Note 22 to our Consolidated Financial Statements.
Available Information
We make available, free of charge on our Internet website (http://www.niskapartners.com), our annual report on Form 10-K, quarterly reports on Form 10-Q, current reports on Form 8-K, and amendments to those reports filed or furnished pursuant to Section 13(a) or 15(d) of the Exchange Act as soon as reasonably practicable after we electronically file the material with, or furnish it to, the Securities and Exchange Commission ("SEC").
The public may also read and copy any materials we have filed with the SEC at the SEC's Public Reference Room at 100 F Street, NE, Room 1580, Washington, DC 20549. Information on the operation of the Public Reference Room may be obtained by calling the SEC at 1-800-SEC-0330. The SEC maintains an internet website that contains our reports, proxy and information statements and our other SEC filings. The address of that site is www.sec.gov.
15
Table of Contents
Item 1A. Risk Factors.
In addition to the factors discussed elsewhere in this report, including the financial statements and related notes, you should consider carefully the risks and uncertainties described below, which could materially adversely affect our business, financial condition and results of operations. If any of these risks or uncertainties were to occur, our business, financial condition or results of operation could be adversely affected.
Risks Inherent in Our Business
We may not have sufficient cash following the establishment of cash reserves and payment of fees and expenses to enable us to make cash distributions to holders of our common units at the minimum quarterly distribution rate under our cash distribution policy.
We may not have sufficient cash each quarter to pay the full amount of our minimum quarterly distribution of $0.35 per unit, or $1.40 per unit per year, which will require cash of approximately $12.3 million per quarter, or $49.2 million per year, based on the number of common units currently outstanding. Under our cash distribution policy, the amount of cash we can distribute on our units principally depends upon the amount of cash generated from our operations, which will fluctuate based on, among other things:
- •
- the rates that we are able to charge new or renewing storage customers that are influenced by, among other things, weather and the seasonality and volatility of natural gas demand and supply;
- •
- our ability to continue to buy, sell and store natural gas for profit at our facilities as well as the cost of natural gas that we purchase for our own account and the duration for which we store it;
- •
- the risk that changes in the regulatory status of one or more of our facilities could remove the right to negotiate market-based rates, instead imposing cost of service rates, could adversely impact the rates we charge;
- •
- technical and operating performance at our facilities;
- •
- the level of our operating and maintenance and general and administrative costs; and
- •
- nonpayment or other nonperformance by our customers.
In addition, the actual amount of cash we will have available for distribution will depend on other factors, including:
- •
- the level of capital expenditures we make;
- •
- the cost of acquisitions that we make, if any;
- •
- our debt service requirements;
- •
- fluctuations in interest rates and currency exchange rates;
- •
- fluctuations in our working capital needs;
- •
- our ability to borrow funds and access capital markets;
- •
- restrictions on distributions contained in debt agreements;
- •
- the amount of cash reserves established by our board;
- •
- fluctuations or changes in tax rates, including Canadian income and withholding taxes; and
- •
- prevailing economic conditions.
16
Table of Contents
For a description of additional restrictions and factors that may affect our ability to pay cash distributions, see "Management's Discussion and Analysis of Financial Condition and Results of Operations—Liquidity and Capital Resources."
Any reduction in the amount of cash available for distributions could impact our ability to pay the minimum quarterly distribution on our common units in full. Moreover, we may not be able to increase distributions on our common units.
The amount of cash we have available for distribution to holders of our units depends primarily on our cash flow and not solely on profitability, which may prevent us from making cash distributions during periods when we record net earnings.
The amount of cash we have available for distribution depends primarily upon our cash flow, including cash flow from reserves and working capital or other borrowings, and not solely on profitability, which will be affected by non-cash items. As a result, we may pay cash distributions during periods when we record net losses for financial accounting purposes and may not pay cash distributions during periods when we record net earnings.
Our level of exposure to the market value of natural gas storage services could adversely affect our revenues and cash available to make distributions.
As portions of our third-party natural gas storage contract portfolio come up for replacement or renewal, and capacity becomes available, adverse market conditions may prevent us from replacing or renewing the contracts on terms favorable to us. The market value of our storage capacity, realized through the value customers are willing to pay for LTF contracts or via the opportunities to be captured by our STF contracts or optimization activities, could be adversely affected by a number of factors beyond our control, including:
- •
- prolonged reduced natural gas price volatility;
- •
- a material reduction in the difference between winter and summer prices on the natural gas futures market, sometimes referred to as the seasonal spread, due to real or perceived changes in supply and demand fundamentals;
- •
- a decrease in demand for natural gas storage in the markets we serve;
- •
- increased competition for storage in the markets we serve; and
- •
- interest rates which, when higher, increase the cost of carrying owned or customer inventory.
A prolonged downturn in the natural gas storage market due to the occurrence of any of the above factors could result in our inability to renegotiate or replace a number of our LTF contracts upon their expiration, leaving more capacity exposed to the value that could be generated through STF contracts or optimization. STF and optimization values would be impacted by the same factors, and market conditions could deteriorate further before the opportunity to extract value with those strategies could be realized.
Further, our lines of business and assets are concentrated solely in the natural gas storage industry. Thus, adverse developments, including any of the industry-specific factors listed above, would have a more severe impact on our business, financial condition, results of operations and ability to pay distributions than if we maintained a more diverse business.
We face significant competition that may cause us to lose market share, negatively affecting our business.
Our ability to renew or replace existing contracts with our customers at rates sufficient to maintain current revenue and cash flows could be adversely affected by the activities of our competitors. The
17
Table of Contents
natural gas storage business is competitive. The principal elements of competition among storage facilities are rates, terms of service, types of service, deliverability, supply and market access, flexibility and reliability of service. Our operations compete primarily with other storage facilities in the same markets in the storage of natural gas. The CPUC has adopted policies that favor the development of new storage projects and there are numerous projects, including expansions of existing facilities and greenfield construction projects, at various stages of development in the market where our Wild Goose facility operates. These projects, if developed and placed into service, may compete with our storage operations.
We also compete with certain pipelines, marketers and liquefied natural gas, or LNG, facilities that provide services that can substitute for certain of the storage services we offer. In addition, natural gas as a fuel competes with other forms of energy available to end-users, including electricity, coal and liquid fuels. Increased demand for such forms of energy at the expense of natural gas could lead to a reduction in demand for natural gas storage services. Some of our competitors have greater financial resources and may now, or in the future, have greater access to expansion or development opportunities than we do.
If our competitors substantially increase the resources they devote to the development and marketing of competitive services or substantially decrease the prices at which they offer their services, we may be unable to compete effectively. Some of these competitors may expand or construct new storage facilities that would create additional competition for us. The storage facility expansion and construction activities of our competitors could result in storage capacity in excess of actual demand, which could reduce the demand for our services, and potentially reduce the rates that we receive for our services.
We also face competition from alternatives to natural gas storage—ways to increase supply of or reduce demand for natural gas at peak times such that storage is less necessary. For example, excess production or supply capability with sufficient delivery capacity on standby until required for peak demand periods or ability for significant demand to quickly switch to alternative fuels at peak times would represent alternatives to natural gas storage.
Competition could intensify the negative impact of factors that significantly decrease demand for natural gas at peak times in the markets served by our storage facilities, such as competing or alternative forms of energy, a recession or other adverse economic conditions, weather, higher fuel costs and taxes or governmental or regulatory actions that directly or indirectly increase the cost or limit the use of natural gas. Increased competition could reduce the volumes of natural gas stored in our facilities or could force us to lower our storage rates.
If third-party pipelines interconnected to our facilities become unavailable or more costly to transport natural gas, our business could be adversely affected.
We depend upon third-party pipelines that provide delivery options to and from our storage facilities for our benefit and the benefit of our customers. Because we do not own these pipelines, their continuing operation is not within our control. These pipelines may become unavailable for a number of reasons, including testing, maintenance, line repair, reduced operating pressure, lack of operating capacity or curtailments of receipt or deliveries due to insufficient capacity. In addition, these third-party pipelines may become unavailable to us and our customers because of the failure of the interconnects that transport natural gas between our facilities and the third-party pipelines. Because of the limited number of interconnects at our facilities (Wild Goose is connected to third- party pipelines by two interconnects, AECO Hub™ by two interconnects (one at each facility) and Salt Plains by two interconnects), the failure of any interconnect could materially impact our ability or the ability of our customers to deliver natural gas into the third-party pipelines. If the costs to us or our customers to access and transport on these third-party pipelines significantly increase, our profitability could be
18
Table of Contents
reduced. If third-party pipelines become partially or completely unavailable, our ability to operate could be restricted, thereby reducing our profitability. A prolonged or permanent interruption at any key pipeline interconnect could have a material adverse effect on our business, financial condition, results of operations and ability to pay distributions to our members.
Our operations are subject to operational hazards and unforeseen interruptions, which could have a material adverse effect on our business.
Our operations are subject to the many hazards inherent in the storage of natural gas, including, but not limited to:
- •
- negative unpredicted performance by our storage reservoirs that could cause us to fail to meet expected or forecasted operational levels or contractual commitments to our customers;
- •
- unanticipated equipment failures at our facilities;
- •
- damage to storage facilities and related equipment caused by tornadoes, hurricanes, floods, earthquakes, fires, extreme weather conditions and other natural disasters and acts of terrorism;
- •
- damage from construction and farm equipment or other surface uses;
- •
- leaks of or other losses of natural gas as a result of the malfunction of equipment or facilities;
- •
- migration of natural gas through faults in the rock or to some area of the reservoir where the existing wells cannot drain the natural gas effectively;
- •
- blowouts (uncontrolled escapes of natural gas from a well), fires and explosions;
- •
- operator error; and
- •
- environmental pollution or release of toxic substances.
These risks could result in substantial losses due to breaches of our contractual commitments, personal injury or loss of life, damage to and destruction of property and equipment and pollution or other environmental damage and may result in curtailment or suspension of our operations. In addition, operational interruptions or disturbances, mechanical malfunctions, faulty measurements or other acts, omissions, or errors may result in significant costs or lost revenues. Natural gas that moves outside of the effective drainage area through migration could be permanently lost and will need to be replaced to maintain design storage performance.
Information technology systems present potential targets for cyber security attacks.
We are reliant on technology to improve efficiency in our business. Information technology systems are critical to the operations of the Company. These systems could be a potential target for a cyber security attack as they are used to store and process sensitive information regarding our operations, financial position, and information pertaining to our customers and vendors. While we take the utmost precautions, we cannot guarantee safety from all threats and attacks. Any successful breach of security could result in the spread of inaccurate or confidential information, disruption of operations, environmental harm, endangerment of employees, damage to our assets, and increased costs to respond. Any of these instances could have a negative impact on cash flows, litigation status and/or our reputation, which could have a material adverse affect on our business, financial conditions, and operations. There is no guarantee that adequate insurance to cover the effects of a cyber security attack will be available at rates we believe are reasonable in the near future or that the cost of responding to a breach will be covered by insurance or recoverable in rates.
19
Table of Contents
We are not fully insured against all risks incident to our business, and if an accident or event occurs that is not fully insured it could adversely affect our business.
We may not be able to obtain the levels or types of insurance we desire, and the insurance coverage we do obtain may contain large deductibles or fail to cover certain hazards or cover all potential losses. The occurrence of any operating risks not covered by insurance could have a material adverse effect on our business, financial condition, results of operations and ability to pay distributions to our members.
We are exposed to the credit risk of our customers, and any material nonpayment or nonperformance by our key customers could adversely affect our financial results and cash available for distribution.
We are subject to the risk of loss resulting from nonpayment or nonperformance by our customers. Our credit procedures and policies may not be adequate to fully eliminate customer credit risk. If we fail to adequately assess the creditworthiness of existing or future customers or unanticipated deterioration in their creditworthiness, any resulting increase in nonpayment or nonperformance by them and our inability to re-market or otherwise use the capacity could have a material adverse effect on our business, financial condition, results of operations and ability to pay distributions to our members.
Weakening world market conditions could impact our operations.
Cash management is an important component to any successful business and our operations heavily rely on our ability to collect from our customers and obtain and secure financing. The recent financial crisis has increased uncertainty and volatility in credit markets. Continuing or further disruptions in global financial markets, including stress on financial institutions, could negatively impact the availability and cost of credit in the future. An increase in interest rates or unavailability of credit could materially adversely affect our cash flows and that of our vendors, thereby having an impact on our operations, ability to make distributions, and ability to make capital expenditures. Reduced availability or increased cost of credit could also adversely impact the financial condition of our customers, and reduce demand for our products and services as a result.
Our debt levels may limit our flexibility in obtaining additional financing and in pursuing other business opportunities.
We have $643.8 million principal amount outstanding of the 8.875% senior notes due 2018 of Niska US and Niska Canada. In addition, we have credit facilities that provide us up to $400 million in borrowing capacity. Our level of debt could have important consequences to us, including the following:
- •
- additional financing for working capital, capital expenditures, acquisitions or other purposes may be impaired or such financing may not be available on favorable terms;
- •
- we will need a substantial portion of our cash flow to make principal and interest payments on our indebtedness, reducing the funds that would otherwise be available for operations, future business opportunities and distributions to members; and
- •
- we may be more vulnerable to competitive pressures or a downturn in our business or the economy generally than our competitors with less debt.
Our ability to service our debt will depend upon, among other things, our future financial and operating performance, which will be affected by prevailing economic conditions and financial, business, regulatory and other factors, some of which are beyond our control. In addition, our ability to service our debt under our credit facilities will depend on market interest rates because the interest rates applicable to our borrowings will fluctuate with movements in interest rate markets. If our operating results are not sufficient to service our current or future indebtedness, we will be forced to take actions
20
Table of Contents
such as reducing or terminating distributions and reducing or delaying our business activities, acquisitions, investments or capital expenditures. In addition, we may take actions such as selling assets, restructuring or refinancing our debt or seeking additional equity capital although we may not be able to effect any of these actions on satisfactory terms, or at all. Our inability to obtain additional financing on terms favorable to us or our inability to service our debt could have a material adverse effect on our business, results of operations, financial condition and ability to pay distributions. See "Management's Discussion and Analysis of Financial Condition and Results of Operations—Liquidity and Capital Resources."
Restrictions in the agreements governing our indebtedness could limit our ability to make distributions to our members.
We are dependent upon the cash flow generated by our operations in order to meet our debt service obligations and to allow us to make distributions to our members. The operating and financial restrictions and covenants in our credit agreement, the indenture governing our senior notes and any future financing agreements could restrict our ability to finance future operations or capital needs or to expand or pursue our business activities, which may, in turn, limit our ability to make distributions to our members. For example, our credit agreement and the indenture governing our senior notes restrict or limit our ability to:
- •
- make distributions;
- •
- incur additional indebtedness or guarantee other indebtedness;
- •
- grant liens or make certain negative pledges;
- •
- make certain loans or investments;
- •
- engage in transactions with affiliates;
- •
- make any material change to the nature of our business;
- •
- make a disposition of assets; or
- •
- enter into a merger or plan to consolidate, liquidate, wind up or dissolve.
Furthermore, our credit agreement contains covenants requiring us to maintain certain financial ratios and tests, including that we maintain a fixed charge coverage ratio of 1.1 to 1.0 at the end of each fiscal quarter when excess availability under both revolving credit facilities is less than 15% of the aggregate amount of availability under both credit facilities. Our ability to comply with those covenants may be affected by events beyond our control, including prevailing economic, financial and industry conditions. If we violate any of the restrictions, covenants, ratios or tests in our credit agreement or the indenture governing our senior notes, the lenders or the note holders, as the case may be, will be able to accelerate the maturity of all borrowings and demand repayment of amounts outstanding, our lenders' commitment to make further loans to us may terminate, and we may be prohibited from making distributions to our members. We might not have, or be able to obtain, sufficient funds to make these accelerated payments.
The indenture governing our senior notes prohibits us from making distributions to unitholders if any default or event of default (as defined in the indenture) exists. In addition, both the indenture and our credit agreement contain covenants limiting our ability to pay distributions to unitholders. The covenants apply differently depending on our fixed charge coverage ratio (defined substantively the same in the indenture and the credit agreement). If the fixed charge coverage ratio is greater than 1.75 to 1.0, we will be permitted to make restricted payments, including distributions to our unitholders, if the aggregate restricted payments since the date of our IPO, excluding certain types of permitted payments, are less than the sum of a number of items including, most importantly, operating
21
Table of Contents
surplus (defined similarly to the definition in our Operating Agreement) calculated as of the end of our preceding fiscal quarter and the aggregate net cash proceeds received by us as a capital contribution or from the issuance of equity interests, including the net proceeds received from our IPO. The indenture governing our senior notes contains an additional general basket of $75 million not contained in our credit agreement.
See "Management's Discussion and Analysis of Financial Condition and Results of Operations—Liquidity and Capital Resources—Our $400.0 Million Credit Agreement" and "Our 8.875% Senior Notes Due 2018." Any subsequent replacement of our credit agreement, our senior notes or any new indebtedness could have similar or greater restrictions.
We will be required to make capital expenditures to increase our asset base. If we are unable to obtain needed capital or financing on satisfactory terms, our ability to pay cash distributions may be diminished or our financial leverage could increase.
In order to increase our asset base, we will need to make expansion capital expenditures. If we do not make sufficient or effective expansion capital expenditures, we will be unable to expand our business operations. To fund our expansion capital expenditures, we will be required to use cash from our operations or incur borrowings or sell additional common units or other membership interests. Such uses of cash from operations will reduce cash available for distribution to our members. Our ability to obtain bank financing or to access the capital markets for future equity or debt offerings may be limited by our financial condition at the time of any such financing or offering and the covenants in our existing debt agreements, as well as by general economic conditions and contingencies and uncertainties that are beyond our control. Even if we are successful in obtaining the necessary funds, the terms of such financings could limit our ability to pay distributions to our members. In addition, incurring additional debt may significantly increase our interest expense and financial leverage and issuing additional membership interests may result in significant unitholder dilution and increase the aggregate amount of cash required to maintain the then-current distribution rate, which could materially decrease our ability to pay distributions at the then-current distribution rate.
If we do not successfully complete expansion projects or make and integrate acquisitions that are accretive, our future growth may be limited.
A principal focus of our strategy is to expand our business. Our ability to grow depends on our ability to complete expansion and development projects and make acquisitions that result in an increase in cash per unit generated from operations. We may be unable to successfully complete accretive expansion or development projects or acquisitions for any of the following reasons:
- •
- we are unable to identify attractive expansion or development projects or acquisition candidates or we are outbid by competitors;
- •
- we are unable to obtain necessary regulatory and/ or government approvals;
- •
- we are unable to realize anticipated costs savings or successfully integrate the businesses we build or acquire;
- •
- we are unable to raise financing on acceptable terms;
- •
- we make or rely upon mistaken assumptions about volumes, revenues and costs, including synergies and potential growth;
- •
- we are unable to secure adequate customer commitments to use the newly expanded or acquired facilities;
- •
- we are unable to hire, train or retain qualified personnel to manage and operate our business and assets;
22
Table of Contents
- •
- we are unable to complete expansion projects on schedule and within budgeted costs;
- •
- we assume unknown liabilities when making acquisitions for which we are not indemnified or for which our indemnity is inadequate;
- •
- our management's and employees' attention is diverted because of other business concerns; or
- •
- we experience unforeseen difficulties operating in new product areas or new geographic areas.
If any expansion or development project or acquisition eventually proves not to be accretive to our cash flow per unit, our business, financial condition, results of operations and ability to pay distributions to our members may be materially adversely affected.
Exposure to currency exchange rate fluctuations will result in fluctuations in our cash flows and operating results.
Currency exchange rate fluctuations could have an adverse effect on our results of operations. Historically, a portion of our revenue has been generated in Canadian dollars, but we incur operating and administrative expenses in both U.S. dollars and Canadian dollars and financing expenses in U.S. dollars. If the Canadian dollar weakens significantly, we would be required to convert more Canadian dollars to U.S. dollars to satisfy our obligations, which would cause us to have less cash available for distribution.
A significant strengthening of the U.S. dollar could result in an increase in our financing expenses and could materially affect our financial results under U.S. GAAP. In addition, because we report our operating results in U.S. dollars, changes in the value of the U.S. dollar also result in fluctuations in our reported revenues and earnings. In addition, under U.S. GAAP, all foreign currency-denominated monetary assets and liabilities such as cash and cash equivalents, accounts receivable, restricted cash, accounts payable, long-term debt, capital lease obligations and asset retirement obligations are revalued and reported based on the prevailing exchange rate at the end of the reporting period. This revaluation may cause us to report significant non-monetary foreign currency exchange gains and losses in certain periods.
Our operations are subject to environmental and worker safety laws and regulations that may expose us to significant costs and liabilities.
Our natural gas storage activities are subject to stringent and complex federal, state, provincial and local environmental and worker safety laws and regulations. We may incur substantial costs in order to conduct our operations in compliance with these laws and regulations. Moreover, new, stricter environmental laws, regulations or enforcement policies could be implemented that significantly increase our compliance costs or the cost of any remediation of environmental contamination that may become necessary, and these costs could be material. In addition, laws and regulations to reduce emissions of greenhouse gases could affect the production or consumption of natural gas and, adversely affect the demand for our storage services and the rates we are able to charge for those services. See "Business—Regulation" for more information.
A change in the jurisdictional characterization of our assets by regulatory agencies or a change in policy by those agencies may result in increased regulation of our assets, which may cause our revenues to decline and operating expenses to increase.
AECO Hub™ in Alberta is not currently subject to rate regulation. The Alberta Energy Resources Conservation Board, or the ERCB, has jurisdiction to regulate the technical aspects of construction, development, and operation of storage facilities. If approved to do so by the Alberta Government, the AUC, may also set prices for natural gas stored in Alberta. It is not currently Alberta Government policy to disturb market-based prices of independent natural gas storage facilities. If, however, the
23
Table of Contents
AUC was authorized to regulate the rates we charge, it could materially adversely affect our business. In addition, a connected pipeline tolling structure is available to our customers at AECO Hub™, allowing them to inject and withdraw natural gas without incremental transportation costs. There has been a decision to include the previously provincially-regulated Alberta System under the jurisdiction of the Federal National Energy Board, or NEB, and it is possible that the NEB could assume federal jurisdiction over, and set rates for, connected storage facilities, including AECO Hub™, or invoke transportation toll design changes that negatively impact AECO Hub™.
Our Wild Goose operations are regulated by the CPUC. The CPUC has authorized us to charge our Wild Goose customers market-based rates because, as an independent storage provider, we, rather than ratepayers, bear the risk of any underutilized or discounted storage capacity. If the CPUC changes this determination, for instance as a result of a complaint, we could be limited to charging rates based on our cost of providing service plus a reasonable rate of return, which could have an adverse impact on our revenues associated with providing storage services.
Our Salt Plains operations are subject to primary regulation by the OCC and are permitted to conduct a limited amount of storage service in interstate commerce under Federal Energy Regulatory Commission, or FERC, regulations and policies that allow pipeline and storage companies to engage in interstate commerce (commonly known as NGPA section 311 services under the Natural Gas Policy Act of 1978), which services are not subject to FERC's broader jurisdiction under the Natural Gas Act. These section 311 services are provided by Salt Plains pursuant to a Statement of Operating Conditions which is on file with FERC. FERC has permitted Salt Plains to charge market-based rates for its section 311 services. Market-based rate authority allows Salt Plains to negotiate rates with individual customers based on market demand. This right to charge market-based rates may be challenged by a party filing a complaint with FERC. Our market-based rate authorization may also be re-examined if we add substantial new storage capacity through expansion or acquisition and as a result obtain market power. Any successful complaint or protest against our rates, or re-examination of those rates by FERC, could limit us to charging rates based on our cost of providing service plus a reasonable rate of return, and could have an adverse impact on our revenues associated with providing storage services. Should FERC or the OCC change their relevant policies, or should we no longer qualify for primary regulation by the OCC, our results of operations could be materially adversely affected.
Our current natural gas storage operations in the United States are generally exempt from the jurisdiction of FERC, under the Natural Gas Act of 1938, or the Natural Gas Act or, in the case of Salt Plains, are providing services under NGPA section 311. If our operations become subject to FERC regulation under the Natural Gas Act, such regulation may extend to such matters as:
- •
- rates, operating terms and conditions of service;
- •
- the types of services we may offer to our customers;
- •
- the expansion of our facilities;
- •
- creditworthiness and credit support requirements;
- •
- relationships among affiliated companies involved in certain aspects of the natural gas business; and
- •
- various other matters.
In the event that our operations become subject to FERC regulation, and should we fail to comply with all applicable FERC-administered statutes, rules, regulations and orders, we could be subject to substantial penalties and fines. Under the Energy Policy Act of 2005, or EPA Act 2005, FERC has civil penalty authority under the Natural Gas Act to impose penalties for certain violations of up to $1,000,000 per day for each violation. FERC also has the authority to order disgorgement of profits from transactions deemed to violate the Natural Gas Act and the EPA Act 2005.
24
Table of Contents
We hold title to our storage reservoirs under various types of leases and easements, and our rights thereunder generally continue only for so long as we pay rent or, in some cases, minimum royalties.
Our rights under storage easements and leases continue for so long as we conduct storage operations and pay our grantors for our use, or otherwise pay rent owing to the applicable lessor. If we were unable to operate our storage facilities for a prolonged period of time (generally one year) or did not pay the rent or minimum royalty, as applicable, to maintain such storage easements and leases in good standing, we might lose title to our natural gas storage rights underlying our storage facilities. In addition, title to some of our real property assets may have title defects which have not historically materially affected the ownership or operation of our assets. In either case, to recover our lost rights or to remove the title defects, we would be required to utilize significant time and resources. In addition, we might be required to exercise our power of condemnation to the extent available. Condemnation proceedings are adversarial proceedings, the outcomes of which are inherently difficult to predict, and the compensation we might be required to pay to the parties whose rights we condemn could be significant and could materially adversely affect our business, financial condition, results of operations and ability to pay distributions to our members.
Our financial results are seasonal and generally lower in the second and third quarters of the calendar year, which may require us to borrow money in order to make distributions to our members during these quarters.
Our cash expenditures related to our optimization activities are highest during summer months, and our cash receipts from our optimization activities are highest during winter months. As a result, our results of operations for the summer are generally lower than for the winter. With lower cash flow during the second and third calendar quarters, we may be required to borrow money in order to pay distributions to our members. Any restrictions on our ability to borrow money could restrict our ability to pay the minimum quarterly distributions to our members.
Our risk management policies cannot eliminate all commodity price risk. In addition, any non-compliance with our risk management policies could result in significant financial losses.
While our hedging policies are designed to minimize commodity price risk, some degree of exposure to unforeseen fluctuations in market conditions remains. We have in place risk management systems that are intended to quantify and manage risks, including risks related to our hedging activities such as commodity price risk and basis risk. We monitor processes and procedures to prevent unauthorized trading and to maintain substantial balance between purchases and future sales and delivery obligations. However, these steps may not detect and prevent all violations of our risk management policies and procedures, particularly if deception or other intentional misconduct is involved. There is no assurance that our risk management procedures will prevent losses that would negatively affect our business, financial condition, results of operations and ability to pay distributions to our members. See "Management's Discussion and Analysis of Financial Condition and Results of Operations—Risk Management Policy and Practices."
New derivatives legislation could have an adverse impact on our ability to hedge risks associated with our business and on the cost of our hedging activities.
We use over-the-counter (OTC) derivative products to hedge commodity risks and, to a lesser extent, our currency risks. On July 21, 2010 new comprehensive financial reform legislation, known as the Dodd-Frank Wall Street Reform and Consumer Protection Act (the "Dodd-Frank Act"), was enacted that establishes federal oversight and regulation of the over-the-counter derivatives market and entities, including us, that participate in that market. The Dodd-Frank Act requires the CFTC, the SEC and other regulators to promulgate rules and regulations implementing the new legislation. In its rulemaking under the Dodd-Frank Act the CFTC has issued final regulations to set position limits for certain futures and option contracts in the major energy markets and for swaps that are their economic equivalents. Certain bona fide hedging transactions would be exempt from these position limits. The
25
Table of Contents
position limits rule was vacated by the United States District Court for the District of Colombia in September of 2012 although the CFTC has stated that it will appeal the District Court's decision. The CFTC also has finalized other regulations, including critical rulemakings on the definition of "swap", "security-based swap", "swap dealer" and "major swap participant". The Dodd-Frank Act and CFTC Rules also may require us in connection with certain derivatives activities to comply with clearing and trade-execution requirements (or take steps to qualify for an exemption to such requirements). In addition new regulations may require us to comply with margin requirements although these regulations are not finalized and their application to us is uncertain at this time. Other regulations also remain to be finalized, and the CFTC has delayed the compliance dates for various regulations already finalized. As a result it is not possible at this time to predict with certainty the full effects of the Dodd-Frank Act and CFTC rules on us and the timing of such effects. The Dodd-Frank Act also may require the counterparties to our derivative instruments to spin off some of their derivatives activities to a separate entity, which may not be as creditworthy as the current counterparty.
The Dodd-Frank Act and any new regulations could significantly increase the cost of derivative contracts (including from swap recordkeeping and reporting requirements and through requirements to post collateral which could adversely affect our available liquidity), materially alter the terms of derivative contracts, reduce the availability of derivatives to protect against risks we encounter, reduce our ability to monetize or restructure our existing derivative contracts, and increase our exposure to less creditworthy counterparties. If we reduce our use of derivatives as a result of the Dodd-Frank Act and regulations, our results of operations may become more volatile and our cash flows may be less predictable. Finally, the Dodd-Frank Act was intended, in part, to reduce the volatility of natural gas prices, which some legislators attributed to speculative trading in derivatives and commodity instruments related to natural gas. Our revenues could therefore be adversely affected if a consequence of the Dodd-Frank Act and regulations is to lower commodity prices. Any of these consequences could have a material adverse effect on us, our financial condition, and our results of operations.
We may enter into commercial obligations that exceed the physical capabilities of our facilities.
We enter into LTF and STF contracts and proprietary optimization transactions based on our understanding of the injection, withdrawal and working gas storage capabilities of our facilities as well as the expected usage patterns of our customers. If our understanding of the capabilities of our facilities or our expectations of the usage by customers is inaccurate we may be obligated to customers to inject, withdraw or store natural gas in manners which our facilities are not physically able to satisfy. If we are unable to satisfy our obligations to our customers we may be liable for damages, the customers could have the right to terminate their contracts with us, and our reputation and customer relationships may be damaged.
Our operations could be affected by terrorist activities and catastrophic events that could result from terrorism.
In the event that our storage facilities are subject to terrorist activities, such activities could significantly impair our operations and result in a decrease in revenues and additional costs to repair and insure our assets. The effects of, or threat of, terrorist activities could result in a significant decline in the North American economy and the decreased availability and increased cost of insurance coverage. Any of these factors could have a material adverse effect on our business, financial condition, results of operations and ability to pay distributions to our members.
We depend on a limited number of customers for a significant portion of our revenues. The loss of any of these customers could result in a decline in our revenues and cash available to make distributions.
We rely on a limited number of customers for a significant portion of our revenues. The loss of all or a portion of the revenues attributable to our key customers as a result of competition, creditworthiness, inability to negotiate extensions or replacements of contracts or otherwise, could have
26
Table of Contents
a material adverse effect on our business, financial condition, results of operations and ability to pay distributions to our members.
Risks Related to Our Structure
Holdco currently controls our manager, which has sole responsibility for conducting our business and managing our operations. Our manager has delegated this responsibility to our board, all of the members of which are appointed by our manager. Our manager and its affiliates, including Holdco, have conflicts of interest with us and limited duties, and they may favor their own interests to the detriment of our common unitholders.
Holdco owns and controls our manager. Our manager appoints all of the members of our board, which manages and operates us. Some of our directors and executive officers are directors or officers of our manager or its affiliates, including Holdco. Although our board has a contractual duty to manage us in a manner beneficial to us and our unitholders, our directors and officers have a fiduciary duty to manage our business in a manner beneficial to Holdco. Therefore, conflicts of interest may arise between Holdco and its affiliates, including our manager, on the one hand, and us and our unitholders, on the other hand. In resolving these conflicts of interest, our board may favor our manager's own interests and the interests of its affiliates over the interests of our common unitholders. These conflicts include the following situations:
- •
- neither our Operating Agreement nor any other agreement requires Holdco to pursue a business strategy that favors us or our unitholders;
- •
- pursuant to our Operating Agreement, our manager has limited its liability and defined its and our board's duties in ways that are protective of it and the board as compared to liabilities and fiduciary duties that would be imposed upon a managing member under Delaware law in the absence of such definition. Our Operating Agreement also restricts the remedies available to our unitholders for actions that, without the limitations, might constitute breaches of fiduciary duty under Delaware common law;
- •
- our board determines the amount and timing of asset purchases and sales, borrowings, issuance of additional membership interests and reserves, each of which can affect the amount of cash that is distributed to unitholders;
- •
- our board determines the amount and timing of any capital expenditures and, based on the applicable facts and circumstances, whether a capital expenditure is classified as a maintenance capital expenditure. This determination can affect the amount of cash that is distributed to our unitholders and to the holders of the new incentive distribution rights;
- •
- our board determines which costs incurred by our manager and its affiliates are reimbursable by us;
- •
- our Operating Agreement does not restrict our manager from causing us to pay it or its affiliates for any services rendered to us or entering into additional contractual arrangements with its affiliates on our behalf;
- •
- our manager may exercise its right to call and purchase common units if it and its affiliates own more than 80% of the common units;
- •
- Holdco and its affiliates are not limited in their ability to compete with us;
- •
- our manager is allowed to take into account the interests of parties other than us, including Holdco and its affiliates, in resolving conflicts of interest with us;
- •
- except in limited circumstances, our manager has the power and authority to conduct our business without unitholder approval;
27
Table of Contents
- •
- our Operating Agreement permits us to borrow funds to permit the payment of cash distributions or fund operating expenditures;
- •
- our manager may cause us to borrow funds in order to permit the payment of cash distributions, even if the purpose or effect of the borrowing is to make incentive distributions;
- •
- our Operating Agreement permits us to distribute up to $50.0 million from capital sources, including on the new incentive distribution rights, without treating such distribution as a distribution from capital;
- •
- our manager controls the enforcement of the obligations that it and its affiliates owe to us; and
- •
- our manager decides whether to retain separate counsel, accountants or others to perform services for us.
Affiliates of our manager, including Holdco and the Carlyle/Riverstone Funds and their portfolio company subsidiaries, are not limited in their ability to compete with us and are not obligated to offer us the opportunity to pursue additional assets or businesses.
Our Operating Agreement among us, Holdco and others does not prohibit affiliates of our manager, including Holdco and the Carlyle/Riverstone Funds, from owning assets or engaging in businesses that compete directly or indirectly with us. The Carlyle/Riverstone Funds and their portfolio companies may acquire, construct or dispose of additional natural gas storage or other assets in the future, without any obligation to offer us the opportunity to purchase or construct any of those assets. The Carlyle/Riverstone Funds and their affiliates are large, established participants in the energy industry and may have greater resources than we have, which may make it more difficult for us to compete with these entities with respect to commercial activities as well as for acquisition opportunities. As a result, competition from these entities could adversely impact our business, financial condition, results of operations and ability to pay distributions to our members.
Holders of our common units have limited voting rights and are not entitled to elect our manager or our directors.
Unlike the holders of common stock in a corporation, unitholders have only limited voting rights on matters affecting our business and, therefore, limited ability to influence management's decisions regarding our business. Unitholders will have no right to elect our manager or our board on an annual or other continuing basis. Our board, including our independent directors, is chosen entirely by our manager. Unlike publicly-traded corporations, we do not conduct annual meetings of our unitholders to elect directors or conduct other matters routinely conducted at annual meetings of stockholders of corporations. Furthermore, if the unitholders were dissatisfied with the performance of our manager, they have little ability to remove our manager.
We are a "controlled company" within the meaning of NYSE rules and, as a result, qualify for, and rely on, exemptions from some of the NYSE listing requirements with respect to independent directors.
Because Holdco controls more than 50% of the voting power for the election of our directors, we are a controlled company within the meaning of NYSE rules, which exempt controlled companies from the following corporate governance requirements:
- •
- the requirement that a majority of the board consist of independent directors;
- •
- the requirement that we have a nominating or corporate governance committee, composed entirely of independent directors, that is responsible for identifying individuals qualified to become board members, consistent with criteria approved by the board, selection of board nominees for the next annual meeting of shareholders, development of corporate governance guidelines and oversight of the evaluation of the board and management;
28
Table of Contents
- •
- the requirement that we have a compensation committee of the board, composed entirely of independent directors, that is responsible for reviewing and approving corporate goals and objectives relevant to chief executive officer compensation, evaluation of the chief executive officer's performance in light of the goals and objectives, determination and approval of the chief executive officer's compensation, making recommendations to the board with respect to compensation of other executive officers and incentive compensation and equity-based plans that are subject to board approval and producing a report on executive compensation to be included in an annual proxy statement or Form 10-K filed with the SEC;
- •
- the requirement that we conduct an annual performance evaluation of the nominating, corporate governance and compensation committees; and
- •
- the requirement that we have written charters for the nominating, corporate governance and compensation committees addressing the committees' responsibilities and annual performance evaluations.
For so long as we remain a controlled company, we are not required to have a majority of independent directors or nominating, corporate governance or compensation committees. Accordingly, our unitholders may not have the same protections afforded to shareholders of companies that are subject to all of the NYSE corporate governance requirements.
Our Operating Agreement limits our manager's and directors' duties to holders of our common units and restricts the remedies available to holders of our common units for actions taken by our manager or board that might otherwise constitute breaches of fiduciary duty.
Our Operating Agreement contains provisions that replace the fiduciary standards to which our manager or directors would otherwise be held by state fiduciary duty laws. The limitation and definition of these duties is permitted by the Delaware law governing limited liability companies. For example, our operating agreement permits our manager or directors to make a number of decisions in their individual capacities, as opposed to their capacities as our manager or directors, free of fiduciary duties to us and our unitholders. This entitles our manager and/or directors to consider only the interests and factors that they desire and relieves them of any duty or obligation to give any consideration to any interest of, or factors affecting, us, our affiliates or our members. Examples of decisions that our manager and/ or directors may make in their individual capacities include:
- •
- how to allocate business opportunities among us and its affiliates;
- •
- whether to exercise its call right;
- •
- how to exercise its voting rights with respect to the units it owns;
- •
- whether to exercise its registration rights;
- •
- whether to elect to reset target distribution levels; and
- •
- whether or not to consent to any merger or consolidation of the partnership or amendment to the partnership agreement.
Even if unitholders are dissatisfied, they cannot initially remove our manager without Holdco's consent.
Unitholders have little ability to remove our manager. The vote of the holders of at least 662/3% of all outstanding common and Notional Subordinated Units voting together as a single class is required to remove our manager. Holdco owns 48.29% of our outstanding common and all of our Notional Subordinated Units. Accordingly, our public unitholders are currently unable to remove our manager without Holdco's consent because Holdco owns sufficient units to be able to prevent the manager's removal.
29
Table of Contents
Our manager, or its interest in us, may be transferred to a third party without unitholder consent.
Our manager may transfer its managing member interest to a third party in a merger or in a sale of all or substantially all of its assets without the consent of our unitholders. Furthermore, our Operating Agreement does not restrict the ability of the owners of our manager from transferring ownership of our manager to a third party. The new owners of our manager would then be in a position to revoke the delegation to our board of the authority to conduct our business and operations or to replace our directors and officers with their own choices. This effectively permits a "change of control" of the company without unitholder vote or consent.
Increases in interest rates could adversely impact our unit price and our ability to issue additional equity to make acquisitions or for other purposes.
An increase in interest rates may cause a corresponding decline in demand for equity investments in general, and in particular for yield-based equity investments such as our common units. Any such increase in interest rates or reduction in demand for our common units resulting from other relatively more attractive investment opportunities may cause the trading price of our common units to decline. Therefore, changes in interest rates may affect our ability to issue additional equity to make acquisitions or for other purposes.
It is our policy to distribute a significant portion of our available cash to our members, which could limit our ability to grow and make acquisitions.
Pursuant to our cash distribution policy, we expect that we will distribute a significant portion of our available cash to our members and will rely primarily upon external financing sources, including commercial bank borrowings and the issuance of debt and equity securities, to fund our acquisitions and expansion capital expenditures. As a result, to the extent we are unable to finance growth externally, our cash distribution policy may impair our ability to grow.
In addition, because we intend to distribute a significant portion of our available cash, our growth may not be as fast as that of businesses that reinvest their available cash to expand ongoing operations. The incurrence of additional commercial borrowings or other debt to finance our growth strategy would result in increased interest expense, which, in turn, may impact the available cash that we have to distribute to our members.
We may issue additional membership interests without unitholder approval, which would dilute a unitholder's existing ownership interests.
Our Operating Agreement does not limit the number of additional membership interests that we may issue at any time without the approval of our unitholders. Our issuance of additional common units or other membership interests of equal or senior rank may have the following effects:
- •
- each unitholder's proportionate ownership interest in us will decrease;
- •
- the amount of cash available for distribution on each unit may decrease;
- •
- the ratio of taxable income to distributions may increase;
- •
- the relative voting strength of each previously outstanding unit may be diminished; and
- •
- the market price of the common units may decline.
Our manager has a call right that may require unitholders to sell their common units at an undesirable time or price.
If at any time our manager and its affiliates own more than 80% of the common units, our manager will have the right, which it may assign to any of its affiliates or to us, but not the obligation, to acquire all, but not less than all, of the common units held by unaffiliated persons at a price not less
30
Table of Contents
than their then-current market price, as calculated pursuant to the terms of our Operating Agreement. As a result, unitholders may be required to sell their common units at an undesirable time or price and may not receive any return on their investment. Unitholders may also incur a tax liability upon a sale of their units. Our manager is not obligated to obtain a fairness opinion regarding the value of the common units to be repurchased by it upon exercise of the call right. There is no restriction in our Operating Agreement that prevents our manager from issuing additional common units and exercising its call right. If our manager exercised its call right, the effect would be to take us private and, if the units were subsequently deregistered, we would no longer be subject to the reporting requirements of the Securities Exchange Act of 1934, as amended, or the Exchange Act. Our manager and its affiliates own approximately 49.3% of our outstanding common units.
Our Operating Agreement restricts the voting rights of unitholders owning 20% or more of our common units.
Our Operating Agreement restricts unitholders' voting rights by providing that any units held by a person or group that owns 20% or more of any class of units then outstanding, other than our manager and its affiliates, their transferees and persons who acquired such units with the prior approval of our board, cannot vote on any matter. Our Operating Agreement also contains provisions limiting the ability of unitholders to call meetings or to acquire information about our operations, as well as other provisions limiting the unitholders' ability to influence the manner or direction of management.
Unitholders may have liability to repay distributions that were wrongfully distributed to them.
Under certain circumstances, unitholders may have to repay amounts wrongfully returned or distributed to them. Under Section 18-607 of the Delaware Limited Liability Company Act, or the Delaware Act, we may not make a distribution to unitholders if the distribution would cause our liabilities to exceed the fair value of our assets. Delaware law provides that for a period of three years from the date of an impermissible distribution, members who received the distribution and who knew at the time of the distribution that it violated Delaware law will be liable to the limited liability company for the distribution amount. A purchaser of common units will be liable for the obligations of the transferor to make contributions to us that are known to such purchaser at the time it became a member and for unknown obligations if the liabilities could be determined from our Operating Agreement.
The market price of our common units could be adversely affected by sales of substantial amounts of our common units in the public or private markets, including sales by Holdco or other large holders.
We have 34,492,245 common units outstanding. 16,992,245 of the common units are owned by Holdco. Sales by Holdco or other large holders of a substantial number of our common units in the public markets, or the perception that such sales might occur, could have a material adverse effect on the price of our common units or could impair our ability to obtain capital through an offering of equity securities. In addition, we provided registration rights to Holdco. Under our Operating Agreement, our manager and its affiliates have additional registration rights relating to the offer and sale of any units that they hold, subject to certain limitations.
31
Table of Contents
Tax Risks to Common Unitholders
Our tax treatment depends on our status as a partnership for federal tax purposes, as well as our not being subject to a material amount of entity-level taxation by individual states. If the Internal Revenue Service, or IRS, treats us as a corporation for federal income tax purposes, or we become subject to entity-level taxation for state tax purposes, our cash available for distribution to you could be substantially reduced.
The anticipated after-tax benefit of an investment in our units depends on our being treated as a partnership for U.S. federal income tax purposes.
Despite the fact that we are organized as a limited liability company under Delaware law, we would be treated as a corporation for U.S. federal income tax purposes unless we satisfy a "qualifying income" requirement. Based upon our current operations, we believe we satisfy the qualifying income requirement. However, the IRS has made no determinations regarding our treatment as a partnership. Failing to meet the qualifying income requirement or a change in current law could cause us to be treated as a corporation for U.S. federal income tax purposes or otherwise subject us to taxation as an entity.
If we were treated as a corporation for U.S. federal income tax purposes, we would pay U.S. federal income tax on our income at the corporate tax rate, which is currently a maximum of 35%, and would likely be liable for state income tax at varying rates. Distributions to our unitholders would generally be taxed again as corporate distributions, and no income, gains, losses, deductions or credits would flow through to our unitholders. Because taxes would be imposed upon us as a corporation, our cash available for distribution to our unitholders could be substantially reduced. Therefore, our treatment as a corporation would result in a reduction in the anticipated cash flow and after-tax return to our unitholders, likely causing a reduction in the value of the units.
At the state level, several states have been evaluating ways to subject partnerships to entity-level taxation through the imposition of state income, franchise or other forms of taxation. If any state were to impose a tax upon us as an entity, the cash available for distribution to you would be reduced and the value of our common units could be negatively impacted.
Our Operating Agreement provides that if a law is enacted or existing law is modified or interpreted in a manner that subjects us to taxation as a corporation or otherwise subjects us to entity-level taxation for U.S. federal, state or local income tax purposes, the minimum quarterly distribution amount and the target distribution amounts may be adjusted to reflect the impact of that law on us.
Notwithstanding our treatment for U.S. federal income tax purposes, we are subject to certain non-U.S. taxes. If a taxing authority were to successfully assert that we have more tax liability than we anticipate or legislation were enacted that increased the taxes to which we are subject, the cash available for distribution to unitholders could be further reduced.
Most of our business operations and subsidiaries are subject to income, withholding and other taxes in the non-U.S. jurisdictions in which they are organized or from which they receive income, reducing the amount of cash available for distribution. In computing our tax obligation in these non-U.S. jurisdictions, we are required to take various tax accounting and reporting positions on matters that are not entirely free from doubt and for which we have not received rulings from the governing tax authorities, such as whether withholding taxes will be reduced by the application of certain tax treaties. Upon review of these positions the applicable authorities may not agree with our positions. A successful challenge by a tax authority could result in additional tax being imposed on us, reducing the cash available for distribution to unitholders. In addition, changes in our operations or ownership could result in higher than anticipated tax being imposed in jurisdictions in which we are organized or from which we receive income and further reduce the cash available for distribution.
32
Table of Contents
Although these taxes may be properly characterized as foreign income taxes, unitholders may not be able to credit them against their liability for U.S. federal income taxes on their share of our earnings.
Our Operating Agreement provides that the adverse impact of any such additional entity-level taxation will be borne directly or indirectly by all members.
We may become a resident of Canada and have to pay tax in Canada on our worldwide income, which could reduce our earnings, and unitholders could then become taxable in Canada in respect of their ownership of our units. Moreover, as a non-resident of Canada we may have to pay tax in Canada on our Canadian source income, which could reduce our earnings.
Under the Income Tax Act (Canada), or the Canadian Tax Act, a company that is resident in Canada is subject to tax in Canada on its worldwide income, and unitholders of a company resident in Canada may be subject to Canadian capital gains tax on a disposition of its units and to Canadian withholding tax on dividends paid in respect of such units.
Our place of residence, under Canadian law, would generally be determined based on the place where our central management and control is, in fact, exercised. It is not our current intention that our central management and control be exercised in Canada. Based on our operations, we do not believe that we are, nor do we expect to be, resident in Canada for purposes of the Canadian Tax Act, and we intend that our affairs will be conducted and operated in a manner such that we do not become a resident of Canada under the Canadian Tax Act. However, if we were or become resident in Canada, we would be or become subject under the Canadian Tax Act to Canadian income tax on our worldwide income. Further, unitholders who are non-residents of Canada may be or become subject under the Canadian Tax Act to tax in Canada on any gains realized on the disposition of our units and would be or become subject to Canadian withholding tax on dividends paid or deemed to be paid by us, subject to any relief that may be available under a tax treaty or convention.
The tax treatment of publicly traded partnerships, companies with multinational operations, or an investment in our units could be subject to potential legislative, judicial or administrative changes or differing interpretations, possibly applied on a retroactive basis.
The present U.S. federal income tax treatment of publicly traded partnerships, companies with multinational operations, or an investment in entities such as Niska Gas Storage Partners LLC may be modified by administrative, legislative or judicial changes or differing interpretations at any time. For example, from time to time, members of Congress propose and consider substantive changes to the existing U.S. federal income tax laws that affect publicly traded partnerships. One such legislative proposal would have eliminated the qualifying income exception to the treatment of all publicly traded partnerships as corporations upon which we rely for our treatment as a partnership for U.S. federal income tax purposes. We are unable to predict whether any of these changes or other proposals will be reintroduced or will ultimately be enacted. Any such changes could negatively impact the value of an investment in our common units. Any modification to U.S. federal income tax laws may be applied retroactively and could make it more difficult or impossible for us to meet the qualifying income requirement to be treated as a partnership for U.S. federal income tax purposes.
If a tax authority contests the positions we take, the market for our common units may be adversely impacted and the cost of any such contest will reduce our cash available for distribution to unitholders.
The tax authorities may adopt positions that differ from the positions we take. It may be necessary to resort to administrative or court proceedings to sustain some or all of the positions we take, and a court may not agree with these positions. Any contest with a tax authority may materially and adversely impact the market for our common units and the price at which they trade. In addition, our costs of
33
Table of Contents
any contest with a tax authority will be borne by our members because the costs will reduce our cash available for distribution.
Unitholders are required to pay taxes on their share of our income even if they do not receive any cash distributions from us.
Because our unitholders are treated as partners for U.S. federal income tax purposes to whom we allocate taxable income, which could be different in amount than the cash we distribute, unitholders are required to pay any U.S. federal income taxes, Medicare taxes and, in some cases, state and local income taxes on their share of our taxable income even if they receive no cash distributions from us. Unitholders may not receive cash distributions from us equal to their share of our taxable income or even equal to the actual tax liability that results from that income.
Tax gain or loss on the disposition of our common units could be more or less than expected.
If unitholders sell their common units, they will recognize a gain or loss for U.S. federal income tax purposes equal to the difference between the amount realized and their tax basis in those common units. Because for U.S. federal income tax purposes distributions in excess of their allocable share of our net taxable income decrease their tax basis in their common units, the amount, if any, of such prior excess distributions with respect to the units they sell will, in effect, become taxable income to them for U.S. federal income tax purposes if they sell such units at a price greater than their tax basis in those units, even if the price they receive is less than their original cost. Furthermore, a substantial portion of the amount realized, whether or not representing gain, may be taxed as ordinary income due to potential recapture items, including depreciation recapture. In addition, because the amount realized includes a unitholder's share of our liabilities, unitholders may incur a tax liability on the sale of their units in excess of the amount of cash they receive.
Tax-exempt entities and non-U.S. persons face unique tax issues from owning our common units that may result in adverse tax consequences to them.
Investment in common units by a tax-exempt entity, such as employee benefit plans and individual retirement accounts (known as IRAs), or a non-U.S. person raises issues unique to them. For example, virtually all of our income allocated to organizations that are exempt from U.S. federal income tax, including IRAs and other retirement plans, is unrelated business taxable income and will be taxable to them. In addition, we expect to withhold taxes from distributions to non-U.S. persons at the highest applicable effective tax rate, and non-U.S. persons are required to file U.S. federal tax returns and pay tax on their shares of our taxable income attributable to our U.S. operations. Tax exempt entities (or those who intend to hold our units through an IRA) and non-U.S. persons should consult a tax advisor before investing in our common units.
We treat each unitholder as having the same tax benefits without regard to the actual common units held. The IRS may challenge this treatment, which could adversely affect the value of the common units.
Because we cannot match transferors and transferees of common units and because of other reasons, we have adopted depreciation and amortization positions that may not conform to all aspects of existing Treasury Regulations. A successful IRS challenge to those positions could adversely affect the amount of taxable income recognized by unitholders as a result of their ownership of our units. It also could affect the amount of gain from a unitholder's sale of common units and could have a negative impact on the value of our common units or result in audit adjustments to that unitholder's tax returns.
34
Table of Contents
We prorate our items of income, gain, loss and deduction between transferors and transferees of our units each month based upon the ownership of our units on the first day of each month, instead of on the basis of the date a particular unit is transferred. The IRS may challenge this treatment, which could change the allocation of items of income, gain, loss and deduction among our unitholders.
We prorate our items of income, gain, loss and deduction between transferors and transferees of our units each month based upon the ownership of our units on the first day of each month, instead of on the basis of the date a particular unit is transferred. The use of this proration method may not be permitted under existing Treasury Regulations. The U.S. Treasury Department has issued proposed Treasury Regulations that provide a safe harbor pursuant to which a publicly-traded partnership may use a similar monthly simplifying convention to allocate tax items among transferor and transferee unitholders. Nonetheless, the proposed regulations do not specifically authorize the use of the proration method we have adopted. If the IRS were to challenge our proration method or new Treasury Regulations were issued, we may be required to change the allocation of items of income, gain, loss and deduction among our unitholders.
The amount of taxable income or loss allocable to each unitholder depends, in part, upon values that we periodically determine for our outstanding equity interests and our assets in order to comply with federal income tax law. The IRS may challenge our determinations of these values, which could adversely affect the value of our units.
U.S. federal income tax law requires us to periodically determine the value of our assets and to calculate the amount of taxable income or loss allocable to each partner based in part upon these values. We determine these asset values and allocations in part by reference to values that we determine for our outstanding equity interests. The IRS may challenge our valuations and related allocations. A successful IRS challenge to these valuations or allocations could adversely affect the amount of taxable income or loss being allocated to our unitholders. It also could affect the amount of gain from a unitholder's sale of units and could have a negative impact on the value of units or result in audit adjustments to our unitholders' tax returns without the benefit of additional deductions.
A unitholder whose units are the subject of a securities loan (e.g., a loan to a "short seller" to cover a short sale of units) may be considered as having disposed of those units. If so, he would no longer be treated for tax purposes as a partner with respect to those units during the period of the loan and may recognize gain or loss from the disposition.
Because there are no specific rules governing the U.S. federal income tax consequence of loaning a partnership interest, a unitholder whose units are the subject of a securities loan may be considered as having disposed of the loaned units. In that case, the unitholder may no longer be treated for tax purposes as a partner with respect to those units during the period of the loan to the short seller and the unitholder may recognize gain or loss from such disposition. Moreover, during the period of the loan, any of our income, gain, loss or deduction with respect to those units may not be reportable by the unitholder and any cash distributions received by the unitholder as to those units could be fully taxable as ordinary income. Unitholders desiring to assure their status as partners and avoid the risk of gain recognition from a securities loan are urged to modify any applicable brokerage account agreements to prohibit their brokers from borrowing their units.
The sale or exchange of 50% or more of our capital and profits interests during any twelve-month period will result in the termination of our tax partnership for U.S. federal income tax purposes.
We will be considered to have terminated our tax partnership for U.S. federal income tax purposes if there is a sale or exchange of 50% or more of the total interests in our capital and profits within a twelve-month period. For purposes of determining whether the 50% threshold has been met, multiple sales of the same interest will be counted only once. Our termination would, among other things, result
35
Table of Contents
in the closing of our taxable year for all unitholders, which would result in us filing two tax returns for one fiscal year and may result in a significant deferral of depreciation deductions allowable in computing our taxable income. In the case of a unitholder reporting on a taxable year other than a calendar year, the closing of our taxable year may also result in more than twelve months of our taxable income or loss being includable in his taxable income for the year of termination. Our termination currently would not affect our classification as a partnership for federal income tax purposes, but it would result in our being treated as a new partnership for tax purposes. If we were treated as a new partnership, we would be required to make new tax elections and could be subject to penalties if we were unable to determine that a termination occurred.
Unitholders are likely subject to state and local taxes and return filing requirements in jurisdictions where we operate or own or acquire property.
In addition to U.S. federal income taxes, unitholders are likely subject to state and local taxes, unincorporated business taxes and estate, inheritance or intangible taxes that are imposed by the various jurisdictions in which we conduct business or own property now or in the future, even if they do not live in any of those jurisdictions. Unitholders are likely required to file state and local income tax returns and pay state and local income taxes in some or all of these jurisdictions. Further, unitholders may be subject to penalties for failure to comply with those requirements. We own assets and conduct business in California, Oklahoma and Texas. Each of California and Oklahoma currently imposes a personal income tax on individuals. Many states also impose an income tax on corporations and other entities. As we make acquisitions or expand our business, we may own assets or conduct business in additional states that impose a personal income tax. It is the unitholder's responsibility to file all U.S. federal, foreign, state and local tax returns. Our counsel has not rendered an opinion on the state or local tax consequences of an investment in our common units.
Item 1B. Unresolved Staff Comments
None.
Item 2. Properties.
Our storage facilities are constructed and maintained on property owned by others. Rights to use our reservoirs for natural gas storage are held pursuant to natural gas storage leases with the surface owners of the lands where the reservoirs are situated as well as mineral owner agreements and similar instruments entered into with the holders of subsurface mineral interests in such lands. Rights for the lands used for our pipelines are derived from right-of-ways, easements, leases and other similar land-use agreements.
For more information on our material properties, see "Business—Our Assets" in Item 1 of this Report.
Item 3. Legal Proceedings
We are not a party to any legal proceeding other than legal proceedings arising in the ordinary course of our business. We are a party to various administrative and regulatory proceedings that have arisen in the ordinary course of our business.
Item 4. Mine Safety Disclosures
Not applicable.
36
Table of Contents
PART II
Item 5. Market for Registrant's Common Equity, Related Shareholder Matters and Issuer Purchases of Equity Securities.
On April 2, 2013, we combined our 33,804,745 subordinated units and our previous Incentive Distribution Rights, or IDRs, and restructured them as a new class of Incentive Distribution Rights (new IDRs). As of June 6, 2013 we had outstanding 34,492,245 common units, a 1.98% managing member interest and our new IDRs. The common units represent all of our limited partner interests and 98.02% of our total ownership interests excluding our new IDRs. As discussed below under "Our Cash Distribution Policy—New Incentive Distribution Rights," the new IDRs represent the right to receive 48% of any quarterly cash distributions after our common unit holders have received the full minimum quarterly distribution for each quarter plus any arrearages from prior quarters (of which there are currently none). Holdco currently owns approximately 49.26% of our outstanding common units and 100% of our new IDRs.
Our common units, which represent limited liability company interests in us, are listed on the NYSE under the symbol "NKA." Our common units have been traded on the NYSE since May 12, 2010. Prior to that time, there was no public market for our stock. The following table sets forth for the indicated periods the high and low sales prices per unit for our common units on the NYSE:
| | | | | | | |
Three Months Ended | | High | | Low | |
|---|
March 31, 2013 | | $ | 13.02 | | $ | 11.10 | |
December 31, 2012 | | $ | 12.71 | | $ | 9.66 | |
September 30, 2012 | | $ | 14.09 | | $ | 12.01 | |
June 30, 2012 | | $ | 13.12 | | $ | 9.20 | |
March 31, 2012 | |
$ |
10.83 | |
$ |
8.98 | |
December 31, 2011 | | $ | 12.89 | | $ | 8.86 | |
September 30, 2011 | | $ | 17.60 | | $ | 11.28 | |
June 30, 2011 | | $ | 22.09 | | $ | 16.25 | |
On June 6, 2013, the closing market price for our common units was $14.12 per unit.
We have gathered tax information from our known unitholders and from brokers/nominees and, based on the information collected, we have approximately 33,800 beneficial unitholders at March 31, 2013.
Cash distributions paid to unitholders for the years ended March 31, 2013 and 2012 were as follows:
| | | | | | | | | |
Record Date | | Payment Date | | Per
Common
Unit | | Per
Subordinated
Unit | |
|---|
February 11, 2013 | | February 15, 2013 | | $ | 0.35 | | $ | — | |
November 13, 2012 | | November 15, 2012 | | $ | 0.35 | | $ | — | |
August 13, 2012 | | August 15, 2012 | | $ | 0.35 | | $ | — | |
May 4, 2012 | | May 15, 2012 | | $ | 0.35 | | $ | — | |
February 13, 2012 | | February 16, 2012 | | $ | 0.35 | | $ | — | |
November 14, 2011 | | November 17, 2011 | | $ | 0.35 | | $ | — | |
August 5, 2011 | | August 12, 2011 | | $ | 0.35 | | $ | 0.35 | |
May 6, 2011 | | May 13, 2011 | | $ | 0.35 | | $ | 0.35 | |
37
Table of Contents
We generally make quarterly cash distributions of substantially all of our available cash, generally defined as consolidated cash receipts less consolidated cash expenditures and such retentions for working capital, anticipated cash expenditures and contingencies as our board deems appropriate. Distributions of cash paid by us to a unitholder will not result in taxable gain or income except to the extent the aggregate amount distributed exceeds the tax basis of the common units owned by the unitholder.
We are a publicly traded LLC and are not subject to federal income tax on our U.S.-sourced income. Instead, unitholders are required to report their allocable share of our income, gain, loss and deduction, regardless of whether we make distributions. We have made quarterly distribution payments since August 2010.
We are subject to withholding taxes by the Canada Revenue Agency ("CRA") for the portion of our quarterly distributions that are derived from our Canadian operations. Unitholders receive foreign tax credits equal in amount to the amount that we pay to the CRA and can apply these credits against other Canadian sourced income, to the extent that they may have any.
As of June 6, 2013, there were 9 holders of record of our common units. The number of record holders does not include holders of units in "street names" or persons, partnerships, associations, corporations or other entities identified in security position listings maintained by depositories.
Our Operating Agreement contains a policy pursuant to which we pay regular quarterly cash distributions in an aggregate amount equal to substantially all of our available cash. Under the policy, each quarter our board makes a determination of the amount of cash available for distribution to members. Our board determines cash available for distribution to be an amount equal to all cash on hand at the end of the quarter, less reserves for the prudent conduct of our business (including reserves for capital expenditures, operating expenditures and debt service) or for distributions to members in respect of future quarters. Our board's determination of available cash takes into account the need to maintain certain cash reserves to preserve our distribution levels across seasonal and cyclical fluctuations in our business. Our board may determine to reserve or reinvest excess cash in order to permit gradual or consistent increases in quarterly distributions and may borrow to fund distributions in quarters when we generate less available cash than necessary to sustain or grow our cash distributions per unit.
These distributions reflect the board's basic judgment that typically our unitholders will be better served by our distributing our available cash, after expenses and reserves, rather than retaining it. Because we believe we will generally finance any expansion capital investments from external financing sources, including commercial bank borrowings and the issuance of debt and equity interests, we believe that our investors are typically best served by our distributing all of our available cash. Because we are not subject to entity-level U.S. federal income tax, we will have more cash to distribute to unitholders than would be the case if we were subject to such tax.
Our manager is entitled to 1.98% of all distributions that we make prior to our liquidation. Our manager has the right, but not the obligation, to contribute a proportionate amount of capital to us to maintain its current managing member interest if we issue additional membership interests in the future. The manager's 1.98% interest in distributions will be reduced if we issue additional membership interests in the future and our manager does not contribute a proportionate amount of capital to us to maintain its 1.98% managing member interest.
38
Table of Contents
Please refer to the "Business—Recent Development" portion of this document.
To date, the Company has not made any payments with respect to the previous incentive distribution rights or the new IDRs.
There is no guarantee that unitholders will receive quarterly cash distributions from us. Our distribution policy may be changed at any time and is subject to certain restrictions, including:
- •
- Our cash distribution policy may be affected by restrictions on distributions under our $400.0 million credit agreement and by the indenture relating to our senior notes as well as by restrictions in future debt agreements that we enter into. Specifically, our credit agreement and indenture contain financial tests and covenants, commensurate with companies of our credit quality that we must satisfy. Should we be unable to satisfy these restrictions under our $400.0 million credit agreement or indenture or if we are otherwise in default under our $400.0 million credit agreement or indenture, we would be prohibited from making cash distributions to unitholders notwithstanding our stated cash distribution policy. See "Management's Discussion and Analysis of Financial Condition and Results of Operations—Liquidity and Capital Resources—Our 8.875% Senior Notes Due 2018" and "—Our $400.0 Million Credit Agreement."
- •
- Our board's determination of cash available for distribution takes into account reserves for the prudent conduct of our business (including reserves for cash distributions to our members), and the establishment of (or any increase in) those reserves could result in a reduction in cash distributions to our unitholders from the levels we currently anticipate.
- •
- Even if our cash distribution policy is not modified or revoked, the amount of distributions we pay under our cash distribution policy and the decision to make any distribution is determined by our board.
- •
- Under Section 18-607 of the Delaware Act, we may not make a distribution to our unitholders if the distribution would cause our liabilities to exceed the fair value of our assets.
- •
- We may lack sufficient cash to pay distributions to our unitholders due to cash flow shortfalls attributable to a number of operational, commercial or other factors as well as increases in our operating or general and administrative expenses, principal and interest payments on our outstanding debt, tax expenses, working capital requirements and anticipated cash needs. Our cash available for distribution to unitholders is directly impacted by our cash expenses necessary to run our business, including capital needs to maintain our storage facilities, to finance our proprietary optimization program and to fund the margin requirements of our hedging instruments.
Sales of Unregistered Securities
None.
Item 6. Selected Financial Data.
The following table shows selected historical consolidated financial and operating data of Niska Gas Storage Partners LLC for the fiscal years ended March 31, 2013, 2012 and 2011, and Niska Predecessor, consisting of the combined financial statements of Niska GS Holdings I, L.P. and Niska GS Holdings II, L.P. for the fiscal years ended March 31, 2010 and 2009.
39
Table of Contents
The historical consolidated financial data presented for the years ended March 31, 2013, 2012 and 2011 and the combined financial data presented for the years ended March 31, 2010 and 2009 are derived from audited financial statements for those respective periods, and should be read together with and are qualified in their entirety by reference to, the historical audited consolidated financial statements of Niska Gas Storage Partners LLC and the accompanying notes included in Item 8.
Moreover, the table should be read together with "Management's Discussion and Analysis of Financial Condition and Results of Operations" included in Item 7.
| | | | | | | | | | | | | | | | |
| | Niska Partners | | Niska Predecessor | |
|---|
| | Years Ended March 31, | |
|---|
| | 2013 | | 2012 | | 2011 | | 2010 | | 2009 | |
|---|
| | (dollars in thousands, except per unit amounts)
| |
|---|
Consolidated Statement of Earnings Data: | | | | | | | | | | | | | | | | |
Revenues(1) | | $ | 140,695 | | $ | 268,581 | | $ | 230,075 | | $ | 270,500 | | $ | 252,200 | |
Depreciation and amortization | | | 50,409 | | | 46,131 | | | 46,891 | | | 43,100 | | | 54,800 | |
Interest and debt expense | | | 67,010 | | | 74,630 | | | 77,007 | | | 38,119 | | | 53,486 | |
Earnings (loss) before income taxes | | | (62,543 | ) | | (185,459 | ) | | 27,403 | | | 121,149 | | | 96,949 | |
Net earnings (loss) | | | (43,601 | ) | | (165,772 | ) | | 57,457 | | | 53,200 | | | 108,800 | |
Earnings (loss) per unit | | | (0.63 | ) | | (2.39 | ) | | 0.31 | | | n/a | | | n/a | |
Balance Sheet and Other Financial Data (at period end): | | | | | | | | | | | | | | | | |
Total current assets | | $ | 247,775 | | $ | 439,427 | | $ | 443,699 | | $ | 430,000 | | $ | 355,900 | |
Total assets | | | 1,524,392 | | | 1,803,358 | | | 2,061,270 | | | 2,099,400 | | | 2,002,900 | |
Total debt (including current portion) | | | 708,790 | | | 793,790 | | | 800,000 | | | 800,000 | | | 662,000 | |
Members' equity | | | 597,377 | | | 690,390 | | | 916,973 | | | 929,800 | | | 977,400 | |
Cash distributions declared (per unit): | | | | | | | | | | | | | | | | |
Common units | | $ | 1.40 | | $ | 1.40 | | $ | 0.873 | | | n/a | | | n/a | |
Subordinated units | | $ | — | | $ | 0.70 | | $ | 0.873 | | | n/a | | | n/a | |
Operational Data: (unaudited) | | | | | | | | | | | | | | | | |
Effective working gas capacity (Bcf)(2) | | | 225.5 | | | 221.5 | | | 204.5 | | | 185.5 | | | 163.7 | |
Capacity added during the period (Bcf) | | | 4.0 | | | 17.0 | | | 19.0 | | | 21.8 | | | 8.4 | |
Percent of operated capacity leased to third parties(3) | | | 74.8 | % | | 62.4 | % | | 71.4 | % | | 79.5 | % | | 89.7 | % |
- (1)
- Revenues include optimization revenues, which are presented net of cost of goods sold.
- (2)
- Represents operated and NGPL capacity. Effective working gas capacity data is as at March 31 in each year.
- (3)
- Excludes NGPL leased capacity of 8.5 Bcf.
40
Table of Contents
Item 7. Management's Discussion and Analysis of Financial Condition and Results of Operations.
The historical financial statements included elsewhere in this document reflect the consolidated assets, liabilities and operations of Niska Gas Storage Partners LLC ("Niska Partners" or "Niska") as at March 31, 2013 and 2012, and for of the years ended March 31, 2013, 2012 and 2011. The following discussion of the historical consolidated and combined financial condition and results of operations should be read in conjunction with the historical financial statements and accompanying notes of Niska included elsewhere in this document. In addition, this discussion includes forward-looking statements that are subject to risks and uncertainties that may result in actual results differing from statements we make. See "Forward-Looking Statements." Factors that could cause actual results to differ include those risks and uncertainties that are discussed in "Risk Factors."
We operate the Countess and Suffield gas storage facilities (collectively, the AECO HubTM) in Alberta, Canada, and the Wild Goose and Salt Plains gas storage facilities in California and Oklahoma, respectively. We market our working gas storage capacity and we optimize our storage capacity with our own proprietary gas purchases at each of these facilities. We earn revenues by (i) leasing storage capacity on a long and short-term basis for which we receive fees and (ii) engaging in optimization, where we purchase and sell gas on an economically hedged basis in order to improve facility utilization at margins higher than those that we receive from third party contracts. The Company has a total of 225.5 Bcf of working gas capacity among its facilities, including 8.5 Bcf leased from a third party pipeline company. We also operate a natural gas marketing business which is an extension of our proprietary optimization activities in Canada.
During the year ended March 31, 2012, we experienced a substantial decline in realized revenues, particularly in our short-term contracting and optimization activities, compared to amounts realized in fiscal 2011. The revenue decline resulted from a significant decline in natural gas price volatility and a significant narrowing of the difference between winter and summer prices in the natural gas futures market, sometimes referred to as the seasonal spread. These conditions resulted from a number of factors including, but not limited to, (i) warmer weather patterns across much of North America; (ii) an increase in the supply of non-conventional natural gas (including shale gas); (iii) real or perceived changes in overall supply and demand fundamentals; (iv) increased development in the number and size of natural gas storage facilities; and (v) the development of new pipeline infrastructure.
During the fourth quarter of fiscal 2012 and into the first quarter of fiscal 2013, these conditions improved somewhat as the seasonal spread widened and modestly higher volatility returned to the natural gas futures market. However, as fiscal 2013 progressed the seasonal spread again narrowed in response to warmer weather in North America during the summer of calendar 2012, significant coal-to-gas switching in response to low natural gas prices and general improvement in North American economic conditions.
We are not able to predict the long-term impact of these factors on our revenues and profitability or the amount or timing of potentially positive developments such as increased demand for natural gas resulting from further long-term switching from coal to natural gas by utilities, continued increases in industrial or consumer demand or exports of Liquefied Natural Gas (LNG) from North America to other continents.
As we enter fiscal 2014, market conditions, including the seasonal spread and natural gas futures price volatility remain uncertain but are reduced compared to our first fiscal quarter of the prior year.
41
Table of Contents
A summary of financial and operating data for the years ended March 31, 2013, 2012 and 2011:
| | | | | | | | | | |
| | Year Ended March 31, | |
|---|
| | 2013 | | 2012 | | 2011 | |
|---|
| | (dollars in thousands)
| |
|---|
Consolidated Statement of Earnings and Comprehensive Income Data: | | | | | | | | | | |
Revenues | | | | | | | | | | |
Fee-based revenue | | $ | 163,325 | | $ | 146,053 | | $ | 160,538 | |
Optimization, net(1) | | | (22,630 | ) | | 122,528 | | | 69,537 | |
| | | | | | | | |
| | | 140,695 | | | 268,581 | | | 230,075 | |
Expenses (Income): | | | | | | | | | | |
Operating | | | 32,535 | | | 43,978 | | | 44,772 | |
General and administrative | | | 38,562 | | | 28,582 | | | 34,568 | |
Depreciation and amortization | | | 50,409 | | | 46,131 | | | 46,891 | |
Loss on impairment and sale of assets(2) | | | 14,927 | | | 5,342 | | | — | |
Interest | | | 67,010 | | | 74,630 | | | 77,007 | |
Loss on extinguishment of debt | | | 599 | | | 4,861 | | | — | |
Impairment of goodwill(2) | | | — | | | 250,000 | | | — | |
Foreign exchange (gains) losses | | | (694 | ) | | 682 | | | (518 | ) |
Other income | | | (110 | ) | | (166 | ) | | (48 | ) |
| | | | | | | | |
Earnings (loss) before income taxes | | | (62,543 | ) | | (185,459 | ) | | 27,403 | |
Income tax (benefit)/expense: | | | | | | | | | | |
Current | | | (1,414 | ) | | 412 | | | 1,213 | |
Deferred | | | (17,528 | ) | | (20,099 | ) | | (31,267 | ) |
| | | | | | | | |
| | | (18,942 | ) | | (19,687 | ) | | (30,054 | ) |
| | | | | | | | |
Net earnings (loss) and comprehensive income (loss) | | $ | (43,601 | ) | $ | (165,772 | ) | $ | 57,457 | |
| | | | | | | | |
Reconciliation of Adjusted EBITDA to net (loss) earnings: | | | | | | | | | | |
Net earnings (loss) | | | (43,601 | ) | | (165,772 | ) | | 57,527 | |
Add (deduct): | | | | | | | | | — | |
Interest expense | | | 67,010 | | | 74,630 | | | 77,007 | |
Income tax benefit | | | (18,942 | ) | | (19,687 | ) | | (30,054 | ) |
Depreciation and amortization | | | 50,409 | | | 46,131 | | | 46,891 | |
Impairment of goodwill | | | — | | | 250,000 | | | — | |
Unrealized risk management losses (gains) | | | 89,851 | | | (83,193 | ) | | 44,787 | |
Loss on extinguishment of debt | | | 599 | | | 4,861 | | | — | |
Foreign exchange (gains) losses | | | (694 | ) | | 682 | | | (518 | ) |
Loss on impairment and sale of assets | | | 14,927 | | | 5,342 | | | — | |
Other income | | | (110 | ) | | (166 | ) | | (48 | ) |
Inventory impairment writedown | | | 22,281 | | | 23,400 | | | — | |
| | | | | | | | |
Adjusted EBITDA(3) | | | 181,730 | | | 136,229 | | | 195,592 | |
Add (deduct): | | | | | | | | | | |
Cash interest expense, net(4) | | | (63,599 | ) | | (69,856 | ) | | (75,991 | ) |
Income taxes recovered (paid) | | | 722 | | | (988 | ) | | (474 | ) |
Maintenance capital expenditures | | | (1,833 | ) | | (1,858 | ) | | (1,681 | ) |
Other income | | | 110 | | | 166 | | | 48 | |
| | | | | | | | |
Cash Available for Distribution(3) | | $ | 117,130 | | $ | 63,694 | | $ | 117,494 | |
| | | | | | | | |
Balance Sheet Data (at period end): | | | | | | | | | | |
Total assets | | | 1,524,392 | | | 1,803,358 | | | 2,061,270 | |
Property, plant and equipment, net of accumulated depreciation | | | 918,061 | | | 968,128 | | | 964,146 | |
Long-term debt(5) | | | 657,274 | | | 657,177 | | | 800,000 | |
Total partners' equity | | | 597,377 | | | 690,390 | | | 916,973 | |
Operating Data (unaudited): | | | | | | | | | | |
Effective working gas capacity (Bcf)(6) | | | 225.5 | | | 221.5 | | | 204.5 | |
Capacity added during period (Bcf) | | | 4.0 | | | 17.0 | | | 19.0 | |
Percent of operated capacity contracted to third parties(7) | | | 74.8 | % | | 62.4 | % | | 71.4 | % |
- (1)
- Optimization revenue is presented net of cost of goods sold. Net optimization revenues include unrealized risk management gains/losses and write-downs of inventory. We had an unrealized risk management loss of
42
Table of Contents
$89.9 million for the year ended March 31, 2013, an unrealized risk management gain of $83.2 million for the year ended March 31, 2012 and an unrealized risk management loss of $44.8 million for the year ended March 31, 2011. We had write-downs of inventory of $22.3 million, $23.4 million and $ nil for the years ended March 31, 2013, 2012 and 2011 respectively. Excluding these non-cash items, which do not affect Adjusted EBITDA, our realized optimization revenues were $89.5 million for the year ended March 31, 2013, $62.7 million for the year ended March 31, 2012 and $114.3 million for the year ended March 31, 2011.
- (2)
- Loss on impairment and sale of assets in the fiscal year ended March 31, 2012 relates to an impairment charge on certain non-core assets and to a loss on sale of cushion gas from one of our U.S. facilities. Goodwill impairment in the fiscal year ended March 31, 2012 relates to goodwill in two subsidiaries that was written down from its carrying amounts of $495.6 million to $245.6 million. Loss on impairment and sale of assets in the fiscal year ended March 31, 2013 relates to losses on sales of cushion gas from one of our Canadian facilities and from one of our U.S. facilities.
- (3)
- Adjusted EBITDA and Cash Available for Distribution in fiscal 2013 include the benefits of inventory write-downs of $43.1 million related to inventory impairments recorded in the fourth quarter of fiscal 2012 and the first quarter of fiscal 2013. Excluding these benefits, Adjusted EBITDA would have been $138.6 million and Cash Available for Distribution would have been $74.0 million.
- (4)
- During fiscal 2012, the Company changed its calculation of cash interest expense, net to include the effect of capitalized interest. Accordingly, cash interest expense in fiscal 2013 and 2012 were reduced by $2.9 million and $4.1 million of capitalized interest, respectively. The amount for fiscal 2011 which included capitalized interest of $2.0 million was not restated.
- (5)
- Excludes revolver drawings, which are recorded in current liabilities.
- (6)
- Represents operated and NGPL capacity.
- (7)
- Excludes NGPL leased capacity of 8.5 Bcf.
The following table sets forth volume utilized by, and revenue and fees/margins derived from, LTF contracts, STF contracts and proprietary optimization transactions for the fiscal years ended March 31, 2013, 2012 and 2011:
| | | | | | | | | | |
| | Year Ended March 31, | |
|---|
| | 2013 | | 2012 | | 2011 | |
|---|
Storage Capacity (Bcf) utilized by: | | | | | | | | | | |
LTF Contracts | | | 126.1 | | | 109.4 | | | 104.7 | |
STF Contracts | | | 36.1 | | | 23.6 | | | 35.2 | |
Proprietary optimization transactions | | | 63.3 | | | 88.5 | | | 64.6 | |
| | | | | | | | |
Total | | | 225.5 | | | 221.5 | | | 204.5 | |
| | | | | | | | |
Revenue (in thousands) | | | | | | | | | | |
Fee-based contracts | | | | | | | | | | |
LTF Contracts | | $ | 108,615 | | $ | 116,244 | | $ | 119,566 | |
STF Contracts | | | 54,710 | | | 29,809 | | | 40,972 | |
| | | | | | | | |
| | | 163,325 | | | 146,053 | | | 160,538 | |
Optimization: | | | | | | | | | | |
Realized proprietary optimization transactions | | | 89,525 | | | 62,735 | | | 114,324 | |
Unrealized risk management gains (losses) | | | (89,874 | ) | | 83,193 | | | (44,787 | ) |
Inventory write-down | | | (22,281 | ) | | (23,400 | ) | | — | |
| | | | | | | | |
| | | (22,630 | ) | | 122,528 | | | 69,537 | |
| | | | | | | | |
Total | | $ | 140,695 | | $ | 268,581 | | $ | 230,075 | |
| | | | | | | | |
Fees/Margins ($/Mcf) | | | | | | | | | | |
LTF Contracts | | $ | 0.86 | | $ | 1.06 | | $ | 1.14 | |
STF Contracts | | | 1.51 | | | 1.26 | | | 1.16 | |
Realized proprietary optimization transactions | | | 1.41 | | | 0.71 | | | 1.77 | |
43
Table of Contents
We use the non-GAAP financial measure Adjusted EBITDA in this report. A reconciliation of Adjusted EBITDA to net earnings, its most directly comparable financial measure as calculated and presented in accordance with GAAP, is shown above.
We define Adjusted EBITDA as net earnings before interest, income taxes, depreciation and amortization, impairment of goodwill, unrealized risk management gains and losses, loss on extinguishment of debt, foreign exchange gains and losses, inventory impairment write-downs, gains and losses on asset dispositions, asset impairments and other income. Adjusted EBITDA is used as a supplemental financial measure by our management and by external users of our financial statements such as commercial banks and ratings agencies, to assess:
- •
- the financial performance of our assets, operations and return on capital without regard to financing methods, capital structure or historical cost basis;
- •
- the ability of our assets to generate cash sufficient to pay interest on our indebtedness and make distributions to our equity holders;
- •
- repeatable operating performance that is not distorted by non-recurring items or market volatility; and
- •
- the viability of acquisitions and capital expenditure projects.
The GAAP measure most directly comparable to Adjusted EBITDA is net earnings. The non-GAAP financial measure of Adjusted EBITDA should not be considered as an alternative to net earnings. Adjusted EBITDA is not a presentation made in accordance with GAAP and has important limitations as an analytical tool. Adjusted EBITDA should not be considered in isolation or as a substitute for analysis of our results as reported under GAAP. Because Adjusted EBITDA excludes some, but not all, items that affect net earnings and is defined differently by different companies, our definition of Adjusted EBITDA may not be comparable to similarly titled measures of other companies.
We recognize that the usefulness of Adjusted EBITDA as an evaluative tool may have certain limitations, including:
- •
- Adjusted EBITDA does not include interest expense. Because we have borrowed money in order to finance our operations, interest expense is a necessary element of our costs and impacts our ability to generate profits and cash flows. Therefore, any measure that excludes interest expense may have material limitations;
- •
- Adjusted EBITDA does not include depreciation and amortization expense. Because we use capital assets, depreciation and amortization expense is a necessary element of our costs and ability to generate profits. Therefore, any measure that excludes depreciation and amortization expense may have material limitations;
- •
- Adjusted EBITDA does not include provision for income taxes. Because the payment of income taxes is a necessary element of our costs, any measure that excludes income tax expense may have material limitations;
- •
- Adjusted EBITDA does not reflect cash expenditures or future requirements for capital expenditures or contractual commitments;
- •
- Adjusted EBITDA does not reflect changes in, or cash requirements for, working capital needs; and
44
Table of Contents
- •
- Adjusted EBITDA does not allow us to analyze the effect of certain recurring and non-recurring items that materially affect our net earnings or loss.
How We Evaluate Our Operations
We generate substantially all of our revenue through long and short-term contracts for the storage of natural gas for third-party customers and the proprietary optimization of storage capacity that is uncontracted, underutilized or available only on a short-term basis. We evaluate our business on the basis of the following key measures:
- •
- volume and fees derived from fee-based contracts;
- •
- volume and margin derived from our proprietary optimization activities;
- •
- operating, general and administrative expenses;
- •
- Adjusted EBITDA;
- •
- capitalization and leverage; and
- •
- borrowing base revolver availability, liquidity, and compliance with debt covenants.
We provide fee-based natural gas storage services to our customers under long-term firm (LTF) and short-term firm (STF) contracts. When a customer enters into a LTF contract, the customer is obligated to pay us monthly reservation fees for a fixed amount of storage which is usable by the customer at their option subject to contractual limits. These fees are fixed regardless of the actual use by the customer, but we also collect a variable fee when the services are actually used in order to allow us to recover our variable operating costs. The volume-weighted average life of our LTF contracts at March 31, 2013 was 2.0 years. Reservation fees comprise over 90% of the revenue generated under LTF contracts and provide a baseline of revenue in excess of our operating and general and administrative costs. We also provide fee-based services under short-term firm (STF) contracts, where a customer pays a fixed fee to inject a specified quantity of gas on a specified date or dates and to store that gas in our storage facilities until withdrawal on a specified future date or dates. Because STF contracts set forth specified future injection or withdrawal dates, we can enter into offsetting transactions to capture incremental value as spot and future natural gas prices fluctuate prior to that activity date.
We monitor both the volume and price of our LTF and STF contracts in order to evaluate the effectiveness of our marketing efforts as well as the relative attractiveness of each of these types of contracts compared to each other as well as in comparison to our optimization strategy. During periods when market values for storage capacity are higher, we typically use more of our capacity under LTF contracts. The fees we are able to generate from our STF contracts reflect market conditions, including interest rates. The capacity used for STF contracts depends, among other things, on available capacity not reserved under LTF contracts as well as market demand and contract rates available for these services.
When market conditions warrant, we enter into economically hedged transactions with available capacity to achieve margins higher than can be obtained from third-party contracts. Because we economically hedge our transactions, we are able to determine in advance the minimum margins that will be realized and add incremental margins by re-hedging as market conditions change.
45
Table of Contents
At times, if spreads move favorably, such as if winter gas prices fall below forward prices for the following summer, we can further increase margins that have been substantially locked in by choosing to hold inventory into a subsequent period and re-hedging the transaction. This has the result of increasing our cash flow margins and overall profitability, although for accounting purposes the income is deferred into a later period, causing the appearance of cyclicality in our reported revenues and profits.
When evaluating the performance of our optimization business, we focus on our realized optimization margins, excluding the impact of unrealized hedging gains and losses and inventory write-downs. For accounting purposes, our net realized optimization revenues include the impact of unrealized economic hedging gains and losses and inventory write-downs, which cause our reported revenues to fluctuate from period to period. However, because substantially all inventory is economically hedged, any inventory write-downs are offset by hedging gains and any unrealized hedging losses are offset by gains when the inventory is sold.
Our most significant variable operating expenses are fuel and electricity costs. These operating expenses vary significantly based upon the amount of natural gas we inject or withdraw throughout the year and the price of the energy commodity at the time of purchase. Variable operating expenses are partially offset by the variable fees we collect from our LTF contracts. The fixed component of our operating expenses include salaries and labor, parts and supplies, surface and mineral lease rentals and other general operating costs. These fixed operating expenses are more stable from year to year but can fluctuate due to unforeseen repairs, equipment malfunctions and overhauls of compressors or engines.
Our general and administrative expenses primarily consist of employee compensation, legal, accounting and tax fees and our office lease.
Capitalization, Leverage and Liquidity
We regularly monitor our credit metrics. Our most important credit metric is our fixed charge coverage ratio, or FCCR, which is contained in the Indenture to our 8.875% Senior Notes and our $400.0 million Revolving Credit Agreement. The FCCR measures our Adjusted EBITDA divided by fixed charges, both of which are defined in the Indenture and credit agreement. As discussed below, when our FCCR is below 2.0 times, we are restricted in our ability to issue new debt. When our FCCR is below 1.75 times, we are restricted in our ability to pay distributions. We also monitor our ratio of long-term and total debt to Adjusted EBITDA and our ratio of debt to debt plus equity. While these metrics are not included in our Indenture or credit agreement, they are common metrics used to measure the credit-worthiness of companies, including those similar to us.
As of March 31, 2013, we had a FCCR of 2.6 to 1, a ratio of total debt to Adjusted EBITDA of 4.0 times, a ratio of long-term debt to Adjusted EBITDA of 3.6 times and a ratio of long-term debt to long-term debt plus equity of 52.4%. When the benefits of inventory write-downs are removed from Adjusted EBITDA, FCCR would have been 2.0 to 1.0, the ratio of total debt to Adjusted EBITDA would have been 5.3 times and the ratio of long-term debt to Adjusted EBITDA would have been 4.7 times. These amounts compare to an FCCR of 1.94 to 1.0, a ratio of total debt to Adjusted EBITDA of 5.8 times (4.8 times using long-term debt only) and a ratio of long-term debt to long-term debt plus equity 51.9%. In fiscal 2012 and 2013 we undertook a number of steps to improve these credit metrics, including the monetization of excess working capital, principally proprietary inventory, the repurchase in fiscal 2012 of a portion of our outstanding Senior Notes and, in fiscal 2013, the amendment and
46
Table of Contents
extension of our $400.0 million revolving credit agreement which provided for lower interest rates under this credit facility.
Funding the purchase of proprietary optimization inventory can consume a significant portion of our available working capital. In times of higher natural gas prices, holding large inventories of proprietary gas may cause us to consume a substantial portion of our available capacity under our credit facility. Accordingly, we closely monitor the utilization and remaining available capacity under our credit facilities and actively pursue additional STF contracts when we determine it is appropriate to maintain liquidity.
Factors that Impact Our Business
Factors that impact the performance of specific components of our business from period to period include the following:
The price available in the marketplace when negotiating new or replacement contracts reflects demand and affects the amount of storage capacity utilized for fee-based contracts that year. We may increase the capacity that we use for fee-based contracts at times of higher market prices and demand. Lower market prices for fee-based contracts may result from lower seasonal spreads or a more competitive environment for storage services.
Capacity added in the prior year or added during a year is expected to generate incremental revenue.
When winter gas prices fall below forward prices for the following summer, we may defer the withdrawal of proprietary optimization inventory until the next fiscal year in order to add incremental margin and economic value. This results in the deferral of realized earnings and cash flow from one fiscal year to the next. In some cases, we can mitigate the impact of deferred earnings and cash flow by entering into STF contracts that straddle the two fiscal years.
The variable operating costs of our facilities (mostly comprised of costs associated with fuel or electricity for compressor operations) are affected by the amount and price of energy used to inject and withdraw natural gas from our facilities and by the number and timing of gas injections and withdrawals. For example, if we experience large injections of natural gas in the early summer (instead of a steady rate of injections throughout the summer), we would have greater than expected costs in our first quarter and lower than expected costs in our second quarter. A mild winter could lead to less withdrawals in total, and therefore lower overall variable costs. These cost variances would be partially offset by similar variances in contract revenues.
Our cost of capital and the amount of our available working capital impacts the amount of capacity utilized for proprietary optimization as compared to STF contracts. A higher cost of capital relative to that of our customers or less availability will generally lead to lower volume used for proprietary optimization transactions. In general, higher carrying costs for us or our customers result in lower margins for us.
47
Table of Contents
Incremental revenue opportunities in the form of STF or proprietary optimization transactions may arise for us if capacity usage by our LTF customers is underutilized or offset by other LTF customers.
Weather extremes and variability directly affect our margins. Very mild years tend to reduce revenue generated under our STF and proprietary optimization strategies, while years with very hot summers, very cold winters or a number of significant storms tend to increase the revenue generated under those strategies.
During the past several years North America has experienced a dramatic increase in the supply of natural gas, principally from the development of unconventional natural gas sources, including shale gas. These increases in supply have been coupled with build-outs of natural gas pipeline capacity in certain areas of the United States, which generally have the effect of increasing deliverability of natural gas to more North American markets and dampening the price differentials for natural gas between geographic markets, including those served by us. We believe that these factors tend to reduce the absolute price of natural gas along with the associated seasonal spread as well as dampen natural gas price volatility. We are unable to determine or predict the direct impact on our business from these developments.
Inflation has been relatively low in recent years and did not have a material impact on our results of operations for the years ended March 31, 2013, 2012 and 2011. Although the impact of inflation has been insignificant in recent years, it remains a factor in the current economy.
Segment Information
Our process for the identification of reportable segments involves examining the nature of services offered, the types of customer contracts entered into and the nature of the economic and regulatory environment. Since our inception, we have operated along functional lines in our commercial, engineering and operations teams for operations in Alberta, northern California and the U.S. midcontinent. All functional lines and facilities offer the same services: fee-based revenue and optimization. The Company has a small marketing business which is an extension of the Company's proprietary optimization activities. Proprietary optimization activities occur when the Company purchases, stores and sells natural gas for its own account in order to utilize or optimize storage capacity that is not contracted or available to third party customers. All services are delivered using reservoir storage. We measure profitability consistently along all functional lines based on revenues and earnings before interest, taxes, depreciation and amortization, and unrealized risk management gains and losses. We have aggregated our functional lines and facilities into one reportable segment as at and for the fiscal years ended March 31, 2013, 2012 and 2011.
Information pertaining to our fee-based and proprietary optimization revenues is presented in the consolidated and combined statements of earnings and comprehensive income. All facilities have the same types of customers: major companies in the energy industry, industrial, commercial, and local distribution companies and municipal energy consumers.
48
Table of Contents
Results of Operations
Fiscal Year Ended March 31, 2013 Compared to Fiscal Year Ended March 31, 2012
- •
- Revenue. Revenues include fee-based revenue and optimization, net. Fee-based revenue consists of long-term contracts for storage fees that are generated when we lease storage capacity on a monthly basis and short-term fees associated with specified injections and withdrawals of natural gas. Optimization revenue results from the purchase of natural gas inventory and its forward sale to future periods through financial and physical energy trading contracts, with our facilities being used to store the inventory between acquisition and disposition of the natural gas inventory.
Details of our revenue include:
| | | | | | | | | | |
| | Year Ended March 31, | |
|---|
| | 2013 | | 2012 | | 2011 | |
|---|
| | (in thousands)
| |
|---|
Long-term contract revenue | | $ | 108,615 | | $ | 116,244 | | $ | 119,566 | |
Short-term contract revenue | | | 54,710 | | | 29,809 | | | 40,972 | |
| | | | | | | | |
Total fee-based revenue | | | 163,325 | | | 146,053 | | | 160,538 | |
| | | | | | | | |
Realized optimization, net | | | 89,525 | | | 62,735 | | | 114,324 | |
Unrealized risk management (losses) gains | | | (89,874 | ) | | 83,193 | | | (44,787 | ) |
Write-down of inventory | | | (22,281 | ) | | (23,400 | ) | | — | |
| | | | | | | | |
Total optimization revenue | | | (22,630 | ) | | 122,528 | | | 69,537 | |
| | | | | | | | |
Total revenue | | $ | 140,695 | | $ | 268,581 | | $ | 230,075 | |
| | | | | | | | |
The change in revenue was primarily attributable to the following:
- •
- LTF Revenues. Fiscal 2013 LTF revenues declined by $7.6 million (7%) from fiscal 2012. The decrease in revenues resulted from lower average rates for LTF contracts in fiscal 2013 compared to fiscal 2012. These lower contract rates were partially offset by additional storage capacity which we allocated to our LTF strategy in the current fiscal year. During fiscal 2013, the absolute amount of capacity utilized for LTF contracts increased by 16.7 Bcf. In addition, fuel and commodity fee revenue decreased by $2.6 million as a result of lower volumes of gas cycled in the current year. Fluctuations in exchange rates between the Canadian and U.S. dollar decreased revenues by $1.3 million compared to last year.
- •
- STF Revenues. STF revenues increased by $24.9 million (84%) compared to fiscal 2012. Higher STF revenues resulted from more capacity being utilized for this strategy compared to the prior fiscal year. During fiscal 2012, we had significant cash on hand, which enhanced the overall benefits associated with our optimization activities compared to STF strategies. Accordingly, a larger portion of our capacity (36.1 Bcf) was utilized for STF in fiscal 2013 compared to fiscal 2012 (23.6 Bcf). Realized margins were $1.51 per Mcf in fiscal 2013 compared to $1.26 per Mcf in fiscal 2012.
- •
- Optimization Revenues. Total optimization revenues, including realized and unrealized gains and losses, along with write-downs of proprietary optimization inventories, decreased to a loss of $22.6 million from net revenue of $122.5 million in fiscal 2012. When evaluating the performance of our optimization business, we focus on our realized optimization margins, excluding the impact of unrealized economic hedging gains and losses and inventory write-downs. For financial reporting purposes, our net optimization revenues include the impact of unrealized economic hedging gains and losses and inventory write-downs, which cause our reported revenues to fluctuate from period to period. However, because all inventory is economically hedged, any inventory write-downs are offset by hedging gains and any unrealized
49
Table of Contents
| | | | | | | | | | |
| | Year Ended March 31, | |
|---|
| | 2013 | | 2012 | | 2011 | |
|---|
| | (in thousands)
| |
|---|
General operating costs, including insurance, vehicle leases, safety and training costs | | $ | 15,862 | | $ | 19,361 | | $ | 21,595 | |
Salaries and benefits | | | 7,449 | | | 7,389 | | | 7,107 | |
Fuel and electricity | | | 6,274 | | | 12,960 | | | 12,908 | |
Maintenance | | | 2,950 | | | 4,268 | | | 3,162 | |
| | | | | | | | |
Total operating expenses | | $ | 32,535 | | $ | 43,978 | | $ | 44,772 | |
| | | | | | | | |
50
Table of Contents
Operating expenses in fiscal 2013 decreased by $11.4 million (26%) compared to the prior year. We ended the previous fiscal year with high levels of inventory which reduced cycled volumes at all of our facilities in the current period. This reduced cycling resulted in a decrease in fuel and electricity costs of $6.8 million, in addition to lower costs for parts, supplies and labor as well as chemicals used in the withdrawal process ($1.9 million in aggregate). Lease costs in fiscal 2013 were reduced by $2.6 million as a result of the cancellation of a third-party storage contract as well as the renegotiation of terms of a lease for certain facility equipment.
- •
- General and Administrative Expenses. General and administrative expenses consisted of the following:
| | | | | | | | | | |
| | Year Ended March 31, | |
|---|
| | 2013 | | 2012 | | 2011 | |
|---|
| | (in thousands)
| |
|---|
Compensation costs | | $ | 23,130 | | $ | 13,837 | | $ | 19,640 | |
General costs, including office and IT costs | | | 4,448 | | | 3,918 | | | 4,120 | |
Legal, audit and regulatory costs | | | 10,984 | | | 10,827 | | | 10,808 | |
| | | | | | | | |
Total general and administrative expenses | | $ | 38,562 | | $ | 28,582 | | $ | 34,568 | |
| | | | | | | | |
Fiscal Year Ended March 31, 2012 Compared to Fiscal Year Ended March 31, 2011
The change in revenue was primarily attributable to the following:
- •
- LTF Revenues. Fiscal 2012 LTF revenues declined by $3.4 million (3%) from fiscal 2011. The decrease in revenues resulted from lower variable cycling fee revenue in 2012 as the warm
51
Table of Contents
winter storage season reduced overall demand for natural gas and resulted in substantially fewer withdrawals compared to fiscal 2011. During fiscal 2012, the absolute amount of capacity utilized for LTF contracts increased by 4.6 Bcf. However, LTF contracts which expired in fiscal 2011 were replaced by new contracts at lower rates. Overall rates, including variable demand charges, were $1.06 per Mcf in 2012 compared to $1.14 per Mcf in fiscal 2011.
- •
- STF Revenues. STF revenues declined by $11.2 million (27%) compared to fiscal 2011. The decline resulted from less capacity being utilized for this strategy. As fiscal 2012 commenced, we had significant cash on hand, which enhanced the overall benefits associated with our optimization activities compared to STF. Accordingly, a smaller portion of our capacity (23.6 Bcf) was utilized for STF in fiscal 2012 compared to fiscal 2011 (35.2 Bcf). Realized margins were $1.26 per Mcf in fiscal 2012 compared to $1.16 per Mcf in fiscal 2011.
- •
- Optimization Revenues. Total optimization revenues, including realized and unrealized gains and losses, along with write-downs of proprietary optimization inventories, increased by $53.1 million from fiscal 2011. The components of optimization revenues are as follows:
- •
- Realized Optimization Revenues. The decrease in realized optimization revenue in fiscal 2012 compared to fiscal 2011 is primarily attributable to lower margins realized from the optimization strategy. The average realized margin decreased by 60% to $0.71 per Mcf from $1.77 per Mcf. Partially offsetting this decline was an increase in capacity that was utilized for proprietary optimization activities due to the significant amount of working capital that was available to us, and further aided by lower commodity prices that existed during fiscal March 31, 2012 compared to fiscal 2011. Capacity utilized for optimization activities increased by 13.8% from 64.6 Bcf for the fiscal year ended March 31, 2011 to 73.5 Bcf for the fiscal year ended March 31, 2012. Realized optimization revenues for the years ended March 31, 2012 and 2011 include revenues from our marketing business of $7.5 million and $6.0 million, respectively.
- •
- Unrealized Risk Management Gains. Unrealized gains are attributable to natural gas prices falling after financial hedges were transacted for the fiscal year ended March 31, 2012 and rising after financial hedges were transacted for the fiscal year ended March 31, 2011. As all inventory is economically hedged, any risk management gains (or losses) are offset by future gains (or losses) associated with the sale of proprietary inventory. Unrealized risk management gains (losses) include gains or losses from our marketing business of $1.0 million of unrealized losses in fiscal 2012 and $17.3 million of unrealized gains in fiscal 2011.
- •
- Write-Down of Inventory. As noted above, we wrote down our proprietary inventory by $23.4 million in the fourth quarter of fiscal 2012. No inventory write-downs were required in fiscal 2011.
- •
- Loss before Income Taxes. Loss before income taxes for the fiscal year ended March 31, 2012 was $185.5 million compared to earnings before income taxes of $27.4 million for the fiscal year ended March 31, 2011. The decrease in earnings before income taxes was primarily attributable to the decreased revenue discussed above, plus the following:
- •
- Operating Expenses. Operating expenses of $44.0 million in fiscal 2012 were essentially flat with $44.8 million in operating expenses incurred in the prior year. Fuel and electricity costs were slightly higher, as electricity price spikes at our Countess facility were offset by generally lower cycling of natural gas at all of our facilities as a result of reduced demand for natural gas. In addition, natural gas prices were lower at our facilities that use natural gas as compressor fuel.
- •
- General and Administrative Expenses. These expenses decreased by $6.0 million (17%) in fiscal 2012 compared to fiscal 2011 principally due to reduced incentive compensation accruals as a
52
Table of Contents
Seasonality and Quarterly Fluctuations
Our business is highly seasonal. In general, revenue is expected to be highest during our third and fourth fiscal quarters (October through March), during the peak of the natural gas storage winter withdrawal season, when we typically sell most of our optimization inventory to serve the seasonal demand created by the North American residential market which uses natural gas to heat their homes. Revenue is typically lower in the natural gas storage summer months (April through October), when natural gas prices are generally lower and we shift to the storage injection season and replenish our natural gas inventory.
Because we purchase natural gas and build inventories in the summer months and hedge sales forward into the winter months, the peak borrowing on our revolving credit facilities are generally highest in the middle of our third fiscal quarter, while our peak accounts receivable collections typically occur in our fourth fiscal quarter. However, in both fiscal 2013 and 2012, realized optimization revenues resulted in losses in the fiscal third quarter. In fiscal 2013, these losses resulted from the
53
Table of Contents
timing of optimization strategies which resulted in earlier recognition of optimization gains in the first and second quarters compared to the third quarter. In fiscal 2012, these losses resulted from the Company's determination to reduce working capital through the sale of excess optimization inventories, which resulted in realized losses in the third quarter, with the offsetting gains recognized in the fourth quarter.
The following table illustrates the differences in the recognition of revenue associated with our revenue strategies.
| | | | | | | | | | | | | | | | |
| | Year Ended March 31, 2013 | |
|---|
| | Qtr 1 | | Qtr 2 | | Qtr 3 | | Qtr 4 | | Total | |
|---|
| | (in thousands)
| |
|---|
Fee-based revenue: | | | | | | | | | | | | | | | | |
LTF revenue | | $ | 27,661 | | $ | 28,129 | | $ | 26,492 | | $ | 26,333 | | $ | 108,615 | |
STF revenue | | | 9,400 | | | 12,869 | | | 14,763 | | | 17,678 | | | 54,710 | |
| | | | | | | | | | | | |
| | | 37,061 | | | 40,998 | | | 41,255 | | | 44,011 | | | 163,325 | |
Realized optimization: | | | | | | | | | | | | | | | | |
Realized optimization, net | | | 33,621 | | | 12,238 | | | (9,542 | ) | | 53,208 | | | 89,525 | |
| | | | | | | | | | | | |
Total realized revenue | | | 70,682 | | | 53,236 | | | 31,713 | | | 97,219 | | | 252,850 | |
Realized revenue as a percentage of total realized revenue | | |
28.0 |
% | |
21.1 |
% | |
12.5 |
% | |
38.4 |
% | |
100.0 |
% |
| | | | | | | | | | | | | | | | |
| | Year Ended March 31, 2012 | |
|---|
| | Qtr 1 | | Qtr 2 | | Qtr 3 | | Qtr 4 | | Total | |
|---|
| | (in thousands)
| |
|---|
Fee-based revenue: | | | | | | | | | | | | | | | | |
LTF revenue | | $ | 29,579 | | $ | 29,495 | | $ | 28,994 | | $ | 28,176 | | $ | 116,244 | |
STF revenue | | | 5,566 | | | 5,739 | | | 8,228 | | | 10,276 | | | 29,809 | |
| | | | | | | | | | | | |
| | | 35,145 | | | 35,234 | | | 37,222 | | | 38,452 | | | 146,053 | |
Realized optimization: | | | | | | | | | | | | | | | | |
Realized optimization, net | | | 21,439 | | | 16,633 | | | (9,054 | ) | | 33,717 | | | 62,735 | |
| | | | | | | | | | | | |
Total realized revenue | | | 56,584 | | | 51,867 | | | 28,168 | | | 72,169 | | | 208,788 | |
Realized revenue as a percentage of total realized revenue | | |
27.1 |
% | |
24.8 |
% | |
13.5 |
% | |
34.6 |
% | |
100.0 |
% |
As noted above, during fiscal 2012 and continuing into fiscal 2013, our revenues and profitability were negatively impacted by a combination of factors that resulted in reduced revenue margins compared to prior periods. We have responded with a number of actions designed to reduce debt and interest costs and to preserve our liquidity and financial flexibility under these conditions. These actions included:
- •
- The monetization of approximately $200 million of excess working capital, principally proprietary inventory;
- •
- The repurchase in fiscal 2012 of approximately $156 million principal amount of our 8.875% Senior Notes;
- •
- The amendment and extension in fiscal 2013 of our $400.0 million Revolving Credit Facility which extended the term of that facility from March 2014 to June 2016 and which reduced
54
Table of Contents
We believe that these actions have strengthened our financial position, improved our liquidity and enhanced our ability to attract capital.
Our primary short-term liquidity needs are to make interest and principal payments under our $400.0 million Credit Agreement, and our Senior Notes, to fund our operating expenses and maintenance capital, to pay for the acquisition of proprietary optimization inventory along with associated margin requirements and to pay quarterly distributions, to the extent declared by our board of directors. We fund these expenditures through a combination of cash on hand, cash from operations and borrowings under our Credit Agreement.
Our medium-to-long-term liquidity needs primarily relate to potential additional debt repurchases or refinancing, organic growth opportunities and, potentially, asset acquisitions. We expect to finance the cost of any significant expansion projects or acquisitions from borrowings under our existing or possible future credit facilities or a mix of borrowings and additional equity offerings as well as cash on hand and cash from operations. As of March 31, 2013, we have announced that we are evaluating a development project called Starks in Southwest Louisiana as a hydrocarbon liquids storage facility. Because this project remains in the evaluation phase, the amount and timing of any capital requirements are uncertain. Other than Starks, as of March 31, 2013, we do not anticipate any expansion projects or acquisitions that would require additional debt or equity financing.
During fiscal 2012, we repurchased $156.2 million of the principal amount of our Senior Notes, reducing the outstanding balance to $643.8 million at March 31, 2012 from $800.0 million at March 31, 2011. These purchases were funded primarily from working capital, including approximately $121 million of proprietary optimization inventory. In addition, in fiscal 2012 we sold approximately 4 Bcf of cushion gas at one of our facilities for proceeds of approximately $15 million and the Carlyle/Riverstone Funds reinvested $11 million of distributions that had been paid to them in additional common units. We did not purchase any additional Senior Notes in fiscal 2013 because market conditions provided incentives to carry our remaining proprietary inventory forward to future periods and, accordingly, such inventories were not liquidated until the fourth quarter of fiscal 2013. In addition, in fiscal 2013 we sold another approximately 5 Bcf of cushion gas at two of our facilities for proceeds of approximately $18 million. Together, these sales allowed us to reduce our outstanding balances under our Credit Facility from $150.0 million at March 31, 2012 to $65.0 million at March 31, 2013 and, upon collection of the proceeds from the liquidation of proprietary optimization inventories subsequent to March 31, 2013, to eliminate outstanding balances altogether. We expect to begin borrowings under the Credit Facility to resume during the summer of 2013 as we begin purchases of proprietary optimization inventories. However, we do not expect inventory balances in fiscal 2014 to approach levels carried during fiscal 2013.
We believe that our existing sources of liquidity described above will be sufficient to fund our short-term liquidity needs through the year ending March 31, 2014. Funding of material organic growth projects or acquisitions as well as other longer-term liquidity needs will depend on the availability and cost of capital in the debt and equity markets, as well as compliance with our debt covenants. Accordingly, the availability of any potential funding on economic terms is uncertain.
Our principal debt covenant is our fixed charge coverage ratio, or FCCR, which is included in both our Credit Facility agreement and the indenture to our Senior Notes. When our FCCR, which is calculated quarterly on a trailing-twelve months basis by dividing Adjusted EBITDA (defined
55
Table of Contents
substantially the same as presented herein) by fixed charges, which are measured as interest expense plus the amount of interest capitalized, but giving pro forma credit for all of the previous twelve months for certain debt purchases and acquisitions, is less than 2.0 to 1.0, we are restricted in our ability to issue new debt. However, this restriction does not affect our ability to access our existing Credit Facility or to amend, extend or replace that facility. When our FCCR is below 1.75 to 1.0, we are restricted in our ability to pay distributions. At March 31, 2013, our FCCR was 2.6 to 1.0. If our FCCR were to be below 1.75 to 1.0, we would be permitted thereafter to pay $75 million of distributions. This $75 million amount is cumulative for all periods that our FCCR is below 1.75 to 1.0. The appropriateness and amount of distributions are determined by our board of directors on a quarterly basis.
Because we intend to distribute all of our available cash to our unitholders, our growth may not be as fast as the growth of businesses that reinvest their available cash to expand ongoing operations. Moreover, because of constraints in the capital markets or our inability to find and develop organic growth opportunities or potential acquisitions, our future growth may be slower than our historical growth. We expect that we will, in large part, rely on external financing sources, including bank borrowings and issuances of debt and equity securities, to fund significant expansion capital expenditures and potential future acquisitions. To the extent we are unable to finance growth externally, our cash distribution policy could significantly impair our ability to grow. To the extent that we issue additional units in connection with any acquisitions or expansion capital expenditures, the payment of distributions on those additional units may increase the risk that we will be unable to maintain or increase our per unit distribution level, which in turn may affect the available cash that we have available to distribute to each unit. Our Operating Agreement does not limit our ability to issue additional units, including units ranking senior to the common units. The incurrence of additional debt by us or our operating subsidiaries would result in increased interest expense, which in turn may also affect the available cash that we have to distribute to our unitholders.
Historical Cash Flows
Our cash flows are significantly influenced by our level of natural gas inventory, margin deposits and related forward sale contracts or hedging positions at the end of each accounting period and may fluctuate significantly from period to period. In addition, our period-to-period cash flows are heavily influenced by the seasonality of our proprietary optimization activities. For example, we generally purchase significant quantities of natural gas during the summer months and sell natural gas during the winter months. The storage of natural gas for our own account can have a material impact on our cash flows from operating activities for the period we pay for and store the natural gas and the subsequent period in which we receive proceeds from the sale of natural gas. When we purchase and store natural gas for our own account, we use cash to pay for the natural gas and record the gas as inventory and thereby reduce our cash flows from operating activities. We typically borrow on our revolving credit facilities to fund these purchases, and these borrowings increase our cash flows from financing activities. Conversely, when we collect the proceeds from the sale of natural gas that we purchased and stored for our own account, the impact on our cash flows from operating activities is positive and the impact on our cash flows from financing activities is negative. Therefore, our cash flows from operating activities fluctuate significantly from period-to-period as we purchase natural gas, store it, and then sell it in a later period. In addition, we have margin requirements on our economically hedged positions. As the cash deposits we make to satisfy our margin requirements increase and decrease with our volume of derivative positions and changes in commodity prices, our cash flows from operating
56
Table of Contents
activities may fluctuate significantly from period to period. The following table summarizes our sources and uses of cash for the fiscal years ended March 31, 2013, 2012, and 2011:
| | | | | | | | | | |
| | Year Ended March 31, | |
|---|
| | 2013 | | 2012 | | 2011 | |
|---|
| | (in thousands)
| |
|---|
Operating Activities | | | | | | | | | | |
Net (Loss) Earnings | | $ | (43,601 | ) | $ | (165,772 | ) | $ | 57,457 | |
Adjustments to reconcile net earnings to net cash provided by operating activities: | | | | | | | | | | |
Unrealized foreign exchange (gains) loss | | | (252 | ) | | 391 | | | 770 | |
Deferred income tax benefit | | | (17,528 | ) | | (20,648 | ) | | (31,267 | ) |
Unrealized risk management losses (gains) | | | 89,851 | | | (83,193 | ) | | 44,787 | |
Depreciation and amortization | | | 50,409 | | | 46,132 | | | 46,891 | |
Deferred charges amortization | | | 3,411 | | | 3,942 | | | 4,124 | |
Loss on extinguishment of debt | | | 599 | | | 4,861 | | | — | |
Loss on impairment and sale of assets | | | 14,927 | | | 5,342 | | | — | |
Impairment of goodwill | | | — | | | 250,000 | | | — | |
Write-down of inventory | | | 22,281 | | | 23,400 | | | — | |
Changes in non-cash working capital | | | 42,033 | | | (56,420 | ) | | (69,377 | ) |
| | | | | | | | |
Net cash provided by operating activities | | $ | 162,130 | | $ | 8,035 | | $ | 53,385 | |
| | | | | | | | |
Net cash used in investing activities | | $ | (27,805 | ) | $ | (52,820 | ) | $ | (20,375 | ) |
| | | | | | | | |
Net cash used in financing activities | | $ | (136,829 | ) | $ | (60,083 | ) | $ | (46,630 | ) |
| | | | | | | | |
Other information: | | | | | | | | | | |
Proprietary inventory at cost (at year-end) | | $ | 83,416 | | $ | 230,739 | | $ | 133,576 | |
| | | | | | | | |
Operating Activities. The variability in net cash provided by operating activities is primarily due to (1) varying market conditions that exist during any given fiscal period, which impacts the margins and fees under each of our fee-based and optimization activities; and (2) market conditions at the end of any given fiscal period, which impacts our decision to sell significant volumes of inventory or hold them over a fiscal period end and sell them in the next fiscal period if there is the economic incentive to do so, such as to increase the margins from previous optimization transactions.
Cash provided by operating activities resulted from the liquidation of inventories carried over from the previous year, along with the settlement of associated hedges. These funds were used to repay drawings on our revolver and complete the expansion of our Wild Goose facility.
| | | | | | | | | | |
| | Year Ended March 31, | |
|---|
| | 2013 | | 2012 | | 2011 | |
|---|
| | (in thousands)
| |
|---|
Changes in non-cash working capital: | | | | | | | | | | |
Margin deposits | | $ | (39,174 | ) | $ | 99,804 | | $ | (90,891 | ) |
Natural gas inventory | | | 125,042 | | | (120,563 | ) | | (17,795 | ) |
Prepaid expenses | | | (1,527 | ) | | 2,669 | | | (4,119 | ) |
Accrued receivables | | | (40,203 | ) | | 9,938 | | | 19,252 | |
Deferred revenue | | | (10,667 | ) | | 6,498 | | | 3,310 | |
Accrued liabilities | | | 8,456 | | | (53,036 | ) | | 22,391 | |
Other | | | 105 | | | (1,730 | ) | | (1,525 | ) |
| | | | | | | | |
Net changes in non-cash working capital | | $ | 42,033 | | $ | (56,420 | ) | $ | (69,377 | ) |
| | | | | | | | |
57
Table of Contents
Working Capital. Working capital is defined as the amount by which current assets exceed current liabilities. Our working capital ratio is defined as current assets divided by current liabilities. Our working capital is affected by the relationship between unrealized financial risk management hedges which are marked-to-market on a monthly basis, the margin deposits required by our brokers for such gains and losses, proprietary inventory which is stored in our facilities and cash used to fund inventory purchases. Our working capital levels are also affected by our capital spending for maintenance and expansion activity.
As of March 31, 2013, we had net working capital of $105.8 million (working capital ratio of 1.7 to 1.0, which is calculated by dividing current assets by current liabilities), representing a significant change compared to net working capital of $135.7 million (working capital ratio of 1.4 to 1.0) at March 31, 2012. The most significant reason for this reduction of $29.9 million is the use of working capital to pay for the completion of our Wild Goose expansion.
Investing Activities. Most of the investing activities in each of the fiscal years ended March 31, 2013, 2012 and 2011 were attributed to expansion capital expenditures at our storage facilities. These expenditures, as outlined in "—Capital Expenditures," have enabled us to increase our effective working gas capacity by 40.0 Bcf during the three year period. However, maintenance capital expenditures have been consistently modest, ranging between $1.7 million and $1.9 million each year during this same period.
Financing Activities. Net cash used in financing activities consists of debt incurred for the acquisition of assets, periodic optional and mandatory retirements of such debt, advances and repayments made on our previous credit facilities to fund proprietary inventory purchases, contributions of capital from our equity holders to fund expansion capital expenditures and debt retirements and distributions made to our equity holders.
During the fiscal year ended March 31, 2013 there was an $85.0 million net reduction in borrowings on our credit facilities with funding primarily derived from net proprietary inventory sales.
During the fiscal year ended March 31, 2012 there was a $150.0 million net increase in credit facility borrowings with the proceeds primarily used for net proprietary inventory purchases. During the same fiscal year, we completed the issuance and sale of 687,500 common units at a price of $16.00 per unit to Sponsor Holdings. Total proceeds of $11.0 million were used to reduce amounts owing under the Senior Notes. In aggregate, we repurchased $156.2 million of the principal amount of our Senior Notes during the fiscal period.
During the fiscal year ended March 31, 2011 we received proceeds of $333.5 million from our IPO in May of 2010, after deducting fees of $23.4 million. This was offset by distributions totaling $313.3 million made to the owners of Niska Predecessor in connection with our debt and equity offerings, and $64.7 million related to quarterly distributions made to our unitholders during the period.
58
Table of Contents
Our capital expenditures for the years ended March 31, 2013, 2012 and 2011 were as follows:
| | | | | | | | | | |
| | Year Ended March 31, | |
|---|
| | 2013 | | 2012 | | 2011 | |
|---|
| | (in thousands)
| |
|---|
Maintenance capital | | $ | 1,833 | | $ | 1,858 | | $ | 1,681 | |
Expansion capital | | | 28,182 | | | 50,962 | | | 18,694 | |
| | | | | | | | |
Total cash expenditures | | | 30,015 | | | 52,820 | | | 20,375 | |
Non-cash working capital related to property, plant and equipment expenditures | | | (5,551 | ) | | 2,874 | | | 2,874 | |
Non-cash transfer of natural gas inventory to property, plant and equipment | | | — | | | — | | | 13,624 | |
| | | | | | | | |
Total | | $ | 24,464 | | $ | 55,694 | | $ | 36,873 | |
| | | | | | | | |
Maintenance capital expenditures are capital expenditures made to replace partially or fully depreciated assets, to maintain the existing operating capacity of our assets and to extend their useful lives. Expansion capital expenditures are made to acquire additional assets to grow our business, to expand and upgrade our facilities and to acquire similar operations or facilities. Cost reduction expenditures are those capital expenditures which increase the effectiveness and/or efficiency of our assets or which enable us to operate at a lower cost.
Under our current plan, we expect to continue to spend approximately $1.0 million to $2.0 million per year for maintenance capital expenditures to maintain the integrity of our storage facilities and ensure the reliable injection, storage and withdrawal of natural gas for our customers. In the fiscal year ended March 31, 2013 we spent a total of $30.0 million to expand the capacity and services of our facilities. Expansion capital expenditures included the addition of 4 Bcf capacity at our AECO facility and the completion of injection and withdrawal enhancements as well as an additional pipeline interconnect as part of a 15 Bcf capacity increase at our Wild Goose facility to 50 Bcf.
Expansion capital for fiscal 2014 is expected to be less than $10.0 million and relates principally to enhancing existing capacity and to developing new projects.
On March 5, 2010, Niska US and Niska Canada, issued 800,000 units, each unit consisting of $218.75 principal amount of 8.875% Senior Notes due 2018 of Niska US and $781.25 principal amount of 8.875% Senior Notes of Niska Canada. During the year ended March 31, 2012, we paid $158.0 million, excluding accrued interest, to repurchase Senior Notes with a principal amount of $156.2 million. There were no repurchases of Senior Notes during the fiscal year ended March 31, 2013.
In this section Niska US and Niska Canada are each referred to individually as an "issuer" and collectively as "the issuers."
The notes are senior unsecured obligations of each issuer, which are: (1) effectively junior to that issuer's secured obligations; (2) equal in right of payment with all existing and future senior unsecured indebtedness of each issuer; and (3) senior in right of payment to any future subordinated indebtedness of each issuer. The notes are fully and unconditionally guaranteed by us and our direct and indirect subsidiaries on a senior unsecured basis, and are: (1) effectively junior to each guarantor's secured obligations; (2) equal in right of payment with all existing and future senior unsecured indebtedness of
59
Table of Contents
each guarantor and (3) senior in right of payment to any future subordinated indebtedness of each guarantor.
Interest on our Senior Notes is payable on March 15 and September 15 of each year they are outstanding. The notes will mature on March 15, 2018. Under the indenture governing our Senior Notes, we are not required to make principal payments prior to the maturity date except upon certain events of default. In addition, in the event of a change in control or certain asset sales, as those terms are defined in the indenture, we may be required to offer to redeem the notes from our holders.
The indenture governing our Senior Notes limits our ability to pay distributions in respect of, repurchase or pay dividends on our membership interests (or other capital stock) or make other restricted payments. The limitation changes depending on our fixed charge coverage ratio, which is defined as the ratio of our consolidated cash flow to our fixed charges, each as defined in the indenture governing our Senior Notes, and measured for the preceding four quarters.
If our fixed charge coverage ratio is not less than 1.75 to 1.0, we are permitted to make restricted payments if the aggregate restricted payments since the date of closing of our IPO, excluding certain types of permitted payments, are less than the sum of a number of items including, most importantly:
- •
- operating surplus (defined similarly to the definition in our Operating Agreement) calculated as of the end of our preceding fiscal quarter; and
- •
- the aggregate net cash proceeds received by us as a capital contribution or from the issuance of equity interests.
If the fixed charge coverage ratio is less than 1.75 to 1.0, we are permitted to make restricted payments if the aggregate restricted payments since the date of closing of our IPO, excluding certain types of permitted payments, are less than the sum of a number of items including, most importantly:
- •
- $75.0 million; and
- •
- the aggregate net cash proceeds received by us as a capital contribution or from the issuance of equity interests.
As of March 31, 2013, the fixed charge coverage ratio was 2.6 to 1.0 and the indenture governing our Senior Notes would have permitted us to distribute approximately $192.8 million.
The indenture does not prohibit certain types or amounts of restricted payments, including a general basket of $75.0 million of restricted payments.
The indenture governing our Senior Notes contains certain other covenants that, among other things, limit our and certain of our subsidiaries' ability to:
- •
- incur additional indebtedness;
- •
- pay dividends on, repurchase or make distributions in respect of our capital stock or make other restricted payments;
- •
- make certain investments;
- •
- sell, transfer, or otherwise convey certain assets;
- •
- create liens;
- •
- consolidate, merge, sell or otherwise dispose of all or substantially all of our assets; and
- •
- enter into certain transactions with our affiliates.
The occurrence of events involving us or certain of our subsidiaries may constitute an event of default under the indenture. Such events include failure to pay interest, principal, or the premium on
60
Table of Contents
the notes when due; failure to comply with the merger, asset sale or change of control covenants; certain defaults on other indebtedness; and certain insolvency proceedings. In the case of an event of default, the holders of the notes are entitled to remedies, including the acceleration of payment of the notes by request of the holders of at least 25% in aggregate principal amount of the notes, and any action by the trustee to collect payment of principal, interest or premium in arrears.
Prior to March 15, 2014, the issuers may redeem some or all of the notes at a make-whole premium, as set forth in the offering memorandum. After March 15, 2014, the issuers may redeem some or all of the notes at a premium that decreases over time until maturity.
Concurrently with the issuance of our Senior Notes, Niska Partners, through its subsidiaries, Niska Gas Storage US, LLC and AECO Gas Storage Partnership entered into senior secured asset-based revolving credit facilities, consisting of a U.S. revolving credit facility and a Canadian revolving credit facility (the "Credit Facilities" or the "$400.0 million Credit Agreement"). On June 29, 2012, Niska Partners, through the same subsidiaries, completed an amendment and restatement of the $400.0 million Credit Agreement. These Credit Facilities provide for revolving loans and letters of credit in an aggregate principal amount of up to $200.0 million for each of the U.S. revolving credit facility and the Canadian revolving credit facility. Subject to certain conditions, each of the U.S. revolving credit facility and the Canadian revolving credit facility may be expanded up to $100.0 million in additional commitments, and the commitments in each facility may be reallocated on terms and according to procedures to be determined. Loans under the U.S. revolving facility will be denominated in U.S. dollars and loans under the Canadian revolving facility may be denominated, at Niska Partners' option, in either U.S. or Canadian dollars. Each revolving credit facility matures on June 29, 2016. $0.6 million was written off during the year ended March 31, 2013, representing a portion of the deferred financing costs associated with the amendment and restatement of the original agreement.
Borrowings under our revolving credit facilities are limited to a borrowing base calculated as the sum of specified percentages of eligible cash equivalents, eligible accounts receivable, the net liquidating value of hedge positions in broker accounts, eligible inventory, issued but unused letters of credit, and certain fixed assets minus the amount of any reserves and other priority claims. Borrowings bear interest at a floating rate, which (1) in the case of U.S. dollar loans can be either LIBOR plus an applicable margin or, at our option, a base rate plus an applicable margin, and (2) in the case of Canadian dollar loans can be either the bankers' acceptance rate plus an applicable margin or, at our option, a prime rate plus an applicable margin. The credit agreement provides that we may borrow only up to the lesser of the level of our then current borrowing base and our committed maximum borrowing capacity, which is currently $400.0 million. Our borrowing base was $327.1 million as of June 3, 2013.
Our obligations under our $400.0 million Credit Agreement are guaranteed by us and all of our direct and indirect wholly owned subsidiaries (subject to certain exceptions) and secured by a lien on substantially all of our and our direct and indirect subsidiaries' current and fixed assets (subject to certain exceptions). Certain fixed assets are required to be part of the collateral only to the extent such fixed assets are included in the borrowing base under the respective revolving credit facility. The aggregate borrowing base under both revolving credit facilities includes $150.0 million (the "PP&E Amount") due to a first-priority lien on fixed assets granted to the lenders. The PP&E Amount will be reduced on a dollar-for-dollar basis upon the release of fixed assets having a value in excess of $50.0 million from such liens.
The following fees are applicable under each revolving credit facility: (1) an unused line fee, based on the unused portion of the respective revolving credit facility; (2) a letter of credit participation fee on the aggregate stated amount of each letter of credit equal to the applicable margin for LIBOR
61
Table of Contents
loans or bankers' acceptance loans, as applicable; and (3) certain other customary fees and expenses of the lenders and agents. We are required to make prepayments under our revolving credit facilities at any time when, and to the extent that, the aggregate amount of the outstanding loans and letters of credit under such revolving credit facility exceeds the lesser of the aggregate amount of commitments in respect of such revolving credit facility and the applicable borrowing base.
Our $400.0 million Credit Agreement contains customary covenants, including, but not limited to, restrictions on our and our subsidiaries' ability to merge and consolidate with other companies, incur indebtedness, grant liens or security interests on assets subject to security interests under the credit agreement, make acquisitions, loans, advances or investments, pay distributions, sell or otherwise transfer assets, optionally prepay or modify terms of any subordinated indebtedness or enter into transactions with affiliates. Our revolving credit facilities require the maintenance of a fixed charge coverage ratio of 1.1 to 1.0 at the end of each fiscal quarter when excess availability under both revolving credit facilities is less than 15% of the aggregate amount of availability under both revolving credit facilities. Such fixed charge coverage ratio will be tested at the end of each quarter until such time as average excess availability exceeds 15% for thirty consecutive days.
Our $400.0 million Credit Agreement contains limitations on our ability to pay distributions in respect of, repurchase or pay dividends on our membership interests (or other capital stock) or make other restricted payments. These limitations are substantially similar to those contained in the indenture governing our Senior Notes described above, except that the credit agreement is less restrictive.
Our $400.0 million Credit Agreement provides that, upon the occurrence of certain events of default, our obligations thereunder may be accelerated and the lending commitments terminated. Such events of default include payment defaults to the lenders, material inaccuracies of representations and warranties, covenant defaults, cross-defaults to other material indebtedness, including our Senior Notes, voluntary and involuntary bankruptcy proceedings, material money judgments, and material events relating to pension plans, certain change of control events and other customary events of default.
As of March 31, 2013, we had $65.0 million in borrowings, with a weighted average interest rate of 3.69%. As of June 3, 2013, we had no borrowings outstanding under our revolving credit facilities and had $28.4 million in letters of credit issued. We and our subsidiaries were in compliance with all covenant requirements under our credit facilities at June 3, 2013.
62
Table of Contents
The following table summarizes by period the payments due for our estimated contractual obligations as of March 31, 2013:
| | | | | | | | | | | | | | | | |
| | Payment due by period | |
|---|
| | Total | | Less than
1 year | | 1 - 3 years | | 3 - 5 years | | More than
5 years | |
|---|
| | (in thousands)
| |
|---|
Long term debt obligations | | $ | 643,790 | | $ | — | | $ | — | | $ | 643,790 | | $ | — | |
Interest on long term debt obligations | | | 285,682 | | | 57,136 | | | 114,273 | | | 114,273 | | | — | |
Operating lease obligations | | | 19,433 | | | 4,173 | | | 8,213 | | | 4,733 | | | 2,314 | |
Capital lease obligations | | | 15,515 | | | 1,657 | | | 3,313 | | | 3,313 | | | 7,232 | |
Leased storage contracts | | | 10,481 | | | 4,081 | | | 5,480 | | | 920 | | | — | |
Mineral and surface leases | | | 215,787 | | | 3,660 | | | 6,955 | | | 7,276 | | | 197,896 | |
Asset retirement obligations | | | 58,051 | | | — | | | — | | | — | | | 58,051 | |
Post-retirement obligation | | | 2,500 | | | — | | | — | | | — | | | 2,500 | |
Deferred income tax | | | 203 | | | 41 | | | 162 | | | — | | | — | |
Purchase obligations(1) | | | 2,132,981 | | | 1,952,782 | | | 173,688 | | | 6,511 | | | — | |
| | | | | | | | | | | | |
Total | | $ | 3,384,423 | | $ | 2,023,530 | | $ | 312,084 | | $ | 780,816 | | $ | 267,993 | |
| | | | | | | | | | | | |
- (1)
- Purchase obligations consist of forward physical and financial commitments related to purchases of natural gas. As we economically hedge substantially all of our natural gas purchases, there are forward sales that offset these commitments that are not included in the above table. As at March 31, 2013, forward physical and financial sales for all future periods totaled $2,121 million.
In accordance with GAAP, there is no carrying value recorded for a credit facility until we borrow from the facility. In the future we may use off-balance sheet arrangements such as undrawn credit facility commitments, including letters of credit, to finance portions of our capital and operating needs. See "—Contractual Obligations" for more information.
On January 1, 2010, we entered into an operating lease for compression and other equipment related to the development of an expansion project at Wild Goose. See "Note 19—Commitments and Contingencies" for more information.
During the year ended March 31, 2012, we determined that the significant reduction in natural gas price volatility and the continued narrow seasonal spread were impairment indicators. We made this determination because these factors had a material negative effect on our current financial performance and our expected performance in future years. Accordingly, we performed an impairment test which resulted in a charge of $250 million related to the goodwill valuation of our AECO HubTM and NGPL reporting units.
We determined the fair value of the AECO HubTM and NGPL reporting units using a combination of the present value of future cash flows method and the comparable transactions method. The present value of future cash flows was estimated using (i) discrete financial forecasts, which rely on estimates of revenue, expenses and volumes, (ii) long-term natural gas volatility and seasonal spreads, (iii) long-term average exchange rate between the United States Dollar and the Canadian Dollar and (iv) appropriate discount rates. The comparable transactions method analyzed other purchases of similar assets and considered (i) the anticipated cash flows determined above, (ii) recent transaction multiples based on
63
Table of Contents
anticipated cash flows and (iii) the similarity of comparable transactions to our facilities. Specifically, we used experience and budgeted amounts to estimate cycling volumes and expenses, future summer to winter spreads reflecting a longer term outlook, and extrinsic values consistent with those achieved in the business to estimate future revenue. These values used to estimate future revenues were lower than the seasonal storage spread and extrinsic values used in the test performed at March 31, 2011. We also used a comparable transaction multiple consistent with recent transactions for depleted reservoir storage facility acquisitions, which are comparable to our owned facilities.
Significant assumptions that we made in measuring the fair value of the assets and liabilities include (1) the replacement cost, depreciation and obsolescence and useful lives of property, plant and equipment and (2) the present value of incremental cash flows attributable to certain intangible assets.
Critical Accounting Estimates and Policies
The historical financial statements included elsewhere in this document have been prepared in accordance with GAAP. GAAP represents a comprehensive set of accounting and disclosure rules and requirements, the application of which requires management's judgments and estimates including, in certain circumstances, choices between acceptable GAAP alternatives.
Please refer to Note 2 of our Consolidated Financial Statements for a discussion of our most critical accounting estimates, judgments and uncertainties that are inherent in the application of GAAP, including revenue recognition, the valuation of risk management assets and liabilities, inventory and goodwill. These estimates affect, among other items, valuing identified intangible assets, evaluating impairments of long-lived assets, depreciation of cushion gas, establishing estimated useful lives for long-lived assets, estimating revenues and expense accruals, assessing income tax expense and the requirement for a valuation allowance against the deferred income tax asset and valuing asset retirement obligations.
Recent Accounting Pronouncements
Please refer to Note 3 of our Consolidated Financial Statements.
Item 7A. Quantitative and Qualitative Disclosures About Market Risks.
The term "market risks" refers to the risk of loss arising from changes in commodity prices, currency exchange rates, interest rates, counterparty credit and liquidity. The disclosures are not meant to be precise indicators of expected future losses, but rather indicators of reasonably possible losses. This forward-looking information provides indicators of how we view and manage our ongoing market risk exposures.
To mitigate exposure to changes in commodity prices, we enter into purchases and sales of natural gas inventory and concurrently match the volumes in these transactions with offsetting forward contracts or other hedging transactions.
Derivative contracts used to manage market risk generally consist of the following:
- •
- Forwards and futures are contractual agreements to purchase or sell a specific financial instrument or natural gas at a specified price and date in the future. We enter into forwards and futures to mitigate the impact of natural gas price volatility. In addition to cash settlement, exchange traded futures may also be settled by physical delivery of natural gas.
- •
- Swap contracts are agreements between two parties to exchange streams of payments over time according to specified terms. Swap contracts require receipt of payment for the notional quantity
64
Table of Contents
In order to manage our exposure to commodity price fluctuations, our policy is to promptly enter into a forward sale contract or other hedging transaction for every proprietary purchase contract we enter into. Therefore, inventory purchases are matched with forward sales or are otherwise economically hedged so that there are no speculative positions beyond the minimal operational tolerances specified in our risk policy.
At March 31, 2013, 25.7 Bcf of natural gas inventory was economically hedged, representing 96.7% of our total current inventory. However, because inventory is recorded at the lower of cost or market, not fair value, if the price of natural gas increased by $1.00 per Mcf the value of that inventory would increase by $26.6 million, but the fair value or mark-to-market value of our hedges would decrease by $25.7 million, due to 3.3% (0.9 Bcf) of that inventory that was not economically hedged. Conversely, if the price of natural gas declined by $1.00 per Mcf, the value of that inventory would decrease by $26.6 million while the fair value of our hedges would increase by only $25.7 million, due to the non-economically hedged position. Long-term inventory and fuel gas used for operating our facilities are not offset. Total volumes of long-term inventory and fuel gas at March 31, 2013 were 3.4 Bcf and 0.0 Bcf, respectively (3.4 Bcf and 0.0 Bcf respectively at March 31, 2012).
Although the intent of our risk-management strategy is to protect our margins and manage our liquidity risk on related margin deposit requirements, we do not qualify any of our derivatives for hedge accounting. Changes in the fair values of these derivatives receive mark-to-market treatment in current earnings and result in greater potential for earnings volatility. This accounting treatment is discussed further under Note 2 of the Notes to our Consolidated Financial Statements.
Our cash flow relating to our Canadian operations is reported in the U.S. dollar equivalent of such amounts measured in Canadian dollars. Monetary assets and liabilities of our Canadian subsidiaries are translated to U.S. dollars using the applicable exchange rate as of the end of a reporting period. Revenues, expenses and cash flow are translated using the average exchange rate during the reporting period.
Because a portion of our Canadian business is conducted in Canadian dollars, we use certain financial instruments to minimize the risks of changes in the exchange rate. These instruments include forward swaps or spot swaps buying or selling U.S. dollars. Options may also be used in the future. All of the financial instruments utilized are placed with large brokers and financial institutions.
At March 31, 2013, we had forward currency exchange contracts for a notional value of $84.0 million. The value of the forward currency contracts was an asset of $0.5 million at March 31, 2013 and a liability of $0.3 million at March 31, 2012, and is recorded in derivative assets and derivative liabilities accounts on the consolidated balance sheets. These contracts expire on various dates between April 2013 and August 2014 and are for the exchange of $84.0 million Canadian dollars into $82.6 million U.S. dollars.
65
Table of Contents
We are exposed to interest rate risk due to variable interest rates under our $400.0 million credit agreement. All such borrowings under our credit facilities bear interest at different rates. As of March 31, 2013, we had $65.0 million in borrowings outstanding under our revolving credit facilities. The credit facilities currently provide an interest rate on borrowings between 3.45% and 6.00%, depending on whether a fixed term or floating rate option is chosen. In the future, we may borrow under fixed rate and variable rate debt instruments that also give rise to interest rate risk. Changes in economic conditions could result in higher interest rates, thereby increasing our interest expense and reducing our funds available for capital investment, operations or distributions to our unitholders. A hypothetical increase or decrease in interest rates by 1% would have changed our interest expense by approximately $2.6 million for the fiscal year ended March 31, 2013.
Counterparty credit risk is the risk of financial loss if a customer fails to perform its contractual obligations. We engage in transactions for the purchase and sale of products and services with major companies in the energy industry and with industrial, commercial, residential and municipal energy consumers. Credit risk associated with trade accounts receivable is mitigated by the high percentage of investment grade customers, collateral support of receivables and our ability to take ownership of customer-owned natural gas stored in its facilities in the event of non-payment.
Margin deposits, or letters of credit in lieu of deposits, are required on derivative instruments utilized to manage our counterparty credit risk. As commodity prices increase or decrease, the fair value of our derivative instruments changes thereby increasing or decreasing our margin deposit requirements. Rising commodity prices or an expectation of rising prices could increase the cash needed to manage our commodity price exposure and thereby increase our liquidity requirements, limit amounts available to us through borrowing and reduce the volume of natural gas we may purchase. Exchange traded futures and options have minimal credit exposure as the exchanges guarantee every contract will be margined on a daily basis. In the event of any default, our account on the exchange would be absorbed by other clearing members. Because every member posts an initial margin, the exchange can protect the exchange members if or when a clearing member defaults.
Liquidity risk is the risk that we will not be able to meet our financial obligations as they become due. Our approach to managing liquidity risk is to contract a substantial part of our facilities to generate constant cash flow and to ensure that they always have sufficient cash and credit facilities to meet their obligations when due, under both normal and stressed conditions, without incurring unacceptable losses or damage to reputation.
The fair values of the derivative instruments are based on quoted market prices obtained from NYMEX or ICE and from various sources such as independent reporting services, industry publications and brokers. These quotes are compared to the contract price of the instrument, which approximates the gain or loss that would have been realized if the contracts had been closed out at a specified time. We utilize observable market data when available, or models that utilize observable market data when determining fair value.
Risk Management Policy and Practices
We have in place risk management practices that are intended to quantify and manage risks facing our business. These risks include, but are not limited to, market, credit, foreign exchange, operational,
66
Table of Contents
and liquidity risks. Our hedging practices mitigate our exposure to commodity price and foreign exchange risks. Strict open position limits are enforced, and physical inventory is offset with forward hedges. Our counterparty strategy ensures we have a strong mix of quality customers. We have models in place to monitor and manage operational and liquidity risks.
The Risk Management Committee, or RMC, is comprised of members of our management team. The RMC provides oversight of our commercial activities. The committee reviews the adequacy of controls to ensure compliance with the risk policy. Our RMC meets weekly to review and respond to risks facing our business. The RMC oversees the analysis of positions and exposures provided by our risk management function, which provides daily and weekly reporting to facilitate understanding of these exposures. The RMC assesses and manages the potential for loss in our positions through these reports. If limits are exceeded, the RMC is informed and appropriate action is taken to review and remedy. The risk management function is independent of the Commercial and Marketing groups and reports through our chief financial officer.
Optimization activities can only be executed by employees authorized to transact under the risk policy. All commercial personnel are annually required to read and certify that they will adhere to the principles purported within the policy. Each person authorized to make transactions is subject to internal volume limits. Counterparties are subject to credit limits as approved by our credit department.
Our commercial and risk functions operate independently to ensure proper segregation of duties. Critical deal information for every transaction is entered into our deal capture systems and confirmed with counterparties.
Despite the policies, procedures and controls described above, there can be no assurance that our risk management systems will prevent losses that would negatively affect our business, results of operations, cash flows and financial condition. See "Risk Factors—Risks Inherent in Our Business—Our risk management policies cannot eliminate all commodity price risk." In addition, any non-compliance with our risk management policies could result in significant financial losses.
Item 8. Financial Statements and Supplementary Data.
The Report of Independent Registered Public Accounting Firm, Consolidated Financial Statements and supplementary financial data required for this Item are set forth on pages F-4 through F-44 of this Annual Report on Form 10-K and are incorporated herein by reference.
Item 9. Changes in and Disagreements with Accountants on Accounting and Financial Disclosure.
None.
Item 9A. Controls and Procedures.
- (a)
- Disclosure Controls and Procedures.
Our principal executive officer (CEO) and principal financial officer (CFO) undertook an evaluation of our disclosure controls and procedures as of the end of the period covered by this report. The CEO and CFO have concluded that our controls and procedures were effective as of March 31, 2013. For purposes of this section, the term "disclosure controls and procedures" means controls and other procedures of an issuer that are designed to ensure that information required to be disclosed by the issuer in the reports that it files or submits under the Exchange Act is recorded, processed, summarized and reported, within the time periods specified in the SEC's rules and forms. Disclosure controls and procedures include, without limitation, controls and procedures designed to ensure that information required to be disclosed by an issuer in the reports that it files or submits under the Exchange Act is accumulated and communicated to the issuer's management, including its principal
67
Table of Contents
executive and principal financial officers, or persons performing similar functions, as appropriate to allow timely decisions regarding required disclosure.
- (b)
- Management's Report on Internal Control over Financial Reporting.
Management's report on internal control over financial reporting is set forth on page F-2 of this Annual Report on Form 10-K and is incorporated herein by reference.
- (c)
- Attestation Report of the Registered Public Accounting Firm.
The attestation report of our registered public accounting firm with respect to internal controls over financial reporting is set forth on page F-3 of this Annual Report on Form 10-K and is incorporated herein by reference.
- (d)
- Changes in Internal Control Over Financial Reporting.
There have been no changes in our internal control over financial reporting (as defined in Rule 13a-15(f) under the Exchange Act) that occurred during our last fiscal quarter that have materially affected or are reasonably likely to materially affect our internal control over financial reporting.
Item 9B. Other Information.
None.
PART III
Item 10. Directors, Executive Officers and Corporate Governance.
Our manager has sole responsibility for conducting our business and for managing our operations. Pursuant to our Operating Agreement, our manager has delegated the power to conduct our business and manage our operations to our board. Our manager may revoke this delegation and resume control of our business at any time. Our manager and our board are not elected by our unitholders and will not be subject to re-election on a regular basis in the future. As long as the delegation of authority is in effect, our manager will appoint all members to our board. Unitholders will not be entitled to elect our directors or directly or indirectly participate in our management or operation. Our Operating Agreement provides that our manager must act in "good faith" when making decisions on our behalf.
Whenever our manager makes a determination or takes or declines to take an action in its individual, rather than representative, capacity or in its sole discretion, it is entitled to make such determination or to take or decline to take such other action free of any fiduciary duty or obligation whatsoever to us or any member, and our manager is not required to act in good faith or pursuant to any other standard imposed by our Operating Agreement or under the Delaware Act or any other law. Examples include the exercise of its limited call rights, its voting rights with respect to the units it owns, its registration rights and its determination whether or not to consent to any merger or consolidation. Actions of our manager which are made in its individual capacity or in its sole discretion will be made by a majority of the owners of our manager.
In selecting and appointing directors to our board, our manager does not apply a formal diversity policy or set of guidelines. However, when appointing new directors, our manager considers each individual director's qualifications, skills, business experience and capacity to serve as a director, as described below for each director, and the diversity of these attributes for the board as a whole.
68
Table of Contents
Directors and Executive Officers
Our directors hold office until the earlier of their death, resignation, retirement, disqualification or removal by the member of our manager. Our executive officers serve at the discretion of our board. There are no family relationships among any of the directors or executive officers. The following table shows information as of May 1, 2013, regarding our current directors and executive officers.
| | | | | |
Name | | Age | | Position |
|---|
Simon Dupéré | | | 50 | | President and Chief Executive Officer and Director |
Vance E. Powers | | | 56 | | Chief Financial Officer |
Rick J. Staples | | | 50 | | Executive Vice President |
Jason A. Dubchak | | | 40 | | Vice President, General Counsel and Corporate Secretary |
Jason S. Kulsky | | | 46 | | Vice President, Business Development |
Deborah M. Fretz | | | 65 | | Director |
James G. Jackson | | | 49 | | Director |
E. Bartow Jones | | | 37 | | Director |
Stephen C. Muther | | | 64 | | Director |
George A. O'Brien | | | 64 | | Director |
David F. Pope | | | 56 | | Director |
William H. Shea, Jr. | | | 58 | | Director |
Andrew W. Ward | | | 46 | | Director |
Simon Dupéré—Mr. Dupéré is our President and Chief Executive Officer and a member of our board. Mr. Dupéré previously served as the Interim President & Chief Executive Officer from July 1, 2011 until April 24, 2012. Mr. Dupéré has also served as our Chief Operating Officer from September 2006 until June 7, 2012. During that time, he was in charge of our field and facility operations, engineering and geoscience, including our existing operations at our four natural gas storage facilities and our expansion and development efforts. He has 28 years of active experience in the natural gas industry. Prior to joining us, Mr. Dupéré was the President and Chief Executive Officer at Intragaz Inc., a natural gas storage company engaged in the development and operation of two gas storage projects in Quebec. Mr. Dupéré has a Bachelor of Science in Physics Engineering from Laval University in Quebec City, Quebec.
Vance E. Powers—Mr. Powers is our Chief Financial Officer. Mr. Powers has served as our Chief Financial Officer since January 1, 2011. Mr. Powers has over 25 years of experience in senior financial, accounting, and reporting positions. From April 2010 until commencing service as Niska's Chief Financial Officer, Mr. Powers served as a finance management consultant to Niska, assisting in the completion of Niska's initial public offering, its transition to a publicly-traded company and its establishment of an investor relations function. From May 2009 to March/April 2010, Mr. Powers was an individual investor. From December 2003 to May 2009, Mr. Powers served as Vice President, Finance and Controller of Buckeye GP LLC, the general partner of Buckeye Partners, L.P. (NYSE: BPL), one of the largest refined petroleum products pipeline and terminal companies in the United States, where he was a key member of the senior executive team and was principally responsible for Buckeye's accounting, financial reporting, planning and analysis and treasury functions. He also served Buckeye GP LLC as Acting Chief Financial Officer from July 2007 until November 2008, where he was additionally responsible for capital markets activities and investor relations. He held similar positions with MainLine Management LLC, the general partner of Buckeye GP Holdings L.P. (NYSE: BGH), and participated in BGH's initial public offering in August 2006. Mr. Powers holds a MBA degree from Lehigh University and a BA from Gettysburg College. He is also a Certified Public Accountant in Pennsylvania.
69
Table of Contents
Rick J. Staples—Mr. Staples is our Executive Vice President, responsible for the marketing, trading and commercial operation of our natural gas storage assets. Previously, Mr. Staples was in the role of Senior Vice President, Commercial Operations from May 2006 to April 2012. He has 28 years of experience in the energy industry, with a primary focus on the midstream sector, including natural gas storage. Prior to joining us in 2006, Mr. Staples served as Director of Gas Storage with TransCanada Pipelines Ltd. from 2001 to 2006. Mr. Staples graduated from the University of Alberta with a degree in Mechanical Engineering. Mr. Staples also graduated from the Queens Executive program (Queens School of Business) in 1997.
Jason A. Dubchak—Mr. Dubchak is our Vice President, General Counsel and Corporate Secretary. Mr. Dubchak has served as our Vice-President, General Counsel and Corporate Secretary since September 2007. Prior to assuming this role, Mr. Dubchak was Associate General Counsel and was continuously with the natural gas storage division of EnCana Corporation and its predecessor, Alberta Energy Company Ltd., respectively, since 2001. He has a Bachelor of Arts (Honors) from the University of Calgary and a Bachelor of Laws from the University of Alberta.
Jason S. Kulsky—Mr. Kulsky is our Vice President, Business Development, and has held that title since May 2006. Mr. Kulsky previously served with the natural gas storage division of EnCana Corporation and its predecessor, Alberta Energy Company Ltd., most recently serving as Manager, Business Development, prior to joining us. Mr. Kulsky is a Chartered Financial Analyst and has a Bachelor of Commerce (Finance) degree from the University of Calgary and an engineering diploma from SAIT Polytechnic.
Deborah M. Fretz—Ms. Fretz is a member of our board and serves as the interim non-executive Chairman. She also serves on both the audit and compensation committees. Ms. Fretz served as President, Chief Executive Officer and director of Sunoco Logistics Partners L.P. ("Sunoco Logistics") from October 2001 to July 1, 2010. Sunoco Logistics is a publicly-traded master limited partnership formed in 2001 to acquire, own and operate a geographically diverse group of crude oil and refined products pipelines, terminals and storage facilities in eleven states. Revenues were $10 billion, with 1,400 employees and interests in 10,000 miles of pipelines and 31 million barrels of storage capacity. Prior to the IPO of Sunoco Logistics Partners, Ms. Fretz held several executive management roles for Sunoco, Inc., the last as Vice President Mid-Continent Refining, Marketing and Logistics which included Sunoco's Lubricant business as well as the MidAmerica refining and marketing business. In February 2012, Ms. Fretz was elected to the board of Alpha Natural Resources (NYSE:ANR), a major U.S. coal supplier of both thermal and metallurgical coal worldwide and has served on the audit and compensation committees since May, 2012. From December 1993 to April 2012, Ms. Fretz served as a board member of GATX Corp., a Chicago-based transportation services firm, where she was Chair of the compensation committee and was formerly Lead Director. In May 2013, Ms. Fretz was elected to the Board of Directors of Chicago Bridge & Iron Company (NYSE: CBI), an energy infrastructure company and a significant provider of government services.
As a result of her service to Sunoco Logistics, Ms. Fretz gained extensive experience in overseeing the strategy, operations, and governance of major public companies. Ms. Fretz was also selected to serve as a director of our board due to her valuable knowledge of the energy industry. Ms. Fretz's experience has also given her knowledge of the unique issues related to operating publicly-traded limited partnerships, which are similar to us. We believe this background and skill set makes Ms. Fretz well-suited to serve as a member of our board.
James G. Jackson—Mr. Jackson is a member of our board and serves on both the audit and compensation committees. Mr. Jackson has been the Chief Financial Officer of BreitBurn GP, LLC, the general partner of BreitBurn Energy Partners L.P. ("BreitBurn") since July 2006 and an Executive Vice President since October 2007. BreitBurn is a publicly traded master limited partnership focused on the acquisition, exploitation and development of oil and gas properties in the United States. Mr. Jackson
70
Table of Contents
also currently serves as the Chief Financial Officer of the general partner of Pacific Coast Energy Company L.P. ("PCEC"). PCEC, which is BreitBurn's predecessor, is a privately held limited partnership engaged in the production and development of oil and gas from properties located in California. Before joining BreitBurn, Mr. Jackson served as a Managing Director in Merrill Lynch & Co.'s Global Markets and Investment Banking Group. Mr. Jackson joined Merrill Lynch in 1992 and was elected Managing Director in 2001. Previously, Mr. Jackson was a Financial Analyst with Morgan Stanley & Co. from 1986 to 1989 and was an Associate in the Mergers and Acquisitions Group of the Long-Term Credit Bank of Japan from 1989 to 1990. Mr. Jackson obtained a B.S. in Business Administration from Georgetown University and an M.B.A. from the Stanford Graduate School of Business.
Mr. Jackson's background and experience with BreitBurn GP, LLC, BreitBurn Energy Partners L.P. and PCEC has provided him with valuable experience and familiarity with master limited partnerships and, more specifically, the natural gas business. These skills coupled with his broad investment banking, acquisition and financing experience brings additional depth to our board's collective expertise, and therefore makes Mr. Jackson well suited to serve as a member of our board of directors.
E. Bartow Jones—Mr. Jones is a member of our board, the board of directors of our manager and the board of supervisors of Niska Holdings, which is our parent. Mr. Jones is currently a Managing Director of Riverstone Holdings LLC where he served as a Principal from 2007 to 2010. Mr. Jones has been with Riverstone since 2001. Mr. Jones currently serves on the boards of directors of Foresight Reserves, L.P., or Foresight, Targe Energy, LLC, or Targe, and the general partner of PVR Partners, L.P., and he previously served on the boards of directors of Buckeye and Mainline Management.
Mr. Jones has worked closely with us since our inception. Mr. Jones's experience in evaluating the financial performance and operations of companies in our industry, as well as his leadership skills and business acumen, provide him with the necessary skills to serve as a member of our board. In addition, Mr. Jones's work with PVR Partners, L.P., Foresight, Buckeye, Targe and MainLine Management has given him both an understanding of the broader energy business and of the unique issues related to operating publicly-traded limited partnerships, which are similar to us.
Stephen C. Muther—Mr. Muther is a member of our board and serves on both the audit committee (as Chairman) and the compensation committee. Mr. Muther served as President of the general partner of Buckeye Partners, L.P. ("BPL") and the general partner of Buckeye GP Holdings L.P. ("BGH") from October 25, 2007 until his retirement in February 2009. BPL is a publicly-traded master limited partnership that is principally engaged in the transportation, terminalling, marketing and storage of refined petroleum products for major integrated oil companies, large refined products marketing companies and major end users of petroleum products. BGH is a publicly-traded master limited partnership that owns 100% of the general partner of BPL. From February 2007 to November 2007, Mr. Muther served as Executive Vice President, Administration and Legal Affairs of the general partners of BPL and BGH, and from May 1990 to February 2007, Mr. Muther held the position of Senior Vice President, Administration, General Counsel and Secretary of the general partner of BPL. Prior to joining Buckeye, Mr. Muther was Associate Litigation and Antitrust Counsel for General Electric Company from July 1984 to May 1990. Mr. Muther was an associate attorney with Debevoise & Plimpton in New York City from February 1975 to June 1984. Mr. Muther graduated from Princeton University in 1971 and from the University of Virginia School of Law in 1974.
As a result of his service to BPL and BGH, Mr. Muther gained extensive experience in overseeing the strategy, operations, and governance of major public companies. Mr. Muther was also selected to serve as a director of our board due to his valuable legal expertise and his knowledge of the energy industry. Mr. Muther's experience has also given him knowledge of the unique issues related to
71
Table of Contents
operating publicly-traded limited partnerships, which are similar to us. We believe this background and skill set makes Mr. Muther well-suited to serve as a member of our board.
George A. O'Brien—Mr. O'Brien is a member of our board and the board of directors of our manager and also serves on the compensation committee as Chairman. Mr. O'Brien has served as a director of Enviva, L.P. from May 2010 until November 2012 and as Executive Vice President from February 2012 until November 2012. He previously has served as an independent director of Magellan GP, LLC, and general partner of Magellan Midstream Partners, L.P., or Magellan, a publicly-traded company that is engaged in the transportation, storage and distribution of refined petroleum products, from December 2003 until November 2009. Mr. O'Brien was President and CEO of Pacific Lumber Company from August 2006 until July 2008. From 1988 until 2005, he worked for International Paper where he served as Senior Vice President of Forest Products responsible for its forestry, wood products, minerals and specialty chemicals businesses. Other responsibilities during his tenure at International Paper included corporate development, CFO of its New Zealand subsidiary, CEO of the New Zealand pulp, paper and tissue businesses and Vice President of Corporate Development. In January 2007, Pacific Lumber Company filed for voluntary reorganization under Chapter 11 of the United States Bankruptcy Code. Pacific Lumber successfully emerged from Chapter 11 in July, 2008. Mr. O'Brien has an agreement with Riverstone, pursuant to which he has agreed to serve on the boards of several Carlyle/Riverstone Funds' portfolio companies.
As a result of his service to Magellan and International Paper, Mr. O'Brien gained extensive experience in overseeing the strategy, operations, and governance of major public companies. Mr. O'Brien was also selected to serve as a director of our board due to his valuable financial expertise, including extensive experience with capital markets transactions and knowledge of the energy industry. Mr. O'Brien's experience has also given him knowledge of the unique issues related to operating publicly-traded limited partnerships, which are similar to us. We believe this background and skill set makes Mr. O'Brien well-suited to serve as a member of our board
David F. Pope—Mr. Pope is a member of our board. Mr. Pope was our former President and Chief Executive Officer from June 2006 to July 2011. Prior to his role at Niska Holdings, Mr. Pope served as the President of Seminole Canada Gas Company since 2002, and prior to that has held various positions in the natural gas industry since 1980. In 1992, Mr. Pope began his employment with Enron Corporation after it acquired Canadian Gas Marketing, a company Mr. Pope founded in 1989. He worked for Enron Corporation as Vice President of its gas marketing and trading group from 1992 until March 2001, nine months' prior to Enron Corporation's filing of a voluntary petition for a Chapter 11 reorganization with the U.S. Bankruptcy Court in December of 2001. Mr. Pope is a former director of GEP Midstream Finance Corp. and Gibson Energy ULC. Mr. Pope has a Bachelor of Engineering in Chemical Engineering from McGill University and has worked in the natural gas industry for his entire career.
As a result of his professional background, we believe Mr. Pope brings to us significant strategic and financial skills and significant operational experience. Combined with his over 30 years of experience in the natural gas industry and deep knowledge of our business, these attributes make Mr. Pope well-suited to serve on our board.
William H. Shea, Jr.—Mr. Shea is a member of our board and the board of directors of our manager and also serves on the compensation committee. Mr. Shea has served as a director of PVR GP, LLC, the general partner of PVR Partners L.P. and Chief Executive Officer of Penn Virginia Resource Partners, L.P. since March 2010, as Chief Executive Officer of PVR GP, LLC from March 2010 to June 2012 and as President and Chief Executive Officer of PVR GP, LLC since June 2012. Previously, Mr. Shea served as the Chairman of Buckeye GP LLC, the general partner of Buckeye Partners, L.P., a refined petroleum products pipeline partnership from May 2004 to July 2007, as President and Chief Executive Officer of Buckeye GP LLC from September 2000 to July 2007 and as
72
Table of Contents
President and Chief Operating Officer of Buckeye GP LLC from July 1998 to September 2000. From August 2006 to July 2007, Mr. Shea served as Chairman of MainLine Management LLC, the general partner of Buckeye GP Holdings, L.P., and as President and Chief Executive Officer of MainLine Management LLC from May 2004 to July 2007. Mr. Shea also serves as a director of Kayne Anderson Energy Total Return Fund, Inc. Kayne Anderson MLP Investment Company, and USA Compression Holdings LLC. Mr. Shea has an agreement with Riverstone, pursuant to which he has agreed to serve on the boards of Carlyle/Riverstone Funds' portfolio companies.
Mr. Shea's experiences as an executive with both PVR and Buckeye, energy companies that operate across a broad spectrum of sectors, including coal, natural gas gathering and processing and refined petroleum products transportation, have given him valuable knowledge about our industry. In addition, Mr. Shea has valuable experience overseeing the strategy and operations of publicly-traded partnerships, which are similar to us. As a result of this experience and resulting skills set, we believe Mr. Shea is an asset to our board.
Andrew W. Ward—Mr. Ward is a member of our board, the board of directors of our manager and the board of supervisors of Niska Holdings, which is our parent. Mr. Ward has served as a member of the board of supervisors of Niska Holdings since May 2006. He is currently a Managing Director of Riverstone Holdings LLC where he served as a Principal from March 2002 to December 2004. Mr. Ward currently serves on the board of directors of the general partner of PVR Partners, L.P., USA Compression Partners LP and various private companies and has previously served on the boards of directors of Buckeye GP LLC, the general partner of Buckeye and MainLine Management LLC, or MainLine Management, the general partner of Buckeye GP Holdings L.P. and Gibson Energy.
Mr. Ward has served as a director since our inception. Mr. Ward's experience in evaluating the financial performance and operations of companies in our industry, combined with his leadership skills and business acumen, makes him a valuable member of our board. In addition, Mr. Ward's work with PVR Partners L.P., USA Compression Partners LP, Gibson Energy, GEP Midstream, Buckeye and MainLine Management and various private companies has given him both an understanding of the midstream sector of the energy business and of the unique issues related to operating publicly-traded limited partnerships, which are similar to us.
Our board has determined that Deborah M. Fretz, Stephen C. Muther and James G. Jackson are independent directors under the listing standards of the NYSE. Our board considered all relevant facts and circumstances and applied the independence guidelines of the NYSE in determining that neither of these directors has any material relationship with us, our management, our general partner or its affiliates or our subsidiaries.
We hold regularly scheduled meetings of our independent directors. In accordance with our Corporate Governance Guidelines, Ms. Fretz, as our non-executive chairman of the board, will continue to preside as lead director over meetings of our independent directors.
The procedure by which any interested party may communicate directly with an independent director is set forth in our Corporate Governance Guidelines, which is available on our website at http://www.niskapartners.com.
Our board has established an audit committee to assist it in its oversight of the integrity of our financial statements and our compliance with legal and regulatory requirements and corporate policies and controls. Our audit committee is comprised of Ms. Fretz, Mr. Muther and Mr. Jackson. Our audit committee is fully independent as defined in the listing standards of the NYSE.
73
Table of Contents
In accordance with Statement of Auditing Standards No. 61 as adopted by the Public Company Accounting Oversight Board, our audit committee has the sole authority to retain and terminate our independent registered public accounting firm, approve all auditing services and related fees and the terms thereof, and pre-approve any non-audit services to be rendered by our independent registered public accounting firm. Our audit committee is also responsible for confirming the independence and objectivity of our independent registered public accounting firm. Our independent registered public accounting firm has unrestricted access to the audit committee. In addition, the audit committee has the authority to review our procedures for internal auditing, review the adequacy of internal controls and engage the services of any other advisors and accountants as the committee deems advisable.
We have designated Ms. Fretz, Mr. Muther and Mr. Jackson as audit committee financial experts. Mr. Muther has been appointed the Chairman of the audit committee.
As a controlled company that is listed on the NYSE, we are not required to have a compensation committee. See "—Significant Differences in Corporate Governance Standards" for a further explanation. In order to conform to best governance practices, however, our board has established a compensation committee to, among other things, oversee the compensation plans described below. The compensation committee establishes and reviews general policies related to our compensation and benefits. The compensation committee has the responsibility to determine and approve, or make recommendations to the board with respect to, the compensation and benefits of our board and executive officers.
The compensation committee is composed of Mr. O'Brien, Mr. Shea, Mr. Muther, Mr. Jackson and Ms. Fretz. Mr. O'Brien has been appointed the Chairman of the compensation committee. Ms. Fretz, Mr. Muther and Mr. Jackson are independent directors (as that term is defined in the applicable NYSE rules and Rule 10A-3 of the Exchange Act). All members of the compensation committee are non-employee directors (as that term is defined in Rule 16b-3 of the Exchange Act). None of our executive officers served as a director or member of a compensation committee of another entity that has or has had an executive officer who served as a member of our board during 2011, 2010 or 2009.
Whenever a conflict arises between our manager or its affiliates, on the one hand, and us or any unaffiliated member, on the other, our board will resolve that conflict. Our board may establish a conflicts committee to review specific matters that our board refers to it. Our board may, but is not required to, seek the approval of such resolution from the conflicts committee. The conflicts committee will determine if the resolution of the conflict of interest is fair and reasonable to us. Such a committee would consist of a minimum of two members, none of whom can be officers or employees of our manager or directors, officers or employees of its affiliates (other than us and our subsidiaries) and each of whom must meet the independence standards for service on an audit committee established by the NYSE and the SEC. Any matters approved by the conflicts committee will be conclusively deemed to be fair and reasonable to us, approved by all of our partners, and not a breach by our manager of any duties it may owe us or our unitholders.
If our board does not seek approval from the conflicts committee, and the board determines that the resolution or course of action taken with respect to the conflict of interest is either (1) on terms no less favorable to us than those generally being provided to or available from unrelated third parties or (2) fair and reasonable to us, taking into account the totality of the relationships between the parties involved, including other transactions that may be particularly favorable or advantageous to us, then it will be presumed that, in making its decision, our board acted in good faith, and in any proceeding
74
Table of Contents
brought by or on behalf of us or any member, the person bringing or prosecuting such proceeding will have the burden of overcoming such presumption.
Reimbursement of Expenses of Our Manager
Our manager does not receive any management fee or other compensation for providing management services to us. Our manager will be reimbursed for any expenses incurred on our behalf. There is no limit on the amount of expenses for which our manager may be reimbursed.
In connection with the earlier acquisition of our assets on May 12, 2006, our predecessor agreed to pay Carlyle/Riverstone an annual management fee of $1.0 million, plus the reimbursement of certain costs and expenses for its services. We are no longer subject to this obligation to Carlyle/Riverstone.
Code of Ethics
We have adopted a Code of Business Conduct and Ethics that applies to all of our officers, directors and employees.
Available on our website at http://www.niskapartners.com are copies of our Audit Committee Charter, our Compensation Committee Charter, our Code of Business Conduct and Ethics and our Corporate Governance Guidelines, all of which also will be provided to unitholders without charge upon their written request to Niska Gas Storage Partners LLC, 1001 Fannin Street, Suite 2500, Houston, TX 77002, Attention: General Counsel.
Section 16(a) Beneficial Ownership Reporting Compliance
Section 16(a) of the Securities Exchange Act requires our officers and directors, and persons who own more than ten percent of a registered class of our equity securities, to file reports of ownership and changes of ownership on Forms 3, 4 and 5 with the Securities and Exchange Commission. Officers, directors and greater-than-ten-percent shareowners are required by regulations promulgated by the Securities and Exchange Commission to furnish us with copies of all Forms 3, 4 and 5 they file.
Based solely upon a review of Forms 3 and 4 and amendments thereto furnished to us during fiscal 2012 and upon a review of Forms 5 and amendments thereto furnished to us with respect to fiscal 2012, or upon written representations received by us from certain reporting persons that no Forms 5 were required for those persons, we believe that no director, executive officer or greater-than-ten-percent shareholder failed to file on a timely basis the reports required by Section 16(a) of the Exchange Act during, or with respect to, fiscal 2012.
Significant Differences in Corporate Governance Standards
Because Holdco controls more than 50% of the voting power for the election of our directors, we are a controlled company within the meaning of NYSE rules, which exempt controlled companies from the following corporate governance requirements:
- •
- the requirement that a majority of the board consist of independent directors;
- •
- the requirement that we have a nominating or corporate governance committee, composed entirely of independent directors, that is responsible for identifying individuals qualified to become board members, consistent with criteria approved by the board, selection of board nominees for the next annual meeting of shareholders, development of corporate governance guidelines and oversight of the evaluation of the board and management;
- •
- the requirement that we have a compensation committee of the board, composed entirely of independent directors, that is responsible for reviewing and approving corporate goals and objectives relevant to chief executive officer compensation, evaluation of the chief executive
75
Table of Contents
officer's performance in light of the goals and objectives, determination and approval of the chief executive officer's compensation, making recommendations to the board with respect to compensation of other executive officers and incentive compensation and equity- based plans that are subject to board approval and producing a report on executive compensation to be included in an annual proxy statement or Form 10-K filed with the SEC;
- •
- the requirement that we conduct an annual performance evaluation of the nominating, corporate governance and compensation committees; and
- •
- the requirement that we have written charters for the nominating, corporate governance and compensation committees addressing the committees' responsibilities and annual performance evaluations.
For so long as we remain a controlled company, we are not required to have a majority of independent directors or nominating, corporate governance or compensation committees. Accordingly, our unitholders may not have the same protections afforded to shareholders of companies that are subject to all of the NYSE corporate governance requirements.
In reliance on these exemptions, our board is not comprised of a majority of independent directors, nor do we maintain a nominating/corporate governance committee.
Item 11. Executive Compensation.
Compensation Discussion and Analysis
This section describes the objectives and elements of our compensation program for the fiscal year ended March 31, 2013 for our named executive officers. This section should be read together with the Compensation Tables that follow, which disclose the compensation awarded to, earned by or paid to the named executive officers with respect to the prior fiscal year, as well as for certain elements of compensation paid to the named executive officers for the fiscal years ending on March 31, 2011 and March 31, 2012. The "named executive officers" for the 2013 fiscal year, along with the title that each officer held during at the end of the 2013 fiscal year, were as follows:
- •
- Simon Dupéré—President and Chief Executive Officer
- •
- Vance E. Powers—Chief Financial Officer
- •
- Rick J. Staples—Executive Vice President
- •
- Jason A. Dubchak—Vice President, General Counsel & Corporate Secretary
- •
- Jason S. Kulsky—Vice President, Business Development
- •
- Darin T. Olson—Former Vice President, Finance
Mr. Dupéré continued to serve as our Interim President and Interim Chief Executive Officer from April 1 to April 24, 2012, at which time he became our permanent President and Chief Executive Officer. Mr. Staples also became our Executive Vice President on April 24, 2012, as he was previously serving as Senior Vice President, Commercial Operations. Mr. Olson served as our Vice President, Finance from April 1, 2012 until November 1, 2012, but he was no longer employed by us on March 31, 2013.
Our manager and our board, as its delegate, manages our operations and activities and makes decisions on our behalf. Our board has established a compensation committee that, while our board has delegation powers from our manager to oversee our operations, will determine and set compensation practices, or make recommendations to the full board regarding compensation matters that the board has reserved final authority over, as applicable. Our Chief Executive Officer is also consulted by the compensation committee and the full board regarding the compensation of the named
76
Table of Contents
executive officers other than himself. The compensation of each of our named executive officers for the fiscal year ending March 31, 2013 was determined and implemented solely by our compensation committee.
The objectives of our executive compensation program are to:
- •
- attract and retain the highest quality executive officers in our industry;
- •
- reward the executive officers as a group for our performance (measured in terms of Adjusted EBITDA); and
- •
- reward executive officers for their individual performance and contributions to our success.
We believe that these objectives are best met by providing a mix of cash and equity-based compensation to our executives. We believe that this mix of compensation elements provides us with a successful compensation program because it allows us to attract and retain a quality team of executives while motivating them to provide a high level of performance to us.
Our board, and the compensation committee of our board, each holds the authority to engage an outside compensation consultant if it appears at any time that such assistance would be appropriate. On September 15, 2010, Cogent Compensation Partners ("Cogent") was formally engaged by our compensation committee to review our overall compensation structure, including short term and long term compensation. Cogent was acquired by Frederic W. Cook and Co., Inc. ("FW Cook"), another outside compensation consultancy in 2012. The team that we worked with at Cogent remained intact as part of the acquisition, but FW Cook became our new compensation consultant firm. Our board did not see any potential conflicts of interest for us with either the previous Cogent team or the new FW Cook team.
Our board, with input from management employees, has historically compared certain aspects of our compensation program to the compensation programs in place at companies that we consider to be our peers. FW Cook reviewed the most recent list of peer companies that we were using to determine if FW Cook agreed that the group was appropriate for our use in evaluating compensation. The peer group that we and FW Cook determined to be appropriate for us during the 2013 fiscal year includes companies in the United States market for which we believe we compete for executive talent in the energy sector. The peer group (the "Peer Group") includes the following companies:
- •
- Chesapeake Midstream Partners
- •
- Copano Energy LLC
- •
- Crestwood Midstream Partners
- •
- Inergy Midstream
- •
- Martin Midstream
- •
- PAA Natural Gas Storage LP
- •
- Regency Energy Partners LP
- •
- Spectra Energy Partners LP
- •
- TC Pipelines
The compensation program established by the compensation committee, in conjunction with FW Cook, for fiscal 2013 was implemented on April 1, 2012. The elements of that compensation plan are discussed below.
77
Table of Contents
Elements of Compensation. The primary elements of our named executive officers' compensation, other than the officer's base salary, are a combination of cash bonus awards and long-term equity-based compensation awards. For the fiscal year ended March 31, 2013, the compensation for our named executive officers consisted of the following key elements:
- •
- base salary;
- •
- discretionary cash bonus awards;
- •
- long-term phantom equity awards; and
- •
- retirement, health and welfare and related benefits.
Base Salary. The compensation committee establishes base salaries for the named executive officers based on various factors, including the amounts it considers necessary to attract and retain high quality executives in our industry along with the responsibilities of the named executive officers, and is responsible for approving any significant changes to executive salaries. Salaries for the named executive officers are generally adjusted on an annual basis to remain competitive as compared to the market, or in connection with significant changes in duties or authorities, as was the case with Mr. Dupéré's salary when he became our Chief Executive Officer. Mr. Dupéré's employment was governed by an employment agreement put in place on April 24, 2012. Mr. Dupéré's compensation pursuant to his employment agreement included an annual base salary of not less than $505,000 Canadian Dollars (approximately $504,444.5 in U.S. dollars using the average annual exchange rate of 0.9989) payable in semi-monthly installments. This base salary was determined based upon the scope of Mr. Dupéré's responsibilities and commensurate with Mr. Dupéré's position as President and Chief Executive Officer.
A significant portion of the compensation of our named executive officers consists of an annual cash bonus. While base salaries offer an important retention element by providing a guaranteed income stream to our employees, we hope to motivate our employees to strive for both individual and overall company success by providing a substantial portion of compensation only when performance for the year calls for an additional compensatory award. Our industry has historically relied heavily on cash bonuses to compensate executive officers for performance, and we intend to compensate our executives in line with our industry trends and practices. On June 7, 2012, our board approved modifications to our short term incentive bonus plan applicable to our employees, including our named executive officers, for the 2013 fiscal year (the "STI"). The STI provides annual bonuses based upon the achievement of company financial and non-financial performance targets and individual performance targets for employees who participate in the plan. The targets are established by the compensation committee each year.
While the ultimate amount of any cash bonus paid to our named executive officers under the STI is determined at the discretion of our board, the bonuses are originally structured around target amounts for each employee, as well as individual and company goals. We communicate a target annual bonus amount to our employees as a certain percentage of their base salary at the beginning of their employment, clearly noting that individual or company performance may significantly impact the relationship of that target annual amount to what is actually paid out in bonuses. For the 2013 fiscal year, the target bonus amounts for Messrs., Dupéré, Powers, Staples, Dubchak, Kulsky and Olson were CDN $505,000; $174,000; $236,250; $130,000, $114,400 and $114,400, respectively (the conversion to U.S. dollars being $504,445; $173,809; $235,990; $129,857; $114,274 and $114,274, respectively). Individual performance goals and results depend on an employee's unit or particular function within a unit, while company performance is tied to Adjusted EBITDA (defined below). We believe that paying a bonus tied to our Adjusted EBITDA aligns the interests of our executives and employees with those of our unitholders and motivates them to provide a high level of performance for us. A portion of the
78
Table of Contents
bonuses are accrued, but not paid, pending the results of the fiscal year-end audit and subsequent audit adjustments. Thus, while those portions are accrued for the year in which they are earned, they are not paid until the following fiscal year.
Based on the actual annual financial results as well as the results of the non-financial measures, the Compensation Committee recommends to the Board the amount of funds available for the STIP bonus pool. The committee also recommends to the Board the amounts to be paid to each of the named executive officers. In doing so it reviews each officer's individual performance and also takes into account advice from FW Cook as well as the Chief Executive Officer. The compensation committee also takes into account such other information as it deems relevant. The Board makes the ultimate determination of the total amount to be paid out in the STIP bonus pool and the specific awards for each of the named executive officers. The remaining funds in the bonus pool are allocated to all remaining participants by the Chief Executive Officer based on each participant's individual results against their performance targets and in consultation with recommendations by the Company's senior managers and supervisors.
The Company performance metrics for the 2013 fiscal year STIP were a combination of financial (weighted at eighty-five percent (85%)) and non-financial measures (weighted at fifteen percent (15%)).
Financial Measure. The financial performance metric will be an earnings before taxes, depreciation and amortization target, or "Adjusted EBITDA Target," and in order for there to be a payout under the STIP for the 2013 fiscal year, the Company must meet a minimum financial threshold of eighty-seven percent (87%) of the Adjusted EBITDA Target set for the year (the "Threshold "). If the Company achieves this Threshold, the financial metric will comprise eighty-five percent (85%) of the Company performance component for the FY2013 STIP. However, the Board may make adjustments to the Adjusted EBITDA Target throughout the year as determined appropriate upon the advice of the management team. If the Company achieves the Threshold for the year, the payout of the Adjusted EBITDA Target component of the STIP will equal fifty percent (50%); if the Company achieves one hundred percent (100%) of its Adjusted EBITDA Target for the year, the payout of the financial measure component will equal one hundred percent (100%); and if the Company achieves one hundred thirteen percent (113%) of its Adjusted EBITDA Target for the year, the payout of the financial measure component of the STIP will equal two hundred percent (200%). The achievement of the Company performance goals between these levels will be determined using straight line interpolation.
Non-Financial Measure. If the Company achieves Threshold, the remaining fifteen percent (15%) of the Company STIP component will be based upon a non-financial metric. The non-financial operational measures will be based upon the Company's total recordable incident rate, or "TRIR." Like the financial metrics, the non-financial metric will also have a threshold, target and maximum achievement level. If the Company achieves the threshold TRIR target for the year, the payout of the Company component of the non-financial measure will equal fifty percent (50%); if the Company achieves one hundred percent (100%) of its TRIR target for the year, the payout of the non-financial measure component will equal one hundred percent (100%); and if the Company achieves the maximum of its TRIR target for the year, the payout of the non-financial measure component of the STIP will equal two hundred percent (200%). The achievement of TRIR between these levels will be determined using straight line interpolation.
The Board has broad discretion to vary or modify any particular performance goals, which may vary between performance goals and participants.
The board determined that the Company had achieved the target level of the Adjusted EBITDA component that would permit a payment of 100% of the financial component of the STI plan and the Company had achieved the maximum level of the TRIR component that would permit a payment of
79
Table of Contents
200% for the non-financial component. The board then made the further decision not to make any discretionary adjustments to the bonus amounts for the 2013 year. The total payout of the STI plan for the 2013 fiscal year will be 115.7% of the plans target level. The amount that has been approved for each named executive officer for the 2013 fiscal year is detailed in the Summary Compensation Table below, although payments were not provided to the applicable named executive officers until May 2013.
The Company adopted the Phantom Unit Performance Plan, or the "PUPP," on March 24, 2011, and the PUPP plan document is filed as Exhibit 10.1 to the Company's Form 8-K filed with the SEC on March 30, 2011. A principal purpose of the PUPP is to further align the interests of participants in the PUPP, including our named executive officers, with the interest of our unit holders by providing certain employees and directors with a phantom unit award. The PUPP is primarily administered by our compensation committee under the overall direction of our board. The compensation committee determines all of the terms and conditions of each award pursuant to the PUPP, subject to the terms and conditions required by the PUPP, and grants phantom units to eligible participants at such times as the compensation committee may determine to be appropriate. Such terms and conditions are set forth in an individual phantom unit award agreement at the time of each grant of phantom units.
The PUPP is a cash-based long term phantom unit plan for our employees and certain directors. A phantom unit is a notional unit granted under the PUPP that represents the right to receive a cash payment equal to the fair market value of a unit of the Company's common units (a "Unit"), following the satisfaction of certain time periods and/or certain performance criteria. On June 7, 2012, the Board approved an amendment to the PUPP to waive the minimum quarterly distribution requirement for PUPP awards. The Board also determined that fifty percent (50%) of the 2013 fiscal year PUPP awards will be based solely on time-based vesting conditions, while the remaining fifty percent (50%) of the 2013 fiscal year PUPP awards will be based upon performance-based vesting conditions. The Special 2013 time-based PUPP awards will vest over a three-year period beginning on the date of grant of the awards. Time and Performance-based PUPP awards will typically be measured over a full three-year time period, except during the three-year ramp-in period following the adoption of the PUPP (2014 being the last year of this period), where performance will be measured for twenty percent (20%) of the original performance-based PUPP award at the end of the first year, and forty percent (40%) of the award on each of the second and third years of the award. The Board has broad discretion to vary or modify any particular performance goals applicable to the PUPP awards, which may vary between performance goals and participants.
The 2013 performance-based PUPP awards were based upon the Company's total unit return ("TUR") relative to a group of direct competitors measured over each year in the three-year vesting period. Following the end of each annual performance period, the Company and each of the members of the chosen peer group will be ranked in accordance with their respective TUR amounts. If the Company ranks below the thirty-third percentile (33%), that portion of the 2013 performance-based PUPP awards will not vest. If the Company ranks at the thirty-third percentile (33%) or above, a certain percentage of the applicable portion of the original PUPP grant will vest in accordance with the following chart:
| | | | | | |
Three Year TUR Ranking | | Performance
Level | | Target Payout
Percentage | |
|---|
75th Percentile | | Maximum | | | 200 | % |
50th Percentile | | Target | | | 100 | % |
33rd Percentile | | Threshold | | | 50 | % |
80
Table of Contents
In addition to the satisfaction of the performance-based vesting conditions, the PUPP participants must also generally be providing services to us or one of our affiliates in order for their phantom unit to become vested. The compensation committee will have authority to provide for accelerated vesting provisions in the event of a termination of employment or a change in control. Generally, in the event of a PUPP participant's death, disability, retirement, or termination of employment without cause, unvested phantom units will vest on a pro rata basis by taking into account the number of days of actual service provided to us or one of our affiliates versus the number of days in the entire vesting period for the award. Where the phantom units are subject to performance criteria, a "target" level of performance will be applied upon any acceleration of vesting, such that a maximum of 100% of the phantom units originally granted will become vested. Where vesting of the phantom units are based solely on time, the phantom units will also vest on a pro rata basis calculated by the number of days of service provided to us or one of our affiliates from the grant date to the vesting date. Unless otherwise provided in an individual award agreement, if we incur a change in control, and the holder is also terminated for certain reasons, the phantom units will also receive accelerated vesting, with any performance-based vesting provisions being accelerated at the "target" performance level.
The phantom units will also be granted with distribution equivalent rights. During the period the phantom unit is outstanding, any distribution that we pay to Unit holders generally will also be credited to the phantom unit holder in the form of additional phantom units. The number of additional phantom units to be credited to a PUPP participant's account will be determined by dividing the full amount of the distribution we would have made to the phantom unit holder if the phantom units were non-restricted Units, by the fair market value of a Unit on the payment date of any distribution.
In the event that a PUPP participant is subject solely to the United States securities and tax laws rather than Canadian tax or securities laws, the PUPP also contains a schedule of certain provisions that will apply to those participants in lieu of certain provisions within the main body of the PUPP document. Mr. Powers, as a U.S. citizen, will be subject to these additional PUPP provisions.
Each of our named executive officers received a grant of phantom units pursuant to the PUPP during the 2013 fiscal year. One-half of the 2013 grant was a time-based award and the second half of the grant was a performance based award. The board set a long-term incentive target for each named executive officer's performance-based phantom unit award that was based upon a percentage of the officer's base salary. Messrs. Dupéré, Staples, Powers, Dubchak, Kulsky, and Olson had a target percentage of base salary of 200%, 150%, 90%, 90%, 50% and 60%, respectively, for the 2013 grants.
Three of our named executive officers received a separate time-based grant of phantom units pursuant to the PUPP during the 2013 fiscal year. The board set the long-term incentive target amount for each of the following named executive officers: Messrs. Dupéré, Staples, and Powers at a grant value of $1,000,000, $300,000, and $200,000. Mr. Dupéré's award was granted pursuant to his employment agreement as an inducement to serve as our Chief Executive Officer. Our board determined that the grants for Messrs. Staples and Powers were necessary for our two other top employees in order to retain them and incentivize them during the three year vesting period for such awards.
As noted above, certain awards granted in previous years may still vest upon our performance during each of three years. Upon reviewing the performance of our company for the 2013 fiscal year against its Peer Group, based on the criteria applicable to the 2012 PUPP awards, our board determined that our company did not meet its threshold targets for the second tranche of the phantom units granted during the 2012 fiscal year, and therefore, the units from the 2012 fiscal year grant that were scheduled to vest at the end of the 2013 fiscal year will not vest and will be forfeited by the named executive officers.
When reviewing the performance of the company for the 2013 fiscal year against its Peer Group, based on the criteria listed above for the 2013 initial grant, our board determined that our company
81
Table of Contents
achieved the maximum performance level for the first tranche of the phantom units granted during the 2013 fiscal year. Therefore the time-based component of the first tranche of the 2013 grants will pay out at 100% of target and the performance component of the first tranche of the 2013 grants will payout at 200% of target amounts.
Niska Predecessor Class B Units. In 2006, Niska Predecessor issued Class B units to some of our employees, including the named executive officers then employed by us. The Class B units represented profits interests in Niska Holdings, and entitle the holders to share in distributions by Niska Holdings once the Class A units in Niska Predecessor have received distributions equal to their contributed capital plus an 8% rate of return. As of March 31, 2012, the risk of forfeiture had lapsed on all of the Class B units upon the completion of the time limitations or the achievement of the performance conditions associated with the units as applicable and certain of our named executive officers continue to hold these vested units and may receive certain profits interests with respect to these awards. No further grant of the Class B units, however, occurred during the prior fiscal year.
2010 Long Term Incentive Plan. We adopted the 2010 Long Term Incentive Plan in connection with our IPO. This plan provides for the grant of unit options, unit appreciation rights, restricted units, phantom units, unit awards, performance or incentive awards and other unit-based awards. Due to certain adverse tax consequences that may accompany the grant of an award that is settled in actual shares of our common units to Canadian citizens, this plan is largely reserved for grants of awards to our U.S. citizen employees, consultants and directors. At this time, no awards to any employee have been made pursuant to the 2010 Long Term Incentive Plan.
Health and Welfare Benefits. All of our regular full-time employees, including our named executive officers, receive certain health and welfare benefits. The benefits include a health and dental plan, a short- and long-term disability plan, basic and optional life insurance, and basic and optional accidental death and dismemberment insurance coverage.
Retirement and Pension Benefits. Our registered retirement savings plan, or RRSP Plan/Non-Registered Employee Savings Plan, provides Canadian resident employees with an opportunity to participate in a retirement savings plan. This type of retirement plan is a Canadian retirement plan with features similar to a 401(k) plan or an individual retirement account administered in the United States. Our employees, including our named executive officers (other than Mr. Powers), are allowed to contribute their own funds, and we will regardless of an employee's contributions, contribute 8% of an employee's base salary into such RRSP Plan contributions as well as discretionary contributions from us on their behalf from time to time. Mr. Dupéré's new employment agreement states that he would receive an annual contribution from us at 8% of his annual salary each year into the plan. Mr. Powers, a U.S. citizen, participates in a U.S. 401(k) Plan which allows Mr. Powers to contribute his own funds and the Company provides an 11% contribution to his 401(k) Plan.
Perquisites. We provide our named executive officers with certain perquisites that we believe are in line with industry standards as well as peer companies within our geographic region, and which are necessary to remain competitive with regard to overall executive compensation. Our named executives received additional payments to be applied to expenses for home computers, club membership (including industry organizations) and other personal expenses, as well as a monthly automobile allowance and paid parking at our office facilities, (other than Mr. Powers who does not receive paid parking at our office facility). Commencing April 24, 2012, as part of his employment agreement, Mr. Dupéré's perquisites were eliminated except for an allowance for parking.
Severance and Change in Control Benefits. Mr. Dupéré was the only named executive officer who had an agreement with us that contained severance provisions during the 2013 fiscal year. The phantom
82
Table of Contents
unit awards granted to each named executive officer also contain change of control provisions. Canadian citizens may be entitled to certain severance benefits under the common law, therefore, to establish clarity with regard to our severance obligations, we have chosen to maintain a formal employment agreement with our chief executive officer that contains negotiated severance benefits. With respect to the PUPP awards, we have provided severance and change in control protections in order to serve as a retention tool. We believe that the post-termination payments in the employment agreements, and the PUPP agreements, as applicable, allow our officers to focus their attention and energy on making the best objective business decisions that are in our interest, and in the interest of our unitholders, without allowing personal considerations to influence the decision-making process. Executive officers at other companies in our industry and the general market against which we compete for executive talent commonly have post-termination and/or change in control provisions, and we have consistently provided this benefit to our executive officers in order to remain competitive in attracting and retaining skilled professionals in our industry.
Tax and Securities Issues. We maintain an insider trading policy that is applicable to our directors and employees, including our named executive officers. We also have generally designed our long term incentive program according to the tax effects that certain awards could have upon our employees. For Canadian citizens, grants of certain equity awards could create immediate adverse tax consequences, so we typically provide Canadian citizens with phantom units.
Report of the Compensation Committee
In light of the foregoing, as required by Item 407(e)(5) of Regulation S-K, our compensation committee has reviewed and discussed the Compensation Discussion and Analysis with our management and, based on such review and discussions, has recommended to the board of directors that the Compensation Discussion and Analysis be included in this annual report.
By the Compensation Committee:
George A. O'Brien, Chairman
Deborah M. Fretz
James G. Jackson
Stephen C. Muther
William H. Shea
Executive Compensation
The following tables, footnotes and the above narratives provide information regarding the compensation, benefits and equity holdings in Niska Gas Storage Partners LLC for the named executive officers.
Summary Compensation for Years Ended March 31, 2013, 2012 and 2011
The year "2011" refers to the fiscal year of April 1, 2010 through March 31, 2011, the year "2012" refers to the fiscal year of April 1, 2011 through March 31, 2012, the year 2013 refers to the fiscal year of April 1, 2012 through March 31, 2013. Compensation to our named executive officers was paid primarily in Canadian dollars, but is reported in U.S. dollars in the tables that follow. An exchange rate of 0.9836 U.S dollars for each Canadian dollar was used for the 2011 amounts of each Canadian dollar (the exchange rate reported by the Bank of Canada on March 31, 2011), and 1.0076 U.S dollars for each Canadian dollar was used for the 2012 amounts of each Canadian dollar (the average exchange rate for the period as reported by the Bank of Canada), and 0.9989 U.S dollars for each Canadian dollar (the average exchange rate for the period as reported by the Bank of Canada). The only
83
Table of Contents
exception to this rule is for our Chief Financial Officer, Vance E. Powers, who is a U.S. resident and paid in U.S. dollars.
| | | | | | | | | | | | | | | | | | | |
Name and Principal Position | | Year
Covered | | Salary
($) | | Bonus
($) | | Unit
Awards
($)(1) | | All Other
Compensation
($)(2) | | Total
($) | |
|---|
Simon Dupéré | | | 2013 | | | 495,800 | | | 583,642 | | | 2,680,382 | | | 49,926 | | | 3,809,750 | |
President and Chief Executive | | | 2012 | | | 372,819 | | | 167,768 | | | 1,864,094 | | | 57,059 | | | 2,461,740 | |
Officer | | | 2011 | | | 270,490 | | | 849,585 | | | | | | 63,566 | | | 1,183,641 | |
Vance E. Powers | | |
2013 | | |
287,436 | | |
201,318 | | |
635,000 | | |
79,093 | | |
1,202,847 | |
Chief Financial Officer | | | 2012 | | | 250,000 | | | 75,000 | | | 875,000 | | | 45,262 | | | 1,245,262 | |
| | | 2011 | | | 55,000 | | | 102,667 | | | — | | | 9,534 | | | 167,201 | |
Rick J. Staples | | |
2013 | | |
312,412 | | |
273,040 | | |
1,086,304 | | |
60,091 | | |
1,731,847 | |
Executive Vice President | | | 2012 | | | 282,133 | | | 126,960 | | | 1,293,110 | | | 58,000 | | | 1,760,203 | |
| | | 2011 | | | 206,556 | | | 503,603 | | | — | | | 50,641 | | | 760,800 | |
Jason A. Dubchak | | |
2013 | | |
259,714 | | |
150,245 | | |
389,571 | | |
32,288 | | |
831,818 | |
Vice President, General Counsel | | | 2012 | | | 251,905 | | | 75,571 | | | 881,666 | | | 31,761 | | | 1,240,903 | |
and Corporate Secretary | | | 2011 | | | 196,720 | | | 354,096 | | | — | | | 26,605 | | | 577,421 | |
Jason S. Kulsky | | |
2013 | | |
228,548 | | |
132,215 | | |
190,457 | | |
36,989 | | |
588,209 | |
Vice President, | | | | | | | | | | | | | | | | | | | |
Business Development | | | | | | | | | | | | | | | | | | | |
Darin T. Olson | | |
2013 | | |
132,734 | | |
0 | | |
228,548 | | |
413,068 | | |
774,350 | |
Former Chief Financial Officer/ | | | 2012 | | | 221,676 | | | 66,503 | | | 665,028 | | | 36,496 | | | 989,703 | |
Former Vice President, Finance | | | 2011 | | | 196,720 | | | 295,080 | | | — | | | 39,757 | | | 531,557 | |
- (1)
- Amounts reported for unit awards represent the grant date fair value of phantom unit awards in accordance with ASC Topic 718, rather than the amounts that may actually be paid to each named executive officer upon the settlement of an award. Pursuant to SEC rules, the amounts shown exclude the effect of estimated forfeitures and are based upon the probable outcome of the performance conditions associated with the phantom unit awards at the grant date, although we know that a portion of the phantom units that were subject to performance-based conditions in 2013 have already been vested at maximum levels rather than target, which was our "probable" outcome in the table above. The "maximum" amounts for the performance-based phantom units would have been as follows: Mr. Dupéré, $1,683,333; Mr. Powers, $434,995; Mr. Staples $787,498; Mr. Dubchak, $390,005; Mr. Kulsky, $190,666 and Mr. Olson, $228,798. Additional details regarding the calculation of our unit-based phantom awards are included in Note 13 of the Notes to our Consolidated Financial Statements. Although the phantom unit awards are reported in the "Unit Awards" column above, the portion of the awards that are still outstanding will be settled, if at all, in cash payments rather than actual common units. With respect to Mr. Olson's phantom units granted in the 2013 year, he forfeited, without consideration, each of those awards upon his termination of employment.
84
Table of Contents
- (2)
- Amounts disclosed in the "All Other Compensation" column for the fiscal year ending in 2013 consist of the following items and amounts in U.S. Dollars:
| | | | | | | | | | | | | | | | | | | | | | | | | |
Executive Officer | | RRSP
Plan
($) | | Parking
($) | | Vehicle
Allowance
($) | | Misc
Allowance &
Vacation
Buy back
($) | | Canadian
Pension
Plan
($) | | Employment
Insurance
($) | | Workers
Comp
Contributions
($) | | Total
($) | |
|---|
Simon Dupéré | | | 39,664 | | | 5,094 | | | 1,158 | | | 0 | | | 2,354 | | | 1,071 | | | 586 | | | 49,926 | |
Rick Staples | | | 24,993 | | | 5,094 | | | 13,985 | | | 11,987 | | | 2,354 | | | 1,071 | | | 608 | | | 60,091 | |
Jason Dubchak | | | 20,779 | | | 5,094 | | | 0 | | | 2,397 | | | 2,354 | | | 1,071 | | | 593 | | | 32,288 | |
Jason Kulsky | | | 18,286 | | | 5,094 | | | 0 | | | 9,589 | | | 2,354 | | | 1,071 | | | 595 | | | 36,989 | |
Darin Olson* | | | 10,738 | | | 3,183 | | | 0 | | | 5,630 | | | 2,321 | | | 1,004 | | | 620 | | | 23,497 | |
- *
- Mr. Olson also received a payment of $389,571 in lieu of notice upon his departure from the company.
| | | | | | | | | | | | | | | | | | | | | | | | | |
US Executive Officer | | 401K
Contributions
($) | | Parking
($) | | Vehicle
Allowance
($) | | Misc.
Allowance &
Vacation
Buy back
($) | | Social
Security
($) | | Medicare
($) | | Workers
Comp
Contributions
($) | | Total
($) | |
|---|
Vance E. Powers | | | 32,139 | | | 0 | | | 0 | | | 33,682 | | | 7,040 | | | 5,732 | | | 500 | | | 79,093 | |
We granted time-based and performance-based phantom unit awards to each of our named executive officers during the fiscal year ended March 31, 2013.
Estimated Possible Payouts Under Equity Incentive Plan Awards
| | | | | | | | | | | | | | | | | | |
Name | | Grant Date | | Threshold
(#)(1) | | Target
(#)(1) | | Maximum
(#)(1) | | All Other
Unit
Awards:
Number of
Units (#)(2) | | Grant Date
Fair Value of
Unit Awards
($)(3) | |
|---|
Simon Dupéré | | 4/1/2012 | | | 44,113 | | | 88,225 | | | 176,450 | | | 88,225 | | | 841,667 | |
| | 4/24/2012 | | | — | | | — | | | — | | | 82,850 | | | 1,000,000 | |
Rick J. Staples | | 4/1/2012 | | |
20,637 | | |
41,274 | | |
82,547 | | |
41,274 | | |
393,750 | |
| | 4/24/2012 | | | — | | | — | | | — | | | 24,855 | | | 300,000 | |
Vance E. Powers | | 4/1/2012 | | |
11,399 | | |
22,799 | | |
45,597 | | |
22,799 | | |
217,500 | |
| | 4/24/2012 | | | — | | | — | | | — | | | 16,570 | | | 200,000 | |
Jason A. Dubchak | | 4/1/2012 | | |
10,220 | | |
20,440 | | |
40,881 | | |
20,440 | | |
195,000 | |
| | 4/24/2012 | | | — | | | — | | | — | | | — | | | — | |
Jason Kulsky | | 4/1/2012 | | |
4,997 | | |
9,993 | | |
19,986 | | |
9,993 | | |
95,333 | |
| | 4/24/2012 | | | — | | | — | | | — | | | — | | | — | |
Darin T. Olson(4) | | 4/1/2012 | | |
5,996 | | |
11,992 | | |
23,983 | | |
11,992 | | |
114,400 | |
| | 4/24/2012 | | | — | | | — | | | — | | | — | | | — | |
- (1)
- We have determined that the performance-based vesting restrictions applicable to the first tranche of the phantom unit awards disclosed above were satisfied for the 2013 year at maximum levels, thus the numbers here reflect the potential values associated with each of the three potential levels
85
Table of Contents
of performance-based phantom units. Any performance-based phantom units that become vested will be settled in cash payments rather than actual common units.
- (2)
- The phantom units disclosed here are time-based phantom units granted pursuant to the PUPP, and such vested phantom units will be settled in cash payments rather than actual common units.
- (3)
- The values reflected here show the grant date fair value of phantom unit awards in accordance with ASC Topic 718, rather than the amounts that may actually be paid to each named executive officer upon the settlement of an award. Assumptions used to determine these amounts are disclosed within the footnotes to the Summary Compensation Table.
- (4)
- Mr. Olson forfeited each of the awards reflected in this table at the time of his termination of employment.
Narrative Description to Summary Compensation Table and Grants of Plan-Based Awards
The PUPP awards provided to each named executive officer may receive accelerated vesting or be forfeited upon the occurrence of certain events. Specific details regarding the potential acceleration of vesting or the settlement of the phantom unit awards upon certain terminations of employment or a change in control are contained in the "Potential Payments Upon Termination or Change in Control" below.
The PUPP awards also have special settlement features. The value of the settlement of the phantom award will depend upon the average closing price of our common units during the thirty day period prior to the vesting event. The settlement date for the awards will also occur on a date following the applicable vesting date that is chosen by the PUPP administrator in its discretion.
Outstanding Equity Awards as of Fiscal Year-End March 31, 2013
The table below reflects the outstanding phantom unit awards that each of our named executive officers held as of March 31, 2013.
Unit Awards
| | | | | | | | | | | | | |
Name | | Number of
Time-based
Units That
Have Not
Vested (#)(1) | | Market Value of
Units That Have
Not Vested ($)(2) | | Equity Incentive
Plan Awards:
Number of
Unearned
Performance-
based Units That
Have Not Vested
(#)(3) | | Equity Incentive
Plan Awards:
Market Value of
Unearned Units
That Have Not
Vested ($)(4) | |
|---|
Simon Dupéré | | | 195,571 | | | 2,518,958 | | | 141,160 | | | 1,818,141 | |
Rick J. Staples | | | 89,765 | | | 1,156,167 | | | 66,038 | | | 850,566 | |
Vance E. Powers | | | 41,018 | | | 528,312 | | | 36,478 | | | 469,836 | |
Jason A. Dubchak | | | 39,131 | | | 504,010 | | | 32,704 | | | 421,233 | |
Jason S. Kulsky | | | 28,040 | | | 361,155 | | | 15,989 | | | 205,936 | |
- (1)
- The outstanding phantom units will be settled, if at all, in cash payments rather than actual common units. Assuming that all service conditions are met for the awards, each of the phantom units reported in this column will vest in accordance with the following schedules:
- (a)
- The remaining phantom units granted on April 1, 2012 will vest in equal installments on each of March 31, 2014 and 2015. Messrs. Dupéré, Staples, Powers, Dubchak, and Kulsky held 70,580; 33,019; 18,239; 16,352; and 7,994 of these units. Each of the time-based phantom unit awards granted to Messrs. Dupéré, Staples and Powers in 2013 cliff vest on April 24, 2015.
- (b)
- The phantom units granted on April 1, 2011 will cliff vest on March 31, 2014.
86
Table of Contents
- (2)
- The values reported in this column are calculated by multiplying the market value of our common units on March 31, 2013 ($12.88, which was the closing price of a share of common stock on March 30, 2013, the last applicable trading day before the end of the fiscal year), and multiplying that price by the number of common units that would be earned if service conditions were met for those awards. The award agreements require that we settle the awards by using the 30 day average of the closing price of our common units, however, which would have been $12.24 as of March 31, 2013. The values above may increase or decrease based upon the value of our common units and the settlement requirements set forth in the award agreements.
- (3)
- The performance-based phantom units reported in this column will be settled, if at all, in cash payments rather than actual common units. Assuming that all service and performance conditions are met for the remaining outstanding awards, each of the phantom units reported in this column will vest in two equal installments on each of March 31, 2014 and 2015. Based upon our performance during the 2013 fiscal year, the number of phantom units reflected in this column also represent the maximum number of phantom units that could become vested rather than the threshold or target numbers.
- (4)
- The values reported in this column are calculated by multiplying the market value of our common units on March 31, 2013 ($12.88, which was the closing price of a share of common stock on March 30, 2013, the last applicable trading day before the end of the fiscal year), and multiplying that price by the number of common units that would be earned if the threshold (rather than target) performance targets were met for those awards. The award agreements require that we settle the awards by using the 30 day average of the closing price of our common units, however, which would have been $12.24 as of March 31, 2013. The values above may increase or decrease based upon the value of our common units and the settlement requirements set forth in the award agreements.
The named executive officers did not hold any options that were exercised during the year ended March 31, 2013. The table below reflects the number of time-based phantom units that became vested during the fiscal year 2013, and the maximum value of the first installment of the performance-based phantom units that were earned in the 2013 fiscal year. The value realized by each named executive officer was calculated using $12.88, the closing price of our common units on March 31, 2013, the date of vesting.
| | | | | | | |
Name | | Number of Units
Acquired on
Vesting (#)(1) | | Value Realized on
Vesting ($)(2) | |
|---|
Simon Dupéré | | | 52,935 | | | 681,803 | |
Rick J. Staples | | | 24,764 | | | 318,962 | |
Vance E. Powers | | | 13,679 | | | 176,189 | |
Jason A. Dubchak | | | 8,085 | | | 104,138 | |
Jason S. Kulsky | | | 5,996 | | | 77,226 | |
- (1)
- The outstanding phantom units will be settled, if at all, in cash payments rather than actual common units. While the awards reported in this column vested in the 2013 fiscal year, settlement of the awards will occur at a later date.
- (2)
- The award agreements require that we settle the awards by using the 30 day average of the closing price of our common units, however, which would have been $12.24 as of March 31, 2013. Based on the value of $12.24 per unit, Messrs. Dupéré, Staples, Powers, Dubchak, and Kulsky will receive $647,925; $303,113; $167,434; $98,964; and $73,389.
87
Table of Contents
We do not maintain or sponsor a pension plan for our named executive officers.
We do not maintain or sponsor a nonqualified deferred compensation plan for our named executive officers.
PUPP. The phantom units that we granted to each of our named executive officers during the 2013 fiscal year contain certain termination and change in control benefits. The PUPP participants must generally be providing services to us or one of our affiliates on the vesting date in order for their award to become vested, but in the event of a PUPP participant's death, disability, retirement, or termination of employment without cause (each term as defined below) an unvested phantom unit (whether time or performance-based) will vest on a pro rata basis by taking into account the number of days of actual service provided to us or one of our affiliates versus the number of days in the entire vesting period for the award. With respect to the pro-rata vesting of performance-based phantom units, a "target" level of performance (i.e., 100% payout) will be applied to the number of performance-based awards that vest on a pro-rata basis.
If we incur a change in control and the participant also is terminated by us (or the successor entity) other than for cause or the participant resigns as a result of a constructive dismissal, then all unvested phantom units will vest, with any performance-based vesting provisions being accelerated at the "target" performance level.
The PUPP defines a "disability" as a participant's inability, due to illness, disease, affliction, mental or physical disability or a similar cause, to perform his or her duties for any consecutive twelve month period or for any eighteen month period, or a court's declaration of the participant's incompetence. A "retirement" is defined as a normal or early retirement pursuant to any applicable retirement plan maintained by us at the time of the retirement. A "change in control" generally will be deemed to have occurred upon (1) the acquisition by any person or group, other than us or one of our affiliates, of ownership of fifty percent (50%) or more of the outstanding shares of Niska Gas Storage Management LLC (a Delaware limited liability company and our "Manager"); or (2) a sale or other disposition of all of substantially all of our assets (or those of our affiliates) to any person other than one of our affiliates. However, the following transactions will not be deemed to result in our change in control: (a) acquisitions by investors in the manager for financing purposes; (b) an underwriter temporarily holding equity interests pursuant to a public offering of those interests; (c) any transfer of assets to an entity that is controlled by us; or (d) an acquisition by any employee benefit plan maintained by us, the manager or an affiliate of either us or the manager. A "constructive dismissal" for a Canadian citizen shall be defined pursuant to the common law, which includes a material change to the executive's title, responsibilities, reporting relationship or compensation, where the termination must occur within the 45 day period following the event that gave rise to the constructive dismissal. A "constructive dismissal" for a U.S. citizen will generally be defined as our material change to the participant's title, responsibilities, reporting relationship or compensation which we do not remedy within a 30 day period of being put on notice of the condition, and where the executive then terminates within a 30 day period following our cure period.
The table below shows the value of the acceleration of the phantom units that each officer would have received upon a termination of employment that occurred on March 31, 2013. For purposes of the table below we have assumed that our common units were valued at $12.88 (the closing price of a common unit on March 30, 2013, the last applicable trading day before the end of the fiscal year). The
88
Table of Contents
actual amount that any named executive officer could receive with respect to his phantom units, however, could only be determined upon an actual termination of employment.
| | | | | | | |
Name | | Termination of Employment Due to
Death, Disability, Retirement, or our
Termination of the Executive
without Cause ($)(1) | | Termination of Employment without
Cause, or due to a Constructive
Dismissal, in Connection with a
Change in Control ($)(2) | |
|---|
Simon Dupéré | | | 1,681,168 | | | 4,570,892 | |
Rick J. Staples | | | 775,575 | | | 1,937,023 | |
Vance E. Powers | | | 425,197 | | | 996,229 | |
Jason A. Dubchak | | | 341,857 | | | 732,178 | |
Jason Kulsky | | | 252,211 | | | 498,445 | |
- (1)
- The amounts reflected in this column were calculated by using the results of the following items: (a) a pro-rata portion of each grant of time-based phantom units calculated based upon the number of days of actual service provided to us or one of our affiliates versus the number of days in the entire vesting period for the award (for Mr. Dupéré, 266,658; Mr. Staples, 109,116; Mr. Powers, 54,548; Mr. Dubchak, 36,406; and Mr. Kulsky, 26,707) multiplied by $12.88; (b) a pro-rata portion of the target number of outstanding performance-based phantom unit awards subject to performance conditions multiplied by $12.88 (for Mr. Dupéré, 88,225; Mr. Staples, 41,274; Mr. Powers, 22,799; Mr. Dubchak, 20,440; and Mr. Kulsky, 11,992, each multiplied by 33%).
- (2)
- The amounts reflected in this column were calculated by using the results of the following two items: (a) the number of time-based phantom units reported for each named executive officer above in the "Outstanding Equity Awards as of Fiscal Year-End March 31, 2013" multiplied by $12.88; and (b) the target number of performance-based phantom unit awards subject to outstanding performance conditions multiplied by $12.88.
Mr. Dupéré's Employment Agreement. Upon his appointment on April 24, 2012, we entered into an employment agreement appointing Mr. Dupéré as President and Chief Executive Officer. The agreement contains certain potential severance and change in control benefits. The Phantom Grant described above will be subject to a three year vesting schedule that will generally lapse on April 24, 2015. If his termination occurs prior to that date due to an Involuntary Termination, he will receive pro-rata accelerated vesting for the Phantom Grant. Other terminations of employment will result in a forfeiture of the award. An "Involuntary Termination" means a termination by us without "cause" or by Mr. Dupéré for "good reason." "Cause" is generally defined in the employment agreement as any action that would entitle us to terminate him without notice or payment in lieu of notice under the common law, including, without limitation, (1) fraud, misappropriation of our property, embezzlement, malfeasance, misfeasance or nonfeasance that is willful or grossly negligent; (2) Mr. Dupéré's willful allowance of a conflict of interest between himself and his duties to us; or (3) Mr. Dupéré's breach of any material covenants or obligations under his employment agreement. A "good reason" event means any of the following without Mr. Dupéré's consent: (a) our requirements that Mr. Dupéré perform duties inconsistent with his position; (b) a material reduction of Mr. Dupéré's annual base salary; (c) our relocation of Mr. Dupéré's primary work location by over 50 miles; (d) our failure to permit Mr. Dupéré to participate in incentive compensation plans or employment benefit programs that are similar to those described within his employment agreement.
Upon Mr. Dupéré's termination from us for "cause," or Mr. Dupéré's resignation, retirement, death or disability, Mr. Dupéré will not receive any further compensation or benefits pursuant to the employment agreement, and he would forfeit his Phantom Grant if such a termination occurred during the first three years of the term of his employment agreement. In the event that Mr. Dupéré's employment is terminated due to an Involuntary Termination during the first three years of
89
Table of Contents
Mr. Dupéré's employment agreement, he will receive a lump sum cash payment equal to two times his then-current annual base salary, less any statutory withholding obligations, and pro-rata vesting acceleration for his Phantom Grant based upon the number of days that Mr. Dupéré was employed during the three year period. If Mr. Dupéré's Involuntary Termination occurs following the first three years of the employment agreement, he would receive a lump sum cash payment equal to two times his then-current annual base salary, less any statutory withholding obligations. In the event that Mr. Dupéré's Involuntary Termination occurs on or during the two year period following a change in control, Mr. Dupéré will receive a lump sum cash payment equal to two times his then-current annual base salary (less any statutory withholding obligations), the accelerated vesting of all equity-based compensation awards held on the date of Mr. Dupéré's termination of employment, and the pro-rata payment of his annual bonus for the year in which the termination occurs.
The employment agreement contains standard restrictive covenants. Mr. Dupéré's non-competition restrictions will extend for a twelve month period following Mr. Dupéré's termination of employment, and his solicitation provision will cover a six month period following his termination of employment. In the event that any incentive-based compensation is paid to Mr. Dupéré during his employment with us, and any law, government regulation or stock exchange listing requires us to recover any necessary portion of that payment from Mr. Dupéré, we will be entitled to recover the grant or payment.
In addition to the amounts noted above with respect to his equity awards, if Mr. Dupéré had incurred a separation from service on March 31, 2013, he could have received the following estimated payments:
| | | | | | | | | | |
| | Salary($) | | Bonus($) | | Total ($) | |
|---|
Involuntary Termination | | | 1,008,889 | | | N/A | | | 1,008,889 | |
Involuntary Termination in connection with Change in Control | | | 1,008,889 | | | 583,642 | | | 1,592,531 | |
Payments in Lieu of Notice for Mr. Olson. Mr. Olson received a payment of $389,571 in lieu of notice but forfeited all phantom units upon his departure from the company on November 1, 2012.
Risk Assessment
Our compensation committee has reviewed our compensation policies as generally applicable to our employees and believes that our policies do not encourage excessive and unnecessary risk-taking, and that the level of risk that they do encourage is not reasonably likely to have a material adverse effect on us.
Our compensation philosophy and culture support the use of base salary, certain performance-based compensation that are generally uniform in design and in operation throughout our organization and with all levels of employees. These compensation policies and practices are centrally designed and administered, and are substantially identical between our business divisions. In addition, the following specific factors, in particular, reduce the likelihood of excessive risk-taking:
- •
- Our overall compensation levels are competitive with the market.
- •
- Our compensation mix is balanced among (i) fixed components like salary and benefits, and (ii) annual incentives that reward our overall financial performance and operational measures.
- •
- The compensation committee has discretion to reduce performance-based awards when it determines that such adjustments would be appropriate based on our interests and the interests of our unit holders.
- •
- Executive officers are subject to certain blackout periods and our insider trading policy.
90
Table of Contents
Director Compensation
Officers, employees or paid consultants and advisors of our manager or its affiliates who also serve as our directors will not receive additional compensation for their service as our directors. Directors who are not officers, employees or paid consultants and advisors of our manager or its affiliates ("Eligible Directors") receive an annual cash retainer of $50,000 and common units with a market value equal to $50,000 at the time of the award. The board chairperson (who was Deborah M. Fretz during the 2013 fiscal year) receives an additional fee of $62,500 and common units with a market value equal to $62,500 at the time of the award. In addition, Eligible Directors receive $1,500 for each board and committee meeting that they attend, other than with respect to the conflicts committee meeting fees, which are $3,000 per meeting. The Chairperson of the audit committee receives an additional annual fee of $15,000. Directors serving as the Chairperson of our other committees will receive an additional annual fee of $10,000. Directors also receive reimbursement for out-of-pocket expenses associated with attending meetings of the board or committees and director and officer liability insurance coverage. Each director will be fully indemnified by us for actions associated with being a director to the fullest extent permitted under Delaware law.
Mr. Dupéré joined our board in connection with his appointment as our Chief Executive Officer. Other board members that served on our board during the 2013 fiscal year (E. Bartow Jones, George A. O'Brien, William H. Shea, and Andrew W. Ward) were not paid any compensation by us for their services to our board, as they are appointed and compensated by Riverstone.
DIRECTOR COMPENSATION TABLE
| | | | | | | | | | | | | |
Name | | Fees
Earned or
Paid in
Cash ($)(1) | | Unit
Awards ($)(2) | | Change in Pension
Value and
Nonqualified
Deferred
Compensation
Earnings(3) | | Total ($) | |
|---|
Deborah M. Fretz | | | 175,000 | | | 112,965 | | | 10,017 | | | 287,965 | |
James G. Jackson | | | 104,000 | | | 50,204 | | | — | | | 154,204 | |
Stephen C. Muther | | | 119,000 | | | 50,204 | | | 286 | | | 169,204 | |
David F. Pope | | | 62,000 | | | 50,204 | | | — | | | 112,204 | |
- (1)
- The directors had the option of participating in the Deferred Plan (described below) for the 2013 fiscal year, thus certain portions of the cash fees reported within this column were not actually received by the directors due to the deferral of that amount into the Deferred Plan. Cash payments actually paid to each director were as follows: Ms. Fretz, $0; Mr. Jackson, $60,000; Mr. Muther, $0; and Mr. Pope, $62,000.
- (2)
- Represents the aggregate number of common unit awards granted to the named director during the prior fiscal year, calculated in accordance with the grant date fair value under ASC Topic 718. Additional details regarding our unit awards are included in Note 13 of the Notes to our Consolidated Financial Statements. As of March 31, 2013, none of the directors held outstanding equity awards.
- (3)
- Represents the above market interest that Ms. Fretz and Mr. Muther received with respect to their respective accounts within the Niska Gas Storage Partners LLC Director Deferred Compensation Plan.
On August 10, 2011, we adopted the Niska Gas Storage Partners LLC Director Deferred Compensation Plan (the "Deferred Plan"). The purpose of the Deferred Plan is to allow us to attract and retain Eligible Directors to serve as our directors. The Deferred Plan is an unfunded arrangement intended to be exempt from the participation, vesting, funding and fiduciary requirements set forth in Title I of the Employee Retirement Income Security Act of 1974, as amended, and to comply with
91
Table of Contents
Section 409A of the Internal Revenue Code of 1986, as amended ("Section 409A"). Our obligations under the Deferred Plan are general unsecured obligations to pay deferred compensation in the future to eligible director participants in accordance with the terms of the Deferred Plan.
Participation and Deferrals. The Deferred Plan is based on a calendar year plan year. Eligible Directors may participate in the Deferred Plan, provided that they are not residents of Canada for purposes of the Income Tax Act (Canada) and not otherwise subject to Canadian taxation under the Income Tax Act (Canada) . Any such Eligible Director may become a participant (a "Participant") in the Deferred Plan for an applicable plan year by electing during the open enrollment period to defer a portion of his or her compensation on an election form. A Participant may defer a stated dollar amount, or a designated full percentage, up to a maximum percentage of 100% of the Participant's compensation for the applicable plan year. At the time of election, the Participant can choose to defer the compensation until either (i) the Participant's termination or (ii) a future year in which the Participant is still providing services to us and that is at least two calendar years after the year in which the deferred compensation would otherwise have been paid (a "Scheduled In-Service Withdrawal"). We may also elect to make a discretionary contribution to a Participant's account, which may be subject to a vesting schedule, in an amount and at such time as determined by our board.
Investment Options. At the time of making his or her deferral election, a Participant will also select the investment option with which the Participant would like for us to credit the Participant for basic deferrals. The Participant may select between two cash investment crediting rate options: (i) an annual rate of interest equal to one percent (1%) below the prime rate of interest as quoted by Bloomberg, compounded daily, or (ii) one or more benchmark mutual funds chosen by the plan administrator as an investment option for the Deferred Plan. Notwithstanding the preceding sentence, under the Deferred Plan, we have the discretion to choose an investment crediting rate for a Participant other than the investment crediting rate requested by the Participant; provided that such investment crediting rate cannot be less than (i) in the preceding sentence.
Distributions. A Participant may elect to receive a distribution of his Deferred Plan account upon a termination of service at any of the following times: (i) as soon as practicable following the termination of service, (ii) in the first January following the termination of service, or (iii) in the second January following the termination of service. All account distributions are made in lump sum cash payments. If a Participant fails to elect the time at which his account balance will be paid out, it will be paid as soon as practicable following the termination of service. If a Participant elected to receive a Scheduled In-Service Withdrawal, the Participant may subsequently elect to delay such distribution for a minimum period of five calendar years; provided that such election is made at least 12 months prior to the date that such distribution would otherwise be made. If a Participant elected to receive a Scheduled In-Service Withdrawal and is otherwise terminated prior to such distribution, the Scheduled In-Service Withdrawal will be cancelled and the entire account balance of the Participant will be paid according to the Participant's termination distribution election. In the event of an unforeseeable emergency, a Participant may apply to the plan administrator, who has sole and absolute discretion to approve such application, to request that all or a portion of the Participant's account balance to be distributed prior to termination or a Scheduled In-Service Withdrawal. In the event a Participant dies while providing services to us, the Participant's account balance will be paid to the Participant's beneficiary in the manner previously elected by the Participant. The Deferred Plan has provisions that provide for special distribution rights with respect to any spousal claims made pursuant to a domestic relations order.
Administration. The Deferred Plan is administered by our board of directors, or a plan administrator that our board may appoint, which we refer to as the plan administrator. The plan administrator directly administers the Deferred Plan and has the right to adopt rules of procedure and regulations necessary for administration of the Deferred Plan and review and render decisions respecting claims for benefits under the Deferred Plan, among other powers and duties. The Deferred
92
Table of Contents
Plan may be amended, suspended, or terminated at any time by our board; provided that, no such amendment, suspension or termination may adversely impact the amount of benefits a participant has accrued under the Deferred Plan or deprive a participant of such benefits except to the extent required by applicable law. The Deferred Plan also provides for claims for benefits procedures and a review process in the event of a dispute by a Participant under the Deferred Plan.
Item 12. Security Ownership of Certain Beneficial Owners and Management.
The following table sets forth the beneficial ownership of our units by:
- •
- each person known by us to be a beneficial owner of more than 5% of our outstanding units;
- •
- each of our directors;
- •
- each of our named executive officers; and
- •
- all of our directors and executive officers as a group.
The amounts and percentage of units beneficially owned are reported on the basis of regulations of the SEC governing the determination of beneficial ownership of securities. Under the rules of the SEC, a person is deemed to be a "beneficial owner" of a security if that person has or shares "voting power," which includes the power to vote or to direct the voting of such security, or "investment power," which includes the power to dispose of or to direct the disposition of such security. Except as indicated by footnote, the persons named in the table below have sole voting and investment power with respect to all units shown as beneficially owned by them as of March 31, 2013, subject to community property laws where applicable.
| | | | | | | | | | | | | | | | |
Name of Beneficial Owner | | Common Units
Beneficially
Owned | | Percentage of
Common Units
Beneficially
Owned | | Subordinated
Units
Beneficially
Owned | | Percentage of
Subordinated
Units
Beneficially
Owned | | Percentage of
Total Common
and
Subordinated
Units
Beneficially
Owned | |
|---|
Niska Sponsor Holdings Cooperatief U.A.(1) | | | 16,992,245 | | | 48.29 | % | | — | | | — | | | 48.29 | % |
Simon Dupéré | | | 89,850 | | | * | | | — | | | — | | | * | |
Vance E. Powers | | | 2,000 | | | * | | | — | | | — | | | * | |
Rick J. Staples | | | — | | | — | | | — | | | — | | | — | |
Jason A. Dubchak | | | — | | | — | | | — | | | — | | | — | |
Jason S. Kulsky | | | 10,000 | | | * | | | — | | | — | | | * | |
Darin T. Olson | | | | (2) | | * | | | — | | | — | | | * | |
Deborah M. Fretz | | | 21,175 | | | * | | | — | | | — | | | * | |
James G. Jackson | | | 7,650 | | | * | | | — | | | — | | | * | |
E. Bartow Jones | | | — | | | — | | | — | | | — | | | — | |
Stephen C. Muther | | | 13,735 | | | * | | | — | | | — | | | * | |
George A. O'Brien | | | — | | | — | | | — | | | — | | | — | |
David F. Pope | | | 4,118 | | | * | | | — | | | — | | | * | |
William H. Shea, Jr. | | | — | | | — | | | — | | | — | | | — | |
Andrew W. Ward | | | — | | | — | | | — | | | — | | | — | |
All directors and executive officers as a group (thirteen persons) | | | 148,528 | | | * | | | — | | | — | | | * | |
93
Table of Contents
- (1)
- The equity interests in Holdco are indirectly owned by our executive officers, certain of our employees and investment limited partnerships affiliated with the Carlyle/Riverstone Global Energy and Power Fund II, L.P. and Carlyle/Riverstone Global Energy and Power Fund III, L.P. C/R Energy GP III, LLC exercises investment discretion and control over the units held by Holdco through Carlyle/Riverstone Energy Partners III, L.P., of which C/R Energy GP III, LLC is the sole general partner. C/R Energy GP III, LLC is managed by an eight person management committee. The address of Holdco and C/R Energy GP III, LLC is 712 Fifth Avenue, 51st Floor, New York, NY 10019.
- (2)
- Darin Olson, former Vice President of Finance, departed the Company on November 1, 2012.
Equity Compensation Plan Information
The following table sets forth certain information with respect to our equity compensation plans as of March 31, 2013.
| | | | | | | | | | |
Plan Category | | Number of Units to be
Issued upon
Exercise/Vesting of
Outstanding Options,
Warrants and Rights
(a) | | Weighted Average
Exercise Price of
Outstanding Options,
Warrants and Rights
(b) | | Number of Units
Remaining Available
for Future Issuance
under Equity
Compensation Plans
(c) | |
|---|
Equity compensation plans approved by unitholders: | | | | | | | | | | |
2010 Long-Term Incentive Plan | | | 0 | (1) | | N/A | | | 2,045,693 | (1) |
Equity compensation plans not approved by unitholders: | | | | | | | | | | |
N/A | | | — | | | — | | | — | |
- (1)
- We have not granted any options, warrants or rights pursuant to the 2010 Long-Term Incentive Plan.
Item 13. Certain Relationships and Related Transactions, and Director Independence.
Certain Relationships and Related Party Transactions
During the year ended March 31, 2012, we purchased certain Class B units of Niska Holdings Canada from certain non-executive officers and employees of Niska Partners for $2.2 million.
On December 20, 2011, we purchased the net assets of Starks Gas Storage LLC, Coastal Bend Gas Storage LLC, and Sundance Gas Storage ULC from Holdco and from R/C Sundance Cooperatief U.A. for consideration of $5.0 million.
On August 24, 2011, we entered into a Common Unit Purchase Agreement with Holdco pursuant to which we issued and sold to Holdco, and Holdco purchased from us, 687,500 common units for a cash purchase price of $16.00 per common unit or $11,000,000 in the aggregate.
Holdco owns 16,304,745 common units, representing approximately 48.29% of our units and the incentive distribution rights. In addition, our manager owns a 1.98% managing member interest in us.
During the year ended March 31, 2011, we entered into various agreements that effected our formation transactions, including the transfer of assets to, and the assumption of liabilities by, us and our subsidiaries. These agreements were not the result of arm's-length negotiations and the terms of these agreements were not necessarily at least as favorable to the parties to these agreements as the terms which could have been obtained from unaffiliated third parties. All of the transaction expenses
94
Table of Contents
incurred in connection with our formation transactions, including the expenses associated with transferring assets to our subsidiaries were paid from the proceeds of our IPO.
On March 5, 2010, our subsidiary, AECO Partnership, entered into a services agreement with certain affiliates of Holdco pursuant to which it would provide employees to manage certain development projects for Holdco or its affiliates in return for a service fee that is to be agreed upon between the parties from time to time. AECO Partnership subsequently assigned its rights and obligations under the services agreement to Niska Gas Storage Management ULC. The initial term of the services agreement expired on March 31, 2012, at which point it was automatically renewed for an additional one-year term. The current term will expire on March 31, 2013, at which point it will automatically renew for an additional one-year term unless it is terminated.
Policies Relating to Conflicts of Interest
Conflicts of interest exist and may arise in the future as a result of the relationships between our manager and its affiliates (including Holdco), on the one hand, and us and our unaffiliated members, on the other hand. Our directors and officers have fiduciary duties to manage our manager in a manner beneficial to its owners. At the same time, our manager has a fiduciary duty to manage us in a manner beneficial to our unitholders. Our Operating Agreement contains provisions that specifically define our manager's fiduciary duties to the unitholders. Our Operating Agreement also specifically defines the remedies available to unitholders for actions taken that, without these defined liability standards, might constitute breaches of fiduciary duty under applicable Delaware law. The Delaware Limited Liability Company Act, which we refer to as the Delaware Act, provides that Delaware limited liability companies may, in their Operating Agreements, expand, restrict or eliminate the fiduciary duties otherwise owed by a manager to members and us.
Under our Operating Agreement, whenever a conflict arises between our manager or its affiliates, on the one hand, and us or any unaffiliated member or our board as our manager's delegate, on the other, our manager will resolve that conflict. Our manager has delegated this responsibility, along with the power to conduct our business, to our board. Our board may, but is not required to, seek the approval of such resolution from the conflicts committee of our board. An independent third party is not required to evaluate the fairness of the resolution.
Whenever a potential conflict of interest exists or arises between the manager or any of its affiliates, on the one hand, and us or any of our members, on the other, the resolution or course of action in respect of such conflict of interest shall be permitted and deemed approved by all our members, and shall not constitute a breach of our Operating Agreement, of any agreement contemplated, or of any duty if the resolution or course of action in respect of such conflict of interest is:
- •
- approved by the conflicts committee of our board, although our board is not obligated to seek such approval;
- •
- approved by the vote of a majority of the outstanding common units, excluding any common units owned by our manager or any of its affiliates;
- •
- on terms no less favorable to us than those generally being provided to or available from unaffiliated third parties; or
- •
- fair and reasonable to us, taking into account the totality of the relationships between the parties involved, including other transactions that may be particularly favorable or advantageous to us.
If our board does not seek approval from the conflicts committee and determines that the resolution or course of action taken with respect to the conflict of interest satisfies either of the
95
Table of Contents
standards set forth in the third and fourth bullet points above, then it will be presumed that, in making its decision, our board acted in good faith, and in any proceeding brought by or on behalf of us or any of our unitholders, the person bringing or prosecuting such proceeding will have the burden of overcoming such presumption. Unless the resolution of a conflict is specifically provided for in our Operating Agreement, our board or the conflicts committee of our board may consider any factors it determines in good faith to consider when resolving a conflict. When our Operating Agreement requires someone to act in good faith, it requires that person to reasonably believe that he is acting in the best interests of us, unless the context otherwise requires. See "Management" for information about the conflicts committee of our board.
The transactions described above under "—Agreements With Affiliates" were described in our registration statement relating to our IPO and deemed approved by all our members under the terms of our Operating Agreement.
Item 14. Principal Accounting Fees and Services.
The following table presents fees for professional services rendered by KPMG LLP for 2013 and 2012:
| | | | | | | |
| | Year Ended March 31, | |
|---|
| | 2013 | | 2012 | |
|---|
Audit Fees | | $ | 1,045,255 | | $ | 1,306,965 | |
Audit -Related fees | | | — | | | 75,000 | |
| | | | | | |
Total | | $ | 1,045,255 | | $ | 1,381,965 | |
| | | | | | |
Our audit committee has adopted an audit committee charter, which is available on our website at www.niskapartners.com, which requires the audit committee to pre-approve all audit and non-audit services to be provided by our independent registered public accounting firm. The audit committee does not delegate its pre-approval responsibilities to management or to an individual member of the audit committee.
PART IV
Item 15. Exhibits, Financial Statement Schedules.
(a) (1) Financial Statements
See "Index to the Consolidated Financial Statements" set forth on Page F-1.
(2) Financial Statement Schedules
All schedules are omitted because they are not applicable or the required information is presented in the financial statements or notes thereto.
96
Table of Contents
(3) Exhibits
EXHIBIT LIST
| | | | | | |
Exhibit
Number | |
| | Description |
|---|
| | 3.1 | | | — | | Certificate of formation of Niska Gas Storage Partners LLC (incorporated by reference to exhibit 3.1 to Amendment No. 2 to the Company's registration statement on Form S-1 (Registration No. 333-165007), filed on April 15, 2010) |
| | | | | | | |
| | 3.2 | | | — | | Second Amended and Restated Operating Agreement of Niska Gas Storage Partners LLC, dated as of April 2, 2013 (incorporated by reference to exhibit 3.2 to the Company's Current Report on Form 8-K, filed on April 3, 2013) |
| | | | | | | |
| | 4.1 | | | — | | Indenture dated as of March 5, 2010 among Niska Gas Storage US, LLC, Niska Gas Storage US Finance Corp., Niska Gas Storage Canada ULC and Niska Gas Storage Canada Finance Corp., as issuers, each of the Guarantors party thereto, and The Bank of New York Mellon, as Trustee (incorporated by reference to exhibit 10.5 to Amendment No. 1 to the Company's Registration Statement on Form S-1 (Registration No. 333-165007), filed on March 29, 2010) |
| | | | | | | |
| | 4.2 | | | — | | Registration Rights Agreement between Niska Gas Storage Partners LLC and Niska Sponsor Holdings Coöperatief U.A. dated May 17, 2010 (incorporated by reference to exhibit 10.2 of the Company's Current Report on Form 8-K, filed on May 19, 2010) |
| | | | | | | |
| | 4.3 | | | — | | Amendment No. 1 to Registration Rights Agreement made as of August 24, 2011, by and between Niska Gas Storage Partners LLC, a Delaware limited liability company and Niska Sponsor Holdings Coöperatief U.A. (incorporated by reference to exhibit 4.1 of the Company's Quarterly Report on Form 10-Q, filed on November 7, 2011) |
| | | | | | | |
| | 10.1 | † | | — | | Niska Gas Storage Partners LLC 2010 Long-Term Incentive Plan effective as of May 16, 2010 (incorporated by reference to exhibit 10.1 of the Company's Current Report on Form 8-K, filed on May 19, 2010) |
| | | | | | | |
| | 10.2 | | | — | | Credit Agreement dated as of March 5, 2010 among Niska Gas Storage US, LLC, as US Borrower, and AECO Gas Storage Partnership, as Canadian Borrower, Niska GS Holdings I, L.P., Niska GS Holdings II, L.P., Royal Bank of Canada, as Administrative Agent and Collateral Agent and the other lenders party thereto (incorporated by reference to exhibit 10.4 to Amendment No. 1 to the Company's Registration Statement on Form S-1 (Registration No. 333-165007), filed on March 29, 2010) |
| | | | | | | |
| | 10.3 | † | | — | | Executive Employment Agreement of Simon Dupéré dated April 24, 2012 (incorporated by reference to exhibit 10.1 of the Company's Current Report on Form 8-K, filed on April 30, 2012) |
| | | | | | | |
| | 10.4 | | | — | | Services Agreement dated March 5, 2010 among AECO Gas Storage Partnership, Niska GS Holdings US, L.P. and Niska Holdings L.P. (incorporated by reference to exhibit 10.3 to Amendment No. 1 to the Company's Registration Statement on Form S-1 (Registration No. 333-165007), filed on March 29, 2010) |
| | | | | | | |
| | 10.5 | | | — | | Common Unit Purchase Agreement made as of August 24, 2011 by and between Niska Gas Storage Partners LLC and Niska Sponsor Holdings Coöperatief U.A. (incorporated by reference to exhibit 10.1 of the Company's Quarterly Report on Form 10-Q, filed on November 7, 2011) |
| |
| | | | | |
97
Table of Contents
| | | | | | |
Exhibit
Number | |
| | Description |
|---|
| | 10.6 | | | | | Amended and Restated Credit Agreement dated June 29, 2012 (incorporated by reference to exhibit 10.1 of the Company's Current Report on Form 8-K, filed on July 5, 2012) |
| | | | | | | |
| | 10.7 | | | — | | Sponsor Equity Restructuring Agreement, by and among Niska Gas Storage Partners LLC and Niska Sponsor Holdings Coöpertief U.A., dated as of April 2, 2013 (incorporated by reference to exhibit 10.1 of the Company's Current Report on Form 8-K, filed on April 3, 2013) |
| | | | | | | |
| | 12.1 | * | | — | | Statement regarding computation of ratios |
| | | | | | | |
| | 21.1 | * | | — | | List of Subsidiaries of Niska Gas Storage Partners LLC |
| | | | | | | |
| | 23.1 | * | | — | | Consent of KPMG (Houston) |
| | | | | | | |
| | 31.1 | * | | — | | Certification of Chief Executive Officer pursuant to Rule 13a-14(a) under the Securities Exchange Act of 1934 |
| | | | | | | |
| | 31.2 | * | | — | | Certification of Chief Financial Officer pursuant to Rule 13a-14(a) under the Securities Exchange Act of 1934 |
| | | | | | | |
| | 32.1 | ** | | — | | Certification of Chief Executive Officer pursuant to 18 U.S.C. Section 1350, as adopted pursuant to Section 906 of the Sarbanes-Oxley Act of 2002 |
| | | | | | | |
| | 32.2 | ** | | — | | Certification of Chief Financial Officer pursuant to 18 U.S.C. Section 1350, as adopted pursuant to Section 906 of the Sarbanes-Oxley Act of 2002 |
| | | | | | | |
| | 101.INS | * | | — | | XBRL Instance Document. |
| | | | | | | |
| | 101.SCH | * | | — | | XBRL Taxonomy Extension Schema Document. |
| | | | | | | |
| | 101.CAL | * | | — | | XBRL Taxonomy Extension Calculation Linkbase Document. |
| | | | | | | |
| | 101.LAB | * | | — | | XBRL Taxonomy Extension Presentation Linkbase Document. |
| | | | | | | |
| | 101.PRE | * | | — | | XBRL Taxonomy Extension Presentation Linkbase Document. |
| | | | | | | |
| | 101.DEF | * | | — | | XBRL Taxonomy Extension Definition Linkbase Document. |
- *
- Filed herewith.
- **
- Furnished herewith.
- †
- Management contract or compensatory plan or arrangement required to be filed as an exhibit to this 10-K pursuant to Item 15(b).
98
Table of Contents
SIGNATURES
Pursuant to the requirements of Section 13 or 15(d) of the Securities Exchange Act of 1934, the registrant has duly caused this report to be signed on its behalf by the undersigned, thereunto duly authorized.
| | | | |
| | | NISKA GAS STORAGE PARTNERS LLC |
|
|
By: |
|
/s/ SIMON DUPÉRÉ
Simon Dupéré
President and Chief Executive Officer and Director |
Date: June 7, 2013
Pursuant to the requirements of the Securities Exchange Act of 1934, this report has been signed below by the following persons on behalf of the registrant and in the capacities and on the dates indicated.
| | | | |
Signature | | Title | | Date |
|---|
|
|
|
|
|
/s/ SIMON DUPÉRÉ
Simon Dupéré | | President and Chief Executive Officer and Director (Principal Executive Officer) | | June 7, 2013 |
/s/ VANCE E. POWERS
Vance E. Powers |
|
Chief Financial Officer (Principal Financial and Accounting Officer) |
|
June 7, 2013 |
/s/ DEBORAH M. FRETZ
Deborah M. Fretz |
|
Director |
|
June 7, 2013 |
/s/ JAMES G. JACKSON
James G. Jackson |
|
Director |
|
June 7, 2013 |
/s/ E. BARTOW JONES
E. Bartow Jones |
|
Director |
|
June 7, 2013 |
/s/ STEPHEN C. MUTHER
Stephen C. Muther |
|
Director |
|
June 7, 2013 |
/s/ GEORGE A. O'BRIEN
George A. O'Brien |
|
Director |
|
June 7, 2013 |
99
Table of Contents
| | | | |
Signature | | Title | | Date |
|---|
|
|
|
|
|
/s/ DAVID F. POPE
David F. Pope | | Director | | June 7, 2013 |
/s/ WILLIAM H. SHEA, JR.
William H. Shea, Jr. |
|
Director |
|
June 7, 2013 |
/s/ ANDREW W. WARD
Andrew W. Ward |
|
Director |
|
June 7, 2013 |
100
Table of Contents
INDEX TO FINANCIAL STATEMENTS
| | |
NISKA GAS STORAGE PARTNERS LLC FINANCIAL STATEMENTS | | |
Management's Report On Internal Control Over Financial Reporting | | F-2 |
Report of Independent Registered Public Accounting Firm On Internal Control Over Financial Reporting | | F-3 |
Report of Independent Registered Public Accounting Firm for the Years Ended March 31, 2013, 2012 and 2011 | | F-4 |
Consolidated Statements of Earnings (Loss) and Comprehensive Income (Loss) for the Years Ended March 31, 2013, 2012 and 2011 | | F-5 |
Consolidated Balance Sheets as of March 31, 2013 and 2012 | | F-6 |
Consolidated Statements of Cash Flows for the Years Ended March 31, 2013, 2012 and 2011 | | F-7 |
Consolidated Statements of Changes in Members' Equity for the Years Ended March 31, 2013, 2012 and 2011 | | F-8 |
Notes to Consolidated Financial Statements | | F-9 |
F-1
Table of Contents
MANAGEMENT'S REPORT ON INTERNAL CONTROL OVER FINANCIAL REPORTING
Management of Niska Gas Storage Partners LLC ("Niska Partners") is responsible for establishing and maintaining adequate internal control over financial reporting. Internal control over financial reporting is a process designed to provide reasonable, but not absolute, assurance regarding the reliability of financial reporting and the preparation of financial statements for external purposes in accordance with accounting principles generally accepted in the United States of America. A company's internal control over financial reporting includes those policies and procedures that pertain to the maintenance of records that, in reasonable detail, accurately and fairly reflect the transactions and dispositions of the assets of the company; provide reasonable assurance that transactions are recorded as necessary to permit preparation of financial statements in accordance with accounting principles generally accepted in the United States of America, and that receipts and expenditures of the company are being made only in accordance with authorizations of management and directors of the company; and provide reasonable assurance regarding prevention or timely detection of unauthorized acquisition, use, or disposition of the company's assets that could have a material effect on the financial statements.
Because of its inherent limitations, internal control over financial reporting may not prevent or detect misstatements. Also, projections of any evaluation of effectiveness to future periods are subject to the risk that controls may become inadequate because of changes in conditions, or that the degree of compliance with the policies or procedures may deteriorate.
Management evaluated Niska Partners' internal control over financial reporting as of March 31, 2013. In making this assessment, management used the criteria set forth by the Committee of Sponsoring Organizations of the Treadway Commission in Internal Control—Integrated Framework ("COSO"). As a result of this assessment and based on the criteria in the COSO framework, management has concluded that, as of March 31, 2013, Niska Partners' internal control over financial reporting was effective.
Niska Partners' independent registered public accounting firm, KPMG LLP, has audited the internal control over financial reporting. Their opinion on the effectiveness of Niska Partners' internal control over financial reporting appears herein.
Date: June 7, 2013
| | |
/s/ SIMON DUPÉRÉ
Simon Dupéré
President and Chief Executive Officer and Director | | /s/ VANCE E. POWERS
Vance E. Powers
Chief Financial Officer |
F-2
Table of Contents
Report of Independent Registered Public Accounting Firm
The Board of Directors
Niska Gas Storage Partners LLC:
We have audited Niska Gas Storage Partners LLC's (the Company) internal control over financial reporting as of March 31, 2013, based on criteria established inInternal Control—Integrated Framework issued by the Committee of Sponsoring Organizations of the Treadway Commission (COSO). The Company's management is responsible for maintaining effective internal control over financial reporting and for its assessment of the effectiveness of internal control over financial reporting, included in the accompanying Management's Report on Internal Control over Financial Reporting. Our responsibility is to express an opinion on the Company's internal control over financial reporting based on our audit.
We conducted our audit in accordance with the standards of the Public Company Accounting Oversight Board (United States). Those standards require that we plan and perform the audit to obtain reasonable assurance about whether effective internal control over financial reporting was maintained in all material respects. Our audit included obtaining an understanding of internal control over financial reporting, assessing the risk that a material weakness exists, and testing and evaluating the design and operating effectiveness of internal control based on the assessed risk. Our audit also included performing such other procedures as we considered necessary in the circumstances. We believe that our audit provides a reasonable basis for our opinion.
A company's internal control over financial reporting is a process designed to provide reasonable assurance regarding the reliability of financial reporting and the preparation of financial statements for external purposes in accordance with generally accepted accounting principles. A company's internal control over financial reporting includes those policies and procedures that (1) pertain to the maintenance of records that, in reasonable detail, accurately and fairly reflect the transactions and dispositions of the assets of the company; (2) provide reasonable assurance that transactions are recorded as necessary to permit preparation of financial statements in accordance with generally accepted accounting principles, and that receipts and expenditures of the company are being made only in accordance with authorizations of management and directors of the company; and (3) provide reasonable assurance regarding prevention or timely detection of unauthorized acquisition, use, or disposition of the company's assets that could have a material effect on the financial statements.
Because of its inherent limitations, internal control over financial reporting may not prevent or detect misstatements. Also, projections of any evaluation of effectiveness to future periods are subject to the risk that controls may become inadequate because of changes in conditions, or that the degree of compliance with the policies or procedures may deteriorate.
In our opinion, Niska Gas Storage Partners LLC maintained, in all material respects, effective internal control over financial reporting as of March 31, 2013, based on criteria established inInternal Control—Integrated Framework issued by COSO.
We also have audited, in accordance with the standards of the Public Company Accounting Oversight Board (United States), the consolidated balance sheets of Niska Gas Storage Partners LLC as of March 31, 2013 and 2012, and the related consolidated statements of earnings (loss) and comprehensive income (loss), changes in members' equity, and cash flows for each of the years in the three-year period ended March 31, 2013, and our report dated June 7, 2013 expressed an unqualified opinion on those consolidated financial statements.
(signed) KPMG LLP
Houston, Texas
June 7, 2013
F-3
Table of Contents
Report of Independent Registered Public Accounting Firm
The Board of Directors
Niska Gas Storage Partners LLC:
We have audited the accompanying consolidated balance sheets of Niska Gas Storage Partners LLC (the Company) as of March 31, 2013 and 2012, and the related consolidated statements of earnings (loss) and comprehensive income (loss), changes in members' equity, and cash flows for each of the years in the three-year period ended March 31, 2013. These consolidated financial statements are the responsibility of the Company's management. Our responsibility is to express an opinion on these consolidated financial statements based on our audits.
We conducted our audits in accordance with the standards of the Public Company Accounting Oversight Board (United States). Those standards require that we plan and perform the audit to obtain reasonable assurance about whether the financial statements are free of material misstatement. An audit includes examining, on a test basis, evidence supporting the amounts and disclosures in the financial statements. An audit also includes assessing the accounting principles used and significant estimates made by management, as well as evaluating the overall financial statement presentation. We believe that our audits provide a reasonable basis for our opinion.
In our opinion, the consolidated financial statements referred to above present fairly, in all material respects, the financial position of Niska Gas Storage Partners LLC as of March 31, 2013 and 2012, and the results of its operations and its cash flows for each of the years in the three-year period ended March 31, 2013, in conformity with U.S. generally accepted accounting principles.
We also have audited, in accordance with the standards of the Public Company Accounting Oversight Board (United States), the Company's internal control over financial reporting as of March 31, 2013, based on criteria established inInternal Control—Integrated Framework issued by the Committee of Sponsoring Organizations of the Treadway Commission (COSO), and our report dated June 7, 2013 expressed an unqualified opinion on the effectiveness of the Company's internal control over financial reporting.
As discussed in Note 2 to the consolidated financial statements, the statements of earnings and comprehensive income, members' equity and cash flows prior to May 17, 2010 have been prepared on a combined basis of accounting.
(signed) KPMG LLP
Houston, Texas
June 7, 2013
F-4
Table of Contents
Niska Gas Storage Partners LLC
Consolidated Statements of Earnings (Loss) and Comprehensive Income (Loss)
(in thousands of U.S. dollars, except for per unit amounts)
| | | | | | | | | | |
| | Year ended March 31, | |
|---|
| | 2013 | | 2012 | | 2011 | |
|---|
REVENUES | | | | | | | | | | |
Fee-based revenue (Note 15) | | $ | 163,325 | | $ | 146,053 | | $ | 160,538 | |
Optimization, net (Note 16) | | | (22,630 | ) | | 122,528 | | | 69,537 | |
| | | | | | | | |
| | | 140,695 | | | 268,581 | | | 230,075 | |
EXPENSES (INCOME) | | | | | | | | | | |
Operating | | | 32,535 | | | 43,978 | | | 44,772 | |
General and administrative | | | 38,562 | | | 28,582 | | | 34,568 | |
Depreciation and amortization (Notes 4 and 5) | | | 50,409 | | | 46,132 | | | 46,891 | |
Impairment of goodwill (Note 5) | | | — | | | 250,000 | | | — | |
Loss on impairment and sale of assets (Note 4) | | | 14,927 | | | 5,342 | | | — | |
Interest (Notes 6 and 17) | | | 67,010 | | | 74,630 | | | 77,007 | |
Loss on extinguishment of debt (Note 7) | | | 599 | | | 4,861 | | | — | |
Foreign exchange (gains) losses | | | (694 | ) | | 682 | | | (518 | ) |
Other income | | | (110 | ) | | (167 | ) | | (48 | ) |
| | | | | | | | |
EARNINGS (LOSS) BEFORE INCOME TAXES | | | (62,543 | ) | | (185,459 | ) | | 27,403 | |
| | | | | | | | |
Income tax (benefit) expense (Note 11) | | | | | | | | | | |
Current | | | (1,414 | ) | | 412 | | | 1,213 | |
Deferred | | | (17,528 | ) | | (20,099 | ) | | (31,267 | ) |
| | | | | | | | |
| | | (18,942 | ) | | (19,687 | ) | | (30,054 | ) |
| | | | | | | | |
NET EARNINGS (LOSS) AND COMPREHENSIVE INCOME (LOSS) | | | (43,601 | ) | | (165,772 | ) | | 57,457 | |
Less: | | | | | | | | | | |
Net earnings prior to initial public offering on May 17, 2010 | | | — | | | — | | | 36,234 | |
| | | | | | | | |
Net earnings (loss) subsequent to initial public offering on May 17, 2010 | | $ | (43,601 | ) | $ | (165,772 | ) | $ | 21,223 | |
| | | | | | | | |
Net earnings (loss) subsequent to initial public offering allocated to: | | | | | | | | | | |
Managing Member | | $ | (863 | ) | $ | (3,283 | ) | $ | 901 | |
| | | | | | | | |
Common unitholders | | $ | (21,584 | ) | $ | (82,063 | ) | $ | 10,161 | |
| | | | | | | | |
Subordinated unitholder | | $ | (21,154 | ) | $ | (80,426 | ) | $ | 10,161 | |
| | | | | | | | |
Earnings (loss) per unit, attributable to the period subsequent to the initial public offering, allocated to common unitholders—basic and diluted | | $ | (0.63 | ) | $ | (2.39 | ) | $ | 0.31 | |
| | | | | | | | |
Earnings (loss) per unit, attributable to the period subsequent to the initial public offering, allocated to subordinated unitholders—basic and diluted | | $ | (0.63 | ) | $ | (2.39 | ) | $ | 0.31 | |
| | | | | | | | |
(See notes to the consolidated financial statements)
F-5
Table of Contents
Niska Gas Storage Partners LLC
Consolidated Balance Sheets
(in thousands of U.S. dollars)
| | | | | | | |
| | As at March 31, | |
|---|
| | 2013 | | 2012 | |
|---|
ASSETS | | �� | | | | | |
Current Assets | | | | | | | |
Cash and cash equivalents | | $ | 10,610 | | $ | 13,342 | |
Margin deposits | | | 18,474 | | | — | |
Trade receivables | | | 2,702 | | | 2,468 | |
Accrued receivables | | | 106,726 | | | 49,046 | |
Natural gas inventory | | | 83,416 | | | 230,739 | |
Prepaid expenses and other current assets | | | 4,688 | | | 3,162 | |
Short-term risk management assets (Notes 12 and 13) | | | 21,159 | | | 140,670 | |
| | | | | | |
| | | 247,775 | | | 439,427 | |
Long-term Assets | | | | | | | |
Property, plant and equipment, net of accumulated depreciation (Note 4) | | | 918,061 | | | 968,128 | |
Goodwill (Note 5) | | | 245,604 | | | 245,604 | |
Long-term natural gas inventory | | | 15,264 | | | 15,264 | |
Intangible assets, net of accumulated amortization (Note 5) | | | 73,998 | | | 85,309 | |
Deferred charges, net of accumulated amortization (Note 6) | | | 14,420 | | | 15,182 | |
Other Assets | | | 2,677 | | | 1,624 | |
Long-term risk management assets (Notes 12 and 13) | | | 6,593 | | | 32,820 | |
| | | | | | |
| | | 1,276,617 | | | 1,363,931 | |
| | | | | | |
| | $ | 1,524,392 | | $ | 1,803,358 | |
| | | | | | |
LIABILITIES AND MEMBERS' EQUITY | | | | | | | |
Current Liabilities | | | | | | | |
Revolving credit facility (Note 7) | | $ | 65,000 | | $ | 150,000 | |
Margin deposits | | | — | | | 20,707 | |
Current portion of obligations under capital lease (Note 8) | | | 1,259 | | | 1,295 | |
Trade payables | | | 1,048 | | | 1,527 | |
Current portion of deferred taxes (Note 11) | | | 14,303 | | | 22,821 | |
Deferred revenue | | | 568 | | | 11,235 | |
Accrued liabilities (Note 9) | | | 39,840 | | | 37,293 | |
Short-term risk management liabilities (Notes 12 and 13) | | | 20,005 | | | 58,870 | |
| | | | | | |
| | | 142,023 | | | 303,748 | |
Long-term Liabilities | | | | | | | |
Long-term risk management liabilities (Notes 12 and 13) | | | 4,574 | | | 21,596 | |
Asset retirement obligations (Note 10) | | | 2,007 | | | 1,554 | |
Other long-term liabilities | | | 1,461 | | | 234 | |
Deferred income taxes (Note 11) | | | 120,935 | | | 129,952 | |
Obligations under capital lease (Note 8) | | | 12,225 | | | 12,094 | |
Long-term debt (Note 7) | | | 643,790 | | | 643,790 | |
| | | | | | |
| | | 927,015 | | | 1,112,968 | |
MEMBERS' EQUITY | | | | | | | |
Common units | | | 321,642 | | | 391,585 | |
Subordinated units | | | 265,877 | | | 287,105 | |
Managing Member's interest | | | 9,858 | | | 11,700 | |
| | | | | | |
| | | 597,377 | | | 690,390 | |
Commitments and contingencies (Notes 7, 14 and 19) | | | | | | | |
Subsequent events (Note 24) | | | | | | | |
| | | | | | |
| | $ | 1,524,392 | | $ | 1,803,358 | |
| | | | | | |
(See notes to the consolidated financial statements)
F-6
Table of Contents
Niska Gas Storage Partners LLC
Consolidated Statements of Cash Flows
(in thousands of U.S. dollars)
| | | | | | | | | | |
| | Year ended March 31, | |
|---|
| | 2013 | | 2012 | | 2011 | |
|---|
Operating Activities | | | | | | | | | | |
Net earnings (loss) | | $ | (43,601 | ) | $ | (165,772 | ) | $ | 57,457 | |
Adjustments to reconcile net earnings to net cash provided by operating activities: | | | | | | | | | | |
Unrealized foreign exchange (gains) losses | | | (252 | ) | | 391 | | | 770 | |
Deferred income tax benefit (Note 11) | | | (17,528 | ) | | (20,648 | ) | | (31,267 | ) |
Unrealized risk management losses (gains) (Notes 12 and 13) | | | 89,851 | | | (83,193 | ) | | 44,787 | |
Depreciation and amortization (Notes 4 and 5) | | | 50,409 | | | 46,132 | | | 46,891 | |
Deferred charges amortization (Note 6) | | | 3,411 | | | 3,942 | | | 4,124 | |
Loss on extinguishment of debt (Note 7) | | | 599 | | | 4,861 | | | — | |
Loss on impairment and sale of assets (Note 4) | | | 14,927 | | | 5,342 | | | — | |
Impairment of goodwill (Note 5) | | | — | | | 250,000 | | | — | |
Write-down of inventory | | | 22,281 | | | 23,400 | | | — | |
Changes in non-cash working capital (Note 20) | | | 42,033 | | | (56,420 | ) | | (69,377 | ) |
| | | | | | | | |
Net cash provided by operating activities | | | 162,130 | | | 8,035 | | | 53,385 | |
| | | | | | | | |
Investing Activities | | | | | | | | | | |
Property, plant and equipment expenditures | | | (30,015 | ) | | (52,820 | ) | | (20,375 | ) |
Proceeds on disposal of assets | | | 2,210 | | | — | | | — | |
| | | | | | | | |
Net cash used in investing activities | | | (27,805 | ) | | (52,820 | ) | | (20,375 | ) |
| | | | | | | | |
Financing Activities | | | | | | | | | | |
Proceeds on revolver drawings | | | 348,448 | | | 701,800 | | | 567,000 | |
Revolver repayments | | | (433,448 | ) | | (551,800 | ) | | (567,000 | ) |
Debt repayments | | | — | | | (158,012 | ) | | — | |
Payment of deferred financing costs | | | (3,248 | ) | | — | | | (2,086 | ) |
Net proceeds from issuance of common units | | | — | | | 11,000 | | | 333,459 | |
Proceeds from obligations under capital lease | | | 947 | | | 13,245 | | | — | |
Repayments of obligations under capital lease | | | (717 | ) | | — | | | — | |
Distributions to partners (Notes 14 and 24) | | | (48,811 | ) | | (74,568 | ) | | (378,003 | ) |
Acquisition of interest in parent company | | | — | | | (2,176 | ) | | — | |
Acquisition of assets from parent company | | | — | | | 428 | | | — | |
| | | | | | | | |
Net cash used in by financing activities | | | (136,829 | ) | | (60,083 | ) | | (46,630 | ) |
| | | | | | | | |
Effect of translation on foreign currency cash and cash equivalents | | | (228 | ) | | 468 | | | (197 | ) |
Net decrease in cash and cash equivalents | | | (2,732 | ) | | (104,400 | ) | | (13,817 | ) |
Cash and cash equivalents, beginning of the year | | | 13,342 | | | 117,742 | | | 131,559 | |
| | | | | | | | |
Cash and cash equivalents, end of the year | | $ | 10,610 | | $ | 13,342 | | $ | 117,742 | |
| | | | | | | | |
Supplemental cash flow disclosures (Note 21) | | | | | | | | | | |
(See notes to the consolidated financial statements)
F-7
Table of Contents
Niska Gas Storage Partners LLC
Consolidated Statements of Changes in Members' Equity
(in thousands of U.S. dollars)
| | | | | | | | | | | | | | | | | | | |
| | Niska Gas Storage Partners LLC | | Niska Predecessor | |
| |
|---|
| | Common
Units | | Subordinated
Units | | Managing
Member's
Interest | | Partners'
Capital | | Retained
Earnings | | Total | |
|---|
Balance, April 1, 2010 | | $ | — | | $ | — | | $ | — | | $ | 849,991 | | $ | 79,795 | | $ | 929,786 | |
Net earnings, April 1, 2010 - May 16, 2010 | | | — | | | — | | | — | | | — | | | 36,234 | | | 36,234 | |
Cash distributions to Partners | | | — | | | — | | | — | | | (153,614 | ) | | (159,726 | ) | | (313,340 | ) |
Non-cash distribution of Starks Gas Storage LLC and Coastal Bend Gas Storage LLC | | | — | | | — | | | — | | | (15,604 | ) | | (10,122 | ) | | (25,726 | ) |
Exchange of Partners' capital for common and subordinated units, incentive distribution rights, and Managing Member's interest | | | 198,340 | | | 411,807 | | | 16,807 | | | (680,773 | ) | | 53,819 | | | — | |
Net proceeds from initial public offering | | | 333,459 | | | — | | | — | | | — | | | — | | | 333,459 | |
Net earnings, May 17, 2010 to March 31, 2011 | | | 10,161 | | | 10,161 | | | 901 | | | — | | | — | | | 21,223 | |
Distributions to Unitholders | | | (31,685 | ) | | (31,685 | ) | | (1,293 | ) | | — | | | — | | | (64,663 | ) |
| | | | | | | | | | | | | | |
Balance, March 31, 2011 | | | 510,275 | | | 390,283 | | | 16,415 | | | — | | | — | | | 916,973 | |
| | | | | | | | | | | | | | |
Net loss | | | (82,063 | ) | | (80,426 | ) | | (3,283 | ) | | — | | | — | | | (165,772 | ) |
Distributions to Unitholders | | | (48,981 | ) | | (24,101 | ) | | (1,486 | ) | | — | | | — | | | (74,568 | ) |
Acquisition of interest in parent company | | | (1,066 | ) | | (1,066 | ) | | (44 | ) | | — | | | — | | | (2,176 | ) |
Acquisition of assets from parent company | | | 212 | | | 208 | | | 8 | | | — | | | — | | | 428 | |
Issuance of common units | | | 11,000 | | | — | | | — | | | — | | | — | | | 11,000 | |
Tax benefit of offering costs | | | 2,208 | | | 2,207 | | | 90 | | | — | | | — | | | 4,505 | |
| | | | | | | | | | | | | | |
Balance, March 31, 2012 | | | 391,585 | | | 287,105 | | | 11,700 | | | — | | | — | | | 690,390 | |
| | | | | | | | | | | | | | |
Net loss | | | (21,584 | ) | | (21,154 | ) | | (863 | ) | | — | | | — | | | (43,601 | ) |
Distributions to Unitholders | | | (48,359 | ) | | (74 | ) | | (979 | ) | | — | | | — | | | (49,412 | ) |
| | | | | | | | | | | | | | |
Balance, March 31, 2013 | | $ | 321,642 | | $ | 265,877 | | $ | 9,858 | | $ | — | | $ | — | | $ | 597,377 | |
| | | | | | | | | | | | | | |
(See notes to the consolidated financial statements)
F-8
Table of Contents
Niska Gas Storage Partners LLC
Notes to Consolidated Financial Statements
(Thousands of U.S. dollars)
1. Description of Business
Niska Gas Storage Partners LLC ("Niska Partners" or the "Company") is a publicly-traded Delaware limited liability company (NYSE:NKA) which independently owns and/or operates natural gas storage assets in North America. The Company operates the Countess and Suffield gas storage facilities (collectively, the AECO Hub™) in Alberta, Canada, and the Wild Goose and Salt Plains gas storage facilities in California and Oklahoma, respectively. Each of these facilities markets natural gas storage services in addition to optimizing storage capacity with its own proprietary gas purchases.
At March 31, 2013, Niska Partners had 34,492,245 common units outstanding and 33,804,745 subordinated units outstanding. Of these amounts, 16,992,245 common units and all of the subordinated units were owned by its parent company, Niska Sponsor Holdings Coöperatief U.A. ("Sponsor Holdings" or "Holdco"), along with a 1.98% Managing Member's interest in the Company and all of the Incentive Distribution Rights ("IDRs"). Including all of the common and subordinated units owned by Sponsor Holdings, along with the 1.98% Managing Member's interest, Sponsor Holdings had a 74.88% ownership interest in the Company, excluding the IDRs. The remaining 17,500,000 common units, representing a 25.12% ownership interest excluding the IDRs, were owned by the public.
On April 2, 2013, the Company completed an equity restructuring which permanently eliminates Niska Partners' subordinated units and previous incentive distribution rights in return for the new IDRs. See Note 24—Subsequent Events for details.
2. Significant Accounting Policies
Basis of presentation
These consolidated financial statements have been prepared to reflect the consolidated financial position, results of operations and cash flows of Niska Partners and its subsidiaries and have been prepared in accordance with accounting principles generally accepted in the United States of America ("GAAP"). The results from the pre-IPO period of April 1, 2010 to May 16, 2010 have been prepared to reflect the combined financial position, results of operations, and cash flows of the predecessor Partnerships and their subsidiaries and have been prepared in accordance with GAAP.
These financial statements include the accounts of Niska Partners and its wholly-owned subsidiaries, including AECO Gas Storage Partnership, Wild Goose Storage LLC, Niska Gas Storage, LLC, Salt Plains Storage, LLC, Access Gas Services Inc., Access Gas Services (Ontario) Inc., EnerStream Agency Services Inc., and Niska Partners Management ULC. All material inter-company transactions have been eliminated.
As the closing of the Company's IPO occurred on May 17, 2010, the earnings for the year ended March 31, 2011 have been determined pro-rata to reflect earnings on a pre- and post-IPO basis. As part of the process of allocating revenues and expenses to both periods, the Company assessed the fair value of its risk management assets and liabilities as of the closing date, resulting in an unrealized gain for the pre-IPO period and an unrealized loss for the post-IPO period. The net unrealized loss for the period from May 17, 2010 to March 31, 2011 is reflected in the per-unit information presented in the consolidated statement of earnings and comprehensive income. Earnings per unit allocated to common and subordinated unitholders in fiscal year 2011 are attributable to the period subsequent to the
F-9
Table of Contents
Niska Gas Storage Partners LLC
Notes to Consolidated Financial Statements (Continued)
(Thousands of U.S. dollars)
2. Significant Accounting Policies (Continued)
Company's IPO although the statement of earnings and comprehensive income is for the fiscal year ended March 31, 2011.
Use of estimates
In preparing these financial statements, Niska Partners is required to make estimates and assumptions that affect both the amount and timing of recording assets, liabilities, revenues and expenses since the determination of these items may be dependent on future events. Management uses the most current information available and exercises careful judgment in making these estimates. Although management believes that these consolidated financial statements have been prepared within limits of materiality and within the framework of its significant accounting policies summarized below, actual results could differ from these estimates. Changes in estimates are accounted for on a prospective basis.
Revenue recognition
The Company's assessment of each of the four revenue recognition criteria as they relate to its revenue producing activities is as follows:
Persuasive evidence of an arrangement exists. The Company's customary practices are to enter into a written contract, executed by both the customer and the Company.
Delivery. Delivery is deemed to have occurred at the time the natural gas is delivered and title is transferred, or in the case of fee-based arrangements, when the services are rendered. To the extent the Company retains its inventory, delivery occurs when the inventory is subsequently sold and title is transferred to the third party purchaser.
The fee is fixed or determinable. The Company negotiates the fee for its services at the outset of their fee-based arrangements. In these arrangements, the fees are nonrefundable. The fees are generally due on the 25th of the month following the delivery or services rendered. For other arrangements, the amount of revenue is determinable when the sale of the applicable product has been completed upon delivery and transfer of title.
Collectability is reasonably assured. Collectability is evaluated on a customer-by-customer basis. New and existing customers are subject to a credit review process, which evaluates the customers' financial position (e.g. cash position and credit rating) and their ability to pay. If collectability is not considered reasonably assured at the outset of an arrangement in accordance with the Company's credit review process, revenue is recognized when the fee is collected.
Fee-based revenue consists of long term contracts for storage fees that are generated when we lease storage capacity on a monthly basis and short term fees associated with park and loan activities. Long-term contract revenue consists of monthly storage fees and fuel and commodity charges for injections and withdrawals. Long-term contract revenue is accrued on a monthly basis in accordance with the terms of the customer contracts. Customer charges for injections and withdrawals are recorded in the month of injection or withdrawal. Short-term contract revenue consists of fees for injections and withdrawals, which include fuel and commodity charges. One half of the fees are earned at the time of
F-10
Table of Contents
Niska Gas Storage Partners LLC
Notes to Consolidated Financial Statements (Continued)
(Thousands of U.S. dollars)
2. Significant Accounting Policies (Continued)
injection by the customer and one half of the fees are earned at the time of withdrawal by the customer.
Energy trading contracts resulting in the delivery of a commodity where Niska Partners is the principal in the transaction are recorded as optimization revenues at the time of physical delivery. Realized and unrealized gains and losses on financial energy trading contracts are included in optimization revenue (see Note 12—Risk Management Activities and Financial Instruments).
Optimization revenue, net includes realized gains and losses and the net change in unrealized gains and losses on financial and physical energy trading contracts. Optimization revenue results from the purchase of inventory and its forward sale to future periods through financial and physical trading contracts. These derivative contracts are economic hedges that have been entered into to manage commodity price and currency risk associated with buying and selling natural gas across future time periods (see Note 12). The Company does not designate these instruments as hedges and therefore records the unrealized gains and losses on the changes in their fair value through net earnings. Contracts resulting in the delivery of a commodity where Niska Partners is the principal in the transaction are recorded as optimization revenues at the time of physical delivery.
Sales taxes collected from customers and remitted to governmental authorities are excluded from revenues in the consolidated statements of earnings and comprehensive income.
Cash and cash equivalents
Niska Partners considers all highly liquid investments purchased with an initial maturity of three months or less to be cash equivalents.
Margin deposits
Cash held in margin represents the right to receive or the obligation to pay cash collateral under a master netting arrangement that has not been offset against derivative positions. These derivatives are marked-to-market daily; the profit or loss on the daily position is then paid to, or received from, the account as appropriate under the terms of the Company's contract with its broker.
Natural gas inventory
The Company's inventory is natural gas injected into storage which is held for resale. Inventory is valued at the lower of weighted average cost or market. Costs to store the gas are recognized as operating expenses in the period the costs are incurred. For the year ended March 31, 2013, the Company recorded a write-down of $22.3 million (March 31, 2012—$23.4 million; March 31, 2011—$ nil), which is included in revenues in Optimization, net.
Long-term inventory represents non-cycling working gas. Non-cycling working gas was injected by the Company to increase pressure within the reservoirs to allow it to market higher cycling contracts or previously un-saleable gas from an underutilized reservoir that can be sold into the market when the Company adds mechanical compression to the reservoir. This mechanical compression allows access to natural gas that was previously required to maintain pressure within the reservoir. Long-term inventory is carried at cost and is subject to an annual test for impairment.
F-11
Table of Contents
Niska Gas Storage Partners LLC
Notes to Consolidated Financial Statements (Continued)
(Thousands of U.S. dollars)
2. Significant Accounting Policies (Continued)
Property, plant and equipment
Property, plant and equipment are recorded at cost when purchased. Depreciation is computed using the declining balance method for each category of asset using the following rates:
| | |
Pipelines and measurement | | 5% |
Wells | | 5% |
Facilities | | Between 5% and 22% |
Computer hardware and software | | 30% |
Office furniture and fixtures | | 20% |
Other | | 10% |
Property, plant and equipment under capital leases are depreciated using the declining balance method over the lesser of the useful lives of the assets or the lease term.
Certain volumes of natural gas defined as cushion gas are required for maintaining a minimum field pressure. Cushion gas is considered a component of the facility and as such is not amortized because it is expected to ultimately be recovered and sold. Cushion gas is monitored to ensure that it provides effective pressure support for the facility. In the event that gas moves to another area of the reservoir where it does not provide effective pressure support, a loss is recorded, within depreciation expense, equal to the estimated volumes that have migrated (see Note 4). Proceeds from sale of cushion gas are classified as operating activities in the Consolidated Statements of Cash Flows since the predominant source of cash flows for natural gas purchases and sales are operating in nature.
Repairs, maintenance and renewals that do not extend the useful lives of the assets are expensed as incurred. Interest costs for the construction or development of long-lived assets held by operational entities are capitalized and amortized over the related asset's estimated useful life (see Note 4).
Asset retirement obligations
Niska Partners records a liability for an asset retirement obligation when the legal obligation to retire the asset has been incurred with an offsetting increase to the carrying value of the related tangible long-lived asset. The recognition of an asset retirement obligation requires that management make numerous estimates, assumptions and judgments regarding such factors as the estimated probabilities, amounts and timing of settlements; the credit-adjusted risk-free rate to be used; inflation rates, and future advances in technology. In periods subsequent to initial measurement of the liability, the Company must recognize changes in the liability resulting from the passage of time and revisions to either the timing or the amount of the original estimate of undiscounted cash flows. Over time, the liability is accreted to its future value, and the capitalized cost is depreciated over the useful life of the related asset. Accretion of the asset retirement obligations due to the passage of time is recorded as an expense in the statement of earnings. Upon settlement of the liability, the Company either settles the obligation for its recorded amount or incurs a gain or loss.
Netting of certain balance sheet accounts
Certain risk management assets and liabilities and certain accrued gas sales and purchases are presented on a net basis in the balance sheet when all of the following exist: (i) Niska Partners and the
F-12
Table of Contents
Niska Gas Storage Partners LLC
Notes to Consolidated Financial Statements (Continued)
(Thousands of U.S. dollars)
2. Significant Accounting Policies (Continued)
other party owe the other determinable amounts; (ii) the Company has the right to set off the amount owed with the amount owed by the other party; (iii) Niska Partners intends to set off; and (iv) the right of setoff is enforceable at law.
Leases
Niska Partners determines a lease to be an operating or capital lease based upon the terms of the lease, estimated fair value of the leased assets, estimated life of the leased assets, and the contractual minimum lease payments as defined within the lease agreements. If the Company concludes that it has substantively all of the risks of ownership of a leased property and therefore is deemed the owner of the property for accounting purposes, it records an asset and related obligations under capital lease at the lower of the present value of the minimum lease payments or the fair value of the asset.
Impairment of long-lived assets
Niska Partners evaluates whether events or circumstances have occurred that indicate that long-lived assets may not be recoverable or that the remaining useful life may warrant revision. When such events or circumstances are present, the Company assesses the recoverability of long-lived assets by determining whether the carrying value will be recovered through the expected undiscounted future cash flows. In the event that the sum of the expected future cash flows resulting from the use of the asset is less than the carrying value of the asset, an impairment loss equal to the excess of the asset's carrying value over its fair value is recorded.
Goodwill and other intangible assets
Niska Partners accounts for business acquisitions using the purchase method of accounting and, accordingly, the assets and liabilities of the acquired entities are recorded at their estimated fair values at the date of acquisition. The excess of the purchase price over the fair value of the net assets acquired is attributed to goodwill.
Goodwill is not amortized and is re-evaluated on an annual basis or more frequently if events or changes in circumstances indicate that the asset might be impaired. Goodwill is tested for impairment between annual tests if an event occurs or circumstances change that would more likely than not reduce the fair value of a reporting unit below its carrying value. These events or circumstances could include a significant change in the business climate, legal factors, operating performance indicators, competition, sale or disposition of a significant portion of the business or other factors.
The performance of the test involves a two-step process. The first step of the impairment test involves comparing the fair values of the applicable reporting units with their aggregate carrying values, including goodwill. If the carrying amount exceeds the fair value of the reporting unit, the Company performs the second step of the goodwill impairment test to determine the amount of impairment loss. The second step of the goodwill impairment test involves comparing the implied fair value of the affected reporting unit's goodwill with the carrying value of that goodwill.
Other intangible assets represent contractual rights obtained in connection with a business combination that had favorable contractual terms relative to market as of the acquisition date.
F-13
Table of Contents
Niska Gas Storage Partners LLC
Notes to Consolidated Financial Statements (Continued)
(Thousands of U.S. dollars)
2. Significant Accounting Policies (Continued)
Intangible assets representing customer contracts are amortized over their useful lives. These assets are reviewed for impairment as impairment indicators arise. When such events or circumstances are present, the recoverability of long-lived assets is assessed by determining whether the carrying value will be recovered through the expected undiscounted future cash flows. In the event that the sum of the expected future cash flows resulting from the use of the asset is less than the carrying value of the asset, an impairment loss equal to the excess of the asset's carrying value over its fair value is recorded.
Pipeline rights of way are formal agreements granting rights of way in perpetuity and are not subject to amortization but are subject to an annual impairment test.
Risk management activities
The Company uses natural gas derivatives and other financial instruments to manage its exposure to changes in natural gas prices, and foreign exchange rates. These financial assets and liabilities, which are recorded at fair value on a recurring basis, are included in one of three categories based on a fair value hierarchy with realized and unrealized gains (losses) recognized in earnings (see Note 12).
The fair value of the Company's derivative risk management contracts are recorded as a component of risk management assets and liabilities, which are classified as current or non-current assets or liabilities based upon the anticipated settlement date of the contracts.
Foreign currency translation
The functional and reporting currency of the Company is the U.S. dollar. Non-U.S. dollar denominated monetary items are translated into U.S. dollars at the rate of exchange in effect at the balance sheet date. Non-U.S. dollar denominated non-monetary items are translated to U.S. dollars at the exchange rate in effect when the transaction occurred. Revenues and expenses denominated in foreign currencies are translated at the actual exchange rate or average exchange rate in effect during the period. Foreign exchange gains or losses on translation are included in income.
Deferred charges
Deferred charges relate to costs incurred on the issuance of debt and are amortized over the term of the related debt to interest expense using the effective interest method for cost related to the senior notes offering and straight-line for deferred charges incurred on the revolving credit facility.
Income taxes
The Company is not directly a taxable entity. Income taxes on its income are the responsibility of the individual unit holders and have accordingly not been recorded in the consolidated financial statements. However, Niska Partners does own corporate subsidiaries, which are taxable corporations subject to Canadian federal and provincial income taxes, which are included in the consolidated financial statements.
Income taxes on the Canadian corporate subsidiaries are provided based on the asset and liability method, which results in deferred income tax assets and liabilities arising from temporary differences. Temporary differences are differences between the tax basis of assets and liabilities and their reported
F-14
Table of Contents
Niska Gas Storage Partners LLC
Notes to Consolidated Financial Statements (Continued)
(Thousands of U.S. dollars)
2. Significant Accounting Policies (Continued)
amounts in the financial statements that will result in taxable or deductible amounts in future years. This method requires the effect of tax rate changes on current and accumulated deferred income taxes to be reflected in the period in which the rate change was enacted. The asset and liability method also requires that deferred income tax assets be reduced by a valuation allowance unless it is more likely than not that the assets will be realized.
The Company's policy is to recognize accrued interest and penalties on accrued tax balances as components of interest expense.
The Canadian subsidiaries remain subject to examination by Canadian federal and provincial tax jurisdictions for all years filed after 2006. The Company's unit holders, relative to the Company, remain subject to examination by US federal and state tax jurisdictions for years from 2009 and beyond.
Long term equity-based incentives
Niska Partners' compensation committee approves awards of phantom units with distribution equivalent rights to certain key employees. These awards include both time-based and performance-based components.
Unit award grants are classified as liabilities. Fair value of the unit grants is determined on the date of grant and re-measured on the close of business at each reporting period end until the settlement date. Fair value at each re-measurement date will be equal to the liability of the settlement expected to be incurred based on the anticipated number of units vested adjusted for the payout threshold associated with the performance targets achieved by the Company as compared to its established peers. The pro-rata number of units vesting will be calculated as the number of performance awards multiplied by the percentage of the requisite service period, plus additional units granted in lieu of the cash distributions paid on the vested units.
Compensation expense is calculated as the re-measured expected payout less previously-recognized compensation expense.
3. Recent Accounting Pronouncements
In July 2012, the FASB issued guidance intended to simplify the impairment test for indefinite-lived intangible assets other than goodwill by giving entities the option to first assess qualitative factors to determine whether it is more likely than not that an indefinite-lived intangible asset is impaired. The results of the qualitative assessment would be used as a basis in determining whether it is necessary to perform the two-step quantitative impairment testing. An entity can choose to perform the qualitative assessment on none, some or all of its indefinite-lived intangible assets, or may bypass the qualitative assessment and proceed directly to the quantitative impairment test. This guidance was effective for annual and interim impairment tests performed for fiscal years beginning after September 15, 2012, with early adoption permitted in certain circumstances. The Company will adopt this guidance on April 1, 2013 and does not expect its adoption to materially impact its financial position, results of operations or cash flows.
In December 2011, the FASB issued ASU No. 2011-11, "Balance Sheet (Topic 210): Disclosures about Offsetting Assets and Liabilities." This accounting standard update will require disclosure of
F-15
Table of Contents
Niska Gas Storage Partners LLC
Notes to Consolidated Financial Statements (Continued)
(Thousands of U.S. dollars)
3. Recent Accounting Pronouncements (Continued)
information to help reconcile differences in the offsetting requirements for assets and liabilities under US GAAP and International Financial Reporting Standards. Under this new guidance, entities are required to disclose both gross and net information about instruments and transactions eligible for offset in the statement of financial position, as well as instruments and transactions subject to an agreement similar to a master netting arrangement. In addition, the standard requires disclosure of collateral received and posted in connection with master netting agreements or similar arrangements. Entities will need to provide the following enhanced disclosures for both assets and liabilities within the scope of the new standard: (i) the gross amounts of those recognized assets and those recognized liabilities; (ii) the amounts offset to determine the net amounts presented in the statement of financial position; (iii) the net amounts presented in the statement of financial position; (iv) the amounts subject to an enforceable master netting arrangement or similar agreement not otherwise included in (ii); and (v) the net amount after deducting the amounts in (iv) from the amounts in (iii). The standard affects all entities with balances presented on a net basis in the financial statements, derivative assets and derivative liabilities, repurchase agreements, and financial assets and financial liabilities executed under a master netting or similar arrangement.
In January 2013, the FASB issued ASU No. 2013-01, "Clarifying the Scope of Disclosures about Offsetting Assets and Liabilities." This ASU amends and clarifies the scope of the balance sheet offsetting disclosures prescribed in ASU No. 2011-11 (described above). Specifically, accounting standard update limits the scope of ASU No. 2011-11's required disclosures to the following financial instruments, to the extent that they are offset in the financial statements or subject to an enforceable master netting arrangement or similar agreement: (i) recognized derivative contracts accounted for under ASC 815, "Derivatives and Hedging;" (ii) repurchase agreements and reverse repurchase agreements; and (iii) securities borrowing and securities lending transactions. These updates are effective for annual reporting periods beginning on or after January 1, 2013, and interim periods within those annual periods. The Company will adopt ASU No. 2011-11 and ASU No. 2013-01 on April 1, 2013 and adoption of these updates is expected to result in an increase in disclosure regarding financial instruments which are subject to offsetting.
In September 2011, the FASB issued guidance that updates the requirements for testing for goodwill impairment. This update, which was effective for interim and annual goodwill impairment tests performed for fiscal years beginning after December 15, 2011, permits entities testing for goodwill impairment the option of performing a qualitative assessment before calculating the fair value of the reporting unit. If it is determined that the fair value of the reporting unit is more likely than not less than the carrying amount on the basis of qualitative factors, the two step impairment test is required. The update does not change how goodwill is calculated or assigned to reporting units. The Company adopted this guidance on April 1, 2012; however, Niska Partners did not elect to apply the qualitative assessment during the fiscal 2013 goodwill impairment test. The adoption did not have a material impact on the Company's financial position, results of operations or cash flows.
F-16
Table of Contents
Niska Gas Storage Partners LLC
Notes to Consolidated Financial Statements (Continued)
(Thousands of U.S. dollars)
4. Property, Plant and Equipment
Property, plant and equipment are comprised of the following:
| | | | | | | | | | |
| | As at March 31, 2013 | |
|---|
| | Cost | | Accumulated
Amortization | | Net Book
Value | |
|---|
Cushion gas | | $ | 406,141 | | $ | — | | $ | 406,141 | |
Pipelines and measurement | | | 296,661 | | | (81,950 | ) | | 214,711 | |
Wells | | | 126,519 | | | (36,179 | ) | | 90,340 | |
Facilities | | | 267,508 | | | (64,238 | ) | | 203,270 | |
Computer hardware and software | | | 4,095 | | | (2,653 | ) | | 1,442 | |
Construction in progress, including projects under development | | | 928 | | | — | | | 928 | |
Office furniture, equipment and other | | | 2,473 | | | (1,244 | ) | | 1,229 | |
| | | | | | | | |
| | $ | 1,104,325 | | $ | (186,264 | ) | $ | 918,061 | |
| | | | | | | | |
| | | | | | | | | | |
| | As at March 31, 2012 | |
|---|
| | Cost | | Accumulated
Amortization | | Net Book
Value | |
|---|
Cushion gas | | $ | 433,578 | | $ | — | | $ | 433,578 | |
Pipelines and measurement | | | 298,760 | | | (70,655 | ) | | 228,105 | |
Wells | | | 125,420 | | | (31,450 | ) | | 93,970 | |
Facilities | | | 179,518 | | | (51,670 | ) | | 127,848 | |
Computer hardware and software | | | 3,728 | | | (2,134 | ) | | 1,594 | |
Construction in progress, including projects under development | | | 81,694 | | | — | | | 81,694 | |
Office furniture, equipment and other | | | 2,407 | | | (1,068 | ) | | 1,339 | |
| | | | | | | | |
| | $ | 1,125,105 | | $ | (156,977 | ) | $ | 968,128 | |
| | | | | | | | |
Facilities as of March 31, 2013 include cost and accumulated depreciation of assets under capital lease of $14.2 million and $1.8 million, respectively. Construction in progress as of March 31, 2012 includes cost of assets under a capital lease of $13.4 million. These assets were brought into service during the year ended March 31, 2013.
During the year ended March 31, 2013, a loss of $9.5 million was recorded in depreciation and amortization expense on the consolidated statements of earnings and comprehensive income for the estimated amount of cushion gas that had migrated (March 31, 2012—$6.7 million; March 31, 2011—$5.5 million). In addition, the Company sold cushion gas from one of its Canada facilities and from two of its U.S. facilities, which resulted in losses of $14.9 million and $2.8 million during the years ended March 31, 2013 and 2012, respectively.
Certain steel pipe that was deemed no longer fit to transport natural gas was sold after March 31, 2012. These assets were valued as of March 31, 2012 using a combination of the present value of future cash flows method and the subsequently agreed selling price, resulting in an impairment charge of $2.5 million (March 31, 2013—$ nil; March 31, 2011—$ nil).
F-17
Table of Contents
Niska Gas Storage Partners LLC
Notes to Consolidated Financial Statements (Continued)
(Thousands of U.S. dollars)
5. Goodwill and Other Intangible Assets
Goodwill
Information regarding the Company's goodwill is included in the following table:
| | | | | | | |
| | Year ended March 31, | |
|---|
| | 2013 | | 2012 | |
|---|
Balance, beginning of the year | | $ | 245,604 | | $ | 495,604 | |
Less: goodwill impairment | | | — | | | (250,000 | ) |
| | | | | | |
Balance, end of the year | | $ | 245,604 | | $ | 245,604 | |
| | | | | | |
Niska Partners is required to perform an annual impairment test with respect to the valuation of its goodwill, a test which is performed at the Company's fiscal year end of March 31. However, Niska Partners is also required to evaluate on an interim basis whether there are factors which indicate that economic and/or business conditions have deteriorated such that the value of its goodwill has declined since its most recent annual test.
The goodwill impairment test is performed at a reporting unit level. Reporting units are identified and distinguished based on how the associated business is managed, taking into consideration the nature of services offered, the types of customer contracts entered into and the nature of the economic and regulatory environment. Niska Partners has four reporting units (its AECO HubTM facility in Alberta, its Wild Goose facility in California, its Salt Plains facility in Oklahoma and its contractual capacity on the Natural Gas Pipeline of America ("NGPL") system). These reporting units are aggregated into one operating segment for financial reporting purposes.
The performance of the impairment test involves a two step process. The first step determines whether an impairment exists by comparing the fair value of a reporting unit with its carrying amount, including goodwill. If the estimated fair value of the reporting unit exceeds its carrying amount, no impairment is necessary. If the carrying amount of a reporting unit exceeds its estimated fair value, the second step measures the amount of impairment by comparing the implied fair value of the reporting unit goodwill with the carrying amount of that goodwill. An entity assigns the fair value of a reporting unit to all of the assets and liabilities of that unit as if the reporting unit had been acquired in a business combination. The excess of the fair value of a reporting unit over the amounts assigned to its assets and liabilities is the implied fair value of goodwill.
The Company determined that no impairment was required for the year ended March 31, 2013 and an impairment charge of $250 million was required for the year ended March 31, 2012 (March 31, 2011—$ nil). The impairment charge was recorded following a period of continued narrow seasonal spreads, along with a significant reduction in natural gas price volatility.
During the year ended March 31, 2012, the Company determined the fair value of the AECO HubTM and NGPL reporting units using a combination of the present value of future cash flows method and the comparable transactions method. The present value of future cash flows was estimated using (i) discrete financial forecasts, which rely on management's estimates of revenue, expenses and volumes, (ii) long-term natural gas volatility and seasonal spreads (iii) long-term average exchange rate between the United States Dollar and the Canadian Dollar and (iv) appropriate discount rates. The comparable transactions method analyzed other purchases of similar assets and considered (i) the
F-18
Table of Contents
Niska Gas Storage Partners LLC
Notes to Consolidated Financial Statements (Continued)
(Thousands of U.S. dollars)
5. Goodwill and Other Intangible Assets (Continued)
anticipated cash flows of the Company determined above, (ii) recent transaction multiples based on anticipated cash flows and (iii) the similarity of comparable transactions to the Company's facilities. Specifically, the Company used experience and budgeted amounts to estimate cycling volumes and expenses, the future summer to winter spreads which reflects its longer term outlook, extrinsic values consistent with those achieved in the business to estimate future revenue, and a discount rate of 8.875%. These values used to estimate future revenues are lower than the seasonal storage spread and extrinsic values used in the Company's most recent annual test. The Company also used a comparable transaction multiple consistent with transactions for depleted reservoir storage facility acquisitions (the type of facilities comparable to the Company's AECO HubTM facility) completed between 2006 and 2012. Both the AECO HubTM facility and the NGPL leased capacity failed step one of the goodwill impairment test; therefore, the second step of impairment test was performed.
In step two, the Company compared the implied fair value of the reporting units' goodwill with the carrying amounts of that goodwill. Under step two of the impairment test, significant assumptions in measuring the fair value of the assets and liabilities include (1) the replacement cost, depreciation and obsolescence and useful lives of property, plant and equipment and (2) the present value of incremental cash flows attributable to certain intangible assets. Based on the step two analysis, the Company determined that an impairment charge of $250 million was required.
The allocation of goodwill balances and related impairment charges by reporting unit consists of the following:
| | | | | | | | | | |
| | Alberta HubTM
Facility | | NGPL Leased
Capacity | | Total | |
|---|
Balance, April 1, 2011 | | $ | 455,004 | | $ | 40,600 | | $ | 495,604 | |
Impairment Charges | | | (227,000 | ) | | (23,000 | ) | | (250,000 | ) |
| | | | | | | | |
Balance, March 31, 2012 | | $ | 228,004 | | $ | 17,600 | | $ | 245,604 | |
| | | | | | | | |
The Company also considered the factors outlined above in determining the goodwill impairment to be an indicator of impairment related to the long-lived assets associated with the AECO HubTM facility and the NGPL leased capacity. Accordingly, these assets were evaluated for impairment prior to completing the goodwill valuation and management concluded that no impairment of other long-lived assets had occurred.
F-19
Table of Contents
Niska Gas Storage Partners LLC
Notes to Consolidated Financial Statements (Continued)
(Thousands of U.S. dollars)
5. Goodwill and Other Intangible Assets (Continued)
Other intangible assets
Information regarding the Company's intangible assets is included in the following table:
| | | | | | | |
| | As at March 31, | |
|---|
| | 2013 | | 2012 | |
|---|
Customer contracts and relationships, beginning of the year | | $ | 163,073 | | $ | 162,935 | |
Additions | | | — | | | 138 | |
Less accumulated amortization | | | (107,345 | ) | | (96,034 | ) |
| | | | | | |
Customer contracts and relationships, end of the year | | | 55,728 | | | 67,039 | |
Pipeline rights of way | | | 18,270 | | | 18,270 | |
| | | | | | |
| | $ | 73,998 | | $ | 85,309 | |
| | | | | | |
Customer contracts and relationships are amortized over the term of the respective contracts, being 1 to 17 years remaining at March 31, 2013. The following tables present actual amortization expense recognized during reported periods and an estimate of future amortization expense based upon the Company's intangible assets at March 31, 2013:
| | | | |
Amortization expense for the fiscal year ended: | |
| |
|---|
March 31, 2013 | | $ | 11,311 | |
March 31, 2012 | | | 13,675 | |
March 31, 2011 | | | 14,605 | |
| | | | |
Future amortization expense estimated for the fiscal year ending: | |
| |
|---|
March 31, 2014 | | $ | 9,932 | |
March 31, 2015 | | | 8,128 | |
March 31, 2016 | | | 6,324 | |
March 31, 2017 | | | 5,422 | |
March 31, 2018 and thereafter | | | 25,922 | |
F-20
Table of Contents
Niska Gas Storage Partners LLC
Notes to Consolidated Financial Statements (Continued)
(Thousands of U.S. dollars)
6. Deferred Charges
| | | | | | | |
| | As at March 31, | |
|---|
| | 2013 | | 2012 | |
|---|
Deferred charges—cost, beginning of the year | | $ | 23,566 | | $ | 26,657 | |
Addition | | | 3,248 | | | — | |
Less write-offs due to amendment and restatement of credit agreement | | | (1,437 | ) | | — | |
Less write-offs due to repayment of debt | | | — | | | (3,091 | ) |
| | | | | | |
Deferred charges—cost, end of the year | | | 25,377 | | | 23,566 | |
Less accumulated amortization | | | (10,957 | ) | | (8,384 | ) |
| | | | | | |
Net book value | | $ | 14,420 | | $ | 15,182 | |
| | | | | | |
Life in years | | | 1 - 5 | | | 2 - 6 | |
The following tables present actual amortization expense recognized during each period reported and an estimate of future amortization expense based upon the Company's deferred charges at March 31, 2013:
| | | | |
Amortization expense by period: | |
| |
|---|
March 31, 2013 | | $ | 3,411 | |
March 31, 2012 | | | 3,942 | |
March 31, 2011 | | | 4,124 | |
| | | | |
Future amortization expense estimated for the fiscal year ending: | |
| |
|---|
March 31, 2014 | | $ | 3,342 | |
March 31, 2015 | | | 3,349 | |
March 31, 2016 | | | 3,355 | |
March 31, 2017 | | | 2,352 | |
March 31, 2018 and thereafter | | | 2,022 | |
F-21
Table of Contents
Niska Gas Storage Partners LLC
Notes to Consolidated Financial Statements (Continued)
(Thousands of U.S. dollars)
7. Debt
Debt obligations
At March 31, 2013 and 2012 the Company's debt consisted of the following:
| | | | | | | |
| | As at March 31 | |
|---|
| | 2013 | | 2012 | |
|---|
8.875% Senior Notes due 2018 | | $ | 643,790 | | $ | 643,790 | |
Revolving Credit Facility | | | 65,000 | | | 150,000 | |
| | | | | | |
| | | 708,790 | | | 793,790 | |
Less: portion classified as current | | | (65,000 | ) | | (150,000 | ) |
| | | | | | |
| | $ | 643,790 | | $ | 643,790 | |
| | | | | | |
Niska Partners' Senior Notes are senior unsecured obligations which are: (1) effectively junior to Niska Partners' secured obligations; (2) equal in right of payment with all existing and future senior unsecured indebtedness of the Company; and (3) senior in right of payment to any future subordinated indebtedness of Niska Partners. The Senior Notes are fully and unconditionally guaranteed by Niska Partners and its direct and indirect subsidiaries on a senior unsecured basis, and are: (1) effectively junior to each guarantor's secured obligations; (2) equal in right of payment with all existing and future senior unsecured indebtedness of each guarantor and (3) senior in right of payment to any future subordinated indebtedness of each guarantor.
During the year ended March 31, 2012, Niska Partners paid $158.0 million, excluding accrued interest, to repurchase Senior Notes with a principal amount of $156.2 million. The Company recognized losses of $4.9 million on these repurchases, which were recorded as losses on extinguishment of debt. The losses on the repurchases were measured based on the carrying value of the repurchased portion of the Senior Notes, which included a portion of the unamortized debt issue costs on the dates of repurchase. The related accrued interest costs were recorded in interest expense. There were no repurchases of Senior Notes during the fiscal year ended March 31, 2013.
Interest on the Senior Notes is payable semi-annually on March 15 and September 15 at a rate of 8.875% per annum. The Senior Notes will mature on March 15, 2018. As at March 31, 2013, the estimated fair value of the Senior Notes was $669.5 million.
Niska Partners has the option to prepay the Senior Notes. Prior to March 15, 2014, the Company may redeem some or all of the Senior Notes at a make-whole premium, as set forth in the offering memorandum. After March 15, 2014, the Company may redeem some or all of the Senior Notes at a premium that will decrease over time until maturity.
The indenture governing the Senior Notes limits Niska Partners' ability to pay distributions in respect of, repurchase or pay dividends on its membership interests (or other capital stock) or make other restricted payments. The limitation changes depending on a fixed charge coverage ratio, which is defined as the ratio of consolidated cash flow to fixed charges, each as defined in the indenture governing the Senior Notes, and measured for the preceding four fiscal quarters.
Under this limitation the indenture would have permitted the Company to distribute approximately $192.8 million as at March 31, 2013.
F-22
Table of Contents
Niska Gas Storage Partners LLC
Notes to Consolidated Financial Statements (Continued)
(Thousands of U.S. dollars)
7. Debt (Continued)
If the fixed charge coverage ratio is greater than 1.75 to 1.0, Niska Partners is permitted to make restricted payments if the aggregate restricted payments since the date of closing of its IPO, excluding certain types of permitted payments, are less than the sum of a number of items including, most importantly:
- •
- operating surplus (defined similarly to the definition in the Company's operating agreement) calculated as of the end of its preceding fiscal quarter; and
- •
- the aggregate net cash proceeds received as a capital contribution or from the issuance of equity interests.
At March 31, 2013, the fixed charge coverage ratio was 2.6 to 1.0 and Niska Partners was permitted to pay the distribution described in Note 24.
The indenture does not prohibit certain types or amounts of restricted payments, including a general basket of $75.0 million of restricted payments.
The indenture governing the Senior Notes contains certain other covenants that, among other things, limit the Company's and certain of the Company's subsidiaries' ability to incur additional indebtedness, pay dividends on, repurchase or make distributions in respect of the Company's capital stock or make other restricted payments, make certain investments, sell, transfer, or otherwise convey certain assets, create liens, consolidate, merge, sell or otherwise dispose of all or substantially all of the Company's assets, and enter into certain transactions with affiliates.
The occurrence of events involving the Company or certain of the Company's subsidiaries may constitute an event of default under the indenture. Such events include failure to pay interest, principal, or the premium on the Senior Notes when due; failure to comply with the merger, asset sale or change of control covenants; certain defaults on other indebtedness; and certain insolvency proceedings. In the case of an event of default, the holders of the Senior Notes are entitled to remedies, including the acceleration of payment of the Senior Notes by request of the holders of at least 25% in aggregate principal amount of the Senior Notes, and any action by the trustee to collect payment of principal, interest or premium in arrears.
Revolving credit facilities
In March 2010, Niska Partners, through its subsidiaries, Niska Gas Storage US, LLC and AECO Gas Storage Partnership entered into senior secured asset-based revolving credit facilities, consisting of a U.S. revolving credit facility and a Canadian revolving credit facility (the "Credit Facilities" or the "$400.0 million Credit Agreement"). On June 29, 2012, Niska Partners, through the same subsidiaries, completed an amendment and restatement of the $400.0 million Credit Agreement. These Credit Facilities provide for revolving loans and letters of credit in an aggregate principal amount of up to $200.0 million for each of the U.S. revolving credit facility and the Canadian revolving credit facility. Subject to certain conditions, each of the U.S. revolving credit facility and the Canadian revolving credit facility may be expanded up to $100.0 million in additional commitments, and the commitments in each facility may be reallocated on terms and according to procedures to be determined. Loans under the U.S. revolving facility will be denominated in U.S. dollars and loans under the Canadian revolving facility may be denominated, at Niska Partners' option, in either U.S. or Canadian dollars.
F-23
Table of Contents
Niska Gas Storage Partners LLC
Notes to Consolidated Financial Statements (Continued)
(Thousands of U.S. dollars)
7. Debt (Continued)
The revolving credit facilities matures on June 29, 2016. During the year ended March 31, 2013, a loss related to the amendment and restatement amounted to $0.6 million representing a portion of the deferred financing costs associated with the original agreement were written off.
Borrowings under the Credit Facilities are limited to a borrowing base calculated as the sum of specified percentages of eligible cash and cash equivalents, eligible accounts receivable, the net liquidating value of hedge positions in broker accounts, eligible inventory, issued but unused letters of credit, and certain fixed assets minus the amount of any reserves and other priority claims. Borrowings will bear interest at prevailing market rates, which (1) in the case of U.S. dollar loans can be either fixed rate plus an applicable margin or, at the Company's option, a base rate plus an applicable margin, and (2) in the case of Canadian dollar loans can be either the bankers' acceptance rate plus an applicable margin or, at the Company's option, a prime rate plus an applicable margin. The credit agreement provides that Niska Partners may borrow only up to the lesser of the level of the then current borrowing base or the committed maximum borrowing capacity, which is currently $400.0 million. As of March 31, 2013, the borrowing base collateral totaled $362.2 million.
Obligations under the $400.0 million Credit Agreement are guaranteed by the Niska Partners' and all of the Company's direct and indirect wholly owned subsidiaries (subject to certain exceptions) and secured by a lien on substantially all of the Company's and its direct and indirect subsidiaries' current and fixed assets (subject to certain exceptions). Certain fixed assets will only be required to be part of the collateral to the extent such fixed assets are included in the borrowing base under the Credit Facility. The aggregate borrowing base under the Credit Facilities includes $150.0 million (the "PP&E Amount") due to a first-priority lien on fixed assets granted to the lenders. The PP&E Amount will be reduced on a dollar-for-dollar basis upon the release of fixed assets having a value in excess of $50.0 million from such liens.
The $400 million Credit Agreement contains limitations on Niska Partners' ability to incur additional debt or to pay distributions in respect of, repurchase or pay dividends on its membership interests (or other capital stock) or make other restricted payments. These limitations are similar to those contained in the indenture governing the Senior Notes, but contain certain substantive differences. As a result of these differences, the limitations on restricted payments contained in the Credit Agreement should be less restrictive than the limitations contained in the indenture. As of March 31, 2013, Niska Partners was in compliance with all covenant requirements under the Senior Notes and the $400 million Credit Agreement.
The following fees are applicable under each revolving credit facility: (1) an unused line fee based on the unused portion of the respective revolving credit facility; (2) a letter of credit participation fee on the aggregate stated amount of each letter of credit equal to the applicable margin for LIBOR loans or bankers' acceptance loans, as applicable; and (3) certain other customary fees and expenses of the lenders and agents. The Company is required to make prepayments under the revolving credit facilities at any time when, and to the extent that, the aggregate amount of the outstanding loans and letters of credit under such revolving credit facility exceeds the lesser of the aggregate amount of commitments in respect of such revolving credit facility and the applicable borrowing base.
The $400.0 million Credit Agreement contains customary covenants, including, but not limited to, restrictions on the Company's and its subsidiaries' ability to merge and consolidate with other
F-24
Table of Contents
Niska Gas Storage Partners LLC
Notes to Consolidated Financial Statements (Continued)
(Thousands of U.S. dollars)
7. Debt (Continued)
companies, incur indebtedness, grant liens or security interests on assets subject to security interests under the credit agreement, make acquisitions, loans, advances or investments, pay distributions, sell or otherwise transfer assets, optionally prepay or modify terms of any subordinated indebtedness or enter into transactions with affiliates. The Credit Facilities require the maintenance of a fixed charge coverage ratio of 1.1 to 1.0 at the end of each fiscal quarter when excess availability under both the U.S. revolving credit facility and the Canadian revolving credit facility is less than 15% of the aggregate amount of availability under both revolving credit facilities. Such fixed charge coverage ratio will be tested at the end of each quarter until such time as average excess availability exceeds 15% for thirty consecutive days.
The $400.0 million Credit Agreement provides that, upon the occurrence of certain events of default, the Company's obligations thereunder may be accelerated and the lending commitments terminated. Such events of default include payment defaults to the lenders, material inaccuracies of representations and warranties, covenant defaults, cross-defaults to other material indebtedness, including the notes, voluntary and involuntary bankruptcy proceedings, material money judgments, material events relating to pension plans, certain change of control events and other customary events of default.
As of March 31, 2013, $65.0 million in borrowings, with a weighted average interest rate of 3.69%, were outstanding under the Credit Facilities and the Company had $3.3 million in letters of credit issued (March 31, 2012—$5.8 million).
Restrictions
Niska Partners has no independent assets or operations other than its investments in its subsidiaries. Both the Senior Notes and the $400.0 million Credit Agreement have been jointly and severally guaranteed by Niska Partners and substantially all of its subsidiaries. Niska Partners' subsidiaries have no significant restrictions on their ability to pay distributions or make loans to Niska Partners, which are prepared and measured on a consolidated basis, and have no restricted assets as of March 31, 2013.
The Company's principal debt covenant is the fixed charge coverage ratio, which is included in both the Credit Facility and in the Indenture. When the fixed charge coverage ratio is less than 2.0 times, Niska Partners is restricted in its ability to issue new debt. When the fixed charge coverage ratio is below 1.75 to 1.0, the Company is restricted in its ability to pay distributions. At March 31, 2013, the fixed charge coverage ratio was 2.6 to 1.0.
8. Obligations Under Capital Lease
The Company leases certain equipment under a nine year lease arrangement for estimated future minimum lease payments of approximately $15.5 million. Niska Partners may purchase the assets after August 15, 2020 for an agreed portion of the acquisition cost. The present value of the minimum future lease payments is based on the total costs incurred by the lessor and has been reflected in the balance sheet as a current and a non-current obligation under capital lease. The underlying obligations are denominated in U.S. dollars, have an imputed interest rate of 3.08% and are expected to mature in August 2021.
F-25
Table of Contents
Niska Gas Storage Partners LLC
Notes to Consolidated Financial Statements (Continued)
(Thousands of U.S. dollars)
8. Obligations Under Capital Lease (Continued)
Following are the future principal and interest payments of obligations under capital lease as of March 31, 2013.
| | | | |
Future principal and interest payments for the fiscal year ending: | |
| |
|---|
March 31, 2014 | | $ | 1,657 | |
March 31, 2015 | | | 1,657 | |
March 31, 2016 | | | 1,657 | |
March 31, 2017 | | | 1,657 | |
March 31, 2018 | | | 1,657 | |
March 31, 2019 and thereafter | | | 7,230 | |
Less: Amount representing interest | | |
(2,031 |
) |
| | | | |
| | $ | 13,484 | |
| | | | |
9. Accrued Liabilities
Niska Partners' accrued liabilities consist of the following:
| | | | | | | |
| | As at March 31, | |
|---|
| | 2013 | | 2012 | |
|---|
Accrued gas purchases | | $ | 14,213 | | $ | 17,688 | |
Employee-related accruals | | | 13,836 | | | 4,117 | |
Accrued interest | | | 2,845 | | | 3,727 | |
Other accrued liabilities | | | 8,946 | | | 11,761 | |
| | | | | | |
| | $ | 39,840 | | $ | 37,293 | |
| | | | | | |
10. Asset Retirement Obligations
Niska Partners' asset retirement obligations relate to plugging and abandonment of the storage facilities at the end of their estimated useful economic lives. At March 31, 2013, the estimated undiscounted cash flows required to settle the asset retirement obligations were approximately $58.1 million, calculated using an inflation rate of 2% per annum. The estimated liability at March 31, 2013 was $2.0 million after discounting the estimated cash flows at a rate of 8% per annum. At March 31, 2013, the expected timing of payment for settlement of the obligations is 44 years.
| | | | | | | |
| | Year ended
March 31, | |
|---|
| | 2013 | | 2012 | |
|---|
Balance, beginning of the year | | $ | 1,554 | | $ | 1,484 | |
Additions | | | 210 | | | 14 | |
Accretion | | | 197 | | | 116 | |
Effect of foreign exchange translation | | | 46 | | | (60 | ) |
| | | | | | |
Balance, end of the year | | $ | 2,007 | | $ | 1,554 | |
| | | | | | |
F-26
Table of Contents
Niska Gas Storage Partners LLC
Notes to Consolidated Financial Statements (Continued)
(Thousands of U.S. dollars)
11. Income Taxes
Total income tax expense (benefit) differed from the amounts computed by applying the tax rate to earnings before income taxes as a result of the following:
| | | | | | | | | | |
| | Year ended March 31, | |
|---|
| | 2013 | | 2012 | | 2011 | |
|---|
Net earnings (loss) before taxes | | $ | (62,543 | ) | $ | (185,459 | ) | $ | 27,403 | |
U.S. federal corporate statutory rate | | | 35.00 | % | | 35.00 | % | | 35.00 | % |
| | | | | | | | |
Expected tax | | | (21,890 | ) | | (64,911 | ) | | 9,591 | |
Canadian statutory tax rate differences | | |
6,145 | | |
22,768 | | |
(212 |
) |
Adjustments and assessments | | | (4,796 | ) | | (7,529 | ) | | (11,621 | ) |
Earnings (loss) of non-taxable entities | | | 1,377 | | | (25,295 | ) | | (24,817 | ) |
Change in valuation allowance | | | (452 | ) | | (8,413 | ) | | (11,168 | ) |
Non-deductible expenses | | | 38 | | | 87 | | | 1,492 | |
Foreign exchange adjustments | | | 10 | | | 22 | | | 102 | |
Non-deductible expense related to asset impairment | | | — | | | 59,304 | | | — | |
Taxable capital gains | | | — | | | 3,895 | | | 6,615 | |
Other permanent differences | | | 626 | | | 385 | | | (36 | ) |
| | | | | | | | |
Income tax benefit | | $ | (18,942 | ) | $ | (19,687 | ) | $ | (30,054 | ) |
| | | | | | | | |
The Company is not a taxable entity. Income taxes on its income are the responsibility of individual unit holders and have accordingly not been recorded in the consolidated financial statements. Niska Partners has Canadian corporate subsidiaries, which are taxable corporations subject to income taxes, which are included in the consolidated financial statements.
As at March 31, 2013, Niska Partners' Canadian subsidiaries had accumulated non-capital losses of approximately $34.9 million (March 31, 2012—$39.9 million) that can be carried forward and applied against future taxable income. These non-capital losses have resulted in deferred income tax assets of $8.5 million (March 31, 2012—$10.1 million). Additionally, Niska Partners' Canadian subsidiaries had recognized deferred income tax assets related to capital losses of $20.6 million at March 31, 2013 (March 31, 2012—$24.3 million). The capital losses represent $2.6 million (March 31, 2012—$3.0 million) of deferred tax assets, of which $2.3 million (March 31, 2012—$3.0 million) have been offset by valuation allowances due to the uncertainty of their realization. Of the total tax assets related to losses, $0.1 million will begin to expire at the end of 2029.
For the year ended March 31, 2013, Niska Partners recognized $ nil (March 31, 2012—$0.3; March 31, 2011—$ nil) of potential interest and penalties associated with uncertain tax positions. The Company files income tax returns in the U.S. federal jurisdiction, various state jurisdictions and other foreign jurisdictions. The Company is subject to income tax examinations for the fiscal years ended 2006 through 2013 in most jurisdictions.
Deferred income tax assets and liabilities reflect the tax effect of differences between the basis of assets and liabilities for book and tax purposes. The tax effect of temporary differences that give rise to
F-27
Table of Contents
Niska Gas Storage Partners LLC
Notes to Consolidated Financial Statements (Continued)
(Thousands of U.S. dollars)
11. Income Taxes (Continued)
significant components of the deferred income tax liabilities and deferred income tax assets are presented below:
| | | | | | | |
| | As at March 31, | |
|---|
| | 2013 | | 2012 | |
|---|
Deferred income tax assets: | | | | | | | |
Non-capital loss carry forwards | | $ | 8,451 | | $ | 10,084 | |
Risk management liabilities | | | 8,904 | | | 25,075 | |
Capital losses | | | 2,577 | | | 3,038 | |
Other | | | 1,972 | | | 3,040 | |
| | | | | | |
| | | 21,904 | | | 41,237 | |
Valuation allowance | | | (2,607 | ) | | (3,059 | ) |
| | | | | | |
Total deferred income tax assets | | $ | 19,297 | | $ | 38,178 | |
| | | | | | |
Deferred income tax liabilities: | | | | | | | |
Property, plant and equipment | | $ | 114,148 | | $ | 119,525 | |
Intangible assets | | | 17,636 | | | 20,358 | |
Partnership deferral income | | | 11,007 | | | 8,703 | |
Risk management assets | | | 11,477 | | | 42,365 | |
Other | | | 267 | | | — | |
| | | | | | |
Total deferred income tax liabilities | | | 154,535 | | | 190,951 | |
| | | | | | |
Net deferred income tax liabilities | | $ | 135,238 | | $ | 152,773 | |
| | | | | | |
The classification of net deferred income tax liabilities recorded on the balance sheets is as follows:
| | | | | | | |
| | As at March 31, | |
|---|
| | 2013 | | 2012 | |
|---|
Deferred income tax liabilities: | | | | | | | |
Current | | $ | 14,303 | | $ | 22,821 | |
Long-term | | | 120,935 | | | 129,952 | |
| | | | | | |
| | $ | 135,238 | | $ | 152,773 | |
| | | | | | |
Uncertain Income Tax Positions
When accounting for uncertainty in income taxes (ASC 740-10), a company recognizes a tax benefit in the financial statements for an uncertain tax position if management's assessment is that the position is "more likely than not" (i.e. a likelihood greater than fifty percent) to be allowed by the tax jurisdiction based solely on the technical merits of the position. The term "tax position" refers to a position in a previously filed tax return or a position expected to be taken in a future tax return that is reflected in measuring current or deferred income tax assets and liabilities for interim or annual periods.
F-28
Table of Contents
Niska Gas Storage Partners LLC
Notes to Consolidated Financial Statements (Continued)
(Thousands of U.S. dollars)
11. Income Taxes (Continued)
The following table indicates the changes to the Company's unrecognized tax benefits for the years ended March 31, 2013 and 2012. The term "unrecognized tax benefits" refers to the differences between a tax position taken or expected to be taken in a tax return and the benefit measured and recognized in the financial statements. Interest and penalties are not included.
| | | | | | | |
| | As at March 31, | |
|---|
| | 2013 | | 2012 | |
|---|
Balance at April 1, | | $ | 3,267 | | $ | 2,243 | |
Additions based on tax positions taken in the current year | | | — | | | 1,454 | |
Reductions based on tax positions taken in a prior year | | | (1,411 | ) | | (430 | ) |
Settlements with taxing authorities in the current year | | | (696 | ) | | — | |
| | | | | | |
Balance at March 31, | | $ | 1,160 | | $ | 3,267 | |
| | | | | | |
Substantially all of the $1.2 million of unrecognized tax benefits at March 31, 2013, would have an impact on the effective tax rate if subsequently recognized.
The Company engages in ongoing discussions with tax authorities regarding the resolution of tax matters in various jurisdictions. Both the outcome of these tax matters and the timing of the resolution and/or closure of the tax audits are highly uncertain. It is management's assessment that no unrecognized tax benefits will be recognized within the next twelve months.
12. Risk Management Activities and Financial Instruments
Risk management overview
The Company has exposure to commodity price, foreign currency, counterparty credit, interest rate, and liquidity risk. Risk management activities are tailored to the risk they are designed to mitigate.
Commodity price risk
As a result of its natural gas inventory, Niska Partners is exposed to risks associated with changes in price when buying and selling natural gas across future time periods. To manage this risk and reduce variability of cash flows, the Company utilizes a combination of financial and physical derivative contracts, including forwards, futures, swaps and option contracts. The use of these contracts is subject to the Company's risk management policies. Niska Partners has not elected hedge accounting treatment and therefore changes in fair value are recorded directly into earnings.
Forwards and futures are contractual agreements to purchase or sell a specific financial instrument or natural gas at a specified price and date in the future. The Company enters into forwards and futures to mitigate the impact of price volatility. In addition to cash settlement, exchange traded futures may also be settled by physical delivery of natural gas.
Swap contracts are agreements between two parties to exchange streams of payments over time according to specified terms. Swap contracts require receipt of payment for the notional quantity of the
F-29
Table of Contents
Niska Gas Storage Partners LLC
Notes to Consolidated Financial Statements (Continued)
(Thousands of U.S. dollars)
12. Risk Management Activities and Financial Instruments (Continued)
commodity based on the difference between a fixed price and the market price on the settlement date. The Company enters into commodity swaps to mitigate the impact of changes in natural gas prices.
Option contracts are contractual agreements to convey the right, but not the obligation, for the purchaser of the option to buy or sell a specific physical or notional amount of a commodity at a fixed price, either at a fixed date or at any time within a specified period. Niska Partners enters into option agreements to mitigate the impact of changes in natural gas prices.
To limit its exposure to changes in commodity prices, Niska Partners enters into purchases and sales of natural gas inventory and concurrently matches the volumes in these transactions with offsetting derivative contracts. To be in compliance with its risk policy, Niska Partners is required to limit its exposure of unmatched volumes of proprietary current natural gas inventory to an aggregate overall limit of 8.0 billion cubic feet ("Bcf"). As at March 31, 2013, 25.7 Bcf of natural gas inventory was offset, representing 96.7% of total current inventory. Non-cycling working gas, which is included in long-term inventory, and fuel gas used for operating our facilities are excluded from the coverage requirement. Total volumes of non-cycling working gas and fuel gas at March 31, 2013 were 3.4 Bcf and 0.0 Bcf, respectively. As of March 31, 2013 and 2012, the volume of inventories which were economically hedge using each type of contract were:
| | | | | | | |
| | As at March 31, | |
|---|
| | 2013 | | 2012 | |
|---|
Forwards | | | 1.6 Bcf | | | — | |
Futures | | | 14.1 Bcf | | | 8.5 Bcf | |
Swaps | | | 10.0 Bcf | | | 60.3 Bcf | |
Options | | | — | | | — | |
| | | | | | |
| | | 25.7 Bcf | | | 68.8 Bcf | |
| | | | | | |
Counterparty credit risk
Niska Partners is exposed to counterparty credit risk on its trade and accrued accounts receivable and risk management assets. Counterparty credit risk is the risk of financial loss to the Company if a customer fails to perform its contractual obligations. Niska Partners engages in transactions for the purchase and sale of products and services with major companies in the energy industry and with industrial, commercial, residential and municipal energy consumers. Credit risk associated with trade accounts receivable is mitigated by the high percentage of investment grade customers, collateral support of receivables and the Company's ability to take ownership of customer-owned natural gas stored in its facilities in the event of non-payment. It is Management's opinion that no allowance for doubtful accounts is required at March 31, 2013 on accrued and trade accounts receivable.
The Company analyzes the financial condition of counterparties prior to entering into an agreement. Credit limits are established and monitored on an ongoing basis. Management believes based on its credit policies, that the Company's financial position, results of operations and cash flows will not be materially affected as a result of non-performance by any single counterparty. Although the Company relies on a few counterparties for a significant portion of its revenues (Note 23), one
F-30
Table of Contents
Niska Gas Storage Partners LLC
Notes to Consolidated Financial Statements (Continued)
(Thousands of U.S. dollars)
12. Risk Management Activities and Financial Instruments (Continued)
counterparty making up 28% of total revenue is a physical natural gas clearing and settlement facility which requires counterparties to post margin deposits which reduces the risk of default.
Exchange traded futures and options comprise approximately 32.2% of Niska Partners' commodity risk management assets at March 31, 2013. These exchange traded contracts have minimal credit exposure as the exchanges guarantee that every contract will be margined on a daily basis. In the event of any default, Niska Partners' account on the exchange would be absorbed by other clearing members. Because every member posts an initial margin, the exchange can protect the exchange members if or when a clearing member defaults.
Included in the fair value of energy contracts at March 31, 2013 and 2012 are one to five year contracts to sell natural gas to customers in retail markets. Niska Partners has recorded reduction in the fair value of these contracts of $1.0 million at March 31, 2013 (March 31, 2012—$3.6 million), representing an estimate of the expected credit exposure from these counterparties over their contractual lives.
Interest rate risk
The Company assesses interest rate risk by continually identifying and monitoring changes in interest rate exposures that may adversely impact expected future cash flows. At March 31, 2013, the Company was exposed to interest rate risk resulting from its variable rate revolving credit facilities, which can be drawn up to $400.0 million. At March 31, 2013, $65.0 million was outstanding on the credit facilities and Niska Partners had exposure to interest rate fluctuations.
Niska Partners had no interest rate swap or swaption agreements at March 31, 2013 and March 31, 2012.
Liquidity risk
Liquidity risk is the risk that Niska Partners will not be able to meet its financial obligations as they become due. The Company's approach to managing liquidity risk is to contract a substantial part of its facilities to generate constant cash flow and to ensure that it always has sufficient cash and credit facilities to meet its obligations when due, under both normal and stressed conditions, without incurring unacceptable losses or damage to its reputation. See Note 7 for details of the Company's debt.
Foreign currency risk
Foreign currency risk is created by fluctuations in foreign exchange rates. As Niska Partners' Canadian subsidiaries conduct a portion of their activities in Canadian dollars, earnings and cash flows are subject to currency fluctuations. The performance of the Canadian dollar relative to the U.S. dollar could positively or negatively affect earnings. Niska Partners is exposed to cash flow risk to the extent that Canadian currency outflows do not match inflows. Niska Partners enters into currency swaps to mitigate the impact of changes in foreign exchange rates. The notional value of currency swaps as at March 31, 2013 was $84.0 million (March 31, 2012—$115.4 million). These contracts expire on various dates between April 2013 and August 2014. Niska Partners did not elect hedge accounting treatment and therefore changes in fair value are recorded directly into earnings under the optimization revenue caption of the statements of earnings and comprehensive income.
F-31
Table of Contents
Niska Gas Storage Partners LLC
Notes to Consolidated Financial Statements (Continued)
(Thousands of U.S. dollars)
13. Fair Value Measurements
The following table shows the fair values of the Company's risk management assets and liabilities:
| | | | | | | | | | |
As at March 31, 2013 | | Energy
Contracts | | Currency
Contracts | | Total | |
|---|
Short-term risk management assets | | $ | 20,383 | | $ | 776 | | $ | 21,159 | |
Long-term risk management assets | | | 6,593 | | | — | | | 6,593 | |
Short-term risk management liabilities | | | (19,792 | ) | | (213 | ) | | (20,005 | ) |
Long-term risk management liabilities | | | (4,477 | ) | | (97 | ) | | (4,574 | ) |
| | | | | | | | |
| | $ | 2,707 | | $ | 466 | | $ | 3,173 | |
| | | | | | | | |
| | | | | | | | | | |
As at March 31, 2012 | | Energy
Contracts | | Currency
Contracts | | Total | |
|---|
Short-term risk management assets | | $ | 140,323 | | $ | 347 | | $ | 140,670 | |
Long-term risk management assets | | | 32,683 | | | 137 | | | 32,820 | |
Short-term risk management liabilities | | | (58,415 | ) | | (455 | ) | | (58,870 | ) |
Long-term risk management liabilities | | | (21,243 | ) | | (353 | ) | | (21,596 | ) |
| | | | | | | | |
| | $ | 93,348 | | $ | (324 | ) | $ | 93,024 | |
| | | | | | | | |
The following amounts represent the Company's expected realization into earnings for derivative instruments, based upon the fair value of these derivatives as of March 31, 2013:
| | | | | | | | | | |
Fiscal year ending March 31, | | Energy
Contracts | | Currency
Contracts | | Total | |
|---|
2014 | | $ | 591 | | $ | 563 | | $ | 1,154 | |
2015 and beyond | | | 2,116 | | | (97 | ) | | 2,019 | |
| | | | | | | | |
| | $ | 2,707 | | $ | 466 | | $ | 3,173 | |
| | | | | | | | |
Net realized and unrealized optimization gains and losses from the settlement of risk management contracts are summarized as follows:
| | | | | | | | | | |
| | Year ended March 31, | |
|---|
| | 2013 | | 2012 | | 2011 | |
|---|
Energy contracts | | | | | | | | | | |
Realized | | $ | 41,304 | | $ | 59,264 | | $ | 87,824 | |
Unrealized | | | (90,641 | ) | | 77,132 | | | (42,529 | ) |
Currency contracts | | | | | | | | | | |
Realized | | | 1,377 | | | (6,064 | ) | | (5,602 | ) |
Unrealized | | | 790 | | | 6,027 | | | (2,257 | ) |
| | | | | | | | |
| | $ | (47,170 | ) | $ | 136,359 | | $ | 37,436 | |
| | | | | | | | |
The carrying amount of cash and cash equivalents, margin deposits, trade receivables, accrued receivables, trade payables and accrued liabilities reported on the consolidated balance sheet
F-32
Table of Contents
Niska Gas Storage Partners LLC
Notes to Consolidated Financial Statements (Continued)
(Thousands of U.S. dollars)
13. Fair Value Measurements (Continued)
approximate fair value. The fair value of debt is the estimated amount the Company would have to pay to transfer its debt, including any premium or discount attributable to the difference between the stated interest rate and market rate of interest at the balance sheet date. Fair values are based on valuations of similar debt at the balance sheet date and supported by observable market transactions when available. See Note 7 for disclosures regarding the fair value of debt.
Fair values have been determined as follows for the Company's financial assets and liabilities that were accounted for or disclosed at fair value on a recurring basis as of March 31, 2013 and 2012:
| | | | | | | | | | | | | |
As at March 31, 2013 | | Level 1 | | Level 2 | | Level 3 | | Total | |
|---|
Assets | | | | | | | | | | | | | |
Commodity derivatives | | $ | — | | $ | 26,976 | | $ | — | | $ | 26,976 | |
Currency derivatives | | | — | | | 776 | | | — | | | 776 | |
| | | | | | | | | | |
Total assets | | | — | | | 27,752 | | | — | | | 27,752 | |
Liabilities | | | | | | | | | | | | | |
Commodity derivatives | | | — | | | 24,269 | | | — | | | 24,269 | |
Currency derivatives | | | — | | | 310 | | | — | | | 310 | |
| | | | | | | | | | |
Total liabilities | | | — | | | 24,579 | | | — | | | 24,579 | |
| | | | | | | | | | |
Net | | $ | — | | $ | 3,173 | | $ | — | | $ | 3,173 | |
| | | | | | | | | | |
| | | | | | | | | | | | | |
As at March 31, 2012 | | Level 1 | | Level 2 | | Level 3 | | Total | |
|---|
Assets | | | | | | | | | | | | | |
Commodity derivatives | | $ | — | | $ | 173,006 | | $ | — | | $ | 173,006 | |
Currency derivatives | | | — | | | 484 | | | — | | | 484 | |
| | | | | | | | | | |
Total assets | | | — | | | 173,490 | | | — | | | 173,490 | |
Liabilities | | | | | | | | | | | | | |
Commodity derivatives | | | — | | | 79,658 | | | — | | | 79,658 | |
Currency derivatives | | | — | | | 808 | | | — | | | 808 | |
| | | | | | | | | | |
Total liabilities | | | — | | | 80,466 | | | — | | | 80,466 | |
| | | | | | | | | | |
Net | | $ | — | | $ | 93,024 | | $ | — | | $ | 93,024 | |
| | | | | | | | | | |
The Company's financial assets and liabilities recorded at fair value on a recurring basis have been categorized as Level 2. The determination of the fair value of assets and liabilities for Level 2 valuations is generally based on a market approach. The key inputs used in Niska Partners' valuation models include transaction-specific details such as notional volumes, contract prices, and contract terms as well as forward market prices and basis differentials for natural gas obtained from third party service providers (typically the New York Mercantile Exchange, or NYMEX). There were no changes in Niska Partners' approach to determining fair value and there were no transfers out of Level 2 during the year ended March 31, 2013 or 2012.
F-33
Table of Contents
Niska Gas Storage Partners LLC
Notes to Consolidated Financial Statements (Continued)
(Thousands of U.S. dollars)
13. Fair Value Measurements (Continued)
In accordance with authoritative guidance, non-financial assets and liabilities are remeasured at fair value on a non-recurring basis. As of March 31, 2013, there were no non-financial assets and liabilities recorded at fair value. During the year ended March 31, 2012, the Company wrote off $250.0 million of goodwill and $2.5 million of certain property, plant and equipment to their estimated fair values. (Notes 4 and 5):
| | | | | | | | | | | | | | | | |
| | March 31,
2012 | | Level 1 | | Level 2 | | Level 3 | | Total | |
|---|
Assets | | | | | | | | | | | | | | | | |
Property, plant and equipment | | $ | 2,200 | | $ | — | | $ | — | | $ | 2,200 | | $ | 2,200 | |
Goodwill | | | 245,604 | | | — | | | — | | | 245,604 | | | 245,604 | |
| | | | | | | | | | | | |
| | $ | 247,804 | | $ | — | | $ | — | | $ | 247,804 | | $ | 247,804 | |
| | | | | | | | | | | | |
14. Members' Equity
Limited Liability
No member of Niska Partners will be obligated personally for any obligation of the Company solely by reason of being a member.
Under certain circumstances, unitholders may have to repay amounts wrongfully returned or distributed to them. Under Section 18-607 of the Delaware Limited Liability Company Act, or the Delaware Act, Niska Partners may not make a distribution to unitholders if the distribution would cause our liabilities to exceed the fair value of our assets. Delaware law provides that for a period of three years from the date of an impermissible distribution, members who received the distribution and who knew at the time of the distribution that it violated Delaware law will be liable to the limited liability company for the distribution amount. A purchaser of common units will be liable for the obligations of the transferor to make contributions to us that are known to such purchaser at the time it became a member and for unknown obligations if the liabilities could be determined from the Company's Operating Agreement.
Summary of changes in Managing Member, Common, and Subordinated units:
The following is a reconciliation of units outstanding for the period indicated:
| | | | | | | | | | |
| | Common
Unitholders | | Subordinated
Unitholders | | Total | |
|---|
Units issued May 17, 2010 | | | 31,179,745 | | | 33,804,745 | | | 64,984,490 | |
Units issued June 11, 2010 | | | 2,625,000 | | | — | | | 2,625,000 | |
Units issued August 24, 2011 | | | 687,500 | | | — | | | 687,500 | |
| | | | | | | | |
Units outstanding at March 31, 2013 | | | 34,492,245 | | | 33,804,745 | | | 68,296,990 | |
| | | | | | | | |
On August 24, 2011, the Company completed the issuance and sale 687,500 common units at a price of $16.00 per unit to Sponsor Holdings. Total proceeds of $11.0 million were used to reduce amounts owing under the Senior Notes. See Notes 7 and 16.
F-34
Table of Contents
Niska Gas Storage Partners LLC
Notes to Consolidated Financial Statements (Continued)
(Thousands of U.S. dollars)
14. Members' Equity (Continued)
On April 2, 2013, the Company completed an equity restructuring which permanently eliminates Niska Partners' subordinated units and previous incentive distribution rights in return for the new IDRs. See Note 24 -Subsequent Events for details.
Managing Member units
The managing member units are held by Niska Gas Storage Management LLC, (the "Managing Member" or the "Manager"), which has a 1.98% managing member interest in Niska Partners. The operating agreement provides that the managing member interest entitles the manager the right to receive distributions of Available Cash (as defined in the operating agreement) each quarter.
The Manager has sole responsibility for conducting the Company's business and for managing its operations. Pursuant to the operating agreement, the manager has delegated the power to conduct Niska Partners' business and manage its operations to the Company's board of directors, all of the members of which are appointed by the manager.
The Manager has agreed not to withdraw voluntarily prior to March 31, 2020 subject to certain conditions outlined in the operating agreement. Prior to that time, the manager may not be removed unless that removal is approved by the vote of the holders of not less than 662/3% of the outstanding units, voting together as a single class, including units held by the manager and its affiliates. Any removal of the manager is also subject to the approval of a successor manager by the vote of the holders of a majority of the outstanding common units and subordinated units, voting as separate classes. The ownership of more than 331/3% of the outstanding units by the manager and its affiliates gives them the ability to prevent the manager's removal. At March 31, 2013, Sponsor Holdings, which is an affiliate of the manager, owned approximately 72.9% of the outstanding common and subordinated units (50.3% after April 2, 2013—see Note 24—Subsequent Events for details). At any time, the owners of the manager may sell or transfer all or part of their ownership interests in the manager to an affiliate or a third-party without the approval of the unitholders.
Common units
The common units are a class of non-managing membership interests in Niska Partners. The holders of the common units are entitled to participate in the Company's distributions and exercise the rights and privileges available to members under the Company's operating agreement. The operating agreement provides that, during the subordination period, the common unitholders have the right to receive distributions of Available Cash (as defined in the operating agreement) each quarter in an amount equal to $0.35 per common unit (the "Minimum Quarterly Distribution"), plus any arrearages in the payment of the Minimum Quarterly Distribution.
Subordinated units
All of the subordinated units are held by Sponsor Holdings.
On April 2, 2013, the Company completed an equity restructuring which permanently eliminates Niska Partners' subordinated units and previous incentive distribution rights in return for the new IDRs. See Note 24—Subsequent Events for details.
F-35
Table of Contents
Niska Gas Storage Partners LLC
Notes to Consolidated Financial Statements (Continued)
(Thousands of U.S. dollars)
14. Members' Equity (Continued)
Acquisition of Assets from Parent
On December 20, 2011 Niska Partners purchased certain assets from companies that are all effectively owned by the same parent company as Niska Partners. As the transaction was completed between entities under common control the assets have been recorded at the parent's carrying value and the difference between the carrying value and the amount of proceeds transferred to the parent has been recognized in equity. Please refer to Note 18—Related Party Transactions for details.
Acquisition of Interest in Parent
Sponsor Holdings is wholly-owned, directly and indirectly, by Niska Holdings L.P ("Niska Holdings Canada"). Niska Holdings Canada's equity consists of Class A and Class B units. Niska Holdings Canada's Class A Units are owned principally by Carlyle/Riverstone Global Energy and Power Fund III, L.P. and Carlyle/Riverstone Global Energy and Power Fund II, L.P. and affiliated entities (together, the "Carlyle/Riverstone Funds") and certain current and former members of Niska Partners' management. The Class B units are owned by certain current and former members of Niska Partners' management and non-executive employees. The Class B units were originally issued by Niska Predecessor in conjunction with a long-term incentive plan and were subject to service and performance conditions, all of which were satisfied in May 2009. The Class B units were, therefore, fully vested. Niska Predecessor had previously recorded compensation expense with respect to the Class B units throughout the vesting period. Upon vesting and the holders of the units being exposed to the risks and rewards of ownership for a reasonable period of time, the compensation arrangement became equity classified.
On June 24, 2011, certain Class B units of Niska Holdings Canada held by non-executive employees were purchased by Niska Partners at fair value. The aggregate purchase price of $2.2 million was recorded as a reduction of equity in the accompanying financial statements, with no gain or loss recognized.
The Class B units represent profit interests in Niska Holdings Canada, and entitle the holders to share in distributions made by Niska Holdings Canada once the Class A units have received distributions equal to their contributed capital plus an 8% cumulative rate of return. The Class B units held by Niska Partners do not currently participate in the earnings of or distributions paid by Niska Partners.
Phantom Unit Performance Plan (the "PUPP")
Effective April 1, 2011, the Company implemented two compensatory PUPP plans to provide long-term incentive compensation for certain employees, consultants and directors and to align their economic interest with those of common unitholders.
A Phantom Unit is a notional unit granted under the PUPP that represents the right to receive a cash payment equal to the fair market value of a unit of the Company's common units, following the satisfaction of certain time periods and/or certain performance criteria. Phantom Units are granted unvested and subject to both time and performance conditions. The default time period over which a Phantom Unit vests is three years from the date of grant. The performance measure is based upon distributed cash flow ("DCF") and total unitholder return ("TUR") metrics compared to such metrics
F-36
Table of Contents
Niska Gas Storage Partners LLC
Notes to Consolidated Financial Statements (Continued)
(Thousands of U.S. dollars)
14. Members' Equity (Continued)
of a select group of peer companies to the Company. The DCF and TUR metrics are calculated based on the Company's percentile ranking during the applicable performance period compared to a peer group. Provided that the Company has satisfied its minimum quarterly distribution targets for the underlying units, the Phantom Units will vest variably according to the Company's performance relative to its peer group.
The plan was amended effective April 1, 2012. The performance measure for Phantom Units granted after that date is based on total unitholder return ("TUR") metrics compared to such metrics of a select group of peer companies to the Company. The TUR metrics are calculated based on the Company's percentile ranking during the applicable performance period compared to a peer group. Provided that the Company has satisfied its minimum quarterly distribution targets for the common units, the Phantom Units will vest variably according to the Company's performance relative to its peer group.
During the year ended March 31, 2013, 695,349 Phantom Units were granted at a weighted average price of $9.99. During the year ended March 31, 2012, 518,425 Phantom Units were granted at a weighted average price of $21.95.
The Plans are administered by the Compensation Committee of the Board of Directors. The Plans currently permit the grant of unit awards, restricted units, phantom units, unit options, unit appreciation rights, other unit-based awards, distribution equivalent rights and substitution awards covering an aggregate of 3,380,474 units. As of March 31, 2013, 2,045,693 units (March 31, 2012—2,862,049 units) were available for grant.
The following is a reconciliation of Phantom Units outstanding as of March 31, 2013:
| | | | | | | | | | |
| | Number of Time-
Based Units | | Number of
Performance-Based
Units | | Total Units | |
|---|
Balance at March 31, 2012 | | | 159,681 | | | 197,165 | | | 356,846 | |
Granted | | | 409,812 | | | 285,537 | | | 695,349 | |
Forfeited | | | (32,038 | ) | | (209,157 | ) | | (241,195 | ) |
Distribution equivalent rights | | | 87,063 | | | 33,944 | | | 121,007 | |
| | | | | | | | |
Balance at March 31, 2013 | | | 624,518 | | | 307,489 | | | 932,007 | |
| | | | | | | | |
Total Phantom Units outstanding as of March 31, 2013 includes 61,498 time-based units and 61,498 performance-based units which vested during fiscal 2013.
��Unit-based compensation costs for the year ended March 31, 2013 were $7.0 million (March 31, 2012—$0.5; March 31, 2011—$ nil).
Incentive distribution rights
Sponsor Holdings holds the incentive distribution rights. The following table illustrates, as of March 31, 2013, the percentage allocations of cash distributions from operating surplus between the unitholders, the Managing Member and the holders of incentive distribution rights, or based on the specified target distribution levels. The amounts set forth under "Marginal Percentage Interest in Cash
F-37
Table of Contents
Niska Gas Storage Partners LLC
Notes to Consolidated Financial Statements (Continued)
(Thousands of U.S. dollars)
14. Members' Equity (Continued)
Distributions" are the percentage interests of the Managing Member, the incentive distribution right holders and the unitholders in any cash distributions from operating surplus Niska Partners distributes up to and including the corresponding amount in the "Total Quarterly Distribution per Unit Target Amount" column. The percentage interests shown for the unitholders and the Managing Member for the minimum quarterly distribution are also applicable to quarterly distribution amounts that are less than the minimum quarterly distribution.
| | | | | | | | | | | | |
| |
| | Marginal Percentage Interest in Cash
Distributions | |
|---|
| | Total Quarterly
Distribution per Unit
Target Amount | | Unitholders | | Managing
Member | | IDR Holder | |
|---|
Minimum Quarterly Distribution | | $0.35 | | | 98.02 | % | | 1.98 | % | | — | |
First Target Distribution | | above $0.35 up to $0.4025 | | | 98.02 | % | | 1.98 | % | | — | |
Second Target Distribution | | above $0.4025 up to $0.4375 | | | 85.02 | % | | 1.98 | % | | 13.00 | % |
Third Target Distribution | | above $0.4375 up to $0.5250 | | | 75.02 | % | | 1.98 | % | | 23.00 | % |
Thereafter | | above $0.5250 | | | 50.02 | % | | 1.98 | % | | 48.00 | % |
To the extent these incentive distributions are made to Sponsor Holdings, there will be more Available Cash proportionately allocated to Sponsor Holdings than to holders of common and subordinated units.
Within 45 days after the end of each quarter Niska Partners may make cash distributions to the members of record on the applicable record date. Niska Partners distributed $51.3 million to the holders of common units and the Managing Member during the year ended March 31, 2013. The Company also distributed $74.6 million to the holders of common and subordinated units and the Managing Member during the year ended March 31, 2012.
On April 2, 2013, the Company completed an equity restructuring which permanently eliminates Niska Partners' subordinated units and previous incentive distribution rights in return for the new IDRs. See Note 24—Subsequent Events for details.
F-38
Table of Contents
Niska Gas Storage Partners LLC
Notes to Consolidated Financial Statements (Continued)
(Thousands of U.S. dollars)
14. Members' Equity (Continued)
Earnings per unit
Niska Partners uses the two-class method for allocating earnings per unit. The two-class method requires the determination of net income allocated to member interests as shown in the following table.
| | | | | | | | | | |
| | Year ended March 31, | |
| |
|---|
| | Period May 17,
2010 to
March 31, 2011 | |
|---|
| | 2013 | | 2012 | |
|---|
Numerator: | | | | | | | | | | |
Net earnings (loss) attributable to Niska Partners | | $ | (43,601 | ) | $ | (165,772 | ) | $ | 21,223 | |
Less: | | | | | | | | | | |
Managing Member's allocation of incentive distributions | | | — | | | — | | | — | |
Managing Member's interest | | | 863 | | | 3,283 | | | (424 | ) |
| | | | | | | | |
Net earnings (loss) attributable to common and subordinated unitholders | | $ | (42,738 | ) | $ | (162,489 | ) | $ | 20,799 | |
| | | | | | | | |
Denominator: | | | | | | | | | | |
Basic: | | | | | | | | | | |
Weighted average units outstanding | | | 68,296,990 | | | 68,010,532 | | | 67,609,490 | |
Diluted: | | | | | | | | | | |
Weighted average units outstanding | | | 68,296,990 | | | 68,010,532 | | | 67,609,490 | |
Earnings (loss) per unit attributable to the period subsequent to the initial public offering: | | | | | | | | | | |
Basic | | $ | (0.63 | ) | $ | (2.39 | ) | $ | 0.31 | |
| | | | | | | | |
Diluted | | $ | (0.63 | ) | $ | (2.39 | ) | $ | 0.31 | |
| | | | | | | | |
15. Fee-based Revenue
Niska Partners' fee-based revenue consists of the following:
| | | | | | | | | | |
| | Year ended March 31 | |
|---|
| | 2013 | | 2012 | | 2011 | |
|---|
Long-term contract revenue | | $ | 108,615 | | $ | 116,244 | | $ | 119,566 | |
Short-term contract revenue | | | 54,710 | | | 29,809 | | | 40,972 | |
| | | | | | | | |
| | $ | 163,325 | | $ | 146,053 | | $ | 160,538 | |
| | | | | | | | |
F-39
Table of Contents
Niska Gas Storage Partners LLC
Notes to Consolidated Financial Statements (Continued)
(Thousands of U.S. dollars)
16. Optimization, net
The following table presents a reconciliation of optimization revenue, net:
| | | | | | | | | | |
| | Year ended March 31, | |
|---|
| | 2013 | | 2012 | | 2011 | |
|---|
Realized optimization, net | | $ | 89,525 | | $ | 62,735 | | $ | 114,324 | |
Unrealized risk management (loss) gains (Note 12) | | | (89,874 | ) | | 83,193 | | | (44,787 | ) |
Write-down of inventory (Note 2) | | | (22,281 | ) | | (23,400 | ) | | — | |
| | | | | | | | |
| | $ | (22,630 | ) | $ | 122,528 | | $ | 69,537 | |
| | | | | | | | |
17. Interest
The following table presents a reconciliation of interest expense:
| | | | | | | | | | |
| | Year ended March 31, | |
|---|
| | 2013 | | 2012 | | 2011 | |
|---|
Gross interest | | $ | 66,527 | | $ | 74,765 | | $ | 74,901 | |
Deferred charges amortization | | | 3,411 | | | 3,942 | | | 4,124 | |
Capitalized interest | | | (2,928 | ) | | (4,077 | ) | | (2,018 | ) |
| | | | | | | | |
| | $ | 67,010 | | $ | 74,630 | | $ | 77,007 | |
| | | | | | | | |
18. Related Party Transactions
There were no amounts owing to or from related parties as at March 31, 2013. Included in accrued receivables as at March 31, 2012 was $1.1 million that was owed from affiliated entities owned by Sponsor Holdings or its parent company. In addition, during the year ended March 31, 2013, Niska Partners recognized management fees amounting $0.2 million (March 31, 2012—$0.9 million; March 31, 2011—$ nil). Management fees are charged, on an arms-length basis, to affiliated entities for certain administrative services rendered and are recorded as a reduction of general and administrative costs.
During the year ended March 31, 2012, Niska Partners purchased the net assets of Starks Gas Storage LLC, Coastal Bend Gas Storage LLC, and Sundance Gas Storage ULC from Sponsor Holdings Cooperatief U.A. and from R/C Sundance Cooperatief U.A. for consideration of $5.0 million. Niska Partners, Sponsor Holdings Cooperatief U.A. and R/C Sundance Cooperatief U.A. are all effectively owned by the same parent company. As a result, the transactions between entities under common control have been recorded at the parent's carrying value and the difference between the carrying value and the amount of proceeds transferred to the parent has been recognized in equity.
During the year ended March 31, 2012, a subsidiary of Niska Partners purchased certain Class B units of Niska Holdings Canada from certain non-executive officers and employees of Niska Partners for $2.2 million. The amount has been reflected as a reduction of members' equity.
On August 24, 2011, the Company completed the issuance and sale 687,500 common units at a price of $16.00 per unit to Sponsor Holdings. Total proceeds of $11.0 million were used to reduce amounts owing under the Senior Notes.
F-40
Table of Contents
Niska Gas Storage Partners LLC
Notes to Consolidated Financial Statements (Continued)
(Thousands of U.S. dollars)
18. Related Party Transactions (Continued)
During the year ended March 31, 2011, Niska Partners paid a fee of $0.2 million (March 31, 2013—$ nil; March 31, 2012—$ nil) to a company in which certain directors of Niska Partners were and continue to be affiliated. These amounts were paid for management services rendered prior to Niska Partners' IPO. Subsequent to the IPO, Niska Partners is no longer responsible for such management fees. These costs were recorded as general and administrative costs.
19. Commitments and Contingencies
Contingencies
The Company and its subsidiaries are subject to various legal proceedings and actions arising in the normal course of business. While the outcome of such legal proceedings and actions cannot be predicted with certainty, it is the opinion of Management that the resolution of such proceedings and actions will not have a material impact on the Company's consolidated financial position or results of operations.
Commitments
Niska Partners has entered into non-cancelable operating leases for office space, leases for land use rights at its operating facilities, storage capacity at other facilities, equipment, and vehicles used in its operations. The remaining lease terms expire between March 2013 and August 2056 and provide for the payment of taxes, insurance and maintenance by the lessee. A renewal option exists on the office space lease to extend the term for another five years, exercisable prior to the termination of the original lease.
The related future minimum lease payments at March 31, 2013 were as follows:
| | | | |
| | Operating
leases | |
|---|
2014 | | $ | 11,914 | |
2015 | | | 11,666 | |
2016 | | | 8,982 | |
2017 | | | 7,448 | |
2018 | | | 5,480 | |
2019 and thereafter | | | 200,210 | |
| | | | |
Total minimum lease payments | | $ | 245,700 | |
| | | | |
The minimum lease payments disclosed in the above table have not been reduced by the total of minimum rentals to be received in the future under non-cancelable subleases as of March 31, 2013 of $2.5 million. Consolidated lease and rental expense, net of sublease recoveries of $0.9 million, amounted to $11.2 million for the year ended March 31, 2013 (March 31, 2012—$14.9 million; March 31, 2011—$13.4 million). During the year ended March 31, 2013, lease and rental expense included contingent rent amounting to $0.3 million (March 31, 2012—$0.7 million; March 31, 2011—$0.8 million). Where applicable, contingent rent is due whenever a certain percentage of revenue exceeds minimum lease costs.
F-41
Table of Contents
Niska Gas Storage Partners LLC
Notes to Consolidated Financial Statements (Continued)
(Thousands of U.S. dollars)
19. Commitments and Contingencies (Continued)
The future obligations arising as a result of forward purchase contracts in place at March 31, 2013 were as follows:
| | | | |
| | Unconditional
purchase
obligations | |
|---|
2014 | | $ | 1,952,782 | |
2015 | | | 156,959 | |
2016 | | | 16,729 | |
2017 | | | 6,105 | |
2018 | | | 406 | |
2019 and thereafter | | | — | |
| | | | |
Total future purchase commitments | | $ | 2,132,981 | |
| | | | |
As at March 31, 2013, the Company had $3.3 million of issued and outstanding letters of credit to various counterparties to support natural gas purchase commitments.
20. Changes in Non-Cash Working Capital
Changes in non-cash working capital include:
| | | | | | | | | | |
| | Year ended March 31, | |
|---|
| | 2013 | | 2012 | | 2011 | |
|---|
Margin deposits | | $ | (39,174 | ) | $ | 99,804 | | $ | (90,891 | ) |
Trade receivables | | | (286 | ) | | (45 | ) | | 1,016 | |
Accrued receivables | | | (40,203 | ) | | 9,938 | | | 19,252 | |
Natural gas inventory | | | 125,042 | | | (120,563 | ) | | (17,795 | ) |
Prepaid expenses and other current assets | | | (1,527 | ) | | 2,669 | | | (4,119 | ) |
Other Assets | | | (1,105 | ) | | (1,637 | ) | | — | |
Trade payables | | | 645 | | | (316 | ) | | (1,446 | ) |
Accrued liabilities | | | 8,456 | | | (53,036 | ) | | 22,391 | |
Income taxes | | | (693 | ) | | (579 | ) | | 738 | |
Deferred revenue | | | (10,667 | ) | | 6,498 | | | 3,310 | |
Due from related party | | | 1,164 | | | 732 | | | (1,838 | ) |
Other long-term liabilities | | | 381 | | | 115 | | | 5 | |
| | | | | | | | |
Net changes in non-cash working capital | | $ | 42,033 | | $ | (56,420 | ) | $ | (69,377 | ) |
| | | | | | | | |
During the year ended March 31, 2013, changes in non-cash working capital include the receipt of proceeds of $32.6 million (March 31, 2012—$ nil; March 31, 2011—$ nil) from sales of cushion gas. The Company included such proceeds in cash flows from operations since the predominant source of cash flows for natural gas purchases and sales are operating in nature.
F-42
Table of Contents
Niska Gas Storage Partners LLC
Notes to Consolidated Financial Statements (Continued)
(Thousands of U.S. dollars)
21. Supplemental Cash Flow Disclosures
| | | | | | | | | | |
| | Year ended March 31, | |
|---|
| | 2013 | | 2012 | | 2011 | |
|---|
Interest paid | | $ | 67,408 | | $ | 75,375 | | $ | 75,991 | |
Taxes (received) paid | | | (722 | ) | | 988 | | | 474 | |
Interest capitalized | | | 2,928 | | | 4,077 | | | 2,018 | |
Non-cash investing activities: | | | | | | | | | | |
Non-cash increase (decrease) in working capital related to property, plant and equipment | | $ | (8,605 | ) | $ | 11,296 | | $ | (2,874 | ) |
Non-cash transfer of natural gas inventory to property, plant and equipment | | | — | | | — | | | 13,624 | |
22. Segment Disclosures
The Company's process for the identification of reportable segments involves examining the nature of services offered, the types of customer contracts entered into and the nature of the economic and regulatory environment.
Niska Partners operates along functional lines in its commercial, engineering, and operations teams for operations in Alberta, Northern California, and the U.S. Midcontinent. All functional lines and facilities offer the same services: fee-based revenue, and optimization. The Company has a small marketing business which is an extension of the Company's proprietary optimization activities. Proprietary optimization activities occur when the Company purchases, stores and sells natural gas for its own account in order to utilize or optimize storage capacity that is not contracted or available to third party customers. All services are delivered using reservoir storage. The Company measures profitability consistently along all functional lines based on revenues and earnings before interest, taxes, depreciation and amortization, before unrealized risk management gains and losses. The Company has aggregated its operating segments into one reportable segment as at March 31, 2013 and 2012 and for each of the three years ended March 31, 2013.
Information pertaining to the Company's short term and long term contract services and net optimization revenues is presented on the consolidated statements of earnings and comprehensive income. All facilities have the same types of customers: major companies in the energy industry, industrial, commercial, and local distribution companies, and municipal energy consumers.
F-43
Table of Contents
Niska Gas Storage Partners LLC
Notes to Consolidated Financial Statements (Continued)
(Thousands of U.S. dollars)
22. Segment Disclosures (Continued)
The following tables summarize the net revenues and assets by geographic area:
| | | | | | | | | | |
| | Year ended March 31, | |
|---|
| | 2013 | | 2012 | | 2011 | |
|---|
Net realized revenues | | | | | | | | | | |
U.S. | | $ | 70,161 | | $ | 70,928 | | $ | 92,361 | |
Canada | | | 160,408 | | | 114,460 | | | 182,501 | |
Net unrealized revenues | | | | | | | | | | |
U.S. | | | (37,139 | ) | | 30,489 | | | (17,121 | ) |
Canada | | | (52,735 | ) | | 52,704 | | | (27,666 | ) |
Inter-entity | | | | | | | | | | |
U.S. | | | — | | | — | | | — | |
Canada | | | — | | | — | | | — | |
| | | | | | | | |
| | $ | 140,695 | | $ | 268,581 | | $ | 230,075 | |
| | | | | | | | |
Long-lived assets (at year-end) | | | | | | | | | | |
U.S. | | $ | 411,420 | | $ | 413,862 | | | | |
Canada | | | 858,604 | | | 917,249 | | | | |
| | | | | | | | | |
| | $ | 1,270,024 | | $ | 1,331,111 | | | | |
| | | | | | | | | |
23. Economic Dependence
Niska Partners' exposure to the volume of business transacted with a natural gas clearing and settlement facility is described in Note 12. While the clearing and settlement facility is its direct counterparty, its risk exposure to dependence on this counterparty is mitigated through the large number of members of the clearing and settlement facility who create the demand for these transactions.
During fiscal 2013, Niska Partners did not have any other customers comprise greater than 10% of total revenue (2012—none, 2011—none).
24. Subsequent Events
Long-term Incentive Plan
Effective April 1, 2013, the Company granted 438,252 Phantom Units of the 2,045,693 units available for issuance as of March 31, 2013.
Equity Restructuring and Elimination of Subordinated Units
On April 2, 2013, the Company completed an equity restructuring with affiliates of Carlyle/Riverstone Energy and Power Fund II and Carlyle/Riverstone Energy and Power Fund III (collectively the "Carlyle/Riverstone Funds"). In the restructuring, Niska Partners' 33.8 million subordinated units and previous incentive distribution rights (all of which were owned by the Carlyle/Riverstone Funds) were combined into and restructured as a new class of Incentive Distribution Rights (new IDRs). The transaction was unanimously approved by Niska Partners' Board of Directors, on the unanimous
F-44
Table of Contents
Niska Gas Storage Partners LLC
Notes to Consolidated Financial Statements (Continued)
(Thousands of U.S. dollars)
24. Subsequent Events (Continued)
approval and recommendation of its Conflicts Committee, which is composed solely of independent directors.
The restructuring permanently eliminated Niska Partners' subordinated units and previous incentive distribution rights in return for the new IDRs. Prior to completion of the restructuring, the Company would have been required to pay the full minimum quarterly distribution of $0.35 per unit on the subordinated units (requiring additional distributions of approximately $12 million per quarter) prior to increasing the quarterly distribution on Niska Partners' common units. Quarterly distributions on the subordinated units had not been paid since the quarter ended September 30, 2011.
The new IDRs entitle the Carlyle/Riverstone Funds to receive 48% of any quarterly cash distributions by the Company after Niska Partners' common unit holders have received the full minimum quarterly distribution (still $0.35 per unit) for each quarter plus any arrearages from prior quarters (of which there are currently none). The prior incentive distribution rights provided for the Carlyle/Riverstone Funds to receive increasing percentages (ranging from 13% to 48%) of incremental cash distributions after Niska Partners' unit holders (both common and subordinated) exceeded quarterly distributions ranging from $0.4025 per unit to $0.5250 per unit. In addition, for a period of five years, and provided that the Carlyle/Riverstone Funds continue to own a majority of both Niska`s managing member and the new IDRs, the Carlyle Riverstone Funds will be deemed to own 33.8 million "Notional Subordinated Units" in connection with votes to remove and replace Niska`s managing member. These Notional Subordinated Units are not entitled to distributions, but merely preserve the Carlyle/Riverstone Fund's voting rights with respect to removal of the managing member. Tables summarizing the changes in incentive distributions are provided below.
| | | | | | | | | | | | |
| |
| | Marginal Percentage Interest
in Cash Distributions | |
|---|
| | Total Quarterly
Distribution per Unit
Target Amount | | Common and
Subordinated
Unitholders | | Managing
Member | | IDR Holder | |
|---|
Minimum Quarterly Distribution | | $0.35 | | | 98.02 | % | | 1.98 | % | | — | |
First Target Distribution | | above $0.35 up to $0.4025 | | | 98.02 | % | | 1.98 | % | | — | |
Second Target Distribution | | above $0.4025 up to $0.4375 | | | 85.02 | % | | 1.98 | % | | 13.00 | % |
Third Target Distribution | | above $0.4375 up to $0.5250 | | | 75.02 | % | | 1.98 | % | | 23.00 | % |
Thereafter | | above $0.5250 | | | 50.02 | % | | 1.98 | % | | 48.00 | % |
| | | | | | | | | | | | |
| |
| | Marginal Percentage Interest
in Cash Distributions | |
|---|
| | Total Quarterly
Distribution per Unit
Target Amount | | Common
Unitholders | | Managing
Member | | IDR Holder | |
|---|
Minimum Quarterly Distribution | | $0.35 | | | 98.02 | % | | 1.98 | % | | — | |
Thereafter | | above $0.35 | | | 50.02 | % | | 1.98 | % | | 48.00 | % |
F-45
Table of Contents
Niska Gas Storage Partners LLC
Notes to Consolidated Financial Statements (Continued)
(Thousands of U.S. dollars)
24. Subsequent Events (Continued)
After completion of the restructuring, the Company had 34.5 million common units issued and outstanding, of which 17.5 million were owned by the public and 17.0 million were owned by the Carlyle/Riverstone Funds. The Carlyle/Riverstone Funds also owned a 1.98% managing member interest in the Company. As a result of the restructuring, the percentage ownership in the Company owned by the Carlyle/Riverstone Funds (excluding the previous incentive distribution rights and the new IDRs, which are a variable interest) has decreased from approximately 74.9% to approximately 50.3%.
Distributions
Subsequent to year end Niska Partners declared and paid distributions to its common unitholders totaling $12.3 million.
25. Quarterly Financial Data (unaudited)
Quarterly results are influenced by the seasonal and other factors inherent in Niska Partners' business. The following table summarizes the quarterly financial data for the years ended March 31, 2013 and 2012:
| | | | | | | | | | | | | | | | |
| | First
Quarter | | Second
Quarter | | Third
Quarter | | Fourth
Quarter | | Year ended
March 31, | |
|---|
2013 | | | | | | | | | | | | | | | | |
Revenue, net | | $ | (2,787 | ) | $ | 24,545 | | $ | 73,831 | | $ | 45,106 | | $ | 140,695 | |
Earnings (loss) before income taxes | | $ | (49,287 | ) | $ | (22,115 | ) | $ | 9,877 | | $ | (1,018 | ) | $ | (62,543 | ) |
Net earnings (loss) and comprehensive income (loss) | | $ | (37,346 | ) | $ | (15,397 | ) | $ | 10,419 | | $ | (1,277 | ) | $ | (43,601 | ) |
Earnings (loss) per share | | $ | (0.54 | ) | $ | (0.22 | ) | $ | 0.15 | | $ | (0.02 | ) | $ | (0.63 | ) |
2012 | | | | | | | | | | | | | | | | |
Revenue, net | | $ | 45,764 | | $ | 75,659 | | $ | 89,904 | | $ | 57,254 | | $ | 268,581 | |
Earnings (loss) before income taxes | | $ | (835 | ) | $ | 22,557 | | $ | (214,223 | ) | $ | 7,042 | | $ | (185,459 | ) |
Net earnings (loss) and comprehensive income (loss) | | $ | 4,625 | | $ | 27,589 | | $ | (213,630 | ) | $ | 15,644 | | $ | (165,772 | ) |
Earnings (loss) per share | | $ | 0.07 | | $ | 0.40 | | $ | (3.07 | ) | $ | 0.22 | | $ | (2.39 | ) |
The Company wrote down proprietary inventories by $22.3 million in the first quarter of fiscal 2013 and $23.4 million in the fourth quarter of fiscal 2012. During the third quarter of the fiscal year ended March 31, 2012, the Company recorded an impairment of goodwill of $250 million.
F-46