UNITED STATES
SECURITIES AND EXCHANGE COMMISSION
Washington, D.C. 20549
SECURITIES AND EXCHANGE COMMISSION
Washington, D.C. 20549
FORM N-CSR
CERTIFIED SHAREHOLDER REPORT OF REGISTERED
MANAGEMENT INVESTMENT COMPANIES
Investment Company Act file number 811-22398
Spinnaker ETF Series
(Exact name of registrant as specified in charter)
(Exact name of registrant as specified in charter)
116 South Franklin Street, Rocky Mount, North Carolina 27802
(Address of principal executive offices) (Zip code)
Paracorp Inc.
2140 South Dupont Hwy, Camden, DE 19934
(Name and address of agent for service)
Registrant's telephone number, including area code: 252-972-9922
Date of fiscal year end: September 30
Date of reporting period: September 30, 2021
Item 1. REPORTS TO STOCKHOLDERS.
Annual Report 2021
For the initial period from March 31, 2021 (Commencement of Operations)
through September 30, 2021
Trajan Wealth Income
Opportunities ETF
This report and the financial statements contained herein are submitted for the general information of the shareholders of the Trajan Wealth Income Opportunities ETF (the “ETF”). The ETF’s shares are not deposits or obligations of, or guaranteed by, any depository institution. The ETF’s shares are not insured by the FDIC, Federal Reserve Board or any other agency, and are subject to investment risks, including possible loss of principal amount invested.
Statements in this Annual Report that reflect projections or expectations of future financial or economic performance of the Trajan Wealth Income Opportunities ETF (the “ETF”) and of the market in general and statements of the ETF’s plans and objectives for future operations are forward-looking statements. No assurance can be given that actual results or events will not differ materially from those projected, estimated, assumed or anticipated in any such forward-looking statements. Important factors that could result in such differences, in addition to the other factors noted with such forward-looking statements, include, without limitation, general economic conditions such as inflation, recession and interest rates. Past performance is not a guarantee of future results. An investor should consider the investment objectives, risks, charges and expenses of the ETF carefully before investing. The prospectus contains this and other information about the ETF. A copy of the prospectus is available at ncfunds.com/fundpages/430.htm or by calling The Nottingham Company at 800-773-3863. The prospectus should be read carefully before investing. |
For More Information on Trajan Wealth Income Opportunities ETF:
See Our Web site @ trajanwealthetf.com
or
Call Our Administrative Services Group at 800-773-3863.
(Unaudited)
Dear Trajan Wealth Income Opportunities (TWIO) Shareholder:
Enclosed please find the Annual Report for the Trajan Wealth Income Opportunities ETF (“TWIO” or the “ETF”) for the period ending September 30, 2021. The ETF commenced operations on March 31, 2021.
TWIO began trading on March 31, 2021. The NAV and share value were $10.00 with the issuance of 30,000 shares. Since introduction, the NAV and share value have grown to $10.16 and 2.2MM shares outstanding through the fiscal period ended September 30, 2021. Since inception, the ETF has paid two quarterly distributions of $0.0575 per share and $0.0825 per share, respectively. The ETF distributes income on a quarterly basis. Since it began trading, the market environment has generally been positive for the ETF’s portfolio of securities. Higher interest rates have been a mild drag on the fixed income portion of the ETF while equity market performance has been a positive. The result has been an increase in the ETF value from $10.00 as of March 31, 2021 to $10.16 as of September 30, 2021. The price of $10.16, in addition to the two distributions, resulted in a return of 2.99% over the initial period from March 31, 2021 (Commencement of Operations) through September 30, 2021. During that same period, the Barclays Capital Aggregate Bond Index returned 1.88%, the S&P Preferred Stock Index returned 1.81%, and the S&P 400 Mid-Cap Index was up 1.32%.
The TWIO portfolio is designed to provide a steady stream of income with a limited amount of price appreciation. Breaking down the return for the first six months of operation, we see that 1.99% came from price appreciation and the remaining 1.00% was income. Going forward, we expect the income component to represent a larger portion of the return than the price component.
The economic/financial market environment and TWIO:
| • | We have been in an environment of above average equity market gains for several years; one consequence of that environment is that equity market valuations are elevated beyond historical averages. |
| • | Interest rates remain at or near historic lows making finding sources of income more difficult and elevating equity valuations. |
| • | As interest rates normalize and GDP growth returns to trend, we expect equity market valuations to move back toward the long-term averages. |
| • | An environment of rising interest rates and slowing growth should, in our opinion, be a net positive for the holdings in TWIO. |
Characteristics of the TWIO portfolio:
| • | The TWIO portfolio is made up of three asset classes; dividend paying common stocks, preferred stocks and bonds. Investments in each of the three asset classes is made with a primary objective of producing current income and secondary objectives of conservation of principal and the opportunity for limited capital appreciation. |
| • | The preferred stocks in TWIO are typically $25 par preferreds. These preferred stocks are largely perpetual preferreds – no fixed maturity date – but have a call that begins 5 years after the date of issuance. |
| • | Since its launch on March 31, TWIO has traded at a premium to NAV over 95% of the time. |
| • | The daily average volume in TWIO for the past 90 days has been 19,400/shares. |
In summary, we believe TWIO is well positioned to take advantage of the post Covid economic environment where GDP growth returns to the 1.5-2.5% real growth and equity market returns are closer to longer term trends. In that type of environment, the income component of any asset will be important as a source of return.
Specifically, from 3/31/21-9/30/21:
| 1. | On March 31, 2021, TWIO had an investment of 230,000 shares at a price of $10.10 after its first day of trading. Since that time, the ETF has grown to 2.2MM shares and a NAV of $10.16 – with two distributions totaling $0.14 per share. The total change has been 2.99% over these initial 6 months from March 31, 2021 through September 30, 2021. |
| 2. | Since inception, the portfolio has experienced one portfolio sale – HMLP (Hoegh LNG Partners) common – and four portfolio purchases – O (Realty Income Corp), WMB (Williams Cos), KREF (KKR Real Estate Finance) preferred and ABR(Arbor Realty Corp) preferred. |
Average Total Returns
Period ended September 30, 2021 | 3 months | 6 months | Since Inception 04/01/2021 | Gross Expense Ratio | Net Expense Ratio |
TWIO | (0.83)% | 2.99% | 2.99% | 1.15% | 0.85% |
Barclays Capital Aggregate Bond Index | 0.05% | 1.88% | 1.88% | N/A | N/A |
S&P Preferred Stock Index | (1.29)% | 1.81% | 1.81% | N/A | N/A |
| S&P 400 Mid-Cap Index | (2.06)% | 1.32% | 1.32% | N/A | N/A |
20% S&P 400 Mid-Cap Index/35% Barclays Capital Aggregate Bond Index/45% S&P Preferred Stock Index | (0.98)% | 1.74% | 1.74% | N/A | N/A |
The performance information quoted represents past performance, which is not a guarantee of future results. Investment return and principal value of an investment will fluctuate so that an investor’s shares, when redeemed, may be worth more or less than their original cost. Current performance may be lower or higher than the performance data quoted. An investor may obtain performance data current to the most recent month-end by calling 1-800-773-3863. Total return measures net investment income and capital gain or loss from portfolio investments. All performance shown assumes reinvestment of dividends and capital gains distributions.
1Gross expense ratio as of the ETF’s most recent Prospectus dated December 16, 2020.
2Net expense ratio is as of the ETF’s most recent Prospectus dated December 16, 2020. The Advisor has entered into an Expense Limitation Agreement with the Fund under which it has agreed to waive or reduce its fees in an amount that limits the Fund’s annual operating expenses (exclusive of (i) any front-end or contingent deferred loads; (ii) brokerage fees and commissions, (iii) acquired fund fees and expenses; (iv) fees and expenses associated with investments in other collective investment vehicles or derivative instruments (including, for example, option and swap fees and expenses); (v) borrowing costs (such as interest and dividend expense on securities sold short); (vi) taxes; and (vii) extraordinary expenses, such as litigation expenses (which may include indemnification of Fund officers and Trustees and contractual indemnification of Fund service providers (other than the Advisor)) to not more than 0.85% of the average daily net assets of the Fund through December 31, 2021. The Expense Limitation Agreement may not be terminated prior to that date. Further, net annual operating expenses for the Fund may exceed those contemplated by the waiver due to acquired fund fees and other expenses that are not waived under the Expense Limitation Agreement.
Management Outlook
At this writing the TWIO portfolio is allocated approximately 30% common stock, 42% preferred stock and 27% fixed income – the portfolio has approximately 1% cash. TWIO has 40 individual holdings; 16 common stocks, 17 preferred stocks, and 8 bonds. The largest holding as a percent of the portfolio is 3.8% and the smallest is 1.8%. We anticipate maintaining a well-diversified portfolio both in terms of asset classes and individual holdings. Industry exposure is well-diversified with Real Estate having the highest weight at 18% of the total exposure – mostly in preferred stocks.
As we look ahead, we anticipate few changes to the overall portfolio. At present, our primary focus is looking for sources of additional yield in the fixed income portfolio and ensuring that the yield of the preferred stock portfolio is maintained as call dates approach. We believe the common stock portfolio is well-diversified but could see some additions to those holdings if the right opportunities were found.
Sincerely,
Sterling Russell, CFA
Portfolio Manager
Trajan Wealth Income Opportunities (TWIO)
(RCTWO1121001)
| Trajan Wealth Income Opportunities ETF | ||||||||||||||||||
| Performance Update | ||||||||||||||||||
| (Unaudited) | ||||||||||||||||||
| For the initial period from March 31, 2021 (Commencement of Operations) through September 30, 2021 | ||||||||||||||||||
| Comparison of the Change in Value of a $10,000 Investment | ||||||||||||||||||
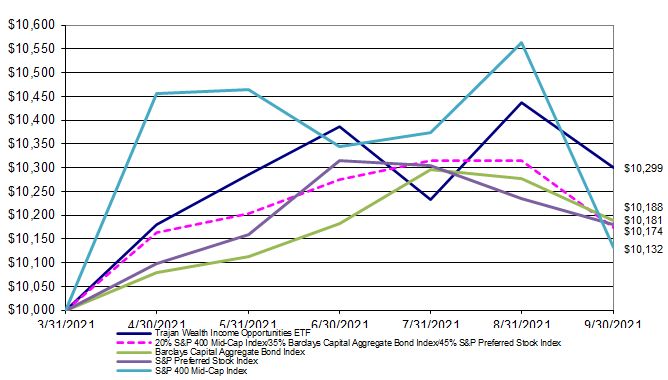
| This graph assumes an initial investment of $10,000 on March 31, 2021 (Commencement of Operations). All dividends and distributions, if any, are reinvested. This graph depicts the performance of the Trajan Wealth Income Opportunities ETF versus the Barclays Capital Aggregate Bond Index, the S&P Preferred Stock Index, the S&P 400 Mid-Cap Index, and the 20% of the S&P 400 Mid-Cap Index, 35% of the Barclays Capital Aggregate Bond Index, and 45% of the S&P Preferred Stock Index. It is important to note that the ETF is a professionally managed exchange-traded fund while the index is not available for investment and is unmanaged. The comparison is shown for illustrative purposes only. | ||||||||||||||||||
| Average Annual Total Returns | ||||||||||||||||||
| As of | Since | Inception | ||||||||||||||||
| September 30, 2021 | Inception | Date | ||||||||||||||||
| Trajan Wealth Income Opportunities ETF | 2.99% | 03/31/21 | ||||||||||||||||
| Barclays Capital Aggregate Bond Index | 1.88% | N/A | ||||||||||||||||
| S&P Preferred Stock Index | 1.81% | N/A | ||||||||||||||||
| S&P 400 Mid-Cap Index | 1.32% | N/A | ||||||||||||||||
| 20% S&P 400 Mid-Cap Index/35% Barclays Capital | ||||||||||||||||||
| Aggregate Bond Index/45% S&P Preferred Stock Index | 1.74% | N/A | ||||||||||||||||
| (Continued) | ||||||||||||||||||
| Trajan Wealth Income Opportunities ETF | ||||||||||||||||||
| Performance Update | ||||||||||||||||||
| (Unaudited) | ||||||||||||||||||
| For the initial period from March 31, 2021 (Commencement of Operations) through September 30, 2021 | ||||||||||||||||||
| Performance quoted in the previous graph represents past performance, which is no guarantee of future results. Investment return and principal value will fluctuate so that shares, when redeemed, may be worth more or less than their original cost. Current performance may be lower or higher than the performance data quoted. The Sub-Advisor has entered into an Expense Limitation Agreement with the Trust, on behalf of the ETF, under which it has agreed to waive or reduce its fees and to assume other expenses of the ETF, if necessary, in amounts that limit the ETF’s total operating expenses (exclusive of (i) any front-end or contingent deferred loads; (ii) brokerage fees and commissions; (iii) acquired fund fees and expenses; (iv) fees and expenses associated with investments in other collective investment vehicles or derivative instruments (including for example option and swap fees and expenses); (v) borrowing costs (such as interest and dividend expense on securities sold short); (vi) taxes; (vii) extraordinary expenses, such as litigation expenses (which may include indemnification of ETF officers and Trustees and contractual indemnification of ETF service providers (other than the Advisor or Sub-Advisor)) to not more than 0.85% of the average daily net assets of the ETF for the current fiscal year. The current term of the Expense Limitation Agreement remains in effect through December 31, 2021. The Expense Limitation Agreement may be terminated by the Board of Trustees of the Trust at any time. The Sub-Advisor cannot recoup from the Fund any amounts paid by the Sub-Advisor under the Expense Limitation Agreement. Without the waiver, the expenses would be estimated to be 1.15% per the ETF’s most recent prospectus dated December 16, 2020. An investor may obtain performance data, current to the most recent month-end, by visiting ncfunds.com. | ||||||||||||||||||
| The graph and table do not reflect the deduction of taxes that an investor would pay on ETF distributions or the redemption of ETF shares. Average annual total returns are historical in nature and measure net investment income and capital gain or loss from portfolio investments assuming reinvestments of distributions, if any. | ||||||||||||||||||
| Trajan Wealth Income Opportunities ETF | ||||||||||||
| Schedule of Investments | ||||||||||||
| As of September 30, 2021 | ||||||||||||
Shares | Value (Note 1) | |||||||||||
| COMMON STOCKS - 30.32% | ||||||||||||
| Consumer Discretionary - 1.84% | ||||||||||||
| Hanesbrands, Inc. | 23,820 | $ | 408,751 | |||||||||
| Consumer Staples - 4.08% | ||||||||||||
| Bunge Ltd. | 5,665 | 460,678 | ||||||||||
| Flowers Foods, Inc. | 18,930 | 447,316 | ||||||||||
| 907,994 | ||||||||||||
| Energy - 3.92% | ||||||||||||
| The Williams Cos., Inc. | 16,079 | 417,089 | ||||||||||
| Valero Energy Corp. | 6,445 | 454,824 | ||||||||||
| 871,913 | ||||||||||||
| Financials - 4.16% | ||||||||||||
| American International Group, Inc. | 8,181 | 449,055 | ||||||||||
| Truist Financial Corp. | 8,109 | 475,593 | ||||||||||
| 924,648 | ||||||||||||
| Health Care - 1.97% | ||||||||||||
| Bristol-Myers Squibb Co. | 7,417 | 438,864 | ||||||||||
| Industrials - 2.19% | ||||||||||||
| Atlas Corp. | 32,022 | 486,414 | ||||||||||
| Information Technology - 1.96% | ||||||||||||
| Seagate Technology PLC | 5,293 | 436,778 | ||||||||||
| Materials - 1.98% | ||||||||||||
| Sonoco Products Co. | 7,398 | 440,773 | ||||||||||
| Real Estate - 4.27% | ||||||||||||
| Medical Properties Trust, Inc. | 22,519 | 451,956 | ||||||||||
| Realty Income Corp. | 7,697 | 499,227 | ||||||||||
| 951,183 | ||||||||||||
| Utilities - 3.96% | ||||||||||||
| Black Hills Corp. | 6,886 | 432,165 | ||||||||||
| OGE Energy Corp. | 13,619 | 448,882 | ||||||||||
| 881,047 | ||||||||||||
| Total Common Stocks (Cost $6,885,952) | 6,748,365 | |||||||||||
| CORPORATE BONDS - 21.40% | Maturity | |||||||||||
| Communication Services - 2.53% | Interest Rate | Date | Par | |||||||||
| T Mobile USA, Inc. | 3.600% | 11/15/2060 | $ 574,800 | 563,861 | ||||||||
| Energy - 3.07% | ||||||||||||
| Buckeye Partners LP | 5.850% | 11/15/2043 | 684,000 | 683,145 | ||||||||
| Health Care - 3.05% | ||||||||||||
| Cleveland Clinic Foundation | 4.858% | 1/1/2114 | 469,200 | 679,115 | ||||||||
| (Continued) | ||||||||||||
| Trajan Wealth Income Opportunities ETF | ||||||||||||
| Schedule of Investments - Continued | ||||||||||||
| As of September 30, 2021 | ||||||||||||
Value (Note 1) | ||||||||||||
| CORPORATE BONDS - Continued | Maturity | |||||||||||
| Industrials - 4.37% | Interest Rate | Date | Par | |||||||||
| US Airways PT Trust 2013-1 | 3.950% | 5/15/2027 | $ 298,226 | $ | 304,746 | |||||||
| Valmont Industries, Inc. | 5.250% | 10/1/2054 | 536,800 | 668,208 | ||||||||
| 972,954 | ||||||||||||
| Information Technology - 2.86% | ||||||||||||
| HP, Inc. | 6.000% | 9/15/2041 | 490,600 | 635,993 | ||||||||
| Materials - 5.52% | ||||||||||||
| Freeport-McMoran, Inc. | 5.450% | 3/15/2043 | 592,000 | 728,900 | ||||||||
| Olin Corp. | 5.000% | 2/1/2030 | 470,200 | 499,588 | ||||||||
| 1,228,488 | ||||||||||||
| Total Corporate Bonds (Cost $4,769,213) | 4,763,556 | |||||||||||
| PREFERRED STOCKS - 41.56% | ||||||||||||
| Communication Services - 2.46% | Interest Rate | Shares | ||||||||||
| Chicken Soup for the Soul Entertainment | 9.750% | 19,460 | 548,383 | |||||||||
| Energy - 4.81% | ||||||||||||
| Scorpio Tankers, Inc. | 7.000% | 22,916 | 569,463 | |||||||||
| Teekay LNG Partners LP | 8.500% | 18,339 | 501,205 | |||||||||
| 1,070,668 | ||||||||||||
| Financials - 22.15% | ||||||||||||
| Annaly Capital Management | 6.750% | 19,694 | 524,648 | |||||||||
| Aspen Insurance Holdings Ltd. | 5.625% | 18,922 | 517,328 | |||||||||
| Athene Holding Ltd. | 6.350% | 14,492 | 429,833 | |||||||||
| Compass Diversified Holdings | 7.875% | 30,547 | 818,660 | |||||||||
| Dime Community Bancshares, Inc. | 5.500% | 20,315 | 522,096 | |||||||||
| Dynex Capital, Inc. | 6.900% | 21,284 | 550,191 | |||||||||
| Federal Agricultural Mortgage Corp. | 5.250% | 17,615 | 462,922 | |||||||||
| Invesco Mortgage Capital, Inc. | 7.750% | 21,944 | 559,572 | |||||||||
| KKR Real Estate Financial Trust, Inc. | 6.500% | 20,922 | 544,809 | |||||||||
| 4,930,059 | ||||||||||||
| Industrials - 5.02% | ||||||||||||
| Costamare, Inc. | 8.875% | 19,776 | 536,226 | |||||||||
| Fortress Transportation and Infrastructure | ||||||||||||
| Investors LLC | 8.250% | 21,592 | 579,745 | |||||||||
| 1,115,971 | ||||||||||||
| Real Estate - 7.12% | ||||||||||||
| Pebblebrook Hotel Trust | 6.375% | 21,133 | 539,948 | |||||||||
| Plymouth Industrial REIT, Inc. | 7.500% | 19,415 | 516,633 | |||||||||
| Summit Hotel Properties, Inc. | 6.250% | 20,274 | 527,732 | |||||||||
| 1,584,313 | ||||||||||||
| Total Preferred Stocks (Cost 9,207,646) | 9,249,394 | |||||||||||
| (Continued) | ||||||||||||
| Trajan Wealth Income Opportunities ETF | ||||||||||||
| Schedule of Investments - Continued | ||||||||||||
| As of September 30, 2021 | ||||||||||||
Value (Note 1) | ||||||||||||
| SHORT-TERM INVESTMENT - 4.49% | ||||||||||||
| Dreyfus Treasury Securities Cash Management Fund - | Shares | |||||||||||
| Institutional Class, 0.01% § | 998,823 | $ | 998,823 | |||||||||
| Total Short-Term Investment (Cost $998,823) | 998,823 | |||||||||||
| Investments, at Value (Cost $21,861,634) - 97.78% | 21,760,138 | |||||||||||
| Other Assets Less Liabilities - 2.22% | 494,555 | |||||||||||
| Net Assets - 100% | $ | 22,254,693 | ||||||||||
| § | Represents 7 day effective yield | |||||||||||
| The following acronyms or abbreviations are used in this schedule of investments: | ||||||||||||
| PLC - Public Limited Company | LP - Limited Partnership | |||||||||||
| LLC - Limited Liability Company | REIT - Real Estate Investment Trust | |||||||||||
| Summary of Investments | ||||||||||||
| by Sector | % of Net | |||||||||||
| Assets | Value | |||||||||||
| Common Stocks: | ||||||||||||
| Consumer Discretionary | 1.84% | $ | 408,751 | |||||||||
| Consumer Staples | 4.08% | 907,994 | ||||||||||
| Energy | 3.92% | 871,913 | ||||||||||
| Financials | 4.16% | 924,648 | ||||||||||
| Health Care | 1.97% | 438,864 | ||||||||||
| Industrials | 2.19% | 486,414 | ||||||||||
| Information Technology | 1.96% | 436,778 | ||||||||||
| Materials | 1.98% | 440,773 | ||||||||||
| Real Estate | 4.27% | 951,183 | ||||||||||
| Utilities | 3.96% | 881,047 | ||||||||||
| Corporate Bonds: | ||||||||||||
| Communication Services | 2.53% | 563,861 | ||||||||||
| Energy | 3.07% | 683,145 | ||||||||||
| Health Care | 3.05% | 679,115 | ||||||||||
| Industrials | 4.37% | 972,954 | ||||||||||
| Information Technology | 2.86% | 635,993 | ||||||||||
| Materials | 5.52% | 1,228,488 | ||||||||||
| Preferred Stocks: | ||||||||||||
| Communication Services | 2.46% | 548,383 | ||||||||||
| Energy | 4.81% | 1,070,668 | ||||||||||
| Financials | 22.15% | 4,930,059 | ||||||||||
| Industrials | 5.02% | 1,115,971 | ||||||||||
| Real Estate | 7.12% | 1,584,313 | ||||||||||
| Short-Term Investment | 4.49% | 998,823 | ||||||||||
| Other Assets Less Liabilities | 2.22% | 494,555 | ||||||||||
| Total Net Assets | 100.00% | $ | 22,254,693 | |||||||||
| See Notes to Financial Statements | ||||||||||||
| Trajan Wealth Income Opportunities ETF | |||
| Statement of Assets and Liabilities | |||
| As of September 30, 2021 | |||
| Assets: | |||
| Investments, at value (cost $21,861,634) | $ | 21,760,138 | |
| Cash | 25,001 | ||
| Receivables: | |||
| Fund shares sold | 4,385,643 | ||
| Interest and dividends | 102,890 | ||
| From Sub-Advisor | 14,825 | ||
| Prepaid Expenses: | |||
| Insurance fees | 1,683 | ||
| Total assets | 26,290,180 | ||
| Liabilities: | |||
| Payables: | |||
| Distributions | 145,200 | ||
| Investments purchased | 3,854,301 | ||
| Accrued expenses: | |||
| Professional fees | 24,110 | ||
| Custody fees | 5,815 | ||
| Trustee fees and meeting expenses | 2,419 | ||
| Shareholder fulfillment expenses | 2,076 | ||
| Administration fees | 669 | ||
| Miscellaneous reporting fees | 359 | ||
| Security pricing fees | 349 | ||
| Registration & filing expenses | 112 | ||
| Transfer agent fees | 44 | ||
| Fund accounting fees | 33 | ||
| Total liabilities | 4,035,487 | ||
| Total Net Assets | $ | 22,254,693 | |
| Net Assets Consist of: | |||
| Paid in Capital | $ | 22,396,351 | |
| Accumulated Deficit | (141,658) | ||
| Total Net Assets | $ | 22,254,693 | |
| Shares Outstanding, no par value (unlimited authorized shares) | 2,190,000 | ||
| Net Asset Value, Offering Price, and Redemption Price Per Share | $ | 10.16 | |
| See Notes to Financial Statements | |||
| Trajan Wealth Income Opportunities ETF | |||
| Statement of Operations | |||
| For the initial period from March 31, 2021 (Commencement of Operations) through September 30, 2021 | |||
| Investment Income: | |||
| Interest | $ | 52,280 | |
| Dividends | 189,239 | ||
Total Investment Income | 241,519 | ||
| Expenses: | |||
Advisory fees (note 2) | 25,644 | ||
| Professional fees | 28,594 | ||
Shareholder fulfillment fees (note 2) | 15,674 | ||
Administration fees (note 2) | 13,796 | ||
Fund accounting fees (note 2) | 10,476 | ||
Custody fees (note 2) | 10,162 | ||
Compliance fees (note 2) | 8,501 | ||
Transfer agent fees (note 2) | 5,044 | ||
Trustee fees (note 3) | 4,252 | ||
Miscellaneous reporting expenses (note 2) | 2,109 | ||
| Pricing fees | 1,914 | ||
| Insurance fees | 1,614 | ||
| Registration and filing expenses | 135 | ||
| Total Expenses | 127,915 | ||
Expenses waived by the Sub-Advisor (note 2) | (21,351) | ||
Expenses reimbursed by the Sub-Advisor (note 2) | (66,992) | ||
| Net Expenses | 39,572 | ||
| Net Investment Income | 201,947 | ||
| Realized and Unrealized Gain (Loss) on Investments: | |||
| Net realized loss from investment transactions | (45,159) | ||
| Net change in unrealized depreciation on investments | (101,496) | ||
| Net Realized and Unrealized Loss on Investments | (146,655) | ||
| Net Increase in Net Assets Resulting from Operations | $ | 55,292 | |
| See Notes to Financial Statements | |||
| Trajan Wealth Income Opportunities ETF | |||||||
| Statement of Changes in Net Assets | |||||||
| For the initial period from March 31, 2021 (Commencement of Operations) through September 30, 2021 | |||||||
| Operations: | |||||||
| Net investment income | $ 201,947 | ||||||
| Net realized loss from investment transactions | (45,159) | ||||||
| Net change in unrealized depreciation on investments | (101,496) | ||||||
| Net Increase in Net Assets Resulting from Operations | 55,292 | ||||||
| Distributions to Investors: | (196,950) | ||||||
| Decrease from Distributions to Investors | (196,950) | ||||||
| Beneficial Interest Transactions: | |||||||
| Shares sold | 22,396,351 | ||||||
| Increase from Beneficial Interest Transactions | 22,396,351 | ||||||
| Net Increase in Net Assets | 22,254,693 | ||||||
| Net Assets: | |||||||
| Beginning of period | - | ||||||
| End of period | $ 22,254,693 | ||||||
| Share Information: | |||||||
| Shares Sold | 2,190,000 | ||||||
| Net Increase in Shares of Beneficial Interest | 2,190,000 | ||||||
| See Notes to Financial Statements | |||||||
| Trajan Wealth Income Opportunities ETF | |||||||
| Financial Highlights | |||||||
| For a share outstanding during the initial period from March 31, 2021 | |||||||
| (Commencement of Operations) through September 30, 2021 | |||||||
| Net Asset Value, Beginning of Period | $ 10.00 | ||||||
| Income (Loss) from Investment Operations: | |||||||
| Net investment income | 0.14 | ||||||
| Net realized and unrealized gain on investments (d) | 0.16 | ||||||
| Total from Investment Operations | 0.30 | ||||||
| Distributions to Investors: | |||||||
| From net investment income | (0.14) | ||||||
| Total from Distributions to Investors | (0.14) | ||||||
| Net Asset Value, End of Period | $ 10.16 | ||||||
| Total Return | 2.99% | (b) | |||||
| Net Assets, End of Period (in thousands) | $ 22,255 | ||||||
| Ratios of: | |||||||
| Gross Expenses to Average Net Assets (c) | 2.71% | (a) | |||||
| Net Expenses to Average Net Assets (c) | 0.85% | (a) | |||||
| Net Investment Income to Average Net Assets | 4.28% | (a) | |||||
| Portfolio turnover rate | 12.90% | (b) | |||||
| (a) | Annualized. | ||||||
| (b) | Not annualized. | ||||||
| (c) | The expense ratios listed reflect total expenses prior to any waivers (gross expense ratio) and after any waivers (net expense ratio). | ||||||
| (d) | The amount of realized and unrealized gain per share does not accord with the amounts reported in the Statement of Operations due to the timing of the Fund share creations in relation to fluctuating market values during the period. | ||||||
| See Notes to Financial Statements | |||||||
| Trajan Wealth Income Opportunities ETF |
Notes to Financial Statements |
| As of September 30, 2021 |
1. Organization and Significant Accounting Policies
The Trajan Wealth Income Opportunities ETF, an actively managed exchange-traded fund (the “ETF”), is a non-diversified series of the Spinnaker ETF Series (the “Trust”). The Trust was established as a Delaware statutory trust under an Agreement and Declaration of Trust on December 21, 2016, and is registered under the Investment Company Act of 1940, as amended (the “1940 Act”).
The ETF commenced operations on March 31, 2021. The investment objective of the ETF is to seek to provide current income, conservation of principal, and the opportunity for limited capital appreciation. The ETF seeks to achieve its investment objective by investing in a combination of domestic preferred securities, income producing fixed income securities, and income producing common stocks.
The Trust will issue and redeem shares at Net Asset Value (“NAV”) only in a large, specified number of shares called a “Creation Unit” or multiples thereof. A Creation Unit consists of 10,000 shares. Creation Unit transactions are typically conducted in exchange for the deposit or delivery of in-kind securities and/or cash. As a practical matter, only authorized participants may purchase or redeem these Creation Units. Except when aggregated in Creation Units, the shares are not redeemable securities of the ETF. The prices at which creations and redemptions occur are based on the next calculation of NAV after an order is received in proper form by Capital Investment Group, Inc. (the “Distributor”). Individual shares of the ETF may only be purchased and sold in secondary market transactions through brokers. Shares of the ETF are listed for trading on NYSE Arca under the trading symbol TWIO, and because shares will trade at market prices rather than NAV, shares of the ETF may trade at a price greater than or less than NAV.
Creation Transaction Fees
A fixed creation transaction fee of $500 per transaction (the “Creation Transaction Fee”) is applicable to each transaction regardless of the number of Creation units purchased in the transactions. An additional variable charge for cash creations or partial cash creations may also be imposed to compensate the Fund for the costs associated with buying the applicable securities. The price for each Creation Unit will equal the Fund’s daily NAV per share times the number of Shares in a Creation Unit plus the Creation Transaction Fees, and, if applicable, any transfer taxes.
The following is a summary of significant accounting policies consistently followed by the ETF. The policies are in conformity with accounting principles generally accepted in the United States of America (“GAAP”). The ETF follows the accounting and reporting guidance in the Financial Accounting Standards Board (“FASB”) Accounting Standards Codification 946 “Financial Services – Investment Companies.”
Investment Valuation
The ETF’s investments in securities are carried at market value. Securities listed on an exchange or quoted on a national market system are valued at the last sales price as of 4:00 p.m. Eastern Time. Securities traded in the NASDAQ over-the-counter market are generally valued at the NASDAQ Official Closing Price. Other securities traded in the over-the-counter market and listed securities for which no sale was reported on that date are valued at the mean of the most recent bid and ask prices. Securities and assets for which representative market quotations are not readily available (e.g., if the exchange on which the security is principally traded closes early or if trading of the particular security is halted during the day and does not resume prior to the ETF’s net asset value calculation) or which cannot be accurately valued using the ETF’s normal pricing procedures are valued at fair value as determined in good faith under policies approved by the Board of Trustees (the “Board” or the “Trustees”). A security’s “fair value” price may differ from the price next available for that security using the ETF’s normal pricing procedures. Instruments with maturities of 60 days or less are valued at amortized cost, which approximates market value.
With respect to any portion of an ETF's assets that may be invested in other mutual funds, the value of the ETF's shares is based on the NAV of the shares of the other mutual funds in which the ETF invests. The valuation methods used by mutual funds in pricing their shares, including the circumstances under which they will use fair value pricing and the effects of using fair value pricing, are included in the prospectuses of such funds. To the extent the ETF invests a portion of its assets in non-registered investment vehicles, the ETF's shares in the non-registered vehicles are fair valued at NAV.
| Trajan Wealth Income Opportunities ETF |
Notes to Financial Statements |
| As of September 30, 2021 |
With respect to an ETF's assets invested directly in securities, the ETF's investments are generally valued at current market prices. Equity securities, debt securities, options and futures are generally valued at the official closing price or, if none, the last reported sales price on the primary exchange or market on which they are listed (closing price). Equity securities and debt securities that are not traded primarily on an exchange are generally valued at the quoted bid price obtained from a broker-dealer.
Fair Value Measurement
Various inputs are used in determining the value of the ETF's investments. These inputs are summarized in the three broad levels listed below:
Level 1: unadjusted quoted prices in active markets for identical securities
Level 2: other significant observable inputs (including quoted prices for similar securities and identical securities in inactive markets, interest rates, credit risk, etc.)
Level 3: significant unobservable inputs (including the ETF’s own assumptions in determining fair value of investments)
The availability of observable inputs can vary from security to security and is affected by a wide variety of factors, including, for example, the type of security, whether the security is new and not yet established in the marketplace, the liquidity of markets, and other characteristics particular to the security. To the extent that valuation is based on models or inputs that are less observable or unobservable in the market, the determination of fair value requires more judgment. Accordingly, the degree of judgment exercised in determining fair value is greatest for instruments categorized in Level 3.
The inputs used to measure fair value may fall into different levels of the fair value hierarchy. In such cases, for disclosure purposes, the level in the fair value hierarchy within which the fair value measurement falls in its entirety, is determined based on the lowest level input that is significant to the fair value measurement in its entirety.
The inputs or methodology used for valuing securities are not necessarily an indication of the risk associated with investing in those securities. The following table summarizes the inputs as of September 30, 2021 for the ETF’s assets measured at fair value:
| Investments in Securities (a) | Total | Level 1 | Level 2 | Level 3 | ||||
| Assets | ||||||||
| Common Stocks* | $ | 6,748,365 | $ | 6,748,365 | $ | - | $ | - |
| Corporate Bonds* | 4,763,556 | - | 4,763,556 | - | ||||
| Preferred Stocks* | 9,249,394 | 9,249,394 | - | - | ||||
| Short-Term Investment | 998,823 | 998,823 | - | - | ||||
| Total Assets | $ | 21,760,138 | $ | 16,996,582 | $ | 4,763,556 | $ | - |
*Refer to the Schedule of Investments for a breakdown by Industry.
(a) The ETF did not hold any Level 3 securities during the period.
Investment Transactions and Investment Income
Investment transactions are accounted for as of the date purchased or sold (trade date). Dividend income and expense are recorded on the ex-dividend date. Interest income is recorded on the accrual basis and includes accretion/amortization of discounts and premiums using the effective interest method. Gains and losses are determined on the identified cost basis, which is the same basis used for Federal income tax purposes.
Expenses
The ETF bears expenses incurred specifically on its behalf as well as a portion of general expenses, which are allocated according to methods reviewed annually by the Trustees.
| Trajan Wealth Income Opportunities ETF |
Notes to Financial Statements |
| As of September 30, 2021 |
Distributions
The ETF may declare and distribute dividends from net investment income, if any, quarterly. The ETF generally declares and distributes capital gains, if any, annually. Dividends and distributions to shareholders are recorded on ex-date.
Estimates
The preparation of financial statements in conformity with GAAP requires management to make estimates and assumptions that affect the reported amounts of assets and liabilities and the disclosure of contingent assets and liabilities at the date of the financial statements and the reported amounts of increases and decreases in the net assets from operations during the reporting period. Actual results could differ from those estimates.
Federal Income Taxes
No provision for income taxes is included in the accompanying financial statements, as the ETF intends to distribute to shareholders all taxable investment income and realized gains and otherwise comply with Subchapter M of the Internal Revenue Code applicable to regulated investment companies.
| 2. | Transactions with Related Parties and Service Providers |
Advisor and Sub-Advisor
The ETF pays a monthly advisory fee to OBP Capital, LLC (the “Advisor”) calculated at the annual rate of 0.55% of the ETF’s average daily net assets.
The Advisor has engaged Trajan Wealth, LLC as the sub-advisor of the ETF (the “Sub-Advisor”) to provide day to day portfolio management of the ETF. The Advisor pays a monthly fee to the Sub-Advisor calculated at the annual rate of 0.45% of the ETF’s average daily net assets. The Sub-Advisor is paid directly by the Advisor out of the advisory fees disclosed above.
The ETF and the Sub-Advisor have entered into a contractual agreement (the “Expense Limitation Agreement”) with the Trust, on behalf of the ETF, under which the Sub-Advisor has agreed to waive or reduce its fees and to assume other expenses of the ETF, if necessary, in amounts that limit the ETF’s total operating expenses (exclusive of (i) any front-end or contingent deferred loads; (ii) brokerage fees and commissions, (iii) acquired fund fees and expenses; (iv) fees and expenses associated with investments in other collective investment vehicles or derivative instruments (including for example option and swap fees and expenses); (v) borrowing costs (such as interest and dividend expense on securities sold short); (vi) taxes; and (vii) extraordinary expenses, such as litigation expenses (which may include indemnification of ETF officers and Trustees and contractual indemnification of ETF service providers (other than the Adviser or Sub-Adviser)) to not more than 0.85% of the average daily net assets of the ETF. The current term of the Expense Limitation Agreement is through December 31, 2021. While there can be no assurance that the Expense Limitation Agreement will continue after that date, it is expected to continue from year-to-year thereafter.
For the initial period ended September 30, 2021, the Advisor earned $4,293 in net advisory fees after payment of the sub-advisor fee.
For the initial period ended September 30, 2021, the Sub-Advisor earned $21,351 in sub-advisory fees, all of which were waived and $66,992 was reimbursed to the ETF pursuant to the Expense Limitation Agreement.
Administrator
The ETF pays a monthly fee to the ETF’s administrator, The Nottingham Company (the “Administrator”), based upon the average daily net assets of the ETF and calculated at the annual rates as shown in the schedule below, which is subject to a minimum of $1,667 per month.
| Trajan Wealth Income Opportunities ETF |
Notes to Financial Statements |
| As of September 30, 2021 |
A breakdown of these fees is provided in the following table:
| Net Assets | Annual Fee |
| On the first $250 million | 0.070% |
| On the next $250 million | 0.060% |
| On the next $500 million | 0.040% |
| On all assets over $1 billion | 0.035% |
A breakdown of the Fund Accounting Fee schedule is as follows:
| Base Fee | Asset-Based Fee |
| $1,667 per month minimum | 1 basis point (0.01%) per year |
The ETF incurred $13,796 in administration fees and $10,476 in fund accounting fees for the initial period ended September 30, 2021.
Compliance Services
The Nottingham Company, Inc. serves as the Trust’s compliance services provider including services as the Trust’s Chief Compliance Officer. The Nottingham Company, Inc. is entitled to receive customary fees from the ETF for its services pursuant to the Compliance Services Agreement with the ETF.
Transfer Agent
Nottingham Shareholder Services, LLC (“Transfer Agent”) serves as transfer, dividend paying, and shareholder servicing agent for the ETF. For its services, the Transfer Agent is entitled to receive compensation from the ETF pursuant to the Transfer Agent’s fee arrangements with the ETF. The ETF incurred $5,044 in transfer agent fees during the initial period ended September 30, 2021.
Distributor
Capital Investment Group, Inc. (the “Distributor”) serves as the Fund’s principal underwriter and distributor. The Distributor receives $6,500 per year paid in monthly installments for services provided and expenses assumed. Additional expenses may be incurred for processing fees during the year. This expense is included in the shareholder fulfillment expenses on the Statement of Operations.
The ETF monthly website fees and New York Stock Exchange fees are also included in the shareholder fulfillment expenses on the Statement of Operations.
| 3. | Trustees and Officers |
The Board is responsible for the management and supervision of the ETF. The Trustees approve all significant agreements between the Trust, on behalf of the ETF, and those companies that furnish services to the ETF; review performance of the Advisor and the ETF; and oversee activities of the ETF. Officers of the Trust and Trustees who are interested persons of the Trust or the Advisor will receive no salary or fees from the Trust. Trustees who are not “interested persons” of the Trust or the Advisor within the meaning of the 1940 Act (the “Independent Trustees”) receive $5,000 per year payable quarterly and $2,000 per series in the Trust. The Trust will reimburse each Trustee and officer of the Trust for his or her travel and other expenses relating to attendance of Board meetings. Additional fees may also be incurred during the year as special meetings are necessary in addition to the regularly scheduled meetings of the Board.
Certain officers of the Trust may also be officers of the Advisor or the Administrator.
| Trajan Wealth Income Opportunities ETF |
Notes to Financial Statements |
| As of September 30, 2021 |
| 4. | Purchases and Sales of Investment Securities |
For the initial period ended September 30, 2021, the aggregate cost of purchases and proceeds from sales of investment securities (excluding short-term securities and securities sold short) were as follows:
| Purchases of Securities | Proceeds from Sales | ||
| $15,928,244 | $1,348,800 |
| Cost from Purchases In-Kind | Proceeds from Redemptions In-Kind |
| $6,330,549 | $ - |
5. Federal Income Tax
Distributions are determined in accordance with Federal income tax regulations, which differ from GAAP, and, therefore, may differ significantly in amount or character from net investment income and realized gains for financial reporting purposes. The general ledger is adjusted for permanent book/tax differences to reflect tax character but is not adjusted for temporary differences.
Management has reviewed the ETF’s tax positions to be taken on the federal income tax returns for the initial period ended September 30, 2021 and determined that the ETF does not have a liability for uncertain tax positions. The ETF recognizes interest and penalties, if any, related to unrecognized tax benefits as income tax expense in the Statement of Operations. During the initial period ended September 30, 2021, the ETF did not incur any interest or penalties.
Distributions during the period ended were characterized for tax purposes as follows:
| September 30, 2021 | |
| Ordinary Income | $ 196,950 |
| Capital Gains | - |
| Total Distributions | $ 196,950 |
At September 30, 2021, the tax-basis cost of investments and components of distributable earnings were as follows:
| Cost of Investments | $21,859,951 | |
| Gross Unrealized Appreciation | $ 218,020 | |
| Gross Unrealized Depreciation | (317,833) | |
| Net Unrealized Depreciation | (99,813) | |
Undistributed Net Investment Income | 449 | |
| Deferred Post-October Losses | (42,294) | |
| Accumulated Deficit | $ (141,658) | |
Realized losses reflected in the accompanying financial statements include net capital losses realized between November 1 and the Fund’s fiscal year-end that have not been recognized for tax purposes (Deferred Post-October Losses).
| Trajan Wealth Income Opportunities ETF |
Notes to Financial Statements |
| As of September 30, 2021 |
6. Concentration of Risk
At various times, the ETF may have cash, cash collateral, and due from broker balances that exceed federally insured limits. It is the opinion of management that the solvency of the financial institutions is not of a particular concern at this time.
7. Principal Risks
Preferred Securities Risk. Investing in preferred securities involves the following risks: (i) certain preferred securities contain provisions that allow an issuer under certain conditions to skip or defer distributions; (ii) preferred securities may be subject to redemption, including at the issuer’s call, and, in the event of redemption, the Fund may not be able to reinvest the proceeds at comparable or favorable rates of return; (iii) preferred securities are generally subordinated to bonds and other debt securities in an issuer’s capital structure in terms of priority for corporate income and liquidation payments; (iv) preferred securities may trade less frequently and in a more limited volume and may be subject to more abrupt or erratic price movements than many other securities; and (v) preferred securities may have a negative yield to call (negative return the Fund receives if the security is held until the call date), which could result in losses for the Fund and its shareholders if an issuer elects to call the security.
Financial Companies Risk. Financial companies, such as retail and commercial banks, insurance companies and financial services companies, are especially subject to the adverse effects of economic recession, currency exchange rates, extensive government regulation, decreases in the availability of capital, volatile interest rates, portfolio concentrations in geographic markets, industries or products (such as commercial and residential real estate loans), competition from new entrants and blurred distinctions in their fields of business.
Energy Companies Risk. Issuers in energy-related industries can be significantly affected by fluctuations in energy prices and supply and demand of energy fuels. Markets for various energy-related commodities can have significant volatility and are subject to control or manipulation by large producers or purchasers. Companies in the energy sector may need to make substantial expenditures, and to incur significant amounts of debt, in order to maintain or expand their reservices. Oil and gas exploration and production can be significantly affected by natural disasters as well as changes in exchange rates, interest rates, government regulation, world events, and economic conditions. These companies may be at risk for environmental damage claims.
Healthcare Companies Risk. The profitability of companies in the healthcare sector, as traditionally defined, including healthcare equipment and services companies, may be affected by government regulations and government healthcare programs, increases or decreases in the cost of medical products and services, an increased emphasis on outpatient services, and product liability claims, among other factors. Many healthcare companies are heavily dependent on patent production, and the expiration of a company’s patent may adversely affect that company’s profitability. Healthcare companies are subject to competitive forces that may result in price discounting and may be thinly capitalized and susceptible to product obsolescence.
Fixed Income Risk. When the Fund invests in fixed income securities, the value of your investment in the Fund will fluctuate with changes in interest rates. Typically, a rise in interest rates causes a decline in the value of fixed income securities owned by the Fund. In general, the market price of fixed income securities with longer maturities will increase or decrease more in response to changes in interest rates than shorter-term securities. Other risk factors include credit risk (the debtor may default), extension risk (an issuer may exercise its right to repay principal on a fixed rate obligation held by the Fund later than expected), and prepayment risk (the debtor may pay its obligation early, reducing the amount of interest payments). These risks could affect the value of a particular investment by the Fund, possibly causing the Fund's share price and total return to be reduced and fluctuate more than other types of investments.
Junk Bond Risk. The Fund may invest in junk bonds that are considered speculative. Junk bonds are subject to the increased risk of an issuer’s inability to meet principal and interest payment obligations and may be less liquid than higher-rated bonds. These securities may be subject to greater price volatility due to such factors as specific corporate developments, interest rate sensitivity, negative perceptions of the junk bond market generally and less secondary market liquidity.
| Trajan Wealth Income Opportunities ETF |
Notes to Financial Statements |
| As of September 30, 2021 |
Small and Mid-Cap Securities Risk. The earnings and prospects of small and medium sized companies are more volatile than larger companies and may experience higher failure rates than larger companies. Small and medium sized companies normally have a lower trading volume than larger companies, which may tend to make their market price fall more disproportionately than larger companies in response to selling pressures and may have limited markets, product lines, or financial resources and lack management experience.
Nano and Micro-Cap Securities Risk. Nano and micro capitalization companies may be newly formed or have limited product lines, distribution channels and financial and managerial resources. The risks associated with those investments are generally greater than those associated with investments in the securities of larger, more established companies. This may cause the Fund’s net asset value to be more volatile when compared to investment companies that focus only on large capitalization companies.
REIT Risk. REITs typically own and operate income-producing real estate, such as residential or commercial buildings, or real estate related assets, including mortgages. As a result, investments in REITs are subject to the risks associated with investing in real estate, which may include, but are not limited to: fluctuations in the value of underlying properties; defaults by borrowers or tenants; market saturation; changes in general and local operating expenses; and other economic, political or regulatory occurrences affecting companies in the real estate sector. REITs are also subject to the risk that the real estate market may experience an economic downturn generally, which may have a material effect on the real estate in which the REITs invest and their underlying portfolio securities. REITs may have also a relatively small market capitalization which may result in their shares experiencing less market liquidity and greater price volatility than larger companies. Increases in interest rates typically lower the present value of a REIT's future earnings stream and may make financing property purchases and improvements more costly. Because the market price of REIT stocks may change based upon investors' collective perceptions of future earnings, the value of the Fund will generally decline when investors anticipate or experience rising interest rates.
U.S. Government Securities Risk. Debt securities issued or guaranteed by certain U.S. Government agencies, instrumentalities, and sponsored enterprises are not supported by the full faith and credit of the U.S. Government, so investments in their securities or obligations issued by them involve credit risk greater than investments in other types of U.S. Government securities.
Extension Risk. Extension risk is the risk that, when interest rates rise, certain obligations will be paid off by the issuer (or other obligated party) more slowly than anticipated, causing the value of these debt securities to fall. Rising interest rates tend to extend the duration of debt securities, making their market value more sensitive to changes in interest rates. The value of longer-term debt securities generally changes more in response to changes in interest rates than shorter-term debt securities. As a result, in a period of rising interest rates, securities may exhibit additional volatility and may lose value.
Call/Prepayment Risk. During periods of falling interest rates, an issuer of a callable bond held by the Fund may “call” or repay the security before its stated maturity. This may cause the Fund to reinvest the proceeds in securities with lower yields, resulting in a decline in the Fund’s income.
Credit/Default Risk. Credit risk is the risk that issuers or guarantors of debt instruments or the counterparty to a derivatives contract, repurchase agreement, or loan of portfolio securities is unable or unwilling to make timely interest and/or principal payments or otherwise honor its obligations. Changes in the financial condition of an issuer or counterparty, changes in specific economic, social or political conditions that affect a particular type of security or other instrument or an issuer, and changes in economic, social, or political conditions generally can increase the risk of default by an issuer or counterparty, which can affect a security’s or other instrument’s credit quality or value and an issuer’s or counterparty’s ability to pay interest and principal when due. Debt instruments are subject to varying degrees of credit risk, which may be reflected in credit ratings. Securities issued by the U.S. government have limited credit risk. Credit rating downgrades and defaults (failure to make interest or principal payment) may potentially reduce the Fund’s income and Share price.
Inflation Risk. Inflation risk is the risk that the value of assets or income from investments will be less in the future as inflation decreases the value of money. As inflation increases, the present value of the Fund’s assets and distributions may decline.
Interest Rate Risk. As interest rates rise, the value of fixed income securities held by the Fund are likely to decrease. Securities with longer durations tend to be more sensitive to interest rate changes, making them more volatile than securities with shorter durations. Interest rates in the United States are near historic lows, which may increase the Fund's exposure to risks associated with rising rates. A wide variety of market factors can cause interest rates to rise, including central bank monetary policy (including the Federal Reserve ending its “quantitative easing” policy of purchasing large quantities of securities issued or guaranteed by the U.S. government), rising inflation, and changes in general economic conditions. Interest rate changes can be sudden and unpredictable. Moreover, rising interest rates may lead to decreased liquidity in the bond markets, making it more difficult for the Fund to value or sell some or all its bond investments at any given time.
| Trajan Wealth Income Opportunities ETF |
Notes to Financial Statements |
| As of September 30, 2021 |
Changes in interest rates may also affect the Fund’s share price; for example, a sharp rise in interest rates could cause the Fund’s share price to fall. Securities with longer durations tend to be more sensitive to interest rate changes, making them more volatile than securities with shorter durations. Duration is an estimate of a security’s sensitivity to changes in prevailing interest rates that is based on certain factors that may prove to be incorrect. It is therefore not an exact measurement and may not be able to reliably predict a security’s price sensitivity to changes in interest rates.
Sector Risk. The Fund may focus its investments in securities of a particular sector. Economic, legislative or regulatory developments may occur that significantly affect the sector. This may cause the Fund's net asset value to fluctuate more than that of a fund that does not focus in a particular sector.
COVID-19 and Other Infectious Illnesses Risk. An outbreak of infectious respiratory illness caused by a novel coronavirus known as COVID-19 was first detected in China in December 2019 and has now been detected globally. COVID-19 has resulted in travel restrictions, closed international borders, enhanced health screenings at ports of entry and elsewhere, disruption of and delays in healthcare service preparation and delivery, prolonged quarantines, cancellations, supply chain disruptions, and lower consumer demand, as well as general concern and uncertainty. The impact of COVID-19, and other infectious illness outbreaks that may arise in the future, could adversely affect the economies of many countries or the entire global economy, individual issuers and capital markets in ways that cannot necessarily be foreseen. In addition, the impact of infectious illnesses in emerging market countries may be greater due to generally less established healthcare systems. Public health crises caused by the COVID-19 outbreak, or other infectious illness outbreaks that may arise in the future, may exacerbate other pre-existing political, social and economic risks in certain countries or globally. As such, issuers of debt securities with operations, productions, offices, and/or personnel in (or other exposure to) areas affected with the virus may experience significant disruptions to their business and/or holdings. The potential impact on the credit markets may include market illiquidity, defaults and bankruptcies, among other consequences, particularly on issuers in the airline, travel and leisure and retail sectors. The extent to which COVID-19 or other infectious illnesses will affect the Fund, the Fund’s service providers’ and/or issuer’s operations and results will depend on future developments, which are highly uncertain and cannot be predicted, including new information that may emerge concerning the severity of COVID-19 or other infectious illnesses and the actions taken to contain COVID-19 or other infectious illnesses. Economies and financial markets throughout the world are becoming increasingly interconnected. As a result, whether or not the Fund invests in securities of issuers located in or with significant exposure to countries experiencing economic, political and/or financial difficulties, the value and liquidity of the Fund’s investments may be negatively affected by such events. If there is a significant decline in the value of the Fund’s portfolio, this may impact the Fund’s asset coverage levels for certain kinds of derivatives and other portfolio transactions. The duration of the COVID-19 outbreak, or any other infectious illness outbreak that may arise in the future, and its impact on the global economy cannot be determined with certainty.
Asset Class Risk. Securities and other assets in the Fund’s portfolio may underperform in comparison to the general financial markets, a particular financial market, or other asset classes.
Non-Diversification Risk. The Fund may invest a large percentage of its assets in securities issued by or representing a small number of issuers. As a result, the Fund’s performance may depend on the performance of a small number of issuers.
Valuation Risk. Unlike publicly traded securities that trade on national securities exchanges, there is no central place or exchange for trading most debt securities. Debt securities generally trade on an “over-the-counter” market. Due to the lack of centralized information and trading, the valuation of debt securities may carry more uncertainty and risk than that of publicly traded securities. Accordingly, determinations of the fair value of debt securities may be based on infrequent and dated information. Also, because the available information is less reliable and more subjective, elements of judgment may play a greater role in valuation of debt securities than for other types of securities.
| Trajan Wealth Income Opportunities ETF |
Notes to Financial Statements |
| As of September 30, 2021 |
8. Commitments and Contingencies
Under the Trust’s organizational documents, its officers and Trustees are indemnified against certain liabilities arising out of the performance of their duties to the ETF. In addition, in the normal course of business, the Trust enters into contracts with its service providers, on behalf of the ETF, and others that provide for general indemnifications. The ETF’s maximum exposure under these arrangements is unknown, as this would involve future claims that may be made against the ETF. The ETF expects risk of loss to be remote.
9. Subsequent Events
In accordance with GAAP, management has evaluated the need for disclosures and/or adjustments resulting from subsequent events through the date of issuance of the financial statements. This evaluation did not result in any subsequent events that necessitated disclosures and/or adjustments.

REPORT OF INDEPENDENT REGISTERED PUBLIC ACCOUNTING FIRM
To the Board of Trustees of Spinnaker ETF Series
and the Shareholders of Trajan Wealth Income Opportunities ETF
Opinion on the Financial Statements
We have audited the accompanying statement of assets and liabilities of Trajan Wealth Income Opportunities ETF, a series of shares of beneficial interest in Spinnaker ETF Series (the “Fund”), including the schedule of investments, as of September 30, 2021, and the related statements of operations, changes in net assets, and the financial highlights for the period March 31, 2021 (commencement of operations) through September 30, 2021, and the related notes (collectively referred to as the “financial statements”). In our opinion, the financial statements present fairly, in all material respects, the financial position of the Fund as of September 30, 2021, and the results of its operations, the changes in its net assets and its financial highlights for the period March 31, 2021 through September 30, 2021, in conformity with accounting principles generally accepted in the United States of America.
Basis for Opinion
These financial statements are the responsibility of the Fund’s management. Our responsibility is to express an opinion on the Fund's financial statements based on our audit. We are a public accounting firm registered with the Public Company Accounting Oversight Board (United States) (“PCAOB”) and are required to be independent with respect to the Fund in accordance with the U.S. federal securities law and the applicable rules and regulations of the Securities and Exchange Commission and the PCAOB.
We conducted our audit in accordance with the standards of the PCAOB. Those standards require that we plan and perform the audit to obtain reasonable assurance about whether the financial statements are free of material misstatement, whether due to error or fraud. The Fund is not required to have, nor were we engaged to perform, an audit of its internal control over financial reporting. As part of our audit we are required to obtain an understanding of internal control over financial reporting but not for the purpose of expressing an opinion on the effectiveness of the Fund’s internal control over financial reporting. Accordingly, we express no such opinion.
Our audit included performing procedures to assess the risk of material misstatement of the financial statements, whether due to error or fraud, and performing procedures that respond to those risks. Such procedures included examining, on a test basis, evidence regarding the amounts and disclosures in the financial statements. Our procedures included confirmation of securities owned as of September 30, 2021 by correspondence with the custodian, brokers, or by other appropriate auditing procedures where replies from brokers were not received. Our audit also included evaluating the accounting principles used and significant estimates made by management, as well as evaluating the overall presentation of the financial statements. We believe that our audit provides a reasonable basis for our opinion.

BBD, LLP
We have served as the auditor of one or more of the Funds in the Spinnaker ETF Series since 2017.
Philadelphia, Pennsylvania
November 29, 2021
| Trajan Wealth Income Opportunities ETF |
Additional Information (Unaudited) |
| As of September 30, 2021 |
| 1. | Proxy Voting Policies and Voting Record |
Copies of the Advisor’s and Sub-Advisor’s Proxy Voting Policies and Procedures are included as Appendix A to the ETF’s Statement of Additional Information and are available, without charge, upon request, by calling 800-773-3863, and on the website of the Securities and Exchange Commission (“SEC”) at http://www.sec.gov. Information regarding how the ETF voted proxies relating to portfolio securities during the most recent twelve-month period ended June 30, is available (1) without charge, upon request, by calling the ETF at the number above and (2) on the SEC’s website at http://www.sec.gov.
| 2. | Quarterly Portfolio Holdings |
The ETF files its complete schedule of portfolio holdings with the SEC for the first and third quarters of each fiscal year on Form N-PORT. The ETF’s Form N-PORT is available on the SEC’s website at http://www.sec.gov. You may also obtain copies without charge, upon request, by calling the ETF at 800-773-3863.
| 3. | Tax Information |
We are required to advise you within 60 days of the ETF’s fiscal year-end regarding federal tax status of certain distributions received by shareholders during each fiscal year. The following information is provided for the ETF’s initial period ended September 30, 2021.
During the initial period, the ETF paid $196,950 in income distributions but no long-term capital gain distributions.
Dividend and distributions received by retirement plans such as IRAs, Keogh-type plans, and 403(b) plans need not be reported as taxable income. However, many retirement plans may need this information for their annual information meeting.
| 4. | Schedule of Shareholder Expenses |
As a shareholder of the ETF, you incur ongoing costs, including management fees and other ETF expenses. This Example is intended to help you understand your ongoing costs (in dollars) of investing in the ETF and to compare these costs with the ongoing costs of investing in other mutual funds.
The Example is based on an investment of $1,000 invested at the beginning of the period and held for the fiscal period from April 1, 2021 through September 30, 2021.
Actual Expenses – The first line of the table below provides information about actual account values and actual expenses. You may use the information in this line, together with the amount you invested, to estimate the expenses that you paid over the period. Simply divide your account value by $1,000 (e.g., an $8,600 account value divided by $1,000 = 8.6), then multiply the result by the number in the first line under the heading entitled “Expenses Paid During Period” to estimate the expenses you paid on your account during this period.
Hypothetical Example for Comparison Purposes – The second line of the table below provides information about hypothetical account values and hypothetical expenses based on the ETF’s actual expense ratio and an assumed rate of return of 5% per year before expenses, which is not the ETF’s actual return. The hypothetical account values and expenses may not be used to estimate the actual ending account balance or expenses you paid for the period. You may use this information to compare the ongoing costs of investing in the ETF and other funds. To do so, compare this 5% hypothetical example with the 5% hypothetical examples that appear in the shareholder reports of the other funds.
Please note that the expenses shown in the table are meant to highlight your ongoing costs only and do not reflect any transactional costs, such as sales charges (loads), redemption fees, or exchange fees. Therefore, the second line of the table is useful in comparing ongoing costs only and will not help you determine the relative total costs of owning different funds. In addition, if these transactional costs were included, your costs would have been higher.
| Trajan Wealth Income Opportunities ETF |
Additional Information (Unaudited) |
| As of September 30, 2021 |
Beginning Account Value April 1, 2021 | Ending Account Value September 30, 2021 | Expenses Paid During Period* | |
Actual Hypothetical (5% annual return before expenses) | |||
| $1,000.00 | $1,029.90 | $4.33 | |
| $1,000.00 | $1,020.81 | $4.31 |
*Expenses are equal to the average account value over the period multiplied by the ETF’s annualized expense ratio of 0.85%, multiplied by 183 days in the period divided by the number of days in the fiscal year (to reflect the initial period).
| 5. | Approval of Investment Advisory Agreement |
In connection with the organizational Board meeting held on December 17, 2019, the Board, including a majority of the Independent Trustees, discussed the approval of the proposal of the management agreement, between the Trust and the Advisor, with respect to the ETF (the "Investment Advisory Agreement").
The Trustees were assisted by legal counsel throughout the review process. The Trustees relied upon the advice of legal counsel and their own business judgment in determining the material factors to be considered in evaluating the Investment Advisory Agreement and the weight to be given to each factor considered. The conclusions reached by the Trustees were based on a comprehensive evaluation of all of the information provided and were not the result of any one factor. Moreover, each Trustee may have afforded different weight to the various factors in reaching his conclusions with respect to the approval of the Investment Advisory Agreement. In connection with their deliberations regarding approval of the Investment Advisory Agreement, the Trustees reviewed materials prepared by the Advisor.
In deciding on whether to approve the renewal of the Investment Advisory Agreement, the Trustees considered numerous factors, including:
| (i) | Nature, Extent, and Quality of Services. The Trustees considered the responsibilities of the Advisor under the Investment Advisory Agreement. The Trustees reviewed the services to be provided by the Advisor to the ETF including, without limitation, the quality of its investment advisory services; assuring compliance with the investment objectives, policies and limitations; and its coordination of services among the service providers. The Trustees evaluated: the Advisor’s staffing, personnel, and methods of operating; the education and experience of the Advisor’s personnel; the Advisor’s compliance program; and the Advisor’s financial condition. |
After reviewing the foregoing information and further information in the memorandum from the Advisor (e.g., descriptions of the Advisor’s business, compliance program, and ADV), the Board concluded that the nature, extent, and quality of the services provided by the Advisor were satisfactory and adequate.
| (ii) | Performance. The Trustees noted that, as the ETF had not yet launched and therefore had no performance to review, the Trustees would review the performance of another account managed by the Advisor. The Trustees reviewed the performance of the other account with the performance of its benchmark and discussed the market factors that influenced the account’s performance. The Trustees noted that the account outperformed its benchmark for the one-year period but underperformed for the since inception period. After further discussion, the Trustees considered the experience of the personnel of the Advisor and determined that the performance of the Advisor was satisfactory. |
| (iii) | Fees and Expenses. The Trustees compared the advisory fee and expense ratio of the ETF to other comparable funds and noted they were below those both the peer group and category. Following this comparison, and upon further consideration and discussion of the foregoing, the Board concluded that the fees to be paid to the Advisor were fair and reasonable in relation to the nature and quality of the services to be provided by the Advisor and that they reflected charges that were within a range of what could have been negotiated at arm’s length. |
| Trajan Wealth Income Opportunities ETF |
Additional Information (Unaudited) |
| As of September 30, 2021 |
| (iv) | Profitability. The Board reviewed the Advisor’s profitability analysis in connection with its management of the ETF. The Trustees noted that the Advisor anticipated negative profitability during the first twelve months of managing the ETF and modest profit during the second twelve months of managing the ETF. |
| (v) | Economies of Scale. The Trustees noted that the ETF would not immediately realize economies of scale upon launch. The Trustees then reviewed the ETF’s fee arrangements for breakpoints or other provisions that would allow the ETF’s shareholders to benefit from economies of scale in the future as the ETF grows. The Trustees determined that the maximum management fee would remain the same regardless of the ETF’s asset levels. It was pointed out that breakpoints in the advisory fee could be reconsidered in the future as the ETF grows. |
Conclusion. Having reviewed and discussed in depth such information from the Advisor as the Trustees believed to be reasonably necessary to evaluate the terms of the Investment Advisory Agreement and as assisted by the advice of legal counsel, the Trustees concluded that approval of the Investment Advisory Agreement was in the best interest of the shareholders of the ETF.
6. Approval of Investment Sub-Advisory Agreement
In connection with the organizational meeting of the Board held on December 17, 2019, the Board, including a majority of the Independent Trustees, discussed the approval of a management agreement between the Advisor and the Sub-Advisor, with respect to the ETF (the “Investment Sub-Advisory Agreement”).
The Trustees were assisted by legal counsel throughout the review process. The Trustees relied upon the advice of legal counsel and their own business judgment in determining the material factors to be considered in evaluating the Investment Sub-Advisory Agreement and the weight to be given to each factor considered. The conclusions reached by the Trustees were based on a comprehensive evaluation of all of the information provided and were not the result of any one factor. Moreover, each Trustee may have afforded different weight to the various factors in reaching his conclusions with respect to the approval of the Investment Sub-Advisory Agreement. In connection with their deliberations regarding approval of the Investment Sub-Advisory Agreement, the Trustees reviewed materials prepared by the Sub-Advisor.
In deciding on whether to approve the proposal of the Investment Sub-Advisory Agreement, the Trustees considered numerous factors, including:
| (i) | Nature, Extent, and Quality of Services. The Trustees considered responsibilities of the Sub-Advisor under the proposed Investment Sub-Advisory Agreement. The Trustees reviewed the services to be provided by the Sub-Advisor to the ETF, including, without limitation, the quality of its investment advisory services and its proxy voting services with respect to the securities in the ETF’s portfolio. After reviewing the foregoing information and further information in the memorandum provided by the Sub-Advisor (e.g., descriptions of the Sub-Advisor’s business, compliance program, and Form ADV), the Board concluded that the nature, extent, and quality of the services provided by the Sub-Advisor were satisfactory and adequate for the ETF. |
| (ii) | Performance. It was noted that, as the ETF had not yet launched, there was no performance to review. Therefore, the Board reviewed the performance of other accounts managed by the Sub-Advisor with the performance of its benchmark and discussed the market factors that influenced the account’s performance. The Board noted the positive performance of the accounts against their benchmarks. After further discussion, the Trustees considered the experience of the personnel of the Sub-Advisor and determined that the performance of the Sub-Advisor was satisfactory. |
| (iii) | Fees and Expenses. In considering the costs of the services to be provided and profits to be realized by the Sub-Advisor and its affiliates from the relationship with the ETF, including any benefits derived by the ETF from the relationship with the ETF, the Trustees first noted that the management fee for the ETF and that it was lower than that charged to the Sub-Advisor’s other accounts. |
| Trajan Wealth Income Opportunities ETF |
Additional Information (Unaudited) |
| As of September 30, 2021 |
The Trustees reviewed the Sub-Advisor’s staffing, personnel, and methods of operating; the education and experience of the Sub-Advisor’s personnel; the Sub-Advisor’s compliance policies and procedures; the financial condition of the Sub-Advisor; and the overall expenses of the ETF. Upon further consideration and discussion of the foregoing, the Board concluded that the fees to be paid to the Sub-Advisor were fair and reasonable in relation to the nature and quality of the services to be provided by the Sub-Advisor and that they reflected charges that were within a range of what could have been negotiated at arm’s length. |
| (iv) | Profitability. The Board reviewed the Sub-Advisor’s profitability analysis in connection with its management of the ETF. The Board noted that the Sub-Advisor anticipated negative profitability during the first twelve months of managing the ETF and modest profit during the second twelve months of managing the ETF. After discussion, the Trustees concluded that the Sub-Advisor’s level of profitability was not excessive. |
| (v) | Economies of Scale. In this regard, the Trustees notes that the size of the ETF was projected to be relatively small upon launch, and that it would therefore not immediately realize economies of scale. The Trustees then reviewed the ETF’s fee arrangements for breakpoints or other provisions that would allow the ETF’s shareholders to benefit from economies of scale in the future as the ETF grows. The Trustees noted that the ETF would be a relatively small size for some time and economies of scale were unlikely to be achievable in the near future. It was pointed out that breakpoints in the sub-advisory fee could be reconsidered in the future as the ETF grows. |
Conclusion. Having reviewed and discussed in depth such information from the Sub-Advisor as the Trustees believed to be reasonably necessary to evaluate the terms of the Investment Sub-Advisory Agreement and as assisted by the advice of legal counsel, the Trustees concluded that approval of the Investment Sub-Advisory Agreement was in the best interest of the shareholders of the ETF.
7. Liquidity Risk Management Program
In October 2016, the Securities and Exchange Commission (“SEC”) adopted Rule 22e-4, or the “Liquidity Rule,” under the Investment Company Act of 1940. The Liquidity Rule requires a mutual fund to adopt a liquidity risk management program (“Program”). In June 2018, the SEC adopted a requirement that a mutual fund disclose information about the operation and effectiveness of its Program in its reports to shareholders.
The ETF has adopted and implemented a Program pursuant to the Liquidity Rule, effective December 1, 2019. The Program is intended to provide a framework for: (1) assessing and managing the ETF’s liquidity risk (i.e., the risk that the ETF could not meet requests to redeem shares without significantly diluting remaining investors’ interests) based on a variety of factors, including the ETF’s investment strategy and liquidity of its portfolio investments, (2) classifying the liquidity of the ETF’s investments, (3) determining the ETF’s highly liquid investment minimum (“HLIM”), if applicable, (4) complying with the ETF’s illiquid investment limit, and (5) reporting to the ETF’s Board of Trustees. The Board of Trustees designated the individuals serving as the Advisor’s liquidity program administrator to serve as the Trust’s program administrator (the “Trust Program Administrator”) to administer the Program. The Trust Program Administrator established a governance committee to assist the Trust Program Administrator in administering the Program.
Under the Program, the ETF’s portfolio investments are classified into one of four liquidity categories defined by the SEC: highly liquid, moderately liquid, less liquid, and illiquid. Liquidity classifications take into account a variety of market, trading, and investment factors, including the ETF’s reasonably anticipated trade size, and the Program Administrator has engaged a third-party vendor to assist with the classification of portfolio investments.
The Liquidity Rule prohibits mutual funds and ETFs from acquiring investments that would cause their illiquid investments to exceed 15% of net assets. The Liquidity Rule also requires funds that do not primarily hold assets that are highly liquid investments to determine a minimum percentage of net assets to be invested in highly liquid investments (the HLIM). The Program includes provisions designed to comply with the 15% limit on illiquid investments and for determining and complying with the HLIM requirement, as applicable.
| Trajan Wealth Income Opportunities ETF |
Additional Information (Unaudited) |
| As of September 30, 2021 |
In accordance with the Liquidity Rule, the Program Administrator prepared, and the ETF’s Board of Trustees reviewed, a report regarding the operation and effectiveness of the Program for initial period. During the period, there were no liquidity events that materially impacted the ETF’s ability to timely meet redemptions without significantly diluting remaining investors’ interests. The report concluded that the Program remains reasonably designed to assess and manage the ETF’s liquidity risk, and that during the period the Program was implemented effectively.
8. Information about Trustees and Officers
The business and affairs of the ETF and the Trust are managed under the direction of the Board of Trustees of the Trust. Information concerning the Trustees and officers of the Trust and ETF is set forth below. Generally, each Trustee and officer serves an indefinite term or until certain circumstances such as their resignation, death, or otherwise as specified in the Trust’s organizational documents. Any Trustee may be removed at a meeting of shareholders by a vote meeting the requirements of the Trust’s organizational documents. The Statement of Additional Information of the ETF includes additional information about the Trustees and officers and is available, without charge, upon request by calling the ETF toll-free at 800-773-3863. The address of each Trustee and officer, unless otherwise indicated below, is 116 South Franklin Street, Rocky Mount, North Carolina 27804. The Independent Trustees received aggregate compensation of $9,001 during the initial period ended September 30, 2021 from the ETF for their services to the ETF and Trust.
Name and Date of Birth | Position held with Funds or Trust | Length of Time Served | Principal Occupation During Past 5 Years | Number of Portfolios in Fund Complex Overseen by Trustee | Other Directorships Held by Trustee During Past 5 Years |
| Independent Trustees | |||||
| Thomas R. Galloway (10/1963) | Independent Trustee, Chairman | Since 12/16 | Independent Investor since 2012. | 5 | Independent Trustee of the Wonderfund Trust for all its series since 2021; Volt ETF Trust for all of its series since 2016; and Prophecy Alpha Fund I, a closed-end interval fund since 2015 (all registered investment companies). |
| Jesse S. Eberdt, III (10/1959) | Independent Trustee | Since 12/16 | Managing Director at Tempus Durham, LLC (advisory firm) since 2010. | 5 | Independent Trustee of the Prophecy Alpha Fund I, a closed-end interval fund since 2015 (a registered investment company). |
| Trajan Wealth Income Opportunities ETF |
Additional Information (Unaudited) |
| As of September 30, 2021 |
Name and Date of Birth | Position held with Funds or Trust | Length of Time Served | Principal Occupation During Past 5 Years |
Officers | |||
| Katherine M. Honey (09/1973) | President and Principal Executive Officer | Since 12/16 | President of The Nottingham Company since 2018. EVP of The Nottingham Company from 2008 to 2018. |
Ashley H. Lanham (03/1984) | Treasurer, Principal Financial Officer, and Principal Accounting Officer | Since 12/16 | Director of Fund Administration. The Nottingham Company since 2008. |
| Tracie A. Coop (12/1976) | Secretary | Since 12/19 | General Counsel, The Nottingham Company since 2019. Formerly, Vice President and Managing Counsel, State Street Bank and Trust Company from 2015 to 2019. Formerly, General Counsel for Santander Asset Management USA, LLC from 2013 to 2015. |
| Matthew Baskir (07/1979) | Chief Compliance Officer | Since 06/20 | Compliance Director, The Nottingham Company, Inc., since 2020. Formerly, Consultant at National Regulatory Services from 2019 to 2020. Formerly, Counsel at Financial Industry Regulatory Authority (FINRA), Member Supervision from 2016-2019. Formerly Counsel at FINRA, Market Regulation Enforcement from 2014 – 2016. |
Trajan Wealth Income Opportunities ETF
is a series of
Spinnaker ETF Series
For Shareholder Service Inquiries: | For Investment Advisor Inquiries: |
| Nottingham Shareholder Services | OBP Capital, LLC |
| 116 South Franklin Street | 116 South Franklin Street |
| Post Office Box 69 | Rocky Mount, North Carolina 27804 |
Rocky Mount, North Carolina 27802-0069
Telephone: 800-773-3863 World Wide Web @: ncfunds.com | Telephone: 800-773-3863 World Wide Web @: trajanwealthetf.com |
| Item 2. | CODE OF ETHICS. |
| (a) | The registrant, as of the end of the period covered by this report, has adopted a code of ethics that applies to the registrant’s principal executive officer, principal financial officer, and principal accounting officer or controller, or persons performing similar functions, regardless of whether these individuals are employed by the registrant or a third party (the “Code of Ethics”). |
| (c) | During the period covered by this report, there have been no substantive amendments to the provisions of the Code of Ethics. |
| (d) | During the period covered by this report, the registrant did not grant any waivers to the provisions of the Code of Ethics. |
| (f)(1) | A copy of the Code of Ethics is filed with this Form N-CSR as Exhibit 13(a)(1). |
| Item 3. | AUDIT COMMITTEE FINANCIAL EXPERT. |
At this time, the registrant believes that the collective knowledge and experience provided by the members of the audit committee together offer the registrant adequate oversight for the registrant’s level of financial complexity.
| Item 4. | PRINCIPAL ACCOUNTANT FEES AND SERVICES. |
| (a) | Audit Fees – Audit fees billed for the Trajan Wealth Income Opportunities ETF (the “Fund”), a series of the Trust, for the last fiscal year are reflected in the table below. These amounts represent aggregate fees billed for the fiscal year for professional services rendered by the registrant’s independent accountant, BBD, LLP (“Accountant”), for the audit of the Fund’s financial statements or services that are normally provided by the Accountant in connection with the registrant’s statutory and regulatory filings or engagements for those fiscal years. |
Fund | September 30, 2021 |
| Trajan Wealth Income Opportunities ETF | $14,000 |
| (b) | Audit-Related Fees – There were no additional fees billed in the fiscal year ended September 30, 2021 for assurance and related services by the Accountant that were reasonably related tot eh performance of the audit of the Fund’s financial statements and that were not reported under paragraph (a) of this item. |
| (c) | Tax Fees – The tax fees billed in the last fiscal year for professional services rendered by the Accountant for tax compliance, tax advice, and tax planning are reflected in the table below. These services were for the completion of the Fund’s federal and state income tax returns, excise tax returns, and assistance with distribution calculations. |
| Fund | September 30, 2021 |
| Trajan Wealth Income Opportunities ETF | $3,000 |
| (d) | All Other Fees – There were no other fees billed in each of the fiscal year ended September 30, 2021, for products and services by the Accountant, other than the services reported in paragraphs (a) through (c) of this item. |
| (e)(1) | The registrant’s Board of Trustees pre-approved the engagement of the Accountant for the last fiscal year at an audit committee meeting of the Board of Trustees called for such purpose; and will pre-approve the Accountant for each fiscal year thereafter at an audit committee meeting called for such purpose. The charter of the audit committee states that the audit committee should pre-approve any audit services and, when appropriate, evaluate and pre-approve any non-audit services provided by the Accountant to the registrant and to pre-approve, when appropriate, any non-audit services provided by the Accountant to the registrant’s investment adviser, or any entity controlling, controlled by, or under common control with the investment adviser that provides ongoing services to the registrant if the engagement relates directly to the operations and financial reporting of the registrant. |
| (2) | There were no services as described in each of paragraph (b) through (d) of this Item that were approved by the audit committee pursuant to paragraph (c)(7)(i)(C) of Rule 2-01 of Regulation S-X. |
| (f) | Not applicable. |
| (g) | Aggregate non-audit fees billed by the Accountant to the Fund for services rendered for the fiscal year ended September 30, 2021, were $3,000. There were no fees billed by the Accountant for non-audit services rendered to the Fund’s investment adviser, or any other entity controlling, controlled by, or under common control with the Fund’s investment adviser. |
| (h) | Not applicable. |
| Item 5. | AUDIT COMMITTEE OF LISTED REGISTRANTS. |
| (a) | The Fund is a listed issuer as defined in Rule 10A-3 under the Exchange Act of 1934 and has a separately designated standing audit committee established in accordance with Section 3(a)(58)(A) of the Exchange Act of 1934. The Fund’s audit committee members are Thomas R. Galloway and Jesse S. Eberdt, III. |
| (b) | Not Applicable. |
| Item 6. | SCHEDULE OF INVESTMENTS. |
A copy of the schedule of investments of unaffiliated issuers as of the close of the reporting period is included as part of the report to shareholders filed under Item 1 of this Form.
| Item 7. | DISCLOSURE OF PROXY VOTING POLICIES AND PROCEDURES FOR CLOSED-END MANAGEMENT INVESTMENT COMPANIES. |
Not applicable.
| Item 8. | PORTFOLIO MANAGERS OF CLOSED-END MANAGEMENT INVESTMENT COMPANIES. |
Not applicable.
| Item 9. | PURCHASES OF EQUITY SECURITIES BY CLOSED-END MANAGEMENT INVESTMENT COMPANY AND AFFILIATED PURCHASERS. |
Not applicable.
| Item 10. | SUBMISSION OF MATTERS TO A VOTE OF SECURITY HOLDERS. |
None.
| Item 11. | CONTROLS AND PROCEDURES. |
| (a) | The President and Principal Executive Officer and the Treasurer, Principal Accounting Officer, and Principal Financial Officer have concluded that the registrant’s disclosure controls and procedures (as defined in Rule 30a-3(c) under the Investment Company Act of 1940) are effective based on their evaluation of the disclosure controls and procedures required by Rule 30a-3(b) under the Investment Company Act of 1940 and Rules 13a-15(b) or 15d-15(b) under the Securities Exchange Act of 1934, as of a date within 90 days of the filing of this report. |
| (b) | There were no changes in the registrant's internal control over financial reporting (as defined in Rule 30a-3(d) under the Investment Company Act of 1940) that occurred during the period covered by this report that have materially affected, or are reasonably likely to materially affect, the registrant’s internal control over financial reporting. |
| Item 12. | DISCLOSURE OF SECURITIES LENDING ACTIVITIES FOR CLOSED-END FUND MANAGEMENT INVESTMENT COMPANIES |
Not applicable.
| Item 13. | EXHIBITS. |
| (a)(1) | Code of Ethics required by Item 2 of Form N-CSR is filed herewith. |
| (a)(2) | Certifications pursuant to Rule 30a-2(a) under the Investment Company Act of 1940 are filed herewith. |
| (a)(3) | Not applicable. |
| (a)(4) | Not applicable. |
| (b) | Certifications pursuant to Rule 30a-2(b) under the Investment Company Act of 1940 and Section 906 of the Sarbanes-Oxley Act of 2002 are filed herewith. |
SIGNATURES
Pursuant to the requirements of the Securities Exchange Act of 1934 and the Investment Company Act of 1940, the registrant has duly caused this report to be signed on its behalf by the undersigned, thereunto duly authorized.
| Spinnaker ETF Series | |
/s/ Katherine M. Honey | |
Date: December 8, 2021 | Katherine M. Honey President and Principal Executive Officer |
Pursuant to the requirements of the Securities Exchange Act of 1934 and the Investment Company Act of 1940, this report has been signed below by the following persons on behalf of the registrant and in the capacities and on the dates indicated.
/s/ Katherine M. Honey | |
Date: December 8, 2021 | Katherine M. Honey President and Principal Executive Officer |
/s/ Ashley H. Lanham | |
Date: December 8, 2021 | Ashley H. Lanham Treasurer, Principal Accounting Officer, and Principal Financial Officer |