UNITED STATES
SECURITIES AND EXCHANGE COMMISSION
Washington, D.C. 20549
FORM 10-K
(Mark One)
| x | ANNUAL REPORT PURSUANT TO SECTION 13 OR 15(d) OF THE SECURITIES EXCHANGE ACT OF 1934 |
For the fiscal year ended December 28, 2013
OR
| ¨ | TRANSITION REPORT PURSUANT TO SECTION 13 OR 15(d) OF THE SECURITIES EXCHANGE ACT OF 1934 FOR THE TRANSITION PERIOD FROM TO |
Commission File Number 001-35957
Gigamon Inc.
(Exact name of Registrant as specified in its Charter)
| | |
| Delaware | | 26-3963351 |
(State or other jurisdiction of
incorporation or organization) | | (I.R.S. Employer
Identification No.) |
| |
| 3300 Olcott Street, Santa Clara, California | | 95054 |
| (Address of principal executive offices) | | (Zip Code) |
Registrant’s telephone number, including area code:(408) 831-4000
Securities registered pursuant to Section 12(b) of the Act: Common Stock, Par Value $0.0001 Per Share; Common stock traded on the New York Stock Exchange LLC
Securities registered pursuant to Section 12(g) of the Act:None
Indicate by check mark if the Registrant is a well-known seasoned issuer, as defined in Rule 405 of the Securities Act. YES ¨ NO x
Indicate by check mark if the Registrant is not required to file reports pursuant to Section 13 or 15(d) of the Act. YES ¨ NO x
Indicate by check mark whether the Registrant: (1) has filed all reports required to be filed by Section 13 or 15(d) of the Securities Exchange Act of 1934 during the preceding 12 months (or for such shorter period that the Registrant was required to file such reports), and (2) has been subject to such filing requirements for the past 90 days. YES x NO ¨
Indicate by check mark whether the Registrant has submitted electronically and posted on its corporate Web site, if any, every Interactive Data File required to be submitted and posted pursuant to Rule 405 of Regulation S-T (§232.405 of this chapter) during the preceding 12 months (or for such shorter period that the Registrant was required to submit and post such files). YES x NO ¨
Indicate by check mark if disclosure of delinquent filers pursuant to Item 405 of Regulation S-K (§229.405) is not contained herein, and will not be contained, to the best of Registrant’s knowledge, in definitive proxy or information statements incorporated by reference in Part III of this Form 10-K or any amendment to this Form 10-K. ¨
Indicate by check mark whether the Registrant is a large accelerated filer, an accelerated filer, a non-accelerated filer, or a smaller reporting company. See the definition of “large accelerated filer”, “accelerated filer”, and “smaller reporting company” in Rule 12b-2 of the Exchange Act. (Check one):
| | | | | | |
| Large accelerated filer ¨ | | Accelerated filer ¨ | | Non-accelerated filer x | | Smaller reporting company ¨ |
| | | | (Do not check if a smaller reporting company) | | |
Indicate by check mark whether the Registrant is a shell company (as defined in Rule 12b-2 of the Exchange Act). YES ¨ NO x
The aggregate market value of the voting and non-voting common equity held by non-affiliates of the Registrant, based on the closing price of the shares of common stock on the New York Stock Exchange on June 29, 2013, was $339,993,400.
The number of shares of Registrant’s Common Stock outstanding as of February 28, 2014 was 31,834,458 shares.
Portions of the Registrant’s Definitive Proxy Statement relating to the Annual Meeting of Shareholders, which will be filed with the Securities and Exchange Commission no later than 120 days after the Registrant’s fiscal year ended on December 28, 2013, are incorporated by reference into Part III of this Report.
Gigamon Inc.
TABLE OF CONTENTS
PART I
SPECIAL NOTE REGARDING FORWARD-LOOKING STATEMENTS
This Annual Report on Form 10-K, including the sections titled “Business,” “Risk Factors” and “Management’s Discussion and Analysis of Financial Condition and Results of Operations,” contains forward-looking statements within the meaning of the federal securities laws, which statements involve substantial risks and uncertainties. Forward-looking statements generally relate to future events or our future financial or operating performance. In some cases you can identify forward-looking statements because they contain words such as “may,” “will,” “should,” “expects,” “plans,” “anticipates,” “could,” “intends,” “target,” “projects,” “contemplates,” “believes,” “estimates,” “predicts,” “potential” or “continue” or the negative of these words or other similar terms or expressions that concern our expectations, strategy, plans or intentions. Forward-looking statements contained in this Annual Report on Form 10-K include, but are not limited to, statements about:
| | • | | our expectations regarding our results of operations and financial condition; |
| | • | | anticipated trends and challenges in our business and in the markets in which we operate; |
| | • | | the impact of seasonality on our business; |
| | • | | our anticipated growth strategies; |
| | • | | maintaining and expanding our end-user customer base and our relationships with our channel partners; |
| | • | | our ability to anticipate market needs and develop new and enhanced products and services to meet those needs; |
| | • | | our reliance on sole source suppliers or limited source suppliers for some of the components and technologies used in our products; |
| | • | | our reliance on a single third-party manufacturer; |
| | • | | the evolution of technology affecting our products, services and markets; |
| | • | | our ability to retain and hire necessary employees and to staff our operations appropriately; |
| | • | | our liquidity and working capital requirements; |
| | • | | our need to obtain additional funding and our ability to obtain future funding on acceptable terms; |
| | • | | management compensation and the methodology for its determination; |
| | • | | our ability to stay abreast of new or modified laws and regulations that currently apply or become applicable to our business both in the United States and internationally; and |
| | • | | the estimates and estimate methodologies used in preparing our consolidated financial statements and determining option exercise prices. |
We caution you that the foregoing list may not contain all of the forward-looking statements made in this Annual Report on Form 10-K.
You should not rely upon forward-looking statements as projections of future events. We have based the forward-looking statements contained in this Annual Report on Form 10-K primarily on our current expectations and projections about future events and trends that we believe may affect our business, financial condition, results of operations and prospects. The outcome of the events described in these forward-looking statements is subject to risks, uncertainties and other factors described in the section titled “Risk Factors” and elsewhere in this Annual Report on Form 10-K. Moreover, we operate
1
in a very competitive and rapidly changing environment. New risks and uncertainties emerge from time to time, and it is not possible for us to predict all risks and uncertainties that could have an impact on the forward-looking statements contained in this Annual Report on Form 10-K. We cannot assure you that the results, events and circumstances reflected in the forward-looking statements will be achieved or occur, and actual results, events or circumstances could differ materially from those described in the forward-looking statements.
The forward-looking statements made in this Annual Report on Form 10-K relate only to events as of the date on which the statements are made. We undertake no obligation to update any forward-looking statements made in this Annual Report on Form 10-K to reflect events or circumstances after the date of this Annual Report on Form 10-K or to reflect new information or the occurrence of unanticipated events, except as required by law. We may not actually achieve the plans, intentions or expectations disclosed in our forward-looking statements and you should not place undue reliance on our forward-looking statements. Our forward-looking statements do not reflect the potential impact of any future acquisitions, mergers, dispositions, joint ventures or investments we may make.
Item 1. Business
Overview
We have developed an innovative solution that delivers pervasive and dynamic intelligent visibility of traffic across networks. Our solution, which we refer to as our Traffic Visibility Fabric, consists of distributed network appliances that enable an advanced level of visibility, modification and control of network traffic. Our Fabric enables IT organizations to forward traffic from network and server infrastructure to management, analysis, compliance and security tools in a manner that is optimized for specific uses or functions. Our patented Flow Mapping™ technology identifies and directs incoming traffic to single or multiple tools based on user-defined rules that can be managed from a centralized management console. Our GigaSMART platform extends the value and intelligence of the Fabric by providing a range of software applications to modify, manipulate, transform, filter, correlate and sample packets. Our Fabric is designed to help organizations optimize the reliability, performance and security of their physical and virtual network infrastructure, minimize capital investment in management, analysis, compliance and security tools, reduce operating expenses and realize greater value from existing tools that are deployed throughout their networks.
Virtualization and cloud computing, mobility, big data and software-defined networking are reshaping the way enterprises and service providers operate and the way people communicate over IP networks in an increasingly connected world. As these forces combine to enable significant benefits to be realized from IT innovation, they also create major challenges in how enterprises and service providers design, operate and manage their networks. As a result, organizations increasingly require enhanced visibility and control of their networks through the efficient collection and analysis of network traffic flows without degrading network performance or reliability. These challenges have forced organizations to deploy a range of traditional approaches and related network hardware, which are costly and can often lead to increased operational complexity without delivering the intelligent filtering capabilities required in the management of network infrastructure. Our Fabric provides the pervasive and dynamic intelligent visibility and control over network traffic, including voice, video and data, that organizations need to successfully manage, analyze and secure their environments. We believe that the market opportunity for this type of solution is large, commensurate with the significant expenditures that enterprises and service providers have and will continue to make deploying network management, analysis, compliance and security tools and hardware.
Our Traffic Visibility Fabric is deployed by enterprises and service providers as a highly scalable infrastructure layer that typically operates “out of band,” or in parallel to, the production network that is
2
supporting primary business activities, and facilitates the transmission of network traffic between the network infrastructure and one or more network management, analysis, compliance or security tools. Our Traffic Visibility Fabric is deployed through our GigaVUE family of products. GigaVUE products are both purpose-built physical appliances that are integrated with our proprietary software, and also an increasing breadth of software-only products. Our products enable our end-user customers to design Traffic Visibility Fabric architectures optimized for a range of scale and performance requirements from 1 Gigabit appliances to multi-Terabit chassis-based solutions. The majority of our GigaVUE products are modular and extensible, enabling our Fabric to be deployed on any size network and to scale as the network grows.
We were founded in 2004 with a vision of developing a new approach to providing visibility and control over monitored network traffic that would enable enterprises and service providers to significantly improve the performance, availability and value of the increasing breadth of tools designed to manage, analyze and secure networks. In 2005, we introduced our patented Flow Mapping technology in combination with the launch of our first product, the GigaVUE-MP. In 2010, we introduced our GigaSMART platform to support advanced packet modification applications, and have since introduced 12 licensable applications including De-Duplication, Tunneling, Advanced Packet Filtering, FlowVUE, GTP Correlation and NetFlow Generation. We have also continued to expand our Fabric Node portfolio including adding the GigaVUE H Series chassis, the first Terabit scale Traffic Visibility Fabric for high-throughput environments, which we launched in 2011. In 2012, we introduced GigaVUE-VM, a software-only version of our platform for virtualized and cloud-based applications, and GigaVUE-FM, our software-only management offering. In 2013, we introduced the GigaVUE-HB1 platform, which incorporates GigaSMART as standard, to extend the reach of the Traffic Visibility Fabric to smaller environments and mid-size enterprises, and several new software applications, including Adaptive Packet Filtering (content-based filtering), FlowVUE and GTP Correlation (subscriber-based sampling).
We sell our products directly through our own sales force and indirectly through our channel partners. As of December 28, 2013, our end-user customers included 66 of the Fortune 100 and we had sold products to over 1,300 end-user customers across many vertical markets.
We have experienced significant growth since our inception in 2004. Our revenue increased from $68.1 million in fiscal 2011 to $140.3 million in fiscal 2013, representing a compound annual growth rate, or CAGR, of 44%. We reported a net loss of $9.5 million in fiscal 2013 and net income of $7.5 million and $16.9 million in fiscal 2012 and 2011, respectively. Our net loss in fiscal 2013 included a one-time cash charge of $20.4 million relating to performance units payments as a result of our initial public offering, or IPO, in June 2013. We generated cash from operations of $23.3 million, $27.7 million and $21.6 million in fiscal 2013, 2012 and 2011, respectively. We operate as a single reportable segment.
Our Solution
We have developed a new and innovative solution that delivers pervasive and dynamic intelligent visibility and control of traffic across networks. Our Traffic Visibility Fabric consists of distributed network appliances that provide an advanced level of network traffic intelligence including proprietary traffic selection, forwarding, manipulation, modification, de-duplication, correlation and sampling capabilities. Our solution enables IT organizations to forward traffic from network infrastructure to management, analysis, compliance and security tools in a manner that is optimized for specific uses, functions or locations. At the heart of the Fabric is our patented Flow Mapping™ technology that identifies and directs incoming traffic to single or multiple tools based on user-defined rules implemented in the Fabric appliances or by a centralized management console. This capability is further extended and enhanced by our GigaSMART platform, which provides a range of software
3
applications to modify, manipulate, transform, filter, correlate and sample packets. Our Fabric helps organizations improve the efficiency, reliability, performance and security of their network infrastructure, minimize capital investment in management, analysis, compliance and security tools, reduce operating expenses and realize greater value from the existing tools that are deployed throughout their networks.
We offer both purpose-built physical appliances that are integrated with our proprietary software, in addition to a range of software products that enable our end-user customers to design Traffic Visibility Fabric architectures optimized for a range of scale and performance requirements from 1 Gigabit appliances to multi-Terabit chassis-based solutions in both physical and virtual environments. Our GigaVUE products are modular and extensible, enabling our Fabric to be deployed on networks of any size and to scale as the network grows. The key benefits of our solution are:
| | • | | Providing Pervasive Visibility and Control. Our Fabric inspects and intelligently filters data packets from concurrent traffic streams in accordance with a set of user-defined criteria before delivering the traffic to management, analysis, compliance and security tools. This provides IT organizations with pervasive visibility and intelligent control over how traffic flows from the network to management, analysis, compliance and security tools, and what modification or manipulation of the traffic is required to improve the performance and efficiency of the management, analysis, compliance or security tools. |
| | • | | Enabling Rapid Response to Dynamic Change. Our Fabric significantly improves network flexibility by enabling static tools to connect to virtualized applications, dynamic infrastructure and mobile machines, which allows our end-user customers to efficiently and securely address their business needs. Our Fabric is designed to have full interoperability with a broad range of tools, allowing IT organizations maximum architectural flexibility in the design, modification and evolution of their infrastructure. |
| | • | | Delivering Scalable, High-Throughput Capacity. Our Fabric provides increased visibility and intelligent traffic filtering without impeding the delivery of traffic to management, analysis, compliance or security tools. At the top end of our GigaVUE family of products, we offer modular chassis products that deliver multi-Terabit performance enabling the Fabric to effectively extend to networks of significant scale and performance requirements. |
| | • | | Improving Network Efficiency and Economy. Our Fabric improves the longevity and associated return on investment of existing tools by both obviating their need to examine all network traffic and increasing their network coverage. Our Fabric mitigates the need to purchase more tools or to upgrade older tools to accommodate network growth. Our solution reduces capital and operating costs by decreasing the necessary outlays associated with new or more advanced tools, limiting the infrastructure footprints in space-constrained data centers and curtailing the staff required to monitor and maintain the network. |
| | • | | Enhancing Network Reliability. By reducing the need for tools to process non-relevant traffic, which can lead to dropped packets and compromised analysis, our Fabric increases the reliability of attached tools and the associated management of critical business processes running on production networks. In addition, because our Fabric is deployed “out of band,” modifications to the configuration of the Traffic Visibility Fabric do not require network downtime while changes are implemented, which helps organizations achieve or maintain 99.999% uptime. |
| | • | | Ease of Deployment and Use. We have designed our Fabric to be easy to install, configure and maintain. Our Fabric can be composed of a single appliance or multiple appliances controlled locally or remotely from a simple centralized interface, enabling our end-user customers to reduce management and maintenance of unmanned, or dark, data centers. |
4
Growth Strategy
Our goal is to continue to develop the nascent market for network traffic visibility solutions, extend our market leadership position and support the ongoing adoption of our innovative Traffic Visibility Fabric by enterprises and service providers. Key elements of our growth strategy include:
| | • | | Continuous Innovation. We intend to enhance the functionality and scalability of our Fabric to address new use cases, tool capabilities, deployment environments, performance levels and the drive for greater software definition of network infrastructure. We will continue to invest in our technology to maintain our competitive advantage and market leadership, and we will build on our consistent track record of technical innovation. For example, in 2011, we became the first to market with a 1 Terabit chassis Traffic Visibility Fabric solution, the GigaVUE H Series; in 2012, we launched our first 100 Gigabit connectivity solution as well as our GigaVUE-VM and GigaVUE-FM products; in 2013, we launched our GigaVUE-HB1 platform for smaller environments and mid-size enterprises, and several new software applications, including Adaptive Packet Filtering (content-based filtering), FlowVUE and GTP Correlation (subscriber-based sampling). |
| | • | | Increase Awareness of Our Value Proposition. We believe awareness of the value proposition of our Traffic Visibility Fabric and its technological capabilities in this emerging market is critical to our success and will help us grow our business and market opportunity. We plan to invest in our brand and develop awareness of the benefits of our Fabric by expanding our presence online and at major trade events, extending our relationship with industry analysts and increasing investment in our channel-partner marketing efforts. |
| | • | | Expand Our Relationships with Existing End-User Customers. We have over 1,300 end-user customers and intend to increase the depth of these existing relationships by offering new products that help them increase the value of their new and existing management, analysis, compliance and security tools, adopt virtualization and cloud technologies and efficiently scale their network environments. |
| | • | | Invest in our Global Distribution Network. Our sales and marketing strategy consists of a hybrid, two-tier sales model that combines a high-touch direct sales force with fulfillment handled by active channel partners that distribute or resell our products. We will continue to invest in our sales and marketing strategy both domestically and internationally to further strengthen our existing relationships with channel partners and expand our network by adding new channel partners to target new end-user customers and broaden our reach, with specific focus on increasing international sales in the near term and building greater awareness of our Traffic Visibility Fabric. |
Technology
Our Traffic Visibility Fabric combines purpose-built hardware with proprietary software that together provide an advanced level of network traffic intelligence, including proprietary traffic selection, forwarding, manipulation, modification, de-duplication, correlation and sampling capabilities. We design physical appliances based upon a combination of commercially available hardware components, processing resources and storage devices. The vast majority of our intellectual property is found in our proprietary software that provides the full benefits of our Fabric including centralized control over our appliance, through both a powerful Command-Line Interface, or CLI, a web enabled Graphic User Interface, or GUI, and GigaVUE-FM, our multi-node Fabric management system.
We have developed our Fabric to provide our end-user customers with a solution to not only meet the immediate demands of today’s network architecture, but also to provide the flexibility to meet
5
the performance demands of future network architecture as scale and complexity increases. The core technology of our solution leverages the following primary elements:
| | • | | Traffic Control. At the core of our Fabric is our patented traffic selection and filtering technology called Flow Mapping™. Flow Mapping allows incoming traffic to be forwarded to single or multiple egress ports based on a set of user-defined map rules. Each map rule consists of a combination of packet selection criteria that can include certain protocol fields or packet “bit patterns” in ISO layer 2, 3 or 4 of the packet, and a required action to be performed on the packet. This allows the replication of traffic to a second destination, or egress port, even though the traffic has been selected and forwarded to another egress port. Actions can include the forwarding of the packet, across the Fabric, the duplication of the packet or, in some cases, the intentional discarding of the packet. The Fabric, and the associated appliances, can support many complex and concurrent maps that execute when ingress traffic is received into any port on the Fabric. One primary value of Flow Mapping is that it enables management and analysis tools that have lower packet processing capacity to monitor higher bandwidth network connections through the intelligent selection of the traffic that is forwarded to the tool. For example, a 10 Gigabit network can be monitored by a collection of 1 Gigabit tools through the segregation of traffic based upon a range of criteria and forwarding of traffic to different tools depending on those criteria. |
We also offer additional traffic control technology via our GigaStream products that provide a traffic-distribution capability enabling traffic to be spread across a number of egress ports based on an operator-selected distribution algorithm. There are two primary GigaStream products: Stack GigaStream that distributes traffic across an intra-Fabric connection between two appliances, allowing multiple 10 Gigabit connections to be bundled to form a single higher bandwidth stacking connection; and Tool GigaStream that allows traffic to be distributed across a number of tools. Furthermore, an inter-site traffic ‘tunneling’ capability is available to allow traffic to be captured at a remote location, and then tunneled to a central location for analysis, inspection and/or monitoring.
| | • | | Packet Modification and Transformation. Our GigaSMART packet processing technology extends the intelligence and value of the Traffic Visibility Fabric by allowing packets to be modified during transit through the Fabric. The modifications include: |
| | ¡ | | Packet Slicing reduces the size of a packet by eliminating trailing packet components that are not relevant to the management analysis, compliance or security tool. |
| | ¡ | | Source Port Labeling adds labels to packets to enable the easy identification of the associated ingress port. |
| | ¡ | | Masking allows for specific portions of the network packet to be replaced or modified, thus masking the contents from any tools or employees reviewing or analyzing the traffic. With the increasing focus and compliance demand for credit card and personal records to be protected, masking allows for sensitive data to be protected while still allowing for full analysis to be undertaken. |
| | ¡ | | Tunneling encapsulates and forwards packets to monitoring tools between networks on separate routed paths, enabling routing of traffic from ‘lights-out’ facilities to centralized monitoring locations. |
| | ¡ | | Header Stripping enables third-party proprietary packet headers (such as Cisco FabricPath, VXLAN, GTP-U) to be removed from each individual packet for tools that are unable to interpret these format headers so that the packets can be appropriately processed by the tools. Furthermore, GigaSMART has the ability to replace removed headers with non-proprietary fields to enable subsequent analysis by network tools. |
6
| | ¡ | | Time stamping adds a precise time measurement to a packet, which is an essential traffic characteristic required for successful latency measurement and analysis, and together with ingress port labeling, allows a permanent record to be added to packet as it arrives at a specific GigaVUE appliance in the Fabric, enabling deeper analysis by network tools. |
| | ¡ | | Adaptive Packet Filtering provides enhanced visibility into tunneled, encapsulated traffic flows such as those deployed in virtualized environments, using flexible pattern-matching regular expression filters to make routing decisions based on application-level packet content, and not just packet headers. |
| | • | | Traffic Intelligence. Our GigaSMART packet processing technology also extends the intelligence and value of the Traffic Visibility Fabric by offering a range of traffic intelligence applications that operate at the flow, or session level, above the level of individual packets, and require advanced correlation capabilities to enable packet de-duplication and to correlate traffic flows to specific users and applications, providing enhanced visibility into the control and data plane traffic flows. These applications include: |
| | ¡ | | Packet De-Duplication establishes a time window during which any duplicates of a packet that ingress the Fabric are discarded. By eliminating packets not relevant to the analysis being completed, an organization can significantly reduce wasted bandwidth, storage capacity and associated tool processing resources. |
| | ¡ | | GTP Correlationreliably correlates subscriber sessions (control and data) to increase analytics accuracy, enable reliable accounting, billing and subscriber management, improve end user quality of experience, and proactively identify service-affecting issues in 3G/4G/LTE mobile service provider environments. |
| | ¡ | | FlowVUE provides flow-aware sampling of active subscriber devices to selectively reduce the volume of traffic delivered to monitoring and analytic tools without negatively impacting the quality of the resulting analysis. Network operators can use this application to enhance end-users’ quality of experience, optimize pricing strategies based subscriber usage patterns and extend the life of existing tools. |
| | ¡ | | NetFlow Generationimproves both the performance of the production network, and the volume, quality and availability of accurate NetFlow data delivered to the tools, by offloading NetFlow Generation from the production network switches and routers and generating NetFlow data directly from the Traffic Visibility Fabric. |
Our GigaSMART technology is tightly integrated into the Flow Mapping capability allowing for a specific subset of the incoming traffic to be selected for additional processing and modification. We intend to expand the number of GigaSMART applications and packet modifications over time as increasing traffic volumes will demand greater functionality within the Fabric.
| | • | | Fabric Performance. Our appliances are designed around a core of packet-forwarding hardware components. When forwarding traffic through the Fabric and depending upon the configuration, topology and requirements, packets can move from an ingress network port to an egress tool port at line rate through the hardware even when complex selection and filtering is applied during the transit process. Our GigaVUE products support packet ingress and egress at speeds of 10 Megabit, 100 Megabit, 1 Gigabit, 10 Gigabit, 40 Gigabit and 100 Gigabit concurrently, and the GigaVUE H Series have a back-plane design allowing concurrent traffic packet transfer from any line card to any other line card at multi-Terabit performance. |
7
Our GigaVUE products are designed with failover protection mechanisms that include dual power-supplies and dual fan trays, and our GigaVUE H Series utilizes back-to-front airflow to comply with data center cooling design requirements.
| | • | | Fabric Scalability. Our proprietary software provides the foundation by which multiple appliances in the Fabric can be combined to form a larger scale deployment while maintaining line rate processing performance of traffic flowing through the Fabric. Traffic can enter at an ingress port on one of our appliances and be forwarded to one or more egress ports on the Fabric. Our software allows a master-subordinate control architecture to be configured, where one Fabric appliance is designated as the “master” and all other appliances assume the role of “subordinate.” The Fabric can be configured and managed by the operator through the “master” using either a CLI, or via the web-enabled GUI, or via GigaVUE-FM, our Fabric management system. This architecture assures the ability to add additional subordinates, or appliances, in order to scale the Fabric, without needing complex configuration changes. |
| | • | | Access and Reporting. Our Fabric provides granular access controls that can be applied to support compliance with applicable regulations such as the Sarbanes-Oxley Act of 2002, or the Sarbanes-Oxley Act. Our solution enables network segmentation, segregation of duties, auditing of network activities and the tracking of access rights and privileges associated with individual users. |
Products
Our GigaVUE product family provides end-user customers with multiple performance and port density configurations in order to establish a Traffic Visibility Fabric optimized for a range of size and performance requirements. Our appliances range from single rack unit appliances to modular multi-slot chassis that accommodates a range of our line cards.
The GigaVUE product family is comprised of the G Series family, the higher density and higher performance H Series family, the Virtual Machine, or VM, and the Fabric Manager, or FM, products. The G Series and the H Series product lines are comprised of purpose-built hardware running our proprietary software while the VM and FM product lines are software-only products. Both the G and H Series incorporate our patented Flow Mapping technology and can be used to either establish a visibility fabric as standalone appliances or to create a multi-appliance fabric architecture. These two Series also support our optional GigaSMART hardware and software technology. Although many of our end-user customers’ need for a visibility fabric can be satisfied by our G Series appliances as standalone solutions, an increasing number of our end-user customers are seeking higher density, higher capacity solutions as the breadth of the Fabric started to span higher-scale and higher-bandwidth environments. As a result, we developed the H Series.
| | • | | The G Series. The GigaVUE G Series was introduced in 2005. The series is comprised of a range of purpose-built, small form-factor traffic visibility appliances with some having network equipment building systems, or NEBS, certification based on compliance guidelines regarding power management, electrical shielding, disaster preparation and hardware interfaces aimed at ensuring network integrity. The complete G Series has achieved the industry recognized Common Criteria EAL2 certification, by achieving a set of common security assurance requirements involving design documentation, design analysis, functional testing or penetration testing based on an international security standard in effect since 1999. Each chassis is modular, providing support for optional line cards (port modules), TAP modules or advanced traffic manipulation or modification blades (the GigaSMART and GigaSECURE modules). The optional GigaSMART card offers de-duplication, tunneling, masking, slicing, time stamping and header stripping capabilities that are enabled through software licenses. Our GigaSMART technology was introduced in 2010 and improves the efficiency of attached |
8
| | network management, analysis, compliance and security tools by off-loading certain processing-intense functions. Our GigaSECURE products were introduced in 2011 and provide in-line packet distribution specifically designed for use with security-based tools such as Intrusion Prevention Systems, or IPS. The GigaSECURE products are designed to support two-way traffic communications and provide “bypass” protection allowing packets to be distributed to multiple IPS devices where they are screened, and then aggregated back together for entry back to the network. These appliances are frequently deployed in 10 Gigabit networks that need to be protected by lower-cost 1 Gigabit tools. Based on the feedback from our end-user customers and our own analysis of competing solutions, we believe that avoiding the need to purchase high cost 10 Gigabit IPS tools more than offsets the cost to our end-user customers of purchasing the GigaVUE and GigaSECURE products. The GigaSECURE products are available in both blade and standalone configurations. |
The following table sets forth our G Series products:
| | • | | The H Series. The GigaVUE H Series was introduced in 2011 and utilizes a robust Linux-based operating platform enabling high-density, high-scale configurations. The series includes both large blade-based modular chassis products as well as fixed-configuration appliances. One member of this family, the GigaVUE-TA1 is a high-density fixed configuration product specifically designed to cost-effectively aggregate 10 Gigabit traffic links together. Our modular appliances share control and line cards providing flexibility across systems. Line cards come in multiple variants including a range of physical media (copper and fiber optic), a range of connection speeds from 1 Gigabit to 100 Gigabit, and a GigaSMART processing blade. The H Series support hundreds of network port connections and multiple appliances that can be clustered together creating a fabric of more than a thousand network and tool connections. With the backplane capacity of the GigaVUE-HD8 exceeding 2 Terabits, a recent line card addition to the family has delivered 100 Gigabit connectivity on a single card. We also recently introduced the GigaVUE-HB1 platform, a small form-factor fabric node that can extend traffic visibility to more remote portions of the network and provide the Traffic Visibility Fabric solutions to smaller environments and mid-size enterprises. |
9
The following table sets forth our H Series products:
The following tables set forth the H Series line cards that are designed to work with both the GigaVUE-HD8 and GigaVUE-HD4 modular chassis products:

10
| | • | | The GigaVUE-VM Virtual Machine. The GigaVUE-VM software was released in 2012 and allows our end-user customers to deploy our Fabric within virtual and cloud-based environments. This software-only product is installed on servers running VMware’s operating system, and provides intelligent selection, filtering and forwarding of traffic from within a server to an external GigaVUE appliance. |
With the rise in the adoption of virtualization and cloud-based solutions, network traffic that currently crosses physical network switches as it travels from server to server may, in a virtualized environment, never physically leave a single server as virtualization allows for many ‘virtual servers’ to run within one physical server. GigaVUE-VM resides within the server and is able to extract traffic that matches the filtering criteria and forward it to the physical Fabric for delivery to management, analysis and security tools.
GigaVUE-VM is sold as a licensed product, and customers can buy packs of 5, 10, 50, 100 and 250 licenses (where each license allows for the installation of one GigaVUE-VM instance).
| | • | | The GigaVUE-FM Fabric Manager. The GigaVUE-FM software was released in 2012 and provides a central management point for the GigaVUE G Series, H Series and VM products. The GigaVUE-FM allows our end-user customers to update the proprietary software running on their deployed G Series and the H Series platforms while also capturing the configuration of the GigaVUE products in a central repository. The GigaVUE-FM also provides a GUI to configure the GigaVUE-VM software products that are deployed on servers within our end-user customer’s infrastructure. |
GigaVUE-FM is sold as a licensed product that can manage up to 100 or up to 250 discrete physical GigaVUE Fabric appliances.
To complement the G Series, H Series, GigaVUE-VM and GigaVUE-FM products, we offer a range of supplemental components and accessories including modules, cables and transceivers. The GigaTAP products provide a range of traditional network TAPs to allow our end-user customers to feed traffic into the Visibility Fabric. The GigaTAP products were introduced in July 2005 and can be integrated into the GigaVUE products or provided as standalone offerings. Other complementary products include transceivers, including a variety of form factors—SFP, SFP+, and QSFP+.
11
Customer Support
We offer ongoing technical support with our hardware and software products, including those sold directly to our end-user customers and through our channel partners. Our primary support offering, SupportCARE, provides two-tiered support levels, including premium-level support coverage. Certain channel partners offer their own additional support services to the end-user customer and then rely on our support organization for more complex support requests. We offer our end-user customers ongoing maintenance services for both hardware and software, which enables them to receive ongoing software updates, upgrades, bug fixes and repairs. These services are sold to end-user customers typically for one-year terms at the time of the initial product sale, and customers may choose to renew for successive annual or multi-year periods. We also provide end-user customers with expedited replacement for any defective hardware. All of our hardware products are sold with a limited 5-year warranty service.
We offer DesignCARE in the North America region through Interlink Communications Systems, Inc., or Interlink, one of our distributors, which provides end-user customers with professional services that range from the architectural design of a Traffic Visibility Fabric for their customized requirements to the complete implementation and configuration of GigaVUE appliances across multiple locations. Our support personnel are based in Milpitas, California, Bracknell, United Kingdom, and Hong Kong. As we expand internationally, we expect to continue to hire additional support personnel to service our global customer base.
End-User Customers
As of December 28, 2013, we had over 1,300 end-user customers, including 66 of the Fortune 100. Our Fabric can be used in a broad range of applications and has been adopted across many vertical markets including finance, high-speed trading, insurance, healthcare, higher education, government, e-commerce, technology, telecom and service providers.
Sales and Marketing
We sell our products through a network of channel partners and our direct sales force. We do not grant a general right of return or any refund terms to our channel partners, except to two of our North American distributors that have a general right of return. For these distributors, we defer revenue recognition from product sales until sell-through to end-user customers has occurred.
We market and sell our products through a hybrid sales model, which combines a high-touch sales organization and an overlay channel sales team that actively assists our extensive network of channel partners throughout the sales process. We also provide our channel partners with marketing assistance, technical training and support. Our direct sales teams are typically comprised of a combination of one or more field sales representatives and a systems engineer. These teams also have access to a pool of shared inside sales and telemarketing representatives. Each sales team is responsible for a geographical territory, has responsibility for a number of major direct end-user customer accounts or has assigned accounts in a specific vertical market.
Our demand generation activities are focused primarily on Fortune 1000 organizations, large service providers and large and mid-sized enterprises where we continue to see increased demand for our Traffic Visibility Fabric. We also focus on ongoing account management for existing end-user customers and the development of follow-on sales as our existing end-user customers continue to expand and enhance their network infrastructure, increasing their demand for our Fabric. The majority of our North American sales are fulfilled by two of our existing channel partners, Arrow Enterprise Computing Solutions, Inc., or Arrow, which we engaged as a distributor in February 2013, and Interlink.
12
For fiscal 2013, 2012 and 2011, Interlink accounted for 51%, 63% and 37% of our revenue, respectively. Sales to Interlink are subject to an agreement between the parties which provides for an initial term of one year, one year renewal terms and permits termination by either party with 60 days written notice prior to the renewal date. No other channel partner represented more than 10% of our revenue in 2013.
To access potential end-user customers worldwide, our direct sales force is distributed across our offices in California, New York, Virginia, the United Kingdom, Russia, Singapore, Hong Kong, Japan, China and through a localized presence in many countries. We are increasingly focused on building our sales presence outside of the United States.
Our marketing strategy is focused on increasing the awareness of, and driving end-user customer demand for, our Traffic Visibility Fabric. We execute on this strategy by leveraging a combination of internal marketing professionals, external marketing agencies and a network of channel partners to effectively communicate the value proposition, differentiation and advantages of our Traffic Visibility Fabric, thereby generating qualified leads for our sales force and channel partners. We focus our resources on a variety of marketing vehicles, including trade shows, advertising, content syndication, public relations, industry research, our website and collaborative relationships with technology vendors.
For additional information about revenue and assets by geographic region, refer to Note 12 to Consolidated Financial Statements included in Part II, Item 8 of this Annual Report on Form 10-K.
Backlog
Products are shipped and billed shortly after receipt of an order. We do not believe that our product backlog at any particular time is meaningful because it is not necessarily indicative of future revenue in any given period as such orders may be rescheduled or cancelled by our partners, or end-user customers, without penalty prior to shipment. Additionally, the majority of our product revenue comes from orders that are received and shipped in the same quarter. Orders for services are billed shortly after receipt of an order and are included in deferred revenue. Timing of revenue recognition for services may vary depending on the contractual service period or when the services are rendered.
Technology Partners
We have ongoing non-exclusive relationships with a number of leading vendors of network management, analysis, compliance and security tools, including arrangements with CA Technologies, Inc., Compuware Corporation, Imperva, Inc., Riverbed Technology, Inc., Empirix Inc., Vistapointe Inc., FireEye, Inc., Palo Alto Networks, Inc., and SourceFire, Inc. (acquired by Cisco Systems, Inc.), some of which include the joint development of use-case and reference architectures that enhance the performance and efficiency of the end-user customer’s network. We expect to continue adding more technology partners and to publish joint case studies with these partners following end-user deployment and approval. In addition to joint development of reference designs and case studies, we have undertaken various joint-marketing activities and events to drive interest and awareness of the combined solution as well as the Visibility Fabric itself. As our Fabric helps optimize the efficiency of our tool partners’ management, analysis, compliance and security tools, we believe these vendors improve awareness at end-user customers of our Fabric and create new deployment opportunities.
Research and Development
We believe continued investment in research and development is critical to our business. Our research and development efforts focus on improving and enhancing our existing products and
13
services, as well as developing new products, features and functionality. We believe that our proprietary software is critical to expanding our leadership position within the traffic visibility market. As a result, we devote the majority of our research and development resources to software development. Our engineering team has deep expertise in key areas related to our research and development efforts, including network analysis and management technologies, network protocol and Ethernet system design. We work closely with our end-user customers to understand their current and future needs and have designed a product development process that captures and integrates feedback from our end-user customers.
We believe the timely development of new products is essential to maintaining our competitive position. As of December 28, 2013, we had 122 employees in our research and development organization, substantially all of whom were located at our headquarters in California. We also test our products to certify and ensure interoperability with third-party hardware and software products. We plan to prioritize and dedicate significant resources to these continued research and development efforts.
Our research and development expenses were $42.1 million, or 30% of our revenue, in fiscal 2013, $17.7 million, or 18% of our revenue, in fiscal 2012, and $12.5 million, or 18% of our revenue, in fiscal 2011. Stock-based compensation of $11.5 million, $0.1 million and zero was included in our research and development expenses in fiscal 2013, 2012 and 2011, respectively. In fiscal 2013, our research and development expenses also included a $5.2 million expense related to our performance units which we recorded upon the completion of our IPO in June 2013.
Manufacturing and Suppliers
We outsource the manufacturing, systems assembly, testing and order fulfillment of our hardware products to Jabil Circuit, Inc., or Jabil. We utilize components from many suppliers. Whenever possible, we strive to have multiple sources for these components to ensure continuous supply. However, we have limited sources of supply for certain components that are technically unique or in high demand, and we have not entered into supply agreements with many of these suppliers. In such cases, we seek to maintain a close direct relationship with the suppliers to ensure supply is adequate and that the components meet our quality requirements. In certain instances, we have entered into license agreements with sole-source suppliers, allowing us to incorporate certain of their components into our hardware products.
We entered into a manufacturing services agreement with Jabil in April 2013, pursuant to which Jabil manufactures, tests, configures, assembles, packages and ships our products. The initial term is one year, with the term automatically renewing for additional one-year terms, unless terminated by either party by giving at least six months written notice before the end of the then-current term. In addition, either party may terminate the agreement (i) for convenience upon nine months written notice by Jabil or six months written notice by us, (ii) for cause upon written notice of a material breach and if the other party does not cure such breach within 30 days of such notice, (iii) immediately upon the bankruptcy or insolvency of the other party, or (iv) upon a change of control of either party, subject to applicable notice periods.
Additionally, we have entered into a license and services agreement with Tall Maple Systems, Inc., or Tall Maple, pursuant to which we have been granted a perpetual, non-exclusive, worldwide license to certain software code of Tall Maple which we integrate into the software component of our H Series products and which can be integrated into our other products and applications. In return, we agreed to pay Tall Maple a license fee. The agreement can only be terminated for cause upon written notice of a material breach and if the other party does not cure such breach within 30 days of such notice.
14
Competition
The markets in which we compete are highly competitive. We expect competition to intensify in the future as existing competitors bundle new and more competitive offerings with their existing products and services, and as new market entrants introduce new products into our markets.
We compete either directly or indirectly with Ethernet switch vendors, such as Cisco Systems, Inc., Juniper Networks, Inc., Brocade Communications Systems, Inc. and Arista Networks, Inc., and network management, analysis, compliance and security tool vendors that offer point solutions that address a portion of the issues that we solve. In the future, we expect to compete with new market entrants, which may include our joint-development partners or other current technology partners.
The principal competitive factors applicable to our products include:
| | • | | functionality and performance; |
| | • | | price and total cost of ownership; |
| | • | | flexibility and scalability of deployment; |
| | • | | product reliability and quality; |
| | • | | interoperability with other products; |
| | • | | the extent and speed of user adoption; and |
| | • | | quality of service, support and fulfillment. |
Although we believe that we compete favorably with respect to the above factors, we believe that other competitors will emerge that may have greater name recognition, longer operating histories, well-established relationships with end-user customers or channel partners in our markets, broader product portfolios and the ability to bundle competitive offerings with other products and services, larger intellectual property portfolios and substantially greater financial, technical, personnel and other resources than we have. We expect competition and competitive pressure, from both new and existing competitors, to increase in the future.
Intellectual Property
To protect our intellectual property, we rely primarily on patent, trademark, copyright and trade secret laws. As of December 28, 2013, we had 15 issued patents that expire between 2025 and 2031, 28 pending patent applications in the United States and five corresponding Patent Cooperation Treaty patent applications. The claims for which we have sought patent protection relate primarily to system architecture, traffic visibility technology, traffic control and management, and filtering technology we have developed. We also license software from third parties for integration into our products, including open source software and other commercially available software.
As part of our strategy to protect our proprietary technologies and our intellectual property rights from unauthorized parties that may attempt to copy aspects of our products or obtain and use our trade secrets or other confidential information, we generally enter into confidentiality agreements with our employees, consultants, channel partners and end-user customers, and generally limit access to and distribution of our proprietary information and proprietary technology.
15
Employees
As of December 28, 2013, our total headcount was 352 employees, including 122 in research and development, 164 in sales and marketing, 26 in manufacturing and support and 40 in general and administrative activities. None of our employees is represented by a labor union or is a party to any collective bargaining arrangement in connection with his or her employment with us. We have never experienced any work stoppages, and we consider our relations with our employees to be good.
Conversion to a Corporation
On May 31, 2013, we converted from a Delaware limited liability company into a Delaware corporation and changed our name from Gigamon LLC to Gigamon Inc. In connection with the conversion, all of our outstanding common units and preferred units converted into shares of common stock and preferred stock, respectively. Further, in connection with the conversion, Gigamon Systems LLC, the prior holder of all of our outstanding common equity interests, exchanged all of the interests that it held in us for our common stock and was liquidated. In connection with this equity exchange, all outstanding options to purchase shares in Gigamon Systems LLC were substituted for options to purchase common stock in Gigamon Inc. Also, certain entities affiliated with Highland Capital Partners that held shares of our preferred stock were merged with and into us, and certain entities affiliated with Highland Capital Partners received our preferred stock in exchange for their respective equity interests. In connection with our IPO, all of our preferred stock converted into common stock.
In this Annual Report on Form 10-K, we refer to all of the transactions related to our conversion to a corporation, and the equity exchange and mergers described above, as the “LLC Conversion.”
Corporate Background and Information
Our business was founded in 2004 and originally operated by a California limited liability company, Gigamon Systems LLC. In January 2009, Gigamon Systems LLC contributed substantially all of its assets and certain of its liabilities to us in exchange for all of our common stock. In January 2010, entities affiliated with Highland Capital Partners invested in our company through the purchase of our preferred stock. On May 31, 2013, we converted from a Delaware limited liability company into a Delaware corporation and changed our name from Gigamon LLC to Gigamon Inc., pursuant to the LLC Conversion described above.
Our principal executive offices are located at 3300 Olcott Street, Santa Clara, California 95054, and our telephone number is (408) 831-4000. Our website address is www.gigamon.com. We make available our Annual Report on Form 10-K, Quarterly Reports on Form 10-Q, Current Reports on Form 8-K, and any amendments to those reports filed or furnished pursuant to Section 13(a) or 15(d) of the Securities Exchange Act of 1934, as amended, or the Exchange Act, on the Investor section of our website as soon as reasonably practicable after they are electronically filed with or furnished to the Securities and Exchange Commission, or the SEC. All such filings are available free of charge. Information contained on, or that can be accessed through, our website, does not constitute part of this Annual Report on Form 10-K and the inclusion of our website address in this report is an inactive textual reference only.
16
Item 1A. Risk Factors
Investing in our common stock involves a high degree of risk. You should carefully consider the risks and uncertainties described below, together with all of the other information in this Annual Report on Form 10-K, before making a decision to invest in our common stock. The risks and uncertainties described below may not be the only ones we face. If any of the risks actually occur, our business, financial condition, operating results and prospects could be materially and adversely affected. In that event, the trading price of our common stock could decline, and you could lose part or all of your investment.
Risks Related to Our Business
The network traffic visibility market is rapidly evolving and difficult to predict. If the network traffic visibility market does not evolve as we anticipate or if our target end-user customers do not adopt our Traffic Visibility Fabric, our sales will not grow as quickly as anticipated and our stock price could decline.
We are in a new, rapidly evolving category within the network infrastructure industry that focuses on providing organizations with enhanced visibility and control over their networks through the efficient collection and analysis of network traffic. As such, it is difficult to predict important market trends, including how large the network traffic visibility market will be or when and what products end-user customers will adopt. For example, organizations that currently use traditional approaches may believe that these approaches already provide them with sufficient network traffic visibility. Therefore, they may continue spending their network infrastructure budgets on these products and may not adopt our Traffic Visibility Fabric in addition to or in lieu of such products.
If the market for network traffic visibility does not evolve in the way we anticipate, if organizations do not recognize the benefit our Traffic Visibility Fabric offers in addition to or in place of existing network traffic visibility products, or if we are unable to sell our family of products to end-user customers, then our revenue may not grow as expected or may decline, and our stock price could decline.
New or existing technologies that are perceived to address network traffic visibility or address the need for network traffic visibility in different ways could gain wide adoption and supplant our products, thereby weakening our sales and our financial results.
The introduction of products and services embodying new technologies could render our existing products obsolete or less attractive to end-user customers. Other network traffic visibility technologies exist and could be developed in the future, and our business could be materially negatively affected if such technologies are widely adopted. We may not be able to successfully anticipate or adapt to changing technology or customer requirements on a timely basis, or at all. If we fail to keep up with technological changes or to convince our end-user customers and potential end-user customers of the value of our solutions even in light of new technologies, our business, operating results and financial condition could be materially and adversely affected.
We are dependent on a single product family comprised of a limited number of products.
Our product offering is limited to a single product family comprised of our GigaVUE, GigaSECURE, GigaSMART and GigaTAP products. Historically, we have derived a substantial portion of our revenue from sales of our GigaVUE appliances and related services, and we expect to continue to derive a significant portion of our product revenue from sales of our GigaVUE appliances and related services for the foreseeable future. A decline in the price of these products and related services, whether due to competition or otherwise, or our inability to increase sales of these products, would
17
harm our business and operating results more seriously than it would if we derived significant revenue from a variety of product lines and services. GigaSECURE, GigaSMART, GigaTAP and related support services represent additional sources of revenue, however, collectively they accounted for a small portion of revenue in fiscal 2013 and 2012. We expect that this concentration of revenue from a single product family comprised of a limited number of products will continue for the foreseeable future. As a result, our future growth and financial performance will depend heavily on our ability to develop and sell enhanced versions of our GigaVUE appliances. If we fail to deliver product enhancements, new releases or new products that end-user customers want, it will be more difficult for us to succeed.
If we are unable to introduce new products successfully and to make enhancements to existing products, our growth rates would likely decline and our business, operating results and competitive position could suffer.
Our continued success depends on our ability to identify and develop new products and to enhance and improve our existing products, and the acceptance of those products by our existing and target end-user customers. Our growth would likely be adversely affected if:
| | • | | we fail to introduce these new products or product enhancements; |
| | • | | our new products or product enhancements are not timely introduced or do not function as expected; |
| | • | | we fail to successfully manage the transition to new products from the products they are replacing; |
| | • | | we do not invest our development efforts in appropriate products or enhancements for markets in which we now compete and expect to compete; |
| | • | | we fail to predict the demand for new products following their introduction to market; or |
| | • | | these new products or enhancements do not attain market acceptance. |
We invest substantial amounts of time and resources in researching and developing new products and enhancing existing products by incorporating additional features, improving functionality and adding other improvements to meet end-user customers’ rapidly evolving demands in our highly competitive industry. Our research and development expenses were $42.1 million, or 30% of our total revenue, in fiscal 2013, $17.7 million, or 18% of our total revenue, in fiscal 2012 and $12.5 million, or 18% of our total revenue, in fiscal 2011.
Our future plans contemplate significant investments in research and development and related product opportunities. We believe that we must continue to dedicate a significant amount of resources to our research and development efforts to maintain our competitive position. However, we often make these investments without being certain that they will result in products or enhancements that the markets will accept or that they will expand our share of those markets.
The introduction of new products or product enhancements may shorten the life cycle of our existing products, or replace sales of some of our current products, thereby offsetting the benefit of even a successful product introduction, and may cause end-user customers to defer purchasing our existing products in anticipation of the new products. This could harm our operating results by decreasing sales, increasing our inventory levels of older products and exposing us to greater risk of product obsolescence. We have also experienced, and may in the future experience, delays in developing and releasing new products and product enhancements. This has led to, and may in the future lead to, delayed sales, deferred revenue, increased expenses and lower than anticipated quarterly revenue. In addition, complexity and difficulties in managing product transitions at the end-of-life stage of a product can create excess inventory of components associated with the outgoing products that can lead to increased expenses. Any or all of the above problems could materially harm our business and operating results.
18
If we are unable to increase market awareness of our company and our products, our revenue may not continue to grow, or may decline.
The network traffic visibility market is nascent and we believe that we have not yet established broad market awareness of our products and services. Market awareness of our value proposition and products and services will be essential to our continued growth and our success, particularly for the service provider and large enterprise markets. If our marketing efforts are unsuccessful in creating market awareness of our company and our products and services, then our business, financial condition and operating results will be adversely affected, and we will not be able to achieve sustained growth.
Our quarterly and annual operating results may vary significantly and be difficult to predict, which may cause our stock price to fluctuate.
Our quarterly and annual operating results have varied historically from period to period, and we expect that they will continue to fluctuate due to a variety of factors, many of which are outside of our control, including:
| | • | | fluctuations in demand for our products and services, the timing of orders from our channel partners and end-user customers, and our ability to accurately forecast end-user customer demand; |
| | • | | the timing of shipments of products, which may depend on many factors such as inventory and logistics and our ability to ship new products on schedule and accurately forecast inventory requirements; |
| | • | | the budgeting cycles and internal purchasing priorities of our end-user customers; |
| | • | | seasonal buying patterns of our end-user customers; |
| | • | | changes in end-user customer or channel partner requirements or market needs; |
| | • | | the mix of products sold and the mix of revenue between products and services; |
| | • | | changes in the growth rate of the network traffic visibility market and related markets, such as the network infrastructure market, and the market for network management, analysis, compliance and security tools; |
| | • | | our ability to control costs, including operating expenses, the costs of hardware and software components, and other manufacturing costs; |
| | • | | our ability to timely develop, introduce and gain market acceptance for new products, technologies and services; |
| | • | | any significant changes in the competitive environment, including the entry of new competitors, and any related discounting of products or services; |
| | • | | the timing and execution of product transitions or new product introductions, and related inventory costs; |
| | • | | deferral of orders from end-user customers in anticipation of new products or product enhancements announced by us or our competitors; |
| | • | | decisions by potential end-user customers to purchase alternative network traffic visibility solutions from their existing network infrastructure vendors or other third parties; |
| | • | | our ability to establish and manage our distribution channels, and the effectiveness of any changes we make to our distribution model; |
| | • | | the ability of our suppliers and contract manufacturers to provide component parts and finished products in a timely manner; |
19
| | • | | changes in end-user customer renewal rates for our services and our ability to up-sell additional products; |
| | • | | general economic conditions, both domestically and in our foreign markets; |
| | • | | the timing of revenue recognition for our sales, which may be affected by the mix of sales by our channel partners; and |
| | • | | future accounting pronouncements or changes in our accounting policies. |
Any one of the factors above or the cumulative effect of some of the factors referred to above may result in significant fluctuations in our quarterly and annual operating results, including fluctuations in our key performance indicators. This variability and unpredictability could result in our failure to meet our internal operating plan or the expectations of securities analysts or investors for any period. In addition, a significant percentage of our operating expenses are fixed in nature in the short term and based on forecasted revenue trends. Accordingly, in the event of revenue shortfalls, we are generally unable to mitigate the negative impact on margins in the short term. If we fail to meet or exceed such expectations for these or any other reasons, the market price of our shares could fall substantially and we could face costly lawsuits, including securities class action suits.
We compete in highly competitive markets, and competitive pressures from existing and new companies may adversely impact our business and operating results.
The markets in which we compete are highly competitive. We expect competition to intensify in the future as existing competitors bundle new and more competitive offerings with their existing products and services, and as new market entrants introduce new products into our markets. This competition could result in increased pricing pressure, reduced profit margins, increased sales and marketing expenses and our failure to increase, or the loss of, market share, any of which would likely seriously harm our business, operating results and financial condition. We also expect that competition will continue to increase as a result of advancements in networking technology and architecture. For example, recently there has been increased focus on software-defined networking, or SDN, which could significantly alter the way in which networks are architected and implemented, and certain of our competitors have publicized an approach to use SDN technology to provide network visibility. If we do not keep pace with product and technology advances and otherwise keep our product offerings competitive, there could be a material and adverse effect on our competitive position, revenue and prospects for growth.
We compete either directly or indirectly with large Ethernet switch vendors, such as Cisco Systems, Inc., Juniper Networks, Inc., Brocade Systems Communications, Inc. and Arista Networks, Inc., and network management, analysis, compliance and security tool vendors that offer point solutions that address a portion of the issues that we solve. The principal competitive factors in our markets include functionality and performance, price and total cost of ownership, ease of use, flexibility and scalability of deployment, brand awareness, breadth of portfolio, product reliability and quality, interoperability with other products, the extent and speed of user adoption and quality of service, support and fulfillment.
Many of our current and potential competitors are substantially larger and have greater financial, technical, research and development, sales and marketing, manufacturing, distribution and other resources and greater name recognition. We could also face competition from new market entrants, including our joint-development partners or other current technology partners. In addition, many of our existing and potential competitors enjoy substantial competitive advantages, such as:
| | • | | longer operating histories; |
| | • | | the capacity to leverage their sales efforts and marketing expenditures across a broader portfolio of products; |
20
| | • | | broader distribution and established relationships with channel partners; |
| | • | | access to larger customer bases; |
| | • | | greater resources to make acquisitions; |
| | • | | larger intellectual property portfolios; |
| | • | | the ability to bundle competitive offerings with other products and services; and |
| | • | | greater customer support. |
As a result, increased competition could result in fewer customer orders, price reductions, reduced operating margins and loss of market share. Our competitors also may be able to provide end-user customers with capabilities or benefits different from or greater than those we can provide in areas such as technical qualifications or geographic presence, or to provide end-user customers a broader range of products, services and prices. In addition, some of our larger potential competitors have substantially broader product offerings and could leverage their relationships based on other products or incorporate functionality into existing products to gain business in a manner that discourages users from purchasing our products, including through selling at zero or negative margins, product bundling or closed technology platforms. These larger potential competitors may also have more extensive relationships within existing and potential end-user customers that provide them with an advantage in competing for business with those end-user customers. In addition, to the extent that one of our competitors establishes or strengthens a cooperative relationship with, or acquires one or more of the network management, analysis, compliance and security tool vendors that we have active and ongoing joint-development relationships with, it could adversely affect our ability to compete. Our ability to compete will depend upon our ability to provide a better solution than our competitors at a competitive price. To remain competitive, we may be required to make substantial additional investments in research, development, marketing and sales in order to respond to competition, and there is no assurance that these investments will achieve any returns for us or that we will be able to compete successfully in the future.
We also expect increased competition if our market continues to expand. Conditions in our market could change rapidly and significantly as a result of technological advancements or other factors. In addition, current or potential competitors may be acquired by third parties that have greater resources available. As a result of these acquisitions, our current or potential competitors might take advantage of the greater resources of the larger organization to compete more aggressively against us.
Defects in our products could harm our reputation and business.
Our products are complex and have contained and may contain undetected defects or errors, especially when first introduced or when new versions are released. Defects in our products may impede or block network traffic or cause our products to fail to provide network traffic visibility as intended. Further, defects in our products may lead to the impairment of tools that rely on data. Defects in our products may lead to product returns and require us to implement design changes or software updates.
Any defects or errors in our products, or the perception of such defects or errors, could result in:
| | • | | expenditure of significant financial and product development resources in efforts to analyze, correct, eliminate or work around errors or defects; |
| | • | | loss of existing or potential end-user customers or channel partners; |
| | • | | delayed or lost revenue; |
| | • | | delay or failure to attain market acceptance; |
21
| | • | | delay in the development or release of new products or services; |
| | • | | negative publicity, which will harm our reputation; |
| | • | | warranty claims against us, which could result in an increase in our provision for doubtful accounts; |
| | • | | an increase in collection cycles for accounts receivable or the expense and risk of litigation; and |
| | • | | harm to our operating results. |
Although we have limitation of liability provisions in our standard terms and conditions of sale, they may not fully or effectively protect us from claims as a result of federal, state or local laws or ordinances or unfavorable judicial decisions in the United States or other countries. The sale and support of our products also entail the risk of product liability claims. We maintain insurance to protect against certain claims associated with the use of our products, but our insurance coverage may not adequately cover any claim asserted against us. In addition, even claims that ultimately are unsuccessful could result in our expenditure of funds in litigation and divert management’s time and other resources.
If we fail to remediate material weakness in our internal control over financial reporting or are unable to implement and maintain effective internal control over financial reporting in the future, the accuracy and timeliness of our financial reporting may be adversely affected.
We must maintain effective internal control over financial reporting in order to accurately and timely report our results of operations and financial condition. In addition, the Sarbanes-Oxley Act requires, among other things, that we assess the effectiveness of our internal control over financial reporting beginning as of the end of our fiscal year 2014, and the effectiveness of our disclosure controls and procedures quarterly. If we are not able to comply with the requirements of the Sarbanes-Oxley Act in a timely manner, the market price of our stock could decline and we could be subject to sanctions or investigations by the New York Stock Exchange, the SEC or other regulatory authorities, which would diminish investor confidence in our financial reporting and require additional financial and management resources, each of which may adversely affect our business and operating results.
In connection with the preparation of our consolidated financial statements for the fiscal year ended December 28, 2013, we identified a deficiency in our internal control over financial reporting with respect to our accounting for income taxes, specifically with respect to the treatment of 2013 Employee Stock Purchase Plan, or ESPP, related expenses for income tax purposes. Further, in connection with our preparation of our consolidated financial statements, we determined that it would be appropriate to revise our financial statements for the second and third quarters of fiscal 2013 to reflect certain corrections related to our treatment of ESPP-related expenses for income tax purposes and our inventory reserve releases. In accordance with applicable accounting guidance, we concluded that these corrections were not material to any of our previously issued financial statements. However, as a result of these revisions, we have concluded that a material weakness existed in our internal control over financial reporting as of December 28, 2013 related to the accounting for income taxes regarding ESPP-related expenses.
A material weakness is a deficiency, or a combination of deficiencies, in internal control over financial reporting, such that there is a reasonable possibility that a material misstatement of a company’s annual or interim financial statements will not be prevented or detected on a timely basis. If we fail to effectively remediate the control deficiency discussed above, we may not be able to prevent a misstatement of the aforementioned account balances or disclosures that could result in a material misstatement to our annual or interim consolidated financial statements in future periods. Accordingly, we determined that this control deficiency constitutes a material weakness.
22
If we fail to effectively remediate this material weakness in our internal control over financial reporting, we may be unable to timely and accurately report our financial results, which could subject us to adverse consequences including, but not limited to, regulatory or enforcement actions by the SEC or the New York Stock Exchange. Even if we are able to report our financial statements accurately and in a timely manner, or if we do not make all necessary improvements to address this material weakness, continued disclosure of this material weakness will be required in future filings with the SEC, which could cause our reputation to be harmed and our stock price to decline.
Furthermore, we, and our independent registered public accounting firm, were not required to perform an evaluation of our internal control over financial reporting as of December 28, 2013, in accordance with the provisions of the Sarbanes-Oxley Act. Accordingly, we cannot assure you that we have identified all, or that we will not in the future have additional, material weaknesses. Material weaknesses may still exist when we report on the effectiveness of our internal control over financial reporting as required by the reporting requirements under Section 404 of the Sarbanes-Oxley Act. The standards required for a Section 404 assessment under the Sarbanes-Oxley Act may in the future require us to implement additional corporate governance practices and adhere to additional reporting requirements. These stringent standards require that our audit committee be advised and regularly updated on management’s assessment of internal control over financial reporting. Our management may not be able to effectively and timely implement controls and procedures that adequately respond to the increased regulatory compliance and reporting requirements that are or will be applicable to us as a public company. If we fail to staff our accounting and finance function adequately or maintain effective internal control over financial reporting, our business and reputation may be harmed and our stock price may decline. Furthermore, investor perceptions of us may be adversely affected which could cause a decline in the market price of our common stock.
Our limited operating history makes it difficult for you to evaluate our current business and future prospects, and may increase the risk of your investment.
We were founded in 2004 and sold our first products commercially in 2005. We have experienced rapid growth since our inception, and we have been increasing the breadth and scope of our product offerings. The majority of our revenue growth, however, has occurred over the past four years. This limited operating history, as well as the early stage of our relationships with many of our channel partners, makes financial forecasting and evaluation of our business difficult. Furthermore, because we depend in part on the market’s acceptance of our products, it is difficult to evaluate trends that may affect our business. We have encountered and will continue to encounter risks and difficulties frequently experienced by growing companies in rapidly changing industries, such as the risks described in this Annual Report on Form 10-K. If we do not address these risks successfully, our business and operating results would be adversely affected, and our stock price could decline.
Some of the components and technologies used in our products are purchased and licensed from a single source or a limited number of sources. The loss of any of these suppliers might cause us to incur additional transition costs, result in delays in the manufacturing and delivery of our products, or cause us to carry excess or obsolete inventory and could require us to redesign our products.
Although supplies of our components are generally available from a variety of sources, we currently depend on a single source or a limited number of sources for most components included in our products. For example, the processors and connectors that we use in the products manufactured by Broadcom Corp., Freescale Semiconductor, Ltd., Cavium, Inc., Tilera Corporation and Molex Inc. are currently available only from a limited number of sources, and neither we nor, to our knowledge, these manufacturers have entered into supply agreements with such sources. We have also entered into license agreements with some of our suppliers for technologies that are used in our products.
23
As there are no other sources for identical components and technologies, if we lost any of these suppliers or were unable to acquire these components or license these technologies, we may not be able to sell our products for a significant period of time, and we could incur significant costs to redesign our hardware and software to incorporate components or technologies from alternative sources or to qualify alternative suppliers. Our reliance on a single source or a limited number of suppliers involves a number of additional risks, including risks related to:
| | • | | supplier capacity constraints; |
| | • | | failure of a key supplier to remain in business and adjust to market conditions; |
| | • | | delays in, or the inability to execute on, a supplier roadmap for components and technologies; and |
In addition, for certain components for which there are multiple sources, we are subject to potential price increases and limited availability as a result of market demand for these components. In the past, unexpected demand for computer and network products has caused worldwide shortages of certain electronic parts. If similar shortages occur in the future, our business would be adversely affected. We carry very little inventory of our products, and we and our manufacturer rely on our suppliers to deliver necessary components in a timely manner. We and our manufacturer rely on purchase orders rather than long-term contracts with these suppliers, and as a result we or our manufacturer might not be able to secure sufficient components, even if they were available, at reasonable prices or of acceptable quality to build products in a timely manner and, therefore, might not be able to meet end-user customer demands for our products, which would have a material and adverse effect on our business, operating results and financial condition.
We rely on third-party channel partners for a substantial portion of our revenue. If our partners fail to perform, our ability to sell our products and services would be limited, and if we fail to optimize our channel partner model going forward, our operating results would be harmed.
A substantial portion of our revenue is generated or processed through sales by our channel partners, which include distributors and resellers. While most of our sales opportunities are identified by our internal sales force, we depend upon our channel partners to manage the sales process through the fulfillment of orders and the distribution of our products. In North America we rely on two distributors, Interlink and Arrow, which we engaged as a distributor in February 2013. Interlink accounted for 51%, 63%, and 37% of our revenue in fiscal 2013, 2012 and 2011, respectively. To the extent our channel partners are unable to generate an increasing amount of our sales opportunities, are unsuccessful in selling our products, or we are unable to enter into arrangements with, and retain, a sufficient number of high quality channel partners in each of the regions in which we sell products, and keep them motivated to sell our products, our ability to sell our products and operating results would be harmed. The termination of our relationship with any significant channel partner may adversely impact our sales, operating results and revenue growth.
We provide sales channel partners with specific programs to assist them in selling our products, but there can be no assurance that these programs will be effective. Our channel partners may be unsuccessful in marketing, selling and supporting our products and services. Our agreements with our channel partners are generally non-exclusive and generally do not contain minimum purchase requirements. Therefore, in most cases our channel partners may also market, sell and support
24
products and services that are competitive with ours, and may devote more resources to the marketing, sale and support of such products. They may have incentives to promote our competitors’ products to the detriment of our own. As is typical in our industry, our channel partners have the ability to terminate their respective relationships with us with limited notice and with limited or no penalty and may cease selling our products altogether. We cannot assure you that we will retain these channel partners or that we will be able to secure additional or replacement channel partners. The loss of one or more of our significant channel partners could harm our operating results.
As we add additional channel partners, particularly in North America where we currently rely primarily on a limited number of distributors, we may not be able enter into arrangements on as favorable terms, including with respect to pricing, which could have an adverse effect on our margins. In addition, most new channel partners would require comprehensive training and may take several months or more to achieve productivity. Furthermore, our channel partner sales structure could subject us to lawsuits, potential liability and reputational harm if, for example, any of our channel partners misrepresents the functionality of our products or services to end-user customers or our channel partners violate laws or our corporate policies. If we fail to optimize our channel partner model or fail to manage existing sales channels, our business and operating results could be materially and adversely affected.
Our sales cycles can be long and unpredictable, and our sales efforts require considerable time and expense.
Our sales efforts involve educating our end-user customers about the use and benefits of our solutions, including their technical capabilities. End-user customers often undertake an evaluation and testing process that can result in a lengthy sales cycle. Also, as our distribution strategy has evolved into more of a channel model, utilizing distributors, the level of variability in the length of sales cycle across transactions has increased and made it more difficult to predict the timing of many of our sales transactions. We spend substantial time and resources on our sales efforts without any assurance that our efforts will produce any sales or a material amount of revenue from such sales. In addition, product purchases are frequently subject to budget constraints, multiple approvals and unplanned administrative, processing and other delays. These factors, among others, have in the past led to, and could continue to result in, long and unpredictable sales cycles. We sell our Traffic Visibility Fabric primarily to enterprise IT departments and service providers. The length of our sales cycles typically ranges from three to six months but can be more than six months, with sales cycles involving service providers taking significantly longer to complete. To the extent that the mix of our future sales shifts in the direction of service providers, the average length of our sales cycles will increase. Furthermore, our sales to federal, state, and local governmental agency end-user customers have increased in recent periods, and we may in the future increase sales to governmental entities. Selling to governmental entities can be highly competitive, expensive and time consuming, often requiring significant upfront time and expense without any assurance that these efforts will generate a sale. As a result of these lengthy and uncertain sales cycles, it is difficult for us to predict when end-user customers may purchase solutions and accept products from us and as a result, our operating results may vary significantly and may be adversely affected.
We currently rely on a single contract manufacturer to manufacture our products, and our failure to manage our relationship with our contract manufacturer successfully could negatively impact our business.
We rely on Jabil to manufacture substantially all of our products. We recently transitioned our manufacturing to Jabil in an effort to expand and upgrade our manufacturing, systems assembly, testing and order fulfillment capabilities. We entered into a manufacturing services agreement with Jabil in April 2013 with an initial term of one year, and the agreement automatically renews for additional one-year terms, unless it is terminated by either party by giving at least six months written
25
notice before the end of the then-current term. In addition, either party may terminate the agreement (i) for convenience upon nine months written notice by Jabil or upon six months written notice by us, (ii) for cause upon written notice of a material breach and if the other party does not cure such breach within 30 days of such notice, (iii) immediately upon the bankruptcy or insolvency of the other party, or (iv) upon a change of control of either party, subject to applicable notice periods.
Our reliance on Jabil reduces our control over the assembly process, exposing us to risks, including reduced control over quality assurance, production costs and product supply. For example, we experienced certain product quality issues and delays in delivery of our products to our end-user customers in the second and third quarters of fiscal 2013, and such delays may continue to occur in the future. If we fail to manage our relationship with Jabil effectively, or if Jabil experiences delays, disruptions, capacity constraints or quality control problems in their operations, our ability to ship products to our end-user customers could be impaired and our competitive position and reputation could be harmed. In addition, any adverse change in Jabil’s financial or business condition could disrupt our ability to supply quality products to our end-user customers. If we are required to change our contract manufacturer or cannot find a suitable alternative in a timely manner, we may lose revenue, incur increased costs and damage our relationships with our channel partners and end-user customers. In addition, qualifying a new contract manufacturer and commencing production can be an expensive and lengthy process. If we experience increased demand that Jabil is unable to fulfill, or if Jabil is unable to provide us with an adequate supply of high-quality products for any reason, we could experience a delay in our order fulfillment, and our business, operating results and financial condition would be adversely affected.
We rely on the availability of licenses to third-party software and other intellectual property.
Many of our products and services include software or other intellectual property licensed from third parties, and we otherwise use software and other intellectual property licensed from third parties in our business. This exposes us to risks over which we may have little or no control. For example, a licensor may have difficulties keeping up with technological changes or may stop supporting the software or other intellectual property that it licenses to us. Also, it will be necessary in the future to renew certain licenses, expand the scope of certain existing licenses or seek new licenses, relating to various aspects of these products and services, or otherwise relating to our business, which may result in increased license fees. There can be no assurance that the necessary licenses will be available on acceptable terms, if at all. In addition, a third party may assert that we or our end-user customers, are in breach of the terms of a license, which could, among other things, give such third party the right to terminate a license, seek damages from us, or both. The inability to obtain or maintain certain licenses or other rights or to obtain or maintain such licenses or rights on favorable terms, or the need to engage in litigation regarding these matters, could result in delays in releases of products and services, and could otherwise disrupt our business, until equivalent technology can be identified, licensed or developed, if at all, and integrated into our products and services or otherwise in the conduct of our business. Any of these events could have a material adverse effect on our business, operating results and financial condition. Moreover, the inclusion in our products and services of software or other intellectual property licensed from third parties on a nonexclusive basis may limit our ability to differentiate our products from those of our competitors.
Furthermore, we have entered into a license and services agreement with Tall Maple Systems, Inc., or Tall Maple, pursuant to which we have been granted a perpetual, non-exclusive, worldwide license to certain software code of Tall Maple, which we integrate into the software component of our H Series products and which can be integrated into our other products and applications. In return, we agreed to pay Tall Maple a license fee. The agreement can only be terminated for cause upon written notice of a material breach and if the other party does not cure such breach within 30 days of such notice. If our agreement with Tall Maple is terminated as a result of a material breach by us that we do
26
not timely cure, we may need to identify, license or develop equivalent software, and integrate such replacement software into the software component of our H Series products, which could impede our ability to sell our H Series products until equivalent software is identified, licensed or developed, and integrated. These delays, if they occur, could adversely affect our business, operating results and financial condition.
Failure to protect our proprietary technology and intellectual property rights could substantially harm our business and operating results.
The success of our business depends on our ability to protect and enforce our trade secrets, trademarks, copyrights, patents and other intellectual property rights. We attempt to protect our intellectual property under patent, trademark, copyright and trade secret laws, and through a combination of confidentiality procedures, contractual provisions and other methods, all of which offer only limited protection.
As of December 28, 2013, we had 15 issued patents in the United States, but this number is relatively small in comparison to some of our competitors and potential competitors. Additionally, as of December 28, 2013, we had 28 pending U.S. patent applications and five corresponding Patent Cooperation Treaty patent applications, and may file additional patent applications in the future. The process of obtaining patent protection is expensive and time-consuming, and we may not be able to prosecute all necessary or desirable patent applications at a reasonable cost or in a timely manner. We may choose not to seek patent protection for certain innovations and may choose not to pursue patent protection in certain jurisdictions. Furthermore, it is possible that our patent applications may not issue as granted patents, that the scope of our issued patents will be insufficient or not have the coverage originally sought, that our issued patents will not provide us with any competitive advantages, and that our patents and other intellectual property rights may be challenged by others or invalidated through administrative process or litigation. In addition, issuance of a patent does not guarantee that we have an absolute right to practice the patented invention, or that we have the right to exclude others from practicing the claimed invention. As a result, we may not be able to obtain adequate patent protection or to enforce our issued patents effectively.
In addition to patented technology, we rely on our unpatented proprietary technology and trade secrets. Despite our efforts to protect our proprietary technology and trade secrets, unauthorized parties may attempt to misappropriate, reverse engineer or otherwise obtain and use them. The contractual provisions that we enter into with employees, consultants, partners, vendors and customers may not prevent unauthorized use or disclosure of our proprietary technology or intellectual property rights and may not provide an adequate remedy in the event of unauthorized use or disclosure of our proprietary technology or intellectual property rights. Moreover, policing unauthorized use of our technologies, products and intellectual property is difficult, expensive and time-consuming, particularly in foreign countries where the laws may not be as protective of intellectual property rights as those in the United States and where mechanisms for enforcement of intellectual property rights may be weak. We may be unable to determine the extent of any unauthorized use or infringement of our products, technologies or intellectual property rights.
From time to time, we may need to take legal action to enforce our patents and other intellectual property rights, to protect our trade secrets, to determine the validity and scope of the intellectual property rights of others or to defend against claims of infringement or invalidity. Such litigation could result in substantial costs and diversion of resources and could negatively affect our business, operating results, financial condition and cash flows. If we are unable to adequately protect our intellectual property rights, we may find ourselves at a competitive disadvantage to others who need not incur the additional expense, time and effort required to create the innovative products that have enabled us to be successful to date.
27
Assertions by third parties of infringement or other violations by us of their intellectual property rights, or other lawsuits asserted against us, could result in significant costs and substantially harm our business and operating results.
Patent and other intellectual property disputes are common in the network infrastructure industry. Some companies in the network infrastructure industry, including some of our competitors, own large numbers of patents, copyrights, trademarks and trade secrets, which they may use to assert claims against us. Third parties may in the future assert claims of infringement, misappropriation or other violations of intellectual property rights against us. They may also assert such claims against our end-user customers or channel partners whom we typically indemnify against claims that our products infringe, misappropriate or otherwise violate the intellectual property rights of third parties. As the number of products and competitors in our market increase and overlaps occur, claims of infringement, misappropriation and other violations of intellectual property rights may increase. Any claim of infringement, misappropriation or other violation of intellectual property rights by a third party, even those without merit, could cause us to incur substantial costs defending against the claim and could distract our management from our business.
The patent portfolios of our most significant competitors and potential competitors are larger than ours. This disparity between our patent portfolio and the patent portfolios of our most significant competitors may increase the risk that they may sue us for patent infringement and may limit our ability to counterclaim for patent infringement or settle through patent cross-licenses. In addition, future assertions of patent rights by third parties, and any resulting litigation, may involve patent holding companies or other adverse patent owners who have no relevant product revenue and against whom our own patents may therefore provide little or no deterrence or protection. We cannot assure you that we are not infringing or otherwise violating any third-party intellectual property rights.
An adverse outcome of a dispute may require us to pay substantial damages including treble damages if we are found to have willfully infringed a third party’s patents or copyrights; cease making, licensing or using solutions that are alleged to infringe or misappropriate the intellectual property of others; expend additional development resources to attempt to redesign our products or services or otherwise to develop non-infringing technology, which may not be successful; enter into potentially unfavorable royalty or license agreements in order to obtain the right to use necessary technologies or intellectual property rights; and indemnify our partners and other third parties. Any damages or royalty obligations we may become subject to, and any third-party indemnity we may need to provide, as a result of an adverse outcome could harm our operating results. Royalty or licensing agreements, if required or desirable, may be unavailable on terms acceptable to us, or at all, and may require significant royalty payments and other expenditures. In addition, some licenses may be non-exclusive, and therefore our competitors may have access to the same technology licensed to us. Any of these events could seriously harm our business, financial condition and operating results.
Under the indemnification provisions of our standard sales contracts, we agree to defend our customers against third-party claims asserting infringement of certain intellectual property rights, which may include patents, copyrights, trademarks or trade secrets, and to pay judgments entered on such claims. Our exposure under these indemnification provisions is generally limited to the total amount paid by our customer under the agreement. However, certain agreements include indemnification provisions that could potentially expose us to losses in excess of the amount received under the agreement. We have not incurred any material costs in the past as a result of such indemnification obligations, and have not accrued any liabilities related to such obligations in our consolidated financial statements.
In addition, we may, from time to time, be a party to other lawsuits in the normal course of our business. Litigation in general, and intellectual property and securities litigation in particular, can be
28
expensive, lengthy and disruptive to normal business operations. Moreover, the results of complex legal proceedings are difficult to predict. Responding to lawsuits is likely to be expensive and time consuming for us, and could divert our management’s attention from our business. An unfavorable resolution of any lawsuit could adversely affect our business, operating results or financial condition.
Our use of open source and third-party technology could impose limitations on our ability to commercialize our software.
We use open source software in our products, and although we monitor our use of open source software to avoid subjecting our products to conditions we do not intend, the terms of many open source licenses have not been interpreted by U.S. courts. As a result, there is a risk that these licenses could be construed in a way that could impose unanticipated conditions or restrictions on our ability to commercialize our products. In such an event, we could be required to seek licenses from third parties to continue offering our products, to make our proprietary code generally available in source code form, to re-engineer our products or to discontinue the sale of our products if re-engineering could not be accomplished on a timely basis, any of which could adversely affect our business, operating results and financial condition.
Adverse economic conditions or reduced information technology and network infrastructure spending may adversely impact our business and operating results.
Our business depends on the overall demand for information technology, network infrastructure and the market for network analysis, compliance and security tools. In addition, the purchase of our products and services is often discretionary and may involve a significant commitment of capital and other resources. Weak global economic conditions, or a reduction in information technology and network infrastructure spending even if economic conditions improve, could adversely impact our business, financial condition and operating results in a number of ways, including longer sales cycles, lower prices for our products and services, higher default rates among our distributors, reduced unit sales and lower or no growth. As global economic conditions continue to be volatile or economic uncertainty remains, trends in information technology and network infrastructure spending also remain unpredictable and subject to reductions due to credit constraints and uncertainties about the future. Unfavorable economic conditions may lead end-customers to delay or reduce purchases of our solutions. Demand for our solutions may not reach our sales targets, or may decline, when there is an economic downturn or economic uncertainty. Our sensitivity to economic cycles and any related fluctuation in demand may have a material adverse effect on our business, financial condition and operating results.
We depend on growth in markets relating to network security, management and analysis, and lack of growth or contraction in one or more of these markets could have a material adverse effect on our sales and financial condition.
Demand for our products is linked to, among other things, growth in the size and complexity of network infrastructures and the demand for networking technologies addressing the security, management and analysis of such infrastructures. If this demand declines, our sales, profitability and financial condition would be materially adversely affected. Segments of the network infrastructure industry have in the past experienced significant economic downturns. The occurrence of any of these factors in the markets relating to network security, management and analysis could materially adversely affect our sales, profitability and financial condition. Furthermore, these markets are dynamic and evolving. Our future financial performance will depend in large part on continued growth in the number of organizations investing in their network infrastructure and the amount they commit to such investments. The market for network infrastructure may not continue to grow at historic rates, or at all. If this market fails to grow, or grows more slowly than we currently anticipate, our sales and profitability could be adversely affected.
29
The market for cloud-based and cloud-focused solutions is at a relatively early stage of development, and if it does not develop or develops more slowly than we expect, our business could be harmed.
The market for cloud-based solutions is at an early stage relative to physical appliances and on-premise solutions, and these types of deployments may not achieve or sustain high levels of demand and market acceptance. In fiscal 2012, we introduced our first offering for virtualized and cloud-based applications, GigaVUE-VM, and expect to increase sales of GigaVUE-VM and expand the range of our cloud-focused offerings in the future. Many factors may affect the market acceptance of cloud-based and cloud-focused solutions, including:
| | • | | perceived security capabilities and reliability; |
| | • | | perceived concerns about the ability to scale operations for large enterprise customers; |
| | • | | concerns with entrusting a third party to store and manage critical data; and |
| | • | | the level of configurability or customizability of the solutions. |
If organizations do not establish a presence in the cloud or do not perceive the benefits of our cloud-focused solutions, or if our competitors or new market entrants are able to develop cloud-focused solutions that are or are perceived to be more effective than ours, this portion of our business may not grow further or may develop more slowly than we expect, either of which would adversely affect our business and operating results.
The average selling price of our products has decreased from time to time, and may decrease in the future, which may negatively impact gross profits.
From time to time, the average selling price of our products has decreased. In the future, it is possible that the average selling prices of our products will decrease in response to competitive pricing pressures, increased sales discounts, new product introductions by us or our competitors or other factors. Such pricing pressures may also be dependent upon the mix of products sold, the mix of revenue between products and services and the degree to which products and services are bundled and sold together for a package price. Therefore, in order to maintain our profitability, we must develop and introduce new products and product enhancements on a timely basis and continually reduce our product costs. Our failure to do so would likely cause our revenue and gross profits to decline, which would harm our business and operating results. In addition, we may experience substantial period-to-period fluctuations in future operating results in the event we experience an erosion of our average selling prices.
Managing inventory of our products and product components is complex. Insufficient inventory may result in lost sales opportunities or delayed revenue, while excess inventory may harm our gross margins.
Our channel partners may increase orders during periods of product shortages, cancel orders if their inventory is too high, return product or take advantage of price protection (if any) or delay orders in anticipation of new products. They also may adjust their orders in response to the supply of our products and the products of our competitors that are available to them and in response to seasonal fluctuations in customer demand. Furthermore, if the time required to manufacture certain products or ship products increases for any reason, this could result in inventory shortfalls. In addition, for those channel partners that have rights of return, inventory held by such channel partners affects our operating results. Managing our inventory depends significantly on our ability to accurately forecast end-user customer demand for our products. Our inventory management and demand planning systems and related supply chain visibility tools may be inadequate to enable us to effectively manage inventory. Inventory management remains an area of focus as we balance the need to maintain inventory levels that are sufficient to ensure
30
competitive lead times against the risk of inventory obsolescence because of rapidly changing technology and customer requirements. If we ultimately determine that we have excess inventory, we may have to reduce our prices or write-down inventory, which in turn could result in lower gross margins. Alternatively, insufficient inventory levels may lead to shortages that result in delayed revenue or loss of sales opportunities altogether as potential end-user customers turn to competitors’ products that are readily available. If we are unable to effectively manage our inventory and that of our distribution partners, our operating results could be adversely affected.
We rely on revenue from support services which may decline, and because we recognize revenue from support services over the term of the relevant service period, downturns or upturns in sales of support services are not immediately reflected in full in our operating results.
Although our services revenue has historically accounted for a small percentage of our revenue, it may become a more meaningful part of revenue over time. Sales of new or renewal services contracts may decline and fluctuate as a result of a number of factors, including end-user customers’ level of satisfaction with our products and services, the prices of our products and services, the prices of products and services offered by our competitors or reductions in our end-user customers’ spending levels. If our sales of new or renewal services contracts decline, our revenue and revenue growth may decline and our business will suffer. In addition, we recognize services revenue over the term of the relevant service period, which is typically twelve months. As a result, some of the revenue we report each quarter is the recognition of deferred revenue from services contracts entered into during previous quarters. Consequently, a decline in new or renewed service contracts in any one quarter will not be fully reflected in revenue in that quarter but will negatively affect our revenue in future quarters. Accordingly, the effect of significant downturns in new or renewed sales of our services is not reflected in full in our operating results until future periods. Our services revenue also makes it difficult for us to rapidly increase our revenue through additional service sales in any period, as revenue from new and renewal service contracts must be recognized over the applicable service period. Furthermore, increases in the average term of services contracts would result in revenue for services contracts being recognized over longer periods of time.
Seasonality may cause fluctuations in our revenue and operating results.
We have experienced seasonality in our product revenue and operating results in the past, and we believe that we will continue to experience such seasonality in the future. The first quarter of each year is usually our lowest revenue quarter during the year and product revenue typically declines sequentially from the prior fourth quarter. We believe that this results from the procurement, budgeting and deployment cycles of many of our end-user customers. We generally expect an increase in sales in the second half of each year as budgets of our end-user customers for annual capital purchases are being fully utilized. We expect that seasonality will continue to affect our revenue and operating results in the future.
Our business and operations have experienced rapid growth, and if we do not appropriately manage any future growth, or are unable to improve our systems and processes, our operating results will be negatively affected.
We have experienced rapid growth over the last several years, which has placed a strain on our management, administrative, operational and financial infrastructure. In addition, some of the members of our current management team have only been working together for a short period of time. We also anticipate that additional investments in key channel partnerships and direct-sales personnel, as well as infrastructure and research and development spending, will be required to:
| | • | | scale our operations and increase productivity; |
| | • | | address the needs of our end-user customers; |
31
| | • | | further develop and enhance our products and services; |
| | • | | develop new technology; and |
| | • | | expand our markets and opportunity under management, including into new industry verticals and geographic areas. |
Our success will depend in part upon our ability to manage our growth effectively. To do so, we must continue to increase the productivity of our existing employees and to hire, train and manage new employees as needed. To manage domestic and international growth of our operations and personnel, we will need to continue to improve our operational, financial and management controls and our reporting processes and procedures, and implement more extensive and integrated financial and business information systems. These additional investments will increase our operating costs, which will make it more difficult for us to offset any future revenue shortfalls by reducing expenses in the short term. Moreover, if we fail to scale our operations successfully, our business and operating results could be materially and adversely affected.
We are dependent on the continued services and performance of our senior management and other key employees, the loss of any of whom could adversely affect our business, operating results and financial condition.
Our future performance depends on the continued services and contributions of our senior management and other key employees to execute on our business plan, and to identify and pursue new opportunities and product innovations. The loss of services of senior management or other key employees could significantly delay or prevent the achievement of our development and strategic objectives. In addition, some of the members of our current management team have only been working together for a short period of time. The loss of the services of our senior management or other key employees for any reason could adversely affect our business, financial condition and operating results.
If we are unable to hire, retain and motivate qualified personnel, our business would suffer.
Our future success depends, in part, on our ability to continue to attract and retain highly skilled personnel. The loss of the services of any of our key personnel, the inability to attract or retain qualified personnel or delays in hiring required personnel, particularly in engineering and sales, may seriously harm our business, financial condition and operating results. None of our key employees has an employment agreement for a specific term, and any of our employees may terminate their employment at any time. Our ability to continue to attract and retain highly skilled personnel will be critical to our future success. Competition for highly skilled personnel is frequently intense, especially in the San Francisco Bay Area, the location in which we have a substantial presence and need for highly-skilled personnel. In addition, a large portion of our employee base is substantially vested in significant stock option grants and restricted stock unit awards, or has received payments from the settlement of their performance units following our IPO. The receipt of shares of common stock upon the exercise of options or the settlement of restricted stock units and the ability to sell their stock on the public market may lead to a larger than normal turnover rate. We intend to continue to issue stock options and restricted stock units as a key component of our overall compensation and employee attraction and retention efforts. In addition, we are required under U.S. generally accepted accounting principles, or GAAP, to recognize compensation expense in our operating results for employee stock-based compensation under our equity grant programs, which may negatively impact our operating results and may increase the pressure to limit stock-based compensation. We may not be successful in attracting, assimilating or retaining qualified personnel to fulfill our current or future needs. Also, to the extent we hire personnel from competitors, we may be subject to allegations that they have been improperly solicited or divulged proprietary or other confidential information.
32
Our long-term success depends, in part, on our ability to expand the sales of our products to end-user customers located outside of the United States, and therefore our business will be susceptible to risks associated with international operations.
While we currently maintain limited operations outside of the United States, we intend to expand these operations in the future. We have limited experience operating in foreign jurisdictions. Our inexperience in operating our business outside of the United States increases the risk that any international expansion efforts we may undertake will not be successful. In addition, conducting and expanding international operations subjects us to new risks that we have not generally faced in the United States. These include:
| | • | | exposure to foreign currency exchange rate risk; |
| | • | | difficulties in managing and staffing international operations; |
| | • | | the increased travel, infrastructure and legal compliance costs associated with multiple international locations; |
| | • | | potentially adverse tax consequences; |
| | • | | the burdens of complying with a wide variety of foreign laws, including trade barriers, and different legal standards; |
| | • | | increased financial accounting and reporting burdens and complexities; |
| | • | | political, social and economic instability abroad, terrorist attacks and security concerns in general; and |
| | • | | reduced or varied protection for intellectual property rights in some countries. |
The occurrence of any one of these risks could negatively affect our international business and, consequently, our business, operating results and financial condition.
We are dependent on various IT systems, and failures of or interruptions to those systems could harm our business.
Many of our business processes depend upon our IT systems, the systems and processes of third parties and on interfaces with the systems of third parties. For example, we rely on Salesforce.com, Inc. for our customer relationship management system. If those systems fail or are interrupted, or if our ability to connect to or interact with one or more networks is interrupted, our processes may function at a diminished level or not at all. This would harm our ability to ship products, and our financial results would likely be harmed.
In addition, reconfiguring our IT systems or other business processes in response to changing business needs may be time consuming and costly. To the extent this impacts our ability to react timely to specific market or business opportunities, our financial results would likely be harmed.
Failure to comply with laws and regulations could harm our business.
Our business is subject to regulation by various federal, state, local and foreign governmental agencies, including agencies responsible for monitoring and enforcing employment and labor laws, workplace safety, product safety, environmental laws, consumer protection laws, anti-bribery laws, import/export controls, federal securities laws and tax laws and regulations. In certain jurisdictions, these regulatory requirements may be more stringent than in the United States. Noncompliance with applicable regulations or requirements could subject us to investigations, sanctions, mandatory product recalls, enforcement actions, disgorgement of profits, fines, damages, civil and criminal penalties or injunctions. If any governmental sanctions are imposed, or if we do not prevail in any possible civil or
33
criminal litigation, our business, operating results and financial condition could be materially adversely affected. In addition, responding to any action will likely result in a significant diversion of management’s attention and resources and an increase in professional fees. Enforcement actions and sanctions could harm our business, operating results and financial condition.
Governmental regulations affecting the import or export of products could negatively affect our revenue.
The U.S. and various foreign governments have imposed controls, export license requirements and restrictions on the import or export of some technologies, especially encryption technology. In addition, from time to time, governmental agencies have proposed additional regulation of encryption technology, such as requiring the escrow and governmental recovery of private encryption keys. Governmental regulation of encryption technology and regulation of imports or exports, or our failure to obtain required import or export approval for our products, could harm our international and domestic sales and adversely affect our revenue. In addition, failure to comply with such regulations could result in penalties, costs and restrictions on export privileges, which would harm our operating results.
Due to the global nature of our business, we could be adversely affected by violations of the U.S. Foreign Corrupt Practices Act, the U.K. Bribery Act, or similar anti-bribery laws in other jurisdictions in which we operate, and various international trade and export laws.
The global nature of our business creates various domestic and local regulatory challenges. The U.S. Foreign Corrupt Practices Act, or the FCPA, the U.K. Bribery Act 2010, or the U.K. Bribery Act, and similar anti-bribery laws in other jurisdictions generally prohibit U.S.-based companies and their intermediaries from making improper payments to non-U.S. officials for the purpose of obtaining or retaining business. In addition, U.S. based companies are required to maintain records that accurately and fairly represent their transactions and have an adequate system of internal accounting controls. We operate in areas of the world that experience corruption by government officials to some degree and, in certain circumstances, compliance with anti-bribery laws may conflict with local customs and practices. Our global operations require us to import and export to and from several countries, which geographically stretches our compliance obligations. In addition, changes in such laws could result in increased regulatory requirements and compliance costs which could adversely affect our business, financial condition and results of operations. We cannot assure that our employees or other agents will not engage in prohibited conduct and render us responsible under the FCPA or the U.K. Bribery Act. If we are found to be in violation of the FCPA, the U.K. Bribery Act or other anti-bribery laws (either due to acts or inadvertence of our employees, or due to the acts or inadvertence of others), we could suffer criminal or civil penalties or other sanctions, which could have a material adverse effect on our business.
We may expand through acquisitions of, or investments in, other companies, each of which may divert our management’s attention, resulting in additional dilution to our stockholders and consumption of resources that are necessary to sustain and grow our business.
Our business strategy may, from time to time, include acquiring complementary products, technologies or businesses. We also may enter into relationships with other businesses in order to expand our product offerings, which could involve preferred or exclusive licenses, additional channels of distribution or discount pricing or investments in other companies. Negotiating these transactions can be time consuming, difficult and expensive, and our ability to close these transactions may be subject to third-party approvals, such as government regulation, which are beyond our control. Consequently, we can make no assurance that these transactions, once undertaken and announced, will close.
An acquisition or investment may result in unforeseen operating difficulties and expenditures. In particular, we may encounter difficulties assimilating or integrating the businesses, technologies, products, personnel or operations of the acquired companies, particularly if the key personnel of the acquired business choose not to work for us, and we may have difficulty retaining the customers of any
34
acquired business. Acquisitions may also disrupt our ongoing business, divert our resources and require significant management attention that would otherwise be available for development of our business. Any acquisition or investment could expose us to unknown liabilities. Moreover, we cannot assure you that the anticipated benefits of any acquisition or investment would be realized or that we would not be exposed to unknown liabilities. An acquisition could also result in dilutive issuances of our equity securities, the incurrence of debt, contingent liabilities, amortization expenses or the write-off of goodwill. These challenges related to acquisitions or investments could adversely affect our business, operating results and financial condition.
If our estimates or judgments relating to our critical accounting policies are based on assumptions that change or prove to be incorrect, our operating results could fall below expectations of securities analysts and investors, resulting in a decline in our stock price.
The preparation of financial statements in conformity with GAAP requires management to make estimates and assumptions that affect the amounts reported in the consolidated financial statements and accompanying notes. We base our estimates on historical experience and on various other assumptions that we believe to be reasonable under the circumstances, as provided in the section titled “Management’s Discussion and Analysis of Financial Condition and Results of Operations,” the results of which form the basis for making judgments about the carrying values of assets, liabilities and equity, and the amount of revenue and expenses that are not readily apparent from other sources. Our operating results may be adversely affected if our assumptions change or if actual circumstances differ from those in our assumptions, which could cause our operating results to fall below the expectations of securities analysts and investors, resulting in a decline in our stock price. Significant assumptions and estimates used in preparing our consolidated financial statements include, or may in the future include, those related to revenue recognition, stock-based compensation expense, long-lived assets, excess and obsolete inventory write-downs, warranty reserves and accounting for income taxes including deferred tax assets and liabilities.
If we fail to comply with environmental requirements, our business, financial condition, operating results and reputation could be adversely affected.
We are subject to various environmental laws and regulations including laws governing the hazardous material content of our products and laws relating to the collection of and recycling of electrical and electronic equipment. Examples of these laws and regulations include the European Union, or EU, Restrictions of Hazardous Substances Directive, or RoHS Directive, and the EU Waste Electrical and Electronic Equipment Directive, or WEEE Directive, as well as the implementing legislation of the EU member states. Similar laws and regulations have been passed or are pending in China, South Korea, Norway and Japan and may be enacted in other regions, including in the United States, and we are, or may in the future be, subject to these laws and regulations.
The RoHS Directive and the similar laws of other jurisdictions ban the use of certain hazardous materials such as lead, mercury and cadmium in the manufacture of electrical equipment, including our products. We do not currently have the policies and procedures in place to ensure that the manufacturer of our physical appliances and major component part suppliers comply with the RoHS Directive requirements. In addition, if there are changes to this or other laws (or their interpretation) or if new similar laws are passed in other jurisdictions, we may be required to reengineer our products to use components compatible with these regulations. This reengineering and component substitution could result in additional costs to us or disrupt our operations or logistics.
The WEEE Directive requires electronic goods producers to be responsible for the collection, recycling and treatment of such products. Changes in interpretation of the directive may cause us to incur costs or have additional regulatory requirements to meet in the future in order to comply with this directive, or with any similar laws adopted in other jurisdictions.
35
Our failure to comply with past, present and future similar laws could result in reduced sales of our products, substantial product inventory write-offs, reputational damage, penalties and other sanctions, which could harm our business and financial condition. We also expect that our products will be affected by new environmental laws and regulations on an ongoing basis. To date, our expenditures for environmental compliance have not had a material impact on our results of operations or cash flows and, although we cannot predict the future impact of such laws or regulations, they will likely result in additional costs and may increase penalties associated with violations or require us to change the content of our products or how they are manufactured, which could have a material adverse effect on our business, operating results and financial condition.
If our end-user customers are not satisfied with our technical support or professional services, they may choose not to purchase our products and services or to renew service contracts, either of which would adversely impact our business and operating results.
Our business relies, in part, on our end-user customers’ satisfaction with the technical support and professional consulting services we provide to support our products. If we fail to provide technical support services that are responsive, satisfy our end-user customers’ expectations and resolve issues that they encounter with our products and services, then they may elect not to purchase or renew annual maintenance and support contracts and they may choose not to purchase additional products and services from us. Accordingly, our failure to provide satisfactory technical support or professional services could have a material and adverse effect on our business and operating results.
We may not be able to utilize all of our deferred tax assets.
We account for income taxes in accordance with Accounting Standards Codification topic 740,Income Taxes, or ASC 740, which provides for an asset and liability approach to accounting for income taxes. Deferred tax assets and liabilities represent the future tax consequences of the differences between the financial statement carrying amounts of assets and liabilities versus the tax bases of assets and liabilities. Under this method, deferred tax assets are recognized for deductible temporary differences, and operating loss and tax credit carryforwards. Deferred tax liabilities are recognized for taxable temporary differences.
The process for calculating and determining deferred tax assets and liabilities involves estimating our actual current tax exposure together with assessing temporary differences resulting from differing treatment of items for tax and accounting purposes. These differences result in deferred tax assets and liabilities, which are included within our consolidated balance sheets. We must then assess the likelihood that our deferred tax assets will be recovered from future taxable income and, to the extent we believe that recovery is not likely, we must establish a valuation allowance. As of December 28, 2013, we had net deferred tax assets of $20.9 million. Significant judgment by our management team is required in determining our income tax benefit (provision), our deferred tax assets and liabilities and any valuation allowance recorded against our net deferred tax assets. Based on our assessment, it is more likely than not that the net deferred tax asset will be realized through future taxable earnings. In the event that actual results differ from these estimates or we adjust these estimates in future periods we may need to establish a valuation allowance which could negatively impact our financial position and results of operations.
New regulations related to conflict minerals may cause us to incur additional expenses and could limit the supply and increase the costs of certain metals used in the manufacturing of our products.
As a public company, we are subject to new requirements under the Dodd-Frank Wall Street Reform and Consumer Protection Act of 2010, or the Dodd-Frank Act, which will require us to diligence, disclose, and report whether or not our products contain conflict minerals. As a newly public
36
company, we must file our initial report with respect to conflict minerals on or prior to May 31, 2016 for the 2015 calendar year. The implementation of these new requirements could adversely affect the sourcing, availability and pricing of the materials used in the manufacture of components used in our products. In addition, we will incur additional costs to comply with the disclosure requirements, including costs related to conducting diligence procedures to determine the sources of conflict minerals that may be used or necessary to the production of our products and, if applicable, potential changes to products, processes or sources of supply as a consequence of such verification activities. It is also possible that we may face reputational harm if we determine that certain of our products contain minerals not determined to be conflict free or if we are unable to alter our products, processes or sources of supply to avoid such materials.
The requirements of being a public company may strain our resources, divert management’s attention and affect our ability to attract and retain executive management and qualified board members.
As a public company, we are subject to the reporting requirements of the Exchange Act, the Sarbanes-Oxley Act, the Dodd-Frank Act, the listing requirements of the New York Stock Exchange and other applicable securities rules and regulations. Compliance with these rules and regulations has increased and may continue to increase our legal and financial compliance costs, make some activities more difficult, time-consuming or costly and increase demand on our systems and resources, particularly after we are no longer an “emerging growth company,” as defined in the Jumpstart our Business Startups Act, or the JOBS Act. The Exchange Act requires, among other things, that we file annual, quarterly and current reports with respect to our business and operating results. The Sarbanes-Oxley Act requires, among other things, that we maintain effective disclosure controls and procedures and internal control over financial reporting. In order to maintain and, if required, improve our disclosure controls and procedures and internal control over financial reporting to meet this standard, significant resources and management oversight may be required. As a result, management’s attention may be diverted from other business concerns, which could adversely affect our business and operating results. Although we have already hired additional employees to comply with these requirements, we may need to hire more employees in the future or engage outside consultants, which will increase our costs and expenses.
In addition, changing laws, regulations and standards relating to corporate governance and public disclosure are creating uncertainty for public companies, increasing legal and financial compliance costs and making some activities more time consuming. These laws, regulations and standards are subject to varying interpretations, in many cases due to their lack of specificity, and, as a result, their application in practice may evolve over time as new guidance is provided by regulatory and governing bodies. This could result in continuing uncertainty regarding compliance matters and higher costs necessitated by ongoing revisions to disclosure and governance practices. We intend to invest resources to comply with evolving laws, regulations and standards, and this investment may result in increased general and administrative expenses and a diversion of management’s time and attention from revenue-generating activities to compliance activities. If our efforts to comply with new laws, regulations and standards differ from the activities intended by regulatory or governing bodies due to ambiguities related to their application and practice, regulatory authorities may initiate legal proceedings against us and our business may be adversely affected.
However, for as long as we remain an “emerging growth company,” we may take advantage of certain exemptions from various reporting requirements that are applicable to public companies that are not “emerging growth companies” including, but not limited to, not being required to comply with the auditor attestation requirements of Section 404 of the Sarbanes-Oxley Act, reduced disclosure obligations regarding executive compensation in our periodic reports and proxy statements, and exemptions from the requirements of holding a nonbinding advisory vote on executive compensation
37
and shareholder approval of any golden parachute payments not previously approved. We may take advantage of these reporting exemptions until we are no longer an “emerging growth company.”
We will cease to be an “emerging growth company” upon the earliest of: (i) the end of our fiscal year 2018, (ii) the beginning of our first fiscal year after our annual gross revenues are $1.0 billion or more, (iii) the date on which we have, during the previous three-year period, issued more than $1.0 billion in non-convertible debt securities or (iv) as of the end of any fiscal year in which the market value of our common stock held by non-affiliates exceeded $700 million as of the end of the second quarter of that fiscal year.
We also expect that these new rules and regulations will make it more expensive for us to obtain director and officer liability insurance, and we may be required to accept reduced coverage or incur substantially higher costs to obtain coverage. These factors could also make it more difficult for us to attract and retain qualified members of our board of directors, particularly to serve on our audit committee and compensation committee, and qualified executive officers.
As a public company, our business and financial condition have become more visible, which we believe may result in threatened or actual litigation, including by competitors and other third parties. If such claims are successful, our business and operating results could be adversely affected, and even if the claims do not result in litigation or are resolved in our favor, these claims, and the time and resources necessary to resolve them, could divert the resources of our management and adversely affect our business and operating results.
As a result of being a public company, we are obligated to develop and maintain proper and effective internal control over financial reporting. We may not complete our analysis of our internal control over financial reporting in a timely manner, or these internal controls may not be determined to be effective, which may adversely affect investor confidence in our company and, as a result, the value of our common stock.
We are required, pursuant to Section 404 of the Sarbanes-Oxley Act to furnish a report by management on, among other things, the effectiveness of our internal control over financial reporting as of the end of our fiscal year 2014. This assessment will need to include disclosure of any material weaknesses identified by our management in our internal control over financial reporting.
We are in the very early stages of the costly and challenging process of compiling the system and processing documentation necessary to perform the evaluation needed to comply with Section 404 of the Sarbanes-Oxley Act. We may not be able to complete our evaluation, testing and any required remediation in a timely fashion. During the evaluation and testing process, if we identify one or more material weaknesses in our internal control over financial reporting, we will be unable to assert that our internal controls are effective.
If we are unable to assert that our internal control over financial reporting is effective, we could lose investor confidence in the accuracy and completeness of our financial reports, which would cause the price of our common stock to decline, and we may be subject to investigation or sanctions by the SEC.
We are required to disclose changes made in our internal control and procedures on a quarterly basis. To comply with the requirements of being a public company, we may need to undertake various actions, such as implementing new internal controls and procedures and hiring accounting or internal audit staff.
Our independent registered public accounting firm is not required to report on the effectiveness of our internal control over financial reporting until the later of the year following our first annual report
38
required to be filed with the SEC, or the date we are no longer an “emerging growth company.” At such time, our independent registered public accounting firm may issue a report that is adverse in the event it is not satisfied with the level at which our controls are documented, designed or operating. Our remediation efforts may not enable us to avoid a material weakness in the future.
We are an “emerging growth company” and we cannot be certain if the reduced disclosure requirements applicable to emerging growth companies will make our common stock less attractive to investors.
We are an “emerging growth company,” as defined in the JOBS Act, and we may take advantage of certain exemptions from various reporting requirements that are applicable to public companies that are not “emerging growth companies” including, but not limited to, not being required to comply with the auditor attestation requirements of Section 404 of the Sarbanes-Oxley Act, reduced disclosure obligations regarding executive compensation in our periodic reports and proxy statements, and exemptions from the requirements of holding a nonbinding advisory vote on executive compensation and shareholder approval of any golden parachute payments not previously approved. We cannot predict if investors will find our common stock less attractive because we may rely on these exemptions. If some investors find our common stock less attractive as a result, there may be a less active trading market for our common stock and our stock price may be more volatile.
Our business is subject to the risks of earthquakes, fire, power outages, floods and other catastrophic events, and to interruption by manmade problems such as terrorism.
A significant natural disaster, such as an earthquake, fire or a flood, or a significant power outage could have a material adverse impact on our business, operating results and financial condition. Our corporate headquarters are located in the San Francisco Bay Area, a region known for seismic activity. In addition, natural disasters could affect our manufacturing vendors or logistics providers’ ability to perform services such as manufacturing products on a timely basis and assisting with shipments on a timely basis. In the event our service providers’ information technology systems or manufacturing or logistics abilities are hindered by any of the events discussed above, shipments could be delayed, resulting in missing financial targets, such as revenue and shipment targets, for a particular quarter. Further, if a natural disaster occurs in a region from which we derive a significant portion of our revenue, end-user customers in that region may delay or forego purchases of our products, which may materially and adversely impact our operating results for a particular period. In addition, acts of terrorism could cause disruptions in our business or the business of our manufacturer, logistics providers, partners, end-user customers or the economy as a whole. Given our typical concentration of sales at each quarter end, any disruption in the business of our manufacturer, logistics providers, partners or customers that impacts sales at the end of our quarter could have a significant adverse impact on our quarterly results. All of the aforementioned risks may be augmented if the disaster recovery plans for us and our suppliers prove to be inadequate. To the extent that any of the above results in delays or cancellations of customer orders, or delays in the manufacture, deployment or shipment of our products, our business, financial condition and operating results would be adversely affected.
Risks Relating to Owning Our Common Stock
Our actual operating results may differ significantly from our guidance.
From time to time, we have released, and may continue to release guidance in our quarterly earnings conference call, quarterly earnings releases, or otherwise, regarding our future performance that represents our management’s estimates as of the date of release. This guidance, which includes forward-looking statements, has been and will be based on projections prepared by our management. These projections are not prepared with a view toward compliance with published guidelines of the
39
American Institute of Certified Public Accountants, and neither our registered public accountants nor any other independent expert or outside party compiles or examines the projections. Accordingly, no such person expresses any opinion or any other form of assurance with respect to the projections.
Projections are based upon a number of assumptions and estimates that, while presented with numerical specificity, are inherently subject to significant business, economic and competitive uncertainties and contingencies, many of which are beyond our control and are based upon specific assumptions with respect to future business decisions, some of which will change. We intend to state possible outcomes as high and low ranges which are intended to provide a sensitivity analysis as variables are changed but are not intended to imply that actual results could not fall outside of the suggested ranges. The principal reason that we release guidance is to provide a basis for our management to discuss our business outlook with analysts and investors. We do not accept any responsibility for any projections or reports published by any such third parties.
Guidance is necessarily speculative in nature, and it can be expected that some or all of the assumptions underlying the guidance furnished by us will not materialize or will vary significantly from actual results. Accordingly, our guidance is only an estimate of what management believes is realizable as of the date of release. Actual results may vary from our guidance and the variations may be material. We undertake no obligation to make revisions or publicly update our guidance in advance of actual results unless required by law. In light of the foregoing, investors are urged to consider all of the information we make publicly available in making an investment decision regarding our common stock and not rely solely upon our guidance.
Any failure to successfully implement our operating strategy or the occurrence of any of the events or circumstances set forth in this “Risk Factors” section could result in the actual operating results being different from our guidance, and the differences may be adverse and material.
Our share price has been and may continue to be volatile, and you could lose all or part of your investment.
Technology stocks have historically experienced high levels of volatility. The trading price of our common stock has been and is likely to continue to be highly volatile and subject to wide fluctuations in response to various factors, some of which are beyond our control and may not be related to our operating performance. Since shares of our common stock were sold in our IPO in June 2013 at a price of $19.00 per share, the reported high and low sales prices of our common stock have ranged from $23.02 to $41.81 through December 28, 2013. These fluctuations could cause you to lose all or part of your investment in our common stock. Factors that may cause the market price of our common stock to fluctuate include:
| | • | | price and volume fluctuations in the overall stock market from time to time; |
| | • | | significant volatility in the market price and trading volume of technology companies in general, and of companies in our industry; |
| | • | | actual or anticipated changes in our results of operations or fluctuations in our operating results; |
| | • | | whether our operating results meet the expectations of securities analysts or investors; |
| | • | | actual or anticipated changes in the expectations of investors or securities analysts; |
| | • | | actual or anticipated developments in our competitors’ businesses or the competitive landscape generally; |
| | • | | litigation involving us, our industry or both; |
40
| | • | | regulatory developments in the United States, foreign countries or both; |
| | • | | general economic conditions and trends; |
| | • | | major catastrophic events; |
| | • | | sales of large blocks of our stock; or |
| | • | | departures of key personnel. |
In addition, if the market for technology stocks, or the stock market in general, experiences a loss of investor confidence, the trading price of our common stock could decline for reasons unrelated to our business, operating results or financial condition. The trading price of our common stock might also decline in reaction to events that affect other companies in our industry even if these events do not directly affect us.
In the past, following periods of volatility in the market price of a company’s securities, securities class action litigation has often been brought against that company. If our stock price is volatile, we may become the target of securities litigation. Securities litigation could result in substantial costs and divert our management’s attention and resources from our business, and this could have a material adverse effect on our business, operating results and financial condition.
Sales of outstanding shares of our common stock into the market in the future could cause the market price of our common stock to drop significantly.
If our existing stockholders sell, or indicate an intention to sell, substantial amounts of our common stock in the public market after the contractual lock-up and other legal restrictions on resale lapse, the trading price of our common stock could decline. There were 31,151,723 shares of common stock outstanding as of December 28, 2013, all of which are freely tradable, unless such shares are held by “affiliates,” as that term is defined in Rule 144 of the Securities Act of 1933, as amended, or the Securities Act.
In addition, we have filed a registration statement to register all shares subject to options or restricted stock units that are currently outstanding or that are reserved for future issuance under our equity compensation plans. If these additional shares are sold, or if it is perceived that they will be sold, in the public market, the trading price of our common stock could decline.
If securities analysts do not publish research or reports about our business, or if they downgrade our stock, the price of our stock could decline.
The trading market for our common stock could be influenced by any research and reports that securities or industry analysts publish about us or our business. Securities and industry analysts have only recently commenced research coverage of us. In the event securities or industry analysts who cover our company downgrade our stock or publish inaccurate or unfavorable research about our business, our stock price would likely decline. If one or more of these analysts cease coverage of our company or fail to publish reports on us regularly, demand for our stock could decrease, which could cause our stock price and trading volume to decline.
The concentration of ownership among our existing directors, executive officers and principal stockholders will provide them, collectively, with substantial control over us, which could limit your ability to influence the outcome of key transactions, including a change of control.
Our directors, executive officers and each of our stockholders who own greater than 5% of our outstanding common stock and their affiliates, in the aggregate, own approximately 42% of the outstanding shares of our common stock, based on the number of shares outstanding as of
41
December 28, 2013. As a result, these stockholders, if acting together, will be able to influence or control matters requiring approval by our stockholders, including the election of directors and the approval of mergers, acquisitions or other extraordinary transactions. They may also have interests that differ from yours and may vote in a way with which you disagree and which may be adverse to your interests. This concentration of ownership may have the effect of delaying, preventing or deterring a change of control of our company, could deprive our stockholders of an opportunity to receive a premium for their common stock as part of a sale of our company and might ultimately affect the market price of our common stock.
We do not intend to pay dividends in the foreseeable future.
We intend to retain any earnings to finance the operation and expansion of our business, and we do not anticipate paying any cash dividends on our common stock for the foreseeable future. As a result, you may only receive a return on your investment in our common stock if the market price of our common stock increases.
We have incurred and will continue to incur increased costs as a result of being a public company.
As a public company, we have incurred and will continue to incur significant legal, accounting and other expenses that we did not incur as a private company. In addition, rules implemented by the SEC and the New York Stock Exchange require certain corporate governance practices by public companies. These rules and regulations increase our legal and financial compliance costs and make some activities more time-consuming and costly. We also incur additional costs associated with our public company reporting requirements. These rules and regulations may also make it more difficult and more expensive for us to obtain director and officer liability insurance, and we may be required to accept reduced policy limits and coverage or incur substantially higher costs to obtain the same or similar coverage. As a result, it may be more difficult for us to attract and retain qualified people to serve on our board of directors, particularly to serve on our audit committee and compensation committee, or as executive officers.
Provisions in our certificate of incorporation and bylaws and under Delaware law might discourage, delay or prevent a change of control of our company or changes in our management and, therefore, depress the trading price of our common stock.
Our certificate of incorporation and bylaws contain provisions that could depress the trading price of our common stock by acting to discourage, delay or prevent a change of control of our company or changes in our management that the stockholders of our company may deem advantageous. These provisions:
| | • | | establish a classified board of directors so that not all members of our board of directors are elected at one time; |
| | • | | authorize the issuance of “blank check” preferred stock that our board of directors could issue to increase the number of outstanding shares to discourage a takeover attempt; |
| | • | | prohibit stockholder action by written consent, which requires all stockholder actions to be taken at a meeting of our stockholders; |
| | • | | prohibit stockholders from calling a special meeting of our stockholders; |
| | • | | provide that the board of directors is expressly authorized to make, alter or repeal our bylaws; and |
| | • | | establish advance notice requirements for nominations for elections to our board of directors or for proposing matters that can be acted upon by stockholders at stockholder meetings. |
42
Additionally, we are subject to Section 203 of the Delaware General Corporation Law, which generally prohibits a Delaware corporation from engaging in any of a broad range of business combinations with any “interested” stockholder for a period of three years following the date on which the stockholder became an “interested” stockholder and which may discourage, delay or prevent a change of control of our company.
Any provision of our certificate of incorporation or bylaws or Delaware law that has the effect of delaying or deterring a change in control could limit the opportunity for our stockholders to receive a premium for their shares of our common stock, and could also affect the price that some investors are willing to pay for our common stock.
Item 1B. Unresolved Staff Comments
None.
Item 2. Properties
In February 2014, we relocated our worldwide headquarters from Milpitas, California, to a facility in Santa Clara, California. Our new worldwide headquarters occupy approximately 105,600 square feet of office space under a sublease arrangement that expires in March 2018 for an aggregate net base rent of $10.7 million. In addition to the base rent, we are responsible for payment of certain operating expenses, including utilities and real estate taxes. Our former headquarters occupy approximately 45,000 square feet in Milpitas, California under a lease that terminates in June 2014.
We have additional office locations in New York, New York and Vienna, Virginia in the United States. We lease space in various international locations for operations and sales personnel. Our current facilities are adequate to meet our existing needs. However, to the extent we meet our current growth expectations, we will need to expand our facilities. We believe that we will be able to obtain additional or substitute facilities on commercially reasonable terms. However, we expect to incur additional expenses in connection with any such new or expanded facilities.
Item 3. Legal Proceedings
We may, from time to time, be subject to legal proceedings and claims arising from the normal course of business activities, and an unfavorable resolution of any of these matters could materially affect our future business, results of operations, financial condition or cash flows.
Item 4. Mine Safety Disclosures
Not applicable.
43
PART II
| Item 5. | Market for Registrant’s Common Equity, Related Stockholder Matters and Issuer Purchases of Equity Securities |
Market Information
Our common stock, $0.0001 par value per share, has been listed on the New York Stock Exchange under the symbol “GIMO” since June 12, 2013. Prior to that date, there was no public trading market for our common stock.
Holders of Record
As of February 15, 2014, there were 20 holders of record of our common stock. The actual number of stockholders is greater than this number of record holders and includes stockholders who are beneficial owners but whose shares are held in street name by brokers and other nominees. This number of holders of record also does not include stockholders whose shares may be held in trust by other entities.
Price Range of Our Common Stock
The following table sets forth for the periods indicated the high and low sales prices per share of our common stock as reported on the New York Stock Exchange:
| | | | | | | | |
| | | High | | | Low | |
Fiscal Year Ended December 28, 2013: | | | | | | | | |
Second Quarter (from June 12, 2013) | | $ | 28.75 | | | $ | 23.02 | |
Third Quarter | | $ | 41.81 | | | $ | 26.40 | |
Fourth Quarter | | $ | 39.85 | | | $ | 25.18 | |
On December 28, 2013, the last reported sale price of our common stock on the New York Stock Exchange was $28.29 per share.
Dividend Policy
We intend to retain any future earnings and do not currently anticipate paying any cash dividends on our common stock. Any future determination to declare cash dividends will be made at the discretion of our board of directors, subject to applicable laws, and will depend on our financial condition, results of operations, capital requirements, general business conditions and other factors that our board of directors may deem relevant.
44
Stock Price Performance Graph
This performance graph shall not be deemed “filed” for purposes of Section 18 of the Exchange Act, or incorporated by reference into any filing of Gigamon Inc. under the Securities Act of 1933, as amended, or the Securities Act, except as shall be expressly set forth by specific reference in such filing. The stock price performance on this performance graph is not necessarily indicative of future stock price performance.
This performance graph compares the cumulative total return on our common stock with that of the NYSE Composite Index and the NASDAQ Telecommunications Index. The initial public offering price of our common stock was $19.00 per share and the closing price was $28.47 per share on June 12, 2013. This performance graph assumes $100 was invested in the common stock of Gigamon Inc. at the closing price of $28.47 per share on June 12, 2013 as required by SEC rules and $100 was invested in each of the NYSE Composite Index and the NASDAQ Telecommunications Index on May 31, 2013.
COMPARISON OF 6 MONTH CUMULATIVE TOTAL RETURN*
Among Gigamon Inc., the NYSE Composite Index,
and the NASDAQ Telecommunications Index
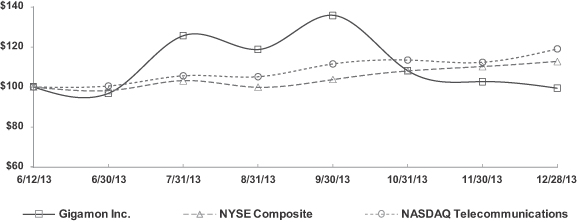
| | * | $100 invested on 6/12/13 in stock or 5/31/13 in index, including reinvestment of dividends. Fiscal year ending December 28. |
Recent Sales of Unregistered Securities
In fiscal 2013, we granted stock options under our 2012 Unit Option Plan, or 2012 Plan, to purchase 1,426,849 shares of our common stock to certain of our officers, directors, employees and consultants at exercise prices ranging from $0.0002 to $19.00 per share and granted 507,264 restricted stock units under our 2012 Plan. During such period, we issued an aggregate of 1,805 shares of common stock that were not registered under the Securities Act pursuant to the exercise of stock options for cash consideration with aggregate exercise proceeds of approximately $11,000. These issuances were undertaken in reliance upon the exemption from registration requirements available under Rule 701 of the Securities Act.
45
Use of Proceeds
On June 11, 2013, our registration statement on Form S-1 (File No. 333-182662) was declared effective by the SEC for our IPO pursuant to which we registered an aggregate of 7,762,500 shares of our common stock, including 1,012,500 shares of common stock registered for sale by us upon the full exercise of the underwriters’ overallotment option and 2,250,000 shares of our common stock sold on behalf of our selling stockholders, at the public offering price of $19.00 per share. The underwriters of the offering were Goldman, Sachs & Co., Merrill Lynch, Pierce, Fenner & Smith Incorporated, Credit Suisse Securities (USA) LLC, Barclays Capital Inc. and Raymond James & Associates, Inc. The offering commenced as of June 12, 2013 and did not terminate before all of the securities registered in the registration statement were sold. On June 17, 2013, we closed the sale of such shares, resulting in net proceeds to us of $93.4 million after deducting underwriting discounts and commissions of $7.3 million and other offering expenses of approximately $4.0 million. We did not receive any proceeds from the sale of shares by the selling stockholders. Following our IPO, we paid an aggregate of $20.4 million to satisfy our obligations to holders of performance units under our 2009 Performance Unit Plan, who are primarily our employees and directors, based on the public offering price of $19.00 per share.
On October 22, 2013, our registration statement on Form S-1 (File No. 333-191581) was declared effective by the SEC for our follow-on public offering pursuant to which we registered an aggregate of 5,100,000 shares of our common stock, including 4,800,000 shares of our common stock sold on behalf of our selling stockholders, at the public offering price of $38.50 per share. The underwriters of the offering were Goldman, Sachs & Co., Merrill Lynch, Pierce, Fenner & Smith Incorporated, Credit Suisse Securities (USA) LLC, Raymond James & Associates, Inc., Pacific Crest Securities LLC and William Blair & Company, L.L.C. The offering commenced as of October 23, 2013 and did not terminate before all of the securities registered in the registration statement were sold. On October 28, 2013, we closed the sale of such shares, resulting in net proceeds to us of $10.2 million after deducting underwriting discounts and commissions of $0.5 million and other offering expenses of approximately $0.8 million. We did not receive any proceeds from the sale of shares by the selling stockholders.
We held the proceeds received from our IPO and follow-on public offering as cash, cash equivalent and investments and intend to continue to invest the funds in short-term marketable securities, including U.S. government, government agency, and corporate debt securities. There has been no material change in the planned use of proceeds from our IPO as described in our final prospectus filed with the SEC on June 12, 2013 pursuant to Rule 424(b) or from our follow-on public offering as described in our final prospectus filed with the SEC on October 23, 2013 pursuant to Rule 424(b).
Issuer Purchases of Equity Securities
None.
46
Item 6. Selected Consolidated Financial Data
Effective January 1, 2013, we changed our reporting period from a calendar year ending on December 31 of each year to a 52- or 53-week fiscal year that ends on the last Saturday in December. Fiscal 2013 was a 52-week fiscal year ended on December 28, 2013, and each quarter was a 13-week quarter.
The following tables summarize our historical consolidated financial data. We have derived the summary consolidated statement of operations data for fiscal 2013, 2012 and 2011, and the selected consolidated balance sheet data as of December 28, 2013 and December 31, 2012, from our audited consolidated financial statements included elsewhere in this Annual Report on Form 10-K. The consolidated statement of operations data for fiscal 2010 and 2009, and the selected consolidated balance sheet data as of December 31, 2011, 2010 and 2009, are derived from our audited consolidated financial statements not included in this Annual Report on Form 10-K. Our historical results are not necessarily indicative of the results that may be expected in the future. The following summary consolidated financial and other data should be read in conjunction with the section titled “Management’s Discussion and Analysis of Financial Condition and Results of Operations” and our consolidated financial statements and related notes included elsewhere in this Annual Report on Form 10-K.
47
| | | | | | | | | | | | | | | | | | | | |
| | | Fiscal Year Ended | |
| | | December 28,
2013 | | | December 31,
2012 | | | December 31,
2011 | | | December 31,
2010 | | | December 31,
2009 | |
| | | (in thousands, except per share amounts) | |
Consolidated Statement of Operations Data: | | | | | | | | | | | | | | | | | | | | |
Revenue: | | | | | | | | | | | | | | | | | | | | |
Product | | $ | 101,717 | | | $ | 69,516 | | | $ | 51,308 | | | $ | 35,577 | | | $ | 24,664 | |
Services | | | 38,578 | | | | 27,199 | | | | 16,797 | | | | 10,909 | | | | 6,723 | |
| | | | | | | | | | | | | | | | | | | | |
Total revenue | | | 140,295 | | | | 96,715 | | | | 68,105 | | | | 46,486 | | | | 31,387 | |
Cost of revenue: | | | | | | | | | | | | | | | | | | | | |
Product | | | 26,103 | | | | 18,039 | | | | 12,528 | | | | 6,122 | | | | 4,826 | |
Services | | | 4,727 | | | | 2,246 | | | | 1,900 | | | | 2,239 | | | | 665 | |
| | | | | | | | | | | | | | | | | | | | |
Total cost of revenue(1) | | | 30,830 | | | | 20,285 | | | | 14,428 | | | | 8,361 | | | | 5,491 | |
| | | | | | | | | | | | | | | | | | | | |
Gross profit | | | 109,465 | | | | 76,430 | | | | 53,677 | | | | 38,125 | | | | 25,896 | |
Operating expenses: | | | | | | | | | | | | | | | | | | | | |
Research and development(1) | | | 42,067 | | | | 17,730 | | | | 12,530 | | | | 12,283 | | | | 4,977 | |
Sales and marketing(1) | | | 72,024 | | | | 39,359 | | | | 19,358 | | | | 12,522 | | | | 5,209 | |
General and administrative(1) | | | 25,575 | | | | 11,665 | | | | 4,766 | | | | 6,610 | | | | 2,506 | |
| | | | | | | | | | | | | | | | | | | | |
Total operating expenses | | | 139,666 | | | | 68,754 | | | | 36,654 | | | | 31,415 | | | | 12,692 | |
| | | | | | | | | | | | | | | | | | | | |
(Loss) income from operations | | | (30,201 | ) | | | 7,676 | | | | 17,023 | | | | 6,710 | | | | 13,204 | |
| | | | | | | | | | | | | | | | | | | | |
Interest income | | | 95 | | | | 64 | | | | 4 | | | | 9 | | | | 65 | |
Other expense, net | | | (94 | ) | | | (70 | ) | | | (16 | ) | | | (7 | ) | | | (7 | ) |
| | | | | | | | | | | | | | | | | | | | |
(Loss) income before income tax benefit (provision) | | | (30,200 | ) | | | 7,670 | | | | 17,011 | | | | 6,712 | | | | 13,262 | |
Income tax benefit (provision) | | | 20,663 | | | | (139 | ) | | | (80 | ) | | | (75 | ) | | | (122 | ) |
| | | | | | | | | | | | | | | | | | | | |
Net (loss) income | | | (9,537 | ) | | | 7,531 | | | | 16,931 | | | | 6,637 | | | | 13,140 | |
| | | | | | | | | | | | | | | | | | | | |
Accretion of preferred units to redemption value and issuance costs | | | (1,088 | ) | | | (2,236 | ) | | | (2,078 | ) | | | (1,834 | ) | | | — | |
Loss (earnings) distributable to preferred stock holders | | | 1,107 | | | | (1,690 | ) | | | (4,741 | ) | | | (1,350 | ) | | | — | |
| | | | | | | | | | | | | | | | | | | | |
Net (loss) income attributable to common stockholders | | $ | (9,518 | ) | | $ | 3,605 | | | $ | 10,112 | | | $ | 3,453 | | | $ | 13,140 | |
| | | | | | | | | | | | | | | | | | | | |
Net (loss) income per share attributable to common stockholders: | | | | | | | | | | | | | | | | | | | | |
Basic and Diluted(2) | | $ | (0.39 | ) | | $ | 0.21 | | | $ | 0.58 | | | $ | 0.19 | | | $ | 0.52 | |
| | | | | | | | | | | | | | | | | | | | |
Weighted average shares used in computing net (loss) income per share attributable to common stockholders: | | | | | | | | | | | | | | | | | | | | |
Basic(2) | | | 24,722 | | | | 17,300 | | | | 17,300 | | | | 17,862 | | | | 25,410 | |
| | | | | | | | | | | | | | | | | | | | |
Diluted(2) | | | 24,722 | | | | 17,303 | | | | 17,300 | | | | 17,862 | | | | 25,410 | |
| | | | | | | | | | | | | | | | | | | | |
| (1) | The following tables present stock-based compensation expense and expenses related to our performance units included in each expense category: |
48
| | | | | | | | | | | | | | | | | | | | |
| | | Fiscal Year Ended | |
| | | December 28,
2013 | | | December 31,
2012 | | | December 31,
2011 | | | December 31,
2010 | | | December 31,
2009 | |
| | | (in thousands) | |
Stock-based compensation expense: | | | | | | | | | | | | | | | | | | | | |
Cost of revenue | | $ | 3,496 | | | $ | 153 | | | $ | — | | | $ | 1,086 | | | $ | 8 | |
Research and development | | | 11,467 | | | | 542 | | | | 8 | | | | 4,692 | | | | 64 | |
Sales and marketing | | | 11,034 | | | | 893 | | | | 2 | | | | 2,377 | | | | 25 | |
General and administrative | | | 6,546 | | | | 2,011 | | | | 2 | | | | 2,212 | | | | 13 | |
| | | | | | | | | | | | | | | | | | | | |
Total stock-based compensation expense | | $ | 32,543 | | | $ | 3,599 | | | $ | 12 | | | $ | 10,367 | | | $ | 110 | |
| | | | | | | | | | | | | | | | | | | | |
| | | | | | | | | | | | | | | | | | | | |
| | | Fiscal Year Ended | |
| | | December 28,
2013 | | | December 31,
2012 | | | December 31,
2011 | | | December 31,
2010 | | | December 31,
2009 | |
| | | (in thousands) | |
Performance units expenses: | | | | | | | | | | | | | | | | | | | | |
Cost of revenue | | $ | 353 | | | $ | — | | | $ | — | | | $ | — | | | $ | — | |
Research and development | | | 5,188 | | | | — | | | | — | | | | — | | | | — | |
Sales and marketing | | | 7,991 | | | | — | | | | — | | | | — | | | | — | |
General and administrative | | | 6,839 | | | | — | | | | — | | | | — | | | | — | |
| | | | | | | | | | | | | | | | | | | | |
Total performance units expenses | | $ | 20,371 | | | $ | — | | | $ | — | | | $ | — | | | $ | — | |
| | | | | | | | | | | | | | | | | | | | |
| | (2) | See Note 2 to our consolidated financial statements for an explanation of the calculations of our basic and diluted net (loss) income per share of common stock. |
| | | | | | | | | | | | | | | | | | | | |
| | | As of | |
| | | December 28,
2013 | | | December 31,
2012 | | | December 31,
2011 | | | December 31,
2010 | | | December 31,
2009 | |
| | | (in thousands) | |
Consolidated Balance Sheet Data: | | | | | | | | | | | | | | | | | | | | |
Cash and cash equivalents | | $ | 79,908 | | | $ | 18,675 | | | $ | 13,102 | | | $ | 5,804 | | | $ | 3,122 | |
Short-term investments | | | 58,242 | | | | — | | | | — | | | | — | | | | — | |
Working capital (deficit) | | | 111,468 | | | | 647 | | | | 183 | | | | (555 | ) | | | (96 | ) |
Total assets | | | 195,517 | | | | 51,497 | | | | 43,995 | | | | 20,876 | | | | 12,809 | |
Redeemable convertible preferred units | | | — | | | | 28,344 | | | | 26,108 | | | | 24,030 | | | | — | |
Total stockholders’ equity (members’ deficit) | | | 123,438 | | | | (30,045 | ) | | | (27,809 | ) | | | (25,731 | ) | | | (1,097 | ) |
49
Item 7. Management’s Discussion and Analysis of Financial Condition and Results of Operations
The following discussion and analysis of our financial condition and results of operations should be read in conjunction with our consolidated financial statements and related notes included elsewhere in this Annual Report on Form 10-K. In addition to historical financial information, this discussion contains forward-looking statements that reflect our plans, estimates and beliefs. The words “believe,” “may,” “will,” “estimate,” “continue,” “anticipate,” “intend,” “expect,” and similar expressions are intended to identify forward-looking statements. Our actual results could differ materially from those contained in or implied by any forward-looking statements. Factors that could cause or contribute to those differences include, but are not limited to, those identified below and those discussed above in the section titled “Risk Factors” and elsewhere in this Annual Report on Form 10-K.
Overview
We have developed an innovative solution that delivers pervasive and dynamic intelligent visibility of traffic across networks. Our solution, which we refer to as our Traffic Visibility Fabric, consists of distributed network appliances that enable an advanced level of visibility, modification and control of network traffic. Our Fabric enables IT organizations to forward traffic from network and server infrastructure to management, analysis, compliance and security tools in a manner that is optimized for specific uses or functions.
In 2005, we introduced our patented Flow Mapping technology in combination with the launch of our first product, the GigaVUE-MP. In 2010, we introduced our GigaSMART platform to support advanced packet modification applications, and have since introduced 12 licensable applications including De-Duplication, Tunneling, Advanced Packet Filtering, FlowVUE, GTP Correlation and NetFlow Generation. We have also continued to expand our Fabric Node portfolio including adding the GigaVUE H Series chassis, the first Terabit scale Traffic Visibility Fabric for high-throughput environments, which we launched in 2011. In 2012, we introduced GigaVUE-VM, a software-only version of our platform for virtualized and cloud-based applications, and GigaVUE-FM, our software-only management offering. In 2013, we introduced the GigaVUE-HB1 platform, which incorporates GigaSMART as standard, to extend the reach of the Traffic Visibility Fabric to smaller environments and mid-size enterprises, and several new software applications, including Adaptive Packet Filtering (content-based filtering), FlowVUE and GTP Correlation (subscriber-based sampling).
We generate product revenue primarily from sales of perpetual software licenses installed on physical appliances for our Traffic Visibility Fabric solutions to channel partners, including distributors and resellers, as well as directly to end-user customers. We market and sell our products through a hybrid sales model, which combines a high-touch sales organization and an overlay channel sales team that actively assists our extensive network of channel partners throughout the sales process. We also provide our channel partners with marketing assistance, technical training and support.
We generate services revenue primarily from the sale of maintenance and support services for our products. A one-year contract for our maintenance and support services is bundled with the initial contract to purchase our products. Following expiration of this one-year contract, our end-user customers typically purchase maintenance and support contracts that generally have one-year terms.
We have experienced significant growth since our inception in 2004. Our revenue increased from $68.1 million in fiscal 2011 to $140.3 million in fiscal 2013, representing a compound annual growth rate, or CAGR, of 44%. Our net loss was $9.5 million in fiscal 2013 and our net income was $7.5 million and $16.9 million in fiscal 2012 and 2011, respectively. Our net loss in fiscal 2013 included a one-time cash charge of $20.4 million relating to performance units payments as a result of our IPO in June 2013. We generated cash from operations of $23.3 million, $27.7 million and $21.6 million in fiscal 2013, 2012 and 2011, respectively. We operate as a single reportable segment.
50
Key Performance Indicators of Our Business
We monitor a variety of key performance indicators to help us evaluate growth trends, establish budgets, measure the effectiveness of our sales and marketing efforts and assess operational efficiencies. These key performance indicators include the following (dollars in thousands):
| | | | | | | | | | | | |
| | | Fiscal Years Ended | |
| | | December 28,
2013 | | | December 31,
2012 | | | December 31,
2011 | |
Key Performance Indicators: | | | | | | | | | | | | |
Revenue | | $ | 140,295 | | | $ | 96,715 | | | $ | 68,105 | |
Gross margin | | | 78 | % | | | 79 | % | | | 79 | % |
(Loss) income from operations | | $ | (30,201 | ) | | $ | 7,676 | | | $ | 17,023 | |
Deferred revenue | | $ | 47,476 | | | $ | 30,820 | | | $ | 21,962 | |
Revenue. We monitor our revenue to assess the acceptance of our products by our end-user customers and growth in the markets we serve.
Gross margin. We monitor our gross margin to assess the impact on our current and forecasted financial results from any changes to the pricing and mix of products we are selling to our end-user customers.
(Loss) income from operations. We monitor our (loss) income from operations to assess how effectively we are conducting our operations as well as controlling our operating expenses, which are primarily driven by headcount.
Deferred revenue. Our deferred revenue consists of amounts that have been invoiced but that have not yet been recognized as revenue. The majority of our deferred revenue balance consists of the unamortized portion of services revenue from maintenance and support contracts. We also defer revenue, and the related costs of product revenue, on sales of products to distributors who stock inventory until the distributors report to us that they have sold the products to end-user customers. We monitor our deferred revenue balance because it represents a significant portion of the revenue that we will recognize in future periods.
Initial Public Offering and Follow-On Public Offering
On June 17, 2013, we completed our IPO, in which 7,762,500 shares of common stock were sold at a public offering of $19.00 per share. We issued and sold 5,512,500 shares of common stock, inclusive of the 1,012,500 shares of common stock sold in connection with the full exercise of the overallotment option of shares granted to the underwriters, at a public offering price of $19.00 per share. We received proceeds of $93.4 million, net of underwriting discounts and commissions and offering expenses. In addition, our selling stockholders sold 2,250,000 shares of common stock at a public offering price of $19.00 per share. We did not receive any proceeds from the sales of shares by the selling stockholders.
On October 28, 2013, we completed our follow-on public offering, in which 5,100,000 shares of our common stock were sold at a public offering price of $38.50 per share. We issued and sold 300,000 shares of common stock, for which we received proceeds of $10.2 million, net of underwriting discounts and commissions and offering expenses. In addition, our selling stockholders sold 4,800,000 shares of common stock, which included 293,718 shares of common stock issued upon the exercise of options by certain selling stockholders with an aggregate exercise price of $1.3 million, at a public offering price of $38.50 per share. We did not receive any proceeds from the sale of shares by the selling stockholders.
51
Financial Overview
Revenue
We generate revenue from the sale of products and related services, including maintenance and support. We present revenue net of discounts, rebates and sales taxes. Our revenue is comprised of the following:
Product revenue. We generate product revenue primarily from sales of perpetual software licenses installed on physical appliances for our Traffic Visibility Fabric solutions. We generally recognize product revenue at the time of product delivery, provided that all other revenue recognition criteria have been met. As a percentage of revenue, we expect our product revenue to vary from quarter-to-quarter based on, among other things, the timing of orders and delivery of products and seasonal and cyclical factors.
We have experienced seasonality in the sale of our products. The first quarter of each year is usually our lowest revenue quarter during the year and product revenue typically declines sequentially from the prior fourth quarter. We generally expect an increase in sales in the second half of the year, primarily due to the buying habits of many of our end-user customers as budgets for annual capital purchases are being fully utilized.
We expect our product revenue to increase in absolute dollars as we continue to add new end-user customers, expand the volume of shipments to our current end-user customers and introduce new products.
Services revenue. We generate service revenue from sales of maintenance and support contracts, which are bundled with sales of products, and from subsequent renewals of those contracts. We offer tiered maintenance and support services under our renewable, fee-based maintenance and support contracts, which includes technical support, hardware repair and replacement parts, bug fixes, patches and unspecified upgrades on a when-and-if-available basis. We recognize services revenue ratably over the duration of the contract, which is typically one year and can be up to five years; as a result, the impact on services revenue will lag any shift in product revenue because product revenue is recognized when a product is sold and revenue criteria are satisfied, whereas services revenue is recognized ratably over the contract term. We expect our services revenue to increase in absolute dollars as we increase our installed base by selling more products and adding more end-user customers.
Cost of revenue
Our cost of revenue consists of the following:
Cost of product revenue. Cost of product revenue primarily consists of the costs associated with manufacturing our products, including third-party hardware manufacturing costs, as well as personnel costs for salary, benefits, bonuses, stock-based compensation expense and other compensation, shipping costs, allocated costs of facilities and information technology, warranty costs and any inventory write-downs. We expect cost of product revenue to increase in absolute dollars in connection with the anticipated increase in product revenue.
Cost of services revenue. Cost of services revenue primarily consists of personnel costs for salary, benefits, bonuses, stock-based compensation expense and other compensation related to our customer support organization, as well as allocated costs of facilities and information technology. We expect cost of services revenue to increase in absolute dollars in connection with the anticipated increase in services revenue.
52
Gross profit and gross margin
Gross profit has been and will continue to be affected by a variety of factors including shipment volumes, changes in the mix of products and services sold, new product introductions and upgrades to existing products, changes in customer mix, changes in pricing, the extent of customer rebates and incentive programs and changes in our product costs including any excess inventory write-offs. We expect our gross margin to fluctuate over time depending on a variety of factors, including those described above, and it may decrease over the longer-term in the event that we experience additional competitive pricing pressure.
Operating expenses
Operating expenses consist of research and development, sales and marketing and general and administrative expenses. Personnel costs comprise a significant component of our operating expenses, and consist of salary, benefits, bonuses, stock-based compensation expense and other compensation. With respect to our sales organization, personnel costs also include sales commissions. Headcount attributable to our operating expenses increased to 326 as of December 28, 2013, compared to 224 as of December 31, 2012 and 136 as of December 31, 2011. We expect to continue to hire new employees to support our anticipated growth, particularly with respect to an anticipated increase in sales and marketing and research and development headcount in fiscal 2014. We expect operating expenses to increase in absolute dollars as we continue to grow, and that our operating margin may decline in the near term as we continue to invest for future growth.
Research and development. Our research and development efforts are focused on new product development and on developing additional functionality for our existing products. Research and development expenses consist primarily of personnel costs, and to a lesser extent, prototype materials, allocated costs of facilities and information technology and product certification. We expense research and development costs as incurred. We expect our research and development expenses to increase in absolute dollars as we continue to develop new products and enhance our existing products.
Sales and marketing. Sales and marketing expenses are the largest component of our operating expenses and consist primarily of personnel costs, as well as travel expenses, trade shows, marketing and promotional activities, and allocated costs of facilities and information technology. We sell our products through our global sales organization, which is divided into three geographic regions: North America, Europe and Asia Pacific. We expect our sales and marketing expenses to increase in absolute dollars as we expand our sales and marketing efforts internationally and domestically to help drive increased revenue.
General and administrative. General and administrative expenses consist of personnel costs and allocated costs of facilities and information technology related to our executive, finance, human resources and legal functions, as well as professional services costs. Professional services costs consist primarily of outside legal and accounting services. We have incurred, and expect to continue to incur, additional expenses as a result of operating as a public company, including costs to maintain compliance with the rules and regulations applicable to companies listed on a national securities exchange and costs related to reporting obligations.
Interest income and other expense, net
Interest income consists primarily of income earned on our invested cash, cash equivalents and investments. We expect interest income to increase modestly depending on our average invested balances during the period and market interest rates.
Other expense, net consists primarily of foreign currency exchange losses related to transactions denominated in currencies other than the U.S. dollar, which have not been material to date.
53
Provision for income taxes
Prior to May 31, 2013, we conducted our operations through Gigamon LLC, a pass through entity that filed its income tax return as a partnership for federal and state income tax purposes. As a result, prior to May 31, 2013, we were not subject to U.S. federal or state income taxes as our taxable income was reported by our individual members.
On May 31, 2013, we converted from a Delaware limited liability company (a pass through entity not subject to U.S. federal and state income taxes) to a Delaware corporation. Accordingly, following such conversion, we elected to be treated as a corporation under Subchapter C of Chapter 1 of the United States Internal Revenue Code, as amended, or the Code, and, therefore, are subject to both federal and state income taxes. As a result of this tax election, we recorded a one-time non-cash income tax benefit of $14.8 million in fiscal 2013, for the deferred tax asset amount recorded upon our change in entity status from a Delaware limited liability company to a Delaware corporation.
We are also subject to state taxes in certain states that may assess capital taxes or taxes based on gross receipts. We also have a subsidiary in a foreign jurisdiction, which is subject to local income taxes.
Stock-based compensation expense and other compensation charges
Prior to the formation of our company in 2009, Gigamon Systems LLC, our majority stockholder prior to the LLC Conversion, issued options to purchase its common units to some of its employees. As these employees became our employees upon the contribution of all of the assets and liabilities of Gigamon Systems LLC to us in January 2009, we assumed all of the necessary tax obligations and recorded a relatively small stock-based compensation expense related to these options in our consolidated statement of operations. Between January 1, 2009 and December 31, 2011, instead of granting stock options to our employees, we granted performance units to our employees under our 2009 Performance Unit Plan. The vested performance units were satisfied by us with a cash payment to the holders of performance units in connection with the completion of our IPO. Accordingly, the grant of performance units did not result in stock-based compensation expense or compensation charges in any period prior to the completion of our IPO, but, upon the completion of our IPO, we recorded cash-based compensation expense and related payroll taxes of $20.4 million for our performance units based on our IPO price of $19.00 per share, which is reflected in cost of revenue and operating expenses in the second quarter of fiscal 2013.
We began granting stock options in April 2012 and began granting restricted stock units, or RSUs, in August 2012. Prior to the second quarter of fiscal 2013, we did not record any stock-based compensation expense associated with stock options and RSUs that did not begin to vest until the completion of our IPO, or the IPO Awards. Upon the completion of our IPO in fiscal 2013, we recorded stock-based compensation expense of $5.5 million, net of estimated forfeitures, related to these IPO Awards and began offering eligible employees the opportunity to purchase shares under our 2013 Employee Stock Purchase Plan. Total stock-based compensation expense, net of estimated forfeitures, was $32.5 million, $3.6 million and zero in fiscal 2013, 2012 and 2011, respectively. As of December 28, 2013, unrecognized stock-based compensation expense, net of estimated forfeitures, was $26.3 million.
Change in Reporting Calendar
Effective January 1, 2013, we changed our reporting period from a calendar year ending on December 31 of each year to a 52- or 53-week fiscal year that ends on the last Saturday in December. Fiscal 2013 was a 52-week fiscal year, which ended on December 28, 2013, and each quarter was a 13-week quarter.
54
Results of Operations
The following tables set forth our results of operations for the periods presented in dollars and as a percentage of our revenue (in thousands, except percentages):
| | | | | | | | | | | | |
| | | Fiscal Year Ended | |
| | | December 28,
2013 | | | December 31,
2012 | | | December 31,
2011 | |
Consolidated Statement of Operations Data: | | | | | | | | | | | | |
Revenue: | | | | | | | | | | | | |
Product | | $ | 101,717 | | | $ | 69,516 | | | $ | 51,308 | |
Services | | | 38,578 | | | | 27,199 | | | | 16,797 | |
| | | | | | | | | | | | |
Total revenue | | | 140,295 | | | | 96,715 | | | | 68,105 | |
| | | |
Cost of revenue: | | | | | | | | | | | | |
Product | | | 26,103 | | | | 18,039 | | | | 12,528 | |
Services | | | 4,727 | | | | 2,246 | | | | 1,900 | |
| | | | | | | | | | | | |
Total cost of revenue | | | 30,830 | | | | 20,285 | | | | 14,428 | |
| | | | | | | | | | | | |
Gross profit | | | 109,465 | | | | 76,430 | | | | 53,677 | |
| | | |
Operating expenses: | | | | | | | | | | | | |
Research and development | | | 42,067 | | | | 17,730 | | | | 12,530 | |
Sales and marketing | | | 72,024 | | | | 39,359 | | | | 19,358 | |
General and administrative | | | 25,575 | | | | 11,665 | | | | 4,766 | |
| | | | | | | | | | | | |
Total operating expenses | | | 139,666 | | | | 68,754 | | | | 36,654 | |
| | | | | | | | | | | | |
(Loss) income from operations | | | (30,201 | ) | | | 7,676 | | | | 17,023 | |
Interest income | | | 95 | | | | 64 | | | | 4 | |
Other expense, net | | | (94 | ) | | | (70 | ) | | | (16 | ) |
| | | | | | | | | | | | |
| (Loss) income before income tax benefit (provision) | | | (30,200 | ) | | | 7,670 | | | | 17,011 | |
Income tax benefit (provision) | | | 20,663 | | | | (139 | ) | | | (80 | ) |
| | | | | | | | | | | | |
Net (loss) income | | $ | (9,537 | ) | | $ | 7,531 | | | $ | 16,931 | |
| | | | | | | | | | | | |
| | | |
| Net (loss) income includes stock-based compensation expense and performance units expenses allocated as follows: | | | | | | | | | | | | |
Stock-based compensation expense: | | | | | | | | | | | | |
Cost of revenue | | $ | 3,496 | | | $ | 153 | | | $ | - | |
Research and development | | | 11,467 | | | | 542 | | | | 8 | |
Sales and marketing | | | 11,034 | | | | 893 | | | | 2 | |
General and administrative | | | 6,546 | | | | 2,011 | | | | 2 | |
| | | | | | | | | | | | |
Total stock-based compensation expense | | $ | 32,543 | | | $ | 3,599 | | | $ | 12 | |
| | | | | | | | | | | | |
| | | |
Performance units expenses: | | | | | | | | | | | | |
Cost of revenue | | $ | 353 | | | $ | - | | | $ | - | |
Research and development | | | 5,188 | | | | - | | | | - | |
Sales and marketing | | | 7,991 | | | | - | | | | - | |
General and administrative | | | 6,839 | | | | - | | | | - | |
| | | | | | | | | | | | |
Total performance units expenses | | $ | 20,371 | | | $ | - | | | $ | - | |
| | | | | | | | | | | | |
55
| | | | | | | | | | | | |
| | | Fiscal Year Ended | |
| | | December 28,
2013 | | | December 31,
2012 | | | December 31,
2011 | |
Percentage of Revenue: | | | | | | | | | | | | |
Revenue: | | | | | | | | | | | | |
Product | | | 73 | % | | | 72 | % | | | 75 | % |
Services | | | 27 | % | | | 28 | % | | | 25 | % |
| | | | | | | | | | | | |
Total revenue | | | 100 | % | | | 100 | % | | | 100 | % |
Cost of revenue | | | 22 | % | | | 21 | % | | | 21 | % |
| | | | | | | | | | | | |
Gross margin | | | 78 | % | | | 79 | % | | | 79 | % |
| | | |
Operating expenses: | | | | | | | | | | | | |
Research and development | | | 30 | % | | | 18 | % | | | 18 | % |
Sales and marketing | | | 51 | % | | | 41 | % | | | 29 | % |
General and administrative | | | 19 | % | | | 12 | % | | | 7 | % |
| | | | | | | | | | | | |
Total operating expenses | | | 100 | % | | | 71 | % | | | 54 | % |
| | | | | | | | | | | | |
(Loss) income from operations | | | (22 | %) | | | 8 | % | | | 25 | % |
Interest income | | | 0 | % | | | 0 | % | | | 0 | % |
Other expense, net | | | (0 | %) | | | (0 | %) | | | (0 | %) |
| | | | | | | | | | | | |
(Loss) income before income tax benefit (provision) | | | (22 | %) | | | 8 | % | | | 25 | % |
Income tax benefit (provision) | | | 15 | % | | | (0 | %) | | | (0 | %) |
| | | | | | | | | | | | |
Net (loss) income | | | (7 | %) | | | 8 | % | | | 25 | % |
| | | | | | | | | | | | |
Comparison of Fiscal 2013 and Fiscal 2012
Revenue
| | | | | | | | | | | | | | | | |
| | | Fiscal Year Ended | | | | | | | |
| | | December 28, 2013 | | | December 31,
2012 | | | Increase | | | % Increase | |
| | | | | | (dollars in thousands) | | | | | | | |
Revenue: | | | | | | | | | | | | | | | | |
Product | | $ | 101,717 | | | $ | 69,516 | | | $ | 32,201 | | | | 46 | % |
Services | | | 38,578 | | | | 27,199 | | | | 11,379 | | | | 42 | % |
| | | | | | | | | | | | | | | | |
Total revenue | | $ | 140,295 | | | $ | 96,715 | | | $ | 43,580 | | | | 45 | % |
| | | | | | | | | | | | | | | | |
Product revenue increased $32.2 million in fiscal 2013, compared to fiscal 2012, primarily due to an increase in the volume of sales of our H Series products, including our recently introduced HB-1 products, partially offset by lower volume of sales of our G Series products. Revenue from our H Series products, including HB-1 products, increased to $64.2 million in fiscal 2013 from $27.1 million in fiscal 2012, partially offset by a decrease in revenue from our G Series products to $37.5 million in fiscal 2013 from $42.4 million in fiscal 2012, primarily due to a decrease in the volume of units sold.
Services revenue increased $11.4 million in fiscal 2013, compared to fiscal 2012, primarily due to the growth in our installed base at our existing end-user customers and also due to an increase in the total number of end-user customers under maintenance and support contracts with us, which was primarily driven by higher sales of our products.
56
Cost of revenue and gross margin
| | | | | | | | | | | | | | | | |
| | | Fiscal Year Ended | | | | | | | |
| | | December 28,
2013 | | | December 31,
2012 | | | Increase | | | % Increase | |
| | | (dollars in thousands) | | | | |
Cost of revenue: | | | | | | | | | | | | | | | | |
Product | | $ | 26,103 | | | $ | 18,039 | | | $ | 8,064 | | | | 45 | % |
Services | | | 4,727 | | | | 2,246 | | | | 2,481 | | | | 110 | % |
| | | | | | | | | | | | | | | | |
Total cost of revenue | | $ | 30,830 | | | $ | 20,285 | | | $ | 10,545 | | | | 52 | % |
| | | | | | | | | | | | | | | | |
| | | | |
Gross margin: | | | | | | | | | | | | | | | | |
Product | | | 74 | % | | | 74 | % | | | | | | | | |
Services | | | 88 | % | | | 92 | % | | | | | | | | |
Total gross margin | | | 78 | % | | | 79 | % | | | | | | | | |
| | | | |
| Stock-based compensation expense included in cost of revenue | | $ | 3,496 | | | $ | 153 | | | $ | 3,343 | | | | * | |
| Performance units expenses included in cost of revenue | | $ | 353 | | | $ | - | | | $ | 353 | | | | * | |
* Not meaningful
Total gross margin decreased to 78% in fiscal 2013 from 79% in fiscal 2012 as expenses increased as a percentage of revenue, primarily due to a $3.3 million increase in stock-based compensation expense and a $0.4 million expense related to our performance units, partially offset by the sale of previously written-down inventory, net of an excess and obsolete inventory write-down, in fiscal 2013.
Product gross margin remained consistent at 74% in fiscal 2013 and fiscal 2012, primarily due to an increase in cost of product revenue resulting from an increase in stock-based compensation expense of $2.0 million and expenses related to our performance units of $0.3 million, offset by the sale of previously written-down inventory of $0.8 million, net of an excess and obsolete inventory write-down, in fiscal 2013, compared to inventory write-downs of $1.5 million in fiscal 2012.
Services gross margin decreased to 88% in fiscal 2013 from 92% in fiscal 2012, primarily due to an increase in stock-based compensation expense of $1.4 million in fiscal 2013.
57
Operating expenses
| | | | | | | | | | | | | | | | |
| | | Fiscal Year Ended | | | | | | | |
| | | December 28,
2013 | | | December 31,
2012 | | | Increase | | | % Increase | |
| | | (dollars in thousands) | | | | |
Operating expenses: | | | | | | | | | | | | | | | | |
Research and development | | $ | 42,067 | | | $ | 17,730 | | | $ | 24,337 | | | | 137 | % |
Sales and marketing | | | 72,024 | | | | 39,359 | | | | 32,665 | | | | 83 | % |
General and administrative | | | 25,575 | | | | 11,665 | | | | 13,910 | | | | 119 | % |
| | | | | | | | | | | | | | | | |
Total operating expenses | | $ | 139,666 | | | $ | 68,754 | | | $ | 70,912 | | | | 103 | % |
| | | | | | | | | | | | | | | | |
| | | | |
Stock-based compensation expense included in: | | | | | | | | | | | | | | | | |
Research and development | | $ | 11,467 | | | $ | 542 | | | $ | 10,925 | | | | * | |
Sales and marketing | | | 11,034 | | | | 893 | | | | 10,141 | | | | * | |
General and administrative | | | 6,546 | | | | 2,011 | | | | 4,535 | | | | 226 | % |
| | | | | | | | | | | | | | | | |
Total stock-based compensation expense | | $ | 29,047 | | | $ | 3,446 | | | $ | 25,601 | | | | * | |
| | | | | | | | | | | | | | | | |
| | | | |
Performance units expenses included in: | | | | | | | | | | | | | | | | |
Research and development | | $ | 5,188 | | | $ | - | | | $ | 5,188 | | | | * | |
Sales and marketing | | | 7,991 | | | | - | | | | 7,991 | | | | * | |
General and administrative | | | 6,839 | | | | - | | | | 6,839 | | | | * | |
| | | | | | | | | | | | | | | | |
Total performance units expenses | | $ | 20,018 | | | $ | - | | | $ | 20,018 | | | | * | |
| | | | | | | | | | | | | | | | |
* Not meaningful
Research and development expenses increased $24.3 million in fiscal 2013 compared to fiscal 2012, primarily due to a $10.9 million increase in stock-based compensation expense and a $5.2 million expense related to our performance units in fiscal 2013. Net of stock-based compensation expense and expenses related to our performance units, research and development expenses increased $8.2 million, primarily attributable to a $5.7 million increase in personnel costs primarily driven by increased headcount, a $1.0 million increase in development expense, a $0.8 million increase in allocated costs of facilities and information technology and a $0.8 million increase in depreciation expense.
Sales and marketing expenses increased $32.7 million in fiscal 2013 compared to fiscal 2012, primarily due to a $10.1 million increase in stock-based compensation expense and an $8.0 million expense related to our performance units in fiscal 2013. Net of stock-based compensation expense and expenses related to our performance units, sales and marketing expenses increased $14.5 million, primarily attributable to a $10.4 million increase in personnel costs, primarily driven by increased headcount and additional commissions related to higher sales of our products and services, a $2.3 million increase in allocated costs of facilities and information technology and a $1.1 million increase in employee-related programs, travel and professional services.
General and administrative expenses increased $13.9 million in fiscal 2013 compared to fiscal 2012 primarily due to a $6.8 million expense related to our performance units and a $4.5 million
58
increase in stock-based compensation expense in fiscal 2013. Net of expenses related to our performance units and stock-based compensation expense, general and administrative expenses increased $2.5 million, primarily attributable to a $1.2 million increase in personnel and other allocated costs of facilities and information technology and a $0.9 million increase in office expense.
Income Tax Benefit (Provision)
| | | | | | | | | | | | | | | | |
| | | Fiscal Year Ended | | | | | | % Increase | |
| | | December 28,
2013 | | | December 31,
2012 | | | Increase | | |
| | | (dollars in thousands) | | | | |
Income tax benefit (provision) | | $ | 20,663 | | | $ | (139) | | | $ | 20,802 | | | | * | |
* Not meaningful.
We recognized an income tax benefit of $20.7 million in fiscal 2013 compared to an income tax provision of $0.1 million in fiscal 2012, primarily due to a one-time tax benefit of $14.8 million for the deferred tax asset recorded upon our change in status from a Delaware limited liability company to a Delaware corporation and also due to operating losses we incurred as a Delaware corporation following the LLC Conversion, partially offset by foreign income taxes. Prior to May 31, 2013, we conducted our U.S. operations through Gigamon LLC, a pass through entity that filed income tax return as a partnership for federal and state income tax purposes, and therefore, we were not subject to U.S. federal or state income taxes as our taxable income was reported by our individual members.
We had no valuation allowance recorded against our deferred tax assets as of December 28, 2013.
Comparison of the Fiscal 2012 and Fiscal 2011
Revenue
| | | | | | | | | | | | | | | | |
| | | Fiscal Year Ended | | | | | | % Increase | |
| | | December 31,
2012 | | | December 31,
2011 | | | Increase | | |
| | | (dollars in thousands) | |
Revenue: | | | | | | | | | | | | | | | | |
Product | | $ | 69,516 | | | $ | 51,308 | | | $ | 18,208 | | | | 35 | % |
Services | | | 27,199 | | | | 16,797 | | | | 10,402 | | | | 62 | % |
| | | | | | | | | | | | | | | | |
Total revenue | | $ | 96,715 | | | $ | 68,105 | | | $ | 28,610 | | | | 42 | % |
| | | | | | | | | | | | | | | | |
Product revenue increased $18.2 million in fiscal 2012 compared to fiscal 2011 primarily due to the introduction of our H Series family of products and to a lesser extent from the sales of our G Series product portfolio. Revenue from our new H Series products in fiscal 2012 increased to $27.1 million from $5.1 million in fiscal 2011. Additionally, revenue from our G Series products decreased by $3.8 million primarily due to a decrease in the volume of units sold in fiscal 2012 compared to fiscal 2011.
Services revenue increased $10.4 million in fiscal 2012 compared to fiscal 2011, primarily due to an increase in the total number of end-user customers under maintenance and support contracts, which was driven by higher sales of our products.
59
Cost of revenue and gross margin
| | | | | | | | | | | | | | | | |
| | | Fiscal Year Ended | | | | | | | |
| | | December 31,
2012 | | | December 31,
2011 | | | Increase | | | % Increase | |
| | | (dollars in thousands) | | | | |
Cost of revenue: | | | | | | | | | | | | | | | | |
Product | | $ | 18,039 | | | $ | 12,528 | | | $ | 5,511 | | | | 44 | % |
Services | | | 2,246 | | | | 1,900 | | | | 346 | | | | 18 | % |
| | | | | | | | | | | | | | | | |
Total cost of revenue | | $ | 20,285 | | | $ | 14,428 | | | $ | 5,857 | | | | 41 | % |
| | | | | | | | | | | | | | | | |
Gross margin: | | | | | | | | | | | | | | | | |
Product | | | 74 | % | | | 76 | % | | | | | | | | |
Services | | | 92 | % | | | 89 | % | | | | | | | | |
Total gross margin | | | 79 | % | | | 79 | % | | | | | | | | |
| Stock-based compensation expense included in cost of revenue | | $ | 153 | | | $ | — | | | $ | 153 | | | | * | |
* Not meaningful
Total gross margin remained consistent at 79% for fiscal 2012 and fiscal 2011.
Product gross margin decreased to 74% in fiscal 2012 from 76% in fiscal 2011, primarily due to an increase in product sales by our distributors with lower margins, partially offset by lower product costs.
Services gross margin increased to 92% in fiscal 2012 from 89% in 2011, primarily due to the utilization of our existing cost infrastructure to manage a higher number of maintenance and support contracts.
Operating expenses
| | | | | | | | | | | | | | | | |
| | | Fiscal Year Ended | | | | | | | |
| | | December 31,
2012 | | | December 31,
2011 | | | Increase | | | % Increase | |
| | | (dollars in thousands) | |
Operating expenses: | | | | | | | | | | | | | | | | |
Research and development | | $ | 17,730 | | | $ | 12,530 | | | $ | 5,200 | | | | 42 | % |
Sales and marketing | | | 39,359 | | | | 19,358 | | | | 20,001 | | | | 103 | % |
General and administrative | | | 11,665 | | | | 4,766 | | | | 6,899 | | | | 145 | % |
| | | | | | | | | | | | | | | | |
Total operating expenses | | $ | 68,754 | | | $ | 36,654 | | | $ | 32,100 | | | | 88 | % |
| | | | | | | | | | | | | | | | |
| Stock-based compensation expense included in: | | | | | | | | | | | | | | | | |
Research and development | | $ | 542 | | | $ | 8 | | | $ | 534 | | | | * | |
Sales and marketing | | | 893 | | | | 2 | | | | 891 | | | | * | |
General and administrative | | | 2,011 | | | | 2 | | | | 2,009 | | | | * | |
| | | | | | | | | | | | | | | | |
Total stock-based compensation expense | | $ | 3,446 | | | $ | 12 | | | $ | 3,434 | | | | * | |
| | | | | | | | | | | | | | | | |
* Not meaningful
60
Research and development expenses increased $5.2 million in fiscal 2012 compared to fiscal 2011, primarily due to a $2.4 million increase in personnel costs primarily as a result of increased headcount and stock-based compensation expense, a $2.2 million increase in allocated costs primarily associated with the increase in headcount and a $0.3 million increase in depreciation expense.
Sales and marketing expenses increased $20.0 million in fiscal 2012 compared to fiscal 2011, primarily due to a $14.1 million increase in personnel costs primarily as a result of increased headcount, an increase in stock-based compensation expense and additional commissions related to higher sales of our products and services, a $2.4 million increase in trade show, marketing and promotional activities, a $1.6 million increase in travel-related expenses, a $1.0 million increase in employee-related programs and a $0.4 million increase in allocated costs of facilities and information technology.
General and administrative expenses increased $6.9 million in fiscal 2012 compared to fiscal 2011, primarily due to a $5.2 million increase in personnel costs primarily as a result of increased headcount and stock-based compensation expense as well as a $2.6 million increase in professional services costs, partially offset by a $0.9 million decrease in allocated costs of facilities and information technology primarily due to the higher allocation of such costs to our research and development and sales and marketing departments.
Non-GAAP Financial Measures
We report all financial information required in accordance with GAAP but we believe that evaluating our ongoing operating results may be difficult to understand if limited to reviewing only GAAP financial measures. Many of our investors have requested that we disclose non-GAAP information because it is useful in understanding our performance as it excludes amounts that many investors feel may obscure our true operating results. Likewise, management uses non-GAAP measures to manage and assess the profitability of our business going forward and does not consider stock-based compensation expense or expenses related to our performance units and related taxes in managing our operations. Specifically, management does not consider these expenses or benefits when developing and monitoring our budgets and spending. As a result, we use calculations of non-GAAP net income and non-GAAP net income per share, which exclude these expenses when evaluating our ongoing operations and allocating resources within the organization.
61
Reconciliations of our GAAP and non-GAAP financial measures were as follows (in thousands, except per share amounts):
| | | | | | | | | | | | |
| | | Fiscal Year Ended | |
| | | December 28,
2013 | | | December 31,
2012 | | | December 31,
2011 | |
GAAP net (loss) income attributable to common stockholders | | $ | (9,518 | ) | | $ | 3,605 | | | $ | 10,112 | |
Stock-based compensation expense | | | 32,543 | | | | 3,599 | | | | 12 | |
Performance unit expenses | | | 20,371 | | | | — | | | | — | |
Accretion of preferred stock to redemption value and issuance costs | | | 1,088 | | | | 2,236 | | | | 2,078 | |
(Loss) earnings distributable to preferred stockholders | | | (1,107 | ) | | | 1,690 | | | | 4,741 | |
Tax benefit upon conversion of LLC to a C corporation | | | (14,811 | ) | | | — | | | | — | |
Income tax effect of non-GAAP adjustments | | | (12,673 | ) | | | — | | | | — | |
| | | | | | | | | | | | |
Non-GAAP net income | | $ | 15,893 | | | | 11,130 | | | | 16,943 | |
| | | | | | | | | | | | |
Basic and diluted GAAP net (loss) income per share attributable to common stockholders | | $ | (0.39 | ) | | $ | 0.21 | | | $ | 0.58 | |
Basic Non-GAAP net income per share | | $ | 0.64 | | | $ | 0.64 | | | $ | 0.98 | |
Diluted Non-GAAP net income per share | | $ | 0.53 | | | $ | 0.62 | | | $ | 0.98 | |
| | | |
GAAP and Non-GAAP weighted average number ofshares - Basic | | | 24,722 | | | | 17,300 | | | | 17,300 | |
GAAP weighted average number of shares - Diluted | | | 24,722 | | | | 17,303 | | | | 17,300 | |
Stock-based compensation impact on weighted average number of shares | | | 5,323 | | | | 570 | | | | — | |
| | | | | | | | | | | | |
Non-GAAP weighted average number of shares - Diluted | | | 30,045 | | | | 17,873 | | | | 17,300 | |
| | | | | | | | | | | | |
Liquidity and Capital Resources
As of December 28, 2013, our principal sources of liquidity, which consisted of cash, cash equivalents and investments of $138.2 million, was held in the United States. Our liquidity requirements are primarily to fund our working capital and operating expenses. As of December 28, 2013, we had no material commitments for capital expenditures.
On June 17, 2013, we completed our IPO, in which 7,762,500 shares of our common stock were sold at a public offering price of $19.00 per share. We issued and sold 5,512,500 shares of common stock, inclusive of the 1,012,500 shares of common stock sold in connection with the full exercise of the overallotment option of shares granted to the underwriters, at a public offering price of $19.00 per share. We received proceeds of $93.4 million, net of underwriting discounts, commissions and offering expenses. In addition, our selling stockholders sold 2,250,000 shares of common stock at a public offering price of $19.00 per share. We did not receive any proceeds from the sales of shares by the selling stockholders. We used a portion of the proceeds that we received from our IPO to satisfy our obligations to holders of vested performance units and related payroll taxes of $20.4 million. The compensation expense related to these performance units was recorded and paid in fiscal 2013.
On October 28, 2013, we completed our follow-on public offering, in which 5,100,000 shares of our common stock were sold at a public offering price of $38.50 per share. We sold 300,000 shares of common stock, for which we received proceeds of $10.2 million, net of underwriting discounts,
62
commissions and offering expenses. In addition, our selling stockholders sold 4,800,000 shares of common stock, which included 293,718 shares of common stock issued upon the exercise of options by certain selling stockholders with an aggregate exercise price of $1.3 million, at a public offering price of $38.50 per share. We did not receive any proceeds from the sale of shares by the selling stockholders.
We intend to retain any future earnings to finance the operations and expansion of our business, and we do not currently anticipate paying any cash dividends on our common stock.
Our future capital requirements will depend on many factors, including our results of operations and the expansion of our research and development, sales and marketing and general and administrative functions. Based on our current operating plan, we believe our existing cash, cash equivalents and investments, combined with cash generated from operations, will be sufficient to fund our working capital and operating expenses for at least the next 12 months. If we require additional capital resources to grow our business internally or to acquire complementary technologies and businesses at any time in the future, we may seek to sell additional equity, or raise funds through debt financing or other sources. The sale of additional equity could result in additional dilution to our stockholders. If we raise additional funds by obtaining loans from third parties, the terms of those financing arrangements may include negative covenants or other restrictions on our business that could impair our operating flexibility, and would also require us to incur interest expense. We can provide no assurance that additional financing will be available at all or, if available, that we would be able to obtain financing on terms favorable to us.
Cash flows
The following table summarizes our cash flows for the periods indicated (in thousands):
| | | | | | | | | | | | |
| | | Fiscal Year Ended | |
| | | December 28,
2013 | | | December 31,
2012 | | | December 31,
2011 | |
Cash provided by operating activities | | $ | 23,308 | | | $ | 27,680 | | | $ | 21,617 | |
Cash used in investing activities | | | (61,767 | ) | | | (2,006 | ) | | | (2,124 | ) |
Cash provided by (used in) financing activities | | | 99,692 | | | | (20,101 | ) | | | (12,195 | ) |
Cash flows from operating activities
Our cash provided by operating activities is generated from sales of our products and services. Our primary uses of cash from operating activities have been for personnel costs, product costs, expenses related to marketing and promotional activities and costs related to our facilities. Our cash flows from operating activities will continue to be affected principally by our working capital requirements and increased spending on personnel, facilities and sales and marketing activities to meet our anticipated business growth.
In fiscal 2013, our operating activities provided cash of $23.3 million. We incurred a net loss of $9.5 million, which included net non-cash expenses of $13.7 million. Non-cash expenses primarily consisted of stock-based compensation expense of $32.5 million and depreciation and amortization expenses of $2.9 million, offset in part by deferred income tax benefit of $20.9 million. Our operating activities provided cash of $23.3 million primarily due to an increase in deferred revenue of $16.7 million driven by an increase in billings for products and services as a result of our larger installed base; a $8.3 million increase in accrued and other liabilities primarily attributable to a $3.9 million increase in employee related accruals and $3.6 million withheld for our ESPP purchases; and a $3.1 million decrease in inventory due to higher inventory turnover in
63
fiscal 2013. These changes were partially offset by a $3.9 million increase in accounts receivable primarily attributable to an increase in the amount of billings and a $3.3 million increase in prepaid expenses, other current assets and other assets. Our days sales outstanding, or DSO, decreased to 52 days as of December 28, 2013 from 60 days as of December 31, 2012.
In fiscal 2012, our operating activities provided cash of $27.7 million primarily as a result of our net income of $7.5 million, which included net non-cash charges of $6.5 million due to stock-based compensation expense of $3.6 million, inventory write-down of $1.5 million, and depreciation and amortization of $1.4 million; a $3.0 million inventory decline driven by higher inventory turnover in fiscal 2012; a $8.9 million increase in deferred revenue due to higher billings for service as we increased the size of our installed base; a $4.0 million increase in accrued and other liabilities primarily due to an increase in employee-related accruals and a $1.7 million decrease in prepaid expenses and other current assets; partially offset by higher accounts receivable of $4.3 million due to an increase in revenue offset by a decrease in our DSO to 60 days as of December 31, 2012 from 69 days as of December 31, 2011.
In fiscal 2011, our operating activities generated cash of $21.6 million primarily as a result of our net income of $16.9 million, which included non-cash charges of $4.0 million due to inventory write-downs and depreciation and amortization; a $10.8 million increase in deferred revenue due to higher service business billings as we added new end-user customers and increased our installed base and a $7.5 million increase in accrued and other liabilities and accounts payable primarily due to an accrual for non-cancelable future commitments related to excess inventories; partially offset by a $9.0 million increase in accounts receivable due to higher sales and an increase in our DSO to 69 days as of December 31, 2011 compared to 49 days as of December 31, 2010, a $3.9 million increase in prepaid expenses and other current assets primarily due to an increase in employee receivables related to equity compensation agreements with certain employees in prior years, and a $4.8 million increase in inventory to support the growth in our product sales.
Cash flows from investing activities
In fiscal 2013, cash used in investing activities of $61.8 million consisted of short-term investment purchases of $59.7 million and property and equipment purchases of $4.0 million, offset by $2.0 million in proceeds from the sale of short-term investments. In fiscal 2012 and 2011, cash used in investing activities was $2.0 million and $2.1 million, respectively, and consisted of capital expenditures for property and equipment to support the growth of our business.
Cash flows from financing activities
In fiscal 2013, cash provided by financing activities was $99.7 million primarily due to net cash proceeds of $95.3 million and $10.2 million from our sale and issuance of common stock in our IPO and follow-on public offering, respectively. We also generated $1.7 million from stock option exercises in fiscal 2013. In addition, we distributed $7.0 million in fiscal 2013 to Gigamon LLC members pursuant to the Restated Limited Liability Company Agreement by and among Gigamon LLC and certain of its members, dated January 20, 2010, as amended, in effect prior to the LLC Conversion.
In fiscal 2012, cash used in financing activities was $20.1 million as a result of cash distributions of $18.2 million to our Gigamon LLC members and $1.9 million in costs paid in connection with our IPO.
In fiscal 2011, cash used in financing activities was $12.2 million as a result of distributions to Gigamon LLC’s members.
64
Contractual Obligations
The following summarizes our contractual obligations as of December 28, 2013:
| | | | | | | | | | | | | | | | | | | | |
| | | Payments Due by Period | |
| | | Less
than 1
year | | | 1 to 3
years | | | 4 to 5
years | | | More
than 5
years | | | Total | |
| | | (in thousands) | |
Operating lease obligations (1) | | $ | 1,423 | | | $ | 6,411 | | | $ | 4,312 | | | $ | 28 | | | $ | 12,174 | |
Purchase commitments (2) | | | 7,451 | | | | — | | | | — | | | | — | | | | 7,451 | |
| | | | | | | | | | | | | | | | | | | | |
Total | | $ | 8,874 | | | $ | 6,411 | | | $ | 4,312 | | | $ | 28 | | | $ | 19,625 | |
| | | | | | | | | | | | | | | | | | | | |
| (1) | Operating lease obligations represent our obligations to make payments under the lease agreements for our facilities and office equipment leases. |
| (2) | Purchase commitments primarily represent our obligations to purchase inventory and related components. We record a liability for firm, non-cancelable and unconditional purchase commitments for quantities in excess of our future demand forecasts consistent with the valuation of our excess and obsolete inventory. |
The above table does not include our unrecognized tax benefit, which was $0.2 million as of December 28, 2013, all of which would affect our income tax benefit (provision), if recognized. The ultimate amount and timing of any future settlements cannot be predicted with reasonable certainty.
Off-Balance Sheet Arrangements
We do not have any relationships with unconsolidated entities or financial partnerships, such as entities often referred to as structured finance or special purpose entities, which would have been established for the purpose of facilitating off-balance sheet arrangements or other contractually narrow or limited purposes.
Critical Accounting Policies and Estimates
Our consolidated financial statements are prepared in accordance with GAAP. The preparation of these financial statements requires us to make estimates and assumptions that affect the reported amounts of assets, liabilities, revenue, operating expenses and related disclosures. On an ongoing basis, we evaluate our estimates and assumptions. We base our estimates and assumptions on historical experience and on various other factors that we believe to be reasonable under the circumstances. Accordingly, actual results could differ significantly from the estimates made by our management. To the extent that there are material differences between our estimates and actual results, our future financial statement presentation, financial condition, results of operations and cash flows would be affected.
We believe that of our significant accounting policies, which are described in the notes to our consolidated financial statements, the accounting policies discussed below involve the greatest degree of judgment and complexity and have the most significant impact on our consolidated financial statements. Accordingly, these are the policies we believe are most critical to aid in understanding and evaluating our financial condition and results of operations.
Revenue recognition
Revenue is recognized when all of the following criteria have been met: (1) persuasive evidence of an arrangement exists, (2) delivery has occurred, (3) sales price is fixed or determinable, and
65
(4) collectability is reasonably assured. We enter into contracts to sell our products and services, and while some of our sales agreements contain standard terms and conditions, there are agreements that contain multiple elements or non-standard terms and conditions. As a result, significant contract interpretation may be required to determine the appropriate accounting, including whether the deliverables specified in a multiple element arrangement should be treated as separate units of accounting for revenue recognition purposes, and, if so, how the price should be allocated among the elements and when to recognize revenue for each element. Changes in the allocation of the sales price between elements may impact the timing of revenue recognition but will not change the total revenue recognized on the contract.
Under our revenue recognition policies, we allocate revenue to each element based on a selling price hierarchy. The selling price for a deliverable is based on our vendor-specific objective evidence, or VSOE, if available, third-party evidence, TPE, if VSOE is not available, or estimated selling price, or ESP, if neither VSOE nor TPE is available. We establish VSOE of selling price using the price charged for a deliverable when sold separately. TPE of selling price is established by evaluating largely interchangeable competitor products or services in stand-alone sales to similarly situated customers. ESP is established considering internal factors such as margin objectives, pricing practices and controls, customer segment pricing strategies and product life cycle. Consideration is also given to market conditions such as industry pricing strategies and technology life cycles. When determining ESP, we apply management judgment to establish margin objectives and pricing strategies and to evaluate market conditions and product life cycles. We do not use TPE as we do not consider our products to be similar to or interchangeable with our competitors’ products in standalone sales to similarly situated customers. Revenue from maintenance service contracts is deferred and recognized ratably over the contractual support period, which is generally one to three years. We applied ESP to the majority of our product revenue and VSOE to our service revenue in fiscal 2013, 2012 and 2011.
Our pricing practices may be required to be modified as our business and offerings evolve over time, which could result in changes in selling prices, including both VSOE and ESP, in subsequent periods. There were no material impacts in fiscal 2013, nor do we expect a material impact in the next 12 months on our revenue recognition due to any changes in our VSOE, TPE or ESP.
Inventories
Our inventories are stated at the lower of cost or market value on a first-in, first-out basis. We record inventory write-downs for the valuation of inventory at the lower of cost or net realizable value by analyzing market conditions and estimates of future sales as compared to inventory balances. Net realizable value is based upon an estimated average market value reduced by estimated completion and selling costs. We record a liability for firm, non-cancelable and unconditional purchase commitments with our contract manufacturer for quantities in excess of our future demand forecasts consistent with the valuation of our excess and obsolete inventory.
We have established procedures to evaluate inventory balances for excess quantities and obsolescence by analyzing inventory on hand, historical sales levels, estimated future demand and other known factors, and reduce inventory balances to net realizable value for excess and obsolete inventory based on this analysis. Unanticipated changes in technology or customer demand could result in a decrease in demand for our products, which may require a write-down of inventory that could materially affect our results of operations. Write-downs, once established, are not reversed until the related inventory has been subsequently sold or disposed.
Warranty
Beginning in February 2011, we have provided a five-year warranty on hardware. We accrue for potential warranty claims as a component of cost of product revenue based on historical experience
66
and other data. Accrued warranty is recorded in accrued liabilities on our consolidated balance sheets and is reviewed periodically for adequacy. If we experience an increase in warranty claims compared with our historical experience, or if the cost of servicing warranty claims is greater than expected, our gross margin and results of operations could be adversely affected. To date, we have not incurred any significant costs associated with our warranty.
Stock-based compensation expense
We value our restricted stock units using the market value of our common stock on the date of grant. We recognize expenses, net of estimated forfeitures, related to stock option grants and employee stock purchase plan purchase rights based on the estimated fair value of the awards on the date of grant using the Black-Scholes option-pricing model. The grant date fair value of these awards is recognized on the graded vesting method over the requisite service period, which is generally the vesting period of the respective awards. Stock-based compensation expense is classified in the consolidated statements of operations based on the functional area to which the related recipient belongs.
The Black-Scholes option-pricing model requires the use of highly subjective and complex assumptions which determine the fair value of stock-based awards, including:
| | • | | Expected term. The expected term represents the period that our stock-based awards are expected to be outstanding. It is based on the “simplified method” for estimating the expected life of a “plain vanilla” stock option. Under this approach, the expected term is presumed to be the midpoint between the average vesting date and the end of the contractual term. |
| | • | | Risk-free interest rate. The risk-free interest rate for the period covering the expected life of the option is based on the U.S. Treasury yield curve in effect at the time of grant. |
| | • | | Expected volatility. As there was no public market for our common stock prior to our IPO in June 2013, we have limited information on the volatility of our common stock. The expected volatility is determined based on historical volatility of the common stock of a peer group of publicly traded companies. When making the selections of our industry peer companies to be used in the volatility calculation, we considered the size, operational and economic similarities to our principle business operations. The industry peer companies used to determine expected volatility were generally consistent with the peer group used for common stock valuations. However, the peer group we use to determine expected volatility is made up of a smaller number of companies than those considered as part of the peer group for common stock valuation purposes primarily because certain of these companies are significantly larger than we are and therefore had a lower volatility. |
| | • | | Expected dividend. The expected dividend yield assumption, based on our future expected dividend payouts, assumes no dividend payouts in the foreseeable future. |
In addition to the assumptions used in the Black-Scholes option-pricing model for stock option awards, we must also estimate a forfeiture rate to calculate the stock-based compensation expense for our awards. Our forfeiture rate is based on an analysis of our actual and estimated forfeitures. We will continue to evaluate the appropriateness of the forfeiture rate based on actual forfeiture experience, analysis of employee turnover and other factors. Quarterly changes in the estimated forfeiture rate can have a significant impact on our stock-based compensation expense as the cumulative effect of adjusting the rate is recognized in the period the forfeiture estimate is changed. If a revised forfeiture rate is higher than the previously estimated forfeiture rate, an adjustment is made that will result in a decrease to the stock-based compensation expense recognized in our consolidated financial statements. If a revised forfeiture rate is lower than the previously estimated forfeiture rate, an adjustment is made that will result in an increase to the stock-based compensation expense recognized in our consolidated financial statements.
67
We have used and will continue to use judgment in evaluating the expected term, expected volatility and forfeiture rate related to our stock-based compensation expense on a prospective basis. As we continue to accumulate additional data related to our common stock, we may have refinements to the estimates of our expected volatility, expected terms and forfeiture rates, which could materially impact our future stock-based compensation expense.
Income Taxes
We are subject to U.S. federal income taxes as well as state taxes. In addition, we are subject to taxes in the foreign jurisdictions where we operate.
Prior to the LLC Conversion in May 2013, we were a Delaware limited liability company that passed through income and losses to our members for U.S. federal and state income tax purposes. As a result, we were not subject to any U.S. federal or state income taxes as our taxable income was reported by our individual members.
Effective as of the completion of the LLC Conversion on May 31, 2013, we account for income taxes using the asset and liability method, which requires the recognition of deferred tax assets and liabilities for the expected future tax consequences of events that have been recognized in our consolidated financial statements or tax returns. In addition, deferred tax assets are recorded for the future benefit of utilizing net operating losses and research and development credit carry forwards. Valuation allowances are provided when necessary to reduce deferred tax assets to the amount expected to be realized.
Accordingly, we assess our needs for a valuation allowance quarterly based on the ASC 740 more-likely-than-not realization threshold criterion. In the assessment, appropriate consideration is given to all positive and negative evidence related to the realization of the deferred tax assets. This assessment considers, among other matters, the nature, frequency and severity of current and cumulative losses, forecasts of future profitability, the duration of statutory carryforward periods, our experience with operating losses and tax credit carryforwards expiring, and tax planning alternatives. Significant judgment is required to determine whether a valuation allowance is necessary and the amount of such valuation allowance, if appropriate. The valuation allowance was reviewed and we determined sufficient positive evidence exists to conclude that it is more-likely-than-not that the deferred tax assets will be realized.
Significant judgment is required in the application of the authoritative accounting guidance prescribing a threshold and measurement attribute for the financial recognition and measurement of a tax position taken or expected to be taken in a tax return. We recognize liabilities for uncertain tax positions based on a two-step process. The first step is to evaluate the tax position for recognition by determining if the weight of available evidence indicates that it is more likely than not that the position will be sustained on audit, including resolution of related appeals or litigation processes, if any. The second step requires us to estimate and measure the tax liability as the largest amount that is more likely than not to be realized upon ultimate settlement. Accounting guidance further requires that a change in judgment related to the expected ultimate resolution of uncertain tax positions to be recognized in earnings in the quarter in which such change occurs. We recognize interest and penalties, if any, related to unrecognized tax benefits in income tax expense.
Recent Accounting Pronouncements
In March 2013, the Financial Accounting Standards Board, or the FASB, issued an accounting standard update requiring an entity to release into net income the entire amount of a cumulative translation adjustment related to its investment in a foreign entity when as a parent it either sells a part
68
or all of its investment in a foreign entity or no longer holds a controlling financial interest in a subsidiary or group of assets within a foreign entity. This accounting standard update will be effective prospectively beginning in the first quarter of fiscal 2014. We do not expect the adoption of this accounting standard update to have a material impact on our consolidated financial statements.
In July 2013, the FASB issued a new accounting standard update that requires the presentation of certain unrecognized tax benefits as reductions to deferred tax assets rather than as liabilities in the consolidated balance sheets when a net operating loss carryforward, a similar tax loss, or a tax credit carryforward exists. Early adoption or a retrospective application is permitted. We are required to adopt this new standard on a prospective basis in the first quarter of fiscal 2014. We do not expect the adoption of this accounting standard update to have a material impact on our consolidated financial statements.
Item 7A. Quantitative and Qualitative Disclosures about Market Risk
We are exposed to market risks in the ordinary course of our business. These risks primarily include risk related to interest rate and foreign currency exchange rate sensitivities.
Interest rate sensitivity
We had cash, cash equivalents and investments of $138.2 million and $18.7 million as of December 28, 2013 and December 31, 2012, respectively. We hold our cash, cash equivalents and investments for working capital purposes. Our cash and cash equivalents are primarily held in cash deposits and money market funds. We have invested portion of our funds in short-term investments that are focused on preservation of capital, supporting our liquidity requirements and compliance with the Investment Company Act of 1940. Our investments are held in U.S. Treasury securities, U.S. agency debt securities and corporate debt securities. Due to the short-term nature of these instruments, we believe that we do not have any material exposure to changes in the fair value of our investment portfolio as a result of changes in interest rates. Declines in interest rates, however, would reduce future interest income. The effect of a hypothetical 10% increase or decrease in overall interest rates would not have had a material impact on the fair value of our available-for-sale securities as of December 28, 2013 and December 31, 2012, or our interest income for fiscal 2013, 2012 and 2011.
Foreign currency exchange rate sensitivity
The U.S. dollar is the functional currency for our subsidiary and our sales to international customers are denominated in U.S. dollars. Because the U.S. dollar is our functional currency, monetary accounts denominated in non-U.S. currencies, such as cash or payables to vendors, are remeasured to U.S. dollars and all gains and losses resulting from remeasurement are recorded in other expense, net in our consolidated statements of operations. Non-monetary assets and liabilities are translated at historical rates. To date, our operating costs have been denominated primarily in U.S. dollars, although we incur a limited amount of operating expenses in non-U.S. currencies such as British pounds, Euros and Hong Kong dollars. As a result, we have limited exposure to foreign currency exchange rates, and therefore we do not currently enter into foreign currency hedging transactions. If our international operations increase, our exposure to foreign currency exchange rate fluctuations may increase. In fiscal 2013, 2012 and 2011, the effect of a hypothetical 10% change in foreign currency exchange rates applicable to our business would not have had a material impact on our consolidated financial statements.
69
Item 8. Financial Statements and Supplementary Data
INDEX TO CONSOLIDATED FINANCIAL STATEMENTS
70
Report of Independent Registered Public Accounting Firm
To the Board of Directors and Stockholders of Gigamon Inc.:
In our opinion, the accompanying consolidated balance sheets and the related consolidated statements of operations, consolidated statements of comprehensive (loss) income, consolidated statements of redeemable convertible preferred units and stockholders’ equity (members’ deficit), and consolidated statements of cash flows present fairly, in all material respects, the financial position of Gigamon Inc., and its subsidiary at December 28, 2013 and December 31, 2012, and the results of their operations and their cash flows for each of the three years in the period ended December 28, 2013 in conformity with accounting principles generally accepted in the United States of America. These financial statements are the responsibility of the Company’s management. Our responsibility is to express an opinion on these financial statements based on our audits. We conducted our audits of these statements in accordance with the standards of the Public Company Accounting Oversight Board (United States). Those standards require that we plan and perform the audit to obtain reasonable assurance about whether the financial statements are free of material misstatement. An audit includes examining, on a test basis, evidence supporting the amounts and disclosures in the financial statements, assessing the accounting principles used and significant estimates made by management, and evaluating the overall financial statement presentation. We believe that our audits provide a reasonable basis for our opinion.
/s/ PricewaterhouseCoopers LLP
San Jose, California
March 13, 2014
71
Gigamon Inc.
Consolidated Balance Sheets
(In thousands)
| | | | | | | | |
| | | December 28,
2013 | | | December 31,
2012 | |
ASSETS | | | | | | | | |
CURRENT ASSETS: | | | | | | | | |
Cash and cash equivalents | | $ | 79,908 | | | $ | 18,675 | |
Short-term investments | | | 58,242 | | | | - | |
Accounts receivable, net of allowance of $0 as of December 28, 2013 and December 31, 2012 | | | 24,528 | | | | 20,677 | |
Inventories | | | 1,484 | | | | 3,736 | |
Deferred tax assets | | | 3,574 | | | | - | |
Prepaid expenses and other current assets | | | 5,606 | | | | 3,407 | |
| | | | | | | | |
Total current assets | | | 173,342 | | | | 46,495 | |
Property and equipment, net | | | 4,389 | | | | 2,686 | |
Deferred tax assets, non-current | | | 17,315 | | | | - | |
Other assets | | | 471 | | | | 2,316 | |
| | | | | | | | |
TOTAL ASSETS | | $ | 195,517 | | | $ | 51,497 | |
| | | | | | | | |
| | |
| LIABILITIES, REDEEMABLE CONVERTIBLE PREFERRED UNITS AND STOCKHOLDERS’ EQUITY (MEMBERS’ DEFICIT) | | | | | | | | |
CURRENT LIABILITIES: | | | | | | | | |
Accounts payable | | $ | 1,405 | | | $ | 3,221 | |
Accrued liabilities | | | 22,401 | | | | 13,889 | |
Gigamon LLC members’ distribution payable | | | 476 | | | | 4,821 | |
Deferred revenue | | | 37,592 | | | | 23,917 | |
| | | | | | | | |
Total current liabilities | | | 61,874 | | | | 45,848 | |
Deferred revenue, non-current | | | 9,884 | | | | 6,903 | |
Other liabilities, non-current | | | 321 | | | | 447 | |
| | | | | | | | |
TOTAL LIABILITIES | | | 72,079 | | | | 53,198 | |
Commitments and Contingencies (Note 6) | | | | | | | | |
| Redeemable convertible Series A preferred units—$2.81 per unit value; no units authorized, issued or outstanding as of December 28, 2013; 8,110 units authorized, issued and outstanding as of December 31, 2012; redemption value of $33,483 | | | - | | | | 28,344 | |
STOCKHOLDERS’ EQUITY (MEMBERS’ DEFICIT) | | | | | | | | |
Common Units—No par value per unit; no units authorized, issued or outstanding as of December 28, 2013; 33,333 units authorized, 17,300 units issued and outstanding as of December 31, 2012 | | | - | | | | 1,625 | |
Preferred stock—$0.0001 par value; 20,000 shares authorized, no shares issued or outstanding as of December 28, 2013; no shares authorized, issued or outstanding as of December 31, 2012 | | | - | | | | - | |
Common stock—$0.0001 par value; 1,000,000 shares authorized, 31,152 shares issued and outstanding as of December 28, 2013; no shares authorized, issued or outstanding as of December 31, 2012 | | | 3 | | | | - | |
Treasury stock—No par value; 8,110 shares authorized and outstanding as of December 28, 2013 and December 31, 2012 | | | (12,469 | ) | | | (12,469 | ) |
Additional paid-in capital | | | 144,810 | | | | 1,522 | |
Accumulated other comprehensive income | | | 23 | | | | - | |
Accumulated deficit | | | (8,929 | ) | | | (20,723 | ) |
| | | | | | | | |
TOTAL STOCKHOLDERS’ EQUITY (MEMBERS’ DEFICIT) | | | 123,438 | | | | (30,045 | ) |
| | | | | | | | |
| TOTAL LIABILITIES, REDEEMABLE CONVERTIBLE PREFERRED UNITS, AND STOCKHOLDERS’ EQUITY (MEMBERS’ DEFICIT) | | $ | 195,517 | | | $ | 51,497 | |
| | | | | | | | |
The accompanying notes are an integral part of these consolidated financial statements.
72
Gigamon Inc.
Consolidated Statements of Operations
(In thousands, except per share amounts)
| | | | | | | | | | | | |
| | | Fiscal Year Ended | |
| | | December 28,
2013 | | | December 31,
2012 | | | December 31,
2011 | |
Revenue: | | | | | | | | | | | | |
Product | | $ | 101,717 | | | $ | 69,516 | | | $ | 51,308 | |
Services | | | 38,578 | | | | 27,199 | | | | 16,797 | |
| | | | | | | | | | | | |
Total revenue | | | 140,295 | | | | 96,715 | | | | 68,105 | |
Cost of revenue: | | | | | | | | | | | | |
Product | | | 26,103 | | | | 18,039 | | | | 12,528 | |
Services | | | 4,727 | | | | 2,246 | | | | 1,900 | |
| | | | | | | | | | | | |
Total cost of revenue | | | 30,830 | | | | 20,285 | | | | 14,428 | |
| | | | | | | | | | | | |
Gross profit | | | 109,465 | | | | 76,430 | | | | 53,677 | |
Operating expenses: | | | | | | | | | | | | |
Research and development | | | 42,067 | | | | 17,730 | | | | 12,530 | |
Sales and marketing | | | 72,024 | | | | 39,359 | | | | 19,358 | |
General and administrative | | | 25,575 | | | | 11,665 | | | | 4,766 | |
| | | | | | | | | | | | |
Total operating expenses | | | 139,666 | | | | 68,754 | | | | 36,654 | |
| | | | | | | | | | | | |
(Loss) income from operations | | | (30,201 | ) | | | 7,676 | | | | 17,023 | |
Interest income | | | 95 | | | | 64 | | | | 4 | |
Other expense, net | | | (94 | ) | | | (70 | ) | | | (16 | ) |
| | | | | | | | | | | | |
(Loss) income before income tax benefit (provision) | | | (30,200 | ) | | | 7,670 | | | | 17,011 | |
Income tax benefit (provision) | | | 20,663 | | | | (139 | ) | | | (80 | ) |
| | | | | | | | | | | | |
Net (loss) income | | | (9,537 | ) | | | 7,531 | | | | 16,931 | |
| Accretion of preferred stock to redemption value and issuance costs | | | (1,088 | ) | | | (2,236 | ) | | | (2,078 | ) |
Loss (earnings) distributable to preferred stockholders | | | 1,107 | | | | (1,690 | ) | | | (4,741 | ) |
| | | | | | | | | | | | |
Net (loss) income attributable to common stockholders | | $ | (9,518 | ) | | $ | 3,605 | | | $ | 10,112 | |
| | | | | | | | | | | | |
| | | |
| Net (loss) income per share attributable to common stockholders: | | | | | | | | | | | | |
Basic and Diluted | | $ | (0.39 | ) | | $ | 0.21 | | | $ | 0.58 | |
| | | | | | | | | | | | |
| | | |
| Weighted average shares used in computing net (loss) income per share attributable to common stockholders: | | | | | | | | | | | | |
Basic | | | 24,722 | | | | 17,300 | | | | 17,300 | |
| | | | | | | | | | | | |
Diluted | | | 24,722 | | | | 17,303 | | | | 17,300 | |
| | | | | | | | | | | | |
The accompanying notes are an integral part of these consolidated financial statements.
73
Gigamon Inc.
Consolidated Statements of Comprehensive (Loss) Income
(In thousands)
| | | | | | | | | | | | |
| | | Fiscal Year Ended | |
| | | December 28,
2013 | | | December 31,
2012 | | | December 31,
2011 | |
Net (loss) income | | $ | (9,537 | ) | | $ | 7,531 | | | $ | 16,931 | |
Other comprehensive income: | | | | | | | | | | | | |
Change in unrealized gain on available-for-sale investments | | | 23 | | | | — | | | | — | |
| | | | | | | | | | | | |
Comprehensive (loss) income | | | (9,514 | ) | | | 7,531 | | | | 16,931 | |
Accretion of preferred units to redemption value and issuance costs | | | (1,088 | ) | | | (2,236 | ) | | | (2,078 | ) |
Loss (earnings) distributable to preferred stockholders | | | 1,107 | | | | (1,690 | ) | | | (4,741 | ) |
| | | | | | | | | | | | |
Comprehensive (loss) income attributable to common stockholders | | $ | (9,495 | ) | | $ | 3,605 | | | $ | 10,112 | |
| | | | | | | | | | | | |
The accompanying notes are an integral part of these consolidated financial statements.
74
Gigamon Inc.
Consolidated Statements of Redeemable Convertible Preferred Units and Stockholders’ Equity (Members’ Deficit)
(In thousands)
| | | | | | | | | | | | | | | | | | | | | | | | | | | | | | | | | | | | | | | | | | | | |
| | | Preferred Units | | | Common Units | | | Common Stock | | | Treasury
Stock | | | Additional
Paid-In
Capital | | | Accumulated
Other
Comprehensive
Income | | | Accumulated
Deficit | | | Total
Stockholders’
Equity
(Members’
Deficit) | |
| | | Units | | | Amount | | | Shares | | | Amount | | | Shares | | | Amount | | | | | | |
| Balance as of December 31, 2010 | | | 8,110 | | | $ | 24,030 | | | | 17,300 | | | $ | 1,625 | | | | - | | | $ | - | | | $ | (12,469 | ) | | $ | 147 | | | $ | - | | | $ | (15,034 | ) | | $ | (25,731 | ) |
| Distribution to Gigamon LLC members | | | - | | | | - | | | | - | | | | - | | | | - | | | | - | | | | - | | | | - | | | | - | | | | (16,943 | ) | | | (16,943 | ) |
| Stock-based compensation expense | | | - | | | | - | | | | - | | | | - | | | | - | | | | - | | | | - | | | | 12 | | | | - | | | | - | | | | 12 | |
| Net income | | | - | | | | - | | | | - | | | | - | | | | - | | | | - | | | | - | | | | - | | | | - | | | | 16,931 | | | | 16,931 | |
| Accretion of preferred units to redemption value and issuance costs | | | - | | | | 2,078 | | | | - | | | | - | | | | - | | | | - | | | | - | | | | - | | | | - | | | | (2,078 | ) | | | (2,078 | ) |
| | | | | | | | | | | | | | | | | | | | | | | | | | | | | | | | | | | | | | | | | | | | |
| Balance as of December 31, 2011 | | | 8,110 | | | | 26,108 | | | | 17,300 | | | | 1,625 | | | | - | | | | - | | | | (12,469 | ) | | | 159 | | | | - | | | | (17,124 | ) | | | (27,809 | ) |
| Distribution to Gigamon LLC members | | | - | | | | - | | | | - | | | | - | | | | - | | | | - | | | | - | | | | - | | | | - | | | | (11,130 | ) | | | (11,130 | ) |
| Stock-based compensation expense | | | - | | | | - | | | | - | | | | - | | | | - | | | | - | | | | - | | | | 3,599 | | | | - | | | | - | | | | 3,599 | |
| Net income | | | - | | | | - | | | | - | | | | - | | | | - | | | | - | | | | - | | | | - | | | | - | | | | 7,531 | | | | 7,531 | |
| Accretion of preferred units to redemption value and issuance costs | | | - | | | | 2,236 | | | | - | | | | - | | | | - | | | | - | | | | - | | | | (2,236 | ) | | | - | | | | - | | | | (2,236 | ) |
| | | | | | | | | | | | | | | | | | | | | | | | | | | | | | | | | | | | | | | | | | | | |
| Balance as of December 31, 2012 | | | 8,110 | | | | 28,344 | | | | 17,300 | | | | 1,625 | | | | - | | | | - | | | | (12,469 | ) | | | 1,522 | | | | - | | | | (20,723 | ) | | | (30,045 | ) |
| Distribution to Gigamon LLC members | | | - | | | | - | | | | - | | | | - | | | | - | | | | - | | | | - | | | | - | | | | - | | | | (2,676 | ) | | | (2,676 | ) |
| Stock-based compensation expense | | | - | | | | - | | | | - | | | | - | | | | - | | | | - | | | | - | | | | 32,543 | | | | - | | | | - | | | | 32,543 | |
| Conversion from LLC to corporation | | | - | | | | - | | | | (17,300 | ) | | | (1,625 | ) | | | 16,852 | | | | 1 | | | | - | | | | (22,383 | ) | | | - | | | | 24,007 | | | | - | |
| Conversion of preferred stock to common stock | | | (8,110 | ) | | | (29,432 | ) | | | - | | | | - | | | | 8,110 | | | | 1 | | | | - | | | | 29,431 | | | | - | | | | - | | | | 29,432 | |
| Issuance of common stock upon initial public offering, net of issuance costs | | | - | | | | - | | | | - | | | | - | | | | 5,513 | | | | 1 | | | | - | | | | 93,360 | | | | - | | | | - | | | | 93,361 | |
| Issuance of common stock upon follow-on public offering, net of issuance costs | | | - | | | | - | | | | - | | | | - | | | | 300 | | | | - | | | | - | | | | 10,224 | | | | - | | | | - | | | | 10,224 | |
| Issuance of common stock upon exercise of stock options | | | - | | | | - | | | | - | | | | - | | | | 344 | | | | - | | | | - | | | | 1,719 | | | | - | | | | - | | | | 1,719 | |
| Issuance of common stock upon vesting of RSUs | | | - | | | | - | | | | - | | | | - | | | | 51 | | | | - | | | | - | | | | - | | | | - | | | | - | | | | - | |
| Shares repurchased for tax withholdings on vesting of RSUs | | | - | | | | - | | | | - | | | | - | | | | (18 | ) | | | - | | | | - | | | | (518 | ) | | | - | | | | - | | | | (518 | ) |
| Net loss | | | - | | | | - | | | | - | | | | - | | | | - | | | | - | | | | - | | | | - | | | | - | | | | (9,537 | ) | | | (9,537 | ) |
| Other comprehensive income | | | - | | | | - | | | | - | | | | - | | | | - | | | | - | | | | - | | | | - | | | | 23 | | | | - | | | | 23 | |
| Accretion of preferred units to redemption value and issuance costs | | | - | | | | 1,088 | | | | - | | | | - | | | | - | | | | - | | | | - | | | | (1,088 | ) | | | - | | | | - | | | | (1,088 | ) |
| | | | | | | | | | | | | | | | | | | | | | | | | | | | | | | | | | | | | | | | | | | | |
| Balance as of December 28, 2013 | | | - | | | $ | - | | | | - | | | $ | - | | | | 31,152 | | | $ | 3 | | | $ | (12,469 | ) | | $ | 144,810 | | | $ | 23 | | | $ | (8,929 | ) | | $ | 123,438 | |
| | | | | | | | | | | | | | | | | | | | | | | | | | | | | | | | | | | | | | | | | | | | |
The accompanying notes are an integral part of these consolidated financial statements.
75
Gigamon Inc.
Consolidated Statements of Cash Flows
(In thousands)
| | | | | | | | | | | | |
| | | Fiscal Year Ended | |
| | | December 28,
2013 | | | December 31,
2012 | | | December 31,
2011 | |
CASH FLOWS FROM OPERATING ACTIVITIES: | | | | | | | | | | | | |
Net (loss) income | | $ | (9,537 | ) | | $ | 7,531 | | | $ | 16,931 | |
Adjustments to reconcile net (loss) income to net cash provided by operating activities: | | | | | | | | | | | | |
Depreciation and amortization | | | 2,850 | | | | 1,354 | | | | 743 | |
Stock-based compensation expense | | | 32,543 | | | | 3,599 | | | | 12 | |
Deferred income taxes | | | (20,889 | ) | | | - | | | | - | |
Inventory (recovery) write-down, net | | | (816 | ) | | | 1,543 | | | | 3,227 | |
Loss on disposal of fixed assets | | | 14 | | | | 52 | | | | - | |
Provision for doubtful accounts | | | - | | | | - | | | | 16 | |
Changes in operating assets and liabilities: | | | | | | | | | | | | |
Accounts receivable | | | (3,851 | ) | | | (4,280 | ) | | | (8,988 | ) |
Inventories | | | 3,068 | | | | 3,004 | | | | (4,811 | ) |
Prepaid expenses and other current assets | | | (2,912 | ) | | | 1,650 | | | | (3,894 | ) |
Other assets | | | (362 | ) | | | (29 | ) | | | 10 | |
Accounts payable | | | (1,758 | ) | | | 398 | | | | 2,042 | |
Accrued liabilities and other liabilities | | | 8,302 | | | | 4,000 | | | | 5,488 | |
Deferred revenue | | | 16,656 | | | | 8,858 | | | | 10,841 | |
| | | | | | | | | | | | |
Net cash provided by operating activities | | | 23,308 | | | | 27,680 | | | | 21,617 | |
| | | |
CASH FLOWS FROM INVESTING ACTIVITIES: | | | | | | | | | | | | |
Purchase of short-term investments | | | (59,725 | ) | | | - | | | | - | |
Sale of short-term investments | | | 2,000 | | | | - | | | | - | |
Purchase of property and equipment | | | (4,042 | ) | | | (2,006 | ) | | | (2,124 | ) |
| | | | | | | | | | | | |
Net cash used in investing activities | | | (61,767 | ) | | | (2,006 | ) | | | (2,124 | ) |
| | | |
CASH FLOWS FROM FINANCING ACTIVITIES: | | | | | | | | | | | | |
Proceeds from (costs paid for) initial public offering, net | | | 95,280 | | | | (1,920 | ) | | | - | |
Proceeds from follow-on public offering, net | | | 10,232 | | | | - | | | | - | |
Proceeds from stock option exercises | | | 1,719 | | | | - | | | | - | |
Shares repurchased for tax withholdings on vesting of restricted stock units | | | (518 | ) | | | - | | | | - | |
Distribution of income to Gigamon LLC members | | | (7,021 | ) | | | (18,181 | ) | | | (12,195 | ) |
| | | | | | | | | | | | |
Net cash provided by (used in) financing activities | | | 99,692 | | | | (20,101 | ) | | | (12,195 | ) |
| | | | | | | | | | | | |
NET INCREASE IN CASH AND CASH EQUIVALENTS | | | 61,233 | | | | 5,573 | | | | 7,298 | |
CASH AND CASH EQUIVALENTS — Beginning of period | | | 18,675 | | | | 13,102 | | | | 5,804 | |
| | | | | | | | | | | | |
CASH AND CASH EQUIVALENTS — End of period | | $ | 79,908 | | | $ | 18,675 | | | $ | 13,102 | |
| | | | | | | | | | | | |
| | | |
SUPPLEMENTAL DISCLOSURES OF CASH FLOW INFORMATION: | | | | | | | | | | | | |
Income taxes paid during the period | | $ | 173 | | | $ | 111 | | | $ | 109 | |
NONCASH INVESTING AND FINANCING ACTIVITIES: | | | | | | | | | | | | |
Conversion of preferred stock into common stock | | $ | 29,432 | | | $ | - | | | $ | - | |
Transfer of property and equipment to inventory | | $ | - | | | $ | - | | | $ | 269 | |
Accretion of preferred units to redemption value and issuance costs discount | | $ | 1,088 | | | $ | 2,236 | | | $ | 2,078 | |
Gigamon LLC members distribution payable withheld for income taxes | | $ | - | | | $ | 871 | | | $ | - | |
Unpaid property and equipment purchases | | $ | 558 | | | $ | 248 | | | $ | - | |
Unpaid public offering costs | | $ | 8 | | | $ | 287 | | | $ | - | |
The accompanying notes are an integral part of these consolidated financial statements.
76
Gigamon Inc.
Notes to Consolidated Financial Statements
1. Description of the Company
The Company
Gigamon Inc. (the “Company”) designs, develops and sells products and services that together provide customers with visibility and control of network traffic. The Company serves global enterprises and services providers that seek to maintain and improve the reliability, performance and security of their network infrastructure. The business was founded in 2004 and was originally operated by Gigamon Systems LLC, a California limited liability company (“Gigamon Systems”). In January 2009, the Company was formed as a limited liability company (“Gigamon LLC”) in the state of Delaware and Gigamon Systems contributed substantially all of its assets and liabilities to Gigamon LLC in exchange for all of Gigamon LLC’s common units. On May 31, 2013, the Company converted from a Delaware limited liability company into a Delaware corporation and changed its name from Gigamon LLC to Gigamon Inc. (the “LLC Conversion”).
2. Summary of Significant Accounting Policies
Basis of Presentation and Consolidation
The Company prepared its consolidated financial statements in accordance with U.S. generally accepted accounting principles (“GAAP”) and applicable rules and regulations of the Securities and Exchange Commission (the “SEC”). The consolidated financial statements include the accounts of the Company and its wholly owned subsidiary in the United Kingdom, established in February 2011. All significant intercompany accounts and transactions have been eliminated in consolidation.
Change in Fiscal Year End
Effective January 1, 2013, the Company changed its reporting period from a calendar year ending on December 31 of each year to a 52- or 53-week fiscal year that ends on the last Saturday in December. Fiscal year 2013 was a 52-week fiscal year ended on December 28, 2013, and each quarter was a 13-week quarter.
Use of Estimates
The preparation of consolidated financial statements in conformity with GAAP requires management to make certain estimates and assumptions that affect the reported amounts of assets and liabilities and disclosure of contingent assets and liabilities at the date of the financial statements, and the reported amounts of revenues and expenses during the reported periods. On an ongoing basis, the Company evaluates its estimates, including but not limited to those related to revenue recognition, provision for doubtful accounts, warranty reserve, excess and obsolete inventory write-downs, stock-based compensation expense, depreciable lives, and income taxes. The Company bases its estimates on historical experience, projections for future performance and other assumptions that it believes to be reasonable under the circumstances. Actual results could differ materially from those estimates.
Initial Public Offering and Conversion of Preferred Stock
In June 2013, the Company completed its initial public offering (the “IPO”), in which 7,762,500 shares of its common stock were sold at a public offering price of $19.00 per share. The Company sold 5,512,500 shares of common stock, inclusive of 1,012,500 shares of common stock
77
sold upon the exercise in full of the overallotment option by the underwriters. The Company received proceeds of $93.4 million, net of underwriting discounts and commissions of $7.3 million and other offering expenses of approximately $4.0 million. In addition, certain selling stockholders sold 2,250,000 shares of common stock at a public offering price of $19.00 per share. The Company did not receive any proceeds from the sales of shares by the selling stockholders. In connection with its IPO, all of the Company’s then-outstanding redeemable convertible preferred stock was converted into 8.1 million shares of common stock.
Follow-On Public Offering
On October 28, 2013, the Company completed its follow-on public offering, in which 5,100,000 shares of its common stock were sold at a public offering price of $38.50 per share. The Company sold 300,000 shares of common stock, for which the Company received proceeds of $10.2 million, net of underwriting discounts and commissions of $0.5 million and other offering expenses of approximately $0.8 million. In addition, the Company’s selling stockholders sold 4,800,000 shares of common stock, which included 293,718 shares of common stock issued upon the exercise of options by certain selling stockholders, with an aggregate exercise price of $1.3 million, at a public offering price of $38.50 per share. The Company did not receive any proceeds from the sale of shares by the selling stockholders.
Reverse Stock Split
Effective May 20, 2013, the Company completed a one-for-three reverse stock split, as approved by its Board of Directors (the “Board”). All shares and per share amounts set forth herein give effect to this reverse stock split.
Foreign Currency Transactions
The Company uses the U.S. dollar as its functional currency. Foreign currency assets and liabilities are remeasured into U.S. dollars using the end-of-period exchange rates except for nonmonetary assets and liabilities, which are remeasured using historical exchange rates. Expenses are remeasured using an average exchange rate for the respective period. Gains or losses from foreign currency transactions are included in other expense, net. Foreign currency transaction gains and losses have not been significant to the consolidated financial statements for all periods presented.
Cash Equivalents and Marketable Securities
All highly liquid marketable securities with original or remaining maturities of less than three months at the date of purchase are considered to be cash equivalents. Marketable securities are generally classified as available-for-sale for use in current operations, if required, and are reported at fair value, with unrealized gains and losses, net of tax, presented as a separate component of stockholders’ equity under accumulated other comprehensive income. All realized gains and losses and unrealized losses resulting from declines in fair value that are other than temporary are recorded in other expense, net in the period of occurrence. The Company uses the specific identification method to determine the realized gains and losses on investments. For all investments in marketable securities, the Company assesses whether the impairment is other than temporary. If the fair value of a security is less than its amortized cost basis, an impairment is considered other than temporary if (i) the Company has the intent to sell the security or it is more likely than not that the Company will be required to sell the security before recovery of its entire amortized cost basis, or (ii) the Company does not expect to recover the entire amortized cost of the security. If an impairment is considered other than temporary based on condition (i), the entire difference between the amortized cost and the fair value of the security is recognized in earnings. If an impairment is considered other than temporary based on condition (ii), the amount representing credit losses, defined as the difference between the present
78
value of the cash flows expected to be collected and the amortized cost basis of the security, will be recognized in earnings, and the amount relating to all other factors will be recognized in other comprehensive income. The Company evaluates both qualitative and quantitative factors such as duration and severity of the unrealized losses, credit ratings, default and loss rates of the underlying collateral, structure and credit enhancements to determine if a credit loss may exist.
Fair Value of Financial Instruments
The Company records its financial assets and liabilities at fair value. The accounting guidance for fair value provides a framework for measuring fair value, clarifies the definition of fair value, and expands disclosures regarding fair value measurements. Fair value is defined as the price that would be received to sell an asset or paid to transfer a liability (an exit price) in an orderly transaction between market participants at the reporting date. The accounting guidance establishes a three-tiered hierarchy, which prioritizes the inputs used in the valuation methodologies in measuring fair value:
Level 1 – Quoted prices in active markets for identical assets or liabilities.
Level 2 – Inputs other than Level 1 that are observable, either directly or indirectly, such as quoted prices in markets that are not active; or other inputs that are observable or can be corroborated by observable market data for substantially the full term of the assets or liabilities.
Level 3 – Unobservable inputs that are supported by little or no market activity and that are significant to the fair value of the assets or liabilities.
The Company recognizes transfers among Level 1, Level 2 and Level 3 classifications as of the actual date of the events or change in circumstances that caused the transfers.
The Company’s financial instruments, including cash equivalents, accounts receivable, accounts payable and accrued liabilities have carrying amounts which approximate fair value due to the short-term maturity of these instruments.
Accounts Receivable
Accounts receivable, which represent trade accounts receivable from both channel partners and direct customers, are recorded at the invoiced amounts and do not bear interest. The Company extends credit to its customers in the normal course of business and performs ongoing credit evaluations of its customers. The Company generally requires no collateral from its customers. The Company establishes an allowance for doubtful accounts for estimated losses resulting from the customer’s inability to make payments. Management determines the collectability of specific customer accounts by their past transaction history. If financial conditions of the Company’s customers were to deteriorate, adversely affecting their ability to make payments, additional allowances would be required. Estimates for allowance for doubtful accounts are charged to operating expenses and a credit to a valuation allowance. As of December 28, 2013 and December 31, 2012, the Company had not recorded an allowance for doubtful accounts.
Concentrations
The Company operates in highly competitive and rapidly changing markets that could negatively impact the Company’s operating results. A number of components that meet the Company’s manufacturing requirements are available only from single source suppliers. In addition, the Company relies on one contract manufacturer to manufacture substantially all of its products. The inability of its single source suppliers and contract manufacturer to provide the Company with adequate supplies of high-quality components and products could cause a delay in order fulfillment, which could adversely affect the Company’s revenue, cost of sales and operating results.
79
Financial instruments that potentially subject the Company to significant concentrations of credit risk consist principally of cash, cash equivalents, investments and accounts receivable. The Company places the majority of its cash, cash equivalents and investments with a limited number of major financial institutions in the United States that management believes are creditworthy. Such deposits may exceed the insured limits provided on them. The Company mitigates credit risk associated with its accounts receivable by performing ongoing credit evaluations of its customers and establishes an allowance for doubtful accounts for estimated losses based on management’s assessment of the collectability of customer accounts. No end-user customer accounted for 10% of more of total accounts receivable.
The Company sells its products primarily through channel partners, including distributors and resellers, and occasionally directly to end-user customers. For fiscal 2013, 2012 and 2011, no end-user customer accounted for 10% or more of revenue.
Customers that represented more than 10% of revenue and accounts receivable are the following:
| | | | | | | | | | | | |
| | | Fiscal Year Ended | |
| | | December 28,
2013 | | | December 31,
2012 | | | December 31,
2011 | |
Percent of Revenue: | | | | | | | | | | | | |
Customer A (distributor) | | | 51 | % | | | 63 | % | | | 37 | % |
Customer B (reseller) | | | * | | | | * | | | | 18 | % |
* less than 10%
| | | | | | | | |
| | | As of | |
| | | December 28,
2013 | | | December 31,
2012 | |
Percent of Accounts Receivable: | | | | | | | | |
Customer A (distributor) | | | 23 | % | | | 50 | % |
Customer B (reseller) | | | 11 | % | | | * | |
* less than 10%
Inventories
Inventory is valued at the lower of cost computed on a first-in, first-out basis, or market value. The Company writes down inventory in excess of forecasted demand over a certain period. In these cases, inventory is reduced to estimated realizable value based on historical usage and expected demand. At the point of inventory write-down, a new lower-cost basis for that inventory is established and subsequent changes in facts and circumstances do not result in the restoration or increase in that newly established cost basis. Inherent in the Company’s estimates of market value in determining inventory valuation are estimates related to economic trends, future demand for the Company’s products, and technical obsolescence of products. The Company uses a contract manufacturer to provide manufacturing services for its products. During the normal course of business, in order to manage manufacturing lead times and help ensure adequate component supply, the Company enters into agreements with the contract manufacturer that either allow them to procure inventory based upon criteria as defined by the Company, or establish the parameters defining the Company’s requirements. A portion of the Company’s reported purchase commitments arising from these agreements consists of non-cancelable commitments. The Company records a liability for firm, non-cancelable and unconditional purchase commitments for quantities in excess of its future demand forecasts consistent with the valuation of the Company’s excess and obsolete inventory.
80
In fiscal 2013, the Company recognized a $0.8 million net inventory benefit within cost of revenue which included the sale of previously written-down inventory of $1.5 million. The Company recorded inventory write-downs of $1.5 million and $3.2 million in fiscal 2012 and fiscal 2011, respectively, as a component of cost of revenue.
Property and Equipment
Property and equipment are stated at cost and depreciated using the straight–line method over the estimated useful lives of the assets. Leasehold improvements are amortized over the lesser of the useful life of these improvements or the remaining term of the lease. Maintenance and repairs are charged to operations as incurred.
The useful lives of the property and equipment are as follows:
| | |
Furniture and fixtures | | 5 years |
Software | | 3 to 5 years |
Equipment and machinery | | 1.5 to 3 years |
Leasehold improvements | | Shorter of lease term or estimated useful life |
Research and Development and Software Development Costs
Research and development costs are expensed as incurred, except for certain software development costs. To-date, software development costs qualifying for capitalization have been insignificant. Accordingly, the Company has not capitalized any software development costs.
Impairment of Long-Lived Assets
The Company reviews long-lived assets for impairment whenever events or changes in circumstances indicate that the carrying amount of an asset may not be recoverable. Recoverability is measured by comparison of the anticipated future net undiscounted cash flows to the related assets’ carrying values.
If such assets are considered to be impaired, the impairment to be recognized is measured by the amount by which the carrying amount of the assets exceeds the projected discounted future net cash flows arising from the asset. No assets were determined to be impaired during any of the periods presented.
Revenue Recognition
The Company generates product revenue from sales of traffic visibility solutions to channel partners and direct customers as well as services revenue from sales of maintenance and support contracts and other billable services. Most of the Company’s products are hardware appliances containing software components that function together to deliver the essential functionality of the solution. The Company typically delivers products and services in a single transaction. The deliverables consist of traffic visibility solutions, maintenance and support, and other billable services. The Company’s typical arrangement includes the sale of one or multiple products that include first year maintenance and support as well as standard warranty. Other arrangements consist of the sale of products bundled with additional maintenance and support or a renewal of maintenance and support contracts. Billable services are billed in advance or when service is provided and performed as requested by customers. Under maintenance and support contracts, services are provided as needed by customers over the fixed arrangement term. The Company does not grant its customers a general right of return or any refund terms, except to two of the Company’s distributors that have a general
81
right of return and in that case, revenue is deferred until sell-through has occurred. Revenue is reported net of rebates, discounts and any other sales incentives.
The Company recognizes revenue when (1) persuasive evidence of an arrangement exists, (2) delivery has occurred or services have been rendered, (3) sales price is fixed or determinable and (4) collectability is reasonably assured.
When sales arrangements contain multiple elements and software and non-software components that function together to deliver the products’ essential functionality, the Company allocates revenue to each element based on a selling price hierarchy: vendor-specific objective evidence (“VSOE”) if available, third-party evidence (“TPE”) of the selling price if VSOE is not available, or best estimated selling prices (“ESP”) if neither VSOE nor TPE is available.
When the Company enters in arrangements to provide more than one product or service (“multiple deliverables”), these arrangements are evaluated to determine if the multiple elements consist of more than one unit of accounting and can be separated accordingly. Based on separation criteria under the guidance, deliverables in multiple element arrangements can be segregated into separate units of accounting if they have value to the customer on a standalone basis. If deliverables can be separated into individual units of accounting, then the arrangement consideration is allocated among deliverables based on their relative selling price. Revenue from each deliverable is recognized when all requirements are met for that specific deliverable. If deliverables cannot be separated into separate units of accounting, then the arrangement will be accounted for as a single unit of accounting and revenue will be recognized when all requirements are met for all deliverables within the arrangement. The Company has established VSOE for maintenance and support contracts since the majority of selling prices fall within a narrow range when sold separately. TPE is not used since this information is not widely available in the market and we do not consider our products to be similar to or interchangeable with our competitors’ products in standalone sales to similarly situated customers. For deliverables with no established VSOE, the Company determines the standalone selling price for such deliverables by establishing ESP, which incorporates historical selling prices, the effect of market conditions, gross margin objectives and pricing practices, as well as entity specific factors. The Company monitors and evaluates ESP on a regular basis to ensure that changes in circumstances are accounted for in a timely manner.
Services revenue is recognized ratably over the contractual support period, which is typically one year and can be up to five years.
In accordance with contractual provisions, the Company may offer cooperative marketing funds based on a fixed dollar percentage of product sales to certain of its channel partners or to fund specific marketing activities for these partners. The Company records such amounts as a reduction to revenue or, if the Company has evidence of fair value of the separable and identifiable benefit received, as marketing expense.
Revenue is recorded net of sales taxes. Costs of products not yet recognized as revenue are deferred and included as a component of prepaid expenses and other current assets in the consolidated balance sheets. As of December 28, 2013 and December 31, 2012, deferred product costs were $0.9 million and $0.6 million, respectively.
Shipping and Handling Charges
Shipping and handling costs are recorded in cost of revenue in the period products are shipped to customers.
82
Warranty
Beginning on February 1, 2011, the Company began providing five-year warranties on its products against defects in manufacturing. Prior to February 1, 2011, the Company provided a one-year warranty on its products. The Company accrues for potential liability claims as a component of cost of product revenue based on historical trends of product failure rates and the expected material and labor costs to provide warranty services. The accrued warranty balance is reviewed periodically for adequacy and is included in accrued liabilities and other liabilities, non-current on the consolidated balance sheets.
Stock-Based Compensation
Stock-based compensation expense related to stock-based transactions, including employee and director awards, as well as employee stock purchase plan purchase rights (“ESPP purchase rights”), is measured and recognized in the consolidated financial statements based on fair value of the award on the grant date. The fair value of option awards and ESPP purchase rights is estimated using the Black-Scholes option-pricing model. This model requires assumptions including the market value of the Company’s common stock, expected volatility, expected term of the award, expected dividend yield and risk-free interest rate. Expected term for stock option awards is determined based on the mid-point of the vest period and the contractual period of each option award due to the Company’s limited historical stock option exercise data. Expected volatility is established based on the historical volatility of the common stock of a peer group of publicly traded companies. The stock-based compensation expense, net of estimated forfeitures, is recognized on a graded-vesting basis over the requisite service periods of the awards, unless a performance-based condition exists. Expense for performance-based awards are recognized when the issuance of the underlying awards are probable. Expense for consultant awards are measured based on the fair value on the vest date. Expenses related to the option grants to consultants that have not been vested as of the reporting date are marked to market until the earlier of the commitment or the completion of the underlying performance. The Company estimates a forfeiture rate to calculate the stock-based compensation for its stock-based awards based on an analysis of its historical experience, analysis of employee turnover and other related factors.
Advertising Costs
Expenses related to advertising of products are charged to sales and marketing expense as incurred. For all periods presented, advertising expenses were insignificant.
Deferred Offering Costs
Deferred offering costs, consisting of legal, accounting and filing fees related to the IPO or the follow-on public offering, were capitalized as other assets and offset against the proceeds received upon the completion of each offering. As of December 28, 2013 and December 31, 2012, the Company had capitalized zero and $2.2 million, respectively, of deferred offering costs within other assets on its consolidated balance sheets.
Income Taxes
The Company is subject to U.S. federal income taxes as well as state taxes. In addition, the Company is subject to taxes in the foreign jurisdictions where it operates.
Prior to the LLC Conversion in May 2013, the Company was a Delaware limited liability company that passed through income and losses to its members. As a result, the Company was not subject to any U.S. federal or state income taxes as the related tax consequences were reported by the individual members.
83
Effective upon the completion of the LLC Conversion, the Company accounts for income taxes using the asset and liability method, which requires the recognition of deferred tax assets and liabilities for the expected future tax consequences of events that have been recognized in its financial statements or tax returns. In addition, deferred tax assets are recorded for the future benefit of utilizing net operating losses and research and development credit carry forwards. Valuation allowances are provided when necessary to reduce deferred tax assets to the amount expected to be realized. Accordingly, the Company assessed the need for a valuation allowance based on the ASC 740 more-likely-than-not realization threshold criterion. Consideration was given to all positive and negative evidence related to the realization of the deferred tax assets. This assessment considered, among other matters, the nature, frequency and severity of current and cumulative losses, forecasts of future profitability, the duration of statutory carryforward periods, experience with operating loss and tax credit carryforwards expiring, and tax planning alternatives. Significant judgment was required to determine whether a valuation allowance was necessary and the amount of such valuation allowance, if appropriate.
The Company applies the authoritative accounting guidance prescribing a threshold and measurement attribute for the financial recognition and measurement of a tax position taken or expected to be taken in a tax return. The Company recognizes liabilities for uncertain tax positions based on a two-step process. The first step is to evaluate the tax position for recognition by determining if the weight of available evidence indicates that it is more-likely-than-not that the position will be sustained on audit, including resolution of related appeals or litigation processes, if any. The second step requires the Company to estimate and measure the tax liability as the largest amount that is more-likely-than-not to be realized upon ultimate settlement. The Company also accounts for any related interest and penalty charges as a component of income taxes.
Comprehensive (Loss) Income
Comprehensive (loss) income is defined as a change in equity of a business enterprise during a period, resulting from transactions from non-owner sources. Comprehensive (loss) income comprises all components of net (loss) income and all components of other comprehensive income within stockholders’ equity. The Company’s other comprehensive income includes unrealized gains and losses from its available-for-sale securities that are not considered other-than-temporarily impaired.
Earnings Per Share
Basic net (loss) income per share attributable to common stockholders is calculated by dividing the net (loss) income attributable to common stock holders by the weighted-average number of common stock outstanding for the period.
Diluted net income per share attributable to common stockholders is computed by giving effect to all potential dilutive common stock outstanding during the period, including options, restricted stock units (“RSUs”) and ESPP purchase rights. The computation of diluted net income does not assume conversion or exercise of potentially dilutive securities that would have an anti-dilutive effect on earnings. The dilutive effect of outstanding options is computed using the treasury stock method. In periods when the Company has incurred a net loss, potential dilutive common securities outstanding have been excluded from the calculation of diluted net loss per share attributable to common stockholders as their effect is antidilutive.
Prior to the conversion of its redeemable convertible Series A preferred stock (the “Series A preferred stock”) to common stock, effective June 17, 2013, the Company applied the two-class method for calculating and presenting earnings per share as the Series A preferred stock was considered a participating security due to the rights of cumulative preferred return. Participating
84
securities are defined as securities that participate in dividends with common units according to a pre-determined formula or a contractual obligation to share in the income of the entity. Under the two-class method, net (loss) income is allocated between common stock and other participating securities based on their participating rights. Accordingly, earnings allocated or distributed to the Series A preferred stock as well as the related number of outstanding shares of the Series A preferred stock have been excluded from the computation of basic and diluted net (loss) income per share attributable to common stockholders.
Dilutive securities that were subject to the Company’s IPO were excluded from the Company’s diluted net (loss) income per share calculation for the periods before the close of the Company’s IPO in June 2013.
Recent Accounting Pronouncements
In March 2013, the Financial Accounting Standards Board (“FASB”) issued an accounting standard update requiring an entity to release into net income the entire amount of a cumulative translation adjustment related to its investment in a foreign entity when as a parent it either sells a part or all of its investment in a foreign entity or no longer holds a controlling financial interest in a subsidiary or group of assets within a foreign entity. This accounting standard update will be effective prospectively for the Company beginning in the first quarter of fiscal 2014. The Company does not expect the adoption of this accounting standard update to have a material impact on its consolidated financial statements.
In July 2013, the FASB issued a new accounting standard update that requires the presentation of certain unrecognized tax benefits as reductions to deferred tax assets rather than as liabilities in the consolidated balance sheets when a net operating loss carryforward, a similar tax loss, or a tax credit carryforward exists. Early adoption or a retrospective application is permitted. The Company is required to adopt this new standard on a prospective basis in the first quarter of fiscal 2014. The Company does not expect the adoption of this accounting standard update to have a material impact on its consolidated financial statements.
85
3. Fair Value Measurements
Cash, Cash Equivalent and Investments
The components of the Company’s cash, cash equivalents and investments are as follows (in thousands):
| | | | | | | | | | | | | | | | |
| | | | | | Fair Value Measured Using | |
| | | As of
December 28,
2013 | | | Quoted Prices
in Active
Markets for
Identical
Assets
(Level 1) | | | Significant
Other
Observable
Inputs
(Level 2) | | | Significant
Unobservable
Inputs
(Level 3) | |
Cash and cash equivalents: | | | | | | | | | | | | | | | | |
Money market funds | | $ | 79,100 | | | $ | 79,100 | | | $ | — | | | $ | — | |
Corporate debt securities | | | 501 | | | | — | | | | 501 | | | | — | |
| | | | | | | | | | | | | | | | |
Total cash equivalents | | | 79,601 | | | $ | 79,100 | | | $ | 501 | | | $ | — | |
| | | | | | | | | | | | | | | | |
Cash | | | 307 | | | | | | | | | | | | | |
| | | | | | | | | | | | | | | | |
Total cash and cash equivalents | | $ | 79,908 | | | | | | | | | | | | | |
| | | | | | | | | | | | | | | | |
Short-term investments: | | | | | | | | | | | | | | | | |
Corporate debt securities | | $ | 42,210 | | | $ | — | | | $ | 42,210 | | | $ | — | |
U.S. agency debt securities | | | 11,035 | | | | — | | | | 11,035 | | | | — | |
U.S. government securities | | | 4,997 | | | | — | | | | 4,997 | | | | — | |
| | | | | | | | | | | | | | | | |
Total short-term investments | | $ | 58,242 | | | $ | — | | | $ | 58,242 | | | $ | — | |
| | | | | | | | | | | | | | | | |
| | | | | | | | | | | | | | | | |
| | | | | | Fair Value Measured Using | |
| | | As of
December 31,
2012 | | | Quoted Prices
in Active
Markets for
Identical
Assets
(Level 1) | | | Significant
Other
Observable
Inputs
(Level 2) | | | Significant
Unobservable
Inputs
(Level 3) | |
Cash and cash equivalents: | | | | | | | | | | | | | | | | |
Money market funds | | $ | 11,615 | | | $ | 11,615 | | | $ | — | | | $ | — | |
| | | | | | | | | | | | | | | | |
Cash | | | 7,060 | | | | | | | | | | | | | |
| | | | | | | | | | | | | | | | |
Total cash equivalents | | $ | 18,675 | | | | | | | | | | | | | |
| | | | | | | | | | | | | | | | |
Cash equivalents consist of money market funds and highly-liquid corporate debt securities. The Company holds money market funds that invest primarily in high-quality short-term money-market instruments. These funds are not insured or guaranteed by the Federal Deposit Insurance Corporation or any other government agency.
Money market funds and U.S. government securities have been classified as Level 1 because these securities are valued based upon quoted prices in active markets. The Company’s Level 2 assets are priced using quoted market prices for similar instruments or non-binding market prices that are corroborated by observable market data. The Company uses inputs such as actual trade data, benchmark yields, broker/dealer quotes or alternative pricing sources with reasonable levels of price transparency which are obtained from quoted market prices, independent pricing vendors, or other sources, to determine the ultimate fair value of these assets. The transfers between Level 1 and 2 in fiscal 2013 pertained to the purchases and sales of corporate debt securities and U.S. agency debt securities.
86
Financial instruments measured at amortized costs, gross unrealized gain, gross unrealized loss and fair value by significant investment categories are summarized as follows (in thousands):
| | | | | | | | | | | | | | | | |
| | | As of December 28, 2013 | |
| | | Amortized
Costs | | | Gross
Unrealized
Gains | | | Gross
Unrealized
Losses | | | Fair Value | |
Cash and cash equivalents: | | | | | | | | | | | | | | | | |
Money market funds | | $ | 79,100 | | | $ | — | | | $ | — | | | $ | 79,100 | |
Corporate debt securities | | | 501 | | | | — | | | | — | | | | 501 | |
Cash | | | 307 | | | | — | | | | — | | | | 307 | |
| | | | | | | | | | | | | | | | |
Total cash and cash equivalents | | $ | 79,908 | | | $ | — | | | $ | — | | | $ | 79,908 | |
| | | | | | | | | | | | | | | | |
Short-term investments: | | | | | | | | | | | | | | | | |
Corporate debt securities | | $ | 42,191 | | | $ | 19 | | | $ | — | | | $ | 42,210 | |
U.S. agency debt securities | | | 11,037 | | | | — | | | | (2 | ) | | | 11,035 | |
U.S. government securities | | | 4,991 | | | | 6 | | | | — | | | | 4,997 | |
| | | | | | | | | | | | | | | | |
Total short-term investments | | $ | 58,219 | | | $ | 25 | | | $ | (2 | ) | | $ | 58,242 | |
| | | | | | | | | | | | | | | | |
The Company sold $2.0 million of marketable securities in fiscal 2013 and the net realized gain was not material.
The contractual maturity date of the cash, cash equivalent and short-term investments was as follows (in thousands):
| | | | | | | | |
| | | As of | |
| | | December 28,
2013 | | | December 31,
2012 | |
Due within one year | | $ | 100,674 | | | $ | 11,615 | |
Due between one and five years | | | 37,169 | | | | — | |
| | | | | | | | |
Total | | | 137,843 | | | | 11,615 | |
Cash | | | 307 | | | | 7,060 | |
| | | | | | | | |
Total | | $ | 138,150 | | | $ | 18,675 | |
| | | | | | | | |
4. Balance Sheet Components
Inventories
Inventories are comprised of the following (in thousands):
| | | | | | | | |
| | | As of | |
| | | December 28,
2013 | | | December 31,
2012 | |
Raw materials | | $ | 59 | | | $ | 1,583 | |
Finished goods | | | 1,425 | | | | 2,153 | |
| | | | | | | | |
Total inventories | | $ | 1,484 | | | $ | 3,736 | |
| | | | | | | | |
87
Prepaid expenses and Other Current Assets
Prepaid expenses and other current assets are comprised of the following (in thousands):
| | | | | | | | |
| | | As of | |
| | | December 28,
2013 | | | December 31,
2012 | |
Deferred costs of goods sold | | $ | 876 | | | $ | 611 | |
Prepaid events | | | 858 | | | | 818 | |
Prepaid licenses and maintenance support | | | 738 | | | | 108 | |
Prepaid insurance | | | 547 | | | | 341 | |
Other receivables | | | 441 | | | | 247 | |
Other prepaids and current assets | | | 2,146 | | | | 1,282 | |
| | | | | | | | |
Total prepaid expenses and other current assets | | $ | 5,606 | | | $ | 3,407 | |
| | | | | | | | |
Property and equipment, net
Property and equipment, net are comprised of the following (in thousands):
| | | | | | | | |
| | | As of | |
| | | December 28,
2013 | | | December 31,
2012 | |
Equipment and machinery | | $ | 7,251 | | | $ | 3,718 | |
Furniture and fixtures | | | 465 | | | | 350 | |
Leasehold improvements | | | 291 | | | | 151 | |
Software | | | 1,439 | | | | 899 | |
| | | | | | | | |
Total property and equipment | | | 9,446 | | | | 5,118 | |
Less accumulated depreciation and amortization | | | (5,057 | ) | | | (2,432 | ) |
| | | | | | | | |
Total property and equipment, net | | $ | 4,389 | | | $ | 2,686 | |
| | | | | | | | |
Depreciation expense was $2.6 million, $1.4 million and $0.7 million for fiscal 2013, 2012 and 2011, respectively.
Other Assets
The following table shows the components of other assets (in thousands):
| | | | | | | | |
| | | As of | |
| | | December 28,
2013 | | | December 31,
2012 | |
Refundable deposits | | $ | 353 | | | $ | 109 | |
Deferred offering costs | | | — | | | | 2,207 | |
Other assets, non-current | | | 118 | | | | — | |
| | | | | | | | |
Total other assets | | $ | 471 | | | $ | 2,316 | |
| | | | | | | | |
Total deferred offering costs of approximately $4.0 million, incurred in connection with the IPO, were capitalized and offset against the proceeds received upon the completion of the offering in June 2013.
88
Accrued Liabilities
The following table shows the components of accrued liabilities (in thousands):
| | | | | | | | |
| | | As of | |
| | | December 28,
2013 | | | December 31,
2012 | |
Accrued employee related costs | | $ | 9,781 | | | $ | 5,843 | |
Accrued employee stock purchase plan contributions | | | 3,558 | | | | — | |
Accrued inventory and other purchases | | | 2,881 | | | | 846 | |
Accrued payroll and other taxes | | | 1,908 | | | | 4,586 | |
Accrued professional services | | | 1,028 | | | | 1,280 | |
Accrued warranty, current | | | 384 | | | | 195 | |
Income tax payable | | | 196 | | | | 76 | |
Sales return reserve | | | 191 | | | | 240 | |
Customer deposits | | | 147 | | | | — | |
Other accruals | | | 2,327 | | | | 823 | |
| | | | | | | | |
Total accrued liabilities | | $ | 22,401 | | | $ | 13,889 | |
| | | | | | | | |
Accrued Warranty
The following table presents the activity related to the current and non-current product warranty within accrued liabilities and other non-current liabilities (in thousands):
| | | | | | | | | | | | |
| | | Fiscal Year Ended | |
| | | December 28,
2013 | | | December 31,
2012 | | | December 31,
2011 | |
Balance at beginning of period | | $ | 350 | | | $ | 231 | | | $ | — | |
Accrual for warranty during the period | | | 970 | | | | 421 | | | | 415 | |
Actual costs incurred | | | (634 | ) | | | (302 | ) | | | (184 | ) |
| | | | | | | | | | | | |
Balance at end of period | | $ | 686 | | | $ | 350 | | | $ | 231 | |
| | | | | | | | | | | | |
| | | | | | | | |
| | | As of | |
| | | December 28,
2013 | | | December 31,
2012 | |
Reported as: | | | | | | | | |
Current | | $ | 384 | | | $ | 195 | |
Non-current | | | 302 | | | | 155 | |
| | | | | | | | |
Total accrued warranty | | $ | 686 | | | $ | 350 | |
| | | | | | | | |
89
Deferred Revenue
The following table presents the components of the Company’s deferred revenue (in thousands):
| | | | | | | | |
| | | As of | |
| | | December 28,
2013 | | | December 31,
2012 | |
Deferred product revenue | | $ | 7,147 | | | $ | 4,197 | |
Deferred service revenue | | | 40,329 | | | | 26,623 | |
| | | | | | | | |
Total deferred revenue | | $ | 47,476 | | | $ | 30,820 | |
| | | | | | | | |
| | | | | | | | |
| | | As of | |
| | | December 28,
2013 | | | December 31,
2012 | |
Reported as: | | | | | | | | |
Current | | $ | 37,592 | | | $ | 23,917 | |
Non-current | | | 9,884 | | | | 6,903 | |
| | | | | | | | |
Total deferred revenue | | $ | 47,476 | | | $ | 30,820 | |
| | | | | | | | |
Accumulated Other Comprehensive Income
Accumulated other comprehensive income consists of unrealized gains and losses from available-for-sale securities. The following summarizes the activity within accumulated other comprehensive income (in thousands):
| | | | | | | | | | | | |
| | | Accumulated Other Comprehensive Income | |
| | | Net Unrealized
Gains | | | Income Tax
Provision | | | Net Unrealized Gain,
net of tax | |
Balance as of December 31, 2012 | | $ | — | | | $ | — | | | $ | — | |
Available-for-sale securities: | | | | | | | | | | | | |
Unrealized gains, net | | | 24 | | | | — | | | | 24 | |
Reclassification of net realized gain to other expense, net | | | (1 | ) | | | — | | | | (1 | ) |
| | | | | | | | | | | | |
Total other comprehensive income | | | 23 | | | | — | | | | 23 | |
| | | | | | | | | | | | |
Balance as of December 28, 2013 | | $ | 23 | | | $ | — | | | $ | 23 | |
| | | | | | | | | | | | |
There were no reclassifications out of accumulated other comprehensive income into the consolidated statements of operations in fiscal 2012 and 2011.
5. Related Party Transactions
Related Party Receivable
Prior to the LLC Conversion, in accordance with the agreement between the Company’s members, based upon the cash position of the Company, an advancement of the distribution for the year may be declared before the end of the fiscal year to all members. The advancement was treated as an interest bearing loan and interest was paid by the recipients at the end of the year. The interest rate was determined based on the fair market rate at the time of advancement. In fiscal 2010, a total of
90
$2.0 million was advanced at an interest rate of 1.25% and interest of $9,000 was collected. The advances were repaid in 2011. No new loans were made in fiscal 2013 and 2012.
During fiscal 2013, 2012 and 2011, the Company paid income taxes of $28,000, $0.1 million and $0.3 million, respectively, on behalf of Gigamon Systems, a majority shareholder, and was fully reimbursed as of December 28, 2013 and December 31, 2012 for such payments.
Founders’ Bonuses
The Company paid bonuses to certain founder employees through December 31, 2012, pursuant to the Restated Limited Liability Company Agreement by and among the Company and certain of its stockholders, dated January 20, 2010, as amended (the “LLC Agreement”), prior to its termination on May 31, 2013. For fiscal 2013, 2012 and 2011, founders’ bonus expense was zero, $2.9 million and $4.2 million, respectively.
Gigamon LLC Members’ Distribution Payable
Prior to the LLC Conversion, in accordance with the LLC Agreement, the Company distributed to the holders of Series A preferred units and common units (hereafter referred to as the members) pro rata net income or losses based upon the number of units held by the members. The Series A preferred units allocation was based on an as-converted to common units basis.
During fiscal 2013, 2012 and 2011, the Company distributed $7.0 million, $18.2 million and $12.2 million, respectively; such distribution amounts included zero, $1.6 million and $0.2 million, respectively, of income taxes paid on behalf of members. The undistributed amount was recorded as Gigamon LLC members’ distribution payable within accrued liabilities in the consolidated balance sheets. As of December 28, 2013 and December 31, 2012, the members’ distribution payable was $0.5 million and $4.8 million, respectively.
6. Commitments and Contingencies
Lease Commitments
On July 2, 2013, the Company entered into a sublease agreement to lease 105,664 square feet of office space, located in Santa Clara, California, with a term of 51 months from January 2014 through March 2018, for an aggregate net base rent of $10.7 million. In addition to the monthly base rent, the Company is responsible for payment of certain operating expenses, including utilities and real estate taxes. The Company is using the leased space as its worldwide corporate headquarters. In addition, the Company leases office space for its former headquarters and its United Kingdom subsidiary under non-cancelable operating leases that expire at various times through December 2017.
The Company had an option to extend the lease on its former headquarters in Milpitas, California from June 2016 to June 2019, as well as an early termination option which allowed the Company to terminate this lease in June 2014 by providing a written notice and an early termination fee of $250,000 at least 180 days prior to the early termination date. On November 12, 2013, the Company exercised its early termination option and paid the early termination fee of $250,000. The Company will continue to pay rent, operating expenses and all other charges due under the lease for its former headquarters in accordance with the lease terms until the termination date on June 17, 2014.
The Company has also entered into lease agreements for additional office space for sales offices in New York, Virginia, China, Japan, Hong Kong, Russia and Singapore. The Company recognizes rent expense on a straight–line basis over the lease period.
91
Rent expense related to the Company’s operating leases was approximately $1.1 million, $0.6 million and $0.5 million for fiscal 2013, 2012 and 2011, respectively.
Future minimum lease payments under non-cancelable operating leases as of December 28, 2013 were as follows (in thousands):
| | | | |
| Fiscal Year: | | | |
2014 | | $ | 1,423 | |
2015 | | | 3,158 | |
2016 | | | 3,253 | |
2017 | | | 3,345 | |
2018 | | | 967 | |
Thereafter | | | 28 | |
| | | | |
Total | | $ | 12,174 | |
| | | | |
Purchase Commitments
As of December 28, 2013 and December 31, 2012, the Company’s purchase commitments with its vendors totaled $7.5 million and $5.9 million, respectively.
Revolving Line of Credit
The Company’s bank line of credit with Silicon Valley Bank, which provided for borrowings of up to $10.0 million, expired in July 2013. There were no borrowings outstanding under the credit facility as of December 28, 2013 and December 31, 2012. The Company was in compliance with the covenants under this credit facility prior to the expiration of the facility.
Legal Proceedings
From time to time, the Company may become involved in legal proceedings arising in the ordinary course of business. The Company is not currently a party to any legal proceedings the outcome of which, if determined adversely to the Company, would individually or in the aggregate be expected to have a material adverse effect on its business, operating results, financial condition or cash flows.
Indemnification Obligations
Under the indemnification provisions of its standard sales related contracts, the Company agrees to defend its customers against third-party claims asserting infringement of certain intellectual property rights, which may include patents, copyrights, trademarks, or trade secrets, and to pay judgments entered on such claims. The Company’s exposure under these indemnification provisions is generally limited to the total amount paid by its customer under the agreement. However, certain agreements include indemnification provisions that could potentially expose the Company to losses in excess of the amount received under the agreement. The Company has not incurred any costs as a result of such indemnifications and has not accrued any liabilities related to such obligations in the consolidated financial statements. In addition, the Company indemnifies its officers, directors, and certain key employees while they are serving in good faith in their company capacities. To date, there have been no claims under any indemnification provisions. The fair values of these obligations are not material as of each balance sheet date presented.
92
7. Performance Unit Plan
In fiscal 2009, the Company adopted the 2009 Performance Unit Plan (the “2009 Plan”). The 2009 Plan was not an equity plan and was intended to provide an incentive payment to employees, consultants and Board members by providing payment based on the appreciation in value of the Company at the time of a change in control event, such as a business acquisition, merger or an IPO (each performance unit a “PUP”). PUPs did not constitute ownership units or interests of the Company.
The distribution amount was defined as the difference between the redemption value of the units received at the time of the change of control and the base value of the PUP, which was $0.15 as determined by the Board at each award date. While the distributable amount may be satisfied in either cash or stock at the time of a change in control, the Company elected to make such distribution in cash.
Under existing accounting guidance, the compensation expense associated with the 2009 Plan is not required to be reflected in the consolidated financial statements until Change of Control is deemed probable. Accordingly, the Company had not recorded any liabilities or compensation expense associated with the PUPs in its consolidated financial statements until the period in which a change of control occurred. Accordingly, the Company recorded compensation and related payroll tax expenses of $20.4 million in its consolidated financial statements in fiscal 2013, for the 1,057,772 PUPs vested upon the completion of the IPO on June 17, 2013. No related compensation expense was recorded in fiscal 2012 and 2011. The 2009 Plan was terminated in June 2013, in connection with the completion of the IPO.
The following table summarizes the Company’s PUP activity:
| | | | | | | | | | | | |
| | | | | | PUPS Outstanding | |
| | | PUPS
Available
for Grant | | | Number of
PUPS | | | Weighted-
Average
Base
Price | |
Balances — December 31, 2010 | | | 683,658 | | | | 939,317 | | | $ | 0.15 | |
Granted | | | (770,143 | ) | | | 770,143 | | | | 0.15 | |
Cancelled | | | 157,811 | | | | (157,811 | ) | | | 0.15 | |
| | | | | | | | | | | | |
Balances — December 31, 2011 | | | 71,326 | | | | 1,551,649 | | | | 0.15 | |
Cancelled | | | 146,834 | | | | (146,837 | ) | | | 0.15 | |
| | | | | | | | | | | | |
Balances — December 31, 2012 | | | 218,160 | | | | 1,404,812 | | | | 0.15 | |
Settled | | | — | | | | (1,057,772 | ) | | | 0.15 | |
Cancelled | | | 347,040 | | | | (347,040 | ) | | | 0.15 | |
Termination of the Plan | | | (565,200 | ) | | | — | | | | 0.15 | |
| | | | | | | | | | | | |
Balances — December 28, 2013 | | | — | | | | — | | | | | |
| | | | | | | | | | | | |
| | | | | | |
As of December 31, 2012 |
Base Price | | Number Outstanding | | Weighted Average Remaining
Contractual Life (in Years) | | Number Vested |
$0.15 | | 1,404,812 | | 7.96 | | 862,922 |
93
8. Preferred Stock and Stockholders’ Equity (Members’ Deficit)
LLC Conversion
On May 31, 2013, the Company converted from a Delaware limited liability company into a Delaware corporation and changed the Company’s name from Gigamon LLC to Gigamon Inc. Effective May 31, 2013, all of the Company’s outstanding common units and preferred units were converted into shares of common stock and preferred stock. Immediately following the LLC Conversion, certain entities affiliated with Highland Capital Partners that held the Company’s Series A preferred stock were merged with and into the Company, and the entities affiliated with Highland Capital Partners that merged with and into the Company received preferred stock in exchange for their equity interests. Further, in connection with the LLC Conversion, Gigamon Systems LLC, the holder of all of the Company’s outstanding common units prior to the LLC Conversion, exchanged all of the interests that it held in the Company for 16,851,635 shares of the common stock of Gigamon Inc. In addition, all outstanding options to purchase shares in Gigamon Systems LLC were substituted for fully vested options to purchase 448,349 shares of the Company’s common stock, at a weighted average exercise price of $0.02 per share, for which the Company recognized related stock-based compensation expense of $8.5 million in fiscal 2013. Additionally, the Company recorded a net adjustment to deferred income tax asset of $14.8 million and reclassified $24.0 million from accumulated deficit to additional paid-in capital.
Redeemable Convertible Series A Preferred Units
The LLC Agreement authorized the Company to issue 8,109,848 Series A preferred units (“Series A”) at no par value. Upon the LLC Conversion, all of the then-outstanding Series A were converted into shares of Series A preferred stock. Furthermore, in connection with the closing of the Company’s IPO, all of the Company’s then-outstanding shares of Series A preferred stock were converted into shares of common stock on June 17, 2013 (the “Series A Conversion”). As of December 28, 2013 and December 31, 2012, the Company had zero and 8,109,847 Series A units outstanding, respectively.
The rights, privileges and restrictions of Series A units as set forth in the LLC Agreement as in effect prior to the LLC Conversion are summarized as follows:
Voting
Each unit of Series A had voting rights equal to an equivalent number of common units into which it was convertible and voted together as one class with the common units.
Liquidation
Upon a liquidation or a deemed liquidation event, the Company was obligated to distribute the net proceeds or assets available for distribution, whether in cash or in other property, to the holders of Series A and common units as follows:
| | • | | First, to the holders of Series A on apari passu basis, and |
| | • | | Next, to the holders of common units,pro rata in proportion to the number of common units held by such holders. |
A merger or consolidation of the Company into another entity in which the members of the Company would own less than 50% of the voting stock/units of the surviving company or the sale or transfer of substantially all of the assets would be deemed a liquidation of the Company.
94
Conversion
Conversion was either at the option of the holder or was automatic upon the written consent of the requisite Series A Preferred Holders. “Requisite Series A Preferred Holders” was defined as holders of a majority of the Series A units then issued and outstanding, voting as a separate class.
Each Series A unit was convertible into a common unit by dividing $2.81 by the conversion price in effect. The initial conversion price of $2.81 was subject to adjustments for subdivisions or combinations of common units, reclassification, exchange and substitution and dilutive issuances. As of December 31, 2012, the conversion price in effect was the same as the issuance price. In connection with the LLC Conversion, the Series A units were converted into shares of Series A preferred stock at a ratio of 1-to-1.
Redemption
The holders of Series A units were entitled to elect to require the Company to purchase all of the outstanding Series A, after January 20, 2015, at $2.81 per unit plus accrued preferred return at 8% per annum, payable in three equal annual installments. Prior to the redemption upon the completion of the IPO, the Company was accreting to the January 20, 2015 redemption value of $33.5 million. For fiscal 2013, 2012 and 2011, the Company recorded $1.0 million, $2.1 million and $2.0 million, respectively, for the accretion of the Series A units to their redemption value using the effective interest method. As redemption of Series A units was outside the control of the Company, all units have been presented outside of Members’ deficit in the Company’s consolidated balance sheets and consolidated statements of redeemable convertible preferred units and stockholders’ equity (members’ deficit).
The Company initially recorded the Series A units at their issuance price net of issuance costs, which represented the carrying value. The difference between the initial carrying value of Series A units and their total redemption value was accreted from the issuance date through the first redemption date, January 20, 2015, using the effective interest rate method. The Company recorded accretion of issuance costs of $56,000, $121,000 and $119,000, respectively, for fiscal 2013, 2012 and 2011.
Preferred Stock
The Company has authorized 20,000,000 shares of undesignated preferred stock, $0.0001 par value per share. As of December 28, 2013 and December 31, 2012, the Company had no shares of preferred stock issued or outstanding.
Common Units
Prior to the LLC Conversion, the Company had 33,333,333 common units authorized. Each holder of common units was entitled to one vote for each common unit held. Upon the LLC Conversion, all of the then-outstanding common units were converted into shares of common stock. As of December 28, 2013 and December 31, 2012, the Company had zero and 17,300,005 common units outstanding, respectively.
Common Stock
The Company has authorized 1,000,000,000 shares of common stock, $0.0001 par value per share. Each holder of common stock is entitled to one vote for each share of common stock held. Cumulative voting for the election of directors is not provided in the Company’s amended and restated certificate of incorporation. The Company’s common stock is not entitled to preemptive rights, and is not subject to conversion, redemption or sinking fund provisions. Subject to preferences that may apply
95
to any shares of preferred stock outstanding at the time, the holders of common stock are entitled to receive dividends out of funds legally available if the Board, in its discretion, determines to issue dividends and then only at the times and in the amounts that the Board may determine.
As of December 28, 2013, the Company had 31,151,723 shares of common stock issued and outstanding. The Company had zero shares of common stock authorized, issued or outstanding as of December 31, 2012.
Treasury Stock
As of December 28, 2013 and December 31, 2012, the Company had 8,109,848 shares of treasury stock outstanding, with a carrying value of $12.5 million, or $1.35 per share, within stockholders’ equity (members’ deficit) on its consolidated financial statements. The treasury stock was repurchased in fiscal 2010 pursuant to a purchase and redemption agreement and does not have any restrictions imposed by state law.
Equity Award Plans
Unit Option Plan
In March 2012, the Company adopted the 2012 Unit Option Plan (the “Option Plan”). The Option Plan authorized the Company to grant options and RSUs, up to a maximum of 3,300,505 shares, to employees, members and consultants of the Company. The Option Plan was terminated in connection with the Company’s IPO but will continue to govern the terms and conditions of outstanding awards granted thereunder. Prior to its termination, the Option Plan authorized the Company to grant options and RSUs up to a maximum of 4,967,172 units to employees, directors and consultants of the Company.
The following table summarizes the activity under the Option Plan prior to its termination (in shares):
| | | | |
| | | Number of
shares | |
Shares available for future grant at December 31, 2012 | | | 732,267 | |
Additional authorization | | | 1,666,667 | |
Options granted | | | (1,426,849 | ) |
RSUs granted | | | (507,264 | ) |
Options cancelled | | | 64,653 | |
RSUs cancelled | | | 3,234 | |
Transferred to 2013 Equity Incentive Plan upon termination | | | (532,708 | ) |
| | | | |
Shares available for future grant at December 28, 2013 | | | — | |
| | | | |
Under the Option Plan, stock options granted to new hires are generally subject to a four-year vesting period whereby options become 25% vested on the first anniversary from the grant date and then ratably monthly thereafter through the end of the vesting period. Vested options may be exercised up to ten years from the vesting commencement date, as defined in the Option Plan. Vested but unexercised options, under the Option Plan, expire 30 days after termination of employment with the Company. Prior to the IPO, vesting of certain options under the Option Plan was also subject to the completion of the IPO (the “IPO Stock Options”).
96
2013 Equity Incentive Plan
In May 2013, the Company adopted the 2013 Equity Incentive Plan (the “2013 Equity Plan”). All authorized but unissued shares of the Company’s Option Plan were added to the 2013 Equity Plan’s authorized pool in June 2013. The Company is authorized to issue up to a maximum of 2,929,481 shares of common stock for future issuance, plus up to an additional 4,967,172 shares upon termination of awards under the Option Plan. In addition, the 2013 Equity Plan is subject to increase annually on the first day of each of the Company’s fiscal years beginning with fiscal 2014, by an amount equal to the least of (i) 1,464,740 shares, (ii) 5% of the outstanding shares of common stock as of the last day of the immediately preceding fiscal year, or (iii) such other amount as determined by the Board. Vested but unexercised options, under the 2013 Equity Plan, expire three months after termination of service with the Company.
The 2013 Equity Plan permits the grant of stock options, stock appreciation rights, restricted stock, RSUs, performance units and performance shares to employees, directors and consultants of the Company.
Employee Stock Purchase Plan
In conjunction with the completion of its IPO, the Company adopted the 2013 Employee Stock Purchase Plan (the “ESPP”). Under the ESPP, 439,422 shares of the Company’s common stock are authorized for future issuance. The number of authorized shares under the ESPP is subject to increase on an annual basis. The ESPP allows eligible employees to purchase shares of the Company’s common stock at a discount through payroll deductions of up to 15% of their eligible compensation, subject to plan limitations. The ESPP provides for a 24-month offering period comprised of four purchase periods of approximately six months. Employees are able to purchase shares at 85% of the lower of the market value of the Company’s common stock (i) at the date of commencement of the offering period or (ii) at the last day of the purchase period. The offering periods are scheduled to start on the first trading day on or after May 15 and November 15 of each year, except for the first offering period, which commenced on the first trading day upon the completion of the Company’s IPO, or June 12, 2013, and ends on August 17, 2015. In fiscal 2013, the Company recorded stock-based compensation expense of $4.7 million for its ESPP. No shares have been purchased by employees under the ESPP as of and for the fiscal year ended December 28, 2013.
Stock Option Activity
Stock options granted to new hires, under the 2013 Equity Plan and formerly under the Option Plan (together, the “Option Plans”), are generally subject to a four-year vesting period whereby options become 25% vested on the first anniversary from the grant date and then ratably monthly thereafter through the end of the vesting period. Vested options may be exercised up to ten years from the vesting commencement date.
In fiscal 2013 and fiscal 2012, the Company granted its employees zero shares and 66,663 shares subject to performance-based options, respectively. These options vest based upon the achievement of sales goals for each individual grantee. Based upon the achievement of each individual’s sales goals, 21,749 shares and 9,123 shares subject to such options had vested as of December 28, 2013 and December 31, 2012, respectively. The Company recognized approximately $134,400 and $90,000 in stock-based compensation expense during fiscal 2013 and fiscal 2012, respectively. As of December 28, 2013 and December 31, 2012, 39,998 shares and 50,666 shares subject to such performance-based options, respectively, were outstanding, with unrecognized expense of $0.1 million and $0.2 million, net of estimated forfeitures, respectively.
97
In fiscal 2013, the Company granted 448,349 shares subject to fully-vested options to certain employees, with an average exercise price of $0.02 per share, as substitute options to purchase our common stock in connection with the LLC Conversion. In fiscal 2012, the Company granted 153,647 shares subject to fully-vested options to certain employees, with an average exercise price of $10.38 per unit. Stock-based compensation expense recognized in fiscal 2013 and fiscal 2012 in connection with these fully vest options was $8.5 million and $0.9 million, respectively.
In fiscal 2012, the Company granted a total of 1,143,413 shares subject to the IPO Stock Options, for which the Company recorded $3.8 million of stock-based compensation expense in fiscal 2013 upon the completion of its IPO in June 2013.
The following table summarizes the stock option activity related to shares of common stock under the Company’s Option Plans:
| | | | | | | | | | | | | | | | |
| | | Number of
Stock
Options
Outstanding | | | Weighted-
Average
Exercise
Price | | | Weighted-
Average
Remaining
Contractual
Life (Years) | | | Aggregate
Intrinsic
Value | |
| | | (in thousands) | |
Options granted | | | 2,524,492 | | | $ | 7.87 | | | | | | | | | |
Options cancelled | | | (106,095 | ) | | $ | 6.50 | | | | | | | | | |
| | | | | | | | | | | | | | | | |
Balance — December 31, 2012 | | | 2,418,397 | | | $ | 7.92 | | | | 9.40 | | | $ | 12,527 | |
Options granted | | | 1,599,514 | | | $ | 11.36 | | | | | | | | | |
Options exercised | | | (344,592 | ) | | $ | 4.99 | | | | | | | | | |
Options cancelled | | | (295,016 | ) | | $ | 8.86 | | | | | | | | | |
| | | | | | | | | | | | | | | | |
Balance — December 28, 2013 | | | 3,378,303 | | | $ | 9.77 | | | | 8.78 | | | $ | 62,725 | |
| | | | | | | | | | | | | | | | |
Vested and expected to vest — December 31, 2012 | | | 1,173,666 | | | $ | 9.34 | | | | 9.51 | | | $ | 4,428 | |
| | | | | | | | | | | | | | | | |
Exercisable — December 31, 2012 | | | 189,459 | | | $ | 10.19 | | | | 9.61 | | | $ | 559 | |
| | | | | | | | | | | | | | | | |
Vested and expected to vest — December 28, 2013 | | | 3,216,818 | | | $ | 9.68 | | | | 8.64 | | | $ | 60,034 | |
| | | | | | | | | | | | | | | | |
Exercisable — December 28, 2013 | | | 972,268 | | | $ | 6.34 | | | | 8.65 | | | $ | 21,344 | |
| | | | | | | | | | | | | | | | |
Aggregate intrinsic value represents the difference between the Company’s fair market value per share of $28.29 and $13.11 as of December 28, 2013 and December 31, 2012, respectively, and the exercise price of the awards for the total number of underlying options.
Weighted-average fair value per share for option awards vested in fiscal 2013 and fiscal 2012 was $5.67 and $6.06, respectively. The total intrinsic value of options exercised was $10.6 million and zero in fiscal 2013 and fiscal 2012, respectively. No award was granted or vested under the Option Plan prior to fiscal 2012. Excluded from the options vested and expected to vest as of December 31, 2012 were 1,070,316 stock options that did not commence vesting until the completion of the Company’s IPO in June 2013.
98
Additional information regarding the Company’s outstanding stock options and vested and exercisable stock options is summarized below:
| | | | | | | | | | | | | | | | | | | | |
| | | As of December 28, 2013 | |
| | | Options Outstanding | | | Options Vested and
Exercisable | |
Exercise Prices | | Number of
Stock
Options
Outstanding | | | Weighted-
Average
Remaining
Contractual
Life (Years) | | | Weighted-
Average
Exercise
Price per
Share | | | Shares
Subject
to Stock
Options | | | Weighted-
Average
Exercise
Price per
Share | |
$0.00 - $6.09 | | | 1,667,580 | | | | 8.43 | | | $ | 4.98 | | | | 647,032 | | | $ | 2.69 | |
$10.38 - $19.00 | | | 1,629,724 | | | | 9.04 | | | $ | 13.53 | | | | 325,236 | | | $ | 11.93 | |
$29.36 - $37.18 | | | 80,999 | | | | 9.88 | | | $ | 30.37 | | | | — | | | $ | — | |
| | | | | | | | | | | | | | | | | | | | |
| | | 3,378,303 | | | | 8.78 | | | $ | 9.77 | | | | 972,268 | | | $ | 6.34 | |
| | | | | | | | | | | | | | | | | | | | |
Restricted Stock Unit Activity
RSUs generally vest ratably on a quarterly basis over a period of three to four years. The vesting is subject to the employee’s continuing service with the Company over that period. Until vested, RSUs do not have the voting or dividend participation rights of common stock and the shares of common stock underlying the awards are not considered issued and outstanding. RSUs are converted into shares of the Company’s common stock upon vesting on a one-for-one basis. Prior to our IPO, vesting of RSUs was subject to the occurrence of a liquidity event, and in certain instances additional vesting criteria. The liquidity event was defined as the earliest of (i) the closing of a sale event of the Company, or (ii) six months following the IPO of the Company’s common stock.
The following table summarizes the RSU activity under the Company’s Option Plans:
| | | | | | | | | | | | | | | | |
| | | Number of
RSUs
Outstanding | | | Weighted-
Average
Grant Date
Fair Value | | | Weighted-
Average
Remaining
Contractual
Life (Years) | | | Aggregate
Intrinsic
Value | |
| | | | | | | (in thousands) | |
RSUs granted | | | 149,841 | | | $ | 11.12 | | | | | | | | | |
| | | | | | | | | | | | | | | | |
Balance — December 31, 2012 | | | 149,841 | | | $ | 11.12 | | | | 1.98 | | | $ | 1,965 | |
RSUs granted | | | 764,509 | | | $ | 22.13 | | | | | | | | | |
RSUs vested | | | (50,849 | ) | | $ | 11.06 | | | | | | | | | |
RSUs cancelled | | | (22,552 | ) | | $ | 16.16 | | | | | | | | | |
| | | | | | | | | | | | | | | | |
Balance — December 28, 2013 | | | 840,949 | | | $ | 21.00 | | | | 1.40 | | | $ | 23,790 | |
| | | | | | | | | | | | | | | | |
Vested and expected to vest — December 28, 2013 | | | 783,633 | | | $ | 20.89 | | | | 1.35 | | | $ | 22,169 | |
| | | | | | | | | | | | | | | | |
Aggregate intrinsic value represents the difference between the Company’s fair market value per share of $28.29 and $13.11 as of December 28, 2013 and December 31, 2012, respectively, and the exercise price of the awards for the total number of underlying RSUs. Weighted average fair value per share for RSUs vested in fiscal 2013 was $11.06 million. Total intrinsic value of RSUs vested in fiscal 2013 was $1.5 million. In fiscal 2013, the Company recognized stock-based compensation expense of $6.0 million related to its RSUs.
99
The Company did not recognize stock-based compensation expense related to its RSUs for fiscal 2012 as the liquidity event had not occurred as of December 31, 2012. Accordingly, none of the Company’s outstanding RSUs was vested or exercisable as of December 31, 2012.
Stock-Based Compensation Expense
The fair value of stock options is estimated on the date of grant using the Black-Scholes option-pricing model. It is based on the “simplified method” for developing the estimate of the expected life of a “plain vanilla” stock option. Under this approach, the expected term is presumed to be the midpoint between the average vesting date and the end of the contractual term of the option. The risk-free interest rate for the period covering the expected life of the option is based on the U.S. Treasury yield curve in effect at the time of grant. The expected volatility was determined based on historical volatility of the common stock of publicly traded comparable companies and the expected life of the options since the Company has not had sufficient public trading history of its common stock. The dividend yield assumption is based on the Company’s historical dividend payouts. The Company uses the graded vesting method for expense attribution.
Prior to the IPO, determining the market value of the Company’s common stock required complex and subjective judgment and estimates. There was inherent uncertainty in making these judgments and estimates. The absence of an active market for the Company’s common units or common stock prior to the IPO required the Board to estimate the fair value of its common stock for purposes of setting the exercise price of the options and estimating the fair value of common stock at each meeting at which options were granted based on factors such as the valuations of comparable companies, the status of the Company’s development and sales efforts, revenue growth and additional objective and subjective factors relating to the Company’s business. The Company performed its analysis in accordance with applicable elements of the practice aid issued by the American Institute of Certified Public Accountants entitled Valuation of Privately Held Company Equity Securities Issued as Compensation.
The fair value of the option awards and ESPP purchase rights granted and the assumptions used in the Black-Scholes option pricing model are summarized as follows:
| | | | |
| | | Fiscal Year Ended |
| | | December 28,
2013 | | December 31,
2012 |
Stock option awards: | | | | |
Expected term (in years) | | 5.00 - 6.08 | | 5.00 - 6.08 |
Risk-free interest rate | | 0.89% - 1.84% | | 0.91% - 1.28% |
Expected volatility | | 62.1% - 65.3% | | 62.5% - 65.1% |
Expected dividend rate | | 0% | | 0% |
Grant date fair value per award | | $9.44 - $23.29 | | $5.67 - $9.18 |
ESPP purchase right: | | | | |
Expected term (in years) | | 0.68 - 2.18 | | — |
Risk-free interest rate | | 0.08% - 0.20% | | —% |
Expected volatility | | 53.6% - 63.1% | | —% |
Expected dividend rate | | 0% | | —% |
Grant date fair value per share | | $12.11 - $15.68 | | $— |
The cost of RSUs is determined using the fair value of the Company’s common stock on the date of the grant. In fiscal 2013, the Company granted 764,509 RSUs with a grant date fair value per share ranging from $15.57 to $38.33. In fiscal 2012, the Company granted 95,842 RSUs and 53,999 RSUs with a grant date fair value per share of $10.38 and $12.42, respectively, including performance-based RSUs covering 8,666 shares.
100
As of December 28, 2013, unrecognized compensation expense related to stock options, RSUs and ESPP purchase rights, net of estimated forfeitures, of $10.3 million, $10.9 million, and $5.1 million, respectively, with a weighted-average remaining amortization period of 1.4 years, 1.4 years and 0.9 year, respectively. As of December 31, 2012, excluding the 1,070,316 IPO Stock Options and 149,841 RSUs that were subject to the IPO, unrecognized compensation expense related to unvested stock options, net of estimated forfeitures, was $4.9 million with a weighted-average remaining amortization period of 1.8 years. There was no capitalized stock-based compensation expense for any of the periods presented.
The following table summarizes the stock-based compensation expense recorded in the Company’s consolidated statement of operations (in thousands):
| | | | | | | | | | | | |
| | | Fiscal Year Ended | |
| | | December 28,
2013 | | | December 31,
2012 | | | December 31,
2011 | |
Cost of revenue | | $ | 3,496 | | | $ | 153 | | | $ | — | |
Research and development | | | 11,467 | | | | 542 | | | | 8 | |
Sales and marketing | | | 11,034 | | | | 893 | | | | 2 | |
General and administrative | | | 6,546 | | | | 2,011 | | | | 2 | |
| | | | | | | | | | | | |
Total stock-based compensation expense | | $ | 32,543 | | | $ | 3,599 | | | $ | 12 | |
| | | | | | | | | | | | |
Common Stock Reserved for Future Issuance
The Company had the following shares of common stock reserved for future issuance (in shares):
| | | | | | | | |
| | | As of | |
| | | December 28,
2013 | | | December 31,
2012 | |
Option Plan: | | | | | | | | |
Common stock subject to options outstanding | | | 3,205,638 | | | | 2,418,397 | |
RSUs outstanding | | | 585,205 | | | | 149,841 | |
Shares available for future grants | | | — | | | | 732,267 | |
2013 Equity Plan: | | | | | | | | |
Common stock subject to options outstanding | | | 172,665 | | | | — | |
RSUs outstanding | | | 255,744 | | | | — | |
Shares available for future grants | | | 3,281,959 | | | | — | |
ESPP | | | 439,422 | | | | — | |
Convertible preferred units | | | — | | | | 8,109,847 | |
| | | | | | | | |
Common stock reserved for future issuances | | | 7,940,633 | | | | 11,410,352 | |
| | | | | | | | |
9. Employee Benefit Plans
The Company sponsors a 401(k) defined contribution plan providing a matching contribution of 50% of each participant’s contribution, up to the lesser of 6% of the participant’s annual compensation or $7,650 for 2013. In 2012, the Company provided a contribution equal to 3% of each participant’s compensation up to $7,500.
The Company’s contributions to the 401(k) defined contribution plan were $1.6 million, $0.8 million and $0.4 million for fiscal 2013, 2012 and 2011, respectively.
101
10. Income Tax
The Company recorded an income tax benefit of $20.7 million in fiscal 2013 primarily attributable to the impact of domestic deferred tax and a nominal amount of foreign income tax expense. In connection with the conversion from a Delaware LLC to a Delaware corporation under Subchapter C of Chapter 1 of the United States Internal Revenue Code, the Company is now subject to both federal and state income taxes and, therefore, the Company recognized deferred tax assets of $14.8 million, upon its conversion to a Delaware corporation, and an income tax benefit of $5.9 million for the tax impact on its results of operations as a Delaware corporation.
(Loss) income before income tax benefit (provision) consisted of the following (in thousands):
| | | | | | | | | | | | |
| | | Fiscal Year Ended | |
| | | December 28,
2013 | | | December 31,
2012 | | | December 31,
2011 | |
United States | | $ | (31,024 | ) | | $ | 7,295 | | | $ | 16,778 | |
Foreign | | | 824 | | | | 375 | | | | 233 | |
| | | | | | | | | | | | |
Total | | $ | (30,200 | ) | | $ | 7,670 | | | $ | 17,011 | |
| | | | | | | | | | | | |
The income tax benefit (provision) consisted of the following (in thousands):
| | | | | | | | | | | | |
| | | Fiscal Year Ended | |
| | | December 28,
2013 | | | December 31,
2012 | | | December 31,
2011 | |
Federal: | | | | |
Current | | $ | — | | | $ | — | | | | — | |
Deferred | | | 19,504 | | | | — | | | | — | |
State: | | | | |
Current | | | (10 | ) | | | — | | | | — | |
Deferred | | | 1,373 | | | | — | | | | — | |
Foreign: | | | | |
Current | | | (216 | ) | | | (139 | ) | | | (80 | ) |
Deferred | | | 12 | | | | — | | | | — | |
| | | | | | | | | | | | |
Total income tax benefit (provision) | | $ | 20,663 | | | $ | (139 | ) | | | (80 | ) |
| | | | | | | | | | | | |
102
The items accounting for the difference between income taxes computed at the federal statutory income tax rate and the income tax benefit consisted of the following (dollars in thousands):
| | | | | | | | | | | | |
| | | Fiscal Year Ended | |
| | | December 28,
2013 | | | December 31,
2012 | | | December 31,
2011 | |
Federal statutory rate | | | 35.0 | % | | | * | | | | * | |
Effect of: | | | | |
Tax benefit at federal statutory rate | | $ | (10,570 | ) | | | * | | | | * | |
State tax benefit, net of federal tax benefit | | | (376 | ) | | | * | | | | * | |
ESPP | | | 1,760 | | | | * | | | | * | |
Other permanent items | | | 281 | | | | * | | | | * | |
Impact of foreign operations | | | (37 | ) | | | * | | | | * | |
Tax credits | | | (240 | ) | | | * | | | | * | |
LLC income flow-through | | | 3,319 | | | | * | | | | * | |
Recognition of deferred tax assets | | | (14,800 | ) | | | * | | | | * | |
| | | | | | | | | | | | |
Total income tax benefit | | | $ (20,663 | ) | | | * | | | | * | |
| | | | | | | | | | | | |
*Not applicable, as the Company was a limited liability company and subject only to foreign taxes on its wholly-owned United Kingdom subsidiary.
The components of the Company’s deferred tax assets and liabilities are as follows (in thousands):
| | | | | | | | |
| | | As of | |
| | | December 28,
2013 | | | December 31,
2012 | |
Deferred tax assets: | | | | | | | | |
Stock-based compensation | | $ | 9,797 | | | $ | — | |
Fixed assets | | | 4,972 | | | | — | |
Net operating loss | | | 2,306 | | | | — | |
Accruals and reserves | | | 2,099 | | | | — | |
Deferred revenue | | | 963 | | | | — | |
Inventory reserve | | | 512 | | | | — | |
Credits | | | 240 | | | | — | |
| | | | | | | | |
Gross deferred tax assets | | | 20,889 | | | | — | |
Valuation allowance | | | — | | | | — | |
| | | | | | | | |
Total deferred tax assets | | | 20,889 | | | | — | |
Deferred tax liabilities | | | — | | | | — | |
| | | | | | | | |
Total | | $ | 20,889 | | | $ | — | |
| | | | | | | | |
103
The following table presents a summary of the current and non-current deferred tax assets and deferred tax liabilities (in thousands):
| | | | | | | | |
| | | As of | |
| | | December 28,
2013 | | | December 31,
2012 | |
Deferred tax assets, current | | $ | 3,574 | | | $ | — | |
Deferred tax liabilities, current | | | — | | | | — | |
Deferred tax assets, non-current | | | 17,315 | | | | — | |
Deferred tax liabilities, non-current | | | — | | | | — | |
| | | | | | | | |
Total deferred tax assets, net | | $ | 20,889 | | | $ | — | |
| | | | | | | | |
As of December 28, 2013, the Company had federal and state net operating loss carryforwards of approximately $13.1 million and $3.1 million, respectively, available to reduce any future taxable income. If not utilized, the federal and state net operating loss carryforwards will expire in fiscal 2033.
The Company also has federal and state research and development tax credit carryforwards of approximately $0.1 million and $0.2 million, respectively. If not utilized, the federal credit carryforwards will also expire in fiscal 2033. The state credit will carry forward indefinitely.
Utilization of the net operating loss carryforwards and credits may be subject to a substantial annual limitation due to the ownership change limitations provided by the Internal Revenue Code of 1986, as amended, and similar state provisions. The annual limitation may result in the expiration of net operating losses and credits before utilization.
The Company uses the with-and-without approach described in guidance which has been incorporated into ASC 740,Income Taxes, to determine the recognition and measurement of excess tax benefits. Accordingly, the Company has elected to recognize excess income tax benefits from share-based awards in additional paid-in capital only if an incremental income tax benefit would be realized after considering all other tax attributes presently available to the Company. As of December 28, 2013, the amount of excess tax benefits from stock options included in federal and state net operating losses was $6.8 million and $1.8 million, respectively. The impact of this excess tax benefit will be recognized as additional paid-in capital when it reduces taxes payable. In addition, the Company has elected to account for the indirect effects of share-based awards on other tax attributes, such as the research, foreign and other tax credits, through the consolidated statement of operations.
The Company assesses the likelihood to recover its deferred tax assets. The Company considers all available evidence, both positive and negative, including historical levels of income, expectations and risks associated with estimates of future taxable income and ongoing prudent and feasible tax planning strategies in assessing the need for a valuation allowance. If it is not more-likely-than-not that the Company expects to recover its deferred tax assets, the Company will increase its provision for income taxes by recording a valuation allowance against the deferred tax assets that it estimates will not ultimately be recoverable. As of December 28, 2013, the Company determined that it was more-likely-than-not that the amount of deferred tax assets recorded on the balance sheet would be realized.
As of December 28, 2013, the Company had $0.2 million of unrecognized tax benefits, all of which would affect income tax benefit (expense) if recognized. As of December 28, 2013, the Company’s federal, state, and foreign returns for the tax years 2008 through the current period are still open to examination. The Company does not expect the unrecognized tax benefits to change significantly over the next 12 months. The Company recognizes both interest and penalties associated with uncertain tax positions as a component of income tax expense. As of December 28, 2013 and December 31, 2012, the Company had not accrued any interest or penalties associated with uncertain
104
tax positions. The ultimate amount and timing of any future settlements cannot be predicted with reasonable certainty.
A reconciliation of the gross unrecognized tax benefit is as follows (in thousands):
| | | | | | | | | | | | |
| | | Fiscal Year Ended | |
| | | December 28,
2013 | | | December 31,
2012 | | | December 31,
2011 | |
Unrecognized tax benefits at the beginning of the period | | $ | — | | | $ | — | | | | — | |
Additions for tax positions related to the current year | | | 186 | | | | — | | | | — | |
| | | | | | | | | | | | |
Unrecognized tax benefits at the end of the period | | $ | 186 | | | $ | — | | | | — | |
| | | | | | | | | | | | |
As of December 28, 2013, the Company had not recorded any tax provision for U.S. federal and state income taxes on approximately $1.2 million of undistributed earnings in foreign subsidiaries, which it expects to reinvest outside of the U.S. indefinitely. If the Company were to repatriate these earnings to the U.S., it would be subject to U.S. income taxes, an adjustment for foreign tax credits, and foreign withholding taxes. The determination of the amount of unrecognized deferred income tax liability related to these earnings is not practicable.
11. Net (Loss) Income per Share
The net (loss) income per share and weighted-average shares information presented in the consolidated financial statements gives effect to the Company’s one-for-three reverse stock split completed on May 20, 2013. Effective June 17, 2013, all shares of the then-outstanding redeemable convertible preferred stock were converted to common stock and are included in the weighted-average shares used to compute net (loss) income per share starting from the conversion date. Due to the net loss incurred in fiscal 2013, potential dilutive securities were excluded from the calculation of diluted net loss per share attributable to common stockholders for such period as their effect was anti-dilutive. Dilutive securities in the Company’s diluted net (loss) income per share calculation for the periods before the close of the Company’s IPO in June 2013 do not include stock options and RSUs with vesting contingent upon an IPO or a liquidity event.
The following table presents the computation of basic and diluted net (loss) income per share attributable to common stockholders (in thousands, except per share data):
| | | | | | | | | | | | |
| | | Fiscal Year Ended | |
| | | December 28,
2013 | | | December 31,
2012 | | | December 31,
2011 | |
Numerator: | | | | | | | | | | | | |
Net (loss) income attributable to common stockholders | | $ | (9,518 | ) | | $ | 3,605 | | | $ | 10,112 | |
| | | | | | | | | | | | |
Denominator: | | | | | | | | | | | | |
Weighted average shares used for basic net (loss) income per share computation | | | 24,722 | | | | 17,300 | | | | 17,300 | |
Weighted average effect of dilutive securities: | | | | | | | | | | | | |
Stock options | | | — | | | | 3 | | | | — | |
| | | | | | | | | | | | |
Weighted average shares used for diluted net (loss) income per share computation | | | 24,722 | | | | 17,303 | | | | 17,300 | |
| | | | | | | | | | | | |
Net (loss) income per share attributable to common stockholders : | | | | | | | | | | | | |
Basic | | $ | (0.39 | ) | | $ | 0.21 | | | $ | 0.58 | |
| | | | | | | | | | | | |
Diluted | | $ | (0.39 | ) | | $ | 0.21 | | | $ | 0.58 | |
| | | | | | | | | | | | |
105
The following shares of potentially dilutive securities were excluded from the computation of diluted net (loss) income per share for the periods presented (in thousands):
| | | | | | | | | | | | |
| | | Fiscal Year Ended | |
| | | December 28,
2013 | | | December 31,
2012 | | | December 31,
2011 | |
Convertible Series A preferred | | | 8,110 | | | | 8,110 | | | | 8,110 | |
Equity awards to purchase common stock | | | 5,073 | | | | 3,786 | | | | — | |
12. Segment Information
Operating segments are defined as components of an enterprise that engage in business activities for which separate financial information is available and evaluated by the chief operating decision maker in deciding how to allocate resources and assessing performance. The Company’s chief operating decision maker is its chief executive officer. The chief executive officer reviews financial information presented on a consolidated basis, for purposes of allocating resources and evaluating financial performance. The Company has one business activity and there are no segment managers who are held accountable for operations, or plans for levels or components below the consolidated unit level. Accordingly, the Company operates as a single reportable segment.
The following table summarizes the Company’s revenue by geographic region, based on the location to where the product was shipped (in thousands):
| | | | | | | | | | | | |
| | | Fiscal Year Ended | |
| | | December 28,
2013 | | | December 31,
2012 | | | December 31,
2011 | |
United States | | $ | 103,257 | | | $ | 71,666 | | | $ | 48,323 | |
Rest of Americas | | | 5,846 | | | | 5,729 | | | | 3,959 | |
Europe, Middle East and Africa | | | 19,753 | | | | 13,373 | | | | 10,370 | |
Asia Pacific | | | 11,439 | | | | 5,947 | | | | 5,453 | |
| | | | | | | | | | | | |
Total | | $ | 140,295 | | | $ | 96,715 | | | $ | 68,105 | |
| | | | | | | | | | | | |
The Company’s long-lived assets by geographic region are summarized as follows (in thousands):
| | | | | | | | |
| | | As of | |
| | | December 28,
2013 | | | December 31,
2012 | |
United States | | $ | 4,203 | | | $ | 2,539 | |
Other | | | 186 | | | | 147 | |
| | | | | | | | |
Total | | $ | 4,389 | | | $ | 2,686 | |
| | | | | | | | |
13. Subsequent Events
In January 2014, the Company granted stock options and RSUs to purchase 33,040 shares and 34,128 shares of its common stock, respectively, to its directors and employees. These stock options and RSUs have a vesting period of three and four years, respectively.
On February 14, 2014, the Company granted its employees RSUs to purchase 521,501 shares of its common stock. The Company also granted stock options to purchase 209,581 shares of its common stock. These RSUs and stock options vest over four years.
On February 18, 2014, the Company issued 242,278 shares of its common stock, at $16.15 per share, to its employees upon the completion of its ESPP purchase period.
106
Supplementary Quarterly Financial Data (Unaudited)
The following table sets forth selected unaudited consolidated statement of operations data for each quarter of the two fiscal years ended December 28, 2013 (in thousands, except per share amounts):
| | | | | | | | | | | | | | | | | | | | | | | | | | | | | | | | |
| | | Three Months Ended | |
| | | Dec 28,
2013 | | | Sept 28,
2013 | | | June 29,
2013 | | | March 30,
2013 | | | Dec 31,
2012 | | | Sept 30,
2012 | | | June 30,
2012 | | | Mar 31,
2012 | |
Consolidated Statement of Operations Data: | | | | | | | (As Revised) | | | | (As Revised) | | | | | | | | | | | | | | | | | | | | | |
Revenue: | | | | | | | | | | | | | | | | | | | | | | | | | | | | | | | | |
Product | | $ | 31,698 | | | $ | 29,146 | | | $ | 23,354 | | | $ | 17,519 | | | $ | 23,710 | | | $ | 18,700 | | | $ | 16,213 | | | $ | 10,893 | |
Services | | | 11,389 | | | | 9,840 | | | | 9,055 | | | | 8,294 | | | | 8,142 | | | | 6,994 | | | | 6,254 | | | | 5,809 | |
| | | | | | | | | | | | | | | | | | | | | | | | | | | | | | | | |
Total revenue | | | 43,087 | | | | 38,986 | | | | 32,409 | | | | 25,813 | | | | 31,852 | | | | 25,694 | | | | 22,467 | | | | 16,702 | |
| | | | | | | | | | | | | | | | | | | | | | | | | | | | | | | | |
Cost of revenue: | | | | | | | | | | | | | | | | | | | | | | | | | | | | | | | | |
Product | | | 7,646 | | | | 6,789 | | | | 6,944 | | | | 4,724 | | | | 6,064 | | | | 4,524 | | | | 4,086 | | | | 3,365 | |
Services | | | 1,170 | | | | 993 | | | | 1,911 | | | | 653 | | | | 744 | | | | 557 | | | | 453 | | | | 492 | |
| | | | | | | | | | | | | | | | | | | | | | | | | | | | | | | | |
Total cost of revenue | | | 8,816 | | | | 7,782 | | | | 8,855 | | | | 5,377 | | | | 6,808 | | | | 5,081 | | | | 4,539 | | | | 3,857 | |
| | | | | | | | | | | | | | | | | | | | | | | | | | | | | | | | |
Gross profit | | | 34,271 | | | | 31,204 | | | | 23,554 | | | | 20,436 | | | | 25,044 | | | | 20,613 | | | | 17,928 | | | | 12,845 | |
| | | | | | | | | | | | | | | | | | | | | | | | | | | | | | | | |
Research and development | | | 10,341 | | | | 8,958 | | | | 17,097 | | | | 5,671 | | | | 5,406 | | | | 4,809 | | | | 3,570 | | | | 3,945 | |
Sales and marketing | | | 18,004 | | | | 15,485 | | | | 26,114 | | | | 12,421 | | | | 12,061 | | | | 9,963 | | | | 9,112 | | | | 8,223 | |
General and administrative | | | 4,682 | | | | 4,696 | | | | 12,688 | | | | 3,509 | | | | 3,904 | | | | 3,720 | | | | 2,735 | | | | 1,306 | |
| | | | | | | | | | | | | | | | | | | | | | | | | | | | | | | | |
Total operating expenses | | | 33,027 | | | | 29,139 | | | | 55,899 | | | | 21,601 | | | | 21,371 | | | | 18,492 | | | | 15,417 | | | | 13,474 | |
| | | | | | | | | | | | | | | | | | | | | | | | | | | | | | | | |
Income (loss) from operations | | | 1,244 | | | | 2,065 | | | | (32,345 | ) | | | (1,165 | ) | | | 3,673 | | | | 2,121 | | | | 2,511 | | | | (629 | ) |
Interest income | | | 60 | | | | 32 | | | | 1 | | | | 2 | | | | 3 | | | | 55 | | | | 3 | | | | 3 | |
Other expense, net | | | (17 | ) | | | (52 | ) | | | (18 | ) | | | (7 | ) | | | (20 | ) | | | (17 | ) | | | (7 | ) | | | (26 | ) |
| | | | | | | | | | | | | | | | | | | | | | | | | | | | | | | | |
Income (loss) before income tax (provision) benefit | | | 1,287 | | | | 2,045 | | | | (32,362 | ) | | | (1,170 | ) | | | 3,656 | | | | 2,159 | | | | 2,507 | | | | (652 | ) |
Income tax (provision) benefit | | | (1,375 | ) | | | (502 | ) | | | 22,569 | | | | (29 | ) | | | (11 | ) | | | (37 | ) | | | (28 | ) | | | (63 | ) |
| | | | | | | | | | | | | | | | | | | | | | | | | | | | | | | | |
Net (loss) income | | | (88 | ) | | | 1,543 | | | | (9,793 | ) | | | (1,199 | ) | | | 3,645 | | | | 2,122 | | | | 2,479 | | | | (715 | ) |
Accretion of preferred stock to redemption value and issuance costs | | | — | | | | — | | | | (503 | ) | | | (585 | ) | | | (575 | ) | | | (564 | ) | | | (553 | ) | | | (544 | ) |
Loss (earnings) distributable to preferred stockholders | | | — | | | | — | | | | 538 | | | | 569 | | | | (980 | ) | | | (497 | ) | | | (615 | ) | | | 402 | |
| | | | | | | | | | | | | | | | | | | | | | | | | | | | | | | | |
Net (loss) income attributable to common stockholders | | $ | (88 | ) | | $ | 1,543 | | | $ | (9,758 | ) | | $ | (1,215 | ) | | $ | 2,090 | | | $ | 1,061 | | | $ | 1,311 | | | $ | (857 | ) |
| | | | | | | | | | | | | | | | | | | | | | | | | | | | | | | | |
Net (loss) income per share attributable to common stockholders: | | | | | | | | | | | | | | | | | | | | | | | | | | | | | | | | |
Basic | | $ | (0.00 | ) | | $ | 0.05 | | | $ | (0.51 | ) | | $ | (0.07 | ) | | $ | 0.12 | | | $ | 0.06 | | | $ | 0.08 | | | $ | (0.05 | ) |
| | | | | | | | | | | | | | | | | | | | | | | | | | | | | | | | |
Diluted | | $ | (0.00 | ) | | $ | 0.05 | | | $ | (0.51 | ) | | $ | (0.07 | ) | | $ | 0.12 | | | $ | 0.06 | | | $ | 0.08 | | | $ | (0.05 | ) |
| | | | | | | | | | | | | | | | | | | | | | | | | | | | | | | | |
During the three months ended December 28, 2013, the Company identified immaterial errors related to income taxes and inventory in the unaudited interim financial statements for the quarterly periods ended June 29, 2013 and September 28, 2013. The benefit for income taxes was cumulatively overstated by $1.8 million through the nine month period ended September 28, 2013 as a result of the stock-based compensation expense from the Company’s ESPP being inappropriately included in the determination of the deferred income tax benefit. The recovery of previously written-down inventory was cumulatively understated by $0.1 million through the nine month period ended September 28, 2013 due to an error in the calculation. These errors did not impact any annual or other interim periods.
107
The Company assessed the materiality of the above errors individually and in the aggregate on prior periods’ financial statements in accordance with the Securities and Exchange Commission’s Staff Accounting Bulletin No. 99 and, based on an analysis of quantitative and qualitative factors, determined that the errors were not material to the Company’s June 29, 2013 and September 28, 2013 interim consolidated financial statements and, therefore, these previously issued consolidated financial statements could continue to be relied upon and that amendments of the previously filed Quarterly Reports on Form 10-Q were not required. However, the cumulative errors would be material to the financial results for the three months ended December 28, 2013 if the aggregated corrections were recorded in such period. Accordingly, the Company will revise its previously issued interim financial statements for the three month periods ended June 29, 2013 and September 28, 2013 to correct the errors in future Quarterly Reports on Form 10-Q where interim financial statements for such periods are included. The Company has reflected the corrections of these errors in the applicable quarterly financial periods presented above.
108
The following table set forth the impact of the revisions on each of the impacted interim periods (in thousands, except per share amounts):
| | | | | | | | | | | | | | | | | | | | | | | | | | | | | | | | |
| | | Three Months ended September 28, 2013 | | | Three Months ended June 29, 2013 | |
| | | Sept 28,
2013 | | | Income Tax
Adjustment | | | Inventory
Adjustment | | | Sept 28,
2013 | | | June 29,
2013 | | | Income Tax
Adjustment | | | Inventory
Adjustment | | | June 29,
2013 | |
Consolidated Statement of Operations Data: | |
| (As
Reported) |
| | | | | | | | | | | (Revised) | | |
| (As
Reported) |
| | | | | | | | | | | (Revised) | |
Revenue: | | | | | | | | | | | | | | | | | | | | | | | | | | | | | | | | |
Product | | $ | 29,146 | | | $ | — | | | $ | — | | | $ | 29,146 | | | $ | 23,354 | | | $ | — | | | $ | — | | | $ | 23,354 | |
Services | | | 9,840 | | | | — | | | | — | | | | 9,840 | | | | 9,055 | | | | — | | | | — | | | | 9,055 | |
| | | | | | | | | | | | | | | | | | | | | | | | | | | | | | | | |
Total revenue | | | 38,986 | | | | — | | | | — | | | | 38,986 | | | | 32,409 | | | | — | | | | — | | | | 32,409 | |
| | | | | | | | | | | | | | | | | | | | | | | | | | | | | | | | |
Cost of revenue: | | | | | | | | | | | | | | | | | | | | | | | | | | | | | | | | |
Product | | | 6,744 | | | | — | | | | 45 | | | | 6,789 | | | | 7,098 | | | | — | | | | (154 | ) | | | 6,944 | |
Services | | | 993 | | | | — | | | | — | | | | 993 | | | | 1,911 | | | | — | | | | — | | | | 1,911 | |
| | | | | | | | | | | | | | | | | | | | | | | | | | | | | | | | |
Total cost of revenue | | | 7,737 | | | | — | | | | 45 | | | | 7,782 | | | | 9,009 | | | | — | | | | (154 | ) | | | 8,855 | |
| | | | | | | | | | | | | | | | | | | | | | | | | | | | | | | | |
Gross profit | | | 31,249 | | | | — | | | | (45 | ) | | | 31,204 | | | | 23,400 | | | | — | | | | 154 | | | | 23,554 | |
| | | | | | | | | | | | | | | | | | | | | | | | | | | | | | | | |
Research and development | | | 8,958 | | | | — | | | | — | | | | 8,958 | | | | 17,097 | | | | — | | | | — | | | | 17,097 | |
Sales and marketing | | | 15,485 | | | | — | | | | — | | | | 15,485 | | | | 26,114 | | | | — | | | | — | | | | 26,114 | |
General and administrative | | | 4,696 | | | | — | | | | — | | | | 4,696 | | | | 12,688 | | | | — | | | | — | | | | 12,688 | |
| | | | | | | | | | | | | | | | | | | | | | | | | | | | | | | | |
Total operating expenses | | | 29,139 | | | | — | | | | — | | | | 29,139 | | | | 55,899 | | | | — | | | | — | | | | 55,899 | |
| | | | | | | | | | | | | | | | | | | | | | | | | | | | | | | | |
Income (loss) from operations | | | 2,110 | | | | — | | | | (45 | ) | | | 2,065 | | | | (32,499 | ) | | | — | | | | 154 | | | | (32,345 | ) |
Interest income | | | 32 | | | | — | | | | — | | | | 32 | | | | 1 | | | | — | | | | — | | | | 1 | |
Other expense, net | | | (52 | ) | | | — | | | | — | | | | (52 | ) | | | (18 | ) | | | — | | | | — | | | | (18 | ) |
| | | | | | | | | | | | | | | | | | | | | | | | | | | | | | | | |
| Income (loss) before income tax (provision) benefit | | | 2,090 | | | | — | | | | (45 | ) | | | 2,045 | | | | (32,516 | ) | | | — | | | | 154 | | | | (32,362 | ) |
Income tax (provision) benefit | | | (704 | ) | | | 202 | | | | — | | | | (502 | ) | | | 24,571 | | | | (2,002 | ) | | | — | | | | 22,569 | |
| | | | | | | | | | | | | | | | | | | | | | | | | | | | | | | | |
Net income (loss) | | | 1,386 | | | $ | 202 | | | $ | (45 | ) | | $ | 1,543 | | | $ | (7,945 | ) | | $ | (2,002 | ) | | $ | 154 | | | $ | (9,793 | ) |
| Accretion of preferred stock to redemption value and issuance costs | | | — | | | | — | | | | — | | | | — | | | | (503 | ) | | | — | | | | — | | | | (503 | ) |
| Loss distributable to preferred stockholders | | | — | | | | — | | | | — | | | | — | | | | 538 | | | | — | | | | — | | | | 538 | |
| | | | | | | | | | | | | | | | | | | | | | | | | | | | | | | | |
| Net income (loss) attributable to common stockholders | | $ | 1,386 | | | $ | 202 | | | $ | (45 | ) | | $ | 1,543 | | | $ | (7,910 | ) | | $ | (2,002 | ) | | $ | 154 | | | $ | (9,758 | ) |
| | | | | | | | | | | | | | | | | | | | | | | | | | | | | | | | |
| Net income (loss) per share attributable to common stockholders: | | | | | | | | | | | | | | | | | | | | | | | | | | | | | | | | |
Basic | | $ | 0.04 | | | | | | | | | | | $ | 0.05 | | | $ | (0.41 | ) | | | | | | | | | | $ | (0.51 | ) |
| | | | | | | | | | | | | | | | | | | | | | | | | | | | | | | | |
Diluted | | $ | 0.04 | | | | | | | | | | | $ | 0.05 | | | $ | (0.41 | ) | | | | | | | | | | $ | (0.51 | ) |
| | | | | | | | | | | | | | | | | | | | | | | | | | | | | | | | |
109
| Item 9. | Changes in and Disagreements with Accountants on Accounting and Financial Disclosure |
None.
| Item 9A. | Controls and Procedures |
Evaluation of Disclosure Controls and Procedures
Disclosure controls and procedures are designed to ensure that information required to be disclosed by us in reports filed or submitted under the Exchange Act, is recorded, processed, summarized and reported within the time periods specified in the SEC’s rules and forms. Disclosure controls and procedures include, without limitation, controls and procedures designed to ensure that information required to be disclosed in reports filed under the Exchange Act is accumulated and communicated to management, including our principal executive officer and principal financial officer, or persons performing similar functions, as appropriate to allow for timely decisions regarding required disclosure. Due to inherent limitations, internal control over financial reporting may not prevent or detect misstatements. Further, projections of any evaluation of effectiveness to future periods are subject to the risk that controls may become inadequate because of changes in conditions, or that degree of compliance with the policies and procedures may deteriorate. Accordingly, even effective disclosure controls and procedures can only provide reasonable assurance of achieving their control objectives.
As of December 28, 2013 we have carried out an evaluation under the supervision of, and with the participation of our management, including our chief executive officer and chief financial officer, of the effectiveness of the design and operation of our disclosure controls and procedures as defined in Rules 13a-15(e) and 15d-15(e) of the Exchange Act. Based on our evaluation, our chief executive officer and chief financial officer concluded that our disclosure controls and procedures were not effective as of December 28, 2013 due to the existence of a material weakness in our internal control over financial reporting described below. Notwithstanding the existence of the material weakness discussed below, our management, including our chief executive officer and chief financial officer, has concluded that the consolidated financial statements included in this Annual Report on Form 10-K fairly present, in all material respects, our financial position, results of operations and cash flows for the periods presented in this Annual Report on Form 10-K in conformity with GAAP.
Material Weakness in Internal Control over Financial Reporting
A material weakness is a deficiency, or a combination of deficiencies, in internal control over financial reporting, such that there is a reasonable possibility that a material misstatement of our annual or interim financial statements will not be prevented or detected on a timely basis.
We did not maintain effective internal control over financial reporting over the accuracy of the accounting for income taxes related to ESPP-related expenses. Specifically our internal controls with respect to the treatment of ESPP-related expenses for income tax purposes were not designed to effectively account for ESPP-related expenses as a non-deductible expense for income tax provision purposes in accordance with GAAP. This control deficiency resulted in an audit adjustment to our income tax benefits and deferred taxes and the revision of our consolidated financial statements for the interim periods ended June 29, 2013 and September 28, 2013. Additionally, this control deficiency could result in a misstatement of the aforementioned account balances or disclosures that would result in a material misstatement to the annual or interim consolidated financial statements that would not be prevented or detected. Accordingly, we determined that this control deficiency constitutes a material weakness.
110
Plan for Remediation of Material Weakness in Internal Control over Financial Reporting
We have begun taking steps to remediate the material weakness identified above and plan to take additional actions to remediate the underlying cause of this material weakness, primarily through:
(1) enhancing the comprehensive income tax provision preparation process that we use for our quarterly close process to include additional consideration of ESPP-related expenses included in the stock-based compensation expense, and (2) holding formal meetings during the quarterly close process with our tax advisors to assess and review the treatment of ESPP-related expenses and related support.
These actions are subject to ongoing review by our senior management, as well as oversight by the audit committee of our board of directors. Although we plan to complete this remediation process as quickly as possible, we cannot, at this time, estimate when such remediation may occur, and our initiatives may not prove successful in remediating this material weakness.
Changes in Internal Control over Financial Reporting
There were no changes in our internal control over financial reporting which occurred during the three months ended December 28, 2013 that have materially affected, or are reasonably likely to materially affect, our internal control over financial reporting. However, as described above under “Material Weakness in Internal Control over Financial Reporting,” we began taking steps to remediate the material weakness identified above and plan to take additional actions to remediate the underlying cause of this material weakness.
Management’s Annual Report on Internal Control over Financial Reporting
This report does not include a report of management’s assessment regarding internal control over financial reporting or an attestation report of our independent registered public accounting firm due to a transition period established by rules of the SEC for newly public companies.
| Item 9B. | Other Information |
None.
111
PART III
| Item | 10. Directors, Executive Officers and Corporate Governance |
The following table provides information regarding our executive officers and directors as of January 31, 2014:
| | | | | | |
Name | | Age | | | Position(s) |
Executive Officers: | | | | | | |
Paul A. Hooper | | | 50 | | | Chief Executive Officer and Director |
Duston M. Williams | | | 55 | | | Chief Financial Officer |
Michael T. Hoffman | | | 45 | | | Vice President of Worldwide Sales |
Patrick P. Leong | | | 46 | | | Chief Technology Officer and Director |
Shehzad T. Merchant | | | 45 | | | Chief Strategy Officer |
Paul B. Shinn | | | 43 | | | General Counsel |
David A. de Simone | | | 58 | | | Vice President of Engineering |
Other Directors: | | | | | | |
Corey M. Mulloy(2)(3) | | | 42 | | | Chairman |
Kenneth A. Goldman(1) | | | 64 | | | Director |
John H. Kispert(1) | | | 50 | | | Director |
Paul J. Milbury(1) | | | 65 | | | Director |
Michael C. Ruettgers(2)(3) | | | 71 | | | Director |
| (1) | Member of our audit committee |
| (2) | Member of our compensation committee |
| (3) | Member of our nominating and corporate governance committee |
Paul A. Hooper has served as our chief executive officer and as a member of our board of directors since December 2012, and previously served as our vice president of marketing from July 2011 to December 2012. Prior to joining our company, he served in several positions at Extreme Networks, Inc., including the chief marketing officer, vice president and general manager for the volume products group, and chief information officer, from August 2002 to July 2011. From November 1999 to August 2002, Mr. Hooper served in several positions, including vice president of information technology, at myCFO, Inc., a financial services and advisory company. From March 1998 to November 1999, Mr. Hooper served as senior director of information technology at JDS Uniphase Corporation, a telecommunications networking company. From August 1996 to March 1998, Mr. Hooper served as senior director of networking and telecommunications at Netscape Communications Corporation, a software and services company.
We believe that Mr. Hooper is qualified to serve as a member of our board of directors because of the perspective he brings as our chief executive officer and his experience in senior management positions at several technology companies.
Duston M. Williamshas served as our chief financial officer since March 2012. Prior to joining our company, he served as chief financial officer for SandForce, Inc., a data storage company, from March 2011 through its sale to LSI Corporation in January 2012. From July 2010 to February 2011, Mr. Williams served as the chief financial officer of Soraa Inc., a solid state lighting company. From June 2006 to June 2010, Mr. Williams served as vice president and chief financial officer of Infinera Corporation. From December 2004 to June 2006, Mr. Williams served as executive vice president and
112
chief financial officer of Maxtor Corporation. From July 2003 to November 2004, Mr. Williams served as chief financial officer of Aruba Wireless Networks. From July 2001 to February 2003, Mr. Williams served as the chief financial officer of Rhapsody Networks Inc., a data storage networking company. From January 2000 to June 2001, Mr. Williams served as chief financial officer of Netigy Corporation, an infrastructure consulting and services company. From July 1986 to December 1999, Mr. Williams served in a variety of accounting and finance positions at Western Digital Corporation, including as its senior vice president and chief financial officer. Mr. Williams currently serves as a member of the board of directors of Applied Micro Circuits Corporation, a global computing and connectivity solutions corporation. Mr. Williams holds a B.S. degree in accounting from Bentley College and an M.B.A. degree from the University of Southern California.
Michael T. Hoffman joined our company in June 2008 and has served as our vice president of worldwide sales since August 2011. Mr. Hoffman also served as our vice president of North American sales from July 2009 until August 2011, and as a regional sales manager from June 2008 to July 2009. Prior to joining our company, he served as the vice president of enterprise sales at MRV Communications, Inc., a telecommunications networking equipment and services company, from January 2006 to June 2008. From November 1999 to January 2006, Mr. Hoffman served as regional director at Fluke Corporation, a network, security and software company. From July 1999 to November 1999, Mr. Hoffman served as an account manager at Quest Media and Supplies, Inc., an IT distributor and consulting company. From March 1996 to July 1999, Mr. Hoffman served as a sales engineer at Ward/Davis Associates, a manufacturer’s representative firm specializing in network test and measurement. From September 1995 to March 1996, Mr. Hoffman served as an account manager at Pitney Bowes Inc. From September 1987 to September 1995, Mr. Hoffman served in the U.S. Navy’s Advanced Electronics Field. Mr. Hoffman holds a B.A. degree in management and an M.B.A. degree from St. Mary’s College.
Patrick P. Leong co-founded our company in 2004 and has served as a member of our board of directors since inception. Mr. Leong has served as our chief technology officer since October 2005. Prior to founding our company, he served as a principal engineer at Ciena Corporation from March 2001 to August 2004, which he joined in connection with Ciena’s acquisition of Cyras Systems, Inc. in March 2001, where he served in a similar capacity from August 2000. From December 1996 to July 2000, Mr. Leong served in various roles, including manager of high speed products, at the Sniffer Division of McAfee, Inc. Mr. Leong holds a B.S. degree in physics from John Carroll University, an M.S. degree in computer science from the University of New Mexico, and a Ph.D. degree in applied physics from Columbia University.
We believe that Mr. Leong is qualified to serve as a member of our board of directors because of his technical acumen and the experience he brings as our co-founder and chief technology officer, as well as his perspective as one of our largest stockholders.
Shehzad T. Merchant has served as our chief strategy officer since March 2013. Prior to joining our company, he served in various roles at Extreme Networks, including chief technology officer and vice president of technology, from July 2009 to March 2013. From June 2006 to December 2008, Mr. Merchant served in the office of the chief technology officer of Nevis Networks, Inc., a network control company. From June 2005 to June 2006, Mr. Merchant co-founded and served as vice president of product development of Polytime Systems Inc., a software security company. From June 1996 to January 2005, Mr. Merchant served in various roles, including senior director of technology of the LAN business unit, at Extreme Networks. Mr. Merchant holds a B.E. degree in electronics engineering from University of Mumbai and an M.S. degree in computer engineering from the University of Southern California.
Paul B. Shinn has served as our general counsel since May 2012. Prior to joining our company, he served in several positions, including vice president and associate general counsel of the Enterprise
113
Group, at Hewlett-Packard Company from March 2007 through May 2012. From March 1997 to February 2007, Mr. Shinn was an attorney at the law firm Wilson Sonsini Goodrich & Rosati, P.C. Mr. Shinn holds B.A. degrees in government and philosophy from the University of Notre Dame and a J.D. degree from Santa Clara University School of Law.
David A. de Simone has served as our vice president of engineering since October 2012. Prior to joining our company, he served as senior vice president of product and technology at Blue Arc Corporation (acquired by Hitachi Data Systems Corp.), a network storage device manufacturer, from June 2011 to January 2012. From September 2003 to June 2011, Mr. de Simone served in several senior vice president roles at Blue Coat Systems, Inc., a provider of Web security and WAN optimization solutions, most recently as senior vice president of product. From December 2002 to September 2003, Mr. de Simone was an independent business consultant. From May 2000 to December 2002, Mr. de Simone served as vice president of platform engineering at Brocade Communications, Inc. From 1989 to 2000, Mr. de Simone served in a variety of roles at Tandem Computers, Inc. and then Compaq Computer Corporation, following its acquisition of Tandem, including as a vice president of engineering. Mr. de Simone holds a B.S. degree in electrical engineering from the University of California, Davis.
Non-Employee Directors
Corey M. Mulloy has served as the chairman of our board of directors since March 2013, and as a member of our board of directors since January 2010. Since 1997, he has served in several roles at Highland Capital Partners, a venture capital firm, and has been a general partner since 2005. From 1995 to 1997, Mr. Mulloy served as a financial analyst in the investment banking group at Robertson, Stephens & Co., L.L.C., an investment bank. Mr. Mulloy also serves as a director of a number of private companies. Mr. Mulloy holds a B.A. degree in economics from Swarthmore College and an M.B.A. degree from Harvard Business School.
We believe that Mr. Mulloy is qualified to serve as a member of our board of directors because of his experience in the venture capital industry analyzing, investing in and serving on the boards of directors of technology companies, as well as his perspective as a representative of one of our largest stockholders.
Kenneth A. Goldman has served as a member of our board of directors since January 2011. Since October 2012, Mr. Goldman has served as the chief financial officer of Yahoo! Inc. From September 2007 to October 2012, he served as the senior vice president, finance and administration, and chief financial officer, of Fortinet Inc. From November 2006 to August 2007, Mr. Goldman served as executive vice president and chief financial officer of Dexterra, Inc., a mobile platform and application provider. From August 2000 until March 2006, Mr. Goldman served as senior vice president, finance and administration, and chief financial officer of Siebel Systems, Inc. Mr. Goldman has also served as senior vice president and chief financial officer of Excite@Home Corporation and Sybase, Inc., and has served as chief financial officer of Cypress Semiconductor Corporation, and VLSI Technology, Inc. Mr. Goldman currently serves on the boards of directors of Infinera Corporation, NXP Semiconductors N.V. and Yahoo! Japan Corp. From December 1999 to December 2003, Mr. Goldman served as an advisory council member of the Financial Accounting Standards Board Advisory Council. Mr. Goldman holds a B.S. degree in electrical engineering from Cornell University and an M.B.A. degree from Harvard Business School.
We believe that Mr. Goldman is qualified to serve as a member of our board of directors because of his financial and accounting expertise, his experience serving as the chief financial officer of numerous public companies in the technology industry, and his experience serving on the boards of directors of several public companies and as a member of the Financial Accounting Standards Board Advisory Council.
114
John H. Kispert has served as a member of our board of directors since December 2013. Since February 2009, Mr. Kispert has served as the chief executive officer and member of the board of directors of Spansion Inc., a manufacturer of flash memory products, as well as interim chief financial officer from April 2009 to May 2009. From 1995 to January 2009, Mr. Kispert served in a number of finance and operational roles at KLA-Tencor Corporation, a supplier of semiconductor manufacturing process control and yield management solutions, including serving as president and chief operations officer from January 2006 to January 2009 and as executive vice president and chief financial officer from March 2000 to December 2005. Mr. Kispert also serves on the board of directors of Extreme Networks, Inc. Mr. Kispert holds a B.S. degree in Political Science from Grinnell College and an M.B.A. degree from the University of California, Los Angeles.
We believe that Mr. Kispert is qualified to serve as a member of our board of directors because of his financial and operational expertise, his experience serving as the chief executive officer and the chief financial officer of numerous public companies in the technology industry, and his experience serving on the boards of directors of public companies.
Paul J. Milbury has served as a member of our board of directors since January 2014. Mr. Milbury served as vice president of operations and chief financial officer of Starent Networks, Corp., a provider of mobile network solutions, from January 2007 until its acquisition by Cisco Systems, Inc. in December 2009. Mr. Milbury played a key role in integrating Starent Networks, Corp. into Cisco Systems, Inc. to create the Mobile Internet Technology Group from December 2009 to July 2010. From December 2000 to March 2007, Mr. Milbury served as vice president and chief financial officer of Avid Technology, Inc., a digital media creation, management and distribution solutions company. Mr. Milbury currently serves on the board of directors of Infinera Corporation, an optical equipment provider. Mr. Milbury also serves as a director of a number of private companies. Mr. Milbury holds a B.B.A. degree in business and economics and an M.B.A. degree from the University of Massachusetts, Amherst.
We believe that Mr. Milbury is qualified to serve as a member of our board of directors because of his financial and operational expertise, his experience serving as the chief financial officer of numerous public companies in the networking technology industry, and his experience serving on the boards of directors of several companies.
Michael C. Ruettgers has served as a member of our board of directors since December 2010. In December 2005, he retired from his position at EMC Corporation, where he served as chairman from 2004 to December 2005, executive chairman from 2001 to 2004, and chief executive officer from 1992 to 2001. From 1988 to 1992, Mr. Ruettgers served in various senior executive positions at EMC. Mr. Ruettgers currently serves on the boards of directors of Raytheon Corporation and Wolfson Microelectronics plc. Mr. Ruettgers holds a B.S. degree in business administration from Idaho State University and an M.B.A. degree from Harvard Business School.
We believe that Mr. Ruettgers is qualified to serve as a member of our board of directors because of his extensive business experience, skills and acumen developed as a senior executive at a large public company operating in the technology industry, as well as his experience serving on the boards of directors of public companies.
Each officer serves at the discretion of our board of directors and holds office until his or her successor is duly elected and qualified or until his or her earlier resignation or removal. There are no family relationships among any of our directors or executive officers.
115
Code of Business Conduct and Ethics
We have adopted a Worldwide Code of Business Conduct and Ethics that applies to all of our employees, directors and principal executive officers, including our chief executive officer, chief financial officer and senior financial officers. This code of ethics is posted on our website at www.gigamon.com. Alternatively, you may obtain a free copy of this code of ethics by contacting our corporate offices by calling 1 (408) 831-4000 or by visiting our worldwide headquarters at 3300 OIcott Street, Santa Clara, California 95054.
We intend to satisfy the disclosure requirement under Item 5.05 of Form 8-K regarding an amendment to, or waiver from, a provision of this code of ethics by posting such information on our Website, at the address and location specified above.
Board of Directors
Our business and affairs are managed under the direction of our board of directors. The number of directors is fixed by our board of directors, subject to the terms of our amended and restated certificate of incorporation and amended and restated bylaws. Our board of directors consists of seven directors, five of whom qualify as “independent” under the New York Stock Exchange listing standards.
In accordance with our amended and restated certificate of incorporation and our amended and restated bylaws, our board of directors is divided into three classes with staggered three-year terms. Only one class of directors will be elected at each annual meeting of our stockholders, with the other classes continuing for the remainder of their respective three-year terms. Our directors are divided among the three classes as follows:
| • | | the Class I directors are Mr. Leong and Mr. Ruettgers, and their terms expire at the annual meeting of stockholders to be held in 2014; |
| • | | the Class II directors are Mr. Goldman and Mr. Mulloy, and their terms expire at the annual meeting of stockholders to be held in 2015; and |
| • | | the Class III directors are Mr. Hooper, Mr. Kispert and Mr. Milbury, and their terms expire at the annual meeting of stockholders to be held in 2016. |
Any increase or decrease in the number of directors will be distributed among the three classes so that, as nearly as possible, each class will consist of one-third of the directors. This classification of our board of directors may have the effect of delaying or preventing changes in control of our company.
Director Independence
Our board of directors has undertaken a review of the independence of each director. Based on information provided by each director concerning his background, employment and affiliations, our board of directors determined that Messrs. Goldman, Kispert, Mulloy, Milbury and Ruettgers do not have a relationship that would interfere with the exercise of independent judgment in carrying out the responsibilities of a director and that each of these directors is “independent” as that term is defined under the applicable rules and regulations of the SEC and the listing requirements and rules of the New York Stock Exchange. In making these determinations, our board of directors considered the current and prior relationships that each non-employee director has with our company and all other facts and circumstances our board of directors deemed relevant in determining their independence, including the beneficial ownership of our capital stock by each non-employee director, and the transactions involving them described in the section titled “Certain Relationships and Related Party Transactions, and Director Independence.”
116
Committees of the Board of Directors
Our board of directors has established an audit committee, a compensation committee and a nominating and corporate governance committee. The composition and responsibilities of each of the committees of our board of directors is described below. Members will serve on these committees until their resignation or until otherwise determined by our board of directors.
Audit Committee
Our audit committee is comprised of Messrs. Goldman, Kispert and Milbury, with Mr. Goldman serving as chairman. The composition of our audit committee meets the requirements for independence under current New York Stock Exchange listing standards and SEC rules and regulations. Each member of our audit committee meets the financial literacy requirements of the current New York Stock Exchange listing standards. In addition, our board of directors has determined that Mr. Goldman is an audit committee financial expert within the meaning of Item 407(d) of Regulation S-K under the Securities Act. Our audit committee, among other things:
| • | | selects a qualified firm to serve as the independent registered public accounting firm to audit our financial statements; |
| • | | helps to ensure the independence and performance of the independent registered public accounting firm; |
| • | | discusses the scope and results of the audit with the independent registered public accounting firm, and reviews with management and the independent accountants, our interim and year end operating results; |
| • | | develops procedures for employees to submit concerns anonymously about questionable accounting or audit matters; |
| • | | reviews our policies on risk assessment and risk management; |
| • | | reviews related party transactions; |
| • | | obtains and reviews a report by the independent registered public accounting firm at least annually, that describes our internal quality-control procedures, any material issues with such procedures, and any steps taken to deal with such issues; and |
| • | | approves (or, as permitted, pre-approves) all audit and all permissible non-audit services, other than de minimis non-audit services, to be performed by the independent registered public accounting firm. |
Our audit committee operates under a written charter that satisfies the applicable rules of the SEC and the listing standards of the New York Stock Exchange.
Compensation Committee
Our compensation committee is comprised of Messrs. Mulloy and Ruettgers, with Mr. Mulloy serving as chairman. The composition of our compensation committee meets the requirements for independence under current New York Stock Exchange listing standards and SEC rules and regulations. Each member of the compensation committee is also a non-employee director, as defined pursuant to Rule 16b-3 promulgated under the Exchange Act, and an outside director, as defined pursuant to Section 162(m) of the Code. The purpose of our compensation committee is to discharge
117
the responsibilities of our board of directors relating to compensation of our executive officers. Our compensation committee, among other things:
| • | | reviews, approves and determines, or makes recommendations to our board of directors regarding, the compensation of our executive officers; |
| • | | administers our stock and equity incentive plans; |
| • | | reviews and approves and makes recommendations to our board of directors regarding incentive compensation and equity plans; and |
| • | | establishes and reviews general policies relating to compensation and benefits of our employees. |
Our compensation committee operates under a written charter that satisfies the applicable rules of the SEC and the listing standards of the New York Stock Exchange.
Nominating and Corporate Governance Committee
Our nominating and corporate governance committee is comprised of Messrs. Mulloy and Ruettgers, with Mr. Mulloy serving as chairman. The composition of our nominating and corporate governance committee meets the requirements for independence under current New York Stock Exchange listing standards. Our nominating and corporate governance committee, among other things:
| • | | identifies, evaluates and selects, or makes recommendations to our board of directors regarding nominees for election to our board of directors and its committees; |
| • | | evaluates the performance of our board of directors and of individual directors; |
| • | | considers and makes recommendations to our board of directors regarding the composition of our board of directors and its committees; |
| • | | reviews developments in corporate governance practices; |
| • | | evaluates the adequacy of our corporate governance practices and reporting; and |
| • | | develops and makes recommendations to our board of directors regarding corporate governance guidelines and matters. |
Our nominating and corporate governance committee operates under a written charter that satisfies the applicable listing standards of the New York Stock Exchange.
Compensation Committee Interlocks and Insider Participation
None of our executive officers currently serves, or in the past year has served, as a member of the board of directors or compensation committee of any entity that has one or more executive officers serving on our board of directors or compensation committee.
Director Compensation
Prior to our IPO, we had not implemented a formal policy with respect to compensation payable to our non-employee directors for service as directors. Prior to our IPO, we paid cash director fees to Messrs. Goldman, Miller and Ruettgers. Our board of directors has approved an outside director compensation policy that is applicable to all of our non-employee directors and became effective upon
118
the completion of our IPO. This policy provides that each such non-employee director will receive the following compensation for service on our board of directors and its committees:
| • | | an annual cash retainer for general services of $30,000; |
| • | | no cash awards for attending board meetings; |
| • | | a $11,500 cash retainer for the chairman of our audit committee and a $5,000 cash retainer for each of its other members; |
| • | | a $7,500 cash retainer for the chairman of our compensation committee and a $4,000 cash retainer for each of its other members; |
| • | | a $5,000 cash retainer for the chairman of our nominating and corporate governance committee and a $3,000 cash retainer for each of its other members; |
| • | | upon first joining the board, an automatic initial grant of a stock option to purchase a number of shares of our common stock equal to 0.106% of our then outstanding common shares, to vest annually over three years, subject to continued service through each vesting date; and |
| • | | each year shortly following the annual meeting, an automatic annual grant of a stock option to purchase a number of shares of our common stock equal to 0.053% of our then outstanding common shares, vesting monthly over one year, subject to continued service through each vesting date. |
In addition, we reimburse our directors for expenses associated with attending meetings of our board of directors and committees of our board of directors.
The following table summarizes compensation paid to our non-employee directors during the fiscal year ended December 28, 2013. Directors who are also our employees receive no additional compensation for their service as a director. During the fiscal year ended December 28, 2013, two directors, Mr. Hooper, our chief executive officer, and Mr. Leong, our chief technology officer, were employees. Mr. Hooper’s compensation is discussed in the section titled “Executive Compensation” and Mr. Leong did not receive any compensation for his service as a member of our board of directors.
| | | | | | | | | | | | | | | | |
Name | | Fees Earned
or Paid in
Cash($)(1) | | | Option Awards
($)(2) | | | All Other
Compensation($) | | | Total($) | |
Kenneth A. Goldman | | | 29,797 | | | | — | | | | 1,319,500 | | | | 1,349,297 | |
Ted C. Ho(3) | | | — | | | | — | | | | — | | | | — | |
John H. Kispert(4) | | | 1,976 | | | | 561,490 | | | | — | | | | 563,466 | |
Andrew M. Miller(5) | | | 11,260 | | | | — | | | | 60,000 | | | | 71,260 | |
Corey M. Mulloy | | | 26,679 | | | | — | | | | — | | | | 26,679 | |
Michael C. Ruettgers | | | 28,133 | | | | — | | | | 2,576,154 | | | | 2,604,287 | |
| (1) | Represents 2013 director fees paid in cash. |
| (2) | The amounts in the “Option Awards” column reflect the aggregate grant date fair value of stock options granted during the fiscal year computed in accordance with FASB ASC Topic 718. The assumptions that we used to calculate these amounts are discussed in Note 8 to our consolidated financial statements included in the Annual Report on Form 10-K. As required by SEC rules, the amounts shown exclude the impact of estimated forfeitures related to service-based vesting conditions. |
119
| (3) | Mr. Ho resigned from our board of directors effective March 2013. |
| (4) | Mr. Kispert joined our board of directors in December 2013. |
| (5) | Mr. Miller resigned from our board of directors effective July 2013. |
Item 11. Executive Compensation
Our principal executive officer and the next two most highly compensated executive officers for 2013, which we refer to as our “named executive officers” in this Annual Report on Form 10-K, are:
| • | | Paul A. Hooper, our chief executive officer; |
| • | | Michael T. Hoffman, our vice president of worldwide sales; and |
| • | | Shehzad T. Merchant, our chief strategy officer. |
2013 Summary Compensation Table
The following table and narrative summarizes and explains the compensation that we paid to, or that was earned by, each person who acted as our principal executive officer and each of the named officers referred to by Item 402(m)(2) of Regulation S-K during our fiscal 2013.
| | | | | | | | | | | | | | | | | | | | | | | | | | | | | | | | |
Name and Principal Position | | Year | | | Salary($) | | | Bonus($)(1) | | | Stock
Awards($)(2) | | | Option
Awards($)(3) | | | Non-Equity
Incentive Plan
Compensation($) | | | All Other
Compensation
($) | | | Total($) | |
Paul A. Hooper Chief Executive Officer | | | 2013 | | | | 320,000 | | | | — | | | | 355,950 | | | | 1,994,630 | | | | 342,961 | (4) | | | 1,240,911 | (6) | | | 4,254,452 | |
Michael T. Hoffman Vice President of Worldwide Sales | | | 2013 | | | | 231,050 | | | | 40,000 | | | | 112,989 | | | | 892,920 | | | | 393,397 | (5) | | | 2,064,293 | (7) | | | 3,734,649 | |
Shehzad T. Merchant Chief Strategy Officer | | | 2013 | | | | 188,462 | | | | — | | | | 564,994 | | | | 884,163 | | | | 125,678 | (4) | | | 929 | (8) | | | 1,764,226 | |
| (1) | The amounts in the “Bonus” column reflect discretionary bonsues earned and payable to Mr. Hoffman. |
| (2) | The amounts in the “Stock Awards” column reflect the aggregate grant date fair value of equity awards granted during the fiscal year computed in accordance with FASB ASC Topic 718. The assumptions that we used to calculate these amounts are discussed in Note 8 to our consolidated financial statements included in this Annual Report on Form 10-K. As required by SEC rules, the amounts shown exclude the impact of estimated forfeitures related to service-based vesting conditions. |
| (3) | The amounts in the “Option Awards” column reflect the aggregate grant date fair value of stock options granted during the fiscal year computed in accordance with FASB ASC Topic 718. The assumptions that we used to calculate these amounts are discussed in Note 8 to our consolidated financial statements included in this Annual Report on Form 10-K. As required by SEC rules, the amounts shown exclude the impact of estimated forfeitures related to service-based vesting conditions. |
| (4) | The amounts included in the “Non-Equity Incentive Plan Compensation” column for Messrs. Hooper and Merchant represent the amounts earned and payable pursuant to the Corporate Bonus Plan. See the section titled “–Corporate Bonus Plan” for additional information. |
| (5) | The amount represents sales commissions earned and payable. |
| (6) | The amount represents (i) $6,500 in 401(k) matching contributions made by us on behalf of Mr. Hooper, and (ii) a payment of $1,234,411 for vested performance units which Mr. Hooper held under our 2009 Plan based on a per unit value equal to the IPO price of $19.00 per share, less the $0.15 base price as described below in the section titled “Certain Relationships and Related Transactions, and Director Independence.” |
| (7) | The amount represents (i) $7,650 in 401(k) matching contributions made by us on behalf of Mr. Hoffman, (ii) a payment of $942,841 for vested performance units which Mr. Hoffman held under our 2009 Plan based on a per unit value equal to the IPO price of $19.00 per share, less the $0.15 base price as described below in the section titled “Certain Relationships and Related Transactions, and Director Independence,” and |
120
| | (iii) payments made by the Company to, and on behalf of, Mr. Hoffman totaling $1,114,162 pursuant to the option remediation agreement as described below in the section titled Certain Relationships and Related Transactions, and Director Independence.” |
| (8) | The amount represents 401(k) matching contributions made by us on behalf of Mr. Merchant. |
Executive Employment Arrangements
On December 19, 2012, we entered into an offer letter agreement with Paul A. Hooper, our chief executive officer. The offer letter agreement has no specific term and constitutes at-will employment. Mr. Hooper’s current annual base salary is $332,800 and he is eligible for an annual cash target bonus of $332,800. Mr. Hooper’s base salary is subject to review annually. We have also entered into a change in control severance agreement with Mr. Hooper dated September 17, 2012, as amended by Mr. Hooper’s offer letter agreement.
On July 29, 2009, we entered into an offer letter agreement with Michael T. Hoffman, our vice president of worldwide sales. The offer letter agreement has no specific term and constitutes at-will employment. Mr. Hoffman’s current annual base salary is $247,200 and he is eligible for target cash bonuses and target sales commissions of $372,860. Mr. Hoffman’s base salary is subject to review annually. We have also entered into a change in control severance agreement with Mr. Hoffman dated March 13, 2013.
On March 8, 2013, we entered into an offer letter agreement with Shehzad T. Merchant, our chief strategy officer. The offer letter agreement has no specific term and constitutes at-will employment. Mr. Merchant’s current annual base salary is $260,000 and he is eligible for an annual cash target bonus of $130,000. Mr. Merchant’s base salary is subject to review annually. We have also entered into a change in control severance agreement with Mr. Merchant dated April 29, 2013.
Change in Control Severance Agreements
We have entered into change in control severance agreements with our chief executive officer, Paul A. Hooper, our vice president of worldwide sales, Michael T. Hoffman, and our chief strategy officer, Shehzad T. Merchant, which provide for severance compensation. With the exception of Mr. Hooper’s agreement, the agreements provide that upon a termination of employment without cause or resignation for good reason (as such terms are defined in the agreements) before the date that is three months prior to a change in control of our company or following the date that is 12 months following a change in control, then the executive will receive a cash severance payment equal to six months of his base salary plus reimbursement for COBRA premiums for up to six months and will be entitled to six months of accelerated vesting of his equity awards. The agreements further provides that upon a termination of employment without cause or resignation for good reason during the period beginning three months prior to a change in control and ending 12 months following a change in control, then the executive will receive a cash severance payment equal to six months of his base salary plus reimbursements for COBRA premiums for up to six months and will be entitled to either 24 months of accelerated vesting of his equity awards if the change in control occurs within the first 12 months following the executive’s date of hire, or full accelerated vesting if the change in control occurs after the first 12 months following the executive’s date of hire. The agreements require the executive to sign a general release of claims in favor of the company as a condition of receiving the severance and equity acceleration benefits described above. The agreements each have a three year term and then renew automatically for successive one year terms unless either party provides the other party with written notice of non-renewal at least 60 days prior to the end of the then-current term. Additionally, Mr. Hoffman’s agreement provides for payment of one half of his annual bonus and sales commission targets upon a termination of his employment without cause or resignation for good reason during the period beginning three months prior to a change in control and ending 12 months following a change in control.
121
Mr. Hooper’s agreement is subject to substantially similar terms to the change in control severance agreements described above, with the exception that his agreement provides for a cash severance payment equal to 12 months of his base salary plus reimbursements for COBRA premiums for up to 12 months and 12 months of accelerated vesting of his equity awards upon a termination of his employment without cause or resignation for good reason at any time before the date that is three months prior to a change in control or after 12 months following a change in control. Additionally, Mr. Hooper’s agreement provides that upon a termination of his employment without cause or resignation for good reason during the period beginning three months prior to a change in control and ending twelve months following a change in control, he will be entitled to a cash severance payment equal to 12 months of his base salary plus reimbursement for COBRA premiums for up to 12 months and will be entitled to either 24 months of accelerated vesting of his equity awards if the change in control occurs within the first 12 months following his date of hire, or full accelerated vesting if the change in control occurs after the first 12 months following his date of hire.
Corporate Bonus Plan
In fiscal 2013, we began sponsoring and maintaining our Corporate Bonus Plan, or our Bonus Plan. The Bonus Plan offers the eligible employees, including our executive officers, the opportunity to earn bonuses based on the achievement of specified corporate performance goals during each performance period.
The performance periods under the Bonus Plan correspond to our fiscal year, beginning on January 1st for fiscal 2013. Participants are assigned an annual target bonus value, set as a percentage of their annual base salary for the performance period. Participants may earn more or less than their annual target bonus value based on the extent to which achievement of our specified performance goals results in the funding of a bonus pool and a participant’s individual performance. If target metrics are surpassed, a participant in the Bonus Plan may be awarded a bonus payment of up to a maximum of 200% of the target bonus value.
The bonus pool is funded based upon our achievement of specified revenue and operating profit targets established by the compensation committee each fiscal year. If our performance results in the bonus pool being funded at 100% of targeted levels, participants are eligible to receive bonuses at their annual target bonus levels. The compensation committee may impose minimum company performance thresholds before the bonus pool is funded, such as revenue, operating profit or profitability thresholds.
Bonuses under the Bonus Plan are paid bi-annually, following the close of our second fiscal quarter and fiscal year end. Payments to executive officers following the close of our second fiscal quarter are paid at 50% of the then calculated payout (e.g. 25% of the target award), and the remaining portion of the annual bonus is paid following the close of our fiscal year end. Participants must be employed from May 1st through June 30th to qualify for a bonus payment following the close of our second fiscal quarter, which will be paid by July 31st, and from November 1st through December 28th to qualify for a bonus payment following the close of our fiscal 2013, which will be paid by February 28th of the following fiscal year.
122
Outstanding Equity Awards at Fiscal Year-End
The following table provides information regarding outstanding equity awards held by our named executive officers as of December 28, 2013.
| | | | | | | | | | | | | | | | | | | | | | |
| | | Option Awards | | Stock Awards |
Name | | Grant Date | | Number of
Securities
Underlying
Unexercised
Options (#)
Exercisable | | | Number of
Securities
Underlying
Unexercised
Options (#)
Unexercisable | | | Option
Exercise
Price ($) | | | Option
Expiration
Date | | Number of
Shares that
have Not
Vested | | | Market Value
of Shares
that have Not
Vested |
Paul A. Hooper | | 4/30/2013 | | | — | | | | 37,666 | (1) | | | 14.70 | | | 4/30/2023 | | | — | | | — |
| | 4/30/2013 | | | — | | | | — | | | | — | | | — | | | 21,000 | (2) | | 594,090 |
| | 3/1/2013 | | | 38,194 | | | | 128,472 | (3) | | | 13.11 | | | 3/1/2023 | | | — | | | — |
| | 4/5/2012 | | | 19,471 | | | | 97,362 | (4) | | | 6.09 | | | 4/5/2022 | | | — | | | — |
Michael T. Hoffman | | 4/30/2013 | | | — | | | | 12,000 | (5) | | | 14.70 | | | 4/30/2023 | | | — | | | — |
| | 4/30/2013 | | | — | | | | — | | | | — | | | — | | | 6,666 | (6) | | 188,581 |
| | 3/1/2013 | | | 5,832 | | | | 61,667 | (7) | | | 13.11 | | | 3/1/2023 | | | — | | | — |
| | 4/5/2012 | | | 4,175 | | | | 41,751 | (8) | | | 6.09 | | | 4/5/2022 | | | — | | | — |
Shehzad T. Merchant | | 4/30/2013 | | | — | | | | 83,333 | (9) | | | 14.70 | | | 4/30/2023 | | | — | | | — |
| | 4/30/2013 | | | — | | | | — | | | | — | | | — | | | 33,333 | (10) | | 942,991 |
| (1) | This option vests, subject to Mr. Hooper’s continued role as a service provider to us, as to 50% of the total shares on May 1, 2015, and with respect to 1/48th of the total shares monthly thereafter. |
| (2) | The shares underlying the RSUs vest, subject to Mr. Hooper’s continued role as a service provider to us, as to 50% of the RSUs on May 15, 2015, and with respect to 1/16th of the total RSUs vesting on August 15, November 15, February 15 and May 15 of each year thereafter. |
| (3) | This option commenced vesting upon the completion of the IPO and will vest, subject to Mr. Hooper’s continued role as a service provider to us, with respect to 1/36th of the total shares monthly thereafter. |
| (4) | This option commenced vesting upon the completion of the IPO and will vest, subject to Mr. Hooper’s continued role as a service provider to us, with respect to 1/36th of the total shares monthly thereafter. |
| (5) | This option vests, subject to Mr. Hoffman continued role as a service provider to us, as to 50% of the total shares on May 1, 2015, and with respect to 1/48th of the total shares monthly thereafter. |
| (6) | The shares underlying the RSUs vest, subject to Mr. Hoffman’s continued role as a service provider to us, as to 50% of the RSUs on May 15, 2015, and with respect to 1/16th of the total RSUs vesting on August 15, November 15, February 15 and May 15 of each year thereafter. |
| (7) | This option vests, subject to Mr. Hoffman continued role as a service provider to us, with respect to 1/48th of the total shares monthly beginning on January 1, 2013. |
| (8) | This option vests, subject to Mr. Hoffman continued role as a service provider to us, with respect to 1/36th of the total shares monthly beginning on June 11, 2013. |
| (9) | This option vests, subject to Mr. Merchant’s continued role as a service provider to us, with respect to 1/4th of the total shares on March 29, 2014, and with respect to 1/36th of the total shares monthly thereafter. |
| (10) | The shares underlying the RSUs vest, subject to Mr. Merchant’s continued role as a service provider to us, as to 11,333 of the RSUs on May 15, 2014, and 2,750 of the RSUs vesting on August 15, November 15, February 15 and May 15 of each year thereafter. |
Other Employee Benefits and Perquisites
Our historic compensation program reflects our startup origins and form of organization. We have generally not offered extensive benefits or other compensation programs to the named executive officers, apart from cash compensation described above and employee benefits made available generally to our employees, including 401(k) plan matching contributions. See the section titled “—Retirement Plans” for additional information.
123
Employee Benefit Plans
2013 Equity Incentive Plan
Our 2013 Equity Incentive Plan, or 2013 Plan, was adopted by our board of directors and stockholders in May 2013 and became effective in June 2013. Our 2013 Plan permits the grant of incentive stock options, within the meaning of Section 422 of the Code, to our employees and any of our parent and subsidiary corporations’ employees, and the grant of nonstatutory stock options, stock appreciation rights, restricted stock, restricted stock units, performance units and performance shares to our employees, directors and consultants and our parent and subsidiary corporations’ employees and consultants.
Authorized Shares
As of December 28, 2013, the maximum aggregate number of shares issuable under the 2013 Plan was 3,710,370 shares of our common stock, plus any shares subject to stock options or similar awards granted under the 2012 Unit Option Plan that expire or terminate without having been exercised in full and shares issued pursuant to awards granted under the 2012 Unit Option Plan that are forfeited to or repurchased by us, with the maximum number of shares to be added to the 2013 Plan from the 2012 Unit Option Plan, equal to 4,186,283 shares. In addition, the number of shares available for issuance under the 2013 Plan will be annually increased on the first day of each of our fiscal years beginning with fiscal 2014, by an amount equal to the least of:
| • | | 5% of the outstanding shares of our common stock as of the last day of our immediately preceding fiscal year; or |
| • | | such other amount as our board of directors may determine. |
Shares issued pursuant to awards under the 2013 Plan that we repurchase or that expire become unexercisable or are forfeited. Shares that are surrendered pursuant to an exchange program, as well as shares used to pay the exercise price of an award or to satisfy the tax withholding obligations related to an award, will become available for future grant under the 2013 Plan. In addition, to the extent that an award is paid out in cash rather than shares, such cash payment will not reduce the number of shares available for issuance under the 2013 Plan. With respect to stock appreciation rights, only shares actually issued pursuant to the award cease to be available under the 2013 Plan.
Plan Administration
Our board of directors or one or more committees appointed by our board of directors administers the 2013 Plan. In the case of awards intended to qualify as “performance-based compensation” within the meaning of Section 162(m) of the Code, the compensation committee will consist of two or more “outside directors” within the meaning of Section 162(m) of the Code.
Subject to the provisions of our 2013 Plan, the administrator has the power to determine the terms of awards, including the recipients, the exercise price, if any, the number of shares covering each award, the fair market value of a share of our common stock, the vesting schedule applicable to the awards, together with any vesting acceleration, the form of consideration, if any, payable upon exercise of the award, and the terms of the award agreement for use under the 2013 Plan. The administrator also has the authority, subject to the terms of the 2013 Plan, to amend existing awards to reduce or increase their exercise price, to allow participants the opportunity to transfer outstanding awards to a financial institution or other person or entity selected by the administrator, to institute an
124
exchange program by which outstanding awards may be surrendered in exchange for awards that may have different exercise prices and terms, to prescribe rules and to construe and interpret the 2013 Plan and awards granted under the 2013 Plan.
Stock Options
The administrator may grant incentive and/or nonstatutory stock options under our 2013 Plan, provided that incentive stock options are only granted to employees. The exercise price of such options must equal at least the fair market value of our common stock on the date of grant. The term of an incentive stock option may not exceed 10 years; provided, however, that an incentive stock option held by a participant who owns more than 10% of the total combined voting power of all classes of our stock, or of certain of our parent or subsidiary corporations, may not have a term in excess of five years and must have an exercise price of at least 110% of the fair market value of our common stock on the grant date. The administrator will determine the methods of payment of the exercise price of an option, which may include cash, shares or other property acceptable to the administrator, as well as other types of consideration permitted by applicable law. Subject to the provisions of our 2013 Plan, the administrator determines the remaining terms of the options. After the termination of service of an employee, director or consultant, the participant may exercise his or her option, to the extent vested as of such date of termination, for the period of time stated in his or her option agreement. However, in no event may an option be exercised later than the expiration of its term.
Stock Appreciation Rights
Stock appreciation rights may be granted under our 2013 Plan. Stock appreciation rights allow the recipient to receive the appreciation in the fair market value of our common stock between the exercise date and the date of grant. Subject to the provisions of our 2013 Plan, the administrator determines the terms of stock appreciation rights, including when such rights vest and become exercisable and whether to settle such awards in cash or with shares of our common stock, or a combination thereof, except that the per share exercise price for the shares to be issued pursuant to the exercise of a stock appreciation right will be no less than 100% of the fair market value per share on the date of grant. The specific terms of any grant of stock appreciation rights will be set forth in an award agreement between us and the recipient.
Restricted Stock
Restricted stock may be granted under our 2013 Plan. Restricted stock awards are grants of shares of our common stock that are subject to various restrictions, including restrictions on transferability and forfeiture provisions. Shares of restricted stock will vest and the restrictions on such shares will lapse, in accordance with terms and conditions established by the administrator. Such terms may include, among other things, vesting upon the achievement of specific performance goals determined by the administrator and/or continued service to us. The administrator, in its sole discretion, may accelerate the time at which any restrictions will lapse or be removed. Recipients of restricted stock awards generally will have voting and dividend rights with respect to such shares upon grant without regard to vesting, unless the administrator provides otherwise. Shares of restricted stock that do not vest for any reason will be forfeited by the recipient and will revert to us. The specific terms of any grant of restricted stock will be set forth in an award agreement between us and the recipient.
Restricted Stock Units
Restricted stock units may be granted under our 2013 Plan. Each restricted stock unit granted is a bookkeeping entry representing an amount equal to the fair market value of one share of our common stock. The administrator determines the terms and conditions of restricted stock units
125
including the vesting criteria, which may include achievement of specified performance criteria or continued service to us, and the form and timing of payment. The administrator, in its sole discretion, may accelerate the time at which any restrictions will lapse or be removed. The administrator determines in its sole discretion whether an award will be settled in stock, cash or a combination of both. The specific terms of any grant of restricted stock units will be set forth in an award agreement between us and the recipient.
Performance Units/Performance Shares
Performance units and performance shares may be granted under our 2013 Plan. Performance units and performance shares are awards that will result in a payment to a participant only if performance goals established by the administrator are achieved or the awards otherwise vest. The administrator will establish organizational or individual performance goals in its discretion, which, depending on the extent to which they are met, will determine the number and/or the value of performance units and performance shares to be paid out to participants. After the grant of a performance unit or performance share, the administrator, in its sole discretion, may reduce or waive any performance objectives or other vesting provisions for such performance units or performance shares. Performance units shall have an initial dollar value established by the administrator prior to the grant date. Performance shares will have an initial value equal to the fair market value of our common stock on the grant date. The administrator, in its sole discretion, may pay earned performance units or performance shares in the form of cash, in shares or in some combination thereof. The specific terms of any grant of performance units and performance shares will be set forth in an award agreement between us and the recipient.
Transferability of Awards
Unless the administrator provides otherwise, our 2013 Plan generally does not allow for the transfer of awards and only the recipient of an award may exercise such an award during his or her lifetime.
Certain Adjustments
In the event of certain changes in our capitalization, to prevent diminution or enlargement of the benefits or potential benefits available under the 2013 Plan, the administrator will make adjustments to one or more of the number and class of shares that may be delivered under the plan and/or the number, class and price of shares covered by each outstanding award and the numerical share limits contained in the 2013 Plan. In the event of our proposed liquidation or dissolution, the administrator will notify participants as soon as practicable and all awards will terminate immediately prior to the consummation of such proposed transaction.
Merger or Change of Control
Our 2013 Plan provides that in the event of a merger or change of control, as defined under the 2013 Plan, each outstanding award will be treated as the administrator determines, except that if a successor corporation or its parent or subsidiary does not assume or substitute an equivalent award for any outstanding award, then such award will fully vest, all restrictions on such award will lapse, all performance goals or other vesting criteria applicable to such award will be deemed achieved at 100% of target levels and such award will become fully exercisable, if applicable, for a specified period prior to the transaction. The award will then terminate upon the expiration of the specified period of time. If the service of an outside director is terminated on or following a change of control, other than pursuant to a voluntary resignation, his or her awards will become fully vested and exercisable, and all performance goals or other vesting requirements will be deemed achieved at 100% of target levels.
126
Plan Amendment, Termination
The administrator has the authority to amend, suspend or terminate the 2013 Plan provided such action does not impair the existing rights of any participant. Our 2013 Plan will automatically terminate in 2023, unless we terminate it sooner.
2013 Employee Stock Purchase Plan
Our named executive officers and all of our other eligible employees are allowed to participate in our 2013 Employee Stock Purchase Plan. We believe that providing the opportunity to participate in the 2013 Employee Stock Purchase Plan provides our employees with a further incentive towards ensuring our success and accomplishing our corporate goals.
The specific provisions of our 2013 Employee Stock Purchase Plan are as provided for below. Our board of directors and stockholders adopted and approved our 2013 Employee Stock Purchase Plan in May 2013 and it became effective in June 2013.
Authorized Shares
As of December 28, 2013, a total of 439,422 shares of our common stock were available for sale under the 2013 Employee Stock Purchase Plan. In addition, our 2013 Employee Stock Purchase Plan provides for annual increases in the number of shares available for issuance under plan on the first day of each fiscal year beginning in fiscal 2014, equal to the least of:
| • | | 1.5% of the outstanding shares of our common stock as of the last day of our immediately preceding fiscal year; or |
| • | | such other amount as our board of directors may determine. |
Our compensation committee administers the 2013 Employee Stock Purchase Plan, and has full and exclusive authority to interpret the terms of the plan and determine eligibility to participate subject to the conditions of the plan as described below.
Eligibility
Generally, all of our employees will be eligible to participate if they are employed by us, or any participating subsidiary, for at least 20 hours per week and more than five months in any calendar year. However, an employee may not be granted an option to purchase stock under the 2013 Employee Stock Purchase Plan if such employee:
| • | | immediately after the grant would own stock possessing 5% or more of the total combined voting power or value of all classes of our capital stock; or |
| • | | hold rights to purchase stock under all of our employee stock purchase plans that accrue at a rate that exceeds $25,000 worth of stock for each calendar year. |
Our 2013 Employee Stock Purchase Plan is intended to qualify under Section 423 of the Code. Each offering period includes purchase periods, which will be the approximately six-month period commencing with one exercise date and ending with the next exercise date. The offering periods are scheduled to start on the first trading day on or after May 15 and November 15 of each year, except for the first such offering period, which commenced on June 12, 2013.
127
Our 2013 Employee Stock Purchase Plan permits participants to purchase common stock through payroll deductions of up to 15% of their eligible compensation, which includes base pay, commissions, payments for overtime and shift premium, incentive compensation, bonuses and other similar compensation. A participant may purchase a maximum of 1,500 shares during a six-month period.
Amounts deducted and accumulated by the participant are used to purchase shares of our common stock at the end of each six-month purchase period. The purchase price of the shares will be 85% of the lower of the fair market value of our common stock on the first trading day of each offering period or on the exercise date. If the fair market value of our common stock on the exercise date is less than the fair market value on the first trading day of the offering period, participants will be withdrawn from the current offering period following their purchase of shares on the purchase date and will be automatically re-enrolled in a new offering period. Participants may end their participation at any time during an offering period, and will be paid their accrued contributions that have not yet been used to purchase shares of common stock. Participation ends automatically upon termination of employment with us.
A participant may not transfer rights granted under the 2013 Employee Stock Purchase Plan. If the compensation committee permits the transfer of rights, it may only be done other than by will, the laws of descent and distribution, or as otherwise provided under the 2013 Employee Stock Purchase Plan.
Merger or Change of Control
In the event of our merger or change in control, as defined under the 2013 Employee Stock Purchase Plan, a successor corporation may assume or substitute for each outstanding option. If the successor corporation refuses to assume or substitute for the option, the offering period then in progress will be shortened, and a new exercise date will be set. The administrator will notify each participant that the exercise date has been changed and that the participant’s option will be exercised automatically on the new exercise date unless prior to such date the participant has withdrawn from the offering period.
Plan Amendment and Termination
Our 2013 Employee Stock Purchase Plan will automatically terminate in 2023, unless we terminate it sooner. Our board of directors has the authority to amend, suspend or terminate our 2013 Employee Stock Purchase Plan, except that, subject to certain exceptions described in the 2013 Employee Stock Purchase Plan, no such action may adversely affect any outstanding rights to purchase stock under our 2013 Employee Stock Purchase Plan.
2012 Unit Option Plan
Our 2012 Unit Option Plan, or our 2012 Option Plan, was adopted by our board of directors on March 21, 2012 and approved by our stockholders on March 22, 2012. The 2012 Option Plan provides for the grant of options to purchase shares of our common stock to certain of our employees, consultants, and stockholders, as determined by the plan administrator. The 2012 Unit Option Plan was terminated in connection with our IPO, but will continue to govern the terms and conditions of outstanding awards granted thereunder.
Authorized Shares
Awards with respect to 3,790,843 shares of our common stock were reserved for issuance pursuant to outstanding awards under the 2012 Option Plan as of December 28, 2013. No shares are available for future grants.
128
Plan Administration
Our board of directors or compensation committee administers the 2012 Option Plan. Subject to the provisions of our 2012 Option Plan, the administrator has the power to modify or amend each option granted under the 2012 Option Plan; authorize any person to execute on our behalf any instrument required to effect the grant of an option previously granted by the plan administrator; and to make all other determinations deemed necessary or advisable for administering the 2012 Option Plan.
With the consent of affected option holders, the administrator may institute a program under which outstanding options are cancelled in exchange for new options covering the same or a different number of shares of our common stock but with an exercise price per share based on the fair market value per share of our common stock on the new option grant date.
Stock Options
After the termination of employment or other service, the participant may exercise his or her option, to the extent vested as of such date of termination, within thirty days of termination. However, in no event may an option be exercised later than the expiration of its term. Additionally, if a recipient’s service is terminated for misconduct, the recipient’s outstanding options immediately terminate.
Transferability of Options
The 2012 Option Plan generally does not allow for the transfer of options other than by will or the laws of descent and distribution and only the recipient of an option may exercise the award during his or her lifetime. The administrator may, in its sole discretion, make an option transferrable. If this occurs, the option may only be transferred by will, by the laws of descent and distribution, to a revocable trust, or as permitted by Rule 701 of the Securities Act.
Certain Adjustments
If any change is made in our common stock subject to the 2012 Option Plan, such as through a stock split, stock dividend, recapitalization, combination of shares, exchange of shares or other change affecting the outstanding common stock as a class without the receipt of consideration by us, the administrator will adjust the number and class of shares that may be covered by each outstanding option. Any adjustments will be consistent with Section 409A of the Code, as applicable.
Trigger Event or Corporate Transaction
In the event of a trigger event, as defined under our 2012 Option Plan, or a merger or other reorganization, all options granted under the 2012 Option Plan shall be exchanged for or converted into options to acquire shares of the resulting corporation’s common stock with terms substantially equivalent to the terms of the options they are intended to replace.
Sale Event
In the event of a sale event, as defined under our 2012 Option Plan, the administrator shall determine how the options will be treated, including, without limitation, that options shall be assumed or substantially equivalent options will be substituted by the acquiring or succeeding corporation; options will terminate on or immediately prior to the consummation of the sale event; outstanding options will vest and become exercisable, in whole or in part, upon or immediately prior to the consummation to such sale event; or the options shall be terminated in exchange for cash and/or property. The administrator is not required to treat all optionees equally in the event of such an occurrence.
129
Plan Amendment and Termination
The administrator has the authority to amend, suspend, or terminate the 2012 Option Plan at any time, provided such action does not impair the rights of any optionee.
2009 Performance Unit Plan
Our 2009 Performance Unit Plan, or our 2009 Plan, provided for the grant of performance units as incentives to certain of our employees, consultants, and directors upon a change of control or initial public offering. We discontinued issuing awards under our 2009 Plan as of December 31, 2011 and paid out an aggregate of $20.4 million in fiscal 2013. After this payment, there were no rights or awards outstanding under the 2009 Plan.
Retirement Plans
We maintain a 401(k) profit sharing plan which is intended to be a tax qualified plan under Sections 401(a) and 401(k) of the Code. All of our U.S. employees are eligible to participate on the first day of the month following the date of hire. The 401(k) profit sharing plan includes a salary deferral arrangement pursuant to which participants may elect to defer up to 90% of their current compensation not in excess of the statutorily prescribed limit, which was equal to $17,500 in 2013 (catch up contributions for employees over 50 allow an additional deferral of $5,500 each year), and have the amount of their compensation reduction contributed to the 401(k) plan. In addition, the 401(k) profit sharing plan permits discretionary company matching and discretionary nonelective employer contributions. In 2013, we began providing a matching contribution of 50% of a participant’s contribution, up to 6% of the participant’s annual compensation, with a maximum contribution of $7,650 per year.
Compensation Committee Interlocks and Insider Participation
Information concerning compensation committee interlocks and insider participation appearing in the Proxy Statement under “Compensation Committee Interlocks and Insider Participation” is incorporated herein by reference.
Compensation Committee Report
Information concerning the compensation committee report appearing in the Proxy Statement under “Compensation Committee Report” is incorporated herein by reference.
| Item 12. | Security Ownership of Certain Beneficial Owners and Management and Related Stockholder Matters |
Information concerning the security ownership of certain beneficial owners and management appearing in the Proxy Statement, under “Security Ownership of Certain Beneficial Owners and Management and Related Stockholder Matters,” is incorporated herein by reference.
Information concerning our equity compensation plan information appearing in the Proxy Statement, under “Equity Compensation Plan Information,” is incorporated herein by reference.
130
Item 13. Certain Relationships and Related Transactions, and Director Independence
In addition to the compensation arrangements and indemnification arrangements, discussed, when required, above in the section titled “Executive Compensation,” and the registration rights for our capital stock, the following is a description of each transaction since January 1, 2013, and each currently proposed transaction in which:
| • | | we have been or are to be a participant; |
| • | | the amounts involved exceeded or will exceed $120,000; and |
| • | | any of our directors, executive officers, or stockholders who own greater than 5% of our outstanding capital stock and their affiliates had or will have a direct or indirect material interest. |
LLC Conversion
On May 31, 2013, we converted from a Delaware limited liability company into a Delaware corporation and changed our name from Gigamon LLC to Gigamon Inc. In connection with the conversion, all of our outstanding common units and preferred units converted into shares of common stock and preferred stock, respectively. Further, in connection with the conversion, Gigamon Systems LLC, the holder of all of our outstanding common equity interests prior to the LLC Conversion, exchanged all of the interests that it held in us for our common stock and will liquidate. In connection with this equity exchange, all outstanding options to purchase shares in Gigamon Systems LLC have been substituted for options to purchase common stock in Gigamon Inc. Also, certain entities affiliated with Highland Capital Partners that held shares of our preferred stock have been merged with and into us, and certain entities affiliated with Highland Capital Partners received our preferred stock in exchange for their respective equity interests.
Investor Rights Agreement
We are party to an Investor Rights Agreement, or IRA, dated as of January 20, 2010, with Ted C. Ho, King L. Won, Patrick P. Leong, Thomas K.Y. Cheung and the entities affiliated with Highland Capital Partners who each beneficially own greater than 5% of our outstanding capital stock, which provides, among other things, that certain holders of our common stock have certain rights relating to the registration of their shares of common stock.
Offer Letter Agreements, Change in Control Severance Agreements and Equity Awards
We have entered into offer letter agreements with certain of our executive officers. See the section titled “Executive Compensation—Executive Employment Agreements” for more information regarding these agreements.
We have entered into change in control arrangements with certain of our executive officers that, among other things, provide for certain severance and change in control benefits. See the section titled “Executive Compensation— Change in Control Severance Agreements” for more information regarding these agreements.
We have granted equity awards to our executive officers and certain of our directors. See the sections titled “Executive Compensation—Outstanding Equity Awards at Fiscal Year End” and “Management—Director Compensation” for a description of these options.
131
Other Transactions
We entered into an advisor agreement with our former chief executive officer and director, Ted C. Ho, which terminated effective June 30, 2013.
On August 17, 2012, we entered into an option remediation agreement with Michael T. Hoffman, our vice president of worldwide sales. Pursuant to the option remediation agreement, we agreed to pay certain taxes, penalties and interest that Mr. Hoffman incurred or may incur in connection with the exercise of his options in Gigamon Systems LLC, and also agreed to grant Mr. Hoffman an option to purchase 48,623 shares of our common stock and 1,680 restricted stock units. In exchange for the foregoing, Mr. Hoffman agreed that such consideration satisfied in full all outstanding obligations owed to him by us related to such option exercise, and agreed to have units of Gigamon Systems LLC withheld to satisfy the purchase price and taxes related to the aforementioned exercise of his option. In fiscal 2013, we paid $1.1 million for estimated tax remediation costs in connection with Mr. Hoffman’s option remediation.
We have paid distributions to our stockholders. See the section titled “Management’s Discussion and Analysis of Financial Condition and Results of Operations–Liquidity and Capital Resources” for additional information.
In fiscal 2013, we paid Michael C. Ruettgers, a non-employee director, $2.6 million for vested performance units which he held under our 2009 Plan based on a per unit value equal to the IPO price of $19.00 per share, less the $0.15 base price. Each performance unit represented a contractual right to receive a payment upon a “Change of Control,” which included the completion of the IPO, based on the value of one share of our common stock, less a per unit base price of $0.15. The performance units held by Mr. Ruettgers vested in full upon the completion of the IPO.
In fiscal 2013, we paid Kenneth A. Goldman, a non-employee director, $1.3 million for vested performance units which he held under our 2009 Plan based on a per unit value equal to the IPO price of $19.00 per share, less the $0.15 base price. Each performance unit represented a contractual right to receive a payment upon a “Change of Control,” which included the completion of the IPO, based on the value of one share of our common stock, less a per unit base price of $0.15. The performance units held by Mr. Goldman vested in full upon the completion of the IPO.
In fiscal 2013, we paid Paul A. Hooper, our chief executive officer, $1.2 million for vested performance units which he held under our 2009 Plan based on a per unit value equal to the IPO price of $19.00 per share, less the $0.15 base price. Each performance unit represented a contractual right to receive a payment upon a “Change of Control,” which included the completion of the IPO, based on the value of one share of our common stock, less a per unit base price of $0.15. The performance units held by Mr. Hooper vested in full upon the completion of the IPO.
In fiscal 2013, we paid Michael T. Hoffman, our vice president of worldwide sales, $0.9 million for vested performance units which he held under our 2009 Plan based on a per unit value equal to the IPO price of $19.00 per share, less the $0.15 base price. Each performance unit represented a contractual right to receive a payment upon a “Change of Control,” which included the completion of the IPO, based on the value of one share of our common stock, less a per unit base price of $0.15. The performance units held by Mr. Hoffman vested in full upon the completion of the IPO.
Other than as described above, since January 1, 2013, we have not entered into any transactions, nor are there any currently proposed transactions, between us and a related party where the amount involved exceeds, or would exceed, $120,000, and in which any related person had or will have a direct or indirect material interest. We believe the terms of the transactions described above were comparable to terms we could have obtained in arm’s-length dealings with unrelated third parties.
132
Limitation of Liability and Indemnification of Officers and Directors
Our amended and restated certificate of incorporation and amended and restated bylaws provide that we will indemnify our directors and officers, and may indemnify our employees and other agents, to the fullest extent permitted by the Delaware General Corporation Law, which prohibits our amended and restated certificate of incorporation from limiting the liability of our directors for the following:
| • | | any breach of the director’s duty of loyalty to us or to our stockholders; |
| • | | acts or omissions not in good faith or that involve intentional misconduct or a knowing violation of law; |
| • | | unlawful payment of dividends or unlawful stock repurchases or redemptions; and |
| • | | any transaction from which the director derived an improper personal benefit. |
If Delaware law is amended to authorize corporate action further eliminating or limiting the personal liability of a director, then the liability of our directors will be eliminated or limited to the fullest extent permitted by Delaware law, as so amended. Our amended and restated certificate of incorporation does not eliminate a director’s duty of care and, in appropriate circumstances, equitable remedies, such as injunctive or other forms of non-monetary relief, remain available under Delaware law. This provision also does not affect a director’s responsibilities under any other laws, such as the federal securities laws or other state or federal laws. Under our amended and restated bylaws, we are also empowered to purchase insurance on behalf of any person whom we are required or permitted to indemnify.
In addition to the indemnification required in our amended and restated certificate of incorporation and amended and restated bylaws, we have entered into an indemnification agreement with each of our directors, as well as our executive officers. These agreements provide for the indemnification of our directors, officers and some employees for certain expenses and liabilities incurred in connection with any action, suit, proceeding or alternative dispute resolution mechanism, or hearing, inquiry or investigation that may lead to the foregoing, to which they are a party, or are threatened to be made a party, by reason of the fact that they are or were a director, officer, employee, agent or fiduciary of our company, or any of our subsidiaries, by reason of any action or inaction by them while serving as an officer, director, agent or fiduciary, or by reason of the fact that they were serving at our request as a director, officer, employee, agent or fiduciary of another entity. In the case of an action or proceeding by or in the right of our company or any of our subsidiaries, no indemnification will be provided for any claim where a court determines that the indemnified party is prohibited from receiving indemnification. We believe that these charter and bylaw provisions and indemnification agreements are necessary to attract and retain qualified persons as directors and officers.
The limitation of liability and indemnification provisions in our amended and restated certificate of incorporation and amended and restated bylaws may discourage stockholders from bringing a lawsuit against directors for breach of their fiduciary duties. They may also reduce the likelihood of derivative litigation against directors and officers, even though an action, if successful, might benefit us and our stockholders. A stockholder’s investment may be harmed to the extent we pay the costs of settlement and damage awards against directors and officers pursuant to these indemnification provisions. Insofar as indemnification for liabilities arising under the Securities Act may be permitted to our directors, officers and controlling persons pursuant to the foregoing provisions, or otherwise, we have been advised that, in the opinion of the SEC, such indemnification is against public policy as expressed in the Securities Act, and is, therefore, unenforceable. There is no pending litigation or proceeding naming any of our directors or officers as to which indemnification is being sought, nor are we aware of any pending or threatened litigation that may result in claims for indemnification by any director or officer.
133
Policies and Procedures for Related Party Transactions
The audit committee has the primary responsibility for reviewing and approving or disapproving “related party transactions,” which are transactions between us and related persons in which the aggregate amount involved exceeds or may be expected to exceed $120,000 and in which a related person has or will have a direct or indirect material interest. For purposes of this policy, a related person will be defined as a director, executive officer, nominee for director, or stockholders who own greater than 5% of our outstanding common stock and their affiliates, in each case since the beginning of the most recently completed fiscal year, and their immediate family members. Our audit committee charter provides that the audit committee shall review and approve or disapprove any related party transactions.
Director Independence
See Item 10, “Directors, Executive Officers, and Corporate Governance” for information regarding director independence.
Item 14. Principal Accounting Fees and Services
Information concerning principal accountant fees and services and the audit committee’s preapproval policies and procedures appearing in the Proxy Statement under the headings “Principal Accountant Fees and Services” is incorporated herein by reference.
PART IV
Item 15. Exhibits and Financial Statement Schedules
Documents filed as part of this report are as follows:
(a) Consolidated Financial Statements
Our Consolidated Financial Statements are listed in the “Index to Consolidated Financial Statements” Under Part II, Item 8 of this report.
(b) Financial Statement Schedules
All financial statement schedules are omitted because the information called for is not required or is shown either in the consolidated financial statements or in the notes thereto.
(c) Exhibits
The documents listed in the Exhibit Index of this report are incorporated by reference or are filed with this report, in each case as indicated therein (numbered in accordance with Item 601 of Regulation S-K).
134
SIGNATURES
Pursuant to the requirements of Section 13 or 15(d) of the Securities and Exchange Act of 1934, the Registrant has duly caused this report to be signed on its behalf by the undersigned, thereunto duly authorized, on March 13, 2014.
| | |
| GIGAMON INC. |
| |
| By: | | /s/ Paul A. Hooper |
| | Paul A. Hooper |
| | Chief Executive Officer |
POWER OF ATTORNEY
Pursuant to the requirements of the Securities Act of 1933, this Annual Report on Form 10-K has been signed by the following persons in the capacities and on the dates indicated.
| | | | |
Signature | | Title | | Date |
| | |
/s/ Paul A. Hooper Paul A. Hooper | | Chief Executive Officer and Director (Principal Executive Officer) | | March 13, 2014 |
| | |
/s/ Duston M. Williams Duston M. Williams | | Chief Financial Officer (Principal Financial Officer) | | March 13, 2014 |
| | |
/s/ Ravi Narula Ravi Narula | | Controller and Chief Accounting Officer (Principal Accounting Officer) | | March 13, 2014 |
| | |
/s/ Kenneth A. Goldman Kenneth A. Goldman | | Director | | March 13, 2014 |
| | |
/s/ John Kispert John H. Kispert | | Director | | March 13, 2014 |
| | |
/s/ Patrick P. Leong Patrick P. Leong | | Director | | March 13, 2014 |
| | |
/s/ Paul J. Milbury Paul J. Milbury | | Director | | March 13, 2014 |
| | |
/s/ Corey M. Mulloy Corey M. Mulloy | | Director | | March 13, 2014 |
| | |
/s/ Michael C. Ruettgers Michael C. Ruettgers | | Director | | March 13, 2014 |
135
EXHIBIT INDEX
| | | | | | | | | | |
Exhibit
Number | | Description | | Incorporated by Reference |
| | | Form | | File No. | | Exhibit | | Filing Date |
| | | | | |
| 1.1 | | Form of Underwriting Agreement | | | | | | | | |
| | | | | |
| 2.1 | | Conversion Agreement dated as of May 31, 2013, between the registrant and the other parties thereto | | S-1/A | | 333-182662 | | 2.1 | | June 4, 2013 |
| | | | | |
| 2.2 | | Agreement and Plan of Merger dated as of May 31, 2013, between the registrant and the other parties thereto | | S-1/A | | 333-182662 | | 2.2 | | June 4, 2013 |
| | | | | |
| 2.3 | | Transfer Agreement and Plan of Reorganization dated as of May 31, 2013, between the registrant and the parties thereto | | S-1/A | | 333-182662 | | 2.3 | | June 4, 2013 |
| | | | | |
| 3.1 | | Restated Limited Liability Company Agreement dated as of January 20, 2010, between the registrant and the other parties thereto, as amended by Amendment No. 1 to Restated Limited Liability Company Agreement dated as of April 26, 2011 | | S-1 | | 333-182662 | | 3.1 | | July 13, 2012 |
| | | | | |
| 3.2 | | Amended and Restated Certificate of Incorporation of registrant, as currently in effect | | 10-Q | | 001-35957 | | 3.1 | | August 12, 2013 |
| | | | | |
| 3.3 | | Amended and Restated Bylaws of registrant, as currently in effect | | 10-Q | | 001-35957 | | 3.2 | | August 12, 2013 |
| | | | | |
| 4.1 | | Specimen common stock certificate of the registrant | | S-1/A | | 333-182662 | | 4.1 | | June 4, 2013 |
| | | | | |
| 4.2 | | Investor Rights Agreement dated as of January 20, 2010, between the registrant and the other parties thereto | | S-1 | | 333-182662 | | 4.2 | | July 13, 2012 |
| | | | | |
| 5.1* | | Opinion of Wilson Sonsini Goodrich & Rosati, P.C. | | | | | | | | |
| | | | | |
| 10.1+ | | Form of Indemnification Agreement between the registrant and its directors and officers | | S-1/A | | 333-182662 | | 10.1 | | May 29, 2013 |
| | | | | |
| 10.2+ | | 2009 Performance Unit Plan | | S-1 | | 333-182662 | | 10.2 | | July 13, 2012 |
| | | | | |
| 10.3+ | | Form of Performance Unit Grant Notice and Agreement under 2009 Performance Unit Plan | | S-1 | | 333-182662 | | 10.3 | | July 13, 2012 |
| | | | | |
| 10.4+ | | 2012 Unit Option Plan | | S-1 | | 333-182662 | | 10.4 | | July 13, 2012 |
| | | | | |
| 10.5+ | | Form of Unit Option Agreement and Restricted Stock Unit Agreement under 2012 Unit Option Plan | | S-1/A | | 333-182662 | | 10.5 | | May 1, 2013 |
136
| | | | | | | | | | |
Exhibit
Number | | Description | | Incorporated by Reference |
| | | Form | | File No. | | Exhibit | | Filing Date |
| | | | | |
| 10.6+ | | 2013 Equity Incentive Plan | | S-1/A | | 333-182662 | | 10.6 | | May 29, 2013 |
| | | | | |
| 10.7+ | | Form of Stock Option Agreement and Restricted Stock Unit Agreement under 2013 Equity Incentive Plan | | S-1/A | | 333-182662 | | 10.7 | | May 29, 2013 |
| | | | | |
| 10.8+ | | 2013 Employee Stock Purchase Plan | | S-1/A | | 333-182662 | | 10.13 | | June 7, 2013 |
| | | | | |
| 10.9+ | | Gigamon Inc. 2013 Corporate Bonus Plan | | 8-K | | 001-35957 | | 10.1 | | July 29, 2013 |
| | | | | |
| 10.10+ | | Offer Letter, between the registrant and Michael C. Ruettgers, dated November 4, 2010 | | S-1 | | 333-182662 | | 10.8 | | July 13, 2012 |
| | | | | |
| 10.11+ | | Offer Letter, between the registrant and Kenneth A. Goldman, dated February 7, 2011 | | S-1 | | 333-182662 | | 10.9 | | July 13, 2012 |
| | | | | |
| 10.12+ | | Offer Letter, between the registrant and Michael T. Hoffman, dated December 15, 2008, as amended | | S-1/A | | 333-182662 | | 10.15 | | March 25, 2013 |
| | | | | |
| 10.13+ | | Offer Letter, between the registrant and Duston M. Williams, dated February 15, 2012 | | S-1/A | | 333-182662 | | 10.16 | | March 25, 2013 |
| | | | | |
| 10.14+ | | Offer Letter, between the registrant and Paul B. Shinn, dated April 24, 2012 | | S-1/A | | 333-182662 | | 10.17 | | March 25, 2013 |
| | | | | |
| 10.15+ | | Offer Letter, between the registrant and David A. de Simone, dated September 26, 2012 | | S-1/A | | 333-182662 | | 10.18 | | March 25, 2013 |
| | | | | |
| 10.16+ | | Offer Letter, between the registrant and Paul A. Hooper, dated December 19, 2012 | | S-1/A | | 333-182662 | | 10.19 | | March 25, 2013 |
| | | | | |
| 10.17+ | | Offer Letter, between the registrant and Shehzad Merchant, dated March 8, 2013 | | S-1/A | | 333-182662 | | 10.28 | | May 1, 2013 |
| | | | | |
| 10.18+ | | Offer Letter, between the registrant and John H. Kispert, dated November 20, 2013 | | 8-K | | 001-35957 | | 10.1 | | December 12, 2013 |
| | | | | |
| 10.19+ | | Offer Letter, between the registrant and Paul J. Milbury, dated January 10, 2014 | | S-1/A | | 001-35957 | | 10.1 | | January 30, 2014 |
| | | | | |
| 10.20+ | | Change in Control Severance Agreement, between registrant and Paul A. Hooper, dated September 17, 2012, as amended | | S-1/A | | 333-182662 | | 10.20 | | March 25, 2013 |
| | | | | |
| 10.21+ | | Change in Control Severance Agreement, between registrant and Michael T. Hoffman, dated September 17, 2012, as amended | | S-1/A | | 333-182662 | | 10.21 | | March 25, 2013 |
| | | | | |
| 10.22+ | | Change in Control Severance Agreement, between registrant and David A. de Simone, dated October 31, 2012 | | S-1/A | | 333-182662 | | 10.22 | | March 25, 2013 |
137
| | | | | | | | | | |
Exhibit
Number | | Description | | Incorporated by Reference |
| | | Form | | File No. | | Exhibit | | Filing Date |
| | | | | |
| 10.23+ | | Change in Control Severance Agreement, between registrant and Paul B. Shinn, dated March 11, 2013 | | S-1/A | | 333-182662 | | 10.23 | | March 25, 2013 |
| | | | | |
| 10.24+ | | Change in Control Severance Agreement, between registrant and Patrick P. Leong, dated March 14, 2013 | | S-1/A | | 333-182662 | | 10.24 | | March 25, 2013 |
| | | | | |
| 10.25+ | | Change in Control Severance Agreement, between registrant and Thomas K.Y. Cheung, dated March 19, 2013 | | S-1/A | | 333-182662 | | 10.25 | | March 25, 2013 |
| | | | | |
| 10.26+ | | Change in Control Severance Agreement, between registrant and Shehzad Merchant, dated April 29, 2013 | | S-1/A | | 333-182662 | | 10.29 | | May 1, 2013 |
| | | | | |
| 10.27+ | | Advisor Agreement, between registrant and Ted C. Ho, dated February 16, 2013 | | S-1/A | | 333-182662 | | 10.26 | | March 25, 2013 |
| | | | | |
| 10.28+ | | Option Remediation Agreement, between registrant and Michael T. Hoffman, dated August 17, 2012 | | S-1/A | | 333-182662 | | 10.27 | | March 25, 2013 |
| | | | | |
| 10.29 | | Commercial/Industrial Lease dated as of May 21, 2010, between the registrant and LBA Realty Fund II-WBP II, LLC | | S-1 | | 333-182662 | | 10.11 | | July 13, 2012 |
| | | | | |
| 10.30 | | Sublease dated as of July 2, 2013 between the registrant and Palo Alto Networks, Inc., as amended | | 10-Q | | 001-35957 | | 10.1 | | August 12, 2013 |
| | | | | |
| 10.31† | | Distribution Agreement dated as of December 28, 2010, between the registrant and Interlink Communication Systems, Inc., as amended | | S-1/A | | 333-182662 | | 10.12 | | March 25, 2013 |
| | | | | |
| 10.32† | | Loan and Security Agreement dated as of April 29, 2011, between the registrant and Silicon Valley Bank, as amended | | S-1/A | | 333-182662 | | 10.14 | | May 29, 2013 |
| | | | | |
| 10.33† | | License and Services Agreement dated as of November 12, 2009, between the registrant and Tall Maple Systems, Inc. | | S-1/A | | 333-182662 | | 10.30 | | May 1, 2013 |
| | | | | |
| 10.34+* | | Manufacturing Services Agreement dated as of April 29, 2013, between the registrant and Jabil Circuit, Inc. | | S-1/A | | 333-182662 | | 10.31 | | June 7, 2013 |
| | | | | |
| 10.35+* | | Consulting Agreement, between registrant and Ted C. Ho, dated September 25, 2013 | | | | | | | | |
| | | | | |
| 21.1 | | List of subsidiaries of registrant | | S-1 | | 333-182662 | | 21.1 | | July 13, 2012 |
| | | | | |
| 23.1 | | Consent of PricewaterhouseCoopers LLP, Independent Registered Public Accounting Firm | | | | | | | | |
138
| | | | | | | | | | |
Exhibit
Number | | Description | | Incorporated by Reference |
| | | Form | | File No. | | Exhibit | | Filing Date |
| | | | | |
| 23.2* | | Consent of Wilson Sonsini Goodrich & Rosati, P.C. (included in Exhibit 5.1) | | | | | | | | |
| | | | | |
| 24.1* | | Power of Attorney (see page II-7 of the registration statement on Form S-1 filed on October 4, 2013) | | | | | | | | |
| | | | | |
| 31.1 | | Certification of Chief Executive Officer pursuant to Rule 13a-14 (a) of the Securities Exchange Act of 1934 | | | | | | | | |
| | | | | |
| 31.2 | | Certification of Chief Financial Officer pursuant to Rule 13a-14 (a) of the Securities Exchange Act of 1934 | | | | | | | | |
| | | | | |
| 32.1 | | Certification of Chief Executive Officer pursuant to Section 906 of the Sarbanes-Oxley Act of 2002 | | | | | | | | |
| | | | | |
| 32.2 | | Certification of Chief Financial Officer pursuant to Section 906 of the Sarbanes-Oxley Act of 2002 | | | | | | | | |
| | | | | |
| 101.INS** | | XBRL Instance Document | | | | | | | | |
| | | | | |
| 101.SCH** | | XBRL Taxonomy Extension Schema Document | | | | | | | | |
| | | | | |
| 101.CAL** | | XBRL Taxonomy Extension Calculation Linkbase Document | | | | | | | | |
| | | | | |
| 101.DEF** | | XBRL Taxonomy Extension Definition Linkbase Document | | | | | | | | |
| | | | | |
| 101.LAB** | | XBRL Taxonomy Extension Labels Linkbase Document | | | | | | | | |
| | | | | |
| 101.PRE** | | XBRL Taxonomy Extension Presentation Linkbase Document | | | | | | | | |
| + | Indicates a management contract or compensatory plan. |
| † | Registrant has omitted portions of the relevant exhibit and filed such exhibit separately with the Securities and Exchange Commission pursuant to a grant of confidential treatment under Rule 406 promulgated under the Securities Act. |
| ** | XBRL (Extensible Business Reporting Language) information is furnished and not filed or a part of a registration statement or prospectus for purposes of sections 11 or 12 of the Securities Act of 1933, as amended, is deemed not filed for purposes of section 18 of the Securities Exchange Act of 1934, as amended, and is otherwise not subject to liability under these sections. |
139