Outset Medical Investor Presentation November 2023
Forward-looking statements and non-GAAP information This presentation and the accompanying oral statements contain forward-looking statements within the meaning of the federal securities laws. All statements other than statements of historical fact are forward-looking statements. In some cases, you can identify forward-looking statements by terminology such as “may,” “will,” “should,” “could,” “expect,” “plan,” anticipate,” “believe,” “estimate,” “predict,” “intend,” “potential,” “would,” “continue,” “ongoing” or the negative of these terms or similar expressions. Forward-looking statements are based on management’s current assumptions and expectations of future events and trends, which affect or may affect our business, strategy, operations or financial performance, and actual results and other events may differ materially from those expressed or implied in such statements due to numerous risks and uncertainties. These forward-looking statements include, but are not limited to, statements about the Company’s possible or assumed future results of operations and financial position, including expectations regarding projected revenues, and revenue growth rate, gross margin (including non-GAAP gross margin), operating expenses, capital expenditures, cash burn, profitability and outlook, statements regarding our overall business strategy, expectations regarding future projected installed base, plans and objectives of management, our expectations regarding the market sizes and growth potential for Tablo and the total addressable market opportunities for Tablo, our planned expansion within the home hemodialysis market and expected drivers of home dialysis adoption, continued execution of our initiatives designed to expand gross margins, our ability to respond to and resolve any reports, observations or other actions by the Food and Drug Administration (FDA) and other regulators in a timely and effective manner, as well as our expectations regarding the impact of macroeconomic factors on us, our customers and our suppliers. Forward-looking statements are inherently subject to risks and uncertainties, some of which cannot be predicted or quantified, which could cause actual results to differ materially from those expressed or implied in these forward-looking statements. These risks and uncertainties include: our future financial performance, including our expectations regarding our revenues, cost of revenues, operating expenses, gross margin and our ability to achieve and maintain future profitability; continued execution of our initiatives designed to expand gross margins; our ability to attain market acceptance among providers and patients; our ability to manage our growth; our expansion into the home hemodialysis market; our ability to ensure strong product performance and reliability; our relations with third-party suppliers, including contract manufacturers and single source suppliers; our ability to overcome manufacturing disruptions; the impact of epidemics, natural or man-made disasters, and similar events, on our industry, business and results of operations; our ability to offer high-quality support for Tablo; our expectations of the sizes of the markets for Tablo; our ability to innovate and improve Tablo; our ability to effectively manage privacy, information and data security; concentration of our revenues in a single product and concentration of a large percentage of our revenues from a limited number of customers; our ability to compete effectively; our ability to accurately forecast customer demand and manage our inventory; our ability to ensure the proper training and use of Tablo; our compliance with FDA and other regulations applicable to our products and business operations and our ability to respond to and resolve any reports, observations or other actions by the FDA or other regulators in a timely and effective manner; as well as other risks and uncertainties described in the Risk Factors section of our public filings with the SEC, including our most recent Annual Report on Form 10-K and Quarterly Reports on Form 10-Q filed with the Securities and Exchange Commission. Forward-looking statements should be considered in light of these risks and uncertainties, and you should not rely on these forward-looking statements as predictions of future events. These forward-looking statements speak only as of their date and we undertake no obligation to publicly update or revise any forward-looking statement, whether as a result of new information, future developments or otherwise. This presentation and the accompanying oral presentation also contain statistical data, estimates and forecasts that are based on independent industry publications or other publicly available information, as well as other information based on our internal sources. This information involves many assumptions and limitations, and you are cautioned not to give undue weight to such information. We have not independently verified the accuracy or completeness of the information contained in the industry publications and other publicly available information. Accordingly, we make no representations as to the accuracy or completeness of that information nor do we undertake to update such information after the date of this presentation. In addition to financial information presented in accordance with U.S. generally accepted accounting principles ("GAAP"), this presentation and the accompanying oral statements include certain non-GAAP financial measures, which may include Non- GAAP gross profit/loss, gross margin, operating expenses, net income/loss, and basic and diluted net income/loss per share. Any non-GAAP measure is presented for supplemental informational purposes only and should not be considered a substitute for or superior to financial information presented in accordance with GAAP. There are limitations related to the use of non-GAAP financial measures because they are not prepared in accordance with GAAP, may exclude significant expenses required by GAAP to be recognized in our financial statements, and may not be comparable to non-GAAP financial measures used by other companies. A reconciliation of these measures to the most directly comparable GAAP measures is included at the end of this presentation.
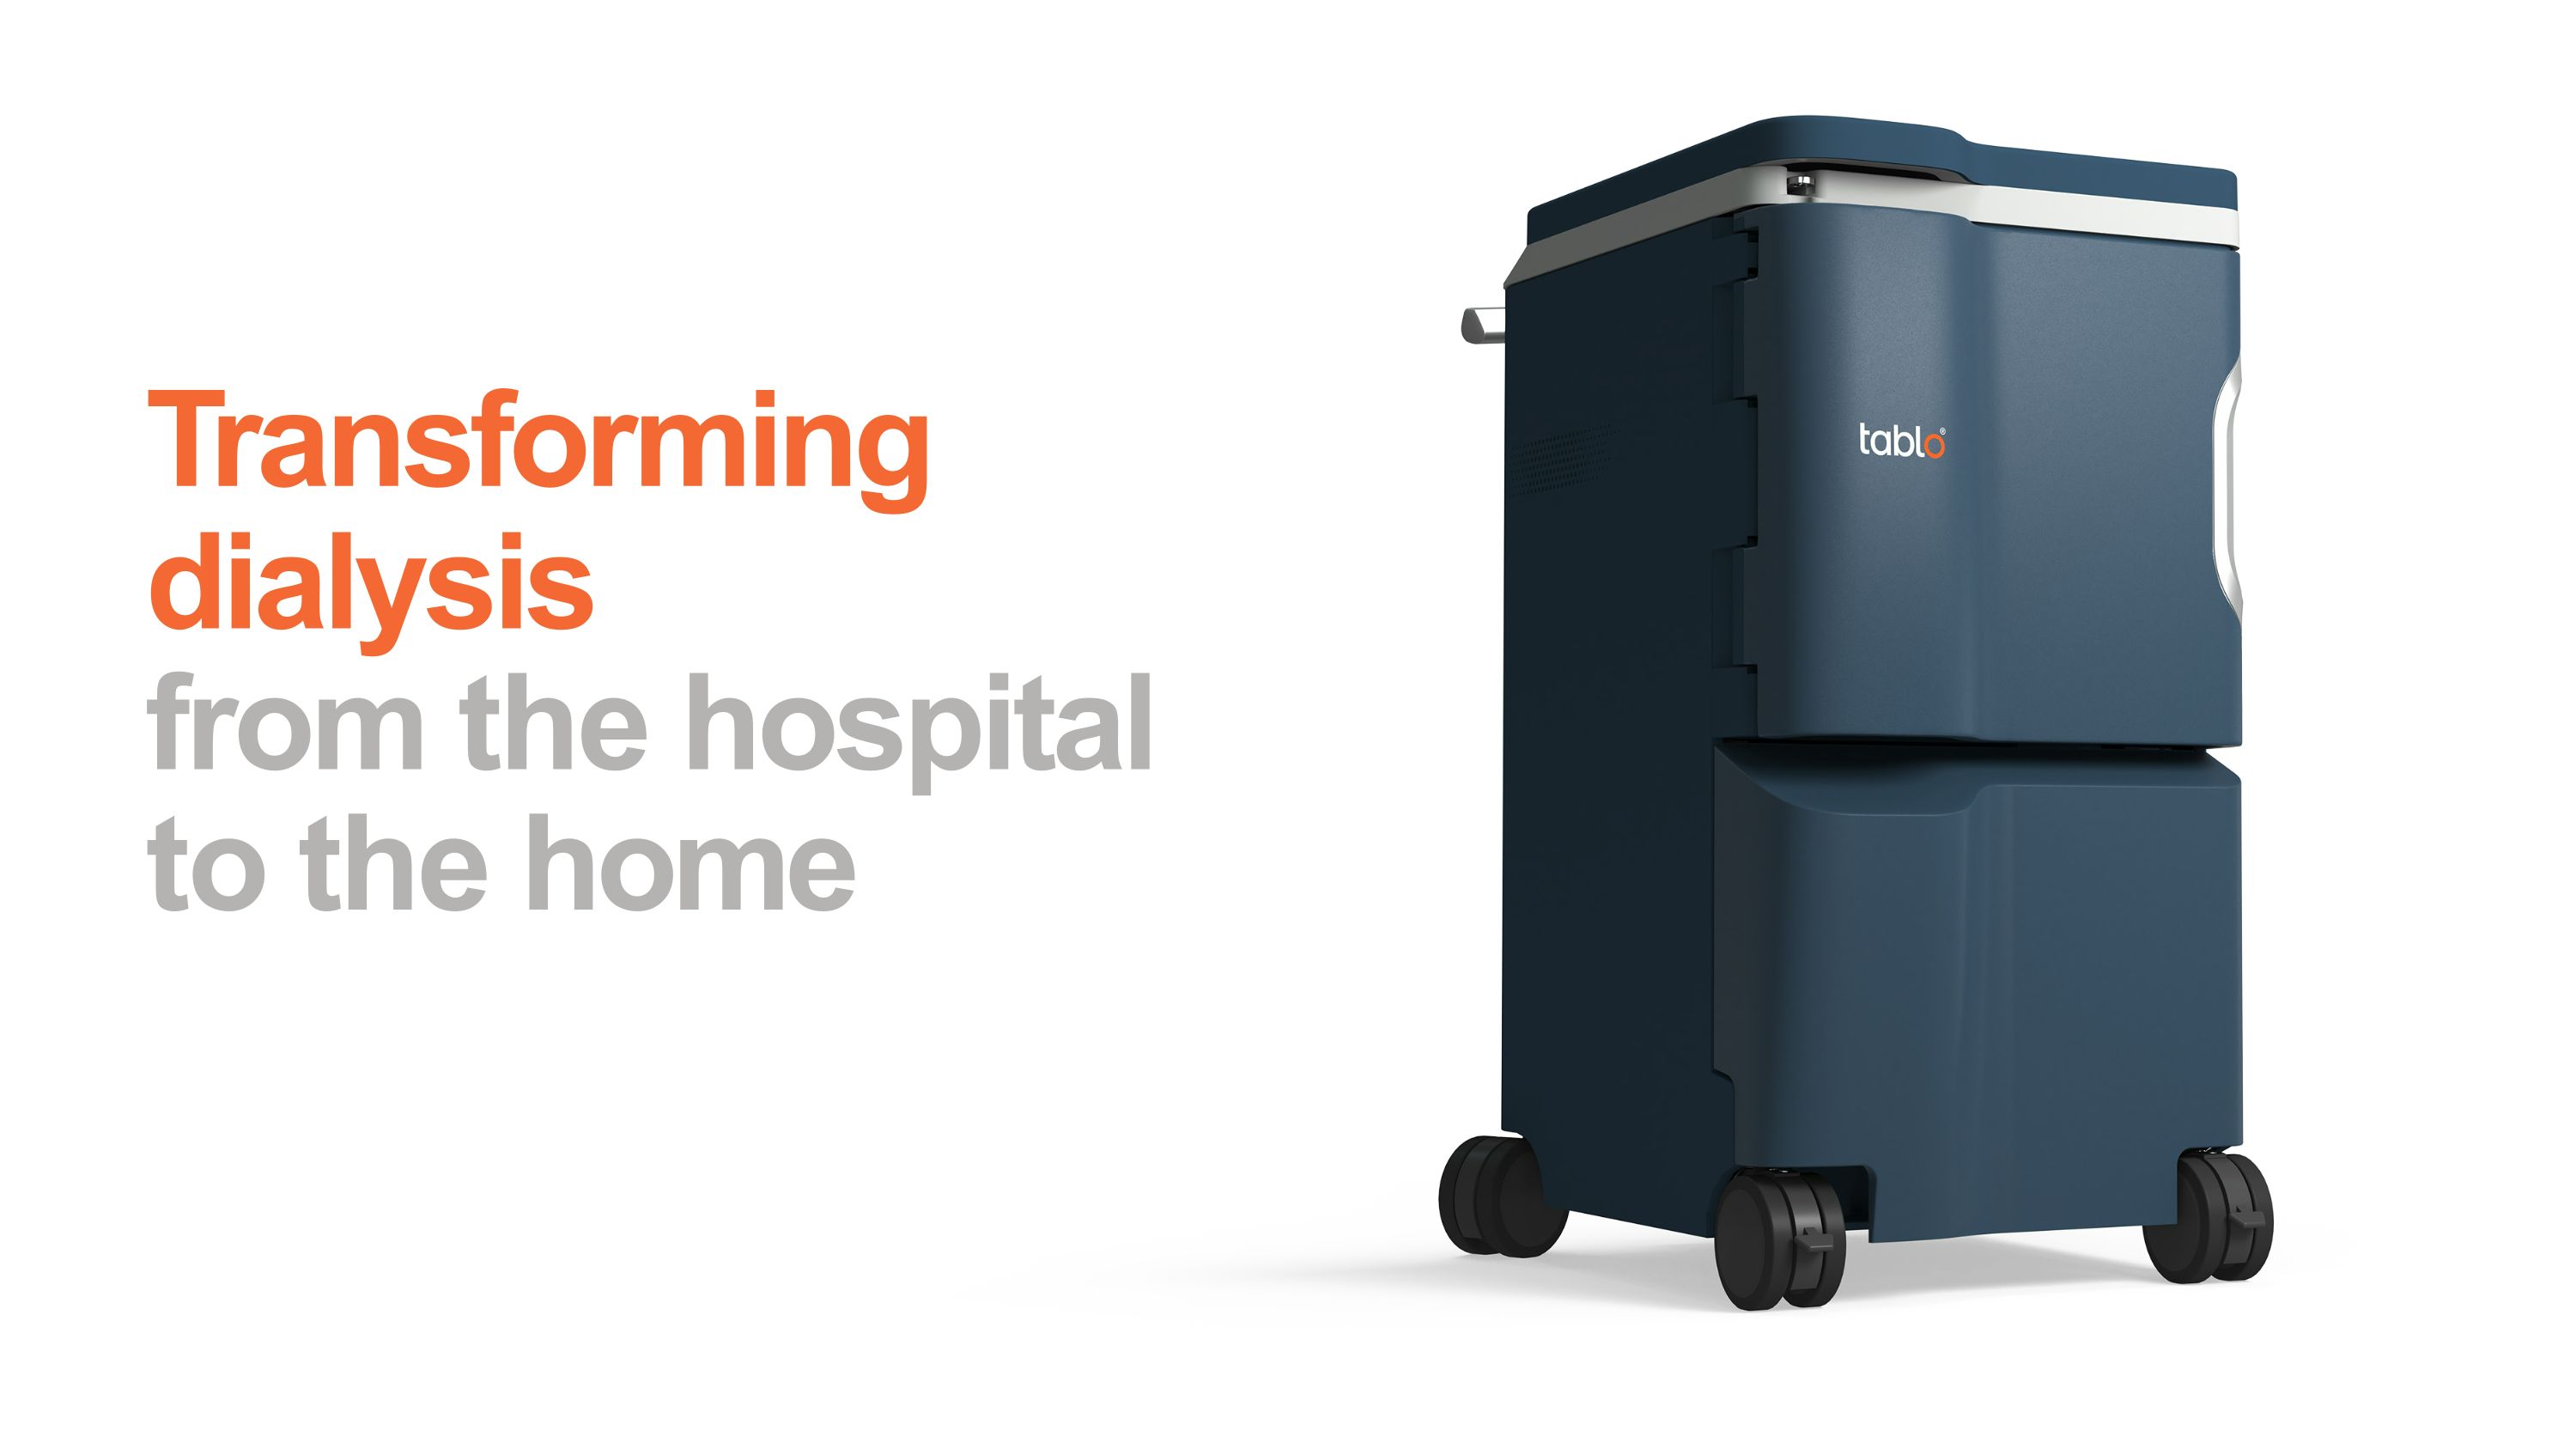
Transforming dialysis from the hospital to the home
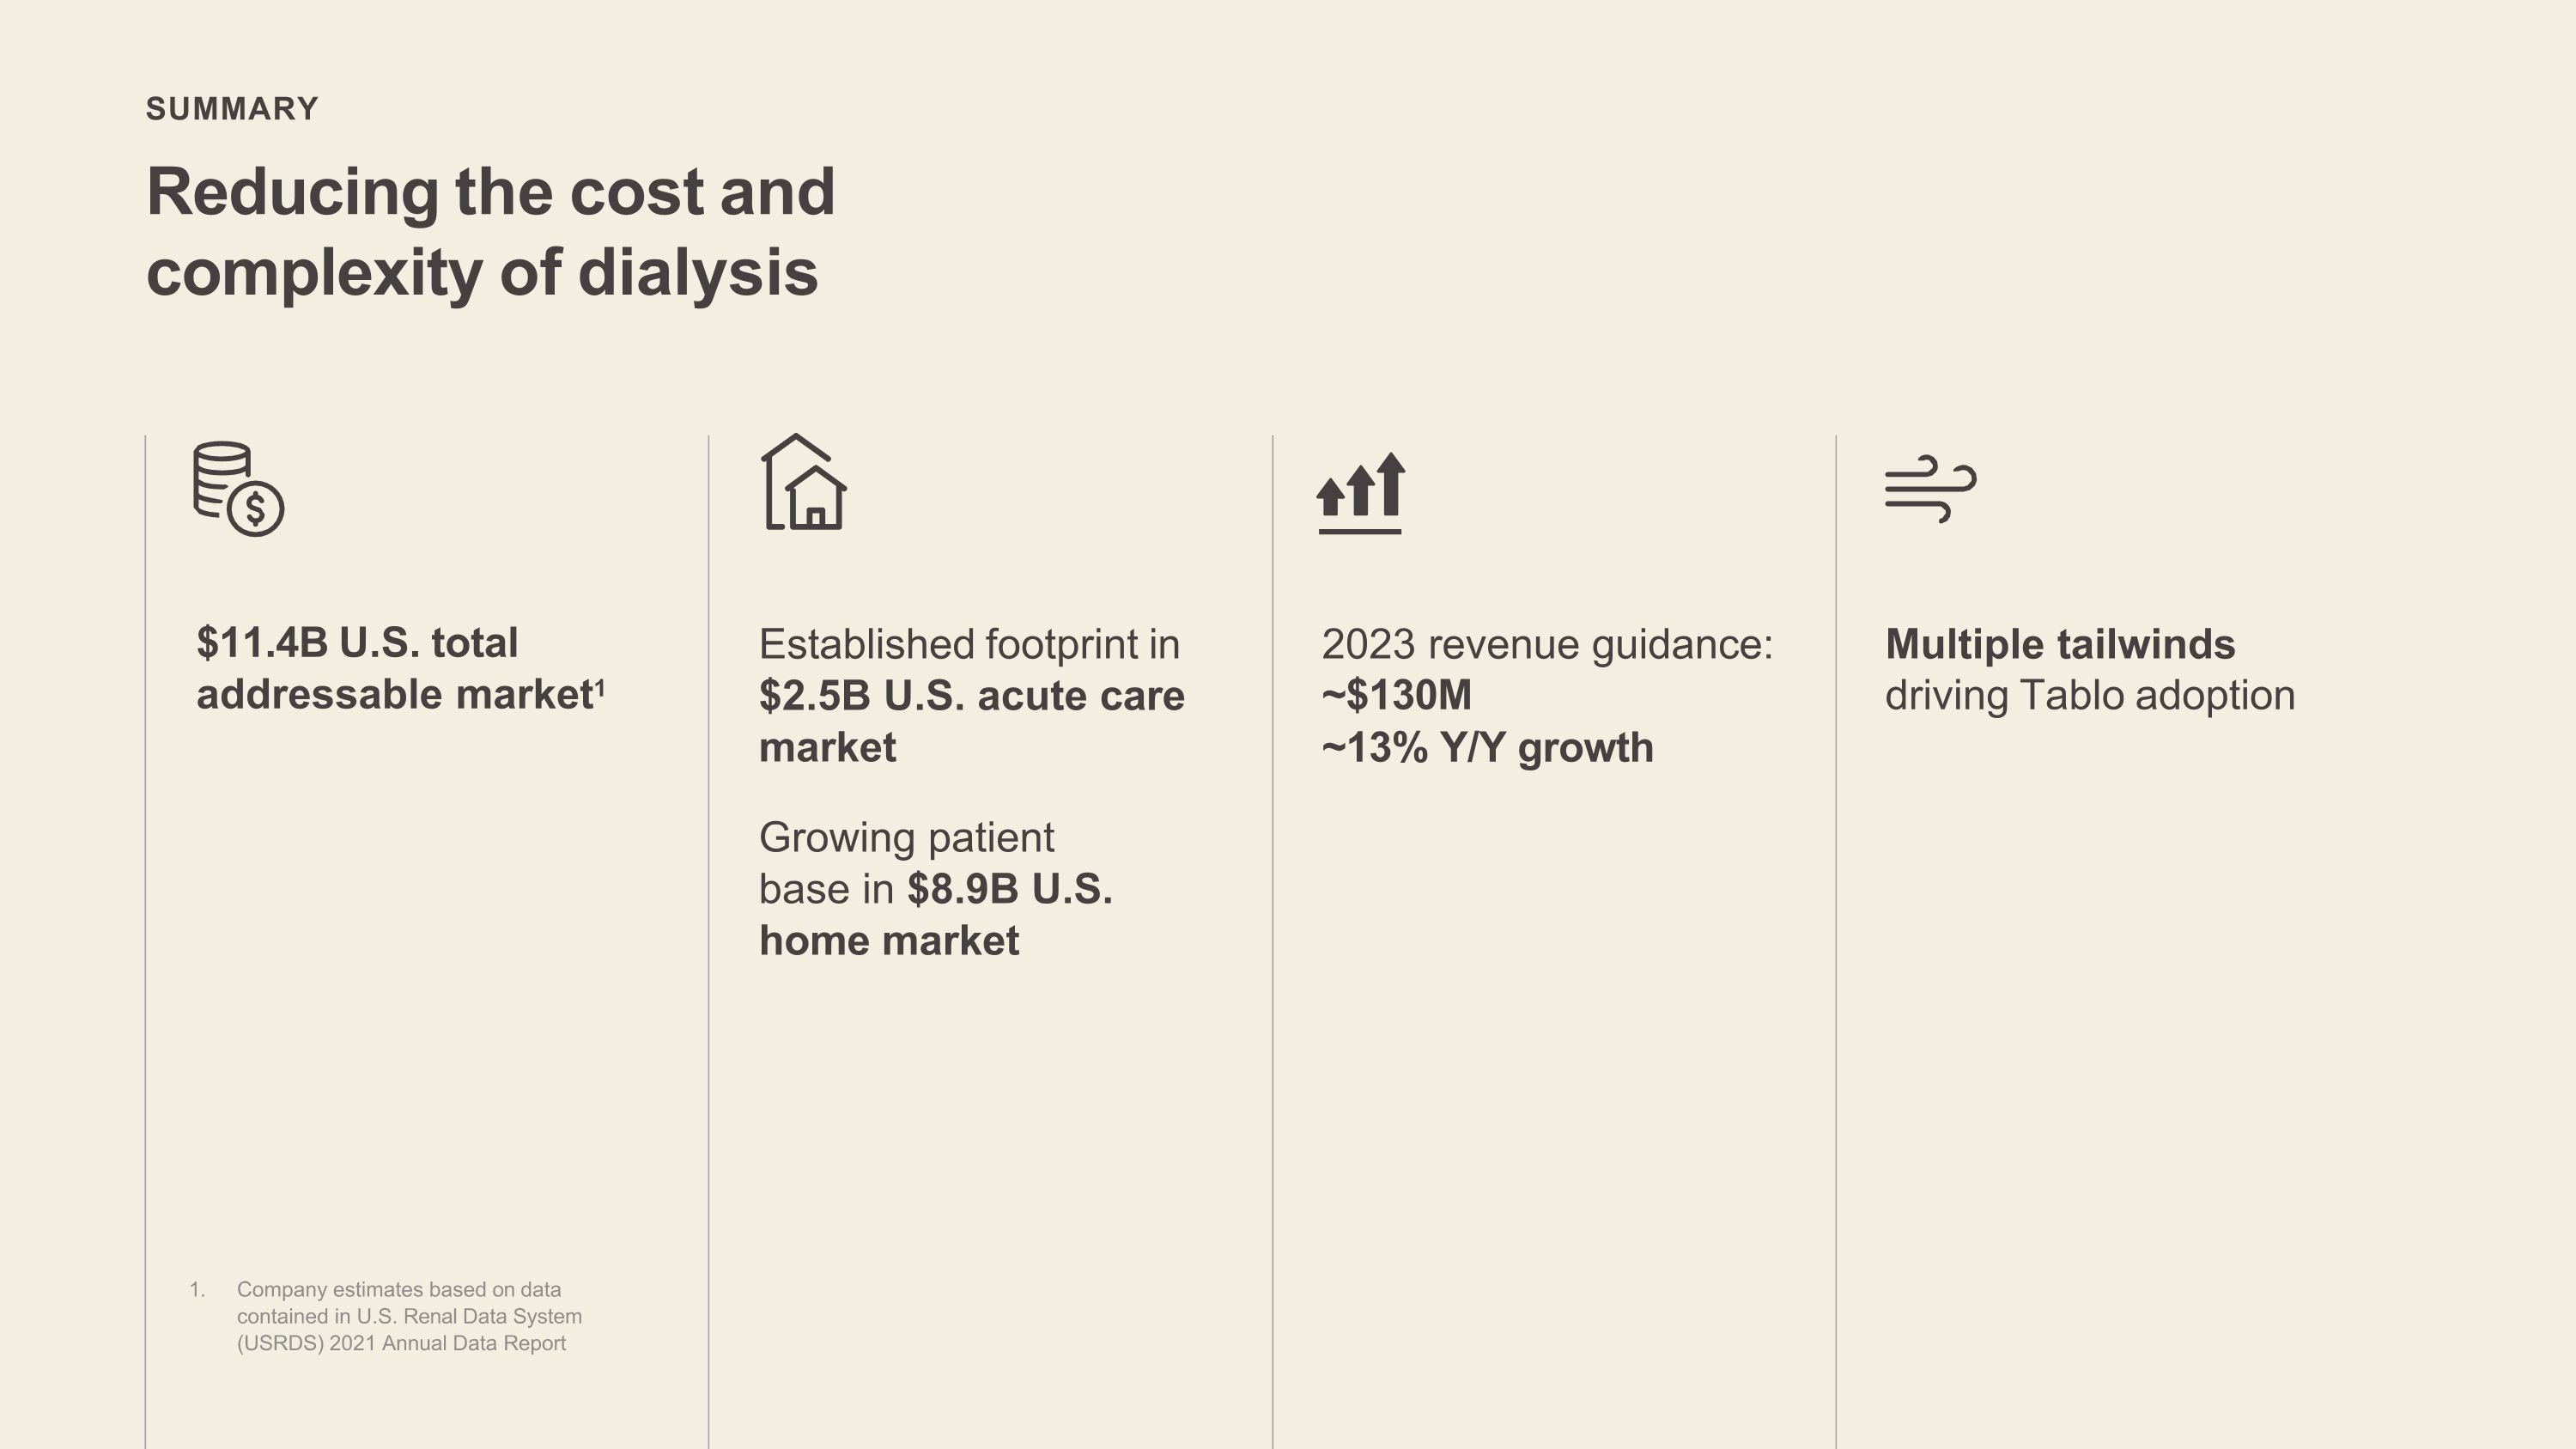
Reducing the cost and complexity of dialysis SUMMARY Established footprint in $2.5B U.S. acute care market Growing patient base in $8.9B U.S. home market $11.4B U.S. total addressable market1 1. Company estimates based on data contained in U.S. Renal Data System (USRDS) 2021 Annual Data Report 2023 revenue guidance: ~$130M ~13% Y/Y growth Multiple tailwinds driving Tablo adoption
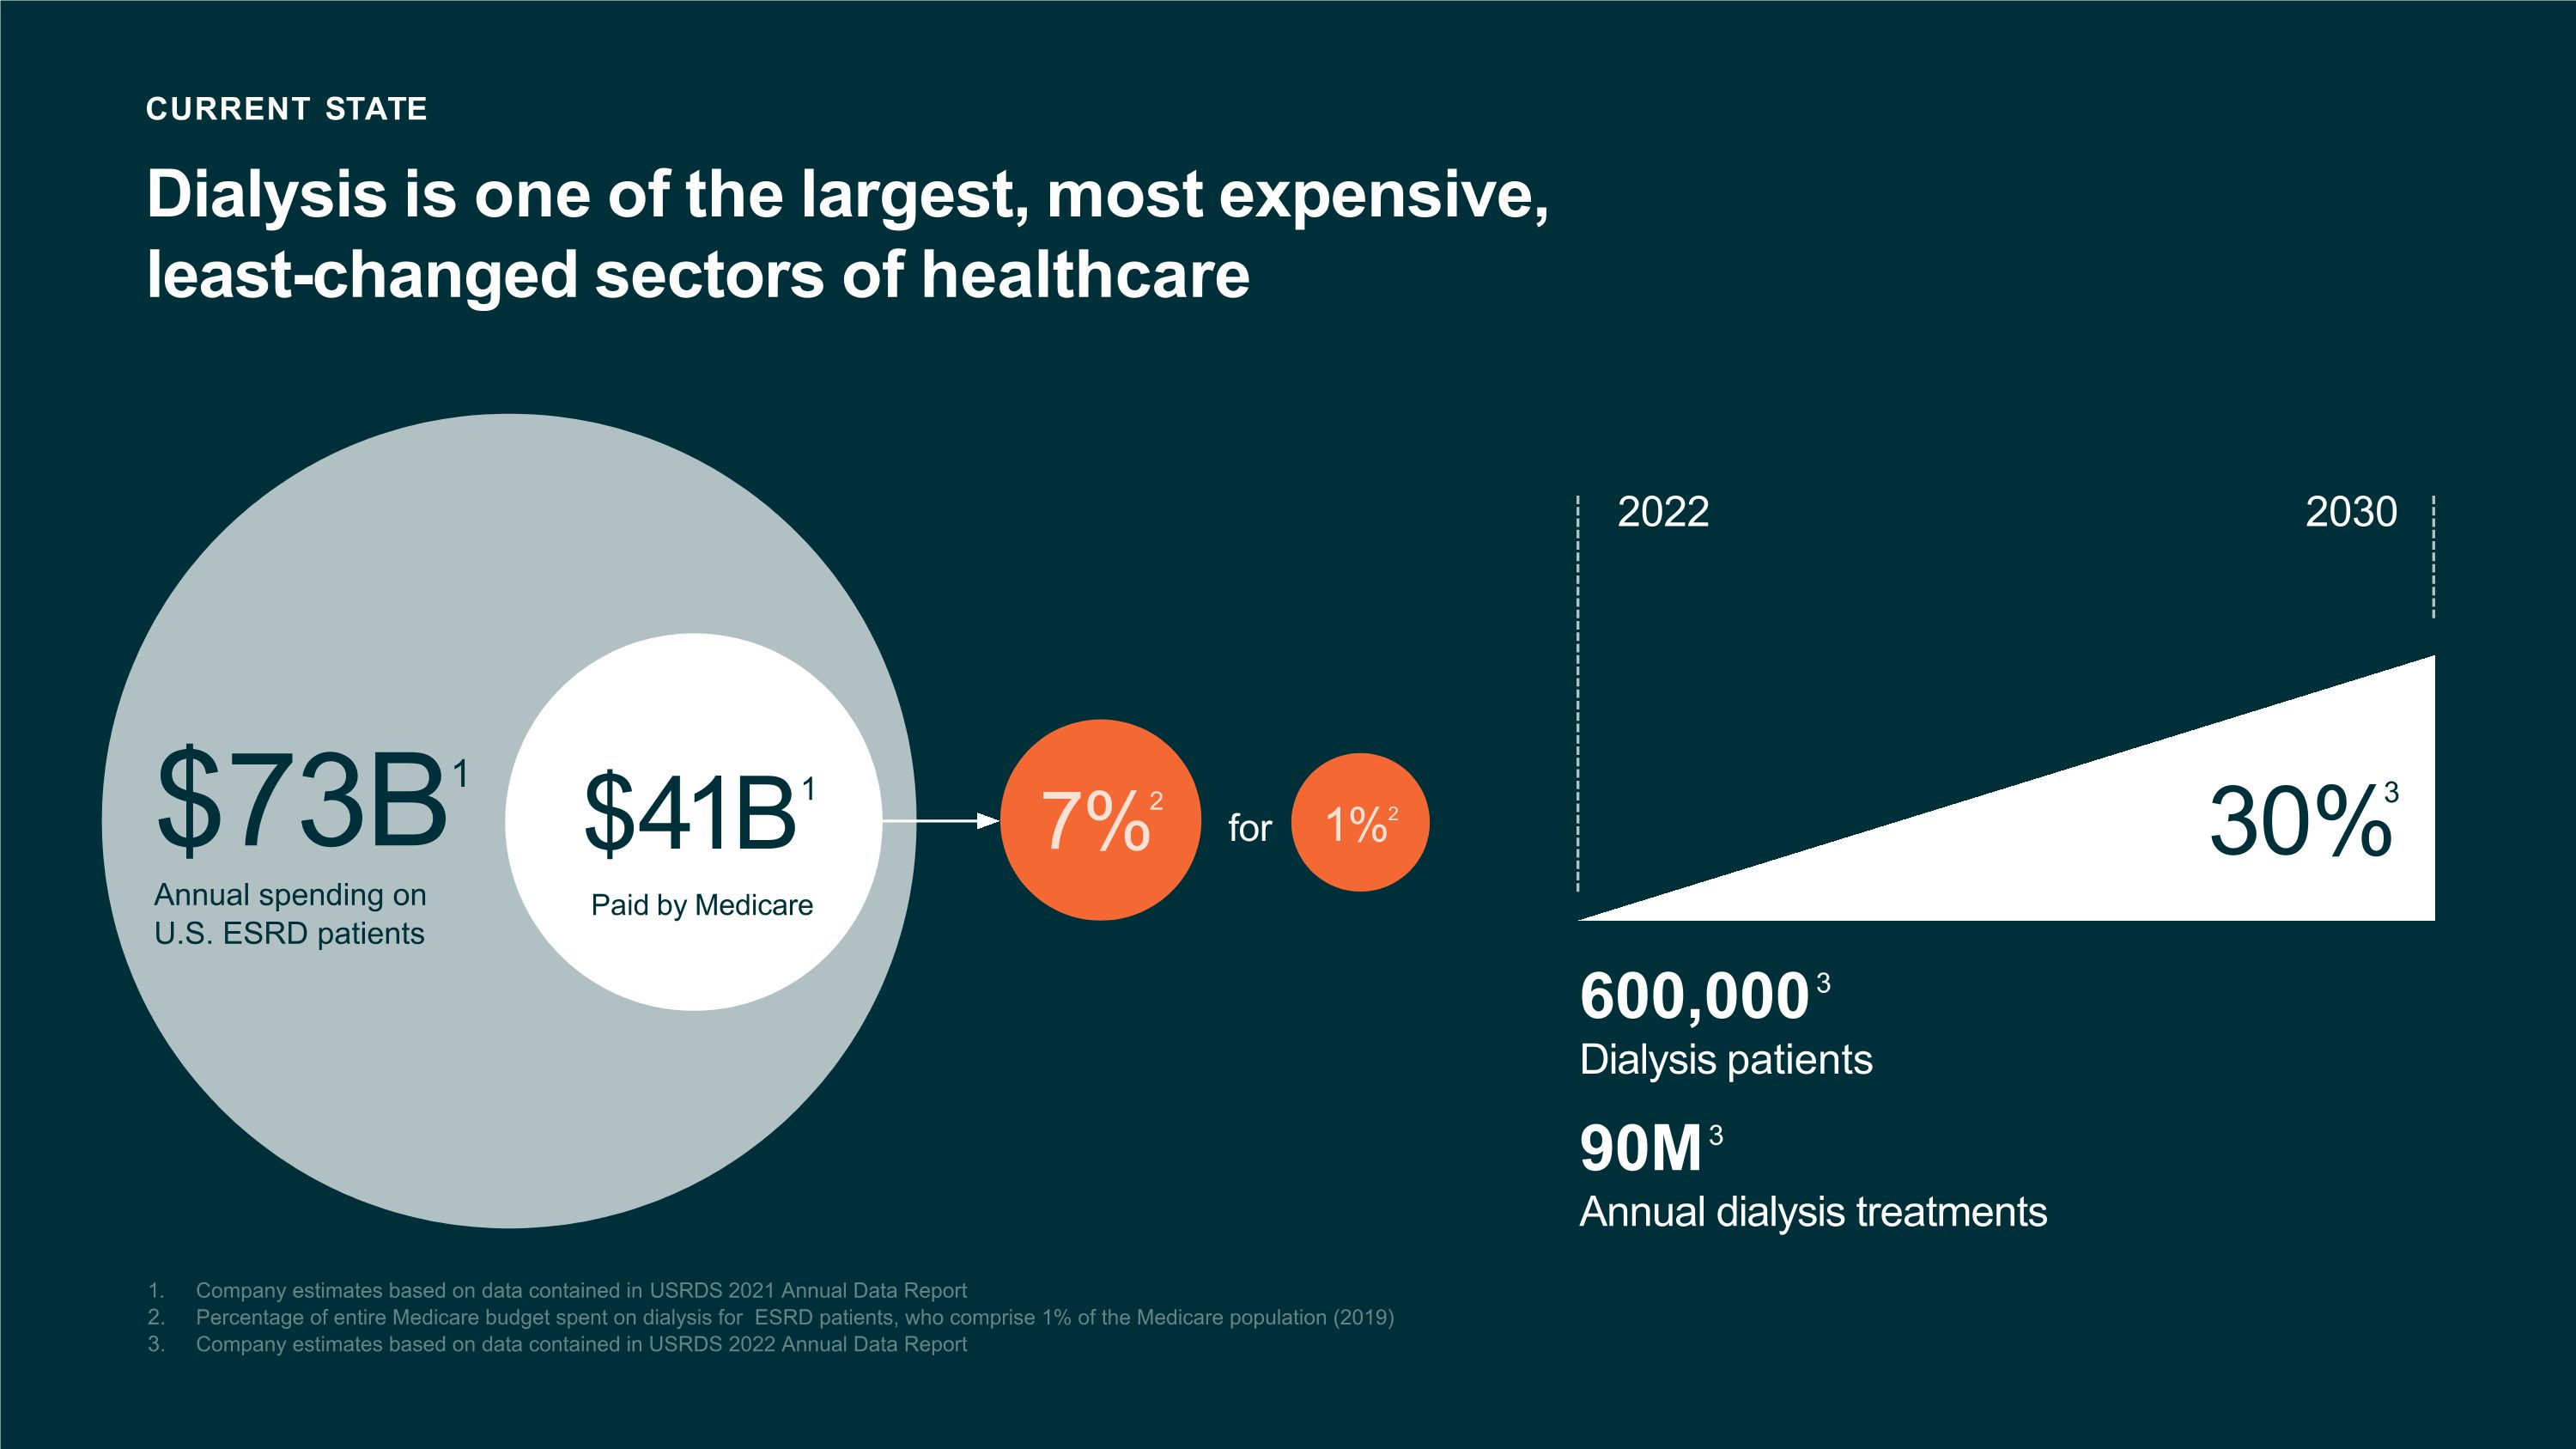
7%2 for 1%2 CURRENT STATE Dialysis is one of the largest, most expensive, least-changed sectors of healthcare $73B1 Annual spending on U.S. ESRD patients $41B1 Paid by Medicare 600,0003 Dialysis patients 90M3 Annual dialysis treatments 2022 2030 30% 1. Company estimates based on data contained in USRDS 2021 Annual Data Report Percentage of entire Medicare budget spent on dialysis for ESRD patients, who comprise 1% of the Medicare population (2019) Company estimates based on data contained in USRDS 2022 Annual Data Report 3
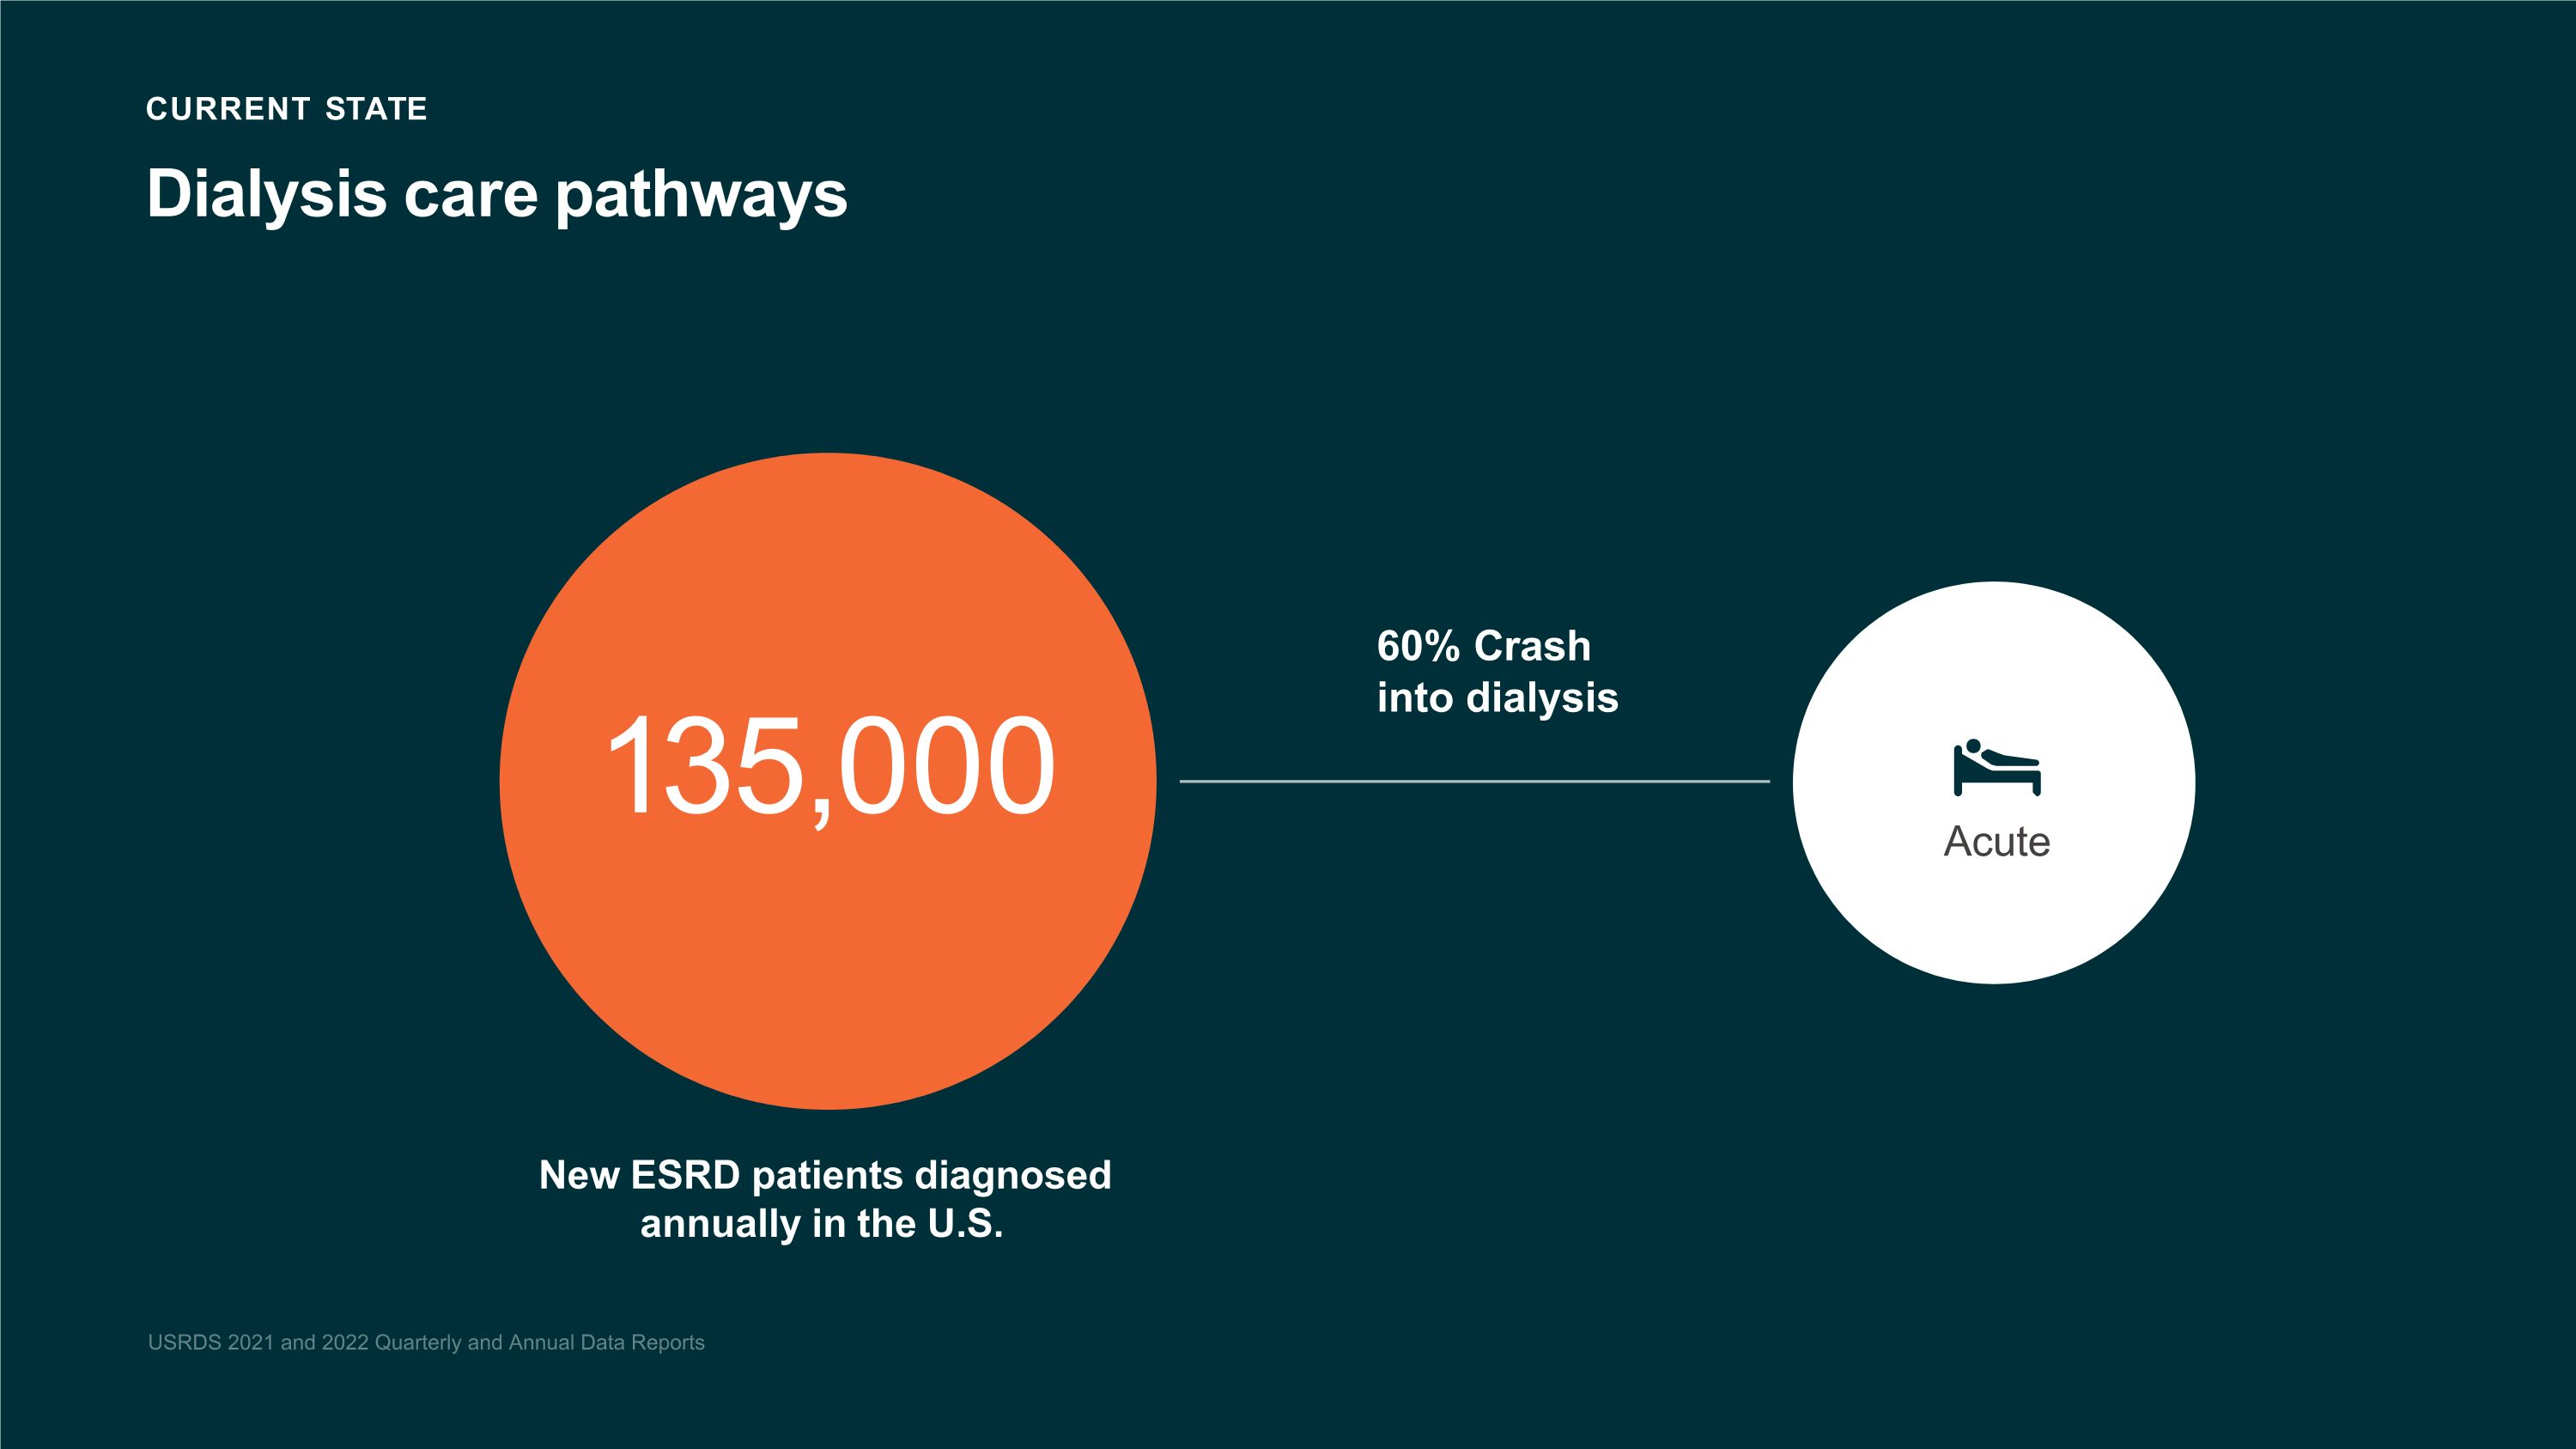
135,000 New ESRD patients diagnosed annually in the U.S. 60% Crash into dialysis Acute USRDS 2021 and 2022 Quarterly and Annual Data Reports CURRENT STATE Dialysis care pathways
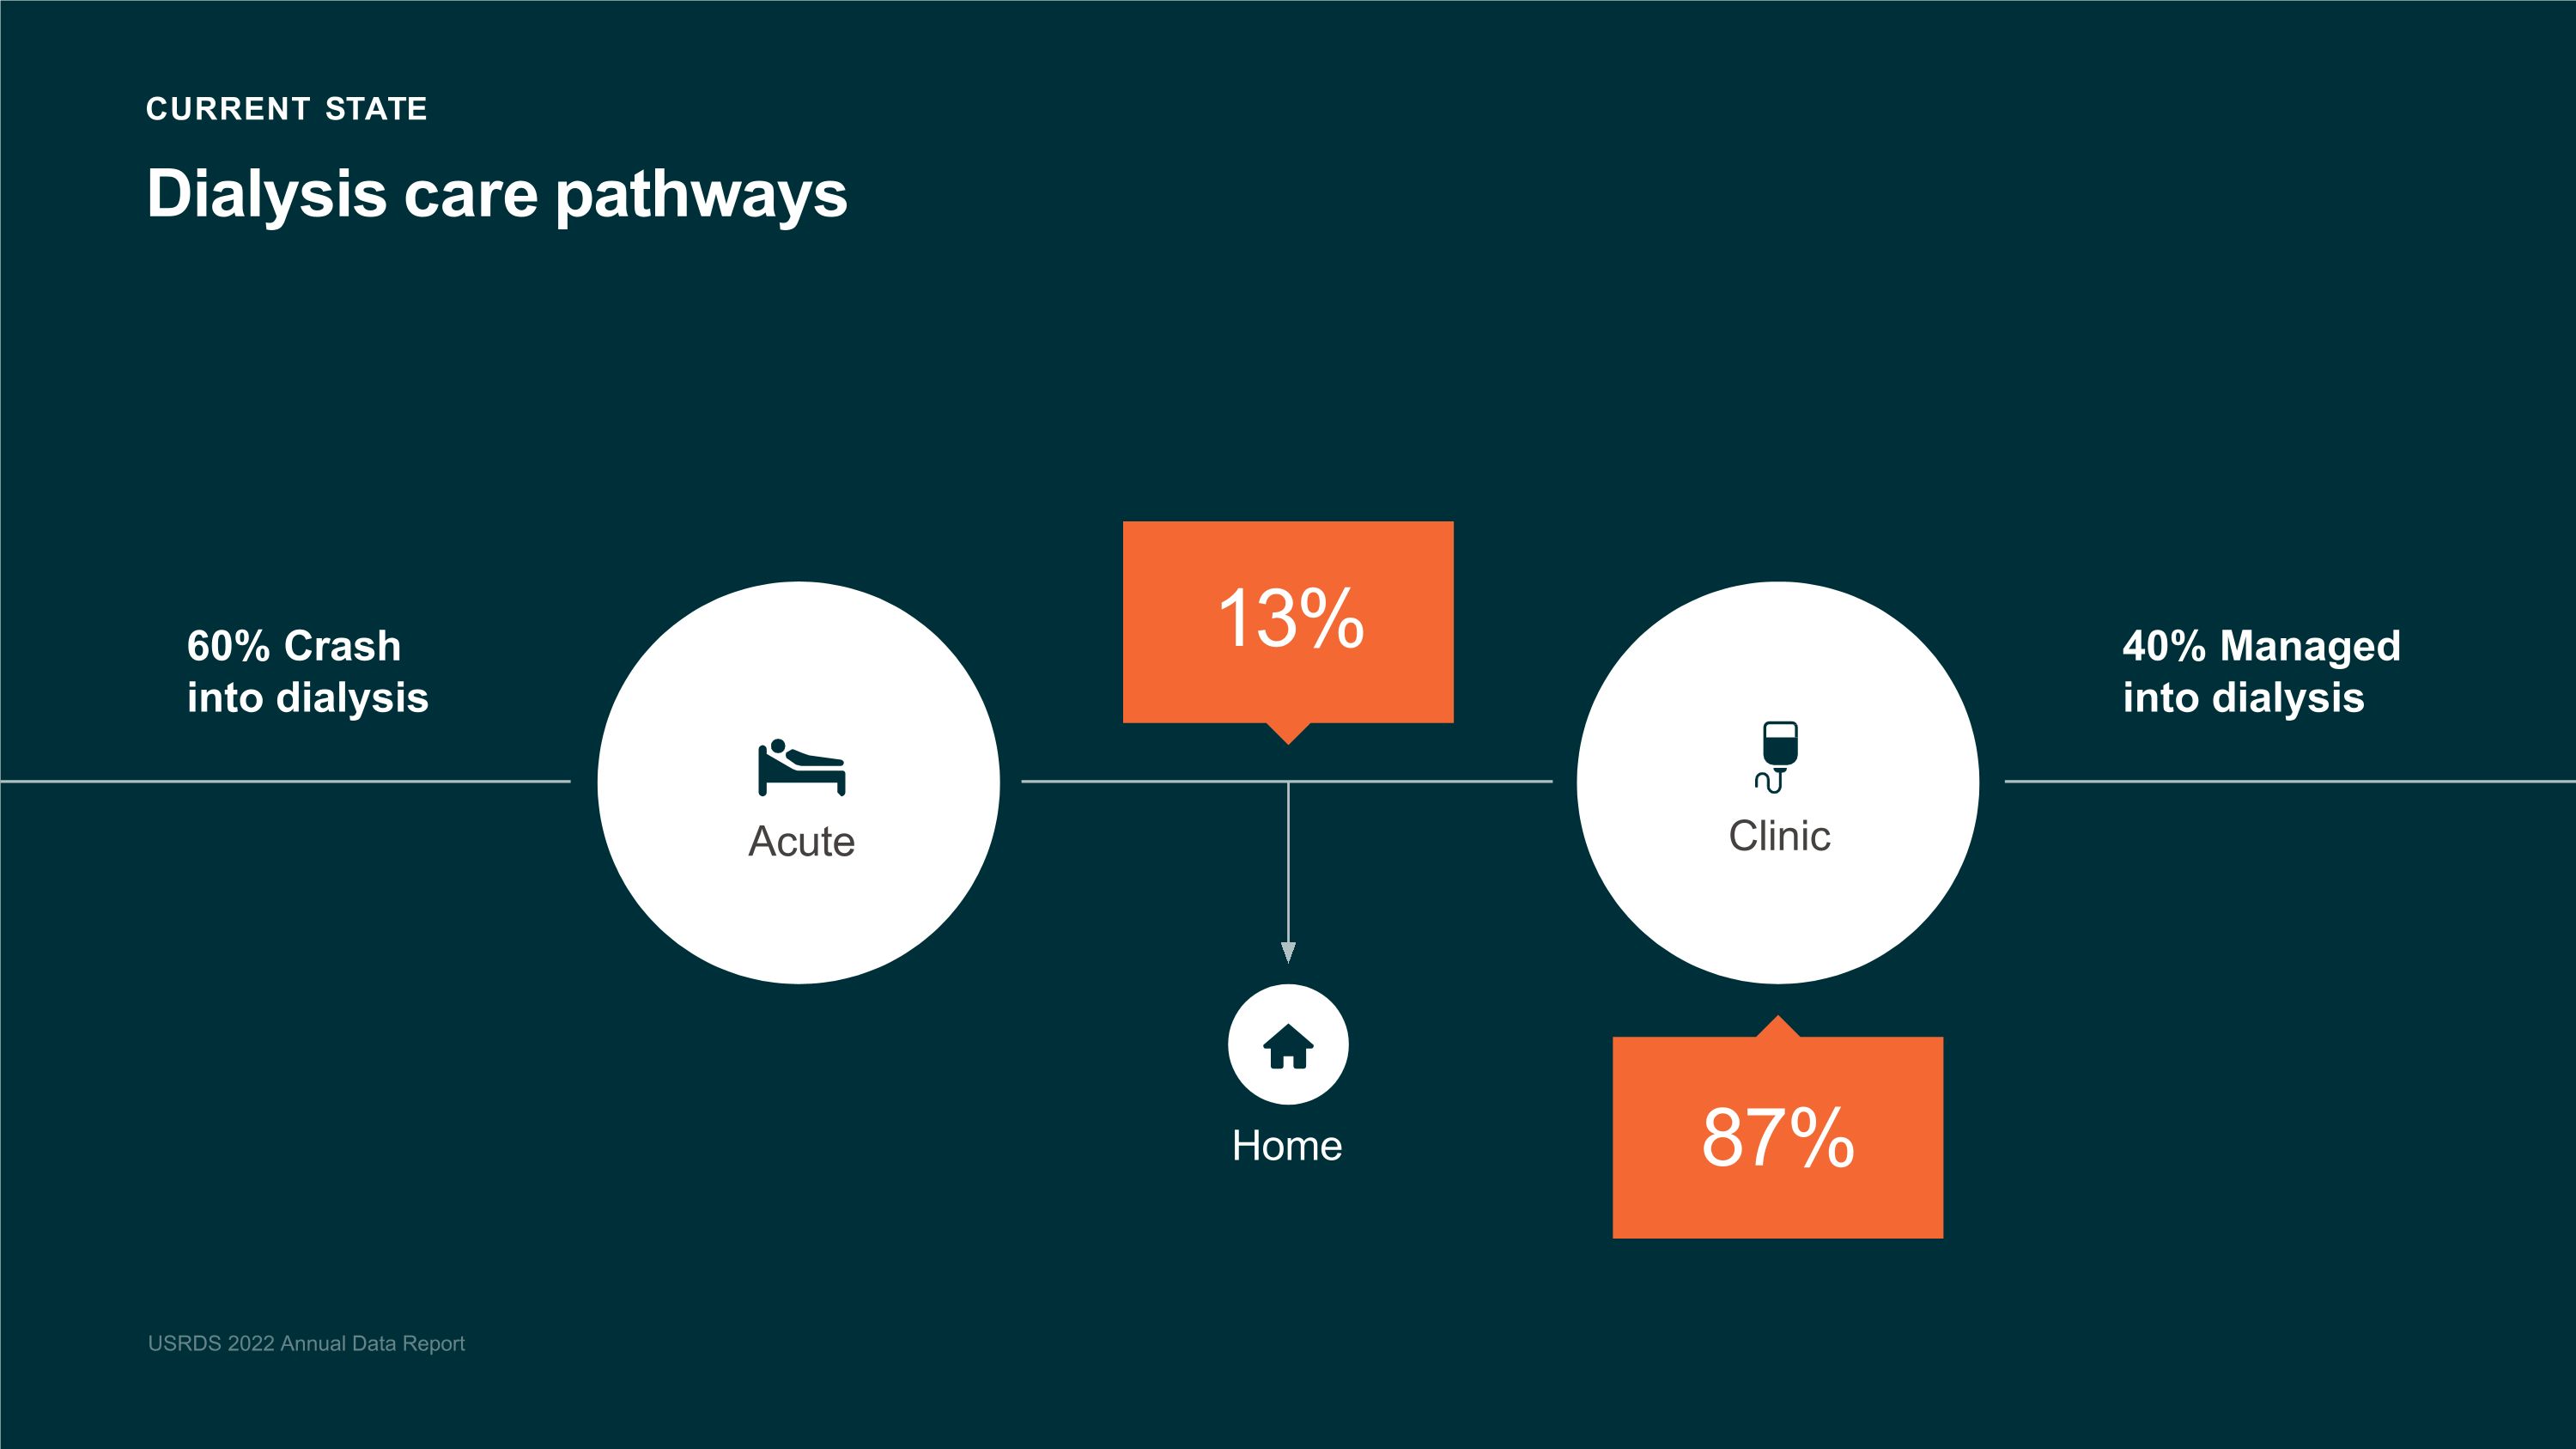
60% Crash into dialysis 40% Managed into dialysis Clinic 13% 87% Acute Home USRDS 2022 Annual Data Report CURRENT STATE Dialysis care pathways
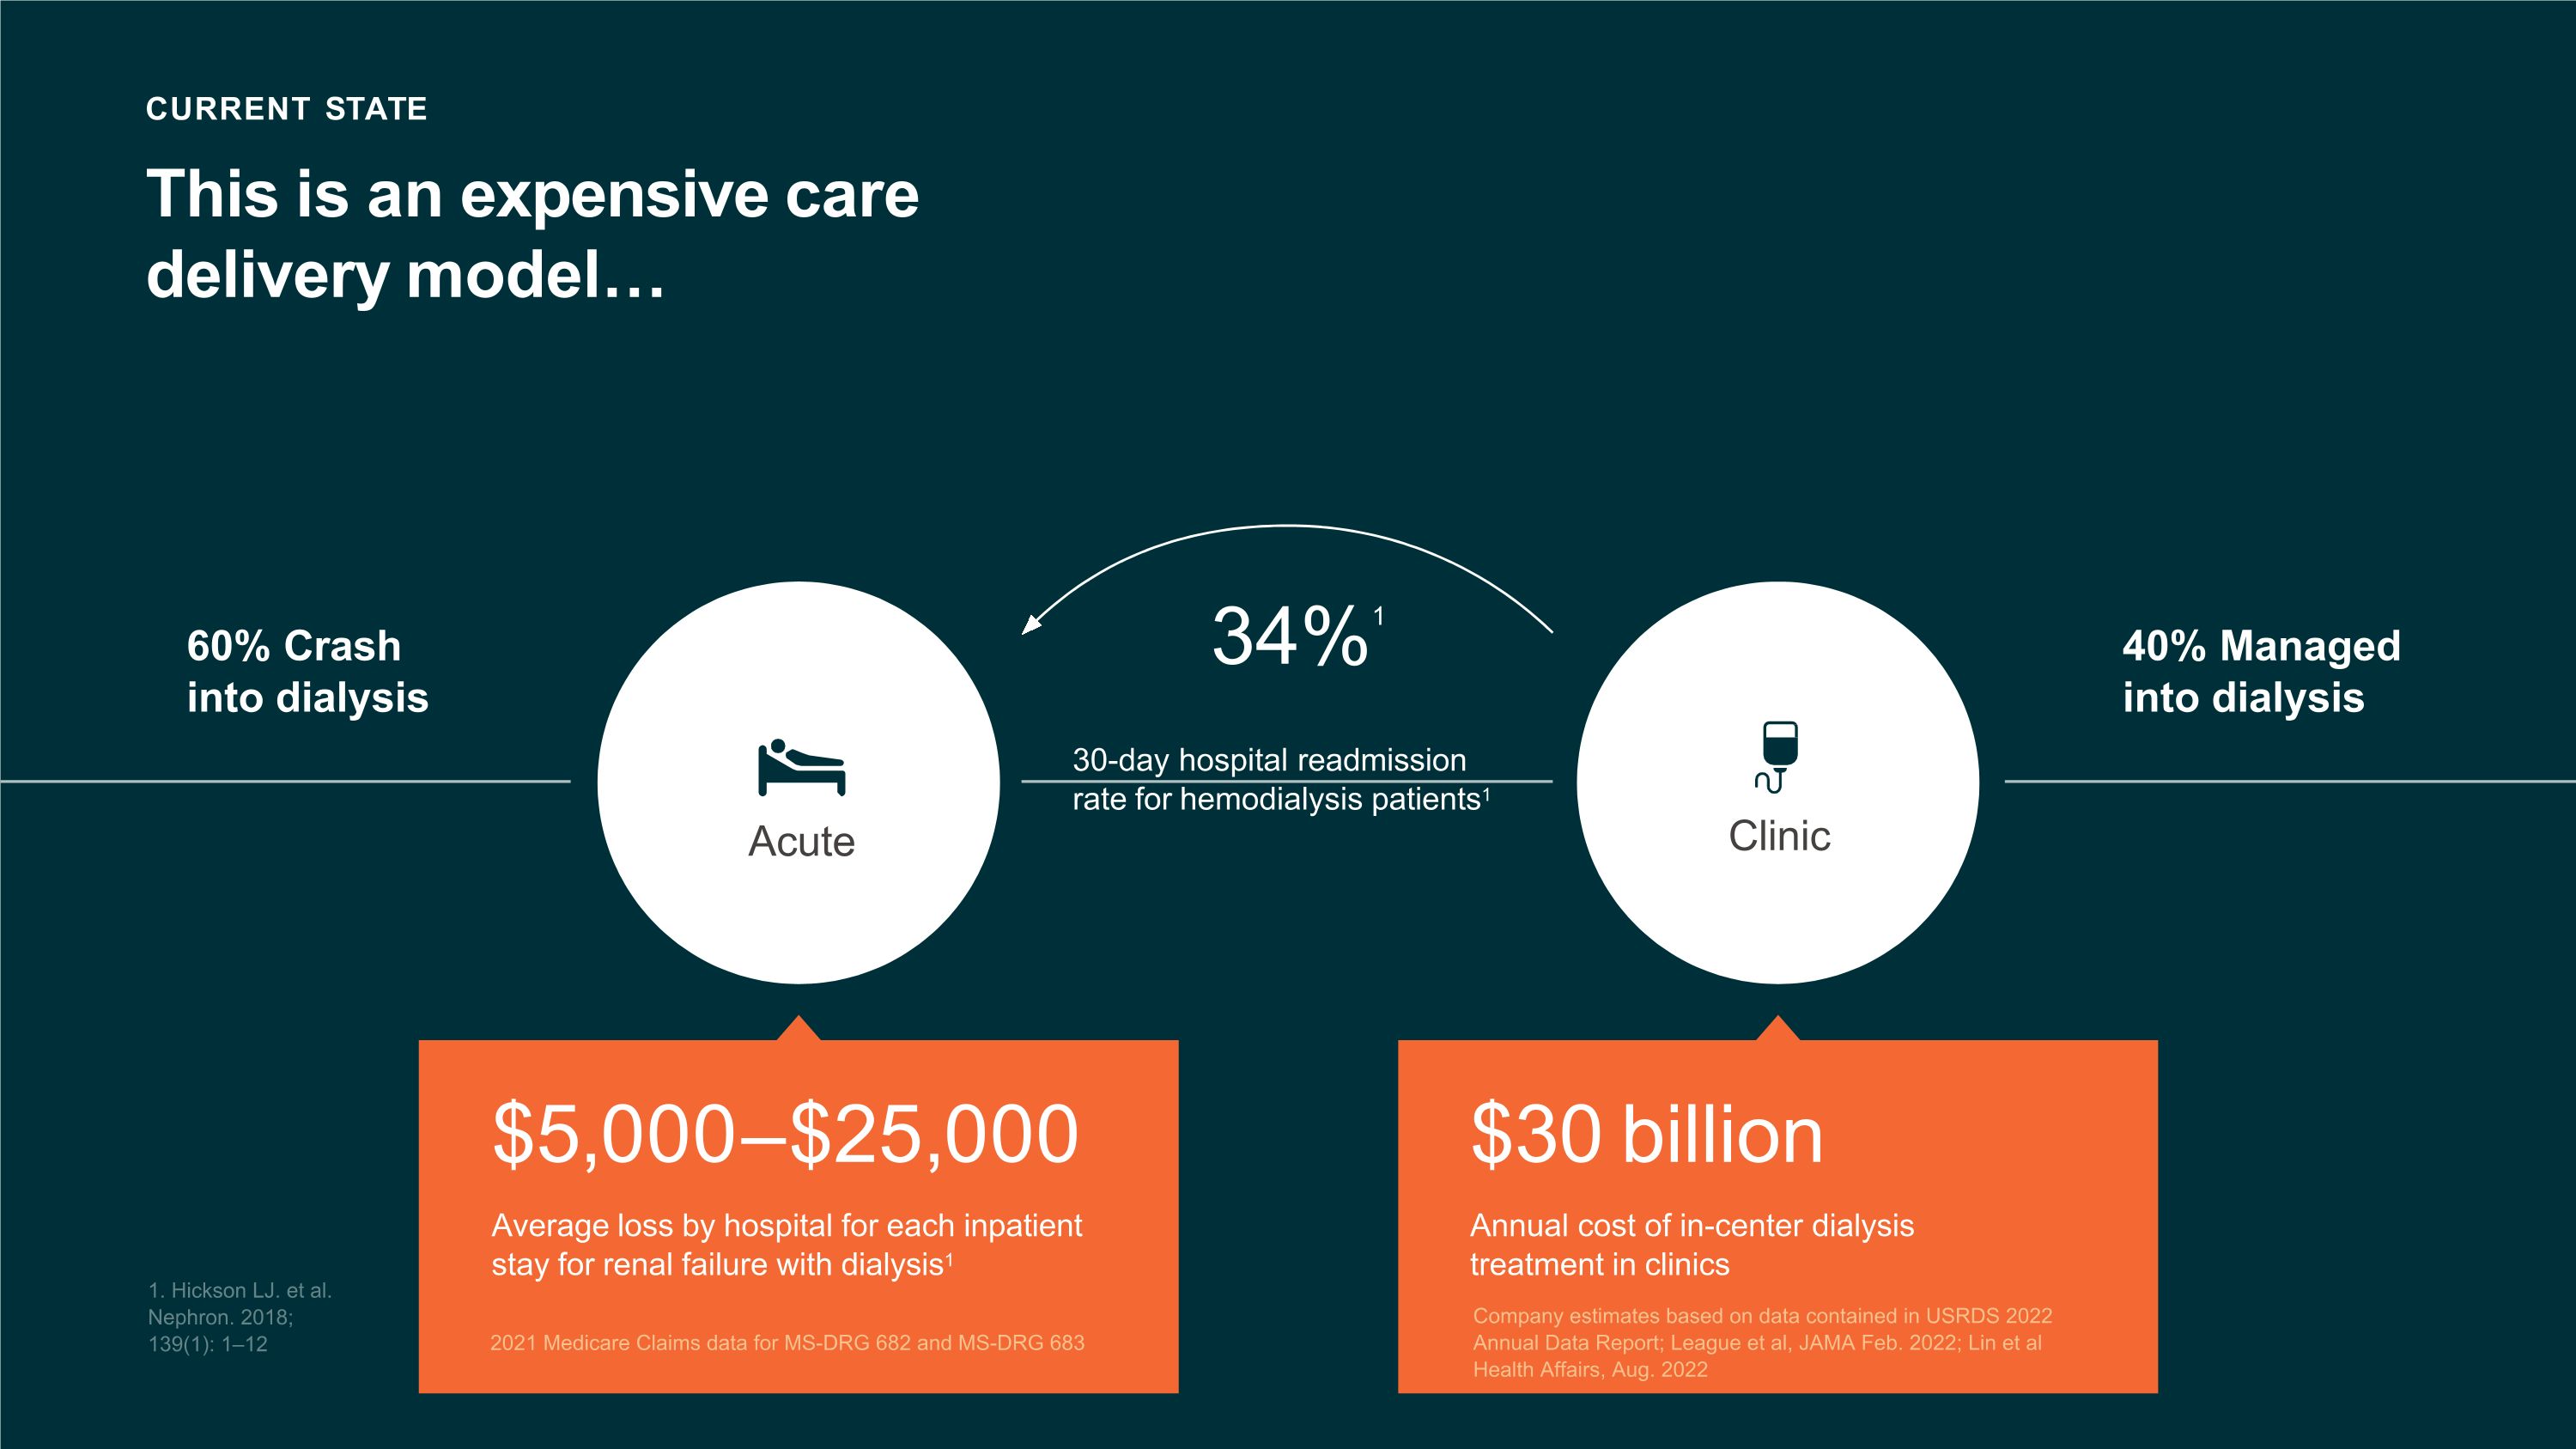
CURRENT STATE This is an expensive care delivery model… 60% Crash into dialysis 40% Managed into dialysis Acute Clinic $5,000–$25,000 Average loss by hospital for each inpatient stay for renal failure with dialysis1 $30 billion Annual cost of in-center dialysis treatment in clinics 34%1 30-day hospital readmission rate for hemodialysis patients1 1. Hickson LJ. et al. Nephron. 2018; 139(1): 1–12 2021 Medicare Claims data for MS-DRG 682 and MS-DRG 683 Company estimates based on data contained in USRDS 2022 Annual Data Report; League et al, JAMA Feb. 2022; Lin et al Health Affairs, Aug. 2022
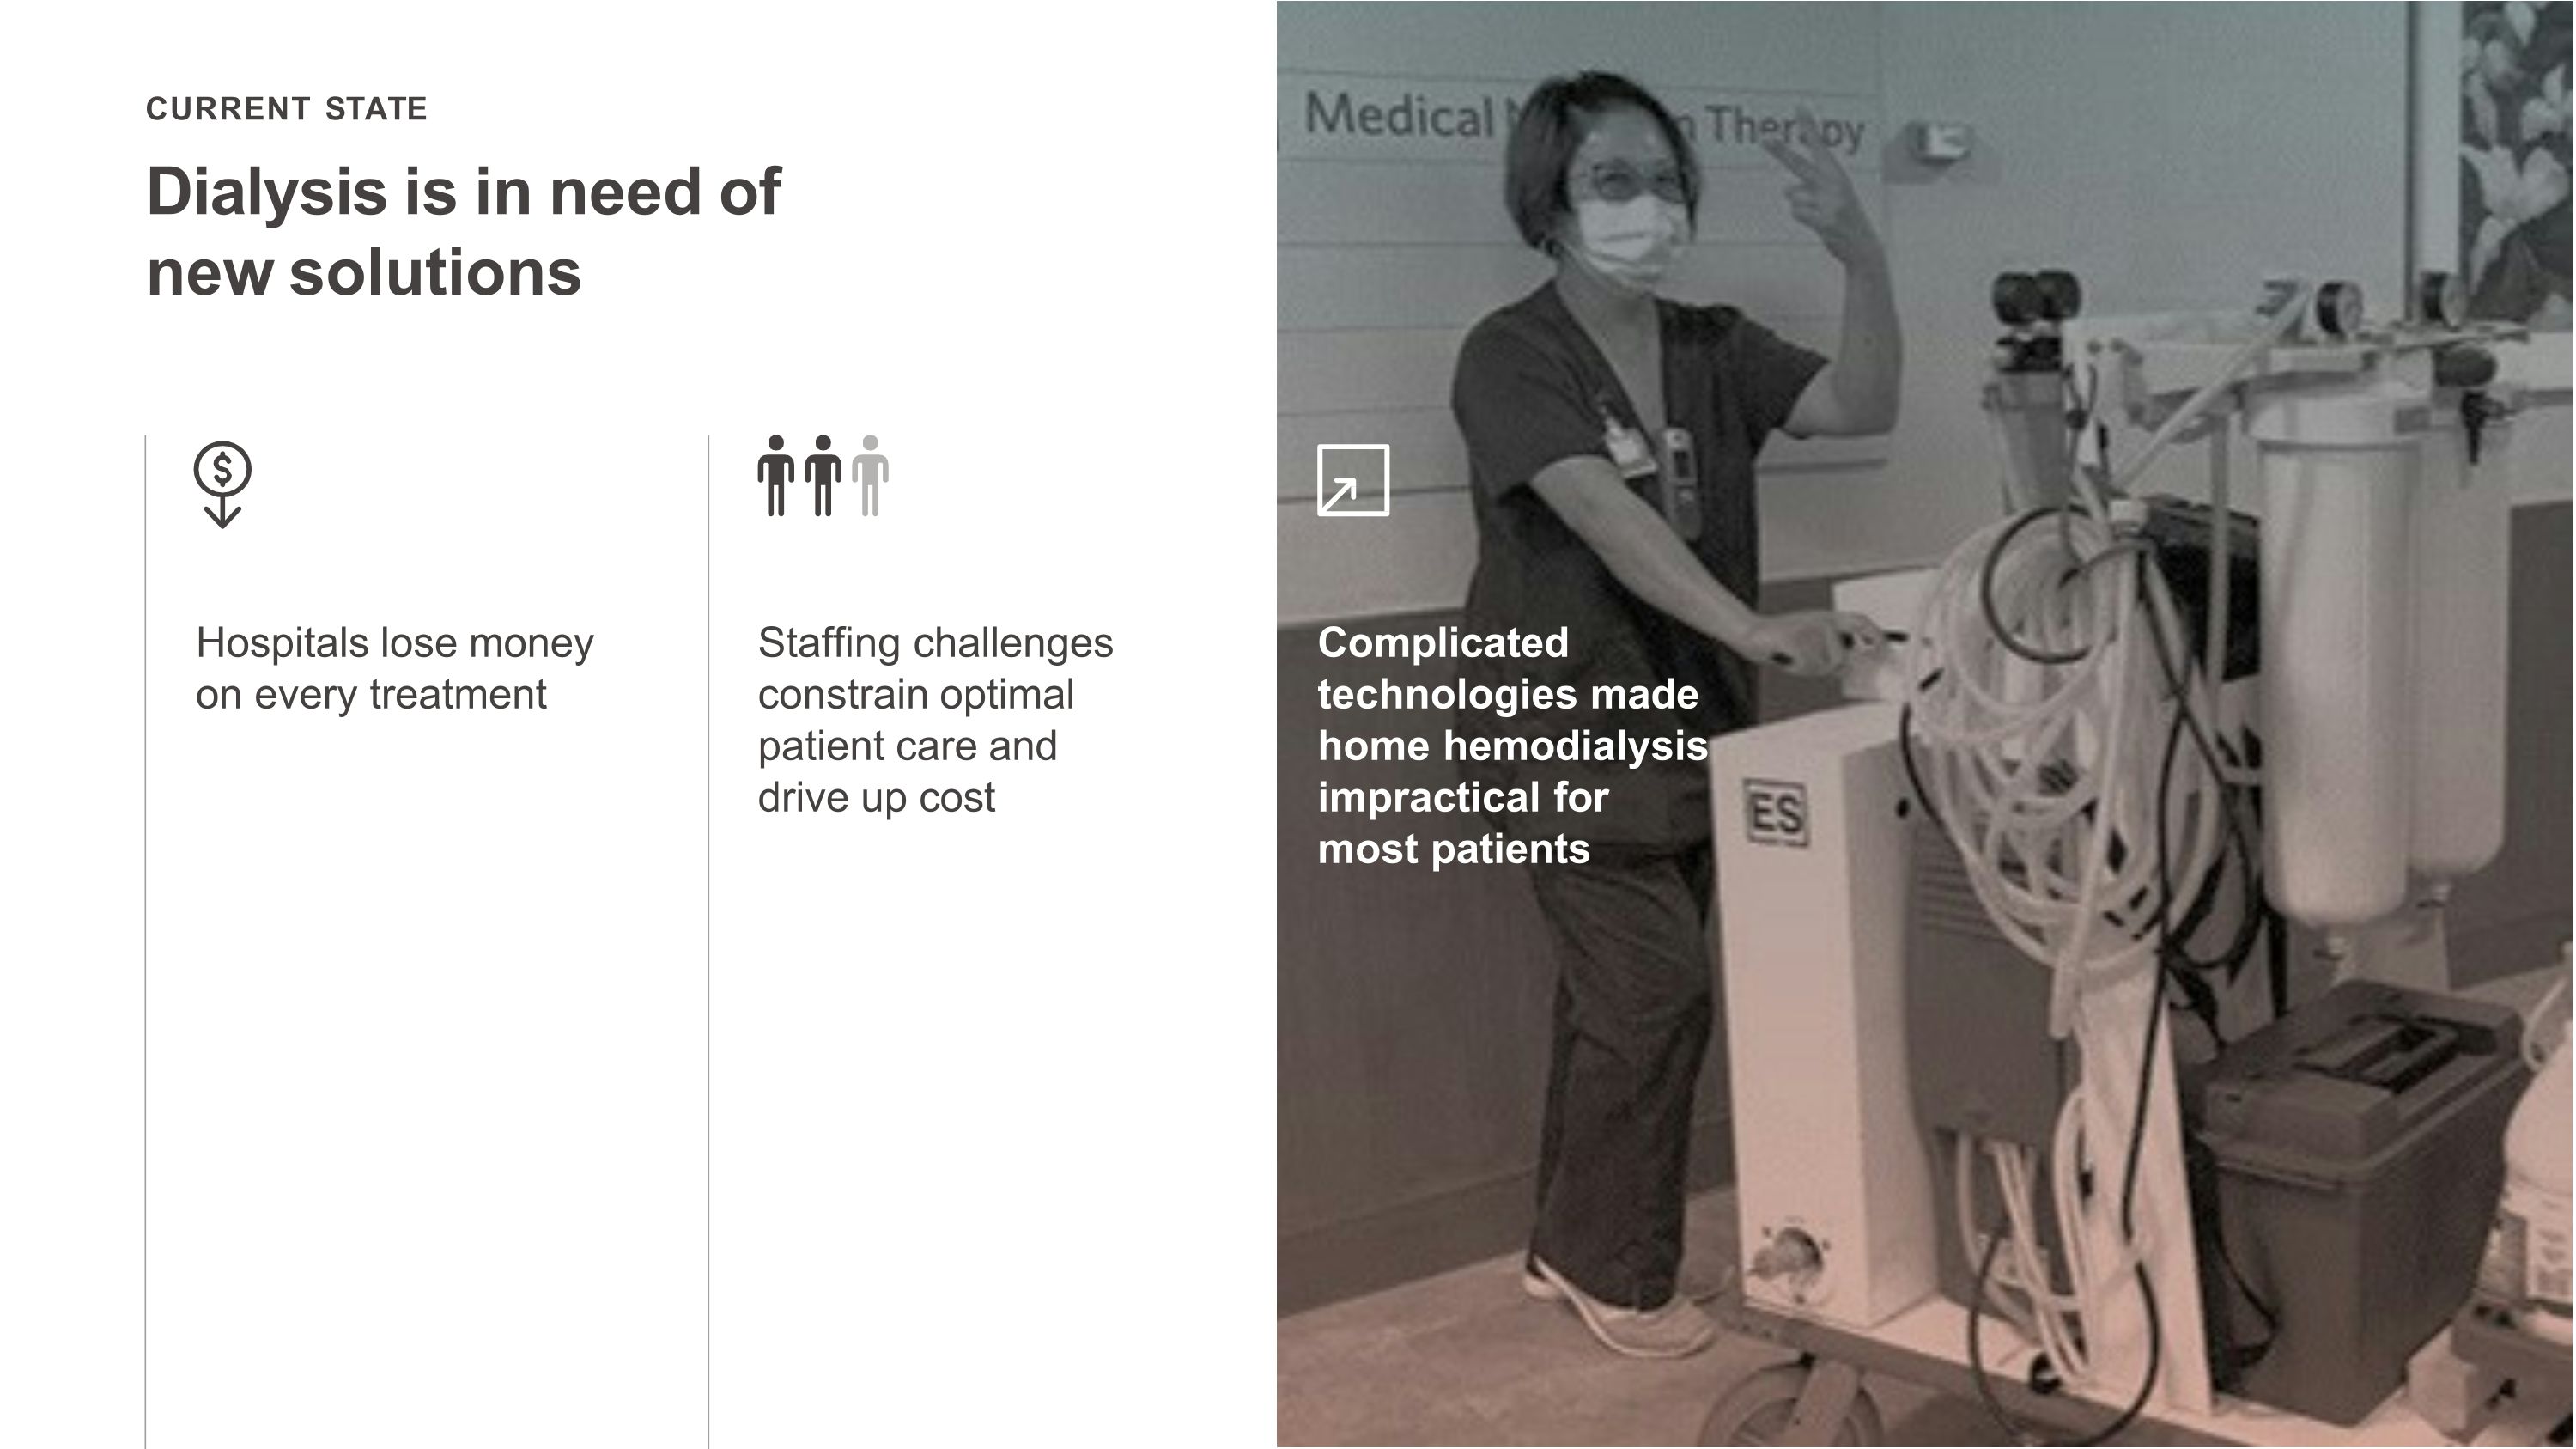
Dialysis is in need of new solutions CURRENT STATE Hospitals lose money on every treatment Staffing challenges constrain optimal patient care and drive up cost Complicated technologies made home hemodialysis impractical for most patients
We see a technology-driven way forward
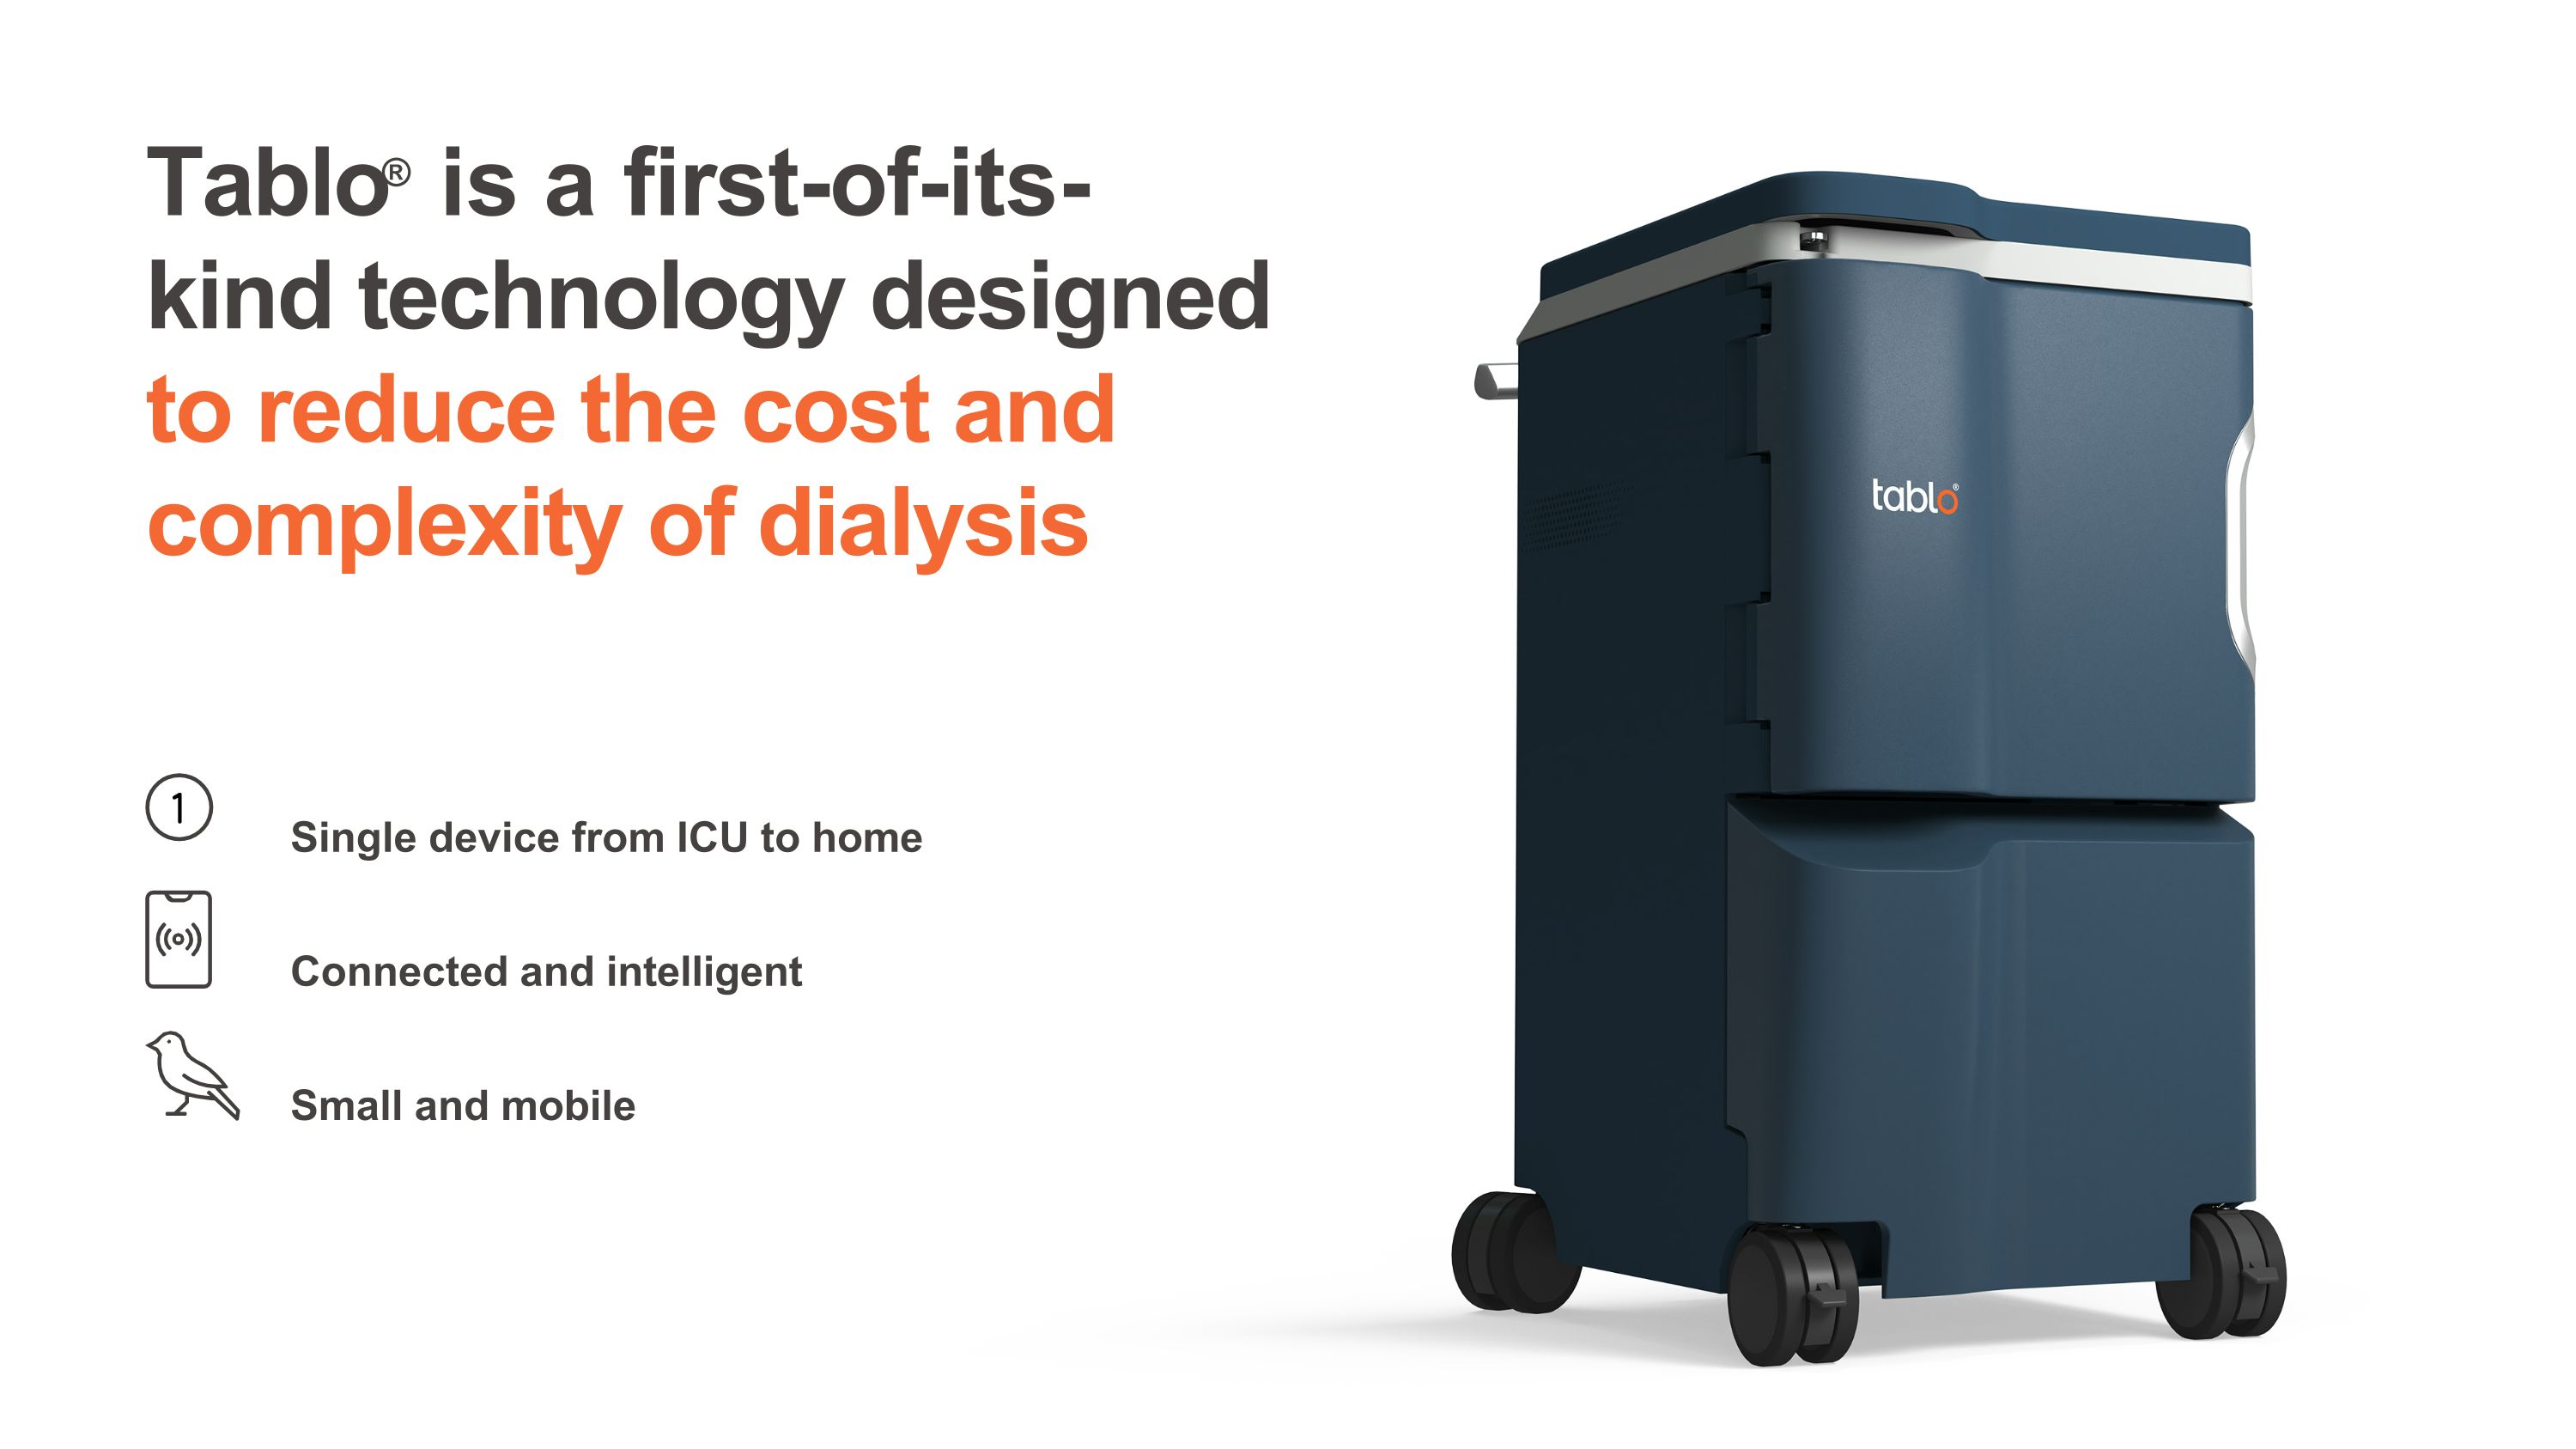
Tablo® is a first-of-its-�kind technology designed to reduce the cost and complexity of dialysis Single device from ICU to home Connected and intelligent Small and mobile
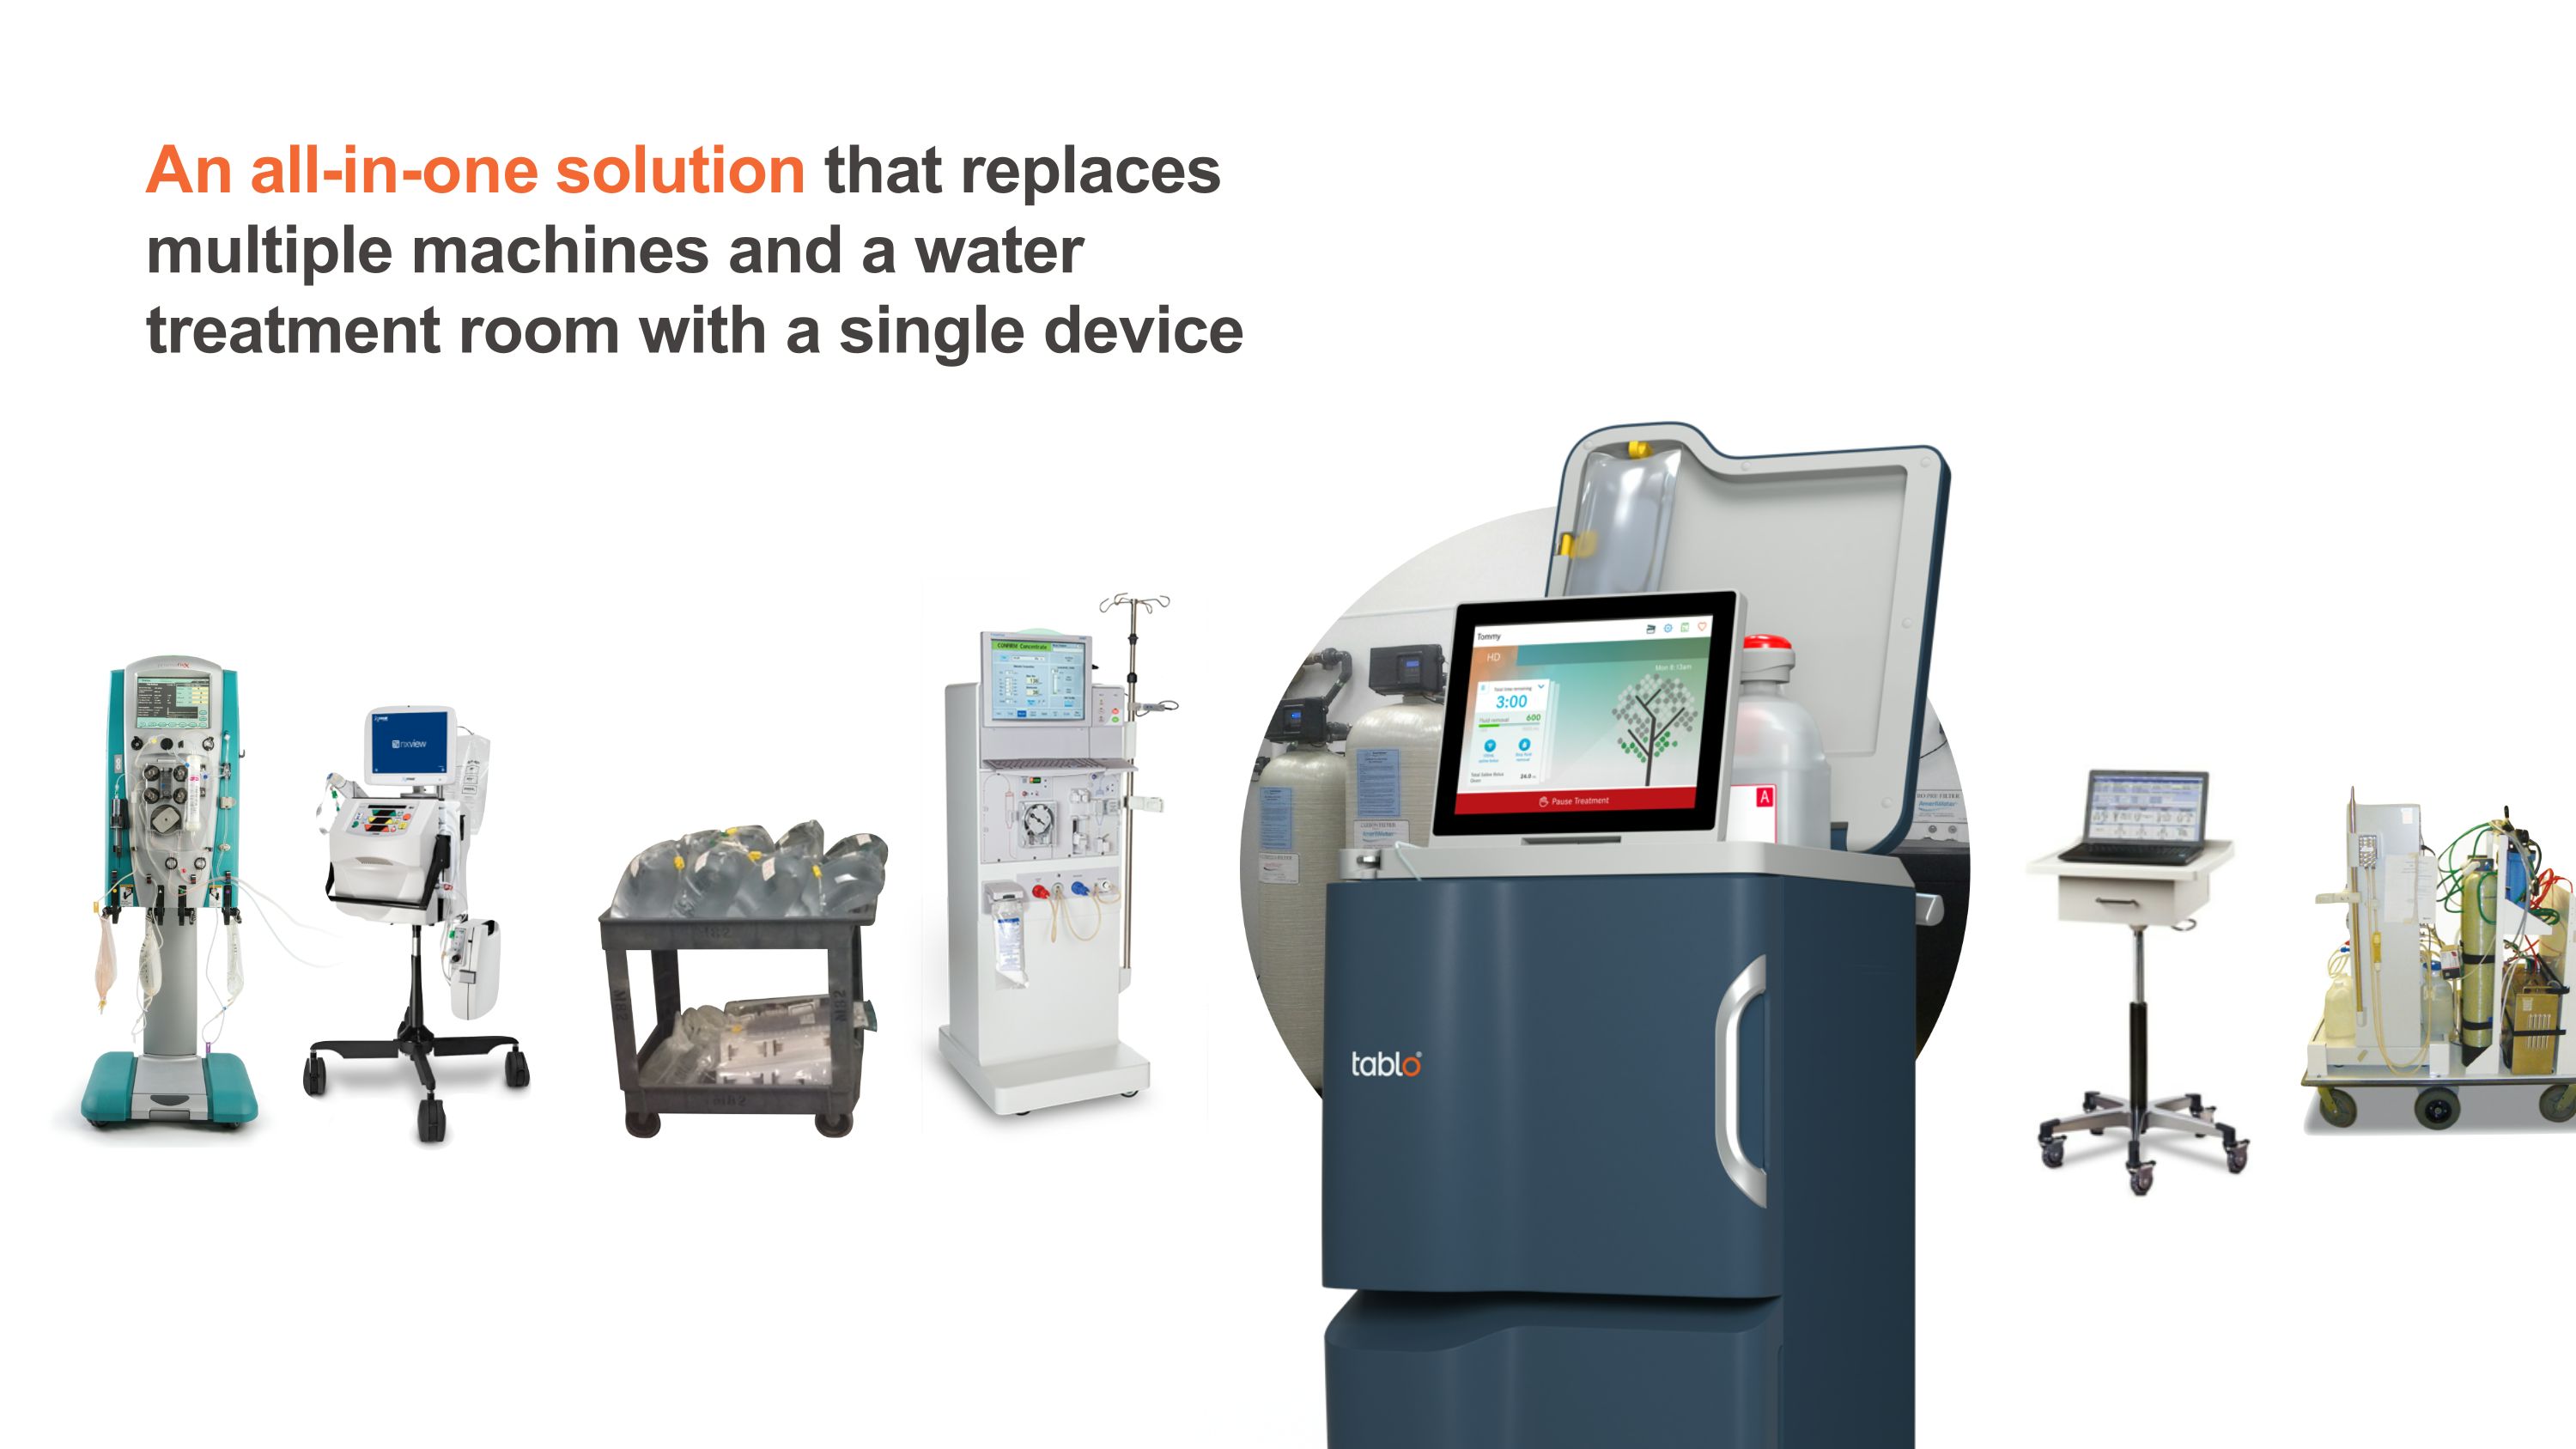
An all-in-one solution that replaces multiple machines and a water treatment room with a single device
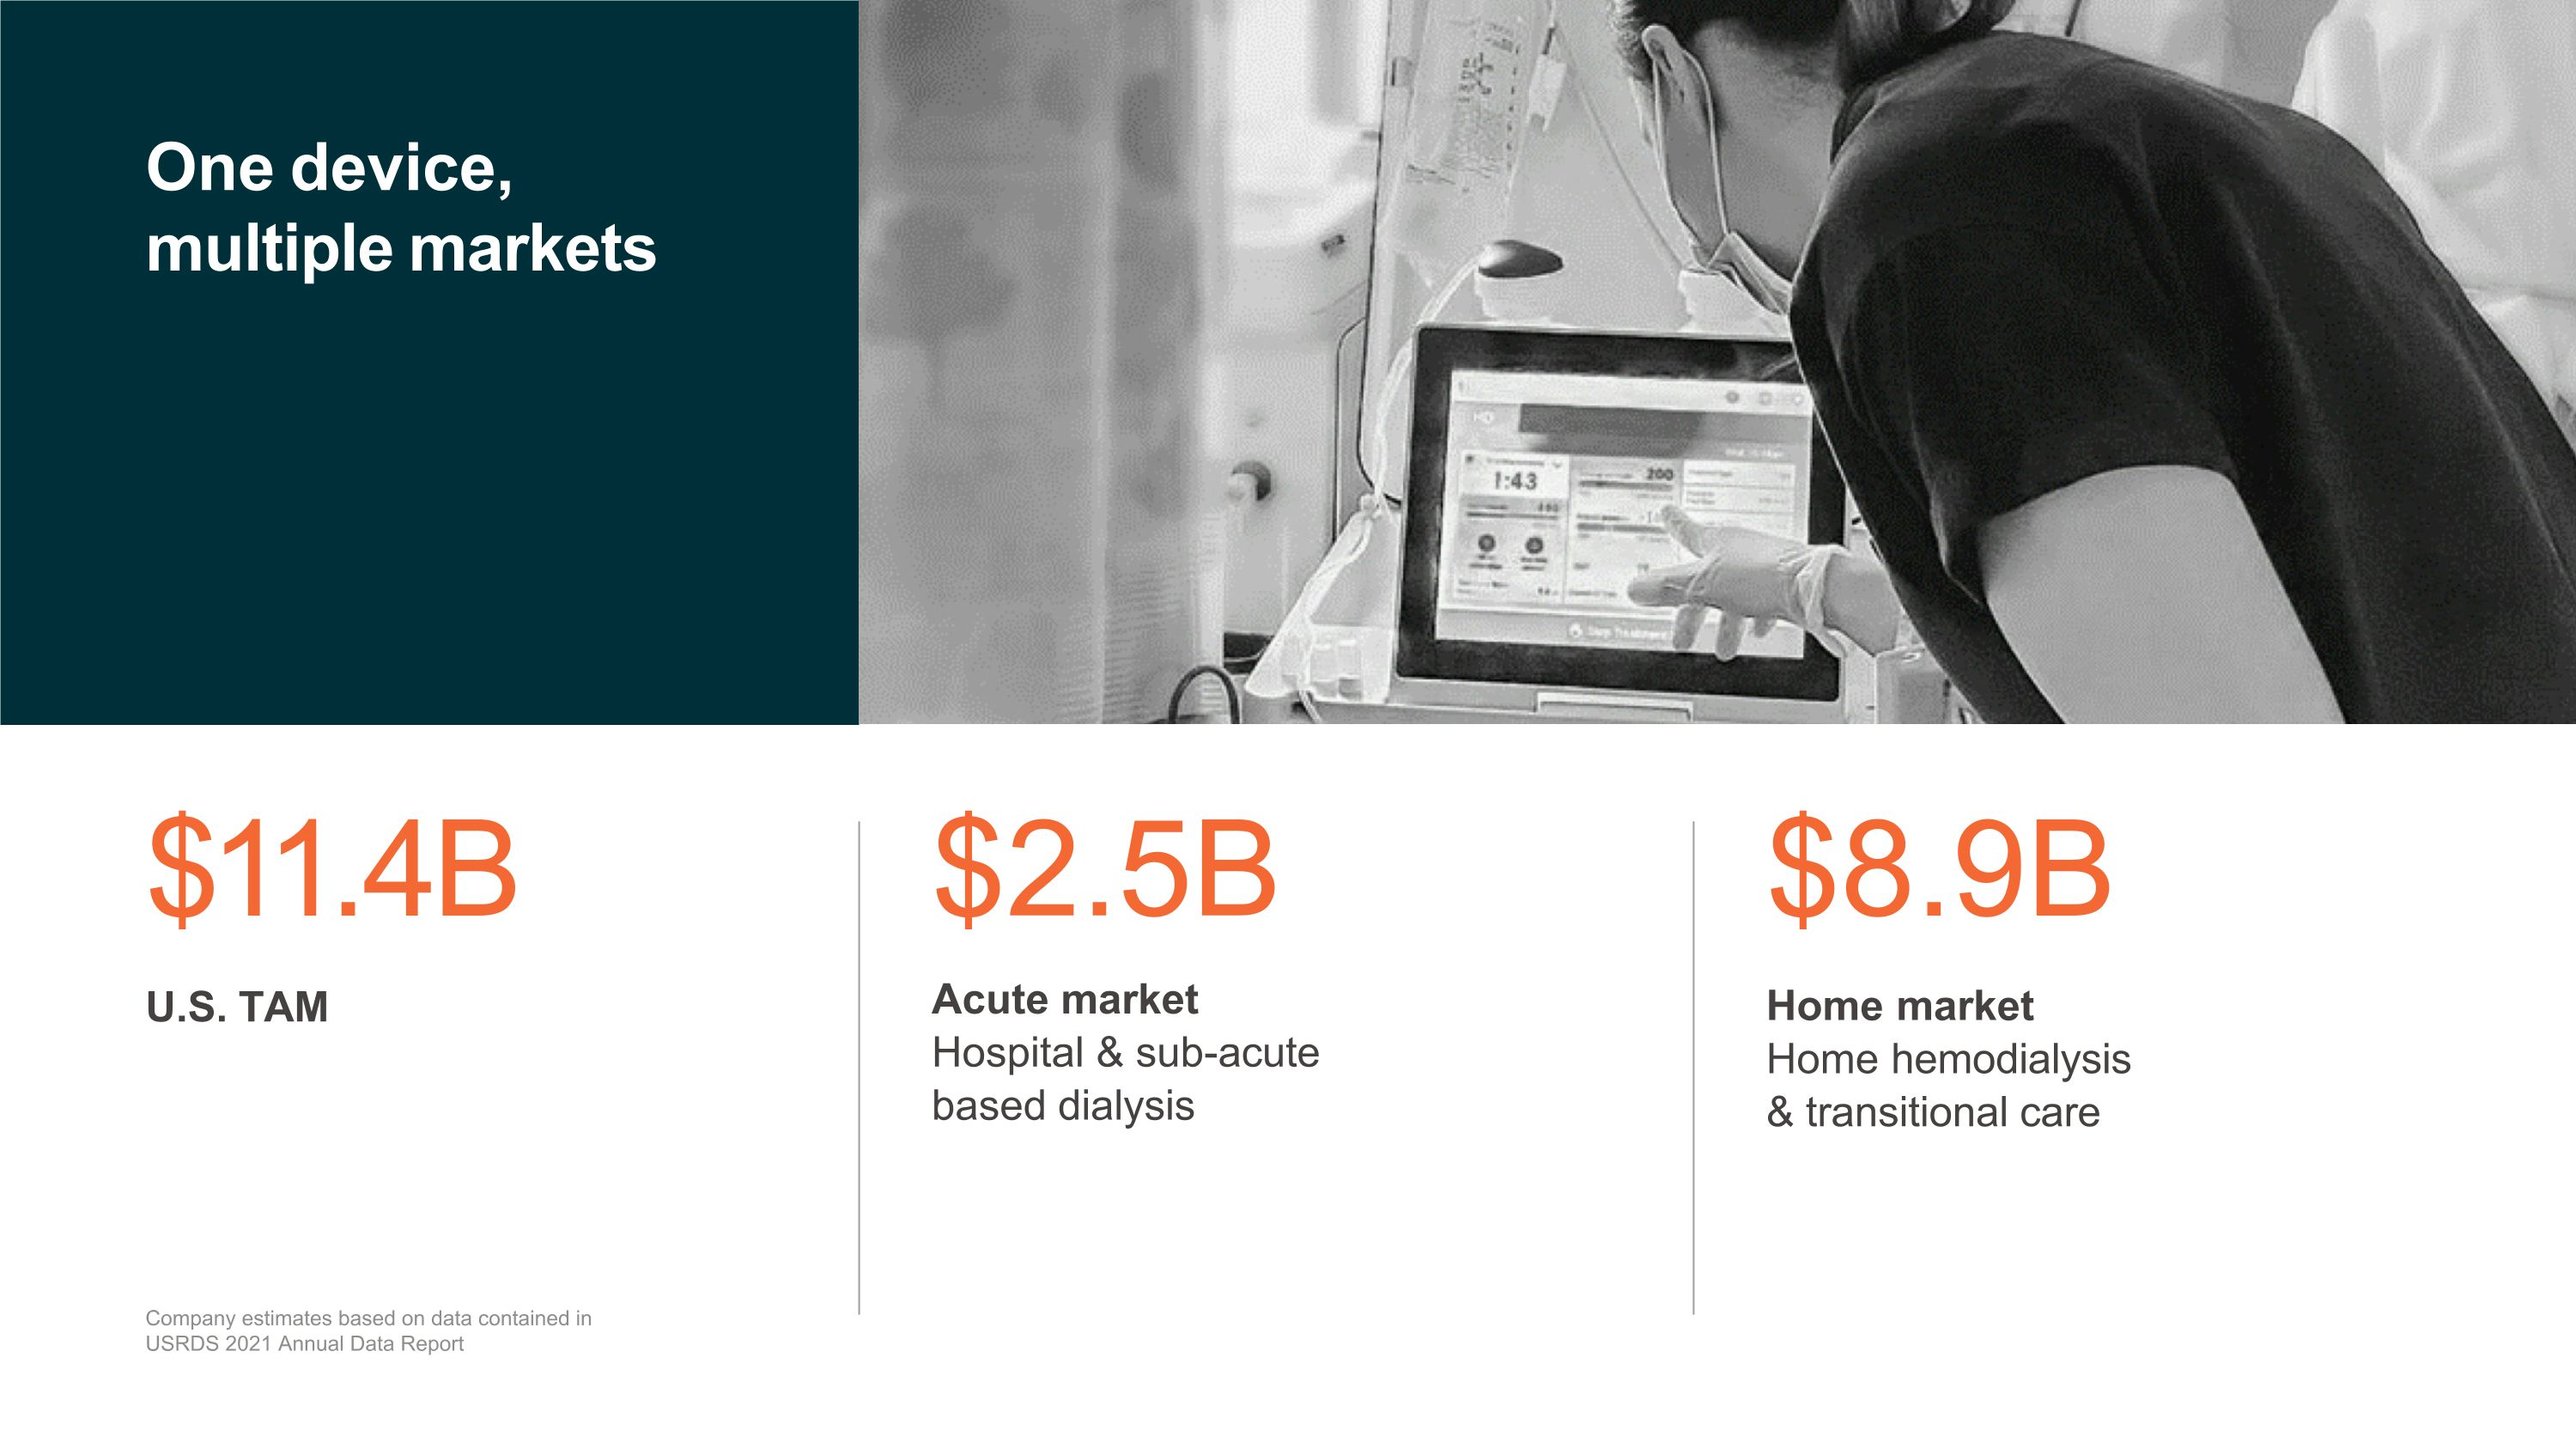
One device, multiple markets $2.5B Acute market Hospital & sub-acute based dialysis $8.9B Home market Home hemodialysis & transitional care $11.4B U.S. TAM Company estimates based on data contained in USRDS 2021 Annual Data Report
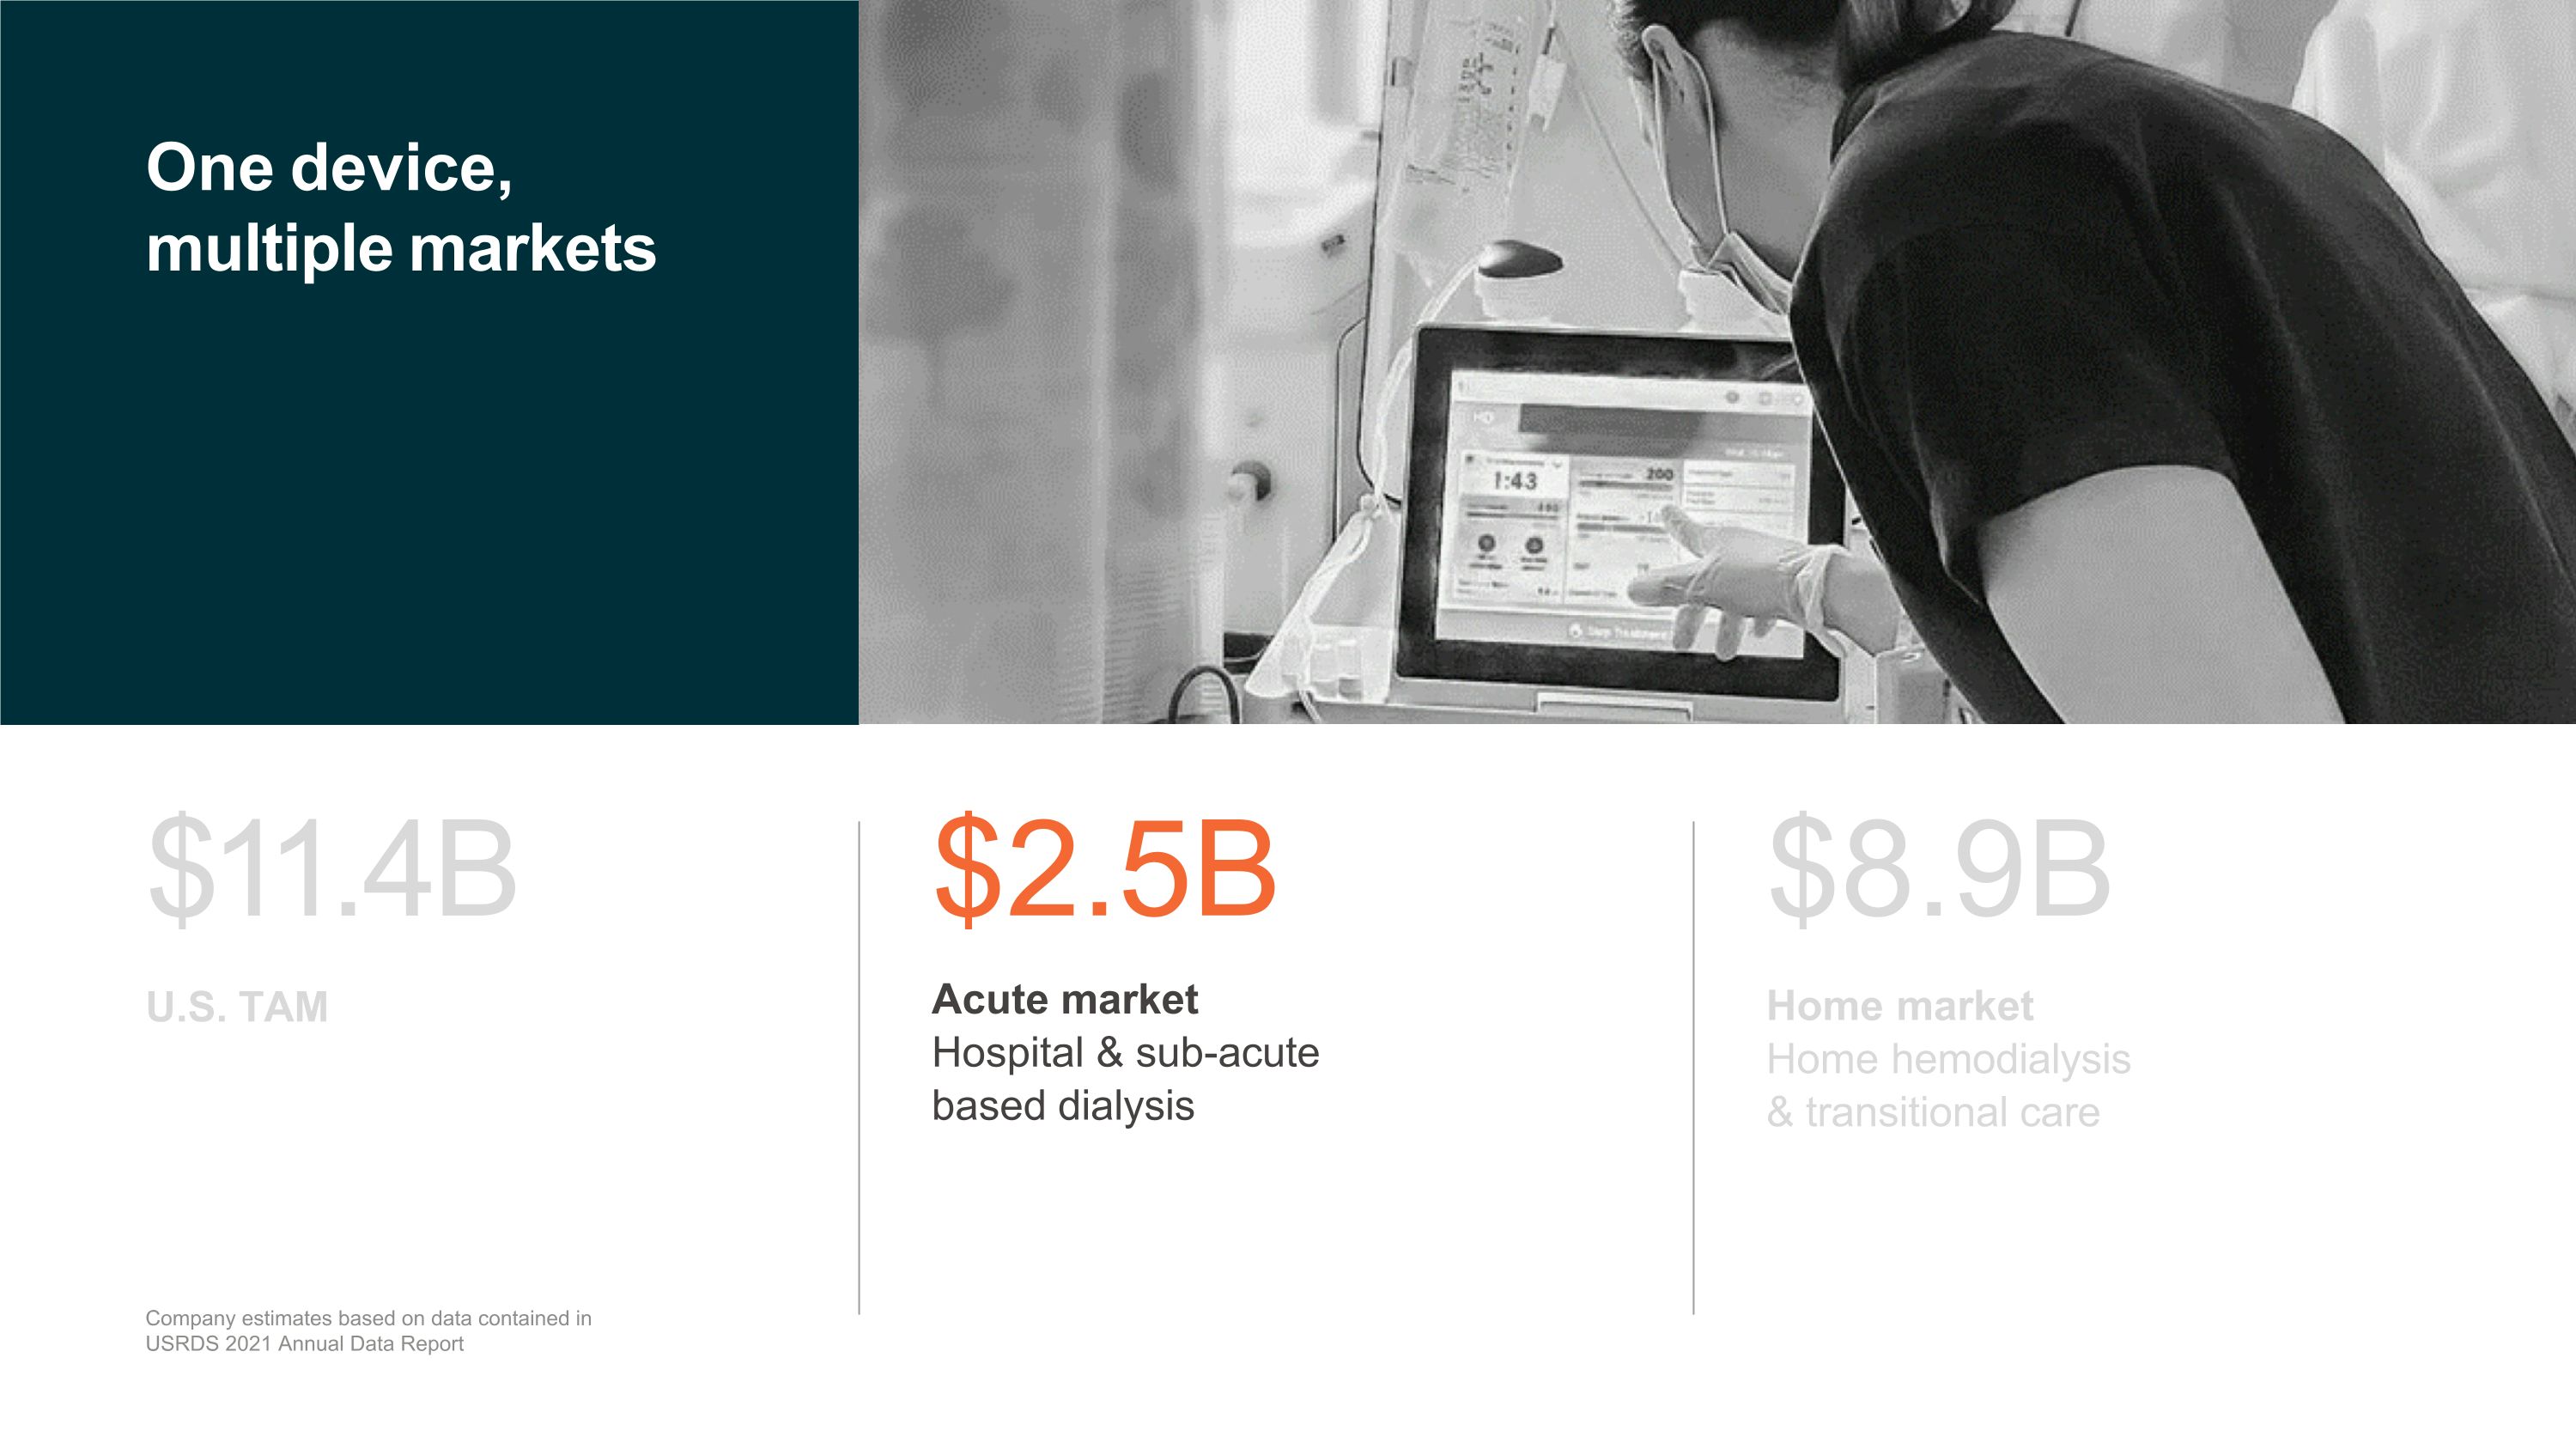
One device, multiple markets $11.4B U.S. TAM $2.5B Acute market Hospital & sub-acute based dialysis $8.9B Home market Home hemodialysis & transitional care Company estimates based on data contained in USRDS 2021 Annual Data Report
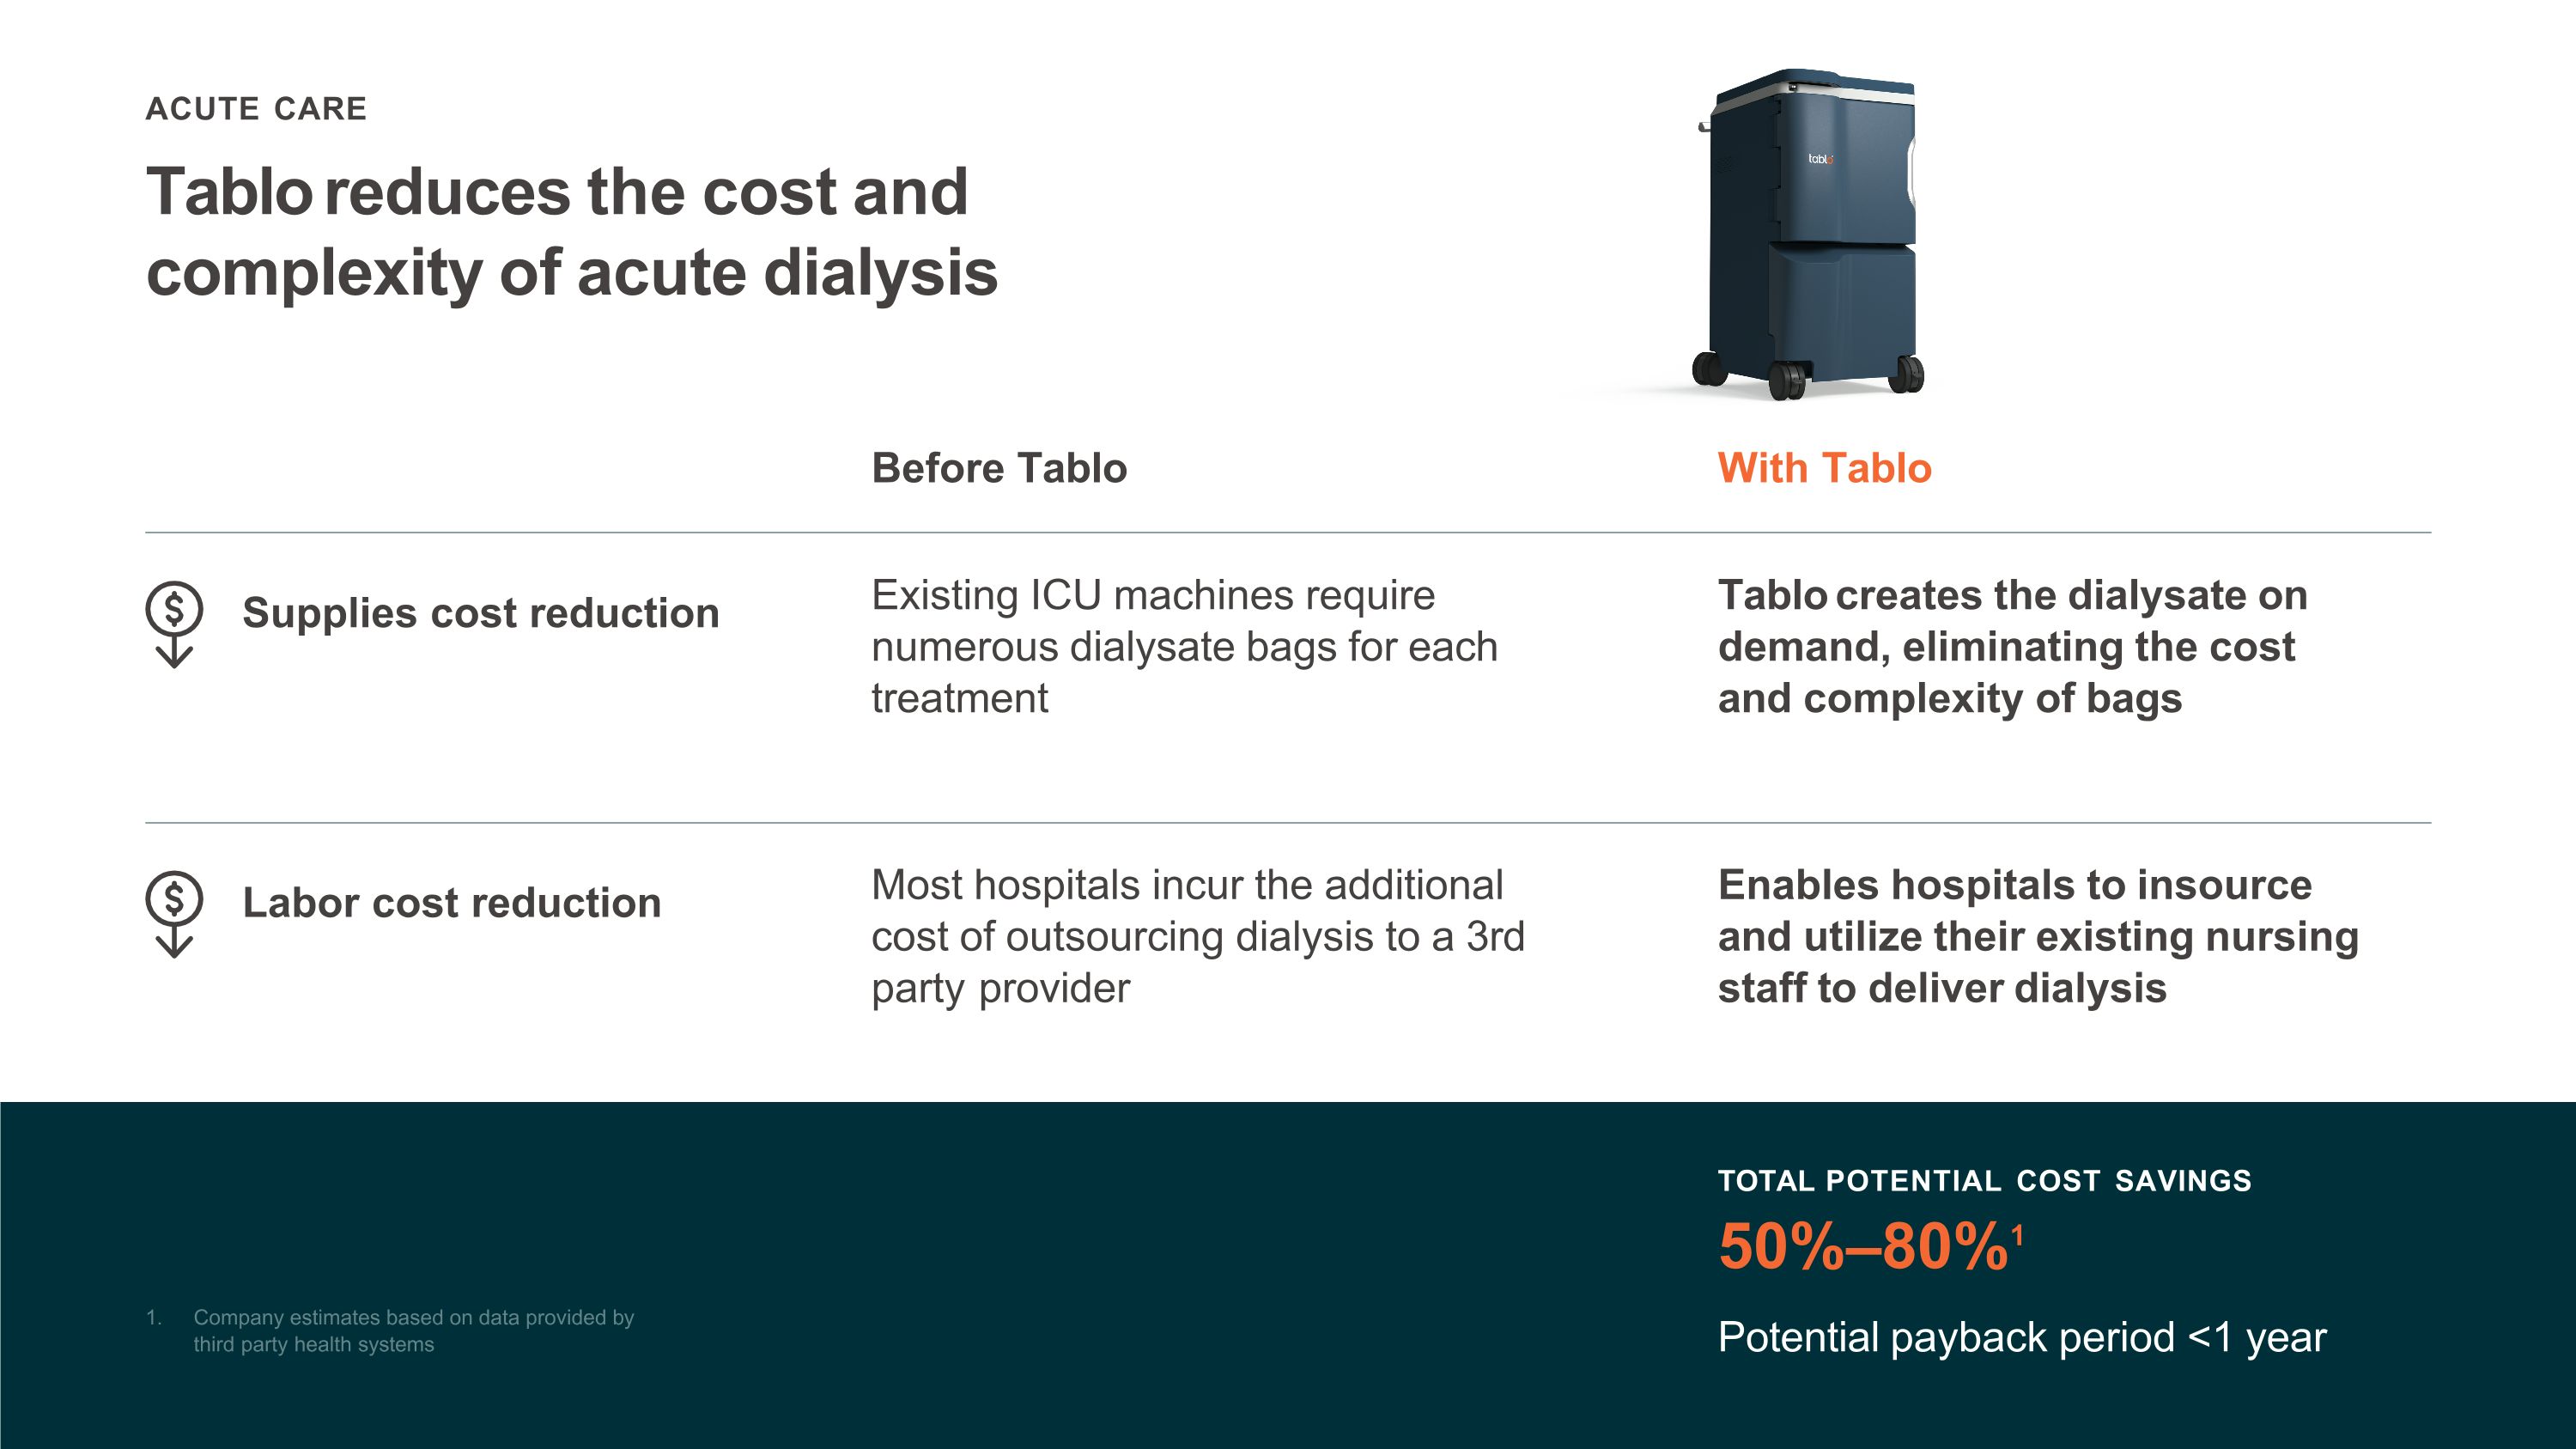
ACUTE CARE Tablo reduces the cost and complexity of acute dialysis TOTAL POTENTIAL COST SAVINGS 50%–80%1 Potential payback period <1 year 1. Company estimates based on data provided by third party health systems Supplies cost reduction Before Tablo With Tablo Existing ICU machines require numerous dialysate bags for each treatment Tablo creates the dialysate on demand, eliminating the cost and complexity of bags Most hospitals incur the additional cost of outsourcing dialysis to a 3rd party provider Enables hospitals to insource and utilize their existing nursing staff to deliver dialysis Labor cost reduction
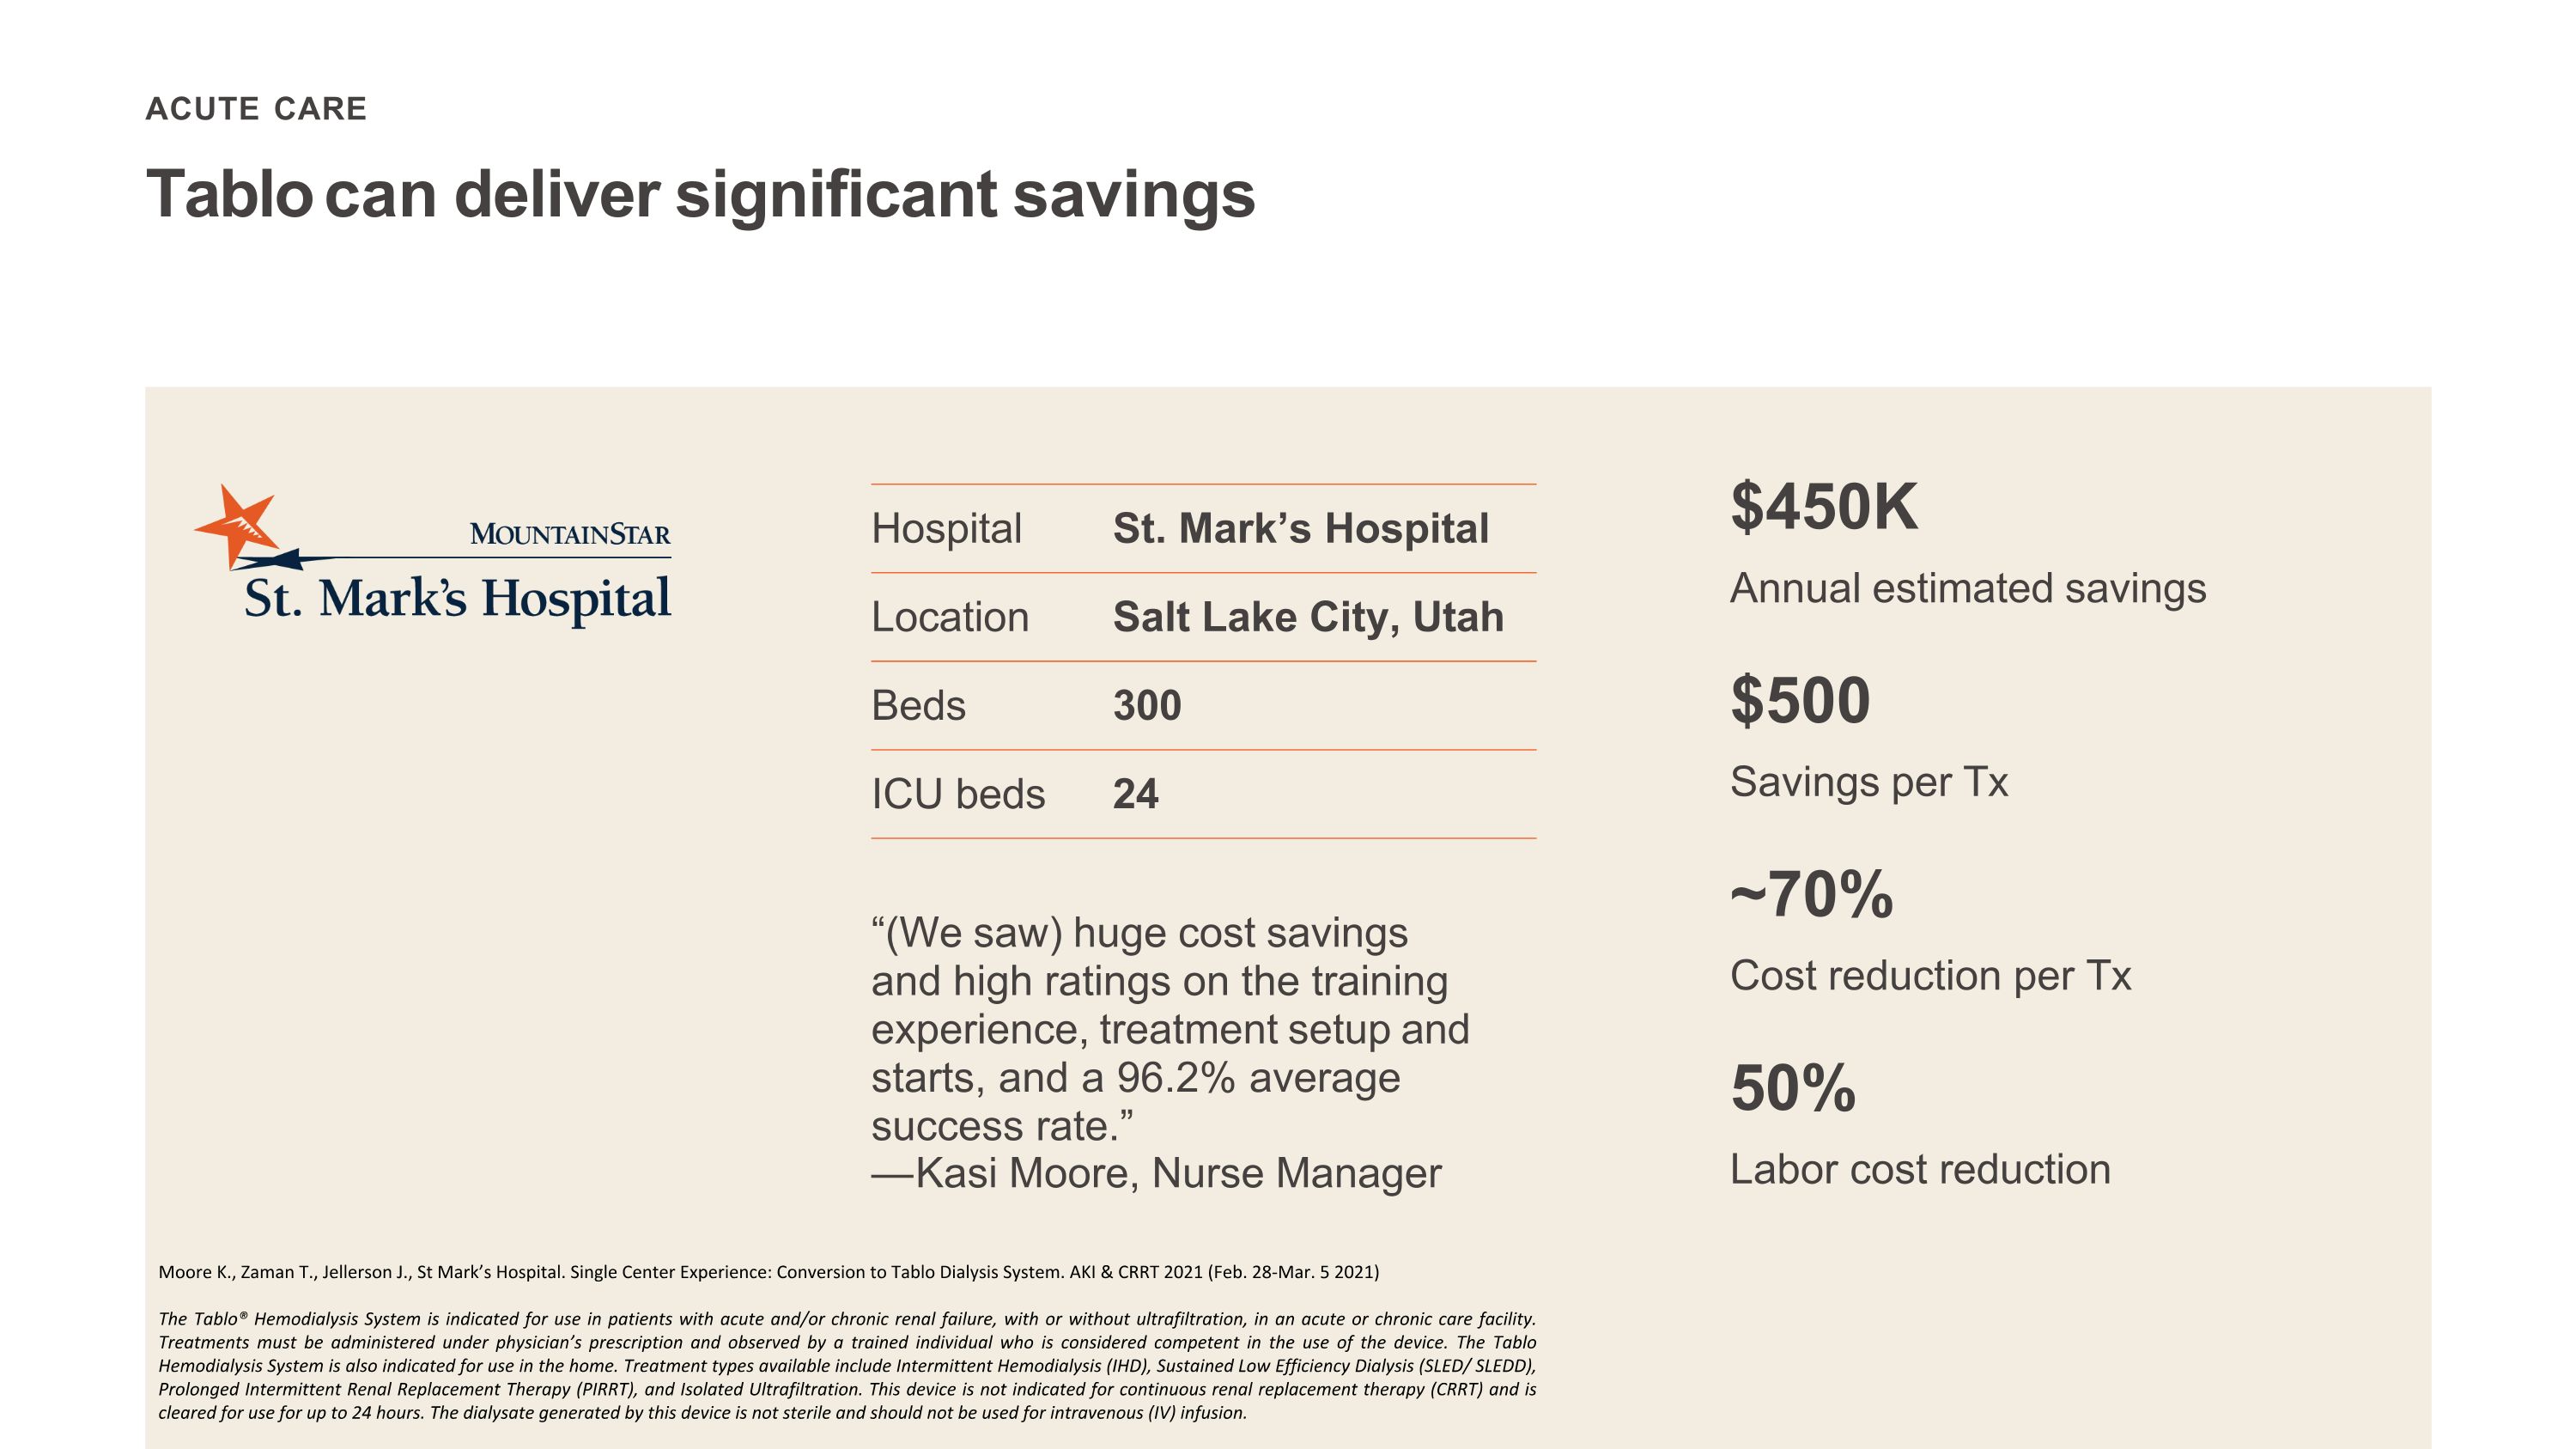
ACUTE CARE Tablo can deliver significant savings Hospital St. Mark’s Hospital Location Salt Lake City, Utah Beds 300 ICU beds 24 “(We saw) huge cost savings and high ratings on the training experience, treatment setup and starts, and a 96.2% average success rate.” —Kasi Moore, Nurse Manager $450K Annual estimated savings $500 Savings per Tx ~70% Cost reduction per Tx 50% Labor cost reduction Moore K., Zaman T., Jellerson J., St Mark’s Hospital. Single Center Experience: Conversion to Tablo Dialysis System. AKI & CRRT 2021 (Feb. 28-Mar. 5 2021) The Tablo® Hemodialysis System is indicated for use in patients with acute and/or chronic renal failure, with or without ultrafiltration, in an acute or chronic care facility. Treatments must be administered under physician’s prescription and observed by a trained individual who is considered competent in the use of the device. The Tablo Hemodialysis System is also indicated for use in the home. Treatment types available include Intermittent Hemodialysis (IHD), Sustained Low Efficiency Dialysis (SLED/ SLEDD), Prolonged Intermittent Renal Replacement Therapy (PIRRT), and Isolated Ultrafiltration. This device is not indicated for continuous renal replacement therapy (CRRT) and is cleared for use for up to 24 hours. The dialysate generated by this device is not sterile and should not be used for intravenous (IV) infusion.

One device, multiple markets $2.5B Acute market Hospital & sub-acute based dialysis $8.9B Home market Home hemodialysis & transitional care $11.4B U.S. TAM Company estimates based on data contained in USRDS 2021 Annual Data Report
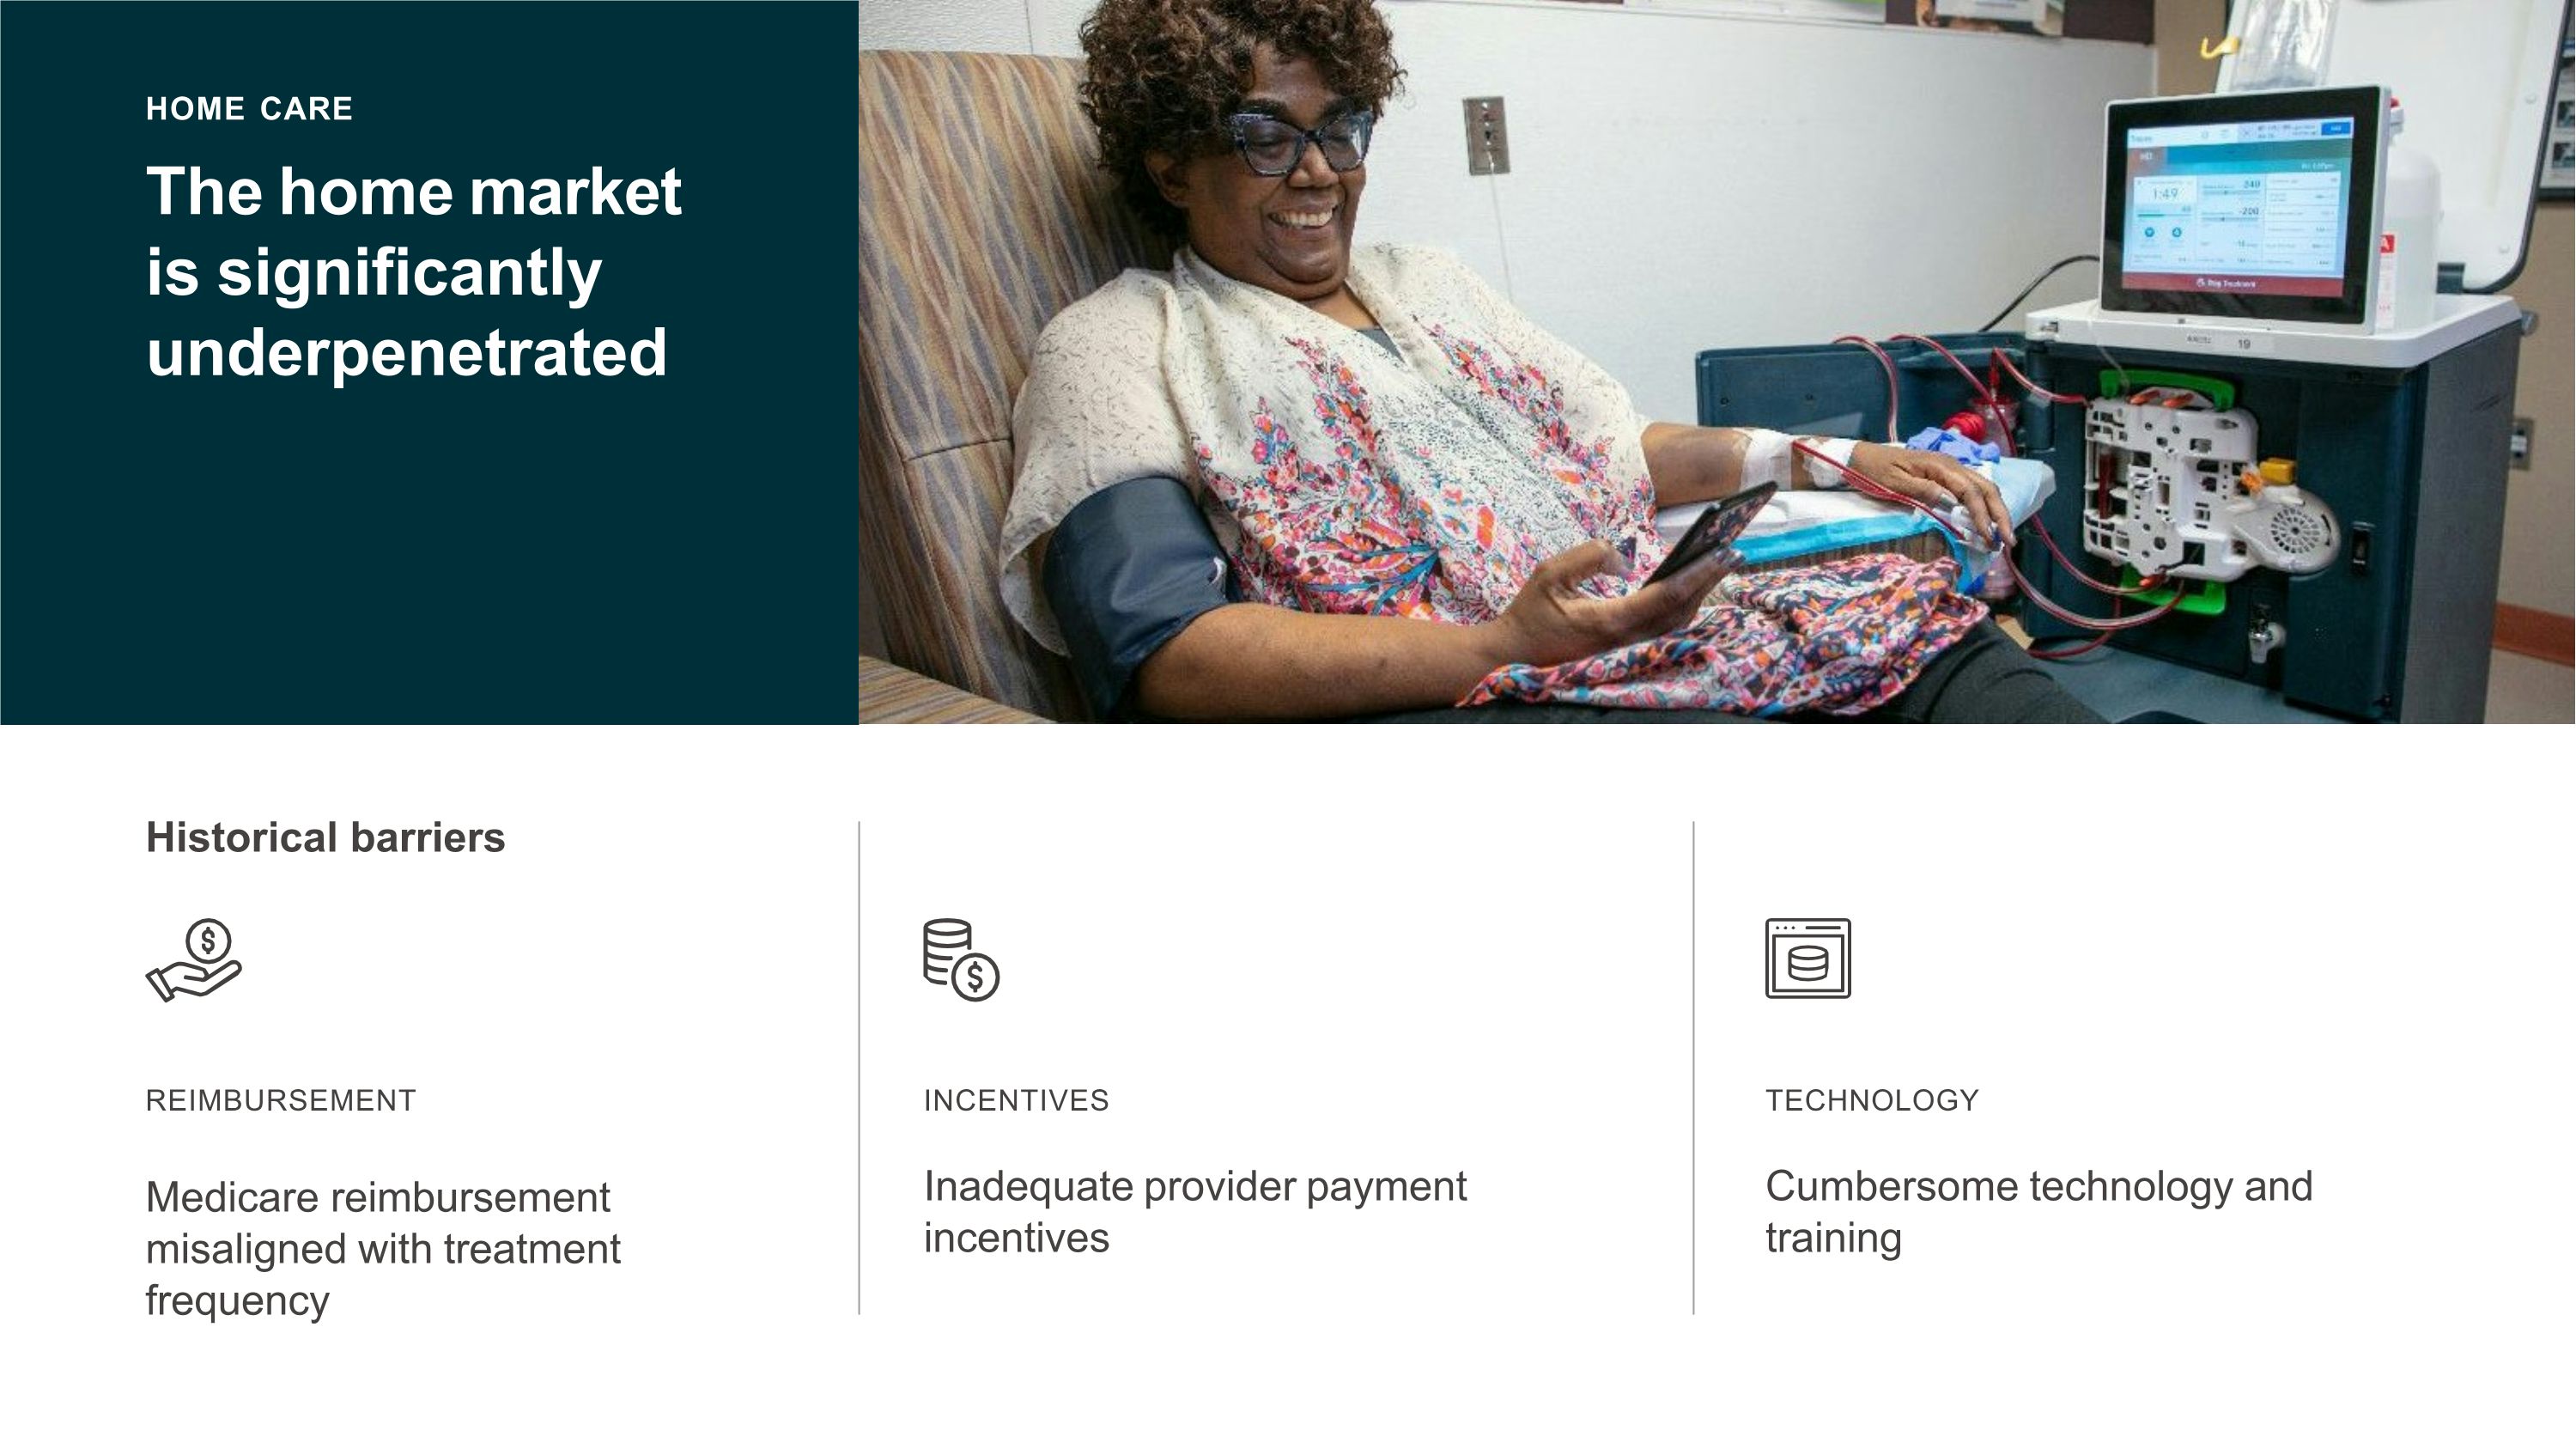
The home market is significantly underpenetrated HOME CARE REIMBURSEMENT Medicare reimbursement misaligned with treatment frequency Historical barriers INCENTIVES Inadequate provider payment incentives TECHNOLOGY Cumbersome technology and training
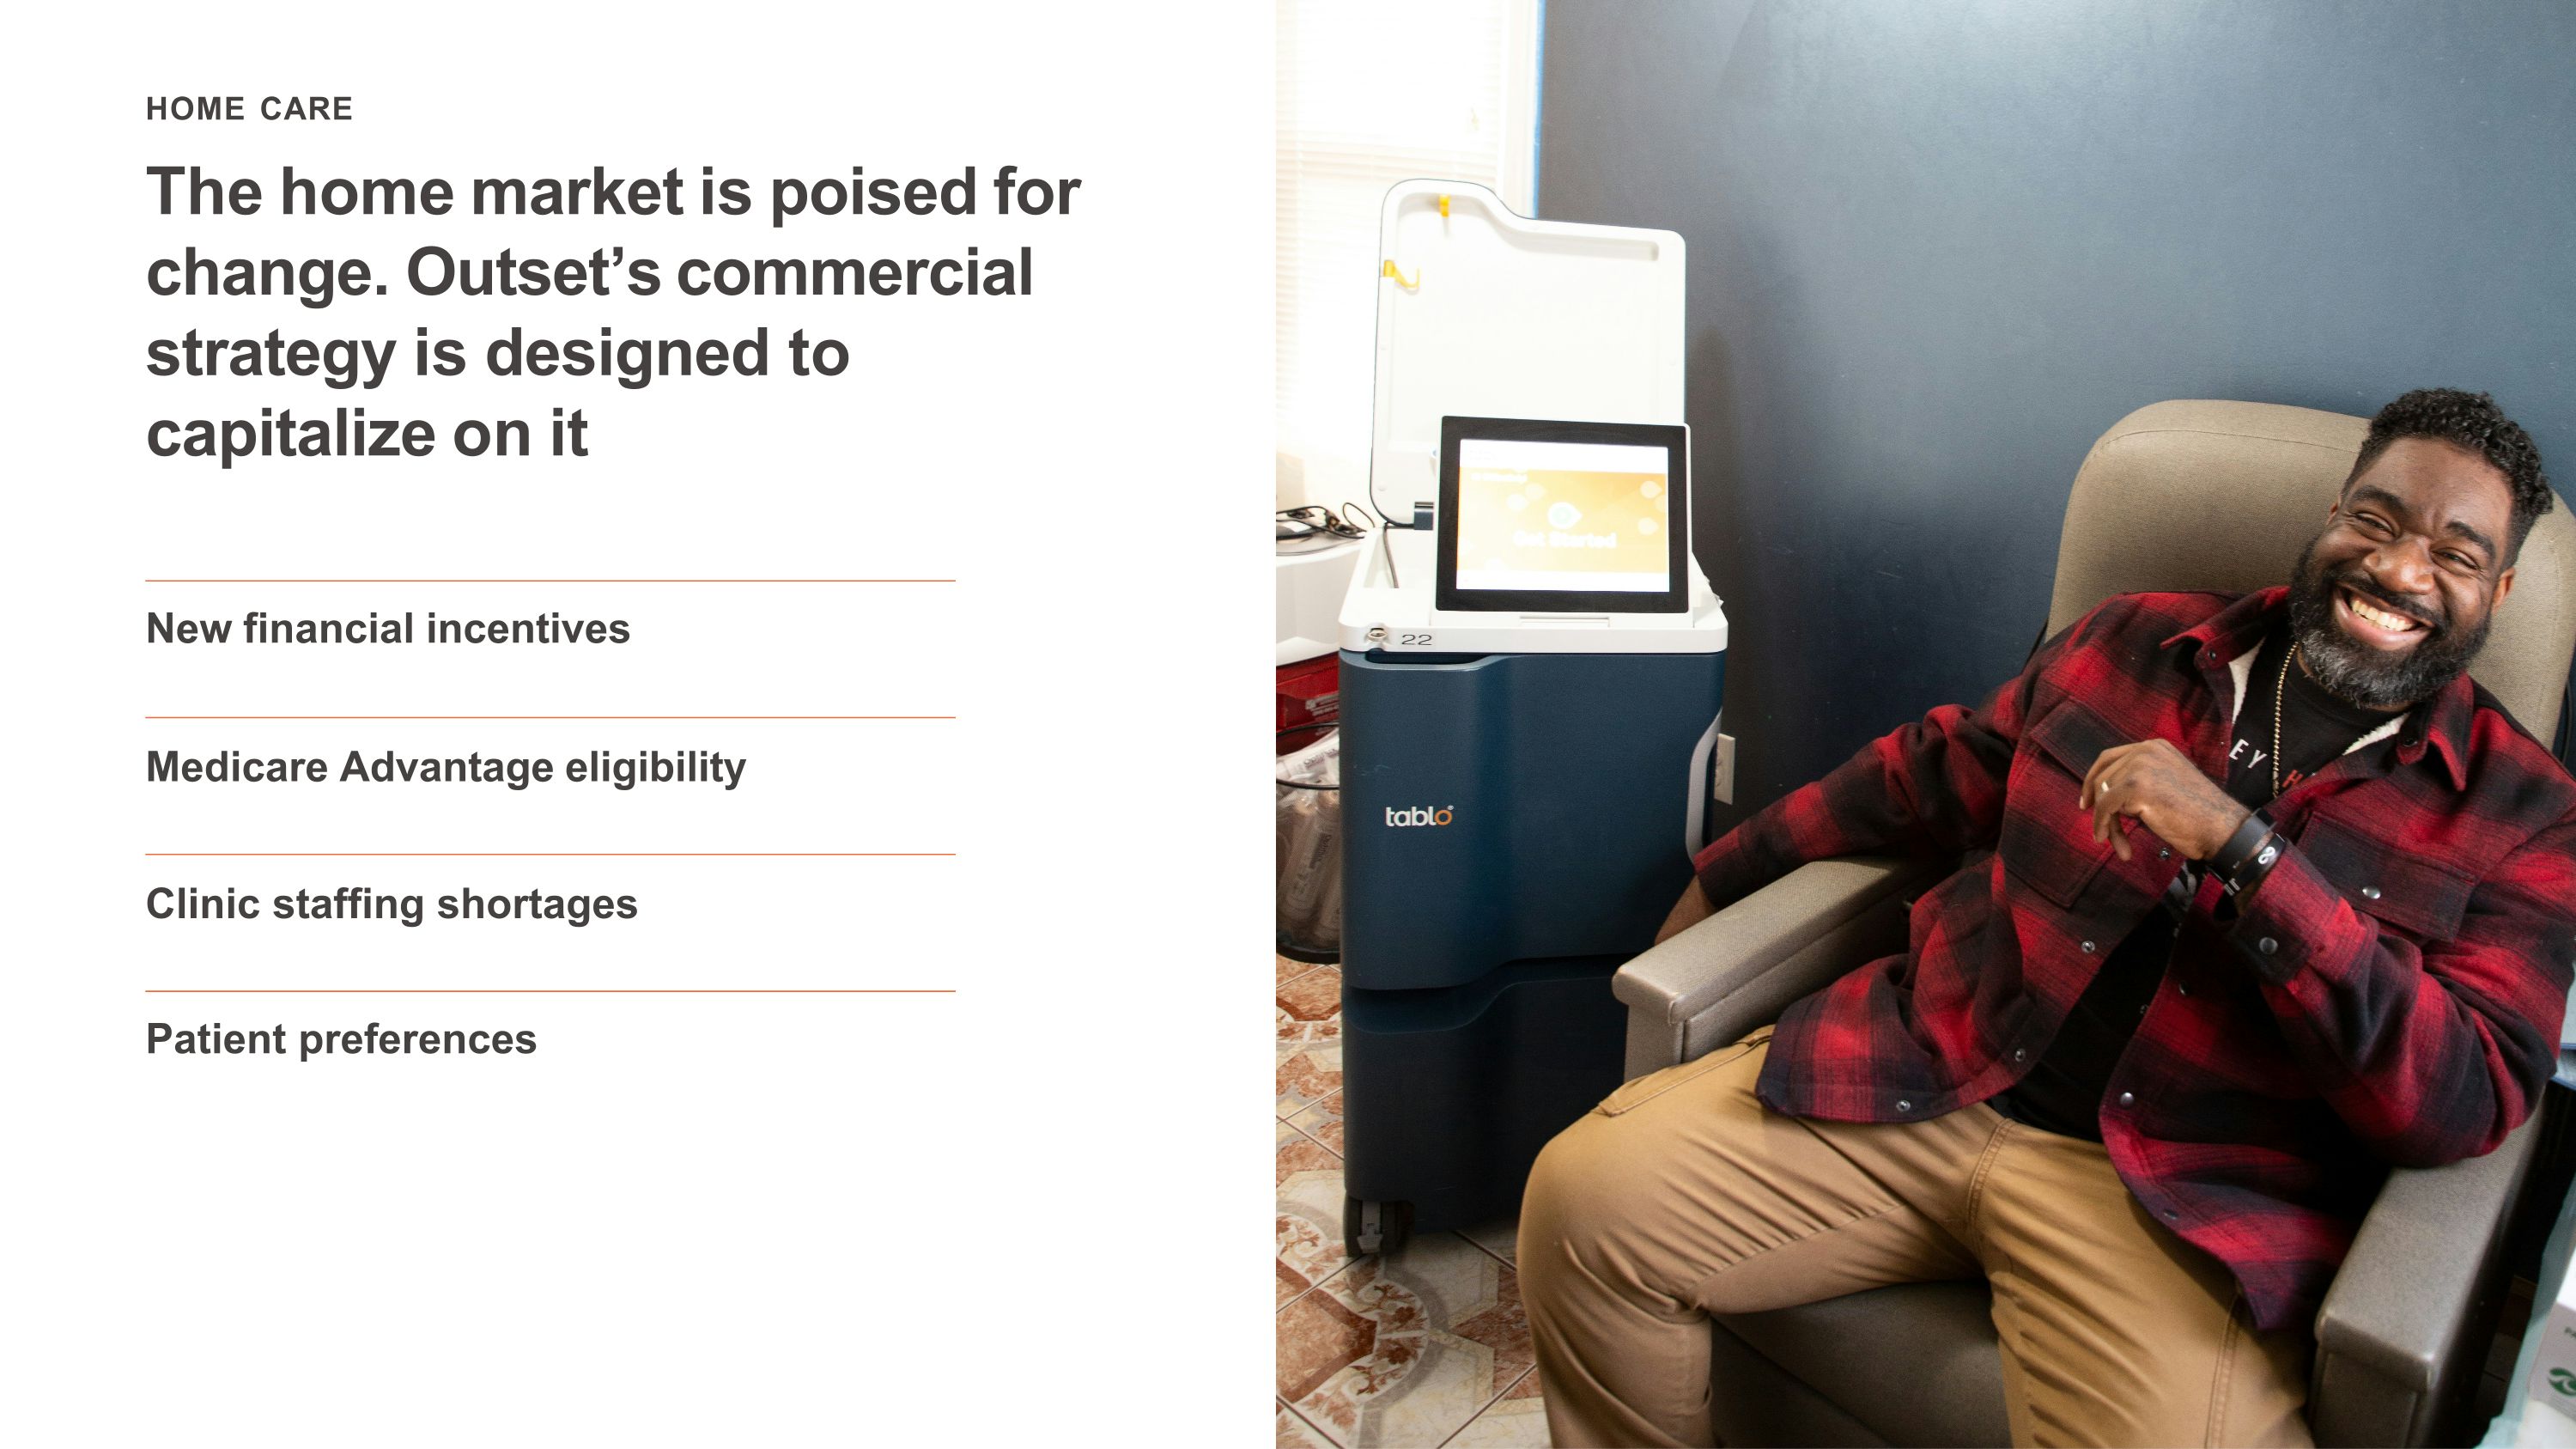
The home market is poised for change. Outset’s commercial strategy is designed to capitalize on it HOME CARE New financial incentives Medicare Advantage eligibility Clinic staffing shortages Patient preferences
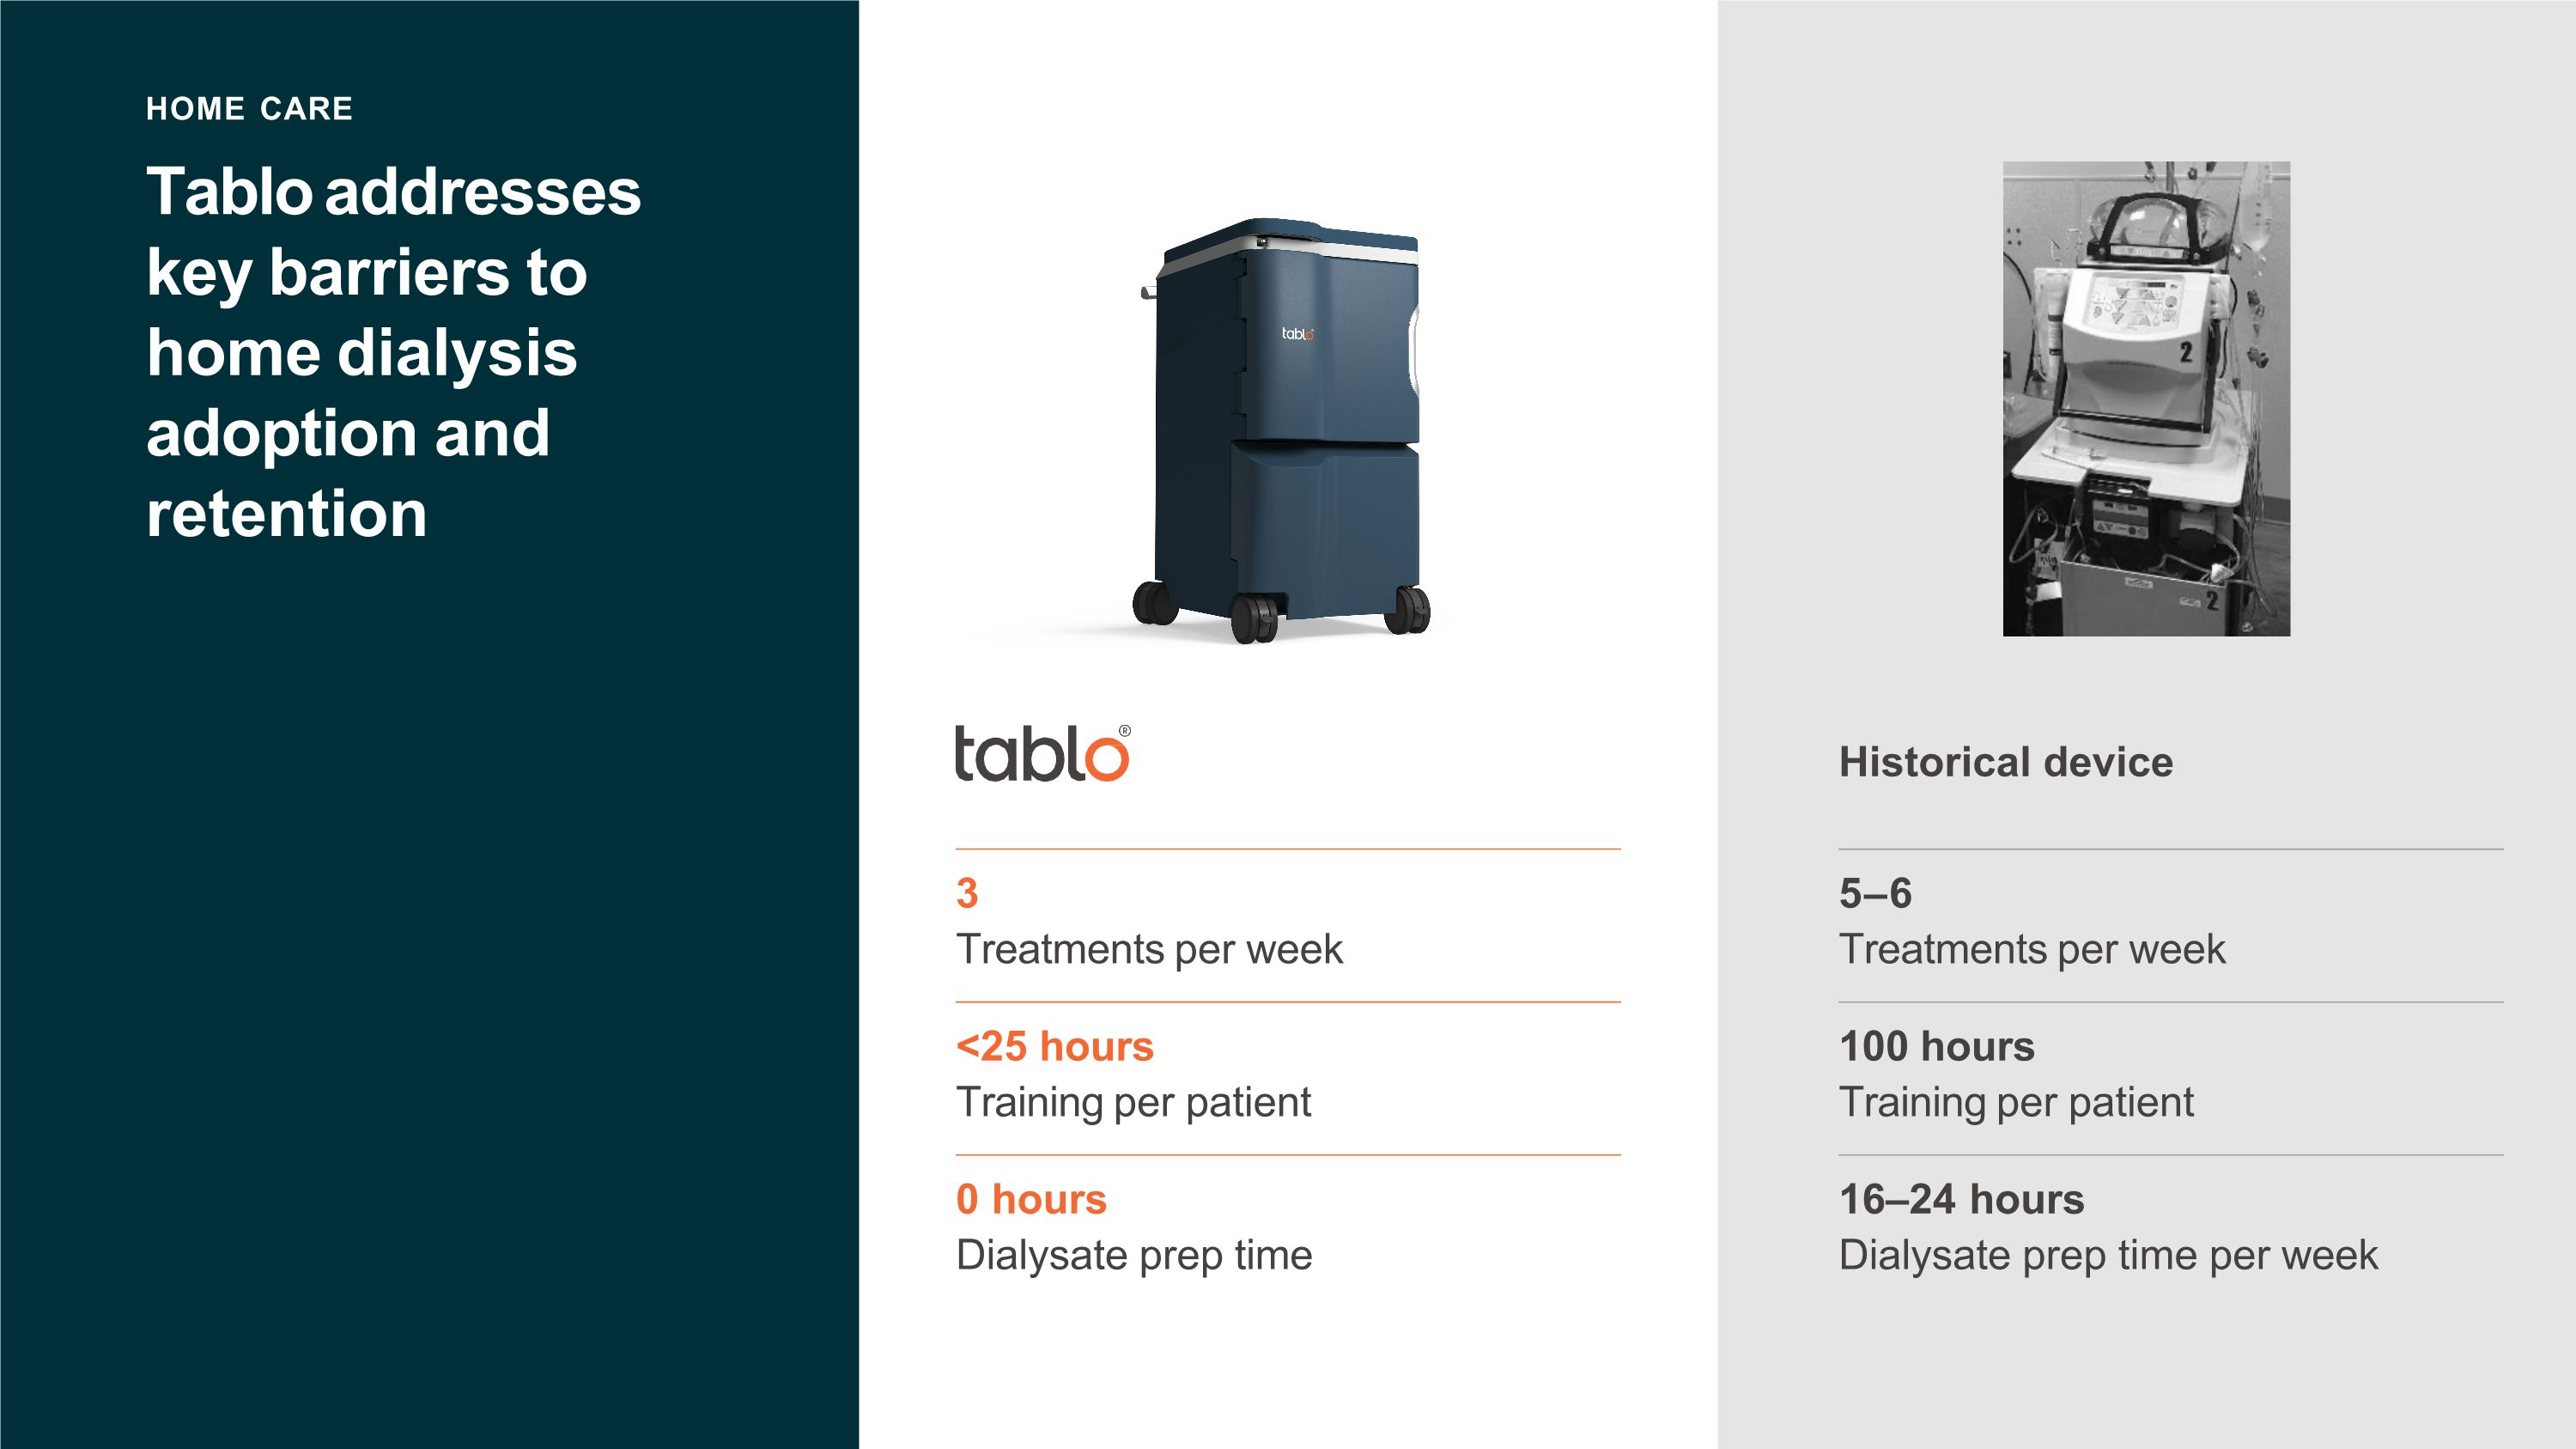
Tablo addresses key barriers to home dialysis adoption and retention HOME CARE 5–6 Treatments per week 100 hours Training per patient 16–24 hours Dialysate prep time per week Historical device 3 Treatments per week <25 hours Training per patient 0 hours Dialysate prep time
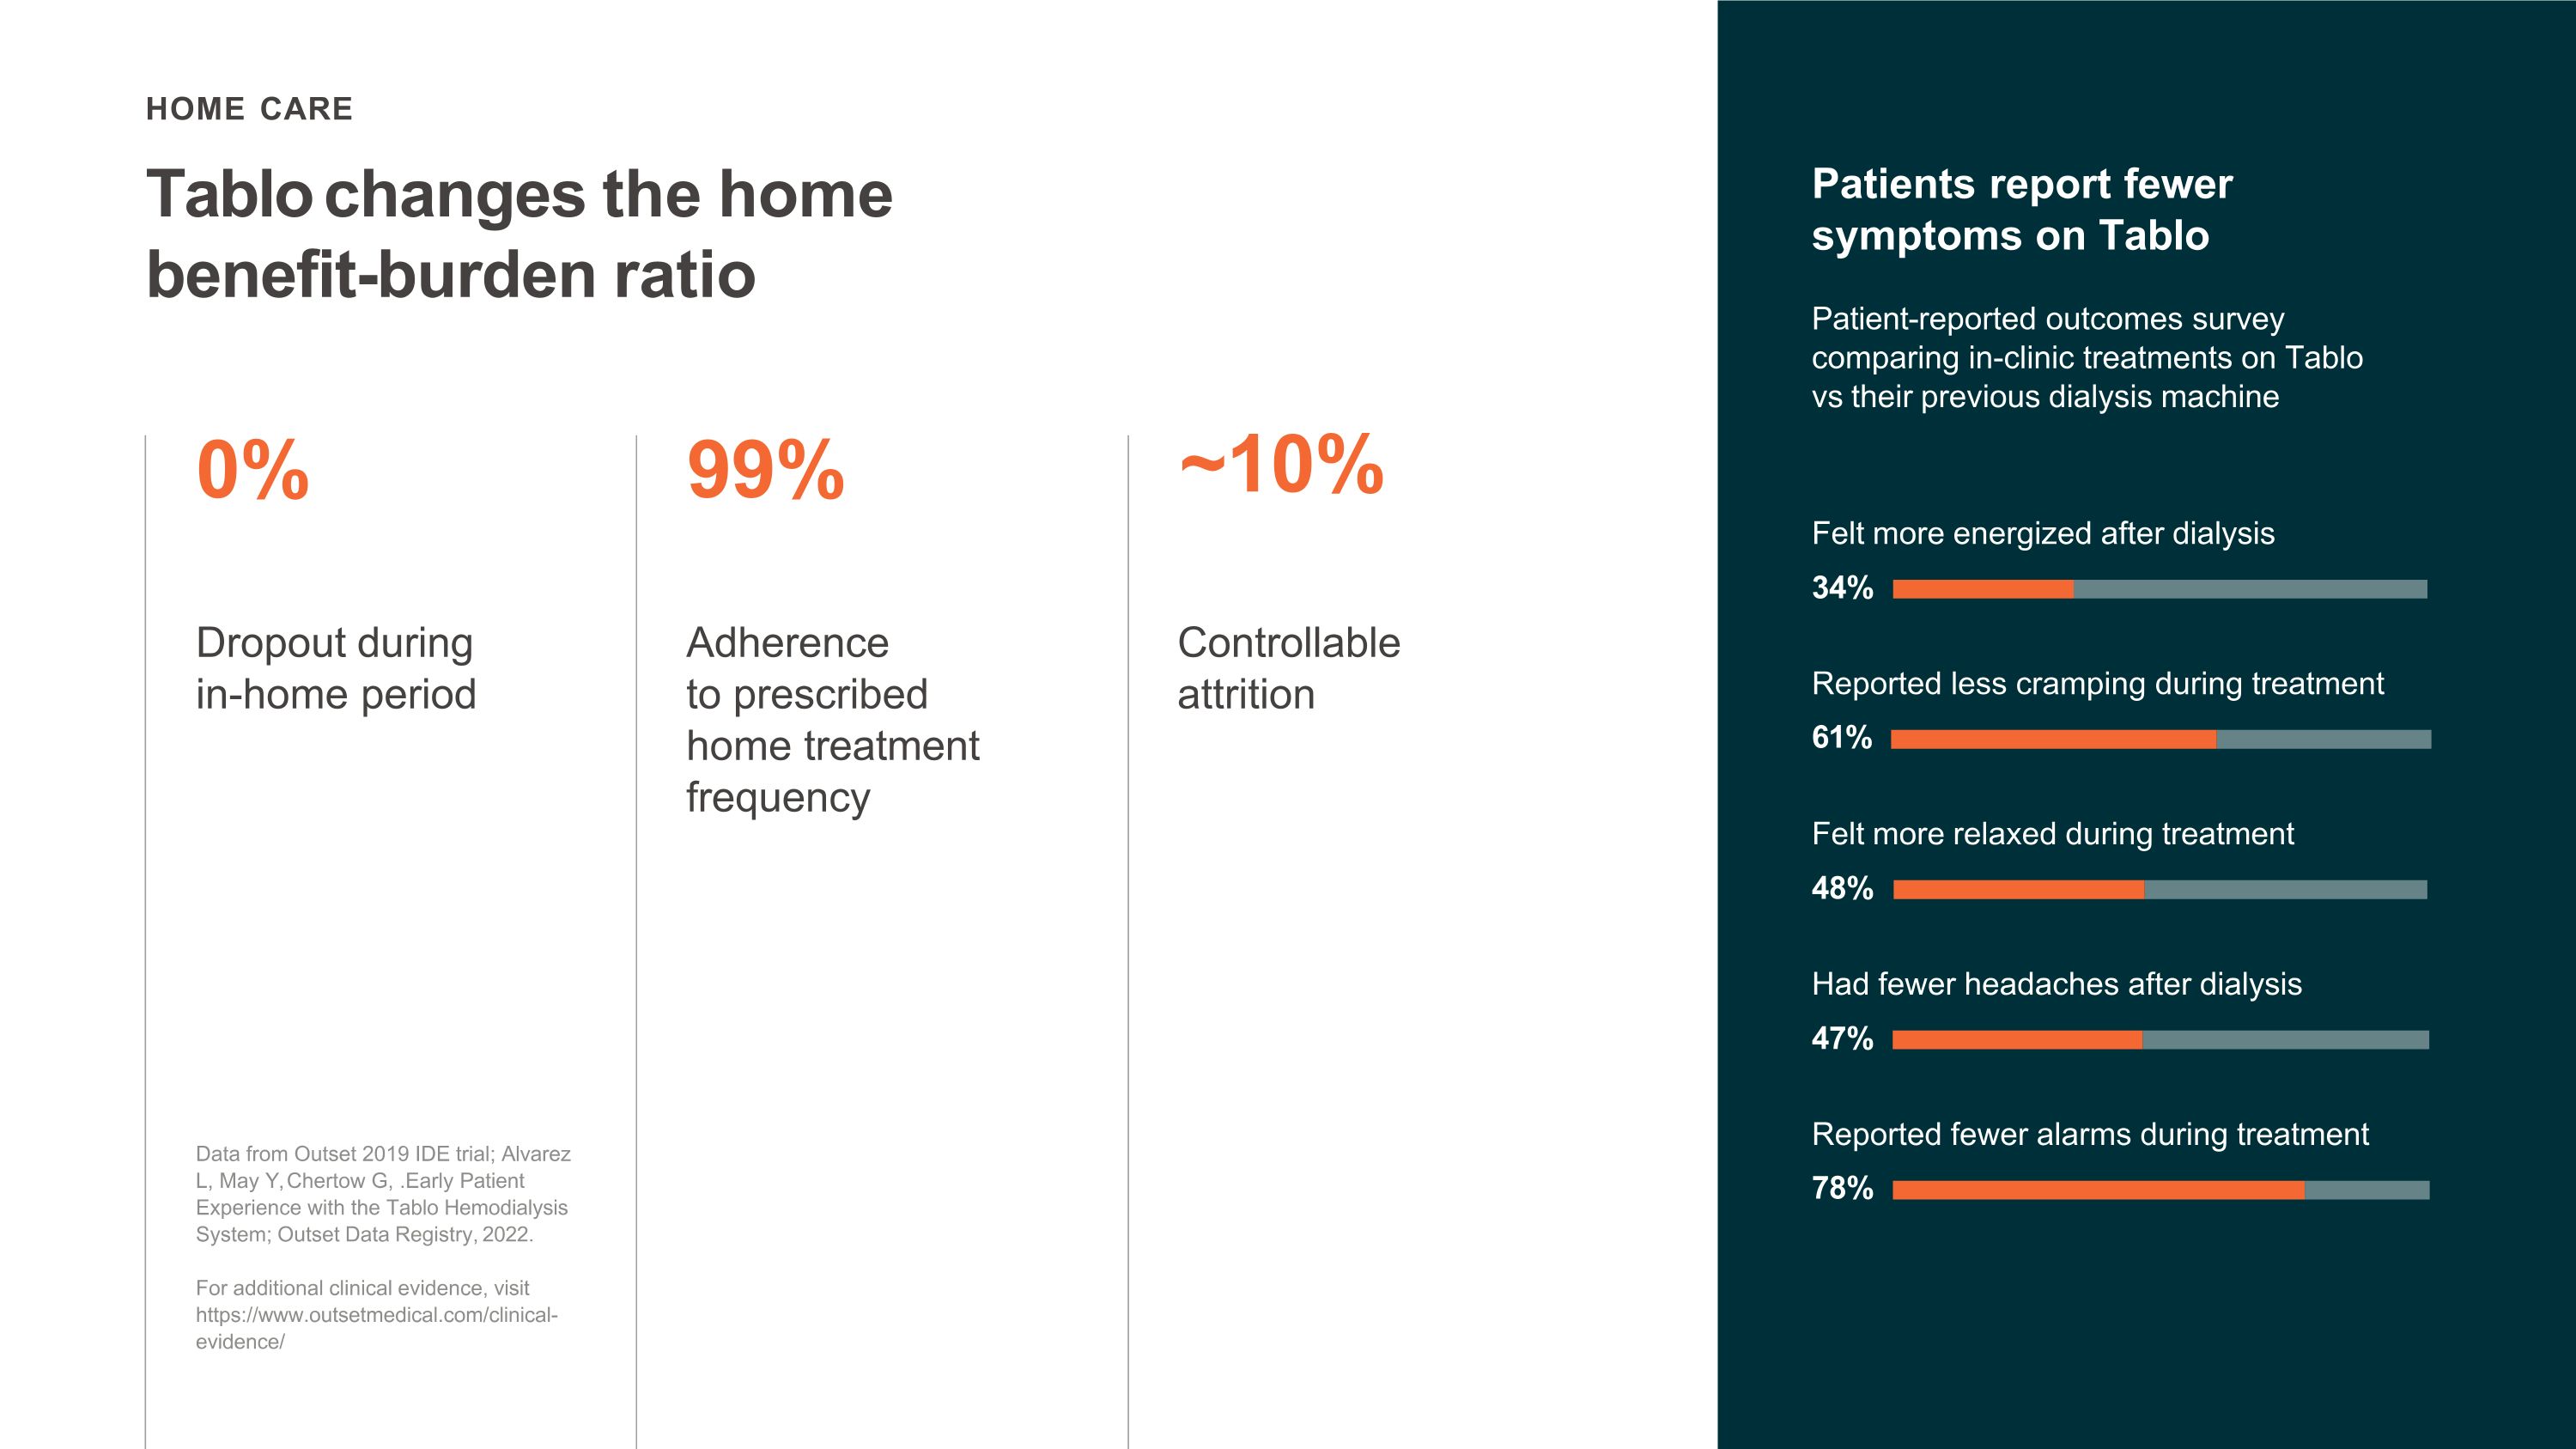
HOME CARE Tablo changes the home benefit-burden ratio Patients report fewer symptoms on Tablo Patient-reported outcomes survey comparing in-clinic treatments on Tablo vs their previous dialysis machine Felt more energized after dialysis 34% Reported less cramping during treatment 61% Felt more relaxed during treatment 48% Had fewer headaches after dialysis 47% Reported fewer alarms during treatment 78% ~10% Controllable attrition Adherence to prescribed home treatment frequency 99% Dropout during in-home period 0% Data from Outset 2019 IDE trial; Alvarez L, May Y, Chertow G, .Early Patient Experience with the Tablo Hemodialysis System; Outset Data Registry, 2022. For additional clinical evidence, visit https://www.outsetmedical.com/clinical- evidence/
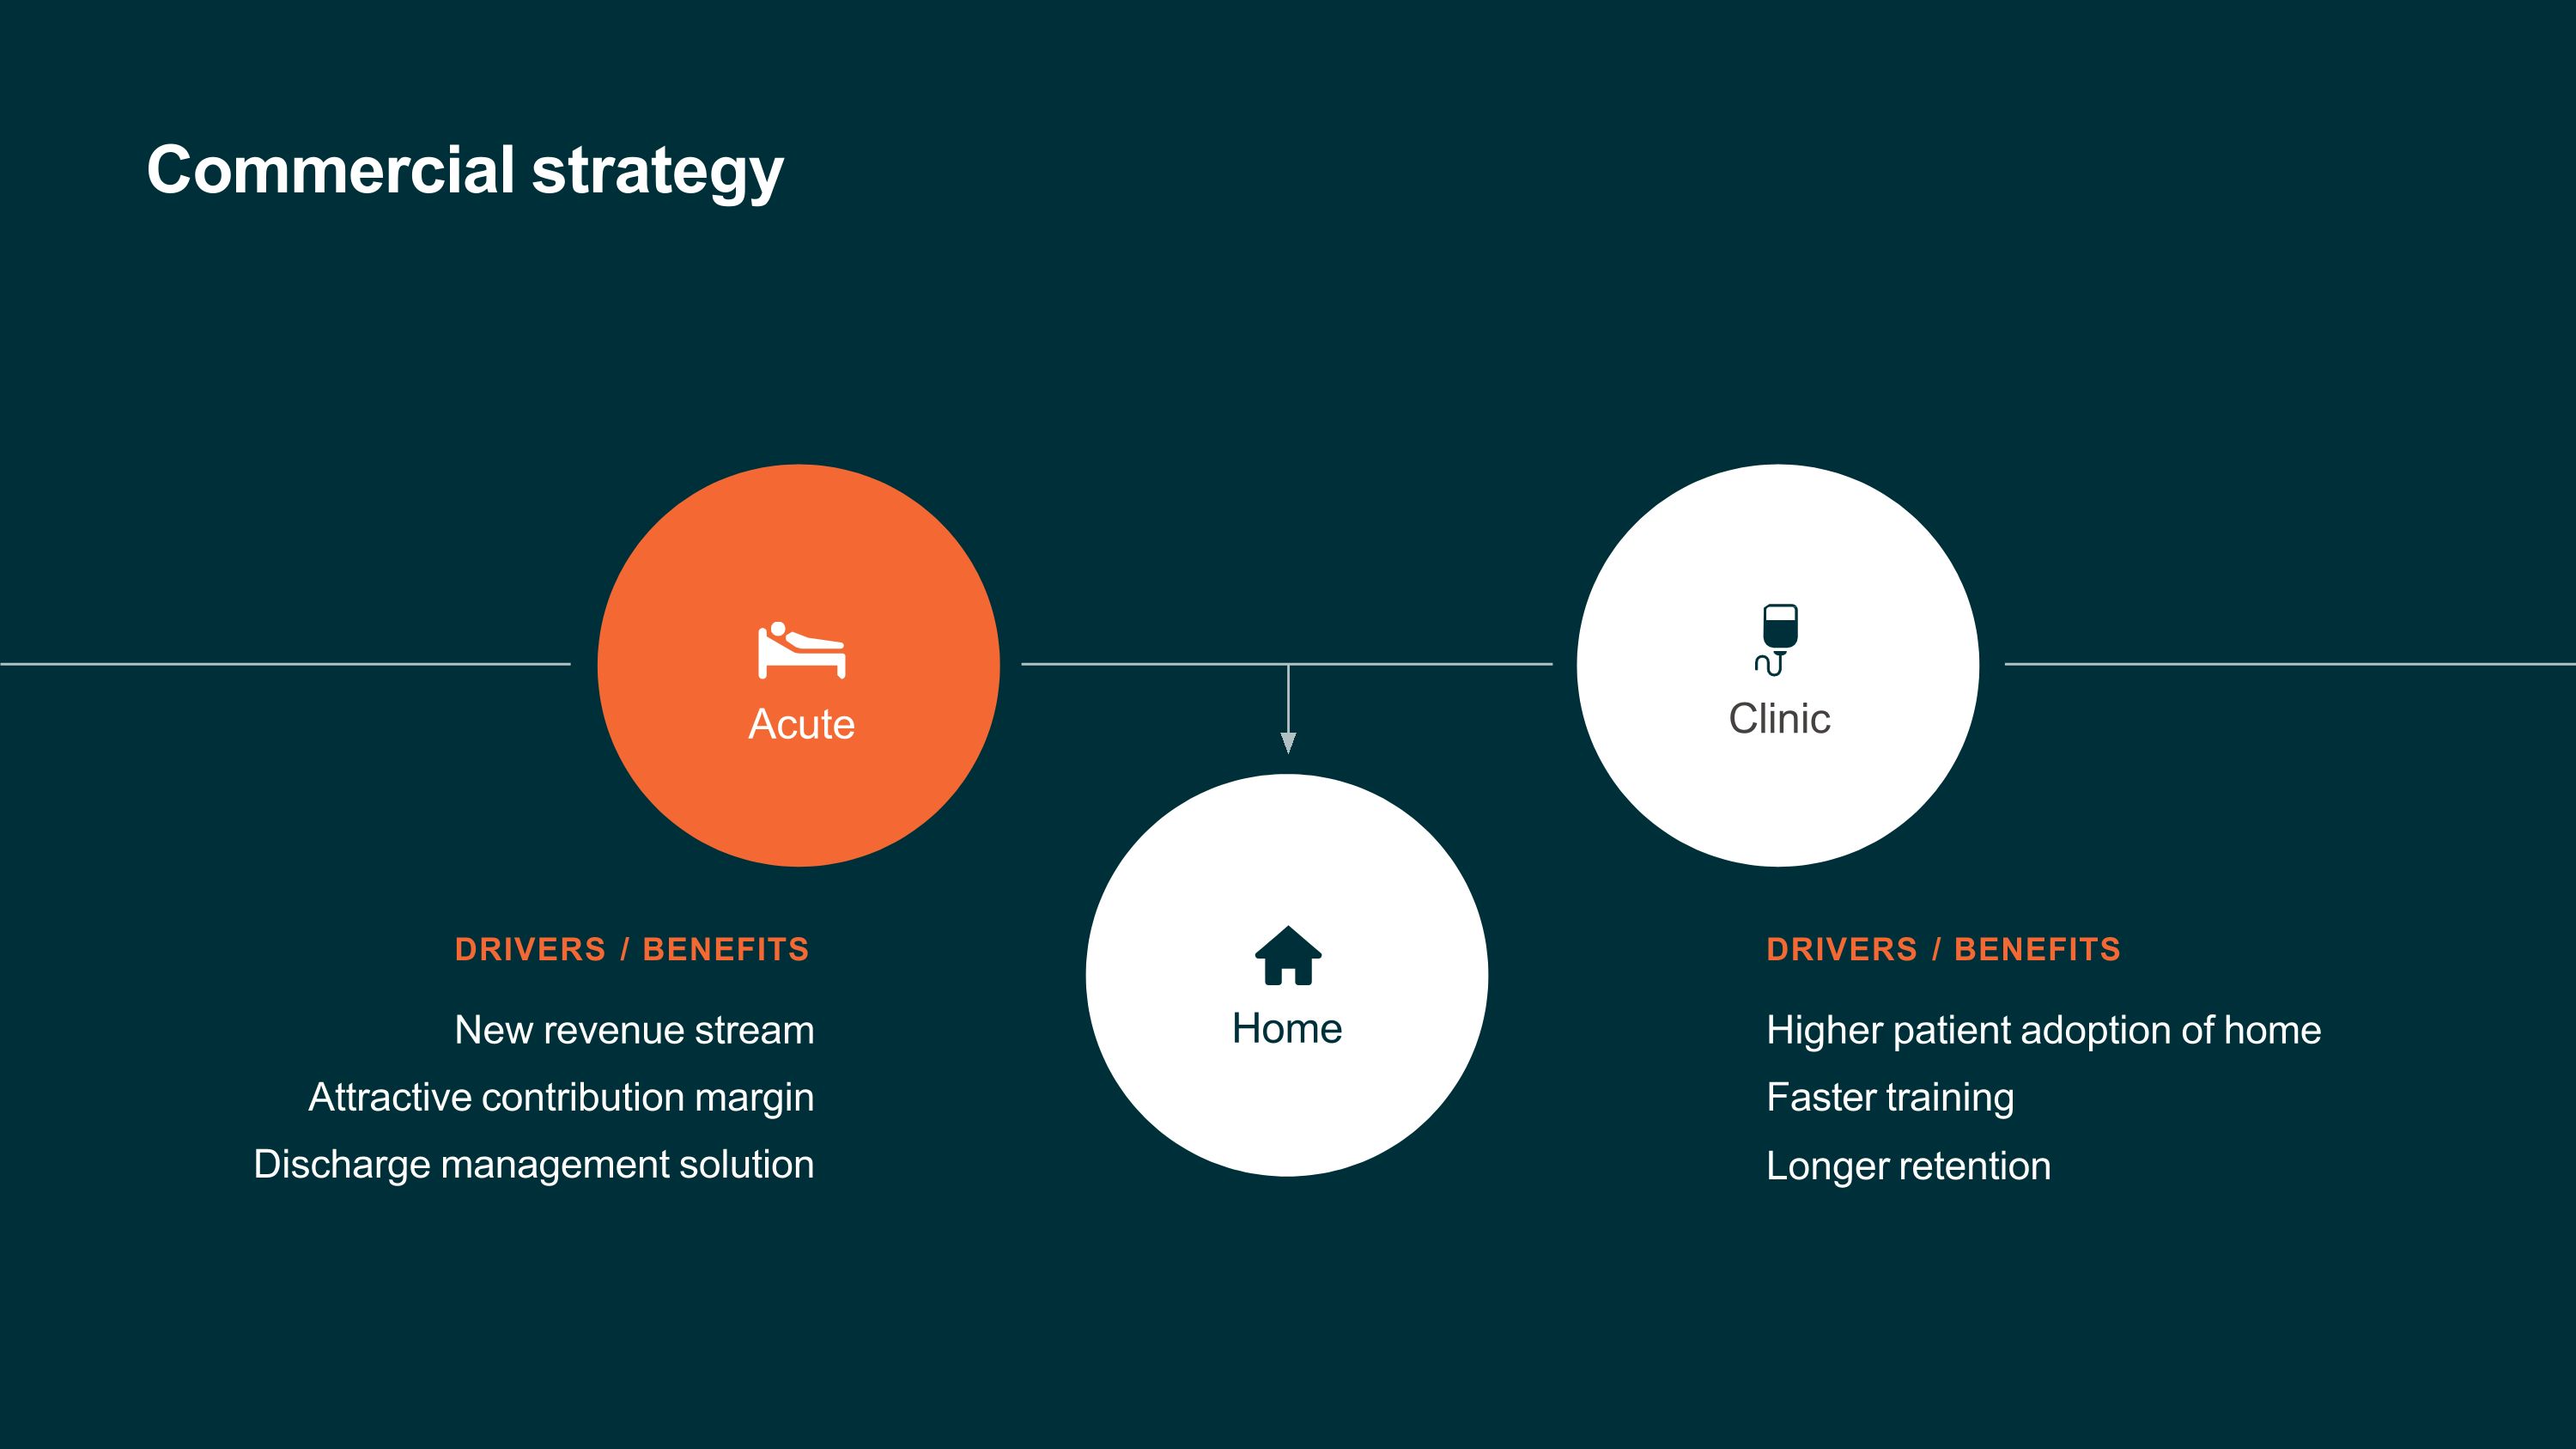
Commercial strategy Clinic DRIVERS / BENEFITS New revenue stream Attractive contribution margin Discharge management solution Acute Home DRIVERS / BENEFITS Higher patient adoption of home Faster training Longer retention
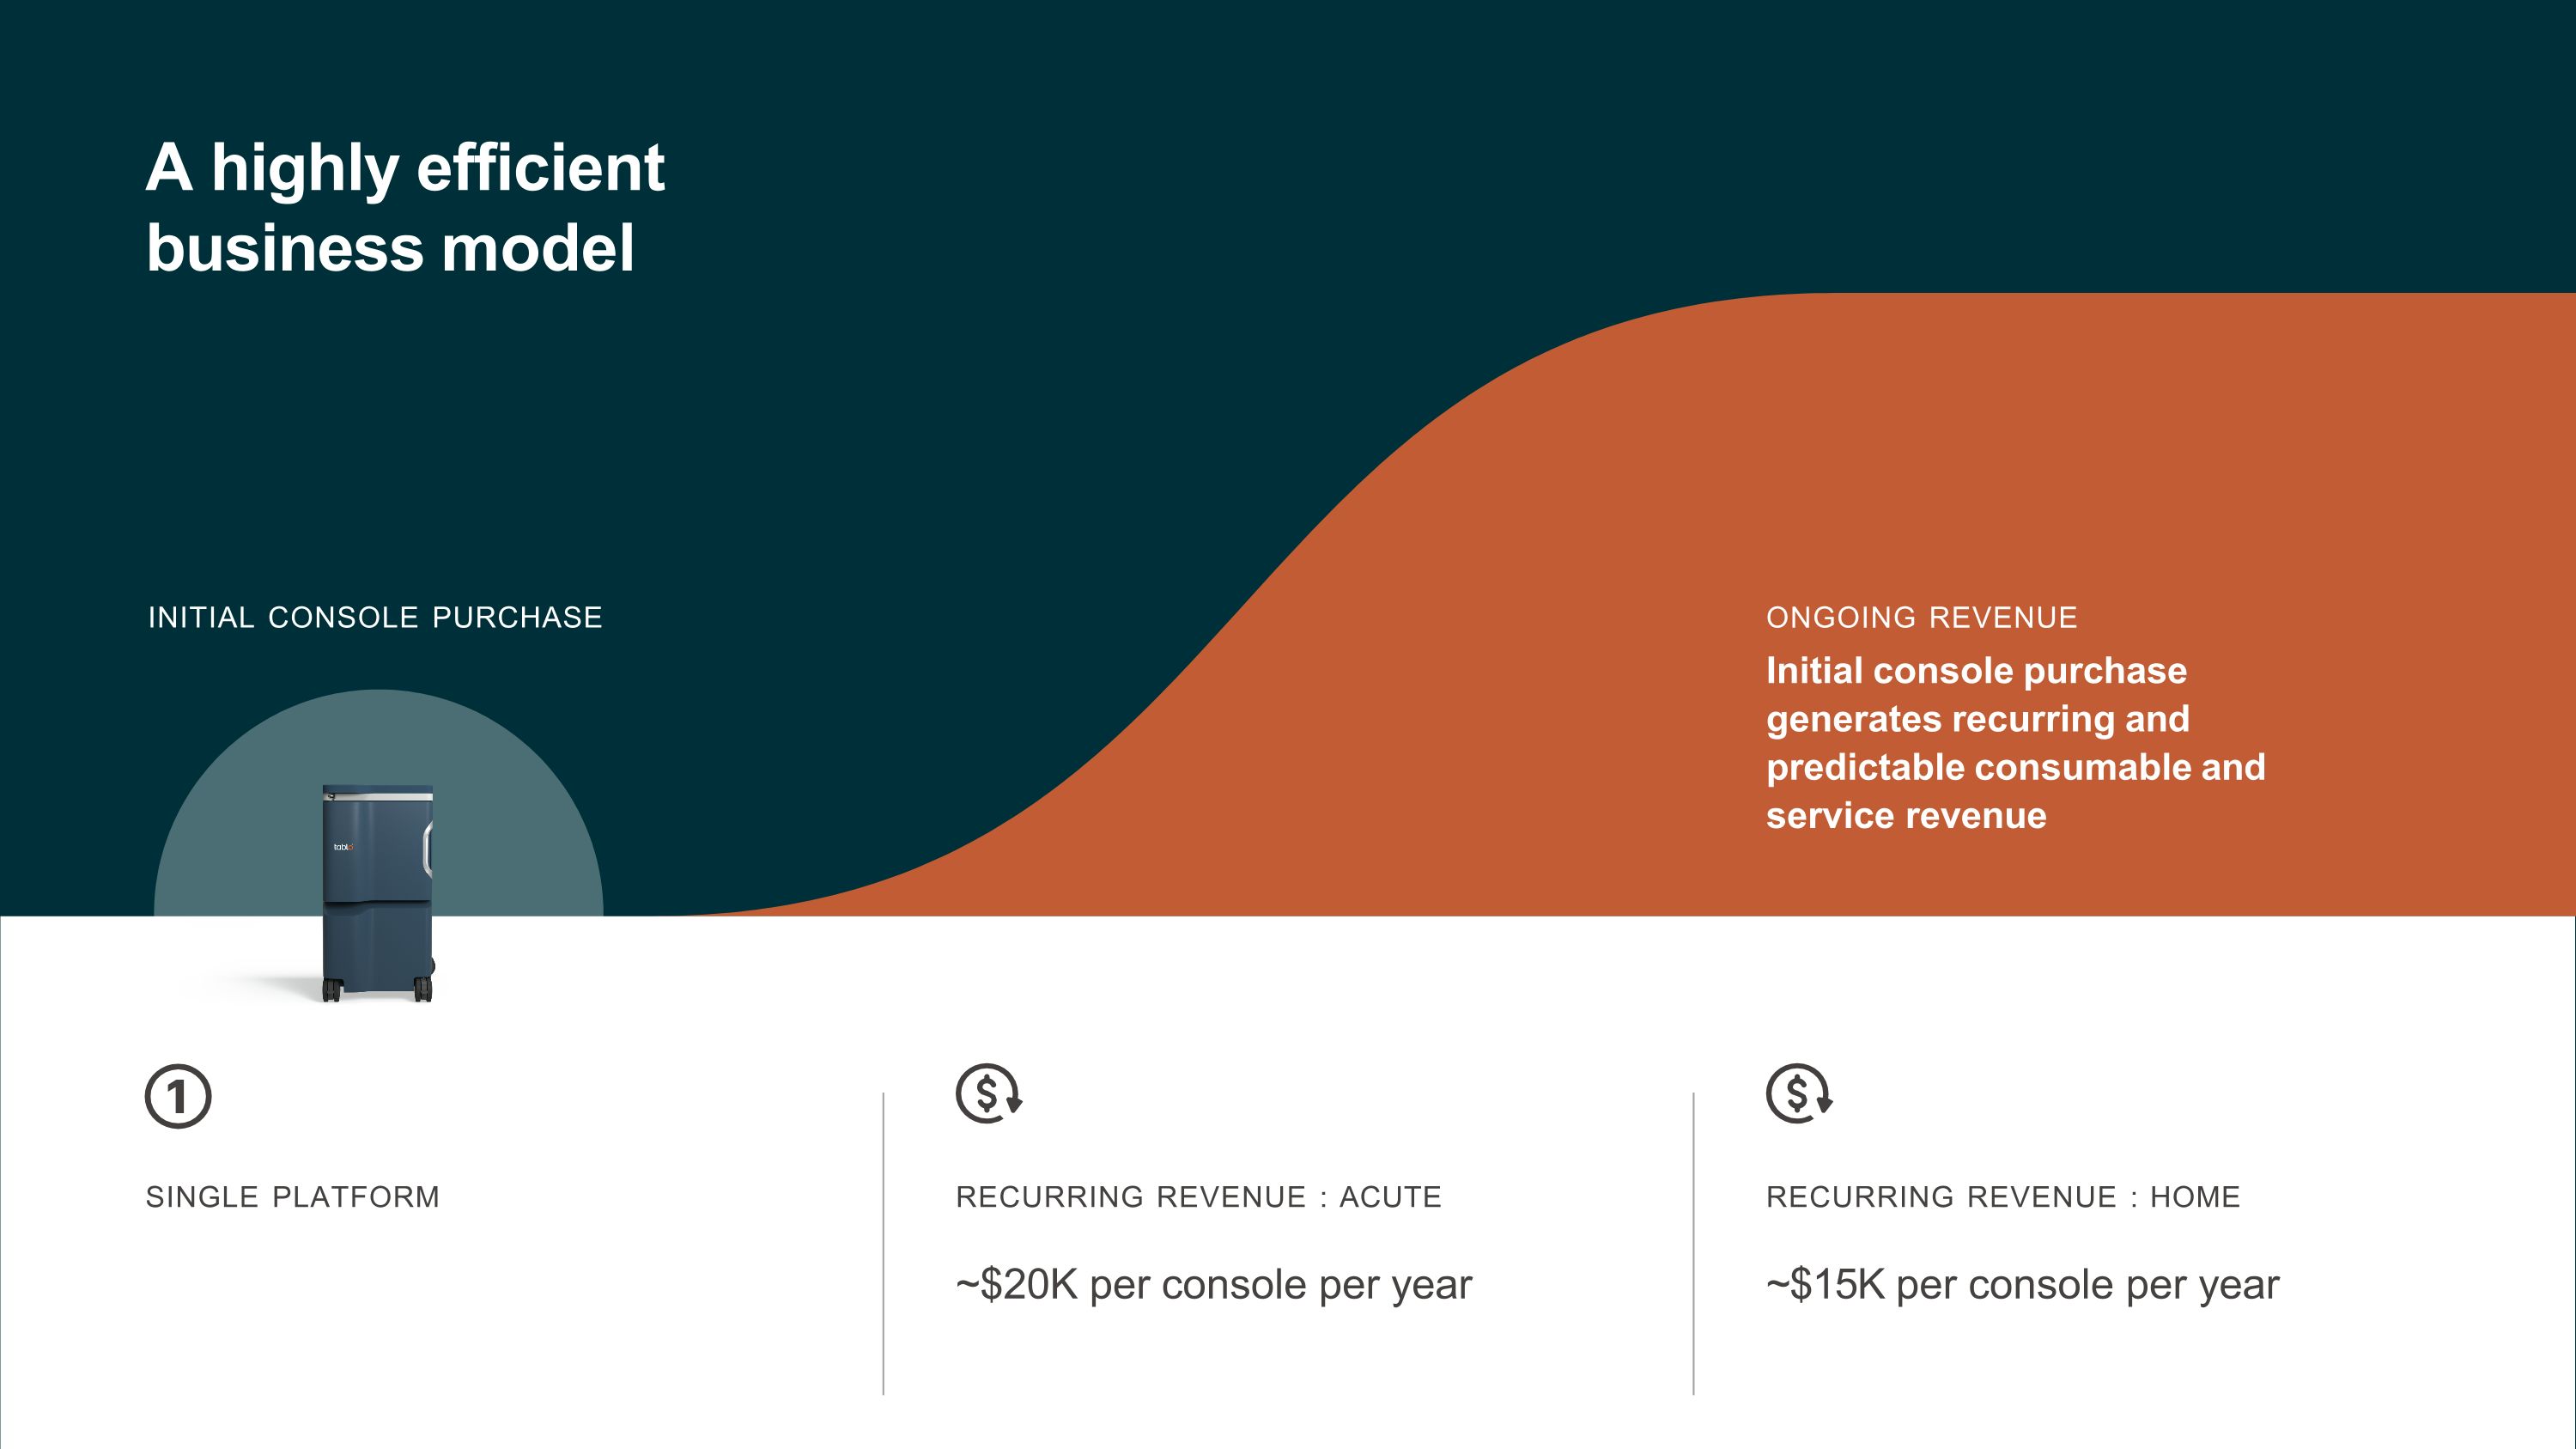
A highly efficient business model SINGLE PLATFORM RECURRING REVENUE : ACUTE ~$20K per console per year RECURRING REVENUE : HOME ~$15K per console per year ONGOING REVENUE Initial console purchase generates recurring and predictable consumable and service revenue INITIAL CONSOLE PURCHASE
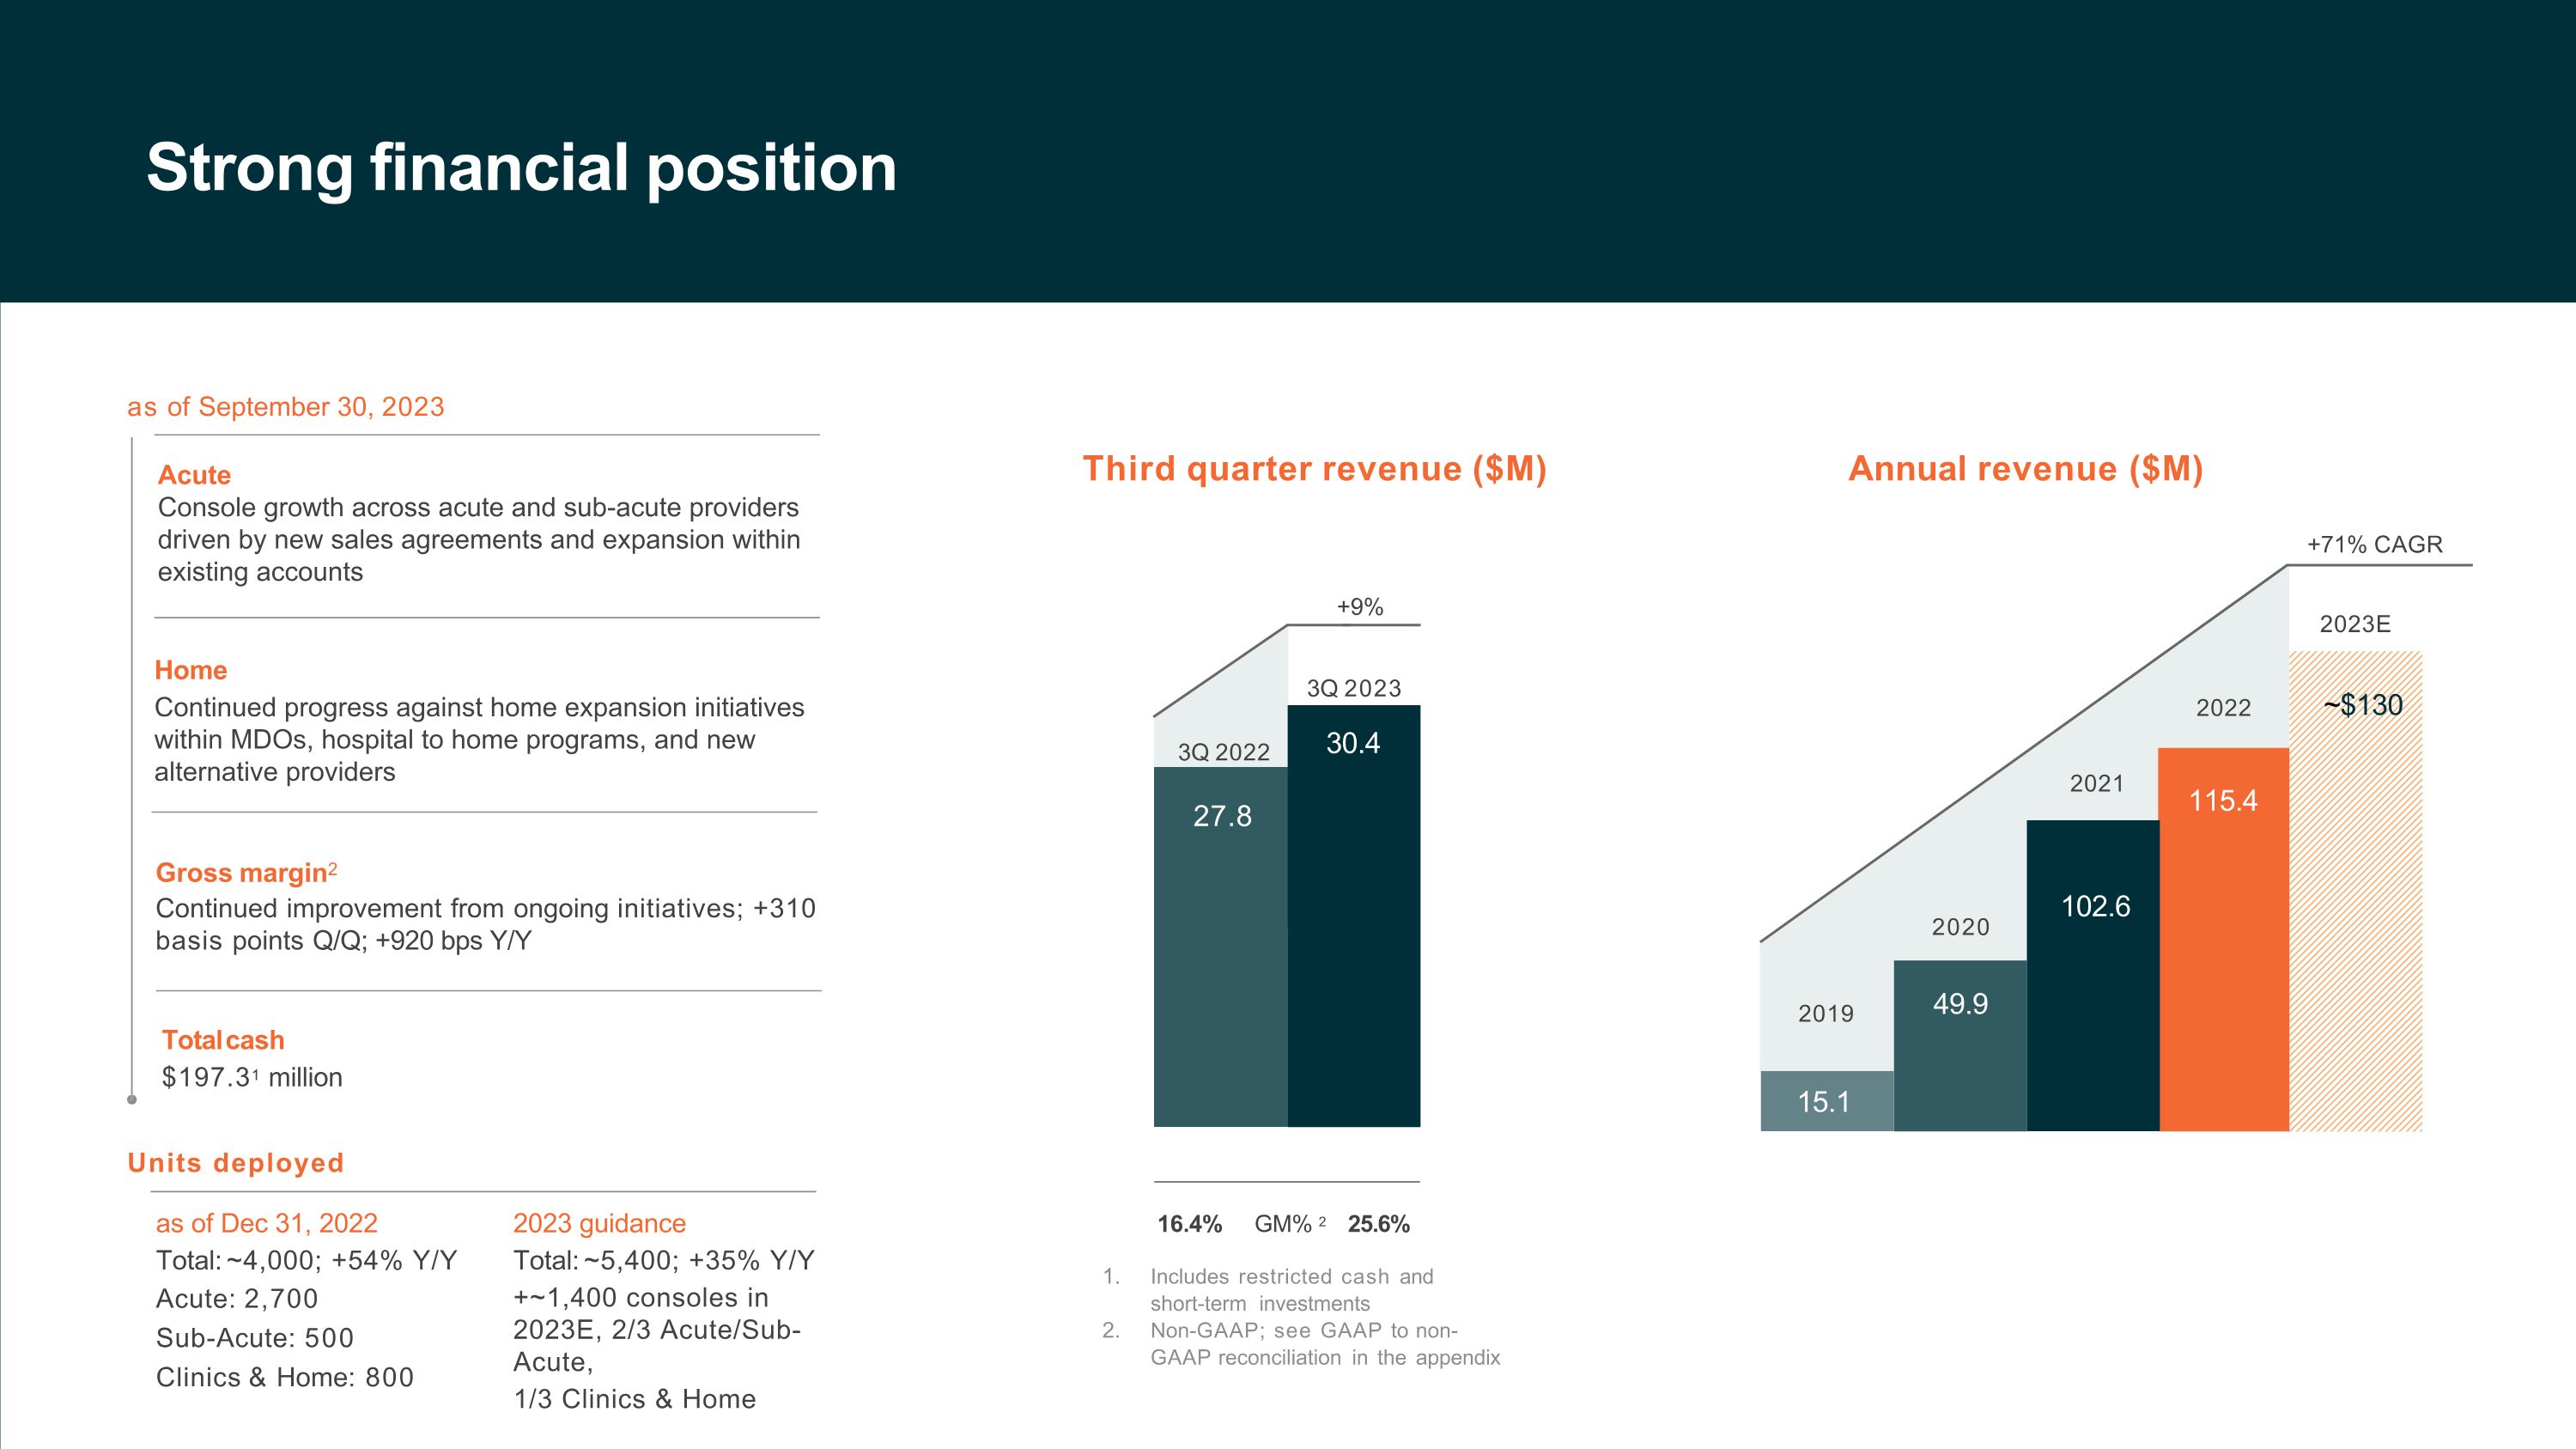
Strong financial position as of September 30, 2023 Acute Console growth across acute and sub-acute providers driven by new sales agreements and expansion within existing accounts Home Continued progress against home expansion initiatives within MDOs, hospital to home programs, and new alternative providers Gross margin2 Continued improvement from ongoing initiatives; +310 basis points Q/Q; +920 bps Y/Y as of Dec 31, 2022 Total: ~4,000; +54% Y/Y Acute: 2,700 Sub-Acute: 500 Clinics & Home: 800 Total cash $197.31 million 27.8 16.4% GM% 2 25.6% Third quarter revenue ($M) Includes restricted cash and short-term investments Non-GAAP; see GAAP to non-GAAP reconciliation in the appendix 3Q 2022 3Q 2023 30.4 +9% Annual revenue ($M) 115.4 +71% CAGR 2021 2020 2022 2019 ~$130 2023E 49.9 102.6 15.1 Units deployed 2023 guidance Total: ~5,400; +35% Y/Y +~1,400 consoles in 2023E, 2/3 Acute/Sub-Acute, 1/3 Clinics & Home
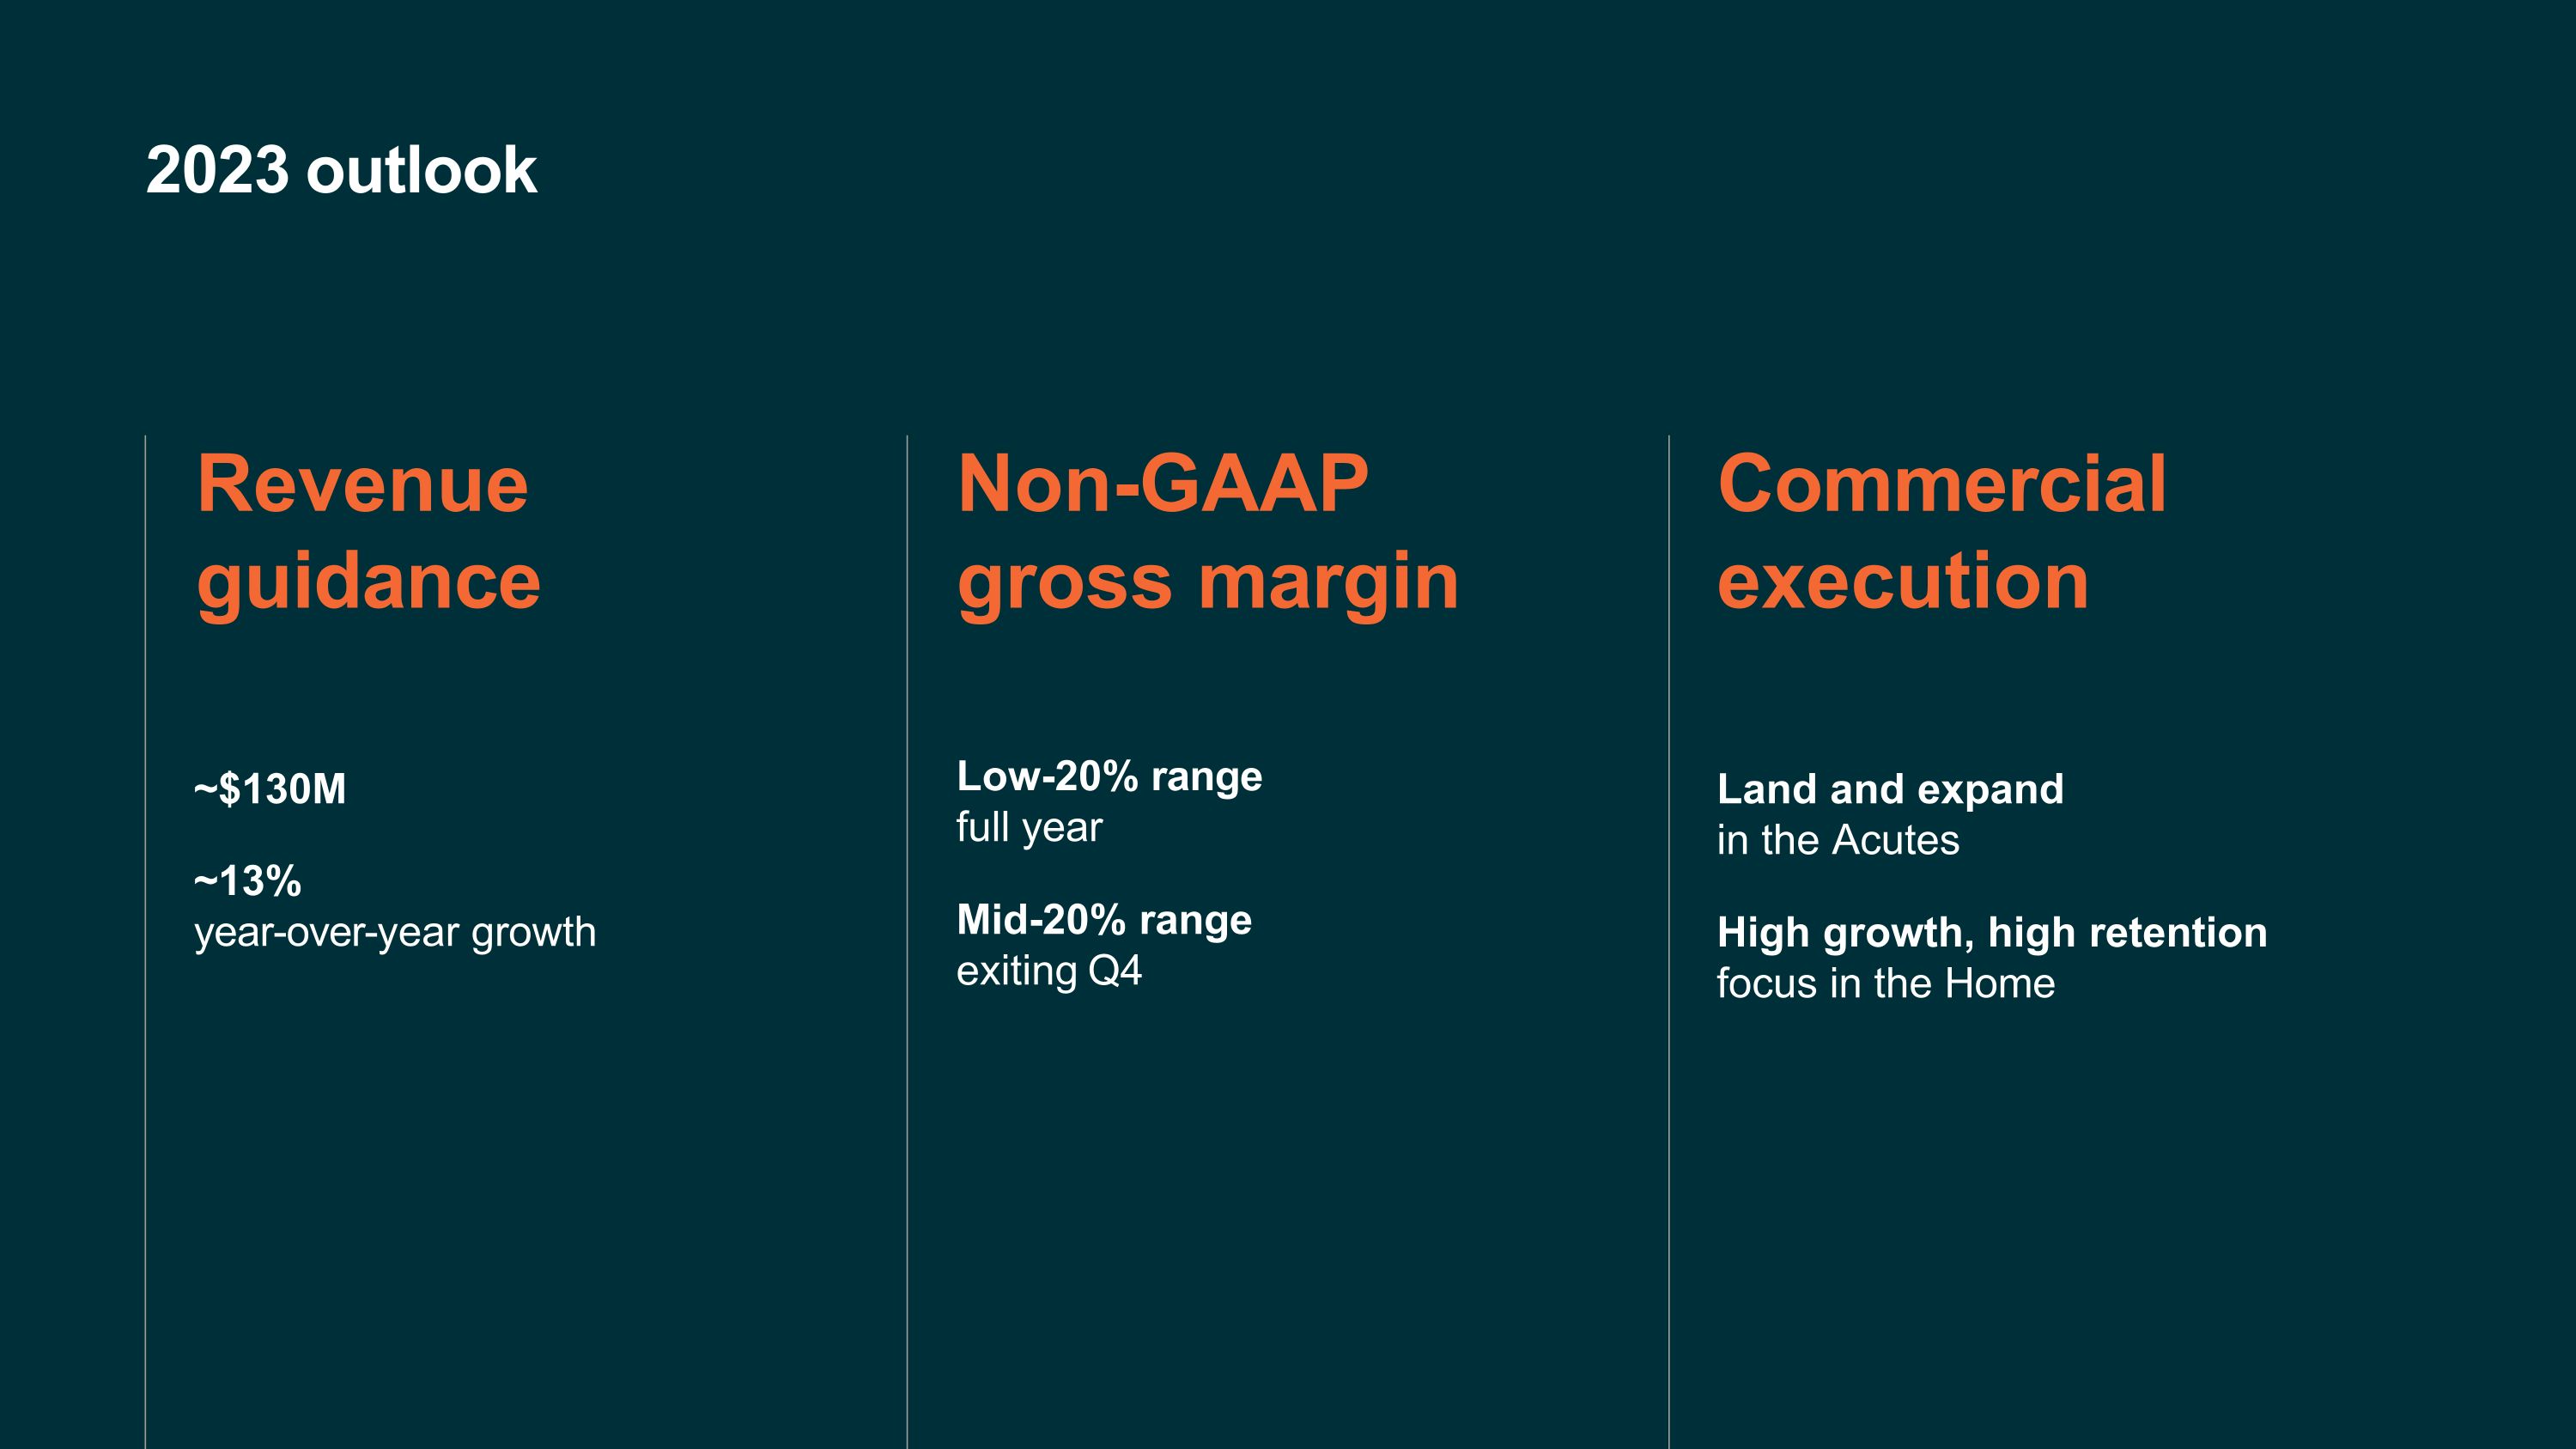
2023 outlook Non-GAAP gross margin Low-20% range full year Mid-20% range exiting Q4 Commercial execution Land and expand in the Acutes High growth, high retention focus in the Home Revenue guidance ~$130M ~13% year-over-year growth
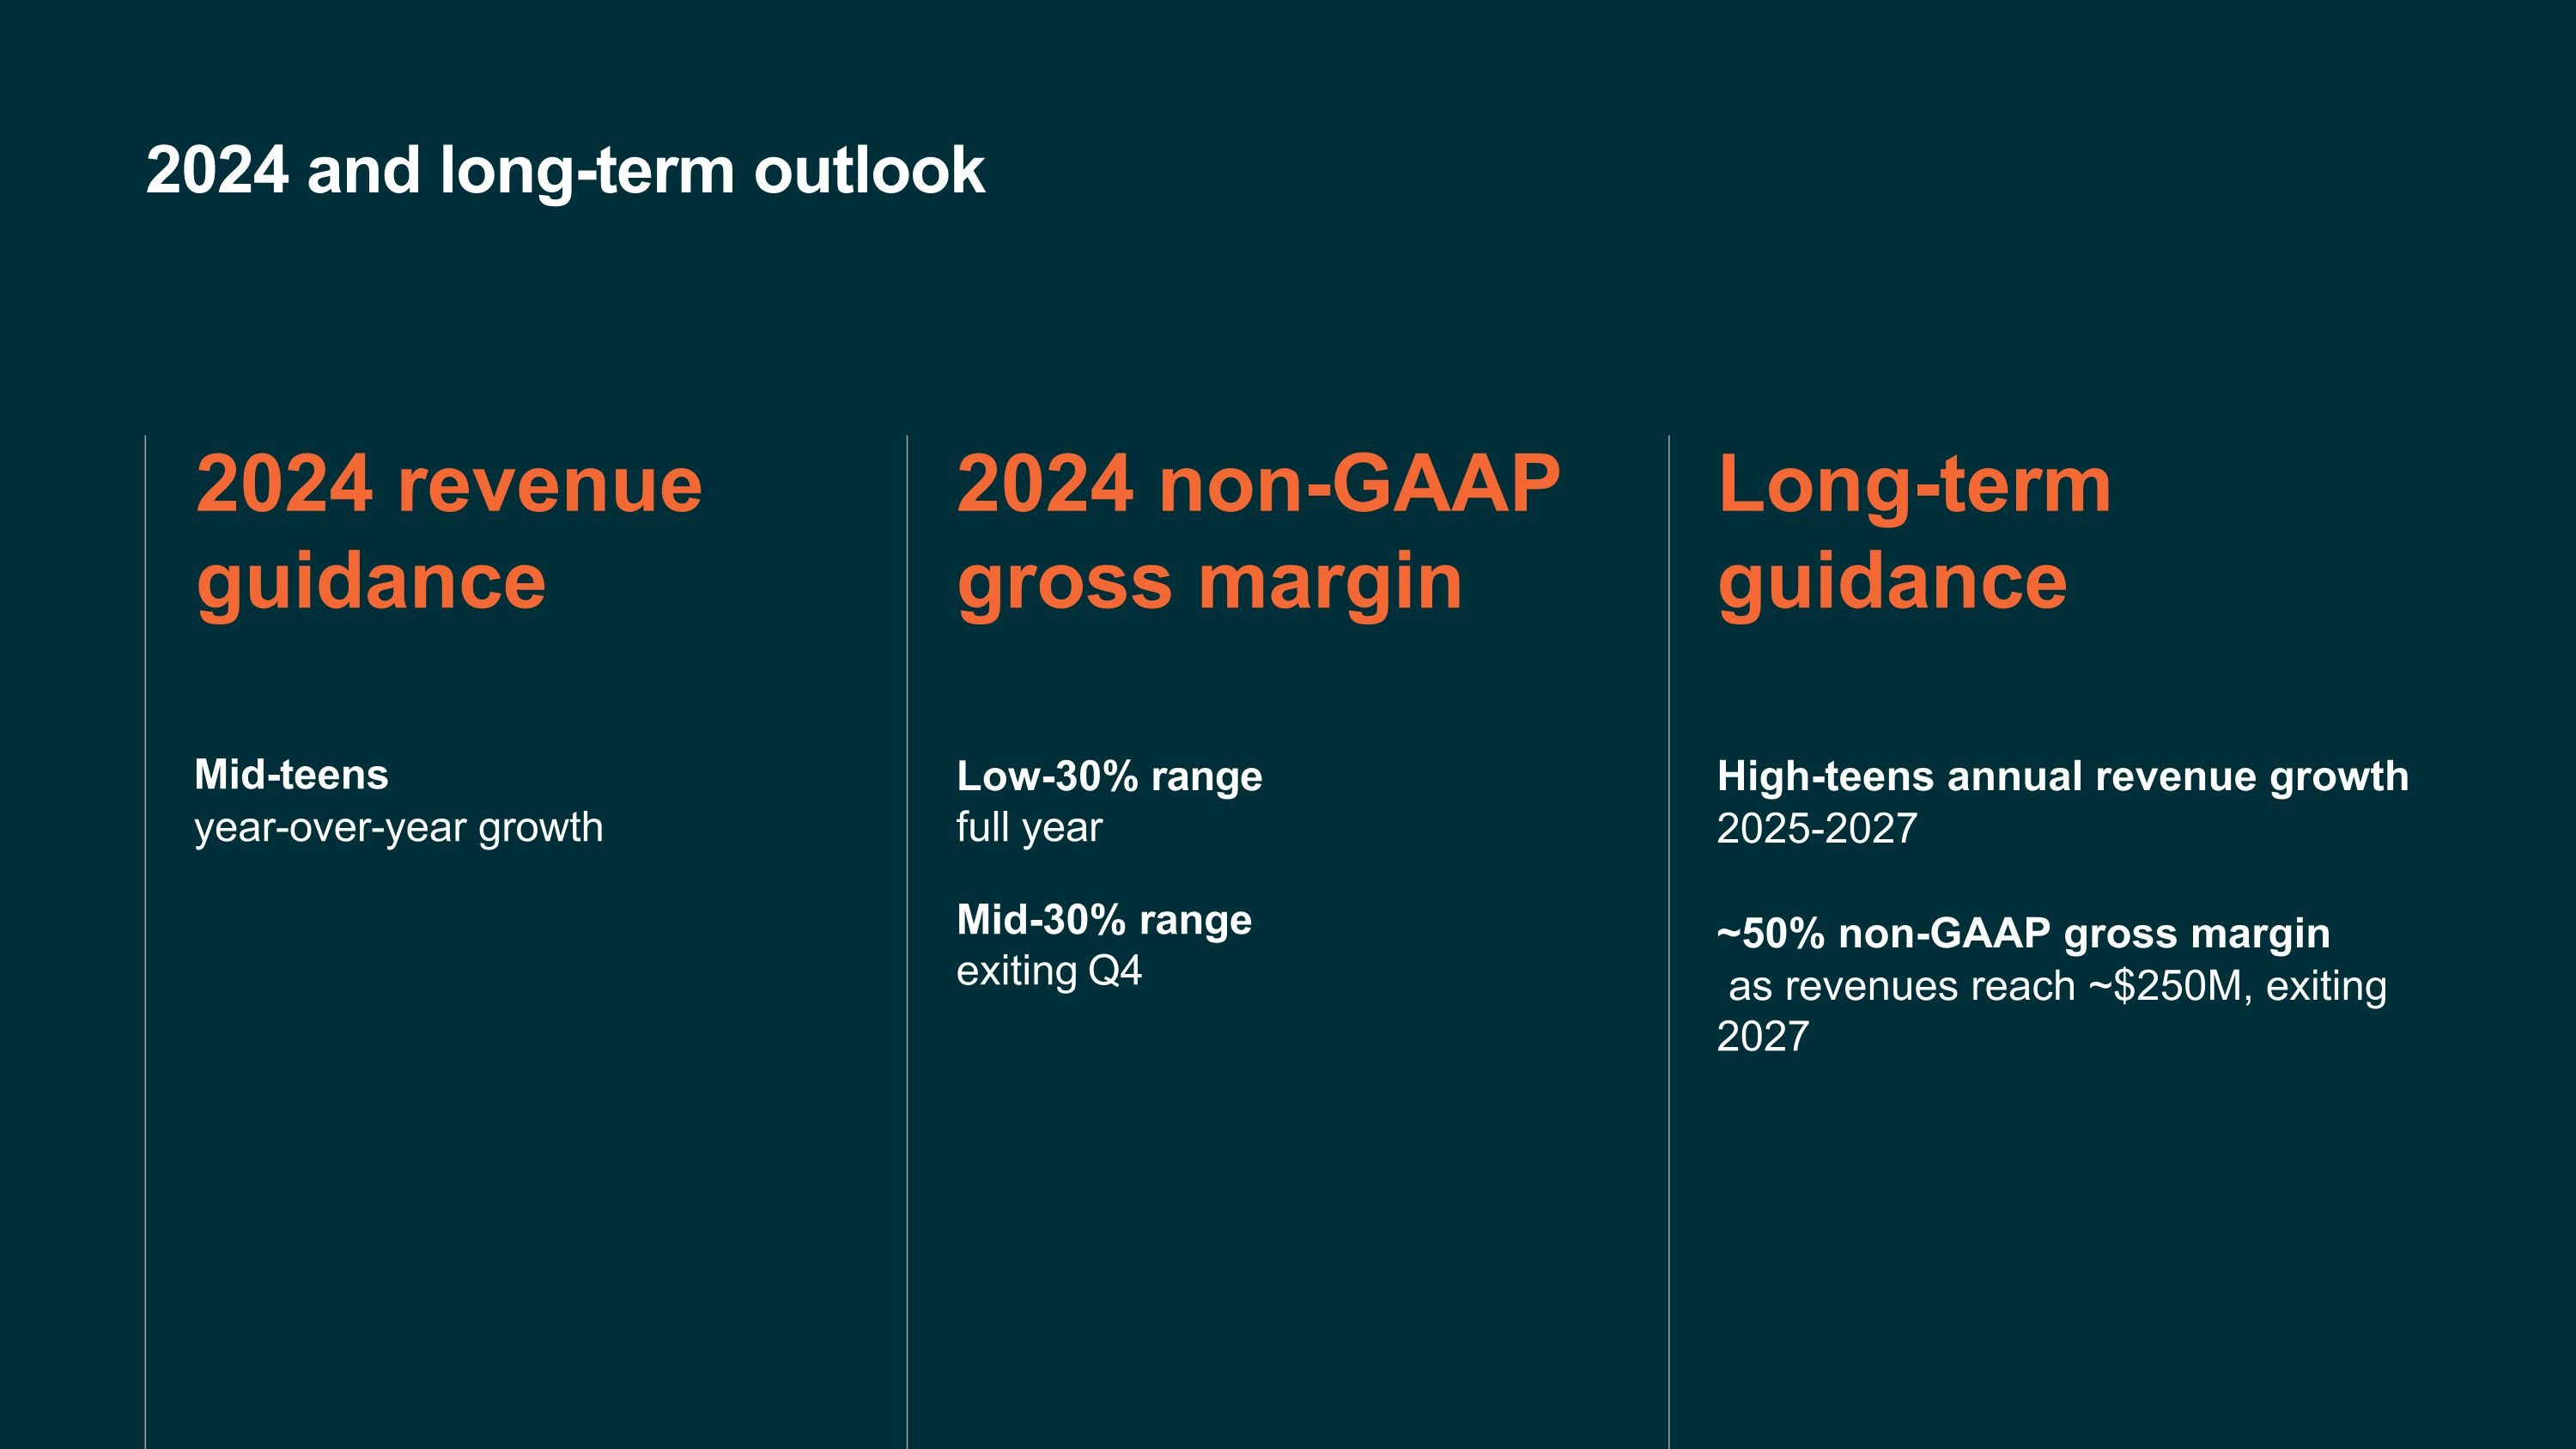
2024 and long-term outlook 2024 non-GAAP gross margin Low-30% range full year Mid-30% range exiting Q4 Long-term guidance High-teens annual revenue growth 2025-2027 ~50% non-GAAP gross margin as revenues reach ~$250M, exiting 2027 2024 revenue guidance Mid-teens year-over-year growth
Outset Medical 3052 Orchard Drive San Jose, CA 95134 outsetmedical.com
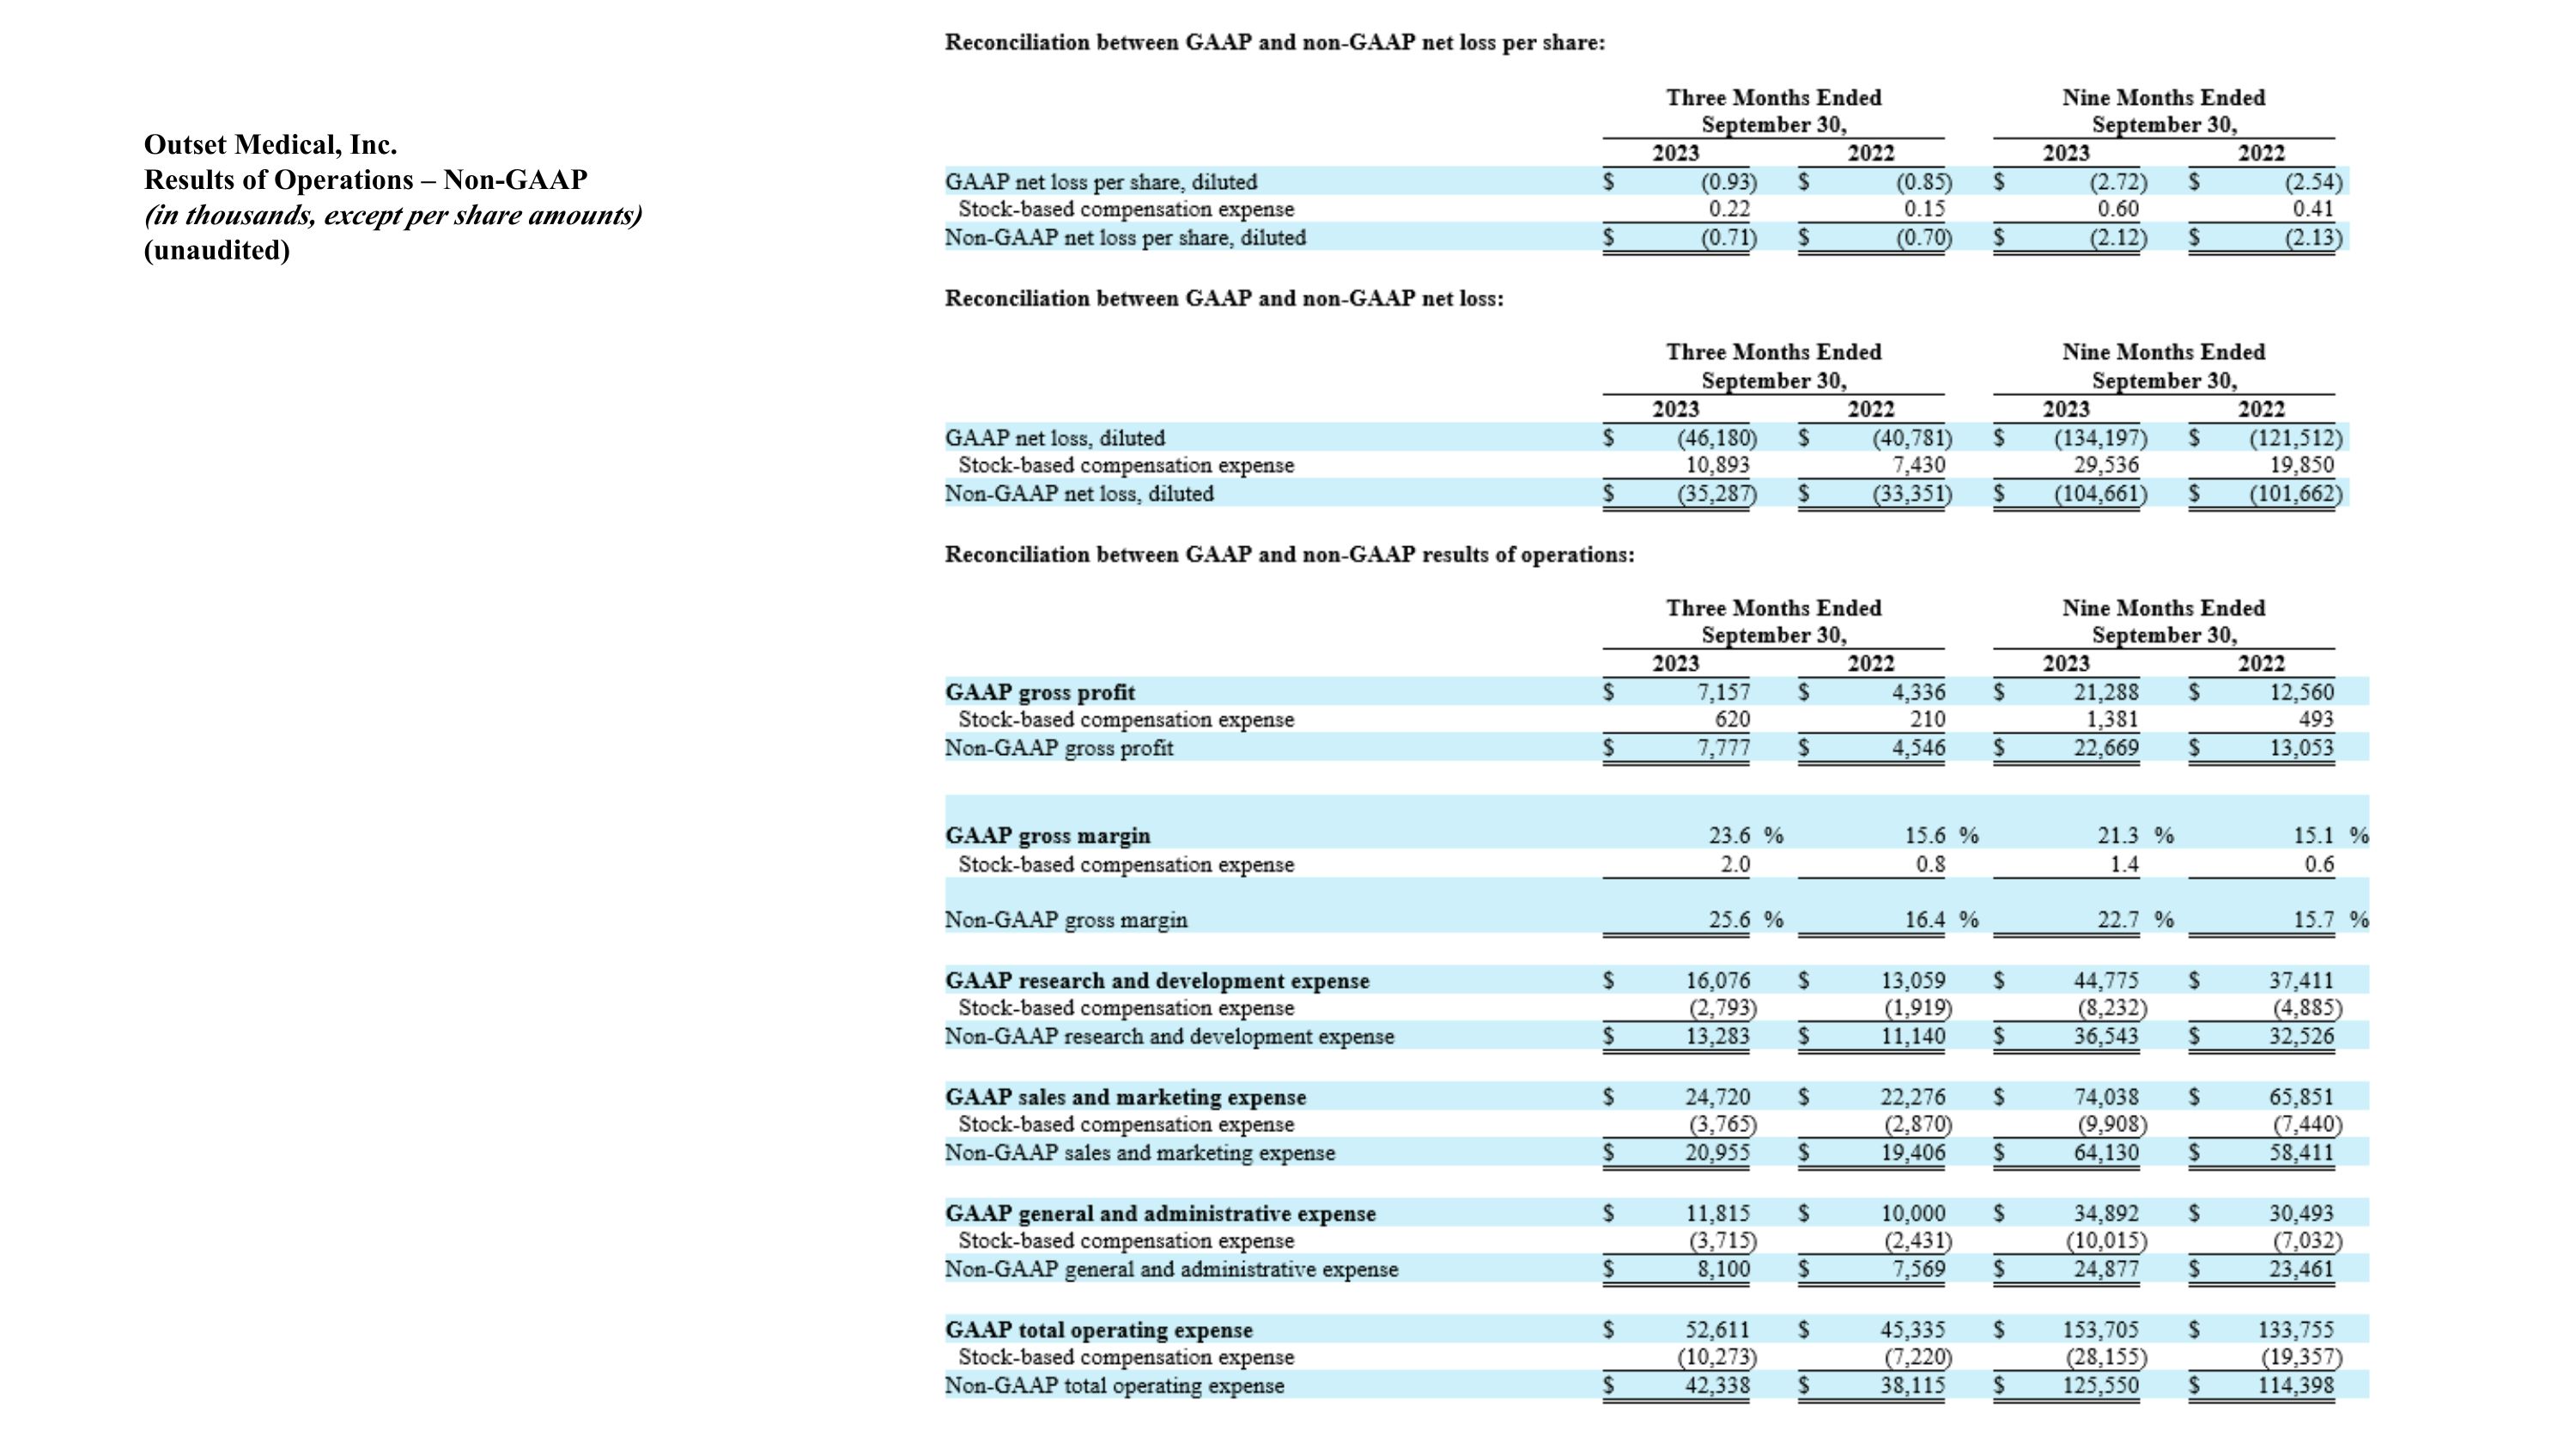
Outset Medical, Inc.�Results of Operations – Non-GAAP�(in thousands, except per share amounts)�(unaudited)


