UNITED STATES
SECURITIES AND EXCHANGE COMMISSION
Washington, D.C. 20549
FORM N-CSR
CERTIFIED SHAREHOLDER REPORT OF REGISTERED
MANAGEMENT INVESTMENT COMPANIES
Investment Company Act file number | 811-22392 | |||||||
| ||||||||
Cohen & Steers Preferred Securities and Income Fund, Inc. | ||||||||
(Exact name of registrant as specified in charter) | ||||||||
| ||||||||
280 Park Avenue, New York, NY |
| 10017 | ||||||
(Address of principal executive offices) |
| (Zip code) | ||||||
| ||||||||
Adam M. Derechin Cohen & Steers Capital Management, Inc. 280 Park Avenue New York, New York 10017 | ||||||||
(Name and address of agent for service) | ||||||||
| ||||||||
Registrant’s telephone number, including area code: | (212) 832-3232 |
| ||||||
| ||||||||
Date of fiscal year end: | December 31 |
| ||||||
| ||||||||
Date of reporting period: | June 30, 2011 |
| ||||||
Item 1. Reports to Stockholders.
COHEN & STEERS PREFERRED SECURITIES AND INCOME FUND, INC.
To Our Shareholders:
We would like to share with you our report for the six months ended June 30, 2011. The net asset values (NAV) per share at that date were $12.38, $12.34 and $12.38 for Class A, Class C and Class I shares, respectively.
The total returns, including income and change in NAV, for the Fund and its comparative benchmarks were:
| Six Months Ended June 30, 2011 | |||||||
| Cohen & Steers Preferred Securities and Income Fund—Class A | 5.72 | % | |||||
| Cohen & Steers Preferred Securities and Income Fund—Class C | 5.40 | % | |||||
| Cohen & Steers Preferred Securities and Income Fund—Class I | 5.89 | % | |||||
| BofA Merrill Lynch Fixed Rate Preferred Indexa | 5.41 | % | |||||
| Blended benchmark—50% BofA Merrill Lynch US Capital Securities Index / 50% BofA Merrill Lynch Fixed Rate Preferred Indexa | 4.73 | % | |||||
| S&P 500 Indexa | 6.02 | % | |||||
The performance data quoted represent past performance. Past performance is no guarantee of future results. The investment return and the principal value of an investment will fluctuate and shares, if redeemed, may be worth more or less than their original cost. Current performance may be lower or higher than the performance data quoted. Current total returns of the Fund can be obtained by visiting our Web site at cohenandsteers.com. Performance quoted does not reflect the deduction of the maximum 4.5% initial sales charge on Class A shares or the 1% maximum contingent deferred sales charge on Class C shares. If such charges were included, returns would have been lower.
The Fund implements fair value pricing when the daily change in a specific U.S. market index exceeds a predetermined percentage. Fair value pricing adjusts the valuation of non-U.S. holdings to account for such index change following the close of foreign markets. This standard practice has been adopted by a majority of the fund industry to deter investors from arbitraging funds with a large percentage of non-U.S. holdings. In the event fair value pricing is implemented on the first and/or last day of a performance measurement period, the Fund's return may diverge from the relative performance of its benchmark index, which does not use fair value pricing. An investor cannot invest directly in an index.
Please note that distributions paid by the Fund to shareholders are subject to recharacterization for tax purposes and are taxable up to the amount of the Fund's investment company taxable income and net realized gains. Distributions in excess of the Fund's investment company taxable income and realized gains are a return of capital distributed from the Fund's assets.
a The BofA Merrill Lynch Fixed Rate Preferred Index is an unmanaged index of preferred securities. The BofA Merrill Lynch US Capital Securities Index is a subset of The BofA Merrill Lynch US Corporate Index including all fixed-to-floating rate, perpetual callable and capital securities. The S&P 500 Index is an unmanaged index of common stocks that is frequently used as a general measure of stock market performance.
1
COHEN & STEERS PREFERRED SECURITIES AND INCOME FUND, INC.
Investment Review
Preferred securities had a positive total return in the six-month period ended June 30, 2011. The group performed well in the first few months of the year amid good earnings reports from the important financial sector and signs of an improving economy. However, macro conditions became more challenging: U.S. economic data began to disappoint, while markets again focused on Europe's sovereign debt problems and China's attempts to cool its growth. Preferreds nonetheless added to their year-to-date gains in the second quarter, when a flight to safety drove Treasury yields lower, to the benefit of fixed income assets broadly.
Preferreds within the financial sector modestly trailed the Fund's benchmark. U.S. banks reported better-than-expected improvements in credit quality and capital ratios, although revenue trends generally remained weak, in part reflecting slow loan growth. Bank stocks also faced regulatory uncertainty: global capital requirements remained unclear, as did the profitability of certain business lines and even the possibility of dividing banking and capital markets operations in the U.K., for instance.
New contingent capital securities were greeted with healthy demand
A significant development in the preferred market in the period was the large, successful issuance of contingent capital securities (so-called "CoCos"). Markets focused more on this emerging asset class after Credit Suisse priced its large public deal at 7.875%. This type of preferred may convert into common shares if a company's core Tier 1 capital ratio falls below a certain level (in the case of Credit Suisse, a relatively high 7%). With many existing preferreds destined to lose their Tier 1 status under Basel 3, issuers may increasingly use CoCos as an alternative source of equity-like capital.
Regulatory par call risk emerged
In May, regional bank Fifth Third exercised a par call on a trust preferred trading at a premium via "special event" language, taking the market by surprise. This awakened many to the risk that certain bank preferreds may be subject to near-term par calls as a result of changes to bank regulation. In this particular case, the issuer could call the security at par anytime following a proposed change of this nature. (Typically, there is a short, specified window in which to call such an issue after a special event.)
Insurance and real estate preferreds outperformed
Insurance preferreds outperformed the Fund's benchmark amid increased visibility on the potential redemption of existing issues. With rating agencies now providing less "equity credit" for more debt-like preferred securities, insurance companies may find these issues to be relatively expensive financing. Investors bid up securities that might be redeemed or that could benefit from less overall supply in the sector.
REIT preferreds also outperformed, reflecting a steady improvement in real estate fundamentals, low and declining capital costs and an increasing number of transactions that revealed rising property values. Preferreds issued by telecommunications and utility companies were not as strong, but still generated positive returns.
2
COHEN & STEERS PREFERRED SECURITIES AND INCOME FUND, INC.
Fund performance
The Fund had a positive total return in the period. Class A and Class I shares outperformed the benchmark while Class C slightly underperformed. Security selection was favorable across most sectors, led by the banking group. Good performers included a potential Basel 3 compliant Tier 1 security issued by Intesa Sanpaolo; it received a lift as markets focused more on the nascent asset class. Farm Credit Bank, a high-coupon preferred that we consider defensive, also contributed to performance. In the telecommunications sector, we had an out-of-index position in Centaur Funding and an overweight in Qwest that performed well.
Other factors that helped relative performance included our overweight in the real estate sector and general underweight in banking preferreds. In addition, we had positioned the Fund defensively relative to regulatory par call risk and outperformed as markets focused on that risk.
Securities that detracted included Sunstone Hotel, a new offering that includes the LBO protection language we advocate. However, it traded down in the secondary market. We also had an overweight in a MetLife preferred that underperformed the index.
Investment Outlook
The most recent readings on global developed economies have led us to take a somewhat more cautious approach—for instance, by reducing our allocation to banks that we believe are more vulnerable to a global slowdown. We have also increased allocations to less cyclical industries, including utilities and telecommunications companies.
We recognize that weak housing markets and government austerity programs have continued to weigh on growth, but still believe that the U.S. economy will not return to a recession. In the current environment, as growth may remain slower than in recent quarters, the Federal Reserve may delay interest rate hikes longer than previously expected, which would likely support preferreds and other fixed income classes.
Slower growth and uncertainties in Europe have made us more selective and generally more cautious in our investments. Nonetheless, preferred income spreads over government and corporate bonds remain well above average, and fundamentals continue to improve for many issuers. In addition, preferreds should remain an attractive alternative to other sources of income, many of which offer yields at or near all-time lows. We continue to see scope for good performance in the months ahead, but also believe active management will remain important to delivering value.
We expect new supply of preferreds to continue to arise mostly from non-bank issuers, in the U.S. and abroad, including REITs and other non-financial companies. Banks will likely remain on the sidelines until there is more regulatory clarity. We will continue to look for value in transactions priced around the globe and across various currencies.
3
COHEN & STEERS PREFERRED SECURITIES AND INCOME FUND, INC.
Sincerely,
 |  | ||||||
| MARTIN COHEN | ROBERT H. STEERS | ||||||
| Co-chairman | Co-chairman | ||||||
 |  | ||||||
| JOSEPH M. HARVEY | WILLIAM F. SCAPELL | ||||||
| Portfolio Manager | Portfolio Manager | ||||||
The views and opinions in the preceding commentary are subject to change. There is no guarantee that any market forecast set forth in the commentary will be realized. This material represents an assessment of the market environment at a specific point in time, should not be relied upon as investment advice and is not intended to predict or depict performance of any investment.
Visit Cohen & Steers online at cohenandsteers.com
For more information about any of our funds, visit cohenandsteers.com, where you will find daily net asset values, fund fact sheets and portfolio highlights. You can also access newsletters, education tools and market updates covering the global real estate, listed infrastructure, utilities, large cap value and preferred securities sectors.
In addition, our Web site contains comprehensive information about our firm, including our most recent press releases, profiles of our senior investment professionals and an overview of our investment approach.
4
COHEN & STEERS PREFERRED SECURITIES AND INCOME FUND, INC.
Performance Review (Unaudited)
Total Return for Periods Ended June 30, 2011
| Class A Shares | Class C Shares | Class I Shares | |||||||||||||
| 1 Year (with sales charge) | 12.94 | %a | 16.46 | %b | — | ||||||||||
| 1 Year (without sales charge) | 18.26 | % | 17.46 | % | 18.51 | % | |||||||||
| Since Inceptionc (with sales charge) | 8.81 | %a | 12.40 | % | — | ||||||||||
| Since Inceptionc (without sales charge) | 13.23 | % | 12.40 | % | 13.52 | % | |||||||||
The performance data quoted represent past performance. Past performance is no guarantee of future results. The investment return and principal value of an investment will fluctuate and shares, if redeemed, may be worth more or less than their original cost. Current performance may be lower or higher than the performance data quoted. Performance information current to the most recent month-end can be obtained by visiting our Web site at cohenandsteers.com. The performance table does not reflect the deduction of taxes that a shareholder would pay on Fund distributions or the redemption of Fund shares. During the periods presented above, the advisor waived fees and/or reimbursed expenses. Without this arrangement, performance would have been lower.
The gross and net expense ratios, respectively, for each class of shares as disclosed in the May 1, 2011 prospectuses were as follows: Class A—1.67% and 1.10%; Class C—2.32% and 1.75%; and Class I—1.32% and 0.75%. Through April 30, 2012, the advisor has contractually agreed to waive its fee and/or reimburse the Fund for expenses incurred to the extent necessary to maintain the Fund's annual operating expenses at 1.10% for Class A shares, 1.75% for Class C shares and 0.75% for Class I shares.
a Reflects a 4.50% front-end sales charge.
b Reflects a contingent deferred sales charge of 1%.
c Inception date May 3, 2010.
5
COHEN & STEERS PREFERRED SECURITIES AND INCOME FUND, INC.
Expense Example (Unaudited)
As a shareholder of the Fund, you incur two types of costs: (1) transaction costs, including sales charges (loads) on purchase payments and redemption fees; and (2) ongoing costs including management fees; distribution and/or service (12b-1) fees; and other Fund expenses. This example is intended to help you understand your ongoing costs (in dollars) of investing in the Fund and to compare these costs with the ongoing costs of investing in other mutual funds.
The example is based on an investment of $1,000 invested at the beginning of the period and held for the entire period January 1, 2011—June 30, 2011.
Actual Expenses
The first line of the following table provides information about actual account values and expenses. You may use the information in this line, together with the amount you invested, to estimate the expenses that you paid over the period. Simply divide your account value by $1,000 (for example, an $8,600 account value divided by $1,000 = 8.6), then multiply the result by the number in the first line under the heading entitled "Expenses Paid During Period" to estimate the expenses you paid on your account during this period.
Hypothetical Example for Comparison Purposes
The second line of the following table provides information about hypothetical account values and hypothetical expenses based on the Fund's actual expense ratio and an assumed rate of return of 5% per year before expenses, which is not the Fund's actual return. The hypothetical account values and expenses may not be used to estimate the actual ending account balance or expenses you paid for the period. You may use this information to compare the ongoing cost of investing in the Fund and other funds. To do so, compare this 5% hypothetical example with the 5% hypothetical examples that appear in the shareholder reports of other funds.
Please note that the expenses shown in the table are meant to highlight your ongoing costs only and do not reflect any transactional costs, such as sales charges (loads) and redemption fees. Therefore, the second line of the table is useful in comparing ongoing costs only, and will not help you determine the relative total costs of owning different funds. In addition, if these transactional costs were included, your costs would have been higher.
6
COHEN & STEERS PREFERRED SECURITIES AND INCOME FUND, INC.
Expense Example (Unaudited)—(Continued)
| Beginning Account Value January 1, 2011 | Ending Account Value June 30, 2011 | Expenses Paid During Perioda January 1, 2011– June 30, 2011 | |||||||||||||
| Class A | |||||||||||||||
| Actual (5.72% return) | $ | 1,000.00 | $ | 1,057.20 | $ | 4.95 | |||||||||
| Hypothetical (5% annual return before expenses) | $ | 1,000.00 | $ | 1,019.98 | $ | 4.86 | |||||||||
| Class C | |||||||||||||||
| Actual (5.40% return) | $ | 1,000.00 | $ | 1,054.00 | $ | 8.25 | |||||||||
| Hypothetical (5% annual return before expenses) | $ | 1,000.00 | $ | 1,016.76 | $ | 8.10 | |||||||||
| Class I | |||||||||||||||
| Actual (5.89% return) | $ | 1,000.00 | $ | 1,058.90 | $ | 3.17 | |||||||||
| Hypothetical (5% annual return before expenses) | $ | 1,000.00 | $ | 1,021.72 | $ | 3.11 | |||||||||
a Expenses are equal to the Fund's Class A, Class C and Class I annualized expense ratio of 0.97%, 1.62% and 0.62%, respectively, multiplied by the average account value over the period, multiplied by 181/365 (to reflect the one-half year period). If the Fund had borne all of its expenses that were assumed by the advisor, the annualized expense ratios would have been 1.37%, 2.02% and 1.02%, respectively.
7
COHEN & STEERS PREFERRED SECURITIES AND INCOME FUND, INC.
JUNE 30, 2011
Top Ten Long-Term Holdingsa
(Unaudited)
| Security | Value | % of Net Assets | |||||||||
| JP Morgan Chase & Co., 7.90%, due 4/29/49, Series I | $ | 16,273,949 | 3.6 | % | |||||||
| Wells Fargo & Co., 7.50%, Series L (Convertible) | 13,409,000 | 2.9 | |||||||||
| Farm Credit Bank of Texas, 10.00%, due 12/15/20, ($1,000 Par Value) Series I | 11,659,875 | 2.6 | |||||||||
| Qwest Corp., 7.375%, due 6/1/51 | 10,782,441 | 2.4 | |||||||||
| Wells Fargo & Co., 7.98%, due 3/29/49, Series K (FRN) | 10,470,250 | 2.3 | |||||||||
| Citigroup Capital VIII, 6.95%, due 9/15/31, (TruPS) | 9,883,044 | 2.2 | |||||||||
| Centaur Funding Corp., 9.08%, due 4/21/20, 144A | 9,419,281 | 2.1 | |||||||||
| MetLife Capital Trust IV, 7.875%, due 12/15/37, 144A | 8,465,887 | 1.9 | |||||||||
| Bank of America Corp., 8.125%, due 12/29/49, Series M (FRN) | 8,416,758 | 1.8 | |||||||||
| Prudential PLC, 7.75%, due 6/23/16, Series EMTN | 7,449,375 | 1.6 | |||||||||
a Top ten holdings are determined on the basis of the value of individual securities held. All of the securities listed above are preferred stock. The Fund may also hold positions in other types of securities issued by the companies listed above. See the Schedule of Investments for additional details on such other positions.
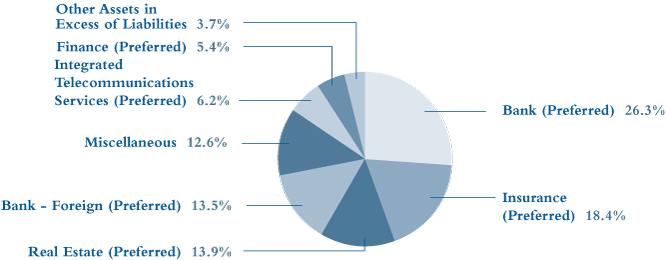
Sector Breakdown
(Based on Net Assets)
(Unaudited)
8
COHEN & STEERS PREFERRED SECURITIES AND INCOME FUND, INC.
SCHEDULE OF INVESTMENTS
June 30, 2011 (Unaudited)
| Number of Shares | Value | ||||||||||||||
| PREFERRED SECURITIES—$25 PAR VALUE | 44.1% | ||||||||||||||
| BANK | 11.5% | ||||||||||||||
| Ally Financial, 7.35%, due 8/8/32 | 83,822 | $ | 1,996,640 | ||||||||||||
| Ally Financial, 7.375%, due 12/16/44 | 66,000 | 1,558,260 | |||||||||||||
| Ally Financial, 8.50%, due 5/15/16, Series A | 71,000 | 1,777,130 | |||||||||||||
| BAC Capital Trust II, 7.00%, due 2/1/32, Series V | 34,349 | 863,190 | |||||||||||||
| Bank of America Corp., 6.375%, Series III | 37,300 | 850,813 | |||||||||||||
| Citigroup, 8.50%, Series F | 55,000 | 1,476,200 | |||||||||||||
| Citigroup Capital VII, 7.125%, due 7/31/31, (TruPS) | 127,022 | 3,200,954 | |||||||||||||
| Citigroup Capital VIII, 6.95%, due 9/15/31, (TruPS) | 396,114 | 9,883,044 | |||||||||||||
| Citigroup Capital XIII, 7.875%, due 10/30/40 | 48,000 | 1,333,440 | |||||||||||||
| Citigroup Capital XIV, 6.875%, due 6/30/66, (TruPS) | 81,079 | 1,990,490 | |||||||||||||
| Citigroup Capital XVI, 6.45%, due 12/31/66, Series W (TruPS) | 50,000 | 1,205,000 | |||||||||||||
| Citigroup Capital XVII, 6.35%, due 3/15/67, Series E | 39,400 | 940,872 | |||||||||||||
| CoBank ACB, 7.00%, 144A ($50 Par Value)a,b | 62,000 | 2,828,750 | |||||||||||||
| Deutsche Bank Capital Funding Trust IX, 6.625% | 44,000 | 1,057,320 | |||||||||||||
| Deutsche Bank Capital Funding Trust X, 7.35% | 104,719 | 2,659,863 | |||||||||||||
| Fifth Third Capital Trust VI, 7.25%, due 11/15/67, (FRN) | 113,819 | 2,877,344 | |||||||||||||
| Fleet Capital Trust VIII, 7.20%, due 3/15/32 | 29,307 | 733,554 | |||||||||||||
| KeyCorp, 7.75%, due 12/31/49, Series A ($100 Par Value) (Convertible) | 14,277 | 1,599,024 | |||||||||||||
| KeyCorp Capital IX, 6.75%, due 12/15/66 | 211,812 | 5,356,726 | |||||||||||||
| Regions Financing Trust III, 8.875%, due 6/15/78 | 86,142 | 2,190,591 | |||||||||||||
| Wachovia Corp., 7.25%, Series A | 73,772 | 1,905,531 | |||||||||||||
| Zions Bancorp, 9.50%, due 12/29/49, Series C | 156,400 | 4,088,296 | |||||||||||||
| 52,373,032 | |||||||||||||||
| BANK—FOREIGN | 3.7% | ||||||||||||||
| Barclays Bank PLC, 7.10%, Series III | 55,411 | 1,404,669 | |||||||||||||
| Barclays Bank PLC, 7.75%, Series IV | 115,787 | 2,973,410 | |||||||||||||
| Deutsche Bank Contingent Capital Trust III, 7.60% | 175,785 | 4,524,706 | |||||||||||||
| HSBC Holdings PLC, 8.00%, Series II | 47,625 | 1,294,924 | |||||||||||||
| Lloyds Banking Group PLC, 7.75%, due 7/15/50 | 25,227 | 652,118 | |||||||||||||
| National Westminster Bank PLC, 7.76%, Series C | 249,659 | 5,896,945 | |||||||||||||
| 16,746,772 | |||||||||||||||
See accompanying notes to financial statements.
9
COHEN & STEERS PREFERRED SECURITIES AND INCOME FUND, INC.
SCHEDULE OF INVESTMENTS—(Continued)
June 30, 2011 (Unaudited)
| Number of Shares | Value | ||||||||||||||
| ELECTRIC—INTEGRATED | 0.2% | ||||||||||||||
| FPC Capital I, 7.10%, due 5/13/39, Series A (QUIPS) | 32,075 | $ | 821,762 | ||||||||||||
| FINANCE | 3.5% | ||||||||||||||
| CREDIT CARD | 0.2% | ||||||||||||||
| Capital One Capital II, 7.50%, due 6/15/66, (TruPS) | 34,862 | 882,008 | |||||||||||||
| INVESTMENT BANKER/BROKER | 1.3% | ||||||||||||||
| GMAC Capital Trust I, 8.125%, due 2/15/40, Series II | 90,000 | 2,304,000 | |||||||||||||
| Merrill Lynch Capital Trust II, 6.45%, due 6/15/62, (ICONs)(FRN) | 39,825 | 942,658 | |||||||||||||
| Morgan Stanley Capital Trust VII, 6.60%, due 10/15/66 | 116,221 | 2,855,550 | |||||||||||||
| 6,102,208 | |||||||||||||||
| MORTGAGE LOAN/BROKER | 2.0% | ||||||||||||||
| Countrywide Capital IV, 6.75%, due 4/1/33 | 109,738 | 2,716,016 | |||||||||||||
| Countrywide Capital V, 7.00%, due 11/1/36 | 256,096 | 6,381,912 | |||||||||||||
| 9,097,928 | |||||||||||||||
| TOTAL FINANCE | 16,082,144 | ||||||||||||||
| INSURANCE | 5.8% | ||||||||||||||
| LIFE/HEALTH INSURANCE—FOREIGN | 1.0% | ||||||||||||||
| Aegon NV, 6.875% | 55,660 | 1,333,614 | |||||||||||||
| Aegon NV, 7.25% | 120,449 | 3,013,634 | |||||||||||||
| 4,347,248 | |||||||||||||||
| MULTI-LINE | 1.3% | ||||||||||||||
| American Financial Group, 7.00%, due 9/30/50 | 60,542 | 1,535,951 | |||||||||||||
| American International Group, 7.70%, due 12/18/62 | 178,003 | 4,460,755 | |||||||||||||
| 5,996,706 | |||||||||||||||
| MULTI-LINE—FOREIGN | 2.0% | ||||||||||||||
| Allianz SE, 8.375% | 94,175 | 2,472,094 | |||||||||||||
| ING Groep N.V., 7.375% | 220,411 | 5,444,151 | |||||||||||||
| ING Groep N.V., 8.50% | 44,018 | 1,146,229 | |||||||||||||
| 9,062,474 | |||||||||||||||
See accompanying notes to financial statements.
10
COHEN & STEERS PREFERRED SECURITIES AND INCOME FUND, INC.
SCHEDULE OF INVESTMENTS—(Continued)
June 30, 2011 (Unaudited)
| Number of Shares | Value | ||||||||||||||
| REINSURANCE—FOREIGN | 1.5% | ||||||||||||||
| Arch Capital Group Ltd., 7.875%, Series B | 49,033 | $ | 1,245,438 | ||||||||||||
| Endurance Specialty Holdings Ltd., 7.50%, Series B | 117,298 | 2,926,585 | |||||||||||||
| Montpelier Re Holdings Ltd., 8.875% | 112,175 | 2,894,115 | |||||||||||||
| 7,066,138 | |||||||||||||||
| TOTAL INSURANCE | 26,472,566 | ||||||||||||||
| INTEGRATED TELECOMMUNICATIONS SERVICES | 4.1% | ||||||||||||||
| Qwest Corp., 7.375%, due 6/1/51 | 419,877 | 10,782,441 | |||||||||||||
| Telephone & Data Systems, 6.875%, due 11/15/59 | 105,339 | 2,654,543 | |||||||||||||
| Telephone & Data Systems, 7.00%, due 3/15/60 | 205,000 | 5,178,300 | |||||||||||||
| 18,615,284 | |||||||||||||||
| MEDIA—DIVERSIFIED SERVICES | 0.3% | ||||||||||||||
| CBS Corp., 6.75%, due 3/27/56 | 37,067 | 943,726 | |||||||||||||
| Comcast Corp., 6.625%, due 5/15/56 | 28,050 | 721,726 | |||||||||||||
| 1,665,452 | |||||||||||||||
| REAL ESTATE | 13.9% | ||||||||||||||
| DIVERSIFIED | 2.8% | ||||||||||||||
| Cousins Properties, 7.75%, Series A | 94,037 | 2,348,104 | |||||||||||||
| Duke Realty Corp., 7.25%, Series N | 53,933 | 1,351,022 | |||||||||||||
| DuPont Fabros Technology, 7.875%, Series A | 87,700 | 2,218,810 | |||||||||||||
| Harris Preferred Capital Corp., 7.375%, Series A | 11,947 | 301,184 | |||||||||||||
| Lexington Corporate Properties Trust, 8.05%, Series B | 81,750 | 2,060,917 | |||||||||||||
| Lexington Realty Trust, 7.55%, Series D | 53,560 | 1,318,647 | |||||||||||||
| Sovereign Real Estate Investment Trust, 12.00%, 144A ($1000 Par Value)a | 2,500 | 2,909,375 | |||||||||||||
| 12,508,059 | |||||||||||||||
| HEALTH CARE | 0.6% | ||||||||||||||
| Cogdell Spencer, 8.50%, Series A | 60,000 | 1,506,000 | |||||||||||||
| Health Care REIT, 6.50%, Series I ($50 Par Value)(Convertible) | 25,000 | 1,291,250 | |||||||||||||
| 2,797,250 | |||||||||||||||
See accompanying notes to financial statements.
11
COHEN & STEERS PREFERRED SECURITIES AND INCOME FUND, INC.
SCHEDULE OF INVESTMENTS—(Continued)
June 30, 2011 (Unaudited)
| Number of Shares | Value | ||||||||||||||
| HOTEL | 1.4% | ||||||||||||||
| Hersha Hospitality Trust, 8.00%, Series B | 55,000 | $ | 1,359,050 | ||||||||||||
| Pebblebrook Hotel Trust, 7.875%, Series A | 84,851 | 2,133,154 | |||||||||||||
| Sunstone Hotel Investors, 8.00%, Series D | 117,400 | 2,812,904 | |||||||||||||
| 6,305,108 | |||||||||||||||
| INDUSTRIAL | 0.7% | ||||||||||||||
| First Potomac Realty Trust, 7.75%, Series A | 120,000 | 3,040,800 | |||||||||||||
| OFFICE | 2.2% | ||||||||||||||
| CommonWealth REIT, 6.50%, Series D (Convertible) | 169,859 | 3,787,855 | |||||||||||||
| Cousins Properties, 7.50%, Series B | 63,738 | 1,590,263 | |||||||||||||
| Hudson Pacific Properties, 8.375%, Series B | 67,910 | 1,764,981 | |||||||||||||
| SL Green Realty Corp., 7.625%, Series C | 107,530 | 2,697,928 | |||||||||||||
| 9,841,027 | |||||||||||||||
| OFFICE/INDUSTRIAL | 0.4% | ||||||||||||||
| PS Business Parks, 7.375%, Series O | 77,656 | 1,956,931 | |||||||||||||
| RESIDENTIAL | 1.8% | ||||||||||||||
| APARTMENT | 1.3% | ||||||||||||||
| Alexandria Real Estate Equities, 8.375%, Series C | 40,000 | 1,049,600 | |||||||||||||
| Alexandria Real Estate Equities, 7.00%, Series D | 35,000 | 915,250 | |||||||||||||
| Apartment Investment & Management Co., 7.75%, Series U | 88,966 | 2,240,164 | |||||||||||||
| Apartment Investment & Management Co., 7.875%, Series Y | 70,000 | 1,764,000 | |||||||||||||
| 5,969,014 | |||||||||||||||
| MANUFACTURED HOME | 0.5% | ||||||||||||||
| Equity Lifestyle Properties, 8.034%, Series A | 92,649 | 2,346,799 | |||||||||||||
| TOTAL RESIDENTIAL | 8,315,813 | ||||||||||||||
See accompanying notes to financial statements.
12
COHEN & STEERS PREFERRED SECURITIES AND INCOME FUND, INC.
SCHEDULE OF INVESTMENTS—(Continued)
June 30, 2011 (Unaudited)
| Number of Shares | Value | ||||||||||||||
| SHOPPING CENTER | 3.8% | ||||||||||||||
| COMMUNITY CENTER | 2.6% | ||||||||||||||
| Cedar Shopping Centers, 8.875%, Series A | 38,000 | $ | 955,320 | ||||||||||||
| Developers Diversified Realty Corp., 7.375%, Series H | 135,587 | 3,405,946 | |||||||||||||
| Developers Diversified Realty Corp., 7.50%, Series I | 92,100 | 2,318,157 | |||||||||||||
| Kite Realty Group Trust, 8.25%, Series A | 57,490 | 1,440,699 | |||||||||||||
| Ramco-Gershenson Properties Trust, 7.25%, Series D ($50 Par Value)(Convertible) | 20,000 | 1,003,600 | |||||||||||||
| Regency Centers Corp., 7.45%, Series C | 75,079 | 1,897,246 | |||||||||||||
| Regency Centers Corp., 7.25%, Series D | 30,300 | 760,530 | |||||||||||||
| 11,781,498 | |||||||||||||||
| REGIONAL MALL | 1.2% | ||||||||||||||
| CBL & Associates Properties, 7.375%, Series D | 169,948 | 4,207,913 | |||||||||||||
| Taubman Centers, 8.00%, Series G | 54,800 | 1,401,784 | |||||||||||||
| 5,609,697 | |||||||||||||||
| TOTAL SHOPPING CENTER | 17,391,195 | ||||||||||||||
| SPECIALTY | 0.2% | ||||||||||||||
| Entertainment Properties Trust, 7.375%, Series D | 45,039 | 1,113,815 | |||||||||||||
| TOTAL REAL ESTATE | 63,269,998 | ||||||||||||||
| TRANSPORT—MARINE | 1.1% | ||||||||||||||
| Seaspan Corp., 9.50%, due 1/29/49, Series C | 185,700 | 5,067,753 | |||||||||||||
| TOTAL PREFERRED SECURITIES—$25 PAR VALUE (Identified cost—$198,613,833) | 201,114,763 | ||||||||||||||
See accompanying notes to financial statements.
13
COHEN & STEERS PREFERRED SECURITIES AND INCOME FUND, INC.
SCHEDULE OF INVESTMENTS—(Continued)
June 30, 2011 (Unaudited)
| Number of Shares | Value | ||||||||||||||
| PREFERRED SECURITIES—CAPITAL SECURITIES | 45.9% | ||||||||||||||
| BANK | 14.8% | ||||||||||||||
| Bank of America Corp., 8.125%, due 12/29/49, Series M (FRN) | 8,050,000 | $ | 8,416,758 | ||||||||||||
| Citigroup Capital III, 7.625%, due 12/1/36 | 3,000,000 | 3,160,440 | |||||||||||||
| CoBank ACB, 11.00%, Series C, 144A ($50 Par Value)a | 45,000 | 2,365,312 | |||||||||||||
| Farm Credit Bank of Texas, 10.00%, due 12/15/20 ($1,000 Par Value), Series I | 10,200 | 11,659,875 | |||||||||||||
| JP Morgan Chase & Co., 7.90%, due 4/29/49, Series I (FRN) | 15,100,000 | 16,273,949 | |||||||||||||
| NB Capital Trust II, 7.83%, due 12/15/26 | 1,750,000 | 1,782,813 | |||||||||||||
| Wells Fargo & Co., 7.98%, due 3/29/49, Series K (FRN) | 9,650,000 | 10,470,250 | |||||||||||||
| Wells Fargo & Co., 7.50%, Series L (Convertible) | 12,650 | 13,409,000 | |||||||||||||
| 67,538,397 | |||||||||||||||
| BANK—FOREIGN | 9.8% | ||||||||||||||
| Abbey National Capital Trust I, 8.963%, due 12/29/49 | 2,950,000 | 3,267,520 | |||||||||||||
| Barclays Bank PLC, 6.278%, due 12/31/49 | 1,250,000 | 1,073,829 | |||||||||||||
| Barclays Bank PLC, 6.86%, due 9/29/49, 144A (FRN)a | 7,400,000 | 6,863,500 | |||||||||||||
| BNP Paribas, 7.195%, due 12/31/49, 144Aa | 4,800,000 | 4,680,000 | |||||||||||||
| BPCE SA, 9.00%, due 12/31/49 | 750,000 | 1,120,241 | |||||||||||||
| Claudius Ltd., 7.875%, due 12/12/49 | 2,000,000 | 2,085,000 | |||||||||||||
| HSBC Capital Funding LP, 10.176%, due 12/29/49, 144Aa | 4,274,000 | 5,705,790 | |||||||||||||
| Intesa Sanpaolo SpA, 9.50%, due 12/31/49 | 1,000,000 | 1,475,527 | |||||||||||||
| LBG Capital No.1 PLC, 8.00%, due 12/29/49, 144Aa | 3,550,000 | 3,212,750 | |||||||||||||
| Rabobank Nederland, 8.375%, due 12/31/49 | 2,250,000 | 2,399,836 | |||||||||||||
| Rabobank Nederland, 11.00%, due 6/29/49, 144Aa | 1,080,000 | 1,382,084 | |||||||||||||
| Resona Preferred Global Securities, 7.191%, due 12/29/49, 144A (FRN)a | 4,220,000 | 4,230,314 | |||||||||||||
| Santander UK PLC, 7.95%, due 10/26/29 | 1,500,000 | 1,638,355 | |||||||||||||
| SMFG Preferred Capital, 9.50%, due 7/29/49, 144A (FRN)a | 1,100,000 | 1,292,500 | |||||||||||||
| Standard Chartered PLC, 7.014%, due 7/29/49, 144Aa | 4,450,000 | 4,280,224 | |||||||||||||
| 44,707,470 | |||||||||||||||
See accompanying notes to financial statements.
14
COHEN & STEERS PREFERRED SECURITIES AND INCOME FUND, INC.
SCHEDULE OF INVESTMENTS—(Continued)
June 30, 2011 (Unaudited)
| Number of Shares | Value | ||||||||||||||
| FINANCE | 1.9% | ||||||||||||||
| CREDIT CARD | 0.8% | ||||||||||||||
| American Express Co., 6.80%, due 9/1/66 | 2,300,000 | $ | 2,371,875 | ||||||||||||
| Capital One Capital III, 7.686%, due 8/15/36 | 950,000 | 974,938 | |||||||||||||
| 3,346,813 | |||||||||||||||
| DIVERSIFIED FINANCIAL SERVICES | 0.9% | ||||||||||||||
| Credit Suisse Group Guernsey I Ltd., 7.875%, due 2/24/41 | 4,000,000 | 4,116,000 | |||||||||||||
| MORTGAGE LOAN/BROKER | 0.2% | ||||||||||||||
| Countrywide Capital III, 8.05%, due 6/15/27, Series B | 1,010,000 | 1,050,400 | |||||||||||||
| TOTAL FINANCE | 8,513,213 | ||||||||||||||
| INSURANCE | 12.6% | ||||||||||||||
| LIFE/HEALTH INSURANCE | 1.3% | ||||||||||||||
| American General Institutional Capital B, 8.125%, due 3/15/46, 144Aa | 1,750,000 | 1,894,375 | |||||||||||||
| Great-West Life & Annuity Insurance Co., 7.153%, due 5/16/46, 144Aa | 1,300,000 | 1,345,500 | |||||||||||||
| Lincoln National Corp., 7.00%, due 5/17/66 | 2,750,000 | 2,782,450 | |||||||||||||
| 6,022,325 | |||||||||||||||
| LIFE/HEALTH INSURANCE—FOREIGN | 1.6% | ||||||||||||||
| Prudential PLC, 7.75%, due 6/23/16 | 7,250,000 | 7,449,375 | |||||||||||||
| MULTI-LINE | 5.1% | ||||||||||||||
| American International Group, 8.175%, due 5/15/58, (FRN) | 6,250,000 | 6,852,188 | |||||||||||||
| AON Corp., 8.205%, due 1/1/27 | 1,000,000 | 1,138,964 | |||||||||||||
| MetLife Capital Trust IV, 7.875%, due 12/15/37, 144Aa | 8,065,000 | 8,465,887 | |||||||||||||
| MetLife Capital Trust X, 9.25%, due 4/8/38, 144Aa | 5,525,000 | 6,768,125 | |||||||||||||
| 23,225,164 | |||||||||||||||
| MULTI-LINE—FOREIGN | 1.7% | ||||||||||||||
| AXA SA, 8.60%, due 12/15/30 | 3,000,000 | 3,583,338 | |||||||||||||
| AXA SA, 6.463%, due 12/29/49, 144Aa | 1,000,000 | 875,000 | |||||||||||||
| Old Mutual Capital Funding, 8.00%, due 5/29/49 | 3,250,000 | 3,241,875 | |||||||||||||
| 7,700,213 | |||||||||||||||
See accompanying notes to financial statements.
15
COHEN & STEERS PREFERRED SECURITIES AND INCOME FUND, INC.
SCHEDULE OF INVESTMENTS—(Continued)
June 30, 2011 (Unaudited)
| Number of Shares | Value | ||||||||||||||
| PROPERTY CASUALTY | 1.5% | ||||||||||||||
| ACE Capital Trust II, 9.70%, due 4/1/30 | 1,800,000 | $ | 2,336,600 | ||||||||||||
| Liberty Mutual Group, 7.80%, due 3/15/37, 144Aa | 4,325,000 | 4,357,437 | |||||||||||||
| 6,694,037 | |||||||||||||||
| REINSURANCE—FOREIGN | 1.4% | ||||||||||||||
| Catlin Insurance Co., 7.249%, due 12/31/49, 144Aa | 4,650,000 | 4,464,000 | |||||||||||||
| Swiss Re Capital I LP, 6.854%, due 5/29/49, 144Aa | 2,000,000 | 1,932,970 | |||||||||||||
| 6,396,970 | |||||||||||||||
| TOTAL INSURANCE | 57,488,084 | ||||||||||||||
| INTEGRATED TELECOMMUNICATIONS SERVICES | 2.1% | ||||||||||||||
| Centaur Funding Corp., 9.08%, due 4/21/20, 144Aa | 8,258 | 9,419,281 | |||||||||||||
| OIL & GAS EXPLORATION & PRODUCTION | 0.6% | ||||||||||||||
| Origin Energy Finance Ltd., 7.875%, due 6/16/71 (Australia) (EUR)c | 2,000,000 | 2,893,049 | |||||||||||||
| PIPELINES | 2.2% | ||||||||||||||
| Enbridge Energy Partners LP, 8.05%, due 10/1/37 | 4,300,000 | 4,671,008 | |||||||||||||
| Enterprise Products Operating LP, 8.375%, due 8/1/66 | 4,860,000 | 5,266,398 | |||||||||||||
| 9,937,406 | |||||||||||||||
| UTILITIES | 1.9% | ||||||||||||||
| ELECTRIC UTILITIES | 0.7% | ||||||||||||||
| FPL Group Capital, 7.30%, due 9/1/67, Series D | 2,900,000 | 3,041,505 | |||||||||||||
| MULTI UTILITIES | 1.2% | ||||||||||||||
| Dominion Resources, 7.50%, due 6/30/66, Series A | 2,395,000 | 2,532,342 | |||||||||||||
| PPL Capital Funding, 6.70%, due 3/30/67, Series A | 2,838,000 | 2,820,021 | |||||||||||||
| 5,352,363 | |||||||||||||||
| TOTAL UTILITIES | 8,393,868 | ||||||||||||||
| TOTAL PREFERRED SECURITIES—CAPITAL SECURITIES (Identified cost—$207,173,231) | 208,890,768 | ||||||||||||||
See accompanying notes to financial statements.
16
COHEN & STEERS PREFERRED SECURITIES AND INCOME FUND, INC.
SCHEDULE OF INVESTMENTS—(Continued)
June 30, 2011 (Unaudited)
| Principal Amount | Value | ||||||||||||||
| CORPORATE BONDS | 6.3% | ||||||||||||||
| BANK | 0.3% | ||||||||||||||
| Regions Financial Corp., 7.375%, due 12/10/37 | $ | 1,500,000 | $ | 1,430,599 | |||||||||||
| BANK—FOREIGN | 1.8% | ||||||||||||||
| BBVA Bancomer SA Texas, 7.25%, due 4/22/20, 144Aa | 1,750,000 | 1,841,875 | |||||||||||||
| Itau Unibanco Holding SA, 6.20%, due 12/21/21, 144Aa | 4,750,000 | 4,856,875 | |||||||||||||
| Royal Bank of Scotland Group PLC, 7.648%, due 8/29/49 | 1,632,000 | 1,476,960 | |||||||||||||
| 8,175,710 | |||||||||||||||
| INSURANCE | 2.4% | ||||||||||||||
| PROPERTY CASUALTY | 0.9% | ||||||||||||||
| Liberty Mutual Insurance, 7.697%, due 10/15/97, 144Aa | 4,500,000 | 4,170,483 | |||||||||||||
| REINSURANCE—FOREIGN | 1.5% | ||||||||||||||
| QBE Capital Funding III Ltd., 7.25%, due 5/24/41, 144Aa | 4,000,000 | 4,020,504 | |||||||||||||
| Swiss Reinsurance Co. Ltd., Series I, 7.635%, due 12/31/49 (Australia) | AUD | 3,000,000 | 2,634,684 | ||||||||||||
| 6,655,188 | |||||||||||||||
| TOTAL INSURANCE | 10,825,671 | ||||||||||||||
| INTEGRATED TELECOMMUNICATIONS SERVICES | 1.2% | ||||||||||||||
| Citizens Communications Co., 9.00%, due 8/15/31 | $ | 5,350,000 | 5,510,500 | ||||||||||||
| INVESTMENT ADVISORY SERVICES | 0.4% | ||||||||||||||
| Old Mutual PLC, 8.00%, due 6/3/21, (United Kingdom) | GBP | 1,000,000 | 1,614,115 | ||||||||||||
| REAL ESTATE—SHOPPING CENTER | 0.2% | ||||||||||||||
| BR Malls International Finance Ltd., 8.50%, due 1/29/49, 144A(Brazil)a | $ | 1,000,000 | 1,063,800 | ||||||||||||
| TOTAL CORPORATE BONDS (Identified cost—$28,529,818) | 28,620,395 | ||||||||||||||
See accompanying notes to financial statements.
17
COHEN & STEERS PREFERRED SECURITIES AND INCOME FUND, INC.
SCHEDULE OF INVESTMENTS—(Continued)
June 30, 2011 (Unaudited)
| Number of Shares | Value | ||||||||||||||
| SHORT-TERM INVESTMENTS | 3.0% | ||||||||||||||
| MONEY MARKET FUNDS | |||||||||||||||
| BlackRock Liquidity Funds: FedFund, 0.01%d | 3,550,000 | $ | 3,550,000 | ||||||||||||
| Federated Government Obligations Fund, 0.01%d | 10,100,223 | 10,100,223 | |||||||||||||
| TOTAL SHORT-TERM INVESTMENTS (Identified cost—$13,650,223) | 13,650,223 | ||||||||||||||
| TOTAL INVESTMENTS (Identified cost—$447,967,105) | 99.3 | % | 452,276,149 | ||||||||||||
| OTHER ASSETS IN EXCESS OF LIABILITIES | 0.7 | 3,229,692 | |||||||||||||
| NET ASSETS | 100.0 | % | $ | 455,505,841 | |||||||||||
Glossary of Portfolio Abbreviations
AUD Australian Dollar
EUR Euro Currency
FRN Floating Rate Note
GBP Great Britain Pound
ICONs Income Capital Obligation Notes
QUIPS Quarterly Income Preferred Securities
REIT Real Estate Investment Trust
TruPS Trust Preferred Securities
Note: Percentages indicated are based on the net assets of the Fund.
a Resale is restricted to qualified institutional investors. Aggregate holdings equal 20.9% of net assets of the Fund, of which 0.6% are illiquid.
b Illiquid security. Aggregate holdings equal 0.6% of net assets of the Fund.
c Fair valued security. This security has been valued at its fair value as determined in good faith under procedures established by and under the general supervision of the Fund's Board of Directors. Aggregate fair value securities represent 0.6% of the net assets of the Fund.
d Rate quoted represents the seven day yield of the fund.
See accompanying notes to financial statements.
18
COHEN & STEERS PREFERRED SECURITIES AND INCOME FUND, INC.
STATEMENT OF ASSETS AND LIABILITIES
June 30, 2011 (Unaudited)
| ASSETS: | |||||||
| Investments in securities, at value (Identified cost—$447,967,105) | $ | 452,276,149 | |||||
| Cash | 5,668 | ||||||
| Receivable for: | |||||||
| Fund shares sold | 4,902,874 | ||||||
| Dividends and interest | 3,863,565 | ||||||
| Investment securities sold | 559,770 | ||||||
| Other assets | 30 | ||||||
| Total Assets | 461,608,056 | ||||||
| LIABILITIES: | |||||||
| Payable for: | |||||||
| Investment securities purchased | 3,238,124 | ||||||
| Dividends declared | 1,680,898 | ||||||
| Fund shares redeemed | 886,799 | ||||||
| Investment management fees | 116,034 | ||||||
| Administration fees | 17,902 | ||||||
| Distribution fees | 5,524 | ||||||
| Shareholder servicing fees | 1,931 | ||||||
| Other liabilities | 155,003 | ||||||
| Total Liabilities | 6,102,215 | ||||||
| NET ASSETS | $ | 455,505,841 | |||||
| NET ASSETS consist of: | |||||||
| Paid-in capital | $ | 451,472,745 | |||||
| Dividends in excess of net investment income | (1,157,652 | ) | |||||
| Accumulated undistributed net realized gain | 881,111 | ||||||
| Net unrealized appreciation | 4,309,637 | ||||||
| $ | 455,505,841 | ||||||
See accompanying notes to financial statements.
19
COHEN & STEERS PREFERRED SECURITIES AND INCOME FUND, INC.
STATEMENT OF ASSETS AND LIABILITIES—(Continued)
June 30, 2011 (Unaudited)
| CLASS A SHARES: | |||||||
| NET ASSETS | $ | 98,851,285 | |||||
| Shares issued and outstanding ($0.001 par value common stock outstanding) | 7,987,670 | ||||||
| Net asset value and redemption price per share | $ | 12.38 | |||||
| Maximum offering price per share ($12.38 ÷ 0.955)a | $ | 12.96 | |||||
| CLASS C SHARES: | |||||||
| NET ASSETS | $ | 102,865,269 | |||||
| Shares issued and outstanding ($0.001 par value common stock outstanding) | 8,338,919 | ||||||
| Net asset value and offering price per shareb | $ | 12.34 | |||||
| CLASS I SHARES: | |||||||
| NET ASSETS | $ | 253,789,287 | |||||
| Shares issued and outstanding ($0.001 par value common stock outstanding) | 20,495,483 | ||||||
| Net asset value, offering, redemption price per share | $ | 12.38 | |||||
a On investments of $100,000 or more, the offering price is reduced.
b Redemption price per share is equal to the net asset value per share less any applicable deferred sales charge of 1% on shares held for less than one year.
See accompanying notes to financial statements.
20
COHEN & STEERS PREFERRED SECURITIES AND INCOME FUND, INC.
STATEMENT OF OPERATIONS
For the Six Months Ended June 30, 2011 (Unaudited)
| Investment Income: | |||||||
| Dividend income (net of $8,779 of foreign withholding tax) | $ | 5,515,299 | |||||
| Interest income | 4,870,026 | ||||||
| Total Income | 10,385,325 | ||||||
| Expenses: | |||||||
| Investment management fees | 1,002,437 | ||||||
| Distribution fees—Class A | 90,907 | ||||||
| Distribution fees—Class C | 270,863 | ||||||
| Shareholder servicing fees—Class A | 36,363 | ||||||
| Shareholder servicing fees—Class C | 90,288 | ||||||
| Administration fees | 120,994 | ||||||
| Registration and filing fees | 107,043 | ||||||
| Professional fees | 61,625 | ||||||
| Transfer agent fees and expenses | 60,502 | ||||||
| Shareholder reporting expenses | 58,445 | ||||||
| Custodian fees and expenses | 31,827 | ||||||
| Directors' fees and expenses | 8,347 | ||||||
| Line of credit fees | 3,295 | ||||||
| Miscellaneous | 6,658 | ||||||
| Total Expenses | 1,949,594 | ||||||
| Reduction of Expenses (See Note 2) | (572,972 | ) | |||||
| Net Expenses | 1,376,622 | ||||||
| Net Investment Income | 9,008,703 | ||||||
| Net Realized and Unrealized Gain: | |||||||
| Net realized gain on: | |||||||
| Investments | 1,198,385 | ||||||
| Foreign currency transactions | 203 | ||||||
| Net realized gain | 1,198,588 | ||||||
| Net change in unrealized appreciation (depreciation) on: | |||||||
| Investments | 2,896,504 | ||||||
| Foreign currency translations | 1,174 | ||||||
| Net change in unrealized appreciation (depreciation) | 2,897,678 | ||||||
| Net realized and unrealized gain | 4,096,266 | ||||||
| Net Increase in Net Assets Resulting from Operations | $ | 13,104,969 | |||||
See accompanying notes to financial statements.
21
COHEN & STEERS PREFERRED SECURITIES AND INCOME FUND, INC.
STATEMENT OF CHANGES IN NET ASSETS (Unaudited)
| For the Six Months Ended June 30, 2011 | For the Period May 3, 2010a through December 31, 2010 | ||||||||||
| Change in Net Assets: | |||||||||||
| From Operations: | |||||||||||
| Net investment income | $ | 9,008,703 | $ | 3,016,794 | |||||||
| Net realized gain (loss) | 1,198,588 | (121,845 | ) | ||||||||
| Net change in unrealized appreciation (depreciation) | 2,897,678 | 1,411,959 | |||||||||
| Net increase in net assets resulting from operations | 13,104,969 | 4,306,908 | |||||||||
| Dividends and Distributions to Shareholders from: | |||||||||||
| Net investment income: | |||||||||||
| Class A | (2,521,404 | ) | (1,012,791 | ) | |||||||
| Class C | (2,303,649 | ) | (734,519 | ) | |||||||
| Class I | (5,395,950 | ) | (1,172,191 | ) | |||||||
| Net realized gain: | |||||||||||
| Class A | — | (85,047 | ) | ||||||||
| Class C | — | (62,623 | ) | ||||||||
| Class I | — | (92,572 | ) | ||||||||
| Tax return of capital: | |||||||||||
| Class A | — | (57,526 | ) | ||||||||
| Class C | — | (42,359 | ) | ||||||||
| Class I | — | (62,617 | ) | ||||||||
| Total dividends and distributions to shareholders | (10,221,003 | ) | (3,322,245 | ) | |||||||
| Capital Stock Transactions: | |||||||||||
| Increase in net assets from Fund share transactions | 288,744,438 | 162,792,499 | |||||||||
| Total increase in net assets | 291,628,404 | 163,777,162 | |||||||||
| Net Assets: | |||||||||||
| Beginning of period | 163,877,437 | 100,275 | |||||||||
| End of periodb | $ | 455,505,841 | $ | 163,877,437 | |||||||
a Commencement of operations.
b Includes dividends in excess of net investment income and accumulated undistributed net investment income of $1,157,652 and $54,648, respectively.
See accompanying notes to financial statements.
22
COHEN & STEERS PREFERRED SECURITIES AND INCOME FUND, INC.
FINANCIAL HIGHLIGHTS (Unaudited)
The following table includes selected data for a share outstanding throughout each period and other performance information derived from the financial statements. It should be read in conjunction with the financial statements and notes thereto.
| Class A | |||||||||||
| Per Share Operating Performance: | For the Six Months Ended June 30, 2011 | For the Period May 3, 2010a through December 31, 2010 | |||||||||
| Net asset value, beginning of period | $ | 12.10 | $ | 11.46 | |||||||
| Income from investment operations: | |||||||||||
| Net investment incomeb | 0.38 | 0.53 | |||||||||
| Net realized and unrealized gain | 0.31 | 0.52 | |||||||||
| Total from investment operations | 0.69 | 1.05 | |||||||||
| Less dividends and distributions to shareholders from: | |||||||||||
| Net investment income | (0.41 | ) | (0.34 | ) | |||||||
| Net realized gain | — | (0.04 | ) | ||||||||
| Tax return of capital | — | (0.03 | ) | ||||||||
| Total dividends and distributions to shareholders | (0.41 | ) | (0.41 | ) | |||||||
| Redemption fees retained by the Fundc | 0.00 | 0.00 | |||||||||
| Net increase in net asset value | 0.28 | 0.64 | |||||||||
| Net asset value, end of period | $ | 12.38 | $ | 12.10 | |||||||
| Total investment returnd,e | 5.72 | % | 9.22 | % | |||||||
| Ratios/Supplemental Data: | |||||||||||
| Net assets, end of period (in millions) | $ | 98.9 | $ | 50.4 | |||||||
| Ratio of expenses to average daily net assets (before expense reduction)f,g | 1.37 | % | 1.67 | % | |||||||
| Ratio of expenses to average daily net assets (net of expense reduction)f,g | 0.97 | % | 0.85 | % | |||||||
| Ratio of net investment income to average daily net assets (before expense reduction)f,g | 5.74 | % | 5.71 | % | |||||||
| Ratio of net investment income to average daily net assets (net of expense reduction)f,g | 6.14 | % | 6.53 | % | |||||||
| Portfolio turnover rated | 25 | % | 31 | % | |||||||
a Commencement of operations.
b Calculation based on average shares outstanding.
c Amount is less than $0.005.
d Not annualized.
e Does not reflect sales charges, which would reduce return.
f Annualized.
g Reflects Fund level ratio for non-class specific expenses plus class specific expenses.
See accompanying notes to financial statements.
23
COHEN & STEERS PREFERRED SECURITIES AND INCOME FUND, INC.
FINANCIAL HIGHLIGHTS (Unaudited)—(Continued)
| Class C | |||||||||||
| Per Share Operating Performance: | For the Six Months Ended June 30, 2011 | For the Period May 3, 2010a through December 31, 2010 | |||||||||
| Net asset value, beginning of period | $ | 12.06 | $ | 11.46 | |||||||
| Income from investment operations: | |||||||||||
| Net investment incomeb | 0.34 | 0.49 | |||||||||
| Net realized and unrealized gain | 0.31 | 0.49 | |||||||||
| Total from investment operations | 0.65 | 0.98 | |||||||||
| Less dividends and distributions to shareholders from: | |||||||||||
| Net investment income | (0.37 | ) | (0.31 | ) | |||||||
| Net realized gain | — | (0.04 | ) | ||||||||
| Tax return of capital | — | (0.03 | ) | ||||||||
| Total dividends and distributions to shareholders | (0.37 | ) | (0.38 | ) | |||||||
| Redemption fees retained by the Fundc | 0.00 | 0.00 | |||||||||
| Net increase in net asset value | 0.28 | 0.60 | |||||||||
| Net asset value, end of period | $ | 12.34 | $ | 12.06 | |||||||
| Total investment returnd,e | 5.40 | % | 8.62 | % | |||||||
| Ratios/Supplemental Data: | |||||||||||
| Net assets, end of period (in millions) | $ | 102.9 | $ | 48.4 | |||||||
| Ratio of expenses to average daily net assets (before expense reduction)f,g | 2.02 | % | 2.32 | % | |||||||
| Ratio of expenses to average daily net assets (net of expense reduction)f,g | 1.62 | % | 1.50 | % | |||||||
| Ratio of net investment income to average daily net assets (before expense reduction)f,g | 5.13 | % | 5.22 | % | |||||||
| Ratio of net investment income to average daily net assets (net of expense reduction)f,g | 5.53 | % | 6.04 | % | |||||||
| Portfolio turnover rated | 25 | % | 31 | % | |||||||
a Commencement of operations.
b Calculation based on average shares outstanding.
c Amount is less than $0.005.
d Not annualized.
e Does not reflect sales charges, which would reduce return.
f Annualized.
g Reflects Fund level ratio for non-class specific expenses plus class specific expenses.
See accompanying notes to financial statements.
24
COHEN & STEERS PREFERRED SECURITIES AND INCOME FUND, INC.
FINANCIAL HIGHLIGHTS (Unaudited)—(Continued)
| Class I | |||||||||||
| Per Share Operating Performance: | For the Six Months Ended June 30, 2011 | For the Period May 3, 2010a through December 31, 2010 | |||||||||
| Net asset value, beginning of period | $ | 12.10 | $ | 11.46 | |||||||
| Income from investment operations: | |||||||||||
| Net investment incomeb | 0.42 | 0.58 | |||||||||
| Net realized and unrealized gain | 0.29 | 0.49 | |||||||||
| Total from investment operations | 0.71 | 1.07 | |||||||||
| Less dividends and distributions to shareholders from: | |||||||||||
| Net investment income | (0.43 | ) | (0.36 | ) | |||||||
| Net realized gain | — | (0.04 | ) | ||||||||
| Tax return of capital | — | (0.03 | ) | ||||||||
| Total dividends and distributions to shareholders | (0.43 | ) | (0.43 | ) | |||||||
| Redemption fees retained by the Fundc | 0.00 | 0.00 | |||||||||
| Net increase in net asset value | 0.28 | 0.64 | |||||||||
| Net asset value, end of period | $ | 12.38 | $ | 12.10 | |||||||
| Total investment returnd | 5.89 | % | 9.39 | % | |||||||
| Ratios/Supplemental Data: | |||||||||||
| Net assets, end of period (in millions) | $ | 253.8 | $ | 65.1 | |||||||
| Ratio of expenses to average daily net assets (before expense reduction)e,f | 1.02 | % | 1.32 | % | |||||||
| Ratio of expenses to average daily net assets (net of expense reduction)e,f | 0.62 | % | 0.50 | % | |||||||
| Ratio of net investment income to average daily net assets (before expense reduction)e,f | 6.35 | % | 6.43 | % | |||||||
| Ratio of net investment income to average daily net assets (net of expense reduction)e,f | 6.75 | % | 7.25 | % | |||||||
| Portfolio turnover rated | 25 | % | 31 | % | |||||||
a Commencement of operations.
b Calculation based on average shares outstanding.
c Amount is less than $0.005.
d Not annualized.
e Annualized.
f Reflects Fund level ratio for non-class specific expenses.
See accompanying notes to financial statements.
25
COHEN & STEERS PREFERRED SECURITIES AND INCOME FUND, INC.
NOTES TO FINANCIAL STATEMENTS (Unaudited)
Note 1. Significant Accounting Policies
Cohen & Steers Preferred Securities and Income Fund, Inc. (the Fund) was incorporated under the laws of the State of Maryland on February 22, 2010 and is registered under the Investment Company Act of 1940, as amended, as a nondiversified, open-end management investment company. The Fund's investment objective is total return. The Fund had no operations until April 27, 2010 when it sold 100 shares each of Class A and C and 8,550 shares of Class I for $100,275 to Cohen & Steers Capital Management, Inc. (the advisor). Investment operations commenced on May 3, 2010. The authorized shares of the Fund are divided into three classes designated Class A, C and I shares. Each of the Fund's shares has equal dividend, liquidation and voting rights (except for matters relating to distributions and shareholder servicing of such shares).
The following is a summary of significant accounting policies consistently followed by the Fund in the preparation of its financial statements. The policies are in conformity with accounting principles generally accepted in the United States of America (GAAP). The preparation of the financial statements in accordance with GAAP requires management to make estimates and assumptions that affect the reported amounts of assets and liabilities at the date of the financial statements and the reported amounts of income and expenses during the reporting period. Actual results could differ from those estimates.
Portfolio Valuation: Investments in securities that are listed on the New York Stock Exchange are valued, except as indicated below, at the last sale price reflected at the close of the New York Stock Exchange on the business day as of which such value is being determined. If there has been no sale on such day, the securities are valued at the mean of the closing bid and asked prices on such day or, if no asked price is available, at the bid price.
Securities not listed on the New York Stock Exchange but listed on other domestic or foreign securities exchanges are valued in a similar manner. Securities traded on more than one securities exchange are valued at the last sale price on the business day as of which such value is being determined as reflected on the tape at the close of the exchange representing the principal market for such securities. If after the close of a foreign market, but prior to the close of business on the day the securities are being valued, market conditions change significantly, certain foreign securities may be fair valued pursuant to procedures established by the Board of Directors.
Readily marketable securities traded in the over-the-counter market, including listed securities whose primary market is believed by the advisor to be over-the-counter, are valued at the official closing prices as reported by sources as the Board of Directors deem appropriate to reflect their fair market value. If there has been no sale on such day, the securities are valued at the mean of the closing bid and asked prices on such day, or if no asked price is available, at the bid price. However, certain fixed-income securities may be valued on the basis of prices provided by a pricing service when such prices are believed by the advisor, pursuant to delegation by, the Board of Directors, to reflect the fair market value of such securities.
26
COHEN & STEERS PREFERRED SECURITIES AND INCOME FUND, INC.
NOTES TO FINANCIAL STATEMENTS (Unaudited)—(Continued)
Securities for which market prices are unavailable, or securities for which the advisor determines that the bid and/or asked price or a counterparty valuation does not reflect market value, will be valued at fair value pursuant to procedures approved by the Fund's Board of Directors. Circumstances in which market prices may be unavailable include, but are not limited to, when trading in a security is suspended, the exchange on which the security is traded is subject to an unscheduled close or disruption or material events occur after the close of the exchange on which the security is principally traded. In these circumstances, the Fund determines fair value in a manner that fairly reflects the market value of the security on the valuation date based on consideration of any information or factors it deems appropriate. These may include, but are not limited to, recent transactions in comparable securities, information relating to the specific security and developments in the markets.
The Fund's use of fair value pricing may cause the net asset value of Fund shares to differ from the net asset value that would be calculated using market quotations. Fair value pricing involves subjective judgments and it is possible that the fair value determined for a security may be materially different than the value that could be realized upon the sale of that security.
Short-term debt securities with a maturity date of 60 days or less are valued at amortized cost, which approximates value. Investments in open-end mutual funds are valued at their closing net asset value.
Fair value is defined as the price that the Fund would receive to sell an investment or pay to transfer a liability in an orderly transaction with an independent buyer in the principal market, or in the absence of a principal market the most advantageous market for the investment or liability. The hierarchy of inputs that are used in determining the fair value of the Fund's investments is summarized below.
• Level 1—quoted prices in active markets for identical investments
• Level 2—other significant observable inputs (including quoted prices for similar investments, interest rates, credit risk, etc.)
• Level 3—significant unobservable inputs (including the Fund's own assumptions in determining the fair value of investments)
The inputs or methodology used for valuing securities are not necessarily an indication of the risk associated with investing in those securities.
27
COHEN & STEERS PREFERRED SECURITIES AND INCOME FUND, INC.
NOTES TO FINANCIAL STATEMENTS (Unaudited)—(Continued)
The following is a summary of the inputs used as of June 30, 2011 in valuing the Fund's investments carried at value:
| Total | Quoted Prices In Active Market for Identical Assets (Level 1) | Significant Other Observable Inputs (Level 2) | Significant Unobservable Inputs (Level 3) | ||||||||||||||||
| Preferred Securities—$25 Par Value—Bank | $ | 52,373,032 | $ | 49,544,282 | $ | — | $ | 2,828,750 | |||||||||||
| Preferred Securities—$25 Par Value—Multi-Line—Foreign | 9,062,474 | 6,590,380 | 2,472,094 | — | |||||||||||||||
| Preferred Securities—$25 Par Value—Real Estate—Diversified | 12,508,059 | 9,598,684 | 2,909,375 | — | |||||||||||||||
| Preferred Securities—$25 Par Value—Other Industries | 127,171,198 | 127,171,198 | — | — | |||||||||||||||
| Preferred Securities—Capital Securities—Bank | 67,538,397 | 13,409,000 | 54,129,397 | — | |||||||||||||||
| Preferred Securities—Capital Securities—Oil & Gas Exploration & Production | 2,893,049 | — | — | 2,893,049 | |||||||||||||||
| Preferred Securities—Capital Securities—Other Industries | 138,459,322 | — | 138,459,322 | — | |||||||||||||||
| Corporate Bonds | 28,620,395 | — | 28,620,395 | — | |||||||||||||||
| Money Market Funds | 13,650,223 | — | 13,650,223 | — | |||||||||||||||
| Total Investments | $ | 452,276,149 | $ | 206,313,544 | $ | 240,240,806 | $ | 5,721,799 | |||||||||||
28
COHEN & STEERS PREFERRED SECURITIES AND INCOME FUND, INC.
NOTES TO FINANCIAL STATEMENTS (Unaudited)—(Continued)
Following is a reconciliation of investments in which significant unobservable inputs (Level 3) were used in determining fair value:
| Total Investments in Securities | Preferred Securities—$25 Par Value—Bank | Preferred Securities—Capital Securities—Oil & Gas Exploration & Production | |||||||||||||
| Balance as of December 31, 2010 | $ | — | $ | — | $ | — | |||||||||
| Change in unrealized depreciation | (114,470 | ) | (106,410 | ) | (8,060 | ) | |||||||||
| Purchases | 5,836,269 | 2,935,160 | 2,901,109 | ||||||||||||
| Balance as of June 30, 2011 | $ | 5,721,799 | $ | 2,828,750 | $ | 2,893,049 | |||||||||
Investments classified as Level 3 infrequently trade and have significant unobservable inputs. The Level 3 preferred securities have been fair valued utilizing inputs and assumptions which include book value, recent comparables in similar securities, as well as liquidity and market risk factors.
Security Transactions, Investment Income and Expense Allocations: Security transactions are recorded on trade date. Realized gains and losses on investments sold are recorded on the basis of identified cost. Interest income is recorded on the accrual basis. Discounts are accreted and premiums are amortized over the life of the respective securities. Dividend income is recorded on the ex-dividend date, except for certain dividends on foreign securities, which are recorded as soon as the Fund is informed after the ex-dividend date. Income, expenses (other than expenses attributable to a specific class), and realized and unrealized gains or losses on investments are allocated to each class of shares based on its relative net assets.
Foreign Currency Translations: The books and records of the Fund are maintained in U.S. dollars as follows: (1) the foreign currency market value of investment securities, other assets and liabilities and foreign currency contracts are translated at the exchange rates prevailing at the end of the period; and (2) purchases, sales, income and expenses are translated at the exchange rates prevailing on the respective dates of such transactions. The resultant exchange gains and losses are recorded as realized and unrealized gain/loss on foreign exchange transactions. Pursuant to U.S. federal income tax regulations, certain foreign exchange gains/losses included in realized and unrealized gain/loss are included in or are a reduction of ordinary income for federal income tax purposes. The Fund does not isolate that portion of the results of operations arising as a result of changes in the foreign exchange rates from the changes in the market prices of the securities.
Foreign Securities and Forward Foreign Currency Exchange Contracts: The Fund may directly purchase securities of foreign issuers. Investing in securities of foreign issuers involves special risks not typically associated with investing in securities of U.S. issuers. The risks include possible revaluation of currencies, the ability to repatriate funds, less complete financial information about companies and possible future adverse political and
29
COHEN & STEERS PREFERRED SECURITIES AND INCOME FUND, INC.
NOTES TO FINANCIAL STATEMENTS (Unaudited)—(Continued)
economic developments. Moreover, securities of many foreign issuers and their markets may be less liquid and their prices more volatile than those of securities of comparable U.S. issuers.
In connection with its investments in foreign securities, the Fund may be exposed to foreign currency risks associated with portfolio investments and therefore use forward foreign currency exchange contracts (forward contracts) to hedge or manage these exposures. Forward contracts represent obligations to purchase or sell foreign currency on a specified future date at a price fixed at the time the contracts are entered into. The risks include the potential inability of counterparties to meet the terms of their contracts and from unanticipated movements in the value of a foreign currency relative to the U.S. dollar. Forward contracts are valued daily at the applicable forward rate. The resultant unrealized exchange gains and losses are recorded as unrealized foreign currency translation gains or losses. The Fund records realized gains or losses on delivery of the currency or at the time the forward contract is extinguished (compensated) by entering into a closing transaction prior to delivery.
Dividends and Distributions to Shareholders: Dividends from net investment income and capital gain distributions are determined in accordance with U.S. federal income tax regulations, which may differ from GAAP. Dividends from net investment income, if any, are declared and paid monthly. Net realized capital gains, unless offset by any available capital loss carryforward, are typically distributed to shareholders at least annually. Dividends and distributions to shareholders are recorded on the ex-dividend date and are automatically reinvested in full and fractional shares of the Fund based on the net asset value per share at the close of business on the payable date unless the shareholder has elected to have them paid in cash. Distributions paid by the Fund are subject to recharacterization for tax purposes.
Income Taxes: It is the policy of the Fund to continue to qualify as a regulated investment company, if such qualification is in the best interest of the shareholders, by complying with the requirements of Subchapter M of the Internal Revenue Code applicable to regulated investment companies, and by distributing substantially all of its taxable earnings to its shareholders. Accordingly, no provision for federal income or excise tax is necessary. Dividend and interest income from holdings in non-U.S. securities is recorded net of non-U.S. taxes paid. Management has analyzed the Fund's tax positions taken on federal income tax returns as well as its tax positions in non-U.S. jurisdictions where it trades for all open tax years and has concluded that as of June 30, 2011, no additional provisions for income tax would be required in the Fund's financial statements. The Fund's tax positions for the tax years for which the applicable statutes of limitations have not expired are subject to examination by the Internal Revenue Service, state departments of revenue and by foreign tax authorities.
30
COHEN & STEERS PREFERRED SECURITIES AND INCOME FUND, INC.
NOTES TO FINANCIAL STATEMENTS (Unaudited)—(Continued)
Note 2. Investment Advisory and Administration Fees and Other Transactions with Affiliates
Investment Advisory Fees: The advisor serves as the Fund's investment advisor pursuant to an investment advisory agreement (the advisory agreement). Under the terms of the advisory agreement, the advisor provides the Fund with the day-to-day investment decisions and generally manages the Fund's investments in accordance with the stated policies of the Fund, subject to the supervision of the Fund's Board of Directors.
For the services provided to the Fund, the advisor receives a fee, accrued daily and paid monthly, at the annual rate of 0.70% of the average daily net assets of the Fund.
For the period January 1, 2011 through April 30, 2011, the advisor has contractually agreed to waive its fee and/or reimburse the Fund for expenses incurred to the extent necessary to maintain the Fund's operating expenses at 0.85% for Class A shares, 1.50% for Class C shares and 0.50% for Class I shares. For the period May 1, 2011 through April 30, 2012, the advisor has contractually agreed to waive its fee and/or reimburse the Fund for expenses incurred to the extent necessary to maintain the Fund's operating expenses at 1.10% for Class A shares, 1.75% for Class C shares and 0.75% for Class I shares.
Administration Fees: The Fund has entered into an administration agreement with the advisor under which the advisor performs certain administrative functions for the Fund and receives a fee, accrued daily and paid monthly, at the annual rate of 0.05% of the Fund's average daily net assets. For the six months ended June 30, 2011, the Fund paid the advisor $71,603 in fees under this administration agreement. Additionally, the Fund pays State Street Bank and Trust Company as co-administrator under a fund accounting and administration agreement.
Distribution Fees: Shares of the Fund are distributed by Cohen & Steers Securities, LLC (the distributor), an affiliated entity of the advisor. The Fund has adopted a distribution plan (the plan) pursuant to Rule 12b-1 under the Investment Company Act of 1940. The plan provides that the Fund will pay the distributor a fee, accrued daily and paid monthly, at an annual rate of up to 0.25% of the average daily net assets attributable to the Class A shares and up to 0.75% of the average daily net assets attributable to the Class C shares.
For the six months ended June 30, 2011, the Fund has been advised that the distributor received $74,838 in sales commissions from the sale of Class A shares and that the distributor also received $495 and $22,039 of contingent deferred sales charges relating to redemptions of Class A and Class C shares, respectively. The distributor has advised the Fund that proceeds from the contingent deferred sales charges on the Class C shares are paid to the distributor and are used by the distributor to defray its expenses related to providing distribution related services to the Fund in connection with the sale of this class, including payments to dealers and other financial intermediaries for selling this class and interest and other financing costs associated with this class.
31
COHEN & STEERS PREFERRED SECURITIES AND INCOME FUND, INC.
NOTES TO FINANCIAL STATEMENTS (Unaudited)—(Continued)
Shareholder Servicing Fees: For shareholder services, the Fund pays the distributor a fee, accrued daily and paid monthly, at an annual rate of up to 0.10% of the average daily net asset value of the Fund's Class A shares and up to 0.25% of the average daily net asset value of the Fund's Class C shares. The distributor is responsible for paying qualified financial institutions for shareholder services.
Directors' and Officers' Fees: Certain directors and officers of the Fund are also directors, officers, and/or employees of the advisor. The Fund does not pay compensation to any affiliated directors and officers except for the Chief Compliance Officer, who received $2,426 from the Fund for the six months ended June 30, 2011.
Note 3. Purchases and Sales of Securities
Purchases and sales of securities, excluding short-term investments, for the six months ended June 30, 2011, totaled $347,647,350 and $70,562,505, respectively.
Note 4. Income Tax Information
As of June 30, 2011, the federal tax cost and net unrealized appreciation on securities were as follows:
| Cost for federal income tax purposes | $ | 447,967,105 | |||||
| Gross unrealized appreciation | $ | 6,290,262 | |||||
| Gross unrealized depreciation | (1,981,218 | ) | |||||
| Net unrealized appreciation | $ | 4,309,044 | |||||
The Fund incurred capital and currency losses of $226,395 and $25,761, respectively, after October 31, 2010 that it has elected to treat as arising in the following fiscal year.
32
COHEN & STEERS PREFERRED SECURITIES AND INCOME FUND, INC.
NOTES TO FINANCIAL STATEMENTS (Unaudited)—(Continued)
Note 5. Capital Stock
The Fund is authorized to issue 600 million shares of capital stock, at a par value of $0.001 per share. The Board of Directors of the Fund may increase or decrease the aggregate number of shares of common stock that the Fund has authority to issue. Transactions in Fund shares were as follows:
| For the Six Months Ended June 30, 2011 | For the Period May 3, 2010a through December 31, 2010 | ||||||||||||||||||
| Shares | Amount | Shares | Amount | ||||||||||||||||
| Class A: | |||||||||||||||||||
| Sold | 4,509,829 | $ | 55,875,591 | 6,591,941 | $ | 79,151,012 | |||||||||||||
| Issued as reinvestment of dividends and distributions | 114,510 | 1,419,523 | 36,829 | 444,762 | |||||||||||||||
| Redeemed | (805,270 | ) | (10,004,203 | ) | (2,460,269 | ) | (30,138,240 | ) | |||||||||||
| Redemption fees retained by the Fundb | — | 2,555 | — | 6,031 | |||||||||||||||
| Net increase | 3,819,069 | $ | 47,293,466 | 4,168,501 | $ | 49,463,565 | |||||||||||||
| Class C: | |||||||||||||||||||
| Sold | 4,519,215 | $ | 55,834,499 | 4,060,335 | $ | 48,771,017 | |||||||||||||
| Issued as reinvestment of dividends and distributions | 48,276 | 596,500 | 14,454 | 174,270 | |||||||||||||||
| Redeemed | (239,233 | ) | (2,960,315 | ) | (64,228 | ) | (775,585 | ) | |||||||||||
| Redemption fees retained by the Fundb | — | 2,491 | — | 4,411 | |||||||||||||||
| Net increase | 4,328,258 | $ | 53,473,175 | 4,010,561 | $ | 48,174,113 | |||||||||||||
| Class I: | |||||||||||||||||||
| Sold | 16,954,108 | $ | 210,762,673 | 6,440,977 | $ | 78,027,900 | |||||||||||||
| Issued as reinvestment of dividends and distributions | 105,255 | 1,305,938 | 21,656 | 261,800 | |||||||||||||||
| Redeemed | (1,943,309 | ) | (24,094,145 | ) | (1,091,754 | ) | (13,141,832 | ) | |||||||||||
| Redemption fees retained by the Fundb | — | 3,331 | — | 6,953 | |||||||||||||||
| Net increase | 15,116,054 | $ | 187,977,797 | 5,370,879 | $ | 65,154,821 | |||||||||||||
a Commencement of operations.
b A 2% redemption fee may be charged on shares sold within 60 days of the time of purchase. Redemption fees are paid directly to the Fund. Effective March 1, 2011, the Fund no longer charges redemption fees.
33
COHEN & STEERS PREFERRED SECURITIES AND INCOME FUND, INC.
NOTES TO FINANCIAL STATEMENTS (Unaudited)—(Continued)
Note 6. Borrowings
The Fund, in conjunction with other Cohen & Steers funds, is a party to a $200,000,000 syndicated credit agreement (the credit agreement) with State Street Bank and Trust Company, as administrative agent and operations agent, and the lenders identified in the credit agreement, which expires January 27, 2012. The Fund pays a commitment fee of 0.125% per annum on its proportionate share of the unused portion of the credit agreement. (For the period January 1, 2011 through January 28, 2011, the commitment fee was 0.15%).
During the six months ended June 30, 2011, the Fund did not borrow under the credit agreement.
Note 7. Other
In the normal course of business, the Fund enters into contracts that provide general indemnifications. The Fund's maximum exposure under these arrangements is dependent on claims that may be made against the Fund in the future and, therefore, cannot be estimated; however, based on experience, the risk of material loss from such claims is considered remote.
Note 8. Subsequent Events
Events and transactions occurring after June 30, 2011 and through the date that the financial statements were issued, have been evaluated in the preparation of the financial statements and no additional disclosure is required.
34
COHEN & STEERS PREFERRED SECURITIES AND INCOME FUND, INC.
OTHER INFORMATION
A description of the policies and procedures that the Fund uses to determine how to vote proxies relating to portfolio securities is available (i) without charge, upon request, by calling 800-330-7348, (ii) on our Web site at cohenandsteers.com or (iii) on the Securities and Exchange Commission's Web site at http://www.sec.gov. In addition, the Fund's proxy voting record for the most recent 12-month period ended June 30 is available by August 31 of each year (i) without charge, upon request, by calling 800-330-7348 or (ii) on the SEC's Web site at http://www.sec.gov.
The Fund files its complete schedule of portfolio holdings with the SEC for the first and third quarters of each fiscal year on Form N-Q. The Fund's Forms N-Q are available (i) without charge, upon request by calling 800-330-7348, or (ii) on the SEC's Web site at http://www.sec.gov. In addition, the Forms N-Q may be reviewed and copied at the SEC's Public Reference Room in Washington, DC. Information on the operation of the Public Reference Room may be obtained by calling 800-SEC-0330.
Please note that the distributions paid by the Fund to shareholders are subject to recharacterization for tax purposes. The Fund may also pay distributions in excess of the Fund's net investment company taxable income and this excess could be a tax free return of capital distributed from the Fund's assets. The final tax treatment of all distributions is reported to shareholders on their 1099-DIV forms, which are mailed after the close of each calendar year.
APPROVAL OF INVESTMENT ADVISORY AGREEMENT
The Board of Directors of the Fund, including a majority of the directors who are not parties to the Fund's investment advisory agreement (the "Advisory Agreement"), or interested persons of any such party ("Independent Directors"), has the responsibility under the 1940 Act to approve the Fund's Advisory Agreement for its initial two year term and its continuation annually thereafter at a meeting of the Board of Directors called for the purpose of voting on the approval or continuation. At a telephone meeting held on June 14, 2011 and at a meeting held in person on June 21-22, 2011, the Advisory Agreement was discussed and was unanimously continued for a term ending June 30, 2012 by the Fund's Board of Directors, including the Independent Directors. The Independent Directors were represented by independent counsel who assisted them in their deliberations during the meeting and executive session.
In considering whether to continue the Advisory Agreement, the Board of Directors reviewed materials provided by the Fund's investment advisor (the "Investment Advisor") and Fund counsel which included, among other things, fee, expense and performance information compared to peer funds ("Peer Funds") and performance comparisons to a larger category universe prepared by an independent data provider; summary information prepared by the Investment Advisor; and a memorandum outlining the legal duties of the Board of Directors. The Board of Directors also spoke directly with investment advisory personnel. In addition, the Board of Directors considered information provided from time to time by the Investment Advisor throughout the year at meetings of the Board of Directors, including presentations by portfolio managers relating to the investment performance of the Fund and the investment strategies used in pursuing the Fund's objective. In particular, the Board of Directors considered the following:
(i) The nature, extent and quality of services to be provided by the Investment Advisor: The Board of Directors reviewed the services that the Investment Advisor provides to the Fund, including, but not limited to,
35
COHEN & STEERS PREFERRED SECURITIES AND INCOME FUND, INC.
making the day-to-day investment decisions for the Fund, and generally managing the Fund's investments in accordance with the stated policies of the Fund. The Board of Directors also discussed with officers and portfolio managers of the Fund the types of transactions that were being done on behalf of the Fund. Additionally, the Board of Directors took into account the services provided by the Investment Advisor to its other funds, including those that have investment objectives and strategies similar to the Fund. The Board of Directors next considered the education, background and experience of the Investment Advisor's personnel, noting particularly that the favorable history and reputation of the portfolio managers for the Fund has had, and would likely continue to have, a favorable impact on the Fund. The Board of Directors further noted the Investment Advisor's ability to attract qualified and experienced personnel. After consideration of the above factors, among others, the Board of Directors concluded that the nature, extent and quality of services provided by the Investment Advisor are adequate and appropriate.
(ii) Investment performance of the Fund and the Investment Advisor: The Board of Directors noted that the Fund has been in existence for approximately one year and considered the investment performance of the Fund compared to Peer Funds and compared to a relevant benchmark and a blended benchmark. The Board of Directors noted that the Fund outperformed the Peer Funds' medians and the blended benchmark for the year-to-date and since inception (May 3, 2010) periods ended March 31, 2011. The Board of Directors engaged in discussions with the Investment Advisor regarding the contributors and detractors to the Fund's performance during the periods. The Board of Directors also considered information provided by the Investment Advisor, including a narrative summary of various factors affecting performance. The Board of Directors further considered the Fund's performance versus a group of open-end funds compiled by the Investment Advisor, and noted that the Fund outperformed the median of the group for the year-to-date period ended March 31, 2011. The Board of Directors then determined that Fund performance, in light of all considerations noted above, was satisfactory.
(iii) Cost of the services to be provided and profits to be realized by the Investment Advisor from the relationship with the Fund: Next, the Board of Directors considered the advisory fees and administrative fees payable by the Fund as well as the Fund's expense ratio. The Board of Directors noted that the Fund's actual management fee was lower than the Peer Funds and that the contractual management fee was higher than the median. The Board of Directors considered that the Investment Advisor is waiving its fees and/or reimbursing expenses to limit the overall operating expenses of the Fund. The Board of Directors further considered the Fund's expenses versus a group of open-end funds selected by the Investment Advisor, noting that the Fund's contractual management fee was higher than the median, but that the actual management fee and total expense ratios were lower than the median. The Board of Directors then considered the administrative services to be provided by the Investment Advisor, including compliance and accounting services, and further noted that the Fund would pay an administration fee to the Investment Advisor. The Board of Directors noted the limited utility of the comparisons, as there are only two other diversified preferred securities mutual funds. Nonetheless, the Board of Directors noted that that the Fund's fees and expenses were reasonable considering those of the comparison funds.
The Board of Directors also reviewed information regarding the profitability to the Investment Advisor of its relationship with the Fund. The Board of Directors considered the level of the Investment Advisor's profits and whether the profits were reasonable for the Investment Advisor. The Board of Directors noted that the Investment
36
COHEN & STEERS PREFERRED SECURITIES AND INCOME FUND, INC.
Advisor is currently waiving its fee and/or reimbursing expenses of the Fund. The Board of Directors took into consideration other benefits to be derived by the Investment Advisor in connection with the Advisory Agreement, noting particularly the research and related services, within the meaning of Section 28(e) of the Securities Exchange Act of 1934, as amended, that the Investment Advisor receives by allocating the Fund's brokerage transactions. The Board of Directors also considered the fees received by the Investment Advisor under the Administration Agreement, and noted the significant services received, such as compliance, accounting and operational services and furnishing office space and facilities for the Fund, and providing persons satisfactory to the Board of Directors to serve as officers of the Fund, and that these services were beneficial to the Fund. The Board of Directors noted that because of the Fund's short operating history, the operating expenses continue to be subsidized, and the Fund is not yet profitable.
(iv) The extent to which economies of scale would be realized as the Fund grows and whether fee levels would reflect such economies of scale: The Board of Directors considered the Fund's asset size and determined that there were not at this time significant economies of scale that were not being shared with shareholders.
(v) Comparison of services to be rendered and fees to be paid to those under other investment advisory contracts, such as contracts of the same and other investment advisors or other clients: As discussed above in (iii), the Board of Directors compared the fees paid under the Advisory Agreement to those under other investment advisory contracts of other investment advisors managing Peer Funds. The Board of Directors also considered the services rendered, fees paid and profitability under the Advisory Agreement to the Investment Advisor's other fund advisory contracts, as well as the services rendered, fees paid and profitability under the Advisory Agreement to the Investment Advisor's other advisory contracts with institutional and other clients with similar investment mandates. The Board of Directors also considered the entrepreneurial risk and financial exposure assumed by the Investment Advisor in developing and managing the Fund that the Investment Advisor does not have with institutional and other clients. The Board of Directors determined that on a comparative basis the fees under the Advisory Agreement were reasonable in relation to the services provided.
No single factor was cited as determinative to the decision of the Board of Directors. Rather, after weighing all of the considerations and conclusions discussed above, the Board of Directors, including the Independent Directors, unanimously approved the continuance of the Advisory Agreement.
37
COHEN & STEERS PREFERRED SECURITIES AND INCOME FUND, INC.
Cohen & Steers Privacy Policy
| Facts | What Does Cohen & Steers Do With Your Personal Information? | ||||||
| Why? | Financial companies choose how they share your personal information. Federal law gives consumers the right to limit some but not all sharing. Federal law also requires us to tell you how we collect, share, and protect your personal information. Please read this notice carefully to understand what we do. | ||||||
| What? | The types of personal information we collect and share depend on the product or service you have with us. This information can include: • Social Security number and account balances • Transaction history and account transactions • Purchase history and wire transfer instructions | ||||||
| How? | All financial companies need to share customers' personal information to run their everyday business. In the section below, we list the reasons financial companies can share their customers' personal information; the reasons Cohen & Steers chooses to share; and whether you can limit this sharing. | ||||||
| Reasons we can share your personal information | Does Cohen & Steers share? | Can you limit this sharing? | |||||||||
| For our everyday business purposes— such as to process your transactions, maintain your account(s), respond to court orders and legal investigations, or reports to credit bureaus | Yes | No | |||||||||
| For our marketing purposes— to offer our products and services to you | Yes | No | |||||||||
| For joint marketing with other financial companies— | No | We don't share | |||||||||
| For our affiliates' everyday business purposes— information about your transactions and experiences | No | We don't share | |||||||||
| For our affiliates' everyday business purposes— information about your creditworthiness | No | We don't share | |||||||||
| For our affiliates to market to you— | No | We don't share | |||||||||
| For non-affiliates to market to you— | No | We don't share | |||||||||
Questions? Call 800.330.7348
38
COHEN & STEERS PREFERRED SECURITIES AND INCOME FUND, INC.
Cohen & Steers Privacy Policy—(Continued)
| Who we are | |||||||
| Who is providing this notice? | Cohen & Steers Capital Management, Inc., Cohen & Steers Asia Limited, Cohen & Steers UK Limited, Cohen & Steers Europe SA, Cohen & Steers Securities, LLC, Cohen & Steers Private Funds, and Cohen & Steers Open and Closed-End Funds (collectively, "Cohen & Steers"). | ||||||
| What we do | |||||||
| How does Cohen & Steers protect my personal information? | To protect your personal information from unauthorized access and use, we use security measures that comply with federal law. These measures include computer safeguards and secured files and buildings. We restrict access to your information to those employees who need it to perform their jobs, and also require companies that provide services on our behalf to protect your information. | ||||||
| How does Cohen & Steers collect my personal information? | We collect your personal information, for example, when you • Open an account or buy securities from us • Provide account information or give us your contact information • Make deposits or withdrawals from your account We also collect your personal information from other companies. | ||||||
| Why can't I limit all sharing? | Federal law gives you the right to limit only • sharing for affiliates' everyday business purposes—information about your creditworthiness • affiliates from using your information to market to you • sharing for non-affiliates to market to you State law and individual companies may give you additional rights to limit sharing. | ||||||
| Definitions | |||||||
| Affiliates | Companies related by common ownership or control. They can be financial and nonfinancial companies. • Cohen & Steers does not share with affiliates. | ||||||
| Non-affiliates | Companies not related by common ownership or control. They can be financial and nonfinancial companies • Cohen & Steers does not share with non-affiliates so they can market to you. | ||||||
| Joint marketing | A formal agreement between nonaffiliated financial companies that together market financial products or services to you. • Cohen & Steers does not jointly market. | ||||||
39
COHEN & STEERS PREFERRED SECURITIES AND INCOME FUND, INC.
Cohen & Steers Investment Solutions
COHEN & STEERS
GLOBAL REALTY SHARES
• Designed for investors seeking total return, investing primarily in global real estate equity securities
• Symbols: CSFAX, CSFBX*, CSFCX, CSSPX
COHEN & STEERS
INSTITUTIONAL GLOBAL REALTY SHARES
• Designed for institutional investors seeking total return, investing primarily in global real estate securities
• Symbol: GRSIX
COHEN & STEERS REALTY INCOME FUND
• Designed for investors seeking total return, investing primarily in real estate securities with an emphasis on both income and capital appreciation
• Symbols: CSEIX, CSBIX*, CSCIX, CSDIX
COHEN & STEERS
INTERNATIONAL REALTY FUND
• Designed for investors seeking total return, investing primarily in international real estate securities
• Symbols: IRFAX, IRFCX, IRFIX
COHEN & STEERS
EMERGING MARKETS REAL ESTATE FUND
• Designed for investors seeking total return, investing primarily in emerging market real estate securities
• Symbols: APFAX, APFCX, APFIX
COHEN & STEERS REALTY SHARES
• Designed for investors seeking total return, investing primarily in REITs
• Symbol: CSRSX
COHEN & STEERS
INSTITUTIONAL REALTY SHARES
• Designed for institutional investors seeking total return, investing primarily in REITs
• Symbol: CSRIX
COHEN & STEERS
GLOBAL INFRASTRUCTURE FUND
• Designed for investors seeking total return, investing primarily in global infrastructure securities
• Symbols: CSUAX, CSUBX*, CSUCX, CSUIX
COHEN & STEERS
DIVIDEND VALUE FUND
• Designed for investors seeking high current income and long-term growth of income and capital appreciation, investing primarily in dividend paying common stocks and preferred stocks
• Symbols: DVFAX, DVFCX, DVFIX
COHEN & STEERS
PREFERRED SECURITIES AND INCOME FUND
• Designed for investors seeking total return (high current income and capital appreciation), investing primarily in preferred and debt securities
• Symbols: CPXAX, CPXCX, CPXIX
Distributed by Cohen & Steers Securities, LLC.
COHEN & STEERS
GLOBAL REALTY MAJORS ETF
• Designed for investors who seek a relatively low-cost "passive" approach for investing in a portfolio of real estate equity securities of companies in a specified index
• Symbol: GRI
Distributed by ALPS Distributors, Inc.
ISHARES COHEN & STEERS
REALTY MAJORS INDEX FUND
• Designed for investors who seek a relatively low-cost "passive" approach for investing in a portfolio of real estate equity securities of companies in a specified index
• Symbol: ICF
Distributed by SEI Investments Distribution Co.
* Class B shares are no longer offered except through dividend reinvestment and permitted exchanges by existing Class B shareholders.
Please consider the investment objectives, risks, charges and expenses of the fund carefully before investing. A prospectus containing this and other information can be obtained by calling 800-330-7348 or by visiting cohenandsteers.com. Please read the prospectus carefully before investing.
40
COHEN & STEERS PREFERRED SECURITIES AND INCOME FUND, INC.
OFFICERS AND DIRECTORS
Robert H. Steers
Director and co-chairman
Martin Cohen
Director and co-chairman
Michael G. Clark
Director
Bonnie Cohen
Director
George Grossman
Director
Richard E. Kroon
Director
Richard J. Norman
Director
Frank K. Ross
Director
Willard H. Smith Jr.
Director
C. Edward Ward, Jr.
Director
Adam M. Derechin
President and chief executive officer
Joseph M. Harvey
Vice president
William F. Scapell
Vice president
Francis C. Poli
Secretary
James Giallanza
Treasurer and chief financial officer
Lisa D. Phelan
Chief compliance officer
KEY INFORMATION
Investment Advisor
Cohen & Steers Capital Management, Inc.
280 Park Avenue
New York, NY 10017
(212) 832-3232
Co-administrator and Custodian
State Street Bank and Trust Company
One Lincoln Street
Boston, MA 02111
Transfer Agent
Boston Financial Data Services, Inc.
30 Dan Road
Canton, MA 02021
(800) 437-9912
Legal Counsel
Stroock & Stroock & Lavan LLP
180 Maiden Lane
New York, NY 10038
Distributor
Cohen & Steers Securities, LLC
280 Park Avenue
New York, NY 10017
Nasdaq Symbol: Class A—CPXAX
Class C—CPXCX
Class I—CPXIX
Web site: cohenandsteers.com
This report is authorized for delivery only to shareholders of Cohen & Steers Preferred Securities and Income Fund, Inc. unless accompanied or preceded by the delivery of a currently effective prospectus setting forth details of the Fund. Past performance is no guarantee of future results and your investment may be worth more or less at the time you sell.
41


eDelivery NOW AVAILABLE
Stop traditional mail delivery; receive your shareholder reports and prospectus online.
Sign up at cohenandsteers.com
COHEN & STEERS
PREFERRED SECURITIES AND INCOME FUND
280 PARK AVENUE
NEW YORK, NY 10017
SEMIANNUAL REPORT
JUNE 30, 2011
CPXAXSAR
Item 2. Code of Ethics.
Not applicable.
Item 3. Audit Committee Financial Expert.
Not applicable.
Item 4. Principal Accountant Fees and Services.
Not applicable.
Item 5. Audit Committee of Listed Registrants.
Not applicable.
Item 6. Schedule of Investments.
Included in Item 1 above.
Item 7. Disclosure of Proxy Voting Policies and Procedures for Closed-End Management Investment Companies.
Not applicable.
Item 8. Portfolio Managers of Closed-End Investment Companies.
Not applicable.
Item 9. Purchases of Equity Securities by Closed-End Management Investment Company and Affiliated Purchasers.
Not applicable.
Item 10. Submission of Matters to a Vote of Security Holders.
Not applicable.
Item 11. Controls and Procedures.
(a) The registrant’s principal executive officer and principal financial officer have concluded that the registrant’s disclosure controls and procedures are reasonably designed to ensure that information required to be disclosed by the registrant in this Form N-CSR was recorded, processed, summarized and reported within the time periods specified in the Securities and Exchange Commission’s rules and forms, based upon such officers’ evaluation of these controls and procedures as of a date within 90 days of the filing date of this report.
(b) There were no changes in the registrant’s internal control over financial reporting that occurred during the second fiscal quarter of the period covered by this report that have materially affected, or are reasonably likely to materially affect, the registrant’s internal control over financial reporting.
Item 12. Exhibits.
(a)(1) Not applicable.
(a)(2) Certifications of principal executive officer and principal financial officer as required by Rule 30a-2(a) under the Investment Company Act of 1940.
(a)(3) Not applicable
(b) Certifications of chief executive officer and chief financial officer as required by Rule 30a- 2(b) under the Investment Company Act of 1940.
SIGNATURES
Pursuant to the requirements of the Securities Exchange Act of 1934 and the Investment Company Act of 1940, the registrant has duly caused this report to be signed on its behalf by the undersigned, thereunto duly authorized.
COHEN & STEERS PREFERRED SECURITIES AND INCOME FUND, INC.
| By: | /s/ Adam M. Derechin |
| |
|
| Name: | Adam M. Derechin |
|
|
| Title: | President and Chief Executive Officer |
|
|
|
|
| |
| Date: August 31, 2011 |
| ||
Pursuant to the requirements of the Securities Exchange Act of 1934 and the Investment Company Act of 1940, this report has been signed below by the following persons on behalf of the registrant and in the capacities and on the dates indicated.
| By: | /s/ Adam M. Derechin |
| |
|
| Name: | Adam M. Derechin |
|
|
| Title: | President and Chief Executive Officer |
|
|
|
| (principal executive officer) |
|
|
|
|
| |
| By: | /s/ James Giallanza |
| |
|
| Name: | James Giallanza |
|
|
| Title: | Treasurer and Chief Financial Officer |
|
|
|
| (principal financial officer) |
|
|
|
|
| |
|
|
|
| |
| Date: August 31, 2011 |
| ||