UNITED STATES
SECURITIES AND EXCHANGE COMMISSION
Washington, D.C. 20549
FORM N-CSR
CERTIFIED SHAREHOLDER REPORT OF REGISTERED
MANAGEMENT INVESTMENT COMPANIES
Investment Company Act file number | 811-22392 | |||||||
| ||||||||
Cohen & Steers Preferred Securities and Income Fund, Inc. | ||||||||
(Exact name of registrant as specified in charter) | ||||||||
| ||||||||
280 Park Avenue, New York, NY |
| 10017 | ||||||
(Address of principal executive offices) |
| (Zip code) | ||||||
| ||||||||
Adam M. Derechin Cohen & Steers Capital Management, Inc. 280 Park Avenue New York, New York 10017 | ||||||||
(Name and address of agent for service) | ||||||||
| ||||||||
Registrant’s telephone number, including area code: | (212) 832-3232 |
| ||||||
| ||||||||
Date of fiscal year end: | December 31 |
| ||||||
| ||||||||
Date of reporting period: | December 31, 2011 |
| ||||||
Item 1. Reports to Stockholders.
COHEN & STEERS PREFERRED SECURITIES AND INCOME FUND, INC.
To Our Shareholders:
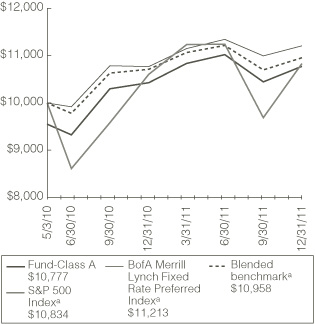
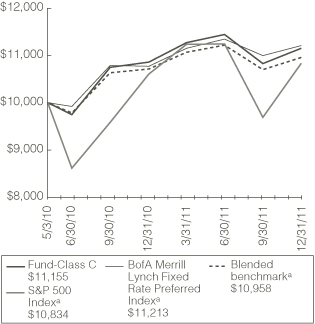
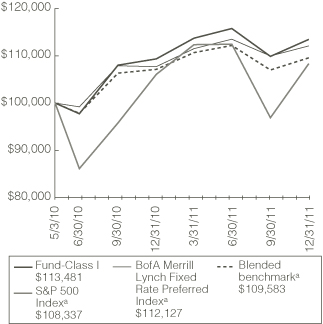
We would like to share with you our report for the year ended December 31, 2011. The net asset values (NAV) per share at that date were $11.69, $11.65 and $11.70 for Class A, Class C and Class I shares, respectively.
The total returns, including income and change in NAV, for the Fund and its comparative benchmarks were:
| Six Months Ended December 31, 2011 | Year Ended December 31, 2011 | ||||||||||
| Cohen & Steers Preferred Securities and Income Fund—Class A | –2.26 | % | 3.32 | % | |||||||
| Cohen & Steers Preferred Securities and Income Fund—Class C | –2.58 | % | 2.69 | % | |||||||
| Cohen & Steers Preferred Securities and Income Fund—Class I | –2.03 | % | 3.74 | % | |||||||
| BofA Merrill Lynch Fixed Rate Preferred Indexa | –1.23 | % | 4.11 | % | |||||||
| Blended benchmark—50% BofA Merrill Lynch US Capital Securities Index/50% BofA Merrill Lynch Fixed Rate Preferred Indexa | –2.35 | % | 2.27 | % | |||||||
| S&P 500 Indexa | –3.69 | % | 2.11 | % | |||||||
The performance data quoted represent past performance. Past performance is no guarantee of future results. The investment return and the principal value of an investment will fluctuate and shares, if redeemed, may be worth more or less than their original cost. Current performance may be lower or higher than the performance data quoted. Current total returns of the Fund can be obtained by visiting our Web site at cohenandsteers.com. Performance quoted does not reflect the deduction of the maximum 4.5% initial sales charge on Class A shares or the 1% maximum contingent deferred sales charge on Class C shares. If such charges were included, returns would have been lower.
The Fund implements fair value pricing when the daily change in a specific U.S. market index exceeds a predetermined percentage. Fair value pricing adjusts the valuation of certain non-U.S. holdings to account for such index change following the close of foreign markets. This standard practice has been adopted by a majority of the fund industry to deter investors from arbitraging funds with a large percentage of non-U.S. holdings. In the event fair value pricing is implemented on the first and/or last day of a performance measurement period, the Fund's return may diverge from the relative performance of its benchmark index, which does not use fair value pricing. An investor cannot invest directly in an index.
Please note that distributions paid by the Fund to shareholders are subject to recharacterization for tax purposes and are taxable up to the amount of the Fund's investment company taxable income and net realized gains. Distributions in excess of the Fund's investment company taxable income and realized gains are a return of capital distributed from the Fund's assets.
a The BofA Merrill Lynch Fixed Rate Preferred Index is an unmanaged index of preferred securities. The BofA Merrill Lynch US Capital Securities Index is a subset of The BofA Merrill Lynch US Corporate Index including all fixed-to-floating rate, perpetual callable and capital securities. The S&P 500 Index is an unmanaged index of common stocks that is frequently used as a general measure of stock market performance.
1
COHEN & STEERS PREFERRED SECURITIES AND INCOME FUND, INC.
Investment Review
Preferred securities had a positive total return for the year despite concerns brought by fiscal strains in Europe and signs of a slowing global economy. The group's above-average income, compared with stocks and most fixed income classes, continued to attract yield-seeking investors amid low and declining interest rates. The income rate of generally 7% or so paid by preferreds also contributed directly to performance, as even securities that fell somewhat in price had positive total returns. Preferreds were further supported by technical factors related to anticipated Tier 1 capital regulatory changes (more securities being called or otherwise removed from the market, along with relatively limited new supply in the period).
Preferreds, and financial markets broadly, made gains through July, but encountered turbulence when it appeared that the global economic recovery was on a weaker trajectory than previously expected. Investor confidence was further eroded by the growing risk of a Greek default, sparking fears of heavy bank losses and fiscal contagion. In addition, the debate over raising the U.S. debt ceiling was followed quickly by a downgrade of the U.S. by Standard & Poor's.
Although preferred securities had price declines in August and September, they held up much better than stocks on a total return basis. The group then participated in the fourth-quarter recovery, as markets turned up on signs of improving U.S. economic data and progress in Europe. Adjustable-rate preferreds fared poorly, however, as expectations for interest-rate increases in the U.S. were pushed out to 2013 or beyond, reducing the demand for securities whose yields are tied to short-term interest rates.
Performance was positive across most sectors, with non-financial preferreds faring the best. Preferreds issued by real estate, telecommunications and utilities companies were particularly buoyant. Returns from bank preferreds were mixed and the securities more volatile. U.S. bank preferreds generally offered positive returns; they reported better-than-expected improvements in credit quality and capital ratios, although revenue trends generally remained weak, in part reflecting slow loan growth. In addition, the potential for the issuers to buy back their preferreds due to regulatory reform kept issues well bid.
By contrast, European bank and insurance company issues generally declined—some significantly—hindered by fears of sovereign risk, including the potential dissolution of the European Union and related uncertainty over capital adequacy and funding. However, many of these issues, too, found footing late in the year as a number of foreign banks offered to buy back their securities at premiums to the market prices—albeit still at deep discounts to par.
New contingent capital securities were greeted with healthy demand
A significant development in the preferred market in the period was the large, successful issuance of contingent capital securities. These so-called "CoCos" may convert into common shares if a company's core Tier 1 capital ratio falls below a certain level. Another version of these securities would write down to a lower par figure under similar circumstances. Markets focused on this emerging asset class after Credit Suisse priced its large public deal at 7.875% and placed private transactions at the same time. With many existing preferreds destined to lose their Tier 1 status under Basel 3 (the next
2
COHEN & STEERS PREFERRED SECURITIES AND INCOME FUND, INC.
guidelines from a committee represented by the world's central banks), issuers may increasingly use CoCos as an alternative source of equity-like capital.
Regulatory par call risk emerged
In May, regional bank Fifth Third exercised a par call on a trust preferred trading at a premium via "special event" language, taking the market by surprise. This awakened many to the risk that certain bank preferreds may be subject to near-term par calls as a result of changes to bank regulation that diminish the regulatory capital benefit of the securities. In this particular case, the issuer could call the security at par anytime following a proposed change of this nature. (Typically, there is a short, specified window in which to call such an issue after a special event.)
By paying close attention to prospectus language, we were well-aware of the special event call risk associated with certain premium issues and did not hold the Fifth Third issue when it was called. Later in the year, Wells Fargo also exercised regulatory call language to take out nearly $6 billion of securities—again calling at par many securities trading at premiums. We did not own the premium securities and continue to avoid premium priced securities that have this risk.
Fund performance
The Fund had a positive total return in the year underperforming the BofA Merrill Lynch Fixed Rate Preferred Index but outperforming its blended benchmark. Our allocations to the real estate and telecommunication sectors benefited relative returns, as did our allocation to energy pipeline companies. Our security selection in bank preferreds aided performance as well, particularly with respect to European banks.
Factors that detracted from relative performance included security selection in the finance and utilities sectors. In addition, the Fund's positions in below-investment-grade securities detracted from performance as the economic environment cooled in the second half of the year.
During 2011, the Fund used derivatives in the form of currency forward contracts in an attempt to limit currency risk on Fund positions denominated in foreign currencies. These contracts did not have a material effect on the Fund's total return in the period.
Investment Outlook
In terms of preferreds' broad performance potential, we note that bond yields are at or near historic lows, and that the Federal Reserve is likely to hold interest rates steady until 2013. In such an environment, the income offered by preferreds (7–8% or more) will be hard to come by, likely resulting in good investor demand in the year ahead. At the same time, the high income these securities produce is also likely to continue to factor meaningfully into their total return and dampen returns volatility.
The theme of new regulations defining Tier 1 capital will remain key in the coming year. In the U.S., the Collins Amendment to the Dodd-Frank Act phases out Tier 1 treatment for debt-structured "trust preferred" securities over a period of three years, beginning in 2013. Phase-out of Tier 1 benefits is also slated to take place for a large number of existing preferred instruments abroad. Once banks have
3
COHEN & STEERS PREFERRED SECURITIES AND INCOME FUND, INC.
clarity on exactly what will qualify as Tier 1 (based on final announcements from the U.S Federal Reserve as well as the global Basel Committee) we expect to see an accelerating wave of refinancings via companies calling, buying back and tendering for their securities—ultimately involving hundreds of billions of dollars of preferred securities globally. This activity should continue to provide price support to existing issues while presenting new investment opportunities in the U.S., and globally as new preferreds—potentially with new formats—come to market to replace called issues.
Turning to the macro environment, the U.S. economic picture has brightened modestly in recent weeks, a positive for credit and preferreds. We expect slow but sustained growth. However, Europe remains a market risk. While recent fiscal, political and central bank initiatives to address the sovereign credit crisis in Europe are somewhat encouraging, the political landscape remains very uncertain there, and economic austerity measures will weigh on growth. There is a long road ahead to get to the deeper fiscal union that markets seem to require. Importantly, the European Central Bank has been actively funding European banks via long-term refinancing, which has provided vital breathing room for banks seeking time to retrench and recapitalize. We are cautiously optimistic regarding the ability of Europe to find better footing and calm markets; however, we respect that the issues are difficult and complex and continue to tread more lightly there.
Given global uncertainties, our portfolio remains more heavily weighted towards domestic issuers. Our preference for non-financials also remains in place. For instance, we favor REIT preferreds, which offer high income and generally attractive metrics, including lower leverage and decent cash flow growth. We also continue to like telecom and pipeline issuer preferreds.
In the financials space, our focus is on more traditional banking models, including Tier 1 issues of certain U.S. regional banks. We also have a generally favorable view of insurance company credit fundamentals. While we remain more defensive relative to credit, improvements in the U.S. economy as well as the steps taken in Europe to date have brightened the outlook for risk assets somewhat, and some valuations look compelling. Hence, we have added at the margin to more battered securities, including those of certain European issuers. Our core holdings will remain more conservative for the time being, but we will continue to look for value in beaten-down issues opportunistically and as we see economies and markets mending.
4
COHEN & STEERS PREFERRED SECURITIES AND INCOME FUND, INC.
Sincerely,
 |  | ||||||
| MARTIN COHEN | ROBERT H. STEERS | ||||||
| Co-chairman | Co-chairman | ||||||
 |  | ||||||
| JOSEPH M. HARVEY | WILLIAM F. SCAPELL | ||||||
| Portfolio Manager | Portfolio Manager | ||||||
The views and opinions in the preceding commentary are subject to change. There is no guarantee that any market forecast set forth in the commentary will be realized. This material represents an assessment of the market environment at a specific point in time, should not be relied upon as investment advice and is not intended to predict or depict performance of any investment.
Visit Cohen & Steers online at cohenandsteers.com
For more information about any of our funds, visit cohenandsteers.com, where you will find daily net asset values, fund fact sheets and portfolio highlights. You can also access newsletters, education tools and market updates covering the global real estate, listed infrastructure, utilities, large cap value and preferred securities sectors.
In addition, our Web site contains comprehensive information about our firm, including our most recent press releases, profiles of our senior investment professionals and an overview of our investment approach.
5
COHEN & STEERS PREFERRED SECURITIES AND INCOME FUND, INC.
Performance Review (Unaudited)
Class A—Growth of a $10,000 Investment
Class C—Growth of a $10,000 Investment
Class I—Growth of a $100,000 Investment
6
COHEN & STEERS PREFERRED SECURITIES AND INCOME FUND, INC.
Performance Review (Unaudited)—(Continued)
Average Annual Total Returns—For Periods Ended December 31, 2011
| Class A Shares | Class C Shares | Class I Shares | |||||||||||||
| 1 Year (with sales charge) | –1.33 | %b | 1.69 | %c | — | ||||||||||
| 1 Year (without sales charge) | 3.32 | % | 2.69 | % | 3.74 | % | |||||||||
| Since Inceptiond (with sales charge) | 4.61 | %b | 6.79 | % | — | ||||||||||
| Since Inceptiond (without sales charge) | 7.55 | % | 6.79 | % | 7.90 | % | |||||||||
The performance data quoted represent past performance. Past performance is no guarantee of future results. The investment return and principal value of an investment will fluctuate and shares, if redeemed, may be worth more or less than their original cost. Current performance may be lower or higher than the performance data quoted. Performance information current to the most recent month-end can be obtained by visiting our Web site at cohenandsteers.com. The performance graph and table do not reflect the deduction of taxes that a shareholder would pay on Fund distributions or the redemption of Fund shares.
The annualized gross and net expense ratios, respectively, for each class of shares as disclosed in the May 1, 2011 prospectuses were as follows: Class A—1.67% and 1.10%; Class C—2.32% and 1.75%; and Class I—1.32% and 0.75%. Gross expenses were estimated for the current fiscal year. Through June 30, 2014, the advisor has contractually agreed to waive its fee and/or reimburse the Fund for expenses incurred (excluding distribution and shareholder servicing fees applicable to Class A and Class C shares and extraordinary expenses) to the extent necessary to maintain the Fund's annual operating expenses at 1.10% for Class A shares, 1.75% for Class C shares and 0.75% for Class I shares. This contractual agreement can be amended at any time by agreement of the Fund and the advisor.
a The comparative indexes are not adjusted to reflect expenses or other fees that the SEC requires to be reflected in the Fund's performance. The Fund's performance assumes the reinvestment of all dividends and distributions. For more information, including charges and expenses, please read the prospectus carefully before you invest.
b Reflects a 4.50% front-end sales charge.
c Reflects a contingent deferred sales charge of 1%.
d Inception date May 3, 2010.
7
COHEN & STEERS PREFERRED SECURITIES AND INCOME FUND, INC.
Expense Example
(Unaudited)
As a shareholder of the Fund, you incur two types of costs: (1) transaction costs, including sales charges (loads) on purchase payments; and (2) ongoing costs including management fees; distribution and/or service (12b-1) fees; and other Fund expenses. This example is intended to help you understand your ongoing costs (in dollars) of investing in the Fund and to compare these costs with the ongoing costs of investing in other mutual funds.
The example is based on an investment of $1,000 invested at the beginning of the period and held for the entire period July 1, 2011—December 31, 2011.
Actual Expenses
The first line of the following table provides information about actual account values and expenses. You may use the information in this line, together with the amount you invested, to estimate the expenses that you paid over the period. Simply divide your account value by $1,000 (for example, an $8,600 account value divided by $1,000 = 8.6), then multiply the result by the number in the first line under the heading entitled "Expenses Paid During Period" to estimate the expenses you paid on your account during this period.
Hypothetical Example for Comparison Purposes
The second line of the following table provides information about hypothetical account values and hypothetical expenses based on the Fund's actual expense ratio and an assumed rate of return of 5% per year before expenses, which is not the Fund's actual return. The hypothetical account values and expenses may not be used to estimate the actual ending account balance or expenses you paid for the period. You may use this information to compare the ongoing cost of investing in the Fund and other funds. To do so, compare this 5% hypothetical example with the 5% hypothetical examples that appear in the shareholder reports of other funds.
Please note that the expenses shown in the table are meant to highlight your ongoing costs only and do not reflect any transactional costs, such as sales charges (loads). Therefore, the second line of the table is useful in comparing ongoing costs only, and will not help you determine the relative total costs of owning different funds. In addition, if these transactional costs were included, your costs would have been higher.
8
COHEN & STEERS PREFERRED SECURITIES AND INCOME FUND, INC.
Expense Example (Unaudited)—(Continued)
| Beginning Account Value July 1, 2011 | Ending Account Value December 31, 2011 | Expenses Paid During Perioda July 1, 2011– December 31, 2011 | |||||||||||||
| Class A | |||||||||||||||
| Actual (–2.26% return) | $ | 1,000.00 | $ | 977.40 | $ | 5.48 | |||||||||
| Hypothetical (5% annual return before expenses) | $ | 1,000.00 | $ | 1,019.66 | $ | 5.60 | |||||||||
| Class C | |||||||||||||||
| Actual (–2.58% return) | $ | 1,000.00 | $ | 974.20 | $ | 8.71 | |||||||||
| Hypothetical (5% annual return before expenses) | $ | 1,000.00 | $ | 1,016.38 | $ | 8.89 | |||||||||
| Class I | |||||||||||||||
| Actual (–2.03% return) | $ | 1,000.00 | $ | 979.70 | $ | 3.74 | |||||||||
| Hypothetical (5% annual return before expenses) | $ | 1,000.00 | $ | 1,021.42 | $ | 3.82 | |||||||||
a Expenses are equal to the Fund's Class A, Class C and Class I annualized expense ratio of 1.10%, 1.75% and 0.75%, respectively, multiplied by the average account value over the period, multiplied by 184/365 (to reflect the one-half year period). If the Fund had borne all of its expenses that were assumed by the advisor, the annualized expense ratios would have been 1.25%, 1.90% and 0.90%, respectively.
9
COHEN & STEERS PREFERRED SECURITIES AND INCOME FUND, INC.
DECEMBER 31, 2011
Top Ten Long-Term Holdingsa
(Unaudited)
| Security | Value | % of Net Assets | |||||||||
| JP Morgan Chase & Co., 7.90%, due 4/29/49, Series I (FRN) | $ | 24,410,244 | 3.5 | % | |||||||
| Centaur Funding Corp., 9.08%, due 4/21/20, 144A | 16,995,742 | 2.4 | |||||||||
| Farm Credit Bank of Texas, 10.00%, due 12/15/20, ($1000 Par Value) Series I | 16,622,875 | 2.4 | |||||||||
| Wells Fargo & Co., 7.50%, Series L (Convertible) | 15,483,152 | 2.2 | |||||||||
| Capital One Capital III, 7.686%, due 8/15/36 | 14,718,375 | 2.1 | |||||||||
| Citigroup Capital VIII, 6.95%, due 9/15/31, (TruPS) | 14,608,413 | 2.1 | |||||||||
| Wells Fargo & Co., 7.98%, due 3/29/49, Series K (FRN) | 12,753,562 | 1.8 | |||||||||
| MetLife Capital Trust IV, 7.875%, due 12/15/37, 144A | 12,056,512 | 1.7 | |||||||||
| PNC Financial Services Group, 6.75%, due 7/29/49, (FRN) | 11,286,985 | 1.6 | |||||||||
| Qwest Corp., 7.375%, due 6/1/51 | 10,954,146 | 1.6 | |||||||||
a Top ten holdings are determined on the basis of the value of individual securities held. All of the securities listed above are preferred stock. The Fund may also hold positions in other types of securities issued by the companies listed above. See the Schedule of Investments for additional details on such other positions.
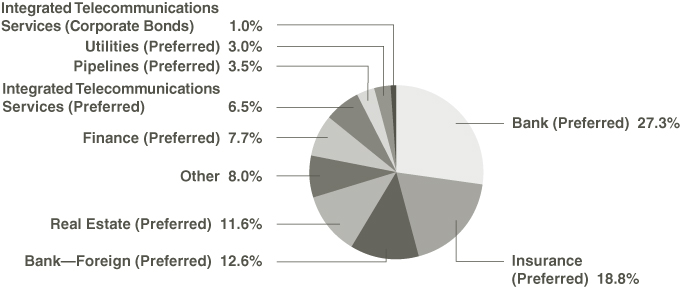
Sector Breakdown
(Based on Net Assets)
(Unaudited)
10
COHEN & STEERS PREFERRED SECURITIES AND INCOME FUND, INC.
SCHEDULE OF INVESTMENTS
December 31, 2011
| Number of Shares | Value | ||||||||||||||
| PREFERRED SECURITIES—$25 PAR VALUE | 41.0% | ||||||||||||||
| BANK | 10.1% | ||||||||||||||
| Ally Financial, 7.25%, due 2/7/33 | 70,720 | $ | 1,440,566 | ||||||||||||
| Ally Financial, 7.30%, due 3/9/31, (PINES) | 46,284 | 957,616 | |||||||||||||
| Ally Financial, 7.35%, due 8/8/32 | 60,422 | 1,241,672 | |||||||||||||
| BAC Capital Trust II, 7.00%, due 2/1/32, Series V | 113,271 | 2,366,231 | |||||||||||||
| Citigroup Capital VII, 7.125%, due 7/31/31, (TruPS) | 97,972 | 2,370,922 | |||||||||||||
| Citigroup Capital VIII, 6.95%, due 9/15/31, (TruPS) | 625,896 | 14,608,413 | |||||||||||||
| Citigroup Capital XIV, 6.875%, due 6/30/66, (TruPS) | 123,327 | 2,882,152 | |||||||||||||
| Citigroup Capital XV, 6.50%, due 9/15/66, (TruPS) | 62,600 | 1,364,054 | |||||||||||||
| Citigroup Capital XVI, 6.45%, due 12/31/66, Series W (TruPS) | 148,000 | 3,179,040 | |||||||||||||
| Citigroup Capital XVII, 6.35%, due 3/15/67, Series E | 47,200 | 1,019,048 | |||||||||||||
| CoBank ACB, 7.00%, 144A ($50 Par Value)a,b | 62,000 | 2,832,625 | |||||||||||||
| Fifth Third Capital Trust V, 7.25%, due 8/15/67 | 52,937 | 1,339,306 | |||||||||||||
| Fifth Third Capital Trust VI, 7.25%, due 11/15/67, (FRN) | 237,318 | 6,008,892 | |||||||||||||
| First Niagara Financial Group, 8.625%, Series B | 200,300 | 5,137,695 | |||||||||||||
| Fleet Capital Trust VIII, 7.20%, due 3/15/32 | 94,952 | 1,969,304 | |||||||||||||
| KeyCorp, 7.75%, due 12/31/49, Series A ($100 Par Value)(Convertible) | 14,277 | 1,508,222 | |||||||||||||
| KeyCorp Capital X, 8.00%, due 3/15/68, (TruPS) | 137,232 | 3,504,905 | |||||||||||||
| Regions Financing Trust III, 8.875%, due 6/15/78 | 177,366 | 4,478,492 | |||||||||||||
| SunTrust Capital IX, 7.875%, due 3/15/68 | 15,007 | 379,677 | |||||||||||||
| Wachovia Capital Trust IV, 6.375%, due 3/1/67 | 49,350 | 1,240,166 | |||||||||||||
| Wachovia Corp., 7.25%, Series A | 105,101 | 2,713,708 | |||||||||||||
| Zions Bancorp, 9.50%, due 12/29/49, Series C | 333,412 | 8,418,653 | |||||||||||||
| 70,961,359 | |||||||||||||||
| BANK—FOREIGN | 4.5% | ||||||||||||||
| Barclays Bank PLC, 7.10%, Series III | 83,269 | 1,646,228 | |||||||||||||
| Barclays Bank PLC, 7.75%, Series IV | 211,508 | 4,458,589 | |||||||||||||
| Deutsche Bank Capital Funding Trust VIII, 6.375% | 132,000 | 2,418,240 | |||||||||||||
| Deutsche Bank Capital Funding Trust X, 7.35% | 141,585 | 2,861,433 | |||||||||||||
| Deutsche Bank Contingent Capital Trust III, 7.60% | 224,003 | 4,845,185 | |||||||||||||
| HSBC Holdings PLC, 8.00%, Series II | 326,817 | 8,516,851 | |||||||||||||
| National Westminster Bank PLC, 7.76%, Series C | 329,583 | 5,527,107 | |||||||||||||
| Santander Finance Preferred, 10.50%, Series X | 43,541 | 1,143,822 | |||||||||||||
| 31,417,455 | |||||||||||||||
See accompanying notes to financial statements.
11
COHEN & STEERS PREFERRED SECURITIES AND INCOME FUND, INC.
SCHEDULE OF INVESTMENTS—(Continued)
December 31, 2011
| Number of Shares | Value | ||||||||||||||
| ELECTRIC—INTEGRATED | 0.8% | ||||||||||||||
| DTE Energy Co., 6.50%, due 12/1/61 | 220,000 | $ | 5,909,200 | ||||||||||||
| FINANCE | 3.0% | ||||||||||||||
| CREDIT CARD | 0.5% | ||||||||||||||
| MBNA Capital, 8.10%, due 2/15/33, Series E (TOPrS) | 59,502 | 1,392,942 | |||||||||||||
| MBNA Capital, 8.125%, due 10/1/32, Series D (TruPS) | 97,695 | 2,305,602 | |||||||||||||
| 3,698,544 | |||||||||||||||
| INVESTMENT BANKER/BROKER | 0.9% | ||||||||||||||
| Merrill Lynch Capital Trust II, 6.45%, due 6/15/62, (ICONs)(FRN) | 39,825 | 743,134 | |||||||||||||
| Morgan Stanley Capital Trust III, 6.25%, due 3/1/33 | 61,566 | 1,271,338 | |||||||||||||
| Morgan Stanley Capital Trust VII, 6.60%, due 10/15/66 | 199,968 | 4,351,304 | |||||||||||||
| 6,365,776 | |||||||||||||||
| MORTGAGE LOAN/BROKER | 1.6% | ||||||||||||||
| Countrywide Capital IV, 6.75%, due 4/1/33 | 187,950 | 3,732,687 | |||||||||||||
| Countrywide Capital V, 7.00%, due 11/1/36 | 367,941 | 7,461,843 | |||||||||||||
| 11,194,530 | |||||||||||||||
| TOTAL FINANCE | 21,258,850 | ||||||||||||||
| INSURANCE | 5.7% | ||||||||||||||
| LIFE/HEALTH INSURANCE—FOREIGN | 0.8% | ||||||||||||||
| Aegon NV, 6.875% | 107,514 | 2,249,193 | |||||||||||||
| Aegon NV, 7.25% | 94,549 | 2,090,478 | |||||||||||||
| Aviva PLC, 8.25%, due 12/1/41 | 50,000 | 1,256,000 | |||||||||||||
| 5,595,671 | |||||||||||||||
| MULTI-LINE | 1.1% | ||||||||||||||
| American Financial Group, 7.00%, due 9/30/50 | 63,731 | 1,670,389 | |||||||||||||
| American International Group, 7.70%, due 12/18/62 | 264,253 | 6,180,878 | |||||||||||||
| 7,851,267 | |||||||||||||||
See accompanying notes to financial statements.
12
COHEN & STEERS PREFERRED SECURITIES AND INCOME FUND, INC.
SCHEDULE OF INVESTMENTS—(Continued)
December 31, 2011
| Number of Shares | Value | ||||||||||||||
| MULTI-LINE—FOREIGN | 2.3% | ||||||||||||||
| Allianz SE, 8.375% | 174,175 | $ | 4,457,800 | ||||||||||||
| ING Groep N.V., 6.125% | 80,000 | 1,304,800 | |||||||||||||
| ING Groep N.V., 6.375% | 35,158 | 588,545 | |||||||||||||
| ING Groep N.V., 7.05% | 110,000 | 1,992,100 | |||||||||||||
| ING Groep N.V., 7.375% | 294,685 | 5,431,045 | |||||||||||||
| ING Groep N.V., 8.50% | 98,018 | 2,134,832 | |||||||||||||
| 15,909,122 | |||||||||||||||
| REINSURANCE—FOREIGN | 1.5% | ||||||||||||||
| Arch Capital Group Ltd., 8.00%, Series A | 23,111 | 588,637 | |||||||||||||
| Arch Capital Group Ltd., 7.875%, Series B | 79,983 | 2,032,368 | |||||||||||||
| Axis Capital Holdings Ltd., 7.25%, Series A | 40,000 | 1,004,800 | |||||||||||||
| Endurance Specialty Holdings Ltd., 7.50%, Series B | 154,298 | 3,933,056 | |||||||||||||
| Montpelier Re Holdings Ltd., 8.875% | 100,175 | 2,729,769 | |||||||||||||
| 10,288,630 | |||||||||||||||
| TOTAL INSURANCE | 39,644,690 | ||||||||||||||
| INTEGRATED TELECOMMUNICATIONS SERVICES | 4.1% | ||||||||||||||
| Qwest Corp., 7.375%, due 6/1/51 | 412,741 | 10,954,146 | |||||||||||||
| Qwest Corp., 7.50%, due 9/15/51 | 294,205 | 7,767,012 | |||||||||||||
| Telephone & Data Systems, 6.875%, due 11/15/59 | 136,432 | 3,634,549 | |||||||||||||
| Telephone & Data Systems, 7.00%, due 3/15/60 | 227,146 | 6,128,399 | |||||||||||||
| 28,484,106 | |||||||||||||||
| MEDIA—DIVERSIFIED SERVICES | 0.4% | ||||||||||||||
| CBS Corp., 6.75%, due 3/27/56 | 67,067 | 1,704,172 | |||||||||||||
| Comcast Corp., 6.625%, due 5/15/56 | 28,050 | 731,825 | |||||||||||||
| 2,435,997 | |||||||||||||||
See accompanying notes to financial statements.
13
COHEN & STEERS PREFERRED SECURITIES AND INCOME FUND, INC.
SCHEDULE OF INVESTMENTS—(Continued)
December 31, 2011
| Number of Shares | Value | ||||||||||||||
| REAL ESTATE | 11.6% | ||||||||||||||
| DIVERSIFIED | 2.5% | ||||||||||||||
| Cousins Properties, 7.75%, Series A | 108,638 | $ | 2,618,176 | ||||||||||||
| DuPont Fabros Technology, 7.875%, Series A | 227,329 | 5,708,231 | |||||||||||||
| Lexington Corporate Properties Trust, 8.05%, Series B | 121,673 | 3,029,658 | |||||||||||||
| Lexington Realty Trust, 7.55%, Series D | 82,244 | 1,966,454 | |||||||||||||
| Sovereign Real Estate Investment Trust, 12.00%, 144A ($1,000 Par Value)a | 1,500 | 1,672,555 | |||||||||||||
| Vornado Realty Trust, 6.625%, Series G | 60,000 | 1,519,200 | |||||||||||||
| Vornado Realty Trust, 6.875%, Series J | 50,053 | 1,345,925 | |||||||||||||
| 17,860,199 | |||||||||||||||
| HEALTH CARE | 0.2% | ||||||||||||||
| Cogdell Spencer, 8.50%, Series A | 65,000 | 1,644,500 | |||||||||||||
| HOTEL | 1.2% | ||||||||||||||
| Hersha Hospitality Trust, 8.00%, Series B | 115,335 | 2,548,903 | |||||||||||||
| Pebblebrook Hotel Trust, 7.875%, Series A | 92,851 | 2,229,353 | |||||||||||||
| Sunstone Hotel Investors, 8.00%, Series A | 33,000 | 776,490 | |||||||||||||
| Sunstone Hotel Investors, 8.00%, Series D | 119,300 | 2,702,145 | |||||||||||||
| 8,256,891 | |||||||||||||||
| INDUSTRIAL | 0.5% | ||||||||||||||
| First Potomac Realty Trust, 7.75%, Series A | 132,001 | 3,386,486 | |||||||||||||
| OFFICE | 2.0% | ||||||||||||||
| BioMed Realty Trust, 7.375%, Series A | 60,000 | 1,525,800 | |||||||||||||
| CommonWealth REIT, 6.50%, Series D (Convertible) | 226,959 | 4,604,998 | |||||||||||||
| Cousins Properties, 7.50%, Series B | 83,350 | 2,015,403 | |||||||||||||
| Hudson Pacific Properties, 8.375%, Series B | 105,410 | 2,734,336 | |||||||||||||
| SL Green Realty Corp., 7.625%, Series C | 129,430 | 3,224,101 | |||||||||||||
| 14,104,638 | |||||||||||||||
| OFFICE/INDUSTRIAL | 0.7% | ||||||||||||||
| PS Business Parks, 6.875%, Series I | 30,000 | 754,200 | |||||||||||||
| PS Business Parks, 7.00%, Series H | 64,948 | 1,637,988 | |||||||||||||
| PS Business Parks, 7.375%, Series O | 112,609 | 2,835,495 | |||||||||||||
| 5,227,683 | |||||||||||||||
See accompanying notes to financial statements.
14
COHEN & STEERS PREFERRED SECURITIES AND INCOME FUND, INC.
SCHEDULE OF INVESTMENTS—(Continued)
December 31, 2011
| Number of Shares | Value | ||||||||||||||
| RESIDENTIAL | 1.7% | ||||||||||||||
| APARTMENT | 0.9% | ||||||||||||||
| Alexandria Real Estate Equities, 7.00%, Series D | 25,000 | $ | 599,750 | ||||||||||||
| Apartment Investment & Management Co., 7.75%, Series U | 116,966 | 2,931,168 | |||||||||||||
| Apartment Investment & Management Co., 8.00%, Series V | 35,150 | 885,429 | |||||||||||||
| Apartment Investment & Management Co., 7.875%, Series Y | 88,000 | 2,215,840 | |||||||||||||
| 6,632,187 | |||||||||||||||
| MANUFACTURED HOME | 0.8% | ||||||||||||||
| Equity Lifestyle Properties, 8.034%, Series A | 212,920 | 5,389,005 | |||||||||||||
| TOTAL RESIDENTIAL | 12,021,192 | ||||||||||||||
| SHOPPING CENTER | 2.6% | ||||||||||||||
| COMMUNITY CENTER | 1.9% | ||||||||||||||
| Cedar Shopping Centers, 8.875%, Series A | 38,000 | 903,260 | |||||||||||||
| DDR Corp., 7.375%, Series H | 128,587 | 3,118,235 | |||||||||||||
| DDR Corp., 7.50%, Series I | 148,100 | 3,628,450 | |||||||||||||
| Kite Realty Group Trust, 8.25%, Series A | 62,490 | 1,440,394 | |||||||||||||
| Ramco-Gershenson Properties Trust, 7.25%, Series D ($50 Par Value)(Convertible) | 15,218 | 645,091 | |||||||||||||
| Regency Centers Corp., 7.45%, Series C | 75,079 | 1,904,754 | |||||||||||||
| Regency Centers Corp., 7.25%, Series D | 67,127 | 1,680,189 | |||||||||||||
| 13,320,373 | |||||||||||||||
| REGIONAL MALL | 0.7% | ||||||||||||||
| CBL & Associates Properties, 7.375%, Series D | 202,810 | 4,802,541 | |||||||||||||
| TOTAL SHOPPING CENTER | 18,122,914 | ||||||||||||||
| SPECIALTY | 0.2% | ||||||||||||||
| Entertainment Properties Trust, 7.375%, Series D | 45,039 | 1,122,822 | |||||||||||||
| TOTAL REAL ESTATE | 81,747,325 | ||||||||||||||
| TRANSPORT—MARINE | 0.8% | ||||||||||||||
| Seaspan Corp., 9.50%, due 1/29/49, Series C | 207,760 | 5,671,848 | |||||||||||||
| TOTAL PREFERRED SECURITIES—$25 PAR VALUE (Identified cost—$294,870,268) | 287,530,830 | ||||||||||||||
See accompanying notes to financial statements.
15
COHEN & STEERS PREFERRED SECURITIES AND INCOME FUND, INC.
SCHEDULE OF INVESTMENTS—(Continued)
December 31, 2011
| Number of Shares | Value | ||||||||||||||
| PREFERRED SECURITIES—CAPITAL SECURITIES | 52.3% | ||||||||||||||
| BANK | 17.2% | ||||||||||||||
| Citigroup Capital III, 7.625%, due 12/1/36 | 3,000,000 | $ | 2,935,182 | ||||||||||||
| Citigroup Capital XXI, 8.30%, due 12/21/57 | 7,500,000 | 7,509,375 | |||||||||||||
| CoBank ACB, 11.00%, Series C, 144A ($50 Par Value)a | 45,000 | 2,368,125 | |||||||||||||
| Farm Credit Bank of Texas, 10.00%, due 12/15/20, ($1000 Par Value) Series I | 14,200 | 16,622,875 | |||||||||||||
| Goldman Sachs Capital I, 6.345%, due 2/15/34 | 3,790,000 | 3,216,649 | |||||||||||||
| Huntington Bancshares, 8.50%, due 12/31/49, Series A (Convertible) | 4,500 | 4,882,455 | |||||||||||||
| JP Morgan Chase & Co., 7.90%, due 4/29/49, Series I (FRN) | 22,850,000 | 24,410,244 | |||||||||||||
| JP Morgan Chase Capital XVIII, 6.95%, due 8/17/36, Series R | 3,500,000 | 3,548,125 | |||||||||||||
| JP Morgan Chase Capital XXV, 6.80%, due 10/1/37, Series Y | 9,750,000 | 9,884,063 | |||||||||||||
| JP Morgan Chase Capital XXVII, 7.00%, due 11/1/39, Series AA | 2,424,000 | 2,463,390 | |||||||||||||
| NB Capital Trust II, 7.83%, due 12/15/26 | 1,750,000 | 1,564,063 | |||||||||||||
| NB Capital Trust IV, 8.25%, due 4/15/27 | 1,850,000 | 1,715,875 | |||||||||||||
| PNC Financial Services Group, 6.75%, due 7/29/49, (FRN) | 11,500,000 | 11,286,985 | |||||||||||||
| Wells Fargo & Co., 7.98%, due 3/29/49, Series K (FRN) | 11,850,000 | 12,753,562 | |||||||||||||
| Wells Fargo & Co., 7.50%, Series L (Convertible) | 14,545 | 15,483,152 | |||||||||||||
| 120,644,120 | |||||||||||||||
See accompanying notes to financial statements.
16
COHEN & STEERS PREFERRED SECURITIES AND INCOME FUND, INC.
SCHEDULE OF INVESTMENTS—(Continued)
December 31, 2011
| Number of Shares | Value | ||||||||||||||
| BANK—FOREIGN | 8.1% | ||||||||||||||
| Abbey National Capital Trust I, 8.963%, due 12/29/49 | 4,900,000 | $ | 4,459,000 | ||||||||||||
| Barclays Bank PLC, 6.278%, due 12/31/49 | 2,600,000 | 1,794,814 | |||||||||||||
| BNP Paribas, 7.195%, due 12/31/49, 144Aa | 5,850,000 | 4,138,875 | |||||||||||||
| Claudius Ltd., 7.875%, due 12/12/49 | 2,000,000 | 1,974,400 | |||||||||||||
| HSBC Capital Funding LP, 10.176%, due 12/29/49, 144Aa | 4,274,000 | 5,299,760 | |||||||||||||
| LBG Capital No.1 PLC, 8.00%, due 12/29/49, 144Aa | 3,550,000 | 2,591,500 | |||||||||||||
| Rabobank Nederland, 8.375%, due 12/31/49 | 1,250,000 | 1,244,744 | |||||||||||||
| Rabobank Nederland, 8.40%, due 12/31/49 | 3,000,000 | 2,981,415 | |||||||||||||
| Rabobank Nederland, 11.00%, due 6/29/49, 144Aa | 9,180,000 | 10,787,574 | |||||||||||||
| Resona Preferred Global Securities, 7.191%, due 12/29/49, 144A (FRN)a | 7,220,000 | 7,144,898 | |||||||||||||
| Santander UK PLC, 7.95%, due 10/26/29 | 1,500,000 | 1,269,235 | |||||||||||||
| SMFG Preferred Capital, 9.50%, due 7/29/49, 144A (FRN)a | 8,100,000 | 9,335,250 | |||||||||||||
| Standard Chartered PLC, 7.014%, due 7/29/49, 144Aa | 4,450,000 | 4,069,596 | |||||||||||||
| 57,091,061 | |||||||||||||||
| FINANCE | 4.7% | ||||||||||||||
| CREDIT CARD | 3.8% | ||||||||||||||
| American Express Co., 6.80%, due 9/1/66 | 5,805,000 | 5,797,744 | |||||||||||||
| Capital One Capital III, 7.686%, due 8/15/36 | 14,700,000 | 14,718,375 | |||||||||||||
| Capital One Capital VI, 8.875%, due 5/15/40 | 5,500,000 | 5,735,900 | |||||||||||||
| 26,252,019 | |||||||||||||||
| DIVERSIFIED FINANCIAL SERVICES | 0.4% | ||||||||||||||
| Credit Suisse Group Guernsey I Ltd., 7.875%, due 2/24/41 | 3,000,000 | 2,695,500 | |||||||||||||
| INVESTMENT ADVISORY SERVICES—FOREIGN | 0.4% | ||||||||||||||
| Old Mutual PLC, 8.00%, due 6/3/21, (United Kingdom)(GBP) | 2,000,000 | 2,974,005 | |||||||||||||
| MORTGAGE LOAN/BROKER | 0.1% | ||||||||||||||
| Countrywide Capital III, 8.05%, due 6/15/27, Series B | 1,010,000 | 924,150 | |||||||||||||
| TOTAL FINANCE | 32,845,674 | ||||||||||||||
See accompanying notes to financial statements.
17
COHEN & STEERS PREFERRED SECURITIES AND INCOME FUND, INC.
SCHEDULE OF INVESTMENTS—(Continued)
December 31, 2011
| Number of Shares | Value | ||||||||||||||
| INSURANCE | 13.1% | ||||||||||||||
| LIFE/HEALTH INSURANCE | 1.9% | ||||||||||||||
| American General Institutional Capital B, 8.125%, due 3/15/46, 144Aa | 1,750,000 | $ | 1,592,500 | ||||||||||||
| Great-West Life & Annuity Insurance Co., 7.153%, due 5/16/46, 144Aa | 2,800,000 | 2,744,000 | |||||||||||||
| Lincoln National Corp., 7.00%, due 5/17/66 | 2,750,000 | 2,509,375 | |||||||||||||
| Prudential Financial, 8.875%, due 6/15/38 | 5,500,000 | 6,352,500 | |||||||||||||
| 13,198,375 | |||||||||||||||
| LIFE/HEALTH INSURANCE—FOREIGN | 1.5% | ||||||||||||||
| Dai-Ichi Mutual Life, 7.25%, due 12/29/49, 144Aa | 3,500,000 | 3,529,246 | |||||||||||||
| Prudential PLC, 7.75%, due 6/23/16 | 7,380,000 | 7,162,290 | |||||||||||||
| 10,691,536 | |||||||||||||||
| MULTI-LINE | 4.2% | ||||||||||||||
| American International Group, 8.175%, due 5/15/58, (FRN) | 8,050,000 | 7,245,000 | |||||||||||||
| MetLife Capital Trust IV, 7.875%, due 12/15/37, 144Aa | 11,565,000 | 12,056,512 | |||||||||||||
| MetLife Capital Trust X, 9.25%, due 4/8/38, 144Aa | 9,025,000 | 10,356,188 | |||||||||||||
| 29,657,700 | |||||||||||||||
| MULTI-LINE—FOREIGN | 1.5% | ||||||||||||||
| AXA SA, 8.60%, due 12/15/30 | 2,000,000 | 1,974,308 | |||||||||||||
| AXA SA, 6.463%, due 12/29/49, 144Aa | 2,500,000 | 1,612,500 | |||||||||||||
| AXA SA, 6.379%, due 12/31/49, 144Aa | 3,250,000 | 2,145,000 | |||||||||||||
| Old Mutual Capital Funding PLC, 8.00%, due 5/29/49 | 5,250,000 | 5,032,125 | |||||||||||||
| 10,763,933 | |||||||||||||||
| PROPERTY CASUALTY | 1.3% | ||||||||||||||
| ACE Capital Trust II, 9.70%, due 4/1/30 | 1,800,000 | 2,396,727 | |||||||||||||
| Liberty Mutual Group, 7.80%, due 3/15/37, 144Aa | 7,225,000 | 6,502,500 | |||||||||||||
| 8,899,227 | |||||||||||||||
See accompanying notes to financial statements.
18
COHEN & STEERS PREFERRED SECURITIES AND INCOME FUND, INC.
SCHEDULE OF INVESTMENTS—(Continued)
December 31, 2011
| Number of Shares | Value | ||||||||||||||
| REINSURANCE—FOREIGN | 2.7% | ||||||||||||||
| Catlin Insurance Co., 7.249%, due 12/31/49, 144Aa | 9,150,000 | $ | 7,846,125 | ||||||||||||
| QBE Capital Funding III Ltd., 7.25%, due 5/24/41, 144Aa | 6,775,000 | 5,975,340 | |||||||||||||
| Swiss Re Capital I LP, 6.854%, due 5/29/49, 144Aa | 3,000,000 | 2,564,574 | |||||||||||||
| Swiss Reinsurance Co. Ltd., Series I, 7.635%, due 12/31/49, (Australia)(AUD) | 3,000,000 | 2,432,818 | |||||||||||||
| 18,818,857 | |||||||||||||||
| TOTAL INSURANCE | 92,029,628 | ||||||||||||||
| INTEGRATED TELECOMMUNICATIONS SERVICES | 2.4% | ||||||||||||||
| Centaur Funding Corp., 9.08%, due 4/21/20, 144Aa | 14,999 | 16,995,742 | |||||||||||||
| OIL & GAS EXPLORATION & PRODUCTION | 0.3% | ||||||||||||||
| Origin Energy Finance Ltd., 7.875%, due 6/16/71, (Australia)(EUR)c | 2,000,000 | 2,355,536 | |||||||||||||
| PIPELINES | 3.5% | ||||||||||||||
| Enbridge Energy Partners LP, 8.05%, due 10/1/37 | 8,000,000 | 8,462,520 | |||||||||||||
| Enterprise Products Operating LLC, 7.034%, due 1/15/68, Series B | 6,850,000 | 7,132,713 | |||||||||||||
| Enterprise Products Operating LP, 8.375%, due 8/1/66 | 8,126,000 | 8,703,076 | |||||||||||||
| 24,298,309 | |||||||||||||||
| UTILITIES | 3.0% | ||||||||||||||
| ELECTRIC UTILITIES | 1.0% | ||||||||||||||
| FPL Group Capital, 7.30%, due 9/1/67, Series D | 7,200,000 | 7,496,633 | |||||||||||||
| GAS UTILITIES | 0.5% | ||||||||||||||
| Southern Union Co., 3.447%, due 11/1/66, (FRN) | 3,723,000 | 3,490,312 | |||||||||||||
| MULTI UTILITIES | 1.5% | ||||||||||||||
| Dominion Resources, 7.50%, due 6/30/66, Series A | 4,395,000 | 4,619,127 | |||||||||||||
| PPL Capital Funding, 6.70%, due 3/30/67, Series A | 5,838,000 | 5,701,152 | |||||||||||||
| 10,320,279 | |||||||||||||||
| TOTAL UTILITIES | 21,307,224 | ||||||||||||||
| TOTAL PREFERRED SECURITIES—CAPITAL SECURITIES (Identified cost—$377,352,386) | 367,567,294 | ||||||||||||||
See accompanying notes to financial statements.
19
COHEN & STEERS PREFERRED SECURITIES AND INCOME FUND, INC.
SCHEDULE OF INVESTMENTS—(Continued)
December 31, 2011
| Principal Amount | Value | ||||||||||||||
| CORPORATE BONDS | 2.1% | ||||||||||||||
| BANK | 0.3% | ||||||||||||||
| Regions Financial Corp., 7.375%, due 12/10/37 | $ | 2,800,000 | $ | 2,380,000 | |||||||||||
| INSURANCE—PROPERTY CASUALTY | 0.8% | ||||||||||||||
| Liberty Mutual Insurance, 7.697%, due 10/15/97, 144Aa | 5,500,000 | 5,214,171 | |||||||||||||
| INTEGRATED TELECOMMUNICATIONS SERVICES | 1.0% | ||||||||||||||
| Citizens Communications Co., 9.00%, due 8/15/31 | 7,350,000 | 6,743,625 | |||||||||||||
| TOTAL CORPORATE BONDS (Identified cost—$15,259,983) | 14,337,796 | ||||||||||||||
| Number of Shares | |||||||||||||||
| SHORT-TERM INVESTMENTS | 3.9% | ||||||||||||||
| MONEY MARKET FUNDS | |||||||||||||||
| BlackRock Liquidity Funds: FedFund, 0.01%d | 13,800,264 | 13,800,264 | |||||||||||||
| Federated Government Obligations Fund, 0.01%d | 13,800,236 | 13,800,236 | |||||||||||||
| TOTAL SHORT-TERM INVESTMENTS (Identified cost—$27,600,500) | 27,600,500 | ||||||||||||||
| TOTAL INVESTMENTS (Identified cost—$715,083,137) | 99.3 | % | 697,036,420 | ||||||||||||
| OTHER ASSETS IN EXCESS OF LIABILITIES | 0.7 | 5,140,392 | |||||||||||||
| NET ASSETS | 100.0 | % | $ | 702,176,812 | |||||||||||
See accompanying notes to financial statements.
20
COHEN & STEERS PREFERRED SECURITIES AND INCOME FUND, INC.
SCHEDULE OF INVESTMENTS—(Continued)
December 31, 2011
Open forward foreign currency exchange contracts outstanding at December 31, 2011 are as follows:
| Counterparty | Contracts to Deliver | In Exchange For | Settlement Date | Unrealized Appreciation/ (Depreciation) | |||||||||||||||
| Brown Brothers, Harriman | AUD | 2,355,519 | USD | 2,410,308 | 1/4/12 | $ | 1,083 | ||||||||||||
| Brown Brothers, Harriman | USD | 2,415,349 | AUD | 2,355,519 | 1/4/12 | (6,124 | ) | ||||||||||||
| Brown Brothers, Harriman | AUD | 2,375,490 | USD | 2,428,083 | 2/2/12 | 6,410 | |||||||||||||
| Brown Brothers, Harriman | EUR | 1,780,000 | USD | 2,397,179 | 1/4/12 | 93,413 | |||||||||||||
| Brown Brothers, Harriman | USD | 2,310,440 | EUR | 1,780,000 | 1/4/12 | (6,674 | ) | ||||||||||||
| Brown Brothers, Harriman | EUR | 1,822,500 | USD | 2,365,951 | 2/2/12 | 6,763 | |||||||||||||
| Brown Brothers, Harriman | GBP | 1,806,600 | USD | 2,840,879 | 1/4/12 | 35,229 | |||||||||||||
| Brown Brothers, Harriman | USD | 2,807,095 | GBP | 1,806,600 | 1/4/12 | (1,445 | ) | ||||||||||||
| Brown Brothers, Harriman | GBP | 1,910,682 | USD | 2,967,958 | 2/2/12 | 1,408 | |||||||||||||
| $ | 130,063 | ||||||||||||||||||
Glossary of Portfolio Abbreviations
AUD Australian Dollar
EUR Euro Currency
FRN Floating Rate Note
GBP Great British Pound
ICONs Income Capital Obligation Notes
PINES Public Income Notes
REIT Real Estate Investment Trust
TOPrS Trust Originated Preferred Securities
TruPS Trust Preferred Securities
USD United States Dollar
Note: Percentages indicated are based on the net assets of the Fund.
a Resale is restricted to qualified institutional investors. Aggregate holdings equal 18.4% of net assets of the Fund, of which 0.4% are illiquid.
b Illiquid security. Aggregate holdings equal 0.4% of net assets of the Fund.
c Fair valued security. This security has been valued at its fair value as determined in good faith under procedures established by and under the general supervision of the Fund's Board of Directors. Aggregate fair value securities represent 0.3% of the net assets of the Fund.
d Rate quoted represents the seven day yield of the fund.
See accompanying notes to financial statements.
21
COHEN & STEERS PREFERRED SECURITIES AND INCOME FUND, INC.
STATEMENT OF ASSETS AND LIABILITIES
December 31, 2011
| ASSETS: | |||||||
| Investments in securities, at value (Identified cost—$715,083,137) | $ | 697,036,420 | |||||
| Cash | 253,844 | ||||||
| Receivable for: | |||||||
| Dividends and interest | 7,741,265 | ||||||
| Fund shares sold | 7,198,982 | ||||||
| Investment securities sold | 2,030,727 | ||||||
| Unrealized appreciation on forward foreign currency exchange contracts | 144,306 | ||||||
| Other assets | 8,953 | ||||||
| Total Assets | 714,414,497 | ||||||
| LIABILITIES: | |||||||
| Unrealized depreciation on forward foreign currency exchange contracts | 14,243 | ||||||
| Payable for: | |||||||
| Investment securities purchased | 11,325,343 | ||||||
| Fund shares redeemed | 358,160 | ||||||
| Investment management fees | 322,332 | ||||||
| Administration fees | 28,301 | ||||||
| Distribution fees | 12,003 | ||||||
| Shareholder servicing fees | 4,181 | ||||||
| Other liabilities | 173,122 | ||||||
| Total Liabilities | 12,237,685 | ||||||
| NET ASSETS | $ | 702,176,812 | |||||
| NET ASSETS consist of: | |||||||
| Paid-in capital | $ | 724,026,387 | |||||
| Accumulated undistributed net investment income | 640,387 | ||||||
| Accumulated net realized loss | (4,573,567 | ) | |||||
| Net unrealized depreciation | (17,916,395 | ) | |||||
| $ | 702,176,812 | ||||||
See accompanying notes to financial statements.
22
COHEN & STEERS PREFERRED SECURITIES AND INCOME FUND, INC.
STATEMENT OF ASSETS AND LIABILITIES—(Continued)
December 31, 2011
| CLASS A SHARES: | |||||||
| NET ASSETS | $ | 136,406,545 | |||||
| Shares issued and outstanding ($0.001 par value common stock outstanding) | 11,664,505 | ||||||
| Net asset value and redemption price per share | $ | 11.69 | |||||
| Maximum offering price per share ($11.69 ÷ 0.955)a | $ | 12.24 | |||||
| CLASS C SHARES: | |||||||
| NET ASSETS | $ | 152,113,344 | |||||
| Shares issued and outstanding ($0.001 par value common stock outstanding) | 13,053,040 | ||||||
| Net asset value and offering price per shareb | $ | 11.65 | |||||
| CLASS I SHARES: | |||||||
| NET ASSETS | $ | 413,656,923 | |||||
| Shares issued and outstanding ($0.001 par value common stock outstanding) | 35,345,330 | ||||||
| Net asset value, offering, redemption price per share | $ | 11.70 | |||||
a On investments of $100,000 or more, the offering price is reduced.
b Redemption price per share is equal to the net asset value per share less any applicable deferred sales charge of 1% on shares held for less than one year.
See accompanying notes to financial statements.
23
COHEN & STEERS PREFERRED SECURITIES AND INCOME FUND, INC.
STATEMENT OF OPERATIONS
For the Year Ended December 31, 2011
| Investment Income: | |||||||
| Dividend income (net of $16,818 of foreign withholding tax) | $ | 16,794,743 | |||||
| Interest income (net of $855 of foreign withholding tax) | 15,154,927 | ||||||
| Total Income | 31,949,670 | ||||||
| Expenses: | |||||||
| Investment management fees | 3,041,712 | ||||||
| Distribution fees—Class A | 217,435 | ||||||
| Distribution fees—Class C | 739,997 | ||||||
| Shareholder servicing fees—Class A | 86,974 | ||||||
| Shareholder servicing fees—Class C | 246,666 | ||||||
| Administration fees | 330,916 | ||||||
| Transfer agent fees and expenses | 198,318 | ||||||
| Registration and filing fees | 159,923 | ||||||
| Professional fees | 107,709 | ||||||
| Shareholder reporting expenses | 103,621 | ||||||
| Custodian fees and expenses | 71,531 | ||||||
| Directors' fees and expenses | 41,695 | ||||||
| Line of credit fees | 11,282 | ||||||
| Miscellaneous | 21,963 | ||||||
| Total Expenses | 5,379,742 | ||||||
| Reduction of Expenses (See Note 2) | (1,015,531 | ) | |||||
| Net Expenses | 4,364,211 | ||||||
| Net Investment Income | 27,585,459 | ||||||
| Net Realized and Unrealized Gain (Loss): | |||||||
| Net realized gain (loss) on: | |||||||
| Investments | (4,167,856 | ) | |||||
| Foreign currency transactions | 165,170 | ||||||
| Net realized loss | (4,002,686 | ) | |||||
| Net change in unrealized appreciation (depreciation) on: | |||||||
| Investments | (19,459,257 | ) | |||||
| Foreign currency translations | 130,903 | ||||||
| Net change in unrealized appreciation (depreciation) | (19,328,354 | ) | |||||
| Net realized and unrealized loss | (23,331,040 | ) | |||||
| Net Increase in Net Assets Resulting from Operations | $ | 4,254,419 | |||||
See accompanying notes to financial statements.
24
COHEN & STEERS PREFERRED SECURITIES AND INCOME FUND, INC.
STATEMENT OF CHANGES IN NET ASSETS
| For the Year Ended December 31, 2011 | For the Period May 3, 2010a through December 31, 2010 | ||||||||||
| Change in Net Assets: | |||||||||||
| From Operations: | |||||||||||
| Net investment income | $ | 27,585,459 | $ | 3,016,794 | |||||||
| Net realized loss | (4,002,686 | ) | (121,845 | ) | |||||||
| Net change in unrealized appreciation (depreciation) | (19,328,354 | ) | 1,411,959 | ||||||||
| Net increase in net assets resulting from operations | 4,254,419 | 4,306,908 | |||||||||
| Dividends and Distributions to Shareholders from: | |||||||||||
| Net investment income: | |||||||||||
| Class A | (5,295,510 | ) | (1,012,791 | ) | |||||||
| Class C | (5,461,040 | ) | (734,519 | ) | |||||||
| Class I | (16,507,064 | ) | (1,172,191 | ) | |||||||
| Net realized gain: | |||||||||||
| Class A | — | (85,047 | ) | ||||||||
| Class C | — | (62,623 | ) | ||||||||
| Class I | — | (92,572 | ) | ||||||||
| Tax return of capital: | |||||||||||
| Class A | (757,867 | ) | (57,526 | ) | |||||||
| Class C | (865,727 | ) | (42,359 | ) | |||||||
| Class I | (2,183,495 | ) | (62,617 | ) | |||||||
| Total dividends and distributions to shareholders | (31,070,703 | ) | (3,322,245 | ) | |||||||
| Capital Stock Transactions: | |||||||||||
| Increase in net assets from Fund share transactions | 565,115,659 | 162,792,499 | |||||||||
| Total increase in net assets | 538,299,375 | 163,777,162 | |||||||||
| Net Assets: | |||||||||||
| Beginning of period | 163,877,437 | 100,275 | |||||||||
| End of periodb | $ | 702,176,812 | $ | 163,877,437 | |||||||
a Commencement of operations.
b Includes accumulated undistributed net investment income of $640,387 and $54,648, respectively.
See accompanying notes to financial statements.
25
COHEN & STEERS PREFERRED SECURITIES AND INCOME FUND, INC.
FINANCIAL HIGHLIGHTS
The following table includes selected data for a share outstanding throughout each period and other performance information derived from the financial statements. It should be read in conjunction with the financial statements and notes thereto.
| Class A | |||||||||||
| Per Share Operating Performance: | For the Year Ended December 31, 2011 | For the Period May 3, 2010a through December 31, 2010 | |||||||||
| Net asset value, beginning of period | $ | 12.10 | $ | 11.46 | |||||||
| Income from investment operations: | |||||||||||
| Net investment incomeb | 0.75 | 0.53 | |||||||||
| Net realized and unrealized gain (loss) | (0.35 | ) | 0.52 | ||||||||
| Total from investment operations | 0.40 | 1.05 | |||||||||
| Less dividends and distributions to shareholders from: | |||||||||||
| Net investment income | (0.70 | ) | (0.34 | ) | |||||||
| Net realized gain | — | (0.04 | ) | ||||||||
| Tax return of capital | (0.11 | ) | (0.03 | ) | |||||||
| Total dividends and distributions to shareholders | (0.81 | ) | (0.41 | ) | |||||||
| Redemption fees retained by the Fundc | 0.00 | 0.00 | |||||||||
| Net increase (decrease) in net asset value | (0.41 | ) | 0.64 | ||||||||
| Net asset value, end of period | $ | 11.69 | $ | 12.10 | |||||||
| Total investment returnd | 3.32 | % | 9.22 | %e | |||||||
| Ratios/Supplemental Data: | |||||||||||
| Net assets, end of period (in millions) | $ | 136.4 | $ | 50.4 | |||||||
| Ratio of expenses to average daily net assets (before expense reduction)f | 1.29 | % | 1.67 | %g | |||||||
| Ratio of expenses to average daily net assets (net of expense reduction)f | 1.06 | % | 0.85 | %g | |||||||
| Ratio of net investment income to average daily net assets (before expense reduction)f | 5.95 | % | 5.71 | %g | |||||||
| Ratio of net investment income to average daily net assets (net of expense reduction)f | 6.18 | % | 6.53 | %g | |||||||
| Portfolio turnover rate | 44 | % | 31 | %e | |||||||
a Commencement of operations.
b Calculation based on average shares outstanding.
c Amount is less than $0.005.
d Does not reflect sales charges, which would reduce return.
e Not annualized.
f Non class specific expenses are calculated at the Fund level and class specific expenses are calculated at the class level.
g Annualized.
See accompanying notes to financial statements.
26
COHEN & STEERS PREFERRED SECURITIES AND INCOME FUND, INC.
FINANCIAL HIGHLIGHTS—(Continued)
| Class C | |||||||||||
| Per Share Operating Performance: | For the Year Ended December 31, 2011 | For the Period May 3, 2010a through December 31, 2010 | |||||||||
| Net asset value, beginning of period | $ | 12.06 | $ | 11.46 | |||||||
| Income from investment operations: | |||||||||||
| Net investment incomeb | 0.67 | 0.49 | |||||||||
| Net realized and unrealized gain (loss) | (0.34 | ) | 0.49 | ||||||||
| Total from investment operations | 0.33 | 0.98 | |||||||||
| Less dividends and distributions to shareholders from: | |||||||||||
| Net investment income | (0.63 | ) | (0.31 | ) | |||||||
| Net realized gain | — | (0.04 | ) | ||||||||
| Tax return of capital | (0.11 | ) | (0.03 | ) | |||||||
| Total dividends and distributions to shareholders | (0.74 | ) | (0.38 | ) | |||||||
| Redemption fees retained by the Fundc | 0.00 | 0.00 | |||||||||
| Net increase (decrease) in net asset value | (0.41 | ) | 0.60 | ||||||||
| Net asset value, end of period | $ | 11.65 | $ | 12.06 | |||||||
| Total investment returnd | 2.69 | % | 8.62 | %e | |||||||
| Ratios/Supplemental Data: | |||||||||||
| Net assets, end of period (in millions) | $ | 152.1 | $ | 48.4 | |||||||
| Ratio of expenses to average daily net assets (before expense reduction)f | 1.94 | % | 2.32 | %g | |||||||
| Ratio of expenses to average daily net assets (net of expense reduction)f | 1.71 | % | 1.50 | %g | |||||||
| Ratio of net investment income to average daily net assets (before expense reduction)f | 5.36 | % | 5.22 | %g | |||||||
| Ratio of net investment income to average daily net assets (net of expense reduction)f | 5.59 | % | 6.04 | %g | |||||||
| Portfolio turnover rate | 44 | % | 31 | %e | |||||||
a Commencement of operations.
b Calculation based on average shares outstanding.
c Amount is less than $0.005.
d Does not reflect sales charges, which would reduce return.
e Not annualized.
f Non class specific expenses are calculated at the Fund level and class specific expenses are calculated at the class level.
g Annualized.
See accompanying notes to financial statements.
27
COHEN & STEERS PREFERRED SECURITIES AND INCOME FUND, INC.
FINANCIAL HIGHLIGHTS—(Continued)
| Class I | |||||||||||
| Per Share Operating Performance: | For the Year Ended December 31, 2011 | For the Period May 3, 2010a through December 31, 2010 | |||||||||
| Net asset value, beginning of period | $ | 12.10 | $ | 11.46 | |||||||
| Income from investment operations: | |||||||||||
| Net investment incomeb | 0.80 | 0.58 | |||||||||
| Net realized and unrealized gain (loss) | (0.35 | ) | 0.49 | ||||||||
| Total from investment operations | 0.45 | 1.07 | |||||||||
| Less dividends and distributions to shareholders from: | |||||||||||
| Net investment income | (0.74 | ) | (0.36 | ) | |||||||
| Net realized gain | — | (0.04 | ) | ||||||||
| Tax return of capital | (0.11 | ) | (0.03 | ) | |||||||
| Total dividends and distributions to shareholders | (0.85 | ) | (0.43 | ) | |||||||
| Redemption fees retained by the Fundc | 0.00 | 0.00 | |||||||||
| Net increase (decrease) in net asset value | (0.40 | ) | 0.64 | ||||||||
| Net asset value, end of period | $ | 11.70 | $ | 12.10 | |||||||
| Total investment return | 3.74 | % | 9.39 | %d | |||||||
| Ratios/Supplemental Data: | |||||||||||
| Net assets, end of period (in millions) | $ | 413.7 | $ | 65.1 | |||||||
| Ratio of expenses to average daily net assets (before expense reduction)e | 0.94 | % | 1.32 | %f | |||||||
| Ratio of expenses to average daily net assets (net of expense reduction)e | 0.71 | % | 0.50 | %f | |||||||
| Ratio of net investment income to average daily net assets (before expense reduction)e | 6.47 | % | 6.43 | %f | |||||||
| Ratio of net investment income to average daily net assets (net of expense reduction)e | 6.70 | % | 7.25 | %f | |||||||
| Portfolio turnover rate | 44 | % | 31 | %d | |||||||
a Commencement of operations.
b Calculation based on average shares outstanding.
c Amount is less than $0.005.
d Not annualized.
e Non class specific expenses are calculated at the Fund level and class specific expenses are calculated at the class level.
f Annualized.
See accompanying notes to financial statements.
28
COHEN & STEERS PREFERRED SECURITIES AND INCOME FUND, INC.
NOTES TO FINANCIAL STATEMENTS
Note 1. Significant Accounting Policies
Cohen & Steers Preferred Securities and Income Fund, Inc. (the Fund) was incorporated under the laws of the State of Maryland on February 22, 2010 and is registered under the Investment Company Act of 1940, as amended, as a nondiversified, open-end management investment company. The Fund's investment objective is total return. The Fund had no operations until April 27, 2010 when it sold 100 shares each of Class A and C and 8,550 shares of Class I for $100,275 to Cohen & Steers Capital Management, Inc. (the advisor). Investment operations commenced on May 3, 2010. The authorized shares of the Fund are divided into three classes designated Class A, C and I shares. Each of the Fund's shares has equal dividend, liquidation and voting rights (except for matters relating to distributions and shareholder servicing of such shares).
The following is a summary of significant accounting policies consistently followed by the Fund in the preparation of its financial statements. The policies are in conformity with accounting principles generally accepted in the United States of America (GAAP). The preparation of the financial statements in accordance with GAAP requires management to make estimates and assumptions that affect the reported amounts of assets and liabilities at the date of the financial statements and the reported amounts of income and expenses during the reporting period. Actual results could differ from those estimates.
Portfolio Valuation: Investments in securities that are listed on the New York Stock Exchange are valued, except as indicated below, at the last sale price reflected at the close of the New York Stock Exchange on the business day as of which such value is being determined. If there has been no sale on such day, the securities are valued at the mean of the closing bid and asked prices on such day or, if no asked price is available, at the bid price. Forward contracts are valued daily at the prevailing forward exchange rate.
Securities not listed on the New York Stock Exchange but listed on other domestic or foreign securities exchanges are valued in a similar manner. Securities traded on more than one securities exchange are valued at the last sale price on the business day as of which such value is being determined as reflected on the tape at the close of the exchange representing the principal market for such securities. If after the close of a foreign market, but prior to the close of business on the day the securities are being valued, market conditions change significantly, certain foreign securities may be fair valued pursuant to procedures established by the Board of Directors.
Readily marketable securities traded in the over-the-counter market, including listed securities whose primary market is believed by the advisor to be over-the-counter, are valued at the official closing prices as reported by sources as the Board of Directors deem appropriate to reflect their fair market value. If there has been no sale on such day, the securities are valued at the mean of the closing bid and asked prices on such day, or if no asked price is available, at the bid price. However, certain fixed-income securities may be valued on the basis of prices provided by a pricing service when such prices are believed by the advisor, pursuant to delegation by the Board of Directors, to reflect the fair market value of such securities.
Securities for which market prices are unavailable, or securities for which the advisor determines that the bid and/or asked price does not reflect market value, will be valued at fair value pursuant to procedures approved by the Fund's Board of Directors. Circumstances in which market prices may be
29
COHEN & STEERS PREFERRED SECURITIES AND INCOME FUND, INC.
NOTES TO FINANCIAL STATEMENTS—(Continued)
unavailable include, but are not limited to, when trading in a security is suspended, the exchange on which the security is traded is subject to an unscheduled close or disruption or material events occur after the close of the exchange on which the security is principally traded. In these circumstances, the Fund determines fair value in a manner that fairly reflects the market value of the security on the valuation date based on consideration of any information or factors it deems appropriate. These may include, but are not limited to, recent transactions in comparable securities, information relating to the specific security and developments in the markets.
The Fund's use of fair value pricing may cause the net asset value of Fund shares to differ from the net asset value that would be calculated using market quotations. Fair value pricing involves subjective judgments and it is possible that the fair value determined for a security may be materially different than the value that could be realized upon the sale of that security.
Short-term debt securities with a maturity date of 60 days or less are valued at amortized cost, which approximates value. Investments in open-end mutual funds are valued at their closing net asset value.
Fair value is defined as the price that the Fund would receive to sell an investment or pay to transfer a liability in an orderly transaction with an independent buyer in the principal market, or in the absence of a principal market, the most advantageous market for the investment or liability. The hierarchy of inputs that are used in determining the fair value of the Fund's investments is summarized below.
• Level 1—quoted prices in active markets for identical investments
• Level 2—other significant observable inputs (including quoted prices for similar investments, interest rates, credit risk, etc.)
• Level 3—significant unobservable inputs (including the Fund's own assumptions in determining the fair value of investments)
The inputs or methodology used for valuing securities are not necessarily an indication of the risk associated with investing in those securities.
The following is a summary of the inputs used as of December 31, 2011 in valuing the Fund's investments carried at value:
| Total | Quoted Prices In Active Market for Identical Assets (Level 1) | Significant Other Observable Inputs (Level 2) | Significant Unobservable Inputs (Level 3) | ||||||||||||||||
| Preferred Securities—$25 Par Value—Bank | $ | 70,961,359 | $ | 68,128,734 | $ | — | $ | 2,832,625 | |||||||||||
| Preferred Securities—$25 Par Value—Insurance— Multi-Line—Foreign | 15,909,122 | 11,451,322 | 4,457,800 | — | |||||||||||||||
| Preferred Securities—$25 Par Value—Other Industries | 200,660,349 | 200,660,349 | — | — | |||||||||||||||
30
COHEN & STEERS PREFERRED SECURITIES AND INCOME FUND, INC.
NOTES TO FINANCIAL STATEMENTS—(Continued)
| Total | Quoted Prices In Active Market for Identical Assets (Level 1) | Significant Other Observable Inputs (Level 2) | Significant Unobservable Inputs (Level 3) | ||||||||||||||||
| Preferred Securities— Capital Securities—Bank | $ | 120,644,120 | $ | 22,733,732 | $ | 97,910,388 | $ | — | |||||||||||
| Preferred Securities— Capital Securities— Oil & Gas Exploration & Production | 2,355,536 | — | — | 2,355,536 | |||||||||||||||
| Preferred Securities— Capital Securities— Other Industries | 244,567,638 | — | 244,567,638 | — | |||||||||||||||
| Corporate Bonds | 14,337,796 | — | 14,337,796 | — | |||||||||||||||
| Money Market Funds | 27,600,500 | — | 27,600,500 | — | |||||||||||||||
| Total Investments | $ | 697,036,420 | $ | 302,974,137 | $ | 388,874,122 | $ | 5,188,161 | |||||||||||
| Other Financial Instruments* | $ | 130,063 | — | $ | 130,063 | — | |||||||||||||
* Other financial instruments are forward foreign currency exchange contracts.
Following is a reconciliation of investments in which significant unobservable inputs (Level 3) were used in determining fair value:
| Total Investments in Securities | Preferred Securities— $25 Par Value— Bank | Preferred Securities— Capital Securities— Oil & Gas Exploration & Production | |||||||||||||
| Balance as of December 31, 2010 | $ | — | $ | — | $ | — | |||||||||
| Amortization | 3 | — | 3 | ||||||||||||
| Change in unrealized depreciation | (648,111 | ) | (102,535 | ) | (545,576 | ) | |||||||||
| Purchases | 5,836,269 | 2,935,160 | 2,901,109 | ||||||||||||
| Balance as of December 31, 2011 | $ | 5,188,161 | $ | 2,832,625 | $ | 2,355,536 | |||||||||
Investments classified as Level 3 infrequently trade and have significant unobservable inputs. The Level 3 preferred securities have been fair valued utilizing inputs and assumptions which include book value, recent comparables in similar securities, as well as liquidity and market risk factors.
31
COHEN & STEERS PREFERRED SECURITIES AND INCOME FUND, INC.
NOTES TO FINANCIAL STATEMENTS—(Continued)
Security Transactions, Investment Income and Expense Allocations: Security transactions are recorded on trade date. Realized gains and losses on investments sold are recorded on the basis of identified cost. Interest income is recorded on the accrual basis. Discounts are accreted and premiums are amortized over the life of the respective securities. Dividend income is recorded on the ex-dividend date, except for certain dividends on foreign securities, which are recorded as soon as the Fund is informed after the ex-dividend date. The Fund records distributions received in excess of income from underlying investments as a reduction of cost of investments and/or an increase in realized gain. Such amounts are based on estimates if actual amounts are not available, and actual amounts of income, realized gain and return of capital may differ from the estimated amounts. The Fund adjusts the estimated amounts of the components of distributions (and consequently its net investment income) as an increase to unrealized appreciation/(depreciation) and realized gain/(loss) on investments as necessary once the issuers provide information about the actual composition of the distributions. Income, expenses (other than expenses attributable to a specific class), and realized and unrealized gains or losses on investments are allocated to each class of shares based on its relative net assets.
Foreign Currency Translations: The books and records of the Fund are maintained in U.S. dollars as follows: (1) the foreign currency market value of investment securities, other assets and liabilities and foreign currency contracts are translated at the exchange rates prevailing at the end of the period; and (2) purchases, sales, income and expenses are translated at the exchange rates prevailing on the respective dates of such transactions. The resultant exchange gains and losses are recorded as realized and unrealized gain/loss on foreign exchange transactions. Pursuant to U.S. federal income tax regulations, certain foreign exchange gains/losses included in realized and unrealized gain/loss are included in or are a reduction of ordinary income for federal income tax purposes. The Fund does not isolate that portion of the results of operations arising as a result of changes in the foreign exchange rates from the changes in the market prices of the securities.
Foreign Securities and Forward Foreign Currency Exchange Contracts: The Fund may directly purchase securities of foreign issuers. Investing in securities of foreign issuers involves special risks not typically associated with investing in securities of U.S. issuers. The risks include possible revaluation of currencies, the ability to repatriate funds, less complete financial information about companies and possible future adverse political and economic developments. Moreover, securities of many foreign issuers and their markets may be less liquid and their prices more volatile than those of securities of comparable U.S. issuers.
In connection with its investments in foreign securities, the Fund may be exposed to foreign currency risks associated with portfolio investments and therefore use forward foreign currency exchange contracts (forward contracts) to hedge or manage these exposures. Forward contracts represent obligations to purchase or sell foreign currency on a specified future date at a price fixed at the time the contracts are entered into. The risks include the potential inability of counterparties to meet the terms of their contracts and unanticipated movements in the value of a foreign currency relative to the U.S. dollar. The resultant unrealized exchange gains and losses are recorded as unrealized foreign currency translation gains or losses. The Fund records realized gains or losses on delivery of the currency or at the time the forward contract is extinguished (compensated) by entering into a closing transaction prior to delivery.
32
COHEN & STEERS PREFERRED SECURITIES AND INCOME FUND, INC.
NOTES TO FINANCIAL STATEMENTS—(Continued)
Dividends and Distributions to Shareholders: Dividends from net investment income and capital gain distributions are determined in accordance with U.S. federal income tax regulations, which may differ from GAAP. Dividends from net investment income, if any, are declared and paid monthly. Net realized capital gains, unless offset by any available capital loss carryforward, are typically distributed to shareholders at least annually. Dividends and distributions to shareholders are recorded on the ex-dividend date and are automatically reinvested in full and fractional shares of the Fund based on the net asset value per share at the close of business on the payable date unless the shareholder has elected to have them paid in cash.
Distributions paid by the Fund are subject to recharacterization for tax purposes. Based upon the results of operations for the year ended December 31, 2011, a portion of the dividends have been reclassified to return of capital.
Income Taxes: It is the policy of the Fund to continue to qualify as a regulated investment company, if such qualification is in the best interest of the shareholders, by complying with the requirements of Subchapter M of the Internal Revenue Code applicable to regulated investment companies, and by distributing substantially all of its taxable earnings to its shareholders. Accordingly, no provision for federal income or excise tax is necessary. Dividend and interest income from holdings in non-U.S. securities is recorded net of non-U.S. taxes paid. Management has analyzed the Fund's tax positions taken on federal income tax returns as well as its tax positions in non-U.S. jurisdictions where it trades for all open tax years and has concluded that as of December 31, 2011, no additional provisions for income tax would be required in the Fund's financial statements. The Fund's tax positions for the tax years for which the applicable statutes of limitations have not expired are subject to examination by the Internal Revenue Service, state departments of revenue and by foreign tax authorities.
Note 2. Investment Advisory and Administration Fees and Other Transactions with Affiliates
Investment Advisory Fees: The advisor serves as the Fund's investment advisor pursuant to an investment advisory agreement (the advisory agreement). Under the terms of the advisory agreement, the advisor provides the Fund with day-to-day investment decisions and generally manages the Fund's investments in accordance with the stated policies of the Fund, subject to the supervision of the Board of Directors.
For the services provided to the Fund, the advisor receives a fee, accrued daily and paid monthly, at the annual rate of 0.70% of the average daily net assets of the Fund.
For the period May 1, 2011 through June 30, 2014, the advisor contractually agreed to waive its fee and/or reimburse the Fund for expenses incurred (excluding distribution and shareholder servicing fees applicable to Class A and Class C shares and extraordinary expenses) to the extent necessary to maintain the Fund's operating expenses at 1.10% for Class A shares, 1.75% for Class C shares and 0.75% for Class I shares. This contractual agreement can be amended at any time by agreement of the Fund and the advisor. For the period January 1, 2011 through April 30, 2011, the advisor contractually agreed to waive its fee and/or reimburse the Fund for expenses incurred to the extent necessary to maintain the Fund's operating expenses at 0.85% for Class A shares, 1.50% for Class C shares and 0.50% for Class I shares.
33
COHEN & STEERS PREFERRED SECURITIES AND INCOME FUND, INC.
NOTES TO FINANCIAL STATEMENTS—(Continued)
Administration Fees: The Fund has entered into an administration agreement with the advisor under which the advisor performs certain administrative functions for the Fund and receives a fee, accrued daily and paid monthly, at the annual rate of 0.05% of the Fund's average daily net assets. For the year ended December 31, 2011, the Fund paid the advisor $217,265 in fees under this administration agreement. Additionally, the Fund pays State Street Bank and Trust Company as co-administrator under a fund accounting and administration agreement.
Distribution Fees: Shares of the Fund are distributed by Cohen & Steers Securities, LLC (the distributor), an affiliated entity of the advisor. The Fund has adopted a distribution plan (the plan) pursuant to Rule 12b-1 under the Investment Company Act of 1940. The plan provides that the Fund will pay the distributor a fee, accrued daily and paid monthly, at an annual rate of up to 0.25% of the average daily net assets attributable to the Class A shares and up to 0.75% of the average daily net assets attributable to the Class C shares.
For the year ended December 31, 2011, the Fund has been advised that the distributor received $186,948 in sales commissions from the sale of Class A shares and that the distributor also received $4,019 and $68,927 of contingent deferred sales charges relating to redemptions of Class A and Class C shares, respectively. The distributor has advised the Fund that proceeds from the contingent deferred sales charges on the Class C shares are paid to the distributor and are used by the distributor to defray its expenses related to providing distribution related services to the Fund in connection with the sale of this class, including payments to dealers and other financial intermediaries for selling this class and interest and other financing costs associated with this class.
Shareholder Servicing Fees: For shareholder services, the Fund pays the distributor a fee, accrued daily and paid monthly, at an annual rate of up to 0.10% of the average daily net asset value of the Fund's Class A shares and up to 0.25% of the average daily net asset value of the Fund's Class C shares. The distributor is responsible for paying qualified financial institutions for shareholder services.
Effective January 1, 2012, the Board of Directors of the Fund approved the adoption of a shareholder services plan for the Fund's Class I shares, pursuant to which the Fund pays the distributor a fee at an annual rate of up to 0.10% of the average daily net asset value of the Fund's Class I shares.
Directors' and Officers' Fees: Certain directors and officers of the Fund are also directors, officers, and/or employees of the advisor. The Fund does not pay compensation to any directors and officers affiliated with the advisor except for the Chief Compliance Officer, who received compensation from the advisor that was reimbursed by the Fund in the amount of $7,366 for the year ended December 31, 2011.
Note 3. Purchases and Sales of Securities
Purchases and sales of securities, excluding short-term investments, for the year ended December 31, 2011, totaled $723,736,698 and $187,156,789, respectively.
34
COHEN & STEERS PREFERRED SECURITIES AND INCOME FUND, INC.
NOTES TO FINANCIAL STATEMENTS—(Continued)
Note 4. Income Tax Information
The tax character of dividends and distributions paid was as follows:
| For the Year Ended December 31, 2011 | For the Period May 3, 2010a through December 31, 2010 | ||||||||||
| Ordinary income | $ | 27,263,614 | $ | 3,107,140 | |||||||
| Long-term capital gain | — | 52,603 | |||||||||
| Tax return of capital | 3,807,089 | 162,502 | |||||||||
| Total dividends and distributions | $ | 31,070,703 | $ | 3,322,245 | |||||||
a Commencement of operations.
As of December 31, 2011, the tax-basis components of accumulated earnings and the federal tax cost were as follows:
| Cost for federal income tax purposes | $ | 715,649,271 | |||||
| Gross unrealized appreciation | $ | 6,893,128 | |||||
| Gross unrealized depreciation | (25,505,979 | ) | |||||
| Net unrealized depreciation | $ | (18,612,851 | ) | ||||
As of December 31, 2011, the Fund had a net capital loss carryforward of $2,842,997 which may be used to offset future capital gains. These losses are comprised of a short-term capital loss carryover of $2,842,997 recognized during the current year which under current Federal income tax rules may offset capital gains recognized in any future period. In addition, the Fund incurred short-term capital losses of $698,811, long-term capital losses of $27,363 and net ordinary losses of $17,344 after October 31, 2011, that it has elected to treat as arising in the following fiscal year.
As of December 31, 2011, the Fund had temporary book/tax differences primarily attributable to wash sales on portfolio securities and permanent book/tax differences primarily attributable to foreign currency transactions, income from certain preferred securities and prior year REIT redesignations. To reflect reclassifications arising from the permanent differences, paid-in capital was charged $10,490, accumulated net realized loss was charged $253,404 and accumulated undistributed net investment income was credited $263,894. Net assets were not affected by this reclassification.
35
COHEN & STEERS PREFERRED SECURITIES AND INCOME FUND, INC.
NOTES TO FINANCIAL STATEMENTS—(Continued)
Note 5. Capital Stock
The Fund is authorized to issue 600 million shares of capital stock, at a par value of $0.001 per share. The Board of Directors of the Fund may increase or decrease the aggregate number of shares of common stock that the Fund has authority to issue. Transactions in Fund shares were as follows:
| For the Year Ended December 31, 2011 | For the Period May 3, 2010a through December 31, 2010 | ||||||||||||||||||
| Shares | Amount | Shares | Amount | ||||||||||||||||
| CLASS A: | |||||||||||||||||||
| Sold | 11,460,890 | $ | 137,745,212 | 6,591,941 | $ | 79,151,012 | |||||||||||||
| Issued as reinvestment of dividends and distributions | 291,649 | 3,504,192 | 36,829 | 444,762 | |||||||||||||||
| Redeemed | (4,256,635 | ) | (50,730,825 | ) | (2,460,269 | ) | (30,138,240 | ) | |||||||||||
| Redemption fees retained by the Fundb | — | 2,555 | — | 6,031 | |||||||||||||||
| Net increase | 7,495,904 | $ | 90,521,134 | 4,168,501 | $ | 49,463,565 | |||||||||||||
| CLASS C: | |||||||||||||||||||
| Sold | 9,849,875 | $ | 118,620,691 | 4,060,335 | $ | 48,771,017 | |||||||||||||
| Issued as reinvestment of dividends and distributions | 145,208 | 1,731,681 | 14,454 | 174,270 | |||||||||||||||
| Redeemed | (952,704 | ) | (11,299,508 | ) | (64,228 | ) | (775,585 | ) | |||||||||||
| Redemption fees retained by the Fundb | — | 2,491 | — | 4,411 | |||||||||||||||
| Net increase | 9,042,379 | $ | 109,055,355 | 4,010,561 | $ | 48,174,113 | |||||||||||||
| CLASS I: | |||||||||||||||||||
| Sold | 37,537,321 | $ | 455,670,619 | 6,440,977 | $ | 78,027,900 | |||||||||||||
| Issued as reinvestment of dividends and distributions | 355,156 | 4,245,465 | 21,656 | 261,800 | |||||||||||||||
| Redeemed | (7,926,576 | ) | (94,380,245 | ) | (1,091,754 | ) | (13,141,832 | ) | |||||||||||
| Redemption fees retained by the Fundb | — | 3,331 | — | 6,953 | |||||||||||||||
| Net increase | 29,965,901 | $ | 365,539,170 | 5,370,879 | $ | 65,154,821 | |||||||||||||
a Commencement of operations.
b A 2% redemption fee may be charged on shares sold within 60 days of the time of purchase. Redemption fees are paid directly to the Fund. Effective March 1, 2011, the Fund no longer charges redemption fees.
36
COHEN & STEERS PREFERRED SECURITIES AND INCOME FUND, INC.
NOTES TO FINANCIAL STATEMENTS—(Continued)
Note 6. Borrowings
The Fund, in conjunction with other Cohen & Steers funds, is a party to a $200,000,000 syndicated credit agreement (the credit agreement) with State Street Bank and Trust Company, as administrative agent and operations agent, and the lenders identified in the credit agreement, which expires January 27, 2012. The Fund pays a commitment fee of 0.125% per annum on its proportionate share of the unused portion of the credit agreement. (For the period January 1, 2011 through January 28, 2011, the commitment fee was 0.15%). Effective January 27, 2012, the credit agreement was renewed under similar terms and expires January 25, 2013. The commitment fee was reduced to 0.10%.
During the year ended December 31, 2011, the Fund did not borrow under the credit agreement.
Note 7. Derivative Investments
The following tables present the value of derivatives held at December 31, 2011 and the effect of derivatives held during the year ended December 31, 2011, along with the respective location in the financial statements. The notional amount of outstanding forward foreign currency exchange contracts at December 31, 2011 is $7,761,992. The average notional amount outstanding during the year ended December 31, 2011 was $3,198,000.
| Statement of Assets and Liabilities | |||||||||||||||||||
| Assets | Liabilities | ||||||||||||||||||
| Derivatives | Location | Fair Value | Location | Fair Value | |||||||||||||||
| Foreign exchange contracts | Unrealized appreciation | $ | 144,306 | Unrealized depreciation | $ | 14,243 | |||||||||||||
| Statement of Operations | |||||||||||||||||||
| Derivatives | Location | Realized Gain | Change in Unrealized Appreciation | ||||||||||||
| Foreign exchange contracts | Net Realized and Unrealized Gain (Loss) | $ | 173,891 | $ | 130,063 | ||||||||||
Note 8. Other
In the normal course of business, the Fund enters into contracts that provide general indemnifications. The Fund's maximum exposure under these arrangements is dependent on claims that may be made against the Fund in the future and, therefore, cannot be estimated; however, based on experience, the risk of material loss from such claims is considered remote.
37
COHEN & STEERS PREFERRED SECURITIES AND INCOME FUND, INC.
NOTES TO FINANCIAL STATEMENTS—(Continued)
Note 9. New Accounting Pronouncement
In May 2011, the Financial Accounting Standards Board ("FASB") issued Accounting Standards Update No. 2011-04, "Fair Value Measurements and Disclosures (Topic 820)—Amendments to Achieve Common Fair Value Measurement and Disclosure Requirements in U.S. GAAP and IFRSs" ("ASU 2011-04"). ASU 2011-04 clarifies the application of existing fair value measurement requirements, changes certain principles related to measuring fair value, and requires additional disclosures about fair value measurements.
Required disclosures are expanded under the new guidance, especially for fair value measurements that are categorized within Level 3 of the fair value hierarchy, for which quantitative information about the unobservable inputs used, and a narrative description of the valuation processes in place and sensitivity of recurring Level 3 measurements to changes in unobservable inputs will be required.
Management is currently evaluating the impact the adoption of this pronouncement will have on the Fund's financial statements. ASU 2011-04 is effective for fiscal years and interim periods beginning after December 15, 2011.
Note 10. Subsequent Events
Events and transactions occurring after December 31, 2011 and through the date that the financial statements were issued, have been evaluated in the preparation of the financial statements and no additional disclosure is required.
38
COHEN & STEERS PREFERRED SECURITIES AND INCOME FUND, INC.
REPORT OF INDEPENDENT REGISTERED PUBLIC ACCOUNTING FIRM
To the Board of Directors and Shareholders of
Cohen & Steers Preferred Securities and Income Fund, Inc.
In our opinion, the accompanying statement of assets and liabilities, including the schedule of investments, and the related statements of operations and of changes in net assets and the financial highlights present fairly, in all material respects, the financial position of Cohen & Steers Preferred Securities and Income Fund, Inc. (the "Fund") at December 31, 2011, and the results of its operations for the year then ended and the changes in its net assets and the financial highlights for the year then ended and for the period from May 3, 2010 (commencement of operations) through December 31, 2010, in conformity with accounting principles generally accepted in the United States of America. These financial statements and financial highlights (hereafter referred to as "financial statements") are the responsibility of the Fund's management. Our responsibility is to express an opinion on these financial statements based on our audits. We conducted our audits of these financial statements in accordance with the standards of the Public Company Accounting Oversight Board (United States). Those standards require that we plan and perform the audit to obtain reasonable assurance about whether the financial statements are free of material misstatement. An audit includes examining, on a test basis, evidence supporting the amounts and disclosures in the financial statements, assessing the accounting principles used and significant estimates made by management, and evaluating the overall financial statement presentation. We believe that our audits, which included confirmation of securities at December 31, 2011 by correspondence with the custodian and brokers, provide a reasonable basis for our opinion.
PricewaterhouseCoopers LLP
New York, New York
February 17, 2012
39
COHEN & STEERS PREFERRED SECURITIES AND INCOME FUND, INC.
TAX INFORMATION—2011 (Unaudited)
Pursuant to the Jobs and Growth Relief Reconciliation Act of 2003, the Fund designates qualified dividend income of $8,763,453. Additionally, 21.45 % of the ordinary dividends qualified for the dividends received deduction available to corporations.
OTHER INFORMATION
A description of the policies and procedures that the Fund uses to determine how to vote proxies relating to portfolio securities is available (i) without charge, upon request, by calling 800-330-7348, (ii) on our Web site at cohenandsteers.com or (iii) on the Securities and Exchange Commission's Web site at http://www.sec.gov. In addition, the Fund's proxy voting record for the most recent 12-month period ended June 30 is available by August 31 of each year (i) without charge, upon request, by calling 800-330-7348 or (ii) on the SEC's Web site at http://www.sec.gov.
The Fund files its complete schedule of portfolio holdings with the SEC for the first and third quarters of each fiscal year on Form N-Q. The Fund's Forms N-Q are available (i) without charge, upon request by calling 800-330-7348, or (ii) on the SEC's Web site at http://www.sec.gov. In addition, the Forms N-Q may be reviewed and copied at the SEC's Public Reference Room in Washington, DC. Information on the operation of the Public Reference Room may be obtained by calling 800-SEC-0330.
Please note that the distributions paid by the Fund to shareholders are subject to recharacterization for tax purposes. The Fund may also pay distributions in excess of the Fund's net investment company taxable income and this excess could be a tax free return of capital distributed from the Fund's assets. The final tax treatment of all distributions is reported to shareholders on their 1099-DIV forms, which are mailed after the close of each calendar year.
40
COHEN & STEERS PREFERRED SECURITIES AND INCOME FUND, INC.
MANAGEMENT OF THE FUND
The business and affairs of the Fund are managed under the direction of the Board of Directors. The Board of Directors approves all significant agreements between the Fund and persons or companies furnishing services to it, including the Fund's agreements with its advisor, administrator, co-administrator, custodian and transfer agent. The management of the Fund's day-to-day operations is delegated to its officers, the advisor, administrator and co-administrator, subject always to the investment objective and policies of the Fund and to the general supervision of the Board of Directors.
The Board of Directors and officers of the Fund and their principal occupations during at least the past five years are set forth below. The statement of additional information (SAI) includes additional information about fund directors and is available, without charge, upon request by calling 800-330-7348.
| Name, Address1 and Age | Position(s) Held with Fund | Term of Office2 | Principal Occupation During At Least The Past 5 Years (Including Other Directorships Held) | Number of Funds Within Fund Complex Overseen by Director (Including the Fund) | Length of Time Served3 | ||||||||||||||||||
| Interested Director4 | |||||||||||||||||||||||
| Robert H. Steers Age: 58 | Director and Co-Chairman | Until next election of directors | Co-Chairman and Co-Chief Executive Officer of Cohen & Steers Capital Management, Inc. (the Advisor) since 2003 and its parent, Cohen & Steers, Inc. since 2004. Vice President of Cohen & Steers Securities, LLC. | 19 | 1991 to present | ||||||||||||||||||
| Martin Cohen Age: 63 | Director and Co-Chairman | Until next election of directors | Co-Chairman and Co-Chief Executive Officer of the Advisor since 2003 and Cohen & Steers, Inc. since 2004. Prior to that, President of the Advisor; Vice President of Cohen & Steers Securities, LLC. | 19 | 1991 to present | ||||||||||||||||||
| Disinterested Directors | |||||||||||||||||||||||
| Michael G. Clark Age: 46 | Director | Until next election of directors | From May 2006 to June 2011, President and Chief Executive Officer of DWS Funds and Managing Director of Deutsche Asset Management. | 19 | June 2011 to present | ||||||||||||||||||
(table continued on next page)
41
COHEN & STEERS PREFERRED SECURITIES AND INCOME FUND, INC.
(table continued from previous page)
| Name, Address1 and Age | Position(s) Held with Fund | Term of Office2 | Principal Occupation During At Least The Past 5 Years (Including Other Directorships Held) | Number of Funds Within Fund Complex Overseen by Director (Including the Fund) | Length of Time Served3 | ||||||||||||||||||
| Bonnie Cohen5 Age: 69 | Director | Until next election of directors | Consultant. Board Member, United States Department of Defense Business Board since 2010; Advisory Board member, Posse Foundation since 2004; Trustee, H. Rubenstein Foundation since 1996; Trustee, District of Columbia Public Libraries since 2004; Board member Teluride Mountain Film Festival since 2010; Former Director, Reis, Inc. (real estate analytics firm) from 2003 to 2009; Former member of the Investment Committee, The Moriah Fund from 2002 to 2008; Former Board member, Foundation for Arts and Preservations in Embassies from 2001 to 2009; Former Under Secretary of State for Management, United States Department of State, 1996-2000. | 19 | 2001 to present | ||||||||||||||||||
| George Grossman Age: 58 | Director | Until next election of directors | Attorney-at-law | 19 | 1993 to present | ||||||||||||||||||
| Richard E. Kroon Age: 69 | Director | Until next election of directors | Member of Investment Committee, Monmouth University since 2004; Retired Chairman and Managing Partner of Sprout Group venture capital funds, then an affiliate of Donaldson, Lufkin and Jenrette Securities Corporation from 1981 to 2001. Former chairman of the National Venture Capital Association for the year 2000. | 19 | 2004 to present | ||||||||||||||||||
(table continued on next page)
42
COHEN & STEERS PREFERRED SECURITIES AND INCOME FUND, INC.
(table continued from previous page)
| Name, Address1 and Age | Position(s) Held with Fund | Term of Office2 | Principal Occupation During At Least The Past 5 Years (Including Other Directorships Held) | Number of Funds Within Fund Complex Overseen by Director (Including the Fund) | Length of Time Served3 | ||||||||||||||||||
| Richard J. Norman Age: 68 | Director | Until next election of directors | Private Investor. Member, District of Columbia Department of Corrections Chaplains Corps from 2008 to February 2010; Member, Montgomery County, Maryland Department of Corrections Chaplains Corp since February 2010; Special Representative, Salvation Army World Service Organization (SAWSO) since 2010; Advisory Board Member, The Salvation Army since 1985; Financial Education Fund Chair, The Foundation Board of Maryland Public Television since 2009; Former President, Executive Committee, Chair of Investment Committee, The Foundation Board of Maryland Public Television from 1997 to 2008. Prior thereto, Investment Representative of Morgan Stanley Dean Witter from 1966 to 2000. | 19 | 2001 to present | ||||||||||||||||||
| Frank K. Ross Age: 68 | Director | Until next election of directors | Visiting Professor of Accounting, Howard University School of Business since 2004; Board member and Audit Committee Chair and Human Resources and Compensation Committee Member, Pepco Holdings, Inc. (electric utility) since 2004. Formerly, Midatlantic Area Managing Partner for Assurance Services at KPMG LLP and Managing Partner of its Washington, DC offices from 1977 to 2003. | 19 | 2004 to present | ||||||||||||||||||
(table continued on next page)
43
COHEN & STEERS PREFERRED SECURITIES AND INCOME FUND, INC.
(table continued from previous page)
| Name, Address1 and Age | Position(s) Held with Fund | Term of Office2 | Principal Occupation During At Least The Past 5 Years (Including Other Directorships Held) | Number of Funds Within Fund Complex Overseen by Director (Including the Fund) | Length of Time Served3 | ||||||||||||||||||
| Willard H. Smith Jr.6 Age: 75 | Director | Until next election of directors | Board member, Essex Property Trust, Inc. since 1996; Former Board member, Realty Income Corporation from 1996 to 2009; Former Board member, Highwoods Property Trust from 1996 to 2005; Former Board member, Crest Net Lease, Inc. from 1999 to 2009 Formerly, Managing Director at Merrill Lynch & Co., Equity Capital Markets Division, from 1983 to 1995. | 19 | 1996 to present | ||||||||||||||||||
| C. Edward Ward Jr. Age: 65 | Director | Until next election of directors | Member of The Board of Trustees of Manhattan College, Riverdale, New York since 2004. Formerly Director of closed-end fund management for the New York Stock Exchange, where he worked from 1979 to 2004. | 19 | 2004 to present | ||||||||||||||||||
1 The address for each director is 280 Park Avenue, New York, NY 10017.
2 On March 12, 2008, the Board of Directors adopted a mandatory retirement policy stating a Director must retire from the Board on December 31st of the year in which he or she turns 75 years of age.
3 The length of time served represents the year in which the director was first elected or appointed to any fund in the Cohen & Steers fund complex.
4 "Interested person", as defined in the 1940 Act, of the fund because of affiliation with CSCM (Interested Directors).
5 Martin Cohen and Bonnie Cohen are not related.
6 Effective December 31, 2011, Willard H. Smith Jr. retired from the Board of Directors in accordance with the mandatory retirement policy.
44
COHEN & STEERS PREFERRED SECURITIES AND INCOME FUND, INC.
The officers of the fund (other than Messrs. Cohen and Steers, whose biographies are provided above), their address, their ages and their principal occupations for at least the past five years are set forth below.
| Name, Address and Age1 | Position(s) Held with Fund | Principal Occupation During At Least the Past 5 Years | Length of Time Served2 | ||||||||||||
| Adam M. Derechin Age: 47 | President and Chief Executive Officer | Chief Operating Officer of CSCM (since 2003) and CNS (since 2004). Prior to that, Senior Vice President of CSCM and Vice President and Assistant Treasurer of the Cohen & Steers funds. | Since 2005 | ||||||||||||
| Joseph M. Harvey Age: 48 | Vice President | President and Chief Investment Officer of CSCM (since 2003) and President of CNS (since 2004). Prior to that, Senior Vice President and Director of Investment Research of CSCM. | Since 2004 | ||||||||||||
| William F. Scapell Age: 44 | Vice President | Senior Vice President of CSCM since 2003. Prior to that, chief strategist for preferred securities at Merrill Lynch & Co., Inc. | Since 2003 | ||||||||||||
| Francis C. Poli Age: 49 | Secretary | Executive Vice President, Secretary and General Counsel of CSCM and CNS since March 2007. Prior thereto, General Counsel of Allianz Global Investors of America LP. | Since 2007 | ||||||||||||
| James Giallanza Age: 45 | Treasurer and Chief Financial Officer | Senior Vice President of CSCM since September 2006. Prior thereto, Deputy Head of the US Funds Administration and Treasurer & CFO of various mutual funds within the Legg Mason (formally Citigroup Asset Management) fund complex from August 2004 to September 2006; Director/Controller of the US wholesale business at UBS Global Asset Management (U.S.) from September 2001 to July 2004. | Since 2006 | ||||||||||||
| Lisa D. Phelan Age: 43 | Chief Compliance Officer | Senior Vice President and Director of Compliance of CSCM since 2007 and prior to that, Vice President since 2006. Chief Compliance Officer of CSSL since 2004. Prior to that, Compliance Officer of CSCM since 2004. Chief Compliance Officer, Avatar Associates & Overture Asset Managers, 2003-2004. | Since 2006 | ||||||||||||
1 The address of each officer is 280 Park Avenue, New York, NY 10017.
2 Officers serve one-year terms. The length of time served represents the year in which the officer was first elected to that position in any fund in the Cohen & Steers fund complex. All of the officers listed above are officers of one or more of the other funds in the complex.
45
COHEN & STEERS PREFERRED SECURITIES AND INCOME FUND, INC.
Cohen & Steers Privacy Policy
| Facts | What Does Cohen & Steers Do With Your Personal Information? | ||||||
| Why? | Financial companies choose how they share your personal information. Federal law gives consumers the right to limit some but not all sharing. Federal law also requires us to tell you how we collect, share, and protect your personal information. Please read this notice carefully to understand what we do. | ||||||
| What? | The types of personal information we collect and share depend on the product or service you have with us. This information can include: • Social Security number and account balances • Transaction history and account transactions • Purchase history and wire transfer instructions | ||||||
| How? | All financial companies need to share customers' personal information to run their everyday business. In the section below, we list the reasons financial companies can share their customers' personal information; the reasons Cohen & Steers chooses to share; and whether you can limit this sharing. | ||||||
| Reasons we can share your personal information | Does Cohen & Steers share? | Can you limit this sharing? | |||||||||
| For our everyday business purposes— such as to process your transactions, maintain your account(s), respond to court orders and legal investigations, or reports to credit bureaus | Yes | No | |||||||||
| For our marketing purposes— to offer our products and services to you | Yes | No | |||||||||
| For joint marketing with other financial companies— | No | We don't share | |||||||||
| For our affiliates' everyday business purposes— information about your transactions and experiences | No | We don't share | |||||||||
| For our affiliates' everyday business purposes— information about your creditworthiness | No | We don't share | |||||||||
| For our affiliates to market to you— | No | We don't share | |||||||||
| For non-affiliates to market to you— | No | We don't share | |||||||||
Questions? Call 800.330.7348
46
COHEN & STEERS PREFERRED SECURITIES AND INCOME FUND, INC.
Cohen & Steers Privacy Policy—(Continued)
| Who we are | |||||||
| Who is providing this notice? | Cohen & Steers Capital Management, Inc., Cohen & Steers Asia Limited, Cohen & Steers UK Limited, Cohen & Steers Europe SA, Cohen & Steers Securities, LLC, Cohen & Steers Private Funds, and Cohen & Steers Open and Closed-End Funds (collectively, "Cohen & Steers"). | ||||||
| What we do | |||||||
| How does Cohen & Steers protect my personal information? | To protect your personal information from unauthorized access and use, we use security measures that comply with federal law. These measures include computer safeguards and secured files and buildings. We restrict access to your information to those employees who need it to perform their jobs, and also require companies that provide services on our behalf to protect your information. | ||||||
| How does Cohen & Steers collect my personal information? | We collect your personal information, for example, when you • Open an account or buy securities from us • Provide account information or give us your contact information • Make deposits or withdrawals from your account We also collect your personal information from other companies. | ||||||
| Why can't I limit all sharing? | Federal law gives you the right to limit only • sharing for affiliates' everyday business purposes—information about your creditworthiness • affiliates from using your information to market to you • sharing for non-affiliates to market to you State law and individual companies may give you additional rights to limit sharing. | ||||||
| Definitions | |||||||
| Affiliates | Companies related by common ownership or control. They can be financial and nonfinancial companies. • Cohen & Steers does not share with affiliates. | ||||||
| Non-affiliates | Companies not related by common ownership or control. They can be financial and nonfinancial companies. • Cohen & Steers does not share with non-affiliates so they can market to you. | ||||||
| Joint marketing | A formal agreement between nonaffiliated financial companies that together market financial products or services to you. • Cohen & Steers does not jointly market. | ||||||
47
COHEN & STEERS PREFERRED SECURITIES AND INCOME FUND, INC.
Cohen & Steers Investment Solutions
COHEN & STEERS GLOBAL REALTY SHARES
• Designed for investors seeking total return, investing primarily in global real estate equity securities
• Symbols: CSFAX, CSFBX*, CSFCX, CSSPX
COHEN & STEERS INSTITUTIONAL REALTY SHARES
• Designed for institutional investors seeking total return, investing primarily in REITs
• Symbol: CSRIX
COHEN & STEERS REALTY INCOME FUND
• Designed for investors seeking total return, investing primarily in real estate securities with an emphasis on both income and capital appreciation
• Symbols: CSEIX, CSBIX*, CSCIX, CSDIX
COHEN & STEERS INTERNATIONAL REALTY FUND
• Designed for investors seeking total return, investing primarily in international real estate securities
• Symbols: IRFAX, IRFCX, IRFIX
COHEN & STEERS
EMERGING MARKETS REAL ESTATE FUND
• Designed for investors seeking total return, investing primarily in emerging market real estate securities
• Symbols: APFAX, APFCX, APFIX
COHEN & STEERS REALTY SHARES
• Designed for investors seeking total return, investing primarily in REITs
• Symbol: CSRSX
COHEN & STEERS
INSTITUTIONAL GLOBAL REALTY SHARES
• Designed for institutional investors seeking total return, investing primarily in global real estate securities
• Symbol: GRSIX
COHEN & STEERS GLOBAL INFRASTRUCTURE FUND
• Designed for investors seeking total return, investing primarily in global infrastructure securities
• Symbols: CSUAX, CSUBX*, CSUCX, CSUIX
COHEN & STEERS DIVIDEND VALUE FUND
• Designed for investors seeking high current income and long-term growth of income and capital appreciation, investing primarily in dividend paying common stocks and preferred stocks
• Symbols: DVFAX, DVFCX, DVFIX
COHEN & STEERS
PREFERRED SECURITIES AND INCOME FUND
• Designed for investors seeking total return (high current income and capital appreciation), investing primarily in preferred and debt securities
• Symbols: CPXAX, CPXCX, CPXIX
COHEN & STEERS REAL ASSETS FUND
• Designed for investors seeking total return and the maximization of real returns during inflationary environments by investing primarily in real assets
• Symbols: RAPAX, RAPCX, RAPIX, RAPRX, RAPZX
Distributed by Cohen & Steers Securities, LLC.
COHEN & STEERS GLOBAL REALTY MAJORS ETF
• Designed for investors who seek a relatively low-cost "passive" approach for investing in a portfolio of real estate equity securities of companies in a specified index
• Symbol: GRI
Distributed by ALPS Distributors, Inc.
ISHARES COHEN & STEERS
REALTY MAJORS INDEX FUND
• Designed for investors who seek a relatively low-cost "passive" approach for investing in a portfolio of real estate equity securities of companies in a specified index
• Symbol: ICF
Distributed by SEI Investments Distribution Co.
* Class B shares are no longer offered except through dividend reinvestment and permitted exchanges by existing Class B shareholders.
Please consider the investment objectives, risks, charges and expenses of the fund carefully before investing. A prospectus containing this and other information can be obtained by calling 800-330-7348 or by visiting cohenandsteers.com. Please read the prospectus carefully before investing.
48
COHEN & STEERS PREFERRED SECURITIES AND INCOME FUND, INC.
OFFICERS AND DIRECTORS
Robert H. Steers
Director and co-chairman
Martin Cohen
Director and co-chairman
Michael G. Clark
Director
Bonnie Cohen
Director
George Grossman
Director
Richard E. Kroon
Director
Richard J. Norman
Director
Frank K. Ross
Director
Willard H. Smith Jr.
Director
C. Edward Ward, Jr.
Director
Adam M. Derechin
President and chief executive officer
Joseph M. Harvey
Vice president
William F. Scapell
Vice president
Francis C. Poli
Secretary
James Giallanza
Treasurer and chief financial officer
Lisa D. Phelan
Chief compliance officer
KEY INFORMATION
Investment Advisor
Cohen & Steers Capital Management, Inc.
280 Park Avenue
New York, NY 10017
(212) 832-3232
Co-administrator and Custodian
State Street Bank and Trust Company
One Lincoln Street
Boston, MA 02111
Transfer Agent
Boston Financial Data Services, Inc.
30 Dan Road
Canton, MA 02021
(800) 437-9912
Legal Counsel
Ropes & Gray LLP
1211 Avenue of the Americas
New York, NY 10036
Distributor
Cohen & Steers Securities, LLC
280 Park Avenue
New York, NY 10017
Nasdaq Symbol: Class A—CPXAX
Class C—CPXCX
Class I— CPXIX
Web site: cohenandsteers.com
This report is authorized for delivery only to shareholders of Cohen & Steers Preferred Securities and Income Fund, Inc. unless accompanied or preceded by the delivery of a currently effective prospectus setting forth details of the Fund. Past performance is no guarantee of future results and your investment may be worth more or less at the time you sell.
49

eDelivery NOW AVAILABLE
Stop traditional mail delivery; receive your shareholder reports and prospectus online.
Sign up at cohenandsteers.com
COHEN & STEERS
PREFERRED SECURITIES AND INCOME FUND
280 PARK AVENUE
NEW YORK, NY 10017
Annual Report December 31, 2011
Cohen & Steers Preferred Securities and Income Fund
CPXAXAR
Item 2. Code of Ethics.
The Registrant has adopted an Amended and Restated Code of Ethics that applies to its Principal Executive Officer and Principal Financial Officer. The Code of Ethics was in effect during the reporting period. The Registrant has not amended the Code of Ethics as described in Form N-CSR during the reporting period. The Registrant has not granted any waiver, including an implicit waiver, from a provision of the Code of Ethics as described in Form N-CSR during the reporting period. A current copy of the Code of Ethics is available on the Registrant’s website at cohenandsteers.com/downloads/code_of_ethics_exec_and_senior.pdf. Upon request, a copy of the Code of Ethics can be made by calling 800-330-7348 or writing to the Secretary of the Registrant, 280 Park Avenue, 10th floor, New York, NY 10017.
Item 3. Audit Committee Financial Expert.
The registrant’s board has determined that Michael G. Clark and Frank K. Ross, each a member of the board’s audit committee, are each an “audit committee financial expert”. Mr. Clark and Mr. Ross are each “independent,” as such term is defined in Form N-CSR.
Item 4. Principal Accountant Fees and Services.
(a) – (d) Aggregate fees billed to the registrant for the last two fiscal years for professional services rendered by the registrant’s principal accountant were as follows:
|
| 2011 |
| 2010 |
| ||
Audit Fees |
| $ | 45,000 |
| $ | 45,000 |
|
Audit-Related Fees |
| $ | 0 |
| $ | 0 |
|
Tax Fees |
| $ | 6,250 |
| $ | 6,250 |
|
All Other Fees |
| $ | 0 |
| $ | 0 |
|
Tax fees were billed in connection with the preparation of tax returns, calculation and designation of dividends and other miscellaneous tax services.
(e)(1) The audit committee is required to pre-approve audit and non-audit services performed for the registrant by the principal accountant. The audit committee also is required to pre-approve non-audit services performed by the registrant’s principal accountant for the registrant’s investment advisor and any sub-advisor (not including any sub-advisor whose role is primarily portfolio management and is subcontracted with or overseen by another investment advisor) and/or to any entity controlling, controlled by or under common control with the registrant’s investment advisor that provides ongoing services to the registrant, if the engagement for services relates directly to the operations and financial reporting of the registrant.
The audit committee may delegate pre-approval authority to one or more of its members who are independent members of the board of directors of the registrant. The member or members to whom such authority is delegated shall report any pre-approval decisions to the audit committee at its next scheduled meeting. The audit committee may not delegate its responsibility to pre-approve services to be performed by the registrant’s principal accountant to the investment advisor.
(e) (2) No services included in (b) – (d) above were approved by the audit committee pursuant to paragraphs (c)(7)(i)(C) of Rule 2-01 of Regulation S-X.
(f) Not applicable.
(g) For the fiscal years ended December 31, 2011 and December 31, 2010 (the registrant commenced operations on May 3, 2010), the aggregate fees billed by the registrant’s principal accountant for non-audit services rendered to the registrant and for non-audit services rendered to the registrant’s investment advisor (not including any sub-advisor whose role is primarily portfolio management and is subcontracted with or overseen by another investment advisor) and/or to any entity controlling, controlled by or under common control with the registrant’s investment advisor that provides ongoing services to the registrant were:
|
| 2011 |
| 2010 |
| ||
Registrant |
| $ | 6,250 |
| $ | 6,250 |
|
Investment Advisor |
| $ | 20,000 |
| $ | 20,000 |
|
(h) The registrant’s audit committee considered whether the provision of non-audit services that were rendered to the registrant’s investment advisor (not including any sub-advisor whose role is primarily portfolio management and is subcontracted with or overseen by another investment advisor) and/or to any entity controlling, controlled by or under common control with the registrant’s investment advisor that provides ongoing services to the registrant that were not required to be pre-approved pursuant to paragraph (c)(7)(ii) of Rule 2-01 of Regulation S-X was compatible with maintaining the principal accountant’s independence.
Item 5. Audit Committee of Listed Registrants.
Not applicable.
Item 6. Schedule of Investments.
Included in Item 1 above.
Item 7. Disclosure of Proxy Voting Policies and Procedures for Closed-End Management Investment Companies.
Not applicable.
Item 8. Portfolio Managers of Closed-End Investment Companies.
Not applicable.
Item 9. Purchases of Equity Securities by Closed-End Management Investment Company and Affiliated Purchasers.
Not applicable.
Item 10. Submission of Matters to a Vote of Security Holders.
Not applicable.
Item 11. Controls and Procedures.
(a) The registrant’s principal executive officer and principal financial officer have concluded that the registrant’s disclosure controls and procedures are reasonably designed to ensure that information required to be disclosed by the registrant in this Form N-CSR was recorded, processed, summarized and reported within the time periods specified in the Securities and Exchange Commission’s rules and forms, based upon such officers’ evaluation of these controls and procedures as of a date within 90 days of the filing date of this report.
(b) There were no changes in the registrant’s internal control over financial reporting that occurred during the second fiscal quarter of the period covered by this report that have materially affected, or are reasonably likely to materially affect, the registrant’s internal control over financial reporting.
Item 12. Exhibits.
(a)(1) Not applicable.
(a)(2) Certifications of principal executive officer and principal financial officer as required by Rule 30a-2(a) under the Investment Company Act of 1940.
(a)(3) Not applicable
(b) Certifications of chief executive officer and chief financial officer as required by Rule 30a- 2(b) under the Investment Company Act of 1940.
SIGNATURES
Pursuant to the requirements of the Securities Exchange Act of 1934 and the Investment Company Act of 1940, the registrant has duly caused this report to be signed on its behalf by the undersigned, thereunto duly authorized.
COHEN & STEERS PREFERRED SECURITIES AND INCOME FUND, INC.
By: | /s/ Adam M. Derechin |
|
| Name: Adam M. Derechin | |
| Title: President and Chief Executive Officer | |
|
| |
Date: March 2, 2012 | ||
Pursuant to the requirements of the Securities Exchange Act of 1934 and the Investment Company Act of 1940, this report has been signed below by the following persons on behalf of the registrant and in the capacities and on the dates indicated.
By: | /s/ Adam M. Derechin |
| |
| Name: | Adam M. Derechin | |
| Title: | President and Chief Executive Officer | |
|
| (Principal Executive Officer) | |
|
| ||
By: | /s/ James Giallanza |
| |
| Name: | James Giallanza | |
| Title: | Treasurer and Chief Financial Officer | |
|
| (Principal Financial Officer) | |
|
| ||
|
| ||
Date: March 2, 2012 | |||