UNITED STATES
SECURITIES AND EXCHANGE COMMISSION
Washington, D.C. 20549
FORM N-CSR
CERTIFIED SHAREHOLDER REPORT OF REGISTERED
MANAGEMENT INVESTMENT COMPANIES
Investment Company Act file number | 811-22392 | |||||||
| ||||||||
Cohen & Steers Preferred Securities and Income Fund, Inc. | ||||||||
(Exact name of registrant as specified in charter) | ||||||||
| ||||||||
280 Park Avenue, New York, |
| NY 10017 | ||||||
(Address of principal executive offices) |
| (Zip code) | ||||||
| ||||||||
Tina M. Payne Cohen & Steers Capital Management, Inc. 280 Park Avenue New York, New York 10017 | ||||||||
(Name and address of agent for service) | ||||||||
| ||||||||
Registrant’s telephone number, including area code: | (212) 832-3232 |
| ||||||
| ||||||||
Date of fiscal year end: | December 31 |
| ||||||
| ||||||||
Date of reporting period: | June 30, 2016 |
| ||||||
Item 1. Reports to Stockholders.
COHEN & STEERS PREFERRED SECURITIES AND INCOME FUND, INC.
To Our Shareholders:
We would like to share with you our report for the six months ended June 30, 2016. The net asset values (NAV) per share at that date were $13.65, $13.58, $13.68, $13.67 and $13.67 for Class A, Class C, Class I, Class R and Class Z shares, respectively.
The total returns, including income and change in NAV, for the Fund and its comparative benchmarks were:
| Six Months Ended June 30, 2016 | |||||||
| Cohen & Steers Preferred Securities and Income Fund—Class A | 3.42 | % | |||||
| Cohen & Steers Preferred Securities and Income Fund—Class C | 3.12 | % | |||||
| Cohen & Steers Preferred Securities and Income Fund—Class I | 3.59 | % | |||||
| Cohen & Steers Preferred Securities and Income Fund—Class R | 3.33 | % | |||||
| Cohen & Steers Preferred Securities and Income Fund—Class Z | 3.67 | % | |||||
| BofA Merrill Lynch Fixed-Rate Preferred Securities Indexa | 5.09 | % | |||||
| Blended Benchmark—50% BofA Merrill Lynch U.S. Capital Securities Index/50% BofA Merrill Lynch Fixed-Rate Preferred Securities Indexa | 4.42 | % | |||||
| S&P 500 Indexa | 3.84 | % | |||||
The performance data quoted represent past performance. Past performance is no guarantee of future results. The investment return and the principal value of an investment will fluctuate and shares, if redeemed, may be worth more or less than their original cost. Current performance may be lower or higher than the performance data quoted. Current total returns of the Fund can be obtained by visiting our website at cohenandsteers.com. All share class returns assume the reinvestment of all dividends and distributions at NAV. Fund performance figures reflect fee waivers and/or expense reimbursements, without which the performance would have been lower. Performance quoted does not reflect the deduction of the maximum 3.75% initial sales charge on Class A shares and 1.00% maximum contingent deferred sales charge on Class C shares. The 1.00% maximum contingent deferred sales charge on Class C shares applies if redemption occurs on or before the one year anniversary date of their purchase. If such charges were included, returns would have been lower. Index performance does not reflect the deduction of any fees, taxes or expenses. An investor cannot invest directly in an index. Performance figures for periods shorter than one year are not annualized.
a The BofA Merrill Lynch Fixed-Rate Preferred Securities Index tracks the performance of fixed-rate U.S. dollar-denominated preferred securities issued in the U.S. domestic market. The BofA Merrill Lynch U.S. Capital Securities Index is a subset of the BofA Merrill Lynch U.S. Corporate Index including all fixed-to-floating rate, perpetual callable and capital securities. The S&P 500 Index is an unmanaged index of 500 large-capitalization stocks that is frequently used as a general measure of U.S. stock market performance. Benchmark returns are shown for comparative purposes only and may not be representative of the Fund's portfolio. The Fund's benchmarks do not include below-investment grade securities.
1
COHEN & STEERS PREFERRED SECURITIES AND INCOME FUND, INC.
The Fund makes regular monthly distributions at a level rate (the Policy). Distributions paid by the Fund are subject to recharacterization for tax purposes and are taxable up to the amount of the Fund's investment company taxable income and net realized gains. As a result of the Policy, the Fund may pay distributions in excess of the Fund's investment company taxable income and net realized gains. This excess would be a return of capital distributed from the Fund's assets. Distributions of capital decrease the Fund's total assets and, therefore, could have the effect of increasing the Fund's expense ratio. In addition, in order to make these distributions, the Fund may have to sell portfolio securities at a less than opportune time.
Market Review
Preferred securities had positive returns for the six-month period ended June 30, 2016, in a broadly favorable environment for fixed income securities. Conditions were initially difficult for credit-sensitive issues, amid plummeting oil prices and disappointing global economic data. As oil moved steadily up from mid-February lows and U.S. data firmed, these trends reversed, sending equity and debt markets higher.
The monetary policy backdrop was broadly supportive. The European Central Bank announced additional quantitative easing measures that went beyond expectations, and the U.S. Federal Reserve, which had modestly raised interest rates in late 2015, took a more dovish tone, citing global growth risks.
Preferreds were also supported by the ongoing improvements in the financial profiles of banks (the main issuers of preferreds), due to mandated higher capital levels. In June, U.S. banks passed the Federal Reserve's widely anticipated annual stress test, receiving passing marks for both the quantitative and qualitative parts of the tests. In a sign of the strength of banks' balance sheets, the Fed gave the banks permission to return more capital to shareholders.
Financial markets encountered turmoil late in the period when the U.K. electorate voted to withdraw from the European Union, contrary to expectations. The so-called Brexit news spurred a sharp selloff in global equity markets and a rally in assets perceived to be safe, including sovereign bonds, as investors weighed the global economic ramifications. Global equity markets bounced back in the week following Brexit as the initial shock wore off, but sovereign yields remained near historically low levels and in some cases were in negative territory.
Fund Performance
The Fund had a positive total return in the period, although it underperformed its blended benchmark. Security selection in the banking sector detracted from relative performance, due largely to our out-of-index positions in certain European issues that underperformed. These included contingent capital securities (CoCos), a relatively new form of Tier 1 capital issued so far mainly by European banks.
As a group, CoCos had only a slightly positive return in the period. The group often, though not always, trades in sync with European bank stocks, which fell sharply in the first quarter and again following the Brexit vote.
2
COHEN & STEERS PREFERRED SECURITIES AND INCOME FUND, INC.
From a general perspective, our early-year underweight in exchange-traded preferreds hindered relative performance, as the group outpaced the much broader market of over-the-counter (OTC) preferred issues. While positive for the period, the OTC market is geographically diverse and was more affected by the elevated European credit volatility that emerged in the period.
Factors that helped relative performance included our security selection and overweight in the real estate sector, which outpaced the wider preferreds market. Real estate investment trusts' (REITs) preferred and common shares were aided by continued strong fundamentals for commercial real estate across most property types and REITs' perceived relative insulation from the U.K. and European economies. In the REIT preferreds market, the technical backdrop remained favorable, with net low new supply meeting firm investment demand for these securities' above-average income. Security selection in the insurance sector aided relative returns as well.
Impact of Derivatives on Fund Performance
The Fund used derivatives in the form of currency options for hedging purposes, as well as forward foreign currency exchange contracts for managing currency risk on certain Fund positions denominated in foreign currencies. The forward foreign currency exchange contracts contributed to the Fund's total return during the six-month period ended June 30, 2016, while the currency options did not have a material effect on the Fund's total return for the period.
Sincerely,
|
| ||||||||||
WILLIAM F. SCAPELL | ELAINE ZAHARIS-NIKAS | ||||||||||
Portfolio Manager | Portfolio Manager | ||||||||||


The views and opinions in the preceding commentary are subject to change without notice and are as of the date of the report. There is no guarantee that any market forecast set forth in the commentary will be realized. This material represents an assessment of the market environment at a specific point in time, should not be relied upon as investment advice and is not intended to predict or depict performance of any investment.
3
COHEN & STEERS PREFERRED SECURITIES AND INCOME FUND, INC.
Visit Cohen & Steers online at cohenandsteers.com
For more information about the Cohen & Steers family of mutual funds, visit cohenandsteers.com. Here you will find fund net asset values, fund fact sheets and portfolio highlights, as well as educational resources and timely market updates.
Our website also provides comprehensive information about Cohen & Steers, including our most recent press releases, profiles of our senior investment professionals and their investment approach to each asset class. The Cohen & Steers family of mutual funds invests in major real asset categories including real estate securities, listed infrastructure, commodities and natural resource equities, as well as preferred securities and other income solutions.
4
COHEN & STEERS PREFERRED SECURITIES AND INCOME FUND, INC.
Performance Review (Unaudited)
Average Annual Total Returns—For Periods Ended June 30, 2016
| Class A Shares | Class C Shares | Class I Shares | Class R Shares | Class Z Shares | |||||||||||||||||||
1 Year (with sales charge) | 2.67 | %a | 4.94 | %b | — | — | — | ||||||||||||||||
1 Year (without sales charge) | 6.67 | % | 5.94 | % | 7.02 | % | 6.47 | % | 7.10 | % | |||||||||||||
5 Years (with sales charge) | 7.52 | %a | 7.65 | % | — | — | — | ||||||||||||||||
5 Years (without sales charge) | 8.35 | % | 7.65 | % | 8.74 | % | — | — | |||||||||||||||
Since Inceptionc (with sales charge) | 8.57 | %a | 8.52 | % | — | — | — | ||||||||||||||||
Since Inceptionc (without sales charge) | 9.25 | % | 8.52 | % | 9.63 | % | 6.16 | % | 6.69 | % | |||||||||||||
The performance data quoted represent past performance. Past performance is no guarantee of future results. The investment return and principal value of an investment will fluctuate and shares, if redeemed, may be worth more or less than their original cost. Current performance may be lower or higher than the performance data quoted. Performance information current to the most recent month end can be obtained by visiting our website at cohenandsteers.com. All share class returns assume the reinvestment of all dividends and distributions at NAV. The performance table does not reflect the deduction of taxes that a shareholder would pay on Fund distributions or the redemption of Fund shares. During the periods presented above, the investment advisor waived fees and/or reimbursed expenses. Without this arrangement, performance would have been lower.
The annualized gross and net expense ratios, respectively, for each class of shares as disclosed in the May 1, 2016 prospectus, were as follows: Class A—1.19% and 1.19%; Class C—1.84% and 1.84%; Class I—0.94% and 0.85%; Class R—1.34% and 1.34%; and Class Z—0.84% and 0.84%. The investment advisor has contractually agreed to waive its fee and/or reimburse expenses through June 30, 2018, so that the Fund's total annual operating expenses (excluding acquired fund fees and expenses, taxes and extraordinary expenses) do not exceed 1.20% for Class A shares, 1.85% for Class C shares, 0.85% for Class I shares, 1.35% for Class R shares and 0.85% for Class Z shares. This contractual agreement can be amended at any time by agreement of the Fund and the investment advisor and will terminate automatically in the event of termination of the investment advisory agreement between the investment advisor and the Fund.
a Reflects a 3.75% front-end sales charge.
b Reflects a contingent deferred sales charge of 1.00%.
c Inception date of May 3, 2010 for Class A, C and I shares and October 1, 2014 for Class R and Z shares.
5
COHEN & STEERS PREFERRED SECURITIES AND INCOME FUND, INC.
Expense Example (Unaudited)
As a shareholder of the Fund, you incur two types of costs: (1) transaction costs, including sales charges (loads) on purchase payments; and (2) ongoing costs including investment advisory fees; distribution and/or service (12b-1) fees; and other Fund expenses. This example is intended to help you understand your ongoing costs (in dollars) of investing in the Fund and to compare these costs with the ongoing costs of investing in other mutual funds.
The example is based on an investment of $1,000 invested at the beginning of the period and held for the entire period January 1, 2016—June 30, 2016.
Actual Expenses
The first line of the following table provides information about actual account values and expenses. You may use the information in this line, together with the amount you invested, to estimate the expenses that you paid over the period. Simply divide your account value by $1,000 (for example, an $8,600 account value divided by $1,000 = 8.6), then multiply the result by the number in the first line under the heading entitled "Expenses Paid During Period" to estimate the expenses you paid on your account during this period.
Hypothetical Example for Comparison Purposes
The second line of the following table provides information about hypothetical account values and hypothetical expenses based on the Fund's actual expense ratio and an assumed rate of return of 5% per year before expenses, which is not the Fund's actual return. The hypothetical account values and expenses may not be used to estimate the actual ending account balance or expenses you paid for the period. You may use this information to compare the ongoing cost of investing in the Fund and other funds. To do so, compare this 5% hypothetical example with the 5% hypothetical examples that appear in the shareholder reports of other funds.
Please note that the expenses shown in the table are meant to highlight your ongoing costs only and do not reflect any transaction costs, such as sales charges (loads). Therefore, the second line of the table is useful in comparing ongoing costs only, and will not help you determine the relative total costs of owning different funds. In addition, if these transactional costs were included, your costs would have been higher.
6
COHEN & STEERS PREFERRED SECURITIES AND INCOME FUND, INC.
Expense Example (Unaudited)—(Continued)
| Beginning Account Value January 1, 2016 | Ending Account Value June 30, 2016 | Expenses Paid During Perioda January 1, 2016– June 30, 2016 | |||||||||||||
Class A | |||||||||||||||
Actual (3.42% return) | $ | 1,000.00 | $ | 1,034.20 | $ | 5.97 | |||||||||
| Hypothetical (5% annual return before expenses) | $ | 1,000.00 | $ | 1,019.00 | $ | 5.92 | |||||||||
Class C | |||||||||||||||
Actual (3.12% return) | $ | 1,000.00 | $ | 1,031.20 | $ | 9.24 | |||||||||
| Hypothetical (5% annual return before expenses) | $ | 1,000.00 | $ | 1,015.76 | $ | 9.17 | |||||||||
Class I | |||||||||||||||
Actual (3.59% return) | $ | 1,000.00 | $ | 1,035.90 | $ | 4.30 | |||||||||
| Hypothetical (5% annual return before expenses) | $ | 1,000.00 | $ | 1,020.64 | $ | 4.27 | |||||||||
Class R | |||||||||||||||
Actual (3.33% return) | $ | 1,000.00 | $ | 1,033.30 | $ | 6.72 | |||||||||
| Hypothetical (5% annual return before expenses) | $ | 1,000.00 | $ | 1,018.25 | $ | 6.67 | |||||||||
Class Z | |||||||||||||||
Actual (3.67% return) | $ | 1,000.00 | $ | 1,036.70 | $ | 4.20 | |||||||||
| Hypothetical (5% annual return before expenses) | $ | 1,000.00 | $ | 1,020.74 | $ | 4.17 | |||||||||
a Expenses are equal to the Fund's Class A, Class C, Class I , Class R and Class Z annualized net expense ratios of 1.18%, 1.83%, 0.85%, 1.33% and 0.83%, respectively, multiplied by the average account value over the period, multiplied by 182/366 (to reflect the one-half year period).
7
COHEN & STEERS PREFERRED SECURITIES AND INCOME FUND, INC.
June 30, 2016
Top Ten Holdingsa
(Unaudited)
| Security | Value | % of Net Assets | |||||||||
General Electric Co., 5.00%, Series D | $ | 173,846,773 | 3.0 | ||||||||
Rabobank Nederland, 11.00%, 144A (Netherlands) | 131,225,036 | 2.2 | |||||||||
Emera, 6.75%, due 6/15/76, Series 16-A (Canada) | 119,010,107 | 2.0 | |||||||||
Wells Fargo & Co., 7.98%, Series K | 105,436,112 | 1.8 | |||||||||
JPMorgan Chase & Co., 6.75%, Series S | 104,197,275 | 1.8 | |||||||||
Meiji Yasuda Life Insurance Co., 5.20%, due 10/20/45, 144A (Japan) | 99,877,181 | 1.7 | |||||||||
Prudential Financial, 5.625%, due 6/15/43 | 92,331,286 | 1.6 | |||||||||
Bank of America Corp., 6.50%, Series Z | 88,708,801 | 1.5 | |||||||||
JPMorgan Chase & Co., 7.90%, Series I | 86,857,312 | 1.5 | |||||||||
Nippon Life Insurance Co., 4.70%, due 1/20/46, 144A (Japan) | 85,095,868 | 1.5 | |||||||||
a Top ten holdings are determined on the basis of the value of individual securities held. The Fund may also hold positions in other types of securities issued by the companies listed above. See the Schedule of Investments for additional details on such other positions.
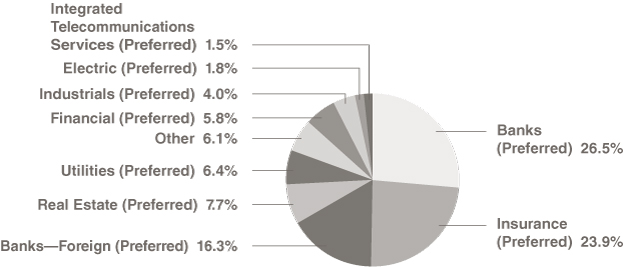
Sector Breakdown
(Based on Net Assets)
(Unaudited)
8
COHEN & STEERS PREFERRED SECURITIES AND INCOME FUND, INC.
SCHEDULE OF INVESTMENTS
June 30, 2016 (Unaudited)
| Number of Shares | Value | ||||||||||||||
PREFERRED SECURITIES—$25 PAR VALUE | 37.7% | ||||||||||||||
BANKS | 11.6% | ||||||||||||||
Astoria Financial Corp., 6.50%, Series C | 286,122 | $ | 7,593,678 | ||||||||||||
Bank of America Corp., 6.20%, Series CC | 891,049 | 23,390,036 | |||||||||||||
Bank of America Corp., 6.00%, Series EE | 1,412,000 | 36,768,480 | |||||||||||||
Bank of America Corp., 6.50%, Series Y | 1,695,472 | 45,981,201 | |||||||||||||
BB&T Corp., 5.625% | 1,009,534 | 26,651,698 | |||||||||||||
Capital One Financial Corp., 6.70%, Series D | 349,175 | 9,881,652 | |||||||||||||
Citigroup, 6.875%, Series K | 1,057,058 | 30,073,300 | |||||||||||||
Citigroup, 6.30%, Series S | 1,108,770 | 29,604,159 | |||||||||||||
Citigroup Capital XIII, 7.008%, due 10/30/40, (FRN) | 1,019,511 | 26,578,652 | |||||||||||||
Countrywide Capital IV, 6.75%, due 4/1/33 | 706,780 | 18,199,585 | |||||||||||||
Farm Credit Bank of Texas, 6.75%, 144Aa | 211,700 | 22,089,582 | |||||||||||||
Fifth Third Bancorp, 6.625%, Series I | 663,555 | 20,125,623 | |||||||||||||
First Republic Bank, 6.20%, Series B | 427,908 | 11,373,795 | |||||||||||||
| GMAC Capital Trust I, 6.411%, due 2/15/40, Series 2 (TruPS) (FRN) | 2,503,469 | 62,136,101 | |||||||||||||
Goldman Sachs Group/The, 6.30%, Series N | 405,677 | 10,941,109 | |||||||||||||
Huntington Bancshares, 6.25%, Series D | 2,161,475 | 58,251,751 | |||||||||||||
JPMorgan Chase & Co., 6.10%, Series AA | 236,250 | 6,286,613 | |||||||||||||
JPMorgan Chase & Co., 6.15%, Series BB | 679,438 | 18,174,966 | |||||||||||||
JPMorgan Chase & Co., 6.125%, Series Y | 877,800 | 23,525,040 | |||||||||||||
PNC Financial Services Group, 6.125%, Series P | 571,449 | 17,309,190 | |||||||||||||
PrivateBancorp, 7.125%, due 10/30/42 | 433,704 | 11,428,100 | |||||||||||||
Regions Financial Corp., 6.375%, Series B | 1,432,881 | 40,306,943 | |||||||||||||
SunTrust Banks, 5.875%, Series E | 158,684 | 4,174,976 | |||||||||||||
US Bancorp, 6.50%, Series F | 353,188 | 10,878,190 | |||||||||||||
Wells Fargo & Co., 5.85% | 1,480,158 | 40,837,559 | |||||||||||||
Wells Fargo & Co., 6.625% | 186,640 | 5,554,406 | |||||||||||||
Wells Fargo & Co., 6.00%, Series V | 197,775 | 5,357,725 | |||||||||||||
Wells Fargo & Co., 5.70%, Series W | 798,770 | 21,175,393 | |||||||||||||
Wells Fargo & Co., 5.50%, Series X | 860,000 | 22,170,800 | |||||||||||||
Zions Bancorp, 7.90%, Series F | 357,785 | 9,599,372 | |||||||||||||
Zions Bancorp, 6.30%, Series G | 101,538 | 2,975,063 | |||||||||||||
679,394,738 | |||||||||||||||
See accompanying notes to financial statements.
9
COHEN & STEERS PREFERRED SECURITIES AND INCOME FUND, INC.
SCHEDULE OF INVESTMENTS—(Continued)
June 30, 2016 (Unaudited)
| Number of Shares | Value | ||||||||||||||
BANKS—FOREIGN | 1.1% | ||||||||||||||
| Barclays Bank PLC, 8.125%, Series 5 (United Kingdom) | 672,330 | $ | 17,379,731 | ||||||||||||
| Barclays Bank PLC, 7.10%, Series III (United Kingdom) | 1,079,892 | 27,796,420 | |||||||||||||
| HSBC Holdings PLC, 8.00%, Series 2 (United Kingdom) | 280,000 | 7,428,400 | |||||||||||||
| National Westminster Bank PLC, 7.763%, Series C (United Kingdom) | 444,772 | 11,577,415 | |||||||||||||
64,181,966 | |||||||||||||||
ELECTRIC | 1.8% | ||||||||||||||
INTEGRATED ELECTRIC | 0.9% | ||||||||||||||
DTE Energy Co, 5.375%, due 6/1/76, Series B | 1,395,174 | 36,302,427 | |||||||||||||
Integrys Holdings, 6.00%, due 8/1/73 | 616,877 | 16,694,234 | |||||||||||||
52,996,661 | |||||||||||||||
REGULATED ELECTRIC | 0.9% | ||||||||||||||
Southern Co./The, 6.25%, due 10/15/75 | 1,777,500 | 49,556,700 | |||||||||||||
TOTAL ELECTRIC | 102,553,361 | ||||||||||||||
FINANCIAL | 4.7% | ||||||||||||||
DIVERSIFIED FINANCIAL SERVICES | 1.2% | ||||||||||||||
KKR & Co. LP, 6.75%, Series A | 1,272,053 | 34,103,741 | |||||||||||||
State Street Corp., 5.90%, Series D | 288,410 | 8,130,278 | |||||||||||||
State Street Corp., 5.35%, Series G | 1,048,325 | 28,137,043 | |||||||||||||
70,371,062 | |||||||||||||||
INVESTMENT ADVISORY SERVICES | 0.5% | ||||||||||||||
Affiliated Managers Group, 6.375%, due 8/15/42 | 419,576 | 11,194,287 | |||||||||||||
Ares Management LP, 7.00%, Series A | 640,000 | 16,390,400 | |||||||||||||
27,584,687 | |||||||||||||||
INVESTMENT BANKER/BROKER | 3.0% | ||||||||||||||
Charles Schwab Corp./The, 6.00%, Series C | 592,000 | 16,149,760 | |||||||||||||
Charles Schwab Corp./The, 5.95%, Series D | 1,645,700 | 44,170,588 | |||||||||||||
Morgan Stanley, 6.875% | 1,583,781 | 45,517,866 | |||||||||||||
Morgan Stanley, 6.375%, Series I | 2,611,878 | 70,651,300 | |||||||||||||
176,489,514 | |||||||||||||||
TOTAL FINANCIAL | 274,445,263 | ||||||||||||||
See accompanying notes to financial statements.
10
COHEN & STEERS PREFERRED SECURITIES AND INCOME FUND, INC.
SCHEDULE OF INVESTMENTS—(Continued)
June 30, 2016 (Unaudited)
| Number of Shares | Value | ||||||||||||||
INDUSTRIALS—CHEMICALS | 1.0% | ||||||||||||||
CHS, 6.75% | 833,495 | $ | 23,754,607 | ||||||||||||
CHS, 7.50%, Series 4 | 337,525 | 9,700,469 | |||||||||||||
CHS, 7.10%, Series II | 931,510 | 27,106,941 | |||||||||||||
60,562,017 | |||||||||||||||
INSURANCE | 5.7% | ||||||||||||||
LIFE/HEALTH INSURANCE—FOREIGN | 0.4% | ||||||||||||||
Aegon NV, 6.50% (Netherlands) | 810,308 | 21,335,410 | |||||||||||||
MULTI-LINE | 1.6% | ||||||||||||||
Allstate Corp., 6.625%, Series E | 724,421 | 20,653,242 | |||||||||||||
Hanover Insurance Group/The, 6.35%, due 3/30/53 | 408,438 | 10,545,869 | |||||||||||||
| Hartford Financial Services Group, 7.875%, due 4/15/42 | 557,445 | 17,565,092 | |||||||||||||
WR Berkley Corp., 5.625%, due 4/30/53 | 640,824 | 16,334,604 | |||||||||||||
WR Berkley Corp., 5.75%, due 6/1/56 | 1,139,400 | 28,917,972 | |||||||||||||
94,016,779 | |||||||||||||||
MULTI-LINE—FOREIGN | 2.5% | ||||||||||||||
ING Groep N.V., 7.05% (Netherlands) | 1,571,713 | 41,446,072 | |||||||||||||
ING Groep N.V., 7.20% (Netherlands) | 1,536,360 | 40,467,722 | |||||||||||||
PartnerRe Ltd, 5.875%, Series I (Bermuda) | 372,949 | 9,711,592 | |||||||||||||
PartnerRe Ltd., 6.50%, Series G (Bermuda) | 1,195,240 | 34,638,055 | |||||||||||||
PartnerRe Ltd., 7.25%, Series H (Bermuda) | 600,709 | 18,099,362 | |||||||||||||
144,362,803 | |||||||||||||||
REINSURANCE | 0.7% | ||||||||||||||
Reinsurance Group of America, 5.75%, due 6/15/56 | 1,105,000 | 30,056,000 | |||||||||||||
Reinsurance Group of America, 6.20%, due 9/15/42 | 474,760 | 14,128,858 | |||||||||||||
44,184,858 | |||||||||||||||
REINSURANCE—FOREIGN | 0.5% | ||||||||||||||
Aspen Insurance Holdings Ltd., 5.95% (Bermuda) | 533,876 | 15,167,417 | |||||||||||||
Aspen Insurance Holdings Ltd., 7.25% (Bermuda) | 338,689 | 8,924,455 | |||||||||||||
| Axis Capital Holdings Ltd., 6.875%, Series C (Bermuda) | 317,492 | 8,321,466 | |||||||||||||
32,413,338 | |||||||||||||||
TOTAL INSURANCE | 336,313,188 | ||||||||||||||
See accompanying notes to financial statements.
11
COHEN & STEERS PREFERRED SECURITIES AND INCOME FUND, INC.
SCHEDULE OF INVESTMENTS—(Continued)
June 30, 2016 (Unaudited)
| Number of Shares | Value | ||||||||||||||
INTEGRATED TELECOMMUNICATIONS SERVICES | 0.6% | ||||||||||||||
Qwest Corp., 6.875%, due 10/1/54 | 378,458 | $ | 9,904,246 | ||||||||||||
Qwest Corp., 7.00%, due 4/1/52 | 248,907 | 6,479,049 | |||||||||||||
Qwest Corp., 7.375%, due 6/1/51 | 500,000 | 13,310,000 | |||||||||||||
Qwest Corp., 7.50%, due 9/15/51 | 181,763 | 4,694,938 | |||||||||||||
34,388,233 | |||||||||||||||
REAL ESTATE | 7.7% | ||||||||||||||
DIVERSIFIED | 3.4% | ||||||||||||||
Colony Capital, 7.125% | 464,352 | 10,861,193 | |||||||||||||
Colony Financial, 8.50%, Series A | 454,820 | 11,597,910 | |||||||||||||
Coresite Realty Corp., 7.25%, Series A | 406,311 | 10,746,926 | |||||||||||||
DuPont Fabros Technology, 6.625%, Series C | 400,000 | 10,920,000 | |||||||||||||
Equity Commonwealth, 6.50%, Series D | 402,733 | 10,603,960 | |||||||||||||
National Retail Properties, 5.70%, Series E | 684,045 | 18,264,001 | |||||||||||||
NorthStar Realty Finance Corp., 8.50%, Series D | 588,434 | 14,581,395 | |||||||||||||
NorthStar Realty Finance Corp., 8.75%, Series E | 413,128 | 10,332,331 | |||||||||||||
Retail Properties of America, 7.00% | 506,582 | 13,277,514 | |||||||||||||
Urstadt Biddle Properties, 7.125%, Series F | 277,630 | 7,401,616 | |||||||||||||
VEREIT, 6.70%, Series F | 2,017,929 | 52,264,361 | |||||||||||||
Vornado Realty Trust, 6.625%, Series G | 435,304 | 11,400,612 | |||||||||||||
Vornado Realty Trust, 5.40%, Series L | 318,000 | 8,258,460 | |||||||||||||
| Wells Fargo Real Estate Investment Corp., 6.375%, Series A | 301,681 | 8,308,295 | |||||||||||||
198,818,574 | |||||||||||||||
HEALTH CARE | 0.2% | ||||||||||||||
Sabra Health Care REIT, 7.125%, Series A | 430,575 | 11,272,454 | |||||||||||||
HOTEL | 0.9% | ||||||||||||||
Chesapeake Lodging Trust, 7.75%, Series A | 395,206 | 10,421,582 | |||||||||||||
Hersha Hospitality Trust, 6.875%, Series C | 199,569 | 5,188,794 | |||||||||||||
Hospitality Properties Trust, 7.125%, Series D | 163,806 | 4,219,643 | |||||||||||||
LaSalle Hotel Properties, 6.375%, Series I | 360,722 | 9,183,982 | |||||||||||||
LaSalle Hotel Properties, 6.30%, Series J | 216,000 | 5,585,760 | |||||||||||||
Pebblebrook Hotel Trust, 6.50%, Series C | 170,000 | 4,387,700 | |||||||||||||
Summit Hotel Properties, 7.125% | 317,800 | 8,305,703 | |||||||||||||
Sunstone Hotel Investors, 6.95%, Series E | 255,000 | 6,777,900 | |||||||||||||
54,071,064 | |||||||||||||||
See accompanying notes to financial statements.
12
COHEN & STEERS PREFERRED SECURITIES AND INCOME FUND, INC.
SCHEDULE OF INVESTMENTS—(Continued)
June 30, 2016 (Unaudited)
| Number of Shares | Value | ||||||||||||||
INDUSTRIALS | 0.1% | ||||||||||||||
Gramercy Property Trust, 7.125%, Series A | 252,096 | $ | 6,717,098 | ||||||||||||
OFFICE | 0.4% | ||||||||||||||
Corporate Office Properties Trust, 7.375%, Series L | 352,000 | 9,144,960 | |||||||||||||
PS Business Parks, 6.45%, Series S | 217,689 | 5,605,492 | |||||||||||||
PS Business Parks, 6.00%, Series T | 346,663 | 9,047,904 | |||||||||||||
23,798,356 | |||||||||||||||
RESIDENTIAL | 0.9% | ||||||||||||||
APARTMENT | 0.8% | ||||||||||||||
American Homes 4 Rent, 5.50%, Series C | 392,187 | 10,404,721 | |||||||||||||
American Homes 4 Rent, 6.50%, Series D | 525,583 | 13,807,066 | |||||||||||||
American Homes 4 Rent, 6.35%, Series E | 650,000 | 16,308,500 | |||||||||||||
Apartment Investment & Management Co., 6.875% | 240,000 | 6,480,000 | |||||||||||||
47,000,287 | |||||||||||||||
MANUFACTURED HOME | 0.1% | ||||||||||||||
Equity Lifestyle Properties, 6.75%, Series C | 261,988 | 6,934,822 | |||||||||||||
TOTAL RESIDENTIAL | 53,935,109 | ||||||||||||||
SELF STORAGE | 0.3% | ||||||||||||||
Public Storage, 5.875%, Series A | 204,243 | 5,641,192 | |||||||||||||
Public Storage, 5.375%, Series V | 340,557 | 8,881,726 | |||||||||||||
14,522,918 | |||||||||||||||
SHOPPING CENTERS | 1.3% | ||||||||||||||
COMMUNITY CENTER | 0.6% | ||||||||||||||
Cedar Realty Trust, 7.25%, Series B | 447,900 | 11,656,598 | |||||||||||||
DDR Corp., 6.50%, Series J | 236,707 | 6,168,584 | |||||||||||||
Saul Centers, 6.875%, Series C | 360,731 | 9,631,518 | |||||||||||||
WP GLIMCHER, 7.50%, Series H | 201,800 | 5,174,152 | |||||||||||||
32,630,852 | |||||||||||||||
REGIONAL MALL | 0.7% | ||||||||||||||
CBL & Associates Properties, 7.375%, Series D | 723,312 | 18,032,168 | |||||||||||||
Pennsylvania REIT, 8.25%, Series A | 265,069 | 6,992,520 | |||||||||||||
Taubman Centers, 6.50%, Series J | 170,050 | 4,423,001 | |||||||||||||
Taubman Centers, 6.25%, Series K | 387,909 | 10,105,029 | |||||||||||||
39,552,718 | |||||||||||||||
TOTAL SHOPPING CENTERS | 72,183,570 | ||||||||||||||
See accompanying notes to financial statements.
13
COHEN & STEERS PREFERRED SECURITIES AND INCOME FUND, INC.
SCHEDULE OF INVESTMENTS—(Continued)
June 30, 2016 (Unaudited)
| Number of Shares | Value | ||||||||||||||
SPECIALTY | 0.2% | ||||||||||||||
Digital Realty Trust, 6.35%, Series I | 499,000 | $ | 13,248,450 | ||||||||||||
TOTAL REAL ESTATE | 448,567,593 | ||||||||||||||
TECHNOLOGY—SOFTWARE | 0.6% | ||||||||||||||
eBay, 6.00%, due 2/1/56 | 1,401,316 | 37,232,966 | |||||||||||||
UTILITIES | 2.9% | ||||||||||||||
Entergy New Orleans, 5.50%, due 4/1/66 | 509,700 | 13,685,445 | |||||||||||||
| NextEra Energy Capital Holdings, 5.25%, due 6/1/76, Series K | 1,507,426 | 38,725,774 | |||||||||||||
PPL Capital Funding, 5.90%, due 4/30/73, Series B | 257,400 | 6,924,060 | |||||||||||||
SCE Trust III, 5.75% | 590,928 | 17,136,912 | |||||||||||||
SCE Trust IV, 5.375%, Series J | 1,600,000 | 44,592,000 | |||||||||||||
SCE Trust V, 5.45%, Series K | 1,705,000 | 48,677,750 | |||||||||||||
169,741,941 | |||||||||||||||
| TOTAL PREFERRED SECURITIES—$25 PAR VALUE (Identified cost—$2,063,279,640) | 2,207,381,266 | ||||||||||||||
PREFERRED SECURITIES—CAPITAL SECURITIES | 57.9% | ||||||||||||||
BANKS | 14.9% | ||||||||||||||
AgriBank FCB, 6.875% | 127,000 | 13,402,475 | |||||||||||||
Bank of America Corp., 6.30%, Series DD | 33,900,000 | 36,103,500 | |||||||||||||
Bank of America Corp., 6.50%, Series Z | 83,197,000 | 88,708,801 | |||||||||||||
Citigroup, 6.125%, Series R | 33,564,000 | 34,109,415 | |||||||||||||
Citigroup, 6.25%, Series T | 79,675,000 | 81,965,656 | |||||||||||||
CoBank ACB, 6.25%, 144Aa | 315,300 | 32,692,669 | |||||||||||||
CoBank ACB, 6.125%, Series G | 200,200 | 19,062,804 | |||||||||||||
CoBank ACB, 6.25%, Series I | 39,121,000 | 41,343,973 | |||||||||||||
| Countrywide Capital III, 8.05%, due 6/15/27, Series B | 3,000,000 | 3,810,921 | |||||||||||||
Farm Credit Bank of Texas, 10.00%, Series I | 29,250 | 34,743,516 | |||||||||||||
Goldman Sachs Capital I, 6.345%, due 2/15/34 | 13,687,000 | 16,129,623 | |||||||||||||
| Huntington Bancshares, 8.50%, Series A (Convertible) | 12,788 | 18,031,080 | |||||||||||||
JPMorgan Chase & Co., 7.90%, Series Ib | 85,050,000 | 86,857,312 | |||||||||||||
JPMorgan Chase & Co., 6.75%, Series S | 94,510,000 | 104,197,275 | |||||||||||||
JPMorgan Chase & Co., 5.30%, Series Z | 29,525,000 | 29,488,094 | |||||||||||||
PNC Financial Services Group, 6.75% | 28,152,000 | 31,457,045 | |||||||||||||
See accompanying notes to financial statements.
14
COHEN & STEERS PREFERRED SECURITIES AND INCOME FUND, INC.
SCHEDULE OF INVESTMENTS—(Continued)
June 30, 2016 (Unaudited)
| Number of Shares | Value | ||||||||||||||
| Sovereign Real Estate Investment Trust, 12.00%, 144Aa | 4,090 | $ | 5,209,637 | ||||||||||||
US Bancorp, 5.125%, Series I | 11,334,000 | 11,674,020 | |||||||||||||
Wells Fargo & Co., 7.98%, Series K | 100,655,000 | 105,436,112 | |||||||||||||
Wells Fargo & Co., 7.50%, Series L (Convertible) | 20,000 | 25,984,000 | |||||||||||||
Wells Fargo & Co., 5.875%, Series U | 48,850,000 | 52,147,375 | |||||||||||||
872,555,303 | |||||||||||||||
BANKS—FOREIGN | 15.2% | ||||||||||||||
| Allied Irish Banks PLC, 7.375%, Series EMTN (EUR) (Ireland) | 22,600,000 | 22,139,675 | |||||||||||||
| Australia & New Zealand Banking Group Ltd./ United Kingdom, 6.75%, 144A (Australia)a | 40,655,000 | 42,047,312 | |||||||||||||
| Banco Bilbao Vizcaya Argentaria SA, 8.875% (EUR) (Spain) | 47,600,000 | 52,329,922 | |||||||||||||
| Banco Bilbao Vizcaya Argentaria SA, 9.00% (Spain) | 15,800,000 | 15,806,178 | |||||||||||||
Bank of Ireland, 7.375% (EUR) (Ireland) | 23,200,000 | 23,965,331 | |||||||||||||
Barclays PLC, 8.25% (United Kingdom) | 37,509,000 | 36,830,087 | |||||||||||||
BNP Paribas, 7.195%, 144A (France)a | 24,671,000 | 26,706,358 | |||||||||||||
BNP Paribas SA, 7.625%, 144A (France)a | 27,400,000 | 27,468,500 | |||||||||||||
| Cooperatieve Rabobank UA, 6.625% (EUR) (Netherlands) | 20,800,000 | 23,197,841 | |||||||||||||
Credit Agricole SA, 8.125%, 144A (France)a | 45,900,000 | 45,821,649 | |||||||||||||
| Credit Suisse Group AG, 7.50%, 144A (Switzerland)a | 22,559,000 | 22,783,236 | |||||||||||||
| Dresdner Funding Trust I, 8.151%, due 6/30/31, 144A (Germany)a | 39,516,945 | 46,155,792 | |||||||||||||
| HSBC Capital Funding LP, 10.176%, 144A (United Kingdom)a | 30,454,000 | 43,884,214 | |||||||||||||
HSBC Holdings PLC, 6.875% (United Kingdom) | 46,300,000 | 46,184,250 | |||||||||||||
Lloyds Banking Group PLC, 7.50% (United Kingdom) | 57,250,000 | 56,105,000 | |||||||||||||
| Nationwide Building Society, 10.25%, due 12/6/99 (GBP) (United Kingdom) | 33,456,000 | 55,149,083 | |||||||||||||
| Rabobank Nederland, 11.00%, 144A (Netherlands)a | 109,697,000 | 131,225,036 | |||||||||||||
| Royal Bank of Scotland Group PLC, 7.50% (United Kingdom) | 20,875,000 | 19,152,813 | |||||||||||||
See accompanying notes to financial statements.
15
COHEN & STEERS PREFERRED SECURITIES AND INCOME FUND, INC.
SCHEDULE OF INVESTMENTS—(Continued)
June 30, 2016 (Unaudited)
| Number of Shares | Value | ||||||||||||||
| Royal Bank of Scotland Group PLC, 7.648% (United Kingdom) | 25,829,000 | $ | 30,607,365 | ||||||||||||
| Royal Bank of Scotland Group PLC, 8.00% (United Kingdom) | 22,900,000 | 21,411,500 | |||||||||||||
UBS AG, 7.625%, due 8/17/22 (Switzerland) | 10,000,000 | 11,350,000 | |||||||||||||
UBS Group AG, 6.875% (Switzerland) | 40,100,000 | 39,348,125 | |||||||||||||
UBS Group AG, 7.00% (Switzerland) | 15,400,000 | 15,668,514 | |||||||||||||
UBS Group AG, 7.125% (Switzerland) | 34,915,000 | 34,798,733 | |||||||||||||
890,136,514 | |||||||||||||||
FINANCIAL—DIVERSIFIED FINANCIAL SERVICES | 1.1% | ||||||||||||||
| Depository Trust & Clearing Corp/The, 4.875%, Series C, 144Aa | 24,000,000 | 24,090,000 | |||||||||||||
| National Rural Utilities Cooperative Finance Corp., 5.25%, due 4/20/46 | 19,200,000 | 19,695,187 | |||||||||||||
State Street Corp., 5.25%, Series F | 17,725,000 | 18,301,063 | |||||||||||||
62,086,250 | |||||||||||||||
INDUSTRIALS—DIVERSIFIED MANUFACTURING | 3.0% | ||||||||||||||
General Electric Co., 5.00%, Series D | 163,659,000 | 173,846,773 | |||||||||||||
INSURANCE | 18.2% | ||||||||||||||
LIFE/HEALTH INSURANCE | 6.2% | ||||||||||||||
MetLife, 5.25%, Series C | 29,754,000 | 29,605,230 | |||||||||||||
MetLife Capital Trust IV, 7.875%, due 12/15/67, 144Aa | 64,168,000 | 76,841,180 | |||||||||||||
MetLife Capital Trust X, 9.25%, due 4/8/68, 144Aa | 55,828,000 | 76,753,060 | |||||||||||||
Provident Financing Trust I, 7.405%, due 3/15/38 | 15,475,000 | 17,242,214 | |||||||||||||
Prudential Financial, 5.625%, due 6/15/43 | 88,434,000 | 92,331,286 | |||||||||||||
Prudential Financial, 5.875%, due 9/15/42 | 41,362,000 | 44,774,365 | |||||||||||||
Voya Financial, 5.65%, due 5/15/53 | 26,025,000 | 24,561,094 | |||||||||||||
362,108,429 | |||||||||||||||
See accompanying notes to financial statements.
16
COHEN & STEERS PREFERRED SECURITIES AND INCOME FUND, INC.
SCHEDULE OF INVESTMENTS—(Continued)
June 30, 2016 (Unaudited)
| Number of Shares | Value | ||||||||||||||
LIFE/HEALTH INSURANCE—FOREIGN | 7.1% | ||||||||||||||
| Achmea BV, 4.25%, Series EMTN (EUR) (Netherlands) | 24,000,000 | $ | 23,389,336 | ||||||||||||
| Cloverie PLC for Zurich Insurance Co., Ltd., 5.625%, due 6/24/46 (Ireland) | 27,900,000 | 29,556,562 | |||||||||||||
| Dai-ichi Life Insurance Co. Ltd., 5.10%, 144A (Japan)a | 14,200,000 | 15,584,500 | |||||||||||||
| Dai-ichi Life Insurance Co. Ltd., 7.25%, 144A (Japan)a | 20,808,000 | 24,888,699 | |||||||||||||
| Demeter BV (Swiss Re Ltd.), 5.652%, due 8/15/52 (Netherlands) | 33,700,000 | 34,396,242 | |||||||||||||
Fukoku Mutual Life Insurance Co., 5.00% (Japan) | 10,000,000 | 10,573,000 | |||||||||||||
La Mondiale Vie, 7.625% (France) | 36,550,000 | 38,720,339 | |||||||||||||
| Meiji Yasuda Life Insurance Co., 5.20%, due 10/20/45, 144A (Japan)a | 91,025,000 | 99,877,181 | |||||||||||||
| Nippon Life Insurance Co., 4.70%, due 1/20/46, 144A (Japan)a | 80,600,000 | 85,095,868 | |||||||||||||
| Nippon Life Insurance Co., 5.10%, due 10/16/44, 144A (Japan)a | 24,200,000 | 26,072,257 | |||||||||||||
| Prudential PLC, 5.25%, Series EMTN (United Kingdom) | 10,000,000 | 10,294,840 | |||||||||||||
| Sumitomo Life Insurance Co., 6.50%, due 9/20/73, 144A (Japan)a | 16,500,000 | 19,305,000 | |||||||||||||
417,753,824 | |||||||||||||||
MULTI-LINE—FOREIGN | 1.1% | ||||||||||||||
Aviva PLC, 8.25% (United Kingdom) | 15,417,000 | 16,378,266 | |||||||||||||
AXA SA, 8.60%, due 12/15/30 (France) | 18,063,000 | 24,836,625 | |||||||||||||
AXA SA, 6.463%, 144A (France)a | 21,980,000 | 22,946,021 | |||||||||||||
64,160,912 | |||||||||||||||
PROPERTY CASUALTY | 1.2% | ||||||||||||||
| Farmers Exchange Capital II, 6.151%, due 11/1/53, 144Aa | 3,220,000 | 3,404,783 | |||||||||||||
Liberty Mutual Group, 7.80%, due 3/7/87, 144Aa | 61,886,000 | 67,610,455 | |||||||||||||
71,015,238 | |||||||||||||||
See accompanying notes to financial statements.
17
COHEN & STEERS PREFERRED SECURITIES AND INCOME FUND, INC.
SCHEDULE OF INVESTMENTS—(Continued)
June 30, 2016 (Unaudited)
| Number of Shares | Value | ||||||||||||||
PROPERTY CASUALTY—FOREIGN | 1.7% | ||||||||||||||
| Mitsui Sumitomo Insurance Co., Ltd., 7.00%, due 3/15/72, 144A (Japan)a | 12,886,000 | $ | 15,479,308 | ||||||||||||
| QBE Insurance Group Ltd., 6.75%, due 12/2/44 (Australia) | 41,438,000 | 44,390,457 | |||||||||||||
| QBE Insurance Group Ltd., 5.875%, due 6/17/46, Series EMTN (Australia) | 20,400,000 | 20,787,457 | |||||||||||||
| RL Finance Bonds No. 3 PLC, 6.125%, due 11/13/28 (GBP) (United Kingdom) | 8,600,000 | 11,749,287 | |||||||||||||
| Sompo Japan Nipponkoa Insurance, 5.325%, due 3/28/73, 144A (Japan)a | 7,800,000 | 8,556,600 | |||||||||||||
100,963,109 | |||||||||||||||
REINSURANCE—FOREIGN | 0.9% | ||||||||||||||
| Aquarius + Investments PLC, 8.25% (Switzerland) | 49,800,000 | 52,868,377 | |||||||||||||
TOTAL INSURANCE | 1,068,869,889 | ||||||||||||||
INTEGRATED TELECOMMUNICATIONS SERVICES | 0.9% | ||||||||||||||
| America Movil SAB de CV, 6.375%, due 9/6/73, Series B (EUR) (Mexico) | 10,000,000 | 12,488,570 | |||||||||||||
| Centaur Funding Corp., 9.08%, due 4/21/20, 144A (Cayman Islands)a | 24,262 | 28,697,397 | |||||||||||||
| Telefonica Europe BV, 7.625% (EUR) (Netherlands) | 11,400,000 | 14,066,710 | |||||||||||||
55,252,677 | |||||||||||||||
MATERIAL—METALS & MINING | 1.1% | ||||||||||||||
| BHP Billiton Finance USA Ltd., 6.75%, due 10/19/75, 144A (Australia)a | 59,249,000 | 63,026,124 | |||||||||||||
UTILITIES | 3.5% | ||||||||||||||
ELECTRIC UTILITIES | 0.1% | ||||||||||||||
| NextEra Energy Capital Holdings, 7.30%, due 9/1/67, Series D | 6,612,000 | 6,330,990 | |||||||||||||
See accompanying notes to financial statements.
18
COHEN & STEERS PREFERRED SECURITIES AND INCOME FUND, INC.
SCHEDULE OF INVESTMENTS—(Continued)
June 30, 2016 (Unaudited)
| Number of Shares | Value | ||||||||||||||
ELECTRIC UTILITIES—FOREIGN | 3.4% | ||||||||||||||
Emera, 6.75%, due 6/15/76, Series 16-A (Canada) | 117,150,000 | $ | 119,010,107 | ||||||||||||
Enel SpA, 8.75%, due 9/24/73, 144A (Italy)a | 68,099,000 | 77,717,984 | |||||||||||||
196,728,091 | |||||||||||||||
TOTAL UTILITIES | 203,059,081 | ||||||||||||||
| TOTAL PREFERRED SECURITIES—CAPITAL SECURITIES (Identified cost—$3,316,629,930) | 3,388,832,611 | ||||||||||||||
| Principal Amount | |||||||||||||||
CORPORATE BONDS—INTEGRATED TELECOMMUNICATIONS SERVICES | 0.7% | ||||||||||||||
Embarq Corp., 7.995%, due 6/1/36 | $ | 16,660,000 | 16,722,475 | ||||||||||||
Frontier Communications Corp., 9.00%, due 8/15/31 | 29,638,000 | 26,211,107 | |||||||||||||
| TOTAL CORPORATE BONDS (Identified cost—$46,835,043) | 42,933,582 | ||||||||||||||
| Number of Shares | |||||||||||||||
SHORT-TERM INVESTMENTS | 1.4% | ||||||||||||||
MONEY MARKET FUNDS | |||||||||||||||
| State Street Institutional Treasury Money Market Fund, 0.14%c | 79,300,000 | 79,300,000 | |||||||||||||
| TOTAL SHORT-TERM INVESTMENTS (Identified cost—$79,300,000) | 79,300,000 | ||||||||||||||
TOTAL INVESTMENTS (Identified cost—$5,506,044,613) | 97.7 | % | 5,718,447,459 | ||||||||||||
OTHER ASSETS IN EXCESS OF LIABILITIES | 2.3 | 135,069,138 | |||||||||||||
NET ASSETS | 100.0 | % | $ | 5,853,516,597 | |||||||||||
See accompanying notes to financial statements.
19
COHEN & STEERS PREFERRED SECURITIES AND INCOME FUND, INC.
SCHEDULE OF INVESTMENTS—(Continued)
June 30, 2016 (Unaudited)
Forward foreign currency exchange contracts outstanding at June 30, 2016 were as follows:
Counterparty | Contracts to Deliver | In Exchange For | Settlement Date | Unrealized Appreciation (Depreciation) | |||||||||||||||
Brown Brothers Harriman | EUR | 15,741,443 | USD | 17,538,486 | 7/5/16 | $ | 69,423 | ||||||||||||
Brown Brothers Harriman | EUR | 161,264,956 | USD | 179,750,597 | 7/5/16 | 786,841 | |||||||||||||
Brown Brothers Harriman | GBP | 56,746,522 | USD | 82,588,548 | 7/5/16 | 7,044,769 | |||||||||||||
Brown Brothers Harriman | USD | 75,874,072 | GBP | 56,746,522 | 7/5/16 | (330,293 | ) | ||||||||||||
Brown Brothers Harriman | USD | 15,507,897 | EUR | 13,789,700 | 7/5/16 | (204,780 | ) | ||||||||||||
Brown Brothers Harriman | USD | 166,741,271 | EUR | 150,118,635 | 7/5/16 | (147,144 | ) | ||||||||||||
Brown Brothers Harriman | USD | 14,480,958 | EUR | 13,098,064 | 7/5/16 | 54,617 | |||||||||||||
Brown Brothers Harriman | EUR | 154,313,722 | USD | 171,553,805 | 8/2/16 | 129,050 | |||||||||||||
Brown Brothers Harriman | GBP | 49,940,862 | USD | 66,776,426 | 8/2/16 | 276,698 | |||||||||||||
$ | 7,679,181 | ||||||||||||||||||
Glossary of Portfolio Abbreviations
EUR Euro Currency
FRN Floating Rate Note
GBP Great British Pound
REIT Real Estate Investment Trust
TruPS Trust Preferred Securities
USD United States Dollar
Note: Percentages indicated are based on the net assets of the Fund.
a Resale is restricted to qualified institutional investors. Aggregate holdings equal 20.2% of the net assets of the Fund, of which 0.0% are illiquid.
b A portion of the security is segregated as collateral for open forward foreign currency exchange contracts. $13,786,875 in aggregate has been segregated as collateral.
c Rate quoted represents the annualized seven-day yield of the Fund.
See accompanying notes to financial statements.
20
COHEN & STEERS PREFERRED SECURITIES AND INCOME FUND, INC.
STATEMENT OF ASSETS AND LIABILITIES
June 30, 2016 (Unaudited)
ASSETS: | |||||||
Investments in securities, at value (Identified cost—$5,506,044,613) | $ | 5,718,447,459 | |||||
Cash | 84,112,559 | ||||||
Foreign currency, at value (Identified cost—$321,953) | 321,403 | ||||||
Receivable for: | |||||||
Dividends and interest | 48,893,184 | ||||||
Fund shares sold | 41,312,202 | ||||||
Investment securities sold | 12,859,705 | ||||||
Unrealized appreciation on forward foreign currency exchange contracts | 8,361,398 | ||||||
Other assets | 55,478 | ||||||
Total Assets | 5,914,363,388 | ||||||
LIABILITIES: | |||||||
Unrealized depreciation on forward foreign currency exchange contracts | 682,217 | ||||||
Payable for: | |||||||
Investment securities purchased | 36,103,949 | ||||||
Dividends declared | 10,890,697 | ||||||
Fund shares redeemed | 8,634,873 | ||||||
Investment advisory fees | 3,164,604 | ||||||
Shareholder servicing fees | 518,416 | ||||||
Administration fees | 233,539 | ||||||
Distribution fees | 46,424 | ||||||
Directors' fees | 454 | ||||||
Other liabilities | 571,618 | ||||||
Total Liabilities | 60,846,791 | ||||||
NET ASSETS | $ | 5,853,516,597 | |||||
NET ASSETS consist of: | |||||||
Paid-in capital | $ | 5,661,558,952 | |||||
Dividends in excess of net investment income | (26,085,817 | ) | |||||
Accumulated net realized loss | (1,936,391 | ) | |||||
Net unrealized appreciation | 219,979,853 | ||||||
$ | 5,853,516,597 | ||||||
See accompanying notes to financial statements.
21
COHEN & STEERS PREFERRED SECURITIES AND INCOME FUND, INC.
STATEMENT OF ASSETS AND LIABILITIES—(Continued)
June 30, 2016 (Unaudited)
CLASS A SHARES: | |||||||
NET ASSETS | $ | 942,429,724 | |||||
| Shares issued and outstanding ($0.001 par value common stock outstanding) | 69,035,805 | ||||||
Net asset value and redemption price per share | $ | 13.65 | |||||
Maximum offering price per share ($13.65 ÷ 0.9625)a | $ | 14.18 | |||||
CLASS C SHARES: | |||||||
NET ASSETS | $ | 826,122,647 | |||||
| Shares issued and outstanding ($0.001 par value common stock outstanding) | 60,821,952 | ||||||
Net asset value and offering price per shareb | $ | 13.58 | |||||
CLASS I SHARES: | |||||||
NET ASSETS | $ | 4,082,573,254 | |||||
| Shares issued and outstanding ($0.001 par value common stock outstanding) | 298,456,547 | ||||||
Net asset value, offering and redemption price per share | $ | 13.68 | |||||
CLASS R SHARES: | |||||||
NET ASSETS | $ | 2,350,221 | |||||
| Shares issued and outstanding ($0.001 par value common stock outstanding) | 171,934 | ||||||
Net asset value, offering and redemption price per share | $ | 13.67 | |||||
CLASS Z SHARES: | |||||||
NET ASSETS | $ | 40,751 | |||||
| Shares issued and outstanding ($0.001 par value common stock outstanding) | 2,980 | ||||||
Net asset value, offering and redemption price per share | $ | 13.67 | |||||
a On investments of $100,000 or more, the offering price is reduced.
b Redemption price per share is equal to the net asset value per share less any applicable contingent deferred sales charge of 1.00% on shares held for less than one year.
See accompanying notes to financial statements.
22
COHEN & STEERS PREFERRED SECURITIES AND INCOME FUND, INC.
STATEMENT OF OPERATIONS
For the Six Months Ended June 30, 2016 (Unaudited)
Investment Income: | |||||||
Interest income (net of $133,032 of foreign withholding tax) | $ | 85,854,475 | |||||
| Dividend income | 65,473,669 | ||||||
Total Investment Income | 151,328,144 | ||||||
Expenses: | |||||||
Investment advisory fees | 17,776,561 | ||||||
Distribution fees—Class A | 1,070,731 | ||||||
Distribution fees—Class C | 2,760,445 | ||||||
Distribution fees—Class R | 2,099 | ||||||
Shareholder servicing fees—Class A | 428,292 | ||||||
Shareholder servicing fees—Class C | 920,148 | ||||||
Shareholder servicing fees—Class I | 874,756 | ||||||
Administration fees | 1,583,763 | ||||||
Transfer agent fees and expenses | 798,671 | ||||||
Registration and filing fees | 312,899 | ||||||
Directors' fees and expenses | 187,775 | ||||||
Shareholder reporting expenses | 142,961 | ||||||
Custodian fees and expenses | 127,128 | ||||||
Professional fees | 53,343 | ||||||
Proxy expenses | 29,098 | ||||||
Line of credit fees | 1,089 | ||||||
| Miscellaneous | 110,608 | ||||||
Total Expenses | 27,180,367 | ||||||
Reduction of Expenses (See Note 2) | (542,219 | ) | |||||
Net Expenses | 26,638,148 | ||||||
Net Investment Income | 124,689,996 | ||||||
Net Realized and Unrealized Gain (Loss): | |||||||
Net realized gain (loss) on: | |||||||
Investments | (5,475,273 | ) | |||||
Written option contracts | (6,170,950 | ) | |||||
Foreign currency transactions | 4,402,598 | ||||||
Net realized loss | (7,243,625 | ) | |||||
Net change in unrealized appreciation (depreciation) on: | |||||||
Investments | 58,650,433 | ||||||
Foreign currency translations | 6,575,050 | ||||||
Net change in unrealized appreciation (depreciation) | 65,225,483 | ||||||
Net realized and unrealized gain (loss) | 57,981,858 | ||||||
Net Increase in Net Assets Resulting from Operations | $ | 182,671,854 | |||||
See accompanying notes to financial statements.
23
COHEN & STEERS PREFERRED SECURITIES AND INCOME FUND, INC.
STATEMENT OF CHANGES IN NET ASSETS (Unaudited)
| For the Six Months Ended June 30, 2016 | For the Year Ended December 31, 2015 | ||||||||||
Change in Net Assets: | |||||||||||
From Operations: | |||||||||||
Net investment income | $ | 124,689,996 | $ | 191,051,350 | |||||||
Net realized gain (loss) | (7,243,625 | ) | 11,631,691 | ||||||||
| Net change in unrealized appreciation (depreciation) | 65,225,483 | 11,998,517 | |||||||||
| Net increase in net assets resulting from operations | 182,671,854 | 214,681,558 | |||||||||
Dividends and Distributions to Shareholders from: | |||||||||||
Net investment income: | |||||||||||
Class A | (24,359,826 | ) | (30,515,439 | ) | |||||||
Class C | (18,689,437 | ) | (25,315,796 | ) | |||||||
Class I | (105,458,132 | ) | (133,993,158 | ) | |||||||
Class R | (32,368 | ) | (4,728 | ) | |||||||
Class Z | (1,174 | ) | (764 | ) | |||||||
Net realized gain: | |||||||||||
Class A | — | (2,689,958 | ) | ||||||||
Class C | — | (2,502,752 | ) | ||||||||
Class I | — | (10,773,153 | ) | ||||||||
Class R | — | (488 | ) | ||||||||
Class Z | — | (91 | ) | ||||||||
Return of capital: | |||||||||||
Class A | — | (2,947,501 | ) | ||||||||
Class C | — | (2,469,333 | ) | ||||||||
Class I | — | (12,850,286 | ) | ||||||||
Class R | — | (463 | ) | ||||||||
Class Z | — | (66 | ) | ||||||||
| Total dividends and distributions to shareholders | (148,540,937 | ) | (224,063,976 | ) | |||||||
Capital Stock Transactions: | |||||||||||
| Increase in net assets from Fund share transactions | 1,127,569,658 | 1,536,819,642 | |||||||||
Total increase in net assets | 1,161,700,575 | 1,527,437,224 | |||||||||
Net Assets: | |||||||||||
Beginning of period | 4,691,816,022 | 3,164,378,798 | |||||||||
End of perioda | $ | 5,853,516,597 | $ | 4,691,816,022 | |||||||
a Includes dividends in excess of net investment income of $26,085,817 and $2,234,876, respectively.
See accompanying notes to financial statements.
24
COHEN & STEERS PREFERRED SECURITIES AND INCOME FUND, INC.
FINANCIAL HIGHLIGHTS (Unaudited)
The following tables include selected data for a share outstanding throughout each period and other performance information derived from the financial statements. They should be read in conjunction with the financial statements and notes thereto.
Class A | |||||||||||||||||||||||||||
| For the Six Months Ended | For the Year Ended December 31, | ||||||||||||||||||||||||||
Per Share Operating Performance: | June 30, 2016 | 2015 | 2014 | 2013 | 2012 | 2011 | |||||||||||||||||||||
| Net asset value, beginning of period | $ | 13.57 | $ | 13.56 | $ | 12.87 | $ | 13.34 | $ | 11.69 | $ | 12.10 | |||||||||||||||
| Income (loss) from investment operations: | |||||||||||||||||||||||||||
Net investment incomea | 0.32 | 0.65 | 0.71 | 0.69 | 0.71 | 0.75 | |||||||||||||||||||||
| Net realized and unrealized gain (loss) | 0.13 | 0.12 | 0.76 | (0.35 | ) | 1.80 | (0.35 | ) | |||||||||||||||||||
| Total from investment operations | 0.45 | 0.77 | 1.47 | 0.34 | 2.51 | 0.40 | |||||||||||||||||||||
| Less dividends and distributions to shareholders from: | |||||||||||||||||||||||||||
Net investment income | (0.37 | ) | (0.64 | ) | (0.69 | ) | (0.70 | ) | (0.73 | ) | (0.70 | ) | |||||||||||||||
Net realized gain | — | (0.06 | ) | (0.09 | ) | (0.06 | ) | (0.11 | ) | — | |||||||||||||||||
Return of capital | — | (0.06 | ) | — | (0.05 | ) | (0.02 | ) | (0.11 | ) | |||||||||||||||||
| Total dividends and distributions to shareholders | (0.37 | ) | (0.76 | ) | (0.78 | ) | (0.81 | ) | (0.86 | ) | (0.81 | ) | |||||||||||||||
| Redemption fees retained by the Fund | — | — | — | — | — | 0.00 | b | ||||||||||||||||||||
| Net increase (decrease) in net asset value | 0.08 | 0.01 | 0.69 | (0.47 | ) | 1.65 | (0.41 | ) | |||||||||||||||||||
Net asset value, end of period | $ | 13.65 | $ | 13.57 | $ | 13.56 | $ | 12.87 | $ | 13.34 | $ | 11.69 | |||||||||||||||
Total investment returnc,d | 3.42 | %e | 5.78 | % | 11.61 | % | 2.55 | % | 22.04 | % | 3.32 | % | |||||||||||||||
See accompanying notes to financial statements.
25
COHEN & STEERS PREFERRED SECURITIES AND INCOME FUND, INC.
FINANCIAL HIGHLIGHTS (Unaudited)—(Continued)
Class A | |||||||||||||||||||||||||||
| For the Six Months Ended | For the Year Ended December 31, | ||||||||||||||||||||||||||
Ratios/Supplemental Data: | June 30, 2016 | 2015 | 2014 | 2013 | 2012 | 2011 | |||||||||||||||||||||
| Net assets, end of period (in millions) | $ | 942.4 | $ | 779.4 | $ | 568.2 | $ | 425.5 | $ | 413.6 | $ | 136.4 | |||||||||||||||
| Ratio of expenses to average daily net assets (before expense reduction) | 1.18 | %f | 1.19 | % | 1.19 | % | 1.20 | % | 1.22 | %g | 1.29 | %g | |||||||||||||||
| Ratio of expenses to average daily net assets (net of expense reduction) | 1.18 | %f | 1.17 | % | 1.12 | % | 1.10 | % | 1.10 | %g | 1.06 | %g | |||||||||||||||
| Ratio of net investment income to average daily net assets (before expense reduction) | 4.77 | %f | 4.75 | % | 5.18 | % | 5.10 | % | 5.45 | %g | 5.95 | %g | |||||||||||||||
| Ratio of net investment income to average daily net assets (net of expense reduction) | 4.77 | %f | 4.77 | % | 5.25 | % | 5.20 | % | 5.57 | %g | 6.18 | %g | |||||||||||||||
Portfolio turnover rate | 31 | %e | 46 | % | 41 | % | 56 | % | 39 | % | 44 | % | |||||||||||||||
a Calculation based on average shares outstanding.
b Amount is less than $0.005.
c Return assumes the reinvestment of all dividends and distributions at NAV.
d Does not reflect sales charges, which would reduce return.
e Not annualized.
f Annualized.
g Non-class specific expenses are calculated at the Fund level and class specific expenses are calculated at the class level.
See accompanying notes to financial statements.
26
COHEN & STEERS PREFERRED SECURITIES AND INCOME FUND, INC.
FINANCIAL HIGHLIGHTS (Unaudited)—(Continued)
Class C | |||||||||||||||||||||||||||
| For the Six Months Ended | For the Year Ended December 31, | ||||||||||||||||||||||||||
Per Share Operating Performance: | June 30, 2016 | 2015 | 2014 | 2013 | 2012 | 2011 | |||||||||||||||||||||
| Net asset value, beginning of period | $ | 13.50 | $ | 13.49 | $ | 12.81 | $ | 13.29 | $ | 11.65 | $ | 12.06 | |||||||||||||||
| Income (loss) from investment operations: | |||||||||||||||||||||||||||
Net investment incomea | 0.27 | 0.56 | 0.62 | 0.60 | 0.63 | 0.67 | |||||||||||||||||||||
| Net realized and unrealized gain (loss) | 0.14 | 0.12 | 0.75 | (0.36 | ) | 1.79 | (0.34 | ) | |||||||||||||||||||
| Total from investment operations | 0.41 | 0.68 | 1.37 | 0.24 | 2.42 | 0.33 | |||||||||||||||||||||
| Less dividends and distributions to shareholders from: | |||||||||||||||||||||||||||
Net investment income | (0.33 | ) | (0.55 | ) | (0.60 | ) | (0.61 | ) | (0.65 | ) | (0.63 | ) | |||||||||||||||
Net realized gain | — | (0.06 | ) | (0.09 | ) | (0.06 | ) | (0.11 | ) | — | |||||||||||||||||
Return of capital | — | (0.06 | ) | — | (0.05 | ) | (0.02 | ) | (0.11 | ) | |||||||||||||||||
| Total dividends and distributions to shareholders | (0.33 | ) | (0.67 | ) | (0.69 | ) | (0.72 | ) | (0.78 | ) | (0.74 | ) | |||||||||||||||
| Redemption fees retained by the Fund | — | — | — | — | — | 0.00 | b | ||||||||||||||||||||
| Net increase (decrease) in net asset value | 0.08 | 0.01 | 0.68 | (0.48 | ) | 1.64 | (0.41 | ) | |||||||||||||||||||
Net asset value, end of period | $ | 13.58 | $ | 13.50 | $ | 13.49 | $ | 12.81 | $ | 13.29 | $ | 11.65 | |||||||||||||||
Total investment returnc,d | 3.12 | %e | 5.09 | % | 10.85 | % | 1.83 | % | 21.31 | % | 2.69 | % | |||||||||||||||
See accompanying notes to financial statements.
27
COHEN & STEERS PREFERRED SECURITIES AND INCOME FUND, INC.
FINANCIAL HIGHLIGHTS (Unaudited)—(Continued)
Class C | |||||||||||||||||||||||||||
| For the Six Months Ended | For the Year Ended December 31, | ||||||||||||||||||||||||||
Ratios/Supplemental Data: | June 30, 2016 | 2015 | 2014 | 2013 | 2012 | 2011 | |||||||||||||||||||||
| Net assets, end of period (in millions) | $ | 826.1 | $ | 683.5 | $ | 548.6 | $ | 465.8 | $ | 410.5 | $ | 152.1 | |||||||||||||||
| Ratio of expenses to average daily net assets (before expense reduction) | 1.83 | %f | 1.84 | % | 1.84 | % | 1.86 | % | 1.87 | %g | 1.94 | %g | |||||||||||||||
| Ratio of expenses to average daily net assets (net of expense reduction) | 1.83 | %f | 1.82 | % | 1.77 | % | 1.75 | % | 1.75 | %g | 1.71 | %g | |||||||||||||||
| Ratio of net investment income to average daily net assets (before expense reduction) | 4.13 | %f | 4.08 | % | 4.53 | % | 4.47 | % | 4.82 | %g | 5.36 | %g | |||||||||||||||
| Ratio of net investment income to average daily net assets (net of expense reduction) | 4.13 | %f | 4.10 | % | 4.60 | % | 4.58 | % | 4.94 | %g | 5.59 | %g | |||||||||||||||
Portfolio turnover rate | 31 | %e | 46 | % | 41 | % | 56 | % | 39 | % | 44 | % | |||||||||||||||
a Calculation based on average shares outstanding.
b Amount is less than $0.005.
c Return assumes the reinvestment of all dividends and distributions at NAV.
d Does not reflect sales charges, which would reduce return.
e Not annualized.
f Annualized.
g Non-class specific expenses are calculated at the Fund level and class specific expenses are calculated at the class level.
See accompanying notes to financial statements.
28
COHEN & STEERS PREFERRED SECURITIES AND INCOME FUND, INC.
FINANCIAL HIGHLIGHTS (Unaudited)—(Continued)
Class I | |||||||||||||||||||||||||||
| For the Six Months Ended | For the Year Ended December 31, | ||||||||||||||||||||||||||
Per Share Operating Performance: | June 30, 2016 | 2015 | 2014 | 2013 | 2012 | 2011 | |||||||||||||||||||||
| Net asset value, beginning of period | $ | 13.60 | $ | 13.58 | $ | 12.88 | $ | 13.36 | $ | 11.70 | $ | 12.10 | |||||||||||||||
| Income (loss) from investment operations: | |||||||||||||||||||||||||||
Net investment incomea | 0.34 | 0.70 | 0.76 | 0.74 | 0.76 | 0.80 | |||||||||||||||||||||
| Net realized and unrealized gain (loss) | 0.14 | 0.12 | 0.76 | (0.37 | ) | 1.80 | (0.35 | ) | |||||||||||||||||||
| Total from investment operations | 0.48 | 0.82 | 1.52 | 0.37 | 2.56 | 0.45 | |||||||||||||||||||||
| Less dividends and distributions to shareholders from: | |||||||||||||||||||||||||||
Net investment income | (0.40 | ) | (0.68 | ) | (0.73 | ) | (0.74 | ) | (0.77 | ) | (0.74 | ) | |||||||||||||||
Net realized gain | — | (0.06 | ) | (0.09 | ) | (0.06 | ) | (0.11 | ) | — | |||||||||||||||||
Return of capital | — | (0.06 | ) | — | (0.05 | ) | (0.02 | ) | (0.11 | ) | |||||||||||||||||
| Total dividends and distributions to shareholders | (0.40 | ) | (0.80 | ) | (0.82 | ) | (0.85 | ) | (0.90 | ) | (0.85 | ) | |||||||||||||||
| Redemption fees retained by the Fund | — | — | — | — | — | 0.00 | b | ||||||||||||||||||||
| Net increase (decrease) in net asset value | 0.08 | 0.02 | 0.70 | (0.48 | ) | 1.66 | (0.40 | ) | |||||||||||||||||||
Net asset value, end of period | $ | 13.68 | $ | 13.60 | $ | 13.58 | $ | 12.88 | $ | 13.36 | $ | 11.70 | |||||||||||||||
Total investment returnc | 3.59 | %d | 6.20 | % | 12.00 | % | 2.82 | % | 22.52 | % | 3.74 | % | |||||||||||||||
See accompanying notes to financial statements.
29
COHEN & STEERS PREFERRED SECURITIES AND INCOME FUND, INC.
FINANCIAL HIGHLIGHTS (Unaudited)—(Continued)
Class I | |||||||||||||||||||||||||||
| For the Six Months Ended | For the Year Ended December 31, | ||||||||||||||||||||||||||
Ratios/Supplemental Data: | June 30, 2016 | 2015 | 2014 | 2013 | 2012 | 2011 | |||||||||||||||||||||
| Net assets, end of period (in millions) | $ | 4,082.6 | $ | 3,228.7 | $ | 2,047.6 | $ | 1,248.5 | $ | 982.4 | $ | 413.7 | |||||||||||||||
| Ratio of expenses to average daily net assets (before expense reduction) | 0.88 | %e | 0.88 | % | 0.90 | % | 0.87 | % | 0.87 | %f | 0.94 | %f | |||||||||||||||
| Ratio of expenses to average daily net assets (net of expense reduction) | 0.85 | %e | 0.83 | % | 0.77 | % | 0.75 | % | 0.75 | %f | 0.71 | %f | |||||||||||||||
| Ratio of net investment income to average daily net assets (before expense reduction) | 5.08 | %e | 5.07 | % | 5.49 | % | 5.47 | % | 5.83 | %f | 6.47 | %f | |||||||||||||||
| Ratio of net investment income to average daily net assets (net of expense reduction) | 5.11 | %e | 5.12 | % | 5.62 | % | 5.59 | % | 5.95 | %f | 6.70 | %f | |||||||||||||||
Portfolio turnover rate | 31 | %d | 46 | % | 41 | % | 56 | % | 39 | % | 44 | % | |||||||||||||||
a Calculation based on average shares outstanding.
b Amount is less than $0.005.
c Return assumes the reinvestment of all dividends and distributions at NAV.
d Not annualized.
e Annualized.
f Non-class specific expenses are calculated at the Fund level and class specific expenses are calculated at the class level.
See accompanying notes to financial statements.
30
COHEN & STEERS PREFERRED SECURITIES AND INCOME FUND, INC.
FINANCIAL HIGHLIGHTS (Unaudited)—(Continued)
Class R | |||||||||||||||
Per Share Operating Performance: | For the Six Months Ended June 30, 2016 | For the Year Ended December 31, 2015 | For the Period October 1, 2014a through December 31, 2014 | ||||||||||||
Net asset value, beginning of period | $ | 13.60 | $ | 13.58 | $ | 13.55 | |||||||||
Income (loss) from investment operations: | |||||||||||||||
Net investment incomeb | 0.34 | 0.64 | 0.17 | ||||||||||||
Net realized and unrealized gain | 0.10 | 0.12 | 0.05 | ||||||||||||
Total from investment operations | 0.44 | 0.76 | 0.22 | ||||||||||||
Less dividends and distributions to shareholders from: | |||||||||||||||
Net investment income | (0.37 | ) | (0.62 | ) | (0.10 | ) | |||||||||
Net realized gain | — | (0.06 | ) | (0.09 | ) | ||||||||||
Return of capital | — | (0.06 | ) | — | |||||||||||
Total dividends and distributions to shareholders | (0.37 | ) | (0.74 | ) | (0.19 | ) | |||||||||
Net increase in net asset value | 0.07 | 0.02 | 0.03 | ||||||||||||
Net asset value, end of period | $ | 13.67 | $ | 13.60 | $ | 13.58 | |||||||||
Total investment returnc | 3.33 | %d | 5.67 | % | 1.66 | %d | |||||||||
Ratios/Supplemental Data: | |||||||||||||||
Net assets, end of period (in 000s) | $ | 2,350.2 | $ | 204.8 | $ | 10.0 | |||||||||
| Ratio of expenses to average daily net assets (before expense reduction) | 1.33 | %e | 1.34 | % | 1.36 | %e | |||||||||
| Ratio of expenses to average daily net assets (net of expense reduction) | 1.33 | %e | 1.33 | % | 1.30 | %e | |||||||||
| Ratio of net investment income to average daily net assets (before expense reduction) | 5.11 | %e | 4.73 | % | 4.88 | %e | |||||||||
| Ratio of net investment income to average daily net assets (net of expense reduction) | 5.11 | %e | 4.74 | % | 4.94 | %e | |||||||||
Portfolio turnover rate | 31 | %d | 46 | % | 41 | %d | |||||||||
a Inception date.
b Calculation based on average shares outstanding.
c Return assumes the reinvestment of all dividends and distributions at NAV.
d Not annualized.
e Annualized.
See accompanying notes to financial statements.
31
COHEN & STEERS PREFERRED SECURITIES AND INCOME FUND, INC.
FINANCIAL HIGHLIGHTS (Unaudited)—(Continued)
Class Z | |||||||||||||||
Per Share Operating Performance: | For the Six Months Ended June 30, 2016 | For the Year Ended December 31, 2015 | For the Period October 1, 2014a through December 31, 2014 | ||||||||||||
Net asset value, beginning of period | $ | 13.59 | $ | 13.58 | $ | 13.55 | |||||||||
Income (loss) from investment operations: | |||||||||||||||
Net investment incomeb | 0.34 | 0.71 | 0.18 | ||||||||||||
Net realized and unrealized gain | 0.14 | 0.10 | 0.06 | ||||||||||||
Total from investment operations | 0.48 | 0.81 | 0.24 | ||||||||||||
Less dividends and distributions to shareholders from: | |||||||||||||||
Net investment income | (0.40 | ) | (0.68 | ) | (0.12 | ) | |||||||||
Net realized gain | — | (0.06 | ) | (0.09 | ) | ||||||||||
Return of capital | — | (0.06 | ) | — | |||||||||||
Total dividends and distributions to shareholders | (0.40 | ) | (0.80 | ) | (0.21 | ) | |||||||||
Net increase in net asset value | 0.08 | 0.01 | 0.03 | ||||||||||||
Net asset value, end of period | $ | 13.67 | $ | 13.59 | $ | 13.58 | |||||||||
Total investment returnc | 3.67 | %d,e | 6.13 | % | 1.78 | %e | |||||||||
Ratios/Supplemental Data: | |||||||||||||||
Net assets, end of period (in 000s) | $ | 40.8 | $ | 32.4 | $ | 10.0 | |||||||||
| Ratio of expenses to average daily net assets (before expense reduction) | 0.83 | %f | 0.84 | % | 0.85 | %f | |||||||||
| Ratio of expenses to average daily net assets (net of expense reduction) | 0.83 | %f | 0.83 | % | 0.80 | %f | |||||||||
| Ratio of net investment income to average daily net assets (before expense reduction) | 5.13 | %f | 5.20 | % | 5.35 | %f | |||||||||
| Ratio of net investment income to average daily net assets (net of expense reduction) | 5.13 | %f | 5.21 | % | 5.40 | %f | |||||||||
Portfolio turnover rate | 31 | %e | 46 | % | 41 | %e | |||||||||
a Inception date.
b Calculation based on average shares outstanding.
c Return assumes the reinvestment of all dividends and distributions at NAV.
d The net asset value (NAV) disclosed in the June 30, 2016 semi-annual report reflects adjustments in accordance with accounting principles generally accepted in the United States of America and as such, differs from the NAV reported on June 30, 2016. The total return reported is based on the unadjusted NAV which was the official NAV for executing transactions on June 30, 2016.
e Not annualized.
f Annualized.
See accompanying notes to financial statements.
32
COHEN & STEERS PREFERRED SECURITIES AND INCOME FUND, INC.
NOTES TO FINANCIAL STATEMENTS (Unaudited)
Note 1. Organization and Significant Accounting Policies
Cohen & Steers Preferred Securities and Income Fund, Inc. (the Fund) was incorporated under the laws of the State of Maryland on February 22, 2010 and is registered under the Investment Company Act of 1940 (the 1940 Act) as a diversified, open-end management investment company. The Fund's investment objective is total return. The authorized shares of the Fund are divided into five classes designated Class A, C, I, R and Z shares. Each of the Fund's shares has equal dividend, liquidation and voting rights (except for matters relating to distribution and shareholder servicing of such shares).
The following is a summary of significant accounting policies consistently followed by the Fund in the preparation of its financial statements. The Fund is an investment company and, accordingly, follows the investment company accounting and reporting guidance of the Financial Accounting Standards Board Accounting Standards Codification Topic (ASC) 946—Investment Companies. The accounting policies of the Fund are in conformity with accounting principles generally accepted in the United States of America (GAAP). The preparation of the financial statements in accordance with GAAP requires management to make estimates and assumptions that affect the reported amounts of assets and liabilities at the date of the financial statements and the reported amounts of income and expenses during the reporting period. Actual results could differ from those estimates.
Portfolio Valuation: Investments in securities that are listed on the New York Stock Exchange (NYSE) are valued, except as indicated below, at the last sale price reflected at the close of the NYSE on the business day as of which such value is being determined. If there has been no sale on such day, the securities are valued at the mean of the closing bid and ask prices on such day or, if no ask price is available, at the bid price. Forward foreign currency contracts are valued daily at the prevailing forward exchange rate. Over-the-counter options are valued based upon prices provided by the respective counterparty.
Securities not listed on the NYSE but listed on other domestic or foreign securities exchanges are valued in a similar manner. Securities traded on more than one securities exchange are valued at the last sale price reflected at the close of the exchange representing the principal market for such securities on the business day as of which such value is being determined. If after the close of a foreign market, but prior to the close of business on the day the securities are being valued, market conditions change significantly, certain non-U.S. equity holdings may be fair valued pursuant to procedures established by the Board of Directors.
Readily marketable securities traded in the over-the-counter market, including listed securities whose primary market is believed by Cohen & Steers Capital Management, Inc. (the investment advisor) to be over-the-counter, are valued at the last sale price on the valuation date as reported by sources deemed appropriate by the Board of Directors to reflect their fair market value. If there has been no sale on such day, the securities are valued at the mean of the closing bid and ask prices on such day or, if no ask price is available, at the bid price. However, certain fixed-income securities may be valued on the basis of prices provided by a third-party pricing service or third-party broker-dealers when such prices are believed by the investment advisor, pursuant to delegation by the Board of Directors, to reflect the fair market value of such securities. The pricing services or broker-dealers use multiple valuation techniques to determine fair value. In instances where sufficient market activity exists, the pricing services or broker-dealers may utilize a market-based approach through which quotes from
33
COHEN & STEERS PREFERRED SECURITIES AND INCOME FUND, INC.
NOTES TO FINANCIAL STATEMENTS (Unaudited)—(Continued)
market makers are used to determine fair value. In instances where sufficient market activity may not exist or is limited, the pricing services or broker-dealers also utilize proprietary valuation models which may consider market transactions in comparable securities and the various relationships between securities in determining fair value and/or characteristics such as benchmark yield curves, option-adjusted spreads, credit spreads, estimated default rates, coupon rates, anticipated timing of principal repayments, underlying collateral, and other unique security features which are used to calculate the fair values.
Short-term debt securities with a maturity date of 60 days or less are valued at amortized cost, which approximates fair value. Investments in open-end mutual funds are valued at their closing net asset value.
The policies and procedures approved by the Fund's Board of Directors delegate authority to make fair value determinations to the investment advisor, subject to the oversight of the Board of Directors. The investment advisor has established a valuation committee (Valuation Committee) to administer, implement and oversee the fair valuation process according to the policies and procedures approved annually by the Board of Directors. Among other things, these procedures allow the Fund to utilize independent pricing services, quotations from securities and financial instrument dealers and other market sources to determine fair value.
Securities for which market prices are unavailable, or securities for which the investment advisor determines that the bid and/or ask price or a counterparty valuation does not reflect market value, will be valued at fair value, as determined in good faith by the Valuation Committee, pursuant to procedures approved by the Fund's Board of Directors. Circumstances in which market prices may be unavailable include, but are not limited to, when trading in a security is suspended, the exchange on which the security is traded is subject to an unscheduled close or disruption or material events occur after the close of the exchange on which the security is principally traded. In these circumstances, the Fund determines fair value in a manner that fairly reflects the market value of the security on the valuation date based on consideration of any information or factors it deems appropriate. These may include, but are not limited to, recent transactions in comparable securities, information relating to the specific security and developments in the markets.
The Fund's use of fair value pricing may cause the net asset value of Fund shares to differ from the net asset value that would be calculated using market quotations. Fair value pricing involves subjective judgments and it is possible that the fair value determined for a security may be materially different than the value that could be realized upon the sale of that security.
Fair value is defined as the price that the Fund would expect to receive upon the sale of an investment or expect to pay to transfer a liability in an orderly transaction with an independent buyer in the principal market or, in the absence of a principal market, the most advantageous market for the investment or liability. The hierarchy of inputs that are used in determining the fair value of the Fund's investments is summarized below.
• Level 1—quoted prices in active markets for identical investments
• Level 2—other significant observable inputs (including quoted prices for similar investments, interest rates, credit risk, etc.)
• Level 3—significant unobservable inputs (including the Fund's own assumptions in determining the fair value of investments)
34
COHEN & STEERS PREFERRED SECURITIES AND INCOME FUND, INC.
NOTES TO FINANCIAL STATEMENTS (Unaudited)—(Continued)
The inputs or methodology used for valuing securities may or may not be an indication of the risk associated with investing in those securities.
For movements between the levels within the fair value hierarchy, the Fund has adopted a policy of recognizing the transfer at the end of the period in which the underlying event causing the movement occurred. Changes in valuation techniques may result in transfers into or out of an assigned level within the disclosure hierarchy. There were no transfers between Level 1 and Level 2 as of June 30, 2016.
The following is a summary of the inputs used as of June 30, 2016 in valuing the Fund's investments carried at value:
Total | Quoted Prices in Active Markets for Identical Investments (Level 1) | Other Significant Observable Inputs (Level 2) | Significant Unobservable Inputs (Level 3) | ||||||||||||||||
| Preferred Securities— $25 Par Value: | |||||||||||||||||||
Banks | $ | 679,394,738 | $ | 657,305,156 | $ | 22,089,582 | $ | — | |||||||||||
| Electric— Integrated Electric | 52,996,661 | 36,302,427 | 16,694,234 | — | |||||||||||||||
Other Industries | 1,474,989,867 | 1,474,989,867 | — | — | |||||||||||||||
| Preferred Securities— Capital Securities: | |||||||||||||||||||
Banks | 872,555,303 | 44,015,080 | 828,540,223 | — | |||||||||||||||
Other Industries | 2,516,277,308 | — | 2,516,277,308 | — | |||||||||||||||
Corporate Bonds | 42,933,582 | — | 42,933,582 | — | |||||||||||||||
Short-Term Investments | 79,300,000 | — | 79,300,000 | — | |||||||||||||||
Total Investmentsa | $ | 5,718,447,459 | $ | 2,212,612,530 | $ | 3,505,834,929 | $ | — | |||||||||||
| Forward foreign currency exchange contracts | $ | 8,361,398 | $ | — | $ | 8,361,398 | $ | — | |||||||||||
| Total Appreciation in Other Financial Instrumentsa | $ | 8,361,398 | $ | — | $ | 8,361,398 | $ | — | |||||||||||
| Forward foreign currency exchange contracts | $ | (682,217 | ) | $ | — | $ | (682,217 | ) | $ | — | |||||||||
| Total Depreciation in Other Financial Instrumentsa | $ | (682,217 | ) | $ | — | $ | (682,217 | ) | $ | — | |||||||||
a Portfolio holdings are disclosed individually on the Schedule of Investments.
35
COHEN & STEERS PREFERRED SECURITIES AND INCOME FUND, INC.
NOTES TO FINANCIAL STATEMENTS (Unaudited)—(Continued)
Following is a reconciliation of investments for which significant unobservable inputs (Level 3) were used in determining fair value:
| Preferred Securities—Capital Securities—Banks | |||||||
Balance as of December 31, 2015 | $ | 23,350,849 | |||||
Change in unrealized appreciation (depreciation) | 921,592 | ||||||
Transfers out of Level 3a | (24,272,441 | ) | |||||
Balance as of June 30, 2016 | $ | — | |||||
a Transfers from Level 3 to Level 2 are due to an increase in market activity (e.g. frequency of trades), which resulted in an increase in available market inputs to determine prices.
Security Transactions, Investment Income and Expense Allocations: Security transactions are recorded on trade date. Realized gains and losses on investments sold are recorded on the basis of identified cost. Interest income is recorded on the accrual basis. Discounts are accreted and premiums are amortized over the life of the respective securities. Dividend income is recorded on the ex-dividend date, except for certain dividends on foreign securities, which are recorded as soon as the Fund is informed after the ex-dividend date. Distributions from Real Estate Investment Trusts (REITs) are recorded as ordinary income, net realized capital gain or return of capital based on information reported by the REITs and management's estimates of such amounts based on historical information. These estimates are adjusted when the actual source of distributions is disclosed by the REITs and actual amounts may differ from the estimated amounts. Income, expenses (other than expenses attributable to a specific class) and realized and unrealized gains or losses on investments are allocated to each class of shares based on its relative net assets.
Options: The Fund may purchase and write exchange-listed and over-the-counter put or call options on securities, stock indices and other financial instruments for hedging purposes, to enhance portfolio returns and reduce overall volatility.
When the Fund writes (sells) an option, an amount equal to the premium received by the Fund is recorded on the Statement of Assets and Liabilities as a liability. The amount of the liability is subsequently marked-to-market to reflect the current market value of the option written. When an option expires, the Fund realizes a gain on the option to the extent of the premium received. Premiums received from writing options which are exercised or closed are added to or offset against the proceeds or amount paid on the transaction to determine the realized gain or loss. If a put option on a security is exercised, the premium reduces the cost basis of the security purchased by the Fund. If a call option is exercised, the premium is added to the proceeds of the security sold to determine the realized gain or loss. The Fund, as writer of an option, bears the market risk of an unfavorable change in the price of the underlying index or security. Other risks include the possibility of an illiquid options market or the inability of the counterparties to fulfill their obligations under the contracts.
36
COHEN & STEERS PREFERRED SECURITIES AND INCOME FUND, INC.
NOTES TO FINANCIAL STATEMENTS (Unaudited)—(Continued)
Put and call options purchased are accounted for in the same manner as portfolio securities. Premiums paid for purchasing options which expire are treated as realized losses. Premiums paid for purchasing options which are exercised or closed are added to the amounts paid or offset against the proceeds on the underlying investment transaction to determine the realized gain or loss when the underlying transaction is executed. The risk associated with purchasing an option is that the Fund pays a premium whether or not the option is exercised. Additionally, the Fund bears the risk of loss of the premium and change in market value should the counterparty not perform under the contract.
At June 30, 2016, the Fund did not have any option contracts outstanding.
Foreign Currency Translation: The books and records of the Fund are maintained in U.S. dollars. Investment securities and other assets and liabilities denominated in foreign currencies are translated into U.S. dollars based upon prevailing exchange rates on the date of valuation. Purchases and sales of investment securities and income and expense items denominated in foreign currencies are translated into U.S. dollars based upon prevailing exchange rates on the respective dates of such transactions. The Fund does not isolate that portion of the results of operations resulting from fluctuations in foreign exchange rates on investments from the fluctuations arising from changes in market prices of securities held. Such fluctuations are included with the net realized and unrealized gain or loss on investments.
Net realized foreign exchange gains or losses arise from sales of foreign currencies, including gains and losses on forward foreign currency exchange contracts, currency gains or losses realized between the trade and settlement dates on securities transactions, and the difference between the amounts of dividends, interest, and foreign withholding taxes recorded on the Fund's books and the U.S. dollar equivalent of the amounts actually received or paid. Net unrealized foreign exchange gains and losses arise from changes in the values of assets and liabilities, other than investments in securities, on the date of valuation, resulting from changes in exchange rates. Pursuant to U.S. federal income tax regulations, certain foreign currency gains/losses included in realized and unrealized gains/losses are included in or are a reduction of ordinary income for federal income tax purposes.
Forward Foreign Currency Exchange Contracts: The Fund enters into forward foreign currency exchange contracts to hedge the currency exposure associated with certain of its non-U.S. dollar denominated securities. A forward foreign currency exchange contract is a commitment between two parties to purchase or sell foreign currency at a set price on a future date. The market value of a forward foreign currency exchange contract fluctuates with changes in foreign currency exchange rates. These contracts are marked to market daily and the change in value is recorded by the Fund as unrealized appreciation and/or depreciation on foreign currency translations. Realized gains or losses equal to the difference between the value of the contract at the time it was opened and the value at the time it was closed are included in net realized gain or loss on foreign currency transactions. For federal income tax purposes, the Fund has made an election to treat gains and losses from forward foreign currency exchange contracts as capital gains and losses.
Forward foreign currency exchange contracts involve elements of market risk in excess of the amounts reflected on the Statement of Assets and Liabilities. The Fund bears the risk of an unfavorable change in the foreign exchange rate underlying the contract. Risks may also arise upon entering these contracts from the potential inability of the counterparties to meet the terms of their contracts. In
37
COHEN & STEERS PREFERRED SECURITIES AND INCOME FUND, INC.
NOTES TO FINANCIAL STATEMENTS (Unaudited)—(Continued)
connection with these contracts, securities may be identified as collateral in accordance with the terms of the respective contracts.
Dividends and Distributions to Shareholders: Dividends from net investment income and capital gain distributions are determined in accordance with U.S. federal income tax regulations, which may differ from GAAP. Dividends from net investment income, if any, are declared and paid monthly. Net realized capital gains, unless offset by any available capital loss carryforward, are typically distributed to shareholders at least annually. Dividends and distributions to shareholders are recorded on the ex-dividend date and are automatically reinvested in full and fractional shares of the Fund based on the net asset value per share at the close of business on the payable date, unless the shareholder has elected to have them paid in cash.
Dividends from net investment income are subject to recharacterization for tax purposes. Based upon the results of operations for the six months ended June 30, 2016, the investment advisor considers it likely that a portion of the dividends will be reclassified to distributions from return of capital upon the final determination of the Fund's taxable income after December 31, 2016, the Fund's fiscal year end.
Income Taxes: It is the policy of the Fund to continue to qualify as a regulated investment company, if such qualification is in the best interest of the shareholders, by complying with the requirements of Subchapter M of the Internal Revenue Code applicable to regulated investment companies, and by distributing substantially all of its taxable earnings to its shareholders. Also, in order to avoid the payment of any federal excise taxes, the Fund will distribute substantially all of its net investment income and net realized gains on a calendar year basis. Accordingly, no provision for federal income or excise tax is necessary. Dividend and interest income from holdings in non-U.S. securities is recorded net of non-U.S. taxes paid. Management has analyzed the Fund's tax positions taken on federal and applicable state income tax returns as well as its tax positions in non-U.S. jurisdictions in which it trades for all open tax years and has concluded that as of June 30, 2016, no additional provisions for income tax are required in the Fund's financial statements. The Fund's tax positions for the tax years for which the applicable statutes of limitations have not expired are subject to examination by the Internal Revenue Service, state departments of revenue and by foreign tax authorities.
Note 2. Investment Advisory Fees, Administration Fees and Other Transactions with Affiliates
Investment Advisory Fees: The investment advisor serves as the Fund's investment advisor pursuant to an investment advisory agreement (the investment advisory agreement). Under the terms of the investment advisory agreement, the investment advisor provides the Fund with day-to-day investment decisions and generally manages the Fund's investments in accordance with the stated policies of the Fund, subject to the supervision of the Board of Directors.
For the services provided to the Fund, the investment advisor receives a fee, accrued daily and paid monthly, at the annual rate of 0.70% of the average daily net assets of the Fund.
For the seven months ended July 31, 2015, the investment advisor had contractually agreed to waive its fee and/or reimburse expenses so that the Fund's total annual operating expenses (excluding
38
COHEN & STEERS PREFERRED SECURITIES AND INCOME FUND, INC.
NOTES TO FINANCIAL STATEMENTS (Unaudited)—(Continued)
acquired fund fees and expenses and extraordinary expenses) did not exceed 1.15% for Class A shares, 1.80% for Class C shares, 0.80% for Class I shares, 1.30% for Class R shares and 0.80% for Class Z shares. On June 16, 2015, the Board of Directors of the Fund approved an amendment to the Fund's fee waiver/expense reimbursement agreement, effective August 1, 2015 whereby the investment advisor contractually agreed to waive its fee and/or reimburse expenses so that the Fund's total annual operating expenses (excluding acquired fund fees and expenses and extraordinary expenses) do not exceed 1.20% for Class A shares, 1.85% for Class C shares, 0.85% for Class I shares, 1.35% for Class R shares and 0.85% for Class Z shares. On June 15, 2016, the Board of Directors approved a continuation of the Fund's fee waiver/expense reimbursement agreement through June 30, 2018. This contractual agreement may be amended or terminated at any time by agreement of the Fund and the investment advisor and will terminate automatically in the event of termination of the investment advisory agreement between the investment advisor and the Fund. For the six months ended June 30, 2016, fees waived and/or expenses reimbursed totaled $542,219.
Administration Fees: The Fund has entered into an administration agreement with the investment advisor under which the investment advisor performs certain administrative functions for the Fund and receives a fee, accrued daily and paid monthly, at the annual rate of 0.05% of the average daily net assets of the Fund. For the six months ended June 30, 2016, the Fund incurred $1,269,754 in fees under this administration agreement. Additionally, the Fund pays State Street Bank and Trust Company as co-administrator under a fund accounting and administration agreement.
Distribution Fees: Shares of the Fund are distributed by Cohen & Steers Securities, LLC (the distributor), an affiliated entity of the investment advisor. The Fund has adopted an amended distribution and service plan (the plan) pursuant to Rule 12b-1 under the 1940 Act. The plan provides that the Fund will pay the distributor a fee, accrued daily and paid monthly, at an annual rate of up to 0.25% of the average daily net assets attributable to Class A shares, up to 0.75% of the average daily net assets attributable to Class C shares and up to 0.50% of the average daily net assets attributable to Class R shares. In addition, with respect to Class R shares, such amounts may also be used to pay for services to Fund shareholders or services related to the maintenance of shareholder accounts.
There is a maximum initial sales charge of 3.75% for Class A shares. There is a contingent deferred sales charge (CDSC) of 1.00% on purchases of $1 million or more of Class A shares, which applies if redemption occurs within one year from purchase. There is a CDSC of 1.00% on Class C shares, which applies if redemption occurs within one year from purchase. For the six months ended June 30, 2016, the Fund has been advised that the distributor received $218,281, which represents a portion of the sales commissions paid by shareholders from the sale of Class A shares, and $17,120 and $53,240 of CDSC relating to redemptions of Class A and Class C shares, respectively. The distributor has advised the Fund that proceeds from the CDSC on these classes are used by the distributor to defray its expenses related to providing distribution-related services to the Fund in connection with the sale of these classes, including payments to dealers and other financial intermediaries for selling these classes. The payment of a CDSC may result in the Distributor receiving amounts greater or less than the upfront commission paid by the Distributor to the financial intermediary.
39
COHEN & STEERS PREFERRED SECURITIES AND INCOME FUND, INC.
NOTES TO FINANCIAL STATEMENTS (Unaudited)—(Continued)
Shareholder Servicing Fees: For shareholder services, the Fund pays the distributor or its affiliates a fee, accrued daily, at an annual rate of up to 0.10% of the average daily net assets of the Fund's Class A and Class I shares and up to 0.25% of the average daily net assets of the Fund's Class C shares. The distributor is responsible for paying qualified financial institutions for shareholder services.
Directors' and Officers' Fees: Certain directors and officers of the Fund are also directors, officers and/or employees of the investment advisor. The Fund does not pay compensation to directors and officers affiliated with the investment advisor except for the Chief Compliance Officer, who received compensation from the investment advisor, which was reimbursed by the Fund, in the amount of $32,772 for the six months ended June 30, 2016.
Other: The Fund may have shareholders investing indirectly through an account, platform or program sponsored by a financial institution. Investment and asset allocation decisions by such financial institution regarding the account, platform or program through which multiple shareholders invest may result in subscription and redemption decisions that have a significant impact on the assets, expenses and trading activities of the Fund. Such a decision may cause the Fund to sell assets at disadvantageous times or prices, and may negatively affect the Fund's net asset value and performance.
Note 3. Purchases and Sales of Securities
Purchases and sales of securities, excluding short-term investments, for the six months ended June 30, 2016, totaled $2,667,566,299 and $1,561,260,789, respectively.
Transactions in written option contracts during the six months ended June 30, 2016, were as follows:
| Number of Contracts | Premiums | ||||||||||
Written option contracts outstanding at December 31, 2015 | — | $ | — | ||||||||
Option contracts written | 300 | 3,196,250 | |||||||||
Option contracts terminated in closing transactions | (300 | ) | (3,196,250 | ) | |||||||
Written option contracts outstanding at June 30, 2016 | — | $ | — | ||||||||
Note 4. Derivative Investments
The following tables present the value of derivatives held at June 30, 2016 and the effect of derivatives held during the six months ended June 30, 2016, along with the respective location in the financial statements.
40
COHEN & STEERS PREFERRED SECURITIES AND INCOME FUND, INC.
NOTES TO FINANCIAL STATEMENTS (Unaudited)—(Continued)
Statement of Assets and Liabilities | |||||||||||||||||||
Assets | Liabilities | ||||||||||||||||||
Derivatives | Location | Fair Value | Location | Fair Value | |||||||||||||||
Foreign Exchange Risk: | |||||||||||||||||||
| Forward foreign currency exchange contractsa | Unrealized appreciation | $ | 8,361,398 | Unrealized depreciation | $ | 682,217 | |||||||||||||
a Forward foreign currency exchange contracts executed with Brown Brothers Harriman are not subject to a master netting arrangement or another similar agreement.
Statement of Operations | |||||||||||||||
Derivatives | Location | Realized Gain (Loss) | Change in Unrealized Appreciation (Depreciation) | ||||||||||||
Foreign Exchange Risk: | |||||||||||||||
| Forward foreign currency exchange contracts | Net Realized and Unrealized Gain (Loss) | $ | 4,252,330 | $ | 6,588,740 | ||||||||||
| Written option contracts | Net Realized and Unrealized Gain (Loss) | (6,170,950 | ) | — | |||||||||||
The following summarizes the volume of the Fund's forward foreign currency exchange contracts activity during the six months ended June 30, 2016:
| Forward Foreign Currency Exchange Contracts | |||||||
Average Notional Amount | $ | 245,224,201 | |||||
Ending Notional Amount | $ | 238,330,231 | |||||
41
COHEN & STEERS PREFERRED SECURITIES AND INCOME FUND, INC.
NOTES TO FINANCIAL STATEMENTS (Unaudited)—(Continued)
Note 5. Income Tax Information
As of June 30, 2016, the federal tax cost and net unrealized appreciation and depreciation in value of securities held were as follows:
Cost for federal income tax purposes | $ | 5,506,044,613 | |||||
Gross unrealized appreciation | $ | 253,185,061 | |||||
| Gross unrealized depreciation | (40,782,215 | ) | |||||
Net unrealized appreciation | $ | 212,402,846 | |||||
Note 6. Capital Stock
The Fund is authorized to issue 1 billion shares of capital stock, at a par value of $0.001 per share. The Board of Directors of the Fund may increase or decrease the aggregate number of shares of common stock that the Fund has authority to issue. Transactions in Fund shares were as follows:
| For the Six Months Ended June 30, 2016 | For the Year Ended December 31, 2015 | ||||||||||||||||||
Shares | Amount | Shares | Amount | ||||||||||||||||
Class A: | |||||||||||||||||||
Sold | 25,601,671 | $ | 343,951,572 | 29,848,638 | $ | 407,252,247 | |||||||||||||
| Issued as reinvestment of dividends and distributions | 1,373,279 | 18,464,886 | 1,953,750 | 26,613,376 | |||||||||||||||
Redeemed | (15,385,308 | ) | (205,265,458 | ) | (16,260,221 | ) | (221,779,427 | ) | |||||||||||
Net increase | 11,589,642 | $ | 157,151,000 | 15,542,167 | $ | 212,086,196 | |||||||||||||
Class C: | |||||||||||||||||||
Sold | 13,373,217 | $ | 178,901,784 | 14,576,166 | $ | 198,077,811 | |||||||||||||
| Issued as reinvestment of dividends and distributions | 765,811 | 10,248,368 | 1,185,191 | 16,070,080 | |||||||||||||||
Redeemed | (3,934,565 | ) | (52,566,071 | ) | (5,793,968 | ) | (78,687,960 | ) | |||||||||||
Net increase | 10,204,463 | $ | 136,584,081 | 9,967,389 | $ | 135,459,931 | |||||||||||||
Class I: | |||||||||||||||||||
Sold | 111,802,133 | $ | 1,506,180,476 | 150,748,349 | $ | 2,062,202,741 | |||||||||||||
| Issued as reinvestment of dividends and distributions | 4,173,900 | 56,277,442 | 5,566,014 | 75,949,086 | |||||||||||||||
Redeemed | (55,013,375 | ) | (730,753,692 | ) | (69,554,300 | ) | (949,096,248 | ) | |||||||||||
Net increase | 60,962,658 | $ | 831,704,226 | 86,760,063 | $ | 1,189,055,579 | |||||||||||||
42
COHEN & STEERS PREFERRED SECURITIES AND INCOME FUND, INC.
NOTES TO FINANCIAL STATEMENTS (Unaudited)—(Continued)
| For the Six Months Ended June 30, 2016 | For the Year Ended December 31, 2015 | ||||||||||||||||||
Shares | Amount | Shares | Amount | ||||||||||||||||
Class R: | |||||||||||||||||||
Sold | 286,902 | $ | 3,865,166 | 22,474 | $ | 306,880 | |||||||||||||
| Issued as reinvestments of dividends and distributions | 2,264 | 30,569 | 278 | 3,757 | |||||||||||||||
Redeemed | (132,297 | ) | (1,773,559 | ) | (8,425 | ) | (114,963 | ) | |||||||||||
Net increase | 156,869 | $ | 2,122,176 | 14,327 | $ | 195,674 | |||||||||||||
Class Z: | |||||||||||||||||||
Sold | 550 | $ | 7,500 | 1,624 | $ | 22,003 | |||||||||||||
| Issued as reinvestment of dividends and distributions | 65 | 880 | 24 | 328 | |||||||||||||||
Redeemed | (16 | ) | (205 | ) | (5 | ) | (69 | ) | |||||||||||
Net increase | 599 | $ | 8,175 | 1,643 | $ | 22,262 | |||||||||||||
Note 7. Borrowings
The Fund, in conjunction with other Cohen & Steers open-end funds, was a party to a $50,000,000 syndicated credit agreement (the credit agreement) with State Street Bank and Trust Company, as administrative agent and operations agent, and the lenders identified in the credit agreement (as applicable), which expired January 22, 2016. The Fund paid a commitment fee of 0.15% per annum on its proportionate share of the unused portion of the credit agreement. As approved by the Board of Directors on December 8, 2015, the Fund did not renew the credit agreement.
During the period January 1, 2016 through January 22, 2016, the Fund did not borrow under the credit agreement.
Note 8. Other Risks
Preferred Securities Risk: Preferred securities are subject to credit risk, which is the risk that a security will decline in price, or the issuer of the security will fail to make dividend, interest or principal payments when due, because the issuer experiences a decline in its financial status. Preferred securities are also subject to interest rate risk and may decline in value because of changes in market interest rates. The Fund may be subject to a greater risk of rising interest rates than would normally be the case in an environment of low interest rates and the effect of potential government fiscal policy initiatives and resulting market reaction to those initiatives. In addition, an issuer may be permitted to defer or omit distributions. Preferred securities are also generally subordinated to bonds and other debt instruments in a company's capital structure. During periods of declining interest rates, an issuer may be able to exercise an option to redeem (call) its issue at par earlier than scheduled, and the Fund may be forced to reinvest in lower yielding securities. Certain preferred securities may be substantially less liquid than many other
43
COHEN & STEERS PREFERRED SECURITIES AND INCOME FUND, INC.
NOTES TO FINANCIAL STATEMENTS (Unaudited)—(Continued)
securities, such as common stocks. Generally, preferred security holders have no voting rights with respect to the issuing company unless certain events occur. Certain preferred securities may give the issuers special redemption rights allowing the securities to be redeemed prior to a specified date if certain events occur, such as changes to tax or securities laws.
Credit and Below Investment Grade Securities Risk: Preferred securities may be rated below investment-grade or may be unrated. Below-investment grade securities, or equivalent unrated securities, which are commonly known as "high-yield bonds" or "junk bonds," generally involve greater volatility of price and risk of loss of income and principal, and may be more susceptible to real or perceived adverse economic and competitive industry conditions than higher grade securities. It is reasonable to expect that any adverse economic conditions could disrupt the market for lower-rated securities, have an adverse impact on the value of those securities and adversely affect the ability of the issuers of those securities to repay principal and interest on those securities.
Concentration Risk: Because the Fund invests at least 25% of its net assets in the financials sector, it will be more susceptible to adverse economic or regulatory occurrences affecting this sector, such as changes in interest rates, loan concentration and competition. In addition, the Fund will also be subject to the risks of investing in the individual industries and securities that comprise the financials sector, including the bank, diversified financials, real estate (including REITs) and insurance industries. To the extent that the Fund focuses its investments in other sectors or industries, such as (but not limited to) energy, industrials, utilities, pipelines, health care and telecommunications, the Fund will be subject to the risks associated with these particular sectors and industries. These sectors and industries may be adversely affected by, among others, changes in government regulation, world events and economic conditions.
Contingent Capital Securities Risk: Contingent capital securities (sometimes referred to as "CoCos") are debt or preferred securities with loss absorption characteristics built into the terms of the security, for example a mandatory conversion into common stock of the issuer under certain circumstances, such as the issuer's capital ratio falling below a certain level. Since the common stock of the issuer may not pay a dividend, investors in these instruments could experience a reduced income rate, potentially to zero, and conversion would deepen the subordination of the investor, hence worsening the investor's standing in a bankruptcy. Some CoCos provide for a reduction in the value or principal amount of the security under such circumstances. In addition, most CoCos are considered to be high yield or "junk" securities and are therefore subject to the risks of investing in below investment-grade securities.
Liquidity Risk: Liquidity risk is the risk that particular investments of the Fund may become difficult to sell or purchase. The market for certain investments may become less liquid or illiquid due to adverse changes in the conditions of a particular issuer or due to adverse market or economic conditions. In addition, dealer inventories of certain securities, which provide an indication of the ability of dealers to engage in "market making," are at, or near, historic lows in relation to market size, which has the potential to increase price volatility in the fixed income markets in which the Fund invests. Federal banking regulations may also cause certain dealers to reduce their inventories of certain securities, which may further decrease the Fund's ability to buy or sell such securities. As a result of this decreased liquidity, the Fund may have to accept a lower price to sell a security, sell other securities to raise cash, or give up an investment opportunity, any of which could have a negative effect on performance. Further, transactions in less liquid or illiquid securities may entail transaction costs that are higher than those for transactions in liquid securities.
44
COHEN & STEERS PREFERRED SECURITIES AND INCOME FUND, INC.
NOTES TO FINANCIAL STATEMENTS (Unaudited)—(Continued)
Liquidity risk also includes the risk that market conditions or large shareholder redemptions may impact the ability of the Fund to meet redemption requests within required time periods. In order to meet such redemption requests, the fund may be forced to sell securities at inopportune times or prices.
Foreign (Non-U.S.) and Emerging Market Securities Risk: The Fund directly purchases securities of foreign issuers. Risks of investing in foreign securities, which can be expected to be greater for investments in emerging markets, include currency risks, future political and economic developments and possible imposition of foreign withholding taxes on income or proceeds payable on the securities. In addition, there may be less publicly available information about a foreign issuer than about a domestic issuer, and foreign issuers may not be subject to the same accounting, auditing and financial recordkeeping standards and requirements as domestic issuers. Moreover, securities of many foreign issuers and their markets may be less liquid and their prices more volatile than securities of comparable U.S. issuers.
Foreign Currency Risk: Although the Fund will report its NAV and pay dividends in U.S. dollars, foreign securities often are purchased with and make any dividend and interest payments in foreign currencies. Therefore, the Fund's investments in foreign securities will be subject to foreign currency risk, which means that the Fund's NAV could decline solely as a result of changes in the exchange rates between foreign currencies and the U.S. dollar. Certain foreign countries may impose restrictions on the ability of issuers of foreign securities to make payment of principal, dividends and interest to investors located outside the country, due to blockage of foreign currency exchanges or otherwise. The Fund may, but is not required to, engage in various investments that are designed to hedge the Fund's foreign currency risks, and such investments are subject to the risks described under "Derivatives and Hedging Transactions Risk" below.
Derivatives and Hedging Transactions Risk: The Fund's use of derivatives, including for the purpose of hedging interest rate or foreign currency risks, presents risks different from, and possibly greater than, the risks associated with investing directly in traditional securities. Among the risks presented are counterparty risk, financial leverage risk, liquidity risk, over-the-counter (OTC) trading risk and tracking risk. The use of derivatives can lead to losses because of adverse movements in the price or value of the underlying asset, index or rate, which may be magnified by certain features of the derivatives.
This is not a complete list of risks that may affect the Fund. For additional information concerning the risks applicable to the Fund, please consult the Fund's prospectus.
Note 9. Other
In the normal course of business, the Fund enters into contracts that provide general indemnifications. The Fund's maximum exposure under these arrangements is dependent on claims that may be made against the Fund in the future and, therefore, cannot be estimated; however, based on experience, the risk of material loss from such claims is considered remote.
Note 10. Subsequent Events
Management has evaluated events and transactions occurring after June 30, 2016 through the date that the financial statements were issued, and had determined that no additional disclosure in the financial statements is required.
45
COHEN & STEERS PREFERRED SECURITIES AND INCOME FUND, INC.
OTHER INFORMATION
A description of the policies and procedures that the Fund uses to determine how to vote proxies relating to portfolio securities is available (i) without charge, upon request, by calling 800-330-7348, (ii) on our website at cohenandsteers.com or (iii) on the Securities and Exchange Commission's (the SEC) website at http://www.sec.gov. In addition, the Fund's proxy voting record for the most recent 12-month period ended June 30 is available by August 31 of each year (i) without charge, upon request, by calling 800-330-7348 or (ii) on the SEC's website at http://www.sec.gov.
The Fund files its complete schedule of portfolio holdings with the SEC for the first and third quarters of each fiscal year on Form N-Q. The Fund's Forms N-Q are available (i) without charge, upon request, by calling 800-330-7348 or (ii) on the SEC's website at http://www.sec.gov. In addition, the Forms N-Q may be reviewed and copied at the SEC's Public Reference Room in Washington, DC. Information on the operation of the Public Reference Room may be obtained by calling 800-SEC-0330.
Please note that distributions paid by the Fund to shareholders are subject to recharacterization for tax purposes and are taxable up to the amount of the Fund's investment company taxable income and net realized gains. Distributions in excess of the Fund's investment company taxable income and net realized gains are a return of capital distributed from the Fund's assets. To the extent this occurs, the Fund's shareholders of record will be notified of the estimated amount of capital returned to shareholders for each such distribution and this information will also be available at cohenandsteers.com. The final tax treatment of all distributions is reported to shareholders on their 1099-DIV forms, which are mailed after the close of each calendar year. Distributions of capital decrease the Fund's total assets and, therefore, could have the effect of increasing the Fund's expense ratio. In addition, in order to make these distributions, the Fund may have to sell portfolio securities at a less than opportune time.
APPROVAL OF INVESTMENT ADVISORY AGREEMENT
The Board of Directors of the Fund, including a majority of the directors who are not parties to the Fund's investment advisory agreement (the Advisory Agreement), or interested persons of any such party (Independent Directors), has the responsibility under the 1940 Act to approve the Fund's Advisory Agreement for its initial two year term and its continuation annually thereafter at a meeting of the Board of Directors called for the purpose of voting on the approval or continuation. At a meeting of the Independent Directors held on June 7, 2016 and at a meeting of the full Board of Directors held in person on June 15, 2016, the Advisory Agreement was discussed and was unanimously continued for a term ending June 30, 2017 by the Fund's Board of Directors, including the Independent Directors. The Independent Directors were represented by independent counsel who assisted them in their deliberations during the meeting and executive session.
In considering whether to continue the Advisory Agreement, the Board of Directors reviewed materials provided by the Fund's investment advisor (the Investment Advisor) and Fund counsel which included, among other things, fee, expense and performance information compared to peer funds (Peer Funds) and performance comparisons to a larger category universe prepared by an independent data provider; summary information prepared by the Investment Advisor; and a memorandum outlining the legal duties of the Board of Directors. The Board of Directors also spoke directly with representatives of the independent data provider and met with investment advisory personnel. In addition, the Board of Directors considered information provided from time to time by the Investment Advisor throughout the
46
COHEN & STEERS PREFERRED SECURITIES AND INCOME FUND, INC.
year at meetings of the Board of Directors, including presentations by portfolio managers relating to the investment performance of the Fund and the investment strategies used in pursuing the Fund's objective. In particular, the Board of Directors considered the following:
(i) The nature, extent and quality of services to be provided by the Investment Advisor: The Board of Directors reviewed the services that the Investment Advisor provides to the Fund, including, but not limited to, making the day-to-day investment decisions for the Fund, and generally managing the Fund's investments in accordance with the stated policies of the Fund. The Board of Directors also discussed with officers and portfolio managers of the Fund the types of transactions that were being done on behalf of the Fund. Additionally, the Board of Directors took into account the services provided by the Investment Advisor to its other funds, including those that have investment objectives and strategies similar to the Fund. The Board of Directors also considered the education, background and experience of the Investment Advisor's personnel, particularly noting the potential benefit that the portfolio managers' work experience and favorable reputation can have on the Fund. The Board of Directors further noted the Investment Advisor's ability to attract qualified and experienced personnel. The Board of Directors also considered the administrative services provided by the Investment Advisor, including compliance and accounting services. After consideration of the above factors, among others, the Board of Directors concluded that the nature, extent and quality of services provided by the Investment Advisor are adequate and appropriate.
(ii) Investment performance of the Fund and the Investment Advisor: The Board of Directors considered the investment performance of the Fund compared to Peer Funds and compared to a relevant benchmark and blended benchmark. The Board of Directors noted that the Fund slightly outperformed the Peer Funds' median for the one-year period ended March 31, 2016, and outperformed the Peer Funds' median for the three- and five-year periods ended March 31, 2016, ranking two out of five, one out of five and one out of four, respectively. The Board of Directors also noted that the Fund slightly outperformed its blended benchmark for the one-year period ended March 31, 2016 and outperformed its blended benchmark for the three- and five-year periods ended March 31, 2016. The Fund slightly outperformed its relevant benchmark for the three-year period ended March 31, 2016, outperformed the relevant benchmark for the five-year period ended March 31, 2016 and underperformed the relevant benchmark for the one-year period ended March 31, 2016.The Board of Directors engaged in discussions with the Investment Advisor regarding the contributors to and detractors from the Fund's performance during the periods. The Board of Directors also considered supplemental information provided by the Investment Advisor, including a narrative summary of various factors affecting performance and the Investment Advisor's performance in managing other funds and products investing in preferred securities. The Board of Directors then determined that Fund performance, in light of all considerations noted above, supported the continuation of the Advisory Agreement.
(iii) Cost of the services to be provided and profits to be realized by the Investment Advisor from the relationship with the Fund: The Board of Directors considered the advisory fees and administrative fees payable by the Fund as well as the total expense ratio. As part of its analysis, the Board of Directors gave consideration to the fee and expense analyses provided by the independent data provider. The Board of Directors noted that the Fund's actual and contractual management fees were slightly higher than the Peer Funds' medians, ranking four out of five funds for each. The Board of Directors also noted
47
COHEN & STEERS PREFERRED SECURITIES AND INCOME FUND, INC.
that the Fund's net expense ratio represented the Peer Funds' median, ranking three out of five funds. The Board of Directors noted that all of the Fund's peer rankings were within 0.02% of the Peer Funds' medians. The Board of Directors considered that the Investment Advisor is waiving a portion of its fees and/or reimbursing expenses to limit the overall operating expenses of the Fund. The Board of Directors then considered the administrative services provided by the Investment Advisor, including compliance and accounting services, and further noted that the Fund pays an administration fee to the Investment Advisor. The Board of Directors concluded that the Fund's expense structure was generally satisfactory.
The Board of Directors also reviewed information regarding the profitability to the Investment Advisor of its relationship with the Fund. The Board of Directors considered the level of the Investment Advisor's profits and whether the profits were reasonable for the Investment Advisor. The Board of Directors noted that the Investment Advisor is currently waiving a portion of its fee and/or reimbursing expenses of the Fund. The Board of Directors took into consideration other benefits to be derived by the Investment Advisor in connection with the Advisory Agreement, noting particularly the research and related services, within the meaning of Section 28(e) of the Securities Exchange Act of 1934, as amended, that the Investment Advisor receives by allocating the Fund's brokerage transactions. The Board of Directors also considered the fees received by the Investment Advisor under the Administration Agreement, and noted the significant services received, such as compliance, accounting and operational services and furnishing office space and facilities for the Fund, and providing persons satisfactory to the Board of Directors to serve as officers of the Fund, and that these services were beneficial to the Fund. The Board of Directors concluded that the profits realized by the Investment Advisor from its relationships with the Fund were reasonable and consistent with the Investment Advisor's fiduciary duties.
(iv) The extent to which economies of scale would be realized as the Fund grows and whether fee levels would reflect such economies of scale: The Board of Directors considered the Fund's asset size and determined that there were not at this time significant economies of scale that were not being shared with shareholders.
(v) Comparison of services to be rendered and fees to be paid to those under other investment advisory contracts, such as contracts of the same and other investment advisers or other clients: As discussed above in (iii), the Board of Directors compared the fees paid under the Advisory Agreement to those under other investment advisory contracts of other investment advisers managing Peer Funds. The Board of Directors also compared the services rendered, fees paid and profitability under the Advisory Agreement to those under the Investment Advisor's other fund advisory agreements and advisory contracts with institutional and other clients with similar investment mandates. The Board of Directors also considered the entrepreneurial risk and financial exposure assumed by the Investment Advisor in developing and managing the Fund that the Investment Advisor does not have with institutional and other clients and other differences in the management of registered investment companies and institutional accounts. The Board of Directors determined that on a comparative basis the fees under the Advisory Agreement were reasonable in relation to the services provided.
No single factor was cited as determinative to the decision of the Board of Directors. Rather, after weighing all of the considerations and conclusions discussed above, the Board of Directors, including the Independent Directors, unanimously approved the continuation of the Advisory Agreement.
48
COHEN & STEERS PREFERRED SECURITIES AND INCOME FUND, INC.
Cohen & Steers Privacy Policy
Facts | What Does Cohen & Steers Do With Your Personal Information? | ||||||
Why? | Financial companies choose how they share your personal information. Federal law gives consumers the right to limit some but not all sharing. Federal law also requires us to tell you how we collect, share, and protect your personal information. Please read this notice carefully to understand what we do. | ||||||
What? | The types of personal information we collect and share depend on the product or service you have with us. This information can include: • Social Security number and account balances • Transaction history and account transactions • Purchase history and wire transfer instructions | ||||||
How? | All financial companies need to share customers' personal information to run their everyday business. In the section below, we list the reasons financial companies can share their customers' personal information; the reasons Cohen & Steers chooses to share; and whether you can limit this sharing. | ||||||
Reasons we can share your personal information | Does Cohen & Steers share? | Can you limit this sharing? | |||||||||
| For our everyday business purposes— such as to process your transactions, maintain your account(s), respond to court orders and legal investigations, or reports to credit bureaus | Yes | No | |||||||||
| For our marketing purposes— to offer our products and services to you | Yes | No | |||||||||
For joint marketing with other financial companies— | No | We don't share | |||||||||
| For our affiliates' everyday business purposes— information about your transactions and experiences | No | We don't share | |||||||||
| For our affiliates' everyday business purposes— information about your creditworthiness | No | We don't share | |||||||||
For our affiliates to market to you— | No | We don't share | |||||||||
For non-affiliates to market to you— | No | We don't share | |||||||||
Questions? Call 800.330.7348
49
COHEN & STEERS PREFERRED SECURITIES AND INCOME FUND, INC.
Cohen & Steers Privacy Policy—(Continued)
Who we are | |||||||
Who is providing this notice? | Cohen & Steers Capital Management, Inc., Cohen & Steers Asia Limited, Cohen & Steers Japan, LLC, Cohen & Steers UK Limited, Cohen & Steers Securities, LLC, Cohen & Steers Private Funds and Cohen & Steers Open and Closed-End Funds (collectively, Cohen & Steers). | ||||||
What we do | |||||||
How does Cohen & Steers protect my personal information? | To protect your personal information from unauthorized access and use, we use security measures that comply with federal law. These measures include computer safeguards and secured files and buildings. We restrict access to your information to those employees who need it to perform their jobs, and also require companies that provide services on our behalf to protect your information. | ||||||
How does Cohen & Steers collect my personal information? | We collect your personal information, for example, when you: • Open an account or buy securities from us • Provide account information or give us your contact information • Make deposits or withdrawals from your account We also collect your personal information from other companies. | ||||||
Why can't I limit all sharing? | Federal law gives you the right to limit only: • sharing for affiliates' everyday business purposes—information about your creditworthiness • affiliates from using your information to market to you • sharing for non-affiliates to market to you State law and individual companies may give you additional rights to limit sharing. | ||||||
Definitions | |||||||
Affiliates | Companies related by common ownership or control. They can be financial and nonfinancial companies. • Cohen & Steers does not share with affiliates. | ||||||
Non-affiliates | Companies not related by common ownership or control. They can be financial and nonfinancial companies. • Cohen & Steers does not share with non-affiliates. | ||||||
Joint marketing | A formal agreement between non-affiliated financial companies that together market financial products or services to you. • Cohen & Steers does not jointly market. | ||||||
50
COHEN & STEERS PREFERRED SECURITIES AND INCOME FUND, INC.
Cohen & Steers Investment Solutions
COHEN & STEERS REAL ASSETS FUND
• Designed for investors seeking total return and the maximization of real returns during inflationary environments by investing primarily in real assets
• Symbols: RAPAX, RAPCX, RAPIX, RAPRX, RAPZX
COHEN & STEERS
INSTITUTIONAL GLOBAL REALTY SHARES
• Designed for institutional investors seeking total return, investing primarily in global real estate securities
• Symbol: GRSIX
COHEN & STEERS GLOBAL REALTY SHARES
• Designed for investors seeking total return, investing primarily in global real estate equity securities
• Symbols: CSFAX, CSFCX, CSSPX, GRSRX, CSFZX
COHEN & STEERS REALTY SHARES
• Designed for investors seeking total return, investing primarily in U.S. real estate securities
• Symbol: CSRSX
COHEN & STEERS REAL ESTATE SECURITIES FUND
• Designed for investors seeking total return, investing primarily in U.S. real estate securities
• Symbols: CSEIX, CSCIX, CSDIX, CIRRX, CSZIX
COHEN & STEERS INSTITUTIONAL REALTY SHARES
• Designed for institutional investors seeking total return, investing primarily in U.S. real estate securities
• Symbol: CSRIX
COHEN & STEERS INTERNATIONAL REALTY FUND
• Designed for investors seeking total return, investing primarily in international (non-U.S.) real estate securities
• Symbols: IRFAX, IRFCX, IRFIX, IRFRX, IRFZX
COHEN & STEERS
ACTIVE COMMODITIES STRATEGY FUND
• Designed for investors seeking total return, investing primarily in a diversified portfolio of exchange-traded commodity future contracts and other commodity-related derivative instruments
• Symbols: CDFAX, CDFCX, CDFIX, CDFRX, CDFZX
COHEN & STEERS GLOBAL INFRASTRUCTURE FUND
• Designed for investors seeking total return, investing primarily in global infrastructure securities
• Symbols: CSUAX, CSUCX, CSUIX, CSURX, CSUZX
COHEN & STEERS
MLP & ENERGY OPPORTUNITY FUND
• Designed for investors seeking total return, investing primarily in midstream energy master limited partnership (MLP) units and related stocks
• Symbols: MLOAX, MLOCX, MLOIX, MLORX, MLOZX
COHEN & STEERS
LOW DURATION PREFERRED AND INCOME FUND
• Designed for investors seeking high current income and capital preservation by investing in low-duration preferred and other income securities issued by U.S. and non-U.S. companies
• Symbols: LPXAX, LPXCX, LPXIX, LPXRX, LPXZX
COHEN & STEERS
PREFERRED SECURITIES AND INCOME FUND
• Designed for investors seeking total return (high current income and capital appreciation), investing primarily in preferred and debt securities issued by U.S. and non-U.S. companies
• Symbols: CPXAX, CPXCX, CPXIX, CPRRX, CPXZX
COHEN & STEERS DIVIDEND VALUE FUND
• Designed for investors seeking long-term growth of income and capital appreciation, investing primarily in dividend paying common stocks and preferred stocks
• Symbols: DVFAX, DVFCX, DVFIX, DVFRX, DVFZX
Distributed by Cohen & Steers Securities, LLC.
COHEN & STEERS GLOBAL REALTY MAJORS ETF
• Designed for investors who seek a relatively low-cost passive approach for investing in a portfolio of global real estate equity securities of companies in a specified index
• Symbol: GRI
Distributed by ALPS Distributors, Inc.
ISHARES COHEN & STEERS
REALTY MAJORS INDEX FUND
• Designed for investors who seek a relatively low-cost passive approach for investing in a portfolio of U.S. real estate equity securities of companies in a specified index
• Symbol: ICF
Distributed by SEI Investments Distribution Co.
Please consider the investment objectives, risks, charges and expenses of the fund carefully before investing. A summary prospectus and prospectus containing this and other information can be obtained by calling 800-330-7348 or by visiting cohenandsteers.com. Please read the summary prospectus and prospectus carefully before investing.
51
COHEN & STEERS PREFERRED SECURITIES AND INCOME FUND, INC.
OFFICERS AND DIRECTORS
Robert H. Steers
Director and Chairman
Joseph M. Harvey
Director and Vice President
Michael G. Clark
Director
Bonnie Cohen
Director
George Grossman
Director
Dean Junkans
Director
Richard E. Kroon
Director
Gerald J. Maginnis
Director
Jane F. Magpiong
Director
Richard J. Norman
Director
Frank K. Ross
Director
C. Edward Ward, Jr.
Director
Adam M. Derechin
President and Chief Executive Officer
William F. Scapell
Vice President
Elaine Zaharis-Nikas
Vice President
Tina M. Payne
Secretary and Chief Legal Officer
James Giallanza
Treasurer and Chief Financial Officer
Lisa D. Phelan
Chief Compliance Officer
KEY INFORMATION
Investment Advisor
Cohen & Steers Capital Management, Inc.
280 Park Avenue
New York, NY 10017
(212) 832-3232
Co-administrator and Custodian
State Street Bank and Trust Company
One Lincoln Street
Boston, MA 02111
Transfer Agent
Boston Financial Data Services, Inc.
P.O. Box 8123
Boston, MA 02266
(800) 437-9912
Legal Counsel
Ropes & Gray LLP
1211 Avenue of the Americas
New York, NY 10036
Distributor
Cohen & Steers Securities, LLC
280 Park Avenue
New York, NY 10017
Nasdaq Symbol: Class A—CPXAX
Class C—CPXCX
Class I—CPXIX
Class R—CPRRX
Class Z—CPXZX
Website: cohenandsteers.com
This report is authorized for delivery only to shareholders of Cohen & Steers Preferred Securities and Income Fund, Inc. unless accompanied or preceded by the delivery of a currently effective prospectus setting forth details of the Fund. Performance data quoted represent past performance. Past performance is no guarantee of future results and your investment may be worth more or less at the time you sell your shares.
52
COHEN & STEERS
PREFERRED SECURITIES AND INCOME FUND
280 PARK AVENUE
NEW YORK, NY 10017
eDelivery NOW AVAILABLE
Stop traditional mail delivery; receive your shareholder reports and prospectus online.
Sign up at cohenandsteers.com

Semiannual Report June 30, 2016
Cohen & Steers Preferred Securities and Income Fund
CPXAXSAR
Item 2. Code of Ethics.
Not applicable.
Item 3. Audit Committee Financial Expert.
Not applicable.
Item 4. Principal Accountant Fees and Services.
Not applicable.
Item 5. Audit Committee of Listed Registrants.
Not applicable.
Item 6. Schedule of Investments.
Included in Item 1 above.
Item 7. Disclosure of Proxy Voting Policies and Procedures for Closed-End Management Investment Companies.
Not applicable.
Item 8. Portfolio Managers of Closed-End Management Investment Companies.
Not applicable.
Item 9. Purchases of Equity Securities by Closed-End Management Investment Company and Affiliated Purchasers.
Not applicable.
Item 10. Submission of Matters to a Vote of Security Holders.
None.
Item 11. Controls and Procedures.
(a) The registrant’s principal executive officer and principal financial officer have concluded, based upon their evaluation of the registrant’s disclosure controls and procedures as conducted within 90 days of the filing date of this report, that these disclosure controls and procedures provide reasonable assurance that material information required to be disclosed by the registrant in the report it files or submits on Form N-CSR is recorded, processed, summarized and reported within the time periods specified in the Securities and Exchange Commission’s rules and forms
and that such material information is accumulated and communicated to the registrant’s management, including its principal executive officer and principal financial officer, as appropriate, in order to allow timely decisions regarding required disclosure.
(b) There were no changes in the registrant’s internal control over financial reporting that occurred during the second fiscal quarter of the period covered by this report that have materially affected, or are reasonably likely to materially affect, the registrant’s internal control over financial reporting.
Item 12. Exhibits.
(a)(1) Not applicable.
(a)(2) Certifications of principal executive officer and principal financial officer as required by Rule 30a-2(a) under the Investment Company Act of 1940.
(a)(3) Not applicable.
(b) Certifications of chief executive officer and chief financial officer as required by Rule 30a- 2(b) under the Investment Company Act of 1940.
SIGNATURES
Pursuant to the requirements of the Securities Exchange Act of 1934 and the Investment Company Act of 1940, the registrant has duly caused this report to be signed on its behalf by the undersigned, thereunto duly authorized.
COHEN & STEERS PREFERRED SECURITIES AND INCOME FUND, INC. | ||
| ||
| ||
By: | /s/ Adam M. Derechin |
|
| Name: Adam M. Derechin |
|
| Title: President and Chief Executive Officer |
|
|
|
|
Date: September 2, 2016 |
| |
Pursuant to the requirements of the Securities Exchange Act of 1934 and the Investment Company Act of 1940, this report has been signed below by the following persons on behalf of the registrant and in the capacities and on the dates indicated.
By: | /s/ Adam M. Derechin |
| |
| Name: | Adam M. Derechin |
|
| Title: | President and Chief Executive Officer |
|
|
| (Principal Executive Officer) |
|
|
|
| |
By: | /s/ James Giallanza |
| |
| Name: | James Giallanza |
|
| Title: | Treasurer and Chief Financial Officer |
|
|
| (Principal Financial Officer) |
|
|
|
| |
|
|
| |
Date: September 2, 2016 |
| ||