UNITED STATES
SECURITIES AND EXCHANGE COMMISSION
Washington, D.C. 20549
FORM N-CSR
CERTIFIED SHAREHOLDER REPORT OF REGISTERED
MANAGEMENT INVESTMENT COMPANIES
Investment Company Act File Number: 811-22392
Cohen & Steers Preferred Securities and Income Fund, Inc.
(Exact name of registrant as specified in charter)
| 280 Park Avenue, New York, NY | 10017 | |
| (Address of principal executive offices) | (Zip code) |
Francis C. Poli
Cohen & Steers Capital Management, Inc.
280 Park Avenue
New York, New York 10017
(Name and address of agent for service)
Registrant’s telephone number, including area code: (212) 832-3232
Date of fiscal year end: December 31
Date of reporting period: December 31, 2017
Item 1. Reports to Stockholders.
COHEN & STEERS PREFERRED SECURITIES AND INCOME FUND, INC.
To Our Shareholders:
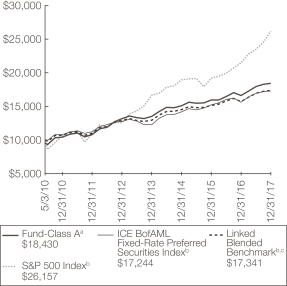
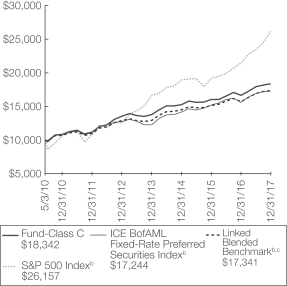
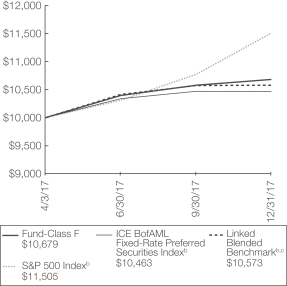
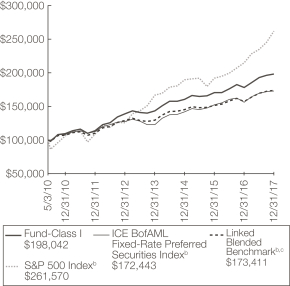
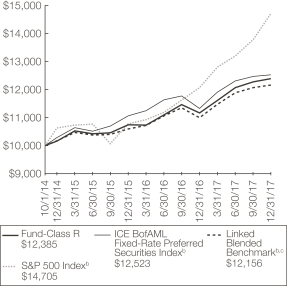
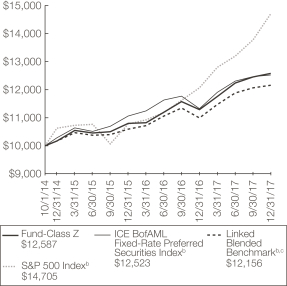
We would like to share with you our report for the year ended December 31, 2017. The total returns for the Fund and its comparative benchmarks were:
| Six Months Ended December 31, 2017 | Year Ended December 31, 2017 | |||||||
Cohen & Steers Preferred Securities and Income Fund—Class A | 2.67 | % | 11.04 | % | ||||
Cohen & Steers Preferred Securities and Income Fund—Class C | 2.35 | % | 10.30 | % | ||||
Cohen & Steers Preferred Securities and Income Fund—Class F | 2.77 | % | — | a | ||||
Cohen & Steers Preferred Securities and Income Fund—Class I | 2.82 | % | 11.37 | % | ||||
Cohen & Steers Preferred Securities and Income Fund—Class R | 2.59 | % | 10.86 | % | ||||
Cohen & Steers Preferred Securities and Income Fund—Class Z | 2.85 | % | 11.41 | % | ||||
ICE BofAML Fixed-Rate Preferred Securities Indexb | 1.71 | % | 10.58 | % | ||||
Blended Benchmark—60% ICE BofAML US IG Institutional Capital Securities Index/30% ICE BofAML Core Fixed-Rate Preferred Securities Index/10% Bloomberg Barclays Developed Market USD Contingent Capital Indexb | 2.29 | % | 10.56 | % | ||||
S&P 500 Indexb | 11.42 | % | 21.83 | % | ||||
| a | Inception date of Class F shares was April 3, 2017. Total return for Class F shares was 6.79% for the period April 3, 2017 through December 31, 2017. |
| b | The ICE BofAML Fixed-Rate Preferred Securities Index tracks the performance of fixed-rate U.S. dollar-denominated preferred securities issued in the U.S. domestic market. The ICE BofAML US IG Institutional Capital Securities Index is a subset of the ICE BofAML US Corporate Index including all fixed-to-floating rate, perpetual callable and capital securities. The ICE BofAML Core Fixed-Rate Preferred Securities Index tracks the performance of fixed-rate U.S. dollar-denominated preferred securities issued in the U.S. domestic market, excluding $1,000 par securities. The Bloomberg Barclays Developed Market USD Contingent Capital Index includes hybrid capital securities in developed markets with explicit equity conversion or write down loss absorption mechanisms that are based on an issuer’s regulatory capital ratio or other explicit solvency-based triggers. The S&P 500 Index is an unmanaged index of 500 large-capitalization stocks that is frequently used as a general measure of U.S. stock market performance. Benchmark returns are shown for comparative purposes only and may not be representative of the Fund’s portfolio. |
1
COHEN & STEERS PREFERRED SECURITIES AND INCOME FUND, INC.
The performance data quoted represent past performance. Past performance is no guarantee of future results. The investment return and the principal value of an investment will fluctuate and shares, if redeemed, may be worth more or less than their original cost. Current performance may be lower or higher than the performance data quoted. Current total returns of the Fund can be obtained by visiting our website at cohenandsteers.com. All share class returns assume the reinvestment of all dividends and distributions at net asset value (NAV). Fund performance figures reflect fee waivers and/or expense reimbursements, where applicable, without which the performance would have been lower. Performance quoted does not reflect the deduction of the maximum 3.75% initial sales charge on Class A shares or the 1.00% maximum contingent deferred sales charge on Class C shares. The 1.00% maximum contingent deferred sales charge on Class C shares applies if redemption occurs on or before the one year anniversary date of their purchase. If such charges were included, returns would have been lower. Index performance does not reflect the deduction of any fees, taxes or expenses. An investor cannot invest directly in an index. Performance figures for periods shorter than one year are not annualized.
The Fund makes regular monthly distributions at a level rate (the Policy). Distributions paid by the Fund are subject to recharacterization for tax purposes and are taxable up to the amount of the Fund’s investment company taxable income and net realized gains. As a result of the Policy, the Fund may pay distributions in excess of the Fund’s investment company taxable income and net realized gains. This excess would be a return of capital distributed from the Fund’s assets. Distributions of capital decrease the Fund’s total assets and, therefore, could have the effect of increasing the Fund’s expense ratio. In addition, in order to make these distributions, the Fund may have to sell portfolio securities at a less than opportune time.
Market Review
Preferred securities delivered strong returns in 2017 and outperformed most other classes of fixed income, including U.S. Treasuries, investment-grade bonds and high-yield debt. The year was defined by a broad-based acceleration in global growth—the most expansive since the International Monetary Fund began collecting data in 1980—as well as subdued inflation, low interest rates and a high investor appetite for income.
Supported by economic growth, central banks took measures to tighten highly accommodative monetary policy conditions. The U.S. Federal Reserve hiked overnight rates three times to end the year at 1.5%, and also laid out plans for slowly shrinking its balance sheet beginning in late 2017. The Bank of England and the Bank of Canada also raised rates, while the European Central Bank (ECB) announced plans to reduce its quantitative easing program by cutting its monthly bond purchases in half to €30 billion ($36 billion) per month for the first nine months of 2018.
The yield on the 10-year U.S. Treasury, which rose dramatically late in 2016 following the U.S. presidential election, touched a 2017 low in September as geopolitical concerns rose and the chances of passing substantial pro-growth legislation declined. However, Treasury yields rallied to the upper end of their yield ranges late in 2017, with the 10-year U.S. Treasury ending the year relatively unchanged at 2.4%, as the Tax Cut and Jobs Act was enacted in late December. Sovereign yields in Europe rose modestly from near-zero levels, as the region’s economy continued to improve. In addition, the supportive growth and inflation conditions, coupled with the investor demand mentioned above, led to a widespread tightening of credit spreads.
2
COHEN & STEERS PREFERRED SECURITIES AND INCOME FUND, INC.
Fund Performance
The Fund had a positive total return in the year and outperformed its benchmark in all share classes except for Class C shares, which underperformed. In general, we sought to own securities with meaningful call protection in both the retail and over-the-counter (OTC) markets, with the aim of limiting redemption risk and allowing more room for a security’s price to appreciate. With credit spreads compressing and sovereign yields generally relatively steady over the year, this had an overall positive effect on performance.
U.S. and European banks—the largest issuers of preferreds—enjoyed strong earnings growth, benefiting from higher net interest margins, as well as improved trading and investment banking income—all of which contributed to improving credit fundamentals. Security selection and an overweight in the banking sector contributed to relative performance. We were overweight European contingent capital securities (CoCos), which were among the strongest performers in the period, as economic fundamentals and a better political backdrop in Europe continued to support credit spread compression amid improvements in banking markets.
In August, we reduced our allocation to property & casualty and reinsurance companies, becoming more underweight as the outlook for hurricane damage in the U.S. worsened. While these companies have strong capital positions, the large accumulated losses from hurricane activity raised near-term earnings concerns. Security selection and an underweight in the insurance sector also contributed to performance.
Security selection in the telecommunications sector further contributed to performance.
Security selection in the real estate sector detracted modestly from performance, due in part to not owning several Public Storage securities that outperformed.
Impact of Derivatives on Fund Performance
The Fund used derivatives in the form of currency options for hedging purposes, as well as forward foreign currency exchange contracts for managing currency risk on certain Fund positions denominated in foreign currencies. The forward foreign currency exchange contracts detracted from the Fund’s total return during the 12-month period ended December 31, 2017, while the currency options did not have a material effect on the Fund’s total return for the period.
The Fund also used “swaptions,” which are options to enter into fixed-payer swaps with the intention of managing interest-rate risk. The swaptions did not have a material effect on the Fund’s total return during the 12-month period ended December 31, 2017.
3
COHEN & STEERS PREFERRED SECURITIES AND INCOME FUND, INC.
Sincerely,
 |  | |
WILLIAM F. SCAPELL Portfolio Manager | ELAINE ZAHARIS-NIKAS Portfolio Manager |
The views and opinions in the preceding commentary are subject to change without notice and are as of the date of the report. There is no guarantee that any market forecast set forth in the commentary will be realized. This material represents an assessment of the market environment at a specific point in time, should not be relied upon as investment advice and is not intended to predict or depict performance of any investment.
Visit Cohen & Steers online at cohenandsteers.com
For more information about the Cohen & Steers family of mutual funds, visit cohenandsteers.com. Here you will find fund net asset values, fund fact sheets and portfolio highlights, as well as educational resources and timely market updates.
Our website also provides comprehensive information about Cohen & Steers, including our most recent press releases, profiles of our senior investment professionals and their investment approach to each asset class. The Cohen & Steers family of mutual funds invests in major real asset categories including real estate securities, listed infrastructure, commodities and natural resource equities, as well as preferred securities and other income solutions.
4
COHEN & STEERS PREFERRED SECURITIES AND INCOME FUND, INC.
Performance Review (Unaudited)
Class A—Growth of a $10,000 Investment
| Class C—Growth of a $10,000 Investment
|
 |  |
Class F—Growth of a $10,000 Investment
| Class I—Growth of a $100,000 Investment
|
 |  |
5
COHEN & STEERS PREFERRED SECURITIES AND INCOME FUND, INC.
Performance Review (Unaudited)—(Continued)
Class R—Growth of a $10,000 Investment
| Class Z—Growth of a $10,000 Investment
|
 |  |
Average Annual Total Returns—For Periods Ended December 31, 2017
| Class A Shares | Class C Shares | Class F Shares | Class I Shares | Class R Shares | Class Z Shares | |||||||||||||||||||
1 Year (with sales charge) | 6.88% | a | 9.30% | d | — | — | — | — | ||||||||||||||||
1 Year (without sales charge) | 11.04% | 10.30% | — | 11.37 | % | 10.86 | % | 11.41 | % | |||||||||||||||
5 Years (with sales charge) | 6.17% | a | 6.28% | — | — | — | — | |||||||||||||||||
5 Years (without sales charge) | 6.98% | 6.28% | — | 7.33 | % | — | — | |||||||||||||||||
Since Inceptione (with sales charge) | 8.42% | a | 8.24% | — | — | — | — | |||||||||||||||||
Since Inceptione (without sales charge) | 8.96% | 8.24% | 6.79 | % | 9.33 | % | 6.80 | % | 7.34 | % | ||||||||||||||
The performance data quoted represent past performance. Past performance is no guarantee of future results. The investment return and principal value of an investment will fluctuate and shares, if redeemed, may be worth more or less than their original cost. Current performance may be lower or higher than the performance data quoted. Performance information current to the most recent month end can be obtained by visiting our website at cohenandsteers.com. All share class returns assume the reinvestment of all dividends and distributions at NAV. The performance graph and table do not reflect the deduction of taxes that a shareholder would pay on Fund distributions or the redemption of Fund shares. During the periods presented above, the investment advisor waived fees and/or reimbursed expenses. Without this arrangement, performance would have been lower.
6
COHEN & STEERS PREFERRED SECURITIES AND INCOME FUND, INC.
Performance Review (Unaudited)—(Continued)
The annualized gross and net expense ratios, respectively, for each class of shares as disclosed in the April 1, 2017 prospectus were as follows: Class A—1.18% and 1.18%; Class C—1.83% and 1.83%; Class F—0.83% and 0.83%; Class I—0.88% and 0.85%; Class R—1.33% and 1.33%; and Class Z—0.83% and 0.83%. The investment advisor has contractually agreed to waive its fee and/or reimburse expenses through June 30, 2019, so that the Fund’s total annual operating expenses (excluding acquired fund fees and expenses, taxes and extraordinary expenses) do not exceed 1.20% for Class A shares, 1.85% for Class C shares, 0.85% for Class F shares, 0.85% for Class I shares, 1.35% for Class R shares and 0.85% for Class Z shares. This contractual agreement can be amended at any time by agreement of the Board of Directors of the Fund and the investment advisor and will terminate automatically in the event of termination of the investment advisory agreement between the investment advisor and the Fund.
| a | Reflects a 3.75% front-end sales charge. |
| b | The comparative indexes are not adjusted to reflect expenses or other fees that the U.S. Securities and Exchange Commission (SEC) requires to be reflected in the Fund’s performance. Index performance does not reflect the deduction of any fees, taxes or expenses. An investor cannot invest directly in an index. The Fund’s benchmarks do not include below-investment-grade securities. The Fund’s performance assumes the reinvestment of all dividends and distributions at NAV. For more information, including charges and expenses, please read the prospectus carefully before you invest. |
| c | The Linked Blended Benchmark is represented by 50% ICE BofAML Fixed-Rate Preferred Securities Index and 50% ICE BofAML Capital Securities Index through December 31, 2016 and 60% ICE BofAML US IG Institutional Capital Securities Index, 30% ICE BofAML Core Fixed Rate Preferred Securities Index and 10% Bloomberg Barclays Developed Market USD Contingent Capital Index for periods thereafter. |
| d | Reflects a contingent deferred sales charge of 1.00%. |
| e | Inception date of May 3, 2010 for Class A, C and I shares, April 3, 2017 for Class F shares and October 1, 2014 for Class R and Z shares. |
7
COHEN & STEERS PREFERRED SECURITIES AND INCOME FUND, INC.
Expense Example (Unaudited)
As a shareholder of the Fund, you incur two types of costs: (1) transaction costs, including sales charges (loads) on purchase payments; and (2) ongoing costs including investment advisory fees; distribution and/or service (12b-1) fees; and other Fund expenses. This example is intended to help you understand your ongoing costs (in dollars) of investing in the Fund and to compare these costs with the ongoing costs of investing in other mutual funds.
The example is based on an investment of $1,000 invested at the beginning of the period and held for the entire period July 1, 2017—December 31, 2017.
Actual Expenses
The first line of the following table provides information about actual account values and expenses. You may use the information in this line, together with the amount you invested, to estimate the expenses that you paid over the period. Simply divide your account value by $1,000 (for example, an $8,600 account value divided by $1,000 = 8.6), then multiply the result by the number in the first line under the heading entitled “Expenses Paid During Period” to estimate the expenses you paid on your account during this period.
Hypothetical Example for Comparison Purposes
The second line of the following table provides information about hypothetical account values and hypothetical expenses based on the Fund’s actual expense ratio and an assumed rate of return of 5% per year before expenses, which is not the Fund’s actual return. The hypothetical account values and expenses may not be used to estimate the actual ending account balance or expenses you paid for the period. You may use this information to compare the ongoing cost of investing in the Fund and other funds. To do so, compare this 5% hypothetical example with the 5% hypothetical examples that appear in the shareholder reports of other funds.
Please note that the expenses shown in the table are meant to highlight your ongoing costs only and do not reflect any transaction costs, such as sales charges (loads). Therefore, the second line of the table is useful in comparing ongoing costs only, and will not help you determine the relative total costs of owning different funds. In addition, if these transactional costs were included, your costs would have been higher.
8
COHEN & STEERS PREFERRED SECURITIES AND INCOME FUND, INC.
Expense Example (Unaudited)—(Continued)
| Beginning Account Value July 1, 2017 | Ending Account Value December 31, 2017 | Expenses Paid During Perioda July 1, 2017— December 31, 2017 | ||||||||||
Class A | ||||||||||||
Actual (2.67% return) | $ | 1,000.00 | $ | 1,026.70 | $ | 5.93 | ||||||
Hypothetical (5% annual return | $ | 1,000.00 | $ | 1,019.36 | $ | 5.90 | ||||||
Class C | ||||||||||||
Actual (2.35% return) | $ | 1,000.00 | $ | 1,023.50 | $ | 9.23 | ||||||
Hypothetical (5% annual return | $ | 1,000.00 | $ | 1,016.08 | $ | 9.20 | ||||||
Class F | ||||||||||||
Actual (2.77% return) | $ | 1,000.00 | $ | 1,027.70 | $ | 4.14 | ||||||
Hypothetical (5% annual return | $ | 1,000.00 | $ | 1,021.12 | $ | 4.13 | ||||||
Class I | ||||||||||||
Actual (2.82% return) | $ | 1,000.00 | $ | 1,028.20 | $ | 4.35 | ||||||
Hypothetical (5% annual return | $ | 1,000.00 | $ | 1,020.92 | $ | 4.33 | ||||||
Class R | ||||||||||||
Actual (2.59% return) | $ | 1,000.00 | $ | 1,025.90 | $ | 6.69 | ||||||
Hypothetical (5% annual return before expenses) | $ | 1,000.00 | $ | 1,018.60 | $ | 6.67 | ||||||
Class Z | ||||||||||||
Actual (2.85% return) | $ | 1,000.00 | $ | 1,028.50 | $ | 4.14 | ||||||
Hypothetical (5% annual return | $ | 1,000.00 | $ | 1,021.12 | $ | 4.13 | ||||||
| a | Expenses are equal to the Fund’s Class A, Class C, Class F, Class I, Class R and Class Z annualized net expense ratios of 1.16%, 1.81%, 0.81%, 0.85%, 1.31% and 0.81%, respectively, multiplied by the average account value over the period, multiplied by 184/365 (to reflect the one-half year period). |
9
COHEN & STEERS PREFERRED SECURITIES AND INCOME FUND, INC.
December 31, 2017
Top Ten Holdingsa
(Unaudited)
Security | Value | % of Net Assets | ||||||
Rabobank Nederland, 11.00% to 6/30/19, 144A (Netherlands) | $ | 179,032,230 | 2.3 | |||||
General Electric Co., 5.00% to 1/21/21, Series D | 152,640,539 | 1.9 | ||||||
JPMorgan Chase & Co., 6.75% to 2/1/24, Series S | 149,127,806 | 1.9 | ||||||
BHP Billiton Finance USA Ltd., 6.75% to 10/20/25, due 10/19/75, 144A (Australia) | 144,124,666 | 1.8 | ||||||
Emera, 6.75% to 6/15/26, due 6/15/76, Series 16-A (Canada) | 134,760,410 | 1.7 | ||||||
Royal Bank of Scotland Group PLC, 8.625% to 8/15/21 (United Kingdom) | 123,835,162 | 1.6 | ||||||
Prudential Financial, 5.625% to 6/15/23, due 6/15/43 | 115,839,101 | 1.5 | ||||||
Enel SpA, 8.75% to 9/24/23, due 9/24/73, 144A (Italy) | 114,562,778 | 1.4 | ||||||
Bank of America Corp., 6.50% to 10/23/24, Series Z | 106,523,462 | 1.3 | ||||||
MetLife, 9.25%, due 4/8/38, 144A | 105,651,592 | 1.3 | ||||||
| a | Top ten holdings are determined on the basis of the value of individual securities held. The Fund may also hold positions in other types of securities issued by the companies listed above. See the Schedule of Investments for additional details on such other positions. |
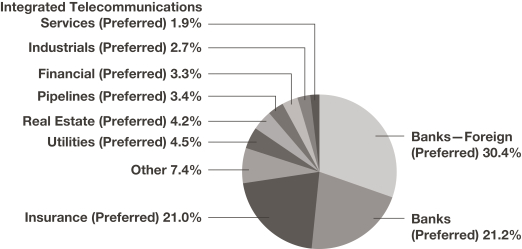
Sector Breakdown
(Based on Net Assets)
(Unaudited)
10
COHEN & STEERS PREFERRED SECURITIES AND INCOME FUND, INC.
SCHEDULE OF INVESTMENTS
December 31, 2017
| Number of Shares | Value | |||||||||||
PREFERRED SECURITIES—$25 PAR VALUE | 21.4% | |||||||||||
BANKS | 7.4% | |||||||||||
Bank of America Corp., 6.20%, Series CCa |
| 1,368,624 | $ | 37,555,043 | ||||||||
Bank of America Corp., 6.00%, Series EEa |
| 1,009,560 | 27,449,936 | |||||||||
Bank of America Corp., 6.50%, Series Ya |
| 1,561,228 | 42,184,381 | |||||||||
Capital One Financial Corp., 6.70%, Series Da |
| 349,175 | 9,364,874 | |||||||||
Capital One Financial Corp., 5.20%, Series Ga |
| 353,371 | 8,844,876 | |||||||||
Citigroup, 6.875% to 11/15/23, Series Ka,b |
| 530,309 | 15,129,716 | |||||||||
Citigroup, 6.30%, Series Sa |
| 1,277,726 | 34,409,161 | |||||||||
GMAC Capital Trust I, 7.20% , due 2/15/40, Series 2 (TruPS) (FRN) (3 Month US LIBOR + 5.785%)c |
| 3,923,869 | 101,824,401 | |||||||||
Goldman Sachs Group/The, 6.30%, Series Na |
| 231,247 | 6,437,917 | |||||||||
Huntington Bancshares, 6.25%, Series Da |
| 1,267,995 | 35,681,379 | |||||||||
JPMorgan Chase & Co., 6.15%, Series BBa |
| 502,374 | 13,528,932 | |||||||||
JPMorgan Chase & Co., 6.125%, Series Ya |
| 698,792 | 18,622,807 | |||||||||
New York Community Bancorp, 6.375% to 3/17/27, Series Aa,b |
| 1,569,922 | 44,899,769 | |||||||||
People’s United Financial, 5.625% to 12/15/26, Series Aa,b |
| 202,367 | 5,731,033 | |||||||||
Regions Financial Corp., 6.375% to 9/15/24, Series Ba,b |
| 1,228,110 | 34,915,167 | |||||||||
Sterling Bancorp, 6.50%, Series Aa |
| 286,122 | 7,530,731 | |||||||||
Wells Fargo & Co., 5.85% to 9/15/23, Series Qa,b |
| 1,410,028 | 38,070,756 | |||||||||
Wells Fargo & Co., 6.00%, Series Va |
| 913,895 | 24,501,525 | |||||||||
Wells Fargo & Co., 5.70%, Series Wa |
| 548,770 | 14,262,532 | |||||||||
Wells Fargo & Co., 5.50%, Series Xa |
| 389,243 | 9,941,266 | |||||||||
Wells Fargo & Co., 5.625%, Series Ya |
| 2,047,462 | 53,111,164 | |||||||||
|
| |||||||||||
| 583,997,366 | ||||||||||||
|
| |||||||||||
BANKS—FOREIGN | 0.4% | |||||||||||
Deutsche Bank Contingent Capital Trust III, 7.60% (Germany)a |
| 660,390 | 16,972,023 | |||||||||
Deutsche Bank Contingent Capital Trust V, 8.05% (Germany)a |
| 465,504 | 12,163,619 | |||||||||
|
| |||||||||||
| 29,135,642 | ||||||||||||
|
| |||||||||||
ELECTRIC | 1.1% | |||||||||||
INTEGRATED ELECTRIC | 0.5% | |||||||||||
DTE Energy Co., 5.375%, due 6/1/76, Series B |
| 834,617 | 21,257,695 | |||||||||
See accompanying notes to financial statements.
11
COHEN & STEERS PREFERRED SECURITIES AND INCOME FUND, INC.
SCHEDULE OF INVESTMENTS—(Continued)
December 31, 2017
| Number of Shares | Value | |||||||||||
Integrys Holdings, 6.00% to 8/1/23, due 8/1/73b |
| 537,422 | $ | 14,570,854 | ||||||||
|
| |||||||||||
| 35,828,549 | ||||||||||||
|
| |||||||||||
REGULATED ELECTRIC | 0.6% | |||||||||||
Southern Co./The, 5.25%, due 12/1/77 |
| 480,000 | 12,216,000 | |||||||||
Southern Co./The, 6.25%, due 10/15/75 |
| 1,429,933 | 38,593,892 | |||||||||
|
| |||||||||||
| 50,809,892 | ||||||||||||
|
| |||||||||||
TOTAL ELECTRIC |
| 86,638,441 | ||||||||||
|
| |||||||||||
FINANCIAL | 3.1% | |||||||||||
DIVERSIFIED FINANCIAL SERVICES | 0.5% | |||||||||||
KKR & Co. LP, 6.75%, Series Aa |
| 1,272,053 | 34,358,152 | |||||||||
State Street Corp., 5.35% to 3/15/26, Series Ga,b |
| 250,475 | 6,792,882 | |||||||||
|
| |||||||||||
| 41,151,034 | ||||||||||||
|
| |||||||||||
INVESTMENT ADVISORY SERVICES | 0.2% | |||||||||||
Ares Management LP, 7.00%, Series Aa |
| 618,000 | 16,377,000 | |||||||||
|
| |||||||||||
INVESTMENT BANKER/BROKER | 2.4% | |||||||||||
Carlyle Group LP/The, 5.875%, Series Aa |
| 788,000 | 19,991,560 | |||||||||
Charles Schwab Corp./The, 5.95%, Series Da |
| 802,804 | 21,675,708 | |||||||||
Morgan Stanley, 6.875% to 1/15/24, Series Fa,b |
| 1,014,076 | 28,840,321 | |||||||||
Morgan Stanley, 6.375% to 10/15/24, Series Ia,b |
| 2,175,128 | 60,577,315 | |||||||||
Morgan Stanley, 5.85% to 4/15/27, Series Ka,b |
| 2,118,780 | 57,418,938 | |||||||||
|
| |||||||||||
| 188,503,842 | ||||||||||||
|
| |||||||||||
TOTAL FINANCIAL |
| 246,031,876 | ||||||||||
|
| |||||||||||
INDUSTRIALS—CHEMICALS | 0.8% | |||||||||||
CHS, 6.75% to 9/30/24, Series IIIa,b |
| 859,303 | 22,745,750 | |||||||||
CHS, 7.10% to 3/31/24, Series IIa,b |
| 907,316 | 24,824,166 | |||||||||
CHS, 7.50%, Series IVa |
| 452,176 | 12,728,754 | |||||||||
|
| |||||||||||
| 60,298,670 | ||||||||||||
|
| |||||||||||
INSURANCE | 3.2% | |||||||||||
LIFE/HEALTH INSURANCE—FOREIGN | 0.2% | |||||||||||
Aegon NV, 6.50% (Netherlands)a |
| 709,461 | 18,410,513 | |||||||||
|
| |||||||||||
MULTI-LINE | 0.8% | |||||||||||
Allstate Corp., 6.625%, Series Ea |
| 525,984 | 13,807,080 | |||||||||
Hanover Insurance Group/The, 6.35%, due 3/30/53 |
| 487,938 | 12,354,590 | |||||||||
See accompanying notes to financial statements.
12
COHEN & STEERS PREFERRED SECURITIES AND INCOME FUND, INC.
SCHEDULE OF INVESTMENTS—(Continued)
December 31, 2017
| Number of Shares | Value | |||||||||||
WR Berkley Corp., 5.625%, due 4/30/53 |
| 480,802 | $ | 12,140,251 | ||||||||
WR Berkley Corp., 5.75%, due 6/1/56 |
| 1,062,797 | 27,558,326 | |||||||||
|
| |||||||||||
| 65,860,247 | ||||||||||||
|
| |||||||||||
MULTI-LINE—FOREIGN | 0.7% | |||||||||||
PartnerRe Ltd., 6.50%, Series G (Bermuda)a |
| 1,036,594 | 27,884,378 | |||||||||
PartnerRe Ltd., 5.875%, Series I (Bermuda)a |
| 925,200 | 24,305,004 | |||||||||
|
| |||||||||||
| 52,189,382 | ||||||||||||
|
| |||||||||||
PROPERTY CASUALTY—FOREIGN | 0.2% | |||||||||||
Axis Capital Holdings Ltd., 5.50%, Series Ea |
| 281,836 | 7,093,812 | |||||||||
Validus Holdings Ltd., 5.80%, Series Ba |
| 426,951 | 10,938,485 | |||||||||
|
| |||||||||||
| 18,032,297 | ||||||||||||
|
| |||||||||||
REINSURANCE | 0.3% | |||||||||||
Reinsurance Group of America, 5.75% to 6/15/26, |
| 703,307 | 19,685,563 | |||||||||
|
| |||||||||||
REINSURANCE—FOREIGN | 1.0% | |||||||||||
Arch Capital Group Ltd., 5.25%, Series Ea |
| 1,247,702 | 31,342,274 | |||||||||
Arch Capital Group Ltd., 5.45%, Series Fa |
| 1,427,000 | 36,160,180 | |||||||||
Aspen Insurance Holdings Ltd., 5.95% to 7/1/23 |
| 440,298 | 12,011,330 | |||||||||
|
| |||||||||||
| 79,513,784 | ||||||||||||
|
| |||||||||||
TOTAL INSURANCE |
| 253,691,786 | ||||||||||
|
| |||||||||||
INTEGRATED TELECOMMUNICATIONS SERVICES | 0.3% | |||||||||||
AT&T, 5.35%, due 11/1/66 |
| 822,000 | 21,445,980 | |||||||||
|
| |||||||||||
REAL ESTATE | 3.6% | |||||||||||
DIVERSIFIED | 1.3% | |||||||||||
Colony NorthStar, 8.50%, Series Da |
| 537,413 | 13,736,276 | |||||||||
Colony NorthStar, 8.75%, Series Ea |
| 459,286 | 12,203,229 | |||||||||
Colony NorthStar, 7.15%, Series Ia |
| 300,000 | 7,554,000 | |||||||||
National Retail Properties, 5.70%, Series Ea |
| 284,600 | 7,274,376 | |||||||||
National Retail Properties, 5.20%, Series Fa |
| 234,830 | 5,891,885 | |||||||||
VEREIT, 6.70%, Series Fa |
| 1,886,603 | 48,240,439 | |||||||||
See accompanying notes to financial statements.
13
COHEN & STEERS PREFERRED SECURITIES AND INCOME FUND, INC.
SCHEDULE OF INVESTMENTS—(Continued)
December 31, 2017
| Number of Shares | Value | |||||||||||
Wells Fargo Real Estate Investment Corp., 6.375%, Series Aa |
| 204,893 | $ | 5,427,615 | ||||||||
|
| |||||||||||
| 100,327,820 | ||||||||||||
|
| |||||||||||
HEALTH CARE | 0.1% | |||||||||||
Sabra Health Care REIT, 7.125%, Series Aa |
| 457,575 | 11,654,435 | |||||||||
|
| |||||||||||
HOTEL | 0.3% | |||||||||||
Hersha Hospitality Trust, 6.875%, Series Ca |
| 199,569 | 5,016,167 | |||||||||
Summit Hotel Properties, 7.125%a |
| 332,521 | 8,442,708 | |||||||||
Sunstone Hotel Investors, 6.95%, Series Ea |
| 255,000 | 6,678,450 | |||||||||
|
| |||||||||||
| 20,137,325 | ||||||||||||
|
| |||||||||||
INDUSTRIALS | 0.1% | |||||||||||
PS Business Parks, 5.75%, Series Ua |
| 199,856 | 5,046,364 | |||||||||
|
| |||||||||||
NET LEASE | 0.1% | |||||||||||
Gramercy Property Trust, 7.125%, Series Aa |
| 252,096 | 6,748,610 | |||||||||
|
| |||||||||||
OFFICE | 0.1% | |||||||||||
Equity Commonwealth, 6.50%, Series Da |
| 402,733 | 10,734,848 | |||||||||
|
| |||||||||||
RESIDENTIAL | 0.7% | |||||||||||
APARTMENT | 0.1% | |||||||||||
Apartment Investment & Management Co., 6.875%a |
| 240,000 | 6,576,000 | |||||||||
|
| |||||||||||
SINGLE FAMILY | 0.6% | |||||||||||
American Homes 4 Rent, 5.50%, Series Ca |
| 548,078 | 15,592,819 | |||||||||
American Homes 4 Rent, 6.50%, Series Da |
| 625,583 | 17,128,463 | |||||||||
American Homes 4 Rent, 6.35%, Series Ea |
| 650,000 | 17,413,500 | |||||||||
|
| |||||||||||
| 50,134,782 | ||||||||||||
|
| |||||||||||
TOTAL RESIDENTIAL |
| 56,710,782 | ||||||||||
|
| |||||||||||
SHOPPING CENTERS | 0.5% | |||||||||||
COMMUNITY CENTER | 0.4% | |||||||||||
Cedar Realty Trust, 7.25%, Series Ba |
| 155,111 | 3,918,104 | |||||||||
DDR Corp., 6.375%, Series Aa |
| 322,264 | 8,475,543 | |||||||||
DDR Corp., 6.50%, Series Ja |
| 236,707 | 5,941,346 | |||||||||
Saul Centers, 6.875%, Series Ca |
| 419,409 | 10,590,077 | |||||||||
|
| |||||||||||
| 28,925,070 | ||||||||||||
|
| |||||||||||
See accompanying notes to financial statements.
14
COHEN & STEERS PREFERRED SECURITIES AND INCOME FUND, INC.
SCHEDULE OF INVESTMENTS—(Continued)
December 31, 2017
| Number of Shares | Value | |||||||||||
REGIONAL MALL | 0.1% | |||||||||||
Taubman Centers, 6.50%, Series Ja |
| 170,050 | $ | 4,271,656 | ||||||||
Taubman Centers, 6.25%, Series Ka |
| 312,909 | 7,894,694 | |||||||||
|
| |||||||||||
| 12,166,350 | ||||||||||||
|
| |||||||||||
TOTAL SHOPPING CENTERS |
| 41,091,420 | ||||||||||
|
| |||||||||||
SPECIALTY | 0.4% | |||||||||||
Digital Realty Trust, 6.625%, Series Ca |
| 430,000 | 11,863,700 | |||||||||
Digital Realty Trust, 6.35%, Series Ia |
| 699,000 | 19,229,490 | |||||||||
|
| |||||||||||
| 31,093,190 | ||||||||||||
|
| |||||||||||
TOTAL REAL ESTATE |
| 283,544,794 | ||||||||||
|
| |||||||||||
TECHNOLOGY—SOFTWARE | 0.2% | |||||||||||
eBay, 6.00%, due 2/1/56 |
| 646,467 | 17,415,821 | |||||||||
|
| |||||||||||
UTILITIES | 1.3% | |||||||||||
Dominion Resources, 5.25%, due 7/30/76, Series A |
| 882,447 | 22,564,170 | |||||||||
Entergy New Orleans, 5.50%, due 4/1/66 |
| 98,845 | 2,527,467 | |||||||||
NextEra Energy Capital Holdings, 5.25%, due 6/1/76, Series K |
| 218,351 | 5,583,235 | |||||||||
SCE Trust III, 5.75% to 3/15/24, Series Ha,b |
| 486,833 | 13,168,833 | |||||||||
SCE Trust IV, 5.375% to 9/15/25, Series Ja,b |
| 1,436,385 | 37,058,733 | |||||||||
SCE Trust V, 5.45% to 3/15/26, Series Ka,b |
| 187,850 | 4,964,875 | |||||||||
SCE Trust VI, 5.00%a |
| 889,829 | 21,373,692 | |||||||||
|
| |||||||||||
| 107,241,005 | ||||||||||||
|
| |||||||||||
TOTAL PREFERRED SECURITIES—$25 PAR VALUE |
| 1,689,441,381 | ||||||||||
|
| |||||||||||
| Principal Amount | ||||||||||||
PREFERRED SECURITIES—CAPITAL SECURITIES | 74.9% | |||||||||||
BANKS | 13.8% | |||||||||||
Bank of America Corp., 6.10% to 3/17/25, Series AAa,b |
| $ | 40,525,000 | 44,526,844 | ||||||||
Bank of America Corp., 6.30% to 3/10/26, Series DDa,b |
| 30,180,000 | 34,178,850 | |||||||||
Bank of America Corp., 6.25% to 9/5/24, Series Xa,b |
| 39,898,000 | 44,139,157 | |||||||||
Bank of America Corp., 6.50% to 10/23/24, Series Za,b |
| 93,647,000 | 106,523,462 | |||||||||
Citigroup, 6.125% to 11/15/20, Series Ra,b |
| 71,579,000 | 76,231,635 | |||||||||
Citigroup, 6.25% to 8/15/26, Series Ta,b |
| 73,273,000 | 80,911,710 | |||||||||
See accompanying notes to financial statements.
15
COHEN & STEERS PREFERRED SECURITIES AND INCOME FUND, INC.
SCHEDULE OF INVESTMENTS—(Continued)
December 31, 2017
| Principal Amount | Value | |||||||||||
CoBank ACB, 6.25% to 10/1/22, Series F, 144Aa,b,d |
| $ | 346,400 | † | $ | 37,671,000 | ||||||
CoBank ACB, 6.125%, Series Ga |
| 175,200 | † | 17,892,300 | ||||||||
CoBank ACB, 6.20% to 1/1/25, Series Ha,b |
| 103,600 | † | 11,124,050 | ||||||||
CoBank ACB, 6.25% to 10/1/26, Series Ia,b |
| 41,929,000 | 46,202,613 | |||||||||
Countrywide Capital III, 8.05%, due 6/15/27, Series B |
| 3,000,000 | 3,854,380 | |||||||||
Farm Credit Bank of Texas, 6.75% to 9/15/23, 144Aa,b,d |
| 251,700 | † | 27,687,000 | ||||||||
Farm Credit Bank of Texas, 10.00%, 144A, Series Ia,d |
| 29,250 | † | 34,953,750 | ||||||||
Goldman Sachs Capital I, 6.345%, due 2/15/34 |
| 22,174,000 | 27,983,145 | |||||||||
Goldman Sachs Group/The, 5.70% to 5/10/19, Series La,b |
| 25,062,000 | 25,872,756 | |||||||||
Goldman Sachs Group/The, 5.00% to 11/10/22, Series Pa,b |
| 25,345,000 | 25,002,843 | |||||||||
JPMorgan Chase & Co., 7.90% to 4/30/18, Series Ia,b |
| 31,175,000 | 31,603,656 | |||||||||
JPMorgan Chase & Co., 6.75% to 2/1/24, Series Sa,b |
| 131,535,000 | 149,127,806 | |||||||||
JPMorgan Chase & Co., 5.30% to 5/1/20, Series Za,b |
| 27,075,000 | 28,147,170 | |||||||||
PNC Financial Services Group, 6.75% to 8/1/21a,b |
| 49,912,000 | 55,467,206 | |||||||||
SunTrust Banks, 5.125% to 12/15/27, Series Ha,b |
| 28,960,000 | 28,438,720 | |||||||||
Wells Fargo & Co., 7.98% to 3/15/18, Series Ka,b |
| 44,958,000 | 45,742,517 | |||||||||
Wells Fargo & Co., 5.875% to 6/15/25, Series Ua,b |
| 42,430,000 | 47,046,384 | |||||||||
Wells Fargo Capital X, 5.95%, due 12/1/86, (TruPS) |
| 51,626,000 | 58,853,640 | |||||||||
|
| |||||||||||
| 1,089,182,594 | ||||||||||||
|
| |||||||||||
BANKS—FOREIGN | 30.0% | |||||||||||
Australia & New Zealand Banking Group Ltd./United Kingdom, 6.75% to 6/15/26, 144A (Australia)a,b,d |
| 45,705,000 | 52,103,700 | |||||||||
Banco Bilbao Vizcaya Argentaria SA, 6.125% to 11/16/27 (Spain)a,b |
| 34,200,000 | 35,354,250 | |||||||||
Banco Bilbao Vizcaya Argentaria SA, 8.875% to 4/14/21 (EUR) (Spain)a,b |
| 39,600,000 | 56,442,679 | |||||||||
Banco Bilbao Vizcaya Argentaria SA, 9.00% to 5/9/18 (Spain)a,b |
| 27,200,000 | 27,880,000 | |||||||||
Banco de Sabadell SA, 6.125% to 11/23/22 (EUR) (Spain)a,b |
| 18,600,000 | 22,875,127 | |||||||||
Banco Santander SA, 6.75% to 4/25/22 (EUR) (Spain)a,b |
| 29,200,000 | 39,870,933 | |||||||||
Bank of Nova Scotia/The, 4.65% to 10/12/22 (Canada)a,b |
| 18,202,000 | 18,105,074 | |||||||||
See accompanying notes to financial statements.
16
COHEN & STEERS PREFERRED SECURITIES AND INCOME FUND, INC.
SCHEDULE OF INVESTMENTS—(Continued)
December 31, 2017
| Principal Amount | Value | |||||||||
Barclays PLC, 7.875% to 3/15/22 (United Kingdom)a,b | $ | 42,550,000 | $ | 46,751,813 | ||||||
Barclays PLC, 8.25% to 12/15/18 (United Kingdom)a,b | 40,530,000 | 42,571,699 | ||||||||
BNP Paribas, 7.195% to 6/25/37, 144A (France)a,b,d | 45,771,000 | 52,979,933 | ||||||||
BNP Paribas SA, 7.375% to 8/19/25, 144A (France)a,b,d | 25,600,000 | 29,600,000 | ||||||||
BNP Paribas SA, 7.625% to 3/30/21, 144A (France)a,b,d | 77,000,000 | 84,892,500 | ||||||||
Credit Agricole SA, 8.125% to 12/23/25, 144A (France)a,b,d | 60,900,000 | 73,193,030 | ||||||||
Credit Suisse Group AG, 7.125% to 7/29/22 (Switzerland)a,b | 76,000,000 | 83,277,000 | ||||||||
Credit Suisse Group AG, 7.50% to 12/11/23, 144A (Switzerland)a,b,d | 12,359,000 | 14,150,437 | ||||||||
Danske Bank A/S, 6.125% to 3/28/24 (Denmark)a,b | 56,620,000 | 60,491,393 | ||||||||
Deutsche Bank AG, 7.50% to 4/30/25 (Germany)a,b | 15,775,000 | 16,725,444 | ||||||||
DNB Bank ASA, 5.75% to 3/26/20 (Norway)a,b | 13,000,000 | 13,418,626 | ||||||||
DNB Bank ASA, 6.50% to 3/26/22 (Norway)a,b | 49,000,000 | 52,797,500 | ||||||||
Dresdner Funding Trust I, 8.151%, due 6/30/31, 144A (Germany)d | 46,016,945 | 61,173,914 | ||||||||
HSBC Capital Funding LP, 10.176% to 6/30/30, 144A (United Kingdom)a,b,d | 46,566,000 | 75,204,090 | ||||||||
HSBC Holdings PLC, 5.625% to 1/17/20 (United Kingdom)a,b | 15,200,000 | 15,713,000 | ||||||||
HSBC Holdings PLC, 6.00% to 5/22/27 (United Kingdom)a,b | 42,000,000 | 44,257,500 | ||||||||
HSBC Holdings PLC, 6.375% to 3/30/25 (United Kingdom)a,b | 74,234,000 | 79,987,135 | ||||||||
HSBC Holdings PLC, 6.875% to 6/1/21 (United Kingdom)a,b | 61,758,000 | 66,698,640 | ||||||||
ING Groep N.V., 6.875% to 4/16/22 (Netherlands)a,b | 42,200,000 | 46,209,000 | ||||||||
Intesa Sanpaolo SpA, 7.00% to 1/19/21, Series EMTN (EUR) (Italy)a,b | 17,781,000 | 23,650,084 | ||||||||
Itau Unibanco Holding SA/Cayman Island, 6.125% to 12/12/22, 144A (Brazil)a,b,d | 26,800,000 | 26,819,792 | ||||||||
Lloyds Banking Group PLC, 7.50% to 6/27/24 (United Kingdom)a,b | 67,561,000 | 76,766,186 | ||||||||
Macquarie Bank Ltd./London, 6.125% to 3/8/27, 144A (Australia)a,b,d | 59,413,000 | 61,863,786 | ||||||||
Nationwide Building Society, 10.25% (GBP) (United Kingdom)a | 46,181,000 | 98,125,381 | ||||||||
See accompanying notes to financial statements.
17
COHEN & STEERS PREFERRED SECURITIES AND INCOME FUND, INC.
SCHEDULE OF INVESTMENTS—(Continued)
December 31, 2017
| Principal Amount | Value | |||||||||||
Rabobank Nederland, 11.00% to 6/30/19, 144A (Netherlands)a,b,d |
| $ | 159,672,000 | $ | 179,032,230 | |||||||
Royal Bank of Scotland Group PLC, 7.648% to 9/30/31 (United Kingdom)a,b |
| 18,069,000 | 23,670,390 | |||||||||
Royal Bank of Scotland Group PLC, 8.00% to 8/10/25 (United Kingdom)a,b |
| 34,000,000 | 38,972,500 | |||||||||
Royal Bank of Scotland Group PLC, 8.625% to 8/15/21 (United Kingdom)a,b |
| 109,710,000 | 123,835,162 | |||||||||
Santander UK Group Holdings PLC, 6.75% to 6/24/22 (GBP) (United Kingdom)a,b |
| 13,400,000 | 19,974,948 | |||||||||
Skandinaviska Enskilda Banken AB, 5.75% to 5/13/20, Series EMTN (Sweden)a,b |
| 33,400,000 | 34,624,711 | |||||||||
Societe Generale SA, 7.375% to 9/13/21, 144A (France)a,b,d |
| 51,400,000 | 55,835,820 | |||||||||
Societe Generale SA, 7.875% to 12/18/23, 144A (France)a,b,d |
| 31,200,000 | 35,139,000 | |||||||||
Societe Generale SA, 8.25% to 11/29/18, Series EMTN (France)a,b |
| 10,600,000 | 11,116,167 | |||||||||
Standard Chartered PLC, 7.50% to 4/2/22, 144A (United Kingdom)a,b,d |
| 23,926,000 | 25,899,895 | |||||||||
Standard Chartered PLC, 7.75% to 4/2/23, 144A (United Kingdom)a,b,d |
| 22,800,000 | 25,023,000 | |||||||||
Stichting AK Rabobank Certificaten, 6.50% (EUR) (Netherlands)a |
| 11,000,000 | 16,382,442 | |||||||||
Swedbank AB, 6.00% to 3/17/22 (Sweden)a,b |
| 47,600,000 | 50,447,337 | |||||||||
UBS Group AG, 6.875% to 3/22/21 (Switzerland)a,b |
| 28,500,000 | 30,616,125 | |||||||||
UBS Group AG, 6.875% to 8/7/25 (Switzerland)a,b |
| 17,600,000 | 19,519,544 | |||||||||
UBS Group AG, 7.00% to 2/19/25 (Switzerland)a,b |
| 15,400,000 | 17,479,000 | |||||||||
UBS Group AG, 7.125% to 2/19/20 (Switzerland)a,b |
| 34,115,000 | 36,298,189 | |||||||||
UBS Group AG, 7.125% to 8/10/21 (Switzerland)a,b |
| 64,900,000 | 70,791,103 | |||||||||
UniCredit SpA, 5.375% to 6/3/25 (EUR) (Italy)a,b |
| 34,000,000 | 40,927,949 | |||||||||
UniCredit SpA, 6.75% to 9/10/21, Series EMTN (EUR) (Italy)a,b |
| 13,600,000 | 17,642,234 | |||||||||
|
| |||||||||||
| 2,373,177,392 | ||||||||||||
|
| |||||||||||
FINANCIAL—DIVERSIFIED FINANCIAL SERVICES | 0.2% | |||||||||||
State Street Corp., 5.25% to 9/15/20, Series Fa,b |
| 17,725,000 | 18,634,293 | |||||||||
|
| |||||||||||
See accompanying notes to financial statements.
18
COHEN & STEERS PREFERRED SECURITIES AND INCOME FUND, INC.
SCHEDULE OF INVESTMENTS—(Continued)
December 31, 2017
| Principal Amount | Value | |||||||||||
FOOD | 0.3% | |||||||||||
Land O’ Lakes, 7.25%, 144Aa,d |
| $ | 17,695,000 | $ | 19,331,787 | |||||||
|
| |||||||||||
INDUSTRIALS—DIVERSIFIED MANUFACTURING | 1.9% | |||||||||||
General Electric Co., 5.00% to 1/21/21, Series Da,b |
| 147,929,000 | 152,640,539 | |||||||||
|
| |||||||||||
INSURANCE | 17.8% | |||||||||||
LIFE/HEALTH INSURANCE | 6.6% | |||||||||||
MetLife, 10.75%, due 8/1/39 |
| 5,850,000 | 9,798,750 | |||||||||
MetLife, 9.25%, due 4/8/38, 144Ad |
| 71,507,000 | 105,651,592 | |||||||||
MetLife, 5.25% to 6/15/20, Series Ca,b |
| 63,064,000 | 65,727,823 | |||||||||
MetLife Capital Trust IV, 7.875%, due 12/15/37, 144Ad |
| 52,953,000 | 70,824,638 | |||||||||
Provident Financing Trust I, 7.405%, due 3/15/38 |
| 15,475,000 | 17,641,500 | |||||||||
Prudential Financial, 5.20% to 3/15/24, due 3/15/44b |
| 64,050,000 | 68,293,313 | |||||||||
Prudential Financial, 5.375% to 5/15/25, due 5/15/45b |
| 4,550,000 | 4,886,700 | |||||||||
Prudential Financial, 5.625% to 6/15/23, due 6/15/43b |
| 106,838,000 | 115,839,101 | |||||||||
Voya Financial, 5.65% to 5/15/23, due 5/15/53b |
| 59,559,000 | 63,579,233 | |||||||||
|
| |||||||||||
| 522,242,650 | ||||||||||||
|
| |||||||||||
LIFE/HEALTH INSURANCE—FOREIGN | 7.6% | |||||||||||
ASR Nederland NV, 4.625% to 10/19/27 (EUR) (Netherlands)a,b |
| 12,269,000 | 15,627,747 | |||||||||
Dai-ichi Life Insurance Co. Ltd., 4.00% to 7/24/26, 144A (Japan)a,b,d |
| 73,000,000 | 71,700,600 | |||||||||
Dai-ichi Life Insurance Co. Ltd., 5.10% to 10/28/24, 144A (Japan)a,b,d |
| 16,600,000 | 17,596,000 | |||||||||
Dai-ichi Life Insurance Co. Ltd., 7.25% to 7/25/21, 144A (Japan)a,b,d |
| 35,533,000 | 40,152,290 | |||||||||
Demeter BV (Swiss Re Ltd.), 5.625% to 8/15/27, due 8/15/52 (Netherlands)b |
| 13,600,000 | 14,820,532 | |||||||||
Fukoku Mutual Life Insurance Co, 6.50% to 9/19/23 (Japan)a,b |
| 7,025,000 | 7,903,125 | |||||||||
La Mondiale SAM, 5.875% to 1/26/27, due 1/26/47 (France)b |
| 35,750,000 | 38,875,623 | |||||||||
La Mondiale Vie, 7.625% to 4/23/19 (France)a,b |
| 33,600,000 | 35,647,416 | |||||||||
Legal & General Group PLC, 5.25% to 3/21/27, due 3/21/47, Series EMTN (United Kingdom)b |
| 35,150,000 | 37,295,908 | |||||||||
Meiji Yasuda Life Insurance Co., 5.20% to 10/20/25, |
| 75,325,000 | 80,786,062 | |||||||||
See accompanying notes to financial statements.
19
COHEN & STEERS PREFERRED SECURITIES AND INCOME FUND, INC.
SCHEDULE OF INVESTMENTS—(Continued)
December 31, 2017
| Principal Amount | Value | |||||||||||
Nippon Life Insurance Co., 4.70% to 1/20/26, due 1/20/46, 144A (Japan)b,d |
| $ | 65,200,000 | $ | 67,482,000 | |||||||
Nippon Life Insurance Co., 5.10% to 10/16/24, due 10/16/44, 144A (Japan)b,d |
| 31,000,000 | 32,782,500 | |||||||||
Phoenix Group Holdings, 5.375%, due 7/6/27, Series EMTN (United Kingdom) |
| 44,650,000 | 47,012,744 | |||||||||
Sumitomo Life Insurance Co., 4.00% to 9/14/27, due 9/14/77, 144A (Japan)b,d |
| 81,400,000 | 79,944,916 | |||||||||
Sumitomo Life Insurance Co., 6.50% to 9/20/23, due 9/20/73, 144A (Japan)b,d |
| 9,300,000 | 10,489,564 | |||||||||
|
| |||||||||||
| 598,117,027 | ||||||||||||
|
| |||||||||||
MULTI-LINE—FOREIGN | 0.2% | |||||||||||
AXA SA, 8.60%, due 12/15/30 (France) |
| 10,000,000 | 14,412,500 | |||||||||
|
| |||||||||||
PROPERTY CASUALTY | 0.7% | |||||||||||
Liberty Mutual Group, 7.80%, due 3/7/37, 144Ad |
| 46,290,000 | 59,042,895 | |||||||||
|
| |||||||||||
PROPERTY CASUALTY—FOREIGN | 2.2% | |||||||||||
Direct Line Insurance Group PLC, 4.75% to 12/7/27 (GBP) |
| 17,000,000 | 23,152,595 | |||||||||
QBE Insurance Group Ltd., 6.75% to 12/2/24, due 12/2/44 (Australia)b |
| 41,401,000 | 47,093,638 | |||||||||
QBE Insurance Group Ltd., 5.25% to 5/16/25, Series EMTN (Australia)a,b |
| 19,200,000 | 19,655,424 | |||||||||
QBE Insurance Group Ltd., 5.875% to 6/17/26, due 6/17/46, Series EMTN (Australia)b |
| 47,145,000 | 51,430,905 | |||||||||
VIVAT NV, 6.25% to 11/16/22 (Netherlands)a,b |
| 30,500,000 | 30,614,863 | |||||||||
|
| |||||||||||
| 171,947,425 | ||||||||||||
|
| |||||||||||
REINSURANCE—FOREIGN | 0.5% | |||||||||||
Aquarius + Investments PLC, 8.25% to 9/1/18, Series EMTN (Ireland)a,b |
| 37,740,000 | 39,145,135 | |||||||||
|
| |||||||||||
TOTAL INSURANCE |
| 1,404,907,632 | ||||||||||
|
| |||||||||||
INTEGRATED TELECOMMUNICATIONS SERVICES | 1.6% | |||||||||||
Centaur Funding Corp., 9.08%, due 4/21/20, 144A |
| 44,126 | † | 50,434,244 | ||||||||
SoftBank Group Corp., 6.00% to 7/19/23 (Japan)a,b |
| 28,100,000 | 27,838,249 | |||||||||
See accompanying notes to financial statements.
20
COHEN & STEERS PREFERRED SECURITIES AND INCOME FUND, INC.
SCHEDULE OF INVESTMENTS—(Continued)
December 31, 2017
| Principal Amount | Value | |||||||||||
SoftBank Group Corp., 6.875% to 7/19/27 (Japan)a,b |
| $ | 48,500,000 | $ | 49,196,945 | |||||||
|
| |||||||||||
| 127,469,438 | ||||||||||||
|
| |||||||||||
MATERIAL—METALS & MINING | 1.8% | |||||||||||
BHP Billiton Finance USA Ltd., 6.75% to 10/20/25, due 10/19/75, 144A (Australia)b,d |
| 123,174,000 | 144,124,666 | |||||||||
|
| |||||||||||
MEDIA | 0.3% | |||||||||||
Viacom, 5.875% to 2/28/22, due 2/28/57b |
| 12,000,000 | 11,815,785 | |||||||||
Viacom, 6.25% to 2/28/27, due 2/28/57b |
| 10,450,000 | 10,219,821 | |||||||||
|
| |||||||||||
| 22,035,606 | ||||||||||||
|
| |||||||||||
PIPELINES | 3.4% | |||||||||||
Enbridge, 5.50% to 7/15/27, due 7/15/77 (Canada)b |
| 15,212,000 | 15,154,955 | |||||||||
Enbridge, 6.00% to 1/15/27, due 1/15/77, Series 16-A (Canada)b |
| 24,883,000 | 25,940,527 | |||||||||
Energy Transfer Partners LP, 6.625% to 2/15/28, Series Ba,b |
| 6,570,000 | 6,393,431 | |||||||||
Enterprise Products Operating LLC, 5.25% to 8/16/27, |
| 13,603,000 | 13,500,978 | |||||||||
Plains All American Pipeline LP, 6.125% to 11/15/22, |
| 14,470,000 | 14,484,470 | |||||||||
Transcanada Trust, 5.30% to 3/15/27, due 3/15/77 (Canada)b |
| 60,422,000 | 62,423,479 | |||||||||
Transcanada Trust, 5.625% to 5/20/25, due 5/20/75 (Canada)b |
| 32,754,000 | 34,555,470 | |||||||||
Transcanada Trust, 5.875% to 8/15/26, due 8/15/76, Series 16-A (Canada)b |
| 91,396,000 | 99,164,660 | |||||||||
|
| |||||||||||
| 271,617,970 | ||||||||||||
|
| |||||||||||
REAL ESTATE | 0.6% | |||||||||||
FINANCE | 0.5% | |||||||||||
AT Securities BV, 5.25% to 7/21/23 (Netherlands)a,b |
| 36,000,000 | 36,543,960 | |||||||||
|
| |||||||||||
SPECIALTY | 0.1% | |||||||||||
Equinix, 2.875%, due 2/1/26 (EUR) (United States) |
| 7,000,000 | 8,413,433 | |||||||||
|
| |||||||||||
TOTAL REAL ESTATE |
| 44,957,393 | ||||||||||
|
| |||||||||||
See accompanying notes to financial statements.
21
COHEN & STEERS PREFERRED SECURITIES AND INCOME FUND, INC.
SCHEDULE OF INVESTMENTS—(Continued)
December 31, 2017
| Principal Amount | Value | |||||||||||
UTILITIES | 3.2% | |||||||||||
ELECTRIC UTILITIES | 0.1% | |||||||||||
NextEra Energy Capital Holdings, 4.80% to 12/1/27, due 12/1/77b |
| $ | 5,720,000 | $ | 5,763,800 | |||||||
|
| |||||||||||
ELECTRIC UTILITIES—FOREIGN | 3.1% | |||||||||||
Emera, 6.75% to 6/15/26, due 6/15/76, Series 16-A (Canada)b |
| 119,257,000 | 134,760,410 | |||||||||
Enel SpA, 8.75% to 9/24/23, due 9/24/73, 144A (Italy)b,d |
| 91,926,000 | 114,562,778 | |||||||||
|
| |||||||||||
| 249,323,188 | ||||||||||||
|
| |||||||||||
TOTAL UTILITIES |
| 255,086,988 | ||||||||||
|
| |||||||||||
TOTAL PREFERRED SECURITIES—CAPITAL SECURITIES |
| 5,923,166,298 | ||||||||||
|
| |||||||||||
| Number of Shares | ||||||||||||
SHORT-TERM INVESTMENTS | 2.2% | |||||||||||
MONEY MARKET FUNDS |
| |||||||||||
State Street Institutional Treasury Money Market Fund, Premier Class, 1.15%e |
| 175,714,845 | 175,714,845 | |||||||||
|
| |||||||||||
TOTAL SHORT-TERM INVESTMENTS |
| 175,714,845 | ||||||||||
|
| |||||||||||
TOTAL INVESTMENTSIN SECURITIES | 98.5 | % | 7,788,322,524 | |||||||||
OTHER ASSETSIN EXCESSOF LIABILITIES | 1.5 | 117,968,868 | ||||||||||
|
|
|
| |||||||||
NET ASSETS | 100.0 | % | $ | 7,906,291,392 | ||||||||
|
|
|
| |||||||||
See accompanying notes to financial statements.
22
COHEN & STEERS PREFERRED SECURITIES AND INCOME FUND, INC.
SCHEDULE OF INVESTMENTS—(Continued)
December 31, 2017
Forward Foreign Currency Exchange Contracts
| Counterparty | Contracts to Deliver | In Exchange For | Settlement Date | Unrealized Appreciation (Depreciation) | ||||||||||||||||
Brown Brothers Harriman | EUR | 172,922,681 | USD | 206,575,164 | 1/3/18 | $ | (905,994 | ) | ||||||||||||
Brown Brothers Harriman | EUR | 31,235,602 | USD | 36,827,712 | 1/3/18 | (650,303 | ) | |||||||||||||
Brown Brothers Harriman | GBP | 96,772,432 | USD | 131,182,773 | 1/3/18 | 525,396 | ||||||||||||||
Brown Brothers Harriman | USD | 245,202,264 | EUR | 204,158,283 | 1/3/18 | (243,091 | ) | |||||||||||||
Brown Brothers Harriman | USD | 130,882,779 | GBP | 96,772,432 | 1/3/18 | (225,401 | ) | |||||||||||||
Brown Brothers Harriman | EUR | 201,580,706 | USD | 242,503,605 | 2/2/18 | 218,988 | ||||||||||||||
Brown Brothers Harriman | GBP | 104,618,270 | USD | 141,612,337 | 2/2/18 | 225,136 | ||||||||||||||
| $ | (1,055,269 | ) | ||||||||||||||||||
| ||||||||||||||||||||
The total amount of all forward foreign currency exchange contracts as presented in the table above is representative of the volume of activity for this derivative type during the year ended December 31, 2017.
Glossary of Portfolio Abbreviations
EUR | Euro Currency | |
FRN | Floating Rate Note | |
GBP | Great British Pound | |
LIBOR | London Interbank Offered Rate | |
REIT | Real Estate Investment Trust | |
TruPS | Trust Preferred Securities | |
USD | United States Dollar |
Note: Percentages indicated are based on the net assets of the Fund.
| † | Represents shares. |
| a | Perpetual security. Perpetual securities have no stated maturity date, but they may be called/redeemed by the issuer. The date indicated, if any, represents the next call date. |
| b | Security converts to floating rate after the indicated fixed-rate coupon period. |
| c | Variable rate. Rate shown is in effect at December 31, 2017. |
| d | Resale is restricted to qualified institutional investors. Aggregate holdings amounted to $1,918,129,409 or 24.3% of the net assets of the Fund, of which 0.0% are illiquid. |
| e | Rate quoted represents the annualized seven-day yield of the fund. |
See accompanying notes to financial statements.
23
COHEN & STEERS PREFERRED SECURITIES AND INCOME FUND, INC.
STATEMENT OF ASSETS AND LIABILITIES
December 31, 2017
ASSETS: | ||||
Investments in securities, at value (Identified cost—$7,397,008,488) | $ | 7,788,322,524 | ||
Foreign currency, at value (Identified cost—$3,711,777) | 3,743,595 | |||
Receivable for: | ||||
Dividends and interest | 98,252,236 | |||
Fund shares sold | 29,161,705 | |||
Investment securities sold | 1,170,779 | |||
Unrealized appreciation on forward foreign currency exchange contracts | 969,520 | |||
Other assets | 63,082 | |||
|
| |||
Total Assets | 7,921,683,441 | |||
|
| |||
LIABILITIES: | ||||
Unrealized depreciation on forward foreign currency exchange contracts | 2,024,789 | |||
Payable for: | ||||
Fund shares redeemed | 6,366,325 | |||
Investment advisory fees | 4,571,489 | |||
Shareholder servicing fees | 857,912 | |||
Administration fees | 334,730 | |||
Distribution fees | 95,810 | |||
Directors’ fees | 327 | |||
Other liabilities | 1,140,667 | |||
|
| |||
Total Liabilities | 15,392,049 | |||
|
| |||
NET ASSETS | $ | 7,906,291,392 | ||
|
| |||
NET ASSETS consist of: | ||||
Paid-in capital | $ | 7,503,089,773 | ||
Accumulated undistributed net investment income | 601,509 | |||
Accumulated undistributed net realized gain | 12,260,636 | |||
Net unrealized appreciation | 390,339,474 | |||
|
| |||
| $ | 7,906,291,392 | |||
|
|
See accompanying notes to financial statements.
24
COHEN & STEERS PREFERRED SECURITIES AND INCOME FUND, INC.
STATEMENT OF ASSETS AND LIABILITIES—(Continued)
December 31, 2017
CLASS A SHARES: | ||||
NET ASSETS | $ | 981,761,931 | ||
Shares issued and outstanding ($0.001 par value common stock outstanding) | 69,447,549 | |||
|
| |||
Net asset value and redemption price per share | $ | 14.14 | ||
|
| |||
Maximum offering price per share ($14.14 ÷ 0.9625)a | $ | 14.69 | ||
|
| |||
CLASS C SHARES: | ||||
NET ASSETS | $ | 838,053,220 | ||
Shares issued and outstanding ($0.001 par value common stock outstanding) | 59,607,121 | |||
|
| |||
Net asset value and offering price per shareb | $ | 14.06 | ||
|
| |||
CLASS F SHARES: | ||||
NET ASSETS | $ | 616,466,686 | ||
Shares issued and outstanding ($0.001 par value common stock outstanding) | 43,532,802 | |||
|
| |||
Net asset value and offering price per share | $ | 14.16 | ||
|
| |||
CLASS I SHARES: | ||||
NET ASSETS | $ | 5,466,718,871 | ||
Shares issued and outstanding ($0.001 par value common stock outstanding) | 385,867,329 | |||
|
| |||
Net asset value, offering and redemption price per share | $ | 14.17 | ||
|
| |||
CLASS R SHARES: | ||||
NET ASSETS | $ | 2,428,464 | ||
Shares issued and outstanding ($0.001 par value common stock outstanding) | 171,568 | |||
|
| |||
Net asset value, offering and redemption price per share | $ | 14.15 | ||
|
| |||
CLASS Z SHARES: | ||||
NET ASSETS | $ | 862,220 | ||
Shares issued and outstanding ($0.001 par value common stock outstanding) | 60,885 | |||
|
| |||
Net asset value, offering and redemption price per share | $ | 14.16 | ||
|
|
| a | On investments of $100,000 or more, the offering price is reduced. |
| b | Redemption price per share is equal to the net asset value per share less any applicable contingent deferred sales charge of 1.00% on shares held for less than one year. |
See accompanying notes to financial statements.
25
COHEN & STEERS PREFERRED SECURITIES AND INCOME FUND, INC.
STATEMENT OF OPERATIONS
For the Year Ended December 31, 2017
Investment Income: | ||||
Interest income | $ | 276,230,199 | ||
Dividend income | 117,190,496 | |||
|
| |||
Total Investment Income | 393,420,695 | |||
|
| |||
Expenses: | ||||
Investment advisory fees | 50,888,348 | |||
Distribution fees—Class A | 2,455,943 | |||
Distribution fees—Class C | 6,375,444 | |||
Distribution fees—Class R | 15,664 | |||
Shareholder servicing fees—Class A | 982,377 | |||
Shareholder servicing fees—Class C | 2,125,148 | |||
Shareholder servicing fees—Class I | 2,905,014 | |||
Administration fees | 4,437,583 | |||
Transfer agent fees and expenses | 1,721,447 | |||
Directors’ fees and expenses | 520,183 | |||
Registration and filing fees | 493,758 | |||
Shareholder reporting expenses | 386,075 | |||
Custodian fees and expenses | 311,563 | |||
Professional fees | 95,759 | |||
Miscellaneous | 253,604 | |||
|
| |||
Total Expenses | 73,967,910 | |||
Reduction of Expenses (See Note 2) | (929,723 | ) | ||
|
| |||
Net Expenses | 73,038,187 | |||
|
| |||
Net Investment Income (Loss) | 320,382,508 | |||
|
| |||
Net Realized and Unrealized Gain (Loss): | ||||
Net realized gain (loss) on: | ||||
Investments in securities | 103,341,495 | |||
Written option contracts | 8,058,167 | |||
Foreign currency transactions | (116,587 | ) | ||
Forward foreign currency exchange contracts | (32,906,149 | ) | ||
|
| |||
Net realized gain (loss) | 78,376,926 | |||
|
| |||
Net change in unrealized appreciation (depreciation) on: | ||||
Investments in securities | 349,026,862 | |||
Written option contracts | (2,021,460 | ) | ||
Foreign currency translations | 173,052 | |||
Forward foreign currency exchange contracts | (3,196,935 | ) | ||
|
| |||
Net change in unrealized appreciation (depreciation) | 343,981,519 | |||
|
| |||
Net Realized and Unrealized Gain (Loss) | 422,358,445 | |||
|
| |||
Net Increase (Decrease) in Net Assets Resulting from Operations | $ | 742,740,953 | ||
|
|
See accompanying notes to financial statements.
26
COHEN & STEERS PREFERRED SECURITIES AND INCOME FUND, INC.
STATEMENT OF CHANGES IN NET ASSETS
| For the Year Ended December 31, 2017 | For the Year Ended December 31, 2016 | |||||||
Change in Net Assets: | ||||||||
From Operations: | ||||||||
Net investment income (loss) | $ | 320,382,508 | $ | 274,551,793 | ||||
Net realized gain (loss) | 78,376,926 | 47,738,893 | ||||||
Net change in unrealized appreciation (depreciation) | 343,981,519 | (108,396,415 | ) | |||||
|
|
|
| |||||
Net increase (decrease) in net assets resulting from operations | 742,740,953 | 213,894,271 | ||||||
|
|
|
| |||||
Dividends and Distributions to Shareholders from: | ||||||||
Net investment income: | ||||||||
Class A | (45,335,773 | ) | (42,621,959 | ) | ||||
Class C | (33,763,878 | ) | (31,896,539 | ) | ||||
Class F | (5,392,857 | ) | — | |||||
Class I | (261,607,855 | ) | (198,638,409 | ) | ||||
Class R | (142,351 | ) | (92,465 | ) | ||||
Class Z | (23,445 | ) | (2,703 | ) | ||||
Net realized gain: | ||||||||
Class A | (5,625,107 | ) | (7,020,281 | ) | ||||
Class C | (4,857,804 | ) | (6,390,737 | ) | ||||
Class F | (3,560,914 | ) | — | |||||
Class I | (31,451,827 | ) | (33,945,851 | ) | ||||
Class R | (14,002 | ) | (30,020 | ) | ||||
Class Z | (4,948 | ) | (890 | ) | ||||
Return of capital: | ||||||||
Class A | — | (352,958 | ) | |||||
Class C | — | (272,224 | ) | |||||
Class F | — | — | ||||||
Class I | — | (1,653,689 | ) | |||||
Class R | — | (871 | ) | |||||
Class Z | — | (26 | ) | |||||
|
|
|
| |||||
Total dividends and distributions to shareholders | (391,780,761 | ) | (322,919,622 | ) | ||||
|
|
|
| |||||
Capital Stock Transactions: | ||||||||
Increase (decrease) in net assets from Fund share transactions | 1,242,237,110 | 1,730,303,419 | ||||||
|
|
|
| |||||
Total increase (decrease) in net assets | 1,593,197,302 | 1,621,278,068 | ||||||
Net Assets: | ||||||||
Beginning of year | 6,313,094,090 | 4,691,816,022 | ||||||
|
|
|
| |||||
End of yeara | $ | 7,906,291,392 | $ | 6,313,094,090 | ||||
|
|
|
| |||||
| a | Includes accumulated undistributed net investment income and dividends in excess of net investment income of $601,509 and $2,396,307, respectively. |
See accompanying notes to financial statements.
27
COHEN & STEERS PREFERRED SECURITIES AND INCOME FUND, INC.
FINANCIAL HIGHLIGHTS
The following tables include selected data for a share outstanding throughout each period and other performance information derived from the financial statements. They should be read in conjunction with the financial statements and notes thereto.
| Class A | ||||||||||||||||||||
| For the Year Ended December 31, | ||||||||||||||||||||
Per Share Operating Performance: | 2017 | 2016 | 2015 | 2014 | 2013 | |||||||||||||||
Net asset value, beginning of year | $ | 13.41 | $ | 13.57 | $ | 13.56 | $ | 12.87 | $ | 13.34 | ||||||||||
|
|
|
|
|
|
|
|
|
| |||||||||||
Income (loss) from investment operations: | ||||||||||||||||||||
Net investment income (loss)a | 0.60 | 0.62 | 0.65 | 0.71 | 0.69 | |||||||||||||||
Net realized and unrealized gain (loss) | 0.86 | (0.05 | ) | 0.12 | 0.76 | (0.35 | ) | |||||||||||||
|
|
|
|
|
|
|
|
|
| |||||||||||
Total from investment operations | 1.46 | 0.57 | 0.77 | 1.47 | 0.34 | |||||||||||||||
|
|
|
|
|
|
|
|
|
| |||||||||||
Less dividends and distributions to shareholders from: | ||||||||||||||||||||
Net investment income | (0.65 | ) | (0.62 | ) | (0.64 | ) | (0.69 | ) | (0.70 | ) | ||||||||||
Net realized gain | (0.08 | ) | (0.10 | ) | (0.06 | ) | (0.09 | ) | (0.06 | ) | ||||||||||
Return of capital | — | (0.01 | ) | (0.06 | ) | — | (0.05 | ) | ||||||||||||
|
|
|
|
|
|
|
|
|
| |||||||||||
Total dividends and distributions to shareholders | (0.73 | ) | (0.73 | ) | (0.76 | ) | (0.78 | ) | (0.81 | ) | ||||||||||
|
|
|
|
|
|
|
|
|
| |||||||||||
Net increase (decrease) in net asset value | 0.73 | (0.16 | ) | 0.01 | 0.69 | (0.47 | ) | |||||||||||||
|
|
|
|
|
|
|
|
|
| |||||||||||
Net asset value, end of year | $ | 14.14 | $ | 13.41 | $ | 13.57 | $ | 13.56 | $ | 12.87 | ||||||||||
|
|
|
|
|
|
|
|
|
| |||||||||||
Total investment returnb,c | 11.04 | % | 4.23 | % | 5.78 | % | 11.61 | % | 2.55 | % | ||||||||||
|
|
|
|
|
|
|
|
|
| |||||||||||
Ratios/Supplemental Data: | ||||||||||||||||||||
Net assets, end of year (in millions) | $ | 981.8 | $ | 926.0 | $ | 779.4 | $ | 568.2 | $ | 425.5 | ||||||||||
|
|
|
|
|
|
|
|
|
| |||||||||||
Ratio of expenses to average daily net assets (before expense reduction) | 1.16 | % | 1.18 | % | 1.19 | % | 1.19 | % | 1.20 | % | ||||||||||
|
|
|
|
|
|
|
|
|
| |||||||||||
Ratio of expenses to average daily net assets (net of expense reduction) | 1.16 | % | 1.18 | % | 1.17 | % | 1.12 | % | 1.10 | % | ||||||||||
|
|
|
|
|
|
|
|
|
| |||||||||||
Ratio of net investment income (loss) to average daily net assets (before expense reduction) | 4.24 | % | 4.56 | % | 4.75 | % | 5.18 | % | 5.10 | % | ||||||||||
|
|
|
|
|
|
|
|
|
| |||||||||||
Ratio of net investment income (loss) to average daily net assets (net of expense reduction) | 4.24 | % | 4.56 | % | 4.77 | % | 5.25 | % | 5.20 | % | ||||||||||
|
|
|
|
|
|
|
|
|
| |||||||||||
Portfolio turnover rate | 36 | % | 51 | % | 46 | % | 41 | % | 56 | % | ||||||||||
|
|
|
|
|
|
|
|
|
| |||||||||||
| a | Calculation based on average shares outstanding. |
| b | Return assumes the reinvestment of all dividends and distributions at net asset value. |
| c | Does not reflect sales charges, which would reduce return. |
See accompanying notes to financial statements.
28
COHEN & STEERS PREFERRED SECURITIES AND INCOME FUND, INC.
FINANCIAL HIGHLIGHTS—(Continued)
| Class C | ||||||||||||||||||||
| For the Year Ended December 31, | ||||||||||||||||||||
Per Share Operating Performance: | 2017 | 2016 | 2015 | 2014 | 2013 | |||||||||||||||
Net asset value, beginning of year | $ | 13.34 | $ | 13.50 | $ | 13.49 | $ | 12.81 | $ | 13.29 | ||||||||||
|
|
|
|
|
|
|
|
|
| |||||||||||
Income (loss) from investment operations: | ||||||||||||||||||||
Net investment income (loss)a | 0.50 | 0.53 | 0.56 | 0.62 | 0.60 | |||||||||||||||
Net realized and unrealized gain (loss) | 0.85 | (0.05 | ) | 0.12 | 0.75 | (0.36 | ) | |||||||||||||
|
|
|
|
|
|
|
|
|
| |||||||||||
Total from investment operations | 1.35 | 0.48 | 0.68 | 1.37 | 0.24 | |||||||||||||||
|
|
|
|
|
|
|
|
|
| |||||||||||
Less dividends and distributions to shareholders from: | ||||||||||||||||||||
Net investment income | (0.55 | ) | (0.53 | ) | (0.55 | ) | (0.60 | ) | (0.61 | ) | ||||||||||
Net realized gain | (0.08 | ) | (0.10 | ) | (0.06 | ) | (0.09 | ) | (0.06 | ) | ||||||||||
Return of capital | — | (0.01 | ) | (0.06 | ) | — | (0.05 | ) | ||||||||||||
|
|
|
|
|
|
|
|
|
| |||||||||||
Total dividends and distributions to shareholders | (0.63 | ) | (0.64 | ) | (0.67 | ) | (0.69 | ) | (0.72 | ) | ||||||||||
|
|
|
|
|
|
|
|
|
| |||||||||||
Net increase (decrease) in net asset value | 0.72 | (0.16 | ) | 0.01 | 0.68 | (0.48 | ) | |||||||||||||
|
|
|
|
|
|
|
|
|
| |||||||||||
Net asset value, end of year | $ | 14.06 | $ | 13.34 | $ | 13.50 | $ | 13.49 | $ | 12.81 | ||||||||||
|
|
|
|
|
|
|
|
|
| |||||||||||
Total investment returnb,c | 10.30 | % | 3.60 | % | 5.09 | % | 10.85 | % | 1.83 | % | ||||||||||
|
|
|
|
|
|
|
|
|
| |||||||||||
Ratios/Supplemental Data: | ||||||||||||||||||||
Net assets, end of year (in millions) | $ | 838.1 | $ | 857.0 | $ | 683.5 | $ | 548.6 | $ | 465.8 | ||||||||||
|
|
|
|
|
|
|
|
|
| |||||||||||
Ratio of expenses to average daily net assets (before expense reduction) | 1.81 | % | 1.83 | % | 1.84 | % | 1.84 | % | 1.86 | % | ||||||||||
|
|
|
|
|
|
|
|
|
| |||||||||||
Ratio of expenses to average daily net assets (net of expense reduction) | 1.81 | % | 1.83 | % | 1.82 | % | 1.77 | % | 1.75 | % | ||||||||||
|
|
|
|
|
|
|
|
|
| |||||||||||
Ratio of net investment income (loss) to average daily net assets (before expense reduction) | 3.59 | % | 3.91 | % | 4.08 | % | 4.53 | % | 4.47 | % | ||||||||||
|
|
|
|
|
|
|
|
|
| |||||||||||
Ratio of net investment income (loss) to average daily net assets (net of expense reduction) | 3.59 | % | 3.91 | % | 4.10 | % | 4.60 | % | 4.58 | % | ||||||||||
|
|
|
|
|
|
|
|
|
| |||||||||||
Portfolio turnover rate | 36 | % | 51 | % | 46 | % | 41 | % | 56 | % | ||||||||||
|
|
|
|
|
|
|
|
|
| |||||||||||
| a | Calculation based on average shares outstanding. |
| b | Return assumes the reinvestment of all dividends and distributions at net asset value. |
| c | Does not reflect sales charges, which would reduce return. |
See accompanying notes to financial statements.
29
COHEN & STEERS PREFERRED SECURITIES AND INCOME FUND, INC.
FINANCIAL HIGHLIGHTS—(Continued)
| Class F | ||||
Per Share Operating Performance: | For the Period April 3, 2017a through December 31, 2017 | |||
Net asset value, beginning of period | $ | 13.82 | ||
|
| |||
Income (loss) from investment operations: | ||||
Net investment income (loss)b | 0.53 | |||
Net realized and unrealized gain (loss) | 0.40 | |||
|
| |||
Total from investment operations | 0.93 | |||
|
| |||
Less dividends and distributions to shareholders from: | ||||
Net investment income | (0.51 | ) | ||
Net realized gain | (0.08 | ) | ||
|
| |||
Total dividends and distributions to shareholders | (0.59 | ) | ||
|
| |||
Net increase (decrease) in net asset value | 0.34 | |||
|
| |||
Net asset value, end of period | $ | 14.16 | ||
|
| |||
Total investment returnc | 6.79 | %d | ||
|
| |||
Ratios/Supplemental Data: | ||||
Net assets, end of period (in millions) | $ | 616.5 | ||
|
| |||
Ratio of expenses to average daily net assets (before expense reduction) | 0.81 | %e | ||
|
| |||
Ratio of expenses to average daily net assets (net of expense reduction) | 0.81 | %e | ||
|
| |||
Ratio of net investment income (loss) to average daily net assets (before expense reduction) | 5.20 | %e | ||
|
| |||
Ratio of net investment income (loss) to average daily net assets (net of expense reduction) | 5.20 | %e | ||
|
| |||
Portfolio turnover rate | 36 | %d | ||
|
| |||
| a | Inception date. |
| b | Calculation based on average shares outstanding. |
| c | Return assumes the reinvestment of all dividends and distributions at net asset value. |
| d | Not annualized. |
| e | Annualized. |
See accompanying notes to financial statements.
30
COHEN & STEERS PREFERRED SECURITIES AND INCOME FUND, INC.
FINANCIAL HIGHLIGHTS—(Continued)
| Class I | ||||||||||||||||||||
| For the Year Ended December 31, | ||||||||||||||||||||
Per Share Operating Performance: | 2017 | 2016 | 2015 | 2014 | 2013 | |||||||||||||||
Net asset value, beginning of year | $ | 13.44 | $ | 13.60 | $ | 13.58 | $ | 12.88 | $ | 13.36 | ||||||||||
|
|
|
|
|
|
|
|
|
| |||||||||||
Income (loss) from investment operations: | ||||||||||||||||||||
Net investment income (loss)a | 0.64 | 0.67 | 0.70 | 0.76 | 0.74 | |||||||||||||||
Net realized and unrealized gain (loss) | 0.86 | (0.06 | ) | 0.12 | 0.76 | (0.37 | ) | |||||||||||||
|
|
|
|
|
|
|
|
|
| |||||||||||
Total from investment operations | 1.50 | 0.61 | 0.82 | 1.52 | 0.37 | |||||||||||||||
|
|
|
|
|
|
|
|
|
| |||||||||||
Less dividends and distributions to shareholders from: | ||||||||||||||||||||
Net investment income | (0.69 | ) | (0.66 | ) | (0.68 | ) | (0.73 | ) | (0.74 | ) | ||||||||||
Net realized gain | (0.08 | ) | (0.10 | ) | (0.06 | ) | (0.09 | ) | (0.06 | ) | ||||||||||
Return of capital | — | (0.01 | ) | (0.06 | ) | — | (0.05 | ) | ||||||||||||
|
|
|
|
|
|
|
|
|
| |||||||||||
Total dividends and distributions to shareholders | (0.77 | ) | (0.77 | ) | (0.80 | ) | (0.82 | ) | (0.85 | ) | ||||||||||
|
|
|
|
|
|
|
|
|
| |||||||||||
Net increase (decrease) in net asset value | 0.73 | (0.16 | ) | 0.02 | 0.70 | (0.48 | ) | |||||||||||||
|
|
|
|
|
|
|
|
|
| |||||||||||
Net asset value, end of year | $ | 14.17 | $ | 13.44 | $ | 13.60 | $ | 13.58 | $ | 12.88 | ||||||||||
|
|
|
|
|
|
|
|
|
| |||||||||||
Total investment returnb | 11.37 | % | 4.58 | % | 6.20 | % | 12.00 | % | 2.82 | % | ||||||||||
|
|
|
|
|
|
|
|
|
| |||||||||||
Ratios/Supplemental Data: | ||||||||||||||||||||
Net assets, end of year (in millions) | $ | 5,466.7 | $ | 4,525.8 | $ | 3,228.7 | $ | 2,047.6 | $ | 1,248.5 | ||||||||||
|
|
|
|
|
|
|
|
|
| |||||||||||
Ratio of expenses to average daily net assets (before expense reduction) | 0.87 | % | 0.88 | % | 0.88 | % | 0.90 | % | 0.87 | % | ||||||||||
|
|
|
|
|
|
|
|
|
| |||||||||||
Ratio of expenses to average daily net assets (net of expense reduction) | 0.85 | % | 0.85 | % | 0.83 | % | 0.77 | % | 0.75 | % | ||||||||||
|
|
|
|
|
|
|
|
|
| |||||||||||
Ratio of net investment income (loss) to average daily net assets (before expense reduction) | 4.53 | % | 4.86 | % | 5.07 | % | 5.49 | % | 5.47 | % | ||||||||||
|
|
|
|
|
|
|
|
|
| |||||||||||
Ratio of net investment income (loss) to average daily net assets (net of expense reduction) | 4.55 | % | 4.89 | % | 5.12 | % | 5.62 | % | 5.59 | % | ||||||||||
|
|
|
|
|
|
|
|
|
| |||||||||||
Portfolio turnover rate | 36 | % | 51 | % | 46 | % | 41 | % | 56 | % | ||||||||||
|
|
|
|
|
|
|
|
|
| |||||||||||
| a | Calculation based on average shares outstanding. |
| b | Return assumes the reinvestment of all dividends and distributions at net asset value. |
See accompanying notes to financial statements.
31
COHEN & STEERS PREFERRED SECURITIES AND INCOME FUND, INC.
FINANCIAL HIGHLIGHTS—(Continued)
| Class R | ||||||||||||||||
| For the Year Ended December 31, | For the Period October 1, 2014a through December 31, 2014 | |||||||||||||||
Per Share Operating Performance: | 2017 | 2016 | 2015 | |||||||||||||
Net asset value, beginning of period | $ | 13.42 | $ | 13.60 | $ | 13.58 | $ | 13.55 | ||||||||
|
|
|
|
|
|
|
| |||||||||
Income (loss) from investment operations: | ||||||||||||||||
Net investment income (loss)b | 0.57 | 0.62 | 0.64 | 0.17 | ||||||||||||
Net realized and unrealized gain (loss) | 0.86 | (0.08 | ) | 0.12 | 0.05 | |||||||||||
|
|
|
|
|
|
|
| |||||||||
Total from investment operations | 1.43 | 0.54 | 0.76 | 0.22 | ||||||||||||
|
|
|
|
|
|
|
| |||||||||
Less dividends and distributions to shareholders from: | ||||||||||||||||
Net investment income | (0.62 | ) | (0.61 | ) | (0.62 | ) | (0.10 | ) | ||||||||
Net realized gain | (0.08 | ) | (0.10 | ) | (0.06 | ) | (0.09 | ) | ||||||||
Return of capital | — | (0.01 | ) | (0.06 | ) | — | ||||||||||
|
|
|
|
|
|
|
| |||||||||
Total dividends and distributions to shareholders | (0.70 | ) | (0.72 | ) | (0.74 | ) | (0.19 | ) | ||||||||
|
|
|
|
|
|
|
| |||||||||
Net increase (decrease) in net asset value | 0.73 | (0.18 | ) | 0.02 | 0.03 | |||||||||||
|
|
|
|
|
|
|
| |||||||||
Net asset value, end of period | $ | 14.15 | $ | 13.42 | $ | 13.60 | $ | 13.58 | ||||||||
|
|
|
|
|
|
|
| |||||||||
Total investment returnc | 10.86 | % | 4.00 | % | 5.67 | % | 1.66 | %d | ||||||||
|
|
|
|
|
|
|
| |||||||||
Ratios/Supplemental Data: | ||||||||||||||||
Net assets, end of period (in 000s) | $ | 2,428.5 | $ | 4,094.7 | $ | 204.8 | $ | 10.0 | ||||||||
|
|
|
|
|
|
|
| |||||||||
Ratio of expenses to average daily net assets (before expense reduction) | 1.31 | % | 1.33 | % | 1.34 | % | 1.36 | %e | ||||||||
|
|
|
|
|
|
|
| |||||||||
Ratio of expenses to average daily net assets (net of expense reduction) | 1.31 | % | 1.33 | % | 1.33 | % | 1.30 | %e | ||||||||
|
|
|
|
|
|
|
| |||||||||
Ratio of net investment income (loss) to average daily net assets (before expense reduction) | 4.09 | % | 4.49 | % | 4.73 | % | 4.88 | %e | ||||||||
|
|
|
|
|
|
|
| |||||||||
Ratio of net investment income (loss) to average daily net assets (net of expense reduction) | 4.09 | % | 4.49 | % | 4.74 | % | 4.94 | %e | ||||||||
|
| �� |
|
|
|
|
|
| ||||||||
Portfolio turnover rate | 36 | % | 51 | % | 46 | % | 41 | %d | ||||||||
|
|
|
|
|
|
|
| |||||||||
| a | Inception date. |
| b | Calculation based on average shares outstanding. |
| c | Return assumes the reinvestment of all dividends and distributions at net asset value. |
| d | Not annualized. |
| e | Annualized. |
See accompanying notes to financial statements.
32
COHEN & STEERS PREFERRED SECURITIES AND INCOME FUND, INC.
FINANCIAL HIGHLIGHTS—(Continued)
| Class Z | ||||||||||||||||
| For the Year Ended December 31, | For the Period October 1, 2014a through December 31, 2014 | |||||||||||||||
Per Share Operating Performance: | 2017 | 2016 | 2015 | |||||||||||||
Net asset value, beginning of period | $ | 13.43 | $ | 13.59 | $ | 13.58 | $ | 13.55 | ||||||||
|
|
|
|
|
|
|
| |||||||||
Income (loss) from investment operations: | ||||||||||||||||
Net investment income (loss)b | 0.66 | 0.69 | 0.71 | 0.18 | ||||||||||||
Net realized and unrealized gain (loss) | 0.84 | (0.08 | ) | 0.10 | 0.06 | |||||||||||
|
|
|
|
|
|
|
| |||||||||
Total from investment operations | 1.50 | 0.61 | 0.81 | 0.24 | ||||||||||||
|
|
|
|
|
|
|
| |||||||||
Less dividends and distributions to shareholders from: | ||||||||||||||||
Net investment income | (0.69 | ) | (0.66 | ) | (0.68 | ) | (0.12 | ) | ||||||||
Net realized gain | (0.08 | ) | (0.10 | ) | (0.06 | ) | (0.09 | ) | ||||||||
Return of capital | — | (0.01 | ) | (0.06 | ) | — | ||||||||||
|
|
|
|
|
|
|
| |||||||||
Total dividends and distributions to shareholders | (0.77 | ) | (0.77 | ) | (0.80 | ) | (0.21 | ) | ||||||||
|
|
|
|
|
|
|
| |||||||||
Net increase (decrease) in net asset value | 0.73 | (0.16 | ) | 0.01 | 0.03 | |||||||||||
|
|
|
|
|
|
|
| |||||||||
Net asset value, end of period | $ | 14.16 | $ | 13.43 | $ | 13.59 | $ | 13.58 | ||||||||
|
|
|
|
|
|
|
| |||||||||
Total investment returnc | 11.41 | % | 4.59 | % | 6.13 | % | 1.78 | %d | ||||||||
|
|
|
|
|
|
|
| |||||||||
Ratios/Supplemental Data: | ||||||||||||||||
Net assets, end of period (in 000s) | $ | 862.2 | $ | 141.6 | $ | 32.4 | $ | 10.0 | ||||||||
|
|
|
|
|
|
|
| |||||||||
Ratio of expenses to average daily net assets (before expense reduction) | 0.81 | % | 0.83 | % | 0.84 | % | 0.85 | %e | ||||||||
|
|
|
|
|
|
|
| |||||||||
Ratio of expenses to average daily net assets | 0.81 | % | 0.83 | % | 0.83 | % | 0.80 | %e | ||||||||
|
|
|
|
|
|
|
| |||||||||
Ratio of net investment income (loss) to average daily net assets (before expense reduction) | 4.70 | % | 5.07 | % | 5.20 | % | 5.35 | %e | ||||||||
|
|
|
|
|
|
|
| |||||||||
Ratio of net investment income (loss) to average daily net assets (net of expense reduction) | 4.70 | % | 5.07 | % | 5.21 | % | 5.40 | %e | ||||||||
|
|
|
|
|
|
|
| |||||||||
Portfolio turnover rate | 36 | % | 51 | % | 46 | % | 41 | %d | ||||||||
|
|
|
|
|
|
|
| |||||||||
| a | Inception date. |
| b | Calculation based on average shares outstanding. |
| c | Return assumes the reinvestment of all dividends and distributions at net asset value. |
| d | Not annualized. |
| e | Annualized. |
See accompanying notes to financial statements.
33
COHEN & STEERS PREFERRED SECURITIES AND INCOME FUND, INC.
NOTES TO FINANCIAL STATEMENTS
Note 1. Organization and Significant Accounting Policies
Cohen & Steers Preferred Securities and Income Fund, Inc. (the Fund) was incorporated under the laws of the State of Maryland on February 22, 2010 and is registered under the Investment Company Act of 1940 (the 1940 Act), as a diversified, open-end management investment company. The Fund’s investment objective is total return. The authorized shares of the Fund are divided into seven classes designated Class A, C, F, I, R, T and Z shares. Each of the Fund’s shares has equal dividend, liquidation and voting rights (except for matters relating to distribution and shareholder servicing of such shares). Class F shares became available for investment on April 3, 2017, on which date the Fund sold 724 shares of Class F shares for $10,000 to Cohen & Steers Capital Management, Inc. (the investment advisor). Class T shares are currently not available for purchase.
The following is a summary of significant accounting policies consistently followed by the Fund in the preparation of its financial statements. The Fund is an investment company and, accordingly, follows the investment company accounting and reporting guidance of the Financial Accounting Standards Board Accounting Standards Codification Topic (ASC) 946—Investment Companies. The accounting policies of the Fund are in conformity with accounting principles generally accepted in the United States of America (GAAP). The preparation of the financial statements in accordance with GAAP requires management to make estimates and assumptions that affect the reported amounts of assets and liabilities at the date of the financial statements and the reported amounts of income and expenses during the reporting period. Actual results could differ from those estimates.
Portfolio Valuation: Investments in securities that are listed on the New York Stock Exchange (NYSE) are valued, except as indicated below, at the last sale price reflected at the close of the NYSE on the business day as of which such value is being determined. If there has been no sale on such day, the securities are valued at the mean of the closing bid and ask prices on such day or, if no ask price is available, at the bid price. Forward foreign currency contracts are valued daily at the prevailing forward exchange rate. Over-the-counter options (OTC) are valued based upon prices provided by a third-party pricing service or counterparty.
Securities not listed on the NYSE but listed on other domestic or foreign securities exchanges (including NASDAQ) are valued in a similar manner. Securities traded on more than one securities exchange are valued at the last sale price reflected at the close of the exchange representing the principal market for such securities on the business day as of which such value is being determined. If after the close of a foreign market, but prior to the close of business on the day the securities are being valued, market conditions change significantly, certain non-U.S. equity holdings may be fair valued pursuant to procedures established by the Board of Directors.
Readily marketable securities traded in the OTC market, including listed securities whose primary market is believed by the investment advisor to be OTC, are valued on the basis of prices provided by a third-party pricing service or third-party broker-dealers when such prices are believed by the investment advisor, pursuant to delegation by the Board of Directors, to reflect the fair value of such securities.
Fixed-income securities are valued on the basis of prices provided by a third-party pricing service or third-party broker-dealers when such prices are believed by the investment advisor, pursuant to delegation by the Board of Directors, to reflect the fair value of such securities. The pricing services or broker-dealers use multiple valuation techniques to determine fair value. In instances where sufficient
34
COHEN & STEERS PREFERRED SECURITIES AND INCOME FUND, INC.
NOTES TO FINANCIAL STATEMENTS—(Continued)
market activity exists, the pricing services or broker-dealers may utilize a market-based approach through which quotes from market makers are used to determine fair value. In instances where sufficient market activity may not exist or is limited, the pricing services or broker-dealers also utilize proprietary valuation models which may consider market transactions in comparable securities and the various relationships between securities in determining fair value and/or characteristics such as benchmark yield curves, option-adjusted spreads, credit spreads, estimated default rates, coupon rates, anticipated timing of principal repayments, underlying collateral, and other unique security features which are then used to calculate the fair values.
Short-term debt securities with a maturity date of 60 days or less are valued at amortized cost, which approximates fair value. Investments in open-end mutual funds are valued at their closing net asset value (NAV).
The policies and procedures approved by the Fund’s Board of Directors delegate authority to make fair value determinations to the investment advisor, subject to the oversight of the Board of Directors. The investment advisor has established a valuation committee (Valuation Committee) to administer, implement and oversee the fair valuation process according to the policies and procedures approved annually by the Board of Directors. Among other things, these procedures allow the Fund to utilize independent pricing services, quotations from securities and financial instrument dealers and other market sources to determine fair value.
Securities for which market prices are unavailable, or securities for which the investment advisor determines that the bid and/or ask price or a counterparty valuation does not reflect market value, will be valued at fair value, as determined in good faith by the Valuation Committee, pursuant to procedures approved by the Fund’s Board of Directors. Circumstances in which market prices may be unavailable include, but are not limited to, when trading in a security is suspended, the exchange on which the security is traded is subject to an unscheduled close or disruption or material events occur after the close of the exchange on which the security is principally traded. In these circumstances, the Fund determines fair value in a manner that fairly reflects the market value of the security on the valuation date based on consideration of any information or factors it deems appropriate. These may include, but are not limited to, recent transactions in comparable securities, information relating to the specific security and developments in the markets.
The Fund’s use of fair value pricing may cause the NAV of Fund shares to differ from the NAV that would be calculated using market quotations. Fair value pricing involves subjective judgments and it is possible that the fair value determined for a security may be materially different than the value that could be realized upon the sale of that security.
Fair value is defined as the price that the Fund would expect to receive upon the sale of an investment or expect to pay to transfer a liability in an orderly transaction with an independent buyer in the principal market or, in the absence of a principal market, the most advantageous market for the investment or liability. The hierarchy of inputs that are used in determining the fair value of the Fund’s investments is summarized below.
| • | Level 1—quoted prices in active markets for identical investments |
| • | Level 2—other significant observable inputs (including quoted prices for similar investments, interest rates, credit risk, etc.) |
35
COHEN & STEERS PREFERRED SECURITIES AND INCOME FUND, INC.
NOTES TO FINANCIAL STATEMENTS—(Continued)
| • | Level 3—significant unobservable inputs (including the Fund’s own assumptions in determining the fair value of investments) |
The inputs or methodology used for valuing investments may or may not be an indication of the risk associated with those investments.
For movements between the levels within the fair value hierarchy, the Fund has adopted a policy of recognizing the transfer at the end of the period in which the underlying event causing the movement occurred. Changes in valuation techniques may result in transfers into or out of an assigned level within the disclosure hierarchy. As of December 31, 2017, there were $10,734,848 of securities transferred from Level 1 to Level 2 which resulted from a change in the use of a quoted price to a mean price, supplied by an independent pricing service, for one security.
The following is a summary of the inputs used as of December 31, 2017 in valuing the Fund’s investments carried at value:
| Total | Quoted Prices in Active Markets for Identical Investments (Level 1) | Other Significant Observable Inputs (Level 2) | Significant Unobservable Inputs (Level 3) | |||||||||||||
Preferred Securities— | ||||||||||||||||
$25 Par Value: | ||||||||||||||||
Electric— | $ | 35,828,549 | $ | 21,257,695 | $ | 14,570,854 | $ | — | ||||||||
Real Estate— | 10,734,848 | — | 10,734,848 | — | ||||||||||||
Other Industries | 1,642,877,984 | 1,642,877,984 | — | — | ||||||||||||
Preferred Securities— | ||||||||||||||||
Capital Securities | 5,923,166,298 | — | 5,923,166,298 | — | ||||||||||||
Short-Term Investments | 175,714,845 | — | 175,714,845 | — | ||||||||||||
|
|
|
|
|
|
|
| |||||||||
Total Investments in Securitiesa | $ | 7,788,322,524 | $ | 1,664,135,679 | $ | 6,124,186,845 | $ | — | ||||||||
|
|
|
|
|
|
|
| |||||||||
Forward Foreign Currency Exchange Contracts | $ | 969,520 | $ | — | $ | 969,520 | $ | — | ||||||||
|
|
|
|
|
|
|
| |||||||||
Total Unrealized Appreciation in | $ | 969,520 | $ | — | $ | 969,520 | $ | — | ||||||||
|
|
|
|
|
|
|
| |||||||||
Forward Foreign Currency Exchange Contracts | $ | (2,024,789 | ) | $ | — | $ | (2,024,789 | ) | $ | — | ||||||
|
|
|
|
|
|
|
| |||||||||
Total Unrealized Depreciation in | $ | (2,024,789 | ) | $ | — | $ | (2,024,789 | ) | $ | — | ||||||
|
|
|
|
|
|
|
| |||||||||
| a | Portfolio holdings are disclosed individually on the Schedule of Investments. |
36
COHEN & STEERS PREFERRED SECURITIES AND INCOME FUND, INC.
NOTES TO FINANCIAL STATEMENTS—(Continued)
The following is a reconciliation of investments for which significant unobservable inputs (Level 3) were used in determining fair value:
| Preferred Securities—Capital Securities—Banks | ||||
Balance as of December 31, 2016 | $ | 5,228,043 | ||
Sales | (5,081,825 | ) | ||
Realized gain (loss) | 266,025 | |||
Change in unrealized appreciation (depreciation) | (412,243 | ) | ||
|
| |||
Balance as of December 31, 2017 | $ | — | ||
|
| |||
Security Transactions, Investment Income and Expense Allocations: Security transactions are recorded on trade date. Realized gains and losses on investments sold are recorded on the basis of identified cost. Interest income, which includes the amortization of premiums and accretion of discounts, is recorded on the accrual basis. Dividend income is recorded on the ex-dividend date, except for certain dividends on foreign securities, which are recorded as soon as the Fund is informed after the ex-dividend date. Distributions from REITs are recorded as ordinary income, net realized capital gain or return of capital based on information reported by the REITs and management’s estimates of such amounts based on historical information. These estimates are adjusted when the actual source of distributions is disclosed by the REITs and actual amounts may differ from the estimated amounts. Income, expenses (other than expenses attributable to a specific class) and realized and unrealized gains or losses on investments are allocated to each class of shares based on its relative net assets.
Foreign Currency Translation: The books and records of the Fund are maintained in U.S. dollars. Investment securities and other assets and liabilities denominated in foreign currencies are translated into U.S. dollars based upon prevailing exchange rates on the date of valuation. Purchases and sales of investment securities and income and expense items denominated in foreign currencies are translated into U.S. dollars based upon prevailing exchange rates on the respective dates of such transactions. The Fund does not isolate that portion of the results of operations resulting from fluctuations in foreign exchange rates on investments from the fluctuations arising from changes in market prices of securities held. Such fluctuations are included with the net realized and unrealized gain or loss on investments.
Net realized foreign exchange gains or losses arise from sales of foreign currencies, including gains and losses on forward foreign currency exchange contracts, currency gains or losses realized between the trade and settlement dates on securities transactions, and the difference between the amounts of dividends, interest, and foreign withholding taxes recorded on the Fund’s books and the U.S. dollar equivalent of the amounts actually received or paid. Net unrealized foreign exchange gains and losses arise from changes in the values of assets and liabilities, other than investments in securities, on the date of valuation, resulting from changes in exchange rates. Pursuant to U.S. federal income tax regulations, certain foreign currency gains/losses included in realized and unrealized gains/losses are included in or are a reduction of ordinary income for federal income tax purposes.
37
COHEN & STEERS PREFERRED SECURITIES AND INCOME FUND, INC.
NOTES TO FINANCIAL STATEMENTS—(Continued)
Options: The Fund may purchase and write exchange-listed and OTC put or call options on securities, stock indices, currencies and other financial instruments for hedging purposes, to enhance portfolio returns and reduce overall volatility.
When the Fund writes (sells) an option, an amount equal to the premium received by the Fund is recorded on the Statement of Assets and Liabilities as a liability. The amount of the liability is subsequently marked-to-market to reflect the current market value of the option written. When an option expires, the Fund realizes a gain on the option to the extent of the premium received. Premiums received from writing options which are exercised or closed are added to or offset against the proceeds or amount paid on the transaction to determine the realized gain or loss. If a put option on a security is exercised, the premium reduces the cost basis of the security purchased by the Fund. If a call option is exercised, the premium is added to the proceeds of the security sold to determine the realized gain or loss. The Fund, as writer of an option, bears the market risk of an unfavorable change in the price of the underlying index, currency or security. Other risks include the possibility of an illiquid options market or the inability of the counterparties to fulfill their obligations under the contracts.
Put and call options purchased are accounted for in the same manner as portfolio securities. Premiums paid for purchasing options which expire are treated as realized losses. Premiums paid for purchasing options which are exercised or closed are added to the amounts paid or offset against the proceeds on the underlying investment transaction to determine the realized gain or loss when the underlying transaction is executed. The risk associated with purchasing an option is that the Fund pays a premium whether or not the option is exercised. Additionally, the Fund bears the risk of loss of the premium and change in market value should the counterparty not perform under the contract.
At December 31, 2017, the Fund did not have any option contracts outstanding.
Interest Rate Swaptions: The Fund may write or purchase interest rate swaptions, which are options to enter into a pre-defined swap agreement at a specified date in the future, with the intention of managing interest-rate risk. The writer of the swaption becomes the counterparty to the swap if the buyer exercises the swaption. The interest rate swaption agreement will specify whether the buyer of the swaption will be a fixed-rate receiver or a fixed-rate payer upon exercise.
At December 31, 2017, the Fund did not have any swaption contracts outstanding.
Forward Foreign Currency Exchange Contracts: The Fund enters into forward foreign currency exchange contracts to hedge the currency exposure associated with certain of its non-U.S. dollar denominated securities. A forward foreign currency exchange contract is a commitment between two parties to purchase or sell foreign currency at a set price on a future date. The market value of a forward foreign currency exchange contract fluctuates with changes in foreign currency exchange rates. These contracts are marked to market daily and the change in value is recorded by the Fund as unrealized appreciation and/or depreciation on forward foreign currency exchange contracts. Realized gains or losses equal to the difference between the value of the contract at the time it was opened and the value at the time it was closed are included in net realized gain or loss on forward foreign currency exchange contracts. For federal income tax purposes, the Fund has made an election to treat gains and losses from forward foreign currency exchange contracts as capital gains and losses.
38
COHEN & STEERS PREFERRED SECURITIES AND INCOME FUND, INC.
NOTES TO FINANCIAL STATEMENTS—(Continued)
Forward foreign currency exchange contracts involve elements of market risk in excess of the amounts reflected on the Statement of Assets and Liabilities. The Fund bears the risk of an unfavorable change in the foreign exchange rate underlying the contract. Risks may also arise upon entering these contracts from the potential inability of the counterparties to meet the terms of their contracts. In connection with these contracts, securities may be identified as collateral in accordance with the terms of the respective contracts.
Dividends and Distributions to Shareholders: Dividends from net investment income and capital gain distributions are determined in accordance with U.S. federal income tax regulations, which may differ from GAAP. Dividends from net investment income, if any, are declared and paid monthly. Net realized capital gains, unless offset by any available capital loss carryforward, are typically distributed to shareholders at least annually. Dividends and distributions to shareholders are recorded on the ex-dividend date and are automatically reinvested in full and fractional shares of the Fund based on the NAV per share at the close of business on the payable date, unless the shareholder has elected to have them paid in cash.
Dividends from net investment income are subject to recharacterization for tax purposes. Based upon the results of operations for the year ended December 31, 2017, a portion of the dividends have been reclassified to distributions from net realized gain.
Income Taxes: It is the policy of the Fund to continue to qualify as a regulated investment company (RIC), if such qualification is in the best interest of the shareholders, by complying with the requirements of Subchapter M of the Internal Revenue Code applicable to regulated investment companies, and by distributing substantially all of its taxable earnings to its shareholders. Also, in order to avoid the payment of any federal excise taxes, the Fund will distribute substantially all of its net investment income and net realized gains on a calendar year basis. Accordingly, no provision for federal income or excise tax is necessary. Dividend and interest income from holdings in non-U.S. securities is recorded net of non-U.S. taxes paid. Management has analyzed the Fund’s tax positions taken on federal and applicable state income tax returns as well as its tax positions in non-U.S. jurisdictions in which it trades for all open tax years and has concluded that as of December 31, 2017, no additional provisions for income tax are required in the Fund’s financial statements. The Fund’s tax positions for the tax years for which the applicable statutes of limitations have not expired are subject to examination by the Internal Revenue Service, state departments of revenue and by foreign tax authorities.
Note 2. Investment Advisory Fees, Administration Fees and Other Transactions with Affiliates
Investment Advisory Fees: Cohen & Steers Capital Management, Inc. serves as the Fund’s investment advisor pursuant to an investment advisory agreement (the investment advisory agreement). Under the terms of the investment advisory agreement, the investment advisor provides the Fund with day-to-day investment decisions and generally manages the Fund’s investments in accordance with the stated policies of the Fund, subject to the supervision of the Board of Directors.
For the services provided to the Fund, the investment advisor receives a fee, accrued daily and paid monthly, at the annual rate of 0.70% of the average daily net assets of the Fund.
39
COHEN & STEERS PREFERRED SECURITIES AND INCOME FUND, INC.
NOTES TO FINANCIAL STATEMENTS—(Continued)
For the year ended December 31, 2017 and through June 30, 2019, the investment advisor has contractually agreed to waive its fee and/or reimburse expenses so that the Fund’s total annual operating expenses (excluding acquired fund fees and expenses, taxes and extraordinary expenses) do not exceed 1.20% for Class A shares, 1.85% for Class C shares, 0.85% for Class F shares, 0.85% for Class I shares, 1.35% for Class R shares and 0.85% for Class Z shares. This contractual agreement can be amended at any time by agreement of the Board of Directors of the Fund and the investment advisor and will terminate automatically in the event of termination of the investment advisory agreement between the investment advisor and the Fund. For the year ended December 31, 2017, fees waived and/or expenses reimbursed totaled $929,723.
Administration Fees: The Fund has entered into an administration agreement with the investment advisor under which the investment advisor performs certain administrative functions for the Fund and receives a fee, accrued daily and paid monthly, at the annual rate of 0.05% of the average daily net assets of the Fund. For the year ended December 31, 2017, the Fund incurred $3,634,882 in fees under this administration agreement. Additionally, the Fund pays State Street Bank and Trust Company as co-administrator under a fund accounting and administration agreement.
Distribution Fees: Shares of the Fund are distributed by Cohen & Steers Securities, LLC (the distributor), an affiliated entity of the investment advisor. The Fund has adopted an amended distribution and service plan (the plan) pursuant to Rule 12b-1 under the 1940 Act. The plan provides that the Fund will pay the distributor a fee, accrued daily and paid monthly, at an annual rate of up to 0.25% of the average daily net assets attributable to Class A shares, up to 0.75% of the average daily net assets attributable to Class C shares and up to 0.50% of the average daily net assets attributable to Class R shares. In addition, with respect to Class R shares, such amounts may also be used to pay for services to Fund shareholders or services related to the maintenance of shareholder accounts.
There is a maximum initial sales charge of 3.75% for Class A shares. There is a contingent deferred sales charge (CDSC) of 1.00% on purchases of $1 million or more of Class A shares, which applies if redemption occurs within one year from purchase. There is a CDSC of 1.00% on Class C shares, which applies if redemption occurs within one year from purchase. For the year ended December 31, 2017, the Fund has been advised that the distributor received $256,618, which represents a portion of the sales commissions paid by shareholders from the sale of Class A shares, and $26,265 and $169,231 of CDSC relating to redemptions of Class A and Class C shares, respectively. The distributor has advised the Fund that proceeds from the CDSC on these classes are used by the distributor to defray its expenses related to providing distribution-related services to the Fund in connection with the sale of these classes, including payments to dealers and other financial intermediaries for selling these classes. The payment of a CDSC may result in the distributor receiving amounts greater or less than the upfront commission paid by the distributor to the financial intermediary.
Shareholder Servicing Fees: For shareholder services, the Fund pays the distributor or its affiliates a fee, accrued daily, at an annual rate of up to 0.10% of the average daily net assets of the Fund’s Class A and Class I shares and up to 0.25% of the average daily net assets of the Fund’s Class C shares. The distributor is responsible for paying qualified financial institutions for shareholder services.
Directors’ and Officers’ Fees: Certain directors and officers of the Fund are also directors, officers and/or employees of the investment advisor. The Fund does not pay compensation to directors and
40
COHEN & STEERS PREFERRED SECURITIES AND INCOME FUND, INC.
NOTES TO FINANCIAL STATEMENTS—(Continued)
officers affiliated with the investment advisor except for the Chief Compliance Officer, who received compensation from the investment advisor, which was reimbursed by the Fund, in the amount of $83,200 for the year ended December 31, 2017.
Other: The Fund may have shareholders investing indirectly through an account, platform or program sponsored by a financial institution. Investment and asset allocation decisions by such financial institution regarding the account, platform or program through which multiple shareholders invest may result in subscription and redemption decisions that have a significant impact on the assets, expenses and trading activities of the Fund. Such a decision may cause the Fund to sell assets at disadvantageous times or prices, and may negatively affect the Fund’s NAV and performance.
Note 3. Purchases and Sales of Securities
Purchases and sales of securities, excluding short-term investments, for the year ended December 31, 2017, totaled $3,711,089,788 and $2,557,379,998, respectively.
Note 4. Derivative Investments
The following tables present the value of derivatives held at December 31, 2017 and the effect of derivatives held during the year ended December 31, 2017, along with the respective location in the financial statements.
Statement of Assets and Liabilities
Assets | Liabilities | |||||||||||
Derivatives | Location | Fair Value | Location | Fair Value | ||||||||
Foreign Exchange Risk: | ||||||||||||
Forward foreign currency exchange contractsa | Unrealized appreciation | $ | 969,520 | Unrealized depreciation | $ | 2,024,789 | ||||||
| a | Forward foreign currency exchange contracts executed with Brown Brothers Harriman are not subject to a master netting arrangement or another similar agreement. |
Statement of Operations
Derivatives | Location | Realized Gain (Loss) | Change in Unrealized Appreciation (Depreciation) | |||||||
Foreign Exchange Risk: | ||||||||||
Forward foreign currency exchange contracts | Net Realized and Unrealized Gain (Loss) | $ | (32,906,149 | ) | $ | (3,196,935 | ) | |||
Written option contracts | Net Realized and Unrealized Gain (Loss) | 2,080,512 | — | |||||||
Interest Rate Risk: | ||||||||||
Written option contracts | Net Realized and Unrealized Gain (Loss) | 5,977,655 | (2,021,460 | ) | ||||||
41
COHEN & STEERS PREFERRED SECURITIES AND INCOME FUND, INC.
NOTES TO FINANCIAL STATEMENTS—(Continued)
For federal income tax purposes, the Fund has made an election to treat gains and losses from forward foreign currency exchange contracts as capital gains and losses.
The following summarizes the volume of the Fund’s written option and swaption activity for the year ended December 31, 2017:
| Written Option Contracts | Written Swaption Contracts | |||||||
Average Notional Amount | $ | 632,999,500 | a | $ | 624,575,000 | b | ||
Ending Notional Amount | — | — | ||||||
| a | Average for the period April 12, 2017 through May 9, 2017, which represents the period the Fund had option contracts outstanding. Notional amount is calculated using the number of contracts multiplied by notional contract size multiplied by the foreign currency exchange rate. |
| b | Average for the period January 1, 2017 through April 24, 2017, which represents the period the Fund had swaption contracts outstanding. Amount represents the average notional value of the underlying swap contracts. |
Note 5. Income Tax Information
The tax character of dividends and distributions paid was as follows:
| For the Year Ended December 31, | ||||||||
| 2017 | 2016 | |||||||
Ordinary income | $ | 352,699,453 | $ | 273,252,075 | ||||
Long-term capital gain | 39,081,308 | 47,387,779 | ||||||
Return of capital | — | 2,279,768 | ||||||
|
|
|
| |||||
Total dividends and distributions | $ | 391,780,761 | $ | 322,919,622 | ||||
|
|
|
| |||||
As of December 31, 2017, the tax-basis components of accumulated earnings, the federal tax cost and net unrealized appreciation (depreciation) in value of investments held were as follows:
Cost of investments in securities for federal income tax purposes | $ | 7,396,132,989 | ||
|
| |||
Gross unrealized appreciation on investments | $ | 399,127,763 | ||
Gross unrealized depreciation on investments | (7,326,014 | ) | ||
|
| |||
Net unrealized appreciation (depreciation) on investments | $ | 391,801,749 | ||
|
| |||
Undistributed ordinary income | $ | 3,985,020 | ||
|
| |||
Undistributed long-term capital gains | $ | 6,782,417 | ||
|
|
42
COHEN & STEERS PREFERRED SECURITIES AND INCOME FUND, INC.
NOTES TO FINANCIAL STATEMENTS—(Continued)
As of December 31, 2017, the Fund had temporary book/tax differences primarily attributable to wash sales on portfolio securities, unrealized appreciation on passive foreign investment companies and certain fixed income securities and permanent book/tax differences primarily attributable to foreign currency transactions, prior year REIT adjustments and certain fixed income securities. To reflect reclassifications arising from the permanent differences, paid-in capital was charged $4,907,346, accumulated undistributed net realized gain was charged $23,974,121 and accumulated undistributed net investment income was credited $28,881,467. Net assets were not affected by this reclassification.
Note 6. Capital Stock
On December 6, 2016, February 6, 2017 and June 13, 2017, the Board of Directors of the Fund approved increases to the Fund’s authorized shares of capital stock. The Fund is now authorized to issue 2.2 billion shares of capital stock, at a par value of $0.001 per share, classified in seven classes as follows: 200 million of Class A capital stock, 200 million of Class C capital stock, 200 million of Class F capital stock, 1 billion of Class I capital stock, 200 million of Class R capital stock, 200 million of Class T capital stock and 200 million of Class Z capital stock. Class T shares are currently not available for purchase. The Board of Directors of the Fund may increase or decrease the aggregate number of shares of common stock that the Fund has authority to issue. Transactions in Fund shares were as follows:
| For the Year Ended December 31, 2017 | For the Year Ended December 31, 2016 | |||||||||||||||
| Shares | Amount | Shares | Amount | |||||||||||||
Class A: | ||||||||||||||||
Sold | 25,850,583 | $ | 362,239,815 | 41,888,808 | $ | 569,777,201 | ||||||||||
Issued as reinvestment of dividends and distributions | 2,879,012 | 40,411,516 | 2,811,605 | 38,240,624 | ||||||||||||
Redeemed | (28,348,189 | ) | (397,664,677 | ) | (33,080,433 | ) | (447,500,016 | ) | ||||||||
|
|
|
|
|
|
|
| |||||||||
Net increase (decrease) | 381,406 | $ | 4,986,654 | 11,619,980 | $ | 160,517,809 | ||||||||||
|
|
|
|
|
|
|
| |||||||||
Class C: | ||||||||||||||||
Sold | 9,488,240 | $ | 132,473,666 | 22,635,036 | $ | 306,758,369 | ||||||||||
Issued as reinvestment of dividends and distributions | 1,712,600 | 23,908,607 | 1,590,255 | 21,522,555 | ||||||||||||
Redeemed | (15,844,813 | ) | (220,584,615 | ) | (10,591,686 | ) | (143,439,587 | ) | ||||||||
|
|
|
|
|
|
|
| |||||||||
Net increase (decrease) | (4,643,973 | ) | $ | (64,202,342 | ) | 13,633,605 | $ | 184,841,337 | ||||||||
|
|
|
|
|
|
|
| |||||||||
43
COHEN & STEERS PREFERRED SECURITIES AND INCOME FUND, INC.
NOTES TO FINANCIAL STATEMENTS—(Continued)
| For the Year Ended December 31, 2017 | For the Year Ended December 31, 2016 | |||||||||||||||
| Shares | Amount | Shares | Amount | |||||||||||||
Class Fa: | ||||||||||||||||
Sold | 44,494,147 | $ | 635,520,272 | — | $ | — | ||||||||||
Issued as reinvestment of dividends and distributions | 46,485 | 658,506 | — | — | ||||||||||||
Redeemed | (1,007,830 | ) | (14,305,618 | ) | — | — | ||||||||||
|
|
|
|
|
|
|
| |||||||||
Net increase (decrease) | 43,532,802 | $ | 621,873,160 | — | $ | — | ||||||||||
|
|
|
|
|
|
|
| |||||||||
Class I: | ||||||||||||||||
Sold | 195,980,718 | $ | 2,754,079,773 | 227,772,318 | $ | 3,113,674,936 | ||||||||||
Issued as reinvestment of dividends and distributions | 12,194,711 | 171,745,839 | 9,332,847 | 127,358,389 | ||||||||||||
Redeemed | (159,157,330 | ) | (2,245,081,738 | ) | (137,749,824 | ) | (1,860,181,279 | ) | ||||||||
|
|
|
|
|
|
|
| |||||||||
Net increase (decrease) | 49,018,099 | $ | 680,743,874 | 99,355,341 | $ | 1,380,852,046 | ||||||||||
|
|
|
|
|
|
|
| |||||||||
Class R: | ||||||||||||||||
Sold | 35,293 | $ | 492,748 | 434,189 | $ | 5,916,777 | ||||||||||
Issued as reinvestments of dividends and distributions | 9,069 | 126,806 | 7,933 | 108,416 | ||||||||||||
Redeemed | (177,803 | ) | (2,493,468 | ) | (152,178 | ) | (2,045,303 | ) | ||||||||
|
|
|
|
|
|
|
| |||||||||
Net increase (decrease) | (133,441 | ) | $ | (1,873,914 | ) | 289,944 | $ | 3,979,890 | ||||||||
|
|
|
|
|
|
|
| |||||||||
Class Z: | ||||||||||||||||
Sold | 49,668 | $ | 700,208 | 7,986 | $ | 109,918 | ||||||||||
Issued as reinvestment of dividends and distributions | 1,968 | 27,820 | 224 | 3,048 | ||||||||||||
Redeemed | (1,295 | ) | (18,350 | ) | (47 | ) | (629 | ) | ||||||||
|
|
|
|
|
|
|
| |||||||||
Net increase (decrease) | 50,341 | $ | 709,678 | 8,163 | $ | 112,337 | ||||||||||
|
|
|
|
|
|
|
| |||||||||
| a. | Inception date of April 3, 2017. |
44
COHEN & STEERS PREFERRED SECURITIES AND INCOME FUND, INC.
NOTES TO FINANCIAL STATEMENTS—(Continued)
Note 7. Other Risks
Preferred Securities Risk: Preferred securities are subject to credit risk, which is the risk that a security will decline in price, or the issuer of the security will fail to make dividend, interest or principal payments when due, because the issuer experiences a decline in its financial status. Preferred securities are also subject to interest rate risk and may decline in value because of changes in market interest rates. The Fund may be subject to a greater risk of rising interest rates than would normally be the case in an environment of low interest rates and the effect of potential government fiscal policy initiatives and resulting market reaction to those initiatives. In addition, an issuer may be permitted to defer or omit distributions. Preferred securities are also generally subordinated to bonds and other debt instruments in a company’s capital structure. During periods of declining interest rates, an issuer may be able to exercise an option to redeem (call) its issue at par earlier than scheduled, and the Fund may be forced to reinvest in lower yielding securities. Certain preferred securities may be substantially less liquid than many other securities, such as common stocks. Generally, preferred security holders have no voting rights with respect to the issuing company unless certain events occur. Certain preferred securities may give the issuers special redemption rights allowing the securities to be redeemed prior to a specified date if certain events occur, such as changes to tax or securities laws.
Credit and Below-Investment-Grade Securities Risk: Preferred securities may be rated below investment-grade or may be unrated. Below-investment-grade securities, or equivalent unrated securities, which are commonly known as “high-yield bonds” or “junk bonds,” generally involve greater volatility of price and risk of loss of income and principal, and may be more susceptible to real or perceived adverse economic and competitive industry conditions than higher grade securities. It is reasonable to expect that any adverse economic conditions could disrupt the market for lower-rated securities, have an adverse impact on the value of those securities and adversely affect the ability of the issuers of those securities to repay principal and interest on those securities.
Concentration Risk: Because the Fund invests at least 25% of its net assets in the financials sector, it will be more susceptible to adverse economic or regulatory occurrences affecting this sector, such as changes in interest rates, loan concentration and competition. In addition, the Fund will also be subject to the risks of investing in the individual industries and securities that comprise the financials sector, including the bank, diversified financials, real estate (including REITs) and insurance industries. To the extent that the Fund focuses its investments in other sectors or industries, such as (but not limited to) energy, industrials, utilities, pipelines, health care and telecommunications, the Fund will be subject to the risks associated with these particular sectors and industries. These sectors and industries may be adversely affected by, among others, changes in government regulation, world events and economic conditions.
Contingent Capital Securities Risk: Contingent capital securities (sometimes referred to as “CoCos”) are debt or preferred securities with loss absorption characteristics built into the terms of the security, for example a mandatory conversion into common stock of the issuer under certain circumstances, such as the issuer’s capital ratio falling below a certain level. Since the common stock of the issuer may not pay a dividend, investors in these instruments could experience a reduced income rate, potentially to zero, and conversion would deepen the subordination of the investor, hence worsening the investor’s standing in a bankruptcy. Some CoCos provide for a reduction in the value or
45
COHEN & STEERS PREFERRED SECURITIES AND INCOME FUND, INC.
NOTES TO FINANCIAL STATEMENTS—(Continued)
principal amount of the security under such circumstances. In addition, most CoCos are considered to be high yield or “junk” securities and are therefore subject to the risks of investing in below investment-grade securities.
Liquidity Risk: Liquidity risk is the risk that particular investments of the Fund may become difficult to sell or purchase. The market for certain investments may become less liquid or illiquid due to adverse changes in the conditions of a particular issuer or due to adverse market or economic conditions. In addition, dealer inventories of certain securities, which provide an indication of the ability of dealers to engage in “market making,” are at, or near, historic lows in relation to market size, which has the potential to increase price volatility in the fixed income markets in which the Fund invests. Federal banking regulations may also cause certain dealers to reduce their inventories of certain securities, which may further decrease the Fund’s ability to buy or sell such securities. As a result of this decreased liquidity, the Fund may have to accept a lower price to sell a security, sell other securities to raise cash, or give up an investment opportunity, any of which could have a negative effect on performance. Further, transactions in less liquid or illiquid securities may entail transaction costs that are higher than those for transactions in liquid securities.
Liquidity risk also includes the risk that market conditions or large shareholder redemptions may impact the ability of the Fund to meet redemption requests within required time periods. In order to meet such redemption requests, the fund may be forced to sell securities at inopportune times or prices.
Foreign (Non-U.S.) and Emerging Market Securities Risk: The Fund directly purchases securities of foreign issuers. Risks of investing in foreign securities, which can be expected to be greater for investments in emerging markets, include currency risks, future political and economic developments and possible imposition of foreign withholding taxes on income or proceeds payable on the securities. In addition, there may be less publicly available information about a foreign issuer than about a domestic issuer, and foreign issuers may not be subject to the same accounting, auditing and financial recordkeeping standards and requirements as domestic issuers. Moreover, securities of many foreign issuers and their markets may be less liquid and their prices more volatile than securities of comparable U.S. issuers.
Foreign Currency Risk: Although the Fund will report its NAV and pay dividends in U.S. dollars, foreign securities often are purchased with and make any dividend and interest payments in foreign currencies.
Therefore, the Fund’s investments in foreign securities will be subject to foreign currency risk, which means that the Fund’s NAV could decline solely as a result of changes in the exchange rates between foreign currencies and the U.S. dollar. Certain foreign countries may impose restrictions on the ability of issuers of foreign securities to make payment of principal, dividends and interest to investors located outside the country, due to blockage of foreign currency exchanges or otherwise. The Fund may, but is not required to, engage in various investments that are designed to hedge the Fund’s foreign currency risks, and such investments are subject to the risks described under “Derivatives and Hedging Transactions Risk” below.
Derivatives and Hedging Transactions Risk: The Fund’s use of derivatives, including for the purpose of hedging interest rate or foreign currency risks, presents risks different from, and possibly
46
COHEN & STEERS PREFERRED SECURITIES AND INCOME FUND, INC.
NOTES TO FINANCIAL STATEMENTS—(Continued)
greater than, the risks associated with investing directly in traditional securities. Among the risks presented are counterparty risk, financial leverage risk, liquidity risk, OTC trading risk and tracking risk. The use of derivatives can lead to losses because of adverse movements in the price or value of the underlying asset, index or rate, which may be magnified by certain features of the derivatives.
Geopolitical Risk: Occurrence of global events similar to those in recent years, such as war, terrorist attacks, natural disasters, country instability, infectious disease epidemics, market instability, debt crises and downgrades, embargoes, tariffs, sanctions and other trade barriers and other governmental trade or market control programs, the potential exit of a country from its respective union and related geopolitical events, may result in market volatility and may have long-lasting impacts on both the U.S. and global financial markets. Additionally, those events, as well as other changes in foreign and domestic political and economic conditions, could adversely affect individual issuers or related groups of issuers, securities markets, interest rates, secondary trading, credit ratings, inflation, investor sentiment and other factors affecting the value of the Fund’s investments. The decision of the United Kingdom (UK) to exit from the European Union following the June 2016 vote on the matter (referred to as Brexit) may cause uncertainty and thus adversely impact financial results of the Fund and the global financial markets. Growing tensions between the United States and other foreign powers, or among foreign powers, and possible diplomatic, trade or other sanctions could adversely impact the markets and the Fund. The strengthening of the U.S. dollar relative to other currencies may, among other things, adversely affect the Fund’s investments denominated in non-U.S. dollar currencies. It is difficult to predict when similar events affecting the U.S. or global financial markets may occur, the effects that such events may have, and the duration of those effects.
Regulatory Risk: The U.S. government has proposed and adopted multiple regulations that could have a long-lasting impact on the Fund and on the mutual fund industry in general. The Department of Labor’s (DOL) final rule on conflicts of interest on fiduciary investment advice, as well as the U.S. Securities and Exchange Commission’s (SEC) final rules and amendments to modernize reporting and disclosure and to develop and implement a Liquidity Risk Management Program for open-end investment companies could, among other things, restrict and/or increase the cost of the Fund’s ability to engage in transactions, impact flows into the Fund and/or increase overall expenses of the Fund. In addition, Congress, various exchanges and regulatory and self-regulatory authorities, both domestic and foreign, have undertaken reviews of options and futures trading in light of market volatility. Among the actions that have been taken or proposed to be taken are new limits and reporting requirements for speculative positions, new or more stringent daily price fluctuation limits for futures and options transactions, and increased margin requirements for various types of futures transactions. While the full extent of all of these regulations is still unclear, these regulations and actions may adversely affect the instruments in which the Fund invests and its ability to execute its investment strategy.
LIBOR Risk: Many financial instruments use or may use a floating rate based on the LIBOR which is the offered rate for short-term Eurodollar deposits between major international banks. On July 27, 2017, the head of the UK’s Financial Conduct Authority announced a desire to phase out the use of LIBOR by the end of 2021. Due to the recency of this announcement, there remains uncertainty regarding the future utilization of LIBOR and the nature of any replacement rate. As such, the potential effect of a transition away from LIBOR on the Fund or the financial instruments in which the Fund invests cannot yet be determined.
47
COHEN & STEERS PREFERRED SECURITIES AND INCOME FUND, INC.
NOTES TO FINANCIAL STATEMENTS—(Continued)
This is not a complete list of risks that may affect the Fund. For additional information concerning the risks of investing in the Fund, please consult the Fund’s prospectus.
Note 8. Other
In the normal course of business, the Fund enters into contracts that provide general indemnifications. The Fund’s maximum exposure under these arrangements is dependent on claims that may be made against the Fund in the future and, therefore, cannot be estimated; however, based on experience, the risk of material loss from such claims is considered remote.
Note 9. New Accounting Guidance
In October 2016, the SEC adopted new rules and amended existing rules (together, the “final rules”) intended to modernize the reporting and disclosure of information by registered investment companies. In part, the final rules amend Regulation S-X and require standardized, enhanced disclosure about derivatives in investment company financial statements, as well as other amendments. The compliance date for the amendments to Regulation S-X was for periods ending after August 1, 2017. The adoption of these amendments, effective with these financial statements for the year ended December 31, 2017, required amended and additional disclosures reflected herein, but had no effect on the Fund’s net assets or results of operations.
In March 2017, the Financial Accounting Standards Board (FASB) issued Accounting Standards Update (ASU) No. 2017-08, Receivables—Nonrefundable Fees and Other Costs (Subtopic 310-20): Premium Amortization on Purchased Callable Debt Securities. The amendments in the ASU shorten the amortization period for certain callable debt securities, held at a premium, to be amortized to the earliest call date. The ASU is effective for fiscal years and interim periods within those fiscal years beginning after December 15, 2018. The adoption will have no effect on the Fund’s net assets or results of operations.
Note 10. Subsequent Events
Management has evaluated events and transactions occurring after December 31, 2017 through the date that the financial statements were issued, and had determined that no additional disclosure in the financial statements is required.
48
COHEN & STEERS PREFERRED SECURITIES AND INCOME FUND, INC.
REPORT OF INDEPENDENT REGISTERED PUBLIC ACCOUNTING FIRM
To the Board of Directors and Shareholders of
Cohen & Steers Preferred Securities and Income Fund, Inc.
Opinion on the Financial Statements
We have audited the accompanying statement of assets and liabilities, including the schedule of investments, of Cohen & Steers Preferred Securities and Income Fund, Inc. (the “Fund”) as of December 31, 2017, the related statement of operations for the year ended December 31, 2017, the statement of changes in net assets for each of the two years in the period ended December 31, 2017, including the related notes, and the financial highlights for each of the periods indicated therein (collectively referred to as the “financial statements”). In our opinion, the financial statements present fairly, in all material respects, the financial position of the Fund as of December 31, 2017, the results of its operations for the year then ended, the changes in its net assets for each of the two years in the period ended December 31, 2017 and the financial highlights for each of the periods indicated therein in conformity with accounting principles generally accepted in the United States of America.
Basis for Opinion
These financial statements are the responsibility of the Fund’s management. Our responsibility is to express an opinion on the Fund’s financial statements based on our audits. We are a public accounting firm registered with the Public Company Accounting Oversight Board (United States) (“PCAOB”) and are required to be independent with respect to the Fund in accordance with the U.S. federal securities laws and the applicable rules and regulations of the Securities and Exchange Commission and the PCAOB.
We conducted our audits of these financial statements in accordance with the standards of the PCAOB. Those standards require that we plan and perform the audit to obtain reasonable assurance about whether the financial statements are free of material misstatement, whether due to error or fraud.
Our audits included performing procedures to assess the risks of material misstatement of the financial statements, whether due to error or fraud, and performing procedures that respond to those risks. Such procedures included examining, on a test basis, evidence regarding the amounts and disclosures in the financial statements. Our audits also included evaluating the accounting principles used and significant estimates made by management, as well as evaluating the overall presentation of the financial statements. Our procedures included confirmation of securities owned as of December 31, 2017 by correspondence with the custodian, transfer agent and brokers. We believe that our audits provide a reasonable basis for our opinion.
PricewaterhouseCoopers LLP
New York, New York
February 22, 2018
We have served as the auditor of one or more investment companies in the Cohen & Steers family of mutual funds since 1991.
49
COHEN & STEERS PREFERRED SECURITIES AND INCOME FUND, INC.
TAX INFORMATION—2017 (Unaudited)
Pursuant to the Jobs and Growth Relief Reconciliation Act of 2003, the Fund designates qualified dividend income of $288,956,381. Additionally, 36.77% of the ordinary dividends qualified for the dividends received deduction available to corporations. Also, the Fund designates a long-term capital gain distribution of $39,081,308 at the 20% maximum rate. The Fund also designates a short-term capital gain distribution of $6,433,294.
OTHER INFORMATION
A description of the policies and procedures that the Fund uses to determine how to vote proxies relating to portfolio securities is available (i) without charge, upon request, by calling 800-330-7348, (ii) on our website at cohenandsteers.com or (iii) on the SEC’s website at http://www.sec.gov. In addition, the Fund’s proxy voting record for the most recent 12-month period ended June 30 is available by August 31 of each year (i) without charge, upon request, by calling 800-330-7348 or (ii) on the SEC’s website at http://www.sec.gov.
The Fund files its complete schedule of portfolio holdings with the SEC for the first and third quarters of each fiscal year on Form N-Q. The Fund’s Forms N-Q are available (i) without charge, upon request, by calling 800-330-7348 or (ii) on the SEC’s website at http://www.sec.gov. In addition, the Forms N-Q may be reviewed and copied at the SEC’s Public Reference Room in Washington, DC. Information on the operation of the Public Reference Room may be obtained by calling 800-SEC-0330.
Please note that distributions paid by the Fund to shareholders are subject to recharacterization for tax purposes and are taxable up to the amount of the Fund’s investment company taxable income and net realized gains. Distributions in excess of the Fund’s investment company taxable income and net realized gains are a return of capital distributed from the Fund’s assets. To the extent this occurs, the Fund’s shareholders of record will be notified of the estimated amount of capital returned to shareholders for each such distribution and this information will also be available at cohenandsteers.com. The final tax treatment of all distributions is reported to shareholders on their 1099-DIV forms, which are mailed after the close of each calendar year. Distributions of capital decrease the Fund’s total assets and, therefore, could have the effect of increasing the Fund’s expense ratio. In addition, in order to make these distributions, the Fund may have to sell portfolio securities at a less than opportune time.
Election of Additional Director
Effective September 12, 2017, the Board of Directors voted to increase the number of directors on the Fund’s Board of Directors from twelve to thirteen and elected Daphne L. Richards as a Director of the Fund.
In addition to her tenure as a Director of various Cohen & Steers Funds, Ms. Richards has served as an Independent Director of Cartica Management, LLC since 2015. She has also been a Member of the Investment Committee of the Berkshire Taconic Community Foundation since 2015, a Member of the Advisory Board of Northeast Dutchess Fund since 2016, a Member of the “100 Women in Finance” Global Association Board and Chair of its Advisory Council since 2012, and has been the President and CIO of Ledge Harbor Management since 2016. Previously, Ms. Richards worked at Bessemer Trust Company from 1999 to 2014. Prior thereto, Ms. Richards held investment positions at Frank Russell Company from 1996 to 1999, Union Bank of Switzerland from 1993 to 1996, Credit Suisse from 1990 to 1993, and Hambros International Venture Capital Fund from 1988 to 1989.
50
COHEN & STEERS PREFERRED SECURITIES AND INCOME FUND, INC.
Changes to the Board of Directors
On December 5, 2017, the Board of Directors voted to decrease the number of directors on the Fund’s Board of Directors from thirteen to ten, effective January 1, 2018. Directors Bonnie Cohen and Richard E. Kroon retired from the Board of Directors on December 31, 2017 pursuant to the Fund’s mandatory retirement policy. Director Richard J. Norman resigned from the Board of Directors effective December 31, 2017.
51
COHEN & STEERS PREFERRED SECURITIES AND INCOME FUND, INC.
MANAGEMENT OF THE FUND
The business and affairs of the Fund are managed under the direction of the Board of Directors. The Board of Directors approves all significant agreements between the Fund and persons or companies furnishing services to it, including the Fund’s agreements with its investment advisor, administrator, co-administrator, custodian and transfer agent. The management of the Fund’s day-to-day operations is delegated to its officers, the investment advisor, administrator and co-administrator, subject always to the investment objective and policies of the Fund and to the general supervision of the Board of Directors.
The Board of Directors and officers of the Fund and their principal occupations during at least the past five years are set forth below. The statement of additional information (SAl) includes additional information about fund directors and is available, without charge, upon request by calling 800-330-7348.
Name, Address and Year of Birth1 | Position(s) Held With Fund | Term of Office2 | Principal Occupation During At Least The Past 5 Years (Including Other Directorships Held) | Number of Funds Within Fund Complex Overseen by Director (Including the Fund) | Length of Time Served3 | |||||||
| Interested Directors4 | ||||||||||||
Robert H. Steers Year of Birth: 1953 | Director, Chairman | Until Next Election of Directors | Chief Executive Officer of Cohen & Steers Capital Management, Inc. (CSCM or the Advisor) and its parent, Cohen & Steers, Inc. (CNS) since 2014. Prior to that, Co-Chairman and Co-Chief Executive Officer of the Advisor since 2003 and CNS since 2004. Prior to that, Chairman of the Advisor; Vice President of Cohen & Steers Securities, LLC. | 22 | Since 1991 | |||||||
Joseph M. Harvey Year of Birth: 1963 | Director | Until Next Election of Directors | President and Chief Investment Officer of the Advisor (since 2003) and President of CNS (since 2004). Prior to that, Senior Vice President and Director of Investment Research of CSCM. | 22 | Since 2014 | |||||||
(table continued on next page)
52
COHEN & STEERS PREFERRED SECURITIES AND INCOME FUND, INC.
(table continued from previous page)
Name, Address and Year of Birth1 | Position(s) Held With Fund | Term of Office2 | Principal Occupation During At Least The Past 5 Years (Including Other Directorships Held) | Number of Funds Within Fund Complex Overseen by Director (Including the Fund) | Length of Time Served3 | |||||||
| Disinterested Directors | ||||||||||||
Michael G. Clark Year of Birth: 1965 | Director | Until Next Election of Directors | From 2006 to 2011, President and Chief Executive Officer of DWS Funds and Managing Director of Deutsche Asset Management. | 22 | Since 2011 | |||||||
Bonnie Cohen Year of Birth: 1942 | Director | —5 | Consultant. Board Member, DC Public Library Foundation since 2012, President since 2014; Board member, Telluride Mountain Film Festival since 2010; Trustee, H. Rubenstein Foundation since 1996; Trustee, District of Columbia Public Libraries from 2004 to 2014. | 22 | Since 2001 | |||||||
George Grossman Year of Birth: 1953 | Director | Until Next Election of Directors | Attorney-at-law. | 22 | Since 1993 | |||||||
(table continued on next page)
53
COHEN & STEERS PREFERRED SECURITIES AND INCOME FUND, INC.
(table continued from previous page)
Name, Address and Year of Birth1 | Position(s) Held With Fund | Term of Office2 | Principal Occupation During At Least The Past 5 Years (Including Other Directorships Held) | Number of Funds Within Fund Complex Overseen by Director (Including the Fund) | Length of Time Served3 | |||||
Dean Junkans Year of Birth: 1959 | Director | Until Next Election of Directors | C.F.A.; Adjunct Professor and Executive -In -Residence, Bethel University since 2015; Chief Investment Officer at Wells Fargo Private Bank from 2004 to 2014 and Chief Investment Officer of the Wealth, Brokerage and Retirement group at Wells Fargo & Company from 2011 to 2014; Former member and Chair, Claritas Advisory Committee at the CFA Institute from 2013 to 2015; Board Member and Investment Committee member, Bethel University Foundation since 2010; formerly Corporate Executive Board Member of the National Chief Investment Officers Circle, 2010 to 2015; formerly, Member of the Board of Governors of the University of Wisconsin Foundation, River Falls, 1996 to 2004; U.S. Army Veteran, Gulf War. | 22 | Since 2015 | |||||
Richard E. Kroon Year of Birth: 1942 | Director | —5 | Former member of Investment Committee, Monmouth University from 2004 to 2016; Former Director, Retired Chairman and Managing Partner of Sprout Group venture capital funds, then an affiliate of Donaldson, Lufkin and Jenrette Securities Corporation from 1981 to 2001. Former Director of the National Venture Capital Association from 1997 to 2000, and Chairman for the year 2000. | 22 | Since 2004 | |||||
(table continued on next page)
54
COHEN & STEERS PREFERRED SECURITIES AND INCOME FUND, INC.
(table continued from previous page)
Name, Address and Year of Birth1 | Position(s) Held With Fund | Term of Office2 | Principal Occupation During At Least The Past 5 Years (Including Other Directorships Held) | Number of Funds Within Fund Complex Overseen by Director (Including the Fund) | Length of Time Served3 | |||||
Gerald J. Maginnis Year of Birth: 1955 | Director | Until Next Election of Directors | Philadelphia Office Managing Partner, KPMG LLP from 2006 to 2015; Partner in Charge, KPMG Pennsylvania Audit Practice from 2002 to 2008; President, Pennsylvania Institute of Certified Public Accountants (PICPA) from 2014 to 2015; member, PICPA Board of Directors from 2012 to 2016; member, Council of the American Institute of Certified Public Accountants (AICPA) from 2014 to 2017; member, Board of Trustees of AICPA Foundation since 2015. | 22 | Since 2015 | |||||
Jane F. Magpiong Year of Birth: 1960 | Director | Until Next Election of Directors | President, Untap Potential since 2013; Board Member, Crespi High School, from 2014 to 2017; Senior Managing Director, TIAA-CREF, from 2011 to 2013; National Head of Wealth Management, TIAA-CREF, from 2008 to 2011; and prior to that, President, Bank of America Private Bank from 2005 to 2008. | 22 | Since 2015 | |||||
(table continued on next page)
55
COHEN & STEERS PREFERRED SECURITIES AND INCOME FUND, INC.
(table continued from previous page)
Name, Address and Year of Birth1 | Position(s) Held With Fund | Term of Office2 | Principal Occupation During At Least The Past 5 Years (Including Other Directorships Held) | Number of Funds Within Fund Complex Overseen by Director (Including the Fund) | Length of Time Served3 | |||||
Richard J. Norman Year of Birth: 1943 | Director | —5 | Private Investor. Member, Montgomery County, Maryland Department of Corrections Volunteer Corps. since 2010; Liaison for Business Leadership, Salvation Army World Service Organization (SAWSO) since 2010; Advisory Board Member, The Salvation Army since 1985; Prior thereto, Investment Representative of Morgan Stanley Dean Witter from 1966 to 2000. | 22 | Since 2001 | |||||
(table continued on next page)
56
COHEN & STEERS PREFERRED SECURITIES AND INCOME FUND, INC.
(table continued from previous page)
Name, Address and Year of Birth1 | Position(s) Held With Fund | Term of Office2 | Principal Occupation During At Least The Past 5 Years (Including Other Directorships Held) | Number of Funds Within Fund Complex Overseen by Director (Including the Fund) | Length of Time Served3 | |||||
Daphne L. Richards Year of Birth: 1966 | Director | Until Next Election of Directors | Independent Director of Cartica Management, LLC since 2015; Member of the Investment Committee of the Berkshire Taconic Community Foundation since 2015; Member of the Advisory Board of Northeast Dutchess Fund since 2016; Member of the 100 Women in Finance Global Association Board and Chair of its Advisory Council since 2012; President and CIO of Ledge Harbor Management since 2016; Previously, worked at Bessemer Trust Company from 1999 to 2014; Prior thereto, Ms. Richards held investment positions at Frank Russell Company from 1996 to 1999, Union Bank of Switzerland from 1993 to 1996; Credit Suisse from 1990 to 1993; and Hambros International Venture Capital Fund from 1988 to 1989. | 22 | Since September 2017 | |||||
(table continued on next page)
57
COHEN & STEERS PREFERRED SECURITIES AND INCOME FUND, INC.
(table continued from previous page)
Name, Address and Year of Birth1 | Position(s) Held With Fund | Term of Office2 | Principal Occupation During At Least The Past 5 Years (Including Other Directorships Held) | Number of Funds Within Fund Complex Overseen by Director (Including the Fund) | Length of Time Served3 | |||||
Frank K. Ross Year of Birth: 1943 | Director | Until Next Election of Directors | Visiting Professor of Accounting and Director of the Center for Accounting Education at Howard University School of Business since 2004; Board member and member of Audit Committee (Chairman from 2007 to 2012) and Human Resources and Compensation Committee Member, Pepco Holdings, Inc. (electric utility) from 2004 to 2014; Formerly, Mid-Atlantic Area Managing Partner for Assurance Services at KPMG LLP and Managing Partner of its Washington, DC offices from 1995 to 2003. | 22 | Since 2004 | |||||
C. Edward Ward, Jr. Year of Birth: 1946 | Director | Until Next Election of Directors | Member of The Board of Trustees of Manhattan College, Riverdale, New York from 2004 to 2014. Formerly, Director of closed-end fund management for the NYSE where he worked from 1979 to 2004. | 22 | Since 2004 | |||||
| 1 | The address for each director is 280 Park Avenue, New York, NY 10017. |
| 2 | On March 12, 2008, the Board of Directors adopted a mandatory retirement policy stating a Director must retire from the Board on December 31st of the year in which he or she turns 75 years of age. |
| 3 | The length of time served represents the year in which the Director was first elected or appointed to any fund in the Cohen & Steers fund complex. |
| 4 | “Interested person” as defined in the 1940 Act, of the Fund because of affiliation with CSCM (Interested Directors). |
| 5 | Bonnie Cohen and Richard E. Kroon retired from the Board of Directors on December 31, 2017 pursuant to the Fund’s mandatory retirement policy. Richard J. Norman resigned from the Board of Directors effective December 31, 2017. |
58
COHEN & STEERS PREFERRED SECURITIES AND INCOME FUND, INC.
The officers of the Fund (other than Messrs. Steers and Harvey, whose biographies are provided above), their address, their year of birth and their principal occupations for at least the past five years are set forth below.
Name, Address and | Position(s) Held | Principal Occupation During | Length | |||
Adam M. Derechin 1964 | President and Chief Executive Officer | Chief Operating Officer of CSCM since 2003 and CNS since 2004. | Since 2005 | |||
William F. Scapell 1968 | Vice President | Executive Vice President of CSCM since 2014, Prior to that, Senior Vice President of CSCM since 2003. | Since 2003 | |||
Elaine Zaharis-Nikas 1973 | Vice President | Senior Vice President of CSCM since 2014. Prior to that, Vice President of CSCM since 2003. | Since 2015 | |||
Francis C. Poli 1962 | Secretary and Chief Legal Officer | Executive Vice President, Secretary and General Counsel of CSCM and CNS since March 2007. | Since 2007 | |||
James Giallanza 1966 | Chief Financial Officer | Executive Vice President of CSCM since 2014 and Prior to that, Senior Vice President of CSCM since 2006. | Since 2006 | |||
Albert Laskaj 1977 | Treasurer | Vice President of CSCM since 2015. Prior to that, Director of Legg Mason & Co. since 2013. Vice President of Legg Mason from 2008 to 2013 and Treasurer of certain mutual funds since 2010. | Since 2015 | |||
Lisa D. Phelan 1968 | Chief Compliance Officer | Executive Vice President of CSCM since 2015 and prior to that, Senior Vice President of CSCM since 2008. Chief Compliance Officer of CSCM, the Cohen & Steers funds, Cohen & Steers Asia Limited and CSSL since 2007, 2006, 2005 and 2004, respectively. | Since 2006 | |||
| 1 | The address of each officer is 280 Park Avenue, New York, NY 10017. |
| 2 | Officers serve one-year terms. The length of time served represents the year in which the officer was first elected as an officer of any fund in the Cohen & Steers fund complex. All of the officers listed above are officers of one or more of the other funds in the complex. |
59
COHEN & STEERS PREFERRED SECURITIES AND INCOME FUND, INC.
Cohen & Steers Privacy Policy
| Facts | What Does Cohen & Steers Do With Your Personal Information? | |||
| Why? | Financial companies choose how they share your personal information. Federal law gives consumers the right to limit some but not all sharing. Federal law also requires us to tell you how we collect, share, and protect your personal information. Please read this notice carefully to understand what we do. | |||
| What? | The types of personal information we collect and share depend on the product or service you have with us. This information can include:
• Social Security number and account balances
• Transaction history and account transactions
• Purchase history and wire transfer instructions | |||
| How? | All financial companies need to share customers’ personal information to run their everyday business. In the section below, we list the reasons financial companies can share their customers’ personal information; the reasons Cohen & Steers chooses to share; and whether you can limit this sharing. | |||
| Reasons we can share your personal information | Does Cohen & Steers share? | Can you limit this sharing? | ||
For our everyday business purposes— such as to process your transactions, maintain your account(s), respond to court orders and legal investigations, or reports to credit bureaus | Yes | No | ||
For our marketing purposes— to offer our products and services to you | Yes | No | ||
| For joint marketing with other financial companies— | No | We don’t share | ||
For our affiliates’ everyday business purposes— information about your transactions and experiences | No | We don’t share | ||
For our affiliates’ everyday business purposes— information about your creditworthiness | No | We don’t share | ||
| For our affiliates to market to you— | No | We don’t share | ||
| For non-affiliates to market to you— | No | We don’t share | ||
| Questions? Call 800.330.7348 | ||||
60
COHEN & STEERS PREFERRED SECURITIES AND INCOME FUND, INC.
Cohen & Steers Privacy Policy—(Continued)
| Who we are | ||||
| Who is providing this notice? | Cohen & Steers Capital Management, Inc., Cohen & Steers Asia Limited, Cohen & Steers Japan, LLC, Cohen & Steers UK Limited, Cohen & Steers Securities, LLC, Cohen & Steers Private Funds and Cohen & Steers Open and Closed-End Funds (collectively, Cohen & Steers). | |||
| What we do | ||||
| How does Cohen & Steers protect my personal information? | To protect your personal information from unauthorized access and use, we use security measures that comply with federal law. These measures include computer safeguards and secured files and buildings. We restrict access to your information to those employees who need it to perform their jobs, and also require companies that provide services on our behalf to protect your information. | |||
| How does Cohen & Steers collect my personal information? | We collect your personal information, for example, when you:
• Open an account or buy securities from us
• Provide account information or give us your contact information
• Make deposits or withdrawals from your account
We also collect your personal information from other companies. | |||
| Why can’t I limit all sharing? | Federal law gives you the right to limit only:
• sharing for affiliates’ everyday business purposes—information about your creditworthiness
• affiliates from using your information to market to you
• sharing for non-affiliates to market to you
State law and individual companies may give you additional rights to limit sharing. | |||
| Definitions | ||||
| Affiliates | Companies related by common ownership or control. They can be financial and nonfinancial companies.
• Cohen & Steers does not share with affiliates. | |||
| Non-affiliates | Companies not related by common ownership or control. They can be financial and nonfinancial companies.
• Cohen & Steers does not share with non-affiliates. | |||
| Joint marketing | A formal agreement between non-affiliated financial companies that together market financial products or services to you.
• Cohen & Steers does not jointly market. | |||
61
COHEN & STEERS PREFERRED SECURITIES AND INCOME FUND, INC.
Cohen & Steers Investment Solutions
COHEN & STEERS REAL ASSETS FUND
| • | Designed for investors seeking total return and the maximization of real returns during inflationary environments by investing primarily in real assets |
| • | Symbols: RAPAX, RAPCX, RAPIX, RAPRX, RAPZX |
COHEN & STEERS
INSTITUTIONAL GLOBAL REALTY SHARES
| • | Designed for institutional investors seeking total return, investing primarily in global real estate securities |
| • | Symbol: GRSIX |
COHEN & STEERS GLOBAL REALTY SHARES
| • | Designed for investors seeking total return, investing primarily in global real estate equity securities |
| • | Symbols: CSFAX, CSFCX, CSSPX, GRSRX, CSFZX |
COHEN & STEERS REALTY SHARES
| • | Designed for investors seeking total return, investing primarily in U.S. real estate securities |
| • | Symbol: CSRSX |
COHEN & STEERS REAL ESTATE SECURITIES FUND
| • | Designed for investors seeking total return, investing primarily in U.S. real estate securities |
| • | Symbols: CSEIX, CSCIX, CREFX, CSDIX, CIRRX, CSZIX |
COHEN & STEERS INSTITUTIONAL REALTY SHARES
| • | Designed for institutional investors seeking total return, investing primarily in U.S. real estate securities |
| • | Symbol: CSRIX |
COHEN & STEERS INTERNATIONAL REALTY FUND
| • | Designed for investors seeking total return, investing primarily in international (non-U.S.) real estate securities |
| • | Symbols: IRFAX, IRFCX, IRFIX, IRFRX, IRFZX |
COHEN & STEERS
ACTIVE COMMODITIES STRATEGY FUND
| • | Designed for investors seeking total return, investing primarily in a diversified portfolio of exchange-traded commodity future contracts and other commodity-related derivative instruments |
| • | Symbols: CDFAX, CDFCX, CDFIX, CDFRX, CDFZX |
COHEN & STEERS GLOBAL INFRASTRUCTURE FUND
| • | Designed for investors seeking total return, investing primarily in global infrastructure securities |
| • | Symbols: CSUAX, CSUCX, CSUIX, CSURX, CSUZX |
COHEN & STEERS
MLP & ENERGY OPPORTUNITY FUND
| • | Designed for investors seeking total return, investing primarily in midstream energy master limited partnership (MLP) units and related stocks |
| • | Symbols: MLOAX, MLOCX, MLOIX, MLORX, MLOZX |
COHEN & STEERS
LOW DURATION PREFERREDAND INCOME FUND
| • | Designed for investors seeking high current income and capital preservation by investing in low-duration preferred and other income securities issued by U.S. and non-U.S. companies |
| • | Symbols: LPXAX, LPXCX, LPXIX, LPXRX, LPXZX |
COHEN & STEERS
PREFERRED SECURITIESAND INCOME FUND
| • | Designed for investors seeking total return (high current income and capital appreciation), investing primarily in preferred and debt securities issued by U.S. and non-U.S. companies |
| • | Symbols: CPXAX, CPXCX, CPXFX, CPXIX, CPRRX, CPXZX |
COHEN & STEERS DIVIDEND VALUE FUND
| • | Designed for investors seeking long-term growth of income and capital appreciation, investing primarily in dividend paying common stocks and preferred stocks |
| • | Symbols: DVFAX, DVFCX, DVFIX, DVFRX, DVFZX |
Distributed by Cohen & Steers Securities, LLC.
COHEN & STEERS GLOBAL REALTY MAJORS ETF
| • | Designed for investors who seek a relatively low-cost passive approach for investing in a portfolio of global real estate equity securities of companies in a specified index |
| • | Symbol: GRI |
Distributed by ALPS Distributors, Inc.
ISHARES COHEN & STEERS REALTY MAJORS INDEX FUND
| • | Designed for investors who seek a relatively low-cost passive approach for investing in a portfolio of U.S. real estate equity securities of companies in a specified index |
| • | Symbol: ICF |
Distributed by SEI Investments Distribution Co.
Please consider the investment objectives, risks, charges and expenses of any Cohen & Steers U.S. registered open-end fund carefully before investing. A summary prospectus and prospectus containing this and other information can be obtained by calling 800-330-7348 or by visiting cohenandsteers.com. Please read the summary prospectus and prospectus carefully before investing.
62
COHEN & STEERS PREFERRED SECURITIES AND INCOME FUND, INC.
OFFICERS AND DIRECTORS
Robert H. Steers
Director and Chairman
Joseph M. Harvey
Director and Vice President
Michael G. Clark
Director
Bonnie Cohen
Director
George Grossman
Director
Dean Junkans
Director
Richard E. Kroon
Director
Gerald J. Maginnis
Director
Jane F. Magpiong
Director
Richard J. Norman
Director
Daphne L. Richards
Director
Frank K. Ross
Director
C. Edward Ward, Jr.
Director
Adam M. Derechin
President and Chief Executive Officer
William F. Scapell
Vice President
Elaine Zaharis-Nikas
Vice President
Francis C. Poli
Secretary and Chief Legal Officer
James Giallanza
Chief Financial Officer
Albert Laskaj
Treasurer
Lisa D. Phelan
Chief Compliance Officer
KEY INFORMATION
Investment Advisor
Cohen & Steers Capital Management, Inc.
280 Park Avenue
New York, NY 10017
(212) 832-3232
Co-administrator and Custodian
State Street Bank and Trust Company
One Lincoln Street
Boston, MA 02111
Transfer Agent
DST Asset Manager Solutions, Inc.
P.O. Box 8123
Boston, MA 02266
(800) 437-9912
Legal Counsel
Ropes & Gray LLP
1211 Avenue of the Americas
New York, NY 10036
Distributor
Cohen & Steers Securities, LLC
280 Park Avenue
New York, NY 10017
| NASDAQ Symbol: | Class A—CPXAX | |
| Class C—CPXCX | ||
| Class F—CPXFX | ||
| Class I—CPXIX | ||
| Class R—CPRRX | ||
| Class T—CPXTX* | ||
| Class Z—CPXZX |
Website: cohenandsteers.com
This report is authorized for delivery only to shareholders of Cohen & Steers Preferred Securities and Income Fund, Inc. unless accompanied or preceded by the delivery of a currently effective prospectus setting forth details of the Fund. Performance data quoted represent past performance. Past performance is no guarantee of future results and your investment may be worth more or less at the time you sell your shares.
| * | Class T shares are currently not available for purchase. |
63
COHEN & STEERS
PREFERRED SECURITIESAND INCOME FUND
280 PARK AVENUE
NEW YORK, NY 10017
eDelivery AVAILABLE
Stop traditional mail delivery;
receive your shareholder reports
and prospectus online.
Sign up at cohenandsteers.com

Annual Report December 31, 2017
Cohen & Steers
Preferred
Securities and
Income Fund
CPXAXAR
Item 2. Code of Ethics.
The Registrant has adopted an Amended and Restated Code of Ethics that applies to its Principal Executive Officer and Principal Financial Officer. The Code of Ethics was in effect during the reporting period. The Registrant has not amended the Code of Ethics as described in Form N-CSR during the reporting period. The Registrant has not granted any waiver, including an implicit waiver, from a provision of the Code of Ethics as described in Form N-CSR during the reporting period. A current copy of the Code of Ethics is available on the Registrant’s website at https://www.cohenandsteers.com/assets/content/uploads/Code_of_Ethics_for_Principal_Executive_and_Principal_Financial_Officers_of_the_Funds.pdf. Upon request, a copy of the Code of Ethics can be made by calling 800-330-7348 or writing to the Secretary of the Registrant, 280 Park Avenue, 10th floor, New York, NY 10017.
Item 3. Audit Committee Financial Expert.
The registrant’s board has determined that Gerald J. Maginnis and Frank K. Ross qualify as audit committee financial experts based on their years of experience in the public accounting profession. The registrant’s board has determined that Michael G. Clark qualifies as an audit committee financial expert based on his years of experience in the public accounting profession and the investment management and financial services industry. Each of Messrs. Clark, Maginnis and Ross is a member of the board’s audit committee, and each is “independent” as such term is defined in Form N-CSR.
Item 4. Principal Accountant Fees and Services.
(a) – (d) Aggregate fees billed to the registrant for the last two fiscal years ended Decembe 31, 2017 and December 31, 2016 for professional services rendered by the registrant’s principal accountant were as follows:
| 2017 | 2016 | |||||||
Audit Fees | $ | 42,200 | $ | 47,700 | ||||
Audit-Related Fees | $ | 0 | $ | 0 | ||||
Tax Fees | $ | 5,740 | $ | 6,600 | ||||
All Other Fees | $ | 0 | $ | 0 | ||||
Tax fees were billed in connection with tax compliance services, including the preparation and review of federal and state tax returns.
(e)(1) The audit committee is required to pre-approve audit and non-audit services performed for the registrant by the principal accountant. The audit committee also is required to pre-approve non-audit services performed by the registrant’s principal accountant for the registrant’s investment advisor and any sub-advisor (not including any sub-advisor whose role is primarily portfolio management and is subcontracted with or overseen by another investment advisor) and/or to any entity controlling, controlled by or under common control with the registrant’s investment advisor that provides ongoing services to the registrant, if the engagement for services relates directly to the operations and financial reporting of the registrant.
The audit committee may delegate pre-approval authority to one or more of its members who are independent members of the board of directors of the registrant. The member or members to whom such authority is delegated shall report any pre-approval decisions to the audit committee at its next scheduled meeting. The audit committee may not delegate its responsibility to pre-approve services to be performed by the registrant’s principal accountant to the investment advisor.
(e)(2) No services included in (b) – (d) above were approved by the audit committee pursuant to paragraphs (c)(7)(i)(C) of Rule 2-01 of Regulation S-X.
(f) Not applicable.
(g) For the fiscal years ended December 31, 2017 and December 31, 2016, the aggregate fees billed by the registrant’s principal accountant for non-audit services rendered to the registrant and for non-audit services rendered to the registrant’s investment advisor (not including any sub-advisor whose role is primarily portfolio management and is subcontracted with or overseen by another investment advisor) and/or to any entity controlling, controlled by or under common control with the registrant’s investment advisor that provides ongoing services to the registrant were:
| 2017 | 2016 | |||||||
Registrant | $ | 5,740 | $ | 6,600 | ||||
Investment Advisor | $ | 0 | $ | 0 | ||||
(h) The registrant’s audit committee considered whether the provision of non-audit services that were rendered to the registrant’s investment advisor (not including any sub-advisor whose role is primarily portfolio management and is subcontracted with or overseen by another investment advisor) and/or to any entity controlling, controlled by or under common control with the registrant’s investment advisor that provides ongoing services to the registrant that were not required to be pre-approved pursuant to paragraph (c)(7)(ii) of Rule 2-01 of Regulation S-X was compatible with maintaining the principal accountant’s independence.
Item 5. Audit Committee of Listed Registrants.
Not applicable.
Item 6. Schedule of Investments.
Included in Item 1 above.
Item 7. Disclosure of Proxy Voting Policies and Procedures for Closed-End Management Investment Companies.
Not applicable.
Item 8. Portfolio Managers of Closed-End Investment Companies.
Not applicable.
Item 9. Purchases of Equity Securities by Closed-End Management Investment Company and Affiliated Purchasers.
Not applicable.
Item 10. Submission of Matters to a Vote of Security Holders.
None.
Item 11. Controls and Procedures.
| (a) | The registrant’s principal executive officer and principal financial officer have concluded that the registrant’s disclosure controls and procedures are reasonably designed to ensure that information required to be disclosed by the registrant in this Form N-CSR was recorded, processed, summarized and reported within the time periods specified in the Securities and Exchange Commission’s rules and forms, based upon such officers’ evaluation of these controls and procedures as of a date within 90 days of the filing date of this report. |
| (b) | There were no changes in the registrant’s internal control over financial reporting that occurred during the period covered by this report that have materially affected, or are reasonably likely to materially affect, the registrant’s internal control over financial reporting. |
Item 12. Disclosure of Securities Lending Activities for Closed-End Management Investment Companies.
Not applicable.
Item 13. Exhibits.
(a)(1) Not Applicable.
(a)(2) Certifications of principal executive officer and principal financial officer as required by Rule 30a-2(a) under the Investment Company Act of 1940.
(a)(3) Not applicable.
(b) Certifications of chief executive officer and chief financial officer as required by Rule 30a- 2(b) under the Investment Company Act of 1940.
SIGNATURES
Pursuant to the requirements of the Securities Exchange Act of 1934 and the Investment Company Act of 1940, the registrant has duly caused this report to be signed on its behalf by the undersigned, thereunto duly authorized.
COHEN & STEERS PREFERRED SECURITIES AND INCOME FUND, INC.
| By: | /s/ Adam M. Derechin | |||
Name: Adam M. Derechin Title: President and Chief Executive Officer | ||||
| Date: | March 5, 2018 | |||
Pursuant to the requirements of the Securities Exchange Act of 1934 and the Investment Company Act of 1940, this report has been signed below by the following persons on behalf of the registrant and in the capacities and on the dates indicated.
| By: | /s/ Adam M. Derechin | |||
Name: Adam M. Derechin Title: President and Chief Executive Officer (Principal Executive Officer) | ||||
| By: | /s/ James Giallanza | |||
Name: James Giallanza Title: Chief Financial Officer (Principal Financial Officer) | ||||
Date: March 5, 2018 | ||||