Exhibit 99.1

August 10, 2021
Fellow Shareholders,
Our record second quarter reflects continued strong execution in support of our vision to define a new category of interactive sports and entertainment television. Within the quarter we made meaningful advancement towards our long-term growth and margin targets, while also capitalizing on the favorable trends we are seeing in the category.
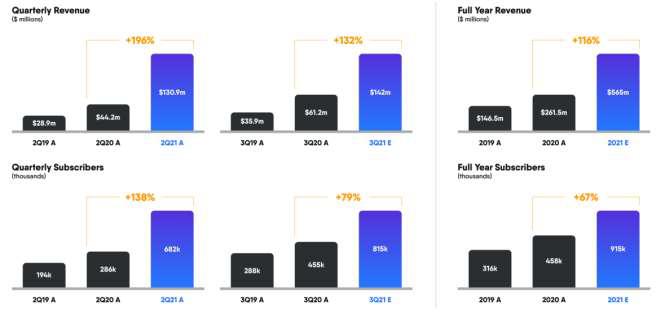
In the quarter, we delivered triple-digit year-over-year growth in total paid subscribers (up 138% to 681,721), total revenue (up 196% to $130.9 million) and advertising revenue (up 281% to $16.5 million). Engagement reached record highs, with fuboTV customers streaming 245 million hours of content during the quarter, a 148% increase year-over-year.
We also made significant progress towards our profitability goals, driven by a 62% year-over-year increase in advertising Monthly Average Revenue Per User (ARPU) and a 30% increase in total Monthly ARPU. This positions us well to continue making deliberate, strategic investments in team, technology and infrastructure to optimize our market position and grow share, while also driving margin expansion.
Our second quarter results showcase the continued momentum in our business, with consumers choosing fuboTV over more expensive legacy pay TV services due to our innovative product experience and customer-friendly approach at an affordable price. This shift, along with a heavy sports calendar, drove a healthy 91,291 net subscribers added in the quarter.
As we have consistently highlighted, it is our view that there will be a major shift back to aggregation and bundling as the proliferation of SVOD services becomes increasingly burdensome and costly for consumers. Moreover, we continue to believe that consumers will ultimately favor a more personalized and interactive premium viewing experience.
The broader industry has followed our lead on both fronts in recent weeks, repeatedly pointing to consumer fatigue as a consequence of actively managing numerous subscriptions, and with certain industry players also announcing plans to expand their existing portfolio of product offerings. We see both of these trends as continued validation of our unique model and our ability to offer a truly differentiated consumer experience in this category. We believe that the delivery of a unified, personalized and interactive streaming experience is the future of this space and the key to capturing market share. Our internally developed technology stack allows us to remain nimble and support continuous product development velocity to innovate against consumer preferences and pain points. Our product and technology-leading approach positions us well to win the so-called streaming wars by providing consumers easy access to premium content, favorite sports teams and live TV channels at a fair price.

In light of our strong execution in the quarter, and the strength of the macro tailwinds we are seeing, we are increasing our full year 2021 revenue guidance to $560-570 million, representing a 116% increase at the mid-point year-over-year, and our guidance on year-end subscribers to 910,000-920,000, representing a 67% increase at the mid-point compared to our subscribers at year-end 2020.
Q2 2021 Highlights
| | ● | Total revenue grew 196% YoY to $130.9 million |
| | | |
| | ● | Advertising revenue grew 281% YoY to $16.5 million |
| | | |
| | ● | Subscription revenue increased 189% YoY to $114.4 million |
| | | |
| | ● | Subscribers grew 138% YoY and 15% Q/Q to 681,721 |
| | | |
| | ● | Average Revenue Per User (ARPU) per month increased 30% YoY to $71.43 |
| | | |
| | ● | Advertising ARPU per month increased 62% YoY to $8.70 |
| | | |
| | ● | Adjusted Contribution Margin was positive 8.3%, up 316 bps YoY from 5.1%1 |
Note: 2019 financials and metrics represent pro-forma fuboTV pre-merger plus FaceBank pre-merger.
| Key Operating Metrics | | | 2Q19 | | | | 2Q20 | | | | 2Q21 | | | | 2Q21 YoY % | |
| Subscribers (thousands) | | | 194 | | | | 286 | | | | 682 | | | | +138% | |
| Content Hours Streamed (millions) | | | 54 | | | | 99 | | | | 245 | | | | +148% | |
| ARPU | | $ | 50.70 | | | $ | 54.79 | | | $ | 71.43 | | | | +30% | |
| Advertising ARPU | | $ | 4.26 | | | $ | 5.37 | | | $ | 8.70 | | | | +62% | |
| Adjusted Contribution Margin % | | | -4.4 | % | | | 5.1 | % | | | 8.3 | % | | | +316 bps | |
| Summary Financials (millions) | | | 2Q19 | | | | 2Q20 | | | | 2Q21 | | | | 2Q21 YoY % | |
| Revenue | | $ | 28.9 | | | $ | 44.2 | | | $ | 130.9 | | | | +196% | |
| Total Operating Expenses | | $ | 74.5 | | | $ | 111.5 | | | $ | 211.9 | | | | +90% | |
| Net Loss | | $ | -43.0 | | | $ | -73.6 | | | $ | -94.9 | | | | -29 | % |
| Net Loss Margin | | | -148.6 | % | | | -166.6 | % | | | -72.5 | % | | | +9,412 bps | |
| Adjusted EBITDA | | $ | -40.4 | | | $ | -41.9 | | | $ | -47.4 | | | | -13 | % |
| Adjusted EBITDA Margin | | | -139.7 | % | | | -95.0 | % | | | -36.2 | % | | | +5,876 bps | |
1 Refer to the reconciliation of Revenue to ARPU and Adjusted Contribution Margin in the non-GAAP information in the tables, which for prior periods are presented on a fuboTV pre-merger-only basis.
| Guidance | | | 3Q21 | | | | FY21 | |
| Revenue ($ in millions) | | $ | 140-$144 | | | $ | 560-$570 | |
| Subscribers (thousands) | | | 810-820 | | | | 910-920 | |
Earnings per share (EPS) in the second quarter of 2021 was a loss of $0.68, including $0.02 impact from expenses incurred for our wagering business, compared to a loss of $2.08 in the second quarter of 2020. Adjusted EPS in the second quarter of 2021 was a loss of $0.38, excluding the non-cash impact of stock based compensation, the re-measurement of warrant liabilities and the amortization of intangibles and debt discount. 2
As we continue to lay the foundation for future growth, our strategic investments in programming, team, technology and infrastructure have resulted in expected expense increases on an absolute dollar basis year-over-year. However, expenses continue to be significantly reduced in proportion to revenue, resulting in a material year-over-year improvement in Adjusted EBITDA margin which improved from negative -95.0% to -36.2% as we continuously improve our operating leverage and further advance on our path to profitability. 3
We ended the quarter with $412.1 million of cash, cash equivalents and restricted cash. This included the repayment in full of the $18.1 million senior secured loan with AMC Networks as part of our ongoing capital structure optimization.
Operating cash flow in the quarter was negative $33.6 million, improving $20.2 million compared to the first quarter of 2021, and inclusive of $4.3 million negative impact from payments associated with the build-up of our wagering infrastructure.
As of June 30, 2021 the Company had 140,920,362 common shares issued and outstanding.
Operational Highlights
The Company delivered record results during the second quarter of 2021, growing total revenue by 196%, increasing advertising revenue by 281% and delivering subscriber growth of 138%, each compared to the prior year period.
Net subscriber additions in the second quarter increased approximately 91,000, compared to a decline of approximately 1,000 in the second quarter of 2020. We have added approximately 396,000 net subscribers since the second quarter of 2020, resulting in subscriber growth of 138% year-over-year, compared to the 31% growth for the entire vMVPD market over the same period. 4 We drove this strong subscriber growth with efficient deployment of sales and marketing dollars, which came in at 16% of revenue in the quarter, down from 18% in the first quarter of 2021. We also saw churn improve by 203 basis points year-over-year.
2 Refer to the reconciliations of GAAP Net Loss to Non-GAAP Adjusted Net Loss in the non-GAAP information in the tables. Adjusted EPS represents Adjusted Net Loss divided by the number of weighted average shares outstanding for the applicable period.
3 Refer to the reconciliations of GAAP Net Loss to Non-GAAP Adjusted EBITDA in the non-GAAP information in the tables.
4 Source: Nielsen Media Research NPower, 2Q21 vs. 2Q20 Based on Household Universe Estimates
In the second quarter of 2021, our users (paid and trial) streamed over 245 million hours, an increase of 148% year-over-year. Our monthly active users (MAUs) watched 134 hours per month on average, demonstrating strong engagement with our platform’s leading sports, news and entertainment content. Engagement was also driven by a heavier sports calendar compared to the first quarter, including our exclusive streams of the South American Qatar World Cup qualifying matches (CONMEBOL), and expanded smart TV distribution.

The second quarter was also record-breaking for our advertising business, representing the company’s strongest ad sales quarter in our history. Ad revenue reached $16.5 million and grew 281% year-over-year, accounting for 13% of total revenue in the second quarter of 2021, compared to 10% in the second quarter of 2020. Advertising ARPU was up 62% year-over-year to $8.70, and increased 22% sequentially.
This growth demonstrates the foundational strength of our advertising model, offering brands the engagement and premium live content of linear TV, augmented by the efficiencies and first-party addressable targeting capabilities of a connected TV (CTV) platform. In the second quarter, our recurring advertiser base of Fortune 500 companies and blue-chip national brands continued to rapidly expand, drawn to our platform’s differentiated and highly engaged premium audience: 94% of our content was viewed on a big-screen connected TV and 89% of viewing was for live content. We continue to grow our national ad sales team to address significant demand in the marketplace and offer advertisers optimal flexibility and ROI for their campaigns.
Alongside our record revenue growth in the quarter, we also reported continued margin expansion year-over-year, with an adjusted contribution margin of 8.3%, up 316 basis points from the second quarter of 2020. This growth was driven by ARPU expansion of both advertising and subscriptions, partly as a result of strong execution associated with upsells and packaging. This is evidenced by our Attach Rate of 2.3, up from 1.2 in the second quarter of 2020, and the 1.5 million attachments sold in the quarter.
Business Expansion
We were pleased with the performance of our exclusive CONMEBOL streams, which began in June and will continue through early 2022 in the run-up to the World Cup. This coveted piece of content features some of soccer’s most competitive teams (Argentina, Brazil and Uruguay) and biggest stars (Messi, Suarez, Neymar, etc). Alongside the matches, fuboTV produced nearly 20 hours of live shoulder programming in English and Spanish for our ad-supported linear channel Fubo Sports Network. The June match window proved very popular with our subscribers, driving a significant lift in viewership hours over three days. We expect that our full run of CONMEBOL will drive well over four million viewing hours.

Turning to the distribution side of our business, we brought fuboTV to an even greater number of consumers in the second quarter through our launch on LG Smart TVs, one of the leading smart TV platforms in the U.S. We are also pleased to announce that fuboTV has closed a partnership with Vizio to launch on their popular SmartCast platform in the coming weeks. These important partnerships offer consumers multiple options for accessing their favorite content on the big screen. This is particularly significant, as 94% of our subscribers enjoyed fuboTV on a connected or smart TV in the second quarter.
Ad Sales
The second quarter was the strongest advertising quarter in fuboTV’s history, in terms of both absolute revenue (up 281% year-over-year) as well as advertising ARPU (up 62% year-over-year). Advertising revenue accounted for 13% of total revenue in the quarter compared to 10% in the prior year period, providing a significant contribution to margin expansion. This ongoing momentum is driven by strong subscriber growth and enhanced monetization, as we continue to benefit from industry trends, specifically the rapid adoption of CTV devices by consumers, the migration of sports entertainment from linear to live TV streaming and the shift of linear ad dollars to CTV.
Earlier in the quarter, we announced the launch of our Branded Content studio, as well as our first-party data partnership with LiveRamp, enabling advertisers to bring together our ROI-driving addressable and programmatic capabilities with unique, custom branded experiences. We capitalized on the high demand for CTV in this year’s upfront, with buyers seeking to reach our valuable cord-cutting audience of premium paying subscribers that can’t be accessed via linear TV. These trends continue to accelerate: a report issued in June 2021 by GroupM’s Business Intelligence unit found that one in five of all TV ad dollars is now going to a CTV platform. fuboTV’s concentration of live sports content also drove outperformance on advertising in the quarter.
Wagering & Interactivity
fuboTV is focused on activating our vision of an interactive streaming platform that transcends the industry’s current vMVPD model. We are tracking well, and are on schedule to launch Fubo Sportsbook in the fourth quarter of this year. The launch of our own sportsbook is an important driver of this strategy as we aim to turn passive viewers into active participants and define a new category of interactive sports and entertainment television. While other industry players have recently moved to partner with gaming and media distribution companies - confirming that the television market is moving towards interactivity - we’ve stayed ahead of the curve. Fubo Sportsbook will represent a differentiated and industry-first integration of streaming and a sports wagering product and we continue to build our team of talent in support of this initiative.
We are building Fubo Sportsbook to be a holistic and hyper-personalized betting experience reflecting what the user is watching on fuboTV at that very moment. We’re excited to preview for the first time today how the Fubo Sportsbook app will immediately and in real time update with relevant bets based on what the user is watching - even as they change the channel to a new game. This invisible connection between streaming video and our mobile betting app is a feature we believe only fuboTV can bring to market. We expect to roll out continued product advancements to enhance the customer journey.
With our sportsbook, we are focused on becoming an emerging player across those states within which we will operate, and establishing and growing our market share in those regions over time. Our existing fuboTV business puts us at a distinct advantage here, as it allows us to leverage product integrations and marketing synergies that support our long-term gross margin targets in this segment.
In July, we announced a market access agreement for Pennsylvania through a partnership with The Cordish Companies - our fourth state following previous agreements for Iowa (via Casino Queen) as well as Indiana and New Jersey (via Caesars Entertainment Inc). These launches are subject to obtaining requisite regulatory approvals in each market.
Our launch of predictive, free-to-play games is also progressing well. This is a key component of our overall wagering strategy, as it represents a new potential customer on-ramp to our experience and also positions us to assess the propensity of our customers to engage in greater levels of interactivity on our platform. Free-to-play also importantly serves to train and educate our customers which we believe will ultimately reduce the customer learning curve and drive greater levels of adoption of our wagering offering.
We leveraged our exclusive CONMEBOL coverage to begin beta testing the free gaming experience integrated into our core video product. Additionally, we tested a new FanView feature, which allows for supplemental, user-initiated interactive content, like live game stats and scores, to sit next to and under a reduced-size video player. Our goals were to test free gaming with a cohort of users on select devices, gather data on usability and optimize ahead of launch.
As expected, gaming proved extremely popular across the subset of users with whom we conducted our test. We saw a nice lift in viewership, with subscribers who engaged in free gaming watching CONMEBOL content for significantly more time per user than those that did not play. We’re looking forward to bringing the interactive experience of free-to-play gaming and FanView to all fuboTV subscribers alongside multiple sports in the fall.

Guidance
We are very pleased with our performance in the first half of 2021 and believe that we are well positioned to continue to execute on our long-term revenue and margin goals, all while delivering a differentiated and world-class experience to the consumer.
Accordingly, we are increasing our full year 2021 revenue guidance to $560-570 million, representing a 116% increase at the mid-point compared to 2020, up from an increase of 101% in our prior guidance. Similarly, we are increasing our end-of-year subscribers guidance to 910,000-920,000, representing a 67% increase at the midpoint compared to 2020. This subscriber outlook implies full year 2021 net additions of at least 367,000, 58% higher than our full year 2020 net additions of 232,000.
Third quarter revenue is estimated to be between $140 million and $144 million, up 132% year-over-year at the midpoint. Third quarter end-of-period subscribers are estimated to be between 810,000 and 820,000, up 79% year-over-year at the midpoint.
The above guidance does not include any projected revenues from online sports wagering.
Conclusion
fuboTV delivered a strong second quarter in 2021 across a number of our key financial and operational metrics: subscribers, total revenue, advertising revenue and margin expansion. Engagement reached record highs as we added exclusive sports streaming rights with CONMEBOL and began beta testing predictive, free-to-play gaming integrated into our streaming platform ahead of our expected launch this fall. Our Fubo Sportsbook with real-money wagering remains on track for a fourth quarter launch as we intend to further combine interactivity with streaming video.
There is strong investor interest around fuboTV, and only eight months after our listing on the New York Stock Exchange, we were added to the Russell 2000® Index in June. This marks another important milestone for the company as we push forward on our goal to turn passive viewers into active participants and define a new category of interactive sports and entertainment television.
We look forward to keeping you updated on our remarkable progress.
Sincerely,
| David Gandler, co-founder and CEO | Edgar Bronfman Jr., executive chairman |
Q2 2021 Earnings Live Video Webcast
fuboTV CEO David Gandler and CFO Simone Nardi will host a live video webcast today at 5:30 p.m. ET to deliver brief remarks followed by Q&A. The live webinar will be available on the Events page of fuboTV’s investor relations website. An archived replay will be available on fuboTV’s website following the webinar. Participants should join the webinar 10 minutes in advance to ensure that they are connected prior to the event.
More Information
We encourage you to read our full set of financial statements and SEC filings, and to sign up for email alerts, on the investor relations section of our website at ir.fubo.tv.
Additional information is available at www.sec.gov under fuboTV Inc.’s filings, as well as https://ir.fubo.tv.
fuboTV intends to use its website as a disclosure channel and investors are encouraged to refer to it, as well as press releases and SEC filings. The company encourages reading the full set of financial statements and related disclosures in its Form 10-Q for the quarter ended June 30, 2021, that will be filed by August 16, 2021.
About fuboTV
With a mission to provide the world’s most thrilling sports-first live TV experience through the greatest breadth of premium content, interactivity and integrated wagering, fuboTV Inc. (NYSE: FUBO) is focused on bringing to life its vision of a streaming platform that transcends the industry’s current virtual MVPD model. fuboTV Inc. operates in the U.S., Canada and Spain.
Leveraging its proprietary data and technology platform optimized for live TV and sports viewership, fuboTV Inc. aims to turn passive viewers into active participants and define a new category of interactive television. Through its cable TV replacement product, fuboTV, subscribers can stream a broad mix of 100+ live TV channels, including 74 of the top 100 Nielsen-ranked networks across sports, news and entertainment — more than any other live TV streaming platform (source: Nielsen Total Viewers, 2020). fuboTV intends to add interactivity to its streaming experience with the launch of predictive free-to-play gaming in the fall of 2021.
Fubo Gaming Inc., a subsidiary of fuboTV Inc., expects to launch Fubo Sportsbook, a comprehensive sports entertainment experience through sports betting, in Q4 2021, subject to obtaining requisite regulatory approvals.
Forward-Looking Statements
This letter contains forward-looking statements of fuboTV Inc. (“fuboTV”) that involve substantial risks and uncertainties. All statements contained in this letter that do not relate to matters of historical fact are forward-looking statements within the meaning of The Private Securities Litigation Reform Act of 1995, including statements regarding our financial condition, anticipated financial performance, market opportunity, business strategy and plans, the continued shift in consumer behavior and the expected launch of free-to-play gaming, Fanview and Fubo Sportsbook. The words “could,” “will,” “plan,” “intend,” “anticipate,” “approximate,” “expect,” “potential,” “believe,” or the negative of these terms or other similar expressions are intended to identify forward-looking statements, although not all forward-looking statements contain these identifying words. Actual results or events could differ materially from the plans, intentions and expectations disclosed in the forward-looking statements that fuboTV makes due to a number of important factors, including but not limited to risks related to the ability to realize the anticipated benefits of the Balto and Vigtory acquisitions; our actual operating results may differ significantly from our guidance; risks related to the company’s access to capital and fundraising prospects to fund its ongoing operations; we may require additional capital to meet our financial obligations and support our planned growth; risks related to diverting management’s attention from fuboTV’s ongoing business operations to address integration and fundraising efforts; we may never achieve or maintain profitability; our revenue and gross profit are subject to seasonality; our operating results may fluctuate; we may not be successful in attracting and retaining subscribers; we may not be able to license streaming content or other rights on acceptable terms; risks related to our ability to capitalize successfully on market trends and develop and market a sports wagering offering, and other risks, including the effects of industry, market, economic, political or regulatory conditions, future exchange and interest rates, and changes in tax and other laws, regulations, rates and policies, including the impact of COVID-19 on the broader market. Further risks that could cause actual results to differ materially from those matters expressed in or implied by such forward-looking statements are discussed in our Quarterly Report on Form 10Q for the quarterly period ended June 30, 2021 to be filed with the Securities and Exchange Commission (“SEC”) and our other periodic filings with the SEC. We encourage you to read such risks in detail. The forward-looking statements in this letter represent fuboTV’s views as of the date of this letter. fuboTV anticipates that subsequent events and developments will cause its views to change. However, while it may elect to update these forward-looking statements at some point in the future, it specifically disclaims any obligation to do so. You should, therefore, not rely on these forward-looking statements as representing fuboTV’s views as of any date subsequent to the date of this letter.
(fuboTV Inc. Financial Statements begin on the following pages)
fuboTV Inc.
Condensed Consolidated Statements of Operations and Comprehensive Loss
(in thousands, except share and per share amounts)
| | | For the Three Months Ended | |
| | | June 30, | |
| | | 2021 | | | 2020 | |
| | | Unaudited | | | Unaudited | |
| Revenues | | | | | | |
| Subscriptions | | $ | 114,368 | | | $ | 39,511 | |
| Advertisements | | | 16,466 | | | | 4,323 | |
| Other | | | 50 | | | | 338 | |
| Total revenues | | | 130,884 | | | | 44,172 | |
| Operating expenses | | | | | | | | |
| Subscriber related expenses | | | 120,500 | | | | 53,087 | |
| Broadcasting and transmission | | | 12,395 | | | | 9,492 | |
| Sales and marketing | | | 21,514 | | | | 7,577 | |
| Technology and development | | | 20,001 | | | | 9,551 | |
| General and administrative | | | 28,293 | | | | 17,338 | |
| Depreciation and amortization | | | 9,247 | | | | 14,417 | |
| Total operating expenses | | | 211,950 | | | | 111,462 | |
| Operating loss | | | (81,066 | ) | | | (67,290 | ) |
| | | | | | | | | |
| Other income (expense) | | | | | | | | |
| Interest expense and financing costs | | | (4,175 | ) | | | (13,325 | ) |
| Amortization of debt discount | | | (4,043 | ) | | | - | |
| Loss on issuance of notes, bonds and warrants | | | - | | | | (602 | ) |
| Loss on extinguishment of debt | | | (380 | ) | | | - | |
| Loss on deconsolidation of Nexway | | | - | | | | - | |
| Change in fair value of warrant liabilities | | | (6,019 | ) | | | 4,966 | |
| Change in fair value of subsidiary warrant liabilities | | | - | | | | 18 | |
| Change in fair value of shares settled liability | | | - | | | | (1,485 | ) |
| Change in fair value of derivative liability | | | - | | | | (823 | ) |
| Unrealized gain on equity method investment | | | - | | | | 2,614 | |
| Other expense | | | - | | | | (1,158 | ) |
| Total other expense | | | (14,617 | ) | | | (9,795 | ) |
| Loss before income taxes | | | (95,683 | ) | | | (77,085 | ) |
| Income tax benefit | | | 753 | | | | 3,481 | |
| Net loss | | | (94,930 | ) | | | (73,604 | ) |
| Less: net loss attributable to non-controlling interest | | | 15 | | | | 682 | |
| Net loss attributable to controlling interest | | $ | (94,915 | ) | | $ | (72,922 | ) |
| Less: Deemed dividend - beneficial conversion feature on preferred stock | | | - | | | | - | |
| Net loss attributable to common stockholders | | $ | (94,915 | ) | | $ | (72,922 | ) |
| | | | | | | | | |
| Net loss per share attributable to common stockholders | | | | | | | | |
| Basic and diluted | | $ | (0.68 | ) | | $ | (2.08 | ) |
| Weighted average shares outstanding: | | | | | | | | |
| Basic and diluted | | | 140,596,001 | | | | 35,045,390 | |
| | | | | | | | | |
| Stock-based compensation was allocated as follows: | | | | | | | | |
| Subscriber related expenses | | | 16 | | | | 7 | |
| Sales and marketing | | | 790 | | | | 625 | |
| Technology and development | | | 8,551 | | | | 1,195 | |
| General and administrative | | | 15,074 | | | | 9,096 | |
| Total stock-based compensation | | | 24,431 | | | | 10,923 | |
fuboTV Inc.
Condensed Consolidated Balance Sheets
(in thousands)
| | | June 30, | | | December 31, | |
| | | 2021 | | | 2020 | |
| | | Unaudited | | | Audited | |
| ASSETS | | | | | | | | |
| Cash and cash equivalents | | $ | 406,740 | | | $ | 134,942 | |
| Accounts receivable, net | | | 20,908 | | | | 17,495 | |
| Prepaid and other current assets | | | 8,785 | | | | 4,277 | |
| Total current assets | | | 436,433 | | | | 156,714 | |
| | | | | | | | | |
| Property and equipment, net | | | 3,871 | | | | 1,771 | |
| Restricted cash | | | 5,404 | | | | 1,279 | |
| Intangible assets, net | | | 199,603 | | | | 216,449 | |
| Goodwill | | | 489,089 | | | | 478,406 | |
| Right-of-use assets | | | 7,537 | | | | 4,639 | |
| Other non-current assets | | | 919 | | | | 91 | |
| Total assets | | $ | 1,142,856 | | | $ | 859,349 | |
| | | | | | | | | |
| LIABILITIES AND STOCKHOLDERS’ EQUITY | | | | | | | | |
| Current liabilities | | | | | | | | |
| Accounts payable | | | 32,657 | | | | 31,160 | |
| Accrued expenses | | | 140,806 | | | | 126,393 | |
| Notes payable | | | 4,846 | | | | 4,593 | |
| Deferred revenue | | | 24,496 | | | | 17,428 | |
| Warrant liabilities | | | 14,049 | | | | 22,686 | |
| Long-term borrowings - current portion | | | - | | | | 24,255 | |
| Current portion of lease liability | | | 1,331 | | | | 799 | |
| Total current liabilities | | | 218,185 | | | | 227,314 | |
| | | | | | | | | |
| Convertible notes, net of discount | | | 307,981 | | | | - | |
| Deferred income taxes | | | 3,877 | | | | 5,100 | |
| Lease liability | | | 6,395 | | | | 3,859 | |
| Other long-term liabilities | | | 21 | | | | 128 | |
| Total liabilities | | | 536,459 | | | | 236,401 | |
| | | | | | | | | |
| Stockholders’ equity: | | | | | | | | |
| Series AA Convertible Preferred stock, par value $0.0001, 35,800,000 shares authorized, no shares issued and outstanding at June 30, 2021 and 23,219,613 shares issued and outstanding December 31, 2020 | | | - | | | | 406,665 | |
| Common stock par value $0.0001: 400,000,000 shares authorized; 141,097,294 and 92,490,768 shares issued at June 30, 2021 and December 31, 2020, respectively; 140,920,362 and 91,690,768 shares outstanding at June 30, 2021 and December 31, 2020, respectively | | | 14 | | | | 9 | |
| Additional paid-in capital | | | 1,409,049 | | | | 853,824 | |
| Treasury stock, at cost, 176,932 and 800,000 shares at June 30, 2021 and December 31, 2020 | | | - | | | | - | |
| Accumulated deficit | | | (791,481 | ) | | | (626,456 | ) |
| Non-controlling interest | | | (11,185 | ) | | | (11,094 | ) |
| | | | | | | | | |
| Total stockholders’ equity | | | 606,397 | | | | 622,948 | |
| TOTAL LIABILITIES AND STOCKHOLDERS’ EQUITY | | $ | 1,142,856 | | | $ | 859,349 | |
fuboTV Inc.
Condensed Consolidated Statements of Cash Flows
(in thousands)
| | | For the Six Months Ended | |
| | | June 30, | |
| | | 2021 | | | 2020 | |
| | | Unaudited | | | Unaudited | |
| Cash flows from operating activities | | | | | | | | |
| Net loss | | $ | (165,116 | ) | | $ | (129,947 | ) |
| Adjustments to reconcile net loss to net cash used in operating activities: | | | | | | | | |
| Depreciation and amortization | | | 18,456 | | | | 19,637 | |
| Stock-based compensation | | | 33,805 | | | | 17,776 | |
| Loss on deconsolidation of Nexway, net of cash retained by Nexway | | | - | | | | 8,564 | |
| Loss on issuance of notes, bonds and warrants | | | - | | | | 24,655 | |
| Loss on extinguishment of debt | | | 380 | | | | - | |
| Common stock issued in connection with note payable | | | - | | | | 67 | |
| Non-cash expense relating to issuance of warrants and common stock | | | - | | | | 2,208 | |
| Amortization of debt discount | | | 6,555 | | | | 10,981 | |
| Deferred income tax benefit | | | (1,218 | ) | | | (4,519 | ) |
| Change in fair value of derivative liability | | | - | | | | 526 | |
| Change in fair value of warrant liabilities | | | 6,604 | | | | (4,600 | ) |
| Change in fair value of subsidiary warrant liability | | | - | | | | (3 | ) |
| Change in fair value of shares settled liability | | | - | | | | 1,665 | |
| Change in fair value of profit share liability | | | - | | | | 148 | |
| Unrealized gain on investment | | | - | | | | (2,614 | ) |
| Amortization of right-of-use assets | | | 624 | | | | 167 | |
| Accrued interest on notes payable | | | - | | | | 246 | |
| Other adjustments | | | 245 | | | | 979 | |
| Changes in operating assets and liabilities of business, net of acquisitions: | | | | | | | | |
| Accounts receivable, net | | | (3,413 | ) | | | 792 | |
| Prepaid expenses and other assets | | | (5,583 | ) | | | (614 | ) |
| Accounts payable | | | 1,390 | | | | 3 | |
| Accrued expenses | | | 13,233 | | | | 796 | |
| Due to related parties | | | - | | | | 10,889 | |
| Deferred revenue | | | 7,068 | | | | 46 | |
| Lease liabilities | | | (454 | ) | | | (162 | ) |
| Net cash used in operating activities | | | (87,424 | ) | | | (42,314 | ) |
| | | | | | | | | |
| Cash flows from investing activities | | | | | | | | |
| Advance to fuboTV Pre-Merger | | | - | | | | (10,000 | ) |
| Acquisition of fuboTV’s Pre-Merger cash and cash equivalents and restricted cash | | | - | | | | 9,373 | |
| Cash paid for acquisition | | | (1,740 | ) | | | - | |
| Purchases of property and equipment | | | (2,138 | ) | | | (70 | ) |
| Purchase of intangible assets | | | (1,300 | ) | | | - | |
| Net cash used in investing activities | | | (5,178 | ) | | | (697 | ) |
| | | | | | | | | |
| Cash flows from financing activities | | | | | | | | |
| Proceeds from sale of common stock and warrants, net of fees | | | - | | | | 28,926 | |
| Proceeds from convertible note, net of issuance costs | | | 389,946 | | | | 3,003 | |
| Proceeds from exercise of stock options | | | 1,976 | | | | - | |
| Proceeds from the exercise of common stock warrants | | | 1,312 | | | | - | |
| Repayments of convertible notes | | | - | | | | (1,140 | ) |
| Proceeds from notes payable and long-term borrowings | | | - | | | | 23,649 | |
| Repayments of notes payable and long-term borrowings | | | (24,709 | ) | | | (9,657 | ) |
| Proceeds from the issuance of Series D Preferred Stock | | | - | | | | 203 | |
| Redemption of Series D Preferred Stock | | | - | | | | (611 | ) |
| Repayments to related parties | | | - | | | | (300 | ) |
| Net cash provided by financing activities | | | 368,525 | | | | 44,073 | |
| | | | | | | | | |
| Net increase in cash, cash equivalents and restricted cash | | | 275,923 | | | | 1,062 | |
| Cash, cash equivalents and restricted cash at beginning of period | | | 136,221 | | | | 7,624 | |
| Cash, cash equivalents and restricted cash at end of period | | $ | 412,144 | | | $ | 8,686 | |
| | | | | | | | | |
| Supplemental disclosure of cash flows information: | | | | | | | | |
| Interest paid | | | 432 | | | | 4,110 | |
| Income tax paid | | | - | | | | - | |
| | | | | | | | | |
| Non cash financing and investing activities: | | | | | | | | |
| Conversion of Series AA preferred stock to common stock | | | 406,665 | | | | - | |
| Issuance of convertible preferred stock for Merger | | | - | | | | 566,124 | |
| Reclass of shares settled liability to additional paid-in capital for issuance of common stock | | | - | | | | 9,054 | |
| Reclass of shares settled liability for intangible asset to stock-based compensation | | | - | | | | 1,000 | |
| Issuance of treasury stock in connection with acquisition | | | 8,538 | | | | - | |
| Cashless exercise of common stock warrants | | | 14,991 | | | | - | |
| Lender advanced loan proceeds direct to fuboTV | | | - | | | | 7,579 | |
| Issuance of common stock - subsidiary share exchange | | | - | | | | 2,042 | |
| Accrued Series D Preferred Stock dividends | | | - | | | | 17 | |
| Deemed dividend related to immediate accretion of redemption feature of convertible preferred stock | | | - | | | | 171 | |
Key Metrics and Non-GAAP Measures
Paid Subscribers
We believe the number of paid subscribers is a relevant measure to gauge the size of our user base. Total subscribers that have completed registration with fuboTV, have activated a payment method (only reflects one paying user per plan), from which fuboTV has collected payment from in the month ending the relevant period.
Attachments
Attachments are incremental add-ons sold on top of the base subscription.
Attach Rate
The Attach Rate represents the total number of Attachments at the end of the period divided by the number of Subscribers at the end of the period.
Monthly Active Users (MAUs)
Monthly Active Users (MAU) refers to the total count of Paid Subscribers that have consumed content for greater than 10 seconds in the 30-days preceding the period-end indicated.
Daily Active Users (DAUs)
Daily Active Users (DAU) refers to the total count of Paid Subscribers that have consumed content for greater than 10 seconds in a given day
Content Hours
We believe the number of Content Hours streamed on our platform is a relevant measure to gauge user engagement. Content Hours is defined as the sum of total hours of content watched on the fuboTV platform for a given period.
Monthly Content Hours Watched per MAU
Content Hours per MAU refers to the total hours of content viewed by MAUs in a given month divided by the MAU count in the period.
Daily Content Hours Watched per DAU (“Daily Engagement”)
Content Hours per DAU refers to the total hours of content viewed by DAUs in a given day, divided by the DAU count in the day.
Monthly Subscription Average Revenue per User (Monthly Sub ARPU)
Sub ARPU (Average Revenue Per User) is a fuboTV measure defined as total subscriber revenue collected in the period divided by the average daily paid subscribers in such period divided by the number of months in the period.
Monthly Advertising Average Revenue per User (Monthly Ad ARPU)
Ad ARPU (Average Revenue Per User) is a fuboTV measure defined as total advertising revenue in the period divided by the average daily paid subscribers in such period divided by the number of months in the period.
Monthly Average Revenue per User (Monthly ARPU)
We believe Monthly Average Revenue Per User (ARPU) is a relevant measure to gauge the revenue received per subscriber on a monthly basis. ARPU is a fuboTV measure defined as total subscriber revenue collected in the period (subscriber and advertising revenues excluding other revenues) divided by the average daily paid subscribers in such period divided by the number of months in the period.
Average Cost Per User (ACPU)
We believe Monthly Average Cost Per User (ACPU) is a relevant measure to gauge our variable expenses per subscriber. ACPU reflects variable COGS per user defined as subscriber related expenses less minimum guarantees expensed, payment processing for deferred revenue, In-App-Billing (IAB) fees for deferred revenue and other subscriber related expenses in a given period, divided by the average daily subscribers in the period, divided by the number of months in the period.
Adjusted Contribution Margin
We believe Adjusted Contribution Margin (ACM) is a relevant metric to gauge our per-subscriber profitability. ACM is a non-GAAP measure that measures variable costs against subscriber revenue. ACM is calculated by subtracting ACPU from ARPU.
Adjusted EBITDA
Adjusted EBITDA is a non-GAAP measure defined as Net Loss, adjusted for depreciation and amortization, stock-based compensation, income tax benefit, other expenses, and one-time non-cash expenses.
Adjusted EBITDA Margin
Adjusted EBITDA Margin is a non-GAAP measure defined as Adjusted EBITDA divided by revenue.
Adjusted Net Loss
Adjusted Net Loss is a non-GAAP measure defined as Net Loss Attributable to Controlling Interest, adjusting for stock-based compensation, change in fair value of warrants, amortization of debt discount, amortization of intangible assets and other non-cash items.
Adjusted EPS (Earnings per Share)
Adjusted EPS is a non-GAAP measure defined as Adjusted Net Loss divided by weighted average shares outstanding.
Reconciliation of Non-GAAP Financial Measures
Certain measures used in this letter, including Adjusted EBITDA, Adjusted EBITDA Margin, ARPU, Advertising ARPU, Adjusted Contribution Margin, Adjusted Net Loss and Adjusted EPS are non-GAAP financial measures. We believe these are useful financial measures for investors as they are supplemental measures used by management in evaluating our core operating performance. Our non-GAAP financial measures have limitations as analytical tools and you should not consider them in isolation or as a substitute for an analysis of our results under GAAP. There are a number of limitations related to the use of these non-GAAP financial measures versus their nearest GAAP equivalents. First, these non-GAAP financial measures are not a substitute for GAAP financial measures. Second, these non-GAAP financial measures may not provide information directly comparable to measures provided by other companies in our industry, as those other companies may calculate their non-GAAP financial measures differently.
The following tables reconcile the most directly comparable GAAP financial measure to the non-GAAP financial measure.
fuboTV Inc.
Reconciliation of Revenue to Non-GAAP Platform Bookings and Reconciliation of Subscriber Related Expenses to Non-GAAP Variable COGS and Adjusted Contribution Margin
(in thousands, except average subscribers and average per user amounts)
Year-over-Year Comparison
| | | Three Months Ended | |
| | | June 30, 2021 | | | June 30, 2020 | | | June 30, 2019 | |
| | | As-Reported | | | As-Reported | | | Pro-forma Combined | |
| Revenue (GAAP) | | $ | 130,884 | | | $ | 44,172 | | | $ | 28,921 | |
| Subtract: | | | | | | | | | | | | |
| Other Revenue | | | (50 | ) | | | (338 | ) | | | (240 | ) |
| Prior period subscriber deferred revenue | | | (20,118 | ) | | | (8,066 | ) | | | (3,835 | ) |
| Add: | | | | | | | | | | | | |
| Current period subscriber deferred revenue | | | 24,419 | | | | 8,332 | | | | 5,163 | |
| Non-GAAP Platform Bookings | | | 135,135 | | | | 44,100 | | | | 30,009 | |
| Divide: | | | | | | | | | | | | |
| Average Subscribers | | | 630,624 | | | | 268,298 | | | | 197,314 | |
| Months in Period | | | 3 | | | | 3 | | | | 3 | |
| Non-GAAP Monthly Average Revenue per User (Monthly ARPU) | | $ | 71.43 | | | $ | 54.79 | | | $ | 50.70 | |
| | | | | | | | | | | | | |
| Subscriber Related Expenses (GAAP) | | $ | 120,500 | | | $ | 53,087 | | | $ | 44,010 | |
| Add (Subtract): | | | | | | | | | | | | |
| Payment Processing for Deferred Revenue (current period) | | | 30 | | | | 202 | | | | 129 | |
| In-App Billing Fees for Deferred Revenue (current period) | | | 3 | | | | 42 | | | | 33 | |
| Content Credits | | | 4,843 | | | | - | | | | - | |
| Minimum Guarantees Expensed | | | (130 | ) | | | (10,222 | ) | | | (12,134 | ) |
| Payment Processing for Deferred Revenue (prior period) | | | 30 | | | | (161 | ) | | | (80 | ) |
| In-App Billing Fees for Deferred Revenue (prior period) | | | 5 | | | | (41 | ) | | | (92 | ) |
| Other Subscriber Related Expenses | | | (1,313 | ) | | | (1,055 | ) | | | (529 | ) |
| Non-GAAP Variable COGS | | | 123,968 | | | | 41,852 | | | | 31,337 | |
| Divide: | | | | | | | | | | | | |
| Average Subscribers | | | 630,624 | | | | 268,298 | | | | 197,314 | |
| Months in Period | | | 3 | | | | 3 | | | | 3 | |
| Non-GAAP Monthly Average Cost per User (Monthly ACPU) | | $ | 65.53 | | | $ | 52.00 | | | $ | 52.94 | |
| | | | | | | | | | | | | |
| Non-GAAP Monthly Average Revenue per User (Monthly ARPU) | | $ | 71.43 | | | $ | 54.79 | | | $ | 50.70 | |
| Subtract: | | | | | | | | | | | | |
| Non-GAAP Monthly Average Cost per User (Monthly ACPU) | | $ | 65.53 | | | $ | 52.00 | | | $ | 52.94 | |
| Divide: | | | | | | | | | | | | |
| Non-GAAP Monthly Average Revenue per User (Monthly ARPU) | | $ | 71.43 | | | $ | 54.79 | | | $ | 50.70 | |
| Non-GAAP Adjusted Contribution Margin | | | 8.3 | % | | | 5.1 | % | | | -4.4 | % |
fuboTV Inc.
Reconciliation of Subscription Revenue to Non-GAAP Subscription ARPU and Reconciliation of Advertising Revenue to Non-GAAP Advertising ARPU
(in thousands, except average subscribers and average per user amounts)
Year-over-Year Comparison
| | | Three Months Ended | |
| | | June 30, 2021 | | | June 30, 2020 | | | June 30, 2019 | |
| | | As-Reported | | | As-Reported | | | Pro-forma Combined | |
| Subscription Revenue (GAAP) | | $ | 114,368 | | | $ | 39,511 | | | $ | 26,158 | |
| Subtract: | | | | | | | | | | | | |
| Prior period subscriber deferred revenue | | | (20,118 | ) | | | (8,066 | ) | | | (3,835 | ) |
| Add: | | | | | | | | | | | | |
| Current period subscriber deferred revenue | | | 24,419 | | | | 8,332 | | | | 5,163 | |
| Non-GAAP Subscription Platform Bookings | | | 118,670 | | | | 39,777 | | | | 27,486 | |
| Divide: | | | | | | | | | | | | |
| Average Subscribers | | | 630,624 | | | | 268,298 | | | | 197,314 | |
| Months in Period | | | 3 | | | | 3 | | | | 3 | |
| Non-GAAP Monthly Subscription Average Revenue per User (Monthly ARPU) | | $ | 62.73 | | | $ | 49.42 | | | $ | 46.43 | |
| | | | | | | | | | | | | |
| Advertising Revenue (GAAP) | | $ | 16,466 | | | $ | 4,323 | | | $ | 2,523 | |
| Divide: | | | | | | | | | | | | |
| Average Subscribers | | | 630,624 | | | | 268,298 | | | | 197,314 | |
| Months in Period | | | 3 | | | | 3 | | | | 3 | |
| Non-GAAP Monthly Advertising Average Revenue per User (Monthly ARPU) | | $ | 8.70 | | | $ | 5.37 | | | $ | 4.26 | |
fuboTV Inc.
Reconciliation of Net Loss to Non-GAAP Adjusted EBITDA
(in thousands)
Year-over-Year Comparison
| | | Three Months Ended | |
| | | June 30, 2021 | | | June 30, 2020 | | | June 30, 2019 | |
| | | As-Reported | | | As-Reported | | | Pro-forma Combined | |
| Reconciliation of Net Loss to Adjusted EBITDA | | | | | | | | | |
| Net loss | | $ | (94,930 | ) | | $ | (73,603 | ) | | $ | (42,965 | ) |
| Depreciation and amortization of intangible assets | | | 9,247 | | | | 14,417 | | | | 5,158 | |
| Stock-based Compensation | | | 24,431 | | | | 10,923 | | | | - | |
| Other income (expense) | | | 14,617 | | | | 9,794 | | | | (1,560 | ) |
| Income tax benefit (expense) | | | (753 | ) | | | (3,481 | ) | | | (1,037 | ) |
| Adjusted EBITDA | | | (47,388 | ) | | | (41,949 | ) | | | (40,404 | ) |
| | | | | | | | | | | | | |
| Adjusted EBITDA | | | (47,388 | ) | | | (41,949 | ) | | | (40,404 | ) |
| Divide: | | | | | | | | | | | | |
| Revenue | | | 130,884 | | | | 44,172 | | | | 28,921 | |
| Adjusted EBITDA Margin | | | -36.2 | % | | | -95.0 | % | | | -139.7 | % |
fuboTV Inc.
Reconciliation of Net Loss Attributable to Controlling Interest to Non-GAAP Adjusted Net Loss and Adjusted EPS
(in thousands)
Year-over-Year Comparison
| | | Three Months Ended | |
| | | June 30, 2021 | | | June 30, 2020 | |
| | | As-Reported | | | As-Reported | |
| Net loss attributable to controlling interest | | $ | (94,915 | ) | | $ | (72,922 | ) |
| Stock-based Compensation | | | 24,431 | | | | 10,923 | |
| Other Non-GAAP Adj.* | | | 6,019 | | | | (4,540 | ) |
| Amortization of debt discount | | | 4,043 | | | | 781 | |
| Amortization of intangibles | | | 9,073 | | | | 14,286 | |
| Adjusted Net Loss | | | (51,349 | ) | | | (51,472 | ) |
| | | | | | | | | |
| Weighted average shares outstanding: | | | | | | | | |
| Basic and diluted | | | 140,596,001 | | | | 35,045,390 | |
| | | | | | | | | |
| Adjusted EPS | | $ | (0.38 | ) | | $ | (1.46 | ) |
*Includes Change in fair value of warrant liabilities, Change in fair value of subsidiary warrant liabilities, Change in fair value of shares settled liability, Change in fair value of shares derivative liability, Loss on issuance of notes, bonds and warrants and Unrealized gain on equity method investment
# # #
Contacts
Investor Contacts:
Alison Sternberg, fuboTV
asternberg@fubo.tv
The Blueshirt Group
ir@fubo.tv
Media Contacts:
Jennifer L. Press, fuboTV
jpress@fubo.tv
Katie Minogue, fuboTV
kminogue@fubo.tv