Exhibit 99.1

November 9, 2021
Fellow Shareholders,
Before we dive into our record third quarter, we are thrilled to announce that, since closing the quarter, fuboTV has passed the one million subscriber mark. This is an extraordinary milestone by any measure but particularly remarkable given the momentum of our business over six short years. To put this in perspective, as of the end of the second quarter 2020, we had approximately 286,000 subscribers.
The implications of this milestone are significant and far-reaching. One million subscribers means increased relevance, leverage and influence with content partners and leagues and the opportunity to go upstream on tentpole sports properties. It also means billions of data points for product iteration and personalization, greater advertising sales opportunities, increased mindshare with potential and current subscribers, and more MFN protection. And, even at the one million subscriber mark, we are still just scratching the surface of the massive opportunity ahead of us with 72.6 million subscribers still active on traditional pay television1.
When we reported our second quarter 2020 results, we asserted that consumers would continue to choose streaming over traditional pay television due to the more personalized, premium viewing experience. We also highlighted our advantage over traditional pay television, due to the strength of our product offering and our modern technology stack that we are continuously optimizing, enabling us to innovate faster than the incumbents.
Our mission to define a new category of interactive sports and entertainment television is characterized by the delivery of a differentiated consumer experience. We do this through a laser focus on the acquisition and presentation of compelling content and ongoing product advancements including FanView and free-to-play predictive games. Today, we are announcing the acquisition of Edisn.ai to enhance our AI-driven interactive experiences, personalization and platform stability.
Additionally, we continue to extend our value proposition to a greater number of consumers worldwide with the expansion of our international footprint. We are also thrilled to announce today an agreement to acquire France’s leading live TV streaming platform, Molotov SAS - a strategic asset that we believe will help accelerate our goal of achieving global scale and operating leverage.
1 MoffettNathanson estimates and analysis as of Q2 2021

And we are further poised to transform how consumers watch and engage with live television with the recent launch of our first generation integrated Fubo Sportsbook, now live in our first state. This will not only serve as an important new on-ramp to our platform, but it is also expected to extend the engagement and lifetime value of our existing subscribers.
Collectively, we believe these initiatives will create a flywheel effect of driving subscriber growth, increasing engagement and enhancing monetization while also attracting advertising dollars to our premium paying audience. At the same time, we will continue to benefit from our position at the intersection of three industry mega-trends: the secular decline of traditional pay television; the shift of TV ad dollars to connected devices; and the rapid adoption of online sports wagering.
Our record third-quarter 2021 results again showcase consistent and strong execution in support of our mission and continued traction towards our long-term growth and margin targets.
In the quarter, we delivered triple-digit year-over-year growth in total paid subscribers (up 108% to 944,605), total revenue (up 156% to $156.7 million) and advertising revenue (up 147% to $18.6 million). Additionally, we added 262,884 net subscribers in the third quarter - more subscribers than added throughout all of 2020. Viewership also reached record highs, with fuboTV customers streaming 284 million hours of content during the quarter, a 113% increase year-over-year.
We also made meaningful progress towards our profitability goals. Adjusted Contribution Margin (ACM) was 12.4%, up 189 basis points compared to the normalized third quarter 2020 results2. This is on the back of a 10% year-over-year increase in Monthly Advertising Average Revenue Per User (ARPU) and a 10% increase in total monthly ARPU.
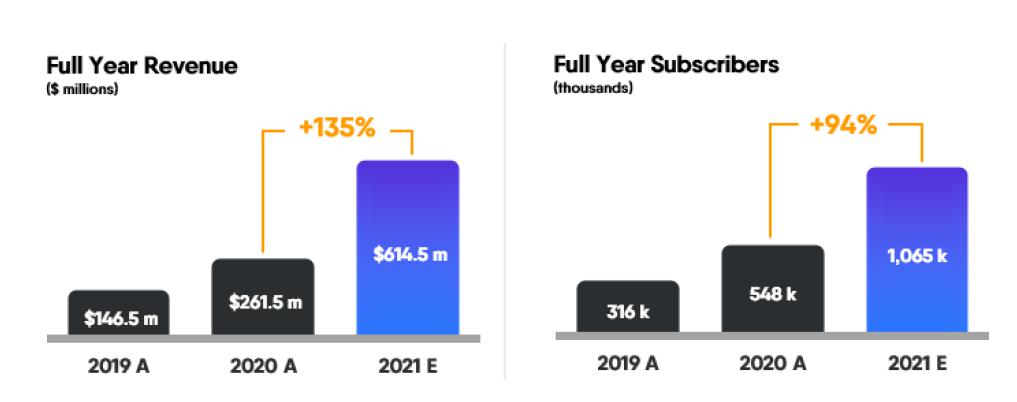
In light of our strong execution in the quarter, and the continued strength of the macro tailwinds we have consistently highlighted and continue to see, we are increasing our full year 2021 revenue guidance to $612-617 million, representing 135% year-over-year growth at the midpoint, and increasing our guidance on year-end subscribers to 1,060,000-1,070,000, representing a 94% year-over-year increase at the mid-point compared to our subscribers at year-end 2020.
Q3 2021 Highlights
| | ● | Total revenue grew 156% YoY to $156.7 million |
| | ● | Advertising revenue grew 147% YoY to $18.6 million |
| | ● | Subscription revenue increased 158% YoY to $138.1 million |
| | ● | Subscribers grew 108% YoY and 39% QoQ to 944,605 |
| | ● | Average Revenue Per User (ARPU) per month increased 10% YoY to $74.54 |
| | ● | Advertising ARPU per month increased 10% YoY to $8.23 |
| | ● | Adjusted Contribution Margin was positive 12.4%, up 189 bps YoY from the normalized 10.5%2 |
2 Q3 2020 reported ACM was 16.1% and benefitted in part from the unusual timing of some content deals in July. Normalized for this unusual, one-time impact, the Q3 2020 ACM would have been 10.5%, as detailed in the Q3 2020 Shareholder Letter. Refer to the reconciliation of Revenue to ARPU and Adjusted Contribution Margin in the non-GAAP information in the tables.
Note: 2019 financials and metrics represent pro-forma fuboTV pre-merger plus FaceBank pre-merger.
| Key Operating Metrics | | | 3Q19 | | | | 3Q20 | | | | 3Q21 | | | | 3Q21 YoY % | |
| Subscribers (thousands) | | | 288 | | | | 455 | | | | 945 | | | | +108% | |
| Content Hours Streamed (millions) | | | 73 | | | | 133 | | | | 284 | | | | +113% | |
| ARPU | | $ | 59.28 | | | $ | 67.70 | | | $ | 74.54 | | | | +10% | |
| Advertising ARPU | | $ | 4.52 | | | $ | 7.52 | | | $ | 8.23 | | | | +10% | |
| Adjusted Contribution Margin % | | | 0.5 | % | | | 10.5 | %2 | | | 12.4 | % | | | +189 bps | 2 |
| Summary Financials (millions) | | | 3Q19 | | | | 3Q20 | | | | 3Q21 | | | | 3Q21 YoY % | |
| Revenue | | $ | 41.7 | | | $ | 61.2 | | | $ | 156.7 | | | | +156 | % |
| Total Operating Expenses | | $ | 97.5 | | | $ | 363.4 | | | $ | 259.9 | | | | -28 | % |
| Net Loss | | $ | -56.2 | | | $ | -274.1 | | | $ | -105.9 | | | | +61 | % |
| Net Loss Margin | | | -134.9 | % | | | -447.9 | % | | | -67.6 | % | | | +38,033 bps | |
| Adjusted EBITDA | | $ | -50.4 | | | $ | -47.5 | | | $ | -81.3 | | | | -71 | % |
| Adjusted EBITDA Margin | | | -120.9 | % | | | -77.6 | % | | | -51.9 | % | | | +2,570 bps | |
| Guidance | | | 4Q21 | | | | FY21 | |
| Revenue ($ in millions) | | | $205-$210 | | | | $612-$617 | |
| Subscribers (thousands) | | | 1,060-1,070 | | | | 1,060-1,070 | |
Earnings per share (EPS) in the third quarter of 2021 was a loss of $0.74, including $0.05 impact from expenses incurred for our wagering business and $0.01 impact from deal-related expenses. This compared to a loss of $6.20 in the third quarter of 2020. Adjusted EPS in the third quarter of 2021 was a loss of $0.59, excluding the non-cash impact of stock-based compensation, the re-measurement of warrant liabilities and the amortization of intangibles and debt discount3. This compares to an Adjusted EPS loss of $1.08 a year prior.
As we continue to lay the foundation for future growth, our strategic investments in programming, team, technology and infrastructure resulted in expected increased expenses on an absolute dollar value basis in the third quarter compared to the prior year. However, expenses continue to be significantly reduced in proportion to revenue year-over-year, resulting in a material improvement in Adjusted EBITDA margin which improved 25.7 percentage points to -51.9% in the third quarter of 2021 from -77.6% a year prior, as we continuously improve our operating leverage and further advance on our path to profitability.
3 Refer to the reconciliations of GAAP Net Loss to Non-GAAP Adjusted Net Loss in the non-GAAP information in the tables. Adjusted EPS represents Adjusted Net Loss divided by the number of weighted average shares outstanding for the applicable period.
We ended the quarter with $398.5 million of cash, cash equivalents and restricted cash. This included $70.0 million net proceeds from sales of securities pursuant to our At-The-Market (ATM) program, partially offset by $7.0 million interest payment and $33.7 million cash outflow on wagering activities, primarily in connection with our market access licensing deals. As we have previously highlighted, the filing of our shelf registration statement in August and our ATM program are part of our ongoing capital optimization plan to build optionality in order to fund growth initiatives.
Operating cash flow in the quarter was negative $55.7 million, inclusive of the negative impacts of $5.0 million non-recurring payments, $5.2 million operating cash outflow associated with the wagering business and $7.0 semi-annual interest payment on the 2026 convertible notes.
As of September 30, 2021, the Company had 144,559,694 common shares issued and outstanding.
Operational Highlights
The Company delivered record results during the third quarter of 2021, growing total revenue by 156%, increasing advertising revenue by 147% and delivering subscriber growth of 108%, each compared to the prior year period.
Net subscriber additions in the third quarter were approximately 263,000, 56% more than in the third quarter of 2020 and more than we added in the entire year of 2020. We have added approximately 490,000 net subscribers since the third quarter of 2020, resulting in subscriber growth of 108% year-over-year, compared to the 34% growth for the entire vMVPD market over the same period.4 We drove this strong subscriber growth with efficient deployment of sales and marketing dollars, which came in at 32% of revenue in the quarter, down from 36% in the third quarter of 2020. We also saw churn improve by 78 basis points year-over-year.
Turning to engagement, in the third quarter of 2021, our users (paid and trial) streamed 284 million hours, an increase of 113% year-over-year. Our monthly active users (MAUs) watched 121 hours per month on average, impacted by the strong influx of new subscribers at the end of the quarter and consistent with the seasonal trends that we typically see in the third quarter. We are also very pleased with the initial data we see on the retention metrics of these new cohorts, highlighting the quality of these additions.
4 Source: Nielsen Media Research NPower, 3Q21 vs. 3Q20 Based on Household Universe Estimates

The third quarter was also record-breaking for our advertising business, as we delivered the company’s strongest ad sales quarter in our history. Ad revenue reached $18.6 million and grew 147% year-over-year, accounting for 12% of total revenue in the third quarter of 2021. Advertising ARPU was up 10% year-over-year to $8.23, driven by enhanced monetization and impacted by the large influx of subscribers at the end of the quarter.
Alongside our record revenue growth in the quarter, we also reported continued margin expansion year-over-year, with an adjusted contribution margin of 12.4%, up 189 basis points from the normalized third quarter of 2020. This growth was driven by ARPU expansion of both advertising and subscriptions, partly as a result of strong execution associated with upsells and packaging. This is evidenced by our Attach Rate of 2.3, up from 1.8 in the third quarter of 2020, and the 2.2 million attachments sold as of the end of the quarter. This is also illustrative of our ability to extend the lifetime value of our customers through the provision of additional products and services on our platform.
International Expansion
We are thrilled to announce today that fubo has achieved a major milestone towards global expansion with the acquisition of Molotov SAS, France’s leading live TV streaming platform with nearly four million monthly active users. Molotov operates a freemium business model, which leverages a free tier to drive growth and upsell customers to premium add-on channel packages. The technology capabilities between the companies will enable us to more efficiently launch our interactive sports and entertainment streaming platform on a global scale. The transaction is expected to close in the first quarter of 2022, subject to certain closing conditions.
Content Differentiation
We recently bolstered our sports-first content offering with the addition of two regional sports networks (RSNs) to our channel lineup: AT&T SportsNet Rocky Mountain (coverage of Utah Jazz, Vegas Golden Knights, Colorado Rockies) and ROOT SPORTS Northwest (coverage of Seattle Mariners, Seattle Kraken, Portland Trail Blazers). The addition of these networks brings all four of AT&T’s RSNs to fuboTV.
Expanded Distribution
fuboTV is well-positioned to leverage the decline of traditional TV viewership and shift to connected televisions (CTV). In fact, 94% of our viewing hours in the third quarter were on a big screen. With our September launch on Vizio’s SmartCast platform, fuboTV is now available on all major CTV platforms. These include Android TV, Apple TV, FireTV, Hisense Smart TVs (with the Vidaa operating system), LG Smart TV, Roku, Samsung Smart TV and Xbox One in addition to Vizio SmartCast.

Ad Sales
The third quarter was the strongest advertising revenue quarter in fuboTV’s history, at $18.6 million, up 147% year-over-year. Ad ARPU also grew 10% year-over-year. Advertising revenue accounted for 12% of total revenue, providing a significant contribution to margin expansion.
This ongoing momentum is driven by strong subscriber growth and enhanced monetization, as we continue to drive success from industry trends, specifically the rapid adoption of CTV devices by consumers, the migration of sports and entertainment from linear to live TV streaming and the shift of linear ad dollars to CTV. These trends continue to accelerate, with industry sources citing CTV as the fastest-growing video advertising platform in 2021.
As expected, in the third quarter, we saw a large influx of subscribers within the last few weeks of September. As these new subscribers become more familiar and more engaged with the platform, we expect to increase their monetization as they continue to mature into potential long-term subscribers. This, combined with the continued acceleration of advertiser demand and growth in the overall market, will continue to drive strength in our advertising business.
We also continue to drive innovation through our industry leading partnerships. Within the quarter, we expanded our relationship with Magnite, selecting them as our preferred sell-side platform. Additionally, we announced an alliance with leading media agency Dentsu. With fubo as the first vMVPD to integrate with Dentsu’s proprietary M1 data platform, advertisers can leverage M1’s highly accurate connected individual, device, and panel data across fuboTV’s CTV inventory, which includes 50,000 live sports events per year as well as 100 + premium sports, news, and entertainment channels.
These developments further underscore our powerful value proposition to advertisers: premium television content, combined with a fully addressable and highly valued audience that can’t be reached on traditional TV. Furthermore, 90% of fuboTV’s viewing hours during the quarter were for live content underscoring its appeal to advertisers, particularly those targeting sports fans and content.
Expanding Technology Capabilities
Our internally built technology stack is the cornerstone to our platform and has kept us innovating ahead of the streaming industry. We continue to prioritize our product and engineering capabilities to bring to market a category-defining streaming experience, characterized by interactivity.
Accordingly, we are thrilled to announce today the acquisition of Edisn.ai, an AI-powered computer vision platform with patent-pending video recognition technologies based in Bangalore, India. With Edisn.ai, fuboTV will expand its data science and engineering organization globally, while significantly bolstering our technology capabilities in support of the integration of interactivity into our live streaming platform.
Edisn.ai’s computer vision technology - which can recognize and track key objects in live video feeds (including athletes, actors, brand logos, products, events and more) - can enable better play-by-play identification and frame-accurate video-data synchronization, both critical to the successful execution of free-to-play games and real-money wagering.
Edisn.ai’s technology can also improve the accuracy of fuboTV’s electronic program guide and cloud DVR - both important consumer-facing product features. On the business side, Edisn.ai gives us the ability to expand our ad tech capabilities through better detection of ad breaks and targeted contextual advertising.
fuboTV also intends to leverage Edisn.ai’s tech synergies for international expansion alongside its acquisition earlier this month of France’s leading live TV streaming platform, Molotov.
Interactivity, Wagering and Free-To-Play Games
fuboTV continues to advance the development of a unique interactive streaming platform that transcends the industry’s current vMVPD model. As we have repeatedly highlighted, we believe interactivity is a key product differentiator for fuboTV and, by integrating interactivity into our live streaming product, we can define a new category of interactive sports and entertainment television.
We aim to turn passive viewers into active participants through the launch of two interactive product features: real-money wagering and free-to-play games. We believe these features will represent a new potential customer on-ramp to our experience, driving greater levels of engagement. Additionally, fuboTV will be positioned to assess the propensity of our customers to engage in interactivity on our platform.
Wagering
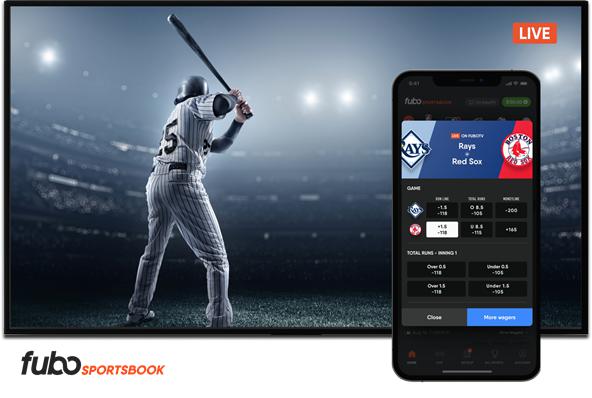
Fubo Sportsbook was successfully launched in Iowa on November 3. This is the first of a healthy pipeline of other states where we plan to launch in the ensuing months, which will allow us to unlock the scale of our subscriber base to drive growth of our Sportsbook, driving down acquisition costs. The Fubo Sportsbook app features our “Watching Now” proprietary functionality, which updates in real time with relevant bets based on what the user is watching on fuboTV - even as they change the channel to a new game. This seamless connection between streaming video and our mobile betting app - all within the fuboTV ecosystem - is a feature we believe only fuboTV has brought to market and requires a close connection between these two apps. We expect to continue to roll out additional product advancements in the coming weeks and months designed to further enhance the customer journey, as this revenue stream continues to grow and mature.
We continue to successfully gain market access into new states that are important to both our streaming and gaming expansion strategy. In August, we announced a sports betting license in Arizona (through a partnership with Ak-Chin Indian Community) which, along with our existing licenses in IA, IN, NJ and PA, represents the fifth state where we have officially announced market access. Market launches are subject to obtaining requisite regulatory approvals in each state.
We also recently announced strategic partnerships with the New York Jets (NFL), Cleveland Cavaliers (NBA) and NASCAR, which represent strong customer acquisition channels and market entry opportunities.
We continue to build a strong team of talent at Fubo Gaming. To that end, we have successfully hired new engineers, product leaders, and specialized marketers. We have also appointed a long-time industry veteran to head our trading operations, furthering our capabilities to create unique and exclusive wagering experiences.
Free-To-Play Games
We successfully took our predictive, free-to-play games and FanView live stats feature out of beta in the third quarter alongside our exclusive streams of the South American Qatar World Cup 2022 Qualifiers (CONMEBOL). CONMEBOL viewers who participated in our gaming contests in September spent 57% more time watching the games than non-participants, demonstrating that interactivity brings stickiness to our video product. We are now focused on broadening the experience across a wider range of sports content and across new platforms.
Social Impact
We have a strong commitment to environmental, social and governance issues, stemming from our ties to the communities within which we work and live. Accordingly, we plan to increase our focus on these efforts through a variety of initiatives. As an initial step, we are very pleased to announce that, through the support of our subscribers, fuboTV has donated $100,000 through a philanthropic partnership with the Breast Cancer Research Foundation (BCRF). As part of the partnership, we donated $1.00 from every subscription of the Sports Plus add-on channel package during the month of September to BCRF.
Additionally, Jerome “The Bus” Bettis, Football Hall of Famer and BCRF Board Member, joined our effort to raise awareness of the critical need for breast cancer research. Throughout September, we aired promotional spots featuring Bettis announcing the partnership, as well as PSAs encouraging viewers to donate directly to BCRF. Both the promo spots and the PSA were produced by fuboTV’s Fubo Sports Network.
Guidance
We are thrilled with our performance in the third quarter of 2021 and believe that we remain well positioned to continue to execute on our long-term revenue and margin goals, all while delivering a differentiated and world-class experience to the consumer.
Accordingly, we are increasing our full year 2021 revenue guidance to $612-617 million, representing a 135% increase at the mid-point compared to 2020, up from an increase of 116% in our prior guidance. Similarly, we are increasing our end-of-year subscriber guidance to 1,060,000-1,070,000, representing a 94% increase at the midpoint compared to 2020. This subscriber outlook implies full year 2021 net additions of approximately 517,120 or 123% higher than our full year 2020 net additions of 232,000.
This guidance implies an estimate for the fourth quarter revenue to be between $205 million and $210 million, up 97% year-over-year at the midpoint.
The above guidance does not include any projected revenues from Fubo Sportsbook nor from fourth quarter 2021 M&A activity.
Conclusion
fuboTV delivered a strong third quarter across a number of our key financial and operational metrics: subscribers, total revenue, advertising revenue and margin expansion. Engagement continues to strengthen as we add differentiated content to our offering and focus on innovating our product to meet consumer preferences. Our expansion into real-money wagering is now a reality with the launch of Fubo Sportsbook in the first state with additional states slated in the following months. This launch represents a differentiated and industry-first integration of streaming and a sports wagering product, and we see ourselves in the very early innings of a massive opportunity.
Most notably, since the closing of the quarter, we have passed the one million subscriber mark. This is a tremendous milestone for the company that advances us even further towards our goal of turning passive viewers into active participants and defining a new category of interactive sports and entertainment television.
We look forward to keeping you updated on our remarkable progress.
Sincerely,
| David Gandler, co-founder and CEO | Edgar Bronfman Jr., executive chairman |
Q3 2021 Earnings Live Video Webcast
fuboTV CEO David Gandler and CFO Simone Nardi will host a live video webcast today at 5:30 p.m. ET to deliver brief remarks followed by Q&A. The live webinar will be available on the Events page of fuboTV’s investor relations website. An archived replay will be available on fuboTV’s website following the webinar. Participants should join the webinar 10 minutes in advance to ensure that they are connected prior to the event.
More Information
We encourage you to read our full set of financial statements and SEC filings, and to sign up for email alerts, on the investor relations section of our website at ir.fubo.tv.
Additional information is available at www.sec.gov under fuboTV Inc.’s filings, as well as https://ir.fubo.tv.
fuboTV intends to use its website as a disclosure channel and investors are encouraged to refer to it, as well as press releases and SEC filings. The company encourages reading the full set of financial statements and related disclosures in its Form 10-Q for the quarter ended September 30, 2021, that will be filed by November 15, 2021.
About fuboTV
With a mission to provide the world’s most thrilling sports-first live TV experience through the greatest breadth of premium content, interactivity and integrated wagering, fuboTV Inc. (NYSE: FUBO) is focused on bringing to life its vision of a streaming platform that transcends the industry’s current virtual MVPD model. fuboTV Inc. operates in the U.S., Canada and Spain.
Leveraging its proprietary data and technology platform optimized for live TV and sports viewership, fuboTV Inc. aims to turn passive viewers into active participants and define a new category of interactive sports and entertainment television. Through its cable TV replacement product, fuboTV, subscribers can stream a broad mix of 100+ live TV channels, including 74 of the top 100 Nielsen-ranked networks across sports, news and entertainment — more than any other live TV streaming platform (source: Nielsen Total Viewers, 2020). Subscribers can interact with fuboTV’s live streaming experience through predictive free-to-play games, which are integrated into select sports content.
Fubo Gaming Inc., a subsidiary of fuboTV Inc., launched Fubo Sportsbook, a next-generation mobile sportsbook purpose-built to integrate with fuboTV, in 2021.
Forward-Looking Statements
This letter contains forward-looking statements of fuboTV Inc. (“fuboTV”) that involve substantial risks and uncertainties. All statements contained in this letter that do not relate to matters of historical fact are forward-looking statements within the meaning of The Private Securities Litigation Reform Act of 1995, including statements regarding the Molotov and Edisn.ai acquisitions, expected synergies of the technology platforms, our international expansion plans and the markets in which we expect to operate, our financial condition, anticipated financial performance, market opportunity and future plans regarding subscription levels, business strategy and plans, the continued shift in consumer behavior and the expected launch of Fubo Sportsbook in additional markets. The words “could,” “will,” “plan,” “intend,” “anticipate,” “approximate,” “expect,” “potential,” “believe” or the negative of these terms or other similar expressions are intended to identify forward-looking statements, although not all forward-looking statements contain these identifying words. Actual results or events could differ materially from the plans, intentions and expectations disclosed in the forward-looking statements that fuboTV makes due to a number of important factors, including but not limited to risks related to our pursuit and engagement in acquisitions; our actual operating results may differ significantly from our guidance; risks related to the Company’s access to capital and fundraising prospects to fund its ongoing operations and support its planned growth; risks related to diverting management’s attention from fuboTV’s ongoing business operations to address integration and fundraising efforts; the restrictions imposed by content providers on our distribution and marketing of our products and services; our reliance on third party platforms to operate certain aspects of our business; risks related to our technology, as well as cybersecurity and data privacy-related risks; our ability to achieve or maintain profitability; our revenue and gross profit are subject to seasonality; our operating results may fluctuate; our ability to attract and retain subscribers; we may not be able to license streaming content or other rights on acceptable terms; risks related to our ability to capitalize develop and market a sports wagering offering and the regulatory regime and related risks associated with such offering; risks related to the difficulty in measuring key metrics related to our business; risks related to the highly competitive nature of our industry; risks related to ongoing or future legal proceedings; and other risks, including the effects of industry, market, economic, political or regulatory conditions, future exchange and interest rates, and changes in tax and other laws, regulations, rates and policies, including the impact of COVID-19 on the broader market. Further risks that could cause actual results to differ materially from those matters expressed in or implied by such forward-looking statements are discussed in our Quarterly Report on Form 10-Q for the quarterly period ended September 30, 2021 to be filed with the Securities and Exchange Commission (“SEC”) and our other periodic filings with the SEC. We encourage you to read such risks in detail. The forward-looking statements in this letter represent fuboTV’s views as of the date of this letter. fuboTV anticipates that subsequent events and developments will cause its views to change. However, while it may elect to update these forward-looking statements at some point in the future, it specifically disclaims any obligation to do so. You should, therefore, not rely on these forward-looking statements as representing fuboTV’s views as of any date subsequent to the date of this letter.
(fuboTV Inc. Financial Statements begin on the following pages)
fuboTV Inc.
Condensed Consolidated Statements of Operations and Comprehensive Loss
(in thousands, except share and per share amounts)
| | | For the Three Months Ended | |
| | | September 30, | |
| | | 2021 | | | 2020 | |
| | | Unaudited | | | Unaudited | |
| Revenues | | | | | | | | |
| Subscriptions | | $ | 138,119 | | | $ | 53,433 | |
| Advertising | | | 18,570 | | | | 7,520 | |
| Other | | | 1 | | | | 249 | |
| Total revenues | | | 156,690 | | | | 61,202 | |
| Operating expenses | | | | | | | | |
| Subscriber related expenses | | | 143,370 | | | | 61,228 | |
| Broadcasting and transmission | | | 14,320 | | | | 9,778 | |
| Sales and marketing | | | 50,381 | | | | 22,269 | |
| Technology and development | | | 15,257 | | | | 10,727 | |
| General and administrative | | | 27,288 | | | | 8,270 | |
| Depreciation and amortization | | | 9,332 | | | | 14,413 | |
| Impairment of intangible assets and goodwill | | | - | | | | 236,681 | |
| Total operating expenses | | | 259,948 | | | | 363,366 | |
| Operating loss | | | (103,258 | ) | | | (302,164 | ) |
| | | | | | | | | |
| Other income (expense) | | | | | | | | |
| Interest expense and financing costs | | | (3,402 | ) | | | (2,203 | ) |
| Amortization of debt discount | | | (4,138 | ) | | | - | |
| Gain on sale of assets | | | - | | | | 7,631 | |
| Gain on extinguishment of debt | | | - | | | | 1,321 | |
| Change in fair value of warrant liabilities | | | 4,490 | | | | 4,543 | |
| Change in fair value of derivative liability | | | - | | | | 101 | |
| Other income (expense) | | | (72 | ) | | | 583 | |
| Total other income (expense) | | | (3,122 | ) | | | 11,976 | |
| Loss before income taxes | | | (106,380 | ) | | | (290,188 | ) |
| Income tax benefit | | | 515 | | | | 16,071 | |
| Net loss | | | (105,865 | ) | | | (274,117 | ) |
| Less: net loss attributable to non-controlling interest | | | 14 | | | | - | |
| Net loss attributable to common stockholders | | $ | (105,851 | ) | | $ | (274,117 | ) |
| | | | | | | | | |
| Net loss per share attributable to common stockholders | | | | | | | | |
| Basic and diluted | | $ | (0.74 | ) | | $ | (6.20 | ) |
| Weighted average shares outstanding: | | | | | | | | |
| Basic and diluted | | | 142,529,770 | | | | 44,199,709 | |
| | | | | | | | | |
| Stock-based compensation was allocated as follows: | | | | | | | | |
| Subscriber related expenses | | | 13 | | | | 12 | |
| Sales and marketing | | | 821 | | | | 1,010 | |
| Technology and development | | | 1,535 | | | | 2,303 | |
| General and administrative | | | 10,298 | | | | 2,980 | |
| Total stock-based compensation | | | 12,667 | | | | 6,305 | |
fuboTV Inc.
Condensed Consolidated Balance Sheets
(in thousands)
| | | September 30, | | | December 31, | |
| | | 2021 | | | 2020 | |
| | | Unaudited | | | Audited | |
| ASSETS | | | | | | | | |
| Cash and cash equivalents | | $ | 393,130 | | | $ | 134,942 | |
| Accounts receivable, net | | | 26,132 | | | | 17,495 | |
| Prepaid and other current assets | | | 13,746 | | | | 4,277 | |
| Total current assets | | | 433,008 | | | | 156,714 | |
| | | | | | | | | |
| Property and equipment, net | | | 5,311 | | | | 1,771 | |
| Restricted cash | | | 5,402 | | | | 1,279 | |
| Intangible assets, net | | | 219,254 | | | | 216,449 | |
| Goodwill | | | 489,089 | | | | 478,406 | |
| Right-of-use assets | | | 7,177 | | | | 4,639 | |
| Other non-current assets | | | 962 | | | | 91 | |
| Total assets | | $ | 1,160,203 | | | $ | 859,349 | |
| | | | | | | | | |
| LIABILITIES AND STOCKHOLDERS’ EQUITY | | | | | | | | |
| Current liabilities | | | | | | | | |
| Accounts payable | | | 52,629 | | | | 31,160 | |
| Accrued expenses | | | 148,248 | | | | 126,393 | |
| Notes payable | | | 4,978 | | | | 4,593 | |
| Deferred revenue | | | 35,894 | | | | 17,428 | |
| Warrant liabilities | | | 8,320 | | | | 22,686 | |
| Long-term borrowings - current portion | | | - | | | | 24,255 | |
| Current portion of lease liability | | | 1,315 | | | | 799 | |
| Total current liabilities | | | 251,384 | | | | 227,314 | |
| | | | | | | | | |
| Convertible notes, net of discount | | | 312,119 | | | | - | |
| Deferred income taxes | | | 3,362 | | | | 5,100 | |
| Lease liabilities | | | 6,057 | | | | 3,859 | |
| Other long-term liabilities | | | - | | | | 128 | |
| Total liabilities | | | 572,922 | | | | 236,401 | |
| | | | | | | | | |
| Stockholders’ equity: | | | | | | | | |
| Series AA Convertible Preferred stock, par value $0.0001, 35,800,000 shares authorized, no shares issued and outstanding at September 30, 2021 and 23,219,613 shares issued and outstanding at December 31, 2020 | | | - | | | | 406,665 | |
| Common stock par value $0.0001: 400,000,000 shares authorized; 144,736,626 and 92,490,768 shares issued at September 30, 2021 and December 31, 2020, respectively; 144,559,694 and 91,690,768 shares outstanding at September 30, 2021 and December 31, 2020 respectively | | | 15 | | | | 9 | |
| Additional paid-in capital | | | 1,495,797 | | | | 853,824 | |
| Treasury stock, at cost, 176,932 and 800,000 shares at September 30, 2021 and December 31, 2020 | | | - | | | | - | |
| Accumulated deficit | | | (897,332 | ) | | | (626,456 | ) |
| Non-controlling interest | | | (11,199 | ) | | | (11,094 | ) |
| | | | | | | | | |
| Total stockholders’ equity | | | 587,281 | | | | 622,948 | |
| TOTAL LIABILITIES AND STOCKHOLDERS’ EQUITY | | $ | 1,160,203 | | | $ | 859,349 | |
fuboTV Inc.
Condensed Consolidated Statements of Cash Flows
(in thousands)
| | | For the Nine Months Ended | |
| | | September 30, | |
| | | 2021 | | | 2020 | |
| | | Unaudited | | | Unaudited | |
| Cash flows from operating activities | | | | | | | | |
| Net loss | | $ | (270,981 | ) | | $ | (404,064 | ) |
| Adjustments to reconcile net loss to net cash used in operating activities: | | | | | | | | |
| Depreciation and amortization | | | 27,788 | | | | 34,050 | |
| Stock-based compensation | | | 46,472 | | | | 24,081 | |
| Impairment expense intangibles | | | - | | | | 88,059 | |
| Impairment expense goodwill | | | - | | | | 148,622 | |
| Loss on deconsolidation of Nexway, net of cash retained by Nexway | | | - | | | | 8,564 | |
| Loss on issuance of common stock and warrants | | | - | | | | 13,507 | |
| Loss on extinguishment of debt | | | 380 | | | | 9,827 | |
| Common stock issued in connection with note payable | | | - | | | | 67 | |
| Gain on sale of assets | | | - | | | | (7,631 | ) |
| Non-cash expense relating to issuance of warrants and common stock | | | - | | | | 2,209 | |
| Amortization of debt discount | | | 10,693 | | | | 12,271 | |
| Deferred income tax benefit | | | (1,733 | ) | | | (20,589 | ) |
| Change in fair value of derivative liability | | | - | | | | 426 | |
| Change in fair value of warrant liabilities | | | 2,114 | | | | (9,146 | ) |
| Change in fair value of shares settled liability | | | - | | | | 1,665 | |
| Change in fair value of profit share liability | | | - | | | | 148 | |
| Unrealized gain on investment | | | - | | | | (2,614 | ) |
| Amortization of right-of-use assets | | | 984 | | | | 434 | |
| Accrued interest on notes payable | | | - | | | | 244 | |
| Foreign currency loss | | | - | | | | 1,010 | |
| Other adjustments | | | 449 | | | | (56 | ) |
| Changes in operating assets and liabilities of business, net of acquisitions: | | | | | | | | |
| Accounts receivable, net | | | (8,637 | ) | | | (2,071 | ) |
| Prepaid expenses and other assets | | | (10,587 | ) | | | (10,558 | ) |
| Accounts payable | | | 21,341 | | | | 7,881 | |
| Accrued expenses | | | 21,029 | | | | (11,569 | ) |
| Due to related parties | | | - | | | | 36,589 | |
| Deferred revenue | | | 18,466 | | | | 6,615 | |
| Lease liabilities | | | (808 | ) | | | (421 | ) |
| Net cash used in operating activities | | | (143,030 | ) | | | (72,450 | ) |
| | | | | | | | | |
| Cash flows from investing activities | | | | | | | | |
| Advance to fuboTV Pre-Merger | | | - | | | | (10,000 | ) |
| Acquisition of fuboTV’s Pre-Merger cash and cash equivalents and restricted cash | | | - | | | | 9,373 | |
| Sale of Facebank AG | | | - | | | | (619 | ) |
| Cash paid for acquisition | | | (1,740 | ) | | | - | |
| Purchases of property and equipment | | | (3,862 | ) | | | (103 | ) |
| Purchase of intangible assets | | | (30,071 | ) | | | - | |
| Net cash used in investing activities | | | (35,673 | ) | | | (1,349 | ) |
| | | | | | | | | |
| Cash flows from financing activities | | | | | | | | |
| Proceeds from sale of common stock and warrants, net of fees | | | - | | | | 97,142 | |
| Proceeds from the issuance of common stock / At-the-market offering | | | 71,846 | | | | - | |
| Offering costs for the issuance of common stock / At-the-market offering | | | (1,876 | ) | | | - | |
| Proceeds from convertible note, net of issuance costs | | | 389,446 | | | | 3,003 | |
| Proceeds from exercise of stock options | | | 2,546 | | | | 324 | |
| Proceeds from the exercise of warrants | | | 3,761 | | | | - | |
| Repayments of convertible notes | | | - | | | | (3,913 | ) |
| Proceeds from notes payable and long-term borrowings | | | - | | | | 33,649 | |
| Repayments of notes payable and long-term borrowings | | | (24,709 | ) | | | (22,550 | ) |
| Proceeds from the issuance of Series D Preferred Stock | | | - | | | | 203 | |
| Redemption of Series D Preferred Stock | | | - | | | | (883 | ) |
| Repayments of note payable related party | | | - | | | | (333 | ) |
| Repayments to related parties | | | - | | | | (328 | ) |
| Net cash provided by financing activities | | | 441,014 | | | | 106,314 | |
| | | | | | | | | |
| Net increase in cash, cash equivalents and restricted cash | | | 262,311 | | | | 32,515 | |
| Cash, cash equivalents and restricted cash at beginning of period | | | 136,221 | | | | 7,624 | |
| Cash, cash equivalents and restricted cash at end of period | | $ | 398,532 | | | $ | 40,139 | |
| | | | | | | | | |
| Supplemental disclosure of cash flows information: | | | | | | | | |
| Interest paid | | | 7,670 | | | | 6,161 | |
| | | | | | | | | |
| Non cash financing and investing activities: | | | | | | | | |
| Conversion of Series AA preferred stock to common stock | | | 406,665 | | | | - | |
| Issuance of convertible preferred stock for Merger | | | - | | | | 566,124 | |
| Issuance of common stock to original owners of Facebank AG | | | - | | | | 12,395 | |
| Reclass of shares settled liability to additional paid-in capital for issuance of common stock | | | - | | | | 9,054 | |
| Reclass of shares settled liability for intangible asset to stock-based compensation | | | - | | | | 1,000 | |
| Issuance of treasury stock in connection with acquisition | | | 8,538 | | | | - | |
| Cashless exercise of warrants | | | 16,480 | | | | - | |
| Accrued expenses - At-the-market offering | | | 146 | | | | - | |
| Common stock issued in connection with note payable | | | - | | | | 259 | |
| | | | | | | | | |
| Issuance of common stock - subsidiary share exchange | | | - | | | | 2,042 | |
| Accrued Series D Preferred Stock dividends | | | - | | | | 17 | |
| Deemed dividend related to immediate accretion of redemption feature of convertible preferred stock | | | - | | | | 171 | |
Key Metrics and Non-GAAP Measures
Paid Subscribers
We believe the number of paid subscribers is a relevant measure to gauge the size of our user base. Total subscribers that have completed registration with fuboTV, have activated a payment method (only reflects one paying user per plan), from which fuboTV has collected payment from in the month ending the relevant period.
Attachments
Attachments are incremental add-ons sold on top of the base subscription.
Attach Rate
The Attach Rate represents the total number of Attachments at the end of the period divided by the number of Subscribers at the end of the period.
Monthly Active Users (MAUs)
Monthly Active Users (MAU) refers to the total count of Paid Subscribers that have consumed content for greater than 10 seconds in the 30-days preceding the period-end indicated.
Daily Active Users (DAUs)
Daily Active Users (DAU) refers to the total count of Paid Subscribers that have consumed content for greater than 10 seconds in a given day
Content Hours
We believe the number of Content Hours streamed on our platform is a relevant measure to gauge user engagement. Content Hours is defined as the sum of total hours of content watched on the fuboTV platform for a given period.
Monthly Content Hours Watched per MAU
Content Hours per MAU refers to the total hours of content viewed by MAUs in a given month divided by the MAU count in the period.
Daily Content Hours Watched per DAU (“Daily Engagement”)
Content Hours per DAU refers to the total hours of content viewed by DAUs in a given day, divided by the DAU count in the day.
Monthly Subscription Average Revenue per User (Monthly Sub ARPU)
Sub ARPU (Average Revenue Per User) is a fuboTV measure defined as total subscriber revenue collected in the period divided by the average daily paid subscribers in such period divided by the number of months in the period.
Monthly Advertising Average Revenue per User (Monthly Ad ARPU)
Ad ARPU (Average Revenue Per User) is a fuboTV measure defined as total advertising revenue in the period divided by the average daily paid subscribers in such period divided by the number of months in the period.
Monthly Average Revenue per User (Monthly ARPU)
We believe Monthly Average Revenue Per User (ARPU) is a relevant measure to gauge the revenue received per subscriber on a monthly basis. ARPU is a fuboTV measure defined as total subscriber revenue collected in the period (subscriber and advertising revenues excluding other revenues) divided by the average daily paid subscribers in such period divided by the number of months in the period.
Average Cost Per User (ACPU)
We believe Monthly Average Cost Per User (ACPU) is a relevant measure to gauge our variable expenses per subscriber. ACPU reflects variable COGS per user defined as subscriber related expenses less minimum guarantees expensed, payment processing for deferred revenue, In-App-Billing (IAB) fees for deferred revenue and other subscriber related expenses in a given period, divided by the average daily subscribers in the period, divided by the number of months in the period.
Adjusted Contribution Margin
We believe Adjusted Contribution Margin (ACM) is a relevant metric to gauge our per-subscriber profitability. ACM is a non-GAAP measure that measures variable costs against subscriber revenue. ACM is calculated by subtracting ACPU from ARPU.
Adjusted EBITDA
Adjusted EBITDA is a non-GAAP measure defined as Net Loss, adjusted for depreciation and amortization, stock-based compensation, income tax benefit, impairment of intangibles, other expenses, and one-time non-cash expenses.
Adjusted EBITDA Margin
Adjusted EBITDA Margin is a non-GAAP measure defined as Adjusted EBITDA divided by revenue.
Adjusted Net Loss
Adjusted Net Loss is a non-GAAP measure defined as Net Loss Attributable to Controlling Interest, adjusting for stock-based compensation, change in fair value of warrants, amortization of debt discount, amortization of intangible assets and other non-cash items.
Adjusted EPS (Earnings per Share)
Adjusted EPS is a non-GAAP measure defined as Adjusted Net Loss divided by weighted average shares outstanding.
Reconciliation of Non-GAAP Financial Measures
Certain measures used in this letter, including Adjusted EBITDA, Adjusted EBITDA Margin, ARPU, Advertising ARPU, Adjusted Contribution Margin, Adjusted Net Loss and Adjusted EPS are non-GAAP financial measures. We believe these are useful financial measures for investors as they are supplemental measures used by management in evaluating our core operating performance. Our non-GAAP financial measures have limitations as analytical tools and you should not consider them in isolation or as a substitute for an analysis of our results under GAAP. There are a number of limitations related to the use of these non-GAAP financial measures versus their nearest GAAP equivalents. First, these non-GAAP financial measures are not a substitute for GAAP financial measures. Second, these non-GAAP financial measures may not provide information directly comparable to measures provided by other companies in our industry, as those other companies may calculate their non-GAAP financial measures differently.
The following tables reconcile the most directly comparable GAAP financial measure to the non-GAAP financial measure.
fuboTV Inc.
Reconciliation of Revenue to Non-GAAP Platform Bookings and Reconciliation of Subscriber Related Expenses to Non-GAAP Variable COGS and Adjusted Contribution Margin
(in thousands, except average subscribers and average per user amounts)
Year-over-Year Comparison
| | | Three Months Ended | |
| | | September 30, 2021 | | | September 30, 2020 | | | September 30, 2019 | |
| | | As-Reported | | | As-Reported | | | Pro Forma Combined | |
| Revenue (GAAP) | | $ | 156,690 | | | $ | 61,202 | | | $ | 41,684 | |
| Add (Subtract): | | | | | | | | | | | | |
| Other Revenue | | | (1 | ) | | | (249 | ) | | | (6,072 | ) |
| Prior period subscriber deferred revenue | | | (24,419 | ) | | | (8,332 | ) | | | (5,163 | ) |
| Current period subscriber deferred revenue | | | 35,824 | | | | 15,119 | | | | 8,569 | |
| Non-GAAP Platform Bookings | | | 168,094 | | | | 67,740 | | | | 39,018 | |
| Divide: | | | | | | | | | | | | |
| Average Subscribers | | | 751,679 | | | | 333,549 | | | | 219,388 | |
| Months in Period | | | 3 | | | | 3 | | | | 3 | |
| Non-GAAP Monthly Average Revenue per User (Monthly ARPU) | | $ | 74.54 | | | $ | 67.70 | | | $ | 59.28 | |
| | | | | | | | | | | | | |
| Subscriber Related Expenses (GAAP) | | $ | 143,370 | | | $ | 61,228 | | | $ | 50,893 | |
| Add (Subtract): | | | | | | | | | | | | |
| Payment Processing for Deferred Revenue (current period) | | | 193 | | | | 258 | | | | 197 | |
| In-App Billing Fees for Deferred Revenue (current period) | | | 72 | | | | 156 | | | | 56 | |
| Minimum Guarantees and Content Credits | | | 5,687 | | | | (3,548 | ) | | | (11,611 | ) |
| Payment Processing for Deferred Revenue (prior period) | | | 25 | | | | (202 | ) | | | (129 | ) |
| In-App Billing Fees for Deferred Revenue (prior period) | | | 3 | | | | (42 | ) | | | (33 | ) |
| Other Subscriber Related Expenses | | | (2,078 | ) | | | (1,031 | ) | | | (530 | ) |
| Non-GAAP Variable COGS | | | 147,272 | | | | 56,819 | | | | 38,843 | |
| Divide: | | | | | | | | | | | | |
| Average Subscribers | | | 751,679 | | | | 333,549 | | | | 219,388 | |
| Months in Period | | | 3 | | | | 3 | | | | 3 | |
| Non-GAAP Monthly Average Cost per User (Monthly ACPU) | | $ | 65.31 | | | $ | 56.78 | | | $ | 59.02 | |
| | | | | | | | | | | | | |
| Non-GAAP Monthly Average Revenue per User (Monthly ARPU) | | $ | 74.54 | | | $ | 67.70 | | | $ | 59.28 | |
| Subtract: | | | | | | | | | | | | |
| Non-GAAP Monthly Average Cost per User (Monthly ACPU) | | $ | 65.31 | | | $ | 56.78 | | | $ | 59.02 | |
| Divide: | | | | | | | | | | | | |
| Non-GAAP Monthly Average Revenue per User (Monthly ARPU) | | $ | 74.54 | | | $ | 67.70 | | | $ | 59.28 | |
| Non-GAAP Adjusted Contribution Margin | | | 12.4 | % | | | 16.1 | % | | | 0.5 | % |
Note: 2019 financials and metrics represent pro-forma fuboTV pre-merger plus FaceBank pre-merger.
fuboTV Inc.
Reconciliation of Subscription Revenue to Non-GAAP Subscription ARPU and Reconciliation of Advertising Revenue to Non-GAAP Advertising ARPU
(in thousands, except average subscribers and average per user amounts)
Year-over-Year Comparison
| | | Three Months Ended | |
| | | September 30, 2021 | | | September 30, 2020 | | | September 30, 2019 | |
| | | As-Reported | | | As-Reported | | | Pro Forma Combined | |
| Subscription Revenue (GAAP) | | $ | 138,119 | | | $ | 53,433 | | | $ | 32,637 | |
| Add (Subtract): | | | | | | | | | | | | |
| Prior period subscriber deferred revenue | | | (24,419 | ) | | | (8,332 | ) | | | (5,163 | ) |
| Current period subscriber deferred revenue | | | 35,824 | | | | 15,119 | | | | 8,569 | |
| Non-GAAP Subscription Platform Bookings | | | 149,524 | | | | 60,220 | | | | 36,043 | |
| Divide: | | | | | | | | | | | | |
| Average Subscribers | | | 751,679 | | | | 333,549 | | | | 219,388 | |
| Months in Period | | | 3 | | | | 3 | | | | 3 | |
| Non-GAAP Monthly Subscription Average Revenue per User (Monthly ARPU) | | $ | 66.31 | | | $ | 60.18 | | | $ | 54.76 | |
| | | | | | | | | | | | | |
| Advertising Revenue (GAAP) | | $ | 18,570 | | | $ | 7,520 | | | $ | 2,975 | |
| Divide: | | | | | | | | | | | | |
| Average Subscribers | | | 751,679 | | | | 333,549 | | | | 219,388 | |
| Months in Period | | | 3 | | | | 3 | | | | 3 | |
| Non-GAAP Monthly Advertising Average Revenue per User (Monthly ARPU) | | $ | 8.23 | | | $ | 7.52 | | | $ | 4.52 | |
Note: 2019 financials and metrics represent pro-forma fuboTV pre-merger plus FaceBank pre-merger.
fuboTV Inc.
Reconciliation of Net Loss to Non-GAAP Adjusted EBITDA
(in thousands)
Year-over-Year Comparison
| | | Three Months Ended | |
| | | September 30, 2021 | | | September 30, 2020 | | | September 30, 2019 | |
| | | As-Reported | | | As-Reported | | | Pro Forma Combined | |
| Reconciliation of Net Loss to Adjusted EBITDA | | | | | | | | | | | | |
| Net loss | | $ | (105,865 | ) | | $ | (274,117 | ) | | $ | (56,235 | ) |
| Depreciation and amortization | | | 9,332 | | | | 14,413 | | | | 5,399 | |
| Impairment of Intangible Assets | | | - | | | | 236,681 | | | | - | |
| Stock-based Compensation | | | 12,667 | | | | 6,305 | | | | - | |
| Non-GAAP one-time non-cash operating expenses | | | - | | | | (2,705 | ) | | | - | |
| Other income (expense) | | | 3,122 | | | | (11,976 | ) | | | 1,465 | |
| Income tax benefit | | | (515 | ) | | | (16,071 | ) | | | (1,028 | ) |
| Adjusted EBITDA | | | (81,259 | ) | | | (47,470 | ) | | | (50,399 | ) |
| | | | | | | | | | | | | |
| Adjusted EBITDA | | | (81,259 | ) | | | (47,470 | ) | | | (50,399 | ) |
| Divide: | | | | | | | | | | | | |
| Revenue | | | 156,690 | | | | 61,202 | | | | 41,684 | |
| Adjusted EBITDA Margin | | | -51.9 | % | | | -77.6 | % | | | -120.9 | % |
Note: 2019 financials and metrics represent pro-forma fuboTV pre-merger plus FaceBank pre-merger.
fuboTV Inc.
Reconciliation of Net Loss Attributable to Controlling Interest to Non-GAAP Adjusted Net Loss and Adjusted EPS
(in thousands)
Year-over-Year Comparison
| | | Three Months Ended | |
| | | September 30, 2021 | | | September 30, 2020 | |
| | | As-Reported | | | As-Reported | |
| Net loss attributable to common stockholders | | $ | (105,851 | ) | | $ | (274,117 | ) |
| Stock-based Compensation | | | 12,667 | | | | 6,305 | |
| Other Non-GAAP Adj.* | | | (4,490 | ) | | | (4,543 | ) |
| Amortization of debt discount | | | 4,138 | | | | 1,290 | |
| Amortization of intangibles | | | 9,119 | | | | 14,286 | |
| Impairment and restructuring charges | | | - | | | | 236,681 | |
| Provision of tax benefit related to impairment of FB intangibles | | | - | | | | (27,642 | ) |
| Adjusted Net Loss | | | (84,417 | ) | | | (47,740 | ) |
| | | | | | | | | |
| Weighted average shares outstanding: | | | | | | | | |
| Basic and diluted | | | 142,529,770 | | | | 44,199,709 | |
| | | | | | | | | |
| Adjusted EPS | | $ | (0.59 | ) | | $ | (1.08 | ) |
Note: 2019 financials and metrics represent pro-forma fuboTV pre-merger plus FaceBank pre-merger.
*Includes Change in fair value of warrant liabilities, Change in fair value of shares settled liability, Change in fair value of shares derivative liability, Loss on issuance of notes, bonds and warrants and Unrealized gain on equity method investment
# # #
Contacts
Investor Contacts:
Alison Sternberg, fuboTV
asternberg@fubo.tv
The Blueshirt Group
ir@fubo.tv
Media Contacts:
Jennifer L. Press, fuboTV
jpress@fubo.tv
Bianca Illion, fuboTV
billion@fubo.tv