Exhibit 99.1

November 4, 2022
Fellow Shareholders:
Our third quarter was marked by meaningful progress against our long-term plan of continued growth with improved profitability.
| ● | Revenue and subscriber growth for our global streaming business continued to show strength, with North America revenue and subscriber growth coming in ahead of our third quarter forecast. |
| ● | Achieved sequential improvement in operating cash flow with year-over-year improvement in Adjusted EBITDA (AEBITDA) Margin. |
| ● | Advertising business showed increased momentum as the quarter progressed, and we expect this trend to continue through the remainder of the year. |
| ● | Continued additions to our compelling content portfolio, in support of unit economic expansion while adhering to vigilant cost management. |
We remain committed to our goal of driving controlled growth and generating positive free cash flow in 2025. During our Investor Day in mid-August, we shared our multi-pronged approach to executing our long-term plan, including: driving increased leverage of our content acquisition costs, increasing the efficiency of our subscriber acquisition efforts, furthering our investment in our ad tech team, technology, and infrastructure, enacting ARPU expansion tactics designed to strengthen unit economics, and maintaining our rigor around enterprise-wide cost discipline. Collectively, these initiatives drove outperformance in the quarter and represent ongoing traction towards our mission to build a leading global live TV streaming platform differentiated by the greatest breadth of premium content and interactivity.
Our decision to close the Fubo Gaming business and cease operation of our owned-and-operated Fubo Sportsbook was made in support of our profitability goals. But, as we continue to focus on data and interactivity to differentiate our virtual MVPD, we still believe the integration of gaming and live sports streaming is powerful. As a result, we are exploring ways to optimize our user base in the gaming space without investing our own funds.
As we have repeatedly stated in prior quarters, the market is moving in our direction with cord cutting continuing to accelerate. In addition, it has been well-reported that consumers are growing frustrated with the multiple streaming services on the market and the increased fragmentation of content. With only a handful of popular shows available on each service, the average U.S. household now subscribes to 4.7 “plus” streaming services, according to Kantar1. But stacking multiple services is costly. Many streaming services have recently raised prices to support their growing investment in content2. As a result, consumers are now paying monthly subscription fees approaching the cost of cable, just to access content everyone in the family wants to watch.
1 Kantar/Entertainment On Demand Q4 2021.
2 Global content spend is expected to exceed $230 billion in 2022, with growth driven by subscription SVOD platforms, according to Ampere Analysis.
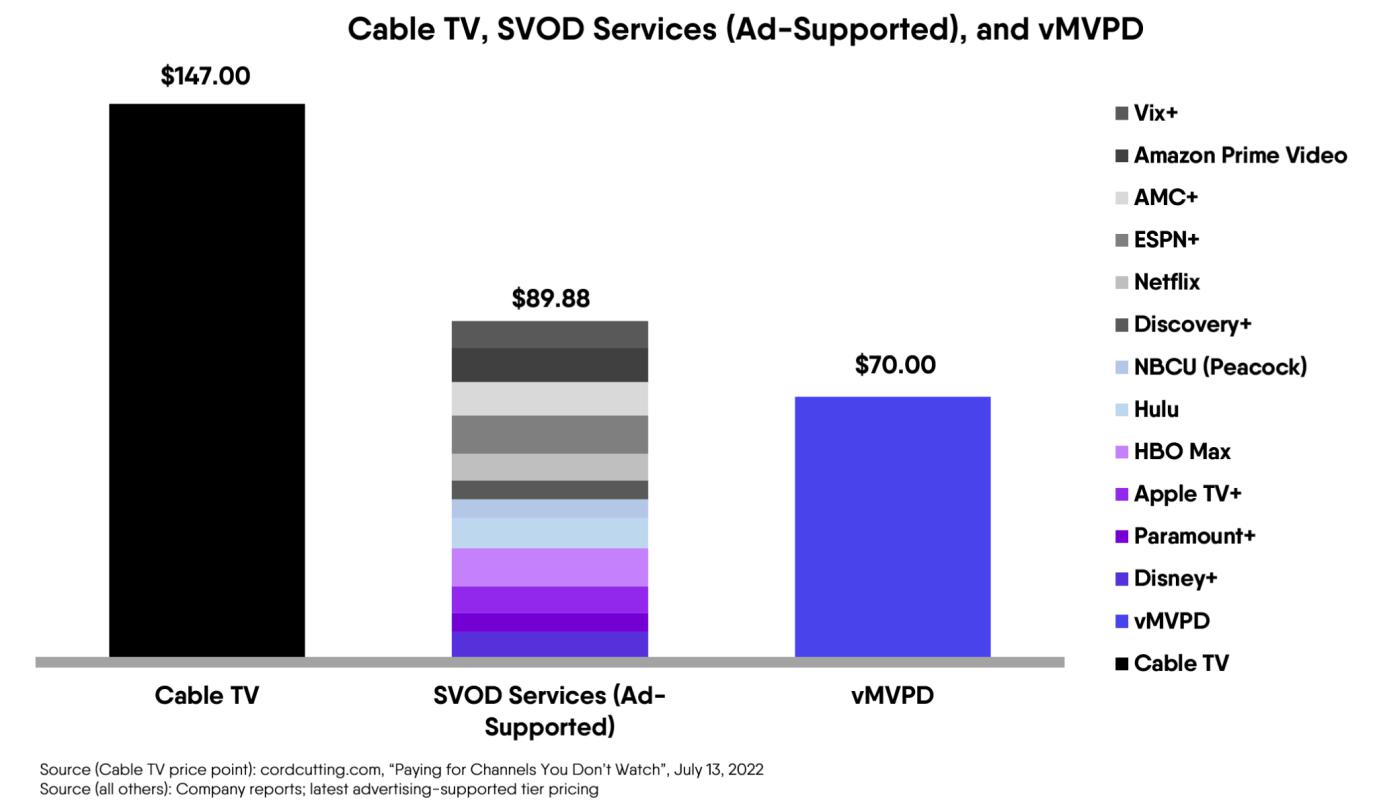
This is why we are more bullish than ever on our aggregation model. Consumers gravitate towards streaming platforms that offer meaningful content, both live and VOD, that is presented to them through a custom and personalized experience. After all, technology is about effectiveness and efficiency - and that’s why we believe vMVPDs are a better choice than “plus” services and cable. Our winning value proposition to consumers was recently underscored by our #1 ranking in Customer Satisfaction among Live TV Streaming Providers by J.D. Power for 2022, the inaugural year the J.D. Power annual U.S. Television Service Provider Satisfaction Study surveyed live TV streaming platforms. FuboTV scored number one by consumers in satisfaction for Programming, Features & Functionality, Customer Care and Billing & Payment.
We believe this distinction reinforces the quality of our product and technology, giving FuboTV the credence of a premium platform. We believe Fubo has continued pricing power in the marketplace thanks to our diversified content mix, aggregated and presented through a customized and interactive streaming experience. Moreover, not only does our premium offering continue to drive an ever greater number of consumers to our platform, our differentiated product experience and broad content portfolio keep them there - with this quarter representing an all-time low for subscriber churn.
Netflix recently announced that it intends to transition away from guiding on what has previously been the industry’s most important KPI: subscribers. This tells us that as this category approaches maturity, platforms are turning to other monetization levers to drive growth. This dynamic is further supported by the recent trend of “plus” services escalating prices by 10-40%3. At the same time, other streaming players have begun to introduce advertising-supported tiers despite historically operating without advertising. This underscores what we have consistently asserted over many quarters: multiple monetization levers are vital to long-term growth. These moves will likely further accelerate the pivot of ad sales dollars away from linear television to connected TV (CTV). We are excited by our unique positioning here, and the opportunity to drive ARPU expansion as a result of our product leadership coupled with the tailwinds of these industry trends.
Turning to our results, FuboTV posted North American subscription revenue growth of 42% year-over-year. The strength of these results is particularly notable relative to recent industry growth headwinds and against the backdrop of a highly competitive operating environment. In addition, North American ad revenue grew 21% year-over-year. We closed the quarter with $307.4 million in cash, cash equivalents, restricted cash and short-term investments, and we are confident in our current liquidity position. We also achieved a sequential improvement in Operating Cash Flow and year-over-year improvement in Adjusted EBITDA (AEBITDA) Margin. We expect these trends to continue throughout the balance of the year.
We are very pleased with the performance of our French streaming service, Molotov, which continues to deliver against Rest of World (ROW) revenue and subscriber forecasts. In ROW streaming, we ended the quarter with approximately 358,000 total paid subscribers and $5.8 million in total revenue. Revenue in the quarter was negatively impacted by FX movements. While our focus is primarily on integration and realization of the approximately $75 million of cost synergies estimated between 2022 and 2025, we are also pleased to note that ROW subscriber growth and cash flow has continued to perform well against expectations.
Q3 2022 Results and Q4 Guidance
Summary Financials (millions) (GLOBAL) | | 3Q21 | | | 3Q22 | | | 3Q22 YoY % | |
| Revenue | | $ | 156.7 | | | $ | 224.8 | | | | +43 | % |
| Total Operating Expenses | | $ | 259.9 | | | $ | 375.1 | | | | +44 | % |
| Net Loss | | $ | -105.9 | | | $ | -152.7 | | | | -44 | % |
| Net Loss Margin | | | -67.6 | % | | | -67.9 | % | | | -38 bps | |
| Adjusted EBITDA | | $ | -81.3 | | | $ | -92.7 | | | | -14 | % |
| Adjusted EBITDA Margin | | | -51.9 | % | | | -41.2 | % | | | +1,062 bps | |
3 Company web sites, press reports
Key Operating Metrics (NORTH AMERICA STREAMING)4 | | 3Q21 | | | 3Q22 | | | 3Q22 YoY % | |
| Subscribers (thousands) | | | 937 | | | | 1,231 | | | | +31 | % |
| Revenue ($ in millions) | | $ | 156.6 | | | $ | 219.2 | | | | +40 | % |
| Subscription ARPU | | $ | 61.87 | | | $ | 64.15 | | | | +4 | % |
| Advertising ARPU | | $ | 8.32 | | | $ | 7.37 | | | | -12 | % |
| Total ARPU | | $ | 70.19 | | | $ | 71.52 | | | | +2 | % |
Key Operating Metrics (REST OF WORLD STREAMING)5 | | 3Q21 | | | 3Q22 | | | 3Q22 YoY % |
| Subscribers (thousands) | | | - | | | | 358 | | | N/A |
| Revenue ($ in millions) | | | - | | | $ | 5.8 | | | N/A |
| Total ARPU | | | - | | | $ | 5.46 | | | N/A |
| Guidance (NA) | | 4Q22 | | | FY22 | |
| Revenue ($ in millions) | | $ | 277.5-$282.5 | | | $ | 949.7-$954.7 | |
| Subscribers (thousands) | | | 1,355-1,375 | | | | 1,355-1,375 | |
| Guidance (ROW) | | 4Q22 | | | FY22 | |
| Revenue ($ in millions) | | $ | 5-$6 | | | $ | 22.2-$23.2 | |
| Subscribers (thousands) | | | 355-365 | | | | 355-365 | |
Net loss in the third quarter was $152.7 million. This includes a non-cash impairment charge of $35.5 million pertaining to intangible and other long-lived assets associated with our gaming segment. We had a third quarter 2022 earnings per share (EPS) loss of $0.82, inclusive of this non-cash impairment charge of $0.19, $0.05 impact from operating expenses incurred for our wagering business, and $0.03 associated with the Molotov business acquired in 4Q21, compared to a loss of $0.74 in the third quarter of 2021. Adjusted EPS in the third quarter of 2022 was a loss of $0.52. Adjusted EPS excludes the impact of the non-cash impairment charge, stock-based compensation, amortization of intangibles, amortization of debt discount and other non-cash items6.
4 FuboTV previously calculated ARPU using Platform Bookings, which consisted of Subscription revenue and Advertising revenue, adjusted for deferred revenue. Beginning this quarter, FuboTV is calculating ARPU using Subscription revenue and Advertising revenue presented on a GAAP basis. For comparative purposes, 3Q21 ARPU metrics have been recast based on the new calculation.
5 Comparable information for 3Q21 is not presented for ROW metrics because, until our acquisition of our French streaming service, Molotov, in December 2021, we primarily operated in North America and therefore we believe such a comparison would not provide useful information for investors in evaluating our business.
6 Refer to the reconciliations of GAAP Net Loss to Non-GAAP Adjusted Net Loss in the non-GAAP information in the tables. Adjusted EPS represents Adjusted Net Loss divided by the number of weighted average shares outstanding for the applicable period.
We ended the quarter with $307.4 million of cash and cash equivalents, restricted cash and short-term investments. We remain highly disciplined in the management of our capital structure to afford FuboTV the financial flexibility and optionality to fund measured and disciplined growth initiatives.
Operating cash flow in the quarter was negative $76.4 million, including $8.6 million operating cash outflow associated with the wagering business. This compares favorably to our second quarter operating cash flow of negative $91.3 million. As of September 30, 2022, FuboTV had 189,343,531 shares of common stock issued and outstanding.
Operational Highlights
Note: To allow a more meaningful assessment of the operational advancements in the business, the metrics reported in this “Operational Highlights” section refer to our North America streaming business.
Ad Sales
Our ad business experienced a solid quarter. As we announced at the outset of the year, our focus has been on investing in our advertising team, technology and infrastructure. These investments are beginning to pay off. Third quarter ad revenue reached $22.5 million, an increase of 21% versus Q3 2021 while September was Fubo’s strongest ad revenue month in our history. We expect to see this continued strength into the fourth quarter, with increased demand heading into the seasonally strong holiday period augmented by a competitive mid-term election cycle.
We are thrilled to have Lynette Kaylor, a veteran programmatic and agency executive, leading Fubo’s ad sales effort. In her new role, Lynette leads Fubo’s North American sales strategy and ad operations as well as manages the company’s growing sales team.
Under Lynette’s leadership, our team added nearly 150 new advertisers to our platform in the quarter. We remain focused on maintaining a robust portfolio of advertising partners through new additions and ongoing efforts to increase our share of wallet amongst our current partners.
On the technology and infrastructure front, we have made improvements designed to drive higher CPMs and fill rates. We expect further improvements in the coming quarters as our work to enhance our technology and drive ad ARPU expansion continues.
We remain bullish on the long-term growth of connected television (CTV) advertising and our positioning in the category. FuboTV offers advertisers the engagement and premium live content of linear TV with the addressable targeting and measurement capabilities of a connected TV platform. In the third quarter, 94% of our content was viewed on a big-screen connected TV and 88% of viewing was for live content. This represents a highly engaged audience that advertisers will pay a premium to reach.
Content
Our strategy is to expand unit economics by balancing the aggregation of the best sports and entertainment content with vigilance around content costs.
With our recently announced deal with Altitude Sports we now carry 15 regional sports networks (RSNs), covering well over half of U.S. households. This is more than our direct vMVPD competitors and allows us to cater to the ardent sports fan while also offering a broad suite of non-sports content. We remain an affordable option for cord cutters to watch their favorite local teams, with over 3,000 live regional games.
We are also extremely proud to partner with actor and serial entrepreneur Ryan Reynolds and his Maximum Effort Productions. Through our deal, we will be working with Ryan and his team to create original content for the Maximum Effort channel and plan to partner with brands to minimize the incremental cost to Fubo. Fubo will manage all advertising sales for the channel, which we expect to launch in mid-2023.
The forthcoming Maximum Effort Channel is an important component of our overall FAST channels strategy, which continues to gain momentum on our platform. With free ad-supported television networks like MEC, we believe we can grow ad revenue and expand our entertainment programming with minimal incremental content costs. In the third quarter, we added 19 new FAST channels, bringing Fubo’s total offering to 60.
We continue to evaluate additional content that strengthens the value proposition to the consumer, while also supporting our long-term margin goals.
Optimizing Live TV and Sports Viewership
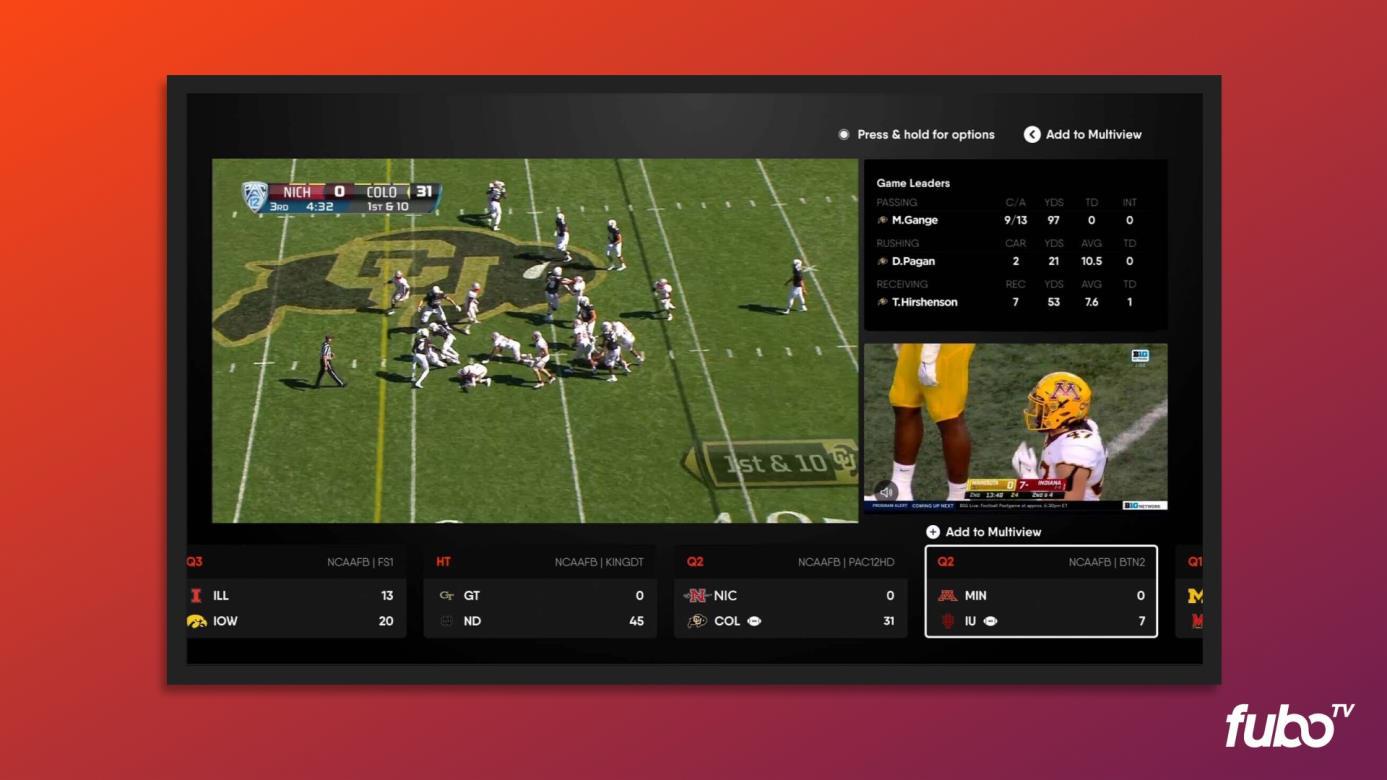
As we shared previously, we believe our internally-built technology stack and new global Unified Platform will position us to innovate faster and more effectively than our competitors. We continue to differentiate our offering to provide consumers with the greatest breadth of premium content aggregated through a custom and personalized viewing experience. Our goal is to offer consumers a choice on how they want to engage with live TV: whether that be leaning back or leaning forward. For consumers who wish to lean forward, we offer multiple interactive product features that have led to higher engagement. Over time, we believe interactivity will expand ARPU and drive engagement and retention.
Product Innovation
Leveraging our proprietary data and technology platform, the focus during the quarter was to further enhance our popular interactive products. For example, FanView, a widget that offers live stats and scores within the game video, was enabled at the start of the football season. Additionally, in select markets, we began rolling out our Video-Data Syncing capability, powered by the computer vision platform recently acquired and further developed through our Edisn.ai acquisition. With this upgraded technology, users can now track critical team and player statistics right on the screen, which will be updated in real time. We believe these capabilities position us at the front of the competition when it comes to on-screen innovation, and that they only begin to scratch the surface of what we will be able to accomplish.
Guidance
North America Streaming
Our Q4 2022 guidance projects 1,355,000 - 1,375,000 subscribers, representing 22% year-over-year growth at the midpoint, and revenue of $277.5 - $282.5 million, representing 22% year-over-year growth at the midpoint. This reflects an upwards revision of our previous year-end subscriber guidance of 1,330,000 - 1,350,000. On a full-year basis, we are also updating our previous revenue guidance to $949.7 - $954.7 million, representing 50% year-over-year growth at the midpoint, as compared to prior full-year revenue guidance of $910 - $930 million. This upward revision of our previous full-year guidance takes into account our outperformance in Q3 2022 and expectations of continued strength in subscriber growth in Q4 2022.
ROW Streaming
We are guiding to Q4 2022 revenue of $5.0 - $6.0 million. This implies FY 2022 revenue of $22.2 - $23.2 million, consistent with our prior full-year guidance. We are also guiding to total year-end subscribers of 355,000 - 365,000, as compared to our prior guidance of 340,000 - 360,000.
Please note that above guidance for North America streaming and ROW streaming reflects our internal forecasts as of today. As a result of, among other things, the current macroeconomic environment, our actual operating results may differ significantly from our guidance.
Conclusion
During the quarter, we advanced towards our profitability targets and performed well against our previous guidance. Our North American streaming business achieved double-digit year-over-year growth across subscribers, total revenue and ad revenue. Our ROW streaming business continued to deliver strong performance.
We remain vigilant around overall cost discipline, with a focus on the judicious deployment of capital and cash preservation. This approach, combined with our reallocation of resources following the recent closure of our Fubo Sportsbook, strengthens our current liquidity position. We were pleased to see improvements in our AEBITDA Margin in the third quarter which we expect will continue throughout the balance of the year.
Fubo remains committed to profitably scaling a leading global live TV streaming platform differentiated by the greatest breadth of premium content and interactivity. We continue to make progress towards our profitability targets and look forward to keeping you updated on our progress in the quarters to come.
Sincerely,
David Gandler, co-founder and CEO Edgar Bronfman Jr., executive chairman
Q3 2022 Earnings Live Conference Call
FuboTV CEO David Gandler and CFO John Janedis will host a live conference call today at 8:30 a.m. ET to deliver brief remarks followed by Q&A. The live call will be available on the Events page of FuboTV’s investor relations website. An archived replay will be available on FuboTV’s website following the call. Participants should join the call 10 minutes in advance to ensure that they are connected prior to the event.
More Information
We encourage you to read our full set of financial statements and SEC filings, and to sign up for email alerts, on the investor relations section of our website at ir.fubo.tv.
Additional information is available at www.sec.gov under FuboTV Inc.’s filings, as well as https://ir.fubo.tv.
FuboTV intends to use its website as a disclosure channel and investors are encouraged to refer to it, as well as press releases and SEC filings. The company encourages reading the full set of financial statements and related disclosures in its Quarterly Report on Form 10-Q for the quarterly period ended September 30, 2022 that will be filed with the SEC.
About FuboTV
With a mission to build the world’s leading global live TV streaming platform with the greatest breadth of premium content and interactivity, FuboTV Inc. (NYSE: FUBO) aims to transcend the industry’s current TV model. FuboTV Inc. operates in the U.S., Canada, France and Spain.
Leveraging its proprietary data and technology platform optimized for live TV and sports viewership, FuboTV Inc. aims to turn passive viewers into active participants and define a new category of interactive sports and entertainment television. In the U.S., the company’s sports-first cable TV replacement product, FuboTV, aggregates more than 125 live sports, news and entertainment networks and is the only live TV streaming platform with every Nielsen-rated sports channel (source: Nielsen Total Viewers, 2021). Subscribers can engage with the content they are watching on FuboTV through interactive product features like FanView, an in-video experience showcasing live game, team and player stats and scores in real time. Fubo was also the first virtual MVPD to enable simultaneous viewing on up to four screens (Multiview on Apple TV) as well the first to stream in 4K HDR.
Ranked #1 in Customer Satisfaction among Live TV Streaming Providers by J.D. Power (2022), FuboTV has been called “a force in sports streaming” by Forbes, “the best streaming service for sports aficionados” by Tom’s Guide and was heralded by CNET for its “ease of use.” Learn more at https://fubo.tv
Forward-Looking Statements
This letter contains forward-looking statements of FuboTV Inc. (“FuboTV”) that involve substantial risks and uncertainties. All statements contained in this letter that do not relate to matters of historical fact are forward-looking statements within the meaning of The Private Securities Litigation Reform Act of 1995, including statements regarding our business strategy and plans, including content partnerships and strategy, market opportunity, expectations regarding innovation, growth and profitability, the continued shift in consumer behavior and advertising trends, the integration of Molotov and expected synergies, seasonality, our financial condition, and anticipated financial performance, including quarterly and annual guidance and cash flow and Adjusted EBITDA targets. The words “could,” “will,” “plan,” “intend,” “anticipate,” “approximate,” “expect,” “potential,” “believe” or the negative of these terms or other similar expressions are intended to identify forward-looking statements, although not all forward-looking statements contain these identifying words. Actual results or events could differ materially from the plans, intentions and expectations disclosed in the forward-looking statements that FuboTV makes due to a number of important factors, including but not limited to risks related to our pursuit and engagement in acquisitions; our actual operating results may differ significantly from our guidance; risks related to FuboTV’s access to capital and fundraising prospects to fund its ongoing operations and support its planned growth; risks related to diverting management’s attention from FuboTV’s ongoing business operations to address integration and fundraising efforts; the restrictions imposed by content providers on our distribution and marketing of our products and services; our reliance on third party platforms to operate certain aspects of our business; risks related to our technology, as well as cybersecurity and data privacy-related risks; our ability to achieve or maintain profitability; our revenue and gross profit are subject to seasonality; our operating results may fluctuate; our ability to attract and retain subscribers; we may not be able to license streaming content or other rights on acceptable terms; risks related to the prior operation and dissolution of our wagering business; risks related to the difficulty in measuring key metrics related to our business; risks related to the highly competitive nature of our industry; risks related to ongoing or future legal proceedings; and other risks, including the effects of industry, market, economic, political or regulatory conditions, future exchange and interest rates, and changes in tax and other laws, regulations, rates and policies, including the impact of COVID-19 on the broader market. Further risks that could cause actual results to differ materially from those matters expressed in or implied by such forward-looking statements are discussed in our Quarterly Report on Form 10-Q for the quarterly period ended June 30, 2022 filed with the Securities and Exchange Commission (“SEC”) on August 8, 2022, our Quarterly Report on Form 10-Q for the quarterly period ended September 30, 2022 to be filed with the SEC, and our other periodic filings with the SEC. We encourage you to read such risks in detail. The forward-looking statements in this letter represent FuboTV’s views as of the date of this letter. FuboTV anticipates that subsequent events and developments will cause its views to change. However, while it may elect to update these forward-looking statements at some point in the future, it specifically disclaims any obligation to do so. You should, therefore, not rely on these forward-looking statements as representing FuboTV’s views as of any date subsequent to the date of this letter.
(FuboTV Inc. Financial Statements begin on the following pages)
fuboTV Inc.
Condensed Consolidated Statements of Operations and Comprehensive Loss
(in thousands, except share and per share amounts)
| | | For the Three Months Ended | |
| | | September 30, | |
| | | 2022 | | | 2021 | |
| | | Unaudited | | | Unaudited | |
| Revenues | | | | | | | | |
| Subscription | | $ | 201,911 | | | $ | 138,119 | |
| Advertising | | | 22,714 | | | | 18,570 | |
| Wagering | | | (176 | ) | | | - | |
| Other | | | 364 | | | | 1 | |
| Total revenues | | | 224,813 | | | | 156,690 | |
| Operating expenses | | | | | | | | |
| Subscriber related expenses | | | 214,466 | | | | 143,370 | |
| Broadcasting and transmission | | | 16,608 | | | | 14,320 | |
| Sales and marketing | | | 57,975 | | | | 50,381 | |
| Technology and development | | | 20,129 | | | | 15,257 | |
| General and administrative | | | 21,989 | | | | 27,288 | |
| Depreciation and amortization | | | 8,521 | | | | 9,332 | |
| Impairment of intangible and other long-lived assets | | | 35,454 | | | | - | |
| Total operating expenses | | | 375,142 | | | | 259,948 | |
| Operating loss | | | (150,329 | ) | | | (103,258 | ) |
| | | | | | | | | |
| Other income (expense) | | | | | | | | |
| Interest expense and financing costs | | | (2,792 | ) | | | (3,402 | ) |
| Amortization of debt discount | | | (625 | ) | | | (4,138 | ) |
| Change in fair value of warrant liabilities | | | - | | | | 4,490 | |
| Other income (expense) | | | 608 | | | | (72 | ) |
| Total other income (expense) | | | (2,809 | ) | | | (3,122 | ) |
| Loss before income taxes | | | (153,138 | ) | | | (106,380 | ) |
| Income tax benefit | | | 392 | | | | 515 | |
| Net loss | | | (152,746 | ) | | | (105,865 | ) |
| Less: Net loss attributable to non-controlling interest | | | 98 | | | | 14 | |
| Net loss attributable to common stockholders | | $ | (152,648 | ) | | $ | (105,851 | ) |
| | | | | | | | | |
| Other comprehensive income (loss) | | | | | | | | |
| Foreign currency translation adjustment | | | (8,720 | ) | | | - | |
| Comprehensive loss | | $ | (161,368 | ) | | $ | (105,851 | ) |
| | | | | | | | | |
| Net loss per share attributable to common stockholders | | | | | | | | |
| Basic and diluted | | $ | (0.82 | ) | | $ | (0.74 | ) |
| Weighted average shares outstanding: | | | | | | | | |
| Basic and diluted | | | 186,750,504 | | | | 142,529,770 | |
| | | | | | | | | |
| Stock-based compensation was allocated as follows: | | | | | | | | |
| Subscriber related expenses | | | 15 | | | | 13 | |
| Sales and marketing | | | 5,432 | | | | 821 | |
| Technology and development | | | 2,575 | | | | 1,535 | |
| General and administrative | | | 5,614 | | | | 10,298 | |
| Total stock-based compensation | | | 13,636 | | | | 12,667 | |
fuboTV Inc.
Condensed Consolidated Balance Sheets
(in thousands)
| | | September 30, | | | December 31, | |
| | | 2022 | | | 2021 | |
| | | Unaudited | | | Audited | |
| ASSETS | | | | | | | | |
| Cash and cash equivalents | | $ | 201,221 | | | $ | 374,294 | |
| Cash reserved for users | | | 918 | | | | 579 | |
| Short-term investments | | | 100,000 | | | | - | |
| Accounts receivable, net | | | 43,938 | | | | 34,308 | |
| Prepaid sports rights | | | 34,242 | | | | 3,284 | |
| Prepaid and other current assets | | | 13,715 | | | | 16,040 | |
| Total current assets | | | 394,034 | | | | 428,505 | |
| | | | | | | | | |
| Property and equipment, net | | | 6,307 | | | | 6,817 | |
| Restricted cash | | | 6,131 | | | | 5,112 | |
| Intangible assets, net | | | 202,932 | | | | 218,186 | |
| Goodwill | | | 607,223 | | | | 630,269 | |
| Right-of-use assets | | | 38,738 | | | | 37,755 | |
| Other non-current assets | | | 12,662 | | | | 43,134 | |
| Total assets | | $ | 1,268,027 | | | $ | 1,369,778 | |
| | | | | | | | | |
| LIABILITIES, TEMPORARY EQUITY AND STOCKHOLDERS’ EQUITY | | | | | | | | |
| Current liabilities | | | | | | | | |
| Accounts payable | | | 73,599 | | | | 56,460 | |
| Accrued expenses and other current liabilities | | | 210,031 | | | | 219,579 | |
| Notes payable | | | 5,539 | | | | 5,113 | |
| Deferred revenue | | | 58,674 | | | | 44,296 | |
| Warrant liabilities | | | - | | | | 3,548 | |
| Long-term borrowings - current portion | | | 1,887 | | | | 3,668 | |
| Current portion of lease liabilities | | | 5,768 | | | | 4,633 | |
| Total current liabilities | | | 355,498 | | | | 337,297 | |
| | | | | | | | | |
| Convertible notes, net of discount | | | 393,462 | | | | 316,354 | |
| Deferred income taxes | | | 1,279 | | | | 2,431 | |
| Lease liabilities | | | 37,279 | | | | 34,129 | |
| Other long-term liabilities | | | 18,963 | | | | 8,686 | |
| Total liabilities | | | 806,481 | | | | 698,897 | |
| | | | | | | | | |
| Redeemable non-controlling interest | | | 1,528 | | | | - | |
| | | | | | | | | |
| Stockholders’ equity: | | | | | | | | |
| Common stock par value $0.0001: 400,000,000 shares authorized; 189,343,531 and 153,950,895 shares issued and outstanding at September 30, 2022 and December 31, 2021, respectively | | | 19 | | | | 16 | |
| Additional paid-in capital | | | 1,889,274 | | | | 1,691,206 | |
| Accumulated deficit | | | (1,406,107 | ) | | | (1,009,293 | ) |
| Non-controlling interest | | | (11,561 | ) | | | (11,220 | ) |
| Accumulated other comprehensive income (loss) | | | (11,607 | ) | | | 172 | |
| Total stockholders’ equity | | | 460,018 | | | | 670,881 | |
| TOTAL LIABILITIES AND STOCKHOLDERS’ EQUITY | | $ | 1,268,027 | | | $ | 1,369,778 | |
fuboTV Inc.
Condensed Consolidated Statements of Cash Flows
(in thousands)
| | | For the Nine Months Ended | |
| | | September 30, | |
| | | 2022 | | | 2021 | |
| | | Unaudited | | | Unaudited | |
| Cash flows from operating activities | | | | | | | | |
| Net loss | | $ | (409,837 | ) | | $ | (270,981 | ) |
| Adjustments to reconcile net loss to net cash used in operating activities: | | | | | | | | |
| Depreciation and amortization | | | 28,502 | | | | 27,788 | |
| Amortization of gaming licenses and market access fees | | | 2,957 | | | | - | |
| Stock-based compensation | | | 47,294 | | | | 46,472 | |
| Impairment of goodwill, intangible assets, and other long-lived assets | | | 46,136 | | | | - | |
| Amortization of debt discount | | | 1,844 | | | | 10,693 | |
| Loss on extinguishment of debt | | | - | | | | 380 | |
| Deferred income tax benefit | | | (1,150 | ) | | | (1,733 | ) |
| Change in fair value of warrant liabilities | | | 1,701 | | | | 2,114 | |
| Amortization of right-of-use assets | | | 2,948 | | | | 984 | |
| Other adjustments | | | 1,571 | | | | 449 | |
| Changes in operating assets and liabilities of business, net of acquisitions: | | | | | | | - | |
| Cash reserved for users | | | (339 | ) | | | - | |
| Accounts receivable, net | | | (9,824 | ) | | | (8,637 | ) |
| Prepaid expenses and other assets | | | (53 | ) | | | (10,587 | ) |
| Prepaid sports rights | | | (30,958 | ) | | | - | |
| Accounts payable | | | 19,173 | | | | 21,341 | |
| Accrued expenses and other liabilities | | | (9,231 | ) | | | 21,029 | |
| Deferred revenue | | | 14,448 | | | | 18,466 | |
| Lease liabilities | | | 354 | | | | (808 | ) |
| Net cash used in operating activities | | | (294,464 | ) | | | (143,030 | ) |
| | | | | | | | | |
| Cash flows from investing activities | | | | | | | | |
| Cash paid for acquisition | | | - | | | | (1,740 | ) |
| Purchase of short-term investments | | | (100,000 | ) | | | - | |
| Purchases of property and equipment | | | (1,146 | ) | | | (3,862 | ) |
| Capitalization of internal use software | | | (3,519 | ) | | | - | |
| Purchase of intangible assets - gaming | | | (2,700 | ) | | | - | |
| Payments for market access and license fee deposits | | | (3,462 | ) | | | (30,071 | ) |
| Net cash used in investing activities | | | (110,827 | ) | | | (35,673 | ) |
| | | | | | | | | |
| Cash flows from financing activities | | | | | | | | |
| Proceeds from the issuance of common stock / At-the-Market offering, net of offering costs | | | 228,960 | | | | 69,970 | |
| Proceeds from convertible note, net of issuance costs | | | - | | | | 389,446 | |
| Proceeds from exercise of stock options | | | 749 | | | | 2,546 | |
| Proceeds from the exercise of common stock warrants | | | 5,000 | | | | 3,761 | |
| Repayments of notes payable and long-term borrowings | | | (1,472 | ) | | | (24,709 | ) |
| Net cash provided by financing activities | | | 233,237 | | | | 441,014 | |
| | | | | | | | | |
| Net increase in cash, cash equivalents and restricted cash | | | (172,054 | ) | | | 262,311 | |
| Cash, cash equivalents and restricted cash at beginning of period | | | 379,406 | | | | 136,221 | |
| Cash, cash equivalents and restricted cash at end of period | | $ | 207,352 | | | $ | 398,532 | |
| | | | | | | | | |
| Supplemental disclosure of cash flows information: | | | | | | | | |
| Interest paid | | | 13,469 | | | | 7,670 | |
| | | | | | | | | |
| Non cash financing and investing activities: | | | | | | | | |
| Conversion of Series AA preferred stock to common stock | | | - | | | | 406,665 | |
| Issuance of treasury stock in connection with acquisitions | | | - | | | | 8,538 | |
| Reclassification of the equity components of the 2026 Convertible Notes to liability upon adoption of ASU 2020-06 | | | 75,264 | | | | - | |
| Cashless exercise of warrants | | | 5,249 | | | | 16,480 | |
| Accrued expenses - At-the-Market offering | | | 292 | | | | 146 | |
Key Performance Metrics and Non-GAAP Measures
Paid Subscribers
We believe the number of paid subscribers is a relevant measure to gauge the size of our user base. Total subscribers that have completed registration with fuboTV, have activated a payment method (only reflects one paying user per plan), from which fuboTV has collected payment from in the month ending the relevant period. Users who are on a free (trial) period are not included in this metric.
Average Revenue per User (ARPU)
Beginning in the third quarter of 2022, Average Revenue Per User (ARPU) is calculated using Subscription revenue and Advertising revenue on a GAAP basis. Previously, ARPU was calculated using Platform Bookings, which consisted of Subscription revenue and Advertising revenue, adjusted for deferred revenue.
We believe ARPU provides useful information for investors to gauge the revenue generated per subscriber on a monthly basis. ARPU, with respect to a given period, is defined as total Subscription revenue and Advertising revenue recognized in such period, divided by the average daily paid subscribers in such period, divided by the number of months in such period. Advertising revenue, like Subscription revenue, is primarily driven by the number of subscribers to our platform and per-subscriber viewership such as the type of, and duration of, content watched on platform. We believe ARPU is an important metric for both management and investors to evaluate the Company’s core operating performance and measure our subscriber monetization, as well as evaluate unit economics, payback on subscriber acquisition cost and lifetime value per subscriber. In addition, we believe that presenting a geographic breakdown for North America ARPU and ROW ARPU allows for a more meaningful assessment of the business because of the significant differences in both Subscription revenue and Advertising revenue generated on a per subscriber basis in North America when compared to ROW due to our current subscription pricing models and advertising monetization in the two geographic regions.
Subscription Average Revenue per User (Sub ARPU)
Beginning in the third quarter of 2022, Subscription Average Revenue Per User (Sub ARPU) is calculated using Subscription revenue on a GAAP basis. Previously, Sub ARPU was calculated using Subscription Platform Bookings, which consisted of Subscription revenue, adjusted for deferred revenue.
We believe Sub ARPU provides useful information for investors to gauge the Subscription revenue generated per subscriber on a monthly basis. Sub ARPU, with respect to a given period, is defined as total Subscription revenue recognized in such period, divided by the average daily paid subscribers in such period, divided by the number of months in such period. We believe Sub ARPU is an important metric for both management and investors to evaluate the Company’s core operating performance and measure our subscriber monetization, as well as evaluate unit economics, payback on subscriber acquisition cost and lifetime value per subscriber. In addition, we believe that presenting a geographic breakdown for North America Sub ARPU and ROW Sub ARPU allows for a more meaningful assessment of the business because of the significant differences in Subscription revenue generated on a per subscriber basis in North America when compared to ROW due to our current subscription pricing models in the two geographic regions.
Advertising Average Revenue per User (Ad ARPU)
We believe Advertising Average Revenue Per User (Ad ARPU) provides useful information for investors to gauge the Advertising revenue generated per subscriber on a monthly basis. Ad ARPU, with respect to a given period, is defined as total Advertising revenue recognized in such period, divided by the average daily paid subscribers in such period, divided by the number of months in such period. Advertising revenue is primarily driven by the number of subscribers to our platform and per-subscriber viewership such as the type of, and duration of, content watched on platform. We believe Ad ARPU is an important metric for both management and investors to evaluate the Company’s core operating performance and measure our subscriber monetization, as well as evaluate unit economics, payback on subscriber acquisition cost and lifetime value per subscriber. In addition, we believe that presenting a geographic breakdown for North America Ad ARPU and ROW Ad ARPU allows for a more meaningful assessment of the business because of the significant differences in Advertising revenue generated on a per subscriber basis in North America when compared to ROW due to our advertising monetization in the two geographic regions.
Adjusted EBITDA
Adjusted EBITDA is a non-GAAP measure defined as Net Loss, adjusted for depreciation and amortization, stock-based compensation, income tax benefit, impairment of intangibles, other expenses, and one-time non-cash expenses.
Adjusted EBITDA Margin
Adjusted EBITDA Margin is a non-GAAP measure defined as Adjusted EBITDA divided by revenue.
Adjusted Net Loss
Adjusted Net Loss is a non-GAAP measure defined as Net Loss Attributable to Controlling Interest, adjusting for stock-based compensation, change in fair value of warrants, amortization of debt discount, amortization of intangible assets and other non-cash items.
Adjusted EPS (Earnings per Share)
Adjusted EPS is a non-GAAP measure defined as Adjusted Net Loss divided by weighted average shares outstanding.
Reconciliation of Key Performance Metrics and Non-GAAP Financial Measures
Certain measures used in this letter, including Adjusted EBITDA, Adjusted EBITDA Margin, Adjusted Net Loss and Adjusted EPS are non-GAAP financial measures. We believe these are useful financial measures for investors as they are supplemental measures used by management in evaluating our core operating performance. Our non-GAAP financial measures have limitations as analytical tools and you should not consider them in isolation or as a substitute for an analysis of our results under GAAP. There are a number of limitations related to the use of these non-GAAP financial measures versus their nearest GAAP equivalents. First, these non-GAAP financial measures are not a substitute for GAAP financial measures. Second, these non-GAAP financial measures may not provide information directly comparable to measures provided by other companies in our industry, as those other companies may calculate their non-GAAP financial measures differently.
The following tables include reconciliations of the non-GAAP financial measures used in this letter to their most directly comparable GAAP financial measures.
fuboTV Inc.
Reconciliation of GAAP Subscription and Advertising Revenue to North America ARPU
(in thousands, except average subscribers and average per user amounts)
Year-over-Year Comparison
| | | Three Months Ended | |
| | | September 30, 2022 | | | September 30, 2021 | |
| | | As-Reported | | | As-Reported | |
| Subscription Revenue (GAAP) | | $ | 201,911 | | | $ | 138,119 | |
| Advertising Revenue (GAAP) | | | 22,714 | | | | 18,570 | |
| Subtract: | | | | | | | | |
| ROW Subscription Revenue | | | (5,613 | ) | | | (98 | ) |
| ROW Advertising Revenue | | | (172 | ) | | | - | |
| Total | | $ | 218,840 | | | $ | 156,591 | |
| Divide: | | | | | | | | |
| Average Subscribers (North America) | | | 1,020,045 | | | | 743,603 | |
| Months in Period | | | 3 | | | | 3 | |
| North America Monthly Average Revenue per User (NA ARPU) | | $ | 71.52 | | | $ | 70.19 | |
fuboTV Inc.
Reconciliation of GAAP Subscription and Advertising Revenue to ROW ARPU
(in thousands, except average subscribers and average per user amounts)
| | | Three Months Ended | |
| | | September 30, 2022 | |
| | | As-Reported | |
| Subscription Revenue (GAAP) | | $ | 201,911 | |
| Advertising Revenue (GAAP) | | | 22,714 | |
| Subtract: | | | | |
| North America Subscription Revenue | | | (196,298 | ) |
| North America Advertising Revenue | | | (22,542 | ) |
| Total | | $ | 5,785 | |
| Divide: | | | | |
| Average Subscribers (ROW) | | | 352,722 | |
| Months in Period | | | 3 | |
| ROW Monthly Average Revenue per User (ROW ARPU) | | $ | 5.46 | |
Note: Comparable information for the third quarter of 2021 is not presented for ROW ARPU because, until our acquisition of our French streaming service, Molotov, in December 2021, we primarily operated in North America and therefore we believe such a comparison would not provide useful information for investors in evaluating our business.
fuboTV Inc.
Reconciliation of GAAP Subscription Revenue to North America Subscription ARPU and Reconciliation of GAAP Advertising Revenue to North America Advertising ARPU
(in thousands, except average subscribers and average per user amounts)
Year-over-Year Comparison
| | | Three Months Ended | |
| | | September 30, 2022 | | | September 30, 2021 | |
| | | As-Reported | | | As-Reported | |
| Subscription Revenue (GAAP) | | $ | 201,911 | | | $ | 138,119 | |
| Add (Subtract): | | | | | | | | |
| ROW Subscription Revenue | | | (5,613 | ) | | | (98 | ) |
| North America Subscription Revenue | | | 196,298 | | | | 138,021 | |
| Divide: | | | | | | | | |
| Average Subscribers | | | 1,020,045 | | | | 743,603 | |
| Months in Period | | | 3 | | | | 3 | |
| North America Monthly Subscription Average Revenue per User (NA Sub ARPU) | | $ | 64.15 | | | $ | 61.87 | |
| | | | | | | | | |
| Advertising Revenue (GAAP) | | $ | 22,714 | | | $ | 18,570 | |
| Add (Subtract): | | | | | | | | |
| ROW Advertising Revenue | | | (172 | ) | | | - | |
| North America Advertising Revenue | | | 22,542 | | | | 18,570 | |
| Divide: | | | | | | | | |
| Average Subscribers | | | 1,020,045 | | | | 743,603 | |
| Months in Period | | | 3 | | | | 3 | |
| North America Monthly Advertising Average Revenue per User (NA Ad ARPU) | | $ | 7.37 | | | $ | 8.32 | |
| | | | | | | | | |
| North America Monthly Subscription Average Revenue per User (NA Sub ARPU) | | $ | 64.15 | | | $ | 61.87 | |
| North America Monthly Advertising Average Revenue per User (NA Ad ARPU) | | $ | 7.37 | | | $ | 8.32 | |
| North America Monthly Average Revenue per User (NA ARPU) | | $ | 71.52 | | | $ | 70.19 | |
fuboTV Inc.
Reconciliation of GAAP Subscription Revenue to ROW Subscription ARPU and Reconciliation of GAAP Advertising Revenue to ROW Advertising ARPU
(in thousands, except average subscribers and average per user amounts)
| | | Three Months Ended | |
| | | September 30, 2022 | |
| | | | As-Reported | |
| Subscription Revenue (GAAP) | | $ | 201,911 | |
| Add (Subtract): | | | | |
| North America Subscription Revenue | | | (196,298 | ) |
| ROW Subscription Revenue | | | 5,613 | |
| Divide: | | | | |
| Average Subscribers | | | 352,722 | |
| Months in Period | | | 3 | |
| ROW Monthly Subscription Average Revenue per User (ROW Sub ARPU) | | $ | 5.30 | |
| | | | | |
| Advertising Revenue (GAAP) | | $ | 22,714 | |
| Add (Subtract): | | | | |
| North America Advertising Revenue | | | (22,542 | ) |
| ROW Advertising Revenue | | | 172 | |
| Divide: | | | | |
| Average Subscribers | | | 352,722 | |
| Months in Period | | | 3 | |
| ROW Monthly Advertising Average Revenue per User (ROW Ad ARPU) | | $ | 0.16 | |
| | | | | |
| ROW Monthly Subscription Average Revenue per User (ROW Sub ARPU) | | $ | 5.30 | |
| ROW Monthly Advertising Average Revenue per User (ROW Ad ARPU) | | $ | 0.16 | |
| ROW Monthly Average Revenue per User (ROW ARPU) | | $ | 5.46 | |
Note: Comparable information for the third quarter of 2021 is not presented for Rest of World (ROW) metrics because, until our acquisition of our French streaming service, Molotov, in December 2021, we primarily operated in North America and therefore we believe such a comparison would not provide useful information for investors in evaluating our business.
fuboTV Inc.
Reconciliation of Net Loss to Non-GAAP Adjusted EBITDA
(in thousands)
Year-over-Year Comparison
| | | Three Months Ended | |
| | | September 30, 2022 | | | September 30, 2021 | |
| | | As-Reported | | | As-Reported | |
| Reconciliation of Net Loss to Adjusted EBITDA | | | | | | | | |
| Net loss | | $ | (152,746 | ) | | $ | (105,865 | ) |
| Depreciation and amortization | | | 8,521 | | | | 9,332 | |
| Impairment of intangible and other long-lived assets | | | 35,454 | | | | - | |
| Stock-based Compensation | | | 13,636 | | | | 12,667 | |
| Other expense | | | 2,809 | | | | 3,122 | |
| Income tax benefit | | | (392 | ) | | | (515 | ) |
| Adjusted EBITDA | | | (92,718 | ) | | | (81,259 | ) |
| | | | | | | | | |
| Adjusted EBITDA | | | (92,718 | ) | | | (81,259 | ) |
| Divide: | | | | | | | | |
| Revenue | | | 224,813 | | | | 156,690 | |
| Adjusted EBITDA Margin | | | -41.2 | % | | | -51.9 | % |
fuboTV Inc.
Reconciliation of Net Loss Attributable to Controlling Interest to Non-GAAP Adjusted Net Loss and Adjusted EPS
(in thousands)
Year-over-Year Comparison
| | | Three Months Ended | |
| | | September 30, 2022 | | | September 30, 2021 | |
| | | As-Reported | | | As-Reported | |
| Net loss attributable to common stockholders | | $ | (152,648 | ) | | $ | (105,851 | ) |
| Stock-based Compensation | | | 13,636 | | | | 12,667 | |
| Other Non-GAAP Adj.* | | | - | | | | (4,490 | ) |
| Amortization of debt discount | | | 625 | | | | 4,138 | |
| Amortization of intangibles | | | 8,093 | | | | 9,119 | |
| Impairment of intangible and other long-lived assets | | | 35,454 | | | | - | |
| Adjusted Net Loss | | | (94,840 | ) | | | (84,417 | ) |
| | | | | | | | | |
| Weighted average shares outstanding: | | | | | | | | |
| Basic and diluted | | | 186,750,504 | | | | 142,529,770 | |
| | | | | | | | | |
| Adjusted EPS | | $ | (0.52 | ) | | $ | (0.59 | ) |
*Includes Change in fair value of warrant liabilities in 2021
# # #
Contacts
Investor Contacts:
Alison Sternberg, fuboTV
asternberg@fubo.tv
JCIR for fuboTV
ir@fubo.tv
Media Contacts:
Jennifer L. Press, fuboTV
jpress@fubo.tv
Bianca Illion, fuboTV
billion@fubo.tv