Exhibit 99.1

May 5, 2023
Fellow Shareholders:
In the first quarter Fubo exceeded guidance, posting 22% year-over-year growth in subscribers and revenue growth of 34% for North America (NA). The quarter also marked a substantial year-over-year improvement in our cash usage, as we continue to balance our focus on growth with an increased emphasis on unit economics, cost controls and profitability. And, we further strengthened our balance sheet and liquidity position, ending the quarter with $364.8 million in cash, cash equivalents and restricted cash. We are confident that our cash balance is sufficient to fund our operating plan until we achieve positive cash flow in 2025. Accordingly, we have no plans to utilize the at-the-market (ATM) program based on our current outlook.
Q1 2023 Highlights1:
| ● | Meaningfully exceeded the midpoint of our Q1 NA subscriber guidance of 1.150 million and revenue guidance of $297.5 million by 135K subs and $19 million, respectively. |
| ● | Successfully expanded NA ARPU by 8% year-over-year to $76.79. |
| ● | Captured record 13 million viewership hours from 100+ FAST channels, which represent an important driver of continued margin expansion. |
| ● | Posted positive Gross Profit and a 1,075 bps year-over-year improvement in Gross Margin. |
| ● | Achieved year-over-year improvement in Net Loss of $45 million and a $42 million improvement in net cash used in operating activities. |
| ● | Made considerable progress toward our goal of becoming cash flow and Adjusted EBITDA (AEBITDA) positive in 2025, with a Q1 AEBITDA improvement of $36 million and a Q1 Free Cash Flow improvement of $40 million, compared to Q1 of 2022. |
Consumers are choosing Fubo in greater numbers, both with their wallets and with their time and attention. Our growing market share, coupled with the over 100 hours per month our users spend on our platform on average, support why Fubo ranks #1 in Customer Satisfaction among Live TV Streaming Providers by J.D. Power.
In March, we rebranded the company from FuboTV to Fubo to reflect the breadth of our offering. We kicked off the rebrand with a national multi-platform advertising campaign co-produced by our partner Ryan Reynolds and starring 15-time NBA All-Star, NBA Champion and Hall of Famer, Kevin Garnett, along with veteran NFL quarterback, Mark Sanchez.
1 Except as otherwise indicated, financial information presented in this letter reflects Fubo’s results on a continuing operations basis, which excludes our former wagering reportable segment. See “Basis of Presentation – Continuing Operations” below.

Q1 Performance
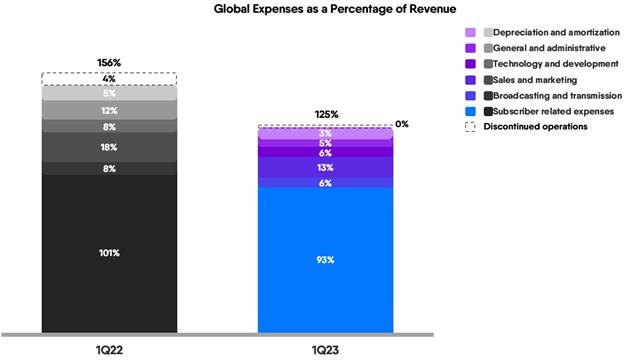
Fubo posted Q1 North American subscription revenue growth of 37% year-over-year, driven by both expansion in ARPU, primarily due to recent price increases and the addition of RSNs, as well as ongoing strong subscriber growth. Our subscriber growth came in ahead of guidance and was accompanied by lower-than-expected churn, which we believe reaffirms the pricing power and strong appeal of our sports-first offering. While North American advertising revenue was relatively flat, we expect an acceleration in the second quarter. Notably, we achieved this growth efficiently, with total sales and marketing as a percentage of revenue declining from ~18% to ~13%.
Note: Except as otherwise indicated, financial information presented and discussed in this letter reflects Fubo’s results on a continuing operations basis, which excludes our former wagering reportable segment. See “Basis of Presentation – Continuing Operations” below for further detail.
Q1 2023 Results and Guidance2
Summary Financials (millions) (GLOBAL) | | 1Q22 | | | 1Q23 | | | 1Q23 YoY % | |
| Revenue | | $ | 242.3 | | | $ | 324.4 | | | | +34 | % |
| Total Operating Expenses | | $ | 365.3 | | | $ | 405.8 | | | | +11 | % |
| Net Loss | | $ | -128.4 | | | $ | -83.4 | | | | -35 | % |
| Net Loss Margin | | | -53.0 | % | | | -25.7 | % | | | +2,727 | bps |
| Adjusted EBITDA | | $ | -95.3 | | | $ | -58.9 | | | | -38 | % |
| Adjusted EBITDA Margin | | | -39.3 | % | | | -18.2 | % | | | +2,118 | bps |
Key Operating Metrics (NORTH AMERICA STREAMING) | | 1Q22 | | | 1Q23 | | | 1Q23 YoY % | |
| Subscribers (thousands) | | | 1,056 | | | | 1,285 | | | | +22 | % |
| Revenue ($ in millions) | | $ | 236.8 | | | $ | 316.5 | | | | +34 | % |
| ARPU | | $ | 71.43 | | | $ | 76.79 | | | | +8 | % |
Key Operating Metrics (REST OF WORLD STREAMING) | | 1Q22 | | | 1Q23 | | | 1Q23 YoY % | |
| Subscribers (thousands) | | | 305 | | | | 379 | | | | +24 | % |
| Revenue ($ in millions) | | $ | 5.5 | | | $ | 7.8 | | | | +41 | %3 |
| ARPU | | $ | 7.63 | | | $ | 6.57 | | | | -14 | % |
2 Our consolidated Net Loss for 1Q23 was -$83.6 million, which includes -$256 thousand loss from discontinued operations. Loss from continuing operations was -$83.4 million.
3 Excluding a $0.4 million foreign currency headwind during 1Q23, revenue growth was 48% at constant currency compared to the same period in the prior year. See Key Performance Metrics and Non-GAAP Measures below.
| Guidance (NA) | | 2Q23 | | | FY23 | |
| Revenue ($ in millions) | | | $292.5-$297.5 | | | | $1,235-$1,265 | |
| Subscribers (thousands) | | | 1,120-1,140 | | | | 1,550-1,570 | |
| Guidance (ROW) | | 2Q23 | | | FY23 | |
| Revenue ($ in millions) | | | $6.9-$7.9 | | | | $28.6-$32.6 | |
| Subscribers (thousands) | | | 378-383 | | | | 395-415 | |
Net loss from continuing operations in the first quarter was $83.4 million, leading to an earnings per share (EPS) loss of $0.37. This compares favorably to a loss of $0.81 in the first quarter of 2022. Adjusted EPS in the first quarter of 2023 was a loss of $0.27, an improvement compared to an adjusted EPS loss of 0.62 in 1Q22. Adjusted EPS excludes the impact of stock-based compensation, amortization of intangibles, amortization of debt discount and other non-cash items.
The success of our ongoing efforts to identify efficiencies and maximize leverage across each operating expense category led to year-over-year improvements in both cash usage and AEBITDA Margin.
We closed the quarter with $364.8 million in cash, cash equivalents and restricted cash. During the quarter, we raised $117.2 million in net proceeds from our at-the-market (ATM) program, $106.1 million of which settled in Q1 and the remainder settled in Q2. We remain highly disciplined in the management of our capital structure.
Q1 2023 Operational Highlights
North America Ad Sales
Fubo’s ongoing strategic initiatives focused on increasing monetization in our North American ad business delivered ad revenue of $22.5 million in the quarter. This was flat year-over-year, which we believe reflects the resilience of our ad offering in the face of continued pressures on the advertising market.
In 2023, we are more focused than ever on maximizing our highly sought-after audience and our premium sports-first content to accelerate our direct sales business alongside our successful programmatic business.
North America Content
We continue to gain greater leverage over our subscriber related expenses (SRE), which decreased from 101% to 93% of revenue in Q1 versus the same prior year period. We expect this year-over-year trend to continue as we work towards meaningfully growing subscribers, optimizing our pricing and further improving our mix of premium plans.
In February, we officially launched the Bally Sports regional sports networks (RSNs) across the country. Fubo is now the home of local teams in every sport, with nearly 100% of our U.S. subscribers receiving RSN coverage. Additionally, with the launch of MLB.TV on Fubo, we now offer the most comprehensive professional baseball coverage of any streaming platform. Fubo is also the only streaming platform to offer all four major sports league channels (NFL Network, MLB Network, NBA TV and NHL Network), along with all of their premium add-ons. These offerings, in aggregate, support Fubo’s position as the leading streaming platform for fans looking to engage with their favorite sports leagues.
Product Roadmap
Fubo’s proprietary tech stack has enabled us to continuously evolve and improve the live TV streaming experience. We were the first virtual MVPD to launch 4K streaming (2018) and MultiView (2020) - and now, with the acquisition of Edisn.ai, we are aiming to build the future of live TV with AI as its centerpiece. By leveraging Edisn’s real-time computer vision, in addition to all of the new capabilities from Large Language Models like GPT4, we intend to design a completely new way for our customers to interact with and watch Live TV.
First on our roadmap is Instant Highlights, offering users easy access to a game’s biggest moments - while that game is still ongoing. Instant Highlights is expected to be released as a beta product feature on several devices in the coming days and will launch on further platforms in the coming months.
Looking ahead, we aim to advance the DVR experience through additional AI product features envisioned to change how consumers interact with streaming video.
Guidance
North America Streaming
Q2 2023 guidance projects 1,120,000 to 1,140,000 subscribers, representing 19% year-over-year growth at the midpoint, and revenue of $292.5 to $297.5 million, representing 36% year-over-year growth at the midpoint.
On a full-year basis we are raising our previous guidance. Our FY 2023 guidance now projects 1,550,000 to 1,570,000 subscribers, representing 8% year-over-year growth at the midpoint, and revenue of $1,235 to $1,265 million, representing 27% year-over-year growth at the midpoint.
ROW Streaming
Q2 2023 guidance projects 377,500 to 382,500 subscribers, representing 10% year-over-year growth at the midpoint, and revenue of $6.9-$7.9 million, representing 27% year-over-year growth at the midpoint.
Our FY 2023 guidance projects 395,000 to 415,000 subscribers, representing a 4% year-over-year decline at the midpoint, and revenue of $28.6 to $32.6 million, representing 26% year-over-year growth at the midpoint and an increase to our previous guidance. Excluding the impact of the 2022 World Cup, we are forecasting at least mid-single-digit subscriber growth for 2023 at the midpoint of our guidance range.
Conclusion
We are pleased with our execution to start 2023 - beating our expectations across our KPIs. While the macro uncertainty continues, the second quarter has started well, with customer engagement ongoing and advertising accelerating sequentially. Our increased North America and Rest of World guidance for the year reflects our confidence in our continued leadership in streaming. In addition, we remain confident in our path to generate positive cash flow in 2025.
We look forward to keeping you updated on our progress in the quarters to come.
Sincerely,
David Gandler, co-founder and CEO Edgar Bronfman Jr., executive chairman
Q1 2023 Earnings Live Conference Call
Fubo CEO David Gandler and CFO John Janedis will host a live conference call today at 8:30 a.m. ET to deliver brief remarks followed by Q&A. The live call will be available on the Events page of Fubo’s investor relations website. A replay will be available on Fubo’s website following the call. Participants should join the call 10 minutes prior to ensure that they are connected prior to the event.
More Information
We encourage you to read our full set of financial statements and SEC filings, and to sign up for email alerts, on the investor relations section of our website at ir.fubo.tv.
Additional information is available at www.sec.gov under FuboTV Inc.’s filings, as well as https://ir.fubo.tv.
Fubo intends to use its website as a disclosure channel and investors are encouraged to refer to it, as well as press releases and SEC filings. The company encourages reading the full set of financial statements and related disclosures in its Annual Report on Form 10-K for the year ended December 31, 2022 that has been filed with the SEC.
About Fubo
With a mission to build the world’s leading global live TV streaming platform with the greatest breadth of premium content and interactivity, FuboTV Inc. (NYSE: FUBO) aims to transcend the industry’s current TV model. The company operates Fubo in the U.S., Canada and Spain and Molotov in France.
In the U.S., Fubo is a sports-first cable TV replacement product that aggregates more than 175 live sports, news and entertainment networks and is the only live TV streaming platform with every Nielsen-rated sports channel (source: Nielsen Total Viewers, 2022). Leveraging Fubo’s proprietary data and technology platform optimized for live TV and sports viewership, subscribers can engage with the content they are watching through interactive product features like FanView, an in-video experience showcasing live game, team and player stats and scores in real time. Fubo was also the first virtual MVPD to enable simultaneous viewing of up to four live channels (Multiview on Apple TV) as well the first to stream in 4K HDR.
Ranked #1 in Customer Satisfaction among Live TV Streaming Providers by J.D. Power (2022), Fubo has been called “a force in sports streaming” by Forbes, “the best streaming service for sports aficionados” by Tom’s Guide and was heralded by CNET for its “ease of use.” Learn more at https://fubo.tv
Forward-Looking Statements
This letter contains forward-looking statements of FuboTV Inc. (“Fubo”) that involve substantial risks and uncertainties. All statements contained in this letter that do not relate to matters of historical fact are forward-looking statements within the meaning of The Private Securities Litigation Reform Act of 1995, including statements regarding our business strategy and plans, including content partnerships, market opportunity, expectations regarding innovation, growth, profitability and becoming cash flow positive in 2025, industry, advertising and broader economic trends, planned product offerings, our anticipated cash requirements, our financial condition, our intent not to use our at-the-market (ATM) program and anticipated financial performance, including quarterly and annual guidance, and cash flow and Adjusted EBITDA targets. The words “could,” “will,” “plan,” “intend,” “anticipate,” “approximate,” “expect,” “potential,” “believe” or the negative of these terms or other similar expressions are intended to identify forward-looking statements, although not all forward-looking statements contain these identifying words. Actual results or events could differ materially from the plans, intentions and expectations disclosed in the forward-looking statements that Fubo makes due to a number of important factors, including but not limited to the following: our ability to achieve or maintain profitability; risks related to our access to capital and fundraising prospects to fund our financial operations and support our planned business growth; our revenue and gross profit are subject to seasonality; our operating results may fluctuate; our ability to effectively manage our growth; our ability to attract and retain subscribers; obligations imposed on us through our agreements with certain distribution partners; we may not be able to license streaming content or other rights on acceptable terms; the restrictions imposed by content providers on our distribution and marketing of our products and services; our reliance on third party platforms to operate certain aspects of our business; risks related to our reporting obligations; risks related to the difficulty in measuring key metrics related to our business; risks related to preparing and forecasting our financial results; risks related to the highly competitive nature of our industry; risks related to our technology, as well as cybersecurity and data privacy-related risks; risks related to ongoing or future legal proceedings; and other risks, including the effects of industry, market, economic, political or regulatory conditions, future exchange and interest rates, and changes in tax and other laws, regulations, rates and policies. Further risks that could cause actual results to differ materially from those matters expressed in or implied by such forward-looking statements are discussed in our Annual Report on Form 10-K for the year ended December 31, 2022 filed with the Securities and Exchange Commission (“SEC”), our Quarterly Report on Form 10-Q for the quarterly period ended March 31, 2023 to be filed with the SEC, and our other periodic filings with the SEC. We encourage you to read such risks in detail. The forward-looking statements in this letter represent Fubo’s views as of the date of this letter. Fubo anticipates that subsequent events and developments will cause its views to change. However, while it may elect to update these forward-looking statements at some point in the future, it specifically disclaims any obligation to do so. You should, therefore, not rely on these forward-looking statements as representing Fubo’s views as of any date subsequent to the date of this letter.
(FuboTV Inc. Financial Statements begin on the following pages)
fuboTV Inc.
Condensed Consolidated Statements of Operations and Comprehensive Loss
(in thousands, except share and per share amounts)
| | | For the Three Months Ended | |
| | | March 31, | |
| | | 2023 | | | 2022 | |
| | | Unaudited | | | Unaudited | |
| Revenues | | | | | | | | |
| Subscription | | $ | 300,875 | | | $ | 219,168 | |
| Advertising | | | 22,721 | | | | 23,152 | |
| Other | | | 778 | | | | - | |
| Total revenues | | | 324,374 | | | | 242,320 | |
| Operating expenses | | | | | | | | |
| Subscriber related expenses | | | 301,378 | | | | 245,661 | |
| Broadcasting and transmission | | | 19,764 | | | | 20,297 | |
| Sales and marketing | | | 42,946 | | | | 42,552 | |
| Technology and development | | | 18,227 | | | | 18,718 | |
| General and administrative | | | 14,677 | | | | 26,693 | |
| Depreciation and amortization | | | 8,842 | | | | 11,356 | |
| Total operating expenses | | | 405,834 | | | | 365,277 | |
| Operating loss | | | (81,460 | ) | | | (122,957 | ) |
| | | | | | | | | |
| Other income (expense) | | | | | | | | |
| Interest expense, net of interest income | | | (1,255 | ) | | | (3,601 | ) |
| Amortization of debt discount | | | (623 | ) | | | (600 | ) |
| Change in fair value of warrant liabilities | | | - | | | | (1,701 | ) |
| Other income (expense) | | | (144 | ) | | | 93 | |
| Total other expense | | | (2,022 | ) | | | (5,809 | ) |
| | | | | | | | | |
| Loss from continuing operations before income taxes | | | (83,482 | ) | | | (128,766 | ) |
| Income tax benefit | | | 114 | | | | 403 | |
| Net loss from continuing operations | | | (83,368 | ) | | | (128,363 | ) |
| | | | | | | | | |
| Discontinued operations | | | | | | | | |
| Loss from discontinued operations before income taxes | | | (256 | ) | | | (12,454 | ) |
| Income tax benefit | | | - | | | | - | |
| Net loss from discontinued operations | | | (256 | ) | | | (12,454 | ) |
| | | | | | | | | |
| Net loss | | | (83,624 | ) | | | (140,817 | ) |
| | | | | | | | | |
| Less: Net loss attributable to non-controlling interest | | | 11 | | | | 93 | |
| Net loss attributable to common shareholders | | $ | (83,613 | ) | | $ | (140,724 | ) |
| | | | | | | | | |
| Other comprehensive income (loss) | | | | | | | | |
| Foreign currency translation adjustment | | | (2,756 | ) | | | (2,215 | ) |
| Comprehensive loss attributable to common shareholders | | $ | (86,369 | ) | | $ | (142,939 | ) |
| | | | | | | | | |
| Net loss per share attributable to common shareholders | | | | | | | | |
| Basic and diluted loss per share from continuing operations | | $ | (0.37 | ) | | $ | (0.81 | ) |
| Basic and diluted loss per share from discontinued operations | | $ | (0.00 | ) | | $ | (0.08 | ) |
| Basic and diluted net loss per share | | $ | (0.37 | ) | | $ | (0.89 | ) |
| Weighted average shares outstanding: | | | | | | | | |
| Basic and diluted | | | 225,461,595 | | | | 157,503,479 | |
| | | | | | | | | |
| Stock-based compensation was allocated as follows: | | | | | | | | |
| Subscriber related expenses | | | 52 | | | | 40 | |
| Sales and marketing | | | 6,673 | | | | 8,734 | |
| Technology and development | | | 3,042 | | | | 2,451 | |
| General and administrative | | | 3,921 | | | | 6,202 | |
| Total stock-based compensation | | | 13,688 | | | | 17,427 | |
fuboTV Inc.
Condensed Consolidated Balance Sheets
(in thousands)
| | | March 31, | | | December 31, | |
| | | 2023 | | | 2022 | |
| | | Unaudited | | | Audited | |
| ASSETS | | | | | | | | |
| Cash and cash equivalents | | $ | 358,665 | | | $ | 337,087 | |
| Accounts receivable, net | | | 41,314 | | | | 43,996 | |
| Prepaid sports rights | | | 44,399 | | | | 37,668 | |
| Prepaid and other current assets | | | 12,696 | | | | 13,508 | |
| Assets of discontinued operations | | | 2,765 | | | | 4,643 | |
| Total current assets | | | 459,839 | | | | 436,902 | |
| | | | | | | | | |
| Property and equipment, net | | | 5,263 | | | | 4,975 | |
| Restricted cash | | | 6,141 | | | | 6,139 | |
| Intangible assets, net | | | 167,405 | | | | 171,832 | |
| Goodwill | | | 620,898 | | | | 618,506 | |
| Right-of-use assets | | | 35,287 | | | | 35,888 | |
| Other non-current assets | | | 3,175 | | | | 3,532 | |
| Total assets | | $ | 1,298,008 | | | $ | 1,277,774 | |
| | | | | | | | | |
| LIABILITIES, TEMPORARY EQUITY AND SHAREHOLDERS’ EQUITY | | | | | | | | |
| Current liabilities | | | | | | | | |
| Accounts payable | | | 62,084 | | | | 66,952 | |
| Accrued expenses and other current liabilities | | | 253,339 | | | | 264,415 | |
| Notes payable | | | 5,841 | | | | 5,687 | |
| Deferred revenue | | | 66,451 | | | | 65,370 | |
| Long-term borrowings - current portion | | | 1,806 | | | | 1,986 | |
| Current portion of lease liabilities | | | 2,550 | | | | 1,763 | |
| Liabilities of discontinued operations | | | 31,716 | | | | 32,581 | |
| Total current liabilities | | | 423,787 | | | | 438,754 | |
| | | | | | | | | |
| Convertible notes, net of discount | | | 394,717 | | | | 394,094 | |
| Deferred income taxes | | | 651 | | | | 765 | |
| Lease liabilities | | | 38,564 | | | | 39,266 | |
| Other long-term liabilities | | | 2,477 | | | | 1,565 | |
| Total liabilities | | | 860,196 | | | | 874,444 | |
| | | | | | | | | |
| Redeemable non-controlling interest | | | - | | | | 1,648 | |
| | | | | | | | | |
| Shareholders’ equity: | | | | | | | | |
| Common stock par value $0.0001: 400,000,000 shares authorized; 281,599,807 and 209,684,548 shares issued and outstanding at March 31, 2023 and December 31, 2022, respectively | | | 28 | | | | 21 | |
| Additional paid-in capital | | | 2,088,632 | | | | 1,972,006 | |
| Accumulated deficit | | | (1,641,701 | ) | | | (1,558,088 | ) |
| Non-controlling interest | | | (11,299 | ) | | | (11,662 | ) |
| Accumulated other comprehensive income (loss) | | | 2,152 | | | | (595 | ) |
| Total shareholders’ equity | | | 437,812 | | | | 401,682 | |
| TOTAL LIABILITIES AND SHAREHOLDERS’ EQUITY | | $ | 1,298,008 | | | $ | 1,277,774 | |
fuboTV Inc.
Condensed Consolidated Statements of Cash Flows
(in thousands)
| | | For the Three Months Ended | |
| | | March 31, | |
| | | 2023 | | | 2022 | |
| | | Unaudited | | | Unaudited | |
| Cash flows from operating activities | | | | | | | | |
| Net loss | | $ | (83,624 | ) | | $ | (140,817 | ) |
| Less: Loss from discontinued operations, net of tax | | | 256 | | | | 12,454 | |
| Net loss from continuing operations | | | (83,368 | ) | | | (128,363 | ) |
| Adjustments to reconcile net loss to net cash used in operating activities: | | | | | | | | |
| Depreciation and amortization | | | 8,842 | | | | 11,356 | |
| Stock-based compensation | | | 13,688 | | | | 17,427 | |
| Amortization of debt discount | | | 623 | | | | 600 | |
| Deferred income tax benefit | | | (114 | ) | | | (403 | ) |
| Change in fair value of warrant liabilities | | | - | | | | 1,701 | |
| Amortization of right-of-use assets | | | 667 | | | | 707 | |
| Other adjustments | | | 163 | | | | (180 | ) |
| Changes in operating assets and liabilities of business, net of acquisitions: | | | | | | | | |
| Accounts receivable, net | | | 2,739 | | | | 674 | |
| Prepaid expenses and other assets | | | 1,877 | | | | 2,860 | |
| Prepaid sports rights | | | (6,731 | ) | | | (20,413 | ) |
| Accounts payable | | | (4,974 | ) | | | (6,706 | ) |
| Accrued expenses and other liabilities | | | (11,569 | ) | | | 2,210 | |
| Deferred revenue | | | 1,048 | | | | (1,297 | ) |
| Lease liabilities | | | 70 | | | | 628 | |
| Net cash used in operating activities - continuing operations | | | (77,039 | ) | | | (119,199 | ) |
| Net cash used in operating activities - discontinued operations | | | (1,150 | ) | | | (5,676 | ) |
| Net cash used in operating activities | | | (78,189 | ) | | | (124,875 | ) |
| | | | | | | | | |
| Cash flows from investing activities | | | | | | | | |
| Purchases of property and equipment | | | (102 | ) | | | (798 | ) |
| Capitalization of internal use software | | | (3,816 | ) | | | (1,026 | ) |
| Net cash used in investing activities - continuing operations | | | (3,918 | ) | | | (1,824 | ) |
| Net cash used in investing activities - discontinued operations | | | - | | | | (4,071 | ) |
| Net cash used in investing activities | | | (3,918 | ) | | | (5,895 | ) |
| | | | | | | | | |
| Cash flows from financing activities | | | | | | | | |
| Proceeds from sale of common stock and warrants, net of fees | | | 106,130 | | | | 203,765 | |
| Redemption of NCI | | | (2,147 | ) | | | - | |
| Proceeds from exercise of stock options | | | 46 | | | | 443 | |
| Vested restricted stock unit settled for cash | | | (125 | ) | | | - | |
| Proceeds from the exercise of warrants | | | - | | | | 5,000 | |
| Repayments of notes payable and long-term borrowings | | | (217 | ) | | | - | |
| Net cash provided by financing activities - continuing operations | | | 103,687 | | | | 209,208 | |
| Net cash provided by financing activities - discontinued operations | | | - | | | | - | |
| Net cash provided by financing activities | | | 103,687 | | | | 209,208 | |
| | | | | | | | | |
| Net increase in cash, cash equivalents and restricted cash | | | 21,580 | | | | 78,438 | |
| Cash, cash equivalents and restricted cash at beginning of period | | | 343,226 | | | | 376,080 | |
| Cash, cash equivalents and restricted cash at end of period | | $ | 364,806 | | | $ | 454,518 | |
| | | | | | | | | |
| Supplemental disclosure of cash flows information: | | | | | | | | |
| Interest paid | | | 6,550 | | | | 6,647 | |
| Income tax paid | | | 6 | | | | - | |
| | | | | | | | | |
| Non cash financing and investing activities: | | | | | | | | |
| Shares settled liability | | | 1,825 | | | | - | |
| Reclassification of the equity components of the 2026 Convertible Notes to liability upon adoption of ASU 2020-06 | | | - | | | | 75,264 | |
| Cashless exercise of warrants | | | - | | | | 5,249 | |
| Accrued expenses - At-the-market offering | | | 91 | | | | 19 | |
Basis of Presentation – Continuing Operations
In connection with the dissolution of Fubo Gaming, Inc. and termination of Fubo Sportsbook, the assets and liabilities and the operations of our former wagering reportable segment, are presented as discontinued operations in our consolidated financial statements. With respect to our continuing operations, we operate as a single reportable segment. Financial information presented in this letter reflects Fubo’s results on a continuing operations basis, which excludes our former wagering reportable segment. Prior periods have been recast to conform to this presentation.
Key Performance Metrics and Non-GAAP Measures
Paid Subscribers
We believe the number of paid subscribers is a relevant measure to gauge the size of our user base. Paid subscribers is defined as total subscribers that have completed registration with Fubo, have activated a payment method (only reflects one paying user per plan), from which Fubo has collected payment from in the month ending the relevant period. Users who are on a free (trial) period are not included in this metric.
Average Revenue per User (ARPU)
Beginning in the third quarter of 2022, Average Revenue Per User (ARPU) is calculated using Subscription revenue and Advertising revenue on a GAAP basis. Previously, ARPU was calculated using Platform Bookings, which consisted of Subscription revenue and Advertising revenue, adjusted for deferred revenue.
We believe ARPU provides useful information for investors to gauge the revenue generated per subscriber on a monthly basis. ARPU, with respect to a given period, is defined as total Subscription revenue and Advertising revenue recognized in such period, divided by the average daily paid subscribers in such period, divided by the number of months in such period. Advertising revenue, like Subscription revenue, is primarily driven by the number of subscribers to our platform and per-subscriber viewership such as the type of, and duration of, content watched on platform. We believe ARPU is an important metric for both management and investors to evaluate the Company’s core operating performance and measure our subscriber monetization, as well as evaluate unit economics, payback on subscriber acquisition cost and lifetime value per subscriber. In addition, we believe that presenting a geographic breakdown for North America ARPU and ROW ARPU allows for a more meaningful assessment of the business because of the significant differences in both Subscription revenue and Advertising revenue generated on a per subscriber basis in North America when compared to ROW due to our current subscription pricing models and advertising monetization in the two geographic regions.
Adjusted EBITDA
Adjusted EBITDA is a non-GAAP measure defined as Net Loss from Continuing Operations, adjusted for depreciation and amortization, stock-based compensation, income tax benefit, other expenses, and one-time non-cash expenses.
Adjusted EBITDA Margin
Adjusted EBITDA Margin is a non-GAAP measure defined as Adjusted EBITDA divided by Revenue.
Adjusted Net Loss
Adjusted Net Loss is a non-GAAP measure defined as Net Loss Attributable to Common Shareholders, adjusting for discontinued operations, stock-based compensation, change in fair value of warrants, amortization of debt discount, amortization of intangible assets and other non-cash items.
Adjusted EPS (Earnings per Share)
Adjusted EPS is a non-GAAP measure defined as Adjusted Net Loss divided by weighted average shares outstanding.
Free Cash Flow
Free Cash Flow is a non-GAAP measure defined as net cash used in operating activities - continuing operations, reduced by capital expenditures (consisting of purchases of property and equipment and capitalization of internal use software). We believe Free Cash Flow is an important liquidity measure of the cash that is available, after capital expenditures, for operational expenses, investments in our business, strategic acquisitions, and for certain other activities such as repaying debt obligations and stock repurchases. Free Cash Flow is a key financial indicator used by management. Free Cash Flow is useful to investors as a liquidity measure because it measures our ability to generate or use cash. The use of Free Cash Flow as an analytical tool has limitations due to the fact that it does not represent the residual cash flow available for discretionary expenditures. Because of these limitations, Free Cash Flow should be considered along with other operating and financial performance measures presented in accordance with GAAP.
Gross Profit and Gross Margin (GAAP)
Gross Profit is defined as Revenue less Subscriber related expenses and Broadcasting and transmission. Gross Margin is defined as Gross Profit divided by Revenue. We believe these measures are useful because they represent key profitability metrics for our business and are used by management to evaluate the performance of our business, including measuring the cost to deliver our product to subscribers against revenue.
Revenue Growth Presented on a Constant Currency Basis
Revenue growth presented on a constant currency basis is a non-GAAP measure defined as revenues for a given period restated at the comparative period’s foreign currency exchange rates measured against the comparative period’s revenues.
Reconciliation of Key Performance Metrics and Non-GAAP Financial Measures
Certain measures used in this letter, including Adjusted EBITDA, Adjusted EBITDA Margin, Adjusted Net Loss, Adjusted EPS and Free Cash Flow, as well as revenue growth presented on a constant currency basis, are non-GAAP financial measures. We believe these are useful financial measures for investors as they are supplemental measures used by management in evaluating our core operating performance. Our non-GAAP financial measures have limitations as analytical tools and you should not consider them in isolation or as a substitute for an analysis of our results under GAAP. There are a number of limitations related to the use of these non-GAAP financial measures versus their nearest GAAP equivalents. First, these non-GAAP financial measures are not a substitute for GAAP financial measures. Second, these non-GAAP financial measures may not provide information directly comparable to measures provided by other companies in our industry, as those other companies may calculate their non-GAAP financial measures differently.
The following tables include reconciliations of the non-GAAP financial measures used in this letter to their most directly comparable GAAP financial measures. We have recast our previously disclosed non-GAAP financial measures to only reflect the results from continuing operations, thereby removing the discontinued operations of our former wagering reportable segment.
fuboTV Inc.
Reconciliation of GAAP Subscription and Advertising Revenue to North America ARPU
(in thousands, except average subscribers and average per user amounts)
Year-over-Year Comparison
| | | Three Months Ended | |
| | | March 31, 2023 | | | March 31, 2022 | |
| | | As-Reported | | | As-Reported | |
| Subscription Revenue (GAAP) | | $ | 300,875 | | | $ | 219,168 | |
| Advertising Revenue (GAAP) | | | 22,721 | | | | 23,152 | |
| Subtract: | | | | | | | | |
| ROW Subscription Revenue | | | (7,618 | ) | | | (5,163 | ) |
| ROW Advertising Revenue | | | (206 | ) | | | (383 | ) |
| Total | | | 315,772 | | | | 236,774 | |
| Divide: | | | | | | | | |
| Average Subscribers (North America) | | | 1,370,783 | | | | 1,104,999 | |
| Months in Period | | | 3 | | | | 3 | |
| North America Monthly Average Revenue per User (NA ARPU) | | $ | 76.79 | | | $ | 71.43 | |
fuboTV Inc.
Reconciliation of GAAP Subscription and Advertising Revenue to ROW ARPU
(in thousands, except average subscribers and average per user amounts)
Year-over-Year Comparison
| | | Three Months Ended | | | Three Months Ended | |
| | | March 31, 2023 | | | March 31, 2022 | |
| | | As-Reported | | | As-Reported | |
| Subscription Revenue (GAAP) | | $ | 300,875 | | | $ | 219,168 | |
| Advertising Revenue (GAAP) | | | 22,721 | | | | 23,152 | |
| Subtract: | | | | | | | | |
| North America Subscription Revenue | | | (293,257 | ) | | | (214,005 | ) |
| North America Advertising Revenue | | | (22,515 | ) | | | (22,769 | ) |
| Total | | | 7,824 | | | | 5,546 | |
| Divide: | | | | | | | | |
| Average Subscribers (ROW) | | | 396,956 | | | | 242,369 | |
| Months in Period | | | 3 | | | | 3 | |
| ROW Monthly Average Revenue per User (ROW ARPU) | | $ | 6.57 | | | $ | 7.63 | |
fuboTV Inc.
Reconciliation of Net Loss from Continuing Operations to Non-GAAP Adjusted EBITDA
(in thousands)
Year-over-Year Comparison
| | | Three Months Ended | |
| | | March 31, 2023 | | | March 31, 2022 | |
| | | As-Reported | | | As-Reported | |
| Reconciliation of Net Loss from Continuing Operations to Adjusted EBITDA | | | | | | | | |
| Net loss from continuing operations | | $ | (83,368 | ) | | $ | (128,363 | ) |
| Depreciation and amortization | | | 8,842 | | | | 11,356 | |
| Stock-based Compensation | | | 13,688 | | | | 17,427 | |
| Non-GAAP one-time non-cash operating expenses | | | - | | | | (1,162 | ) |
| Other expense | | | 2,022 | | | | 5,809 | |
| Income tax benefit | | | (114 | ) | | | (403 | ) |
| Adjusted EBITDA | | | (58,930 | ) | | | (95,336 | ) |
| | | | | | | | | |
| Adjusted EBITDA | | | (58,930 | ) | | | (95,336 | ) |
| Divide: | | | | | | | | |
| Revenue | | | 324,373 | | | | 242,320 | |
| Adjusted EBITDA Margin | | | -18.2 | % | | | -39.3 | % |
fuboTV Inc.
Reconciliation of Net Cash Used in Operating Activities - Continuing Operations to Free Cash Flow
(in thousands)
Year-over-Year Comparison
| | | Three Months Ended | |
| | | March 31, 2023 | | | March 31, 2022 | |
| | | As-Reported | | | As-Reported | |
| Net cash used in operating activities - continuing operations | | $ | (77,039 | ) | | $ | (119,199 | ) |
| Subtract: | | | | | | | | |
| Purchases of property and equipment | | | (102 | ) | | | (798 | ) |
| Capitalization of internal use software | | | (3,816 | ) | | | (1,026 | ) |
| Free Cash Flow | | | (80,957 | ) | | | (121,023 | ) |
fuboTV Inc.
Reconciliation of Net Loss Attributable to Common Shareholders to Non-GAAP Adjusted Net Loss and Adjusted EPS
(in thousands)
Year-over-Year Comparison
| | | Three Months Ended | |
| | | March 31, 2023 | | | March 31, 2022 | |
| | | As-Reported | | | As-Reported | |
| Net loss attributable to common shareholders | | $ | (83,613 | ) | | $ | (140,724 | ) |
| Subtract: | | | | | | | | |
| Net loss from discontinued operations | | | (256 | ) | | | (12,454 | ) |
| Net loss from continuing operations attributable to common shareholders | | | (83,357 | ) | | | (128,270 | ) |
| | | | | | | | | |
| Net loss from continuing operations attributable to common shareholders | | | (83,357 | ) | | | (128,270 | ) |
| Stock-based Compensation | | | 13,688 | | | | 17,427 | |
| Other Non-GAAP Adj.* | | | - | | | | 1,701 | |
| Amortization of debt discount | | | 623 | | | | 600 | |
| Amortization of intangibles | | | 8,426 | | | | 11,052 | |
| Adjusted net loss from continuing operations | | | (60,620 | ) | | | (97,489 | ) |
| | | | | | | | | |
| Weighted average shares outstanding: | | | | | | | | |
| Basic and diluted | | | 225,462,483 | | | | 157,503,479 | |
| | | | | | | | | |
| Adjusted EPS from continuing operations | | $ | (0.27 | ) | | $ | (0.62 | ) |
*Includes Change in fair value of warrant liabilities
# # #
Contacts
Investor Contacts:
Alison Sternberg, Fubo
asternberg@fubo.tv
JCIR for Fubo
ir@fubo.tv
Media Contacts:
Jennifer L. Press, Fubo
jpress@fubo.tv
Bianca Illion, Fubo
billion@fubo.tv