Exhibit 99.1

March 1, 2024
Fellow Shareholders:
We continue to execute on our long-term strategy to provide an aggregated and curated sports-centric entertainment offering to our customers. We believe that a sports-first, live streaming experience should benefit all market participants, and we strive to be champions of the consumer on this front.
Our mission has always been to serve the consumer by aggregating the best in TV, including premium sports, news and entertainment content, through a single app with must-have features. And since our founding in 2015, our subscriber base has steadily grown - a testament to the high-value that consumers place on our compelling and technologically innovative content offering. Our performance in Q4 and FY 2023 reaffirms our belief in Fubo’s value proposition and the unparalleled streaming experience that we aim to bring to consumers.
The fourth quarter capped another great year for Fubo, as we again exceeded guidance across key financial and operational metrics. In Q4, Fubo posted 12% year-over-year growth in subscribers and 29% year-over-year revenue growth in North America (NA), along with strong results across several key performance metrics, including an all-time high $86.65 average revenue per user (ARPU). The quarter also marked a healthy year-over-year improvement in profitability and cash usage, reflecting the success of our continuing initiatives focused on increasing efficiency across our operations.
We enter 2024 with considerable optimism, strong momentum, and with meaningful improvements across just about every facet of our business. We expect both top-line growth across revenue and subscribers as well as further leverage in reducing our expenses. We also plan to continue strategically investing in our business, including expanding our content offering, furthering the use of technology (including AI), and in other areas that increase monetization, such as advertising. We have also recently taken meaningful steps in response to actions by competitors that we believe are harmful to Fubo, the industry as a whole, and most importantly, to consumers.
| | |  |
| | | 1 |
Q4 2023 Highlights1:
| ● | Posted NA subscribers of 1.618 million, an all-time high and ahead of the midpoint of our Q4 NA subscriber guidance of 1.592 million. |
| ● | Grew NA Revenue to $402 million, representing a 29% increase over the prior year period and surpassing the midpoint of our guidance of $387.5 million. |
| | ○ | NA Subscription revenue growth of 30% year-over-year. |
| | ○ | NA Advertising revenue growth of 15% year-over-year. |
| ● | Gross Margin of 10% representing an 888 bps year-over-year improvement. |
| ● | Expanded NA ARPU by 15% year-over-year to $86.65, representing an all-time high. |
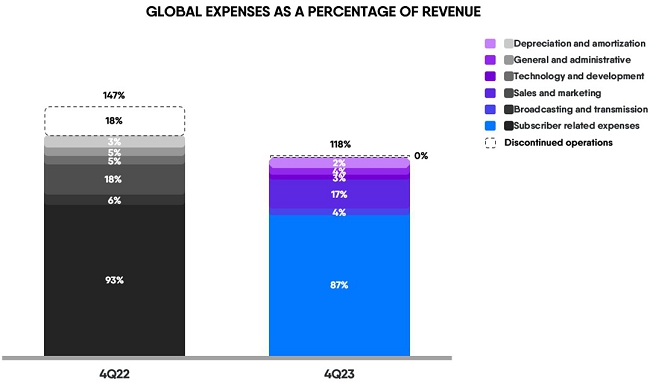
| ● | Drove a 662 bps reduction in Subscriber-related expenses (SRE) as a percentage of revenue to 87%, reflecting significant progress in optimizing content costs. |
| ● | Achieved year-over-year improvement in Net Loss of $25 million and a $19 million improvement in net cash used in operating activities. |
| ● | Marked progress towards our goal of positive cash flow and Adjusted EBITDA (AEBITDA) in 2025, with a Q4 AEBITDA improvement of $25 million and a Q4 Free Cash Flow improvement of $15 million, compared to Q4 2022. |
Note: Except as otherwise indicated, financial information presented and discussed in this letter reflects Fubo’s results on a continuing operations basis, which excludes our former wagering reportable segment. See “Basis of Presentation – Continuing Operations” below for further detail.
Q4 2023 Results and Q1 Guidance2
Summary Financials (millions) (GLOBAL) | | 4Q22 | | | 4Q23 | | | 4Q23 YoY % |
| Revenue | | $ | 319.3 | | | $ | 410.2 | | | +28% |
| Total Operating Expenses | | $ | 413.2 | | | $ | 482.3 | | | +17% |
| Net Loss | | $ | -95.9 | | | $ | -71.0 | | | +26% |
| Net Loss Margin | | | -30.0 | % | | | -17.3 | % | | +1,272 bps |
| Adjusted EBITDA | | $ | -75.4 | | | $ | -50.7 | | | +33% |
| Adjusted EBITDA Margin | | | -23.6 | % | | | -12.4 | % | | +1,126 bps |
Key Operating Metrics (NORTH AMERICA STREAMING) | | 4Q22 | | | 4Q23 | | | 4Q23 YoY % |
| Subscribers (thousands) | | | 1,445 | | | | 1,618 | | | +12% |
| Revenue ($ in millions) | | $ | 312.1 | | | $ | 401.8 | | | +29% |
| ARPU | | $ | 75.20 | | | $ | 86.65 | | | +15% |
1 Except as otherwise indicated, financial information presented in this letter reflects Fubo’s results on a continuing operations basis, which excludes our former wagering reportable segment. See “Basis of Presentation – Continuing Operations” below.
2 Our consolidated Net Loss for 4Q23 was $70.5 million, which includes $0.5 million gain from discontinued operations. Net Loss from continuing operations was $71.0 million.
| | | |
| | | 2 |
Key Operating Metrics (REST OF WORLD STREAMING) | | 4Q22 | | | 4Q23 | | | 4Q23 YoY % |
| Subscribers (thousands) | | | 420 | | | | 406 | | | -3% |
| Revenue ($ in millions) | | $ | 7.2 | | | $ | 8.4 | | | +18% |
| ARPU | | $ | 6.09 | | | $ | 6.81 | | | +12% |
| Guidance (NA) | | 1Q24 | | FY24 |
| Revenue ($ in millions) | | $365-$375 | | $1,505-$1,525 |
| Subscribers (thousands) | | 1,415-1,435 | | 1,665-1,685 |
| Guidance (ROW) | | 1Q24 | | FY24 |
| Revenue ($ in millions) | | $6.6-$8.6 | | $31-$35 |
| Subscribers (thousands) | | 380-385 | | 390-410 |
Net Loss from continuing operations in the fourth quarter was $71 million, leading to an earnings per share (EPS) loss of $0.24. This compares favorably to a Net Loss from continuing operations of $95.9 million, or an EPS loss of $0.48 in the fourth quarter of 2022. Adjusted EPS in the fourth quarter of 2023 improved to a loss of $0.17, compared to an adjusted EPS loss of $0.39 in Q4 2022. Adjusted EPS excludes the impact of stock-based compensation, amortization of intangibles, amortization of debt discount and other non-cash items.
In Q4 2023 we achieved a $15 million improvement in Free Cash Flow and a $25 million improvement in AEBITDA, when compared to Q4 2022. These improvements were a result of our ongoing efforts to drive operating leverage across the business, and represent the 4th consecutive quarter of year-over-year improvements in these metrics.
We maintained a strong balance sheet and healthy liquidity position, ending the quarter with $251 million in cash, cash equivalents and restricted cash. We believe that we have sufficient liquidity to fund our current operating plan as we progress towards our stated profitability goals.
| | | |
| | | 3 |
Q4 2023 Operational Highlights
North America Ad Sales
Fubo delivered North America ad revenue of $38.6 million in the quarter, an increase of 15% year-over-year. 2023 FY ad revenues were $114 million for a year-over-year increase of 14%. This performance reflects the continued positive impact of our improved go-to market strategies to better leverage our premium sports-first content and our highly sought-after audience with top agency holding companies. This is especially true around key tentpoles and seasonal events that typically drive higher viewer engagement and premium CPMs.
We ended the year with 158 FAST channels on the platform. FAST channels represent a key pillar of our strategy to provide a greater diversity of content to our users and, at the same time, expand advertising.
North America Content
We continue to gain added leverage over our subscriber related expenses (SRE), which decreased from 93% to 87% of revenue in Q4 versus the same period in the prior year. We expect this year-over-year trend to continue as we work to grow subscribers, optimize our pricing, manage our cost structure, and further improve our mix of premium plans.
| | | |
| | | 4 |
Product Roadmap
In 2023, Fubo made significant progress on the roll-out of our global Unified Platform (UP), with every application being re-built and re-designed to better leverage technology synergies across the globe. This new technical architecture is already allowing us to rapidly iterate our product experience while also laying the foundation for additional platform level enhancements. We expect to deliver an increasingly personalized Fubo experience, including incorporating various AI features. We will also continue to focus on building our technology advantage to create must-have product features designed with the consumer top of mind across the entire demand curve at a range of price points.
Guidance
North America Streaming
Our FY 2024 subscriber guidance projects 1,665,000 to 1,685,000 subscribers, representing 4% year-over-year growth at the midpoint. This reflects conservatism in our outlook, and in particular, our exposure to potential industry volatility, and our intention to maintain discipline in subscriber acquisition costs relative to monetization.
Our FY 2024 revenue guidance projects $1,505 to $1,525 million, representing 13% year-over-year growth at the midpoint. Our projection of revenue growth meaningfully outpacing subscriber growth reflects our continued expectation of ARPU expansion as the result of improved unit economics and margin gains.
Our 1Q 2024 subscriber guidance projects 1,415,000 to 1,435,000 subscribers, representing 11% year-over-year growth at the midpoint. Our 1Q 2024 revenue guidance projects $365 to $375 million, representing 17% year-over-year growth at the midpoint.
Rest of World
Our FY 2024 subscriber guidance projects 390,000 to 410,000 subscribers, representing a -2% year-over-year decline at the midpoint. Our FY 2024 revenue guidance projects $31 to $35 million, representing 2% year-over-year growth at the midpoint.
Our 1Q 2024 subscriber guidance projects 380,000 to 385,000 subscribers, representing 1% year-over-year growth at the midpoint. Our 1Q 2024 revenue guidance projects $6.6 to $8.6 million, representing a -2% year-over-year decline at the midpoint.
Conclusion
As we enter 2024, we remain focused on continuing to provide consumers a differentiated experience, while also balancing profitability targets and growth. We believe that our balance sheet, which includes $251 million in cash, cash equivalents and restricted cash, provides us with liquidity to both continue to strategically support the business and reach positive cash flow in 2025. Our company has never been more aligned in its vision and strategy, and we are excited about the opportunities ahead of us to deliver long-term value to our employees, partners, customers, and shareholders.
We look forward to keeping you updated on our progress in the quarters to come.
Sincerely,
| David Gandler, co-founder and CEO | | Edgar Bronfman Jr., executive chairman | |
| | | |
| | | 5 |
Q4 2023 Earnings Live Conference Call
Fubo CEO, David Gandler, and CFO, John Janedis, will host a live conference call today at 8:30 a.m. ET to deliver brief remarks followed by Q&A. The live webcast will be available on the Events & Presentations page of Fubo’s investor relations website. An archived replay will be available on Fubo’s website following the call. Participants should join the call 10 minutes prior to ensure that they are connected prior to the event.
More Information
We encourage you to read our full set of financial statements and SEC filings, and to sign up for email alerts, on the investor relations section of our website at ir.fubo.tv.
Additional information is available at www.sec.gov under FuboTV Inc.’s filings, as well as https://ir.fubo.tv.
Fubo intends to use its website as a disclosure channel and investors are encouraged to refer to it, as well as press releases and SEC filings. The company encourages reading the full set of financial statements and related disclosures in its Annual Report on Form 10-K for the year ended December 31, 2023 that will be filed with the SEC.
About Fubo
With a global mission to aggregate the best in TV, including premium sports, news and entertainment content, through a single app, FuboTV Inc. (d/b/a Fubo) (NYSE: FUBO) aims to transcend the industry’s current TV model. The company operates Fubo in the U.S., Canada and Spain and Molotov in France.
In the U.S., Fubo is a sports-first cable TV replacement product that aggregates more than 300 live sports, news and entertainment networks and is the only live TV streaming platform with every Nielsen-rated sports channel (source: Nielsen Total Viewers, 2023). Leveraging Fubo’s proprietary data and technology platform optimized for live TV and sports viewership, subscribers can engage with the content they are watching through an intuitive and personalized streaming experience. Fubo has continuously pushed the boundaries of live TV streaming. It was the first virtual MVPD to launch 4K streaming and MultiView, which it did years ahead of its peers, as well as Instant Headlines, a first-of-its-kind AI feature that generates contextual news topics as they are reported live on air.
Learn more at https://fubo.tv
| | | |
| | | 6 |
Forward-Looking Statements
This letter contains forward-looking statements of FuboTV Inc. (“Fubo”) that involve substantial risks and uncertainties. All statements contained in this letter that do not relate to matters of historical fact are forward-looking statements within the meaning of The Private Securities Litigation Reform Act of 1995, including statements regarding our business strategy and plans, including content partnerships, market opportunity, expectations regarding innovation, growth, profitability and becoming cash flow positive in 2025, industry, advertising and consumer trends, anticompetitive practices among our competitors and our response plan, planned product offerings, including technology advancements, our anticipated cash requirements, our financial condition and our anticipated financial performance, including quarterly and annual guidance, and cash flow and Adjusted EBITDA targets. The words “could,” “will,” “plan,” “intend,” “anticipate,” “approximate,” “expect,” “potential,” “believe” or the negative of these terms or other similar expressions are intended to identify forward-looking statements, although not all forward-looking statements contain these identifying words. Actual results or events could differ materially from the plans, intentions and expectations disclosed in the forward-looking statements that Fubo makes due to a number of important factors, including but not limited to the following: our ability to achieve or maintain profitability; risks related to our access to capital and fundraising prospects to fund our financial operations and support our planned business growth; our revenue and gross profit are subject to seasonality; our operating results may fluctuate; our ability to effectively manage our growth; the long-term nature of our content commitments; our ability to renew our long-term content contracts on sufficiently favorable terms; our ability to attract and retain subscribers; obligations imposed on us through our agreements with certain distribution partners; we may not be able to license streaming content or other rights on acceptable terms; the restrictions imposed by content providers on our distribution and marketing of our products and services; our reliance on third party platforms to operate certain aspects of our business; risks related to the difficulty in measuring key metrics related to our business; risks related to preparing and forecasting our financial results; risks related to the highly competitive nature of our industry; risks related to our technology, as well as cybersecurity and data privacy-related risks; risks related to ongoing or future legal proceedings; and other risks, including the effects of industry, market, economic, political or regulatory conditions, future exchange and interest rates, and changes in tax and other laws, regulations, rates and policies. Further risks that could cause actual results to differ materially from those matters expressed in or implied by such forward-looking statements are discussed in our Quarterly Report on Form 10-Q for the quarterly period ended September 30, 2023 filed with the Securities and Exchange Commission (“SEC”), our Annual Report on Form 10-K for the year ended December 31, 2023 to be filed with the SEC, and our other periodic filings with the SEC. We encourage you to read such risks in detail. The forward-looking statements in this letter represent Fubo’s views as of the date of this letter. Fubo anticipates that subsequent events and developments will cause its views to change. However, while it may elect to update these forward-looking statements at some point in the future, it specifically disclaims any obligation to do so. You should, therefore, not rely on these forward-looking statements as representing Fubo’s views as of any date subsequent to the date of this letter.
(FuboTV Inc. Financial Statements begin on the following pages)
| | | |
| | | 7 |
fuboTV Inc.
Condensed Consolidated Statements of Operations and Comprehensive Loss
(in thousands, except share and per share amounts)
| | | For the Three Months Ended | | | For the Years Ended | |
| | | December 31, | | | December 31, | |
| | | 2023 | | | 2022 | | | 2023 | | | 2022 | |
| | | Unaudited | | | Unaudited | | | Audited | | | Audited | |
| Revenues | | | | | | | | | | | | | | | | |
| Subscription | | $ | 370,087 | | | $ | 284,864 | | | $ | 1,249,579 | | | $ | 905,886 | |
| Advertising | | | 38,987 | | | | 33,853 | | | | 115,370 | | | | 101,739 | |
| Other | | | 1,107 | | | | 598 | | | | 3,276 | | | | 1,071 | |
| Total revenues | | | 410,181 | | | | 319,315 | | | | 1,368,225 | | | | 1,008,696 | |
| Operating expenses | | | | | | | | | | | | | | | | |
| Subscriber related expenses | | | 354,854 | | | | 297,388 | | | | 1,213,253 | | | | 976,415 | |
| Broadcasting and transmission | | | 15,546 | | | | 19,315 | | | | 68,824 | | | | 73,377 | |
| Sales and marketing | | | 69,786 | | | | 57,615 | | | | 207,045 | | | | 183,615 | |
| Technology and development | | | 14,164 | | | | 14,905 | | | | 67,675 | | | | 69,264 | |
| General and administrative | | | 18,286 | | | | 15,436 | | | | 64,282 | | | | 81,151 | |
| Depreciation and amortization | | | 9,638 | | | | 8,557 | | | | 36,496 | | | | 36,731 | |
| Total operating expenses | | | 482,274 | | | | 413,216 | | | | 1,657,575 | | | | 1,420,553 | |
| Operating loss | | | (72,093 | ) | | | (93,901 | ) | | | (289,350 | ) | | | (411,857 | ) |
| | | | | | | | | | | | | | | | | |
| Other income (expense) | | | | | | | | | | | | | | | | |
| Interest expense | | | (3,457 | ) | | | (3,568 | ) | | | (13,712 | ) | | | (14,194 | ) |
| Interest income | | | 2,908 | | | | 1,546 | | | | 10,971 | | | | 2,498 | |
| Amortization of debt discount | | | (656 | ) | | | (632 | ) | | | (2,574 | ) | | | (2,476 | ) |
| Gain (loss) on extinguishment of debt | | | 1,607 | | | | - | | | | 1,607 | | | | - | |
| Change in fair value of warrant liabilities | | | - | | | | - | | | | - | | | | (1,701 | ) |
| Other income (expense) | | | 252 | | | | 124 | | | | (923 | ) | | | 1,019 | |
| Total other income (expense) | | | 654 | | | | (2,530 | ) | | | (4,631 | ) | | | (14,854 | ) |
| | | | | | | | | | | | | | | | | |
| Loss from continuing operations before income taxes | | | (71,439 | ) | | | (96,431 | ) | | | (293,981 | ) | | | (426,711 | ) |
| Income tax benefit | | | 397 | | | | 516 | | | | 879 | | | | 1,666 | |
| Net loss from continuing operations | | | (71,042 | ) | | | (95,915 | ) | | | (293,102 | ) | | | (425,045 | ) |
| | | | | | | | | | | | | | | | | |
| Discontinued operations | | | | | | | | | | | | | | | | |
| Income (loss) from discontinued operations before income taxes | | | 515 | | | | (56,167 | ) | | | 5,185 | | | | (136,874 | ) |
| Income tax benefit | | | - | | | | - | | | | - | | | | - | |
| Net income (loss) from discontinued operations | | | 515 | | | | (56,167 | ) | | | 5,185 | | | | (136,874 | ) |
| | | | | | | | | | | | | | | | | |
| Net loss | | | (70,527 | ) | | | (152,082 | ) | | | (287,917 | ) | | | (561,919 | ) |
| | | | | | | | | | | | | | | | | |
| Less: Net loss attributable to non-controlling interest | | | 437 | | | | 101 | | | | 463 | | | | 442 | |
| Net loss attributable to common shareholders | | $ | (70,090 | ) | | $ | (151,981 | ) | | $ | (287,454 | ) | | $ | (561,477 | ) |
| | | | | | | | | | | | | | | | | |
| Other comprehensive income (loss) | | | | | | | | | | | | | | | | |
| Foreign currency translation adjustment | | | 3,857 | | | | 10,840 | | | | 4,822 | | | | (767 | ) |
| Comprehensive loss attributable to common shareholders | | $ | (66,233 | ) | | $ | (141,141 | ) | | $ | (282,632 | ) | | $ | (562,244 | ) |
| | | | | | | | | | | | | | | | | |
| Net loss per share attributable to common shareholders | | | | | | | | | | | | | | | | |
| Basic and diluted loss per share from continuing operations | | $ | (0.24 | ) | | $ | (0.48 | ) | | $ | (1.06 | ) | | $ | (2.33 | ) |
| Basic and diluted income (loss) per share from discontinued operations | | $ | 0.00 | | | $ | (0.28 | ) | | $ | 0.02 | | | $ | (0.75 | ) |
| Basic and diluted net loss per share | | $ | (0.24 | ) | | $ | (0.76 | ) | | $ | (1.04 | ) | | $ | (3.08 | ) |
| Weighted average shares outstanding: | | | | | | | | | | | | | | | | |
| Basic and diluted | | | 294,737,521 | | | | 200,129,461 | | | | 276,282,572 | | | | 182,472,069 | |
| | | | | | | | | | | | | | | | | |
| Stock-based compensation was allocated as follows: | | | | | | | | | | | | | | | | |
| Subscriber related expenses | | | 64 | | | | 53 | | | | 211 | | | | 144 | |
| Sales and marketing | | | 4,308 | | | | 3,699 | | | | 22,886 | | | | 22,198 | |
| Technology and development | | | 3,101 | | | | 2,538 | | | | 12,024 | | | | 9,998 | |
| General and administrative | | | 4,291 | | | | 3,623 | | | | 16,094 | | | | 20,114 | |
| Total stock-based compensation | | | 11,764 | | | | 9,913 | | | | 51,215 | | | | 52,454 | |
| | | |
| | | 8 |
fuboTV Inc.
Condensed Consolidated Balance Sheets
(in thousands)
| | | December 31, | | | December 31, | |
| | | 2023 | | | 2022 | |
| | | Unaudited | | | Audited | |
| ASSETS | | | | | | | | |
| Cash and cash equivalents | | $ | 245,278 | | | $ | 337,087 | |
| Accounts receivable, net | | | 80,299 | | | | 43,996 | |
| Prepaid sports rights | | | 39,911 | | | | 37,668 | |
| Prepaid and other current assets | | | 20,804 | | | | 13,508 | |
| Assets of discontinued operations | | | 462 | | | | 4,643 | |
| Total current assets | | | 386,754 | | | | 436,902 | |
| | | | | | | | | |
| Property and equipment, net | | | 4,835 | | | | 4,975 | |
| Restricted cash | | | 6,142 | | | | 6,139 | |
| Intangible assets, net | | | 158,448 | | | | 171,832 | |
| Goodwill | | | 622,818 | | | | 618,506 | |
| Right-of-use assets | | | 35,825 | | | | 35,888 | |
| Other non-current assets | | | 17,818 | | | | 3,532 | |
| Total assets | | $ | 1,232,640 | | | $ | 1,277,774 | |
| | | | | | | | | |
| LIABILITIES, TEMPORARY EQUITY AND SHAREHOLDERS’ EQUITY | | | | | | | | |
| Current liabilities | | | | | | | | |
| Accounts payable | | | 74,311 | | | | 66,952 | |
| Accrued expenses and other current liabilities | | | 320,041 | | | | 264,415 | |
| Notes payable | | | 6,323 | | | | 5,687 | |
| Deferred revenue | | | 90,203 | | | | 65,370 | |
| Long-term borrowings - current portion | | | 1,612 | | | | 1,986 | |
| Current portion of lease liabilities | | | 5,247 | | | | 1,763 | |
| Liabilities of discontinued operations | | | 19,608 | | | | 32,581 | |
| Total current liabilities | | | 517,345 | | | | 438,754 | |
| | | | | | | | | |
| Convertible notes, net of discount | | | 391,748 | | | | 394,094 | |
| Deferred income taxes | | | - | | | | 765 | |
| Lease liabilities | | | 38,087 | | | | 39,266 | |
| Other long-term liabilities | | | 1,635 | | | | 1,565 | |
| Total liabilities | | | 948,815 | | | | 874,444 | |
| | | | | | | | | |
| Redeemable non-controlling interest | | | - | | | | 1,648 | |
| | | | | | | | | |
| Shareholders’ equity: | | | | | | | | |
| Common stock par value $0.0001: 800,000,000 shares authorized; 299,215,160 and 209,684,548 shares issued and outstanding at December 31, 2023 and December 31, 2022, respectively | | | 30 | | | | 21 | |
| Additional paid-in capital | | | 2,136,870 | | | | 1,972,006 | |
| Accumulated deficit | | | (1,845,542 | ) | | | (1,558,088 | ) |
| Non-controlling interest | | | (11,751 | ) | | | (11,662 | ) |
| Accumulated other comprehensive income (loss) | | | 4,218 | | | | (595 | ) |
| Total shareholders’ equity | | | 283,825 | | | | 401,682 | |
| TOTAL LIABILITIES AND SHAREHOLDERS’ EQUITY AND TEMPORARY EQUITY | | $ | 1,232,640 | | | $ | 1,277,774 | |
| | | |
| | | 9 |
fuboTV Inc.
Condensed Consolidated Statements of Cash Flows
(in thousands)
| | | For the Twelve Months Ended | |
| | | December 31, | |
| | | 2023 | | | 2022 | |
| | | Unaudited | | | Unaudited | |
| Cash flows from operating activities | | | | | | | | |
| Net loss | | $ | (287,917 | ) | | $ | (561,919 | ) |
| Less: Income (loss) from discontinued operations, net of tax | | | 5,185 | | | | (136,874 | ) |
| Net loss from continuing operations | | | (293,102 | ) | | | (425,045 | ) |
| Adjustments to reconcile net loss to net cash used in operating activities: | | | | | | | | |
| Depreciation and amortization | | | 36,496 | | | | 36,731 | |
| Stock-based compensation | | | 51,215 | | | | 52,454 | |
| Amortization of debt discount | | | 2,574 | | | | 2,476 | |
| Gain on extinguishment of debt | | | (1,607 | ) | | | - | |
| Deferred income tax benefit | | | (995 | ) | | | (1,666 | ) |
| Change in fair value of warrant liabilities | | | - | | | | 1,701 | |
| Amortization of right-of-use assets | | | 3,126 | | | | 3,078 | |
| Other adjustments | | | 695 | | | | 1,155 | |
| Changes in operating assets and liabilities of business, net of acquisitions: | | | | | | | | |
| Accounts receivable, net | | | (36,200 | ) | | | (9,778 | ) |
| Prepaid expenses and other assets | | | (14,498 | ) | | | (950 | ) |
| Prepaid sports rights | | | (1,525 | ) | | | (34,384 | ) |
| Accounts payable | | | 6,635 | | | | 12,014 | |
| Accrued expenses and other liabilities | | | 52,180 | | | | 50,116 | |
| Deferred revenue | | | 24,774 | | | | 21,102 | |
| Lease liabilities | | | (2,813 | ) | | | 1,210 | |
| Net cash used in operating activities - continuing operations | | | (173,045 | ) | | | (289,786 | ) |
| Net cash used in operating activities - discontinued operations | | | (4,577 | ) | | | (26,915 | ) |
| Net cash used in operating activities | | | (177,622 | ) | | | (316,701 | ) |
| | | | | | | | | |
| Cash flows from investing activities | | | | | | | | |
| Purchases of short-term investments | | | - | | | | (100,000 | ) |
| Proceeds from maturity of short-term investments | | | - | | | | 100,000 | |
| Purchases of property and equipment | | | (1,071 | ) | | | (1,130 | ) |
| Sale of property and equipment | | | 28 | | | | - | |
| Capitalization of Internal Use Software | | | (17,282 | ) | | | (4,857 | ) |
| Purchase of intangible assets | | | (3,592 | ) | | | - | |
| Purchase of strategic investment | | | (3,500 | ) | | | - | |
| Net cash used in investing activities - continuing operations | | | (25,417 | ) | | | (5,987 | ) |
| Net cash used in investing activities - discontinued operations | | | - | | | | (6,436 | ) |
| Net cash used in investing activities | | | (25,417 | ) | | | (12,423 | ) |
| | | | | | | | | |
| Cash flows from financing activities | | | | | | | | |
| Proceeds from sale of common stock, net of fees | | | 116,886 | | | | 292,123 | |
| Redemption of non-controlling interest | | | (2,147 | ) | | | - | |
| Repurchase of convertible notes | | | (3,313 | ) | | | - | |
| Vested restricted stock unit settled for cash | | | (125 | ) | | | - | |
| Proceeds from exercise of stock options | | | 373 | | | | 829 | |
| Proceeds from the exercise of warrants | | | - | | | | 5,000 | |
| Repayments of notes payable and long-term borrowings | | | (441 | ) | | | (1,682 | ) |
| Net cash provided by financing activities - continuing operations | | | 111,233 | | | | 296,270 | |
| Net cash provided by financing activities - discontinued operations | | | - | | | | - | |
| Net cash provided by financing activities | | | 111,233 | | | | 296,270 | |
| | | | | | | | | |
| Net decrease in cash, cash equivalents and restricted cash | | | (91,806 | ) | | | (32,854 | ) |
| Cash, cash equivalents and restricted cash at beginning of period | | | 343,226 | | | | 376,080 | |
| Cash, cash equivalents and restricted cash at end of period | | $ | 251,420 | | | $ | 343,226 | |
| | | | | | | | | |
| Supplemental disclosure of cash flows information: | | | | | | | | |
| Interest paid | | | 13,169 | | | | 13,469 | |
| Income tax paid | | | 258 | | | | - | |
| | | | | | | | | |
| Non cash financing and investing activities: | | | | | | | | |
| Strategic investment - marketing commitment | | | 4,000 | | | | - | |
| Reclassification of the equity components of the 2026 Convertible Notes to liability upon adoption of ASU 2020-06 | | | - | | | | 75,264 | |
| Cashless exercise of warrants | | | - | | | | 5,249 | |
| Accrued expenses - At-the-market offering | | | 15 | | | | 18 | |
| Accounts payable - purchase of intangible assets | | | 540 | | | | - | |
| Accounts payable - purchase of property and equipment | | | 12 | | | | - | |
| | | |
| | | 10 |
Basis of Presentation – Continuing Operations
In connection with the dissolution of Fubo Gaming, Inc. and termination of Fubo Sportsbook, the assets and liabilities and the operations of our former wagering reportable segment are presented as discontinued operations in our consolidated financial statements. With respect to our continuing operations, we operate as a single reportable segment. Financial information presented in this letter reflects Fubo’s results on a continuing operations basis, which excludes our former wagering reportable segment.
Key Performance Metrics and Non-GAAP Measures
Paid Subscribers
We believe the number of paid subscribers is a relevant measure to gauge the size of our user base. Paid subscribers (“subscribers”) are total subscribers that have completed registration with Fubo, have activated a payment method (only reflects one paying user per plan), from which Fubo has collected payment in the month ending the relevant period. Users who are on a free (trial) period are not included in this metric.
Average Revenue per User (ARPU)
Beginning in the third quarter of 2022, Average Revenue Per User (ARPU) is calculated using GAAP Subscription revenue and GAAP Advertising revenue. Previously, ARPU was calculated using Platform Bookings, which consisted of GAAP Subscription revenue and GAAP Advertising revenue, adjusted for deferred revenue.
We believe ARPU provides useful information for investors to gauge the revenue generated per subscriber on a monthly basis. ARPU, with respect to a given period, is defined as total Subscription revenue and Advertising revenue recognized in such period, divided by the average daily paid subscribers in such period, divided by the number of months in such period. Advertising revenue, like Subscription revenue, is primarily driven by the number of subscribers to our platform and per-subscriber viewership such as the type of, and duration of, content watched on platform. We believe ARPU is an important metric for both management and investors to evaluate the Company’s core operating performance and measure our subscriber monetization, as well as evaluate unit economics, payback on subscriber acquisition cost and lifetime value per subscriber. In addition, we believe that presenting a geographic breakdown for North America ARPU and ROW ARPU allows for a more meaningful assessment of the business because of the significant differences in both Subscription revenue and Advertising revenue generated on a per subscriber basis in North America when compared to ROW due to our current subscription pricing models and advertising monetization in the two geographic regions.
| | | |
| | | 11 |
Adjusted EBITDA
Adjusted EBITDA is a non-GAAP measure defined as Net Loss from Continuing Operations, adjusted for depreciation and amortization, stock-based compensation, income tax benefit, other expenses, and one-time non-cash expenses.
Adjusted EBITDA Margin
Adjusted EBITDA Margin is a non-GAAP measure defined as Adjusted EBITDA divided by Revenue.
Adjusted Net Loss
Adjusted Net Loss is a non-GAAP measure defined as Net Loss Attributable to Common Shareholders, adjusting for discontinued operations, stock-based compensation, change in fair value of warrants, amortization of debt discount, amortization of intangible assets and other non-cash items.
Adjusted EPS (Earnings per Share)
Adjusted EPS is a non-GAAP measure defined as Adjusted Net Loss divided by weighted average shares outstanding.
Free Cash Flow
Free Cash Flow is a non-GAAP measure defined as net cash used in operating activities - continuing operations, reduced by capital expenditures (consisting of purchases of property and equipment), purchases of intangible assets and capitalization of internal use software. We believe Free Cash Flow is an important liquidity measure of the cash that is available for operational expenses, investments in our business, strategic acquisitions, and for certain other activities such as repaying debt obligations and stock repurchases. Free Cash Flow is a key financial indicator used by management. Free Cash Flow is useful to investors as a liquidity measure because it measures our ability to generate or use cash. The use of Free Cash Flow as an analytical tool has limitations due to the fact that it does not represent the residual cash flow available for discretionary expenditures. Because of these limitations, Free Cash Flow should be considered along with other operating and financial performance measures presented in accordance with GAAP.
Gross Profit and Gross Margin (GAAP)
Gross Profit is defined as Revenue less Subscriber related expenses and Broadcasting and transmission. Gross Margin is defined as Gross Profit divided by Revenue. We believe these measures are useful because they represent key profitability metrics for our business and are used by management to evaluate the performance of our business, including measuring the cost to deliver our product to subscribers against revenue.
Subscriber Acquisition Cost
Subscriber Acquisition Cost (SAC) reflects total GAAP sales and marketing expenses less headcount related to sales and marketing spend for a given period divided by Gross Paid Subscriber Additions for the same period.
| | | |
| | | 12 |
Reconciliation of Key Performance Metrics and Non-GAAP Financial Measures
Certain measures used in this letter, including Adjusted EBITDA, Adjusted EBITDA Margin, Adjusted Net Loss, Adjusted EPS and Free Cash Flow are non-GAAP financial measures. We believe these are useful financial measures for investors as they are supplemental measures used by management in evaluating our core operating performance. Our non-GAAP financial measures have limitations as analytical tools and you should not consider them in isolation or as a substitute for an analysis of our results under GAAP. There are a number of limitations related to the use of these non-GAAP financial measures versus their nearest GAAP equivalents. First, these non-GAAP financial measures are not a substitute for GAAP financial measures. Second, these non-GAAP financial measures may not provide information directly comparable to measures provided by other companies in our industry, as those other companies may calculate their non-GAAP financial measures differently.
The following tables include reconciliations of the non-GAAP financial measures used in this letter to their most directly comparable GAAP financial measures. The tables also include reconciliations of GAAP Subscription revenue and GAAP Advertising revenue to North America ARPU and ROW ARPU, respectively, each of which is a key performance metric.
| | | |
| | | 13 |
fuboTV Inc.
Reconciliation of GAAP Subscription and Advertising Revenue to North America ARPU
(in thousands, except average subscribers and average per user amounts)
Year-over-Year Comparison
| | | Three Months Ended | |
| | | December 31, 2023 | | | December 31, 2022 | |
| | | As-Reported | | | As-Reported | |
| Subscription Revenue (GAAP) | | $ | 370,087 | | | $ | 284,864 | |
| Advertising Revenue (GAAP) | | | 38,987 | | | | 33,853 | |
| Subtract: | | | | | | | | |
| ROW Subscription Revenue | | | (8,042 | ) | | | (6,892 | ) |
| ROW Advertising Revenue | | | (382 | ) | | | (277 | ) |
| Total | | | 400,650 | | | | 311,548 | |
| Divide: | | | | | | | | |
| Average Subscribers (North America) | | | 1,541,290 | | | | 1,380,956 | |
| Months in Period | | | 3 | | | | 3 | |
| North America Monthly Average Revenue per User (NA ARPU) | | $ | 86.65 | | | $ | 75.20 | |
| | | |
| | | 14 |
fuboTV Inc.
Reconciliation of GAAP Subscription and Advertising Revenue to North America ARPU
(in thousands, except average subscribers and average per user amounts)
Full Year Comparison
| | | Years Ended | |
| | | December 31, 2023 | | | December 31, 2022 | |
| | | As-Reported | | | As-Reported | |
| Subscription Revenue (GAAP) | | $ | 1,249,579 | | | $ | 905,886 | |
| Advertising Revenue (GAAP) | | | 115,370 | | | | 101,739 | |
| Subtract: | | | | | | | | |
| ROW Subscription Revenue | | | (31,674 | ) | | | (23,207 | ) |
| ROW Advertising Revenue | | | (1,123 | ) | | | (1,134 | ) |
| Total | | | 1,332,152 | | | | 983,284 | |
| Divide: | | | | | | | | |
| Average Subscribers (North America) | | | 1,349,647 | | | | 1,126,461 | |
| Months in Period | | | 12 | | | | 12 | |
| North America Monthly Average Revenue per User (NA ARPU) | | $ | 82.25 | | | $ | 72.74 | |
| | | |
| | | 15 |
fuboTV Inc.
Reconciliation of GAAP Subscription and Advertising Revenue to ROW ARPU
(in thousands, except average subscribers and average per user amounts)
Year-over-Year Comparison
| | | Three Months Ended | |
| | | December 31, 2023 | | | December 31, 2022 | |
| | | As-Reported | | | As-Reported | |
| Subscription Revenue (GAAP) | | $ | 370,087 | | | $ | 284,864 | |
| Advertising Revenue (GAAP) | | | 38,987 | | | | 33,853 | |
| Subtract: | | | | | | | | |
| North America Subscription Revenue | | | (362,045 | ) | | | (277,972 | ) |
| North America Advertising Revenue | | | (38,605 | ) | | | (33,576 | ) |
| Total | | | 8,424 | | | | 7,169 | |
| Divide: | | | | | | | | |
| Average Subscribers (ROW) | | | 412,565 | | | | 392,558 | |
| Months in Period | | | 3 | | | | 3 | |
| ROW Monthly Average Revenue per User (ROW ARPU) | | $ | 6.81 | | | $ | 6.09 | |
| | | |
| | | 16 |
fuboTV Inc.
Reconciliation of GAAP Subscription and Advertising Revenue to ROW ARPU
(in thousands, except average subscribers and average per user amounts)
Full Year Comparison
| | | Years Ended | |
| | | December 31, 2023 | | | December 31, 2022 | |
| | | As-Reported | | | As-Reported | |
| Subscription Revenue (GAAP) | | $ | 1,249,579 | | | $ | 905,886 | |
| Advertising Revenue (GAAP) | | | 115,370 | | | | 101,739 | |
| Subtract: | | | | | | | | |
| North America Subscription Revenue | | | (1,217,905 | ) | | | (882,679 | ) |
| North America Advertising Revenue | | | (114,247 | ) | | | (100,605 | ) |
| Total | | | 32,797 | | | | 24,341 | |
| Divide: | | | | | | | | |
| Average Subscribers (ROW) | | | 401,009 | | | | 330,222 | |
| Months in Period | | | 12 | | | | 12 | |
| ROW Monthly Average Revenue per User (ROW ARPU) | | $ | 6.82 | | | $ | 6.14 | |
| | | |
| | | 17 |
fuboTV Inc.
Reconciliation of Net Loss from Continuing Operations to Non-GAAP Adjusted EBITDA
(in thousands)
Year-over-Year Comparison
| | | Three Months Ended | |
| | | December 31, 2023 | | | December 31, 2022 | |
| | | As-Reported | | | As-Reported | |
| Reconciliation of Net Loss from Continuing Operations to Adjusted EBITDA | | | | | | | | |
| Net loss from continuing operations | | $ | (71,042 | ) | | $ | (95,915 | ) |
| Depreciation and amortization | | | 9,638 | | | | 8,557 | |
| Stock-based compensation | | | 11,764 | | | | 9,913 | |
| Other income (expense) | | | (654 | ) | | | 2,530 | |
| Income tax benefit | | | (397 | ) | | | (516 | ) |
| Adjusted EBITDA | | | (50,691 | ) | | | (75,431 | ) |
| | | | | | | | | |
| Adjusted EBITDA | | | (50,691 | ) | | | (75,431 | ) |
| Divide: | | | | | | | | |
| Revenue | | | 410,181 | | | | 319,315 | |
| Adjusted EBITDA Margin | | | -12.4 | % | | | -23.6 | % |
| | | |
| | | 18 |
fuboTV Inc.
Reconciliation of Net Loss from Continuing Operations to Non-GAAP Adjusted EBITDA
(in thousands)
Full Year Comparison
| | | Years Ended | |
| | | December 31, 2023 | | | December 31, 2022 | |
| | | As-Reported | | | As-Reported | |
| Reconciliation of Net Loss from Continuing Operations to Adjusted EBITDA | | | | | | | | |
| Net loss from continuing operations | | $ | (293,102 | ) | | $ | (425,045 | ) |
| Depreciation and amortization | | | 36,496 | | | | 36,731 | |
| Stock-based compensation | | | 51,215 | | | | 52,454 | |
| One-time non-cash operating expenses | | | - | | | | (1,162 | ) |
| Other income (expense) | | | 4,631 | | | | 14,854 | |
| Income tax benefit | | | (879 | ) | | | (1,666 | ) |
| Adjusted EBITDA | | | (201,639 | ) | | | (323,834 | ) |
| | | | | | | | | |
| Adjusted EBITDA | | | (201,639 | ) | | | (323,834 | ) |
| Divide: | | | | | | | | |
| Revenue | | | 1,368,225 | | | | 1,008,696 | |
| Adjusted EBITDA Margin | | | -14.7 | % | | | -32.1 | % |
| | | |
| | | 19 |
fuboTV Inc.
Reconciliation of Net Cash Used in Operating Activities - Continuing Operations to Free Cash Flow
(in thousands)
Year-over-Year Comparison
| | | Three Months Ended | |
| | | December 31, 2023 | | | December 31, 2022 | |
| | | As-Reported | | | As-Reported | |
| Net cash used in operating activities - continuing operations | | $ | (57 | ) | | $ | (19,118 | ) |
| Subtract: | | | | | | | | |
| Purchases of property and equipment | | | (696 | ) | | | (99 | ) |
| Capitalization of internal use software | | | (4,407 | ) | | | (1,338 | ) |
| Purchase of intangible assets | | | (693 | ) | | | - | |
| Free Cash Flow | | | (5,853 | ) | | | (20,555 | ) |
| | | |
| | | 20 |
fuboTV Inc.
Reconciliation of Net Cash Used in Operating Activities - Continuing Operations to Free Cash Flow
(in thousands)
Full Year Comparison
| | | Years Ended | |
| | | December 31, 2023 | | | December 31, 2022 | |
| | | As-Reported | | | As-Reported | |
| Net cash used in operating activities - continuing operations | | $ | (173,045 | ) | | $ | (289,786 | ) |
| Subtract: | | | | | | | | |
| Purchases of property and equipment | | | (1,071 | ) | | | (1,130 | ) |
| Capitalization of internal use software | | | (17,282 | ) | | | (4,857 | ) |
| Purchase of intangible assets | | | (3,592 | ) | | | - | |
| Free Cash Flow | | | (194,990 | ) | | | (295,773 | ) |
| | | |
| | | 21 |
fuboTV Inc.
Reconciliation of Net Loss Attributable to Common Shareholders to Non-GAAP Adjusted Net Loss and Adjusted EPS
(in thousands)
Year-over-Year Comparison
| | | Three Months Ended | |
| | | December 31, 2023 | | | December 31, 2022 | |
| | | As-Reported | | | As-Reported | |
| Net loss attributable to common shareholders | | $ | (70,090 | ) | | $ | (151,981 | ) |
| Subtract: | | | | | | | | |
| Net income (loss) from discontinued operations, net of tax | | | 515 | | | | (56,167 | ) |
| Net loss from continuing operations attributable to common shareholders | | | (70,605 | ) | | | (95,814 | ) |
| | | | | | | | | |
| Net loss from continuing operations attributable to common shareholders | | | (70,605 | ) | | | (95,814 | ) |
| Stock-based Compensation | | | 11,764 | | | | 9,913 | |
| Amortization of debt discount | | | 656 | | | | 632 | |
| Amortization of intangibles | | | 9,282 | | | | 8,241 | |
| Adjusted net loss from continuing operations | | | (48,903 | ) | | | (77,028 | ) |
| | | | | | | | | |
| Weighted average shares outstanding: | | | | | | | | |
| Basic and diluted | | | 294,737,521 | | | | 200,129,461 | |
| | | | | | | | | |
| Adjusted EPS from continuing operations | | $ | (0.17 | ) | | $ | (0.39 | ) |
| | | |
| | | 22 |
fuboTV Inc.
Reconciliation of Net Loss Attributable to Common Shareholders to Non-GAAP Adjusted Net Loss and Adjusted EPS
(in thousands)
Full Year Comparison
| | | Years Ended | |
| | | December 31, 2023 | | | December 31, 2022 | |
| | | As-Reported | | | As-Reported | |
| Net loss attributable to common shareholders | | $ | (287,454 | ) | | $ | (561,477 | ) |
| Subtract: | | | | | | | | |
| Net loss from discontinued operations, net of tax | | | 5,185 | | | | (136,874 | ) |
| Net loss from continuing operations attributable to common shareholders | | | (292,639 | ) | | | (424,603 | ) |
| | | | | | | | | |
| Net loss from continuing operations attributable to common shareholders | | | (292,639 | ) | | | (424,603 | ) |
| Stock-based Compensation | | | 51,215 | | | | 52,454 | |
| Other Non-GAAP Adj.* | | | - | | | | 1,701 | |
| Amortization of debt discount | | | 2,574 | | | | 2,476 | |
| Amortization of intangibles | | | 35,043 | | | | 35,484 | |
| Adjusted net loss from continuing operations | | | (203,807 | ) | | | (332,488 | ) |
| | | | | | | | | |
| Weighted average shares outstanding: | | | | | | | | |
| Basic and diluted | | | 276,282,572 | | | | 182,472,069 | |
| | | | | | | | | |
| Adjusted EPS from continuing operations | | $ | (0.73 | ) | | $ | (1.83 | ) |
*Includes Change in fair value of warrant liabilities in 2022
| | | |
| | | 23 |
# # #
Contacts
Investor Contacts:
Alison Sternberg, Fubo
asternberg@fubo.tv
JCIR for Fubo
ir@fubo.tv
Media Contacts:
Jennifer L. Press, Fubo
jpress@fubo.tv
Bianca Illion, Fubo
billion@fubo.tv
| | | |
| | | 24 |