© THREDUP The following contains confidential information. Do not distribute without permission. INVESTOR PRESENTATION Fourth Quarter 2023
2© THREDUP This presentation and the accompanying oral commentary contains forward-looking statements within the meaning of the federal securities laws, which are statements that involve substantial risks and uncertainties. Forward-looking statements generally relate to future events or our future financial or operating performance. In some cases, you can identify forward-looking statements because they contain words such as “may,” “will,” “shall,” “should,” “expects,” “plans,” “anticipates,” “could,” “intends,” “target,” “projects,” “contemplates,” “believes,” “estimates,” “predicts,” “potential” or “continue” or the negative of these words or other similar terms or expressions that concern our expectations, strategy, plans or intentions. Forward-looking statements in this presentation include, but are not limited to, guidance on financial results for the first quarter and full year of 2024; statements about future operating results, capital expenditures and other developments in our business in the U.S. and Europe and our long term growth; the momentum of our business; our investments in technology and infrastructure, including our AI-powered search experience; our ability to successfully integrate and realize the benefits of our past or future strategic acquisitions, investments or restructuring activities; the success and expansion of our RaaS model and the timing and plans for future RaaS clients; and our ability to attract new Active Buyers. Forward-looking statements are neither historical facts nor assurances of future performance. Forward-looking statements involve substantial risks and uncertainties that may cause actual results to differ materially from those that we expect, including those more fully described in our filings with the Securities and Exchange Commission (“SEC”), including in the sections entitled “Risk Factors” and “Management’s Discussion and Analysis of Financial Condition and Results of Operations”. These risks and uncertainties include, but are not limited to: our ability to attract new users and convert users into buyers and active buyers; our ability to achieve profitability; the sufficiency of our cash, cash equivalents and capital resources to meet our liquidity needs; our ability to effectively manage or sustain our growth and to effectively expand our operations; our ability to continue to generate revenue from new RaaS offerings as sources of revenue; risks from an intensely competitive market; our ability to effectively deploy new and evolving technologies, such as artificial intelligence and machine learning, in our offerings; risks arising from economic and industry trends, including the effects of foreign currency exchange rate fluctuations, inflationary pressures, increased interest rates, changing consumer habits, climate change and general global economic uncertainty; our ability to comply with applicable laws and regulations; and our ability to successfully integrate and realize the benefits of our past or future strategic acquisitions or investments. The forward-looking statements in this presentation are based on information available to us as of the date hereof, and we disclaim any obligation to update any forward-looking statements, except as required by law. These forward-looking statements should not be relied upon as representing ThredUp’s views as of any date subsequent to the date of this press release. Additional information regarding these and other factors that could affect ThredUp's results is included in ThredUp’s SEC filings, which may be obtained by visiting our Investor Relations website at ir.thredup.com or the SEC's website at www.sec.gov. This presentation also contain estimates and other statistical data made by third parties and by the Company relating to market size, growth, sustainability metrics and other industry data. These data involve a number of assumptions and limitations, and you are cautioned not to give undue weight to such estimates. The Company has not independently verified the statistical and other industry data generated by third parties and contained in this presentation and, accordingly, it cannot guarantee their accuracy or completeness. In addition, projections, assumptions and estimates of its future performance and the future performance of the markets in which it competes are necessarily subject to a high degree of uncertainty and risk due to a variety of factors. These and other factors could cause results or outcomes to differ materially from those expressed in the estimates made by the third parties and by the Company. In addition to our results determined in accordance with GAAP, this presentation includes certain non-GAAP financial measures, including Adjusted EBITDA, Adjusted EBITDA margin, non-GAAP Operations, Product and Technology Expense, non-GAAP Marketing Expense and non-GAAP SG&A Expense, which we believe are useful in evaluating our operating performance. We use these non-GAAP measures to evaluate and assess our operating performance and the operating leverage in our business, and for internal planning and forecasting purposes. We believe that these non-GAAP measures, when taken collectively with our GAAP results, may be helpful to investors because they provide consistency and comparability with past financial performance and assist in comparisons with other companies, some of which use similar non-GAAP financial information to supplement their GAAP results. Theses non-GAAP measures are presented for supplemental informational purposes only, should not be considered a substitute for financial information presented in accordance with GAAP and may be different from similarly-titled non-GAAP measures used by other companies. A reconciliation is provided below for these non-GAAP measures to the most directly comparable financial measure stated in accordance with GAAP. Investors are encouraged to review our results determined in accordance with GAAP and the reconciliation of these non-GAAP measures. Safe Harbor

@ThredUp 3 ThredUp’s mission is to inspire the world to think secondhand first.
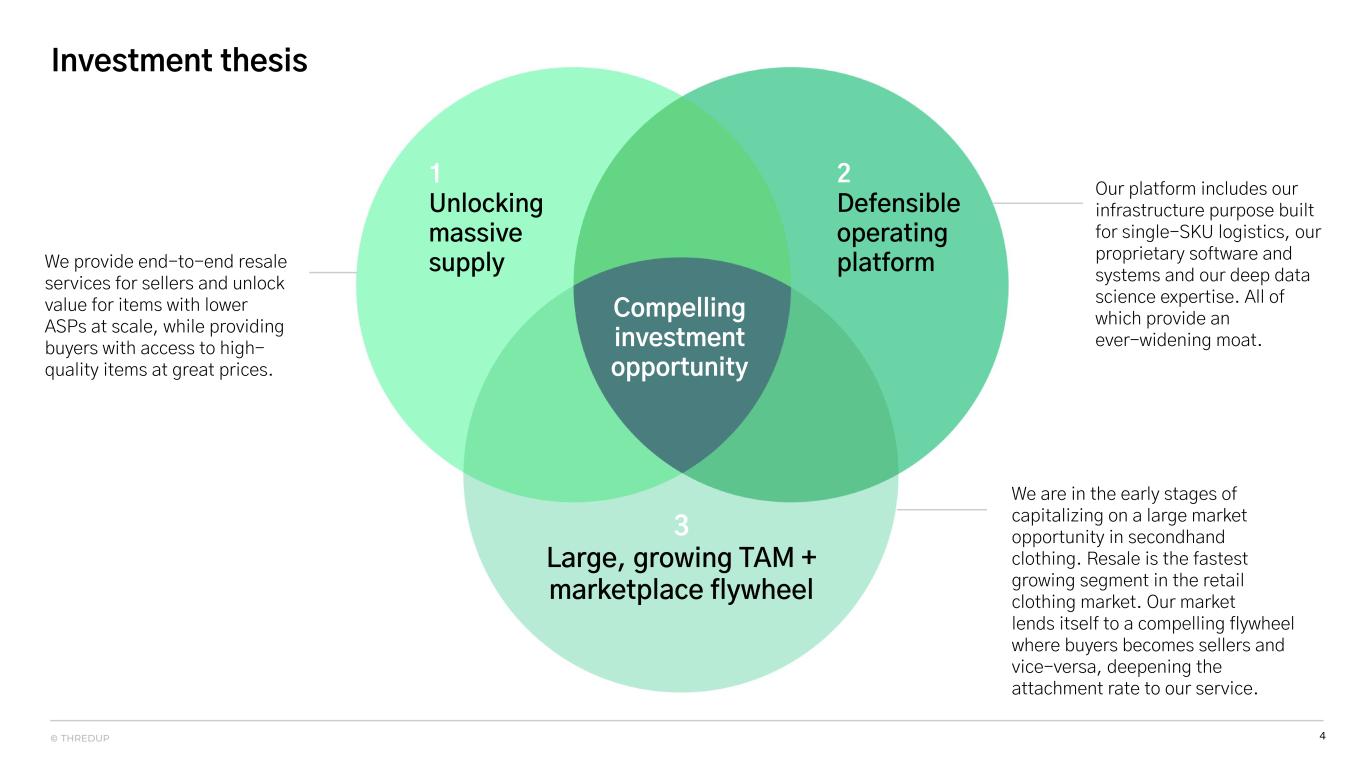
4© THREDUP Compelling investment opportunity 2 Defensible operating platform 1 Unlocking massive supply Investment thesis 3 Large, growing TAM + marketplace flywheel Our platform includes our infrastructure purpose built for single-SKU logistics, our proprietary software and systems and our deep data science expertise. All of which provide an ever-widening moat. We provide end-to-end resale services for sellers and unlock value for items with lower ASPs at scale, while providing buyers with access to high- quality items at great prices. We are in the early stages of capitalizing on a large market opportunity in secondhand clothing. Resale is the fastest growing segment in the retail clothing market. Our market lends itself to a compelling flywheel where buyers becomes sellers and vice-versa, deepening the attachment rate to our service.
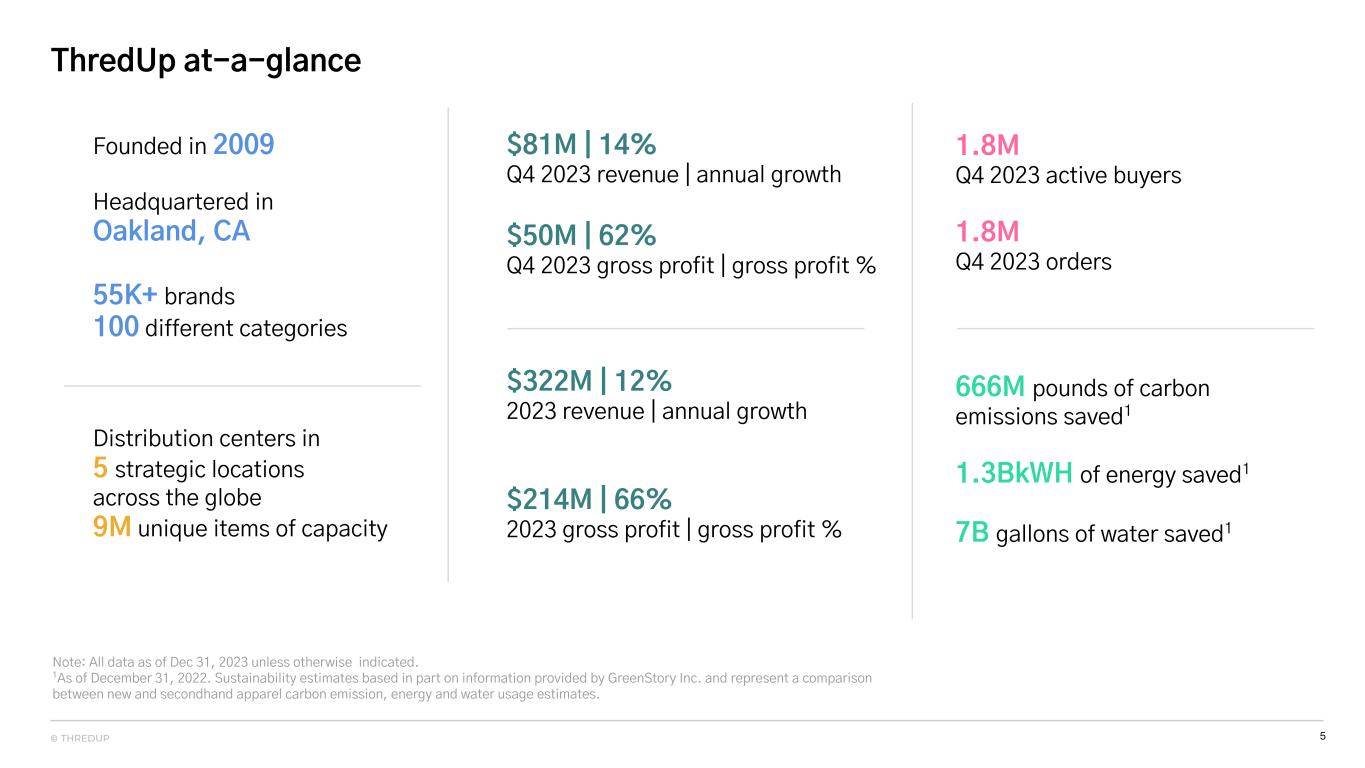
5© THREDUP ThredUp at-a-glance $81M | 14% Q4 2023 revenue | annual growth $50M | 62% Q4 2023 gross profit | gross profit % $322M | 12% 2023 revenue | annual growth $214M | 66% 2023 gross profit | gross profit % 1.8M Q4 2023 active buyers 1.8M Q4 2023 orders 666M pounds of carbon emissions saved1 1.3BkWH of energy saved1 7B gallons of water saved1 Founded in 2009 Headquartered in Oakland, CA 55K+ brands 100 different categories Distribution centers in 5 strategic locations across the globe 9M unique items of capacity Note: All data as of Dec 31, 2023 unless otherwise indicated. 1As of December 31, 2022. Sustainability estimates based in part on information provided by GreenStory Inc. and represent a comparison between new and secondhand apparel carbon emission, energy and water usage estimates.
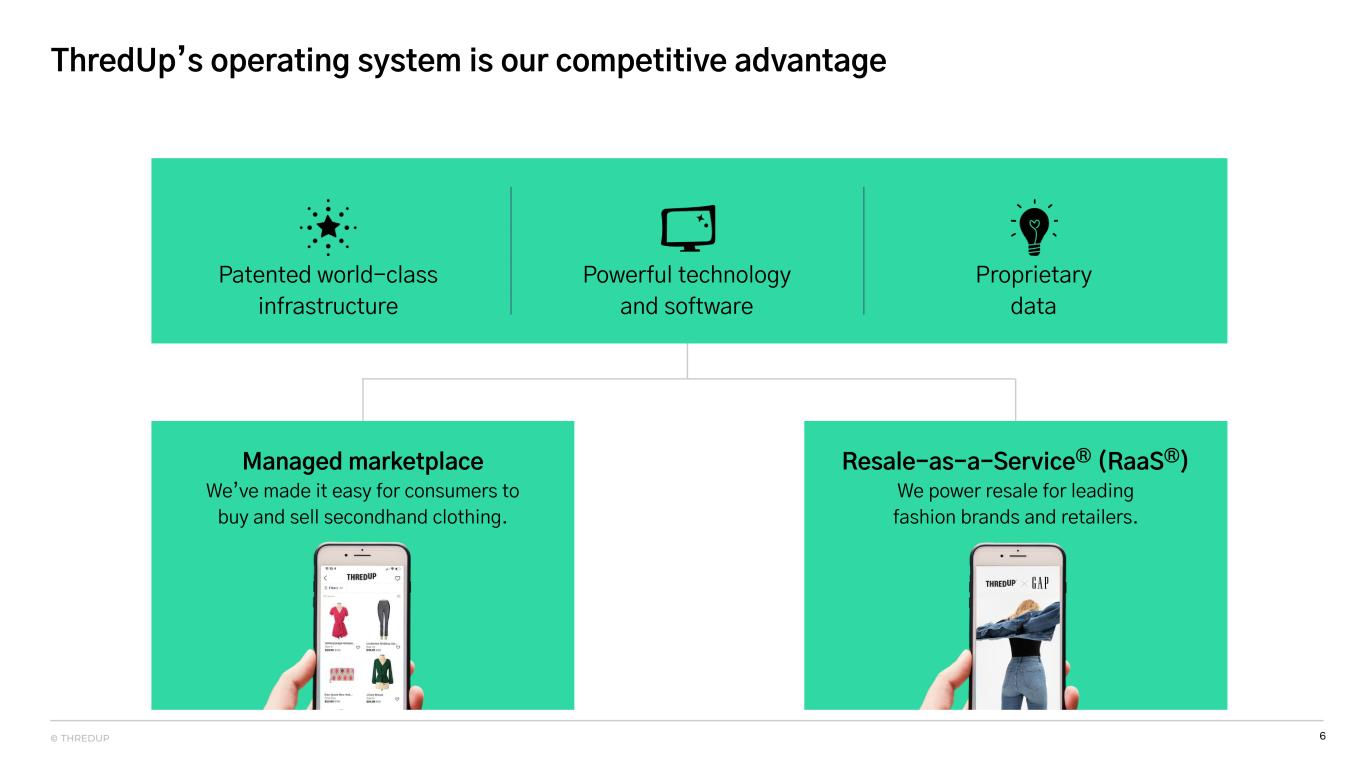
6© THREDUP ThredUp’s operating system is our competitive advantage Patented world-class infrastructure Powerful technology and software Proprietary data Managed marketplace We’ve made it easy for consumers to buy and sell secondhand clothing. Resale-as-a-ServiceⓇ (RaaSⓇ) We power resale for leading fashion brands and retailers.
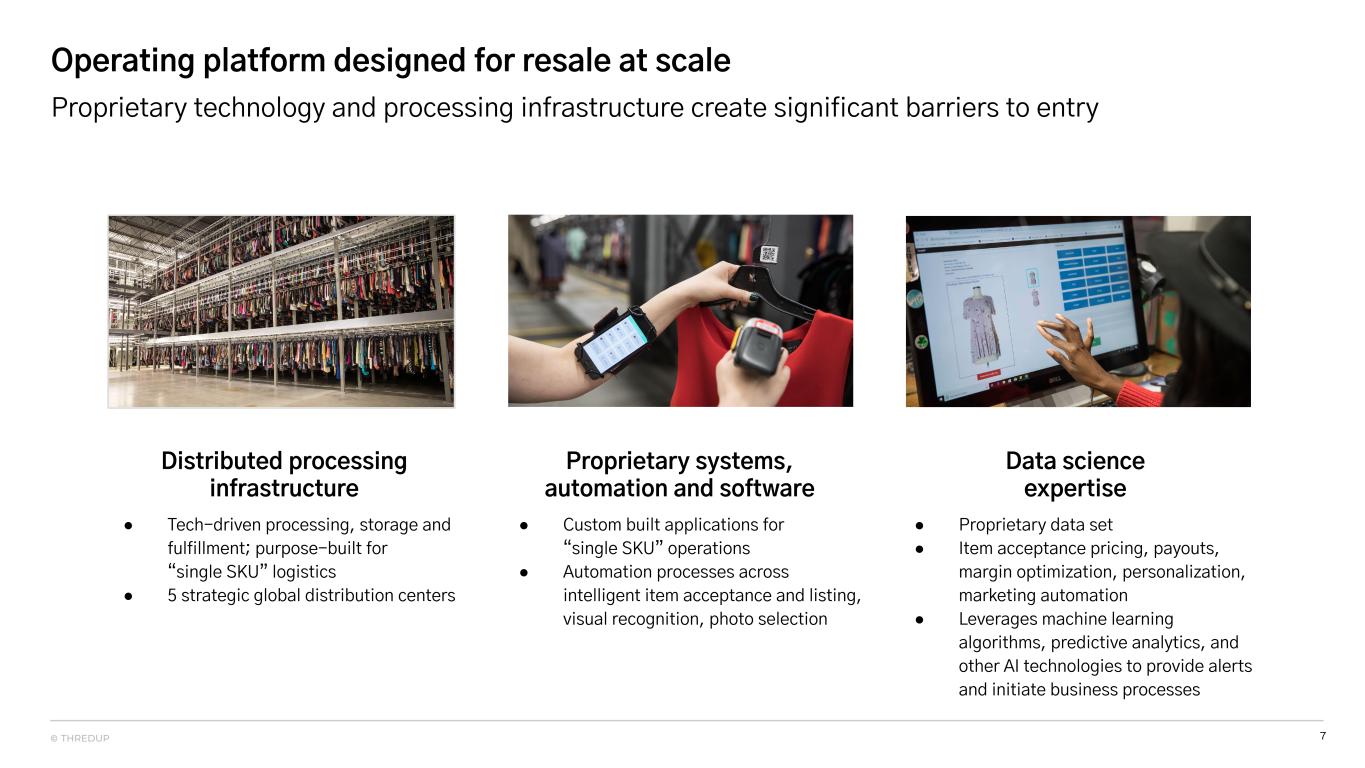
7© THREDUP Operating platform designed for resale at scale Distributed processing infrastructure Proprietary systems, automation and software Data science expertise ● Tech-driven processing, storage and fulfillment; purpose-built for “single SKU” logistics ● 5 strategic global distribution centers ● Custom built applications for “single SKU” operations ● Automation processes across intelligent item acceptance and listing, visual recognition, photo selection ● Proprietary data set ● Item acceptance pricing, payouts, margin optimization, personalization, marketing automation ● Leverages machine learning algorithms, predictive analytics, and other AI technologies to provide alerts and initiate business processes Proprietary technology and processing infrastructure create significant barriers to entry
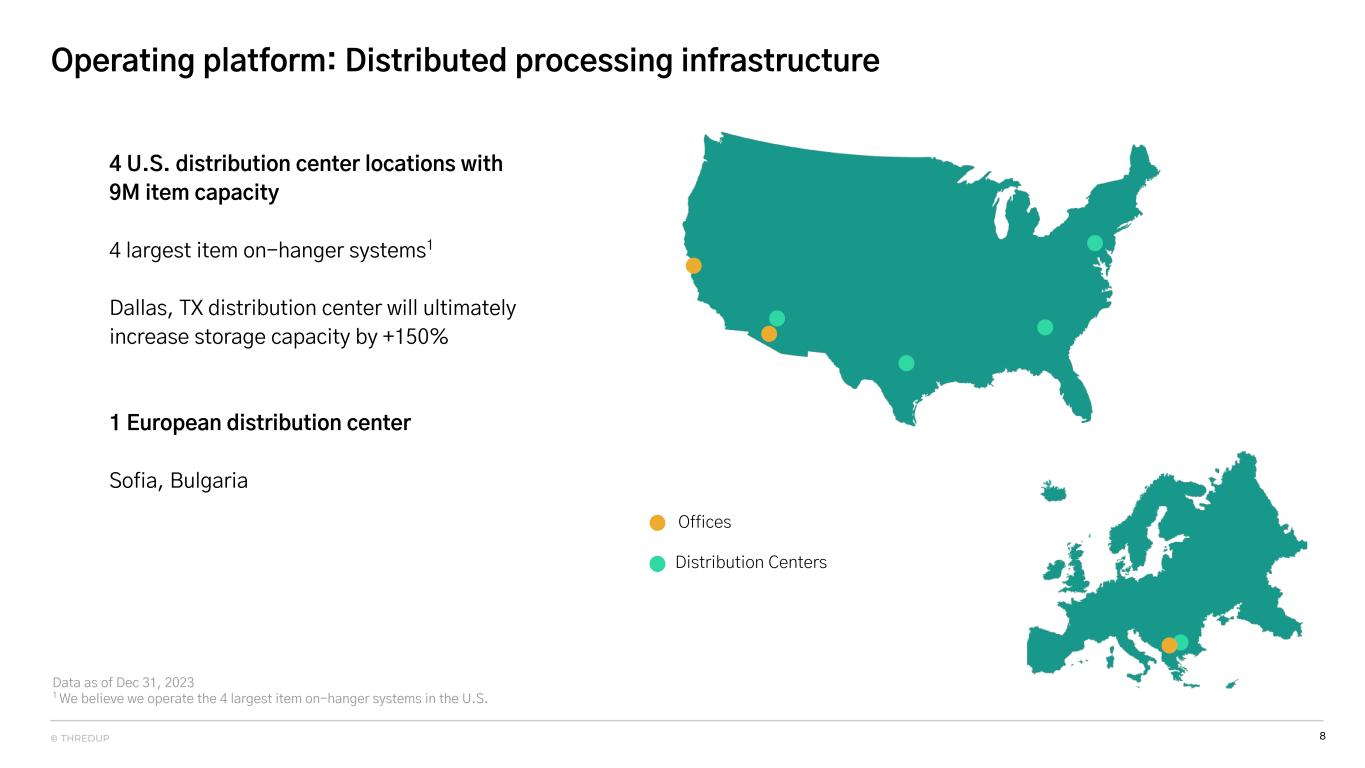
8© THREDUP Operating platform: Distributed processing infrastructure Data as of Dec 31, 2023 1 We believe we operate the 4 largest item on-hanger systems in the U.S. Distribution Centers Offices 4 U.S. distribution center locations with 9M item capacity 4 largest item on-hanger systems1 Dallas, TX distribution center will ultimately increase storage capacity by +150% 1 European distribution center Sofia, Bulgaria
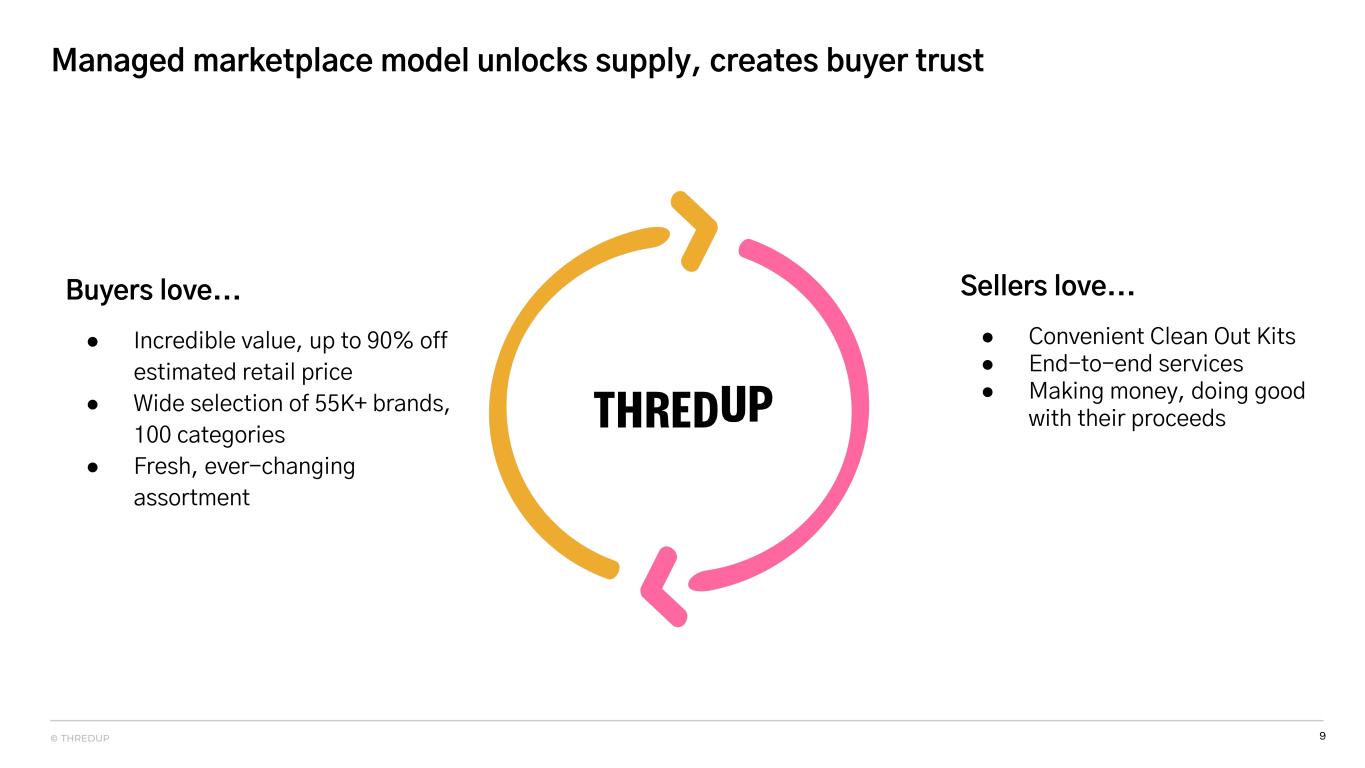
9© THREDUP Managed marketplace model unlocks supply, creates buyer trust Buyers love... ● Incredible value, up to 90% off estimated retail price ● Wide selection of 55K+ brands, 100 categories ● Fresh, ever-changing assortment Sellers love... ● Convenient Clean Out Kits ● End-to-end services ● Making money, doing good with their proceeds
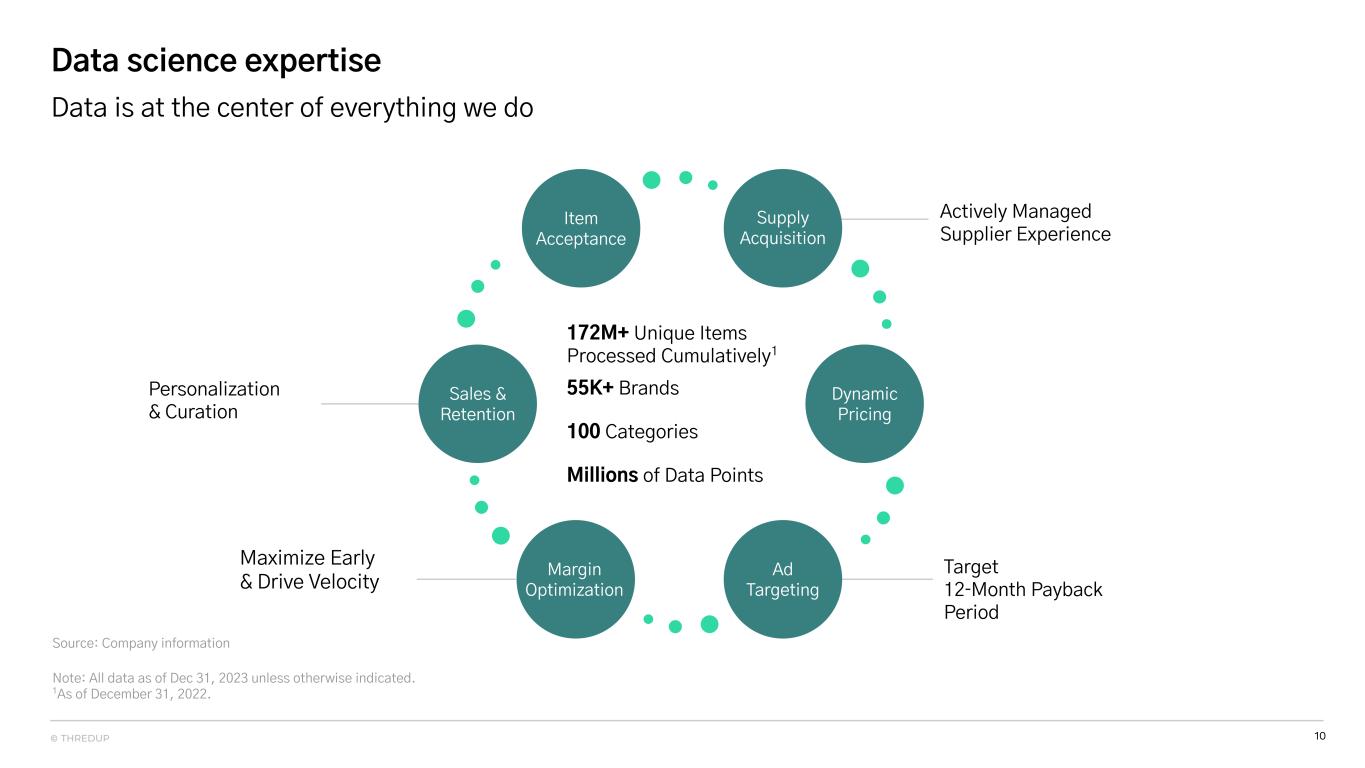
10© THREDUP Data science expertise Source: Company information Note: All data as of Dec 31, 2023 unless otherwise indicated. 1As of December 31, 2022. 172M+ Unique Items Processed Cumulatively1 55K+ Brands 100 Categories Millions of Data Points Target 12‐Month Payback Period Actively Managed Supplier Experience Personalization & Curation Maximize Early & Drive Velocity Item Acceptance Supply Acquisition Dynamic Pricing Ad Targeting Margin Optimization Sales & Retention Data is at the center of everything we do
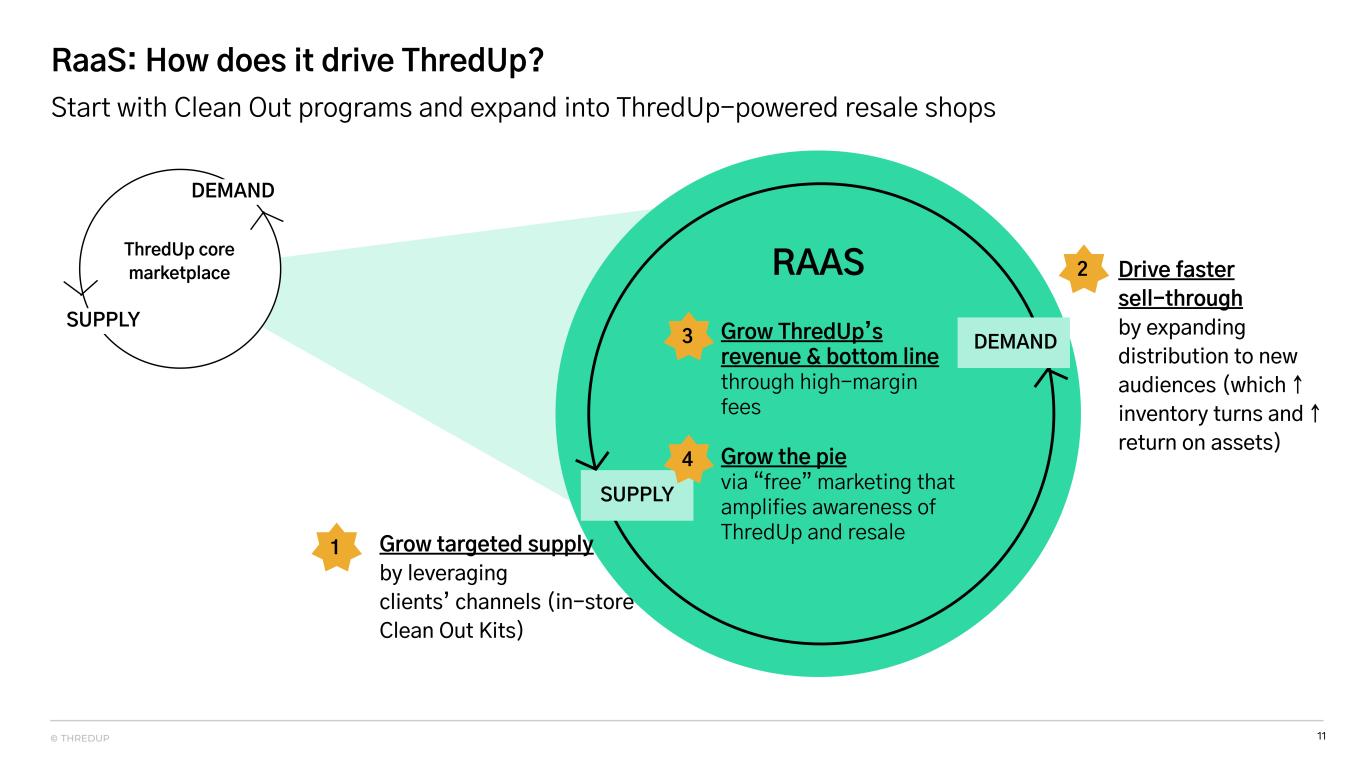
11© THREDUP RaaS: How does it drive ThredUp? Start with Clean Out programs and expand into ThredUp-powered resale shops SUPPLY DEMAND RAAS Drive faster sell-through by expanding distribution to new audiences (which ↑ inventory turns and ↑ return on assets) ThredUp core marketplace DEMAND SUPPLY Grow targeted supply by leveraging clients’ channels (in-store Clean Out Kits) ● Grow ThredUp’s revenue & bottom line through high-margin fees ● Grow the pie via “free” marketing that amplifies awareness of ThredUp and resale 4 3 2 1
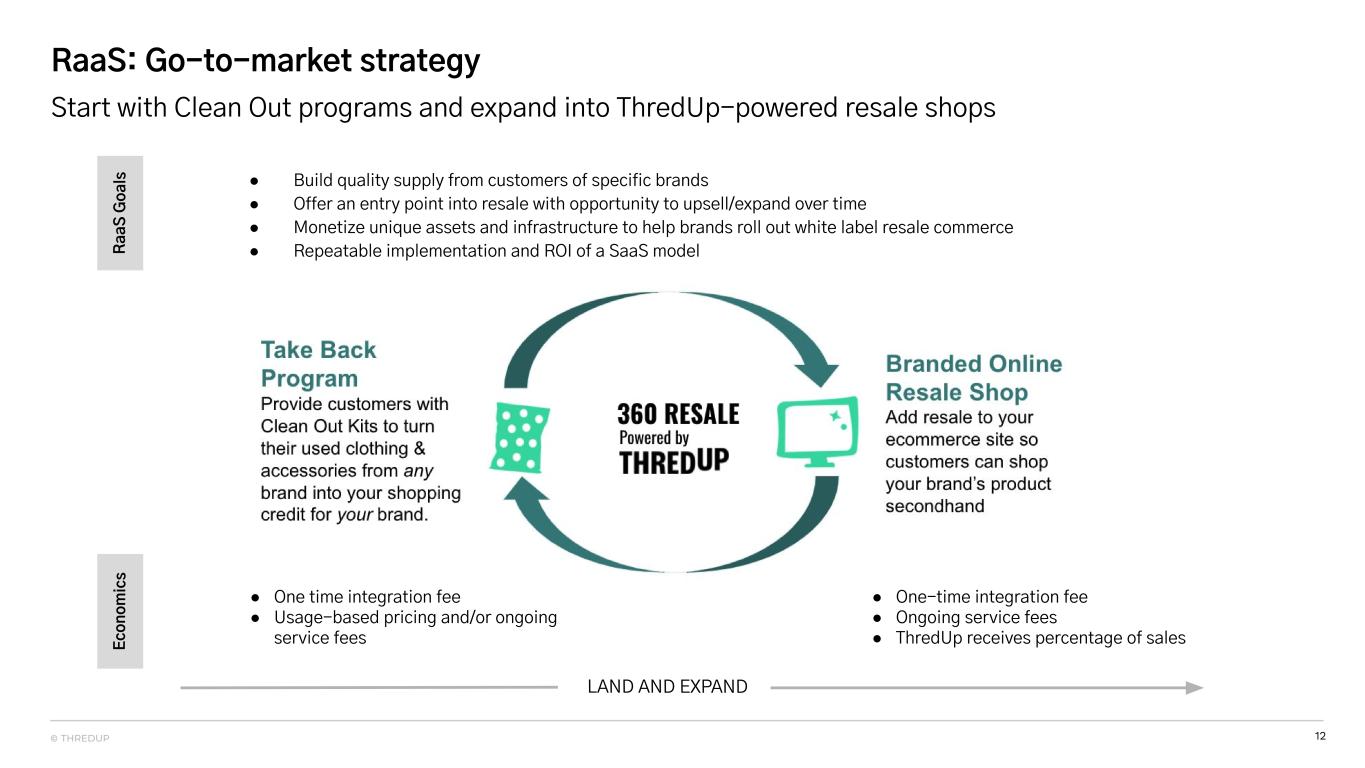
12© THREDUP RaaS: Go-to-market strategy Start with Clean Out programs and expand into ThredUp-powered resale shops LAND AND EXPAND ● Build quality supply from customers of specific brands ● Offer an entry point into resale with opportunity to upsell/expand over time ● Monetize unique assets and infrastructure to help brands roll out white label resale commerce ● Repeatable implementation and ROI of a SaaS modelRa aS G oa ls Ec on om ic s ● One time integration fee ● Usage-based pricing and/or ongoing service fees ● One-time integration fee ● Ongoing service fees ● ThredUp receives percentage of sales
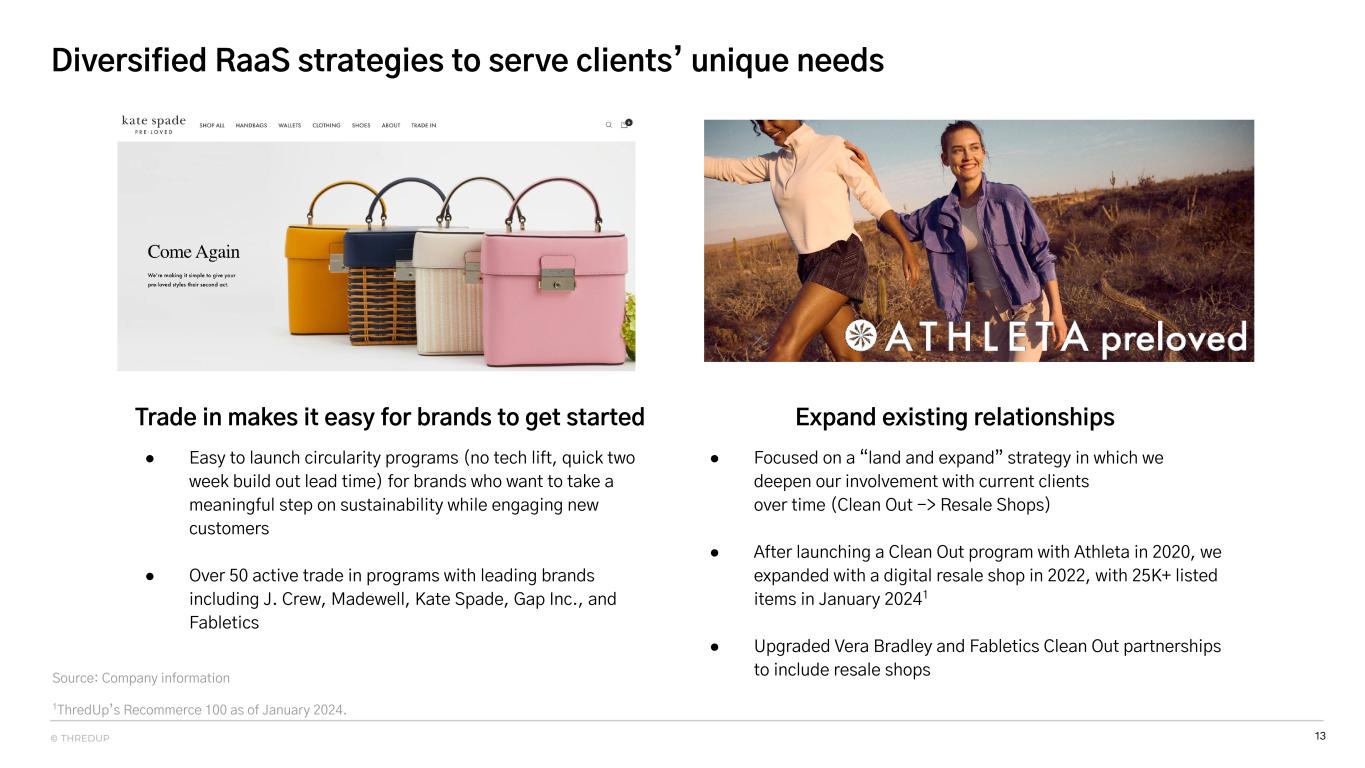
13© THREDUP Diversified RaaS strategies to serve clients’ unique needs Trade in makes it easy for brands to get started Expand existing relationships ● Easy to launch circularity programs (no tech lift, quick two week build out lead time) for brands who want to take a meaningful step on sustainability while engaging new customers ● Over 50 active trade in programs with leading brands including J. Crew, Madewell, Kate Spade, Gap Inc., and Fabletics ● Focused on a “land and expand” strategy in which we deepen our involvement with current clients over time (Clean Out -> Resale Shops) ● After launching a Clean Out program with Athleta in 2020, we expanded with a digital resale shop in 2022, with 25K+ listed items in January 20241 ● Upgraded Vera Bradley and Fabletics Clean Out partnerships to include resale shopsSource: Company information 1ThredUp’s Recommerce 100 as of January 2024.
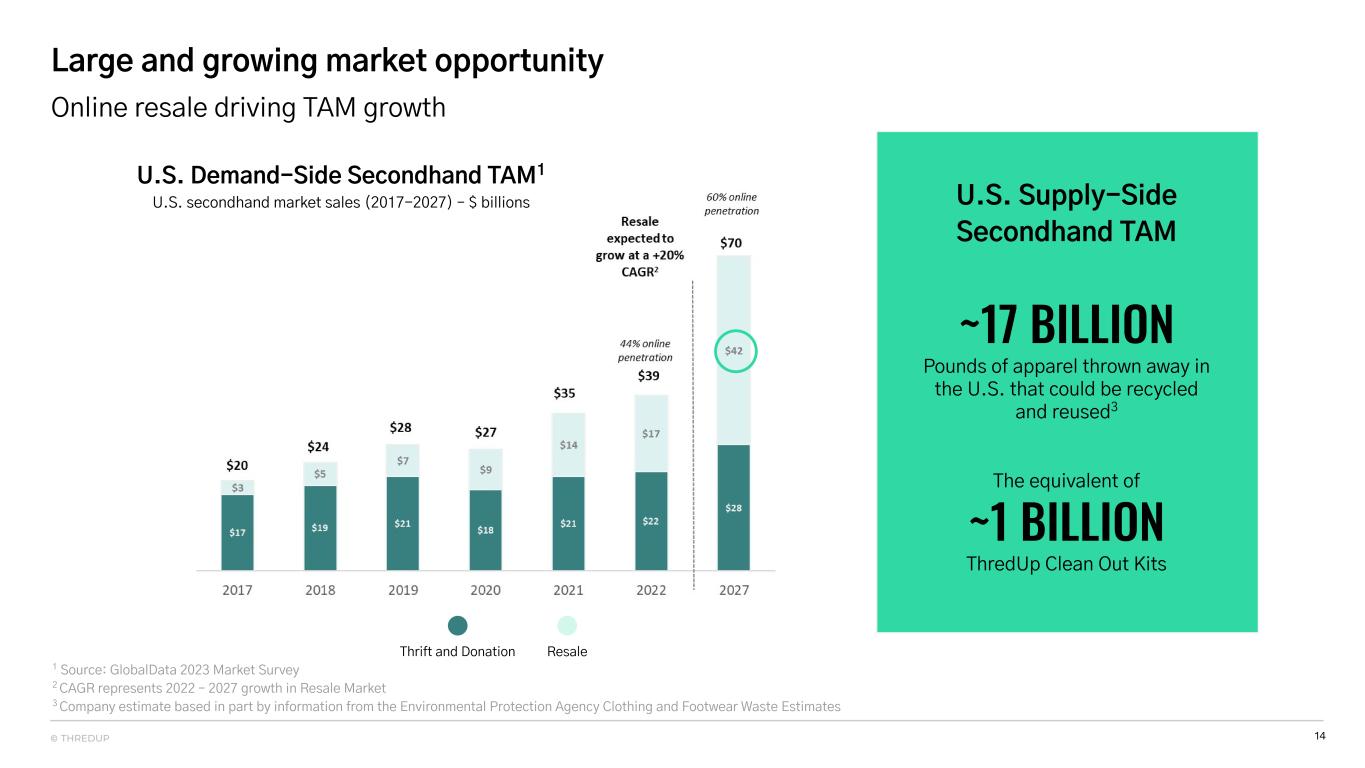
14© THREDUP Large and growing market opportunity U.S. Demand-Side Secondhand TAM1 U.S. secondhand market sales (2017-2027) – $ billions U.S. Supply-Side Secondhand TAM ~17 BILLION Pounds of apparel thrown away in the U.S. that could be recycled and reused3 The equivalent of ~1 BILLION ThredUp Clean Out Kits Thrift and Donation Resale 1 Source: GlobalData 2023 Market Survey 2 CAGR represents 2022 – 2027 growth in Resale Market 3 Company estimate based in part by information from the Environmental Protection Agency Clothing and Footwear Waste Estimates Online resale driving TAM growth
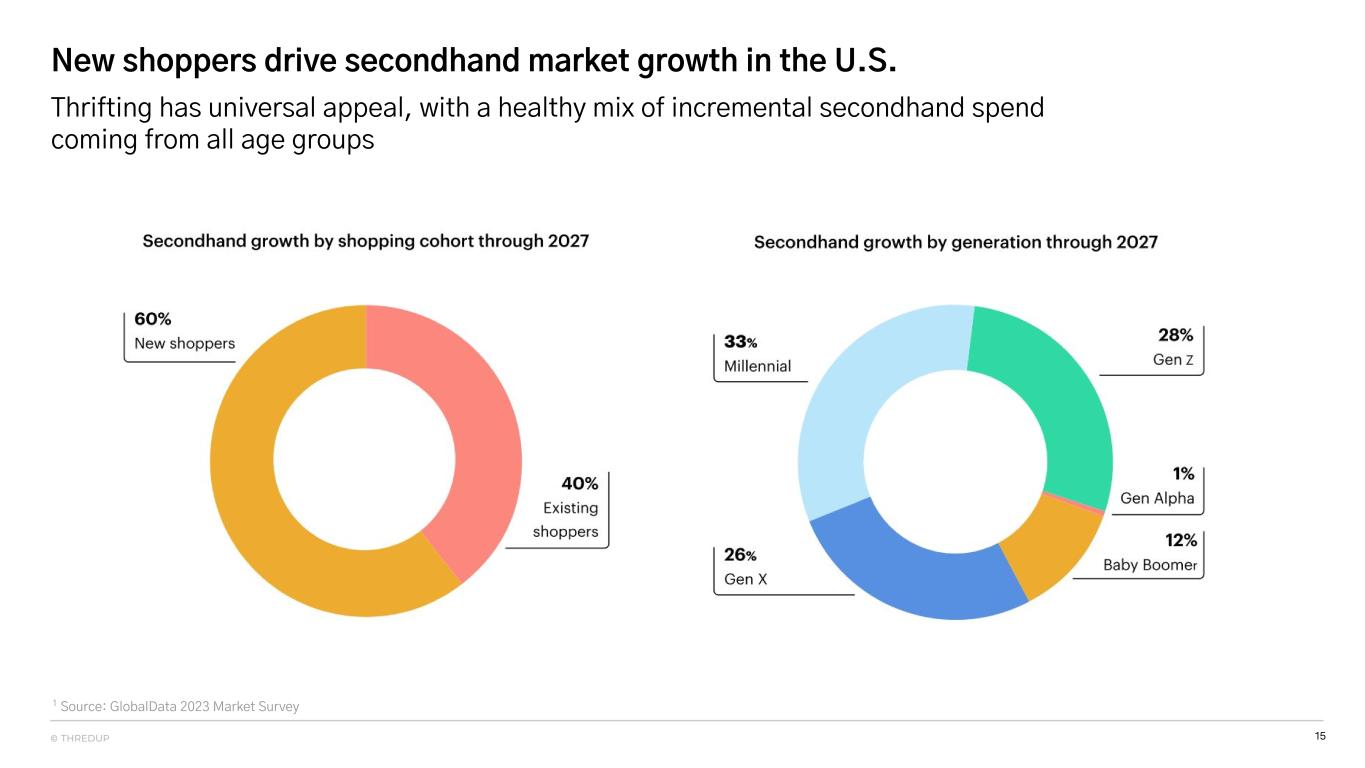
15© THREDUP New shoppers drive secondhand market growth in the U.S. 1 Source: GlobalData 2023 Market Survey Thrifting has universal appeal, with a healthy mix of incremental secondhand spend coming from all age groups
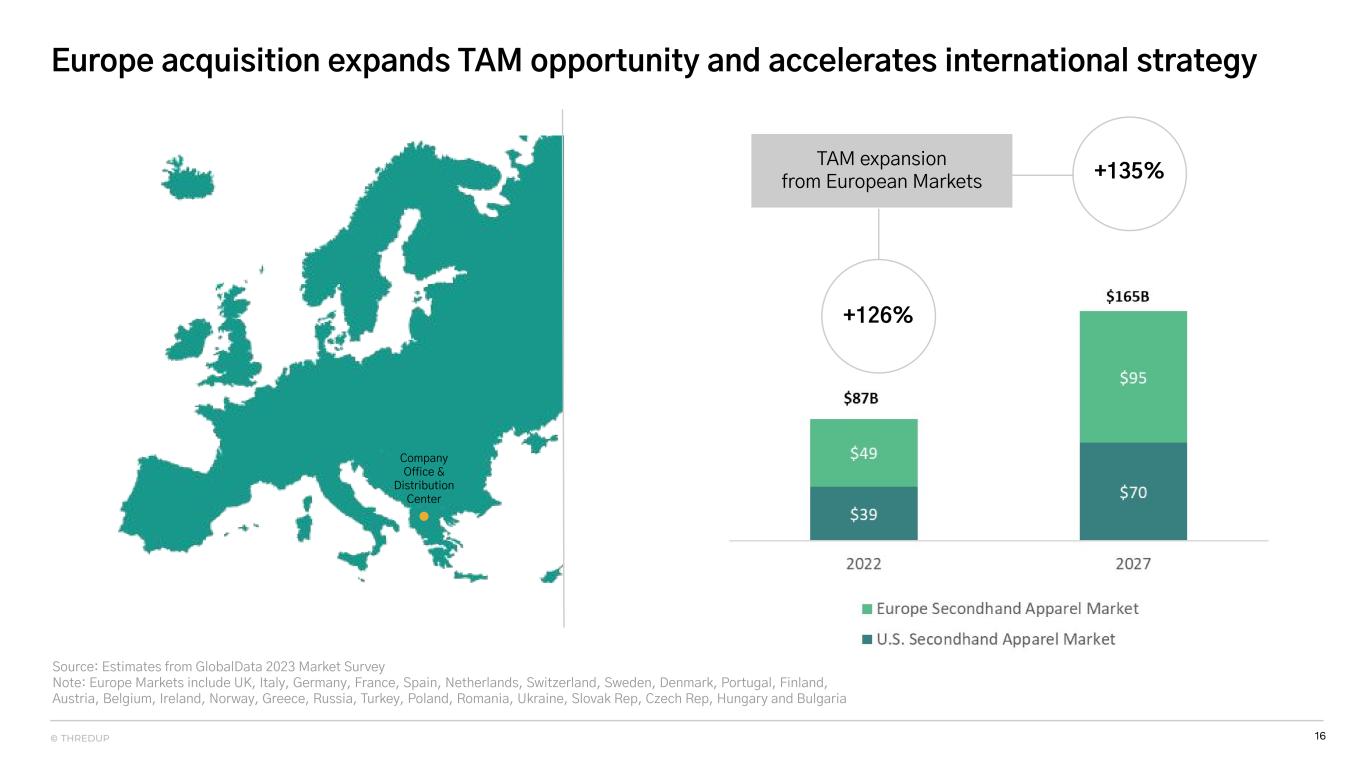
16© THREDUP Europe acquisition expands TAM opportunity and accelerates international strategy TAM expansion from European Markets +135% Company Office & Distribution Center +126% Source: Estimates from GlobalData 2023 Market Survey Note: Europe Markets include UK, Italy, Germany, France, Spain, Netherlands, Switzerland, Sweden, Denmark, Portugal, Finland, Austria, Belgium, Ireland, Norway, Greece, Russia, Turkey, Poland, Romania, Ukraine, Slovak Rep, Czech Rep, Hungary and Bulgaria
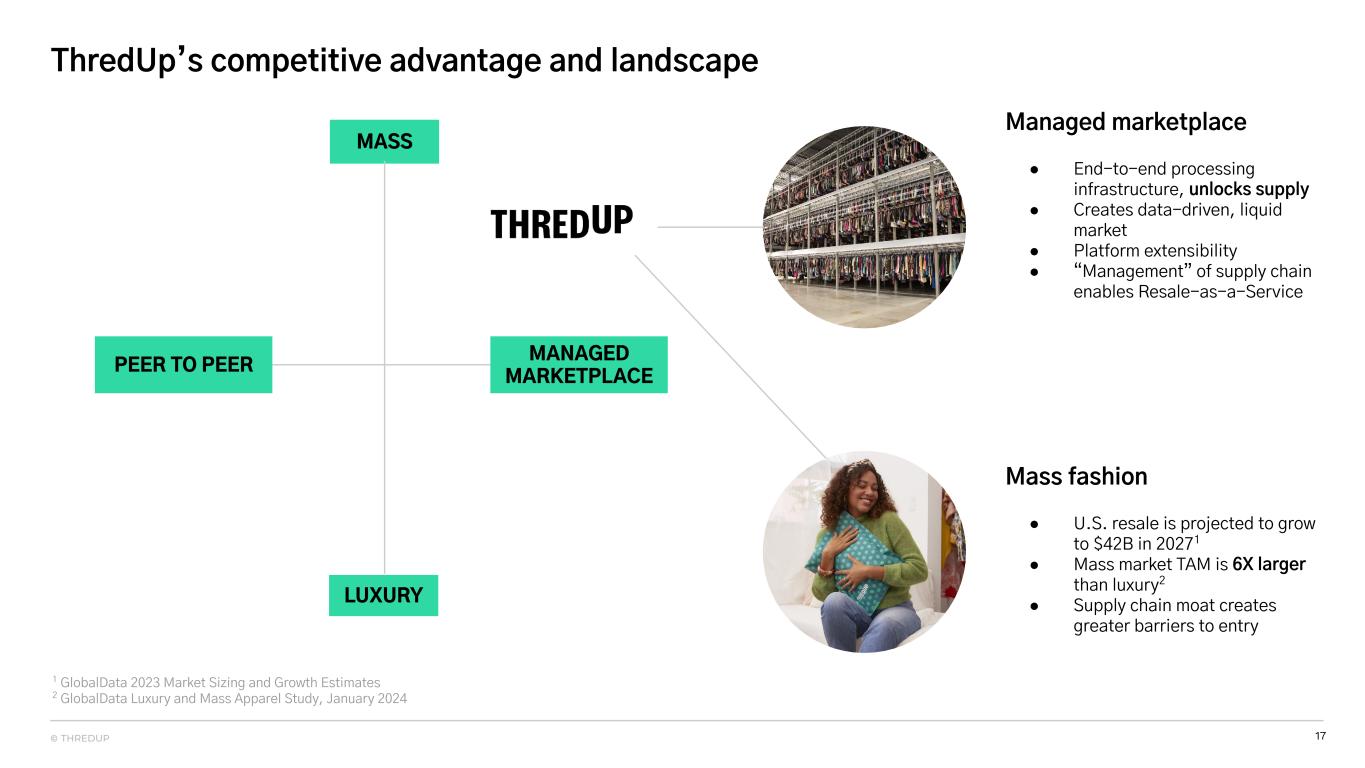
17© THREDUP ThredUp’s competitive advantage and landscape 1 GlobalData 2023 Market Sizing and Growth Estimates 2 GlobalData Luxury and Mass Apparel Study, January 2024 MASS PEER TO PEER MANAGED MARKETPLACE LUXURY Managed marketplace ● End-to-end processing infrastructure, unlocks supply ● Creates data-driven, liquid market ● Platform extensibility ● “Management” of supply chain enables Resale-as-a-Service Mass fashion ● U.S. resale is projected to grow to $42B in 20271 ● Mass market TAM is 6X larger than luxury2 ● Supply chain moat creates greater barriers to entry
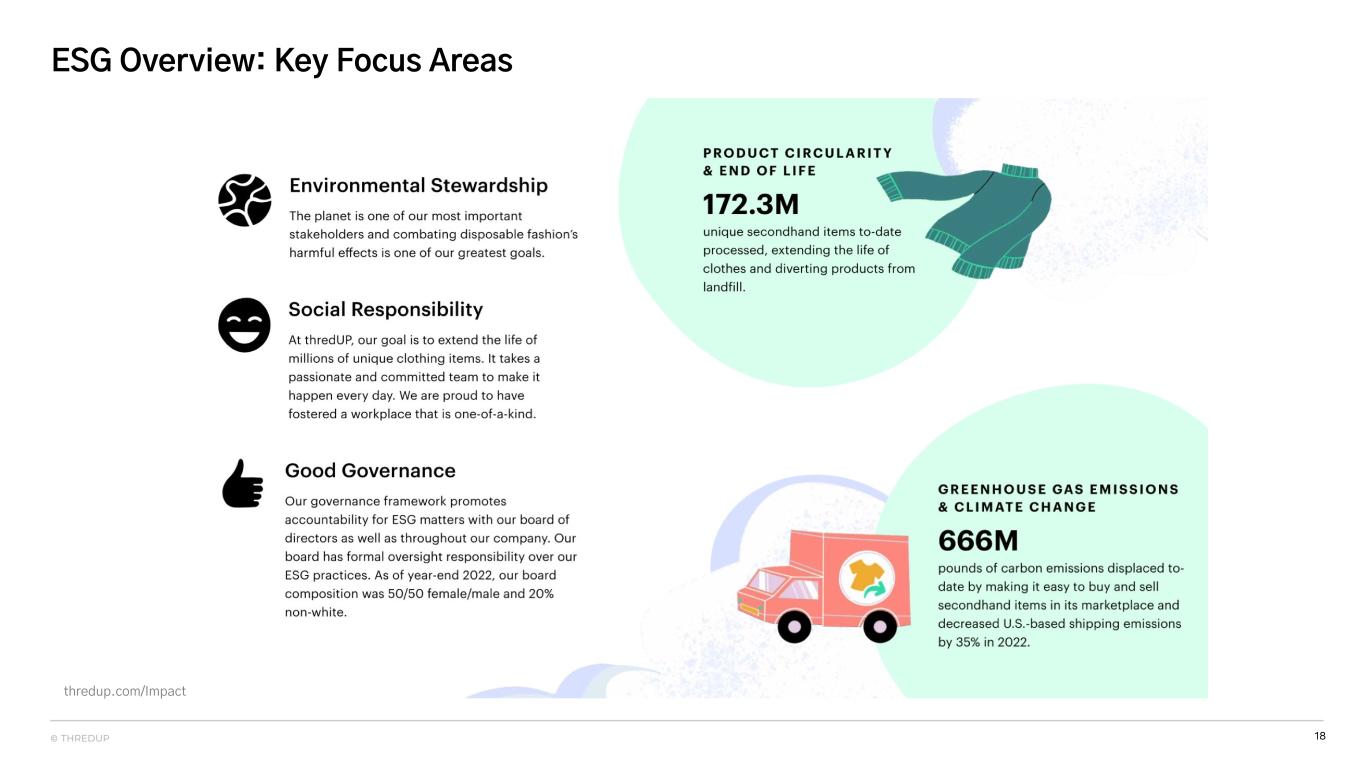
18© THREDUP ESG Overview: Key Focus Areas thredup.com/Impact
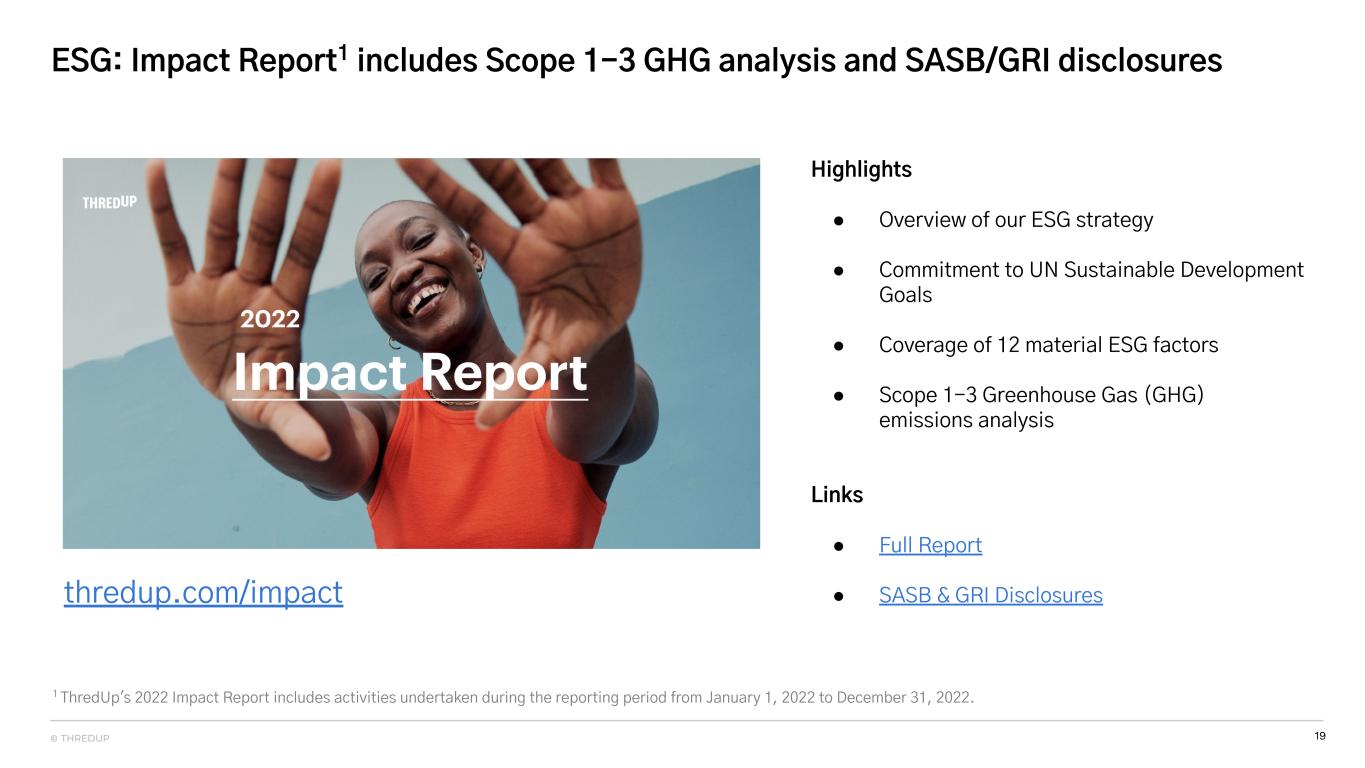
19© THREDUP ESG: Impact Report1 includes Scope 1-3 GHG analysis and SASB/GRI disclosures 1 ThredUp's 2022 Impact Report includes activities undertaken during the reporting period from January 1, 2022 to December 31, 2022. Highlights ● Overview of our ESG strategy ● Commitment to UN Sustainable Development Goals ● Coverage of 12 material ESG factors ● Scope 1-3 Greenhouse Gas (GHG) emissions analysis Links ● Full Report ● SASB & GRI Disclosuresthredup.com/impact
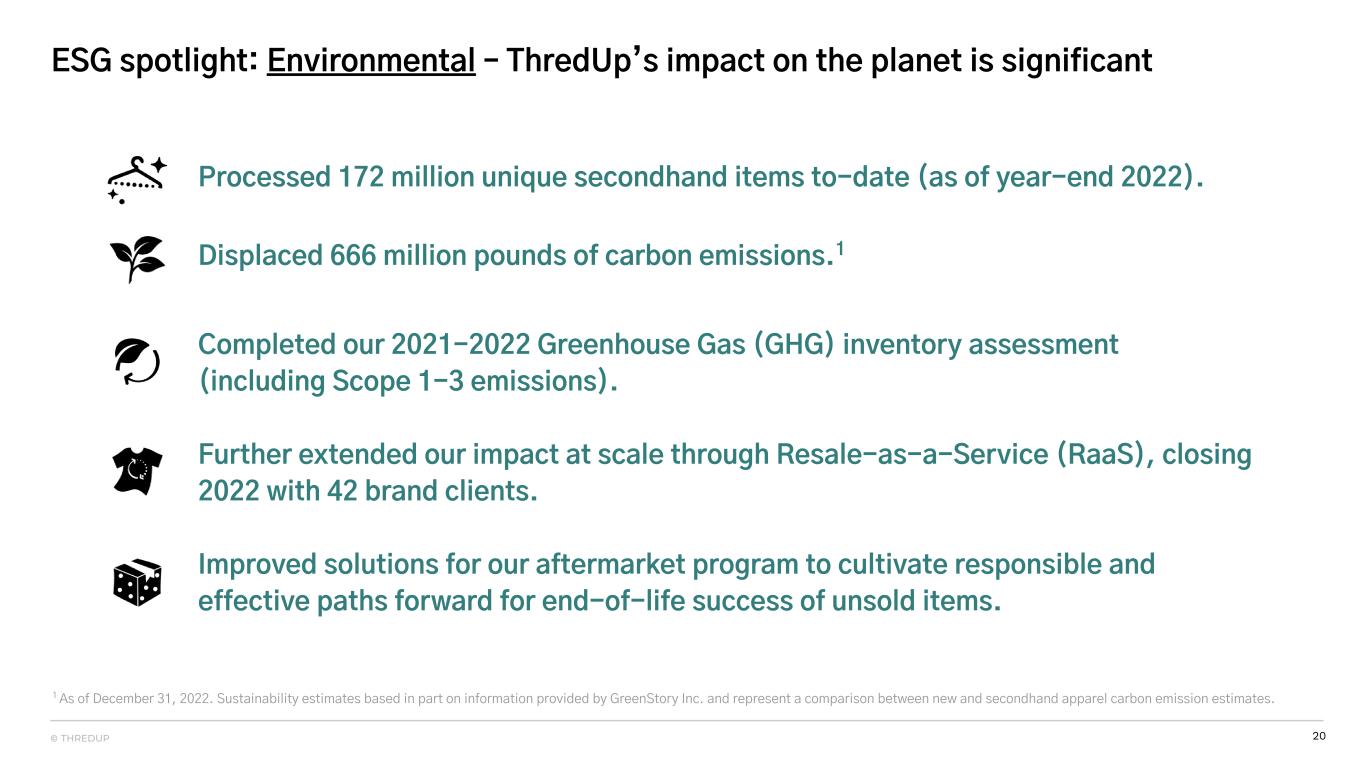
20© THREDUP ESG spotlight: Environmental – ThredUp’s impact on the planet is significant Processed 172 million unique secondhand items to-date (as of year-end 2022). Displaced 666 million pounds of carbon emissions.1 Completed our 2021-2022 Greenhouse Gas (GHG) inventory assessment (including Scope 1-3 emissions). Further extended our impact at scale through Resale-as-a-Service (RaaS), closing 2022 with 42 brand clients. Improved solutions for our aftermarket program to cultivate responsible and effective paths forward for end-of-life success of unsold items. 1 As of December 31, 2022. Sustainability estimates based in part on information provided by GreenStory Inc. and represent a comparison between new and secondhand apparel carbon emission estimates.
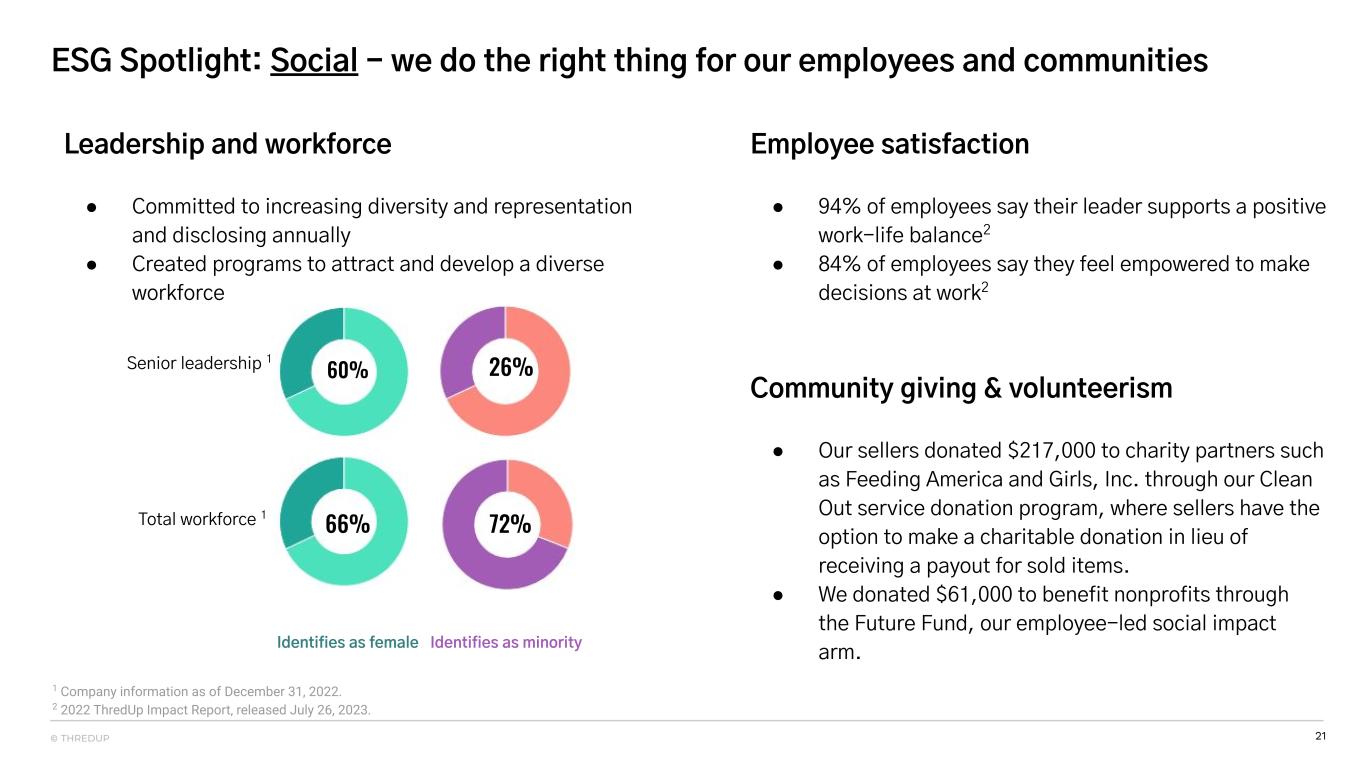
21© THREDUP ESG Spotlight: Social - we do the right thing for our employees and communities 1 Company information as of December 31, 2022. 2 2022 ThredUp Impact Report, released July 26, 2023. Senior leadership 1 Total workforce 1 60% 26% 66% 72% Identifies as minorityIdentifies as female Leadership and workforce ● Committed to increasing diversity and representation and disclosing annually ● Created programs to attract and develop a diverse workforce Employee satisfaction ● 94% of employees say their leader supports a positive work-life balance2 ● 84% of employees say they feel empowered to make decisions at work2 Community giving & volunteerism ● Our sellers donated $217,000 to charity partners such as Feeding America and Girls, Inc. through our Clean Out service donation program, where sellers have the option to make a charitable donation in lieu of receiving a payout for sold items. ● We donated $61,000 to benefit nonprofits through the Future Fund, our employee-led social impact arm.
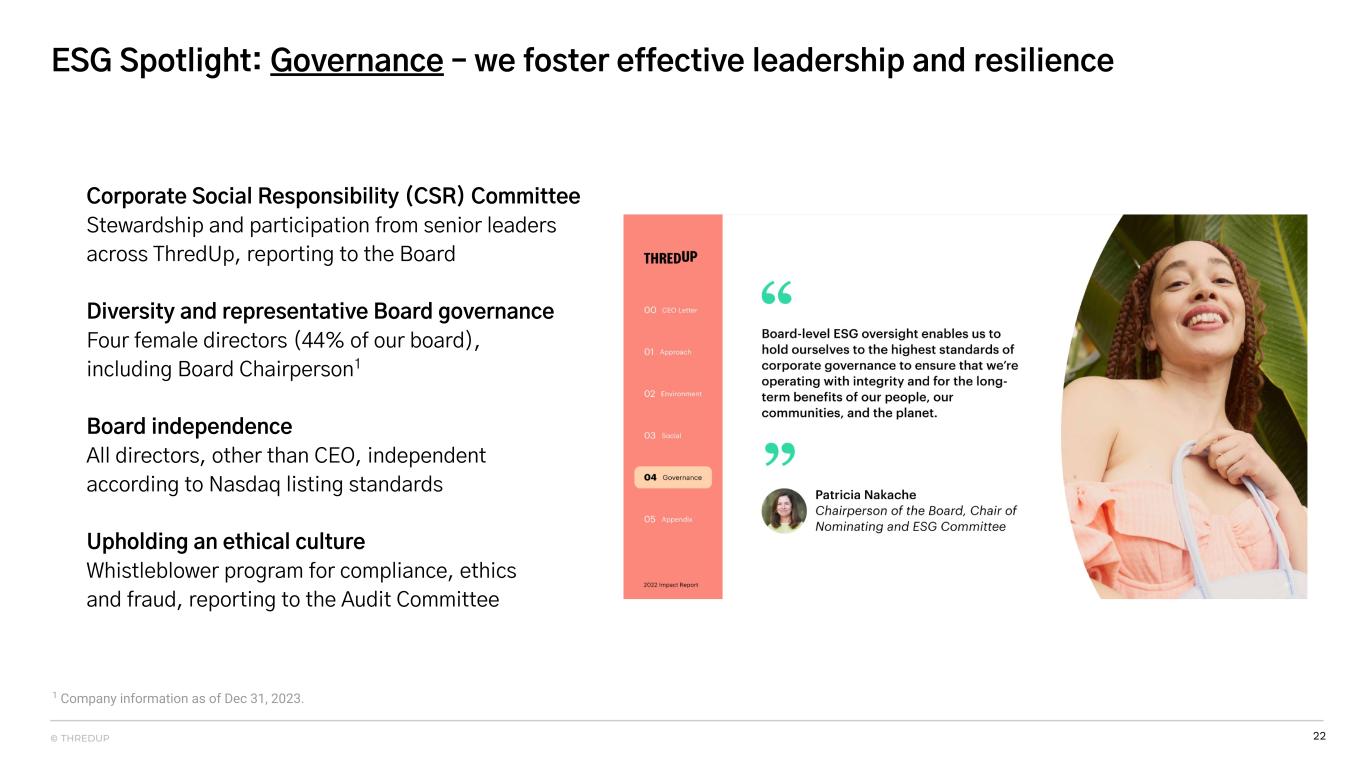
22© THREDUP ESG Spotlight: Governance – we foster effective leadership and resilience Corporate Social Responsibility (CSR) Committee Stewardship and participation from senior leaders across ThredUp, reporting to the Board Diversity and representative Board governance Four female directors (44% of our board), including Board Chairperson1 Board independence All directors, other than CEO, independent according to Nasdaq listing standards Upholding an ethical culture Whistleblower program for compliance, ethics and fraud, reporting to the Audit Committee 1 Company information as of Dec 31, 2023.

© THREDUP 23• CONFIDENTIAL FINANCIAL HIGHLIGHTS
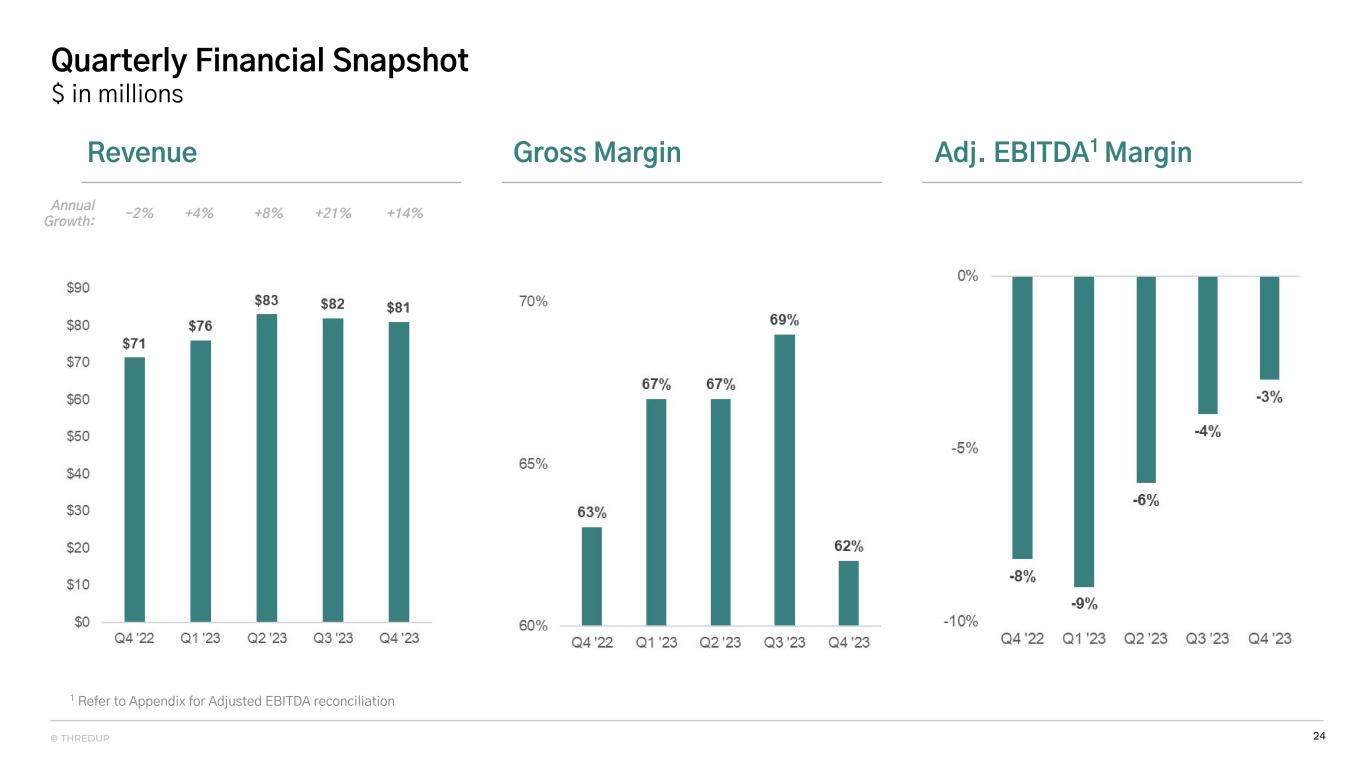
24© THREDUP Quarterly Financial Snapshot $ in millions Revenue Gross Margin Adj. EBITDA1 Margin 1 Refer to Appendix for Adjusted EBITDA reconciliation Annual Growth: +14%+4%-2% +21%+8%
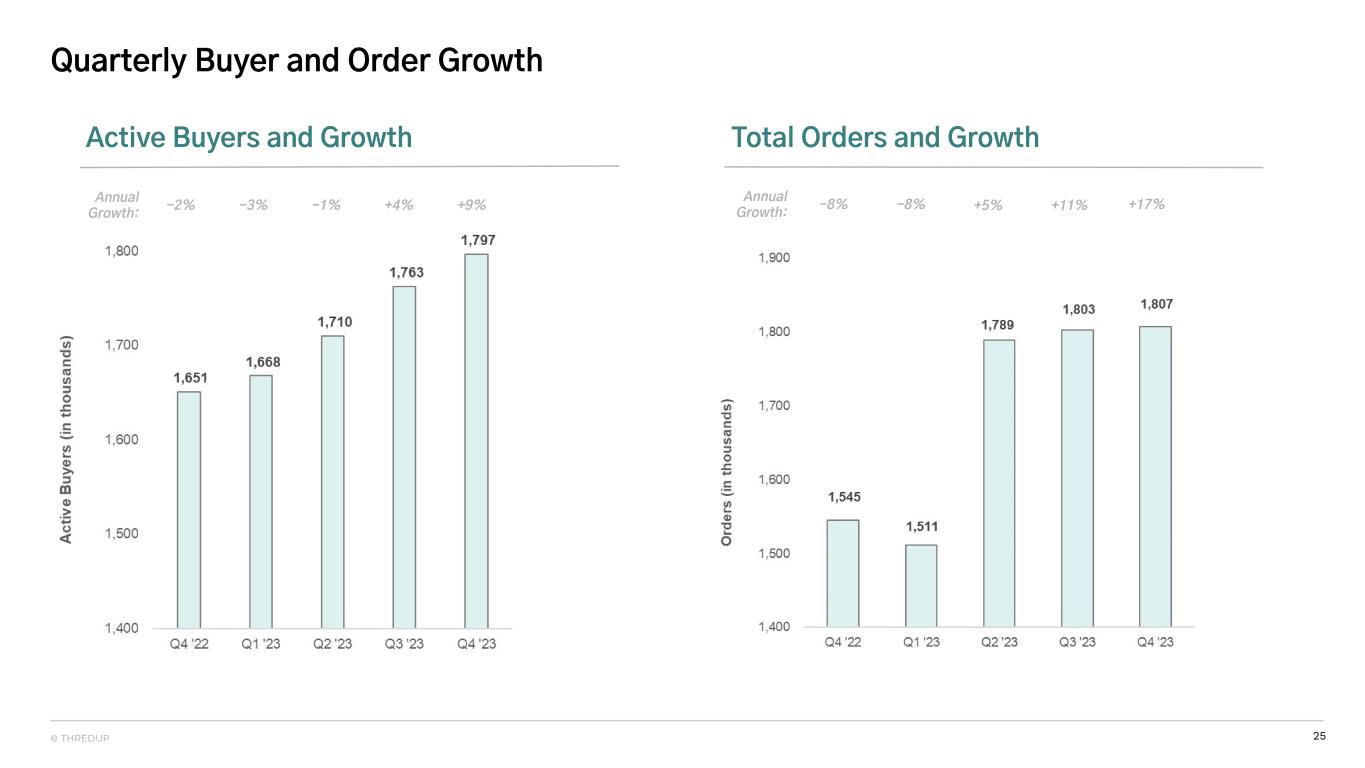
25© THREDUP Total Orders and Growth Quarterly Buyer and Order Growth Active Buyers and Growth Annual Growth: -8% +17%Annual Growth: -3% +9%-2% -8%-1% +5% +11%+4%
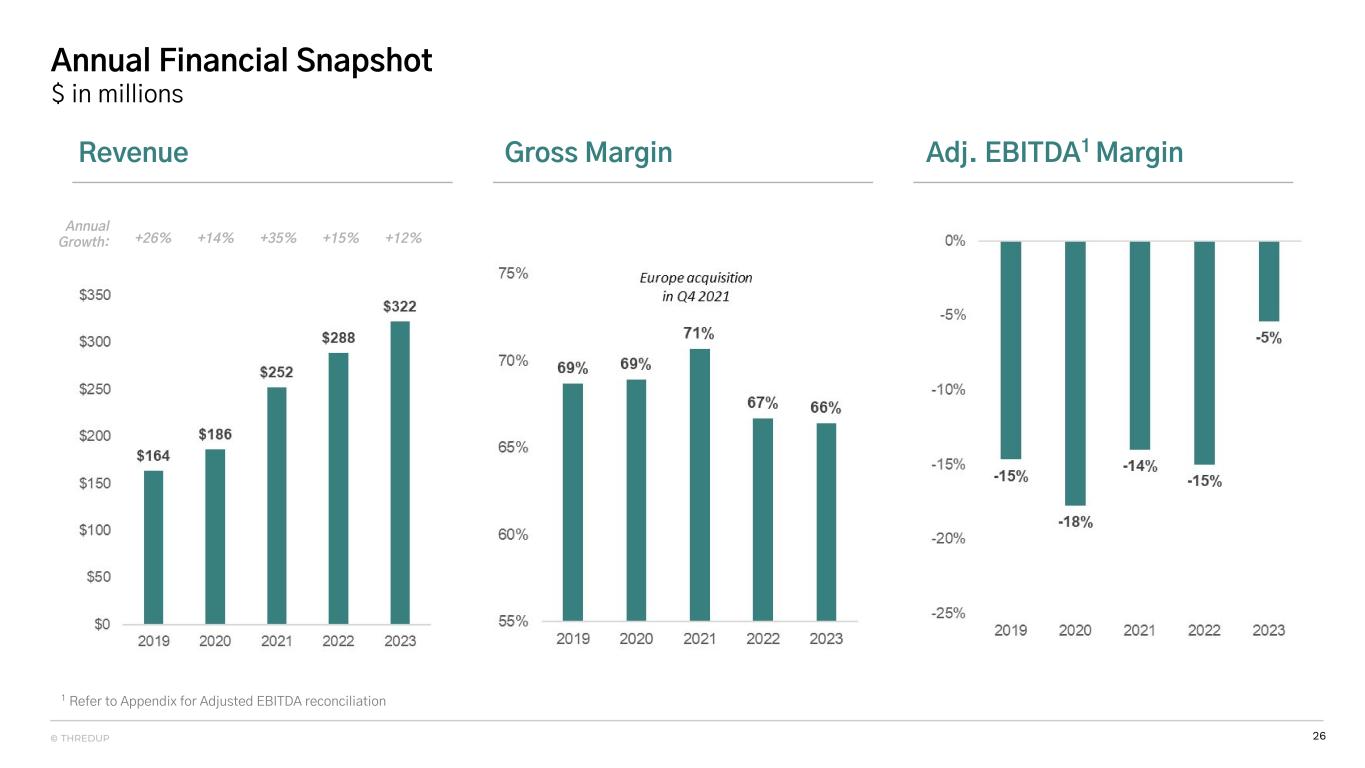
26© THREDUP Annual Financial Snapshot $ in millions Revenue Gross Margin Adj. EBITDA1 Margin 1 Refer to Appendix for Adjusted EBITDA reconciliation Annual Growth: +12%+35%+14% +15%+26%
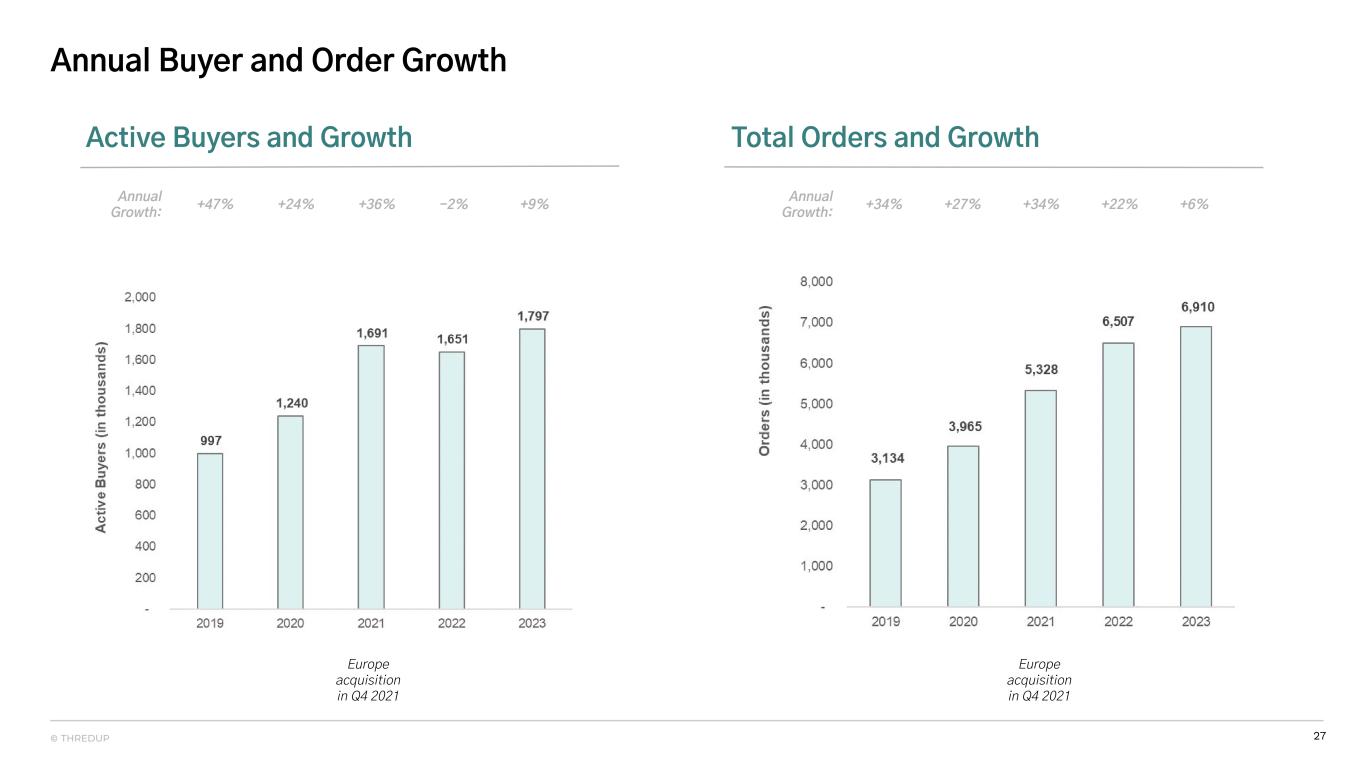
27© THREDUP Total Orders and Growth Annual Buyer and Order Growth Active Buyers and Growth Annual Growth: +34% +34%+27%Annual Growth: +47% +36%+24% Europe acquisition in Q4 2021 -2% Europe acquisition in Q4 2021 +22%+9% +6%
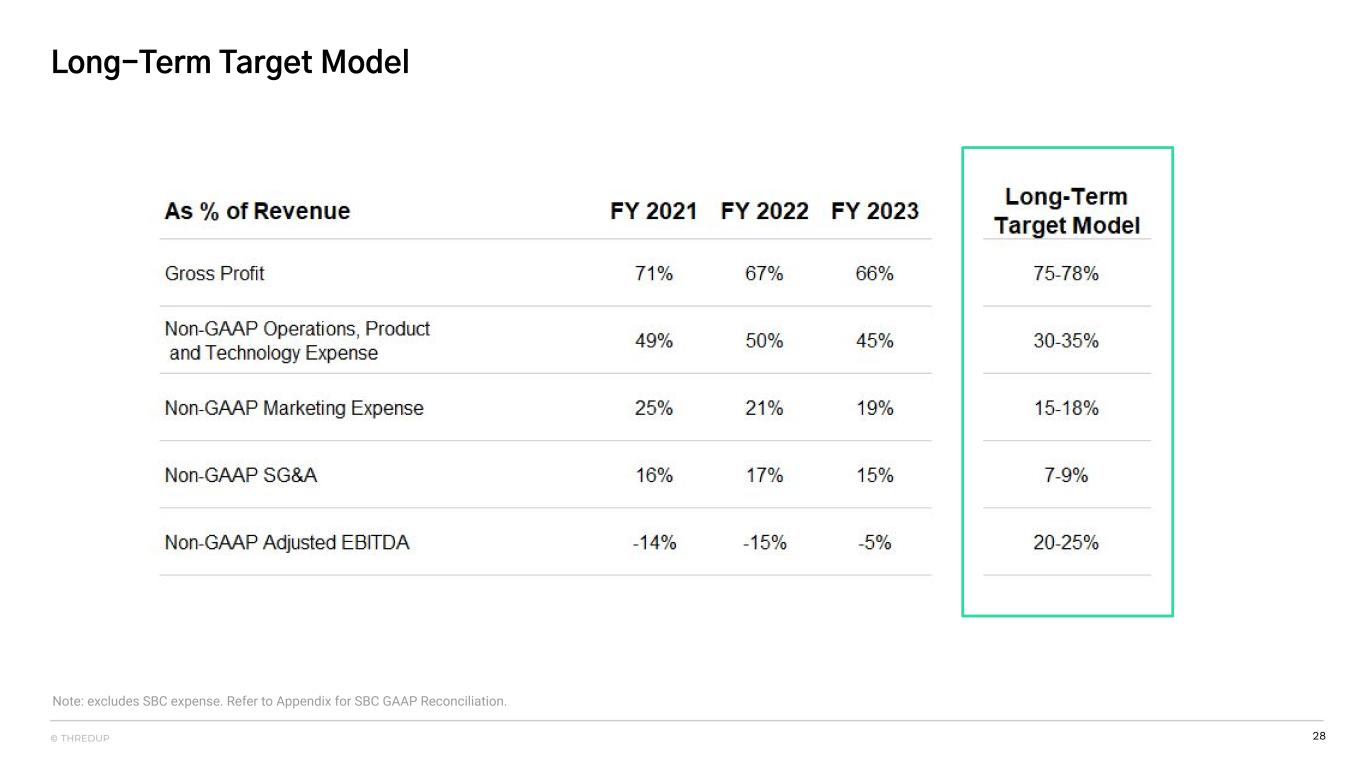
28© THREDUP Long-Term Target Model Note: excludes SBC expense. Refer to Appendix for SBC GAAP Reconciliation.

APPENDIX
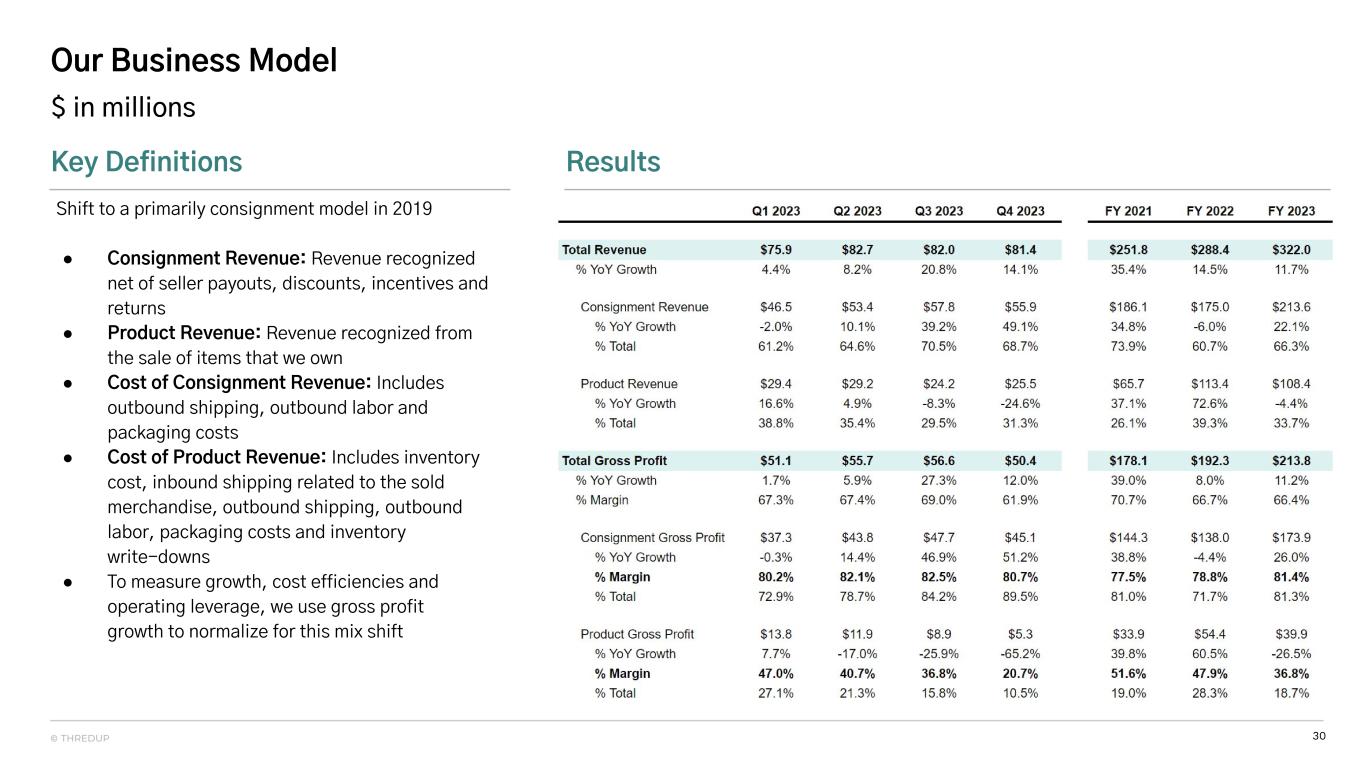
30© THREDUP Our Business Model $ in millions Shift to a primarily consignment model in 2019 ● Consignment Revenue: Revenue recognized net of seller payouts, discounts, incentives and returns ● Product Revenue: Revenue recognized from the sale of items that we own ● Cost of Consignment Revenue: Includes outbound shipping, outbound labor and packaging costs ● Cost of Product Revenue: Includes inventory cost, inbound shipping related to the sold merchandise, outbound shipping, outbound labor, packaging costs and inventory write-downs ● To measure growth, cost efficiencies and operating leverage, we use gross profit growth to normalize for this mix shift Key Definitions Results
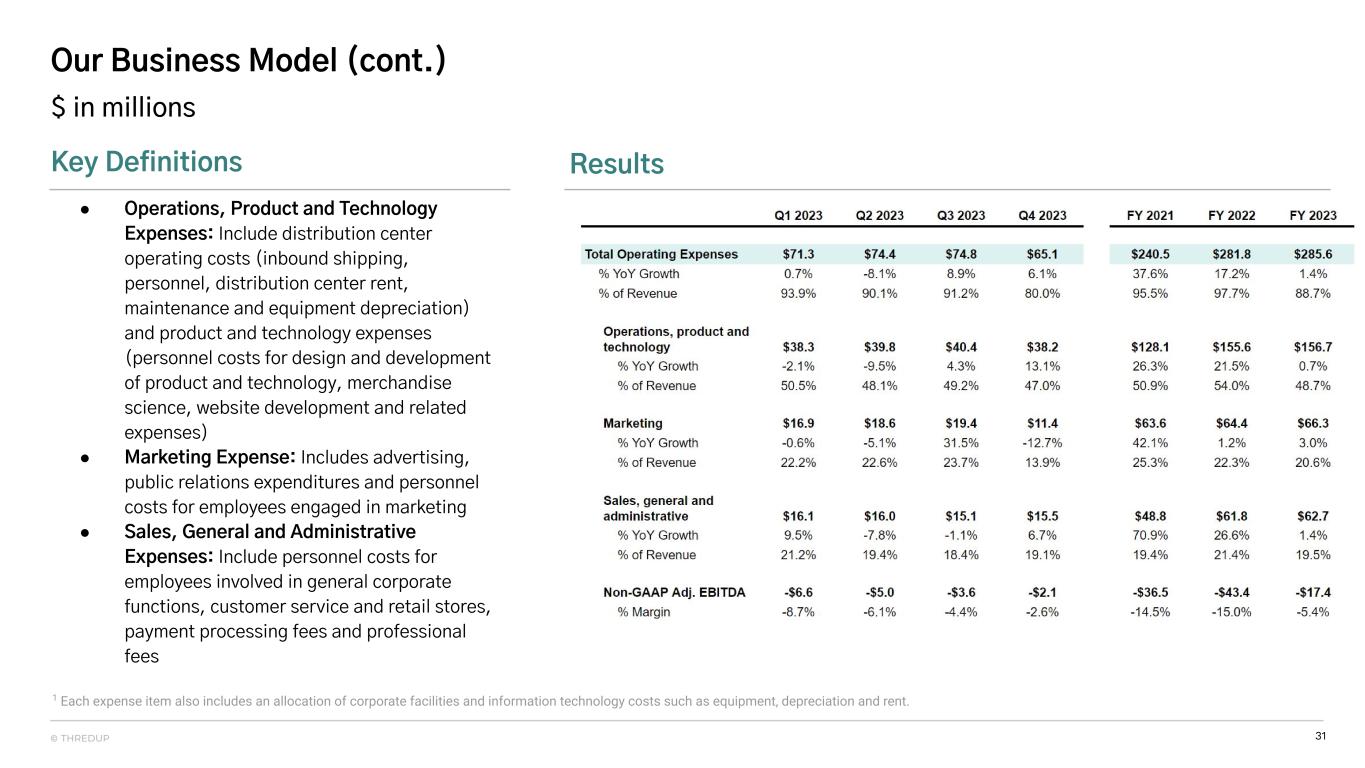
31© THREDUP Our Business Model (cont.) $ in millions ● Operations, Product and Technology Expenses: Include distribution center operating costs (inbound shipping, personnel, distribution center rent, maintenance and equipment depreciation) and product and technology expenses (personnel costs for design and development of product and technology, merchandise science, website development and related expenses) ● Marketing Expense: Includes advertising, public relations expenditures and personnel costs for employees engaged in marketing ● Sales, General and Administrative Expenses: Include personnel costs for employees involved in general corporate functions, customer service and retail stores, payment processing fees and professional fees Key Definitions Results 1 Each expense item also includes an allocation of corporate facilities and information technology costs such as equipment, depreciation and rent.
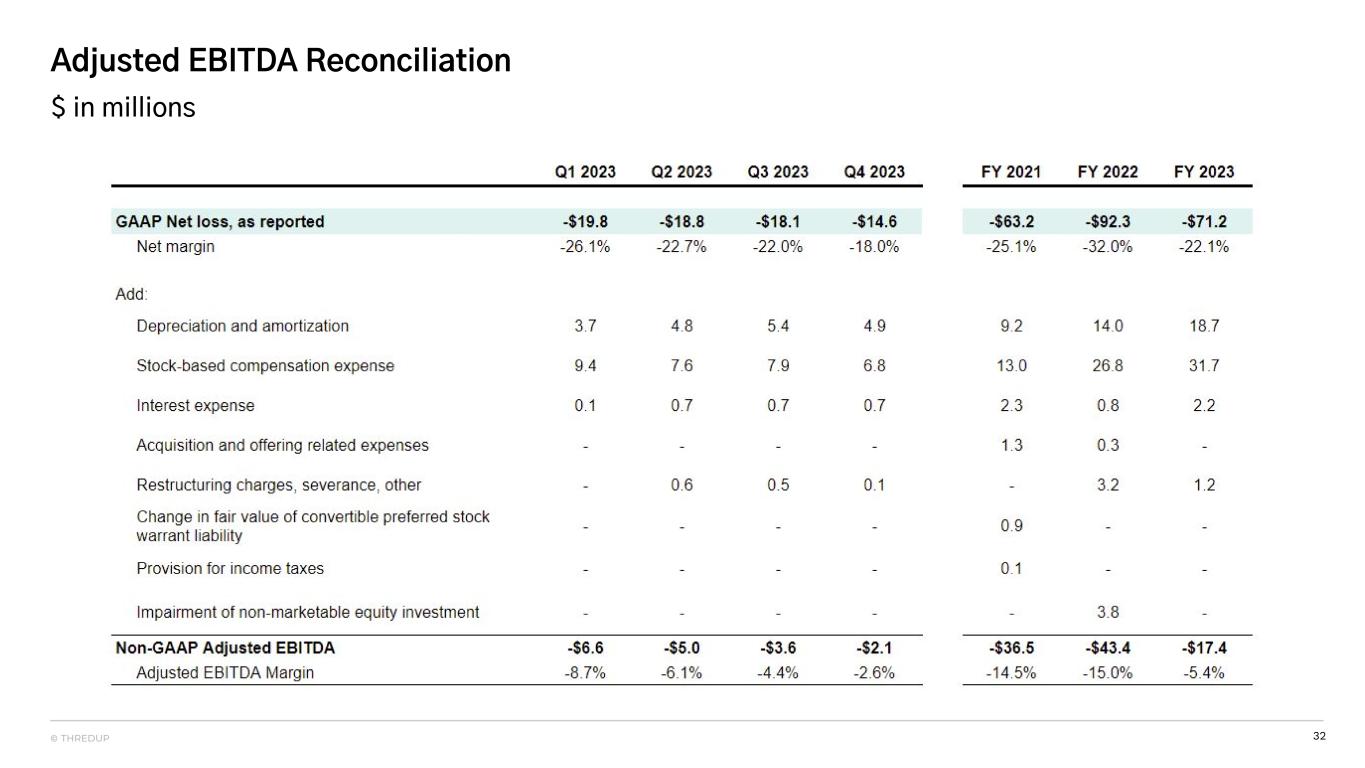
32© THREDUP Adjusted EBITDA Reconciliation $ in millions
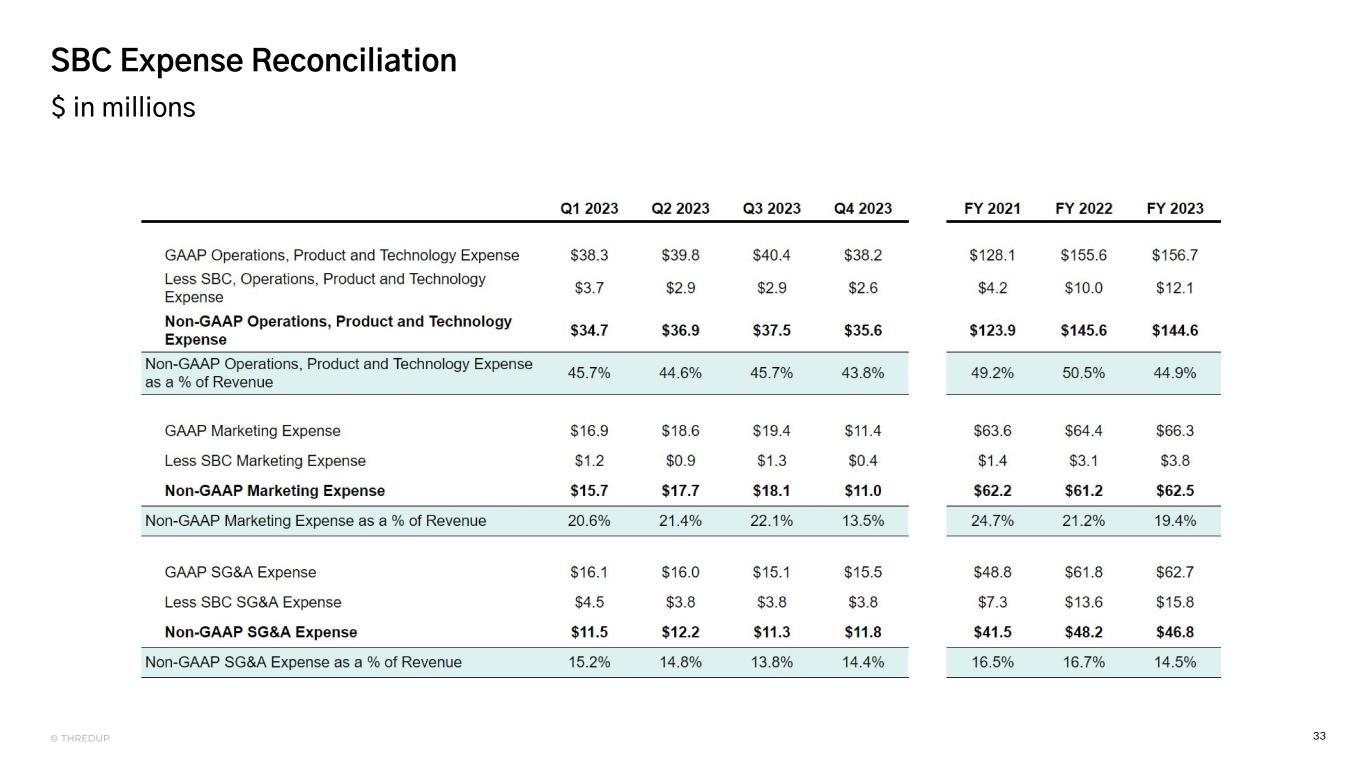
33© THREDUP SBC Expense Reconciliation $ in millions
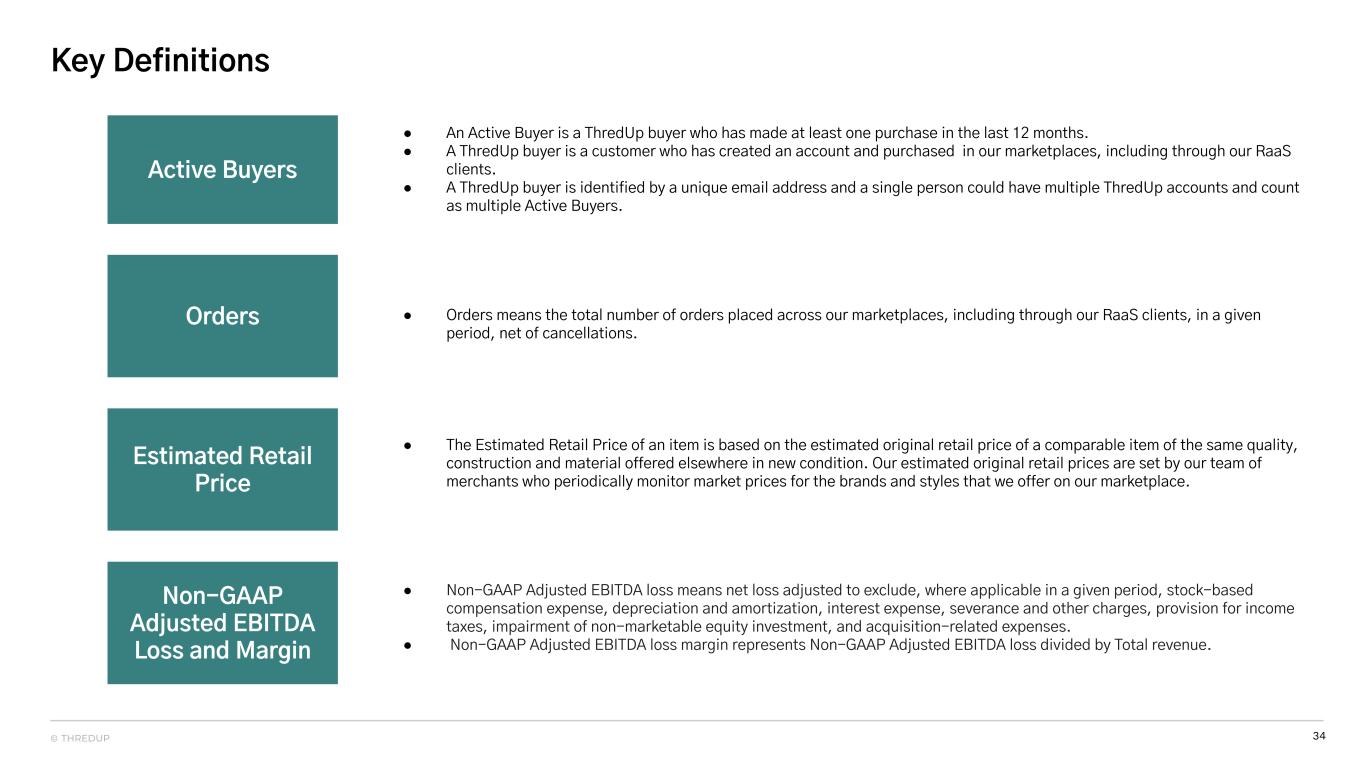
34© THREDUP Key Definitions Active Buyers ● An Active Buyer is a ThredUp buyer who has made at least one purchase in the last 12 months. ● A ThredUp buyer is a customer who has created an account and purchased in our marketplaces, including through our RaaS clients. ● A ThredUp buyer is identified by a unique email address and a single person could have multiple ThredUp accounts and count as multiple Active Buyers. Orders ● Orders means the total number of orders placed across our marketplaces, including through our RaaS clients, in a given period, net of cancellations. Estimated Retail Price ● The Estimated Retail Price of an item is based on the estimated original retail price of a comparable item of the same quality, construction and material offered elsewhere in new condition. Our estimated original retail prices are set by our team of merchants who periodically monitor market prices for the brands and styles that we offer on our marketplace. ● Non-GAAP Adjusted EBITDA loss means net loss adjusted to exclude, where applicable in a given period, stock-based compensation expense, depreciation and amortization, interest expense, severance and other charges, provision for income taxes, impairment of non-marketable equity investment, and acquisition-related expenses. ● Non-GAAP Adjusted EBITDA loss margin represents Non-GAAP Adjusted EBITDA loss divided by Total revenue. Non-GAAP Adjusted EBITDA Loss and Margin


