Exhibit 99.1
Fox Chase Bancorp, Inc.
Conversion
Valuation
Appraisal
April 29, 2010
Table of Contents
Fox Chase Bancorp, Inc.
Hatboro, Pennsylvania
TABLE OF CONTENTS | I | |||
INTRODUCTION | 1 | |||
1. | OVERVIEW AND FINANCIAL ANALYSIS | 3 | ||
| GENERAL OVERVIEW | 3 | |||
| HISTORYAND OVERVIEW | 4 | |||
| STRATEGIC DIRECTION | 5 | |||
| BALANCE SHEET TRENDS | 6 | |||
| LOAN PORTFOLIO | 8 | |||
| INVESTMENTS | 11 | |||
| INVESTMENTSAND MORTGAGE-BACKED SECURITIES | 12 | |||
| ASSET QUALITY | 13 | |||
| FUNDING COMPOSITION | 16 | |||
| ASSET/LIABILITY MANAGEMENT | 18 | |||
| NET WORTHAND CAPITAL | 19 | |||
| PROFITABILITY TRENDS | 20 | |||
| LEGAL PROCEEDINGS | 24 | |||
| SUBSIDIARIES | 24 | |||
2. | MARKET AREA ANALYSIS | 25 | ||
3. | COMPARISONS WITH PUBLICLY TRADED THRIFTS | 30 | ||
| INTRODUCTION | 30 | |||
| SELECTION CRITERIA | 30 | |||
| OVERVIEWOFTHE COMPARABLES | 32 | |||
4. | MARKET VALUE DETERMINATION | 34 | ||
| MARKET VALUE ADJUSTMENTS | 34 | |||
| FINANCIAL CONDITION | 35 | |||
| BALANCE SHEET GROWTH | 39 | |||
| EARNINGS QUALITY, PREDICTABILITYAND GROWTH | 40 | |||
| MARKETAREA | 45 | |||
| CASH DIVIDENDS | 47 | |||
| LIQUIDITYOFTHE ISSUE | 48 | |||
| RECENT REGULATORY MATTERS | 49 | |||
5. | OTHER FACTORS | 50 | ||
| MANAGEMENT | 50 | |||
| SUBSCRIPTION INTEREST | 51 | |||
| VALUATION ADJUSTMENTS | 53 | |||
6. | VALUATION | 54 | ||
| DISCUSSIONOF WEIGHT GIVENTO VALUATION MULTIPLES | 54 | |||
| FULL OFFERING VALUEIN RELATIONTO COMPARABLES | 56 | |||
| COMPARISONTOOTHER PENDING SECOND STEP CONVERSIONS | 59 | |||
| COMPARISONOFTHEEXCHANGEVALUEANDSTOCKPRICE | 60 | |||
| VALUATION CONCLUSION | 61 | |||
List of Figures
Fox Chase Bancorp, Inc.
Hatboro, Pennsylvania
FIGURE 1 - CURRENT FACILITIES LIST | 3 | |
FIGURE 2 - ASSET AND RETAINED EARNINGS CHART | 6 | |
FIGURE 3 - KEY BALANCE SHEET DATA | 7 | |
FIGURE 4 - KEY RATIOS | 7 | |
FIGURE 5 - NET LOANS RECEIVABLE CHART | 8 | |
FIGURE 6 - LOAN MIX AS OF DECEMBER 31, 2009 | 9 | |
FIGURE 7 - LOAN MIX AT DECEMBER 31, 2009 | 10 | |
FIGURE 8 - SECURITIES CHART | 11 | |
FIGURE 9 - INVESTMENT MIX | 12 | |
FIGURE 10 - ASSET QUALITY CHART | 13 | |
FIGURE 11 - NONPERFORMING LOANS | 14 | |
FIGURE 12 - ALLOWANCE FOR POSSIBLE LOAN AND LEASE LOSSES CHART | 15 | |
FIGURE 13 - DEPOSIT AND BORROWING TREND CHART | 16 | |
FIGURE 14 - DEPOSIT MIX | 17 | |
FIGURE 15 - INTEREST RATE RISK | 18 | |
FIGURE 16 - CAPITAL ANALYSIS | 19 | |
FIGURE 17 - NET INCOME CHART | 20 | |
FIGURE 18 - AVERAGE YIELDS AND COSTS | 21 | |
FIGURE 19 - SPREAD AND MARGIN CHART | 22 | |
FIGURE 20 - INCOME STATEMENT TRENDS | 23 | |
FIGURE 21 - DEPOSIT AND DEMOGRAPHIC DATA FOR ATLANTIC, NJ | 26 | |
FIGURE 22 - DEPOSIT AND DEMOGRAPHIC DATA FOR CAPE MAY, NJ | 26 | |
FIGURE 23 - DEPOSIT AND DEMOGRAPHIC DATA FOR BUCKS, PA | 27 | |
FIGURE 24 - DEPOSIT AND DEMOGRAPHIC DATA FOR CHESTER, PA | 27 | |
FIGURE 25 - DEPOSIT AND DEMOGRAPHIC DATA FOR DELAWARE, PA | 28 | |
FIGURE 26 - DEPOSIT AND DEMOGRAPHIC DATA FOR MONTGOMERY, PA | 28 | |
FIGURE 27 - DEPOSIT AND DEMOGRAPHIC DATA FOR PHILADELPHIA, PA | 29 | |
FIGURE 28 - FRANCHISE DEPOSIT AND DEMOGRAPHIC SUMMARY DATA | 29 | |
FIGURE 29 - COMPARABLE GROUP | 31 | |
FIGURE 30 - KEY FINANCIAL INDICATORS | 33 | |
FIGURE 31 - KEY BALANCE SHEET DATA | 35 | |
FIGURE 32 - CAPITAL DATA | 36 | |
FIGURE 33 - ASSET QUALITY TABLE | 37 | |
FIGURE 34 - BALANCE SHEET GROWTH DATA | 39 | |
FIGURE 35 - NET INCOME CHART | 41 | |
FIGURE 36 - PROFITABILITY DATA | 42 | |
FIGURE 37 - INCOME STATEMENT DATA | 43 | |
FIGURE 38 - MARKET AREA DATA | 45 | |
FIGURE 39 - DIVIDEND DATA | 47 | |
FIGURE 40 - MARKET CAPITALIZATION DATA | 48 | |
FIGURE 41 - SECOND STEP CONVERSIONS (SINCE 1/1/08) PRO FORMA DATA | 51 | |
FIGURE 42 - CONVERSIONS PRICE APPRECIATION | 52 | |
FIGURE 43 - VALUE RANGE | 56 | |
FIGURE 44 – APPRAISED VALUE | 56 | |
FIGURE 46 - COMPARABLE CONVERSION PRICING MULTIPLES TO THE BANK’S PRO FORMA MIDPOINT | 57 | |
FIGURE 47 - COMPARABLE CONVERSION PRICING MULTIPLES TO THE BANK’S PRO FORMA SUPER MAXIMUM | 57 |
FIGURE 48 - COMPARABLE CONVERSION PRICING MULTIPLES TO THE BANK’S PRO FORMA MINIMUM | 58 | |
FIGURE 49 - COMPARISON TO OTHER PENDING SECOND STEP CONVERSIONS | 59 | |
FIGURE 50 - COMPARISON OF THE EXCHANGE VALUE PER MINORITY SHARE AND STOCK PRICE | 60 |
List of Exhibits
Fox Chase Bancorp, Inc.
Hatboro, Pennsylvania
Exhibit | ||
| 1. | Profile of FinPro, Inc. and the Author of the Appraisal | |
| 2. | Consolidated Balance Sheets | |
| 3. | Consolidated Statements of Income | |
| 4. | Consolidated Statements of Equity and Comprehensive Income | |
| 5. | Consolidated Statements of Cash Flows | |
| 6. | Income Reconciliation of TFR to Consolidated Statements | |
| 7. | Comparable Group Selection Screens | |
| 8. | Selected Financial Data | |
| 9. | Industry Pricing Multiples | |
| 10. | Second Step Conversions 2008 to Year-to-Date | |
| 11. | Appraisal Full Offering No Foundation Pro Forma December 31, 2009 – 12 Months | |
| Conversion Valuation Appraisal Report | Page: 1 |
Introduction
Fox Chase Bancorp, Inc., a Maryland corporation, is offering shares of common stock for sale in connection with the conversion of Fox Chase Bank from the mutual holding company form of organization to the stock form of organization. Upon completion of the conversion and the offering, all of the common stock of Fox Chase Bancorp, Inc. will be owned by public stockholders. This report represents FinPro, Inc.’s (“FinPro”) independent appraisal of the estimated pro forma market value of the common stock (the “Common Stock”) of Fox Chase Bancorp, Inc. (hereafter referred to on a consolidated basis as the “Bank”).
In compiling the pro formas, FinPro relied upon the assumptions provided by the Bank and its agents. The pro forma assumptions are as follows:
| • | 59.9% of the total shares will be sold to the depositors and public, |
| • | the stock will be issued at $10.00 per share, |
| • | the conversion expenses will be $4.5 million at the midpoint, |
| • | there will be an ESOP equal to 4% of the shares issued funded internally, amortized over 15 years straight-line, |
| • | there will be an MRP equal to 3.15% of the shares issued, amortized over 5 years straight-line, |
| • | there will be a Stock Option Plan equal to 7.87% of the shares issued, expensed at $2.92 per option over 5 years straight-line, |
| • | the tax rate is assumed at 34.00% and, |
| • | the net proceeds will be invested at the three-year Treasury Note rate of 1.66%, pre-tax. |
It is our understanding that the Bank will offer its stock in a subscription and community offering to Eligible Account Holders, to the Employee Plans, and to Supplemental Eligible Account Holders of the Bank. This appraisal has been prepared in accordance with Regulation 563b.7 and the “Guidelines for Appraisal Reports for the Valuation of Savings and Loan Associations Converting from Mutual to Stock Form of Organization” of the Office of Thrift Supervision (“OTS”) which have been adopted in practice by the Federal Deposit Insurance Corporation (“FDIC”), including the most recent revisions as of October 21, 1994, and applicable regulatory interpretations thereof.
In the course of preparing our report, we reviewed the Bank’s audited financials for the years ended December 31, 2009 and December 31, 2009. We also reviewed the registration statement on Form S-1 as filed with the Securities and Exchange Commission (“SEC”). We have conducted due diligence analysis of the Bank and held due diligence related discussions with the Bank’s Management and Board, Stifel, Nicolaus & Company, Incorporated, (the Bank’s underwriter), and Kilpatrick Stockton LLP (the Bank’s special counsel). The valuation parameters set forth in the appraisal were predicated on these discussions but all conclusions related to the valuation were reached and made independent of such discussions.
| Conversion Valuation Appraisal Report | Page: 2 |
Where appropriate, we considered information based upon other publicly available sources, which we believe to be reliable; however, we cannot guarantee the accuracy or completeness of such information. We visited the Bank’s primary market area and reviewed the market area’s economic condition. We also reviewed the competitive environment in which the Bank operates and its relative strengths and weaknesses. We compared the Bank’s performance with selected publicly traded thrift institutions. We reviewed conditions in the securities markets in general and in the market for savings institutions in particular. Our analysis included a review of the estimated effects of the Conversion of the Bank on the operations and expected financial performance as they related to the Bank’s estimated pro forma value.
In preparing our valuation, we relied upon and assumed the accuracy and completeness of financial and other information provided to us by the Bank and its independent accountants. We did not independently verify the financial statements and other information provided by the Bank and its independent accountants, nor did we independently value any of the Bank’s assets or liabilities. This estimated valuation considers the Bank only as a going concern and should not be considered as an indication of its liquidation value.
Our valuation is not intended, and must not be construed, to be a recommendation of any kind as the advisability of purchasing shares of Common Stock in the stock issuance. Moreover, because such valuation is necessarily based upon estimates and projections of a number of matters, all of which are subject to change from time to time, no assurance can be given that persons who purchase shares of Common Stock in the stock issuance will thereafter be able to sell such shares at prices related to the foregoing valuation of the pro forma market value thereof. FinPro is not a seller of securities within the meaning of any federal or state securities laws. Any report prepared by FinPro shall not be used as an offer or solicitation with respect to the purchase or sale of any securities.
The estimated valuation herein will be updated as appropriate. These updates will consider, among other factors, any developments or changes in the Bank’s financial condition, operating performance, management policies and procedures and current conditions in the securities market for thrift institution common stock. Should any such developments or changes, in our opinion, be material to the estimated pro forma market value of the Bank, appropriate adjustments to the estimated pro forma market value will be made. The reasons for any such adjustments will be explained at that time.
| Conversion Valuation Appraisal Report | Page: 3 |
1. Overview and Financial Analysis
GENERAL OVERVIEW
As of December 31, 2009, the Bank had $1.2 billion in total assets, $858.3 million in deposits, $631.3 million in net loans and $123.6 million in equity. The following table sets forth information with respect to the Bank’s full-service banking offices. The data shown below is the most recently available public data with regard to branch deposits.
FIGURE 1 – CURRENT FACILITIES LIST
| Deposits as of June 30, | Growth (%) | ||||||||||||||||
Address | City | State | 2009 | 2008 | 2004 | 2008-2009 | 2004-2009 | ||||||||||
New Jersey | |||||||||||||||||
1) 6059 Black Horse Pike | Egg Harbor | NJ | $ | 55,866 | $ | 38,706 | $ | 61,631 | 44.33 | -9.35 | |||||||
2) 921 West Ave | Ocean City | NJ | 23,795 | 15,392 | 37,878 | 54.59 | -37.18 | ||||||||||
3) 8 US Rt 9 S | Marmora | NJ | 14,792 | 7,735 | — | 91.23 | — | ||||||||||
Pennsylvania | |||||||||||||||||
1) 401 Rhawn St | Philadelphia | PA | 298,206 | 260,515 | 379,362 | 14.47 | -21.39 | ||||||||||
2) 815 Bustleton Pike | Richboro | PA | 154,967 | 104,923 | 144,550 | 47.70 | 7.21 | ||||||||||
3) 4390 Davisville Rd | Hatboro | PA | 111,791 | 82,107 | 72,564 | 36.15 | 54.06 | ||||||||||
4) 1 Fitzwatertown Rd | Willow Grove | PA | 63,114 | 36,728 | 57,581 | 71.84 | 9.61 | ||||||||||
5) 1041 York Rd | Warminster | PA | 51,217 | 27,994 | 38,012 | 82.96 | 34.74 | ||||||||||
6) 137 N High St | West Chester | PA | 43,199 | 13,604 | — | 217.55 | — | ||||||||||
7) 5871 Lower York Rd | Lahaska | PA | 30,083 | 12,073 | — | 149.18 | — | ||||||||||
8) 210 W State St | Media | PA | 15,394 | 3,827 | — | 302.25 | — | ||||||||||
| Total | $ | 862,424 | $ | 603,604 | $ | 791,578 | |||||||||||
Source: SNL Financial
| Conversion Valuation Appraisal Report | Page: 4 |
HISTORYAND OVERVIEW
FOX CHASE BANK
Fox Chase Bank is headquartered in Hatboro, Pennsylvania and has provided community banking services to customers for over 142 years. The Bank currently operates eleven full-service locations in Bucks, Chester, Delaware, Montgomery and Philadelphia counties in Pennsylvania and Atlantic and Cape May counties in the southern New Jersey area. At December 31, 2009, the Bank exceeded all regulatory capital requirements and was not a participant in any of the U.S. Treasury’s capital raising programs for financial institutions.
The Bank is a full service retail banking institution. The Company’s primary business lines involve generating funds from deposits or borrowings and investing such funds in loans and investment securities. The principal focus is to become the leading relationship-based business and consumer bank in our market areas. The Bank currently operates eleven retail banking locations and ten automated teller machines throughout the Philadelphia metropolitan area and in the southern New Jersey area.
The Company’s principal executive offices are located at 4390 Davisville Road, Hatboro, Pennsylvania 19040.
| Conversion Valuation Appraisal Report | Page: 5 |
STRATEGIC DIRECTION
The Bank’s business strategy is to grow and improve profitability by:
| • | remaining a community-oriented financial institution; |
| • | improve earnings through asset diversification and growth; |
| • | improve asset quality; |
| • | improve the funding mix by focusing on core deposits; |
| • | grow through geographic expansion; |
| • | maintain strong capital levels; and |
| • | continue expense control. |
| Conversion Valuation Appraisal Report | Page: 6 |
BALANCE SHEET TRENDS
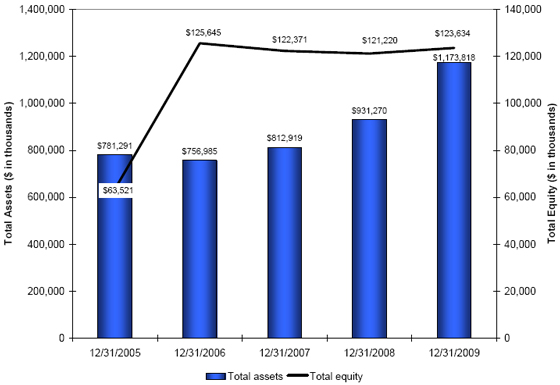
The Bank’s balance sheet declined by $24.3 million between December 31, 2005 and December 31, 2006, but assets increased $55.9 million between December 31, 2006 and December 31, 2007. The balance sheet grew by $118.4 million from December 31, 2007 to December 31, 2008 and grew by $242.5 million between December 31, 2008 and December 31, 2009.
Equity was $123.6 million as of December 31, 2009 and the equity to assets ratio was 10.53% at December 31, 2009.
FIGURE 2 - ASSETAND RETAINED EARNINGS CHART
Source: Offering Prospectus
| Conversion Valuation Appraisal Report | Page: 7 |
The following tables set forth certain information concerning the financial position of the Bank at the dates indicated.
FIGURE 3 - KEY BALANCE SHEET DATA
| At December 31, | |||||||||||||||
| Selected Financial Condition (in thousands) | 2009 | 2008 | 2007 | 2006 | 2005 | ||||||||||
| (in thousands) | |||||||||||||||
Total assets | $ | 1,173,818 | $ | 931,270 | $ | 812,919 | $ | 756,985 | $ | 781,291 | |||||
Cash and cash equivalents | 65,418 | 3,944 | 31,275 | 134,441 | 46,086 | ||||||||||
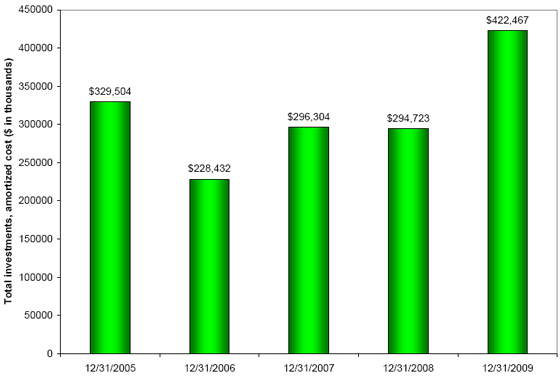
Securities available-for-sale | 422,467 | 294,723 | 296,304 | 228,432 | 329,504 | ||||||||||
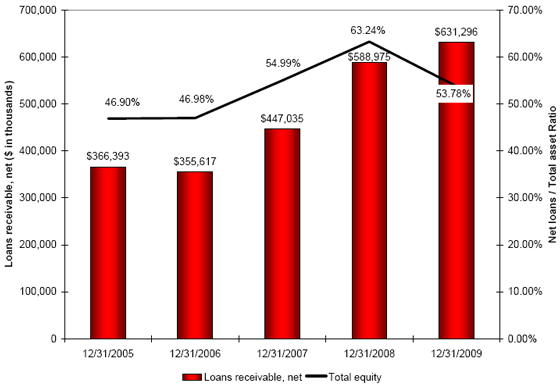
Loans receivable, net | 631,296 | 588,975 | 447,035 | 355,617 | 366,393 | ||||||||||
Deposits | 858,277 | 608,472 | 585,560 | 596,534 | 682,307 | ||||||||||
Federal Home Loan Bank advances | 137,165 | 146,379 | 80,000 | 30,000 | 30,000 | ||||||||||
Other borrowed funds | 50,000 | 50,000 | 20,000 | — | — | ||||||||||
Total stockholders’ equity | 123,634 | 121,220 | 122,371 | 125,645 | 63,521 | ||||||||||
Source: Offering Prospectus
FIGURE 4 - KEY RATIOS
| At December 31, | |||||||||||||||
| 2009 | 2008 | 2007 | 2006 | 2005 | |||||||||||
Performance Ratios: | |||||||||||||||
Return on average assets | -0.09 | % | 0.14 | % | 0.26 | % | 0.49 | % | 0.71 | % | |||||
Return on average equity | -0.82 | % | 1.00 | % | 1.54 | % | 4.59 | % | 9.50 | % | |||||
Interest rate spread (1) | 1.74 | % | 2.01 | % | 1.85 | % | 1.90 | % | 1.78 | % | |||||
Net interest margin (2) | 2.16 | % | 2.59 | % | 2.60 | % | 2.33 | % | 2.05 | % | |||||
Noninterest expense to average assets | 1.81 | % | 2.18 | % | 2.48 | % | 2.66 | % | 1.80 | % | |||||
Efficiency ratio (3) | 79.90 | % | 82.00 | % | 91.80 | % | 105.80 | % | 79.70 | % | |||||
Average interest-earning assets to average interest-bearing liabilities | 115.60 | % | 119.70 | % | 123.70 | % | 113.50 | % | 109.10 | % | |||||
Average equity to average assets | 11.11 | % | 13.98 | % | 16.66 | % | 10.58 | % | 7.44 | % | |||||
Asset Quality Ratios: | |||||||||||||||
Allowance for loan losses as a percent of total loans | 1.65 | % | 1.05 | % | 0.75 | % | 0.82 | % | 2.22 | % | |||||
Allowance for loan losses as a percent of nonperforming loans and accruing loans of 90 days or more past due | 35.73 | % | 107.01 | % | 412.21 | % | 91.44 | % | 163.90 | % | |||||
Net charge-offs to average outstanding loans during the period | 0.75 | % | — | — | — | — | |||||||||
Nonperforming loans as a percent of total loans | 4.62 | % | 0.98 | % | 0.18 | % | 0.90 | % | 1.36 | % | |||||
Nonperforming loans as a percent of total assets | 2.87 | % | 0.63 | % | 0.10 | % | 0.43 | % | 0.67 | % | |||||
Capital Ratios: | |||||||||||||||
Total equity to total assets | 10.53 | % | 13.02 | % | 15.05 | % | 16.60 | % | 8.13 | % | |||||
Tier 1 capital (to adjusted assets) (4) | 8.51 | % | 10.70 | % | 12.03 | % | 12.49 | % | 8.40 | % | |||||
Tier 1 capital (to risk-weighted assets) (4) | 15.41 | % | 18.11 | % | 21.78 | % | 26.79 | % | 17.76 | % | |||||
Total risk-based capital (to risk-weighted assets) (4) | 16.57 | % | 19.25 | % | 22.54 | % | 27.62 | % | 19.02 | % | |||||
Other Data: | |||||||||||||||
Deposit accounts | 52,416 | 49,252 | 52,817 | 55,957 | 61,349 | ||||||||||
Offices | 11 | 11 | 11 | 11 | 8 | ||||||||||
| (1) | Represents the difference between the weighted average yield on average interest-earning assets and the weighted average cost of interest-bearing liabilities. |
| (2) | Represents net interest income as a percent of average interest-earning assets. |
| (3) | Represents noninterest expense divided by the sum of net interest income and noninterest income, excluding gains or losses on the sale of securities, premises and equipment and assets acquired through foreclosure. For 2006, reflects a charge of $1.5 million for the contribution made to the Fox Chase Bank Charitable Foundation in connection with our initial public offering. |
| (4) | Ratios are for Fox Chase Bank. |
Source: Offering Prospectus
| Conversion Valuation Appraisal Report | Page: 8 |
LOAN PORTFOLIO
The Bank’s loan portfolio has increased by $264.9 million from December 31, 2005 to December 31, 2009, with $141.9 million of the growth coming between December 31, 2007 and December 31, 2008. As a percent of assets, the loan portfolio has increased from 46.90% to 53.78% between December 31, 2005 and December 31, 2009, respectively.
FIGURE 5 - NET LOANS RECEIVABLE CHART
Source: Offering Prospectus
| Conversion Valuation Appraisal Report | Page: 9 |
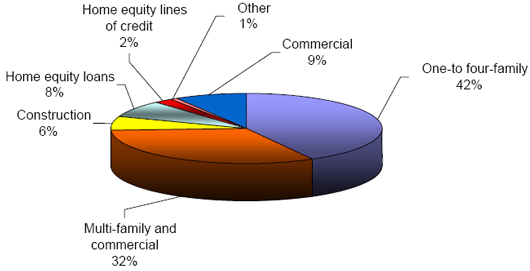
Since December 31, 2005, the loan portfolio composition has shifted toward multi-family and commercial real estate and commercial loans and has shifted away from one-to-four-family residential real estate and home equity loans.
FIGURE 6 - LOAN MIXASOF DECEMBER 31, 2009
| At December 31, | |||||||||||||||||||||||||||||||||||
| 2009 | 2008 | 2007 | 2006 | 2005 | |||||||||||||||||||||||||||||||
| Amount | Percent | Amount | Percent | Amount | Percent | Amount | Percent | Amount | Percent | ||||||||||||||||||||||||||
Real estate loans: | |||||||||||||||||||||||||||||||||||
One-to four-family | $ | 268,535 | 41.80 | % | $ | 260,833 | 43.80 | % | $ | 215,817 | 47.90 | % | $ | 209,463 | 58.30 | % | $ | 228,476 | 60.90 | % | |||||||||||||||
Multi-family and commercial | 207,738 | 32.40 | % | 155,564 | 26.20 | % | 76,287 | 16.90 | % | 44,681 | 12.40 | % | 32,923 | 8.80 | % | ||||||||||||||||||||
Construction | 40,799 | 6.40 | % | 65,002 | 10.90 | % | 46,471 | 10.30 | % | 11,568 | 3.20 | % | 31,015 | 8.30 | % | ||||||||||||||||||||
Total real estate loans | 517,072 | 80.60 | % | 481,399 | 80.90 | % | 338,575 | 75.10 | % | 265,712 | 73.90 | % | 292,414 | 78.00 | % | ||||||||||||||||||||
Consumer loans: | |||||||||||||||||||||||||||||||||||
Home equity loans | 50,080 | 7.80 | % | 63,987 | 10.70 | % | 68,431 | 15.20 | % | 73,456 | 20.50 | % | 65,003 | 17.30 | % | ||||||||||||||||||||
Home equity lines of credit | 13,664 | 2.10 | % | 11,486 | 1.90 | % | 9,642 | 2.10 | % | 10,468 | 2.90 | % | 16,269 | 4.30 | % | ||||||||||||||||||||
Other | 5,618 | 0.90 | % | 613 | 0.20 | % | 671 | 0.20 | % | 1,178 | 0.40 | % | 1,468 | 0.40 | % | ||||||||||||||||||||
Total consumer loans | 69,362 | 10.80 | % | 76,086 | 12.80 | % | 78,744 | 17.50 | % | 85,102 | 23.80 | % | 82,740 | 22.00 | % | ||||||||||||||||||||
Commercial and industrial | 55,434 | 8.60 | % | 37,371 | 6.30 | % | 33,356 | 7.40 | % | 8,194 | 2.30 | % | 175 | — | |||||||||||||||||||||
Total loans | 641,868 | 100.00 | % | 594,856 | 100.00 | % | 450,675 | 100.00 | % | 359,008 | 100.00 | % | 375,329 | 100.00 | % | ||||||||||||||||||||
Less: | |||||||||||||||||||||||||||||||||||
Deferred loan origination costs (fees), net | 33 | 379 | (264 | ) | (442 | ) | (587 | ) | |||||||||||||||||||||||||||
Allowance for loan losses | (10,605 | ) | (6,260 | ) | (3,376 | ) | (2,949 | ) | (8,349 | ) | |||||||||||||||||||||||||
Net loans | $ | 631,296 | $ | 588,975 | $ | 447,035 | $ | 355,617 | $ | 366,393 | |||||||||||||||||||||||||
Source: Offering Prospectus
| Conversion Valuation Appraisal Report | Page: 10 |
The two large components in the loan portfolio are 1-4 family residential loans, which account for 42% of the portfolio mix at December 31, 2009, and multi-family and commercial real estate loans, which account for 32% of the portfolio mix at December 31, 2009.
FIGURE 7 - LOAN MIXAT DECEMBER 31, 2009
Source: Offering Prospectus
| Conversion Valuation Appraisal Report | Page: 11 |
INVESTMENTS
The investment portfolio increased $126.2 million between December 31, 2007 and December 31, 2009.
FIGURE 8 - SECURITIES CHART
Source: Offering Prospectus
| Conversion Valuation Appraisal Report | Page: 12 |
INVESTMENTSAND MORTGAGE-BACKED SECURITIES
The following table sets forth the amortized cost and fair values of the Bank’s securities portfolio at the dates indicated. All of the securities were classified as available-for-sale at the dates indicated. The portfolio is predominately agency sponsored MBS. As a result of negative trends for the Company’s private label residential mortgage security, management’s analysis during the second quarter 2009 indicated that the security was other-than-temporary impaired in the amount of $605 thousand, $157 thousand of which was recognized on the Statement of Operations and $448 thousand in other comprehensive income (before taxes). There was no additional other-than-temporary credit impairment charge on this investment in the third or fourth quarter of 2009.
FIGURE 9 - INVESTMENT MIX
| At December 31, | ||||||||||||||||||
| 2009 | 2008 | 2007 | ||||||||||||||||
| Amortized Cost | Fair Value | Amortized Cost | Fair Value | Amortized Cost | Fair Value | |||||||||||||
| (in thousands) | ||||||||||||||||||
Obligations of U.S. government agencies | $ | 305 | $ | 306 | $ | — | $ | — | $ | 10,000 | $ | 10,016 | ||||||
State and political subdivisions | 9,199 | 9,292 | 14,679 | 14,463 | 81,019 | 81,143 | ||||||||||||
Corporate securities | 9,838 | 9,950 | 11,124 | 10,578 | — | — | ||||||||||||
Total investment securities | 19,342 | 19,548 | 25,803 | 25,041 | 91,019 | 91,159 | ||||||||||||
Private label residential mortgage related security | 628 | 195 | 889 | 269 | 1,181 | 1,208 | ||||||||||||
Private label commercial mortgage related securities | 17,607 | 17,833 | 10,049 | 7,304 | 10,069 | 10,137 | ||||||||||||
Agency residential mortgage related securities | 374,824 | 384,891 | 257,990 | 262,109 | 193,112 | 193,800 | ||||||||||||
Total mortgage related securities | 393,059 | 402,919 | 268,928 | 269,682 | 204,362 | 205,145 | ||||||||||||
Total securities | $ | 412,401 | $ | 422,467 | $ | 294,731 | $ | 294,723 | $ | 295,381 | $ | 296,304 | ||||||
Source: Offering Prospectus
| Conversion Valuation Appraisal Report | Page: 13 |
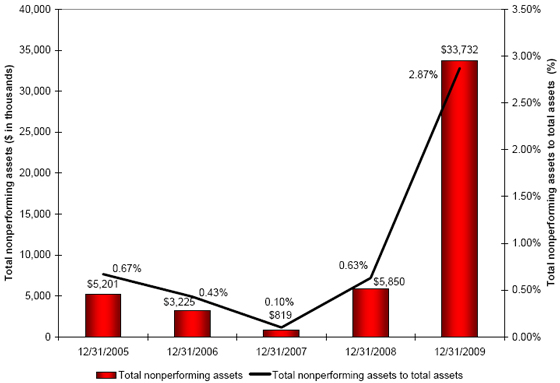
ASSET QUALITY
The Bank’s nonperforming assets increased to $33.7 million at December 31, 2009 from $5.2 million at December 31, 2005. The Bank’s nonperforming asset to total assets ratio increased from 0.67% at December 31, 2005 to 2.87% at December 31, 2009.
The increase in NPAs between December 31, 2008 and December 31, 2009 was primarily attributable to a $12.2 million increase in nonaccrual construction loans, a $6.2 million increase in nonaccrual 1-4 family mortgages and a $4.1 million increase in real estate owned.
The increase on nonaccrual construction loans relates to weak sales of new construction properties. The increase in nonaccrual 1-4 family mortgages was attributable to higher unemployment among other things.
FIGURE 10 - ASSET QUALITY CHART
Source: Offering Prospectus
| Conversion Valuation Appraisal Report | Page: 14 |
At December 31, 2009, the Company’s nonperforming loans to total loan ratio was 4.62% and the nonperforming assets to total assets ratio was 2.87%. The largest increases in the portfolio were construction loans, one-to-four family real estate, and multi-family and commercial real estate and the construction categories. Nonperforming one-to-four-family real estate loans increased by $6.2 million from December 31, 2008 to December 31, 2009. Nonperforming multi-family and commercial real estate increased by $4.1 million from December 31, 2008 to December 31, 2009. Nonperforming construction loans increased $12.2 million from December 31, 2008 to December 31, 2009.
FIGURE 11 - NONPERFORMING LOANS
| At December 31, | ||||||||||||||||||||
| 2009 | 2008 | 2007 | 2006 | 2005 | ||||||||||||||||
| (Dollars in thousands) | ||||||||||||||||||||
Nonaccrual loans: | ||||||||||||||||||||
One- to four-family real estate | $ | 7,740 | $ | 1,503 | $ | 155 | $ | 284 | $ | 548 | ||||||||||
Multi-family and commercial real estate | 4,738 | 685 | 105 | — | 2,972 | |||||||||||||||
Construction | 15,739 | 3,495 | — | — | — | |||||||||||||||
Consumer | 612 | 167 | — | — | — | |||||||||||||||
Commercial and industrial | 250 | — | — | — | — | |||||||||||||||
Total | 29,079 | 5,850 | 260 | 284 | 3,520 | |||||||||||||||
Accruing loans past due 90 days or more: | ||||||||||||||||||||
One- to four-family | — | — | 559 | — | — | |||||||||||||||
Multi-family and commercial real estate | 601 | — | — | 2,941 | 1,574 | |||||||||||||||
Total | 601 | — | 559 | 2,941 | 1,574 | |||||||||||||||
Total of nonaccrual loans and accruing loans 90 days or more past due | $ | 29,680 | $ | 5,850 | $ | 819 | $ | 3,225 | $ | 5,094 | ||||||||||
Real estate owned | 4,052 | — | — | — | 107 | |||||||||||||||
Total nonperforming assets | $ | 33,732 | $ | 5,850 | $ | 819 | $ | 3,225 | $ | 5,201 | ||||||||||
Total nonperforming loans and accruing loans past due 90 days or more to total loans | 4.62 | % | 0.98 | % | 0.18 | % | 0.90 | % | 1.36 | % | ||||||||||
Total nonperforming loans to total assets | 2.53 | % | 0.63 | % | 0.10 | % | 0.43 | 0.65 | % | |||||||||||
Total nonperforming assets to total assets | 2.87 | % | 0.63 | % | 0.10 | % | 0.43 | 0.67 | % | |||||||||||
Source: Offering Prospectus
| Conversion Valuation Appraisal Report | Page: 15 |
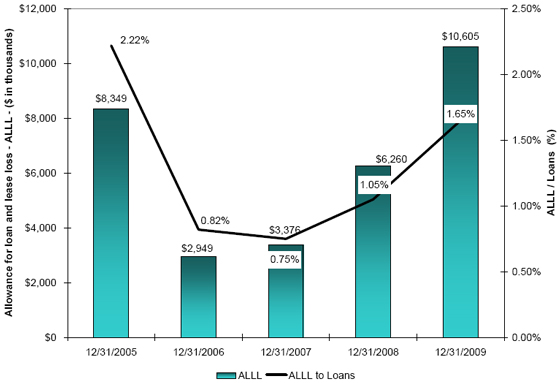
The Bank’s reserve to loan ratio was 1.65% as of December 31, 2009. The ratio has trended upward since 2007.
FIGURE 12 - ALLOWANCEFOR POSSIBLE LOANAND LEASE LOSSES CHART
Source: Offering Prospectus
| Conversion Valuation Appraisal Report | Page: 16 |
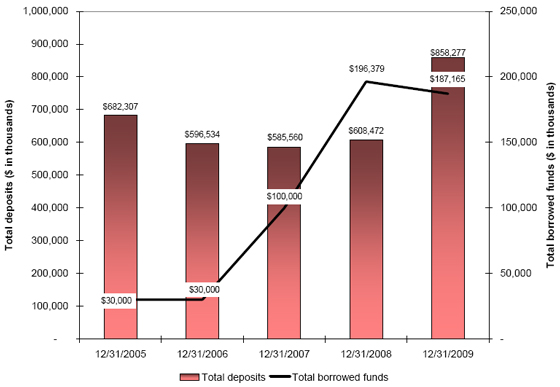
FUNDING COMPOSITION
Following two years of declines, the Bank experienced deposit growth of $272.7 million between December 31, 2007 and December 31, 2009. Borrowings trended upward between December 31, 2006 and December 31, 2009 due to the Bank implementing leverage strategies. As of December 31, 2009, the Bank had outstanding borrowings of $187.2 million.
FIGURE 13 - DEPOSITAND BORROWING TREND CHART
Source: Offering Prospectus
| Conversion Valuation Appraisal Report | Page: 17 |
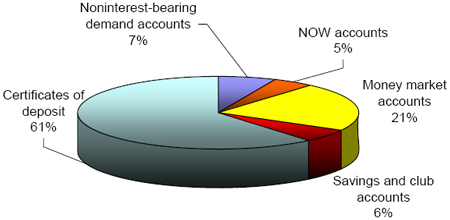
The following chart illustrates the Bank’s deposit mix as of December 31, 2009. The two largest components of the deposit mix are certificates of deposit and money market accounts.
FIGURE 14 - DEPOSIT MIX
Source: Offering Prospectus
| Conversion Valuation Appraisal Report | Page: 18 |
ASSET/LIABILITY MANAGEMENT
The following table, which is based on information that the Bank provided to the Office of Thrift Supervision, presents the change in the net portfolio value of the Bank at September 30, 2009 (the latest date for which the information is available) that would occur in the event of an immediate change in interest rates based on Office of Thrift Supervision assumptions, with no effect given to any steps that the Bank might take to counteract that change. The Bank’s interest rate risk position is considered to be “Minimum Risk” according to TB-13a.
FIGURE 15 – INTEREST RATE RISK
| Net Portfolio Value | Net Portfolio Value as % of Portfolio Value of Assets | ||||||||||||||
Basis point ("bp") Change in rates | Amount | Change | % Change | NPV Ratio | Change (bp) | ||||||||||
| (Dollars in thousands) | |||||||||||||||
300 | $ | 80,064 | $ | (45,613 | ) | -36 | % | 6.84 | % | -333 | |||||
200 | 99,038 | (26,640 | ) | -21 | % | 8.28 | % | -189 | |||||||
100 | 118,970 | (6,707 | ) | -5 | % | 9.77 | % | -40 | |||||||
50 | 119,307 | (6,370 | ) | -5 | % | 9.72 | % | -45 | |||||||
0 | 125,677 | — | 10.17 | % | 0 | ||||||||||
-50 | 122,942 | (2,735 | ) | -2 | % | 9.90 | % | -27 | |||||||
-100 | 124,218 | (1,459 | ) | -1 | % | 9.97 | % | -20 | |||||||
Source: Offering Prospectus
| Conversion Valuation Appraisal Report | Page: 19 |
NET WORTHAND CAPITAL
At December 31, 2009 the Bank had capital in excess of the minimum requirements for all capital ratios.
FIGURE 16 - CAPITALANALYSIS
| At December 31, 2009 | ||||||
Bank Level Regulatory Capital Position | Amount (000’s) | Percentage of Assets | ||||
GAAP capital | $ | 106,136 | 9.02 | % | ||
Tier 1 leverage capital | ||||||
Capital level | 99,592 | 8.51 | % | |||
Requirement | 46,809 | 4.00 | % | |||
Excess | 52,783 | 4.51 | % | |||
Tier 1 risk-based capital | ||||||
Capital level | 99,592 | 15.41 | % | |||
Requirement | 25,854 | 4.00 | % | |||
Excess | 73,738 | 11.41 | % | |||
Total risk-based capital | ||||||
Capital level | 107,092 | 16.57 | % | |||
Requirement | 51,707 | 8.00 | % | |||
Excess | $ | 55,385 | 8.57 | % | ||
Source: Offering Prospectus
| Conversion Valuation Appraisal Report | Page: 20 |
PROFITABILITY TRENDS
Net income trended downward between the twelve months ended December 31, 2005 and the twelve months ended December 31, 2009. The decline of over this time period was primarily attributable to higher provision expense. Provision recoveries were $6.0 million and $5.9 million for the twelve months ended December 31, 2005 and December 31, 2006, respectively. Provision expense increased to $425 thousand for the twelve months ended December 31, 2007 and increased to $2.9 million and $9.1 million for the twelve months ended December 31, 2008 and December 31, 2009, respectively.
The adverse change in profitability between December 31, 2008 and December 31, 2009 was primarily attributable to a $6.2 million increase in provision expense and a $1.4 million increase in noninterest expense. The increased provision expense was largely attributable to the $4.7 million in charge-offs and the rise in NPAs.
FIGURE 17 - NET INCOME CHART
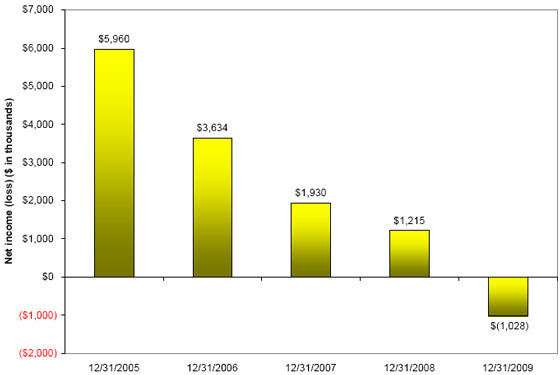
For the twelve months ended,
Source: Offering Prospectus
| Conversion Valuation Appraisal Report | Page: 21 |
The net interest spread and margin decreased between the twelve months ended December 31, 2008 and the twelve months ended December 31, 2009. The decline was primarily attributable to the yield on earning assets declining more than the cost of funding.
FIGURE 18 - AVERAGE YIELDSAND COSTS
| Years Ended December 31, | |||||||||||||||||||||||||||
| 2009 | 2008 | 2007 | |||||||||||||||||||||||||
| Average Balance | Interest and Dividends | Yield/ Cost | Average Balance | Interest and Dividends | Yield/ Cost | Average Balance | Interest and Dividends | Yield/ Cost | |||||||||||||||||||
| (Dollars in thousands) | |||||||||||||||||||||||||||
Assets: | |||||||||||||||||||||||||||
Interest-earning assets: | |||||||||||||||||||||||||||
Interest-earning demand deposits | $ | 50,506 | $ | 622 | 1.23 | % | $ | 10,218 | $ | 131 | 1.28 | % | $ | 81,864 | $ | 4,167 | 5.09 | % | |||||||||
Money market funds | 27,564 | 183 | 0.67 | % | 16,892 | 536 | 3.17 | % | 806 | 40 | 4.96 | % | |||||||||||||||
Mortgage-related securities | 352,542 | 14,654 | 4.16 | % | 246,811 | 12,356 | 5.01 | % | 147,978 | 7,329 | 4.95 | % | |||||||||||||||
Taxable securities | 28,102 | 764 | 2.72 | % | 29,334 | 1,240 | 4.23 | % | 61,530 | 3,236 | 5.26 | % | |||||||||||||||
Nontaxable securities | 12,082 | 482 | 3.99 | % | 15,350 | 613 | 3.99 | % | 24,023 | 924 | 3.85 | % | |||||||||||||||
Loans: | |||||||||||||||||||||||||||
Residential loans | 266,577 | 14,575 | 5.47 | % | 238,858 | 13,550 | 5.67 | % | 208,828 | 11,791 | 5.65 | % | |||||||||||||||
Commercial loans | 285,460 | 15,882 | 5.49 | % | 203,391 | 13,048 | 6.31 | % | 113,822 | 8,800 | 7.63 | % | |||||||||||||||
Consumer loans | 73,572 | 4,236 | 5.76 | % | 76,545 | 4,410 | 5.76 | % | 81,467 | 4,770 | 5.86 | % | |||||||||||||||
Total Loans | 625,609 | 34,693 | 5.51 | % | 518,794 | 31,008 | 5.94 | % | 404,117 | 25,361 | 6.25 | % | |||||||||||||||
Allowance for loan losses | -7,311 | -3,857 | -3,056 | ||||||||||||||||||||||||
Net loans | 618,298 | 34,693 | 514,937 | 31,008 | 401,061 | 25,361 | |||||||||||||||||||||
Total interest-earning assets | 1,089,094 | 51,398 | 4.67 | % | 833,542 | 45,884 | 5.45 | % | 717,262 | 41,057 | 5.68 | % | |||||||||||||||
Noninterest-earning assets | 37,282 | 35,946 | 36,172 | ||||||||||||||||||||||||
Total assets | $ | 1,126,376 | $ | 869,488 | $ | 753,434 | |||||||||||||||||||||
Liabilities and equity: | |||||||||||||||||||||||||||
Interest-bearing liabilities: | |||||||||||||||||||||||||||
NOW and money market deposit accounts | $ | 189,946 | 2,874 | 1.51 | % | $ | 109,499 | 2,307 | 2.11 | % | $ | 81,943 | 1,997 | 2.44 | % | ||||||||||||
Savings accounts | 51,350 | 90 | 0.17 | % | 52,748 | 158 | 0.30 | % | 59,160 | 424 | 0.72 | % | |||||||||||||||
Certificates of deposit | 506,076 | 17,625 | 3.48 | % | 385,141 | 15,998 | 4.15 | % | 402,120 | 18,105 | 4.50 | % | |||||||||||||||
Total interest-bearing deposits | 747,372 | 20,589 | 2.75 | % | 547,388 | 18,463 | 3.37 | % | 543,223 | 20,526 | 3.78 | % | |||||||||||||||
FHLB advances | 144,224 | 5,311 | 3.63 | % | 122,145 | 4,653 | 3.73 | % | 34,422 | 1,642 | 4.77 | % | |||||||||||||||
Other borrowed funds - short term | 284 | 2 | 0.69 | % | — | 0.00 | % | — | — | 0.00 | % | ||||||||||||||||
Other borrowed funds - long term | 50,000 | 1,733 | 3.42 | % | 26,863 | 963 | 3.53 | % | 2,222 | 82 | 3.62 | % | |||||||||||||||
Total borrowings | 194,508 | 7,046 | 3.57 | % | 149,008 | 5,598 | 3.70 | % | 36,644 | 1,724 | 4.64 | % | |||||||||||||||
Total interest-bearing liabilities | 941,880 | 27,635 | 2.92 | % | 696,396 | 24,061 | 3.44 | % | 579,867 | 22,250 | 3.83 | % | |||||||||||||||
Noninterest-bearing deposits | 50,743 | 46,044 | 43,036 | ||||||||||||||||||||||||
Other noninterest-bearing liabilities | 8,665 | 5,462 | 4,983 | ||||||||||||||||||||||||
Total liabilities | 1,001,288 | 747,902 | 627,886 | ||||||||||||||||||||||||
Retained earnings | 120,619 | 121,852 | 126,257 | ||||||||||||||||||||||||
Accumulated comprehensive income | 4,469 | -266 | -709 | ||||||||||||||||||||||||
Total stockholder’s equity | 125,088 | 121,586 | 125,548 | ||||||||||||||||||||||||
Total liabilities and stockholders’ equity | $ | 1,126,376 | $ | 869,488 | $ | 753,434 | |||||||||||||||||||||
Net interest income | $ | 23,763 | $ | 21,823 | $ | 18,807 | |||||||||||||||||||||
Interest rate spread | 1.74 | % | 2.01 | % | 1.85 | % | |||||||||||||||||||||
Net interest margin | 2.16 | % | 2.59 | % | 2.60 | % | |||||||||||||||||||||
Average interest-earning assets to average interest-bearing liabilities | 115.63 | % | 119.69 | % | 123.69 | % | |||||||||||||||||||||
Source: Offering Prospectus
| Conversion Valuation Appraisal Report | Page: 22 |
Spread and margin trended downward between December 31, 2007 and December 31, 2009, due in large part to declining yield.
The net interest spread and margin both decreased between the twelve months ended December 31, 2008 and December 31, 2009 due to yields declining more than the cost of funding.
FIGURE 19 - SPREADAND MARGIN CHART
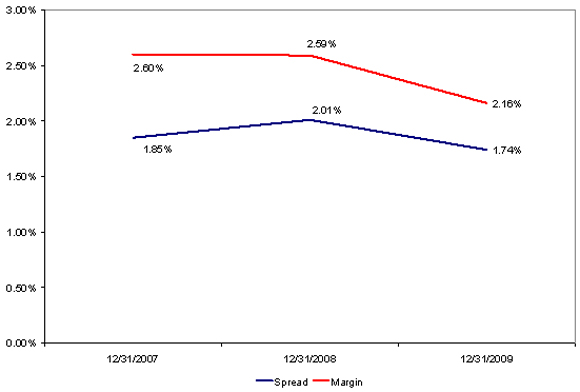
Source: Offering Prospectus
| Conversion Valuation Appraisal Report | Page: 23 |
Net income trended downward between the twelve months ended December 31, 2005 and the twelve months ended December 31, 2009. The decline over this time period was primarily attributable to higher provision expenses. Net interest income and noninterest income increased between the twelve months ended December 31, 2008 and the twelve months ended December 31, 2009. This increase was offset by higher provision expense and higher noninterest expense during the period between the twelve months ended December 31, 2008 and the twelve months ended December 31, 2009.
FIGURE 20 - INCOME STATEMENT TRENDS
| At December 31, | ||||||||||||||||||
| Selected Financial Condition (in thousands) | 2009 | 2008 | 2007 | 2006 | 2005 | |||||||||||||
| (in thousands) | ||||||||||||||||||
Interest income | $ | 51,398 | $ | 45,884 | $ | 41,057 | $ | 37,177 | $ | 37,601 | ||||||||
Interest expense | 27,635 | 24,061 | 22,250 | 20,459 | 20,697 | |||||||||||||
Net interest income | 23,763 | 21,823 | 18,807 | 16,718 | 16,904 | |||||||||||||
Provision (credit) for loan losses | 9,052 | 2,900 | 425 | (5,394 | ) | (6,025 | ) | |||||||||||
Net interest income after provision (credit) for loan losses | 14,711 | 18,923 | 18,382 | 22,112 | 22,929 | |||||||||||||
Noninterest income | 3,767 | 1,405 | 2,696 | 2,073 | 1,214 | |||||||||||||
Noninterest expense | 20,333 | 18,948 | 18,688 | 19,867 | 15,208 | |||||||||||||
(Loss) income before income tax (benefit) expense | (1,855 | ) | 1,380 | 2,390 | 4,318 | 8,935 | ||||||||||||
Income tax (benefit) expense | (827 | ) | 165 | 460 | 684 | 2,975 | ||||||||||||
Net (loss) income (1) | $ | (1,028 | ) | $ | 1,215 | $ | 1,930 | $ | 3,634 | $ | 5,960 | |||||||
Source: Offering Prospectus
| (1) | Net income for 2006 reflects a charge of $1.5 million for the contribution made to the Fox Chase Bank Charitable Foundation in connection with our initial public offering. |
| Conversion Valuation Appraisal Report | Page: 24 |
LEGAL PROCEEDINGS
At December 31, 2009, the Bank was not involved in any legal proceedings the outcome of which it believes would be material to its financial condition or results of operations. Periodically, there have been various claims and lawsuits against the Bank, such as claims to enforce liens, condemnation proceedings on properties in which the Bank holds security interests, claims involving the making and servicing of real property loans and other issues incident to the Bank’s business. The Bank is currently not a party to any pending legal proceedings that the Bank believes would have a material adverse effect on the financial condition, results of operations or cash flows.
SUBSIDIARIES
Fox Chase Bank established Fox Chase Financial, Inc. in 1999. As a Delaware-chartered corporation investment company, Fox Chase Financial manages and holds investment securities.
In February 2009, Fox Chase Bank established Fox Chase Service Corporation as a wholly-owned subsidiary. A Pennsylvania-chartered corporation, Fox Chase Service Corporation made and manages the Bank’s investment in Philadelphia Mortgage Advisors, Inc.
| Conversion Valuation Appraisal Report | Page: 25 |
2. Market Area Analysis
New Jersey Market Area.The economy of Atlantic County is dominated by the gaming industry in nearby Atlantic City as the primary employer. The economy of Cape May County is primarily geared towards tourism. According to published statistics, Atlantic County’s population in 2009 was approximately 279,000 and Cape May County’s population was approximately 101,000. The economy in Atlantic County, while strong in recent years as new and expanding casinos in Atlantic City were being developed, began deteriorating as gaming revenues fell in 2008 and 2009. Cape May County also generally benefits from the growth in and around Atlantic City, as many residents commute to that area for employment. Although the economy in this market area has been strong in recent years, during 2008 and 2009 gaming revenues and casino development has declined, resulting in a significant deterioration in development and employment. Additionally, median household and per capita income in Atlantic and Cape May Counties are lower than the comparable figures for New Jersey as a whole. The southern New Jersey market is located outside of a major metropolitan area, resulting in lower average income levels and a smaller portion of higher-paying, professional jobs.
Philadelphia Market Area. The economy of the Philadelphia market area is primarily dominated by the service sector. According to published statistics, the population of the five-county area served by the Bank’s branches totaled approximately 3.9 million in 2008. The economy in the Philadelphia market area contains a highly-educated workforce and a diverse local economy as traditional employers in the manufacturing and financial services industry have been bolstered by growth in the life sciences and health care industries as well as the information technology and communication sectors. The median household and per capita income in Bucks, Chester, Delaware and Montgomery Counties significantly exceeds the comparable figures for Pennsylvania as a whole, while the median household and per capita income in Philadelphia County trailed the comparable figures for Pennsylvania.
| Conversion Valuation Appraisal Report | Page: 26 |
The following tables provide deposit and demographic data for the Bank’s market area.
FIGURE 21 – DEPOSITAND DEMOGRAPHIC DATAFOR ATLANTIC, NJ
| Market: Atlantic, NJ | Deposit Data as of 6/30/2009 | |||||
Deposits Summary | ||||||||||||||
| (Deposit data in $000) | ||||||||||||||
| 6/2004 | 6/2005 | 6/2006 | 6/2007 | 6/2008 | 6/2009 | CAGR(%) | ||||||||
Total Deposits | 3,686,797 | 4,604,486 | 4,704,101 | 4,769,306 | 4,126,909 | 4,450,923 | 1.56 | |||||||
Demographic Data
| Base 2000 | Current 2009 | Projected 2014 | % Change 2000-2009 | % Change 2009-2014 | ||||||
Total Population: | 252,552 | 279,172 | 289,448 | 10.54 | 3.68 | |||||
0-14 Age Group (%): | 21 | 20 | 19 | 1.16 | 3.12 | |||||
15-34 Age Group (%): | 25 | 26 | 27 | 13.36 | 6.25 | |||||
35-54 Age Group (%): | 31 | 29 | 26 | 4.84 | -6.43 | |||||
55+ Age Group (%): | 23 | 25 | 28 | 24.00 | 13.09 | |||||
Total Households: | 95,024 | 105,339 | 109,300 | 10.86 | 3.76 | |||||
$0-24K Households (%): | 26 | 19 | 17 | -21.12 | -8.59 | |||||
$25-50K Households (%): | 30 | 25 | 22 | -7.86 | -7.16 | |||||
$50K+ Households (%): | 44 | 56 | 61 | 43.16 | 12.74 | |||||
Average Household Income: | 54,678 | 67,826 | 69,627 | 24.05 | 2.66 | |||||
Median Household Income: | 43,991 | 55,982 | 59,659 | 27.26 | 6.57 | |||||
Per Capita Income: | 21,034 | 26,022 | 26,761 | 23.71 | 2.84 | |||||
Source: ESRI
Source: SNL Securities and ESRI
FIGURE 22 – DEPOSITAND DEMOGRAPHIC DATAFOR CAPE MAY, NJ
| Market: Cape May, NJ | Deposit Data as of 6/30/2009 |
Deposits Summary | ||||||||||||||
(Deposit data in $000) | ||||||||||||||
| 6/2004 | 6/2005 | 6/2006 | 6/2007 | 6/2008 | 6/2009 | CAGR(%) | ||||||||
Total Deposits | 2,398,471 | 2,565,456 | 2,566,519 | 2,513,469 | 2,432,984 | 2,598,470 | 0.49 | |||||||
Demographic Data
| Base 2000 | Current 2009 | Projected 2014 | % Change 2000-2009 | % Change 2009-2014 | ||||||
Total Population: | 102,326 | 100,834 | 99,950 | -1.46 | -0.88 | |||||
0-14 Age Group (%): | 18 | 16 | 15 | -15.87 | -2.81 | |||||
15-34 Age Group (%): | 21 | 21 | 20 | -1.16 | -1.87 | |||||
35-54 Age Group (%): | 29 | 27 | 25 | -7.87 | -10.01 | |||||
55+ Age Group (%): | 32 | 36 | 39 | 12.64 | 7.42 | |||||
Total Households: | 42,148 | 42,787 | 42,707 | 1.52 | -0.19 | |||||
$0-24K Households (%): | 29 | 19 | 17 | -31.90 | -12.12 | |||||
$25-50K Households (%): | 30 | 26 | 24 | -11.16 | -10.52 | |||||
$50K+ Households (%): | 41 | 55 | 60 | 33.92 | 9.01 | |||||
Average Household Income: | 57,755 | 71,553 | 73,604 | 23.89 | 2.87 | |||||
Median Household Income: | 41,660 | 54,354 | 58,341 | 30.47 | 7.34 | |||||
Per Capita Income: | 24,172 | 30,858 | 32,015 | 27.66 | 3.75 | |||||
Source: ESRI
Source: SNL Securities and ESRI
| Conversion Valuation Appraisal Report | Page: 27 |
FIGURE 23 – DEPOSITAND DEMOGRAPHIC DATAFOR BUCKS, PA
| Market: Bucks, PA | Deposit Data as of 6/30/2009 |
| Deposits Summary | ||||||||||||||
(Deposit data in $000) | ||||||||||||||
| 6/2004 | 6/2005 | 6/2006 | 6/2007 | 6/2008 | 6/2009 | CAGR(%) | ||||||||
Total Deposits | 10,446,988 | 11,054,621 | 11,912,031 | 12,130,075 | 12,355,319 | 13,986,195 | 3.30 | |||||||
| Demographic Data | ||||||||||||||
| Base 2000 | Current 2009 | Projected 2014 | % Change 2000-2009 | % Change 2009-2014 | ||||||
Total Population: | 597,635 | 634,223 | 648,313 | 6.12 | 2.22 | |||||
0-14 Age Group (%): | 21 | 20 | 20 | -1.36 | 1.54 | |||||
15-34 Age Group (%): | 24 | 23 | 23 | 1.02 | 2.51 | |||||
35-54 Age Group (%): | 33 | 32 | 29 | 1.26 | -5.21 | |||||
55+ Age Group (%): | 22 | 26 | 28 | 26.59 | 11.59 | |||||
Total Households: | 218,725 | 234,527 | 240,768 | 7.22 | 2.66 | |||||
$0-24K Households (%): | 16 | 10 | 9 | -33.69 | -2.39 | |||||
$25-50K Households (%): | 25 | 16 | 14 | -28.74 | -11.36 | |||||
$50K+ Households (%): | 59 | 74 | 77 | 33.05 | 6.43 | |||||
Average Household Income: | 73,983 | 98,997 | 103,374 | 33.81 | 4.42 | |||||
Median Household Income: | 59,726 | 79,444 | 83,374 | 33.01 | 4.95 | |||||
Per Capita Income: | 27,430 | 36,801 | 38,605 | 34.16 | 4.90 | |||||
Source: ESRI
Source: SNL Securities and ESRI
FIGURE 24 – DEPOSITAND DEMOGRAPHIC DATAFOR CHESTER, PA
| Market: Chester, PA | Deposit Data as of 6/30/2009 |
| Deposits Summary | ||||||||||||||
(Deposit data in $000) | ||||||||||||||
| 6/2004 | 6/2005 | 6/2006 | 6/2007 | 6/2008 | 6/2009 | CAGR(%) | ||||||||
Total Deposits | 7,174,541 | 7,752,029 | 8,739,697 | 9,034,615 | 8,889,453 | 10,212,787 | 4.84 | |||||||
| Demographic Data | ||||||||||||||
| Base 2000 | Current 2009 | Projected 2014 | % Change 2000-2009 | % Change 2009-2014 | ||||||
Total Population: | 433,501 | 499,763 | 532,960 | 15.29 | 6.64 | |||||
0-14 Age Group (%): | 22 | 21 | 20 | 8.90 | 5.35 | |||||
15-34 Age Group (%): | 25 | 24 | 24 | 9.96 | 9.21 | |||||
35-54 Age Group (%): | 33 | 31 | 29 | 10.06 | -2.33 | |||||
55+ Age Group (%): | 21 | 24 | 27 | 36.73 | 16.65 | |||||
Total Households: | 157,905 | 184,056 | 197,363 | 16.56 | 7.23 | |||||
$0-24K Households (%): | 15 | 10 | 9 | -23.08 | 1.88 | |||||
$25-50K Households (%): | 22 | 15 | 13 | -20.22 | -7.39 | |||||
$50K+ Households (%): | 63 | 75 | 78 | 38.71 | 10.88 | |||||
Average Household Income: | 85,047 | 112,852 | 118,507 | 32.69 | 5.01 | |||||
Median Household Income: | 64,836 | 87,308 | 93,734 | 34.66 | 7.36 | |||||
Per Capita Income: | 31,627 | 41,991 | 44,340 | 32.77 | 5.59 | |||||
Source: ESRI
Source: SNL Securities and ESRI
| Conversion Valuation Appraisal Report | Page: 28 |
FIGURE 25 – DEPOSITAND DEMOGRAPHIC DATAFOR DELAWARE, PA
| Market: Delaware, PA | Deposit Data as of 6/30/2008 |
| Deposits Summary | ||||||||||||||
(Deposit data in $000) | ||||||||||||||
| 6/2004 | 6/2005 | 6/2006 | 6/2007 | 6/2008 | 6/2009 | CAGR(%) | ||||||||
Total Deposits | 7,911,118 | 8,385,152 | 8,796,331 | 9,082,089 | 9,140,696 | 10,650,784 | 3.42 | |||||||
| Demographic Data | ||||||||||
| Base 2000 | Current 2009 | Projected 2014 | % Change 2000-2009 | % Change 2009-2014 | ||||||
Total Population: | 550,864 | 558,969 | 559,509 | 1.47 | 0.10 | |||||
0-14 Age Group (%): | 21 | 19 | 19 | -6.55 | -0.99 | |||||
15-34 Age Group (%): | 26 | 26 | 26 | 0.52 | 1.44 | |||||
35-54 Age Group (%): | 30 | 29 | 26 | -1.40 | -8.52 | |||||
55+ Age Group (%): | 24 | 27 | 29 | 12.91 | 8.89 | |||||
Total Households: | 206,320 | 209,124 | 209,753 | 1.36 | 0.30 | |||||
$0-24K Households (%): | 23 | 15 | 15 | -32.87 | -3.47 | |||||
$25-50K Households (%): | 27 | 21 | 19 | -20.69 | -12.25 | |||||
$50K+ Households (%): | 50 | 64 | 67 | 28.85 | 5.37 | |||||
Average Household Income: | 65,639 | 83,416 | 87,323 | 27.08 | 4.68 | |||||
Median Household Income: | 50,104 | 66,300 | 69,779 | 32.32 | 5.25 | |||||
Per Capita Income: | 25,040 | 31,792 | 33,396 | 26.96 | 5.05 | |||||
Source: ESRI
Source: SNL Securities and ESRI
FIGURE 26 – DEPOSITAND DEMOGRAPHIC DATAFOR MONTGOMERY, PA
| Market: Montgomery, PA | Deposit Data as of 6/30/2008 |
| Deposits Summary | ||||||||||||||
(Deposit data in $000) | ||||||||||||||
| 6/2004 | 6/2005 | 6/2006 | 6/2007 | 6/2008 | 6/2009 | CAGR(%) | ||||||||
Total Deposits | 15,585,373 | 16,783,565 | 18,410,895 | 19,539,913 | 20,436,795 | 21,818,516 | 4.38 | |||||||
| Demographic Data | ||||||||||
| Base 2000 | Current 2009 | Projected 2014 | % Change 2000-2009 | % Change 2009-2014 | ||||||
Total Population: | 750,097 | 786,653 | 801,186 | 4.87 | 1.85 | |||||
0-14 Age Group (%): | 20 | 19 | 19 | -0.83 | 0.67 | |||||
15-34 Age Group (%): | 24 | 23 | 24 | -1.14 | 4.70 | |||||
35-54 Age Group (%): | 31 | 31 | 28 | 2.64 | -6.45 | |||||
55+ Age Group (%): | 24 | 27 | 29 | 18.71 | 9.60 | |||||
Total Households: | 286,098 | 302,908 | 309,446 | 5.88 | 2.16 | |||||
$0-24K Households (%): | 16 | 10 | 9 | -34.38 | -3.00 | |||||
$25-50K Households (%): | 24 | 17 | 15 | -23.67 | -11.96 | |||||
$50K+ Households (%): | 60 | 73 | 76 | 28.48 | 6.22 | |||||
Average Household Income: | 79,813 | 103,260 | 108,780 | 29.38 | 5.35 | |||||
Median Household Income: | 60,868 | 80,212 | 84,230 | 31.78 | 5.01 | |||||
Per Capita Income: | 30,898 | 40,149 | 42,445 | 29.94 | 5.72 | |||||
Source: ESRI
Source: SNL Securities and ESRI
| Conversion Valuation Appraisal Report | Page: 29 |
FIGURE 27 - DEPOSITAND DEMOGRAPHIC DATAFOR PHILADELPHIA, PA
| Market: Philadelphia, PA | Deposit Data as of 6/30/2008 | |||
| Deposits Summary | ||||||||||||||
| (Deposit data in $000) | ||||||||||||||
| 6/2004 | 6/2005 | 6/2006 | 6/2007 | 6/2008 | 6/2009 | CAGR(%) | ||||||||
Total Deposits | 29,257,357 | 35,226,046 | 41,545,533 | 44,400,259 | 44,803,956 | 47,957,154 | 10.83 |
Demographic Data
| Base 2000 | Current 2009 | Projected 2014 | % Change 2000-2009 | % Change 2009-2014 | ||||||
Total Population: | 1,517,550 | 1,452,449 | 1,413,509 | -4.29 | -2.68 | |||||
0-14 Age Group (%): | 21 | 20 | 20 | -11.47 | -2.07 | |||||
15-34 Age Group (%): | 30 | 30 | 29 | -4.95 | -3.89 | |||||
35-54 Age Group (%): | 27 | 26 | 24 | -5.55 | -9.76 | |||||
55+ Age Group (%): | 22 | 24 | 27 | 4.94 | 5.85 | |||||
Total Households: | 590,071 | 568,420 | 554,585 | -3.67 | -2.43 | |||||
$0-24K Households (%): | 42 | 33 | 32 | -25.15 | -5.38 | |||||
$25-50K Households (%): | 29 | 26 | 23 | -14.48 | -13.43 | |||||
$50K+ Households (%): | 29 | 42 | 46 | 38.04 | 6.66 | |||||
Average Household Income: | 41,525 | 52,609 | 54,501 | 26.69 | 3.60 | |||||
Median Household Income: | 30,781 | 41,408 | 45,404 | 34.52 | 9.65 | |||||
Per Capita Income: | 16,509 | 21,112 | 21,992 | 27.88 | 4.17 | |||||
Source: ESRI | ||||||||||
Source: SNL Securities and ESRI
FIGURE 28 - FRANCHISE DEPOSITAND DEMOGRAPHIC SUMMARY DATA
County | Market Rank | Number of Branches | Company Deposits in Market ($000) | Deposit Market Share (%) | Percent of National Franchise (%) | Total Population 2009 (Actual) | Population Change 2000-2009 (%) | Projected Population Change 2009-2014 (%) | Median HH Income 2009 ($) | HH Income Change 2000-2009 (%) | Projected HH Income Change 2009-2014 (%) | |||||||||||||
Philadelphia | 14 | 1 | 298,206 | 0.62 | 34.58 | 1,452,449 | (4.29 | ) | (2.68 | ) | 41,408 | 34.52 | 9.65 | |||||||||||
Bucks | 16 | 3 | 236,267 | 1.69 | 27.40 | 634,223 | 6.12 | 2.22 | 79,444 | 33.01 | 4.95 | |||||||||||||
Montgomery | 20 | 2 | 174,905 | 0.80 | 20.28 | 786,653 | 4.87 | 1.85 | 80,212 | 31.78 | 5.01 | |||||||||||||
Chester | 31 | 1 | 43,199 | 0.42 | 5.01 | 499,763 | 15.29 | 6.64 | 87,308 | 34.66 | 7.36 | |||||||||||||
Delaware | 36 | 1 | 15,394 | 0.14 | 1.78 | 558,969 | 1.47 | 0.10 | 66,300 | 32.32 | 5.25 | |||||||||||||
PA Totals | 8 | 767,971 | 89.05 | 3,932,057 | ||||||||||||||||||||
Weighted Average: Pennsylvania Franchise | 2.22 | 0.44 | 65,028 | 33.40 | 6.93 | |||||||||||||||||||
Aggregate: Entire State of Pennsylvania | 12,598,860 | 2.59 | 0.80 | 53,225 | 32.70 | 4.87 | ||||||||||||||||||
Atlantic | 14 | 1 | 55,866 | 1.26 | 6.48 | 279,172 | 10.54 | 3.68 | 55,982 | 27.26 | 6.57 | |||||||||||||
Cape May | 11 | 2 | 38,587 | 1.48 | 4.47 | 100,834 | (1.46 | ) | (0.88 | ) | 54,354 | 30.47 | 7.34 | |||||||||||
NJ Totals | 3 | 94,453 | 10.95 | 380,006 | ||||||||||||||||||||
Weighted Average: New Jersey Franchise | 5.64 | 1.82 | 55,317 | 28.57 | 6.88 | |||||||||||||||||||
Aggregate: Entire State of New Jersey | 8,834,947 | 5.00 | 1.67 | 72,809 | 32.18 | 5.61 | ||||||||||||||||||
Aggregate: National | 309,731,508 | 10.06 | 4.63 | 54,719 | 29.78 | 4.06 | ||||||||||||||||||
Source: SNL Securities
| Conversion Valuation Appraisal Report | Page: 30 |
3. Comparisons with Publicly Traded Thrifts
INTRODUCTION
This section presents an analysis of the Bank’s operations against a selected group (“Comparable Group”) of publicly traded thrifts. The Comparable Group was selected based upon similarity of characteristics to the Bank. The Comparable Group multiples provide the basis for the valuation of the Bank.
Factors that influence the Bank’s value such as balance sheet structure and size, profitability, income and expense trends, capital levels, credit risk, and recent operating results can be measured against the Comparable Group. The Comparable Group’s current market pricing, coupled with the appropriate aggregate adjustment for differences between the Bank and the Comparable Group, will then be utilized as the basis for the pro forma valuation of the Bank’s to-be-issued common stock.
SELECTION CRITERIA
The goal of the selection criteria process is to find those institutions with characteristics that most closely match those of the Bank. In an ideal world, all of the Comparable Group would contain the exact characteristics of the Bank. However, none of the Comparables selected will be exact clones of the Bank.
As of the date of this appraisal, there are a total of 256 thrifts that trade on public exchanges. There are 147 traded on the NYSE, NASDAQ or AMEX. FinPro limited the Comparable Group to institutions whose common stock is listed on a major exchange, (defined as the NYSE, NASDAQ or AMEX) since these companies tend to trade regularly. FinPro believes that thrifts that trade over-the-counter or as pink sheets are inappropriate for the Comparable Group, due to irregular trading activity and wide bid/ask spreads, which may skew the trading value and make trading multiples less reliable as an indicator of value.
Institutions that were structured as Mutual Holding Companies (MHC’s) were eliminated. 38 institutions were eliminated due to the MHC structure, leaving 109 remaining institutions.
Institutions outside of the Mid-Atlantic and Northeast region were eliminated. 59 institutions were eliminated due to being outside the target region.
| Conversion Valuation Appraisal Report | Page: 31 |
Of the 50 remaining institutions, 37 institutions were eliminated due to their size. An institution was eliminated if total assets were below $800 million or above $1.9 billion.
After narrowing the list down for the size range, 13 institutions remained. One institution was then eliminated due to insufficient data. One institution was eliminated due to being located in New Hampshire, which was viewed being too far removed from the target region. One institution was removed due to the institution serving a specific ethnic mix.
The remaining 10 institutions were deemed acceptable Comparables.
Using the criteria established, the Comparable Group was created. It is important to note that none of the Comparables will be identical clones of the Bank and as such subjective adjustments will have to be made. A variance to the Comparable median was established for each data field.
FIGURE 29 - COMPARABLE GROUP
| Corporate | ||||||||||||
Ticker | Short Name | Exchange | City | State | Number of Offices | IPO Date | ||||||
| Comparable Thrift Data | ||||||||||||
ABBC | Abington Bancorp, Inc. | NASDAQ | Jenkintown | PA | 20 | 06/28/2007 | ||||||
BFED | Beacon Federal Bancorp, Inc. | NASDAQ | East Syracuse | NY | 8 | 10/02/2007 | ||||||
CBNJ | Cape Bancorp, Inc. | NASDAQ | Cape May Court House | NJ | 18 | 02/01/2008 | ||||||
ESSA | ESSA Bancorp, Inc. | NASDAQ | Stroudsburg | PA | 17 | 04/04/2007 | ||||||
HARL | Harleysville Savings Financial Corporation | NASDAQ | Harleysville | PA | 8 | 08/04/1987 | ||||||
HIFS | Hingham Institution for Savings | NASDAQ | Hingham | MA | 10 | 12/20/1988 | ||||||
LEGC | Legacy Bancorp, Inc. | NASDAQ | Pittsfield | MA | 20 | 10/26/2005 | ||||||
LSBX | LSB Corporation | NASDAQ | North Andover | MA | 8 | 05/02/1986 | ||||||
UBNK | United Financial Bancorp, Inc. | NASDAQ | West Springfield | MA | 24 | 12/04/2007 | ||||||
WFD | Westfield Financial, Inc. | NASDAQ | Westfield | MA | 11 | 01/04/2007 | ||||||
FXCB | Fox Chase Bancorp, Inc. (MHC) | NASDAQ | Hatboro | PA | 11 | 10/02/2006 | ||||||
| Conversion Valuation Appraisal Report | Page: 32 |
OVERVIEWOFTHE COMPARABLES
The members of the Comparable Group were reviewed against the Bank to ensure comparability based upon the following criteria:
| 1. | Asset size |
| 2. | Profitability |
| 3. | Capital Level |
| 4. | Balance Sheet Mix |
| 5. | Operating Strategy |
| 6. | Date of conversion |
1. Asset SizeIdeally, the Comparable Group should have a similar asset size to the Bank. The Comparable Group ranged in size from $806.6 million to $1.5 billion in total assets with a median of $1.1 billion. The Bank’s asset size was $1.2 billion as of December 31, 2009. At the pro forma midpoint of the offering range, the Bank is expected to have assets of $1.3 billion.
2. ProfitabilityThe Comparable Group had a median core ROAA of 0.54% and a median core ROAE of 3.35% for the last twelve months. The Bank had a core ROAA of -0.21% and a core ROAE of -1.92% for the twelve months ended December 31, 2009. On a pro forma basis, the Bank’s core ROAA and core ROAE are -0.19% and -1.08%, respectively.
3. Capital LevelThe Comparable Group had a median tangible equity to tangible assets ratio of 10.11% with a high of 20.47% and a low of 6.13%. At December 31, 2009, the Bank had a tangible equity to tangible assets ratio of 10.53%. On a pro forma basis, at the midpoint, the Bank would have a tangible equity to tangible assets ratio of 16.93%.
4. Balance Sheet MixAt December 31, 2009, the Bank had a net loan to asset ratio of 53.78%. The median loan to asset ratio for the Comparables was 68.96%, ranging from a low of 38.96% to a high of 77.95%. On the liability side, the Bank’s deposit to asset ratio was 73.12% at December 31, 2009 while the Comparable median was 66.83%, ranging from 45.58% to 71.45%. The Bank’s borrowing to asset ratio of 15.94% is below the Comparable median of 23.12%.
5. Operating StrategyAn institution’s operating characteristics are important because they determine future performance. Operational strategy also affects expected rates of return and investors’ general perception of the quality, risk and attractiveness of a given company. Specific operating characteristics include profitability, balance sheet growth, asset quality, capitalization and non-financial factors such as management strategies and lines of business.
6. Date of ConversionRecent conversions, those completed on or after March 2, 2009, were excluded since the earnings of a newly converted institution do not reflect the reinvestment of conversion proceeds. Additionally, new issues tend to trade at a discount to the market averages.
| Conversion Valuation Appraisal Report | Page: 33 |
The following table represents key financial indicators for the Bank and the Comparable Group.
FIGURE 30 - KEY FINANCIAL INDICATORS
| The Bank at or for the Twelve Months Ended 12/31/09 | Comparable Group Median Last Twelve Months | ||||
Balance Sheet Data | |||||
Gross Loans to Deposits | 74.79 | 104.16 | |||
Total Net Loans to Assets | 53.78 | 68.96 | |||
Securities to Assets | 35.99 | 22.66 | |||
Deposits to Assets | 73.12 | 66.83 | |||
Borrowed Funds to Assets | 15.94 | 23.12 | |||
Balance Sheet Growth | |||||
Asset Growth Rate | 26.04 | 3.84 | |||
Loan Growth Rate | 7.19 | 3.27 | |||
Deposit Growth Rate | 41.05 | 14.07 | |||
Capital | |||||
Equity to Assets | 10.53 | 12.39 | |||
Tangible Equity to Tangible Assets | 10.53 | 10.11 | |||
Intangible Assets to Equity | — | — | |||
Regulatory Core Capital to Assets | 8.51 | 10.85 | |||
Equity + Reserves to Assets | 11.44 | 13.37 | |||
Asset Quality | |||||
Non-Performing Loans to Loans | 4.62 | 1.57 | |||
Reserves to Non-Performing Loans | 35.73 | 59.77 | |||
Non-Performing Assets to Assets | 2.87 | 1.29 | |||
Non-Performing Assets to Equity | 27.28 | 12.19 | |||
Reserves to Loans | 1.65 | 1.21 | |||
Reserves to Non-Performing Assets + 90 Days Del. | 31.44 | 58.81 | |||
Profitability | |||||
Return on Average Assets | (0.09 | ) | 0.44 | ||
Return on Average Equity | (0.82 | ) | 2.74 | ||
Core Return on Average Assets | (0.21 | ) | 0.54 | ||
Core Return on Average Equity | (1.92 | ) | 3.35 | ||
Income Statement | |||||
Yield on Average Earning Assets | 4.67 | 5.16 | |||
Cost of Average Interest Bearing Liabilities | 2.92 | 2.47 | |||
Net Interest Spread | 1.74 | 2.49 | |||
Net Interest Margin | 2.16 | 2.94 | |||
Noninterest Income to Average Assets | 0.14 | 0.41 | |||
Noninterest Expense to Average Assets | 1.81 | 1.97 | |||
Efficiency Ratio | 79.90 | 66.02 | |||
Overhead Ratio | 76.82 | 61.25 |
Source: The Bank’s Offering Circular, FinPro calculations and SNL Securities
| Conversion Valuation Appraisal Report | Page: 34 |
4. MARKET VALUE DETERMINATION
MARKET VALUE ADJUSTMENTS
The estimated pro forma market value of the Bank, along with certain adjustments to its value relative to market values for the Comparable Group are delineated in this section. The adjustments are made from potential investors’ viewpoint and are adjustments necessary when comparing the Bank to the Comparable Group. The adjustment factors are subjectively assessed using the appraiser’s knowledge and expertise and an aggregate adjustment is determined. Potential investors include depositors holding subscription rights and unrelated parties who may purchase stock in the community offering and who are assumed to be aware of all relevant and necessary facts as they pertain to the value of the Bank relative to other publicly traded thrift institutions and relative to alternative investment opportunities.
There are numerous criteria on which the market value adjustments are based. The major criteria utilized for purposes of this report include:
Adjustments Relative to the Comparable Group:
| • | Financial Condition |
| • | Balance Sheet Growth |
| • | Earnings Quality, Predictability and Growth |
| • | Market Area |
| • | Cash Dividends |
| • | Liquidity of the Issue |
| • | Recent Regulatory Matters |
Adjustments for Other Factors:
| • | Management |
| • | Subscription Interest |
| • | Other than Temporary Impairment Charge |
To ascertain the market value of the Bank, the median trading multiple values for the Comparable Group are utilized as the starting point. The adjustment, up or down, to the Comparable Group median multiple values is made based on the comparison of the Bank to the Comparable Group.
| Conversion Valuation Appraisal Report | Page: 35 |
FINANCIAL CONDITION
The balance sheet strength of an institution is an important market value determinant, as the investment community considers such factors as cash liquidity, capitalization, asset composition, funding mix, intangible levels and interest rate risk in assessing the attractiveness of investing in the common stock of a thrift. The following figures summarize the key financial elements of the Bank measured against the Comparable Group.
FIGURE 31 - KEY BALANCE SHEET DATA
| Key Financial Data for the Most Recent Period End | |||||||||||||||||
Ticker | Short Name | Total Assets ($000) | Loans/ Deposits (%) | Loans/ Assets (%) | Securities/ Assets (%) | Deposits/ Assets (%) | Borrowings/ Assets (%) | ||||||||||
| Comparable Thrift Data | |||||||||||||||||
ABBC | Abington Bancorp, Inc. | 1,238,112 | 91.00 | 62.49 | 27.06 | 68.67 | 13.20 | ||||||||||
BFED | Beacon Federal Bancorp, Inc. | 1,066,897 | 119.96 | 77.95 | 18.12 | 64.98 | 25.20 | ||||||||||
CBNJ | Cape Bancorp, Inc. | 1,072,985 | 103.78 | 74.14 | NA | 71.45 | 15.94 | ||||||||||
ESSA | ESSA Bancorp, Inc. | 1,058,692 | 152.39 | 69.46 | 24.46 | 45.58 | 36.44 | ||||||||||
HARL | Harleysville Savings Financial Corporation | 843,074 | 104.53 | 60.95 | NA | 58.31 | 34.45 | ||||||||||
HIFS | Hingham Institution for Savings | 966,387 | 108.66 | 75.93 | 10.90 | 69.88 | 22.52 | ||||||||||
LEGC | Legacy Bancorp, Inc. | 946,224 | 97.95 | 68.45 | 20.86 | 69.88 | 16.54 | ||||||||||
LSBX | LSB Corporation | 806,567 | 107.96 | 67.50 | 27.06 | 62.53 | 29.26 | ||||||||||
UBNK | United Financial Bancorp, Inc. | 1,512,664 | 103.59 | 72.95 | 20.62 | 70.42 | 14.06 | ||||||||||
WFD | Westfield Financial, Inc. | 1,199,757 | 70.68 | 38.96 | 54.58 | 55.12 | 23.72 | ||||||||||
| Average | 1,071,136 | 106.05 | 66.88 | 25.46 | 63.68 | 23.13 | |||||||||||
| Median | 1,062,795 | 104.16 | 68.96 | 22.66 | 66.83 | 23.12 | |||||||||||
| Maximum | 1,512,664 | 152.39 | 77.95 | 54.58 | 71.45 | 36.44 | |||||||||||
| Minimum | 806,567 | 70.68 | 38.96 | 10.90 | 45.58 | 13.20 | |||||||||||
FXCB | Fox Chase Bancorp, Inc. (MHC) | 1,173,818 | 74.79 | 53.78 | 35.99 | 73.12 | 15.94 | ||||||||||
| Variance to the Comparable Median | 111,024 | (29.37 | ) | (15.18 | ) | 13.33 | 6.29 | (7.18 | ) | ||||||||
Sources: SNL and Offering Circular Data, FinPro Computations
Asset Size – The Bank’s assets, at $1.2 billion, are moderately above the Comparable Group median of $1.1 billion. At the pro forma midpoint of the offering range, the Bank is expected to have assets of $1.3 billion.
Asset Composition – The Bank’s loans to assets ratio of 53.78% is below the Comparable Group median of 68.96%. The Bank has a higher level of securities as a percentage of assets.
Funding Mix– The Bank funds itself through deposits, 73.12% of assets, and borrowings, 15.94% of assets. The Comparable Group has a deposits to assets ratio of 66.83% and a borrowing to asset ratio of 23.12%.
| Conversion Valuation Appraisal Report | Page: 36 |
Cash Liquidity – The cash liquidity of the Bank and the Comparable Group appear to be sufficient to meet funding requirements and regulatory guidelines.
Interest Rate Risk – The Bank’s interest rate risk position is illustrated on page 18. The Bank’s interest rate risk position is considered to be “Minimum Risk”. The pro forma increase in capital is expected to reduce the institution’s interest rate risk. No similar data is available for the Comparable Group.
FIGURE 32 - CAPITAL DATA
| Capital for the Most Recent Period End | |||||||||||||||
Ticker | Short Name | Equity/ Assets (%) | Tangible Tang Equity/ Tang Assets (%) | Intangible Assets/ Equity (%) | Core Capital/ Tangible Assets (%) | Equity + Reserves/ Assets (%) | |||||||||
| Comparable Thrift Data | |||||||||||||||
ABBC | Abington Bancorp, Inc. | 17.30 | 17.30 | — | 13.14 | 18.03 | |||||||||
BFED | Beacon Federal Bancorp, Inc. | 9.49 | 9.49 | — | 8.56 | 10.96 | |||||||||
CBNJ | Cape Bancorp, Inc. | 12.05 | 10.11 | 17.87 | NA | 13.16 | |||||||||
ESSA | ESSA Bancorp, Inc. | 16.91 | 16.91 | — | NA | 17.54 | |||||||||
HARL | Harleysville Savings Financial Corporation | 6.13 | 6.13 | — | NA | 6.41 | |||||||||
HIFS | Hingham Institution for Savings | 6.94 | 6.94 | — | NA | 7.57 | |||||||||
LEGC | Legacy Bancorp, Inc. | 12.72 | 11.62 | 9.72 | NA | 13.57 | |||||||||
LSBX | LSB Corporation | 7.69 | 7.69 | — | NA | 8.59 | |||||||||
UBNK | United Financial Bancorp, Inc. | 14.82 | NA | NA | NA | 15.46 | |||||||||
WFD | Westfield Financial, Inc. | 20.47 | 20.47 | — | NA | 21.10 | |||||||||
Average | 12.45 | 11.85 | 3.07 | 10.85 | 13.24 | ||||||||||
Median | 12.39 | 10.11 | — | 10.85 | 13.37 | ||||||||||
Maximum | 20.47 | 20.47 | 17.87 | 13.14 | 21.10 | ||||||||||
Minimum | 6.13 | 6.13 | — | 8.56 | 6.41 | ||||||||||
FXCB | Fox Chase Bancorp, Inc. (MHC) | 10.53 | 10.53 | — | 8.51 | 11.44 | |||||||||
Variance to the Comparable Median | (1.86 | ) | 0.42 | — | (2.34 | ) | (1.93 | ) | |||||||
Sources: SNL and Offering Circular Data, FinPro Computations
Capitalization – The Comparable Group’s median tangible equity to tangible assets ratio of 10.11% is inline with the Bank’s ratio of 10.53%. The Bank’s pro forma equity to assets ratio is projected to be 16.93% at the midpoint of the valuation range.
| Conversion Valuation Appraisal Report | Page: 37 |
The asset quality of an institution is an important determinant of market value. The investment community considers levels of nonperforming loans, Real Estate Owned (“REO”) and levels of Allowance for Loan and Lease Losses (“ALLL”) in assessing the attractiveness of investing in the common stock of an institution.
FIGURE 33 - ASSET QUALITY TABLE
| Asset Quality for the Most Recent Period Available | ||||||||||||||||
Ticker | Short Name | NPLs/ Loans (%) | Reserves/ NPLs (%) | NPAs/ Assets (%) | NPAs/ Equity (%) | Reserves/ Loans (%) | Reserves/ NPAs + 90 (%) | |||||||||
| Comparable Thrift Data | ||||||||||||||||
ABBC | Abington Bancorp, Inc. | 3.66 | 32.07 | 4.13 | 23.89 | 1.17 | 15.83 | |||||||||
BFED | Beacon Federal Bancorp, Inc. | 1.87 | 100.38 | 1.53 | 16.17 | 1.88 | 90.90 | |||||||||
CBNJ | Cape Bancorp, Inc. | 4.01 | 41.39 | 3.45 | 29.22 | 1.49 | 36.00 | |||||||||
ESSA | ESSA Bancorp, Inc. | 1.66 | 50.87 | 0.92 | 5.21 | 0.90 | 65.39 | |||||||||
HARL | Harleysville Savings Financial Corporation | 0.17 | 259.95 | 0.10 | 1.66 | 0.45 | 259.95 | |||||||||
HIFS | Hingham Institution for Savings | 1.30 | 61.03 | 1.36 | 19.27 | 0.83 | 45.59 | |||||||||
LEGC | Legacy Bancorp, Inc. | 2.73 | 45.77 | 2.06 | 16.19 | 1.25 | 41.59 | |||||||||
LSBX | LSB Corporation | 0.62 | 217.08 | 0.24 | 3.30 | 1.34 | 358.58 | |||||||||
UBNK | United Financial Bancorp, Inc. | 1.49 | 58.51 | 1.22 | 8.21 | 0.87 | 52.23 | |||||||||
WFD | Westfield Financial, Inc. | 1.15 | 139.76 | 0.60 | 2.88 | 1.62 | 107.19 | |||||||||
| Average | 1.86 | 100.68 | 1.56 | 12.60 | 1.18 | 107.32 | ||||||||||
| Median | 1.57 | 59.77 | 1.29 | 12.19 | 1.21 | 58.81 | ||||||||||
| Maximum | 4.01 | 259.95 | 4.13 | 29.22 | 1.88 | 358.58 | ||||||||||
| Minimum | 0.17 | 32.07 | 0.10 | 1.66 | 0.45 | 15.83 | ||||||||||
FXCB | Fox Chase Bancorp, Inc. (MHC) | 4.62 | 35.73 | 2.87 | 27.28 | 1.65 | 31.44 | |||||||||
| Variance to the Comparable Median | 3.05 | (24.04 | ) | 1.58 | 15.09 | 0.44 | (27.37 | ) | ||||||||
Sources: SNL and Offering Circular Data, FinPro Computations
The Bank’s NPA to asset ratio of 2.87% was above the Comparable Group NPA to asset ratio of 1.29%. The Bank’s reserve level, 1.65% to total loans, is above the Comparable median of 1.21% of loans. The Bank’s level of reserves to NPLs, at 35.73%, is below the Comparable Group median of 59.77%. The Bank’s level of NPAs and NPLs increased substantially in the quarter ended December 31, 2009.
| Conversion Valuation Appraisal Report | Page: 38 |
Positive | Neutral | Negative | ||
| Higher Pro forma Capital | Similar Capital | Higher NPLs and NPAs | ||
| Lower Borrowings to Assets | Lower ALLL to NPLs | |||
| Higher Deposits | Lower Loan to assets | |||
| Higher ALLL to Loans | ||||
The Bank’s asset mix is weaker than the Comparable Group’s mix. The Bank has a higher level of deposits and lower level of borrowings as a percentage of assets relative to the Comparable Group. The Bank has similar tangible capital levels, but at the midpoint of the range will have higher tangible capital levels after the conversion. The higher pro forma capital levels will provide the ability for the Bank to grow earning assets. The Bank has a higher level of NPLs and NPAs and the increase came in the quarter ending December 31, 2009. The Bank has a higher level of reserves as a percentage of loans relative to the Comparable levels. The investment community is carefully scrutinizing asset quality. Taken collectively, a downward adjustment is warranted for financial condition.
| Conversion Valuation Appraisal Report | Page: 39 |
BALANCE SHEET GROWTH
The Bank’s assets, loans and deposits have all increased. Relative to the Comparable Group median, the Bank’s asset, loan and deposit growth is significantly higher. The additional capital raised as part of the offering will provide the Bank with the opportunity to grow its balance sheet at a time when the industry is lacking capital.
FIGURE 34 - BALANCE SHEET GROWTH DATA
| Growth | |||||||||||
Ticker | Short Name | Asset Growth LTM (%) | Loan Growth LTM (%) | Deposit Growth LTM (%) | |||||||
| Comparable Thrift Data | |||||||||||
ABBC | Abington Bancorp, Inc. | 4.06 | 0.72 | 27.86 | |||||||
BFED | Beacon Federal Bancorp, Inc. | 4.46 | 6.46 | 10.67 | |||||||
CBNJ | Cape Bancorp, Inc. | (2.96 | ) | (1.31 | ) | (3.01 | ) | ||||
ESSA | ESSA Bancorp, Inc. | 0.77 | (2.06 | ) | 20.83 | ||||||
HARL | Harleysville Savings Financial Corporation | 3.61 | 5.82 | 11.85 | |||||||
HIFS | Hingham Institution for Savings | 15.05 | 9.06 | 20.22 | |||||||
LEGC | Legacy Bancorp, Inc. | (2.26 | ) | (7.36 | ) | 2.73 | |||||
LSBX | LSB Corporation | 3.61 | 13.44 | 16.29 | |||||||
UBNK | United Financial Bancorp, Inc. | 21.68 | 28.17 | 33.93 | |||||||
WFD | Westfield Financial, Inc. | 6.58 | (1.16 | ) | 10.07 | ||||||
| Average | 5.46 | 5.18 | 15.14 | ||||||||
| Median | 3.84 | 3.27 | 14.07 | ||||||||
| Maximum | 21.68 | 28.17 | 33.93 | ||||||||
| Minimum | (2.96 | ) | (7.36 | ) | (3.01 | ) | |||||
FXCB | Fox Chase Bancorp, Inc. (MHC) | 26.04 | 7.19 | 41.05 | |||||||
| Variance to the Comparable Median | 22.20 | 3.92 | 26.98 | ||||||||
Sources: SNL and Offering Circular Data, FinPro Computations
Positive | Neutral | Negative | ||
Higher Asset, Loan and Deposit Growth |
An upward adjustment is warranted.
| Conversion Valuation Appraisal Report | Page: 40 |
EARNINGS QUALITY, PREDICTABILITYAND GROWTH
The earnings quality, predictability and growth are critical components in the establishment of market values for thrifts. Thrift earnings are primarily a function of:
| • | net interest income |
| • | loan loss provision |
| • | non-interest income |
| • | non-interest expense |
The quality and predictability of earnings is dependent on both internal and external factors. Some internal factors include the mix of the balance sheet, the interest rate sensitivity of the balance sheet, the asset quality, and the infrastructure in place to deliver the assets and liabilities to the public. External factors include the competitive market for both assets and liabilities, the global interest rate scenario, local economic factors and regulatory issues.
Investors are focusing on earnings sustainability as interest rate volatility has caused a wide variation in income levels. With the intense competition for both assets and deposits, banks cannot easily replace lost spread and margin with balance sheet growth.
Each of these factors can influence the earnings of an institution, and each of these factors is volatile. Investors prefer stability and consistency. As such, solid, consistent earnings are preferred to high but risky earnings. Investors also prefer earnings to be diversified and not entirely dependent on interest income.
| Conversion Valuation Appraisal Report | Page: 41 |
Net income trended downward between the twelve months ended December 31, 2005 and the twelve months ended December 31, 2009. The decline over this time period was primarily attributable to higher provision expenses. Net interest income and noninterest income increased between the twelve months ended December 31, 2008 and the twelve months ended December 31, 2009. This increase was offset by higher provision expense and higher noninterest expense for the same periods.
FIGURE 35 - NET INCOME CHART
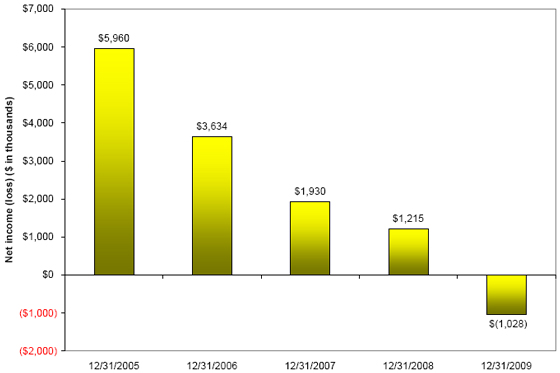
For the twelve months ended,
Source: Offering Prospectus
| Conversion Valuation Appraisal Report | Page: 42 |
The Bank’s core ROAA and core ROAE are below the Comparable Group medians. The Bank’s higher capitalization and benefit plan expenses following the offering are expected to reduce return on equity for the near term. On a pro forma basis at the midpoint of the range, the Bank’s core ROAA and core ROAE are -0.19% and -1.08%, respectively.
FIGURE 36 - PROFITABILITY DATA
| LTM Profitability | ||||||||||||||
Ticker | Short Name | Return on Avg Assets (%) | Return on Avg Equity (%) | Core Return on Avg Assets (%) | Core Return on Avg Equity (%) | |||||||||
| Comparable Thrift Data | ||||||||||||||
ABBC | Abington Bancorp, Inc. | (0.59 | ) | (3.15 | ) | (0.57 | ) | (3.01 | ) | |||||
BFED | Beacon Federal Bancorp, Inc. | 0.34 | 3.70 | 0.48 | 5.31 | |||||||||
CBNJ | Cape Bancorp, Inc. | (1.58 | ) | (12.69 | ) | (1.24 | ) | (9.95 | ) | |||||
ESSA | ESSA Bancorp, Inc. | 0.54 | 3.00 | 0.54 | 3.00 | |||||||||
HARL | Harleysville Savings Financial Corporation | 0.54 | 8.99 | 0.57 | 9.50 | |||||||||
HIFS | Hingham Institution for Savings | 0.98 | 13.68 | 1.01 | 14.09 | |||||||||
LEGC | Legacy Bancorp, Inc. | (0.87 | ) | (6.58 | ) | (0.19 | ) | (1.40 | ) | |||||
LSBX | LSB Corporation | 0.70 | 8.07 | 0.55 | 6.26 | |||||||||
UBNK | United Financial Bancorp, Inc. | 0.41 | 2.48 | 0.60 | 3.69 | |||||||||
WFD | Westfield Financial, Inc. | 0.47 | 2.21 | 0.53 | 2.49 | |||||||||
| Average | 0.09 | 1.97 | 0.23 | 3.00 | ||||||||||
| Median | 0.44 | 2.74 | 0.54 | 3.35 | ||||||||||
| Maximum | 0.98 | 13.68 | 1.01 | 14.09 | ||||||||||
| Minimum | (1.58 | ) | (12.69 | ) | (1.24 | ) | (9.95 | ) | ||||||
FXCB | Fox Chase Bancorp, Inc. (MHC) | (0.09 | ) | (0.82 | ) | (0.21 | ) | (1.92 | ) | |||||
| Variance to the Comparable Median | (0.53 | ) | (3.56 | ) | (0.75 | ) | (5.27 | ) | ||||||
Sources: SNL and Offering Circular Data, FinPro Computations
| Conversion Valuation Appraisal Report | Page: 43 |
FIGURE 37 - INCOME STATEMENT DATA
| LTM Income Statement | |||||||||||||||||||||||
Ticker | Short Name | Yield on Ave Earn Assets (%) | Cost of Funds (%) | Net Interest Spread (%) | Net Interest Margin (%) | Noninterest Income/ Avg Assets (%) | Noninterest Expense/ Avg Assets (%) | Efficiency Ratio (%) | Overhead Ratio (%) | ||||||||||||||
| Comparable Thrift Data | |||||||||||||||||||||||
ABBC | Abington Bancorp, Inc. | 4.85 | 2.47 | 2.38 | 2.78 | (0.12 | ) | 1.86 | 77.00 | 78.12 | |||||||||||||
BFED | Beacon Federal Bancorp, Inc. | 5.46 | 2.97 | 2.49 | 2.79 | 0.50 | 1.74 | 53.92 | 45.40 | ||||||||||||||
CBNJ | Cape Bancorp, Inc. | 5.36 | 2.03 | 3.34 | 3.58 | 0.51 | 2.57 | 65.23 | 59.89 | ||||||||||||||
ESSA | ESSA Bancorp, Inc. | 5.15 | 2.70 | 2.45 | 2.94 | 0.56 | 2.44 | 68.77 | 62.60 | ||||||||||||||
HARL | Harleysville Savings Financial Corporation | 4.97 | NA | NA | 2.08 | 0.23 | 1.43 | 62.29 | 57.92 | ||||||||||||||
HIFS | Hingham Institution for Savings | 5.16 | NA | NA | 3.25 | 0.22 | 1.58 | 44.13 | 40.20 | ||||||||||||||
LEGC | Legacy Bancorp, Inc. | 5.04 | 2.31 | 2.73 | 3.09 | 0.59 | 3.01 | 84.34 | 81.13 | ||||||||||||||
LSBX | LSB Corporation | 5.29 | NA | NA | 2.62 | 0.23 | 1.69 | 61.10 | 57.54 | ||||||||||||||
UBNK | United Financial Bancorp, Inc. | 5.20 | NA | NA | 3.50 | 0.64 | 2.72 | 68.67 | 62.63 | ||||||||||||||
WFD | Westfield Financial, Inc. | 4.66 | NA | NA | 2.94 | 0.32 | 2.08 | 66.81 | 63.00 | ||||||||||||||
| Average | 5.11 | 2.50 | 2.68 | 2.96 | 0.37 | 2.11 | 65.23 | 60.84 | |||||||||||||||
| Median | 5.16 | 2.47 | 2.49 | 2.94 | 0.41 | 1.97 | 66.02 | 61.25 | |||||||||||||||
| Maximum | 5.46 | 2.97 | 3.34 | 3.58 | 0.64 | 3.01 | 84.34 | 81.13 | |||||||||||||||
| Minimum | 4.66 | 2.03 | 2.38 | 2.08 | (0.12 | ) | 1.43 | 44.13 | 40.20 | ||||||||||||||
FXCB | Fox Chase Bancorp, Inc. (MHC) | 4.67 | 2.92 | 1.74 | 2.16 | 0.14 | 1.81 | 79.90 | 76.82 | ||||||||||||||
| Variance to the Comparable Median | (0.49 | ) | 0.45 | (0.75 | ) | (0.78 | ) | (0.27 | ) | (0.16 | ) | 13.88 | 15.57 | ||||||||||
Sources: SNL and Offering Circular Data, FinPro Computations
Note: The cost of funds and the net interest spread medians are less reliable due to the lack of five data points.
The Bank has a 78 basis point disadvantage in net margin and 27 basis point disadvantage in noninterest income as a percentage of average assets relative to the Comparable Group. This disadvantage was partially offset by a 16 basis point advantage in noninterest expense as a percentage of average assets.
The Bank’s efficiency ratio of 79.90% is above the Comparable median of 66.02%.
On a forward looking basis, after the conversion the Bank’s operating expenses are expected to rise as a result of the stock benefit plans and additional costs of being a public company. At the same time, the Bank will have additional capital to deploy and leverage.
| Conversion Valuation Appraisal Report | Page: 44 |
Positive | Neutral | Negative | ||
| Conversion Proceeds can be Leveraged to Generate Addition Earnings | Lower Core ROAA and Lower Core ROAE | |||
| Lower Noninterest Expense | Lower Noninterest Income | |||
| Lower Margin | ||||
The Bank’s profitability is below the Comparables on an ROAA and ROAE basis. The Bank’s earnings composition is mixed compared to the Comparable Group as the Bank has a lower margin and lower noninterest income, but lower noninterest expense. The Bank’s historical earnings have been trending downward. After the conversion, the Bank will have capital that can be leveraged to enhance future earnings. Taken collectively, a moderate downward adjustment is warranted for this factor.
| Conversion Valuation Appraisal Report | Page: 45 |
MARKETAREA
The market area that an institution serves has a significant impact on value, as future success is interrelated with the economic, demographic and competitive aspects of the market. The location of an institution will have an impact on the trading value of an institution, as many analysts compare the pricing of institutions relative to a state or regional multiples in investor presentations.
The following figure compares the demographic and competitive data for the counties serviced by the Bank, to the county data of the Comparable Group members.
FIGURE 38 – MARKET AREA DATA
Institution Name | County, State | Number of Branches | Company Deposits in Market ($000) | Deposit Market Share (%) | Total Population 2009 (Actual) | Population per Branch (Actual) | Population | Median HH Income 2009 ($) | HH Income | Unemployment December 2009 (%) | ||||||||||||||||||||
| Change 2000-2009 (%) | Change 2009-2014 (%) | Change 2000-2009 (%) | Change 2009-2014 (%) | |||||||||||||||||||||||||||
| Abington Bancorp, Inc. | Montogomery, PA | 228 | 609,081 | 2.10 | % | 786,653 | 3,450 | 4.87 | % | 1.85 | % | 80,212 | 31.78 | % | 5.01 | % | 8.20 | % | ||||||||||||
| Abington Bancorp, Inc. | Bucks, PA | 169 | 86,463 | 0.70 | % | 634,223 | 3,753 | 6.12 | % | 2.22 | % | 79,444 | 33.01 | % | 4.95 | % | 8.90 | % | ||||||||||||
| Abington Bancorp, Inc. | Delaware, PA | 119 | 16,168 | 0.18 | % | 558,969 | 4,697 | 1.47 | % | 0.10 | % | 66,300 | 32.32 | % | 5.25 | % | 9.10 | % | ||||||||||||
| Deposit Weighted Market Data | 1.89 | % | 3,515 | 4.94 | % | 1.86 | % | 79,803 | 31.94 | % | 5.01 | % | 8.31 | % | ||||||||||||||||
| Beacon Federal Bancorp, Inc. | Onondaga, NY | 124 | 332,953 | 4.54 | % | 456,119 | 3,678 | -0.48 | % | -0.66 | % | 53,512 | 30.91 | % | 8.72 | % | 9.00 | % | ||||||||||||
| Beacon Federal Bancorp, Inc. | Smith, TX | 58 | 92,399 | 2.75 | % | 202,787 | 3,496 | 16.07 | % | 7.44 | % | 46,999 | 26.09 | % | 4.80 | % | 6.20 | % | ||||||||||||
| Beacon Federal Bancorp, Inc. | Middlesex, MA | 308 | 67,181 | 0.20 | % | 1,485,082 | 4,822 | 1.34 | % | 0.61 | % | 84,469 | 38.90 | % | 6.08 | % | 9.30 | % | ||||||||||||
| Beacon Federal Bancorp, Inc. | Warren, TN | 18 | 64,497 | 9.44 | % | 39,847 | 2,214 | 4.10 | % | 1.52 | % | 38,963 | 26.59 | % | 2.55 | % | 15.30 | % | ||||||||||||
| Beacon Federal Bancorp, Inc. | Oneida, NY | 53 | 37,661 | 1.21 | % | 233,392 | 4,404 | -0.88 | % | -0.62 | % | 47,038 | 31.01 | % | 9.75 | % | 7.90 | % | ||||||||||||
| Beacon Federal Bancorp, Inc. | Rutherford, TN | 62 | 21,368 | 0.77 | % | 258,542 | 4,170 | 42.04 | % | 17.95 | % | 63,174 | 36.55 | % | 6.35 | % | 10.30 | % | ||||||||||||
| Deposit Weighted Market Data | 3.98 | % | 3,684 | 4.13 | % | 1.57 | % | 54,327 | 30.81 | % | 7.18 | % | 9.25 | % | ||||||||||||||||
| Cape Bancorp, Inc. | Atlantic, NJ | 76 | 411,778 | 9.98 | % | 279,172 | 3,673 | 10.54 | % | 3.68 | % | 55,982 | 27.26 | % | 6.57 | % | 13.40 | % | ||||||||||||
| Cape Bancorp, Inc. | Cape May, NJ | 57 | 335,236 | 13.78 | % | 100,834 | 1,769 | -1.46 | % | -0.88 | % | 54,354 | 30.47 | % | 7.34 | % | 6.50 | % | ||||||||||||
| Deposit Weighted Market Data | 11.69 | % | 2,819 | 5.15 | % | 1.63 | % | 55,251 | 28.70 | % | 6.92 | % | 10.30 | % | ||||||||||||||||
| ESSA Bancorp, Inc. | Monroe, PA | 51 | 369,240 | 18.49 | % | 174,579 | 3,423 | 25.88 | % | 9.97 | % | 59,940 | 29.51 | % | 0.44 | % | 9.70 | % | ||||||||||||
| ESSA Bancorp, Inc. | Northampton, PA | 100 | 7,847 | 0.17 | % | 300,620 | 3,006 | 12.56 | % | 5.48 | % | 60,207 | 33.14 | % | 6.11 | % | 8.80 | % | ||||||||||||
| Deposit Weighted Market Data | 18.11 | % | 3,414 | 25.60 | % | 9.88 | % | 59,946 | 29.59 | % | 0.56 | % | 9.68 | % | ||||||||||||||||
| Harleysville Savings Financial Corpor | Montgomery, PA | 235 | 446,454 | 1.54 | % | 786,653 | 3,347 | 4.87 | % | 1.85 | % | 80,212 | 31.78 | % | 5.01 | % | 8.20 | % | ||||||||||||
| Deposit Weighted Market Data | 1.54 | % | 3,347 | 4.87 | % | 1.85 | % | 80,212 | 31.78 | % | 5.01 | % | 8.20 | % | ||||||||||||||||
| Hingham Institution for Savings | Plymouth, MA | 127 | 366,836 | 5.83 | % | 498,968 | 3,929 | 5.53 | % | 1.84 | % | 76,101 | 36.76 | % | 6.59 | % | 11.60 | % | ||||||||||||
| Hingham Institution for Savings | Norfolk, MA | 161 | 90,148 | 0.58 | % | 661,665 | 4,110 | 1.75 | % | 0.49 | % | 88,399 | 39.52 | % | 6.37 | % | 8.90 | % | ||||||||||||
| Hingham Institution for Savings | Suffolk, MA | 164 | 12,715 | 0.02 | % | 695,403 | 4,240 | 0.81 | % | 0.61 | % | 53,416 | 35.68 | % | 6.47 | % | 13.30 | % | ||||||||||||
| Deposit Weighted Market Data | 4.67 | % | 3,972 | 4.68 | % | 1.55 | % | 77,847 | 37.26 | % | 6.54 | % | 11.13 | % | ||||||||||||||||
| Legacy Bancorp, Inc. | Berkshire, MA | 56 | 522,948 | 18.24 | % | 130,714 | 2,334 | -3.14 | % | -2.36 | % | 50,638 | 29.77 | % | 6.56 | % | 9.90 | % | ||||||||||||
| Legacy Bancorp, Inc. | Greene, NY | 25 | 36,839 | 4.28 | % | 50,332 | 2,013 | 4.43 | % | 1.24 | % | 46,233 | 26.31 | % | 4.87 | % | 7.30 | % | ||||||||||||
| Legacy Bancorp, Inc. | Washington, NY | 18 | 20,906 | 3.46 | % | 63,809 | 3,545 | 4.53 | % | 1.81 | % | 47,455 | 25.19 | % | 4.55 | % | 7.00 | % | ||||||||||||
| Legacy Bancorp, Inc. | Hampshire, MA | 49 | 20,595 | 0.71 | % | 154,109 | 3,145 | 1.22 | % | 0.11 | % | 62,790 | 36.11 | % | 5.36 | % | 8.70 | % | ||||||||||||
| Legacy Bancorp, Inc. | Schoharie, NY | 12 | 11,404 | 3.03 | % | 32,034 | 2,670 | 1.43 | % | 0.31 | % | 45,764 | 25.21 | % | 5.59 | % | 8.40 | % | ||||||||||||
| Deposit Weighted Market Data | 15.65 | % | 2,148 | -2.61 | % | -2.00 | % | 46,183 | 27.09 | % | 5.88 | % | 8.90 | % | ||||||||||||||||
| LSB Corporation | Essex, MA | 173 | 346,942 | 2.19 | % | 744,480 | 4,303 | 2.91 | % | 0.62 | % | 69,858 | 34.96 | % | 6.80 | % | 10.20 | % | ||||||||||||
| LSB Corporation | Rockingham, NH | 79 | 26,099 | 0.60 | % | 302,476 | 3,829 | 9.06 | % | 3.08 | % | 75,903 | 30.27 | % | 5.61 | % | 6.40 | % | ||||||||||||
| Deposit Weighted Market Data | 2.08 | % | 4,270 | 3.34 | % | 0.79 | % | 70,281 | 34.63 | % | 6.72 | % | 9.93 | % | ||||||||||||||||
| United Financial Bancorp, Inc. | Hampden, MA | 126 | 791,195 | 10.16 | % | 459,791 | 3,649 | 0.78 | % | -0.39 | % | 50,540 | 27.24 | % | 7.01 | % | 12.00 | % | ||||||||||||
| United Financial Bancorp, Inc. | Worcester, MA | 133 | 217,739 | 2.16 | % | 794,206 | 5,971 | 5.76 | % | 1.83 | % | 62,731 | 31.03 | % | 5.37 | % | 9.90 | % | ||||||||||||
| United Financial Bancorp, Inc. | Hampshire, MA | 50 | 38,539 | 1.34 | % | 154,109 | 3,082 | 1.22 | % | 0.11 | % | 62,790 | 36.11 | % | 5.36 | % | 8.70 | % | ||||||||||||
| Deposit Weighted Market Data | 8.17 | % | 4,111 | 1.83 | % | 0.09 | % | 53,525 | 28.35 | % | 6.61 | % | 11.44 | % | ||||||||||||||||
| Westfield Financial, Inc. | Hampden, MA | 126 | 587,284 | 7.54 | % | 459,791 | 3,649 | 0.78 | % | -0.39 | % | 50,540 | 27.24 | % | 7.01 | % | 12.00 | % | ||||||||||||
| Deposit Weighted Market Data | 7.54 | % | 3,649 | 0.78 | % | -0.39 | % | 50,540 | 27.24 | % | 7.01 | % | 0.12 | |||||||||||||||||
| Comparable Median | 6.10 | % | 3,582 | 4.40 | % | 1.56 | % | 57,598 | 30.20 | % | 6.58 | % | 9.81 | % | ||||||||||||||||
| Fox Chase Bancorp, Inc. (MHC) | Philadelphia, PA | 228 | 260,515 | 0.58 | % | 1,452,449 | 6,370 | -4.29 | % | -2.68 | % | 41,408 | 34.52 | % | 9.65 | % | 17.20 | % | ||||||||||||
| Fox Chase Bancorp, Inc. (MHC) | Bucks, PA | 167 | 144,990 | 1.17 | % | 634,223 | 3,798 | 6.12 | % | 2.22 | % | 79,444 | 33.01 | % | 4.95 | % | 8.90 | % | ||||||||||||
| Fox Chase Bancorp, Inc. (MHC) | Montgomery, PA | 230 | 118,835 | 0.41 | % | 786,653 | 3,420 | 4.87 | % | 1.85 | % | 80,212 | 31.78 | % | 5.01 | % | 8.20 | % | ||||||||||||
| Fox Chase Bancorp, Inc. (MHC) | Atlantic, NJ | 77 | 38,706 | 0.94 | % | 279,172 | 3,626 | 10.54 | % | 3.68 | % | 55,982 | 27.26 | % | 6.57 | % | 13.40 | % | ||||||||||||
| Fox Chase Bancorp, Inc. (MHC) | Cape May, NJ | 59 | 23,127 | 0.95 | % | 100,834 | 1,709 | -1.46 | % | -0.88 | % | 54,354 | 30.47 | % | 7.34 | % | 6.50 | % | ||||||||||||
| Fox Chase Bancorp, Inc. (MHC) | Chester, PA | 134 | 13,604 | 0.15 | % | 499,763 | 3,730 | 15.29 | % | 6.64 | % | 87,308 | 34.66 | % | 7.36 | % | 7.20 | % | ||||||||||||
| Fox Chase Bancorp, Inc. (MHC) | Delaware, PA | 119 | 3,827 | 0.04 | % | 558,969 | 4,697 | 1.47 | % | 0.10 | % | 66,300 | 32.32 | % | 5.25 | % | 9.10 | % | ||||||||||||
| Deposit Weighted Market Data | 1014 | 603,604 | 0.71 | % | 4,747 | 1.55 | % | 0.09 | % | 60,807 | 32.99 | % | 7.24 | % | 12.50 | % | ||||||||||||||
Pennsylvania | 5,807 | 12,598,860 | 2,170 | 2.59 | % | 0.80 | % | 53,225 | 32.70 | % | 4.87 | % | 9.50 | % | ||||||||||||||||
New Jersey | 3,750 | 8,834,947 | 2,356 | 5.00 | % | 1.67 | % | 72,809 | 32.18 | % | 5.61 | % | 11.20 | % | ||||||||||||||||
National | 99,546 | 309,731,508 | 3,111 | 10.06 | % | 4.63 | % | 54,719 | 29.78 | % | 4.06 | % | 10.60 | % | ||||||||||||||||
Sources: SNL Securities
| Conversion Valuation Appraisal Report | Page: 46 |
The Bank’s population per branch in its market area is higher than the Comparable Group median as well as Pennsylvania, New Jersey and national statistics. Historical population growth was higher for the state and national figures as well as the Comparable median compared to the Bank’s market area’s population growth. Projected population growth for the Bank’s market area is projected to be below all other benchmarks. The Bank’s market area median household income was above the Comparable Group median and Pennsylvania State and national figures, but below the New Jersey State median. Household income in the Bank’s market area is projected to outpace household income growth of the Comparable Group median as well as the state and national figures. The Bank’s market area unemployment percentage was above all other benchmarks, primarily driven by the relatively high unemployment rate in the Philadelphia, Pennsylvania marketplace. Due to the various strengths and weaknesses of the Bank’s market area, no adjustment was given.
Positive | Neutral | Negative | ||
| Population Per Branch | Actual and Projected Population Growth | |||
| Higher Median HH Income | Unemployment Rate | |||
| Higher Projected Median HH Income Growth | ||||
| Conversion Valuation Appraisal Report | Page: 47 |
CASH DIVIDENDS
The industry has typically not disclosed dividend policies concurrent with conversion. Recently, a number of financial institutions have cut dividend rates in an effort to conserve capital.
FIGURE 39 - DIVIDEND DATA
| Dividends | ||||||
Ticker | Short Name | Current Dividend Yield (%) | LTM Dividend Payout Ratio (%) | |||
| Comparable Thrift Data | ||||||
ABBC | Abington Bancorp, Inc. | 2.12 | NM | |||
BFED | Beacon Federal Bancorp, Inc. | 2.35 | 37.04 | |||
CBNJ | Cape Bancorp, Inc. | — | — | |||
ESSA | ESSA Bancorp, Inc. | 1.53 | 45.24 | |||
HARL | Harleysville Savings Financial Corporation | 5.08 | 61.29 | |||
HIFS | Hingham Institution for Savings | 2.56 | 26.81 | |||
LEGC | Legacy Bancorp, Inc. | 2.10 | NM | |||
LSBX | LSB Corporation | 2.70 | 25.74 | |||
UBNK | United Financial Bancorp, Inc. | 1.92 | 77.78 | |||
WFD | Westfield Financial, Inc. | 2.16 | 263.16 | |||
| Average | 2.25 | 67.13 | ||||
| Median | 2.14 | 41.14 | ||||
| Maximum | 5.08 | 263.16 | ||||
| Minimum | — | — | ||||
FXCB | Fox Chase Bancorp, Inc. (MHC) | NA | NA | |||
| Variance to the Comparable Median | NA | NA | ||||
Sources: SNL and Offering Circular Data, FinPro Computations
All but one of the Comparable institutions had declared cash dividends. The median dividend payout ratio for the Comparable Group was 41.14%, ranging from a high of 263.16% to a low of 0.00%. The Bank, on a pro forma basis at the mid point of the value range will have a tangible equity to tangible assets ratio of 16.90%. The Bank will have adequate capital to pay cash dividends, but may not have sufficient earnings.
As such, no adjustment is warranted for this factor. The earning adjustment was made previously.
| Conversion Valuation Appraisal Report | Page: 48 |
LIQUIDITYOFTHE ISSUE
The Comparable Group is by definition composed only of companies that trade in the public markets with all of the Comparables trading on NASDAQ. Typically, the number of shares outstanding and the market capitalization provides an indication of how much liquidity there will be in a given stock. The actual liquidity can be measured by volume traded over a given period of time.
FIGURE 40 - MARKET CAPITALIZATION DATA
| Market Data | |||||||||||||||||
Ticker | Short Name | Market Value ($) | Stock Price ($) | Price High ($) | Price Low ($) | Book Value ($) | Tangible Book Value ($) | ||||||||||
| Comparable Thrift Data | |||||||||||||||||
ABBC | Abington Bancorp, Inc. | 197.00 | 9.45 | 9.63 | 7.05 | 10.18 | 10.18 | ||||||||||
BFED | Beacon Federal Bancorp, Inc. | 55.70 | 8.52 | 9.25 | 8.14 | 15.48 | 15.48 | ||||||||||
CBNJ | Cape Bancorp, Inc. | 95.20 | 7.15 | 8.15 | 6.00 | 9.71 | 7.97 | ||||||||||
ESSA | ESSA Bancorp, Inc. | 180.20 | 13.09 | 13.52 | 11.32 | 13.01 | 13.01 | ||||||||||
HARL | Harleysville Savings Financial Corporation | 54.80 | 14.96 | 14.96 | 13.06 | 14.12 | 14.12 | ||||||||||
HIFS | Hingham Institution for Savings | 76.50 | 36.00 | 37.99 | 31.26 | 31.56 | 31.56 | ||||||||||
LEGC | Legacy Bancorp, Inc. | 83.20 | 9.54 | 9.88 | 8.94 | 13.80 | 12.40 | ||||||||||
LSBX | LSB Corporation | 60.20 | 13.35 | 14.00 | 10.72 | 13.77 | 13.77 | ||||||||||
UBNK | United Financial Bancorp, Inc. | 244.10 | 14.58 | 15.16 | 12.72 | 13.39 | 12.93 | ||||||||||
WFD | Westfield Financial, Inc. | 273.40 | 9.24 | 10.37 | 7.99 | 8.30 | 8.30 | ||||||||||
| Average | 132.03 | 13.59 | 14.29 | 11.72 | 14.33 | 13.97 | |||||||||||
| Median | 89.20 | 11.32 | 11.95 | 9.83 | 13.58 | 12.97 | |||||||||||
| Maximum | 273.40 | 36.00 | 37.99 | 31.26 | 31.56 | 31.56 | |||||||||||
| Minimum | 54.80 | 7.15 | 8.15 | 6.00 | 8.30 | 7.97 | |||||||||||
FXCB | Fox Chase Bancorp, Inc. (MHC) | 154.50 | 11.35 | 12.00 | 8.55 | 9.20 | 9.20 | ||||||||||
| Variance to the Comparable Median | 65.30 | 0.03 | 0.05 | (1.28 | ) | (4.38 | ) | (3.77 | ) | ||||||||
Sources: SNL and Offering Circular Data, FinPro Computations
The market capitalization values of the Comparable Group range from a low of $54.8 million to a high of $273.4 million with a median market capitalization of $89.2 million. The Bank expects to have $170.3 million of market capital at the midpoint on a pro forma basis. It is expected that the Bank will trade on NASDAQ along with all of the Comparables.
No adjustment for this factor appears warranted as both the Bank and the Comparables are expected to be liquidly traded.
| Conversion Valuation Appraisal Report | Page: 49 |
RECENT REGULATORY MATTERS
Regulatory matters influence the market for thrift conversions. It is expected that industry regulation will increase as a result of the current crisis and there is a lack of clarity to the resulting regulatory framework. Both the Bank and the Comparable Group are expected to operate in substantially the same regulatory environment.
No adjustment for this factor is warranted as both the Bank and the Comparables will operate in the same ownership structure and will be supervised in the same regulatory environment.
| Conversion Valuation Appraisal Report | Page: 50 |
5. Other Factors
MANAGEMENT
The current team has considerable banking experience and has held similar positions in other financial institutions. The Bank’s organizational chart is reasonable for an institution of its size and complexity.
The Board is active and oversees and advises on all key strategic and policy decisions.
As such, no adjustment appears to be warranted for this factor.
| Conversion Valuation Appraisal Report | Page: 51 |
SUBSCRIPTION INTEREST
There have been four second step conversions since January 1, 2008. The median price to tangible book value of these conversions was 73.1%. Northwest’s price to pro forma tangible book value was above the others and is partially attributable to the size of the institution. Eagle completed its second step earlier this month at 81.2% of tangible book.
FIGURE 41 - SECOND STEP CONVERSIONS (SINCE 1/1/08) PRO FORMA DATA
| Price to Pro Forma | ||||||||||||||||
Ticker | Name | IPO Date | Gross Proceeds ($) | IPO Price ($) | EPS (%) | Book Value (%) | Tangible Book Value (%) | |||||||||
BCSB | BCSB Bancorp, Inc. | 4/11/2008 | $ | 15,677 | $ | 10.00 | NM | 61.8 | 65.0 | |||||||
NWBI | Northwest Bancshares, Inc. | 12/18/2009 | 603,041 | 10.00 | 24.8 | 89.0 | 103.8 | |||||||||
OSHC | Ocean Shore Holding Co. | 12/21/2009 | 26,868 | 8.00 | 17.3 | 63.0 | 63.0 | |||||||||
EBMTD | Eagle Bancorp Montana, Inc. | 4/5/2010 | 19,856 | 10.00 | 12.3 | 81.2 | 81.2 | |||||||||
| Average | 18.1 | 73.8 | 78.3 | |||||||||||||
| Median | 17.3 | 72.1 | 73.1 | |||||||||||||
Source: SNL Securities
| Conversion Valuation Appraisal Report | Page: 52 |
There was a first day “pop” for 2009 year-to-date and 2008 full year transactions. The median price change after 1 day was 8.95%. All four second step conversions are currently trading above their IPO price.
FIGURE 42 - CONVERSIONS PRICE APPRECIATION
| Percentage Change in Price | ||||||||||||||
Ticker | Name | IPO Date | After 1 Day (%) | After 1 Week (%) | After 1 Month (%) | After 3 Months (%) | To Date (%) | |||||||
BCSB | BCSB Bancorp, Inc. | 4/11/2008 | 10.40 | 14.90 | 13.50 | 4.00 | 4.80 | |||||||
NWBI | Northwest Bancshares, Inc. | 12/18/2009 | 13.50 | 13.00 | 14.00 | 18.00 | 26.30 | |||||||
OSHC | Ocean Shore Holding Co. | 12/21/2009 | 7.50 | 11.88 | 13.13 | 36.25 | 43.00 | |||||||
EBMTD | Eagle Bancorp Montana, Inc. | 4/5/2010 | 5.50 | 5.00 | NA | NA | 4.40 | |||||||
| Average | 9.23 | 11.20 | 13.54 | 19.42 | 11.25 | |||||||||
| Median | 8.95 | 12.44 | 13.50 | 18.00 | 10.96 | |||||||||
Source: SNL Securities
No adjustment is given for subscription interest.
| Conversion Valuation Appraisal Report | Page: 53 |
VALUATION ADJUSTMENTS
Relative to the Comparables the following adjustments need to be made to the Bank’s pro forma market value.
Valuation Factor | Valuation Adjustment | |
Financial Condition | Downward | |
Balance Sheet Growth | Upward | |
Earnings Quality, Predictability and Growth | Moderate Downward | |
Market Area | No Adjustment | |
Dividends | No Adjustment | |
Liquidity of the Issue | No Adjustment | |
Recent Regulatory Matters | No Adjustment | |
Additionally, the following adjustment should be made to the Bank’s market value.
Valuation Factor | Valuation Adjustment | |
Management | No Adjustment | |
Subscription Interest | No Adjustment | |
| Conversion Valuation Appraisal Report | Page: 54 |
6. Valuation
In applying the accepted valuation methodology promulgated by the regulators, i.e., the pro forma market value approach, three key pricing multiples were considered. The four multiples include:
Price to core earnings (“P/E”)
Price to book value (“P/B”) / Price to tangible book value (“P/TB”)
Price to assets (“P/A”)
All of the approaches were calculated on a pro forma basis including the effects of the conversion proceeds. All of the assumptions utilized are presented in Exhibit 11.
DISCUSSIONOF WEIGHT GIVENTO VALUATION MULTIPLES
To ascertain the pro forma estimated market value of the Bank, the market multiples for the Comparable Group were utilized. As a secondary check, all publicly traded thrifts and the recent and historical conversions were assessed. The multiples for the Comparable Group, all publicly traded thrifts are shown in Exhibit 9.
Price to Earnings – According to the Appraisal Guidelines: “When both the converting institution and the comparable companies are recording “normal” earnings. A P/E approach may be the simplest and most direct method of valuation. When earnings are low or negative, however, this approach may not be appropriate and the greater consideration should be given to the P/BV approach.” In this particular case, the Bank’s earnings are skewed by credit costs. As such, this approach was given limited consideration in this appraisal.
In the pro forma figures for the Bank, FinPro incorporated the impact of SFAS 123, which requires the expensing of stock options. In preparing the fully converted pro forma figures for the Comparable Group, FinPro also incorporated the impact of SFAS 123.
| Conversion Valuation Appraisal Report | Page: 55 |
Price to Book/Price to Tangible Book- According to the Appraisal Guidelines: “The P/BV approach works best when the converting institution and the Comparables have a normal amount of book value. The P/BV approach could seriously understate the value of an institution that has almost no book value but has an outstanding future earnings potential. For converting institutions with high net worth, the appraiser may have difficulty in arriving at a pro forma market value because of pressure placed on the P/E multiple as higher P/BV levels are required to reflect a similar P/BV ratio as the peer group average. The P/BV approach also suffers from the use of historical cost accounting data.”
Since thrift earnings in general have had a high degree of volatility, the P/B is utilized frequently as the benchmark for market value. A better approach is the P/TB approach. In general, investors tend to price financial institutions on a tangible book basis, because it incorporates the P/B approach adjusted for intangibles. Initially following conversion, FinPro believes that thrifts often trade on a price to tangible book basis.
Price to Assets- According to the Appraisal Guidelines: “This approach remedies the problems of a small base that can occur with the P/BV approach, but the approach has many of the other limitations of the latter approach (the P/BV approach).” FinPro places little weight on this valuation approach due to the lack of consideration of asset and funding mixes and the resulting earnings impact.
| Conversion Valuation Appraisal Report | Page: 56 |
FULL OFFERING VALUEIN RELATIONTO COMPARABLES
Based upon the adjustments defined in the previous section, the Bank is pricing at the midpoint as a standard conversion is estimated to be $171,181,280. Based upon a range below and above the midpoint value, the respective values are $145,504,090 at the minimum and $196,858,470 at the maximum respectively. At the super maximum of the range, the offering value would be $226,387,240.
At the various levels of the estimated value range, the full offering would result in the following offering data:
FIGURE 43 - VALUE RANGE
Conclusion | Total Shares Shares | Price Per Share | Total Value | |||||
Appraised Value - Midpoint | 17,118,128 | $ | 10.00 | $ | 171,181,280 | |||
Range: | ||||||||
- Minimum | 14,550,409 | $ | 10.00 | 145,504,090 | ||||
- Maximum | 19,685,847 | 10.00 | 196,858,470 | |||||
- Super Maximum | 22,638,724 | 10.00 | 226,387,240 | |||||
Source: FinPro Inc. Pro forma Model
FIGURE 44 - APPRAISED VALUE
The appraised value of the institution resulted in an exchange value per minority share that ranges from $10.69 per share at the minimum to $16.64 per share at the super maximum, with an exchange value per share of $12.58 at the midpoint.
| Appraised Value | ||||||||||||||||
| Conclusion | Minimum | Midpoint | Maximum | SuperMaximum * | ||||||||||||
Total Shares | 14,550,409 | 17,118,128 | 19,685,847 | 22,638,724 | ||||||||||||
Price per Share | $ | 10 | $ | 10 | $ | 10 | $ | 10 | ||||||||
Full Conversion Value | $ | 145,504,090 | $ | 171,181,280 | $ | 196,858,470 | $ | 226,387,240 | ||||||||
Exchange Shares | 5,837,909 | 6,868,128 | 7,898,347 | 9,083,099 | ||||||||||||
Exchange Percent | 40.12 | % | 40.12 | % | 40.12 | % | 40.12 | % | ||||||||
Conversion Shares | 8,712,500 | 10,250,000 | 11,787,500 | 13,555,625 | ||||||||||||
Conversion Percent | 59.88 | % | 59.88 | % | 59.88 | % | 59.88 | % | ||||||||
Gross Proceeds | $ | 87,125,000 | $ | 102,500,000 | $ | 117,875,000 | $ | 135,556,250 | ||||||||
Exchange Value | $ | 58,379,090 | $ | 68,681,280 | $ | 78,983,470 | $ | 90,830,990 | ||||||||
Exchange Ratio | 1.0692 | 1.2578 | 1.4465 | 1.6635 | ||||||||||||
Exchange Value per Minority Share | $ | 10.69 | $ | 12.58 | $ | 14.47 | $ | 16.64 | ||||||||
Fully Converted Tangible Book to Minority Share | $ | 14.72 | $ | 15.74 | $ | 16.75 | $ | 17.92 | ||||||||
| Conversion Valuation Appraisal Report | Page: 57 |
FIGURE 45 –CONVERSION OFFERING PRICING MULTIPLES
| Bank | Comparables | State | National | ||||||||||||||||||||
| Mean | Median | Mean | Median | Mean | Median | ||||||||||||||||||
| Min | -58.82 | ||||||||||||||||||||||
Price-Core Earnings Ratio P/E | Mid | -71.43 | 21.50 | 18.30 | 17.29 | 12.30 | 23.46 | 16.05 | |||||||||||||||
| Max | -83.33 | ||||||||||||||||||||||
| Smax | -90.91 | ||||||||||||||||||||||
| Min | 72.62 | % | |||||||||||||||||||||
Price-to-Book Ratio P/B | Mid | 79.94 | % | 92.83 | % | 98.80 | % | 91.97 | % | 96.00 | % | 81.02 | % | 80.30 | % | ||||||||
| Max | 86.36 | % | |||||||||||||||||||||
| Smax | 92.85 | % | |||||||||||||||||||||
| Min | 72.62 | % | |||||||||||||||||||||
Price-to-Tangible Book Ratio P/TB | Mid | 79.94 | % | 95.61 | % | 98.80 | % | 99.34 | % | 99.20 | % | 89.23 | % | 84.05 | % | ||||||||
| Max | 86.36 | % | |||||||||||||||||||||
| Smax | 92.85 | % | |||||||||||||||||||||
| Min | 11.64 | % | |||||||||||||||||||||
Price-to-Assets Ratio P/A | Mid | 13.54 | % | 11.68 | % | 8.83 | % | 9.65 | % | 8.87 | % | 8.80 | % | 6.76 | % | ||||||||
| Max | 15.40 | % | |||||||||||||||||||||
| Smax | 17.50 | % | |||||||||||||||||||||
Source: FinPro Calculations
FIGURE 46 - COMPARABLE CONVERSION PRICING MULTIPLESTOTHE BANK’S PRO FORMA MIDPOINT
| Price Relative to | |||||||||||||||
| Earnings | Core Earnings | Book | Tangible Book | Assets | |||||||||||
The Bank (at midpoint) Full Conversion | (142.86 | ) | (66.67 | ) | 79.94 | % | 79.94 | % | 13.54 | % | |||||
Comparable Group Median | 15.80 | 18.30 | 98.80 | % | 98.80 | % | 8.83 | % | |||||||
(Discount) Premium | -1004.18 | % | -464.32 | % | -19.09 | % | -19.09 | % | 53.34 | % | |||||
Source: SNL data, FinPro Calculations
As Figure 46 demonstrates, at the midpoint of the estimated valuation range the Bank is priced at a 19.09% discount to the Comparable Group.
FIGURE 47 - COMPARABLE CONVERSION PRICING MULTIPLESTOTHE BANK’S PRO FORMA SUPER MAXIMUM
| Price Relative to | |||||||||||||||
| Earnings | Core Earnings | Book | Tangible Book | Assets | |||||||||||
The Bank (at the supermax) Full Conversion | (166.67 | ) | (83.33 | ) | 92.85 | % | 92.85 | % | 17.50 | % | |||||
Comparable Group Median | 15.80 | 18.30 | 98.80 | % | 98.80 | % | 8.83 | % | |||||||
(Discount) Premium | -1154.87 | % | -555.36 | % | -6.02 | % | -6.02 | % | 98.19 | % | |||||
Source: SNL data, FinPro Calculations
As Figure 47 demonstrates, at the super maximum of the estimated valuation range the Bank is priced at a 6.02% discount to the Comparable Group.
| Conversion Valuation Appraisal Report | Page: 58 |
FIGURE 48 - COMPARABLE CONVERSION PRICING MULTIPLESTOTHE BANK’S PRO FORMA MINIMUM
| Price Relative to | |||||||||||||||
| Earnings | Core Earnings | Book | Tangible Book | Assets | |||||||||||
The Bank (at the minimum) Full Conversion | (142.86 | ) | (58.82 | ) | 72.62 | % | 72.62 | % | 11.64 | % | |||||
Comparable Group Median | (166.67 | ) | (83.33 | ) | 92.85 | % | 92.85 | % | 17.50 | % | |||||
(Discount) Premium | -14.29 | % | -29.41 | % | -21.79 | % | -21.79 | % | -33.49 | % | |||||
Source: SNL data, FinPro Calculations
As Figure 48 demonstrates, at the minimum of the estimated valuation range the Bank is priced at a 21.79% discount to the Comparable Group.
| Conversion Valuation Appraisal Report | Page: 59 |
COMPARISONTOOTHER PENDING
SECOND STEP CONVERSIONS
FIGURE 49 - COMPARISONTOOTHER PENDING SECOND STEP CONVERSIONS
As Figure 49 demonstrates, the Bank’s offering price to tangible book value per share range is inbetween the high end and low end of the pending second step conversion comparable tangible book basis. The Bank is priced between 72.62% and 92.85% of tangible book value per share.
Ticker | Institution | State | Type | Gross Proceeds ($) | Price/ TBVS Range (%) | ||||||
ORIT | Oritani Financial Corp | NJ | Second Step | $ | 515,775 | 82.44 - 98.52 | |||||
FFCO | FedFirst Financial Corp. | PA | Second Step | 29,756.00 | 57.67 - 76.69 | ||||||
ONFC | Oneida Financial Corp. | NY | Second Step | 41,659.00 | 89.49 -112.04 | ||||||
JXSB | Jacksonville Bancorp | IL | Second Step | 15,539.00 | 58.28 - 77.88 | ||||||
VPFG | ViewPoint Financial Group | TX | Second Step | 264,500.00 | 86.00 -108.70 | ||||||
COBK | Colonial Financial Services | NJ | Second Step | 35,708.00 | 64.68 - 85.76 | ||||||
FXCB | Fox Chase Bancorp, Inc. (MHC) | PA | Second Step | $ | 129,663 | 72.62 - 92.85 | |||||
Source: SNL Securities, FinPro calculations
| * | Offering data is presented at the supermax for all deal; Price/Tangible Book Range presents values at the minimum and supermax |
| Conversion Valuation Appraisal Report | Page: 60 |
COMPARISONOFTHE EXCHANGE
VALUEAND STOCK PRICE
FIGURE 50 – COMPARISONOFTHE EXCHANGE VALUE PER MINORITY SHAREAND STOCK PRICE
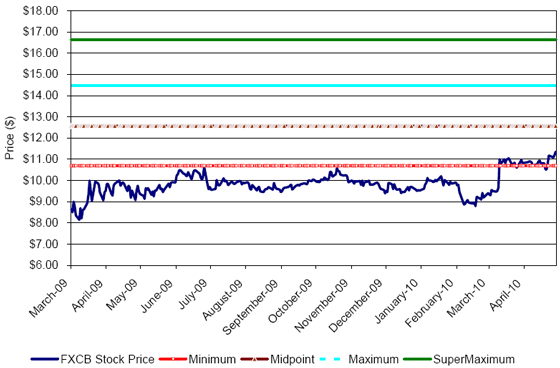
Source: SNL data, FinPro Calculations
As Figure 50 demonstrates, the Bank’s stock price is currently between the minimum and the midpoint of the range.
| Conversion Valuation Appraisal Report | Page: 61 |
VALUATION CONCLUSION
We believe that the discount on a tangible book basis at the midpoint is appropriate relative to the Comparable Group. The resulting pro forma multiples are inline with other pending offerings.
It is, therefore, FinPro’s opinion that as of April 29, 2010, the estimated pro forma market value of the Bank in a full offering was $171,181,280 at the midpoint of a range with a minimum of $145,504,090 to a maximum of $196,858,470 at 15% below and 15% above the midpoint of the range respectively. Assuming an adjusted maximum value of 15% above the maximum value, the adjusted maximum value or super maximum value in a full offering is $226,387,240.
The document represents an initial valuation for the Bank. Due to the duration of time that passes between the time this document is compiled and the time the offering closes, numerous factors could lead FinPro to update or revise the appraised value of the Bank. Some factors that could lead FinPro to adjust the appraised value include: (1) changes in the Bank’s operations and financial condition; (2) changes in the market valuation or financial condition of the Comparable Group; (3) changes in the broader market; and (4) changes in the market for thrift conversions. Should there be material changes to any of these factors, FinPro will prepare an appraisal update to appropriately adjust the value of the Bank. At the time of closing, FinPro will prepare a final appraisal to determine if the valuation range is still appropriate and determine the exact valuation amount appropriate for the Bank.