Sale of Tower Korea December 28, 2012
2 Forward - Looking Statements and Risk Factors This presentation contains statements which constitute forward - looking statements, within the meaning of the Private Securities Litigation Reform Act of 1995, including but not limited to statements regarding near - term and longer - term prospects, outlook fo r revenue, Adjusted EBITDA, cash flow, net debt, and value accretion. The forward - looking statements can be identified by words such as “anticipate,” “believe,” “potential,” “plan,” “estimate,” “expect,” “intend,” “project,” “target,” and other si mil ar expressions. Forward - looking statements are made as of the date of this presentation and are based upon management’s current expectations and beliefs concerning future developments and their potential effects on us. Such forward - looking statements are not guarantees of future performance. The following important factors, as well as risk factors described in o ur reports filed with the SEC, could cause our actual results to differ materially from estimates or expectations reflected in s uch forward - looking statements: • automobile production volumes; • the financial condition of our customers and suppliers; • our ability to make scheduled payments on our indebtedness and comply with the covenants and restrictions contained in the instruments governing our indebtedness; • our ability to refinance our indebtedness; • our ability to generate non - automotive revenues; • risks associated with our non - U.S. operations, including foreign exchange risks and economic uncertainty in some regions; • any increase in the expense and funding requirements of our pension and other postretirement benefits; • our customers’ ability to obtain equity and debt financing for their businesses; • our dependence on our largest customers; • pricing pressure from our customers; • work stoppages or other labor issues affecting us or our customers or suppliers; and • costs or liabilities relating to environmental and safety regulations We do not assume any obligation to update or revise the forward - looking statements contained in this presentation.
• On December 28 in Seoul, Tower sold 100% of the stock in our wholly - owned Korean subsidiary to SECO, a privately owned Korean auto parts supplier. • Tower Korea included 5 manufacturing plants, a tooling plant, and a headquarters/technical center - - all located in Korea. 100% of its parts sales were to Hyundai - Kia. • The business rationale for this transaction and select key financial details are provided on the following slides. 3 Transaction Description
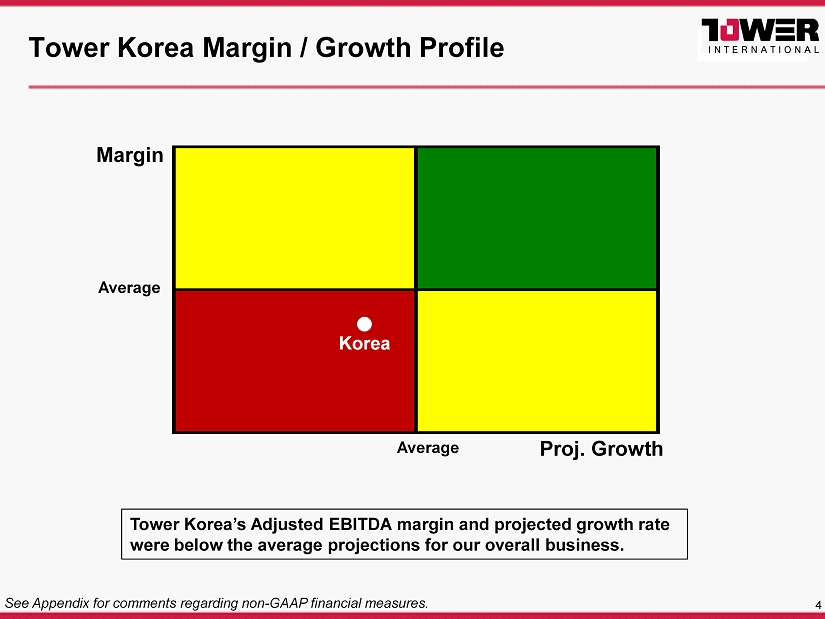
4 Tower Korea Margin / Growth Profile Tower Korea’s Adjusted EBITDA margin and projected growth rate were below the average projections for our overall business. Margin Proj. Growth Average Average Korea See Appendix for comments regarding non - GAAP financial measures.
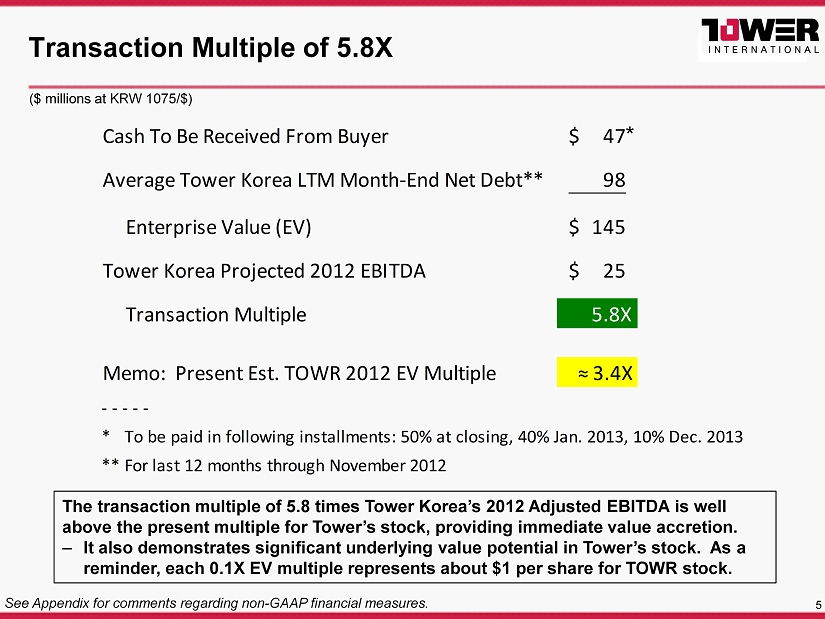
5 Transaction Multiple of 5.8X ($ millions at KRW 1075/$) Cash To Be Received From Buyer 47$ Average Tower Korea LTM Month-End Net Debt** 98 Enterprise Value (EV) 145$ Tower Korea Projected 2012 EBITDA 25$ Transaction Multiple 5.8X Memo: Present Est. TOWR 2012 EV Multiple ≈ 3.4X - - - - - * To be paid in following installments: 50% at closing, 40% Jan. 2013, 10% Dec. 2013 ** For last 12 months through November 2012 The transaction multiple of 5.8 times Tower Korea’s 2012 Adjusted EBITDA is well above the present multiple for Tower’s stock, providing immediate value accretion. – It also demonstrates significant underlying value potential in Tower’s stock. As a reminder, each 0.1X EV multiple represents about $1 per share for TOWR stock. See Appendix for comments regarding non - GAAP financial measures. *
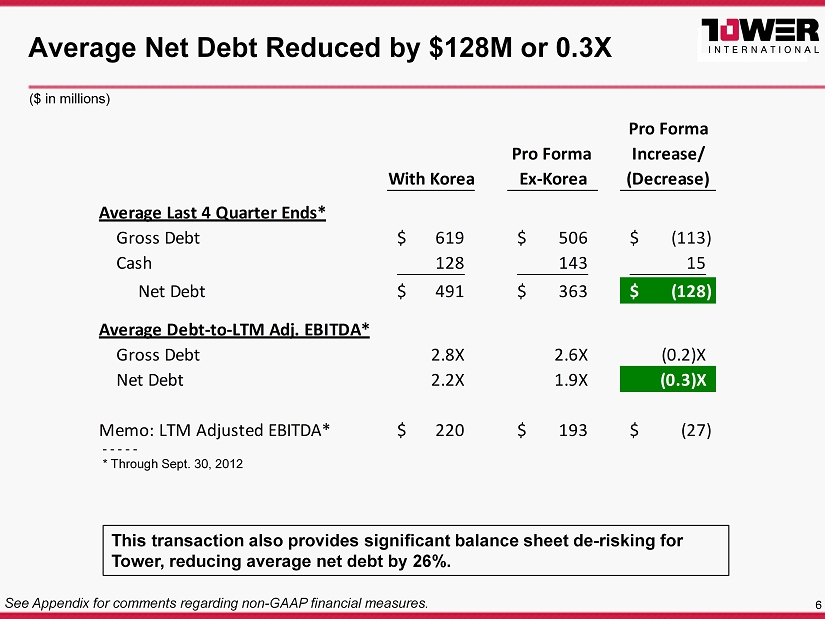
6 Average Net Debt Reduced by $128M or 0.3X Pro Forma Pro Forma Increase/ With Korea Ex-Korea (Decrease) Average Last 4 Quarter Ends* Gross Debt 619$ 506$ (113)$ Cash 128 143 15 Net Debt 491$ 363$ (128)$ Average Debt-to-LTM Adj. EBITDA* Gross Debt 2.8X 2.6X (0.2)X Net Debt 2.2X 1.9X (0.3)X Memo: LTM Adjusted EBITDA* 220$ 193$ (27)$ This transaction also provides significant balance sheet de - risking for Tower, reducing average net debt by 26%. ($ in millions) - - - - - * Through Sept. 30, 2012 See Appendix for comments regarding non - GAAP financial measures.
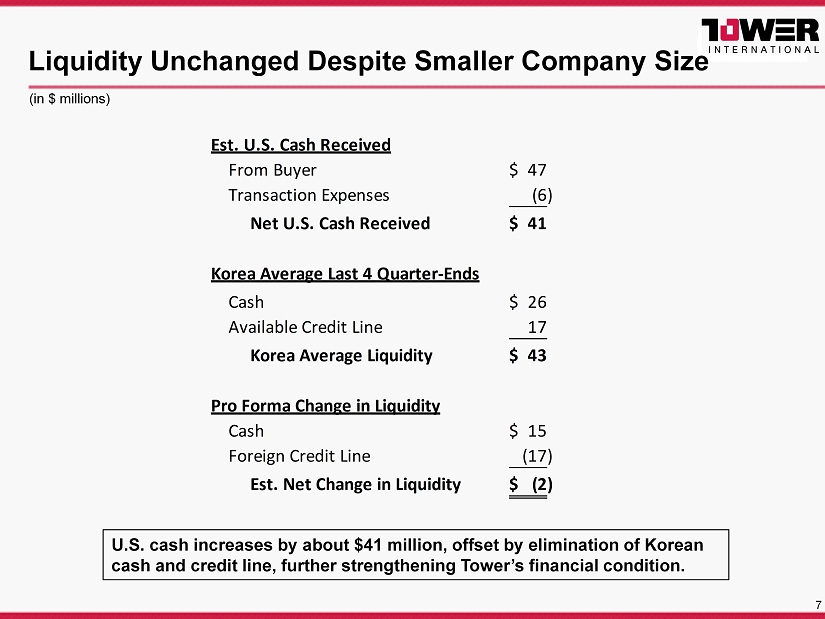
7 Liquidity Unchanged Despite Smaller Company Size Est. U.S. Cash Received From Buyer 47$ Transaction Expenses (6) Net U.S. Cash Received 41$ Korea Average Last 4 Quarter-Ends Cash 26$ Available Credit Line 17 Korea Average Liquidity 43$ Pro Forma Change in Liquidity Cash 15$ Foreign Credit Line (17) Est. Net Change in Liquidity (2)$ U.S. cash increases by about $41 million, offset by elimination of Korean cash and credit line, further strengthening Tower’s financial condition. (in $ millions)
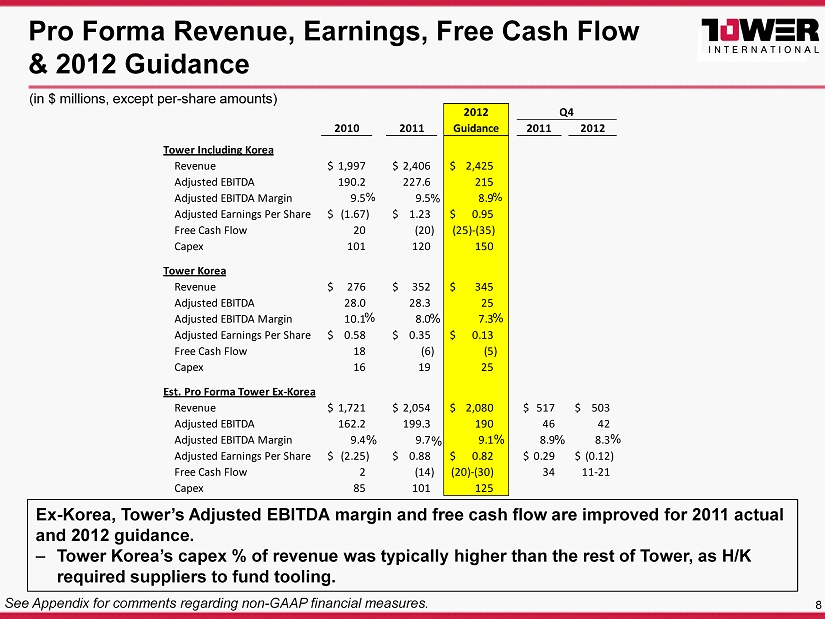
8 Pro Forma Revenue, Earnings, Free Cash Flow & 2012 Guidance 2010 2011 2011 2012 Tower Including Korea Revenue 1,997$ 2,406$ 2,425$ Adjusted EBITDA 190.2 227.6 215 Adjusted EBITDA Margin 9.5 9.5 8.9 Adjusted Earnings Per Share (1.67)$ 1.23$ 0.95$ Free Cash Flow 20 (20) (25)-(35) Capex 101 120 150 Tower Korea Revenue 276$ 352$ 345$ Adjusted EBITDA 28.0 28.3 25 Adjusted EBITDA Margin 10.1 8.0 7.3 Adjusted Earnings Per Share 0.58$ 0.35$ 0.13$ Free Cash Flow 18 (6) (5) Capex 16 19 25 Est. Pro Forma Tower Ex-Korea Revenue 1,721$ 2,054$ 2,080$ 517$ 503$ Adjusted EBITDA 162.2 199.3 190 46 42 Adjusted EBITDA Margin 9.4 9.7 9.1 8.9 8.3 Adjusted Earnings Per Share (2.25)$ 0.88$ 0.82$ 0.29$ (0.12)$ Free Cash Flow 2 (14) (20)-(30) 34 11-21 Capex 85 101 125 Q42012 Guidance Ex - Korea, Tower’s Adjusted EBITDA margin and free cash flow are improved for 2011 actual and 2012 guidance. – Tower Korea’s capex % of revenue was typically higher than the rest of Tower, as H/K required suppliers to fund tooling. % % % % % (in $ millions, except per - share amounts) % % % % % % See Appendix for comments regarding non - GAAP financial measures.
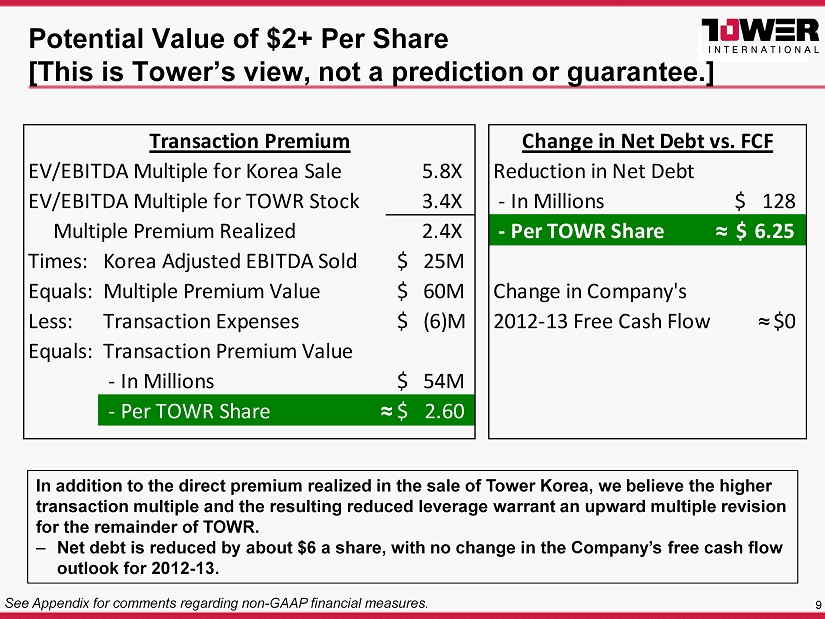
9 Potential Value of $2+ Per Share [This is Tower’s view, not a prediction or guarantee.] EV/EBITDA Multiple for Korea Sale 5.8X Reduction in Net Debt EV/EBITDA Multiple for TOWR Stock 3.4X - In Millions 128$ Multiple Premium Realized 2.4X - Per TOWR Share 6.25$ Times: Korea Adjusted EBITDA Sold $ 25M Equals:Multiple Premium Value $ 60M Change in Company's Less: Transaction Expenses $ (6)M 2012-13 Free Cash Flow $0 Equals:Transaction Premium Value - In Millions $ 54M - Per TOWR Share 2.60$ Change in Net Debt vs. FCFTransaction Premium In addition to the direct premium realized in the sale of Tower Korea, we believe the higher transaction multiple and the resulting reduced leverage warrant an upward multiple revision for the remainder of TOWR. – Net debt is reduced by about $6 a share, with no change in the Company’s free cash flow outlook for 2012 - 13. ≈ ≈ See Appendix for comments regarding non - GAAP financial measures. ≈
x Immediate potentially significant value x Plus a stronger company going forward: – Reduced leverage/de - risked balance sheet – Improved liquidity relative to global revenue – Ongoing margin and growth rate prospects slightly improved x Good for colleagues and customers 10 Summary of Transaction Benefits
11 Appendix
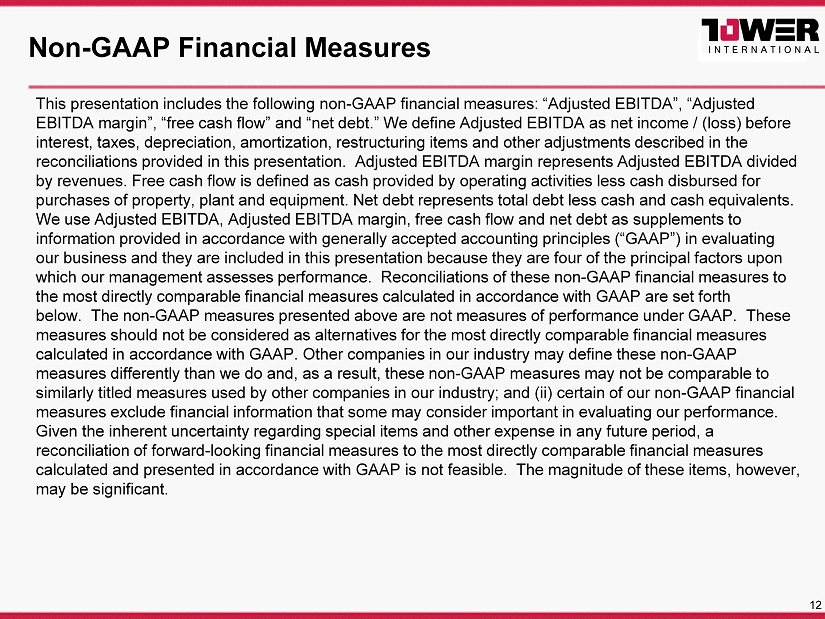
This presentation includes the following non - GAAP financial measures: “Adjusted EBITDA”, “Adjusted EBITDA margin”, “free cash flow” and “net debt.” We define Adjusted EBITDA as net income / (loss) before interest, taxes, depreciation, amortization, restructuring items and other adjustments described in the reconciliations provided in this presentation. Adjusted EBITDA margin represents Adjusted EBITDA divided by revenues. Free cash flow is defined as cash provided by operating activities less cash disbursed for purchases of property, plant and equipment. Net debt represents total debt less cash and cash equivalents. We use Adjusted EBITDA, Adjusted EBITDA margin, free cash flow and net debt as supplements to information provided in accordance with generally accepted accounting principles (“GAAP”) in evaluating our business and they are included in this presentation because they are four of the principal factors upon which our management assesses performance. Reconciliations of these non - GAAP financial measures to the most directly comparable financial measures calculated in accordance with GAAP are set forth below. The non - GAAP measures presented above are not measures of performance under GAAP. These measures should not be considered as alternatives for the most directly comparable financial measures calculated in accordance with GAAP. Other companies in our industry may define these non - GAAP measures differently than we do and, as a result, these non - GAAP measures may not be comparable to similarly titled measures used by other companies in our industry; and (ii) certain of our non - GAAP financial measures exclude financial information that some may consider important in evaluating our performance. Given the inherent uncertainty regarding special items and other expense in any future period, a reconciliation of forward - looking financial measures to the most directly comparable financial measures calculated and presented in accordance with GAAP is not feasible. The magnitude of these items, however, may be significant. 12 Non - GAAP Financial Measures
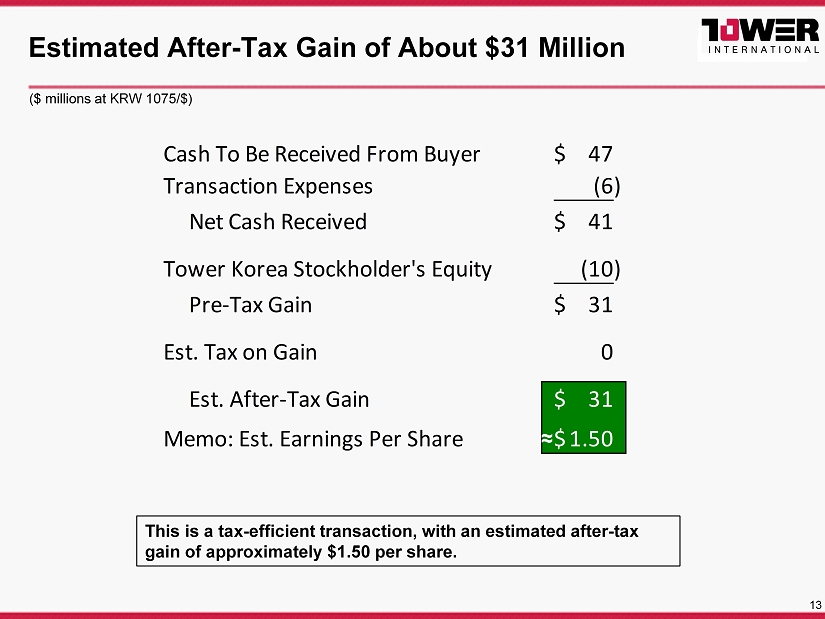
13 Estimated After - Tax Gain of About $31 Million Cash To Be Received From Buyer 47$ Transaction Expenses (6) Net Cash Received 41$ Tower Korea Stockholder's Equity (10) Pre-Tax Gain 31$ Est. Tax on Gain 0 Est. After-Tax Gain 31$ Memo: Est. Earnings Per Share 1.50$ This is a tax - efficient transaction, with an estimated after - tax gain of approximately $1.50 per share. ($ millions at KRW 1075/$) ≈
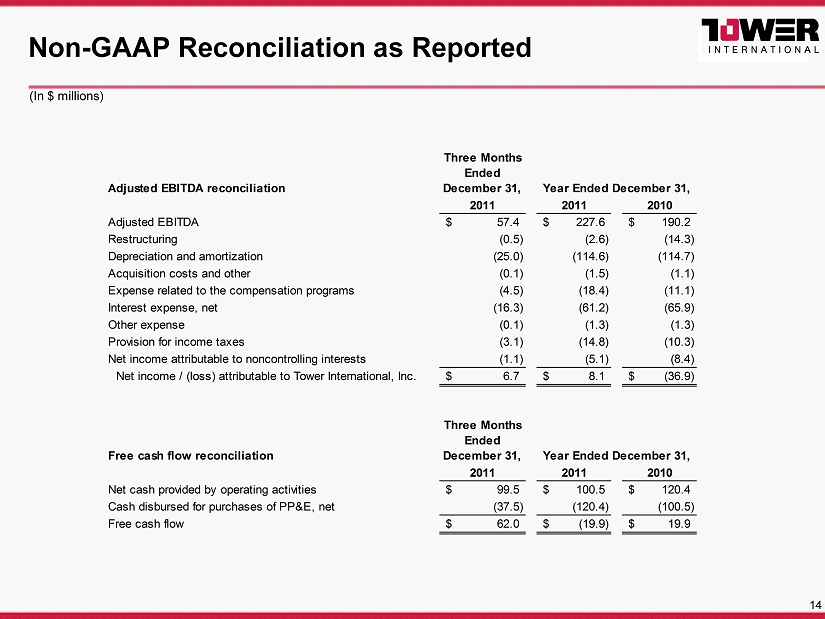
14 Non - GAAP Reconciliation as Reported (In $ millions) Adjusted EBITDA reconciliation Three Months Ended December 31, 2011 2011 2010 Adjusted EBITDA 57.4$ 227.6$ 190.2$ Restructuring (0.5) (2.6) (14.3) Depreciation and amortization (25.0) (114.6) (114.7) Acquisition costs and other (0.1) (1.5) (1.1) Expense related to the compensation programs (4.5) (18.4) (11.1) Interest expense, net (16.3) (61.2) (65.9) Other expense (0.1) (1.3) (1.3) Provision for income taxes (3.1) (14.8) (10.3) Net income attributable to noncontrolling interests (1.1) (5.1) (8.4) Net income / (loss) attributable to Tower International, Inc. 6.7$ 8.1$ (36.9)$ Free cash flow reconciliation Three Months Ended December 31, 2011 2011 2010 Net cash provided by operating activities 99.5$ 100.5$ 120.4$ Cash disbursed for purchases of PP&E, net (37.5) (120.4) (100.5) Free cash flow 62.0$ (19.9)$ 19.9$ Year Ended December 31, Year Ended December 31,
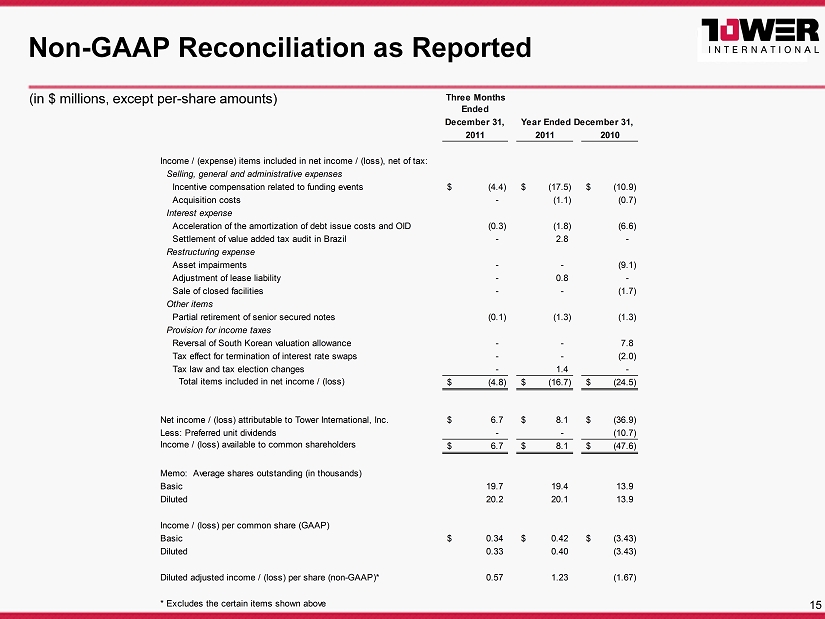
15 Non - GAAP Reconciliation as Reported Three Months Ended December 31, 2011 2011 2010 Income / (expense) items included in net income / (loss), net of tax: Selling, general and administrative expenses Incentive compensation related to funding events (4.4)$ (17.5)$ (10.9)$ Acquisition costs - (1.1) (0.7) Interest expense Acceleration of the amortization of debt issue costs and OID (0.3) (1.8) (6.6) Settlement of value added tax audit in Brazil - 2.8 - Restructuring expense Asset impairments - - (9.1) Adjustment of lease liability - 0.8 - Sale of closed facilities - - (1.7) Other items Partial retirement of senior secured notes (0.1) (1.3) (1.3) Provision for income taxes Reversal of South Korean valuation allowance - - 7.8 Tax effect for termination of interest rate swaps - - (2.0) Tax law and tax election changes - 1.4 - Total items included in net income / (loss) (4.8)$ (16.7)$ (24.5)$ Net income / (loss) attributable to Tower International, Inc. 6.7$ 8.1$ (36.9)$ Less: Preferred unit dividends - - (10.7) Income / (loss) available to common shareholders 6.7$ 8.1$ (47.6)$ Memo: Average shares outstanding (in thousands) Basic 19.7 19.4 13.9 Diluted 20.2 20.1 13.9 Income / (loss) per common share (GAAP) Basic 0.34$ 0.42$ (3.43)$ Diluted 0.33 0.40 (3.43) Diluted adjusted income / (loss) per share (non-GAAP)* 0.57 1.23 (1.67) * Excludes the certain items shown above Year Ended December 31, (in $ millions, except per - share amounts)
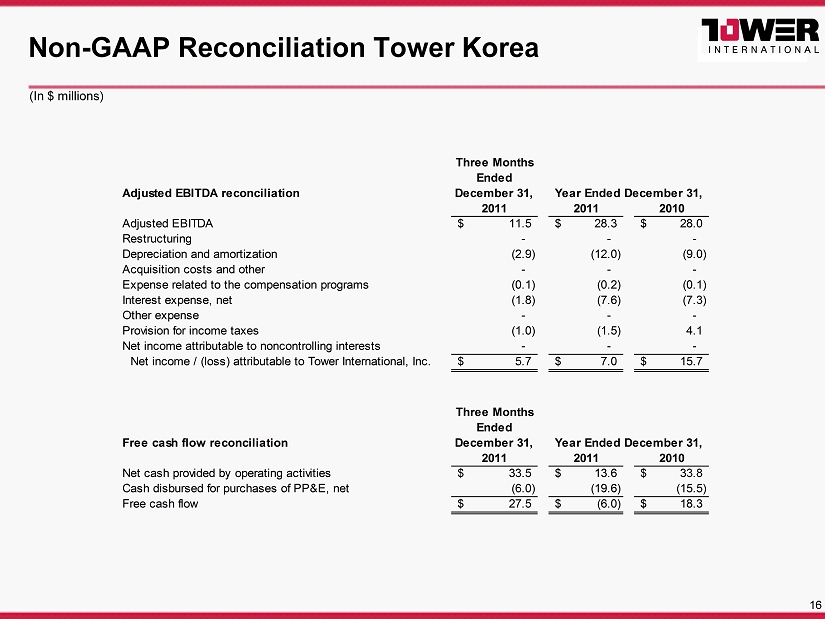
16 Non - GAAP Reconciliation Tower Korea Adjusted EBITDA reconciliation Three Months Ended December 31, 2011 2011 2010 Adjusted EBITDA 11.5$ 28.3$ 28.0$ Restructuring - - - Depreciation and amortization (2.9) (12.0) (9.0) Acquisition costs and other - - - Expense related to the compensation programs (0.1) (0.2) (0.1) Interest expense, net (1.8) (7.6) (7.3) Other expense - - - Provision for income taxes (1.0) (1.5) 4.1 Net income attributable to noncontrolling interests - - - Net income / (loss) attributable to Tower International, Inc. 5.7$ 7.0$ 15.7$ Free cash flow reconciliation Three Months Ended December 31, 2011 2011 2010 Net cash provided by operating activities 33.5$ 13.6$ 33.8$ Cash disbursed for purchases of PP&E, net (6.0) (19.6) (15.5) Free cash flow 27.5$ (6.0)$ 18.3$ Year Ended December 31, Year Ended December 31, (In $ millions)
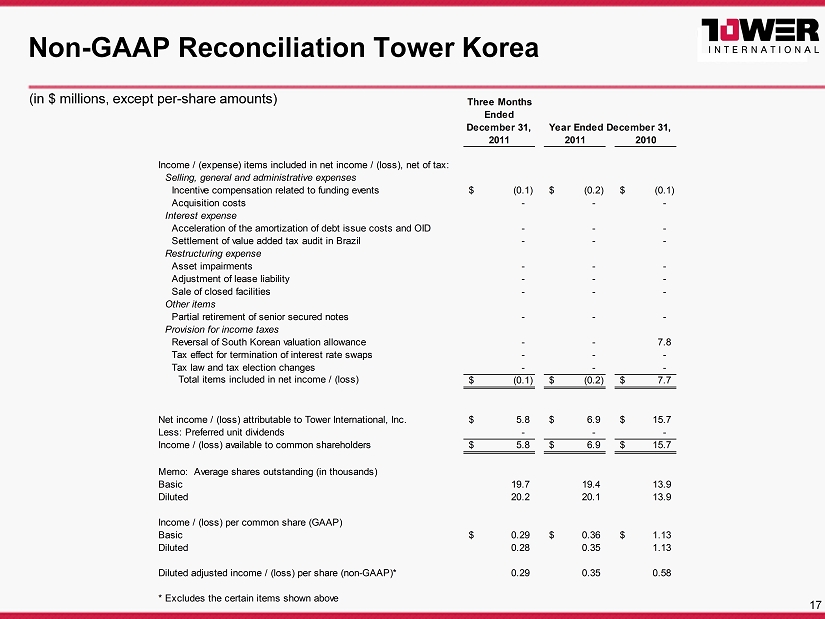
17 Non - GAAP Reconciliation Tower Korea Three Months Ended December 31, 2011 2011 2010 Income / (expense) items included in net income / (loss), net of tax: Selling, general and administrative expenses Incentive compensation related to funding events (0.1)$ (0.2)$ (0.1)$ Acquisition costs - - - Interest expense Acceleration of the amortization of debt issue costs and OID - - - Settlement of value added tax audit in Brazil - - - Restructuring expense Asset impairments - - - Adjustment of lease liability - - - Sale of closed facilities - - - Other items Partial retirement of senior secured notes - - - Provision for income taxes Reversal of South Korean valuation allowance - - 7.8 Tax effect for termination of interest rate swaps - - - Tax law and tax election changes - - - Total items included in net income / (loss) (0.1)$ (0.2)$ 7.7$ Net income / (loss) attributable to Tower International, Inc. 5.8$ 6.9$ 15.7$ Less: Preferred unit dividends - - - Income / (loss) available to common shareholders 5.8$ 6.9$ 15.7$ Memo: Average shares outstanding (in thousands) Basic 19.7 19.4 13.9 Diluted 20.2 20.1 13.9 Income / (loss) per common share (GAAP) Basic 0.29$ 0.36$ 1.13$ Diluted 0.28 0.35 1.13 Diluted adjusted income / (loss) per share (non-GAAP)* 0.29 0.35 0.58 * Excludes the certain items shown above Year Ended December 31, (in $ millions, except per - share amounts)
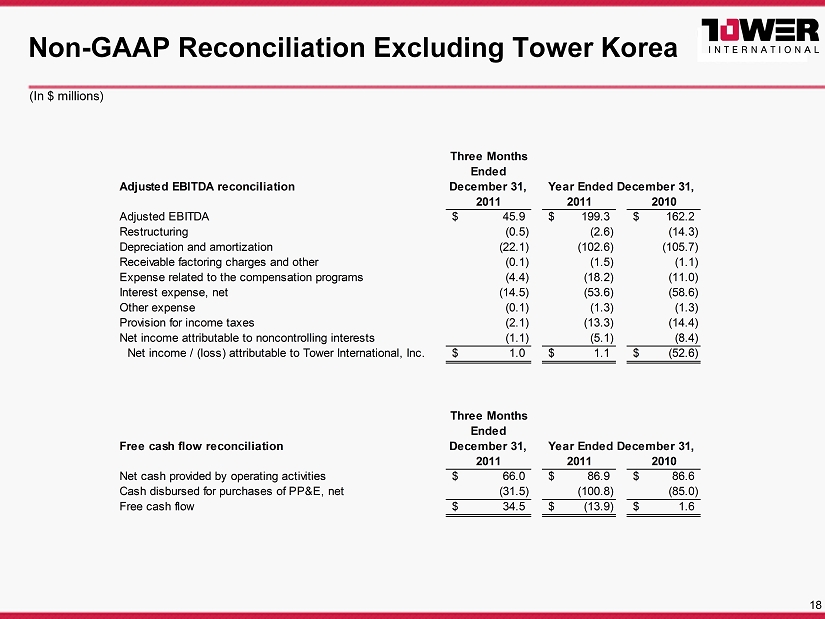
18 Non - GAAP Reconciliation Excluding Tower Korea Adjusted EBITDA reconciliation Three Months Ended December 31, 2011 2011 2010 Adjusted EBITDA 45.9$ 199.3$ 162.2$ Restructuring (0.5) (2.6) (14.3) Depreciation and amortization (22.1) (102.6) (105.7) Receivable factoring charges and other (0.1) (1.5) (1.1) Expense related to the compensation programs (4.4) (18.2) (11.0) Interest expense, net (14.5) (53.6) (58.6) Other expense (0.1) (1.3) (1.3) Provision for income taxes (2.1) (13.3) (14.4) Net income attributable to noncontrolling interests (1.1) (5.1) (8.4) Net income / (loss) attributable to Tower International, Inc. 1.0$ 1.1$ (52.6)$ Free cash flow reconciliation Three Months Ended December 31, 2011 2011 2010 Net cash provided by operating activities 66.0$ 86.9$ 86.6$ Cash disbursed for purchases of PP&E, net (31.5) (100.8) (85.0) Free cash flow 34.5$ (13.9)$ 1.6$ Year Ended December 31, Year Ended December 31, (In $ millions)
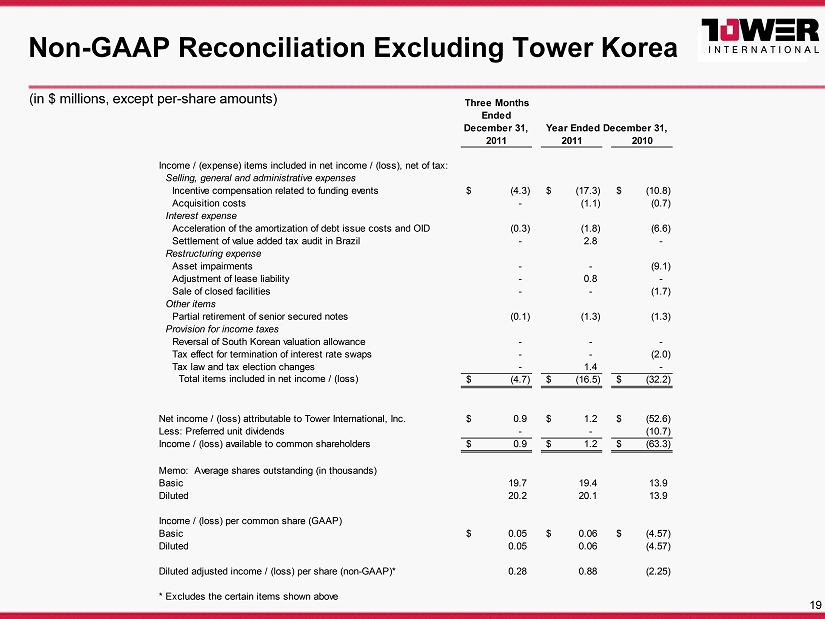
19 Non - GAAP Reconciliation Excluding Tower Korea Three Months Ended December 31, 2011 2011 2010 Income / (expense) items included in net income / (loss), net of tax: Selling, general and administrative expenses Incentive compensation related to funding events (4.3)$ (17.3)$ (10.8)$ Acquisition costs - (1.1) (0.7) Interest expense Acceleration of the amortization of debt issue costs and OID (0.3) (1.8) (6.6) Settlement of value added tax audit in Brazil - 2.8 - Restructuring expense Asset impairments - - (9.1) Adjustment of lease liability - 0.8 - Sale of closed facilities - - (1.7) Other items Partial retirement of senior secured notes (0.1) (1.3) (1.3) Provision for income taxes Reversal of South Korean valuation allowance - - - Tax effect for termination of interest rate swaps - - (2.0) Tax law and tax election changes - 1.4 - Total items included in net income / (loss) (4.7)$ (16.5)$ (32.2)$ Net income / (loss) attributable to Tower International, Inc. 0.9$ 1.2$ (52.6)$ Less: Preferred unit dividends - - (10.7) Income / (loss) available to common shareholders 0.9$ 1.2$ (63.3)$ Memo: Average shares outstanding (in thousands) Basic 19.7 19.4 13.9 Diluted 20.2 20.1 13.9 Income / (loss) per common share (GAAP) Basic 0.05$ 0.06$ (4.57)$ Diluted 0.05 0.06 (4.57) Diluted adjusted income / (loss) per share (non-GAAP)* 0.28 0.88 (2.25) * Excludes the certain items shown above Year Ended December 31, (in $ millions, except per - share amounts)