UNITED STATES
SECURITIES AND EXCHANGE COMMISSION
Washington, D.C. 20549
FORM N-CSR
CERTIFIED SHAREHOLDER REPORT OF REGISTERED
MANAGEMENT INVESTMENT COMPANIES
Investment Company Act file number: 811-22903
J.P. Morgan Exchange-Traded Fund Trust
(Exact name of registrant as specified in charter)
270 Park Avenue
New York, NY 10017
(Address of principal executive offices) (Zip code)
Noah Greenhill, Esq.
J.P. Morgan Investment Management Inc.
270 Park Avenue
New York, NY 10017
(Name and Address of Agent for Service)
With copies to:
| Elizabeth A. Davin, Esq. JPMorgan Chase & Co. 1111 Polaris Parkway Columbus, OH 43240 | Jon S. Rand, Esq. Dechert LLP 1095 Avenue of the Americas New York, NY 10036 |
Registrant’s telephone number, including area code: (800) 480-4111
Date of fiscal year end: February 28
Date of reporting period: March 1, 2018 through August 31, 2018
Form N-CSR is to be used by management investment companies to file reports with the Commission not later than 10 days after the transmission to stockholders of any report that is required to be transmitted to stockholders under Rule 30e-1 under the Investment Company Act of 1940 (17 CFR 270.30e-1). The Commission may use the information provided on Form N-CSR in its regulatory, disclosure review, inspection, and policymaking roles.
A registrant is required to disclose the information specified by Form N-CSR, and the Commission will make this information public. A registrant is not required to respond to the collection of information contained in Form N-CSR unless the Form displays a currently valid Office of Management and Budget (“OMB”) control number. Please direct comments concerning the accuracy of the information collection burden estimate and any suggestions for reducing the burden to Secretary, Securities and Exchange Commission, 450 Fifth Street, NW, Washington, DC 20549-0609. The OMB has reviewed this collection of information under the clearance requirements of 44 U.S.C. Section 3507.
ITEM 1. REPORTS TO STOCKHOLDERS.
The following is a copy of the report transmitted to shareholders pursuant to Rule 30e-1 under the Investment Company Act of 1940 (17 CFR 270.30e-1).
Semi-Annual Report
J.P. Morgan Exchange-Traded Funds
August 31, 2018 (Unaudited)
JPMorgan Disciplined High Yield ETF
JPMorgan Global Bond Opportunities ETF
JPMorgan Ultra-Short Income ETF
JPMorgan USD Emerging Markets Sovereign Bond ETF
 |
| President’s Letter | 1 | |||
| Market Overview | 2 | |||
| Fund Commentaries: | ||||
| 3 | ||||
| 5 | ||||
| 7 | ||||
| 9 | ||||
| Schedules of Portfolio Investments | 12 | |||
| Financial Statements | 65 | |||
| Financial Highlights | 72 | |||
| Notes to Financial Statements | 74 | |||
| Schedule of Shareholder Expenses | 88 | |||
Investments in a Fund are not bank deposits or obligations of, or guaranteed or endorsed by, any bank and are not insured or guaranteed by the FDIC, the Federal Reserve Board or any other government agency. You could lose money if you sell when a Fund’s share price is lower than when you invested.
Past performance is no guarantee of future performance. The general market views expressed in this report are opinions based on market and other conditions through the end of the reporting period and are subject to change without notice. These views are not intended to predict the future performance of a Fund or the securities markets. References to specific securities and their issuers are for illustrative purposes only and are not intended to be, and should not be interpreted as, recommendations to purchase or sell such securities. Such views are not meant as investment advice and may not be relied on as an indication of trading intent on behalf of the Fund.
Prospective investors should refer to the Funds’ prospectuses for a discussion of the Funds’ investment objectives, strategies and risks. Call J.P. Morgan Exchange-Traded Funds at (844) 457-6383 for a prospectus containing more complete information about a Fund, including management fees and other expenses. Please read it carefully before investing.
Shares are bought and sold throughout the day on an exchange at market price (not at net asset value) through a brokerage account, and are not individually subscribed and redeemed from a Fund. Shares may only be subscribed and redeemed directly from a Fund by Authorized Participants, in very large creation/redemption units. Brokerage commissions will reduce returns.
October 9, 2018 (Unaudited)
Dear Shareholder,
This year continues to be a superlative one for JPMorgan’s Exchange-Traded Funds. We’ve expanded our product lineup to 27 ETFs that provide investors with access to an expansive range of asset classes and investment factors. By the mid-point of this year, our assets under management exceeded $5 billion and quickly reached more than $11 billion by the end of August 2018.
 |
“Bonds play a critical role in portfolios, even as interest rates rise and fears of inflation and an equity market downturn have intensified. We continue to believe our innovative fixed income solutions can help you navigate changing markets.” |
Also this year, we launched our BetaBuilders® suite of ETFs, which offers investors broad, market-capitalization weighted exposure to leading regional or asset class indexes. Other notable achievements over the past six months include JPMorgan Ultra-Short Income ETF (JPST) surpassing $2 billion in AUM shortly after its one-year anniversary and JPMorgan Global Bond Opportunities ETF (JPGB) earning Best New International/Global Fixed-Income ETF at the fifth annual ETF.com Awards in March.1
Meanwhile, financial market performance was mixed during the six months ended August 31, 2018. U.S. equities largely outperformed other developed markets and the S&P 500 Index reached record highs in late August amid record corporate
earnings and revenues and strong consumer spending. Bond markets underperformed amid rising interest rates and select emerging markets were hit particularly hard by rising borrowing costs.
We continue to believe our innovative fixed income solutions can help you navigate changing markets. For investors targeting lower duration amid higher interest rates, I’m pleased to report that JPST, which seeks to provide current income while seeking to maintain a low volatility of principal, generated a positive return for the reporting period and outperformed its broad market based benchmark index, the ICE BofAML 3-Month US Treasury Bill Index. Additionally, JPST captured 81% of the Bloomberg Barclays US Aggregate Bond Index’s yield with only 9% of the index’s duration.2
We are proud to bring J.P. Morgan’s experience and capabilities to the ETF market place. We are committed to building solutions that address your needs and help you build stronger portfolios. Thank you for your belief in our Firm and our process.
Sincerely,

Joanna M. Gallegos
President, J.P. Morgan Exchange-Traded Funds
J.P Morgan Asset Management
1-844-4JPM-ETF or jpmorgan.com/etfs for more information
| 1 | ETF.com Award winners are selected by a majority vote of the ETF.com Awards Selection Committee, a group of independent ETF experts. Voting was completed by Jan. 20, 2018, and results were announced at the ETF.com U.S. Awards Dinner on March 22, 2018. |
| 2 | Source: J.P. Morgan Asset Management as of 6/30/18. Based on the 30-Day Average Yield for JPMorgan Prime Money Market Fund — Capital share class (ticker CJPXX) as a proxy for money market funds, the 30-Day SEC Yield for JPST and the yield on the Bloomberg Barclays US Aggregate Bond Index. U.S. mutual funds and ETFs are different investment vehicles with differing investment approaches. JPST seeks to provide current income while seeking to maintain a low volatility of principal through investments in investment-grade, U.S. dollar denominated fixed and floating-rate debt. JPMorgan Prime Money Market Fund seeks current income while seeking to maintain liquidity and a low volatility of principal. You could lose money by investing in the Fund. Because the share price of the Fund will fluctuate, when you sell your shares they may be worth more or less than what you originally paid for them. The Bloomberg Barclays US Aggregate Bond Index is an unmanaged index representing SEC-registered taxable and dollar denominated securities. It covers the U.S. investment-grade fixed rate bond market, with index components for government and corporate securities, mortgage pass-throughs and asset-backed securities. Mutual funds have fees that reduce their performance; indexes do not. You cannot invest directly in an index. Please consult an investment or tax professional for more information. |
For illustrative purposes only. Diversification does not guarantee investment returns and does not eliminate the risk of loss. Diversification among investment options and asset classes may help to reduce overall volatility. |
| AUGUST 31, 2018 | J.P. MORGAN EXCHANGE-TRADED FUNDS | 1 | ||||||
J.P. Morgan Exchange-Traded Funds
SIX MONTHS ENDED AUGUST 31, 2018 (Unaudited)
During the reporting period, U.S. financial markets largely outperformed other developed markets and emerging markets. Positive economic data, record high corporate earnings and rising interest rates provided support for U.S. equities, while investor uncertainty about overseas markets bolstered U.S. Treasury bonds during the final months of the reporting period.
Within fixed income markets, high yield bonds (also known as “junk bonds”) outperformed investment grade corporate debt and U.S. Treasury bonds. Emerging markets debt was among the worst performers, as rising U.S. interest rates and a stronger U.S. dollar hurt those nations most reliant on foreign borrowing and/or oil imports. Discrete political issues also weighed on bonds issued by Turkey, Brazil, Russia and Italy.
| 2 | J.P. MORGAN EXCHANGE-TRADED FUNDS | AUGUST 31, 2018 | ||||
JPMorgan Disciplined High Yield ETF
FUND COMMENTARY
SIX MONTHS ENDED AUGUST 31, 2018 (Unaudited)
| REPORTING PERIOD RETURN: | ||||
| JPMorgan Disciplined High Yield ETF | ||||
| Net Asset Value* | 1.86% | |||
| Market Price** | 1.63% | |||
| ICE BofAML US High Yield Index (formerly BofA Merrill Lynch U.S. High Yield Index) | 2.23% | |||
| Bloomberg Barclays US Aggregate Bond Index | 1.15% | |||
| Net Assets as of 8/31/2018 | $ | 154,311,737 | ||
| Duration as of 8/31/2018 | 4.28 Years | |||
INVESTMENT OBJECTIVE***
The JPMorgan Disciplined High Yield ETF (the “Fund”) seeks to provide a high level of income. Capital appreciation is a secondary objective.
INVESTMENT APPROACH
The Fund invests in a diversified portfolio of high-yield securities (also called “junk bonds”). Issuers may be domestic or foreign, but the Fund only invests in U.S. dollar-denominated investments.
HOW DID THE FUND PERFORM?
For the six months ended August 31, 2018, the Fund posted positive absolute performance and underperformed the ICE BofAML US High Yield Index (the “Benchmark”) and outperformed the Bloomberg Barclays US Aggregate Bond Index.
During the reporting period, bonds rated CCC and lower significantly outperformed bonds rated BB and single-B as investors generally sought higher yields from lower quality debt. The Fund’s overweight position in bonds rated BB and its lack of holdings in bonds rated CCC detracted from performance relative to the Benchmark. To maintain sufficient liquidity, the Fund did not invest in bond issues of less than $500 million or in bond issuers with less than $1 billion in total bonds outstanding, which also detracted from relative performance.
Bonds issued by publicly traded companies outperformed bonds issued by privately held companies during the reporting period. The Fund does not invest in bonds issued by privately held companies, which helped performance relative to the Benchmark.
HOW WAS THE FUND POSITIONED?
The Fund’s managers believe that bonds rated CCC generally have materially higher volatility and default risk than bonds rated BB and single-B, while providing inadequate incremental return over a market cycle to justify the higher volatility. In addition, the managers believe bonds issued by private
companies have had a materially higher probability of default than similarly-rated bonds issued by public companies. As such, the Fund does not invest in bonds rated CCC or bonds issued by private companies. Relative to the Benchmark, the Fund was overweight in bonds rated BB and underweight in bonds rated B and CCC.
PORTFOLIO COMPOSITION**** | ||||
Consumer Discretionary | 24.2 | % | ||
Energy | 15.3 | |||
Telecommunication Services | 9.9 | |||
Industrials | 9.1 | |||
Health Care | 8.7 | |||
Materials | 7.9 | |||
Information Technology | 7.4 | |||
Financials | 6.1 | |||
Real Estate | 3.4 | |||
Consumer Staples | 2.8 | |||
Utilities | 2.5 | |||
Short-Term Investments | 2.7 | |||
| * | The return shown is based on net asset value calculated for shareholder transactions and may differ from the return shown in the financial highlights, which reflects adjustments made to the net asset value in accordance with accounting principles generally accepted in the United States of America. The net asset value was $49.78 as of August 31, 2018. |
| ** | Market price return is calculated assuming an initial investment made at the market price at the beginning of the period, reinvestment of all dividends and distributions at market price during the period, and sale at the market price on the last day of the period. The price used to calculate the market price return is the midpoint of the bid/ask spread at the close of business on the Cboe BZX Exchange, Inc. The midpoint price was $49.94 as of August 31, 2018. |
| *** | The adviser seeks to achieve the Fund’s objective. There can be no guarantee it will be achieved. |
| **** | Percentages indicated are based on total investments as of August 31, 2018. The Fund’s composition is subject to change. |
| AUGUST 31, 2018 | J.P. MORGAN EXCHANGE-TRADED FUNDS | 3 | ||||||
JPMorgan Disciplined High Yield ETF
FUND COMMENTARY
SIX MONTHS ENDED AUGUST 31, 2018 (Unaudited) (continued)
AVERAGE ANNUAL TOTAL RETURNS AS OF AUGUST 31, 2018 (Unaudited) | ||||||||||||||||
| INCEPTION DATE | SIX MONTHS | 1 YEAR | SINCE INCEPTION | |||||||||||||
| JPMorgan Disciplined High Yield ETF | ||||||||||||||||
Net Asset Value | September 14, 2016 | 1.86% | 1.68% | 4.67% | ||||||||||||
Market Price | 1.63% | 1.27% | 4.82% | |||||||||||||
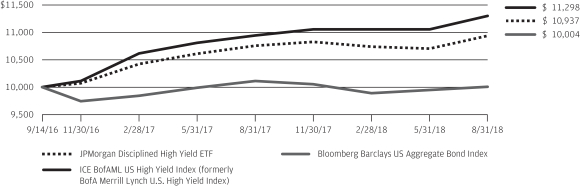
LIFE OF FUND PERFORMANCE (9/14/16 TO 8/31/18)
The performance quoted is past performance and is not a guarantee of future results. Exchange-traded funds are subject to certain market risks. Investment returns and principal value of an investment will fluctuate so that an investor’s shares, when sold or redeemed, may be worth more or less than their original cost. Current performance may be higher or lower than the performance data shown. For up-to-date, month-end performance information please call 1-844-457-6383.
Fund commenced operations on September 14, 2016.
The graph illustrates comparative performance for $10,000 invested in shares of the JPMorgan Disciplined High Yield ETF, the ICE BofAML US High Yield Index and the Bloomberg Barclays US Aggregate Bond Index from September 14, 2016 to August 31, 2018. The performance of the Fund reflects the deduction of Fund expenses and assumes reinvestment of all dividends and capital gain distributions, if any. The performance of the ICE BofAML US High Yield Index and the Bloomberg Barclays US Aggregate Index does not reflect the deduction of expenses associated with an exchange-traded fund and has been adjusted to reflect reinvestment of all dividends and capital gain distributions of the securities included in the Index, if applicable. The ICE BofAML US High Yield Index is
an unmanaged index, which measures the performance of U.S. dollar denominated below investment grade corporate debt publicly issued in the U.S. domestic market. The Bloomberg Barclays US Aggregate Bond Index is an unmanaged index that represents securities that are SEC-registered, taxable, and dollar denominated. The index covers the U.S. investment grade fixed rate bond market, with index components for government and corporate securities, mortgage pass-through securities, and asset-backed securities. Investors cannot invest directly in an index.
Fund performance reflects the partial waiver of the Fund’s fees and reimbursement of expenses for certain periods since the inception date. Without these waivers and reimbursements, performance would have been lower. Also, performance shown in this section does not reflect the deduction of taxes that a shareholder may pay on Fund distributions or redemption or sale of Fund shares.
The returns shown are based on net asset values calculated for shareholder transactions and may differ from the returns shown in the financial highlights, which reflect adjustments made to the net asset values in accordance with accounting principles generally accepted in the United States of America.
| 4 | J.P. MORGAN EXCHANGE-TRADED FUNDS | AUGUST 31, 2018 | ||||
JPMorgan Global Bond Opportunities ETF
FUND COMMENTARY
SIX MONTHS ENDED AUGUST 31, 2018 (Unaudited)
REPORTING PERIOD RETURN: | ||||
| JPMorgan Global Bond Opportunities ETF | ||||
| Net Asset Value* | -0.53% | |||
| Market Price** | -0.63% | |||
| Bloomberg Barclays Multiverse Index | -1.92% | |||
| Net Assets as of 8/31/2018 | $ | 174,649,161 | ||
| Duration as of 8/31/2018 | 2.93 Years | |||
INVESTMENT OBJECTIVE***
The JPMorgan Global Bond Opportunities ETF (the “Fund”) seeks to provide total return.
INVESTMENT APPROACH
The Fund invests in bond and currency sectors across developed and emerging markets without benchmark constraints. The Fund is flexible and opportunistic and the Fund’s adviser has broad discretion to shift the Fund’s exposures to strategies, sectors, countries or currencies based on changing market conditions and its view of the best mix of investment opportunities.
HOW DID THE FUND PERFORM?
For the six months ended August 31, 2018, the Fund posted a return of -0.53%. The Fund is managed with an unconstrained orientation and is not managed relative to a benchmark index. While the Fund is not managed to a benchmark, its return is compared to the Bloomberg Barclays Multiverse Index, which returned -1.92% for the reporting period.
The Fund’s allocations to corporate high yield bonds (also known as “junk bonds”) and securitized debt were the leading contributors to absolute performance. High yield returns were supported by robust corporate earnings in the second quarter of 2018 and low default rates. Low supply of newly issued high yield bonds also supported prices. Strong U.S. consumer spending data bolstered yields on securitized debt.
The Fund’s allocation to emerging markets debt was the leading detractor from absolute performance. During the reporting period, emerging markets debt was hurt by the combination of rising U.S. interest rates and a strengthening U.S. dollar, along with discrete political-economic issues. The Fund’s short position in government interest rates detracted from performance as U.S. Treasury yields, which generally move in the opposite direction of prices, were restrained by U.S. trade tensions with China and other leading trading partners.
The Fund’s short position in German government bonds and its long positions in Italy, Spain and Portugal also detracted from performance as German bond prices rose amid political uncertainty in Italy.
HOW WAS THE FUND POSITIONED?
During the reporting period, the Fund invested opportunistically across different markets and sectors. The Fund’s managers applied a flexible investment approach and did not manage to a benchmark. This allowed the Fund to shift its allocations based on changing market conditions. The Fund had exposure to a
broad range of asset classes during the reporting period, including high yield and investment grade corporate bonds, agency and non-agency mortgage-backed securities, asset-backed securities, commercial mortgage-backed securities, emerging markets debt, convertible bonds and foreign government securities. At the end of the reporting period, the Fund’s largest allocations were to U.S. high yield bonds, investment grade corporate bonds and emerging markets sovereign debt. The Fund’s smallest allocations were in non-agency mortgage-backed securities, asset-backed securities, and collateralized loan obligations.
PORTFOLIO COMPOSITION BY COUNTRY**** | ||||
| United States | | 52.4 | % | |
| Spain | | 4.1 | ||
| Portugal | | 3.9 | ||
| United Kingdom | | 3.4 | ||
| France | | 3.2 | ||
| Indonesia | | 2.2 | ||
| Luxembourg | | 1.7 | ||
| Italy | | 1.6 | ||
| Sweden | | 1.5 | ||
| Australia | | 1.5 | ||
| Germany | | 1.4 | ||
| Ireland | | 1.4 | ||
| Netherlands | | 1.3 | ||
| Mexico | | 1.3 | ||
| Switzerland | | 1.3 | ||
| Canada | | 1.2 | ||
| South Africa | | 1.1 | ||
| Greece | | 1.0 | | |
| Others (each less than 1.0%) | | 9.6 | | |
| Short-Term Investments | | 4.9 | | |
| * | The return shown is based on net asset value calculated for shareholder transactions and may differ from the return shown in the financial highlights, which reflects adjustments made to the net asset value in accordance with accounting principles generally accepted in the United States of America. The net asset value was $49.90 as of August 31, 2018. |
| ** | Market price return is calculated assuming an initial investment made at the market price at the beginning of the period, reinvestment of all dividends and distributions at market price during the period, and sale at the market price on the last day of the period. The price used to calculate the market price return is the midpoint of the bid/ask spread at the close of business on the Cboe BZX Exchange, Inc. The midpoint price was $49.90 as of August 31, 2018. |
| *** | The adviser seeks to achieve the Fund’s objective. There can be no guarantee it will be achieved. |
| **** | Percentages indicated are based on total investments as of August 31, 2018. The Fund’s composition is subject to change. |
| AUGUST 31, 2018 | J.P. MORGAN EXCHANGE-TRADED FUNDS | 5 | ||||||
JPMorgan Global Bond Opportunities ETF
FUND COMMENTARY
SIX MONTHS ENDED AUGUST 31, 2018 (Unaudited) (continued)
AVERAGE ANNUAL TOTAL RETURNS AS OF AUGUST 31, 2018 (Unaudited) | ||||||||||||||||
| INCEPTION DATE | SIX MONTHS | 1 YEAR | SINCE INCEPTION | |||||||||||||
| JPMorgan Global Bond Opportunities ETF | ||||||||||||||||
| Net Asset Value | April 5, 2017 | -0.51% | 0.76% | 2.29% | ||||||||||||
| Market Price | -0.63% | 0.32% | 2.29% | |||||||||||||
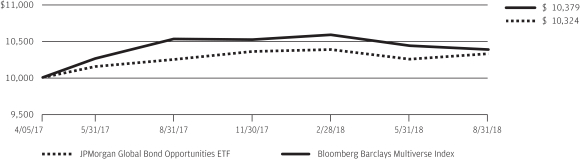
LIFE OF FUND PERFORMANCE (4/5/17 TO 8/31/18)
The performance quoted is past performance and is not a guarantee of future results. Exchange-traded funds are subject to certain market risks. Investment returns and principal value of an investment will fluctuate so that an investor’s shares, when sold or redeemed, may be worth more or less than their original cost. Current performance may be higher or lower than the performance data shown. For up-to-date, month-end performance information please call 1-844-457-6383.
Fund commenced operations on April 5, 2017.
The graph illustrates comparative performance for $10,000 invested in shares of the JPMorgan Global Bond Opportunities ETF and the Bloomberg Barclays Multiverse Index from April 5, 2017 to August 31, 2018. The performance of the Fund reflects the deduction of Fund expenses and assumes reinvestment of all dividends and capital gain distributions, if any. The performance of the Bloomberg Barclays Multiverse Index does not reflect the deduction of expenses associated with an exchange-traded fund and has been adjusted to reflect reinvestment of all dividends and capital gain distributions of the securities included in the Index, if applicable.
The Bloomberg Barclays Multiverse Index is an unmanaged index, which measure the global fixed-income bond market that combines the Bloomberg Barclays Global Aggregate Index and the Bloomberg Barclays Global High Yield Index. The Bloomberg Barclays Global Aggregate Index measures global investment grade debt from twenty-four different local currency markets. The Bloomberg Barclays Global High-Yield Index measures the global high-yield fixed income markets. Investors cannot invest directly in an index.
Fund performance reflects the partial waiver of the Fund’s fees and reimbursement of expenses for certain periods since the inception date. Without these waivers and reimbursements, performance would have been lower. Also, performance shown in this section does not reflect the deduction of taxes that a shareholder may pay on Fund distributions or redemption or sale of Fund shares.
The returns shown are based on net asset values calculated for shareholder transactions and may differ from the returns shown in the financial highlights, which reflect adjustments made to the net asset values in accordance with accounting principles generally accepted in the United States of America.
| 6 | J.P. MORGAN EXCHANGE-TRADED FUNDS | AUGUST 31, 2018 | ||||
JPMorgan Ultra-Short Income ETF
FUND COMMENTARY
SIX MONTHS ENDED AUGUST 31, 2018 (Unaudited)
| REPORTING PERIOD RETURN: | ||||
| JPMorgan Ultra-Short Income ETF | ||||
| Net Asset Value* | 1.29% | |||
| Market Price** | 1.29% | |||
| ICE BofAML 3-Month US Treasury Bill Index (formerly BofA Merrill Lynch 3-Month U.S. Treasury Bill Index) | 0.93% | |||
| Net Assets as of 8/31/2018 | $ | 2,266,793,031 | ||
| Duration as of 8/31/2018 | 0.51 Years | |||
INVESTMENT OBJECTIVE***
The JPMorgan Ultra-Short Income ETF (the “Fund”) seeks to provide current income while seeking to maintain a low volatility of principal.
INVESTMENT APPROACH
The Fund primarily invests mainly in investment-grade, U.S. dollar-denominated fixed, variable and floating-rate debt. The Fund seeks to maintain a duration of one year or less, although under certain market conditions, the Fund’s duration may be longer than one year. The Fund’s adviser has broad discretion to shift the Fund’s exposure to strategies and sectors based on changing market conditions and its view of the best mix of investment opportunities.
HOW DID THE FUND PERFORM?
For the six months ended August 31, 2018, the Fund posted a positive return of 1.29%. While the Fund is not managed to a benchmark, its return is compared to the ICE BofAML 3-Month US Treasury Bill Index (the “Index”). While the Fund held a small amount of U.S. Treasury securities during the reporting period, the Index holds only U.S. Treasuries. The Fund outperformed the Index during the reporting period.
The Fund’s allocations to money market securities and investment grade corporate bonds were leading contributors to both absolute performance and performance relative to the Index during the reporting period. The Fund’s allocations to high quality collateralized loan obligations, asset-backed securities and commercial mortgage-backed securities also contributed to absolute and relative performance.
While the Fund’s longer overall duration relative to the Index was a modest detractor from relative performance, the enhanced yield from longer-dated securities contributed to absolute performance. Duration measures the price sensitivity of a portfolio of bonds to relative changes in interest rates. Generally, bonds with longer duration will experience a larger decrease in price as interest rates rise versus bonds with shorter duration.
HOW WAS THE FUND POSITIONED?
During the reporting period, the Fund’s portfolio management team believed that interest rates would continue to move higher at a measured pace and that corporate credit fundamentals remained favorable, despite geopolitical risks and the potential
impact of further escalation in international trade tensions. However, the team added a small allocation to U.S. Treasury bonds in an effort to protect against potential market volatility from trade uncertainty. As such, the portfolio was positioned during the reporting period with an overall average duration of 0.51 years. In descending order, the Fund’s largest allocations were in corporate bonds, money market securities, collateralized loan obligations, asset-backed securities, commercial mortgage-backed securities, U.S. Treasury bonds and non-corporate credit.
PORTFOLIO COMPOSITION BY SECTOR**** | ||||
| Financials | 42.1 | % | ||
| Asset-Backed Securities | 13.7 | |||
| Utilities | 5.1 | |||
| Consumer Discretionary | 4.1 | |||
| Certificates of Deposit | 3.4 | |||
| Industrials | 2.7 | |||
| Health Care | 2.5 | |||
| Energy | 2.2 | |||
| Consumer Staples | 1.7 | |||
| Telecommunication Services | 1.6 | |||
| Information Technology | 1.5 | |||
| Materials | 1.2 | |||
| Real Estate | 1.2 | |||
| Others (each less than 1.0%) | 1.3 | |||
| Short-Term Investments | 15.7 | |||
| * | The return shown is based on net asset value calculated for shareholder transactions and may differ from the return shown in the financial highlights, which reflects adjustments made to the net asset value in accordance with accounting principles generally accepted in the United States of America. The net asset value was $50.15 as of August 31, 2018. |
| ** | Market price return is calculated assuming an initial investment made at the market price at the beginning of the period, reinvestment of all dividends and distributions at market price during the period, and sale at the market price on the last day of the period. The price used to calculate the market price return is the midpoint of the bid/ask spread at the close of business on the Cboe BZX Exchange, Inc. The midpoint price was $50.19 as of August 31, 2018. |
| *** | The adviser seeks to achieve the Fund’s objective. There can be no guarantee it will be achieved. |
| **** | Percentages indicated are based on total investments as of August 31, 2018. The Fund’s composition is subject to change. |
| AUGUST 31, 2018 | J.P. MORGAN EXCHANGE-TRADED FUNDS | 7 | ||||||
JPMorgan Ultra-Short Income ETF
FUND COMMENTARY
SIX MONTHS ENDED AUGUST 31, 2018 (Unaudited) (continued)
AVERAGE ANNUAL TOTAL RETURNS AS OF AUGUST 31, 2018 (Unaudited) | ||||||||||||||||
| INCEPTION DATE | SIX MONTHS | 1 YEAR | SINCE INCEPTION | |||||||||||||
| JPMorgan Ultra-Short Income ETF | ||||||||||||||||
| Net Asset Value | May 17, 2017 | 1.29% | 2.05% | 1.98% | ||||||||||||
| Market Price | 1.29% | 2.03% | 2.04% | |||||||||||||
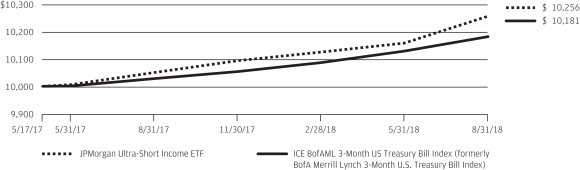
LIFE OF FUND PERFORMANCE (5/17/17 TO 8/31/18)
The performance quoted is past performance and is not a guarantee of future results. Exchange-traded funds are subject to certain market risks. Investment returns and principal value of an investment will fluctuate so that an investor’s shares, when sold or redeemed, may be worth more or less than their original cost. Current performance may be higher or lower than the performance data shown. For up-to-date, month-end performance information please call 1-844-457-6383.
Fund commenced operations on May 17, 2017.
The graph illustrates comparative performance for $10,000 invested in shares of the JPMorgan Ultra-Short Income ETF and the ICE BofAML 3-Month US Treasury Bill Index from May 17, 2017 to August 31, 2018. The performance of the Fund reflects the deduction of Fund expenses and assumes reinvestment of all dividends and capital gain distributions, if any. The performance of the ICE BofAML 3-Month US Treasury Bill Index does not reflect the deduction of expenses associated with an exchange-traded fund and has been adjusted to reflect reinvestment of all dividends and capital gain distributions of the
securities included in the Index, if applicable. The ICE BofAML 3-Month US Treasury Bill Index is comprised of a single issue purchased at the beginning of the month and held for a full month. The index is rebalanced monthly and the issue selected is the outstanding Treasury Bill that matures closest to, but not beyond 3 months from the rebalancing date. Investors cannot invest directly in an index.
Fund performance reflects the partial waiver of the Fund’s fees and reimbursement of expenses for certain periods since the inception date. Without these waivers and reimbursements, performance would have been lower. Also, performance shown in this section does not reflect the deduction of taxes that a shareholder may pay on Fund distributions or redemption or sale of Fund shares.
The returns shown are based on net asset values calculated for shareholder transactions and may differ from the returns shown in the financial highlights, which reflect adjustments made to the net asset values in accordance with accounting principles generally accepted in the United States of America.
| 8 | J.P. MORGAN EXCHANGE-TRADED FUNDS | AUGUST 31, 2018 | ||||
JPMorgan USD Emerging Markets Sovereign Bond ETF
FUND COMMENTARY
SIX MONTHS ENDED AUGUST 31, 2018 (Unaudited)
| REPORTING PERIOD RETURN: | ||||
| JPMorgan USD Emerging Markets Sovereign Bond ETF | ||||
| Net Asset Value* | -3.89% | |||
| Market Price** | -3.45% | |||
| JPMorgan Emerging Markets Risk-Aware Bond Index | -3.57% | |||
| Net Assets as of 8/31/2018 | $ | 50,355,700 | ||
| Duration as of 8/31/2018 | 6.73 Years | |||
INVESTMENT OBJECTIVE***
The JPMorgan USD Emerging Markets Sovereign Bond ETF (the “Fund”) seeks investment results that closely correspond, before fees and expenses, to the performance of the JPMorgan Emerging Markets Risk-Aware Bond Index (the “Underlying Index”).
INVESTMENT APPROACH
The Fund is passively managed to the Underlying Index, which is comprised of liquid, U.S. dollar-denominated sovereign and quasi-sovereign fixed and floating rate debt securities from emerging markets. The Underlying Index utilizes a rules-based, proprietary methodology that filters for liquidity and country risk and allocates risk across credit ratings. The Underlying Index methodology includes monthly rebalancing. The Fund also employs optimization techniques to minimize tracking error to the Underlying Index
HOW DID THE FUND PERFORM?
For the six month ended August 31, 2018, the Fund posted a return of -3.89% and its performance deviated from the Underlying Index by -0.32%. Because the Fund’s holdings were
closely aligned with those of the Underlying Index, variances in
relative performance due to security selection and/or sector allocation were not significant. The majority of the Fund’s deviation against the Underlying Index was due to operating expenses, fees and tax management of the Fund’s portfolio.
The Fund’s and the Underlying Index’s exposures to Turkey and Ecuador were leading detractors from absolute performance. The Fund’s and the Underlying Index’s liquidity filter also detracted from absolute performance as less liquid bond issues outperformed other issues of emerging markets sovereign and quasi-sovereign debt.
The Fund and the Underlying Index had no exposure to Argentina and Venezuela, which was a positive contributor to absolute performance.
HOW WAS THE FUND POSITIONED?
The Fund invested at least 80% of its assets in securities included in the Underlying Index. During the reporting period, the Fund’s and Underlying Index’s largest allocations were to Turkey and Brazil and their smallest allocations were to India and Morocco.
| AUGUST 31, 2018 | J.P. MORGAN EXCHANGE-TRADED FUNDS | 9 | ||||||
JPMorgan USD Emerging Markets Sovereign Bond ETF
FUND COMMENTARY
SIX MONTHS ENDED AUGUST 31, 2018 (Unaudited) (continued)
PORTFOLIO COMPOSITION BY COUNTRY**** | ||||
| Turkey | 6.5 | % | ||
| Brazil | 6.4 | |||
| South Africa | 5.6 | |||
| Dominican Republic | 4.6 | |||
| Egypt | 4.4 | |||
| Ukraine | 4.3 | |||
| Mexico | 4.3 | |||
| Ecuador | 4.3 | |||
| Lebanon | 4.0 | |||
| Indonesia | 3.4 | |||
| Sri Lanka | 3.1 | |||
| China | 2.9 | |||
| Philippines | 2.8 | |||
| Russia | 2.8 | |||
| Croatia | 2.7 | |||
| Colombia | 2.6 | |||
| Kazakhstan | 2.3 | |||
| Azerbaijan | 2.3 | |||
| Peru | 2.1 | |||
| Oman | 2.0 | |||
| Poland | 1.9 | |||
| Jamaica | 1.9 | |||
| Hungary | 1.8 | |||
| Pakistan | 1.7 | |||
| Kenya | 1.7 | |||
| Uruguay | 1.6 | |||
| Ivory Coast | 1.6 | |||
| Malaysia | 1.5 | |||
| Panama | 1.4 | |||
| Chile | 1.4 | |||
| Iraq | 1.3 | |||
| Romania | 1.0 | |||
| Serbia | 1.0 | |||
| Others (each less than 1.0%) | 6.3 | |||
| Short-Term Investments | 0.5 | |||
| * | The return shown is based on net asset value calculated for shareholder transactions and may differ from the return shown in the financial highlights, which reflects adjustments made to the net asset value in accordance with accounting principles generally accepted in the United States of America. The net asset value was $45.78 as of August 31, 2018. |
| ** | Market price return is calculated assuming an initial investment made at the market price at the beginning of the period, reinvestment of all dividends and distributions at market price during the period, and sale at the market price on the last day of the period. The price used to calculate the market price return is the midpoint of the bid/ask spread at the close of business on the NYSE Arca, Inc. The midpoint price was $46.11 as of August 31, 2018. |
| *** | The adviser seeks to achieve the Fund’s objective. There can be no guarantee it will be achieved. |
| **** | Percentages indicated are based on total investments as of August 31, 2018. The Fund’s composition is subject to change. |
| 10 | J.P. MORGAN EXCHANGE-TRADED FUNDS | AUGUST 31, 2018 | ||||
TOTAL RETURNS AS OF AUGUST 31, 2018 (Unaudited) | ||||||||||||
| INCEPTION DATE | SIX MONTHS | CUMULATIVE SINCE INCEPTION | ||||||||||
| JPMorgan USD Emerging Markets Sovereign Bond ETF | ||||||||||||
| Net Asset Value | January 29, 2018 | -3.89% | -5.84% | |||||||||
| Market Price | -3.45% | -5.18% | ||||||||||
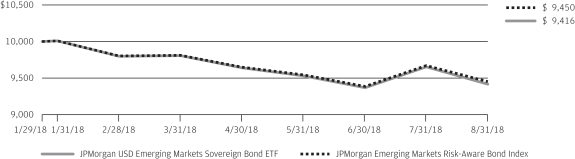
LIFE OF FUND PERFORMANCE (1/29/18 TO 8/31/18)
The performance quoted is past performance and is not a guarantee of future results. Exchange-traded funds are subject to certain market risks. Investment returns and principal value of an investment will fluctuate so that an investor’s shares, when sold or redeemed, may be worth more or less than their original cost. Current performance may be higher or lower than the performance data shown. For up-to-date, month-end performance information please call 1-844-457-6383.
Fund commenced operations on January 29, 2018.
The graph illustrates comparative performance for $10,000 invested in shares of the JPMorgan USD Emerging Markets Sovereign Bond ETF and the JPMorgan Emerging Markets Risk-Aware Bond Index from January 29, 2018 to August 31, 2018. The performance of the Fund reflects the deduction of Fund expenses and assumes reinvestment of all dividends and capital gain distributions, if any. The performance of the JPMorgan Emerging Markets Risk-Aware Bond Index does not reflect the deduction of expenses associated with an exchange-traded fund and has been adjusted to reflect reinvestment of all dividends and capital gain distributions of the securities included in the Index, if applicable. The JPMorgan Emerging Markets Risk-Aware Bond Index (the “index”) is comprised of liquid, U.S. dollar-denominated sovereign and quasi-sovereign fixed and floating rate debt securities from emerging markets selected using a rules-based methodology and is owned by J.P. Morgan Investment Inc., the Fund’s adviser (the “Adviser”). The Index is maintained and calculated by J.P. Morgan Securities LLC (“JPMS” or the “Index Provider”), which selects securities in accordance with the methodology from among the components of the J.P. Morgan Emerging Market Bond Index Global Diversified, which was developed and is maintained by the Index Provider. The Index Provider and the Adviser are both wholly-owned subsidiaries of JPMorgan Chase & Co., a publicly-held financial services holding company. The Index starts with the
J.P. Morgan Emerging Market Bond Index Global Diversified and applies a proprietary methodology that filters for liquidity and for country risk and allocates risk based on credit rating. Historically, the J.P. Morgan Emerging Markets Bond Index Global Diversified has included bonds issued by the countries of Angola, Argentina, Armenia, Azerbaijan, Belize, Bolivia, Brazil, Cameroon, Chile, China, Colombia, Costa Rica, Cote D’Ivoire, Croatia, Dominican Republic, Ecuador, Egypt, El Salvador, Ethiopia, Gabon, Georgia, Ghana, Guatemala, Honduras, Hungary, India, Indonesia, Iraq, Jamaica, Jordan, Kazakhstan, Kenya, Latvia, Lebanon, Lithuania, Malaysia, Mexico, Mongolia, Morocco, Mozambique, Namibia, Nigeria, Oman, Pakistan, Panama, Paraguay, Peru, Philippines, Poland, Romania, Russian Federation, Senegal, Serbia, Slovakia, South Africa, Sri Lanka, Suriname, Trinidad and Tobago, Tunisia, Turkey, Ukraine, Uruguay, Venezuela, Vietnam, Zambia; however, this universe of countries may change in accordance with the Index Provider’s determination of eligible emerging market countries and there is no assurance that a particular country will be represented in the Underlying Index at any given time. Investors cannot invest directly in an index.
Fund performance reflects the partial waiver of the Fund’s fees and reimbursement of expenses for certain periods since the inception date. Without these waivers and reimbursements, performance would have been lower. Also, performance shown in this section does not reflect the deduction of taxes that a shareholder may pay on Fund distributions or redemption or sale of Fund shares.
The returns shown are based on net asset values calculated for shareholder transactions and may differ from the returns shown in the financial highlights, which reflect adjustments made to the net asset values in accordance with accounting principles generally accepted in the United States of America.
| AUGUST 31, 2018 | J.P. MORGAN EXCHANGE-TRADED FUNDS | 11 | ||||||
JPMorgan Disciplined High Yield ETF
SCHEDULE OF PORTFOLIO INVESTMENTS
AS OF AUGUST 31, 2018 (Unaudited)
| PRINCIPAL AMOUNT($) | INVESTMENTS | VALUE($) | ||||||
Corporate Bonds — 96.3% | ||||||||
Aerospace & Defense — 2.3% | ||||||||
Arconic, Inc. | ||||||||
| 250,000 | 6.15%, 8/15/2020 | 260,000 | ||||||
| 344,000 | 5.40%, 4/15/2021 | 353,171 | ||||||
| 398,000 | 5.13%, 10/1/2024 | 399,791 | ||||||
Bombardier, Inc. (Canada) | ||||||||
| 394,000 | 8.75%, 12/1/2021 (a) | 435,370 | ||||||
| 344,000 | 6.13%, 1/15/2023 (a) | 346,580 | ||||||
| 419,000 | 7.50%, 3/15/2025 (a) | 432,617 | ||||||
| 348,000 | KLX, Inc. 5.88%, 12/1/2022 (a) | 360,180 | ||||||
TransDigm, Inc. | ||||||||
| 325,000 | 6.00%, 7/15/2022 | 328,250 | ||||||
| 338,000 | 6.50%, 7/15/2024 | 343,493 | ||||||
| 280,000 | 6.38%, 6/15/2026 | 282,975 | ||||||
|
| |||||||
| 3,542,427 | ||||||||
|
| |||||||
Air Freight & Logistics — 0.3% | ||||||||
XPO Logistics, Inc. | ||||||||
| 307,000 | 6.50%, 6/15/2022 (a) | 317,122 | ||||||
| 155,000 | 6.13%, 9/1/2023 (a) | 159,650 | ||||||
|
| |||||||
| 476,772 | ||||||||
|
| |||||||
Airlines — 0.2% | ||||||||
American Airlines Group, Inc. | ||||||||
| 176,000 | 5.50%, 10/1/2019 (a) | 178,200 | ||||||
| 149,000 | 4.63%, 3/1/2020 (a) | 149,894 | ||||||
|
| |||||||
| 328,094 | ||||||||
|
| |||||||
Auto Components — 1.6% | ||||||||
| 263,000 | Allison Transmission, Inc. 5.00%, 10/1/2024 (a) | 259,055 | ||||||
American Axle & Manufacturing, Inc. | ||||||||
| 86,000 | 6.63%, 10/15/2022 | 88,150 | ||||||
| 181,000 | 6.25%, 4/1/2025 | 180,095 | ||||||
| 155,000 | 6.50%, 4/1/2027 | 153,450 | ||||||
Goodyear Tire & Rubber Co. (The) | ||||||||
| 263,000 | 5.13%, 11/15/2023 | 262,343 | ||||||
| 235,000 | 5.00%, 5/31/2026 | 220,606 | ||||||
| 182,000 | 4.88%, 3/15/2027 | 166,985 | ||||||
Icahn Enterprises LP | ||||||||
| 392,000 | 6.00%, 8/1/2020 | 398,742 | ||||||
| 311,000 | 5.88%, 2/1/2022 | 316,300 | ||||||
| 348,000 | 6.25%, 2/1/2022 | 357,535 | ||||||
| 130,000 | 6.38%, 12/15/2025 | 131,625 | ||||||
|
| |||||||
| 2,534,886 | ||||||||
|
| |||||||
| PRINCIPAL AMOUNT($) | INVESTMENTS | VALUE($) | ||||||
Automobiles — 1.0% | ||||||||
Fiat Chrysler Automobiles NV (United Kingdom) | ||||||||
| 402,000 | 4.50%, 4/15/2020 | 404,010 | ||||||
| 400,000 | 5.25%, 4/15/2023 | 406,500 | ||||||
Jaguar Land Rover Automotive plc (United Kingdom) | ||||||||
| 200,000 | 4.13%, 12/15/2018 (a) | 200,000 | ||||||
| 200,000 | 4.25%, 11/15/2019 (a) | 199,500 | ||||||
| 200,000 | 3.50%, 3/15/2020 (a) | 197,000 | ||||||
| 200,000 | 4.50%, 10/1/2027 (a) | 169,250 | ||||||
|
| |||||||
| 1,576,260 | ||||||||
|
| |||||||
Banks — 1.7% | ||||||||
CIT Group, Inc. | ||||||||
| 101,500 | 3.88%, 2/19/2019 | 102,058 | ||||||
| 114,000 | 4.13%, 3/9/2021 | 114,428 | ||||||
| 326,000 | 5.00%, 8/15/2022 | 332,520 | ||||||
| 212,000 | 5.00%, 8/1/2023 | 215,445 | ||||||
| 103,000 | 5.25%, 3/7/2025 | 104,738 | ||||||
| 346,000 | Goldman Sachs Capital I 6.35%, 2/15/2034 | 404,852 | ||||||
Intesa Sanpaolo SpA (Italy) | ||||||||
| 600,000 | 5.02%, 6/26/2024 (a) | 542,594 | ||||||
| 400,000 | 5.71%, 1/15/2026 (a) | 362,934 | ||||||
Lloyds Banking Group plc (United Kingdom) | ||||||||
| 29,000 | (ICE LIBOR USD 3 Month + 1.27%), 6.66%, 5/21/2037 (a) (b) (c) (d) | 29,834 | ||||||
UniCredit SpA (Italy) | ||||||||
| 400,000 | (USD ICE Swap Rate 5 Year + 3.70%), 5.86%, 6/19/2032 (a) (c) | 349,350 | ||||||
|
| |||||||
| 2,558,753 | ||||||||
|
| |||||||
Beverages — 0.0% (e) | ||||||||
| 40,000 | Cott Holdings, Inc. (Canada) 5.50%, 4/1/2025 (a) | 39,174 | ||||||
|
| |||||||
Building Products — 0.2% | ||||||||
| 112,000 | Builders FirstSource, Inc. 5.63%, 9/1/2024 (a) | 108,780 | ||||||
| 146,000 | Summit Materials LLC 6.13%, 7/15/2023 | 148,008 | ||||||
|
| |||||||
| 256,788 | ||||||||
|
| |||||||
Capital Markets — 1.5% | ||||||||
| 408,000 | Deutsche Bank AG (Germany) 4.50%, 4/1/2025 | 381,557 | ||||||
| 408,000 | (USD Swap Semi 5 Year + 2.25%), 4.30%, 5/24/2028 (c) | 372,733 | ||||||
| 400,000 | (USD ICE Swap Rate 5 Year + 2.55%), 4.87%, 12/1/2032 (c) | 347,124 | ||||||
SEE NOTES TO FINANCIAL STATEMENTS.
| 12 | J.P. MORGAN EXCHANGE-TRADED FUNDS | AUGUST 31, 2018 | ||||
| PRINCIPAL AMOUNT($) | INVESTMENTS | VALUE($) | ||||||
Corporate Bonds — continued | ||||||||
Capital Markets — continued | ||||||||
| 340,000 | Dresdner Funding Trust I (Germany) 8.15%, 6/30/2031 (a) | 418,424 | ||||||
MSCI, Inc. | ||||||||
| 248,000 | 5.25%, 11/15/2024 (a) | 254,820 | ||||||
| 240,000 | 5.75%, 8/15/2025 (a) | 250,800 | ||||||
| 98,000 | 4.75%, 8/1/2026 (a) | 97,755 | ||||||
| 144,000 | 5.38%, 5/15/2027 (a) | 147,960 | ||||||
|
| |||||||
| 2,271,173 | ||||||||
|
| |||||||
Chemicals — 2.2% | ||||||||
| 318,000 | Ashland LLC 4.75%, 8/15/2022 (f) | 321,244 | ||||||
Blue Cube Spinco LLC | ||||||||
| 212,000 | 9.75%, 10/15/2023 | 240,355 | ||||||
| 99,000 | 10.00%, 10/15/2025 | 114,592 | ||||||
CF Industries, Inc. | ||||||||
| 56,000 | 7.13%, 5/1/2020 | 59,220 | ||||||
| 174,000 | 3.45%, 6/1/2023 | 167,040 | ||||||
| 213,000 | 5.15%, 3/15/2034 | 200,752 | ||||||
| 192,000 | 4.95%, 6/1/2043 | 168,576 | ||||||
| 214,000 | 5.38%, 3/15/2044 | 195,275 | ||||||
Chemours Co. (The) | ||||||||
| 224,000 | 6.63%, 5/15/2023 | 234,640 | ||||||
| 214,000 | 7.00%, 5/15/2025 | 228,445 | ||||||
| 155,000 | 5.38%, 5/15/2027 | 152,288 | ||||||
| 192,000 | Huntsman International LLC 4.88%, 11/15/2020 | 196,416 | ||||||
Olin Corp. | ||||||||
| 97,000 | 5.13%, 9/15/2027 | 96,030 | ||||||
| 115,000 | 5.00%, 2/1/2030 | 109,825 | ||||||
Platform Specialty Products Corp. | ||||||||
| 304,000 | 6.50%, 2/1/2022 (a) | 310,840 | ||||||
| 235,000 | 5.88%, 12/1/2025 (a) | 233,238 | ||||||
| 150,000 | Tronox, Inc. 6.50%, 4/15/2026 (a) | 147,000 | ||||||
| 168,000 | WR Grace & Co.-Conn. 5.13%, 10/1/2021 (a) | 172,620 | ||||||
|
| |||||||
| 3,348,396 | ||||||||
|
| |||||||
Commercial Services & Supplies — 1.9% | ||||||||
ADT Corp. (The) | ||||||||
| 268,000 | 6.25%, 10/15/2021 | 282,740 | ||||||
| 269,000 | 3.50%, 7/15/2022 | 254,542 | ||||||
| 189,000 | 4.13%, 6/15/2023 | 179,786 | ||||||
Aramark Services, Inc. | ||||||||
| 241,000 | 5.13%, 1/15/2024 | 244,733 | ||||||
| 129,000 | 5.00%, 4/1/2025 (a) | 129,806 | ||||||
| 77,000 | 4.75%, 6/1/2026 | 75,845 | ||||||
| PRINCIPAL AMOUNT($) | INVESTMENTS | VALUE($) | ||||||
Commercial Services & Supplies — continued |
| |||||||
| 315,000 | 5.00%, 2/1/2028 (a) | 308,700 | ||||||
| 190,000 | Nielsen Co. Luxembourg SARL (The) 5.50%, 10/1/2021 (a) | 190,238 | ||||||
Nielsen Finance LLC | ||||||||
| 241,000 | 4.50%, 10/1/2020 | 240,397 | ||||||
| 699,000 | 5.00%, 4/15/2022 (a) | 678,764 | ||||||
Pitney Bowes, Inc. | ||||||||
| 150,000 | 3.62%, 10/1/2021 (f) | 142,219 | ||||||
| 145,000 | 4.63%, 3/15/2024 | 130,021 | ||||||
|
| |||||||
| 2,857,791 | ||||||||
|
| |||||||
Communications Equipment — 1.0% | ||||||||
CommScope Technologies LLC | ||||||||
| 419,000 | 6.00%, 6/15/2025 (a) | 433,665 | ||||||
| 177,000 | 5.00%, 3/15/2027 (a) | 172,132 | ||||||
CommScope, Inc. | ||||||||
| 94,000 | 5.00%, 6/15/2021 (a) | 94,470 | ||||||
| 170,000 | 5.50%, 6/15/2024 (a) | 172,125 | ||||||
Nokia OYJ (Finland) | ||||||||
| 111,000 | 5.38%, 5/15/2019 | 112,604 | ||||||
| 115,000 | 3.38%, 6/12/2022 | 112,399 | ||||||
| 108,000 | 4.38%, 6/12/2027 | 103,815 | ||||||
| 128,000 | 6.63%, 5/15/2039 | 137,600 | ||||||
Telefonaktiebolaget LM Ericsson (Sweden) | ||||||||
| 278,000 | 4.13%, 5/15/2022 | 274,933 | ||||||
|
| |||||||
| 1,613,743 | ||||||||
|
| |||||||
Construction & Engineering — 0.3% | ||||||||
AECOM | ||||||||
| 224,000 | 5.88%, 10/15/2024 | 239,095 | ||||||
| 276,000 | 5.13%, 3/15/2027 | 271,170 | ||||||
|
| |||||||
| 510,265 | ||||||||
|
| |||||||
Consumer Finance — 2.3% | ||||||||
Ally Financial, Inc. | ||||||||
| 263,000 | 8.00%, 3/15/2020 | 279,109 | ||||||
| 207,000 | 4.13%, 3/30/2020 | 207,776 | ||||||
| 283,000 | 5.75%, 11/20/2025 | 293,259 | ||||||
| 545,000 | 8.00%, 11/1/2031 | 666,262 | ||||||
Navient Corp. | ||||||||
| 226,000 | 5.50%, 1/15/2019 | 227,763 | ||||||
| 342,000 | 8.00%, 3/25/2020 | 362,605 | ||||||
| 251,000 | 6.50%, 6/15/2022 | 259,547 | ||||||
| 218,000 | 5.50%, 1/25/2023 | 215,545 | ||||||
Springleaf Finance Corp. | ||||||||
| 101,000 | 5.25%, 12/15/2019 | 102,389 | ||||||
SEE NOTES TO FINANCIAL STATEMENTS.
| AUGUST 31, 2018 | J.P. MORGAN EXCHANGE-TRADED FUNDS | 13 | ||||||
JPMorgan Disciplined High Yield ETF
SCHEDULE OF PORTFOLIO INVESTMENTS
AS OF AUGUST 31, 2018 (Unaudited) (continued)
| PRINCIPAL AMOUNT($) | INVESTMENTS | VALUE($) | ||||||
Corporate Bonds — continued | ||||||||
Consumer Finance — continued | ||||||||
| 231,000 | 8.25%, 12/15/2020 | 249,769 | ||||||
| 31,000 | 7.75%, 10/1/2021 | 33,480 | ||||||
| 224,000 | 6.13%, 5/15/2022 | 230,160 | ||||||
| 151,000 | 5.63%, 3/15/2023 | 150,622 | ||||||
| 209,000 | 6.88%, 3/15/2025 | 209,063 | ||||||
| 76,000 | 7.13%, 3/15/2026 | 75,625 | ||||||
|
| |||||||
| 3,562,974 | ||||||||
|
| |||||||
Containers & Packaging — 2.4% | ||||||||
Ardagh Packaging Finance plc (Ireland) | ||||||||
| 400,000 | 4.63%, 5/15/2023 (a) | 396,500 | ||||||
| 600,000 | 7.25%, 5/15/2024 (a) | 630,750 | ||||||
| 600,000 | 6.00%, 2/15/2025 (a) | 586,500 | ||||||
Ball Corp. | ||||||||
| 275,000 | 4.38%, 12/15/2020 | 278,438 | ||||||
| 278,000 | 4.00%, 11/15/2023 | 271,397 | ||||||
| 280,000 | 5.25%, 7/1/2025 | 288,400 | ||||||
Berry Global, Inc. | ||||||||
| 148,000 | 5.50%, 5/15/2022 | 150,775 | ||||||
| 194,000 | 5.13%, 7/15/2023 | 193,030 | ||||||
| 106,000 | 4.50%, 2/15/2026 (a) | 99,375 | ||||||
Crown Americas LLC | ||||||||
| 280,000 | 4.50%, 1/15/2023 | 280,000 | ||||||
| 253,000 | 4.75%, 2/1/2026 (a) | 242,880 | ||||||
Owens-Brockway Glass Container, Inc. | ||||||||
| 97,000 | 5.00%, 1/15/2022 (a) | 97,242 | ||||||
| 194,000 | 5.88%, 8/15/2023 (a) | 198,850 | ||||||
|
| |||||||
| 3,714,137 | ||||||||
|
| |||||||
Diversified Consumer Services — 0.2% | ||||||||
Service Corp. International | ||||||||
| 206,000 | 5.38%, 5/15/2024 | 210,120 | ||||||
| 151,000 | 4.63%, 12/15/2027 | 144,960 | ||||||
|
| |||||||
| 355,080 | ||||||||
|
| |||||||
Diversified Financial Services — 0.2% | ||||||||
| 113,000 | Nationstar Mortgage LLC 6.50%, 7/1/2021 | 113,000 | ||||||
Voya Financial, Inc. | ||||||||
| 173,000 | (ICE LIBOR USD 3 Month + 3.58%), 5.65%, 5/15/2053 (c) | 173,000 | ||||||
|
| |||||||
| 286,000 | ||||||||
|
| |||||||
Diversified Telecommunication Services — 6.3% |
| |||||||
Altice France SA (France) | ||||||||
| 400,000 | 6.25%, 5/15/2024 (a) | 395,000 | ||||||
| 1,559,000 | 7.38%, 5/1/2026 (a) | 1,531,717 | ||||||
| PRINCIPAL AMOUNT($) | INVESTMENTS | VALUE($) | ||||||
Diversified Telecommunication Services — continued |
| |||||||
CCO Holdings LLC | ||||||||
| 124,000 | 5.88%, 4/1/2024 (a) | 126,480 | ||||||
| 704,000 | 5.75%, 2/15/2026 (a) | 704,000 | ||||||
| 65,000 | 5.50%, 5/1/2026 (a) | 64,188 | ||||||
| 912,000 | 5.13%, 5/1/2027 (a) | 869,820 | ||||||
| 702,000 | 5.00%, 2/1/2028 (a) | 657,444 | ||||||
CenturyLink, Inc. | ||||||||
| 367,000 | Series S, 6.45%, 6/15/2021 | 381,680 | ||||||
| 396,000 | Series T, 5.80%, 3/15/2022 | 404,791 | ||||||
| 276,000 | Series Y, 7.50%, 4/1/2024 | 295,320 | ||||||
| 415,000 | Embarq Corp. 8.00%, 6/1/2036 | 404,625 | ||||||
| 400,000 | Intelsat Jackson Holdings SA (Luxembourg) 8.00%, 2/15/2024 (a) | 421,000 | ||||||
Level 3 Financing, Inc. | ||||||||
| 280,000 | 5.38%, 8/15/2022 | 282,800 | ||||||
| 261,000 | 5.38%, 1/15/2024 | 261,000 | ||||||
| 224,000 | 5.38%, 5/1/2025 | 221,200 | ||||||
| 200,000 | Sable International Finance Ltd. 6.88%, 8/1/2022 (a) | 208,250 | ||||||
| 750,000 | Sprint Capital Corp. 6.88%, 11/15/2028 | 744,375 | ||||||
Telecom Italia Capital SA (Italy) | ||||||||
| 278,000 | 7.20%, 7/18/2036 | 296,765 | ||||||
| 302,000 | 7.72%, 6/4/2038 | 330,690 | ||||||
| 400,000 | Telecom Italia SpA (Italy) 5.30%, 5/30/2024 (a) | 399,000 | ||||||
Virgin Media Finance plc (United Kingdom) | ||||||||
| 128,000 | 6.38%, 4/15/2023 (a) | 131,840 | ||||||
Virgin Media Secured Finance plc (United Kingdom) | ||||||||
| 400,000 | 5.25%, 1/15/2026 (a) | 389,080 | ||||||
| 200,000 | 5.50%, 8/15/2026 (a) | 196,500 | ||||||
|
| |||||||
| 9,717,565 | ||||||||
|
| |||||||
Electric Utilities — 0.7% | ||||||||
| 220,000 | DPL, Inc. 7.25%, 10/15/2021 | 238,150 | ||||||
| 329,000 | Emera, Inc. (Canada) Series 16-A, (ICE LIBOR USD 3 Month + 5.44%), 6.75%, 6/15/2076 (c) | 348,780 | ||||||
NextEra Energy Operating Partners LP | ||||||||
| 171,000 | 4.25%, 9/15/2024 (a) | 166,725 | ||||||
| 166,000 | 4.50%, 9/15/2027 (a) | 157,700 | ||||||
| 162,000 | Vistra Operations Co. LLC 5.50%, 9/1/2026 (a) | 164,883 | ||||||
|
| |||||||
| 1,076,238 | ||||||||
|
| |||||||
Electrical Equipment — 0.4% | ||||||||
| 150,000 | Energizer Gamma Acquisition, Inc. 6.38%, 7/15/2026 (a) | 155,062 | ||||||
SEE NOTES TO FINANCIAL STATEMENTS.
| 14 | J.P. MORGAN EXCHANGE-TRADED FUNDS | AUGUST 31, 2018 | ||||
| PRINCIPAL AMOUNT($) | INVESTMENTS | VALUE($) | ||||||
Corporate Bonds — continued | ||||||||
Electrical Equipment — continued | ||||||||
Sensata Technologies BV | ||||||||
| 149,000 | 4.88%, 10/15/2023 (a) | 149,000 | ||||||
| 207,000 | 5.00%, 10/1/2025 (a) | 206,483 | ||||||
| 176,000 | Vertiv Group Corp. 9.25%, 10/15/2024 (a) | 180,840 | ||||||
|
| |||||||
| 691,385 | ||||||||
|
| |||||||
Electronic Equipment, Instruments & Components — 0.3% |
| |||||||
CDW LLC | ||||||||
| 154,000 | 5.00%, 9/1/2023 | 157,080 | ||||||
| 139,000 | 5.50%, 12/1/2024 | 144,560 | ||||||
| 194,000 | 5.00%, 9/1/2025 | 192,788 | ||||||
|
| |||||||
| 494,428 | ||||||||
|
| |||||||
Energy Equipment & Services — 2.7% | ||||||||
Diamond Offshore Drilling, Inc. | ||||||||
| 134,000 | 7.88%, 8/15/2025 | 136,680 | ||||||
| 136,000 | 5.70%, 10/15/2039 | 108,120 | ||||||
| 221,000 | 4.88%, 11/1/2043 | 157,463 | ||||||
Ensco plc | ||||||||
| 98,000 | 4.50%, 10/1/2024 | 81,340 | ||||||
| 171,000 | 5.20%, 3/15/2025 | 142,999 | ||||||
| 274,000 | 7.75%, 2/1/2026 | 261,670 | ||||||
| 271,000 | 5.75%, 10/1/2044 | 197,152 | ||||||
| 362,000 | McDermott Technology Americas, Inc. 10.63%, 5/1/2024 (a) | 385,186 | ||||||
Nabors Industries, Inc. | ||||||||
| 208,000 | 5.00%, 9/15/2020 | 208,741 | ||||||
| 197,000 | 4.63%, 9/15/2021 | 195,676 | ||||||
| 165,000 | 5.50%, 1/15/2023 | 164,490 | ||||||
| 235,000 | 5.75%, 2/1/2025 (a) | 226,036 | ||||||
Noble Holding International Ltd. | ||||||||
| 186,000 | 7.75%, 1/15/2024 | 181,815 | ||||||
| 207,000 | 7.88%, 2/1/2026 (a) | 212,175 | ||||||
| 124,000 | 5.25%, 3/15/2042 | 86,180 | ||||||
Rowan Cos., Inc. | ||||||||
| 193,000 | 4.88%, 6/1/2022 | 179,490 | ||||||
| 165,000 | 7.38%, 6/15/2025 | 158,400 | ||||||
SESI LLC | ||||||||
| 195,000 | 7.13%, 12/15/2021 | 197,925 | ||||||
| 145,000 | 7.75%, 9/15/2024 | 150,075 | ||||||
| 44,500 | Transocean Phoenix 2 Ltd. 7.75%, 10/15/2024 (a) | 47,003 | ||||||
| 32,300 | Transocean Proteus Ltd. 6.25%, 12/1/2024 (a) | 33,090 | ||||||
| 349,000 | Transocean, Inc. 9.00%, 7/15/2023 (a) | 376,484 | ||||||
| 212,000 | 7.50%, 1/15/2026 (a) | 215,975 | ||||||
|
| |||||||
| 4,104,165 | ||||||||
|
| |||||||
| PRINCIPAL AMOUNT($) | INVESTMENTS | VALUE($) | ||||||
Equity Real Estate Investment Trusts (REITs) — 2.8% |
| |||||||
| 163,000 | CyrusOne LP 5.00%, 3/15/2024 | 165,037 | ||||||
Equinix, Inc. | ||||||||
| 275,000 | 5.38%, 4/1/2023 | 280,844 | ||||||
| 320,000 | 5.88%, 1/15/2026 | 332,000 | ||||||
| 347,000 | 5.38%, 5/15/2027 | 353,072 | ||||||
| 356,000 | ESH Hospitality, Inc. 5.25%, 5/1/2025 (a) | 344,875 | ||||||
Iron Mountain, Inc. | ||||||||
| 88,000 | 6.00%, 8/15/2023 | 90,310 | ||||||
| 279,000 | 5.75%, 8/15/2024 | 276,559 | ||||||
| 278,000 | 4.88%, 9/15/2027 (a) | 257,595 | ||||||
| 220,000 | 5.25%, 3/15/2028 (a) | 208,175 | ||||||
MGM Growth Properties Operating Partnership LP | ||||||||
| 337,000 | 5.63%, 5/1/2024 | 346,689 | ||||||
| 148,000 | 4.50%, 9/1/2026 | 140,970 | ||||||
MPT Operating Partnership LP | ||||||||
| 149,000 | 6.38%, 3/1/2024 | 157,091 | ||||||
| 103,000 | 5.25%, 8/1/2026 | 103,000 | ||||||
| 392,000 | 5.00%, 10/15/2027 | 384,160 | ||||||
SBA Communications Corp. | ||||||||
| 216,000 | 4.88%, 7/15/2022 | 218,700 | ||||||
| 212,000 | 4.00%, 10/1/2022 | 207,281 | ||||||
| 320,000 | 4.88%, 9/1/2024 | 315,744 | ||||||
| 160,000 | Uniti Group LP 6.00%, 4/15/2023 (a) | 153,600 | ||||||
|
| |||||||
| 4,335,702 | ||||||||
|
| |||||||
Food & Staples Retailing — 0.3% | ||||||||
| 445,000 | Rite Aid Corp. 6.13%, 4/1/2023 (a) | 399,254 | ||||||
| 105,000 | Tesco plc (United Kingdom) 6.15%, 11/15/2037 (a) | 111,936 | ||||||
|
| |||||||
| 511,190 | ||||||||
|
| |||||||
Food Products — 1.9% | ||||||||
B&G Foods, Inc. | ||||||||
| 206,000 | 4.63%, 6/1/2021 | 204,970 | ||||||
| 258,000 | 5.25%, 4/1/2025 | 250,582 | ||||||
Lamb Weston Holdings, Inc. | ||||||||
| 228,000 | 4.63%, 11/1/2024 (a) | 224,010 | ||||||
| 228,000 | 4.88%, 11/1/2026 (a) | 224,580 | ||||||
Pilgrim’s Pride Corp. | ||||||||
| 275,000 | 5.75%, 3/15/2025 (a) | 266,063 | ||||||
| 231,000 | 5.88%, 9/30/2027 (a) | 219,450 | ||||||
Post Holdings, Inc. | ||||||||
| 269,000 | 5.50%, 3/1/2025 (a) | 268,327 | ||||||
| 481,000 | 5.00%, 8/15/2026 (a) | 461,760 | ||||||
| 385,000 | 5.75%, 3/1/2027 (a) | 380,188 | ||||||
SEE NOTES TO FINANCIAL STATEMENTS.
| AUGUST 31, 2018 | J.P. MORGAN EXCHANGE-TRADED FUNDS | 15 | ||||||
JPMorgan Disciplined High Yield ETF
SCHEDULE OF PORTFOLIO INVESTMENTS
AS OF AUGUST 31, 2018 (Unaudited) (continued)
| PRINCIPAL AMOUNT($) | INVESTMENTS | VALUE($) | ||||||
Corporate Bonds — continued | ||||||||
Food Products — continued | ||||||||
| 225,000 | 5.63%, 1/15/2028 (a) | 217,406 | ||||||
| 218,000 | TreeHouse Foods, Inc. 6.00%, 2/15/2024 (a) | 220,725 | ||||||
|
| |||||||
| 2,938,061 | ||||||||
|
| |||||||
Gas Utilities — 0.5% | ||||||||
AmeriGas Partners LP | ||||||||
| 171,000 | 5.63%, 5/20/2024 | 169,717 | ||||||
| 207,000 | 5.50%, 5/20/2025 | 202,860 | ||||||
| 201,000 | 5.88%, 8/20/2026 | 199,493 | ||||||
| 129,000 | Suburban Propane Partners LP 5.50%, 6/1/2024 | 126,420 | ||||||
|
| |||||||
| 698,490 | ||||||||
|
| |||||||
Health Care Equipment & Supplies — 0.6% | ||||||||
| 258,000 | Hologic, Inc. 4.38%, 10/15/2025 (a) | 248,325 | ||||||
Mallinckrodt International Finance SA | ||||||||
| 207,000 | 4.88%, 4/15/2020 (a) | 206,224 | ||||||
| 245,000 | 5.75%, 8/1/2022 (a) | 228,462 | ||||||
| 208,000 | 5.63%, 10/15/2023 (a) | 185,380 | ||||||
| 96,000 | Teleflex, Inc. 4.63%, 11/15/2027 | 91,440 | ||||||
|
| |||||||
| 959,831 | ||||||||
|
| |||||||
Health Care Providers & Services — 5.7% | ||||||||
| 187,000 | Acadia Healthcare Co., Inc. 5.63%, 2/15/2023 | 190,740 | ||||||
Centene Corp. | ||||||||
| 396,000 | 5.63%, 2/15/2021 | 403,920 | ||||||
| 276,000 | 6.13%, 2/15/2024 | 290,145 | ||||||
| 336,000 | 4.75%, 1/15/2025 | 337,680 | ||||||
| 459,000 | 5.38%, 6/1/2026 (a) | 473,839 | ||||||
DaVita, Inc. | ||||||||
| 345,000 | 5.75%, 8/15/2022 | 349,744 | ||||||
| 492,000 | 5.13%, 7/15/2024 | 474,347 | ||||||
| 418,000 | 5.00%, 5/1/2025 | 396,055 | ||||||
| 335,000 | Encompass Health Corp. 5.75%, 11/1/2024 | 339,188 | ||||||
Envision Healthcare Corp. | ||||||||
| 214,000 | 5.13%, 7/1/2022 (a) | 217,210 | ||||||
| 320,000 | 5.63%, 7/15/2022 | 328,000 | ||||||
| 224,000 | 6.25%, 12/1/2024 (a) | 239,120 | ||||||
HCA, Inc. | ||||||||
| 840,000 | 6.50%, 2/15/2020 | 871,920 | ||||||
| 559,000 | 5.00%, 3/15/2024 | 571,577 | ||||||
| 728,000 | 5.38%, 2/1/2025 | 736,321 | ||||||
| 45,000 | 5.50%, 6/15/2047 | 45,113 | ||||||
LifePoint Health, Inc. | ||||||||
| 304,000 | 5.50%, 12/1/2021 | 308,940 | ||||||
| 103,000 | 5.88%, 12/1/2023 | 107,919 | ||||||
| PRINCIPAL AMOUNT($) | INVESTMENTS | VALUE($) | ||||||
Health Care Providers & Services — continued |
| |||||||
| 97,000 | 5.38%, 5/1/2024 | 100,759 | ||||||
| 194,000 | Molina Healthcare, Inc. 5.38%, 11/15/2022 (f) | 197,880 | ||||||
Tenet Healthcare Corp. | ||||||||
| 502,000 | 6.00%, 10/1/2020 | 521,453 | ||||||
| 548,000 | 4.63%, 7/15/2024 | 536,782 | ||||||
| 392,000 | 5.13%, 5/1/2025 | 389,550 | ||||||
| 332,000 | WellCare Health Plans, Inc. 5.25%, 4/1/2025 | 339,470 | ||||||
|
| |||||||
| 8,767,672 | ||||||||
|
| |||||||
Health Care Technology — 0.4% | ||||||||
IQVIA, Inc. | ||||||||
| 221,000 | 4.88%, 5/15/2023 (a) | 221,553 | ||||||
| 400,000 | 5.00%, 10/15/2026 (a) | 395,000 | ||||||
|
| |||||||
| 616,553 | ||||||||
|
| |||||||
Hotels, Restaurants & Leisure — 6.7% | ||||||||
1011778 BC ULC (Canada) | ||||||||
| 348,000 | 4.63%, 1/15/2022 (a) | 348,000 | ||||||
| 422,000 | 4.25%, 5/15/2024 (a) | 403,010 | ||||||
| 850,000 | 5.00%, 10/15/2025 (a) | 820,250 | ||||||
Boyd Gaming Corp. | ||||||||
| 216,000 | 6.88%, 5/15/2023 | 227,070 | ||||||
| 214,000 | 6.38%, 4/1/2026 | 219,082 | �� | |||||
| 205,000 | 6.00%, 8/15/2026 | 206,538 | ||||||
| 477,000 | Caesars Resort Collection LLC 5.25%, 10/15/2025 (a) | 456,131 | ||||||
| 258,000 | Eldorado Resorts, Inc. 6.00%, 4/1/2025 | 262,192 | ||||||
GLP Capital LP | ||||||||
| 275,000 | 4.88%, 11/1/2020 | 281,875 | ||||||
| 96,000 | 5.38%, 11/1/2023 | 101,040 | ||||||
| 128,000 | 5.25%, 6/1/2025 | 133,120 | ||||||
| 270,000 | 5.38%, 4/15/2026 | 280,382 | ||||||
Hilton Domestic Operating Co., Inc. | ||||||||
| 318,000 | 4.25%, 9/1/2024 | 309,255 | ||||||
| 462,000 | 5.13%, 5/1/2026 (a) | 462,578 | ||||||
Hilton Worldwide Finance LLC | ||||||||
| 260,000 | 4.63%, 4/1/2025 | 256,750 | ||||||
| 189,000 | 4.88%, 4/1/2027 | 185,929 | ||||||
International Game Technology plc | ||||||||
| 200,000 | 5.63%, 2/15/2020 (a) | 203,500 | ||||||
| 400,000 | 6.25%, 2/15/2022 (a) | 412,800 | ||||||
| 400,000 | 6.50%, 2/15/2025 (a) | 420,000 | ||||||
KFC Holding Co. | ||||||||
| 287,000 | 5.00%, 6/1/2024 (a) | 286,282 | ||||||
SEE NOTES TO FINANCIAL STATEMENTS.
| 16 | J.P. MORGAN EXCHANGE-TRADED FUNDS | AUGUST 31, 2018 | ||||
| PRINCIPAL AMOUNT($) | INVESTMENTS | VALUE($) | ||||||
Corporate Bonds — continued | ||||||||
Hotels, Restaurants & Leisure — continued | ||||||||
| 292,000 | 5.25%, 6/1/2026 (a) | 292,000 | ||||||
| 187,000 | 4.75%, 6/1/2027 (a) | 178,118 | ||||||
MGM Resorts International | ||||||||
| 370,000 | 6.63%, 12/15/2021 | 391,275 | ||||||
| 227,000 | 7.75%, 3/15/2022 | 249,416 | ||||||
| 346,000 | 6.00%, 3/15/2023 | 359,200 | ||||||
| 207,000 | 5.75%, 6/15/2025 | 208,449 | ||||||
| 21,000 | NCL Corp. Ltd. 4.75%, 12/15/2021 (a) | 21,131 | ||||||
Sabre GLBL, Inc. | ||||||||
| 119,000 | 5.38%, 4/15/2023 (a) | 119,893 | ||||||
| 103,000 | 5.25%, 11/15/2023 (a) | 103,219 | ||||||
| 351,000 | Scientific Games International, Inc. 5.00%, 10/15/2025 (a) | 333,450 | ||||||
Six Flags Entertainment Corp. | ||||||||
| 278,000 | 4.88%, 7/31/2024 (a) | 273,135 | ||||||
| 148,000 | 5.50%, 4/15/2027 (a) | 146,890 | ||||||
| 300,000 | Stars Group Holdings BV (Canada) 7.00%, 7/15/2026 (a) | 312,000 | ||||||
| 184,000 | Wyndham Destinations, Inc. 4.25%, 3/1/2022 | 177,089 | ||||||
Wynn Las Vegas LLC | ||||||||
| 153,000 | 4.25%, 5/30/2023 (a) | 146,689 | ||||||
| 540,000 | 5.50%, 3/1/2025 (a) | 534,276 | ||||||
| 281,000 | 5.25%, 5/15/2027 (a) | 262,735 | ||||||
|
| |||||||
| 10,384,749 | ||||||||
|
| |||||||
Household Durables — 1.2% | ||||||||
Brookfield Residential Properties, Inc. (Canada) | ||||||||
| 134,000 | 6.50%, 12/15/2020 (a) | 134,804 | ||||||
| 99,000 | 6.13%, 7/1/2022 (a) | 99,742 | ||||||
Lennar Corp. | ||||||||
| 23,000 | 4.50%, 11/15/2019 | 23,230 | ||||||
| 138,000 | 4.13%, 1/15/2022 | 137,137 | ||||||
| 28,000 | 4.75%, 11/15/2022 (f) | 28,035 | ||||||
| 181,000 | 4.50%, 4/30/2024 | 177,661 | ||||||
| 257,000 | 4.75%, 11/29/2027 | 245,114 | ||||||
| 96,000 | MDC Holdings, Inc. 6.00%, 1/15/2043 | 82,560 | ||||||
PulteGroup, Inc. | ||||||||
| 205,000 | 4.25%, 3/1/2021 | 206,086 | ||||||
| 194,000 | 5.50%, 3/1/2026 | 192,545 | ||||||
| 184,000 | 5.00%, 1/15/2027 | 175,260 | ||||||
| 158,000 | Taylor Morrison Communities, Inc. 5.25%, 4/15/2021 (a) | 157,803 | ||||||
| 134,000 | Tempur Sealy International, Inc. 5.50%, 6/15/2026 | 130,650 | ||||||
|
| |||||||
| 1,790,627 | ||||||||
|
| |||||||
| PRINCIPAL AMOUNT($) | INVESTMENTS | VALUE($) | ||||||
Household Products — 0.4% | ||||||||
| 180,000 | Energizer Holdings, Inc. 5.50%, 6/15/2025 (a) | 179,550 | ||||||
Spectrum Brands, Inc. | ||||||||
| 134,000 | 6.63%, 11/15/2022 | 137,853 | ||||||
| 295,000 | 5.75%, 7/15/2025 | 297,950 | ||||||
|
| |||||||
| 615,353 | ||||||||
|
| |||||||
Independent Power and Renewable Electricity Producers — 1.3% |
| |||||||
AES Corp. | ||||||||
| 206,000 | 4.88%, 5/15/2023 | 208,575 | ||||||
| 124,000 | 5.50%, 4/15/2025 | 127,410 | ||||||
NRG Energy, Inc. | ||||||||
| 139,000 | 6.25%, 7/15/2022 | 143,517 | ||||||
| 293,000 | 7.25%, 5/15/2026 | 316,440 | ||||||
| 347,000 | 6.63%, 1/15/2027 | 363,049 | ||||||
Vistra Energy Corp. | ||||||||
| 489,000 | 7.38%, 11/1/2022 | 509,171 | ||||||
| 337,000 | 7.63%, 11/1/2024 | 362,275 | ||||||
|
| |||||||
| 2,030,437 | ||||||||
|
| |||||||
Insurance — 0.1% | ||||||||
| 163,000 | Genworth Holdings, Inc. 7.63%, 9/24/2021 | 168,705 | ||||||
|
| |||||||
Internet & Direct Marketing Retail — 1.2% | ||||||||
Netflix, Inc. | ||||||||
| 26,000 | 5.50%, 2/15/2022 | 26,812 | ||||||
| 173,000 | 5.88%, 2/15/2025 | 178,623 | ||||||
| 269,000 | 4.38%, 11/15/2026 | 253,449 | ||||||
| 447,000 | 4.88%, 4/15/2028 (a) | 423,533 | ||||||
| 516,000 | 5.88%, 11/15/2028 (a) | 517,192 | ||||||
QVC, Inc. | ||||||||
| 176,000 | 4.38%, 3/15/2023 | 173,988 | ||||||
| 139,000 | 4.85%, 4/1/2024 | 138,929 | ||||||
| 164,000 | 4.45%, 2/15/2025 | 157,380 | ||||||
|
| |||||||
| 1,869,906 | ||||||||
|
| |||||||
Internet Software & Services — 1.0% | ||||||||
VeriSign, Inc. | ||||||||
| 176,000 | 4.63%, 5/1/2023 | 178,499 | ||||||
| 148,000 | 5.25%, 4/1/2025 | 150,043 | ||||||
| 168,000 | 4.75%, 7/15/2027 | 161,910 | ||||||
Zayo Group LLC | ||||||||
| 401,000 | 6.00%, 4/1/2023 | 413,299 | ||||||
| 238,000 | 6.38%, 5/15/2025 | 248,710 | ||||||
| 465,000 | 5.75%, 1/15/2027 (a) | 466,162 | ||||||
|
| |||||||
| 1,618,623 | ||||||||
|
| |||||||
SEE NOTES TO FINANCIAL STATEMENTS.
| AUGUST 31, 2018 | J.P. MORGAN EXCHANGE-TRADED FUNDS | 17 | ||||||
JPMorgan Disciplined High Yield ETF
SCHEDULE OF PORTFOLIO INVESTMENTS
AS OF AUGUST 31, 2018 (Unaudited) (continued)
| PRINCIPAL AMOUNT($) | INVESTMENTS | VALUE($) | ||||||
Corporate Bonds — continued | ||||||||
IT Services — 1.4% | ||||||||
First Data Corp. | ||||||||
| 960,000 | 7.00%, 12/1/2023 (a) | 998,880 | ||||||
| 537,000 | 5.00%, 1/15/2024 (a) | 538,101 | ||||||
| 620,000 | 5.75%, 1/15/2024 (a) | 632,400 | ||||||
|
| |||||||
| 2,169,381 | ||||||||
|
| |||||||
Leisure Products — 0.3% | ||||||||
| 450,000 | Mattel, Inc. 6.75%, 12/31/2025 (a) | 440,748 | ||||||
|
| |||||||
Machinery — 0.5% | ||||||||
Novelis Corp. | ||||||||
| 328,000 | 6.25%, 8/15/2024 (a) | 332,100 | ||||||
| 467,000 | 5.88%, 9/30/2026 (a) | 454,765 | ||||||
|
| |||||||
| 786,865 | ||||||||
|
| |||||||
Media — 10.6% | ||||||||
Altice Financing SA (Luxembourg) | ||||||||
| 600,000 | 6.63%, 2/15/2023 (a) | 603,744 | ||||||
| 850,000 | 7.50%, 5/15/2026 (a) | 809,625 | ||||||
Altice Luxembourg SA (Luxembourg) | ||||||||
| 400,000 | 7.75%, 5/15/2022 (a) | 385,500 | ||||||
| 400,000 | 7.63%, 2/15/2025 (a) | 369,716 | ||||||
Altice US Finance I Corp. | ||||||||
| 400,000 | 5.38%, 7/15/2023 (a) | 402,500 | ||||||
| 400,000 | 5.50%, 5/15/2026 (a) | 393,000 | ||||||
AMC Entertainment Holdings, Inc. | ||||||||
| 139,000 | 5.75%, 6/15/2025 | 134,918 | ||||||
| 174,000 | 5.88%, 11/15/2026 | 169,650 | ||||||
AMC Networks, Inc. | ||||||||
| 138,000 | 4.75%, 12/15/2022 | 138,000 | ||||||
| 330,000 | 5.00%, 4/1/2024 | 324,637 | ||||||
| 232,000 | 4.75%, 8/1/2025 | 223,880 | ||||||
Cequel Communications Holdings I LLC | ||||||||
| 327,000 | 5.13%, 12/15/2021 (a) | 326,856 | ||||||
| 200,000 | 7.75%, 7/15/2025 (a) | 212,750 | ||||||
| 400,000 | 7.50%, 4/1/2028 (a) | 417,000 | ||||||
| 176,000 | Cinemark USA, Inc. 4.88%, 6/1/2023 | 173,800 | ||||||
Clear Channel Worldwide Holdings, Inc. | ||||||||
| 210,000 | Series A, 6.50%, 11/15/2022 | 213,937 | ||||||
| 561,000 | Series B, 6.50%, 11/15/2022 | 573,623 | ||||||
CSC Holdings LLC | ||||||||
| 600,000 | 10.13%, 1/15/2023 (a) | 657,000 | ||||||
| 567,000 | 10.88%, 10/15/2025 (a) | 659,846 | ||||||
| 400,000 | 5.50%, 4/15/2027 (a) | 389,500 | ||||||
DISH DBS Corp. | ||||||||
| 612,000 | 6.75%, 6/1/2021 | 621,180 | ||||||
| 613,000 | 5.88%, 7/15/2022 | 588,480 | ||||||
| PRINCIPAL AMOUNT($) | INVESTMENTS | VALUE($) | ||||||
Media — continued | ||||||||
| 610,000 | 5.88%, 11/15/2024 | 530,700 | ||||||
Lamar Media Corp. | ||||||||
| 155,000 | 5.00%, 5/1/2023 | 157,712 | ||||||
| 152,000 | 5.38%, 1/15/2024 | 154,660 | ||||||
| 128,000 | Live Nation Entertainment, Inc. 4.88%, 11/1/2024 (a) | 125,920 | ||||||
| 393,000 | Meredith Corp. 6.88%, 2/1/2026 (a) | 397,913 | ||||||
| 267,000 | Nexstar Broadcasting, Inc. 5.63%, 8/1/2024 (a) | 262,381 | ||||||
Outfront Media Capital LLC | ||||||||
| 156,000 | 5.25%, 2/15/2022 | 156,778 | ||||||
| 158,000 | 5.63%, 2/15/2024 | 159,778 | ||||||
| 266,000 | Quebecor Media, Inc. (Canada) 5.75%, 1/15/2023 | 275,310 | ||||||
| 134,000 | Sinclair Television Group, Inc. 5.38%, 4/1/2021 | 134,502 | ||||||
| 108,000 | 6.13%, 10/1/2022 | 110,722 | ||||||
| 160,000 | 5.63%, 8/1/2024 (a) | 157,600 | ||||||
Sirius XM Radio, Inc. | ||||||||
| 325,000 | 3.88%, 8/1/2022 (a) | 318,890 | ||||||
| 467,000 | 6.00%, 7/15/2024 (a) | 485,260 | ||||||
| 36,000 | 5.38%, 4/15/2025 (a) | 36,540 | ||||||
| 467,000 | 5.00%, 8/1/2027 (a) | 451,234 | ||||||
TEGNA, Inc. | ||||||||
| 140,000 | 5.13%, 7/15/2020 | 141,225 | ||||||
| 146,000 | 6.38%, 10/15/2023 | 151,292 | ||||||
| 400,000 | Telenet Finance Luxembourg Notes SARL (Belgium) 5.50%, 3/1/2028 (a) | 374,000 | ||||||
| 316,000 | Tribune Media Co. 5.88%, 7/15/2022 | 320,740 | ||||||
| 400,000 | Unitymedia GmbH (Germany) 6.13%, 1/15/2025 (a) | 418,000 | ||||||
| 200,000 | Unitymedia Hessen GmbH & Co. KG (Germany) 5.00%, 1/15/2025 (a) | 203,250 | ||||||
| 200,000 | UPC Holding BV (Netherlands) 5.50%, 1/15/2028 (a) | 186,250 | ||||||
| 400,000 | UPCB Finance IV Ltd. (Netherlands) 5.38%, 1/15/2025 (a) | 395,040 | ||||||
Viacom, Inc. | ||||||||
| 184,000 | (ICE LIBOR USD 3 Month + 3.90%), 5.88%, 2/28/2057 (c) | 179,616 | ||||||
| 184,000 | (ICE LIBOR USD 3 Month + 3.90%), 6.25%, 2/28/2057 (c) | 182,108 | ||||||
Videotron Ltd. (Canada) | ||||||||
| 237,000 | 5.00%, 7/15/2022 | 241,148 | ||||||
| 184,000 | 5.13%, 4/15/2027 (a) | 182,160 | ||||||
| 150,000 | Ziggo Bond Finance BV (Netherlands) 6.00%, 1/15/2027 (a) | 136,125 | ||||||
SEE NOTES TO FINANCIAL STATEMENTS.
| 18 | J.P. MORGAN EXCHANGE-TRADED FUNDS | AUGUST 31, 2018 | ||||
| PRINCIPAL AMOUNT($) | INVESTMENTS | VALUE($) | ||||||
Corporate Bonds — continued | ||||||||
Media — continued | ||||||||
| 600,000 | Ziggo BV (Netherlands) 5.50%, 1/15/2027 (a) | 565,128 | ||||||
|
| |||||||
| 16,381,124 | ||||||||
|
| |||||||
Metals & Mining — 3.3% | ||||||||
Alcoa Nederland Holding BV | ||||||||
| 200,000 | 6.75%, 9/30/2024 (a) | 212,000 | ||||||
| 200,000 | 7.00%, 9/30/2026 (a) | 215,750 | ||||||
| 200,000 | 6.13%, 5/15/2028 (a) | 206,500 | ||||||
Allegheny Technologies, Inc. | ||||||||
| 99,000 | 5.95%, 1/15/2021 | 100,485 | ||||||
| 179,000 | 7.88%, 8/15/2023 (f) | 191,530 | ||||||
| 312,000 | Cleveland-Cliffs, Inc. 5.75%, 3/1/2025 | 306,403 | ||||||
Constellium NV | ||||||||
| 250,000 | 6.63%, 3/1/2025 (a) | 254,375 | ||||||
| 250,000 | 5.88%, 2/15/2026 (a) | 245,000 | ||||||
FMG Resources August 2006 Pty. Ltd. (Australia) | ||||||||
| 214,000 | 4.75%, 5/15/2022 (a) | 209,998 | ||||||
| 161,000 | 5.13%, 3/15/2023 (a) | 157,378 | ||||||
| 207,000 | 5.13%, 5/15/2024 (a) | 200,272 | ||||||
Freeport-McMoRan, Inc. | ||||||||
| 581,000 | 3.55%, 3/1/2022 | 560,665 | ||||||
| 593,000 | 3.88%, 3/15/2023 | 570,762 | ||||||
| 571,000 | 5.45%, 3/15/2043 | 509,389 | ||||||
| 139,000 | Hudbay Minerals, Inc. (Canada) 7.63%, 1/15/2025 (a) | 141,259 | ||||||
Steel Dynamics, Inc. | ||||||||
| 194,000 | 5.13%, 10/1/2021 | 196,716 | ||||||
| 149,000 | 5.50%, 10/1/2024 | 152,725 | ||||||
| 222,000 | Teck Resources Ltd. (Canada) 6.25%, 7/15/2041 | 233,722 | ||||||
United States Steel Corp. | ||||||||
| 213,000 | 6.88%, 8/15/2025 | 216,195 | ||||||
| 178,000 | 6.25%, 3/15/2026 | 177,332 | ||||||
|
| |||||||
| 5,058,456 | ||||||||
|
| |||||||
Mortgage Real Estate Investment Trusts (REITs) — 0.3% |
| |||||||
Starwood Property Trust, Inc. | ||||||||
| 108,000 | 3.63%, 2/1/2021 (a) | 105,300 | ||||||
| 171,000 | 5.00%, 12/15/2021 | 172,283 | ||||||
| 115,000 | 4.75%, 3/15/2025 | 109,250 | ||||||
|
| |||||||
| 386,833 | ||||||||
|
| |||||||
Oil, Gas & Consumable Fuels — 12.5% | ||||||||
Antero Resources Corp. | ||||||||
| 280,000 | 5.38%, 11/1/2021 | 284,550 | ||||||
| PRINCIPAL AMOUNT($) | INVESTMENTS | VALUE($) | ||||||
Oil, Gas & Consumable Fuels — continued |
| |||||||
| 320,000 | 5.13%, 12/1/2022 | 323,200 | ||||||
| 215,000 | 5.63%, 6/1/2023 | 221,246 | ||||||
| 109,000 | Carrizo Oil & Gas, Inc. 6.25%, 4/15/2023 | 111,452 | ||||||
Cheniere Corpus Christi Holdings LLC | ||||||||
| 415,000 | 7.00%, 6/30/2024 | 459,094 | ||||||
| 418,000 | 5.88%, 3/31/2025 | 444,125 | ||||||
| 462,000 | 5.13%, 6/30/2027 | 470,085 | ||||||
| 418,000 | Cheniere Energy Partners LP 5.25%, 10/1/2025 | 418,000 | ||||||
| 399,000 | Chesapeake Energy Corp. 8.00%, 12/15/2022 (a) | 419,449 | ||||||
| 377,000 | CNX Resources Corp. 5.88%, 4/15/2022 | 376,981 | ||||||
Continental Resources, Inc. | ||||||||
| 448,000 | 5.00%, 9/15/2022 | 453,551 | ||||||
| 418,000 | 4.50%, 4/15/2023 | 427,458 | ||||||
| 269,000 | 3.80%, 6/1/2024 | 264,755 | ||||||
| 240,000 | 4.38%, 1/15/2028 | 238,269 | ||||||
Crestwood Midstream Partners LP | ||||||||
| 200,000 | 6.25%, 4/1/2023 (f) | 206,250 | ||||||
| 145,000 | 5.75%, 4/1/2025 | 148,081 | ||||||
| 115,000 | DCP Midstream LP Series A, (ICE LIBOR USD 3 Month + 5.15%), 7.37%, 12/15/2022 (b) (c) (d) | 115,000 | ||||||
DCP Midstream Operating LP | ||||||||
| 139,000 | 5.35%, 3/15/2020 (a) | 142,127 | ||||||
| 67,000 | 3.88%, 3/15/2023 | 65,325 | ||||||
| 174,000 | (ICE LIBOR USD 3 Month + 3.85%), 5.85%, 5/21/2043 (a) (c) | 160,080 | ||||||
| 155,000 | Denbury Resources, Inc. 9.00%, 5/15/2021 (a) | 166,625 | ||||||
Diamondback Energy, Inc. | ||||||||
| 147,000 | 4.75%, 11/1/2024 | 147,919 | ||||||
| 149,000 | 5.38%, 5/31/2025 | 152,352 | ||||||
Enbridge, Inc. (Canada) | ||||||||
| 210,000 | Series 16-A, (ICE LIBOR USD 3 Month + 3.89%), 6.00%, 1/15/2077 (c) | 204,225 | ||||||
| 281,000 | (ICE LIBOR USD 3 Month + 3.42%), 5.50%, 7/15/2077 (c) | 262,033 | ||||||
| 265,000 | (ICE LIBOR USD 3 Month + 3.64%), 6.25%, 3/1/2078 (c) | 256,840 | ||||||
Energy Transfer Equity LP | ||||||||
| 334,000 | 7.50%, 10/15/2020 | 359,467 | ||||||
| 272,000 | 4.25%, 3/15/2023 | 272,762 | ||||||
| 336,000 | 5.88%, 1/15/2024 | 357,000 | ||||||
| 60,000 | 5.50%, 6/1/2027 | 62,925 | ||||||
SEE NOTES TO FINANCIAL STATEMENTS.
| AUGUST 31, 2018 | J.P. MORGAN EXCHANGE-TRADED FUNDS | 19 | ||||||
JPMorgan Disciplined High Yield ETF
SCHEDULE OF PORTFOLIO INVESTMENTS
AS OF AUGUST 31, 2018 (Unaudited) (continued)
| PRINCIPAL AMOUNT($) | INVESTMENTS | VALUE($) | ||||||
Corporate Bonds — continued | ||||||||
Oil, Gas & Consumable Fuels — continued | ||||||||
Energy Transfer Partners LP | ||||||||
| 267,000 | Series A, (ICE LIBOR USD 3 Month + 4.03%), 6.25%, 2/15/2023 (b) (c) (d) | 258,323 | ||||||
| 171,000 | Series B, (ICE LIBOR USD 3 Month + 4.16%), 6.63%, 2/15/2028 (b) (c) (d) | 164,694 | ||||||
EnLink Midstream Partners LP | ||||||||
| 170,000 | 4.40%, 4/1/2024 | 165,646 | ||||||
| 220,000 | 4.15%, 6/1/2025 | 207,014 | ||||||
| 150,000 | 5.45%, 6/1/2047 | 133,130 | ||||||
| 207,000 | Extraction Oil & Gas, Inc. 5.63%, 2/1/2026 (a) | 193,804 | ||||||
Genesis Energy LP | ||||||||
| 176,000 | 6.75%, 8/1/2022 | 179,520 | ||||||
| 174,000 | 6.50%, 10/1/2025 | 168,345 | ||||||
Gulfport Energy Corp. | ||||||||
| 198,000 | 6.00%, 10/15/2024 | 195,525 | ||||||
| 176,000 | 6.38%, 5/15/2025‡ | 174,460 | ||||||
MEG Energy Corp. (Canada) | ||||||||
| 214,000 | 6.38%, 1/30/2023 (a) | 194,205 | ||||||
| 267,000 | 7.00%, 3/31/2024 (a) | 242,636 | ||||||
| 252,000 | 6.50%, 1/15/2025 (a) | 250,740 | ||||||
Murphy Oil Corp. | ||||||||
| 10,000 | 4.00%, 6/1/2022 | 9,860 | ||||||
| 176,000 | 4.45%, 12/1/2022 (f) | 175,588 | ||||||
| 170,000 | 6.88%, 8/15/2024 | 179,552 | ||||||
| 170,000 | 5.75%, 8/15/2025 | 170,298 | ||||||
Newfield Exploration Co. | ||||||||
| 214,000 | 5.75%, 1/30/2022 | 225,770 | ||||||
| 280,000 | 5.63%, 7/1/2024 | 298,550 | ||||||
| 202,000 | 5.38%, 1/1/2026 | 210,585 | ||||||
| 181,000 | NGL Energy Partners LP 7.50%, 11/1/2023 | 185,072 | ||||||
| 114,000 | NuStar Logistics LP 5.63%, 4/28/2027 | 113,572 | ||||||
| 249,000 | Oasis Petroleum, Inc. 6.88%, 3/15/2022 | 253,669 | ||||||
Parsley Energy LLC | ||||||||
| 198,000 | 5.38%, 1/15/2025 (a) | 199,465 | ||||||
| 194,000 | 5.63%, 10/15/2027 (a) | 196,425 | ||||||
| 217,000 | PBF Holding Co. LLC 7.25%, 6/15/2025 | 228,935 | ||||||
| 136,000 | PDC Energy, Inc. 5.75%, 5/15/2026 | 131,920 | ||||||
Peabody Energy Corp. | ||||||||
| 149,000 | 6.00%, 3/31/2022 (a) | 149,559 | ||||||
| 108,000 | 6.38%, 3/31/2025 (a) | 109,485 | ||||||
QEP Resources, Inc. | ||||||||
| 165,000 | 5.38%, 10/1/2022 | 165,874 | ||||||
| 198,000 | 5.25%, 5/1/2023 | 193,050 | ||||||
| 148,000 | 5.63%, 3/1/2026 | 141,525 | ||||||
| PRINCIPAL AMOUNT($) | INVESTMENTS | VALUE($) | ||||||
Oil, Gas & Consumable Fuels — continued | ||||||||
Range Resources Corp. | ||||||||
| 162,000 | 5.00%, 8/15/2022 | 159,570 | ||||||
| 220,000 | 5.00%, 3/15/2023 | 215,226 | ||||||
| 226,000 | 4.88%, 5/15/2025 | 216,395 | ||||||
| 192,000 | Seven Generations Energy Ltd. (Canada) 5.38%, 9/30/2025 (a) | 186,240 | ||||||
SM Energy Co. | ||||||||
| 160,000 | 6.13%, 11/15/2022 | 164,600 | ||||||
| 150,000 | 5.63%, 6/1/2025 | 148,500 | ||||||
| 114,000 | 6.75%, 9/15/2026 | 118,133 | ||||||
Southwestern Energy Co. | ||||||||
| 329,000 | 4.10%, 3/15/2022 | 320,775 | ||||||
| 330,000 | 6.20%, 1/23/2025 (f) | 330,412 | ||||||
| 159,000 | 7.50%, 4/1/2026 | 166,553 | ||||||
Sunoco LP | ||||||||
| 284,000 | 4.88%, 1/15/2023 (a) | 280,177 | ||||||
| 232,000 | 5.50%, 2/15/2026 (a) | 222,140 | ||||||
Tallgrass Energy Partners LP | ||||||||
| 214,000 | 5.50%, 9/15/2024 (a) | 220,153 | ||||||
| 227,000 | 5.50%, 1/15/2028 (a) | 229,270 | ||||||
Targa Resources Partners LP | ||||||||
| 176,000 | 4.13%, 11/15/2019 | 176,141 | ||||||
| 124,000 | 4.25%, 11/15/2023 | 120,280 | ||||||
| 36,000 | 6.75%, 3/15/2024 | 37,800 | ||||||
| 255,000 | 5.88%, 4/15/2026 (a) | 261,375 | ||||||
| 212,000 | 5.00%, 1/15/2028 (a) | 205,905 | ||||||
TerraForm Power Operating LLC | ||||||||
| 103,000 | 4.25%, 1/31/2023 (a) | 100,425 | ||||||
| 194,000 | 5.00%, 1/31/2028 (a) | 181,633 | ||||||
Whiting Petroleum Corp. | ||||||||
| 245,000 | 5.75%, 3/15/2021 | 251,125 | ||||||
| 285,000 | 6.63%, 1/15/2026 | 296,400 | ||||||
| 191,000 | Williams Cos., Inc. (The) 5.75%, 6/24/2044 | 205,325 | ||||||
WPX Energy, Inc. | ||||||||
| 177,000 | 6.00%, 1/15/2022 | 182,753 | ||||||
| 98,000 | 8.25%, 8/1/2023 | 111,230 | ||||||
| 184,000 | 5.25%, 9/15/2024 | 185,380 | ||||||
| 128,000 | 5.75%, 6/1/2026 | 129,120 | ||||||
|
| |||||||
| 19,281,058 | ||||||||
|
| |||||||
Personal Products — 0.2% | ||||||||
Edgewell Personal Care Co. | ||||||||
| 138,000 | 4.70%, 5/19/2021 | 139,035 | ||||||
| 98,000 | 4.70%, 5/24/2022 | 97,294 | ||||||
|
| |||||||
| 236,329 | ||||||||
|
| |||||||
SEE NOTES TO FINANCIAL STATEMENTS.
| 20 | J.P. MORGAN EXCHANGE-TRADED FUNDS | AUGUST 31, 2018 | ||||
| PRINCIPAL AMOUNT($) | INVESTMENTS | VALUE($) | ||||||
Corporate Bonds — continued | ||||||||
Pharmaceuticals — 1.9% | ||||||||
Bausch Health Cos., Inc. | ||||||||
| 263,000 | 6.50%, 3/15/2022 (a) | 272,205 | ||||||
| 914,000 | 5.88%, 5/15/2023 (a) | 873,784 | ||||||
| 562,000 | 7.00%, 3/15/2024 (a) | 592,910 | ||||||
| 914,000 | 6.13%, 4/15/2025 (a) | 850,020 | ||||||
| 390,000 | 5.50%, 11/1/2025 (a) | 389,025 | ||||||
|
| |||||||
| 2,977,944 | ||||||||
|
| |||||||
Real Estate Management & Development — 0.6% |
| |||||||
| 277,000 | Howard Hughes Corp. (The) 5.38%, 3/15/2025 (a) | 273,538 | ||||||
| 313,000 | Kennedy-Wilson, Inc. 5.88%, 4/1/2024 | 310,261 | ||||||
Realogy Group LLC | ||||||||
| 156,000 | 5.25%, 12/1/2021 (a) | 156,000 | ||||||
| 145,000 | 4.88%, 6/1/2023 (a) | 135,575 | ||||||
|
| |||||||
| 875,374 | ||||||||
|
| |||||||
Road & Rail — 1.7% | ||||||||
Ashtead Capital, Inc. (United Kingdom) | ||||||||
| 200,000 | 5.63%, 10/1/2024 (a) | 207,500 | ||||||
| 200,000 | 4.13%, 8/15/2025 (a) | 192,500 | ||||||
| 200,000 | 4.38%, 8/15/2027 (a) | 192,750 | ||||||
| 191,000 | Avis Budget Car Rental LLC 5.50%, 4/1/2023 | 190,045 | ||||||
Herc Rentals, Inc. | ||||||||
| 38,000 | 7.50%, 6/1/2022 (a) | 39,757 | ||||||
| 39,000 | 7.75%, 6/1/2024 (a) | 42,060 | ||||||
Hertz Corp. (The) | ||||||||
| 139,000 | 5.88%, 10/15/2020 | 138,262 | ||||||
| 291,000 | 7.63%, 6/1/2022 (a) | 288,818 | ||||||
| 173,000 | 5.50%, 10/15/2024 (a) | 144,887 | ||||||
Park Aerospace Holdings Ltd. (Ireland) | ||||||||
| 531,000 | 5.25%, 8/15/2022 (a) | 540,956 | ||||||
| 283,000 | 4.50%, 3/15/2023 (a) | 279,816 | ||||||
| 389,000 | 5.50%, 2/15/2024 (a) | 399,698 | ||||||
|
| |||||||
| 2,657,049 | ||||||||
|
| |||||||
Semiconductors & Semiconductor Equipment — 1.0% |
| |||||||
| 102,000 | Micron Technology, Inc. 5.50%, 2/1/2025 | 105,560 | ||||||
NXP BV (Netherlands) | ||||||||
| 400,000 | 4.13%, 6/1/2021 (a) | 400,500 | ||||||
| 400,000 | 3.88%, 9/1/2022 (a) | 396,500 | ||||||
| 400,000 | 4.63%, 6/1/2023 (a) | 406,000 | ||||||
| 200,000 | Sensata Technologies UK Financing Co. plc 6.25%, 2/15/2026 (a) | 210,250 | ||||||
|
| |||||||
| 1,518,810 | ||||||||
|
| |||||||
| PRINCIPAL AMOUNT($) | INVESTMENTS | VALUE($) | ||||||
Software — 1.2% | ||||||||
CDK Global, Inc. | ||||||||
| 109,000 | 5.00%, 10/15/2024 (f) | 111,725 | ||||||
| 153,000 | 5.88%, 6/15/2026 | 157,076 | ||||||
| 184,000 | 4.88%, 6/1/2027 | 180,780 | ||||||
| 282,000 | Change Healthcare Holdings LLC 5.75%, 3/1/2025 (a) | 275,655 | ||||||
| 119,000 | Nuance Communications, Inc. 5.63%, 12/15/2026 | 118,553 | ||||||
Open Text Corp. (Canada) | ||||||||
| 226,000 | 5.63%, 1/15/2023 (a) | 233,345 | ||||||
| 238,000 | 5.88%, 6/1/2026 (a) | 245,735 | ||||||
Symantec Corp. | ||||||||
| 213,000 | 4.20%, 9/15/2020 | 214,365 | ||||||
| 318,000 | 5.00%, 4/15/2025 (a) | 315,178 | ||||||
|
| |||||||
| 1,852,412 | ||||||||
|
| |||||||
Specialty Retail — 0.7% | ||||||||
L Brands, Inc. | ||||||||
| 228,000 | 6.63%, 4/1/2021 | 239,400 | ||||||
| 277,000 | 5.63%, 2/15/2022 | 280,116 | ||||||
| 93,000 | 5.25%, 2/1/2028 | 79,980 | ||||||
| 276,000 | 6.88%, 11/1/2035 | 229,853 | ||||||
Penske Automotive Group, Inc. | ||||||||
| 130,000 | 5.75%, 10/1/2022 | 132,600 | ||||||
| 124,000 | 5.50%, 5/15/2026 | 121,520 | ||||||
| 26,000 | Sally Holdings LLC 5.63%, 12/1/2025 | 23,855 | ||||||
|
| |||||||
| 1,107,324 | ||||||||
|
| |||||||
Technology Hardware, Storage & Peripherals — 1.3% |
| |||||||
EMC Corp. | ||||||||
| 560,000 | 2.65%, 6/1/2020 | 547,595 | ||||||
| 286,000 | 3.38%, 6/1/2023 | 269,834 | ||||||
NCR Corp. | ||||||||
| 148,000 | 4.63%, 2/15/2021 | 145,410 | ||||||
| 189,000 | 5.00%, 7/15/2022 | 184,275 | ||||||
| 218,000 | 6.38%, 12/15/2023 | 218,817 | ||||||
| 646,000 | Western Digital Corp. 4.75%, 2/15/2026 | 633,358 | ||||||
|
| |||||||
| 1,999,289 | ||||||||
|
| |||||||
Textiles, Apparel & Luxury Goods — 0.3% | ||||||||
Hanesbrands, Inc. | ||||||||
| 261,000 | 4.63%, 5/15/2024 (a) | 254,475 | ||||||
| 290,000 | 4.88%, 5/15/2026 (a) | 279,125 | ||||||
|
| |||||||
| 533,600 | ||||||||
|
| |||||||
Thrifts & Mortgage Finance — 0.1% | ||||||||
| 147,000 | Ladder Capital Finance Holdings LLLP 5.25%, 3/15/2022 (a) | 147,551 | ||||||
|
| |||||||
SEE NOTES TO FINANCIAL STATEMENTS.
| AUGUST 31, 2018 | J.P. MORGAN EXCHANGE-TRADED FUNDS | 21 | ||||||
JPMorgan Disciplined High Yield ETF
SCHEDULE OF PORTFOLIO INVESTMENTS
AS OF AUGUST 31, 2018 (Unaudited) (continued)
| PRINCIPAL AMOUNT($) | INVESTMENTS | VALUE($) | ||||||
Corporate Bonds — continued | ||||||||
Trading Companies & Distributors — 1.1% |
| |||||||
| 359,000 | Beacon Roofing Supply, Inc. 4.88%, 11/1/2025 (a) | 331,178 | ||||||
| 276,000 | HD Supply, Inc. 5.75%, 4/15/2024 (a) (f) | 290,145 | ||||||
United Rentals North America, Inc. | ||||||||
| 140,000 | 4.63%, 7/15/2023 | 141,505 | ||||||
| 278,000 | 5.88%, 9/15/2026 | 286,340 | ||||||
| 279,000 | 5.50%, 5/15/2027 | 278,302 | ||||||
| 461,000 | 4.88%, 1/15/2028 | 439,391 | ||||||
|
| |||||||
| 1,766,861 | ||||||||
|
| |||||||
Wireless Telecommunication Services — 3.5% |
| |||||||
| 200,000 | C&W Senior Financing DAC (Ireland) 6.88%, 9/15/2027 (a) | 198,500 | ||||||
Hughes Satellite Systems Corp. | ||||||||
| 226,000 | 6.50%, 6/15/2019 | 231,402 | ||||||
| 261,000 | 7.63%, 6/15/2021 | 280,901 | ||||||
| 213,000 | 5.25%, 8/1/2026 | 203,681 | ||||||
| 181,000 | 6.63%, 8/1/2026 | 173,308 | ||||||
| 300,000 | Inmarsat Finance plc (United Kingdom) 4.88%, 5/15/2022 (a) | 300,750 | ||||||
Millicom International Cellular SA (Colombia) | ||||||||
| 200,000 | 6.00%, 3/15/2025 (a) | 202,000 | ||||||
| 200,000 | 5.13%, 1/15/2028 (a) | 184,850 | ||||||
Sprint Corp. | ||||||||
| 1,262,000 | 7.88%, 9/15/2023 | 1,358,227 | ||||||
| 703,000 | 7.13%, 6/15/2024 | 729,363 | ||||||
T-Mobile US, Inc. | ||||||||
| 369,000 | 6.38%, 3/1/2025‡ | — | ||||||
| 432,000 | 6.50%, 1/15/2026‡ | — | ||||||
T-Mobile USA, Inc. | ||||||||
| 474,000 | 6.38%, 3/1/2025 | 492,960 | ||||||
| 565,000 | 6.50%, 1/15/2026 | 597,312 | ||||||
| 168,000 | 4.75%, 2/1/2028‡ | — | ||||||
| 416,000 | 4.75%, 2/1/2028 | 391,789 | ||||||
|
| |||||||
| 5,345,043 | ||||||||
|
| |||||||
Total Corporate Bonds | 148,744,444 | |||||||
|
| |||||||
SHARES | INVESTMENTS | VALUE($) | ||||||
Short-term Investments — 2.7% | ||||||||
Investment Companies — 2.7% | ||||||||
| 4,098,667 | JPMorgan U.S. Government Money Market Fund, Class Institutional Shares, 1.82% (g) (h) | 4,098,667 | ||||||
|
| |||||||
Total Investments — 99.0% | 152,843,111 | |||||||
Other Assets Less Liabilities — 1.0% | 1,468,626 | |||||||
|
| |||||||
NET ASSETS — 100.0% | $ | 154,311,737 | ||||||
|
| |||||||
Percentages indicated are based on net assets.
| Abbreviations | ||
| ICE | — Intercontinental Exchange | |
| LIBOR | — London Interbank Offered Rate | |
| OYJ | — Public Limited Company | |
| USD | — United States Dollar | |
| (a) | — Securities exempt from registration under Rule 144A or section 4(a)(2), of the Securities Act of 1933, as amended. Under procedures approved by the Board of Trustees, such securities have been determined to be liquid by the investment adviser and may be resold, normally to qualified institutional buyers in transactions exempt from registration. | |
| (b) | — Security is perpetual and thus, does not have a predetermined maturity date. The coupon rate for this security is fixed for a period of time and may be structured to adjust thereafter. The date shown, if applicable, reflects the next call date. The coupon rate shown is the rate in effect as of August 31, 2018. | |
| (c) | — Variable or floating rate security, linked to the referenced benchmark. The interest rate shown is the current rate as of August 31, 2018. | |
| (d) | — Security is an interest bearing note with preferred security characteristics. | |
| (e) | — Amount rounds to less than 0.1% of net assets. | |
| (f) | — Step bond. Interest rate is a fixed rate for an initial period that either resets at a specific date or may reset in the future contingent upon a predetermined trigger. The interest rate shown is the current rate as of August 31, 2018. | |
| (g) | — Investment in affiliate. Fund is registered under the Investment Company Act of 1940, as amended, and advised by J.P. Morgan Investment Management Inc. | |
| (h) | — The rate shown is the current yield as of August 31, 2018. | |
| ‡ | — Value determined using significant unobservable inputs. |
SEE NOTES TO FINANCIAL STATEMENTS.
| 22 | J.P. MORGAN EXCHANGE-TRADED FUNDS | AUGUST 31, 2018 | ||||
JPMorgan Global Bond Opportunities ETF
SCHEDULE OF PORTFOLIO INVESTMENTS
AS OF AUGUST 31, 2018 (Unaudited)
(Amounts in U.S. Dollars, unless otherwise noted)
PRINCIPAL AMOUNT | INVESTMENTS | VALUE | ||||||
Corporate Bonds — 56.1% | ||||||||
Argentina — 0.2% | ||||||||
Pampa Energia SA | ||||||||
| 94,000 | 7.38%, 7/21/2023 (a) | 81,427 | ||||||
| 150,000 | 7.50%, 1/24/2027 (b) | 119,250 | ||||||
| 120,000 | YPF SA 6.95%, 7/21/2027 (a) | 96,000 | ||||||
|
| |||||||
| 296,677 | ||||||||
|
| |||||||
Australia — 0.2% | ||||||||
| 200,000 | Australia & New Zealand Banking Group Ltd. (USD ICE Swap Rate 5 Year + 5.17%), 6.75%, 6/15/2026 (a) (c) (d) (e) | 207,500 | ||||||
| EUR 125,000 | Origin Energy Finance Ltd. (EUR Swap Annual 5 Year + 3.67%), 4.00%, 9/16/2074 (b) (d) | 149,171 | ||||||
|
| |||||||
| 356,671 | ||||||||
|
| |||||||
Azerbaijan — 0.1% | ||||||||
| 260,000 | State Oil Co. of the Azerbaijan Republic 4.75%, 3/13/2023 (b) | 255,125 | ||||||
|
| |||||||
Bahrain — 0.1% | ||||||||
| 200,000 | Batelco International Finance No. 1 Ltd. 4.25%, 5/1/2020 (b) | 196,500 | ||||||
|
| |||||||
Belgium — 0.5% | ||||||||
Anheuser-Busch InBev Finance, Inc. | ||||||||
| 495,000 | 3.65%, 2/1/2026 | 484,231 | ||||||
| 20,000 | 4.70%, 2/1/2036 | 20,274 | ||||||
| 35,000 | 4.90%, 2/1/2046 | 35,570 | ||||||
| EUR 200,000 | Nyrstar Netherlands Holdings BV 6.88%, 3/15/2024 (b) | 206,298 | ||||||
| EUR 100,000 | Solvay Finance SA (EUR Swap Annual 5 Year + 3.70%), 5.42%, | 129,478 | ||||||
|
| |||||||
| 875,851 | ||||||||
|
| |||||||
Brazil — 0.6% | ||||||||
| 400,000 | Cemig Geracao e Transmissao SA 9.25%, 12/5/2024 (a) | 399,360 | ||||||
| 200,000 | JSL Europe SA 7.75%, 7/26/2024 (b) | 177,940 | ||||||
| 200,000 | Suzano Austria GmbH 5.75%, 7/14/2026 (b) | 200,000 | ||||||
| 200,000 | Votorantim Cimentos SA 7.25%, 4/5/2041 (b) | 196,250 | ||||||
|
| |||||||
| 973,550 | ||||||||
|
| |||||||
Canada — 1.2% | ||||||||
| 15,000 | 1011778 BC ULC 5.00%, 10/15/2025 (a) | 14,475 | ||||||
| 41,000 | Athabasca Oil Corp. 9.88%, 2/24/2022 (a) | 42,332 | ||||||
PRINCIPAL AMOUNT | INVESTMENTS | VALUE | ||||||
Canada — continued | ||||||||
Bombardier, Inc. | ||||||||
| 162,000 | 8.75%, 12/1/2021 (a) | 179,010 | ||||||
| 10,000 | 6.00%, 10/15/2022 (a) | 10,050 | ||||||
| 57,000 | 7.50%, 3/15/2025 (a) | 58,852 | ||||||
Cenovus Energy, Inc. | ||||||||
| 75,000 | 4.25%, 4/15/2027 | 72,444 | ||||||
| 83,000 | 6.75%, 11/15/2039 | 94,837 | ||||||
| 52,000 | 5.20%, 9/15/2043 | 50,651 | ||||||
| 47,000 | Cott Holdings, Inc. 5.50%, 4/1/2025 (a) | 46,029 | ||||||
| 216,000 | Emera US Finance LP 3.55%, 6/15/2026 | 205,264 | ||||||
Encana Corp. | ||||||||
| 100,000 | 6.50%, 8/15/2034 | 117,532 | ||||||
| 25,000 | 6.50%, 2/1/2038 | 29,663 | ||||||
| 129,000 | Garda World Security Corp. 8.75%, | 127,065 | ||||||
| 15,000 | Gateway Casinos & Entertainment Ltd. 8.25%, 3/1/2024 (a) | 15,900 | ||||||
| 15,000 | Kronos Acquisition Holdings, Inc. 9.00%, 8/15/2023 (a) | 13,725 | ||||||
| 50,000 | Mattamy Group Corp. 6.50%, 10/1/2025 (a) | 49,260 | ||||||
MEG Energy Corp. | ||||||||
| 185,000 | 6.38%, 1/30/2023 (a) | 167,888 | ||||||
| 74,000 | 6.50%, 1/15/2025 (a) | 73,630 | ||||||
NOVA Chemicals Corp. | ||||||||
| 80,000 | 4.88%, 6/1/2024 (a) | 78,200 | ||||||
| 30,000 | 5.25%, 6/1/2027 (a) | 28,500 | ||||||
| 40,000 | Open Text Corp. 5.88%, 6/1/2026 (a) | 41,300 | ||||||
Precision Drilling Corp. | ||||||||
| 65,000 | 7.75%, 12/15/2023 | 68,737 | ||||||
| 6,000 | 7.13%, 1/15/2026 (a) | 6,173 | ||||||
| 275,000 | Quebecor Media, Inc. 5.75%, 1/15/2023 | 284,625 | ||||||
| 24,000 | Seven Generations Energy Ltd. 5.38%, 9/30/2025 (a) | 23,280 | ||||||
| 24,000 | Stars Group Holdings BV 7.00%, 7/15/2026 (a) | 24,960 | ||||||
| 69,000 | Teck Resources Ltd. 6.13%, 10/1/2035 | 73,140 | ||||||
Videotron Ltd. | ||||||||
| 65,000 | 5.38%, 6/15/2024 (a) | 66,788 | ||||||
| 40,000 | 5.13%, 4/15/2027 (a) | 39,600 | ||||||
|
| |||||||
| 2,103,910 | ||||||||
|
| |||||||
SEE NOTES TO FINANCIAL STATEMENTS.
| AUGUST 31, 2018 | J.P. MORGAN EXCHANGE-TRADED FUNDS | 23 | ||||||
JPMorgan Global Bond Opportunities ETF
SCHEDULE OF PORTFOLIO INVESTMENTS
AS OF AUGUST 31, 2018 (Unaudited) (continued)
(Amounts in U.S. Dollars, unless otherwise noted)
PRINCIPAL AMOUNT | INVESTMENTS | VALUE | ||||||
Corporate Bonds — continued | ||||||||
China — 0.3% | ||||||||
| 200,000 | GCL New Energy Holdings Ltd. 7.10%, 1/30/2021 (b) | 175,973 | ||||||
| 200,000 | GOME Retail Holdings Ltd. 5.00%, 3/10/2020 (b) | 188,316 | ||||||
| 200,000 | Sino-Ocean Land Treasure III Ltd. (US Treasury Yield Curve Rate T Note Constant Maturity 5 Year + 3.26%), 4.90%, | 166,197 | ||||||
|
| |||||||
| 530,486 | ||||||||
|
| |||||||
Denmark — 0.3% | ||||||||
| EUR 200,000 | Danske Bank A/S (EUR Swap Annual 5 Year + 5.47%), 5.88%, 4/6/2022 (b) (c) (d) (e) | 250,082 | ||||||
| EUR 200,000 | TDC A/S 3.75%, 3/2/2022 (f) | 254,204 | ||||||
|
| |||||||
| 504,286 | ||||||||
|
| |||||||
Finland — 0.1% | ||||||||
| 40,000 | Nokia OYJ 4.38%, 6/12/2027 | 38,450 | ||||||
| EUR 100,000 | Stora Enso OYJ 2.50%, 6/7/2027 (b) | 121,163 | ||||||
|
| |||||||
| 159,613 | ||||||||
|
| |||||||
France — 3.2% | ||||||||
Altice France SA | ||||||||
| EUR 150,000 | 5.63%, 5/15/2024 (b) | 181,982 | ||||||
| 200,000 | 6.25%, 5/15/2024 (a) | 197,500 | ||||||
BPCE SA | ||||||||
| 260,000 | 5.15%, 7/21/2024 (a) | 265,958 | ||||||
| EUR 200,000 | (EUR Swap Annual 5 Year + 2.37%), 2.75%, 11/30/2027 (b) (d) | 243,785 | ||||||
| EUR 100,000 | Casino Guichard Perrachon SA 4.05%, 8/5/2026 (b) (f) | 98,095 | ||||||
| EUR 100,000 | Constantin Investissement 3 SASU 5.38%, 4/15/2025 (b) | 114,943 | ||||||
Credit Agricole SA | ||||||||
| EUR 300,000 | (EUR Swap Annual 5 Year + 5.12%), 6.50%, 6/23/2021 (b) (c) (d) (e) | 383,363 | ||||||
| 200,000 | (USD Swap Semi 5 Year + 6.19%), 8.12%, 12/23/2025 (a) (c) (d) (e) | 220,025 | ||||||
| EUR 300,000 | Elis SA 1.88%, 2/15/2023(b) | 350,210 | ||||||
Europcar Mobility Group | ||||||||
| EUR 200,000 | 5.75%, 6/15/2022(b) | 238,908 | ||||||
| EUR 100,000 | 4.13%, 11/15/2024(b) | 116,096 | ||||||
| EUR 200,000 | Faurecia SA 3.63%, 6/15/2023(b) | 241,603 | ||||||
PRINCIPAL AMOUNT | INVESTMENTS | VALUE | ||||||
France — continued | ||||||||
La Financiere Atalian SASU | ||||||||
| EUR 100,000 | 4.00%, 5/15/2024 (b) | 112,651 | ||||||
| EUR 100,000 | 5.13%, 5/15/2025 (a) | 114,130 | ||||||
| EUR 250,000 | Loxam SAS 4.25%, 4/15/2024 (b) | 306,093 | ||||||
Orano SA | ||||||||
| EUR 50,000 | 4.38%, 11/6/2019 | 60,765 | ||||||
| EUR 300,000 | 3.13%, 3/20/2023 (b) | 350,865 | ||||||
| EUR 100,000 | Paprec Holding SA 4.00%, 3/31/2025 (b) | 117,209 | ||||||
| EUR 350,000 | Peugeot SA 2.38%, 4/14/2023 (b) | 429,501 | ||||||
| EUR 100,000 | Picard Groupe SAS (EURIBOR 3 Month + 3.00%), 3.00%, 11/30/2023 (b) (d) | 114,235 | ||||||
| EUR 300,000 | Rexel SA 2.63%, 6/15/2024 (b) | 355,320 | ||||||
| 200,000 | Societe Generale SA (USD ICE Swap Rate 5 Year + 5.87%), 8.00%, | 213,250 | ||||||
| EUR 200,000 | SPIE SA 3.13%, 3/22/2024 (b) | 233,283 | ||||||
TOTAL SA | ||||||||
| EUR 125,000 | (EUR Swap Annual 5 Year + 1.86%), 2.25%, 2/26/2021 (b) (c) (d) (e) | 148,639 | ||||||
| EUR 100,000 | (EUR Swap Annual 5 Year + 3.78%), 3.88%, 5/18/2022 (b) (c) (d) (e) | 125,054 | ||||||
Vallourec SA | ||||||||
| EUR 100,000 | 6.63%, 10/15/2022 (b) | 121,437 | ||||||
| EUR 100,000 | 2.25%, 9/30/2024 (b) | 95,481 | ||||||
|
| |||||||
| 5,550,381 | ||||||||
|
| |||||||
Germany — 1.4% | ||||||||
| EUR 200,000 | CTC BondCo GmbH 5.25%, 12/15/2025 (b) | 229,248 | ||||||
| 300,000 | Deutsche Bank AG 4.25%, 10/14/2021 | 298,593 | ||||||
| EUR 225,000 | IHO Verwaltungs GmbH 3.75% (cash), 9/15/2026 (b) (g) | 267,938 | ||||||
| EUR 225,000 | Nidda BondCo GmbH 5.00%, 9/30/2025 (b) | 254,409 | ||||||
| EUR 200,000 | Nidda Healthcare Holding GmbH 3.50%, 9/30/2024 (b) | 230,971 | ||||||
| EUR 125,000 | ProGroup AG 3.00%, 3/31/2026 (b) | 145,094 | ||||||
| EUR 100,000 | Tele Columbus AG 3.88%, 5/2/2025 (b) | 102,771 | ||||||
thyssenkrupp AG | ||||||||
| EUR 300,000 | 1.38%, 3/3/2022 (b) | 351,446 | ||||||
| EUR 100,000 | 2.50%, 2/25/2025(b) | 121,907 | ||||||
SEE NOTES TO FINANCIAL STATEMENTS.
| 24 | J.P. MORGAN EXCHANGE-TRADED FUNDS | AUGUST 31, 2018 | ||||
PRINCIPAL AMOUNT | INVESTMENTS | VALUE | ||||||
Corporate Bonds — continued | ||||||||
Germany — continued | ||||||||
| EUR 100,000 | Unitymedia GmbH 3.75%, 1/15/2027 (b) | 122,524 | ||||||
| EUR 100,000 | Unitymedia Hessen GmbH & Co. KG 3.50%, 1/15/2027 (b) | 122,311 | ||||||
| EUR 200,000 | WEPA Hygieneprodukte GmbH 3.75%, 5/15/2024 (b) | 228,835 | ||||||
|
| |||||||
| 2,476,047 | ||||||||
|
| |||||||
Greece — 0.5% | ||||||||
| EUR 440,000 | Alpha Bank AE 2.50%, 2/5/2023 (b) | 517,352 | ||||||
| EUR 100,000 | Crystal Almond SARL 10.00%, 11/1/2021 (b) | 125,361 | ||||||
| EUR 100,000 | National Bank of Greece SA 2.75%, 10/19/2020 (b) | 119,832 | ||||||
| EUR 100,000 | OTE plc 3.50%, 7/9/2020 (b) | 121,310 | ||||||
|
| |||||||
| 883,855 | ||||||||
|
| |||||||
Guatemala — 0.1% | ||||||||
| 200,000 | Comunicaciones Celulares SA 6.88%, 2/6/2024 (b) | 206,250 | ||||||
|
| |||||||
Hong Kong — 0.1% | ||||||||
| 200,000 | WTT Investment Ltd. 5.50%, 11/21/2022 (a) | 199,250 | ||||||
|
| |||||||
India — 0.3% | ||||||||
| 260,000 | ABJA Investment Co. Pte. Ltd. 5.45%, 1/24/2028 (b) | 232,148 | ||||||
| 200,000 | JSW Steel Ltd. 5.25%, 4/13/2022 (b) | 198,750 | ||||||
|
| |||||||
| 430,898 | ||||||||
|
| |||||||
Ireland — 1.4% | ||||||||
AerCap Ireland Capital DAC | ||||||||
| 330,000 | 4.63%, 7/1/2022 | 337,573 | ||||||
| 180,000 | 3.65%, 7/21/2027 | 166,723 | ||||||
| EUR 100,000 | Allied Irish Banks plc (EUR Swap Annual 5 Year + 3.95%), 4.13%, | 122,898 | ||||||
Ardagh Packaging Finance plc | ||||||||
| EUR 200,000 | 4.13%, 5/15/2023 (b) | 242,223 | ||||||
| EUR 275,000 | 6.75%, 5/15/2024 (b) | 344,950 | ||||||
| 210,000 | 7.25%, 5/15/2024 (a) | 220,763 | ||||||
| EUR 100,000 | Bank of Ireland (EUR Swap Annual 5 Year + 3.55%), 4.25%, 6/11/2024 (b) (d) | 118,924 | ||||||
| EUR 200,000 | eircom Finance DAC 4.50%, 5/31/2022 (b) | 237,281 | ||||||
| 200,000 | James Hardie International Finance DAC 4.75%, 1/15/2025 (a) | 193,876 | ||||||
PRINCIPAL AMOUNT | INVESTMENTS | VALUE | ||||||
Ireland — continued | ||||||||
| 129,000 | Park Aerospace Holdings Ltd. 5.50%, 2/15/2024 (a) | 132,548 | ||||||
| EUR 250,000 | Smurfit Kappa Acquisitions ULC 2.38%, 2/1/2024 (b) | 300,836 | ||||||
|
| |||||||
| 2,418,595 | ||||||||
|
| |||||||
Israel — 0.3% | ||||||||
| EUR 100,000 | Teva Pharmaceutical Finance Netherlands II BV 1.13%, 10/15/2024 (b) | 101,993 | ||||||
Teva Pharmaceutical Finance Netherlands III BV | ||||||||
| 145,000 | 3.15%, 10/1/2026 | 120,350 | ||||||
| 200,000 | 6.75%, 3/1/2028 | 208,491 | ||||||
|
| |||||||
| 430,834 | ||||||||
|
| |||||||
Italy — 1.6% | ||||||||
| EUR 100,000 | Buzzi Unicem SpA 2.13%, 4/28/2023 (b) | 118,713 | ||||||
Enel Finance International NV | ||||||||
| GBP 50,000 | 5.63%, 8/14/2024 (b) | 75,100 | ||||||
| 200,000 | 3.50%, 4/6/2028 (a) | 180,087 | ||||||
| EUR 200,000 | EVOCA SpA 7.00%, 10/15/2023 (b) | 247,099 | ||||||
| 275,000 | Intesa Sanpaolo SpA 3.88%, 7/14/2027 (a) | 236,119 | ||||||
| EUR 200,000 | Leonardo SpA 4.88%, 3/24/2025 | 266,764 | ||||||
| EUR 250,000 | Saipem Finance International BV 2.63%, 1/7/2025 (b) | 283,973 | ||||||
| EUR 100,000 | Snaitech SpA 6.38%, 11/7/2021 (b) | 120,706 | ||||||
Telecom Italia SpA | ||||||||
| EUR 100,000 | 5.25%, 2/10/2022 (b) | 130,588 | ||||||
| EUR 200,000 | 3.25%, 1/16/2023 (b) | 244,294 | ||||||
| EUR 225,000 | 3.63%, 1/19/2024 (b) | 278,477 | ||||||
| EUR 225,000 | 3.63%, 5/25/2026 (b) | 272,863 | ||||||
Wind Tre SpA | ||||||||
| EUR 150,000 | 2.63%, 1/20/2023 (a) | 166,617 | ||||||
| EUR 100,000 | 2.63%, 1/20/2023 (b) | 111,078 | ||||||
|
| |||||||
| 2,732,478 | ||||||||
|
| |||||||
Japan — 0.1% | ||||||||
| EUR 175,000 | SoftBank Group Corp. 4.00%, 7/30/2022 (b) | 216,558 | ||||||
|
| |||||||
Kazakhstan — 0.1% | ||||||||
| 250,000 | KazMunayGas National Co. JSC 4.75%, 4/19/2027 (b) | 249,375 | ||||||
|
| |||||||
SEE NOTES TO FINANCIAL STATEMENTS.
| AUGUST 31, 2018 | J.P. MORGAN EXCHANGE-TRADED FUNDS | 25 | ||||||
JPMorgan Global Bond Opportunities ETF
SCHEDULE OF PORTFOLIO INVESTMENTS
AS OF AUGUST 31, 2018 (Unaudited) (continued)
(Amounts in U.S. Dollars, unless otherwise noted)
PRINCIPAL AMOUNT | INVESTMENTS | VALUE | ||||||
Corporate Bonds — continued | ||||||||
Kuwait — 0.3% | ||||||||
Kuwait Projects Co. SPC Ltd. | ||||||||
| 200,000 | 5.00%, 3/15/2023 (b) | 200,750 | ||||||
| 270,000 | 4.50%, 2/23/2027 (b) | 251,100 | ||||||
|
| |||||||
| 451,850 | ||||||||
|
| |||||||
Luxembourg — 1.6% | ||||||||
| EUR 225,000 | Altice Finco SA 4.75%, 1/15/2028 (b) | 220,361 | ||||||
Altice Luxembourg SA | ||||||||
| EUR 100,000 | 7.25%, 5/15/2022 (b) | 116,833 | ||||||
| EUR 300,000 | 6.25%, 2/15/2025 (b) | 332,200 | ||||||
| EUR 100,000 | Auris Luxembourg II SA 8.00%, 1/15/2023 (b) | 120,747 | ||||||
| EUR 150,000 | Galapagos SA 5.38%, 6/15/2021‡ (b) | 156,118 | ||||||
| EUR 100,000 | INEOS Finance plc 4.00%, 5/1/2023 (b) | 118,412 | ||||||
| EUR 100,000 | INEOS Group Holdings SA 5.38%, | 122,053 | ||||||
| 30,000 | Intelsat Connect Finance SA 9.50%, 2/15/2023 (a) | 29,901 | ||||||
Intelsat Jackson Holdings SA | ||||||||
| 176,000 | 7.25%, 10/15/2020 | 176,220 | ||||||
| 102,000 | 7.50%, 4/1/2021 | 102,637 | ||||||
| 20,000 | 5.50%, 8/1/2023 | 18,244 | ||||||
| 158,000 | 8.00%, 2/15/2024 (a) | 166,295 | ||||||
| 37,000 | 9.75%, 7/15/2025 (a) | 39,174 | ||||||
Intelsat Luxembourg SA | ||||||||
| 4,000 | 7.75%, 6/1/2021 | 3,855 | ||||||
| 16,000 | 8.13%, 6/1/2023 | 13,860 | ||||||
| EUR 300,000 | Matterhorn Telecom Holding SA 4.88%, 5/1/2023 (b) | 353,419 | ||||||
| EUR 250,000 | SES SA (EUR Swap Annual 5 Year + 4.66%), 4.62%, 1/2/2022 (b) (c) (d) (e) | 300,331 | ||||||
| EUR 200,000 | SIG Combibloc Holdings SCA 7.75%, 2/15/2023 (b) | 241,717 | ||||||
| EUR 180,000 | Telenet Finance VI Luxembourg SCA 4.88%, 7/15/2027 (b) | 224,021 | ||||||
|
| |||||||
| 2,856,398 | ||||||||
|
| |||||||
Mexico — 0.8% | ||||||||
| 200,000 | Banco Mercantil del Norte SA (US Treasury Yield Curve Rate T Note Constant Maturity 5 Year + 5.04%), 6.87%, 7/6/2022 (a) (c) (d) (e) | 200,750 | ||||||
PRINCIPAL AMOUNT | INVESTMENTS | VALUE | ||||||
Mexico — continued | ||||||||
| 200,000 | BBVA Bancomer SA (US Treasury Yield Curve Rate T Note Constant Maturity 5 Year + 2.65%), 5.13%, 1/18/2033 (a) (d) | 182,840 | ||||||
| 200,000 | Cemex SAB de CV 7.75%, 4/16/2026 (a) | 218,140 | ||||||
| 200,000 | Nemak SAB de CV 4.75%, 1/23/2025 (a) | 192,700 | ||||||
Petroleos Mexicanos | ||||||||
| 170,000 | 4.88%, 1/24/2022 | 170,977 | ||||||
| 310,000 | 5.35%, 2/12/2028 (b) | 288,068 | ||||||
| 220,000 | 5.63%, 1/23/2046 | 180,708 | ||||||
|
| |||||||
| 1,434,183 | ||||||||
|
| |||||||
Morocco — 0.1% | ||||||||
| 250,000 | OCP SA 4.50%, 10/22/2025 (b) | 241,563 | ||||||
|
| |||||||
Netherlands — 1.2% | ||||||||
ABN AMRO Bank NV | ||||||||
| EUR 200,000 | (EUR Swap Annual 5 Year + 5.45%), 5.75%, 9/22/2020 (b) (c) (d) (e) | 247,472 | ||||||
| 200,000 | 4.75%, 7/28/2025 (a) | 202,511 | ||||||
ING Groep NV | ||||||||
| 220,000 | (USD Swap Semi 5 Year + 5.12%), 6.87%, 4/16/2022 (b) (c) (d) (e) | 223,773 | ||||||
| EUR 100,000 | (EUR Swap Annual 5 Year + 2.85%), 3.00%, 4/11/2028 (d) | 122,683 | ||||||
| EUR 225,000 | Sigma Holdco BV 5.75%, 5/15/2026 (b) | 248,384 | ||||||
| EUR 200,000 | Sunshine Mid BV 6.50%, 5/15/2026 (a) | 222,882 | ||||||
| EUR 270,000 | UPCB Finance IV Ltd. 4.00%, 1/15/2027 (b) | 321,567 | ||||||
| EUR 300,000 | Ziggo Bond Finance BV 4.63%, 1/15/2025 (b) | 346,484 | ||||||
| EUR 100,000 | Ziggo BV 4.25%, 1/15/2027 (b) | 116,069 | ||||||
|
| |||||||
| 2,051,825 | ||||||||
|
| |||||||
Peru — 0.3% | ||||||||
| 400,000 | Nexa Resources SA 5.38%, 5/4/2027 (b) | 381,000 | ||||||
| 140,000 | Southern Copper Corp. 5.88%, 4/23/2045 | 152,600 | ||||||
|
| |||||||
| 533,600 | ||||||||
|
| |||||||
Portugal — 0.2% | ||||||||
| EUR 100,000 | EDP — Energias de Portugal SA (EUR Swap Annual 5 Year + 5.04%), 5.38%, 9/16/2075 (b) (d) | 125,623 | ||||||
SEE NOTES TO FINANCIAL STATEMENTS.
| 26 | J.P. MORGAN EXCHANGE-TRADED FUNDS | AUGUST 31, 2018 | ||||
PRINCIPAL AMOUNT | INVESTMENTS | VALUE | ||||||
Corporate Bonds — continued | ||||||||
Portugal — continued | ||||||||
| EUR 200,000 | EDP Finance BV 2.38%, 3/23/2023 (b) | 248,029 | ||||||
|
| |||||||
| 373,652 | ||||||||
|
| |||||||
Qatar — 0.2% | ||||||||
| 200,000 | ABQ Finance Ltd. 3.50%, 2/22/2022 (b) | 194,250 | ||||||
| 68,400 | Ras Laffan Liquefied Natural Gas Co. Ltd. II 5.30%, 9/30/2020 (b) | 69,768 | ||||||
|
| |||||||
| 264,018 | ||||||||
|
| |||||||
South Korea — 0.1% | ||||||||
| 200,000 | Woori Bank (US Treasury Yield Curve Rate T Note Constant Maturity 5 Year + 3.35%), 5.25%, 5/16/2022 (b) (c) (d) (e) | 195,150 | ||||||
|
| |||||||
Spain — 1.7% | ||||||||
| EUR 100,000 | Bankia SA (EUR Swap Annual 5 Year + 3.35%), 3.38%, 3/15/2027 (b) (d) | 118,772 | ||||||
| EUR 100,000 | Bankinter SA (EUR Swap Annual 5 Year + 2.40%), 2.50%, 4/6/2027 (b) (d) | 117,491 | ||||||
CaixaBank SA | ||||||||
| EUR 400,000 | (EUR Swap Annual 5 Year + 6.50%), 6.75%, 6/13/2024 (b) (c) (d) (e) | 499,830 | ||||||
| EUR 200,000 | (EUR Swap Annual 5 Year + 3.35%), 3.50%, 2/15/2027 (b) (d) | 243,665 | ||||||
| EUR 100,000 | Cellnex Telecom SA 2.88%, 4/18/2025 (b) | 118,569 | ||||||
| EUR 195,402 | eDreams ODIGEO SA 8.50%, 8/1/2021 (b) | 236,426 | ||||||
| EUR 100,000 | Grifols SA 3.20%, 5/1/2025 (b) | 116,194 | ||||||
| EUR 100,000 | LHMC Finco SARL 6.25%, 12/20/2023 (a) | 119,548 | ||||||
| EUR 200,000 | Repsol International Finance BV (EUR Swap Annual 10 Year + 4.20%), 4.50%, 3/25/2075 (b) (d) | 246,918 | ||||||
Telefonica Europe BV | ||||||||
| EUR 200,000 | (EUR Swap Annual 6 Year + 3.80%), 5.00%, 3/31/2020 (b) (c) (d) (e) | 243,938 | ||||||
| EUR 400,000 | (EUR Swap Annual 5 Year + 3.86%), 3.75%, 3/15/2022 (b) (c) (d) (e) | 470,503 | ||||||
PRINCIPAL AMOUNT | INVESTMENTS | VALUE | ||||||
Spain — continued | ||||||||
| EUR 200,000 | (EUR Swap Annual 5 Year + 2.33%), 2.63%, 6/7/2023 (b) (c) (d) (e) | 216,480 | ||||||
Series NC5, | ||||||||
| EUR 100,000 | (EUR Swap Annual 5 Year + 2.45%), 3.00%, 12/4/2023 (b) (c) (d) (e) | 109,251 | ||||||
| EUR 100,000 | (EUR Swap Annual 10 Year + 4.30%), 5.88%, 3/31/2024 (b) (c) (d) (e) | 125,340 | ||||||
|
| |||||||
| 2,982,925 | ||||||||
|
| |||||||
Sri Lanka — 0.1% | ||||||||
| 200,000 | National Savings Bank 8.88%, 9/18/2018 (b) | 200,262 | ||||||
|
| |||||||
Sweden — 1.5% | ||||||||
| 200,000 | Nordea Bank AB (USD Swap Semi 5 Year + 3.39%), 6.13%, 9/23/2024 (a) (c) (d) (e) | 196,756 | ||||||
| SEK 7,000,000 | Nordea Hypotek AB Series 5531, 1.00%, 4/8/2022 (b) | 783,935 | ||||||
| EUR 100,000 | Skandinaviska Enskilda Banken AB (EUR Swap Annual 5 Year + 1.45%), 2.50%, 5/28/2026 (b) (d) | 121,055 | ||||||
| SEK 6,000,000 | Stadshypotek AB Series 1586, 4.50%, 9/21/2022 (b) | 762,935 | ||||||
| EUR 125,000 | Telefonaktiebolaget LM Ericsson 1.88%, 3/1/2024 (b) | 143,869 | ||||||
| EUR 180,000 | Verisure Holding AB 6.00%, 11/1/2022 (b) | 217,052 | ||||||
| EUR 100,000 | Verisure Midholding AB 5.75%, 12/1/2023 (b) | 116,860 | ||||||
Volvo Car AB | ||||||||
| EUR 100,000 | 3.25%, 5/18/2021 (b) | 124,299 | ||||||
| EUR 100,000 | 2.00%, 1/24/2025 (b) | 114,901 | ||||||
|
| |||||||
| 2,581,662 | ||||||||
|
| |||||||
Switzerland — 1.3% | ||||||||
Credit Suisse Group AG | ||||||||
| 450,000 | (USD Swap Semi 5 Year + 4.60%), 7.50%, 12/11/2023 (a) (c) (d) (e) | 478,125 | ||||||
| 200,000 | (USD Swap Semi 5 Year + 4.60%), 7.50%, 12/11/2023 (a) (c) (d) (e) | 212,500 | ||||||
| 250,000 | 4.28%, 1/9/2028 (a) | 245,872 | ||||||
SEE NOTES TO FINANCIAL STATEMENTS.
| AUGUST 31, 2018 | J.P. MORGAN EXCHANGE-TRADED FUNDS | 27 | ||||||
JPMorgan Global Bond Opportunities ETF
SCHEDULE OF PORTFOLIO INVESTMENTS
AS OF AUGUST 31, 2018 (Unaudited) (continued)
(Amounts in U.S. Dollars, unless otherwise noted)
PRINCIPAL AMOUNT | INVESTMENTS | VALUE | ||||||
Corporate Bonds — continued | ||||||||
Switzerland — continued | ||||||||
| EUR 100,000 | Dufry One BV 2.50%, 10/15/2024 (b) | 117,186 | ||||||
| GBP 100,000 | Glencore Finance Europe Ltd. 6.00%, 4/3/2022 (b) (f) | 145,065 | ||||||
UBS Group AG | ||||||||
| 220,000 | (USD Swap Semi 5 Year + 5.46%), 7.13%, 2/19/2020 (b) (c) (d) (e) | 226,600 | ||||||
| EUR 600,000 | (EUR Swap Annual 5 Year + 5.29%), 5.75%, 2/19/2022 (b) (c) (d) (e) | 772,973 | ||||||
|
| |||||||
| 2,198,321 | ||||||||
|
| |||||||
Turkey — 0.3% | ||||||||
| 210,000 | Akbank Turk A/S (USD Swap Semi 5 Year + 4.03%), 6.80%, 4/27/2028 (b) (d) | 121,800 | ||||||
| 260,000 | Petkim Petrokimya Holding A/S 5.88%, 1/26/2023 (b) | 221,325 | ||||||
| 210,000 | Turkiye Garanti Bankasi A/S 5.25%, | 172,200 | ||||||
|
| |||||||
| 515,325 | ||||||||
|
| |||||||
United Arab Emirates — 0.0% (h) | ||||||||
| 47,000 | Shelf Drilling Holdings Ltd. 8.25%, | 47,764 | ||||||
|
| |||||||
United Kingdom — 3.3% | ||||||||
BAT Capital Corp. | ||||||||
| 270,000 | 3.56%, 8/15/2027 (a) | 252,899 | ||||||
| 315,000 | 4.39%, 8/15/2037 (a) | 293,104 | ||||||
| EUR 200,000 | Fiat Chrysler Automobiles NV 3.75%, 3/29/2024 (b) | 250,634 | ||||||
Fiat Chrysler Finance Europe SA | ||||||||
| EUR 125,000 | 4.75%, 3/22/2021 (b) | 158,878 | ||||||
| EUR 100,000 | 4.75%, 7/15/2022 (b) | 129,855 | ||||||
HSBC Holdings plc | ||||||||
| 280,000 | 3.40%, 3/8/2021 | 280,016 | ||||||
| EUR 220,000 | (EUR Swap Annual 5 Year + 5.34%), 6.00%, 9/29/2023 (b) (c) (d) (e) | 286,328 | ||||||
| 237,000 | (ICE LIBOR USD 3 Month + 1.00%), 3.32%, 5/18/2024 (d) | 237,661 | ||||||
| 200,000 | (USD ICE Swap Rate 5 Year + 4.37%), 6.38%, 3/30/2025 (c) (d) (e) | 200,500 | ||||||
Iceland Bondco plc | ||||||||
| GBP 125,000 | 4.63%, 3/15/2025 (b) | 147,664 | ||||||
| GBP 100,000 | 4.63%, 3/15/2025 (a) | 118,131 | ||||||
PRINCIPAL AMOUNT | INVESTMENTS | VALUE | ||||||
United Kingdom — continued | ||||||||
| GBP 100,000 | Jaguar Land Rover Automotive plc 3.88%, 3/1/2023 (b) | 125,047 | ||||||
| 200,000 | Lloyds Banking Group plc 4.58%, 12/10/2025 | 197,045 | ||||||
| EUR 100,000 | NGG Finance plc (EUR Swap Annual 7 Year + 2.88%), 4.25%, 6/18/2076 (b) (d) | 122,895 | ||||||
| EUR 200,000 | Nomad Foods Bondco plc 3.25%, 5/15/2024 (b) | 234,464 | ||||||
Royal Bank of Scotland Group plc | ||||||||
| 200,000 | (USD Swap Semi 5 Year + 7.60%), 8.63%, 8/15/2021 (c) (d) (e) | 214,080 | ||||||
| 252,000 | 6.10%, 6/10/2023 | 263,198 | ||||||
| 400,000 | Santander UK Group Holdings plc 3.57%, 1/10/2023 | 391,157 | ||||||
| EUR 200,000 | Sky plc 1.50%, 9/15/2021 (b) | 240,374 | ||||||
| 200,000 | Standard Chartered plc (USD Swap Semi 5 Year + 5.72%), 7.75%, | 207,250 | ||||||
| EUR 200,000 | Synlab Unsecured Bondco plc | 246,718 | ||||||
Tesco Corporate Treasury Services plc | ||||||||
| EUR 250,000 | 2.13%, 11/12/2020 (b) | 300,429 | ||||||
| EUR 400,000 | 2.50%, 7/1/2024 (b) | 492,516 | ||||||
| EUR 200,000 | Virgin Media Finance plc 4.50%, 1/15/2025 (b) | 235,932 | ||||||
| EUR 100,000 | Worldpay Finance plc 3.75%, 11/15/2022 (b) | 125,361 | ||||||
|
| |||||||
| 5,752,136 | ||||||||
|
| |||||||
United States — 30.4% | ||||||||
| 120,000 | 21st Century Fox America, Inc. 4.95%, 10/15/2045 | 131,237 | ||||||
| 104,000 | Acadia Healthcare Co., Inc. 6.50%, 3/1/2024 | 107,770 | ||||||
| 120,000 | ACCO Brands Corp. 5.25%, | 119,400 | ||||||
| 25,000 | ACE Cash Express, Inc. 12.00%, | 26,737 | ||||||
| EUR 100,000 | Adient Global Holdings Ltd. 3.50%, | 108,455 | ||||||
| 154,000 | ADT Corp. (The) 4.13%, 6/15/2023 | 146,492 | ||||||
| 95,000 | AECOM 5.88%, 10/15/2024 | 101,402 | ||||||
| 100,000 | AES Corp. 5.50%, 4/15/2025 | 102,750 | ||||||
| 30,000 | Ahern Rentals, Inc. 7.38%, 5/15/2023 (a) | 29,514 | ||||||
SEE NOTES TO FINANCIAL STATEMENTS.
| 28 | J.P. MORGAN EXCHANGE-TRADED FUNDS | AUGUST 31, 2018 | ||||
PRINCIPAL AMOUNT | INVESTMENTS | VALUE | ||||||
Corporate Bonds — continued | ||||||||
United States — continued | ||||||||
| 45,000 | Air Lease Corp. 3.00%, 9/15/2023 | 42,905 | ||||||
| 70,000 | Air Medical Group Holdings, Inc. 6.38%, 5/15/2023 (a) | 63,000 | ||||||
| 25,000 | AK Steel Corp. 7.00%, 3/15/2027 | 23,687 | ||||||
Albertsons Cos. LLC | ||||||||
| 184,000 | 6.63%, 6/15/2024 | 177,560 | ||||||
| 25,000 | 5.75%, 3/15/2025 | 22,625 | ||||||
| 124,000 | Alliance Data Systems Corp. 5.38%, | 124,620 | ||||||
Allison Transmission, Inc. | ||||||||
| 20,000 | 5.00%, 10/1/2024 (a) | 19,700 | ||||||
| 50,000 | 4.75%, 10/1/2027 (a) | 47,000 | ||||||
Ally Financial, Inc. | ||||||||
| 80,000 | 4.25%, 4/15/2021 | 80,214 | ||||||
| 75,000 | 4.13%, 2/13/2022 | 74,625 | ||||||
| 375,000 | 4.63%, 5/19/2022 | 377,344 | ||||||
Altria Group, Inc. | ||||||||
| 40,000 | 4.00%, 1/31/2024 | 40,853 | ||||||
| 15,000 | 4.25%, 8/9/2042 | 13,977 | ||||||
| 115,000 | 3.88%, 9/16/2046 | 102,138 | ||||||
| 155,000 | AMC Entertainment Holdings, Inc. 5.75%, 6/15/2025 | 150,448 | ||||||
| 184,000 | AMC Networks, Inc. 5.00%, 4/1/2024 | 181,010 | ||||||
American Axle & Manufacturing, Inc. | ||||||||
| 241,000 | 6.63%, 10/15/2022 | 247,025 | ||||||
| 85,000 | 6.25%, 4/1/2025 | 84,575 | ||||||
| 43,000 | 6.50%, 4/1/2027 | 42,570 | ||||||
| 180,000 | American Tower Corp. REIT, 5.00%, 2/15/2024 | 188,954 | ||||||
| 155,000 | American Tower Trust #1 REIT, 3.65%, 3/23/2028 (a) | 152,725 | ||||||
| 210,000 | American Woodmark Corp. 4.88%, | 202,125 | ||||||
| 130,000 | Amkor Technology, Inc. 6.38%, 10/1/2022 | 132,275 | ||||||
| 80,000 | AMN Healthcare, Inc. 5.13%, 10/1/2024 (a) | 77,700 | ||||||
| 10,000 | Analog Devices, Inc. 4.50%, 12/5/2036 | 9,790 | ||||||
Andeavor Logistics LP | ||||||||
| 9,000 | 6.25%, 10/15/2022 | 9,315 | ||||||
| 106,000 | 5.25%, 1/15/2025 | 108,518 | ||||||
Antero Resources Corp. | ||||||||
| 328,000 | 5.13%, 12/1/2022 | 331,280 | ||||||
PRINCIPAL AMOUNT | INVESTMENTS | VALUE | ||||||
United States — continued | ||||||||
| EUR 100,000 | Aramark International Finance SARL 3.13%, 4/1/2025 (b) | 120,311 | ||||||
| 337,000 | Arconic, Inc. 5.90%, 2/1/2027 | 341,246 | ||||||
| 75,000 | AT&T, Inc. 4.75%, 5/15/2046 | 67,654 | ||||||
Avis Budget Car Rental LLC | ||||||||
| 115,000 | 5.50%, 4/1/2023 | 114,425 | ||||||
| 45,000 | 6.38%, 4/1/2024 (a) | 44,775 | ||||||
| 16,000 | 5.25%, 3/15/2025 (a) | 15,000 | ||||||
| EUR 100,000 | Avis Budget Finance plc 4.13%, 11/15/2024 (b) | 118,977 | ||||||
| EUR 100,000 | Axalta Coating Systems LLC 4.25%, | 121,867 | ||||||
| 20,000 | B&G Foods, Inc. 5.25%, 4/1/2025 | 19,425 | ||||||
| EUR 250,000 | Ball Corp. 4.38%, 12/15/2023 | 329,174 | ||||||
Bank of America Corp. | ||||||||
| 270,000 | 2.63%, 4/19/2021 | 265,724 | ||||||
| 810,000 | (ICE LIBOR USD 3 Month + 0.79%), 3.00%, 12/20/2023 (d) | 788,538 | ||||||
| 230,000 | Series DD, (ICE LIBOR USD 3 Month + 4.55%), 6.30%, 3/10/2026 (c) (d) (e) | 246,100 | ||||||
| 180,000 | Series L, 4.18%, 11/25/2027 | 175,822 | ||||||
| 335,000 | Series FF, (ICE LIBOR USD 3 Month + 2.93%), 5.87%, | 335,000 | ||||||
Bausch Health Cos., Inc. | ||||||||
| 74,000 | 6.50%, 3/15/2022 (a) | 76,590 | ||||||
| EUR 300,000 | 4.50%, 5/15/2023 (b) | 339,519 | ||||||
| 323,000 | 5.88%, 5/15/2023 (a) | 308,788 | ||||||
| 160,000 | 7.00%, 3/15/2024 (a) | 168,800 | ||||||
| 445,000 | 6.13%, 4/15/2025 (a) | 413,850 | ||||||
| EUR 100,000 | Becton Dickinson and Co. 1.40%, 5/24/2023 | 117,687 | ||||||
| EUR 200,000 | Belden, Inc. 3.38%, 7/15/2027 (b) | 225,534 | ||||||
Berry Global, Inc. | ||||||||
| 75,000 | 5.13%, 7/15/2023 | 74,625 | ||||||
| 13,000 | 4.50%, 2/15/2026 (a) | 12,187 | ||||||
| 110,000 | Blue Cube Spinco LLC 10.00%, 10/15/2025 | 127,325 | ||||||
| 130,000 | Blue Racer Midstream LLC 6.13%, | 132,597 | ||||||
Boyd Gaming Corp. | ||||||||
| 80,000 | 6.88%, 5/15/2023 | 84,100 | ||||||
| 89,000 | 6.38%, 4/1/2026 | 91,114 | ||||||
| 27,000 | Brink’s Co. (The) 4.63%, 10/15/2027 (a) | 25,245 | ||||||
SEE NOTES TO FINANCIAL STATEMENTS.
| AUGUST 31, 2018 | J.P. MORGAN EXCHANGE-TRADED FUNDS | 29 | ||||||
JPMorgan Global Bond Opportunities ETF
SCHEDULE OF PORTFOLIO INVESTMENTS
AS OF AUGUST 31, 2018 (Unaudited) (continued)
(Amounts in U.S. Dollars, unless otherwise noted)
PRINCIPAL AMOUNT | INVESTMENTS | VALUE | ||||||
Corporate Bonds — continued | ||||||||
United States — continued | ||||||||
| 25,000 | Bristow Group, Inc. 8.75%, 3/1/2023 (a) | 23,875 | ||||||
| 210,000 | Broadcom Corp. 3.63%, 1/15/2024 | 203,299 | ||||||
Buckeye Partners LP | ||||||||
| 171,000 | 4.15%, 7/1/2023 | 170,090 | ||||||
| 30,000 | 3.95%, 12/1/2026 | 27,591 | ||||||
| 119,000 | Cablevision Systems Corp. 8.00%, 4/15/2020 | 125,247 | ||||||
| 22,000 | California Resources Corp. 8.00%, | 19,717 | ||||||
| 45,000 | Callon Petroleum Co. 6.13%, 10/1/2024 | 46,012 | ||||||
| 87,000 | Calpine Corp. 5.25%, 6/1/2026 (a) | 82,135 | ||||||
| 221,000 | Camelot Finance SA 7.88%, 10/15/2024 (a) | 220,171 | ||||||
Capital One Financial Corp. | ||||||||
| 175,000 | 4.20%, 10/29/2025 | 172,185 | ||||||
| 180,000 | 3.80%, 1/31/2028 | 171,295 | ||||||
| 47,000 | Carrizo Oil & Gas, Inc. 6.25%, 4/15/2023 | 48,057 | ||||||
| 15,000 | Catalent Pharma Solutions, Inc. 4.88%, 1/15/2026 (a) | 14,306 | ||||||
CCO Holdings LLC | ||||||||
| 84,000 | 5.88%, 4/1/2024 (a) | 85,680 | ||||||
| 865,000 | 5.75%, 2/15/2026 (a) | 865,000 | ||||||
| 280,000 | 5.13%, 5/1/2027 (a) | 267,050 | ||||||
| 134,000 | Centene Corp. 6.13%, 2/15/2024 | 140,867 | ||||||
Central Garden & Pet Co. | ||||||||
| 20,000 | 6.13%, 11/15/2023 | 20,625 | ||||||
| 75,000 | 5.13%, 2/1/2028 | 70,594 | ||||||
CenturyLink, Inc. | ||||||||
| 25,000 | Series S, 6.45%, 6/15/2021 | 26,000 | ||||||
| 30,000 | Series T, 5.80%, 3/15/2022 | 30,666 | ||||||
| 150,000 | Series W, 6.75%, 12/1/2023 | 156,375 | ||||||
| 240,000 | CF Industries, Inc. 4.50%, 12/1/2026 (a) | 239,540 | ||||||
| 255,000 | Charter Communications Operating LLC 4.91%, 7/23/2025 | 260,016 | ||||||
Chemours Co. (The) | ||||||||
| 40,000 | 6.63%, 5/15/2023 | 41,900 | ||||||
| 42,000 | 7.00%, 5/15/2025 | 44,835 | ||||||
| 153,000 | Cheniere Corpus Christi Holdings LLC 5.88%, 3/31/2025 | 162,562 | ||||||
Chesapeake Energy Corp. | ||||||||
| 73,000 | 8.00%, 12/15/2022 (a) | 76,741 | ||||||
| 45,000 | 8.00%, 1/15/2025 | 45,956 | ||||||
| 65,000 | 8.00%, 6/15/2027 | 65,813 | ||||||
PRINCIPAL AMOUNT | INVESTMENTS | VALUE | ||||||
United States — continued | ||||||||
| 134,000 | Cincinnati Bell, Inc. 7.00%, 7/15/2024 (a) | 117,920 | ||||||
| 10,000 | Cinemark USA, Inc. 4.88%, 6/1/2023 | 9,875 | ||||||
| 165,000 | CIT Group, Inc. 5.00%, 8/15/2022 | 168,300 | ||||||
| 27,000 | CITGO Petroleum Corp. 6.25%, 8/15/2022 (a) | 27,202 | ||||||
Citigroup, Inc. | ||||||||
| 100,000 | (ICE LIBOR USD 3 Month + 0.72%), 3.14%, 1/24/2023 (d) | 98,562 | ||||||
| 200,000 | Series T, (ICE LIBOR USD 3 Month + 4.52%), 6.25%, 8/15/2026 (c) (d) (e) | 209,750 | ||||||
Clear Channel Worldwide Holdings, Inc. | ||||||||
| 172,000 | Series B, 7.63%, 3/15/2020 | 172,645 | ||||||
| 505,000 | Series B, 6.50%, 11/15/2022 | 516,362 | ||||||
| 32,000 | Clearwater Paper Corp. 4.50%, 2/1/2023 | 29,680 | ||||||
| 25,000 | CNG Holdings, Inc. 9.38%, 5/15/2020 (a) | 24,875 | ||||||
| 15,000 | CNO Financial Group, Inc. 5.25%, 5/30/2025 | 15,225 | ||||||
| 21,000 | CNX Resources Corp. 5.88%, 4/15/2022 | 20,999 | ||||||
| 75,000 | Cogent Communications Finance, Inc. 5.63%, 4/15/2021 (a) | 75,375 | ||||||
| 25,000 | Cogent Communications Group, Inc. 5.38%, 3/1/2022 (a) | 25,437 | ||||||
Comcast Corp. | ||||||||
| 105,000 | 4.60%, 8/15/2045 | 103,246 | ||||||
| 90,000 | 4.00%, 3/1/2048 | 81,314 | ||||||
| 80,000 | Commercial Metals Co. 4.88%, 5/15/2023 | 78,000 | ||||||
| 330,000 | CommScope Technologies LLC 6.00%, 6/15/2025 (a) | 341,550 | ||||||
Community Health Systems, Inc. | ||||||||
| 33,000 | 5.13%, 8/1/2021 | 31,845 | ||||||
| 21,000 | 6.25%, 3/31/2023 | 19,950 | ||||||
| 37,000 | 8.63%, 1/15/2024 (a) | 38,572 | ||||||
| 60,000 | 8.13%, 6/30/2024 (a) | 49,350 | ||||||
| 53,000 | Concho Resources, Inc. 3.75%, 10/1/2027 | 50,679 | ||||||
| EUR 200,000 | Constellium NV 4.25%, 2/15/2026 (b) | 235,785 | ||||||
| 105,000 | Cooper-Standard Automotive, Inc. 5.63%, 11/15/2026 (a) | 103,425 | ||||||
SEE NOTES TO FINANCIAL STATEMENTS.
| 30 | J.P. MORGAN EXCHANGE-TRADED FUNDS | AUGUST 31, 2018 | ||||
PRINCIPAL AMOUNT | INVESTMENTS | VALUE | ||||||
Corporate Bonds — continued | ||||||||
United States — continued | ||||||||
| 70,000 | CoreCivic, Inc. REIT, 4.63%, 5/1/2023 | 67,900 | ||||||
Coty, Inc. | ||||||||
| EUR 150,000 | 4.00%, 4/15/2023 (b) | 172,455 | ||||||
| 75,000 | 6.50%, 4/15/2026 (a) | 70,547 | ||||||
| 41,000 | Covanta Holding Corp. 5.88%, 7/1/2025 | 40,876 | ||||||
| 35,000 | Crestwood Midstream Partners LP 6.25%, 4/1/2023 (f) | 36,094 | ||||||
| 74,000 | Crown Americas LLC 4.25%, 9/30/2026 | 67,895 | ||||||
Crown European Holdings SA | ||||||||
| EUR 150,000 | 4.00%, 7/15/2022 (b) | 191,088 | ||||||
| EUR 125,000 | 2.63%, 9/30/2024 (b) | 146,847 | ||||||
CSC Holdings LLC | ||||||||
| 27,000 | 5.25%, 6/1/2024 | 26,190 | ||||||
| 210,000 | 6.63%, 10/15/2025 (a) | 218,137 | ||||||
| 10,000 | CSI Compressco LP 7.50%, 4/1/2025 (a) | 10,075 | ||||||
| 20,000 | CURO Financial Technologies Corp. 12.00%, 3/1/2022 (a) | 22,050 | ||||||
| 82,000 | CVR Partners LP 9.25%, 6/15/2023 (a) | 87,432 | ||||||
CVS Health Corp. | ||||||||
| 100,000 | 4.30%, 3/25/2028 | 99,246 | ||||||
| 65,000 | 4.78%, 3/25/2038 | 64,662 | ||||||
| 210,000 | Dana Financing Luxembourg SARL 6.50%, 6/1/2026 (a) | 215,512 | ||||||
| EUR 125,000 | Darling Global Finance BV 3.63%, | 148,039 | ||||||
DaVita, Inc. | ||||||||
| 82,000 | 5.13%, 7/15/2024 | 79,058 | ||||||
| 115,000 | 5.00%, 5/1/2025 | 108,962 | ||||||
| 105,000 | DCP Midstream Operating LP 3.88%, 3/15/2023 | 102,375 | ||||||
| 60,000 | Delek Logistics Partners LP 6.75%, 5/15/2025 | 60,000 | ||||||
Dell International LLC | ||||||||
| 90,000 | 5.88%, 6/15/2021 (a) | 92,596 | ||||||
| 195,000 | 7.13%, 6/15/2024 (a) | 208,465 | ||||||
| 255,000 | 6.02%, 6/15/2026 (a) | 270,140 | ||||||
| 15,000 | Diamond Offshore Drilling, Inc. 7.88%, 8/15/2025 | 15,300 | ||||||
| 38,000 | Diamondback Energy, Inc. 4.75%, 11/1/2024 | 38,237 | ||||||
DISH DBS Corp. | ||||||||
| 10,000 | 6.75%, 6/1/2021 | 10,150 | ||||||
PRINCIPAL AMOUNT | INVESTMENTS | VALUE | ||||||
United States — continued | ||||||||
| 157,000 | 5.88%, 7/15/2022 | 150,720 | ||||||
| 125,000 | 5.00%, 3/15/2023 | 111,250 | ||||||
| 415,000 | 5.88%, 11/15/2024 | 361,050 | ||||||
| 127,000 | 7.75%, 7/1/2026 | 114,617 | ||||||
| 65,000 | DJO Finance LLC 8.13%, 6/15/2021 (a) | 67,132 | ||||||
| 39,000 | Dole Food Co., Inc. 7.25%, 6/15/2025 (a) | 38,220 | ||||||
| 25,000 | Downstream Development Authority of the Quapaw Tribe of Oklahoma 10.50%, 2/15/2023 (a) | 24,937 | ||||||
| 40,000 | Eldorado Resorts, Inc. 7.00%, 8/1/2023 | 42,132 | ||||||
Encompass Health Corp. | ||||||||
| 85,000 | 5.75%, 11/1/2024 | 86,062 | ||||||
| 105,000 | 5.75%, 9/15/2025 | 105,788 | ||||||
| 67,000 | Endo Finance LLC 5.75%, 1/15/2022 (a) | 61,975 | ||||||
| 70,000 | Energizer Holdings, Inc. 5.50%, 6/15/2025 (a) | 69,825 | ||||||
| 57,000 | Energy Transfer Equity LP 5.88%, 1/15/2024 | 60,562 | ||||||
| 11,000 | Ensco plc 5.20%, 3/15/2025 | 9,199 | ||||||
| 108,000 | Entegris, Inc. 4.63%, 2/10/2026 (a) | 104,085 | ||||||
| 5,000 | Enterprise Development Authority (The) 12.00%, 7/15/2024 (a) | 4,856 | ||||||
Enterprise Products Operating LLC | ||||||||
| 125,000 | Series E, (ICE LIBOR USD 3 Month + 3.03%), 5.25%, 8/16/2077 (d) | 118,125 | ||||||
| 28,000 | (ICE LIBOR USD 3 Month + 2.57%), 5.38%, 2/15/2078 (d) | 26,161 | ||||||
| 134,000 | Envision Healthcare Corp. 5.63%, 7/15/2022 | 137,350 | ||||||
EP Energy LLC | ||||||||
| 81,000 | 9.38%, 5/1/2024 (a) | 63,788 | ||||||
| 87,000 | 8.00%, 11/29/2024 (a) | 87,217 | ||||||
| 68,000 | 8.00%, 2/15/2025 (a) | 49,130 | ||||||
| 172,000 | 7.75%, 5/15/2026 (a) | 175,870 | ||||||
Equinix, Inc. | ||||||||
| 60,000 | REIT, 5.38%, 4/1/2023 | 61,275 | ||||||
| EUR 325,000 | REIT, 2.88%, 10/1/2025 | 370,154 | ||||||
| 105,000 | REIT, 5.88%, 1/15/2026 | 108,937 | ||||||
| 133,000 | ESH Hospitality, Inc. REIT, 5.25%, 5/1/2025 (a) | 128,844 | ||||||
SEE NOTES TO FINANCIAL STATEMENTS.
| AUGUST 31, 2018 | J.P. MORGAN EXCHANGE-TRADED FUNDS | 31 | ||||||
JPMorgan Global Bond Opportunities ETF
SCHEDULE OF PORTFOLIO INVESTMENTS
AS OF AUGUST 31, 2018 (Unaudited) (continued)
(Amounts in U.S. Dollars, unless otherwise noted)
PRINCIPAL AMOUNT | INVESTMENTS | VALUE | ||||||
Corporate Bonds — continued | ||||||||
United States — continued | ||||||||
| 56,000 | Exela Intermediate LLC 10.00%, 7/15/2023 (a) | 58,660 | ||||||
| 32,000 | Fidelity & Guaranty Life Holdings, Inc. 5.50%, 5/1/2025 (a) | 31,680 | ||||||
First Data Corp. | ||||||||
| 170,000 | 5.38%, 8/15/2023 (a) | 173,000 | ||||||
| 138,000 | 7.00%, 12/1/2023 (a) | 143,589 | ||||||
| 250,000 | 5.75%, 1/15/2024 (a) | 255,000 | ||||||
| 15,000 | FirstCash, Inc. 5.38%, 6/1/2024 (a) | 15,000 | ||||||
| 295,000 | FirstEnergy Corp. Series B, 3.90%, 7/15/2027 | 289,705 | ||||||
| 115,000 | Ford Motor Co. 5.29%, 12/8/2046 | 102,073 | ||||||
Freeport-McMoRan, Inc. | ||||||||
| 153,000 | 3.55%, 3/1/2022 | 147,645 | ||||||
| 35,000 | 3.88%, 3/15/2023 | 33,687 | ||||||
| 50,000 | 4.55%, 11/14/2024 | 48,125 | ||||||
Frontier Communications Corp. | ||||||||
| 35,000 | 8.75%, 4/15/2022 | 28,175 | ||||||
| 15,000 | 8.50%, 4/1/2026 (a) | 14,112 | ||||||
| 40,000 | FXI Holdings, Inc. 7.88%, 11/1/2024 (a) | 38,550 | ||||||
| 60,000 | Gates Global LLC 6.00%, 7/15/2022 (a) | 60,600 | ||||||
| 90,000 | GCI LLC 6.88%, 4/15/2025 | 93,037 | ||||||
| 200,000 | GE Capital International Funding Co. Unlimited Co. 4.42%, 11/15/2035 | 192,425 | ||||||
| EUR 100,000 | General Electric Co. 1.50%, 5/17/2029 | 112,682 | ||||||
General Motors Co. | ||||||||
| 115,000 | 5.15%, 4/1/2038 | 109,117 | ||||||
| 50,000 | 5.20%, 4/1/2045 | 46,159 | ||||||
| 80,000 | Genesis Energy LP 5.63%, 6/15/2024 | 74,600 | ||||||
GEO Group, Inc. (The) | ||||||||
| 55,000 | REIT, 5.88%, 10/15/2024 | 53,625 | ||||||
| 75,000 | REIT, 6.00%, 4/15/2026 | 72,375 | ||||||
| 20,000 | Gilead Sciences, Inc. 4.00%, 9/1/2036 | 19,347 | ||||||
GLP Capital LP | ||||||||
| 64,000 | 5.38%, 11/1/2023 | 67,360 | ||||||
| 65,000 | 5.25%, 6/1/2025 | 67,600 | ||||||
Golden Nugget, Inc. | ||||||||
| 50,000 | 6.75%, 10/15/2024 (a) | 50,812 | ||||||
PRINCIPAL AMOUNT | INVESTMENTS | VALUE | ||||||
United States — continued | ||||||||
Goldman Sachs Group, Inc. (The) | ||||||||
| 405,000 | Series P, (ICE LIBOR USD 3 Month + 2.87%), 5.00%, 11/10/2022 (c) (d) (e) | 383,127 | ||||||
| 205,000 | (ICE LIBOR USD 3 Month + 0.99%), 2.90%, 7/24/2023 (d) | 198,984 | ||||||
| 130,000 | (ICE LIBOR USD 3 Month + 1.60%), 3.92%, 11/29/2023 (d) | 135,654 | ||||||
| 201,000 | (ICE LIBOR USD 3 Month + 1.17%), 3.48%, 5/15/2026 (d) | 199,997 | ||||||
| 190,000 | Series O, (ICE LIBOR USD 3 Month + 3.83%), 5.30%, 11/10/2026 (c) (d) (e) | 190,095 | ||||||
| 210,000 | 3.85%, 1/26/2027 | 204,320 | ||||||
| 67,000 | (ICE LIBOR USD 3 Month + 1.16%), 3.81%, 4/23/2029 (d) | 64,036 | ||||||
Goodyear Tire & Rubber Co. (The) | ||||||||
| 149,000 | 5.00%, 5/31/2026 | 139,874 | ||||||
| 21,000 | 4.88%, 3/15/2027 | 19,267 | ||||||
| 88,000 | Gulfport Energy Corp. 6.00%, 10/15/2024 | 86,900 | ||||||
| 15,000 | H&E Equipment Services, Inc. 5.63%, 9/1/2025 | 14,892 | ||||||
| 51,000 | Hanesbrands, Inc. 4.88%, 5/15/2026 (a) | 49,087 | ||||||
| 185,000 | Harris Corp. 4.85%, 4/27/2035 | 190,044 | ||||||
HCA, Inc. | ||||||||
| 158,000 | 5.88%, 3/15/2022 | 167,875 | ||||||
| 213,000 | 5.88%, 5/1/2023 | 223,650 | ||||||
| 630,000 | 5.38%, 2/1/2025 | 637,201 | ||||||
| 375,000 | 5.88%, 2/15/2026 | 387,656 | ||||||
Hertz Corp. (The) | ||||||||
| 12,000 | 7.38%, 1/15/2021 | 11,985 | ||||||
| 35,000 | 7.63%, 6/1/2022 (a) | 34,737 | ||||||
| 200,000 | 5.50%, 10/15/2024 (a) | 167,500 | ||||||
| EUR 125,000 | Hertz Holdings Netherlands BV 4.13%, 10/15/2021 (b) | 148,239 | ||||||
Hexion, Inc. | ||||||||
| 60,000 | 6.63%, 4/15/2020 | 56,775 | ||||||
| 10,000 | 9.00%, 11/15/2020 | 8,475 | ||||||
Hilcorp Energy I LP | ||||||||
| 70,000 | 5.00%, 12/1/2024 (a) | 67,637 | ||||||
| 25,000 | 5.75%, 10/1/2025 (a) | 24,813 | ||||||
SEE NOTES TO FINANCIAL STATEMENTS.
| 32 | J.P. MORGAN EXCHANGE-TRADED FUNDS | AUGUST 31, 2018 | ||||
PRINCIPAL AMOUNT | INVESTMENTS | VALUE | ||||||
Corporate Bonds — continued | ||||||||
United States — continued | ||||||||
| 175,000 | Hill-Rom Holdings, Inc. 5.75%, 9/1/2023 (a) | 180,250 | ||||||
| 10,000 | Hilton Domestic Operating Co., Inc. 5.13%, 5/1/2026 (a) | 10,012 | ||||||
| 23,000 | Hilton Grand Vacations Borrower LLC 6.13%, 12/1/2024 | 23,690 | ||||||
Hilton Worldwide Finance LLC | ||||||||
| 65,000 | 4.63%, 4/1/2025 | 64,187 | ||||||
| 53,000 | 4.88%, 4/1/2027 | 52,139 | ||||||
| 76,000 | Holly Energy Partners LP 6.00%, 8/1/2024 (a) | 77,330 | ||||||
| 140,000 | Hologic, Inc. 4.38%, 10/15/2025 (a) | 134,750 | ||||||
| 104,000 | Hughes Satellite Systems Corp. 5.25%, 8/1/2026 | 99,450 | ||||||
Huntsman International LLC | ||||||||
| EUR 200,000 | 5.13%, 4/15/2021 | 257,977 | ||||||
| 135,000 | 5.13%, 11/15/2022 | 139,219 | ||||||
| EUR 100,000 | 4.25%, 4/1/2025 | 133,776 | ||||||
| 45,000 | Icahn Enterprises LP 6.00%, 8/1/2020 | 45,774 | ||||||
| 21,000 | IHS Markit Ltd. 4.00%, 3/1/2026 (a) | 20,149 | ||||||
| 136,000 | Infor Software Parent LLC 7.13% (cash), 5/1/2021 (a) (g) | 137,234 | ||||||
| 226,000 | Infor US, Inc. 6.50%, 5/15/2022 | 228,931 | ||||||
| EUR 200,000 | International Game Technology plc 4.75%, 2/15/2023 (b) | 251,894 | ||||||
| 51,000 | inVentiv Group Holdings, Inc. 7.50%, 10/1/2024 (a) | 53,938 | ||||||
IQVIA, Inc. | ||||||||
| EUR 250,000 | 3.50%, 10/15/2024 (b) | 297,495 | ||||||
| EUR 200,000 | 3.25%, 3/15/2025 (b) | 234,538 | ||||||
| 200,000 | 5.00%, 10/15/2026 (a) | 197,500 | ||||||
| 25,000 | IRB Holding Corp. 6.75%, 2/15/2026 (a) | 23,875 | ||||||
| 676,000 | Iron Mountain, Inc. REIT, 5.75%, 8/15/2024 | 670,085 | ||||||
| 140,000 | ITC Holdings Corp. 3.35%, 11/15/2027 | 132,591 | ||||||
| 125,000 | Jack Ohio Finance LLC 6.75%, 11/15/2021 (a) | 129,375 | ||||||
| 20,000 | Jaguar Holding Co. II 6.38%, 8/1/2023 (a) | 20,100 | ||||||
| 150,000 | JBS USA LUX SA 6.75%, 2/15/2028 (a) | 143,250 | ||||||
| 7,000 | JC Penney Corp., Inc. 5.88%, 7/1/2023 (a) | 6,283 | ||||||
PRINCIPAL AMOUNT | INVESTMENTS | VALUE | ||||||
United States — continued | ||||||||
| 70,000 | Jeld-Wen, Inc. 4.63%, 12/15/2025 (a) | 65,275 | ||||||
| 14,000 | Kennedy-Wilson, Inc. 5.88%, 4/1/2024 | 13,878 | ||||||
| 90,000 | Kinetic Concepts, Inc. 7.88%, 2/15/2021 (a) | 93,037 | ||||||
| 55,000 | Kraft Heinz Foods Co. 4.38%, 6/1/2046 | 48,060 | ||||||
| EUR 100,000 | Kraton Polymers LLC 5.25%, 5/15/2026 (a) | 119,853 | ||||||
| 135,000 | Kroger Co. (The) 2.65%, 10/15/2026 | 121,483 | ||||||
| EUR 100,000 | Kronos International, Inc. 3.75%, 9/15/2025 (a) | 113,753 | ||||||
L Brands, Inc. | ||||||||
| 85,000 | 5.63%, 10/15/2023 | 85,000 | ||||||
| 18,000 | 5.25%, 2/1/2028 | 15,480 | ||||||
| 70,000 | 6.75%, 7/1/2036 | 57,050 | ||||||
| 75,000 | Lamar Media Corp. 5.75%, 2/1/2026 | 77,906 | ||||||
Lennar Corp. | ||||||||
| 103,000 | 5.88%, 11/15/2024 | 106,873 | ||||||
| 25,000 | 4.75%, 11/29/2027 | 23,844 | ||||||
| 284,000 | Level 3 Financing, Inc. 5.25%, 3/15/2026 | 278,348 | ||||||
| 350,000 | Level 3 Parent LLC 5.75%, 12/1/2022 | 352,625 | ||||||
| 17,000 | LGI Homes, Inc. 6.88%, 7/15/2026 (a) | 16,894 | ||||||
| 15,000 | Liberty Mutual Group, Inc. 7.80%, 3/15/2037 (a) | 17,700 | ||||||
| 172,000 | Live Nation Entertainment, Inc. 4.88%, 11/1/2024 (a) | 169,205 | ||||||
| 69,000 | LKQ Corp. 4.75%, 5/15/2023 | 69,172 | ||||||
| EUR 100,000 | LKQ Italia Bondco SpA 3.88%, 4/1/2024 (b) | 123,040 | ||||||
| 38,000 | LPL Holdings, Inc. 5.75%, 9/15/2025 (a) | 37,145 | ||||||
| 53,000 | Marathon Petroleum Corp. 4.75%, 9/15/2044 | 51,441 | ||||||
| 16,000 | Marriott Ownership Resorts, Inc. 6.50%, 9/15/2026 (a) | 16,320 | ||||||
| 125,000 | Martin Marietta Materials, Inc. 3.50%, 12/15/2027 | 115,969 | ||||||
| 49,000 | Martin Midstream Partners LP 7.25%, 2/15/2021 | 48,878 | ||||||
SEE NOTES TO FINANCIAL STATEMENTS.
| AUGUST 31, 2018 | J.P. MORGAN EXCHANGE-TRADED FUNDS | 33 | ||||||
JPMorgan Global Bond Opportunities ETF
SCHEDULE OF PORTFOLIO INVESTMENTS
AS OF AUGUST 31, 2018 (Unaudited) (continued)
(Amounts in U.S. Dollars, unless otherwise noted)
PRINCIPAL AMOUNT | INVESTMENTS | VALUE | ||||||
Corporate Bonds — continued | ||||||||
United States — continued | ||||||||
Masco Corp. | ||||||||
| 195,000 | 4.38%, 4/1/2026 | 195,185 | ||||||
| 30,000 | 3.50%, 11/15/2027 | 27,793 | ||||||
| 167,000 | MasTec, Inc. 4.88%, 3/15/2023 | 164,077 | ||||||
Mattel, Inc. | ||||||||
| 10,000 | 3.15%, 3/15/2023 | 8,740 | ||||||
| 104,000 | 6.75%, 12/31/2025 (a) | 101,862 | ||||||
| 20,000 | MetLife, Inc. 6.40%, 12/15/2036 | 21,350 | ||||||
MGM Resorts International | ||||||||
| 477,000 | 6.00%, 3/15/2023 | 495,198 | ||||||
| 55,000 | 4.63%, 9/1/2026 | 51,837 | ||||||
Morgan Stanley | ||||||||
| 100,000 | Series H, (ICE LIBOR USD 3 Month + 3.61%), 5.45%, 7/15/2019 (c) (d) (e) | 101,375 | ||||||
| 100,000 | Series J, (ICE LIBOR USD 3 Month + 3.81%), 5.55%, 7/15/2020 (c) (d) (e) | 103,125 | ||||||
| 200,000 | 3.63%, 1/20/2027 | 192,491 | ||||||
| 15,000 | (ICE LIBOR USD 3 Month + 1.14%), 3.77%, 1/24/2029 (d) | 14,463 | ||||||
| 240,000 | (ICE LIBOR USD 3 Month + 1.46%), 3.97%, 7/22/2038 (d) | 224,649 | ||||||
| 59,000 | MPH Acquisition Holdings LLC 7.13%, 6/1/2024 (a) | 61,065 | ||||||
| 270,000 | Mylan, Inc. 4.20%, 11/29/2023 | 268,696 | ||||||
Nabors Industries, Inc. | ||||||||
| 53,000 | 5.50%, 1/15/2023 | 52,836 | ||||||
| 9,000 | 5.10%, 9/15/2023 | 8,693 | ||||||
| 90,000 | 5.75%, 2/1/2025 (a) | 86,567 | ||||||
| 109,000 | Nationstar Mortgage LLC 6.50%, 7/1/2021 | 109,000 | ||||||
Netflix, Inc. | ||||||||
| 70,000 | 4.38%, 11/15/2026 | 65,953 | ||||||
| 175,000 | 4.88%, 4/15/2028 (a) | 165,813 | ||||||
| 123,000 | New Albertsons LP 8.00%, 5/1/2031 | 104,242 | ||||||
| 33,000 | New Home Co., Inc. (The) 7.25%, 4/1/2022 | 33,495 | ||||||
| 10,000 | NextEra Energy Operating Partners LP 4.25%, 9/15/2024 (a) | 9,750 | ||||||
Nielsen Co. Luxembourg SARL (The) | ||||||||
| 110,000 | 5.50%, 10/1/2021 (a) | 110,138 | ||||||
| 78,000 | Nielsen Finance LLC 5.00%, 4/15/2022 (a) | 75,742 | ||||||
PRINCIPAL AMOUNT | INVESTMENTS | VALUE | ||||||
United States — continued | ||||||||
| 410,000 | Noble Energy, Inc. 3.85%, 1/15/2028 | 391,003 | ||||||
Noble Holding International Ltd. | ||||||||
| 7,000 | 7.75%, 1/15/2024 | 6,843 | ||||||
| 45,000 | 7.88%, 2/O1/2026 (a) | 46,125 | ||||||
| 73,000 | Novelis Corp. 5.88%, 9/30/2026 (a) | 71,087 | ||||||
| 93,000 | NRG Energy, Inc. 6.63%, 1/15/2027 | 97,301 | ||||||
| 44,000 | NRG Yield Operating LLC 5.00%, 9/15/2026 | 42,130 | ||||||
| 50,000 | Nuance Communications, Inc. 5.63%, 12/15/2026 | 49,813 | ||||||
| 20,000 | NVA Holdings, Inc. 6.88%, 4/1/2026 (a) | 19,875 | ||||||
| 160,000 | Oasis Petroleum, Inc. 6.88%, 1/15/2023 | 163,400 | ||||||
| EUR 150,000 | OI European Group BV 3.13%, 11/15/2024 (b) | 178,636 | ||||||
| 130,000 | ONEOK, Inc. 4.00%, 7/13/2027 | 126,918 | ||||||
| 75,000 | Outfront Media Capital LLC 5.88%, 3/15/2025 | 75,656 | ||||||
| 165,000 | Owens Corning 4.30%, 7/15/2047 | 136,597 | ||||||
Party City Holdings, Inc. | ||||||||
| 10,000 | 6.13%, 8/15/2023 (a) | 10,150 | ||||||
| 27,000 | 6.63%, 8/1/2026 (a) | 27,203 | ||||||
| 20,000 | Pattern Energy Group, Inc. 5.88%, 2/1/2024 (a) | 20,150 | ||||||
| 22,000 | PBF Holding Co. LLC 7.25%, 6/15/2025 | 23,210 | ||||||
| 35,000 | Penske Automotive Group, Inc. 5.75%, 10/1/2022 | 35,700 | ||||||
PetSmart, Inc. | ||||||||
| 87,000 | 7.13%, 3/15/2023 (a) | 58,508 | ||||||
| 85,000 | 5.88%, 6/1/2025 (a) | 68,956 | ||||||
| 14,000 | 8.88%, 6/1/2025 (a) | 9,450 | ||||||
| 60,000 | Pilgrim’s Pride Corp. 5.75%, 3/15/2025 (a) | 58,050 | ||||||
| 86,000 | PolyOne Corp. 5.25%, 3/15/2023 | 88,498 | ||||||
Post Holdings, Inc. | ||||||||
| 10,000 | 5.50%, 3/1/2025 (a) | 9,975 | ||||||
| 63,000 | 5.00%, 8/15/2026 (a) | 60,480 | ||||||
| 50,000 | 5.75%, 3/1/2027 (a) | 49,375 | ||||||
| 50,000 | 5.63%, 1/15/2028 (a) | 48,313 | ||||||
| 130,000 | PPL Capital Funding, Inc. 3.10%, 5/15/2026 | 121,756 | ||||||
| 106,000 | Prime Security Services Borrower LLC 9.25%, 5/15/2023 (a) | 113,558 | ||||||
SEE NOTES TO FINANCIAL STATEMENTS.
| 34 | J.P. MORGAN EXCHANGE-TRADED FUNDS | AUGUST 31, 2018 | ||||
PRINCIPAL AMOUNT | INVESTMENTS | VALUE | ||||||
Corporate Bonds — continued | ||||||||
United States — continued | ||||||||
| EUR 100,000 | PSPC Escrow Corp. 6.00%, 2/1/2023 (b) | 121,734 | ||||||
| EUR 225,000 | PVH Corp. 3.63%, 7/15/2024 (b) | 286,354 | ||||||
QEP Resources, Inc. | ||||||||
| 38,000 | 5.38%, 10/1/2022 | 38,202 | ||||||
| 5,000 | 5.63%, 3/1/2026 | 4,781 | ||||||
| 164,000 | Quicken Loans, Inc. 5.75%, 5/1/2025 (a) | 162,360 | ||||||
| 216,000 | Rackspace Hosting, Inc. 8.63%, | 212,625 | ||||||
| 25,000 | Radian Group, Inc. 4.50%, 10/1/2024 | 24,625 | ||||||
| 50,000 | Rain CII Carbon LLC 7.25%, 4/1/2025 (a) | 51,250 | ||||||
| 100,000 | Range Resources Corp. 4.88%, 5/15/2025 | 95,750 | ||||||
| 150,000 | Realty Income Corp. REIT, 3.65%, 1/15/2028 | 145,889 | ||||||
Reynolds Group Issuer, Inc. | ||||||||
| 121,138 | 5.75%, 10/15/2020 | 121,290 | ||||||
| 76,000 | 5.13%, 7/15/2023 (a) | 75,715 | ||||||
| 110,000 | RHP Hotel Properties LP REIT, 5.00%, 4/15/2021 | 110,911 | ||||||
| 80,000 | Rite Aid Corp. 6.13%, 4/1/2023 (a) | 71,776 | ||||||
Rockwell Collins, Inc. | ||||||||
| 325,000 | 3.70%, 12/15/2023 | 325,238 | ||||||
| 340,000 | 3.50%, 3/15/2027 | 325,641 | ||||||
| 280,000 | Roper Technologies, Inc. 3.80%, 12/15/2026 | 273,838 | ||||||
| 85,000 | Sabre GLBL, Inc. 5.38%, 4/15/2023 (a) | 85,638 | ||||||
| 45,000 | SBA Communications Corp. REIT, 4.88%, 9/1/2024 | 44,402 | ||||||
| 55,000 | Scientific Games International, Inc. 5.00%, 10/15/2025 (a) | 52,250 | ||||||
| 225,000 | Scotts Miracle-Gro Co. (The) 6.00%, 10/15/2023 | 228,375 | ||||||
| 119,000 | Sealed Air Corp. 5.13%, 12/1/2024 (a) | 120,488 | ||||||
| 46,000 | SemGroup Corp. 5.63%, 11/15/2023 | 44,505 | ||||||
| 25,000 | Seminole Hard Rock Entertainment, Inc. 5.88%, 5/15/2021 (a) | 25,000 | ||||||
| 145,000 | Sempra Energy 3.80%, 2/1/2038 | 133,153 | ||||||
| 85,000 | Sensata Technologies BV 4.88%, | 85,000 | ||||||
PRINCIPAL AMOUNT | INVESTMENTS | VALUE | ||||||
United States — continued | ||||||||
Service Corp. International | ||||||||
| 50,000 | 5.38%, 1/15/2022 | 50,767 | ||||||
| 70,000 | 7.50%, 4/1/2027 | 78,050 | ||||||
| 225,000 | Shire Acquisitions Investments Ireland DAC 2.88%, 9/23/2023 | 214,741 | ||||||
| EUR 200,000 | Silgan Holdings, Inc. 3.25%, 3/15/2025 | 238,348 | ||||||
Sinclair Television Group, Inc. | ||||||||
| 25,000 | 6.13%, 10/1/2022 | 25,630 | ||||||
| 266,000 | 5.63%, 8/1/2024 (a) | 262,010 | ||||||
Sirius XM Radio, Inc. | ||||||||
| 10,000 | 4.63%, 5/15/2023 (a) | 9,965 | ||||||
| 410,000 | 6.00%, 7/15/2024 (a) | 426,031 | ||||||
| 182,000 | 5.38%, 4/15/2025 (a) | 184,730 | ||||||
| 12,000 | 5.00%, 8/1/2027 (a) | 11,595 | ||||||
| 40,000 | Six Flags Entertainment Corp. 4.88%, 7/31/2024 (a) | 39,300 | ||||||
| 45,000 | Solera LLC 10.50%, 3/1/2024 (a) | 49,388 | ||||||
| 25,000 | Sotheby’s 4.88%, 12/15/2025 (a) | 23,870 | ||||||
| 130,000 | Southwestern Energy Co. 6.20%, 1/23/2025 (f) | 130,163 | ||||||
| 80,000 | Spectrum Brands Holdings, Inc. 7.75%, 1/15/2022 | 82,200 | ||||||
| 158,000 | Spectrum Brands, Inc. 6.63%, 11/15/2022 | 162,543 | ||||||
Springleaf Finance Corp. | ||||||||
| 111,000 | 6.13%, 5/15/2022 | 114,053 | ||||||
| 32,000 | 7.13%, 3/15/2026 | 31,842 | ||||||
| 175,000 | Sprint Capital Corp. 8.75%, 3/15/2032 | 193,375 | ||||||
Sprint Corp. | ||||||||
| 490,000 | 7.88%, 9/15/2023 | 527,362 | ||||||
| 30,000 | 7.13%, 6/15/2024 | 31,125 | ||||||
| 659,000 | 7.63%, 2/15/2025 | 699,364 | ||||||
| 50,000 | SPX FLOW, Inc. 5.63%, 8/15/2024 (a) | 50,125 | ||||||
Standard Industries, Inc. | ||||||||
| 24,000 | 6.00%, 10/15/2025 (a) | 24,544 | ||||||
| 109,000 | 4.75%, 1/15/2028 (a) | 101,403 | ||||||
| 160,000 | Staples, Inc. 8.50%, 9/15/2025 (a) | 151,184 | ||||||
| 10,000 | Station Casinos LLC 5.00%, 10/1/2025 (a) | 9,663 | ||||||
| 42,000 | Steel Dynamics, Inc. 5.00%, 12/15/2026 | 41,790 | ||||||
| 153,000 | Summit Materials LLC 6.13%, 7/15/2023 | 155,104 | ||||||
SEE NOTES TO FINANCIAL STATEMENTS.
| AUGUST 31, 2018 | J.P. MORGAN EXCHANGE-TRADED FUNDS | 35 | ||||||
JPMorgan Global Bond Opportunities ETF
SCHEDULE OF PORTFOLIO INVESTMENTS
AS OF AUGUST 31, 2018 (Unaudited) (continued)
(Amounts in U.S. Dollars, unless otherwise noted)
PRINCIPAL AMOUNT | INVESTMENTS | VALUE | ||||||
Corporate Bonds — continued | ||||||||
United States — continued | ||||||||
| 130,000 | Sunoco Logistics Partners Operations LP 5.35%, 5/15/2045 | 125,724 | ||||||
| 80,000 | SUPERVALU, Inc. 6.75%, 6/1/2021 | 81,400 | ||||||
| 50,000 | Synchrony Financial 4.25%, 8/15/2024 | 48,477 | ||||||
| 20,000 | Talen Energy Supply LLC 6.50%, 6/1/2025 | 14,900 | ||||||
| 30,000 | Tallgrass Energy Partners LP 5.50%, 9/15/2024 (a) | 30,863 | ||||||
Targa Resources Partners LP | ||||||||
| 116,000 | 4.25%, 11/15/2023 | 112,520 | ||||||
| 170,000 | 6.75%, 3/15/2024 | 178,500 | ||||||
| 41,000 | Team Health Holdings, Inc. 6.38%, | 35,568 | ||||||
| 75,000 | TEGNA, Inc. 6.38%, 10/15/2023 | 77,719 | ||||||
| 36,000 | 5.50%, 9/15/2024 (a) | 36,630 | ||||||
| 55,000 | Tempur Sealy International, Inc. 5.63%, 10/15/2023 | 55,000 | ||||||
| 50,000 | 5.50%, 6/15/2026 | 48,750 | ||||||
Tenet Healthcare Corp. | ||||||||
| 124,000 | 4.50%, 4/1/2021 | 123,845 | ||||||
| 200,000 | 7.50%, 1/1/2022 (a) | 209,438 | ||||||
| 145,000 | 8.13%, 4/1/2022 | 153,156 | ||||||
| 185,000 | 6.75%, 6/15/2023 | 185,000 | ||||||
| 134,000 | 5.13%, 5/1/2025 | 133,163 | ||||||
| 65,000 | Tenneco, Inc. 5.00%, 7/15/2026 | 57,688 | ||||||
| 113,000 | Terex Corp. 5.63%, 2/1/2025 (a) | 112,153 | ||||||
| 10,000 | Terraform Global Operating LLC 6.13%, 3/1/2026 (a) | 9,675 | ||||||
| 17,000 | TerraForm Power Operating LLC 4.25%, 1/31/2023 (a) | 16,575 | ||||||
| 34,000 | 6.62%, 6/15/2025 (a) (f) | 36,210 | ||||||
| 21,000 | 5.00%, 1/31/2028 (a) | 19,661 | ||||||
T-Mobile US, Inc. | ||||||||
| 150,000 | 6.50%, 1/15/2024‡ | — | ||||||
| 160,000 | 6.50%, 1/15/2026‡ | — | ||||||
| 150,000 | T-Mobile USA, Inc. 6.38%, 3/1/2025 | 156,000 | ||||||
| 16,000 | Transocean Guardian Ltd. 5.88%, | 16,080 | ||||||
| 51,000 | Transocean Proteus Ltd. 6.25%, 12/1/2024 (a) | 52,248 | ||||||
Transocean, Inc. | ||||||||
| 59,000 | 9.00%, 7/15/2023 (a) | 63,646 | ||||||
| 56,000 | 7.50%, 1/15/2026 (a) | 57,050 | ||||||
| 9,000 | 7.50%, 4/15/2031 | 8,302 | ||||||
| 108,000 | 6.80%, 3/15/2038 | 88,965 | ||||||
| 29,000 | 9.35%, 12/15/2041 (f) | 28,783 | ||||||
PRINCIPAL AMOUNT | INVESTMENTS | VALUE | ||||||
United States — continued | ||||||||
| 50,000 | TreeHouse Foods, Inc. 6.00%, 2/15/2024 (a) | 50,625 | ||||||
| 17,000 | Trinseo Materials Operating SCA 5.38%, 9/1/2025 (a) | 16,681 | ||||||
Triumph Group, Inc. | ||||||||
| 10,000 | 4.88%, 4/1/2021 | 9,575 | ||||||
| 75,000 | 7.75%, 8/15/2025 | 72,844 | ||||||
| 19,000 | Tronox, Inc. 6.50%, 4/15/2026 (a) | 18,620 | ||||||
| 54,000 | Tutor Perini Corp. 6.88%, 5/1/2025 (a) | 54,945 | ||||||
| 175,000 | Ultra Resources, Inc. 6.88%, 4/15/2022 (a) | 85,313 | ||||||
United Continental Holdings, Inc. | ||||||||
| 15,000 | 4.25%, 10/1/2022 | 14,738 | ||||||
| 25,000 | 5.00%, 2/1/2024 | 24,750 | ||||||
United Rentals North America, Inc. | ||||||||
| 120,000 | 5.75%, 11/15/2024 | 123,864 | ||||||
| 359,000 | 5.50%, 5/15/2027 | 358,103 | ||||||
| 90,000 | United States Cellular Corp. 6.70%, 12/15/2033 | 91,913 | ||||||
United States Steel Corp. | ||||||||
| 10,000 | 6.88%, 8/15/2025 | 10,150 | ||||||
| 30,000 | 6.25%, 3/15/2026 | 29,888 | ||||||
United Technologies Corp. | ||||||||
| 125,000 | 3.95%, 8/16/2025 | 125,552 | ||||||
| 150,000 | 4.13%, 11/16/2028 | 149,920 | ||||||
Uniti Group LP | ||||||||
| 85,000 | REIT, 6.00%, 4/15/2023 (a) | 81,600 | ||||||
| 85,000 | REIT, 8.25%, 10/15/2023 | 80,086 | ||||||
Univision Communications, Inc. | ||||||||
| 61,000 | 5.13%, 5/15/2023 (a) | 57,950 | ||||||
| 21,000 | 5.13%, 2/15/2025 (a) | 19,268 | ||||||
| 153,000 | US Concrete, Inc. 6.38%, 6/1/2024 | 154,339 | ||||||
| 30,000 | Valvoline, Inc. 4.38%, 8/15/2025 | 28,650 | ||||||
| 20,000 | Venator Finance SARL 5.75%, 7/15/2025 (a) | 18,650 | ||||||
VEREIT Operating Partnership LP | ||||||||
| 250,000 | REIT, 4.60%, 2/6/2024 | 252,172 | ||||||
| 200,000 | REIT, 3.95%, 8/15/2027 | 190,531 | ||||||
| 4,000 | Verscend Escrow Corp. 9.75%, 8/15/2026 (a) | 4,099 | ||||||
| 97,000 | Vertiv Group Corp. 9.25%, 10/15/2024 (a) | 99,667 | ||||||
| 170,000 | VICI Properties 1 LLC REIT, 8.00%, 10/15/2023 | 187,850 | ||||||
| 85,000 | Vista Outdoor, Inc. 5.88%, 10/1/2023 | 83,300 | ||||||
SEE NOTES TO FINANCIAL STATEMENTS.
| 36 | J.P. MORGAN EXCHANGE-TRADED FUNDS | AUGUST 31, 2018 | ||||
PRINCIPAL AMOUNT | INVESTMENTS | VALUE | ||||||
Corporate Bonds — continued | ||||||||
United States — continued | ||||||||
| 140,000 | Vistra Energy Corp. 5.88%, 6/1/2023 | 144,025 | ||||||
| 55,000 | Vistra Operations Co. LLC 5.50%, | 55,979 | ||||||
| 42,000 | Warner Media LLC 2.95%, 7/15/2026 | 38,153 | ||||||
Weatherford International Ltd. | ||||||||
| 23,000 | 9.88%, 2/15/2024 | 21,735 | ||||||
| 38,000 | 6.50%, 8/1/2036 | 28,215 | ||||||
| 21,000 | 7.00%, 3/15/2038 | 15,960 | ||||||
| 140,000 | Welbilt, Inc. 9.50%, 2/15/2024 | 153,300 | ||||||
| 42,000 | WellCare Health Plans, Inc. 5.25%, 4/1/2025 | 42,945 | ||||||
| 150,000 | Wells Fargo & Co. 4.90%, 11/17/2045 | 151,488 | ||||||
| 147,000 | WESCO Distribution, Inc. 5.38%, 6/15/2024 | 145,898 | ||||||
| 50,000 | Western Digital Corp. 4.75%, 2/15/2026 | 49,022 | ||||||
| 120,000 | Western Gas Partners LP 4.75%, 8/15/2028 | 119,410 | ||||||
Whiting Petroleum Corp. | ||||||||
| 85,000 | 5.75%, 3/15/2021 | 87,125 | ||||||
| 45,000 | 6.63%, 1/15/2026 | 46,800 | ||||||
| 275,000 | Williams Cos., Inc. (The) 4.00%, 9/15/2025 | 271,667 | ||||||
| 226,000 | Windstream Services LLC 9.00%, | 163,285 | ||||||
WMG Acquisition Corp. | ||||||||
| EUR 150,000 | 4.13%, 11/1/2024 (b) | 180,006 | ||||||
| 113,000 | 4.88%, 11/1/2024 (a) | 109,751 | ||||||
| 70,000 | WPX Energy, Inc. 8.25%, 8/1/2023 | 79,450 | ||||||
| 10,000 | Wyndham Destinations, Inc. 4.50%, 4/1/2027 (f) | 9,553 | ||||||
| 10,000 | Wyndham Hotels & Resorts, Inc. 5.38%, 4/15/2026 (a) | 9,925 | ||||||
| 100,000 | Wynn Las Vegas LLC 5.50%, 3/1/2025 (a) | 98,940 | ||||||
| 90,000 | XPO Logistics, Inc. 6.50%, 6/15/2022 (a) | 92,967 | ||||||
Zayo Group LLC | ||||||||
| 203,000 | 6.38%, 5/15/2025 | 212,135 | ||||||
| 21,000 | 5.75%, 1/15/2027 (a) | 21,053 | ||||||
|
| |||||||
| 53,167,632 | ||||||||
|
| |||||||
Total Corporate Bonds | 97,895,456 | |||||||
|
| |||||||
PRINCIPAL AMOUNT | INVESTMENTS | VALUE | ||||||
Foreign Government Securities — 16.0% | ||||||||
Argentina — 0.2% |
| |||||||
| ARS 7,813,628 | Bonos de la Nacion Argentina con Ajuste por CER 4.00%, 3/6/2020 | 222,141 | ||||||
| EUR 170,000 | Provincia de Buenos Aires 5.38%, 1/20/2023 (b) | 159,836 | ||||||
|
| |||||||
| 381,977 | ||||||||
|
| |||||||
Australia — 1.3% | ||||||||
| AUD 3,100,000 | Commonwealth of Australia 3.00%, | 2,211,011 | ||||||
|
| |||||||
Belarus — 0.2% | ||||||||
Republic of Belarus | ||||||||
| 200,000 | 6.88%, 2/28/2023 (a) | 203,750 | ||||||
| 200,000 | 7.63%, 6/29/2027 (a) | 208,500 | ||||||
|
| |||||||
| 412,250 | ||||||||
|
| |||||||
Colombia — 0.1% | ||||||||
| 200,000 | Republic of Colombia 5.00%, 6/15/2045 | 200,000 | ||||||
|
| |||||||
Costa Rica — 0.1% | ||||||||
| 203,000 | Republic of Costa Rica 7.00%, 4/4/2044 (b) | 191,328 | ||||||
|
| |||||||
Dominican Republic — 0.2% | ||||||||
| 350,000 | Government of Dominican Republic 6.88%, 1/29/2026 (b) | 375,550 | ||||||
|
| |||||||
Ecuador — 0.3% | ||||||||
Republic of Ecuador | ||||||||
| 350,000 | 10.50%, 3/24/2020 (b) | 359,625 | ||||||
| 200,000 | 10.75%, 3/28/2022 (a) | 206,250 | ||||||
|
| |||||||
| 565,875 | ||||||||
|
| |||||||
Egypt — 0.7% | ||||||||
Arab Republic of Egypt | ||||||||
| 900,000 | 5.75%, 4/29/2020 (b) | 906,750 | ||||||
| EUR 290,000 | 4.75%, 4/16/2026 (a) | 313,896 | ||||||
|
| |||||||
| 1,220,646 | ||||||||
|
| |||||||
El Salvador — 0.4% | ||||||||
| 590,000 | Republic of El Salvador 7.75%, 1/24/2023 (b) | 617,287 | ||||||
|
| |||||||
Gabon — 0.1% | ||||||||
| 200,000 | Gabonese Republic 6.38%, 12/12/2024 (b) | 181,750 | ||||||
|
| |||||||
Greece — 0.4% | ||||||||
| EUR 686,000 | Greece Government Bond 3.38%, | 767,306 | ||||||
|
| |||||||
SEE NOTES TO FINANCIAL STATEMENTS.
| AUGUST 31, 2018 | J.P. MORGAN EXCHANGE-TRADED FUNDS | 37 | ||||||
JPMorgan Global Bond Opportunities ETF
SCHEDULE OF PORTFOLIO INVESTMENTS
AS OF AUGUST 31, 2018 (Unaudited) (continued)
(Amounts in U.S. Dollars, unless otherwise noted)
PRINCIPAL AMOUNT | INVESTMENTS | VALUE | ||||||
Foreign Government Securities — continued | ||||||||
Hungary — 0.1% | ||||||||
| HUF 33,000,000 | Republic of Hungary 7.50%, 11/12/2020 | 132,890 | ||||||
|
| |||||||
Indonesia — 2.1% | ||||||||
Republic of Indonesia | ||||||||
| IDR 20,461,000,000 | 8.25%, 7/15/2021 | 1,408,517 | ||||||
| IDR 20,434,000,000 | 8.75%, 5/15/2031 | 1,428,433 | ||||||
| IDR 7,468,000,000 | 8.25%, 5/15/2036 | 491,149 | ||||||
| 340,000 | 6.63%, 2/17/2037 (b) | 404,348 | ||||||
|
| |||||||
| 3,732,447 | ||||||||
|
| |||||||
Iraq — 0.1% | ||||||||
| 200,000 | Republic of Iraq 6.75%, 3/9/2023 (b) | 194,000 | ||||||
|
| |||||||
Ivory Coast — 0.2% | ||||||||
| EUR 240,000 | Republic of Cote d’Ivoire 5.13%, 6/15/2025 (b) | 274,053 | ||||||
|
| |||||||
Lebanon — 0.2% | ||||||||
Republic of Lebanon | ||||||||
| 150,000 | 5.15%, 11/12/2018 (b) | 149,812 | ||||||
| 272,000 | 5.45%, 11/28/2019 (b) | 260,100 | ||||||
|
| |||||||
| 409,912 | ||||||||
|
| |||||||
Mexico — 0.5% | ||||||||
| MXN 16,900,000 | United Mexican States 7.50%, 6/3/2027 | 859,743 | ||||||
|
| |||||||
Nigeria — 0.1% | ||||||||
| 270,000 | Federal Republic of Nigeria 7.63%, 11/28/2047 (a) | 244,687 | ||||||
|
| |||||||
Oman — 0.2% | ||||||||
| 400,000 | Oman Government International Bond 4.75%, 6/15/2026 (a) | 369,000 | ||||||
|
| |||||||
Paraguay — 0.3% | ||||||||
| 420,000 | Republic of Paraguay 5.00%, 4/15/2026 (b) | 433,125 | ||||||
|
| |||||||
Portugal — 3.6% | ||||||||
Portugal Obrigacoes do Tesouro | ||||||||
| 820,000 | 5.13%, 10/15/2024 (b) | 856,626 | ||||||
| EUR 860,000 | 2.88%, 10/15/2025 (a) (b) | 1,097,570 | ||||||
| EUR 1,425,000 | 2.88%, 7/21/2026 (a) (b) | 1,809,221 | ||||||
| EUR 1,595,000 | 4.13%, 4/14/2027 (a) (b) | 2,199,403 | ||||||
| EUR 350,000 | 2.25%, 4/18/2034 (a) (b) | 394,960 | ||||||
|
| |||||||
| 6,357,780 | ||||||||
|
| |||||||
Qatar — 0.7% | ||||||||
State of Qatar | ||||||||
| 410,000 | 2.38%, 6/2/2021 (b) | 398,417 | ||||||
PRINCIPAL AMOUNT | INVESTMENTS | VALUE | ||||||
Qatar — continued | ||||||||
| 620,000 | 3.88%, 4/23/2023 (a) | 622,945 | ||||||
| 200,000 | 4.63%, 6/2/2046 (b) | 199,250 | ||||||
|
| |||||||
| 1,220,612 | ||||||||
|
| |||||||
Saudi Arabia — 0.2% | ||||||||
| 260,000 | Kingdom of Saudi Arabia 5.00%, 4/17/2049 (b) | 257,075 | ||||||
|
| |||||||
Serbia — 0.2% | ||||||||
| 300,000 | Republic of Serbia 4.88%, 2/25/2020 (b) | 304,500 | ||||||
|
| |||||||
South Africa — 1.1% | ||||||||
| ZAR 40,120,000 | Republic of South Africa 6.50%, 2/28/2041 | 1,917,928 | ||||||
|
| |||||||
Spain — 2.3% | ||||||||
Kingdom of Spain | ||||||||
| EUR 1,335,000 | 2.90%, 10/31/2046 (a) (b) | 1,656,410 | ||||||
| EUR 1,979,000 | 2.70%, 10/31/2048 (a) (b) | 2,331,200 | ||||||
|
| |||||||
| 3,987,610 | ||||||||
|
| |||||||
Zambia — 0.1% | ||||||||
| 200,000 | Republic of Zambia 8.50%, 4/14/2024 (b) | 144,000 | ||||||
|
| |||||||
Total Foreign Government Securities | 27,964,342 | |||||||
|
| |||||||
Asset-Backed Securities — 7.5% | ||||||||
Cayman Islands — 0.2% | ||||||||
| 86,592 | Renew Series 2017-1A, Class B, 5.75%, 9/20/2052‡ (a) | 88,027 | ||||||
| 260,000 | Shackleton CLO Ltd. Series 2014-6RA, Class B, 4.07%, 7/17/2028‡ (a) (i) | 259,348 | ||||||
|
| |||||||
| 347,375 | ||||||||
|
| |||||||
United States — 7.3% | ||||||||
| 291,114 | Accelerated Assets LLC Series 2018-1, Class C, 6.65%, 12/2/2033‡ (a) | 291,551 | ||||||
| 47,000 | American Credit Acceptance Receivables Trust Series 2016-4, Class D, 4.11%, | 47,270 | ||||||
| 250,000 | Apidos CLO XXX Class A2, 0.00%, 10/18/2031 (a) (i) | 250,000 | ||||||
| 250,000 | Benefit Street Partners CLO XI Series 2017-11, Class A2A, 4.09%, 4/15/2029 (a) (i) | 250,348 | ||||||
| 231,925 | Business Jet Securities LLC Series 2018-2, Class C, 6.66%, 6/15/2033 (a) | 233,370 | ||||||
SEE NOTES TO FINANCIAL STATEMENTS.
| 38 | J.P. MORGAN EXCHANGE-TRADED FUNDS | AUGUST 31, 2018 | ||||
PRINCIPAL AMOUNT | INVESTMENTS | VALUE | ||||||
Asset-Backed Securities — continued | ||||||||
United States — continued | ||||||||
| 164,428 | Chase Funding Trust Series 2003-6, Class 1A7, 5.08%, 11/25/2034‡ (f) | 168,448 | ||||||
Citi Held For Asset Issuance | ||||||||
| 104,240 | Series 2015-PM2, Class C, 5.96%, 3/15/2022‡ (a) | 104,351 | ||||||
| 84,510 | Series 2015-PM3, Class C, 6.99%, 5/16/2022‡ (a) | 84,848 | ||||||
CLUB Credit Trust | ||||||||
| 36,874 | Series 2017-P1, Class A, 2.42%, 9/15/2023 (a) | 36,777 | ||||||
| 115,000 | Series 2017-P1, Class B, 3.56%, 9/15/2023 (a) | 114,506 | ||||||
| 183,812 | Series 2017-P2, Class A, 2.61%, 1/15/2024 (a) | 182,824 | ||||||
CPS Auto Receivables Trust | ||||||||
| 640,000 | Series 2018-A, Class B, 2.77%, | 634,910 | ||||||
| 400,000 | Series 2018-A, Class D, 3.66%, 12/15/2023 (a) | 398,503 | ||||||
Credit Acceptance Auto Loan Trust | ||||||||
| 250,000 | Series 2018-1A, Class C, 3.77%, 6/15/2027 (a) | 247,893 | ||||||
| 250,000 | Series 2018-3A, Class B, 3.89%, 10/15/2027 (a) | 249,943 | ||||||
| 129,286 | Credit-Based Asset Servicing & Securitization LLC Series 2004-CB5, Class M1, 2.98%, 1/25/2034‡ (i) | 130,149 | ||||||
| 131,939 | CWABS, Inc. Asset-Backed Certificates Series 2003-5, Class AF5, 5.20%, 2/25/2034‡ (f) | 135,397 | ||||||
| 256,000 | Drive Auto Receivables Trust Series 2018-3, Class D, 4.30%, 9/16/2024 | 258,830 | ||||||
DT Auto Owner Trust | ||||||||
| 100,000 | Series 2017-3A, Class D, 3.58%, 5/15/2023 (a) | 100,129 | ||||||
| 320,000 | Series 2018-2A, Class D, 4.15%, 3/15/2024 (a) | 320,420 | ||||||
Exeter Automobile Receivables Trust | ||||||||
| 100,000 | Series 2015-2A, Class D, 5.79%, 5/16/2022 (a) | 102,121 | ||||||
| 220,000 | Series 2015-3A, Class D, 6.55%, 10/17/2022 (a) | 228,990 | ||||||
| 99,000 | Series 2018-3A, Class C, 3.71%, 6/15/2023 (a) | 99,087 | ||||||
| 180,000 | Series 2017-3A, Class C, 3.68%, 7/17/2023 (a) | 179,952 | ||||||
PRINCIPAL AMOUNT | INVESTMENTS | VALUE | ||||||
United States — continued | ||||||||
| 350,000 | Series 2016-3A, Class D, 6.40%, 7/17/2023 (a) | 361,060 | ||||||
| 210,000 | Series 2018-3A, Class D, 4.35%, 6/17/2024 (a) | 211,405 | ||||||
Flagship Credit Auto Trust | ||||||||
| 350,000 | Series 2018-3, Class A, 3.07%, 2/15/2023 (a) | 349,970 | ||||||
| 280,000 | Series 2017-4, Class D, 3.58%, 1/15/2024 (a) | 275,659 | ||||||
| 380,000 | Series 2017-2, Class E, 5.55%, 7/15/2024 (a) | 384,824 | ||||||
| 170,000 | Series 2018-3, Class C, 3.79%, 12/16/2024 (a) | 170,138 | ||||||
| 40,000 | Series 2018-3, Class D, 4.15%, 12/16/2024 (a) | 40,096 | ||||||
FREED ABS Trust | ||||||||
| 148,654 | Series 2018-1, Class A, 3.61%, | 148,487 | ||||||
| 100,000 | Series 2018-1, Class B, 4.56%, 7/18/2024‡ (a) | 100,235 | ||||||
| 350,000 | Lendmark Funding Trust Series 2017-1A, Class C, 5.41%, 12/22/2025‡ (a) | 358,194 | ||||||
Marlette Funding Trust | ||||||||
| 100,000 | Series 2018-1A, Class B, 3.19%, 3/15/2028‡ (a) | 99,421 | ||||||
| 100,000 | Series 2018-1A, Class C, 3.69%, 3/15/2028 (a) | 99,310 | ||||||
| 410,000 | Series 2018-2A, Class B, 3.61%, 7/17/2028‡ (a) | 408,745 | ||||||
| 280,000 | Series 2018-2A, Class C, 4.37%, 7/17/2028‡ (a) | 280,347 | ||||||
| 100,000 | Series 2018-3A, Class A, 3.20%, 9/15/2028 (a) | 100,017 | ||||||
| 190,000 | MFA LLC Series 2018-NPL2, Class A1, 4.16%, 7/25/2048 (a) (f) | 190,000 | ||||||
| 270,085 | MFA Trust Series 2017-NPL1, Class A1, 3.35%, 11/25/2047‡ (a) (f) | 267,383 | ||||||
| 353,818 | Morgan Stanley ABS Capital I, Inc. Trust Series 2004-NC8, Class B1, 4.69%, | 351,720 | ||||||
OneMain Direct Auto Receivables Trust | ||||||||
| 100,000 | Series 2018-1A, Class B, 3.71%, 4/14/2025 (a) | 100,137 | ||||||
| 160,000 | Series 2018-1A, Class D, 4.40%, 1/14/2028 (a) | 160,607 | ||||||
SEE NOTES TO FINANCIAL STATEMENTS.
| AUGUST 31, 2018 | J.P. MORGAN EXCHANGE-TRADED FUNDS | 39 | ||||||
JPMorgan Global Bond Opportunities ETF
SCHEDULE OF PORTFOLIO INVESTMENTS
AS OF AUGUST 31, 2018 (Unaudited) (continued)
(Amounts in U.S. Dollars, unless otherwise noted)
PRINCIPAL AMOUNT | INVESTMENTS | VALUE | ||||||
Asset-Backed Securities — continued | ||||||||
United States — continued | ||||||||
| 100,000 | Onemain Financial Issuance Trust Series 2018-1A, Class D, 4.08%, 3/14/2029‡ (a) | 100,213 | ||||||
| 293,000 | Oportun Funding VI LLC Series 2017-A, Class B, 3.97%, 6/8/2023‡ (a) (i) | 289,470 | ||||||
Pretium Mortgage Credit Partners I LLC | ||||||||
| 206,664 | Series 2017-NPL5, Class A1, 3.33%, 12/30/2032 (a) (i) | 205,624 | ||||||
| 220,016 | Series 2018-NPL1, Class A1, 3.38%, 1/27/2033‡ (a) (f) | 218,031 | ||||||
| 100,000 | Prosper Marketplace Issuance Trust Series 2018-1A, Class B, 3.90%, 6/17/2024 (a) | 99,971 | ||||||
| 350,000 | Santander Drive Auto Receivables Trust Series 2018-4, Class D, 3.98%, 12/15/2025 | 349,987 | ||||||
| 100,000 | SoFi Consumer Loan Program Trust Series 2018-1, Class B, 3.65%, 2/25/2027‡ (a) | 99,184 | ||||||
| 231,445 | Stanwich Mortgage Loan Trust Series 2018-NPB1, Class A1, 4.02%, 5/16/2023 (a) (f) | 231,324 | ||||||
Structured Asset Investment Loan Trust | ||||||||
| 88,784 | Series 2004-8, Class M3, 3.04%, 9/25/2034‡ (i) | 86,336 | ||||||
| 126,474 | Series 2005-HE3, Class M1, 2.78%, 9/25/2035‡ (i) | 126,031 | ||||||
| 328,000 | T-Mobile USA, Inc. 6.00%, 4/15/2024‡ | — | ||||||
| 67,745 | Veros Automobile Receivables Trust Series 2017-1, Class A, 2.84%, 4/17/2023 (a) | 67,505 | ||||||
| 244,801 | VOLT LX LLC Series 2017-NPL7, Class A1, 3.25%, 6/25/2047‡ (a) (f) | 243,345 | ||||||
| 78,263 | VOLT LXII LLC Series 2017-NPL9, Class A1, 3.13%, 9/25/2047‡ (a) (f) | 77,386 | ||||||
| 76,772 | VOLT LXIV LLC Series 2017-NP11, Class A1, 3.38%, 10/25/2047‡ (a) (f) | 76,134 | ||||||
| 389,000 | VOLT LXIX LLC Series 2018-NPL5, Class A2, 5.80%, 8/25/2048 (a) (f) | 388,507 | ||||||
| 300,000 | VOLT LXVIII LLC Series 2018-NPL4, Class A2, 5.93%, 7/27/2048 (a) (f) | 299,819 | ||||||
PRINCIPAL AMOUNT | INVESTMENTS | VALUE | ||||||
United States — continued | ||||||||
Westlake Automobile Receivables Trust | ||||||||
| 130,000 | Series 2018-3A, Class C, 3.61%, 10/16/2023 (a) | 129,984 | ||||||
| 80,000 | Series 2018-3A, Class D, 4.00%, 10/16/2023 (a) | 80,232 | ||||||
| 310,000 | Series 2018-2A, Class E, 4.86%, 1/16/2024 (a) | 310,656 | ||||||
|
| |||||||
| 12,788,111 | ||||||||
|
| |||||||
Total Asset-backed Securities | 13,135,486 | |||||||
|
| |||||||
Commercial Mortgage-Backed Securities — 5.8% | ||||||||
United States — 5.8% | ||||||||
| 400,000 | BAMLL Re-REMIC Trust Series 2014-FRR4, Class BK29, PO, 4/27/2023 (a) | 278,387 | ||||||
Banc of America Commercial Mortgage Trust | ||||||||
| 38,531 | Series 2006-1, Class E, 6.20%, 9/10/2045‡ (a) (i) | 39,857 | ||||||
| 531,804 | Series 2007-5, Class AJ, 6.27%, 2/10/2051 (i) | 544,477 | ||||||
| 105,000 | BANK Series 2017-BNK9, Class D, 2.80%, 11/15/2054 (a) | 82,135 | ||||||
| 492,000 | BHMS ATLS Series 2018-ATLS, Class A, 3.31%, 7/15/2035 (a) (i) | 491,999 | ||||||
| 485,000 | BX Commercial Mortgage Trust Series 2018-BIOA, Class D, 3.38%, 3/15/2037‡ (a) (i) | 483,520 | ||||||
BX Trust | ||||||||
| 100,000 | Series 2018-MCSF, Class B, 2.87%, 4/15/2035‡ (a) (i) | 99,135 | ||||||
| 100,000 | Series 2018-MCSF, Class C, 3.07%, 4/15/2035‡ (a) (i) | 99,259 | ||||||
| 210,000 | BXMT Ltd. Series 2017-FL1, Class D, 4.76%, 6/15/2035‡ (a) (i) | 211,313 | ||||||
| 90,000 | CD Mortgage Trust Series 2017-CD4, Class D, 3.30%, 5/10/2050‡ (a) | 75,604 | ||||||
Citigroup Commercial Mortgage Trust | ||||||||
| 205,000 | Series 2015-P1, Class D, 3.23%, 9/15/2048‡ (a) | 178,093 | ||||||
| 350,000 | Series 2016-P5, Class C, 4.47%, 10/10/2049‡ (i) | 346,158 | ||||||
COBALT CMBS Commercial Mortgage Trust | ||||||||
| 206,337 | Series 2007-C3, Class AJ, 6.02%, 5/15/2046 (i) | 209,990 | ||||||
| 570,000 | Series 2007-C3, Class B, 6.02%, 5/15/2046‡ (i) | 568,068 | ||||||
SEE NOTES TO FINANCIAL STATEMENTS.
| 40 | J.P. MORGAN EXCHANGE-TRADED FUNDS | AUGUST 31, 2018 | ||||
PRINCIPAL AMOUNT | INVESTMENTS | VALUE | ||||||
Commercial Mortgage-Backed Securities — continued | ||||||||
United States — continued | ||||||||
| 300,000 | Cold Storage Trust Series 2017-ICE3, Class B, 3.31%, 4/15/2036‡ (a) (i) | 301,499 | ||||||
Commercial Mortgage Trust | ||||||||
| 120,000 | Series 2004-GG1, Class H, 6.60%, 6/10/2036‡ (a) (i) | 121,046 | ||||||
| 540,000 | Series 2015-CR23, Class CME, 3.81%, 5/10/2048‡ (a) (i) | 533,718 | ||||||
| 150,000 | Series 2015-CR24, Class D, 3.46%, 8/10/2048 (i) | 127,331 | ||||||
| 100,000 | CSAIL Commercial Mortgage Trust Series 2017-C8, Class C, 4.32%, 6/15/2050‡ | 100,116 | ||||||
FHLMC Multifamily Structured Pass-Through Certificates | ||||||||
| 4,063,942 | Series K033, Class X1, IO, 0.42%, 7/25/2023 (i) | 54,688 | ||||||
| 2,640,000 | Series K036, Class X3, IO, 2.18%, 12/25/2041 (i) | 250,638 | ||||||
| 6,800,000 | Series K720, Class X3, IO, 1.38%, 8/25/2042 (i) | 309,963 | ||||||
| 3,470,000 | Series K041, Class X3, IO, 1.70%, 11/25/2042 (i) | 296,144 | ||||||
| 3,025,000 | Series K042, Class X3, IO, 1.66%, 1/25/2043 (i) | 257,135 | ||||||
| 10,025,000 | Series K718, Class X3, IO, 1.49%, 2/25/2043 (i) | 447,082 | ||||||
| 1,915,000 | Series K045, Class X3, IO, 1.55%, 4/25/2043 (i) | 155,917 | ||||||
| 1,365,000 | Series K054, Class X3, IO, 1.65%, 4/25/2043 (i) | 133,951 | ||||||
| 1,010,000 | Series K050, Class X3, IO, 1.61%, 10/25/2043 (i) | 90,785 | ||||||
| 1,395,000 | Series K051, Class X3, IO, 1.67%, 10/25/2043 (i) | 135,655 | ||||||
| 750,000 | Series K052, Class X3, IO, 1.67%, 1/25/2044 (i) | 73,518 | ||||||
| 2,890,000 | Series K726, Class X3, IO, 2.20%, 7/25/2044 (i) | 300,767 | ||||||
| 950,000 | Series K067, Class X3, IO, 2.19%, 9/25/2044 (i) | 140,480 | ||||||
| 400,000 | Series K072, Class X3, IO, 2.21%, 12/25/2045 (i) | 61,917 | ||||||
| 1,820,000 | Series K078, Class X3, IO, 2.29%, 6/25/2046 (i) | 304,833 | ||||||
FREMF Mortgage Trust | ||||||||
| 92,395 | Series 2017-KF31, Class B, 4.98%, 4/25/2024 (a) (i) | 94,459 | ||||||
PRINCIPAL AMOUNT | INVESTMENTS | VALUE | ||||||
United States — continued | ||||||||
| 98,449 | Series 2017-KF36, Class B, 4.73%, 8/25/2024 (a) (i) | 99,223 | ||||||
| 98,619 | Series 2017-KF38, Class B, 4.58%, 9/25/2024 (a) (i) | 99,338 | ||||||
| 190,000 | Series 2017-K728, Class B, 3.76%, 11/25/2050 (a) (i) | 183,680 | ||||||
| 105,000 | Series 2017-K728, Class C, 3.76%, 11/25/2050 (a) (i) | 98,516 | ||||||
| 701,198 | GNMA Series 2017-23, IO, 0.73%, | 42,814 | ||||||
| 100,000 | GRACE Mortgage Trust Series 2014-GRCE, Class B, 3.52%, 6/10/2028 (a) | 100,237 | ||||||
| 320,000 | GS Mortgage Securities Trust Series 2012-GCJ9, Class D, 4.91%, 11/10/2045‡ (a) (i) | 307,285 | ||||||
JP Morgan Chase Commercial Mortgage Securities Trust | ||||||||
| 85,000 | Series 2004-CBX, Class C, 5.07%, 1/12/2037‡ (i) | 86,063 | ||||||
| 25,111 | Series 2007-LD11, Class AM, 6.18%, 6/15/2049 (i) | 25,517 | ||||||
| 78,992 | LB Commercial Mortgage Trust Series 2007-C3, Class AJ, 6.09%, 7/15/2044 (i) | 80,204 | ||||||
| 252,891 | LB-UBS Commercial Mortgage Trust Series 2006-C6, Class AJ, 5.45%, 9/15/2039‡ (i) | 203,577 | ||||||
| 250,000 | Morgan Stanley Bank of America Merrill Lynch Trust Series 2014-C19, Class D, 3.25%, 12/15/2047 (a) | 213,572 | ||||||
| 80,069 | Morgan Stanley Capital I Trust Series 2005-HQ7, Class E, 5.55%, 11/14/2042‡ (i) | 81,025 | ||||||
| 70,000 | UBS Commercial Mortgage Trust Series 2017-C6, Class D, 2.50%, | 49,334 | ||||||
Wachovia Bank Commercial Mortgage Trust | ||||||||
| 110,000 | Series 2007-C30, Class B, 5.46%, 12/15/2043 (i) | 111,193 | ||||||
| 205,000 | Series 2007-C30, Class C, 5.48%, 12/15/2043 (i) | 203,135 | ||||||
| 22,494 | Series 2007-C31, Class C, 6.18%, 4/15/2047‡ (i) | 22,494 | ||||||
| 63,609 | Series 2006-C29, Class B, 5.43%, 11/15/2048 (i) | 63,947 | ||||||
SEE NOTES TO FINANCIAL STATEMENTS.
| AUGUST 31, 2018 | J.P. MORGAN EXCHANGE-TRADED FUNDS | 41 | ||||||
JPMorgan Global Bond Opportunities ETF
SCHEDULE OF PORTFOLIO INVESTMENTS
AS OF AUGUST 31, 2018 (Unaudited) (continued)
(Amounts in U.S. Dollars, unless otherwise noted)
PRINCIPAL AMOUNT | INVESTMENTS | VALUE | ||||||
Commercial Mortgage-Backed Securities — continued | ||||||||
United States — continued | ||||||||
| 100,000 | Wells Fargo Commercial Mortgage Trust Series 2015-NXS1, Class D, 4.24%, 5/15/2048 (i) | 90,102 | ||||||
|
| |||||||
Total Commercial Mortgage-Backed Securities | 10,160,893 | |||||||
|
| |||||||
Mortgage-Backed Securities — 4.0% | ||||||||
United States — 4.0% |
| |||||||
| 2,576,487 | FHLMC Gold Pools, 15 Year, Single Family Pool # G18702, 3.50%, 8/1/2033 | 2,607,267 | ||||||
| 2,083,012 | FHLMC Gold Pools, 30 Year, Single Family Pool # G67705, 4.00%, 10/1/2047 | 2,135,168 | ||||||
| 2,221,712 | FNMA, 15 Year, Single Family Pool # 890789, 3.00%, 9/1/2032 | 2,209,275 | ||||||
|
| |||||||
Total Mortgage-Backed Securities | 6,951,710 | |||||||
|
| |||||||
Collateralized Mortgage Obligations — 2.9% | ||||||||
Netherlands — 0.2% | ||||||||
| 255,000 | Permanent Master Issuer plc Series 2018-1A, Class 1A1, 2.75%, 7/15/2058 (a) (i) | 254,567 | ||||||
|
| |||||||
United States — 2.7% | ||||||||
Alternative Loan Trust | ||||||||
| 189,316 | Series 2004-25CB, Class A1, 6.00%, 12/25/2034 | 191,074 | ||||||
| 116,868 | Series 2005-6CB, Class 1A6, 5.50%, 4/25/2035 | 117,809 | ||||||
| 176,605 | Series 2005-80CB, Class 5A1, 6.00%, 2/25/2036 | 177,751 | ||||||
| 210,455 | Series 2007-2CB, Class 1A6, 5.75%, 3/25/2037 | 182,072 | ||||||
| 55,709 | Chase Mortgage Finance Trust Series 2007-A1, Class 1A5, 4.00%, 2/25/2037 (i) | 56,236 | ||||||
| 76,780 | CHL Mortgage Pass-Through Trust Series 2007-16, Class A1, 6.50%, 10/25/2037 | 64,058 | ||||||
FHLMC REMIC | ||||||||
| 2,899,483 | Series 2916, Class S, IF, IO, 5.19%, 1/15/2035 (i) | 464,788 | ||||||
| 815,644 | Series 4689, Class SD, IF, IO, 4.09%, 6/15/2047 (i) | 144,871 | ||||||
| 639,958 | Series 4714, Class SA, IF, IO, 4.09%, 8/15/2047 (i) | 122,155 | ||||||
PRINCIPAL AMOUNT | INVESTMENTS | VALUE | ||||||
United States — continued | ||||||||
| 80,000 | FHLMC Structured Agency Credit Risk Debt Notes Series 2018-HQA1, Class M2, 4.36%, 9/25/2030 (i) | 80,895 | ||||||
FNMA REMIC | ||||||||
| 653,385 | Series 2010-57, Class ID, IO, 4.00%, 6/25/2025 | 47,729 | ||||||
| 2,700,187 | Series 2012-146, Class AI, IO, 3.00%, 1/25/2028 | 236,524 | ||||||
| 1,401,060 | Series 2016-68, Class BI, IO, 3.00%, 10/25/2031 | 158,279 | ||||||
| 544,353 | Series 2012-63, Class NI, IO, 4.00%, 6/25/2040 | 52,785 | ||||||
| 193,390 | Series 2012-93, Class SE, IF, IO, 4.04%, 9/25/2042 (i) | 31,750 | ||||||
| 261,426 | Series 2012-124, Class UI, IO, 4.00%, 11/25/2042 | 54,930 | ||||||
| 359,248 | Series 2012-133, Class NS, IF, IO, 4.09%, 12/25/2042 (i) | 63,472 | ||||||
| 445,904 | Series 2016-77, Class SA, IF, IO, 3.94%, 10/25/2046 (i) | 86,621 | ||||||
| 2,011,196 | Series 2017-31, Class SG, IF, IO, 4.04%, 5/25/2047 (i) | 338,393 | ||||||
| 533,301 | Series 2017-39, Class ST, IF, IO, 4.04%, 5/25/2047 (i) | 88,337 | ||||||
| 918,434 | Series 2017-69, Class SH, IF, IO, 4.14%, 9/25/2047 (i) | 169,015 | ||||||
| 426,615 | FNMA STRIPS Series 409, Class 27, IO, 4.00%, 4/25/2027 (i) | 39,106 | ||||||
GNMA | ||||||||
| 327,411 | Series 2015-H13, Class GI, IO, 1.61%, 4/20/2065 (i) | 16,846 | ||||||
| 412,315 | Series 2017-H14, Class FG, 3.53%, 6/20/2067 (i) | 425,251 | ||||||
| 100,000 | Homeward Opportunities Fund I Trust Series 2018-1, Class A1, 3.77%, 6/25/2048 (a) (i) | 100,016 | ||||||
| 125,877 | Merrill Lynch Mortgage Investors Trust Series 2004-C, Class A1, 2.62%, 7/25/2029 (i) | 120,761 | ||||||
| 310,000 | OBX Trust Series 2018-EXP1, Class 2A1, 2.91%, 4/25/2048 (a) (i) | 310,000 | ||||||
| 210,000 | PNMAC GMSR Issuer Trust Series 2018-GT2, Class A, 4.71%, 8/25/2025 (a) (i) | 210,940 | ||||||
| 115,446 | RALI Trust Series 2005-QO1, Class A1, 2.36%, 8/25/2035 (i) | 101,343 | ||||||
SEE NOTES TO FINANCIAL STATEMENTS.
| 42 | J.P. MORGAN EXCHANGE-TRADED FUNDS | AUGUST 31, 2018 | ||||
PRINCIPAL AMOUNT | INVESTMENTS | VALUE | ||||||
Collateralized Mortgage Obligations — continued | ||||||||
United States — continued | ||||||||
| 27,534 | Structured Adjustable Rate Mortgage Loan Trust Series 2004-8, Class 3A, 4.28%, 7/25/2034 (i) | 27,429 | ||||||
| 240,000 | Toorak Mortgage Corp. Ltd. Series 2018-1, Class A1, 4.34%, 8/25/2021 (a) (f) | 240,003 | ||||||
| 250,000 | Verus Securitization Trust Series 2018-2, Class A1, 3.68%, 6/1/2058 (a) (i) | 250,039 | ||||||
|
| |||||||
| 4,771,278 | ||||||||
|
| |||||||
Total Collateralized Mortgage Obligations | 5,025,845 | |||||||
|
| |||||||
U.S. Treasury Obligations — 1.2% | ||||||||
U.S. Treasury Bonds | ||||||||
| 90,000 | 2.75%, 11/15/2047 | 85,177 | ||||||
| 90,000 | 3.00%, 2/15/2048 | 89,546 | ||||||
PRINCIPAL AMOUNT | INVESTMENTS | VALUE | ||||||
| 1,970,000 | U.S. Treasury Notes 2.88%, 5/15/2028 | 1,970,308 | ||||||
|
| |||||||
Total U.S. Treasury Obligations | 2,145,031 | |||||||
|
| |||||||
| SHARES | ||||||||
Short-term Investments — 4.8% | ||||||||
Investment Companies — 4.8% | ||||||||
| 8,342,272 | JPMorgan U.S. Government Money Market Fund, Class Institutional Shares, 1.82% (j) (k) | 8,342,272 | ||||||
|
| |||||||
Total Investments — 98.3% | 171,621,035 | |||||||
Other Assets Less Liabilities — 1.7% | 3,028,126 | |||||||
|
| |||||||
NET ASSETS — 100.0% | $ | 174,649,161 | ||||||
|
| |||||||
Percentages indicated are based on net assets.
| Futures contracts outstanding as of August 31, 2018: | ||||||||||||||||||||
| DESCRIPTION | NUMBER OF CONTRACTS | EXPIRATION DATE | TRADING CURRENCY | NOTIONAL AMOUNT($) | VALUE AND UNREALIZED APPRECIATION (DEPRECIATION)($) | |||||||||||||||
Long Contracts | ||||||||||||||||||||
Euro-BTP | 16 | 12/2018 | EUR | 2,243,126 | (2,191 | ) | ||||||||||||||
Euro-Buxl | 5 | 12/2018 | EUR | 1,029,237 | 3,940 | |||||||||||||||
U.S. Treasury 10 Year Note | 27 | 12/2018 | USD | 3,244,219 | (4,219 | ) | ||||||||||||||
U.S. Treasury 2 Year Note | 2 | 12/2018 | USD | 422,688 | (31 | ) | ||||||||||||||
U.S. Treasury 5 Year Note | 76 | 12/2018 | USD | 8,614,719 | (1,156 | ) | ||||||||||||||
|
| |||||||||||||||||||
| (3,657 | ) | |||||||||||||||||||
|
| |||||||||||||||||||
Short Contracts |
| |||||||||||||||||||
Australia 10 Year Bond | (58 | ) | 09/2018 | AUD | (5,445,204 | ) | (56,186 | ) | ||||||||||||
Euro-Bobl | (104 | ) | 12/2018 | EUR | (15,887,696 | ) | (12,202 | ) | ||||||||||||
Euro-Bund | (38 | ) | 12/2018 | EUR | (7,091,765 | ) | (19,908 | ) | ||||||||||||
Euro-OAT | (13 | ) | 12/2018 | EUR | (2,301,941 | ) | (4,096 | ) | ||||||||||||
Euro-Schatz | (43 | ) | 12/2018 | EUR | (5,587,926 | ) | (803 | ) | ||||||||||||
U.S. Treasury 10 Year Note | (36 | ) | 12/2018 | USD | (4,325,625 | ) | 11,171 | |||||||||||||
U.S. Treasury 10 Year Ultra Note | (120 | ) | 12/2018 | USD | (15,350,625 | ) | 54,044 | |||||||||||||
U.S. Treasury 2 Year Note | (12 | ) | 12/2018 | USD | (2,536,125 | ) | 913 | |||||||||||||
U.S. Treasury 5 Year Note | (43 | ) | 12/2018 | USD | (4,874,117 | ) | 7,391 | |||||||||||||
U.S. Treasury Long Bond | (1 | ) | 12/2018 | USD | (144,000 | ) | 844 | |||||||||||||
3 Month Eurodollar | (152 | ) | 12/2019 | USD | (36,877,100 | ) | 244,398 | |||||||||||||
|
| |||||||||||||||||||
| 225,566 | ||||||||||||||||||||
|
| |||||||||||||||||||
| 221,909 | ||||||||||||||||||||
|
| |||||||||||||||||||
SEE NOTES TO FINANCIAL STATEMENTS.
| AUGUST 31, 2018 | J.P. MORGAN EXCHANGE-TRADED FUNDS | 43 | ||||||
JPMorgan Global Bond Opportunities ETF
SCHEDULE OF PORTFOLIO INVESTMENTS
AS OF AUGUST 31, 2018 (Unaudited) (continued)
(Amounts in U.S. Dollars, unless otherwise noted)
| Forward foreign currency exchange contracts outstanding as of August 31, 2018: | ||||||||||||||||||||||||
| CURRENCY PURCHASED | CURRENCY SOLD | COUNTERPARTY | SETTLEMENT DATE | UNREALIZED APPRECIATION (DEPRECIATION)($) | ||||||||||||||||||||
| EUR | 10,351,725 | USD | 11,988,430 | BNP Paribas SA | 9/5/2018 | 27,335 | ||||||||||||||||||
| EUR | 352,378 | USD | 402,409 | Citibank, NA | 9/5/2018 | 6,614 | ||||||||||||||||||
| EUR | 141,755 | USD | 161,394 | National Australia Bank Ltd. | 9/5/2018 | 3,148 | ||||||||||||||||||
| EUR | 34,984 | USD | 39,880 | Royal Bank of Canada | 9/5/2018 | 728 | ||||||||||||||||||
| GBP | 124,072 | USD | 158,136 | National Australia Bank Ltd. | 9/5/2018 | 2,716 | ||||||||||||||||||
| USD | 298,938 | ARS | 8,603,443 | Citibank, NA** | 9/5/2018 | 65,783 | ||||||||||||||||||
| USD | 2,279,595 | AUD | 3,069,000 | BNP Paribas SA | 9/5/2018 | 73,291 | ||||||||||||||||||
| USD | 30,141,809 | EUR | 25,646,551 | Barclays Bank plc | 9/5/2018 | 372,575 | ||||||||||||||||||
| USD | 12,860,326 | EUR | 10,954,624 | Citibank, NA | 9/5/2018 | 144,747 | ||||||||||||||||||
| USD | 191,202 | EUR | 162,736 | Merrill Lynch International | 9/5/2018 | 2,306 | ||||||||||||||||||
| USD | 47,172 | EUR | 40,571 | Royal Bank of Canada | 9/5/2018 | 78 | ||||||||||||||||||
| USD | 944,876 | GBP | 717,328 | TD Bank Financial Group | 9/5/2018 | 14,897 | ||||||||||||||||||
| USD | 7,412,031 | IDR | 107,799,004,212 | Goldman Sachs International** | 9/5/2018 | 93,700 | ||||||||||||||||||
| USD | 1,644,697 | SEK | 14,373,523 | Citibank, NA | 9/5/2018 | 72,987 | ||||||||||||||||||
| USD | 2,236,843 | ZAR | 29,627,155 | Citibank, NA | 9/5/2018 | 220,704 | ||||||||||||||||||
| EUR | 230,214 | USD | 267,521 | National Australia Bank Ltd. | 10/3/2018 | 255 | ||||||||||||||||||
| GBP | 98,334 | USD | 126,580 | Australia & New Zealand Banking Group Ltd. | 10/3/2018 | 1,049 | ||||||||||||||||||
| USD | 274,082 | ARS | 8,603,443 | Goldman Sachs International** | 10/3/2018 | 48,332 | ||||||||||||||||||
| USD | 2,236,991 | AUD | 3,069,000 | Goldman Sachs International | 10/3/2018 | 30,759 | ||||||||||||||||||
| USD | 30,065,002 | EUR | 25,660,509 | BNP Paribas SA | 10/3/2018 | 217,742 | ||||||||||||||||||
| USD | 542,327 | EUR | 463,474 | Morgan Stanley | 10/3/2018 | 3,233 | ||||||||||||||||||
| USD | 773,830 | GBP | 593,256 | Citibank, NA | 10/3/2018 | 3,833 | ||||||||||||||||||
| USD | 3,714,254 | IDR | 54,506,681,350 | Goldman Sachs International** | 10/3/2018 | 95,719 | ||||||||||||||||||
| USD | 1,581,427 | SEK | 14,373,523 | State Street Corp. | 10/3/2018 | 6,317 | ||||||||||||||||||
| USD | 2,065,961 | ZAR | 29,627,155 | Barclays Bank plc | 10/3/2018 | 57,595 | ||||||||||||||||||
|
| |||||||||||||||||||||||
Total unrealized appreciation | 1,566,443 | |||||||||||||||||||||||
|
| |||||||||||||||||||||||
| ARS | 8,603,443 | USD | 283,008 | Goldman Sachs International** | 9/5/2018 | (49,852 | ) | |||||||||||||||||
| AUD | 3,069,000 | USD | 2,236,810 | Goldman Sachs International | 9/5/2018 | (30,506 | ) | |||||||||||||||||
| EUR | 100,526 | USD | 117,164 | Australia & New Zealand Banking Group Ltd. | 9/5/2018 | (477 | ) | |||||||||||||||||
| EUR | 234,923 | USD | 273,517 | Barclays Bank plc | 9/5/2018 | (830 | ) | |||||||||||||||||
| EUR | 25,660,509 | USD | 30,002,295 | BNP Paribas SA | 9/5/2018 | (216,859 | ) | |||||||||||||||||
| GBP | 593,256 | USD | 772,952 | Citibank, NA | 9/5/2018 | (3,826 | ) | |||||||||||||||||
| IDR | 49,034,265,862 | USD | 3,405,086 | Citibank, NA** | 9/5/2018 | (76,215 | ) | |||||||||||||||||
| IDR | 58,764,738,350 | USD | 4,027,100 | Goldman Sachs International** | 9/5/2018 | (37,641 | ) | |||||||||||||||||
| SEK | 14,373,523 | USD | 1,577,995 | State Street Corp. | 9/5/2018 | (6,285 | ) | |||||||||||||||||
| USD | 42,037 | EUR | 36,242 | Barclays Bank plc | 9/5/2018 | (32 | ) | |||||||||||||||||
| USD | 41,353 | EUR | 36,077 | Morgan Stanley | 9/5/2018 | (523 | ) | |||||||||||||||||
| ZAR | 29,627,155 | USD | 2,073,651 | Barclays Bank plc | 9/5/2018 | (57,512 | ) | |||||||||||||||||
| EUR | 196,426 | USD | 229,629 | Australia & New Zealand Banking Group Ltd. | 10/3/2018 | (1,154 | ) | |||||||||||||||||
| USD | 12,013,443 | EUR | 10,351,725 | BNP Paribas SA | 10/3/2018 | (27,263 | ) | |||||||||||||||||
| USD | 373,960 | EUR | 322,438 | Goldman Sachs International | 10/3/2018 | (1,087 | ) | |||||||||||||||||
|
| |||||||||||||||||||||||
Total unrealized depreciation | (510,062 | ) | ||||||||||||||||||||||
|
| |||||||||||||||||||||||
Net unrealized appreciation | 1,056,381 | |||||||||||||||||||||||
|
| |||||||||||||||||||||||
SEE NOTES TO FINANCIAL STATEMENTS.
| 44 | J.P. MORGAN EXCHANGE-TRADED FUNDS | AUGUST 31, 2018 | ||||
Abbreviations
| ABS | Asset-backed Securities | |
| ARS | Argentine Peso | |
| AUD | Australian Dollar | |
| CLO | Collateralized Loan Obligations | |
| CMBS | Commercial Mortgage Backed Security | |
| EUR | Euro | |
| EURIBOR | Euro Interbank Offered Rate | |
| FHLMC | Federal Home Loan Mortgage Corp. | |
| FNMA | Federal National Mortgage Association | |
| GBP | British Pound | |
| GNMA | Government National Mortgage Association | |
| HUF | Hungarian Forint | |
| ICE | Intercontinental Exchange | |
| IDR | Indonesian Rupiah | |
| IF | Inverse Floaters represent securities that pay interest at a rate that increases (decreases) with a decline (incline) in a specified index. The interest rate shown is the rate in effect as of August 31, 2018. The rate may be subject to a cap and floor. | |
| IO | Interest Only represents the right to receive the monthly interest payments on an underlying pool of mortgage loans. The principal amount shown represents the par value on the underlying pool. The yields on these securities are subject to accelerated principal paydowns as a result of prepayment or refinancing of the underlying pool of mortgage instruments. As a result, interest income may be reduced considerably. | |
| LIBOR | London Interbank Offered Rate | |
| MXN | Mexican Peso | |
| OYJ | Public Limited Company | |
| PO | Principal Only represents the right to receive the principal portion only on an underlying pool of mortgage loans. The market value of these securities is extremely volatile in response to changes in market interest rates. As prepayments on the underlying mortgages of these securities increase, the yield on these securities increases. | |
| REIT | Real Estate Investment Trust | |
| REMIC | Real Estate Mortgage Investment Conduit | |
| SCA | Limited partnership with share capital | |
| SEK | Swedish Krona | |
| STRIPS | Separate Trading of Registered Interest and Principal of Securities. The STRIPS Program lets investors hold and trade individual interest and principal components of eligible notes and bonds as separate securities. |
| USD | United States Dollar | |
| ZAR | South African Rand | |
| (a) | Securities exempt from registration under Rule 144A or section 4(a)(2), of the Securities Act of 1933, as amended. Under procedures approved by the Board of Trustees, such securities have been determined to be liquid by the investment adviser and may be resold, normally to qualified institutional buyers in transactions exempt from registration. | |
| (b) | Security exempt from registration pursuant to Regulation S under the Securities Act of 1933, as amended. Regulation S applies to securities offerings that are made outside of the United States and do not involve direct selling efforts in the United States and as such may have restrictions on resale. | |
| (c) | Security is perpetual and thus, does not have a predetermined maturity date. The coupon rate for this security is fixed for a period of time and may be structured to adjust thereafter. The date shown, if applicable, reflects the next call date. The coupon rate shown is the rate in effect as of August 31, 2018. | |
| (d) | Variable or floating rate security, linked to the referenced benchmark. The interest rate shown is the current rate as of August 31, 2018. | |
| (e) | Security is an interest bearing note with preferred security characteristics. | |
| (f) | Step bond. Interest rate is a fixed rate for an initial period that either resets at a specific date or may reset in the future contingent upon a predetermined trigger. The interest rate shown is the current rate as of August 31, 2018. | |
| (g) | Security has the ability to pay in kind (“PIK”) or pay income in cash. When applicable, separate rates of such payments are disclosed. | |
| (h) | Amount rounds to less than 0.1% of net assets. | |
| (i) | Variable or floating rate security, the interest rate of which adjusts periodically based on changes in current interest rates and prepayments on the underlying pool of assets. The interest rate shown is the current rate as of August 31, 2018. | |
| (j) | Investment in affiliate. Fund is registered under the Investment Company Act of 1940, as amended, and advised by J.P. Morgan Investment Management Inc. | |
| (k) | The rate shown is the current yield as of August 31, 2018. | |
| ** | Non-deliverable forward. | |
| ‡ | Value determined using significant unobservable inputs. | |
SEE NOTES TO FINANCIAL STATEMENTS.
| AUGUST 31, 2018 | J.P. MORGAN EXCHANGE-TRADED FUNDS | 45 | ||||||
JPMorgan Ultra-Short Income ETF
SCHEDULE OF PORTFOLIO INVESTMENTS
AS OF AUGUST 31, 2018 (Unaudited)
| PRINCIPAL AMOUNT($) | INVESTMENTS | VALUE($) | ||||||
Corporate Bonds — 65.3% | ||||||||
Aerospace & Defense — 0.4% | ||||||||
| 834,000 | General Dynamics Corp. (ICE LIBOR USD 3 Month + 0.29%), 2.63%, 5/11/2020 (a) | 837,290 | ||||||
| 1,000,000 | Rockwell Collins, Inc. 5.25%, 7/15/2019 | 1,020,470 | ||||||
| 6,226,000 | United Technologies Corp. (ICE LIBOR USD 3 Month + 0.65%), 2.97%, 8/16/2021 (a) | 6,239,180 | ||||||
|
| |||||||
| 8,096,940 | ||||||||
|
| |||||||
Automobiles — 2.7% | ||||||||
BMW US Capital LLC (Germany) | ||||||||
| 11,909,000 | 1.45%, 9/13/2019 (b) | 11,762,140 | ||||||
| 5,381,000 | (ICE LIBOR USD 3 Month + 0.37%), 2.69%, 8/14/2020 (a) (b) | 5,390,804 | ||||||
| 1,910,000 | (ICE LIBOR USD 3 Month + 0.41%), 2.75%, 4/12/2021 (a) (b) | 1,914,375 | ||||||
Daimler Finance North America LLC (Germany) | ||||||||
| 8,295,000 | 1.50%, 7/5/2019 (b) | 8,205,192 | ||||||
| 4,070,000 | 2.25%, 7/31/2019 (b) | 4,047,696 | ||||||
| 1,000,000 | 1.75%, 10/30/2019 (b) | 985,538 | ||||||
| 1,836,000 | (ICE LIBOR USD 3 Month + 0.39%), 2.73%, 5/4/2020 (a) (b) | 1,840,453 | ||||||
| 1,700,000 | (ICE LIBOR USD 3 Month + 0.53%), 2.87%, 5/5/2020 (a) (b) | 1,705,636 | ||||||
| 2,900,000 | (ICE LIBOR USD 3 Month + 0.43%), 2.77%, 2/12/2021 (a) (b) | 2,900,759 | ||||||
| 2,100,000 | (ICE LIBOR USD 3 Month + 0.45%), 2.76%, 2/22/2021 (a) (b) | 2,104,337 | ||||||
Nissan Motor Acceptance Corp. | ||||||||
| 1,255,000 | 2.35%, 3/4/2019 (b) | 1,252,235 | ||||||
| 800,000 | 2.00%, 3/8/2019 (b) | 796,963 | ||||||
| 3,196,000 | 1.55%, 9/13/2019 (b) | 3,149,917 | ||||||
| 630,000 | (ICE LIBOR USD 3 Month + 0.58%), 2.92%, 1/13/2020 (a) (b) | 632,665 | ||||||
| 4,350,000 | (ICE LIBOR USD 3 Month + 0.39%), 2.73%, 9/28/2020 (a) (b) | 4,356,267 | ||||||
| 5,826,000 | (ICE LIBOR USD 3 Month + 0.52%), 2.86%, 3/15/2021 (a) (b) | 5,839,566 | ||||||
Volkswagen Group of America Finance LLC (Germany) | ||||||||
| 2,600,000 | 2.13%, 5/23/2019 (b) | 2,588,041 | ||||||
| 2,480,000 | 2.45%, 11/20/2019 (b) | 2,459,911 | ||||||
|
| |||||||
| 61,932,495 | ||||||||
|
| |||||||
Banks — 26.4% | ||||||||
ABN AMRO Bank NV (Netherlands) | ||||||||
| 1,200,000 | 2.10%, 1/18/2019 (b) | 1,197,276 | ||||||
| PRINCIPAL AMOUNT($) | INVESTMENTS | VALUE($) | ||||||
Banks — continued | ||||||||
| 2,932,000 | 1.80%, 9/20/2019 (b) | 2,895,203 | ||||||
| 3,900,000 | (ICE LIBOR USD 3 Month + 0.41%), 2.75%, 1/19/2021 (a) (b) | 3,902,652 | ||||||
| 5,778,000 | (ICE LIBOR USD 3 Month + 0.57%), 2.88%, 8/27/2021 (a) (b) | 5,791,284 | ||||||
ANZ New Zealand Int’l Ltd. (New Zealand) | ||||||||
| 1,760,000 | 2.25%, 2/1/2019 (b) | 1,757,948 | ||||||
| 1,090,000 | 2.60%, 9/23/2019 (b) | 1,085,671 | ||||||
| 4,365,000 | (ICE LIBOR USD 3 Month + 1.01%), 3.35%, 7/28/2021 (a) (b) | 4,428,534 | ||||||
Australia & New Zealand Banking Group Ltd. (Australia) | ||||||||
| 8,396,000 | 2.25%, 6/13/2019 | 8,370,497 | ||||||
| 2,785,000 | 1.60%, 7/15/2019 | 2,759,479 | ||||||
| 3,413,000 | 2.05%, 9/23/2019 | 3,382,020 | ||||||
| 3,000,000 | (ICE LIBOR USD 3 Month + 0.32%), 2.66%, 7/2/2020 (a) (b) | 3,005,586 | ||||||
| 3,841,000 | (ICE LIBOR USD 3 Month + 0.32%), 2.66%, 11/9/2020 (a) (b) | 3,849,104 | ||||||
| 2,300,000 | (ICE LIBOR USD 3 Month + 0.46%), 2.77%, 5/17/2021 (a) (b) | 2,305,896 | ||||||
| 2,100,000 | (ICE LIBOR USD 3 Month + 0.99%), 3.29%, 6/1/2021 (a) (b) | 2,133,748 | ||||||
Bank of America Corp. | ||||||||
| 250,000 | Series L, 2.60%, 1/15/2019 | 250,028 | ||||||
| 2,255,000 | 7.63%, 6/1/2019 | 2,334,009 | ||||||
| 7,958,000 | Bank of America NA (ICE LIBOR USD 3 Month + 0.25%), 2.56%, 8/28/2020 (a) | 7,962,902 | ||||||
Bank of Montreal (Canada) | ||||||||
| 5,750,000 | 1.50%, 7/18/2019 | 5,691,617 | ||||||
| 7,200,000 | (ICE LIBOR USD 3 Month + 0.34%), 2.68%, 7/13/2020 (a) | 7,229,261 | ||||||
| 1,319,000 | Series D, (ICE LIBOR USD 3 Month + 0.46%), 2.80%, 4/13/2021 (a) | 1,325,300 | ||||||
Bank of Nova Scotia (The) (Canada) | ||||||||
| 7,913,000 | 2.05%, 6/5/2019 | 7,882,270 | ||||||
| 4,404,000 | 1.65%, 6/14/2019 | 4,370,327 | ||||||
| 475,000 | (ICE LIBOR USD 3 Month + 0.66%), 3.00%, 6/14/2019 (a) | 476,974 | ||||||
Banque Federative du Credit Mutuel SA (France) | ||||||||
| 715,000 | 2.75%, 1/22/2019 (b) | 715,395 | ||||||
| 6,903,000 | 1.90%, 3/28/2019 (b) | 6,871,275 | ||||||
| 14,022,000 | 2.00%, 4/12/2019 (b) | 13,952,829 | ||||||
| 250,000 | (ICE LIBOR USD 3 Month + 0.49%), 2.84%, 7/20/2020 (a) (b) | 251,268 | ||||||
SEE NOTES TO FINANCIAL STATEMENTS.
| 46 | J.P. MORGAN EXCHANGE-TRADED FUNDS | AUGUST 31, 2018 | ||||
| PRINCIPAL AMOUNT($) | INVESTMENTS | VALUE($) | ||||||
Corporate Bonds — continued | ||||||||
Banks — continued | ||||||||
Barclays Bank plc (United Kingdom) | ||||||||
| 1,581,000 | 2.50%, 2/20/2019 | 1,579,942 | ||||||
| 602,000 | 5.13%, 1/8/2020 | 616,012 | ||||||
| 1,750,000 | (ICE LIBOR USD 3 Month + 0.65%), 2.99%, 8/7/2020 (a) | 1,757,807 | ||||||
| 764,000 | BB&T Corp. 2.25%, 2/1/2019 | 763,133 | ||||||
| 1,000,000 | BNP Paribas SA (France) 2.40%, 12/12/2018 | 999,821 | ||||||
BNZ International Funding Ltd. (New Zealand) | ||||||||
| 10,575,000 | 2.35%, 3/4/2019 (b) | 10,562,161 | ||||||
| 1,737,000 | (ICE LIBOR USD 3 Month + 0.70%), 3.01%, 2/21/2020 (a) (b) | 1,748,663 | ||||||
Branch Banking & Trust Co. | ||||||||
| 1,500,000 | 2.30%, 10/15/2018 | 1,499,803 | ||||||
| 1,902,000 | 1.45%, 5/10/2019 | 1,887,449 | ||||||
Capital One NA | ||||||||
| 670,000 | 2.40%, 9/5/2019 | 666,566 | ||||||
| 6,800,000 | 1.85%, 9/13/2019 | 6,734,429 | ||||||
| 3,175,000 | 2.35%, 1/31/2020 | 3,143,332 | ||||||
Citibank NA | ||||||||
| 8,558,000 | (ICE LIBOR USD 3 Month + 0.32%), 2.66%, 5/1/2020 (a) | 8,564,904 | ||||||
| 8,309,000 | (ICE LIBOR USD 3 Month + 0.57%), 2.92%, 7/23/2021 (a) | 8,351,419 | ||||||
| 886,000 | Citigroup, Inc. 2.50%, 7/29/2019 | 884,064 | ||||||
Citizens Bank NA | ||||||||
| 750,000 | 2.30%, 12/3/2018 | 749,719 | ||||||
| 3,186,000 | 2.50%, 3/14/2019 | 3,183,826 | ||||||
| 2,685,000 | (ICE LIBOR USD 3 Month + 0.54%), 2.86%, 3/2/2020 (a) | 2,691,632 | ||||||
| 1,900,000 | (ICE LIBOR USD 3 Month + 0.57%), 2.88%, 5/26/2020 (a) | 1,906,036 | ||||||
| 3,850,000 | Comerica, Inc. 2.13%, 5/23/2019 | 3,832,811 | ||||||
Commonwealth Bank of Australia (Australia) | ||||||||
| 1,000,000 | 2.25%, 3/13/2019 | 998,610 | ||||||
| 1,455,000 | 2.05%, 3/15/2019 | 1,450,206 | ||||||
| 5,371,000 | 2.30%, 9/6/2019 | 5,349,207 | ||||||
| 1,344,000 | 5.00%, 10/15/2019 (b) | 1,374,353 | ||||||
| 3,991,000 | 1.75%, 11/7/2019 (b) | 3,937,156 | ||||||
| 675,000 | (ICE LIBOR USD 3 Month + 0.45%), 2.78%, 3/10/2020 (a) (b) | 677,603 | ||||||
Compass Bank | ||||||||
| 603,000 | 2.75%, 9/29/2019 | 601,021 | ||||||
| 9,251,000 | (ICE LIBOR USD 3 Month + 0.73%), 3.06%, 6/11/2021 (a) | 9,269,195 | ||||||
| PRINCIPAL AMOUNT($) | INVESTMENTS | VALUE($) | ||||||
Banks — continued | ||||||||
Cooperatieve Rabobank UA (Netherlands) | ||||||||
| 9,260,000 | 1.38%, 8/9/2019 | 9,140,877 | ||||||
| 4,019,000 | 2.25%, 1/14/2020 | 3,977,263 | ||||||
| 4,500,000 | (ICE LIBOR USD 3 Month + 0.43%), 2.76%, 4/26/2021 (a) | 4,506,439 | ||||||
| 12,609,000 | Credit Agricole SA (France) 2.50%, 4/15/2019 (b) | 12,589,873 | ||||||
| 6,758,000 | Danske Bank A/S (Denmark) 1.65%, 9/6/2019 (b) | 6,667,383 | ||||||
DBS Group Holdings Ltd. (Singapore) | ||||||||
| 13,300,000 | 2.25%, 7/16/2019 (b) | 13,182,316 | ||||||
| 5,815,000 | (ICE LIBOR USD 3 Month + 0.49%), 2.81%, 6/8/2020 (a) (b) | 5,822,374 | ||||||
| 7,000,000 | DNB Bank ASA (Norway) (ICE LIBOR USD 3 Month + 0.37%), 2.71%, 10/2/2020 (a) (b) | 7,015,331 | ||||||
| 6,062,000 | Fifth Third Bancorp 2.30%, 3/1/2019 | 6,053,240 | ||||||
Fifth Third Bank | ||||||||
| 4,168,000 | 2.30%, 3/15/2019 | 4,163,085 | ||||||
| 880,000 | 1.63%, 9/27/2019 | 869,462 | ||||||
HSBC Holdings plc (United Kingdom) | ||||||||
| 7,000,000 | (ICE LIBOR USD 3 Month + 0.60%), 2.92%, 5/18/2021 (a) | 7,020,865 | ||||||
| 1,690,000 | (ICE LIBOR USD 3 Month + 1.66%), 3.97%, 5/25/2021 (a) | 1,744,315 | ||||||
| 5,000,000 | Huntington National Bank (The) 2.20%, 4/1/2019 | 4,987,462 | ||||||
KeyBank NA | ||||||||
| 5,634,000 | 1.60%, 8/22/2019 | 5,572,184 | ||||||
| 6,721,000 | 2.50%, 12/15/2019 | 6,685,114 | ||||||
Lloyds Bank plc (United Kingdom) | ||||||||
| 2,428,000 | 2.05%, 1/22/2019 | 2,421,362 | ||||||
| 200,000 | (ICE LIBOR USD 3 Month + 1.00%), 3.35%, 1/22/2019 (a) | 200,695 | ||||||
| 2,101,000 | (ICE LIBOR USD 3 Month + 0.49%), 2.83%, 5/7/2021 (a) | 2,109,047 | ||||||
| 8,560,000 | Mitsubishi UFJ Financial Group, Inc. (Japan) (ICE LIBOR USD 3 Month + 0.65%), 2.98%, 7/26/2021 (a) | 8,599,733 | ||||||
| 10,643,000 | Mitsubishi UFJ Trust & Banking Corp. (Japan) 2.45%, 10/16/2019 (b) | 10,576,857 | ||||||
Mizuho Bank Ltd. (Japan) | ||||||||
| 900,000 | 2.15%, 10/20/2018 (b) | 899,613 | ||||||
| 10,144,000 | 2.45%, 4/16/2019 (b) | 10,129,303 | ||||||
| 8,608,000 | 2.65%, 9/25/2019 (b) | 8,583,130 | ||||||
MUFG Bank Ltd. (Japan) | ||||||||
| 6,600,000 | 2.30%, 3/10/2019 (b) | 6,588,289 | ||||||
| 4,839,000 | 2.35%, 9/8/2019 (b) | 4,812,385 | ||||||
SEE NOTES TO FINANCIAL STATEMENTS.
| AUGUST 31, 2018 | J.P. MORGAN EXCHANGE-TRADED FUNDS | 47 | ||||||
JPMorgan Ultra-Short Income ETF
SCHEDULE OF PORTFOLIO INVESTMENTS
AS OF AUGUST 31, 2018 (Unaudited) (continued)
| PRINCIPAL AMOUNT($) | INVESTMENTS | VALUE($) | ||||||
Corporate Bonds — continued | ||||||||
Banks — continued | ||||||||
National Australia Bank Ltd. (Australia) | ||||||||
| 3,000,000 | 2.40%, 12/9/2019 (b) | 2,980,303 | ||||||
| 8,400,000 | (ICE LIBOR USD 3 Month + 0.51%), 2.82%, 5/22/2020 (a) (b) | 8,441,597 | ||||||
| 7,170,000 | (ICE LIBOR USD 3 Month + 0.35%), 2.69%, 1/12/2021 (a) (b) | 7,176,778 | ||||||
| 4,490,000 | (ICE LIBOR USD 3 Month + 1.00%), 3.34%, 7/12/2021 (a) (b) | 4,565,842 | ||||||
National Bank of Canada (Canada) | ||||||||
| 2,160,000 | 2.10%, 12/14/2018 | 2,158,471 | ||||||
| 1,130,000 | (ICE LIBOR USD 3 Month + 0.60%), 2.94%, 1/17/2020 (a) | 1,136,222 | ||||||
Nordea Bank AB (Sweden) | ||||||||
| 10,160,000 | 2.38%, 4/4/2019 (b) | 10,148,528 | ||||||
| 2,105,000 | 1.63%, 9/30/2019 (b) | 2,075,800 | ||||||
| 4,311,000 | (ICE LIBOR USD 3 Month + 0.47%), 2.79%, 5/29/2020 (a) (b) | 4,328,822 | ||||||
PNC Bank NA | ||||||||
| 1,190,000 | 2.20%, 1/28/2019 | 1,188,723 | ||||||
| 3,250,000 | 1.95%, 3/4/2019 | 3,241,269 | ||||||
| 1,500,000 | 2.25%, 7/2/2019 | 1,495,835 | ||||||
| 7,500,000 | 1.45%, 7/29/2019 | 7,420,963 | ||||||
| 4,700,000 | Regions Bank (ICE LIBOR USD 3 Month + 0.38%), 2.72%, 4/1/2021 (a) | 4,696,419 | ||||||
Royal Bank of Canada (Canada) | ||||||||
| 665,000 | (ICE LIBOR USD 3 Month + 0.71%), 3.05%, 4/15/2019 (a) | 668,106 | ||||||
| 10,000,000 | 1.50%, 7/29/2019 | 9,894,070 | ||||||
| 5,817,000 | (ICE LIBOR USD 3 Month + 0.30%), 2.64%, 7/22/2020 (a) | 5,833,168 | ||||||
| 7,000,000 | (ICE LIBOR USD 3 Month + 0.39%), 2.73%, 4/30/2021 (a) | 7,019,704 | ||||||
Santander UK plc (United Kingdom) | ||||||||
| 9,246,000 | 2.50%, 3/14/2019 | 9,242,845 | ||||||
| 894,000 | 2.35%, 9/10/2019 | 889,401 | ||||||
| 2,800,000 | (ICE LIBOR USD 3 Month + 0.62%), 2.92%, 6/1/2021 (a) | 2,814,625 | ||||||
Skandinaviska Enskilda Banken AB (Sweden) | ||||||||
| 200,000 | 2.38%, 11/20/2018 (c) | 199,869 | ||||||
| 5,625,000 | 2.38%, 3/25/2019 (b) | 5,610,133 | ||||||
| 3,900,000 | 1.50%, 9/13/2019 | 3,843,084 | ||||||
| 7,500,000 | (ICE LIBOR USD 3 Month + 0.43%), 2.74%, 5/17/2021 (a) (b) | 7,506,652 | ||||||
| 4,900,000 | Societe Generale SA (France) (ICE LIBOR USD 3 Month + 1.33%), 3.67%, 4/8/2021 (a) (b) | 5,002,459 | ||||||
| PRINCIPAL AMOUNT($) | INVESTMENTS | VALUE($) | ||||||
Banks — continued | ||||||||
Standard Chartered plc (United Kingdom) | ||||||||
| 13,963,000 | 2.10%, 8/19/2019 (b) | 13,832,755 | ||||||
| 3,165,000 | 2.40%, 9/8/2019 (b) | 3,132,527 | ||||||
Sumitomo Mitsui Banking Corp. (Japan) | ||||||||
| 1,835,000 | 2.25%, 7/11/2019 | 1,826,845 | ||||||
| 5,304,000 | 2.45%, 1/16/2020 | 5,255,504 | ||||||
| 9,485,000 | 2.51%, 1/17/2020 | 9,407,435 | ||||||
| 9,113,000 | (ICE LIBOR USD 3 Month + 0.35%), 2.69%, 1/17/2020 (a) | 9,135,655 | ||||||
Sumitomo Mitsui Trust Bank Ltd. (Japan) | ||||||||
| 4,916,000 | 2.05%, 3/6/2019 (b) | 4,901,999 | ||||||
| 1,383,000 | (ICE LIBOR USD 3 Month + 0.51%), 2.82%, 3/6/2019 (a) (b) | 1,385,532 | ||||||
| 2,432,000 | 1.95%, 9/19/2019 (b) | 2,403,214 | ||||||
| 4,798,000 | 2.05%, 10/18/2019 (b) | 4,747,354 | ||||||
| 4,200,000 | (ICE LIBOR USD 3 Month + 0.91%), 3.24%, 10/18/2019 (a) (b) | 4,232,725 | ||||||
SunTrust Banks, Inc. | ||||||||
| 1,950,000 | 2.35%, 11/1/2018 | 1,949,906 | ||||||
| 10,233,000 | 2.50%, 5/1/2019 | 10,228,644 | ||||||
Svenska Handelsbanken AB (Sweden) | ||||||||
| 2,414,000 | 2.25%, 6/17/2019 | 2,404,833 | ||||||
| 1,450,000 | 1.50%, 9/6/2019 | 1,430,362 | ||||||
| 3,980,000 | (ICE LIBOR USD 3 Month + 0.49%), 2.80%, 9/6/2019 (a) | 3,993,820 | ||||||
| 4,075,000 | (ICE LIBOR USD 3 Month + 0.47%), 2.78%, 5/24/2021 (a) | 4,088,162 | ||||||
| 2,240,000 | Swedbank AB (Sweden) 2.38%, 2/27/2019 (b) | 2,234,969 | ||||||
Toronto-Dominion Bank (The) (Canada) | ||||||||
| 650,000 | 1.95%, 1/22/2019 | 648,728 | ||||||
| 1,000,000 | 1.45%, 8/13/2019 | 988,358 | ||||||
| 8,231,000 | (ICE LIBOR USD 3 Month + 0.28%), 2.61%, 6/11/2020 (a) | 8,252,990 | ||||||
US Bank NA | ||||||||
| 250,000 | (ICE LIBOR USD 3 Month + 0.15%), 2.46%, 5/24/2019 (a) | 250,159 | ||||||
| 1,331,000 | (ICE LIBOR USD 3 Month + 0.32%), 2.65%, 4/26/2021 (a) | 1,335,911 | ||||||
| 5,739,000 | Wells Fargo Bank NA (ICE LIBOR USD 3 Month + 0.50%), 2.85%, 7/23/2021 (a) | 5,757,594 | ||||||
Westpac Banking Corp. (Australia) | ||||||||
| 8,050,000 | 1.65%, 5/13/2019 | 7,993,216 | ||||||
| 15,000,000 | 1.60%, 8/19/2019 | 14,843,820 | ||||||
| 3,500,000 | 4.88%, 11/19/2019 | 3,582,271 | ||||||
SEE NOTES TO FINANCIAL STATEMENTS.
| 48 | J.P. MORGAN EXCHANGE-TRADED FUNDS | AUGUST 31, 2018 | ||||
| PRINCIPAL AMOUNT($) | INVESTMENTS | VALUE($) | ||||||
Corporate Bonds — continued | ||||||||
Banks — continued | ||||||||
| 1,283,000 | (ICE LIBOR USD 3 Month + 0.28%), 2.59%, 5/15/2020 (a) | 1,284,870 | ||||||
| 450,000 | (ICE LIBOR USD 3 Month + 0.36%), 2.66%, 9/1/2020 (a) (b) | 451,273 | ||||||
|
| |||||||
| 598,438,349 | ||||||||
|
| |||||||
Beverages — 0.4% | ||||||||
| 4,773,000 | Anheuser-Busch InBev Worldwide, Inc. (Belgium) 6.88%, 11/15/2019 | 4,988,313 | ||||||
| 1,715,000 | Diageo Capital plc (United Kingdom) (ICE LIBOR USD 3 Month + 0.24%), 2.56%, 5/18/2020 (a) | 1,718,047 | ||||||
| 2,500,000 | Molson Coors Brewing Co. 1.90%, 3/15/2019 | 2,489,085 | ||||||
|
| |||||||
| 9,195,445 | ||||||||
|
| |||||||
Biotechnology — 0.0% (d) | ||||||||
| 195,000 | Gilead Sciences, Inc. (ICE LIBOR USD 3 Month + 0.22%), 2.54%, 3/20/2019 (a) | 195,248 | ||||||
|
| |||||||
Capital Markets — 4.3% | ||||||||
| 1,172,000 | CDP Financial, Inc. (Canada) 4.40%, 11/25/2019 (b) | 1,195,220 | ||||||
| 3,500,000 | Credit Suisse AG (Switzerland) 2.30%, 5/28/2019 | 3,491,280 | ||||||
Goldman Sachs Group, Inc. (The) | ||||||||
| 2,368,000 | 2.63%, 1/31/2019 | 2,367,721 | ||||||
| 1,929,000 | 7.50%, 2/15/2019 | 1,969,892 | ||||||
| 1,350,000 | (ICE LIBOR USD 3 Month + 0.80%), 3.13%, 12/13/2019 (a) | 1,359,847 | ||||||
| 4,053,000 | (ICE LIBOR USD 3 Month + 1.16%), 3.51%, 4/23/2020 (a) | 4,105,863 | ||||||
| 1,900,000 | (ICE LIBOR USD 3 Month + 1.20%), 3.54%, 9/15/2020 (a) | 1,930,077 | ||||||
| 4,800,000 | (ICE LIBOR USD 3 Month + 0.73%), 3.07%, 12/27/2020 (a) | 4,823,765 | ||||||
ING Bank NV (Netherlands) | ||||||||
| 3,766,000 | 2.30%, 3/22/2019 (b) | 3,757,930 | ||||||
| 3,160,000 | 1.65%, 8/15/2019 (b) | 3,119,172 | ||||||
| 3,422,000 | (ICE LIBOR USD 3 Month + 0.61%), 2.92%, 8/15/2019 (a) (b) | 3,433,133 | ||||||
| 4,242,000 | 2.50%, 10/1/2019 (b) | 4,219,274 | ||||||
Macquarie Bank Ltd. (Australia) | ||||||||
| 250,000 | 1.87%, 2/28/2019 (b) | 249,134 | ||||||
| 8,800,000 | 2.60%, 6/24/2019 (b) | 8,789,746 | ||||||
| 1,572,000 | Macquarie Group Ltd. (Australia) 7.63%, 8/13/2019 (b) | 1,635,787 | ||||||
| PRINCIPAL AMOUNT($) | INVESTMENTS | VALUE($) | ||||||
Capital Markets — continued | ||||||||
Morgan Stanley | ||||||||
| 3,980,000 | 2.45%, 2/1/2019 | 3,978,206 | ||||||
| 2,500,000 | 7.30%, 5/13/2019 | 2,576,426 | ||||||
| 1,280,000 | 2.38%, 7/23/2019 | 1,275,329 | ||||||
| 7,420,000 | 5.63%, 9/23/2019 | 7,627,688 | ||||||
| 2,116,000 | Series 3NC2, (ICE LIBOR USD 3 Month + 0.80%), 3.12%, 2/14/2020 (a) | 2,120,663 | ||||||
| 9,903,000 | Nomura Holdings, Inc. (Japan) 2.75%, 3/19/2019 | 9,903,646 | ||||||
UBS AG (Switzerland) | ||||||||
| 5,000,000 | 2.38%, 8/14/2019 | 4,980,471 | ||||||
| 17,049,000 | (ICE LIBOR USD 3 Month + 0.58%), 2.90%, 6/8/2020 (a) (b) | 17,104,938 | ||||||
| 651,000 | USAA Capital Corp. 2.13%, 6/3/2019 (b) | 648,402 | ||||||
|
| |||||||
| 96,663,610 | ||||||||
|
| |||||||
Chemicals — 1.0% | ||||||||
| 8,115,000 | Dow Chemical Co. (The) 8.55%, 5/15/2019 | 8,424,533 | ||||||
| 8,548,000 | LyondellBasell Industries NV 5.00%, 4/15/2019 | 8,613,719 | ||||||
| 6,260,000 | Nutrien Ltd. (Canada) 6.50%, 5/15/2019 | 6,406,664 | ||||||
|
| |||||||
| 23,444,916 | ||||||||
|
| |||||||
Construction Materials — 0.2% | ||||||||
Martin Marietta Materials, Inc. | ||||||||
| 500,000 | (ICE LIBOR USD 3 Month + 0.50%), 2.82%, 12/20/2019 (a) | 501,025 | ||||||
| 3,581,000 | (ICE LIBOR USD 3 Month + 0.65%), 2.96%, 5/22/2020 (a) | 3,595,521 | ||||||
|
| |||||||
| 4,096,546 | ||||||||
|
| |||||||
Consumer Finance — 3.4% | ||||||||
| 4,050,000 | AerCap Ireland Capital DAC (Ireland) 3.75%, 5/15/2019 | 4,072,913 | ||||||
| 3,354,000 | American Express Co. (ICE LIBOR USD 3 Month + 0.53%), 2.84%, 5/17/2021 (a) | 3,373,753 | ||||||
American Express Credit Corp. | ||||||||
| 3,923,000 | 1.88%, 5/3/2019 | 3,904,853 | ||||||
| 3,303,000 | (ICE LIBOR USD 3 Month + 0.49%), 2.80%, 8/15/2019 (a) | 3,315,532 | ||||||
| 3,500,000 | 1.70%, 10/30/2019 | 3,457,714 | ||||||
| 10,000,000 | American Honda Finance Corp. 1.20%, 7/12/2019 | 9,890,532 | ||||||
Capital One Financial Corp. | ||||||||
| 1,582,000 | 2.45%, 4/24/2019 | 1,579,789 | ||||||
| 7,250,000 | (ICE LIBOR USD 3 Month + 0.76%), 3.10%, 5/12/2020 (a) | 7,298,887 | ||||||
SEE NOTES TO FINANCIAL STATEMENTS.
| AUGUST 31, 2018 | J.P. MORGAN EXCHANGE-TRADED FUNDS | 49 | ||||||
JPMorgan Ultra-Short Income ETF
SCHEDULE OF PORTFOLIO INVESTMENTS
AS OF AUGUST 31, 2018 (Unaudited) (continued)
| PRINCIPAL AMOUNT($) | INVESTMENTS | VALUE($) | ||||||
Corporate Bonds — continued | ||||||||
Consumer Finance — continued | ||||||||
| 1,609,000 | Caterpillar Financial Services Corp. (ICE LIBOR USD 3 Month + 0.13%), 2.45%, 11/29/2019 (a) | 1,609,416 | ||||||
Ford Motor Credit Co. LLC | ||||||||
| 2,000,000 | 2.38%, 3/12/2019 | 1,992,435 | ||||||
| 3,000,000 | 2.26%, 3/28/2019 | 2,985,090 | ||||||
| 1,240,000 | 1.90%, 8/12/2019 | 1,224,438 | ||||||
| 510,000 | (ICE LIBOR USD 3 Month + 0.83%), 3.17%, 8/12/2019 (a) | 511,566 | ||||||
| 1,750,000 | (ICE LIBOR USD 3 Month + 0.79%), 3.12%, 6/12/2020 (a) | 1,755,924 | ||||||
General Motors Financial Co., Inc. | ||||||||
| 2,838,000 | 2.40%, 5/9/2019 | 2,829,301 | ||||||
| 1,097,000 | 3.50%, 7/10/2019 | 1,102,825 | ||||||
| 1,800,000 | (ICE LIBOR USD 3 Month + 0.93%), 3.27%, 4/13/2020 (a) | 1,812,632 | ||||||
HSBC USA, Inc. | ||||||||
| 100,000 | (ICE LIBOR USD 3 Month + 0.88%), 3.22%, 9/24/2018 (a) | 100,055 | ||||||
| 6,830,000 | 2.25%, 6/23/2019 | 6,807,911 | ||||||
| 6,926,000 | 2.38%, 11/13/2019 | 6,882,134 | ||||||
| 1,595,000 | ICBCIL Finance Co. Ltd. (China) 2.38%, 5/19/2019 (b) | 1,581,195 | ||||||
| 4,495,000 | John Deere Capital Corp. 1.70%, 1/15/2020 | 4,428,250 | ||||||
| 879,000 | PACCAR Financial Corp. (ICE LIBOR USD 3 Month + 0.26%), 2.60%, 5/10/2021 (a) | 880,515 | ||||||
Toyota Motor Credit Corp. | ||||||||
| 1,052,000 | (ICE LIBOR USD 3 Month + 0.14%), 2.46%, 11/14/2019 (a) | 1,053,252 | ||||||
| 3,500,000 | (ICE LIBOR USD 3 Month + 0.20%), 2.75%, 6/3/2020 (a) | 3,476,152 | ||||||
|
| |||||||
| 77,927,064 | ||||||||
|
| |||||||
Diversified Financial Services — 1.0% | ||||||||
AIG Global Funding | ||||||||
| 2,056,000 | 1.95%, 10/18/2019 (b) | 2,032,079 | ||||||
| 2,125,000 | (ICE LIBOR USD 3 Month + 0.48%), 2.82%, 7/2/2020 (a) (b) | 2,130,424 | ||||||
| 700,000 | Federation des Caisses Desjardins du Quebec (Canada) (ICE LIBOR USD 3 Month + 0.33%), 2.67%, 10/30/2020 (a) (b) | 700,481 | ||||||
National Rural Utilities Cooperative Finance Corp. | ||||||||
| 434,000 | 10.38%, 11/1/2018 | 439,335 | ||||||
| 3,505,000 | 1.65%, 2/8/2019 | 3,491,172 | ||||||
| PRINCIPAL AMOUNT($) | INVESTMENTS | VALUE($) | ||||||
Diversified Financial Services — continued |
| |||||||
| 2,691,000 | 2.00%, 1/27/2020 | 2,659,716 | ||||||
| 7,159,000 | (ICE LIBOR USD 3 Month + 0.38%), 2.57%, 6/30/2021 (a) | 7,161,119 | ||||||
| 4,849,000 | Nationwide Building Society (United Kingdom) 2.35%, 1/21/2020 (b) | 4,790,128 | ||||||
|
| |||||||
| 23,404,454 | ||||||||
|
| |||||||
Diversified Telecommunication Services — 1.4% |
| |||||||
| 500,000 | AT&T, Inc. 2.38%, 11/27/2018 | 499,721 | ||||||
| 3,639,000 | British Telecommunications plc (United Kingdom) 2.35%, 2/14/2019 | 3,632,404 | ||||||
Deutsche Telekom International Finance BV (Germany) | ||||||||
| 348,000 | 6.00%, 7/8/2019 | 357,140 | ||||||
| 4,490,000 | (ICE LIBOR USD 3 Month + 0.45%), 2.78%, 9/19/2019 (a) (b) | 4,497,459 | ||||||
| 605,000 | (ICE LIBOR USD 3 Month + 0.58%), 2.92%, 1/17/2020 (a) (b) | 607,399 | ||||||
Orange SA (France) | ||||||||
| 11,817,000 | 2.75%, 2/6/2019 | 11,824,012 | ||||||
| 1,649,000 | 1.63%, 11/3/2019 | 1,625,104 | ||||||
| 4,371,000 | SES GLOBAL Americas Holdings GP (Luxembourg) 2.50%, 3/25/2019 (b) | 4,359,677 | ||||||
| 4,894,000 | Verizon Communications, Inc. (ICE LIBOR USD 3 Month + 0.55%), 2.86%, 5/22/2020 (a) | 4,927,338 | ||||||
|
| |||||||
| 32,330,254 | ||||||||
|
| |||||||
Electric Utilities — 3.5% | ||||||||
| 1,998,000 | Arizona Public Service Co. 8.75%, 3/1/2019 | 2,055,392 | ||||||
| 430,000 | Duke Energy Carolinas LLC Series C, 7.00%, 11/15/2018 | 433,686 | ||||||
| 360,750 | Duke Energy Florida LLC 2.10%, 12/15/2019 | 359,168 | ||||||
| 1,373,000 | Duke Energy Ohio, Inc. 5.45%, 4/1/2019 | 1,394,317 | ||||||
| 7,225,000 | Emera US Finance LP (Canada) 2.15%, 6/15/2019 | 7,172,407 | ||||||
| 1,031,000 | Indiana Michigan Power Co. 7.00%, 3/15/2019 | 1,053,713 | ||||||
| 2,403,000 | Kansas City Power & Light Co. Series 09A, 7.15%, 4/1/2019 | 2,459,897 | ||||||
| 475,000 | Metropolitan Edison Co. 7.70%, 1/15/2019 | 483,538 | ||||||
| 2,399,000 | MidAmerican Energy Co. 2.40%, 3/15/2019 | 2,396,513 | ||||||
NextEra Energy Capital Holdings, Inc. | ||||||||
| 2,000,000 | 1.65%, 9/1/2018 | 2,000,000 | ||||||
| 5,902,000 | 2.30%, 4/1/2019 | 5,888,558 | ||||||
SEE NOTES TO FINANCIAL STATEMENTS.
| 50 | J.P. MORGAN EXCHANGE-TRADED FUNDS | AUGUST 31, 2018 | ||||
| PRINCIPAL AMOUNT($) | INVESTMENTS | VALUE($) | ||||||
Corporate Bonds — continued | ||||||||
Electric Utilities — continued | ||||||||
| 12,660,000 | (ICE LIBOR USD 3 Month + 0.55%), 2.86%, 8/28/2021 (a) | 12,656,360 | ||||||
| 3,070,000 | Niagara Mohawk Power Corp. 4.88%, 8/15/2019 (b) | 3,123,749 | ||||||
| 11,509,000 | Oncor Electric Delivery Co. LLC 2.15%, 6/1/2019 | 11,464,445 | ||||||
| 812,000 | PacifiCorp 5.50%, 1/15/2019 | 820,366 | ||||||
| 6,603,000 | Progress Energy, Inc. 7.05%, 3/15/2019 | 6,753,240 | ||||||
| 697,000 | Public Service Electric & Gas Co. Series I, 1.80%, 6/1/2019 | 692,549 | ||||||
| 3,636,000 | Southwestern Electric Power Co. 6.45%, 1/15/2019 | 3,687,105 | ||||||
| 5,597,000 | State Grid Overseas Investment Ltd. (China) 2.75%, 5/7/2019 (b) | 5,583,007 | ||||||
| 4,973,000 | Virginia Electric & Power Co. 5.00%, 6/30/2019 | 5,061,662 | ||||||
| 3,338,000 | Wisconsin Power & Light Co. 5.00%, 7/15/2019 | 3,402,694 | ||||||
|
| |||||||
| 78,942,366 | ||||||||
|
| |||||||
Electrical Equipment — 0.1% | ||||||||
Emerson Electric Co. | ||||||||
| 1,368,000 | 5.25%, 10/15/2018 | 1,372,406 | ||||||
| 1,245,000 | 5.00%, 4/15/2019 | 1,264,717 | ||||||
|
| |||||||
| 2,637,123 | ||||||||
|
| |||||||
Energy Equipment & Services — 0.0% (d) | ||||||||
| 600,000 | Schlumberger Holdings Corp. 2.35%, 12/21/2018 (b) | 599,828 | ||||||
|
| |||||||
Equity Real Estate Investment Trusts (REITs) — 1.2% |
| |||||||
| 1,889,000 | ERP Operating LP 2.38%, 7/1/2019 | 1,882,928 | ||||||
| 2,500,000 | HCP, Inc. 3.75%, 2/1/2019 | 2,503,388 | ||||||
| 4,137,000 | Scentre Group Trust 1 (Australia) 2.38%, 11/5/2019 (b) | 4,098,897 | ||||||
| 3,082,000 | Simon Property Group LP 2.20%, 2/1/2019 | 3,078,672 | ||||||
| 4,750,000 | VEREIT Operating Partnership LP 3.00%, 2/6/2019 | 4,749,098 | ||||||
| 5,895,000 | WEA Finance LLC (Australia) 2.70%, 9/17/2019 (b) | 5,876,354 | ||||||
| 5,273,000 | Welltower, Inc. 4.13%, 4/1/2019 | 5,294,815 | ||||||
|
| |||||||
| 27,484,152 | ||||||||
|
| |||||||
Food & Staples Retailing — 0.2% | ||||||||
| 3,899,000 | Walmart, Inc. (ICE LIBOR USD 3 Month + 0.04%), 2.38%, 6/23/2020 (a) | 3,904,899 | ||||||
|
| |||||||
Food Products — 0.7% | ||||||||
| 2,050,000 | General Mills, Inc. 5.65%, 2/15/2019 | 2,075,569 | ||||||
| PRINCIPAL AMOUNT($) | INVESTMENTS | VALUE($) | ||||||
Food Products — continued | ||||||||
| 6,000,000 | Mondelez International Holdings Netherlands BV (ICE LIBOR USD 3 Month + 0.61%), 2.95%, 10/28/2019 (a) (b) | 6,020,040 | ||||||
Tyson Foods, Inc. | ||||||||
| 697,000 | (ICE LIBOR USD 3 Month + 0.45%), 2.76%, 5/30/2019 (a) | 698,041 | ||||||
| 2,000,000 | 2.65%, 8/15/2019 | 1,995,493 | ||||||
| 832,000 | (ICE LIBOR USD 3 Month + 0.55%), 2.87%, 6/2/2020 (a) | 835,224 | ||||||
| 3,213,000 | Unilever Capital Corp. (United Kingdom) 4.80%, 2/15/2019 | 3,245,356 | ||||||
|
| |||||||
| 14,869,723 | ||||||||
|
| |||||||
Gas Utilities — 0.0% (d) | ||||||||
| 440,000 | Atmos Energy Corp. 8.50%, 3/15/2019 | 453,123 | ||||||
|
| |||||||
Health Care Equipment & Supplies — 0.0% (d) |
| |||||||
| 1,020,000 | Zimmer Biomet Holdings, Inc. (ICE LIBOR USD 3 Month + 0.75%), 3.08%, 3/19/2021 (a) | 1,021,602 | ||||||
|
| |||||||
Health Care Providers & Services — 1.1% |
| |||||||
| 5,946,000 | Cardinal Health, Inc. 1.95%, 6/14/2019 | 5,909,262 | ||||||
| 11,950,000 | CVS Health Corp. (ICE LIBOR USD 3 Month + 0.63%), 2.96%, 3/9/2020 (a) | 12,021,150 | ||||||
Express Scripts Holding Co. | ||||||||
| 1,143,000 | 2.25%, 6/15/2019 | 1,138,477 | ||||||
| 2,500,000 | (ICE LIBOR USD 3 Month + 0.75%), 3.06%, 11/30/2020 (a) | 2,504,120 | ||||||
| 3,501,000 | UnitedHealth Group, Inc. 1.70%, 2/15/2019 | 3,487,235 | ||||||
|
| |||||||
| 25,060,244 | ||||||||
|
| |||||||
Household Products — 0.1% | ||||||||
| 910,000 | Kimberly-Clark Corp. 1.40%, 2/15/2019 | 905,343 | ||||||
| 475,000 | Reckitt Benckiser Treasury Services plc (United Kingdom) 2.13%, 9/21/2018 (b) | 474,946 | ||||||
|
| |||||||
| 1,380,289 | ||||||||
|
| |||||||
Independent Power and Renewable Electricity Producers — 0.3% |
| |||||||
Exelon Generation Co. LLC | ||||||||
| 1,617,000 | 5.20%, 10/1/2019 | 1,653,140 | ||||||
| 4,700,000 | 2.95%, 1/15/2020 | 4,682,871 | ||||||
|
| |||||||
| 6,336,011 | ||||||||
|
| |||||||
Industrial Conglomerates — 0.4% | ||||||||
Hutchison Whampoa International Ltd. (Hong Kong) | ||||||||
| 7,234,000 | 7.63%, 4/9/2019 (b) | 7,423,893 | ||||||
SEE NOTES TO FINANCIAL STATEMENTS.
| AUGUST 31, 2018 | J.P. MORGAN EXCHANGE-TRADED FUNDS | 51 | ||||||
JPMorgan Ultra-Short Income ETF
SCHEDULE OF PORTFOLIO INVESTMENTS
AS OF AUGUST 31, 2018 (Unaudited) (continued)
| PRINCIPAL AMOUNT($) | INVESTMENTS | VALUE($) | ||||||
Corporate Bonds — continued | ||||||||
Industrial Conglomerates — continued | ||||||||
| 1,101,000 | 5.75%, 9/11/2019 (b) | 1,128,557 | ||||||
|
| |||||||
| 8,552,450 | ||||||||
|
| |||||||
Insurance — 5.8% | ||||||||
| 8,518,000 | AIA Group Ltd. (Hong Kong) 2.25%, 3/11/2019 (b) | 8,474,558 | ||||||
| 7,983,000 | American International Group, Inc. 2.30%, 7/16/2019 | 7,952,425 | ||||||
Athene Global Funding | ||||||||
| 2,745,000 | 2.88%, 10/23/2018 (b) | 2,744,747 | ||||||
| 6,495,000 | (ICE LIBOR USD 3 Month + 1.14%), 3.49%, 4/20/2020 (a) (b) | 6,575,006 | ||||||
Jackson National Life Global Funding | ||||||||
| 2,050,000 | 2.30%, 4/16/2019 (b) | 2,046,869 | ||||||
| 5,000,000 | (ICE LIBOR USD 3 Month + 0.30%), 2.64%, 4/27/2020 (a) (b) | 5,004,891 | ||||||
| 3,446,000 | (ICE LIBOR USD 3 Month + 0.48%), 2.81%, 6/11/2021 (a) (b) | 3,453,322 | ||||||
Metropolitan Life Global Funding I | ||||||||
| 10,000,000 | 2.30%, 4/10/2019 (b) | 9,984,957 | ||||||
| 3,712,000 | 1.55%, 9/13/2019 (b) | 3,667,864 | ||||||
| 950,000 | 1.75%, 9/19/2019 (b) | 938,973 | ||||||
| 5,759,000 | (ICE LIBOR USD 3 Month + 0.22%), 2.55%, 9/19/2019 (a) (b) | 5,769,393 | ||||||
| 250,000 | (ICE LIBOR USD 3 Month + 0.40%), 2.73%, 6/12/2020 (a) (b) | 251,246 | ||||||
| 11,000,000 | (SOFRRATE + 0.57%), 2.50%, 9/7/2020 (a) (b) | 11,000,000 | ||||||
New York Life Global Funding | ||||||||
| 5,000,000 | 2.10%, 1/2/2019 (b) | 4,995,490 | ||||||
| 1,075,000 | 2.15%, 6/18/2019 (b) | 1,070,643 | ||||||
| 4,255,000 | 1.50%, 10/24/2019 (b) | 4,194,901 | ||||||
| 2,017,000 | (ICE LIBOR USD 3 Month + 0.32%), 2.66%, 8/6/2021 (a) (b) | 2,021,176 | ||||||
Pricoa Global Funding I | ||||||||
| 664,000 | 2.20%, 5/16/2019 (b) | 662,389 | ||||||
| 1,092,000 | 1.45%, 9/13/2019 (b) | 1,077,546 | ||||||
Principal Life Global Funding II | ||||||||
| 17,874,000 | 1.50%, 4/18/2019 (b) | 17,748,638 | ||||||
| 1,624,000 | 2.38%, 9/11/2019 (b) | 1,616,434 | ||||||
Protective Life Global Funding | ||||||||
| 5,319,000 | 1.72%, 4/15/2019 (b) | 5,288,747 | ||||||
| 4,873,000 | 1.56%, 9/13/2019 (b) | 4,809,620 | ||||||
| 10,380,000 | (ICE LIBOR USD 3 Month + 0.37%), 2.71%, 7/13/2020 (a) (b) | 10,390,237 | ||||||
Reliance Standard Life Global Funding II | ||||||||
| 1,620,000 | 2.15%, 10/15/2018 (b) | 1,619,484 | ||||||
| PRINCIPAL AMOUNT($) | INVESTMENTS | VALUE($) | ||||||
Insurance — continued | ||||||||
| 7,004,000 | 2.50%, 4/24/2019 (b) | 6,995,668 | ||||||
| 890,000 | Suncorp-Metway Ltd. (Australia) 2.10%, 5/3/2019 (b) | 885,986 | ||||||
|
| |||||||
| 131,241,210 | ||||||||
|
| |||||||
Internet Software & Services — 1.2% | ||||||||
| 8,775,000 | Alibaba Group Holding Ltd. (China) 2.50%, 11/28/2019 | 8,704,259 | ||||||
| 16,394,000 | Tencent Holdings Ltd. (China) 3.38%, 5/2/2019 (b) | 16,437,156 | ||||||
| 1,159,000 | 2.88%, 2/11/2020 (b) | 1,151,163 | ||||||
|
| |||||||
| 26,292,578 | ||||||||
|
| |||||||
IT Services — 0.3% | ||||||||
| 750,000 | DXC Technology Co. (ICE LIBOR USD 3 Month + 0.95%), 3.25%, 3/1/2021 (a) | 750,064 | ||||||
Western Union Co. (The) | ||||||||
| 810,000 | (ICE LIBOR USD 3 Month + 0.80%), 3.11%, 5/22/2019 (a) | 811,893 | ||||||
| 4,676,000 | 3.35%, 5/22/2019 | 4,688,391 | ||||||
|
| |||||||
| 6,250,348 | ||||||||
|
| |||||||
Machinery — 0.2% | ||||||||
| 2,524,000 | Illinois Tool Works, Inc. 6.25%, 4/1/2019 | 2,574,932 | ||||||
| 1,800,000 | Stanley Black & Decker, Inc. 2.45%, 11/17/2018 | 1,799,447 | ||||||
|
| |||||||
| 4,374,379 | ||||||||
|
| |||||||
Media — 0.9% | ||||||||
| 3,738,000 | Comcast Corp. 5.70%, 7/1/2019 | 3,827,158 | ||||||
| 2,857,000 | Discovery Communications LLC (ICE LIBOR USD 3 Month + 0.71%), 3.03%, 9/20/2019 (a) | 2,868,662 | ||||||
| 2,370,000 | NBCUniversal Enterprise, Inc. 1.97%, 4/15/2019 (b) | 2,359,953 | ||||||
| 11,792,000 | Omnicom Group, Inc. 6.25%, 7/15/2019 | 12,130,787 | ||||||
|
| |||||||
| 21,186,560 | ||||||||
|
| |||||||
Multiline Retail — 0.4% | ||||||||
| 8,912,000 | Dollar Tree, Inc. (ICE LIBOR USD 3 Month + 0.70%), 3.04%, 4/17/2020 (a) | 8,930,519 | ||||||
|
| |||||||
Multi-Utilities — 0.9% | ||||||||
Consolidated Edison Co. of New York, Inc. | ||||||||
| 850,000 | 7.13%, 12/1/2018 | 858,878 | ||||||
| 1,655,000 | 6.65%, 4/1/2019 | 1,690,885 | ||||||
| 2,131,000 | Series C, (ICE LIBOR USD 3 Month + 0.40%), 2.74%, 6/25/2021 (a) | 2,139,454 | ||||||
SEE NOTES TO FINANCIAL STATEMENTS.
| 52 | J.P. MORGAN EXCHANGE-TRADED FUNDS | AUGUST 31, 2018 | ||||
| PRINCIPAL AMOUNT($) | INVESTMENTS | VALUE($) | ||||||
Corporate Bonds — continued | ||||||||
Multi-Utilities — continued | ||||||||
Consumers Energy Co. | ||||||||
| 1,601,000 | 6.13%, 3/15/2019 | 1,630,421 | ||||||
| 530,000 | 6.70%, 9/15/2019 | 550,940 | ||||||
Dominion Energy, Inc. | ||||||||
| 135,000 | 1.88%, 12/15/2018 (b) | 134,745 | ||||||
| 2,400,000 | Series A, 1.88%, 1/15/2019 | 2,393,716 | ||||||
| 540,000 | (ICE LIBOR USD 3 Month + 0.55%), 2.85%, 6/1/2019 (a) (b) | 541,511 | ||||||
| 7,881,000 | Series B, 1.60%, 8/15/2019 | 7,789,472 | ||||||
| 1,897,000 | DTE Energy Co. 1.50%, 10/1/2019 | 1,865,474 | ||||||
Sempra Energy | ||||||||
| 221,000 | 9.80%, 2/15/2019 | 227,780 | ||||||
| 750,000 | (ICE LIBOR USD 3 Month + 0.50%), 2.84%, 1/15/2021 (a) | 750,598 | ||||||
| 1,050,000 | (ICE LIBOR USD 3 Month + 0.45%), 2.79%, 3/15/2021 (a) | 1,050,916 | ||||||
|
| |||||||
| 21,624,790 | ||||||||
|
| |||||||
Oil, Gas & Consumable Fuels — 2.2% | ||||||||
| 3,456,000 | Chevron Corp. 4.95%, 3/3/2019 | 3,499,172 | ||||||
| 1,500,000 | Enable Midstream Partners LP 2.40%, 5/15/2019 (e) | 1,493,072 | ||||||
| 9,412,000 | Enterprise Products Operating LLC Series N, 6.50%, 1/31/2019 | 9,553,399 | ||||||
| 15,973,000 | EOG Resources, Inc. 5.63%, 6/1/2019 | 16,304,795 | ||||||
| 4,791,000 | Magellan Midstream Partners LP 6.55%, 7/15/2019 | 4,938,221 | ||||||
| 4,139,000 | ONEOK Partners LP 8.63%, 3/1/2019 | 4,252,902 | ||||||
Phillips 66 | ||||||||
| 250,000 | (ICE LIBOR USD 3 Month + 0.75%), 3.09%, 4/15/2020 (a) (b) | 250,099 | ||||||
| 1,000,000 | (ICE LIBOR USD 3 Month + 0.60%), 2.91%, 2/26/2021 (a) | 1,001,272 | ||||||
TransCanada PipeLines Ltd. (Canada) | ||||||||
| 1,552,000 | 3.13%, 1/15/2019 | 1,554,285 | ||||||
| 6,619,000 | 7.13%, 1/15/2019 | 6,723,045 | ||||||
|
| |||||||
| 49,570,262 | ||||||||
|
| |||||||
Pharmaceuticals — 1.3% | ||||||||
| 3,336,000 | Allergan Funding SCS 2.45%, 6/15/2019 | 3,325,306 | ||||||
Bayer US Finance II LLC (Germany) | ||||||||
| 4,000,000 | 2.13%, 7/15/2019 (b) | 3,975,164 | ||||||
| 5,000,000 | (ICE LIBOR USD 3 Month + 0.63%), 2.97%, 6/25/2021 (a) (b) | 5,021,604 | ||||||
| 3,393,000 | GlaxoSmithKline Capital plc (United Kingdom) (ICE LIBOR USD 3 Month + 0.35%), 2.67%, 5/14/2021 (a) | 3,421,320 | ||||||
| PRINCIPAL AMOUNT($) | INVESTMENTS | VALUE($) | ||||||
Pharmaceuticals — continued | ||||||||
| 13,269,000 | Novartis Securities Investment Ltd. (Switzerland) 5.13%, 2/10/2019 | 13,407,727 | ||||||
|
| |||||||
| 29,151,121 | ||||||||
|
| |||||||
Road & Rail — 0.8% | ||||||||
| 2,239,000 | Canadian Pacific Railway Co. (Canada) 7.25%, 5/15/2019 | 2,307,265 | ||||||
| 2,488,000 | ERAC USA Finance LLC 2.35%, 10/15/2019 (b) | 2,468,693 | ||||||
Ryder System, Inc. | ||||||||
| 9,925,000 | 2.55%, 6/1/2019 | 9,910,582 | ||||||
| 3,407,000 | 2.45%, 9/3/2019 | 3,388,598 | ||||||
|
| |||||||
| 18,075,138 | ||||||||
|
| |||||||
Software — 0.1% | ||||||||
| 1,900,000 | Oracle Corp. 2.38%, 1/15/2019 | 1,900,553 | ||||||
|
| |||||||
Technology Hardware, Storage & Peripherals — 0.0% (d) |
| |||||||
| 400,000 | Apple, Inc. (ICE LIBOR USD 3 Month + 0.20%), 2.54%, 2/7/2020 (a) | 401,360 | ||||||
|
| |||||||
Thrifts & Mortgage Finance — 0.8% | ||||||||
BPCE SA (France) | ||||||||
| 1,053,000 | 2.50%, 12/10/2018 | 1,053,091 | ||||||
| 16,412,000 | 2.50%, 7/15/2019 | 16,336,735 | ||||||
|
| |||||||
| 17,389,826 | ||||||||
|
| |||||||
Tobacco — 0.4% | ||||||||
BAT Capital Corp. (United Kingdom) | ||||||||
| 1,800,000 | (ICE LIBOR USD 3 Month + 0.59%), 2.91%, 8/14/2020 (a) (b) | 1,806,448 | ||||||
| 5,000,000 | Philip Morris International, Inc. 1.38%, 2/25/2019 | 4,972,124 | ||||||
| 1,962,000 | Reynolds American, Inc. (United Kingdom) 8.13%, 6/23/2019 | 2,042,631 | ||||||
|
| |||||||
| 8,821,203 | ||||||||
|
| |||||||
Trading Companies & Distributors — 0.8% |
| |||||||
Air Lease Corp. | ||||||||
| 852,000 | 2.63%, 9/4/2018 | 852,000 | ||||||
| 1,337,000 | 3.38%, 1/15/2019 | 1,339,460 | ||||||
| 6,254,000 | Aviation Capital Group LLC (ICE LIBOR USD 3 Month + 0.67%), 3.01%, 7/30/2021 (a) (b) | 6,268,942 | ||||||
| 4,090,000 | BOC Aviation Ltd. (Singapore) (ICE LIBOR USD 3 Month + 1.05%), 3.40%, 5/2/2021 (a) (b) | 4,114,088 | ||||||
| 5,607,000 | International Lease Finance Corp. 5.88%, 4/1/2019 | 5,697,701 | ||||||
|
| |||||||
| 18,272,191 | ||||||||
|
| |||||||
SEE NOTES TO FINANCIAL STATEMENTS.
| AUGUST 31, 2018 | J.P. MORGAN EXCHANGE-TRADED FUNDS | 53 | ||||||
JPMorgan Ultra-Short Income ETF
SCHEDULE OF PORTFOLIO INVESTMENTS
AS OF AUGUST 31, 2018 (Unaudited) (continued)
| PRINCIPAL AMOUNT($) | INVESTMENTS | VALUE($) | ||||||
Corporate Bonds — continued | ||||||||
Water Utilities — 0.3% | ||||||||
| 7,055,000 | United Utilities plc (United Kingdom) 5.38%, 2/1/2019 | 7,118,755 | ||||||
|
| |||||||
Wireless Telecommunication Services — 0.1% |
| |||||||
| 3,293,000 | America Movil SAB de CV (Mexico) 5.00%, 10/16/2019 | 3,352,775 | ||||||
|
| |||||||
Total Corporate Bonds | 1,480,920,699 | |||||||
|
| |||||||
Asset-backed Securities — 13.5% | ||||||||
| 1,000,000 | Allegro CLO II-S Ltd. Series 2014-1RA, Class X, 10/21/2028 (b) (f) (g) | 1,000,000 | ||||||
| 1,480,000 | ALM VI Ltd. (Cayman Islands) | 1,480,000 | ||||||
| 2,700,000 | ALM VII Ltd. (Cayman Islands) | 2,717,680 | ||||||
| 6,000,000 | ALM XIX Ltd. (Cayman Islands) | 6,014,196 | ||||||
Americredit Automobile Receivables Trust | ||||||||
| 1,110,000 | Series 2018-1, Class A2A, 2.71%, 7/19/2021 | 1,109,214 | ||||||
| 8,867,000 | Series 2018-2, Class A2A, 2.86%, 11/18/2021 | 8,867,756 | ||||||
AmeriCredit Automobile Receivables Trust | ||||||||
| 122,507 | Series 2014-3, Class C, 2.58%, 9/8/2020 | 122,483 | ||||||
| 105,551 | Series 2017-2, Class A2A, 1.65%, 9/18/2020 | 105,308 | ||||||
| 249,349 | Series 2016-3, Class A3, 1.46%, 5/10/2021 | 248,143 | ||||||
| 250,446 | Series 2017-4, Class A2A, 1.83%, 5/18/2021 | 249,679 | ||||||
| 636,579 | Series 2016-4, Class A3, 1.53%, 7/8/2021 | 632,953 | ||||||
| 927,138 | Anchorage Capital CLO Ltd. (Cayman Islands) Series 2013-1A, Class X, 2.99%, 10/13/2030 (b) (g) | 926,674 | ||||||
| 802,356 | Apidos CLO XVII (Cayman Islands) | 801,938 | ||||||
| 1,000,000 | Apidos CLO XVIII Series 2014-18, Class A1R, 3.47%, 7/22/2026 (b) (g) | 999,852 | ||||||
| 3,190,000 | Apidos CLO XXV (Cayman Islands) | 3,190,038 | ||||||
| 218,750 | ARES XLVI CLO Ltd. Series 2017-46A, Class X, 2.94%, 1/15/2030‡ (b) (g) | 218,747 | ||||||
| PRINCIPAL AMOUNT($) | INVESTMENTS | VALUE($) | ||||||
| 362,500 | Ares XXVII CLO Ltd. (Cayman Islands) Series 2013-2A, Class XR, 3.24%, 7/28/2029 (b) (g) | 362,482 | ||||||
| 1,400,000 | Ares XXXVR CLO Ltd. Series 2015-35RA, Class X, 2.99%, 7/15/2030 (b) (g) | 1,400,000 | ||||||
| 5,486,000 | Avery Point VI CLO Ltd. Series 2015-6, Class AR, 8/5/2027 (b) (g) | 5,486,000 | ||||||
| 5,000,000 | Battalion CLO VII Ltd. (Cayman Islands) Series 2014-7A, Class XRR, 3.24%, 7/17/2028‡ (b) (g) | 4,999,750 | ||||||
| 206,250 | Benefit Street Partners CLO II Ltd. (Cayman Islands) Series 2013-IIA, Class X, 4.04%, 7/15/2029‡ (b) (g) | 208,119 | ||||||
| 328,125 | Benefit Street Partners CLO XI (Cayman Islands) Series 2017-11A, Class X, 3.34%, 4/15/2029‡ (b) (g) | 328,109 | ||||||
BlueMountain CLO Ltd. (Cayman Islands) | ||||||||
| 9,028,981 | Series 2013-4A, Class AR, 3.35%, 4/15/2025 (b) (g) | 9,026,047 | ||||||
| 10,032,000 | Series 2014-2A, Class AR, 3.28%, 7/20/2026 (b) (g) | 10,031,418 | ||||||
| 10,966,274 | Series 2012-2A, Class AR, 3.74%, 11/20/2028 (b) (g) | 10,970,869 | ||||||
Capital Auto Receivables Asset Trust | ||||||||
| 225,242 | Series 2015-2, Class A4, 1.97%, 1/21/2020 | 225,108 | ||||||
| 43,518 | Series 2015-4, Class A3, 1.83%, 3/20/2020 | 43,489 | ||||||
| 365,000 | Series 2015-2, Class C, 2.67%, 8/20/2020 | 364,695 | ||||||
CarMax Auto Owner Trust | ||||||||
| 126,858 | Series 2017-3, Class A2A, 1.64%, 9/15/2020 | 126,442 | ||||||
| 6,335,000 | Series 2018-3, Class A2A, 2.88%, 10/15/2021 | 6,336,823 | ||||||
CIFC Funding Ltd. (Cayman Islands) | ||||||||
| 763,982 | Series 2013-1, Class X, 3.19%, 7/16/2030 (b) (g) | 763,944 | ||||||
| 1,285,714 | Series 2014-1A, Class X, 2.93%, 1/18/2031 (b) (g) | 1,285,502 | ||||||
| 4,000,000 | Series 2013-3RA, Class X, 3.00%, 4/24/2031 (b) (g) | 3,998,000 | ||||||
| 15,000,000 | Citibank Credit Card Issuance Trust | 14,930,742 | ||||||
| 223,438 | Clear Creek CLO Ltd. (Cayman Islands) Series 2015-1A, Class X, 3.35%, 10/20/2030‡ (b) (g) | 223,326 | ||||||
| 1,012,500 | Denali Capital CLO XII Ltd. (Cayman Islands) Series 2016-1A, Class X, 2.89%, 4/15/2031 (b) (g) | 1,011,994 | ||||||
SEE NOTES TO FINANCIAL STATEMENTS.
| 54 | J.P. MORGAN EXCHANGE-TRADED FUNDS | AUGUST 31, 2018 | ||||
| PRINCIPAL AMOUNT($) | INVESTMENTS | VALUE($) | ||||||
Asset-Backed Securities — continued | ||||||||
| 7,153,000 | Discover Card Execution Note Trust | 7,055,854 | ||||||
Drive Auto Receivables Trust | ||||||||
| 6,802,905 | Series 2017-3, Class A3, 1.85%, 4/15/2020 | 6,798,864 | ||||||
| 1,240,000 | Series 2018-2, Class A2, 2.64%, 9/15/2020 | 1,239,829 | ||||||
| 136,000 | Series 2017-3, Class B, 2.30%, 5/17/2021 | 135,727 | ||||||
| 540,000 | Series 2018-2, Class A3, 2.88%, 6/15/2021 | 539,850 | ||||||
| 3,333,000 | Series 2018-3, Class A3, 3.01%, 11/15/2021 | 3,327,147 | ||||||
Dryden 30 Senior Loan Fund (Cayman Islands) | ||||||||
| 250,000 | Series 2013-30A, Class X, 2.91%, 11/15/2028‡ (b) (g) | 249,998 | ||||||
| 450,000 | Series 2013-30A, Class AR, 3.13%, 11/15/2028 (b) (g) | 447,252 | ||||||
| 240,000 | Dryden 50 Senior Loan Fund (Cayman Islands) Series 2017-50A, Class X, 3.14%, 7/15/2030‡ (b) (g) | 239,880 | ||||||
Ford Credit Auto Owner Trust | ||||||||
| 11,349,000 | Series 2014-1, Class A, 2.26%, 11/15/2025 (b) | 11,311,330 | ||||||
| 5,224,000 | Series 2015-1, Class A, 2.12%, 7/15/2026 (b) | 5,163,313 | ||||||
| 5,500,000 | Galaxy XVIII CLO Ltd. (Cayman Islands) Series 2018-28A, Class X, 2.99%, 7/15/2031 (b) (g) | 5,500,000 | ||||||
| 750,000 | Galaxy XXI CLO Ltd. (Cayman Islands) Series 2015-21A, Class X, 2.85%, 4/20/2031‡ (b) (g) | 749,962 | ||||||
| 20,921,000 | GE Capital Credit Card Master Note Trust Series 2012-7, Class A, 1.76%, 9/15/2022 | 20,682,331 | ||||||
| 650,000 | GoldenTree Loan Opportunities IX Ltd. (Cayman Islands) Series 2014-9A, Class AR, 3.71%, 10/29/2026 (b) (g) | 650,235 | ||||||
| 1,500,000 | GT Loan Financing I Ltd. (Cayman Islands) Series 2013-1, Class XR, 3.18%, 7/28/2031 (b) (g) | 1,500,000 | ||||||
| 10,090,000 | Honda Auto Receivables Owner Trust | 10,087,565 | ||||||
ICG US CLO Ltd. (Cayman Islands) | ||||||||
| 928,571 | Series 2017-2, Class X, 3.15%, 10/23/2029 (b) (g) | 928,525 | ||||||
| 1,650,000 | Series 2014-1A, Class X, 3.00%, 1/20/2030 (b) (g) | 1,649,175 | ||||||
| PRINCIPAL AMOUNT($) | INVESTMENTS | VALUE($) | ||||||
KKR CLO Ltd. (Cayman Islands) | ||||||||
| 1,000,000 | Series 12, Class A1R, 3.39%, 7/15/2027 (b) (g) | 999,591 | ||||||
| 1,218,750 | Series 11, Class X, 2.94%, 1/15/2031 (b) (g) | 1,218,141 | ||||||
| 2,204,000 | KVK CLO Ltd. (Cayman Islands) | 2,204,000 | ||||||
| 500,000 | LCM XVI LP (Cayman Islands) Series 16A, Class AR, 3.37%, 7/15/2026 (b) (g) | 499,741 | ||||||
| 15,024,000 | Magnetite IX Ltd. (Cayman Islands) | 15,023,174 | ||||||
| 8,650,000 | Magnetite XI Ltd. (Cayman Islands) Series 2014-11A, Class A1R, 3.45%, 1/18/2027 (b) (g) | 8,645,511 | ||||||
| 9,348,000 | Magnetite XVIII Ltd. (Cayman Islands) Series 2016-18A, Class A, 3.71%, 11/15/2028 (b) (g) | 9,356,581 | ||||||
| 5,000,000 | Neuberger Berman CLO XIV Ltd. (Cayman Islands) Series 2013-14A, Class AR, 3.59%, 1/28/2030 (b) (g) | 5,004,480 | ||||||
Neuberger Berman CLO XVI-S Ltd. (Cayman Islands) | ||||||||
| 125,000 | Series 2017-16SA, Class X, 2.94%, 1/15/2028 (b) (g) | 124,994 | ||||||
| 724,000 | Series 2017-16SA, Class A, 3.19%, 1/15/2028 (b) (g) | 719,866 | ||||||
| 1,081,000 | Oak Hill Credit Partners X Ltd. (Cayman Islands) Series 2014-10A, Class AR, 3.48%, 7/20/2026 (b) (g) | 1,081,530 | ||||||
| 6,200,000 | Oak Hill Credit Partners XII Ltd. (Cayman Islands) Series 2015-12A, Class XR, 3.00%, 7/23/2030 (b) (g) | 6,200,000 | ||||||
OCP CLO Ltd. (Cayman Islands) | ||||||||
| 3,931,288 | Series 2012-2A, Class A1R, 3.71%, 11/22/2025 (b) (g) | 3,933,510 | ||||||
| 665,000 | Series 2015-8A, Class A1R, 3.19%, 4/17/2027 (b) (g) | 663,187 | ||||||
| 2,000,000 | Series 2015-9, Class A1R, 3.14%, 7/15/2027 (b) (g) | 1,994,158 | ||||||
| 1,192,658 | Octagon Investment Partners XVII Ltd. (Cayman Islands) Series 2013-1A, Class X, 2.94%, 1/25/2031‡ (b) (g) | 1,192,641 | ||||||
| 400,000 | Octagon Investment Partners XX Ltd. (Cayman Islands) Series 2014-1A, Class AR, 3.47%, 8/12/2026 (b) (g) | 400,482 | ||||||
| 2,000,000 | OHA Credit Funding 1 Ltd. Series 2018-1, Class X, 10/20/2030 (b) (f) (g) | 2,000,000 | ||||||
SEE NOTES TO FINANCIAL STATEMENTS.
| AUGUST 31, 2018 | J.P. MORGAN EXCHANGE-TRADED FUNDS | 55 | ||||||
JPMorgan Ultra-Short Income ETF
SCHEDULE OF PORTFOLIO INVESTMENTS
AS OF AUGUST 31, 2018 (Unaudited) (continued)
| PRINCIPAL AMOUNT($) | INVESTMENTS | VALUE($) | ||||||
Asset-Backed Securities — continued | ||||||||
| 2,300,000 | OHA Loan Funding Ltd. (Cayman Islands) Series 2013-2A, Class X, 2.91%, 5/23/2031‡ (b) (g) | 2,298,850 | ||||||
| 5,650,000 | Regatta XIII Funding Ltd. (Cayman Islands) Series 2018-2A, Class X, 2.98%, 7/15/2031 (b) (g) | 5,649,717 | ||||||
Santander Drive Auto Receivables Trust | ||||||||
| 249,930 | Series 2017-2, Class A3, 1.87%, 12/15/2020 | 249,628 | ||||||
| 3,045,000 | Series 2018-4, Class A2, 2.73%, 3/15/2021 | 3,044,121 | ||||||
Shackleton CLO Ltd. (Cayman Islands) | ||||||||
| 459,000 | Series 2015-8, Class A1R, 3.27%, 10/20/2027 (b) (g) | 458,715 | ||||||
| 6,000,000 | Series 2014-6RA, Class A, 3.36%, 7/17/2028 (b) (g) | 5,980,770 | ||||||
| 247,735 | Symphony CLO V Ltd. (Cayman Islands) Series 2007-5A, Class A1, 3.09%, 1/15/2024 (b) (g) | 248,138 | ||||||
| 340,000 | Symphony CLO XIV Ltd. (Cayman Islands) Series 2014-14A, Class A2R, 3.62%, 7/14/2026 (b) (g) | 340,236 | ||||||
| 10,284,000 | Synchrony Credit Card Master Note Trust Series 2016-3, Class A, 1.58%, 9/15/2022 | 10,150,859 | ||||||
THL Credit Wind River CLO Ltd. (Cayman Islands) | ||||||||
| 7,500,000 | Series 2017-1A, Class A, 3.67%, 4/18/2029 (b) (g) | 7,522,980 | ||||||
| 875,000 | Series 2014-2A, Class X, 2.99%, 1/15/2031‡ (b) (g) | 874,562 | ||||||
| 2,250,000 | Series 2014-1A, Class X, 2.96%, 7/18/2031‡ (b) (g) | 2,249,901 | ||||||
| 8,084,000 | Toyota Auto Receivables Owner Trust Series 2018-C, Class A2A, 2.77%, 8/16/2021 | 8,083,966 | ||||||
| 4,595,000 | Treman Park CLO Ltd. (Cayman Islands) Series 2015-1A, Class AR, 3.72%, 4/20/2027 (b) (g) | 4,598,474 | ||||||
Verizon Owner Trust | ||||||||
| 14,000,000 | Series 2016-2A, Class A, 1.68%, 5/20/2021 (b) | 13,891,329 | ||||||
| 440,000 | Series 2017-3A, Class A1B, 2.35%, 4/20/2022 (b) (g) | 440,001 | ||||||
| 1,000,000 | Voya CLO Ltd. Series 2014-4, Class XR, 3.04%, 7/14/2031 (b) (g) | 999,985 | ||||||
|
| |||||||
Total Asset-Backed Securities | 307,408,176 | |||||||
|
| |||||||
| PRINCIPAL AMOUNT($) | INVESTMENTS | VALUE($) | ||||||
Certificates of Deposit — 3.4% | ||||||||
Bank of Nova Scotia (The) (Canada) | ||||||||
| 3,055,000 | (ICE LIBOR USD 3 Month + 0.28%), 2.62%, 10/15/2019 (a) | 3,059,658 | ||||||
| 2,700,000 | (ICE LIBOR USD 3 Month + 0.26%), 2.60%, 11/4/2019 (a) | 2,703,719 | ||||||
| 2,500,000 | (ICE LIBOR USD 3 Month + 0.30%), 2.61%, 5/22/2020 (a) | 2,501,666 | ||||||
Canadian Imperial Bank of Commerce (Canada) | ||||||||
| 1,950,000 | (ICE LIBOR USD 3 Month + 0.41%), 2.73%, 9/20/2019 (a) | 1,954,791 | ||||||
| 4,000,000 | (ICE LIBOR USD 3 Month + 0.40%), 2.80%, 5/2/2020 (a) | 4,007,716 | ||||||
| 21,500,000 | Credit Agricole Corporate and Investment Bank (France) (ICE LIBOR USD 3 Month + 0.35%), 2.69%, 7/30/2020 (a) | 21,487,948 | ||||||
| 5,000,000 | National Bank of Canada (Canada) (ICE LIBOR USD 3 Month + 0.19%), 2.50%, 2/14/2020 (a) | 4,999,278 | ||||||
Nordea Bank AB (Sweden) | ||||||||
| 9,140,000 | (ICE LIBOR USD 3 Month + 0.15%), 2.46%, 2/14/2020 (a) | 9,138,680 | ||||||
| 2,850,000 | (ICE LIBOR USD 3 Month + 0.40%), 2.74%, 3/27/2020 (a) | 2,858,687 | ||||||
| 4,000,000 | (ICE LIBOR USD 3 Month + 0.30%), 2.62%, 6/5/2020 (a) | 4,004,784 | ||||||
Sumitomo Mitsui Banking Corp. (Japan) | ||||||||
| 2,959,000 | (ICE LIBOR USD 3 Month + 0.37%), 2.71%, 1/31/2020 (a) | 2,961,025 | ||||||
| 4,000,000 | (ICE LIBOR USD 3 Month + 0.41%), 2.74%, 6/18/2020 (a) | 4,000,683 | ||||||
Svenska Handelsbanken AB (Sweden) | ||||||||
| 3,500,000 | (ICE LIBOR USD 3 Month + 0.27%), 2.62%, 10/21/2019 (a) | 3,502,707 | ||||||
| 4,965,000 | (ICE LIBOR USD 3 Month + 0.40%), 2.74%, 4/1/2020 (a) | 4,968,786 | ||||||
| 2,773,000 | (ICE LIBOR USD 3 Month + 0.30%), 2.63%, 6/11/2020 (a) | 2,772,519 | ||||||
| 2,040,000 | UBS AG (Switzerland) (ICE LIBOR USD 3 Month + 0.42%), 2.74%, 3/2/2020 (a) | 2,040,298 | ||||||
|
| |||||||
Total Certificates of Deposit | 76,962,945 | |||||||
|
| |||||||
U.S. Treasury Obligations — 0.9% | ||||||||
| 20,000,000 | U.S. Treasury Notes 0.88%, 7/31/2019 | 19,718,750 | ||||||
|
| |||||||
Commercial Mortgage-Backed Securities — 0.4% | ||||||||
| 1,000,000 | BXMT Ltd. Series 2017-FL1, Class A, 2.93%, 6/15/2035 (b) (g) | 1,000,000 | ||||||
SEE NOTES TO FINANCIAL STATEMENTS.
| 56 | J.P. MORGAN EXCHANGE-TRADED FUNDS | AUGUST 31, 2018 | ||||
| PRINCIPAL AMOUNT($) | INVESTMENTS | VALUE($) | ||||||
Commercial Mortgage-Backed Securities — continued | ||||||||
| 500,000 | BXP Trust Series 2017-CQHP, Class A, 2.91%, 11/15/2034 (b) (g) | 500,285 | ||||||
| 900,000 | CGDBB Commercial Mortgage Trust | 899,999 | ||||||
| 1,800,000 | Citigroup Commercial Mortgage Trust Series 2017-1500, Class A, 2.91%, 7/15/2032 (b) (g) | 1,800,583 | ||||||
| 500,000 | Cold Storage Trust Series 2017-ICE3, Class A, 3.06%, 4/15/2036 (b) (g) | 501,558 | ||||||
| 2,900,000 | Exantas Capital Corp. Ltd. (Cayman Islands) Series 2018-RSO6, Class A, 2.89%, 6/15/2035 (b) (g) | 2,895,163 | ||||||
| 39,658 | Morgan Stanley Bank of America Merrill Lynch Trust Series 2014-C16, Class A1, 1.29%, 6/15/2047 | 39,588 | ||||||
| 1,000,000 | TPG Real Estate Finance Ltd. (Cayman Islands) Series 2018-FL1, Class A, 2.81%, 2/15/2035 (b) (g) | 999,688 | ||||||
|
| |||||||
Total Commercial Mortgage-Backed Securities | 8,636,864 | |||||||
|
| |||||||
Foreign Government Securities — 0.1% | ||||||||
Japan Bank for International Cooperation (Japan) | ||||||||
| 800,000 | 1.75%, 11/13/2018 | 798,968 | ||||||
| 200,000 | (ICE LIBOR USD 3 Month + 0.48%), 2.78%, 6/1/2020 (a) | 201,029 | ||||||
| 400,000 | Japan Finance Organization for Municipalities (Japan) 2.13%, 3/6/2019 (b) | 398,780 | ||||||
|
| |||||||
Total Foreign Government Securities | 1,398,777 | |||||||
|
| |||||||
Short-Term Investments — 15.5% | ||||||||
Certificates of Deposit — 2.8% | ||||||||
| 2,200,000 | Bank of Montreal (Canada) (ICE LIBOR USD 3 Month + 0.25%), 2.58%, 3/18/2019 (a) | 2,201,747 | ||||||
Bank of Nova Scotia (The) (Canada) | ||||||||
| 1,450,000 | 1.93%, 12/6/2018 | 1,448,656 | ||||||
| 1,400,000 | (ICE LIBOR USD 3 Month + 0.28%), 2.60%, 3/20/2019 (a) | 1,401,874 | ||||||
| 5,800,000 | BNP Paribas (France) (ICE LIBOR USD 3 Month + 0.14%), 2.47%, 6/19/2019 (a) | 5,800,438 | ||||||
| 550,000 | Cooperatieve Rabobank UA (Netherlands) 1.99%, 11/13/2018 | 549,778 | ||||||
Credit Suisse AG (Switzerland) | ||||||||
| 600,000 | 2.22%, 1/16/2019 | 599,542 | ||||||
| PRINCIPAL AMOUNT($) | INVESTMENTS | VALUE($) | ||||||
Certificates of Deposit — continued | ||||||||
| 700,000 | 2.33%, 2/1/2019 | 699,651 | ||||||
| 1,500,000 | (ICE LIBOR USD 3 Month + 0.30%), 2.62%, 3/8/2019 (a) | 1,502,218 | ||||||
| 700,000 | 1.75%, 3/12/2019 | 698,177 | ||||||
| 4,200,000 | Deutsche Bank AG (Germany) (ICE LIBOR USD 3 Month + 0.31%), 2.65%, 11/13/2018 (a) | 4,200,045 | ||||||
| 900,000 | DNB Bank ASA (Norway) 1.68%, 10/19/2018 | 899,569 | ||||||
| 8,000,000 | Goldman Sachs Bank USA (ICE LIBOR USD 3 Month + 0.15%), 2.47%, 8/16/2019 (a) | 7,999,221 | ||||||
Industrial & Commercial Bank of China Ltd. (China) | ||||||||
| 6,500,000 | 2.55%, 10/1/2018 | 6,502,206 | ||||||
| 5,800,000 | 2.65%, 11/2/2018 | 5,802,958 | ||||||
| 350,000 | MUFG Bank Ltd. (Japan) 2.15%, 1/16/2019 | 349,662 | ||||||
Natixis SA (France) | ||||||||
| 420,000 | 1.82%, 11/8/2018 | 419,722 | ||||||
| 1,300,000 | (ICE LIBOR USD 3 Month + 0.19%), 2.53%, 2/1/2019 (a) | 1,300,731 | ||||||
Royal Bank of Canada (Canada) | ||||||||
| 1,000,000 | 1.95%, 12/6/2018 | 999,039 | ||||||
| 1,300,000 | 2.24%, 2/1/2019 | 1,298,952 | ||||||
| 600,000 | Standard Chartered Bank (United Kingdom) 1.83%, 10/26/2018 | 599,714 | ||||||
| 400,000 | Sumitomo Mitsui Banking Corp. (Japan) (ICE LIBOR USD 3 Month + 0.37%), 2.70%, 7/11/2019 (a) | 400,601 | ||||||
| 2,463,000 | Svenska Handelsbanken AB (Sweden) (ICE LIBOR USD 3 Month + 0.40%), 2.74%, 2/12/2019 (a) | 2,466,898 | ||||||
| 2,300,000 | Toronto-Dominion Bank (The) (Canada) (ICE LIBOR USD 3 Month + 0.22%), 2.54%, 3/20/2019 (a) | 2,303,793 | ||||||
Wells Fargo Bank NA | ||||||||
| 5,500,000 | 2.72%, 5/7/2019 | 5,508,095 | ||||||
| 8,600,000 | 2.70%, 8/7/2019 | 8,603,769 | ||||||
|
| |||||||
Total Certificates of Deposit | 64,557,056 | |||||||
|
| |||||||
Commercial Paper — 8.9% | ||||||||
AT&T, Inc. | ||||||||
| 8,100,000 | 3.00%, 5/28/2019 (h) | 7,928,685 | ||||||
| 3,900,000 | 3.09%, 5/30/2019 (h) | 3,816,845 | ||||||
| 7,800,000 | 3.09%, 6/5/2019 (h) | 7,629,600 | ||||||
Bank of China Ltd. (China) | ||||||||
| 5,000,000 | 2.49%, 11/26/2018 (h) | 4,970,142 | ||||||
SEE NOTES TO FINANCIAL STATEMENTS.
| AUGUST 31, 2018 | J.P. MORGAN EXCHANGE-TRADED FUNDS | 57 | ||||||
JPMorgan Ultra-Short Income ETF
SCHEDULE OF PORTFOLIO INVESTMENTS
AS OF AUGUST 31, 2018 (Unaudited) (continued)
| PRINCIPAL AMOUNT($) | INVESTMENTS | VALUE($) | ||||||
Short-Term Investments — continued | ||||||||
Commercial Paper — continued | ||||||||
| 10,000,000 | 2.79%, 12/27/2018 (h) | 9,914,614 | ||||||
| 8,000,000 | 2.94%, 3/27/2019 (h) | 7,865,077 | ||||||
| 3,400,000 | 3.02%, 4/23/2019 (h) | 3,334,216 | ||||||
| 1,425,000 | Bell Canada, Inc. (Canada) 2.68%, 10/18/2018 (h) | 1,420,592 | ||||||
| 250,000 | BPCE SA (France) 1.73%, 10/3/2018 (h) | 249,553 | ||||||
| 3,500,000 | China Petrochemical Corp. (China) 2.63%, 10/29/2018 (b) (h) | 3,488,029 | ||||||
Coca-Cola Co. (The) | ||||||||
| 3,740,000 | 2.64%, 5/30/2019 (h) | 3,667,038 | ||||||
| 8,264,000 | 2.60%, 7/17/2019 (h) | 8,070,586 | ||||||
| 500,000 | Credit Suisse AG 2.03%, 9/7/2018 (h) | 499,812 | ||||||
| 10,000,000 | Dexia Credit Local SA (France) 2.61%, 5/7/2019 (h) | 9,826,046 | ||||||
| 15,000,000 | Electricite de France SA (France) 2.55%, 1/30/2019 (h) | 14,831,977 | ||||||
| 2,000,000 | Enbridge Energy Partners LP 3.11%, 9/10/2018 (h) | 1,998,769 | ||||||
| 10,700,000 | Entergy Corp. 2.65%, 9/10/2018 (h) | 10,693,271 | ||||||
| 1,000,000 | Federation des caisses Desjardins du Quebec (The) (Canada) 2.73%, 7/22/2019 (h) | 975,553 | ||||||
| 18,500,000 | First Abu Dhabi Bank PJSC (United Arab Emirates) 2.60%, 1/16/2019 (h) | 18,319,446 | ||||||
Ford Motor Credit Co. LLC | ||||||||
| 250,000 | 2.25%, 12/5/2018 (h) | 248,158 | ||||||
| 500,000 | 3.16%, 4/9/2019 (h) | 490,442 | ||||||
| 8,955,000 | Macquarie Bank Ltd. (Australia) 2.73%, 8/8/2019 (h) | 8,721,816 | ||||||
| 5,000,000 | Marriott International, Inc. 2.62%, 9/12/2018 (h) | 4,996,292 | ||||||
| 10,300,000 | Michelin Luxembourg SCS (France) 2.52%, 9/13/2018 (h) | 10,291,706 | ||||||
| 800,000 | National Australia Bank Ltd. (Australia) 1.75%, 11/2/2018 (h) | 796,979 | ||||||
| 3,136,000 | National Grid USA 2.67%, 10/11/2018 (h) | 3,127,725 | ||||||
| 5,500,000 | Schlumberger Holdings Corp. 2.86%, 3/1/2019 (h) | 5,424,536 | ||||||
Societe Generale SA (France) | ||||||||
| 15,500,000 | 2.90%, 8/2/2019 (h) | 15,054,401 | ||||||
| 5,000,000 | 2.89%, 8/26/2019 (h) | 4,858,329 | ||||||
| 9,600,000 | Suncor Energy, Inc. (Canada) 2.63%, 10/16/2018 (h) | 9,571,370 | ||||||
| 1,800,000 | UBS AG (Switzerland) 2.28%, 10/3/2018 (h) | 1,796,584 | ||||||
Vodafone Group plc (United Kingdom) | ||||||||
| 250,000 | 1.78%, 9/4/2018 (h) | 249,939 | ||||||
| 550,000 | 1.80%, 9/5/2018 (h) | 549,833 | ||||||
| PRINCIPAL AMOUNT($) | INVESTMENTS | VALUE($) | ||||||
Commercial Paper — continued | ||||||||
VW Credit, Inc. (Germany) | ||||||||
| 800,000 | 2.67%, 2/19/2019 (h) | 789,730 | ||||||
| 5,000,000 | 2.67%, 2/22/2019 (h) | 4,934,569 | ||||||
| 9,750,000 | Westpac Banking Corp. (Australia) (ICE LIBOR USD 3 Month + 0.00%), 2.42%, 8/12/2019 (a) (h) | 9,749,987 | ||||||
|
| |||||||
Total Commercial Paper | 201,152,247 | |||||||
|
| |||||||
| SHARES | ||||||||
Investment Companies — 3.0% | ||||||||
| 67,510,638 | JPMorgan U.S. Government Money Market Fund, Class Institutional Shares, 1.82% (i) (j) | 67,510,638 | ||||||
|
| |||||||
| PRINCIPAL AMOUNT($) | ||||||||
Repurchase Agreements — 0.8% | ||||||||
| 3,000,000 | Citigroup Global Markets Holdings, Inc., 3.04%, dated 8/31/2018, due 1/18/2019, repurchase price $3,035,475, collateralized by U.S. Treasury Securities, 2.88%, due 8/15/2028, with the value of $3,060,009. | 3,000,000 | ||||||
| 9,000,000 | Merrill Lynch PFS, Inc., 2.40%, dated 8/31/2018, due 10/17/2018, repurchase price $9,028,200, collateralized by Municipal Debt Securities, 5.50%, due 8/1/2020, with the value of $9,720,000. | 9,000,000 | ||||||
| 6,500,000 | Wells Fargo Securities LLC, 3.00%, dated 8/31/2018, due 11/14/2018, repurchase price $6,540,625, collateralized by Asset-Backed Securities, 2.46% - 8.45%, due 10/16/2023 - 12/25/2056, Corporate Bonds, 9.00%, due 12/15/2019, Municipal Debt Securities, 5.25%, due 8/1/2041, with the value of $7,259,259. | 6,500,000 | ||||||
|
| |||||||
Total Repurchase Agreements | 18,500,000 | |||||||
|
| |||||||
Total Short-term Investments | 351,719,941 | |||||||
|
| |||||||
Total Investments — 99.1% | 2,246,766,152 | |||||||
Other Assets Less Liabilities — 0.9% | 20,026,879 | |||||||
|
| |||||||
Net Assets — 100.0% | $ | 2,266,793,031 | ||||||
|
| |||||||
Percentages indicated are based on net assets.
SEE NOTES TO FINANCIAL STATEMENTS.
| 58 | J.P. MORGAN EXCHANGE-TRADED FUNDS | AUGUST 31, 2018 | ||||
Abbreviations
| CIFC | Commercial Industrial Finance Corp. | |
| CLO | Collateralized Loan Obligations | |
| ICE | Intercontinental Exchange | |
| LIBOR | London Interbank Offered Rate | |
| REIT | Real Estate Investment Trust | |
| SOFRRATE | Secured Overnight Financing Rate | |
| USD | United States Dollar | |
| (a) | Variable or floating rate security, linked to the referenced benchmark. The interest rate shown is the current rate as of August 31, 2018. | |
| (b) | Securities exempt from registration under Rule 144A or section 4(a)(2), of the Securities Act of 1933, as amended. Under procedures approved by the Board of Trustees, such securities have been determined to be liquid by the investment adviser and may be resold, normally to qualified institutional buyers in transactions exempt from registration. | |
| (c) | Security exempt from registration pursuant to Regulation S under the Securities Act of 1933, as amended. Regulation S applies to securities offerings that are made outside of the United States and do not involve direct selling efforts in the United States and as such may have restrictions on resale. | |
| (d) | Amount rounds to less than 0.1% of net assets. | |
| (e) | Step bond. Interest rate is a fixed rate for an initial period that either resets at a specific date or may reset in the future contingent upon a predetermined trigger. The interest rate shown is the current rate as of August 31, 2018. | |
| (f) | All or a portion of the security is a when-issued security, delayed delivery security, or forward commitment. | |
| (g) | Variable or floating rate security, the interest rate of which adjusts periodically based on changes in current interest rates and prepayments on the underlying pool of assets. The interest rate shown is the current rate as of August 31, 2018. | |
| (h) | The rate shown is the effective yield as of August 31, 2018. | |
| (i) | Investment in affiliate. Fund is registered under the Investment Company Act of 1940, as amended, and advised by J.P. Morgan Investment Management Inc. | |
| (j) | The rate shown is the current yield as of August 31, 2018. | |
| ‡ | Value determined using significant unobservable inputs. | |
SEE NOTES TO FINANCIAL STATEMENTS.
| AUGUST 31, 2018 | J.P. MORGAN EXCHANGE-TRADED FUNDS | 59 | ||||||
JPMorgan USD Emerging Markets Sovereign Bond ETF
SCHEDULE OF PORTFOLIO INVESTMENTS
AS OF AUGUST 31, 2018 (Unaudited)
| PRINCIPAL AMOUNT($) | INVESTMENTS | VALUE($) | ||||||
Foreign Government Securities — 83.9% | ||||||||
Angola — 0.7% |
| |||||||
| 300,000 | Republic of Angola 9.50%, 11/12/2025 (a) | 331,500 | ||||||
|
| |||||||
Azerbaijan — 1.1% |
| |||||||
Republic of Azerbaijan | ||||||||
| 200,000 | 4.75%, 3/18/2024 (a) | 199,500 | ||||||
| 440,000 | 3.50%, 9/1/2032 (a) | 363,000 | ||||||
|
| |||||||
| 562,500 | ||||||||
|
| |||||||
Bolivia, Plurinational State of — 0.4% |
| |||||||
| 200,000 | Plurinational State of Bolivia 4.50%, 3/20/2028 (a) | 183,750 | ||||||
|
| |||||||
Brazil — 5.3% |
| |||||||
Federative Republic of Brazil | ||||||||
| 351,000 | 4.88%, 1/22/2021 | 354,159 | ||||||
| 520,000 | 4.25%, 1/7/2025 | 484,640 | ||||||
| 381,000 | 6.00%, 4/7/2026 | 382,905 | ||||||
| 450,000 | 8.25%, 1/20/2034 | 516,937 | ||||||
| 856,000 | 5.63%, 1/7/2041 | 740,440 | ||||||
| 250,000 | 5.63%, 2/21/2047 | 209,000 | ||||||
|
| |||||||
| 2,688,081 | ||||||||
|
| |||||||
China — 0.8% |
| |||||||
| 414,000 | Export-Import Bank of China (The) 2.00%, 4/26/2021 (b) | 397,732 | ||||||
|
| |||||||
Colombia — 2.5% |
| |||||||
Republic of Colombia | ||||||||
| 277,000 | 4.38%, 7/12/2021 | 283,371 | ||||||
| 100,000 | 8.13%, 5/21/2024 | 120,600 | ||||||
| 216,000 | 3.88%, 4/25/2027 | 210,168 | ||||||
| 205,000 | 5.63%, 2/26/2044 | 222,220 | ||||||
| 437,000 | 5.00%, 6/15/2045 | 437,000 | ||||||
|
| |||||||
| 1,273,359 | ||||||||
|
| |||||||
Croatia — 2.7% |
| |||||||
Republic of Croatia | ||||||||
| 554,000 | 6.38%, 3/24/2021 (a) | 588,625 | ||||||
| 205,000 | 5.50%, 4/4/2023 (a) | 217,043 | ||||||
| 509,000 | 6.00%, 1/26/2024 (a) | 551,629 | ||||||
|
| |||||||
| 1,357,297 | ||||||||
|
| |||||||
Dominican Republic — 4.6% |
| |||||||
Government of Dominican Republic | ||||||||
| 478,000 | 7.50%, 5/6/2021 (a) | 501,900 | ||||||
| 116,000 | 5.50%, 1/27/2025 (a) | 116,580 | ||||||
| 741,000 | 5.95%, 1/25/2027 (b) | 753,226 | ||||||
| 619,000 | 7.45%, 4/30/2044 (a) | 664,806 | ||||||
| 258,000 | 6.85%, 1/27/2045 (a) | 259,935 | ||||||
|
| |||||||
| 2,296,447 | ||||||||
|
| |||||||
| PRINCIPAL AMOUNT($) | INVESTMENTS | VALUE($) | ||||||
Ecuador — 4.2% |
| |||||||
Republic of Ecuador | ||||||||
| 281,000 | 10.75%, 3/28/2022 (a) | 289,781 | ||||||
| 200,000 | 8.75%, 6/2/2023 (a) | 190,000 | ||||||
| 701,000 | 7.95%, 6/20/2024 (a) | 632,653 | ||||||
| 432,000 | 9.65%, 12/13/2026 (a) | 411,480 | ||||||
| 201,000 | 8.88%, 10/23/2027 (a) | 182,407 | ||||||
| 500,000 | 7.88%, 1/23/2028 (a) | 427,500 | ||||||
|
| |||||||
| 2,133,821 | ||||||||
|
| |||||||
Egypt — 4.3% |
| |||||||
Arab Republic of Egypt | ||||||||
| 537,000 | 6.13%, 1/31/2022 (a) | 533,644 | ||||||
| 717,000 | 5.88%, 6/11/2025 (a) | 672,187 | ||||||
| 200,000 | 7.50%, 1/31/2027 (a) | 199,000 | ||||||
| 800,000 | 8.50%, 1/31/2047 (a) | 781,000 | ||||||
|
| |||||||
| 2,185,831 | ||||||||
|
| |||||||
Ethiopia — 0.4% |
| |||||||
| 200,000 | Federal Democratic Republic of Ethiopia 6.63%, 12/11/2024 (a) | 195,000 | ||||||
|
| |||||||
Gabon — 0.5% |
| |||||||
| 290,000 | Gabonese Republic 6.38%, 12/12/2024 (a) | 263,538 | ||||||
|
| |||||||
Ghana — 0.8% |
| |||||||
| 385,000 | Republic of Ghana 7.88%, 8/7/2023 (b) | 397,031 | ||||||
|
| |||||||
Hungary — 1.8% |
| |||||||
Republic of Hungary | ||||||||
| 406,000 | 6.38%, 3/29/2021 | 434,323 | ||||||
| 104,000 | 5.38%, 2/21/2023 | 110,890 | ||||||
| 104,000 | 5.38%, 3/25/2024 | 111,053 | ||||||
| 190,000 | 7.63%, 3/29/2041 | 266,712 | ||||||
|
| |||||||
| 922,978 | ||||||||
|
| |||||||
India — 0.2% |
| |||||||
| 100,000 | Export-Import Bank of India 3.38%, 8/5/2026 (a) | 92,663 | ||||||
|
| |||||||
Indonesia — 2.9% |
| |||||||
Republic of Indonesia | ||||||||
| 298,000 | 4.88%, 5/5/2021 (a) | 308,430 | ||||||
| 480,000 | 4.75%, 1/8/2026 (a) | 491,400 | ||||||
| 200,000 | 3.50%, 1/11/2028 | 187,250 | ||||||
| 401,000 | 6.75%, 1/15/2044 (a) | 497,741 | ||||||
|
| |||||||
| 1,484,821 | ||||||||
|
| |||||||
Iraq — 1.3% |
| |||||||
Republic of Iraq | ||||||||
| 200,000 | 6.75%, 3/9/2023 (a) | 194,000 | ||||||
SEE NOTES TO FINANCIAL STATEMENTS.
| 60 | J.P. MORGAN EXCHANGE-TRADED FUNDS | AUGUST 31, 2018 | ||||
| PRINCIPAL AMOUNT($) | INVESTMENTS | VALUE($) | ||||||
Foreign Government Securities — continued | ||||||||
Iraq — continued |
| |||||||
| 520,000 | 5.80%, 1/15/2028 (a) | 474,500 | ||||||
|
| |||||||
| 668,500 | ||||||||
|
| |||||||
Ivory Coast — 1.6% |
| |||||||
Republic of Cote d’Ivoire | ||||||||
| 574,000 | 6.38%, 3/3/2028 (a) | 530,232 | ||||||
| 111,000 | 5.75%, 12/31/2032 (b) (c) | 99,900 | ||||||
| 200,000 | 6.13%, 6/15/2033 (a) | 172,500 | ||||||
|
| |||||||
| 802,632 | ||||||||
|
| |||||||
Jamaica — 1.9% |
| |||||||
Jamaica Government International Bond | ||||||||
| 425,000 | 6.75%, 4/28/2028 | 462,188 | ||||||
| 425,000 | 7.88%, 7/28/2045 | 487,156 | ||||||
|
| |||||||
| 949,344 | ||||||||
|
| |||||||
Kazakhstan — 1.2% |
| |||||||
Republic of Kazakhstan | ||||||||
| 350,000 | 3.88%, 10/14/2024 (a) | 354,375 | ||||||
| 200,000 | 6.50%, 7/21/2045 (a) | 247,000 | ||||||
|
| |||||||
| 601,375 | ||||||||
|
| |||||||
Kenya — 1.7% |
| |||||||
Republic of Kenya | ||||||||
| 394,000 | 6.88%, 6/24/2024 (a) | 387,598 | ||||||
| 200,000 | 7.25%, 2/28/2028 (a) | 191,000 | ||||||
| 280,000 | 8.25%, 2/28/2048 (a) | 259,700 | ||||||
|
| |||||||
| 838,298 | ||||||||
|
| |||||||
Lebanon — 4.0% |
| |||||||
Republic of Lebanon | ||||||||
| 570,000 | 8.25%, 4/12/2021 (b) | 550,050 | ||||||
| 532,000 | 6.10%, 10/4/2022 (b) | 462,175 | ||||||
| 106,000 | 6.00%, 1/27/2023 (b) | 90,630 | ||||||
| 137,000 | 6.60%, 11/27/2026 (b) | 107,717 | ||||||
| 172,000 | 6.75%, 11/29/2027 (b) | 134,805 | ||||||
| 103,000 | 6.65%, 2/26/2030 (b) | 77,636 | ||||||
| 750,000 | 7.00%, 3/23/2032 (b) | 568,125 | ||||||
|
| |||||||
| 1,991,138 | ||||||||
|
| |||||||
Lithuania — 0.4% |
| |||||||
| 200,000 | Republic of Lithuania 6.13%, 3/9/2021 (a) | 214,010 | ||||||
|
| |||||||
Mexico — 2.0% |
| |||||||
United Mexican States | ||||||||
| 725,000 | 4.13%, 1/21/2026 | 721,013 | ||||||
| 200,000 | 4.35%, 1/15/2047 | 182,000 | ||||||
| 100,000 | 5.75%, 10/12/2110 | 100,000 | ||||||
|
| |||||||
| 1,003,013 | ||||||||
|
| |||||||
| PRINCIPAL AMOUNT($) | INVESTMENTS | VALUE($) | ||||||
Mongolia — 0.4% |
| |||||||
| 200,000 | Mongolia Government International Bond 5.13%, 12/5/2022 (a) | 191,500 | ||||||
|
| |||||||
Morocco — 0.3% |
| |||||||
| 150,000 | Kingdom of Morocco 4.25%, 12/11/2022 (a) | 150,938 | ||||||
|
| |||||||
Oman — 2.0% |
| |||||||
Oman Government International Bond | ||||||||
| 565,000 | 4.75%, 6/15/2026 (a) | 521,212 | ||||||
| 381,000 | 5.38%, 3/8/2027 (a) | 362,426 | ||||||
| 150,000 | 6.50%, 3/8/2047 (a) | 137,063 | ||||||
|
| |||||||
| 1,020,701 | ||||||||
|
| |||||||
Pakistan — 1.7% |
| |||||||
Republic of Pakistan | ||||||||
| 600,000 | 8.25%, 4/15/2024 (a) | 600,000 | ||||||
| 295,000 | 6.88%, 12/5/2027 (a) | 266,606 | ||||||
|
| |||||||
| 866,606 | ||||||||
|
| |||||||
Panama — 1.3% |
| |||||||
Republic of Panama | ||||||||
| 269,000 | 4.00%, 9/22/2024 | 273,708 | ||||||
| 200,000 | 3.88%, 3/17/2028 | 199,250 | ||||||
| 206,000 | 4.50%, 5/15/2047 | 206,257 | ||||||
|
| |||||||
| 679,215 | ||||||||
|
| |||||||
Peru — 1.4% |
| |||||||
Republic of Peru | ||||||||
| 551,000 | 4.13%, 8/25/2027 | 570,285 | ||||||
| 100,000 | 5.63%, 11/18/2050 | 119,500 | ||||||
|
| |||||||
| 689,785 | ||||||||
|
| |||||||
Philippines — 2.8% |
| |||||||
Republic of Philippines | ||||||||
| 160,000 | 10.63%, 3/16/2025 | 223,800 | ||||||
| 200,000 | 5.50%, 3/30/2026 | 223,250 | ||||||
| 496,000 | 6.38%, 1/15/2032 | 606,980 | ||||||
| 103,000 | 6.38%, 10/23/2034 | 129,001 | ||||||
| 214,000 | 3.70%, 3/1/2041 | 202,115 | ||||||
|
| |||||||
| 1,385,146 | ||||||||
|
| |||||||
Poland — 1.9% |
| |||||||
Republic of Poland | ||||||||
| 160,000 | 5.00%, 3/23/2022 | 168,749 | ||||||
| 706,000 | 3.00%, 3/17/2023 | 693,802 | ||||||
| 100,000 | 4.00%, 1/22/2024 | 102,058 | ||||||
|
| |||||||
| 964,609 | ||||||||
|
| |||||||
SEE NOTES TO FINANCIAL STATEMENTS.
| AUGUST 31, 2018 | J.P. MORGAN EXCHANGE-TRADED FUNDS | 61 | ||||||
JPMorgan USD Emerging Markets Sovereign Bond ETF
SCHEDULE OF PORTFOLIO INVESTMENTS
AS OF AUGUST 31, 2018 (Unaudited) (continued)
| PRINCIPAL AMOUNT($) | INVESTMENTS | VALUE($) | ||||||
Foreign Government Securities — continued | ||||||||
Romania — 1.0% |
| |||||||
Republic of Romania | ||||||||
| 136,000 | 6.75%, 2/7/2022 (a) | 148,750 | ||||||
| 240,000 | 4.88%, 1/22/2024 (a) | 248,400 | ||||||
| 104,000 | 6.13%, 1/22/2044 (a) | 118,690 | ||||||
|
| |||||||
| 515,840 | ||||||||
|
| |||||||
Russia — 1.7% |
| |||||||
Russian Federation | ||||||||
| 200,000 | 4.25%, 6/23/2027 (a) | 190,500 | ||||||
| 125,000 | 12.75%, 6/24/2028 (a) | 200,937 | ||||||
| 55,625 | 7.50%, 3/31/2030 (b) (c) | 60,854 | ||||||
| 200,000 | 5.88%, 9/16/2043 (a) | 213,500 | ||||||
| 200,000 | 5.25%, 6/23/2047 (a) | 190,000 | ||||||
|
| |||||||
| 855,791 | ||||||||
|
| |||||||
Serbia — 1.0% |
| |||||||
| 442,000 | Republic of Serbia 7.25%, 9/28/2021 (a) | 481,228 | ||||||
|
| |||||||
Slovakia — 0.4% |
| |||||||
| 200,000 | Slovak Republic 4.38%, 5/21/2022 (a) | 207,922 | ||||||
|
| |||||||
South Africa — 3.8% |
| |||||||
Republic of South Africa | ||||||||
| 426,000 | 5.88%, 5/30/2022 | 440,910 | ||||||
| 484,000 | 5.88%, 9/16/2025 | 490,050 | ||||||
| 494,000 | 4.30%, 10/12/2028 | 433,485 | ||||||
| 204,000 | 5.38%, 7/24/2044 | 177,990 | ||||||
| 205,000 | 5.00%, 10/12/2046 | 172,200 | ||||||
| 221,000 | 5.65%, 9/27/2047 | 196,690 | ||||||
|
| |||||||
| 1,911,325 | ||||||||
|
| |||||||
Sri Lanka — 3.1% |
| |||||||
Republic of Sri Lanka | ||||||||
| 100,000 | 6.25%, 10/4/2020 (a) | 101,500 | ||||||
| 385,000 | 6.25%, 7/27/2021 (a) | 390,775 | ||||||
| 671,000 | 6.85%, 11/3/2025 (a) | 666,806 | ||||||
| 405,000 | 6.20%, 5/11/2027 (a) | 380,194 | ||||||
|
| |||||||
| 1,539,275 | ||||||||
|
| |||||||
Trinidad and Tobago — 0.4% | ||||||||
| 200,000 | Republic of Trinidad & Tobago 4.50%, 8/4/2026 (a) | 192,000 | ||||||
|
| |||||||
Turkey — 6.4% | ||||||||
Republic of Turkey | ||||||||
| 124,000 | 5.63%, 3/30/2021 | 113,460 | ||||||
| 681,000 | 6.25%, 9/26/2022 | 611,197 | ||||||
| 275,000 | 5.75%, 3/22/2024 | 235,812 | ||||||
| 216,000 | 7.38%, 2/5/2025 | 196,560 | ||||||
| PRINCIPAL AMOUNT($) | INVESTMENTS | VALUE($) | ||||||
Turkey — continued | ||||||||
| 651,000 | 6.00%, 3/25/2027 | 535,448 | ||||||
| 235,000 | 6.13%, 10/24/2028 | 189,763 | ||||||
| 200,000 | 8.00%, 2/14/2034 | 180,000 | ||||||
| 480,000 | 6.88%, 3/17/2036 | 381,600 | ||||||
| 156,000 | 6.75%, 5/30/2040 | 122,070 | ||||||
| 206,000 | 6.00%, 1/14/2041 | 148,320 | ||||||
| 455,000 | 6.63%, 2/17/2045 | 346,369 | ||||||
| 240,000 | 5.75%, 5/11/2047 | 167,400 | ||||||
|
| |||||||
| 3,227,999 | ||||||||
|
| |||||||
Ukraine — 4.3% | ||||||||
Republic of Ukraine | ||||||||
| 387,000 | 7.75%, 9/1/2021 (a) | 383,614 | ||||||
| 375,000 | 7.75%, 9/1/2022 (a) | 368,437 | ||||||
| 101,000 | 7.75%, 9/1/2023 (a) | 97,970 | ||||||
| 110,000 | 7.75%, 9/1/2024 (a) | 105,600 | ||||||
| 109,000 | 7.75%, 9/1/2025 (a) | 102,324 | ||||||
| 682,000 | 7.75%, 9/1/2026 (a) | 627,440 | ||||||
| 100,000 | 7.75%, 9/1/2027 (a) | 91,000 | ||||||
| 443,000 | 7.38%, 9/25/2032 (a) | 375,443 | ||||||
|
| |||||||
| 2,151,828 | ||||||||
|
| |||||||
Uruguay — 1.6% | ||||||||
Republic of Uruguay | ||||||||
| 270,000 | 4.38%, 10/27/2027 | 275,737 | ||||||
| 140,000 | 7.63%, 3/21/2036 | 188,125 | ||||||
| 350,000 | 5.10%, 6/18/2050 | 356,563 | ||||||
|
| |||||||
| 820,425 | ||||||||
|
| |||||||
Vietnam — 0.4% | ||||||||
| 200,000 | Republic of Vietnam 4.80%, 11/19/2024 (a) | 204,226 | ||||||
|
| |||||||
Zambia — 0.7% | ||||||||
| 480,000 | Republic of Zambia 8.97%, 7/30/2027 (a) | 345,600 | ||||||
|
| |||||||
Total Foreign Government Securities | 42,236,618 | |||||||
|
| |||||||
Corporate Bonds — 14.4% | ||||||||
Azerbaijan — 1.1% | ||||||||
| 200,000 | Southern Gas Corridor CJSC 6.88%, 3/24/2026 (a) | 216,250 | ||||||
| 350,000 | State Oil Co. of the Azerbaijan Republic 4.75%, 3/13/2023 (b) | 343,438 | ||||||
|
| |||||||
| 559,688 | ||||||||
|
| |||||||
Brazil — 1.0% | ||||||||
| 500,000 | Banco Nacional de Desenvolvimento Economico e Social 5.75%, 9/26/2023 (a) | 507,542 | ||||||
|
| |||||||
SEE NOTES TO FINANCIAL STATEMENTS.
| 62 | J.P. MORGAN EXCHANGE-TRADED FUNDS | AUGUST 31, 2018 | ||||
| PRINCIPAL AMOUNT($) | INVESTMENTS | VALUE($) | ||||||
Corporate Bonds — continued | ||||||||
Chile — 1.3% | ||||||||
Corp. Nacional del Cobre de Chile | ||||||||
| 125,000 | 4.50%, 9/16/2025 (a) | 127,264 | ||||||
| 372,000 | 3.63%, 8/1/2027 (a) | 354,380 | ||||||
| 201,000 | 4.50%, 8/1/2047 (a) | 193,463 | ||||||
|
| |||||||
| 675,107 | ||||||||
|
| |||||||
China — 2.0% | ||||||||
| 200,000 | CNOOC Curtis Funding No. 1 Pty. Ltd. 4.50%, 10/3/2023 (a) | 206,042 | ||||||
Sinopec Group Overseas Development Ltd. | ||||||||
| 200,000 | 3.63%, 4/12/2027 (a) | 192,661 | ||||||
State Grid Overseas Investment Ltd. | ||||||||
| 400,000 | 3.13%, 5/22/2023 (a) | 390,292 | ||||||
| 250,000 | 3.50%, 5/4/2027 (a) | 240,236 | ||||||
|
| |||||||
| 1,029,231 | ||||||||
|
| |||||||
Indonesia — 0.4% | ||||||||
| 200,000 | Perusahaan Listrik Negara PT 5.25%, 10/24/2042 (a) | 191,688 | ||||||
|
| |||||||
Kazakhstan — 1.1% | ||||||||
| 200,000 | Kazakhstan Temir Zholy Finance BV 6.95%, 7/10/2042 (a) | 218,500 | ||||||
| 320,000 | KazMunayGas National Co. JSC 5.38%, 4/24/2030 (a) | 321,600 | ||||||
|
| |||||||
| 540,100 | ||||||||
|
| |||||||
Malaysia — 1.5% | ||||||||
Petronas Capital Ltd. | ||||||||
| 440,000 | 7.88%, 5/22/2022 (a) | 503,658 | ||||||
| 231,000 | 4.50%, 3/18/2045 (a) | 235,992 | ||||||
|
| |||||||
| 739,650 | ||||||||
|
| |||||||
Mexico — 2.3% | ||||||||
Petroleos Mexicanos | ||||||||
| 100,000 | (ICE LIBOR USD 3 Month + 3.65%), 5.98%, 3/11/2022 (d) | 106,150 | ||||||
| 125,000 | 5.38%, 3/13/2022 | 127,500 | ||||||
| 161,000 | 4.63%, 9/21/2023 | 158,633 | ||||||
| 767,000 | 5.63%, 1/23/2046 | 630,014 | ||||||
| 125,000 | 6.35%, 2/12/2048 (a) | 110,375 | ||||||
|
| |||||||
| 1,132,672 | ||||||||
|
| |||||||
Peru — 0.7% | ||||||||
| 352,000 | Petroleos del Peru SA 5.63%, 6/19/2047 (a) | 352,440 | ||||||
|
| |||||||
Russia — 1.0% | ||||||||
| 200,000 | Russian Railways via RZD Capital plc 5.70%, 4/5/2022 (b) | 205,000 | ||||||
| PRINCIPAL AMOUNT($) | INVESTMENTS | VALUE($) | ||||||
Russia — continued | ||||||||
Vnesheconombank Via VEB Finance plc | ||||||||
| 200,000 | 5.94%, 11/21/2023 (a) | 192,000 | ||||||
| 125,000 | 6.80%, 11/22/2025 (a) | 123,281 | ||||||
|
| |||||||
| 520,281 | ||||||||
|
| |||||||
South Africa — 1.7% | ||||||||
Eskom Holdings SOC Ltd. | ||||||||
| 494,000 | 7.13%, 2/11/2025 (a) | 466,213 | ||||||
| 200,000 | 6.35%, 8/10/2028 (a) | 199,500 | ||||||
| 200,000 | Transnet SOC Ltd. 4.00%, 7/26/2022 (a) | 188,000 | ||||||
|
| |||||||
| 853,713 | ||||||||
|
| |||||||
Tunisia — 0.3% | ||||||||
| 200,000 | Banque Centrale de Tunisie International Bond 5.75%, 1/30/2025 (a) | 174,000 | ||||||
|
| |||||||
Total Corporate Bonds | 7,276,112 | |||||||
|
| |||||||
| SHARES | ||||||||
Short-Term Investments — 0.5% | ||||||||
Investment Companies — 0.5% |
| |||||||
| 252,493 | JPMorgan U.S. Government Money Market Fund, Class Institutional Shares, 1.82% (e) (f) | 252,493 | ||||||
|
| |||||||
Total Investments — 98.8% | 49,765,223 | |||||||
Other Assets Less Liabilities — 1.2% | 590,477 | |||||||
|
| |||||||
Net Assets — 100.0% | $ | 50,355,700 | ||||||
|
| |||||||
| Percentages | indicated are based on net assets. |
Abbreviations
| ICE | Intercontinental Exchange | |
| LIBOR | London Interbank Offered Rate | |
| USD | United States Dollar | |
| (a) | Securities exempt from registration under Rule 144A or section 4(a)(2), of the Securities Act of 1933, as amended. Under procedures approved by the Board of Trustees, such securities have been determined to be liquid by the investment adviser and may be resold, normally to qualified institutional buyers in transactions exempt from registration. | |
| (b) | Security exempt from registration pursuant to Regulation S under the Securities Act of 1933, as amended. Regulation S applies to securities offerings that are made outside of the United States and do not involve direct selling efforts in the United States and as such may have restrictions on resale. | |
SEE NOTES TO FINANCIAL STATEMENTS.
| AUGUST 31, 2018 | J.P. MORGAN EXCHANGE-TRADED FUNDS | 63 | ||||||
JPMorgan USD Emerging Markets Sovereign Bond ETF
SCHEDULE OF PORTFOLIO INVESTMENTS
AS OF AUGUST 31, 2018 (Unaudited) (continued)
| (c) | Step bond. Interest rate is a fixed rate for an initial period that either resets at a specific date or may reset in the future contingent upon a predetermined trigger. The interest rate shown is the current rate as of August 31, 2018. | |
| (d) | Variable or floating rate security, linked to the referenced benchmark. The interest rate shown is the current rate as of August 31, 2018. | |
| (e) | Investment in affiliate. Fund is registered under the Investment Company Act of 1940, as amended, and advised by J.P. Morgan Investment Management Inc. | |
| (f) | The rate shown is the current yield as of August 31, 2018. |
SEE NOTES TO FINANCIAL STATEMENTS.
| 64 | J.P. MORGAN EXCHANGE-TRADED FUNDS | AUGUST 31, 2018 | ||||
STATEMENTS OF ASSETS AND LIABILITIES
AS OF AUGUST 31, 2018 (Unaudited)
| JPMorgan Disciplined High Yield ETF | JPMorgan Global Bond Opportunities ETF | JPMorgan Ultra-Short Income ETF | JPMorgan USD Emerging Markets Sovereign Bond ETF | |||||||||||||
ASSETS: |
| |||||||||||||||
Investments in non-affiliates, at value | $ | 148,744,444 | $ | 163,278,763 | $ | 2,160,755,514 | $ | 49,512,730 | ||||||||
Investments in affiliates, at value | 4,098,667 | 8,342,272 | 67,510,638 | 252,493 | ||||||||||||
Repurchase agreements, at value | — | — | 18,500,000 | — | ||||||||||||
Restricted cash | 800 | 2,200 | 4,950 | — | ||||||||||||
Cash | 652 | — | — | — | ||||||||||||
Foreign currency, at value | — | 613,132 | — | — | ||||||||||||
Deposits at broker for futures contracts | — | 950,000 | — | — | ||||||||||||
Segregated cash balance with Authorized Participant for deposit securities | 24,902 | — | — | — | ||||||||||||
Deferred offering costs | — | — | — | 16,518 | ||||||||||||
Prepaid Expenses | 4,099 | 6,255 | 10,034 | 890 | ||||||||||||
Receivables: | ||||||||||||||||
Investment securities sold | 12,703 | 198,924 | 3,120,324 | 631,468 | ||||||||||||
Fund shares sold | — | — | 42,676,135 | — | ||||||||||||
Interest from non-affiliates | 2,215,052 | 1,980,535 | 11,349,843 | 834,487 | ||||||||||||
Dividends from affiliates | 3,570 | 11,683 | 117,443 | 290 | ||||||||||||
Variation margin on futures contracts | — | 42,445 | — | — | ||||||||||||
Unrealized appreciation on forward foreign currency exchange contracts | — | 1,566,443 | — | — | ||||||||||||
Due from Adviser | — | — | — | 17,859 | ||||||||||||
|
|
|
|
|
|
|
| |||||||||
Total Assets | 155,104,889 | 176,992,652 | 2,304,044,881 | 51,266,735 | ||||||||||||
|
|
|
|
|
|
|
| |||||||||
LIABILITIES: |
| |||||||||||||||
Payables: | ||||||||||||||||
Due to custodian | — | 48,681 | 205,954 | — | ||||||||||||
Distributions | 635,035 | 490,980 | 4,064,124 | 211,464 | ||||||||||||
Investment securities purchased | — | 1,135,801 | 32,700,323 | 618,489 | ||||||||||||
Unrealized depreciation on forward foreign currency exchange contracts | — | 510,062 | — | — | ||||||||||||
Collateral upon return of deposit securities | 24,902 | — | — | — | ||||||||||||
Accrued liabilities: | ||||||||||||||||
Investment advisory fees | 13,022 | 33,948 | 70,884 | — | ||||||||||||
Administration fees | 11,148 | 12,653 | 137,934 | 3,685 | ||||||||||||
Custodian, Accounting and Transfer Agent fees | 9,539 | 11,154 | 8,066 | 3,734 | ||||||||||||
Trustees’ and Chief Compliance Officer’s fees | 1,491 | 1,348 | 316 | 1,466 | ||||||||||||
Professional Fees | 60,564 | 76,289 | 19,849 | 47,194 | ||||||||||||
Other | 37,451 | 22,575 | 44,400 | 25,003 | ||||||||||||
|
|
|
|
|
|
|
| |||||||||
Total Liabilities | 793,152 | 2,343,491 | 37,251,850 | 911,035 | ||||||||||||
|
|
|
|
|
|
|
| |||||||||
Net Assets | $ | 154,311,737 | $ | 174,649,161 | $ | 2,266,793,031 | $ | 50,355,700 | ||||||||
|
|
|
|
|
|
|
| |||||||||
NET ASSETS: |
| |||||||||||||||
Paid-in-Capital | $ | 156,996,468 | $ | 177,694,108 | $ | 2,266,352,130 | $ | 55,018,929 | ||||||||
Accumulated undistributed (distributions in excess of) net investment income | 3,958 | (522,174 | ) | 129,265 | 46 | |||||||||||
Accumulated net realized gains (losses) | (284,949 | ) | 1,022,426 | (36,342 | ) | (260,339 | ) | |||||||||
Net unrealized appreciation (depreciation) | (2,403,740 | ) | (3,545,199 | ) | 347,978 | (4,402,936 | ) | |||||||||
|
|
|
|
|
|
|
| |||||||||
Total Net Assets | $ | 154,311,737 | $ | 174,649,161 | $ | 2,266,793,031 | $ | 50,355,700 | ||||||||
|
|
|
|
|
|
|
| |||||||||
Outstanding number of shares | 3,100,000 | 3,500,000 | 45,200,000 | 1,100,000 | ||||||||||||
|
|
|
|
|
|
|
| |||||||||
Net asset value, per share | $ | 49.78 | $ | 49.90 | $ | 50.15 | $ | 45.78 | ||||||||
|
|
|
|
|
|
|
| |||||||||
Cost of investments in non-affiliates | $ | 151,148,184 | $ | 167,985,985 | $ | 2,160,407,536 | $ | 53,915,666 | ||||||||
Cost of investments in affiliates | 4,098,667 | 8,342,272 | 67,510,638 | 252,493 | ||||||||||||
Cost of repurchase agreements | — | — | 18,500,000 | — | ||||||||||||
Cost of foreign currency | — | 721,855 | — | — | ||||||||||||
SEE NOTES TO FINANCIAL STATEMENTS.
| AUGUST 31, 2018 | J.P. MORGAN EXCHANGE-TRADED FUNDS | 65 | ||||||
STATEMENTS OF OPERATIONS
FOR THE SIX MONTHS ENDED AUGUST 31, 2018 (Unaudited)
| JPMorgan Disciplined High Yield ETF | JPMorgan Global Bond Opportunities ETF | JPMorgan Ultra-Short Income ETF | JPMorgan USD Emerging Markets Sovereign Bond ETF | |||||||||||||
INVESTMENT INCOME: |
| |||||||||||||||
Interest income from non-affiliates | $ | 3,391,488 | $ | 3,473,396 | $ | 12,495,520 | $ | 1,350,320 | ||||||||
Dividend income from affiliates | 18,245 | 95,625 | 401,362 | 4,156 | ||||||||||||
Foreign taxes withheld | — | (36,204 | ) | — | — | |||||||||||
|
|
|
|
|
|
|
| |||||||||
Total investment income | 3,409,733 | 3,532,817 | 12,896,882 | 1,354,476 | ||||||||||||
|
|
|
|
|
|
|
| |||||||||
EXPENSES: |
| |||||||||||||||
Investment advisory fees (Note 3.A) | 194,470 | 454,833 | 720,464 | 83,905 | ||||||||||||
Administration fees (Note 3.B) | 55,100 | 70,293 | 408,268 | 22,288 | ||||||||||||
Interest expense to affiliates | — | 1,279 | — | 32 | ||||||||||||
Professional fees | 63,048 | 68,990 | 44,308 | 49,770 | ||||||||||||
Trustees’ and Chief Compliance Officer’s fees | 6,972 | 9,767 | 19,138 | 4,371 | ||||||||||||
Printing and mailing costs | 23,085 | 15,959 | 28,696 | 14,751 | ||||||||||||
Registration and filing fees | 14,982 | 12,874 | 35,275 | 11,013 | ||||||||||||
Custodian, Accounting and Transfer Agent fees (Note 3.C) | 28,341 | 46,376 | 31,503 | 16,225 | ||||||||||||
Insurance expense | 2,986 | 3,245 | 3,803 | 1,945 | ||||||||||||
Offering costs (Note 2.H) | — | 7,950 | 5,910 | 22,339 | ||||||||||||
Other | 819 | 906 | 2,518 | 2,092 | ||||||||||||
|
|
|
|
|
|
|
| |||||||||
Total expenses | 389,803 | 692,472 | 1,299,883 | 228,731 | ||||||||||||
|
|
|
|
|
|
|
| |||||||||
Less fees waived (Note 3.D) | (130,713 | ) | (242,333 | ) | (458,866 | ) | (106,193 | ) | ||||||||
Less expense reimbursements from affiliates (Note 3.D) | — | — | — | (21,514 | ) | |||||||||||
Less expense reimbursements from non-affiliates (Note 3.C) | (1,400 | ) | (4,400 | ) | (7,150 | ) | — | |||||||||
|
|
|
|
|
|
|
| |||||||||
Net expenses | 257,690 | 445,739 | 833,867 | 101,024 | ||||||||||||
|
|
|
|
|
|
|
| |||||||||
Net investment income (loss) | 3,152,043 | 3,087,078 | 12,063,015 | 1,253,452 | ||||||||||||
|
|
|
|
|
|
|
| |||||||||
REALIZED/UNREALIZED GAINS (LOSSES): | ||||||||||||||||
Net realized gain (loss) on transactions from: |
| |||||||||||||||
investments in non-affiliates | (229,900 | ) | (1,619,426 | )(a) | (45,303 | ) | (252,222 | ) | ||||||||
Futures | — | (580,717 | ) | (354 | ) | — | ||||||||||
Foreign currency transactions | — | 39,044 | — | — | ||||||||||||
Forward foreign currency exchange contracts | — | 2,737,502 | — | — | ||||||||||||
|
|
|
|
|
|
|
| |||||||||
Net realized gain (loss) | (229,900 | ) | 576,403 | (45,657 | ) | (252,222 | ) | |||||||||
|
|
|
|
|
|
|
| |||||||||
Change in net unrealized appreciation/depreciation on: |
| |||||||||||||||
Investments in non-affiliates | (250,126 | ) | (4,903,023 | )(b) | 631,142 | (3,076,122 | ) | |||||||||
Futures | — | (132,646 | ) | (136 | ) | — | ||||||||||
Foreign currency translations | — | (122,962 | ) | — | — | |||||||||||
Forward foreign currency exchange contracts | — | 682,042 | — | — | ||||||||||||
|
|
|
|
|
|
|
| |||||||||
Change in net unrealized appreciation/depreciation | (250,126 | ) | (4,476,589 | ) | 631,006 | (3,076,122 | ) | |||||||||
|
|
|
|
|
|
|
| |||||||||
Net realized/unrealized gains (losses) | (480,026 | ) | (3,900,186 | ) | 585,349 | (3,328,344 | ) | |||||||||
|
|
|
|
|
|
|
| |||||||||
Change in net assets resulting from operations | $ | 2,672,017 | $ | (813,108 | ) | $ | 12,648,364 | $ | (2,074,892 | ) | ||||||
|
|
|
|
|
|
|
| |||||||||
| (a) | Net of foreign capital gains tax of approximately $(4,167). |
| (b) | Net of change in foreign capital gains tax of approximately $11,081. |
SEE NOTES TO FINANCIAL STATEMENTS.
| 66 | J.P. MORGAN EXCHANGE-TRADED FUNDS | AUGUST 31, 2018 | ||||
STATEMENTS OF CHANGES IN NET ASSETS
FOR THE PERIODS INDICATED
| JPMorgan Disciplined High Yield ETF | ||||||||
| Six Months Ended August 31, 2018 (Unaudited) | Year Ended February 28, 2018 | |||||||
CHANGE IN NET ASSETS RESULTING FROM OPERATIONS: |
| |||||||
Net investment income (loss) | $ | 3,152,043 | $ | 2,362,661 | ||||
Net realized gain (loss) | (229,900 | ) | (6,636 | ) | ||||
Change in net unrealized appreciation/depreciation | (250,126 | ) | (2,542,614 | ) | ||||
|
|
|
| |||||
Change in net assets resulting from operations | 2,672,017 | (186,589 | ) | |||||
|
|
|
| |||||
DISTRIBUTIONS TO SHAREHOLDERS: |
| |||||||
From net investment income | (3,214,768 | ) | (2,305,921 | ) | ||||
|
|
|
| |||||
Total distributions to shareholders | (3,214,768 | ) | (2,305,921 | ) | ||||
|
|
|
| |||||
CAPITAL TRANSACTIONS: |
| |||||||
Change in net assets resulting from capital transactions | 49,663,180 | 77,109,750 | ||||||
|
|
|
| |||||
NET ASSETS: |
| |||||||
Change in net assets | 49,120,429 | 74,617,240 | ||||||
Beginning of period | 105,191,308 | 30,574,068 | ||||||
|
|
|
| |||||
End of period | $ | 154,311,737 | $ | 105,191,308 | ||||
|
|
|
| |||||
Accumulated undistributed (distributions in excess of) net investment income | $ | 3,958 | $ | 66,683 | ||||
|
|
|
| |||||
CAPITAL SHARE TRANSACTIONS: | ||||||||
Proceeds from shares issued | $ | 49,663,180 | $ | 77,109,750 | ||||
SHARE TRANSACTIONS: |
| |||||||
Issued (See Note 4) | 1,000,000 | 1,500,000 | ||||||
|
|
|
| |||||
Net increase in shares from share transactions | 1,000,000 | 1,500,000 | ||||||
|
|
|
| |||||
SEE NOTES TO FINANCIAL STATEMENTS.
| AUGUST 31, 2018 | J.P. MORGAN EXCHANGE-TRADED FUNDS | 67 | ||||||
STATEMENTS OF CHANGES IN NET ASSETS
FOR THE PERIODS INDICATED (continued)
| JPMorgan Global Bond Opportunities ETF | ||||||||
| Six Months Ended August 31, 2018 (Unaudited) | Period Ended February 28, 2018 (a) | |||||||
CHANGE IN NET ASSETS RESULTING FROM OPERATIONS: |
| |||||||
Net investment income (loss) | $ | 3,087,078 | $ | 3,696,762 | ||||
Net realized gain (loss) | 576,403 | (2,316,581 | ) | |||||
Change in net unrealized appreciation/depreciation | (4,476,589 | ) | 931,390 | |||||
|
|
|
| |||||
Change in net assets resulting from operations | (813,108 | ) | 2,311,571 | |||||
|
|
|
| |||||
DISTRIBUTIONS TO SHAREHOLDERS: |
| |||||||
From net investment income | (1,268,010 | ) | (3,275,400 | ) | ||||
|
|
|
| |||||
Total distributions to shareholders | (1,268,010 | ) | (3,275,400 | ) | ||||
|
|
|
| |||||
CAPITAL TRANSACTIONS: |
| |||||||
Change in net assets resulting from capital transactions | 25,096,047 | 152,598,061 | ||||||
|
|
|
| |||||
NET ASSETS: |
| |||||||
Change in net assets | 23,014,929 | 151,634,232 | ||||||
Beginning of period | 151,634,232 | — | ||||||
|
|
|
| |||||
End of period | $ | 174,649,161 | $ | 151,634,232 | ||||
|
|
|
| |||||
Accumulated undistributed (distributions in excess of) net investment income | $ | (522,174 | ) | $ | (2,341,242 | ) | ||
|
|
|
| |||||
CAPITAL SHARE TRANSACTIONS: | ||||||||
Proceeds from shares issued | $ | 25,096,047 | $ | 152,598,061 | ||||
SHARE TRANSACTIONS: |
| |||||||
Issued | 500,000 | 3,000,000 | ||||||
|
|
|
| |||||
Net increase in shares from share transactions | 500,000 | 3,000,000 | ||||||
|
|
|
| |||||
| (a) | Commencement of operations was April 5, 2017. |
SEE NOTES TO FINANCIAL STATEMENTS.
| 68 | J.P. MORGAN EXCHANGE-TRADED FUNDS | AUGUST 31, 2018 | ||||
| JPMorgan Ultra-Short Income ETF | ||||||||
| Six Months Ended August 31, 2018 (Unaudited) | Period Ended February 28, 2018 (a) | |||||||
CHANGE IN NET ASSETS RESULTING FROM OPERATIONS: |
| |||||||
Net investment income (loss) | $ | 12,063,015 | $ | 1,036,708 | ||||
Net realized gain (loss) | (45,657 | ) | 9,316 | |||||
Change in net unrealized appreciation/depreciation | 631,006 | (283,028 | ) | |||||
|
|
|
| |||||
Change in net assets resulting from operations | 12,648,364 | 762,996 | ||||||
|
|
|
| |||||
DISTRIBUTIONS TO SHAREHOLDERS: |
| |||||||
From net investment income | (11,995,110 | ) | (975,348 | ) | ||||
|
|
|
| |||||
Total distributions to shareholders | (11,995,110 | ) | (975,348 | ) | ||||
|
|
|
| |||||
CAPITAL TRANSACTIONS: |
| |||||||
Change in net assets resulting from capital transactions | 2,066,088,511 | 200,263,618 | ||||||
|
|
|
| |||||
NET ASSETS: |
| |||||||
Change in net assets | 2,066,741,765 | 200,051,266 | ||||||
Beginning of period | 200,051,266 | — | ||||||
|
|
|
| |||||
End of period | $ | 2,266,793,031 | $ | 200,051,266 | ||||
|
|
|
| |||||
Accumulated undistributed (distributions in excess of) net investment income | $ | 129,265 | $ | 61,360 | ||||
|
|
|
| |||||
CAPITAL SHARE TRANSACTIONS: | ||||||||
Proceeds from shares issued | $ | 2,073,595,891 | $ | 200,263,618 | ||||
Redeemed | (7,507,380 | ) | — | |||||
SHARE TRANSACTIONS: |
| |||||||
Issued | 41,350,000 | 4,000,000 | ||||||
Redeemed | (150,000 | ) | — | |||||
|
|
|
| |||||
Net increase in shares from share transactions | 41,200,000 | 4,000,000 | ||||||
|
|
|
| |||||
| (a) | Commencement of operations was May 17, 2017. |
SEE NOTES TO FINANCIAL STATEMENTS.
| AUGUST 31, 2018 | J.P. MORGAN EXCHANGE-TRADED FUNDS | 69 | ||||||
STATEMENTS OF CHANGES IN NET ASSETS
FOR THE PERIODS INDICATED (continued)
| JPMorgan USD Emerging Markets Sovereign Bond ETF | ||||||||
| Six Months Ended August 31, 2018 (Unaudited) | Period Ended February 28, 2018 (a) | |||||||
CHANGE IN NET ASSETS RESULTING FROM OPERATIONS: |
| |||||||
Net investment income (loss) | $ | 1,253,452 | $ | 198,418 | ||||
Net realized gain (loss) | (252,222 | ) | (8,117 | ) | ||||
Change in net unrealized appreciation/depreciation | (3,076,122 | ) | (1,326,814 | ) | ||||
|
|
|
| |||||
Change in net assets resulting from operations | (2,074,892 | ) | (1,136,513 | ) | ||||
|
|
|
| |||||
DISTRIBUTIONS TO SHAREHOLDERS: |
| |||||||
From net investment income | (1,283,337 | ) | (168,487 | ) | ||||
|
|
|
| |||||
Total distributions to shareholders | (1,283,337 | ) | (168,487 | ) | ||||
|
|
|
| |||||
CAPITAL TRANSACTIONS: |
| |||||||
Change in net assets resulting from capital transactions | — | 55,018,929 | ||||||
|
|
|
| |||||
NET ASSETS: |
| |||||||
Change in net assets | (3,358,229 | ) | 53,713,929 | |||||
Beginning of period | 53,713,929 | — | ||||||
|
|
|
| |||||
End of period | $ | 50,355,700 | $ | 53,713,929 | ||||
|
|
|
| |||||
Accumulated undistributed (distributions in excess of) net investment income | $ | 46 | $ | 29,931 | ||||
|
|
|
| |||||
CAPITAL SHARE TRANSACTIONS: | ||||||||
Proceeds from shares issued | $ | — | $ | 55,018,929 | ||||
SHARE TRANSACTIONS: |
| |||||||
Issued | — | 1,100,000 | ||||||
|
|
|
| |||||
Net increase in shares from share transactions | — | 1,100,000 | ||||||
|
|
|
| |||||
| (a) | Commencement of operations was January 29, 2018. |
SEE NOTES TO FINANCIAL STATEMENTS.
| 70 | J.P. MORGAN EXCHANGE-TRADED FUNDS | AUGUST 31, 2018 | ||||
THIS PAGE IS INTENTIONALLY LEFT BLANK
| AUGUST 31, 2018 | J.P. MORGAN EXCHANGE-TRADED FUNDS | 71 | ||||||
FOR THE PERIODS INDICATED
| Per share operating performance | ||||||||||||||||||||||||||||||||
| Investment Operations | Distributions | |||||||||||||||||||||||||||||||
| Net asset value, beginning of period | Net investment income (loss) (b) | Net realized and unrealized gains (losses) on investments | Total from investment operations | Net investment income | Net realized gain (loss) | Total distributions | Net asset value, end of period | |||||||||||||||||||||||||
JPMorgan Disciplined High Yield ETF | ||||||||||||||||||||||||||||||||
Six Months Ended August 31, 2018 (Unaudited) | $ | 50.09 | $ | 1.22 | $ | (0.31 | ) | $ | 0.91 | $ | (1.22 | ) | $ | — | $ | (1.22 | ) | $ | 49.78 | |||||||||||||
Year Ended February 28, 2018 | 50.96 | 2.44 | (0.92 | ) | 1.52 | (2.39 | ) | — | (2.39 | ) | 50.09 | |||||||||||||||||||||
September 14, 2016 (a) through February 28, 2017 | 50.00 | 1.14 | 0.96 | 2.10 | (1.14 | ) | — | (h) | (1.14 | ) | 50.96 | |||||||||||||||||||||
JPMorgan Global Bond Opportunities ETF | ||||||||||||||||||||||||||||||||
Six Months Ended August 31, 2018 (Unaudited) | 50.54 | 0.94 | (1.20 | ) | (0.26 | ) | (0.38 | ) | — | (0.38 | ) | 49.90 | ||||||||||||||||||||
April 5, 2017 (a) through February 28, 2018 | 50.00 | 1.83 | 0.05 | (i) | 1.88 | (1.34 | ) | — | (1.34 | ) | 50.54 | |||||||||||||||||||||
JPMorgan Ultra-Short Income ETF | ||||||||||||||||||||||||||||||||
Six Months Ended August 31, 2018 (Unaudited) | 50.01 | 0.63 | 0.01 | 0.64 | (0.50 | ) | — | (0.50 | ) | 50.15 | ||||||||||||||||||||||
May 17, 2017(a) through February 28, 2018 | 50.00 | 0.70 | (0.08 | ) | 0.62 | (0.61 | ) | — | (0.61 | ) | 50.01 | |||||||||||||||||||||
JPMorgan USD Emerging Markets Sovereign Bond ETF | ||||||||||||||||||||||||||||||||
Six Months Ended August 31, 2018 (Unaudited) | 48.83 | 1.14 | (3.02 | ) | (1.88 | ) | (1.17 | ) | — | (1.17 | ) | 45.78 | ||||||||||||||||||||
January 29, 2018 (a) through February 28, 2018 | 50.00 | 0.19 | (1.21 | ) | (1.02 | ) | (0.15 | ) | — | (0.15 | ) | 48.83 | ||||||||||||||||||||
| (a) | Commencement of operations. |
| (b) | Calculated based upon average shares outstanding. |
| (c) | Not annualized for periods less than one year. |
| (d) | Includes adjustments in accordance with accounting principles generally accepted in the United States of America and as such, the net asset values for financial reporting purposes and the returns based upon those net asset values may differ from the net asset values and returns for shareholder transactions. |
| (e) | Market price total return is calculated assuming an initial investment made at the beginning of the period market price, reinvestment of all dividends and distributions at market price during the period, and sale at the market price on the last day of the period. The market price presented to calculate the market price total return is the mid-point of the bid/ask spread at the close of business for the Disciplined High Yield ETF, Global Bond Opportunities ETF and Ultra-Short Income ETF on the Cboe BZX Exchange, Inc. and on the NYSE Arca, Inc. for the USD Emerging Markets Sovereign Bond ETF. Since the Shares of the Fund did not trade in the secondary market until the day after the Fund’s inception, for the period from the inception to the first day of secondary market trading, the NAV is used as a proxy for the secondary market trading price to calculate the market returns. |
| (f) | Annualized for periods less than one year, unless otherwise indicated. |
| (g) | Certain non-recurring expenses incurred by the Fund were not annualized for the period indicated. |
| (h) | Amount rounds to less than $0.005. |
| (i) | Calculation of the net realized and unrealized gains (losses) per share do not correlate with the Fund’s net realized and unrealized gains (losses) presented in the Statement of Changes in Net Assets due to the timing of capital transactions in relation to the fluctuating market values of the Fund’s investments. |
SEE NOTES TO FINANCIAL STATEMENTS.
| 72 | J.P. MORGAN EXCHANGE-TRADED FUNDS | AUGUST 31, 2018 | ||||
| Ratios/Supplemental data | ||||||||||||||||||||||||||||||
| Ratios to average net assets (f) | ||||||||||||||||||||||||||||||
| Market price, end of period | Total return (c)(d) | Market price total return (c)(e) | Net assets, end of period | Net expenses | Net investment income (loss) | Expenses without waivers and reimbursements | Portfolio turnover rate (c) | |||||||||||||||||||||||
| $49.94 | 1.86 | % | 1.63 | % | $ | 154,311,737 | 0.40 | % | 4.85 | % | 0.60 | % | 12 | % | ||||||||||||||||
| 50.36 | 3.00 | 3.12 | 105,191,308 | 0.40 | 4.78 | 0.98 | 23 | |||||||||||||||||||||||
| 51.16 | 4.24 | 4.64 | 30,574,068 | 0.39 | (g) | 4.99 | 1.74 | (g) | 8 | |||||||||||||||||||||
| 49.90 | (0.51 | ) | (0.63 | ) | 174,649,161 | 0.54 | (g) | 3.73 | 0.84 | (g) | 39 | |||||||||||||||||||
| 50.60 | 3.76 | 3.88 | 151,634,232 | 0.53 | (g) | 3.98 | 1.10 | (g) | 52 | |||||||||||||||||||||
| 50.19 | 1.29 | 1.29 | 2,266,793,031 | 0.17 | (g) | 2.48 | 0.27 | (g) | 23 | |||||||||||||||||||||
| 50.05 | 1.25 | 1.33 | 200,051,266 | 0.16 | (g) | 1.77 | 0.55 | (g) | 25 | |||||||||||||||||||||
| 46.11 | (3.89 | ) | (3.45 | ) | 50,355,700 | 0.35 | (g) | 4.78 | 0.83 | (g) | 15 | |||||||||||||||||||
| 48.95 | (2.03 | ) | (1.79 | ) | 53,713,929 | 0.35 | (g) | 4.79 | 2.74 | (g) | 2 | |||||||||||||||||||
SEE NOTES TO FINANCIAL STATEMENTS.
| AUGUST 31, 2018 | J.P. MORGAN EXCHANGE-TRADED FUNDS | 73 | ||||||
AS OF AUGUST 31, 2018 (Unaudited)
1. Organization
J.P. Morgan Exchange-Traded Fund Trust (the “Trust”) was formed on February 25, 2010, and is governed by a Declaration of Trust as amended and restated February 19, 2014, and is registered under the Investment Company Act of 1940, as amended (the “1940 Act”), as an open-end management investment company.
The following are 4 separate funds of the Trust (each, a “Fund” and collectively, the “Funds”) covered by this report:
| Diversified/Non-Diversified | ||
| JPMorgan Disciplined High Yield ETF | Diversified | |
| JPMorgan Global Bond Opportunities ETF | Diversified | |
| JPMorgan Ultra-Short Income ETF | Diversified | |
| JPMorgan USD Emerging Markets Sovereign Bond ETF | Diversified |
JPMorgan Disciplined High Yield ETF (the “Disciplined High Yield ETF”) commenced operations on September 14, 2016. The investment objective of the Fund is to seek to provide a high level of income with capital appreciation as a secondary objective.
JPMorgan Global Bond Opportunities ETF (the “Global Bond Opportunities ETF”) commenced operations on April 5, 2017. The investment objective of the Fund is to seek to provide total return.
JPMorgan Ultra-Short Income ETF (the “Ultra-Short Income ETF”) commenced operations on May 17, 2017. The investment objective of the Fund is to seek to provide current income while seeking to maintain a low volatility of principal.
JPMorgan USD Emerging Markets Sovereign Bond ETF (the “USD Emerging Markets Sovereign Bond ETF”) commenced operations on January 29, 2018. The investment objective of the Fund is to seek to provide investment results that closely correspond, before fees and expenses, to the performance of the JPMorgan Emerging Markets Risk-Aware Bond Index.
J.P. Morgan Investment Management Inc. (“JPMIM”), an indirect, wholly-owned subsidiary of JPMorgan Chase & Co. (“JPMorgan”), acts as Adviser (the “Adviser”) and Administrator (the “Administrator”) to the Funds.
Shares of Disciplined High Yield ETF, Global Bond Opportunities ETF and Ultra-Short Income ETF are listed and traded on the Cboe BZX Exchange, Inc. Shares of USD Emerging Markets Sovereign Bond ETF are listed and traded on the NYSE Arca, Inc. Market prices for the Funds’ shares may be different from their net asset value (“NAV”). The Funds issue and redeem their shares on a continuous basis, through JPMorgan Distribution Services, Inc. (the “Distributor” or “JPMDS”), an indirect, wholly-owned subsidiary of JPMorgan, at NAV in large blocks of shares, referred to as “Creation Units” as shown in the table below:
| Shares per Creation Unit | ||||
Disciplined High Yield ETF | 100,000 | |||
Global Bond Opportunities ETF | 100,000 | |||
Ultra-Short Income ETF | 50,000 | |||
USD Emerging Markets Sovereign Bond ETF | 100,000 | |||
The Funds may elect creations and redemptions in cash or partially in cash. Shares are generally traded in the secondary market in amounts less than a Creation Unit at market prices that change throughout the day. Only individuals or institutions that have entered into an authorized participant agreement with the Distributor may do business directly with the Funds (each, an “Authorized Participant”).
2. Significant Accounting Policies
The following is a summary of significant accounting policies followed by the Funds in the preparation of their financial statements. The Funds are investment companies and, thus, follow the investment company accounting and reporting guidance of the Financial Accounting Standards Board Accounting Standards Codification Topic 946 — Investment Companies, which is part of U.S. generally accepted accounting principles (“GAAP”). The preparation of financial statements in conformity with GAAP requires management to make estimates and assumptions that affect the reported amounts of assets and liabilities and disclosure of contingent assets and liabilities at the date of the financial statements and the reported amounts of increases and decreases in net assets from operations during the reporting period. Actual results could differ from those estimates.
A. Valuation of Investments — The valuation of investments is in accordance with GAAP and the Funds’ valuation policies set forth by and under the supervision and responsibility of the Board of Trustees (the “Board”), which established the following approach to valuation, as described more fully below: (i) investments for which market quotations are readily available shall be valued at such unadjusted quoted prices, and (ii) all other investments for which market quotations are not readily available shall be valued at their fair value as determined in good faith by the Board.
The Administrator has established the J.P. Morgan Asset Management Americas Valuation Committee (“AVC”) to assist the Board with the oversight and monitoring of the valuation of the Funds’ investments. The Administrator implements the valuation policies of the Funds’ investments, as directed by the Board. The AVC oversees and carries out the policies for the valuation of investments held in the Funds. This includes monitoring the appropriateness of fair values based on results of ongoing valuation oversight including, but not limited to, consideration of macro or security specific events, market events and pricing vendor and broker due diligence. The Administrator is responsible for discussing and assessing the potential impacts to the fair values on an ongoing basis, and at least on a quarterly basis with the AVC and the Board.
| 74 | J.P. MORGAN EXCHANGE-TRADED FUNDS | AUGUST 31, 2018 | ||||
A market-based approach is primarily used to value the Funds’ investments. Investments for which market quotations are not readily available are fair valued by approved affiliated and unaffiliated pricing vendors or third party broker-dealers (collectively referred to as “Pricing Services”) or may be internally fair valued using methods set forth by the valuation policies approved by the Board. This may include related or comparable assets or liabilities, recent transactions, market multiples, book values and other relevant information for the investment to determine the fair value of the
investment. An income-based valuation approach may be used in which the anticipated future cash flows of the investment are discounted to calculate the fair value. Discounts may also be applied due to the nature or duration of any restrictions on the disposition of the investments. Valuations may be based upon current market prices of securities that are comparable in coupon, rating, maturity and industry. It is possible that the estimated values may differ significantly from the values that would have been used, had a ready market for the investments existed, and such differences could be material.
Fixed income instruments are valued based on prices received from Pricing Services. The Pricing Services use multiple valuation techniques to determine the valuation of fixed income instruments. In instances where sufficient market activity exists, the Pricing Services may utilize a market based approach through which trades or quotes from market makers are used to determine the valuation of these instruments. In instances where sufficient market activity may not exist, the Pricing Services also utilize proprietary valuation models which may consider market transactions in comparable securities and the various relationships between securities in determining fair value and/or market characteristics in order to estimate the relevant cash flows, which are then discounted to calculate the fair values.
Investments in open-end investment companies, excluding exchange traded funds (“ETFs”) (the “Underlying Funds”), are valued at each Underlying Fund’s NAV per share as of the report date.
Futures contracts are generally valued on the basis of available market quotations. Forward foreign currency exchange contracts are valued utilizing market quotations from approved Pricing Services.
See the tables on “Quantitative Information about Level 3 Fair Value Measurements” for information on the valuation techniques and inputs used to value level 3 securities held by Global Bond Opportunities ETF and Ultra-Short Income ETF at August 31, 2018.
Valuations reflected in this report are as of the report date. As a result, changes in valuation due to market events and/or issuer related events after the report date and prior to issuance of the report are not reflected herein.
The various inputs that are used in determining the valuation of the Funds’ investments are summarized into the three broad levels listed below.
| • | Level 1 — Unadjusted inputs using quoted prices in active markets for identical investments. |
| • | Level 2 — Other significant observable inputs including, but not limited to, quoted prices for similar investments, inputs other than quoted prices that are observable for investments (such as interest rates, prepayment speeds, credit risk, etc.) or other market corroborated inputs. |
| • | Level 3 — Significant inputs based on the best information available in the circumstances, to the extent observable inputs are not available (including the Funds’ assumptions in determining the fair value of investments). |
A financial instrument’s level within the fair value hierarchy is based on the lowest level of any input, both individually and in the aggregate, that is significant to the fair value measurement. The inputs or methodology used for valuing instruments are not necessarily an indication of the risk associated with investing in those instruments.
The following tables represent each valuation input as presented on the Schedules of Portfolio Investments (“SOIs”):
| Disciplined High Yield ETF | Level 1 Quoted prices | Level 2 Other significant | Level 3 Significant | Total | ||||||||||||
Investments in Securities | ||||||||||||||||
Debt Securities | ||||||||||||||||
Corporate Bonds | ||||||||||||||||
Oil, Gas & Consumable Fuels | $ | — | $ | 19,106,598 | $ | 174,460 | $ | 19,281,058 | ||||||||
Wireless Telecommunication Services | — | 5,345,043 | — | 5,345,043 | ||||||||||||
Other Corporate Bonds | — | 124,118,343 | — | 124,118,343 | ||||||||||||
|
|
|
|
|
|
|
| |||||||||
Total Corporate Bonds | — | 148,569,984 | 174,460 | 148,744,444 | ||||||||||||
|
|
|
|
|
|
|
| |||||||||
Short-Term Investments | ||||||||||||||||
Investment Companies | 4,098,667 | — | — | 4,098,667 | ||||||||||||
|
|
|
|
|
|
|
| |||||||||
Total Investments in Securities | $ | 4,098,667 | $ | 148,569,984 | $ | 174,460 | $ | 152,843,111 | ||||||||
|
|
|
|
|
|
|
| |||||||||
| AUGUST 31, 2018 | J.P. MORGAN EXCHANGE-TRADED FUNDS | 75 | ||||||
NOTES TO FINANCIAL STATEMENTS
AS OF AUGUST 31, 2018 (Unaudited) (continued)
| Global Bond Opportunities ETF | Level 1 Quoted prices | Level 2 Other significant | Level 3 Significant | Total | ||||||||||||
Investments in Securities | ||||||||||||||||
Debt Securities | ||||||||||||||||
Asset-Backed Securities | ||||||||||||||||
Cayman Islands | $ | — | $ | — | $ | 347,375 | $ | 347,375 | ||||||||
United States | — | 8,691,192 | 4,096,919 | 12,788,111 | ||||||||||||
|
|
|
|
|
|
|
| |||||||||
Total Asset-Backed Securities | — | 8,691,192 | 4,444,294 | 13,135,486 | ||||||||||||
|
|
|
|
|
|
|
| |||||||||
Collateralized Mortgage Obligations | — | 5,025,845 | — | 5,025,845 | ||||||||||||
Commercial Mortgage-Backed Securities | ||||||||||||||||
United States | — | 6,303,063 | 3,857,830 | 10,160,893 | ||||||||||||
Corporate Bonds | ||||||||||||||||
Luxembourg | — | 2,700,280 | 156,118 | 2,856,398 | ||||||||||||
Other Corporate Bonds | — | 95,039,058 | — | 95,039,058 | ||||||||||||
|
|
|
|
|
|
|
| |||||||||
Total Corporate Bonds | — | 97,739,338 | 156,118 | 97,895,456 | ||||||||||||
|
|
|
|
|
|
|
| |||||||||
Mortgage-Backed Securities | — | 6,951,710 | — | 6,951,710 | ||||||||||||
Foreign Government Securities | — | 27,964,342 | — | 27,964,342 | ||||||||||||
U.S. Treasury Obligations | — | 2,145,031 | — | 2,145,031 | ||||||||||||
Short-Term Investments | ||||||||||||||||
Investment Companies | 8,342,272 | — | — | 8,342,272 | ||||||||||||
|
|
|
|
|
|
|
| |||||||||
Total Investments in Securities | $ | 8,342,272 | $ | 154,820,521 | $ | 8,458,242 | $ | 171,621,035 | ||||||||
|
|
|
|
|
|
|
| |||||||||
Appreciation in Other Financial Instruments | ||||||||||||||||
Forward Foreign Currency Exchange Contracts | $ | — | $ | 1,566,443 | $ | — | $ | 1,566,443 | ||||||||
Futures Contracts | 322,701 | — | — | 322,701 | ||||||||||||
|
|
|
|
|
|
|
| |||||||||
Total Appreciation in Other Financial Instruments | $ | 322,701 | $ | 1,566,443 | $ | — | $ | 1,889,144 | ||||||||
|
|
|
|
|
|
|
| |||||||||
Depreciation in Other Financial Instruments | ||||||||||||||||
Forward Foreign Currency Exchange Contracts | $ | — | $ | (510,062 | ) | $ | — | $ | (510,062 | ) | ||||||
Futures Contracts | (100,792 | ) | — | — | (100,792 | ) | ||||||||||
|
|
|
|
|
|
|
| |||||||||
Total Depreciation in Other Financial Instruments | $ | (100,792 | ) | $ | (510,062 | ) | $ | — | $ | (610,854 | ) | |||||
|
|
|
|
|
|
|
| |||||||||
| Ultra-Short Income ETF | Level 1 Quoted prices | Level 2 Other significant | Level 3 Significant | Total | ||||||||||||
Investments in Securities |
| |||||||||||||||
Debt Securities |
| |||||||||||||||
Asset-Backed Securities | $ | — | $ | 289,890,331 | $ | 17,517,845 | $ | 307,408,176 | ||||||||
Certificates of Deposit | — | 76,962,945 | — | 76,962,945 | ||||||||||||
Commercial Mortgage-Backed Securities | — | 8,636,864 | — | 8,636,864 | ||||||||||||
Corporate Bonds |
| |||||||||||||||
Other Corporate Bonds | — | 1,480,920,699 | — | 1,480,920,699 | ||||||||||||
Foreign Government Securities | — | 1,398,777 | — | 1,398,777 | ||||||||||||
U.S. Treasury Obligations | — | 19,718,750 | — | 19,718,750 | ||||||||||||
Short-Term Investments |
| |||||||||||||||
Certificates of Deposit | — | 64,557,056 | — | 64,557,056 | ||||||||||||
Commercial Paper | — | 201,152,247 | 201,152,247 | |||||||||||||
Investment Companies | 67,510,638 | — | — | 67,510,638 | ||||||||||||
Repurchase Agreements | — | 18,500,000 | — | 18,500,000 | ||||||||||||
|
|
|
|
|
|
|
| |||||||||
Total Short-Term Investments | 67,510,638 | 284,209,303 | 351,719,941 | |||||||||||||
|
|
|
|
|
|
|
| |||||||||
Total Investments in Securities | $ | 67,510,638 | $ | 2,161,737,669 | $ | 17,517,845 | $ | 2,246,766,152 | ||||||||
|
|
|
|
|
|
|
| |||||||||
| 76 | J.P. MORGAN EXCHANGE-TRADED FUNDS | AUGUST 31, 2018 | ||||
| USD Emerging Markets Sovereign Bond ETF | Level 1 Quoted prices | Level 2 Other significant | Level 3 Significant | Total | ||||||||||||
Investments in Securities | ||||||||||||||||
Debt Securities | ||||||||||||||||
Corporate Bonds | ||||||||||||||||
Other Corporate Bonds | $ | — | $ | 7,276,112 | $ | — | $ | 7,276,112 | ||||||||
Foreign Government Securities | — | 42,236,618 | — | 42,236,618 | ||||||||||||
Short-Term Investments | ||||||||||||||||
Investment Companies | 252,493 | — | — | 252,493 | ||||||||||||
|
|
|
|
|
|
|
| |||||||||
Total Investments in Securities | $ | 252,493 | $ | 49,512,730 | $ | — | $ | 49,765,223 | ||||||||
|
|
|
|
|
|
|
| |||||||||
Transfers between fair value levels are valued utilizing values as of the beginning of the period.
There were no transfers among any levels during the period ended August 31, 2018 for USD Emerging Markets Sovereign Bond ETF.
There were no significant transfers among any levels during the period ended August 31, 2018 for Disciplined High Yield ETF and Ultra-Short Income ETF.
Transfers from level 2 to level 3 are due to a decline in market activity (e.g. frequency of trades), which resulted in a lack of available market inputs to determine the price for the period ended August 31, 2018 for Global Bond Opportunities ETF.
The following is a summary of investments for which significant unobservable inputs (level 3) were used in determining fair value:
| Global Bond Opportunities ETF | Balance as of February 28, 2018 | Realized gain (loss) | Change in net unrealized appreciation (depreciation) | Net accretion (amortization) | Purchases1 | Sales2 | Transfers into Level 3 | Transfers out of Level 3 | Balance as of August 31, 2018 | |||||||||||||||||||||||||||
Investments in Securities: |
| |||||||||||||||||||||||||||||||||||
Asset-Backed Securities — Cayman Islands | $ | 95,564 | $ | (138 | ) | $ | (785 | ) | $ | (8 | ) | $ | 260,000 | $ | (7,258 | ) | $ | — | $ | — | $ | 347,375 | ||||||||||||||
Asset-Backed Securities — United States | 2,264,474 | (6,234 | ) | 373 | (1,129 | ) | 1,090,162 | (578,806 | ) | 1,328,079 | — | 4,096,919 | ||||||||||||||||||||||||
Commercial Mortgage-Backed Securities — United States | 2,953,242 | (58,516 | ) | 34,174 | 1,424 | 1,212,640 | (1,068,350 | ) | 1,546,204 | (762,988 | ) | 3,857,830 | ||||||||||||||||||||||||
Corporate Bonds — Luxembourg | — | — | (21,695 | ) | (583 | ) | — | — | 178,396 | — | 156,118 | |||||||||||||||||||||||||
|
|
|
|
|
|
|
|
|
|
|
|
|
|
|
|
|
| |||||||||||||||||||
| $ | 5,313,280 | $ | (64,888 | ) | $ | 12,067 | $ | (296 | ) | $ | 2,562,802 | $ | (1,654,414 | ) | $ | 3,052,679 | $ | (762,988 | ) | $ | 8,458,242 | |||||||||||||||
|
|
|
|
|
|
|
|
|
|
|
|
|
|
|
|
|
| |||||||||||||||||||
| Ultra-Short Income ETF | Balance as of February 28, 2018 | Realized gain (loss) | Change in net unrealized appreciation (depreciation) | Net accretion (amortization) | Purchases1 | Sales2 | Transfers Level 3 | Transfers out of Level 3 | Balance as of August 31, 2018 | |||||||||||||||||||||||||||
Investments in Securities: |
| |||||||||||||||||||||||||||||||||||
Asset-Backed Securities | $ | — | $ | (321 | ) | $ | (3,559 | ) | $ | (42 | ) | $ | 13,911,151 | $ | (1,437,584 | ) | $ | 5,048,200 | $ | — | $ | 17,517,845 | ||||||||||||||
|
|
|
|
|
|
|
|
|
|
|
|
|
|
|
|
|
| |||||||||||||||||||
| 1 | Purchases include all purchases of securities and securities received in corporate actions. |
| 2 | Sales include all sales of securities, maturities, paydowns and securities tendered in corporate actions. |
The changes in net unrealized appreciation (depreciation) attributable to securities owned at August 31, 2018, which were valued using significant unobservable inputs (level 3), were as follows:
Global Bond Opportunities ETF | $ | 7,444 | ||
Ultra-Short Income ETF | (3,559 | ) |
These amounts are included in Change in net unrealized appreciation/depreciation of investments in non-affiliates on the Statements of Operations (SOP).
| AUGUST 31, 2018 | J.P. MORGAN EXCHANGE-TRADED FUNDS | 77 | ||||||
NOTES TO FINANCIAL STATEMENTS
AS OF AUGUST 31, 2018 (Unaudited) (continued)
| Global Bond Opportunities ETF | ||||||||||||||||
| Quantitative Information about Level 3 Fair Value Measurements # | ||||||||||||||||
| Fair Value at August 31, 2018 | Valuation Technique(s) | Unobservable Input | Range (Weighted Average) | |||||||||||||
Asset-Backed Securities | $ | 4,184,946 | Discounted Cash Flow | Constant Prepayment Rate | 5.00% - 35.00% (17.46%) | |||||||||||
|
| |||||||||||||||
| Constant Default Rate | 0.00% - 4.19% (0.71%) | |||||||||||||||
| Yield (Discount Rate of Cash Flows) | 3.03% - 6.68% (4.49%) | |||||||||||||||
| 4,184,946 | ||||||||||||||||
| ||||||||||||||||
Commercial Mortgage-Backed Securities | 3,646,517 | Discounted Cash Flow | Yield (Discount Rate of Cash Flows) | (28.19)% - 18.38% (5.45%) | ||||||||||||
|
| |||||||||||||||
| 3,646,517 | ||||||||||||||||
| ||||||||||||||||
Total | $ | 7,831,463 | ||||||||||||||
| ||||||||||||||||
| # | The table above does not include level 3 securities that are valued by brokers and pricing services. At August 31, 2018, the value of these securities was $626,779. The inputs for these securities are not readily available or cannot be reasonably estimated and are generally those inputs described in Note 2.A. |
The significant unobservable inputs used in the fair value measurement of the Fund’s investments are listed above. Generally, a change in the assumptions used in any input in isolation may be accompanied by a change in another input. Significant changes in any of the unobservable inputs may significantly impact the fair value measurement. The impact is based on the relationship between each unobservable input and the fair value measurement. Significant increases (decreases) in the default rate may decrease (increase) the fair value measurement. A significant change in the discount rate or prepayment rate (Constant Prepayment Rate or PSA Prepayment Model) may decrease or increase the fair value measurement.
| Ultra-Short Income ETF | ||||||||||||||||
| Quantitative Information about Level 3 Fair Value Measurements # | ||||||||||||||||
| Fair Value at April 31, 2018 | Valuation Technique(s) | Unobservable Input | Range (Weighted Average) | |||||||||||||
| $15,267,944 | Discounted Cash Flow | Yield (Discount Rate of Cash Flows) | 3.22% -4.68% (3.59%) | |||||||||||||
|
| |||||||||||||||
Asset-Backed Securities | 15,267,944 | |||||||||||||||
|
|
|
|
|
|
|
|
| ||||||||
Total | $15,267,944 | |||||||||||||||
|
|
|
|
|
|
|
|
| ||||||||
| # | The table above does not include level 3 securities that are valued by brokers and pricing services. At August 31, 2018, the value of these securities was $2,249,901. The inputs for these securities are not readily available or cannot be reasonably estimated and are generally those inputs described in Note 2.A. |
The significant unobservable inputs used in the fair value measurement of the Fund’s investments are listed above. Generally, a change in the assumptions used in any input in isolation may be accompanied by a change in another input. Significant changes in any of the unobservable inputs may significantly impact the fair value measurement. The impact is based on the relationship between each unobservable input and the fair value measurement. Significant increases (decreases) in the yield, and default rate may decrease (increase) the fair value measurement. A significant change in the prepayment rate (Constant Prepayment Rate or PSA Prepayment Model) may decrease or increase the fair value measurement.
B. Restricted Securities — Certain securities held by the Funds may be subject to legal or contractual restrictions on resale. Restricted securities generally are resold in transactions exempt from registration under the Securities Act of 1933, as amended (the “Securities Act”). Disposal of these securities may involve time-consuming negotiations and expense. Prompt sale at the current valuation may be difficult and could adversely affect the NAVs of the Funds.
As of August 31, 2018, the Funds had no investments in restricted securities other than securities sold to the Funds under Rule 144A and/or Regulation S under the Securities Act.
C. When-Issued Securities, Delayed Delivery Securities and Forward Commitments — Ultra-Short Income ETF purchased when-issued securities, including To Be Announced (“TBA”) securities, and entered into contracts to purchase or sell securities for a fixed price that may be settled a month or more after the trade date. When-issued securities are securities that have been authorized, but not issued in the market. A forward commitment involves entering into a contract to purchase or sell securities for a fixed price at a future date that may be settled a month or more after the trade date. A delayed delivery security is agreed upon in advance between the buyer and the seller of the security and is generally delivered beyond seven days of the agreed upon date. The purchase of securities on a when-issued, delayed delivery or forward commitment basis involves the risk that the value of the security to be purchased declines before the settlement date. The sale of securities on a forward commitment basis involves the risk
| 78 | J.P. MORGAN EXCHANGE-TRADED FUNDS | AUGUST 31, 2018 | ||||
that the value of the securities sold may increase before the settlement date. The Fund may be exposed to credit risk if the counterparty fails to perform under the terms of the transaction. Interest income for securities purchased on a when-issued, delayed delivery or forward commitment basis is not accrued until the settlement date.
Ultra-Short Income ETF had delayed delivery securities outstanding as of August 31, 2018. The values of these securities held at August 31, 2018 are detailed on the SOI.
D. Repurchase Agreements — The Funds may enter into repurchase agreement transactions that meet the credit guidelines of JPMIM, an indirect, wholly-owned subsidiary of JPMorgan. Repurchase agreements involve the purchase of securities subject to the seller’s agreement to repurchase the securities at a mutually agreed upon date and price. The Funds require that the collateral received in a repurchase agreement transaction be transferred to a custodian in a manner sufficient to enable the Funds to obtain collateral in the event of a counterparty default. If the counterparty defaults and the fair value of the collateral declines, realization of the collateral by the Funds may be delayed or limited. Repurchase agreement collateral may be held in segregated accounts maintained by JPMorgan Chase Bank, N.A. (“JPMCB”), a wholly-owned subsidiary of JPMorgan.
The Funds’ repurchase agreements are not subject to master netting arrangements.
E. Derivatives — The Funds used derivative instruments including futures, forward foreign currency exchange contracts, options and swaps, in connection with their respective investment strategies. Derivative instruments may be used as substitutes for securities in which the Funds can invest, to hedge portfolio investments or to generate income or gain to the Funds. Derivatives may also be used to manage duration, sector and yield curve exposures and credit and spread volatility.
The Funds may be subject to various risks from the use of derivatives including the risk that changes in the value of a derivative may not correlate perfectly with the underlying asset, rate or index; counterparty credit risk related to derivatives counterparties’ failure to perform under contract terms; liquidity risk related to the lack of a liquid market for these contracts allowing a Fund to close out its position(s); and documentation risk relating to disagreement over contract terms. Investing in certain derivatives also results in a form of leverage and as such, the Funds’ risk of loss associated with these instruments may exceed their value, as recorded on the Statements of Assets and Liabilities (“SAL”).
The Funds are party to various derivative contracts governed by International Swaps and Derivatives Association master agreements (“ISDA agreements”). The Funds’ ISDA agreements, which are separately negotiated with each dealer counterparty, may contain provisions allowing, absent other considerations, a counterparty to exercise rights, to the extent not otherwise waived, against the Funds in the event the Funds’ net assets decline over time by a pre-determined percentage or fall below a pre-determined floor. The ISDA agreements may also contain provisions allowing, absent other conditions, the Funds to exercise rights, to the extent not otherwise waived, against a counterparty (e.g., decline in a counterparty’s credit rating below a specified level). Such rights for both a counterparty and the Funds often include the ability to terminate (i.e., close out) open contracts at prices which may favor a counterparty, which could have an adverse effect on the Funds. The ISDA agreements give the Funds and a counterparty the right, upon an event of default, to close out all transactions traded under such agreements and to net amounts owed or due across all transactions and offset such net payable or receivable with collateral posted to a segregated account by one party to the other.
Counterparty credit risk may be mitigated to the extent a counterparty posts collateral for mark to market gains to the Funds.
Notes C(1) — C(2) below describe the various derivatives used by the Funds.
(1). Futures Contracts — The Global Bond Opportunities ETF and Ultra-Short Income ETF used treasury, index or other financial futures contracts to gain or reduce exposure to the stock and bond markets, maintain liquidity and minimize transaction costs. The Funds also bought futures contracts to immediately invest incoming cash in the market or sold futures in response to cash outflows, thereby simulating an invested position in the underlying index while maintaining a cash balance for liquidity.
Futures contracts provide for the delayed delivery of the underlying instrument at a fixed price or are settled for a cash amount based on the change in the value of the underlying instrument at a specific date in the future. Upon entering into a futures contract, the Funds are required to deposit with the broker, cash or securities in an amount equal to a certain percentage of the contract amount, which is referred to as the initial margin deposit. Subsequent payments, referred to as variation margin, are made or received by the Funds periodically and are based on changes in the market value of open futures contracts. Changes in the market value of open futures contracts are recorded as Change in net unrealized appreciation/depreciation on the SOP. Realized gains or losses, representing the difference between the value of the contract at the time it was opened and the value at the time it was closed, are reported on the SOP at the closing or expiration of the futures contract. Securities deposited as initial margin are designated on the SOIs and cash deposited, which is considered restricted, is recorded on the SAL. A receivable from and/or a payable to brokers for the daily variation margin is also recorded on the SAL.
The use of futures contracts exposes the Funds to interest rate risk. The Funds may be subject to the risk that the change in the value of the futures contract may not correlate perfectly with the underlying instrument. Use of long futures contracts subjects the Funds to risk of loss in excess of the amounts shown on the SAL, up to the notional amount of the futures contracts. Use of short futures contracts subjects the Funds to unlimited risk of loss. The Funds may enter into futures contracts only on exchanges or boards of trade. The exchange or board of trade acts as the counterparty to each futures transaction; therefore, the Funds’ credit risk is limited to failure of the exchange or board of trade. Under some circumstances, futures exchanges may establish daily limits on the amount that the price of a futures contract can vary from the previous day’s settlement price, which could effectively prevent liquidation of positions.
The Funds’ futures contracts are not subject to master netting arrangements (the right to close out all transactions traded with a counterparty and net amounts owed or due across transactions).
| AUGUST 31, 2018 | J.P. MORGAN EXCHANGE-TRADED FUNDS | 79 | ||||||
NOTES TO FINANCIAL STATEMENTS
AS OF AUGUST 31, 2018 (Unaudited) (continued)
(2). Forward Foreign Currency Exchange Contracts — The Global Bond Opportunities ETF may be exposed to foreign currency risks associated with some or all of the portfolio investments and used forward foreign currency exchange contracts to hedge or manage certain of these exposures as part of an investment strategy. The Fund also bought forward foreign currency exchange contracts to gain exposure to currencies. Forward foreign currency exchange contracts represent obligations to purchase or sell foreign currency on a specified future date at a price fixed at the time the contracts are entered into. Non-deliverable forward foreign currency exchange contracts are settled with the counterparty in U.S. Dollar without the delivery of foreign currency.
The values of the forward foreign currency exchange contracts are adjusted daily based on the applicable exchange rate of the underlying currency. Changes in the value of these contracts are recorded as unrealized appreciation or depreciation until the contract settlement date. When the forward foreign currency exchange contract is closed, the Fund records a realized gain or loss equal to the difference between the value at the time the contract was opened and the value at the time it was closed. The Fund also records a realized gain or loss when a forward foreign currency exchange contract offsets another forward foreign currency exchange contract with the same counterparty upon settlement.
The Fund’s forward foreign currency exchange contracts are subject to master netting arrangements (the right to close out all transactions with a counterparty and net amounts owed or due across transactions).
The Fund may be required to post or receive collateral for non-deliverable forward foreign currency exchange contracts.
(3). Summary of Derivatives Information
The following table presents the value of derivatives held as of August 31, 2018, by their primary underlying risk exposure and respective location on the SAL:
| Global Bond Opportunities ETF | ||||||||||||||
| Derivative Contracts | Statements of Assets and Liabilities Location | |||||||||||||
| Gross Assets: | Futures Contracts (a) | Forward Foreign Currency Exchange Contracts | Total | |||||||||||
| Interest rate contracts | Receivables, Net assets — Unrealized Appreciation | $ | 322,701 | $ | — | $ | 322,701 | |||||||
Foreign exchange contracts | Receivables | — | 1,566,443 | 1,566,443 | ||||||||||
|
|
|
|
|
| |||||||||
Total | $ | 322,701 | $ | 1,566,443 | $ | 1,889,144 | ||||||||
|
|
|
|
|
| |||||||||
Gross Liabilities: | ||||||||||||||
| Interest rate contracts | Payables, Net assets — Unrealized Depreciation | $ | (100,792 | ) | $ | — | $ | (100,792 | ) | |||||
Foreign exchange contracts | Payables | — | (510,062 | ) | (510,062 | ) | ||||||||
|
|
|
| �� |
|
| ||||||||
Total | $ | (100,792 | ) | $ | (510,062 | ) | $ | (610,854 | ) | |||||
|
|
|
|
|
| |||||||||
| (a) | This amount reflects the cumulative appreciation/depreciation of futures contracts as reported on the SOI. The Statements of Assets and Liabilities only reflects the current day variation margin receivable/payable from/to brokers. |
The following table presents the Fund’s gross derivative assets and liabilities by counterparty net of amounts available for offset under netting arrangements and any related collateral received or posted by the Fund as of August 31, 2018.
Global Bond Opportunities ETF
| Counterparty | Gross Amount of Derivative Assets Subject to Netting Arrangements Presented in the Statement of Assets and | Derivatives Available for offset | Collateral Received | Net Amount Due from Counterparty (not less than zero) | ||||||||||||
Australia & New Zealand Banking Group Ltd. | $ | 1,049 | $ | (1,049 | ) | $ | — | $ | — | |||||||
Barclays Bank plc | 430,170 | (58,374 | ) | — | 371,796 | |||||||||||
BNP Paribas SA | 318,368 | (244,122 | ) | — | 74,246 | |||||||||||
Citibank, NA | 514,668 | (80,041 | ) | — | 434,627 | |||||||||||
Goldman Sachs International | 268,510 | (119,086 | ) | — | 149,424 | |||||||||||
Merrill Lynch International | 2,306 | — | — | 2,306 | ||||||||||||
Morgan Stanley | 3,233 | (523 | ) | — | 2,710 | |||||||||||
National Australia Bank Ltd. | 6,119 | — | — | 6,119 | ||||||||||||
Royal Bank of Canada | 806 | — | — | 806 | ||||||||||||
State Street Corp. | 6,317 | (6,285 | ) | — | 32 | |||||||||||
TD Bank Financial Group | 14,897 | — | — | 14,897 | ||||||||||||
|
|
|
|
|
|
|
| |||||||||
Total | $ | 1,566,443 | $ | (509,480 | ) | $ | — | $ | 1,056,963 | |||||||
|
|
|
|
|
|
|
| |||||||||
| 80 | J.P. MORGAN EXCHANGE-TRADED FUNDS | AUGUST 31, 2018 | ||||
| Counterparty | Gross Amount of Derivative Liabilities Presented in the Statement of Assets and | Derivatives Available for Offset | Collateral Pledged | Net Amount Due from Counterparty (not less than zero) | ||||||||||||
Australia & New Zealand Banking Group Ltd. | $ | 1,631 | $ | (1,049 | ) | $ | — | $ | 582 | |||||||
Barclays Bank plc | 58,374 | (58,374 | ) | — | — | |||||||||||
BNP Paribas SA | 244,122 | (244,122 | ) | — | — | |||||||||||
Citibank, NA | 80,041 | (80,041 | ) | — | — | |||||||||||
Goldman Sachs International | 119,086 | (119,086 | ) | — | — | |||||||||||
Morgan Stanley | 523 | (523 | ) | — | — | |||||||||||
State Street Corp. | 6,285 | (6,285 | ) | — | — | |||||||||||
|
|
|
|
|
|
|
| |||||||||
Total | $ | 510,062 | $ | (509,480 | ) | $ | — | $ | 582 | |||||||
|
|
|
|
|
|
|
| |||||||||
| (a) | For financial reporting purposes, the Fund does not offset derivative assets and derivative liabilities subject to master netting arrangements on the Statements of Assets and Liabilities. |
The following tables present the effect of derivatives on the SOP for the six months ended August 31, 2018, by primary underlying risk exposure:
| Global Bond Opportunities ETF | ||||||||||||
| Amount of Realized Gain (Loss) on Derivatives Recognized on the Statements of Operations | ||||||||||||
| Derivative Contracts | Futures Contracts | Forward Foreign Currency Exchange Contracts | Total | |||||||||
Interest rate contracts | $ | (580,717 | ) | $ | — | $ | (580,717 | ) | ||||
Foreign exchange contracts | — | 2,737,502 | 2,737,502 | |||||||||
|
|
|
|
|
| |||||||
Total | $ | (580,717 | ) | $ | 2,737,502 | $ | 2,156,785 | |||||
|
|
|
|
|
| |||||||
| Amount of Change in Unrealized Appreciation (Depreciation) on Derivatives Recognized on the Statements of Operations | ||||||||||||
| Derivative contracts | Futures Contracts | Forward Foreign Currency Exchange Contracts | Total | |||||||||
Interest rate contracts | $ | (132,646 | ) | $ | — | $ | (132,646 | ) | ||||
Foreign exchange contracts | — | 682,042 | 682,042 | |||||||||
|
|
|
|
|
| |||||||
Total | $ | (132,646 | ) | $ | 682,042 | $ | 549,396 | |||||
|
|
|
|
|
| |||||||
| Ultra-Short Income ETF | ||||
| Amount of Realized Gain (Loss) on Derivatives Recognized on the Statements of Operations | ||||
| Derivative Contracts | Futures Contracts | |||
Interest rate contracts | $ | (354 | ) | |
|
| |||
| Amount of Change in Unrealized Appreciation (Depreciation) on Derivatives Recognized on the Statements of Operations | ||||
| Derivative contracts | Futures Contracts | |||
Interest rate contracts | $ | (136 | ) | |
|
| |||
| AUGUST 31, 2018 | J.P. MORGAN EXCHANGE-TRADED FUNDS | 81 | ||||||
NOTES TO FINANCIAL STATEMENTS
AS OF AUGUST 31, 2018 (Unaudited) (continued)
Derivatives Volume
The table below discloses the volume of the Funds’ futures contracts and forward foreign currency exchange contracts activity during the six months ended August 31, 2018. Please refer to the tables in the Summary of Derivatives Information for derivative-related gains and losses associated with volume activity.
| Global Bond Opportunities ETF | Ultra-Short Income ETF | |||||||
Futures Contracts: | ||||||||
Average Notional Balance Long | 20,347,242 | $ | — | |||||
Average Notional Balance Short | 98,493,541 | 2,124,688 | (a) | |||||
Ending Notional Balance Long | 15,553,989 | — | ||||||
Ending Notional Balance Short | 100,422,124 | — | ||||||
Forward Foreign Currency Exchange Contracts: | ||||||||
Average Settlement Value Purchased | 27,607,158 | — | ||||||
Average Settlement Value Sold | 75,040,999 | — | ||||||
Ending Settlement Value Purchased | 58,143,557 | — | ||||||
Ending Settlement Value Sold | 111,782,156 | — | ||||||
| (a) | For the period from March 1, 2018 to March 31, 2018. |
The Funds’ derivatives contracts held at August 31, 2018 are not accounted for as hedging instruments under GAAP.
F. Investment Transactions with Affiliates — The Funds invested in Underlying Funds which are advised by the Adviser. An issuer which is under common control with a Fund may be considered an affiliate. For the purposes of the financial statements, the Funds assume the issuers listed in the table below to be affiliated issuers. Underlying Funds’ distributions may be reinvested into the Underlying Funds. Reinvestment amounts are included in the purchase cost amounts in the tables below. Included in the purchases and sales amounts in the tables below are exchanges between certain shares of the Underlying Funds. Such exchanges are not treated as purchases and sales for the purpose of recognizing realized gains (losses) or portfolio turnover.
| Security Description | Value at February 28, 2018 | Purchases at Cost | Proceeds from Sales | Net Realized Gain (Loss) | Change in Unrealized Appreciation/ (Depreciation) | Value at August 31, 2018 | Shares at August 31, 2018 | Dividend Income | Capital Gain Distributions | |||||||||||||||||||||||||||
| Disciplined High Yield ETF |
| |||||||||||||||||||||||||||||||||||
JPMorgan U.S. Government Money Market Fund, Class Institutional Shares, | $ | 2,316,266 | $ | 41,519,045 | $ | 39,736,644 | $ | — | $ | — | $ | 4,098,667 | 4,098,667 | $ | 18,245 | $ | — | |||||||||||||||||||
Global Bond Opportunities ETF |
| |||||||||||||||||||||||||||||||||||
JPMorgan U.S. Government Money Market Fund, Class Institutional Shares, | — | 62,451,972 | 54,109,700 | — | — | 8,342,272 | 8,342,272 | 95,625 | — | |||||||||||||||||||||||||||
Ultra-Short Income ETF |
| |||||||||||||||||||||||||||||||||||
JPMorgan U.S. Government Money Market Fund, Class Institutional Shares, | 18,312,370 | 1,008,257,197 | 959,058,929 | — | — | 67,510,638 | 67,510,638 | 401,362 | — | |||||||||||||||||||||||||||
USD Emerging Markets Sovereign Bond ETF |
| |||||||||||||||||||||||||||||||||||
JPMorgan U.S. Government Money Market Fund, Class Institutional Shares, | 2,764,325 | 4,284,575 | 6,796,407 | — | — | 252,493 | 252,493 | 4,156 | — | |||||||||||||||||||||||||||
| (a) | Investment in affiliate. Fund is registered under the Investment Company Act of 1940, as amended, and advised by J.P. Morgan Investment Management Inc. |
| (b) | The rate shown is the current yield as of August 31, 2018. |
| 82 | J.P. MORGAN EXCHANGE-TRADED FUNDS | AUGUST 31, 2018 | ||||
G. Foreign Currency Translation — The books and records of the Funds are maintained in U.S. dollars. Foreign currency amounts are translated into U.S. dollars at the prevailing exchange rates of such currencies against the U.S. dollar. The market value of investment securities and other assets and liabilities are translated at the exchange rate as of the valuation date. Purchases and sales of investment securities, income and expenses are translated at the exchange rate prevailing on the respective dates of such transactions.
The Funds do not isolate the effect of changes in foreign exchange rates from changes in market prices on securities held. Accordingly, such changes are included within Change in net unrealized appreciation/depreciation on investments on the SOP.
Reported realized foreign currency gains and losses arise from the disposition of foreign currency, currency gains or losses realized between the trade and settlement dates on securities transactions, and the difference between the amounts of dividends, interest and foreign withholding taxes recorded on each Fund’s books on the transaction date and the U.S. dollar equivalent of the amounts actually received or paid. These reported realized foreign currency gains and losses are included in Net realized gain (loss) on foreign currency transactions on the SOP. Unrealized foreign currency gains and losses arise from changes (due to changes in exchange rates) in the value of foreign currency and other assets and liabilities denominated in foreign currencies, which are held at year end and are included in Change in net unrealized appreciation/ depreciation on foreign currency translations on the SOP.
H. Offering and Organizational Costs — Total offering costs incurred in connection with the offering of shares of the Funds are amortized on a straight line basis over 12 months from the date the Funds commenced operations. For the period ended August 31, 2018, total offering costs incurred were:
Global Bond Opportunities ETF (a) | $ | 83,078 | ||
Ultra-Short Income ETF (b) | 27,538 | |||
USD Emerging Markets Sovereign Bond ETF (c) | 40,194 |
| (a) | Commencement of operations was April 5, 2017. |
| (b) | Commencement of operations was May 17, 2017. |
| (c) | Commencement of operations was January 29, 2018. |
Costs paid in connection with the organization of the Funds, if any, were recorded as an expense at the time the Funds commenced operations and are included as part of Professional fees on the SOP. For the six months ended August 31, 2018, total offering costs amortized were:
Global Bond Opportunities ETF | $ | 7,950 | ||
Ultra-Short Income ETF | 5,910 | |||
USD Emerging Markets Sovereign Bond ETF | 22,339 |
I. Security Transactions and Investment Income — Investment transactions are accounted for on the trade date (the date the order to buy or sell is executed). Securities gains and losses are calculated on a specifically identified cost basis. Interest income is determined on the basis of coupon interest accrued using the effective interest method which adjusts for amortization of premiums and accretion of discounts. Dividend income net of foreign taxes withheld, if any, is recorded on the ex-dividend date or when a Fund first learns of the dividend.
J. Allocation of Expenses — Expenses directly attributable to a fund are charged directly to that fund, while the expenses attributable to more than one fund of the Trust are allocated among the respective funds.
K. Federal Income Taxes — Each Fund is treated as a separate taxable entity for Federal income tax purposes. Each Fund’s policy is to comply with the provisions of the Internal Revenue Code (the “Code”), applicable to regulated investment companies and to distribute to shareholders all of its distributable net investment income and net realized capital gains on investments. Accordingly, no provision for Federal income tax is necessary. Management has reviewed the Funds’ tax positions for all open tax years and has determined that as of August 31, 2018, no liability for income tax is required in the Funds’ financial statements for net unrecognized tax benefits. However, management’s conclusions may be subject to future review based on changes in, or the interpretation of, the accounting standards or tax laws and regulations. Each of the Funds’ Federal tax returns for the prior three fiscal years, or since inception if shorter, remains subject to examination by the Internal Revenue Service.
L. Foreign Taxes — The Funds may be subject to foreign taxes on income, gains on investments or currency purchases/repatriation, a portion of which may be recoverable. The Funds will accrue such taxes and recoveries as applicable, based upon their current interpretation of tax rules and regulations that exist in the markets in which they invest.
M. Distributions to Shareholders — Distributions from net investment income, if any, are generally declared and paid monthly. Net realized capital gains, if any, are distributed by each Fund at least annually. The amount of distributions from net investment income and net realized capital gains is determined in accordance with Federal income tax regulations, which may differ from GAAP. To the extent these “book/tax” differences are permanent in nature (i.e., that they result from other than timing of recognition — “temporary differences”), such amounts are reclassified within the capital accounts based on their Federal tax-basis treatment.
| AUGUST 31, 2018 | J.P. MORGAN EXCHANGE-TRADED FUNDS | 83 | ||||||
NOTES TO FINANCIAL STATEMENTS
AS OF AUGUST 31, 2018 (Unaudited) (continued)
3. Fees and Other Transactions with Affiliates
A. Investment Advisory Fee — Pursuant to an Investment Advisory Agreement, the Adviser supervises the investments of each Fund and for such services is paid a fee. The fee is accrued daily and paid monthly based on each Fund’s respective average daily net assets. The annual rate for each Fund is as follows:
Disciplined High Yield ETF | 0.30 | % | ||
Global Bond Opportunities ETF | 0.55 | % | ||
Ultra-Short Income ETF | 0.15 | % | ||
USD Emerging Markets Sovereign Bond ETF | 0.32 | % |
The Adviser waived Investment Advisory fees and/or reimbursed expenses as outlined in Note 3.D.
B. Administration Fee — Pursuant to an Administration Agreement, the Administrator provides certain administration services to the Funds. In consideration of these services, the Administrator receives a fee accrued daily and paid monthly at an annual rate of 0.085% of the average daily net assets of each Fund in the Trust covered by the Administration Agreement (excluding certain funds of funds and money market funds).
The Administrator waived Administration fees as outlined in Note 3.D.
JPMorgan Chase Bank, N.A. (“JPMCB”), a wholly-owned subsidiary of JPMorgan, serves as the Funds’ sub-administrator (the “Sub-administrator”). For its services as Sub-administrator, JPMCB receives a portion of the fees payable to the Administrator.
C. Custodian, Accounting and Transfer Agent Fees — JPMCB provides custody, accounting and transfer agency services to the Funds. The amounts paid directly to JPMCB by the Funds for custody services are included in the Custodian, Accounting and Transfer Agent fees on the SOP. Interest income earned on cash balances at the custodian, if any, is included in Interest income from affiliates on the SOP. With respect to the transfer agency services provided by JPMCB for each creation or redemption transaction, the Authorized Participant will generally be responsible for such associated expenses; during the period, the Funds paid no transfer agency fees to JPMCB.
Additionally, Authorized Participants generally pay transaction fees associated with the creation and redemption of fund shares. These fees are used to offset certain custodian charges incurred by the Fund for these transactions.
For the six months ended August 31, 2018, the amount of transaction fees paid by the Authorized Participants that were used to reimburse custodian fees were as follows:
Disciplined High Yield ETF | $ | 1,400 | ||
Global Bond Opportunities ETF | 4,400 | |||
Ultra-Short Income ETF | 7,150 |
Such amounts are included in expense reimbursements from non-affiliates in the SOP.
Restricted cash on the SAL is cash received from Authorized Participants for the reimbursement of creation and/or redemption of Fund shares.
Interest expense paid to the custodian related to cash overdrafts, if any, is included in Interest expense to affiliates on the SOP.
D. Waivers and Reimbursements — The Adviser has contractually agreed to waive fees and/or reimburse the Funds to the extent that total annual operating expenses, (excluding acquired fund fees and expenses, dividend expenses related to short sales, interest, taxes, expenses related to litigation and potential litigation, and extraordinary expenses), exceed the percentages of the Funds’ respective average daily net assets as shown in the table below:
| Expense Cap | ||||
Disciplined High Yield ETF | 0.40 | % | ||
Global Bond Opportunities ETF | 0.55 | % | ||
Ultra-Short Income ETF | 0.18 | % | ||
USD Emerging Markets Sovereign Bond ETF | 0.39 | % | ||
The expense limitation agreements were in effect for the six months ended August 31, 2018 and are in place until at least June 30, 2021.
For the six months ended August 31, 2018, the Funds’ service providers waived fees and/or reimbursed expenses for each of the Funds as follows. None of these parties expect the Funds to repay any such waived fees and/or reimbursed expenses in future years.
| Contractual Waivers | ||||||||||||||||
| Investment Advisory Fees | Administration Fees | Total | Contractual Reimbursements | |||||||||||||
Disciplined High Yield ETF | $ | 77,138 | $ | 51,425 | $ | 128,563 | $ | — | ||||||||
Global Bond Opportunities ETF | 161,322 | 70,293 | 231,615 | — | ||||||||||||
Ultra-Short Income ETF | 252,139 | 168,093 | 420,232 | — | ||||||||||||
USD Emerging Markets Sovereign Bond ETF | 82,670 | 22,288 | 104,958 | 21,514 | ||||||||||||
| 84 | J.P. MORGAN EXCHANGE-TRADED FUNDS | AUGUST 31, 2018 | ||||
Additionally, the Funds may invest in one or more money market funds advised by the Adviser or its affiliates (affiliated money market funds). The Adviser, Administrator and/or JPMDS, as shareholder servicing agent, have contractually agreed to waive fees and/or reimburse expenses in an amount sufficient to offset the respective net fees each collects from the affiliated money market fund on the applicable Fund’s investment in such affiliated money market fund.
The amounts of these waivers resulting from investments in these money market funds for the six months ended August 31, 2018 were as follows:
Disciplined High Yield ETF | $ | 2,150 | ||
Global Bond Opportunities ETF | 10,718 | |||
Ultra-Short Income ETF | 38,634 | |||
USD Emerging Markets Sovereign Bond ETF | 1,235 |
E. Distribution Services — The Distributor or its agent distributes Creation Units for each Fund on an agency basis. The Distributor does not maintain a secondary market in shares of each Fund. JPMDS receives no fees for their distribution services under their respective distribution agreements with the Trust (the “Distribution Agreements”). Although the Trust does not pay any fees under the Distribution Agreements, JPMIM pays JPMDS for certain distribution related services.
F. Other — Certain officers of the Trust are affiliated with the Adviser, the Administrator and JPMDS. Such officers, with the exception of the Chief Compliance Officer, receive no compensation from the Funds for serving in their respective roles.
The Board appointed a Chief Compliance Officer to the Funds in accordance with Federal securities regulations. Each Fund, along with other affiliated funds, makes reimbursement payments, on a pro-rata basis, to the Administrator for a portion of the fees associated with the Office of the Chief Compliance Officer. Such fees are included in Trustees’ and Chief Compliance Officer’s fees on the SOP.
The Funds may use related party broker-dealers. For the six months ended August 31, 2018, the Funds did not incur any brokerage commissions with broker-dealers affiliated with the Adviser.
The Securities and Exchange Commission (“SEC”) has granted an exemptive order permitting the Funds to engage in principal transactions with J.P. Morgan Securities, Inc., an affiliated broker, involving taxable money market instruments, subject to certain conditions.
4. Investment Transactions
During the six months ended August 31, 2018, purchases and sales of investments (excluding short-term investments) were as follows:
| Purchases (excluding U.S. Government) | Sales (excluding U.S. Government) | Purchases of U.S. Government | Sales of U.S. Government | |||||||||||||
Disciplined High Yield ETF | $ | 58,885,171 | $ | 14,456,942 | $ | — | $ | — | ||||||||
Global Bond Opportunities ETF | 78,566,419 | 58,435,497 | 2,129,830 | — | ||||||||||||
Ultra-Short Income ETF | 1,365,909,363 | 141,075,959 | — | — | ||||||||||||
USD Emerging Markets Sovereign Bond ETF | 8,272,838 | 7,893,048 | — | — | ||||||||||||
For the six months ended August 31, 2018, in-kind transactions associated with creations and redemptions were as follows:
| Fund | In-Kind Purchases | In-Kind Sales | Realized Gain (Loss) | |||||||||
Disciplined High Yield ETF | $ | 3,897,204 | $ | — | $ | — | ||||||
5. Federal Income Tax Matters
For Federal income tax purposes, the estimated cost and unrealized appreciation (depreciation) in value of investments held at August 31, 2018 were as follows:
| Aggregate Cost | Gross Unrealized Appreciation | Gross Unrealized Depreciation | Net Unrealized Appreciation (Depreciation) | |||||||||||||
Disciplined High Yield ETF | $ | 155,246,851 | $ | 562,315 | $ | (2,966,055 | ) | $ | (2,403,740 | ) | ||||||
Global Bond Opportunities ETF | 176,328,257 | 2,813,227 | (6,242,159 | ) | (3,428,932 | ) | ||||||||||
Ultra-Short Income ETF | 2,246,418,174 | 1,109,031 | (761,053 | ) | 347,978 | |||||||||||
USD Emerging Markets Sovereign Bond ETF | 54,168,159 | 10,477 | (4,413,413 | ) | (4,402,936 | ) | ||||||||||
As of February 28, 2018, the Funds had net capital loss carryforwards with no expiration dates, as follows:
| Capital Loss Carryforward Character | ||||||||
| Short-Term | Long-Term | |||||||
Disciplined High Yield ETF | $ | (24,473 | ) | $ | (22,246 | ) | ||
Global Bond Opportunities ETF | — | — | ||||||
Ultra-Short Income ETF | — | — | ||||||
USD Emerging Markets Sovereign Bond ETF | (8,120 | ) | — | |||||
| AUGUST 31, 2018 | J.P. MORGAN EXCHANGE-TRADED FUNDS | 85 | ||||||
NOTES TO FINANCIAL STATEMENTS
AS OF AUGUST 31, 2018 (Unaudited) (continued)
6. Capital Share Transactions
The Trust issues and redeems shares of the Funds only in Creation Units through the Distributor at NAV. Capital shares transactions detail can be found in the Statements of Changes in Net Assets.
Shares of the Funds may only be purchased or redeemed by Authorized Participants. Such Authorized Participants may from time to time hold, of record or beneficially, a substantial percentage of the Funds’ shares outstanding, act as executing or clearing broker for investment transactions on behalf of the Funds. An Authorized Participant is either (1) a “Participating Party” or other participant in the clearing process through the Continuous Net Settlement System of the National Securities Clearing Corporation (“NSCC”); or (2) a DTC Participant; which, in either case, must have executed an agreement with the Distributor.
Creation Units of a Fund may be created in advance of receipt by the Trust of all or a portion of the applicable basket of equity securities and other instruments (“Deposit Instruments”) and cash as described in the Funds’ registration statement. In these instances, the initial Deposit Instruments and cash must be deposited in an amount equal to the sum of the cash amount, plus at least 105% of the market value of undelivered Deposit Instruments. A transaction fee may be imposed to offset transfer and other transaction costs associated with the purchase or redemption of Creation Units.
Authorized Participants transacting in Creation Units for cash may also pay a variable charge to compensate the relevant fund for market impact expenses relating to investing in portfolio securities. Such variable charges, if any, are included in “Proceeds from shares purchased” or “Proceeds from shares issued” in the Statements of Changes in Net Assets.
7. Risks, Concentrations and Indemnifications
In the normal course of business, the Funds enter into contracts that contain a variety of representations which provide general indemnifications. Each Fund’s maximum exposure under these arrangements is unknown. The amount of exposure would depend on future claims that may be brought against each Fund. However, based on experience, the Funds expect the risk of loss to be remote.
As of August 31, 2018, the Adviser owns shares representing more than 10% of net assets of following Funds:
| % of Ownership | ||||
Disciplined High Yield ETF | 14 | % | ||
Global Bond Opportunities ETF | 56 | % | ||
USD Emerging Markets Sovereign Bond ETF | 91 | % | ||
Significant shareholder transactions by the Adviser may impact the Funds’ performance.
The Global Bond Opportunities ETF and Ultra-Short Income ETF are subject to risks associated with securities with contractual cash flows including asset backed and mortgage-related securities such as collateralized mortgage obligations, mortgage-pass-through securities and commercial mortgage-backed securities, including securities backed by sub-prime mortgage loans. The value, liquidity and related income of these securities are sensitive to changes in economic conditions, including real estate value, pre-payments, delinquencies and/or defaults, and may be adversely affected by shifts in the market’s perception of the issuers and changes in interest rates.
The Disciplined High Yield ETF invests in high yield securities that are not rated or rated below investment grade (commonly known as “junk bonds.”) These securities are considered to be high risk investments. Investments in lower-rated securities or unrated securities of comparable quality tend to be more sensitive to economic conditions than higher rated securities. Junk bonds involve a greater risk of default by the issuer because such securities are generally unsecured and are often subordinated to other creditors’ claims. The market price of these securities can change suddenly and unexpectedly. As a result, the Fund is intended for investors who are able and willing to assume a high degree of risk.
Global Bond Opportunities ETF’s and USD Emerging Markets Sovereign Bond ETF’s investments in sovereign and corporate debt obligations within emerging market countries may be subject to potentially higher risks than investments in more developed markets and the prices of such investments may be volatile. The yields of emerging market debt obligations reflect, among other things, perceived credit risk. The consequences of political, social or economic instability in these markets may have disruptive effects on the market prices of the Funds’ investments and the income they generate, as well as the Funds’ ability to repatriate such amounts.
Derivatives may be riskier than other types of investments because they may be more sensitive to changes in economic and market conditions and could result in losses that significantly exceed the Funds’ original investment. Many derivatives create leverage thereby causing the Funds to be more volatile than they would have been if they had not used derivatives. Derivatives also expose the Funds to counterparty risk (the risk that the derivative counterparty will not fulfill its contractual obligations), including credit risk of the derivative counterparty.
The Global Bond Opportunities ETF and Ultra-Short Income ETF are also subject to counterparty credit risk, which is the risk that a counterparty fails to perform on agreements with the Fund such as forward foreign currency exchange contracts, and TBA securities.
The Funds are subject to interest rate and credit risk. The value of debt securities may decline as interest rates increase. The Funds could lose money if the issuer of a fixed income security is unable to pay interest or repay principal when it is due. The Funds invest in floating rate loans and other floating rate debt securities. Although these investments are generally less sensitive to interest rate changes than other fixed rate instruments, the value of floating rate loans and other floating rate investments may decline if their interest rates do not rise as quickly, or as much, as
| 86 | J.P. MORGAN EXCHANGE-TRADED FUNDS | AUGUST 31, 2018 | ||||
general interest rates. Many factors can cause interest rates to rise. Some examples include central bank monetary policy, rising inflation rates and general economic conditions. Given that the Federal Reserve has been raising interest rates and may continue to do so, the Funds may face a heightened level of interest rate risk. The ability of the issuers of debt to meet their obligations may be affected by the economic and political developments in a specific industry or region.
The Funds may have elements of risk not typically associated with investments in the United States of America due to concentrated investments in a limited number of countries or regions, which may vary throughout the period depending on the Funds. Such concentrations may subject each Fund to additional risks resulting from political or economic conditions in such countries or regions and the possible imposition of adverse governmental laws or currency exchange restrictions could cause the securities and their markets to be less liquid and their prices to be more volatile than those of comparable U.S. securities.
Disruptions to creations and redemptions, the existence of significant market volatility or potential lack of an active trading market for the Shares (including through a trading halt), as well as other factors, may result in Shares trading significantly above (at a premium) or below (at a discount) to the NAV or to the intraday value of the Fund’s holdings. During such periods, investors may incur significant losses if shares are sold.
USD Emerging Markets Sovereign Bond ETF may not track the return of the underlying index for a number of reasons and therefore may not achieve its investment objective. For example, the Fund incurs a number of operating expenses not applicable to its underlying index, and incurs costs in buying and selling securities, especially when rebalancing the Fund’s securities holdings to reflect changes in the composition of the underlying index. In addition, a Fund’s return may differ from the return of its underlying index as a result of, among other things, pricing differences and the inability to purchase certain securities included in the underlying index due to regulatory or other restrictions. To the extent of the previously outlined items, the Fund’s return differs from the return of the underlying index.
8. New Accounting Pronouncements
In March 2017, the FASB issued ASU 2017-08 (“ASU 2017-08”) Premium Amortization on Purchased Callable Debt Securities, which shortens the premium amortization period for purchased non-contingently callable debt securities. ASU 2017-08 requires that the premium be amortized to the earliest call date, for purchased non-contingently callable debt securities. ASU 2017-08 is effective for the fiscal years, and interim periods within those fiscal years, beginning after December 15, 2018. Management is currently evaluating the implications of these changes on the financial statements, if any.
In August 2018, the Financial Accounting Standard Board (“FASB”) issued Accounting Standard Update (“ASU”) 2018-13 (“ASU 2018-13”), Fair Value Measurement (Topic 820): Disclosure Framework — Changes to the Disclosure Requirements for Fair Value Measurement, which adds, removes, and modifies certain aspects of the fair value disclosure. ASU 2018-13 amendments are the result of a broader disclosure project, FASB Concepts Statement Conceptual Framework for Financial Reporting — Chapter 8: Notes to Financial Statements, to improve the effectiveness of the fair value disclosure requirements. ASU 2018-13 is effective for the fiscal years, and interim periods within those fiscal years, beginning after December 15, 2019; early adoption is permitted. Management is currently evaluating the implications of these changes.
9. Subsequent Event
Effective October 5, 2018, the Funds, except Global Bond Opportunities ETF, may engage in securities lending to broker dealers or other financial institutions approved by the Funds. Citibank N. A. serves as lending agent for the Funds.
| AUGUST 31, 2018 | J.P. MORGAN EXCHANGE-TRADED FUNDS | 87 | ||||||
SCHEDULE OF SHAREHOLDER EXPENSES
(Unaudited)
Hypothetical $1,000 Investment
As a shareholder of the Funds, you incur ongoing costs, investment advisory fees, administration fees and other Fund expenses, in addition to brokerage commissions on your purchases and sales of Fund shares. The examples below are intended to help you understand your ongoing costs (in dollars) of investing in the Fund and to compare these ongoing costs with the ongoing costs of investing in other funds. The examples assume that you had a $1,000 investment at the beginning of the reporting period, March 1, 2018 and continued to hold your shares at the end of the reporting period, August 31, 2018.
Actual Expenses
For the Fund in the table below, the first line provides information about actual account values and actual expenses. You may use the information in this line, together with the amount you invested, to estimate the expenses that you paid over the period. Simply divide your account value by $1,000 (for example, an $8,600 account value divided by $1,000 = 8.6), then multiply the result by the number under the heading
entitled “Expenses Paid During the Period” to estimate the expenses you paid on your account during this period.
Hypothetical Example for Comparison Purposes
The second line in the table below provides information about hypothetical account values and hypothetical expenses based on the Fund’s actual expense ratio and an assumed rate of return of 5% per year before expenses, which is not the Fund’s actual return. The hypothetical account values and expenses may not be used to estimate the actual ending account balance or expenses you paid for the period. You may use this information to compare the ongoing costs of investing in the Fund and other Funds. To do so, compare this 5% hypothetical example with the 5% hypothetical examples that appear in the shareholder reports of other funds. The examples also assume all dividends and distributions have been reinvested. The examples do not take into account brokerage commissions that you pay when purchasing or selling shares of a Fund.
Beginning Account Value March 1, 2018 | Ending Account Value August 31, 2018 | Annualized Expense Ratio | Expenses Paid During | |||||||||||||
Disciplined High Yield ETF |
| |||||||||||||||
Actual (1) | $ | 1,000.00 | $ | 1,018.60 | 0.40 | % | $ | 2.04 | ||||||||
Hypothetical (1) | 1,000.00 | 1,023.19 | 0.40 | % | $ | 2.04 | ||||||||||
Global Bond Opportunities ETF |
| |||||||||||||||
Actual (1) | $ | 1,000.00 | $ | 994.90 | 0.54 | % | $ | 2.72 | ||||||||
Hypothetical (1) | 1,000.00 | 1,022.48 | 0.54 | % | 2.75 | |||||||||||
Ultra-Short Income ETF |
| |||||||||||||||
Actual (1) | $ | 1,000.00 | $ | 1,012.90 | 0.17 | % | $ | 0.86 | ||||||||
Hypothetical (1) | 1,000.00 | 1,024.35 | 0.17 | % | 0.87 | |||||||||||
USD Emerging Markets Sovereign Bond ETF |
| |||||||||||||||
Actual (1) | $ | 1,000.00 | $ | 961.10 | 0.35 | % | $ | 1.73 | ||||||||
Hypothetical (1) | 1,000.00 | 1,023.44 | 0.35 | % | 1.79 | |||||||||||
| (1) | Expenses are equal to each Fund’s annualized net expense ratio, multiplied by the average account value over the period, multiplied by 184/365 (to reflect the one-half year period). |
| 88 | J.P. MORGAN EXCHANGE-TRADED FUNDS | AUGUST 31, 2018 | ||||
J.P. Morgan Exchange-Traded Funds are distributed by JPMorgan Distribution Services, Inc, an indirect, wholly-owned subsidiary of JPMorgan Chase & Co.
Contact J.P. Morgan Exchange-Traded Funds at 1-844-457-6383 (844-4JPM ETF) for a fund prospectus. You can also visit us at www.jpmorganfunds.com. Investors should carefully consider the investment objectives and risks as well as charges and expenses of the fund before investing. The prospectus contains this and other information about the fund. Read the prospectus carefully before investing.
Investors may obtain information about the Securities Investor Protection Corporation (SIPC), including the SIPC brochure, by visiting www.sipc.org or by calling SIPC at 202-371-8300.
The Fund files a complete schedule of its fund holdings for the first and third quarters of its fiscal year with the SEC on Form N-Q. The Fund’s Forms N-Q is available on the SEC’s website at http://www.sec.gov and may be reviewed and copied at the SEC’s Public Reference Room in Washington, DC. Information on the operation of the SEC’s Public Reference Room may be obtained by calling 1-800-SEC-0330. Shareholders may request the Form N-Q without charge by calling 1-844-457-6383 or by visiting the J.P. Morgan Funds’ website at www.jpmorganfunds.com.
A description of each Fund’s policies and procedures with respect to the disclosure of each Fund’s holdings is available in the prospectus and Statement of Additional Information.
A copy of proxy policies and procedures is available without charge upon request by calling 1-844-457-6383 and on the Fund’s website at www.jpmorganfunds.com. A description of such policies and procedures is on the SEC’s website at www.sec.gov. The Trustees have delegated the authority to vote proxies for securities owned by the Fund to the Adviser. A copy of the Fund’s voting record for the most recent 12-month period ended June 30 is available on the SEC’s website at www.sec.gov or at the Fund’s website at www.jpmorganfunds.com no later than August 31 of each year. The Fund’s proxy voting record will include, among other things, a brief description of the matter voted on for each fund security, and will state how each vote was cast, for example, for or against the proposal.


J.P. Morgan Asset Management is the marketing name for the asset management business of JPMorgan Chase & Co. Those businesses include, but are not limited to, J.P. Morgan Investment Management Inc., Security Capital Research & Management Incorporated and J.P. Morgan Alternative Asset Management, Inc.
| © JPMorgan Chase & Co., 2018. All rights reserved. August 2018. | SAN-ETF-818 |
Semi-Annual Report
J.P. Morgan Exchange-Traded Funds
August 31, 2018 (Unaudited)
JPMorgan BetaBuilders MSCI US REIT ETF

Investments in a Fund are not bank deposits or obligations of, or guaranteed or endorsed by, any bank and are not insured or guaranteed by the FDIC, the Federal Reserve Board or any other government agency. You could lose money if you sell when the Fund’s share price is lower than when you invested.
Past performance is no guarantee of future performance. The general market views expressed in this report are opinions based on market and other conditions through the end of the reporting period and are subject to change without notice. These views are not intended to predict the future performance of a Fund or the securities markets. References to specific securities and their issuers are for illustrative purposes only and are not intended to be, and should not be interpreted as, recommendations to purchase or sell such securities. Such views are not meant as investment advice and may not be relied on as an indication of trading intent on behalf of any Fund.
Prospective investors should refer to the Fund’s prospectuses for a discussion of the Fund’s investment objectives, strategies and risks. Call J.P. Morgan Exchange-Traded Funds at (844) 457-6383 for a prospectus containing more complete information about a Fund, including management fees and other expenses. Please read it carefully before investing.
Shares are bought and sold throughout the day on an exchange at market price (not at net asset value) through a brokerage account, and are not individually subscribed and redeemed from a Fund. Shares may only be subscribed and redeemed directly from a Fund by Authorized Participants, in very large creation/redemption units. Brokerage commissions will reduce returns.
OCTOBER 9, 2018 (Unaudited)
Dear Shareholder,
This year continues to be a superlative one for JPMorgan’s Exchange-Traded Funds. We’ve expanded our product lineup to 27 ETFs that provide investors with access to a broad range of asset classes and investment factors. By the mid-point of this year, our assets under management exceeded $5 billion and quickly reached more than $11 billion by the end of August 2018.
 |
“With equity market volatility and U.S. interest rates apparently on the rise, we still believe Real Estate Investment Trusts offer an attractive alternative for clients looking to generate income, grow principal and diversify beyond traditional asset classes.” |
Also this year, we launched our BetaBuilders® suite of ETFs, which offers investors broad, market-capitalization weighted exposure to leading regional or asset class indexes. Other notable achievements over the past six months include JPMorgan Ultra-Short Income ETF (JPST) surpassing $2 billion in AUM shortly after its one-year anniversary and JPMorgan Global Bond Opportunities ETF (JPGB) earning Best New International/Global Fixed-Income ETF at the fifth annual ETF.com Awards in March.1
Meanwhile, financial market performance was mixed during the six months ended August 31, 2018. Equities in the U.S. largely outperformed other developed markets and the S&P 500 Index reached record highs in late August amid record corporate earnings and revenues and strong consumer spending. Returns
for real estate sector equities were positive but lackluster compared with the broader market, as investor expectations for rising interest rates weighed on the real estate market.
With equity market volatility and U.S. interest rates apparently on the rise, we still believe Real Estate Investment Trusts offer an attractive alternative for clients looking to generate income, grow principal and diversify beyond traditional asset classes. Our newly launched JPMorgan BetaBuilders MSCI US REIT ETF (BBRE) seeks to capture those opportunities by closely mirroring the pure REIT exposure found in its index. We believe our BetaBuilders® U.S. REIT ETF, along with the rest of our BetaBuilders® solutions, can help you navigate dynamic global markets
We are proud to bring J.P. Morgan’s experience and capabilities to the ETF market place. We are committed to building solutions that address your needs and help you build stronger portfolios. Thank you for your belief in our Firm and our process.
Sincerely,

Joanna M. Gallegos
President, J.P. Morgan Exchange-Traded Funds
J.P Morgan Asset Management
1-844-4JPM-ETF or jpmorgan.com/etfs for more information
| 1 | ETF.com Award winners are selected by a majority vote of the ETF.com Awards Selection Committee, a group of independent ETF experts. Voting was completed by Jan. 20, 2018, and results were announced at the ETF.com U.S. Awards Dinner on March 22, 2018. |
| AUGUST 31, 2018 | J.P. MORGAN EXCHANGE-TRADED FUNDS | 1 | ||||||
JPMorgan BetaBuilders MSCI US REIT ETF
Period June 15, 2018 (Fund Inception Date) Through August 31, 2018 (Unaudited)
| Reporting Period Return: | ||||
| JPMorgan BetaBuilders MSCI US REIT ETF | ||||
| Net Asset Value* | 7.15% | |||
| Market Price** | 0.81% | |||
| MSCI US REIT Index | 7.18% | |||
| Net Assets as of 8/31/2018 | $ | 54,645,940 | ||
INVESTMENT OBJECTIVE***
The JPMorgan BetaBuilders MSCI US REIT ETF (the “Fund”) seeks investment results that closely correspond, before fees and expenses, to the performance of the MSCI US REIT Index (the “Underlying Index”).
INVESTMENT APPROACH
The Underlying Index is a free-float adjusted market-cap weighted index made up of the stocks of publicly traded equity real estate investment trusts (REITs). Using a “passive” investment approach, the Fund attempts to replicate the Underlying Index as closely as possible and invests at least 80% of its assets in securities included in the Underlying Index.
HOW DID THE MARKET PERFORM?
U.S. equities largely outperformed other asset classes during the reporting period amid positive economic data, record high corporate earnings and continued low interest rates.
The S&P 500 Index reached new intraday and closing highs in late August. Overall, returns for real estate sector equities were
positive but lackluster compared with the broader market for U.S. equities, as investor expectations for rising interest rates weighed on the real estate market.
HOW DID THE FUND PERFORM?
For the period from Fund inception on June 15, 2018 to August 31, 2018, the Fund performed in line with the Underlying Index, before considering the effects of operating expenses, fees and tax management of the Fund’s portfolio.
The Fund’s and the Underlying Index’s exposures to the retail and health care sectors were leading contributors to absolute performance. The Fund’s and the Underlying Index’s exposures to the hotel and resorts sector and the industrial sector made the smallest contributions to absolute performance.
HOW WAS THE FUND POSITIONED?
During the reporting period, the Fund’s and the Underlying Index’s largest allocations were in the apartments and industrial sectors and their smallest allocations were in the shopping centers and hotels sectors.
| 2 | J.P. MORGAN EXCHANGE-TRADED FUNDS | AUGUST 31, 2018 | ||||
| TOP TEN EQUITY HOLDINGS OF THE PORTFOLIO**** | ||||||||
| 1. | Simon Property Group, Inc. | 6.3 | % | |||||
| 2. | Prologis, Inc. | 4.7 | ||||||
| 3. | Equinix, Inc. | 3.9 | ||||||
| 4. | Public Storage | 3.7 | ||||||
| 5. | Digital Realty Trust, Inc. | 2.9 | ||||||
| 6. | AvalonBay Communities, Inc. | 2.8 | ||||||
| 7. | Equity Residential | 2.8 | ||||||
| 8. | Welltower, Inc. | 2.8 | ||||||
| 9. | Ventas, Inc. | 2.4 | ||||||
| 10. | Boston Properties, Inc. | 2.3 | ||||||
PORTFOLIO COMPOSITION BY INDUSTRY**** | ||||
| Apartments | 20.5 | % | ||
| Industrial | 15.0 | |||
| Office | 13.4 | |||
| Health Care | 11.3 | |||
| Regional Malls | 9.5 | |||
| Diversified | 8.2 | |||
| Storage | 8.2 | |||
| Hotels | 7.0 | |||
| Shopping Centers | 6.3 | |||
| Short-Term Investments | 0.4 | |||
| Investments of cash collateral from securities loaned | 0.2 | |||
| * | The return shown is based on net asset value calculated for shareholder transactions and may differ from the return shown in the financial highlights, which reflects adjustments made to the net asset value in accordance with accounting principles generally accepted in the United States of America. The net asset value was $80.96 as of August 31, 2018. |
| ** | Market price return is calculated assuming an initial investment made at the inception date net asset value, reinvestment of all dividends and distributions at market price during the period, and sale at the market price on the last day of the period. The price used to calculate the market price return is the midpoint of the bid/ask spread at the close of business on the Cboe BZX Exchange, Inc. The midpoint price was $76.28 as of August 31, 2018. |
| *** | The adviser seeks to achieve the Fund’s objective. There can be no guarantee it will be achieved. |
| **** | Percentages indicated are based on total investments as of August 31, 2018. The Fund’s composition is subject to change. |
| AUGUST 31, 2018 | J.P. MORGAN EXCHANGE-TRADED FUNDS | 3 | ||||||
JPMorgan BetaBuilders MSCI US REIT ETF
FUND COMMENTARY
Period June 15, 2018 (Fund Inception Date) Through August 31, 2018 (Unaudited) (continued)
TOTAL RETURNS AS OF AUGUST 31, 2018 (Unaudited) | ||||||||
| INCEPTION DATE | CUMULATIVE SINCE INCEPTION | |||||||
JPMorgan BetaBuilders MSCI US REIT ETF | ||||||||
Net Asset Value | June 15, 2018 | 7.15% | ||||||
Market Price | 0.81% | |||||||
LIFE OF FUND PERFORMANCE (6/15/18 TO 08/31/18)
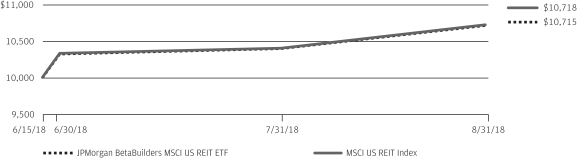
The performance quoted is past performance and is not a guarantee of future results. Exchange-traded funds are subject to certain market risks. Investment returns and principal value of an investment will fluctuate so that an investor’s shares, when sold or redeemed, may be worth more or less than their original cost. Current performance may be higher or lower than the performance data shown. For up-to-date, month-end performance information please call 1-844-457-6383.
Fund commenced operations on June 15, 2018.
The graph illustrates comparative performance for $10,000 invested in shares of the JPMorgan BetaBuilders MSCI US REIT ETF and the MSCI US REIT Index from June 15, 2018 to August 31, 2018. The performance of the Fund reflects the deduction of Fund expenses and assumes reinvestment of all dividends and capital gain distributions, if any. The performance of the MSCI US REIT Index does not reflect the deduction of expenses associated with an exchange-traded fund and has been adjusted to reflect reinvestment of all dividends and capital gain distributions of the securities included in the Index, if applicable. The Underlying Index is a free-float adjusted market-cap weighted index designed to measure the performance of US equity real estate investment trust (REIT) securities. The Underlying Index is made up of the stocks of publicly traded US equity REITs, as determined by MSCI Inc., the index provider. To be included
initially in the Underlying Index, an equity REIT must meet certain criteria established by the index provider, including meeting a minimum market capitalization threshold as well as a liquidity threshold based on a number of factors, including trading volume and frequency of trading. Equity REITs in the Underlying Index tend to be small- and mid-cap stocks, and may include Health Care REITs, Hotel & Resort REITs, Industrial REITs, Office REITs, Residential REITs, Retail REITs, Diversified REITs and certain Specialized REITs. Specialized REITs that may be included in the Underlying Index own and/or operate (i) storage and self-storage facilities, (ii) data centers, (iii) correctional facilities, (iv) theaters, (v) casinos and gaming facilities or (vi) restaurants.
Fund performance reflects the waiver of the Fund’s fees and reimbursement of expenses for certain periods since the inception date. Without these waivers and reimbursements, performance would have been lower. Also, performance shown in this section does not reflect the deduction of taxes that a shareholder may pay on Fund distributions or redemption or sale of Fund shares.
The returns shown are based on net asset values calculated for shareholder transactions and may differ from the returns shown in the financial highlights, which reflect adjustments made to the net asset values in accordance with accounting principles generally accepted in the United States of America.
| 4 | J.P. MORGAN EXCHANGE-TRADED FUNDS | AUGUST 31, 2018 | ||||
JPMorgan BetaBuilders MSCI US REIT ETF
SCHEDULE OF PORTFOLIO INVESTMENTS
AS OF AUGUST 31, 2018 (Unaudited)
| Investments | Shares | Value ($) | ||||||
COMMON STOCKS — 99.8% |
| |||||||
Apartments — 20.5% |
| |||||||
Agree Realty Corp., REIT | 1,906 | 108,775 | ||||||
American Campus Communities, Inc., REIT | 8,393 | 351,918 | ||||||
American Homes 4 Rent, Class A, REIT | 16,315 | 378,508 | ||||||
Apartment Investment & Management Co., Class A, REIT | 9,662 | 423,196 | ||||||
AvalonBay Communities, Inc., REIT | 8,487 | 1,555,582 | ||||||
Camden Property Trust, REIT | 5,697 | 541,557 | ||||||
Education Realty Trust, Inc., REIT | 4,655 | 192,624 | ||||||
Equity LifeStyle Properties, Inc., REIT | 5,177 | 501,548 | ||||||
Equity Residential, REIT | 22,610 | 1,531,827 | ||||||
Essex Property Trust, Inc., REIT | 4,056 | 998,912 | ||||||
Front Yard Residential Corp., REIT | 3,120 | 38,126 | ||||||
Getty Realty Corp., REIT | 2,077 | 60,461 | ||||||
Independence Realty Trust, Inc., REIT | 5,341 | 55,173 | ||||||
Invitation Homes, Inc., REIT | 19,173 | 448,073 | ||||||
Mid-America Apartment Communities, Inc., REIT | 6,987 | 723,574 | ||||||
National Retail Properties, Inc., REIT | 9,447 | 435,412 | ||||||
NexPoint Residential Trust, Inc., REIT | 1,084 | 35,013 | ||||||
Preferred Apartment Communities, Inc., Class A, REIT | 2,408 | 42,911 | ||||||
Realty Income Corp., REIT | 17,463 | 1,022,808 | ||||||
Select Income, REIT | 4,121 | 84,687 | ||||||
Spirit Realty Capital, Inc., REIT | 26,315 | 220,257 | ||||||
STORE Capital Corp., REIT | 10,945 | 315,325 | ||||||
Sun Communities, Inc., REIT | 4,918 | 507,439 | ||||||
UDR, Inc., REIT | 16,432 | 656,787 | ||||||
|
| |||||||
| 11,230,493 | ||||||||
|
| |||||||
Diversified — 8.3% |
| |||||||
Alexander & Baldwin, Inc., REIT | 4,197 | 98,504 | ||||||
American Assets Trust, Inc., REIT | 2,029 | 80,146 | ||||||
Armada Hoffler Properties, Inc., REIT | 2,778 | 43,309 | ||||||
Brookfield Property Partners LP | 187 | 3,736 | ||||||
Colony Capital, Inc., REIT | 28,941 | 177,408 | ||||||
CoreCivic, Inc., REIT | 7,279 | 188,453 | ||||||
CorePoint Lodging, Inc., REIT | 2,524 | 52,625 | ||||||
Cousins Properties, Inc., REIT | 25,805 | 241,277 | ||||||
Duke Realty Corp., REIT | 21,923 | 624,586 | ||||||
EPR Properties, REIT | 4,564 | 320,302 | ||||||
Forest City Realty Trust, Inc., Class A, REIT | 13,946 | 350,742 | ||||||
Four Corners Property Trust, Inc., REIT | 3,770 | 101,564 | ||||||
Gaming and Leisure Properties, Inc., REIT | 12,455 | 445,765 | ||||||
GEO Group, Inc. (The), REIT | 7,554 | 191,645 | ||||||
Gladstone Commercial Corp., REIT | 1,745 | 34,743 | ||||||
Global Net Lease, Inc., REIT | 4,135 | 89,688 | ||||||
Investors Real Estate Trust, REIT | 7,373 | 40,183 | ||||||
iStar, Inc., REIT | 4,169 | 46,651 | ||||||
Lexington Realty Trust, REIT | 13,263 | 123,876 | ||||||
NorthStar Realty Europe Corp., REIT | 2,884 | 39,569 | ||||||
One Liberty Properties, Inc., REIT | 881 | 25,364 | ||||||
PS Business Parks, Inc., REIT | 1,258 | 164,081 | ||||||
Spirit MTA, REIT* | 2,756 | 29,544 | ||||||
UMH Properties, Inc., REIT | 2,018 | 32,207 | ||||||
VICI Properties, Inc., REIT‡ | 17,046 | 356,432 | ||||||
| Investments | Shares | Value ($) | ||||||
Diversified — continued |
| |||||||
Washington, REIT | 4,829 | 152,403 | ||||||
Whitestone, REIT | 2,199 | 29,994 | ||||||
WP Carey, Inc., REIT | 6,582 | 438,230 | ||||||
|
| |||||||
| 4,523,027 | ||||||||
|
| |||||||
Health Care — 11.4% |
| |||||||
CareTrust REIT, Inc., REIT | 4,675 | 86,254 | ||||||
Community Healthcare Trust, Inc., REIT | 1,116 | 34,630 | ||||||
HCP, Inc., REIT | 28,848 | 779,761 | ||||||
Healthcare Realty Trust, Inc., REIT | 7,688 | 238,020 | ||||||
Healthcare Trust of America, Inc., Class A, REIT | 12,599 | 359,953 | ||||||
LTC Properties, Inc., REIT | 2,433 | 113,013 | ||||||
Medical Properties Trust, Inc., REIT | 22,397 | 337,075 | ||||||
National Health Investors, Inc., REIT | 2,550 | 202,088 | ||||||
New Senior Investment Group, Inc., REIT | 5,044 | 31,979 | ||||||
Omega Healthcare Investors, Inc., REIT | 12,195 | 403,045 | ||||||
Physicians Realty Trust, REIT | 11,176 | 195,468 | ||||||
Sabra Health Care REIT, Inc., REIT | 10,947 | 258,130 | ||||||
Senior Housing Properties Trust, REIT | 14,592 | 278,853 | ||||||
Universal Health Realty Income Trust, REIT | 801 | 61,076 | ||||||
Ventas, Inc., REIT | 21,879 | 1,309,896 | ||||||
Welltower, Inc., REIT | 22,841 | 1,523,723 | ||||||
|
| |||||||
| 6,212,964 | ||||||||
|
| |||||||
Hotels — 7.1% |
| |||||||
Apple Hospitality REIT, Inc., REIT | 13,437 | 237,163 | ||||||
Ashford Hospitality Trust, Inc., REIT | 5,754 | 37,343 | ||||||
Braemar Hotels & Resorts, Inc., REIT | 1,796 | 20,744 | ||||||
Chatham Lodging Trust, REIT | 2,817 | 60,425 | ||||||
Chesapeake Lodging Trust, REIT | 3,708 | 122,030 | ||||||
DiamondRock Hospitality Co., REIT | 12,316 | 147,299 | ||||||
Hersha Hospitality Trust, REIT | 2,294 | 54,138 | ||||||
Hospitality Properties Trust, REIT | 10,092 | 292,567 | ||||||
Host Hotels & Resorts, Inc., REIT | 45,522 | 980,089 | ||||||
LaSalle Hotel Properties, REIT | 6,778 | 237,976 | ||||||
MGM Growth Properties LLC, Class A, REIT | 4,354 | 133,798 | ||||||
Park Hotels & Resorts, Inc., REIT | 12,350 | 413,108 | ||||||
Pebblebrook Hotel Trust, REIT | 4,239 | 163,668 | ||||||
RLJ Lodging Trust, REIT | 10,758 | 235,708 | ||||||
Ryman Hospitality Properties, Inc., REIT | 2,834 | 251,461 | ||||||
Summit Hotel Properties, Inc., REIT | 6,429 | 88,270 | ||||||
Sunstone Hotel Investors, Inc., REIT | 13,854 | 232,470 | ||||||
Xenia Hotels & Resorts, Inc., REIT | 6,560 | 159,146 | ||||||
|
| |||||||
| 3,867,403 | ||||||||
|
| |||||||
Industrial — 15.0% |
| |||||||
CoreSite Realty Corp., REIT | 2,116 | 246,450 | ||||||
CyrusOne, Inc., REIT | 6,086 | 407,519 | ||||||
Digital Realty Trust, Inc., REIT | 12,646 | 1,571,645 | ||||||
EastGroup Properties, Inc., REIT | 2,146 | 208,741 | ||||||
Equinix, Inc., REIT | 4,879 | 2,127,878 | ||||||
First Industrial Realty Trust, Inc., REIT | 7,698 | 249,877 | ||||||
Industrial Logistics Properties Trust, REIT | 1,397 | 33,626 | ||||||
Liberty Property Trust, REIT | 9,075 | 397,031 | ||||||
SEE NOTES TO FINANCIAL STATEMENTS.
| AUGUST 31, 2018 | J.P. MORGAN EXCHANGE-TRADED FUNDS | 5 | ||||||
JPMorgan BetaBuilders MSCI US REIT ETF
SCHEDULE OF PORTFOLIO INVESTMENTS
AS OF AUGUST 31, 2018 (Unaudited) (continued)
| Investments | Shares | Value ($) | ||||||
COMMON STOCKS — continued |
| |||||||
Industrial — continued |
| |||||||
Monmouth Real Estate Investment Corp., REIT | 4,620 | 80,342 | ||||||
Prologis, Inc., REIT | 38,612 | 2,593,954 | ||||||
STAG Industrial, Inc., REIT | 5,971 | 172,383 | ||||||
Terreno Realty Corp., REIT | 3,438 | 132,054 | ||||||
|
| |||||||
| 8,221,500 | ||||||||
|
| |||||||
Office — 13.5% |
| |||||||
Alexandria Real Estate Equities, Inc., REIT | 6,324 | 811,685 | ||||||
Boston Properties, Inc., REIT | 9,479 | 1,236,536 | ||||||
Brandywine Realty Trust, REIT | 10,963 | 183,740 | ||||||
Columbia Property Trust, Inc., REIT | 7,283 | 175,375 | ||||||
Corporate Office Properties Trust, REIT | 6,272 | 193,052 | ||||||
Douglas Emmett, Inc., REIT | 9,912 | 387,163 | ||||||
Easterly Government Properties, Inc., REIT | 3,542 | 71,725 | ||||||
Empire State Realty Trust, Inc., Class A, REIT | 8,584 | 150,993 | ||||||
Equity Commonwealth, REIT* | 7,458 | 239,103 | ||||||
Franklin Street Properties Corp., REIT | 6,585 | 56,433 | ||||||
Government Properties Income Trust, REIT | 6,088 | 102,948 | ||||||
Highwoods Properties, Inc., REIT | 6,351 | 315,899 | ||||||
Hudson Pacific Properties, Inc., REIT | 9,621 | 325,575 | ||||||
JBG SMITH Properties, REIT | 6,881 | 257,762 | ||||||
Kilroy Realty Corp., REIT | 6,069 | 443,887 | ||||||
Mack-Cali Realty Corp., REIT | 5,535 | 120,884 | ||||||
New York REIT, Inc., REIT* | 1,031 | 19,228 | ||||||
Paramount Group, Inc., REIT | 13,291 | 211,061 | ||||||
Piedmont Office Realty Trust, Inc., Class A, REIT | 7,870 | 156,141 | ||||||
SL Green Realty Corp., REIT | 5,430 | 566,892 | ||||||
Tier REIT, Inc., REIT | 2,943 | 70,161 | ||||||
VEREIT, Inc., REIT | 59,456 | 464,946 | ||||||
Vornado Realty Trust, REIT | 10,510 | 809,270 | ||||||
|
| |||||||
| 7,370,459 | ||||||||
|
| |||||||
Regional Malls — 9.5% |
| |||||||
Brookfield Property REIT, Inc., REIT | 39,906 | 798,918 | ||||||
CBL & Associates Properties, Inc., REIT | 10,602 | 47,285 | ||||||
Macerich Co. (The), REIT | 6,493 | 381,399 | ||||||
Pennsylvania, REIT | 4,320 | 44,064 | ||||||
Simon Property Group, Inc., REIT | 19,016 | 3,480,498 | ||||||
Tanger Factory Outlet Centers, Inc., REIT | 5,796 | 139,452 | ||||||
Taubman Centers, Inc., REIT | 3,745 | 241,964 | ||||||
Washington Prime Group, Inc., REIT | 11,421 | 88,399 | ||||||
|
| |||||||
| 5,221,979 | ||||||||
|
| |||||||
Shopping Centers — 6.3% |
| |||||||
Acadia Realty Trust, REIT | 5,010 | 142,885 | ||||||
Alexander’s, Inc., REIT | 141 | 50,891 | ||||||
Brixmor Property Group, Inc., REIT | 18,595 | 338,801 | ||||||
Cedar Realty Trust, Inc., REIT | 5,631 | 25,171 | ||||||
DDR Corp., REIT | 9,634 | 134,780 | ||||||
Federal Realty Investment Trust, REIT | 4,496 | 587,223 | ||||||
Kimco Realty Corp., REIT | 26,091 | 446,417 | ||||||
Kite Realty Group Trust, REIT | 5,138 | 89,812 | ||||||
| Investments | Shares | Value ($) | ||||||
Shopping Centers — continued |
| |||||||
Ramco-Gershenson Properties Trust, REIT | 4,914 | 68,599 | ||||||
Regency Centers Corp., REIT | 9,362 | 618,173 | ||||||
Retail Opportunity Investments Corp., REIT | 6,922 | 136,640 | ||||||
Retail Properties of America, Inc., Class A, REIT | 13,478 | 171,575 | ||||||
Retail Value, Inc., REIT* | 907 | 32,398 | ||||||
Saul Centers, Inc., REIT | 814 | 48,840 | ||||||
Seritage Growth Properties, Class A, REIT (a) | 2,057 | 105,894 | ||||||
Urban Edge Properties, REIT | 6,996 | 159,929 | ||||||
Urstadt Biddle Properties, Inc., Class A, REIT | 1,831 | 41,655 | ||||||
Weingarten Realty Investors, REIT | 7,476 | 231,233 | ||||||
|
| |||||||
| 3,430,916 | ||||||||
|
| |||||||
Storage — 8.2% |
| |||||||
Americold Realty Trust, REIT | 3,502 | 87,200 | ||||||
CubeSmart, REIT | 11,193 | 341,946 | ||||||
Extra Space Storage, Inc., REIT | 7,744 | 714,074 | ||||||
Iron Mountain, Inc., REIT | 16,679 | 602,112 | ||||||
Life Storage, Inc., REIT | 2,856 | 278,746 | ||||||
National Storage Affiliates Trust, REIT | 3,465 | 98,267 | ||||||
Public Storage, REIT | 9,629 | 2,046,933 | ||||||
QTS Realty Trust, Inc., Class A, REIT | 3,133 | 143,272 | ||||||
Rexford Industrial Realty, Inc., REIT | 4,978 | 161,785 | ||||||
|
| |||||||
| 4,474,335 | ||||||||
|
| |||||||
TOTAL COMMON STOCKS |
| 54,553,076 | ||||||
|
| |||||||
SHORT-TERM INVESTMENTS — 0.4% |
| |||||||
INVESTMENT COMPANIES — 0.4% |
| |||||||
JPMorgan U.S. Government Money Market Fund, Class Institutional Shares, 1.82% (b)(c) | 192,916 | 192,916 | ||||||
|
| |||||||
INVESTMENT OF CASH COLLATERAL RECEIVED |
| |||||||
JPMorgan U.S. Government Money Market Fund, Share Class IM, 1.87% (b)(c) | 100,225 | 100,225 | ||||||
|
| |||||||
TOTAL INVESTMENT OF CASH COLLATERAL RECEIVED FROM SECURITIES LOANED |
| 100,225 | ||||||
|
| |||||||
Total Investments — 100.4% |
| 54,846,217 | ||||||
Liabilities in Excess of Other Assets — (0.4%) |
| (200,277 | ) | |||||
|
| |||||||
Net Assets — 100.0% |
| $ | 54,645,940 | |||||
|
| |||||||
Percentages indicated are based on net assets.
SEE NOTES TO FINANCIAL STATEMENTS.
| 6 | J.P. MORGAN EXCHANGE-TRADED FUNDS | AUGUST 31, 2018 | ||||
| Futures contracts outstanding as of August 31, 2018: | ||||||||||||||||||||
| Description | Number of Contracts | Expiration Date | Trading Currency | Notional Amount ($) | Value and Unrealized Appreciation (Depreciation) ($) | |||||||||||||||
Long Contracts |
| |||||||||||||||||||
DJ US Real Estate Index | 2 | 09/2018 | USD | 65,680 | 3,070 | |||||||||||||||
|
| |||||||||||||||||||
| 3,070 | ||||||||||||||||||||
|
| |||||||||||||||||||
| Abbreviations | ||
| MTA | MetropolitanTransportation Authority | |
| REIT | RealEstate Investment Trust | |
| USD | UnitedStates Dollar | |
| (a) | Thesecurity or a portion of this security is on loan at August 31, 2018. The total value of securities on loan at August 31, 2018 was $97,907. | |
| (b) | Investmentin affiliate. Fund is registered under the Investment Company Act of 1940, as amended, and advised by J.P. Morgan Investment Management Inc. | |
| (c) | Therate shown is the current yield as of August 31, 2018. | |
| * | Non-incomeproducing security. | |
| ‡ | Valuedetermined using significant unobservable inputs. |
SEE NOTES TO FINANCIAL STATEMENTS.
| AUGUST 31, 2018 | J.P. MORGAN EXCHANGE-TRADED FUNDS | 7 | ||||||
STATEMENT OF ASSETS AND LIABILITIES
AS OF AUGUST 31, 2018 (Unaudited)
| JPMorgan BetaBuilders MSCI US REIT ETF | ||||
ASSETS: |
| |||
Investments in non-affiliates, at value | $ | 54,553,076 | ||
Investments in affiliates, at value | 192,916 | |||
Investments of cash collateral received from securities loaned (Note 2.D) | 100,225 | |||
Restricted cash | 400 | |||
Deposits at broker for futures contracts | 20,000 | |||
Deferred offering costs | 12,618 | |||
Receivables: | ||||
Investment securities sold | 161,552 | |||
Dividends from non-affiliates | 39,842 | |||
Dividends from affiliates | 321 | |||
Securities lending income | 79 | |||
Variation margin on futures contracts | 580 | |||
Due from Adviser | 12,809 | |||
|
| |||
Total Assets | 55,094,418 | |||
|
| |||
LIABILITIES: |
| |||
Payables: | ||||
Investment securities purchased | 320,298 | |||
Collateral received on securities loaned | 100,225 | |||
Accrued liabilities: | ||||
Administration fees | 3,893 | |||
Custodian, Accounting and Transfer Agent fees | 5,697 | |||
Trustees’ and Chief Compliance Officer’s fees | 551 | |||
Professional Fees | 12,916 | |||
Other | 4,898 | |||
|
| |||
Total Liabilities | 448,478 | |||
|
| |||
Net Assets | $ | 54,645,940 | ||
|
| |||
NET ASSETS: |
| |||
Paid-in-Capital | $ | 51,074,946 | ||
Accumulated undistributed (distributions in excess of) net investment income | 384,515 | |||
Accumulated net realized gains (losses) | 48,456 | |||
Net unrealized appreciation (depreciation) | 3,138,023 | |||
|
| |||
Total Net Assets | $ | 54,645,940 | ||
|
| |||
Outstanding number of shares | 675,000 | |||
|
| |||
Net asset value, per share | $ | 80.96 | ||
|
| |||
Cost of investments in non-affiliates | $ | 51,418,123 | ||
Cost of investments in affiliates | 192,916 | |||
Investment securities on loan, at value | 97,907 | |||
SEE NOTES TO FINANCIAL STATEMENTS.
| 8 | J.P. MORGAN EXCHANGE-TRADED FUNDS | AUGUST 31, 2018 | ||||
STATEMENT OF OPERATIONS
FOR THE PERIOD ENDED AUGUST 31, 2018 (Unaudited)
| JPMorgan BetaBuilders MSCI US REIT ETF (a) | ||||
INVESTMENT INCOME: |
| |||
Dividend income from non-affiliates | $ | 365,399 | ||
Dividend income from affiliates | 562 | |||
Non-cash dividend income from non-affiliates | 30,469 | |||
Income from securities lending (net) (Note 2.D) | 82 | |||
|
| |||
Total investment income | 396,512 | |||
|
| |||
EXPENSES: |
| |||
Investment advisory fees (Note 3.A) | 13,106 | |||
Administration fees (Note 3.B) | 9,283 | |||
Professional fees | 13,236 | |||
Trustees’ and Chief Compliance Officer’s fees | 645 | |||
Printing and mailing costs | 774 | |||
Registration and filing fees | 3,750 | |||
Custodian, Accounting and Transfer Agent fees (Note 3.C) | 5,697 | |||
Insurance expense | 129 | |||
Offering costs (Note 2.D) | 3,429 | |||
Other | 1,052 | |||
|
| |||
Total expenses | 51,101 | |||
|
| |||
Less fees waived (Note 3.D) | (22,389 | ) | ||
Less expense reimbursements from affiliates (Note 3.D) | (16,315 | ) | ||
Less expense reimbursements from non-affiliates (Note 3.C) | (400 | ) | ||
|
| |||
Net expenses | 11,997 | |||
|
| |||
Net investment income (loss) | 384,515 | |||
|
| |||
REALIZED/UNREALIZED GAINS (LOSSES): | ||||
Net realized gain (loss) on transactions from: |
| |||
Investments in non-affiliates | 42,486 | |||
Futures | 5,970 | |||
|
| |||
Net realized gain (loss) | 48,456 | |||
|
| |||
Change in net unrealized appreciation/depreciation on: |
| |||
Investments in non-affiliates | 3,134,953 | |||
Futures | 3,070 | |||
|
| |||
Change in net unrealized appreciation/depreciation | 3,138,023 | |||
|
| |||
Net realized/unrealized gains (losses) | 3,186,479 | |||
|
| |||
Change in net assets resulting from operations | $ | 3,570,994 | ||
|
| |||
| (a) | Commencement of operations was June 15, 2018. |
SEE NOTES TO FINANCIAL STATEMENTS.
| AUGUST 31, 2018 | J.P. MORGAN EXCHANGE-TRADED FUNDS | 9 | ||||||
STATEMENT OF CHANGES IN NET ASSETS
FOR THE PERIOD INDICATED
| JPMorgan BetaBuilders MSCI US REIT ETF | ||||
| Period Ended August 31, 2018 (a) (Unaudited) | ||||
CHANGE IN NET ASSETS RESULTING FROM OPERATIONS: |
| |||
Net investment income (loss) | $ | 384,515 | ||
Net realized gain (loss) | 48,456 | |||
Change in net unrealized appreciation/depreciation | 3,138,023 | |||
|
| |||
Change in net assets resulting from operations | 3,570,994 | |||
|
| |||
CAPITAL TRANSACTIONS: |
| |||
Change in net assets resulting from capital transactions | 51,074,946 | |||
|
| |||
NET ASSETS: |
| |||
Change in net assets | 54,645,940 | |||
Beginning of period | — | |||
|
| |||
End of period | $ | 54,645,940 | ||
|
| |||
Accumulated undistributed (distributions in excess of) net investment income | $ | 384,515 | ||
|
| |||
CAPITAL SHARE TRANSACTIONS: | ||||
Proceeds from shares issued | $ | 51,074,946 | ||
SHARE TRANSACTIONS: |
| |||
Issued (See Note 4) | 675,000 | |||
|
| |||
Net increase in shares from share transactions | 675,000 | |||
|
| |||
| (a) | Commencement of operations was June 15, 2018. |
SEE NOTES TO FINANCIAL STATEMENTS.
| 10 | J.P. MORGAN EXCHANGE-TRADED FUNDS | AUGUST 31, 2018 | ||||
THIS PAGE IS INTENTIONALLY LEFT BLANK
| AUGUST 31, 2018 | J.P. MORGAN EXCHANGE-TRADED FUNDS | 11 | ||||||
FOR THE PERIOD INDICATED
| Per share operating performance | ||||||||||||||||||||
| Investment operations | ||||||||||||||||||||
| Net asset value, beginning of period | Net investment income (loss) (b) | Net realized and unrealized gains (losses) on investments | Total from investment operations | Net asset value, end of period | ||||||||||||||||
JPMorgan BetaBuilders MSCI US REIT ETF | ||||||||||||||||||||
June 15, 2018 (a) through August 31, 2018 (Unaudited) | $ | 75.67 | $ | 0.57 | $ | 4.72 | $ | 5.29 | $ | 80.96 | ||||||||||
| (a) | Commencement of operations. |
| (b) | Calculated based upon average shares outstanding. |
| (c) | Not annualized for periods less than one year. |
| (d) | Includes adjustments in accordance with accounting principles generally accepted in the United States of America and as such, the net asset values for financial reporting purposes and the returns based upon those net asset values may differ from the net asset values and returns for shareholder transactions. |
| (e) | Market price total return is calculated assuming an initial investment made at the beginning of the period market price, reinvestment of all dividends and distributions at market price during the period, and sale at the market price on the last day of the period. The market price presented to calculate the market price total return is the mid-point of the bid/ask spread at the close of business on the Cboe BZX Exchange, Inc. |
| (f) | Annualized for periods less than one year, unless otherwise indicated. |
| (g) | Certain non-recurring expenses incurred by the Fund were not annualized for the period indicated. |
| 12 | J.P. MORGAN EXCHANGE-TRADED FUNDS | AUGUST 31, 2018 | ||||
| Ratios/Supplemental data | ||||||||||||||||||||||||||||||
| Ratios to average net assets (f) | ||||||||||||||||||||||||||||||
| Market price, end of period | Total return (c)(d) | Market price total return (c)(e) | Net assets, end of period | Net expenses | Net investment income (loss) | Expenses without waivers and reimbursements | Portfolio turnover rate (c) | |||||||||||||||||||||||
| $ | 76.28 | 6.99 | % | 0.81 | % | $ | 54,645,940 | 0.08 | % (g) | 3.52 | % | 0.44 | % (g) | 1 | % | |||||||||||||||
| AUGUST 31, 2018 | J.P. MORGAN EXCHANGE-TRADED FUNDS | 13 | ||||||
AS OF AUGUST 31, 2018 (Unaudited)
1. Organization
J.P. Morgan Exchange-Traded Fund Trust (the “Trust”) was formed on February 25, 2010, and is governed by a Declaration of Trust as amended and restated February 19, 2014, and is registered under the Investment Company Act of 1940, as amended (the “1940 Act”), as an open-end management investment company. JPMorgan BetaBuilders MSCI US REIT ETF (the “Fund” or the “MSCI US REIT ETF”) is a separate diversified series of the Trust covered in this report.
The Fund commenced operations on June 15, 2018. The investment objective of the Fund is to seek investment results that closely correspond, before fees and expenses, to the performance of the MSCI US REIT Index.
J.P. Morgan Investment Management Inc. (“JPMIM”), an indirect, wholly-owned subsidiary of JPMorgan Chase & Co. (“JPMorgan”), acts as Adviser (the “Adviser”) and Administrator (the “Administrator”) to the Fund.
Shares of the Fund are listed and traded on the Cboe BZX Exchange, Inc. Market prices for the Fund’s shares may be different from its net asset value (“NAV”). The Fund issues and redeems its shares on a continuous basis, through JPMorgan Distribution Services, Inc. (the “Distributor” or “JPMDS”), an indirect, wholly-owned subsidiary of JPMorgan, at NAV in large blocks of shares, typically 25,000 shares, referred to as “Creation Units”.
Creation Units are issued and redeemed principally in-kind for a basket of securities. A cash amount may be substituted in a Fund with sizeable exposure to market or sponsor restricted securities. Shares are generally traded in the secondary market in amounts less than a Creation Unit at market prices that change throughout the day. Only individuals or institutions that have entered into an authorized participant agreement with the Distributor may do business directly with the Fund (each, an “Authorized Participant”).
2. Significant Accounting Policies
The following is a summary of significant accounting policies followed by the Fund in the preparation of its financial statements. The Fund is an investment company and, accordingly, follows the investment company accounting and reporting guidance of the Financial Accounting Standards Board Accounting Standards Codification Topic 946 — Investment Companies, which is part of U.S. generally accepted accounting principles (“GAAP”). The preparation of financial statements in conformity with GAAP requires management to make estimates and assumptions that affect the reported amounts of assets and liabilities and disclosure of contingent assets and liabilities at the date of the financial statements and the reported amounts of increases and decreases in net assets from operations during the reporting period. Actual results could differ from those estimates.
A. Valuation of Investments — The valuation of investments is in accordance with GAAP and the Fund’s valuation policies set forth by and under the supervision and responsibility of the Board of Trustees (the “Board”), which established the following approach to valuation, as described more fully below: (i) investments for which market quotations are readily available shall be valued at such unadjusted quoted prices and (ii) all other investments for which market quotations are not readily available shall be valued at their fair value as determined in good faith by the Board.
The Administrator has established the J.P. Morgan Asset Management Americas Valuation Committee (“AVC”) to assist the Board with the oversight and monitoring of the valuation of the Fund’s investments. The Administrator implements the valuation policies of the Fund’s investments, as directed by the Board. The AVC oversees and carries out the policies for the valuation of investments held in the Fund. This includes monitoring the appropriateness of fair values based on results of ongoing valuation oversight including, but not limited to consideration of macro or security specific events, market events and pricing vendor and broker due diligence. The Administrator is responsible for discussing and assessing the potential impacts to the fair values on an ongoing basis, and at least on a quarterly basis with the AVC and the Board.
A market-based approach is primarily used to value the Fund’s investments. Investments for which market quotations are not readily available are fair valued by approved affiliated and unaffiliated pricing vendors or third party broker-dealers (collectively referred to as “Pricing Services”) or may be internally fair valued using methods set forth by the valuation policies approved by the Board. This may include related or comparable assets or liabilities, recent transactions, market multiples, book values and other relevant information for the investment to determine the fair value of the investment. An income-based valuation approach may be used in which the anticipated future cash flows of the investment are discounted to calculate the fair value. Discounts may also be applied due to the nature or duration of any restrictions on the disposition of the investments. Valuations may be based upon current market prices of securities that are comparable in coupon, rating, maturity and industry. It is possible that the estimated values may differ significantly from the values that would have been used, had a ready market for the investments existed, and such differences could be material.
Equities and other exchange-traded instruments are valued at the last sale price or official market closing price on the primary exchange on which the instrument is traded before the NAV of the Fund is calculated on a valuation date. Investments in open-end investment companies excluding Exchange-Traded Funds (“ETFs”) (the “Underlying Funds”) are valued at each Underlying Fund’s NAV per share as of the report date.
Futures contracts are generally valued on the basis of available market quotations.
See the table on “Quantitative Information about level 3 Fair Value Measurements” for information on the valuation techniques and inputs used to value level 3 securities held by the Fund at August 31, 2018.
Valuations reflected in this report are as of the report date. As a result, changes in valuation due to market events and/or issuer related events after the report date and prior to issuance of the report are not reflected herein.
| 14 | J.P. MORGAN EXCHANGE-TRADED FUNDS | AUGUST 31, 2018 | ||||
The various inputs that are used in determining the valuation of the Fund’s investments are summarized into the three broad levels listed below.
| • | Level 1 — Unadjusted inputs using quoted prices in active markets for identical investments. |
| • | Level 2 — Other significant observable inputs including, but not limited to, quoted prices for similar investments, inputs other than quoted prices that are observable for investments (such as interest rates, prepayment speeds, credit risk, etc.) or other market corroborated inputs. |
| • | Level 3 — Significant inputs based on the best information available in the circumstances, to the extent observable inputs are not available (including the Fund’s assumptions in determining the fair value of investments). |
A financial instrument’s level within the fair value hierarchy is based on the lowest level of any input, both individually and in the aggregate, that is significant to the fair value measurement. The inputs or methodology used for valuing instruments are not necessarily an indication of the risk associated with investing in those instruments.
The following table represents each valuation input as presented on the Schedule of Portfolio Investments (“SOI”):
Level 1 Quoted prices | Level 2 Other significant | Level 3 Significant | Total | |||||||||||||
Investments in Securities | ||||||||||||||||
Common Stocks | ||||||||||||||||
Diversified | $ | 4,166,595 | $ | — | $ | 356,432 | $ | 4,523,027 | ||||||||
Other Common Stocks | 50,030,049 | — | — | 50,030,049 | ||||||||||||
|
|
|
|
|
|
|
| |||||||||
Total Common Stocks | 54,196,644 | — | 356,432 | 54,553,076 | ||||||||||||
|
|
|
|
|
|
|
| |||||||||
Short-Term Investments | ||||||||||||||||
Investment Companies | 192,916 | — | — | 192,916 | ||||||||||||
Investment of cash collateral received from securities loaned | 100,225 | — | — | 100,225 | ||||||||||||
|
|
|
|
|
|
|
| |||||||||
Total Investments in Securities | $ | 54,489,785 | $ | — | $ | 356,432 | * | $ | 54,846,217 | |||||||
|
|
|
|
|
|
|
| |||||||||
Appreciation in Other Financial Instruments | ||||||||||||||||
Futures Contracts | $ | 3,070 | $ | — | $ | — | $ | 3,070 | ||||||||
|
|
|
|
|
|
|
| |||||||||
| * | Level 3 securities are valued by brokers and pricing services. At August 31, 2018, the value of these securities was approximately $356,432. The inputs for these securities are not readily available or cannot be reasonably estimated and are generally those inputs described in Note 2.A. The appropriateness of fair values for these securities is monitored on an ongoing basis which may include results of back testing, results of broker and vendor due diligence, unchanged price review and consideration of macro or security specific events. |
Transfers between fair value levels are valued utilizing values as of the beginning of the period.
There were no transfers among any levels during the period ended August 31, 2018.
The following is a summary of investments for which significant unobservable inputs (level 3) were used in determining fair value:
| Balance as of June 15, 2018* | Realized gain (loss) | Change in net unrealized appreciation (depreciation) | Net accretion (amortization) | Purchases1 | Sales2 | Transfers into Level 3 | Transfers out of Level 3 | Balance as of August 31, 2018 | ||||||||||||||||||||||||||||
Investments in Securities: | ||||||||||||||||||||||||||||||||||||
Common Stocks — Diversified | $ | — | $ | — | $ | 8,489 | $ | — | $ | 347,943 | $ | — | $ | — | $ | — | $ | 356,432 | ||||||||||||||||||
|
|
|
|
|
|
|
|
|
|
|
|
|
|
|
|
|
| |||||||||||||||||||
| * | Commencement of operations |
| 1 | Purchases include all purchases of securities and securities received in corporate actions. |
| 2 | Sales include all sales of securities, maturities, paydowns and securities tendered in corporate actions. |
The changes in net unrealized appreciation (depreciation) attributable to securities owned at August 31, 2018, which were valued using significant unobservable inputs (level 3) amounted to $8,489.
B. Restricted Securities — Certain securities held by the Fund may be subject to legal or contractual restrictions on resale. Restricted securities generally are resold in transactions exempt from registration under the Securities Act of 1933 as amended (the “Securities Act”). Disposal of these securities may involve time-consuming negotiations and expense. Prompt sale at the current valuation may be difficult and could adversely affect the NAV of the Fund.
As of August 31, 2018, the Fund had no investments in restricted securities other than securities sold to the Fund under Rule 144A and/or Regulation S under the Securities Act.
| AUGUST 31, 2018 | J.P. MORGAN EXCHANGE-TRADED FUNDS | 15 | ||||||
NOTES TO FINANCIAL STATEMENTS
AS OF AUGUST 31, 2018 (Unaudited) (continued)
C. Futures Contracts — The Fund used index futures contracts to gain or reduce exposure to the stock market, maintain liquidity or minimize transaction costs. The Fund also bought futures contracts to invest incoming cash in the market or sold futures in response to cash outflows, thereby simulating an invested position in the underlying index while maintaining cash balance for liquidity.
Futures contracts provide for the delayed delivery of the underlying instrument at a fixed price or are settled for a cash amount based on the change in the value of the underlying instrument at a specific date in the future. Upon entering into a futures contract, the Fund is required to deposit with the broker, cash or securities in an amount equal to a certain percentage of the contract amount, which is referred to as the initial margin deposit. Subsequent payments, referred to as variation margin, are made or received by the Fund periodically and are based on changes in the market value of open futures contracts. Changes in the market value of open futures contracts are recorded as Change in net unrealized appreciation/depreciation on the Statement of Operations (“SOP”). Realized gains or losses, representing the difference between the value of the contract at the time it was opened and the value at the time it was closed, are reported on the SOP at the closing or expiration of the futures contract. Securities deposited as initial margin are designated on the SOI and cash deposited, which is considered restricted, is recorded on the Statement of Assets and Liabilities (SAL). A receivable from and/or a payable to brokers for the daily variation margin is also recorded on the SAL.
The use of futures contracts exposes the Fund to equity price risk. The Fund may be subject to the risk that the change in the value of the futures contract may not correlate perfectly with the underlying instrument. Use of long futures contracts subjects the Fund to risk of loss in excess of the amounts shown on the SAL, up to the notional amount of the futures contracts. Use of short futures contracts subjects the Fund to unlimited risk of loss. The Fund may enter into futures contracts only on exchanges or boards of trade. The exchange or board of trade acts as the counterparty to each futures transaction; therefore, the Fund’s credit risk is limited to failure of the exchange or board of trade. Under some circumstances, futures exchanges may establish daily limits on the amount that the price of a futures contract can vary from the previous day’s settlement price, which could effectively prevent liquidation of positions.
The Fund’s futures contracts are not subject to master netting arrangements (the right to close out all transactions traded with a counterparty and net amounts owed or due across transactions).
The following table presents the value of derivatives held as of August 31, 2018, by their primary underlying risk exposure and respective location on the SAL:
| Derivative Contracts | Statement of Assets and Liabilities Location | |||||
| Gross Assets: | Futures Contracts (a) | |||||
| Equity contracts | Receivables, Net assets — Unrealized Appreciation | $ | 3,070 | |||
|
| |||||
| (a) | This amount represents the cumulative appreciation (depreciation) of futures contracts as reported on the SOI. The SAL only reflects the current day variation margin receivable/payable from/to brokers. |
The following tables present the effect of derivatives on the SOP for the period ended August 31, 2018, by primary underlying risk exposure:
| Amount of Realized Gain (Loss) on Derivatives Recognized on the Statement of Operations | ||||
| Derivative Contracts | Futures Contracts | |||
Equity contracts | $ | 5,970 | ||
|
| |||
| Amount of Change in Unrealized Appreciation (Depreciation) on Derivatives Recognized on the Statement of Operations | ||||
| Derivative contracts | Futures Contracts | |||
Equity contracts | $ | 3,070 | ||
|
| |||
Derivatives Volume
The table below discloses the volume of the Fund’s futures contracts activity during the period ended August 31, 2018:
Futures Contracts: | ||||
Average Notional Balance Long | $ | 225,213 | (a) | |
Ending Notional Balance Long | 65,680 |
| (a) | For the period June 15, 2018 through August 31, 2018. |
The Fund’s derivatives contracts held at August 31, 2018 are not accounted for as hedging instruments under GAAP.
D. Securities Lending — Effective June 18, 2018, MSCI US REIT ETF became authorized to engage in securities lending in order to generate additional income. The Fund is able to lend to approved borrowers. Citibank N. A. (“Citibank”) serves as lending agent for the Fund, pursuant to a Securities Lending Agency Agreement (the “Securities Lending Agency Agreement”). Securities loaned are collateralized by cash equal to at least 100%
| 16 | J.P. MORGAN EXCHANGE-TRADED FUNDS | AUGUST 31, 2018 | ||||
of the market value plus accrued interest on the securities lent, which is invested in the IM Shares of JPMorgan U.S. Government Money Market Fund. The Fund retains loan fees and the interest on cash collateral investments but is required to pay the borrower a rebate for the use of cash collateral. In cases where the lent security is of high value to borrowers, there may be a negative rebate (ie: a net payment to the Fund). Upon termination of a loan, the Fund is required to return to the borrower an amount equal to the cash collateral, plus any rebate owed to the borrowers. Loans are subject to termination by the Fund or the borrower at any time.
The net income earned on the securities lending (after payment of rebates and Citibank’s fee) is included in the SOP as Income from securities lending (net). The Fund also receives payments from the borrower during the period of the loan, equivalent to dividends and interest earned on the securities loaned, which are recorded as Dividend or Interest income, respectively, on the SOP.
For the period ended August 31, 2018, the Fund earned $91 from Collateral Investments, prior to rebates or fees but after voluntary waivers as described below, from an investment in an affiliated fund.
Under the Securities Lending Agency Agreement, Citibank marks to market the loaned securities on a daily basis. In the event the cash received from the borrower is less than 102% of the value of the loaned securities (105% for loans of non-U.S. securities), Citibank requests additional cash from the borrower so as to maintain a collateralization level a of at least 102% of the value of the loaned securities plus accrued interest.
The value of securities out on loan is recorded as an asset on the SAL. The value of the cash collateral received is recorded as a liability on the SAL and details of Collateral Investments are disclosed in the SOI. At August 31, 2018, the value of outstanding securities on loan and the value of Collateral Investments were as follows:
| Value of Securities on Loan | Cash Collateral Posted by Borrower | Total value of Collateral Investments | ||||||||||
Betabuilders MSCI US REIT ETF | $ | 97,907 | $ | 100,225 | $ | 100,225 | ||||||
The Fund bears the risk of loss associated with the Collateral Investments and is not entitled to additional collateral from the borrower to cover any such losses. To the extent that the value of the Collateral Investments declines below the amount owed to a borrower, the Fund may incur losses that exceed the amount it earned on lending the security. Upon termination of a loan, the Fund may use leverage (borrow money) to repay the borrower for cash collateral posted if the Adviser does not believe that it is prudent to sell the Collateral Investments to fund the payment of this liability. Securities lending activity is not subject to master netting arrangements.
Securities lending also involves counterparty risks, including the risk that the loaned securities may not be returned in a timely manner or at all. Subject to certain conditions, Citibank has agreed to indemnify the Fund from losses resulting from a borrower’s failure to return a loaned security.
JPMIM waived fees associated with the Fund’s investment in JPMorgan U.S. Government Money Market Fund in the amount of $5. JPMIM voluntarily waived investment advisory fees charged to the Fund to reduce the impact of the investment in the JPMorgan U.S. Government Money Market Fund from 0.16% to 0.06%. The above waiver is included in the determination of earnings on cash collateral investment and in the calculation of Citibank’s compensation.
E. Investment Transactions with Affiliates — The Fund invested in Underlying Funds which are advised by the Adviser. An issuer which is under common control with a Fund may be considered an affiliate. For the purposes of the financial statements, the Fund assumes the issuers listed in the tables below to be affiliated issuers. Underlying Fund’s distributions may be reinvested into the Underlying Funds. Reinvestment amounts are included in the purchase cost amounts in the tables below. Included in the purchases and sales amounts in the tables below are exchanges between certain shares of the Underlying Funds. Such exchanges are not treated as purchases and sales for the purpose of recognizing realized gains (losses) or portfolio turnover.
| Security Description | Value at June 15, 2018* | Purchases at Cost | Proceeds from Sales | Net Realized Gain (Loss) | Change in Unrealized Appreciation/ (Depreciation) | Value at August 31, 2018 | Shares at August 31, 2018 | Dividend Income | Capital Gain Distributions | |||||||||||||||||||||||||||
JPMorgan U.S. Government Money Market Fund, Class Institutional Shares, 1.82% (a) (b) | $ | — | $ | 1,137,242 | $ | 944,326 | $ | — | $ | — | $ | 192,916 | 192,916 | $ | 562 | $ | — | |||||||||||||||||||
JPMorgan U.S. Government Money Market Fund, Share Class IM, 1.87% (a) (b) | — | 252,650 | 152,425 | — | — | 100,225 | 100,225 | 91 | — | |||||||||||||||||||||||||||
|
|
|
|
|
|
|
|
|
|
|
|
|
|
|
|
|
| |||||||||||||||||||
Total | $ | — | $ | — | $ | — | $ | — | $ | — | $ | 293,141 | $ | — | $ | — | ||||||||||||||||||||
|
|
|
|
|
|
|
|
|
|
|
|
|
|
|
|
|
| |||||||||||||||||||
| * | Commencement of operations |
| (a) | Investment in affiliate. Fund is registered under the Investment Company Act of 1940, as amended, and advised by J.P. Morgan Investment Management Inc. |
| (b) | The rate shown is the current yield as of August 31, 2018. |
| AUGUST 31, 2018 | J.P. MORGAN EXCHANGE-TRADED FUNDS | 17 | ||||||
NOTES TO FINANCIAL STATEMENTS
AS OF AUGUST 31, 2018 (Unaudited) (continued)
F. Offering and Organizational Costs — Total offering costs incurred in connection with the offering of shares of the Fund is amortized on a straight line basis over 12 months from the date the Fund commenced operations. For the period ended August 31, 2018, total offering costs incurred were $16,047.
Costs paid in connection with the organization of the Fund, if any, were recorded as an expense at the time the Fund commenced operations and are included as part of Professional fees on the SOP. For the period ended August 31, 2018, total offering costs amortized were $3,429.
G. Security Transactions and Investment Income — Investment transactions are accounted for on the trade date (the date the order to buy or sell is executed). Securities gains and losses are calculated on a specifically identified cost basis. Interest income is determined on the basis of coupon interest accrued using the effective interest method which adjusts for amortization of premiums and accretion of discounts. Dividend income, net of foreign taxes withheld, if any, is recorded on the ex-dividend date or when the Fund first learns of the dividend.
To the extent such information is publicly available, the Fund records distributions received in excess of income earned from underlying investments as a reduction of cost of investments and/or realized gain. Such amounts are based on estimates if actual amounts are not available and actual amounts of income, realized gain and return of capital may differ from the estimated amounts. The Fund adjusts the estimated amounts of the components of distributions (and consequently its net investment income) as necessary once the issuers provide information about the actual composition of the distributions.
H. Allocation of Expenses — Expenses directly attributable to a fund are charged directly to that fund, while the expenses attributable to more than one fund of the Trust are allocated among the respective funds.
I. Federal Income Taxes — The Fund is treated as a separate taxable entity for Federal income tax purposes. The Fund’s policy is to comply with the provisions of the Internal Revenue Code (the “Code”), applicable to regulated investment companies and to distribute to shareholders all of its distributable net investment income and net realized capital gains on investments. Accordingly, no provision for Federal income tax is necessary. Management has reviewed the Fund’s tax positions for all open tax years and has determined that as of August 31, 2018, no liability for income tax is required in the Fund’s financial statements for net unrecognized tax benefits. However, management’s conclusions may be subject to future review based on changes in, or the interpretation of, the accounting standards or tax laws and regulations. The Fund’s Federal tax returns since inception remain subject to examination by the Internal Revenue Service.
J. Distributions to Shareholders — Distributions from net investment income, if any, are generally declared and paid quarterly. Net realized capital gains, if any, are distributed by the Fund at least annually. The amount of distributions from net investment income and net realized capital gains is determined in accordance with Federal income tax regulations, which may differ from GAAP. To the extent these “book/tax” differences are permanent in nature (i.e., that they result from other than timing of recognition — “temporary differences”), such amounts are reclassified within the capital accounts based on their Federal tax-basis treatment.
3. Fees and Other Transactions with Affiliates
A. Investment Advisory Fee — Pursuant to an Investment Advisory Agreement, the Adviser supervises the investments of the Fund and for such services is paid a fee. The fee is accrued daily and paid monthly at an annual rate of 0.12% of the Fund’s average daily net assets.
The Adviser waived Investment Advisory fees and/or reimbursed expenses as outlined in Note 3.D.
B. Administration Fee — Pursuant to an Administration Agreement, the Administrator provides certain administration services to the Fund. In consideration of these services, the Administrator receives a fee accrued daily and paid monthly at an annual rate of 0.085% of the average daily net assets of the Fund in the Trust covered by the Administration Agreement (excluding certain funds of funds and money market funds).
The Administrator waived Administration fees as outlined in Note 3.D.
JPMorgan Chase Bank, N.A. (“JPMCB”), a wholly-owned subsidiary of JPMorgan, serves as the Fund’s sub-administrator (the “Sub-administrator”). For its services as Sub-administrator, JPMCB receives a portion of the fees payable to the Administrator.
C. Custodian, Accounting and Transfer Agent Fees — JPMCB provides custody, accounting and transfer agency services to the Fund. The amount paid directly to JPMCB by the Fund for custody services are included in the Custodian, Accounting and Transfer Agent fees on the SOP. Interest income earned on cash balances at the custodian, if any, is included in Interest income from affiliates on the SOP. With respect to the transfer agency services provided by JPMCB for each creation or redemption transaction, the Authorized Participant will generally be responsible for such associated expenses; during the period, the Fund paid no transfer agency fees to JPMCB.
Additionally, Authorized Participants generally pay transaction fees associated with the creation and redemption of fund shares. These fees are used to offset certain custodian charges incurred by the Fund for these transactions.
For the period ended August 31, 2018, the amount of transaction fees paid by the Authorized Participants that were used to reimburse custodian fees were $400.
Such amounts are included in expense reimbursements from non-affiliates in the SOP.
Restricted cash on the SAL is cash received from Authorized Participants for the reimbursement of creation and/or redemption of Fund shares.
Interest expense paid to the custodian related to cash overdrafts, if any, is included in Interest expense to affiliates on the SOP.
| 18 | J.P. MORGAN EXCHANGE-TRADED FUNDS | AUGUST 31, 2018 | ||||
D. Waivers and Reimbursements — The Adviser has contractually agreed to waive fees and/or reimburse the Fund to the extent that total annual operating expenses, (excluding acquired fund fees and expenses, dividend expenses related to short sales, interest, taxes, expenses related to litigation and potential litigation, and extraordinary expenses), exceed 0.11% of the Fund’s average daily net assets.
The expense limitation agreement is in effect for the period ended August 31, 2018 and the current agreement is in place until at least June 30, 2021.
For the period ended August 31, 2018, the Fund’s service providers waived fees and/or reimbursed expenses for the Fund as follows. None of these parties expect the Fund to repay any such waived fees and/or reimbursed expenses in future years.
| Contractual Waivers | ||||||||||||||||
| Investment Advisory Fees | Administration Fees | Total | Contractual Reimbursements | |||||||||||||
BetaBuilders MSCI US REIT ETF | $ | 13,078 | $ | 9,283 | $ | 22,361 | $ | 16,315 | ||||||||
Additionally, the Fund may invest in one or more money market funds advised by the Adviser or its affiliates (affiliated money market funds). The Adviser, Administrator and/or JPMDS, as shareholder servicing agent, have contractually agreed to waive fees and/or reimburse expenses in an amount sufficient to offset the respective net fees each collects from the affiliated money market fund on the Fund’s investment in such affiliated money market fund.
The amount of the waivers resulting from investments in the money market fund for the period ended August 31, 2018 was $28.
E. Distribution Services — The Distributor or its agent distributes Creation Units for the Fund on an agency basis. The Distributor does not maintain a secondary market in shares of the Fund. JPMDS receives no fees for their distribution services under their respective distribution agreements with the Trust (the “Distribution Agreements”). Although the Trust does not pay any fees under the Distribution Agreements, JPMIM pays JPMDS for certain distribution related services.
F. Other — Certain officers of the Trust are affiliated with the Adviser, the Administrator and JPMDS. Such officers, with the exception of the Chief Compliance Officer, receive no compensation from the Fund for serving in their respective roles.
The Board appointed a Chief Compliance Officer to the Fund in accordance with Federal securities regulations. The Fund, along with other affiliated funds, makes reimbursement payments, on a pro-rata basis, to the Administrator for a portion of the fees associated with the Office of the Chief Compliance Officer. Such fees are included in Trustees’ and Chief Compliance Officer’s fees on the SOP.
The Fund may use related party broker-dealers. For the period ended August 31, 2018, the Fund did not incur any brokerage commissions with broker dealers affiliated with the Adviser.
The Securities and Exchange Commission (“SEC”) has granted an exemptive order permitting the Fund to engage in principal transactions with J.P. Morgan Securities, Inc., an affiliated broker, involving taxable money market instruments, subject to certain conditions.
4. Investment Transactions
During the period ended August 31, 2018, purchases and sales of investments (excluding short-term investments) were as follows:
| Purchases (excluding U.S. Government) | Sales (excluding U.S. Government) | |||||||
BetaBuilders MSCI US REIT ETF (a) | $ | 1,349,797 | $ | 557,452 | ||||
During the period ended August 31, 2018, there were no purchases or sales of U.S. Government securities.
For the period ended August 31, 2018, in-kind transactions associated with creations and redemptions were:
| In-Kind Purchases | In-Kind Sales | Realized Gain (Loss) | ||||||||||
BetaBuilders MSCI US REIT ETF (a) | $ | 50,679,708 | $ | — | $ | — | ||||||
| (a) | Commencement of operations was June 15, 2018. |
5. Federal Income Tax Matters
For Federal income tax purposes, the estimated cost and unrealized appreciation (depreciation) in value of investments held at August 31, 2018 were as follows:
| Aggregate Cost | Gross Unrealized Appreciation | Gross Unrealized Depreciation | Net Unrealized Appreciation (Depreciation) | |||||||||||||
BetaBuilders MSCI US REIT ETF | $ | 51,711,264 | $ | 3,393,489 | $ | (255,466 | ) | $ | 3,138,023 | |||||||
| AUGUST 31, 2018 | J.P. MORGAN EXCHANGE-TRADED FUNDS | 19 | ||||||
NOTES TO FINANCIAL STATEMENTS
AS OF AUGUST 31, 2018 (Unaudited) (continued)
6. Capital Share Transactions
The Trust issues and redeems shares of the Fund only in Creation Units through the Distributor at NAV. Capital shares transactions detail can be found in the Statements of Changes in Net Assets.
Shares of the Fund may only be purchased or redeemed by Authorized Participants. Such Authorized Participants may from time to time hold, of record or beneficially, a substantial percentage of the Fund’s shares outstanding, act as executing or clearing broker for investment transactions on behalf of the Fund. An Authorized Participant is either (1) a “Participating Party” or other participant in the clearing process through the Continuous Net Settlement System of the National Securities Clearing Corporation (“NSCC”); or (2) a DTC Participant; which, in either case, must have executed an agreement with the Distributor.
7. Risks, Concentrations and Indemnifications
In the normal course of business, the Fund enters into contracts that contain a variety of representations which provide general indemnifications. The Fund’s maximum exposure under these arrangements is unknown. The amount of exposure would depend on future claims that may be made against the Fund that has not yet occurred. However, based on experience, the Fund expects the risk of loss to be remote.
As of August 31, 2018, the Adviser owns shares representing more than 96% of the net assets of the Fund.
Significant shareholder transactions by the Adviser may impact the Fund’s performance.
Because the Fund may invest a significant portion of its assets in REITs, the Fund may be subject to certain risks similar to those associated with direct investments in real estate. REITs may be affected by changes in the value of their underlying properties and by defaults by tenants. REITs depend generally on their ability to generate cash flow to make distributions to shareholders, and certain REITs have self-liquidation provisions by which mortgages held may be paid in full and distributions of capital returns may be made at any time.
Disruptions to creations and redemptions, the existence of significant market volatility or potential lack of an active trading market for the Shares (including through a trading halt), as well as other factors, may result in Shares trading significantly above (at a premium) or below (at a discount) to the NAV or to the intraday value of the Fund’s holdings. During such periods, investors may incur significant losses if shares are sold.
The Fund may not track the return of the underlying index for a number of reasons and therefore may not achieve its investment objective. For example, the Fund incurs a number of operating expenses not applicable to its underlying index, and incurs costs in buying and selling securities, especially when rebalancing the Fund’s securities holdings to reflect changes in the composition of the underlying index. In addition, a Fund’s return may differ from the return of its underlying index as a result of, among other things, pricing differences and the inability to purchase certain securities included in the underlying index due to regulatory or other restrictions. To the extent of the previously outlined items, the Fund’s return differs from the return of the underlying index.
Derivatives may be riskier than other types of investments because they may be more sensitive to changes in economic and market conditions and could result in losses that significantly exceed the Funds’ original investment. Derivatives also expose the Funds to counterparty risk (the risk that the derivative counterparty will not fulfill its contractual obligations), including credit risk of the derivative counterparty.
8. New Accounting Pronouncement
In August 2018, the Financial Accounting Standard Board (“FASB”) issued Accounting Standard Update (“ASU”) 2018-13 (“ASU 2018-13”), Fair Value Measurement (Topic 820): Disclosure Framework — Changes to the Disclosure Requirements for Fair Value Measurement, which adds, removes, and modifies certain aspects of the fair value disclosure. ASU 2018-13 amendments are the result of a broader disclosure project, FASB Concepts Statement Conceptual Framework for Financial Reporting — Chapter 8: Notes to Financial Statements, to improve the effectiveness of the fair value disclosure requirements. ASU 2018-13 is effective for the fiscal years, and interim periods within those fiscal years, beginning after December 15, 2019; early adoption is permitted. Management is currently evaluating the implications of these changes.
| 20 | J.P. MORGAN EXCHANGE-TRADED FUNDS | AUGUST 31, 2018 | ||||
SCHEDULE OF SHAREHOLDER EXPENSES
(Unaudited)
Hypothetical $1,000 Investment
As a shareholder of the Fund, you incur ongoing costs, investment advisory fees, administration fees and other Fund expenses, in addition to brokerage commissions on your purchases and sales of Fund shares. The examples below are intended to help you understand your ongoing costs (in dollars) of investing in the Fund and to compare these ongoing costs with the ongoing costs of investing in other funds. The examples assume that you had a $1,000 investment at the beginning of the reporting period June 15, 2018 and continued to hold your shares at the end of the reporting period, August 31, 2018.
Actual Expenses
For the Fund in the table below, the first line provides information about actual account values and actual expenses. You may use the information in this line, together with the amount you invested, to estimate the expenses that you paid over the period. Simply divide your account value by $1,000 (for example, an $8,600 account value divided by $1,000 = 8.6),
then multiply the result by the number under the heading entitled “Expenses Paid During the Period” to estimate the expenses you paid on your account during this period.
Hypothetical Example for Comparison Purposes
The second line in the table below provides information about hypothetical account values and hypothetical expenses based on the Fund’s actual expense ratio and an assumed rate of return of 5% per year before expenses, which is not the Fund’s actual return. The hypothetical account values and expenses may not be used to estimate the actual ending account balance or expenses you paid for the period. You may use this information to compare the ongoing costs of investing in the Fund and other Funds. To do so, compare this 5% hypothetical example with the 5% hypothetical examples that appear in the shareholder reports of other funds. The examples also assume all dividends and distributions have been reinvested.
| Beginning Account Value June 15, 2018 | Ending Account Value August 31, 2018 | Annualized Expense Ratio | Expenses Paid During the Period | |||||||||||||
JPMorgan BetaBuilders MSCI US REIT ETF | ||||||||||||||||
Actual (1) | $ | 1,000.00 | $ | 1,069.90 | 0.08 | % | $ | 0.17 | ||||||||
Hypothetical (2) | 1,000.00 | 1,024.80 | 0.08 | 0.41 | ||||||||||||
| (1) | Expenses are equal to the Fund’s annualized expense ratio, multiplied by the average account value over the period, multiplied by 75/365 (to reflect the actual period). The Fund commenced operations on June 15, 2018. |
| (2) | Expenses are equal to each Fund’s annualized net expense ratio, multiplied by the average account value over the period, multiplied by 184/365 (to reflect the one-half year period). |
| AUGUST 31, 2018 | J.P. MORGAN EXCHANGE-TRADED FUNDS | 21 | ||||||
BOARD APPROVAL OF INITIAL INVESTMENT ADVISORY AGREEMENT
(Unaudited)
On March 13-14, 2018, the Board of Trustees held an in-person meeting and approved the initial investment advisory agreement (the “Advisory Agreement”) for the JPMorgan BetaBuilders MSCI US REIT ETF (the “Fund”). The Advisory Agreement was approved by a majority of the Trustees who are not “Interested Persons” (as defined in the 1940 Act) of any party to the Advisory Agreement or any of their affiliates. In connection with the approval of the Advisory Agreement, the Trustees reviewed written materials prepared by the Adviser and received oral presentations from Adviser personnel. Before voting on the proposed Advisory Agreement, the Trustees reviewed the Advisory Agreement with representatives of the Adviser and with counsel to the Trust and independent legal counsel to the Trustees and received a memorandum from independent legal counsel discussing the legal standards for their consideration of the proposed Advisory Agreement. The Trustees also discussed the proposed Advisory Agreement in executive session with independent legal counsel at which no representatives of the Adviser were present. Set forth below is a summary of the material factors evaluated by the Trustees in determining whether to approve the Advisory Agreement.
The Trustees considered information provided with respect to the Fund and the approval of the Advisory Agreement. Each Trustee attributed his or her own evaluation of the significance of the various factors, and no factor alone was considered determinative. The Trustees determined that the proposed compensation to be received by the Adviser from the Fund under the Advisory Agreement was fair and reasonable and that the initial approval of the Advisory Agreement was in the best interests of the Fund and its potential shareholders.
The factors summarized below were considered and discussed by the Trustees in reaching their conclusions:
Nature, Extent and Quality of Services Provided by the Adviser
In connection with the approval of the initial Advisory Agreement, the Trustees considered the materials furnished specifically in connection with the approval of the Advisory Agreement, as well as other relevant information furnished for the Trustees. The Trustees considered the background and experience of the Adviser’s senior management and investment personnel of the Adviser. In addition, the Trustees reviewed the qualifications, backgrounds and responsibilities of the portfolio management team primarily responsible for the day-to-day management of the Fund. The Trustees also considered the investment strategy for the Fund, and the infrastructure supporting the portfolio management team. In addition, the Trustees considered information about the structure and distribution strategy of the Fund, how it fits within the Trust’s other fund offerings, and how it will be positioned against peer funds, as identified by management.
The Trustees also considered their knowledge of the nature and quality of the services provided by the Adviser and its affiliates
gained from their experience as Trustees of the Trust and in the financial industry generally. In addition, they considered the overall reputation and capabilities of the Adviser and its affiliates, the commitment of the Adviser to provide high quality service to the Fund, their overall confidence in the Adviser’s integrity and the Adviser’s responsiveness to requests for additional information, questions or concerns raised by them.
Based upon these considerations and other factors, the Trustees concluded that they were satisfied with the nature, extent and quality of services to be provided to the Fund by the Adviser.
Fall-Out Benefits
The Trustees reviewed information regarding potential “fall-out” or ancillary benefits received by the Adviser and its affiliates as a result of their relationship with the Trust.
The Trustees also considered the fees that J.P. Morgan Investment Management Inc., in its role as Administrator, will earn from the Fund for providing administrative services. The Trustees also considered the fees paid to JPMorgan Chase Bank, N.A., an affiliate of the Adviser, for custody, transfer agency and other related services for the Fund. Additionally, the Trustees considered that any fall-out or ancillary benefits would be comparable to those related to the other funds in the complex.
Economies of Scale
The Trustees considered the extent to which the Fund will benefit from economies of scale. The Trustees noted that neither the proposed investment advisory fee schedule nor the proposed administration agreement for the Fund contain breakpoints. The Trustees considered whether it would be appropriate to add advisory fee breakpoints and the Trustees concluded that the current fee structure for the Fund was reasonable in light of the fee waivers and expense limitations that the Adviser has in place, limiting the overall net expense ratio of the Fund to competitive levels. With respect to fees for administrative services, the Trustees also considered the fact that the Fund would benefit from the economies of scale present in the broader J.P. Morgan fund complex, as the Fund was able to negotiate an administration fee at a level consistent with the lower effective rate currently paid by the J.P. Morgan mutual funds, which includes breakpoints. The Trustees also took into consideration management’s belief that because of such economies of scale, the Fund’s administration fee is lower than what the Fund would have to pay if it was not part of the J.P. Morgan fund complex.
Investment Performance
The Trustees considered the Fund’s investment strategy and processes, the portfolio management team and competitive positioning against identified peer funds, and concluded that the prospects for competitive future performance were acceptable.
| 22 | J.P. MORGAN EXCHANGE-TRADED FUNDS | AUGUST 31, 2018 | ||||
Advisory Fees and Expense Ratios
The Trustees considered the contractual advisory fee rate that will be paid by the Fund to the Adviser and compared that rate to the fees charged to mutual funds with similar investment objectives or in similar asset classes managed by the Adviser, as well as information prepared by Broadridge Investor Communications Solutions Inc., using data from Lipper Inc. (together, “Broadridge/Lipper”), independent providers of investment company data, concerning management fee rates paid by other funds in the same Broadridge/Lipper category as the Fund. The Trustees also reviewed information about other projected expenses and the expense ratio for the Fund. The
Trustees considered the projected fee waiver and/or expense reimbursement arrangements proposed for the Fund and considered the net advisory fee rate after taking into account any projected waivers and/or reimbursements.
The Trustees noted that the Fund’s estimated net advisory fee and total expenses were in line with identified peer funds. The Trustees also noted that because the Fund was not yet operational, no profitability information was available. After considering the factors identified above, in light of the information, the Trustees concluded that the advisory fee was reasonable.
| AUGUST 31, 2018 | J.P. MORGAN EXCHANGE-TRADED FUNDS | 23 | ||||||
J.P. Morgan Exchange-Traded Funds are distributed by JPMorgan Distribution Services, Inc, an indirect, wholly-owned subsidiary of JPMorgan Chase & Co.
Contact J.P. Morgan Exchange-Traded Funds at 1-844-457-6383 (844-4JPM ETF) for a fund prospectus. You can also visit us at www.jpmorganfunds.com. Investors should carefully consider the investment objectives and risks as well as charges and expenses of the fund before investing. The prospectus contains this and other information about the fund. Read the prospectus carefully before investing.
Investors may obtain information about the Securities Investor Protection Corporation (SIPC), including the SIPC brochure, by visiting www.sipc.org or by calling SIPC at 202-371-8300.
The Fund files a complete schedule of its fund holdings for the first and third quarters of its fiscal year with the SEC on Form N-Q. The Fund’s Forms N-Q is available on the SEC’s website at http://www.sec.gov and may be reviewed and copied at the SEC’s Public Reference Room in Washington, DC. Information on the operation of the SEC’s Public Reference Room may be obtained by calling 1-800-SEC-0330. Shareholders may request the Form N-Q without charge by calling 1-844-457-6383 or by visiting the J.P. Morgan Funds’ website at www.jpmorganfunds.com.
A description of each Fund’s policies and procedures with respect to the disclosure of each Fund’s holdings is available in the prospectus and Statement of Additional Information.
A copy of proxy policies and procedures is available without charge upon request by calling 1-844-457-6383 and on the Fund’s website at www.jpmorganfunds.com. A description of such policies and procedures is on the SEC’s website at www.sec.gov. The Trustees have delegated the authority to vote proxies for securities owned by the Fund to the Adviser. A copy of the Fund’s voting record for the most recent 12-month period ended June 30 is available on the SEC’s website at www.sec.gov or at the Fund’s website at www.jpmorganfunds.com no later than August 31 of each year. The Fund’s proxy voting record will include, among other things, a brief description of the matter voted on for each fund security, and will state how each vote was cast, for example, for or against the proposal.


J.P. Morgan Asset Management is the marketing name for the asset management businesses of JPMorgan Chase & Co. Those businesses include, but are not limited to, J.P. Morgan Investment Management Inc., Security Capital Research & Management Incorporated and J.P. Morgan Alternative Asset Management, Inc.
| © JPMorgan Chase & Co., 2018. All rights reserved. August 2018. | SAN-RETF-818 |
ITEM 2. CODE OF ETHICS.
Disclose whether, as of the end of the period covered by the report, the registrant has adopted a code of ethics that applies to the registrant’s principal executive officer, principal financial officer, principal accounting officer or controller, or persons performing similar functions, regardless of whether these individuals are employed by the registrant or a third party. If the registrant has not adopted such a code of ethics, explain why it has not done so.
The registrant must briefly describe the nature of any amendment, during the period covered by the report, to a provision of its code of ethics that applies to the registrant’s principal executive officer, principal financial officer, principal accounting officer or controller, or persons performing similar functions, regardless of whether these individuals are employed by the registrant or a third party, and that relates to any element of the code of ethics definition enumerated in paragraph (b) of this Item. The registrant must file a copy of any such amendment as an exhibit pursuant to Item 13(a)(1), unless the registrant has elected to satisfy paragraph (f) of this Item by positing its code of ethics on its website pursuant to paragraph (f)(2) of this Item, or by undertaking to provide its code of ethics to any person without charge, upon request, pursuant to paragraph (f)(3) of this Item.
If the registrant has, during the period covered by the report, granted a waiver, including an implicit waiver, from a provision of the code of ethics that applies to the registrant’s principal executive officer, principal financial officer, principal accounting officer or controller, or persons performing similar functions, regardless of whether these individuals are employed by the registrant or third party, that relates to one or more items set forth in paragraph (b) of this Item, the registrant must briefly describe the nature of the waiver, the name of the person to whom the waiver was granted, and the date of the waiver.
Not applicable to a semi-annual report.
ITEM 3. AUDIT COMMITTEE FINANCIAL EXPERT.
(a) (1) Disclose that the registrant’s board of directors has determined that the registrant either:
(i) Has at least one audit committee financial expert serving on its audit committee; or
(ii) Does not have an audit committee financial expert serving on its audit committee.
(2) If the registrant provides the disclosure required by paragraph (a)(1)(i) of this Item, it must disclose the name of the audit committee financial expert and whether that person is “independent.” In order to be considered “independent” for purposes of this Item, a member of an audit committee may not, other than in his or her capacity as a member of the audit committee, the board of directors, or any other board committee:
(i) Accept directly or indirectly any consulting, advisory, or other compensatory fee from the issuer; or
(ii) Be an “interested person” of the investment company as defined in Section 2(a)(19) of the Act (15 U.S.C. 80a-2(a)(19)).
(3) If the registrant provides the disclosure required by paragraph (a)(1)(ii) of this Item, it must explain why it does not have an audit committee financial expert.
Not applicable to a semi-annual report.
ITEM 4. PRINCIPAL ACCOUNTANT FEES AND SERVICES.
(a) Disclose, under the caption Audit Fees, the aggregate fees billed for each of the last two fiscal years for professional services rendered by the principal accountant for the audit of the registrant’s annual financial statements or services that are normally provided by the accountant in connection with statutory and regulatory filings or engagements for those fiscal years.
(b) Disclose, under the caption Audit-Related Fees, the aggregate fees billed in each of the last two fiscal years for assurance and related services by the principal accountant that are reasonably related to the performance of the audit of the registrant’s financial statements and are not reported under paragraph (a) of this Item. Registrants shall describe the nature of the services comprising the fees disclosed under this category.
(c) Disclose, under the caption Tax Fees, the aggregate fees billed in each of the last two fiscal years for professional services rendered by the principal accountant for tax compliance, tax advice, and tax planning. Registrants shall describe the nature of the services comprising the fees disclosed under this category.
(d) Disclose, under the caption All Other Fees, the aggregate fees billed in each of the last two fiscal years for products and services provided by the principal accountant, other than the services reported in paragraphs (a) through (c) of this Item. Registrants shall describe the nature of the services comprising the fees disclosed under this category.
(e) (1) Disclose the audit committee’s pre-approval policies and procedures described in paragraph (c)(7) of Rule 2-01 of Regulation S-X.
(2) Disclose the percentage of services described in each of paragraphs (b) through (d) of this Item that were approved by the audit committee pursuant to paragraph (c)(7)(i)(C) of Rule 2-01 of Regulation S-X.
(f) If greater than 50 percent, disclose the percentage of hours expended on the principal accountant’s engagement to audit the registrant’s financial statements for the most recent fiscal year that were attributed to work performed by persons other than the principal accountant’s full-time, permanent employees.
(g) Disclose the aggregate non-audit fees billed by the registrant’s accountant for services rendered to the registrant, and rendered to the registrant’s investment adviser (not including any sub-adviser whose role is primarily portfolio management and is subcontracted with or overseen by another investment adviser), and any entity controlling, controlled by, or under common control with the adviser that provides ongoing services to the registrant for each of the last two fiscal years of the registrant.
(h) Disclose whether the registrant’s audit committee of the board of directors has considered whether the provision of non-audit services that were rendered to the registrant’s investment adviser (not including any subadviser whose role is primarily portfolio management and is subcontracted with or overseen by another investment adviser), and any entity controlling, controlled by, or under common control with the investment adviser that provides ongoing services to the registrant that were not pre-approved pursuant to paragraph (c)(7)(ii) of Rule 2-01 of Regulation S-X is compatible with maintaining the principal accountant’s independence.
Not applicable to a semi-annual report.
ITEM 5. AUDIT COMMITTEE OF LISTED REGISTRANTS.
(a) If the registrant is a listed issuer as defined in Rule 10A-3 under the Exchange Act (17CFR 240.10A-3), state whether or not the registrant has a separately-designated standing audit committee established in accordance with Section 3(a)(58)(A) of the Exchange Act (15 U.S.C. 78c(a)(58)(A)). If the registrant has such a committee, however designated, identify each committee member. If the entire board of directors is acting as the registrant’s audit committee as specified in Section 3(a)(58)(B) of the Exchange Act (15
U.S.C. 78c(a)(58)(B)), so state.
(b) If applicable, provide the disclosure required by Rule 10A-3(d) under the Exchange Act (17CFR 240.10A-3(d)) regarding an exemption from the listing standards for all audit committees.
Not applicable to a semi-annual report.
ITEM 6. SCHEDULE OF INVESTMENTS.
File Schedule I – Investments in securities of unaffiliated issuers as of the close of the reporting period as set forth in Section 210.12-12 of Regulation S-X, unless the schedule is included as part of the report to shareholders filed under Item 1 of this Form.
Included in Item 1.
ITEM 7. DISCLOSURE OF PROXY VOTING POLICIES AND PROCEDURES FOR CLOSED-END MANAGEMENT INVESTMENT COMPANIES.
Not applicable.
ITEM 8. PORTFOLIO MANAGERS OF CLOSED-END MANAGEMENT INVESTMENT COMPANIES.
Not applicable.
ITEM 9. PURCHASE OF EQUITY SECURITIES BY CLOSED-END MANAGEMENT INVESTMENT COMPANY AND AFFILIATED PURCHASERS.
Not applicable.
ITEM 10. SUBMISSION OF MATTERS TO A VOTE OF SECURITY HOLDERS.
Describe any material changes to the procedures by which shareholders may recommend nominees to the registrant’s board of directors, where those changes were implemented after the registrant last provided disclosure in response to the requirements of Item 7(d)(2)(ii)(G) of Schedule 14A (17 CFR 240.14a-101), or this Item.
No material changes to report.
ITEM 11. CONTROLS AND PROCEDURES.
(a) Disclose the conclusions of the registrant’s principal executive and principal financial officers, or persons performing similar functions, regarding the effectiveness of the registrant’s disclosure controls and procedures (as defined in Rule 30a-3(c) under the Act (17 CFR 270.30a-3(c))) as of a date within 90 days of the filing date of the report that includes the disclosure required by this paragraph, based on the evaluation of these controls and procedures required by Rule 30a-3(b) under the Act (17 CFR 270.30a-3(b))and Rules 13a-15(b) or 15d-15(b) under the Exchange Act (17 CFR 240.13a-15(b) or 240.15d-15(b)).
The Registrant’s principal executive and principal financial officers have concluded, based on their evaluation of the Registrant’s disclosure controls and procedures as of a date within 90 days of the filing date of this report, that the Registrant’s disclosure controls and procedures are reasonably designed to ensure that information required to be disclosed by the Registrant on Form N-CSR is recorded, processed, summarized and reported within the required time periods and that information required to be disclosed by the Registrant in the reports that it files or submits on Form N-CSR is accumulated and communicated to the Registrant’s management, including its principal executive and principal financial officers, as appropriate to allow timely decisions regarding required disclosure.
(b) Disclose any change in the registrant’s internal control over financial reporting (as defined in Rule 30a-3(d) under the Act (17 CFR 270.30a-3(d)) that occurred during the registrant’s second fiscal quarter of the period covered by this report that has materially affected, or is reasonably likely to materially affect, the registrant’s internal control over financial reporting.
There were no changes in the Registrant’s internal control over financial reporting that occurred during the last fiscal quarter covered by this report that have materially affected, or are reasonably likely to materially affect, the Registrant’s internal control over financial reporting.
ITEM 12. DISCLOSURE OF SECURITIES LENDING ACTIVITIES FOR CLOSED-END MANAGEMENT INVESTMENT COMPANIES.
Not applicable.
ITEM 13. EXHIBITS.
(a) File the exhibits listed below as part of this Form. Letter or number the exhibits in the sequence indicated.
(1) Any code of ethics, or amendment thereto, that is the subject of the disclosure required by Item 2, to the extent that the registrant intends to satisfy the Item 2 requirements through filing of an exhibit.
Not applicable.
(2) A separate certification for each principal executive officer and principal financial officer of the registrant as required by Rule 30a-2(a) under the Act (17 CFR 270.30a-2).
Certifications pursuant to Rule 30a-2(a) under the Investment Company Act of 1940 are attached hereto.
(3) Any written solicitation to purchase securities under Rule 23c-1 under the Act (17 CFR 270.23c-1) sent or given during the period covered by the report by or on behalf of the registrant to 10 or more persons.
Not applicable.
(b) A separate or combined certification for each principal executive officer and principal officer of the registrant as required by Rule 30a-2(b) under the Act of 1940.
Certifications pursuant to Rule 30a -2(b) under the Investment Company Act of 1940 are attached hereto.
SIGNATURES
Pursuant to the requirements of the Securities Exchange Act of 1934 and the Investment Company Act of 1940, the registrant has duly caused this report to be signed on its behalf by the undersigned, thereunto duly authorized.
| J.P. Morgan Exchange-Traded Fund Trust | ||
| By: | /s/ Joanna M. Gallegos | |
| Joanna M. Gallegos | ||
| President and Principal Executive Officer | ||
| November 5, 2018 | ||
Pursuant to the requirements of the Securities Exchange Act of 1934 and the Investment Company Act of 1940, this report has been signed below by the following persons on behalf of the registrant and in the capacities and on the dates indicated.
| By: | /s/ Joanna M. Gallegos | |
| Joanna M. Gallegos | ||
| President and Principal Executive Officer | ||
| November 5, 2018 |
| By: | /s/ Lauren A. Paino | |
| Lauren A. Paino | ||
| Treasurer and Principal Financial Officer | ||
| November 5, 2018 |