UNITED STATES
SECURITIES AND EXCHANGE COMMISSION
Washington, D.C. 20549
FORMN-CSR
CERTIFIED SHAREHOLDER REPORT OF REGISTERED
MANAGEMENT INVESTMENT COMPANIES
Investment Company Act file number:811-22903
J.P. Morgan Exchange-Traded Fund Trust
(Exact name of registrant as specified in charter)
277 Park Avenue
New York, NY 10172
(Address of principal executive offices) (Zip code)
Gregory S. Samuels
J.P. Morgan Investment Management Inc.
277 Park Avenue
New York, NY 10172
(Name and Address of Agent for Service)
With copies to:
| | |
| Elizabeth A. Davin, Esq. | | Jon S. Rand, Esq. |
| JPMorgan Chase & Co. | | Dechert LLP |
| 1111 Polaris Parkway | | 1095 Avenue of the Americas |
| Columbus, OH 43240 | | New York, NY 10036 |
Registrant’s telephone number, including area code: 1-844-457-6383
Date of fiscal year end: Last day of February
Date of reporting period: March 1, 2019 through August 31, 2019
FormN-CSR is to be used by management investment companies to file reports with the Commission not later than 10 days after the transmission to stockholders of any report that is required to be transmitted to stockholders under Rule30e-1 under the Investment Company Act of 1940 (17 CFR270.30e-1). The Commission may use the information provided on FormN-CSR in its regulatory, disclosure review, inspection, and policymaking roles.
A registrant is required to disclose the information specified by FormN-CSR, and the Commission will make this information public. A registrant is not required to respond to the collection of information contained in FormN-CSR unless the Form displays a currently valid Office of Management and Budget (“OMB”) control number. Please direct comments concerning the accuracy of the information collection burden estimate and any suggestions for reducing the burden to Secretary, Securities and Exchange Commission, 450 Fifth Street, NW, Washington, DC 20549-0609. The OMB has reviewed this collection of information under the clearance requirements of 44 U.S.C. Section 3507.
ITEM 1. REPORTS TO STOCKHOLDERS.
The following is a copy of the report transmitted to shareholders pursuant to Rule30e-1 under the Investment Company Act of 1940 (17 CFR270.30e-1).
Semi-Annual Report
J.P. Morgan Exchange-Traded Funds
August 31, 2019 (Unaudited)
JPMorgan BetaBuilders 1-5 Year U.S. Aggregate Bond ETF
JPMorgan Core Plus Bond ETF
JPMorgan Corporate Bond Research Enhanced ETF
JPMorgan Global Bond Opportunities ETF
JPMorgan High Yield Research Enhanced ETF (formerly known as JPMorgan Disciplined High Yield ETF)
JPMorgan Municipal ETF
JPMorgan U.S. Aggregate Bond ETF
JPMorgan Ultra-Short Income ETF
JPMorgan Ultra-Short Municipal Income ETF
JPMorgan USD Emerging Markets Sovereign Bond ETF
Beginning on January 1, 2021, as permitted by regulations adopted by the Securities and Exchange Commission, paper copies of the Funds’ annual and semi-annual shareholder reports will no longer be sent by mail, unless you specifically request paper copies of the reports. Instead, the reports will be made available on the Funds’ website www.jpmorganfunds.com and you will be notified by mail each time a report is posted and provided with a website to access the report. If you already elected to receive shareholder reports electronically, you will not be affected by this change and you need not take any action.
You may elect to receive shareholder reports and other communications from the Funds’ electronically anytime by contacting your financial intermediary (such as a broker dealer, bank, or retirement plan).
Alternatively, you may elect to receive paper copies of all future reports free of charge by contacting your financial intermediary. Your election to receive paper reports will apply to all funds held within your account(s).
CONTENTS
Investments in a Fund are not bank deposits or obligations of, or guaranteed or endorsed by, any bank and are not insured or guaranteed by the FDIC, the Federal Reserve Board or any other government agency. You could lose money if you sell when a Fund’s share price is lower than when you invested.
Past performance is no guarantee of future performance. The general market views expressed in this report are opinions based on market and other conditions through the end of the reporting period and are subject to change without notice. These views are not intended to predict the future performance of a Fund or the securities markets. References to specific securities and their issuers are for illustrative purposes only and are not intended to be, and should not be interpreted as, recommendations to purchase or sell such securities. Such views are not meant as investment advice and may not be relied on as an indication of trading intent on behalf of the Fund.
Prospective investors should refer to the Funds’ prospectuses for a discussion of the Funds’ investment objectives, strategies and risks. Call J.P. Morgan Exchange-Traded Funds at (844)457-6383 for a prospectus containing more complete information about a Fund, including management fees and other expenses. Please read it carefully before investing.
Shares are bought and sold throughout the day on an exchange at market price (not at net asset value) through a brokerage account, and are not individually subscribed and redeemed from a Fund. Shares may only be subscribed and redeemed directly from a Fund by Authorized Participants, in very large creation/redemption units. Brokerage commissions will reduce returns.
PRESIDENT’S LETTER
October 10, 2019 (Unaudited)
Dear Shareholder,
The upward trajectory of JPMorgan Exchange-Traded Funds’ growth has continued in 2019. So far this year, we’ve increased our assets under management to more than $27 billion; placing J.P. Morgan as a top five provider in ETF flows as of the end of September 2019.1 We continue to offer an expanding suite oflow-cost, liquid and transparent solutions for building well-diversified, well-priced portfolios. J. P. Morgan is proud to provide ETFs that can help each investor to achieve their goals.
| | |
 | | “Amid changing market environments, we believe that investors should have all the tools to build a diversified ETF portfolio — J.P. Morgan ETFs span asset classes, management styles and portfolio needs to help investors build portfolios that endure over market cycles.” |
While our ETF business has been progressing, the U.S. economic expansion slowed but remained above global growth trends through the six months ended August 31, 2019. U.S. equity and bond markets provided positive returns amid growth in corporate profits and continued strength in consumer spending. In July, the U.S. Federal Reserve cut interest rates for the first time in more than a decade, which provided further support for both equity and bond prices. However, a slowing global economy and a sharp increase in reciprocal trade tariffs between the U.S. and China led to increased volatility in financial markets and downward pressure on asset prices in August. For the six months, the S&P 500
| 1 | Bloomberg LP, September 30, 2019. |
returned 6.15% and the Bloomberg Barclays U.S. Aggregate Index returned 8.02%.
Amid an uncertain macro backdrop, we believe diversification is key — both across and within asset classes. As interest rate volatility increases, an appropriately diversified fixed income portfolio can help investors generate income and diversify equity volatility. J.P. Morgan’s fixed income ETFs offerlow-cost, research-driven choices to achieve critical objectives and build a diversified bond portfolio. Our full suite of fixed income solutions span across global markets and into factor-based and active strategies with the potential for better performance, lower risk and greater diversification to stocks.
We are proud to bring a range of investment solutions to help you navigate a changing market landscape. We are committed to building solutions that address your needs and help you build stronger portfolios. Thank you for your belief in our Firm and our process.
Sincerely,

Joanna M. Gallegos
President, J.P. Morgan Exchange-Traded Funds
J.P Morgan Asset Management
1-844-4JPM-ETF or jpmorgan.com/etfs for more information
| | | | | | | | |
| | | |
| AUGUST 31, 2019 | | J.P. MORGAN EXCHANGE-TRADED FUNDS | | | | | 1 | |
J.P. Morgan Exchange-Traded Funds
MARKET OVERVIEW
SIX MONTHS ENDED AUGUST 31, 2019 (Unaudited)
Both equity and bond markets in the U.S. provided positive returns for the six month reporting period amid continued U.S. economic growth, buoyant corporate earnings and the U.S. Federal Reserve’s first reduction in benchmark interest rates in more than a decade. Global bond markets generally provided positive returns, particularly in emerging markets and lower-rated corporate bonds, which benefitted from investor demand for higher yielding assets.
While financial markets largely rallied in the first months of the reporting period, investor concerns about slowing global economic growth and an increase in U.S.-China trade tensions drove an increase in market volatility and weighed down asset prices in the final months of the period.
Amid market volatility, investors flocked to longer-dated U.S. Treasury bonds in August, which drove the yields on the30-year U.S. Treasury bonds below 2% for the first time. More notably, yields on10-year U.S. Treasury bonds fell below yields ontwo-year U.S. Treasury bonds for the first time since 2007. Thisso-called yield curve inversion, which has preceded every U.S. economic recession since 1950, put further pressure on financial markets at the end of the reporting period.
For the six months ended August 31, 2019, the Bloomberg Barclays U.S. Aggregate Index returned 8.02% and the Bloomberg Barclays U.S. High Yield Bond Index returned 4.46%.
| | | | | | |
| | | |
| 2 | | | | J.P. MORGAN EXCHANGE-TRADED FUNDS | | AUGUST 31, 2019 |
JPMorgan BetaBuilders 1-5 Year U.S. Aggregate Bond ETF
FUND COMMENTARY
PERIOD MARCH 12, 2019 (FUND INCEPTION DATE) THROUGH AUGUST 31, 2019 (Unaudited)
| | | | |
| REPORTING PERIOD RETURN: | |
| Net Asset Value* | | | 3.56% | |
| Market Price** | | | 3.64% | |
| Bloomberg Barclays Short-Term US Aggregate Bond Index | | | 3.63% | |
| |
| Net Assets as of 8/31/2019 | | $ | 31,990,088 | |
| Duration as of 8/31/2019 | | | 2.6 Years | |
INVESTMENT OBJECTIVE***
The JPMorgan BetaBuilders1-5 Year U.S. Aggregate Bond ETF (the “Fund”) seeks investment results that closely correspond, before fees and expenses, to the performance of the Bloomberg Barclays Short-Term US Aggregate Bond Index (the “Underlying Index”),
INVESTMENT APPROACH
The Underlying Index, which includes bonds with remaining effective maturities between one and five years, is a subset of the Bloomberg Barclays US Aggregate Index which consists of U.S. dollar denominated investment-grade taxable bonds. Using a “passive” investment approach, the Fund attempts to replicate the Underlying Index as closely as possible and invests at least 80% of its assets in securities included in the Underlying Index.
HOW DID THE FUND PERFORM?
For the period from inception on March 12, 2019 to August 31, 2019, the Fund performed in line with the Underlying Index, before considering the effects of operating expenses, fees and tax management of the Fund’s portfolio.
The Fund and the Underlying Index’s exposure to U.S. Treasury bonds was a leading contributor to performance during the reporting period. The Fund’s and the Underlying Index’s exposures to U.S. agency mortgage backed securities was a leading detractor from performance.
HOW WAS THE FUND POSITIONED?
At the end of the reporting period, the Fund’s and the Underlying Index’s largest allocations were in the U.S. Treasury and corporate bond sectors and the smallest allocations were in the securitized debt and government related bond sectors.
| | | | |
PORTFOLIO COMPOSITION**** | |
| U.S. Treasury Obligations | | | 57.9 | % |
| Corporate Bonds | | | 25.1 | |
| Mortgage-Backed Securities | | | 6.7 | |
| Supranational | | | 2.9 | |
| U.S. Government Agency Securities | | | 2.3 | |
| Commercial Mortgage-Backed Securities | | | 1.9 | |
| Foreign Government Securities | | | 1.4 | |
| Asset-Backed Securities | | | 1.1 | |
| Municipal Bonds | | | 0.1 | |
| Short-Term Investments | | | 0.6 | |
| * | | The return shown is based on net asset value calculated for shareholder transactions and may differ from the return shown in the financial highlights, which reflects adjustments made to the net asset value in accordance with accounting principles generally accepted in the United States of America. The net asset value was $25.59 as of August 31, 2019. |
| ** | | Market price return is calculated assuming an initial investment made at the inception date net asset value, reinvestment of all dividends and distributions at market price during the period, and sale at the market price on the last day of the period. The price used to calculate the market price return is the midpoint of the bid/ask spread at the close of business on the Cboe BZX Exchange, Inc. The midpoint price was $25.61 as of August 31, 2019. |
| *** | | The adviser seeks to achieve the Fund’s objective. There can be no guarantee it will be achieved. |
| **** | | Percentages indicated are based on total investments as of August 31, 2019. The Fund’s composition is subject to change. |
| | | | | | | | |
| | | |
| AUGUST 31, 2019 | | J.P. MORGAN EXCHANGE-TRADED FUNDS | | | | | 3 | |
JPMorgan BetaBuilders 1-5 Year U.S. Aggregate Bond ETF
FUND COMMENTARY
PERIOD MARCH 12, 2019 (FUND INCEPTION DATE) THROUGH AUGUST 31, 2019 (Unaudited) (continued)
| | | | | | | | |
TOTAL RETURNSAS OF AUGUST 31, 2019 (Unaudited) | |
| | | INCEPTION DATE | | | CUMULATIVE
SINCE
INCEPTION | |
JPMorgan Betabuilders1-5 Year U.S. Aggregate Bond ETF | | | | | | | | |
Net Asset Value | | | March 12, 2019 | | | | 3.56 | % |
Market Price | | | | | | | 3.64 | % |
LIFE OF FUND PERFORMANCE(3/12/19 TO 8/31/19)
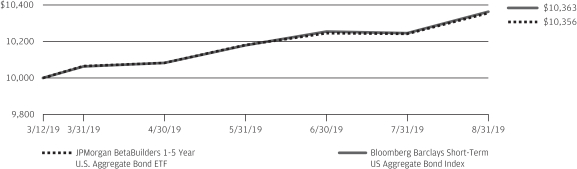
The performance quoted is past performance and is not a guarantee of future results. Exchange-traded funds are subject to certain market risks. Investment returns and principal value of an investment will fluctuate so that an investor’s shares, when sold or redeemed, may be worth more or less than their original cost. Current performance may be higher or lower than the performance data shown. For up-to-date, month-end performance information please call 1-844-457-6383.
Fund commenced operations on March 12, 2019.
The graph illustrates comparative performance for $10,000 invested in shares of the JPMorgan BetaBuilders 1-5 Year U.S. Aggregate Bond ETF and the Bloomberg Barclays Short-Term US Aggregate Bond Index from March 12, 2019 to August 31, 2019. The performance of the Fund reflects the deduction of Fund expenses and assumes reinvestment of all dividends and capital gain distributions, if any. The performance of the Bloomberg Barclays Short-Term US Aggregate Bond Index does not reflect the deduction of expenses associated with an exchange-traded fund and has been adjusted to reflect reinvestment of
all dividends and capital gain distributions of the securities included in the Index, if applicable. The Bloomberg Barclays Short-Term US Aggregate Bond Index is an unmanaged index that represents securities that are SEC-registered, taxable, and dollar denominated. The index covers the U.S. investment grade fixed rate bond market, with index components for government and corporate securities, mortgage pass-through securities, and asset-backed securities. Investors cannot invest directly in an index.
Fund performance reflects the waiver of the Fund’s fees and reimbursement of expenses for certain periods since the inception date. Without these waivers and reimbursements, performance would have been lower. Also, performance shown in this section does not reflect the deduction of taxes that a shareholder may pay on Fund distributions or redemption or sale of Fund shares.
The returns shown are based on net asset values calculated for shareholder transactions and may differ from the returns shown in the financial highlights, which reflect adjustments made to the net asset values in accordance with accounting principles generally accepted in the United States of America.
| | | | | | |
| | | |
| 4 | | | | J.P. MORGAN EXCHANGE-TRADED FUNDS | | AUGUST 31, 2019 |
JPMorgan Core Plus Bond ETF
FUND COMMENTARY
SIX MONTHS ENDED AUGUST 31, 2019 (Unaudited)
| | | | |
| REPORTING PERIOD RETURN: | |
| Net Asset Value* | | | 7.71% | |
| Market Price** | | | 7.68% | |
| Bloomberg Barclays US Aggregate Index | | | 8.02% | |
| |
| Net Assets as of 8/31/2019 | | $ | 32,078,250 | |
| Duration as of 8/31/2019 | | | 6.1 Years | |
INVESTMENT OBJECTIVE***
The JPMorgan Core Plus Bond ETF (the “Fund”) seeks to provide a high level of current income by investing primarily in a diversified portfolio of high, medium andlow-grade debt securities.
INVESTMENT APPROACH
The Fund invests primarily in investment grade bonds, with the flexibility to invest up to 35% in high yield debt (also known as “junk bonds”). Up to 35% of the Fund’s assets may be invested in foreign securities. The portfolio managers allocate the Fund’s assets among a range of sectors based on strategic positioning and other tactical considerations. In buying and selling investments for the Fund, the adviser looks for market sectors and securities that it believes will perform well over time. The adviser selects individual securities after performing a risk/reward analysis that includes an evaluation of interest rate risk, credit risk, currency risk, legal provisions and the structure of the transactions
HOW DID THE FUND PERFORM?
For the six months ended August 31, 2019, the Fund underperformed the Bloomberg Barclays US Aggregate Index (the “Index”).
The Fund’sout-of-Index allocation to high yield corporate bonds was a leading contributor to relative performance. The Fund’s overweight position and security selection in short-dated securitized credit sectors, including asset-backed securities and commercial mortgage-backed securities also contributed to relative performance.
Relative to the Index, the Fund’s underweight position in investment grade credit detracted from performance. Agency mortgage-backed securities had negative performance for the reporting period and the Fund’s overweight position in the sector also detracted from relative performance.
HOW WAS THE FUND POSITIONED?
The Fund’s portfolio managers focused on security selection and relative value, which seeks to take advantage of pricing discrepancies between individual securities or market sectors. The managers employed macro-economic analysis to
determine asset allocations and positioning on the yield curve. The yield curve shows the relationship between yields and maturity dates for a set of similar bonds at a given point in time. The Fund’s portfolio managers usedbottom-up research andtop-down macro perspective to construct a diversified portfolio of fixed income securities. As a result of this process, the Fund’s largest sector allocations at the end of the reporting period were in mortgage-backed securities and U.S. Treasuries and its smallest allocations were in emerging markets debt and commercial mortgage-backed securities.
| | | | |
PORTFOLIO COMPOSITION**** | |
| Corporate Bonds | | | 26.1 | % |
| Mortgage-Backed Securities | | | 17.4 | |
| U.S. Treasury Obligations | | | 14.9 | |
| Asset-Backed Securities | | | 13.0 | |
| Collateralized Mortgage Obligations | | | 6.1 | |
| Commercial Mortgage-Backed Securities | | | 6.1 | |
| Others (each less than 1.0%) | | | 0.0 | (a) |
| Short-Term Investments | | | 16.4 | |
| (a) | | Amount rounds to less than 0.1%. |
| * | | The return shown is based on net asset value calculated for shareholder transactions and may differ from the return shown in the financial highlights, which reflects adjustments made to the net asset value in accordance with accounting principles generally accepted in the United States of America. The net asset value was $53.46 as of August 31, 2019. |
| ** | | Market price return is calculated assuming an initial investment made at the inception date net asset value, reinvestment of all dividends and distributions at market price during the period, and sale at the market price on the last day of the period. The price used to calculate the market price return is the midpoint of the bid/ask spread at the close of business on the Cboe BZX Exchange, Inc. The midpoint price was $53.57 as of August 31, 2019. |
| *** | | The adviser seeks to achieve the Fund’s objective. There can be no guarantee it will be achieved. |
| **** | | Percentages indicated are based on total investments as of August 31, 2019. The Fund’s composition is subject to change. |
| | | | | | | | |
| | | |
| AUGUST 31, 2019 | | J.P. MORGAN EXCHANGE-TRADED FUNDS | | | | | 5 | |
JPMorgan Core Plus Bond ETF
FUND COMMENTARY
SIX MONTHS ENDED AUGUST 31, 2019 (Unaudited) (continued)
| | | | | | | | | | | | |
TOTAL RETURNSAS OF AUGUST 31, 2019 (Unaudited) | |
| | | INCEPTION DATE | | | SIX MONTHS* | | | CUMULATIVE
SINCE
INCEPTION | |
JPMorgan Core Plus Bond ETF | | | | | | | | | | | | |
Net Asset Value | | | January 28, 2019 | | | | 7.71 | % | | | 8.76 | % |
Market Price | | | | | | | 7.68 | % | | | 8.98 | % |
LIFE OF FUND PERFORMANCE(1/28/19 TO 8/31/19)
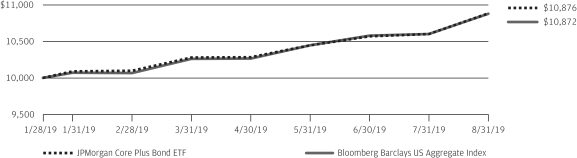
The performance quoted is past performance and is not a guarantee of future results. Exchange-traded funds are subject to certain market risks. Investment returns and principal value of an investment will fluctuate so that an investor’s shares, when sold or redeemed, may be worth more or less than their original cost. Current performance may be higher or lower than the performance data shown. For up-to-date, month-end performance information please call 1-844-457-6383.
Fund commenced operations on January 28, 2019.
The graph illustrates comparative performance for $10,000 invested in shares of the JPMorgan Core Plus Bond ETF and the Bloomberg Barclays US Aggregate Index from January 28, 2019 to August 31, 2019. The performance of the Fund reflects the deduction of Fund expenses and assumes reinvestment of all dividends and capital gain distributions, if any. The performance of the Bloomberg Barclays US Aggregate Index does not reflect the deduction of expenses associated with an exchange-traded fund and has been adjusted to reflect reinvestment of all dividends and capital gain distributions of the securities
included in the Index, if applicable. The Bloomberg Barclays US Aggregate Index is an unmanaged index that represents securities that are SEC-registered, taxable, and dollar denominated. The index covers the U.S. investment grade fixed rate bond market, with index components for government and corporate securities, mortgage pass-through securities, and asset-backed securities. Investors cannot invest directly in an index.
Fund performance reflects the waiver of the Fund’s fees and reimbursement of expenses for certain periods since the inception date. Without these waivers and reimbursements, performance would have been lower. Also, performance shown in this section does not reflect the deduction of taxes that a shareholder may pay on Fund distributions or redemption or sale of Fund shares.
The returns shown are based on net asset values calculated for shareholder transactions and may differ from the returns shown in the financial highlights, which reflect adjustments made to the net asset values in accordance with accounting principles generally accepted in the United States of America.
| | | | | | |
| | | |
| 6 | | | | J.P. MORGAN EXCHANGE-TRADED FUNDS | | AUGUST 31, 2019 |
JPMorgan Corporate Bond Research Enhanced ETF
FUND COMMENTARY
SIX MONTHS ENDED AUGUST 31, 2019 (Unaudited)
| | | | |
| REPORTING PERIOD RETURN: | |
| Net Asset Value* | | | 11.26% | |
| Market Price** | | | 11.21% | |
| Bloomberg Barclays U.S. Corporate Bond Index | | | 11.08% | |
| |
| Net Assets as of 8/31/2019 | | $ | 29,344,923 | |
| Duration as of 8/31/2019 | | | 7.9 Years | |
INVESTMENT OBJECTIVE***
The JPMorgan Corporate Bond Research Enhanced ETF (the “Fund”) seeks to provide total return from a portfolio of investment grade corporate bonds.
INVESTMENT APPROACH
The Fund invests primarily in investment grade bonds and uses fundamental credit research for enhanced security selection and sector allocation. The Fund seeks to outperform the Bloomberg Barclays U.S. Corporate Bond Index while maintaining similar risk characteristics.
HOW DID THE FUND PERFORM?
For the six months ended August 31, 2019, the Fund outperformed the Bloomberg Barclays U.S. Corporate Bond Index (the “Index”).
Relative to the Index, the Fund’s security selection within the energy and communications sectors was a leading contributor to performance during the reporting period. The Fund’s overweight position in Anadarko Petroleum Corp. was the largest contributor to performance as the company’s bonds benefitted from the company’s acquisition by Occidental Petroleum Corp.
In the communications sector, the Fund’s positions in Vodafone Group PLC and Verizon Communications Inc. helped relative performance.
The Fund’s underweight position in the technology sector detracted from relative performance as some of the higher quality, large issuers such as Microsoft Corp. and Apple Inc. outperformed during the period. The Fund’s underweight position in the insurance subsector also detracted from performance.
HOW WAS THE FUND POSITIONED?
During the reporting period, the Fund’s portfolio managers sought to invest in companies that they believed were attractive from a fundamental and relative value analysis, while seeking to underweight companies that were unattractive based on their analysis. From a sector perspective, the Fund remained largely in line with the sector weightings in the Index, with its largest underweight allocations in the consumer cyclical and technology sectors, and its largest overweight allocations in the financial and capital goods sectors.
| | | | |
PORTFOLIO COMPOSITION**** | |
| Corporate Bonds | | | 97.7 | % |
| U.S. Treasury Obligations | | | 1.2 | |
| Asset-Backed Securities | | | 0.1 | |
| Short-Term Investments | | | 1.0 | |
| * | | The return shown is based on net asset value calculated for shareholder transactions and may differ from the return shown in the financial highlights, which reflects adjustments made to the net asset value in accordance with accounting principles generally accepted in the United States of America. The net asset value was $55.90 as of August 31, 2019. |
| ** | | Market price return is calculated assuming an initial investment made at the inception date net asset value, reinvestment of all dividends and distributions at market price during the period, and sale at the market price on the last day of the period. The price used to calculate the market price return is the midpoint of the bid/ask spread at the close of business on the NYSE Arca, Inc. The midpoint price was $56.00 as of August 31, 2019. |
| *** | | The adviser seeks to achieve the Fund’s objective. There can be no guarantee it will be achieved. |
| **** | | Percentages indicated are based on total investments as of August 31, 2019. The Fund’s composition is subject to change. |
| | | | | | | | |
| | | |
| AUGUST 31, 2019 | | J.P. MORGAN EXCHANGE-TRADED FUNDS | | | | | 7 | |
JPMorgan Corporate Bond Research Enhanced ETF
FUND COMMENTARY
SIX MONTHS ENDED AUGUST 31, 2019 (Unaudited) (continued)
| | | | | | | | | | | | |
TOTAL RETURNSAS OF AUGUST 31, 2019 (Unaudited) | |
| | | INCEPTION DATE | | | SIX MONTHS* | | | CUMULATIVE
SINCE
INCEPTION | |
JPMorgan Corporate Bond Research Enhanced ETF | | | | | | | | | | | | |
Net Asset Value | | | December 12, 2018 | | | | 11.26 | % | | | 14.88 | % |
Market Price | | | | | | | 11.21 | % | | | 15.08 | % |
LIFE OF FUND PERFORMANCE(12/12/18 TO 8/31/19)
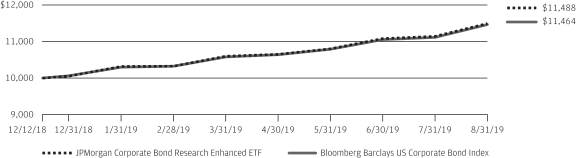
The performance quoted is past performance and is not a guarantee of future results. Exchange-traded funds are subject to certain market risks. Investment returns and principal value of an investment will fluctuate so that an investor’s shares, when sold or redeemed, may be worth more or less than their original cost. Current performance may be higher or lower than the performance data shown. For up-to-date, month-end performance information please call 1-844-457-6383.
Fund commenced operations on December 12, 2018.
The graph illustrates comparative performance for $10,000 invested in shares of the JPMorgan Corporate Bond Research Enhanced ETF and the Bloomberg Barclays US Corporate Bond Index from December 12, 2018 to August 31, 2019. The performance of the Fund reflects the deduction of Fund expenses and assumes reinvestment of all dividends and capital gain distributions, if any. The performance of the Bloomberg Barclays US Corporate Bond Index does not reflect the deduction of expenses associated with an exchange-traded fund and has been adjusted to reflect reinvestment of all dividends and capital gain
distributions of the securities included in the Index, if applicable. The Bloomberg Barclays US Corporate Bond Index broadly measures the investment grade, fixed-rate, taxable, corporate bond market. It includes USD denominated securities publicly issued by U.S. and non-U.S. industrial, utility, and financial issuers that meet specified maturity, liquidity, and quality requirements. Securities in the index roll up to the U.S. Credit and U.S. Aggregate Indices.
Fund performance reflects the waiver of the Fund’s fees and reimbursement of expenses for certain periods since the inception date. Without these waivers and reimbursements, performance would have been lower. Also, performance shown in this section does not reflect the deduction of taxes that a shareholder may pay on Fund distributions or redemption or sale of Fund shares.
The returns shown are based on net asset values calculated for shareholder transactions and may differ from the returns shown in the financial highlights, which reflect adjustments made to the net asset values in accordance with accounting principles generally accepted in the United States of America.
| | | | | | |
| | | |
| 8 | | | | J.P. MORGAN EXCHANGE-TRADED FUNDS | | AUGUST 31, 2019 |
JPMorgan Global Bond Opportunities ETF
FUND COMMENTARY
SIX MONTHS ENDED AUGUST 31, 2019 (Unaudited)
| | | | |
| REPORTING PERIOD RETURN: | |
| Net Asset Value* | | | 6.18% | |
| Market Price** | | | 6.32% | |
| Bloomberg Barclays Multiverse Index | | | 6.21% | |
| |
| Net Assets as of 8/31/2019 | | $ | 194,475,936 | |
| Duration as of 8/31/2019 | | | 4.2 Years | |
INVESTMENT OBJECTIVE***
The JPMorgan Global Bond Opportunities ETF (the “Fund”) seeks to provide total return.
INVESTMENT APPROACH
The Fund invests across sectors in developed and emerging markets without benchmark constraints. The Fund is flexible and opportunistic and the Fund’s adviser has broad discretion to shift the Fund’s exposures to strategies, sectors, countries or currencies based on changing market conditions and its view of the best mix of investment opportunities.
HOW DID THE FUND PERFORM?
For the six months ended August 31, 2019, the Fund posted a positive return of 6.18%. The Fund is managed with an unconstrained orientation and is not managed relative to a benchmark index. While the Fund is not managed to a benchmark, its return is compared to the Bloomberg Barclays Multiverse Index, which returned 6.21% for the reporting period.
The Fund’s allocations to corporate high yield bonds (also known as “junk bonds”), investment grade bonds, and emerging market debt were leading contributors to absolute performance. High yield bonds benefitted from investors seeking higher yields, positive investor sentiment and low default rates. The Fund’s allocation to securitized debt also contributed to absolute performance. During the reporting period, securitized debt benefitted from lower volatility relative to other bond market sectors and continued economic growth in the U.S.
There were no significant detractors from absolute performance. The Fund’s exposure to foreign currencies was the smallest contributor to absolute performance.
Relative to the Bloomberg Barclays Multiverse Index, the Fund’s shorter overall duration detracted from performance as interest rates fell during the period. Duration measures the price sensitivity of the portfolio of bonds relative to changes in interest rates. Generally, bonds with shorter duration will generally experience smaller price appreciation when interest rates fall, compared with bonds of longer duration.
HOW WAS THE FUND POSITIONED?
During the reporting period, the Fund invested opportunistically across different markets and sectors. The Fund’s managers applied a flexible investment approach and did not manage to a benchmark. This allowed the Fund to shift its allocations based on changing market conditions. The Fund had exposure to a broad range of asset classes during the reporting period, including high yield and investment grade corporate bonds, agency andnon-agency mortgage-backed securities, asset-backed securities, commercial mortgage-backed securities, emerging markets debt, convertible bonds and foreign government securities. At the end of the reporting period, the Fund’s largest allocations were in U.S. high yield bonds, government bonds and securitized debt. The Fund’s smallest allocations were innon-agency mortgage-backed securities, convertible bonds and collateralized loan obligations.
| | | | | | | | |
| | | |
| AUGUST 31, 2019 | | J.P. MORGAN EXCHANGE-TRADED FUNDS | | | | | 9 | |
JPMorgan Global Bond Opportunities ETF
FUND COMMENTARY
SIX MONTHS ENDED AUGUST 31, 2019 (Unaudited) (continued)
| | | | |
PORTFOLIO COMPOSITION BY COUNTRY**** | |
| United States | | | 46.2 | % |
| Spain | | | 5.0 | |
| Portugal | | | 4.2 | |
| Canada | | | 3.7 | |
| United Kingdom | | | 3.3 | |
| France | | | 2.8 | |
| Italy | | | 2.5 | |
| Indonesia | | | 1.6 | |
| South Africa | | | 1.6 | |
| Mexico | | | 1.6 | |
| Greece | | | 1.5 | |
| Luxembourg | | | 1.2 | |
| Germany | | | 1.2 | |
| Netherlands | | | 1.2 | |
| Switzerland | | | 1.2 | |
| Malaysia | | | 1.0 | |
| Ireland | | | 1.0 | |
| Poland | | | 1.0 | |
| Brazil | | | 1.0 | |
| Others (each less than 1.0%) | | | 13.2 | |
| Short-Term Investments | | | 4.0 | |
| * | | The return shown is based on net asset value calculated for shareholder transactions and may differ from the return shown in the financial highlights, which reflects adjustments made to the net asset value in accordance with accounting principles generally accepted in the United States of America. The net asset value was $51.18 as of August 31, 2019. |
| ** | | Market price return is calculated assuming an initial investment made at the market price at the beginning of the period, reinvestment of all dividends and distributions at market price during the period, and sale at the market price on the last day of the period. The price used to calculate the market price return is the midpoint of the bid/ask spread at the close of business on the Cboe BZX Exchange, Inc. The midpoint price was $51.33 as of August 31, 2019. |
| *** | | The adviser seeks to achieve the Fund’s objective. There can be no guarantee it will be achieved. |
| **** | | Percentages indicated are based on total investments as of August 31, 2019. The Fund’s composition is subject to change. |
| | | | | | |
| | | |
| 10 | | | | J.P. MORGAN EXCHANGE-TRADED FUNDS | | AUGUST 31, 2019 |
| | | | | | | | | | | | | | | | |
AVERAGE ANNUAL TOTAL RETURNSAS OF AUGUST 31, 2019 (Unaudited) | |
| | | INCEPTION DATE | | | SIX MONTHS* | | | 1 YEAR | | | SINCE
INCEPTION | |
JPMorgan Global Bond Opportunities ETF | | | | | | | | | | | | | | | | |
| Net Asset Value | | | April 5, 2017 | | | | 6.18 | % | | | 8.94 | % | | | 5.01 | % |
| Market Price | | | | | | | 6.32 | % | | | 9.27 | % | | | 5.13 | % |
LIFE OF FUND PERFORMANCE(4/5/17 TO 8/31/19)
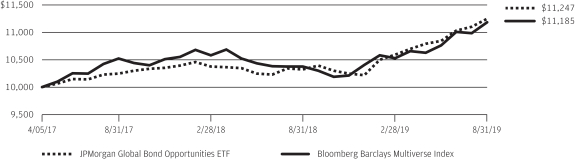
The performance quoted is past performance and is not a guarantee of future results. Exchange-traded funds are subject to certain market risks. Investment returns and principal value of an investment will fluctuate so that an investor’s shares, when sold or redeemed, may be worth more or less than their original cost. Current performance may be higher or lower than the performance data shown. Forup-to-date,month-end performance information please call1-844-457-6383.
Fund commenced operations on April 5, 2017.
The graph illustrates comparative performance for $10,000 invested in shares of the JPMorgan Global Bond Opportunities ETF and the Bloomberg Barclays Multiverse Index from April 5, 2017 to August 31, 2019. The performance of the Fund reflects the deduction of Fund expenses and assumes reinvestment of all dividends and capital gain distributions, if any. The performance of the Bloomberg Barclays Multiverse Index does not reflect the deduction of expenses associated with an exchange-traded fund and has been adjusted to reflect reinvestment of all dividends and capital gain distributions of the securities included in the Index, if applicable.
The Bloomberg Barclays Multiverse Index is an unmanaged index, which measure the global fixed-income bond market that combines the Bloomberg Barclays Global Aggregate Index and the Bloomberg Barclays Global High Yield Index. The Bloomberg Barclays Global Aggregate Index measures global investment grade debt from twenty-four different local currency markets. The Bloomberg Barclays Global High-Yield Index measures the global high-yield fixed income markets. Investors cannot invest directly in an index.
Fund performance reflects the partial waiver of the Fund’s fees and reimbursement of expenses for certain periods since the inception date. Without these waivers and reimbursements, performance would have been lower. Also, performance shown in this section does not reflect the deduction of taxes that a shareholder may pay on Fund distributions or redemption or sale of Fund shares.
The returns shown are based on net asset values calculated for shareholder transactions and may differ from the returns shown in the financial highlights, which reflect adjustments made to the net asset values in accordance with accounting principles generally accepted in the United States of America.
| | | | | | | | |
| | | |
| AUGUST 31, 2019 | | J.P. MORGAN EXCHANGE-TRADED FUNDS | | | | | 11 | |
JPMorgan High Yield Research Enhanced ETF
(formerly known as JPMorgan Disciplined High Yield ETF)1
FUND COMMENTARY
SIX MONTHS ENDED AUGUST 31, 2019 (Unaudited)
| | | | |
| REPORTING PERIOD RETURN: | |
| Net Asset Value* | | | 5.46% | |
| Market Price** | | | 5.71% | |
| ICE BofAML US High Yield Index | | | 4.51% | |
| Bloomberg Barclays US Aggregate Index | | | 8.02% | |
| |
| Net Assets as of 8/31/2019 | | $ | 164,107,476 | |
| Duration as of 8/31/2019 | | | 3.1 Years | |
INVESTMENT OBJECTIVE***
The JPMorgan High Yield Research Enhanced ETF (the “Fund”) seeks to provide a high level of income. Capital appreciation is a secondary objective.
INVESTMENT APPROACH
The Fund invests in a diversified portfolio of high-yield securities (also called “junk bonds”). Issuers may be domestic or foreign, but the Fund only invests in U.S. dollar-denominated investments.
HOW DID THE FUND PERFORM?
For the six months ended August 31, 2019, the Fund posted a positive absolute performance and outperformed the ICE BofAML US High Yield Index (the “Benchmark”) and underperformed the Bloomberg Barclays US Aggregate Index.
During the reporting period, bonds rated CCC and lower significantly underperformed bonds rated BB andsingle-B as prices for lower rated bonds generally fell. Relative to the Benchmark, the Fund’s overweight position in bonds rated BB and its lack of holdings in bonds rated CCC helped performance during the reporting period. Bonds issued by publicly traded companies outperformed bonds issued by privately held companies during the reporting period. The Fund did not invest in bonds issued by privately held companies, which helped performance relative to the Benchmark.
To maintain sufficient liquidity, the Fund did not invest in bond issues of less than $500 million or in bond issuers with less than $1 billion in total bonds outstanding, which also contributed to relative performance.
HOW WAS THE FUND POSITIONED?
The Fund’s managers believed that bonds rated CCC generally have materially higher volatility and default risk than bonds rated BB andsingle-B, while providing inadequate incremental return over a market cycle to justify the higher volatility. In addition, the managers believe bonds issued by private companies have had a materially higher probability of default than similarly-rated bonds issued by public companies. As such, the Fund did not invest in bonds rated CCC or bonds issued by private companies. Relative to the Benchmark, the Fund was overweight in bonds rated BB and underweight in bonds rated B and CCC.
| | | | | | |
| | | |
| 12 | | | | J.P. MORGAN EXCHANGE-TRADED FUNDS | | AUGUST 31, 2019 |
| | | | |
PORTFOLIO COMPOSITION BY INDUSTRY**** | |
| Oil, Gas & Consumable Fuels | | | 11.3 | % |
| Media | | | 9.9 | |
| Hotels, Restaurants & Leisure | | | 7.7 | |
| Diversified Telecommunication Services | | | 7.0 | |
| Health Care Providers & Services | | | 6.5 | |
| Wireless Telecommunication Services | | | 4.0 | |
| Metals & Mining | | | 3.5 | |
| Equity Real Estate Investment Trusts (REITs) | | | 3.0 | |
| Aerospace & Defense | | | 3.0 | |
| Consumer Finance | | | 2.5 | |
| Containers & Packaging | | | 2.4 | |
| Commercial Services & Supplies | | | 2.2 | |
| Banks | | | 2.0 | |
| Pharmaceuticals | | | 2.0 | |
| Food Products | | | 2.0 | |
| Technology Hardware, Storage & Peripherals | | | 2.0 | |
| Chemicals | | | 2.0 | |
| Communications Equipment | | | 1.8 | |
| Auto Components | | | 1.7 | |
| Trading Companies & Distributors | | | 1.6 | |
| Software | | | 1.5 | |
| Entertainment | | | 1.4 | |
| Capital Markets | | | 1.4 | |
| Energy Equipment & Services | | | 1.4 | |
| Electric Utilities | | | 1.3 | |
| Investment of cash collateral from securities loaned | | | 1.3 | |
| IT Services | | | 1.1 | |
| Independent Power and Renewable Electricity Producers | | | 1.1 | |
| Household Durables | | | 1.0 | |
| Others (each less than 1.0%) | | | 8.5 | |
| Short-Term Investments | | | 1.9 | |
| 1 | | On September 9, 2019, the Fund’s name was changed to JPMorgan High Yield Research Enhanced ETF. The Fund’s investment approach also changed and its primary benchmark was changed to the Bloomberg Barclays US Corporate High Yield – 2% Issuer Capped Index. |
| * | | The return shown is based on net asset value calculated for shareholder transactions and may differ from the return shown in the financial highlights, which reflects adjustments made to the net asset value in accordance with accounting principles generally accepted in the United States of America. The net asset value was $51.28 as of August 31, 2019. |
| ** | | Market price return is calculated assuming an initial investment made at the market price at the beginning of the period, reinvestment of all dividends and distributions at market price during the period, and sale at the market price on the last day of the period. The price used to calculate the market price return is the midpoint of the bid/ask spread at the close of business on the Cboe BZX Exchange, Inc. The midpoint price was $51.36 as of August 31, 2019. |
| *** | | The adviser seeks to achieve the Fund’s objective. There can be no guarantee it will be achieved. |
| **** | | Percentages indicated are based on total investments as of August 31, 2019. The Fund’s composition is subject to change. |
| | | | | | | | |
| | | |
| AUGUST 31, 2019 | | J.P. MORGAN EXCHANGE-TRADED FUNDS | | | | | 13 | |
JPMorgan High Yield Research Enhanced ETF
(formerly known as JPMorgan Disciplined High Yield ETF)
FUND COMMENTARY
SIX MONTHS ENDED AUGUST 31, 2019 (Unaudited) (continued)
| | | | | | | | | | | | | | | | |
AVERAGE ANNUAL TOTAL RETURNSAS OF AUGUST 31, 2019 (Unaudited) | |
| | | INCEPTION DATE | | | SIX MONTHS* | | | 1 YEAR | | | SINCE
INCEPTION | |
JPMorgan High Yield Research Enhanced ETF | | | | | | | | | | | | | | | | |
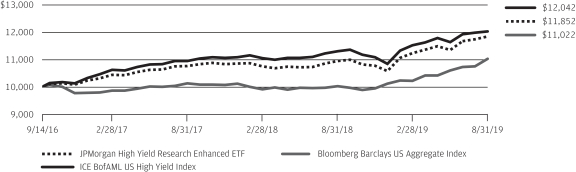
| Net Asset Value | | | September 14, 2016 | | | | 5.46 | % | | | 8.36 | % | | | 5.90 | % |
| Market Price | | | | | | | 5.71 | % | | | 8.18 | % | | | 5.94 | % |
LIFE OF FUND PERFORMANCE(9/14/16 TO 8/31/19)
The performance quoted is past performance and is not a guarantee of future results. Exchange-traded funds are subject to certain market risks. Investment returns and principal value of an investment will fluctuate so that an investor’s shares, when sold or redeemed, may be worth more or less than their original cost. Current performance may be higher or lower than the performance data shown. Forup-to-date,month-end performance information please call1-844-457-6383.
Fund commenced operations on September 14, 2016.
The graph illustrates comparative performance for $10,000 invested in shares of the JPMorgan High Yield Research Enhanced ETF, the ICE BofAML US High Yield Index and the Bloomberg Barclays US Aggregate Index from September 14, 2016 to August 31, 2019. The performance of the Fund reflects the deduction of Fund expenses and assumes reinvestment of all dividends and capital gain distributions, if any. The performance of the ICE BofAML US High Yield Index and the Bloomberg Barclays US Aggregate Index does not reflect the deduction of expenses associated with an exchange-traded fund and has been adjusted to reflect reinvestment of all dividends and capital gain distributions of the securities included in the Index, if applicable. The ICE BofAML US High Yield Index is an unmanaged index, which measures the performance
of U.S. dollar denominated below investment grade corporate debt publicly issued in the U.S. domestic market. The Bloomberg Barclays US Aggregate Index is an unmanaged index that represents securities that areSEC-registered, taxable, and dollar denominated. The index covers the U.S. investment grade fixed rate bond market, with index components for government and corporate securities, mortgage pass-through securities, and asset-backed securities. Investors cannot invest directly in an index.
Fund performance reflects the partial waiver of the Fund’s fees and reimbursement of expenses for certain periods since the inception date. Without these waivers and reimbursements, performance would have been lower. Also, performance shown in this section does not reflect the deduction of taxes that a shareholder may pay on Fund distributions or redemption or sale of Fund shares.
The returns shown are based on net asset values calculated for shareholder transactions and may differ from the returns shown in the financial highlights, which reflect adjustments made to the net asset values in accordance with accounting principles generally accepted in the United States of America.
| | | | | | |
| | | |
| 14 | | | | J.P. MORGAN EXCHANGE-TRADED FUNDS | | AUGUST 31, 2019 |
JPMorgan Municipal ETF
FUND COMMENTARY
SIX MONTHS ENDED AUGUST 31, 2019 (Unaudited)
| | | | |
| REPORTING PERIOD RETURN: | |
| Net Asset Value* | | | 6.56% | |
| Market Price** | | | 6.42% | |
| Bloomberg Barclays US1-15 Year Blend(1-17) Municipal Bond Index | | | 5.04% | |
| |
| Net Assets as of 8/31/2019 | | $ | 35,531,083 | |
| Duration as of 8/31/2019 | | | 5.7 Years | |
INVESTMENT OBJECTIVE***
The JPMorgan Municipal ETF (the “Fund”) seeks to provide monthly dividends, which are excluded from gross income, and to protect the value of your investment by investing primarily in municipal obligations. For purposes of the Fund’s investment objective, “gross income” means gross income for federal income tax purposes.
INVESTMENT APPROACH
The Fund invests primarily in a diversified portfolio of intermediate-term municipal bonds, the income from which is exempt from federal income tax. The Fund seeks to maintain an average weighted maturity between three and ten years.
HOW DID THE FUND PERFORM?
For the six months ended August 31, 2019, the Fund outperformed to the Bloomberg Barclays US1-15 Year Blend(1-17) Municipal Bond Index (the “Index”). Interest rates fell during the reporting period and lower rated bonds generally outperformed higher rated bonds.
Relative to the Index, the Fund’s longer overall duration was a leading contributor to performance. Duration measures the price sensitivity of a portfolio of bonds relative to changes in interest rates. Generally, a portfolio of bonds with a longer duration will experience a larger increase in price when interest rates fall. The Fund’s overweight allocations to bonds rated BBB and BB and its overweight allocations to local general obligation bonds and the leasing sector also contributed to relative performance.
The Fund’s underweight allocations to the hospital, industrial development revenue/pollution control revenue and transportation sectors were leading detractors from relative performance. The Fund’s allocation to floating rate notes, which were not held in the Index and were used tactically to maintain liquidity and market stability in the portfolio, also detracted from performance. Typically, floating rate notes do not experience price appreciation when interest rates fall. The Fund’s underweight positions in Connecticut and New Jersey bonds and its overweight positions in Texas and Florida bonds also hurt relative performance.
HOW WAS THE FUND POSITIONED?
At the end of the reporting period, the Fund’s largest allocations were in revenue bonds and general obligation bonds, while its smallest allocation was inpre-refunded bonds. In terms of quality, the Fund’s largest allocations were in bonds rated AA andsingle-A, while its smallest allocations were in unrated bonds and bonds rated BB. The Fund’s overall duration was 5.7 years compared with 4.5 years for the Index.
| | | | |
PORTFOLIO COMPOSITION**** | |
| Municipal Bonds | | | 97.4 | % |
| Short-Term Investments | | | 2.6 | |
| * | | The return shown is based on net asset value calculated for shareholder transactions and may differ from the return shown in the financial highlights, which reflects adjustments made to the net asset value in accordance with accounting principles generally accepted in the United States of America. The net asset value was $54.66 as of August 31, 2019. |
| ** | | Market price return is calculated assuming an initial investment made at the inception date net asset value, reinvestment of all dividends and distributions at market price during the period, and sale at the market price on the last day of the period. The price used to calculate the market price return is the midpoint of the bid/ask spread at the close of business on the Cboe BZX Exchange, Inc. The midpoint price was $54.68 as of August 31, 2019. |
| *** | | The adviser seeks to achieve the Fund’s objective. There can be no guarantee it will be achieved. |
| **** | | Percentages indicated are based on total investments as of August 31, 2019. The Fund’s composition is subject to change. |
| | | | | | | | |
| | | |
| AUGUST 31, 2019 | | J.P. MORGAN EXCHANGE-TRADED FUNDS | | | | | 15 | |
JPMorgan Municipal ETF
FUND COMMENTARY
SIX MONTHS ENDED AUGUST 31, 2019 (Unaudited) (continued)
| | | | | | | | | | | | |
TOTAL RETURNSAS OF AUGUST 31, 2019 (Unaudited) | |
| | | INCEPTION DATE | | | SIX MONTHS* | | | CUMULATIVE
SINCE
INCEPTION | |
JPMorgan Municipal ETF | | | | | | | | | | | | |
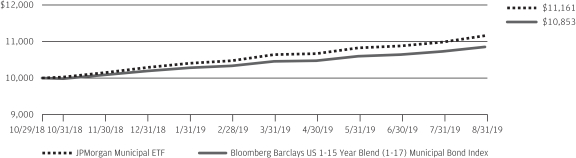
| Net Asset Value | | | October 29, 2018 | | | | 6.56 | % | | | 11.61 | % |
| Market Price | | | | | | | 6.42 | % | | | 11.65 | % |
LIFE OF FUND PERFORMANCE(10/29/18 TO 8/31/19)
The performance quoted is past performance and is not a guarantee of future results. Exchange-traded funds are subject to certain market risks. Investment returns and principal value of an investment will fluctuate so that an investor’s shares, when sold or redeemed, may be worth more or less than their original cost. Current performance may be higher or lower than the performance data shown. For up-to-date, month-end performance information please call 1-844-457-6383.
Fund commenced operations on October 29, 2018.
The graph illustrates comparative performance for $10,000 invested in shares of the JPMorgan Municipal ETF and the Bloomberg Barclays US 1-15 Year Blend (1-17) Municipal Bond Index from October 29, 2018 to August 31, 2019. The performance of the Fund reflects the deduction of Fund expenses and assumes reinvestment of all dividends and capital gain distributions, if any. The performance of the Bloomberg Barclays US 1-15 Year Blend (1-17) Municipal Bond Index does not reflect the deduction of expenses associated with an
exchange-traded fund and has been adjusted to reflect reinvestment of all dividends and capital gain distributions of the securities included in the Index, if applicable. The Bloomberg Barclays US 1-15 Year Blend (1-17) Municipal Bond Index represents the performance of municipal bonds with maturities from 1 to 17 years.
Fund performance reflects the waiver of the Fund’s fees and reimbursement of expenses for certain periods since the inception date. Without these waivers and reimbursements, performance would have been lower. Also, performance shown in this section does not reflect the deduction of taxes that a shareholder may pay on Fund distributions or redemption or sale of Fund shares.
The returns shown are based on net asset values calculated for shareholder transactions and may differ from the returns shown in the financial highlights, which reflect adjustments made to the net asset values in accordance with accounting principles generally accepted in the United States of America.
| | | | | | |
| | | |
| 16 | | | | J.P. MORGAN EXCHANGE-TRADED FUNDS | | AUGUST 31, 2019 |
JPMorgan U.S. Aggregate Bond ETF
FUND COMMENTARY
SIX MONTHS ENDED AUGUST 31, 2019 (Unaudited)
| | | | |
| REPORTING PERIOD RETURN: | |
| Net Asset Value* | | | 7.88% | |
| Market Price** | | | 8.07% | |
| Bloomberg Barclays US Aggregate Index | | | 8.02% | |
| |
| Net Assets as of 8/31/2019 | | $ | 189,858,909 | |
| Duration as of 8/31/2019 | | | 5.7 Years | |
INVESTMENT OBJECTIVE***
The JPMorgan U.S. Aggregate Bond ETF (the “Fund”) seeks to provide long-term total return.
INVESTMENT APPROACH
The Fund invests in a diversified portfolio of high-quality fixed income securities, including corporate bonds, U.S. Treasury obligations and other U.S. government and agency securities, and asset-backed, mortgage-related and mortgage-backed securities. With respect to corporatesub-sectors, the Fund applies a multi-factor credit screening process that seeks exposure to corporate debt issuers with attractive value, quality and momentum characteristics.
HOW DID THE FUND PERFORM?
For the six months ended August 31, 2019, the Fund underperformed the Bloomberg Barclays US Aggregate Index (the “Index”).
Relative to the Index, the Fund’s security selection within corporate bonds detracted from performance. During the reporting period, interest rates generally declined and lower quality bonds outperformed higher quality bonds.
HOW WAS THE FUND POSITIONED?
During the reporting period, the Fund applied a multi-factor credit screening process to the corporatesub-sectors of the Index that sought exposure to corporate debt issuers that the Fund’s portfolio managers believed had attractive value, quality and momentum characteristics. The Fund’s and the Index’s largest allocations at the end of the reporting period were in government bonds and corporate bonds and its smallest allocations were in agency debt and municipal bonds.
| | | | |
PORTFOLIO COMPOSITION**** | |
| U.S. Treasury Obligations | | | 39.8 | % |
| Mortgage-Backed Securities | | | 26.8 | |
| Corporate Bonds | | | 25.8 | |
| Commercial Mortgage-Backed Securities | | | 2.0 | |
| Foreign Government Securities | | | 1.6 | |
| Supranational | | | 1.3 | |
| U.S. Government Agency Securities | | | 1.3 | |
| Others (each less than 1.0%) | | | 1.1 | |
| Short-Term Investments | | | 0.3 | |
| * | | The return shown is based on net asset value calculated for shareholder transactions and may differ from the return shown in the financial highlights, which reflects adjustments made to the net asset value in accordance with accounting principles generally accepted in the United States of America. The net asset value was $26.93 as of August 31, 2019. |
| ** | | Market price return is calculated assuming an initial investment made at the inception date net asset value, reinvestment of all dividends and distributions at market price during the period, and sale at the market price on the last day of the period. The price used to calculate the market price return is the midpoint of the bid/ask spread at the close of business on the NYSE Arca, Inc. The midpoint price was $27.00 as of August 31, 2019. |
| *** | | The adviser seeks to achieve the Fund’s objective. There can be no guarantee it will be achieved. |
| **** | | Percentages indicated are based on total investments as of August 31, 2019. The Fund’s composition is subject to change. |
| | | | | | | | |
| | | |
| AUGUST 31, 2019 | | J.P. MORGAN EXCHANGE-TRADED FUNDS | | | | | 17 | |
JPMorgan U.S. Aggregate Bond ETF
FUND COMMENTARY
SIX MONTHS ENDED AUGUST 31, 2019 (Unaudited) (continued)
| | | | | | | | | | | | |
TOTAL RETURNSAS OF AUGUST 31, 2019 (Unaudited) | |
| | | INCEPTION DATE | | | SIX MONTHS* | | | CUMULATIVE
SINCE
INCEPTION | |
JPMorgan U.S. Aggregate Bond ETF | | | | | | | | | | | | |
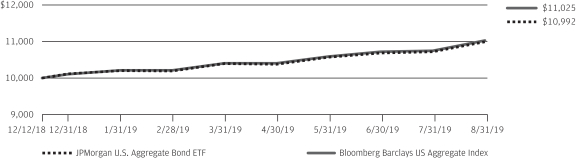
| Net Asset Value | | | December 12, 2018 | | | | 7.88 | % | | | 9.92 | % |
| Market Price | | | | | | | 8.07 | % | | | 10.21 | % |
LIFE OF FUND PERFORMANCE(12/12/18 TO 8/31/19)
The performance quoted is past performance and is not a guarantee of future results. Exchange-traded funds are subject to certain market risks. Investment returns and principal value of an investment will fluctuate so that an investor’s shares, when sold or redeemed, may be worth more or less than their original cost. Current performance may be higher or lower than the performance data shown. For up-to-date, month-end performance information please call 1-844-457-6383.
Fund commenced operations on December 12, 2018.
The graph illustrates comparative performance for $10,000 invested in shares of the JPMorgan U.S. Aggregate Bond ETF and the Bloomberg Barclays US Aggregate Index from December 12, 2018 to August 31, 2019. The performance of the Fund reflects the deduction of Fund expenses and assumes reinvestment of all dividends and capital gain distributions, if any. The performance of the Bloomberg Barclays US Aggregate Index does not reflect the deduction of expenses associated with an exchange-traded fund and has been adjusted to reflect reinvestment of all dividends and capital gain distributions of the secu-
rities included in the Index, if applicable. The Bloomberg Barclays US Aggregate Index is an unmanaged index that represents securities that are SEC-registered, taxable, and dollar denominated. The index covers the U.S. investment grade fixed rate bond market, with index components for government and corporate securities, mortgage pass-through securities, and asset-backed securities. Investors cannot invest directly in an index.
Fund performance reflects the waiver of the Fund’s fees and reimbursement of expenses for certain periods since the inception date. Without these waivers and reimbursements, performance would have been lower. Also, performance shown in this section does not reflect the deduction of taxes that a shareholder may pay on Fund distributions or redemption or sale of Fund shares.
The returns shown are based on net asset values calculated for shareholder transactions and may differ from the returns shown in the financial highlights, which reflect adjustments made to the net asset values in accordance with accounting principles generally accepted in the United States of America.
| | | | | | |
| | | |
| 18 | | | | J.P. MORGAN EXCHANGE-TRADED FUNDS | | AUGUST 31, 2019 |
JPMorgan Ultra-Short Income ETF
FUND COMMENTARY
SIX MONTHS ENDED AUGUST 31, 2019 (Unaudited)
| | | | |
| REPORTING PERIOD RETURN: | |
| Net Asset Value* | | | 1.81% | |
| Market Price** | | | 1.81% | |
| ICE BofAML US3-Month Treasury Bill Index | | | 1.25% | |
| |
| Net Assets as of 8/31/2019 | | $ | 8,377,351,630 | |
| Duration as of 8/31/2019 | | | 0.5 Years | |
INVESTMENT OBJECTIVE***
The JPMorgan Ultra-Short Income ETF (the “Fund”) seeks to provide current income while seeking to maintain a low volatility of principal.
INVESTMENT APPROACH
The Fund primarily invests mainly in investment-grade, U.S. dollar-denominated short-term fixed, variable and floating-rate debt. The Fund seeks to maintain a duration of one year or less, although under certain market conditions, the Fund’s duration may be longer than one year. Duration measures the price sensitivity of a portfolio of bonds to relative changes in interest rates. Generally, bonds with longer duration will experience a larger decrease or increase in price as interest rates rise or fall, respectively, versus bonds with shorter duration. The Fund’s adviser has broad discretion to shift the Fund’s exposure to strategies and sectors based on changing market conditions and its view of the best mix of investment opportunities.
HOW DID THE FUND PERFORM?
For the six months ended August 31, 2019, the Fund outperformed the ICE BofAML US3-Month Treasury Bill Index (the “Index”). Interest rates fell during the reporting period and lower rated bonds generally outperformed higher rated bonds.
The Fund’s allocations to investment grade corporate bonds and money market securities were leading contributors to both absolute performance and performance relative to the Index during the reporting period. The Fund’s allocations to collateralized loan obligations, asset backed securities and commercial mortgage backed securities also contributed to absolute and relative performance. The Fund also added exposure to U.S. Treasury bonds which, given the steep decline in bond yields over the period, positively contributed to absolute and relative performance.
There were no significant detractors from absolute or relative performance during the reporting period.
HOW WAS THE FUND POSITIONED?
During the reporting period, the Fund’s portfolio management team positioned the Fund according to its belief that interest rates would be moving lower throughout the year and that corporate credit fundamentals would remain favorable, despite
geopolitical risks and the potential impact of protracted trade tensions between the U.S. and China. The team added to its U.S. Treasury bonds allocation in an effort to protect against market volatility from trade uncertainty and benefit from a shift to a declining interest rate environment. In descending order, the Fund’s largest allocations were in corporate bonds, money market securities, collateralized loan obligations, asset backed securities, U.S. Treasury bonds, commercial mortgage backed securities, andnon-corporate credit.
| | | | |
PORTFOLIO COMPOSITION BY SECTOR**** | |
| Financials | | | 45.6 | % |
| Asset-Backed Securities | | | 11.2 | |
| U.S. Treasury Obligations | | | 6.2 | |
| Utilities | | | 2.8 | |
| Energy | | | 2.8 | |
| Consumer Discretionary | | | 2.7 | |
| Industrials | | | 2.5 | |
| Health Care | | | 2.3 | |
| Consumer Staples | | | 2.0 | |
| Communication Services | | | 1.9 | |
| Real Estate | | | 1.1 | |
| Others (each less than 1.0%) | | | 2.0 | |
| Short-Term Investments | | | 16.9 | |
| * | | The return shown is based on net asset value calculated for shareholder transactions and may differ from the return shown in the financial highlights, which reflects adjustments made to the net asset value in accordance with accounting principles generally accepted in the United States of America. The net asset value was $50.40 as of August 31, 2019. |
| ** | | Market price return is calculated assuming an initial investment made at the market price at the beginning of the period, reinvestment of all dividends and distributions at market price during the period, and sale at the market price on the last day of the period. The price used to calculate the market price return is the midpoint of the bid/ask spread at the close of business on the Cboe BZX Exchange, Inc. The midpoint price was $50.43 as of August 31, 2019. |
| *** | | The adviser seeks to achieve the Fund’s objective. There can be no guarantee it will be achieved. |
| **** | | Percentages indicated are based on total investments as of August 31, 2019. The Fund’s composition is subject to change. |
| | | | | | | | |
| | | |
| AUGUST 31, 2019 | | J.P. MORGAN EXCHANGE-TRADED FUNDS | | | | | 19 | |
JPMorgan Ultra-Short Income ETF
FUND COMMENTARY
SIX MONTHS ENDED AUGUST 31, 2019 (Unaudited) (continued)
| | | | | | | | | | | | | | | | |
AVERAGE ANNUAL TOTAL RETURNSAS OF AUGUST 31, 2019 (Unaudited) | |
| | | INCEPTION DATE | | | SIX MONTHS* | | | 1 YEAR | | | SINCE
INCEPTION | |
JPMorgan Ultra-Short Income ETF | | | | | | | | | | | | | | | | |
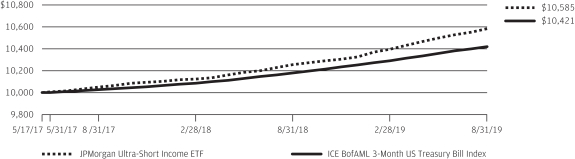
| Net Asset Value | | | May 17, 2017 | | | | 1.81 | % | | | 3.21 | % | | | 2.51 | % |
| Market Price | | | | | | | 1.81 | % | | | 3.18 | % | | | 2.54 | % |
LIFE OF FUND PERFORMANCE(5/17/17 TO 8/31/19)
The performance quoted is past performance and is not a guarantee of future results. Exchange-traded funds are subject to certain market risks. Investment returns and principal value of an investment will fluctuate so that an investor’s shares, when sold or redeemed, may be worth more or less than their original cost. Current performance may be higher or lower than the performance data shown. Forup-to-date,month-end performance information please call1-844-457-6383.
Fund commenced operations on May 17, 2017.
The graph illustrates comparative performance for $10,000 invested in shares of the JPMorgan Ultra-Short Income ETF and the ICE BofAML 3-Month US Treasury Bill Index from May 17, 2017 to August 31, 2019. The performance of the Fund reflects the deduction of Fund expenses and assumes reinvestment of all dividends and capital gain distributions, if any. The performance of the ICE BofAML 3-Month US Treasury Bill Index does not reflect the deduction of expenses associated with an exchange-traded fund and has been adjusted to reflect reinvestment of all dividends and capital gain distributions of the
securities included in the Index, if applicable. The ICE BofAML 3-Month US Treasury Bill Index is comprised of a single issue purchased at the beginning of the month and held for a full month. The index is rebalanced monthly and the issue selected is the outstanding Treasury Bill that matures closest to, but not beyond 3 months from the rebalancing date. Investors cannot invest directly in an index.
Fund performance reflects the partial waiver of the Fund’s fees and reimbursement of expenses for certain periods since the inception date. Without these waivers and reimbursements, performance would have been lower. Also, performance shown in this section does not reflect the deduction of taxes that a shareholder may pay on Fund distributions or redemption or sale of Fund shares.
The returns shown are based on net asset values calculated for shareholder transactions and may differ from the returns shown in the financial highlights, which reflect adjustments made to the net asset values in accordance with accounting principles generally accepted in the United States of America.
| | | | | | |
| | | |
| 20 | | | | J.P. MORGAN EXCHANGE-TRADED FUNDS | | AUGUST 31, 2019 |
JPMorgan Ultra-Short Municipal Income ETF
FUND COMMENTARY
SIX MONTHS ENDED AUGUST 31, 2019 (Unaudited)
| | | | |
| REPORTING PERIOD RETURN: | | | |
| Net Asset Value* | | | 1.26% | |
| Market Price** | | | 1.26% | |
| Bloomberg Barclays 1-Year Municipal Bond Index | | | 1.51% | |
| |
| Net Assets as of 8/31/2019 | | $ | 123,669,200 | |
| Duration as of 8/31/2019 | | | 0.7 Years | |
INVESTMENT OBJECTIVE***
The JPMorgan Ultra-Short Municipal Income ETF (the “Fund”) seeks as high a level of current income exempt from federal income tax as is consistent with relative stability of principal.
INVESTMENT APPROACH
The Fund invests primarily in investment grade fixed, variable and floating rate municipal securities, the income from which is exempt from federal income tax. The Fund seeks to maintain an average weighted maturity of two years or less.
HOW DID THE FUND PERFORM?
For the six months ended August 31, 2019, the Fund underperformed the Bloomberg Barclays 1- Year Municipal Bond Index (the “Index”). Interest rates fell during the reporting period and lower rated bonds generally outperformed higher rated bonds.
The Fund’s allocation to variable rate bonds, which are not held in the Index and are used tactically to maintain liquidity and market stability in the portfolio, was a leading detractor from both absolute performance and performance relative to the Index. Typically, variable rate bonds do not experience price appreciation when interest rates fall. The Fund’s underweight allocations to bonds ratedsingle-A and BBB and its overweight allocation to local general obligation bonds also detracted from relative performance.
The Fund’s allocation to bonds with maturities longer than two years, which are not held in the Index, was a leading contributor to both absolute performance and performance relative to the Index during the reporting period. Relative to the Index, the Fund’s overweight allocations to the leasing and industrial development revenue/pollution control revenue sectors, and its
underweight allocation to bonds issued in California also contributed to performance.
HOW WAS THE FUND POSITIONED?
At the end of the reporting period, the Fund’s overall duration was 0.7 years vs. 1.5 years for the Index. Duration measures the price sensitivity of a portfolio of bonds relative to changes in interest rates. Generally, bonds with shorter duration experience smaller increase in price as interest rates fall, relative to longer duration bonds.
| | | | |
PORTFOLIO COMPOSITION**** | |
| Municipal Bonds | | | 98.6 | % |
| Short-Term Investments | | | 1.4 | |
| * | | The return shown is based on net asset value calculated for shareholder transactions and may differ from the return shown in the financial highlights, which reflects adjustments made to the net asset value in accordance with accounting principles generally accepted in the United States of America. The net asset value was $50.48 as of August 31, 2019. |
| ** | | Market price return is calculated assuming an initial investment made at the inception date net asset value, reinvestment of all dividends and distributions at market price during the period, and sale at the market price on the last day of the period. The price used to calculate the market price return is the midpoint of the bid/ask spread at the close of business on the Cboe BZX Exchange, Inc. The midpoint price was $50.51 as of August 31, 2019. |
| *** | | The adviser seeks to achieve the Fund’s objective. There can be no guarantee it will be achieved. |
| **** | | Percentages indicated are based on total investments as of August 31, 2019. The Fund’s composition is subject to change. |
| | | | | | | | |
| | | |
| AUGUST 31, 2019 | | J.P. MORGAN EXCHANGE-TRADED FUNDS | | | | | 21 | |
JPMorgan Ultra-Short Municipal Income ETF
FUND COMMENTARY
SIX MONTHS ENDED AUGUST 31, 2019 (Unaudited) (continued)
| | | | | | | | | | | | |
TOTAL RETURNSAS OF AUGUST 31, 2019 (Unaudited) | |
| | | INCEPTION DATE | | | SIX MONTHS* | | | CUMULATIVE
SINCE
INCEPTION | |
JPMorgan Ultra-Short Municipal Income ETF | | | | | | | | | | | | |
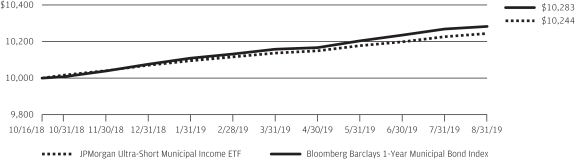
| Net Asset Value | | | October 16, 2018 | | | | 1.26 | % | | | 2.44 | % |
| Market Price | | | | | | | 1.26 | % | | | 2.50 | % |
LIFE OF FUND PERFORMANCE(10/16/18 TO 8/31/19)
The performance quoted is past performance and is not a guarantee of future results. Exchange-traded funds are subject to certain market risks. Investment returns and principal value of an investment will fluctuate so that an investor’s shares, when sold or redeemed, may be worth more or less than their original cost. Current performance may be higher or lower than the performance data shown. For up-to-date, month-end performance information please call 1-844-457-6383.
Fund commenced operations on October 16, 2018.
The graph illustrates comparative performance for $10,000 invested in shares of the JPMorgan Ultra-Short Municipal Income ETF and the Bloomberg Barclays1-Year Municipal Bond Index from October 16, 2018 to August 31, 2019. The performance of the Fund reflects the deduction of Fund expenses and assumes reinvestment of all dividends and capital gain distributions, if any. The performance of the Bloomberg Barclays 1-Year Municipal Bond Index does not reflect the deduction of expenses associated with an exchange-traded fund and has been adjusted to reflect reinvestment of all dividends and capital gain distributions of the securities included in the Index, if applicable. The Bloomberg
Barclays 1 Year Municipal Bond Index is an unmanaged index that includes bonds with a minimum credit rating of BAA3, are issued as part of a deal of at least $50 million, have an amount outstanding of at least $5 million, and have maturities of 1 to 2 years. The performance of the index does not reflect the deduction of expenses associated with a mutual fund, such as investment management fees. By contrast, the performance of the Fund reflects the deduction of the mutual fund expenses, including sales charges if applicable. An individual cannot invest directly in an index.
Fund performance reflects the waiver of the Fund’s fees and reimbursement of expenses for certain periods since the inception date. Without these waivers and reimbursements, performance would have been lower. Also, performance shown in this section does not reflect the deduction of taxes that a shareholder may pay on Fund distributions or redemption or sale of Fund shares.
The returns shown are based on net asset values calculated for shareholder transactions and may differ from the returns shown in the financial highlights, which reflect adjustments made to the net asset values in accordance with accounting principles generally accepted in the United States of America.
| | | | | | |
| | | |
| 22 | | | | J.P. MORGAN EXCHANGE-TRADED FUNDS | | AUGUST 31, 2019 |
JPMorgan USD Emerging Markets Sovereign Bond ETF
FUND COMMENTARY
SIX MONTHS ENDED AUGUST 31, 2019 (Unaudited)
| | | | |
| REPORTING PERIOD RETURN: | | | |
| Net Asset Value* | | | 9.62% | |
| Market Price** | | | 9.94% | |
| JPMorgan Emerging Markets Risk-Aware Bond Index | | | 9.88% | |
| |
| Net Assets as of 8/31/2019 | | $ | 66,104,839 | |
| Duration as of 8/31/2019 | | | 7.5 Years | |
INVESTMENT OBJECTIVE***
The JPMorgan USD Emerging Markets Sovereign Bond ETF (the “Fund”) seeks investment results that closely correspond, before fees and expenses, to the performance of the JPMorgan Emerging Markets Risk-Aware Bond Index (the “Underlying Index”).
INVESTMENT APPROACH
The Fund is passively managed to the Underlying Index, which is comprised of liquid, U.S. dollar-denominated sovereign and quasi-sovereign fixed and floating rate debt securities from emerging markets. The Underlying Index utilizes a rules-based, proprietary methodology that filters for liquidity and country risk and allocates risk across credit ratings. The Underlying Index methodology includes monthly rebalancing within countries and semi-annual rebalancing across countries. The Fund also employs optimization techniques that seek to minimize tracking error to the Underlying Index.
HOW DID THE FUND PERFORM?
For the six months ended August 31, 2019, the Fund performed in line with the Underlying Index. The majority of the Fund’s deviation against the Underlying Index was due to operating expenses, fees and tax management of the Fund’s portfolio.
The Fund’s and the Underlying Index’s liquidity filter detracted from absolute performance as less liquid bond issues outperformed other issues of emerging markets sovereign and quasi-sovereign debt. The Fund’s and the Underlying Index’s risk filter caused it to have no exposure to Argentina and Venezuela, which was a positive contributor to absolute performance.
HOW WAS THE FUND POSITIONED?
The Fund invested at least 80% of its assets in securities included in the Underlying Index. During the reporting period, the Fund’s and Underlying Index’s largest allocations were to Turkey and Brazil and their smallest allocations were to Jordan and Romania.
| | | | | | | | |
| | | |
| AUGUST 31, 2019 | | J.P. MORGAN EXCHANGE-TRADED FUNDS | | | | | 23 | |
JPMorgan USD Emerging Markets Sovereign Bond ETF
FUND COMMENTARY
SIX MONTHS ENDED AUGUST 31, 2019 (Unaudited) (continued)
| | | | |
PORTFOLIO COMPOSITION BY COUNTRY**** | |
| Turkey | | | 6.4 | % |
| Brazil | | | 5.0 | |
| South Africa | | | 5.0 | |
| Oman | | | 4.8 | |
| Ukraine | | | 4.7 | |
| Egypt | | | 4.5 | |
| Dominican Republic | | | 4.5 | |
| Ecuador | | | 4.2 | |
| Mexico | | | 4.0 | |
| Sri Lanka | | | 3.8 | |
| Indonesia | | | 3.3 | |
| Russia | | | 2.7 | |
| Philippines | | | 2.7 | |
| Colombia | | | 2.6 | |
| China | | | 2.6 | |
| Kazakhstan | | | 2.3 | |
| Peru | | | 2.3 | |
| Saudi Arabia | | | 2.2 | |
| Azerbaijan | | | 2.0 | |
| Uruguay | | | 2.0 | |
| Jamaica | | | 1.8 | |
| Pakistan | | | 1.6 | |
| Panama | | | 1.6 | |
| Kenya | | | 1.5 | |
| Malaysia | | | 1.5 | |
| Qatar | | | 1.5 | |
| Chile | | | 1.4 | |
| Ghana | | | 1.4 | |
| Ivory Coast | | | 1.4 | |
| Poland | | | 1.4 | |
| Hungary | | | 1.3 | |
| Croatia | | | 1.2 | |
| Iraq | | | 1.2 | |
| Jordan | | | 1.1 | |
| Romania | | | 1.1 | |
| United States | | | 1.0 | |
| Others (each less than 1.0%) | | | 6.0 | |
| Short-Term Investments | | | 0.4 | |
| * | | The return shown is based on net asset value calculated for shareholder transactions and may differ from the return shown in the financial highlights, which reflects adjustments made to the net asset value in accordance with accounting principles generally accepted in the United States of America. The net asset value was $50.85 as of August 31, 2019. |
| ** | | Market price return is calculated assuming an initial investment made at the market price at the beginning of the period, reinvestment of all dividends and distributions at market price during the period, and sale at the market price on the last day of the period. The price used to calculate the market price return is |
| | the midpoint of the bid/ask spread at the close of business on the NYSE Arca, Inc. The midpoint price was $51.11 as of August 31, 2019. |
| *** | | The adviser seeks to achieve the Fund’s objective. There can be no guarantee it will be achieved. |
| **** | | Percentages indicated are based on total investments as of August 31, 2019. The Fund’s composition is subject to change. |
| | | | | | |
| | | |
| 24 | | | | J.P. MORGAN EXCHANGE-TRADED FUNDS | | AUGUST 31, 2019 |
| | | | | | | | | | | | | | | | |
AVERAGE ANNUAL TOTAL RETURNSAS OF AUGUST 31, 2019 (Unaudited) | |
| | | INCEPTION DATE | | | SIX MONTHS* | | | 1 YEAR | | | SINCE
INCEPTION | |
JPMorgan USD Emerging Markets Sovereign Bond ETF | | | | | | | | | | | | | | | | |
| Net Asset Value | | | January 29, 2018 | | | | 9.62% | | | | 16.67% | | | | 6.10% | |
| Market Price | | | | | | | 9.94% | | | | 16.41% | | | | 6.42% | |
LIFE OF FUND PERFORMANCE(1/29/18 TO 8/31/19)
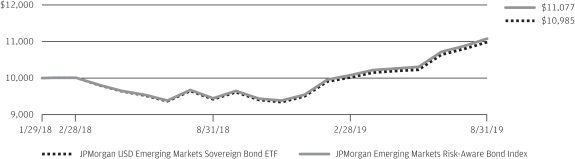
The performance quoted is past performance and is not a guarantee of future results. Exchange-traded funds are subject to certain market risks. Investment returns and principal value of an investment will fluctuate so that an investor’s shares, when sold or redeemed, may be worth more or less than their original cost. Current performance may be higher or lower than the performance data shown. Forup-to-date,month-end performance information please call1-844-457-6383.
Fund commenced operations on January 29, 2018.
The graph illustrates comparative performance for $10,000 invested in shares of the JPMorgan USD Emerging Markets Sovereign Bond ETF and the JPMorgan Emerging Markets Risk-Aware Bond Index from January 29, 2018 to August 31, 2019. The performance of the Fund reflects the deduction of Fund expenses and assumes reinvestment of all dividends and capital gain distributions, if any. The performance of the JPMorgan Emerging Markets Risk-Aware Bond Index does not reflect the deduction of expenses associated with an exchange-traded fund and has been adjusted to reflect reinvestment of all dividends and capital gain distributions of the securities included in the Index, if applicable. The JPMorgan Emerging Markets Risk-Aware Bond Index (the “index”) is comprised of liquid, U.S. dollar-denominated sovereign and quasi-sovereign fixed and floating rate debt securities from emerging markets selected using a rules-based methodology and is owned by J.P. Morgan Investment Inc., the Fund’s adviser (the “Adviser”). The Index is maintained and calculated by J.P. Morgan Securities LLC (“JPMS” or the “Index Provider”), which selects securities in accordance with the methodology from among the components of the J.P. Morgan Emerging Market Bond Index Global Diversified, which was developed and is maintained by the Index Provider. The Index Provider and the Adviser are both wholly-owned subsidiaries of JPMorgan Chase & Co., a publicly-held financial services holding company. The Index starts with the J.P. Morgan
Emerging Market Bond Index Global Diversified and applies a proprietary methodology that filters for liquidity and for country risk and allocates risk based on credit rating. Historically, the J.P. Morgan Emerging Markets Bond Index Global Diversified has included bonds issued by the countries of Angola, Argentina, Armenia, Azerbaijan, Belize, Bolivia, Brazil, Cameroon, Chile, China, Colombia, Costa Rica, Cote D’Ivoire, Croatia, Dominican Republic, Ecuador, Egypt, El Salvador, Ethiopia, Gabon, Georgia, Ghana, Guatemala, Honduras, Hungary, India, Indonesia, Iraq, Jamaica, Jordan, Kazakhstan, Kenya, Latvia, Lebanon, Lithuania, Malaysia, Mexico, Mongolia, Morocco, Mozambique, Namibia, Nigeria, Oman, Pakistan, Panama, Paraguay, Peru, Philippines, Poland, Romania, Russian Federation, Senegal, Serbia, Slovakia, South Africa, Sri Lanka, Suriname, Trinidad and Tobago, Tunisia, Turkey, Ukraine, Uruguay, Venezuela, Vietnam, Zambia; however, this universe of countries may change in accordance with the Index Provider’s determination of eligible emerging market countries and there is no assurance that a particular country will be represented in the Underlying Index at any given time. Investors cannot invest directly in an index.
Fund performance reflects the partial waiver of the Fund’s fees and reimbursement of expenses for certain periods since the inception date. Without these waivers and reimbursements, performance would have been lower. Also, performance shown in this section does not reflect the deduction of taxes that a shareholder may pay on Fund distributions or redemption or sale of Fund shares.
The returns shown are based on net asset values calculated for shareholder transactions and may differ from the returns shown in the financial highlights, which reflect adjustments made to the net asset values in accordance with accounting principles generally accepted in the United States of America.
| | | | | | | | |
| | | |
| AUGUST 31, 2019 | | J.P. MORGAN EXCHANGE-TRADED FUNDS | | | | | 25 | |
JPMorgan BetaBuilders 1-5 Year U.S. Aggregate Bond ETF
SCHEDULE OF PORTFOLIO INVESTMENTS
AS OF AUGUST 31, 2019 (Unaudited)
| | | | | | | | |
| INVESTMENTS | | PRINCIPAL AMOUNT ($) | | | VALUE ($) | |
U.S. Treasury Obligations — 57.8% | |
| | |
U.S. Treasury Notes | | | | | | | | |
| | |
1.38%, 8/31/2020 | | | 2,197,000 | | | | 2,188,075 | |
| | |
1.75%, 11/15/2020 | | | 313,000 | | | | 313,122 | |
| | |
1.75%, 12/31/2020 | | | 328,000 | | | | 328,231 | |
| | |
2.25%, 4/30/2021 | | | 80,000 | | | | 80,844 | |
| | |
1.13%, 9/30/2021 | | | 4,225,000 | | | | 4,190,837 | |
| | |
2.00%, 12/31/2021 | | | 4,196,000 | | | | 4,244,189 | |
| | |
1.75%, 6/30/2022 | | | 200,000 | | | | 201,750 | |
| | |
1.63%, 8/15/2022 | | | 482,000 | | | | 484,674 | |
| | |
1.88%, 9/30/2022 | | | 130,000 | | | | 131,757 | |
| | |
1.75%, 1/31/2023 | | | 23,000 | | | | 23,244 | |
| | |
1.50%, 2/28/2023 | | | 705,000 | | | | 706,763 | |
| | |
1.50%, 3/31/2023 | | | 24,000 | | | | 24,070 | |
| | |
1.25%, 7/31/2023 | | | 467,000 | | | | 463,826 | |
| | |
2.75%, 7/31/2023 | | | 687,000 | | | | 721,323 | |
| | |
2.63%, 12/31/2023 | | | 15,000 | | | | 15,755 | |
| | |
2.75%, 2/15/2024 | | | 16,000 | | | | 16,916 | |
| | |
2.38%, 2/29/2024 | | | 2,627,000 | | | | 2,737,006 | |
| | |
2.13%, 3/31/2024 | | | 70,000 | | | | 72,182 | |
| | |
2.00%, 4/30/2024 | | | 480,000 | | | | 492,562 | |
| | |
2.25%, 4/30/2024 | | | 15,000 | | | | 15,563 | |
| | |
2.00%, 5/31/2024 | | | 335,000 | | | | 344,134 | |
| | |
1.75%, 6/30/2024 | | | 282,000 | | | | 286,505 | |
| | |
1.75%, 7/31/2024 | | | 60,000 | | | | 60,996 | |
| | |
2.13%, 7/31/2024 | | | 325,000 | | | | 335,893 | |
| | | | | | | | |
| | |
Total U.S. Treasury Obligations
(Cost $18,112,689) | | | | | | | 18,480,217 | |
| | | | | | | | |
Corporate Bonds — 25.1% | |
|
Aerospace & Defense — 0.4% | |
| | |
Boeing Co. (The) | | | | | | | | |
| | |
8.75%, 8/15/2021 | | | 10,000 | | | | 11,247 | |
| | |
2.13%, 3/1/2022 | | | 8,000 | | | | 8,033 | |
| | |
Embraer SA (Brazil) 5.15%, 6/15/2022 | | | 15,000 | | | | 15,909 | |
| | |
General Dynamics Corp. 2.25%, 11/15/2022 | | | 16,000 | | | | 16,188 | |
| | |
Lockheed Martin Corp. 3.10%, 1/15/2023 | | | 5,000 | | | | 5,189 | |
| | |
Northrop Grumman Corp. 2.55%, 10/15/2022 | | | 15,000 | | | | 15,233 | |
| | |
Raytheon Co. 2.50%, 12/15/2022 | | | 6,000 | | | | 6,078 | |
| | |
Rockwell Collins, Inc. 3.20%, 3/15/2024 | | | 15,000 | | | | 15,585 | |
| | |
United Technologies Corp. 2.30%, 5/4/2022 | | | 29,000 | | | | 29,252 | |
| | | | | | | | |
| | |
| | | | | | | 122,714 | |
| | | | | | | | |
|
Air Freight & Logistics — 0.1% | |
| | |
FedEx Corp. 2.63%, 8/1/2022 | | | 6,000 | | | | 6,104 | |
| | | | | | | | |
| INVESTMENTS | | PRINCIPAL AMOUNT ($) | | | VALUE ($) | |
| | | | | | | | |
| | |
Air Freight & Logistics — continued | | | | | | | | |
| | |
United Parcel Service of America, Inc. 8.38%, 4/1/2020 | | | 18,000 | | | | 18,630 | |
| | | | | | | | |
| | |
| | | | | | | 24,734 | |
| | | | | | | | |
|
Airlines — 0.1% | |
| | |
Delta Air Lines, Inc. 3.63%, 3/15/2022 | | | 18,000 | | | | 18,495 | |
| | | | | | | | |
|
Auto Components — 0.1% | |
| | |
Aptiv Corp. 4.15%, 3/15/2024 | | | 17,000 | | | | 18,126 | |
| | | | | | | | |
|
Automobiles — 0.0% (a) | |
| | |
General Motors Co. 4.88%, 10/2/2023 | | | 15,000 | | | | 16,134 | |
| | | | | | | | |
|
Banks — 6.9% | |
| | |
Bank of America Corp. | | | | | | | | |
| | |
5.00%, 5/13/2021 | | | 145,000 | | | | 151,952 | |
| | |
(ICE LIBOR USD 3 Month + 0.93%), 2.82%, 7/21/2023 (b) | | | 17,000 | | | | 17,351 | |
| | |
(ICE LIBOR USD 3 Month + 0.78%), 3.55%, 3/5/2024 (b) | | | 12,000 | | | | 12,542 | |
| | |
Bank of Montreal (Canada) | | | | | | | | |
| | |
Series E, 3.30%, 2/5/2024 | | | 5,000 | | | | 5,239 | |
| | |
(USD Swap Semi 5 Year + 1.28%), 4.34%, 10/5/2028 (b) | | | 31,000 | | | | 32,948 | |
| | |
Bank of Nova Scotia (The) (Canada) | | | | | | | | |
| | |
2.70%, 3/7/2022 | | | 15,000 | | | | 15,283 | |
| | |
3.40%, 2/11/2024 | | | 38,000 | | | | 40,044 | |
| | |
BB&T Corp. | | | | | | | | |
| | |
3.20%, 9/3/2021 | | | 27,000 | | | | 27,579 | |
| | |
3.75%, 12/6/2023 | | | 10,000 | | | | 10,671 | |
| | |
BNP Paribas SA (France) 5.00%, 1/15/2021 | | | 25,000 | | | | 25,965 | |
| | |
Canadian Imperial Bank of Commerce (Canada) 2.55%, 6/16/2022 | | | 15,000 | | | | 15,264 | |
| | |
Citigroup, Inc. | | | | | | | | |
| | |
4.05%, 7/30/2022 | | | 15,000 | | | | 15,731 | |
| | |
(ICE LIBOR USD 3 Month + 0.72%), 3.14%, 1/24/2023 (b) | | | 112,000 | | | | 114,527 | |
| | |
(ICE LIBOR USD 3 Month + 0.95%), 2.88%, 7/24/2023 (b) | | | 20,000 | | | | 20,355 | |
| | |
(ICE LIBOR USD 3 Month + 1.02%), 4.04%, 6/1/2024 (b) | | | 12,000 | | | | 12,773 | |
| | |
Citizens Financial Group, Inc. 2.38%, 7/28/2021 | | | 35,000 | | | | 35,118 | |
| | |
Comerica, Inc. 3.70%, 7/31/2023 | | | 15,000 | | | | 15,856 | |
| | |
Cooperatieve Rabobank UA (Netherlands) 4.50%, 1/11/2021 | | | 52,000 | | | | 53,721 | |
| | |
Fifth Third Bancorp | | | | | | | | |
| | |
3.50%, 3/15/2022 | | | 25,000 | | | | 25,829 | |
| | |
4.30%, 1/16/2024 | | | 12,000 | | | | 12,937 | |
| | |
First Horizon National Corp. 3.50%, 12/15/2020 | | | 20,000 | | | | 20,246 | |
SEE NOTES TO FINANCIAL STATEMENTS.
| | | | | | |
| | | |
| 26 | | | | J.P. MORGAN EXCHANGE-TRADED FUNDS | | AUGUST 31, 2019 |
| | | | | | | | |
| INVESTMENTS | | PRINCIPAL AMOUNT ($) | | | VALUE ($) | |
Corporate Bonds — continued | |
|
Banks — continued | |
| | |
First Niagara Financial Group, Inc. 7.25%, 12/15/2021 | | | 12,000 | | | | 13,281 | |
| | |
HSBC Holdings plc (United Kingdom) | | | | | | | | |
| | |
5.10%, 4/5/2021 | | | 82,000 | | | | 85,592 | |
| | |
4.88%, 1/14/2022 | | | 10,000 | | | | 10,605 | |
| | |
4.00%, 3/30/2022 | | | 15,000 | | | | 15,738 | |
| | |
Huntington Bancshares, Inc. 3.15%, 3/14/2021 | | | 22,000 | | | | 22,319 | |
| | |
KeyCorp 2.90%, 9/15/2020 | | | 20,000 | | | | 20,165 | |
| | |
Kreditanstalt fuer Wiederaufbau (Germany) | | | | | | | | |
| | |
2.75%, 10/1/2020 | | | 15,000 | | | | 15,159 | |
| | |
2.50%, 2/15/2022 | | | 16,000 | | | | 16,383 | |
| | |
2.13%, 3/7/2022 | | | 15,000 | | | | 15,231 | |
| | |
2.00%, 10/4/2022 | | | 245,000 | | | | 248,802 | |
| | |
Landwirtschaftliche Rentenbank (Germany) 2.25%, 10/1/2021 | | | 20,000 | | | | 20,272 | |
| | |
Lloyds Bank plc (United Kingdom) 3.30%, 5/7/2021 | | | 35,000 | | | | 35,584 | |
| | |
M&T Bank Corp. 3.55%, 7/26/2023 | | | 22,000 | | | | 23,210 | |
| | |
Mitsubishi UFJ Financial Group, Inc. (Japan) | | | | | | | | |
| | |
3.00%, 2/22/2022 | | | 40,000 | | | | 40,777 | |
| | |
3.22%, 3/7/2022 | | | 17,000 | | | | 17,430 | |
| | |
3.76%, 7/26/2023 | | | 5,000 | | | | 5,286 | |
| | |
3.41%, 3/7/2024 | | | 25,000 | | | | 26,276 | |
| | |
MUFG Americas Holdings Corp. 3.50%, 6/18/2022 | | | 5,000 | | | | 5,171 | |
| | |
NatWest Markets plc (United Kingdom) 5.63%, 8/24/2020 | | | 8,000 | | | | 8,232 | |
| | |
Oesterreichische Kontrollbank AG (Austria) | | | | | | | | |
| | |
2.38%, 10/1/2021 | | | 22,000 | | | | 22,352 | |
| | |
2.63%, 1/31/2022 | | | 17,000 | | | | 17,428 | |
| | |
People’s United Financial, Inc. 3.65%, 12/6/2022 | | | 27,000 | | | | 27,941 | |
| | |
PNC Financial Services Group, Inc. (The) | | | | | | | | |
| | |
3.30%, 3/8/2022 | | | 20,000 | | | | 20,647 | |
| | |
2.85%, 11/9/2022 (c) | | | 12,000 | | | | 12,279 | |
| | |
3.50%, 1/23/2024 | | | 31,000 | | | | 32,964 | |
| | |
Regions Financial Corp. 3.80%, 8/14/2023 | | | 15,000 | | | | 15,875 | |
| | |
Royal Bank of Canada (Canada) | | | | | | | | |
| | |
2.30%, 3/22/2021 | | | 22,000 | | | | 22,159 | |
| | |
2.75%, 2/1/2022 | | | 8,000 | | | | 8,171 | |
| | |
3.70%, 10/5/2023 | | | 15,000 | | | | 15,947 | |
| | |
2.55%, 7/16/2024 | | | 20,000 | | | | 20,358 | |
| | |
Royal Bank of Scotland Group plc (United Kingdom) 6.00%, 12/19/2023 | | | 50,000 | | | | 54,447 | |
| | | | | | | | |
| INVESTMENTS | | PRINCIPAL AMOUNT ($) | | | VALUE ($) | |
| | | | | | | | |
| | |
Banks — continued | | | | | | | | |
| | |
Santander Holdings USA, Inc. | | | | | | | | |
| | |
4.45%, 12/3/2021 | | | 38,000 | | | | 39,645 | |
| | |
3.40%, 1/18/2023 | | | 26,000 | | | | 26,745 | |
| | |
Santander UK Group Holdings plc (United Kingdom) 3.13%, 1/8/2021 | | | 35,000 | | | | 35,188 | |
| | |
Santander UK plc (United Kingdom) 4.00%, 3/13/2024 | | | 15,000 | | | | 15,962 | |
| | |
Sumitomo Mitsui Financial Group, Inc. (Japan) | | | | | | | | |
| | |
2.93%, 3/9/2021 | | | 53,000 | | | | 53,634 | |
| | |
2.85%, 1/11/2022 | | | 10,000 | | | | 10,166 | |
| | |
2.78%, 7/12/2022 | | | 15,000 | | | | 15,266 | |
| | |
3.75%, 7/19/2023 | | | 10,000 | | | | 10,572 | |
| | |
SunTrust Bank | | | | | | | | |
| | |
(ICE LIBOR USD 3 Month + 0.59%), 3.50%, 8/2/2022 (b) | | | 20,000 | | | | 20,473 | |
| | |
3.20%, 4/1/2024 | | | 10,000 | | | | 10,468 | |
| | |
(ICE LIBOR USD 3 Month + 0.74%), 3.69%, 8/2/2024 (b) | | | 12,000 | | | | 12,647 | |
| | |
Toronto-Dominion Bank (The) (Canada) | | | | | | | | |
| | |
2.50%, 12/14/2020 | | | 35,000 | | | | 35,230 | |
| | |
2.55%, 1/25/2021 | | | 17,000 | | | | 17,147 | |
| | |
US Bancorp | | | | | | | | |
| | |
3.00%, 3/15/2022 | | | 50,000 | | | | 51,289 | |
| | |
2.95%, 7/15/2022 | | | 20,000 | | | | 20,516 | |
| | |
Wells Fargo & Co. | | | | | | | | |
| | |
2.50%, 3/4/2021 | | | 83,000 | | | | 83,493 | |
| | |
2.10%, 7/26/2021 | | | 55,000 | | | | 55,044 | |
| | |
Series M, 3.45%, 2/13/2023 | | | 12,000 | | | | 12,466 | |
| | |
Westpac Banking Corp. (Australia) 2.75%, 1/11/2023 | | | 80,000 | | | | 82,155 | |
| | | | | | | | |
| | |
| | | | | | | 2,206,118 | |
| | | | | | | | |
|
Beverages — 0.4% | |
| | |
Anheuser-Busch InBev Finance, Inc. (Belgium) | | | | | | | | |
| | |
2.65%, 2/1/2021 | | | 15,000 | | | | 15,139 | |
| | |
3.70%, 2/1/2024 | | | 15,000 | | | | 16,001 | |
| | |
Coca-Cola Co. (The) | | | | | | | | |
| | |
3.30%, 9/1/2021 | | | 20,000 | | | | 20,579 | |
| | |
2.20%, 5/25/2022 | | | 15,000 | | | | 15,178 | |
| | |
Constellation Brands, Inc. 2.25%, 11/6/2020 | | | 15,000 | | | | 15,020 | |
| | |
Diageo Investment Corp. (United Kingdom) 8.00%, 9/15/2022 | | | 10,000 | | | | 11,759 | |
| | |
Keurig Dr Pepper, Inc. 3.55%, 5/25/2021 | | | 15,000 | | | | 15,360 | |
SEE NOTES TO FINANCIAL STATEMENTS.
| | | | | | | | |
| | | |
| AUGUST 31, 2019 | | J.P. MORGAN EXCHANGE-TRADED FUNDS | | | | | 27 | |
JPMorgan BetaBuilders 1-5 Year U.S. Aggregate Bond ETF
SCHEDULE OF PORTFOLIO INVESTMENTS
AS OF AUGUST 31, 2019 (Unaudited) (continued)
| | | | | | | | |
| INVESTMENTS | | PRINCIPAL AMOUNT ($) | | | VALUE ($) | |
Corporate Bonds — continued | |
|
Beverages — continued | |
| | |
PepsiCo, Inc. | | | | | | | | |
| | |
2.15%, 10/14/2020 | | | 17,000 | | | | 17,049 | |
| | |
2.25%, 5/2/2022 | | | 8,000 | | | | 8,091 | |
| | | | | | | | |
| | |
| | | | | | | 134,176 | |
| | | | | | | | |
|
Biotechnology — 0.5% | |
| | |
AbbVie, Inc. 3.75%, 11/14/2023 | | | 40,000 | | | | 42,182 | |
| | |
Amgen, Inc. | | | | | | | | |
| | |
4.50%, 3/15/2020 | | | 15,000 | | | | 15,176 | |
| | |
3.63%, 5/22/2024 | | | 15,000 | | | | 15,951 | |
| | |
Biogen, Inc. 3.63%, 9/15/2022 | | | 15,000 | | | | 15,631 | |
| | |
Celgene Corp. | | | | | | | | |
| | |
2.88%, 2/19/2021 | | | 24,000 | | | | 24,255 | |
| | |
3.63%, 5/15/2024 | | | 15,000 | | | | 15,887 | |
| | |
Gilead Sciences, Inc. 1.95%, 3/1/2022 | | | 23,000 | | | | 22,983 | |
| | | | | | | | |
| | |
| | | | | | | 152,065 | |
| | | | | | | | |
|
Capital Markets — 1.6% | |
| | |
Ares Capital Corp. 4.20%, 6/10/2024 | | | 5,000 | | | | 5,189 | |
| | |
Bank of New York Mellon Corp. (The) | | | | | | | | |
| | |
2.45%, 11/27/2020 | | | 10,000 | | | | 10,046 | |
| | |
(ICE LIBOR USD 3 Month + 0.63%), 2.66%, 5/16/2023 (b) | | | 42,000 | | | | 42,692 | |
| | |
BlackRock, Inc. 4.25%, 5/24/2021 | | | 15,000 | | | | 15,612 | |
| | |
Charles Schwab Corp. (The) 3.25%, 5/21/2021 | | | 5,000 | | | | 5,111 | |
| | |
Deutsche Bank AG (Germany) | | | | | | | | |
| | |
4.25%, 2/4/2021 | | | 47,000 | | | | 47,528 | |
| | |
Series D, 5.00%, 2/14/2022 | | | 20,000 | | | | 20,730 | |
| | |
Goldman Sachs Group, Inc. (The) | | | | | | | | |
| | |
2.88%, 2/25/2021 | | | 25,000 | | | | 25,238 | |
| | |
(ICE LIBOR USD 3 Month + 1.05%), 2.91%, 6/5/2023 (b) | | | 123,000 | | | | 125,154 | |
| | |
Intercontinental Exchange, Inc. 4.00%, 10/15/2023 | | | 10,000 | | | | 10,752 | |
| | |
Jefferies Group LLC 6.88%, 4/15/2021 | | | 6,000 | | | | 6,400 | |
| | |
Morgan Stanley | | | | | | | | |
| | |
2.75%, 5/19/2022 | | | 15,000 | | | | 15,258 | |
| | |
3.13%, 1/23/2023 | | | 32,000 | | | | 32,984 | |
| | |
(ICE LIBOR USD 3 Month + 0.85%), 3.74%, 4/24/2024 (b) | | | 60,000 | | | | 63,110 | |
| | |
Series F, 3.88%, 4/29/2024 | | | 15,000 | | | | 16,094 | |
| | |
Nomura Holdings, Inc. (Japan) 6.70%, 3/4/2020 | | | 18,000 | | | | 18,399 | |
| | |
Northern Trust Corp. 2.38%, 8/2/2022 | | | 15,000 | | | | 15,236 | |
| | |
State Street Corp. | | | | | | | | |
| | |
(ICE LIBOR USD 3 Month + 0.64%), 2.65%, 5/15/2023 (b) | | | 23,000 | | | | 23,366 | |
| | | | | | | | |
| INVESTMENTS | | PRINCIPAL AMOUNT ($) | | | VALUE ($) | |
| | | | | | | | |
|
Capital Markets — continued | |
| | |
(ICE LIBOR USD 3 Month + 0.77%), 3.78%, 12/3/2024 (b) | | | 12,000 | | | | 12,798 | |
| | |
Stifel Financial Corp. 3.50%, 12/1/2020 | | | 13,000 | | | | 13,169 | |
| | | | | | | | |
| | |
| | | | | | | 524,866 | |
| | | | | | | | |
|
Chemicals — 0.5% | |
| | |
Dow Chemical Co. (The) 3.00%, 11/15/2022 | | | 20,000 | | | | 20,423 | |
| | |
DuPont de Nemours, Inc. 4.21%, 11/15/2023 | | | 10,000 | | | | 10,771 | |
| | |
LYB International Finance BV 4.00%, 7/15/2023 | | | 15,000 | | | | 15,969 | |
| | |
Mosaic Co. (The) 4.25%, 11/15/2023 | | | 10,000 | | | | 10,561 | |
| | |
Nutrien Ltd. (Canada) | | | | | | | | |
| | |
4.88%, 3/30/2020 | | | 10,000 | | | | 10,142 | |
| | |
3.63%, 3/15/2024 | | | 20,000 | | | | 21,040 | |
| | |
Praxair, Inc. 2.70%, 2/21/2023 | | | 15,000 | | | | 15,331 | |
| | |
Sherwin-Williams Co. (The) 2.75%, 6/1/2022 | | | 7,000 | | | | 7,108 | |
| | |
Syngenta Finance NV (Switzerland) 3.13%, 3/28/2022 | | | 57,000 | | | | 57,856 | |
| | | | | | | | |
| | |
| | | | | | | 169,201 | |
| | | | | | | | |
|
Commercial Services & Supplies — 0.1% | |
| | |
RELX Capital, Inc. (United Kingdom) 3.13%, 10/15/2022 | | | 10,000 | | | | 10,257 | |
| | |
Republic Services, Inc. 5.25%, 11/15/2021 | | | 15,000 | | | | 15,982 | |
| | |
Waste Management, Inc. 2.90%, 9/15/2022 | | | 10,000 | | | | 10,256 | |
| | | | | | | | |
| | |
| | | | | | | 36,495 | |
| | | | | | | | |
|
Communications Equipment — 0.1% | |
| | |
Cisco Systems, Inc. | | | | | | | | |
| | |
2.20%, 2/28/2021 | | | 10,000 | | | | 10,066 | |
| | |
2.20%, 9/20/2023 | | | 27,000 | | | | 27,406 | |
| | |
Motorola Solutions, Inc. 3.75%, 5/15/2022 | | | 6,000 | | | | 6,206 | |
| | | | | | | | |
| | |
| | | | | | | 43,678 | |
| | | | | | | | |
|
Consumer Finance — 1.7% | |
| | |
American Express Co. | | | | | | | | |
| | |
3.00%, 2/22/2021 | | | 43,000 | | | | 43,589 | |
| | |
2.65%, 12/2/2022 | | | 12,000 | | | | 12,232 | |
| | |
3.40%, 2/27/2023 | | | 26,000 | | | | 27,159 | |
| | |
American Honda Finance Corp. | | | | | | | | |
| | |
2.60%, 11/16/2022 | | | 25,000 | | | | 25,481 | |
| | |
3.63%, 10/10/2023 | | | 33,000 | | | | 35,078 | |
| | |
Capital One Financial Corp. | | | | | | | | |
| | |
3.45%, 4/30/2021 | | | 15,000 | | | | 15,316 | |
| | |
4.75%, 7/15/2021 | | | 33,000 | | | | 34,498 | |
SEE NOTES TO FINANCIAL STATEMENTS.
| | | | | | |
| | | |
| 28 | | | | J.P. MORGAN EXCHANGE-TRADED FUNDS | | AUGUST 31, 2019 |
| | | | | | | | |
| INVESTMENTS | | PRINCIPAL AMOUNT ($) | | | VALUE ($) | |
Corporate Bonds — continued | |
|
Consumer Finance — continued | |
| | |
Caterpillar Financial Services Corp. | | | | | | | | |
| | |
2.90%, 3/15/2021 | | | 34,000 | | | | 34,570 | |
| | |
2.85%, 6/1/2022 | | | 12,000 | | | | 12,319 | |
| | |
Discover Financial Services 3.85%, 11/21/2022 | | | 25,000 | | | | 26,223 | |
| | |
General Motors Financial Co., Inc. | | | | | | | | |
| | |
3.45%, 1/14/2022 | | | 31,000 | | | | 31,592 | |
| | |
5.10%, 1/17/2024 | | | 55,000 | | | | 59,457 | |
| | |
John Deere Capital Corp. | | | | | | | | |
| | |
2.88%, 3/12/2021 | | | 21,000 | | | | 21,272 | |
| | |
3.15%, 10/15/2021 | | | 18,000 | | | | 18,442 | |
| | |
2.65%, 6/24/2024 | | | 15,000 | | | | 15,439 | |
| | |
PACCAR Financial Corp. 2.65%, 5/10/2022 | | | 8,000 | | | | 8,161 | |
| | |
Synchrony Financial 3.75%, 8/15/2021 | | | 26,000 | | | | 26,585 | |
| | |
Toyota Motor Credit Corp. | | | | | | | | |
| | |
2.80%, 7/13/2022 | | | 26,000 | | | | 26,732 | |
| | |
2.63%, 1/10/2023 | | | 33,000 | | | | 33,793 | |
| | |
2.25%, 10/18/2023 | | | 22,000 | | | | 22,265 | |
| | | | | | | | |
| | |
| | | | | | | 530,203 | |
| | | | | | | | |
|
Diversified Financial Services — 0.4% | |
| | |
Berkshire Hathaway, Inc. 3.40%, 1/31/2022 | | | 37,000 | | | | 38,463 | |
| | |
National Rural Utilities Cooperative Finance Corp. (ICE LIBOR USD 3 Month + 2.91%), 4.67%, 4/30/2043 (b) | | | 15,000 | | | | 15,185 | |
| | |
ORIX Corp. (Japan) 2.90%, 7/18/2022 | | | 10,000 | | | | 10,214 | |
| | |
Private Export Funding Corp. Series EE, 2.80%, 5/15/2022 | | | 30,000 | | | | 30,930 | |
| | |
Shell International Finance BV (Netherlands) | | | | | | | | |
| | |
4.38%, 3/25/2020 | | | 15,000 | | | | 15,192 | |
| | |
3.40%, 8/12/2023 | | | 10,000 | | | | 10,576 | |
| | |
Voya Financial, Inc. 3.13%, 7/15/2024 | | | 15,000 | | | | 15,497 | |
| | | | | | | | |
| | |
| | | | | | | 136,057 | |
| | | | | | | | |
|
Diversified Telecommunication Services — 0.4% | |
| | |
AT&T, Inc. | | | | | | | | |
| | |
2.80%, 2/17/2021 | | | 21,000 | | | | 21,177 | |
| | |
3.40%, 6/15/2022 (c) | | | 6,000 | | | | 6,200 | |
| | |
3.60%, 2/17/2023 | | | 15,000 | | | | 15,679 | |
| | |
3.55%, 6/1/2024 | | | 25,000 | | | | 26,273 | |
| | |
Telefonica Emisiones SA (Spain) 5.46%, 2/16/2021 | | | 25,000 | | | | 26,165 | |
| | |
Verizon Communications, Inc. 5.15%, 9/15/2023 | | | 20,000 | | | | 22,478 | |
| | | | | | | | |
| | |
| | | | | | | 117,972 | |
| | | | | | | | |
| | | | | | | | |
| INVESTMENTS | | PRINCIPAL AMOUNT ($) | | | VALUE ($) | |
| | | | | | | | |
|
Electric Utilities — 0.8% | |
| | |
Duke Energy Corp. 3.75%, 4/15/2024 | | | 8,000 | | | | 8,501 | |
| | |
Duke Energy Florida LLC 3.10%, 8/15/2021 | | | 27,000 | | | | 27,394 | |
| | |
Emera US Finance LP (Canada) 2.70%, 6/15/2021 | | | 9,000 | | | | 9,065 | |
| | |
Entergy Louisiana LLC 4.05%, 9/1/2023 | | | 15,000 | | | | 16,113 | |
| | |
Exelon Corp. 2.45%, 4/15/2021 | | | 17,000 | | | | 17,048 | |
| | |
Fortis, Inc. (Canada) 2.10%, 10/4/2021 | | | 9,000 | | | | 8,962 | |
| | |
Georgia Power Co. Series C, 2.00%, 9/8/2020 | | | 17,000 | | | | 17,005 | |
| | |
Hydro-Quebec (Canada) Series HY, 8.40%, 1/15/2022 | | | 17,000 | | | | 19,506 | |
| | |
NextEra Energy Capital Holdings, Inc. | | | | | | | | |
| | |
Series H, 3.34%, 9/1/2020 | | | 13,000 | | | | 13,137 | |
| | |
3.15%, 4/1/2024 | | | 15,000 | | | | 15,613 | |
| | |
Oncor Electric Delivery Co. LLC 2.75%, 6/1/2024 (d) | | | 20,000 | | | | 20,648 | |
| | |
PPL Capital Funding, Inc. 3.50%, 12/1/2022 | | | 15,000 | | | | 15,563 | |
| | |
Public Service Co. of Colorado 2.25%, 9/15/2022 | | | 18,000 | | | | 18,157 | |
| | |
Public Service Co. of New Hampshire 3.50%, 11/1/2023 | | | 15,000 | | | | 15,823 | |
| | |
Public Service Electric & Gas Co. 2.38%, 5/15/2023 | | | 15,000 | | | | 15,229 | |
| | |
Southern California Edison Co. Series A, 2.90%, 3/1/2021 | | | 8,000 | | | | 8,075 | |
| | | | | | | | |
| | |
| | | | | | | 245,839 | |
| | | | | | | | |
|
Electrical Equipment — 0.1% | |
| | |
ABB Finance USA, Inc. (Switzerland) 3.38%, 4/3/2023 | | | 20,000 | | | | 20,911 | |
| | |
Emerson Electric Co. 2.63%, 12/1/2021 | | | 6,000 | | | | 6,104 | |
| | | | | | | | |
| | |
| | | | | | | 27,015 | |
| | | | | | | | |
|
Electronic Equipment, Instruments & Components — 0.1% | |
| | |
Amphenol Corp. 4.00%, 2/1/2022 | | | 3,000 | | | | 3,113 | |
| | |
Flex Ltd. 5.00%, 2/15/2023 | | | 8,000 | | | | 8,490 | |
| | |
Jabil, Inc. 5.63%, 12/15/2020 | | | 10,000 | | | | 10,381 | |
| | | | | | | | |
| | |
| | | | | | | 21,984 | |
| | | | | | | | |
|
Energy Equipment & Services — 0.1% | |
| | |
National Oilwell Varco, Inc. 2.60%, 12/1/2022 | | | 15,000 | | | | 15,008 | |
| | |
Schlumberger Investment SA 3.65%, 12/1/2023 | | | 15,000 | | | | 15,856 | |
| | | | | | | | |
| | |
| | | | | | | 30,864 | |
| | | | | | | | |
SEE NOTES TO FINANCIAL STATEMENTS.
| | | | | | | | |
| | | |
| AUGUST 31, 2019 | | J.P. MORGAN EXCHANGE-TRADED FUNDS | | | | | 29 | |
JPMorgan BetaBuilders 1-5 Year U.S. Aggregate Bond ETF
SCHEDULE OF PORTFOLIO INVESTMENTS
AS OF AUGUST 31, 2019 (Unaudited) (continued)
| | | | | | | | |
| INVESTMENTS | | PRINCIPAL AMOUNT ($) | | | VALUE ($) | |
Corporate Bonds — continued | |
|
Entertainment — 0.1% | |
| | |
NBCUniversal Media LLC 5.15%, 4/30/2020 | | | 15,000 | | | | 15,293 | |
| | |
TWDC Enterprises 18 Corp. 2.45%, 3/4/2022 | | | 20,000 | | | | 20,367 | |
| | |
Viacom, Inc. 3.88%, 12/15/2021 | | | 12,000 | | | | 12,404 | |
| | | | | | | | |
| | |
| | | | | | | 48,064 | |
| | | | | | | | |
|
Equity Real Estate Investment Trusts (REITs) — 0.7% | |
| | |
American Campus Communities Operating Partnership LP | | | | | | | | |
| | |
3.35%, 10/1/2020 | | | 16,000 | | | | 16,198 | |
| | |
American Tower Corp. | | | | | | | | |
| | |
4.70%, 3/15/2022 | | | 6,000 | | | | 6,373 | |
| | |
3.38%, 5/15/2024 | | | 15,000 | | | | 15,669 | |
| | |
Boston Properties LP 3.85%, 2/1/2023 | | | 15,000 | | | | 15,823 | |
| | |
Brixmor Operating Partnership LP 3.88%, 8/15/2022 | | | 6,000 | | | | 6,261 | |
| | |
CC Holdings GS V LLC 3.85%, 4/15/2023 | | | 24,000 | | | | 25,299 | |
| | |
Digital Realty Trust LP 3.95%, 7/1/2022 | | | 3,000 | | | | 3,142 | |
| | |
ERP Operating LP 4.63%, 12/15/2021 | | | 15,000 | | | | 15,787 | |
| | |
HCP, Inc. 3.15%, 8/1/2022 | | | 6,000 | | | | 6,168 | |
| | |
Healthcare Trust of America Holdings LP | | | | | | | | |
| | |
3.38%, 7/15/2021 | | | 10,000 | | | | 10,182 | |
| | |
Hospitality Properties Trust 4.25%, 2/15/2021 | | | 5,000 | | | | 5,083 | |
| | |
Host Hotels & Resorts LP 5.25%, 3/15/2022 | | | 5,000 | | | | 5,310 | |
| | |
Kimco Realty Corp. 3.40%, 11/1/2022 | | | 6,000 | | | | 6,214 | |
| | |
Liberty Property LP 4.13%, 6/15/2022 | | | 15,000 | | | | 15,714 | |
| | |
Office Properties Income Trust 4.25%, 5/15/2024 | | | 15,000 | | | | 15,299 | |
| | |
Realty Income Corp. 3.25%, 10/15/2022 | | | 8,000 | | | | 8,294 | |
| | |
Simon Property Group LP 3.75%, 2/1/2024 | | | 25,000 | | | | 26,757 | |
| | |
Ventas Realty LP 3.25%, 8/15/2022 | | | 8,000 | | | | 8,224 | |
| | |
VEREIT Operating Partnership LP 4.13%, 6/1/2021 | | | 8,000 | | | | 8,227 | |
| | |
Welltower, Inc. 5.25%, 1/15/2022 | | | 15,000 | | | | 16,049 | |
| | | | | | | | |
| | |
| | | | | | | 236,073 | |
| | | | | | | | |
|
Food & Staples Retailing — 0.3% | |
| | |
Costco Wholesale Corp. | | | | | | | | |
| | |
2.30%, 5/18/2022 | | | 6,000 | | | | 6,078 | |
| | |
2.75%, 5/18/2024 | | | 6,000 | | | | 6,231 | |
| | |
Kroger Co. (The) 2.95%, 11/1/2021 | | | 16,000 | | | | 16,253 | |
| | |
Walgreens Boots Alliance, Inc. 3.30%, 11/18/2021 | | | 15,000 | | | | 15,355 | |
| | |
Walmart, Inc. | | | | | | | | |
| | |
1.90%, 12/15/2020 | | | 21,000 | | | | 21,040 | |
| | | | | | | | |
| INVESTMENTS | | PRINCIPAL AMOUNT ($) | | | VALUE ($) | |
| | | | | | | | |
|
Food & Staples Retailing — continued | |
| | |
3.13%, 6/23/2021 | | | 10,000 | | | | 10,244 | |
| | |
2.35%, 12/15/2022 | | | 10,000 | | | | 10,185 | |
| | |
2.55%, 4/11/2023 | | | 9,000 | | | | 9,226 | |
| | | | | | | | |
| | |
| | | | | | | 94,612 | |
| | | | | | | | |
|
Food Products — 0.4% | |
| | |
Bunge Ltd. Finance Corp. 4.35%, 3/15/2024 | | | 35,000 | | | | 37,362 | |
| | |
Campbell Soup Co. 3.30%, 3/15/2021 | | | 15,000 | | | | 15,211 | |
| | |
Conagra Brands, Inc. 3.20%, 1/25/2023 | | | 10,000 | | | | 10,196 | |
| | |
General Mills, Inc. 3.15%, 12/15/2021 | | | 15,000 | | | | 15,317 | |
| | |
Hershey Co. (The) 4.13%, 12/1/2020 | | | 10,000 | | | | 10,255 | |
| | |
Kellogg Co. 3.13%, 5/17/2022 | | | 10,000 | | | | 10,273 | |
| | |
Mondelez International, Inc. 3.63%, 5/7/2023 | | | 20,000 | | | | 21,062 | |
| | |
Tyson Foods, Inc. 2.25%, 8/23/2021 | | | 10,000 | | | | 10,028 | |
| | | | | | | | |
| | |
| | | | | | | 129,704 | |
| | | | | | | | |
|
Gas Utilities — 0.2% | |
| | |
Dominion Energy Gas Holdings LLC 3.55%, 11/1/2023 | | | 17,000 | | | | 17,728 | |
| | |
ONE Gas, Inc. 3.61%, 2/1/2024 | | | 15,000 | | | | 15,868 | |
| | |
Southern Natural Gas Co. LLC 4.40%, 6/15/2021 | | | 15,000 | | | | 15,432 | |
| | | | | | | | |
| | |
| | | | | | | 49,028 | |
| | | | | | | | |
|
Health Care Equipment & Supplies — 0.2% | |
| | |
Abbott Laboratories 2.55%, 3/15/2022 | | | 15,000 | | | | 15,247 | |
| | |
Becton Dickinson and Co. 2.89%, 6/6/2022 | | | 15,000 | | | | 15,247 | |
| | |
Danaher Corp. 2.40%, 9/15/2020 | | | 15,000 | | | | 15,031 | |
| | |
Medtronic, Inc. 3.15%, 3/15/2022 | | | 12,000 | | | | 12,412 | |
| | |
Zimmer Biomet Holdings, Inc. 3.15%, 4/1/2022 | | | 10,000 | | | | 10,210 | |
| | | | | | | | |
| | |
| | | | | | | 68,147 | |
| | | | | | | | |
|
Health Care Providers & Services — 0.7% | |
| | |
Anthem, Inc. 3.50%, 8/15/2024 | | | 15,000 | | | | 15,727 | |
| | |
Cardinal Health, Inc. 2.62%, 6/15/2022 | | | 20,000 | | | | 20,127 | |
| | |
Cigna Holding Co. 4.00%, 2/15/2022 | | | 8,000 | | | | 8,323 | |
| | |
CVS Health Corp. | | | | | | | | |
| | |
3.70%, 3/9/2023 | | | 21,000 | | | | 21,948 | |
| | |
4.00%, 12/5/2023 | | | 45,000 | | | | 47,827 | |
| | |
Express Scripts Holding Co. | | | | | | | | |
| | |
2.60%, 11/30/2020 | | | 27,000 | | | | 27,115 | |
| | |
3.50%, 6/15/2024 | | | 10,000 | | | | 10,479 | |
| | |
HCA, Inc. 4.75%, 5/1/2023 | | | 10,000 | | | | 10,749 | |
| | |
Humana, Inc. 3.15%, 12/1/2022 | | | 15,000 | | | | 15,392 | |
| | |
McKesson Corp. 2.70%, 12/15/2022 | | | 10,000 | | | | 10,116 | |
SEE NOTES TO FINANCIAL STATEMENTS.
| | | | | | |
| | | |
| 30 | | | | J.P. MORGAN EXCHANGE-TRADED FUNDS | | AUGUST 31, 2019 |
| | | | | | | | |
| INVESTMENTS | | PRINCIPAL AMOUNT ($) | | | VALUE ($) | |
Corporate Bonds — continued | |
|
Health Care Providers & Services — continued | |
| | |
UnitedHealth Group, Inc. 3.35%, 7/15/2022 | | | 37,000 | | | | 38,415 | |
| | | | | | | | |
| | |
| | | | | | | 226,218 | |
| | | | | | | | |
|
Hotels, Restaurants & Leisure — 0.2% | |
| | |
Marriott International, Inc. 3.60%, 4/15/2024 | | | 15,000 | | | | 15,830 | |
| | |
McDonald’s Corp. 2.63%, 1/15/2022 | | | 17,000 | | | | 17,274 | |
| | |
Starbucks Corp. 3.85%, 10/1/2023 | | | 15,000 | | | | 15,977 | |
| | | | | | | | |
| | |
| | | | | | | 49,081 | |
| | | | | | | | |
|
Household Durables — 0.1% | |
| | |
DR Horton, Inc. 5.75%, 8/15/2023 | | | 6,000 | | | | 6,689 | |
| | |
Whirlpool Corp. 4.00%, 3/1/2024 | | | 31,000 | | | | 32,928 | |
| | | | | | | | |
| | |
| | | | | | | 39,617 | |
| | | | | | | | |
|
Household Products — 0.1% | |
| | |
Colgate-Palmolive Co. 2.10%, 5/1/2023 | | | 15,000 | | | | 15,143 | |
| | |
Procter & Gamble Co. (The) 3.10%, 8/15/2023 | | | 17,000 | | | | 17,850 | |
| | | | | | | | |
| | |
| | | | | | | 32,993 | |
| | | | | | | | |
|
Independent Power and Renewable Electricity Producers — 0.0% (a) | |
| | |
Enel Generacion Chile SA (Chile) 4.25%, 4/15/2024 | | | 7,000 | | | | 7,381 | |
| | | | | | | | |
|
Industrial Conglomerates — 0.3% | |
| | |
3M Co. | | | | | | | | |
| | |
2.75%, 3/1/2022 | | | 8,000 | | | | 8,181 | |
| | |
2.25%, 3/15/2023 | | | 6,000 | | | | 6,082 | |
| | |
General Electric Co. | | | | | | | | |
| | |
4.63%, 1/7/2021 | | | 17,000 | | | | 17,384 | |
| | |
3.10%, 1/9/2023 | | | 32,000 | | | | 32,094 | |
| | |
3.45%, 5/15/2024 | | | 16,000 | | | | 16,240 | |
| | |
Honeywell International, Inc. | | | | | | | | |
| | |
2.15%, 8/8/2022 | | | 5,000 | | | | 5,053 | |
| | |
3.35%, 12/1/2023 | | | 10,000 | | | | 10,589 | |
| | |
Roper Technologies, Inc. 3.13%, 11/15/2022 | | | 10,000 | | | | 10,272 | |
| | | | | | | | |
| | |
| | | | | | | 105,895 | |
| | | | | | | | |
|
Insurance — 0.4% | |
| | |
AEGON Funding Co. LLC (Netherlands) 5.75%, 12/15/2020 | | | 18,000 | | | | 18,832 | |
| | |
Allstate Corp. (The) Series B, (ICE LIBOR USD 3 Month + 2.94%), 5.75%, 8/15/2053 (b) | | | 6,000 | | | | 6,390 | |
| | |
American International Group, Inc. | | | | | | | | |
| | |
6.40%, 12/15/2020 | | | 15,000 | | | | 15,806 | |
| | |
4.88%, 6/1/2022 | | | 3,000 | | | | 3,215 | |
| | | | | | | | |
| INVESTMENTS | | PRINCIPAL AMOUNT ($) | | | VALUE ($) | |
| | | | | | | | |
|
Insurance — continued | |
| | |
Aon plc 2.80%, 3/15/2021 | | | 6,000 | | | | 6,057 | |
| | |
Assurant, Inc. 4.00%, 3/15/2023 | | | 3,000 | | | | 3,130 | |
| | |
Chubb INA Holdings, Inc. 2.70%, 3/13/2023 | | | 15,000 | | | | 15,356 | |
| | |
Marsh & McLennan Cos., Inc. 2.75%, 1/30/2022 | | | 15,000 | | | | 15,245 | |
| | |
MetLife, Inc. 3.60%, 4/10/2024 | | | 5,000 | | | | 5,328 | |
| | |
Prudential Financial, Inc. (ICE LIBOR USD 3 Month + 3.04%), 5.20%, 3/15/2044 (b) | | | 19,000 | | | | 19,903 | |
| | |
Trinity Acquisition plc 3.50%, 9/15/2021 | | | 5,000 | | | | 5,105 | |
| | |
Unum Group 3.00%, 5/15/2021 | | | 3,000 | | | | 3,034 | |
| | | | | | | | |
| | |
| | | | | | | 117,401 | |
| | | | | | | | |
|
Interactive Media & Services — 0.0% (a) | |
| | |
Alphabet, Inc. 3.63%, 5/19/2021 | | | 5,000 | | | | 5,151 | |
| | | | | | | | |
|
Internet & Direct Marketing Retail — 0.1% | |
| | |
Amazon.com, Inc. 2.80%, 8/22/2024 | | | 17,000 | | | | 17,743 | |
| | |
eBay, Inc. 3.80%, 3/9/2022 | | | 12,000 | | | | 12,459 | |
| | |
QVC, Inc. 5.13%, 7/2/2022 | | | 5,000 | | | | 5,281 | |
| | | | | | | | |
| | |
| | | | | | | 35,483 | |
| | | | | | | | |
|
IT Services — 0.4% | |
| | |
Fidelity National Information Services, Inc. 2.25%, 8/15/2021 | | | 15,000 | | | | 15,026 | |
| | |
Fiserv, Inc. | | | | | | | | |
| | |
3.50%, 10/1/2022 | | | 15,000 | | | | 15,659 | |
| | |
2.75%, 7/1/2024 | | | 18,000 | | | | 18,389 | |
| | |
Mastercard, Inc. 2.00%, 11/21/2021 | | | 15,000 | | | | 15,066 | |
| | |
Total System Services, Inc. 3.75%, 6/1/2023 | | | 15,000 | | | | 15,687 | |
| | |
Visa, Inc. 2.80%, 12/14/2022 | | | 20,000 | | | | 20,629 | |
| | |
Western Union Co. (The) 5.25%, 4/1/2020 | | | 16,000 | | | | 16,256 | |
| | | | | | | | |
| | |
| | | | | | | 116,712 | |
| | | | | | | | |
|
Life Sciences Tools & Services — 0.1% | |
| | |
Thermo Fisher Scientific, Inc. | | | | | | | | |
| | |
4.70%, 5/1/2020 | | | 10,000 | | | | 10,160 | |
| | |
3.00%, 4/15/2023 | | | 11,000 | | | | 11,314 | |
| | | | | | | | |
| | |
| | | | | | | 21,474 | |
| | | | | | | | |
|
Machinery — 0.0%(a) | |
| | |
CNH Industrial Capital LLC 3.88%, 10/15/2021 | | | 15,000 | | | | 15,340 | |
| | | | | | | | |
|
Media — 0.5% | |
| | |
Charter Communications Operating LLC 4.50%, 2/1/2024 | | | 20,000 | | | | 21,505 | |
SEE NOTES TO FINANCIAL STATEMENTS.
| | | | | | | | |
| | | |
| AUGUST 31, 2019 | | J.P. MORGAN EXCHANGE-TRADED FUNDS | | | | | 31 | |
JPMorgan BetaBuilders 1-5 Year U.S. Aggregate Bond ETF
SCHEDULE OF PORTFOLIO INVESTMENTS
AS OF AUGUST 31, 2019 (Unaudited) (continued)
| | | | | | | | |
| INVESTMENTS | | PRINCIPAL AMOUNT ($) | | | VALUE ($) | |
Corporate Bonds — continued | |
|
Media — continued | |
| | |
Comcast Corp. | | | | | | | | |
| | |
3.30%, 10/1/2020 | | | 15,000 | | | | 15,218 | |
| | |
3.00%, 2/1/2024 | | | 18,000 | | | | 18,714 | |
| | |
3.70%, 4/15/2024 | | | 15,000 | | | | 16,062 | |
| | |
Discovery Communications LLC 3.30%, 5/15/2022 | | | 13,000 | | | | 13,367 | |
| | |
Fox Corp. 3.67%, 1/25/2022 (d) | | | 18,000 | | | | 18,658 | |
| | |
Interpublic Group of Cos., Inc. (The) 4.20%, 4/15/2024 | | | 21,000 | | | | 22,696 | |
| | |
WPP Finance 2010 (United Kingdom) 4.75%, 11/21/2021 | | | 20,000 | | | | 20,993 | |
| | | | | | | | |
| | |
| | | | | | | 147,213 | |
| | | | | | | | |
|
Metals & Mining — 0.2% | |
| | |
ArcelorMittal (Luxembourg) 6.25%, 2/25/2022 (c) | | | 15,000 | | | | 16,280 | |
| | |
BHP Billiton Finance USA Ltd. (Australia) 3.25%, 11/21/2021 | | | 25,000 | | | | 25,661 | |
| | |
Newmont Goldcorp Corp. 3.70%, 3/15/2023 | | | 10,000 | | | | 10,416 | |
| | | | | | | | |
| | |
| | | | | | | 52,357 | |
| | | | | | | | |
|
Multiline Retail — 0.0% (a) | |
| | |
Macy’s Retail Holdings, Inc. 3.45%, 1/15/2021 | | | 10,000 | | | | 10,081 | |
| | |
Target Corp. 2.90%, 1/15/2022 | | | 6,000 | | | | 6,183 | |
| | | | | | | | |
| | |
| | | | | | | 16,264 | |
| | | | | | | | |
|
Multi-Utilities — 0.1% | |
| | |
Berkshire Hathaway Energy Co. 3.75%, 11/15/2023 | | | 15,000 | | | | 15,945 | |
| | |
CenterPoint Energy, Inc. 3.85%, 2/1/2024 | | | 15,000 | | | | 15,946 | |
| | |
DTE Energy Co. Series F, 3.85%, 12/1/2023 | | | 8,000 | | | | 8,486 | |
| | |
San Diego Gas & Electric Co. 3.00%, 8/15/2021 | | | 6,000 | | | | 6,112 | |
| | | | | | | | |
| | |
| | | | | | | 46,489 | |
| | | | | | | | |
|
Oil, Gas & Consumable Fuels — 1.9% | |
| | |
BP Capital Markets America, Inc. | | | | | | | | |
| | |
3.25%, 5/6/2022 | | | 6,000 | | | | 6,195 | |
| | |
3.22%, 4/14/2024 | | | 15,000 | | | | 15,679 | |
| | |
BP Capital Markets plc (United Kingdom) 3.99%, 9/26/2023 | | | 43,000 | | | | 46,212 | |
| | |
Canadian Natural Resources Ltd. (Canada) 3.80%, 4/15/2024 | | | 15,000 | | | | 15,792 | |
| | |
Chevron Corp. 2.42%, 11/17/2020 | | | 32,000 | | | | 32,191 | |
| | |
ConocoPhillips Co. 2.40%, 12/15/2022 | | | 23,000 | | | | 23,244 | |
| | |
Ecopetrol SA (Colombia) 5.88%, 9/18/2023 | | | 18,000 | | | | 20,077 | |
| | | | | | | | |
| INVESTMENTS | | PRINCIPAL AMOUNT ($) | | | VALUE ($) | |
| | | | | | | | |
|
Oil, Gas & Consumable Fuels — continued | |
| | |
Enbridge Energy Partners LP 4.20%, 9/15/2021 | | | 15,000 | | | | 15,473 | |
| | |
Energy Transfer Operating LP 4.90%, 2/1/2024 | | | 27,000 | | | | 29,214 | |
| | |
Enterprise Products Operating LLC 3.50%, 2/1/2022 | | | 15,000 | | | | 15,510 | |
| | |
EOG Resources, Inc. 2.63%, 3/15/2023 | | | 25,000 | | | | 25,546 | |
| | |
EQM Midstream Partners LP 4.75%, 7/15/2023 | | | 25,000 | | | | 25,202 | |
| | |
EQT Corp. 4.88%, 11/15/2021 | | | 17,000 | | | | 17,503 | |
| | |
Equinor ASA (Norway) | | | | | | | | |
| | |
3.15%, 1/23/2022 | | | 9,000 | | | | 9,261 | |
| | |
7.75%, 6/15/2023 | | | 15,000 | | | | 18,035 | |
| | |
Exxon Mobil Corp. 3.18%, 3/15/2024 | | | 22,000 | | | | 23,206 | |
| | |
Kinder Morgan Energy Partners LP | | | | | | | | |
| | |
3.50%, 3/1/2021 | | | 15,000 | | | | 15,229 | |
| | |
4.15%, 2/1/2024 | | | 21,000 | | | | 22,347 | |
| | |
Marathon Petroleum Corp. 5.13%, 3/1/2021 | | | 16,000 | | | | 16,649 | |
| | |
Occidental Petroleum Corp. | | | | | | | | |
| | |
2.70%, 2/15/2023 | | | 10,000 | | | | 10,025 | |
| | |
2.90%, 8/15/2024 | | | 18,000 | | | | 18,162 | |
| | |
ONEOK Partners LP 5.00%, 9/15/2023 | | | 24,000 | | | | 26,126 | |
| | |
Petroleos Mexicanos (Mexico) | | | | | | | | |
| | |
3.50%, 1/30/2023 | | | 40,000 | | | | 38,860 | |
| | |
4.88%, 1/18/2024 | | | 18,000 | | | | 18,072 | |
| | |
Plains All American Pipeline LP 3.85%, 10/15/2023 | | | 15,000 | | | | 15,568 | |
| | |
Sunoco Logistics Partners Operations LP 4.25%, 4/1/2024 | | | 16,000 | | | | 16,896 | |
| | |
Total Capital International SA (France) | | | | | | | | |
| | |
2.88%, 2/17/2022 | | | 10,000 | | | | 10,239 | |
| | |
3.70%, 1/15/2024 | | | 8,000 | | | | 8,528 | |
| | |
3.75%, 4/10/2024 | | | 20,000 | | | | 21,525 | |
| | |
TransCanada PipeLines Ltd. (Canada) 2.50%, 8/1/2022 | | | 6,000 | | | | 6,050 | |
| | |
Williams Cos., Inc. (The) 3.60%, 3/15/2022 | | | 15,000 | | | | 15,444 | |
| | | | | | | | |
| | |
| | | | | | | 598,060 | |
| | | | | | | | |
|
Paper & Forest Products — 0.1% | |
| | |
Fibria Overseas Finance Ltd. (Brazil) 5.25%, 5/12/2024 | | | 5,000 | | | | 5,353 | |
| | |
Georgia-Pacific LLC 8.00%, 1/15/2024 | | | 15,000 | | | | 18,618 | |
| | | | | | | | |
| | |
| | | | | | | 23,971 | |
| | | | | | | | |
|
Pharmaceuticals — 0.9% | |
| | |
Allergan Funding SCS 3.45%, 3/15/2022 | | | 24,000 | | | | 24,652 | |
SEE NOTES TO FINANCIAL STATEMENTS.
| | | | | | |
| | | |
| 32 | | | | J.P. MORGAN EXCHANGE-TRADED FUNDS | | AUGUST 31, 2019 |
| | | | | | | | |
| INVESTMENTS | | PRINCIPAL AMOUNT ($) | | | VALUE ($) | |
Corporate Bonds — continued | |
|
Pharmaceuticals — continued | |
| | |
AstraZeneca plc (United Kingdom) 3.50%, 8/17/2023 | | | 15,000 | | | | 15,711 | |
| | |
Bristol-Myers Squibb Co. 2.60%, 5/16/2022 (d) | | | 27,000 | | | | 27,507 | |
| | |
GlaxoSmithKline Capital plc (United Kingdom) | | | | | | | | |
| | |
2.85%, 5/8/2022 | | | 2,000 | | | | 2,047 | |
| | |
3.00%, 6/1/2024 | | | 18,000 | | | | 18,732 | |
| | |
GlaxoSmithKline Capital, Inc. (United Kingdom) 2.80%, 3/18/2023 | | | 10,000 | | | | 10,315 | |
| | |
Johnson & Johnson 2.25%, 3/3/2022 | | | 20,000 | | | | 20,257 | |
| | |
Merck & Co., Inc. 2.40%, 9/15/2022 | | | 17,000 | | | | 17,268 | |
| | |
Mylan, Inc. 4.20%, 11/29/2023 | | | 15,000 | | | | 15,773 | |
| | |
Novartis Capital Corp. (Switzerland) 2.40%, 5/17/2022 | | | 37,000 | | | | 37,601 | |
| | |
Pfizer, Inc. 3.40%, 5/15/2024 | | | 15,000 | | | | 16,012 | |
| | |
Sanofi (France) 4.00%, 3/29/2021 | | | 15,000 | | | | 15,479 | |
| | |
Shire Acquisitions Investments Ireland DAC 2.40%, 9/23/2021 | | | 33,000 | | | | 33,102 | |
| | |
Zoetis, Inc. 3.25%, 2/1/2023 | | | 20,000 | | | | 20,684 | |
| | | | | | | | |
| | |
| | | | | | | 275,140 | |
| | | | | | | | |
|
Professional Services — 0.0% (a) | |
| | |
Equifax, Inc. 3.60%, 8/15/2021 | | | 6,000 | | | | 6,132 | |
| | | | | | | | |
|
Road & Rail — 0.2% | |
| | |
Burlington Northern Santa Fe LLC 3.00%, 3/15/2023 | | | 15,000 | | | | 15,517 | |
| | |
CSX Corp. 4.25%, 6/1/2021 | | | 4,000 | | | | 4,124 | |
| | |
Norfolk Southern Corp. 3.85%, 1/15/2024 | | | 13,000 | | | | 13,896 | |
| | |
Ryder System, Inc. 3.75%, 6/9/2023 | | | 15,000 | | | | 15,802 | |
| | |
Union Pacific Corp. | | | | | | | | |
| | |
2.95%, 3/1/2022 | | | 6,000 | | | | 6,146 | |
| | |
4.16%, 7/15/2022 | | | 15,000 | | | | 15,820 | |
| | | | | | | | |
| | |
| | | | | | | 71,305 | |
| | | | | | | | |
|
Semiconductors & Semiconductor Equipment — 0.5% | |
| | |
Analog Devices, Inc. 2.95%, 1/12/2021 | | | 15,000 | | | | 15,145 | |
| | |
Applied Materials, Inc. 4.30%, 6/15/2021 | | | 5,000 | | | | 5,206 | |
| | |
Broadcom Corp. | | | | | | | | |
| | |
2.20%, 1/15/2021 | | | 25,000 | | | | 24,880 | |
| | |
3.00%, 1/15/2022 | | | 6,000 | | | | 6,052 | |
| | |
3.63%, 1/15/2024 | | | 10,000 | | | | 10,204 | |
| | |
Intel Corp. | | | | | | | | |
| | |
2.35%, 5/11/2022 | | | 16,000 | | | | 16,208 | |
| | |
2.70%, 12/15/2022 | | | 15,000 | | | | 15,440 | |
| | |
Lam Research Corp. 2.80%, 6/15/2021 | | | 10,000 | | | | 10,113 | |
| | | | | | | | |
| INVESTMENTS | | PRINCIPAL AMOUNT ($) | | | VALUE ($) | |
| | | | | | | | |
|
Semiconductors & Semiconductor Equipment — continued | |
| | |
Microchip Technology, Inc. 4.33%, 6/1/2023 | | | 5,000 | | | | 5,269 | |
| | |
NXP BV (Netherlands) 4.88%, 3/1/2024 (d) | | | 17,000 | | | | 18,516 | |
| | |
QUALCOMM, Inc. 2.60%, 1/30/2023 | | | 30,000 | | | | 30,566 | |
| | |
Texas Instruments, Inc. | | | | | | | | |
| | |
1.85%, 5/15/2022 | | | 3,000 | | | | 3,005 | |
| | |
2.25%, 5/1/2023 | | | 5,000 | | | | 5,055 | |
| | |
Xilinx, Inc. 2.95%, 6/1/2024 | | | 10,000 | | | | 10,309 | |
| | | | | | | | |
| | |
| | | | | | | 175,968 | |
| | | | | | | | |
|
Software — 0.5% | |
| | |
CA, Inc. 3.60%, 8/15/2022 | | | 15,000 | | | | 15,292 | |
| | |
Microsoft Corp. | | | | | | | | |
| | |
2.40%, 2/6/2022 | | | 6,000 | | | | 6,103 | |
| | |
2.38%, 2/12/2022 | | | 58,000 | | | | 58,945 | |
| | |
Oracle Corp. | | | | | | | | |
| | |
2.80%, 7/8/2021 | | | 18,000 | | | | 18,307 | |
| | |
2.40%, 9/15/2023 | | | 30,000 | | | | 30,448 | |
| | |
3.40%, 7/8/2024 | | | 16,000 | | | | 16,956 | |
| | |
VMware, Inc. 2.95%, 8/21/2022 | | | 15,000 | | | | 15,217 | |
| | | | | | | | |
| | |
| | | | | | | 161,268 | |
| | | | | | | | |
|
Specialty Retail — 0.3% | |
| | |
Advance Auto Parts, Inc. 4.50%, 1/15/2022 | | | 15,000 | | | | 15,645 | |
| | |
AutoZone, Inc. 3.70%, 4/15/2022 | | | 5,000 | | | | 5,209 | |
| | |
Home Depot, Inc. (The) | | | | | | | | |
| | |
3.25%, 3/1/2022 | | | 15,000 | | | | 15,581 | |
| | |
2.70%, 4/1/2023 | | | 15,000 | | | | 15,505 | |
| | |
Lowe’s Cos., Inc. 3.75%, 4/15/2021 | | | 15,000 | | | | 15,356 | |
| | |
O’Reilly Automotive, Inc. 3.80%, 9/1/2022 | | | 5,000 | | | | 5,211 | |
| | |
TJX Cos., Inc. (The) 2.75%, 6/15/2021 | | | 15,000 | | | | 15,219 | |
| | | | | | | | |
| | |
| | | | | | | 87,726 | |
| | | | | | | | |
|
Technology Hardware, Storage & Peripherals — 0.6% | |
| | |
Apple, Inc. | | | | | | | | |
| | |
1.55%, 8/4/2021 | | | 53,000 | | | | 52,738 | |
| | |
2.10%, 9/12/2022 | | | 15,000 | | | | 15,134 | |
| | |
2.85%, 2/23/2023 | | | 15,000 | | | | 15,497 | |
| | |
2.40%, 5/3/2023 | | | 15,000 | | | | 15,316 | |
| | |
3.45%, 5/6/2024 | | | 10,000 | | | | 10,711 | |
| | |
Dell International LLC 4.42%, 6/15/2021 (d) | | | 33,000 | | | | 34,033 | |
| | |
Hewlett Packard Enterprise Co. | | | | | | | | |
| | |
3.60%, 10/15/2020 (c) | | | 16,000 | | | | 16,232 | |
| | |
4.40%, 10/15/2022 (c) | | | 3,000 | | | | 3,179 | |
| | |
HP, Inc. 4.30%, 6/1/2021 | | | 15,000 | | | | 15,555 | |
SEE NOTES TO FINANCIAL STATEMENTS.
| | | | | | | | |
| | | |
| AUGUST 31, 2019 | | J.P. MORGAN EXCHANGE-TRADED FUNDS | | | | | 33 | |
JPMorgan BetaBuilders 1-5 Year U.S. Aggregate Bond ETF
SCHEDULE OF PORTFOLIO INVESTMENTS
AS OF AUGUST 31, 2019 (Unaudited) (continued)
| | | | | | | | |
| INVESTMENTS | | PRINCIPAL AMOUNT ($) | | | VALUE ($) | |
Corporate Bonds — continued | |
|
Technology Hardware, Storage & Peripherals — continued | |
| | |
Seagate HDD Cayman 4.25%, 3/1/2022 | | | 10,000 | | | | 10,355 | |
| | | | | | | | |
| | |
| | | | | | | 188,750 | |
| | | | | | | | |
|
Thrifts & Mortgage Finance — 0.0% (a) | |
| | |
New York Community Bancorp, Inc. (ICE LIBOR USD 3 Month + 2.78%), 5.90%, 11/6/2028 (b) | | | 15,000 | | | | 15,804 | |
| | | | | | | | |
|
Tobacco — 0.2% | |
| | |
Altria Group, Inc. 4.75%, 5/5/2021 | | | 19,000 | | | | 19,821 | |
| | |
BAT Capital Corp. (United Kingdom) 2.76%, 8/15/2022 | | | 22,000 | | | | 22,272 | |
| | |
Philip Morris International, Inc. 2.13%, 5/10/2023 | | | 25,000 | | | | 24,958 | |
| | | | | | | | |
| | |
| | | | | | | 67,051 | |
| | | | | | | | |
|
Trading Companies & Distributors — 0.3% | |
| | |
Air Lease Corp. | | | | | | | | |
| | |
3.38%, 6/1/2021 | | | 15,000 | | | | 15,252 | |
| | |
2.75%, 1/15/2023 | | | 15,000 | | | | 15,168 | |
| | |
Aircastle Ltd. 5.50%, 2/15/2022 | | | 15,000 | | | | 16,023 | |
| | |
GATX Corp. 4.85%, 6/1/2021 | | | 15,000 | | | | 15,667 | |
| | |
International Lease Finance Corp. | | | | | | | | |
| | |
8.63%, 1/15/2022 | | | 8,000 | | | | 9,115 | |
| | |
5.88%, 8/15/2022 | | | 31,000 | | | | 34,048 | |
| | | | | | | | |
| | |
| | | | | | | 105,273 | |
| | | | | | | | |
|
Wireless Telecommunication Services — 0.1% | |
| | |
Vodafone Group plc (United Kingdom) | | | | | | | | |
| | |
2.50%, 9/26/2022 | | | 3,000 | | | | 3,038 | |
| | |
3.75%, 1/16/2024 | | | 15,000 | | | | 15,847 | |
| | | | | | | | |
| | |
| | | | | | | 18,885 | |
| | | | | | | | |
| | |
Total Corporate Bonds
(Cost $7,875,523) | | | | | | | 8,032,766 | |
| | | | | | | | |
Mortgage-Backed Securities — 6.7% | |
| | |
FHLMC Gold Pools, 15 Year | | | | | | | | |
| | |
Pool # J14776, 3.00%, 3/1/2026 | | | 26,513 | | | | 27,318 | |
| | |
Pool # G14783, 3.50%, 10/1/2026 | | | 24,180 | | | | 25,058 | |
| | |
Pool # J20134, 3.00%, 8/1/2027 | | | 14,766 | | | | 15,215 | |
| | |
Pool # G18452, 2.50%, 12/1/2027 | | | 60,512 | | | | 61,478 | |
| | |
Pool # J23906, 2.50%, 5/1/2028 | | | 61,865 | | | | 62,852 | |
| | |
Pool # J23582, 3.00%, 5/1/2028 | | | 22,993 | | | | 23,693 | |
| | |
Pool # G15724, 4.00%, 1/1/2029 | | | 5,894 | | | | 6,149 | |
| | |
Pool # G16577, 4.00%, 1/1/2029 | | | 12,954 | | | | 13,512 | |
| | |
Pool # G15093, 3.00%, 4/1/2029 | | | 14,820 | | | | 15,290 | |
| | |
Pool # G18511, 2.50%, 5/1/2029 | | | 10,922 | | | | 11,095 | |
| | |
Pool # G18512, 3.00%, 5/1/2029 | | | 29,440 | | | | 30,334 | |
| | |
Pool # G15290, 3.50%, 2/1/2030 | | | 5,088 | | | | 5,334 | |
| | | | | | | | |
| INVESTMENTS | | PRINCIPAL AMOUNT ($) | | | VALUE ($) | |
| |
| | |
Pool # G18549, 2.50%, 4/1/2030 | | | 45,094 | | | | 45,926 | |
| | |
Pool # G16749, 2.00%, 7/1/2030 | | | 14,233 | | | | 14,334 | |
| | |
Pool # J33012, 3.00%, 10/1/2030 | | | 42,623 | | | | 43,918 | |
| | |
Pool # G15855, 3.50%, 1/1/2031 | | | 3,663 | | | | 3,828 | |
| | |
Pool # G18587, 3.00%, 2/1/2031 | | | 23,466 | | | | 24,179 | |
| | |
Pool # G18597, 3.50%, 4/1/2031 | | | 2,826 | | | | 2,938 | |
| | |
Pool # G18618, 2.00%, 11/1/2031 | | | 15,039 | | | | 15,017 | |
| | |
Pool # G18620, 3.00%, 11/1/2031 | | | 17,832 | | | | 18,375 | |
| | |
Pool # G18626, 2.50%, 1/1/2032 | | | 90,032 | | | | 91,358 | |
| | |
Pool # G18632, 3.00%, 2/1/2032 | | | 29,607 | | | | 30,454 | |
| | |
Pool # G16207, 3.50%, 7/1/2032 | | | 14,164 | | | | 14,890 | |
| | |
Pool # J38058, 3.00%, 11/1/2032 | | | 55,524 | | | | 57,287 | |
| | |
Pool # G18676, 2.50%, 2/1/2033 | | | 20,684 | | | | 20,976 | |
| | |
Pool # J39722, 3.00%, 10/1/2033 | | | 14,785 | | | | 15,171 | |
| | |
Pool # J39886, 4.00%, 11/1/2033 | | | 12,771 | | | | 13,542 | |
| | |
Pool # G18715, 3.00%, 12/1/2033 | | | 18,926 | | | | 19,413 | |
| | |
Pool # G18720, 3.50%, 1/1/2034 | | | 17,511 | | | | 18,145 | |
| | |
Pool # G18723, 3.50%, 2/1/2034 | | | 15,356 | | | | 15,911 | |
| | |
Pool # G18726, 3.50%, 3/1/2034 | | | 13,351 | | | | 13,846 | |
| | |
GNMA I, 15 Year Pool # 794368, 3.00%, 2/15/2027 | | | 3,734 | | | | 3,829 | |
| | |
GNMA II, 15 Year | | | | | | | | |
| | |
Pool # 796502, 3.00%, 4/20/2022 | | | 15,632 | | | | 15,931 | |
| | |
Pool # MA0756, 2.50%, 2/20/2028 | | | 5,583 | | | | 5,705 | |
| | |
Pool # MA1134, 3.00%, 7/20/2028 | | | 16,559 | | | | 17,002 | |
| | |
Pool # MA4355, 2.50%, 4/20/2032 | | | 15,802 | | | | 16,072 | |
| | |
Pool # MA4559, 3.00%, 7/20/2032 | | | 19,855 | | | | 20,302 | |
| | |
Pool # MA4625, 3.50%, 8/20/2032 | | | 14,266 | | | | 14,776 | |
| | |
Pool # MA5236, 3.50%, 6/20/2033 | | | 9,301 | | | | 9,634 | |
| | |
UMBS, 15 Year | | | | | | | | |
| | |
Pool # AC8868, 4.50%, 12/1/2024 | | | 4,364 | | | | 4,535 | |
| | |
Pool # AE0988, 4.00%, 9/1/2025 | | | 8,630 | | | | 8,979 | |
| | |
Pool # ZK2607, 3.50%, 10/1/2025 | | | 5,956 | | | | 6,169 | |
| | |
Pool # AH0563, 3.00%, 12/1/2025 | | | 4,470 | | | | 4,588 | |
| | |
Pool # AL1168, 3.50%, 1/1/2026 | | | 21,106 | | | | 21,862 | |
| | |
Pool # AH9695, 4.00%, 4/1/2026 | | | 9,788 | | | | 10,212 | |
| | |
Pool # AK3264, 3.00%, 2/1/2027 | | | 16,523 | | | | 17,018 | |
| | |
Pool # AK5412, 3.00%, 3/1/2027 | | | 15,687 | | | | 16,143 | |
| | |
Pool # AL1746, 3.50%, 3/1/2027 | | | 16,827 | | | | 17,479 | |
| | |
Pool # BM4533, 4.00%, 8/1/2027 | | | 11,437 | | | | 11,928 | |
| | |
Pool # AQ5118, 2.50%, 11/1/2027 | | | 19,749 | | | | 20,055 | |
| | |
Pool # AQ1688, 2.00%, 12/1/2027 | | | 10,871 | | | | 10,943 | |
| | |
Pool # MA1277, 2.50%, 12/1/2027 | | | 91,282 | | | | 92,694 | |
| | |
Pool # AL3060, 3.00%, 2/1/2028 | | | 42,503 | | | | 43,777 | |
| | |
Pool # AT2769, 2.00%, 5/1/2028 | | | 19,061 | | | | 19,187 | |
| | |
Pool # AL4468, 3.50%, 11/1/2028 | | | 12,580 | | | | 13,192 | |
SEE NOTES TO FINANCIAL STATEMENTS.
| | | | | | |
| | | |
| 34 | | | | J.P. MORGAN EXCHANGE-TRADED FUNDS | | AUGUST 31, 2019 |
| | | | | | | | |
| INVESTMENTS | | PRINCIPAL AMOUNT ($) | | | VALUE ($) | |
Mortgage-Backed Securities — continued | |
| | |
Pool # BM3954, 2.50%, 12/1/2028 | | | 75,662 | | | | 76,831 | |
| | |
Pool # AV8783, 3.00%, 1/1/2029 | | | 35,377 | | | | 36,328 | |
| | |
Pool # AV4793, 3.50%, 5/1/2029 | | | 21,081 | | | | 21,878 | |
| | |
Pool # AW8317, 2.50%, 9/1/2029 | | | 13,532 | | | | 13,741 | |
| | |
Pool # AL7205, 3.50%, 12/1/2029 | | | 5,025 | | | | 5,227 | |
| | |
Pool # AX7696, 3.00%, 1/1/2030 | | | 48,164 | | | | 49,603 | |
| | |
Pool # AS4489, 2.50%, 3/1/2030 | | | 4,080 | | | | 4,152 | |
| | |
Pool # AY6338, 2.50%, 3/1/2030 | | | 62,721 | | | | 63,613 | |
| | |
Pool # AS4678, 3.00%, 3/1/2030 | | | 53,065 | | | | 54,655 | |
| | |
Pool # AS5237, 2.50%, 6/1/2030 | | | 14,835 | | | | 15,046 | |
| | |
Pool # BA6893, 2.50%, 2/1/2031 | | | 9,714 | | | | 9,852 | |
| | |
Pool # BC2482, 3.00%, 3/1/2031 | | | 39,439 | | | | 40,617 | |
| | |
Pool # ZS7502, 2.50%, 4/1/2031 (e) | | | 5,697 | | | | 5,794 | |
| | |
Pool # BM3754, 3.50%, 4/1/2031 | | | 6,200 | | | | 6,497 | |
| | |
Pool # AS7467, 2.50%, 7/1/2031 | | | 19,587 | | | | 19,866 | |
| | |
Pool # AS7606, 2.50%, 7/1/2031 | | | 7,344 | | | | 7,476 | |
| | |
Pool # AS7620, 2.50%, 7/1/2031 | | | 114,510 | | | | 116,358 | |
| | |
Pool # AL8804, 3.50%, 7/1/2031 | | | 6,766 | | | | 7,066 | |
| | |
Pool # MA2774, 2.00%, 10/1/2031 | | | 17,497 | | | | 17,463 | |
| | |
Pool # ZS8628, 2.00%, 11/1/2031 | | | 5,013 | | | | 5,003 | |
| | |
Pool # BM3174, 3.50%, 5/1/2032 | | | 7,792 | | | | 8,174 | |
| | |
Pool # MA3217, 2.50%, 12/1/2032 | | | 12,130 | | | | 12,296 | |
| | |
Pool # 890822, 3.00%, 12/1/2032 | | | 87,837 | | | | 90,411 | |
| | |
Pool # BM3276, 3.50%, 12/1/2032 | | | 21,531 | | | | 22,546 | |
| | |
Pool # BJ9052, 3.50%, 2/1/2033 | | | 8,774 | | | | 9,112 | |
| | |
Pool # ZS7988, 3.50%, 2/1/2033 | | | 20,530 | | | | 21,543 | |
| | |
Pool # ZK9341, 3.00%, 3/1/2033 | | | 5,881 | | | | 6,047 | |
| | |
Pool # MA3437, 3.00%, 8/1/2033 | | | 19,884 | | | | 20,397 | |
| | |
Pool # ZT0716, 3.00%, 10/1/2033 | | | 11,886 | | | | 12,197 | |
| | |
Pool # ZT2104, 2.50%, 12/1/2033 | | | 4,854 | | | | 4,921 | |
| | |
Pool # BN4806, 4.00%, 1/1/2034 | | | 24,088 | | | | 25,161 | |
| | |
Pool # MA3588, 3.50%, 2/1/2034 | | | 42,342 | | | | 43,839 | |
| | |
Pool # CA3440, 3.50%, 4/1/2034 | | | 3,868 | | | | 4,060 | |
| | |
Pool # MA3657, 3.00%, 5/1/2034 | | | 16,277 | | | | 16,693 | |
| | |
Pool # MA3682, 3.50%, 6/1/2034 | | | 7,703 | | | | 7,994 | |
| | |
Pool # MA3695, 3.00%, 7/1/2034 | | | 7,796 | | | | 7,997 | |
| | |
Pool # SB8008, 2.50%, 8/1/2034 | | | 19,760 | | | | 20,021 | |
| | |
Pool # SB8013, 2.50%, 9/1/2034 | | | 12,000 | | | | 12,159 | |
| | |
Pool # SB8012, 3.50%, 9/1/2034 | | | 12,000 | | | | 12,447 | |
| | |
Pool # SB8014, 4.00%, 9/1/2034 | | | 15,000 | | | | 15,620 | |
| | | | | | | | |
| | |
Total Mortgage-Backed Securities
(Cost $2,106,577) | | | | | | | 2,149,549 | |
| | | | | | | | |
Supranational — 2.9% | |
| | |
African Development Bank (Supranational) | | | | | | | | |
| | |
1.25%, 7/26/2021 | | | 26,000 | | | | 25,831 | |
| | | | | | | | |
| INVESTMENTS | | PRINCIPAL AMOUNT ($) | | | VALUE ($) | |
| |
| | |
3.00%, 9/20/2023 | | | 15,000 | | | | 15,851 | |
| | |
Asian Development Bank (Supranational) | | | | | | | | |
| | |
1.75%, 6/8/2021 | | | 57,000 | | | | 57,129 | |
| | |
2.13%, 11/24/2021 | | | 10,000 | | | | 10,125 | |
| | |
1.88%, 2/18/2022 | | | 15,000 | | | | 15,130 | |
| | |
1.88%, 8/10/2022 | | | 29,000 | | | | 29,306 | |
| | |
Asian Infrastructure Investment Bank (The) (Supranational) 2.25%, 5/16/2024 | | | 6,000 | | | | 6,207 | |
| | |
Corp. Andina de Fomento (Supranational) 2.13%, 9/27/2021 | | | 33,000 | | | | 32,885 | |
| | |
Council of Europe Development Bank (Supranational) 1.63%, 3/16/2021 | | | 12,000 | | | | 11,992 | |
| | |
European Bank for Reconstruction & Development (Supranational) | | | | | | | | |
| | |
1.50%, 11/2/2021 | | | 10,000 | | | | 9,983 | |
| | |
2.13%, 3/7/2022 | | | 43,000 | | | | 43,650 | |
| | |
European Investment Bank (Supranational) | | | | | | | | |
| | |
2.25%, 8/15/2022 | | | 76,000 | | | | 77,604 | |
| | |
2.50%, 3/15/2023 | | | 145,000 | | | | 150,131 | |
| | |
3.25%, 1/29/2024 | | | 8,000 | | | | 8,606 | |
| | |
2.63%, 3/15/2024 | | | 15,000 | | | | 15,761 | |
| | |
2.25%, 6/24/2024 | | | 19,000 | | | | 19,680 | |
| | |
Inter-American Development Bank (Supranational) | | | | | | | | |
| | |
2.63%, 4/19/2021 | | | 15,000 | | | | 15,237 | |
| | |
1.75%, 4/14/2022 | | | 70,000 | | | | 70,365 | |
| | |
1.75%, 9/14/2022 | | | 43,000 | | | | 43,319 | |
| | |
International Bank for Reconstruction & Development (Supranational) | | | | | | | | |
| | |
1.63%, 3/9/2021 | | | 100,000 | | | | 99,991 | |
| | |
1.38%, 5/24/2021 | | | 82,000 | | | | 81,676 | |
| | |
2.13%, 7/1/2022 | | | 35,000 | | | | 35,620 | |
| | |
2.50%, 3/19/2024 | | | 18,000 | | | | 18,814 | |
| | |
International Finance Corp. (Supranational) 2.25%, 1/25/2021 | | | 25,000 | | | | 25,186 | |
| | | | | | | | |
| | |
Total Supranational
(Cost $901,391) | | | | | | | 920,079 | |
| | | | | | | | |
U.S. Government Agency Securities — 2.3% | |
| | |
FFCB 2.55%, 3/11/2021 | | | 48,000 | | | | 48,674 | |
| | |
FHLB | | | | | | | | |
| | |
2.63%, 10/1/2020 | | | 45,000 | | | | 45,448 | |
| | |
1.13%, 7/14/2021 | | | 115,000 | | | | 114,143 | |
| | |
2.50%, 3/11/2022 | | | 70,000 | | | | 71,744 | |
| | |
2.13%, 6/10/2022 | | | 15,000 | | | | 15,251 | |
| | |
2.26%, 10/4/2022 | | | 40,000 | | | | 40,011 | |
| | |
FHLMC | | | | | | | | |
| | |
2.38%, 1/13/2022 | | | 120,000 | | | | 122,304 | |
SEE NOTES TO FINANCIAL STATEMENTS.
| | | | | | | | |
| | | |
| AUGUST 31, 2019 | | J.P. MORGAN EXCHANGE-TRADED FUNDS | | | | | 35 | |
JPMorgan BetaBuilders 1-5 Year U.S. Aggregate Bond ETF
SCHEDULE OF PORTFOLIO INVESTMENTS
AS OF AUGUST 31, 2019 (Unaudited) (continued)
| | | | | | | | |
| INVESTMENTS | | PRINCIPAL AMOUNT ($) | | | VALUE ($) | |
U.S. Government Agency Securities — continued | |
| | |
2.55%, 6/6/2022 | | | 20,000 | | | | 20,000 | |
| | |
2.55%, 6/20/2022 | | | 15,000 | | | | 15,003 | |
| | |
FNMA | | | | | | | | |
| | |
1.38%, 2/26/2021 | | | 26,000 | | | | 25,917 | |
| | |
2.75%, 6/22/2021 | | | 50,000 | | | | 51,078 | |
| | |
2.63%, 1/11/2022 | | | 50,000 | | | | 51,270 | |
| | |
2.00%, 10/5/2022 | | | 28,000 | | | | 28,445 | |
| | |
1.75%, 7/2/2024 | | | 15,000 | | | | 15,206 | |
| | |
Israel Government AID Bond (Israel) 5.50%, 12/4/2023 | | | 51,000 | | | | 59,103 | |
| | | | | | | | |
| | |
Total U.S. Government Agency Securities
(Cost $713,496) | | | | | | | 723,597 | |
| | | | | | | | |
Commercial Mortgage-Backed Securities — 1.9% | |
| | |
Citigroup Commercial MortgageTrust Series 2013-GC17, Class A4, 4.13%, 11/10/2046 | | | 20,000 | | | | 21,623 | |
| | |
Commercial Mortgage Trust | | | | | | | | |
| | |
Series 2014-CR16, Class A3, 3.78%, 4/10/2047 | | | 24,970 | | | | 26,742 | |
| | |
Series 2014-LC15, Class A4, 4.01%, 4/10/2047 | | | 20,000 | | | | 21,680 | |
| | |
Series 2014-UBS4, Class A5, 3.69%, 8/10/2047 | | | 30,000 | | | | 32,256 | |
| | |
Series 2013-CR11, Class ASB, 3.66%, 8/10/2050 | | | 17,573 | | | | 18,128 | |
| | |
FHLMC, Multifamily Structured Pass-Through Certificates | | | | | | | | |
| | |
Series K015, Class A2, 3.23%, 7/25/2021 | | | 91,835 | | | | 93,391 | |
| | |
Series K016, Class A2, 2.97%, 10/25/2021 | | | 28,428 | | | | 28,919 | |
| | |
Series K021, Class A1, 1.60%, 1/25/2022 | | | 16,970 | | | | 16,861 | |
| | |
Series K019, Class A2, 2.27%, 3/25/2022 | | | 16,000 | | | | 16,177 | |
| | |
Series K020, Class A2, 2.37%, 5/25/2022 | | | 10,000 | | | | 10,126 | |
| | |
Series K720, Class A2, 2.72%, 6/25/2022 | | | 15,000 | | | | 15,311 | |
| | |
Series K028, Class A2, 3.11%, 2/25/2023 | | | 10,000 | | | | 10,403 | |
| | |
FNMA ACES | | | | | | | | |
| | |
Series 2014-M1, Class A2, 3.34%, 7/25/2023 (f) | | | 14,396 | | | | 15,074 | |
| | |
Series 2014-M8, Class A2, 3.06%, 6/25/2024 (f) | | | 38,000 | | | | 39,924 | |
| | |
GS Mortgage Securities Trust | | | | | | | | |
| | |
Series 2014-GC18, Class A4, 4.07%, 1/10/2047 | | | 30,000 | | | | 32,430 | |
| | | | | | | | |
| INVESTMENTS | | PRINCIPAL AMOUNT ($) | | | VALUE ($) | |
| |
| | |
Series 2014-GC18, Class AS, 4.38%, 1/10/2047 | | | 17,000 | | | | 18,195 | |
| | |
JP Morgan Chase Commercial Mortgage SecuritiesTrust Series 2013-C10, Class AS, 3.37%, 12/15/2047 ‡ | | | 20,000 | | | | 20,694 | |
| | |
JPMBB Commercial Mortgage Securities Trust | | | | | | | | |
| | |
Series 2013-C17, Class ASB, 3.71%, 1/15/2047 | | | 17,225 | | | | 17,891 | |
| | |
Series 2014-C19, Class C, 4.85%, 4/15/2047 (f) | | | 10,000 | | | | 10,743 | |
| | |
Morgan Stanley Bank of America Merrill LynchTrust Series 2015-C25, Class ASB, 3.38%, 10/15/2048 | | | 40,000 | | | | 41,680 | |
| | |
Morgan Stanley Capital I TrustSeries 2011-C3, Class A4, 4.12%, 7/15/2049 | | | 6,000 | | | | 6,095 | |
| | |
UBS Commercial Mortgage TrustSeries 2018-C13, Class A2, 4.21%, 10/15/2051 | | | 10,000 | | | | 10,775 | |
| | |
UBS-Barclays Commercial Mortgage TrustSeries 2013-C6, Class A4, 3.24%, 4/10/2046 | | | 23,000 | | | | 23,936 | |
| | |
Wells Fargo Commercial Mortgage Trust | | | | | | | | |
| | |
Series 2013-LC12, Class A4, 4.22%, 7/15/2046 (f) | | | 12,000 | | | | 12,920 | |
| | |
Series 2014-LC16, Class ASB, 3.48%, 8/15/2050 | | | 9,535 | | | | 9,841 | |
| | |
WFRBS Commercial Mortgage Trust | | | | | | | | |
| | |
Series 2012-C10, Class A3, 2.88%, 12/15/2045 | | | 12,000 | | | | 12,315 | |
| | |
Series 2012-C10, Class B, 3.74%, 12/15/2045 ‡ | | | 15,000 | | | | 15,489 | |
| | |
Series 2014-C20, Class A3, 3.64%, 5/15/2047 | | | 19,782 | | | | 20,214 | |
| | | | | | | | |
| |
Total Commercial Mortgage-Backed Securities
(Cost $608,184) | | | | 619,833 | |
| | | | | | | | |
Foreign Government Securities — 1.4% | |
| | |
Canada Government Bond (Canada) | | | | | | | | |
| | |
2.63%, 1/25/2022 | | | 10,000 | | | | 10,258 | |
| | |
2.00%, 11/15/2022 | | | 20,000 | | | | 20,318 | |
| | |
Export Development Canada (Canada) | | | | | | | | |
| | |
1.50%, 5/26/2021 | | | 15,000 | | | | 14,965 | |
| | |
1.38%, 10/21/2021 | | | 10,000 | | | | 9,951 | |
| | |
2.00%, 5/17/2022 | | | 35,000 | | | | 35,427 | |
| | |
Export-Import Bank of Korea (South Korea) 5.13%, 6/29/2020 | | | 50,000 | | | | 51,192 | |
| | |
Italy Government Bond (Italy) 6.88%, 9/27/2023 | | | 15,000 | | | | 17,298 | |
SEE NOTES TO FINANCIAL STATEMENTS.
| | | | | | |
| | | |
| 36 | | | | J.P. MORGAN EXCHANGE-TRADED FUNDS | | AUGUST 31, 2019 |
| | | | | | | | |
| INVESTMENTS | | PRINCIPAL AMOUNT ($) | | | VALUE ($) | |
Foreign Government Securities — continued | |
| | |
Province of Alberta (Canada) 2.20%, 7/26/2022 | | | 15,000 | | | | 15,237 | |
| | |
Province of British Columbia Canada (Canada) 2.00%, 10/23/2022 | | | 15,000 | | | | 15,185 | |
| | |
Province of Ontario (Canada) | | | | | | | | |
| | |
2.50%, 9/10/2021 | | | 15,000 | | | | 15,240 | |
| | |
2.25%, 5/18/2022 | | | 21,000 | | | | 21,337 | |
| | |
2.45%, 6/29/2022 | | | 15,000 | | | | 15,339 | |
| | |
3.05%, 1/29/2024 | | | 16,000 | | | | 16,974 | |
| | |
Province of Quebec (Canada) 2.63%, 2/13/2023 | | | 27,000 | | | | 27,908 | |
| | |
Republic of Colombia (Colombia) 8.13%, 5/21/2024 | | | 20,000 | | | | 25,050 | |
| | |
Republic of Hungary (Hungary) | | | | | | | | |
| | |
5.38%, 2/21/2023 | | | 18,000 | | | | 19,901 | |
| | |
5.75%, 11/22/2023 | | | 20,000 | | | | 22,757 | |
| | |
Republic of Poland (Poland) | | | | | | | | |
| | |
5.13%, 4/21/2021 | | | 22,000 | | | | 23,126 | |
| | |
5.00%, 3/23/2022 | | | 8,000 | | | | 8,615 | |
| | |
4.00%, 1/22/2024 | | | 7,000 | | | | 7,610 | |
| | |
Republic of Uruguay (Uruguay) 8.00%, 11/18/2022 | | | 5,000 | | | | 5,673 | |
| | |
United Mexican States (Mexico) | | | | | | | | |
| | |
3.50%, 1/21/2021 | | | 8,000 | | | | 8,155 | |
| | |
3.63%, 3/15/2022 | | | 24,000 | | | | 24,833 | |
| | |
4.00%, 10/2/2023 | | | 6,000 | | | | 6,345 | |
| | | | | | | | |
| | |
Total Foreign Government Securities
(Cost $429,515) | | | | | | | 438,694 | |
| | | | | | | | |
Asset-Backed Securities — 1.1% | |
| | |
Ally Auto ReceivablesTrust Series 2018-3, Class A4, 3.12%, 7/17/2023 | | | 10,000 | | | | 10,278 | |
| | |
Ally Master OwnerTrust Series 2018-4, Class A, 3.30%, 7/17/2023 | | | 10,000 | | | | 10,231 | |
| | |
American Express Credit Account MasterTrust Series 2017-7, Class A, 2.35%, 5/15/2025 | | | 30,000 | | | | 30,640 | |
| | |
AmeriCredit Automobile ReceivablesTrust Series 2017-3, Class D, 3.18%, 7/18/2023 | | | 15,000 | | | | 15,218 | |
| | |
BA Credit CardTrust Series 2018-A3, Class A3, 3.10%, 12/15/2023 | | | 22,000 | | | | 22,555 | |
| | |
BMW Vehicle LeaseTrust Series 2018-1, Class A3, 3.26%, 7/20/2021 | | | 10,000 | | | | 10,125 | |
| | |
Capital Auto Receivables AssetTrust Series 2016-1, Class D, 4.03%, 8/21/2023 | | | 8,000 | | | | 8,033 | |
| | |
Capital One Multi-Asset ExecutionTrust Series 2018-A1, Class A1, 3.01%, 2/15/2024 | | | 27,000 | | | | 27,521 | |
| | | | | | | | |
| INVESTMENTS | | PRINCIPAL AMOUNT ($) | | | VALUE ($) | |
| |
| | |
CarMax Auto OwnerTrust Series 2018-3, Class A3, 3.13%, 6/15/2023 | | | 17,000 | | | | 17,337 | |
| | |
Citibank Credit Card Issuance TrustSeries 2018-A3, Class A3, 3.29%, 5/23/2025 | | | 33,000 | | | | 34,762 | |
| | |
Discover Card Execution Note TrustSeries 2018-A4, Class A4, 3.11%, 1/16/2024 | | | 30,000 | | | | 30,757 | |
| | |
Ford Credit Auto LeaseTrust Series 2018-B, Class A3, 3.19%, 12/15/2021 | | | 10,000 | | | | 10,113 | |
| | |
Ford Credit Auto Owner Trust | | | | | | | | |
| | |
Series 2018-A, Class A3, 3.03%, 11/15/2022 | | | 6,000 | | | | 6,072 | |
| | |
Series 2017-A, Class C, 2.41%, 7/15/2023 | | | 6,000 | | | | 6,024 | |
| | |
Ford Credit Floorplan Master Owner Trust ASeries 2018-2, Class A, 3.17%, 3/15/2025 | | | 15,000 | | | | 15,656 | |
| | |
GM Financial Automobile Leasing TrustSeries 2018-3, Class A3, 3.18%, 6/21/2021 | | | 10,000 | | | | 10,076 | |
| | |
GM Financial Consumer Automobile Receivables TrustSeries 2018-1, Class A3, 2.32%, 7/18/2022 | | | 10,000 | | | | 10,030 | |
| | |
Nissan Auto LeaseTrust Series 2019-A, Class A3, 2.76%, 3/15/2022 | | | 7,000 | | | | 7,090 | |
| | |
Nissan Auto Receivables Owner TrustSeries 2017-C, Class A3, 2.12%, 4/18/2022 | | | 15,000 | | | | 15,015 | |
| | |
Santander Drive Auto Receivables TrustSeries 2019-1, Class C, 3.42%, 4/15/2025 | | | 10,000 | | | | 10,228 | |
| | |
Synchrony Credit Card Master Note TrustSeries 2018-2, Class A, 3.47%, 5/15/2026 | | | 15,000 | | | | 15,894 | |
| | |
Toyota Auto Receivables Owner TrustSeries 2018-C, Class A3, 3.02%, 12/15/2022 | | | 12,000 | | | | 12,227 | |
| | |
World Omni Auto Receivables TrustSeries 2018-D, Class B, 3.67%, 12/16/2024 | | | 15,000 | | | | 15,814 | |
| | | | | | | | |
| | |
Total Asset-Backed Securities
(Cost $345,095) | | | | | | | 351,696 | |
| | | | | | | | |
Municipal Bonds — 0.1% | |
|
Florida — 0.1% | |
| | |
Other Revenue — 0.1% | | | | | | | | |
| | |
State Board of Administration Finance Corp. Series 2013A, Rev., 3.00%, 7/1/2020 | | | 20,000 | | | | 20,167 | |
| | | | | | | | |
SEE NOTES TO FINANCIAL STATEMENTS.
| | | | | | | | |
| | | |
| AUGUST 31, 2019 | | J.P. MORGAN EXCHANGE-TRADED FUNDS | | | | | 37 | |
JPMorgan BetaBuilders 1-5 Year U.S. Aggregate Bond ETF
SCHEDULE OF PORTFOLIO INVESTMENTS
AS OF AUGUST 31, 2019 (Unaudited) (continued)
| | | | | | | | |
| INVESTMENTS | | PRINCIPAL AMOUNT ($) | | | VALUE ($) | |
Municipal Bonds — continued | |
|
Illinois — 0.0% (a) | |
|
General Obligation — 0.0% (a) | |
| | |
State of Illinois, Taxable Pension Series 2003, GO, 4.95%, 6/1/2023 | | | 13,091 | | | | 13,693 | |
| | | | | | | | |
|
New Jersey — 0.0% (a) | |
|
Industrial Development Revenue/Pollution Control Revenue — 0.0% (a) | |
| | |
New Jersey Economic Development Authority, Cityscape Schools., Inc. Series B, Rev., AGM, 0.00%, 2/15/2021 | | | 10,000 | | | | 9,702 | |
| | | | | | | | |
| | |
Total Municipal Bonds
(Cost $43,089) | | | | | | | 43,562 | |
| | | | | | | | |
| | |
| | | SHARES | | | | |
Short-Term Investments — 0.6% | | | | | | | | |
| | |
Investment Companies — 0.6% | | | | | | | | |
| | |
JPMorgan U.S. Government Money Market Fund Class Institutional Shares, 1.99% (g) (h)
(Cost $184,514) | | | 184,514 | | | | 184,514 | |
| | | | | | | | |
| | |
Total Investments — 99.9%
(Cost $31,320,073) | | | | | | | 31,944,507 | |
| | |
Other Assets Less Liabilities — 0.1% | | | | | | | 45,581 | |
| | | | | | | | |
| | |
NET ASSETS — 100.0% | | | | | | | 31,990,088 | |
| | | | | | | | |
Percentages indicated are based on net assets.
Abbreviations
| | |
| ACES | | Alternative Credit Enhancement Securities |
| AGM | | Insured by Assured Guaranty Municipal Corp. |
| BA | | Banker’s Acceptance Rate |
| FFCB | | Federal Farm Credit Bank |
| FHLB | | Federal Home Loan Bank |
| FHLMC | | Federal Home Loan Mortgage Corp. |
| FNMA | | Federal National Mortgage Association |
| GNMA | | Government National Mortgage Association |
| GO | | General Obligation |
| ICE | | Intercontinental Exchange |
| LIBOR | | London Interbank Offered Rate |
Rev. UMBS USD | | Revenue Uniform Mortgage-Backed Securities United States Dollar |
| |
| (a) | | Amount rounds to less than 0.1% of net assets. |
| (b) | | Variable or floating rate security, linked to the referenced benchmark. The interest rate shown is the current rate as of August 31, 2019. |
| (c) | | Step bond. Interest rate is a fixed rate for an initial period that either resets at a specific date or may reset in the future contingent upon a predetermined trigger. The interest rate shown is the current rate as of August 31, 2019. |
| (d) | | Securities exempt from registration under Rule 144A or section 4(a)(2), of the Securities Act of 1933, as amended. |
| (e) | | All or a portion of the security is a when-issued security, delayed delivery security, or forward commitment. |
| (f) | | Variable or floating rate security, the interest rate of which adjusts periodically based on changes in current interest rates and prepayments on the underlying pool of assets. The interest rate shown is the current rate as of August 31, 2019. |
| (g) | | Investment in an affiliated fund, which is registered under the Investment Company Act of 1940, as amended, and is advised by J.P. Morgan Investment Management Inc. |
| (h) | | The rate shown is the current yield as of August 31, 2019. |
| ‡ | | Value determined using significant unobservable inputs. |
SEE NOTES TO FINANCIAL STATEMENTS.
| | | | | | |
| | | |
| 38 | | | | J.P. MORGAN EXCHANGE-TRADED FUNDS | | AUGUST 31, 2019 |
JPMorgan Core Plus Bond ETF
SCHEDULE OF PORTFOLIO INVESTMENTS
AS OF AUGUST 31, 2019 (Unaudited)
| | | | | | | | |
| INVESTMENTS | | PRINCIPAL AMOUNT ($) | | | VALUE ($) | |
Corporate Bonds — 26.3% | |
|
Aerospace & Defense — 1.0% | |
| | |
Arconic, Inc. | | | | | | | | |
| | |
5.13%, 10/1/2024 | | | 37,000 | | | | 39,429 | |
| | |
5.95%, 2/1/2037 | | | 14,000 | | | | 15,243 | |
| | |
Boeing Co. (The) | | | | | | | | |
| | |
3.60%, 5/1/2034 | | | 20,000 | | | | 22,114 | |
| | |
3.25%, 2/1/2035 | | | 20,000 | | | | 21,325 | |
| | |
3.95%, 8/1/2059 | | | 15,000 | | | | 16,995 | |
| | |
L3Harris Technologies, Inc. 3.85%, 12/15/2026 (a) | | | 40,000 | | | | 43,364 | |
| | |
Lockheed Martin Corp. 4.09%, 9/15/2052 | | | 20,000 | | | | 24,086 | |
| | |
Precision Castparts Corp. 4.38%, 6/15/2045 | | | 7,000 | | | | 8,582 | |
| | |
Rockwell Collins, Inc. 3.50%, 3/15/2027 | | | 40,000 | | | | 43,079 | |
| | |
TransDigm, Inc. 6.25%, 3/15/2026 (a) | | | 25,000 | | | | 26,968 | |
| | |
United Technologies Corp. 3.65%, 8/16/2023 | | | 60,000 | | | | 63,668 | |
| | | | | | | | |
| | |
| | | | | | | 324,853 | |
| | | | | | | | |
|
Air Freight & Logistics — 0.1% | |
| | |
United Parcel Service, Inc. 3.05%, 11/15/2027 | | | 12,000 | | | | 12,658 | |
| | |
XPO Logistics, Inc. 6.13%, 9/1/2023 (a) | | | 20,000 | | | | 20,680 | |
| | | | | | | | |
| | |
| | | | | | | 33,338 | |
| | | | | | | | |
|
Airlines — 0.1% | |
| | |
Continental Airlines Pass-Through TrustSeries 2012-2, Class A, 4.00%, 10/29/2024 | | | 22,430 | | | | 23,767 | |
| | |
United Airlines Holdings, Inc. 5.00%, 2/1/2024 | | | 20,000 | | | | 21,200 | |
| | | | | | | | |
| | |
| | | | | | | 44,967 | |
| | | | | | | | |
|
Auto Components — 0.3% | |
| | |
Allison Transmission, Inc. 5.00%, 10/1/2024 (a) | | | 18,000 | | | | 18,519 | |
| | |
American Axle & Manufacturing, Inc. 6.25%, 4/1/2025 | | | 8,000 | | | | 7,520 | |
| | |
Goodyear Tire & Rubber Co. (The) 5.00%, 5/31/2026 | | | 19,000 | | | | 18,810 | |
| | |
Icahn Enterprises LP 6.38%, 12/15/2025 | | | 37,000 | | | | 39,174 | |
| | | | | | | | |
| | |
| | | | | | | 84,023 | |
| | | | | | | | |
|
Banks — 4.0% | |
| | |
Bank of America Corp. | | | | | | | | |
| | |
(ICE LIBOR USD 3 Month + 0.79%), | | | | | | | | |
| | |
3.00%, 12/20/2023 (b) | | | 153,000 | | | | 157,016 | |
| | |
3.88%, 8/1/2025 | | | 47,000 | | | | 51,286 | |
| | |
(ICE LIBOR USD 3 Month + 1.06%), 3.56%, 4/23/2027 (b) | | | 40,000 | | | | 42,574 | |
| | | | | | | | |
| INVESTMENTS | | PRINCIPAL AMOUNT ($) | | | VALUE ($) | |
| | | | | | | | |
|
Banks — continued | |
| | |
(ICE LIBOR USD 3 Month + 1.58%), 3.82%, 1/20/2028 (b) | | | 17,000 | | | | 18,436 | |
| | |
(ICE LIBOR USD 3 Month + 1.07%), 3.97%, 3/5/2029 (b) | | | 35,000 | | | | 38,492 | |
| | |
(ICE LIBOR USD 3 Month + 1.21%), 3.97%, 2/7/2030 (b) | | | 20,000 | | | | 22,169 | |
| | |
(ICE LIBOR USD 3 Month + 1.32%), 4.08%, 4/23/2040 (b) | | | 5,000 | | | | 5,737 | |
| | |
(ICE LIBOR USD 3 Month + 1.52%), 4.33%, 3/15/2050 (b) | | | 15,000 | | | | 18,255 | |
| | |
Bank of Montreal (Canada) 2.35%, 9/11/2022 | | | 9,000 | | | | 9,127 | |
| | |
Bank of Nova Scotia (The) (Canada) 3.40%, 2/11/2024 | | | 50,000 | | | | 52,693 | |
| | |
BB&T Corp. 2.85%, 10/26/2024 | | | 30,000 | | | | 30,996 | |
| | |
BNP Paribas SA (France) 3.25%, 3/3/2023 | | | 12,000 | | | | 12,500 | |
| | |
Canadian Imperial Bank of Commerce (Canada) | | | | | | | | |
| | |
(ICE LIBOR USD 3 Month + 0.79%), 2.61%, 7/22/2023 (b) | | | 15,000 | | | | 15,160 | |
| | |
3.10%, 4/2/2024 | | | 24,000 | | | | 24,905 | |
| | |
CIT Group, Inc. 5.25%, 3/7/2025 | | | 24,000 | | | | 26,880 | |
| | |
Citigroup, Inc. | | | | | | | | |
| | |
2.75%, 4/25/2022 | | | 47,000 | | | | 47,842 | |
| | |
(ICE LIBOR USD 3 Month + 1.02%), 4.04%, 6/1/2024 (b) | | | 60,000 | | | | 63,857 | |
| | |
(ICE LIBOR USD 3 Month + 1.19%), 4.07%, 4/23/2029 (b) | | | 30,000 | | | | 33,215 | |
| | |
(ICE LIBOR USD 3 Month + 1.34%), 3.98%, 3/20/2030 (b) | | | 40,000 | | | | 44,212 | |
| | |
(ICE LIBOR USD 3 Month + 1.84%), 4.28%, 4/24/2048 (b) | | | 10,000 | | | | 12,210 | |
| | |
Comerica, Inc. 3.70%, 7/31/2023 | | | 5,000 | | | | 5,286 | |
| | |
HSBC Holdings plc (United Kingdom) | | | | | | | | |
| | |
7.63%, 5/17/2032 | | | 23,000 | | | | 32,950 | |
| | |
6.10%, 1/14/2042 | | | 27,000 | | | | 39,558 | |
| | |
Huntington Bancshares, Inc. 2.30%, 1/14/2022 | | | 18,000 | | | | 18,085 | |
| | |
KeyCorp 5.10%, 3/24/2021 | | | 12,000 | | | | 12,538 | |
| | |
Mitsubishi UFJ Financial Group, Inc. (Japan) | | | | | | | | |
| | |
2.67%, 7/25/2022 | | | 10,000 | | | | 10,121 | |
| | |
3.78%, 3/2/2025 | | | 7,000 | | | | 7,530 | |
| | |
MUFG Americas Holdings Corp. 3.50%, 6/18/2022 | | | 3,000 | | | | 3,102 | |
| | |
Royal Bank of Canada (Canada) 3.20%, 4/30/2021 | | | 100,000 | | | | 102,199 | |
| | |
Royal Bank of Scotland Group plc (United Kingdom) 6.10%, 6/10/2023 | | | 19,000 | | | | 20,606 | |
SEE NOTES TO FINANCIAL STATEMENTS.
| | | | | | | | |
| | | |
| AUGUST 31, 2019 | | J.P. MORGAN EXCHANGE-TRADED FUNDS | | | | | 39 | |
JPMorgan Core Plus Bond ETF
SCHEDULE OF PORTFOLIO INVESTMENTS
AS OF AUGUST 31, 2019 (Unaudited) (continued)
| | | | | | | | |
| INVESTMENTS | | PRINCIPAL AMOUNT ($) | | | VALUE ($) | |
Corporate Bonds — continued | |
|
Banks — continued | |
| | |
Santander UK plc (United Kingdom) 4.00%, 3/13/2024 | | | 5,000 | | | | 5,321 | |
| | |
Sumitomo Mitsui Financial Group, Inc. (Japan) | | | | | | | | |
| | |
2.85%, 1/11/2022 | | | 18,000 | | | | 18,316 | |
| | |
3.75%, 7/19/2023 | | | 12,000 | | | | 12,689 | |
| | |
SunTrust Bank 4.05%, 11/3/2025 | | | 12,000 | | | | 13,173 | |
| | |
Toronto-Dominion Bank (The) (Canada) 3.25%, 3/11/2024 | | | 5,000 | | | | 5,261 | |
| | |
US Bancorp 3.00%, 7/30/2029 | | | 15,000 | | | | 15,673 | |
| | |
Wells Fargo & Co. | | | | | | | | |
| | |
3.07%, 1/24/2023 | | | 110,000 | | | | 112,485 | |
| | |
3.00%, 10/23/2026 | | | 30,000 | | | | 31,182 | |
| | |
(ICE LIBOR USD 3 Month + 1.31%), 3.58%, 5/22/2028 (b) | | | 47,000 | | | | 50,403 | |
| | |
Westpac Banking Corp. (Australia) 3.65%, 5/15/2023 | | | 23,000 | | | | 24,356 | |
| | | | | | | | |
| | |
| | | | | | | 1,268,396 | |
| | | | | | | | |
|
Beverages — 0.3% | |
| | |
Anheuser-Busch Cos. LLC (Belgium) 4.90%, 2/1/2046 | | | 35,000 | | | | 41,819 | |
| | |
Anheuser-Busch InBev Worldwide, Inc. (Belgium) 4.75%, 1/23/2029 | | | 15,000 | | | | 17,531 | |
| | |
Keurig Dr Pepper, Inc. 3.55%, 5/25/2021 | | | 30,000 | | | | 30,688 | |
| | | | | | | | |
| | |
| | | | | | | 90,038 | |
| | | | | | | | |
|
Biotechnology — 0.3% | |
| | |
Celgene Corp. 5.00%, 8/15/2045 | | | 10,000 | | | | 12,728 | |
| | |
Gilead Sciences, Inc. | | | | | | | | |
| | |
2.95%, 3/1/2027 | | | 57,000 | | | | 59,260 | |
| | |
4.15%, 3/1/2047 | | | 25,000 | | | | 28,285 | |
| | | | | | | | |
| | |
| | | | | | | 100,273 | |
| | | | | | | | |
|
Building Products — 0.1% | |
| | |
Standard Industries, Inc. 6.00%, 10/15/2025 (a) | | | 32,000 | | | | 33,640 | |
| | | | | | | | |
|
Capital Markets — 2.1% | |
| | |
Ameriprise Financial, Inc. 4.00%, 10/15/2023 | | | 12,000 | | | | 12,897 | |
| | |
Bank of New York Mellon Corp. (The) 3.50%, 4/28/2023 | | | 12,000 | | | | 12,651 | |
| | |
Goldman Sachs Group, Inc. (The) | | | | | | | | |
| | |
2.35%, 11/15/2021 | | | 95,000 | | | | 95,178 | |
| | |
(ICE LIBOR USD 3 Month + 1.05%), 2.91%, 6/5/2023 (b) | | | 71,000 | | | | 72,244 | |
| | |
(ICE LIBOR USD 3 Month + 1.20%), 3.27%, 9/29/2025 (b) | | | 53,000 | | | | 55,145 | |
| | | | | | | | |
| INVESTMENTS | | PRINCIPAL AMOUNT ($) | | | VALUE ($) | |
| | | | | | | | |
|
Capital Markets — continued | |
| | |
3.50%, 11/16/2026 | | | 12,000 | | | | 12,561 | |
| | |
3.85%, 1/26/2027 | | | 18,000 | | | | 19,221 | |
| | |
(ICE LIBOR USD 3 Month + 1.51%), 3.69%, 6/5/2028 (b) | | | 35,000 | | | | 37,220 | |
| | |
Morgan Stanley | | | | | | | | |
| | |
3.75%, 2/25/2023 | | | 59,000 | | | | 62,060 | |
| | |
(ICE LIBOR USD 3 Month + 0.85%), 3.74%, 4/24/2024 (b) | | | 65,000 | | | | 68,385 | |
| | |
(SOFR + 1.15%), 2.72%, 7/22/2025 (b) | | | 25,000 | | | | 25,478 | |
| | |
3.88%, 1/27/2026 | | | 29,000 | | | | 31,353 | |
| | |
3.63%, 1/20/2027 | | | 21,000 | | | | 22,468 | |
| | |
(ICE LIBOR USD 3 Month + 1.34%), 3.59%, 7/22/2028 (b) | | | 35,000 | | | | 37,299 | |
| | |
(ICE LIBOR USD 3 Month + 1.14%), 3.77%, 1/24/2029 (b) | | | 20,000 | | | | 21,643 | |
| | |
4.38%, 1/22/2047 | | | 20,000 | | | | 24,319 | |
| | |
MSCI, Inc. 5.75%, 8/15/2025 (a) | | | 12,000 | | | | 12,600 | |
| | |
Northern Trust Corp. 3.95%, 10/30/2025 | | | 15,000 | | | | 16,480 | |
| | |
State Street Corp. 3.10%, 5/15/2023 | | | 15,000 | | | | 15,563 | |
| | |
TD Ameritrade Holding Corp. 2.75%, 10/1/2029 | | | 10,000 | | | | 10,182 | |
| | | | | | | | |
| | |
| | | | | | | 664,947 | |
| | | | | | | | |
|
Chemicals — 0.3% | |
| | |
CF Industries, Inc. 4.95%, 6/1/2043 | | | 15,000 | | | | 14,737 | |
| | |
Chemours Co. (The) | | | | | | | | |
| | |
7.00%, 5/15/2025 | | | 17,000 | | | | 16,787 | |
| | |
5.38%, 5/15/2027 | | | 5,000 | | | | 4,438 | |
| | |
Ecolab, Inc. 3.25%, 12/1/2027 | | | 14,000 | | | | 15,191 | |
| | |
Olin Corp. 5.13%, 9/15/2027 | | | 13,000 | | | | 13,358 | |
| | |
PolyOne Corp. 5.25%, 3/15/2023 | | | 12,000 | | | | 12,885 | |
| | |
Valvoline, Inc. 4.38%, 8/15/2025 | | | 10,000 | | | | 10,100 | |
| | | | | | | | |
| | |
| | | | | | | 87,496 | |
| | | | | | | | |
|
Commercial Services & Supplies — 0.3% | |
| | |
ACCO Brands Corp. 5.25%, 12/15/2024 (a) | | | 10,000 | | | | 10,263 | |
| | |
ADT Security Corp. (The) 4.13%, 6/15/2023 | | | 26,000 | | | | 26,414 | |
| | |
Aramark Services, Inc. 4.75%, 6/1/2026 | | | 15,000 | | | | 15,375 | |
| | |
Brink’s Co. (The) 4.63%, 10/15/2027 (a) | | | 20,000 | | | | 20,350 | |
| | |
Covanta Holding Corp. 5.88%, 3/1/2024 | | | 10,000 | | | | 10,275 | |
| | |
Garda World Security Corp. (Canada) 8.75%, 5/15/2025 (a) | | | 5,000 | | | | 5,158 | |
| | |
Pitney Bowes, Inc. 4.95%, 4/1/2023 (c) | | | 13,000 | | | | 12,350 | |
| | |
Waste Management, Inc. 3.20%, 6/15/2026 | | | 5,000 | | | | 5,320 | |
| | | | | | | | |
| | |
| | | | | | | 105,505 | |
| | | | | | | | |
SEE NOTES TO FINANCIAL STATEMENTS.
| | | | | | |
| | | |
| 40 | | | | J.P. MORGAN EXCHANGE-TRADED FUNDS | | AUGUST 31, 2019 |
| | | | | | | | |
| INVESTMENTS | | PRINCIPAL AMOUNT ($) | | | VALUE ($) | |
Corporate Bonds — continued | |
|
Communications Equipment — 0.2% | |
| | |
CommScope, Inc. 5.50%, 6/15/2024 (a) | | | 17,000 | | | | 16,086 | |
| | |
Nokia OYJ (Finland) 4.38%, 6/12/2027 | | | 13,000 | | | | 13,488 | |
| | |
Plantronics, Inc. 5.50%, 5/31/2023 (a) | | | 20,000 | | | | 20,348 | |
| | | | | | | | |
| | |
| | | | | | | 49,922 | |
| | | | | | | | |
|
Construction & Engineering — 0.1% | |
| | |
AECOM 5.13%, 3/15/2027 | | | 18,000 | | | | 18,801 | |
| | |
MasTec, Inc. 4.88%, 3/15/2023 | | | 15,000 | | | | 15,244 | |
| | | | | | | | |
| | |
| | | | | | | 34,045 | |
| | | | | | | | |
|
Consumer Finance — 0.7% | |
| | |
Ally Financial, Inc. | | | | | | | | |
| | |
5.75%, 11/20/2025 | | | 29,000 | | | | 33,205 | |
| | |
8.00%, 11/1/2031 | | | 27,000 | | | | 37,732 | |
| | |
Capital One Financial Corp. 3.20%, 1/30/2023 | | | 23,000 | | | | 23,698 | |
| | |
Credit Acceptance Corp. 6.63%, 3/15/2026 (a) | | | 15,000 | | | | 16,228 | |
| | |
Curo Group Holdings Corp. 8.25%, 9/1/2025 (a) | | | 10,000 | | | | 8,700 | |
| | |
John Deere Capital Corp. 2.65%, 6/10/2026 | | | 28,000 | | | | 29,079 | |
| | |
Springleaf Finance Corp. 7.13%, 3/15/2026 | | | 59,000 | | | | 67,290 | |
| | | | | | | | |
| | |
| | | | | | | 215,932 | |
| | | | | | | | |
|
Containers & Packaging — 0.3% | |
| | |
Ball Corp. 5.25%, 7/1/2025 | | | 20,000 | | | | 22,450 | |
| | |
Crown Americas LLC 4.25%, 9/30/2026 | | | 13,000 | | | | 13,488 | |
| | |
Greif, Inc. 6.50%, 3/1/2027 (a) | | | 25,000 | | | | 26,250 | |
| | |
Reynolds Group Issuer, Inc. 5.75%, 10/15/2020 | | | 24,228 | | | | 24,288 | |
| | |
Sealed Air Corp. 5.50%, 9/15/2025 (a) | | | 12,000 | | | | 13,020 | |
| | | | | | | | |
| | |
| | | | | | | 99,496 | |
| | | | | | | | |
|
Diversified Consumer Services — 0.0% (d) | |
| | |
Service Corp. International 5.38%, 5/15/2024 | | | 12,000 | | | | 12,366 | |
| | | | | | | | |
|
Diversified Financial Services — 0.6% | |
| | |
ACE Cash Express, Inc. 12.00%, 12/15/2022 (a) | | | 5,000 | | | | 5,000 | |
| | |
AIG Global Funding 1.90%, 10/6/2021 (a) | | | 9,000 | | | | 8,953 | |
| | |
Berkshire Hathaway, Inc. 3.13%, 3/15/2026 | | | 27,000 | | | | 28,623 | |
| | |
CNG Holdings, Inc. 12.50%, 6/15/2024 (a) | | | 10,000 | | | | 9,700 | |
| | |
National Rural Utilities Cooperative Finance Corp. | | | | | | | | |
| | |
3.25%, 11/1/2025 | | | 40,000 | | | | 42,398 | |
| | | | | | | | |
| INVESTMENTS | | PRINCIPAL AMOUNT ($) | | | VALUE ($) | |
| | | | | | | | |
|
Diversified Financial Services — continued | |
| | |
3.40%, 2/7/2028 | | | 14,000 | | | | 15,191 | |
| | |
4.40%, 11/1/2048 | | | 14,000 | | | | 17,444 | |
| | |
ORIX Corp. (Japan) 4.05%, 1/16/2024 | | | 9,000 | | | | 9,703 | |
| | |
Shell International Finance BV (Netherlands) | | | | | | | | |
| | |
3.25%, 5/11/2025 | | | 41,000 | | | | 43,588 | |
| | |
3.75%, 9/12/2046 | | | 13,000 | | | | 14,816 | |
| | | | | | | | |
| | |
| | | | | | | 195,416 | |
| | | | | | | | |
|
Diversified Telecommunication Services — 0.8% | |
| | |
AT&T, Inc. 4.75%, 5/15/2046 | | | 20,000 | | | | 22,363 | |
| | |
CCO Holdings LLC 5.75%, 2/15/2026 (a) | | | 71,000 | | | | 75,171 | |
| | |
CenturyLink, Inc. | | | | | | | | |
| | |
Series T, 5.80%, 3/15/2022 | | | 12,000 | | | | 12,585 | |
| | |
5.63%, 4/1/2025 | | | 1,000 | | | | 1,022 | |
| | |
Series G, 6.88%, 1/15/2028 | | | 3,000 | | | | 3,002 | |
| | |
Cincinnati Bell, Inc. 8.00%, 10/15/2025 (a) | | | 4,000 | | | | 3,511 | |
| | |
Embarq Corp. 8.00%, 6/1/2036 | | | 32,000 | | | | 31,372 | |
| | |
Frontier Communications Corp. | | | | | | | | |
| | |
6.88%, 1/15/2025 | | | 35,000 | | | | 17,850 | |
| | |
8.50%, 4/1/2026 (a) | | | 7,000 | | | | 6,807 | |
| | |
Intelsat Jackson Holdings SA (Luxembourg) | | | | | | | | |
| | |
5.50%, 8/1/2023 | | | 5,000 | | | | 4,550 | |
| | |
8.50%, 10/15/2024 (a) | | | 13,000 | | | | 12,903 | |
| | |
Level 3 Financing, Inc. 5.25%, 3/15/2026 | | | 36,000 | | | | 37,530 | |
| | |
Qwest Corp. 6.88%, 9/15/2033 | | | 1,000 | | | | 1,005 | |
| | |
Sprint Capital Corp. 8.75%, 3/15/2032 | | | 10,000 | | | | 12,525 | |
| | |
Telecom Italia Capital SA (Italy) 6.00%, 9/30/2034 | | | 18,000 | | | | 18,450 | |
| | |
Windstream Services LLC 8.63%, 10/31/2025 (a) (c) | | | 10,000 | | | | 10,050 | |
| | | | | | | | |
| | |
| | | | | | | 270,696 | |
| | | | | | | | |
|
Electric Utilities — 0.8% | |
| | |
Alabama Power Co.Series 13-A, 3.55%, 12/1/2023 | | | 15,000 | | | | 15,900 | |
| | |
Arizona Public Service Co. 3.15%, 5/15/2025 | | | 12,000 | | | | 12,540 | |
| | |
Connecticut Light & Power Co. (The) 4.00%, 4/1/2048 | | | 7,000 | | | | 8,238 | |
| | |
Duke Energy Carolinas LLC 3.20%, 8/15/2049 | | | 10,000 | | | | 10,328 | |
| | |
Entergy Louisiana LLC | | | | | | | | |
| | |
2.40%, 10/1/2026 | | | 15,000 | | | | 15,096 | |
| | |
3.05%, 6/1/2031 | | | 25,000 | | | | 26,384 | |
| | |
Indiana Michigan Power Co. Series K, 4.55%, 3/15/2046 | | | 14,000 | | | | 17,264 | |
SEE NOTES TO FINANCIAL STATEMENTS.
| | | | | | | | |
| | | |
| AUGUST 31, 2019 | | J.P. MORGAN EXCHANGE-TRADED FUNDS | | | | | 41 | |
JPMorgan Core Plus Bond ETF
SCHEDULE OF PORTFOLIO INVESTMENTS
AS OF AUGUST 31, 2019 (Unaudited) (continued)
| | | | | | | | |
| INVESTMENTS | | PRINCIPAL AMOUNT ($) | | | VALUE ($) | |
Corporate Bonds — continued | |
|
Electric Utilities — continued | |
| | |
Kentucky Utilities Co. 5.13%, 11/1/2040 | | | 14,000 | | | | 18,205 | |
| | |
Monongahela Power Co. 4.10%, 4/15/2024 (a) | | | 12,000 | | | | 12,968 | |
| | |
Public Service Electric & Gas Co. 3.00%, 5/15/2027 | | | 12,000 | | | | 12,648 | |
| | |
Southern California Edison Co. Series C, 4.13%, 3/1/2048 | | | 14,000 | | | | 15,659 | |
| | |
Southwestern Public Service Co. | | | | | | | | |
| | |
3.30%, 6/15/2024 | | | 12,000 | | | | 12,561 | |
| | |
4.50%, 8/15/2041 | | | 14,000 | | | | 17,022 | |
| | |
Tucson Electric Power Co. | | | | | | | | |
| | |
3.05%, 3/15/2025 | | | 12,000 | | | | 12,341 | |
| | |
4.85%, 12/1/2048 | | | 15,000 | | | | 19,432 | |
| | |
Vistra Operations Co. LLC 5.50%, 9/1/2026 (a) | | | 19,000 | | | | 19,950 | |
| | |
Wisconsin Public Service Corp. 4.75%, 11/1/2044 | | | 15,000 | | | | 19,065 | |
| | | | | | | | |
| | |
| | | | | | | 265,601 | |
| | | | | | | | |
|
Electrical Equipment — 0.1% | |
| | |
Sensata Technologies BV 5.00%, 10/1/2025 (a) | | | 15,000 | | | | 15,900 | |
| | |
Vertiv Group Corp. 9.25%, 10/15/2024 (a) | | | 8,000 | | | | 7,560 | |
| | | | | | | | |
| | |
| | | | | | | 23,460 | |
| | | | | | | | |
|
Electronic Equipment, Instruments & Components — 0.0% (d) | |
| | |
CDW LLC 5.00%, 9/1/2025 | | | 12,000 | | | | 12,540 | |
| | | | | | | | |
|
Energy Equipment & Services — 0.2% | |
| | |
Nabors Industries, Inc. 5.50%, 1/15/2023 | | | 7,000 | | | | 6,239 | |
| | |
Noble Holding International Ltd. 6.20%, 8/1/2040 | | | 5,000 | | | | 2,325 | |
| | |
Schlumberger Holdings Corp. 3.90%, 5/17/2028 (a) | | | 38,000 | | | | 40,495 | |
| | |
Transocean, Inc. 6.80%, 3/15/2038 | | | 5,000 | | | | 3,300 | |
| | | | | | | | |
| | |
| | | | | | | 52,359 | |
| | | | | | | | |
|
Entertainment — 0.4% | |
| | |
Live Nation Entertainment, Inc. 5.63%, 3/15/2026 (a) | | | 2,000 | | | | 2,133 | |
| | |
NBCUniversal Media LLC 2.88%, 1/15/2023 | | | 48,000 | | | | 49,402 | |
| | |
Netflix, Inc. 4.38%, 11/15/2026 | | | 55,000 | | | | 56,306 | |
| | |
Viacom, Inc. (ICE LIBOR USD 3 Month + 3.90%), 5.87%, 2/28/2057 (b) | | | 30,000 | | | | 31,323 | |
| | | | | | | | |
| | |
| | | | | | | 139,164 | |
| | | | | | | | |
|
Equity Real Estate Investment Trusts (REITs) — 0.6% | |
| | |
AvalonBay Communities, Inc. 3.35%, 5/15/2027 | | | 4,000 | | | | 4,294 | |
| | | | | | | | |
| INVESTMENTS | | PRINCIPAL AMOUNT ($) | | | VALUE ($) | |
| | | | | | | | |
|
Equity Real Estate Investment Trusts (REITs) — continued | |
| | |
Brookfield Property REIT, Inc. 5.75%, 5/15/2026 (a) | | | 14,000 | | | | 14,735 | |
| | |
CyrusOne LP 5.38%, 3/15/2027 | | | 17,000 | | | | 18,041 | |
| | |
Equinix, Inc. 5.75%, 1/1/2025 | | | 17,000 | | | | 17,722 | |
| | |
ERP Operating LP 3.25%, 8/1/2027 | | | 7,000 | | | | 7,478 | |
| | |
GLP Capital LP 4.00%, 1/15/2030 | | | 10,000 | | | | 10,081 | |
| | |
Iron Mountain, Inc. 5.75%, 8/15/2024 | | | 18,000 | | | | 18,225 | |
| | |
MGM Growth Properties Operating Partnership LP 5.63%, 5/1/2024 | | | 12,000 | | | | 13,110 | |
| | |
National Retail Properties, Inc. 3.60%, 12/15/2026 | | | 3,000 | | | | 3,181 | |
| | |
Realty Income Corp. 4.13%, 10/15/2026 | | | 9,000 | | | | 9,990 | |
| | |
Simon Property Group LP 2.75%, 6/1/2023 | | | 65,000 | | | | 66,691 | |
| | | | | | | | |
| | |
| | | | | | | 183,548 | |
| | | | | | | | |
|
Food & Staples Retailing — 0.1% | |
| | |
Albertsons Cos. LLC 6.63%, 6/15/2024 | | | 18,000 | | | | 18,855 | |
| | |
New Albertsons LP 8.00%, 5/1/2031 | | | 10,000 | | | | 10,150 | |
| | | | | | | | |
| | |
| | | | | | | 29,005 | |
| | | | | | | | |
|
Food Products — 0.3% | |
| | |
JBS USA LUX SA 5.75%, 6/15/2025 (a) | | | 50,000 | | | | 52,031 | |
| | |
Mead Johnson Nutrition Co. (United Kingdom) 4.13%, 11/15/2025 | | | 13,000 | | | | 14,330 | |
| | |
Pilgrim’s Pride Corp. 5.75%, 3/15/2025 (a) | | | 16,000 | | | | 16,640 | |
| | | | | | | | |
| | |
| | | | | | | 83,001 | |
| | | | | | | | |
|
Gas Utilities — 0.1% | |
| | |
AmeriGas Partners LP 5.50%, 5/20/2025 | | | 23,000 | | | | 24,322 | |
| | |
Atmos Energy Corp. 5.50%, 6/15/2041 | | | 5,000 | | | | 6,709 | |
| | |
Boston Gas Co. 3.00%, 8/1/2029 (a) | | | 5,000 | | | | 5,214 | |
| | |
Brooklyn Union Gas Co. (The) 3.87%, 3/4/2029 (a) | | | 10,000 | | | | 11,165 | |
| | | | | | | | |
| | |
| | | | | | | 47,410 | |
| | | | | | | | |
|
Health Care Equipment & Supplies — 0.1% | |
| | |
Boston Scientific Corp. 4.70%, 3/1/2049 | | | 15,000 | | | | 18,605 | |
| | |
Teleflex, Inc. 4.63%, 11/15/2027 | | | 13,000 | | | | 13,746 | |
| | | | | | | | |
| | |
| | | | | | | 32,351 | |
| | | | | | | | |
|
Health Care Providers & Services — 1.2% | |
| | |
Centene Corp. 5.38%, 6/1/2026 (a) | | | 29,000 | | | | 31,003 | |
| | |
Community Health Systems, Inc. | | | | | | | | |
| | |
8.13%, 6/30/2024 (a) | | | 10,000 | | | | 7,600 | |
| | |
8.00%, 3/15/2026 (a) | | | 9,000 | | | | 8,640 | |
| | |
HCA, Inc. 5.38%, 9/1/2026 | | | 75,000 | | | | 83,625 | |
| | |
MPH Acquisition Holdings LLC 7.13%, 6/1/2024 (a) | | | 3,000 | | | | 2,681 | |
SEE NOTES TO FINANCIAL STATEMENTS.
| | | | | | |
| | | |
| 42 | | | | J.P. MORGAN EXCHANGE-TRADED FUNDS | | AUGUST 31, 2019 |
| | | | | | | | |
| INVESTMENTS | | PRINCIPAL AMOUNT ($) | | | VALUE ($) | |
Corporate Bonds — continued | |
|
Health Care Providers & Services — continued | |
| | |
Polaris Intermediate Corp. 8.50% (cash),
12/1/2022 (a) (e) | | | 5,000 | | | | 4,200 | |
| | |
Team Health Holdings, Inc. 6.38%, 2/1/2025 (a) | | | 18,000 | | | | 12,060 | |
| | |
Tenet Healthcare Corp. 4.50%, 4/1/2021 | | | 31,000 | | | | 32,085 | |
| | |
UnitedHealth Group, Inc. | | | | | | | | |
| | |
3.88%, 10/15/2020 | | | 100,000 | | | | 101,623 | |
| | |
3.38%, 4/15/2027 | | | 23,000 | | | | 24,727 | |
| | |
4.63%, 11/15/2041 | | | 30,000 | | | | 36,473 | |
| | |
3.70%, 8/15/2049 | | | 10,000 | | | | 10,931 | |
| | |
WellCare Health Plans, Inc. 5.25%, 4/1/2025 | | | 24,000 | | | | 25,129 | |
| | | | | | | | |
| | |
| | | | | | | 380,777 | |
| | | | | | | | |
|
Hotels, Restaurants & Leisure — 0.5% | |
| | |
Boyne USA, Inc. 7.25%, 5/1/2025 (a) | | | 19,000 | | | | 20,734 | |
| | |
CCM Merger, Inc. 6.00%, 3/15/2022 (a) | | | 10,000 | | | | 10,250 | |
| | |
Downstream Development Authority of the Quapaw Tribe of Oklahoma 10.50%, 2/15/2023 (a) | | | 14,000 | | | | 14,875 | |
| | |
Enterprise Development Authority (The) 12.00%, 7/15/2024 (a) | | | 7,000 | | | | 7,845 | |
| | |
Hilton Domestic Operating Co., Inc. 5.13%, 5/1/2026 | | | 3,000 | | | | 3,166 | |
| | |
Hilton Grand Vacations Borrower LLC 6.13%, 12/1/2024 | | | 20,000 | | | | 21,250 | |
| | |
Marriott Ownership Resorts, Inc. 6.50%, 9/15/2026 | | | 20,000 | | | | 21,584 | |
| | |
MGM Resorts International 5.50%, 4/15/2027 | | | 21,000 | | | | 22,759 | |
| | |
Scientific Games International, Inc. 5.00%,
10/15/2025 (a) | | | 16,000 | | | | 16,532 | |
| | |
Wyndham Destinations, Inc. 5.40%, 4/1/2024 (c) | | | 10,000 | | | | 10,497 | |
| | |
Wynn Las Vegas LLC 5.50%, 3/1/2025 (a) | | | 25,000 | | | | 26,375 | |
| | | | | | | | |
| | |
| | | | | | | 175,867 | |
| | | | | | | | |
|
Household Durables — 0.1% | |
| | |
Lennar Corp. 4.75%, 5/30/2025 | | | 30,000 | | | | 32,100 | |
| | |
Toll Brothers Finance Corp. 4.88%, 11/15/2025 | | | 13,000 | | | | 13,943 | |
| | | | | | | | |
| | |
| | | | | | | 46,043 | |
| | | | | | | | |
|
Household Products — 0.1% | |
| | |
Kimberly-Clark Corp. 3.20%, 4/25/2029 | | | 5,000 | | | | 5,477 | |
| | |
Spectrum Brands, Inc. 5.75%, 7/15/2025 | | | 20,000 | | | | 20,800 | |
| | | | | | | | |
| | |
| | | | | | | 26,277 | |
| | | | | | | | |
| | | | | | | | |
| INVESTMENTS | | PRINCIPAL AMOUNT ($) | | | VALUE ($) | |
| | | | | | | | |
|
Independent Power and Renewable Electricity Producers — 0.2% | |
| | |
AES Corp. 5.50%, 4/15/2025 | | | 24,000 | | | | 25,051 | |
| | |
Calpine Corp. 5.88%, 1/15/2024 (a) | | | 13,000 | | | | 13,277 | |
| | |
Clearway Energy Operating LLC 5.38%, 8/15/2024 | | | 13,000 | | | | 13,325 | |
| | |
NRG Energy, Inc. 6.63%, 1/15/2027 | | | 24,000 | | | | 25,920 | |
| | | | | | | | |
| | |
| | | | | | | 77,573 | |
| | | | | | | | |
|
Industrial Conglomerates — 0.1% | |
| | |
3M Co. 3.25%, 8/26/2049 | | | 20,000 | | | | 20,238 | |
| | | | | | | | |
|
Insurance — 0.5% | |
| | |
Aflac, Inc. 3.25%, 3/17/2025 | | | 4,000 | | | | 4,231 | |
| | |
Allstate Corp. (The) 5.35%, 6/1/2033 | | | 5,000 | | | | 6,478 | |
| | |
Athene Global Funding 4.00%, 1/25/2022 (a) | | | 9,000 | | | | 9,342 | |
| | |
CNO Financial Group, Inc. 5.25%, 5/30/2025 | | | 15,000 | | | | 16,294 | |
| | |
Jackson National Life Global Funding 2.50%,
6/27/2022 (a) | | | 18,000 | | | | 18,208 | |
| | |
Lincoln National Corp. 3.35%, 3/9/2025 | | | 3,000 | | | | 3,116 | |
| | |
Manulife Financial Corp. (Canada) 4.15%, 3/4/2026 | | | 12,000 | | | | 13,308 | |
| | |
MetLife, Inc. 3.60%, 11/13/2025 | | | 23,000 | | | | 24,983 | |
| | |
New York Life Global Funding 3.00%, 1/10/2028 (a) | | | 12,000 | | | | 12,706 | |
| | |
Pacific Life Insurance Co. (ICE LIBOR USD 3 Month + 2.80%), 4.30%, 10/24/2067 (a) (b) | | | 7,000 | | | | 7,525 | |
| | |
Principal Financial Group, Inc. 3.70%, 5/15/2029 | | | 5,000 | | | | 5,435 | |
| | |
Progressive Corp. (The) 4.35%, 4/25/2044 | | | 3,000 | | | | 3,655 | |
| | |
Prudential Financial, Inc. 3.88%, 3/27/2028 | | | 10,000 | | | | 11,202 | |
| | |
Travelers Cos., Inc. (The) 5.35%, 11/1/2040 | | | 7,000 | | | | 9,543 | |
| | | | | | | | |
| | |
| | | | | | | 146,026 | |
| | | | | | | | |
|
Interactive Media & Services — 0.0% (d) | |
| | |
Rackspace Hosting, Inc. 8.63%, 11/15/2024 (a) | | | 8,000 | | | | 7,340 | |
| | | | | | | | |
|
Internet & Direct Marketing Retail — 0.2% | |
| | |
Amazon.com, Inc. 3.15%, 8/22/2027 | | | 54,000 | | | | 58,070 | |
| | | | | | | | |
|
IT Services — 0.0% (d) | |
| | |
Banff Merger Sub, Inc. 9.75%, 9/1/2026 (a) | | | 7,000 | | | | 6,370 | |
| | |
Mastercard, Inc. 3.65%, 6/1/2049 | | | 5,000 | | | | 5,809 | |
| | | | | | | | |
| | |
| | | | | | | 12,179 | |
| | | | | | | | |
SEE NOTES TO FINANCIAL STATEMENTS.
| | | | | | | | |
| | | |
| AUGUST 31, 2019 | | J.P. MORGAN EXCHANGE-TRADED FUNDS | | | | | 43 | |
JPMorgan Core Plus Bond ETF
SCHEDULE OF PORTFOLIO INVESTMENTS
AS OF AUGUST 31, 2019 (Unaudited) (continued)
| | | | | | | | |
| INVESTMENTS | | PRINCIPAL AMOUNT ($) | | | VALUE ($) | |
Corporate Bonds — continued | |
|
Leisure Products — 0.0% (d) | |
| | |
Mattel, Inc. 6.75%, 12/31/2025 (a) | | | 7,000 | | | | 7,193 | |
| | | | | | | | |
|
Machinery — 0.2% | |
| | |
ATS Automation Tooling Systems, Inc. (Canada) 6.50%, 6/15/2023 (a) | | | 15,000 | | | | 15,506 | |
| | |
Colfax Corp. 6.00%, 2/15/2024 (a) | | | 5,000 | | | | 5,331 | |
| | |
Illinois Tool Works, Inc. 4.88%, 9/15/2041 | | | 7,000 | | | | 9,188 | |
| | |
Parker-Hannifin Corp. 3.25%, 3/1/2027 | | | 24,000 | | | | 25,153 | |
| | |
Tennant Co. 5.63%, 5/1/2025 | | | 10,000 | | | | 10,325 | |
| | | | | | | | |
| | |
| | | | | | | 65,503 | |
| | | | | | | | |
|
Media — 1.1% | |
| | |
AMC Networks, Inc. 5.00%, 4/1/2024 | | | 12,000 | | | | 12,360 | |
| | |
Cinemark USA, Inc. 4.88%, 6/1/2023 | | | 15,000 | | | | 15,281 | |
| | |
Clear Channel Worldwide Holdings, Inc. | | | | | | | | |
| | |
9.25%, 2/15/2024 (a) | | | 4,000 | | | | 4,385 | |
| | |
Comcast Corp. | | | | | | | | |
| | |
3.38%, 8/15/2025 | | | 20,000 | | | | 21,291 | |
| | |
2.35%, 1/15/2027 | | | 60,000 | | | | 60,272 | |
| | |
3.90%, 3/1/2038 | | | 20,000 | | | | 22,425 | |
| | |
4.75%, 3/1/2044 | | | 46,000 | | | | 56,781 | |
| | |
3.40%, 7/15/2046 | | | 15,000 | | | | 15,610 | |
| | |
DISH DBS Corp. 6.75%, 6/1/2021 | | | 20,000 | | | | 21,066 | |
| | |
iHeartCommunications, Inc. 8.38%, 5/1/2027 | | | 5,000 | | | | 5,394 | |
| | |
Lamar Media Corp. 5.75%, 2/1/2026 | | | 24,000 | | | | 25,440 | |
| | |
Sirius XM Radio, Inc. 5.38%, 7/15/2026 (a) | | | 30,000 | | | | 31,687 | |
| | |
TEGNA, Inc. 6.38%, 10/15/2023 | | | 19,000 | | | | 19,532 | |
| | |
Videotron Ltd. (Canada) 5.38%, 6/15/2024 (a) | | | 12,000 | | | | 12,960 | |
| | |
WMG Acquisition Corp. 4.88%, 11/1/2024 (a) | | | 13,000 | | | | 13,423 | |
| | | | | | | | |
| | |
| | | | | | | 337,907 | |
| | | | | | | | |
|
Metals & Mining — 0.4% | |
| | |
Commercial Metals Co. 4.88%, 5/15/2023 | | | 28,000 | | | | 28,981 | |
| | |
Freeport-McMoRan, Inc. | | | | | | | | |
| | |
3.88%, 3/15/2023 | | | 31,000 | | | | 31,322 | |
| | |
5.45%, 3/15/2043 | | | 30,000 | | | | 27,375 | |
| | |
Rio Tinto Finance USA Ltd. (Australia) 7.13%, 7/15/2028 | | | 11,000 | | | | 15,106 | |
| | |
Steel Dynamics, Inc. 4.13%, 9/15/2025 | | | 13,000 | | | | 13,097 | |
| | | | | | | | |
| | |
| | | | | | | 115,881 | |
| | | | | | | | |
|
Multiline Retail — 0.1% | |
| | |
Neiman Marcus Group Ltd. LLC | | | | | | | | |
| | |
14.00% (Blend (cash 8.00% + PIK 6.00%)), 4/25/2024 (a) (e) | | | 13,652 | | | | 8,815 | |
| | | | | | | | |
| INVESTMENTS | | PRINCIPAL AMOUNT ($) | | | VALUE ($) | |
| | | | | | | | |
|
Multiline Retail — continued | |
| | |
8.00%, 10/25/2024 (a) | | | 21,000 | | | | 7,140 | |
| | | | | | | | |
| | |
| | | | | | | 15,955 | |
| | | | | | | | |
|
Multi-Utilities — 0.3% | |
| | |
Berkshire Hathaway Energy Co. | | | | | | | | |
| | |
3.25%, 4/15/2028 | | | 14,000 | | | | 14,885 | |
| | |
5.15%, 11/15/2043 | | | 15,000 | | | | 19,627 | |
| | |
3.80%, 7/15/2048 | | | 15,000 | | | | 16,669 | |
| | |
Consolidated Edison Co. of New York, Inc. Series A, 4.13%, 5/15/2049 | | | 12,000 | | | | 14,030 | |
| | |
Puget Sound Energy, Inc. 4.30%, 5/20/2045 | | | 14,000 | | | | 16,776 | |
| | | | | | | | |
| | |
| | | | | | | 81,987 | |
| | | | | | | | |
|
Oil, Gas & Consumable Fuels — 2.1% | |
| | |
Antero Midstream Partners LP 5.75%, 3/1/2027 (a) | | | 3,000 | | | | 2,752 | |
| | |
Antero Resources Corp. 5.13%, 12/1/2022 | | | 8,000 | | | | 7,360 | |
| | |
BP Capital Markets America, Inc. | | | | | | | | |
| | |
3.02%, 1/16/2027 | | | 16,000 | | | | 16,686 | |
| | |
4.23%, 11/6/2028 | | | 50,000 | | | | 57,034 | |
| | |
BP Capital Markets plc (United Kingdom) 3.81%, 2/10/2024 | | | 39,000 | | | | 41,754 | |
| | |
Buckeye Partners LP 5.60%, 10/15/2044 | | | 4,000 | | | | 3,387 | |
| | |
Cheniere Corpus Christi Holdings LLC 5.88%, 3/31/2025 | | | 18,000 | | | | 20,070 | |
| | |
Cheniere Energy Partners LP 5.25%, 10/1/2025 | | | 12,000 | | | | 12,405 | |
| | |
DCP Midstream Operating LP 5.38%, 7/15/2025 | | | 20,000 | | | | 21,150 | |
| | |
Diamondback Energy, Inc. 4.75%, 11/1/2024 | | | 12,000 | | | | 12,360 | |
| | |
EnLink Midstream Partners LP | | | | | | | | |
| | |
4.40%, 4/1/2024 | | | 8,000 | | | | 7,920 | |
| | |
5.60%, 4/1/2044 | | | 9,000 | | | | 7,605 | |
| | |
EP Energy LLC | | | | | | | | |
| | |
9.38%, 5/1/2024 (a) | | | 10,000 | | | | 750 | |
| | |
8.00%, 11/29/2024 (a) | | | 17,000 | | | | 7,310 | |
| | |
7.75%, 5/15/2026 (a) | | | 10,000 | | | | 8,350 | |
| | |
Hilcorp Energy I LP 5.00%, 12/1/2024 (a) | | | 26,000 | | | | 23,985 | |
| | |
Murphy Oil Corp. 4.20%, 12/1/2022 (c) | | | 13,000 | | | | 13,130 | |
| | |
NGPL PipeCo LLC 4.38%, 8/15/2022 (a) | | | 5,000 | | | | 5,150 | |
| | |
Noble Energy, Inc. 3.85%, 1/15/2028 | | | 40,000 | | | | 41,722 | |
| | |
NuStar Logistics LP 5.63%, 4/28/2027 | | | 20,000 | | | | 20,800 | |
| | |
Occidental Petroleum Corp. | | | | | | | | |
| | |
2.60%, 4/15/2022 | | | 26,000 | | | | 26,113 | |
| | |
4.40%, 4/15/2046 | | | 24,000 | | | | 24,709 | |
SEE NOTES TO FINANCIAL STATEMENTS.
| | | | | | |
| | | |
| 44 | | | | J.P. MORGAN EXCHANGE-TRADED FUNDS | | AUGUST 31, 2019 |
| | | | | | | | |
| INVESTMENTS | | PRINCIPAL AMOUNT ($) | | | VALUE ($) | |
Corporate Bonds — continued | |
|
Oil, Gas & Consumable Fuels — continued | |
| | |
Peabody Energy Corp. 6.00%, 3/31/2022 (a) | | | 12,000 | | | | 12,360 | |
| | |
QEP Resources, Inc. 5.63%, 3/1/2026 | | | 23,000 | | | | 18,630 | |
| | |
Range Resources Corp. 5.00%, 8/15/2022 | | | 6,000 | | | | 5,595 | |
| | |
SM Energy Co. 6.13%, 11/15/2022 | | | 13,000 | | | | 12,090 | |
| | |
Southwestern Energy Co. 7.50%, 4/1/2026 | | | 5,000 | | | | 4,376 | |
| | |
Suncor Energy, Inc. (Canada) 6.80%, 5/15/2038 | | | 7,000 | | | | 10,001 | |
| | |
Sunoco Logistics Partners Operations LP 5.35%, 5/15/2045 | | | 20,000 | | | | 21,794 | |
| | |
Sunoco LP 5.50%, 2/15/2026 | | | 22,000 | | | | 22,825 | |
| | |
Tallgrass Energy Partners LP 5.50%, 9/15/2024 (a) | | | 12,000 | | | | 11,700 | |
| | |
Targa Resources Partners LP 5.13%, 2/1/2025 | | | 25,000 | | | | 25,625 | |
| | |
Total Capital International SA (France) | | | | | | | | |
| | |
3.70%, 1/15/2024 | | | 55,000 | | | | 58,642 | |
| | |
3.46%, 2/19/2029 | | | 15,000 | | | | 16,442 | |
| | |
3.46%, 7/12/2049 | | | 15,000 | | | | 16,152 | |
| | |
TransCanada PipeLines Ltd. (Canada) | | | | | | | | |
| | |
3.75%, 10/16/2023 | | | 24,000 | | | | 25,291 | |
| | |
5.10%, 3/15/2049 | | | 13,000 | | | | 15,881 | |
| | |
Ultra Resources, Inc. 11.00% (Blend (cash 9.00% + PIK 2.00%)), 7/12/2024 (e) | | | 25,283 | | | | 2,967 | |
| | |
Unit Corp. 6.63%, 5/15/2021 | | | 4,000 | | | | 2,870 | |
| | |
WPX Energy, Inc. 5.75%, 6/1/2026 | | | 15,000 | | | | 15,563 | |
| | | | | | | | |
| | |
| | | | | | | 681,306 | |
| | | | | | | | |
|
Paper & Forest Products — 0.0% (d) | |
| | |
Clearwater Paper Corp. 4.50%, 2/1/2023 | | | 13,000 | | | | 13,016 | |
| | | | | | | | |
|
Pharmaceuticals — 1.4% | |
| | |
Advanz Pharma Corp. (Canada) 8.00%, 9/6/2024 | | | 13,000 | | | | 12,610 | |
| | |
Bausch Health Cos., Inc. 7.00%, 3/15/2024 (a) | | | 55,000 | | | | 58,089 | |
| | |
Bristol-Myers Squibb Co. | | | | | | | | |
| | |
2.90%, 7/26/2024 (a) | | | 35,000 | | | | 36,288 | |
| | |
3.40%, 7/26/2029 (a) | | | 40,000 | | | | 43,301 | |
| | |
4.13%, 6/15/2039 (a) | | | 29,000 | | | | 33,656 | |
| | |
4.25%, 10/26/2049 (a) | | | 15,000 | | | | 18,043 | |
| | |
Eli Lilly & Co. | | | | | | | | |
| | |
2.75%, 6/1/2025 | | | 52,000 | | | | 54,065 | |
| | |
3.88%, 3/15/2039 | | | 5,000 | | | | 5,816 | |
| | |
3.95%, 3/15/2049 | | | 10,000 | | | | 11,704 | |
| | |
4.15%, 3/15/2059 | | | 12,000 | | | | 14,310 | |
| | |
GlaxoSmithKline Capital plc (United Kingdom) 3.00%, 6/1/2024 | | | 35,000 | | | | 36,429 | |
| | | | | | | | |
| INVESTMENTS | | PRINCIPAL AMOUNT ($) | | | VALUE ($) | |
| | | | | | | | |
|
Pharmaceuticals — continued | |
| | |
GlaxoSmithKline Capital, Inc. (United Kingdom) 3.88%, 5/15/2028 | | | 10,000 | | | | 11,194 | |
| | |
Novartis Capital Corp. (Switzerland) 4.00%, 11/20/2045 | | | 26,000 | | | | 30,937 | |
| | |
Pfizer, Inc. | | | | | | | | |
| | |
3.60%, 9/15/2028 | | | 53,000 | | | | 58,153 | |
| | |
3.45%, 3/15/2029 | | | 30,000 | | | | 32,846 | |
| | | | | | | | |
| | |
| | | | | | | 457,441 | |
| | | | | | | | |
|
Professional Services — 0.1% | |
| | |
AMN Healthcare, Inc. 5.13%, 10/1/2024 (a) | | | 35,000 | | | | 35,962 | |
| | | | | | | | |
|
Road & Rail — 0.3% | |
| | |
Avis Budget Car Rental LLC 5.25%, 3/15/2025 (a) | | | 11,000 | | | | 11,192 | |
| | |
Burlington Northern Santa Fe LLC | | | | | | | | |
| | |
4.70%, 9/1/2045 | | | 15,000 | | | | 18,738 | |
| | |
3.55%, 2/15/2050 | | | 10,000 | | | | 10,950 | |
| | |
DAE Funding LLC (United Arab Emirates) 5.75%, 11/15/2023 (a) | | | 15,000 | | | | 15,807 | |
| | |
Norfolk Southern Corp. 2.90%, 2/15/2023 | | | 45,000 | | | | 46,260 | |
| | | | | | | | |
| | |
| | | | | | | 102,947 | |
| | | | | | | | |
|
Semiconductors & Semiconductor Equipment — 0.0% (d) | |
| | |
Amkor Technology, Inc. 6.63%, 9/15/2027 (a) | | | 7,000 | | | | 7,621 | |
| | | | | | | | |
|
Software — 0.7% | |
| | |
Microsoft Corp. | | | | | | | | |
| | |
3.50%, 2/12/2035 | | | 20,000 | | | | 22,535 | |
| | |
4.00%, 2/12/2055 | | | 10,000 | | | | 12,250 | |
| | |
3.95%, 8/8/2056 | | | 12,000 | | | | 14,688 | |
| | |
Nuance Communications, Inc. 5.63%, 12/15/2026 | | | 13,000 | | | | 13,699 | |
| | |
Open Text Corp. (Canada) 5.88%, 6/1/2026 (a) | | | 14,000 | | | | 14,962 | |
| | |
Oracle Corp. | | | | | | | | |
| | |
2.65%, 7/15/2026 | | | 112,000 | | | | 114,741 | |
| | |
4.00%, 7/15/2046 | | | 15,000 | | | | 17,115 | |
| | |
4.38%, 5/15/2055 | | | 13,000 | | | | 15,675 | |
| | |
Symantec Corp. 5.00%, 4/15/2025 (a) | | | 11,000 | | | | 11,073 | |
| | | | | | | | |
| | |
| | | | | | | 236,738 | |
| | | | | | | | |
|
Specialty Retail — 0.5% | |
| | |
Group 1 Automotive, Inc. 5.25%, 12/15/2023 (a) | | | 16,000 | | | | 16,400 | |
| | |
Home Depot, Inc. (The) | | | | | | | | |
| | |
3.90%, 12/6/2028 | | | 26,000 | | | | 29,642 | |
| | |
5.95%, 4/1/2041 | | | 23,000 | | | | 33,054 | |
SEE NOTES TO FINANCIAL STATEMENTS.
| | | | | | | | |
| | | |
| AUGUST 31, 2019 | | J.P. MORGAN EXCHANGE-TRADED FUNDS | | | | | 45 | |
JPMorgan Core Plus Bond ETF
SCHEDULE OF PORTFOLIO INVESTMENTS
AS OF AUGUST 31, 2019 (Unaudited) (continued)
| | | | | | | | |
| INVESTMENTS | | PRINCIPAL AMOUNT ($) | | | VALUE ($) | |
Corporate Bonds — continued | |
|
Specialty Retail — continued | |
| | |
3.50%, 9/15/2056 | | | 10,000 | | | | 10,887 | |
| | |
L Brands, Inc. 5.63%, 10/15/2023 | | | 10,000 | | | | 10,500 | |
| | |
Lowe’s Cos., Inc. 4.05%, 5/3/2047 | | | 10,000 | | | | 10,871 | |
| | |
Penske Automotive Group, Inc. 5.50%, 5/15/2026 | | | 25,000 | | | | 26,188 | |
| | |
PetSmart, Inc. | | | | | | | | |
| | |
7.13%, 3/15/2023 (a) | | | 9,000 | | | | 8,370 | |
| | |
5.88%, 6/1/2025 (a) | | | 6,000 | | | | 5,880 | |
| | |
Staples, Inc. 10.75%, 4/15/2027 (a) | | | 6,000 | | | | 6,060 | |
| | | | | | | | |
| | |
| | | | | | | 157,852 | |
| | | | | | | | |
|
Technology Hardware, Storage & Peripherals — 0.7% | |
| | |
Apple, Inc. | | | | | | | | |
| | |
2.75%, 1/13/2025 | | | 70,000 | | | | 72,770 | |
| | |
3.35%, 2/9/2027 | | | 35,000 | | | | 37,825 | |
| | |
4.38%, 5/13/2045 | | | 26,000 | | | | 31,946 | |
| | |
EMC Corp. 3.38%, 6/1/2023 | | | 47,000 | | | | 46,597 | |
| | |
Western Digital Corp. 4.75%, 2/15/2026 | | | 16,000 | | | | 16,375 | |
| | |
Xerox Corp. 4.12%, 3/15/2023 (c) | | | 13,000 | | | | 13,228 | |
| | | | | | | | |
| | |
| | | | | | | 218,741 | |
| | | | | | | | |
|
Textiles, Apparel & Luxury Goods — 0.0% (d) | |
| | |
Hanesbrands, Inc. 4.63%, 5/15/2024 (a) | | | 13,000 | | | | 13,601 | |
| | | | | | | | |
|
Thrifts & Mortgage Finance — 0.1% | |
| | |
Ladder Capital Finance Holdings LLLP 5.25%, 10/1/2025 (a) | | | 13,000 | | | | 13,260 | |
| | |
Quicken Loans, Inc. 5.75%, 5/1/2025 (a) | | | 20,000 | | | | 20,850 | |
| | | | | | | | |
| | |
| | | | | | | 34,110 | |
| | | | | | | | |
|
Tobacco — 0.5% | |
| | |
Altria Group, Inc. 3.88%, 9/16/2046 | | | 20,000 | | | | 19,645 | |
| | |
BAT Capital Corp. (United Kingdom) 3.56%, 8/15/2027 | | | 65,000 | | | | 66,612 | |
| | |
Philip Morris International, Inc. | | | | | | | | |
| | |
2.75%, 2/25/2026 | | | 40,000 | | | | 40,789 | |
| | |
3.13%, 3/2/2028 | | | 12,000 | | | | 12,348 | |
| | |
3.38%, 8/15/2029 | | | 15,000 | | | | 15,738 | |
| | | | | | | | |
| | |
| | | | | | | 155,132 | |
| | | | | | | | |
|
Trading Companies & Distributors — 0.3% | |
| | |
Ahern Rentals, Inc. 7.38%, 5/15/2023 (a) | | | 10,000 | | | | 8,625 | |
| | |
United Rentals North America, Inc. 4.63%, 10/15/2025 | | | 62,000 | | | | 63,764 | |
| | |
WESCO Distribution, Inc. 5.38%, 6/15/2024 | | | 13,000 | | | | 13,422 | |
| | | | | | | | |
| | |
| | | | | | | 85,811 | |
| | | | | | | | |
|
Wireless Telecommunication Services — 0.3% | |
| | |
Sprint Corp. 7.13%, 6/15/2024 | | | 30,000 | | | | 33,164 | |
| | | | | | | | |
| INVESTMENTS | | PRINCIPAL AMOUNT ($) | | | VALUE ($) | |
| | | | | | | | |
|
Wireless Telecommunication Services — continued | |
| | |
T-Mobile USA, Inc. 5.13%, 4/15/2025 | | | 45,000 | | | | 46,882 | |
| | | | | | | | |
| | |
| | | | | | | 80,046 | |
| | | | | | | | |
| | |
Total Corporate Bonds
(Cost $7,979,051) | | | | | | | 8,438,928 | |
| | | | | | | | |
Mortgage-Backed Securities — 17.5% | |
| | |
FHLMC Gold Pools, 30 Year | | | | | | | | |
| | |
Pool # G60855, 4.50%, 12/1/2045 | | | 204,350 | | | | 219,743 | |
| | |
FNMA, Other | | | | | | | | |
| | |
Pool # AN3099, 2.53%, 10/1/2024 | | | 95,608 | | | | 98,726 | |
| | |
Pool # AN9917, 3.80%, 7/1/2028 | | | 349,649 | | | | 394,428 | |
| | |
Pool # AN8227, 3.13%, 2/1/2030 | | | 150,000 | | | | 164,130 | |
| | |
Pool # AN3609, 3.14%, 12/1/2031 | | | 125,000 | | | | 137,734 | |
| | |
Pool # AN9725, 3.76%, 7/1/2033 | | | 108,291 | | | | 123,643 | |
| | |
GNMA II, 30 Year | | | | | | | | |
| | |
Pool # AJ9020, 4.50%, 10/20/2044 | | | 240,317 | | | | 251,671 | |
| | |
Pool # BM2418, 4.00%, 8/20/2049 | | | 74,445 | | | | 79,485 | |
| | |
Pool # BN7049, 4.50%, 8/20/2049 | | | 250,000 | | | | 271,863 | |
| | |
UMBS, 20 Year Pool # MA3004, 4.00%, 5/1/2037 | | | 1,106,849 | | | | 1,162,537 | |
| | |
UMBS, 30 Year | | | | | | | | |
| | |
Pool # BM1164, 3.50%, 12/1/2045 | | | 326,244 | | | | 340,355 | |
| | |
Pool # MA3073, 4.50%, 7/1/2047 | | | 97,083 | | | | 102,735 | |
| | |
Pool # BK4769, 5.00%, 8/1/2048 | | | 1,626,963 | | | | 1,739,168 | |
| | |
Pool # BN5013, 5.00%, 1/1/2049 | | | 221,957 | | | | 244,358 | |
| | |
Pool # BO3039, 3.00%, 7/1/2049 (f) | | | 280,838 | | | | 286,272 | |
| | | | | | | | |
| | |
Total Mortgage-Backed Securities
(Cost $5,512,162) | | | | | | | 5,616,848 | |
| | | | | | | | |
U.S. Treasury Obligations — 15.0% | |
| | |
U.S. Treasury Notes | | | | | | | | |
| | |
2.63%, 12/31/2023 | | | 1,600,000 | | | | 1,680,625 | |
| | |
2.63%, 12/31/2025 | | | 1,000,000 | | | | 1,070,859 | |
| | |
U.S. Treasury STRIPS Bonds | | | | | | | | |
| | |
3.00%, 11/15/2039 (g) | | | 1,600,000 | | | | 1,107,904 | |
| | |
3.13%, 8/15/2048 (g) | | | 1,700,000 | | | | 952,793 | |
| | | | | | | | |
| | |
Total U.S. Treasury Obligations
(Cost $4,173,287) | | | | | | | 4,812,181 | |
| | | | | | | | |
Asset-Backed Securities — 13.1% | |
| | |
American Credit Acceptance ReceivablesTrust Series 2017-1, Class C, 2.88%, 3/13/2023 (a) | | | 23,197 | | | | 23,209 | |
| | |
American Homes 4 RentSeries 2015-SFR1, Class E, 5.64%, 4/17/2052 ‡ (a) | | | 150,000 | | | | 165,649 | |
| | |
American Homes 4 Rent Trust | | | | | | | | |
| | |
Series 2014-SFR3, Class B, 4.20%, 12/17/2036 ‡ (a) | | | 125,000 | | | | 133,993 | |
SEE NOTES TO FINANCIAL STATEMENTS.
| | | | | | |
| | | |
| 46 | | | | J.P. MORGAN EXCHANGE-TRADED FUNDS | | AUGUST 31, 2019 |
| | | | | | | | |
| INVESTMENTS | | PRINCIPAL AMOUNT ($) | | | VALUE ($) | |
Asset-Backed Securities — continued | |
| | |
Series 2015-SFR2, Class A, 3.73%, 10/17/2052 ‡ (a) | | | 96,167 | | | | 102,287 | |
| | |
AmeriCredit Automobile ReceivablesTrust Series 2017-2, Class D, 3.42%, 4/18/2023 | | | 250,000 | | | | 255,748 | |
| | |
B2R MortgageTrust Series 2015-1, Class A1, 2.52%, 5/15/2048 ‡ (a) | | | 6,227 | | | | 6,208 | |
| | |
CPS Auto Receivables Trust | | | | | | | | |
| | |
Series 2015-C, Class D, 4.63%, 8/16/2021 (a) | | | 100,000 | | | | 100,914 | |
| | |
Series 2017-C, Class D, 3.79%, 6/15/2023 (a) | | | 100,000 | | | | 101,474 | |
| | |
Delta Air Lines Pass-Through Trust | | | | | | | | |
| | |
Series 2007-1, Class A, 6.82%, 8/10/2022 | | | 824 | | | | 908 | |
| | |
Series 2019-1, Class AA, 3.20%, 4/25/2024 | | | 15,000 | | | | 15,822 | |
| | |
DT Auto OwnerTrust Series 2017-3A, Class D, 3.58%, 5/15/2023 (a) | | | 99,000 | | | | 99,879 | |
| | |
First Investors Auto Owner Trust | | | | | | | | |
| | |
Series 2015-1A, Class D, 3.59%, 1/18/2022 (a) | | | 100,000 | | | | 100,034 | |
| | |
Series 2016-2A, Class D, 3.35%, 11/15/2022 (a) | | | 90,000 | | | | 91,065 | |
| | |
Series 2017-1A, Class D, 3.60%, 4/17/2023 (a) | | | 81,000 | | | | 82,555 | |
| | |
Flagship Credit Auto Trust | | | | | | | | |
| | |
Series 2015-2, Class B, 3.08%, 12/15/2021 (a) | | | 597 | | | | 597 | |
| | |
Series 2017-2, Class C, 2.96%, 7/15/2023 (a) | | | 85,000 | | | | 85,796 | |
| | |
FNMA, GrantorTrust Series 2017-T1, Class A, 2.90%, 6/25/2027 | | | 598,977 | | | | 629,500 | |
| | |
Genesis Sales Finance Master TrustSeries 2019-AA, Class A, 4.68%, 8/20/2023 (a) | | | 250,000 | | | | 255,582 | |
| | |
GLS Auto ReceivablesTrust Series 2018-3A, Class B, 3.78%, 8/15/2023 (a) | | | 150,000 | | | | 153,016 | |
| | |
Lendmark Funding Trust | | | | | | | | |
| | |
Series 2017-2A, Class A, 2.80%, 5/20/2026 (a) | | | 380,000 | | | | 379,987 | |
| | |
Series 2018-2A, Class A, 4.23%, 4/20/2027 (a) | | | 118,000 | | | | 122,980 | |
| | |
Prestige Auto Receivables TrustSeries 2018-1A, Class D, 4.14%, 10/15/2024 (a) | | | 115,000 | | | | 120,636 | |
| | |
Pretium Mortgage Credit Partners I LLC | | | | | | | | |
| | |
Series 2019-CFL1, Class A1, 3.72%, 1/25/2059 (a) (c) | | | 250,000 | | | | 250,273 | |
| | | | | | | | |
| INVESTMENTS | | PRINCIPAL AMOUNT ($) | | | VALUE ($) | |
| | | | | | | | |
| | |
Progress Residential Trust | | | | | | | | |
| | |
Series 2017-SFR1, Class A, 2.77%, 8/17/2034 (a) | | | 99,635 | | | | 100,919 | |
| | |
Series 2017-SFR1, Class D, 3.57%, 8/17/2034 ‡ (a) | | | 150,000 | | | | 153,024 | |
| | |
Regional Management Issuance TrustSeries 2018-1, Class A, 3.83%, 7/15/2027 (a) | | | 200,000 | | | | 201,448 | |
| | |
Santander Drive Auto Receivables TrustSeries 2019-1, Class C, 3.42%, 4/15/2025 | | | 90,000 | | | | 92,047 | |
| | |
Spirit Master Funding LLCSeries 2014-3A, Class A, 5.74%, 3/20/2042 (a) | | | 148,053 | | | | 154,715 | |
| | |
US Airways Pass-Through TrustSeries 2011-1, Class A, 7.13%, 10/22/2023 | | | 19,925 | | | | 22,581 | |
| | |
Vericrest Opportunity Loan TrustSeries 2019-NPL4, Class A1B, 4.15%, 8/25/2049 (a) (c) | | | 200,000 | | | | 200,898 | |
| | | | | | | | |
| | |
Total Asset-Backed Securities
(Cost $4,105,945) | | | | | | | 4,203,744 | |
| | | | | | | | |
Collateralized Mortgage Obligations — 6.2% | |
| | |
FHLMC, REMIC Series 4281, Class BC, 4.50%, 12/15/2043 (h) | | | 254,834 | | | | 279,338 | |
| | |
FNMA, REMIC | | | | | | | | |
| | |
Series 2003-7, Class FA, 2.90%, 2/25/2033 (h) | | | 188,865 | | | | 190,794 | |
| | |
Series 2013-108, Class GU, 3.00%, 10/25/2033 | | | 545,000 | | | | 573,306 | |
| | |
Series 2005-110, Class TY, 5.50%, 12/25/2035 | | | 100,000 | | | | 114,506 | |
| | |
Series 2007-89, Class F, 2.73%, 9/25/2037 (h) | | | 207,920 | | | | 209,730 | |
| | |
GNMA | | | | | | | | |
| | |
Series 2010-H24, Class FA, 2.73%, 10/20/2060 (h) | | | 116,260 | | | | 115,864 | |
| | |
Series 2014-H03, Class FA, 2.98%, 1/20/2064 (h) | | | 141,908 | | | | 142,292 | |
| | |
Series 2015-H05, Class FC, 2.86%, 2/20/2065 (h) | | | 363,095 | | | | 363,095 | |
| | | | | | | | |
| | |
Total Collateralized Mortgage Obligations
(Cost $1,918,688) | | | | | | | 1,988,925 | |
| | | | | | | | |
Commercial Mortgage-Backed Securities — 6.2% | |
| | |
FHLMC, Multifamily Structured Pass-Through Certificates | | | | | | | | |
| | |
Series KJ08, Class A2, 2.36%, 8/25/2022 | | | 72,882 | | | | 73,630 | |
| | |
Series K088, Class A2, 3.69%, 1/25/2029 | | | 350,000 | | | | 397,458 | |
SEE NOTES TO FINANCIAL STATEMENTS.
| | | | | | | | |
| | | |
| AUGUST 31, 2019 | | J.P. MORGAN EXCHANGE-TRADED FUNDS | | | | | 47 | |
JPMorgan Core Plus Bond ETF
SCHEDULE OF PORTFOLIO INVESTMENTS
AS OF AUGUST 31, 2019 (Unaudited) (continued)
| | | | | | | | |
| INVESTMENTS | | PRINCIPAL AMOUNT ($) | | | VALUE ($) | |
Commercial Mortgage-Backed Securities — continued | |
| | |
FNMA ACESSeries 2017-M3, Class A2, 2.57%, 12/25/2026 (h) | | | 350,000 | | | | 361,520 | |
| | |
FREMF Mortgage Trust | | | | | | | | |
| | |
Series 2015-K720, Class B, 3.50%,
7/25/2022 (a) (h) | | | 180,000 | | | | 184,523 | |
| | |
Series 2015-K44, Class B, 3.81%,
1/25/2048 (a) (h) | | | 200,000 | | | | 210,429 | |
| | |
Series 2015-K45, Class B, 3.71%,
4/25/2048 (a) (h) | | | 100,000 | | | | 105,011 | |
| | |
Series 2015-K50, Class B, 3.91%,
10/25/2048 (a) (h) | | | 200,000 | | | | 211,895 | |
| | |
Series 2015-K51, Class B, 4.09%,
10/25/2048 (a) (h) | | | 150,000 | | | | 158,861 | |
| | |
Series 2016-K52, Class B, 4.06%,
1/25/2049 (a) (h) | | | 250,000 | | | | 267,536 | |
| | | | | | | | |
| |
Total Commercial Mortgage-Backed Securities
(Cost $1,875,126) | | | | 1,970,863 | |
| | | | | | | | |
| | |
| | | SHARES | | | | |
Preferred Stocks — 0.0% (d) | |
|
Internet & Direct Marketing Retail — 0.0% (d) | |
| | |
MYT Holding Co. (Preference), 10.00%, 6/7/2029 (a)
(Cost $3,213) | | | 3,382 | | | | 3,179 | |
| | | | | | | | |
| | |
| | | PRINCIPAL
AMOUNT ($) | | | | |
Convertible Bonds — 0.0% (d) | |
|
Media — 0.0% (d) | |
| | |
DISH Network Corp. 3.38%, 8/15/2026
(Cost $1,712) | | | 2,000 | | | | 1,840 | |
| | | | | | | | |
| | |
| | | SHARES | | | | |
Short-Term Investments — 16.5% | |
|
Investment Companies — 5.5% | |
| | |
JPMorgan U.S. Government Money Market Fund Class Institutional Shares, 1.99% (i) (j)
(Cost $1,751,366) | | | 1,751,366 | | | | 1,751,366 | |
| | | | | | | | |
| | |
| | | PRINCIPAL AMOUNT | | | | |
U.S. Treasury Obligations — 11.0% | |
| | |
U.S. Treasury Bills 2.01%, 11/14/2019 (g) | | | 3,550,000 | | | | 3,536,279 | |
| | | | | | | | |
| | |
TotalShort-Term Investments
(Cost $5,286,786) | | | | | | | 5,287,645 | |
| | | | | | | | |
| | |
Total Investments — 100.8%
(Cost $30,855,970) | | | | | | | 32,324,153 | |
| |
Liabilities in Excess of Other Assets — (0.8)% | | | | (245,903) | |
| | | | | | | | |
| | |
NET ASSETS — 100.0% | | | | | | | 32,078,250 | |
| | | | | | | | |
Percentages indicated are based on net assets.
Abbreviations
| | |
| ACES | | Alternative Credit Enhancement Securities |
| FHLMC | | Federal Home Loan Mortgage Corp. |
| FNMA | | Federal National Mortgage Association |
| GNMA | | Government National Mortgage Association |
| ICE | | Intercontinental Exchange |
| LIBOR | | London Interbank Offered Rate |
| OYJ | | Public Limited Company |
| Preference | | A special type of equity investment that shares in the earnings of the company, has limited voting rights, and may have a dividend preference. Preference shares may also have liquidation preference. |
| REIT | | Real Estate Investment Trust |
| REMIC | | Real Estate Mortgage Investment Conduit |
| SOFR | | Secured Overnight Financing Rate |
| STRIPS | | Separate Trading of Registered Interest and Principal of Securities. The STRIPS Program lets investors hold and trade individual interest and principal components of eligible notes and bonds as separate securities. |
| UMBS | | Uniform Mortgage-Backed Securities |
| USD | | United States Dollar |
| |
| (a) | | Securities exempt from registration under Rule 144A or section 4(a)(2), of the Securities Act of 1933, as amended. |
| (b) | | Variable or floating rate security, linked to the referenced benchmark. The interest rate shown is the current rate as of August 31, 2019. |
| (c) | | Step bond. Interest rate is a fixed rate for an initial period that either resets at a specific date or may reset in the future contingent upon a predetermined trigger. The interest rate shown is the current rate as of August 31, 2019. |
| (d) | | Amount rounds to less than 0.1% of net assets. |
| (e) | | Security has the ability to pay in kind (“PIK”) or pay income in cash. When applicable, separate rates of such payments are disclosed. |
| (f) | | All or a portion of the security is a when-issued security, delayed delivery security, or forward commitment. |
| (g) | | The rate shown is the effective yield as of August 31, 2019. |
| (h) | | Variable or floating rate security, the interest rate of which adjusts periodically based on changes in current interest rates and prepayments on the underlying pool of assets. The interest rate shown is the current rate as of August 31, 2019. |
| (i) | | Investment in an affiliated fund, which is registered under the Investment Company Act of 1940, as amended, and is advised by J.P. Morgan Investment Management Inc. |
| (j) | | The rate shown is the current yield as of August 31, 2019. |
| ‡ | | Value determined using significant unobservable inputs. |
SEE NOTES TO FINANCIAL STATEMENTS.
| | | | | | |
| | | |
| 48 | | | | J.P. MORGAN EXCHANGE-TRADED FUNDS | | AUGUST 31, 2019 |
| | | | | | | | | | | | | | | | | | | | |
| Futures contracts outstanding as of August 31, 2019: | |
| DESCRIPTION | | NUMBER OF CONTRACTS | | | EXPIRATION DATE | | | TRADING CURRENCY | | | NOTIONAL AMOUNT ($) | | | VALUE AND
UNREALIZED
APPRECIATION
(DEPRECIATION) ($) | |
Long Contracts | | | | | | | | | | | | | | | | | | | | |
U.S. Treasury 2 Year Note | | | 4 | | | | 12/2019 | | | | USD | | | | 864,438 | | | | (164 | ) |
U.S. Treasury 5 Year Note | | | 38 | | | | 12/2019 | | | | USD | | | | 4,560,000 | | | | 5,303 | |
U.S. Treasury 10 Year Ultra Note | | | 5 | | | | 12/2019 | | | | USD | | | | 722,578 | | | | 2,098 | |
U.S. Treasury Long Bond | | | 2 | | | | 12/2019 | | | | USD | | | | 330,875 | | | | 1,370 | |
U.S. Treasury Ultra Bond | | | 2 | | | | 12/2019 | | | | USD | | | | 395,312 | | | | 2,558 | |
| | | | | | | | | | | | | | | | | | | | |
| | | | | | | | | | | | | | | | | | | 11,165 | |
| | | | | | | | | | | | | | | | | | | | |
Short Contracts | | | | | | | | | | | | | |
U.S. Treasury 10 Year Note | | | (4 | ) | | | 12/2019 | | | | USD | | | | (527,125 | ) | | | (665 | ) |
| | | | | | | | | | | | | | | | | | | | |
| | | | | | | | | | | | | | | | | | | (665 | ) |
| | | | | | | | | | | | | | | | | | | | |
| | | | | | | | | | | | | | | | | | | 10,500 | |
| | | | | | | | | | | | | | | | | | | | |
| | |
| Abbreviations |
| |
| USD | | United States Dollar |
SEE NOTES TO FINANCIAL STATEMENTS.
| | | | | | | | |
| | | |
| AUGUST 31, 2019 | | J.P. MORGAN EXCHANGE-TRADED FUNDS | | | | | 49 | |
JPMorgan Corporate Bond Research Enhanced ETF
SCHEDULE OF PORTFOLIO INVESTMENTS
AS OF AUGUST 31, 2019 (Unaudited)
| | | | | | | | |
| INVESTMENTS | | PRINCIPAL
AMOUNT ($) | | | VALUE ($) | |
Corporate Bonds — 97.2% | |
| | |
Aerospace & Defense — 3.2% | | | | | | | | |
| | |
Boeing Co. (The) | | | | | | | | |
| | |
2.70%, 5/1/2022 | | | 122,000 | | | | 124,496 | |
| | |
3.10%, 5/1/2026 | | | 58,000 | | | | 61,325 | |
| | |
3.60%, 5/1/2034 | | | 40,000 | | | | 44,229 | |
| | |
L3Harris Technologies, Inc. 4.40%, 6/15/2028 (a) | | | 28,000 | | | | 31,750 | |
| | |
Lockheed Martin Corp. | | | | | | | | |
| | |
3.55%, 1/15/2026 | | | 34,000 | | | | 36,882 | |
| | |
4.09%, 9/15/2052 | | | 76,000 | | | | 91,525 | |
| | |
Northrop Grumman Corp. | | | | | | | | |
| | |
3.25%, 1/15/2028 | | | 22,000 | | | | 23,370 | |
| | |
4.03%, 10/15/2047 | | | 97,000 | | | | 112,306 | |
| | |
Precision Castparts Corp. 3.25%, 6/15/2025 | | | 24,000 | | | | 25,287 | |
| | |
Rockwell Collins, Inc. 3.50%, 3/15/2027 | | | 101,000 | | | | 108,776 | |
| | |
United Technologies Corp. | | | | | | | | |
| | |
3.10%, 6/1/2022 | | | 80,000 | | | | 82,576 | |
| | |
4.13%, 11/16/2028 | | | 30,000 | | | | 34,329 | |
| | |
4.45%, 11/16/2038 | | | 40,000 | | | | 48,585 | |
| | |
4.50%, 6/1/2042 | | | 20,000 | | | | 24,126 | |
| | |
3.75%, 11/1/2046 | | | 70,000 | | | | 77,716 | |
| | | | | | | | |
| | |
| | | | | | | 927,278 | |
| | | | | | | | |
|
Automobiles — 0.6% | |
| | |
General Motors Co. | | | | | | | | |
| | |
4.88%, 10/2/2023 | | | 113,000 | | | | 121,554 | |
| | |
5.00%, 10/1/2028 | | | 26,000 | | | | 27,948 | |
| | |
5.00%, 4/1/2035 | | | 30,000 | | | | 30,841 | |
| | | | | | | | |
| | |
| | | | | | | 180,343 | |
| | | | | | | | |
|
Banks — 16.7% | |
| | |
Bank of America Corp. | | | | | | | | |
| | |
(ICE LIBOR USD 3 Month + 0.66%), 2.37%,
7/21/2021 (b) | | | 380,000 | | | | 380,626 | |
| | |
(ICE LIBOR USD 3 Month + 0.79%), 3.00%, 12/20/2023 (b) | | | 331,000 | | | | 339,688 | |
| | |
(ICE LIBOR USD 3 Month + 1.58%), 3.82%, 1/20/2028 (b) | | | 110,000 | | | | 119,291 | |
| | |
(ICE LIBOR USD 3 Month + 1.04%), 3.42%, 12/20/2028 (b) | | | 150,000 | | | | 158,299 | |
| | |
(ICE LIBOR USD 3 Month + 1.81%), 4.24%, 4/24/2038 (b) | | | 110,000 | | | | 128,271 | |
| | |
Bank of Nova Scotia (The) (Canada) 2.70%, 3/7/2022 | | | 80,000 | | | | 81,508 | |
| | |
Canadian Imperial Bank of Commerce (Canada) 3.10%, 4/2/2024 | | | 180,000 | | | | 186,790 | |
| | |
Citigroup, Inc. 2.90%, 12/8/2021 | | | 50,000 | | | | 50,869 | |
| | |
(ICE LIBOR USD 3 Month + 0.95%), 2.88%, 7/24/2023 (b) | | | 225,000 | | | | 228,866 | |
| | | | | | | | |
| INVESTMENTS | | PRINCIPAL
AMOUNT ($) | | | VALUE ($) | |
| | | | | | | | |
| | |
Banks — continued | | | | | | | | |
| | |
(ICE LIBOR USD 3 Month + 0.90%), 3.35%, 4/24/2025 (b) | | | 50,000 | | | | 52,240 | |
| | |
3.20%, 10/21/2026 | | | 225,000 | | | | 234,799 | |
| | |
(ICE LIBOR USD 3 Month + 1.39%), 3.67%, 7/24/2028 (b) | | | 58,000 | | | | 62,182 | |
| | |
(ICE LIBOR USD 3 Month + 1.17%), 3.88%, 1/24/2039 (b) | | | 20,000 | | | | 22,224 | |
| | |
4.65%, 7/23/2048 | | | 50,000 | | | | 62,777 | |
| | |
Citizens Financial Group, Inc. 4.30%, 12/3/2025 | | | 124,000 | | | | 133,988 | |
| | |
Cooperatieve Rabobank UA (Netherlands) | | | | | | | | |
| | |
4.50%, 1/11/2021 | | | 28,000 | | | | 28,932 | |
| | |
3.88%, 2/8/2022 | | | 59,000 | | | | 61,619 | |
| | |
5.25%, 5/24/2041 | | | 10,000 | | | | 13,727 | |
| | |
HSBC Holdings plc (United Kingdom) | | | | | | | | |
| | |
5.10%, 4/5/2021 | | | 110,000 | | | | 114,823 | |
| | |
4.00%, 3/30/2022 | | | 131,000 | | | | 137,444 | |
| | |
(ICE LIBOR USD 3 Month + 1.61%), 3.97%, 5/22/2030 (b) | | | 200,000 | | | | 214,754 | |
| | |
Huntington Bancshares, Inc. | | | | | | | | |
| | |
2.30%, 1/14/2022 | | | 180,000 | | | | 180,848 | |
| | |
2.63%, 8/6/2024 | | | 45,000 | | | | 45,877 | |
| | |
Mitsubishi UFJ Financial Group, Inc. (Japan) | | | | | | | | |
| | |
2.67%, 7/25/2022 | | | 100,000 | | | | 101,209 | |
| | |
3.76%, 7/26/2023 | | | 66,000 | | | | 69,897 | |
| | |
3.68%, 2/22/2027 | | | 31,000 | | | | 33,598 | |
| | |
3.96%, 3/2/2028 | | | 39,000 | | | | 43,426 | |
PNC Financial Services Group, Inc. (The) | | | | | | | | |
| | |
3.90%, 4/29/2024 | | | 13,000 | | | | 14,009 | |
| | |
3.15%, 5/19/2027 | | | 23,000 | | | | 24,467 | |
| | |
Regions Financial Corp. 3.20%, 2/8/2021 | | | 59,000 | | | | 59,800 | |
| | |
Royal Bank of Scotland Group plc (United Kingdom) | | | | | | | | |
| | |
6.13%, 12/15/2022 | | | 39,000 | | | | 42,190 | |
| | |
6.00%, 12/19/2023 | | | 35,000 | | | | 38,118 | |
| | |
5.13%, 5/28/2024 | | | 101,000 | | | | 106,903 | |
| | |
Sumitomo Mitsui Financial Group, Inc. (Japan) | | | | | | | | |
| | |
2.78%, 7/12/2022 | | | 80,000 | | | | 81,420 | |
| | |
2.63%, 7/14/2026 | | | 70,000 | | | | 70,713 | |
| | |
3.36%, 7/12/2027 | | | 59,000 | | | | 62,919 | |
| | |
SunTrust Bank 2.45%, 8/1/2022 | | | 40,000 | | | | 40,470 | |
| | |
US Bancorp | | | | | | | | |
| | |
Series V, 2.63%, 1/24/2022 | | | 46,000 | | | | 46,762 | |
| | |
Series V, 2.38%, 7/22/2026 | | | 42,000 | | | | 42,782 | |
| | |
Series X, 3.15%, 4/27/2027 | | | 39,000 | | | | 41,777 | |
| | |
Wells Fargo & Co. | | | | | | | | |
| | |
2.10%, 7/26/2021 | | | 100,000 | | | | 100,084 | |
SEE NOTES TO FINANCIAL STATEMENTS.
| | | | | | |
| | | |
| 50 | | | | J.P. MORGAN EXCHANGE-TRADED FUNDS | | AUGUST 31, 2019 |
| | | | | | | | |
| INVESTMENTS | | PRINCIPAL
AMOUNT ($) | | | VALUE ($) | |
Corporate Bonds — continued | | | | | | | | |
| | |
Banks — continued | | | | | | | | |
| | |
2.63%, 7/22/2022 | | | 80,000 | | | | 81,361 | |
| | |
3.75%, 1/24/2024 | | | 40,000 | | | | 42,599 | |
| | |
3.00%, 10/23/2026 | | | 143,000 | | | | 148,634 | |
| | |
4.30%, 7/22/2027 | | | 70,000 | | | | 77,530 | |
| | |
(ICE LIBOR USD 3 Month + 1.31%), 3.58%, 5/22/2028 (b) | | | 141,000 | | | | 151,208 | |
| | |
3.90%, 5/1/2045 | | | 20,000 | | | | 23,409 | |
| | |
4.75%, 12/7/2046 | | | 50,000 | | | | 61,338 | |
| | |
Westpac Banking Corp. (Australia) | | | | | | | | |
| | |
2.75%, 1/11/2023 | | | 70,000 | | | | 71,888 | |
| | |
2.85%, 5/13/2026 | | | 167,000 | | | | 174,075 | |
| | | | | | | | |
| | |
| | | | | | | 4,893,028 | |
| | | | | | | | |
|
Beverages — 2.1% | |
| | |
Anheuser-Busch Cos. LLC (Belgium) | | | | | | | | |
| | |
3.65%, 2/1/2026 | | | 50,000 | | | | 53,728 | |
| | |
4.90%, 2/1/2046 | | | 104,000 | | | | 124,262 | |
| | |
Anheuser-Busch InBev Worldwide, Inc. (Belgium) | | | | | | | | |
| | |
4.00%, 4/13/2028 | | | 40,000 | | | | 44,345 | |
| | |
4.90%, 1/23/2031 | | | 25,000 | | | | 29,940 | |
| | |
4.60%, 4/15/2048 | | | 97,000 | | | | 112,760 | |
| | |
4.44%, 10/6/2048 | | | 30,000 | | | | 33,874 | |
| | |
Keurig Dr Pepper, Inc. | | | | | | | | |
| | |
4.06%, 5/25/2023 | | | 102,000 | | | | 108,319 | |
| | |
4.60%, 5/25/2028 | | | 40,000 | | | | 45,190 | |
| | |
Molson Coors Brewing Co. 4.20%, 7/15/2046 | | | 20,000 | | | | 20,357 | |
| | |
PepsiCo, Inc. 3.45%, 10/6/2046 | | | 30,000 | | | | 33,126 | |
| | | | | | | | |
| | |
| | | | | | | 605,901 | |
| | | | | | | | |
|
Biotechnology — 2.0% | |
| | |
AbbVie, Inc. | | | | | | | | |
| | |
2.90%, 11/6/2022 | | | 160,000 | | | | 162,853 | |
| | |
3.60%, 5/14/2025 | | | 50,000 | | | | 52,138 | |
| | |
4.25%, 11/14/2028 | | | 95,000 | | | | 103,334 | |
| | |
4.70%, 5/14/2045 | | | 50,000 | | | | 54,031 | |
| | |
Celgene Corp. | | | | | | | | |
| | |
3.90%, 2/20/2028 | | | 40,000 | | | | 44,439 | |
| | |
4.35%, 11/15/2047 | | | 70,000 | | | | 84,521 | |
| | |
Gilead Sciences, Inc. 4.15%, 3/1/2047 | | | 63,000 | | | | 71,277 | |
| | | | | | | | |
| | |
| | | | | | | 572,593 | |
| | | | | | | | |
|
Capital Markets — 7.7% | |
| | |
Bank of New York Mellon Corp. (The) | | | | | | | | |
| | |
3.55%, 9/23/2021 | | | 99,000 | | | | 101,952 | |
| | |
2.20%, 8/16/2023 | | | 60,000 | | | | 60,466 | |
| | | | | | | | |
| INVESTMENTS | | PRINCIPAL
AMOUNT ($) | | | VALUE ($) | |
| | | | | | | | |
| | |
Capital Markets — continued | | | | | | | | |
| | |
(ICE LIBOR USD 3 Month + 1.07%), 3.44%, 2/7/2028 (b) | | | 112,000 | | | | 120,158 | |
| | |
CME Group, Inc. 3.00%, 3/15/2025 | | | 82,000 | | | | 86,374 | |
| | |
Credit Suisse Group AG (Switzerland) (ICE LIBOR USD 3 Month + 1.24%), 4.21%, 6/12/2024 (a) (b) | | | 250,000 | | | | 264,725 | |
| | |
Goldman Sachs Group, Inc. (The) | | | | | | | | |
| | |
2.35%, 11/15/2021 | | | 40,000 | | | | 40,075 | |
| | |
5.75%, 1/24/2022 | | | 291,000 | | | | 315,074 | |
| | |
4.00%, 3/3/2024 | | | 188,000 | | | | 202,185 | |
| | |
3.85%, 1/26/2027 | | | 73,000 | | | | 77,952 | |
| | |
(ICE LIBOR USD 3 Month + 1.30%), 4.22%, 5/1/2029 (b) | | | 63,000 | | | | 69,685 | |
| | |
(ICE LIBOR USD 3 Month + 1.37%), 4.02%, 10/31/2038 (b) | | | 138,000 | | | | 152,958 | |
| | |
Morgan Stanley | | | | | | | | |
| | |
2.63%, 11/17/2021 | | | 230,000 | | | | 232,409 | |
| | |
2.75%, 5/19/2022 | | | 182,000 | | | | 185,127 | |
| | |
3.70%, 10/23/2024 | | | 50,000 | | | | 53,410 | |
| | |
3.63%, 1/20/2027 | | | 70,000 | | | | 74,892 | |
| | |
(ICE LIBOR USD 3 Month + 1.14%), 3.77%, 1/24/2029 (b) | | | 100,000 | | | | 108,217 | |
| | |
(ICE LIBOR USD 3 Month + 1.46%), 3.97%, 7/22/2038 (b) | | | 110,000 | | | | 122,890 | |
| | | | | | | | |
| | |
| | | | | | | 2,268,549 | |
| | | | | | | | |
|
Chemicals — 1.3% | |
| | |
Dow Chemical Co. (The) 3.50%, 10/1/2024 | | | 55,000 | | | | 57,669 | |
| | |
DuPont de Nemours, Inc. | | | | | | | | |
| | |
4.21%, 11/15/2023 | | | 164,000 | | | | 176,682 | |
| | |
4.73%, 11/15/2028 | | | 80,000 | | | | 92,513 | |
| | |
Eastman Chemical Co. 4.65%, 10/15/2044 | | | 21,000 | | | | 22,924 | |
| | |
Sherwin-Williams Co. (The) 2.75%, 6/1/2022 | | | 36,000 | | | | 36,557 | |
| | | | | | | | |
| | |
| | | | | | | 386,345 | |
| | | | | | | | |
|
Commercial Services & Supplies — 0.7% | |
| | |
Waste Management, Inc. | | | | | | | | |
| | |
3.20%, 6/15/2026 | | | 80,000 | | | | 85,126 | |
| | |
3.45%, 6/15/2029 | | | 55,000 | | | | 60,237 | |
| | |
4.15%, 7/15/2049 | | | 50,000 | | | | 59,204 | |
| | | | | | | | |
| | |
| | | | | | | 204,567 | |
| | | | | | | | |
|
Communications Equipment — 0.4% | |
| | |
Cisco Systems, Inc. 2.50%, 9/20/2026 | | | 110,000 | | | | 114,117 | |
| | | | | | | | |
|
Consumer Finance — 2.2% | |
| | |
American Express Co. 3.70%, 8/3/2023 | | | 60,000 | | | | 63,593 | |
SEE NOTES TO FINANCIAL STATEMENTS.
| | | | | | | | |
| | | |
| AUGUST 31, 2019 | | J.P. MORGAN EXCHANGE-TRADED FUNDS | | | | | 51 | |
JPMorgan Corporate Bond Research Enhanced ETF
SCHEDULE OF PORTFOLIO INVESTMENTS
AS OF AUGUST 31, 2019 (Unaudited) (continued)
| | | | | | | | |
| INVESTMENTS | | PRINCIPAL
AMOUNT ($) | | | VALUE ($) | |
Corporate Bonds — continued | | | | | | | | |
| | |
Consumer Finance — continued | | | | | | | | |
| | |
Avolon Holdings Funding Ltd. (Ireland) | | | | | | | | |
| | |
3.95%, 7/1/2024 (a) | | | 21,000 | | | | 21,613 | |
| | |
4.38%, 5/1/2026 (a) | | | 20,000 | | | | 20,766 | |
| | |
Capital One Financial Corp. | | | | | | | | |
| | |
3.30%, 10/30/2024 | | | 67,000 | | | | 69,453 | |
| | |
3.80%, 1/31/2028 | | | 40,000 | | | | 42,645 | |
| | |
Discover Financial Services 4.10%, 2/9/2027 | | | 45,000 | | | | 48,450 | |
| | |
General Motors Financial Co., Inc. | | | | | | | | |
| | |
3.20%, 7/6/2021 | | | 154,000 | | | | 155,918 | |
| | |
4.35%, 1/17/2027 | | | 36,000 | | | | 37,306 | |
| | |
John Deere Capital Corp. | | | | | | | | |
| | |
2.80%, 3/6/2023 | | | 104,000 | | | | 107,026 | |
| | |
2.60%, 3/7/2024 | | | 60,000 | | | | 61,559 | |
| | |
Park Aerospace Holdings Ltd. (Ireland) 5.50%, 2/15/2024 (a) | | | 20,000 | | | | 21,628 | |
| | | | | | | | |
| | |
| | | | | | | 649,957 | |
| | | | | | | | |
|
Containers & Packaging — 0.4% | |
| | |
International Paper Co. 4.40%, 8/15/2047 | | | 40,000 | | | | 42,653 | |
| | |
WRKCo, Inc. 4.65%, 3/15/2026 | | | 54,000 | | | | 59,696 | |
| | | | | | | | |
| | |
| | | | | | | 102,349 | |
| | | | | | | | |
|
Diversified Financial Services — 1.2% | |
| | |
Berkshire Hathaway, Inc. 3.13%, 3/15/2026 | | | 30,000 | | | | 31,803 | |
| | |
GE Capital International Funding Co. Unlimited Co. | | | | | | | | |
| | |
2.34%, 11/15/2020 | | | 200,000 | | | | 198,879 | |
| | |
ORIX Corp. (Japan) 2.90%, 7/18/2022 | | | 10,000 | | | | 10,215 | |
| | |
Shell International Finance BV (Netherlands) | | | | | | | | |
| | |
3.25%, 5/11/2025 | | | 22,000 | | | | 23,389 | |
| | |
4.13%, 5/11/2035 | | | 50,000 | | | | 58,318 | |
| | |
4.38%, 5/11/2045 | | | 34,000 | | | | 41,658 | |
| | | | | | | | |
| | |
| | | | | | | 364,262 | |
| | | | | | | | |
|
Diversified Telecommunication Services — 3.3% | |
| | |
AT&T, Inc. | | | | | | | | |
| | |
3.00%, 6/30/2022 | | | 149,000 | | | | 152,334 | |
| | |
3.40%, 5/15/2025 | | | 49,000 | | | | 51,466 | |
| | |
4.30%, 2/15/2030 | | | 16,000 | | | | 17,767 | |
| | |
5.25%, 3/1/2037 | | | 25,000 | | | | 29,718 | |
| | |
4.90%, 8/15/2037 | | | 20,000 | | | | 22,881 | |
| | |
4.35%, 6/15/2045 | | | 20,000 | | | | 21,402 | |
| | |
4.50%, 3/9/2048 | | | 170,000 | | | | 185,559 | |
| | |
Verizon Communications, Inc. | | | | | | | | |
| | |
3.38%, 2/15/2025 | | | 7,000 | | | | 7,433 | |
| | |
4.33%, 9/21/2028 | | | 52,000 | | | | 59,731 | |
| | | | | | | | |
| INVESTMENTS | | PRINCIPAL
AMOUNT ($) | | | VALUE ($) | |
| | | | | | | | |
|
Diversified Telecommunication Services — continued | |
| | |
4.02%, 12/3/2029 (a) | | | 40,000 | | | | 45,180 | |
| | |
4.40%, 11/1/2034 | | | 20,000 | | | | 23,168 | |
| | |
4.27%, 1/15/2036 | | | 210,000 | | | | 241,109 | |
| | |
4.52%, 9/15/2048 | | | 100,000 | | | | 120,426 | |
| | | | | | | | |
| | |
| | | | | | | 978,174 | |
| | | | | | | | |
|
Electric Utilities — 4.9% | |
| | |
Duke Energy Corp. | | | | | | | | |
| | |
3.75%, 4/15/2024 | | | 210,000 | | | | 223,190 | |
| | |
2.65%, 9/1/2026 | | | 18,000 | | | | 18,216 | |
| | |
3.75%, 9/1/2046 | | | 130,000 | | | | 136,883 | |
| | |
Emera US Finance LP (Canada) 4.75%, 6/15/2046 | | | 98,000 | | | | 116,172 | |
| | |
Entergy Louisiana LLC 4.00%, 3/15/2033 | | | 173,000 | | | | 200,780 | |
| | |
Exelon Corp. 4.45%, 4/15/2046 | | | 84,000 | | | | 97,250 | |
| | |
FirstEnergy Corp. | | | | | | | | |
| | |
Series B, 3.90%, 7/15/2027 | | | 119,000 | | | | 127,836 | |
| | |
Series C, 4.85%, 7/15/2047 | | | 30,000 | | | | 36,434 | |
| | |
Florida Power & Light Co. 3.95%, 3/1/2048 | | | 30,000 | | | | 35,336 | |
| | |
Fortis, Inc. (Canada) 3.06%, 10/4/2026 | | | 62,000 | | | | 63,479 | |
| | |
Indiana Michigan Power Co. 4.25%, 8/15/2048 | | | 20,000 | | | | 24,245 | |
| | |
NextEra Energy Capital Holdings, Inc. 3.15%, 4/1/2024 | | | 30,000 | | | | 31,250 | |
| | |
Ohio Power Co. 4.00%, 6/1/2049 | | | 20,000 | | | | 23,312 | |
| | |
Southern California Edison Co. Series C, 3.60%, 2/1/2045 | | | 64,000 | | | | 66,570 | |
| | |
Southern Co. (The) | | | | | | | | |
| | |
2.35%, 7/1/2021 | | | 44,000 | | | | 44,126 | |
| | |
3.25%, 7/1/2026 | | | 24,000 | | | | 24,854 | |
| | |
4.40%, 7/1/2046 | | | 54,000 | | | | 60,991 | |
| | |
Virginia Electric & Power Co. | | | | | | | | |
| | |
Series A, 3.15%, 1/15/2026 | | | 17,000 | | | | 17,925 | |
| | |
Series A, 3.50%, 3/15/2027 | | | 43,000 | | | | 46,356 | |
| | |
4.60%, 12/1/2048 | | | 30,000 | | | | 37,939 | |
| | | | | | | | |
| | |
| | | | | | | 1,433,144 | |
| | | | | | | | |
|
Electrical Equipment — 0.2% | |
| | |
Eaton Corp. 2.75%, 11/2/2022 | | | 53,000 | | | | 54,045 | |
| | | | | | | | |
|
Energy Equipment & Services — 0.9% | |
| | |
Baker Hughes a GE Co. LLC 4.08%, 12/15/2047 | | | 101,000 | | | | 98,595 | |
| | |
Halliburton Co. 5.00%, 11/15/2045 | | | 50,000 | | | | 55,998 | |
| | |
Schlumberger Holdings Corp. | | | | | | | | |
| | |
3.75%, 5/1/2024 (a) | | | 20,000 | | | | 21,149 | |
| | |
3.90%, 5/17/2028 (a) | | | 70,000 | | | | 74,596 | |
| | | | | | | | |
| | |
| | | | | | | 250,338 | |
| | | | | | | | |
SEE NOTES TO FINANCIAL STATEMENTS.
| | | | | | |
| | | |
| 52 | | | | J.P. MORGAN EXCHANGE-TRADED FUNDS | | AUGUST 31, 2019 |
| | | | | | | | |
| INVESTMENTS | | PRINCIPAL
AMOUNT ($) | | | VALUE ($) | |
Corporate Bonds — continued | | | | | | | | |
|
Entertainment — 0.1% | |
| | |
TWDC Enterprises 18 Corp. 4.13%, 6/1/2044 | | | 30,000 | | | | 36,467 | |
| | | | | | | | |
|
Equity Real Estate Investment Trusts (REITs) — 3.1% | |
| | |
American Tower Corp. | | | | | | | | |
| | |
3.38%, 10/15/2026 | | | 110,000 | | | | 115,155 | |
| | |
3.55%, 7/15/2027 | | | 158,000 | | | | 167,997 | |
| | |
Boston Properties LP 4.50%, 12/1/2028 | | | 60,000 | | | | 69,327 | |
| | |
HCP, Inc. 4.00%, 6/1/2025 | | | 50,000 | | | | 53,520 | |
| | |
Simon Property Group LP | | | | | | | | |
| | |
3.38%, 10/1/2024 | | | 60,000 | | | | 63,737 | |
| | |
3.30%, 1/15/2026 | | | 80,000 | | | | 84,562 | |
| | |
UDR, Inc. 3.00%, 8/15/2031 | | | 20,000 | | | | 20,375 | |
| | |
Welltower, Inc. | | | | | | | | |
| | |
3.63%, 3/15/2024 | | | 140,000 | | | | 147,488 | |
| | |
4.00%, 6/1/2025 | | | 140,000 | | | | 150,372 | |
| | |
3.10%, 1/15/2030 | | | 35,000 | | | | 35,618 | |
| | | | | | | | |
| | |
| | | | | | | 908,151 | |
| | | | | | | | |
|
Food & Staples Retailing — 0.6% | |
| | |
Kroger Co. (The) 4.45%, 2/1/2047 | | | 20,000 | | | | 20,928 | |
| | |
Walmart, Inc. | | | | | | | | |
| | |
3.05%, 7/8/2026 | | | 85,000 | | | | 90,841 | |
| | |
3.70%, 6/26/2028 | | | 25,000 | | | | 28,083 | |
| | |
4.05%, 6/29/2048 | | | 39,000 | | | | 48,561 | |
| | | | | | | | |
| | |
| | | | | | | 188,413 | |
| | | | | | | | |
|
Food Products — 0.5% | |
| | |
Kraft Heinz Foods Co. | | | | | | | | |
| | |
3.50%, 6/6/2022 | | | 12,000 | | | | 12,284 | |
| | |
3.95%, 7/15/2025 | | | 22,000 | | | | 22,829 | |
| | |
4.38%, 6/1/2046 | | | 99,000 | | | | 95,137 | |
| | |
Mead Johnson Nutrition Co. (United Kingdom) 4.13%, 11/15/2025 | | | 23,000 | | | | 25,352 | |
| | | | | | | | |
| | |
| | | | | | | 155,602 | |
| | | | | | | | |
|
Gas Utilities — 0.1% | |
| | |
Atmos Energy Corp. 4.13%, 10/15/2044 | | | 31,000 | | | | 36,200 | |
| | | | | | | | |
|
Health Care Equipment & Supplies — 2.1% | |
| | |
Abbott Laboratories 3.75%, 11/30/2026 | | | 80,000 | | | | 88,031 | |
| | |
Becton Dickinson and Co. | | | | | | | | |
| | |
2.89%, 6/6/2022 | | | 90,000 | | | | 91,484 | |
| | |
3.70%, 6/6/2027 | | | 48,000 | | | | 51,422 | |
| | |
4.69%, 12/15/2044 | | | 55,000 | | | | 65,213 | |
| | |
Boston Scientific Corp. | | | | | | | | |
| | |
4.00%, 3/1/2028 | | | 189,000 | | | | 208,040 | |
| | |
4.55%, 3/1/2039 | | | 20,000 | | | | 24,007 | |
| | | | | | | | |
| | | | | | | | |
| INVESTMENTS | | PRINCIPAL
AMOUNT ($) | | | VALUE ($) | |
| | | | | | | | |
|
Health Care Equipment & Supplies — continued | |
| | |
Medtronic, Inc. 4.38%, 3/15/2035 | | | 72,000 | | | | 87,109 | |
| | | | | | | | |
| | |
| | | | | | | 615,306 | |
| | | | | | | | |
|
Health Care Providers & Services — 4.3% | |
| | |
Aetna, Inc. | | | | | | | | |
| | |
2.80%, 6/15/2023 | | | 215,000 | | | | 218,427 | |
| | |
3.88%, 8/15/2047 | | | 20,000 | | | | 19,953 | |
| | |
Anthem, Inc. | | | | | | | | |
| | |
3.65%, 12/1/2027 | | | 31,000 | | | | 32,891 | |
| | |
4.65%, 8/15/2044 | | | 116,000 | | | | 133,412 | |
| | |
Cigna Corp. | | | | | | | | |
| | |
4.80%, 8/15/2038 | | | 68,000 | | | | 78,618 | |
| | |
4.90%, 12/15/2048 | | | 20,000 | | | | 23,668 | |
| | |
CVS Health Corp. | | | | | | | | |
| | |
3.35%, 3/9/2021 | | | 55,000 | | | | 56,003 | |
| | |
2.63%, 8/15/2024 | | | 10,000 | | | | 10,057 | |
| | |
4.10%, 3/25/2025 | | | 129,000 | | | | 138,008 | |
| | |
4.30%, 3/25/2028 | | | 46,000 | | | | 50,211 | |
| | |
3.25%, 8/15/2029 | | | 20,000 | | | | 20,271 | |
| | |
5.05%, 3/25/2048 | | | 136,000 | | | | 158,462 | |
| | |
HCA, Inc. | | | | | | | | |
| | |
4.50%, 2/15/2027 | | | 40,000 | | | | 43,367 | |
| | |
5.25%, 6/15/2049 | | | 110,000 | | | | 122,803 | |
| | |
UnitedHealth Group, Inc. | | | | | | | | |
| | |
3.75%, 7/15/2025 | | | 68,000 | | | | 73,861 | |
| | |
4.25%, 3/15/2043 | | | 70,000 | | | | 81,025 | |
| | | | | | | | |
| | |
| | | | | | | 1,261,037 | |
| | | | | | | | |
|
Hotels, Restaurants & Leisure — 0.8% | |
| | |
McDonald’s Corp. | | | | | | | | |
| | |
3.70%, 1/30/2026 | | | 112,000 | | | | 121,395 | |
| | |
3.80%, 4/1/2028 | | | 33,000 | | | | 36,582 | |
| | |
4.88%, 12/9/2045 | | | 70,000 | | | | 86,298 | |
| | | | | | | | |
| | |
| | | | | | | 244,275 | |
| | | | | | | | |
|
Household Durables — 0.1% | |
| | |
Newell Brands, Inc. 4.20%, 4/1/2026 | | | 32,000 | | | | 33,182 | |
| | | | | | | | |
|
Independent Power and Renewable Electricity Producers — 0.1% | |
| | |
NRG Energy, Inc. 4.45%, 6/15/2029 (a) | | | 20,000 | | | | 21,016 | |
| | | | | | | | |
|
Industrial Conglomerates — 2.1% | |
| | |
General Electric Co. | | | | | | | | |
| | |
4.63%, 1/7/2021 | | | 100,000 | | | | 102,261 | |
| | |
4.65%, 10/17/2021 | | | 60,000 | | | | 62,145 | |
| | |
2.70%, 10/9/2022 | | | 160,000 | | | | 158,959 | |
| | |
6.75%, 3/15/2032 | | | 31,000 | | | | 38,020 | |
| | |
5.88%, 1/14/2038 | | | 41,000 | | | | 47,355 | |
| | |
4.13%, 10/9/2042 | | | 90,000 | | | | 86,280 | |
SEE NOTES TO FINANCIAL STATEMENTS.
| | | | | | | | |
| | | |
| AUGUST 31, 2019 | | J.P. MORGAN EXCHANGE-TRADED FUNDS | | | | | 53 | |
JPMorgan Corporate Bond Research Enhanced ETF
SCHEDULE OF PORTFOLIO INVESTMENTS
AS OF AUGUST 31, 2019 (Unaudited) (continued)
| | | | | | | | |
| INVESTMENTS | | PRINCIPAL
AMOUNT ($) | | | VALUE ($) | |
Corporate Bonds — continued | | | | | | | | |
| | |
Industrial Conglomerates — continued | | | | | | | | |
| | |
Honeywell International, Inc. 2.30%, 8/15/2024 | | | 45,000 | | | | 45,977 | |
| | |
Roper Technologies, Inc. 4.20%, 9/15/2028 | | | 69,000 | | | | 76,632 | |
| | | | | | | | |
| | |
| | | | | | | 617,629 | |
| | | | | | | | |
|
Insurance — 1.6% | |
| | |
American International Group, Inc. | | | | | | | | |
| | |
3.90%, 4/1/2026 | | | 28,000 | | | | 30,059 | |
| | |
4.50%, 7/16/2044 | | | 79,000 | | | | 90,311 | |
| | |
Athene Holding Ltd. 4.13%, 1/12/2028 | | | 84,000 | | | | 85,940 | |
| | |
Berkshire Hathaway Finance Corp. | | | | | | | | |
| | |
4.20%, 8/15/2048 | | | 90,000 | | | | 108,146 | |
| | |
4.25%, 1/15/2049 | | | 20,000 | | | | 24,503 | |
| | |
Marsh & McLennan Cos., Inc. 4.38%, 3/15/2029 | | | 30,000 | | | | 34,463 | |
| | |
MetLife, Inc. 4.13%, 8/13/2042 | | | 20,000 | | | | 22,947 | |
| | |
New York Life Global Funding 2.88%, 4/10/2024 (a) | | | 60,000 | | | | 62,182 | |
| | |
Prudential Financial, Inc. 3.91%, 12/7/2047 | | | 20,000 | | | | 22,271 | |
| | | | | | | | |
| | |
| | | | | | | 480,822 | |
| | | | | | | | |
|
Internet & Direct Marketing Retail — 0.6% | |
| | |
Amazon.com, Inc. | | | | | | | | |
| | |
3.88%, 8/22/2037 | | | 140,000 | | | | 162,555 | |
| | |
4.05%, 8/22/2047 | | | 10,000 | | | | 12,272 | |
| | | | | | | | |
| | |
| | | | | | | 174,827 | |
| | | | | | | | |
|
IT Services — 2.0% | |
| | |
Fidelity National Information Services, Inc. | | | | | | | | |
| | |
3.75%, 5/21/2029 | | | 45,000 | | | | 49,352 | |
| | |
Global Payments, Inc. | | | | | | | | |
| | |
3.20%, 8/15/2029 | | | 70,000 | | | | 71,732 | |
| | |
4.15%, 8/15/2049 | | | 50,000 | | | | 52,897 | |
| | |
International Business Machines Corp. | | | | | | | | |
| | |
2.80%, 5/13/2021 | | | 145,000 | | | | 146,882 | |
| | |
2.85%, 5/13/2022 | | | 100,000 | | | | 102,288 | |
| | |
3.00%, 5/15/2024 | | | 100,000 | | | | 103,993 | |
| | |
Mastercard, Inc. | | | | | | | | |
| | |
2.95%, 6/1/2029 | | | 35,000 | | | | 37,446 | |
| | |
3.65%, 6/1/2049 | | | 20,000 | | | | 23,234 | |
| | | | | | | | |
| | |
| | | | | | | 587,824 | |
| | | | | | | | |
|
Life Sciences Tools & Services — 0.3% | |
| | |
Thermo Fisher Scientific, Inc. 3.00%, 4/15/2023 | | | 70,000 | | | | 72,009 | |
| | | | | | | | |
| | | | | | | | |
| INVESTMENTS | | PRINCIPAL
AMOUNT ($) | | | VALUE ($) | |
| | | | | | | | |
|
Machinery — 0.1% | |
| | |
Illinois Tool Works, Inc. 2.65%, 11/15/2026 | | | 28,000 | | | | 29,142 | |
| | | | | | | | |
|
Media — 3.2% | |
| | |
Charter Communications Operating LLC | | | | | | | | |
| | |
4.46%, 7/23/2022 | | | 88,000 | | | | 92,982 | |
| | |
6.48%, 10/23/2045 | | | 63,000 | | | | 77,902 | |
| | |
Comcast Corp. | | | | | | | | |
| | |
3.70%, 4/15/2024 | | | 167,000 | | | | 178,861 | |
| | |
3.95%, 10/15/2025 | | | 78,000 | | | | 85,405 | |
| | |
4.15%, 10/15/2028 | | | 74,000 | | | | 83,957 | |
| | |
3.90%, 3/1/2038 | | | 20,000 | | | | 22,426 | |
| | |
4.60%, 10/15/2038 | | | 178,000 | | | | 215,441 | |
| | |
4.70%, 10/15/2048 | | | 38,000 | | | | 47,545 | |
| | |
Cox Communications, Inc. 3.50%, 8/15/2027 (a) | | | 70,000 | | | | 73,810 | |
| | |
Time Warner Cable LLC 6.75%, 6/15/2039 | | | 48,000 | | | | 59,039 | |
| | | | | | | | |
| | |
| | | | | | | 937,368 | |
| | | | | | | | |
|
Metals & Mining — 0.6% | |
| | |
Glencore Funding LLC (Switzerland) 4.00%,
3/27/2027 (a) | | | 120,000 | | | | 124,062 | |
| | |
Vale Overseas Ltd. (Brazil) 6.25%, 8/10/2026 | | | 40,000 | | | | 46,070 | |
| | | | | | | | |
| | |
| | | | | | | 170,132 | |
| | | | | | | | |
|
Multi-Utilities — 1.2% | |
| | |
Berkshire Hathaway Energy Co. | | | | | | | | |
| | |
4.50%, 2/1/2045 | | | 80,000 | | | | 97,011 | |
| | |
3.80%, 7/15/2048 | | | 38,000 | | | | 42,229 | |
| | |
4.45%, 1/15/2049 | | | 49,000 | | | | 59,907 | |
| | |
Dominion Energy, Inc. | | | | | | | | |
| | |
3.07%, 8/15/2024 (c) | | | 32,000 | | | | 32,902 | |
| | |
3.90%, 10/1/2025 | | | 17,000 | | | | 18,327 | |
| | |
NiSource, Inc. 2.95%, 9/1/2029 | | | 35,000 | | | | 35,783 | |
| | |
San Diego Gas & Electric Co. Series TTT, 4.10%, 6/15/2049 | | | 30,000 | | | | 34,837 | |
| | |
Sempra Energy 3.80%, 2/1/2038 | | | 38,000 | | | | 39,884 | |
| | | | | | | | |
| | |
| | | | | | | 360,880 | |
| | | | | | | | |
|
Oil, Gas & Consumable Fuels — 7.6% | |
| | |
Andeavor Logistics LP 4.25%, 12/1/2027 | | | 28,000 | | | | 29,631 | |
| | |
BP Capital Markets America, Inc. 3.41%, 2/11/2026 | | | 95,000 | | | | 101,059 | |
| | |
BP Capital Markets plc (United Kingdom) 3.28%, 9/19/2027 | | | 80,000 | | | | 84,796 | |
| | |
Canadian Natural Resources Ltd. (Canada) | | | | | | | | |
| | |
2.95%, 1/15/2023 | | | 125,000 | | | | 126,990 | |
| | |
3.85%, 6/1/2027 | | | 29,000 | | | | 30,717 | |
SEE NOTES TO FINANCIAL STATEMENTS.
| | | | | | |
| | | |
| 54 | | | | J.P. MORGAN EXCHANGE-TRADED FUNDS | | AUGUST 31, 2019 |
| | | | | | | | |
| INVESTMENTS | | PRINCIPAL
AMOUNT ($) | | | VALUE ($) | |
Corporate Bonds — continued | | | | | | | | |
| | |
Oil, Gas & Consumable Fuels — continued | | | | | | | | |
| | |
Columbia Pipeline Group, Inc. 4.50%, 6/1/2025 | | | 60,000 | | | | 65,102 | |
| | |
Enbridge, Inc. (Canada) 4.25%, 12/1/2026 | | | 61,000 | | | | 67,613 | |
| | |
Energy Transfer Operating LP | | | | | | | | |
| | |
7.50%, 10/15/2020 | | | 130,000 | | | | 136,978 | |
| | |
4.75%, 1/15/2026 | | | 22,000 | | | | 24,060 | |
| | |
4.95%, 6/15/2028 | | | 32,000 | | | | 35,797 | |
| | |
Enterprise Products Operating LLC | | | | | | | | |
| | |
3.13%, 7/31/2029 | | | 20,000 | | | | 20,715 | |
| | |
5.10%, 2/15/2045 | | | 43,000 | | | | 51,491 | |
| | |
4.80%, 2/1/2049 | | | 34,000 | | | | 39,948 | |
| | |
4.20%, 1/31/2050 | | | 15,000 | | | | 16,318 | |
| | |
EOG Resources, Inc. 2.63%, 3/15/2023 | | | 70,000 | | | | 71,424 | |
| | |
EQM Midstream Partners LP 4.75%, 7/15/2023 | | | 118,000 | | | | 118,965 | |
| | |
Kinder Morgan, Inc. | | | | | | | | |
| | |
4.30%, 6/1/2025 | | | 13,000 | | | | 14,110 | |
| | |
5.55%, 6/1/2045 | | | 63,000 | | | | 75,602 | |
| | |
Marathon Petroleum Corp. 4.75%, 9/15/2044 | | | 37,000 | | | | 39,887 | |
| | |
MPLX LP | | | | | | | | |
| | |
4.00%, 3/15/2028 | | | 34,000 | | | | 35,641 | |
| | |
4.50%, 4/15/2038 | | | 60,000 | | | | 62,255 | |
| | |
Noble Energy, Inc. | | | | | | | | |
| | |
5.25%, 11/15/2043 | | | 100,000 | | | | 113,371 | |
| | |
5.05%, 11/15/2044 | | | 20,000 | | | | 22,231 | |
| | |
Occidental Petroleum Corp. | | | | | | | | |
| | |
2.70%, 8/15/2022 | | | 170,000 | | | | 171,673 | |
| | |
2.90%, 8/15/2024 | | | 185,000 | | | | 186,730 | |
| | |
3.00%, 2/15/2027 | | | 25,000 | | | | 24,868 | |
| | |
3.50%, 8/15/2029 | | | 41,000 | | | | 41,772 | |
| | |
Phillips 66 | | | | | | | | |
| | |
4.30%, 4/1/2022 | | | 64,000 | | | | 67,644 | |
| | |
4.65%, 11/15/2034 | | | 50,000 | | | | 58,016 | |
| | |
Suncor Energy, Inc. (Canada) 4.00%, 11/15/2047 | | | 30,000 | | | | 33,047 | |
| | |
Sunoco Logistics Partners Operations LP 5.40%, 10/1/2047 | | | 112,000 | | | | 124,922 | |
| | |
TransCanada PipeLines Ltd. (Canada) 4.63%, 3/1/2034 | | | 101,000 | | | | 115,469 | |
| | |
Williams Cos., Inc. (The) 3.75%, 6/15/2027 | | | 16,000 | | | | 16,699 | |
| | | | | | | | |
| | |
| | | | | | | 2,225,541 | |
| | | | | | | | |
|
Pharmaceuticals — 5.3% | |
| | |
Allergan Funding SCS 3.45%, 3/15/2022 | | | 50,000 | | | | 51,347 | |
| | |
AstraZeneca plc (United Kingdom) 4.38%, 11/16/2045 | | | 50,000 | | | | 59,779 | |
| | | | | | | | |
| INVESTMENTS | | PRINCIPAL
AMOUNT ($) | | | VALUE ($) | |
| | | | | | | | |
| | |
Pharmaceuticals — continued | | | | | | | | |
| | |
Bristol-Myers Squibb Co. | | | | | | | | |
| | |
2.90%, 7/26/2024 (a) | | | 54,000 | | | | 55,988 | |
| | |
3.40%, 7/26/2029 (a) | | | 30,000 | | | | 32,476 | |
| | |
4.25%, 10/26/2049 (a) | | | 100,000 | | | | 120,285 | |
| | |
Eli Lilly & Co. | | | | | | | | |
| | |
3.38%, 3/15/2029 | | | 30,000 | | | | 32,956 | |
| | |
3.88%, 3/15/2039 | | | 40,000 | | | | 46,530 | |
| | |
3.95%, 3/15/2049 | | | 55,000 | | | | 64,373 | |
| | |
Merck & Co., Inc. | | | | | | | | |
| | |
2.75%, 2/10/2025 | | | 50,000 | | | | 52,060 | |
| | |
3.40%, 3/7/2029 | | | 30,000 | | | | 33,031 | |
| | |
Novartis Capital Corp. (Switzerland) | | | | | | | | |
| | |
3.40%, 5/6/2024 | | | 59,000 | | | | 63,090 | |
| | |
3.00%, 11/20/2025 | | | 50,000 | | | | 53,005 | |
| | |
4.40%, 5/6/2044 | | | 43,000 | | | | 53,819 | |
| | |
Pfizer, Inc. | | | | | | | | |
| | |
3.00%, 12/15/2026 | | | 40,000 | | | | 42,322 | |
| | |
4.00%, 12/15/2036 | | | 40,000 | | | | 46,482 | |
| | |
4.40%, 5/15/2044 | | | 20,000 | | | | 24,364 | |
| | |
4.13%, 12/15/2046 | | | 62,000 | | | | 74,238 | |
| | |
4.00%, 3/15/2049 | | | 10,000 | | | | 11,774 | |
| | |
Shire Acquisitions Investments Ireland DAC | | | | | | | | |
| | |
2.40%, 9/23/2021 | | | 275,000 | | | | 275,853 | |
| | |
3.20%, 9/23/2026 | | | 221,000 | | | | 229,864 | |
| | |
Zoetis, Inc. | | | | | | | | |
| | |
3.00%, 9/12/2027 | | | 80,000 | | | | 83,100 | |
| | |
4.70%, 2/1/2043 | | | 40,000 | | | | 48,684 | |
| | | | | | | | |
| | |
| | | | | | | 1,555,420 | |
| | | | | | | | |
|
Road & Rail — 2.4% | |
| | |
Burlington Northern Santa Fe LLC | | | | | | | | |
| | |
4.90%, 4/1/2044 | | | 76,000 | | | | 97,497 | |
| | |
4.55%, 9/1/2044 | | | 25,000 | | | | 30,484 | |
| | |
4.15%, 4/1/2045 | | | 51,000 | | | | 59,863 | |
| | |
CSX Corp. | | | | | | | | |
| | |
3.25%, 6/1/2027 | | | 124,000 | | | | 131,646 | |
| | |
4.10%, 3/15/2044 | | | 20,000 | | | | 22,334 | |
| | |
4.30%, 3/1/2048 | | | 77,000 | | | | 89,553 | |
| | |
Norfolk Southern Corp. 4.15%, 2/28/2048 | | | 90,000 | | | | 105,509 | |
| | |
Union Pacific Corp. | | | | | | | | |
| | |
3.95%, 9/10/2028 | | | 21,000 | | | | 23,619 | |
| | |
3.70%, 3/1/2029 | | | 30,000 | | | | 33,339 | |
| | |
4.38%, 9/10/2038 | | | 41,000 | | | | 48,439 | |
| | |
4.30%, 3/1/2049 | | | 50,000 | | | | 59,573 | |
| | | | | | | | |
| | |
| | | | | | | 701,856 | |
| | | | | | | | |
SEE NOTES TO FINANCIAL STATEMENTS.
| | | | | | | | |
| | | |
| AUGUST 31, 2019 | | J.P. MORGAN EXCHANGE-TRADED FUNDS | | | | | 55 | |
JPMorgan Corporate Bond Research Enhanced ETF
SCHEDULE OF PORTFOLIO INVESTMENTS
AS OF AUGUST 31, 2019 (Unaudited) (continued)
| | | | | | | | |
| INVESTMENTS | | PRINCIPAL
AMOUNT ($) | | | VALUE ($) | |
Corporate Bonds — continued | | | | | | | | |
|
Semiconductors & Semiconductor Equipment — 0.7% | |
| | |
Analog Devices, Inc. 3.50%, 12/5/2026 | | | 14,000 | | | | 14,757 | |
| | |
Broadcom Corp. | | | | | | | | |
| | |
3.00%, 1/15/2022 | | | 54,000 | | | | 54,438 | |
| | |
3.88%, 1/15/2027 | | | 92,000 | | | | 92,063 | |
| | |
QUALCOMM,��Inc. 4.30%, 5/20/2047 | | | 40,000 | | | | 45,392 | |
| | | | | | | | |
| | |
| | | | | | | 206,650 | |
| | | | | | | | |
|
Software — 2.7% | |
| | |
Microsoft Corp. | | | | | | | | |
| | |
2.88%, 2/6/2024 | | | 131,000 | | | | 137,165 | |
| | |
3.30%, 2/6/2027 | | | 30,000 | | | | 32,801 | |
| | |
3.45%, 8/8/2036 | | | 20,000 | | | | 22,474 | |
| | |
4.10%, 2/6/2037 | | | 150,000 | | | | 180,857 | |
| | |
3.70%, 8/8/2046 | | | 76,000 | | | | 89,478 | |
| | |
Oracle Corp. | | | | | | | | |
| | |
1.90%, 9/15/2021 | | | 65,000 | | | | 64,970 | |
| | |
2.65%, 7/15/2026 | | | 46,000 | | | | 47,126 | |
| | |
3.25%, 11/15/2027 | | | 53,000 | | | | 56,799 | |
| | |
3.80%, 11/15/2037 | | | 40,000 | | | | 44,606 | |
| | |
4.00%, 7/15/2046 | | | 94,000 | | | | 107,252 | |
| | |
4.00%, 11/15/2047 | | | 10,000 | | | | 11,448 | |
| | | | | | | | |
| | |
| | | | | | | 794,976 | |
| | | | | | | | |
|
Specialty Retail — 0.9% | |
| | |
Home Depot, Inc. (The) | | | | | | | | |
| | |
4.20%, 4/1/2043 | | | 20,000 | | | | 23,827 | |
| | |
4.25%, 4/1/2046 | | | 31,000 | | | | 37,720 | |
| | |
3.50%, 9/15/2056 | | | 20,000 | | | | 21,775 | |
| | |
Lowe’s Cos., Inc. | | | | | | | | |
| | |
3.10%, 5/3/2027 | | | 40,000 | | | | 41,839 | |
| | |
3.70%, 4/15/2046 | | | 80,000 | | | | 81,670 | |
| | |
4.05%, 5/3/2047 | | | 57,000 | | | | 61,966 | |
| | | | | | | | |
| | |
| | | | | | | 268,797 | |
| | | | | | | | |
|
Technology Hardware, Storage & Peripherals — 1.4% | |
| | |
Apple, Inc. | | | | | | | | |
| | |
2.40%, 5/3/2023 | | | 77,000 | | | | 78,631 | |
| | |
3.25%, 2/23/2026 | | | 120,000 | | | | 128,493 | |
| | |
2.90%, 9/12/2027 | | | 71,000 | | | | 74,622 | |
| | |
4.65%, 2/23/2046 | | | 107,000 | | | | 136,846 | |
| | | | | | | | |
| | |
| | | | | | | 418,592 | |
| | | | | | | | |
|
Thrifts & Mortgage Finance — 0.7% | |
| | |
Nationwide Building Society (United Kingdom) (ICE LIBOR USD 3 Month + 1.18%), 3.62%, 4/26/2023 (a) (b) | | | 200,000 | | | | 204,358 | |
| | | | | | | | |
| | | | | | | | |
| Investments | | Principal
Amount ($) | | | Value ($) | |
| | | | | | | | |
|
Tobacco �� 2.3% | |
| | |
Altria Group, Inc. | | | | | | | | |
| | |
4.80%, 2/14/2029 | | | 70,000 | | | | 79,265 | |
| | |
5.80%, 2/14/2039 | | | 20,000 | | | | 24,679 | |
| | |
5.38%, 1/31/2044 | | | 80,000 | | | | 94,640 | |
| | |
5.95%, 2/14/2049 | | | 20,000 | | | | 25,678 | |
| | |
BAT Capital Corp. (United Kingdom) 4.39%, 8/15/2037 | | | 150,000 | | | | 150,967 | |
| | |
Philip Morris International, Inc. | | | | | | | | |
| | |
3.38%, 8/15/2029 | | | 50,000 | | | | 52,462 | |
| | |
3.88%, 8/21/2042 | | | 40,000 | | | | 41,083 | |
| | |
4.25%, 11/10/2044 | | | 20,000 | | | | 21,948 | |
| | |
Reynolds American, Inc. (United Kingdom) | | | | | | | | |
| | |
4.00%, 6/12/2022 | | | 123,000 | | | | 128,552 | |
| | |
4.45%, 6/12/2025 | | | 58,000 | | | | 62,806 | |
| | | | | | | | |
| | |
| | | | | | | 682,080 | |
| | | | | | | | |
|
Trading Companies & Distributors — 0.9% | |
| | |
Air Lease Corp. 3.00%, 9/15/2023 | | | 247,000 | | | | 251,396 | |
| | | | | | | | |
|
Wireless Telecommunication Services — 1.0% | |
| | |
Vodafone Group plc (United Kingdom) | | | | | | | | |
| | |
3.75%, 1/16/2024 | | | 130,000 | | | | 137,527 | |
| | |
4.38%, 5/30/2028 | | | 70,000 | | | | 78,527 | |
| | |
5.25%, 5/30/2048 | | | 70,000 | | | | 83,790 | |
| | | | | | | | |
| | |
| | | | | | | 299,844 | |
| | | | | | | | |
| | |
Total Corporate Bonds
(Cost $25,923,649) | | | | | | | 28,524,782 | |
| | | | | | | | |
|
U.S. Treasury Obligations — 1.1% | |
| | |
U.S. Treasury Bonds | | | | | | | | |
| | |
3.00%, 2/15/2049 | | | 180,000 | | | | 221,751 | |
| | |
2.88%, 5/15/2049 | | | 10,000 | | | | 12,050 | |
| | |
U.S. Treasury Notes | | | | | | | | |
| | |
2.25%, 4/30/2024 | | | 32,500 | | | | 33,723 | |
| | |
2.38%, 5/15/2029 | | | 63,000 | | | | 67,922 | |
| | | | | | | | |
| | |
Total U.S. Treasury Obligations
(Cost $307,614) | | | | | | | 335,446 | |
| | | | | | | | |
|
Asset-Backed Securities — 0.2% | |
| | |
Air Canada Pass-Through Trust (Canada)Series 2017-1, Class AA, 3.30%, 1/15/2030 (a) | | | 28,464 | | | | 29,741 | |
| | |
American Airlines Pass-ThroughTrust Series 2019-1, Class AA, 3.15%, 2/15/2032 | | | 20,000 | | | | 21,140 | |
| | | | | | | | |
| | |
Total Asset-Backed Securities
(Cost $47,578) | | | | | | | 50,881 | |
| | | | | | | | |
SEE NOTES TO FINANCIAL STATEMENTS.
| | | | | | |
| | | |
| 56 | | | | J.P. MORGAN EXCHANGE-TRADED FUNDS | | AUGUST 31, 2019 |
| | | | | | | | |
| INVESTMENTS | | SHARES | | |
VALUE ($) | |
Short-Term Investments — 1.0% | |
|
Investment Companies — 1.0% | |
| | |
JPMorgan U.S. Government Money Market Fund Class Institutional Shares,
1.99% (d) (e)
(Cost $298,084) | | | 298,084 | | | | 298,084 | |
| | | | | | | | |
| | |
Total Investments — 99.5%
(Cost $26,576,925) | | | | | | | 29,209,193 | |
| | |
Other Assets Less Liabilities — 0.5% | | | | | | | 135,730 | |
| | | | | | | | |
| | |
NET ASSETS — 100.0% | | | | | | | 29,344,923 | |
| | | | | | | | |
Percentages indicated are based on net assets.
| | |
| Abbreviations | | |
| |
| ICE | | Intercontinental Exchange |
| LIBOR | | London Interbank Offered Rate |
| USD | | United States Dollar |
| (a) | | Securities exempt from registration under Rule 144A or section 4(a)(2), of the Securities Act of 1933, as amended. |
| (b) | | Variable or floating rate security, linked to the referenced benchmark. The interest rate shown is the current rate as of August 31, 2019. |
| (c) | | Step bond. Interest rate is a fixed rate for an initial period that either resets at a specific date or may reset in the future contingent upon a predetermined trigger. The interest rate shown is the current rate as of August 31, 2019. |
| (d) | | Investment in an affiliated fund, which is registered under the Investment Company Act of 1940, as amended, and is advised by J.P. Morgan Investment Management Inc. |
| (e) | | The rate shown is the current yield as of August 31, 2019. |
| | | | | | | | | | | | | | | | | | | | |
| Futures contracts outstanding as of August 31, 2019: | |
| DESCRIPTION | | NUMBER OF
CONTRACTS | | | EXPIRATION
DATE | | | TRADING
CURRENCY | | | NOTIONAL
AMOUNT ($) | | | VALUE AND
UNREALIZED
APPRECIATION
(DEPRECIATION) ($) | |
Long Contracts | | | | | | | | | | | | | | | | | | | | |
U.S. Treasury 2 Year Note | | | 5 | | | | 12/2019 | | | | USD | | | | 1,080,547 | | | | (174 | ) |
U.S. Treasury Long Bond | | | 3 | | | | 12/2019 | | | | USD | | | | 496,312 | | | | 2,056 | |
| | | | | | | | | | | | | | | | | | | | |
| | | | | | | | | | | | | | | | | | | 1,882 | |
| | | | | | | | | | | | | | | | | | | | |
Short Contracts | | | | | | | | | | | | | |
U.S. Treasury 5 Year Note | | | (1 | ) | | | 12/2019 | | | | USD | | | | (120,000 | ) | | | (143 | ) |
U.S. Treasury 10 Year Note | | | (6 | ) | | | 12/2019 | | | | USD | | | | (790,688 | ) | | | (998 | ) |
U.S. Treasury 10 Year Ultra Note | | | (2 | ) | | | 12/2019 | | | | USD | | | | (289,031 | ) | | | (911 | ) |
U.S. Treasury Ultra Bond | | | (1 | ) | | | 12/2019 | | | | USD | | | | (197,656 | ) | | | (1,307 | ) |
| | | | | | | | | | | | | | | | | | | | |
| | | | | | | | | | | | | | | | | | | (3,359 | ) |
| | | | | | | | | | | | | | | | | | | | |
| | | | | | | | | | | | | | | | | | | (1,477 | ) |
| | | | | | | | | | | | | | | | | | | | |
| | |
| Abbreviations |
| |
USD | | United States Dollar |
SEE NOTES TO FINANCIAL STATEMENTS.
| | | | | | | | |
| | | |
| AUGUST 31, 2019 | | J.P. MORGAN EXCHANGE-TRADED FUNDS | | | | | 57 | |
JPMorgan Global Bond Opportunities ETF
SCHEDULE OF PORTFOLIO INVESTMENTS
AS OF AUGUST 31, 2019 (Unaudited)
(Amounts in U.S. Dollars, unless otherwise noted)
| | | | | | | | |
| INVESTMENTS | | PRINCIPAL
AMOUNT | | | VALUE | |
Corporate Bonds — 45.6% | |
|
Argentina — 0.1% | |
| | |
Agua y Saneamientos Argentinos SA 6.63%, 2/1/2023 (a) | | | 280,000 | | | | 86,800 | |
| | | | | | | | |
|
Australia — 0.7% | |
| | |
Australia & New Zealand Banking Group Ltd. 0.25%, 11/29/2022 | | | EUR 350,000 | | | | 394,207 | |
| | |
Commonwealth Bank of Australia 0.38%, 4/24/2023 (a) | | | EUR 390,000 | | | | 442,062 | |
| | |
National Australia Bank Ltd. 0.88%, 11/16/2022 (a) | | | EUR 276,000 | | | | 316,817 | |
| | |
Transurban Finance Co. Pty. Ltd. 2.00%, 8/28/2025 (a) | | | EUR 150,000 | | | | 182,626 | |
| | |
Westpac Banking Corp. (USD ICE Swap Rate 5 Year + 2.00%), 4.11%, 7/24/2034 (b) | | | 75,000 | | | | 78,956 | |
| | | | | | | | |
| | |
| | | | | | | 1,414,668 | |
| | | | | | | | |
|
Azerbaijan — 0.1% | |
| | |
State Oil Co. of the Azerbaijan Republic 4.75%, 3/13/2023 (a) | | | 260,000 | | | | 272,431 | |
| | | | | | | | |
|
Bahrain — 0.1% | |
| | |
Batelco International Finance No. 1 Ltd. 4.25%, 5/1/2020 (a) | | | 200,000 | | | | 200,500 | |
| | | | | | | | |
|
Belgium — 0.5% | |
| | |
Anheuser-Busch Cos. LLC | | | | | | | | |
| | |
4.70%, 2/1/2036 | | | 20,000 | | | | 23,280 | |
| | |
4.90%, 2/1/2046 | | | 35,000 | | | | 41,819 | |
| | |
Anheuser-Busch InBev Worldwide, Inc. | | | | | | | | |
| | |
4.15%, 1/23/2025 | | | 160,000 | | | | 175,203 | |
| | |
4.75%, 1/23/2029 | | | 375,000 | | | | 438,270 | |
| | |
4.90%, 1/23/2031 | | | 95,000 | | | | 113,772 | |
| | |
Solvay Finance SA (EUR Swap Annual 5 Year + 3.70%), 5.42%, 11/12/2023 (a) (b) (c) (d) | | | EUR 100,000 | | | | 126,802 | |
| | | | | | | | |
| | |
| | | | | | | 919,146 | |
| | | | | | | | |
|
Brazil — 0.9% | |
| | |
Braskem America Finance Co. 7.13%, 7/22/2041 (a) | | | 240,000 | | | | 285,600 | |
| | |
Cemig Geracao e Transmissao SA 9.25%, 12/5/2024 (e) | | | 200,000 | | | | 230,020 | |
| | |
JSL Europe SA 7.75%, 7/26/2024 (a) | | | 200,000 | | | | 206,425 | |
| | |
Klabin Austria GmbH 7.00%, 4/3/2049 (a) | | | 265,000 | | | | 285,418 | |
| | |
Petrobras Global Finance BV | | | | | | | | |
| | |
6.00%, 1/27/2028 | | | 155,000 | | | | 169,763 | |
| | |
6.90%, 3/19/2049 | | | 330,000 | | | | 372,859 | |
| | |
Votorantim Cimentos International SA 7.25%, 4/5/2041 (a) | | | 200,000 | | | | 247,813 | |
| | | | | | | | |
| | |
| | | | | | | 1,797,898 | |
| | | | | | | | |
| | | | | | | | |
| INVESTMENTS | | PRINCIPAL
AMOUNT | | | VALUE | |
| | | | | | | | |
|
Canada — 0.8% | |
| | |
1011778 BC ULC | | | | | | | | |
| | |
4.25%, 5/15/2024 (e) | | | 25,000 | | | | 25,806 | |
| | |
5.00%, 10/15/2025 (e) | | | 15,000 | | | | 15,488 | |
| | |
Advanz Pharma Corp. 8.00%, 9/6/2024 | | | 45,000 | | | | 43,650 | |
| | |
ATS Automation Tooling Systems, Inc. 6.50%, 6/15/2023 (e) | | | 13,000 | | | | 13,439 | |
| | |
Bombardier, Inc. | | | | | | | | |
| | |
6.00%, 10/15/2022 (e) | | | 10,000 | | | | 9,925 | |
| | |
7.50%, 12/1/2024 (e) | | | 35,000 | | | | 34,872 | |
| | |
7.50%, 3/15/2025 (e) | | | 28,000 | | | | 27,265 | |
| | |
7.88%, 4/15/2027 (e) | | | 67,000 | | | | 64,906 | |
| | |
Emera US Finance LP 3.55%, 6/15/2026 | | | 216,000 | | | | 227,967 | |
| | |
Encana Corp. | | | | | | | | |
| | |
6.50%, 8/15/2034 | | | 100,000 | | | | 122,164 | |
| | |
6.50%, 2/1/2038 | | | 25,000 | | | | 30,458 | |
| | |
Garda World Security Corp. 8.75%, 5/15/2025 (e) | | | 99,000 | | | | 102,122 | |
| | |
Gateway Casinos & Entertainment Ltd. 8.25%, 3/1/2024 (e) | | | 36,000 | | | | 37,440 | |
| | |
Hudbay Minerals, Inc. 7.25%, 1/15/2023 (e) | | | 20,000 | | | | 20,647 | |
| | |
Intertape Polymer Group, Inc. 7.00%, 10/15/2026 (e) | | | 16,000 | | | | 16,600 | |
| | |
Kronos Acquisition Holdings, Inc. 9.00%, 8/15/2023 (e) | | | 39,000 | | | | 34,417 | |
| | |
Mattamy Group Corp. 6.50%, 10/1/2025 (e) | | | 16,000 | | | | 16,960 | |
| | |
MEG Energy Corp. | | | | | | | | |
| | |
6.38%, 1/30/2023 (e) | | | 178,000 | | | | 168,210 | |
| | |
6.50%, 1/15/2025 (e) | | | 25,000 | | | | 25,125 | |
| | |
NOVA Chemicals Corp. | | | | | | | | |
| | |
4.88%, 6/1/2024 (e) | | | 80,000 | | | | 82,100 | |
| | |
5.00%, 5/1/2025 (e) | | | 19,000 | | | | 19,427 | |
| | |
5.25%, 6/1/2027 (e) | | | 45,000 | | | | 46,969 | |
| | |
Open Text Corp. 5.88%, 6/1/2026 (e) | | | 40,000 | | | | 42,748 | |
| | |
Precision Drilling Corp. | | | | | | | | |
| | |
7.75%, 12/15/2023 | | | 65,000 | | | | 64,188 | |
| | |
7.13%, 1/15/2026 (e) | | | 6,000 | | | | 5,355 | |
| | |
Quebecor Media, Inc. 5.75%, 1/15/2023 | | | 32,000 | | | | 34,651 | |
| | |
Stars Group Holdings BV 7.00%, 7/15/2026 (e) | | | 14,000 | | | | 14,858 | |
| | |
TransCanada PipeLines Ltd. 5.10%, 3/15/2049 | | | 12,000 | | | | 14,660 | |
SEE NOTES TO FINANCIAL STATEMENTS.
| | | | | | |
| | | |
| 58 | | | | J.P. MORGAN EXCHANGE-TRADED FUNDS | | AUGUST 31, 2019 |
| | | | | | | | |
| INVESTMENTS | | PRINCIPAL
AMOUNT | | | VALUE | |
Corporate Bonds — continued | | | | | | | | |
|
Canada — continued | |
| | |
Videotron Ltd. | | | | | | | | |
| | |
5.38%, 6/15/2024 (e) | | | 65,000 | | | | 70,200 | |
| | |
5.13%, 4/15/2027 (e) | | | 40,000 | | | | 42,100 | |
| | | | | | | | |
| | |
| | | | | | | 1,474,717 | |
| | | | | | | | |
|
China — 0.3% | |
| | |
GCL New Energy Holdings Ltd. 7.10%, 1/30/2021 (a) | | | 200,000 | | | | 190,063 | |
| | |
New Metro Global Ltd. 6.50%, 4/23/2021 (a) | | | 200,000 | | | | 187,230 | |
| | |
Sino-Ocean Land Treasure III Ltd. (US Treasury Yield Curve Rate T Note Constant Maturity 5 Year + 3.26%), 4.90%, 9/21/2022 (a) (b) (c) (d) | | | 200,000 | | | | 173,750 | |
| | | | | | | | |
| | |
| | | | | | | 551,043 | |
| | | | | | | | |
|
Denmark — 0.3% | |
| | |
Danske Bank A/S 5.00%, 1/12/2022 (e) | | | 200,000 | | | | 210,932 | |
| | |
DKT Finance ApS 7.00%, 6/17/2023 (a) | | | EUR 100,000 | | | | 118,417 | |
| | |
TDC A/S 5.00%, 3/2/2022 (f) | | | EUR 200,000 | | | | 243,868 | |
| | | | | | | | |
| | |
| | | | | | | 573,217 | |
| | | | | | | | |
|
Finland — 0.1% | |
| | |
Nokia OYJ | | | | | | | | |
| | |
2.00%, 3/15/2024 (a) | | | EUR 100,000 | | | | 117,578 | |
| | |
4.38%, 6/12/2027 | | | 40,000 | | | | 41,500 | |
| | | | | | | | |
| | |
| | | | | | | 159,078 | |
| | | | | | | | |
|
France — 2.7% | |
| | |
Altice France SA | | | | | | | | |
| | |
5.63%, 5/15/2024 (a) | | | EUR 90,000 | | | | 102,376 | |
| | |
7.38%, 5/1/2026 (e) | | | 200,000 | | | | 213,500 | |
| | |
BPCE SA | | | | | | | | |
| | |
3.00%, 5/22/2022 (e) | | | 250,000 | | | | 254,210 | |
| | |
5.15%, 7/21/2024 (e) | | | 600,000 | | | | 658,822 | |
| | |
(EUR Swap Annual 5 Year + 2.37%), 2.75%, 11/30/2027 (a) (b) | | | EUR 200,000 | | | | 238,432 | |
| | |
Burger King France SAS 6.00%, 5/1/2024 (a) | | | EUR 100,000 | | | | 116,955 | |
| | |
Casino Guichard Perrachon SA 4.56%, 1/25/2023 (a) (f) | | | EUR 100,000 | | | | 101,004 | |
| | |
Constantin Investissement 3 SASU 5.38%, 4/15/2025 (a) | | | EUR 100,000 | | | | 113,477 | |
| | | | | | | | |
| INVESTMENTS | | PRINCIPAL
AMOUNT | | | VALUE | |
| | | | | | | | |
|
France — continued | |
| | |
Credit Agricole SA | | | | | | | | |
| | |
(EUR Swap Annual 5 Year + 5.12%), 6.50%, 6/23/2021 (a) (b) (c) (d) | | | EUR 300,000 | | | | 356,092 | |
| | |
2.38%, 7/1/2021 (e) | | | 250,000 | | | | 251,138 | |
| | |
3.25%, 10/4/2024 (e) | | | 376,000 | | | | 388,845 | |
| | |
(USD Swap Semi 5 Year + 6.19%), 8.12%, 12/23/2025 (b) (c) (d) (e) | | | 200,000 | | | | 233,184 | |
| | |
Elis SA 1.88%, 2/15/2023 (a) | | | EUR 300,000 | | | | 347,371 | |
| | |
Europcar Mobility Group 4.13%, 11/15/2024 (a) | | | EUR 100,000 | | | | 115,429 | |
| | |
Faurecia SE 3.63%, 6/15/2023 (a) | | | EUR 100,000 | | | | 112,033 | |
| | |
La Financiere Atalian SASU 4.00%, 5/15/2024 (a) | | | EUR 200,000 | | | | 153,612 | |
| | |
Loxam SAS 4.25%, 4/15/2024 (a) | | | EUR 150,000 | | | | 171,944 | |
| | |
Orano SA | | | | | | | | |
| | |
4.38%, 11/6/2019 (a) | | | EUR 50,000 | | | | 55,364 | |
| | |
3.13%, 3/20/2023 (a) | | | EUR 300,000 | | | | 357,741 | |
| | |
Picard Groupe SAS (EURIBOR 3 Month + 3.00%), 3.00%, 11/30/2023 (a) (b) | | | EUR 100,000 | | | | 107,674 | |
| | |
Rexel SA 2.63%, 6/15/2024 (a) | | | EUR 300,000 | | | | 337,546 | |
| | |
SPIE SA 3.13%, 3/22/2024 (a) | | | EUR 200,000 | | | | 241,498 | |
| | |
TOTAL SA (EUR Swap Annual 5 Year + 3.78%), 3.88%, 5/18/2022 (a) (b) (c) (d) | | | EUR 100,000 | | | | 120,346 | |
| | |
Vallourec SA 2.25%, 9/30/2024 (a) | | | EUR 100,000 | | | | 78,836 | |
| | | | | | | | |
| | |
| | | | | | | 5,227,429 | |
| | | | | | | | |
|
Germany — 1.2% | |
| | |
CeramTec BondCo GmbH 5.25%, 12/15/2025 (a) | | | EUR 200,000 | | | | 226,657 | |
| | |
Deutsche Bank AG 4.25%, 10/14/2021 | | | 100,000 | | | | 101,697 | |
| | |
IHO Verwaltungs GmbH 3.75% (cash), 9/15/2026 (a) (g) | | | EUR 225,000 | | | | 251,328 | |
| | |
K+S AG 3.25%, 7/18/2024 (a) | | | EUR 100,000 | | | | 120,328 | |
| | |
Nidda BondCo GmbH 5.00%, 9/30/2025 (a) | | | EUR 225,000 | | | | 252,573 | |
| | |
Nidda Healthcare Holding GmbH 3.50%, 9/30/2024 (a) | | | EUR 100,000 | | | | 114,979 | |
| | |
ProGroup AG 3.00%, 3/31/2026 (a) | | | EUR 125,000 | | | | 140,301 | |
| | |
Techem Verwaltungsgesellschaft 674 mbH 6.00%, 7/30/2026 (a) | | | EUR 250,000 | | | | 298,356 | |
| | |
thyssenkrupp AG | | | | | | | | |
| | |
1.38%, 3/3/2022 (a) | | | EUR 200,000 | | | | 223,339 | |
| | |
2.50%, 2/25/2025 (a) | | | EUR 100,000 | | | | 112,731 | |
SEE NOTES TO FINANCIAL STATEMENTS.
| | | | | | | | |
| | | |
| AUGUST 31, 2019 | | J.P. MORGAN EXCHANGE-TRADED FUNDS | | | | | 59 | |
JPMorgan Global Bond Opportunities ETF
SCHEDULE OF PORTFOLIO INVESTMENTS
AS OF AUGUST 31, 2019 (Unaudited) (continued)
(Amounts in U.S. Dollars, unless otherwise noted)
| | | | | | | | |
| INVESTMENTS | | PRINCIPAL
AMOUNT | | | VALUE | |
Corporate Bonds — continued | | | | | | | | |
|
Germany — continued | |
| | |
Unitymedia GmbH 3.75%, 1/15/2027 (a) | | | EUR 200,000 | | | | 234,647 | |
| | |
Unitymedia Hessen GmbH & Co. KG 3.50%, 1/15/2027 (a) | | | EUR 100,000 | | | | 116,775 | |
| | |
WEPA Hygieneprodukte GmbH 3.75%, 5/15/2024 (a) | | | EUR 100,000 | | | | 112,378 | |
| | | | | | | | |
| | |
| | | | | | | 2,306,089 | |
| | | | | | | | |
|
Greece — 0.6% | |
| | |
Alpha Bank AE 2.50%, 2/5/2023 (a) | | | EUR 780,000 | | | | 907,542 | |
| | |
Crystal Almond SARL 10.00%, 11/1/2021 (a) | | | EUR 79,000 | | | | 90,157 | |
| | |
OTE plc 3.50%, 7/9/2020 (a) | | | EUR 100,000 | | | | 112,879 | |
| | | | | | | | |
| | |
| | | | | | | 1,110,578 | |
| | | | | | | | |
|
Guatemala — 0.1% | |
| | |
Comunicaciones Celulares SA 6.88%, 2/6/2024 (a) | | | 200,000 | | | | 206,563 | |
| | | | | | | | |
|
Hong Kong — 0.2% | |
| | |
Melco Resorts Finance Ltd. 5.63%, 7/17/2027 (e) | | | 200,000 | | | | 204,437 | |
| | |
WTT Investment Ltd. 5.50%, 11/21/2022 (e) | | | 200,000 | | | | 204,250 | |
| | | | | | | | |
| | |
| | | | | | | 408,687 | |
| | | | | | | | |
|
Indonesia — 0.4% | |
| | |
Indonesia Asahan Aluminium Persero PT 5.71%, 11/15/2023 (e) | | | 230,000 | | | | 255,300 | |
| | |
Pertamina Persero PT 3.65%, 7/30/2029 (e) | | | 400,000 | | | | 421,855 | |
| | | | | | | | |
| | |
| | | | | | | 677,155 | |
| | | | | | | | |
|
Ireland — 1.0% | |
| | |
AerCap Ireland Capital DAC | | | | | | | | |
| | |
4.63%, 7/1/2022 | | | 330,000 | | | | 348,952 | |
| | |
3.65%, 7/21/2027 | | | 180,000 | | | | 184,667 | |
| | |
Allied Irish Banks plc (EUR Swap Annual 5 Year + 3.95%), 4.13%, 11/26/2025 (a) (b) | | | EUR 100,000 | | | | 114,439 | |
| | |
Ardagh Packaging Finance plc | | | | | | | | |
| | |
4.13%, 5/15/2023 (a) | | | EUR 100,000 | | | | 112,349 | |
| | |
6.75%, 5/15/2024 (a) | | | EUR 175,000 | | | | 202,912 | |
| | |
Avolon Holdings Funding Ltd. | | | | | | | | |
| | |
3.95%, 7/1/2024 (e) | | | 126,000 | | | | 129,679 | |
| | |
4.38%, 5/1/2026 (e) | | | 60,000 | | | | 62,298 | |
| | |
James Hardie International Finance DAC 4.75%, 1/15/2025 (e) | | | 200,000 | | | | 205,000 | |
| | |
Park Aerospace Holdings Ltd. 5.50%, 2/15/2024 (e) | | | 129,000 | | | | 139,501 | |
| | | | | | | | |
| INVESTMENTS | | PRINCIPAL
AMOUNT | | | VALUE | |
| | | | | | | | |
|
Ireland — continued | |
| | |
Smurfit Kappa Acquisitions ULC 2.38%, 2/1/2024 (a) | | | EUR 350,000 | | | | 418,844 | |
| | | | | | | | |
| | |
| | | | | | | 1,918,641 | |
| | | | | | | | |
|
Italy — 1.2% | |
| | |
Enel Finance International NV 3.50%, 4/6/2028 (e) | | | 200,000 | | | | 202,977 | |
| | |
EVOCA SpA 7.00%, 10/15/2023 (a) | | | EUR 200,000 | | | | 229,350 | |
| | |
Leonardo SpA 4.88%, 3/24/2025 | | | EUR 100,000 | | | | 132,595 | |
| | |
Nexi Capital SpA 4.13%, 11/1/2023 (a) | | | EUR 100,000 | | | | 113,202 | |
| | |
Rossini SARL 6.75%, 10/30/2025 (e) | | | EUR 250,000 | | | | 300,125 | |
| | |
Saipem Finance International BV 2.63%, 1/7/2025 (a) | | | EUR 250,000 | | | | 288,501 | |
| | |
Telecom Italia Capital SA 6.00%, 9/30/2034 | | | 30,000 | | | | 30,750 | |
| | |
Telecom Italia SpA | | | | | | | | |
| | |
5.25%, 2/10/2022 (a) | | | EUR 100,000 | | | | 123,093 | |
| | |
3.25%, 1/16/2023 (a) | | | EUR 200,000 | | | | 238,025 | |
| | |
3.63%, 1/19/2024 (a) | | | EUR 225,000 | | | | 271,028 | |
| | |
3.63%, 5/25/2026 (a) | | | EUR 225,000 | | | | 270,557 | |
| | |
2.38%, 10/12/2027 (a) | | | EUR 150,000 | | | | 167,468 | |
| | | | | | | | |
| | |
| | | | | | | 2,367,671 | |
| | | | | | | | |
|
Japan — 0.1% | |
| | |
Sumitomo Mitsui Banking Corp. 0.55%, 11/6/2023 (a) | | | EUR 230,000 | | | | 262,341 | |
| | | | | | | | |
|
Kazakhstan — 0.2% | |
| | |
KazMunayGas National Co. JSC 4.75%, 4/19/2027 (a) | | | 355,000 | | | | 388,193 | |
| | | | | | | | |
|
Kuwait — 0.2% | |
| | |
Kuwait Projects Co. SPC Ltd. 4.50%, 2/23/2027 (a) | | | 270,000 | | | | 273,797 | |
| | | | | | | | |
|
Luxembourg — 1.2% | |
| | |
Altice Finco SA 4.75%, 1/15/2028 (a) | | | EUR 225,000 | | | | 238,050 | |
| | |
Altice Luxembourg SA | | | | | | | | |
| | |
7.25%, 5/15/2022 (a) | | | EUR 58,976 | | | | 66,319 | |
| | |
6.25%, 2/15/2025 (a) | | | EUR 150,000 | | | | 172,161 | |
| | |
8.00%, 5/15/2027 (e) | | | EUR 123,000 | | | | 144,739 | |
| | |
INEOS Group Holdings SA | | | | | | | | |
| | |
5.38%, 8/1/2024 (a) | | | EUR 100,000 | | | | 112,933 | |
| | |
5.63%, 8/1/2024 (e) | | | 200,000 | | | | 203,462 | |
| | |
Intelsat Jackson Holdings SA | | | | | | | | |
| | |
5.50%, 8/1/2023 | | | 80,000 | | | | 72,800 | |
| | |
8.00%, 2/15/2024 (e) | | | 110,000 | | | | 114,537 | |
SEE NOTES TO FINANCIAL STATEMENTS.
| | | | | | |
| | | |
| 60 | | | | J.P. MORGAN EXCHANGE-TRADED FUNDS | | AUGUST 31, 2019 |
| | | | | | | | |
| INVESTMENTS | | PRINCIPAL
AMOUNT | | | VALUE | |
Corporate Bonds — continued | | | | | | | | |
|
Luxembourg — continued | |
| | |
8.50%, 10/15/2024 (e) | | | 99,000 | | | | 98,258 | |
| | |
9.75%, 7/15/2025 (e) | | | 120,000 | | | | 123,150 | |
| | |
Matterhorn Telecom Holding SA 4.88%, 5/1/2023 (a) | | | EUR 300,000 | | | | 333,397 | |
| | |
SES SA (EUR Swap Annual 5 Year + 4.66%), 4.62%, 1/2/2022 (a) (b) (c) (d) | | | EUR 350,000 | | | | 411,594 | |
| | |
Telenet Finance VI Luxembourg SCA 4.88%, 7/15/2027 (a) | | | EUR 210,000 | | | | 253,303 | |
| | | | | | | | |
| | |
| | | | | | | 2,344,703 | |
| | | | | | | | |
|
Mexico — 0.6% | |
| | |
Banco Mercantil del Norte SA (US Treasury Yield Curve Rate T Note Constant Maturity 5 Year + 5.04%), 6.87%, 7/6/2022 (b) (c) (d) (e) | | | 200,000 | | | | 197,625 | |
| | |
BBVA Bancomer SA (US Treasury Yield Curve Rate T Note Constant Maturity 5 Year + 2.65%), 5.13%, 1/18/2033 (b) (e) | | | 200,000 | | | | 191,500 | |
| | |
Cemex SAB de CV 7.75%, 4/16/2026 (e) | | | 200,000 | | | | 215,500 | |
| | |
Petroleos Mexicanos | | | | | | | | |
| | |
5.50%, 1/21/2021 | | | 200,000 | | | | 204,194 | |
| | |
6.38%, 2/4/2021 | | | 260,000 | | | | 267,280 | |
| | | | | | | | |
| | |
| | | | | | | 1,076,099 | |
| | | | | | | | |
|
Morocco — 0.1% | |
| | |
OCP SA 6.88%, 4/25/2044 (a) | | | 200,000 | | | | 248,688 | |
| | | | | | | | |
|
Netherlands — 1.0% | |
| | |
ABN AMRO Bank NV | | | | | | | | |
| | |
(EUR Swap Annual 5 Year + 5.45%), 5.75%, 9/22/2020 (a) (b) (c) (d) | | | EUR 200,000 | | | | 229,200 | |
| | |
4.75%, 7/28/2025 (e) | | | 200,000 | | | | 218,064 | |
| | |
ING Groep NV (EUR Swap Annual 5 Year + 2.85%), 3.00%, 4/11/2028 (b) | | | EUR 100,000 | | | | 120,137 | |
| | |
Promontoria Holding 264 BV 6.75%, 8/15/2023 (a) | | | EUR 100,000 | | | | 98,464 | |
| | |
Sigma Holdco BV 5.75%, 5/15/2026 (a) | | | EUR 225,000 | | | | 244,442 | |
| | |
Sunshine Mid BV 6.50%, 5/15/2026 (e) | | | EUR 200,000 | | | | 233,756 | |
| | |
UPCB Finance IV Ltd. 4.00%, 1/15/2027 (a) | | | EUR 270,000 | | | | 313,064 | |
| | |
Ziggo Bond Co. BV 4.63%, 1/15/2025 (a) | | | EUR 200,000 | | | | 227,646 | |
| | | | | | | | |
| INVESTMENTS | | PRINCIPAL
AMOUNT | | | VALUE | |
| | | | | | | | |
|
Netherlands — continued | |
| | |
Ziggo BV 4.25%, 1/15/2027 (a) | | | EUR 200,000 | | | | 238,981 | |
| | | | | | | | |
| | |
| | | | | | | 1,923,754 | |
| | | | | | | | |
|
Peru — 0.2% | |
| | |
Nexa Resources SA 5.38%, 5/4/2027 (a) | | | 200,000 | | | | 209,425 | |
| | |
Southern Copper Corp. 5.88%, 4/23/2045 | | | 140,000 | | | | 172,156 | |
| | | | | | | | |
| | |
| | | | | | | 381,581 | |
| | | | | | | | |
|
Portugal — 0.2% | |
| | |
EDP — Energias de Portugal SA (EUR Swap Annual 5 Year + 5.04%), 5.38%, 9/16/2075 (a) (b) | | | EUR 100,000 | | | | 118,422 | |
| | |
EDP Finance BV 2.38%, 3/23/2023 (a) | | | EUR 200,000 | | | | 239,525 | |
| | | | | | | | |
| | |
| | | | | | | 357,947 | |
| | | | | | | | |
|
Qatar — 0.1% | |
| | |
ABQ Finance Ltd. 3.50%, 2/22/2022 (a) | | | 200,000 | | | | 203,438 | |
| | |
Ras Laffan Liquefied Natural Gas Co. Ltd. II 5.30%, 9/30/2020 (a) | | | 41,700 | | | | 42,325 | |
| | | | | | | | |
| | |
| | | | | | | 245,763 | |
| | | | | | | | |
|
Singapore — 0.2% | |
| | |
Oversea-Chinese Banking Corp. Ltd. 0.38%, 3/1/2023 (a) | | | EUR 390,000 | | | | 440,991 | |
| | | | | | | | |
|
Spain — 1.4% | |
| | |
AI Candelaria Spain SLU 7.50%, 12/15/2028 (a) | | | 250,000 | | | | 281,250 | |
| | |
Bankinter SA (EUR Swap Annual 5 Year + 2.40%), 2.50%, 4/6/2027 (a) (b) | | | EUR 100,000 | | | | 115,553 | |
| | |
CaixaBank SA | | | | | | | | |
| | |
(EUR Swap Annual 5 Year + 6.50%), 6.75%, 6/13/2024 (a) (b) (c) (d) | | | EUR 200,000 | | | | 237,120 | |
| | |
(EUR Swap Annual 5 Year + 3.35%), 3.50%, 2/15/2027 (a) (b) | | | EUR 200,000 | | | | 233,773 | |
| | |
Cellnex Telecom SA 2.88%, 4/18/2025 (a) | | | EUR 100,000 | | | | 120,885 | |
| | |
Cirsa Finance International SARL 6.25%, 12/20/2023 (e) | | | EUR 200,000 | | | | 236,296 | |
| | |
eDreams ODIGEO SA 5.50%, 9/1/2023 (e) | | | EUR 200,000 | | | | 231,725 | |
| | |
Grifols SA 3.20%, 5/1/2025 (a) | | | EUR 200,000 | | | | 226,769 | |
SEE NOTES TO FINANCIAL STATEMENTS.
| | | | | | | | |
| | | |
| AUGUST 31, 2019 | | J.P. MORGAN EXCHANGE-TRADED FUNDS | | | | | 61 | |
JPMorgan Global Bond Opportunities ETF
SCHEDULE OF PORTFOLIO INVESTMENTS
AS OF AUGUST 31, 2019 (Unaudited) (continued)
(Amounts in U.S. Dollars, unless otherwise noted)
| | | | | | | | |
| INVESTMENTS | | PRINCIPAL
AMOUNT | | | VALUE | |
Corporate Bonds — continued | | | | | | | | |
|
Spain — continued | |
| | |
Repsol International Finance BV (EUR Swap Annual 10 Year + 4.20%), 4.50%, 3/25/2075 (a) (b) | | | EUR 200,000 | | | | 252,030 | |
| | |
Telefonica Europe BV | | | | | | | | |
| | |
(EUR Swap Annual 5 Year + 3.86%), 3.75%, 3/15/2022 (a) (b) (c) (d) | | | EUR 400,000 | | | | 465,997 | |
| | |
(EUR Swap Annual 5 Year + 2.33%), 2.63%, 3/7/2023 (a) (b) (c) (d) | | | EUR 200,000 | | | | 223,679 | |
| | |
Series NC5, (EUR Swap Annual 5 Year + 2.45%), 3.00%, 9/4/2023 (a) (b) (c) (d) | | | EUR 100,000 | | | | 113,708 | |
| | | | | | | | |
| | |
| | | | | | | 2,738,785 | |
| | | | | | | | |
|
Sweden — 0.7% | |
| | |
Stadshypotek AB Series 1586, 4.50%, 9/21/2022 (a) | | | SEK 6,000,000 | | | | 699,160 | |
| | |
Telefonaktiebolaget LM Ericsson 1.88%, 3/1/2024 (a) | | | EUR 225,000 | | | | 262,804 | |
| | |
Verisure Midholding AB 5.75%, 12/1/2023 (a) | | | EUR 200,000 | | | | 227,503 | |
| | |
Volvo Car AB | | | | | | | | |
| | |
3.25%, 5/18/2021 (a) | | | EUR 100,000 | | | | 115,536 | |
| | |
2.00%, 1/24/2025 (a) | | | EUR 100,000 | | | | 112,854 | |
| | | | | | | | |
| | |
| | | | | | | 1,417,857 | |
| | | | | | | | |
|
Switzerland — 1.1% | |
| | |
Credit Suisse Group AG | | | | | �� | | | |
| | |
(USD Swap Semi 5 Year + 4.60%), 7.50%, 12/11/2023 (b) (c) (d) (e) | | | 650,000 | | | | 717,259 | |
| | |
4.28%, 1/9/2028 (e) | | | 250,000 | | | | 271,863 | |
| | |
Dufry One BV 2.50%, 10/15/2024 (a) | | | EUR 100,000 | | | | 113,889 | |
| | |
Glencore Finance Europe Ltd. 6.00%, 4/3/2022 (a) (f) | | | GBP 100,000 | | | | 134,750 | |
| | |
UBS Group Funding Switzerland AG | | | | | | | | |
| | |
(EUR Swap Annual 5 Year + 5.29%), 5.75%, 2/19/2022 (a) (b) (c) (d) | | | EUR 600,000 | | | | 721,888 | |
| | |
(USD Swap Semi 5 Year + 4.87%), 7.00%, 2/19/2025 (a) (b) (c) (d) | | | 200,000 | | | | 218,915 | |
| | | | | | | | |
| | |
| | | | | | | 2,178,564 | |
| | | | | | | | |
|
Taiwan — 0.1% | |
| | |
Competition Team Technologies Ltd. 3.75%, 3/12/2024 (a) | | | 200,000 | | | | 208,188 | |
| | | | | | | | |
| | | | | | | | |
| INVESTMENTS | | PRINCIPAL
AMOUNT | | | VALUE | |
| | | | | | | | |
|
Turkey — 0.2% | |
| | |
Petkim Petrokimya Holding A/S 5.88%, 1/26/2023 (a) | | | 260,000 | | | | 250,250 | |
| | |
Turkiye Garanti Bankasi A/S 5.25%, 9/13/2022 (a) | | | 210,000 | | | | 203,831 | |
| | | | | | | | |
| | |
| | | | | | | 454,081 | |
| | | | | | | | |
|
United Arab Emirates — 0.0% (h) | |
| | |
Shelf Drilling Holdings Ltd. 8.25%, 2/15/2025 (e) | | | 79,000 | | | | 70,335 | |
| | | | | | | | |
|
United Kingdom — 3.1% | |
| | |
Algeco Global Finance plc 6.50%, 2/15/2023 (a) | | | EUR 200,000 | | | | 227,798 | |
| | |
BAT Capital Corp. | | | | | | | | |
| | |
3.56%, 8/15/2027 | | | 270,000 | | | | 276,696 | |
| | |
4.39%, 8/15/2037 | | | 315,000 | | | | 317,032 | |
| | |
Corral Petroleum Holdings AB 11.75% (cash), 5/15/2021 (a) (g) (i) | | | EUR 100,000 | | | | 115,609 | |
| | |
CPUK Finance Ltd. 4.25%, 8/28/2022 (a) | | | GBP 100,000 | | | | 122,821 | |
| | |
EC Finance plc 2.38%, 11/15/2022 (a) | | | EUR 300,000 | | | | 335,073 | |
| | |
Fiat Chrysler Automobiles NV 3.75%, 3/29/2024 (a) | | | EUR 100,000 | | | | 124,779 | |
| | |
Fiat Chrysler Finance Europe SA | | | | | | | | |
| | |
4.75%, 3/22/2021 (a) | | | EUR 225,000 | | | | 265,177 | |
| | |
4.75%, 7/15/2022 (a) | | | EUR 100,000 | | | | 124,293 | |
| HSBC Holdings plc | | | | | | | | |
| | |
3.40%, 3/8/2021 | | | 280,000 | | | | 284,479 | |
| | |
(ICE LIBOR USD 3 Month + 1.21%), 3.80%, 3/11/2025 (b) | | | 245,000 | | | | 255,553 | |
| | |
(USD ICE Swap Rate 5 Year + 4.37%), 6.37%, 3/30/2025 (b) (c) (d) | | | 200,000 | | | | 207,250 | |
| | |
Iceland Bondco plc 4.63%, 3/15/2025 (e) | | | GBP 100,000 | | | | 104,715 | |
| | |
Lloyds Banking Group plc 4.58%, 12/10/2025 | | | 200,000 | | | | 209,923 | |
| | |
Merlin Entertainments plc 2.75%, 3/15/2022 (a) | | | EUR 100,000 | | | | 115,977 | |
| | |
Nomad Foods Bondco plc 3.25%, 5/15/2024 (a) | | | EUR 200,000 | | | | 227,481 | |
| | |
Royal Bank of Scotland Group plc | | | | | | | | |
| | |
(USD Swap Semi 5 Year + 7.60%), 8.62%, 8/15/2021 (b) (c) (d) | | | 200,000 | | | | 211,750 | |
| | |
(ICE LIBOR USD 3 Month + 1.48%), 3.50%, 5/15/2023 (b) | | | 235,000 | | | | 237,827 | |
| | |
6.10%, 6/10/2023 | | | 30,000 | | | | 32,536 | |
| | |
Santander UK Group Holdings plc 3.57%, 1/10/2023 | | | 400,000 | | | | 407,387 | |
SEE NOTES TO FINANCIAL STATEMENTS.
| | | | | | |
| | | |
| 62 | | | | J.P. MORGAN EXCHANGE-TRADED FUNDS | | AUGUST 31, 2019 |
| | | | | | | | |
| INVESTMENTS | | PRINCIPAL
AMOUNT | | | VALUE | |
Corporate Bonds — continued | | | | | | | | |
|
United Kingdom — continued | |
| | |
Sky Ltd. | | | | | | | | |
| | |
1.50%, 9/15/2021 (a) | | | EUR 200,000 | | | | 227,719 | |
| | |
2.25%, 11/17/2025 (a) | | | EUR 200,000 | | | | 250,889 | |
| | |
Standard Chartered plc (USD Swap Semi 5 Year + 5.72%), 7.75%, 4/2/2023 (b) (c) (d) (e) | | | 200,000 | | | | 214,000 | |
| | |
Synlab Unsecured Bondco plc 8.25%, 7/1/2023 (a) | | | EUR 200,000 | | | | 229,133 | |
| | |
Tesco Corporate Treasury Services plc 2.13%, 11/12/2020 (a) | | | EUR 100,000 | | | | 112,146 | |
| | |
Virgin Media Finance plc 4.50%, 1/15/2025 (a) | | | EUR 200,000 | | | | 226,954 | |
| | |
Virgin Media Secured Finance plc 5.50%, 8/15/2026 (e) | | | 200,000 | | | | 209,250 | |
| | |
Vodafone Group plc | | | | | | | | |
| | |
4.38%, 5/30/2028 | | | 245,000 | | | | 274,845 | |
| | |
4.88%, 6/19/2049 | | | 121,000 | | | | 139,764 | |
| | | | | | | | |
| | |
| | | | | | | 6,088,856 | |
| | | | | | | | |
|
United States — 23.6% | |
| | |
Abbott Ireland Financing DAC 1.50%, 9/27/2026 (a) | | | EUR 200,000 | | | | 241,566 | |
| | |
AbbVie, Inc. 4.45%, 5/14/2046 | | | 50,000 | | | | 52,535 | |
| | |
Acadia Healthcare Co., Inc. 6.50%, 3/1/2024 | | | 54,000 | | | | 55,755 | |
| | |
ACCO Brands Corp. 5.25%, 12/15/2024 (e) | | | 120,000 | | | | 123,150 | |
| | |
ACE Cash Express, Inc. 12.00%, 12/15/2022 (e) | | | 23,000 | | | | 23,000 | |
| | |
ADT Security Corp. (The) 4.13%, 6/15/2023 | | | 74,000 | | | | 75,179 | |
| | |
AES Corp. 5.50%, 4/15/2025 | | | 15,000 | | | | 15,657 | |
| | |
Ahern Rentals, Inc. 7.38%, 5/15/2023 (e) | | | 30,000 | | | | 25,875 | |
| | |
Air Lease Corp. 3.25%, 3/1/2025 | | | 45,000 | | | | 46,063 | |
| | |
Air Medical Group Holdings, Inc. 6.38%, 5/15/2023 (e) | | | 70,000 | | | | 61,337 | |
| | |
AK Steel Corp. | | | | | | | | |
| | |
6.38%, 10/15/2025 | | | 20,000 | | | | 16,550 | |
| | |
7.00%, 3/15/2027 | | | 18,000 | | | | 15,120 | |
| | |
Albertsons Cos. LLC | | | | | | | | |
| | |
6.63%, 6/15/2024 | | | 124,000 | | | | 129,890 | |
| | |
5.75%, 3/15/2025 | | | 25,000 | | | | 25,625 | |
| | |
Allison Transmission, Inc. | | | | | | | | |
| | |
5.00%, 10/1/2024 (e) | | | 20,000 | | | | 20,577 | |
| | |
4.75%, 10/1/2027 (e) | | | 50,000 | | | | 51,250 | |
| | |
Ally Financial, Inc. 4.63%, 5/19/2022 | | | 174,000 | | | | 183,135 | |
| | | | | | | | |
| INVESTMENTS | | PRINCIPAL
AMOUNT | | | VALUE | |
| | | | | | | | |
| | |
United States — continued | | | | | | | | |
| | |
Altria Group, Inc. | | | | | | | | |
| | |
1.70%, 6/15/2025 | | | EUR 300,000 | | | | 353,055 | |
| | |
2.20%, 6/15/2027 | | | EUR 250,000 | | | | 302,970 | |
| | |
4.25%, 8/9/2042 | | | 15,000 | | | | 15,463 | |
| | |
3.88%, 9/16/2046 | | | 115,000 | | | | 112,957 | |
| | |
AMC Entertainment Holdings, Inc. | | | | | | | | |
| | |
5.75%, 6/15/2025 | | | 137,000 | | | | 130,150 | |
| | |
5.88%, 11/15/2026 | | | 12,000 | | | | 10,980 | |
| | |
6.13%, 5/15/2027 | | | 18,000 | | | | 16,605 | |
| | |
AMC Networks, Inc. 5.00%, 4/1/2024 | | | 119,000 | | | | 122,570 | |
| | |
American Airlines Group, Inc. 5.00%, 6/1/2022 (e) | | | 15,000 | | | | 15,600 | |
| | |
American Axle & Manufacturing, Inc. | | | | | | | | |
| | |
6.63%, 10/15/2022 | | | 241,000 | | | | 243,109 | |
| | |
6.25%, 4/1/2025 | | | 11,000 | | | | 10,340 | |
| | |
6.50%, 4/1/2027 | | | 7,000 | | | | 6,422 | |
| | |
American Tower Corp. | | | | | | | | |
| | |
REIT, 5.00%, 2/15/2024 | | | 570,000 | | | | 633,272 | |
| | |
REIT, 1.38%, 4/4/2025 | | | EUR 140,000 | | | | 163,214 | |
| | |
American Woodmark Corp. 4.88%, 3/15/2026 (e) | | | 95,000 | | | | 95,475 | |
| | |
AmeriGas Partners LP 5.50%, 5/20/2025 | | | 35,000 | | | | 37,012 | |
| | |
Amkor Technology, Inc. 6.63%, 9/15/2027 (e) | | | 12,000 | | | | 13,065 | |
| | |
AMN Healthcare, Inc. 5.13%, 10/1/2024 (e) | | | 21,000 | | | | 21,577 | |
| | |
Amsted Industries, Inc. | | | | | | | | |
| | |
5.38%, 9/15/2024 (e) | | | 4,000 | | | | 4,110 | |
| | |
5.63%, 7/1/2027 (e) | | | 9,000 | | | | 9,607 | |
| | |
Antero Resources Corp. 5.13%, 12/1/2022 | | | 134,000 | | | | 123,280 | |
| | |
Aramark International Finance SARL 3.13%, 4/1/2025 (a) | | | EUR 100,000 | | | | 113,198 | |
| | |
Arconic, Inc. 5.90%, 2/1/2027 | | | 60,000 | | | | 66,922 | |
| | |
AT&T, Inc. | | | | | | | | |
| | |
2.95%, 7/15/2026 | | | 42,000 | | | | 42,814 | |
| | |
4.75%, 5/15/2046 | | | 75,000 | | | | 83,861 | |
| | |
Avantor, Inc. 6.00%, 10/1/2024 (e) | | | 200,000 | | | | 214,500 | |
| | |
Avis Budget Car Rental LLC | | | | | | | | |
| | |
6.38%, 4/1/2024 (e) | | | 45,000 | | | | 47,025 | |
| | |
5.25%, 3/15/2025 (e) | | | 132,000 | | | | 134,310 | |
| | |
5.75%, 7/15/2027 (e) | | | 14,000 | | | | 14,258 | |
| | |
Avis Budget Finance plc 4.13%, 11/15/2024 (a) | | | EUR 100,000 | | | | 114,246 | |
SEE NOTES TO FINANCIAL STATEMENTS.
| | | | | | | | |
| | | |
| AUGUST 31, 2019 | | J.P. MORGAN EXCHANGE-TRADED FUNDS | | | | | 63 | |
JPMorgan Global Bond Opportunities ETF
SCHEDULE OF PORTFOLIO INVESTMENTS
AS OF AUGUST 31, 2019 (Unaudited) (continued)
(Amounts in U.S. Dollars, unless otherwise noted)
| | | | | | | | |
| INVESTMENTS | | PRINCIPAL
AMOUNT | | | VALUE | |
Corporate Bonds — continued | | | | | | | | |
| | |
United States — continued | | | | | | | | |
| | |
Axalta Coating Systems LLC 4.25%, 8/15/2024 (a) | | | EUR 100,000 | | | | 113,764 | |
| | |
B&G Foods, Inc. 5.25%, 4/1/2025 | | | 49,000 | | | | 49,688 | |
| | |
Ball Corp. 4.38%, 12/15/2023 | | | EUR 150,000 | | | | 192,727 | |
| | |
Banff Merger Sub, Inc. 9.75%, 9/1/2026 (e) | | | 35,000 | | | | 31,850 | |
| | |
Bank of America Corp. 2.63%, 4/19/2021 | | | 270,000 | | | | 272,609 | |
| | |
(ICE LIBOR USD 3 Month + 0.37%), 2.74%, 1/23/2022 (b) | | | 180,000 | | | | 181,464 | |
| | |
(ICE LIBOR USD 3 Month + 0.79%), 3.00%, 12/20/2023 (b) | | | 810,000 | | | | 831,260 | |
| | |
Series DD, (ICE LIBOR USD 3 Month + 4.55%), 6.30%, 3/10/2026 (b) (c) (d) | | | 230,000 | | | | 259,612 | |
| | |
(ICE LIBOR USD 3 Month + 1.06%), 3.56%, 4/23/2027 (b) | | | 295,000 | | | | 313,986 | |
| | |
Series L, 4.18%, 11/25/2027 | | | 180,000 | | | | 195,869 | |
| | |
Series FF, (ICE LIBOR USD 3 Month + 2.93%), 5.87%, 3/15/2028 (b) (c) (d) | | | 335,000 | | | | 364,212 | |
| | |
Bausch Health Cos., Inc. | | | | | | | | |
| | |
6.50%, 3/15/2022 (e) | | | 74,000 | | | | 76,612 | |
| | |
4.50%, 5/15/2023 (a) | | | EUR 300,000 | | | | 333,836 | |
| | |
5.88%, 5/15/2023 (e) | | | 116,000 | | | | 117,450 | |
| | |
7.00%, 3/15/2024 (e) | | | 100,000 | | | | 105,616 | |
| | |
6.13%, 4/15/2025 (e) | | | 495,000 | | | | 509,850 | |
| | |
5.50%, 11/1/2025 (e) | | | 68,000 | | | | 71,314 | |
| | |
Becton Dickinson and Co. 1.40%, 5/24/2023 | | | EUR 100,000 | | | | 115,062 | |
| | |
Belden, Inc. 3.38%, 7/15/2027 (a) | | | EUR 100,000 | | | | 114,026 | |
| | |
Berry Global, Inc. | | | | | | | | |
| | |
5.13%, 7/15/2023 | | | 25,000 | | | | 25,625 | |
| | |
4.50%, 2/15/2026 (e) | | | 13,000 | | | | 12,935 | |
| | |
5.63%, 7/15/2027 (e) | | | 10,000 | | | | 10,500 | |
| | |
Big River Steel LLC 7.25%, 9/1/2025 (e) | | | 10,000 | | | | 10,575 | |
| | |
Blue Racer Midstream LLC 6.13%, 11/15/2022 (e) | | | 80,000 | | | | 80,400 | |
| | |
Boeing Co. (The) 3.50%, 3/1/2039 | | | 135,000 | | | | 144,290 | |
| | |
Booz Allen Hamilton, Inc. 5.13%, 5/1/2025 (e) | | | 13,000 | | | | 13,357 | |
| | |
Boston Scientific Corp. | | | | | | | | |
| | |
3.75%, 3/1/2026 | | | 110,000 | | | | 118,125 | |
| | |
4.00%, 3/1/2029 | | | 280,000 | | | | 312,327 | |
| | |
Boyd Gaming Corp. | | | | | | | | |
| | |
6.88%, 5/15/2023 | | | 80,000 | | | | 82,982 | |
| | | | | | | | |
| INVESTMENTS | | PRINCIPAL
AMOUNT | | | VALUE | |
| | | | | | | | |
| | |
United States — continued | | | | | | | | |
| | |
6.38%, 4/1/2026 | | | 58,000 | | | | 61,480 | |
| | |
Boyne USA, Inc. 7.25%, 5/1/2025 (e) | | | 28,000 | | | | 30,555 | |
| | |
Brazos Valley Longhorn LLC 6.88%, 2/1/2025 | | | 13,000 | | | | 11,570 | |
| | |
Brink’s Co. (The) 4.63%, 10/15/2027 (e) | | | 42,000 | | | | 42,735 | |
| | |
Bristol-Myers Squibb Co. | | | | | | | | |
| | |
2.90%, 7/26/2024 (e) | | | 242,000 | | | | 250,910 | |
| | |
3.40%, 7/26/2029 (e) | | | 130,000 | | | | 140,727 | |
| | |
4.25%, 10/26/2049 (e) | | | 85,000 | | | | 102,242 | |
| | |
Broadcom Corp. 3.13%, 1/15/2025 | | | 210,000 | | | | 207,410 | |
| | |
Buckeye Partners LP | | | | | | | | |
| | |
4.15%, 7/1/2023 | | | 171,000 | | | | 170,743 | |
| | |
3.95%, 12/1/2026 | | | 30,000 | | | | 26,708 | |
| | |
(ICE LIBOR USD 3 Month + 4.02%), 6.37%, 1/22/2078 (b) | | | 45,000 | | | | 33,863 | |
| | |
Cablevision Systems Corp. | | | | | | | | |
| | |
8.00%, 4/15/2020 | | | 39,000 | | | | 40,121 | |
| | |
5.88%, 9/15/2022 | | | 20,000 | | | | 21,394 | |
| | |
California Resources Corp. 8.00%, 12/15/2022 (e) | | | 5,000 | | | | 2,875 | |
| | |
Callon Petroleum Co. 6.13%, 10/1/2024 | | | 38,000 | | | | 36,860 | |
| | |
Calpine Corp. 5.25%, 6/1/2026 (e) | | | 69,000 | | | | 69,862 | |
| | |
Camelot Finance SA 7.88%, 10/15/2024 (e) | | | 30,000 | | | | 31,275 | |
| | |
Capital One Financial Corp. 3.80%, 1/31/2028 | | | 180,000 | | | | 191,904 | |
| | |
Carrizo Oil & Gas, Inc. 6.25%, 4/15/2023 | | | 47,000 | | | | 44,955 | |
| | |
Catalent Pharma Solutions, Inc. 4.88%, 1/15/2026 (e) | | | 35,000 | | | | 35,525 | |
| | |
CCO Holdings LLC | | | | | | | | |
| | |
5.13%, 2/15/2023 | | | 12,000 | | | | 12,195 | |
| | |
5.88%, 4/1/2024 (e) | | | 144,000 | | | | 149,940 | |
| | |
5.75%, 2/15/2026 (e) | | | 501,000 | | | | 530,434 | |
| | |
5.13%, 5/1/2027 (e) | | | 160,000 | | | | 169,198 | |
| | |
5.38%, 6/1/2029 (e) | | | 16,000 | | | | 17,100 | |
| | |
CDK Global, Inc. 5.25%, 5/15/2029 (e) | | | 35,000 | | | | 36,137 | |
| | |
Cedar Fair LP 5.25%, 7/15/2029 (e) | | | 4,000 | | | | 4,340 | |
| | |
Centene Corp. 6.13%, 2/15/2024 | | | 48,000 | | | | 50,304 | |
| | |
Central Garden & Pet Co. | | | | | | | | |
| | |
6.13%, 11/15/2023 | | | 20,000 | | | | 20,750 | |
| | |
5.13%, 2/1/2028 | | | 95,000 | | | | 95,475 | |
SEE NOTES TO FINANCIAL STATEMENTS.
| | | | | | |
| | | |
| 64 | | | | J.P. MORGAN EXCHANGE-TRADED FUNDS | | AUGUST 31, 2019 |
| | | | | | | | |
| INVESTMENTS | | PRINCIPAL
AMOUNT | | | VALUE | |
Corporate Bonds — continued | | | | | | | | |
| | |
United States — continued | | | | | | | | |
| | |
CenturyLink, Inc. | | | | | | | | |
| | |
Series T, 5.80%, 3/15/2022 | | | 80,000 | | | | 83,900 | |
| | |
Series W, 6.75%, 12/1/2023 | | | 80,000 | | | | 86,700 | |
| | |
CF Industries, Inc. 4.50%, 12/1/2026 (e) | | | 190,000 | | | | 206,055 | |
| | |
Charter Communications Operating LLC | | | | | | | | |
| | |
4.91%, 7/23/2025 | | | 279,000 | | | | 308,346 | |
| | |
5.38%, 5/1/2047 | | | 138,000 | | | | 153,261 | |
| | |
Chemours Co. (The) | | | | | | | | |
| | |
6.63%, 5/15/2023 | | | 40,000 | | | | 40,700 | |
| | |
7.00%, 5/15/2025 | | | 33,000 | | | | 32,588 | |
| | |
4.00%, 5/15/2026 | | | EUR 100,000 | | | | 101,839 | |
| | |
Cheniere Corpus Christi Holdings LLC 5.88%, 3/31/2025 | | | 39,000 | | | | 43,485 | |
| | |
Cheniere Energy Partners LP 5.25%, 10/1/2025 | | | 30,000 | | | | 31,012 | |
| | |
Chesapeake Energy Corp. 8.00%, 6/15/2027 | | | 134,000 | | | | 96,816 | |
| | |
Cincinnati Bell, Inc. | | | | | | | | |
| | |
7.00%, 7/15/2024 (e) | | | 29,000 | | | | 26,463 | |
| | |
8.00%, 10/15/2025 (e) | | | 4,000 | | | | 3,511 | |
| | |
Cinemark USA, Inc. 4.88%, 6/1/2023 | | | 15,000 | | | | 15,281 | |
| | |
CITGO Petroleum Corp. 6.25%, 8/15/2022 (e) | | | 27,000 | | | | 27,135 | |
| | |
Citibank NA (ICE LIBOR USD 3 Month + 0.53%), 3.16%, 2/19/2022 (b) | | | 376,000 | | | | 381,569 | |
| | |
Citigroup, Inc. | | | | | | | | |
| | |
(ICE LIBOR USD 3 Month + 0.72%), 3.14%, 1/24/2023 (b) | | | 100,000 | | | | 102,256 | |
| | |
(ICE LIBOR USD 3 Month + 4.23%), 5.90%, 2/15/2023 (b) (c) (d) | | | 58,000 | | | | 60,900 | |
| | |
Series P, (ICE LIBOR USD 3 Month + 3.91%), 5.95%, 5/15/2025 (b) (c) (d) | | | 190,000 | | | | 203,300 | |
| | |
Series T, (ICE LIBOR USD 3 Month + 4.52%), 6.25%, 8/15/2026 (b) (c) (d) | | | 200,000 | | | | 224,000 | |
| | |
Clear Channel Worldwide Holdings, Inc. | | | | | | | | |
| | |
Series B, 6.50%, 11/15/2022 | | | 450,000 | | | | 459,752 | |
| | |
9.25%, 2/15/2024 (e) | | | 85,000 | | | | 93,181 | |
| | |
Clearwater Paper Corp. 4.50%, 2/1/2023 | | | 37,000 | | | | 37,044 | |
| | |
Clearway Energy Operating LLC 5.00%, 9/15/2026 | | | 44,000 | | | | 44,550 | |
| | |
Cleveland-Cliffs, Inc. | | | | | | | | |
| | |
4.88%, 1/15/2024 (e) | | | 15,000 | | | | 15,300 | |
| | | | | | | | |
| INVESTMENTS | | PRINCIPAL
AMOUNT | | | VALUE | |
| | | | | | | | |
| | |
United States — continued | | | | | | | | |
| | |
5.75%, 3/1/2025 | | | 3,000 | | | | 3,007 | |
| | |
CNO Financial Group, Inc. 5.25%, 5/30/2025 | | | 15,000 | | | | 16,294 | |
| | |
CNX Midstream Partners LP 6.50%, 3/15/2026 (e) | | | 20,000 | | | | 18,710 | |
| | |
Cogent Communications Group, Inc. 5.38%, 3/1/2022 (e) | | | 25,000 | | | | 25,937 | |
| | |
Comcast Corp. | | | | | | | | |
| | |
3.95%, 10/15/2025 | | | 250,000 | | | | 273,734 | |
| | |
3.20%, 7/15/2036 | | | 170,000 | | | | 174,967 | |
| | |
4.60%, 8/15/2045 | | | 105,000 | | | | 126,964 | |
| | |
4.70%, 10/15/2048 | | | 120,000 | | | | 150,141 | |
| | |
Commercial Metals Co. 4.88%, 5/15/2023 | | | 15,000 | | | | 15,525 | |
| | |
CommScope Technologies LLC 6.00%, 6/15/2025 (e) | | | 289,000 | | | | 257,932 | |
| | |
CommScope, Inc. 8.25%, 3/1/2027 (e) | | | 48,000 | | | | 47,040 | |
| | |
Community Health Systems, Inc. | | | | | | | | |
| | |
5.13%, 8/1/2021 | | | 33,000 | | | | 33,000 | |
| | |
6.25%, 3/31/2023 | | | 21,000 | | | | 20,320 | |
| | |
8.63%, 1/15/2024 (e) | | | 37,000 | | | | 37,000 | |
| | |
8.13%, 6/30/2024 (e) | | | 34,000 | | | | 25,840 | |
| | |
Concho Resources, Inc. 3.75%, 10/1/2027 | | | 53,000 | | | | 55,170 | |
| | |
Constellation Merger Sub, Inc. 8.50%, 9/15/2025 (e) | | | 21,000 | | | | 17,850 | |
| | |
Constellium SE 4.25%, 2/15/2026 (a) | | | EUR 200,000 | | | | 229,882 | |
| | |
Cooper-Standard Automotive, Inc. 5.63%, 11/15/2026 (e) | | | 105,000 | | | | 90,037 | |
| | |
Coty, Inc. 6.50%, 4/15/2026 (e) | | | 50,000 | | | | 47,250 | |
| | |
Covanta Holding Corp. 5.88%, 7/1/2025 | | | 14,000 | | | | 14,595 | |
| | |
Crestwood Midstream Partners LP 5.75%, 4/1/2025 | | | 30,000 | | | | 30,675 | |
| | |
Crown Americas LLC 4.25%, 9/30/2026 | | | 74,000 | | | | 76,775 | |
| | |
Crown European Holdings SA | | | | | | | | |
| | |
4.00%, 7/15/2022 (a) | | | EUR 350,000 | | | | 423,211 | |
| | |
2.63%, 9/30/2024 (a) | | | EUR 125,000 | | | | 149,114 | |
| | |
CSC Holdings LLC | | | | | | | | |
| | |
5.25%, 6/1/2024 | | | 215,000 | | | | 230,050 | |
| | |
6.63%, 10/15/2025 (e) | | | 210,000 | | | | 224,822 | |
| | |
Curo Group Holdings Corp. 8.25%, 9/1/2025 (e) | | | 110,000 | | | | 95,700 | |
SEE NOTES TO FINANCIAL STATEMENTS.
| | | | | | | | |
| | | |
| AUGUST 31, 2019 | | J.P. MORGAN EXCHANGE-TRADED FUNDS | | | | | 65 | |
JPMorgan Global Bond Opportunities ETF
SCHEDULE OF PORTFOLIO INVESTMENTS
AS OF AUGUST 31, 2019 (Unaudited) (continued)
(Amounts in U.S. Dollars, unless otherwise noted)
| | | | | | | | |
| INVESTMENTS | | PRINCIPAL
AMOUNT | | | VALUE | |
Corporate Bonds — continued | | | | | | | | |
| | |
United States — continued | | | | | | | | |
| | |
CVR Partners LP 9.25%, 6/15/2023 (e) | | | 98,000 | | | | 102,361 | |
| | |
Dana Financing Luxembourg SARL 6.50%, 6/1/2026 (e) | | | 105,000 | | | | 109,987 | |
| | |
Darling Global Finance BV 3.63%, 5/15/2026 (a) | | | EUR 125,000 | | | | 145,788 | |
| | |
DaVita, Inc. 5.13%, 7/15/2024 | | | 82,000 | | | | 83,411 | |
| | |
DCP Midstream Operating LP 3.88%, 3/15/2023 | | | 74,000 | | | | 74,925 | |
| | |
Delek Logistics Partners LP 6.75%, 5/15/2025 | | | 29,000 | | | | 29,000 | |
| | |
Dell International LLC | | | | | | | | |
| | |
7.13%, 6/15/2024 (e) | | | 37,000 | | | | 39,006 | |
| | |
6.02%, 6/15/2026 (e) | | | 255,000 | | | | 287,793 | |
| | |
Diamond Offshore Drilling, Inc. 7.88%, 8/15/2025 | | | 15,000 | | | | 13,804 | |
| | |
Diamond Sports Group LLC | | | | | | | | |
| | |
5.38%, 8/15/2026 (e) | | | 24,000 | | | | 25,200 | |
| | |
6.63%, 8/15/2027 (e) | | | 9,000 | | | | 9,427 | |
| | |
DISH DBS Corp. | | | | | | | | |
| | |
6.75%, 6/1/2021 | | | 10,000 | | | | 10,533 | |
| | |
5.88%, 7/15/2022 | | | 92,000 | | | | 95,220 | |
| | |
5.00%, 3/15/2023 | | | 100,000 | | | | 98,125 | |
| | |
5.88%, 11/15/2024 | | | 415,000 | | | | 394,789 | |
| | |
7.75%, 7/1/2026 | | | 100,000 | | | | 98,250 | |
| | |
Dole Food Co., Inc. 7.25%, 6/15/2025 (e) | | | 39,000 | | | | 37,635 | |
| | |
Downstream Development Authority of the Quapaw Tribe of Oklahoma 10.50%, 2/15/2023 (e) | | | 60,000 | | | | 63,750 | |
| | |
Dun & Bradstreet Corp. (The) 6.88%, 8/15/2026 (e) | | | 13,000 | | | | 14,089 | |
| | |
Eldorado Resorts, Inc. 7.00%, 8/1/2023 | | | 40,000 | | | | 41,800 | |
| | |
Embarq Corp. 8.00%, 6/1/2036 | | | 105,000 | | | | 102,938 | |
| | |
Encompass Health Corp. | | | | | | | | |
| | |
5.75%, 11/1/2024 | | | 110,000 | | | | 111,375 | |
| | |
5.75%, 9/15/2025 | | | 105,000 | | | | 110,381 | |
| | |
Energizer Holdings, Inc. 5.50%, 6/15/2025 (e) | | | 70,000 | | | | 70,913 | |
| | |
EnLink Midstream Partners LP | | | | | | | | |
| | |
4.40%, 4/1/2024 | | | 20,000 | | | | 19,800 | |
| | |
4.15%, 6/1/2025 | | | 20,000 | | | | 19,100 | |
| | |
5.60%, 4/1/2044 | | | 20,000 | | | | 16,900 | |
| | |
Entegris, Inc. 4.63%, 2/10/2026 (e) | | | 65,000 | | | | 66,950 | |
| | |
Entercom Media Corp. 7.25%, 11/1/2024 (e) | | | 20,000 | | | | 20,325 | |
| | | | | | | | |
| INVESTMENTS | | PRINCIPAL
AMOUNT | | | VALUE | |
| | | | | | | | |
| | |
United States — continued | | | | | | | | |
| | |
Enterprise Development Authority (The) 12.00%, 7/15/2024 (e) | | | 63,000 | | | | 70,604 | |
| | |
Enterprise Products Operating LLC Series E, (ICE LIBOR USD 3 Month + 3.03%), 5.25%, 8/16/2077 (b) | | | 125,000 | | | | 123,437 | |
| | |
Envision Healthcare Corp. 8.75%, 10/15/2026 (e) | | | 93,000 | | | | 50,685 | |
| | |
EP Energy LLC | | | | | | | | |
| | |
9.38%, 5/1/2024 (e) | | | 40,000 | | | | 3,000 | |
| | |
8.00%, 11/29/2024 (e) | | | 37,000 | | | | 15,910 | |
| | |
7.75%, 5/15/2026 (e) | | | 36,000 | | | | 30,060 | |
| | |
Equinix, Inc. | | | | | | | | |
| | |
REIT, 5.38%, 4/1/2023 | | | 60,000 | | | | 61,200 | |
| | |
REIT, 2.88%, 10/1/2025 | | | EUR 225,000 | | | | 257,175 | |
| | |
REIT, 5.88%, 1/15/2026 | | | 115,000 | | | | 122,331 | |
| | |
ESH Hospitality, Inc. REIT, 5.25%, 5/1/2025 (e) | | | 110,000 | | | | 113,712 | |
| | |
Exela Intermediate LLC 10.00%, 7/15/2023 (e) | | | 56,000 | | | | 35,000 | |
| | |
Fidelity & Guaranty Life Holdings, Inc. 5.50%, 5/1/2025 (e) | | | 32,000 | | | | 33,920 | |
| | |
FirstCash, Inc. 5.38%, 6/1/2024 (e) | | | 15,000 | | | | 15,562 | |
| | |
FirstEnergy Corp. Series B, 3.90%, 7/15/2027 | | | 295,000 | | | | 316,904 | |
| | |
Fox Corp. | | | | | | | | |
| | |
4.03%, 1/25/2024 (e) | | | 90,000 | | | | 96,389 | |
| | |
4.71%, 1/25/2029 (e) | | | 40,000 | | | | 46,335 | |
| | |
Freeport-McMoRan, Inc. | | | | | | | | |
| | |
3.55%, 3/1/2022 | | | 59,000 | | | | 59,147 | |
| | |
3.88%, 3/15/2023 | | | 25,000 | | | | 25,260 | |
| | |
Frontier Communications Corp. | | | | | | | | |
| | |
7.63%, 4/15/2024 | | | 15,000 | | | | 7,504 | |
| | |
6.88%, 1/15/2025 | | | 35,000 | | | | 17,850 | |
| | |
8.50%, 4/1/2026 (e) | | | 161,000 | | | | 156,573 | |
| | |
FXI Holdings, Inc. 7.88%, 11/1/2024 (e) | | | 14,000 | | | | 12,425 | |
| | |
GCI LLC 6.88%, 4/15/2025 | | | 90,000 | | | | 94,500 | |
| | |
GE Capital International Funding Co. Unlimited Co. 4.42%, 11/15/2035 | | | 200,000 | | | | 203,203 | |
| | |
General Electric Co. | | | | | | | | |
| | |
1.50%, 5/17/2029 | | | EUR 100,000 | | | | 105,605 | |
| | |
2.13%, 5/17/2037 | | | EUR 100,000 | | | | 105,904 | |
| | |
4.50%, 3/11/2044 | | | 120,000 | | | | 121,315 | |
| | |
General Motors Co. 5.15%, 4/1/2038 | | | 115,000 | | | | 119,272 | |
| | |
General Motors Financial Co., Inc. 4.00%, 1/15/2025 | | | 330,000 | | | | 339,674 | |
SEE NOTES TO FINANCIAL STATEMENTS.
| | | | | | |
| | | |
| 66 | | | | J.P. MORGAN EXCHANGE-TRADED FUNDS | | AUGUST 31, 2019 |
| | | | | | | | |
| INVESTMENTS | | PRINCIPAL
AMOUNT | | | VALUE | |
Corporate Bonds — continued | | | | | | | | |
| | |
United States — continued | | | | | | | | |
| | |
Genesis Energy LP 5.63%, 6/15/2024 | | | 35,000 | | | | 33,425 | |
| | |
GEO Group, Inc. (The) REIT, 5.88%, 10/15/2024 | | | 100,000 | | | | 88,000 | |
| | |
Gilead Sciences, Inc. 4.00%, 9/1/2036 | | | 20,000 | | | | 22,801 | |
| | |
Global Partners LP 7.00%, 6/15/2023 | | | 25,000 | | | | 25,250 | |
| | |
Goldman Sachs Group, Inc. (The) | | | | | | | | |
| | |
(ICE LIBOR USD 3 Month + 0.99%), 2.90%, 7/24/2023 (b) | | | 205,000 | | | | 208,249 | |
| | |
(ICE LIBOR USD 3 Month + 1.60%), 3.72%, 11/29/2023 (b) | | | 130,000 | | | | 133,491 | |
| | |
3.85%, 1/26/2027 | | | 159,000 | | | | 169,786 | |
| | |
(ICE LIBOR USD 3 Month + 1.16%), 3.81%, 4/23/2029 (b) | | | 67,000 | | | | 72,104 | |
| | |
Goodyear Tire & Rubber Co. (The) | | | | | | | | |
| | |
5.00%, 5/31/2026 | | | 94,000 | | | | 93,060 | |
| | |
4.88%, 3/15/2027 | | | 21,000 | | | | 20,265 | |
| | |
Gray Television, Inc. 7.00%, 5/15/2027 (e) | | | 60,000 | | | | 65,607 | |
| | |
Gulfport Energy Corp. 6.00%, 10/15/2024 | | | 78,000 | | | | 56,745 | |
| | |
H&E Equipment Services, Inc. 5.63%, 9/1/2025 | | | 15,000 | | | | 15,712 | |
| | |
Hanesbrands, Inc. 4.88%, 5/15/2026 (e) | | | 51,000 | | | | 53,763 | |
| | |
HCA Healthcare, Inc. 6.25%, 2/15/2021 | | | 15,000 | | | | 15,756 | |
| | |
HCA, Inc. | | | | | | | | |
| | |
5.88%, 5/1/2023 | | | 82,000 | | | | 90,559 | |
| | |
5.38%, 2/1/2025 | | | 130,000 | | | | 144,300 | |
| | |
5.88%, 2/15/2026 | | | 440,000 | | | | 501,930 | |
| | |
5.63%, 9/1/2028 | | | 4,000 | | | | 4,551 | |
| | |
Herc Holdings, Inc. 5.50%, 7/15/2027 (e) | | | 19,000 | | | | 19,594 | |
| | |
Hertz Corp. (The) | | | | | | | | |
| | |
7.63%, 6/1/2022 (e) | | | 17,000 | | | | 17,702 | |
| | |
5.50%, 10/15/2024 (e) | | | 213,000 | | | | 208,740 | |
| | |
7.13%, 8/1/2026 (e) | | | 15,000 | | | | 15,308 | |
| | |
Hertz Holdings Netherlands BV 4.13%, 10/15/2021 (a) | | | EUR 125,000 | | | | 139,614 | |
| | |
Hilcorp Energy I LP | | | | | | | | |
| | |
5.00%, 12/1/2024 (e) | | | 23,000 | | | | 21,217 | |
| | |
6.25%, 11/1/2028 (e) | | | 25,000 | | | | 23,000 | |
| | |
Hill-Rom Holdings, Inc. | | | | | | | | |
| | |
5.75%, 9/1/2023 (e) | | | 14,000 | | | | 14,455 | |
| | |
5.00%, 2/15/2025 (e) | | | 15,000 | | | | 15,412 | |
| | | | | | | | |
| INVESTMENTS | | PRINCIPAL
AMOUNT | | | VALUE | |
| | | | | | | | |
| | |
United States — continued | | | | | | | | |
| | |
Hilton Domestic Operating Co., Inc. 5.13%, 5/1/2026 | | | 12,000 | | | | 12,666 | |
| | |
Hilton Grand Vacations Borrower LLC 6.13%, 12/1/2024 | | | 15,000 | | | | 15,938 | |
| | |
Hilton Worldwide Finance LLC | | | | | | | | |
| | |
4.63%, 4/1/2025 | | | 88,000 | | | | 90,860 | |
| | |
4.88%, 4/1/2027 | | | 33,000 | | | | 34,732 | |
| | |
Holly Energy Partners LP 6.00%, 8/1/2024 (e) | | | 16,000 | | | | 16,768 | |
| | |
Hologic, Inc. 4.38%, 10/15/2025 (e) | | | 15,000 | | | | 15,337 | |
| | |
Home Depot, Inc. (The) 2.95%, 6/15/2029 | | | 70,000 | | | | 74,098 | |
| | |
Hughes Satellite Systems Corp. 6.63%, 8/1/2026 | | | 15,000 | | | | 16,162 | |
| | |
Icahn Enterprises LP 6.38%, 12/15/2025 | | | 25,000 | | | | 26,469 | |
| | |
IHS Markit Ltd. 4.00%, 3/1/2026 (e) | | | 21,000 | | | | 22,327 | |
| | |
Infor US, Inc. 6.50%, 5/15/2022 | | | 141,000 | | | | 143,291 | |
| | |
International Game Technology plc 4.75%, 2/15/2023 (a) | | | EUR 200,000 | | | | 244,394 | |
| | |
IQVIA, Inc. | | | | | | | | |
| | |
3.50%, 10/15/2024 (a) | | | EUR 250,000 | | | | 280,821 | |
| | |
3.25%, 3/15/2025 (a) | | | EUR 200,000 | | | | 226,134 | |
| | |
IRB Holding Corp. 6.75%, 2/15/2026 (e) | | | 58,000 | | | | 58,290 | |
| | |
Iron Mountain, Inc. | | | | | | | | |
| | |
REIT, 5.75%, 8/15/2024 | | | 58,000 | | | | 58,725 | |
| | |
REIT, 3.00%, 1/15/2025 (a) | | | EUR 100,000 | | | | 113,114 | |
| | |
ITC Holdings Corp. 3.35%, 11/15/2027 | | | 140,000 | | | | 149,962 | |
| | |
Jack Ohio Finance LLC 6.75%, 11/15/2021 (e) | | | 40,000 | | | | 40,900 | |
| | |
JBS USA LUX SA | | | | | | | | |
| | |
5.88%, 7/15/2024 (e) | | | 7,000 | | | | 7,207 | |
| | |
5.75%, 6/15/2025 (e) | | | 6,000 | | | | 6,244 | |
| | |
6.75%, 2/15/2028 (e) | | | 80,000 | | | | 89,062 | |
| | |
6.50%, 4/15/2029 (e) | | | 43,000 | | | | 47,622 | |
| | |
JELD-WEN, Inc. 4.63%, 12/15/2025 (e) | | | 70,000 | | | | 68,600 | |
| | |
Kaiser Aluminum Corp. 5.88%, 5/15/2024 | | | 10,000 | | | | 10,375 | |
| | |
Kennedy-Wilson, Inc. 5.88%, 4/1/2024 | | | 14,000 | | | | 14,333 | |
| | |
Kinetic Concepts, Inc. 7.88%, 2/15/2021 (e) | | | 79,000 | | | | 81,393 | |
| | |
Kraft Heinz Foods Co. 4.38%, 6/1/2046 | | | 192,000 | | | | 184,508 | |
SEE NOTES TO FINANCIAL STATEMENTS.
| | | | | | | | |
| | | |
| AUGUST 31, 2019 | | J.P. MORGAN EXCHANGE-TRADED FUNDS | | | | | 67 | |
JPMorgan Global Bond Opportunities ETF
SCHEDULE OF PORTFOLIO INVESTMENTS
AS OF AUGUST 31, 2019 (Unaudited) (continued)
(Amounts in U.S. Dollars, unless otherwise noted)
| | | | | | | | |
| INVESTMENTS | | PRINCIPAL
AMOUNT | | | VALUE | |
Corporate Bonds — continued | | | | | | | | |
| | |
United States — continued | | | | | | | | |
| | |
Kroger Co. (The) 2.65%, 10/15/2026 | | | 135,000 | | | | 134,461 | |
| | |
L Brands, Inc. | | | | | | | | |
| | |
5.63%, 10/15/2023 | | | 45,000 | | | | 47,250 | |
| | |
5.25%, 2/1/2028 | | | 18,000 | | | | 16,425 | |
| | |
L3Harris Technologies, Inc. 4.85%, 4/27/2035 | | | 185,000 | | | | 221,355 | |
| | |
Lamar Media Corp. 5.75%, 2/1/2026 | | | 50,000 | | | | 53,000 | |
| | |
Lennar Corp. 5.88%, 11/15/2024 | | | 48,000 | | | | 53,520 | |
| | |
Level 3 Financing, Inc. | | | | | | | | |
| | |
5.38%, 5/1/2025 | | | 25,000 | | | | 26,000 | |
| | |
5.25%, 3/15/2026 | | | 61,000 | | | | 63,593 | |
| | |
Level 3 Parent LLC 5.75%, 12/1/2022 | | | 175,000 | | | | 176,313 | |
| | |
Liberty Mutual Group, Inc. 7.80%, 3/15/2037 (e) | | | 15,000 | | | | 18,975 | |
| | |
Live Nation Entertainment, Inc. 5.63%, 3/15/2026 (e) | | | 14,000 | | | | 14,928 | |
| | |
LKQ Italia Bondco SpA 3.88%, 4/1/2024 (a) | | | EUR 100,000 | | | | 123,360 | |
| | |
Lowe’s Cos., Inc. 3.65%, 4/5/2029 | | | 74,000 | | | | 80,404 | |
| | |
LPL Holdings, Inc. 5.75%, 9/15/2025 (e) | | | 38,000 | | | | 39,995 | |
| | |
Marriott Ownership Resorts, Inc. 6.50%, 9/15/2026 | | | 29,000 | | | | 31,297 | |
| | |
Martin Midstream Partners LP 7.25%, 2/15/2021 | | | 46,000 | | | | 43,700 | |
| | |
MasTec, Inc. 4.88%, 3/15/2023 | | | 34,000 | | | | 34,553 | |
| | |
Matador Resources Co. 5.88%, 9/15/2026 | | | 21,000 | | | | 20,344 | |
| | |
Mattel, Inc. | | | | | | | | |
| | |
3.15%, 3/15/2023 | | | 10,000 | | | | 9,400 | |
| | |
6.75%, 12/31/2025 (e) | | | 170,000 | | | | 174,675 | |
| | |
Mauser Packaging Solutions Holding Co. 5.50%, 4/15/2024 (e) | | | 75,000 | | | | 77,062 | |
| | |
MetLife, Inc. 6.40%, 12/15/2036 | | | 20,000 | | | | 23,336 | |
| | |
MGM Resorts International | | | | | | | | |
| | |
6.00%, 3/15/2023 | | | 315,000 | | | | 346,500 | |
| | |
4.63%, 9/1/2026 | | | 55,000 | | | | 56,925 | |
| | |
Midcontinent Communications 5.38%, 8/15/2027 (e) | | | 9,000 | | | | 9,342 | |
| | |
Morgan Stanley | | | | | | | | |
| | |
3.70%, 10/23/2024 | | | 360,000 | | | | 384,554 | |
| | |
3.63%, 1/20/2027 | | | 200,000 | | | | 213,978 | |
| | |
(ICE LIBOR USD 3 Month + 1.14%), 3.77%, 1/24/2029 (b) | | | 15,000 | | | | 16,233 | |
| | |
(ICE LIBOR USD 3 Month + 1.46%), 3.97%, 7/22/2038 (b) | | | 240,000 | | | | 268,123 | |
| | | | | | | | |
| INVESTMENTS | | PRINCIPAL
AMOUNT | | | VALUE | |
| | | | | | | | |
| | |
United States — continued | | | | | | | | |
| | |
MPH Acquisition Holdings LLC 7.13%, 6/1/2024 (e) | | | 79,000 | | | | 70,611 | |
| | |
MSCI, Inc. 5.38%, 5/15/2027 (e) | | | 34,000 | | | | 36,567 | |
| | |
MTS Systems Corp. 5.75%, 8/15/2027 (e) | | | 14,000 | | | | 14,630 | |
| | |
Nabors Industries, Inc. | | | | | | | | |
| | |
5.10%, 9/15/2023 | | | 9,000 | | | | 7,560 | |
| | |
5.75%, 2/1/2025 | | | 90,000 | | | | 72,000 | |
| | |
Nationstar Mortgage LLC | | | | | | | | |
| | |
6.50%, 7/1/2021 | | | 2,000 | | | | 2,003 | |
| | |
6.50%, 6/1/2022 | | | 45,000 | | | | 45,056 | |
| | |
NCR Corp. | | | | | | | | |
| | |
5.75%, 9/1/2027 (e) | | | 15,000 | | | | 15,841 | |
| | |
6.13%, 9/1/2029 (e) | | | 15,000 | | | | 15,920 | |
| | |
Netflix, Inc. | | | | | | | | |
| | |
4.38%, 11/15/2026 | | | 70,000 | | | | 71,663 | |
| | |
3.63%, 5/15/2027 | | | EUR 100,000 | | | | 118,819 | |
| | |
4.88%, 4/15/2028 | | | 65,000 | | | | 68,006 | |
| | |
New Albertsons LP 8.00%, 5/1/2031 | | | 103,000 | | | | 104,545 | |
| | |
NextEra Energy Operating Partners LP 4.25%, 9/15/2024 (e) | | | 10,000 | | | | 10,370 | |
| | |
Nielsen Co. Luxembourg SARL (The) | | | | | | | | |
| | |
5.50%, 10/1/2021 (e) | | | 110,000 | | | | 110,319 | |
| | |
5.00%, 2/1/2025 (e) | | | 30,000 | | | | 29,625 | |
| | |
Nielsen Finance LLC 5.00%, 4/15/2022 (e) | | | 38,000 | | | | 38,190 | |
| | |
Noble Energy, Inc. 3.85%, 1/15/2028 | | | 410,000 | | | | 427,656 | |
| | |
Noble Holding International Ltd. | | | | | | | | |
| | |
7.88%, 2/1/2026 (e) | | | 53,000 | | | | 42,798 | |
| | |
5.25%, 3/15/2042 | | | 12,000 | | | | 5,280 | |
| | |
Northern Oil and Gas, Inc. 8.50% (cash), 5/15/2023 (g) | | | 30,150 | | | | 31,017 | |
| | |
Novelis Corp. 5.88%, 9/30/2026 (e) | | | 74,000 | | | | 78,163 | |
| | |
NRG Energy, Inc. 6.63%, 1/15/2027 | | | 45,000 | | | | 48,600 | |
| | |
Nuance Communications, Inc. 5.63%, 12/15/2026 | | | 50,000 | | | | 52,688 | |
| | |
NuStar Logistics LP 5.63%, 4/28/2027 | | | 30,000 | | | | 31,200 | |
| | |
Oasis Petroleum, Inc. | | | | | | | | |
| | |
6.88%, 1/15/2023 | | | 125,000 | | | | 113,125 | |
| | |
6.25%, 5/1/2026 (e) | | | 33,000 | | | | 26,606 | |
| | |
Occidental Petroleum Corp. 2.90%, 8/15/2024 | | | 340,000 | | | | 343,180 | |
| | |
OI European Group BV 3.13%, 11/15/2024 (a) | | | EUR 150,000 | | | | 179,144 | |
| | |
ONEOK, Inc. 4.00%, 7/13/2027 | | | 130,000 | | | | 136,754 | |
SEE NOTES TO FINANCIAL STATEMENTS.
| | | | | | |
| | | |
| 68 | | | | J.P. MORGAN EXCHANGE-TRADED FUNDS | | AUGUST 31, 2019 |
| | | | | | | | |
| INVESTMENTS | | PRINCIPAL
AMOUNT | | | VALUE | |
Corporate Bonds — continued | | | | | | | | |
| | |
United States — continued | | | | | | | | |
| | |
Outfront Media Capital LLC 5.88%, 3/15/2025 | | | 75,000 | | | | 77,531 | |
| | |
Par Pharmaceutical, Inc. 7.50%, 4/1/2027 (e) | | | 9,000 | | | | 8,393 | |
| | |
Party City Holdings, Inc. 6.63%, 8/1/2026 (e) | | | 47,000 | | | | 44,768 | |
| | |
Pattern Energy Group, Inc. 5.88%, 2/1/2024 (e) | | | 20,000 | | | | 20,700 | |
| | |
PBF Holding Co. LLC 7.25%, 6/15/2025 | | | 22,000 | | | | 22,790 | |
| | |
Peabody Energy Corp. 6.00%, 3/31/2022 (e) | | | 20,000 | | | | 20,600 | |
| | |
Penske Automotive Group, Inc. | | | | | | | | |
| | |
5.75%, 10/1/2022 | | | 35,000 | | | | 35,459 | |
| | |
5.50%, 5/15/2026 | | | 48,000 | | | | 50,280 | |
| | |
PetSmart, Inc. 5.88%, 6/1/2025 (e) | | | 101,000 | | | | 98,980 | |
| | |
Pilgrim’s Pride Corp. 5.75%, 3/15/2025 (e) | | | 63,000 | | | | 65,520 | |
| | |
Plantronics, Inc. 5.50%, 5/31/2023 (e) | | | 53,000 | | | | 53,922 | |
| | |
Polaris Intermediate Corp. 8.50% (cash), 12/1/2022 (e) (g) | | | 25,000 | | | | 21,000 | |
| | |
Post Holdings, Inc. | | | | | | | | |
| | |
5.00%, 8/15/2026 (e) | | | 63,000 | | | | 65,678 | |
| | |
5.75%, 3/1/2027 (e) | | | 50,000 | | | | 53,125 | |
| | |
5.63%, 1/15/2028 (e) | | | 50,000 | | | | 53,250 | |
| | |
Prime Security Services Borrower LLC | | | | | | | | |
| | |
9.25%, 5/15/2023 (e) | | | 18,000 | | | | 18,929 | |
| | |
5.25%, 4/15/2024 (e) | | | 16,000 | | | | 16,526 | |
| | |
5.75%, 4/15/2026 (e) | | | 16,000 | | | | 16,680 | |
| | |
PVH Corp. 3.63%, 7/15/2024 (a) | | | EUR 125,000 | | | | 154,678 | |
| | |
QEP Resources, Inc. | | | | | | | | |
| | |
5.38%, 10/1/2022 | | | 38,000 | | | | 34,200 | |
| | |
5.63%, 3/1/2026 | | | 5,000 | | | | 4,050 | |
| | |
Qorvo, Inc. 5.50%, 7/15/2026 | | | 52,000 | | | | 55,511 | |
| | |
Quicken Loans, Inc. 5.75%, 5/1/2025 (e) | | | 53,000 | | | | 55,253 | |
| | |
Rackspace Hosting, Inc. 8.63%, 11/15/2024 (e) | | | 38,000 | | | | 34,865 | |
| | |
Radian Group, Inc. 4.50%, 10/1/2024 | | | 25,000 | | | | 25,813 | |
| | |
Rain CII Carbon LLC 7.25%, 4/1/2025 (e) | | | 50,000 | | | | 47,000 | |
| | |
Realty Income Corp. REIT, 3.00%, 1/15/2027 | | | 170,000 | | | | 176,956 | |
| | |
Refinitiv US Holdings, Inc. | | | | | | | | |
| | |
6.25%, 5/15/2026 (e) | | | 21,000 | | | | 22,864 | |
| | |
8.25%, 11/15/2026 (e) | | | 9,000 | | | | 10,125 | |
| | | | | | | | |
| INVESTMENTS | | PRINCIPAL
AMOUNT | | | VALUE | |
| | | | | | | | |
| | |
United States — continued | | | | | | | | |
| | |
Reynolds Group Issuer, Inc. 5.75%, 10/15/2020 | | | 72,683 | | | | 72,865 | |
| | |
Rite Aid Corp. 6.13%, 4/1/2023 (e) | | | 80,000 | | | | 64,600 | |
| | |
Rockwell Collins, Inc. | | | | | | | | |
| | |
3.70%, 12/15/2023 | | | 325,000 | | | | 343,766 | |
| | |
3.20%, 3/15/2024 | | | 400,000 | | | | 416,937 | |
| | |
3.50%, 3/15/2027 | | | 340,000 | | | | 366,175 | |
| | |
Roper Technologies, Inc. 3.80%, 12/15/2026 | | | 280,000 | | | | 303,512 | |
| | |
Schlumberger Holdings Corp. | | | | | | | | |
| | |
3.75%, 5/1/2024 (e) | | | 315,000 | | | | 333,099 | |
| | |
3.90%, 5/17/2028 (e) | | | 120,000 | | | | 127,879 | |
| | |
Scientific Games International, Inc. | | | | | | | | |
| | |
10.00%, 12/1/2022 | | | 16,000 | | | | 16,600 | |
| | |
5.00%, 10/15/2025 (e) | | | 87,000 | | | | 89,892 | |
| | |
Scotts Miracle-Gro Co. (The) 6.00%, 10/15/2023 | | | 70,000 | | | | 72,484 | |
| | |
Sealed Air Corp. 5.13%, 12/1/2024 (e) | | | 94,000 | | | | 100,698 | |
| | |
SemGroup Corp. 5.63%, 11/15/2023 | | | 58,000 | | | | 54,810 | |
| | |
Sempra Energy 3.80%, 2/1/2038 | | | 145,000 | | | | 152,190 | |
| | |
Sensata Technologies BV | | | | | | | | |
| | |
4.88%, 10/15/2023 (e) | | | 85,000 | | | | 89,174 | |
| | |
5.00%, 10/1/2025 (e) | | | 14,000 | | | | 14,840 | |
| | |
Service Corp. International 7.50%, 4/1/2027 | | | 70,000 | | | | 84,000 | |
| | |
Shire Acquisitions Investments Ireland DAC 2.88%, 9/23/2023 | | | 225,000 | | | | 230,133 | |
| | |
Silgan Holdings, Inc. 3.25%, 3/15/2025 | | | EUR 200,000 | | | | 226,679 | |
| | |
Sinclair Television Group, Inc. 5.63%, 8/1/2024 (e) | | | 176,000 | | | | 181,280 | |
| | |
Sirius XM Radio, Inc. | | | | | | | | |
| | |
4.63%, 5/15/2023 (e) | | | 10,000 | | | | 10,175 | |
| | |
4.63%, 7/15/2024 (e) | | | 12,000 | | | | 12,525 | |
| | |
5.38%, 4/15/2025 (e) | | | 93,000 | | | | 96,487 | |
| | |
5.38%, 7/15/2026 (e) | | | 2,000 | | | | 2,113 | |
| | |
5.00%, 8/1/2027 (e) | | | 12,000 | | | | 12,660 | |
| | |
5.50%, 7/1/2029 (e) | | | 14,000 | | | | 15,256 | |
| | |
Six Flags Entertainment Corp. | | | | | | | | |
| | |
4.88%, 7/31/2024 (e) | | | 10,000 | | | | 10,350 | |
| | |
5.50%, 4/15/2027 (e) | | | 4,000 | | | | 4,280 | |
| | |
Solera LLC 10.50%, 3/1/2024 (e) | | | 45,000 | | | | 47,700 | |
| | |
Sotheby’s 4.88%, 12/15/2025 (e) | | | 20,000 | | | | 20,500 | |
| | |
Southwestern Energy Co. 6.20%, 1/23/2025 (f) | | | 87,000 | | | | 76,125 | |
SEE NOTES TO FINANCIAL STATEMENTS.
| | | | | | | | |
| | | |
| AUGUST 31, 2019 | | J.P. MORGAN EXCHANGE-TRADED FUNDS | | | | | 69 | |
JPMorgan Global Bond Opportunities ETF
SCHEDULE OF PORTFOLIO INVESTMENTS
AS OF AUGUST 31, 2019 (Unaudited) (continued)
(Amounts in U.S. Dollars, unless otherwise noted)
| | | | | | | | |
| INVESTMENTS | | PRINCIPAL
AMOUNT | | | VALUE | |
Corporate Bonds — continued | | | | | | | | |
| | |
United States — continued | | | | | | | | |
| | |
Spectrum Brands, Inc. | | | | | | | | |
| | |
6.63%, 11/15/2022 | | | 28,000 | | | | 28,490 | |
| | |
5.75%, 7/15/2025 | | | 90,000 | | | | 93,600 | |
| | |
Springleaf Finance Corp. | | | | | | | | |
| | |
5.63%, 3/15/2023 | | | 60,000 | | | | 64,500 | |
| | |
7.13%, 3/15/2026 | | | 32,000 | | | | 36,496 | |
| | |
Sprint Capital Corp. 8.75%, 3/15/2032 | | | 157,000 | | | | 196,639 | |
| | |
Sprint Corp. | | | | | | | | |
| | |
7.88%, 9/15/2023 | | | 173,000 | | | | 194,625 | |
| | |
7.13%, 6/15/2024 | | | 80,000 | | | | 88,437 | |
| | |
7.63%, 2/15/2025 | | | 376,000 | | | | 420,650 | |
| | |
SPX FLOW, Inc. 5.63%, 8/15/2024 (e) | | | 50,000 | | | | 52,188 | |
| | |
SS&C Technologies, Inc. 5.50%, 9/30/2027 (e) | | | 55,000 | | | | 57,750 | |
| | |
Standard Industries, Inc. | | | | | | | | |
| | |
6.00%, 10/15/2025 (e) | | | 24,000 | | | | 25,230 | |
| | |
4.75%, 1/15/2028 (e) | | | 60,000 | | | | 60,300 | |
| | |
Staples, Inc. | | | | | | | | |
| | |
7.50%, 4/15/2026 (e) | | | 75,000 | | | | 75,750 | |
| | |
10.75%, 4/15/2027 (e) | | | 46,000 | | | | 46,460 | |
| | |
Station Casinos LLC 5.00%, 10/1/2025 (e) | | | 21,000 | | | | 21,422 | |
| | |
Steel Dynamics, Inc. 5.00%, 12/15/2026 | | | 25,000 | | | | 26,125 | |
| | |
Summit Materials LLC 6.13%, 7/15/2023 | | | 20,000 | | | | 20,325 | |
| | |
Summit Midstream Holdings LLC | | | | | | | | |
| | |
5.50%, 8/15/2022 | | | 20,000 | | | | 18,800 | |
| | |
5.75%, 4/15/2025 | | | 20,000 | | | | 17,154 | |
| | |
Sunoco Logistics Partners Operations LP 5.35%, 5/15/2045 | | | 130,000 | | | | 141,660 | |
| | |
Sunoco LP | | | | | | | | |
| | |
4.88%, 1/15/2023 | | | 20,000 | | | | 20,450 | |
| | |
5.50%, 2/15/2026 | | | 15,000 | | | | 15,563 | |
| | |
6.00%, 4/15/2027 | | | 22,000 | | | | 23,155 | |
| | |
Syneos Health, Inc. 7.50%, 10/1/2024 (e) | | | 51,000 | | | | 53,040 | |
| | |
Talen Energy Supply LLC 6.50%, 6/1/2025 | | | 9,000 | | | | 6,840 | |
| | |
Tallgrass Energy Partners LP 5.50%, 9/15/2024 (e) | | | 28,000 | | | | 27,300 | |
| | |
Targa Resources Partners LP | | | | | | | | |
| | |
4.25%, 11/15/2023 | | | 62,000 | | | | 61,922 | |
| | |
6.75%, 3/15/2024 | | | 170,000 | | | | 176,588 | |
| | | | | | | | |
| INVESTMENTS | | PRINCIPAL
AMOUNT | | | VALUE | |
| | | | | | | | |
| | |
United States — continued | | | | | | | | |
| | |
Team Health Holdings, Inc. 6.38%, 2/1/2025 (e) | | | 53,000 | | | | 35,510 | |
| | |
TEGNA, Inc. 6.38%, 10/15/2023 | | | 75,000 | | | | 77,100 | |
| | |
Teleflex, Inc. 5.25%, 6/15/2024 | | | 50,000 | | | | 51,500 | |
| | |
Tempur Sealy International, Inc. | | | | | | | | |
| | |
5.63%, 10/15/2023 | | | 110,000 | | | | 113,300 | |
| | |
5.50%, 6/15/2026 | | | 50,000 | | | | 52,250 | |
| | |
Tenet Healthcare Corp. | | | | | | | | |
| | |
4.50%, 4/1/2021 | | | 74,000 | | | | 76,590 | |
| | |
8.13%, 4/1/2022 | | | 145,000 | | | | 156,223 | |
| | |
6.75%, 6/15/2023 | | | 70,000 | | | | 71,925 | |
| | |
4.63%, 9/1/2024 (e) | | | 6,000 | | | | 6,180 | |
| | |
5.13%, 5/1/2025 | | | 75,000 | | | | 75,187 | |
| | |
4.88%, 1/1/2026 (e) | | | 30,000 | | | | 30,828 | |
| | |
6.25%, 2/1/2027 (e) | | | 35,000 | | | | 36,313 | |
| | |
5.13%, 11/1/2027 (e) | | | 21,000 | | | | 21,709 | |
| | |
Tennant Co. 5.63%, 5/1/2025 | | | 33,000 | | | | 34,073 | |
| | |
Tenneco, Inc. 5.00%, 7/15/2026 | | | 65,000 | | | | 50,497 | |
| | |
Terex Corp. 5.63%, 2/1/2025 (e) | | | 65,000 | | | | 66,142 | |
| | |
Terraform Global Operating LLC 6.13%, 3/1/2026 (e) | | | 10,000 | | | | 10,275 | |
| | |
TerraForm Power Operating LLC | | | | | | | | |
| | |
4.25%, 1/31/2023 (e) | | | 17,000 | | | | 17,419 | |
| | |
6.63%, 6/15/2025 (e) (f) | | | 8,000 | | | | 8,440 | |
| | |
5.00%, 1/31/2028 (e) | | | 21,000 | | | | 21,867 | |
| | |
Thermo Fisher Scientific, Inc. 3.00%, 4/15/2023 | | | 475,000 | | | | 488,630 | |
| | |
T-Mobile USA, Inc. | | | | | | | | |
| | |
6.50%, 1/15/2024 ‡ | | | 150,000 | | | | — | |
| | |
6.38%, 3/1/2025 | | | 79,000 | | | | 81,805 | |
| | |
6.50%, 1/15/2026 | | | 375,000 | | | | 403,125 | |
| | |
6.50%, 1/15/2026 ‡ | | | 160,000 | | | | — | |
| | |
4.50%, 2/1/2026 | | | 50,000 | | | | 51,875 | |
| | |
TransDigm, Inc. 6.25%, 3/15/2026 (e) | | | 70,000 | | | | 75,511 | |
| | |
Transocean Pontus Ltd. 6.13%, 8/1/2025 (e) | | | 18,690 | | | | 18,950 | |
| | |
Transocean Poseidon Ltd. 6.88%, 2/1/2027 (e) | | | 10,000 | | | | 10,438 | |
| | |
Transocean Proteus Ltd. 6.25%, 12/1/2024 (e) | | | 36,000 | | | | 36,810 | |
| | |
Transocean, Inc. | | | | | | | | |
| | |
9.00%, 7/15/2023 (e) | | | 25,000 | | | | 25,843 | |
| | |
7.50%, 1/15/2026 (e) | | | 55,000 | | | | 50,188 | |
| | |
7.50%, 4/15/2031 | | | 9,000 | | | | 6,964 | |
| | |
6.80%, 3/15/2038 | | | 36,000 | | | | 23,760 | |
SEE NOTES TO FINANCIAL STATEMENTS.
| | | | | | |
| | | |
| 70 | | | | J.P. MORGAN EXCHANGE-TRADED FUNDS | | AUGUST 31, 2019 |
| | | | | | | | |
| INVESTMENTS | | PRINCIPAL
AMOUNT | | | VALUE | |
Corporate Bonds — continued | | | | | | | | |
| | |
United States — continued | | | | | | | | |
| | |
9.35%, 12/15/2041 (f) | | | 29,000 | | | | 24,142 | |
| | |
Trinseo Materials Operating SCA 5.38%, 9/1/2025 (e) | | | 28,000 | | | | 26,320 | |
| | |
Triumph Group, Inc. 7.75%, 8/15/2025 | | | 75,000 | | | | 75,188 | |
| | |
Tronox Finance plc 5.75%, 10/1/2025 (e) | | | 8,000 | | | | 7,420 | |
| | |
Tronox, Inc. 6.50%, 4/15/2026 (e) | | | 19,000 | | | | 18,050 | |
| | |
Twin River Worldwide Holdings, Inc. 6.75%, 6/1/2027 (e) | | | 3,000 | | | | 3,161 | |
| | |
Ultra Resources, Inc. 11.00% (Blend (cash 9.00% + PIK 2.00%)), 7/12/2024 (g) | | | 127,428 | | | | 14,952 | |
| | |
Union Pacific Corp. | | | | | | | | |
| | |
3.15%, 3/1/2024 | | | 130,000 | | | | 135,974 | |
| | |
4.30%, 3/1/2049 | | | 100,000 | | | | 119,146 | |
| | |
United Airlines Holdings, Inc. | | | | | | | | |
| | |
5.00%, 2/1/2024 | | | 25,000 | | | | 26,500 | |
| | |
4.88%, 1/15/2025 | | | 13,000 | | | | 13,618 | |
| | |
United Rentals North America, Inc. 5.50%, 5/15/2027 | | | 289,000 | | | | 310,100 | |
| | |
United States Cellular Corp. 6.70%, 12/15/2033 | | | 90,000 | | | | 95,963 | |
| | |
United States Steel Corp. | | | | | | | | |
| | |
6.88%, 8/15/2025 | | | 9,000 | | | | 8,541 | |
| | |
6.25%, 3/15/2026 | | | 28,000 | | | | 24,763 | |
| | |
United Technologies Corp. | | | | | | | | |
| | |
3.95%, 8/16/2025 | | | 125,000 | | | | 137,219 | |
| | |
4.13%, 11/16/2028 | | | 150,000 | | | | 171,645 | |
| | |
3.75%, 11/1/2046 | | | 115,000 | | | | 127,676 | |
| | |
Uniti Group LP REIT, 6.00%, 4/15/2023 (e) | | | 85,000 | | | | 80,962 | |
| | |
Univision Communications, Inc. | | | | | | | | |
| | |
5.13%, 5/15/2023 (e) | | | 26,000 | | | | 25,675 | |
| | |
5.13%, 2/15/2025 (e) | | | 21,000 | | | | 20,263 | |
| | |
Verizon Communications, Inc. 4.33%, 9/21/2028 | | | 230,000 | | | | 264,195 | |
| | |
Vertiv Group Corp. 9.25%, 10/15/2024 (e) | | | 44,000 | | | | 41,580 | |
| | |
VICI Properties 1 LLC REIT, 8.00%, 10/15/2023 | | | 115,000 | | | | 125,638 | |
| | |
Vista Outdoor, Inc. 5.88%, 10/1/2023 | | | 85,000 | | | | 76,765 | |
| | |
Vistra Energy Corp. 5.88%, 6/1/2023 | | | 22,000 | | | | 22,440 | |
| | |
Vistra Operations Co. LLC 5.50%, 9/1/2026 (e) | | | 55,000 | | | | 57,750 | |
| | | | | | | | |
| INVESTMENTS | | PRINCIPAL
AMOUNT | | | VALUE | |
| | | | | | | | |
| | |
United States — continued | | | | | | | | |
| | |
VOC Escrow Ltd. 5.00%, 2/15/2028 (e) | | | 17,000 | | | | 17,425 | |
| | |
W&T Offshore, Inc. 9.75%, 11/1/2023 (e) | | | 44,000 | | | | 42,460 | |
| | |
Walt Disney Co. (The) 4.95%, 10/15/2045 (e) | | | 120,000 | | | | 162,896 | |
| | |
Welbilt, Inc. 9.50%, 2/15/2024 | | | 140,000 | | | | 150,325 | |
| | |
WellCare Health Plans, Inc. 5.25%, 4/1/2025 | | | 28,000 | | | | 29,317 | |
| | |
Wells Fargo & Co. 4.90%, 11/17/2045 | | | 150,000 | | | | 186,678 | |
| | |
WESCO Distribution, Inc. 5.38%, 6/15/2024 | | | 17,000 | | | | 17,553 | |
| | |
Western Digital Corp. 4.75%, 2/15/2026 | | | 50,000 | | | | 51,173 | |
| | |
Whiting Petroleum Corp. | | | | | | | | |
| | |
5.75%, 3/15/2021 | | | 85,000 | | | | 79,492 | |
| | |
6.63%, 1/15/2026 | | | 21,000 | | | | 15,198 | |
| | |
William Carter Co. (The) 5.63%, 3/15/2027 (e) | | | 8,000 | | | | 8,520 | |
| | |
Williams Cos., Inc. (The) 4.00%, 9/15/2025 | | | 275,000 | | | | 292,313 | |
| | |
Windstream Services LLC 8.63%, 10/31/2025 (e) (f) | | | 15,000 | | | | 15,075 | |
| | |
WMG Acquisition Corp. | | | | | | | | |
| | |
4.13%, 11/1/2024 (a) | | | EUR 135,000 | | | | 153,756 | |
| | |
4.88%, 11/1/2024 (e) | | | 113,000 | | | | 116,672 | |
| | |
WPX Energy, Inc. 8.25%, 8/1/2023 | | | 70,000 | | | | 77,875 | |
| | |
Wyndham Destinations, Inc. | | | | | | | | |
| | |
5.40%, 4/1/2024 (f) | | | 2,000 | | | | 2,099 | |
| | |
6.35%, 10/1/2025 (f) | | | 13,000 | | | | 14,251 | |
| | |
5.75%, 4/1/2027 (f) | | | 17,000 | | | | 18,148 | |
| | |
Wynn Las Vegas LLC 5.50%, 3/1/2025 (e) | | | 121,000 | | | | 127,655 | |
| | |
XPO Logistics, Inc. | | | | | | | | |
| | |
6.50%, 6/15/2022 (e) | | | 90,000 | | | | 91,974 | |
| | |
6.13%, 9/1/2023 (e) | | | 26,000 | | | | 26,884 | |
| | |
6.75%, 8/15/2024 (e) | | | 35,000 | | | | 37,712 | |
| | |
Zayo Group LLC 6.38%, 5/15/2025 | | | 104,000 | | | | 106,990 | |
| | | | | | | | |
| | |
| | | | | | | 45,840,526 | |
| | | | | | | | |
| | |
Total Corporate Bonds
(Cost $87,502,256) | | | | | | | 88,613,360 | |
| | | | | | | | |
Foreign Government Securities — 25.6% | |
|
Angola — 0.1% | |
| | |
Republic of Angola 9.50%, 11/12/2025 (a) | | | 200,000 | | | | 226,500 | |
| | | | | | | | |
SEE NOTES TO FINANCIAL STATEMENTS.
| | | | | | | | |
| | | |
| AUGUST 31, 2019 | | J.P. MORGAN EXCHANGE-TRADED FUNDS | | | | | 71 | |
JPMorgan Global Bond Opportunities ETF
SCHEDULE OF PORTFOLIO INVESTMENTS
AS OF AUGUST 31, 2019 (Unaudited) (continued)
(Amounts in U.S. Dollars, unless otherwise noted)
| | | | | | | | |
| INVESTMENTS | | PRINCIPAL
AMOUNT | | | VALUE | |
Foreign Government Securities — continued | |
|
Bahrain — 0.3% | |
| | |
Kingdom of Bahrain | | | | | | | | |
| | |
6.00%, 9/19/2044 (a) | | | 358,000 | | | | 361,804 | |
| | |
7.50%, 9/20/2047 (a) | | | 260,000 | | | | 300,868 | |
| | | | | | | | |
| | |
| | | | | | | 662,672 | |
| | | | | | | | |
|
Belarus — 0.2% | |
| | |
Republic of Belarus 6.88%, 2/28/2023 (a) | | | 350,000 | | | | 375,156 | |
| | | | | | | | |
|
Benin — 0.2% | |
| | |
Benin Government International Bond 5.75%, 3/26/2026 (e) | | | EUR 320,000 | | | | 359,609 | |
| | | | | | | | |
|
Canada — 2.8% | |
| | |
Canada Government Bond 2.25%, 6/1/2029 | | | CAD 6,650,000 | | | | 5,493,218 | |
| | | | | | | | |
|
Colombia — 0.3% | |
| | |
Republic of Colombia | | | | | | | | |
| | |
5.00%, 6/15/2045 | | | 200,000 | | | | 241,800 | |
| | |
5.20%, 5/15/2049 | | | 300,000 | | | | 376,312 | |
| | | | | | | | |
| | |
| | | | | | | 618,112 | |
| | | | | | | | |
|
Cyprus — 0.7% | |
| | |
Republic of Cyprus | | | | | | | | |
| | |
2.75%, 6/27/2024 (a) | | | EUR 230,000 | | | | 286,340 | |
| | |
2.38%, 9/25/2028 (a) | | | EUR 570,000 | | | | 739,917 | |
| | |
2.75%, 2/26/2034 (a) | | | EUR 180,000 | | | | 251,142 | |
| | | | | | | | |
| | |
| | | | | | | 1,277,399 | |
| | | | | | | | |
|
Dominican Republic — 0.4% | |
| | |
Government of Dominican Republic | | | | | | | | |
| | |
6.88%, 1/29/2026 (a) | | | 350,000 | | | | 400,531 | |
| | |
9.75%, 6/5/2026 (e) | | | DOP 14,000,000 | | | | 281,304 | |
| | |
5.95%, 1/25/2027 (a) | | | 160,000 | | | | 175,600 | |
| | | | | | | | |
| | |
| | | | | | | 857,435 | |
| | | | | | | | |
|
Ecuador — 0.2% | |
| | |
Republic of Ecuador 10.50%, 3/24/2020 (a) | | | 350,000 | | | | 358,969 | |
| | | | | | | | |
|
Egypt — 0.2% | |
| | |
Arab Republic of Egypt 7.60%, 3/1/2029 (e) | | | 280,000 | | | | 302,575 | |
| | | | | | | | |
|
El Salvador — 0.3% | |
| | |
Republic of El Salvador | | | | | | | | |
| | |
7.38%, 12/1/2019 (a) | | | 100,000 | | | | 100,594 | |
| | |
7.75%, 1/24/2023 (a) | | | 152,000 | | | | 165,347 | |
| | |
7.12%, 1/20/2050 (e) | | | 227,000 | | | | 231,682 | |
| | | | | | | | |
| | |
| | | | | | | 497,623 | |
| | | | | | | | |
| | | | | | | | |
| INVESTMENTS | | PRINCIPAL
AMOUNT | | | VALUE | |
| | | | | | | | |
|
Ethiopia — 0.1% | |
| | |
Federal Democratic Republic of Ethiopia 6.63%, 12/11/2024 (a) | | | 200,000 | | | | 208,063 | |
| | | | | | | | |
|
Ghana — 0.1% | |
| | |
Republic of Ghana 7.88%, 8/7/2023 (a) | | | 200,000 | | | | 218,000 | |
| | | | | | | | |
|
Greece — 0.9% | |
| | |
Greece Government Bond | | | | | | | | |
| | |
3.38%, 2/15/2025 (a) | | | EUR 946,000 | | | | 1,161,918 | |
| | |
1.88%, 7/23/2026 (a) | | | EUR 466,000 | | | | 529,064 | |
| | | | | | | | |
| | |
| | | | | | | 1,690,982 | |
| | | | | | | | |
|
Guatemala — 0.1% | |
| | |
Republic of Guatemala 6.13%, 6/1/2050 (e) | | | 230,000 | | | | 274,922 | |
| | | | | | | | |
|
Hungary — 0.7% | |
| | |
Republic of Hungary | | | | | | | | |
| | |
3.00%, 8/21/2030 | | | HUF 202,330,000 | | | | 743,695 | |
| | |
3.00%, 10/27/2038 | | | HUF 163,620,000 | | | | 601,749 | |
| | | | | | | | |
| | |
| | | | | | | 1,345,444 | |
| | | | | | | | |
|
Indonesia — 1.2% | |
| | |
Republic of Indonesia | | | | | | | | |
| | |
8.25%, 7/15/2021 | | | IDR 11,161,000,000 | | | | 808,848 | |
| | |
8.25%, 5/15/2029 | | | IDR 6,240,000,000 | | | | 467,450 | |
| | |
8.75%, 5/15/2031 | | | IDR 8,404,000,000 | | | | 638,372 | |
| | |
6.63%, 2/17/2037 (a) | | | 340,000 | | | | 474,088 | |
| | | | | | | | |
| | |
| | | | | | | 2,388,758 | |
| | | | | | | | |
|
Italy — 1.2% | |
| | |
Italy Government Bond | | | | | | | | |
| | |
3.75%, 8/1/2021 (a) | | | EUR 820,000 | | | | 967,461 | |
| | |
1.00%, 7/15/2022 (a) | | | EUR 860,000 | | | | 970,419 | |
| | |
3.85%, 9/1/2049 (a) | | | EUR 215,000 | | | | 331,405 | |
| | | | | | | | |
| | |
| | | | | | | 2,269,285 | |
| | | | | | | | |
|
Ivory Coast — 0.1% | |
| | |
Republic of Cote d’Ivoire 5.13%, 6/15/2025 (a) | | | EUR 240,000 | | | | 280,175 | |
| | | | | | | | |
|
Jamaica — 0.1% | |
| | |
Jamaica Government International Bond 8.00%, 3/15/2039 | | | 220,000 | | | | 284,556 | |
| | | | | | | | |
|
Kenya — 0.1% | |
| | |
Republic of Kenya 8.25%, 2/28/2048 (a) | | | 250,000 | | | | 257,812 | |
| | | | | | | | |
SEE NOTES TO FINANCIAL STATEMENTS.
| | | | | | |
| | | |
| 72 | | | | J.P. MORGAN EXCHANGE-TRADED FUNDS | | AUGUST 31, 2019 |
| | | | | | | | |
| INVESTMENTS | | PRINCIPAL
AMOUNT | | | VALUE | |
Foreign Government Securities — continued | |
|
Lebanon — 0.3% | |
| | |
Republic of Lebanon | | | | | | | | |
| | |
5.45%, 11/28/2019 (a) | | | 250,000 | | | | 246,328 | |
| | |
6.85%, 3/23/2027 (a) | | | 321,000 | | | | 214,468 | |
| | |
6.65%, 11/3/2028 (a) | | | 199,000 | | | | 132,273 | |
| | | | | | | | |
| | |
| | | | | | | 593,069 | |
| | | | | | | | |
|
Malaysia — 1.0% | |
| | |
Malaysia Sovereign Sukuk Bhd. 4.64%, 11/7/2033 | | | MYR 7,245,000 | | | | 1,925,439 | |
| | | | | | | | |
|
Mexico — 1.0% | |
| | |
United Mexican States 7.75%, 5/29/2031 | | | MXN 36,000,000 | | | | 1,887,265 | |
| | | | | | | | |
|
Pakistan — 0.2% | |
| | |
Republic of Pakistan 6.88%, 12/5/2027 (a) | | | 360,000 | | | | 360,450 | |
| | | | | | | | |
|
Panama — 0.2% | |
| | |
Republic of Panama 3.87%, 7/23/2060 | | | 400,000 | | | | 457,625 | |
| | | | | | | | |
|
Paraguay — 0.1% | |
| | |
Republic of Paraguay 5.00%, 4/15/2026 (a) | | | 220,000 | | | | 242,756 | |
| | | | | | | | |
|
Peru — 0.4% | |
| | |
Republic of Peru 6.90%, 8/12/2037 (a) | | | PEN 1,895,000 | | | | 687,720 | |
| | | | | | | | |
|
Poland — 1.0% | |
| | |
Republic of Poland 2.75%, 4/25/2028 | | | PLN 7,090,000 | | | | 1,914,586 | |
| | | | | | | | |
|
Portugal — 3.9% | |
| | |
Portugal Obrigacoes do Tesouro | | | | | | | | |
| | |
5.13%, 10/15/2024 (a) | | | 990,000 | | | | 1,133,507 | |
| | |
2.88%, 10/15/2025 (a) | | | EUR 2,460,000 | | | | 3,213,174 | |
| | |
2.88%, 7/21/2026 (a) | | | EUR 1,035,000 | | | | 1,373,210 | |
| | |
1.95%, 6/15/2029 (a) | | | EUR 790,000 | | | | 1,022,298 | |
| | |
2.25%, 4/18/2034 (a) | | | EUR 545,000 | | | | 746,247 | |
| | | | | | | | |
| | |
| | | | | | | 7,488,436 | |
| | | | | | | | |
|
Qatar — 0.2% | |
| | |
State of Qatar 5.10%, 4/23/2048 (a) | | | 245,000 | | | | 326,845 | |
| | | | | | | | |
|
Romania — 0.3% | |
| | |
Republic of Romania | | | | | | | | |
| | |
2.12%, 7/16/2031 (e) | | | EUR 193,000 | | | | 219,541 | |
| | |
4.63%, 4/3/2049 (e) | | | EUR 256,000 | | | | 360,312 | |
| | | | | | | | |
| | |
| | | | | | | 579,853 | |
| | | | | | | | |
| | | | | | | | |
| INVESTMENTS | | PRINCIPAL
AMOUNT | | | VALUE | |
| | | | | | | | |
|
Russia — 0.5% | |
| | |
Russian Federation 7.75%, 9/16/2026 | | | RUB 59,180,000 | | | | 928,747 | |
| | | | | | | | |
|
Saudi Arabia — 0.2% | |
| | |
Kingdom of Saudi Arabia 0.75%, 7/9/2027 (e) | | | EUR 400,000 | | | | 458,414 | |
| | | | | | | | |
|
Serbia — 0.3% | |
| | |
Republic of Serbia | | | | | | | | |
| | |
4.88%, 2/25/2020 (a) | | | 300,000 | | | | 302,940 | |
| | |
1.50%, 6/26/2029 (e) | | | EUR 230,000 | | | | 263,525 | |
| | | | | | | | |
| | |
| | | | | | | 566,465 | |
| | | | | | | | |
|
South Africa — 1.6% | |
| | |
Republic of South Africa | | | | | | | | |
| | |
8.88%, 2/28/2035 | | | ZAR 4,000,000 | | | | 247,859 | |
| | |
9.00%, 1/31/2040 | | | ZAR 4,000,000 | | | | 243,454 | |
| | |
6.50%, 2/28/2041 | | | ZAR 54,756,087 | | | | 2,530,536 | |
| | | | | | | | |
| | |
| | | | | | | 3,021,849 | |
| | | | | | | | |
|
South Korea — 0.2% | |
| | |
Korea Housing Finance Corp. 0.10%, 6/18/2024 (e) | | | EUR 371,000 | | | | 413,562 | |
| | | | | | | | |
|
Spain — 3.4% | |
| | |
Kingdom of Spain | | | | | | | | |
| | |
2.15%, 10/31/2025 (a) | | | EUR 2,200,000 | | | | 2,775,858 | |
| | |
1.45%, 4/30/2029 (a) | | | EUR 1,750,000 | | | | 2,178,441 | |
| | |
1.85%, 7/30/2035 (a) | | | EUR 580,000 | | | | 765,635 | |
| | |
2.90%, 10/31/2046 (a) | | | EUR 610,000 | | | | 983,252 | |
| | | | | | | | |
| | |
| | | | | | | 6,703,186 | |
| | | | | | | | |
|
Sri Lanka — 0.2% | |
| | |
Republic of Sri Lanka | | | | | | | | |
| | |
6.35%, 6/28/2024 (e) | | | 200,000 | | | | 199,603 | |
| | |
7.55%, 3/28/2030 (e) | | | 200,000 | | | | 200,000 | |
| | | | | | | | |
| | |
| | | | | | | 399,603 | |
| | | | | | | | |
|
United Arab Emirates — 0.3% | |
| | |
Abu Dhabi Government Bond 4.13%, 10/11/2047 (a) | | | 450,000 | | | | 558,844 | |
| | | | | | | | |
| | |
Total Foreign Government Securities
(Cost $48,949,764) | | | | | | | 49,761,979 | |
| | | | | | | | |
Asset-Backed Securities — 7.6% | |
|
Cayman Islands — 0.6% | |
| | |
Apidos CLO Series XXXA, Class A2, 3.90%, 10/18/2031 (e) (i) | | | 250,000 | | | | 246,552 | |
| | |
Benefit Street Partners CLO XISeries 2017-11A, Class A2A, 4.05%, 4/15/2029 (e) (i) | | | 250,000 | | | | 248,797 | |
SEE NOTES TO FINANCIAL STATEMENTS.
| | | | | | | | |
| | | |
| AUGUST 31, 2019 | | J.P. MORGAN EXCHANGE-TRADED FUNDS | | | | | 73 | |
JPMorgan Global Bond Opportunities ETF
SCHEDULE OF PORTFOLIO INVESTMENTS
AS OF AUGUST 31, 2019 (Unaudited) (continued)
(Amounts in U.S. Dollars, unless otherwise noted)
| | | | | | | | |
| INVESTMENTS | | PRINCIPAL
AMOUNT | | | VALUE | |
Asset-Backed Securities — continued | | | | | | | | |
| | |
Cayman Islands — continued | | | | | | | | |
| | |
BlueMountain CLO Ltd.Series 2014-2A, Class BR2, 4.03%, 10/20/2030 ‡ (e) (i) | | | 350,000 | | | | 346,452 | |
| | |
Shackleton CLO Ltd.Series 2014-6RA, Class B, 4.03%, 7/17/2028 (e) (i) | | | 260,000 | | | | 258,919 | |
| | | | | | | | |
| | |
| | | | | | | 1,100,720 | |
| | | | | | | | |
|
United States — 7.0% | |
| | |
ACCTrust Series 2019-1, Class A, 3.75%, 5/20/2022 (e) | | | 95,418 | | | | 96,350 | |
| | |
Accelerated Assets LLCSeries 2018-1, Class C, 6.65%, 12/2/2033 ‡ (e) | | | 236,167 | | | | 246,402 | |
| | |
American Credit Acceptance Receivables Trust | | | | | | | | |
| | |
Series 2016-4, Class D, 4.11%, 4/12/2023 (e) | | | 47,000 | | | | 47,487 | |
| | |
Series 2019-3, Class B, 2.59%, 8/14/2023 (e) | | | 290,000 | | | | 290,218 | |
| | |
Series 2018-3, Class C, 3.75%, 10/15/2024 (e) | | | 60,000 | | | | 60,653 | |
| | |
Series 2019-3, Class C, 2.76%, 9/12/2025 (e) | | | 192,000 | | | | 192,483 | |
| | |
Series 2019-3, Class D, 2.89%, 9/12/2025 (e) | | | 97,000 | | | | 97,443 | |
| | |
Business Jet Securities LLCSeries 2018-2, Class C, 6.66%, 6/15/2033 (e) | | | 170,375 | | | | 173,254 | |
| | |
Chase FundingTrust Series 2003-6, Class 1A7, 5.02%, 11/25/2034 (f) | | | 138,467 | | | | 145,745 | |
| | |
Citi Held For Asset IssuanceSeries 2015-PM2, Class C, 5.96%, 3/15/2022 ‡ (e) | | | 24,142 | | | | 24,173 | |
| | |
Conn’s Receivables Funding LLC | | | | | | | | |
| | |
Series 2019-A, Class B, 4.36%, 10/16/2023 ‡ (e) | | | 110,000 | | | | 111,157 | |
| | |
Series 2019-A, Class C, 5.29%, 10/16/2023 ‡ (e) | | | 100,000 | | | | 100,989 | |
| | |
Consumer Loan Underlying Bond CreditTrust Series 2017-NP1, Class C, 5.13%, 4/17/2023 ‡ (e) | | | 5,782 | | | | 5,788 | |
| | |
CPS Auto Receivables Trust | | | | | | | | |
| | |
Series 2018-A, Class B, 2.77%, 4/18/2022 (e) | | | 640,000 | | | | 641,254 | |
| | |
Series 2018-A, Class D, 3.66%, 12/15/2023 (e) | | | 400,000 | | | | 408,033 | |
| | |
Credit Acceptance Auto Loan Trust | | | | | | | | |
| | |
Series 2018-1A, Class C, 3.77%, 6/15/2027 (e) | | | 250,000 | | | | 256,001 | |
| | |
Series 2018-3A, Class B, 3.89%, 10/15/2027 (e) | | | 250,000 | | | | 259,097 | |
| | | | | | | | |
| INVESTMENTS | | PRINCIPAL
AMOUNT | | | VALUE | |
| | | | | | | | |
| | |
United States — continued | | | | | | | | |
| | |
Credit-Based Asset Servicing & Securitization LLCSeries 2004-CB5, Class M1, 3.06%, 1/25/2034 ‡ (i) | | | 115,796 | | | | 116,190 | |
| | |
CWABS, Inc. Asset-Backed CertificatesSeries 2003-5, Class AF5, 5.12%, 2/25/2034 ‡ (f) | | | 116,679 | | | | 119,742 | |
| | |
Drive Auto Receivables Trust | | | | | | | | |
| | |
Series 2018-3, Class D, 4.30%, 9/16/2024 | | | 256,000 | | | | 264,437 | |
| | |
Series 2018-4, Class C, 3.66%, 11/15/2024 | | | 260,000 | | | | 263,569 | |
| | |
DT Auto Owner Trust | | | | | | | | |
| | |
Series 2018-3A, Class C, 3.79%, 7/15/2024 (e) | | | 260,000 | | | | 266,039 | |
| | |
Series 2019-1A, Class D, 3.87%, 11/15/2024 (e) | | | 65,000 | | | | 67,107 | |
| | |
Series 2019-1A, Class E, 4.94%, 2/17/2026 (e) | | | 100,000 | | | | 104,370 | |
| | |
Exeter Automobile Receivables Trust | | | | | | | | |
| | |
Series 2015-2A, Class D, 5.79%, 5/16/2022 (e) | | | 100,000 | | | | 101,082 | |
| | |
Series 2015-3A, Class D, 6.55%, 10/17/2022 (e) | | | 220,000 | | | | 225,455 | |
| | |
Series 2018-3A, Class C, 3.71%, 6/15/2023 (e) | | | 99,000 | | | | 100,900 | |
| | |
Series 2017-3A, Class C, 3.68%, 7/17/2023 (e) | | | 180,000 | | | | 183,757 | |
| | |
Series 2016-3A, Class D, 6.40%, 7/17/2023 (e) | | | 350,000 | | | | 366,782 | |
| | |
Series 2018-2A, Class D, 4.04%, 3/15/2024 (e) | | | 60,000 | | | | 61,762 | |
| | |
Series 2018-3A, Class D, 4.35%, 6/17/2024 (e) | | | 210,000 | | | | 219,357 | |
| | |
Series 2019-1A, Class C, 3.82%, 12/16/2024 (e) | | | 130,000 | | | | 133,550 | |
| | |
Series 2019-1A, Class D, 4.13%, 12/16/2024 (e) | | | 240,000 | | | | 250,324 | |
| | |
Flagship Credit Auto Trust | | | | | | | | |
| | |
Series 2018-3, Class A, 3.07%, 2/15/2023 (e) | | | 202,288 | | | | 203,358 | |
| | |
Series 2017-4, Class D, 3.58%, 1/15/2024 (e) | | | 280,000 | | | | 287,320 | |
| | |
Series 2017-2, Class E, 5.55%, 7/15/2024 (e) | | | 380,000 | | | | 398,295 | |
| | |
Series 2018-3, Class C, 3.79%, 12/16/2024 (e) | | | 170,000 | | | | 175,908 | |
| | |
FREED ABS Trust | | | | | | | | |
| | |
Series 2018-1, Class A, 3.61%, 7/18/2024 (e) | | | 58,441 | | | | 58,737 | |
SEE NOTES TO FINANCIAL STATEMENTS.
| | | | | | |
| | | |
| 74 | | | | J.P. MORGAN EXCHANGE-TRADED FUNDS | | AUGUST 31, 2019 |
| | | | | | | | |
| INVESTMENTS | | PRINCIPAL
AMOUNT | | | VALUE | |
Asset-Backed Securities — continued | | | | | | | | |
| | |
United States — continued | | | | | | | | |
| | |
Series 2018-1, Class B, 4.56%, 7/18/2024 ‡ (e) | | | 100,000 | | | | 102,420 | |
| | |
GLS Auto Receivables Issuer Trust | | | | | | | | |
| | |
Series 2019-2A, Class B, 3.32%, 3/15/2024 (e) | | | 200,000 | | | | 203,240 | |
| | |
Series 2019-1A, Class C, 3.87%, 12/16/2024 (e) | | | 155,000 | | | | 159,719 | |
| | |
Marlette Funding Trust | | | | | | | | |
| | |
Series 2018-1A, Class B, 3.19%, 3/15/2028 ‡ (e) | | | 100,000 | | | | 100,192 | |
| | |
Series 2018-1A, Class C, 3.69%, 3/15/2028 (e) | | | 100,000 | | | | 100,999 | |
| | |
Series 2018-2A, Class B, 3.61%, 7/17/2028 ‡ (e) | | | 335,000 | | | | 337,308 | |
| | |
Series 2018-2A, Class C, 4.37%, 7/17/2028 (e) | | | 280,000 | | | | 286,541 | |
| | |
Series 2018-3A, Class A, 3.20%, 9/15/2028 (e) | | | 38,250 | | | | 38,333 | |
| | |
MFA LLC | | | | | | | | |
| | |
Series 2017-NPL1, Class A1, 3.35%, 11/25/2047 ‡ (e) (f) | | | 219,216 | | | | 220,351 | |
| | |
Series 2018-NPL2, Class A1, 4.16%, 7/25/2048 ‡ (e) (f) | | | 153,096 | | | | 154,492 | |
| | |
Morgan Stanley ABS Capital I, Inc. TrustSeries 2004-NC8, Class B1, 4.77%, 9/25/2034 ‡ (i) | | | 311,899 | | | | 314,091 | |
| | |
OneMain Direct Auto Receivables Trust | | | | | | | | |
| | |
Series 2018-1A, Class B, 3.71%, 4/14/2025 (e) | | | 100,000 | | | | 103,294 | |
| | |
Series 2018-1A, Class D, 4.40%, 1/14/2028 (e) | | | 160,000 | | | | 166,242 | |
| | |
OneMain Financial Issuance TrustSeries 2018-1A, Class D, 4.08%, 3/14/2029 ‡ (e) | | | 100,000 | | | | 102,580 | |
| | |
Oportun Funding VI LLCSeries 2017-A, Class B, 3.97%, 6/8/2023 ‡ (e) (i) | | | 293,000 | | | | 293,284 | |
| | |
PNMAC GMSR Issuer TrustSeries 2018-GT2, Class A, 4.80%, 8/25/2025 (e) (i) | | | 210,000 | | | | 210,753 | |
| | |
Prestige Auto Receivables TrustSeries 2018-1A, Class C, 3.75%, 10/15/2024 (e) | | | 440,000 | | | | 454,565 | |
| | |
Pretium Mortgage Credit Partners I LLCSeries 2019-NPL2, Class A2, 5.93%, 12/25/2058 ‡ (e) (f) | | | 250,000 | | | | 250,894 | |
| | |
Progress Residential TrustSeries 2018-SFR3, Class E, 4.87%, 10/17/2035 ‡ (e) | | | 262,000 | | | | 275,869 | |
| | | | | | | | |
| INVESTMENTS | | PRINCIPAL
AMOUNT | | | VALUE | |
| | | | | | | | |
| | |
United States — continued | | | | | | | | |
| | |
Santander Drive Auto Receivables TrustSeries 2018-4, Class D, 3.98%, 12/15/2025 | | | 350,000 | | | | 362,418 | |
| | |
SoFi Consumer Loan Program TrustSeries 2018-1, Class B, 3.65%, 2/25/2027 (e) | | | 100,000 | | | | 102,683 | |
| | |
Structured Asset Investment Loan Trust | | | | | | | | |
| | |
Series 2004-8, Class M3, 3.12%, 9/25/2034 ‡ (i) | | | 79,021 | | | | 77,572 | |
| | |
Series 2005-HE3, Class M1, 2.87%, 9/25/2035 ‡ (i) | | | 99,891 | | | | 100,351 | |
| | |
T-Mobile USA, Inc. 6.00%, 4/15/2024 ‡ | | | 328,000 | | | | — | |
| | |
Tricolor Auto Securitization Trust | | | | | | | | |
| | |
Series 2018-2A, Class A, 3.96%, 10/15/2021 (e) | | | 111,419 | | | | 111,975 | |
| | |
Series 2018-2A, Class C, 5.75%, 5/16/2022 (e) | | | 385,581 | | | | 393,854 | |
| | |
Vericrest Opportunity Loan TrustSeries 2019-NPL3, Class A2, 6.17%, 3/25/2049 ‡ (e) (f) | | | 190,000 | | | | 192,038 | |
| | |
Veros Automobile Receivables TrustSeries 2017-1, Class A, 2.84%, 4/17/2023 (e) | | | 8,942 | | | | 8,941 | |
| | |
VOLT LXII LLCSeries 2017-NPL9, Class A1, 3.13%, 9/25/2047 ‡ (e) (f) | | | 56,636 | | | | 56,680 | |
| | |
VOLT LXIV LLCSeries 2017-NP11, Class A1, 3.38%, 10/25/2047 ‡ (e) (f) | | | 37,878 | | | | 37,910 | |
| | |
VOLT LXIX LLCSeries 2018-NPL5, Class A2, 5.80%, 8/25/2048 ‡ (e) (f) | | | 389,000 | | | | 388,424 | |
| | |
VOLT LXX LLCSeries 2018-NPL6, Class A1B, 4.56%, 9/25/2048 ‡ (e) (f) | | | 330,000 | | | | 332,752 | |
| | |
Westlake Automobile Receivables Trust | | | | | | | | |
| | |
Series 2018-3A, Class C, 3.61%, 10/16/2023 (e) | | | 130,000 | | | | 132,247 | |
| | |
Series 2018-3A, Class D, 4.00%, 10/16/2023 (e) | | | 80,000 | | | | 82,342 | |
| | |
Series 2018-2A, Class E, 4.86%, 1/16/2024 (e) | | | 310,000 | | | | 318,449 | |
| | | | | | | | |
| | |
| | | | | | | 13,698,371 | |
| | | | | | | | |
| | |
Total Asset-Backed Securities
(Cost $14,534,350) | | | | | | | 14,799,091 | |
| | | | | | | | |
SEE NOTES TO FINANCIAL STATEMENTS.
| | | | | | | | |
| | | |
| AUGUST 31, 2019 | | J.P. MORGAN EXCHANGE-TRADED FUNDS | | | | | 75 | |
JPMorgan Global Bond Opportunities ETF
SCHEDULE OF PORTFOLIO INVESTMENTS
AS OF AUGUST 31, 2019 (Unaudited) (continued)
(Amounts in U.S. Dollars, unless otherwise noted)
| | | | | | | | |
| INVESTMENTS | | PRINCIPAL
AMOUNT | | | VALUE | |
Commercial Mortgage-Backed Securities — 5.9% | |
|
United States — 5.9% | |
| | |
BAMLL Re-REMIC TrustSeries 2014-FRR4, Class BK29, PO, 4/27/2023 (e) | | | 400,000 | | | | 312,977 | |
| | |
Banc of America Commercial Mortgage TrustSeries 2007-5, Class AJ, 6.02%, 2/10/2051 (i) | | | 343,589 | | | | 372,963 | |
| | |
BANKSeries 2017-BNK9, Class D, 2.80%, 11/15/2054 ‡ (e) | | | 105,000 | | | | 92,887 | |
| | |
BHMSSeries 2018-ATLS, Class A, 3.45%, 7/15/2035 (e) (i) | | | 492,000 | | | | 491,993 | |
| | |
BX Commercial Mortgage Trust | | | | | | | | |
| | |
Series 2018-IND, Class E, 3.90%, 11/15/2035 ‡ (e) (i) | | | 300,486 | | | | 301,239 | |
| | |
Series 2018-BIOA, Class D, 3.52%, 3/15/2037 ‡ (e) (i) | | | 485,000 | | | | 486,214 | |
| | |
BX Trust | | | | | | | | |
| | |
Series 2018-MCSF, Class B, 3.00%, 4/15/2035 ‡ (e) (i) | | | 100,000 | | | | 99,625 | |
| | |
Series 2018-MCSF, Class C, 3.20%, 4/15/2035 ‡ (e) (i) | | | 100,000 | | | | 98,747 | |
| | |
BXMT Ltd.Series 2017-FL1, Class D, 4.90%, 6/15/2035 ‡ (e) (i) | | | 210,000 | | | | 210,722 | |
| | |
Citigroup Commercial Mortgage Trust | | | | | | | | |
| | |
Series 2015-P1, Class D, 3.23%, 9/15/2048 ‡ (e) | | | 205,000 | | | | 194,891 | |
| | |
Series 2016-P5, Class C, 4.46%, 10/10/2049 ‡ (i) | | | 350,000 | | | | 370,709 | |
| | |
Commercial Mortgage TrustSeries 2015-CR23, Class CME, 3.81%, 5/10/2048 ‡ (e) (i) | | | 540,000 | | | | 539,483 | |
| | |
CSAIL Commercial Mortgage TrustSeries 2017-C8, Class C, 4.32%, 6/15/2050 ‡ | | | 100,000 | | | | 105,940 | |
| | |
FHLMC, Multifamily Structured Pass-Through Certificates | | | | | | | | |
| | |
Series K033, Class X1, IO, 0.42%, 7/25/2023 (i) | | | 3,963,706 | | | | 43,617 | |
| | |
Series K078, Class X3, IO, 2.29%, 10/25/2028 (i) | | | 1,820,000 | | | | 298,055 | |
| | |
Series K158, Class A2, 3.90%, 12/25/2030 (i) | | | 250,000 | | | | 291,311 | |
| | |
Series K155, Class A2, 3.75%, 11/25/2032 | | | 650,000 | | | | 743,937 | |
| | |
Series K153, Class X3, IO, 3.90%, 4/25/2035 (i) | | | 340,000 | | | | 118,673 | |
| | |
Series K036, Class X3, IO, 2.18%, 12/25/2041 (i) | | | 2,640,000 | | | | 216,768 | |
| | |
Series K720, Class X3, IO, 1.37%, 8/25/2042 (i) | | | 6,800,000 | | | | 238,347 | |
| | | | | | | | |
| INVESTMENTS | | PRINCIPAL
AMOUNT | | | VALUE | |
| |
| | |
United States — continued | | | | | | | | |
| | |
Series K041, Class X3, IO, 1.70%, 11/25/2042 (i) | | | 3,470,000 | | | | 270,297 | |
| | |
Series K042, Class X3, IO, 1.66%, 1/25/2043 (i) | | | 3,025,000 | | | | 229,956 | |
| | |
Series K718, Class X3, IO, 1.48%, 2/25/2043 (i) | | | 10,025,000 | | | | 340,223 | |
| | |
Series K045, Class X3, IO, 1.55%, 4/25/2043 (i) | | | 1,915,000 | | | | 141,094 | |
| | |
Series K054, Class X3, IO, 1.65%, 4/25/2043 (i) | | | 1,365,000 | | | | 123,405 | |
| | |
Series K050, Class X3, IO, 1.61%, 10/25/2043 (i) | | | 1,010,000 | | | | 83,026 | |
| | |
Series K051, Class X3, IO, 1.67%, 10/25/2043 (i) | | | 1,395,000 | | | | 121,446 | |
| | |
Series K052, Class X3, IO, 1.67%, 1/25/2044 (i) | | | 750,000 | | | | 66,950 | |
| | |
Series K726, Class X3, IO, 2.20%, 7/25/2044 (i) | | | 2,890,000 | | | | 253,287 | |
| | |
Series K067, Class X3, IO, 2.19%, 9/25/2044 (i) | | | 1,385,000 | | | | 201,243 | |
| | |
Series K072, Class X3, IO, 2.21%, 12/25/2045 (i) | | | 400,000 | | | | 60,978 | |
| | |
Series K088, Class X3, IO, 2.42%, 2/25/2047 (i) | | | 980,000 | | | | 180,322 | |
| | |
FREMFSeries 2018-KF46, Class B, 4.17%, 3/25/2028 (e) (i) | | | 688,930 | | | | 680,534 | |
| | |
FREMF Mortgage Trust | | | | | | | | |
| | |
Series 2017-KF31, Class B, 5.12%, 4/25/2024 (e) (i) | | | 56,790 | | | | 57,442 | |
| | |
Series 2017-KF36, Class B, 4.87%, 8/25/2024 (e) (i) | | | 93,312 | | | | 93,705 | |
| | |
Series 2017-KF38, Class B, 4.72%, 9/25/2024 (e) (i) | | | 60,527 | | | | 60,818 | |
| | |
Series 2018-KF47, Class B, 4.22%, 5/25/2025 (e) (i) | | | 46,964 | | | | 46,687 | |
| | |
Series 2018-KF49, Class B, 4.12%, 6/25/2025 (e) (i) | | | 581,045 | | | | 576,593 | |
| | |
Series 2013-K712, Class B, 3.41%, 5/25/2045 (e) (i) | | | 220,000 | | | | 219,818 | |
| | |
Series 2017-K728, Class B, 3.76%, 11/25/2050 (e) (i) | | | 190,000 | | | | 198,574 | |
| | |
Series 2017-K728, Class C, 3.76%, 11/25/2050 (e) (i) | | | 105,000 | | | | 107,271 | |
| | |
GNMASeries 2017-23, IO, 0.74%, 5/16/2059 (i) | | | 666,487 | | | | 38,685 | |
| | |
GS Mortgage Securities TrustSeries 2012-GCJ9, Class D, 4.90%, 11/10/2045 ‡ (e) (i) | | | 320,000 | | | | 329,058 | |
SEE NOTES TO FINANCIAL STATEMENTS.
| | | | | | |
| | | |
| 76 | | | | J.P. MORGAN EXCHANGE-TRADED FUNDS | | AUGUST 31, 2019 |
| | | | | | | | |
| INVESTMENTS | | PRINCIPAL
AMOUNT | | | VALUE | |
Commercial Mortgage-Backed Securities — continued | |
| | |
United States — continued | | | | | | | | |
| | |
LB Commercial Mortgage TrustSeries 2007-C3, Class AJ, 6.07%, 7/15/2044 (i) | | | 65,977 | | | | 66,785 | |
| | |
LB-UBS Commercial Mortgage TrustSeries 2006-C6, Class AJ, 5.45%, 9/15/2039 ‡ (i) | | | 242,970 | | | | 141,214 | |
| | |
Morgan Stanley Capital I TrustSeries 2005-HQ7, Class E, 5.55%, 11/14/2042 ‡ (i) | | | 63,888 | | | | 63,594 | |
| | |
Velocity Commercial Capital Loan Trust | | | | | | | | |
| | |
Series 2018-2, Class A, 4.05%, 10/26/2048 (e) (i) | | | 257,490 | | | | 264,555 | |
| | |
Series 2019-1, Class A, 3.76%, 3/25/2049 (e) (i) | | | 577,016 | | | | 590,254 | |
| | |
Series 2019-1, Class M1, 3.94%, 3/25/2049 ‡ (e) (i) | | | 240,467 | | | | 246,686 | |
| | | | | | | | |
| |
Total Commercial Mortgage-Backed Securities
(Cost $11,158,447) | | | | 11,483,598 | |
| | | | | | | | |
|
Collateralized Mortgage Obligations — 3.8% | |
|
Netherlands — 0.1% | |
| | |
Permanent Master Issuer plcSeries 2018-1A, Class 1A1, 2.68%, 7/15/2058 (e) (i) | | | 255,000 | | | | 255,075 | |
| | | | | | | | |
|
United Kingdom — 0.1% | |
| | |
Lanark Master Issuer plcSeries 2019-1A, Class 1A1, 2.90%, 12/22/2069 (e) (i) | | | 186,667 | | | | 187,093 | |
| | | | | | | | |
|
United States — 3.6% | |
| | |
Alternative Loan Trust | | | | | | | | |
| | |
Series 2004-25CB, Class A1, 6.00%, 12/25/2034 | | | 165,076 | | | | 168,920 | |
| | |
Series 2005-6CB, Class 1A6, 5.50%, 4/25/2035 | | | 101,881 | | | | 104,833 | |
| | |
Series 2005-80CB, Class 5A1, 6.00%, 2/25/2036 | | | 146,051 | | | | 149,583 | |
| | |
Series 2007-2CB, Class 1A6, 5.75%, 3/25/2037 | | | 180,121 | | | | 152,579 | |
| | |
Antler Mortgage TrustSeries 2019-RTL1, Class A2, 4.95%, 8/25/2022 (e) (i) | | | 600,000 | | | | 615,472 | |
| | |
Chase Mortgage Finance TrustSeries 2007-A1, Class 1A5, 4.78%, 2/25/2037 (i) | | | 41,745 | | | | 42,452 | |
| | |
CHL Mortgage Pass-Through TrustSeries 2007-16, Class A1, 6.50%, 10/25/2037 | | | 69,586 | | | | 55,773 | |
| | |
FHLMC Structured Agency Credit Risk DebtNotes Series 2018-HQA1, Class M2, 4.45%, 9/25/2030 (i) | | | 60,000 | | | | 60,431 | |
| | | | | | | | |
| INVESTMENTS | | PRINCIPAL
AMOUNT | | | VALUE | |
| | | | | |
| | |
United States — continued | | | | | | | | |
| | |
FHLMC, REMIC | | | | | | | | |
| | |
Series 2916, Class S, IF, IO, 5.05%, 1/15/2035 (i) | | | 2,445,890 | | | | 506,177 | |
| | |
Series 4305, Class SK, IF, IO, 4.40%, 2/15/2044 (i) | | | 928,659 | | | | 187,437 | |
| | |
Series 4689, Class SD, IF, IO, 3.95%, 6/15/2047 (i) | | | 713,775 | | | | 123,197 | |
| | |
Series 4714, Class SA, IF, IO, 3.95%, 8/15/2047 (i) | | | 541,531 | | | | 109,093 | |
| | |
FNMA, Connecticut Avenue Securities | | | | | | | | |
| | |
Series 2018-C05, Class 1M2, 4.50%, 1/25/2031 (i) | | | 10,000 | | | | 10,120 | |
| | |
Series 2018-C06, Class 1M2, 4.15%, 3/25/2031 (i) | | | 130,000 | | | | 130,285 | |
| | |
Series 2018-C06, Class 2M2, 4.25%, 3/25/2031 (i) | | | 30,000 | | | | 30,047 | |
| | |
FNMA, REMIC | | | | | | | | |
| | |
Series 2010-57, Class ID, IO, 4.00%, 6/25/2025 | | | 424,197 | | | | 19,999 | |
| | |
Series 2012-146, Class AI, IO, 3.00%, 1/25/2028 | | | 2,074,540 | | | | 141,909 | |
| | |
Series 2016-68, Class BI, IO, 3.00%, 10/25/2031 | | | 1,166,846 | | | | 103,936 | |
| | |
Series 2012-93, Class SE, IF, IO, 3.95%, 9/25/2042 (i) | | | 160,858 | | | | 31,490 | |
| | |
Series 2012-124, Class UI, IO, 4.00%, 11/25/2042 | | | 225,602 | | | | 26,155 | |
| | |
Series 2012-133, Class NS, IF, IO, 4.00%, 12/25/2042 (i) | | | 304,648 | | | | 63,209 | |
| | |
Series 2015-40, Class LS, IF, IO, 4.02%, 6/25/2045 (i) | | | 515,570 | | | | 96,572 | |
| | |
Series 2016-75, Class SC, IF, IO, 3.95%, 10/25/2046 (i) | | | 999,217 | | | | 191,150 | |
| | |
Series 2017-31, Class SG, IF, IO, 3.95%, 5/25/2047 (i) | | | 1,744,833 | | | | 325,610 | |
| | |
Series 2017-39, Class ST, IF, IO, 3.95%, 5/25/2047 (i) | | | 461,292 | | | | 88,931 | |
| | |
Series 2017-69, Class SH, IF, IO, 4.05%, 9/25/2047 (i) | | | 778,287 | | | | 157,821 | |
| | |
Series 2019-42, Class SK, IF, IO, 3.90%, 8/25/2049 (i) | | | 1,397,416 | | | | 244,307 | |
| | |
FNMA, STRIPS Series 409, Class 27, IO, 4.00%, 4/25/2027 (i) | | | 321,477 | | | | 26,496 | |
| | |
GNMA | | | | | | | | |
| | |
Series 2017-107, Class KS, IF, IO, 4.03%, 7/20/2047 (i) | | | 575,224 | | | | 97,477 | |
| | |
Series 2019-42, Class SJ, IF, IO, 3.88%, 4/20/2049 (i) | | | 1,578,631 | | | | 282,595 | |
SEE NOTES TO FINANCIAL STATEMENTS.
| | | | | | | | |
| | | |
| AUGUST 31, 2019 | | J.P. MORGAN EXCHANGE-TRADED FUNDS | | | | | 77 | |
JPMorgan Global Bond Opportunities ETF
SCHEDULE OF PORTFOLIO INVESTMENTS
AS OF AUGUST 31, 2019 (Unaudited) (continued)
(Amounts in U.S. Dollars, unless otherwise noted)
| | | | | | | | |
| INVESTMENTS | | PRINCIPAL
AMOUNT | | | VALUE | |
Collateralized Mortgage Obligations — continued | | | | | |
| | |
United States — continued | | | | | | | | |
| | |
Series 2015-H13, Class GI, IO, 1.62%, 4/20/2065 (i) | | | 281,376 | | | | 12,599 | |
| | |
Series 2017-H14, Class FG, 3.49%, 6/20/2067 (i) | | | 398,579 | | | | 406,844 | |
| | |
Homeward Opportunities Fund I Trust | | | | | | | | |
| | |
Series 2018-1, Class A1, 3.77%, 6/25/2048 (e) (i) | | | 71,446 | | | | 72,583 | |
| | |
Series 2019-1, Class M1, 3.95%, 1/25/2059 ‡ (e) (i) | | | 150,000 | | | | 153,348 | |
| | |
Merrill Lynch Mortgage Investors TrustSeries 2004-C, Class A1, 2.71%, 7/25/2029 (i) | | | 96,354 | | | | 93,827 | |
| | |
OBX Trust | | | | | | | | |
| | |
Series 2018-EXP1, Class 2A1, 3.00%, 4/25/2048 (e) (i) | | | 228,983 | | | | 228,666 | |
| | |
Series 2019-EXP1, Class 2A1B, 3.10%, 1/25/2059 (e) (i) | | | 426,000 | | | | 418,843 | |
| | |
PRPM LLCSeries 2019-1A, Class A1, 4.50%, 1/25/2024 (e) (f) | | | 559,557 | | | | 565,529 | |
| | |
Structured Adjustable Rate Mortgage LoanTrust Series 2004-8, Class 3A, 4.41%, 7/25/2034 (i) | | | 22,131 | | | | 22,309 | |
| | |
Toorak Mortgage Corp. Ltd.Series 2018-1, Class A1, 4.34%, 8/25/2021 (e) (f) | | | 240,000 | | | | 241,398 | |
| | |
Verus Securitization Trust | | | | | | | | |
| | |
Series 2018-2, Class A1, 3.68%, 6/1/2058 (e) (i) | | | 159,375 | | | | 160,932 | |
| | |
Series 2019-1, Class A1, 3.84%, 2/25/2059 (e) (i) | | | 267,368 | | | | 271,225 | |
| | | | | | | | |
| | |
| | | | | | | 6,992,159 | |
| | | | | | | | |
| |
Total Collateralized Mortgage Obligations
(Cost $7,270,783) | | | | 7,434,327 | |
| | | | | | | | |
|
Mortgage-Backed Securities — 3.5% | |
|
United States — 3.5% | |
| | |
FHLMC Gold Pools, 30 Year Pool # G67705, 4.00%, 10/1/2047 | | | 1,846,433 | | | | 1,976,143 | |
| | |
UMBS, 15 Year | | | | | | | | |
| | |
Pool # 890789, 3.00%, 9/1/2032 | | | 1,900,037 | | | | 1,951,932 | |
| | |
Pool # BM3956, 3.00%, 12/1/2032 | | | 402,898 | | | | 415,103 | |
| | |
UMBS, 30 Year Pool # CA4123, 3.50%, 9/1/2049 | | | 2,257,819 | | | | 2,403,775 | |
| | | | | | | | |
| | |
Total Mortgage-Backed Securities
(Cost $6,569,039) | | | | | | | 6,746,953 | |
| | | | | | | | |
| | | | | | | | |
| INVESTMENTS | | PRINCIPAL
AMOUNT | | | VALUE | |
U.S. Treasury Obligations — 1.2% | |
| | |
U.S. Treasury Bonds 3.00%, 2/15/2048 | | | 90,000 | | | | 110,324 | |
| | |
U.S. Treasury Notes 2.88%, 5/15/2028 | | | 1,970,000 | | | | 2,192,317 | |
| | | | | | | | |
| | |
| | | | | | | 2,302,641 | |
| | | | | | | | |
| |
Total U.S. Treasury Obligations
(Cost $2,046,982) | | | | 2,302,641 | |
| | | | | | | | |
| | |
| | | NO. OF
WARRANTS | | | | |
Warrants — 0.0% (h) | |
|
Canada — 0.0% (h) | |
| | |
Ultra Petroleum Corp. expiring 7/14/2025, price 1.00 USD *
(Cost $—) | | | 2,450 | | | | 86 | |
| | | | | | | | |
| | |
| | | PRINCIPAL
AMOUNT | | | | |
Short-Term Investments — 3.8% | |
|
Foreign Government Treasury Bills — 0.8% | |
| | |
Italy Government Bond 0.06%, 12/13/2019 (a) (j)
(Cost $1,810,490) | | | EUR 1,595,000 | | | | 1,754,470 | |
| | |
| | | Shares | | | | |
|
Investment Companies — 3.0% | |
| | |
JPMorgan U.S. Government Money Market Fund Class Institutional Shares, 1.99% (k) (l)
(Cost $5,760,227) | | | 5,760,227 | | | | 5,760,227 | |
| | |
TotalShort-Term Investments
(Cost $7,570,717) | | | | | | | 7,514,697 | |
| | | | | | | | |
Total Investments — 97.0%
(Cost $185,602,338) | | | | 188,656,732 | |
Other Assets Less
Liabilities — 3.0% | | | | 5,819,204 | |
| | | | | | | | |
NET ASSETS — 100.0% | | | | | | | 194,475,936 | |
| | | | | | | | |
Percentages indicated are based on net assets.
SEE NOTES TO FINANCIAL STATEMENTS.
| | | | | | |
| | | |
| 78 | | | | J.P. MORGAN EXCHANGE-TRADED FUNDS | | AUGUST 31, 2019 |
Abbreviations
| | |
| ABS | | Asset-backed securities |
| CAD | | Canadian Dollar |
| CLO | | Collateralized Loan Obligations |
| DOP | | Dominican Republic Peso |
| EUR | | Euro |
| EURIBOR | | Euro Interbank Offered Rate |
| FHLMC | | Federal Home Loan Mortgage Corp. |
| FNMA | | Federal National Mortgage Association |
| GBP | | British Pound |
| GNMA | | Government National Mortgage Association |
| HUF | | Hungarian Forint |
| ICE | | Intercontinental Exchange |
| IDR | | Indonesian Rupiah |
| IF | | Inverse Floaters represent securities that pay interest at a rate that increases (decreases) with a decline (incline) in a specified index. The interest rate shown is the rate in effect as of August 31, 2019. The rate may be subject to a cap and floor. |
| IO | | Interest Only represents the right to receive the monthly interest payments on an underlying pool of mortgage loans. The principal amount shown represents the par value on the underlying pool. The yields on these securities are subject to accelerated principal paydowns as a result of prepayment or refinancing of the underlying pool of mortgage instruments. As a result, interest income may be reduced considerably. |
| JSC | | Joint Stock Company |
| LIBOR | | London Interbank Offered Rate |
| MXN | | Mexican Peso |
| MYR | | Malaysian Ringgit |
| OYJ | | Public Limited Company |
| PEN | | Peruvian Nuevo Sol |
| PLN | | Polish Zloty |
| PO | | Principal Only represents the right to receive the principal portion only on an underlying pool of mortgage loans. The market value of these securities is extremely volatile in response to changes in market interest rates. As prepayments on the underlying mortgages of these securities increase, the yield on these securities increases. |
| PT | | Limited liability company |
| REIT | | Real Estate Investment Trust |
| REMIC | | Real Estate Mortgage Investment Conduit |
| Re-REMIC | | Combined Real Estate Mortgage Investment Conduit |
| RUB | | Russian Ruble |
| SCA | | Limited partnership with share capital |
| SEK | | Swedish Krona |
| SPC | | Special purpose company |
| STRIPS | | Separate Trading of Registered Interest and Principal of Securities. The STRIPS Program lets investors hold and trade individual interest and principal components of eligible notes and bonds as separate securities. |
| UMBS | | Uniform Mortgage-Backed Securities |
| USD | | United States Dollar |
| ZAR | | South African Rand |
| | |
| (a) | | Security exempt from registration pursuant to Regulation S under the Securities Act of 1933, as amended. Regulation S applies to securities offerings that are made outside of the United States and do not involve direct selling efforts in the United States and as such may have restrictions on resale. |
| (b) | | Variable or floating rate security, linked to the referenced benchmark. The interest rate shown is the current rate as of August 31, 2019. |
| (c) | | Security is perpetual and thus, does not have a predetermined maturity date. The coupon rate for this security is fixed for a period of time and may be structured to adjust thereafter. The date shown, if applicable, reflects the next call date. The coupon rate shown is the rate in effect as of August 31, 2019. |
| (d) | | Security is an interest bearing note with preferred security characteristics. |
| (e) | | Securities exempt from registration under Rule 144A or section 4(a)(2), of the Securities Act of 1933, as amended. |
| (f) | | Step bond. Interest rate is a fixed rate for an initial period that either resets at a specific date or may reset in the future contingent upon a predetermined trigger. The interest rate shown is the current rate as of August 31, 2019. |
| (g) | | Security has the ability to pay in kind (“PIK”) or pay income in cash. When applicable, separate rates of such payments are disclosed. |
| (h) | | Amount rounds to less than 0.1% of net assets. |
| (i) | | Variable or floating rate security, the interest rate of which adjusts periodically based on changes in current interest rates and prepayments on the underlying pool of assets. The interest rate shown is the current rate as of August 31, 2019. |
| (j) | | The rate shown is the effective yield as of August 31, 2019. |
| (k) | | Investment in an affiliated fund, which is registered under the Investment Company Act of 1940, as amended, and is advised by J.P. Morgan Investment Management Inc. |
| (l) | | The rate shown is the current yield as of August 31, 2019. |
| * | | Non-income producing security. |
| ‡ | | Value determined using significant unobservable inputs. |
SEE NOTES TO FINANCIAL STATEMENTS.
| | | | | | | | |
| | | |
| AUGUST 31, 2019 | | J.P. MORGAN EXCHANGE-TRADED FUNDS | | | | | 79 | |
JPMorgan Global Bond Opportunities ETF
SCHEDULE OF PORTFOLIO INVESTMENTS
AS OF AUGUST 31, 2019 (Unaudited) (continued)
| | | | | | | | | | | | | | | | | | | | |
| Futures contracts outstanding as of August 31, 2019: | |
| DESCRIPTION | | NUMBER OF
CONTRACTS | | | EXPIRATION
DATE | | | TRADING
CURRENCY | | | NOTIONAL
AMOUNT ($) | | | VALUE AND
UNREALIZED
APPRECIATION
(DEPRECIATION) ($) | |
| |
Long Contracts | | | | | |
| | | | | |
| Australia 10 Year Bond | | | 59 | | | | 09/2019 | | | | AUD | | | | 5,911,890 | | | | 279,796 | |
| | | | | |
| Euro-BTP | | | 22 | | | | 09/2019 | | | | EUR | | | | 3,513,465 | | | | 77,183 | |
| | | | | |
| U.S. Treasury 2 Year Note | | | 3 | | | | 12/2019 | | | | USD | | | | 648,328 | | | | (123 | ) |
| | | | | |
| U.S. Treasury 5 Year Note | | | 59 | | | | 12/2019 | | | | USD | | | | 7,080,000 | | | | 8,228 | |
| | | | | |
| U.S. Treasury 10 Year Note | | | 5 | | | | 12/2019 | | | | USD | | | | 658,906 | | | | 809 | |
| | | | | |
| U.S. Treasury 10 Year Ultra Note | | | 34 | | | | 12/2019 | | | | USD | | | | 4,913,531 | | | | 14,269 | |
| | | | | |
| U.S. Treasury Ultra Bond | | | 10 | | | | 12/2019 | | | | USD | | | | 1,976,562 | | | | 12,946 | |
| | | | | | | | | | | | | | | | | | | | |
| | | | | |
| | | | | | | | | | | | | | | | | | | 393,108 | |
| | | | | | | | | | | | | | | | | | | | |
Short Contracts | | | | | |
| | | | | |
| 3 Month Eurodollar | | | (196) | | | | 09/2019 | | | | USD | | | | (47,989,375 | ) | | | (422,278 | ) |
| | | | | |
| Euro-Bobl | | | (38) | | | | 09/2019 | | | | EUR | | | | (5,689,496 | ) | | | (95,980 | ) |
| | | | | |
| Euro-Bund | | | (73) | | | | 09/2019 | | | | EUR | | | | (14,369,309 | ) | | | (434,733 | ) |
| | | | | |
| Euro-Buxl | | | (2) | | | | 09/2019 | | | | EUR | | | | (493,034 | ) | | | (57,240 | ) |
| | | | | |
| U.S. Treasury 5 Year Note | | | (25) | | | | 12/2019 | | | | USD | | | | (3,000,000 | ) | | | (3,521 | ) |
| | | | | |
| U.S. Treasury 10 Year Note | | | (13) | | | | 12/2019 | | | | USD | | | | (1,713,156 | ) | | | (2,161 | ) |
| | | | | |
| U.S. Treasury 10 Year Ultra Note | | | (8) | | | | 12/2019 | | | | USD | | | | (1,156,125 | ) | | | (3,721 | ) |
| | | | | |
| U.S. Treasury Long Bond | | | (2) | | | | 12/2019 | | | | USD | | | | (330,875 | ) | | | (1,380 | ) |
| | | | | | | | | | | | | | | | | | | | |
| | | | | |
| | | | | | | | | | | | | | | | | | | (1,021,014 | ) |
| | | | | | | | | | | | | | | | | | | | |
| | | | | |
| | | | | | | | | | | | | | | | | | | (627,906 | ) |
| | | | | | | | | | | | | | | | | | | | |
| | |
| Abbreviations |
| AUD | | Australian Dollar |
| EUR | | Euro |
| USD | | United States Dollar |
| | | | | | | | | | | | | | | | | | | | |
| Forward foreign currency exchange contracts outstanding as of August 31, 2019: | | | | |
| CURRENCY PURCHASED | | | CURRENCY SOLD | | | COUNTERPARTY | | SETTLEMENT
DATE | | | UNREALIZED
APPRECIATION
(DEPRECIATION) ($) | |
| GBP | | | 112,833 | | | USD | | | 136,134 | | | HSBC Bank, NA | | | 9/4/2019 | | | | 1,162 | |
| USD | | | 16,568,558 | | | EUR | | | 14,822,906 | | | Goldman Sachs International | | | 9/4/2019 | | | | 277,443 | |
| USD | | | 9,930,476 | | | EUR | | | 8,887,109 | | | HSBC Bank, NA | | | 9/4/2019 | | | | 163,099 | |
| USD | | | 345,789 | | | EUR | | | 310,027 | | | State Street Corp. | | | 9/4/2019 | | | | 5,055 | |
| USD | | | 504,592 | | | GBP | | | 414,086 | | | Goldman Sachs International | | | 9/4/2019 | | | | 733 | |
| COP | | | 6,259,449,494 | | | USD | | | 1,812,773 | | | Goldman Sachs International** | | | 9/25/2019 | | | | 3,951 | |
| IDR | | | 12,526,011,740 | | | USD | | | 874,721 | | | Goldman Sachs International** | | | 9/25/2019 | | | | 5,481 | |
| THB | | | 29,859,270 | | | USD | | | 969,142 | | | HSBC Bank, NA | | | 9/25/2019 | | | | 8,090 | |
| USD | | | 901,251 | | | AUD | | | 1,331,639 | | | BNP Paribas | | | 9/25/2019 | | | | 3,868 | |
| USD | | | 417,559 | | | BRL | | | 1,677,751 | | | Citibank, NA** | | | 9/25/2019 | | | | 12,968 | |
| USD | | | 972,842 | | | BRL | | | 3,907,321 | | | Goldman Sachs International** | | | 9/25/2019 | | | | 30,589 | |
| USD | | | 5,556,262 | | | CAD | | | 7,387,139 | | | Merrill Lynch International | | | 9/25/2019 | | | | 5,989 | |
| USD | | | 215,330 | | | CNY | | | 1,526,490 | | | BNP Paribas** | | | 9/25/2019 | | | | 1,386 | |
| USD | | | 868,653 | | | COP | | | 2,987,270,011 | | | Goldman Sachs International** | | | 9/25/2019 | | | | 1,636 | |
| USD | | | 1,408,591 | | | EUR | | | 1,268,357 | | | Citibank, NA | | | 9/25/2019 | | | | 12,303 | |
| USD | | | 506,098 | | | EUR | | | 450,513 | | | Credit Suisse International | | | 9/25/2019 | | | | 10,144 | |
SEE NOTES TO FINANCIAL STATEMENTS.
| | | | | | |
| | | |
| 80 | | | | J.P. MORGAN EXCHANGE-TRADED��FUNDS | | AUGUST 31, 2019 |
| | | | | | | | | | | | | | | | | | | | |
| CURRENCY PURCHASED | | | CURRENCY SOLD | | | COUNTERPARTY | | SETTLEMENT
DATE | | | UNREALIZED
APPRECIATION
(DEPRECIATION) ($) | |
| USD | | | 30,723,734 | | | EUR | | | 27,401,153 | | | Goldman Sachs International | | | 9/25/2019 | | | | 558,801 | |
| USD | | | 1,216,749 | | | EUR | | | 1,096,631 | | | State Street Corp. | | | 9/25/2019 | | | | 9,508 | |
| USD | | | 1,647,325 | | | HUF | | | 480,077,865 | | | Barclays Bank plc | | | 9/25/2019 | | | | 52,445 | |
| USD | | | 195,242 | | | HUF | | | 56,409,212 | | | Citibank, NA | | | 9/25/2019 | | | | 7,843 | |
| USD | | | 2,810,719 | | | MXN | | | 55,306,280 | | | Barclays Bank plc | | | 9/25/2019 | | | | 61,204 | |
| USD | | | 1,905,729 | | | MYR | | | 7,993,770 | | | Deutsche Bank AG** | | | 9/25/2019 | | | | 5,710 | |
| USD | | | 902,077 | | | NZD | | | 1,400,526 | | | State Street Corp. | | | 9/25/2019 | | | | 19,052 | |
| USD | | | 378,527 | | | PEN | | | 1,284,569 | | | Citibank, NA** | | | 9/25/2019 | | | | 430 | |
| USD | | | 1,831,119 | | | PLN | | | 7,172,086 | | | Barclays Bank plc | | | 9/25/2019 | | | | 28,819 | |
| USD | | | 550,897 | | | PLN | | | 2,180,545 | | | State Street Corp. | | | 9/25/2019 | | | | 2,940 | |
| USD | | | 424,513 | | | PLN | | | 1,686,345 | | | TD Bank Financial Group | | | 9/25/2019 | | | | 745 | |
| USD | | | 949,942 | | | RUB | | | 63,017,660 | | | Barclays Bank plc** | | | 9/25/2019 | | | | 7,949 | |
| USD | | | 710,532 | | | SEK | | | 6,806,528 | | | Goldman Sachs International | | | 9/25/2019 | | | | 16,031 | |
| ZAR | | | 7,091,107 | | | USD | | | 466,152 | | | BNP Paribas | | | 9/25/2019 | | | | 22 | |
| ZAR | | | 14,644,261 | | | USD | | | 950,227 | | | State Street Corp. | | | 9/25/2019 | | | | 12,496 | |
| USD | | | 4,384,589 | | | EUR | | | 3,949,276 | | | BNP Paribas | | | 10/3/2019 | | | | 34,180 | |
| USD | | | 21,964,077 | | | EUR | | | 19,787,195 | | | Goldman Sachs International | | | 10/3/2019 | | | | 167,067 | |
| USD | | | 367,739 | | | GBP | | | 301,253 | | | Barclays Bank plc | | | 10/3/2019 | | | | 697 | |
| USD | | | 1,749,935 | | | CNY | | | 12,152,356 | | | Barclays Bank plc** | | | 12/23/2019 | | | | 56,067 | |
| | | | | | | | | | | | | | | | | | | | |
| Total unrealized appreciation | | | | | | | | | | 1,585,903 | |
| | | | | | | | | | | | | | | | | | | | |
| EUR | | | 3,949,276 | | | USD | | | 4,374,668 | | | BNP Paribas | | | 9/4/2019 | | | | (34,216 | ) |
| EUR | | | 19,787,195 | | | USD | | | 21,914,318 | | | Goldman Sachs International | | | 9/4/2019 | | | | (167,201 | ) |
| EUR | | | 283,571 | | | USD | | | 318,596 | | | TD Bank Financial Group | | | 9/4/2019 | | | | (6,937 | ) |
| GBP | | | 301,253 | | | USD | | | 367,272 | | | Barclays Bank plc | | | 9/4/2019 | | | | (707 | ) |
| AUD | | | 1,331,639 | | | USD | | | 904,160 | | | HSBC Bank, NA | | | 9/25/2019 | | | | (6,778 | ) |
| BRL | | | 1,972,780 | | | USD | | | 489,002 | | | Citibank, NA** | | | 9/25/2019 | | | | (13,265 | ) |
| BRL | | | 3,612,292 | | | USD | | | 898,781 | | | Goldman Sachs International** | | | 9/25/2019 | | | | (27,676 | ) |
| EUR | | | 1,327,431 | | | USD | | | 1,477,508 | | | BNP Paribas | | | 9/25/2019 | | | | (16,187 | ) |
| EUR | | | 278,000 | | | USD | | | 313,123 | | | Credit Suisse International | | | 9/25/2019 | | | | (7,083 | ) |
| EUR | | | 258,134 | | | USD | | | 289,995 | | | Merrill Lynch International | | | 9/25/2019 | | | | (5,825 | ) |
| EUR | | | 3,620,802 | | | USD | | | 4,074,256 | | | State Street Corp. | | | 9/25/2019 | | | | (88,246 | ) |
| HUF | | | 89,204,830 | | | USD | | | 304,791 | | | Barclays Bank plc | | | 9/25/2019 | | | | (8,441 | ) |
| HUF | | | 30,819,958 | | | USD | | | 105,794 | | | Royal Bank of Canada | | | 9/25/2019 | | | | (3,406 | ) |
| MXN | | | 19,292,063 | | | USD | | | 984,552 | | | State Street Corp. | | | 9/25/2019 | | | | (25,460 | ) |
| PEN | | | 494,941 | | | USD | | | 146,363 | | | Barclays Bank plc** | | | 9/25/2019 | | | | (683 | ) |
| PLN | | | 3,677,234 | | | USD | | | 934,212 | | | State Street Corp. | | | 9/25/2019 | | | | (10,146 | ) |
| USD | | | 3,286,841 | | | IDR | | | 47,169,454,916 | | | Goldman Sachs International** | | | 9/25/2019 | | | | (27,757 | ) |
| USD | | | 607,652 | | | PEN | | | 2,066,017 | | | Merrill Lynch International** | | | 9/25/2019 | | | | (455 | ) |
| USD | | | 966,007 | | | THB | | | 29,859,270 | | | BNP Paribas | | | 9/25/2019 | | | | (11,226 | ) |
| USD | | | 483,801 | | | ZAR | | | 7,435,000 | | | Barclays Bank plc | | | 9/25/2019 | | | | (4,981 | ) |
| USD | | | 3,026,182 | | | ZAR | | | 46,796,826 | | | Citibank, NA | | | 9/25/2019 | | | | (50,270 | ) |
| USD | | | 506,565 | | | ZAR | | | 7,763,000 | | | Goldman Sachs International | | | 9/25/2019 | | | | (3,780 | ) |
| | | | | | | | | | | | | | | | | | | | |
| Total unrealized depreciation | | | | | | | | | | (520,726 | ) |
| | | | | | | | | | | | | | | | | | | | |
| Net unrealized appreciation | | | | | | | 1,065,177 | |
| | | | | | | | | | | | | | | | | | | | |
SEE NOTES TO FINANCIAL STATEMENTS.
| | | | | | | | |
| | | |
| AUGUST 31, 2019 | | J.P. MORGAN EXCHANGE-TRADED FUNDS | | | | | 81 | |
JPMorgan Global Bond Opportunities ETF
SCHEDULE OF PORTFOLIO INVESTMENTS
AS OF AUGUST 31, 2019 (Unaudited) (continued)
| | |
| Abbreviations |
| |
| AUD | | Australian Dollar |
| BRL | | Brazilian Real |
| CAD | | Canadian Dollar |
| CNY | | China Yuan |
| COP | | Colombian Peso |
| EUR | | Euro |
| GBP | | British Pound |
| HUF | | Hungarian Forint |
| IDR | | Indonesian Rupiah |
| MXN | | Mexican Peso |
| MYR | | Malaysian Ringgit |
| NZD | | New Zealand Dollar |
| PEN | | Peru Nuevo Sol |
| PLN | | Polish Zloty |
| RUB | | Russian Ruble |
| SEK | | Swedish Krona |
| THB | | Thai Baht |
| USD | | United States Dollar |
| ZAR | | South African Rand |
| |
| ** | | Non-deliverable forward. |
Over-the-Counter (“OTC”) Credit default swap contracts outstanding — buy protection(a) as of August 31, 2019:
| | | | | | | | | | | | | | | | | | | | | | | | | | | | | | | | | | | | |
REFERENCE OBLIGATION/
INDEX | | FINANCING
RATE PAID
BY THE
FUND (%) | | | PAYMENT
FREQUENCY | | COUNTERPARTY | | MATURITY
DATE | | | IMPLIED
CREDIT
SPREAD
(%) (b) | | | | | | NOTIONAL
AMOUNT (C) | | | UPFRONT
PAYMENTS
(RECEIPTS)
($) (d) | | | UNREALIZED
APPRECIATION
(DEPRECIATION)
($) | | | VALUE
($) | |
Republic of Turkey, 11.88%, 1/15/2030 | | | 1.00 | | | Quarterly | | Citibank, NA | | | 6/20/2024 | | | | 4.24 | | | | USD | | | | 607,000 | | | | 97,418 | | | | (15,885 | ) | | | 81,533 | |
Republic of Turkey, 11.88%, 1/15/2030 | | | 1.00 | | | Quarterly | | Citibank, NA | | | 6/20/2024 | | | | 4.24 | | | | USD | | | | 311,000 | | | | 50,228 | | | | (8,454 | ) | | | 41,774 | |
Republic of Turkey, 11.88%, 1/15/2030 | | | 1.00 | | | Quarterly | | Citibank, NA | | | 6/20/2024 | | | | 4.24 | | | | USD | | | | 608,000 | | | | 88,713 | | | | (7,047 | ) | | | 81,666 | |
Republic of Turkey, 11.88%, 1/15/2030 | | | 1.00 | | | Quarterly | | Goldman Sachs International | | | 6/20/2024 | | | | 4.24 | | | | USD | | | | 550,000 | | | | 81,789 | | | | (7,912 | ) | | | 73,877 | |
United Mexican States, 4.15%, 3/28/2027 | | | 1.00 | | | Quarterly | | Citibank, NA | | | 6/20/2024 | | | | 1.12 | | | | USD | | | | 1,920,000 | | | | 15,458 | | | | (8,959 | ) | | | 6,499 | |
| | | | | | | | | | | | | | | | | | | | | | | | | | | | | | | | | | | | |
| | | | | | | | | | | | | | | | | | | | | | | | | | | 333,606 | | | | (48,257 | ) | | | 285,349 | |
| | | | | | | | | | | | | | | | | | | | | | | | | | | | | | | | | | | | |
Republic of Indonesia, 5.88%, 3/13/2020 | | | 1.00 | | | Quarterly | | Citibank, NA | | | 6/20/2024 | | | | 0.90 | | | | USD | | | | 1,920,000 | | | | (12,064 | ) | | | (729 | ) | | | (12,793 | ) |
| | | | | | | | | | | | | | | | | | | | | | | | | | | | | | | | | | | | |
| | | | | | | | | | | | | | | | | | | | | | | | | | | (12,064 | ) | | | (729 | ) | | | (12,793 | ) |
| | | | | | | | | | | | | | | | | | | | | | | | | | | | | | | | | | | | |
| | | | | | | | | | | | | | | | | | | | | | | | | | | 321,542 | | | | (48,986 | ) | | | 272,556 | |
| | | | | | | | | | | | | | | | | | | | | | | | | | | | | | | | | | | | |
Centrally Cleared Credit default swap contracts outstanding — buy protection(a)as of August 31, 2019:
| | | | | | | | | | | | | | | | | | | | | | | | | | | | | | | | | | | | |
| REFERENCE OBLIGATION/INDEX | | FINANCING
RATE PAID BY
THE FUND (%) | | | PAYMENT
FREQUENCY | | | MATURITY
DATE | | | IMPLIED
CREDIT
SPREAD
(%) (b) | | | NOTIONAL
AMOUNT (c) | | | UPFRONT
PAYMENTS
(RECEIPTS) ($) (d) | | | UNREALIZED
APPRECIATION
(DEPRECIATION) ($) | | | VALUE ($) | |
CDX.NA.HY.32-V2 | | | 5.00 | | | | Quarterly | | | | 6/20/2024 | | | | 320.51 | | | | USD | | | | 4,620,000 | | | | (345,830 | ) | | | (5,957 | ) | | | (351,787 | ) |
CDX.NA.HY.32-V2 | | | 5.00 | | | | Quarterly | | | | 6/20/2024 | | | | 320.51 | | | | USD | | | | 3,030,000 | | | | (217,555 | ) | | | (13,163 | ) | | | (230,718 | ) |
iTraxx Europe 31-V1 | | | 5.00 | | | | Quarterly | | | | 6/20/2024 | | | | 236.78 | | | | EUR | | | | 2,183,000 | | | | (249,080 | ) | | | (41,511 | ) | | | (290,591 | ) |
iTraxx Europe 31-V1 | | | 5.00 | | | | Quarterly | | | | 6/20/2024 | | | | 236.78 | | | | EUR | | | | 1,900,000 | | | | (204,979 | ) | | | (47,941 | ) | | | (252,920 | ) |
| | | | | | | | | | | | | | | | | | | | | | | | | | | | | | | | | | | | |
| | | | | | | | | | | | | | | | | | | | | | | | | | | (1,017,444 | ) | | | (108,572 | ) | | | (1,126,016 | ) |
| | | | | | | | | | | | | | | | | | | | | | | | | | | | | | | | | | | | |
SEE NOTES TO FINANCIAL STATEMENTS.
| | | | | | |
| | | |
| 82 | | | | J.P. MORGAN EXCHANGE-TRADED FUNDS | | AUGUST 31, 2019 |
| (a) | The Fund, as a buyer of credit protection, is generally obligated to make periodic payments and may also pay or receive an upfront premium to or from the protection seller, in exchange for the right to receive a contingent payment, upon occurrence of a credit event with respect to an underlying reference obligation, as defined under the terms of individual swap contracts. |
| (b) | Implied credit spreads are an indication of the seller’s performance risk, related to the likelihood of a credit event occurring that would require a seller to make payment to a buyer. Implied credit spreads are used to determine the value of swap contracts and reflect the cost of buying/selling protection, which may include upfront payments made to enter into the contract. Therefore, higher spreads would indicate a greater likelihood that a seller will be obligated to perform (i.e. make payment) under the swap contract. Increasing values, in absolute terms and relative to notional amounts, are also indicative of greater performance risk. Implied credit spreads for credit default swaps on credit indices are linked to the weighted average spread across the underlying reference obligations included in a particular index. |
| (c) | The notional amount is the maximum amount that a seller of credit protection would be obligated to pay and a buyer of credit protection would receive, upon occurrence of a credit event. |
| (d) | Upfront payments and receipts generally represent premiums paid or received at the initiation of the agreement to compensate the differences between the stated terms of the swap agreement and current market conditions (credit spreads, interest rates and other relevant factors). |
| | |
| Abbreviations |
| |
| CDX | | Credit Default Swap Index |
| EUR | | Euro |
| USD | | United States Dollar |
Summary of total swap contracts outstanding as of August 31, 2019:
| | | | | | | | |
| | | |
| | | NET UPFRONT
PAYMENTS
(RECEIPTS) ($) | | | VALUE ($) | |
Assets | | | | | | | | |
OTC Credit default swap contracts outstanding — buy protection | | | 333,606 | | | | 285,349 | |
| | | | | | | | |
Total OTC swap contracts outstanding | | | 333,606 | | | | 285,349 | |
| | | | | | | | |
Liabilities | | | | | | | | |
OTC Credit default swap contracts outstanding — buy protection | | | (12,064 | ) | | | (12,793 | ) |
| | | | | | | | |
Total OTC swap contracts outstanding | | | (12,064 | ) | | | (12,793 | ) |
| | | | | | | | |
SEE NOTES TO FINANCIAL STATEMENTS.
| | | | | | | | |
| | | |
| AUGUST 31, 2019 | | J.P. MORGAN EXCHANGE-TRADED FUNDS | | | | | 83 | |
JPMorgan High Yield Research Enhanced ETF
(formerly known as JPMorgan Disciplined High Yield ETF)
SCHEDULE OF PORTFOLIO INVESTMENTS
AS OF AUGUST 31, 2019 (Unaudited)
| | | | | | | | |
| INVESTMENTS | | PRINCIPAL
AMOUNT ($) | | | VALUE ($) | |
Corporate Bonds — 97.1% | |
|
Aerospace & Defense — 3.0% | |
| | |
Arconic, Inc. | | | | | | | | |
| | |
6.15%, 8/15/2020 | | | 288,000 | | | | 297,775 | |
| | |
5.40%, 4/15/2021 | | | 385,000 | | | | 396,743 | |
| | |
5.13%, 10/1/2024 | | | 372,000 | | | | 396,420 | |
| | |
Bombardier, Inc. (Canada) | | | | | | | | |
| | |
6.13%, 1/15/2023 (a) | | | 390,000 | | | | 388,050 | |
| | |
7.50%, 3/15/2025 (a) | | | 468,000 | | | | 455,715 | |
| | |
7.88%, 4/15/2027 (a) | | | 643,000 | | | | 622,906 | |
| | |
TransDigm, Inc. | | | | | | | | |
| | |
6.00%, 7/15/2022 | | | 330,000 | | | | 335,362 | |
| | |
6.50%, 7/15/2024 | | | 374,000 | | | | 386,155 | |
| | |
6.25%, 3/15/2026 (a) | | | 1,287,000 | | | | 1,388,326 | |
| | |
6.38%, 6/15/2026 | | | 262,000 | | | | 274,966 | |
| | | | | | | | |
| | |
| | | | | | | 4,942,418 | |
| | | | | | | | |
|
Air Freight & Logistics — 0.4% | |
| | |
XPO Logistics, Inc. | | | | | | | | |
| | |
6.50%, 6/15/2022 (a) | | | 287,000 | | | | 293,294 | |
| | |
6.13%, 9/1/2023 (a) | | | 145,000 | | | | 149,930 | |
| | |
6.75%, 8/15/2024 (a) | | | 125,000 | | | | 134,687 | |
| | | | | | | | |
| | |
| | | | | | | 577,911 | |
| | | | | | | | |
|
Auto Components — 1.7% | |
| | |
Adient Global Holdings Ltd. 4.88%, 8/15/2026 (a) | | | 300,000 | | | | 231,750 | |
| | |
Adient US LLC 7.00%, 5/15/2026 (a) | | | 260,000 | | | | 265,850 | |
| | |
Allison Transmission, Inc. | | | | | | | | |
| | |
5.00%, 10/1/2024 (a) | | | 273,000 | | | | 280,876 | |
| | |
5.88%, 6/1/2029 (a) | | | 125,000 | | | | 134,063 | |
| | |
American Axle & Manufacturing, Inc. | | | | | | | | |
| | |
6.63%, 10/15/2022 | | | 80,000 | | | | 80,700 | |
| | |
6.25%, 4/1/2025 | | | 169,000 | | | | 158,857 | |
| | |
6.50%, 4/1/2027 | | | 145,000 | | | | 133,037 | |
| | |
Goodyear Tire & Rubber Co. (The) | | | | | | | | |
| | |
5.13%, 11/15/2023 (b) | | | 273,000 | | | | 276,412 | |
| | |
5.00%, 5/31/2026 (b) | | | 244,000 | | | | 241,560 | |
| | |
4.88%, 3/15/2027 (b) | | | 170,000 | | | | 164,050 | |
| | |
Icahn Enterprises LP | | | | | | | | |
| | |
5.88%, 2/1/2022 | | | 390,000 | | | | 396,337 | |
| | |
6.25%, 2/1/2022 | | | 349,000 | | | | 359,470 | |
| | |
6.38%, 12/15/2025 | | | 122,000 | | | | 129,168 | |
| | | | | | | | |
| | |
| | | | | | | 2,852,130 | |
| | | | | | | | |
|
Automobiles — 0.6% | |
| | |
Fiat Chrysler Automobiles NV (United Kingdom) 5.25%, 4/15/2023 | | | 600,000 | | | | 641,586 | |
| | | | | | | | |
| INVESTMENTS | | PRINCIPAL
AMOUNT ($) | | | VALUE ($) | |
| |
|
Automobiles — continued | |
| | |
Jaguar Land Rover Automotive plc (United Kingdom) | | | | | | | | |
| | |
5.63%, 2/1/2023 (a) (b) | | | 150,000 | | | | 143,645 | |
| | |
4.50%, 10/1/2027 (a) | | | 200,000 | | | | 157,580 | |
| | | | | | | | |
| | |
| | | | | | | 942,811 | |
| | | | | | | | |
|
Banks — 2.0% | |
| | |
Barclays plc (United Kingdom) (ICE LIBOR USD 3 Month + 3.05%), 5.09%, 6/20/2030 (c) | | | 480,000 | | | | 498,606 | |
| | |
CIT Group, Inc. | | | | | | | | |
| | |
4.13%, 3/9/2021 | | | 106,000 | | | | 108,252 | |
| | |
5.00%, 8/15/2022 | | | 330,000 | | | | 351,810 | |
| | |
5.00%, 8/1/2023 | | | 198,000 | | | | 214,582 | |
| | |
4.75%, 2/16/2024 | | | 70,000 | | | | 75,163 | |
| | |
5.25%, 3/7/2025 | | | 97,000 | | | | 108,640 | |
| | |
Goldman Sachs Capital I 6.35%, 2/15/2034 | | | 324,000 | | | | 422,575 | |
| | |
Intesa Sanpaolo SpA (Italy) | | | | | | | | |
| | |
5.02%, 6/26/2024 (a) | | | 600,000 | | | | 615,091 | |
| | |
5.71%, 1/15/2026 (a) | | | 600,000 | | | | 633,052 | |
| | |
Royal Bank of Scotland Group plc (United Kingdom) (ICE LIBOR USD 3 Month + 2.50%), 7.65%, 9/30/2031 (c) (d) (e) | | | 233,000 | | | | 312,220 | |
| | | | | | | | |
| | |
| | | | | | | 3,339,991 | |
| | | | | | | | |
|
Beverages — 0.0%(f) | |
| | |
Cott Holdings, Inc. (Canada) 5.50%, 4/1/2025 (a) | | | 40,000 | | | | 41,701 | |
| | | | | | | | |
|
Building Products — 0.3% | |
| | |
Builders FirstSource, Inc. 5.63%, 9/1/2024 (a) | | | 194,000 | | | | 202,003 | |
| | |
Summit Materials LLC 6.13%, 7/15/2023 | | | 201,000 | | | | 204,266 | |
| | | | | | | | |
| | |
| | | | | | | 406,269 | |
| | | | | | | | |
|
Capital Markets — 1.4% | |
| | |
Deutsche Bank AG (Germany) 4.50%, 4/1/2025 | | | 408,000 | | | | 385,462 | |
| | |
(USD Swap Semi 5 Year + 2.25%), 4.30%, 5/24/2028 (c) | | | 408,000 | | | | 375,754 | |
| | |
(USD ICE Swap Rate 5 Year + 2.55%), 4.88%, 12/1/2032 (c) | | | 400,000 | | | | 357,544 | |
| | |
Dresdner Funding Trust I 8.15%, 6/30/2031 (a) | | | 340,000 | | | | 459,850 | |
| | |
MSCI, Inc. | | | | | | | | |
| | |
5.25%, 11/15/2024 (a) | | | 232,000 | | | | 240,862 | |
SEE NOTES TO FINANCIAL STATEMENTS.
| | | | | | |
| | | |
| 84 | | | | J.P. MORGAN EXCHANGE-TRADED FUNDS | | AUGUST 31, 2019 |
| | | | | | | | |
| INVESTMENTS | | PRINCIPAL
AMOUNT ($) | | | VALUE ($) | |
Corporate Bonds — continued | |
|
Capital Markets — continued | |
| | |
5.75%, 8/15/2025 (a) | | | 224,000 | | | | 235,200 | |
| | |
4.75%, 8/1/2026 (a) | | | 92,000 | | | | 96,255 | |
| | |
5.38%, 5/15/2027 (a) | | | 159,000 | | | | 171,005 | |
| | | | | | | | |
| | |
| | | | | | | 2,321,932 | |
| | | | | | | | |
|
Chemicals — 2.0% | |
| | |
Ashland LLC 4.75%, 8/15/2022 (g) | | | 298,000 | | | | 313,186 | |
| | |
Blue Cube Spinco LLC | | | | | | | | |
| | |
9.75%, 10/15/2023 | | | 198,000 | | | | 217,305 | |
| | |
10.00%, 10/15/2025 | | | 93,000 | | | | 104,392 | |
| | |
CF Industries, Inc. | | | | | | | | |
| | |
3.45%, 6/1/2023 | | | 217,000 | | | | 221,909 | |
| | |
5.15%, 3/15/2034 | | | 222,000 | | | | 227,550 | |
| | |
4.95%, 6/1/2043 | | | 180,000 | | | | 176,850 | |
| | |
5.38%, 3/15/2044 | | | 223,000 | | | | 225,359 | |
| | |
Chemours Co. (The) | | | | | | | | |
| | |
6.63%, 5/15/2023 | | | 240,000 | | | | 244,200 | |
| | |
7.00%, 5/15/2025 | | | 200,000 | | | | 197,500 | |
| | |
5.38%, 5/15/2027 | | | 145,000 | | | | 128,687 | |
| | |
Element Solutions, Inc. 5.88%, 12/1/2025 (a) | | | 243,000 | | | | 253,935 | |
| | |
Olin Corp. | | | | | | | | |
| | |
5.13%, 9/15/2027 | | | 144,000 | | | | 147,960 | |
| | |
5.63%, 8/1/2029 | | | 241,000 | | | | 250,339 | |
| | |
5.00%, 2/1/2030 | | | 160,000 | | | | 159,800 | |
| | |
Tronox, Inc. 6.50%, 4/15/2026 (a) (b) | | | 179,000 | | | | 170,050 | |
| | |
WR Grace & Co.-Conn. 5.13%, 10/1/2021 (a) | | | 183,000 | | | | 189,863 | |
| | | | | | | | |
| | |
| | | | | | | 3,228,885 | |
| | | | | | | | |
|
Commercial Services & Supplies — 2.2% | |
| | |
ADT Security Corp. (The) | | | | | | | | |
| | |
6.25%, 10/15/2021 | | | 312,000 | | | | 331,500 | |
| | |
3.50%, 7/15/2022 | | | 312,000 | | | | 312,780 | |
| | |
4.13%, 6/15/2023 | | | 177,000 | | | | 179,821 | |
| | |
4.88%, 7/15/2032 (a) | | | 227,000 | | | | 197,774 | |
| | |
Aramark Services, Inc. | | | | | | | | |
| | |
5.13%, 1/15/2024 | | | 281,000 | | | | 289,728 | |
| | |
5.00%, 4/1/2025 (a) | | | 187,000 | | | | 193,199 | |
| | |
4.75%, 6/1/2026 | | | 73,000 | | | | 74,825 | |
| | |
5.00%, 2/1/2028 (a) | | | 359,000 | | | | 372,911 | |
| | |
Nielsen Co. Luxembourg SARL (The) 5.50%, 10/1/2021 (a) | | | 178,000 | | | | 178,516 | |
| | |
Nielsen Finance LLC | | | | | | | | |
| | |
4.50%, 10/1/2020 | | | 225,000 | | | | 225,180 | |
| | |
5.00%, 4/15/2022 (a) | | | 680,000 | | | | 683,400 | |
| | | | | | | | |
| INVESTMENTS | | PRINCIPAL
AMOUNT ($) | | | VALUE ($) | |
| |
|
Commercial Services & Supplies — continued | |
| | |
Prime Security Services Borrower LLC | | | | | | | | |
| | |
5.25%, 4/15/2024 (a) | | | 241,000 | | | | 248,931 | |
| | |
5.75%, 4/15/2026 (a) (b) | | | 241,000 | | | | 251,243 | |
| | | | | | | | |
| | |
| | | | | | | 3,539,808 | |
| | | | | | | | |
|
Communications Equipment — 1.8% | |
| | |
CommScope Technologies LLC | | | | | | | | |
| | |
6.00%, 6/15/2025 (a) | | | 501,000 | | | | 447,142 | |
| | |
5.00%, 3/15/2027 (a) | | | 216,000 | | | | 180,630 | |
| | |
CommScope, Inc. | | | | | | | | |
| | |
5.00%, 6/15/2021 (a) | | | 60,000 | | | | 60,001 | |
| | |
5.50%, 3/1/2024 (a) | | | 375,000 | | | | 380,156 | |
| | |
5.50%, 6/15/2024 (a) | | | 187,000 | | | | 176,949 | |
| | |
6.00%, 3/1/2026 (a) | | | 375,000 | | | | 381,937 | |
| | |
Nokia OYJ (Finland) | | | | | | | | |
| | |
3.38%, 6/12/2022 | | | 144,000 | | | | 145,800 | |
| | |
4.38%, 6/12/2027 | | | 145,000 | | | | 150,438 | |
| | |
6.63%, 5/15/2039 | | | 146,000 | | | | 168,630 | |
| | |
Telefonaktiebolaget LM Ericsson (Sweden) | | | | | | | | |
| | |
4.13%, 5/15/2022 | | | 338,000 | | | | 350,056 | |
| | |
ViaSat, Inc. | | | | | | | | |
| | |
5.63%, 9/15/2025 (a) | | | 225,000 | | | | 226,688 | |
| | |
5.63%, 4/15/2027 (a) | | | 200,000 | | | | 212,500 | |
| | | | | | | | |
| | |
| | | | | | | 2,880,927 | |
| | | | | | | | |
|
Construction & Engineering — 0.4% | |
| | |
AECOM | | | | | | | | |
| | |
5.88%, 10/15/2024 | | | 249,000 | | | | 268,920 | |
| | |
5.13%, 3/15/2027 | | | 312,000 | | | | 325,890 | |
| | | | | | | | |
| | |
| | | | | | | 594,810 | |
| | | | | | | | |
|
Consumer Finance — 2.5% | |
| | |
Ally Financial, Inc. | | | | | | | | |
| | |
5.13%, 9/30/2024 | | | 221,000 | | | | 246,967 | |
| | |
5.75%, 11/20/2025 | | | 331,000 | | | | 378,995 | |
| | |
8.00%, 11/1/2031 | | | 630,000 | | | | 880,425 | |
| | |
Navient Corp. | | | | | | | | |
| | |
6.50%, 6/15/2022 | | | 267,000 | | | | 289,028 | |
| | |
5.50%, 1/25/2023 | | | 250,000 | | | | 262,575 | |
| | |
6.13%, 3/25/2024 | | | 125,000 | | | | 132,656 | |
| | |
Springleaf Finance Corp. | | | | | | | | |
| | |
8.25%, 12/15/2020 | | | 217,000 | | | | 232,157 | |
| | |
7.75%, 10/1/2021 | | | 31,000 | | | | 33,867 | |
| | |
6.13%, 5/15/2022 | | | 254,000 | | | | 273,685 | |
| | |
5.63%, 3/15/2023 | | | 141,000 | | | | 151,575 | |
| | |
6.13%, 3/15/2024 | | | 216,000 | | | | 235,440 | |
SEE NOTES TO FINANCIAL STATEMENTS.
| | | | | | | | |
| | | |
| AUGUST 31, 2019 | | J.P. MORGAN EXCHANGE-TRADED FUNDS | | | | | 85 | |
JPMorgan High Yield Research Enhanced ETF
(formerly known as JPMorgan Disciplined High Yield ETF)
SCHEDULE OF PORTFOLIO INVESTMENTS
AS OF AUGUST 31, 2019 (Unaudited) (continued)
| | | | | | | | |
| INVESTMENTS | | PRINCIPAL
AMOUNT ($) | | | VALUE ($) | |
Corporate Bonds — continued | |
|
Consumer Finance — continued | |
| | |
6.88%, 3/15/2025 | | | 406,000 | | | | 460,303 | |
| | |
7.13%, 3/15/2026 | | | 489,000 | | | | 557,705 | |
| | | | | | | | |
| | |
| | | | | | | 4,135,378 | |
| | | | | | | | |
|
Containers & Packaging — 2.4% | |
| | |
Ardagh Packaging Finance plc (Ireland) | | | | | | | | |
| | |
4.63%, 5/15/2023 (a) | | | 400,000 | | | | 409,384 | |
| | |
6.00%, 2/15/2025 (a) | | | 600,000 | | | | 626,625 | |
| | |
Ball Corp. | | | | | | | | |
| | |
4.38%, 12/15/2020 | | | 282,000 | | | | 288,345 | |
| | |
4.00%, 11/15/2023 | | | 312,000 | | | | 329,550 | |
| | |
5.25%, 7/1/2025 | | | 312,000 | | | | 350,220 | |
| | |
Berry Global, Inc. | | | | | | | | |
| | |
5.50%, 5/15/2022 | | | 138,000 | | | | 140,319 | |
| | |
5.13%, 7/15/2023 | | | 182,000 | | | | 186,550 | |
| | |
4.50%, 2/15/2026 (a) | | | 125,000 | | | | 124,375 | |
| | |
4.88%, 7/15/2026 (a) | | | 402,000 | | | | 422,100 | |
| | |
5.63%, 7/15/2027 (a) | | | 115,000 | | | | 120,750 | |
| | |
Crown Americas LLC | | | | | | | | |
| | |
4.50%, 1/15/2023 | | | 287,000 | | | | 301,350 | |
| | |
4.75%, 2/1/2026 | | | 237,000 | | | | 248,850 | |
| | |
Owens-Brockway Glass Container, Inc. | | | | | | | | |
| | |
5.00%, 1/15/2022 (a) | | | 119,000 | | | | 121,826 | |
| | |
5.88%, 8/15/2023 (a) | | | 182,000 | | | | 193,830 | |
| | | | | | | | |
| | |
| | | | | | | 3,864,074 | |
| | | | | | | | |
|
Diversified Consumer Services — 0.2% | |
| | |
Service Corp. International | | | | | | | | |
| | |
5.38%, 5/15/2024 | | | 222,000 | | | | 228,771 | |
| | |
4.63%, 12/15/2027 | | | 141,000 | | | | 146,993 | |
| | | | | | | | |
| | |
| | | | | | | 375,764 | |
| | | | | | | | |
|
Diversified Financial Services — 0.2% | |
| | |
Allied Universal Holdco LLC 6.63%, 7/15/2026 (a) | | | 322,000 | | | | 342,125 | |
| | | | | | | | |
|
Diversified Telecommunication Services — 7.0% | |
| | |
Altice France SA (France) | | | | | | | | |
| | |
6.25%, 5/15/2024 (a) | | | 246,000 | | | | 253,606 | |
| | |
7.38%, 5/1/2026 (a) | | | 1,759,000 | | | | 1,877,733 | |
| | |
8.13%, 2/1/2027 (a) | | | 539,000 | | | | 594,247 | |
| | |
CCO Holdings LLC | | | | | | | | |
| | |
5.88%, 4/1/2024 (a) | | | 116,000 | | | | 120,785 | |
| | |
5.75%, 2/15/2026 (a) | | | 721,000 | | | | 763,359 | |
| | |
5.50%, 5/1/2026 (a) | | | 61,000 | | | | 64,279 | |
| | |
5.13%, 5/1/2027 (a) | | | 963,000 | | | | 1,018,363 | |
| | |
5.00%, 2/1/2028 (a) | | | 721,000 | | | | 757,050 | |
| | | | | | | | |
| INVESTMENTS | | PRINCIPAL
AMOUNT ($) | | | VALUE ($) | |
| |
|
Diversified Telecommunication Services — continued | |
| | |
5.38%, 6/1/2029 (a) | | | 191,000 | | | | 204,131 | |
| | |
CenturyLink, Inc. | | | | | | | | |
| | |
Series S, 6.45%, 6/15/2021 | | | 387,000 | | | | 407,801 | |
| | |
Series T, 5.80%, 3/15/2022 | | | 429,000 | | | | 449,914 | |
| | |
Series Y, 7.50%, 4/1/2024 | | | 309,000 | | | | 342,984 | |
| | |
Embarq Corp. 8.00%, 6/1/2036 | | | 469,000 | | | | 459,789 | |
| | |
Intelsat Jackson Holdings SA (Luxembourg) 8.00%, 2/15/2024 (a) | | | 374,000 | | | | 389,427 | |
| | |
Level 3 Financing, Inc. | | | | | | | | |
| | |
5.38%, 8/15/2022 | | | 288,000 | | | | 289,080 | |
| | |
5.38%, 1/15/2024 | | | 245,000 | | | | 249,287 | |
| | |
5.38%, 5/1/2025 | | | 244,000 | | | | 253,760 | |
| | |
Sprint Capital Corp. 6.88%, 11/15/2028 | | | 781,000 | | | | 865,934 | |
| | |
Telecom Italia Capital SA (Italy) | | | | | | | | |
| | |
7.20%, 7/18/2036 | | | 316,000 | | | | 352,340 | |
| | |
7.72%, 6/4/2038 | | | 318,000 | | | | 367,290 | |
| | |
Telecom Italia SpA (Italy) 5.30%, 5/30/2024 (a) | | | 600,000 | | | | 642,000 | |
| | |
Virgin Media Finance plc (United Kingdom) 6.00%, 10/15/2024 (a) | | | 200,000 | | | | 206,500 | |
| | |
Virgin Media Secured Finance plc (United Kingdom) | | | | | | | | |
| | |
5.25%, 1/15/2026 (a) | | | 400,000 | | | | 410,000 | |
| | |
5.50%, 8/15/2026 (a) | | | 200,000 | | | | 209,250 | |
| | | | | | | | |
| | |
| | | | | | | 11,548,909 | |
| | | | | | | | |
|
Electric Utilities — 1.3% | |
| | |
Emera, Inc. (Canada) | | | | | | | | |
| | |
Series 16-A, (ICE LIBOR USD 3 Month + 5.44%), 6.75%, 6/15/2076 (c) | | | 374,000 | | | | 406,725 | |
| | |
NextEra Energy Operating Partners LP | | | | | | | | |
| | |
4.25%, 7/15/2024 (a) | | | 225,000 | | | | 231,187 | |
| | |
4.25%, 9/15/2024 (a) | | | 160,000 | | | | 165,920 | |
| | |
4.50%, 9/15/2027 (a) | | | 156,000 | | | | 160,290 | |
| | |
Vistra Operations Co. LLC | | | | | | | | |
| | |
5.50%, 9/1/2026 (a) | | | 317,000 | | | | 332,850 | |
| | |
5.63%, 2/15/2027 (a) | | | 405,000 | | | | 428,794 | |
| | |
5.00%, 7/31/2027 (a) | | | 410,000 | | | | 423,325 | |
| | | | | | | | |
| | |
| | | | | | | 2,149,091 | |
| | | | | | | | |
|
Electrical Equipment — 0.2% | |
| | |
Sensata Technologies BV | | | | | | | | |
| | |
4.88%, 10/15/2023 (a) | | | 139,000 | | | | 145,825 | |
| | |
5.00%, 10/1/2025 (a) | | | 193,000 | | | | 204,580 | |
| | | | | | | | |
| | |
| | | | | | | 350,405 | |
| | | | | | | | |
SEE NOTES TO FINANCIAL STATEMENTS.
| | | | | | |
| | | |
| 86 | | | | J.P. MORGAN EXCHANGE-TRADED FUNDS | | AUGUST 31, 2019 |
| | | | | | | | |
| INVESTMENTS | | PRINCIPAL
AMOUNT ($) | | | VALUE ($) | |
Corporate Bonds — continued | |
|
Electronic Equipment, Instruments & Components — 0.3% | |
| | |
CDW LLC | | | | | | | | |
| | |
5.00%, 9/1/2023 | | | 144,000 | | | | 146,880 | |
| | |
5.50%, 12/1/2024 | | | 167,000 | | | | 181,821 | |
| | |
5.00%, 9/1/2025 | | | 182,000 | | | | 190,190 | |
| | | | | | | | |
| | |
| | | | | | | 518,891 | |
| | | | | | | | |
|
Energy Equipment & Services — 1.4% | |
| | |
Diamond Offshore Drilling, Inc. | | | | | | | | |
| | |
7.88%, 8/15/2025 | | | 126,000 | | | | 115,958 | |
| | |
5.70%, 10/15/2039 | | | 128,000 | | | | 79,360 | |
| | |
4.88%, 11/1/2043 | | | 207,000 | | | | 117,990 | |
| | |
Nabors Industries, Inc. | | | | | | | | |
| | |
4.63%, 9/15/2021 | | | 240,000 | | | | 228,600 | |
| | |
5.75%, 2/1/2025 | | | 260,000 | | | | 208,000 | |
| | |
Rowan Cos., Inc. 4.88%, 6/1/2022 | | | 200,000 | | | | 163,000 | |
| | |
Transocean Guardian Ltd. 5.88%, 1/15/2024 (a) | | | 94,340 | | | | 95,166 | |
| | |
Transocean Phoenix 2 Ltd. 7.75%, 10/15/2024 (a) | | | 36,000 | | | | 38,025 | |
| | |
Transocean Proteus Ltd. 6.25%, 12/1/2024 (a) | | | 28,500 | | | | 29,141 | |
| | |
Transocean, Inc. | | | | | | | | |
| | |
9.00%, 7/15/2023 (a) | | | 352,000 | | | | 363,873 | |
| | |
7.25%, 11/1/2025 (a) | | | 231,000 | | | | 210,210 | |
| | |
7.50%, 1/15/2026 (a) | | | 198,000 | | | | 180,675 | |
| | |
USA Compression Partners LP | | | | | | | | |
| | |
6.88%, 4/1/2026 | | | 230,000 | | | | 235,750 | |
| | |
6.88%, 9/1/2027 (a) | | | 230,000 | | | | 236,573 | |
| | | | | | | | |
| | |
| | | | | | | 2,302,321 | |
| | | | | | | | |
|
Entertainment — 1.4% | |
| | |
Lions Gate Capital Holdings LLC | | | | | | | | |
| | |
6.38%, 2/1/2024 (a) | | | 125,000 | | | | 132,024 | |
| | |
5.88%, 11/1/2024 (a) | | | 125,000 | | | | 130,000 | |
| | |
Live Nation Entertainment, Inc. 4.88%, 11/1/2024 (a) | | | 163,000 | | | | 168,909 | |
| | |
Netflix, Inc. | | | | | | | | |
| | |
5.50%, 2/15/2022 | | | 26,000 | | | | 27,690 | |
| | |
5.88%, 2/15/2025 | | | 160,000 | | | | 176,600 | |
| | |
4.38%, 11/15/2026 (b) | | | 276,000 | | | | 282,555 | |
| | |
4.88%, 4/15/2028 | | | 451,000 | | | | 471,859 | |
| | |
5.88%, 11/15/2028 | | | 526,000 | | | | 588,462 | |
| | |
Viacom, Inc. | | | | | | | | |
| | |
(ICE LIBOR USD 3 Month + 3.90%), 5.87%, 2/28/2057 (c) | | | 172,000 | | | | 179,587 | |
| | | | | | | | |
| INVESTMENTS | | PRINCIPAL
AMOUNT ($) | | | VALUE ($) | |
| |
|
Entertainment — continued | |
| | |
(ICE LIBOR USD 3 Month + 3.90%), 6.25%, 2/28/2057 (c) | | | 172,000 | | | | 185,115 | |
| | | | | | | | |
| | |
| | | | | | | 2,342,801 | |
| | | | | | | | |
|
Equity Real Estate Investment Trusts (REITs) — 3.1% | |
| | |
Brookfield Property REIT, Inc. 5.75%, 5/15/2026 (a) | | | 310,000 | | | | 326,275 | |
| | |
CyrusOne LP 5.00%, 3/15/2024 | | | 202,000 | | | | 208,565 | |
| | |
Equinix, Inc. | | | | | | | | |
| | |
5.38%, 4/1/2023 | | | 288,000 | | | | 293,760 | |
| | |
5.88%, 1/15/2026 | | | 341,000 | | | | 362,739 | |
| | |
5.38%, 5/15/2027 | | | 395,000 | | | | 426,730 | |
| | |
Iron Mountain, Inc. | | | | | | | | |
| | |
6.00%, 8/15/2023 | | | 82,000 | | | | 83,845 | |
| | |
5.75%, 8/15/2024 | | | 286,000 | | | | 289,575 | |
| | |
4.88%, 9/15/2027 (a) | | | 312,000 | | | | 320,387 | |
| | |
5.25%, 3/15/2028 (a) | | | 257,000 | | | | 266,637 | |
| | |
MGM Growth Properties Operating Partnership LP | | | | | | | | |
| | |
5.63%, 5/1/2024 | | | 315,000 | | | | 344,138 | |
| | |
4.50%, 9/1/2026 | | | 163,000 | | | | 170,742 | |
| | |
5.75%, 2/1/2027 (a) | | | 237,000 | | | | 261,636 | |
| | |
MPT Operating Partnership LP | | | | | | | | |
| | |
6.38%, 3/1/2024 | | | 139,000 | | | | 145,603 | |
| | |
5.25%, 8/1/2026 | | | 122,000 | | | | 128,899 | |
| | |
5.00%, 10/15/2027 | | | 394,000 | | | | 420,595 | |
| | |
SBA Communications Corp. | | | | | | | | |
| | |
4.88%, 7/15/2022 | | | 202,000 | | | | 205,151 | |
| | |
4.00%, 10/1/2022 | | | 229,000 | | | | 233,008 | |
| | |
4.88%, 9/1/2024 | | | 336,000 | | | | 347,760 | |
| | |
Uniti Group LP 6.00%, 4/15/2023 (a) | | | 175,000 | | | | 166,687 | |
| | | | | | | | |
| | |
| | | | | | | 5,002,732 | |
| | | | | | | | |
|
Food Products — 2.0% | |
| | |
B&G Foods, Inc. | | | | | | | | |
| | |
4.63%, 6/1/2021 | | | 192,000 | | | | 192,624 | |
| | |
5.25%, 4/1/2025 | | | 307,000 | | | | 311,314 | |
| | |
Lamb Weston Holdings, Inc. | | | | | | | | |
| | |
4.63%, 11/1/2024 (a) | | | 214,000 | | | | 223,718 | |
| | |
4.88%, 11/1/2026 (a) | | | 214,000 | | | | 223,362 | |
| | |
Pilgrim’s Pride Corp. | | | | | | | | |
| | |
5.75%, 3/15/2025 (a) | | | 316,000 | | | | 328,640 | |
| | |
5.88%, 9/30/2027 (a) | | | 268,000 | | | | 288,770 | |
| | |
Post Holdings, Inc. | | | | | | | | |
| | |
5.50%, 3/1/2025 (a) | | | 316,000 | | | | 330,615 | |
SEE NOTES TO FINANCIAL STATEMENTS.
| | | | | | | | |
| | | |
| AUGUST 31, 2019 | | J.P. MORGAN EXCHANGE-TRADED FUNDS | | | | | 87 | |
JPMorgan High Yield Research Enhanced ETF
(formerly known as JPMorgan Disciplined High Yield ETF)
SCHEDULE OF PORTFOLIO INVESTMENTS
AS OF AUGUST 31, 2019 (Unaudited) (continued)
| | | | | | | | |
| INVESTMENTS | | PRINCIPAL
AMOUNT ($) | | | VALUE ($) | |
Corporate Bonds — continued | |
|
Food Products — continued | |
| | |
5.00%, 8/15/2026 (a) | | | 536,000 | | | | 558,780 | |
| | |
5.75%, 3/1/2027 (a) | | | 410,000 | | | | 435,625 | |
| | |
5.63%, 1/15/2028 (a) | | | 211,000 | | | | 224,715 | |
| | |
TreeHouse Foods, Inc. 6.00%, 2/15/2024 (a) | | | 204,000 | | | | 211,905 | |
| | | | | | | | |
| | |
| | | | | | | 3,330,068 | |
| | | | | | | | |
|
Gas Utilities — 0.5% | |
| | |
AmeriGas Partners LP | | | | | | | | |
| | |
5.63%, 5/20/2024 | | | 189,000 | | | | 200,576 | |
| | |
5.50%, 5/20/2025 | | | 193,000 | | | | 204,097 | |
| | |
5.88%, 8/20/2026 | | | 189,000 | | | | 205,245 | |
| | |
Suburban Propane Partners LP 5.50%, 6/1/2024 | | | 164,000 | | | | 166,460 | |
| | | | | | | | |
| | |
| | | | | | | 776,378 | |
| | | | | | | | |
|
Health Care Equipment & Supplies — 0.2% | |
| | |
Hologic, Inc. 4.38%, 10/15/2025 (a) | | | 267,000 | | | | 273,007 | |
| | |
Teleflex, Inc. 4.63%, 11/15/2027 | | | 118,000 | | | | 124,771 | |
| | | | | | | | |
| | |
| | | | | | | 397,778 | |
| | | | | | | | |
|
Health Care Providers & Services — 6.5% | |
| | |
Acadia Healthcare Co., Inc. 5.63%, 2/15/2023 | | | 175,000 | | | | 178,717 | |
| | |
Centene Corp. | | | | | | | | |
| | |
5.63%, 2/15/2021 | | | 396,000 | | | | 401,445 | |
| | |
6.13%, 2/15/2024 | | | 258,000 | | | | 270,384 | |
| | |
4.75%, 1/15/2025 | | | 339,000 | | | | 351,712 | |
| | |
5.38%, 6/1/2026 (a) | | | 579,000 | | | | 618,980 | |
| | |
DaVita, Inc. | | | | | | | | |
| | |
5.75%, 8/15/2022 | | | 349,000 | | | | 352,525 | |
| | |
5.13%, 7/15/2024 | | | 494,000 | | | | 502,502 | |
| | |
5.00%, 5/1/2025 | | | 422,000 | | | | 422,527 | |
| | |
Encompass Health Corp. 5.75%, 11/1/2024 | | | 310,000 | | | | 313,875 | |
| | |
HCA, Inc. | | | | | | | | |
| | |
7.50%, 2/15/2022 | | | 624,000 | | | | 698,761 | |
| | |
5.38%, 2/1/2025 | | | 775,000 | | | | 860,250 | |
| | |
5.63%, 9/1/2028 | | | 468,000 | | | | 532,496 | |
| | |
5.88%, 2/1/2029 | | | 119,000 | | | | 136,999 | |
| | |
MEDNAX, Inc. | | | | | | | | |
| | |
5.25%, 12/1/2023 (a) | | | 231,000 | | | | 232,155 | |
| | |
6.25%, 1/15/2027 (a) | | | 322,000 | | | | 315,560 | |
| | |
Molina Healthcare, Inc. 5.38%, 11/15/2022 (g) | | | 205,000 | | | | 219,102 | |
| | |
Tenet Healthcare Corp. | | | | | | | | |
| | |
6.00%, 10/1/2020 | | | 470,000 | | | | 488,330 | |
| | | | | | | | |
| INVESTMENTS | | PRINCIPAL
AMOUNT ($) | | | VALUE ($) | |
| |
|
Health Care Providers & Services — continued | |
| | |
8.13%, 4/1/2022 | | | 831,000 | | | | 895,319 | |
| | |
6.75%, 6/15/2023 | | | 408,000 | | | | 419,220 | |
| | |
4.63%, 7/15/2024 | | | 538,000 | | | | 553,467 | |
| | |
4.63%, 9/1/2024 (a) | | | 69,000 | | | | 71,070 | |
| | |
5.13%, 5/1/2025 | | | 407,000 | | | | 408,018 | |
| | |
4.88%, 1/1/2026 (a) | | | 340,000 | | | | 349,384 | |
| | |
6.25%, 2/1/2027 (a) | | | 260,000 | | | | 269,750 | |
| | |
5.13%, 11/1/2027 (a) | | | 254,000 | | | | 262,573 | |
| | |
WellCare Health Plans, Inc. | | | | | | | | |
| | |
5.25%, 4/1/2025 | | | 346,000 | | | | 362,280 | |
| | |
5.38%, 8/15/2026 (a) | | | 217,000 | | | | 231,376 | |
| | | | | | | | |
| | |
| | | | | | | 10,718,777 | |
| | | | | | | | |
|
Health Care Technology — 0.5% | |
| | |
IQVIA, Inc. | | | | | | | | |
| | |
5.00%, 10/15/2026 (a) | | | 400,000 | | | | 422,000 | |
| | |
5.00%, 5/15/2027 (a) | | | 300,000 | | | | 316,875 | |
| | | | | | | | |
| | |
| | | | | | | 738,875 | |
| | | | | | | | |
|
Hotels, Restaurants & Leisure — 7.7% | |
| | |
1011778 BC ULC (Canada) | | | | | | | | |
| | |
4.63%, 1/15/2022 (a) | | | 351,000 | | | | 352,316 | |
| | |
4.25%, 5/15/2024 (a) | | | 483,000 | | | | 498,582 | |
| | |
5.00%, 10/15/2025 (a) | | | 901,000 | | | | 930,282 | |
| | |
Boyd Gaming Corp. | | | | | | | | |
| | |
6.88%, 5/15/2023 | | | 202,000 | | | | 209,530 | |
| | |
6.38%, 4/1/2026 | | | 226,000 | | | | 239,560 | |
| | |
6.00%, 8/15/2026 | | | 191,000 | | | | 201,744 | |
| | |
Caesars Resort Collection LLC 5.25%, 10/15/2025 (a) | | | 481,000 | | | | 489,417 | |
| | |
Cedar Fair LP | | | | | | | | |
| | |
5.38%, 4/15/2027 | | | 160,000 | | | | 172,400 | |
| | |
5.25%, 7/15/2029 (a) | | | 160,000 | | | | 173,600 | |
| | |
Churchill Downs, Inc. | | | | | | | | |
| | |
5.50%, 4/1/2027 (a) | | | 180,000 | | | | 191,250 | |
| | |
4.75%, 1/15/2028 (a) | | | 160,000 | | | | 164,800 | |
| | |
Eldorado Resorts, Inc. | | | | | | | | |
| | |
6.00%, 4/1/2025 | | | 276,000 | | | | 292,560 | |
| | |
6.00%, 9/15/2026 | | | 189,000 | | | | 206,719 | |
| | |
ESH Hospitality, Inc. | | | | | | | | |
| | |
REIT, 5.25%, 5/1/2025 (a) | | | 410,000 | | | | 423,837 | |
| | |
Hilton Domestic Operating Co., Inc. | | | | | | | | |
| | |
4.25%, 9/1/2024 | | | 298,000 | | | | 303,960 | |
| | |
5.13%, 5/1/2026 | | | 432,000 | | | | 455,976 | |
| | |
4.88%, 1/15/2030 (a) | | | 320,000 | | | | 342,400 | |
SEE NOTES TO FINANCIAL STATEMENTS.
| | | | | | |
| | | |
| 88 | | | | J.P. MORGAN EXCHANGE-TRADED FUNDS | | AUGUST 31, 2019 |
| | | | | | | | |
| INVESTMENTS | | PRINCIPAL
AMOUNT ($) | | | VALUE ($) | |
Corporate Bonds — continued | |
|
Hotels, Restaurants & Leisure — continued | |
| | |
Hilton Worldwide Finance LLC | | | | | | | | |
| | |
4.63%, 4/1/2025 | | | 244,000 | | | | 251,930 | |
| | |
4.88%, 4/1/2027 | | | 177,000 | | | | 186,293 | |
| | |
International Game Technology plc | | | | | | | | |
| | |
6.25%, 2/15/2022 (a) | | | 600,000 | | | | 634,500 | |
| | |
6.50%, 2/15/2025 (a) | | | 400,000 | | | | 439,000 | |
| | |
6.25%, 1/15/2027 (a) | | | 213,000 | | | | 233,768 | |
| | |
KFC Holding Co. | | | | | | | | |
| | |
5.00%, 6/1/2024 (a) | | | 294,000 | | | | 303,922 | |
| | |
5.25%, 6/1/2026 (a) | | | 299,000 | | | | 316,193 | |
| | |
4.75%, 6/1/2027 (a) | | | 200,000 | | | | 209,500 | |
| | |
MGM Resorts International | | | | | | | | |
| | |
6.63%, 12/15/2021 | | | 395,000 | | | | 429,563 | |
| | |
7.75%, 3/15/2022 | | | 213,000 | | | | 239,141 | |
| | |
6.00%, 3/15/2023 | | | 395,000 | | | | 434,500 | |
| | |
5.75%, 6/15/2025 | | | 245,000 | | | | 269,814 | |
| | |
5.50%, 4/15/2027 | | | 316,000 | | | | 342,465 | |
| | |
NCL Corp. Ltd.
4.75%, 12/15/2021 (a) | | | 21,000 | | | | 21,315 | |
| | |
Sabre GLBL, Inc. | | | | | | | | |
| | |
5.38%, 4/15/2023 (a) | | | 153,000 | | | | 156,825 | |
| | |
5.25%, 11/15/2023 (a) | | | 144,000 | | | | 147,960 | |
| | |
Scientific Games International, Inc. 5.00%, 10/15/2025 (a) | | | 395,000 | | | | 408,130 | |
| | |
Six Flags Entertainment Corp. | | | | | | | | |
| | |
4.88%, 7/31/2024 (a) | | | 316,000 | | | | 327,060 | |
| | |
5.50%, 4/15/2027 (a) | | | 163,000 | | | | 174,410 | |
| | |
Stars Group Holdings BV (Canada) 7.00%, 7/15/2026 (a) | | | 280,000 | | | | 297,150 | |
| | |
Wyndham Destinations, Inc. 4.25%, 3/1/2022 | | | 172,000 | | | | 176,300 | |
| | |
Wynn Las Vegas LLC | | | | | | | | |
| | |
4.25%, 5/30/2023 (a) | | | 143,000 | | | | 147,147 | |
| | |
5.50%, 3/1/2025 (a) | | | 568,000 | | | | 599,240 | |
| | |
5.25%, 5/15/2027 (a) | | | 288,000 | | | | 298,440 | |
| | | | | | | | |
| | |
| | | | | | | 12,693,499 | |
| | | | | | | | |
|
Household Durables — 1.1% | |
| | |
Brookfield Residential Properties, Inc. (Canada) | | | | | | | | |
| | |
6.50%, 12/15/2020 (a) | | | 152,000 | | | | 152,190 | |
| | |
6.13%, 7/1/2022 (a) | | | 153,000 | | | | 155,104 | |
| | |
Lennar Corp. | | | | | | | | |
| | |
4.13%, 1/15/2022 | | | 155,000 | | | | 159,991 | |
| | |
4.75%, 11/15/2022 (g) | | | 26,000 | | | | 27,430 | |
| | |
4.50%, 4/30/2024 | | | 169,000 | | | | 179,774 | |
| | | | | | | | |
| INVESTMENTS | | PRINCIPAL
AMOUNT ($) | | | VALUE ($) | |
| |
|
Household Durables — continued | |
| | |
4.75%, 11/29/2027 | | | 291,000 | | | | 316,462 | |
| | |
MDC Holdings, Inc. 6.00%, 1/15/2043 | | | 144,000 | | | | 147,600 | |
| | |
PulteGroup, Inc. | | | | | | | | |
| | |
5.50%, 3/1/2026 | | | 216,000 | | | | 237,060 | |
| | |
5.00%, 1/15/2027 | | | 172,000 | | | | 184,900 | |
| | |
Tempur Sealy International, Inc. 5.50%, 6/15/2026 | | | 152,000 | | | | 158,840 | |
| | | | | | | | |
| | |
| | | | | | | 1,719,351 | |
| | | | | | | | |
|
Household Products — 0.5% | |
| | |
Energizer Holdings, Inc. | | | | | | | | |
| | |
5.50%, 6/15/2025 (a) | | | 168,000 | | | | 170,192 | |
| | |
6.38%, 7/15/2026 (a) | | | 140,000 | | | | 147,525 | |
| | |
7.75%, 1/15/2027 (a) | | | 189,000 | | | | 206,719 | |
| | |
Spectrum Brands, Inc. 5.75%, 7/15/2025 | | | 276,000 | | | | 287,040 | |
| | | | | | | | |
| | |
| | | | | | | 811,476 | |
| | | | | | | | |
|
Independent Power and Renewable Electricity Producers — 1.1% | |
| | |
AES Corp. | | | | | | | | |
| | |
4.00%, 3/15/2021 | | | 70,000 | | | | 71,495 | |
| | |
4.88%, 5/15/2023 | | | 222,000 | | | | 225,052 | |
| | |
5.50%, 4/15/2025 | | | 170,000 | | | | 177,443 | |
| | |
Clearway Energy Operating LLC | | | | | | | | |
| | |
5.38%, 8/15/2024 | | | 170,000 | | | | 174,250 | |
| | |
5.75%, 10/15/2025 (a) | | | 187,000 | | | | 194,951 | |
| | |
NRG Energy, Inc. | | | | | | | | |
| | |
7.25%, 5/15/2026 | | | 275,000 | | | | 301,469 | |
| | |
6.63%, 1/15/2027 | | | 389,000 | | | | 420,120 | |
| | |
5.75%, 1/15/2028 | | | 230,000 | | | | 247,825 | |
| | | | | | | | |
| | |
| | | | | | | 1,812,605 | |
| | | | | | | | |
|
Insurance — 0.1% | |
| | |
Genworth Holdings, Inc. 7.63%, 9/24/2021 | | | 179,000 | | | | 186,608 | |
| | | | | | | | |
|
Internet & Direct Marketing Retail — 0.4% | |
| | |
QVC, Inc. | | | | | | | | |
| | |
4.38%, 3/15/2023 | | | 244,000 | | | | 254,881 | |
| | |
4.85%, 4/1/2024 | | | 186,000 | | | | 197,606 | |
| | |
4.45%, 2/15/2025 | | | 154,000 | | | | 160,192 | |
| | | | | | | | |
| | |
| | | | | | | 612,679 | |
| | | | | | | | |
|
IT Services — 1.1% | |
| | |
VeriSign, Inc. | | | | | | | | |
| | |
4.63%, 5/1/2023 | | | 216,000 | | | | 219,510 | |
| | |
5.25%, 4/1/2025 | | | 138,000 | | | | 150,765 | |
| | |
4.75%, 7/15/2027 | | | 228,000 | | | | 241,110 | |
SEE NOTES TO FINANCIAL STATEMENTS.
| | | | | | | | |
| | | |
| AUGUST 31, 2019 | | J.P. MORGAN EXCHANGE-TRADED FUNDS | | | | | 89 | |
JPMorgan High Yield Research Enhanced ETF
(formerly known as JPMorgan Disciplined High Yield ETF)
SCHEDULE OF PORTFOLIO INVESTMENTS
AS OF AUGUST 31, 2019 (Unaudited) (continued)
| | | | | | | | |
| INVESTMENTS | | PRINCIPAL
AMOUNT ($) | | | VALUE ($) | |
Corporate Bonds — continued | |
|
IT Services — continued | |
| | |
Zayo Group LLC | | | | | | | | |
| | |
6.00%, 4/1/2023 | | | 438,000 | | | | 451,744 | |
| | |
6.38%, 5/15/2025 | | | 284,000 | | | | 292,165 | |
| | |
5.75%, 1/15/2027 (a) | | | 503,000 | | | | 513,060 | |
| | | | | | | | |
| | |
| | | | | | | 1,868,354 | |
| | | | | | | | |
|
Leisure Products — 0.3% | |
| | |
Mattel, Inc. 6.75%, 12/31/2025 (a) | | | 421,000 | | | | 432,578 | |
| | | | | | | | |
|
Life Sciences Tools & Services — 0.3% | |
| | |
Avantor, Inc. 6.00%, 10/1/2024 (a) | | | 500,000 | | | | 536,250 | |
| | | | | | | | |
|
Machinery — 0.2% | |
| | |
Colfax Corp. 6.00%, 2/15/2024 (a) | | | 187,000 | | | | 199,389 | |
| | |
Navistar International Corp. 6.63%, 11/1/2025 (a) | | | 125,000 | | | | 126,562 | |
| | | | | | | | |
| | |
| | | | | | | 325,951 | |
| | | | | | | | |
|
Media — 9.9% | |
| | |
Altice Financing SA (Luxembourg) | | | | | | | | |
| | |
6.63%, 2/15/2023 (a) | | | 600,000 | | | | 618,750 | |
| | |
7.50%, 5/15/2026 (a) | | | 850,000 | | | | 905,250 | |
| | |
AMC Networks, Inc. | | | | | | | | |
| | |
4.75%, 12/15/2022 | | | 155,000 | | | | 157,325 | |
| | |
5.00%, 4/1/2024 | | | 308,000 | | | | 317,240 | |
| | |
4.75%, 8/1/2025 | | | 218,000 | | | | 222,633 | |
| | |
Cablevision Systems Corp. 5.88%, 9/15/2022 | | | 92,000 | | | | 98,412 | |
| | |
Cinemark USA, Inc. 4.88%, 6/1/2023 | | | 213,000 | | | | 216,994 | |
| | |
Clear Channel Worldwide Holdings, Inc. | | | | | | | | |
| | |
Series A, 6.50%, 11/15/2022 | | | 196,000 | | | | 200,247 | |
| | |
Series B, 6.50%, 11/15/2022 | | | 561,000 | | | | 573,157 | |
| | |
CSC Holdings LLC | | | | | | | | |
| | |
5.13%, 12/15/2021 (a) | | | 413,000 | | | | 413,516 | |
| | |
5.38%, 7/15/2023 (a) | | | 400,000 | | | | 411,104 | |
| | |
7.75%, 7/15/2025 (a) | | | 400,000 | | | | 429,500 | |
| | |
10.88%, 10/15/2025 (a) | | | 567,000 | | | | 643,545 | |
| | |
5.50%, 5/15/2026 (a) | | | 400,000 | | | | 423,000 | |
| | |
5.50%, 4/15/2027 (a) | | | 400,000 | | | | 428,000 | |
| | |
7.50%, 4/1/2028 (a) | | | 400,000 | | | | 450,000 | |
| | |
6.50%, 2/1/2029 (a) | | | 200,000 | | | | 224,125 | |
| | |
DISH DBS Corp. | | | | | | | | |
| | |
6.75%, 6/1/2021 | | | 572,000 | | | | 602,488 | |
| | |
5.88%, 7/15/2022 | | | 573,000 | | | | 593,055 | |
| | |
5.88%, 11/15/2024 | | | 570,000 | | | | 542,241 | |
| | |
Gray Television, Inc. | | | | | | | | |
| | |
5.13%, 10/15/2024 (a) | | | 152,000 | | | | 156,940 | |
| | | | | | | | |
| INVESTMENTS | | PRINCIPAL
AMOUNT ($) | | | VALUE ($) | |
| |
|
Media — continued | |
| | |
5.88%, 7/15/2026 (a) | | | 202,000 | | | | 211,090 | |
| | |
7.00%, 5/15/2027 (a) | | | 231,000 | | | | 252,587 | |
| | |
iHeartCommunications, Inc. 8.38%, 5/1/2027 | | | 467,000 | | | | 503,776 | |
| | |
Lamar Media Corp. | | | | | | | | |
| | |
5.00%, 5/1/2023 | | | 145,000 | | | | 147,855 | |
| | |
5.38%, 1/15/2024 | | | 142,000 | | | | 145,905 | |
| | |
Meredith Corp. 6.88%, 2/1/2026 | | | 393,000 | | | | 414,615 | |
| | |
Nexstar Broadcasting, Inc. 5.63%, 8/1/2024 (a) | | | 249,000 | | | | 258,960 | |
| | |
Nexstar Escrow, Inc. 5.63%, 7/15/2027 (a) | | | 360,000 | | | | 375,300 | |
| | |
Outfront Media Capital LLC 5.63%, 2/15/2024 | | | 148,000 | | | | 152,440 | |
| | |
Quebecor Media, Inc. (Canada) 5.75%, 1/15/2023 | | | 247,000 | | | | 267,459 | |
| | |
Sinclair Television Group, Inc. | | | | | | | | |
| | |
6.13%, 10/1/2022 | | | 127,000 | | | | 128,746 | |
| | |
5.63%, 8/1/2024 (a) | | | 150,000 | | | | 154,500 | |
| | |
Sirius XM Radio, Inc. | | | | | | | | |
| | |
3.88%, 8/1/2022 (a) | | | 305,000 | | | | 310,338 | |
| | |
4.63%, 7/15/2024 (a) | | | 282,000 | | | | 294,337 | |
| | |
5.38%, 4/15/2025 (a) | | | 36,000 | | | | 37,350 | |
| | |
5.00%, 8/1/2027 (a) | | | 437,000 | | | | 461,035 | |
| | |
5.50%, 7/1/2029 (a) | | | 208,000 | | | | 226,660 | |
| | |
TEGNA, Inc. 6.38%, 10/15/2023 | | | 188,000 | | | | 193,264 | |
| | |
Telenet Finance Luxembourg Notes SARL (Belgium) 5.50%, 3/1/2028 (a) | | | 400,000 | | | | 406,800 | |
| | |
Tribune Media Co. 5.88%, 7/15/2022 | | | 296,000 | | | | 300,348 | |
| | |
Unitymedia GmbH (Germany) 6.13%, 1/15/2025 (a) | | | 400,000 | | | | 417,200 | |
| | |
Unitymedia Hessen GmbH & Co. KG (Germany) | | | | | | | | |
| | |
5.00%, 1/15/2025 (a) | | | 200,000 | | | | 206,524 | |
| | |
UPC Holding BV (Netherlands) 5.50%, 1/15/2028 (a) | | | 200,000 | | | | 208,500 | |
| | |
UPCB Finance IV Ltd. (Netherlands) 5.38%, 1/15/2025 (a) | | | 400,000 | | | | 411,700 | |
| | |
Videotron Ltd. (Canada) | | | | | | | | |
| | |
5.00%, 7/15/2022 | | | 221,000 | | | | 231,774 | |
| | |
5.13%, 4/15/2027 (a) | | | 172,000 | | | | 181,030 | |
| | |
Ziggo Bond Co. BV (Netherlands) 6.00%,
1/15/2027 (a) | | | 150,000 | | | | 156,375 | |
| | |
Ziggo BV (Netherlands) 5.50%, 1/15/2027 (a) | | | 600,000 | | | | 632,970 | |
| | | | | | | | |
| | |
| | | | | | | 16,316,960 | |
| | | | | | | | |
SEE NOTES TO FINANCIAL STATEMENTS.
| | | | | | |
| | | |
| 90 | | | | J.P. MORGAN EXCHANGE-TRADED FUNDS | | AUGUST 31, 2019 |
| | | | | | | | |
| INVESTMENTS | | PRINCIPAL
AMOUNT ($) | | | VALUE ($) | |
Corporate Bonds — continued | |
|
Metals & Mining — 3.5% | |
| | |
Alcoa Nederland Holding BV | | | | | | | | |
| | |
6.75%, 9/30/2024 (a) | | | 200,000 | | | | 210,000 | |
| | |
7.00%, 9/30/2026 (a) | | | 200,000 | | | | 215,440 | |
| | |
6.13%, 5/15/2028 (a) | | | 200,000 | | | | 208,000 | |
| | |
Allegheny Technologies, Inc. | | | | | | | | |
| | |
5.95%, 1/15/2021 | | | 155,000 | | | | 158,487 | |
| | |
7.88%, 8/15/2023 (g) | | | 167,000 | | | | 179,108 | |
| | |
Cleveland-Cliffs, Inc. | | | | | | | | |
| | |
5.75%, 3/1/2025 | | | 82,000 | | | | 82,205 | |
| | |
5.88%, 6/1/2027 (a) | | | 180,000 | | | | 175,500 | |
| | |
Constellium SE | | | | | | | | |
| | |
6.63%, 3/1/2025 (a) | | | 250,000 | | | | 261,719 | |
| | |
5.88%, 2/15/2026 (a) | | | 250,000 | | | | 260,625 | |
| | |
FMG Resources August 2006 Pty. Ltd. (Australia) | | | | | | | | |
| | |
4.75%, 5/15/2022 (a) | | | 200,000 | | | | 206,000 | |
| | |
5.13%, 3/15/2023 (a) | | | 151,000 | | | | 157,040 | |
| | |
5.13%, 5/15/2024 (a) | | | 226,000 | | | | 235,605 | |
| | |
Freeport-McMoRan, Inc. | | | | | | | | |
| | |
3.55%, 3/1/2022 | | | 587,000 | | | | 588,467 | |
| | |
3.88%, 3/15/2023 | | | 605,000 | | | | 611,292 | |
| | |
5.45%, 3/15/2043 | | | 595,000 | | | | 542,938 | |
| | |
Hudbay Minerals, Inc. (Canada) 7.63%,
1/15/2025 (a) | | | 193,000 | | | | 195,891 | |
| | |
Novelis Corp. | | | | | | | | |
| | |
6.25%, 8/15/2024 (a) | | | 332,000 | | | | 347,770 | |
| | |
5.88%, 9/30/2026 (a) | | | 437,000 | | | | 461,581 | |
| | |
Steel Dynamics, Inc. | | | | | | | | |
| | |
5.13%, 10/1/2021 | | | 182,000 | | | | 182,508 | |
| | |
5.50%, 10/1/2024 | | | 139,000 | | | | 143,239 | |
| | |
United States Steel Corp. | | | | | | | | |
| | |
6.88%, 8/15/2025 (b) | | | 228,000 | | | | 216,384 | |
| | |
6.25%, 3/15/2026 | | | 195,000 | | | | 172,454 | |
| | | | | | | | |
| | |
| | | | | | | 5,812,253 | |
| | | | | | | | |
|
Mortgage Real Estate Investment Trusts (REITs) — 0.3% | |
| | |
Starwood Property Trust, Inc. | | | | | | | | |
| | |
3.63%, 2/1/2021 | | | 127,000 | | | | 127,953 | |
| | |
5.00%, 12/15/2021 | | | 185,000 | | | | 191,937 | |
| | |
4.75%, 3/15/2025 | | | 107,000 | | | | 109,675 | |
| | | | | | | | |
| | |
| | | | | | | 429,565 | |
| | | | | | | | |
|
Oil, Gas & Consumable Fuels — 11.3% | |
| | |
Aker BP ASA (Norway) | | | | | | | | |
| | |
4.75%, 6/15/2024 (a) | | | 241,000 | | | | 246,422 | |
| | |
5.88%, 3/31/2025 (a) | | | 161,000 | | | | 169,533 | |
| | | | | | | | |
| INVESTMENTS | | PRINCIPAL
AMOUNT ($) | | | VALUE ($) | |
| |
Oil, Gas & Consumable Fuels — continued | |
| | |
Antero Midstream Partners LP | | | | | | | | |
| | |
5.38%, 9/15/2024 | | | 200,000 | | | | 188,500 | |
| | |
5.75%, 3/1/2027 (a) | | | 200,000 | | | | 183,500 | |
| | |
5.75%, 1/15/2028 (a) | | | 209,000 | | | | 189,667 | |
| | |
Antero Resources Corp. | | | | | | | | |
| | |
5.38%, 11/1/2021 | | | 287,000 | | | | 278,749 | |
| | |
5.13%, 12/1/2022 | | | 300,000 | | | | 276,000 | |
| | |
5.63%, 6/1/2023 (b) | | | 201,000 | | | | 185,422 | |
| | |
Callon Petroleum Co. 6.13%, 10/1/2024 | | | 193,000 | | | | 187,210 | |
| | |
Carrizo Oil & Gas, Inc. 6.25%, 4/15/2023 (b) | | | 102,000 | | | | 97,563 | |
| | |
Cheniere Corpus Christi Holdings LLC | | | | | | | | |
| | |
7.00%, 6/30/2024 | | | 415,000 | | | | 478,806 | |
| | |
5.88%, 3/31/2025 | | | 468,000 | | | | 521,820 | |
| | |
5.13%, 6/30/2027 | | | 468,000 | | | | 516,555 | |
| | |
Cheniere Energy Partners LP | | | | | | | | |
| | |
5.25%, 10/1/2025 | | | 467,000 | | | | 482,761 | |
| | |
5.63%, 10/1/2026 | | | 346,000 | | | | 365,030 | |
| | |
Chesapeake Energy Corp. | | | | | | | | |
| | |
7.00%, 10/1/2024 | | | 280,000 | | | | 213,500 | |
| | |
8.00%, 1/15/2025 | | | 385,000 | | | | 291,637 | |
| | |
8.00%, 3/15/2026 (a) | | | 125,000 | | | | 89,375 | |
| | |
8.00%, 6/15/2027 (b) | | | 400,000 | | | | 289,004 | |
| | |
CNX Resources Corp. | | | | | | | | |
| | |
5.88%, 4/15/2022 | | | 378,000 | | | | 365,715 | |
| | |
7.25%, 3/14/2027 (a) | | | 125,000 | | | | 104,687 | |
| | |
Crestwood Midstream Partners LP | | | | | | | | |
| | |
6.25%, 4/1/2023 (g) | | | 188,000 | | | | 191,290 | |
| | |
5.75%, 4/1/2025 | | | 135,000 | | | | 138,038 | |
| | |
5.63%, 5/1/2027 (a) | | | 125,000 | | | | 124,960 | |
| | |
DCP Midstream LP Series A, (ICE LIBOR USD 3 Month + 5.15%), 7.38%, 12/15/2022 (c) (d) (e) | | | 156,000 | | | | 149,370 | |
| | |
DCP Midstream Operating LP | | | | | | | | |
| | |
3.88%, 3/15/2023 | | | 63,000 | | | | 63,787 | |
| | |
5.38%, 7/15/2025 | | | 257,000 | | | | 271,778 | |
| | |
5.13%, 5/15/2029 | | | 193,000 | | | | 197,835 | |
| | |
(ICE LIBOR USD 3 Month + 3.85%), 5.85%, 5/21/2043 (a) (c) | | | 162,000 | | | | 149,850 | |
| | |
Diamondback Energy, Inc. | | | | | | | | |
| | |
4.75%, 11/1/2024 | | | 378,000 | | | | 389,340 | |
| | |
5.38%, 5/31/2025 | | | 250,000 | | | | 262,500 | |
| | |
Energy Transfer Operating LP | | | | | | | | |
| | |
Series A, (ICE LIBOR USD 3 Month + 4.03%), 6.25%, 2/15/2023 (c) (d) (e) | | | 296,000 | | | | 275,712 | |
SEE NOTES TO FINANCIAL STATEMENTS.
| | | | | | | | |
| | | |
| AUGUST 31, 2019 | | J.P. MORGAN EXCHANGE-TRADED FUNDS | | | | | 91 | |
JPMorgan High Yield Research Enhanced ETF
(formerly known as JPMorgan Disciplined High Yield ETF)
SCHEDULE OF PORTFOLIO INVESTMENTS
AS OF AUGUST 31, 2019 (Unaudited) (continued)
| | | | | | | | |
| INVESTMENTS | | PRINCIPAL
AMOUNT ($) | | | VALUE ($) | |
Corporate Bonds — continued | |
|
Oil, Gas & Consumable Fuels — continued | |
| | |
Series B, (ICE LIBOR USD 3 Month + 4.16%), 6.63%, 2/15/2028 (c) (d) (e) | | | 160,000 | | | | 151,600 | |
| | |
EnLink Midstream Partners LP | | | | | | | | |
| | |
4.40%, 4/1/2024 | | | 160,000 | | | | 158,400 | |
| | |
4.15%, 6/1/2025 | | | 234,000 | | | | 223,470 | |
| | |
5.45%, 6/1/2047 | | | 140,000 | | | | 118,300 | |
| | |
Genesis Energy LP | | | | | | | | |
| | |
6.75%, 8/1/2022 | | | 194,000 | | | | 196,105 | |
| | |
6.50%, 10/1/2025 | | | 162,000 | | | | 157,747 | |
| | |
Matador Resources Co. 5.88%, 9/15/2026 | | | 328,000 | | | | 317,750 | |
| | |
MEG Energy Corp. (Canada) | | | | | | | | |
| | |
6.38%, 1/30/2023 (a) | | | 225,000 | | | | 212,625 | |
| | |
7.00%, 3/31/2024 (a) | | | 275,000 | | | | 261,594 | |
| | |
6.50%, 1/15/2025 (a) | | | 236,000 | | | | 237,180 | |
| | |
Moss Creek Resources Holdings, Inc. 10.50%, 5/15/2027 (a) | | | 150,000 | | | | 117,750 | |
| | |
Murphy Oil Corp. | | | | | | | | |
| | |
4.00%, 6/1/2022 | | | 10,000 | | | | 10,000 | |
| | |
4.20%, 12/1/2022 (g) | | | 189,000 | | | | 190,890 | |
| | |
6.88%, 8/15/2024 | | | 160,000 | | | | 167,648 | |
| | |
5.75%, 8/15/2025 | | | 160,000 | | | | 161,952 | |
| | |
NGL Energy Partners LP 7.50%, 11/1/2023 | | | 169,000 | | | | 171,058 | |
| | |
NuStar Logistics LP | | | | | | | | |
| | |
6.00%, 6/1/2026 | | | 161,000 | | | | 172,673 | |
| | |
5.63%, 4/28/2027 | | | 171,000 | | | | 177,840 | |
| | |
Oasis Petroleum, Inc. 6.88%, 3/15/2022 | | | 233,000 | | | | 216,690 | |
| | |
Parsley Energy LLC | | | | | | | | |
| | |
5.38%, 1/15/2025 (a) | | | 186,000 | | | | 189,720 | |
| | |
5.63%, 10/15/2027 (a) | | | 218,000 | | | | 224,540 | |
| | |
PBF Holding Co. LLC 7.25%, 6/15/2025 | | | 203,000 | | | | 210,290 | |
| | |
PDC Energy, Inc. 5.75%, 5/15/2026 | | | 187,000 | | | | 182,774 | |
| | |
Peabody Energy Corp. | | | | | | | | |
| | |
6.00%, 3/31/2022 (a) | | | 139,000 | | | | 143,170 | |
| | |
6.38%, 3/31/2025 (a) | | | 127,000 | | | | 132,556 | |
| | |
QEP Resources, Inc. | | | | | | | | |
| | |
5.38%, 10/1/2022 | | | 155,000 | | | | 139,500 | |
| | |
5.25%, 5/1/2023 | | | 186,000 | | | | 162,750 | |
| | |
5.63%, 3/1/2026 (b) | | | 138,000 | | | | 111,780 | |
| | |
Range Resources Corp. | | | | | | | | |
| | |
5.00%, 8/15/2022 | | | 152,000 | | | | 141,740 | |
| | |
5.00%, 3/15/2023 | | | 206,000 | | | | 182,310 | |
| | |
4.88%, 5/15/2025 | | | 212,000 | | | | 173,840 | |
| | | | | | | | |
| INVESTMENTS | | PRINCIPAL
AMOUNT ($) | | | VALUE ($) | |
| |
|
Oil, Gas & Consumable Fuels — continued | |
| | |
Seven Generations Energy Ltd. (Canada) | | | | | | | | |
| | |
5.38%, 9/30/2025 (a) | | | 203,000 | | | | 194,373 | |
| | |
SM Energy Co. | | | | | | | | |
| | |
6.13%, 11/15/2022 | | | 150,000 | | | | 139,500 | |
| | |
5.63%, 6/1/2025 | | | 140,000 | | | | 119,000 | |
| | |
6.75%, 9/15/2026 | | | 131,000 | | | | 111,350 | |
| | |
6.63%, 1/15/2027 | | | 156,000 | | | | 132,600 | |
| | |
Southwestern Energy Co. | | | | | | | | |
| | |
6.20%, 1/23/2025 (g) | | | 308,000 | | | | 269,500 | |
| | |
7.50%, 4/1/2026 | | | 174,000 | | | | 152,285 | |
| | |
7.75%, 10/1/2027 | | | 156,000 | | | | 135,720 | |
| | |
Sunoco LP | | | | | | | | |
| | |
4.88%, 1/15/2023 | | | 312,000 | | | | 319,020 | |
| | |
5.50%, 2/15/2026 | | | 226,000 | | | | 234,475 | |
| | |
6.00%, 4/15/2027 | | | 125,000 | | | | 131,563 | |
| | |
Tallgrass Energy Partners LP | | | | | | | | |
| | |
4.75%, 10/1/2023 (a) | | | 170,000 | | | | 168,513 | |
| | |
5.50%, 9/15/2024 (a) | | | 234,000 | | | | 228,150 | |
| | |
5.50%, 1/15/2028 (a) | | | 238,000 | | | | 224,017 | |
| | |
Targa Resources Partners LP | | | | | | | | |
| | |
4.25%, 11/15/2023 | | | 144,000 | | | | 143,820 | |
| | |
6.75%, 3/15/2024 | | | 34,000 | | | | 35,317 | |
| | |
5.88%, 4/15/2026 | | | 283,000 | | | | 296,443 | |
| | |
6.50%, 7/15/2027 (a) | | | 234,000 | | | | 253,890 | |
| | |
5.00%, 1/15/2028 | | | 198,000 | | | | 198,990 | |
| | |
6.88%, 1/15/2029 (a) | | | 234,000 | | | | 258,570 | |
| | |
TerraForm Power Operating LLC | | | | | | | | |
| | |
4.25%, 1/31/2023 (a) | | | 172,000 | | | | 176,240 | |
| | |
5.00%, 1/31/2028 (a) | | | 218,000 | | | | 226,997 | |
| | |
Whiting Petroleum Corp. | | | | | | | | |
| | |
5.75%, 3/15/2021 | | | 229,000 | | | | 214,161 | |
| | |
6.63%, 1/15/2026 | | | 312,000 | | | | 225,794 | |
| | |
WPX Energy, Inc. | | | | | | | | |
| | |
6.00%, 1/15/2022 | | | 165,000 | | | | 169,538 | |
| | |
8.25%, 8/1/2023 | | | 92,000 | | | | 102,350 | |
| | |
5.25%, 9/15/2024 | | | 203,000 | | | | 206,045 | |
| | |
5.75%, 6/1/2026 | | | 156,000 | | | | 161,850 | |
| | | | | | | | |
| | |
| | | | | | | 18,582,229 | |
| | | | | | | | |
|
Personal Products — 0.3% | |
| | |
Edgewell Personal Care Co. | | | | | | | | |
| | |
4.70%, 5/19/2021 | | | 155,000 | | | | 157,712 | |
| | |
4.70%, 5/24/2022 | | | 158,000 | | | | 161,160 | |
| | |
Prestige Brands, Inc. 6.38%, 3/1/2024 (a) | | | 125,000 | | | | 130,938 | |
| | | | | | | | |
| | |
| | | | | | | 449,810 | |
| | | | | | | | |
SEE NOTES TO FINANCIAL STATEMENTS.
| | | | | | |
| | | |
| 92 | | | | J.P. MORGAN EXCHANGE-TRADED FUNDS | | AUGUST 31, 2019 |
| | | | | | | | |
| INVESTMENTS | | PRINCIPAL
AMOUNT ($) | | | VALUE ($) | |
Corporate Bonds — continued | |
|
Pharmaceuticals — 2.0% | |
| | |
Bausch Health Americas, Inc. 8.50%, 1/31/2027 (a) | | | 100,000 | | | | 110,998 | |
| | |
Bausch Health Cos., Inc. | | | | | | | | |
| | |
6.50%, 3/15/2022 (a) | | | 247,000 | | | | 255,719 | |
| | |
5.88%, 5/15/2023 (a) | | | 380,000 | | | | 384,750 | |
| | |
7.00%, 3/15/2024 (a) | | | 564,000 | | | | 595,674 | |
| | |
6.13%, 4/15/2025 (a) | | | 1,043,000 | | | | 1,074,290 | |
| | |
5.50%, 11/1/2025 (a) | | | 363,000 | | | | 380,689 | |
| | |
Elanco Animal Health, Inc. | | | | | | | | |
| | |
3.91%, 8/27/2021 | | | 70,000 | | | | 71,350 | |
| | |
4.27%, 8/28/2023 | | | 217,000 | | | | 227,287 | |
| | |
4.90%, 8/28/2028 | | | 217,000 | | | | 236,665 | |
| | | | | | | | |
| | |
| | | | | | | 3,337,422 | |
| | | | | | | | |
|
Real Estate Management & Development — 0.4% | |
| | |
Howard Hughes Corp. (The) 5.38%, 3/15/2025 (a) | | | 284,000 | | | | 292,520 | |
| | |
Kennedy-Wilson, Inc. 5.88%, 4/1/2024 | | | 319,000 | | | | 326,576 | |
| | | | | | | | |
| | |
| | | | | | | 619,096 | |
| | | | | | | | |
|
Road & Rail — 0.4% | |
| | |
Hertz Corp. (The) | | | | | | | | |
| | |
7.63%, 6/1/2022 (a) | | | 390,000 | | | | 406,107 | |
| | |
5.50%, 10/15/2024 (a) | | | 249,000 | | | | 244,020 | |
| | | | | | | | |
| | |
| | | | | | | 650,127 | |
| | | | | | | | |
|
Semiconductors & Semiconductor Equipment — 0.1% | |
| | |
Sensata Technologies UK Financing Co. plc | | | | | | | | |
| | |
6.25%, 2/15/2026 (a) | | | 200,000 | | | | 212,442 | |
| | | | | | | | |
|
Software — 1.5% | |
| | |
CDK Global, Inc. | | | | | | | | |
| | |
5.00%, 10/15/2024 (g) | | | 144,000 | | | | 151,560 | |
| | |
5.88%, 6/15/2026 | | | 143,000 | | | | 151,880 | |
| | |
4.88%, 6/1/2027 | | | 242,000 | | | | 250,044 | |
| | |
Nuance Communications, Inc. 5.63%, 12/15/2026 | | | 144,000 | | | | 151,740 | |
| | |
Open Text Corp. (Canada) | | | | | | | | |
| | |
5.63%, 1/15/2023 (a) | | | 238,000 | | | | 243,950 | |
| | |
5.88%, 6/1/2026 (a) | | | 247,000 | | | | 263,969 | |
| | |
SS&C Technologies, Inc. 5.50%, 9/30/2027 (a) | | | 631,000 | | | | 662,550 | |
| | |
Symantec Corp. | | | | | | | | |
| | |
4.20%, 9/15/2020 | | | 225,000 | | | | 228,265 | |
| | |
5.00%, 4/15/2025 (a) | | | 324,000 | | | | 326,161 | |
| | | | | | | | |
| | |
| | | | | | | 2,430,119 | |
| | | | | | | | |
| | | | | | | | |
| INVESTMENTS | | PRINCIPAL
AMOUNT ($) | | | VALUE ($) | |
| |
|
Specialty Retail — 0.9% | |
| | |
Bed Bath & Beyond, Inc. 5.17%, 8/1/2044 | | | 268,000 | | | | 186,975 | |
| | |
L Brands, Inc. | | | | | | | | |
| | |
6.63%, 4/1/2021 | | | 214,000 | | | | 225,235 | |
| | |
5.63%, 2/15/2022 | | | 277,000 | | | | 291,196 | |
| | |
5.25%, 2/1/2028 | | | 87,000 | | | | 79,388 | |
| | |
6.88%, 11/1/2035 | | | 322,000 | | | | 272,090 | |
| | |
6.75%, 7/1/2036 | | | 225,000 | | | | 189,000 | |
| | |
Penske Automotive Group, Inc. | | | | | | | | |
| | |
5.75%, 10/1/2022 | | | 147,000 | | | | 148,926 | |
| | |
5.50%, 5/15/2026 | | | 116,000 | | | | 121,510 | |
| | |
Sally Holdings LLC 5.63%, 12/1/2025 (b) | | | 26,000 | | | | 26,065 | |
| | | | | | | | |
| | |
| | | | | | | 1,540,385 | |
| | | | | | | | |
|
Technology Hardware, Storage & Peripherals — 2.0% | |
| | |
Dell International LLC | | | | | | | | |
| | |
5.88%, 6/15/2021 (a) | | | 425,000 | | | | 432,025 | |
| | |
7.13%, 6/15/2024 (a) | | | 500,000 | | | | 527,110 | |
| | |
EMC Corp. 3.38%, 6/1/2023 | | | 294,000 | | | | 291,482 | |
| | |
NCR Corp. | | | | | | | | |
| | |
4.63%, 2/15/2021 | | | 138,000 | | | | 138,014 | |
| | |
5.00%, 7/15/2022 | | | 227,000 | | | | 228,548 | |
| | |
6.38%, 12/15/2023 | | | 204,000 | | | | 210,361 | |
| | |
Western Digital Corp. 4.75%, 2/15/2026 | | | 741,000 | | | | 758,376 | |
| | |
Xerox Corp. | | | | | | | | |
| | |
4.50%, 5/15/2021 | | | 300,000 | | | | 307,500 | |
| | |
4.12%, 3/15/2023 (g) | | | 370,000 | | | | 376,475 | |
| | | | | | | | |
| | |
| | | | | | | 3,269,891 | |
| | | | | | | | |
|
Textiles, Apparel & Luxury Goods — 0.3% | |
| | |
Hanesbrands, Inc. | | | | | | | | |
| | |
4.63%, 5/15/2024 (a) | | | 245,000 | | | | 256,331 | |
| | |
4.88%, 5/15/2026 (a) | | | 272,000 | | | | 286,737 | |
| | | | | | | | |
| | |
| | | | | | | 543,068 | |
| | | | | | | | |
|
Thrifts & Mortgage Finance — 0.1% | |
| | |
Ladder Capital Finance Holdings LLLP | | | | | | | | |
| | |
5.25%, 3/15/2022 (a) | | | 137,000 | | | | 142,480 | |
| | | | | | | | |
|
Tobacco — 0.2% | |
| | |
Vector Group Ltd. 6.13%, 2/1/2025 (a) | | | 268,000 | | | | 262,640 | |
| | | | | | | | |
|
Trading Companies & Distributors — 1.6% | |
| | |
Beacon Roofing Supply, Inc. 4.88%, 11/1/2025 (a) | | | 375,000 | | | | 369,844 | |
| | |
Fortress Transportation & Infrastructure Investors LLC | | | | | | | | |
| | |
6.75%, 3/15/2022 (a) | | | 125,000 | | | | 130,000 | |
| | |
Herc Holdings, Inc. 5.50%, 7/15/2027 (a) | | | 386,000 | | | | 398,062 | |
SEE NOTES TO FINANCIAL STATEMENTS.
| | | | | | | | |
| | | |
| AUGUST 31, 2019 | | J.P. MORGAN EXCHANGE-TRADED FUNDS | | | | | 93 | |
JPMorgan High Yield Research Enhanced ETF
(formerly known as JPMorgan Disciplined High Yield ETF)
SCHEDULE OF PORTFOLIO INVESTMENTS
AS OF AUGUST 31, 2019 (Unaudited) (continued)
| | | | | | | | |
| INVESTMENTS | | PRINCIPAL
AMOUNT ($) | | | VALUE ($) | |
Corporate Bonds — continued | |
|
Trading Companies & Distributors — continued | |
| | |
United Rentals North America, Inc. | | | | | | | | |
| | |
4.63%, 7/15/2023 | | | 131,000 | | | | 133,866 | |
| | |
5.88%, 9/15/2026 | | | 260,000 | | | | 278,850 | |
| | |
6.50%, 12/15/2026 | | | 343,000 | | | | 373,013 | |
| | |
5.50%, 5/15/2027 | | | 312,000 | | | | 334,779 | |
| | |
4.88%, 1/15/2028 | | | 522,000 | | | | 547,447 | |
| | | | | | | | |
| | |
| | | | | | | 2,565,861 | |
| | | | | | | | |
|
Wireless Telecommunication Services — 4.0% | |
| | |
C&W Senior Financing DAC (Ireland) | | | | | | | | |
| | |
7.50%, 10/15/2026 (a) | | | 200,000 | | | | 216,960 | |
| | |
6.88%, 9/15/2027 (a) | | | 400,000 | | | | 425,956 | |
| | |
Hughes Satellite Systems Corp. | | | | | | | | |
| | |
7.63%, 6/15/2021 | | | 245,000 | | | | 264,600 | |
| | |
5.25%, 8/1/2026 | | | 227,000 | | | | 240,620 | |
| | |
6.63%, 8/1/2026 | | | 237,000 | | | | 255,367 | |
| | |
Inmarsat Finance plc (United Kingdom) 4.88%, 5/15/2022 (a) | | | 300,000 | | | | 303,000 | |
| | |
Millicom International Cellular SA (Colombia) | | | | | | | | |
| | |
6.00%, 3/15/2025 (a) | | | 200,000 | | | | 207,625 | |
| | |
6.63%, 10/15/2026 (a) | | | 200,000 | | | | 218,813 | |
| | |
5.13%, 1/15/2028 (a) (b) | | | 200,000 | | | | 207,687 | |
| | |
6.25%, 3/25/2029 (a) | | | 200,000 | | | | 217,813 | |
| | |
Sprint Corp. | | | | | | | | |
| | |
7.88%, 9/15/2023 | | | 1,342,000 | | | | 1,509,750 | |
| | |
7.13%, 6/15/2024 | | | 789,000 | | | | 872,208 | |
| | |
T-Mobile USA, Inc. | | | | | | | | |
| | |
6.38%, 3/1/2025 | | | 524,000 | | | | 542,602 | |
| | |
6.38%, 3/1/2025 ‡ | | | 369,000 | | | | — | |
| | |
6.50%, 1/15/2026 | | | 621,000 | | | | 667,575 | |
| | |
6.50%, 1/15/2026 ‡ | | | 432,000 | | | | — | |
| | |
4.75%, 2/1/2028 | | | 456,000 | | | | 479,931 | |
| | |
4.75%, 2/1/2028 ‡ | | | 168,000 | | | | — | |
| | | | | | | | |
| | |
| | | | | | | 6,630,507 | |
| | | | | | | | |
| | |
Total Corporate Bonds
(Cost $155,728,695) | | | | | | | 159,358,166 | |
| | | | | | | | |
| | |
| | | SHARES | | | | |
Short-Term Investments — 1.9% | |
|
Investment Companies — 1.9% | |
| | |
JPMorgan U.S. Government Money Market Fund Class Institutional Shares, 1.99% (h) (i)
(Cost $3,167,845) | | | 3,167,845 | | | | 3,167,845 | |
| | | | | | | | |
| | | | | | | | |
| INVESTMENTS | | SHARES | | |
VALUE ($) | |
Investment of Cash Collateral from Securities Loaned — 1.3% | |
| | |
JPMorgan U.S. Government Money Market Fund Class IM Shares, 2.05% (h) (i)
(Cost $2,057,978) | | | 2,057,978 | | | | 2,057,978 | |
| | | | | | | | |
Total Investments — 100.3%
(Cost $160,954,518) | | | | | | | 164,583,989 | |
Liabilities in Excess of Other Assets — (0.3)% | | | | | | | (476,513) | |
| | | | | | | | |
NET ASSETS — 100.0% | | | | | | | 164,107,476 | |
| | | | | | | | |
Percentages indicated are based on net assets.
| | |
| Abbreviations |
| |
| ICE | | Intercontinental Exchange |
| LIBOR | | London Interbank Offered Rate |
| OYJ | | Public Limited Company |
| REIT | | Real Estate Investment Trust |
| USD | | United States Dollar |
| |
| (a) | | Securities exempt from registration under Rule 144A or section 4(a)(2), of the Securities Act of 1933, as amended. |
| (b) | | The security or a portion of this security is on loan at August 31, 2019. The total value of securities on loan at August 31, 2019 is $1,987,184. |
| (c) | | Variable or floating rate security, linked to the referenced benchmark. The interest rate shown is the current rate as of August 31, 2019. |
| (d) | | Security is perpetual and thus, does not have a predetermined maturity date. The coupon rate for this security is fixed for a period of time and may be structured to adjust thereafter. The date shown, if applicable, reflects the next call date. The coupon rate shown is the rate in effect as of August 31, 2019. |
| (e) | | Security is an interest bearing note with preferred security characteristics. |
| (f) | | Amount rounds to less than 0.1% of net assets. |
| (g) | | Step bond. Interest rate is a fixed rate for an initial period that either resets at a specific date or may reset in the future contingent upon a predetermined trigger. The interest rate shown is the current rate as of August 31, 2019. |
| (h) | | Investment in an affiliated fund, which is registered under the Investment Company Act of 1940, as amended, and is advised by J.P. Morgan Investment Management Inc. |
| (i) | | The rate shown is the current yield as of August 31, 2019. |
| ‡ | | Value determined using significant unobservable inputs. |
SEE NOTES TO FINANCIAL STATEMENTS.
| | | | | | |
| | | |
| 94 | | | | J.P. MORGAN EXCHANGE-TRADED FUNDS | | AUGUST 31, 2019 |
JPMorgan Municipal ETF
SCHEDULE OF PORTFOLIO INVESTMENTS
AS OF AUGUST 31, 2019 (Unaudited)
| | | | | | | | |
| INVESTMENTS | | PRINCIPAL
AMOUNT ($) | | | VALUE ($) | |
Municipal Bonds — 98.1%(a) | | | | | | | | |
|
Alabama — 1.6% | |
|
Education — 0.4% | |
| | |
Auburn University Series 2016A, Rev., 5.00%, 6/1/2030 | | | 35,000 | | | | 42,845 | |
| | |
University of Alabama (The)Series B-2, Rev., 5.00%, 9/1/2031 | | | 95,000 | | | | 120,738 | |
| | | | | | | | |
| | |
| | | | | | | 163,583 | |
| | | | | | | | |
|
General Obligation — 0.3% | |
| | |
City of Pell City Series A, GO, 5.00%, 2/1/2025 | | | 100,000 | | | | 118,108 | |
| | | | | | | | |
|
Transportation — 0.7% | |
| | |
Alabama Federal Aid Highway Finance Authority Series 2016A, Rev., 5.00%, 9/1/2034 | | | 200,000 | | | | 244,076 | |
| | | | | | | | |
|
Utility — 0.2% | |
| | |
Black Belt Energy Gas District, Gas Supply Series 2017A, Rev., LIQ: Royal Bank of Canada, 4.00%, 7/1/2022 (b) | | | 30,000 | | | | 32,076 | |
| | |
Southeast Alabama Gas Supply District (The), Project No. 1 Series 2018A, Rev., 4.00%, 4/1/2024 (b) | | | 25,000 | | | | 27,495 | |
| | | | | | | | |
| | |
| | | | | | | 59,571 | |
| | | | | | | | |
| | |
Total Alabama | | | | | | | 585,338 | |
| | | | | | | | |
|
Alaska — 0.1% | |
|
Other Revenue — 0.1% | |
| | |
Alaska Municipal Bond Bank Authority Series 3, Rev., 5.00%, 10/1/2025 | | | 20,000 | | | | 23,601 | |
| | | | | | | | |
|
Arizona — 2.2% | |
|
Education — 0.9% | |
| | |
Arizona Industrial Development Authority, Equitable School Revolving Funds Series A, Rev., 5.00%, 11/1/2044 | | | 250,000 | | | | 304,273 | |
| | | | | | | | |
|
General Obligation — 0.2% | |
| | |
City of Phoenix GO, 5.00%, 7/1/2027 | | | 25,000 | | | | 31,193 | |
| | |
Maricopa County School District No. 3 Tempe Elementary, School Improvement Series A, GO, 5.00%, 7/1/2027 | | | 30,000 | | | | 38,517 | |
| | | | | | | | |
| | |
| | | | | | | 69,710 | |
| | | | | | | | |
|
Industrial Development Revenue/Pollution Control Revenue — 0.8% | |
| | |
Arizona Industrial Development Authority, Great Lakes Senior Living Communities LLC Project Series 2019A, Rev., 5.00%, 1/1/2036 | | | 250,000 | | | | 292,965 | |
| | | | | | | | |
|
Utility — 0.3% | |
| | |
Salt Verde Financial Corp. Rev., 5.25%, 12/1/2026 | | | 100,000 | | | | 123,321 | |
| | | | | | | | |
| | |
Total Arizona | | | | | | | 790,269 | |
| | | | | | | | |
| | | | | | | | |
| INVESTMENTS | | PRINCIPAL
AMOUNT ($) | | | VALUE ($) | |
| | | | | | | | |
|
Arkansas — 0.4% | |
|
Education — 0.1% | |
| | |
University of Arkansas, UAMS Campus Rev., 5.00%, 11/1/2021 | | | 40,000 | | | | 43,387 | |
| | | | | | | | |
|
Water & Sewer — 0.3% | |
| | |
City of Fort Smith, Water and Sewer Construction Rev., 5.00%, 10/1/2024 | | | 75,000 | | | | 88,788 | |
| | | | | | | | |
| | |
Total Arkansas | | | | | | | 132,175 | |
| | | | | | | | |
|
California — 2.6% | |
|
Certificate of Participation/Lease — 0.5% | |
| | |
City of Roseville, 316 Vernon Street Project COP, 5.00%, 8/1/2025 | | | 70,000 | | | | 85,935 | |
| | |
City of Santa Rosa, Courthouse Square Project and Lease COP, 4.00%, 10/1/2024 | | | 90,000 | | | | 103,521 | |
| | | | | | | | |
| | |
| | | | | | | 189,456 | |
| | | | | | | | |
|
General Obligation — 0.3% | |
| | |
El Monte City School District, Election 2014 Series A, GO, 5.00%, 8/1/2025 | | | 55,000 | | | | 67,339 | |
| | |
Hermosa Beach City School District, Election of 2016 Series A, GO, 4.00%, 8/1/2023 | | | 15,000 | | | | 16,732 | |
| | | | | | | | |
| | |
| | | | | | | 84,071 | |
| | | | | | | | |
|
Other Revenue — 1.3% | |
| | |
Anaheim Public Financing Authority, Anaheim Convention Center Expansion Project Series A, Rev., 5.00%, 5/1/2026 | | | 50,000 | | | | 59,070 | |
| | |
Chula Vista Municipal Financing Authority Rev., 4.00%, 5/1/2026 | | | 60,000 | | | | 71,393 | |
| | |
Golden State Tobacco Securitization Corp., Tobacco SettlementSeries A-1, Rev., 5.00%, 6/1/2032 | | | 250,000 | | | | 301,883 | |
| | |
Municipal Improvement Corp. of Los Angeles, Real PropertySeries 2014-A, Rev., 5.00%, 5/1/2023 | | | 20,000 | | | | 22,892 | |
| | | | | | | | |
| | |
| | | | | | | 455,238 | |
| | | | | | | | |
|
Utility — 0.5% | |
| | |
California Municipal Finance Authority, San Antonio Gardens Project Rev., 5.00%, 11/15/2039 | | | 150,000 | | | | 178,864 | |
| | | | | | | | |
| | |
Total California | | | | | | | 907,629 | |
| | | | | | | | |
|
Colorado — 1.0% | |
|
Certificate of Participation/Lease — 0.0% (c) | |
| | |
State of Colorado, Higher Education Capital Construction, Lease Purchase Financing Program Series 2014A, COP, 5.00%, 11/1/2025 | | | 10,000 | | | | 12,250 | |
| | | | | | | | |
SEE NOTES TO FINANCIAL STATEMENTS.
| | | | | | | | |
| | | |
| AUGUST 31, 2019 | | J.P. MORGAN EXCHANGE-TRADED FUNDS | | | | | 95 | |
JPMorgan Municipal ETF
SCHEDULE OF PORTFOLIO INVESTMENTS
AS OF AUGUST 31, 2019 (Unaudited) (continued)
| | | | | | | | |
| INVESTMENTS | | PRINCIPAL
AMOUNT ($) | | | VALUE ($) | |
Municipal Bonds — continued | | | | | | | | |
|
Education — 0.2% | |
| | |
University of Colorado, University EnterpriseSeries A-2, Rev., 5.00%, 6/1/2026 | | | 40,000 | | | | 49,850 | |
| | | | | | | | |
|
General Obligation — 0.8% | |
| | |
Southlands Metropolitan District No. 1Series A-1, GO, 5.00%, 12/1/2037 | | | 250,000 | | | | 286,217 | |
| | | | | | | | |
| | |
Total Colorado | | | | | | | 348,317 | |
| | | | | | | | |
|
Connecticut — 1.8% | |
|
General Obligation — 1.5% | |
| | |
State of Connecticut | | | | | | | | |
| | |
Series A, GO, 5.00%, 4/15/2033 | | | 135,000 | | | | 165,078 | |
| | |
Series 2019A, GO, 5.00%, 4/15/2035 | | | 300,000 | | | | 376,533 | |
| | | | | | | | |
| | |
| | | | | | | 541,611 | |
| | | | | | | | |
|
Special Tax — 0.3% | |
| | |
State of Connecticut, Special Tax Transportation Infrastructure Purposes Series B, Rev., 5.00%, 8/1/2023 | | | 75,000 | | | | 85,877 | |
| | | | | | | | |
| | |
Total Connecticut | | | | | | | 627,488 | |
| | | | | | | | |
|
Delaware — 0.1% | |
|
Transportation — 0.1% | |
| | |
Delaware Transportation Authority Rev., 5.00%, 7/1/2022 | | | 25,000 | | | | 27,791 | |
| | | | | | | | |
|
District of Columbia — 1.2% | |
|
Education — 0.4% | |
| | |
District of Columbia, International School Issue Rev., 5.00%, 7/1/2039 | | | 125,000 | | | | 152,361 | |
| | | | | | | | |
|
General Obligation — 0.4% | |
| | |
District of Columbia | | | | | | | | |
| | |
Series 2018B, GO, 5.00%, 6/1/2025 | | | 30,000 | | | | 36,456 | |
| | |
Series D, GO, 5.00%, 6/1/2031 | | | 65,000 | | | | 81,655 | |
| | | | | | | | |
| | |
| | | | | | | 118,111 | |
| | | | | | | | |
|
Other Revenue — 0.1% | |
| | |
District of Columbia, Income Tax Series C, Rev., 5.00%, 12/1/2021 | | | 25,000 | | | | 27,170 | |
| | | | | | | | |
|
Water & Sewer — 0.3% | |
| | |
District of Columbia, Water and Sewer Authority Series B, Rev., 5.00%, 10/1/2025 | | | 65,000 | | | | 79,009 | |
| | |
District of Columbia, Water and Sewer Authority, Public Utility, Subordinate Lien Series 2012A, Rev., 4.00%, 10/1/2022 | | | 35,000 | | | | 38,104 | |
| | | | | | | | |
| | |
| | | | | | | 117,113 | |
| | | | | | | | |
| | |
Total District of Columbia | | | | | | | 414,755 | |
| | | | | | | | |
| | | | | | | | |
| INVESTMENTS | | PRINCIPAL
AMOUNT ($) | | | VALUE ($) | |
| | | | | | | | |
|
Florida — 6.0% | |
|
Certificate of Participation/ Lease — 0.9% | |
| | |
Monroe County School District Series 2018A, COP, 4.00%, 6/1/2025 | | | 45,000 | | | | 51,798 | |
| | |
Palm Beach County School District Series 2015B, COP, 5.00%, 8/1/2021 | | | 10,000 | | | | 10,731 | |
| | |
South Florida Water Management District COP, 5.00%, 10/1/2036 | | | 200,000 | | | | 242,390 | |
| | | | | | | | |
| | |
| | | | | | | 304,919 | |
| | | | | | | | |
|
Education — 1.4% | |
| | |
County of Palm Beach, Atlantic University | | | | | | | | |
| | |
Rev., 5.00%, 4/1/2029 (d) | | | 100,000 | | | | 114,449 | |
| | |
Rev., 5.00%, 4/1/2039 (d) | | | 100,000 | | | | 113,316 | |
| | |
Escambia County School Board, Sales Tax Rev., 5.00%, 9/1/2027 | | | 120,000 | | | | 149,793 | |
| | |
State of Florida, State Board of Education, Lottery | | | | | | | | |
| | |
Series 2016B, Rev., 5.00%, 7/1/2023 | | | 40,000 | | | | 45,814 | |
| | |
Series A, Rev., 5.00%, 7/1/2026 | | | 75,000 | | | | 93,634 | |
| | | | | | | | |
| | |
| | | | | | | 517,006 | |
| | | | | | | | |
|
General Obligation — 0.7% | |
| | |
County of Miami-Dade, Building Better Communities Program Series 2016A, GO, 5.00%, 7/1/2025 | | | 25,000 | | | | 30,341 | |
| | |
Florida State Board of Education, Public Education Capital Outlay | | | | | | | | |
| | |
Series B, GO, 5.00%, 6/1/2024 | | | 30,000 | | | | 35,442 | |
| | |
Series B, GO, 5.00%, 6/1/2026 | | | 20,000 | | | | 25,025 | |
| | |
Series B, GO, 5.00%, 6/1/2031 | | | 75,000 | | | | 94,812 | |
| | |
Reedy Creek Improvement DistrictSeries 2016-A, GO, 5.00%, 6/1/2026 | | | 50,000 | | | | 61,977 | |
| | | | | | | | |
| | |
| | | | | | | 247,597 | |
| | | | | | | | |
|
Hospital — 0.8% | |
| | |
Palm Beach County Health Facilities Authority, ACTS Retirement Life Communities Inc. Obligated Group Rev., 5.00%, 11/15/2032 | | | 240,000 | | | | 284,813 | |
| | | | | | | | |
|
Industrial Development Revenue/Pollution Control Revenue — 0.1% | |
| | |
Florida Department of Environmental ProtectionSeries 2014-A, Rev., 5.00%, 7/1/2020 | | | 35,000 | | | | 36,135 | |
| | | | | | | | |
|
Other Revenue — 1.0% | |
| | |
City of Orlando, Capital Improvement | | | | | | | | |
| | |
Series D, Rev., 5.00%, 10/1/2022 | | | 75,000 | | | | 83,893 | |
| | |
Series B, Rev., 5.00%, 10/1/2024 | | | 60,000 | | | | 71,489 | |
| | |
County of Hillsborough Rev., 5.00%, 10/1/2024 | | | 40,000 | | | | 47,773 | |
SEE NOTES TO FINANCIAL STATEMENTS.
| | | | | | |
| | | |
| 96 | | | | J.P. MORGAN EXCHANGE-TRADED FUNDS | | AUGUST 31, 2019 |
| | | | | | | | |
| INVESTMENTS | | PRINCIPAL
AMOUNT ($) | | | VALUE ($) | |
Municipal Bonds — continued | | | | | | | | |
|
Other Revenue — continued | |
| | |
County of Lee Rev., 5.00%, 10/1/2025 | | | 40,000 | | | | 48,680 | |
| | |
County of Okaloosa Rev., 5.00%, 10/1/2024 | | | 30,000 | | | | 35,733 | |
| | |
County of Osceola, Sales Tax Series 2016A, Rev., 4.00%, 10/1/2023 | | | 10,000 | | | | 11,084 | |
| | |
Sunshine State Governmental Financing Commission, Miami-Dade County Program Series 2011A, Rev., 5.00%, 9/1/2020 | | | 20,000 | | | | 20,769 | |
| | |
Tampa Sports Authority, Stadium Project Rev., 4.00%, 1/1/2023 | | | 20,000 | | | | 21,882 | |
| | | | | | | | |
| | |
| | | | | | | 341,303 | |
| | | | | | | | |
|
Transportation — 0.1% | |
| | |
Tampa-Hillsborough County Expressway Authority Series B, Rev., 5.00%, 7/1/2031 | | | 40,000 | | | | 50,625 | |
| | | | | | | | |
|
Utility — 0.5% | |
| | |
County of Sarasota, Utility System Rev., 5.00%, 10/1/2022 | | | 30,000 | | | | 33,499 | |
| | |
Pinellas County Industrial Development Authority, Drs. Kiran & Pallavi Patel 2017 Foundation For Global Understanding, Inc., Project Rev., 5.00%, 7/1/2029 | | | 125,000 | | | | 150,686 | |
| | | | | | | | |
| | |
| | | | | | | 184,185 | |
| | | | | | | | |
|
Water & Sewer — 0.5% | |
| | |
City of Cape Coral, Water and Sewer Rev., 5.00%, 10/1/2022 | | | 25,000 | | | | 27,906 | |
| | |
City of Miami Beach, Water and Sewer Rev., 5.00%, 9/1/2033 | | | 25,000 | | | | 31,191 | |
| | |
East Central Regional Wastewater Treatment Facilities Operation Board, Green Bonds, Bio Solids Project Rev., 5.00%, 10/1/2024 | | | 30,000 | | | | 35,860 | |
| | |
Tampa Bay Water Utility System Series C, Rev., 5.00%, 10/1/2025 | | | 55,000 | | | | 67,210 | |
| | |
Tohopekaliga Water Authority, Utility System Rev., 5.00%, 10/1/2025 | | | 10,000 | | | | 12,250 | |
| | | | | | | | |
| | |
| | | | | | | 174,417 | |
| | | | | | | | |
| | |
Total Florida | | | | | | | 2,141,000 | |
| | | | | | | | |
|
Georgia — 0.1% | |
|
Hospital — 0.0%(c) | |
| | |
Richmond County Hospital Authority, University Health Services, Inc. Project Rev., 5.00%, 1/1/2022 | | | 20,000 | | | | 21,628 | |
| | | | | | | | |
|
Water & Sewer — 0.1% | |
| | |
County of DeKalb, Water and Sewerage Series B, Rev., 5.25%, 10/1/2026 | | | 25,000 | | | | 31,926 | |
| | | | | | | | |
| | |
Total Georgia | | | | | | | 53,554 | |
| | | | | | | | |
| | | | | | | | |
| INVESTMENTS | | PRINCIPAL
AMOUNT ($) | | | VALUE ($) | |
| | | | | | | | |
|
Hawaii — 0.5% | |
|
General Obligation — 0.4% | |
| | |
City and County of Honolulu, Tax-Exempt Series D, GO, 5.00%, 9/1/2032 | | | 45,000 | | | | 56,851 | |
| | |
State of Hawaii | | | | | | | | |
| | |
Series EP, GO, 5.00%, 8/1/2023 | | | 40,000 | | | | 46,054 | |
| | |
Series FK, GO, 5.00%, 5/1/2033 | | | 30,000 | | | | 37,558 | |
| | | | | | | | |
| | |
| | | | | | | 140,463 | |
| | | | | | | | |
|
Prerefunded — 0.0% (c) | |
| | |
State of Hawaii Series EE, GO, 5.00%, 11/1/2022 (e) | | | 15,000 | | | | 16,831 | |
| | | | | | | | |
|
Transportation — 0.1% | |
| | |
State of Hawaii, Highway Fund Series B, Rev., 5.00%, 1/1/2027 | | | 25,000 | | | | 31,181 | |
| | | | | | | | |
| | |
Total Hawaii | | | | | | | 188,475 | |
| | | | | | | | |
|
Illinois — 4.7% | |
|
General Obligation — 3.5% | |
| | |
Champaign County Community Unit School District No. 4 Champaign, School Building GO, 5.00%, 1/1/2027 | | | 45,000 | | | | 54,419 | |
| | |
City of Decatur GO, 5.00%, 3/1/2027 | | | 130,000 | | | | 155,034 | |
| | |
City of Peoria Series B, GO, 5.00%, 1/1/2027 | | | 230,000 | | | | 276,331 | |
| | |
Cook and DuPage Counties, Village of Elk Grove GO, 5.00%, 1/1/2029 | | | 25,000 | | | | 30,584 | |
| | |
Grundy & Will Counties Community Unit School District No. 1 Coal City GO, 5.00%, 2/1/2027 | | | 225,000 | | | | 268,247 | |
| | |
Kane McHenry Cook and De Kalb Counties Unit School District No. 300, School Bonds GO, 5.00%, 1/1/2024 | | | 35,000 | | | | 40,210 | |
| | |
Kendall and Kane Counties Community Unit School District No. 115 Series 2017B, GO, 5.00%, 1/1/2027 | | | 25,000 | | | | 30,563 | |
| | |
Lake and McHenry Counties Community Unit School District No. 118 Wauconda GO, 5.00%, 1/1/2022 | | | 50,000 | | | | 54,175 | |
| | |
McLean & Woodford Counties Community Unit School District No. 5 Normal Series 2017A, GO, 4.00%, 12/1/2023 | | | 80,000 | | | | 88,592 | |
| | |
State of Illinois | | | | | | | | |
| | |
GO, 5.00%, 4/1/2024 | | | 30,000 | | | | 33,358 | |
| | |
Series A, GO, 5.00%, 10/1/2024 | | | 30,000 | | | | 33,613 | |
| | |
Village of Bolingbrook Series A, GO, AGM, 5.00%, 1/1/2033 | | | 125,000 | | | | 151,676 | |
| | |
Will & Kendall Counties Community Consolidated School District 202 Plainfield GO, 4.00%, 1/1/2023 | | | 10,000 | | | | 10,857 | |
| | | | | | | | |
| | |
| | | | | | | 1,227,659 | |
| | | | | | | | |
SEE NOTES TO FINANCIAL STATEMENTS.
| | | | | | | | |
| | | |
| AUGUST 31, 2019 | | J.P. MORGAN EXCHANGE-TRADED FUNDS | | | | | 97 | |
JPMorgan Municipal ETF
SCHEDULE OF PORTFOLIO INVESTMENTS
AS OF AUGUST 31, 2019 (Unaudited) (continued)
| | | | | | | | |
| INVESTMENTS | | PRINCIPAL
AMOUNT ($) | | | VALUE ($) | |
Municipal Bonds — continued | | | | | | | | |
|
Transportation — 1.1% | |
| | |
Chicago O’Hare International Airport, Third Lien Series 2017B, Rev., 5.00%, 1/1/2034 | | | 40,000 | | | | 48,633 | |
| | |
Illinois State Toll Highway Authority | | | | | | | | |
| | |
Series D, Rev., 5.00%, 1/1/2024 | | | 25,000 | | | | 28,867 | |
| | |
Series A, Rev., 5.00%, 1/1/2036 | | | 250,000 | | | | 315,980 | |
| | | | | | | | |
| | |
| | | | | | | 393,480 | |
| | | | | | | | |
|
Water & Sewer — 0.1% | |
| | |
Illinois Finance Authority, Clean Water Initiative Revolving Fund Rev., 5.00%, 7/1/2032 | | | 35,000 | | | | 43,266 | |
| | | | | | | | |
| | |
Total Illinois | | | | | | | 1,664,405 | |
| | | | | | | | |
|
Indiana — 2.0% | |
|
Education — 0.9% | |
| | |
Adams Central Elementary School Building Corp., Valorem Property Tax First Mortgage Rev., 5.00%, 1/15/2027 | | | 20,000 | | | | 24,967 | |
| | |
Ball State University, Student Fee Series R, Rev., 5.00%, 7/1/2024 | | | 35,000 | | | | 41,428 | |
| | |
Indiana State University, Housing and Dining System Rev., 5.00%, 4/1/2031 | | | 75,000 | | | | 92,972 | |
| | |
Indiana State University, Student Fee Series R, Rev., 5.00%, 10/1/2022 | | | 10,000 | | | | 11,166 | |
| | |
Indiana University | | | | | | | | |
| | |
Series A, Rev., 5.00%, 6/1/2022 | | | 25,000 | | | | 27,644 | |
| | |
Series Y, Rev., 5.00%, 8/1/2028 | | | 25,000 | | | | 32,011 | |
| | |
Perry Township Multi School Building Corp. Rev., 5.00%, 7/15/2025 | | | 35,000 | | | | 42,265 | |
| | |
Warsaw Multi-School Building Corp., Ad Valorem Property Tax Rev., 4.00%, 1/15/2020 | | | 50,000 | | | | 50,505 | |
| | | | | | | | |
| | |
| | | | | | | 322,958 | |
| | | | | | | | |
|
Housing — 0.9% | |
| | |
Decatur County Jail Building Corp. Rev., 5.00%, 7/15/2028 | | | 250,000 | | | | 302,758 | |
| | | | | | | | |
|
Other Revenue — 0.1% | |
| | |
Indiana Finance Authority, State Revolving Fund Program Series A, Rev., 5.00%, 2/1/2031 | | | 25,000 | | | | 30,672 | |
| | | | | | | | |
|
Transportation — 0.1% | |
| | |
Indiana Finance Authority, Highway Series C, Rev., 5.00%, 12/1/2025 | | | 35,000 | | | | 43,076 | |
| | | | | | | | |
| | |
Total Indiana | | | | | | | 699,464 | |
| | | | | | | | |
|
Iowa — 0.4% | |
|
General Obligation — 0.1% | |
| | |
City of West Des Moines, Urban Renewal Series 2016B, GO, 5.00%, 6/1/2024 | | | 35,000 | | | | 41,357 | |
| | | | | | | | |
| | | | | | | | |
| INVESTMENTS | | PRINCIPAL
AMOUNT ($) | | | VALUE ($) | |
| | | | | | | | |
|
Other Revenue — 0.1% | |
| | |
Iowa Finance Authority, State Revolving Fund, Green Bonds Rev., 5.00%, 8/1/2027 | | | 30,000 | | | | 38,513 | |
| | | | | | | | |
|
Water & Sewer — 0.2% | |
| | |
City of Cedar Rapids Series 2018D, Rev., 5.00%, 6/1/2022 | | | 70,000 | | | | 77,402 | |
| | | | | | | | |
| | |
Total Iowa | | | | | | | 157,272 | |
| | | | | | | | |
|
Kansas — 0.2% | |
|
Water & Sewer — 0.2% | |
| | |
City of Wichita, Water & Sewer Utility System Series A, Rev., 5.00%, 10/1/2020 | | | 20,000 | | | | 20,829 | |
| | |
Johnson County Water District No. 1 Series 2017A, Rev., 5.00%, 1/1/2025 | | | 50,000 | | | | 60,304 | |
| | | | | | | | |
| | |
| | | | | | | 81,133 | |
| | | | | | | | |
| | |
Total Kansas | | | | | | | 81,133 | |
| | | | | | | | |
|
Kentucky — 1.0% | |
|
Hospital — 0.2% | |
| | |
Louisville/Jefferson County Metropolitan Government, Health System, Norton Healthcare, Inc.Series 2016-A, Rev., 4.00%, 10/1/2036 | | | 65,000 | | | | 72,159 | |
| | | | | | | | |
|
Industrial Development Revenue/Pollution Control Revenue — 0.6% | |
| | |
Kentucky Economic Development Finance Authority, Baptist Healthcare System Obligated Group Series B, Rev., 5.00%, 8/15/2029 | | | 165,000 | | | | 198,327 | |
| | | | | | | | |
|
Water & Sewer — 0.2% | |
| | |
Louisville & Jefferson County Metropolitan Sewer District, Sewer and Drainage System | | | | | | | | |
| | |
Series B, Rev., 5.00%, 5/15/2024 | | | 25,000 | | | | 29,413 | |
| | |
Series 2017A, Rev., 5.00%, 5/15/2027 | | | 40,000 | | | | 49,958 | |
| | | | | | | | |
| | |
| | | | | | | 79,371 | |
| | | | | | | | |
| | |
Total Kentucky | | | | | | | 349,857 | |
| | | | | | | | |
|
Louisiana — 2.1% | |
|
General Obligation — 0.3% | |
| | |
St. Tammany Parish Wide School District No. 12 Series 2012A, GO, 4.50%, 3/1/2024 | | | 70,000 | | | | 80,359 | |
| | |
State of LouisianaSeries 2016-B, GO, 4.00%, 8/1/2026 | | | 30,000 | | | | 35,419 | |
| | | | | | | | |
| | |
| | | | | | | 115,778 | |
| | | | | | | | |
|
Other Revenue — 0.9% | |
| | |
Louisiana Local Government Environmental Facilities and Community Development Authority Rev., 5.00%, 12/1/2030 | | | 250,000 | | | | 320,545 | |
| | | | | | | | |
SEE NOTES TO FINANCIAL STATEMENTS.
| | | | | | |
| | | |
| 98 | | | | J.P. MORGAN EXCHANGE-TRADED FUNDS | | AUGUST 31, 2019 |
| | | | | | | | |
| INVESTMENTS | | PRINCIPAL
AMOUNT ($) | | | VALUE ($) | |
Municipal Bonds — continued | | | | | | | | |
|
Prerefunded — 0.2% | |
| | |
State of Louisiana, Gas and Fuels TaxSeries 2012A-1, Rev., 5.00%, 5/1/2022 (e) | | | 55,000 | | | | 60,596 | |
| | | | | | | | |
|
Water & Sewer — 0.7% | |
| | |
City of Shreveport, Water and Sewer, Junior Lien Series 2019B, Rev., AGM, 5.00%, 12/1/2032 | | | 200,000 | | | | 253,172 | |
| | | | | | | | |
| | |
Total Louisiana | | | | | | | 750,091 | |
| | | | | | | | |
|
Maine — 0.4% | |
|
General Obligation — 0.1% | |
| | |
Regional School Unit No. 21 GO, 5.00%, 11/1/2025 | | | 30,000 | | | | 36,644 | |
| | | | | | | | |
|
Other Revenue — 0.3% | |
| | |
Maine Municipal Bond Bank Series C, Rev., 5.00%, 11/1/2024 | | | 75,000 | | | | 89,546 | |
| | | | | | | | |
| | |
Total Maine | | | | | | | 126,190 | |
| | | | | | | | |
|
Maryland — 0.8% | |
|
General Obligation — 0.5% | |
| | |
County of Spotsylvania, Commissioners of St. Mary’s, Public Improvement GO, 4.00%, 7/15/2027 | | | 70,000 | | | | 84,904 | |
| | |
State of Maryland, State and Local Facilities Loan of 2017 | | | | | | | | |
| | |
Series C, GO, 5.00%, 8/1/2024 | | | 50,000 | | | | 59,362 | |
| | |
Series A, GO, 5.00%, 8/1/2025 | | | 45,000 | | | | 55,027 | |
| | | | | | | | |
| | |
| | | | | | | 199,293 | |
| | | | | | | | |
|
Transportation — 0.3% | |
| | |
State of Maryland Department of Transportation Rev., 5.00%, 9/1/2026 | | | 75,000 | | | | 94,189 | |
| | | | | | | | |
| | |
Total Maryland | | | | | | | 293,482 | |
| | | | | | | | |
|
Massachusetts — 0.6% | |
|
Education — 0.2% | |
| | |
Massachusetts Development Finance Agency, Emerson College Rev., 5.00%, 1/1/2028 | | | 25,000 | | | | 30,956 | |
| | |
Massachusetts State College Building Authority Series D, Rev., 5.00%, 5/1/2027 | | | 45,000 | | | | 56,905 | |
| | | | | | | | |
| | |
| | | | | | | 87,861 | |
| | | | | | | | |
|
General Obligation — 0.3% | |
| | |
City of Boston Series 2017A, GO, 5.00%, 4/1/2025 | | | 10,000 | | | | 12,174 | |
| | |
Commonwealth of Massachusetts | | | | | | | | |
| | |
Series B, GO, 5.00%, 7/1/2023 | | | 25,000 | | | | 28,639 | |
| | |
Series C, GO, 5.00%, 10/1/2026 | | | 25,000 | | | | 31,355 | |
| | | | | | | | |
| INVESTMENTS | | PRINCIPAL
AMOUNT ($) | | | VALUE ($) | |
| | | | | | | | |
|
General Obligation — continued | |
| | |
Town of Hopkinton GO, 5.00%, 11/15/2024 | | | 30,000 | | | | 36,115 | |
| | | | | | | | |
| | |
| | | | | | | 108,283 | |
| | | | | | | | |
|
Other Revenue — 0.1% | |
| | |
Massachusetts Bay Transportation Authority, Sales Tax Series A, Rev., 5.00%, 7/1/2022 | | | 20,000 | | | | 22,207 | |
| | | | | | | | |
|
Water & Sewer — 0.0% (c) | |
| | |
Springfield Water & Sewer Commission Series C, Rev., 5.00%, 7/15/2023 | | | 10,000 | | | | 11,556 | |
| | | | | | | | |
| | |
Total Massachusetts | | | | | | | 229,907 | |
| | | | | | | | |
|
Michigan — 3.6% | |
|
Education — 1.7% | |
| | |
Eastern Michigan University Series 2017A, Rev., 5.00%, 3/1/2026 | | | 500,000 | | | | 607,080 | |
| | | | | | | | |
|
General Obligation — 1.8% | |
| | |
Berrien Springs Public Schools, School Building and Site GO, Q-SBLF, 5.00%, 5/1/2030 | | | 250,000 | | | | 325,552 | |
| | |
Forest Hills Public Schools, School Building and Site Bonds Series 2019, GO, 5.00%, 5/1/2029 | | | 230,000 | | | | 301,123 | |
| | | | | | | | |
| | |
| | | | | | | 626,675 | |
| | | | | | | | |
|
Hospital — 0.1% | |
| | |
Michigan State Hospital Finance Authority, Trinity Health Credit Group Series C, Rev., 5.00%, 12/1/2025 | | | 25,000 | | | | 30,602 | |
| | | | | | | | |
| | |
Total Michigan | | | | | | | 1,264,357 | |
| | | | | | | | |
|
Minnesota — 1.0% | |
|
Education — 0.1% | |
| | |
University of Minnesota, Board of Regents Series B, Rev., 5.00%, 12/1/2025 | | | 15,000 | | | | 18,528 | |
| | | | | | | | |
|
General Obligation — 0.2% | |
| | |
Alexandria Lake Area Sanitation District, Sanitary Sewer Board Series 2015A, GO, 5.00%, 2/1/2022 | | | 30,000 | | | | 32,811 | |
| | |
City of Hopkins Series 2017B, GO, 4.00%, 2/1/2025 | | | 20,000 | | | | 23,066 | |
| | |
City of Maple Grove, Improvement Series 2013A, GO, 4.00%, 2/1/2022 | | | 20,000 | | | | 21,398 | |
| | | | | | | | |
| | |
| | | | | | | 77,275 | |
| | | | | | | | |
|
Housing — 0.7% | |
| | |
City of Apple Valley, Minnesota Senior Housing, Orchard Path Project Rev., 4.25%, 9/1/2038 | | | 250,000 | | | | 261,707 | |
| | | | | | | | |
| | |
Total Minnesota | | | | | | | 357,510 | |
| | | | | | | | |
SEE NOTES TO FINANCIAL STATEMENTS.
| | | | | | | | |
| | | |
| AUGUST 31, 2019 | | J.P. MORGAN EXCHANGE-TRADED FUNDS | | | | | 99 | |
JPMorgan Municipal ETF
SCHEDULE OF PORTFOLIO INVESTMENTS
AS OF AUGUST 31, 2019 (Unaudited) (continued)
| | | | | | | | |
| INVESTMENTS | | PRINCIPAL
AMOUNT ($) | | | VALUE ($) | |
Municipal Bonds — continued | | | | | | | | |
|
Mississippi — 1.2% | |
|
Education — 0.2% | |
| | |
Mississippi Development Bank, Special Obligation, Hinds County School District Project Rev., 4.00%, 3/1/2031 | | | 25,000 | | | | 29,083 | |
| | |
Mississippi State University Educational Building Corp., New Facilities and Refinancing Project Rev., 5.00%, 8/1/2025 | | | 35,000 | | | | 42,462 | |
| | | | | | | | |
| | |
| | | | | | | 71,545 | |
| | | | | | | | |
|
General Obligation — 0.8% | |
| | |
City of Tupelo Series 2019, GO, 4.00%, 12/1/2029 | | | 220,000 | | | | 267,527 | |
| | |
State of Mississippi Series B, GO, 5.00%, 12/1/2025 | | | 20,000 | | | | 24,585 | |
| | | | | | | | |
| | |
| | | | | | | 292,112 | |
| | | | | | | | |
|
Utility — 0.2% | |
| | |
West Rankin Utility Authority Rev., AGM, 5.00%, 1/1/2029 | | | 70,000 | | | | 81,608 | |
| | | | | | | | |
| | |
Total Mississippi | | | | | | | 445,265 | |
| | | | | | | | |
|
Missouri — 2.0% | |
|
General Obligation — 0.2% | |
| | |
Columbia School District GO, 5.00%, 3/1/2036 | | | 50,000 | | | | 60,421 | |
| | | | | | | | |
|
Hospital — 1.3% | |
| | |
Health and Educational Facilities Authority of the State of Missouri, City Art Institute Rev., 5.00%, 9/1/2030 | | | 200,000 | | | | 250,900 | |
| | |
Health and Educational Facilities Authority of the State of Missouri, St. Luke’s Episcopal-Presbyterian Hospitals Series 2015B, Rev., 5.00%, 12/1/2026 | | | 165,000 | | | | 197,315 | |
| | |
Missouri Development Finance Board, Fulton State Hospital Project Series 2016, Rev., 5.00%, 10/1/2025 | | | 25,000 | | | | 29,603 | |
| | | | | | | | |
| | |
| | | | | | | 477,818 | |
| | | | | | | | |
|
Transportation — 0.1% | |
| | |
Bi-State Development Agency, Metropolitan District, St. Clair County Metrolink Project Rev., AGM, 5.25%, 7/1/2024 | | | 40,000 | | | | 47,853 | |
| | | | | | | | |
|
Utility — 0.1% | |
| | |
County of Jackson, Harry S. Truman Sports Complex Project Rev., 5.00%, 12/1/2025 | | | 25,000 | | | | 29,616 | |
| | | | | | | | |
|
Water & Sewer — 0.3% | |
| | |
City of Kansas, Sanitary Sewer System Series B, Rev., 5.00%, 1/1/2033 | | | 25,000 | | | | 31,482 | |
| | | | | | | | |
| INVESTMENTS | | PRINCIPAL
AMOUNT ($) | | | VALUE ($) | |
| | | | | | | | |
|
Water & Sewer — continued | |
| | |
Metropolitan St. Louis Sewer District Wastewater System Improvement Series 2017A, Rev., 5.00%, 5/1/2027 | | | 45,000 | | | | 57,187 | |
| | | | | | | | |
| | |
| | | | | | | 88,669 | |
| | | | | | | | |
| | |
Total Missouri | | | | | | | 704,377 | |
| | | | | | | | |
|
Montana — 0.6% | |
|
General Obligation — 0.6% | |
| | |
County of Missoula | | | | | | | | |
| | |
Series 2016, GO, 4.00%, 7/1/2025 | | | 50,000 | | | | 58,176 | |
| | |
Series A, GO, 5.00%, 7/1/2030 | | | 120,000 | | | | 148,619 | |
| | | | | | | | |
| | |
| | | | | | | 206,795 | |
| | | | | | | | |
| | |
Total Montana | | | | | | | 206,795 | |
| | | | | | | | |
|
Nebraska — 2.6% | |
|
Education — 0.1% | |
| | |
University of Nebraska Facilities Corp., UNMC Global Center Project Series 2017, Rev., 5.00%, 12/15/2025 | | | 35,000 | | | | 43,201 | |
| | | | | | | | |
|
Utility — 2.3% | |
| | |
Central Plains Energy Project, Gas Project No. 3 Series 2017A, Rev., 5.00%, 9/1/2030 | | | 320,000 | | | | 404,931 | |
| | |
City of Lincoln, Electric System | | | | | | | | |
| | |
Rev., 5.00%, 9/1/2026 | | | 85,000 | | | | 106,186 | |
| | |
Rev., 5.00%, 9/1/2028 | | | 50,000 | | | | 62,958 | |
| | |
Omaha Public Power District, Electric System | | | | | | | | |
| | |
Series B, Rev., 5.00%, 2/1/2025 | | | 120,000 | | | | 142,320 | |
| | |
Series 2016A, Rev., 5.00%, 2/1/2026 | | | 40,000 | | | | 49,417 | |
| | |
Series A, Rev., 5.00%, 2/1/2027 | | | 30,000 | | | | 36,977 | |
| | | | | | | | |
| | |
| | | | | | | 802,789 | |
| | | | | | | | |
|
Water & Sewer — 0.2% | |
| | |
City of Omaha, Sewer Rev., 5.00%, 4/1/2027 | | | 50,000 | | | | 61,773 | |
| | | | | | | | |
| | |
Total Nebraska | | | | | | | 907,763 | |
| | | | | | | | |
|
Nevada — 0.9% | |
|
General Obligation — 0.6% | |
| | |
Clark County School District, Limited Tax | | | | | | | | |
| | |
Series A, GO, 5.00%, 6/15/2032 | | | 95,000 | | | | 118,231 | |
| | |
Series A, GO, 4.00%, 6/15/2035 | | | 90,000 | | | | 102,678 | |
| | | | | | | | |
| | |
| | | | | | | 220,909 | |
| | | | | | | | |
|
Transportation — 0.1% | |
| | |
Clark County Rev., 5.00%, 7/1/2028 | | | 25,000 | | | | 31,739 | |
| | | | | | | | |
SEE NOTES TO FINANCIAL STATEMENTS.
| | | | | | |
| | | |
| 100 | | | | J.P. MORGAN EXCHANGE-TRADED FUNDS | | AUGUST 31, 2019 |
| | | | | | | | |
| INVESTMENTS | | PRINCIPAL
AMOUNT ($) | | | VALUE ($) | |
Municipal Bonds — continued | | | | | | | | |
|
Water & Sewer — 0.2% | |
| | |
Truckee Meadows Water Authority Rev., 5.00%, 7/1/2029 | | | 50,000 | | | | 62,672 | |
| | | | | | | | |
| | |
Total Nevada | | | | | | | 315,320 | |
| | | | | | | | |
|
New Jersey — 2.3% | |
|
Education — 0.3% | |
| | |
New Jersey Economic Development Authority, School Facilities Construction Series II, Rev., 5.00%, 3/1/2027 | | | 115,000 | | | | 124,256 | |
| | | | | | | | |
|
General Obligation — 0.1% | |
| | |
City of New Brunswick Series 2015, GO, 4.00%, 3/15/2024 | | | 10,000 | | | | 11,252 | |
| | |
City of North Wildwood GO, 5.00%, 8/1/2022 | | | 10,000 | | | | 11,115 | |
| | | | | | | | |
| | |
| | | | | | | 22,367 | |
| | | | | | | | |
|
Other Revenue — 0.9% | |
| | |
Passaic County Improvement Authority, City of Paterson Project Series 2017, Rev., 5.00%, 6/15/2025 | | | 10,000 | | | | 12,152 | |
| | |
Tobacco Settlement Financing Corp. Series 2018A, Rev., 5.00%, 6/1/2027 | | | 265,000 | | | | 325,738 | |
| | | | | | | | |
| | |
| | | | | | | 337,890 | |
| | | | | | | | |
|
Prerefunded — 0.2% | |
| | |
New Jersey Turnpike Authority Series A, Rev., 5.00%, 1/1/2022 (e) | | | 65,000 | | | | 70,927 | |
| | | | | | | | |
|
Transportation — 0.8% | |
| | |
New Jersey Transportation Trust Fund Authority, Transportation System Series A, Rev., 4.00%, 12/15/2031 | | | 250,000 | | | | 277,953 | |
| | | | | | | | |
| | |
Total New Jersey | | | | | | | 833,393 | |
| | | | | | | | |
|
New Mexico — 2.1% | |
|
Education — 0.1% | |
| | |
University of New Mexico (The), Board of Regents, Subordinate Lien System Rev., 5.00%, 6/1/2029 | | | 20,000 | | | | 25,004 | |
| | | | | | | | |
|
General Obligation — 0.4% | |
| | |
City of Albuquerque, General Purpose Series 2016A, GO, 5.00%, 7/1/2023 | | | 75,000 | | | | 85,885 | |
| | |
Santa Fe Community College District Series A, GO, 5.00%, 8/1/2023 | | | 50,000 | | | | 57,234 | |
| | | | | | | | |
| | |
| | | | | | | 143,119 | |
| | | | | | | | |
|
Hospital — 0.1% | |
| | |
New Mexico Hospital Equipment Loan Council, Presbyterian Healthcare Services Series 2015A, Rev., 5.00%, 8/1/2025 | | | 25,000 | | | | 30,346 | |
| | | | | | | | |
| | | | | | | | |
| INVESTMENTS | | PRINCIPAL
AMOUNT ($) | | | VALUE ($) | |
| | | | | | | | |
|
Other Revenue — 1.1% | |
| | |
City of Albuquerque, Gross Receipts Series 2015A, Rev., 5.00%, 7/1/2026 | | | 235,000 | | | | 284,195 | |
| | |
New Mexico Finance Authority, Senior Lien Public Project Revolving Fund Series 2016C, Rev., 5.00%, 6/1/2022 | | | 30,000 | | | | 33,178 | |
| | |
State of New Mexico, Severance Tax Permanent Fund Series 2016B, Rev., 4.00%, 7/1/2021 | | | 80,000 | | | | 84,238 | |
| | | | | | | | |
| | |
| | | | | | | 401,611 | |
| | | | | | | | |
|
Transportation — 0.3% | |
| | |
New Mexico Finance Authority, State Transportation, Subordinate Lien Series 2108A, Rev., 5.00%, 6/15/2027 | | | 100,000 | | | | 127,246 | |
| | | | | | | | |
|
Utility — 0.1% | |
| | |
New Mexico Finance Authority, Senior Lien Public Project Revolving Fund Series 2016E, Rev., 5.00%, 6/1/2024 | | | 25,000 | | | | 29,537 | |
| | | | | | | | |
| | |
Total New Mexico | | | | | | | 756,863 | |
| | | | | | | | |
|
New York — 6.4% | |
|
Education — 1.0% | |
| | |
Monroe County IDA, School Facility, Rochester School Modernization Project Rev., 5.00%, 5/1/2030 | | | 80,000 | | | | 96,875 | |
| | |
New York State Dormitory Authority, Columbia University Series B, Rev., 5.00%, 10/1/2038 | | | 25,000 | | | | 32,229 | |
| | |
Orange County Funding Corp., Mount Saint Mary College Project Series 2012B, Rev., 4.00%, 7/1/2023 | | | 200,000 | | | | 214,164 | |
| | | | | | | | |
| | |
| | | | | | | 343,268 | |
| | | | | | | | |
|
General Obligation — 1.9% | |
| | |
City of New York Series I, Subseries I-3, GO, VRDO, LOC: Bank of America NA, 1.27%, 9/6/2019 (b) | | | 500,000 | | | | 500,000 | |
| | |
City of New York, Fiscal Year 2012 Series I, GO, 5.00%, 8/1/2022 | | | 45,000 | | | | 50,050 | |
| | |
City of New York, Fiscal Year 2013 | | | | | | | | |
| | |
Series 2013J, GO, 5.00%, 8/1/2023 | | | 40,000 | | | | 45,955 | |
| | |
Series I, GO, 5.00%, 8/1/2023 | | | 25,000 | | | | 28,721 | |
| | |
City of New York, Fiscal Year 2017 Series C, GO, 4.00%, 8/1/2022 | | | 10,000 | | | | 10,832 | |
| | |
County of Onondaga GO, 5.00%, 3/15/2026 | | | 20,000 | | | | 23,589 | |
| | |
County of Orange, Various Purpose Series A, GO, 4.00%, 3/15/2024 | | | 20,000 | | | | 22,679 | |
| | | | | | | | |
| | |
| | | | | | | 681,826 | |
| | | | | | | | |
SEE NOTES TO FINANCIAL STATEMENTS.
| | | | | | | | |
| | | |
| AUGUST 31, 2019 | | J.P. MORGAN EXCHANGE-TRADED FUNDS | | | | | 101 | |
JPMorgan Municipal ETF
SCHEDULE OF PORTFOLIO INVESTMENTS
AS OF AUGUST 31, 2019 (Unaudited) (continued)
| | | | | | | | |
| INVESTMENTS | | PRINCIPAL
AMOUNT ($) | | | VALUE ($) | |
Municipal Bonds — continued | | | | | | | | |
|
Housing — 0.2% | |
| | |
New York City Transitional Finance Authority, Building Aid, Fiscal Year 2019Series S-2A, Rev., 5.00%, 7/15/2025 | | | 50,000 | | | | 61,232 | |
| | | | | | | | |
|
Other Revenue — 0.9% | |
| | |
New York City Transitional Finance Authority, Future Tax Secured, Fiscal Year 2015 Series C, Rev., 5.00%, 11/1/2022 | | | 25,000 | | | | 28,023 | |
| | |
New York City Transitional Finance Authority, Future Tax Secured, Fiscal Year 2018 Series 1, Rev., 5.00%, 11/1/2026 | | | 25,000 | | | | 31,420 | |
| | |
New York City Trust for Cultural Resources, Carnegie Hall Rev., 5.00%, 12/1/2033 | | | 190,000 | | | | 249,628 | |
| | |
New York Convention Center Development Corp., Hotel Unit fee Secured Rev., 5.00%, 11/15/2025 | | | 25,000 | | | | 30,568 | |
| | | | | | | | |
| | |
| | | | | | | 339,639 | |
| | | | | | | | |
|
Special Tax — 0.5% | |
| | |
New York State Urban Development Corp., State Personal Income Tax, General PurposeSeries 2017-A, Rev., 5.00%, 3/15/2028 | | | 150,000 | | | | 190,359 | |
| | | | | | | | |
|
Water & Sewer — 1.9% | |
| | |
Erie County Water Authority Rev., 5.00%, 12/1/2027 | | | 20,000 | | | | 25,212 | |
| | |
New York City Municipal Water Finance Authority, Water and Sewer System, Second General Resolution, Fiscal Year 2014 Subseries AA-4, Rev., VRDO, LIQ: Bank of Montreal, 1.25%, 9/6/2019 (b) | | | 650,000 | | | | 650,000 | |
| | | | | | | | |
| | |
| | | | | | | 675,212 | |
| | | | | | | | |
| | |
Total New York | | | | | | | 2,291,536 | |
| | | | | | | | |
|
North Carolina — 0.4% | |
|
General Obligation — 0.1% | |
| | |
County of Davidson GO, 5.00%, 6/1/2027 | | | 35,000 | | | | 44,757 | |
| | | | | | | | |
|
Other Revenue — 0.3% | |
| | |
County of Wayne Rev., 5.00%, 6/1/2024 | | | 25,000 | | | | 29,558 | |
| | |
State of North Carolina Rev., 5.00%, 3/1/2021 | | | 25,000 | | | | 26,441 | |
| | |
State of North Carolina, Limited Obligation Series C, Rev., 5.00%, 5/1/2024 | | | 25,000 | | | | 29,506 | |
| | | | | | | | |
| | |
| | | | | | | 85,505 | |
| | | | | | | | |
| | |
Total North Carolina | | | | | | | 130,262 | |
| | | | | | | | |
| | | | | | | | |
| INVESTMENTS | | PRINCIPAL
AMOUNT ($) | | | VALUE ($) | |
| | | | | | | | |
|
North Dakota — 0.1% | |
|
Other Revenue — 0.1% | |
| | |
North Dakota Public Finance Authority, State Revolving Fund Program Series 2011A, Rev., 5.00%, 10/1/2021 | | | 25,000 | | | | 27,010 | |
| | | | | | | | |
|
Ohio — 5.8% | |
|
Education — 1.1% | |
| | |
Bowling Green State University Series 2016A, Rev., 5.00%, 6/1/2024 | | | 25,000 | | | | 29,121 | |
| | |
Ohio Higher Educational Facility Commission Rev., 5.00%, 3/1/2027 | | | 55,000 | | | | 64,783 | |
| | |
Ohio Higher Educational Facility Commission, Denison University Series A, Rev., 5.00%, 11/1/2025 | | | 75,000 | | | | 92,459 | |
| | |
Ohio Higher Educational Facility Commission, University of Findlay 2019 Project Rev., 5.00%, 3/1/2034 | | | 160,000 | | | | 188,592 | |
| | |
Ohio State University (The) Series D, Rev., 4.00%, 12/1/2032 | | | 25,000 | | | | 32,219 | |
| | | | | | | | |
| | |
| | | | | | | 407,174 | |
| | | | | | | | |
|
General Obligation — 0.7% | |
| | |
City of Reynoldsburg GO, 5.00%, 12/1/2026 | | | 15,000 | | | | 18,813 | |
| | |
Sidney City School District GO, 4.00%, 12/1/2026 | | | 105,000 | | | | 124,892 | |
| | |
State of Ohio, Highway Capital Improvements Bonds, Full Faith and Credit/Highway User Receipts Series R, GO, 5.00%, 5/1/2021 | | | 20,000 | | | | 21,287 | |
| | |
State of Ohio, Infrastructure Improvement Bonds Series A, GO, 5.00%, 9/1/2028 | | | 25,000 | | | | 32,892 | |
| | |
State of Ohio, Natural Resources Series V, GO, 5.00%, 10/1/2027 | | | 35,000 | | | | 45,110 | |
| | | | | | | | |
| | |
| | | | | | | 242,994 | |
| | | | | | | | |
|
Hospital — 1.4% | |
| | |
County of Warren, Otterbein Homes Series A, Rev., 4.00%, 7/1/2033 | | | 205,000 | | | | 231,679 | |
| | |
Ohio Higher Educational Facility Commission, Hospital, Cleveland Clinic Health SystemSeries 2013-B-2, Rev., VRDO, LIQ: Bank of New York Mellon, 1.28%, 9/6/2019 (b) | | | 250,000 | | | | 250,000 | |
| | |
State of Ohio, Cleveland Clinic Health System Obligated Group Series 2017A, Rev., 5.00%, 1/1/2028 | | | 25,000 | | | | 32,187 | |
| | | | | | | | |
| | |
| | | | | | | 513,866 | |
| | | | | | | | |
|
Industrial Development Revenue/ Pollution Control Revenue — 0.2% | |
| | |
Ohio Water Development Authority, Water Pollution Control Loan Fund Series A, Rev., 5.00%, 12/1/2026 | | | 45,000 | | | | 56,838 | |
| | | | | | | | |
SEE NOTES TO FINANCIAL STATEMENTS.
| | | | | | |
| | | |
| 102 | | | | J.P. MORGAN EXCHANGE-TRADED FUNDS | | AUGUST 31, 2019 |
| | | | | | | | |
| INVESTMENTS | | PRINCIPAL
AMOUNT ($) | | | VALUE ($) | |
Municipal Bonds — continued | | | | | | | | |
|
Other Revenue — 0.1% | |
| | |
State of Ohio, Capital Facilities Lease-Appropriation Series 2018A, Rev., 5.00%, 6/1/2025 | | | 25,000 | | | | 30,294 | |
| | | | | | | | |
|
Prerefunded — 0.6% | |
| | |
South-Western City School District, School Facilities Construction and Improvement Bonds GO, 5.00%, 6/1/2022 (e) | | | 160,000 | | | | 177,130 | |
| | |
State of Ohio, Highway Capital Improvements Bonds, Full Faith and Credit/Highway User Receipts Series R, GO, 5.00%, 5/1/2024 (e) | | | 25,000 | | | | 29,496 | |
| | | | | | | | |
| | |
| | | | | | | 206,626 | |
| | | | | | | | |
|
Transportation — 0.5% | |
| | |
Ohio Turnpike and Infrastructure Commission Series A, Rev., 5.00%, 2/15/2027 | | | 135,000 | | | | 170,658 | |
| | | | | | | | |
|
Utility — 1.1% | |
| | |
American Municipal Power, Inc., Greenup Hydro-Electric Project Series 2016A, Rev., 5.00%, 2/15/2030 | | | 25,000 | | | | 30,403 | |
| | |
Lancaster Port Authority, Gas Supply Series 2019A, Rev., 5.00%, 2/1/2025 (b) | | | 300,000 | | | | 352,758 | |
| | | | | | | | |
| | |
| | | | | | | 383,161 | |
| | | | | | | | |
|
Water & Sewer — 0.1% | |
| | |
Ohio Water Development Authority, Fresh Water Series 2016B, Rev., 5.00%, 6/1/2026 | | | 30,000 | | | | 37,384 | |
| | | | | | | | |
| | |
Total Ohio | | | | | | | 2,048,995 | |
| | | | | | | | |
|
Oklahoma — 1.2% | |
|
Education — 0.5% | |
| | |
Cleveland County Educational Facilities Authority, Norman Public Schools Project Series 2019, Rev., 5.00%, 6/1/2025 | | | 150,000 | | | | 180,249 | |
| | | | | | | | |
|
Hospital — 0.1% | |
| | |
Oklahoma Development Finance Authority, St. John Health System Rev., 5.00%, 2/15/2020 (e) | | | 55,000 | | | | 55,935 | |
| | | | | | | | |
|
Other Revenue — 0.1% | |
| | |
Edmond Public Works Authority Rev., 4.00%, 7/1/2021 | | | 10,000 | | | | 10,525 | |
| | |
Oklahoma Capitol Improvement Authority Series C, Rev., 5.00%, 1/1/2030 | | | 10,000 | | | | 12,532 | |
| | | | | | | | |
| | |
| | | | | | | 23,057 | |
| | | | | | | | |
| | | | | | | | |
| INVESTMENTS | | PRINCIPAL
AMOUNT ($) | | | VALUE ($) | |
| | | | | | | | |
|
Transportation — 0.3% | |
| | |
Oklahoma Capitol Improvement Authority, State Highway Rev., 5.00%, 7/1/2024 | | | 100,000 | | | | 118,317 | |
| | | | | | | | |
|
Water & Sewer — 0.2% | |
| | |
Oklahoma City Water Utilities Trust, Water and Sewer System Series 2013, Rev., 5.00%, 7/1/2021 | | | 25,000 | | | | 26,782 | |
| | |
Oklahoma Water Resources Board, Clean Water Program Rev., 5.00%, 4/1/2023 | | | 35,000 | | | | 39,753 | |
| | | | | | | | |
| | |
| | | | | | | 66,535 | |
| | | | | | | | |
| | |
Total Oklahoma | | | | | | | 444,093 | |
| | | | | | | | |
|
Oregon — 1.5% | |
|
General Obligation — 0.6% | |
| | |
City of Portland Series A, GO, 5.00%, 4/1/2025 | | | 30,000 | | | | 36,433 | |
| | |
State of Oregon,Article XI-Q State Projects Series A, GO, 5.00%, 5/1/2030 | | | 130,000 | | | | 163,760 | |
| | |
Washington County School District No. 1 West Union, Hillsborough School District GO, 5.00%, 6/15/2028 | | | 25,000 | | | | 31,684 | |
| | | | | | | | |
| | |
| | | | | | | 231,877 | |
| | | | | | | | |
|
Other Revenue — 0.6% | |
| | |
Oregon State Facilities Authority Rev., VRDO, LOC: U.S. Bank NA, 1.26%, 9/6/2019 (b) | | | 200,000 | | | | 200,000 | |
| | | | | | | | |
|
Transportation — 0.3% | |
| | |
State of Oregon, Department of Transportation, User Tax Series 2017A, Rev., 5.00%, 11/15/2025 | | | 30,000 | | | | 36,969 | |
| | |
Tri-County Metropolitan Transportation District of Oregon Series A, Rev., 5.00%, 9/1/2030 | | | 45,000 | | | | 56,725 | |
| | | | | | | | |
| | |
| | | | | | | 93,694 | |
| | | | | | | | |
| | |
Total Oregon | | | | | | | 525,571 | |
| | | | | | | | |
|
Pennsylvania — 7.7% | |
|
Education — 0.8% | |
| | |
Northampton County General Purpose Authority, Moravian College Project Series 2016, Rev., 5.00%, 10/1/2027 | | | 185,000 | | | | 218,477 | |
| | |
Pennsylvania Higher Educational Facilities Authority, State System of Higher EducationSeries 2017AU-1, Rev., 5.00%, 6/15/2026 | | | 70,000 | | | | 86,222 | |
| | | | | | | | |
| | |
| | | | | | | 304,699 | |
| | | | | | | | |
|
General Obligation — 1.8% | |
| | |
Abington School District GO, 5.00%, 10/1/2020 | | | 20,000 | | | | 20,812 | |
| | |
Aliquippa School District GO, 3.88%, 12/1/2037 | | | 200,000 | | | | 220,858 | |
SEE NOTES TO FINANCIAL STATEMENTS.
| | | | | | | | |
| | | |
| AUGUST 31, 2019 | | J.P. MORGAN EXCHANGE-TRADED FUNDS | | | | | 103 | |
JPMorgan Municipal ETF
SCHEDULE OF PORTFOLIO INVESTMENTS
AS OF AUGUST 31, 2019 (Unaudited) (continued)
| | | | | | | | |
| INVESTMENTS | | PRINCIPAL
AMOUNT ($) | | | VALUE ($) | |
Municipal Bonds — continued | | | | | | | | |
|
General Obligation — continued | |
| | |
County of Chester GO, 5.00%, 11/15/2027 | | | 30,000 | | | | 38,720 | |
| | |
Township of Upper St Clair Series A, GO, 4.00%, 6/1/2025 | | | 20,000 | | | | 23,147 | |
| | |
Upper Merion Area School District GO, 5.00%, 1/15/2034 | | | 20,000 | | | | 24,154 | |
| | |
West Mifflin School District GO, 3.00%, 4/1/2034 | | | 300,000 | | | | 315,285 | |
| | | | | | | | |
| | |
| | | | | | | 642,976 | |
| | | | | | | | |
|
Hospital — 1.8% | |
| | |
Berks County Industrial Development Authority, Healthcare Facilities Series 2017A, Rev., 5.00%, 5/15/2037 | | | 250,000 | | | | 286,045 | |
| | |
County of Lehigh, Health Network Hospital Series A, Rev., 4.00%, 7/1/2035 | | | 175,000 | | | | 192,253 | |
| | |
Montgomery County Higher Education and Health Authority, Thomas Jefferson University Series 2018A, Rev., 4.00%, 9/1/2038 | | | 135,000 | | | | 151,285 | |
| | | | | | | | |
| | |
| | | | | | | 629,583 | |
| | | | | | | | |
|
Industrial Development Revenue/ Pollution Control Revenue — 0.6% | |
| | |
Montgomery County Industrial Development Authority, Waverly Heights Ltd. Project | | | | | | | | |
| | |
Series 2019, Rev., 4.00%, 12/1/2037 | | | 100,000 | | | | 109,727 | |
| | |
Series 2019, Rev., 4.00%, 12/1/2038 | | | 100,000 | | | | 109,400 | |
| | | | | | | | |
| | |
| | | | | | | 219,127 | |
| | | | | | | | |
|
Other Revenue — 1.0% | |
| | |
Commonwealth Financing Authority, Tobacco Master Settlement Payment Rev., 5.00%, 6/1/2035 | | | 225,000 | | | | 276,973 | |
| | |
Monroeville Finance Authority, UPMC Obligated Group Rev., 5.00%, 2/15/2022 | | | 60,000 | | | | 65,624 | |
| | | | | | | | |
| | |
| | | | | | | 342,597 | |
| | | | | | | | |
|
Prerefunded — 0.3% | |
| | |
Pennsylvania Turnpike Commission Series B, Rev., 5.25%, 12/1/2021 (e) | | | 95,000 | | | | 103,710 | |
| | | | | | | | |
|
Transportation — 0.6% | |
| | |
Pennsylvania Turnpike Commission | | | | | | | | |
| | |
Series A-1, Rev., 5.00%, 12/1/2029 | | | 105,000 | | | | 133,096 | |
| | |
Series A-1, Rev., 5.00%, 12/1/2031 | | | 60,000 | | | | 75,458 | |
| | | | | | | | |
| | |
| | | | | | | 208,554 | |
| | | | | | | | |
|
Water & Sewer — 0.8% | |
| | |
Pittsburgh Water & Sewer Authority Series B, Rev., AGM, 5.00%, 9/1/2033 | | | 200,000 | | | | 272,572 | |
| | | | | | | | |
| | |
Total Pennsylvania | | | | | | | 2,723,818 | |
| | | | | | | | |
| | | | | | | | |
| INVESTMENTS | | PRINCIPAL
AMOUNT ($) | | | VALUE ($) | |
| | | | | | | | |
|
Rhode Island — 0.3% | |
|
Education — 0.0% (c) | |
| | |
Rhode Island Health & Educational Building Corp., Brown University Issue Series A, Rev., 5.00%, 9/1/2026 | | | 10,000 | | | | 12,566 | |
| | | | | | | | |
|
General Obligation — 0.3% | |
| | |
State of Rhode Island and Providence Plantations, Consolidated Capital Development Loan of 2018 Series 2018A, GO, 5.00%, 4/1/2029 | | | 75,000 | | | | 97,382 | |
| | | | | | | | |
| | |
Total Rhode Island | | | | | | | 109,948 | |
| | | | | | | | |
|
South Carolina — 1.4% | |
|
Industrial Development Revenue/ Pollution Control Revenue — 0.4% | |
| | |
South Carolina Jobs-Economic Development Authority, South Carolina Episcopal Home at Still Homes Series 2018A, Rev., 5.00%, 4/1/2033 | | | 125,000 | | | | 140,267 | |
| | | | | | | | |
|
Transportation — 0.9% | |
| | |
Charleston County Airport District Rev., 5.00%, 7/1/2035 | | | 250,000 | | | | 319,835 | |
| | | | | | | | |
|
Water & Sewer — 0.1% | |
| | |
City of Charleston, Waterworks and Sewer System Rev., 5.00%, 1/1/2026 | | | 25,000 | | | | 30,964 | |
| | |
City of Spartanburg, Water System Series 2017B, Rev., 5.00%, 6/1/2030 | | | 10,000 | | | | 12,519 | |
| | | | | | | | |
| | |
| | | | | | | 43,483 | |
| | | | | | | | |
| | |
Total South Carolina | | | | | | | 503,585 | |
| | | | | | | | |
|
South Dakota — 0.3% | |
|
Education — 0.1% | |
| | |
South Dakota Board of Regents, Housing and Auxiliary Facility System Rev., 5.00%, 4/1/2027 | | | 35,000 | | | | 43,472 | |
| | | | | | | | |
|
Other Revenue — 0.2% | |
| | |
City of Rapid City, Sales Tax Rev., 5.00%, 12/1/2023 | | | 25,000 | | | | 28,861 | |
| | |
South Dakota Conservancy District, State Revolving Fund Program Series 2018, Rev., 5.00%, 8/1/2025 | | | 35,000 | | | | 42,778 | |
| | | | | | | | |
| | |
| | | | | | | 71,639 | |
| | | | | | | | |
| | |
Total South Dakota | | | | | | | 115,111 | |
| | | | | | | | |
|
Tennessee — 1.2% | |
|
General Obligation — 0.7% | |
| | |
City of Johnson City Series 2016A, GO, 5.00%, 6/1/2023 | | | 15,000 | | | | 17,140 | |
| | |
City of Murfreesboro GO, 4.00%, 4/1/2025 | | | 25,000 | | | | 28,301 | |
| | |
County of Robertson GO, 5.00%, 6/1/2025 | | | 25,000 | | | | 30,372 | |
SEE NOTES TO FINANCIAL STATEMENTS.
| | | | | | |
| | | |
| 104 | | | | J.P. MORGAN EXCHANGE-TRADED FUNDS | | AUGUST 31, 2019 |
| | | | | | | | |
| INVESTMENTS | | PRINCIPAL
AMOUNT ($) | | | VALUE ($) | |
Municipal Bonds — continued | | | | | | | | |
|
General Obligation — continued | |
| | |
County of Shelby Series A, GO, 4.00%, 3/1/2021 | | | 20,000 | | | | 20,872 | |
| | |
County of Sullivan GO, 5.00%, 5/1/2026 | | | 30,000 | | | | 37,311 | |
| | |
County of Williamson GO, 5.00%, 4/1/2024 | | | 20,000 | | | | 23,534 | |
| | |
County of Wilson GO, 4.00%, 4/1/2021 | | | 20,000 | | | | 20,909 | |
| | |
Metropolitan Government of Nashville and Davidson County GO, 5.00%, 7/1/2025 | | | 10,000 | | | | 12,191 | |
| | |
Montgomery County, Public Improvement GO, 5.00%, 4/1/2027 | | | 25,000 | | | | 31,770 | |
| | |
State of Tennessee Series A, GO, 5.00%, 9/1/2025 | | | 25,000 | | | | 29,817 | |
| | | | | | | | |
| | |
| | | | | | | 252,217 | |
| | | | | | | | |
|
Prerefunded — 0.1% | |
| | |
Metropolitan Government of Nashville and Davidson County GO, 5.00%, 7/1/2022 (e) | | | 20,000 | | | | 22,065 | |
| | | | | | | | |
|
Utility — 0.4% | |
| | |
Metropolitan Government of Nashville and Davidson County, Electric System Series 2014A, Rev., 5.00%, 5/15/2024 | | | 10,000 | | | | 11,812 | |
| | |
Tennessee Energy Acquisition Corp., Gas Project Series 2017A, Rev., 4.00%, 5/1/2023 (b) | | | 130,000 | | | | 140,590 | |
| | | | | | | | |
| | |
| | | | | | | 152,402 | |
| | | | | | | | |
| | |
Total Tennessee | | | | | | | 426,684 | |
| | | | | | | | |
|
Texas — 9.8% | |
|
Education — 1.5% | |
| | |
Permanent University Fund — Texas A&M University System Series A, Rev., 5.00%, 7/1/2024 | | | 85,000 | | | | 100,626 | |
| | |
Regents of the University of Texas Series A, Rev., 5.00%, 2/15/2024 | | | 35,000 | | | | 40,925 | |
| | |
Texas A&M University, Financing System Series E, Rev., 5.00%, 5/15/2028 | | | 80,000 | | | | 102,258 | |
| | |
Series E, Rev., 5.00%, 5/15/2030 | | | 180,000 | | | | 227,961 | |
| | |
University of Texas (The), Board of Regents, Financing System Series 2016D, Rev., 5.00%, 8/15/2024 | | | 50,000 | | | | 59,457 | |
| | |
University of Texas System (The) Rev., 5.00%, 8/15/2022 | | | 10,000 | | | | 11,138 | |
| | | | | | | | |
| | |
| | | | | | | 542,365 | |
| | | | | | | | |
|
General Obligation — 5.6% | |
| | |
Alamo Community College District, Limited Tax GO, 5.00%, 2/15/2024 | | | 75,000 | | | | 87,214 | |
| | |
Allen Independent School District, School Building GO, PSF-GTD, 5.00%, 2/15/2032 | | | 55,000 | | | | 66,828 | |
| | | | | | | | |
| INVESTMENTS | | PRINCIPAL
AMOUNT ($) | | | VALUE ($) | |
| | | | | | | | |
|
General Obligation — continued | |
| | |
City of Denison Series 2019, GO, 5.00%, 2/15/2028 | | | 245,000 | | | | 313,230 | |
| | |
City of Houston, Public Improvement Series 2013A, GO, 5.00%, 3/1/2020 | | | 30,000 | | | | 30,571 | |
| | |
City of Hutto GO, 5.00%, 8/1/2026 | | | 80,000 | | | | 99,213 | |
| | |
City of League City GO, 5.00%, 2/15/2027 | | | 20,000 | | | | 24,340 | |
| | |
City of Pflugerville GO, 5.00%, 8/1/2026 | | | 25,000 | | | | 31,051 | |
| | |
City of San Angelo GO, 5.00%, 2/15/2027 | | | 20,000 | | | | 25,026 | |
| | |
City of San Marcos GO, 5.00%, 8/15/2031 | | | 270,000 | | | | 336,442 | |
| | |
Clint Independent School District, Unlimited Tax Series A, GO, PSF-GTD, 5.00%, 2/15/2024 | | | 25,000 | | | | 29,095 | |
| | |
County of Bexar, Certificates of Obligation Series A, GO, 5.00%, 6/15/2031 | | | 110,000 | | | | 134,276 | |
| | |
County of Fort Bend Series 2016B, GO, 5.00%, 3/1/2022 | | | 15,000 | | | | 16,451 | |
| | |
County of Hays, Limited Tax GO, 5.00%, 2/15/2026 | | | 20,000 | | | | 24,609 | |
| | |
County of Montgomery, Unlimited Tax GO, 5.00%, 3/1/2025 | | | 25,000 | | | | 30,146 | |
| | |
County of Williamson, Limited Tax GO, 5.00%, 2/15/2026 | | | 40,000 | | | | 49,226 | |
| | |
Cypress-Fairbanks Independent School District, School Building Series 2015A, GO, PSF-GTD, 5.00%, 2/15/2025 | | | 20,000 | | | | 24,071 | |
| | |
Gregory-Portland Independent School District GO, PSF-GTD, 5.00%, 2/15/2033 | | | 30,000 | | | | 36,271 | |
| | |
Harris County, Unlimited Tax Series 2017A, GO, 5.00%, 10/1/2026 | | | 25,000 | | | | 31,418 | |
| | |
Laredo Independent School District, Unlimited Tax GO, PSF-GTD, 5.00%, 8/1/2024 | | | 25,000 | | | | 29,519 | |
| | |
Marion Independent School District GO,PSF-GTD, 4.00%, 8/15/2033 | | | 280,000 | | | | 322,448 | |
| | |
North East Independent School District GO, PSF-GTD, 5.00%, 8/1/2025 | | | 20,000 | | | | 24,355 | |
| | |
Northside Independent School District GO, PSF-GTD, 5.00%, 8/15/2024 | | | 65,000 | | | | 77,286 | |
| | |
Pearland Independent School District Series A, GO, PSF-GTD, 5.00%, 2/15/2023 | | | 25,000 | | | | 28,261 | |
| | |
Prosper Independent School District, Unlimited Tax School Building GO,PSF-GTD, 5.00%, 2/15/2037 | | | 25,000 | | | | 31,310 | |
| | |
Sherman Independent School District Series A, GO, PSF-GTD, 5.00%, 2/15/2030 | | | 25,000 | | | | 31,796 | |
| | |
State of Texas, Transportation Commission MobilitySeries 2015-A, GO, 5.00%, 10/1/2024 | | | 50,000 | | | | 59,598 | |
SEE NOTES TO FINANCIAL STATEMENTS.
| | | | | | | | |
| | | |
| AUGUST 31, 2019 | | J.P. MORGAN EXCHANGE-TRADED FUNDS | | | | | 105 | |
JPMorgan Municipal ETF
SCHEDULE OF PORTFOLIO INVESTMENTS
AS OF AUGUST 31, 2019 (Unaudited) (continued)
| | | | | | | | |
| INVESTMENTS | | PRINCIPAL
AMOUNT ($) | | | VALUE ($) | |
Municipal Bonds — continued | | | | | | | | |
|
General Obligation — continued | |
| | |
Wylie Independent School District, Unlimited Tax GO, PSF-GTD, 4.00%, 2/15/2023 | | | 10,000 | | | | 10,930 | |
| | | | | | | | |
| | |
| | | | | | | 2,004,981 | |
| | | | | | | | |
|
Other Revenue — 0.2% | |
| | |
Metropolitan Transit Authority of Harris County Series 2017A, Rev., 5.00%, 11/1/2025 | | | 45,000 | | | | 55,289 | |
| | | | | | | | |
|
Transportation — 0.1% | |
| | |
Metropolitan Transit Authority of Harris County Series B, Rev., 5.00%, 11/1/2029 | | | 25,000 | | | | 32,080 | |
| | | | | | | | |
|
Utility — 1.5% | |
| | |
Brushy Creek Regional Utility Authority, Inc., Water Treatment And Distribution Project Rev., 5.00%, 8/1/2026 | | | 85,000 | | | | 105,365 | |
| | |
City of Houston, Combined Utility System, First Lien Series 2018D, Rev., 5.00%, 11/15/2030 | | | 45,000 | | | | 58,103 | |
| | |
City of San Antonio, Electric and Gas Systems Rev., 5.00%, 2/1/2028 | | | 100,000 | | | | 126,952 | |
| | |
Lower Colorado River Authority, Transmission Contract, LCRA Transmission Services Corp. Project | | | | | | | | |
| | |
Rev., 5.00%, 5/15/2020 | | | 30,000 | | | | 30,799 | |
| | |
Rev., 5.00%, 5/15/2035 | | | 155,000 | | | | 194,480 | |
| | | | | | | | |
| | |
| | | | | | | 515,699 | |
| | | | | | | | |
|
Water & Sewer — 0.9% | |
| | |
City of Amarillo, Waterworks and Sewer System Series 2015A, Rev., 4.00%, 4/1/2025 | | | 25,000 | | | | 28,864 | |
| | |
City of Dallas, Waterworks and Sewer System Rev., 5.00%, 10/1/2022 | | | 10,000 | | | | 10,810 | |
| | |
North Texas Municipal Water District, Water System Rev., 5.00%, 6/1/2027 | | | 20,000 | | | | 25,493 | |
| | |
San Antonio Water System Series A, Rev., 5.00%, 5/15/2025 | | | 25,000 | | | | 30,289 | |
| | |
Tarrant Regional Water District Rev., 5.00%, 3/1/2025 | | | 125,000 | | | | 150,794 | |
| | |
Trinity River Authority LLC, Tarrant County Water Project Rev., 5.00%, 2/1/2026 | | | 60,000 | | | | 73,735 | |
| | | | | | | | |
| | |
| | | | | | | 319,985 | |
| | | | | | | | |
| | |
Total Texas | | | | | | | 3,470,399 | |
| | | | | | | | |
|
Utah — 2.6% | |
|
Education — 0.4% | |
| | |
Utah Charter School Finance Authority Series A, Rev., 5.00%, 4/15/2030 | | | 110,000 | | | | 140,087 | |
| | | | | | | | |
| | | | | | | | |
| INVESTMENTS | | PRINCIPAL
AMOUNT ($) | | | VALUE ($) | |
| | | | | | | | |
|
General Obligation — 0.3% | |
| | |
Snyderville Basin Special Recreation District Series 2017, GO, 4.00%, 12/15/2025 | | | 100,000 | | | | 117,398 | |
| | | | | | | | |
|
Other Revenue — 0.5% | |
| | |
City of Park City Rev., 5.00%, 6/15/2022 | | | 30,000 | | | | 33,269 | |
| | |
City of South Jordan Rev., 5.00%, 8/15/2029 | | | 45,000 | | | | 59,965 | |
| | |
County of Summit, Sales Tax Rev., 5.00%, 12/15/2023 | | | 70,000 | | | | 81,545 | |
| | | | | | | | |
| | |
| | | | | | | 174,779 | |
| | | | | | | | |
|
Prerefunded — 0.1% | |
| | |
Utah State Board of Regents, University of Utah (The) Series B, Rev., 5.00%, 8/1/2023 (e) | | | 25,000 | | | | 28,770 | |
| | | | | | | | |
|
Transportation — 1.1% | |
| | |
Utah Transit Authority Series A, Rev.,BHAC-CR, 5.00%, 6/15/2035 | | | 295,000 | | | | 406,749 | |
| | | | | | | | |
|
Water & Sewer — 0.2% | |
| | |
Washington County Water Conservancy District Series 2012A, Rev., 4.50%, 10/1/2024 | | | 55,000 | | | | 59,645 | |
| | | | | | | | |
| | |
Total Utah | | | | | | | 927,428 | |
| | | | | | | | |
|
Vermont — 2.4% | |
|
Education — 2.4% | |
| | |
Vermont Educational and Health Buildings Financing Agency, Landmark College Project Series A, Rev., VRDO, LOC: TD Bank NA, 1.32%, 9/6/2019 (b) | | | 850,000 | | | | 850,000 | |
| | | | | | | | |
|
Virginia — 2.0% | |
|
Education — 0.4% | |
| | |
Virginia College Building Authority, 21st Century College and Equipment Programs Series 2017B, Rev., 5.00%, 2/1/2024 | | | 75,000 | | | | 87,665 | |
| | |
Virginia Public School AuthoritySeries 2015-A, Rev., 4.00%, 8/1/2020 | | | 55,000 | | | | 56,456 | |
| | | | | | | | |
| | |
| | | | | | | 144,121 | |
| | | | | | | | |
|
General Obligation — 1.0% | |
| | |
City of Richmond Series B, GO, 5.00%, 7/15/2027 | | | 175,000 | | | | 225,057 | |
| | |
Commonwealth of Virginia Series A, GO, 5.00%, 6/1/2030 | | | 25,000 | | | | 32,531 | |
| | |
County of Spotsylvania, Public Improvement GO, 5.00%, 7/15/2029 | | | 85,000 | | | | 112,288 | |
| | | | | | | | |
| | |
| | | | | | | 369,876 | |
| | | | | | | | |
|
Housing — 0.1% | |
| | |
Virginia Public Building Authority, Public Facilities Series A, Rev., 5.00%, 8/1/2022 | | | 25,000 | | | | 27,830 | |
| | | | | | | | |
SEE NOTES TO FINANCIAL STATEMENTS.
| | | | | | |
| | | |
| 106 | | | | J.P. MORGAN EXCHANGE-TRADED FUNDS | | AUGUST 31, 2019 |
| | | | | | | | |
| INVESTMENTS | | PRINCIPAL
AMOUNT ($) | | | VALUE ($) | |
Municipal Bonds — continued | | | | | | | | |
|
Transportation — 0.4% | |
| | |
Virginia Commonwealth Transportation BoardSeries 2013-A, Rev., GAN, 5.00%, 3/15/2023 | | | 100,000 | | | | 113,657 | |
| | |
Virginia Resources Authority, Infrastructure, Pooled Financing ProgramSeries 2013-C, Rev., 5.00%, 11/1/2023 | | | 35,000 | | | | 40,572 | |
| | | | | | | | |
| | |
| | | | | | | 154,229 | |
| | | | | | | | |
|
Water & Sewer — 0.1% | |
| | |
Hampton Roads Sanitation District, Wastewater Series 2014A, Rev., 5.00%, 7/1/2021 | | | 15,000 | | | | 16,053 | |
| | | | | | | | |
| | |
Total Virginia | | | | | | | 712,109 | |
| | | | | | | | |
|
Washington — 4.8% | |
|
Certificate of Participation/Lease — 0.2% | |
| | |
State of WashingtonSeries 2015-C, COP, 5.00%, 1/1/2029 | | | 55,000 | | | | 66,710 | |
| | | | | | | | |
|
Education — 0.7% | |
| | |
University of Washington Rev., 5.00%, 4/1/2032 | | | 190,000 | | | | 236,443 | |
| | | | | | | | |
|
General Obligation — 2.7% | |
| | |
City of University Place, Limited Tax GO, 5.00%, 12/1/2026 | | | 85,000 | | | | 105,605 | |
| | |
Clark County School District No. 101 La Center, Unlimited Tax GO, 5.00%, 12/1/2029 | | | 50,000 | | | | 65,046 | |
| | |
County of King, Limited Tax | | | | | | | | |
| | |
Series A, GO, 5.00%, 7/1/2025 | | | 50,000 | | | | 60,076 | |
| | |
Series B, GO, 5.00%, 12/1/2025 | | | 20,000 | | | | 23,246 | |
| | |
County of Snohomish, Limited Tax GO, 5.00%, 12/1/2025 | | | 10,000 | | | | 12,081 | |
| | |
King County Public Hospital District No. 2, EvergreenHealth GO, 5.00%, 12/1/2031 | | | 105,000 | | | | 123,227 | |
| | |
King County School District No. 405 Bellevue, Credit Enhancement Program | | | | | | | | |
| | |
GO, 5.00%, 12/1/2021 | | | 30,000 | | | | 32,637 | |
| | |
GO, 5.00%, 12/1/2026 | | | 20,000 | | | | 25,320 | |
| | |
King County School District No. 411 Issaquah GO, 5.00%, 12/1/2024 | | | 35,000 | | | | 41,976 | |
| | |
Kitsap County School District No. 401 Central Kitsap, Unlimited Tax GO, 5.00%, 12/1/2023 | | | 50,000 | | | | 58,179 | |
| | |
Mason County School District No. 309 Shelton, Unlimited Tax GO, 5.00%, 12/1/2029 | | | 45,000 | | | | 56,759 | |
| | |
Pasco School District No. 1, Franklin County, Unlimited Tax GO, 5.00%, 12/1/2030 | | | 35,000 | | | | 44,334 | |
| | |
Pierce and King Counties School District No. 417 Fife GO, 4.00%, 12/1/2020 | | | 75,000 | | | | 77,686 | |
| | | | | | | | |
| INVESTMENTS | | PRINCIPAL
AMOUNT ($) | | | VALUE ($) | |
| | | | | | | | |
|
General Obligation — continued | |
| | |
Pierce County, White River School District No. 416 GO, 5.00%, 12/1/2025 | | | 50,000 | | | | 61,559 | |
| | |
Snohomish County School District No. 15 Edmonds GO, 5.00%, 12/1/2025 | | | 25,000 | | | | 30,872 | |
| | |
Snohomish County School District No. 4 Lake Stevens GO, 5.00%, 12/1/2024 | | | 25,000 | | | | 29,895 | |
| | |
Spokane County, Mead School District No. 354 GO, 5.00%, 12/1/2024 | | | 20,000 | | | | 23,972 | |
| | |
State of Washington, Motor Vehicle Fuel Tax Series 2013E, GO, 5.00%, 2/1/2025 | | | 75,000 | | | | 84,777 | |
| | | | | | | | |
| | |
| | | | | | | 957,247 | |
| | | | | | | | |
|
Hospital — 0.1% | |
| | |
Washington Health Care Facilities Authority, Providence St. Joseph Health Series 2018B, Rev., 5.00%, 10/1/2028 | | | 30,000 | | | | 38,777 | |
| | | | | | | | |
|
Other Revenue — 0.1% | |
| | |
Washington State Convention Center Public Facilities District Rev., 5.00%, 7/1/2032 | | | 35,000 | | | | 43,459 | |
| | | | | | | | |
|
Prerefunded — 0.1% | |
| | |
City of Seattle, Municipal Light and Power Improvement Series 2011A, Rev., 5.00%, 2/1/2021 (e) | | | 20,000 | | | | 21,100 | |
| | |
State of Washington, Various Purpose Series 2011A, GO, 5.00%, 8/1/2020 (e) | | | 25,000 | | | | 25,889 | |
| | | | | | | | |
| | |
| | | | | | | 46,989 | |
| | | | | | | | |
|
Transportation — 0.2% | |
| | |
Central Puget Sound Regional Transit Authority, Sales TaxSeries 2015S-1, Rev., 5.00%, 11/1/2024 | | | 30,000 | | | | 35,937 | |
| | |
Port of Seattle, Intermediate Lien Series B, Rev., 5.00%, 3/1/2022 | | | 30,000 | | | | 32,902 | |
| | | | | | | | |
| | |
| | | | | | | 68,839 | |
| | | | | | | | |
|
Utility — 0.5% | |
| | |
Energy Northwest, Electric | | | | | | | | |
| | |
Series 2016-A, Rev., 5.00%, 7/1/2028 | | | 25,000 | | | | 31,069 | |
| | |
Series 2017A, Rev., 5.00%, 7/1/2028 | | | 55,000 | | | | 70,309 | |
| | |
Energy Northwest, Electric Generating Station Series A, Rev., 5.00%, 7/1/2029 | | | 30,000 | | | | 38,188 | |
| | |
Grant County Public Utility District No. 2, Priest Rapids Hydroelectric Project Series 2014A, Rev., 5.00%, 1/1/2023 | | | 25,000 | | | | 28,058 | |
| | | | | | | | |
| | |
| | | | | | | 167,624 | |
| | | | | | | | |
|
Water & Sewer — 0.2% | |
| | |
City of Bonney Lake, Water & Sewer System Rev., 4.00%, 12/1/2030 | | | 10,000 | | | | 11,532 | |
SEE NOTES TO FINANCIAL STATEMENTS.
| | | | | | | | |
| | | |
| AUGUST 31, 2019 | | J.P. MORGAN EXCHANGE-TRADED FUNDS | | | | | 107 | |
JPMorgan Municipal ETF
SCHEDULE OF PORTFOLIO INVESTMENTS
AS OF AUGUST 31, 2019 (Unaudited) (continued)
| | | | | | | | |
| INVESTMENTS | | PRINCIPAL
AMOUNT ($) | | | VALUE ($) | |
Municipal Bonds — continued | | | | | | | | |
|
Water & Sewer — continued | |
| | |
City of Seattle, Drainage and Wastewater System Improvement Rev., 4.00%, 4/1/2026 | | | 20,000 | | | | 23,583 | |
| | |
City of Seattle, Wastewater System Improvement Rev., 5.00%, 8/1/2024 | | | 35,000 | | | | 41,588 | |
| | | | | | | | |
| | |
| | | | | | | 76,703 | |
| | | | | | | | |
| | |
Total Washington | | | | | | | 1,702,791 | |
| | | | | | | | |
|
Wisconsin — 4.1% | |
|
Education — 0.7% | |
| | |
Public Finance Authority, Piedmont Community Charter School Rev., 5.00%, 6/15/2039 | | | 200,000 | | | | 236,424 | |
| | | | | | | | |
|
General Obligation — 1.5% | |
| | |
City of Milwaukee, Promissory Notes Series N4 & B5, GO, 5.00%, 4/1/2023 | | | 85,000 | | | | 96,581 | |
| | |
City of West Allis, Corporate Purpose Series A, GO, 4.00%, 4/1/2022 | | | 100,000 | | | | 106,712 | |
| | |
Hamilton School District, School Building Improvement GO, 5.00%, 4/1/2025 | | | 60,000 | | | | 72,535 | |
| | |
State of Wisconsin | | | | | | | | |
| | |
Series 3, GO, 5.00%, 11/1/2021 | | | 80,000 | | | | 86,693 | |
| | |
Series B, GO, 4.00%, 5/1/2023 | | | 40,000 | | | | 44,180 | |
| | |
Series 1, GO, 5.00%, 11/1/2024 | | | 40,000 | | | | 47,831 | |
| | |
Series 2, GO, 5.00%, 11/1/2026 | | | 50,000 | | | | 62,148 | |
| | |
Village of Pleasant Prairie GO, 4.00%, 8/1/2024 | | | 10,000 | | | | 11,349 | |
| | | | | | | | |
| | |
| | | | | | | 528,029 | |
| | | | | | | | |
|
Industrial Development Revenue/Pollution Control Revenue — 0.2% | |
| | |
State of Wisconsin Environmental Improvement Fund | | | | | | | | |
| | |
Series A, Rev., 5.00%, 6/1/2025 | | | 35,000 | | | | 42,585 | |
| | |
Series A, Rev., 5.00%, 6/1/2026 | | | 20,000 | | | | 24,966 | |
| | | | | | | | |
| | |
| | | | | | | 67,551 | |
| | | | | | | | |
|
Other Revenue — 0.7% | |
| | |
Public Finance Authority, Cedars Obligated Group | | | | | | | | |
| | |
Rev., 4.25%, 5/1/2029 (d) | | | 125,000 | | | | 124,841 | |
| | |
Rev., 5.50%, 5/1/2039 (d) | | | 125,000 | | | | 126,070 | |
| | | | | | | | |
| | |
| | | | | | | 250,911 | |
| | | | | | | | |
|
Prerefunded — 0.4% | |
| | |
State of Wisconsin Series C, GO, 4.00%, 5/1/2021 (e) | | | 25,000 | | | | 26,179 | |
| | |
State of Wisconsin, Clean Water Fund, Leveraged Loan Portfolio | | | | | | | | |
| | |
Series 1, Rev., 5.00%, 6/1/2023 (e) | | | 25,000 | | | | 28,565 | |
| | |
Rev., 5.00%, 6/1/2024 (e) | | | 65,000 | | | | 76,770 | |
| | | | | | | | |
| | |
| | | | | | | 131,514 | |
| | | | | | | | |
| | | | | | | | |
| INVESTMENTS | | PRINCIPAL
AMOUNT ($) | | | VALUE ($) | |
| | | | | | | | |
|
Transportation — 0.6% | |
| | |
Wisconsin Department of Transportation Series 2, Rev., 5.00%, 7/1/2031 | | | 180,000 | | | | 227,720 | |
| | | | | | | | |
| | |
Total Wisconsin | | | | | | | 1,442,149 | |
| | | | | | | | |
| | |
Total Municipal Bonds
(Cost $32,630,239) | | | | | | | 34,835,325 | |
| | | | | | | | |
| | |
| | |
SHARES | | | | |
Short-Term Investments — 2.6% | | | | | | | | |
|
Investment Companies — 2.6% | |
| | |
JPMorgan Institutional Tax Free Money Market Fund Class IM Shares, 1.25% (f) (g)
(Cost $933,510) | | | 933,508 | | | | 933,602 | |
| | | | | | | | |
| |
Total Investments — 100.7%
(Cost $33,563,749) | | | | 35,768,927 | |
| |
Liabilities in Excess of Other
Assets — (0.7)% | | | | (237,844) | |
| | | | | | | | |
| |
NET ASSETS — 100.0% | | | | 35,531,083 | |
| | | | | | | | |
Percentages indicated are based on net assets.
| | |
Abbreviations |
| |
| AGM | | Insured by Assured Guaranty Municipal Corp. |
| BHAC | | Insured by Berkshire Hathaway Assurance Corp. |
| COP | | Certificate of Participation |
| CR | | Custodial Receipts |
| GAN | | Grant Anticipation Notes |
| GO | | General Obligation |
| IDA | | Industrial Development Authority |
| LIQ | | Liquidity Agreement |
| LOC | | Letter of Credit |
| PSF-GTD | | Permanent School Fund Guaranteed |
| Q-SBLF | | Qualified School Bond Loan Fund |
| Rev. | | Revenue |
| VRDO | | Variable Rate Demand Obligation. The interest rate shown is the rate in effect as of August 31, 2019. |
| |
| (a) | | The date shown represents the earliest of the prerefunded date, next put date or final maturity date. |
| (b) | | Variable or floating rate security, the interest rate of which adjusts periodically based on changes in current interest rates and prepayments on the underlying pool of assets. The interest rate shown is the current rate as of August 31, 2019. |
| (c) | | Amount rounds to less than 0.1% of net assets. |
| (d) | | Securities exempt from registration under Rule 144A or section 4(a)(2), of the Securities Act of 1933, as amended. |
| (e) | | Security is prerefunded or escrowed to maturity. |
| (f) | | Investment in an affiliated fund, which is registered under the Investment Company Act of 1940, as amended, and is advised by J.P. Morgan Investment Management Inc. |
| (g) | | The rate shown is the current yield as of August 31, 2019. |
SEE NOTES TO FINANCIAL STATEMENTS.
| | | | | | |
| | | |
| 108 | | | | J.P. MORGAN EXCHANGE-TRADED FUNDS | | AUGUST 31, 2019 |
JPMorgan U.S. Aggregate Bond ETF
SCHEDULE OF PORTFOLIO INVESTMENTS
AS OF AUGUST 31, 2019 (Unaudited)
| | | | | | | | |
| INVESTMENTS | | PRINCIPAL
AMOUNT ($) | | | VALUE ($) | |
U.S. Treasury Obligations — 39.6% | |
| | |
U.S. Treasury Bonds | | | | | | | | |
| | |
8.75%, 8/15/2020 | | | 1,577,000 | | | | 1,679,382 | |
| | |
7.88%, 2/15/2021 | | | 241,000 | | | | 262,323 | |
| | |
8.13%, 5/15/2021 | | | 887,000 | | | | 983,323 | |
| | |
8.13%, 8/15/2021 | | | 2,028,000 | | | | 2,281,817 | |
| | |
6.75%, 8/15/2026 | | | 169,000 | | | | 228,209 | |
| | |
5.50%, 8/15/2028 | | | 160,000 | | | | 213,737 | |
| | |
5.25%, 11/15/2028 | | | 200,000 | | | | 264,516 | |
| | |
6.13%, 8/15/2029 | | | 150,000 | | | | 213,861 | |
| | |
6.25%, 5/15/2030 | | | 1,138,000 | | | | 1,669,170 | |
| | |
4.50%, 5/15/2038 | | | 921,000 | | | | 1,327,175 | |
| | |
3.50%, 2/15/2039 | | | 792,000 | | | | 1,015,554 | |
| | |
4.25%, 5/15/2039 | | | 792,000 | | | | 1,116,225 | |
| | |
4.50%, 8/15/2039 | | | 117,000 | | | | 170,272 | |
| | |
4.63%, 2/15/2040 | | | 118,000 | | | | 174,903 | |
| | |
3.13%, 2/15/2042 | | | 46,000 | | | | 56,350 | |
| | |
2.75%, 8/15/2042 | | | 231,000 | | | | 266,778 | |
| | |
3.00%, 5/15/2045 | | | 2,298,000 | | | | 2,786,505 | |
| | |
3.00%, 11/15/2045 | | | 66,000 | | | | 80,224 | |
| | |
2.25%, 8/15/2046 | | | 3,155,000 | | | | 3,341,465 | |
| | |
3.00%, 2/15/2047 | | | 1,766,000 | | | | 2,158,521 | |
| | |
3.00%, 5/15/2047 | | | 21,000 | | | | 25,673 | |
| | |
3.00%, 8/15/2048 | | | 39,000 | | | | 47,908 | |
| | |
3.38%, 11/15/2048 | | | 1,203,000 | | | | 1,582,415 | |
| | |
3.00%, 2/15/2049 | | | 250,000 | | | | 307,988 | |
| | |
2.88%, 5/15/2049 | | | 29,000 | | | | 34,944 | |
| | |
2.25%, 8/15/2049 | | | 85,000 | | | | 90,396 | |
| | |
U.S. Treasury Notes | | | | | | | | |
| | |
2.63%, 8/15/2020 | | | 398,000 | | | | 400,985 | |
| | |
2.63%, 8/31/2020 | | | 1,458,000 | | | | 1,469,789 | |
| | |
1.38%, 9/15/2020 | | | 25,000 | | | | 24,902 | |
| | |
1.38%, 9/30/2020 | | | 741,000 | | | | 737,787 | |
| | |
2.88%, 10/31/2020 | | | 32,000 | | | | 32,407 | |
| | |
1.75%, 11/15/2020 | | | 1,302,000 | | | | 1,302,407 | |
| | |
2.00%, 1/15/2021 | | | 121,000 | | | | 121,544 | |
| | |
2.25%, 2/15/2021 | | | 29,000 | | | | 29,254 | |
| | |
1.25%, 3/31/2021 | | | 116,000 | | | | 115,329 | |
| | |
1.75%, 7/31/2021 | | | 600,000 | | | | 602,484 | |
| | |
1.13%, 9/30/2021 | | | 3,074,000 | | | | 3,049,144 | |
| | |
1.50%, 1/31/2022 | | | 3,672,000 | | | | 3,674,582 | |
| | |
2.38%, 3/15/2022 | | | 3,691,000 | | | | 3,775,778 | |
| | |
1.88%, 3/31/2022 | | | 2,591,000 | | | | 2,617,720 | |
| | |
1.75%, 6/15/2022 | | | 2,043,000 | | | | 2,060,557 | |
| | |
1.75%, 6/30/2022 | | | 3,585,000 | | | | 3,616,369 | |
| | |
1.25%, 7/31/2023 | | | 532,000 | | | | 528,384 | |
| | |
2.25%, 12/31/2023 | | | 1,799,000 | | | | 1,861,614 | |
| | | | | | | | |
| INVESTMENTS | | PRINCIPAL
AMOUNT ($) | | | VALUE ($) | |
| | | | | | | | |
| | |
2.25%, 1/31/2024 | | | 633,000 | | | | 655,377 | |
| | |
2.50%, 1/31/2024 | | | 254,000 | | | | 265,688 | |
| | |
2.13%, 2/29/2024 | | | 490,000 | | | | 504,968 | |
| | |
2.38%, 2/29/2024 | | | 6,429,000 | | | | 6,698,717 | |
| | |
2.13%, 3/31/2024 | | | 1,357,000 | | | | 1,399,459 | |
| | |
2.50%, 5/15/2024 | | | 100,000 | | | | 104,918 | |
| | |
2.00%, 5/31/2024 | | | 2,545,000 | | | | 2,614,590 | |
| | |
1.75%, 7/31/2024 | | | 400,000 | | | | 406,703 | |
| | |
1.88%, 8/31/2024 | | | 3,820,000 | | | | 3,904,607 | |
| | |
2.13%, 5/15/2025 | | | 163,000 | | | | 169,151 | |
| | |
2.00%, 8/15/2025 | | | 741,000 | | | | 764,504 | |
| | |
2.63%, 12/31/2025 | | | 2,369,000 | | | | 2,536,866 | |
| | |
2.63%, 1/31/2026 | | | 220,000 | | | | 235,727 | |
| | |
1.63%, 2/15/2026 | | | 162,000 | | | | 163,728 | |
| | |
2.25%, 3/31/2026 | | | 398,000 | | | | 417,869 | |
| | |
2.13%, 5/31/2026 | | | 50,000 | | | | 52,148 | |
| | |
1.88%, 6/30/2026 | | | 300,000 | | | | 308,238 | |
| | |
1.88%, 7/31/2026 | | | 373,000 | | | | 383,316 | |
| | |
1.50%, 8/15/2026 | | | 25,000 | | | | 25,076 | |
| | |
2.00%, 11/15/2026 | | | 250,000 | | | | 259,365 | |
| | |
2.38%, 5/15/2027 | | | 1,278,000 | | | | 1,362,967 | |
| | |
2.25%, 8/15/2027 | | | 451,000 | | | | 477,373 | |
| | |
2.75%, 2/15/2028 | | | 29,000 | | | | 31,912 | |
| | |
2.88%, 8/15/2028 | | | 55,000 | | | | 61,329 | |
| | |
3.13%, 11/15/2028 | | | 830,000 | | | | 945,325 | |
| | |
2.63%, 2/15/2029 | | | 1,686,000 | | | | 1,852,031 | |
| | |
2.38%, 5/15/2029 | | | 212,000 | | | | 228,562 | |
| | | | | | | | |
| | |
Total U.S. Treasury Obligations
(Cost $70,948,847) | | | | | | | 75,231,184 | |
| | | | | | | | |
Mortgage-Backed Securities — 26.7% | |
| | |
FHLMC Gold Pools, 15 Year | | | | | | | | |
| | |
Pool # J10548, 4.00%, 8/1/2024 | | | 69,915 | | | | 72,823 | |
| | |
Pool # G14005, 4.00%, 10/1/2025 | | | 86,158 | | | | 89,904 | |
| | |
Pool # J15449, 4.00%, 5/1/2026 | | | 232,317 | | | | 243,102 | |
| | |
Pool # G15201, 4.00%, 5/1/2027 | | | 63,764 | | | | 66,388 | |
| | |
Pool # G15438, 4.00%, 9/1/2027 | | | 43,834 | | | | 45,748 | |
| | |
Pool # G15602, 2.50%, 11/1/2027 | | | 141,719 | | | | 144,296 | |
| | |
Pool # G18466, 2.00%, 5/1/2028 | | | 28,376 | | | | 28,579 | |
| | |
Pool # G16762, 3.50%, 12/1/2028 | | | 67,610 | | | | 70,064 | |
| | |
Pool # G16570, 4.00%, 7/1/2029 | | | 44,872 | | | | 46,718 | |
| | |
Pool # G18556, 2.50%, 6/1/2030 | | | 90,909 | | | | 92,248 | |
| | |
Pool # V60840, 3.00%, 6/1/2030 | | | 21,790 | | | | 22,454 | |
| | |
Pool # G16622, 3.00%, 11/1/2030 | | | 89,433 | | | | 92,101 | |
| | |
Pool # G16044, 2.50%, 1/1/2032 | | | 228,653 | | | | 232,028 | |
| | |
Pool # J36524, 3.00%, 3/1/2032 | | | 279,016 | | | | 287,001 | |
| | |
Pool # G18706, 3.00%, 9/1/2033 | | | 43,271 | | | | 44,375 | |
| | |
Pool # G18730, 3.50%, 4/1/2034 | | | 188,610 | | | | 195,830 | |
SEE NOTES TO FINANCIAL STATEMENTS.
| | | | | | | | |
| | | |
| AUGUST 31, 2019 | | J.P. MORGAN EXCHANGE-TRADED FUNDS | | | | | 109 | |
JPMorgan U.S. Aggregate Bond ETF
SCHEDULE OF PORTFOLIO INVESTMENTS
AS OF AUGUST 31, 2019 (Unaudited) (continued)
| | | | | | | | |
| INVESTMENTS | | PRINCIPAL
AMOUNT ($) | | | VALUE ($) | |
Mortgage-Backed Securities — continued | |
| | |
FHLMC Gold Pools, 20 Year | | | | | | | | |
| | |
Pool # C91911, 2.50%, 1/1/2037 | | | 36,864 | | | | 37,418 | |
| | |
Pool # G31005, 4.00%, 5/1/2037 | | | 132,026 | | | | 139,863 | |
| | |
Pool # C91974, 4.00%, 11/1/2037 | | | 322,361 | | | | 338,024 | |
| | |
FHLMC Gold Pools, 30 Year | | | | | | | | |
| | |
Pool # A30892, 5.00%, 1/1/2035 | | | 78,512 | | | | 87,196 | |
| | |
Pool # A34212, 6.00%, 4/1/2035 | | | 24,329 | | | | 26,787 | |
| | |
Pool # A89760, 4.50%, 12/1/2039 | | | 57,083 | | | | 61,819 | |
| | |
Pool # G06856, 6.00%, 5/1/2040 | | | 22,625 | | | | 25,913 | |
| | |
Pool # G07794, 5.50%, 6/1/2041 | | | 22,479 | | | | 25,457 | |
| | |
Pool # Q03516, 4.50%, 9/1/2041 | | | 59,987 | | | | 65,008 | |
| | |
Pool # G08477, 3.50%, 2/1/2042 | | | 23,462 | | | | 24,552 | |
| | |
Pool # Q06771, 3.00%, 3/1/2042 | | | 86,911 | | | | 89,870 | |
| | |
Pool # C03858, 3.50%, 4/1/2042 | | | 199,482 | | | | 208,969 | |
| | |
Pool # Q08646, 3.50%, 6/1/2042 | | | 64,609 | | | | 67,615 | |
| | |
Pool # Q13477, 3.00%, 12/1/2042 | | | 249,123 | | | | 257,595 | |
| | |
Pool # Q14321, 3.00%, 12/1/2042 | | | 69,561 | | | | 71,928 | |
| | |
Pool # C04420, 3.00%, 1/1/2043 | | | 343,031 | | | | 354,694 | |
| | |
Pool # Q15020, 4.00%, 1/1/2043 | | | 50,184 | | | | 53,655 | |
| | |
Pool # C09031, 2.50%, 2/1/2043 | | | 216,731 | | | | 218,919 | |
| | |
Pool # Q17374, 4.00%, 4/1/2043 | | | 167,890 | | | | 183,125 | |
| | |
Pool # Q20542, 3.00%, 7/1/2043 | | | 96,095 | | | | 99,360 | |
| | |
Pool # C09044, 3.50%, 7/1/2043 | | | 42,821 | | | | 44,811 | |
| | |
Pool # G08599, 3.50%, 8/1/2044 | | | 161,119 | | | | 168,529 | |
| | |
Pool # G08607, 4.50%, 9/1/2044 | | | 82,810 | | | | 89,038 | |
| | |
Pool # Q31596, 3.50%, 2/1/2045 | | | 110,042 | | | | 115,226 | |
| | |
Pool # Q33006, 3.50%, 4/1/2045 | | | 70,509 | | | | 73,629 | |
| | |
Pool # V81760, 4.00%, 5/1/2045 | | | 50,010 | | | | 52,812 | |
| | |
Pool # G08659, 3.50%, 8/1/2045 | | | 128,873 | | | | 134,568 | |
| | |
Pool # Q35460, 3.50%, 8/1/2045 | | | 257,144 | | | | 269,384 | |
| | |
Pool # Q35223, 4.00%, 8/1/2045 | | | 39,028 | | | | 40,889 | |
| | |
Pool # G60480, 4.50%, 11/1/2045 | | | 201,324 | | | | 217,121 | |
| | |
Pool # G61796, 4.50%, 12/1/2045 | | | 182,307 | | | | 197,284 | |
| | |
Pool # G08700, 4.50%, 3/1/2046 | | | 59,749 | | | | 63,872 | |
| | |
Pool # Q39844, 3.50%, 4/1/2046 | | | 345,530 | | | | 360,072 | |
| | |
Pool # Q40780, 4.00%, 4/1/2046 | | | 121,305 | | | | 127,935 | |
| | |
Pool # G61260, 4.50%, 4/1/2046 | | | 55,659 | | | | 60,270 | |
| | |
Pool # G08710, 3.00%, 6/1/2046 | | | 39,452 | | | | 40,632 | |
| | |
Pool # Q42045, 3.50%, 7/1/2046 | | | 66,577 | | | | 69,837 | |
| | |
Pool # G08720, 4.50%, 8/1/2046 | | | 320,833 | | | | 341,939 | |
| | |
Pool # G08724, 2.50%, 9/1/2046 | | | 35,358 | | | | 35,573 | |
| | |
Pool # G61730, 3.00%, 9/1/2046 | | | 302,568 | | | | 312,850 | |
| | |
Pool # G61537, 3.50%, 9/1/2046 | | | 156,192 | | | | 163,030 | |
| | |
Pool # G61235, 4.50%, 9/1/2046 | | | 67,075 | | | | 72,970 | |
| | |
Pool # G61071, 3.00%, 10/1/2046 | | | 58,276 | | | | 60,087 | |
| | |
Pool # Q43892, 4.50%, 10/1/2046 | | | 171,230 | | | | 189,218 | |
| | | | | | | | |
| INVESTMENTS | | PRINCIPAL
AMOUNT ($) | | | VALUE ($) | |
| | | | | | | | |
| | |
Pool # G08736, 2.50%, 12/1/2046 | | | 28,705 | | | | 28,880 | |
| | |
Pool # Q46336, 4.00%, 1/1/2047 | | | 21,801 | | | | 22,710 | |
| | |
Pool # G08747, 3.00%, 2/1/2047 | | | 521,880 | | | | 535,821 | |
| | |
Pool # Q46343, 4.00%, 2/1/2047 | | | 353,281 | | | | 378,392 | |
| | |
Pool # G61623, 3.00%, 4/1/2047 | | | 69,100 | | | | 71,235 | |
| | |
Pool # G08767, 4.00%, 6/1/2047 | | | 23,342 | | | | 24,492 | |
| | |
Pool # V83480, 3.50%, 10/1/2047 | | | 48,359 | | | | 50,034 | |
| | |
Pool # G08793, 4.00%, 12/1/2047 | | | 136,828 | | | | 143,270 | |
| | |
Pool # Q53751, 3.50%, 1/1/2048 | | | 535,128 | | | | 553,552 | |
| | |
Pool # G08799, 3.00%, 2/1/2048 | | | 432,874 | | | | 444,001 | |
| | |
Pool # G08800, 3.50%, 2/1/2048 | | | 227,548 | | | | 235,617 | |
| | |
Pool # G08812, 3.00%, 4/1/2048 | | | 114,283 | | | | 117,125 | |
| | |
Pool # G08823, 3.50%, 7/1/2048 | | | 397,190 | | | | 410,035 | |
| | |
Pool # Q57420, 4.50%, 7/1/2048 | | | 104,473 | | | | 110,464 | |
| | |
Pool # G08835, 3.50%, 9/1/2048 | | | 44,839 | | | | 46,207 | |
| | |
Pool # Q58632, 3.50%, 9/1/2048 | | | 39,270 | | | | 40,463 | |
| | |
Pool # G08836, 4.00%, 9/1/2048 | | | 271,583 | | | | 282,003 | |
| | |
Pool # G08837, 4.50%, 9/1/2048 | | | 25,676 | | | | 27,040 | |
| | |
Pool # G08842, 4.00%, 10/1/2048 | | | 216,156 | | | | 224,427 | |
| | |
Pool # Q59812, 4.00%, 11/1/2048 | | | 1,105 | | | | 1,151 | |
| | |
Pool # Q62573, 3.50%, 12/1/2048 | | | 418,664 | | | | 432,887 | |
| | |
Pool # G08853, 4.50%, 12/1/2048 | | | 101,373 | | | | 106,672 | |
| | |
Pool # Q62234, 4.50%, 12/1/2048 | | | 95,803 | | | | 102,782 | |
| | |
Pool # G67718, 4.00%, 1/1/2049 | | | 36,024 | | | | 38,250 | |
| | |
Pool # G08862, 4.00%, 2/1/2049 | | | 187,777 | | | | 194,723 | |
| | |
Pool # G08875, 3.00%, 3/1/2049 | | | 133,572 | | | | 136,219 | |
| | |
Pool # G08872, 4.00%, 4/1/2049 | | | 83,858 | | | | 86,912 | |
| | |
Pool # G08874, 5.00%, 4/1/2049 | | | 58,040 | | | | 62,173 | |
| | |
Pool # G08876, 3.50%, 5/1/2049 | | | 24,218 | | | | 24,907 | |
| | |
Pool # G08882, 4.00%, 6/1/2049 | | | 157,778 | | | | 164,210 | |
| | |
GNMA I, 30 Year | | | | | | | | |
| | |
Pool # 726769, 5.00%, 9/15/2039 | | | 43,930 | | | | 48,086 | |
| | |
Pool # 784660, 4.00%, 4/15/2043 | | | 13,799 | | | | 14,713 | |
| | |
Pool # AL2280, 3.00%, 3/15/2045 | | | 56,595 | | | | 58,499 | |
| | |
Pool # AL9314, 3.00%, 3/15/2045 | | | 133,871 | | | | 138,227 | |
| | |
Pool # 784664, 4.00%, 4/15/2045 | | | 59,384 | | | | 63,293 | |
| | |
Pool # AO0544, 3.00%, 8/15/2045 | | | 62,499 | | | | 64,533 | |
| | |
Pool # 627030, 3.00%, 12/15/2045 | | | 29,574 | | | | 30,573 | |
| | |
Pool # 784429, 3.00%, 8/15/2046 | | | 194,296 | | | | 201,256 | |
| | |
Pool # BE6231, 3.50%, 2/15/2048 | | | 92,920 | | | | 96,915 | |
| | |
Pool # BF1292, 4.00%, 3/15/2048 | | | 80,974 | | | | 84,839 | |
| | |
Pool # AF8266, 3.50%, 10/15/2048 | | | 99,523 | | | | 103,940 | |
| | |
GNMA II, 15 Year Pool # MA4625, 3.50%, 8/20/2032 | | | 71,331 | | | | 73,881 | |
| | |
GNMA II, 30 Year | | | | | | | | |
| | |
Pool # 3330, 4.50%, 12/20/2032 | | | 170 | | | | 182 | |
SEE NOTES TO FINANCIAL STATEMENTS.
| | | | | | |
| | | |
| 110 | | | | J.P. MORGAN EXCHANGE-TRADED FUNDS | | AUGUST 31, 2019 |
| | | | | | | | |
| INVESTMENTS | | PRINCIPAL
AMOUNT ($) | | | VALUE ($) | |
Mortgage-Backed Securities — continued | |
| | |
Pool # 711773, 3.50%, 6/20/2033 | | | 79,489 | | | | 82,558 | |
| | |
Pool # 3459, 5.50%, 10/20/2033 | | | 100,450 | | | | 113,900 | |
| | |
Pool # 4222, 6.00%, 8/20/2038 | | | 23,945 | | | | 27,407 | |
| | |
Pool # 709148, 4.50%, 2/20/2039 | | | 59,253 | | | | 62,062 | |
| | |
Pool # 4446, 4.50%, 5/20/2039 | | | 6,999 | | | | 7,542 | |
| | |
Pool # 4467, 4.00%, 6/20/2039 | | | 32,297 | | | | 34,456 | |
| | |
Pool # 4468, 4.50%, 6/20/2039 | | | 6,594 | | | | 7,109 | |
| | |
Pool # 4494, 4.00%, 7/20/2039 | | | 36,107 | | | | 38,523 | |
| | |
Pool # 4495, 4.50%, 7/20/2039 | | | 28,008 | | | | 30,186 | |
| | |
Pool # 4519, 4.50%, 8/20/2039 | | | 10,485 | | | | 11,306 | |
| | |
Pool # 4558, 4.50%, 10/20/2039 | | | 8,580 | | | | 9,254 | |
| | |
Pool # 4576, 4.00%, 11/20/2039 | | | 15,668 | | | | 16,720 | |
| | |
Pool # 4598, 4.50%, 12/20/2039 | | | 16,968 | | | | 18,320 | |
| | |
Pool # 4617, 4.50%, 1/20/2040 | | | 9,429 | | | | 10,183 | |
| | |
Pool # 4636, 4.50%, 2/20/2040 | | | 12,983 | | | | 14,025 | |
| | |
Pool # 4656, 4.00%, 3/20/2040 | | | 25,352 | | | | 27,043 | |
| | |
Pool # 4677, 4.00%, 4/20/2040 | | | 173,611 | | | | 185,169 | |
| | |
Pool # 4678, 4.50%, 4/20/2040 | | | 3,220 | | | | 3,480 | |
| | |
Pool # 4695, 4.00%, 5/20/2040 | | | 8,155 | | | | 8,701 | |
| | |
Pool # 4696, 4.50%, 5/20/2040 | | | 3,370 | | | | 3,644 | |
| | |
Pool # 4712, 4.00%, 6/20/2040 | | | 12,084 | | | | 12,894 | |
| | |
Pool # 4800, 4.00%, 9/20/2040 | | | 13,648 | | | | 14,565 | |
| | |
Pool # 4945, 4.00%, 2/20/2041 | | | 28,023 | | | | 29,925 | |
| | |
Pool # 4976, 3.50%, 3/20/2041 | | | 28,698 | | | | 30,446 | |
| | |
Pool # 4977, 4.00%, 3/20/2041 | | | 49,273 | | | | 52,623 | |
| | |
Pool # 5016, 4.00%, 4/20/2041 | | | 18,849 | | | | 20,131 | |
| | |
Pool # 5054, 4.00%, 5/20/2041 | | | 29,958 | | | | 32,007 | |
| | |
Pool # 5114, 4.00%, 7/20/2041 | | | 4,069 | | | | 4,346 | |
| | |
Pool # 779497, 3.50%, 10/20/2041 | | | 28,449 | | | | 30,061 | |
| | |
Pool # 5233, 4.00%, 11/20/2041 | | | 4,757 | | | | 5,082 | |
| | |
Pool # 5259, 4.00%, 12/20/2041 | | | 18,050 | | | | 19,282 | |
| | |
Pool # 5279, 3.50%, 1/20/2042 | | | 53,946 | | | | 57,304 | |
| | |
Pool # 5330, 3.00%, 3/20/2042 | | | 34,499 | | | | 35,864 | |
| | |
Pool # MA0220, 3.50%, 7/20/2042 | | | 23,238 | | | | 24,685 | |
| | |
Pool # 796468, 4.00%, 9/20/2042 | | | 54,777 | | | | 58,280 | |
| | |
Pool # MA0534, 3.50%, 11/20/2042 | | | 160,455 | | | | 170,444 | |
| | |
Pool # AA6040, 3.00%, 1/20/2043 | | | 145,263 | | | | 150,063 | |
| | |
Pool # AD1584, 3.00%, 1/20/2043 | | | 375,751 | | | | 387,712 | |
| | |
Pool # 783755, 3.00%, 4/20/2043 | | | 316,623 | | | | 329,149 | |
| | |
Pool # 783976, 3.50%, 4/20/2043 | | | 52,127 | | | | 55,372 | |
| | |
Pool # AG2675, 4.00%, 10/20/2043 | | | 71,202 | | | | 75,604 | |
| | |
Pool # MA1376, 4.00%, 10/20/2043 | | | 290,936 | | | | 310,737 | |
| | |
Pool # MA1679, 4.50%, 2/20/2044 | | | 11,729 | | | | 12,582 | |
| | |
Pool # MA1995, 3.50%, 6/20/2044 | | | 83,418 | | | | 87,821 | |
| | |
Pool # AI4705, 3.50%, 9/20/2044 | | | 39,402 | | | | 41,453 | |
| | |
Pool # MA2223, 3.50%, 9/20/2044 | | | 176,217 | | | | 185,092 | |
| | | | | | | | |
| INVESTMENTS | | PRINCIPAL
AMOUNT ($) | | | VALUE ($) | |
| | | | | | | | |
| | |
Pool # AI4926, 3.50%, 11/20/2044 | | | 21,099 | | | | 22,007 | |
| | |
Pool # 784026, 3.50%, 12/20/2044 | | | 273,001 | | | | 287,466 | |
| | |
Pool # AK7035, 3.50%, 2/20/2045 | | | 31,828 | | | | 33,356 | |
| | |
Pool # MA2677, 3.00%, 3/20/2045 | | | 70,152 | | | | 72,659 | |
| | |
Pool # MA2678, 3.50%, 3/20/2045 | | | 457,077 | | | | 478,101 | |
| | |
Pool # MA2754, 3.50%, 4/20/2045 | | | 22,231 | | | | 23,244 | |
| | |
Pool # 626942, 3.00%, 5/20/2045 | | | 493,249 | | | | 504,877 | |
| | |
Pool # MA2829, 5.00%, 5/20/2045 | | | 62,301 | | | | 68,481 | |
| | |
Pool # AM9881, 3.00%, 6/20/2045 | | | 27,752 | | | | 28,633 | |
| | |
Pool # MA2891, 3.00%, 6/20/2045 | | | 24,772 | | | | 25,658 | |
| | |
Pool # AN2972, 4.00%, 9/20/2045 | | | 154,027 | | | | 162,344 | |
| | |
Pool # 784623, 3.50%, 10/20/2045 | | | 138,646 | | | | 145,871 | |
| | |
Pool # AO8403, 3.50%, 10/20/2045 | | | 68,642 | | | | 71,319 | |
| | |
Pool # MA3247, 5.00%, 11/20/2045 | | | 60,031 | | | | 65,227 | |
| | |
Pool # AO9442, 3.50%, 12/20/2045 | | | 39,956 | | | | 41,999 | |
| | |
Pool # AQ6659, 3.50%, 12/20/2045 | | | 385,920 | | | | 406,241 | |
| | |
Pool # 784119, 3.00%, 2/20/2046 | | | 78,421 | | | | 81,428 | |
| | |
Pool # MA3456, 4.50%, 2/20/2046 | | | 31,625 | | | | 33,667 | |
| | |
Pool # AS2837, 3.50%, 3/20/2046 | | | 413,255 | | | | 434,849 | |
| | |
Pool # MA3523, 4.50%, 3/20/2046 | | | 31,413 | | | | 33,496 | |
| | |
Pool # MA3662, 3.00%, 5/20/2046 | | | 107,372 | | | | 111,016 | |
| | |
Pool # AS4942, 4.00%, 5/20/2046 | | | 37,282 | | | | 39,326 | |
| | |
Pool # MA3735, 3.00%, 6/20/2046 | | | 1,029,097 | | | | 1,065,590 | |
| | |
Pool # MA3736, 3.50%, 6/20/2046 | | | 313,745 | | | | 327,457 | |
| | |
Pool # 784768, 3.00%, 9/20/2046 | | | 179,043 | | | | 184,609 | |
| | |
Pool # AW0605, 4.50%, 9/20/2046 | | | 156,456 | | | | 163,434 | |
| | |
Pool # MA4002, 2.50%, 10/20/2046 | | | 136,704 | | | | 138,794 | |
| | |
Pool # AV8383, 3.00%, 10/20/2046 | | | 61,769 | | | | 63,685 | |
| | |
Pool # MA4072, 5.00%, 11/20/2046 | | | 64,438 | | | | 71,046 | |
| | |
Pool # MA4127, 3.50%, 12/20/2046 | | | 88,272 | | | | 92,132 | |
| | |
Pool # MA4260, 2.50%, 2/20/2047 | | | 157,153 | | | | 159,554 | |
| | |
Pool # 675725, 3.50%, 6/20/2047 | | | 17,115 | | | | 18,001 | |
| | |
Pool # MA4838, 4.00%, 11/20/2047 | | | 267,659 | | | | 280,333 | |
| | |
Pool # BD6940, 3.50%, 12/20/2047 | | | 1,036 | | | | 1,090 | |
| | |
Pool # 784678, 4.00%, 1/20/2048 | | | 36,329 | | | | 38,258 | |
| | |
Pool # 784474, 3.50%, 2/20/2048 | | | 282,915 | | | | 297,498 | |
| | |
Pool # MA5019, 3.50%, 2/20/2048 | | | 480,656 | | | | 500,824 | |
| | |
Pool # MA5191, 3.50%, 5/20/2048 | | | 109,686 | | | | 114,229 | |
| | |
Pool # MA5264, 4.00%, 6/20/2048 | | | 157,414 | | | | 164,024 | |
| | |
Pool # MA5265, 4.50%, 6/20/2048 | | | 61,474 | | | | 64,509 | |
| | |
Pool # MA5331, 4.50%, 7/20/2048 | | | 231,477 | | | | 242,878 | |
| | |
Pool # MA5528, 4.00%, 10/20/2048 | | | 99,897 | | | | 104,134 | |
| | |
Pool # MA5595, 4.00%, 11/20/2048 | | | 249,597 | | | | 260,457 | |
| | |
Pool # MA5651, 4.00%, 12/20/2048 | | | 184,606 | | | | 192,609 | |
| | |
Pool # MA5652, 4.50%, 12/20/2048 | | | 73,833 | | | | 77,289 | |
| | |
Pool # BK1663, 5.00%, 12/20/2048 | | | 38,221 | | | | 40,185 | |
SEE NOTES TO FINANCIAL STATEMENTS.
| | | | | | | | |
| | | |
| AUGUST 31, 2019 | | J.P. MORGAN EXCHANGE-TRADED FUNDS | | | | | 111 | |
JPMorgan U.S. Aggregate Bond ETF
SCHEDULE OF PORTFOLIO INVESTMENTS
AS OF AUGUST 31, 2019 (Unaudited) (continued)
| | | | | | | | |
| INVESTMENTS | | PRINCIPAL
AMOUNT ($) | | | VALUE ($) | |
Mortgage-Backed Securities — continued | |
| | |
Pool # MA5709, 3.50%, 1/20/2049 | | | 421,465 | | | | 439,247 | |
| | |
Pool # MA5711, 4.50%, 1/20/2049 | | | 86,541 | | | | 90,592 | |
| | |
Pool # BK3770, 5.50%, 1/20/2049 | | | 79,441 | | | | 85,736 | |
| | |
Pool # MA5762, 3.50%, 2/20/2049 | | | 627,309 | | | | 652,014 | |
| | |
Pool # MA5763, 4.00%, 2/20/2049 | | | 92,570 | | | | 96,624 | |
| | |
Pool # MA5816, 3.50%, 3/20/2049 | | | 269,594 | | | | 280,212 | |
| | |
Pool # MA5876, 4.00%, 4/20/2049 | | | 59,224 | | | | 61,836 | |
| | |
Pool # MA5931, 4.00%, 5/20/2049 | | | 89,286 | | | | 93,270 | |
| | |
Pool # MA5985, 3.50%, 6/20/2049 | | | 75,613 | | | | 78,591 | |
| | |
Pool # MA5987, 4.50%, 6/20/2049 | | | 72,564 | | | | 76,380 | |
| | |
Pool # MA5988, 5.00%, 6/20/2049 | | | 179,213 | | | | 189,460 | |
| | |
Pool # MA6089, 3.00%, 8/20/2049 | | | 98,000 | | | | 101,129 | |
| | |
Pool # MA6093, 5.00%, 8/20/2049 | | | 60,000 | | | | 63,346 | |
| | |
UMBS, 15 Year | | | | | | | | |
| | |
Pool # AC3256, 4.50%, 9/1/2024 | | | 65,735 | | | | 68,892 | |
| | |
Pool # ZK2080, 4.00%, 1/1/2025 | | | 150,725 | | | | 157,222 | |
| | |
Pool # AC7007, 4.50%, 1/1/2025 | | | 89,943 | | | | 94,597 | |
| | |
Pool # AL9580, 4.00%, 3/1/2025 | | | 56,766 | | | | 59,108 | |
| | |
Pool # 932724, 4.00%, 4/1/2025 | | | 22,716 | | | | 23,701 | |
| | |
Pool # ZK2723, 3.50%, 11/1/2025 | | | 58,088 | | | | 60,168 | |
| | |
Pool # AH4450, 3.00%, 1/1/2026 | | | 59,927 | | | | 61,500 | |
| | |
Pool # AK4047, 3.00%, 2/1/2027 | | | 52,580 | | | | 54,159 | |
| | |
Pool # AO4400, 2.50%, 7/1/2027 | | | 165,737 | | | | 168,594 | |
| | |
Pool # AB6811, 2.50%, 10/1/2027 | | | 36,727 | | | | 37,297 | |
| | |
Pool # AQ9442, 2.00%, 12/1/2027 | | | 66,960 | | | | 67,408 | |
| | |
Pool # AP6059, 2.00%, 6/1/2028 | | | 28,489 | | | | 28,679 | |
| | |
Pool # BM5381, 3.00%, 6/1/2028 | | | 214,657 | | | | 220,497 | |
| | |
Pool # FM1105, 2.50%, 6/1/2029 | | | 127,230 | | | | 129,201 | |
| | |
Pool # AS3345, 2.00%, 7/1/2029 | | | 22,778 | | | | 22,768 | |
| | |
Pool # AL7205, 3.50%, 12/1/2029 | | | 305,675 | | | | 317,922 | |
| | |
Pool # BM4202, 3.50%, 12/1/2029 | | | 186,408 | | | | 193,817 | |
| | |
Pool # MA2684, 3.00%, 7/1/2031 | | | 270,897 | | | | 278,990 | |
| | |
Pool # AL9418, 3.50%, 8/1/2031 | | | 104,931 | | | | 109,875 | |
| | |
Pool # BD5647, 2.00%, 11/1/2031 | | | 34,716 | | | | 34,649 | |
| | |
Pool # 890776, 3.50%, 11/1/2031 | | | 80,289 | | | | 83,158 | |
| | |
Pool # BM5490, 3.50%, 11/1/2031 | | | 54,869 | | | | 56,923 | |
| | |
Pool # BM4993, 3.50%, 3/1/2032 | | | 130,819 | | | | 135,770 | |
| | |
Pool # BM4741, 3.00%, 4/1/2032 | | | 39,703 | | | | 40,823 | |
| | |
Pool # BE8694, 3.50%, 7/1/2032 | | | 89,632 | | | | 93,065 | |
| | |
Pool # CA0775, 2.50%, 11/1/2032 | | | 68,599 | | | | 69,709 | |
| | |
Pool # MA3188, 3.00%, 11/1/2032 | | | 70,238 | | | | 72,153 | |
| | |
Pool # BH7081, 2.50%, 12/1/2032 | | | 124,573 | | | | 126,277 | |
| | |
Pool # MA3547, 3.00%, 12/1/2033 | | | 32,208 | | | | 33,021 | |
| | |
Pool # BD9105, 4.00%, 1/1/2034 | | | 137,100 | | | | 143,834 | |
| | |
Pool # MA3764, 2.50%, 9/1/2034 | | | 40,000 | | | | 40,531 | |
| | | | | | | | |
| INVESTMENTS | | PRINCIPAL
AMOUNT ($) | | | VALUE ($) | |
| | | | | | | | |
| | |
UMBS, 20 Year | | | | | | | | |
| | |
Pool # MA0885, 3.50%, 10/1/2031 | | | 78,748 | | | | 82,084 | |
| | |
Pool # AL6159, 4.50%, 1/1/2032 | | | 117,573 | | | | 125,982 | |
| | |
Pool # ZJ9491, 3.50%, 12/1/2032 | | | 35,750 | | | | 37,052 | |
| | |
Pool # MA2079, 4.00%, 11/1/2034 | | | 37,283 | | | | 39,497 | |
| | |
Pool # MA2287, 3.00%, 6/1/2035 | | | 99,432 | | | | 102,327 | |
| | |
Pool # AL6970, 3.50%, 7/1/2035 | | | 74,308 | | | | 77,456 | |
| | |
Pool # MA2508, 4.00%, 1/1/2036 | | | 135,035 | | | | 143,063 | |
| | |
Pool # MA3519, 4.00%, 11/1/2038 | | | 64,269 | | | | 67,347 | |
| | |
Pool # MA3683, 3.50%, 6/1/2039 | | | 138,049 | | | | 143,129 | |
| | |
Pool # RB5001, 3.50%, 7/1/2039 | | | 89,767 | | | | 93,113 | |
| | |
Pool # FM1295, 3.50%, 8/1/2039 | | | 80,452 | | | | 83,573 | |
| | |
UMBS, 30 Year | | | | | | | | |
| | |
Pool # 725232, 5.00%, 3/1/2034 | | | 22,360 | | | | 24,887 | |
| | |
Pool # 790003, 6.00%, 8/1/2034 | | | 24,368 | | | | 27,806 | |
| | |
Pool # 735503, 6.00%, 4/1/2035 | | | 77,048 | | | | 88,239 | |
| | |
Pool # AB0284, 6.00%, 2/1/2037 | | | 88,892 | | | | 101,790 | |
| | |
Pool # BH7907, 6.50%, 12/1/2037 | | | 32,946 | | | | 37,916 | |
| | |
Pool # AU7519, 3.50%, 9/1/2038 | | | 101,233 | | | | 104,732 | |
| | |
Pool # BC1637, 5.00%, 6/1/2039 | | | 93,858 | | | | 104,064 | |
| | |
Pool # 190399, 5.50%, 11/1/2039 | | | 183,503 | | | | 206,548 | |
| | |
Pool # AD0700, 5.50%, 1/1/2040 | | | 103,247 | | | | 116,092 | |
| | |
Pool # AB1143, 4.50%, 6/1/2040 | | | 171,210 | | | | 189,675 | |
| | |
Pool # AD5479, 5.00%, 6/1/2040 | | | 69,867 | | | | 76,968 | |
| | |
Pool # AB1259, 5.00%, 7/1/2040 | | | 89,609 | | | | 99,046 | |
| | |
Pool # BM3090, 3.50%, 2/1/2041 | | | 438,743 | | | | 458,785 | |
| | |
Pool # AL0241, 4.00%, 4/1/2041 | | | 132,671 | | | | 141,767 | |
| | |
Pool # AK2386, 3.50%, 2/1/2042 | | | 85,673 | | | | 89,612 | |
| | |
Pool # AK7028, 4.00%, 4/1/2042 | | | 161,159 | | | | 172,219 | |
| | |
Pool # AO4134, 3.50%, 6/1/2042 | | | 28,516 | �� | | | 29,862 | |
| | |
Pool # AO8694, 4.50%, 7/1/2042 | | | 39,472 | | | | 41,934 | |
| | |
Pool # ZA6807, 4.50%, 8/1/2042 | | | 119,362 | | | | 125,582 | |
| | |
Pool # AB6632, 3.50%, 10/1/2042 | | | 484,408 | | | | 506,686 | |
| | |
Pool # AB7580, 3.00%, 1/1/2043 | | | 358,509 | | | | 370,538 | |
| | |
Pool # AQ1104, 3.00%, 1/1/2043 | | | 63,406 | | | | 65,452 | |
| | |
Pool # AR4239, 3.00%, 2/1/2043 | | | 79,768 | | | | 82,424 | |
| | |
Pool # AR2315, 3.50%, 2/1/2043 | | | 117,394 | | | | 122,936 | |
| | |
Pool # AR6770, 4.00%, 3/1/2043 | | | 32,207 | | | | 34,458 | |
| | |
Pool # AT8912, 3.00%, 7/1/2043 | | | 274,786 | | | | 284,007 | |
| | |
Pool # AU1629, 3.00%, 7/1/2043 | | | 197,676 | | | | 204,401 | |
| | |
Pool # AU3735, 3.00%, 8/1/2043 | | | 280,885 | | | | 290,237 | |
| | |
Pool # BM3704, 3.00%, 9/1/2043 | | | 84,423 | | | | 86,957 | |
| | |
Pool # AU4256, 3.50%, 9/1/2043 | | | 69,864 | | | | 73,122 | |
| | |
Pool # BM4635, 2.50%, 10/1/2043 | | | 324,217 | | | | 327,324 | |
| | |
Pool # AS1121, 4.00%, 11/1/2043 | | | 119,881 | | | | 127,143 | |
| | |
Pool # AL7696, 3.00%, 12/1/2043 | | | 132,181 | | | | 136,611 | |
| | |
Pool # AS1557, 4.00%, 1/1/2044 | | | 120,454 | | | | 128,020 | |
SEE NOTES TO FINANCIAL STATEMENTS.
| | | | | | |
| | | |
| 112 | | | | J.P. MORGAN EXCHANGE-TRADED FUNDS | | AUGUST 31, 2019 |
| | | | | | | | |
| INVESTMENTS | | PRINCIPAL
AMOUNT ($) | | | VALUE ($) | |
Mortgage-Backed Securities — continued | |
| | |
Pool # BM5365, 4.00%, 3/1/2044 | | | 183,471 | | | | 195,675 | |
| | |
Pool # AS2700, 4.00%, 6/1/2044 | | | 113,064 | | | | 120,950 | |
| | |
Pool # AS2947, 4.00%, 7/1/2044 | | | 113,030 | | | | 120,064 | |
| | |
Pool # AL9072, 5.00%, 7/1/2044 | | | 168,713 | | | | 185,003 | |
| | |
Pool # AL9569, 5.00%, 8/1/2044 | | | 379,463 | | | | 418,300 | |
| | |
Pool # BM4620, 3.00%, 10/1/2044 | | | 209,951 | | | | 217,009 | |
| | |
Pool # AX3072, 3.50%, 10/1/2044 | | | 47,728 | | | | 49,831 | |
| | |
Pool # AX2491, 4.00%, 10/1/2044 | | | 24,304 | | | | 25,763 | |
| | |
Pool # AS3710, 4.00%, 11/1/2044 | | | 74,253 | | | | 78,906 | |
| | |
Pool # AS4012, 3.50%, 12/1/2044 | | | 143,052 | | | | 150,242 | |
| | |
Pool # BM5171, 4.00%, 1/1/2045 | | | 122,733 | | | | 130,968 | |
| | |
Pool # AS4402, 3.50%, 2/1/2045 | | | 140,608 | | | | 148,150 | |
| | |
Pool # BM3398, 3.50%, 4/1/2045 | | | 29,159 | | | | 30,621 | |
| | |
Pool # AZ1803, 4.50%, 7/1/2045 | | | 39,852 | | | | 42,338 | |
| | |
Pool # AS5570, 3.50%, 8/1/2045 | | | 136,512 | | | | 142,302 | |
| | |
Pool # AS5778, 3.50%, 9/1/2045 | | | 53,760 | | | | 56,102 | |
| | |
Pool # AS5851, 4.50%, 9/1/2045 | | | 49,275 | | | | 52,765 | |
| | |
Pool # AS6196, 3.50%, 11/1/2045 | | | 71,728 | | | | 75,018 | |
| | |
Pool # AS6686, 4.50%, 1/1/2046 | | | 34,837 | | | | 37,385 | |
| | |
Pool # AS6654, 3.50%, 2/1/2046 | | | 49,298 | | | | 51,413 | |
| | |
Pool # AS6613, 4.00%, 2/1/2046 | | | 117,967 | | | | 124,326 | |
| | |
Pool # AL9128, 4.50%, 2/1/2046 | | | 54,684 | | | | 59,210 | |
| | |
Pool # AS6795, 4.00%, 3/1/2046 | | | 70,938 | | | | 74,758 | |
| | |
Pool # ZA4628, 4.00%, 3/1/2046 | | | 98,249 | | | | 105,112 | |
| | |
Pool # FM1224, 3.50%, 4/1/2046 | | | 55,585 | | | | 58,118 | |
| | |
Pool # BC1863, 2.50%, 5/1/2046 | | | 31,040 | | | | 31,213 | |
| | |
Pool # AL8936, 4.50%, 5/1/2046 | | | 42,311 | | | | 45,425 | |
| | |
Pool # AS7376, 3.00%, 6/1/2046 | | | 636,340 | | | | 654,881 | |
| | |
Pool # BM5587, 4.00%, 6/1/2046 | | | 126,683 | | | | 134,064 | |
| | |
Pool # BE5039, 3.50%, 7/1/2046 | | | 121,792 | | | | 127,915 | |
| | |
Pool # BD2357, 4.50%, 7/1/2046 | | | 117,868 | | | | 125,266 | |
| | |
Pool # ZM1621, 4.50%, 9/1/2046 | | | 229,232 | | | | 255,806 | |
| | |
Pool # MA2806, 3.00%, 11/1/2046 | | | 499,209 | | | | 513,787 | |
| | |
Pool # BM4990, 2.50%, 1/1/2047 | | | 24,482 | | | | 24,709 | |
| | |
Pool # AS8695, 4.00%, 1/1/2047 | | | 82,940 | | | | 89,003 | |
| | |
Pool # AL9916, 4.00%, 2/1/2047 | | | 166,482 | | | | 175,189 | |
| | |
Pool # AS8823, 4.00%, 2/1/2047 | | | 203,779 | | | | 213,847 | |
| | |
Pool # BM5955, 4.00%, 2/1/2047 | | | 98,023 | | | | 104,107 | |
| | |
Pool # MA2920, 3.00%, 3/1/2047 | | | 20,782 | | | | 21,356 | |
| | |
Pool # AS8966, 4.00%, 3/1/2047 | | | 438,497 | | | | 461,691 | |
| | |
Pool # AS9313, 4.00%, 3/1/2047 | | | 51,869 | | | | 55,035 | |
| | |
Pool # AS9480, 4.50%, 4/1/2047 | | | 98,742 | | | | 107,370 | |
| | |
Pool # BM5220, 3.50%, 5/1/2047 | | | 87,663 | | | | 91,105 | |
| | |
Pool # AS9946, 3.50%, 7/1/2047 | | | 374,104 | | | | 390,842 | |
| | |
Pool # AS9988, 4.50%, 7/1/2047 | | | 100,045 | | | | 106,181 | |
| | |
Pool # BH7375, 3.50%, 8/1/2047 | | | 219,307 | | | | 227,368 | |
| | | | | | | | |
| INVESTMENTS | | PRINCIPAL
AMOUNT ($) | | | VALUE ($) | |
| | | | | | | | |
| | |
Pool # CA0553, 4.00%, 8/1/2047 | | | 291,319 | | | | 305,168 | |
| | |
Pool # CA0850, 3.00%, 9/1/2047 | | | 144,151 | | | | 147,941 | |
| | |
Pool # BH9394, 3.50%, 10/1/2047 | | | 287,296 | | | | 297,675 | |
| | |
Pool # BH9392, 3.50%, 11/1/2047 | | | 78,657 | | | | 81,148 | |
| | |
Pool # MA3237, 3.00%, 1/1/2048 | | | 853,485 | | | | 875,395 | |
| | |
Pool # ZS4750, 3.00%, 1/1/2048 | | | 99,955 | | | | 102,560 | |
| | |
Pool # BM3475, 4.00%, 1/1/2048 | | | 64,311 | | | | 69,365 | |
| | |
Pool # BJ5910, 3.50%, 2/1/2048 | | | 293,352 | | | | 311,401 | |
| | |
Pool # MA3276, 3.50%, 2/1/2048 | | | 234,530 | | | | 242,683 | |
| | |
Pool # MA3305, 3.50%, 3/1/2048 | | | 25,932 | | | | 26,859 | |
| | |
Pool # CA2687, 3.00%, 5/1/2048 | | | 48,053 | | | | 49,692 | |
| | |
Pool # BM4054, 4.00%, 5/1/2048 | | | 226,758 | | | | 240,866 | |
| | |
Pool # MA3425, 3.00%, 6/1/2048 | | | 122,258 | | | | 125,044 | |
| | |
Pool # BM4757, 3.50%, 7/1/2048 | | | 121,252 | | | | 126,271 | |
| | |
Pool # MA3414, 3.50%, 7/1/2048 | | | 70,126 | | | | 72,250 | |
| | |
Pool # ZS4777, 3.50%, 7/1/2048 | | | 34,105 | | | | 35,190 | |
| | |
Pool # MA3495, 4.00%, 10/1/2048 | | | 236,930 | | | | 246,071 | |
| | |
Pool # BM5950, 3.00%, 11/1/2048 | | | 298,164 | | | | 307,213 | |
| | |
Pool # MA3521, 4.00%, 11/1/2048 | | | 160,321 | | | | 166,690 | |
| | |
Pool # MA3536, 4.00%, 12/1/2048 | | | 316,296 | | | | 328,447 | |
| | |
Pool # MA3577, 3.00%, 1/1/2049 | | | 72,060 | | | | 73,455 | |
| | |
Pool # BK9581, 3.50%, 1/1/2049 | | | 140,112 | | | | 147,160 | |
| | |
Pool # MA3603, 3.00%, 2/1/2049 | | | 39,173 | | | | 39,977 | |
| | |
Pool # MA3592, 4.00%, 2/1/2049 | | | 415,253 | | | | 430,181 | |
| | |
Pool # QA0443, 4.00%, 2/1/2049 | | | 179,369 | | | | 188,155 | |
| | |
Pool # MA3593, 4.50%, 2/1/2049 | | | 410,412 | | | | 431,379 | |
| | |
Pool # BN4380, 3.00%, 3/1/2049 | | | 88,162 | | | | 89,868 | |
| | |
Pool # MA3614, 3.50%, 3/1/2049 | | | 36,615 | | | | 37,617 | |
| | |
Pool # MA3637, 3.50%, 4/1/2049 | | | 154,801 | | | | 159,047 | |
| | |
Pool # MA3638, 4.00%, 4/1/2049 | | | 132,458 | | | | 137,399 | |
| | |
Pool # ZT1864, 4.00%, 4/1/2049 | | | 28,322 | | | | 29,340 | |
| | |
Pool # BN5418, 4.50%, 4/1/2049 | | | 59,301 | | | | 63,747 | |
| | |
Pool # MA3639, 4.50%, 4/1/2049 | | | 28,166 | | | | 29,654 | |
| | |
Pool # ZT1951, 3.50%, 5/1/2049 | | | 64,903 | | | | 66,717 | |
| | |
Pool # ZT1952, 4.00%, 5/1/2049 | | | 410,879 | | | | 426,470 | |
| | |
Pool # CA3528, 5.00%, 5/1/2049 | | | 59,450 | | | | 63,701 | |
| | |
Pool # ZT2086, 3.50%, 6/1/2049 (a) | | | 99,878 | | | | 102,654 | |
| | |
Pool # MA3687, 4.00%, 6/1/2049 | | | 195,934 | | | | 203,719 | |
| | |
Pool # FM1198, 3.00%, 7/1/2049 | | | 99,794 | | | | 102,519 | |
| | |
Pool # BO1169, 3.50%, 7/1/2049 | | | 246,913 | | | | 254,188 | |
| | |
Pool # MA3692, 3.50%, 7/1/2049 | | | 197,858 | | | | 203,759 | |
| | |
Pool # BO1766, 4.50%, 7/1/2049 | | | 290,257 | | | | 306,356 | |
| | |
Pool # QA1997, 3.00%, 8/1/2049 | | | 75,000 | | | | 76,455 | |
| | |
Pool # SD8005, 3.50%, 8/1/2049 | | | 238,892 | | | | 245,902 | |
| | |
Pool # MA3747, 4.50%, 8/1/2049 | | | 47,701 | | | | 50,303 | |
| | | | | | | | |
| | |
Total Mortgage-Backed Securities (Cost $49,391,962) | | | | | | | 50,656,937 | |
| | | | | | | | |
SEE NOTES TO FINANCIAL STATEMENTS.
| | | | | | | | |
| | | |
| AUGUST 31, 2019 | | J.P. MORGAN EXCHANGE-TRADED FUNDS | | | | | 113 | |
JPMorgan U.S. Aggregate Bond ETF
SCHEDULE OF PORTFOLIO INVESTMENTS
AS OF AUGUST 31, 2019 (Unaudited) (continued)
| | | | | | | | |
| INVESTMENTS | | PRINCIPAL
AMOUNT ($) | | | VALUE ($) | |
Corporate Bonds ��� 25.7% | |
|
Aerospace & Defense — 0.7% | |
| | |
Boeing Co. (The) | | | | | | | | |
| | |
1.65%, 10/30/2020 | | | 101,000 | | | | 100,729 | |
| | |
2.80%, 3/1/2023 | | | 26,000 | | | | 26,655 | |
| | |
1.88%, 6/15/2023 | | | 54,000 | | | | 53,735 | |
| | |
2.80%, 3/1/2024 | | | 100,000 | | | | 103,156 | |
| | |
2.60%, 10/30/2025 | | | 47,000 | | | | 48,128 | |
| | |
3.25%, 3/1/2028 | | | 100,000 | | | | 106,962 | |
| | |
3.45%, 11/1/2028 | | | 50,000 | | | | 54,217 | |
| | |
3.55%, 3/1/2038 | | | 105,000 | | | | 112,202 | |
| | |
3.50%, 3/1/2039 | | | 97,000 | | | | 103,675 | |
| | |
6.88%, 3/15/2039 | | | 30,000 | | | | 45,399 | |
| | |
5.88%, 2/15/2040 | | | 40,000 | | | | 55,954 | |
| | |
3.38%, 6/15/2046 | | | 52,000 | | | | 53,316 | |
| | |
3.83%, 3/1/2059 | | | 97,000 | | | | 105,921 | |
| | |
Hexcel Corp. 3.95%, 2/15/2027 | | | 125,000 | | | | 132,293 | |
| | |
Huntington Ingalls Industries, Inc. 3.48%, 12/1/2027 | | | 79,000 | | | | 83,210 | |
| | |
Spirit AeroSystems, Inc. | | | | | | | | |
| | |
3.95%, 6/15/2023 | | | 33,000 | | | | 34,296 | |
| | |
3.85%, 6/15/2026 | | | 50,000 | | | | 52,469 | |
| | |
4.60%, 6/15/2028 | | | 71,000 | | | | 78,023 | |
| | | | | | | | |
| | |
| | | | | | | 1,350,340 | |
| | | | | | | | |
|
Auto Components — 0.1% | |
| | |
Lear Corp. | | | | | | | | |
| | |
5.25%, 1/15/2025 | | | 151,000 | | | | 156,287 | |
| | |
4.25%, 5/15/2029 | | | 33,000 | | | | 34,210 | |
| | | | | | | | |
| | |
| | | | | | | 190,497 | |
| | | | | | | | |
|
Banks — 3.2% | |
| | |
Bancolombia SA (Colombia) 5.95%, 6/3/2021 | | | 400,000 | | | | 422,056 | |
| | |
Bank of Nova Scotia (The) (Canada) 1.88%, 4/26/2021 | | | 25,000 | | | | 25,011 | |
| | |
BankUnited, Inc. 4.88%, 11/17/2025 | | | 135,000 | | | | 148,543 | |
| | |
Canadian Imperial Bank of Commerce (Canada) | | | | | | | | |
| | |
2.70%, 2/2/2021 | | | 68,000 | | | | 68,700 | |
| | |
2.55%, 6/16/2022 | | | 123,000 | | | | 125,162 | |
| | |
(ICE LIBOR USD 3 Month + 0.79%), 2.61%, 7/22/2023 (b) | | | 28,000 | | | | 28,298 | |
| | |
3.50%, 9/13/2023 | | | 317,000 | | | | 335,493 | |
| | |
3.10%, 4/2/2024 | | | 45,000 | | | | 46,697 | |
| | |
Comerica, Inc. 3.70%, 7/31/2023 | | | 201,000 | | | | 212,502 | |
| | |
Commonwealth Bank of Australia (Australia) 2.55%, 3/15/2021 | | | 250,000 | | | | 252,184 | |
| | | | | | | | |
| INVESTMENTS | | PRINCIPAL
AMOUNT ($) | | | VALUE ($) | |
| | | | | | | | |
|
Banks — continued | |
| | |
Discover Bank | | | | | | | | |
| | |
4.20%, 8/8/2023 | | | 250,000 | | | | 268,442 | |
| | |
3.45%, 7/27/2026 | | | 90,000 | | | | 94,044 | |
| | |
4.65%, 9/13/2028 | | | 90,000 | | | | 101,813 | |
| | |
First Republic Bank 2.50%, 6/6/2022 | | | 100,000 | | | | 100,772 | |
| | |
Huntington Bancshares, Inc. | | | | | | | | |
| | |
2.30%, 1/14/2022 | | | 136,000 | | | | 136,641 | |
| | |
4.00%, 5/15/2025 | | | 147,000 | | | | 158,835 | |
| | |
Kreditanstalt fuer Wiederaufbau (Germany) | | | | | | | | |
| | |
2.63%, 4/12/2021 | | | 145,000 | | | | 147,288 | |
| | |
1.50%, 6/15/2021 | | | 40,000 | | | | 39,930 | |
| | |
1.75%, 9/15/2021 | | | 30,000 | | | | 30,116 | |
| | |
2.50%, 2/15/2022 | | | 25,000 | | | | 25,597 | |
| | |
2.13%, 3/7/2022 | | | 100,000 | | | | 101,542 | |
| | |
2.63%, 2/28/2024 | | | 36,000 | | | | 37,793 | |
| | |
2.50%, 11/20/2024 | | | 60,000 | | | | 63,091 | |
| | |
2.00%, 5/2/2025 | | | 183,000 | | | | 188,047 | |
| | |
2.88%, 4/3/2028 | | | 118,000 | | | | 130,512 | |
| | |
Landesbank Baden-Wuerttemberg (Germany) 7.63%, 2/1/2023 | | | 25,000 | | | | 29,495 | |
| | |
Landwirtschaftliche Rentenbank (Germany) | | | | | | | | |
| | |
3.13%, 11/14/2023 | | | 31,000 | | | | 33,033 | |
| | |
2.00%, 1/13/2025 | | | 25,000 | | | | 25,652 | |
| | |
Lloyds Banking Group plc (United Kingdom) 3.75%, 1/11/2027 | | | 518,000 | | | | 540,874 | |
| | |
(ICE LIBOR USD 3 Month + 1.21%), 3.57%, 11/7/2028 (b) | | | 40,000 | | | | 40,939 | |
| | |
National Bank of Canada (Canada) 2.20%, 11/2/2020 | | | 250,000 | | | | 250,718 | |
| | |
RBC USA Holdco Corp. 5.25%, 9/15/2020 | | | 25,000 | | | | 25,800 | |
| | |
Royal Bank of Canada (Canada) | | | | | | | | |
| | |
2.50%, 1/19/2021 | | | 70,000 | | | | 70,583 | |
| | |
2.30%, 3/22/2021 | | | 25,000 | | | | 25,182 | |
| | |
2.75%, 2/1/2022 | | | 402,000 | | | | 410,599 | |
| | |
3.70%, 10/5/2023 | | | 139,000 | | | | 147,937 | |
| | |
2.55%, 7/16/2024 | | | 125,000 | | | | 127,428 | |
| | |
SunTrust Bank
2.45%, 8/1/2022 | | | 127,000 | | | | 128,492 | |
| | |
(ICE LIBOR USD 3 Month + 0.59%), 3.50%, 8/2/2022 (b) | | | 121,000 | | | | 123,865 | |
| | |
3.00%, 2/2/2023 | | | 101,000 | | | | 103,922 | |
| | |
3.20%, 4/1/2024 | | | 127,000 | | | | 133,178 | |
| | |
4.05%, 11/3/2025 | | | 113,000 | | | | 124,049 | |
| | |
SunTrust Banks, Inc. | | | | | | | | |
| | |
2.90%, 3/3/2021 | | | 108,000 | | | | 109,230 | |
| | |
4.00%, 5/1/2025 | | | 173,000 | | | | 188,516 | |
SEE NOTES TO FINANCIAL STATEMENTS.
| | | | | | |
| | | |
| 114 | | | | J.P. MORGAN EXCHANGE-TRADED FUNDS | | AUGUST 31, 2019 |
| | | | | | | | |
| INVESTMENTS | | PRINCIPAL
AMOUNT ($) | | | VALUE ($) | |
Corporate Bonds — continued | |
|
Banks — continued | |
| | |
SVB Financial Group 5.38%, 9/15/2020 | | | 135,000 | | | | 139,119 | |
| | |
Synovus Financial Corp. 3.13%, 11/1/2022 | | | 90,000 | | | | 90,180 | |
| | | | | | | | |
| | |
| | | | | | | 6,157,900 | |
| | | | | | | | |
|
Beverages — 0.2% | |
| | |
Diageo Capital plc (United Kingdom) 3.88%, 4/29/2043 | | | 124,000 | | | | 143,402 | |
| | |
Diageo Investment Corp. (United Kingdom) 4.25%, 5/11/2042 | | | 200,000 | | | | 239,773 | |
| | | | | | | | |
| | |
| | | | | | | 383,175 | |
| | | | | | | | |
|
Biotechnology — 0.1% | |
| | |
Biogen, Inc. 4.05%, 9/15/2025 | | | 100,000 | | | | 108,594 | |
| | | | | | | | |
|
Building Products — 0.0% (c) | |
| | |
Lennox International, Inc. 3.00%, 11/15/2023 | | | 25,000 | | | | 25,337 | |
| | | | | | | | |
|
Capital Markets — 2.9% | |
| | |
Affiliated Managers Group, Inc. | | | | | | | | |
| | |
4.25%, 2/15/2024 | | | 53,000 | | | | 56,984 | |
| | |
3.50%, 8/1/2025 | | | 50,000 | | | | 52,127 | |
| | |
Ameriprise Financial, Inc. | | | | | | | | |
| | |
3.00%, 3/22/2022 | | | 28,000 | | | | 28,661 | |
| | |
4.00%, 10/15/2023 | | | 55,000 | | | | 59,113 | |
| | |
3.70%, 10/15/2024 | | | 30,000 | | | | 32,291 | |
| | |
2.88%, 9/15/2026 | | | 217,000 | | | | 224,774 | |
| | |
Apollo Investment Corp. 5.25%, 3/3/2025 | | | 40,000 | | | | 40,934 | |
| | |
BGC Partners, Inc. 5.38%, 7/24/2023 | | | 89,000 | | | | 95,882 | |
| | |
BlackRock, Inc. | | | | | | | | |
| | |
4.25%, 5/24/2021 | | | 89,000 | | | | 92,635 | |
| | |
3.38%, 6/1/2022 | | | 163,000 | | | | 170,193 | |
| | |
3.50%, 3/18/2024 | | | 95,000 | | | | 102,278 | |
| | |
3.20%, 3/15/2027 | | | 480,000 | | | | 514,377 | |
| | |
Brookfield Finance, Inc. (Canada) | | | | | | | | |
| | |
3.90%, 1/25/2028 | | | 53,000 | | | | 56,052 | |
| | |
4.70%, 9/20/2047 | | | 417,000 | | | | 471,549 | |
| | |
Cboe Global Markets, Inc. 3.65%, 1/12/2027 | | | 38,000 | | | | 41,101 | |
| | |
CME Group, Inc. | | | | | | | | |
| | |
3.75%, 6/15/2028 | | | 141,000 | | | | 158,928 | |
| | |
5.30%, 9/15/2043 | | | 149,000 | | | | 207,130 | |
| | |
4.15%, 6/15/2048 | | | 57,000 | | | | 69,594 | |
| | |
E*TRADE Financial Corp. 2.95%, 8/24/2022 | | | 120,000 | | | | 122,473 | |
| | |
Eaton Vance Corp. 3.63%, 6/15/2023 | | | 78,000 | | | | 81,896 | |
| | | | | | | | |
| INVESTMENTS | | PRINCIPAL
AMOUNT ($) | | | VALUE ($) | |
| | | | | | | | |
|
Capital Markets — continued | |
| | |
Intercontinental Exchange, Inc. | | | | | | | | |
| | |
2.75%, 12/1/2020 | | | 156,000 | | | | 157,116 | |
| | |
2.35%, 9/15/2022 | | | 146,000 | | | | 147,663 | |
| | |
4.00%, 10/15/2023 | | | 125,000 | | | | 134,398 | |
| | |
3.10%, 9/15/2027 | | | 75,000 | | | | 79,484 | |
| | |
3.75%, 9/21/2028 | | | 100,000 | | | | 111,274 | |
| | |
4.25%, 9/21/2048 | | | 101,000 | | | | 124,355 | |
| | |
Janus Capital Group, Inc. (United Kingdom) 4.88%, 8/1/2025 | | | 25,000 | | | | 27,600 | |
| | |
Lazard Group LLC | | | | | | | | |
| | |
3.75%, 2/13/2025 | | | 253,000 | | | | 265,892 | |
| | |
3.63%, 3/1/2027 | | | 265,000 | | | | 275,689 | |
| | |
4.50%, 9/19/2028 | | | 100,000 | | | | 110,305 | |
| | |
Nasdaq, Inc. | | | | | | | | |
| | |
4.25%, 6/1/2024 | | | 118,000 | | | | 128,532 | |
| | |
3.85%, 6/30/2026 | | | 154,000 | | | | 167,097 | |
| | |
S&P Global, Inc. | | | | | | | | |
| | |
4.00%, 6/15/2025 | | | 25,000 | | | | 27,512 | |
| | |
2.95%, 1/22/2027 | | | 249,000 | | | | 261,487 | |
| | |
4.50%, 5/15/2048 | | | 200,000 | | | | 254,085 | |
| | |
Stifel Financial Corp. | | | | | | | | |
| | |
3.50%, 12/1/2020 | | | 75,000 | | | | 75,975 | |
| | |
4.25%, 7/18/2024 | | | 26,000 | | | | 27,528 | |
| | |
TD Ameritrade Holding Corp. | | | | | | | | |
| | |
2.95%, 4/1/2022 | | | 128,000 | | | | 131,069 | |
| | |
3.75%, 4/1/2024 | | | 144,000 | | | | 154,041 | |
| | |
3.63%, 4/1/2025 | | | 50,000 | | | | 53,514 | |
| | |
3.30%, 4/1/2027 | | | 25,000 | | | | 26,527 | |
| | | | | | | | |
| | |
| | | | | | | 5,420,115 | |
| | | | | | | | |
|
Chemicals — 0.6% | |
| | |
Ecolab, Inc. | | | | | | | | |
| | |
4.35%, 12/8/2021 | | | 25,000 | | | | 26,285 | |
| | |
2.38%, 8/10/2022 | | | 26,000 | | | | 26,260 | |
| | |
3.25%, 1/14/2023 | | | 53,000 | | | | 55,071 | |
| | |
2.70%, 11/1/2026 | | | 35,000 | | | | 36,299 | |
| | |
5.50%, 12/8/2041 | | | 35,000 | | | | 47,670 | |
| | |
3.95%, 12/1/2047 | | | 291,000 | | | | 342,161 | |
| | |
LYB International Finance BV 5.25%, 7/15/2043 | | | 75,000 | | | | 86,636 | |
| | |
NewMarket Corp. 4.10%, 12/15/2022 | | | 50,000 | | | | 52,293 | |
| | |
SASOL Financing USA LLC (South Africa) 6.50%, 9/27/2028 | | | 335,000 | | | | 371,745 | |
| | |
Syngenta Finance NV (Switzerland) 3.13%, 3/28/2022 | | | 25,000 | | | | 25,291 | |
| | | | | | | | |
| | |
| | | | | | | 1,069,711 | |
| | | | | | | | |
SEE NOTES TO FINANCIAL STATEMENTS.
| | | | | | | | |
| | | |
| AUGUST 31, 2019 | | J.P. MORGAN EXCHANGE-TRADED FUNDS | | | | | 115 | |
JPMorgan U.S. Aggregate Bond ETF
SCHEDULE OF PORTFOLIO INVESTMENTS
AS OF AUGUST 31, 2019 (Unaudited) (continued)
| | | | | | | | |
| INVESTMENTS | | PRINCIPAL
AMOUNT ($) | | | VALUE ($) | |
Corporate Bonds — continued | |
|
Commercial Services & Supplies — 0.1% | |
| | |
RELX Capital, Inc. (United Kingdom) | | | | | | | | |
| | |
3.50%, 3/16/2023 | | | 96,000 | | | | 100,056 | |
| | |
4.00%, 3/18/2029 | | | 63,000 | | | | 69,477 | |
| | | | | | | | |
| | |
| | | | | | | 169,533 | |
| | | | | | | | |
|
Communications Equipment — 0.2% | |
| | |
Motorola Solutions, Inc. | | | | | | | | |
| | |
3.75%, 5/15/2022 | | | 42,000 | | | | 43,442 | |
| | |
3.50%, 3/1/2023 | | | 142,000 | | | | 146,174 | |
| | |
4.00%, 9/1/2024 | | | 95,000 | | | | 101,093 | |
| | |
4.60%, 2/23/2028 | | | 40,000 | | | | 43,367 | |
| | |
5.50%, 9/1/2044 | | | 87,000 | | | | 94,209 | |
| | | | | | | | |
| | |
| | | | | | | 428,285 | |
| | | | | | | | |
|
Consumer Finance — 1.7% | |
| | |
American Express Co. | | | | | | | | |
| | |
3.38%, 5/17/2021 | | | 40,000 | | | | 40,869 | |
| | |
2.50%, 8/1/2022 | | | 40,000 | | | | 40,562 | |
| | |
2.65%, 12/2/2022 | | | 82,000 | | | | 83,585 | |
| | |
3.40%, 2/27/2023 | | | 40,000 | | | | 41,787 | |
| | |
3.00%, 10/30/2024 | | | 28,000 | | | | 29,059 | |
| | |
4.05%, 12/3/2042 | | | 263,000 | | | | 313,646 | |
| | |
American Express Credit Corp. | | | | | | | | |
| | |
2.70%, 3/3/2022 | | | 95,000 | | | | 96,891 | |
| | |
3.30%, 5/3/2027 | | | 300,000 | | | | 324,186 | |
| | |
Capital One Financial Corp. | | | | | | | | |
| | |
2.40%, 10/30/2020 | | | 334,000 | | | | 334,946 | |
| | |
4.75%, 7/15/2021 | | | 30,000 | | | | 31,363 | |
| | |
3.20%, 1/30/2023 | | | 220,000 | | | | 226,680 | |
| | |
3.50%, 6/15/2023 | | | 40,000 | | | | 41,776 | |
| | |
3.75%, 4/24/2024 | | | 58,000 | | | | 61,451 | |
| | |
3.30%, 10/30/2024 | | | 125,000 | | | | 129,576 | |
| | |
3.80%, 1/31/2028 | | | 100,000 | | | | 106,613 | |
| | |
Discover Financial Services | | | | | | | | |
| | |
3.85%, 11/21/2022 | | | 230,000 | | | | 241,250 | |
| | |
3.95%, 11/6/2024 | | | 27,000 | | | | 28,783 | |
| | |
3.75%, 3/4/2025 | | | 104,000 | | | | 109,495 | |
| | |
4.50%, 1/30/2026 | | | 20,000 | | | | 22,088 | |
| | |
4.10%, 2/9/2027 | | | 35,000 | | | | 37,684 | |
| | |
Synchrony Financial | | | | | | | | |
| | |
3.75%, 8/15/2021 | | | 501,000 | | | | 512,298 | |
| | |
2.85%, 7/25/2022 | | | 73,000 | | | | 73,985 | |
| | |
4.25%, 8/15/2024 | | | 50,000 | | | | 53,236 | |
| | |
4.50%, 7/23/2025 | | | 25,000 | | | | 26,868 | |
| | |
3.70%, 8/4/2026 | | | 69,000 | | | | 70,759 | |
| | |
3.95%, 12/1/2027 | | | 30,000 | | | | 31,101 | |
| | | | | | | | |
| INVESTMENTS | | PRINCIPAL
AMOUNT ($) | | | VALUE ($) | |
| | | | | | | | |
|
Consumer Finance — continued | |
| | |
5.15%, 3/19/2029 | | | 180,000 | | | | 202,711 | |
| | | | | | | | |
| | |
| | | | | | | 3,313,248 | |
| | | | | | | | |
|
Containers & Packaging — 0.1% | |
| | |
Amcor Finance USA, Inc. (Australia) 3.63%, 4/28/2026 (d) | | | 94,000 | | | | 97,940 | |
| | |
Avery Dennison Corp. 4.88%, 12/6/2028 | | | 81,000 | | | | 92,348 | |
| | |
Sonoco Products Co. 5.75%, 11/1/2040 | | | 65,000 | | | | 81,774 | |
| | | | | | | | |
| | |
| | | | | | | 272,062 | |
| | | | | | | | |
|
Diversified Financial Services — 0.1% | |
| | |
Private Export Funding Corp. | | | | | | | | |
| | |
Series BB, 4.30%, 12/15/2021 | | | 84,000 | | | | 88,828 | |
| | | | | | | | |
|
Diversified Telecommunication Services — 1.1% | |
| | |
Bell Canada, Inc. (Canada) | | | | | | | | |
| | |
4.46%, 4/1/2048 | | | 109,000 | | | | 131,032 | |
| | |
4.30%, 7/29/2049 | | | 60,000 | | | | 70,663 | |
| | |
Deutsche Telekom International Finance BV (Germany) 9.25%, 6/1/2032 | | | 340,000 | | | | 543,512 | |
| | |
TELUS Corp. (Canada) | | | | | | | | |
| | |
2.80%, 2/16/2027 | | | 50,000 | | | | 50,978 | |
| | |
4.60%, 11/16/2048 | | | 159,000 | | | | 191,914 | |
| | |
Verizon Communications, Inc. | | | | | | | | |
| | |
3.13%, 3/16/2022 | | | 25,000 | | | | 25,772 | |
| | |
2.45%, 11/1/2022 | | | 113,000 | | | | 114,565 | |
| | |
3.50%, 11/1/2024 | | | 159,000 | | | | 169,493 | |
| | |
2.63%, 8/15/2026 | | | 25,000 | | | | 25,611 | |
| | |
4.33%, 9/21/2028 | | | 50,000 | | | | 57,434 | |
| | |
4.02%, 12/3/2029 (d) | | | 163,000 | | | | 184,108 | |
| | |
7.75%, 12/1/2030 | | | 80,000 | | | | 118,204 | |
| | |
4.50%, 8/10/2033 | | | 25,000 | | | | 29,555 | |
| | |
4.40%, 11/1/2034 | | | 91,000 | | | | 105,414 | |
| | |
6.40%, 2/15/2038 | | | 40,000 | | | | 54,585 | |
| | |
4.81%, 3/15/2039 | | | 25,000 | | | | 30,659 | |
| | |
4.52%, 9/15/2048 | | | 28,000 | | | | 33,719 | |
| | |
5.01%, 4/15/2049 | | | 37,000 | | | | 47,298 | |
| | |
4.67%, 3/15/2055 | | | 47,000 | | | | 57,889 | |
| | | | | | | | |
| | |
| | | | | | | 2,042,405 | |
| | | | | | | | |
|
Electric Utilities — 0.9% | |
| | |
Avangrid, Inc. 3.80%, 6/1/2029 | | | 60,000 | | | | 65,440 | |
| | |
Baltimore Gas & Electric Co. | | | | | | | | |
| | |
3.35%, 7/1/2023 | | | 25,000 | | | | 26,217 | |
| | |
2.40%, 8/15/2026 | | | 57,000 | | | | 57,444 | |
| | |
6.35%, 10/1/2036 | | | 20,000 | | | | 28,874 | |
| | |
3.50%, 8/15/2046 | | | 390,000 | | | | 415,739 | |
SEE NOTES TO FINANCIAL STATEMENTS.
| | | | | | |
| | | |
| 116 | | | | J.P. MORGAN EXCHANGE-TRADED FUNDS | | AUGUST 31, 2019 |
| | | | | | | | |
| INVESTMENTS | | PRINCIPAL
AMOUNT ($) | | | VALUE ($) | |
Corporate Bonds — continued | |
|
Electric Utilities — continued | |
| | |
DTE Electric Co. | | | | | | | | |
| | |
3.38%, 3/1/2025 | | | 25,000 | | | | 26,609 | |
| | |
4.30%, 7/1/2044 | | | 90,000 | | | | 109,533 | |
| | |
Enel Americas SA (Chile) 4.00%, 10/25/2026 | | | 112,000 | | | | 115,990 | |
| | |
Enel Chile SA (Chile) 4.88%, 6/12/2028 | | | 134,000 | | | | 148,164 | |
| | |
Exelon Corp. | | | | | | | | |
| | |
5.15%, 12/1/2020 | | | 60,000 | | | | 61,719 | |
| | |
4.95%, 6/15/2035 | | | 62,000 | | | | 73,180 | |
| | |
5.10%, 6/15/2045 | | | 83,000 | | | | 104,168 | |
| | |
Iberdrola International BV (Spain) 6.75%, 7/15/2036 | | | 40,000 | | | | 56,380 | |
| | |
NextEra Energy Capital Holdings, Inc. | | | | | | | | |
| | |
Series H, 3.34%, 9/1/2020 | | | 25,000 | | | | 25,264 | |
| | |
2.80%, 1/15/2023 | | | 75,000 | | | | 76,734 | |
| | |
3.25%, 4/1/2026 | | | 40,000 | | | | 41,808 | |
| | |
3.55%, 5/1/2027 | | | 38,000 | | | | 40,619 | |
| | |
Oklahoma Gas & Electric Co. | | | | | | | | |
| | |
3.80%, 8/15/2028 | | | 10,000 | | | | 11,020 | |
| | |
4.15%, 4/1/2047 | | | 27,000 | | | | 31,255 | |
| | |
Public Service Electric & Gas Co. | | | | | | | | |
| | |
2.38%, 5/15/2023 | | | 147,000 | | | | 149,256 | |
| | |
3.65%, 9/1/2042 | | | 25,000 | | | | 27,639 | |
| | |
3.80%, 1/1/2043 | | | 29,000 | | | | 32,704 | |
| | | | | | | | |
| | |
| | | | | | | 1,725,756 | |
| | | | | | | | |
|
Electrical Equipment — 0.1% | |
| | |
Legrand France SA (France) 8.50%, 2/15/2025 | | | 50,000 | | | | 65,083 | |
| | |
Rockwell Automation, Inc. | | | | | | | | |
| | |
3.50%, 3/1/2029 | | | 50,000 | | | | 55,106 | |
| | |
4.20%, 3/1/2049 | | | 66,000 | | | | 81,355 | |
| | | | | | | | |
| | |
| | | | | | | 201,544 | |
| | | | | | | | |
|
Electronic Equipment, Instruments & Components — 0.2% | |
| | |
Allegion US Holding Co., Inc. | | | | | | | | |
| | |
3.20%, 10/1/2024 | | | 25,000 | | | | 25,519 | |
| | |
3.55%, 10/1/2027 | | | 70,000 | | | | 71,925 | |
| | |
FLIR Systems, Inc. 3.13%, 6/15/2021 | | | 60,000 | | | | 60,758 | |
| | |
Keysight Technologies, Inc. 4.60%, 4/6/2027 | | | 110,000 | | | | 121,125 | |
| | | | | | | | |
| | |
| | | | | | | 279,327 | |
| | | | | | | | |
|
Energy Equipment & Services — 0.0%(c) | |
| | |
Helmerich & Payne, Inc. | | | | | | | | |
| | |
4.65%, 3/15/2025 (d) | | | 30,000 | | | | 32,630 | |
| | |
4.65%, 3/15/2025 | | | 30,000 | | | | 32,629 | |
| | | | | | | | |
| | |
| | | | | | | 65,259 | |
| | | | | | | | |
| | | | | | | | |
| INVESTMENTS | | PRINCIPAL
AMOUNT ($) | | | VALUE ($) | |
| | | | | | | | |
|
Entertainment — 0.6% | |
| | |
Electronic Arts, Inc. 4.80%, 3/1/2026 | | | 110,000 | | | | 125,445 | |
| | |
TWDC Enterprises 18 Corp. | | | | | | | | |
| | |
7.00%, 3/1/2032 | | | 25,000 | | | | 37,490 | |
| | |
3.70%, 12/1/2042 | | | 50,000 | | | | 56,886 | |
| | |
3.00%, 7/30/2046 | | | 547,000 | | | | 564,275 | |
| | |
Walt Disney Co. (The) | | | | | | | | |
| | |
4.50%, 2/15/2021 (d) | | | 235,000 | | | | 243,583 | |
| | |
3.00%, 9/15/2022 (d) | | | 25,000 | | | | 25,821 | |
| | |
5.40%, 10/1/2043 (d) | | | 25,000 | | | | 34,762 | |
| | | | | | | | |
| | |
| | | | | | | 1,088,262 | |
| | | | | | | | |
|
Equity Real Estate Investment Trusts (REITs) — 0.0% (c) | |
| | |
Rayonier, Inc. 3.75%, 4/1/2022 | | | 25,000 | | | | 25,486 | |
| | | | | | | | |
|
Food & Staples Retailing — 0.4% | |
| | |
Ahold Finance USA LLC (Netherlands) 6.88%, 5/1/2029 | | | 60,000 | | | | 78,300 | |
| | |
Koninklijke Ahold Delhaize NV (Netherlands) 5.70%, 10/1/2040 | | | 77,000 | | | | 97,678 | |
| | |
Sysco Corp. | | | | | | | | |
| | |
3.30%, 7/15/2026 | | | 290,000 | | | | 305,085 | |
| | |
3.25%, 7/15/2027 | | | 168,000 | | | | 177,339 | |
| | |
4.85%, 10/1/2045 | | | 125,000 | | | | 155,979 | |
| | | | | | | | |
| | |
| | | | | | | 814,381 | |
| | | | | | | | |
|
Food Products — 0.1% | |
| | |
Flowers Foods, Inc. 3.50%, 10/1/2026 | | | 114,000 | | | | 118,198 | |
| | | | | | | | |
|
Gas Utilities — 0.2% | |
| | |
Dominion Energy Gas Holdings LLC 3.60%, 12/15/2024 | | | 90,000 | | | | 95,965 | |
| | |
National Fuel Gas Co. | | | | | | | | |
| | |
4.90%, 12/1/2021 | | | 67,000 | | | | 69,696 | |
| | |
3.75%, 3/1/2023 | | | 130,000 | | | | 134,351 | |
| | |
5.20%, 7/15/2025 | | | 50,000 | | | | 54,850 | |
| | | | | | | | |
| | |
| | | | | | | 354,862 | |
| | | | | | | | |
|
Health Care Equipment & Supplies — 0.8% | |
| | |
Baxter International, Inc. | | | | | | | | |
| | |
2.60%, 8/15/2026 | | | 143,000 | | | | 145,795 | |
| | |
3.50%, 8/15/2046 | | | 50,000 | | | | 50,727 | |
| | |
Edwards Lifesciences Corp. 4.30%, 6/15/2028 | | | 105,000 | | | | 119,257 | |
| | |
Koninklijke Philips NV (Netherlands) | | | | | | | | |
| | |
6.88%, 3/11/2038 | | | 49,000 | | | | 74,213 | |
| | |
5.00%, 3/15/2042 | | | 220,000 | | | | 274,663 | |
| | |
Stryker Corp. | | | | | | | | |
| | |
2.63%, 3/15/2021 | | | 70,000 | | | | 70,563 | |
SEE NOTES TO FINANCIAL STATEMENTS.
| | | | | | | | |
| | | |
| AUGUST 31, 2019 | | J.P. MORGAN EXCHANGE-TRADED FUNDS | | | | | 117 | |
JPMorgan U.S. Aggregate Bond ETF
SCHEDULE OF PORTFOLIO INVESTMENTS
AS OF AUGUST 31, 2019 (Unaudited) (continued)
| | | | | | | | |
| INVESTMENTS | | PRINCIPAL
AMOUNT ($) | | | VALUE ($) | |
Corporate Bonds — continued | |
|
Health Care Equipment & Supplies — continued | |
| | |
3.38%, 5/15/2024 | | | 73,000 | | | | 76,940 | |
| | |
3.38%, 11/1/2025 | | | 100,000 | | | | 106,560 | |
| | |
3.50%, 3/15/2026 | | | 71,000 | | | | 76,271 | |
| | |
3.65%, 3/7/2028 | | | 375,000 | | | | 412,172 | |
| | |
4.10%, 4/1/2043 | | | 25,000 | | | | 28,602 | |
| | |
4.38%, 5/15/2044 | | | 50,000 | | | | 59,269 | |
| | |
4.63%, 3/15/2046 | | | 53,000 | | | | 66,971 | |
| | | | | | | | |
| | |
| | | | | | | 1,562,003 | |
| | | | | | | | |
|
Hotels, Restaurants & Leisure — 0.6% | |
| | |
Choice Hotels International, Inc. 5.75%, 7/1/2022 | | | 29,000 | | | | 31,053 | |
| | |
Darden Restaurants, Inc. | | | | | | | | |
| | |
3.85%, 5/1/2027 | | | 70,000 | | | | 74,783 | |
| | |
4.55%, 2/15/2048 | | | 29,000 | | | | 31,138 | |
| | |
Starbucks Corp. | | | | | | | | |
| | |
2.10%, 2/4/2021 | | | 200,000 | | | | 200,224 | |
| | |
2.70%, 6/15/2022 | | | 300,000 | | | | 306,158 | |
| | |
3.85%, 10/1/2023 | | | 41,000 | | | | 43,675 | |
| | |
3.55%, 8/15/2029 | | | 200,000 | | | | 218,836 | |
| | |
4.30%, 6/15/2045 | | | 175,000 | | | | 197,342 | |
| | | | | | | | |
| | |
| | | | | | | 1,103,209 | |
| | | | | | | | |
|
Household Durables — 0.1% | |
| | |
Harman International Industries, Inc. 4.15%, 5/15/2025 | | | 96,000 | | | | 102,278 | |
| | |
NVR, Inc. 3.95%, 9/15/2022 | | | 75,000 | | | | 77,965 | |
| | | | | | | | |
| | |
| | | | | | | 180,243 | |
| | | | | | | | |
|
Household Products — 0.3% | |
| | |
Church & Dwight Co., Inc. | | | | | | | | |
| | |
2.45%, 8/1/2022 | | | 98,000 | | | | 99,009 | |
| | |
3.15%, 8/1/2027 | | | 49,000 | | | | 51,223 | |
| | |
3.95%, 8/1/2047 | | | 51,000 | | | | 56,401 | |
| | |
Clorox Co. (The) | | | | | | | | |
| | |
3.05%, 9/15/2022 | | | 60,000 | | | | 61,679 | |
| | |
3.50%, 12/15/2024 | | | 62,000 | | | | 66,290 | |
| | |
3.10%, 10/1/2027 | | | 65,000 | | | | 68,703 | |
| | |
3.90%, 5/15/2028 | | | 60,000 | | | | 67,325 | |
| | | | | | | | |
| | |
| | | | | | | 470,630 | |
| | | | | | | | |
|
Independent Power and Renewable Electricity Producers — 0.3% | |
| | |
Enel Generacion Chile SA (Chile) 4.25%, 4/15/2024 | | | 25,000 | | | | 26,359 | |
| | |
Exelon Generation Co. LLC | | | | | | | | |
| | |
3.40%, 3/15/2022 | | | 104,000 | | | | 107,090 | |
| | |
4.25%, 6/15/2022 | | | 75,000 | | | | 78,839 | |
| | | | | | | | |
| INVESTMENTS | | PRINCIPAL
AMOUNT ($) | | | VALUE ($) | |
| | | | | | | | |
|
Independent Power and Renewable Electricity Producers — continued | |
| | |
PSEG Power LLC | | | | | | | | |
| | |
3.00%, 6/15/2021 | | | 50,000 | | | | 50,610 | |
| | |
3.85%, 6/1/2023 | | | 25,000 | | | | 26,412 | |
| | |
8.63%, 4/15/2031 | | | 171,000 | | | | 242,280 | |
| | | | | | | | |
| | |
| | | | | | | 531,590 | |
| | | | | | | | |
|
Industrial Conglomerates — 0.4% | |
| | |
Carlisle Cos., Inc. | | | | | | | | |
| | |
3.75%, 11/15/2022 | | | 86,000 | | | | 88,713 | |
| | |
3.50%, 12/1/2024 | | | 20,000 | | | | 20,807 | |
| | |
3.75%, 12/1/2027 | | | 50,000 | | | | 52,823 | |
| | |
Ingersoll-Rand Global Holding Co. Ltd. | | | | | | | | |
| | |
2.90%, 2/21/2021 | | | 417,000 | | | | 421,253 | |
| | |
4.25%, 6/15/2023 | | | 86,000 | | | | 91,993 | |
| | | | | | | | |
| | |
| | | | | | | 675,589 | |
| | | | | | | | |
|
Insurance — 0.1% | |
| | |
Loews Corp. | | | | | | | | |
| | |
2.63%, 5/15/2023 | | | 107,000 | | | | 108,696 | |
| | |
3.75%, 4/1/2026 | | | 77,000 | | | | 82,976 | |
| | |
6.00%, 2/1/2035 | | | 30,000 | | | | 39,545 | |
| | | | | | | | |
| | |
| | | | | | | 231,217 | |
| | | | | | | | |
|
Interactive Media & Services — 0.2% | |
| | |
Alphabet, Inc. | | | | | | | | |
| | |
3.63%, 5/19/2021 | | | 70,000 | | | | 72,115 | |
| | |
3.38%, 2/25/2024 | | | 40,000 | | | | 42,746 | |
| | |
2.00%, 8/15/2026 | | | 330,000 | | | | 332,652 | |
| | | | | | | | |
| | |
| | | | | | | 447,513 | |
| | | | | | | | |
|
Internet & Direct Marketing Retail — 0.2% | |
| | |
Booking Holdings, Inc. | | | | | | | | |
| | |
2.75%, 3/15/2023 | | | 100,000 | | | | 102,598 | |
| | |
3.65%, 3/15/2025 | | | 64,000 | | | | 68,420 | |
| | |
3.60%, 6/1/2026 | | | 59,000 | | | | 63,288 | |
| | |
3.55%, 3/15/2028 | | | 51,000 | | | | 55,253 | |
| | | | | | | | |
| | |
| | | | | | | 289,559 | |
| | | | | | | | |
|
IT Services — 0.3% | |
| | |
Broadridge Financial Solutions, Inc. 3.40%, 6/27/2026 | | | 105,000 | | | | 109,785 | |
| | |
Mastercard, Inc. | | | | | | | | |
| | |
2.00%, 11/21/2021 | | | 100,000 | | | | 100,445 | |
| | |
3.38%, 4/1/2024 | | | 35,000 | | | | 37,377 | |
| | |
2.95%, 11/21/2026 | | | 40,000 | | | | 42,374 | |
| | |
3.50%, 2/26/2028 | | | 63,000 | | | | 69,476 | |
| | |
3.80%, 11/21/2046 | | | 154,000 | | | | 180,871 | |
| | |
3.95%, 2/26/2048 | | | 96,000 | | | | 115,825 | |
| | | | | | | | |
| | |
| | | | | | | 656,153 | |
| | | | | | | | |
SEE NOTES TO FINANCIAL STATEMENTS.
| | | | | | |
| | | |
| 118 | | | | J.P. MORGAN EXCHANGE-TRADED FUNDS | | AUGUST 31, 2019 |
| | | | | | | | |
| INVESTMENTS | | PRINCIPAL
AMOUNT ($) | | | VALUE ($) | |
Corporate Bonds — continued | |
|
Leisure Products — 0.1% | |
| | |
Hasbro, Inc. | | | | | | | | |
| | |
3.15%, 5/15/2021 | | | 77,000 | | | | 77,887 | |
| | |
3.50%, 9/15/2027 | | | 55,000 | | | | 56,105 | |
| | |
6.35%, 3/15/2040 | | | 60,000 | | | | 71,930 | |
| | | | | | | | |
| | |
| | | | | | | 205,922 | |
| | | | | | | | |
|
Life Sciences Tools & Services — 0.1% | |
| | |
Agilent Technologies, Inc. | | | | | | | | |
| | |
3.20%, 10/1/2022 | | | 118,000 | | | | 120,960 | |
| | |
3.88%, 7/15/2023 | | | 93,000 | | | | 98,132 | |
| | |
Bio-Rad Laboratories, Inc. 4.88%, 12/15/2020 | | | 30,000 | | | | 30,804 | |
| | | | | | | | |
| | |
| | | | | | | 249,896 | |
| | | | | | | | |
|
Machinery — 0.1% | |
| | |
Fortive Corp. | | | | | | | | |
| | |
3.15%, 6/15/2026 | | | 112,000 | | | | 114,700 | |
| | |
4.30%, 6/15/2046 | | | 25,000 | | | | 27,442 | |
| | |
IDEX Corp. | | | | | | | | |
| | |
4.50%, 12/15/2020 | | | 85,000 | | | | 86,971 | |
| | |
4.20%, 12/15/2021 | | | 25,000 | | | | 25,847 | |
| | | | | | | | |
| | |
| | | | | | | 254,960 | |
| | | | | | | | |
|
Metals & Mining — 2.0% | |
| | |
Kinross Gold Corp. (Canada) 4.50%, 7/15/2027 | | | 117,000 | | | | 122,557 | |
| | |
Newmont Goldcorp Corp. | | | | | | | | |
| | |
3.50%, 3/15/2022 | | | 25,000 | | | | 25,661 | |
| | |
3.70%, 3/15/2023 | | | 546,000 | | | | 568,502 | |
| | |
Rio Tinto Alcan, Inc. (Canada) | | | | | | | | |
| | |
7.25%, 3/15/2031 | | | 50,000 | | | | 71,641 | |
| | |
6.13%, 12/15/2033 | | | 90,000 | | | | 124,696 | |
| | |
Rio Tinto Finance USA Ltd. (Australia) 5.20%, 11/2/2040 | | | 50,000 | | | | 65,861 | |
| | |
Rio Tinto Finance USA plc (Australia) | | | | | | | | |
| | |
4.75%, 3/22/2042 | | | 90,000 | | | | 114,042 | |
| | |
4.13%, 8/21/2042 | | | 498,000 | | | | 592,913 | |
| | |
Southern Copper Corp. (Peru) | | | | | | | | |
| | |
7.50%, 7/27/2035 | | | 100,000 | | | | 135,031 | |
| | |
5.25%, 11/8/2042 | | | 95,000 | | | | 108,342 | |
| | |
5.88%, 4/23/2045 | | | 390,000 | | | | 479,578 | |
| | |
Teck Resources Ltd. (Canada) | | | | | | | | |
| | |
6.13%, 10/1/2035 | �� | | 31,000 | | | | 36,261 | |
| | |
6.00%, 8/15/2040 | | | 46,000 | | | | 50,810 | |
| | |
6.25%, 7/15/2041 | | | 206,000 | | | | 233,394 | |
| | |
5.40%, 2/1/2043 | | | 39,000 | | | | 41,314 | |
| | |
Vale Canada Ltd. (Brazil) 7.20%, 9/15/2032 | | | 253,000 | | | | 299,172 | |
| | | | | | | | |
| INVESTMENTS | | PRINCIPAL
AMOUNT ($) | | | VALUE ($) | |
| | | | | | | | |
|
Metals & Mining — continued | |
| | |
Vale Overseas Ltd. (Brazil) | | | | | | | | |
| | |
4.38%, 1/11/2022 | | | 40,000 | | | | 41,338 | |
| | |
6.88%, 11/21/2036 | | | 141,000 | | | | 176,118 | |
| | |
6.88%, 11/10/2039 | | | 100,000 | | | | 125,906 | |
| | |
Vale SA (Brazil) 5.63%, 9/11/2042 | | | 314,000 | | | | 351,484 | |
| | | | | | | | |
| | |
| | | | | | | 3,764,621 | |
| | | | | | | | |
|
Multiline Retail — 0.1% | |
| | |
Dollar General Corp. | | | | | | | | |
| | |
3.25%, 4/15/2023 | | | 71,000 | | | | 73,631 | |
| | |
4.15%, 11/1/2025 | | | 117,000 | | | | 127,573 | |
| | |
3.88%, 4/15/2027 | | | 40,000 | | | | 43,199 | |
| | |
4.13%, 5/1/2028 | | | 25,000 | | | | 27,661 | |
| | | | | | | | |
| | |
| | | | | | | 272,064 | |
| | | | | | | | |
|
Multi-Utilities — 0.3% | |
| | |
Dominion Energy, Inc. | | | | | | | | |
| | |
Series B, 2.75%, 9/15/2022 | | | 200,000 | | | | 202,441 | |
| | |
Series F, 5.25%, 8/1/2033 | | | 25,000 | | | | 30,881 | |
| | |
Series B, 5.95%, 6/15/2035 | | | 50,000 | | | | 64,462 | |
| | |
Series A, 4.60%, 3/15/2049 | | | 50,000 | | | | 59,860 | |
| | |
DTE Energy Co. | | | | | | | | |
| | |
Series B, 2.60%, 6/15/2022 | | | 58,000 | | | | 58,578 | |
| | |
Series B, 3.30%, 6/15/2022 | | | 27,000 | | | | 27,764 | |
| | |
Public Service Enterprise Group, Inc. | | | | | | | | |
| | |
2.00%, 11/15/2021 | | | 55,000 | | | | 54,755 | |
| | |
2.65%, 11/15/2022 | | | 130,000 | | | | 131,264 | |
| | | | | | | | |
| | |
| | | | | | | 630,005 | |
| | | | | | | | |
|
Oil, Gas & Consumable Fuels — 3.5% | |
| | |
Boardwalk Pipelines LP | | | | | | | | |
| | |
3.38%, 2/1/2023 | | | 118,000 | | | | 119,519 | |
| | |
4.95%, 12/15/2024 | | | 46,000 | | | | 49,459 | |
| | |
5.95%, 6/1/2026 | | | 66,000 | | | | 74,610 | |
| | |
4.45%, 7/15/2027 | | | 25,000 | | | | 26,021 | |
| | |
4.80%, 5/3/2029 | | | 40,000 | | | | 42,227 | |
| | |
Burlington Resources LLC 5.95%, 10/15/2036 | | | 115,000 | | | | 157,832 | |
| | |
Cimarex Energy Co. | | | | | | | | |
| | |
4.38%, 6/1/2024 | | | 50,000 | | | | 52,726 | |
| | |
3.90%, 5/15/2027 | | | 128,000 | | | | 130,974 | |
| | |
ConocoPhillips Co. | | | | | | | | |
| | |
2.40%, 12/15/2022 | | | 258,000 | | | | 260,731 | |
| | |
4.30%, 11/15/2044 | | | 316,000 | | | | 373,305 | |
| | |
ConocoPhillips Holding Co. 6.95%, 4/15/2029 | | | 142,000 | | | | 195,664 | |
SEE NOTES TO FINANCIAL STATEMENTS.
| | | | | | | | |
| | | |
| AUGUST 31, 2019 | | J.P. MORGAN EXCHANGE-TRADED FUNDS | | | | | 119 | |
JPMorgan U.S. Aggregate Bond ETF
SCHEDULE OF PORTFOLIO INVESTMENTS
AS OF AUGUST 31, 2019 (Unaudited) (continued)
| | | | | | | | |
| INVESTMENTS | | PRINCIPAL
AMOUNT ($) | | | VALUE ($) | |
Corporate Bonds — continued | |
|
Oil, Gas & Consumable Fuels — continued | |
| | |
Ecopetrol SA (Colombia) 5.88%, 9/18/2023 | | | 55,000 | | | | 61,347 | |
| | |
Eni USA, Inc. (Italy) 7.30%, 11/15/2027 | | | 52,000 | | | | 67,666 | |
| | |
Equinor ASA (Norway) | | | | | | | | |
| | |
2.90%, 11/8/2020 | | | 35,000 | | | | 35,382 | |
| | |
3.63%, 9/10/2028 | | | 40,000 | | | | 44,182 | |
| | |
HollyFrontier Corp. 5.88%, 4/1/2026 | | | 131,000 | | | | 145,796 | |
| | |
Magellan Midstream Partners LP | | | | | | | | |
| | |
4.25%, 2/1/2021 | | | 120,000 | | | | 123,474 | |
| | |
5.00%, 3/1/2026 | | | 300,000 | | | | 340,478 | |
| | |
5.15%, 10/15/2043 | | | 30,000 | | | | 36,007 | |
| | |
Nexen, Inc. (China) 7.88%, 3/15/2032 | | | 60,000 | | | | 90,187 | |
| | |
Petroleos Mexicanos (Mexico) | | | | | | | | |
| | |
6.38%, 2/4/2021 | | | 50,000 | | | | 51,400 | |
| | |
4.63%, 9/21/2023 | | | 50,000 | | | | 50,117 | |
| | |
6.63%, 6/15/2038 | | | 163,000 | | | | 152,405 | |
| | |
5.50%, 6/27/2044 | | | 55,000 | | | | 46,954 | |
| | |
Phillips 66 | | | | | | | | |
| | |
4.30%, 4/1/2022 | | | 131,000 | | | | 138,458 | |
| | |
3.90%, 3/15/2028 | | | 357,000 | | | | 388,106 | |
| | |
4.65%, 11/15/2034 | | | 228,000 | | | | 264,554 | |
| | |
5.88%, 5/1/2042 | | | 30,000 | | | | 39,742 | |
| | |
4.88%, 11/15/2044 | | | 200,000 | | | | 239,573 | |
| | |
Suncor Energy, Inc. (Canada) | | | | | | | | |
| | |
6.80%, 5/15/2038 | | | 29,000 | | | | 41,432 | |
| | |
6.50%, 6/15/2038 | | | 70,000 | | | | 98,465 | |
| | |
6.85%, 6/1/2039 | | | 132,000 | | | | 191,803 | |
| | |
4.00%, 11/15/2047 | | | 800,000 | | | | 881,253 | |
| | |
Valero Energy Corp. | | | | | | | | |
| | |
3.65%, 3/15/2025 | | | 149,000 | | | | 157,210 | |
| | |
3.40%, 9/15/2026 | | | 170,000 | | | | 175,990 | |
| | |
4.35%, 6/1/2028 | | | 174,000 | | | | 189,429 | |
| | |
7.50%, 4/15/2032 | | | 57,000 | | | | 79,012 | |
| | |
6.63%, 6/15/2037 | | | 125,000 | | | | 165,201 | |
| | |
4.90%, 3/15/2045 | | | 100,000 | | | | 115,044 | |
| | |
Valero Energy Partners LP | | | | | | | | |
| | |
4.38%, 12/15/2026 | | | 96,000 | | | | 104,301 | |
| | |
4.50%, 3/15/2028 | | | 45,000 | | | | 49,561 | |
| | |
Western Midstream Operating LP | | | | | | | | |
| | |
5.38%, 6/1/2021 | | | 301,000 | | | | 311,236 | |
| | |
4.00%, 7/1/2022 | | | 79,000 | | | | 80,488 | |
| | |
3.95%, 6/1/2025 | | | 40,000 | | | | 39,670 | |
| | |
4.50%, 3/1/2028 | | | 40,000 | | | | 39,933 | |
| | |
5.45%, 4/1/2044 | | | 25,000 | | | | 23,117 | |
| | | | | | | | |
| | |
| | | | | | | 6,542,041 | |
| | | | | | | | |
| | | | | | | | |
| INVESTMENTS | | PRINCIPAL
AMOUNT ($) | | | VALUE ($) | |
| | | | | | | | |
|
Personal Products — 0.2% | |
| | |
Estee Lauder Cos., Inc. (The) | | | | | | | | |
| | |
3.15%, 3/15/2027 | | | 60,000 | | | | 64,315 | |
| | |
6.00%, 5/15/2037 | | | 55,000 | | | | 77,142 | |
| | |
4.38%, 6/15/2045 | | | 51,000 | | | | 63,454 | |
| | |
4.15%, 3/15/2047 | | | 100,000 | | | | 121,799 | |
| | | | | | | | |
| | |
| | | | | | | 326,710 | |
| | | | | | | | |
|
Pharmaceuticals — 0.9% | |
| | |
Johnson & Johnson | | | | | | | | |
| | |
2.63%, 1/15/2025 | | | 25,000 | | | | 25,945 | |
| | |
2.45%, 3/1/2026 | | | 29,000 | | | | 29,921 | |
| | |
4.38%, 12/5/2033 | | | 60,000 | | | | 72,826 | |
| | |
5.95%, 8/15/2037 | | | 25,000 | | | | 36,200 | |
| | |
3.40%, 1/15/2038 | | | 107,000 | | | | 117,039 | |
| | |
4.50%, 9/1/2040 | | | 40,000 | | | | 49,713 | |
| | |
4.50%, 12/5/2043 | | | 25,000 | | | | 31,596 | |
| | |
3.70%, 3/1/2046 | | | 445,000 | | | | 512,788 | |
| | |
3.75%, 3/3/2047 | | | 56,000 | | | | 65,165 | |
| | |
3.50%, 1/15/2048 | | | 50,000 | | | | 56,202 | |
| | |
Zoetis, Inc. | | | | | | | | |
| | |
3.25%, 8/20/2021 | | | 195,000 | | | | 198,808 | |
| | |
3.25%, 2/1/2023 | | | 176,000 | | | | 182,034 | |
| | |
4.50%, 11/13/2025 | | | 20,000 | | | | 22,296 | |
| | |
3.00%, 9/12/2027 | | | 100,000 | | | | 103,875 | |
| | |
3.90%, 8/20/2028 | | | 136,000 | | | | 150,735 | |
| | |
3.95%, 9/12/2047 | | | 25,000 | | | | 27,918 | |
| | |
4.45%, 8/20/2048 | | | 51,000 | | | | 60,913 | |
| | | | | | | | |
| | |
| | | | | | | 1,743,974 | |
| | | | | | | | |
|
Professional Services — 0.5% | |
| | |
Thomson Reuters Corp. (Canada) | | | | | | | | |
| | |
3.35%, 5/15/2026 | | | 50,000 | | | | 52,023 | |
| | |
5.85%, 4/15/2040 | | | 132,000 | | | | 161,605 | |
| | |
5.65%, 11/23/2043 | | | 368,000 | | | | 437,980 | |
| | |
Verisk Analytics, Inc. | | | | | | | | |
| | |
5.80%, 5/1/2021 | | | 210,000 | | | | 222,212 | |
| | |
4.13%, 9/12/2022 | | | 25,000 | | | | 26,318 | |
| | |
4.13%, 3/15/2029 | | | 25,000 | | | | 27,901 | |
| | | | | | | | |
| | |
| | | | | | | 928,039 | |
| | | | | | | | |
|
Semiconductors & Semiconductor Equipment — 0.5% | |
| | |
Maxim Integrated Products, Inc. | | | | | | | | |
| | |
3.38%, 3/15/2023 | | | 58,000 | | | | 59,783 | |
| | |
3.45%, 6/15/2027 | | | 50,000 | | | | 51,213 | |
| | |
Micron Technology, Inc. 5.50%, 2/1/2025 | | | 255,000 | | | | 260,333 | |
| | |
Texas Instruments, Inc. | | | | | | | | |
| | |
2.75%, 3/12/2021 | | | 119,000 | | | | 120,528 | |
SEE NOTES TO FINANCIAL STATEMENTS.
| | | | | | |
| | | |
| 120 | | | | J.P. MORGAN EXCHANGE-TRADED FUNDS | | AUGUST 31, 2019 |
| | | | | | | | |
| INVESTMENTS | | PRINCIPAL
AMOUNT ($) | | | VALUE ($) | |
Corporate Bonds — continued | |
|
Semiconductors & Semiconductor Equipment — continued | |
| | |
2.25%, 5/1/2023 | | | 65,000 | | | | 65,725 | |
| | |
2.90%, 11/3/2027 | | | 175,000 | | | | 185,168 | |
| | |
4.15%, 5/15/2048 | | | 136,000 | | | | 168,649 | |
| | | | | | | | |
| | |
| | | | | | | 911,399 | |
| | | | | | | | |
|
Software — 0.1% | |
| | |
Cadence Design Systems, Inc. 4.38%, 10/15/2024 | | | 96,000 | | | | 103,760 | |
| | |
Citrix Systems, Inc. 4.50%, 12/1/2027 | | | 116,000 | | | | 125,026 | |
| | | | | | | | |
| | |
| | | | | | | 228,786 | |
| | | | | | | | |
|
Specialty Retail — 0.2% | |
| | |
Best Buy Co., Inc. | | | | | | | | |
| | |
5.50%, 3/15/2021 | | | 104,000 | | | | 108,203 | |
| | |
4.45%, 10/1/2028 | | | 48,000 | | | | 52,343 | |
| | |
TJX Cos., Inc. (The) | | | | | | | | |
| | |
2.75%, 6/15/2021 | | | 85,000 | | | | 86,246 | |
| | |
2.50%, 5/15/2023 | | | 67,000 | | | | 68,470 | |
| | |
2.25%, 9/15/2026 | | | 137,000 | | | | 137,865 | |
| | | | | | | | |
| | |
| | | | | | | 453,127 | |
| | | | | | | | |
|
Textiles, Apparel & Luxury Goods — 0.2% | |
| | |
NIKE, Inc. | | | | | | | | |
| | |
2.25%, 5/1/2023 | | | 72,000 | | | | 73,165 | |
| | |
2.38%, 11/1/2026 | | | 20,000 | | | | 20,573 | |
| | |
3.63%, 5/1/2043 | | | 152,000 | | | | 171,516 | |
| | |
3.88%, 11/1/2045 | | | 56,000 | | | | 65,464 | |
| | |
3.38%, 11/1/2046 | | | 115,000 | | | | 125,044 | |
| | | | | | | | |
| | |
| | | | | | | 455,762 | |
| | | | | | | | |
| | |
Total Corporate BondS
(Cost $45,926,772) | | | | | | | 48,808,117 | |
| | | | | | | | |
Commercial Mortgage-Backed Securities — 2.0% | |
| | |
BANK | | | | | | | | |
| | |
Series 2017-BNK4, Class ASB, 3.42%, 5/15/2050 | | | 30,000 | | | | 31,941 | |
| | |
Series 2019-BN16, Class A4, 4.01%, 2/15/2052 | | | 60,000 | | | | 68,691 | |
| | |
BBCMS MortgageTrust Series 2018-C2, Class A5, 4.31%, 12/15/2051 | | | 40,000 | | | | 46,458 | |
| | |
Benchmark Mortgage TrustSeries 2018-B8, Class A5, 4.23%, 1/15/2052 | | | 40,000 | | | | 46,373 | |
| | |
BENCHMARK Mortgage Trust | | | | | | | | |
| | |
Series 2018-B2, Class B, 4.34%, 2/15/2051 ‡ (e) | | | 20,000 | | | | 22,534 | |
| | |
Series 2018-B6, Class A2, 4.20%, 10/10/2051 | | | 50,000 | | | | 54,001 | |
| | | | | | | | |
| INVESTMENTS | | PRINCIPAL
AMOUNT ($) | | | VALUE ($) | |
| | | | | | | | |
| | |
CD Mortgage Trust | | | | | | | | |
| | |
Series 2017-CD6, Class ASB, 3.33%, 11/13/2050 | | | 20,000 | | | | 21,234 | |
| | |
Series 2017-CD6, Class AM, 3.71%, 11/13/2050 (e) | | | 30,000 | | | | 32,526 | |
| | |
CFCRE Commercial Mortgage TrustSeries 2016-C7, Class ASB, 3.64%, 12/10/2054 | | | 20,000 | | | | 21,360 | |
| | |
Citigroup Commercial Mortgage Trust | | | | | | | | |
| | |
Series 2014-GC21, Class AAB, 3.48%, 5/10/2047 | | | 19,210 | | | | 19,872 | |
| | |
Series 2014-GC23, Class B, 4.17%, 7/10/2047 ‡ (e) | | | 30,000 | | | | 32,100 | |
| | |
Series 2014-GC25, Class AAB, 3.37%, 10/10/2047 | | | 29,000 | | | | 29,856 | |
| | |
Series 2015-GC29, Class C, 4.28%, 4/10/2048 (e) | | | 40,000 | | | | 42,494 | |
| | |
Series 2016-P4, Class A2, 2.45%, 7/10/2049 | | | 41,000 | | | | 41,110 | |
| | |
Series 2016-P5, Class A2, 2.40%, 10/10/2049 | | | 50,000 | | | | 50,337 | |
| | |
Commercial Mortgage Trust | | | | | | | | |
| | |
Series 2013-CR9, Class A4, 4.37%, 7/10/2045 (e) | | | 50,000 | | | | 54,040 | |
| | |
Series 2012-CR3, Class ASB, 2.37%, 10/15/2045 | | | 24,444 | | | | 24,529 | |
| | |
Series 2012-CR4, Class ASB, 2.44%, 10/15/2045 | | | 13,004 | | | | 13,025 | |
| | |
Series 2013-CR7, Class A4, 3.21%, 3/10/2046 | | | 69,298 | | | | 71,861 | |
| | |
Series 2013-CR12, Class C, 5.23%, 10/10/2046 (e) | | | 10,000 | | | | 10,153 | |
| | |
Series 2014-UBS5, Class AM, 4.19%, 9/10/2047 (e) | | | 40,000 | | | | 43,182 | |
| | |
Series 2014-CR20, Class A3, 3.33%, 11/10/2047 | | | 45,000 | | | | 47,815 | |
| | |
Series 2015-LC21, Class AM, 4.04%, 7/10/2048 (e) | | | 30,000 | | | | 32,627 | |
| | |
Series 2015-LC23, Class A2, 3.22%, 10/10/2048 | | | 26,000 | | | | 26,200 | |
| | |
CSAIL Commercial Mortgage Trust | | | | | | | | |
| | |
Series 2015-C4, Class A2, 3.16%, 11/15/2048 | | | 60,000 | | | | 60,298 | |
| | |
Series 2016-C5, Class A5, 3.76%, 11/15/2048 | | | 27,000 | | | | 29,446 | |
| | |
DBJPM MortgageTrust Series 2017-C6, Class A5, 3.33%, 6/10/2050 | | | 20,000 | | | | 21,610 | |
SEE NOTES TO FINANCIAL STATEMENTS.
| | | | | | | | |
| | | |
| AUGUST 31, 2019 | | J.P. MORGAN EXCHANGE-TRADED FUNDS | | | | | 121 | |
JPMorgan U.S. Aggregate Bond ETF
SCHEDULE OF PORTFOLIO INVESTMENTS
AS OF AUGUST 31, 2019 (Unaudited) (continued)
| | | | | | | | |
| INVESTMENTS | | PRINCIPAL
AMOUNT ($) | | | VALUE ($) | |
Commercial Mortgage-Backed Securities — continued | |
| | |
FHLMC, Multifamily StructuredPass-Through Certificates | | | | | | | | |
| | |
Series K019, Class A2, 2.27%, 3/25/2022 | | | 20,000 | | | | 20,221 | |
| | |
Series K023, Class A1, 1.58%, 4/25/2022 | | | 19,923 | | | | 19,802 | |
| | |
Series K027, Class A2, 2.64%, 1/25/2023 | | | 80,000 | | | | 82,045 | |
| | |
Series K029, Class A2, 3.32%, 2/25/2023 | | | 150,000 | | | | 157,099 | |
| | |
Series K036, Class A2, 3.53%, 10/25/2023 (e) | | | 162,000 | | | | 172,139 | |
| | |
Series K725, Class AM, 3.10%, 2/25/2024 (e) | | | 50,000 | | | | 52,541 | |
| | |
Series K728, Class A2, 3.06%, 8/25/2024 (e) | | | 50,000 | | | | 52,573 | |
| | |
Series K040, Class A2, 3.24%, 9/25/2024 | | | 70,000 | | | | 74,479 | |
| | |
Series K048, Class A1, 2.69%, 12/25/2024 | | | 41,123 | | | | 41,985 | |
| | |
Series K731, Class A2, 3.60%, 2/25/2025 (e) | | | 50,000 | | | | 54,017 | |
| | |
Series K051, Class A2, 3.31%, 9/25/2025 | | | 40,000 | | | | 43,249 | |
| | |
Series K735, Class A2, 2.86%, 5/25/2026 | | | 50,000 | | | | 52,934 | |
| | |
Series K057, Class A2, 2.57%, 7/25/2026 | | | 63,000 | | | | 65,794 | |
| | |
Series K063, Class A1, 3.05%, 8/25/2026 | | | 47,155 | | | | 49,338 | |
| | |
Series K085, Class A2, 4.06%, 10/25/2028 (e) | | | 80,000 | | | | 92,969 | |
| | |
Series K156, Class A3, 3.70%, 6/25/2033 (e) | | | 91,000 | | | | 105,016 | |
| | |
FNMA ACES | | | | | | | | |
| | |
Series 2012-M1, Class A2, 2.73%, 10/25/2021 | | | 44,354 | | | | 44,941 | |
| | |
Series 2014-M1, Class A2, 3.34%, 7/25/2023 (e) | | | 47,988 | | | | 50,249 | |
| | |
Series 2014-M2, Class A2, 3.51%, 12/25/2023 (e) | | | 44,717 | | | | 47,569 | |
| | |
Series 2014-M3, Class A2, 3.50%, 1/25/2024 (e) | | | 41,229 | | | | 43,875 | |
| | |
Series 2017-M10, Class AV2, 2.65%, 7/25/2024 (e) | | | 50,000 | | | | 51,537 | |
| | |
Series 2016-M6, Class A1, 2.14%, 5/25/2026 | | | 48,562 | | | | 49,145 | |
| | |
Series 2018-M10, Class A2, 3.50%, 7/25/2028 (e) | | | 40,000 | | | | 44,191 | |
| | |
Series 2019-M1, Class A2, 3.67%, 9/25/2028 (e) | | | 35,000 | | | | 39,154 | |
| | | | | | | | |
| INVESTMENTS | | PRINCIPAL
AMOUNT ($) | | | VALUE ($) | |
| | | | | | | | |
| | |
Series 2018-M13, Class A1, 3.82%, 3/25/2030 (e) | | | 34,803 | | | | 38,982 | |
| | |
GS Mortgage Securities Corp. IISeries 2013-GC10, Class AAB, 2.56%, 2/10/2046 | | | 13,722 | | | | 13,814 | |
| | |
GS Mortgage Securities Trust | | | | | | | | |
| | |
Series 2011-GC5, Class A4, 3.71%, 8/10/2044 | | | 60,000 | | | | 61,302 | |
| | |
Series 2012-GCJ9, Class A3, 2.77%, 11/10/2045 | | | 39,658 | | | | 40,567 | |
| | |
Series 2014-GC24, Class AAB, 3.65%, 9/10/2047 | | | 25,000 | | | | 25,976 | |
| | |
Series 2015-GC28, Class A4, 3.14%, 2/10/2048 | | | 40,000 | | | | 42,138 | |
| | |
Series 2015-GC30, Class A4, 3.38%, 5/10/2050 | | | 25,000 | | | | 26,692 | |
| | |
JP Morgan Chase Commercial Mortgage Securities Trust | | | | | | | | |
| | |
Series 2012-C8, Class A3, 2.83%, 10/15/2045 | | | 7,849 | | | | 8,034 | |
| | |
Series 2013-C16, Class ASB, 3.67%, 12/15/2046 | | | 20,321 | | | | 20,961 | |
| | |
Series 2012-LC9, Class A5, 2.84%, 12/15/2047 | | | 25,000 | | | | 25,604 | |
| | |
JPMBB Commercial Mortgage Securities Trust | | | | | | | | |
| | |
Series 2014-C19, Class A3, 3.67%, 4/15/2047 | | | 40,000 | | | | 40,901 | |
| | |
Series 2015-C29, Class B, 4.12%, 5/15/2048 ‡ (e) | | | 40,000 | | | | 42,859 | |
| | |
Series 2015-C31, Class A3, 3.80%, 8/15/2048 | | | 40,000 | | | | 43,809 | |
| | |
JPMDB Commercial Mortgage Securities Trust | | | | | | | | |
| | |
Series 2016-C2, Class B, 3.99%, 6/15/2049 (e) | | | 20,000 | | | | 21,612 | |
| | |
Series 2017-C5, Class B, 4.01%, 3/15/2050 ‡ (e) | | | 20,000 | | | | 21,705 | |
| | |
Morgan Stanley Bank of America Merrill Lynch Trust | | | | | | | | |
| | |
Series 2012-C5, Class A4, 3.18%, 8/15/2045 | | | 20,000 | | | | 20,565 | |
| | |
Series 2014-C14, Class A3, 3.67%, 2/15/2047 | | | 34,491 | | | | 35,099 | |
| | |
Series 2014-C17, Class A3, 3.53%, 8/15/2047 | | | 29,000 | | | | 29,713 | |
| | |
Series 2015-C22, Class AS, 3.56%, 4/15/2048 ‡ | | | 40,000 | | | | 42,199 | |
| | |
Series 2015-C25, Class ASB, 3.38%, 10/15/2048 | | | 50,000 | | | | 52,102 | |
SEE NOTES TO FINANCIAL STATEMENTS.
| | | | | | |
| | | |
| 122 | | | | J.P. MORGAN EXCHANGE-TRADED FUNDS | | AUGUST 31, 2019 |
| | | | | | | | |
| INVESTMENTS | | PRINCIPAL
AMOUNT ($) | | | VALUE ($) | |
Commercial Mortgage-Backed Securities — continued | |
| | |
Series 2015-C25, Class A5, 3.64%, 10/15/2048 | | | 40,000 | | | | 43,425 | |
| | |
Morgan Stanley Capital I Trust | | | | | | | | |
| | |
Series 2012-C4, Class A4, 3.24%, 3/15/2045 | | | 38,000 | | | | 38,990 | |
| | |
Series 2017-H1, Class C, 4.28%, 6/15/2050 ‡ (e) | | | 50,000 | | | | 54,101 | |
| | |
UBS Commercial Mortgage Trust | | | | | | | | |
| | |
Series 2012-C1, Class A3, 3.40%, 5/10/2045 | | | 29,179 | | | | 29,999 | |
| | |
Series 2017-C1, Class A2, 2.98%, 6/15/2050 | | | 30,000 | | | | 30,650 | |
| | |
Series 2017-C4, Class ASB, 3.37%, 10/15/2050 | | | 40,000 | | | | 42,347 | |
| | |
UBS-Barclays Commercial MortgageTrust Series 2012-C2, Class A4, 3.53%, 5/10/2063 | | | 20,000 | | | | 20,763 | |
| | |
Wells Fargo Commercial Mortgage Trust | | | | | | | | |
| | |
Series 2012-LC5, Class A3, 2.92%, 10/15/2045 | | | 79,638 | | | | 81,687 | |
| | |
Series 2015-C27, Class A4, 3.19%, 2/15/2048 | | | 45,433 | | | | 47,648 | |
| | |
Series 2015-C29, Class A4, 3.64%, 6/15/2048 | | | 20,000 | | | | 21,651 | |
| | |
Series 2018-C45, Class A3, 3.92%, 6/15/2051 | | | 45,000 | | | | 50,609 | |
| | |
Series 2015-NXS3, Class A2, 2.85%, 9/15/2057 | | | 70,000 | | | | 70,287 | |
| | |
WFRBS Commercial Mortgage Trust | | | | | | | | |
| | |
Series 2012-C9, Class AS, 3.39%, 11/15/2045 | | | 60,000 | | | | 62,110 | |
| | |
Series 2014-C20, Class A3, 3.64%, 5/15/2047 | | | 9,891 | | | | 10,108 | |
| | |
Series 2013-C12, Class ASB, 2.84%, 3/15/2048 | | | 7,425 | | | | 7,502 | |
| | |
Series 2014-C22, Class A4, 3.49%, 9/15/2057 | | | 40,000 | | | | 42,562 | |
| | |
Series 2014-C22, Class A5, 3.75%, 9/15/2057 | | | 25,000 | | | | 26,960 | |
| | | | | | | | |
| | |
Total Commercial Mortgage-Backed Securities
(Cost $3,702,923) | | | | | | | 3,838,568 | |
| | | | | | | | |
Foreign Government Securities — 1.6% | |
| | |
Canada Government Bond (Canada) | | | | | | | | |
| | |
2.63%, 1/25/2022 | | | 65,000 | | | | 66,677 | |
| | |
2.00%, 11/15/2022 | | | 25,000 | | | | 25,398 | |
| | |
Export Development Canada (Canada) | | | | | | | | |
| | |
2.00%, 5/17/2022 | | | 25,000 | | | | 25,305 | |
| | |
2.75%, 3/15/2023 | | | 25,000 | | | | 26,075 | |
| | | | | | | | |
| INVESTMENTS | | PRINCIPAL
AMOUNT ($) | | | VALUE ($) | |
| | | | | | | | |
| | |
Export-Import Bank of Korea (South Korea) 2.63%, 12/30/2020 | | | 200,000 | | | | 201,352 | |
| | |
Italy Government Bond (Italy) 5.38%, 6/15/2033 | | | 96,000 | | | | 111,422 | |
| | |
Japan Bank for International Cooperation (Japan) 2.88%, 7/21/2027 | | | 218,000 | | | | 234,045 | |
| | |
Province of Alberta (Canada) 2.95%, 1/23/2024 | | | 50,000 | | | | 52,819 | |
| | |
Province of British Columbia Canada (Canada) 2.25%, 6/2/2026 | | | 49,000 | | | | 50,685 | |
| | |
Province of Ontario (Canada) | | | | | | | | |
| | |
2.55%, 2/12/2021 | | | 20,000 | | | | 20,226 | |
| | |
2.55%, 4/25/2022 | | | 45,000 | | | | 46,055 | |
| | |
3.40%, 10/17/2023 | | | 95,000 | | | | 101,520 | |
| | |
3.05%, 1/29/2024 | | | 55,000 | | | | 58,341 | |
| | |
2.30%, 6/15/2026 | | | 30,000 | | | | 31,052 | |
| | |
Province of Quebec (Canada) | | | | | | | | |
| | |
2.75%, 8/25/2021 | | | 50,000 | | | | 51,032 | |
| | |
2.38%, 1/31/2022 | | | 25,000 | | | | 25,447 | |
| | |
Republic of Colombia (Colombia) | | | | | | | | |
| | |
8.13%, 5/21/2024 | | | 40,000 | | | | 50,100 | |
| | |
4.50%, 3/15/2029 | | | 90,000 | | | | 102,234 | |
| | |
10.38%, 1/28/2033 | | | 36,000 | | | | 57,060 | |
| | |
Republic of Hungary (Hungary) | | | | | | | | |
| | |
6.38%, 3/29/2021 | | | 40,000 | | | | 42,537 | |
| | |
5.75%, 11/22/2023 | | | 50,000 | | | | 56,891 | |
| | |
Republic of Indonesia (Indonesia) 2.95%, 1/11/2023 | | | 200,000 | | | | 202,476 | |
| | |
Republic of Panama (Panama) 6.70%, 1/26/2036 | | | 40,000 | | | | 58,500 | |
| | |
Republic of Peru (Peru) 6.55%, 3/14/2037 | | | 25,000 | | | | 37,945 | |
| | |
Republic of Philippines (Philippines) | | | | | | | | |
| | |
9.50%, 10/21/2024 | | | 90,000 | | | | 121,839 | |
| | |
10.63%, 3/16/2025 | | | 48,000 | | | | 69,195 | |
| | |
9.50%, 2/2/2030 | | | 27,000 | | | | 44,668 | |
| | |
Republic of Poland (Poland) 5.13%, 4/21/2021 | | | 95,000 | | | | 99,864 | |
| | |
Republic of Uruguay (Uruguay) | | | | | | | | |
| | |
8.00%, 11/18/2022 | | | 136,000 | | | | 154,318 | |
| | |
4.50%, 8/14/2024 | | | 29,000 | | | | 31,510 | |
| | |
Svensk Exportkredit AB (Sweden) 2.88%, 3/14/2023 | | | 201,000 | | | | 209,880 | |
| | |
Tunisia Government Bond (Tunisia) 1.42%, 8/5/2021 | | | 205,000 | | | | 203,176 | |
| | |
United Mexican States (Mexico) | | | | | | | | |
| | |
3.50%, 1/21/2021 | | | 30,000 | | | | 30,581 | |
SEE NOTES TO FINANCIAL STATEMENTS.
| | | | | | | | |
| | | |
| AUGUST 31, 2019 | | J.P. MORGAN EXCHANGE-TRADED FUNDS | | | | | 123 | |
JPMorgan U.S. Aggregate Bond ETF
SCHEDULE OF PORTFOLIO INVESTMENTS
AS OF AUGUST 31, 2019 (Unaudited) (continued)
| | | | | | | | |
| INVESTMENTS | | PRINCIPAL
AMOUNT ($) | | | VALUE ($) | |
Foreign Government Securities — continued | |
| | |
8.00%, 9/24/2022 | | | 25,000 | | | | 28,820 | |
| | |
4.00%, 10/2/2023 | | | 70,000 | | | | 74,287 | |
| | |
6.75%, 9/27/2034 | | | 25,000 | | | | 33,938 | |
| | |
4.60%, 1/23/2046 | | | 200,000 | | | | 217,063 | |
| | |
5.75%, 10/12/2110 | | | 108,000 | | | | 127,744 | |
| | | | | | | | |
| | |
Total Foreign Government Securities (Cost $3,036,398) | | | | | | | 3,182,077 | |
| | | | | | | | |
Supranational — 1.3% | |
| | |
Asian Development Bank (Supranational) | | | | | | | | |
| | |
2.88%, 11/27/2020 | | | 84,000 | | | | 85,163 | |
| | |
1.88%, 2/18/2022 | | | 47,000 | | | | 47,407 | |
| | |
1.75%, 9/13/2022 | | | 40,000 | | | | 40,293 | |
| | |
2.50%, 11/2/2027 | | | 80,000 | | | | 85,658 | |
| | |
3.13%, 9/26/2028 | | | 80,000 | | | | 90,366 | |
| | |
Corp. Andina de Fomento (Supranational) | | | | | | | | |
| | |
2.13%, 9/27/2021 | | | 30,000 | | | | 29,896 | |
| | |
3.75%, 11/23/2023 | | | 125,000 | | | | 132,500 | |
| | |
Council of Europe Development Bank (Supranational) 2.50%, 2/27/2024 | | | 25,000 | | | | 26,077 | |
| | |
European Bank for Reconstruction & Development (Supranational) | | | | | | | | |
| | |
2.00%, 2/1/2021 | | | 25,000 | | | | 25,119 | |
| | |
1.50%, 11/2/2021 | | | 32,000 | | | | 31,947 | |
| | |
European Investment Bank (Supranational) | | | | | | | | |
| | |
2.38%, 5/13/2021 | | | 70,000 | | | | 70,902 | |
| | |
2.88%, 12/15/2021 | | | 30,000 | | | | 30,902 | |
| | |
2.63%, 5/20/2022 | | | 26,000 | | | | 26,776 | |
| | |
2.38%, 6/15/2022 | | | 67,000 | | | | 68,570 | |
| | |
2.00%, 12/15/2022 | | | 99,000 | | | | 100,812 | |
| | |
1.88%, 2/10/2025 | | | 200,000 | | | | 204,531 | |
| | |
2.38%, 5/24/2027 | | | 41,000 | | | | 43,541 | |
| | |
4.88%, 2/15/2036 | | | 29,000 | | | | 40,713 | |
| | |
Inter-American Development Bank (Supranational) | | | | | | | | |
| | |
3.13%, 9/18/2028 | | | 109,000 | | | | 123,309 | |
| | |
2.25%, 6/18/2029 | | | 95,000 | | | | 100,813 | |
| | |
3.20%, 8/7/2042 | | | 207,000 | | | | 247,497 | |
| | |
4.38%, 1/24/2044 | | | 145,000 | | | | 206,042 | |
| | |
International Bank for Reconstruction & Development (Supranational) | | | | | | | | |
| | |
1.63%, 9/4/2020 | | | 25,000 | | | | 24,955 | |
| | |
1.63%, 3/9/2021 | | | 89,000 | | | | 88,992 | |
| | |
1.38%, 5/24/2021 | | | 130,000 | | | | 129,487 | |
| | |
2.78%, 6/5/2024 | | | 52,000 | | | | 52,175 | |
| | |
2.50%, 11/25/2024 | | | 50,000 | | | | 52,574 | |
| | |
2.50%, 7/29/2025 | | | 130,000 | | | | 137,401 | |
| | | | | | | | |
| INVESTMENTS | | PRINCIPAL
AMOUNT ($) | | | VALUE ($) | |
| | | | | | | | |
| | |
3.13%, 11/20/2025 | | | 70,000 | | | | 76,685 | |
| | |
1.88%, 10/27/2026 | | | 89,000 | | | | 91,231 | |
| | | | | | | | |
| | |
Total Supranational
(Cost $2,357,266) | | | | | | | 2,512,334 | |
| | | | | | | | |
U.S. Government Agency Securities — 1.3% | |
| | |
FFCB | | | | | | | | |
| | |
1.68%, 10/13/2020 | | | 50,000 | | | | 50,006 | |
| | |
1.75%, 10/26/2020 | | | 75,000 | | | | 75,060 | |
| | |
2.55%, 3/11/2021 | | | 100,000 | | | | 101,404 | |
| | |
1.85%, 8/5/2022 | | | 34,000 | | | | 34,326 | |
| | |
FHLB | | | | | | | | |
| | |
1.38%, 2/18/2021 | | | 55,000 | | | | 54,856 | |
| | |
2.07%, 8/26/2021 | | | 60,000 | | | | 60,009 | |
| | |
3.00%, 10/12/2021 | | | 30,000 | | | | 30,903 | |
| | |
1.88%, 11/29/2021 | | | 80,000 | | | | 80,611 | |
| | |
2.63%, 12/10/2021 | | | 110,000 | | | | 112,735 | |
| | |
3.38%, 12/8/2023 | | | 100,000 | | | | 107,853 | |
| | |
2.50%, 2/13/2024 | | | 30,000 | | | | 31,374 | |
| | |
3.25%, 11/16/2028 | | | 60,000 | | | | 68,083 | |
| | |
5.63%, 3/14/2036 | | | 50,000 | | | | 74,964 | |
| | |
5.50%, 7/15/2036 | | | 35,000 | | | | 52,180 | |
| | |
FHLMC | | | | | | | | |
| | |
1.13%, 8/12/2021 | | | 60,000 | | | | 59,567 | |
| | |
2.38%, 1/13/2022 | | | 50,000 | | | | 50,960 | |
| | |
2.55%, 6/6/2022 | | | 47,000 | | | | 47,001 | |
| | |
2.75%, 6/19/2023 | | | 218,000 | | | | 228,050 | |
| | |
2.49% 12/14/2029 | | | 80,000 | | | | 65,512 | |
| | |
6.25%, 7/15/2032 | | | 40,000 | | | | 60,218 | |
| | |
FNMA | | | | | | | | |
| | |
2.88%, 10/30/2020 | | | 30,000 | | | | 30,419 | |
| | |
2.50%, 4/13/2021 | | | 84,000 | | | | 85,254 | |
| | |
1.25%, 5/6/2021 | | | 34,000 | | | | 33,835 | |
| | |
1.25%, 8/17/2021 | | | 36,000 | | | | 35,789 | |
| | |
2.00%, 1/5/2022 | | | 55,000 | | | | 55,553 | |
| | |
2.38%, 1/19/2023 | | | 121,000 | | | | 124,534 | |
| | |
2.88%, 9/12/2023 | | | 50,000 | | | | 52,786 | |
| | |
2.50%, 2/5/2024 | | | 84,000 | | | | 87,888 | |
| | |
2.63%, 9/6/2024 | | | 25,000 | | | | 26,426 | |
| | |
2.13%, 4/24/2026 | | | 90,000 | | | | 93,448 | |
| | |
1.88%, 9/24/2026 | | | 50,000 | | | | 51,246 | |
| | |
Israel Government AID Bond (Israel) 5.50%, 12/4/2023 | | | 70,000 | | | | 81,132 | |
| | |
Tennessee Valley Authority | | | | | | | | |
| | |
3.88%, 2/15/2021 | | | 20,000 | | | | 20,640 | |
| | |
1.88%, 8/15/2022 | | | 80,000 | | | | 80,582 | |
SEE NOTES TO FINANCIAL STATEMENTS.
| | | | | | |
| | | |
| 124 | | | | J.P. MORGAN EXCHANGE-TRADED FUNDS | | AUGUST 31, 2019 |
| | | | | | | | |
| INVESTMENTS | | PRINCIPAL
AMOUNT ($) | | | VALUE ($) | |
U.S. Government Agency Securities — continued | |
| | |
3.50%, 12/15/2042 | | | 50,000 | | | | 59,092 | |
| | |
4.25%, 9/15/2065 | | | 10,000 | | | | 14,337 | |
| | | | | | | | |
| | |
Total U.S. Government Agency Securities
(Cost $2,280,074) | | | | | | | 2,378,633 | |
| | | | | | | | |
Municipal Bonds — 0.7% | |
|
California — 0.2% | |
| | |
Education — 0.1% | | | | | | | | |
| | |
Regents of the University of California Medical Center Pooled Series H, Rev., 6.55%, 5/15/2048 | | | 40,000 | | | | 62,029 | |
| | | | | | | | |
|
General Obligation — 0.1% | |
| | |
State of California Series 2018, GO, 2.80%, 4/1/2021 | | | 35,000 | | | | 35,525 | |
| | |
State of California, Various Purpose | | | | | | | | |
| | |
GO, 5.70%, 11/1/2021 | | | 50,000 | | | | 53,860 | |
| | |
GO, 7.55%, 4/1/2039 | | | 80,000 | | | | 134,125 | |
| | | | | | | | |
| | |
| | | | | | | 223,510 | |
| | | | | | | | |
|
Transportation — 0.0% (c) | |
| | |
Bay Area Toll Authority, Toll Bridge, San Francisco Bay AreaSeries 2010S-1, Rev., 6.92%, 4/1/2040 | | | 40,000 | | | | 61,435 | |
| | | | | | | | |
|
Utility — 0.0% (c) | |
| | |
State of California Department of Water Resources Power Supply Series 2016P, Rev., 2.00%, 5/1/2022 | | | 35,000 | | | | 35,352 | |
| | | | | | | | |
| | |
Total California | | | | | | | 382,326 | |
| | | | | | | | |
|
Florida — 0.1% | |
|
Other Revenue — 0.1% | |
| | |
State Board of Administration Finance Corp. | | | | | | | | |
| | |
Series 2013A, Rev., 3.00%, 7/1/2020 | | | 45,000 | | | | 45,375 | |
| | |
Series 2016A, Rev., 2.64%, 7/1/2021 | | | 100,000 | | | | 101,128 | |
| | | | | | | | |
| | |
| | | | | | | 146,503 | |
| | | | | | | | |
| | |
Total Florida | | | | | | | 146,503 | |
| | | | | | | | |
|
Illinois — 0.1% | |
|
General Obligation — 0.1% | |
| | |
Metropolitan Water Reclamation District of Greater Chicago, Build America Bonds GO, 5.72%, 12/1/2038 | | | 55,000 | | | | 75,909 | |
| | |
State of Illinois, Taxable Pension | | | | | | | | |
| | |
Series 2003, GO, 4.95%, 6/1/2023 | | | 65,455 | | | | 68,478 | |
| | | | | | | | |
| | |
| | | | | | | 144,387 | |
| | | | | | | | |
|
Other Revenue — 0.0% (c) | |
| | |
Sales Tax Securitization Corp. Series 2019A, Rev., 4.64%, 1/1/2040 | | | 60,000 | | | | 70,572 | |
| | | | | | | | |
| | | | | | | | |
| INVESTMENTS | | PRINCIPAL
AMOUNT ($) | | | VALUE ($) | |
| | | | | | | | |
|
Transportation — 0.0% (c) | |
| | |
Chicago O’Hare International Airport, Senior Lien Rev., 4.47%, 1/1/2049 | | | 25,000 | | | | 32,415 | |
| | | | | | | | |
| | |
Total Illinois | | | | | | | 247,374 | |
| | | | | | | | |
|
Massachusetts — 0.0% (c) | |
|
General Obligation — 0.0% (c) | |
| | |
Commonwealth of Massachusetts, Consolidated Loan of 2010, Build America Bonds | | | | | | | | |
| | |
Series 2010E, GO, 4.20%, 12/1/2021 | | | 40,000 | | | | 41,409 | |
| | |
Series A, GO, 4.91%, 5/1/2029 | | | 15,000 | | | | 18,288 | |
| | | | | | | | |
| | |
| | | | | | | 59,697 | |
| | | | | | | | |
| | |
Total Massachusetts | | | | | | | 59,697 | |
| | | | | | | | |
|
Missouri — 0.0% (c) | |
|
Hospital — 0.0% (c) | |
| | |
Health and Educational Facilities Authority of the State of Missouri, Educational Facilities, The Washington University Series 2017A, Rev., 3.65%, 8/15/2057 | | | 45,000 | | | | 52,662 | |
| | | | | | | | |
|
New Jersey — 0.1% | |
|
Other Revenue — 0.0% (c) | |
| | |
New Jersey Economic Development Authority, Pension Funding Series 1997B, Rev., AGM, 0.00%, 2/15/2023 | | | 40,000 | | | | 37,303 | |
| | | | | | | | |
|
Transportation — 0.1% | |
| | |
New Jersey Transportation Trust Fund Authority, Build America Bonds Series C, Rev., 6.10%, 12/15/2028 | | | 65,000 | | | | 67,991 | |
| | | | | | | | |
| | |
Total New Jersey | | | | | | | 105,294 | |
| | | | | | | | |
|
New York — 0.1% | |
|
General Obligation — 0.0% (c) | |
| | |
City of New York, Build America BondsSeries H-1, GO, 6.25%, 6/1/2035 | | | 25,000 | | | | 25,812 | |
| | |
City of New York, Fiscal Year 2010, Build America Bonds SubseriesA-2, GO, 5.21%, 10/1/2031 | | | 25,000 | | | | 30,619 | |
| | | | | | | | |
| | |
| | | | | | | 56,431 | |
| | | | | | | | |
|
Special Tax — 0.0% (c) | |
| | |
New York State Urban Development Corp., State Personal Income Tax, Build America Bonds Series 2009E, Rev., 5.77%, 3/15/2039 | | | 25,000 | | | | 31,651 | |
| | | | | | | | |
SEE NOTES TO FINANCIAL STATEMENTS.
| | | | | | | | |
| | | |
| AUGUST 31, 2019 | | J.P. MORGAN EXCHANGE-TRADED FUNDS | | | | | 125 | |
JPMorgan U.S. Aggregate Bond ETF
SCHEDULE OF PORTFOLIO INVESTMENTS
AS OF AUGUST 31, 2019 (Unaudited) (continued)
| | | | | | | | |
| INVESTMENTS | | PRINCIPAL
AMOUNT ($) | | | VALUE ($) | |
Municipal Bonds — continued | |
|
Transportation — 0.1% | |
| | |
Port Authority of New York & New Jersey Series 182, Rev., 5.31%, 8/1/2046 | | | 60,000 | | | | 67,558 | |
| | | | | | | | |
| | |
Total New York | | | | | | | 155,640 | |
| | | | | | | | |
|
Oregon — 0.0% (c) | |
|
General Obligation — 0.0% (c) | |
| | |
State of Oregon GO, 5.76%, 6/1/2023 | | | 33,809 | | | | 36,789 | |
| | | | | | | | |
|
Texas — 0.1% | |
|
Education — 0.0% (c) | |
| | |
Permanent University Fund — Texas A&M University System Series B, Rev., 3.66%, 7/1/2047 | | | 20,000 | | | | 21,299 | |
| | | | | | | | |
|
General Obligation — 0.1% | |
| | |
City of Houston GO, 3.96%, 3/1/2047 | | | 40,000 | | | | 46,887 | |
| | | | | | | | |
| | |
Total Texas | | | | | | | 68,186 | |
| | | | | | | | |
| | |
Total Municipal Bonds
(Cost $1,162,203) | | | | | | | 1,254,471 | |
| | | | | | | | |
Asset-Backed Securities — 0.5% | |
| | |
Ally Auto ReceivablesTrust Series 2018-2, Class A3, 2.92%, 11/15/2022 | | | 30,000 | | | | 30,255 | |
| | |
Ally Master Owner TrustSeries 2018-1, Class A2, 2.70%, 1/17/2023 | | | 30,000 | | | | 30,297 | |
| | |
American Express Credit Account MasterTrust Series 2018-6, Class A, 3.06%, 2/15/2024 | | | 100,000 | | | | 102,493 | |
| | |
AmeriCredit Automobile Receivables Trust | | | | | | | | |
| | |
Series 2018-1, Class A3, 3.07%, 12/19/2022 | | | 20,000 | | | | 20,168 | |
| | |
Series 2018-1, Class C, 3.50%, 1/18/2024 | | | 15,000 | | | | 15,485 | |
| | |
Capital One Multi-Asset Execution Trust | | | | | | | | |
| | |
Series 2015-A8, Class A8, 2.05%, 8/15/2023 | | | 20,000 | | | | 20,041 | |
| | |
Series 2016-A5, Class A5, 1.66%, 6/17/2024 | | | 20,000 | | | | 19,987 | |
| | |
Series 2017-A6, Class A6, 2.29%, 7/15/2025 | | | 10,000 | | | | 10,192 | |
| | |
CarMax Auto Owner Trust | | | | | | | | |
| | |
Series 2016-4, Class A4, 1.60%, 6/15/2022 | | | 20,000 | | | | 19,920 | |
| | |
Series 2016-1, Class D, 3.11%, 8/15/2022 | | | 26,000 | | | | 26,068 | |
| | |
Series 2018-1, Class A4, 2.64%, 6/15/2023 | | | 25,000 | | | | 25,444 | |
| | |
Citibank Credit Card Issuance TrustSeries 2018-A6, Class A6, 3.21%, 12/7/2024 | | | 50,000 | | | | 52,460 | �� |
| | | | | | | | |
| INVESTMENTS | | PRINCIPAL
AMOUNT ($) | | | VALUE ($) | |
| | | | | | | | |
| | |
Discover Card Execution Note Trust | | | | | | | | |
| | |
Series 2018-A4, Class A4, 3.11%, 1/16/2024 | | | 40,000 | | | | 41,012 | |
| | |
Series 2018-A1, Class A1, 3.03%, 8/15/2025 | | | 18,000 | | | | 18,785 | |
| | |
Drive Auto Receivables TrustSeries 2018-1, Class D, 3.81%, 5/15/2024 | | | 46,000 | | | | 46,825 | |
| | |
Ford Credit Auto Owner TrustSeries 2018-A, Class A3, 3.03%, 11/15/2022 | | | 50,000 | | | | 50,600 | |
| | |
Ford Credit Floorplan Master Owner Trust ASeries 2018-1, Class A1, 2.95%, 5/15/2023 | | | 30,000 | | | | 30,529 | |
| | |
Honda Auto Receivables Owner Trust | | | | | | | | |
| | |
Series 2018-1, Class A3, 2.64%, 2/15/2022 | | | 20,000 | | | | 20,107 | |
| | |
Series 2016-4, Class A4, 1.36%, 1/18/2023 | | | 67,000 | | | | 66,687 | |
| | |
Hyundai Auto Receivables TrustSeries 2016-B, Class C, 2.19%, 11/15/2022 | | | 20,000 | | | | 20,026 | |
| | |
Santander Drive Auto Receivables Trust | | | | | | | | |
| | |
Series 2018-3, Class C, 3.51%, 8/15/2023 | | | 25,000 | | | | 25,363 | |
| | |
Series 2019-1, Class C, 3.42%, 4/15/2025 | | | 20,000 | | | | 20,455 | |
| | |
Synchrony Credit Card Master Note TrustSeries 2018-2, Class A, 3.47%, 5/15/2026 | | | 50,000 | | | | 52,982 | |
| | |
Toyota Auto Receivables Owner TrustSeries 2018-C, Class A3, 3.02%, 12/15/2022 | | | 70,000 | | | | 71,329 | |
| | | | | | | | |
| | |
Total Asset-Backed Securities
(Cost $824,386) | | | | | | | 837,510 | |
| | | | | | | | |
| | |
| | | SHARES | | | | |
Short-Term Investments — 0.3% | | | | | | | | |
|
Investment Companies — 0.3% | |
| | |
JPMorgan U.S. Government Money Market Fund Class Institutional Shares, 1.99% (f) (g)
(Cost $503,250) | | | 503,250 | | | | 503,250 | |
| | | | | | | | |
| | |
Total Investments — 99.7%
(Cost $180,134,081) | | | | | | | 189,203,081 | |
| | |
Other Assets Less Liabilities — 0.3% | | | | | | | 655,828 | |
| | | | | | | | |
| | |
NET ASSETS — 100.0% | | | | | | | 189,858,909 | |
| | | | | | | | |
Percentages indicated are based on net assets.
SEE NOTES TO FINANCIAL STATEMENTS.
| | | | | | |
| | | |
| 126 | | | | J.P. MORGAN EXCHANGE-TRADED FUNDS | | AUGUST 31, 2019 |
| | |
Abbreviations |
ACES | | Alternative Credit Enhancement Securities |
AGM | | Insured by Assured Guaranty Municipal Corp. |
FFCB | | Federal Farm Credit Bank |
FHLB | | Federal Home Loan Bank |
FHLMC | | Federal Home Loan Mortgage Corp. |
FNMA | | Federal National Mortgage Association |
GNMA | | Government National Mortgage Association |
GO | | General Obligation |
ICE | | Intercontinental Exchange |
LIBOR | | London Interbank Offered Rate |
Rev. | | Revenue |
UMBS | | Uniform Mortgage-Backed Securities |
USD | | United States Dollar |
| |
(a) | | All or a portion of the security is a when-issued security, delayed delivery security, or forward commitment. |
| | |
(b) | | Variable or floating rate security, linked to the referenced benchmark. The interest rate shown is the current rate as of August 31, 2019. |
(c) | | Amount rounds to less than 0.1% of net assets. |
(d) | | Securities exempt from registration under Rule 144A or section 4(a)(2), of the Securities Act of 1933, as amended. |
(e) | | Variable or floating rate security, the interest rate of which adjusts periodically based on changes in current interest rates and prepayments on the underlying pool of assets. The interest rate shown is the current rate as of August 31, 2019. |
(f) | | Investment in an affiliated fund, which is registered under the Investment Company Act of 1940, as amended, and is advised by J.P. Morgan Investment Management Inc. |
(g) | | The rate shown is the current yield as of August 31, 2019. |
‡ | | Value determined using significant unobservable inputs. |
SEE NOTES TO FINANCIAL STATEMENTS.
| | | | | | | | |
| | | |
| AUGUST 31, 2019 | | J.P. MORGAN EXCHANGE-TRADED FUNDS | | | | | 127 | |
JPMorgan Ultra-Short Income ETF
SCHEDULE OF PORTFOLIO INVESTMENTS
AS OF AUGUST 31, 2019 (Unaudited)
| | | | | | | | |
| INVESTMENTS | | PRINCIPAL
AMOUNT ($) | | | VALUE ($) | |
Corporate Bonds — 64.8% | | | | | | | | |
|
Aerospace & Defense — 0.2% | |
| | |
General Dynamics Corp. (ICE LIBOR USD 3 Month + 0.29%), 2.47%, 5/11/2020 (a) | | | 834,000 | | | | 835,063 | |
| | |
Lockheed Martin Corp. 4.25%, 11/15/2019 | | | 8,237,000 | | | | 8,269,207 | |
| | |
United Technologies Corp. (ICE LIBOR USD 3 Month + 0.65%), 2.82%, 8/16/2021 (a) | | | 6,881,000 | | | | 6,881,831 | |
| | | | | | | | |
| | |
| | | | | | | 15,986,101 | |
| | | | | | | | |
|
Automobiles — 2.5% | |
| | |
BMW US Capital LLC (Germany)
1.45%, 9/13/2019 (b) | | | 12,245,000 | | | | 12,241,527 | |
| | |
(ICE LIBOR USD 3 Month + 0.38%), 2.68%, 4/6/2020 (a) (b) | | | 15,489,000 | | | | 15,511,365 | |
| | |
(ICE LIBOR USD 3 Month + 0.41%), 2.75%, 4/12/2021 (a) (b) | | | 12,300,000 | | | | 12,303,542 | |
| | |
(ICE LIBOR USD 3 Month + 0.50%), 2.68%, 8/13/2021 (a) (b) | | | 979,000 | | | | 981,290 | |
| | |
(ICE LIBOR USD 3 Month + 0.64%), 2.94%, 4/6/2022 (a) (b) | | | 10,500,000 | | | | 10,519,916 | |
| | |
Daimler Finance North America LLC (Germany) | | | | | | | | |
| | |
2.25%, 3/2/2020 (b) | | | 19,324,000 | | | | 19,316,968 | |
| | |
(ICE LIBOR USD 3 Month + 0.39%), 2.68%, 5/4/2020 (a) (b) | | | 6,242,000 | | | | 6,247,191 | |
| | |
3.10%, 5/4/2020 (b) | | | 6,874,000 | | | | 6,911,681 | |
| | |
2.20%, 5/5/2020 (b) | | | 2,405,000 | | | | 2,405,142 | |
| | |
(ICE LIBOR USD 3 Month + 0.53%), 2.82%, 5/5/2020 (a) (b) | | | 3,745,000 | | | | 3,750,533 | |
| | |
2.70%, 8/3/2020 (b) | | | 5,567,000 | | | | 5,590,959 | |
| | |
(ICE LIBOR USD 3 Month + 0.43%), 2.61%, 2/12/2021 (a) (b) | | | 3,400,000 | | | | 3,395,376 | |
| | |
(ICE LIBOR USD 3 Month + 0.45%), 2.60%, 2/22/2021 (a) (b) | | | 2,600,000 | | | | 2,596,489 | |
| | |
(ICE LIBOR USD 3 Month + 0.90%), 3.06%, 2/15/2022 (a) (b) | | | 24,697,000 | | | | 24,798,455 | |
| | |
(ICE LIBOR USD 3 Month + 0.88%), 3.03%, 2/22/2022 (a) (b) | | | 28,500,000 | | | | 28,611,641 | |
| | |
Nissan Motor Acceptance Corp. | | | | | | | | |
| | |
1.55%, 9/13/2019 (b) | | | 3,196,000 | | | | 3,195,331 | |
| | |
2.25%, 1/13/2020 (b) | | | 15,977,000 | | | | 15,964,128 | |
| | |
(ICE LIBOR USD 3 Month + 0.58%), 2.88%, 1/13/2020 (a) (b) | | | 630,000 | | | | 630,624 | |
| | |
2.13%, 3/3/2020 (b) | | | 4,651,000 | | | | 4,643,404 | |
| | |
(ICE LIBOR USD 3 Month + 0.39%), 2.72%, 9/28/2020 (a) (b) | | | 5,350,000 | | | | 5,349,452 | |
| | | | | | | | |
| INVESTMENTS | | PRINCIPAL
AMOUNT ($) | | | VALUE ($) | |
| | | | | | | | |
|
Automobiles — continued | |
| | |
Volkswagen Group of America Finance LLC (Germany) | | | | | | | | |
| | |
2.45%, 11/20/2019 (b) | | | 16,215,000 | | | | 16,213,145 | |
| | |
2.40%, 5/22/2020 (b) | | | 1,700,000 | | | | 1,701,829 | |
| | |
(ICE LIBOR USD 3 Month + 0.94%), 3.12%, 11/12/2021 (a) (b) | | | 5,700,000 | | | | 5,729,796 | |
| | | | | | | | |
| | |
| | | | | | | 208,609,784 | |
| | | | | | | | |
|
Banks — 30.0% | |
| | |
ABN AMRO Bank NV (Netherlands) | | | | | | | | |
| | |
1.80%, 9/20/2019 (b) | | | 39,356,000 | | | | 39,340,258 | |
| | |
2.45%, 6/4/2020 (b) | | | 13,319,000 | | | | 13,336,155 | |
| | |
(ICE LIBOR USD 3 Month + 0.41%), 2.71%, 1/19/2021 (a) (b) | | | 4,400,000 | | | | 4,405,702 | |
| | |
(ICE LIBOR USD 3 Month + 0.57%), 2.70%, 8/27/2021 (a) (b) | | | 21,178,000 | | | | 21,253,690 | |
| | |
ANZ New Zealand Int’l Ltd. (New Zealand) | | | | | | | | |
| | |
2.60%, 9/23/2019 (b) | | | 1,590,000 | | | | 1,590,339 | |
| | |
2.20%, 7/17/2020 (b) | | | 17,556,000 | | | | 17,578,944 | |
| | |
2.85%, 8/6/2020 (b) | | | 2,350,000 | | | | 2,367,714 | |
| | |
2.75%, 1/22/2021 (b) | | | 4,556,000 | | | | 4,598,611 | |
| | |
2.75%, 2/3/2021 (b) | | | 835,000 | | | | 842,331 | |
| | |
(ICE LIBOR USD 3 Month + 1.01%), 3.27%, 7/28/2021 (a) (b) | | | 13,356,000 | | | | 13,509,356 | |
| | |
Australia & New Zealand Banking Group Ltd. (Australia) | | | | | | | | |
| | |
2.05%, 9/23/2019 | | | 3,913,000 | | | | 3,912,846 | |
| | |
(ICE LIBOR USD 3 Month + 0.32%), 2.64%, 7/2/2020 (a) (b) | | | 3,000,000 | | | | 3,004,335 | |
| | |
2.25%, 11/9/2020 | | | 14,135,000 | | | | 14,187,635 | |
| | |
(ICE LIBOR USD 3 Month + 0.32%), 2.50%, 11/9/2020 (a) (b) | | | 4,341,000 | | | | 4,349,686 | |
| | |
(ICE LIBOR USD 3 Month + 0.46%), 2.58%, 5/17/2021 (a) (b) | | | 2,300,000 | | | | 2,306,613 | |
| | |
(ICE LIBOR USD 3 Month + 0.99%), 3.51%, 6/1/2021 (a) (b) | | | 2,100,000 | | | | 2,123,919 | |
| | |
(ICE LIBOR USD 3 Month + 0.87%), 3.02%, 11/23/2021 (a) (b) | | | 1,470,000 | | | | 1,485,126 | |
| | |
Bank of America Corp. | | | | | | | | |
| | |
Series L, 2.25%, 4/21/2020 | | | 11,965,000 | | | | 11,976,050 | |
| | |
(ICE LIBOR USD 3 Month + 0.65%), 3.00%, 6/25/2022 (a) | | | 10,680,000 | | | | 10,726,570 | |
| | |
(ICE LIBOR USD 3 Month + 1.18%), 3.46%, 10/21/2022 (a) | | | 18,504,000 | | | | 18,743,363 | |
| | |
Bank of America NA (ICE LIBOR USD 3 Month + 0.35%), 2.48%, 5/24/2021 (a) | | | 35,876,000 | | | | 35,893,899 | |
SEE NOTES TO FINANCIAL STATEMENTS.
| | | | | | |
| | | |
| 128 | | | | J.P. MORGAN EXCHANGE-TRADED FUNDS | | AUGUST 31, 2019 |
| | | | | | | | |
| INVESTMENTS | | PRINCIPAL
AMOUNT ($) | | | VALUE ($) | |
Corporate Bonds — continued | | | | | | | | |
|
Banks — continued | |
| | |
Bank of Montreal (Canada) 3.10%, 7/13/2020 | | | 12,600,000 | | | | 12,728,446 | |
| | |
(ICE LIBOR USD 3 Month + 0.40%), 2.68%, 1/22/2021 (a) | | | 69,769,000 | | | | 69,935,423 | |
| | |
Series D, (ICE LIBOR USD 3 Month + 0.46%), 2.76%, 4/13/2021 (a) | | | 1,819,000 | | | | 1,826,212 | |
| | |
(ICE LIBOR USD 3 Month + 0.57%), 2.90%, 3/26/2022 (a) | | | 30,500,000 | | | | 30,612,564 | |
| | |
Bank of Nova Scotia (The) (Canada)
(ICE LIBOR USD 3 Month + 0.42%), 2.70%, 1/25/2021 (a) | | | 52,500,000 | | | | 52,677,228 | |
| | |
(ICE LIBOR USD 3 Month + 0.64%), 3.11%, 3/7/2022 (a) | | | 10,098,000 | | | | 10,159,356 | |
| | |
Banque Federative du Credit Mutuel SA (France) | | | | | | | | |
| | |
2.20%, 7/20/2020 (b) | | | 13,530,000 | | | | 13,550,264 | |
| | |
(ICE LIBOR USD 3 Month + 0.49%), 2.77%, 7/20/2020 (a) (b) | | | 750,000 | | | | 752,280 | |
| | |
2.75%, 10/15/2020 (b) | | | 33,626,000 | | | | 33,891,846 | |
| | |
(ICE LIBOR USD 3 Month + 0.73%), 3.01%, 7/20/2022 (a) (b) | | | 30,361,000 | | | | 30,507,451 | |
| | |
Barclays Bank plc (United Kingdom) 5.13%, 1/8/2020 | | | 1,277,000 | | | | 1,288,886 | |
| | |
(ICE LIBOR USD 3 Month + 0.65%), 2.86%, 8/7/2020 (a) | | | 1,886,000 | | | | 1,890,738 | |
| | |
BB&T Corp. 2.45%, 1/15/2020 | | | 12,925,000 | | | | 12,934,177 | |
| | |
(ICE LIBOR USD 3 Month + 0.57%), 2.98%, 6/15/2020 (a) | | | 24,141,000 | | | | 24,225,599 | |
| | |
(ICE LIBOR USD 3 Month + 0.22%), 2.47%, 2/1/2021 (a) | | | 10,007,000 | | | | 9,993,421 | |
| | |
BBVA USA (ICE LIBOR USD 3 Month + 0.73%), 3.18%, 6/11/2021 (a) | | | 9,511,000 | | | | 9,492,384 | |
| | |
BNP Paribas SA (France) | | | | | | | | |
| | |
2.38%, 5/21/2020 | | | 13,894,000 | | | | 13,920,590 | |
| | |
5.00%, 1/15/2021 | | | 8,392,000 | | | | 8,716,140 | |
| | |
(ICE LIBOR USD 3 Month + 0.39%), 2.57%, 8/7/2021 (a) (b) | | | 55,000,000 | | | | 54,999,862 | |
| | |
BNZ International Funding Ltd. (New Zealand) | | | | | | | | |
| | |
2.40%, 2/21/2020 (b) | | | 3,565,000 | | | | 3,569,352 | |
| | |
(ICE LIBOR USD 3 Month + 0.70%), 2.85%, 2/21/2020 (a) (b) | | | 3,737,000 | | | | 3,747,707 | |
| | |
(ICE LIBOR USD 3 Month + 0.98%), 3.41%, 9/14/2021 (a) (b) | | | 21,969,000 | | | | 22,234,498 | |
| | |
Branch Banking & Trust Co.
2.10%, 1/15/2020 | | | 1,761,000 | | | | 1,760,821 | |
| | |
(ICE LIBOR USD 3 Month + 0.45%), 2.75%, 1/15/2020 (a) | | | 13,300,000 | | | | 13,314,523 | |
| | | | | | | | |
| INVESTMENTS | | PRINCIPAL
AMOUNT ($) | | | VALUE ($) | |
| | | | | | | | |
|
Banks — continued | |
| | |
(ICE LIBOR USD 3 Month + 0.22%), 2.74%, 6/1/2020 (a) | | | 7,322,000 | | | | 7,325,878 | |
| | |
2.85%, 4/1/2021 | | | 4,492,000 | | | | 4,545,502 | |
| | |
Capital One NA | | | | | | | | |
| | |
1.85%, 9/13/2019 | | | 13,286,000 | | | | 13,284,260 | |
| | |
2.35%, 1/31/2020 | | | 9,666,000 | | | | 9,668,103 | |
| | |
(ICE LIBOR USD 3 Month + 0.82%), 3.01%, 8/8/2022 (a) | | | 17,800,000 | | | | 17,798,818 | |
| | |
Citibank NA | | | | | | | | |
| | |
(ICE LIBOR USD 3 Month + 0.50%), 2.94%, 6/12/2020 (a) | | | 1,690,000 | | | | 1,694,946 | |
| | |
(ICE LIBOR USD 3 Month + 0.57%), 2.83%, 7/23/2021 (a) | | | 9,059,000 | | | | 9,091,804 | |
| | |
(ICE LIBOR USD 3 Month + 0.53%), 2.65%, 2/19/2022 (a) | | | 25,800,000 | | | | 25,823,109 | |
| | |
(ICE LIBOR USD 3 Month + 0.60%), 2.74%, 5/20/2022 (a) | | | 4,100,000 | | | | 4,107,551 | |
| | |
Citigroup, Inc. | | | | | | | | |
| | |
(ICE LIBOR USD 3 Month + 1.38%), 3.71%, 3/30/2021 (a) | | | 8,313,000 | | | | 8,438,491 | |
| | |
(ICE LIBOR USD 3 Month + 1.19%), 3.46%, 8/2/2021 (a) | | | 7,950,000 | | | | 8,054,430 | |
| | |
(ICE LIBOR USD 3 Month + 0.96%), 3.24%, 4/25/2022 (a) | | | 22,058,000 | | | | 22,298,690 | |
| | |
Citizens Bank NA
2.25%, 3/2/2020 | | | 34,000,000 | | | | 34,005,777 | |
| | |
(ICE LIBOR USD 3 Month + 0.54%), 3.06%, 3/2/2020 (a) | | | 10,400,000 | | | | 10,414,712 | |
| | |
2.20%, 5/26/2020 | | | 6,668,000 | | | | 6,666,971 | |
| | |
(ICE LIBOR USD 3 Month + 0.57%), 2.70%, 5/26/2020 (a) | | | 3,900,000 | | | | 3,911,759 | |
| | |
2.25%, 10/30/2020 | | | 3,220,000 | | | | 3,224,661 | |
| | |
(ICE LIBOR USD 3 Month + 0.72%), 2.90%, 2/14/2022 (a) | | | 13,543,000 | | | | 13,556,047 | |
| | |
Comerica Bank 2.50%, 6/2/2020 | | | 20,077,000 | | | | 20,130,997 | |
| | |
Commonwealth Bank of Australia (Australia) | | | | | | | | |
| | |
2.30%, 9/6/2019 | | | 6,371,000 | | | | 6,371,057 | |
| | |
5.00%, 10/15/2019 (b) | | | 10,844,000 | | | | 10,879,239 | |
| | |
1.75%, 11/7/2019 (b) | | | 11,325,000 | | | | 11,315,973 | |
| | |
2.25%, 3/10/2020 (b) | | | 11,042,000 | | | | 11,054,675 | |
| | |
(ICE LIBOR USD 3 Month + 0.45%), 2.90%, 3/10/2020 (a) (b) | | | 1,180,000 | | | | 1,182,405 | |
| | |
2.30%, 3/12/2020 | | | 3,150,000 | | | | 3,154,284 | |
| | |
(ICE LIBOR USD 3 Month + 0.68%), 3.08%, 9/18/2022 (a) (b) | | | 20,500,000 | | | | 20,641,323 | |
SEE NOTES TO FINANCIAL STATEMENTS.
| | | | | | | | |
| | | |
| AUGUST 31, 2019 | | J.P. MORGAN EXCHANGE-TRADED FUNDS | | | | | 129 | |
JPMorgan Ultra-Short Income ETF
SCHEDULE OF PORTFOLIO INVESTMENTS
AS OF AUGUST 31, 2019 (Unaudited) (continued)
| | | | | | | | |
| INVESTMENTS | | PRINCIPAL
AMOUNT ($) | | | VALUE ($) | |
Corporate Bonds — continued | | | | | | | | |
|
Banks — continued | |
| | |
Cooperatieve Rabobank UA (Netherlands) | | | | | | | | |
| | |
2.25%, 1/14/2020 | | | 12,456,000 | | | | 12,464,770 | |
| | |
4.75%, 1/15/2020 (b) | | | 10,067,000 | | | | 10,162,109 | |
| | |
2.50%, 1/19/2021 | | | 17,690,000 | | | | 17,810,143 | |
| | |
(ICE LIBOR USD 3 Month + 0.43%), 2.70%, 4/26/2021 (a) | | | 4,750,000 | | | | 4,763,431 | |
| | |
3.13%, 4/26/2021 | | | 7,586,000 | | | | 7,719,268 | |
| | |
(ICE LIBOR USD 3 Month + 0.83%), 3.17%, 1/10/2022 (a) | | | 3,700,000 | | | | 3,737,038 | |
| | |
Credit Agricole Corporate & Investment Bank SA (France) (ICE LIBOR USD 3 Month + 0.63%), 2.96%, 10/3/2021 (a) | | | 32,889,000 | | | | 32,948,447 | |
| | |
Credit Agricole SA (France)
2.75%, 6/10/2020 (b) | | | 25,670,000 | | | | 25,782,632 | |
| | |
(ICE LIBOR USD 3 Month + 0.97%), 3.42%, 6/10/2020 (a) (b) | | | 3,549,000 | | | | 3,570,091 | |
| | |
(ICE LIBOR USD 3 Month + 1.18%), 3.50%, 7/1/2021 (a) (b) | | | 6,523,000 | | | | 6,609,574 | |
| | |
Credit Suisse Group Funding Guernsey Ltd. (Switzerland) | | | | | | | | |
| | |
3.13%, 12/10/2020 | | | 33,933,000 | | | | 34,313,853 | |
| | |
(ICE LIBOR USD 3 Month + 2.29%), 4.59%, 4/16/2021 (a) | | | 6,956,000 | | | | 7,155,954 | |
| | |
DBS Group Holdings Ltd. (Singapore) (ICE LIBOR USD 3 Month + 0.49%), | | | | | | | | |
| | |
2.94%, 6/8/2020 (a) (b) | | | 9,339,000 | | | | 9,343,693 | |
| | |
2.85%, 4/16/2022 (b) | | | 18,777,000 | | | | 19,091,218 | |
| | |
DNB Bank ASA (Norway)
2.13%, 10/2/2020 (b) | | | 8,133,000 | | | | 8,137,166 | |
| | |
(ICE LIBOR USD 3 Month + 0.37%), 2.69%, 10/2/2020 (a) (b) | | | 7,500,000 | | | | 7,514,645 | |
| | |
2.38%, 6/2/2021 (b) | | | 29,079,000 | | | | 29,200,573 | |
| | |
Federation des Caisses Desjardins du Quebec (Canada) | | | | | | | | |
| | |
2.25%, 10/30/2020 (b) | | | 15,437,000 | | | | 15,477,154 | |
| | |
(ICE LIBOR USD 3 Month + 0.33%), 2.60%, 10/30/2020 (a) (b) | | | 700,000 | | | | 701,342 | |
| | |
Fifth Third Bancorp 2.88%, 7/27/2020 | | | 46,641,000 | | | | 46,945,733 | |
| | |
Fifth Third Bank | | | | | | | | |
| | |
1.63%, 9/27/2019 | | | 7,695,000 | | | | 7,691,881 | |
| | |
(ICE LIBOR USD 3 Month + 0.59%), 2.90%, 9/27/2019 (a) | | | 1,278,000 | | | | 1,278,486 | |
| | |
2.20%, 10/30/2020 | | | 9,340,000 | | | | 9,361,369 | |
| | |
(ICE LIBOR USD 3 Month + 0.25%), 2.52%, 10/30/2020 (a) | | | 9,905,000 | | | | 9,912,450 | |
| | |
(ICE LIBOR USD 3 Month + 0.44%), 2.71%, 7/26/2021 (a) | | | 1,300,000 | | | | 1,302,369 | |
| | | | | | | | |
| INVESTMENTS | | PRINCIPAL
AMOUNT ($) | | | VALUE ($) | |
| | | | | | | | |
|
Banks — continued | |
| | |
First Niagara Financial Group, Inc. 6.75%, 3/19/2020 | | | 12,012,000 | | | | 12,302,479 | |
| | |
HSBC Holdings plc (United Kingdom) (ICE LIBOR USD 3 Month + 2.24%), | | | | | | | | |
| | |
4.69%, 3/8/2021 (a) | | | 3,423,000 | | | | 3,511,835 | |
| | |
5.10%, 4/5/2021 | | | 6,520,000 | | | | 6,805,872 | |
| | |
(ICE LIBOR USD 3 Month + 0.60%), 2.72%, 5/18/2021 (a) | | | 9,538,000 | | | | 9,541,894 | |
| | |
(ICE LIBOR USD 3 Month + 1.66%), 3.79%, 5/25/2021 (a) | | | 16,910,000 | | | | 17,227,538 | |
| | |
(ICE LIBOR USD 3 Month + 0.65%), 3.09%, 9/11/2021 (a) | | | 25,986,000 | | | | 26,009,435 | |
| | |
(ICE LIBOR USD 3 Month + 1.50%), 3.79%, 1/5/2022 (a) | | | 14,543,000 | | | | 14,808,706 | |
| | |
HSBC USA, Inc. | | | | | | | | |
| | |
2.38%, 11/13/2019 | | | 11,836,000 | | | | 11,837,281 | |
| | |
2.35%, 3/5/2020 | | | 11,540,000 | | | | 11,551,933 | |
| | |
5.00%, 9/27/2020 | | | 2,661,000 | | | | 2,738,024 | |
| | |
Huntington Bancshares, Inc. 3.15%, 3/14/2021 | | | 5,019,000 | | | | 5,091,843 | |
| | |
Huntington National Bank (The)
2.38%, 3/10/2020 | | | 11,834,000 | | | | 11,843,625 | |
| | |
(ICE LIBOR USD 3 Month + 0.51%), 2.96%, 3/10/2020 (a) | | | 1,257,000 | | | | 1,259,596 | |
| | |
2.40%, 4/1/2020 | | | 3,086,000 | | | | 3,090,658 | |
| | |
(ICE LIBOR USD 3 Month + 0.55%), 2.84%, 2/5/2021 (a) | | | 22,116,000 | | | | 22,184,845 | |
| | |
ING Groep NV (Netherlands) (ICE LIBOR USD 3 Month + 1.15%), 3.48%, 3/29/2022 (a) | | | 19,625,000 | | | | 19,842,639 | |
| | |
KeyBank NA | | | | | | | | |
| | |
2.50%, 12/15/2019 | | | 9,321,000 | | | | 9,329,708 | |
| | |
2.25%, 3/16/2020 | | | 10,776,000 | | | | 10,786,271 | |
| | |
Lloyds Bank plc (United Kingdom) 5.80%, 1/13/2020 (b) | | | 11,970,000 | | | | 12,121,570 | |
| | |
(ICE LIBOR USD 3 Month + 0.49%), 2.70%, 5/7/2021 (a) | | | 2,101,000 | | | | 2,101,107 | |
| | |
Manufacturers & Traders Trust Co. (ICE LIBOR USD 3 Month + 0.61%), 2.73%, 5/18/2022 (a) | | | 14,091,000 | | | | 14,105,729 | |
| | |
Mitsubishi UFJ Financial Group, Inc. (Japan) | | | | | | | | |
| | |
2.95%, 3/1/2021 | | | 5,500,000 | | | | 5,559,672 | |
| | |
(ICE LIBOR USD 3 Month + 0.65%), 2.92%, 7/26/2021 (a) | | | 9,060,000 | | | | 9,086,691 | |
| | |
(ICE LIBOR USD 3 Month + 1.06%), 3.51%, 9/13/2021 (a) | | | 7,076,000 | | | | 7,150,605 | |
| | |
(ICE LIBOR USD 3 Month + 0.92%), 3.07%, 2/22/2022 (a) | | | 4,689,000 | | | | 4,720,618 | |
SEE NOTES TO FINANCIAL STATEMENTS.
| | | | | | |
| | | |
| 130 | | | | J.P. MORGAN EXCHANGE-TRADED FUNDS | | AUGUST 31, 2019 |
| | | | | | | | |
| INVESTMENTS | | PRINCIPAL
AMOUNT ($) | | | VALUE ($) | |
Corporate Bonds — continued | | | | | | | | |
|
Banks — continued | |
| | |
(ICE LIBOR USD 3 Month + 0.79%), 3.07%, 7/25/2022 (a) | | | 20,592,000 | | | | 20,673,406 | |
| | |
Mitsubishi UFJ Trust & Banking Corp. (Japan) 2.45%, 10/16/2019 (b) | | | 23,344,000 | | | | 23,348,295 | |
| | |
Mizuho Financial Group, Inc. (Japan) 2.63%, 4/12/2021 (b) | | | 47,556,000 | | | | 47,844,262 | |
| | |
(ICE LIBOR USD 3 Month + 1.14%), 3.59%, 9/13/2021 (a) | | | 14,870,000 | | | | 15,042,016 | |
| | |
(ICE LIBOR USD 3 Month + 0.94%), 3.08%, 2/28/2022 (a) | | | 6,525,000 | | | | 6,562,813 | |
| | |
(ICE LIBOR USD 3 Month + 0.88%), 3.33%, 9/11/2022 (a) | | | 7,800,000 | | | | 7,829,442 | |
| | |
MUFG Bank Ltd. (Japan) | | | | | | | | |
| | |
2.35%, 9/8/2019 (b) | | | 10,549,000 | | | | 10,548,973 | |
| | |
2.30%, 3/5/2020 (b) | | | 15,997,000 | | | | 16,011,830 | |
| | |
National Australia Bank Ltd. (Australia) | | | | | | | | |
| | |
2.40%, 12/9/2019 (b) | | | 3,000,000 | | | | 3,002,731 | |
| | |
2.25%, 1/10/2020 | | | 3,357,000 | | | | 3,358,533 | |
| | |
2.13%, 5/22/2020 | | | 2,985,000 | | | | 2,988,427 | |
| | |
(ICE LIBOR USD 3 Month + 0.35%), 2.69%, 1/12/2021 (a) (b) | | | 7,670,000 | | | | 7,684,222 | |
| | |
(ICE LIBOR USD 3 Month + 1.00%), 3.34%, 7/12/2021 (a) (b) | | | 4,750,000 | | | | 4,809,449 | |
| | |
(ICE LIBOR USD 3 Month + 0.71%), 2.95%, 11/4/2021 (a) (b) | | | 17,000,000 | | | | 17,142,416 | |
| | |
(ICE LIBOR USD 3 Month + 0.72%), 2.87%, 5/22/2022 (a) (b) | | | 10,500,000 | | | | 10,578,657 | |
| | |
National Bank of Canada (Canada) (ICE LIBOR USD 3 Month + 0.60%), | | | | | | | | |
| | |
2.90%, 1/17/2020 (a) | | | 16,239,000 | | | | 16,279,936 | |
| | |
2.20%, 11/2/2020 | | | 3,148,000 | | | | 3,157,042 | |
| | |
(ICE LIBOR USD 3 Month + 0.40%), 2.79%, 3/21/2021 (a) (b) | | | 60,000,000 | | | | 60,034,280 | |
| | |
Nordea Bank Abp (Finland) | | | | | | | | |
| | |
1.63%, 9/30/2019 (b) | | | 724,000 | | | | 723,692 | |
| | |
4.88%, 1/27/2020 (b) | | | 10,475,000 | | | | 10,588,861 | |
| | |
2.13%, 5/29/2020 (b) | | | 18,219,000 | | | | 18,237,027 | |
| | |
(ICE LIBOR USD 3 Month + 0.47%), 2.59%, 5/29/2020 (a) (b) | | | 5,302,000 | | | | 5,314,924 | |
| | |
2.50%, 9/17/2020 (b) | | | 4,505,000 | | | | 4,524,600 | |
| | |
4.88%, 1/14/2021 (b) | | | 4,132,000 | | | | 4,286,399 | |
| | |
2.25%, 5/27/2021 (b) | | | 51,449,000 | | | | 51,611,742 | |
| | |
PNC Bank NA | | | | | | | | |
| | |
2.40%, 10/18/2019 | | | 6,922,000 | | | | 6,922,761 | |
| | |
2.30%, 6/1/2020 | | | 4,368,000 | | | | 4,375,507 | |
| | |
2.50%, 1/22/2021 | | | 5,181,000 | | | | 5,216,640 | |
| | |
(ICE LIBOR USD 3 Month + 0.25%), 2.53%, 1/22/2021 (a) | | | 1,500,000 | | | | 1,500,436 | |
| | | | | | | | |
| INVESTMENTS | | PRINCIPAL
AMOUNT ($) | | | VALUE ($) | |
| | | | | | | | |
|
Banks — continued | |
| | |
2.15%, 4/29/2021 | | | 22,347,000 | | | | 22,411,407 | |
| | |
(ICE LIBOR USD 3 Month + 0.50%), 2.76%, 7/27/2022 (a) | | | 2,165,000 | | | | 2,167,173 | |
| | |
Regions Bank (ICE LIBOR USD 3 Month + 0.38%), 2.70%, 4/1/2021 (a) | | | 6,425,000 | | | | 6,414,145 | |
| | |
Royal Bank of Canada (Canada) | | | | | | | | |
| | |
(ICE LIBOR USD 3 Month + 0.30%), 2.58%, 7/22/2020 (a) | | | 6,368,000 | | | | 6,378,395 | |
| | |
(ICE LIBOR USD 3 Month + 0.40%), 2.68%, 1/25/2021 (a) | | | 26,500,000 | | | | 26,592,379 | |
| | |
(ICE LIBOR USD 3 Month + 0.39%), 2.66%, 4/30/2021 (a) | | | 7,500,000 | | | | 7,523,995 | |
| | |
Santander UK plc (United Kingdom) 2.35%, 9/10/2019 | | | 10,103,000 | | | | 10,103,353 | |
| | |
(ICE LIBOR USD 3 Month + 0.62%), 3.14%, 6/1/2021 (a) | | | 2,800,000 | | | | 2,801,086 | |
| | |
3.40%, 6/1/2021 | | | 3,350,000 | | | | 3,419,393 | |
| | |
(ICE LIBOR USD 3 Month + 0.66%), 2.82%, 11/15/2021 (a) | | | 6,288,000 | | | | 6,303,640 | |
| | |
Skandinaviska Enskilda Banken AB (Sweden) | | | | | | | | |
| | |
1.50%, 9/13/2019 | | | 26,598,000 | | | | 26,593,542 | |
| | |
2.30%, 3/11/2020 | | | 4,055,000 | | | | 4,058,735 | |
| | |
2.45%, 5/27/2020 (b) | | | 12,711,000 | | | | 12,736,905 | |
| | |
2.63%, 11/17/2020 (b) | | | 38,006,000 | | | | 38,200,971 | |
| | |
2.63%, 3/15/2021 | | | 12,198,000 | | | | 12,307,712 | |
| | |
(ICE LIBOR USD 3 Month + 0.43%), 2.55%, 5/17/2021 (a) (b) | | | 7,500,000 | | | | 7,516,879 | |
| | |
2.80%, 3/11/2022 | | | 7,280,000 | | | | 7,408,362 | |
| | |
Societe Generale SA (France) | | | | | | | | |
| | |
2.63%, 9/16/2020 (b) | | | 2,026,000 | | | | 2,035,809 | |
| | |
2.50%, 4/8/2021 (b) | | | 6,677,000 | | | | 6,702,447 | |
| | |
(ICE LIBOR USD 3 Month + 1.33%), 3.63%, 4/8/2021 (a) (b) | | | 5,150,000 | | | | 5,223,117 | |
| | |
5.20%, 4/15/2021 (b) | | | 5,000,000 | | | | 5,239,781 | |
| | |
Standard Chartered plc (United Kingdom) | | | | | | | | |
| | |
2.40%, 9/8/2019 (b) | | | 3,165,000 | | | | 3,165,036 | |
| | |
2.25%, 4/17/2020 (b) | | | 19,055,000 | | | | 19,030,788 | |
| | |
3.05%, 1/15/2021 (b) | | | 34,673,000 | | | | 34,910,743 | |
| | |
(ICE LIBOR USD 3 Month + 1.15%), 3.43%, 1/20/2023 (a) (b) | | | 10,773,000 | | | | 10,740,789 | |
| | |
Sumitomo Mitsui Banking Corp. (Japan) (ICE LIBOR USD 3 Month + 0.35%), 2.65%, 1/17/2020 (a) | | | 9,863,000 | | | | 9,873,257 | |
| | |
Sumitomo Mitsui Financial Group, Inc. (Japan) | | | | | | | | |
| | |
(ICE LIBOR USD 3 Month + 1.11%), 3.43%, 7/14/2021 (a) | | | 5,404,000 | | | | 5,461,088 | |
SEE NOTES TO FINANCIAL STATEMENTS.
| | | | | | | | |
| | | |
| AUGUST 31, 2019 | | J.P. MORGAN EXCHANGE-TRADED FUNDS | | | | | 131 | |
JPMorgan Ultra-Short Income ETF
SCHEDULE OF PORTFOLIO INVESTMENTS
AS OF AUGUST 31, 2019 (Unaudited) (continued)
| | | | | | | | |
| INVESTMENTS | | PRINCIPAL
AMOUNT ($) | | | VALUE ($) | |
Corporate Bonds — continued | | | | | | | | |
|
Banks — continued | |
| | |
(ICE LIBOR USD 3 Month + 0.97%), 3.31%, 1/11/2022 (a) | | | 19,000,000 | | | | 19,139,728 | |
| | |
(ICE LIBOR USD 3 Month + 0.74%), 3.04%, 10/18/2022 (a) | | | 1,890,000 | | | | 1,897,092 | |
| | |
Sumitomo Mitsui Trust Bank Ltd. (Japan) | | | | | | | | |
| | |
1.95%, 9/19/2019 (b) | | | 2,432,000 | | | | 2,431,517 | |
| | |
2.05%, 10/18/2019 (b) | | | 5,298,000 | | | | 5,296,835 | |
| | |
(ICE LIBOR USD 3 Month + 0.91%), 3.21%, 10/18/2019 (a) (b) | | | 4,200,000 | | | | 4,205,392 | |
| | |
SunTrust Bank | | | | | | | | |
| | |
(ICE LIBOR USD 3 Month + 0.30%), 2.59%, 1/29/2021 (a) | | | 13,273,000 | | | | 13,291,076 | |
| | |
(ICE LIBOR USD 3 Month + 0.59%), 2.71%, 5/17/2022 (a) | | | 12,044,000 | | | | 12,073,962 | |
| | |
SunTrust Banks, Inc. 2.90%, 3/3/2021 | | | 8,079,000 | | | | 8,171,002 | |
| | |
Svenska Handelsbanken AB (Sweden) 1.50%, 9/6/2019 | | | 11,103,000 | | | | 11,102,516 | |
| | |
(ICE LIBOR USD 3 Month + 0.49%), 2.96%, 9/6/2019 (a) | | | 5,311,000 | | | | 5,311,215 | |
| | |
5.13%, 3/30/2020 (b) | | | 18,279,000 | | | | 18,594,487 | |
| | |
1.95%, 9/8/2020 | | | 2,706,000 | | | | 2,705,511 | |
| | |
2.40%, 10/1/2020 | | | 8,121,000 | | | | 8,150,902 | |
| | |
2.45%, 3/30/2021 | | | 8,784,000 | | | | 8,845,524 | |
| | |
(ICE LIBOR USD 3 Month + 0.47%), 2.60%, 5/24/2021 (a) | | | 28,555,000 | | | | 28,665,940 | |
| | |
Toronto-Dominion Bank (The) (Canada) (ICE LIBOR USD 3 Month + 0.28%), 2.73%, 6/11/2020 (a) | | | 8,731,000 | | | | 8,745,927 | |
| | |
UBS Group Funding Switzerland AG (Switzerland) | | | | | | | | |
| | |
2.95%, 9/24/2020 (b) | | | 16,113,000 | | | | 16,256,415 | |
| | |
(ICE LIBOR USD 3 Month + 1.44%), 3.78%, 9/24/2020 (a) (b) | | | 17,549,000 | | | | 17,789,415 | |
| | |
(ICE LIBOR USD 3 Month + 1.78%), 4.08%, 4/14/2021 (a) (b) | | | 1,400,000 | | | | 1,430,037 | |
| | |
3.00%, 4/15/2021 (b) | | | 9,293,000 | | | | 9,413,266 | |
| | |
(ICE LIBOR USD 3 Month + 1.53%), 3.78%, 2/1/2022 (a) (b) | | | 15,805,000 | | | | 16,178,932 | |
| | |
US Bank NA | | | | | | | | |
| | |
(ICE LIBOR USD 3 Month + 0.31%), 2.60%, 2/4/2021 (a) | | | 21,496,000 | | | | 21,531,872 | |
| | |
(ICE LIBOR USD 3 Month + 0.32%), 2.59%, 4/26/2021 (a) | | | 1,831,000 | | | | 1,833,249 | |
| | |
Westpac Banking Corp. (Australia) | | | | | | | | |
| | |
4.88%, 11/19/2019 | | | 7,187,000 | | | | 7,228,522 | |
| | |
2.15%, 3/6/2020 | | | 6,612,000 | | | | 6,616,305 | |
| | |
(ICE LIBOR USD 3 Month + 0.28%), 2.44%, 5/15/2020 (a) | | | 1,783,000 | | | | 1,785,587 | |
| | |
3.05%, 5/15/2020 | | | 5,500,000 | | | | 5,536,973 | |
| | | | | | | | |
| INVESTMENTS | | PRINCIPAL
AMOUNT ($) | | | VALUE ($) | |
| | | | | | | | |
|
Banks — continued | |
| | |
(ICE LIBOR USD 3 Month + 0.36%), 2.88%, 9/1/2020 (a) (b) | | | 950,000 | | | | 951,925 | |
| | |
2.60%, 11/23/2020 | | | 8,727,000 | | | | 8,791,757 | |
| | | | | | | | |
| | |
| | | | | | | 2,512,003,062 | |
| | | | | | | | |
|
Beverages — 0.4% | |
| | |
Anheuser-Busch InBev Worldwide, Inc. (Belgium) 6.88%, 11/15/2019 | | | 5,773,000 | | | | 5,806,671 | |
| | |
Constellation Brands, Inc.
2.25%, 11/6/2020 | | | 8,000,000 | | | | 8,010,607 | |
| | |
(ICE LIBOR USD 3 Month + 0.70%), 2.86%, 11/15/2021 (a) | | | 14,460,000 | | | | 14,463,149 | |
| | |
Diageo Capital plc (United Kingdom) (ICE LIBOR USD 3 Month + 0.24%), 2.36%, 5/18/2020 (a) | | | 2,215,000 | | | | 2,215,415 | |
| | |
Suntory Holdings Ltd. (Japan) 2.55%, 9/29/2019 (b) | | | 2,023,000 | | | | 2,023,038 | |
| | | | | | | | |
| | |
| | | | | | | 32,518,880 | |
| | | | | | | | |
|
Biotechnology — 0.4% | |
| | |
AbbVie, Inc. | | | | | | | | |
| | |
2.50%, 5/14/2020 | | | 25,382,000 | | | | 25,419,533 | |
| | |
2.30%, 5/14/2021 | | | 10,248,000 | | | | 10,273,595 | |
| | | | | | | | |
| | |
| | | | | | | 35,693,128 | |
| | | | | | | | |
|
Capital Markets — 4.6% | |
| | |
Bank of New York Mellon Corp. (The) 2.30%, 9/11/2019 | | | 4,978,000 | | | | 4,977,927 | |
| | |
CDP Financial, Inc. (Canada) 4.40%, 11/25/2019 (b) | | | 1,172,000 | | | | 1,178,106 | |
| | |
Charles Schwab Corp. (The) (ICE LIBOR USD 3 Month + 0.32%), 2.47%,
5/21/2021 (a) | | | 11,076,000 | | | | 11,081,240 | |
| | |
CPPIB Capital, Inc. (Canada) 1.25%, 9/20/2019 (b) | | | 4,798,000 | | | | 4,796,033 | |
| | |
Goldman Sachs Bank USA 3.20%, 6/5/2020 | | | 1,305,000 | | | | 1,316,483 | |
| | |
(SOFR + 0.60%), 2.71%, 5/24/2021 (a) | | | 15,914,000 | | | | 15,923,524 | |
| | |
Goldman Sachs Group, Inc. (The) | | | | | | | | |
| | |
2.55%, 10/23/2019 | | | 1,033,000 | | | | 1,033,448 | |
| | |
5.38%, 3/15/2020 | | | 7,594,000 | | | | 7,722,120 | |
| | |
(ICE LIBOR USD 3 Month + 1.16%), 3.42%, 4/23/2020 (a) | | | 7,445,000 | | | | 7,483,074 | |
| | |
Series D, 6.00%, 6/15/2020 | | | 3,000,000 | | | | 3,086,188 | |
| | |
(ICE LIBOR USD 3 Month + 1.20%), 3.61%, 9/15/2020 (a) | | | 5,049,000 | | | | 5,091,349 | |
| | |
(ICE LIBOR USD 3 Month + 0.73%), 3.04%, 12/27/2020 (a) | | | 5,444,000 | | | | 5,450,967 | |
SEE NOTES TO FINANCIAL STATEMENTS.
| | | | | | |
| | | |
| 132 | | | | J.P. MORGAN EXCHANGE-TRADED FUNDS | | AUGUST 31, 2019 |
| | | | | | | | |
| INVESTMENTS | | PRINCIPAL
AMOUNT ($) | | | VALUE ($) | |
Corporate Bonds — continued | | | | | | | | |
|
Capital Markets — continued | |
| | |
(ICE LIBOR USD 3 Month + 1.77%), 3.90%, 2/25/2021 (a) | | | 5,144,000 | | | | 5,251,420 | |
| | |
(ICE LIBOR USD 3 Month + 1.11%), 3.38%, 4/26/2022 (a) | | | 20,664,000 | | | | 20,828,513 | |
| | |
(ICE LIBOR USD 3 Month + 0.78%), 3.04%, 10/31/2022 (a) | | | 9,934,000 | | | | 9,956,222 | |
| | |
ING Bank NV (Netherlands)
2.50%, 10/1/2019 (b) | | | 10,911,000 | | | | 10,913,757 | |
| | |
(ICE LIBOR USD 3 Month + 0.69%), 3.01%, 10/1/2019 (a) (b) | | | 2,535,000 | | | | 2,536,580 | |
| | |
2.45%, 3/16/2020 (b) | | | 27,206,000 | | | | 27,259,705 | |
| | |
(ICE LIBOR USD 3 Month + 0.97%), 3.09%, 8/17/2020 (a) (b) | | | 6,025,000 | | | | 6,072,502 | |
| | |
5.00%, 6/9/2021 (b) | | | 4,378,000 | | | | 4,588,254 | |
| | |
Macquarie Bank Ltd. (Australia)
2.85%, 1/15/2021 (b) | | | 16,688,000 | | | | 16,833,848 | |
| | |
(ICE LIBOR USD 3 Month + 0.45%), 2.62%, 8/6/2021 (a) (b) | | | 66,780,000 | | | | 66,717,641 | |
| | |
Morgan Stanley | | | | | | | | |
| | |
5.63%, 9/23/2019 | | | 2,274,000 | | | | 2,277,918 | |
| | |
5.50%, 1/26/2020 | | | 6,500,000 | | | | 6,581,753 | |
| | |
(ICE LIBOR USD 3 Month + 1.14%), 3.40%, 1/27/2020 (a) | | | 4,500,000 | | | | 4,518,374 | |
| | |
5.50%, 7/24/2020 | | | 4,030,000 | | | | 4,149,603 | |
| | |
5.75%, 1/25/2021 | | | 7,403,000 | | | | 7,766,922 | |
| | |
(ICE LIBOR USD 3 Month + 0.55%), 2.73%, 2/10/2021 (a) | | | 5,500,000 | | | | 5,504,702 | |
| | |
2.50%, 4/21/2021 | | | 5,500,000 | | | | 5,530,729 | |
| | |
(ICE LIBOR USD 3 Month + 1.40%), 3.68%, 4/21/2021 (a) | | | 5,904,000 | | | | 5,999,914 | |
| | |
(ICE LIBOR USD 3 Month + 0.93%), 3.21%, 7/22/2022 (a) | | | 28,458,000 | | | | 28,654,887 | |
| | |
Nomura Holdings, Inc. (Japan) 6.70%, 3/4/2020 | | | 26,732,000 | | | | 27,325,577 | |
| | |
UBS AG (Switzerland) 2.20%, 6/8/2020 (b) | | | 6,737,000 | | | | 6,740,053 | |
| | |
(ICE LIBOR USD 3 Month + 0.58%), 3.03%, 6/8/2020 (a) (b) | | | 3,000,000 | | | | 3,008,928 | |
| | |
2.45%, 12/1/2020 (b) | | | 26,063,000 | | | | 26,169,337 | |
| | |
(ICE LIBOR USD 3 Month + 0.48%), 3.00%, 12/1/2020 (a) (b) | | | 10,162,000 | | | | 10,186,186 | |
| | | | | | | | |
| | |
| | | | | | | 384,513,784 | |
| | | | | | | | |
|
Chemicals — 0.4% | |
| | |
Air Liquide Finance SA (France) | | | | | | | | |
| | |
1.38%, 9/27/2019 (b) | | | 22,816,000 | | | | 22,800,721 | |
| | |
1.75%, 9/27/2021 (b) | | | 3,960,000 | | | | 3,933,419 | |
| | |
Chevron Phillips Chemical Co. LLC 2.45%, 5/1/2020 (b) | | | 2,922,000 | | | | 2,923,127 | |
| | | | | | | | |
| INVESTMENTS | | PRINCIPAL
AMOUNT ($) | | | VALUE ($) | |
| | | | | | | | |
|
Chemicals — continued | |
| | |
DuPont de Nemours, Inc. (ICE LIBOR USD 3 Month + 0.71%), 2.87%, 11/15/2020 (a) | | | 7,099,000 | | | | 7,136,846 | |
| | | | | | | | |
| | |
| | | | | | | 36,794,113 | |
| | | | | | | | |
|
Commercial Services & Supplies — 0.2% | |
| | |
Republic Services, Inc. 5.00%, 3/1/2020 | | | 17,167,000 | | | | 17,390,406 | |
| | | | | | | | |
|
Construction Materials — 0.1% | |
| | |
Martin Marietta Materials, Inc. (ICE LIBOR USD 3 Month + 0.65%), 2.80%, 5/22/2020 (a) | | | 6,127,000 | | | | 6,134,613 | |
| | | | | | | | |
|
Consumer Finance — 2.9% | |
| | |
American Express Co. | | | | | | | | |
| | |
2.20%, 10/30/2020 | | | 10,229,000 | | | | 10,248,516 | |
| | |
3.00%, 2/22/2021 | | | 15,608,000 | | | | 15,822,260 | |
| | |
(ICE LIBOR USD 3 Month + 0.53%), 2.65%, 5/17/2021 (a) | | | 3,354,000 | | | | 3,364,781 | |
| | |
(ICE LIBOR USD 3 Month + 0.60%), 2.89%, 11/5/2021 (a) | | | 8,000,000 | | | | 8,043,040 | |
| | |
(ICE LIBOR USD 3 Month + 0.62%), 2.76%, 5/20/2022 (a) | | | 15,171,000 | | | | 15,219,462 | |
| | |
(ICE LIBOR USD 3 Month + 0.65%), 2.78%, 2/27/2023 (a) | | | 5,921,000 | | | | 5,927,038 | |
| | |
American Express Credit Corp.
1.70%, 10/30/2019 | | | 9,547,000 | | | | 9,539,791 | |
| | |
(ICE LIBOR USD 3 Month + 0.57%), 2.84%, 10/30/2019 (a) | | | 1,524,000 | | | | 1,524,612 | |
| | |
2.38%, 5/26/2020 | | | 6,488,000 | | | | 6,496,357 | |
| | |
Avolon Holdings Funding Ltd. (Ireland) 3.63%, 5/1/2022 (b) | | | 11,415,000 | | | | 11,578,235 | |
| | |
Capital One Financial Corp.
2.50%, 5/12/2020 | | | 15,484,000 | | | | 15,511,672 | |
| | |
(ICE LIBOR USD 3 Month + 0.76%), 2.94%, 5/12/2020 (a) | | | 8,250,000 | | | | 8,274,343 | |
| | |
(ICE LIBOR USD 3 Month + 0.95%), 3.40%, 3/9/2022 (a) | | | 8,214,000 | | | | 8,265,724 | |
| | |
Caterpillar Financial Services Corp. | | | | | | | | |
| | |
(ICE LIBOR USD 3 Month + 0.18%), 2.34%, 5/15/2020 (a) | | | 7,353,000 | | | | 7,355,079 | |
| | |
(ICE LIBOR USD 3 Month + 0.23%), 2.64%, 3/15/2021 (a) | | | 30,000,000 | | | | 30,007,500 | |
| | |
(ICE LIBOR USD 3 Month + 0.28%), 2.75%, 9/7/2021 (a) | | | 5,263,000 | | | | 5,266,222 | |
| | |
General Motors Financial Co., Inc. 3.15%, 1/15/2020 | | | 6,581,000 | | | | 6,593,143 | |
| | |
(ICE LIBOR USD 3 Month + 0.93%), 3.23%, 4/13/2020 (a) | | | 17,242,000 | | | | 17,286,758 | |
SEE NOTES TO FINANCIAL STATEMENTS.
| | | | | | | | |
| | | |
| AUGUST 31, 2019 | | J.P. MORGAN EXCHANGE-TRADED FUNDS | | | | | 133 | |
JPMorgan Ultra-Short Income ETF
SCHEDULE OF PORTFOLIO INVESTMENTS
AS OF AUGUST 31, 2019 (Unaudited) (continued)
| | | | | | | | |
| INVESTMENTS | | PRINCIPAL
AMOUNT ($) | | | VALUE ($) | |
Corporate Bonds — continued | | | | | | | | |
|
Consumer Finance — continued | |
| | |
John Deere Capital Corp.
1.70%, 1/15/2020 | | | 5,495,000 | | | | 5,487,470 | |
| | |
(ICE LIBOR USD 3 Month + 0.42%), 2.76%, 7/10/2020 (a) | | | 26,235,000 | | | | 26,320,262 | |
| | |
PACCAR Financial Corp.
| | | | | | | | |
| | |
(ICE LIBOR USD 3 Month + 0.20%), 2.38%, 11/13/2020 (a) | | | 11,340,000 | | | | 11,351,153 | |
| | |
(ICE LIBOR USD 3 Month + 0.26%), 2.44%, 5/10/2021 (a) | | | 1,099,000 | | | | 1,099,489 | |
| | |
Toyota Motor Credit Corp. (ICE LIBOR USD 3 Month + 0.40%), 2.52%, 5/17/2022 (a) | | | 10,900,000 | | | | 10,907,881 | |
| | | | | | | | |
| | |
| | | | | | | 241,490,788 | |
| | | | | | | | |
|
Diversified Financial Services — 1.3% | |
| | |
AIG Global Funding
| | | | | | | | |
| | |
(ICE LIBOR USD 3 Month + 0.48%), 2.80%, 7/2/2020 (a) (b) | | | 3,956,000 | | | | 3,965,595 | |
| | |
(ICE LIBOR USD 3 Month + 0.65%), 2.93%, 1/22/2021 (a) (b) | | | 48,025,000 | | | | 48,157,024 | |
| | |
Boeing Capital Corp. 4.70%, 10/27/2019 | | | 3,910,000 | | | | 3,924,729 | |
| | |
CK Hutchison International II Ltd. (Hong Kong) 2.25%, 9/29/2020 (b) | | | 12,136,000 | | | | 12,128,415 | |
| | |
CK Hutchison International Ltd. (Hong Kong) 1.88%, 10/3/2021 (b) | | | 23,510,000 | | | | 23,252,361 | |
| | |
National Rural Utilities Cooperative Finance Corp. | | | | | | | | |
| | |
2.00%, 1/27/2020 (c) | | | 2,787,000 | | | | 2,783,878 | |
| | |
(ICE LIBOR USD 3 Month + 0.38%), 2.69%, 6/30/2021 (a) | | | 7,659,000 | | | | 7,685,642 | |
| | |
Siemens Financieringsmaatschappij NV (Germany) (ICE LIBOR USD 3 Month + 0.34%), 2.75%, 3/16/2020 (a) (b) | | | 4,536,000 | | | | 4,542,120 | |
| | | | | | | | |
| | |
| | | | | | | 106,439,764 | |
| | | | | | | | |
|
Diversified Telecommunication Services — 1.1% | |
| | |
AT&T, Inc. (ICE LIBOR USD 3 Month + 0.65%), 2.95%, 1/15/2020 (a) | | | 12,300,000 | | | | 12,321,857 | |
| | |
Deutsche Telekom International Finance BV (Germany) | | | | | | | | |
| | |
1.50%, 9/19/2019 (b) | | | 5,145,000 | | | | 5,143,011 | |
| | |
(ICE LIBOR USD 3 Month + 0.45%), 2.87%, 9/19/2019 (a) (b) | | | 4,490,000 | | | | 4,490,882 | |
| | |
2.23%, 1/17/2020 (b) | | | 20,559,000 | | | | 20,544,179 | |
| | |
(ICE LIBOR USD 3 Month + 0.58%), 2.88%, 1/17/2020 (a) (b) | | | 3,009,000 | | | | 3,012,002 | |
| | |
Orange SA (France) 1.63%, 11/3/2019 | | | 8,493,000 | | | | 8,484,087 | |
| | | | | | | | |
| INVESTMENTS | | PRINCIPAL
AMOUNT ($) | | | VALUE ($) | |
| | | | | | | | |
|
Diversified Telecommunication Services — continued | |
| | |
Verizon Communications, Inc | | | | | | | | |
| | |
.(ICE LIBOR USD 3 Month + 0.55%), 2.70%, 5/22/2020 (a) | | | 14,024,000 | | | | 14,055,126 | |
| | |
(ICE LIBOR USD 3 Month + 1.00%), 3.41%, 3/16/2022 (a) | | | 25,699,000 | | | | 26,107,714 | |
| | | | | | | | |
| | |
| | | | | | | 94,158,858 | |
| | | | | | | | |
|
Electric Utilities — 1.6% | |
| | |
Duke Energy Corp. (ICE LIBOR USD 3 Month + 0.50%), 2.68%, 5/14/2021 (a) (b) | | | 14,791,000 | | | | 14,837,375 | |
| | |
Duke Energy Florida LLC | | | | | | | | |
| | |
2.10%, 12/15/2019 (c) | | | 132,750 | | | | 132,696 | |
| | |
1.85%, 1/15/2020 | | | 2,325,000 | | | | 2,323,261 | |
| | |
Eversource Energy 4.50%, 11/15/2019 | | | 4,818,000 | | | | 4,836,859 | |
| | |
Exelon Corp. | | | | | | | | |
| | |
2.85%, 6/15/2020 | | | 3,500,000 | | | | 3,515,587 | |
| | |
5.15%, 12/1/2020 | | | 3,434,000 | | | | 3,532,379 | |
| | |
Florida Power & Light Co. (ICE LIBOR USD 3 Month + 0.40%), 2.64%, 5/6/2022 (a) | | | 20,000,000 | | | | 20,005,422 | |
| | |
LG&E & KU Energy LLC 3.75%, 11/15/2020 | | | 7,783,000 | | | | 7,900,073 | |
| | |
Mississippi Power Co. (ICE LIBOR USD 3 Month + 0.65%), 2.96%, 3/27/2020 (a) | | | 2,849,000 | | | | 2,849,353 | |
| | |
NextEra Energy Capital Holdings, Inc. 2.40%, 9/1/2021 | | | 13,863,000 | | | | 13,935,689 | |
| | |
(ICE LIBOR USD 3 Month + 0.72%), 2.85%, 2/25/2022 (a) | | | 42,944,000 | | | | 43,190,387 | |
| | |
State Grid Overseas Investment 2016 Ltd. (China) 2.25%, 5/4/2020 (b) | | | 9,618,000 | | | | 9,614,853 | |
| | |
Tampa Electric Co. 5.40%, 5/15/2021 | | | 5,014,000 | | | | 5,287,188 | |
| | |
Wisconsin Power & Light Co. 4.60%, 6/15/2020 | | | 1,368,000 | | | | 1,394,230 | |
| | | | | | | | |
| | |
| | | | | | | 133,355,352 | |
| | | | | | | | |
|
Energy Equipment & Services — 0.3% | |
| | |
Schlumberger Holdings Corp. 3.00%, 12/21/2020 (b) | | | 15,462,000 | | | | 15,614,706 | |
| | |
Schlumberger Investment SA 3.30%, 9/14/2021 (b) | | | 7,324,000 | | | | 7,467,126 | |
| | | | | | | | |
| | |
| | | | | | | 23,081,832 | |
| | | | | | | | |
|
Entertainment — 0.5% | |
| | |
NBCUniversal Enterprise, Inc. (ICE LIBOR USD 3 Month + 0.40%), 2.72%, 4/1/2021 (a) (b) | | | 40,262,000 | | | | 40,336,082 | |
| | | | | | | | |
SEE NOTES TO FINANCIAL STATEMENTS.
| | | | | | |
| | | |
| 134 | | | | J.P. MORGAN EXCHANGE-TRADED FUNDS | | AUGUST 31, 2019 |
| | | | | | | | |
| INVESTMENTS | | PRINCIPAL
AMOUNT ($) | | | VALUE ($) | |
Corporate Bonds — continued | | | | | | | | |
|
Equity Real Estate Investment Trusts (REITs) — 1.1% | |
| | |
Scentre Group Trust 1 (Australia) | | | | | | | | |
| | |
2.38%, 11/5/2019 (b) | | | 14,402,000 | | | | 14,396,501 | |
| | |
2.38%, 4/28/2021 (b) | | | 1,737,000 | | | | 1,736,888 | |
| | |
WEA Finance LLC (France) | | | | | | | | |
| | |
2.70%, 9/17/2019 (b) | | | 10,346,000 | | | | 10,346,637 | |
| | |
3.25%, 10/5/2020 (b) | | | 63,945,000 | | | | 64,703,664 | |
| | | | | | | | |
| | |
| | | | | | | 91,183,690 | |
| | | | | | | | |
|
Food & Staples Retailing — 0.6% | |
| | |
Alimentation Couche-Tard, Inc. (Canada) 2.35%, 12/13/2019 (b) | | | 31,182,000 | | | | 31,183,459 | |
| | |
Kroger Co. (The) | | | | | | | | |
| | |
1.50%, 9/30/2019 | | | 9,361,000 | | | | 9,355,846 | |
| | |
6.15%, 1/15/2020 | | | 7,740,000 | | | | 7,845,622 | |
| | | | | | | | |
| | |
| | | | | | | 48,384,927 | |
| | | | | | | | |
|
Food Products — 0.4% | |
| | |
General Mills, Inc. (ICE LIBOR USD 3 Month + 0.54%), 2.86%, 4/16/2021 (a) | | | 8,055,000 | | | | 8,059,430 | |
| | |
Mondelez International Holdings Netherlands BV | | | | | | | | |
| | |
1.63%, 10/28/2019 (b) | | | 4,552,000 | | | | 4,547,241 | |
| | |
(ICE LIBOR USD 3 Month + 0.61%), 2.87%, 10/28/2019 (a) (b) | | | 6,200,000 | | | | 6,205,691 | |
| | |
Mondelez International, Inc. 3.00%, 5/7/2020 | | | 14,496,000 | | | | 14,565,822 | |
| | |
Tyson Foods, Inc. (ICE LIBOR USD 3 Month + 0.55%), 3.07%,
6/2/2020 (a) (c) | | | 1,372,000 | | | | 1,373,601 | |
| | | | | | | | |
| | |
| | | | | | | 34,751,785 | |
| | | | | | | | |
|
Health Care Equipment & Supplies — 0.0%(d) | |
| | |
Zimmer Biomet Holdings, Inc. (ICE LIBOR USD 3 Month + 0.75%), 3.17%, 3/19/2021 (a) | | | 1,510,000 | | | | 1,508,253 | |
| | | | | | | | |
|
Health Care Providers & Services — 0.7% | |
| | |
Cigna Corp. 3.20%, 9/17/2020 | | | 5,909,000 | | | | 5,963,325 | |
| | |
CVS Health Corp. (ICE LIBOR USD 3 Month + 0.63%), | | | | | | | | |
| | |
3.08%, 3/9/2020 (a) | | | 1,743,000 | | | | 1,746,887 | |
| | |
2.80%, 7/20/2020 | | | 31,415,000 | | | | 31,571,601 | |
| | |
Express Scripts Holding Co.
2.60%, 11/30/2020 | | | 18,314,000 | | | | 18,392,328 | |
| | |
(ICE LIBOR USD 3 Month + 0.75%), 2.87%, 11/30/2020 (a) | | | 3,400,000 | | | | 3,400,530 | |
| | | | | | | | |
| | |
| | | | | | | 61,074,671 | |
| | | | | | | | |
| | | | | | | | |
| INVESTMENTS | | PRINCIPAL
AMOUNT ($) | | | VALUE ($) | |
| | | | | | | | |
|
Independent Power and Renewable Electricity Producers — 0.3% | |
| | |
Exelon Generation Co. LLC | | | | | | | | |
| | |
5.20%, 10/1/2019 | | | 11,971,000 | | | | 11,996,279 | |
| | |
2.95%, 1/15/2020 | | | 14,634,000 | | | | 14,662,331 | |
| | | | | | | | |
| | |
| | | | | | | 26,658,610 | |
| | | | | | | | |
|
Industrial Conglomerates — 0.3% | |
| | |
Honeywell International, Inc. (ICE LIBOR USD 3 Month + 0.37%), 2.56%, 8/8/2022 (a) | | | 21,297,000 | | | | 21,351,286 | |
| | |
Hutchison Whampoa International Ltd. (Hong Kong) 5.75%, 9/11/2019 (b) | | | 1,826,000 | | | | 1,826,082 | |
| | | | | | | | |
| | |
| | | | | | | 23,177,368 | |
| | | | | | | | |
|
Insurance — 5.6% | |
| | |
AIA Group Ltd. (Hong Kong) (ICE LIBOR USD 3 Month + 0.52%), 2.91%, 9/20/2021 (a) (b) | | | 10,683,000 | | | | 10,662,734 | |
| | |
Alterra Finance LLC 6.25%, 9/30/2020 | | | 4,128,000 | | | | 4,303,887 | |
| | |
American International Group, Inc. | | | | | | | | |
| | |
6.40%, 12/15/2020 | | | 5,739,000 | | | | 6,046,709 | |
| | |
3.30%, 3/1/2021 | | | 10,954,000 | | | | 11,135,289 | |
| | |
Athene Global Funding
2.75%, 4/20/2020 (b) (c) | | | 18,827,000 | | | | 18,889,177 | |
| | |
(ICE LIBOR USD 3 Month + 1.14%), 3.42%, 4/20/2020 (a) (b) | | | 7,295,000 | | | | 7,335,573 | |
| | |
4.00%, 1/25/2022 (b) | | | 11,205,000 | | | | 11,630,872 | |
| | |
(ICE LIBOR USD 3 Month + 1.23%), 3.56%, 7/1/2022 (a) (b) | | | 26,740,000 | | | | 26,909,756 | |
| | |
Jackson National Life Global Funding | | | | | | | | |
| | |
(ICE LIBOR USD 3 Month + 0.30%),
2.56%, 4/27/2020 (a) (b) | | | 15,809,000 | | | | 15,827,154 | |
| | |
(ICE LIBOR USD 3 Month + 0.30%), 2.60%, 10/15/2020 (a) (b) | | | 17,176,000 | | | | 17,195,789 | |
| | |
(ICE LIBOR USD 3 Month + 0.31%), 2.72%, 3/16/2021 (a) (b) | | | 60,180,000 | | | | 60,188,898 | |
| | |
2.25%, 4/29/2021 (b) | | | 18,748,000 | | | | 18,805,065 | |
| | |
(ICE LIBOR USD 3 Month + 0.48%), 2.93%, 6/11/2021 (a) (b) | | | 3,446,000 | | | | 3,451,553 | |
| | |
(ICE LIBOR USD 3 Month + 0.73%), 3.04%, 6/27/2022 (a) (b) | | | 7,250,000 | | | | 7,311,463 | |
| | |
Marsh & McLennan Cos., Inc. 2.35%, 3/6/2020 | | | 7,619,000 | | | | 7,624,072 | |
| | |
MassMutual Global Funding II | | | | | | | | |
| | |
1.55%, 10/11/2019 (b) | | | 6,914,000 | | | | 6,909,229 | |
| | |
2.00%, 4/15/2021 (b) | | | 18,002,000 | | | | 18,007,866 | |
| | |
Metropolitan Life Global Funding I 2.00%, 4/14/2020 (b) | | | 1,125,000 | | | | 1,124,551 | |
| | |
(ICE LIBOR USD 3 Month + 0.40%), 2.84%, 6/12/2020 (a) (b) | | | 2,631,000 | | | | 2,637,525 | |
SEE NOTES TO FINANCIAL STATEMENTS.
| | | | | | | | |
| | | |
| AUGUST 31, 2019 | | J.P. MORGAN EXCHANGE-TRADED FUNDS | | | | | 135 | |
JPMorgan Ultra-Short Income ETF
SCHEDULE OF PORTFOLIO INVESTMENTS
AS OF AUGUST 31, 2019 (Unaudited) (continued)
| | | | | | | | |
| INVESTMENTS | | PRINCIPAL
AMOUNT ($) | | | VALUE ($) | |
Corporate Bonds — continued | | | | | | | | |
|
Insurance — continued | |
| | |
(SOFR + 0.57%), 2.69%,
9/7/2020 (a) (b) | | | 12,500,000 | | | | 12,534,150 | |
| | |
2.40%, 1/8/2021 (b) | | | 29,283,000 | | | | 29,453,017 | |
| | |
(ICE LIBOR USD 3 Month + 0.23%), 2.53%, 1/8/2021 (a) (b) | | | 12,450,000 | | | | 12,450,627 | |
| | |
New York Life Global Funding
1.50%, 10/24/2019 (b) | | | 4,625,000 | | | | 4,621,065 | |
| | |
(ICE LIBOR USD 3 Month + 0.32%), 2.56%, 8/6/2021 (a) (b) | | | 2,017,000 | | | | 2,019,991 | |
| | |
Pricoa Global Funding I 1.45%, 9/13/2019 (b) | | | 1,242,000 | | | | 1,241,766 | |
| | |
Principal Life Global Funding II | | | | | | | | |
| | |
2.38%, 9/11/2019 (b) | | | 1,624,000 | | | | 1,624,000 | |
| | |
2.15%, 1/10/2020 (b) | | | 15,820,000 | | | | 15,818,677 | |
| | |
(ICE LIBOR USD 3 Month + 0.33%), 2.85%, 3/2/2021 (a) (b) | | | 20,233,000 | | | | 20,227,067 | |
| | |
Protective Life Global Funding | | | | | | | | |
| | |
1.56%, 9/13/2019 (b) | | | 10,119,000 | | | | 10,116,711 | |
| | |
2.26%, 4/8/2020 (b) | | | 15,779,000 | | | | 15,777,116 | |
| | |
(ICE LIBOR USD 3 Month + 0.37%), 2.67%, 7/13/2020 (a) (b) | | | 10,380,000 | | | | 10,404,207 | |
| | |
2.16%, 9/25/2020 (b) | | | 2,458,000 | | | | 2,460,385 | |
| | |
2.70%, 11/25/2020 (b) | | | 7,952,000 | | | | 8,007,385 | |
| | |
Reliance Standard Life Global Funding II | | | | | | | | |
| | |
2.50%, 1/15/2020 (b) | | | 9,888,000 | | | | 9,892,223 | |
| | |
2.38%, 5/4/2020 (b) | | | 54,986,000 | | | | 55,060,762 | |
| | | | | | | | |
| | |
| | | | | | | 467,706,311 | |
| | | | | | | | |
|
Interactive Media & Services — 0.0% (d) | |
| | |
Tencent Holdings Ltd. (China) 2.88%, 2/11/2020 (b) | | | 2,159,000 | | | | 2,163,217 | |
| | | | | | | | |
|
IT Services — 0.8% | |
| | |
International Business Machines Corp. (ICE LIBOR USD 3 Month + 0.40%), | | | | | | | | |
| | |
2.58%, 5/13/2021 (a) | | | 35,040,000 | | | | 35,139,516 | |
| | |
2.80%, 5/13/2021 | | | 30,461,000 | | | | 30,856,427 | |
| | | | | | | | |
| | |
| | | | | | | 65,995,943 | |
| | | | | | | | |
|
Media — 0.1% | |
| | |
Comcast Corp. (ICE LIBOR USD 3 Month + 0.33%), 2.65%, 10/1/2020 (a) | | | 13,434,000 | | | | 13,452,734 | |
| | | | | | | | |
|
Multiline Retail — 0.2% | |
| | |
Dollar Tree, Inc. (ICE LIBOR USD 3 Month + 0.70%), 3.00%, 4/17/2020 (a) | | | 14,311,000 | | | | 14,311,876 | |
| | | | | | | | |
| | | | | | | | |
| INVESTMENTS | | PRINCIPAL
AMOUNT ($) | | | VALUE ($) | |
| | | | | | | | |
|
Multi-Utilities — 0.9% | |
| | |
Consolidated Edison Co. of New York, Inc. Series C, (ICE LIBOR USD 3 Month + 0.40%), 2.75%, 6/25/2021 (a) | | | 2,631,000 | | | | 2,640,524 | |
| | |
Dominion Energy, Inc. 2.72%, 8/15/2021 (e) | | | 20,166,000 | | | | 20,335,636 | |
| | |
DTE Energy Co. | | | | | | | | |
| | |
1.50%, 10/1/2019 | | | 11,937,000 | | | | 11,928,924 | |
| | |
2.40%, 12/1/2019 | | | 3,111,000 | | | | 3,111,074 | |
| | |
TECO Finance, Inc. 5.15%, 3/15/2020 | | | 31,096,000 | | | | 31,542,960 | |
| | |
WEC Energy Group, Inc. 2.45%, 6/15/2020 | | | 5,887,000 | | | | 5,894,077 | |
| | | | | | | | |
| | |
| | | | | | | 75,453,195 | |
| | | | | | | | |
|
Oil, Gas & Consumable Fuels — 2.5% | |
| | |
BG Energy Capital plc (United Kingdom) 4.00%, 12/9/2020 (b) | | | 2,453,000 | | | | 2,506,788 | |
| | |
BP Capital Markets America, Inc. 4.50%, 10/1/2020 | | | 4,183,000 | | | | 4,295,031 | |
| | |
BP Capital Markets plc (United Kingdom) (ICE LIBOR USD 3 Month + 0.25%), 2.38%, 11/24/2020 (a) | | | 31,151,000 | | | | 31,181,372 | |
| | |
Columbia Pipeline Group, Inc. 3.30%, 6/1/2020 | | | 26,017,000 | | | | 26,188,981 | |
| | |
Enbridge Energy Partners LP | | | | | | | | |
| | |
5.20%, 3/15/2020 | | | 19,208,000 | | | | 19,489,810 | |
| | |
4.38%, 10/15/2020 | | | 3,886,000 | | | | 3,967,868 | |
| | |
Enbridge, Inc. (Canada) (ICE LIBOR USD 3 Month + 0.40%), 2.74%, 1/10/2020 (a) | | | 24,575,000 | | | | 24,585,289 | |
| | |
Energy Transfer Operating LP 7.50%, 10/15/2020 | | | 1,000,000 | | | | 1,053,678 | |
| | |
Enterprise Products Operating LLC | | | | | | | | |
| | |
2.55%, 10/15/2019 | | | 1,038,000 | | | | 1,037,921 | |
| | |
5.25%, 1/31/2020 | | | 5,938,000 | | | | 6,006,025 | |
| | |
EOG Resources, Inc. 2.45%, 4/1/2020 | | | 7,091,000 | | | | 7,101,041 | |
| | |
Exxon Mobil Corp. 1.90%, 8/16/2022 | | | 10,747,000 | | | | 10,818,650 | |
| | |
(ICE LIBOR USD 3 Month + 0.33%), 2.50%, 8/16/2022 (a) | | | 26,284,000 | | | | 26,351,918 | |
| | |
Occidental Petroleum Corp. (ICE LIBOR USD 3 Month + 0.95%), 3.14%, 2/8/2021 (a) | | | 23,830,000 | | | | 23,938,665 | |
| | |
Phillips 66 | | | | | | | | |
| | |
(ICE LIBOR USD 3 Month + 0.75%), 3.05%, 4/15/2020 (a) (b) | | | 410,000 | | | | 410,121 | |
| | |
(ICE LIBOR USD 3 Month + 0.60%), 2.73%, 2/26/2021 (a) | | | 1,115,000 | | | | 1,115,042 | |
| | |
Spectra Energy Partners LP (ICE LIBOR USD 3 Month + 0.70%), 3.18%, 6/5/2020 (a) | | | 4,042,000 | | | | 4,050,092 | |
SEE NOTES TO FINANCIAL STATEMENTS.
| | | | | | |
| | | |
| 136 | | | | J.P. MORGAN EXCHANGE-TRADED FUNDS | | AUGUST 31, 2019 |
| | | | | | | | |
| INVESTMENTS | | PRINCIPAL
AMOUNT ($) | | | VALUE ($) | |
Corporate Bonds — continued | | | | | | | | |
|
Oil, Gas & Consumable Fuels — continued | |
| | |
Total Capital International SA (France) 2.22%, 7/12/2021 | | | 16,284,000 | | | | 16,391,919 | |
| | |
TransCanada PipeLines Ltd. (Canada) 2.13%, 11/15/2019 | | | 1,513,000 | | | | 1,511,916 | |
| | | | | | | | |
| | |
| | | | | | | 212,002,127 | |
| | | | | | | | |
|
Pharmaceuticals — 1.1% | |
| | |
Bristol-Myers Squibb Co. | | | | | | | | |
| | |
(ICE LIBOR USD 3 Month + 0.20%), 2.37%, 11/16/2020 (a) (b) | | | 13,848,000 | | | | 13,845,915 | |
| | |
(ICE LIBOR USD 3 Month + 0.38%), 2.55%, 5/16/2022 (a) (b) | | | 14,789,000 | | | | 14,810,147 | |
| | |
EMD Finance LLC (Germany) 2.40%, 3/19/2020 (b) | | | 12,240,000 | | | | 12,245,085 | |
| | |
GlaxoSmithKline Capital plc (United Kingdom) (ICE LIBOR USD 3 Month + 0.35%), 2.53%, 5/14/2021 (a) | | | 3,393,000 | | | | 3,399,786 | |
| | |
Shire Acquisitions Investments Ireland DAC 1.90%, 9/23/2019 | | | 25,000,000 | | | | 24,994,500 | |
| | |
Zoetis, Inc. (ICE LIBOR USD 3 Month + 0.44%), 2.58%, 8/20/2021 (a) | | | 22,847,000 | | | | 22,733,837 | |
| | | | | | | | |
| | |
| | | | | | | 92,029,270 | |
| | | | | | | | |
|
Road & Rail — 0.6% | |
| | |
Burlington Northern Santa Fe LLC 4.70%, 10/1/2019 | | | 3,405,000 | | | | 3,411,257 | |
| | |
ERAC USA Finance LLC 2.35%, 10/15/2019 (b) | | | 9,681,000 | | | | 9,678,683 | |
| | |
Penske Truck Leasing Co. LP 3.65%, 7/29/2021 (b) | | | 15,088,000 | | | | 15,443,655 | |
| | |
Ryder System, Inc. | | | | | | | | |
| | |
2.45%, 9/3/2019 | | | 5,465,000 | | | | 5,465,000 | |
| | |
2.88%, 9/1/2020 | | | 13,115,000 | | | | 13,185,378 | |
| | |
2.88%, 6/1/2022 | | | 6,291,000 | | | | 6,419,800 | |
| | | | | | | | |
| | |
| | | | | | | 53,603,773 | |
| | | | | | | | |
|
Technology Hardware, Storage & Peripherals — 0.0%(d) | |
| | |
Apple, Inc. (ICE LIBOR USD 3 Month + 0.20%), 2.41%, 2/7/2020 (a) | | | 400,000 | | | | 400,258 | |
| | | | | | | | |
|
Thrifts & Mortgage Finance — 1.2% | |
| | |
BPCE SA (France) | | | | | | | | |
| | |
3.15%, 7/31/2020 (b) | | | 65,000,000 | | | | 65,588,786 | |
| | |
2.65%, 2/3/2021 | | | 5,000,000 | | | | 5,035,776 | |
| | |
(ICE LIBOR USD 3 Month + 1.22%), 3.37%, 5/22/2022 (a) (b) | | | 16,733,000 | | | | 16,922,920 | |
| | |
(ICE LIBOR USD 3 Month + 0.88%), 3.00%, 5/31/2022 (a) | | | 1,500,000 | | | | 1,510,478 | |
| | | | | | | | |
| INVESTMENTS | | PRINCIPAL
AMOUNT ($) | | | VALUE ($) | |
| | | | | | | | |
|
Thrifts & Mortgage Finance — continued | |
| | |
Nationwide Building Society (United Kingdom) 2.35%, 1/21/2020 (b) | | | 10,299,000 | | | | 10,309,416 | |
| | | | | | | | |
| | |
| | | | | | | 99,367,376 | |
| | | | | | | | |
|
Tobacco — 0.6% | |
| | |
Altria Group, Inc. | | | | | | | | |
| | |
2.63%, 1/14/2020 | | | 8,796,000 | | | | 8,800,267 | |
| | |
4.75%, 5/5/2021 | | | 5,514,000 | | | | 5,752,456 | |
| | |
BAT Capital Corp. (United Kingdom) 2.30%, 8/14/2020 | | | 8,200,000 | | | | 8,200,885 | |
| | |
(ICE LIBOR USD 3 Month + 0.59%), 2.77%, 8/14/2020 (a) | | | 2,300,000 | | | | 2,304,513 | |
| | |
BAT International Finance plc (United Kingdom) 2.75%, 6/15/2020 (b) | | | 14,626,000 | | | | 14,658,758 | |
| | |
Philip Morris International, Inc. 2.00%, 2/21/2020 | | | 9,640,000 | | | | 9,628,802 | |
| | |
Reynolds American, Inc. (United Kingdom) 6.88%, 5/1/2020 | | | 1,925,000 | | | | 1,980,256 | |
| | | | | | | | |
| | |
| | | | | | | 51,325,937 | |
| | | | | | | | |
|
Trading Companies & Distributors — 1.1% | |
| | |
Air Lease Corp. 4.75%, 3/1/2020 | | | 2,593,000 | | | | 2,622,103 | |
| | |
(ICE LIBOR USD 3 Month + 0.67%), 3.19%, 6/3/2021 (a) | | | 59,617,000 | | | | 59,757,564 | |
| | |
Aviation Capital Group LLC | | | | | | | | |
| | |
(ICE LIBOR USD 3 Month + 0.95%), 3.47%, 6/1/2021 (a) (b) | | | 15,273,000 | | | | 15,350,157 | |
| | |
(ICE LIBOR USD 3 Month + 0.67%), 2.94%, 7/30/2021 (a) (b) | | | 6,254,000 | | | | 6,250,235 | |
| | |
BOC Aviation Ltd. (Singapore)
3.00%, 3/30/2020 (b) | | | 1,420,000 | | | | 1,424,076 | |
| | |
(ICE LIBOR USD 3 Month + 1.05%), 3.32%, 5/2/2021 (a) (b) | | | 4,090,000 | | | | 4,109,980 | |
| | | | | | | | |
| | |
| | | | | | | 89,514,115 | |
| | | | | | | | |
|
Transportation Infrastructure — 0.1% | |
| | |
HPHT Finance 15 Ltd. (Hong Kong) 2.88%, 3/17/2020 (b) | | | 8,593,000 | | | | 8,615,039 | |
| | | | | | | | |
|
Wireless Telecommunication Services — 0.1% | |
| | |
America Movil SAB de CV (Mexico) 5.00%, 3/30/2020 | | | 8,824,000 | | | | 8,956,360 | |
| | | | | | | | |
| | |
Total Corporate Bonds
(Cost $5,409,154,289) | | | | | | | 5,430,143,382 | |
| | | | | | | | |
|
Asset-Backed Securities — 11.1% | |
| | |
AIMCO CLO (Cayman Islands)Series 2015-AA, Class AR, 3.15%, 1/15/2028 (b) (f) | | | 4,500,000 | | | | 4,482,950 | |
SEE NOTES TO FINANCIAL STATEMENTS.
| | | | | | | | |
| | | |
| AUGUST 31, 2019 | | J.P. MORGAN EXCHANGE-TRADED FUNDS | | | | | 137 | |
JPMorgan Ultra-Short Income ETF
SCHEDULE OF PORTFOLIO INVESTMENTS
AS OF AUGUST 31, 2019 (Unaudited) (continued)
| | | | | | | | |
| INVESTMENTS | | PRINCIPAL
AMOUNT ($) | | | VALUE ($) | |
Asset-Backed Securities — continued | |
| | |
Allegro CLO II-S Ltd. (Cayman Islands)Series 2014-1RA, Class X, 2.93%, 10/21/2028 (b) (f) | | | 1,000,000 | | | | 1,000,000 | |
| | |
Ally Auto ReceivablesTrust Series 2018-3, Class A2, 2.72%, 5/17/2021 | | | 1,658,028 | | | | 1,659,225 | |
| | |
ALM VI Ltd. (Cayman Islands)Series 2012-6A, Class X, 2.90%, 7/15/2026 ‡ (b) (f) | | | 400,000 | | | | 400,000 | |
| | |
American Express Credit Account MasterTrust Series 2017-3, Class A, 1.77%, 11/15/2022 | | | 25,000,000 | | | | 24,960,583 | |
| | |
AmeriCredit Automobile Receivables Trust | | | | | | | | |
| | |
Series 2016-4, Class A3, 1.53%, 7/8/2021 | | | 60,181 | | | | 60,159 | |
| | |
Series 2018-1, Class A2A, 2.71%, 7/19/2021 | | | 274,849 | | | | 274,998 | |
| | |
Series 2018-2, Class A2A, 2.86%, 11/18/2021 | | | 4,293,414 | | | | 4,302,150 | |
| | |
Series 2017-2, Class A3, 1.98%, 12/20/2021 | | | 2,037,648 | | | | 2,035,895 | |
| | |
Series 2018-3, Class A2A, 3.11%, 1/18/2022 | | | 5,952,186 | | | | 5,968,699 | |
| | |
Anchorage Capital CLO Ltd. (Cayman Islands)Series 2013-1A, Class X, 2.95%, 10/13/2030 ‡ (b) (f) | | | 185,428 | | | | 185,335 | |
| | |
Apidos CLO (Cayman Islands)Series 2015-21A, Class A1R, 3.23%, 7/18/2027 (b) (f) | | | 10,325,000 | | | | 10,322,233 | |
| | |
ARES XLVI CLO Ltd.Series 2017-46A, Class X, 2.90%, 1/15/2030 ‡ (b) (f) | | | 93,750 | | | | 93,745 | |
| | |
Ares XXXVR CLO Ltd.Series 2015-35RA, Class X, 2.95%, 7/15/2030 (b) (f) | | | 700,000 | | | | 699,965 | |
| | |
Atrium XV (Cayman Islands) Series 15A, Class X, 2.93%, 1/23/2031 (b) (f) | | | 1,858,333 | | | | 1,858,333 | |
| | |
Avery Point III CLO Ltd. (Cayman Islands)Series 2013-3A, Class AR, 3.42%, 1/18/2025 (b) (f) | | | 559,665 | | | | 559,957 | |
| | |
Avery Point VI CLO Ltd. (Cayman Islands)Series 2015-6A, Class AR, 3.34%, 8/5/2027 (b) (f) | | | 41,921,000 | | | | 41,920,413 | |
| | |
Barings CLO Ltd. (Cayman Islands) | | | | | | | | |
| | |
Series 2013-IA, Class AR, 3.08%, 1/20/2028 (b) (f) | | | 6,975,000 | | | | 6,940,669 | |
| | |
Battalion CLO VII Ltd. (Cayman Islands)Series 2014-7A, Class XRR, 3.20%, 7/17/2028 ‡ (b) (f) | | | 4,000,000 | | | | 3,999,800 | |
| | | | | | | | |
| INVESTMENTS | | PRINCIPAL
AMOUNT ($) | | | VALUE ($) | |
| | | | | | | | |
| | |
Battalion CLO XI Ltd. (Cayman Islands) | | | | | | | | |
| | |
Series 2017-11A, Class X, 3.08%, 10/24/2029 (b) (f) | | | 475,000 | | | | 474,763 | |
| | |
Benefit Street Partners CLO II Ltd. (Cayman Islands)Series 2013-IIA, Class X, 4.00%, 7/15/2029 ‡ (b) (f) | | | 137,500 | | | | 137,431 | |
| | |
Benefit Street Partners CLO XI (Cayman Islands)Series 2017-11A, Class X, 3.30%, 4/15/2029 (b) (f) | | | 96,875 | | | | 96,870 | |
| | |
BlueMountain CLO Ltd. (Cayman Islands) | | | | | | | | |
| | |
Series 2012-2A, Class AR2, 3.19%, 11/20/2028 (b) (f) | | | 27,750,000 | | | | 27,697,469 | |
| | |
Series 2013-1A, Class A1R2, 3.51%, 1/20/2029 (b) (f) | | | 12,000,000 | | | | 12,011,220 | |
| | |
Series 2014-2A, Class X, 2.88%, 10/20/2030 (b) (f) | | | 2,142,857 | | | | 2,142,857 | |
| | |
Series 2016-3A, Class X, 2.78%, 11/15/2030 (b) (f) | | | 2,025,000 | | | | 2,024,899 | |
| | |
BMW Vehicle Lease Trust
Series 2019-1, Class A3, 2.84%, 11/22/2021 | | | 12,336,000 | | | | 12,493,348 | |
| | |
Bristol Park CLO Ltd. (Cayman Islands)Series 2016-1A, Class A, 3.72%, 4/15/2029 (b) (f) | | | 33,500,000 | | | | 33,494,908 | |
| | |
Capital Auto Receivables AssetTrust Series 2018-2, Class A2, 3.02%, 2/22/2021 (b) | | | 6,048,133 | | | | 6,061,029 | |
| | |
Carlyle Global Market Strategies CLO Ltd. (Cayman Islands)Series 2012-4A, Class XRR, 3.03%, 4/22/2032 (b) (f) | | | 1,300,000 | | | | 1,299,935 | |
| | |
CarMax Auto Owner Trust
Series 2018-3, Class A2A, 2.88%, 10/15/2021 | | | 3,797,831 | | | | 3,807,386 | |
| | |
CBAM Ltd. (Cayman Islands)Series 2017-3A, Class X, 3.00%, 10/17/2029 (b) (f) | | | 4,470,000 | | | | 4,470,000 | |
| | |
CIFC Funding Ltd. (Cayman Islands) | | | | | | | | |
| | |
Series 2015-4A, Class A1R, 3.43%, 10/20/2027 (b) (f) | | | 440,000 | | | | 439,806 | |
| | |
Series 2016-1A, Class A, 3.76%, 10/21/2028 (b) (f) | | | 8,490,000 | | | | 8,500,502 | |
| | |
Series 2013-1A, Class X, 3.17%, 7/16/2030 (b) (f) | | | 424,435 | | | | 424,413 | |
| | |
Series 2014-1A, Class X, 2.90%, 1/18/2031 (b) (f) | | | 428,571 | | | | 428,571 | |
| | |
Series 2013-3RA, Class X, 2.93%, 4/24/2031 (b) (f) | | | 2,000,000 | | | | 1,999,000 | |
SEE NOTES TO FINANCIAL STATEMENTS.
| | | | | | |
| | | |
| 138 | | | | J.P. MORGAN EXCHANGE-TRADED FUNDS | | AUGUST 31, 2019 |
| | | | | | | | |
| INVESTMENTS | | PRINCIPAL
AMOUNT ($) | | | VALUE ($) | |
Asset-Backed Securities — continued | |
| | |
Citibank Credit Card Issuance Trust
Series 2016-A1, Class A1, 1.75%, 11/19/2021 | | | 24,426,000 | | | | 24,403,880 | |
| | |
Clear Creek CLO (Cayman Islands)Series 2015-1A, Class X, 3.28%, 10/20/2030 ‡ (b) (f) | | | 154,688 | | | | 154,610 | |
| | |
Cloud Pass-Through Trust
Series 2019-1A, Class CLOU,
3.55%, 12/5/2022 (b) (f) | | | 36,027,693 | | | | 36,504,339 | |
| | |
Cole Park CLO Ltd. (Cayman Islands)Series 2015-1A, Class AR, 3.33%, 10/20/2028 (b) (f) | | | 11,565,000 | | | | 11,584,475 | |
| | |
Colombia Cent CLO Ltd. (Cayman Islands)Series 2018-27A, Class X, 2.98%, 10/25/2028 (b) (f) | | | 1,791,666 | | | | 1,791,666 | |
| | |
Dell Equipment Finance Trust
Series 2019-1, Class A2, 2.78%, 8/23/2021 (b) | | | 25,987,000 | | | | 26,171,380 | |
| | |
Discover Card Execution Note Trust
Series 2016-A4, Class A4,
1.39%, 3/15/2022 | | | 7,153,000 | | | | 7,150,969 | |
| | |
Drive Auto Receivables Trust
Series 2018-5, Class A2A,
3.08%, 7/15/2021 | | | 2,270,012 | | | | 2,270,741 | |
| | |
Series 2019-1, Class A2A, 3.08%, 9/15/2021 | | | 557,660 | | | | 558,187 | |
| | |
Series 2018-3, Class A3, 3.01%, 11/15/2021 | | | 361,585 | | | | 361,645 | |
| | |
Series 2019-2, Class A3, 3.04%, 3/15/2023 | | | 25,569,000 | | | | 25,816,733 | |
| | |
Dryden 30 Senior Loan Fund (Cayman Islands)Series 2013-30A, Class X, 2.76%, 11/15/2028 ‡ (b) (f) | | | 50,000 | | | | 49,998 | |
| | |
Dryden 36 Senior Loan Fund (Cayman Islands)Series 2014-36A, Class XR2, 2.95%, 4/15/2029 ‡ (b) (f) | | | 1,400,000 | | | | 1,400,351 | |
| | |
Dryden 50 Senior Loan Fund (Cayman Islands)Series 2017-50A, Class X, 3.10%, 7/15/2030 ‡ (b) (f) | | | 120,000 | | | | 119,940 | |
| | |
Dryden 61 CLO Ltd. (Cayman Islands)Series 2018-61A, Class X, 3.00%, 1/17/2032 (b) (f) | | | 3,750,000 | | | | 3,749,813 | |
| | |
Dryden XXV Senior Loan Fund (Cayman Islands)Series 2012-25A, Class ARR, 3.20%, 10/15/2027 (b) (f) | | | 32,900,000 | | | | 32,819,921 | |
| | |
Ford Credit Auto Owner Trust | | | | | | | | |
| | |
Series 2014-2, Class A, 2.31%, 4/15/2026 (b) | | | 31,385,000 | | | | 31,385,395 | |
| | |
Series 2015-1, Class A, 2.12%, 7/15/2026 (b) | | | 5,224,000 | | | | 5,221,841 | |
| | | | | | | | |
| INVESTMENTS | | PRINCIPAL
AMOUNT ($) | | | VALUE ($) | |
| | | | | | | | |
| | |
Series 2015-2, Class A, 2.44%, 1/15/2027 (b) | | | 6,712,000 | | | | 6,726,762 | |
| | |
Series 2016-1, Class A, 2.31%, 8/15/2027 (b) | | | 6,444,000 | | | | 6,469,706 | |
| | |
Galaxy XVIII CLO Ltd. (Cayman Islands)Series 2018-28A, Class X, 2.95%, 7/15/2031 (b) (f) | | | 3,828,000 | | | | 3,827,809 | |
| | |
Galaxy XXI CLO Ltd. (Cayman Islands)Series 2015-21A, Class X, 2.78%, 4/20/2031 ‡ (b) (f) | | | 250,000 | | | | 249,988 | |
| | |
GE Capital Credit Card MasterNote Trust Series 2012-7, Class A, 1.76%, 9/15/2022 | | | 20,921,000 | | | | 20,916,123 | |
| | |
GoldentTree Loan Management US CLO 1 Ltd. (Cayman Islands)Series 2017-1A, Class A, 3.50%, 4/20/2029 (b) (f) | | | 11,250,000 | | | | 11,268,585 | |
| | |
GT Loan Financing I Ltd. (Cayman Islands)Series 2013-1A, Class XR, 2.91%, 7/28/2031 (b) (f) | | | 1,071,428 | | | | 1,071,428 | |
| | |
Honda Auto Receivables Owner TrustSeries 2018-3, Class A2, 2.67%, 12/22/2020 | | | 4,682,126 | | | | 4,688,911 | |
| | |
ICG US CLO Ltd. (Cayman Islands)Series 2017-2A, Class X, 3.06%, 10/23/2029 (b) (f) | | | 185,714 | | | | 185,705 | |
| | |
KKR CLO Ltd. (Cayman Islands) | | | | | | | | |
| | |
Series 13, Class A1R, 3.12%, 1/16/2028 (b) (f) | | | 12,260,000 | | | | 12,177,282 | |
| | |
Series 17, Class A, 3.64%, 4/15/2029 (b) (f) | | | 20,275,000 | | | | 20,270,783 | |
| | |
Series 11, Class X, 2.90%, 1/15/2031 ‡ (b) (f) | | | 243,750 | | | | 243,628 | |
| | |
KREF Ltd.Series 2018-FL1, Class A, 3.30%, 6/15/2036 (b) (f) | | | 5,000,000 | | | | 5,007,810 | |
| | |
KVK CLO Ltd. (Cayman Islands)Series 2013-1A, Class X, 2.95%, 1/14/2028 ‡ (b) (f) | | | 1,160,000 | | | | 1,160,000 | |
| | |
LCM XVI LP (Cayman Islands) Series 16A, Class XR, 3.00%, 10/15/2031 (b) (f) | | | 5,960,000 | | | | 5,960,000 | |
| | |
LCM XVII LP (Cayman Islands) Series 17A, Class XR, 2.90%, 10/15/2031 (b) (f) | | | 1,080,000 | | | | 1,077,840 | |
| | |
LCM XX LP (Cayman Islands)
Series 20A, Class AR,
3.32%, 10/20/2027 (b) (f) | | | 10,850,000 | | | | 10,870,344 | |
| | |
Magnetite VII Ltd. (Cayman Islands)Series 2012-7A, Class A1R2, 3.10%, 1/15/2028 (b) (f) | | | 750,000 | | | | 743,297 | |
SEE NOTES TO FINANCIAL STATEMENTS.
| | | | | | | | |
| | | |
| AUGUST 31, 2019 | | J.P. MORGAN EXCHANGE-TRADED FUNDS | | | | | 139 | |
JPMorgan Ultra-Short Income ETF
SCHEDULE OF PORTFOLIO INVESTMENTS
AS OF AUGUST 31, 2019 (Unaudited) (continued)
| | | | | | | | |
| INVESTMENTS | | PRINCIPAL
AMOUNT ($) | | | VALUE ($) | |
Asset-Backed Securities — continued | |
| | |
Magnetite XVI Ltd. (Cayman Islands)Series 2015-16A, Class AR, 3.10%, 1/18/2028 (b) (f) | | | 8,515,000 | | | | 8,486,594 | |
| | |
Magnetite XXI Ltd. (Cayman Islands)Series 2019-21A, Class X, 3.28%, 4/20/2030 (b) (f) | | | 5,000,000 | | | | 5,007,125 | |
| | |
Mercedes-Benz Auto Lease Trust
Series 2019-A, Class A2,
3.01%, 2/16/2021 | | | 11,585,952 | | | | 11,616,852 | |
| | |
Neuberger Berman CLO XIX Ltd. (Cayman Islands)
Series 2015-19A, Class A1R2,
3.10%, 7/15/2027 (b) (f) | | | 3,780,000 | | | | 3,766,687 | |
| | |
Neuberger Berman CLO XVI-S Ltd. (Cayman Islands)Series 2017-16SA, Class X, 2.90%, 1/15/2028 (b) (f) | | | 25,000 | | | | 24,999 | |
| | |
Nissan Auto LeaseTrust Series 2019-B, Class A2A, 2.27%, 1/15/2021 | | | 17,074,000 | | | | 17,115,295 | |
| | |
Nissan Auto Receivables OwnerTrust Series 2019-A, Class A2A, 2.82%, 1/18/2022 | | | 10,044,000 | | | | 10,090,219 | |
| | |
Oak Hill Credit Partners Ltd. (Cayman Islands)Series 2014-10RA, Class X, 2.91%, 12/12/2030 (b) (f) | | | 3,112,500 | | | | 3,112,500 | |
| | |
OCP CLO Ltd. (Cayman Islands) | | | | | | | | |
| | |
Series 2015-8A, Class A1R, 3.15%, 4/17/2027 (b) (f) | | | 44,130,134 | | | | 44,078,281 | |
| | |
Series 2015-9A, Class A1R, 3.10%, 7/15/2027 (b) (f) | | | 16,285,000 | | | | 16,252,625 | |
| | |
Series 2016-12A, Class A1R, 3.42%, 10/18/2028 (b) (f) | | | 10,420,000 | | | | 10,420,188 | |
| | |
Octagon Investment Partners 25 Ltd. (Cayman Islands)
Series 2015-1A, Class AR,
3.08%, 10/20/2026 (b) (f) | | | 24,750,000 | | | | 24,684,413 | |
| | |
Octagon Investment Partners 28 Ltd. (Cayman Islands)Series 2016-1A, Class XR, 2.93%, 10/24/2030 (b) (f) | | | 953,333 | | | | 953,333 | |
| | |
Octagon Investment Partners XVII Ltd. (Cayman Islands)Series 2013-1A, Class X, 2.88%, 1/25/2031 ‡ (b) (f) | | | 439,647 | | | | 439,625 | |
| | |
OHA Credit Funding 1 Ltd. (Cayman Islands)Series 2018-1A, Class X, 2.93%, 10/20/2030 (b) (f) | | | 1,666,667 | | | | 1,666,667 | |
| | |
OHA Credit Partners XII Ltd.Series 2015-12A, Class XR, 2.91%, 7/23/2030 (b) (f) | | | 3,100,000 | | | | 3,100,000 | |
| | |
Palmer Square Loan Funding Ltd. (Cayman Islands) | | | | | | | | |
| | |
Series 2019-2A, Class A1, 3.49%, 4/20/2027 (b) (f) | | | 24,650,000 | | | | 24,571,095 | |
| | | | | | | | |
| INVESTMENTS | | PRINCIPAL
AMOUNT ($) | | | VALUE ($) | |
| | | | | | | | |
| | |
Series 2019-3A, Class A1, 3.04%, 8/20/2027 (b) (f) | | | 31,700,000 | | | | 31,683,675 | |
| | |
Regatta XIII Funding Ltd. (Cayman Islands)Series 2018-2A, Class X, 2.95%, 7/15/2031 (b) (f) | | | 3,228,571 | | | | 3,228,410 | |
| | |
Regatta XV Funding Ltd. (Cayman Islands)Series 2018-4A, Class X, 2.93%,
10/25/2031 (b) (f) | | | 3,785,714 | | | | 3,785,714 | |
| | |
Santander Drive Auto Receivables Trust | | | | | | | | |
| | |
Series 2018-4, Class A2, 2.73%, 3/15/2021 | | | 37,795 | | | | 37,801 | |
| | |
Series 2018-3, Class A3, 3.03%, 2/15/2022 | | | 2,864,333 | | | | 2,867,210 | |
| | |
Shackleton CLO Ltd. (Cayman Islands) | | | | | | | | |
| | |
Series 2015-8A, Class A1R, 3.20%, 10/20/2027 (b) (f) | | | 19,416,500 | | | | 19,366,832 | |
| | |
Series 2014-6RA, Class A, 3.32%, 7/17/2028 (b) (f) | | | 16,485,000 | | | | 16,423,165 | |
| | |
Series 2014-5RA, Class X, 2.81%, 5/7/2031 ‡ (b) (f) | | | 428,571 | | | | 428,550 | |
| | |
Symphony CLO XIV Ltd. (Cayman Islands) | | | | | | | | |
| | |
Series 2014-14A, Class A1R, 3.58%, 7/14/2026 (b) (f) | | | 3,619,332 | | | | 3,621,522 | |
| | |
Series 2014-14A, Class A2R, 3.58%, 7/14/2026 (b) (f) | | | 3,561,090 | | | | 3,562,041 | |
| | |
Symphony CLO XV Ltd. (Cayman Islands)Series 2014-15A, Class XR2, 3.00%, 1/17/2032 (b) (f) | | | 5,333,333 | | | | 5,333,333 | |
| | |
Synchrony Credit Card MasterNote Trust Series 2016-3, Class A, 1.58%, 9/15/2022 | | | 10,284,000 | | | | 10,280,791 | |
| | |
THL Credit Wind River CLO Ltd. (Cayman Islands) | | | | | | | | |
| | |
Series 2017-1A, Class A, 3.64%, 4/18/2029 (b) (f) | | | 7,500,000 | | | | 7,515,555 | |
| | |
Series 2014-2A, Class X, 2.95%,
1/15/2031 ‡ (b) (f) | | | 375,000 | | | | 374,813 | |
| | |
Series 2014-1A, Class X, 2.90%, 7/18/2031 ‡ (b) (f) | | | 1,125,000 | | | | 1,124,984 | |
| | |
Toyota Auto Receivables OwnerTrust Series 2018-C, Class A2A, 2.77%, 8/16/2021 | | | 5,516,384 | | | | 5,534,084 | |
| | |
Verizon Owner Trust | | | | | | | | |
| | |
Series 2016-2A, Class A, 1.68%, 5/20/2021 (b) | | | 3,389,194 | | | | 3,385,793 | |
| | |
Series 2017-3A, Class A1B, 2.44%, 4/20/2022 (b) (f) | | | 440,000 | | | | 440,197 | |
| | |
Volvo Financial Equipment LLCSeries 2019-1A, Class A2, 2.90%, 11/15/2021 (b) | | | 5,788,000 | | | | 5,813,406 | |
SEE NOTES TO FINANCIAL STATEMENTS.
| | | | | | |
| | | |
| 140 | | | | J.P. MORGAN EXCHANGE-TRADED FUNDS | | AUGUST 31, 2019 |
| | | | | | | | |
| INVESTMENTS | | PRINCIPAL
AMOUNT ($) | | | VALUE ($) | |
Asset-Backed Securities — continued | | | | | | | | |
| | |
Voya CLO Ltd. (Cayman Islands) | | | | | | | | |
| | |
Series 2014-3A, Class A1R, 3.00%, 7/25/2026 (b) (f) | | | 2,328,272 | | | | 2,322,060 | |
| | |
Series 2015-2A, Class AR, 3.23%, 7/23/2027 (b) (f) | | | 23,350,000 | | | | 23,315,115 | |
| | |
Series 2015-1A, Class A1R, 3.20%, 1/18/2029 (b) (f) | | | 21,087,500 | | | | 20,958,065 | |
| | |
Series 2019-1A, Class A, 3.81%, 4/15/2029 (b) (f) | | | 11,411,000 | | | | 11,431,734 | |
| | |
Series 2014-4A, Class XR, 3.00%, 7/14/2031 (b) (f) | | | 571,429 | | | | 571,400 | |
| | |
Series 2015-3A, Class X, 2.98%, 10/20/2031 (b) (f) | | | 2,988,000 | | | | 2,987,851 | |
| | |
Westlake Automobile ReceivablesTrust Series 2019-1A, Class A2A, 3.06%, 5/16/2022 (b) | | | 7,500,000 | | | | 7,533,276 | |
| | | | | | | | |
| | |
Total Asset-backed Securities
(Cost $931,481,820) | | | | | | | 933,475,276 | |
| | | | | | | | |
|
U.S. Treasury Obligations — 6.3% | |
| | |
U.S. Treasury Notes | | | | | | | | |
| | |
1.00%, 11/30/2019 | | | 36,041,600 | | | | 35,951,496 | |
| | |
1.63%, 12/31/2019 | | | 40,000,000 | | | | 39,953,125 | |
| | |
1.50%, 4/15/2020 | | | 190,000,000 | | | | 189,569,532 | |
| | |
1.63%, 10/15/2020 | | | 83,000,000 | | | | 82,886,523 | |
| | |
1.63%, 6/30/2021 | | | 115,440,400 | | | | 115,575,682 | |
| | |
1.75%, 7/31/2021 | | | 58,880,000 | | | | 59,123,800 | |
| | | | | | | | |
| | |
Total U.S. Treasury Obligations
(Cost $521,208,867) | | | | | | | 523,060,158 | |
| | | | | | | | |
Certificates of Deposit — 1.3% | |
|
Certificate of Deposit — 1.3% | |
| | |
Bank of Nova Scotia (The) (Canada) (ICE LIBOR USD 3 Month + 0.28%), 2.67%, 9/21/2020 (a) | | | 3,000,000 | | | | 3,000,923 | |
| | |
Lloyds Bank Corporate Markets plc (United Kingdom) (ICE LIBOR USD 3 Month + 0.50%), 2.84%, 9/24/2020 (a) | | | 23,000,000 | | | | 23,059,678 | |
| | |
Nordea Bank Abp (Finland) (ICE LIBOR USD 3 Month + 0.32%), 2.61%, 5/5/2021 (a) | | | 21,100,000 | | | | 21,117,063 | |
| | |
Sumitomo Mitsui Banking Corp. (Japan) (ICE LIBOR USD 3 Month + 0.39%), 2.57%, 2/12/2021 (a) | | | 25,823,000 | | | | 25,844,771 | |
| | |
(ICE LIBOR USD 3 Month + 0.36%), 2.64%, 4/6/2021 (a) | | | 25,929,000 | | | | 25,934,937 | |
| | |
Svenska Handelsbanken AB (Sweden) (ICE LIBOR USD 3 Month + 0.28%), 2.68%, 9/11/2020 (a) | | | 6,000,000 | | | | 6,003,626 | |
| | | | | | | | |
| | |
Total Certificates Of Deposit
(Cost $104,883,442) | | | | | | | 104,960,998 | |
| | | | | | | | |
| | | | | | | | |
| INVESTMENTS | | PRINCIPAL
AMOUNT ($) | | | VALUE ($) | |
| | | | | | | | |
|
Commercial Mortgage-Backed Securities — 0.6% | |
| | |
BX Commercial Mortgage Trust
Series 2018-IND, Class A,
2.95%, 11/15/2035 (b) (f) | | | 13,448,768 | | | | 13,454,105 | |
| | |
BXMT Ltd.Series 2017-FL1, Class A, 3.07%, 6/15/2035 (b) (f) | | | 1,000,000 | | | | 1,000,000 | |
| | |
BXPTrust Series 2017-CQHP, Class A, 3.05%, 11/15/2034 (b) (f) | | | 500,000 | | | | 498,594 | |
| | |
CGDBB Commercial Mortgage Trust
Series 2017-BIOC, Class A,
2.99%, 7/15/2032 (b) (f) | | | 900,000 | | | | 899,998 | |
| | |
Citigroup Commercial Mortgage Trust
Series 2017-1500, Class A,
3.05%, 7/15/2032 (b) (f) | | | 1,800,000 | | | | 1,800,018 | |
| | |
Credit Suisse Mortgage Capital CertificatesSeries 2019-ICE4, Class A, 3.18%, 5/15/2036 (b) (f) | | | 28,000,000 | | | | 28,017,570 | |
| | |
KNDL Mortgage Trust
Series 2019-KNSQ, Class A,
3.00%, 5/15/2036 (b) (f) | | | 5,600,000 | | | | 5,598,237 | |
| | | | | | | | |
| | |
Total Commercial Mortgage-backed Securities
(Cost $51,248,934) | | | | | | | 51,268,522 | |
| | | | | | | | |
|
Foreign Government Securities — 0.0%(d) | |
| | |
Japan Bank for International Cooperation (Japan) (ICE LIBOR USD 3 Month + 0.48%), 3.00%, 6/1/2020 (a)
(Cost $200,000) | | | 200,000 | | | | 200,586 | |
| | | | | | | | |
Short-Term Investments — 15.6% | | | | | | | | |
|
Certificates of Deposit — 3.7% | |
| | |
Barclays Bank plc (United Kingdom) | | | | | | | | |
| | |
3.00%, 9/19/2019 | | | 25,250,000 | | | | 25,260,080 | |
| | |
2.95%, 4/9/2020 | | | 52,000,000 | | | | 52,278,944 | |
| | |
Canadian Imperial Bank of Commerce (Canada) | | | | | | | | |
| | |
(ICE LIBOR USD 3 Month + 0.41%), 2.80%, 9/20/2019 (a) | | | 1,950,000 | | | | 1,950,546 | |
| | |
3.08%, 10/25/2019 | | | 32,000,000 | | | | 32,050,519 | |
| | |
(ICE LIBOR USD 3 Month + 0.40%), 2.67%, 5/2/2020 (a) | | | 4,000,000 | | | | 4,007,932 | |
| | |
Credit Agricole Corporate and Investment Bank (France) (ICE LIBOR USD 3 Month + 0.35%), 2.62%, 7/30/2020 (a) | | | 21,500,000 | | | | 21,522,944 | |
| | |
Credit Suisse AG (Switzerland) 2.94%, 9/27/2019 | | | 21,000,000 | | | | 21,012,113 | |
| | |
Lloyds Bank plc 3.03%, 10/21/2019 | | | 6,000,000 | | | | 6,007,262 | |
SEE NOTES TO FINANCIAL STATEMENTS.
| | | | | | | | |
| | | |
| AUGUST 31, 2019 | | J.P. MORGAN EXCHANGE-TRADED FUNDS | | | | | 141 | |
JPMorgan Ultra-Short Income ETF
SCHEDULE OF PORTFOLIO INVESTMENTS
AS OF AUGUST 31, 2019 (Unaudited) (continued)
| | | | | | | | |
| INVESTMENTS | | PRINCIPAL
AMOUNT ($) | | | VALUE ($) | |
Short-Term Investments — continued | | | | | | | | |
|
Certificates of Deposit — continued | |
| | |
Mizuho Bank Ltd. (Japan) (ICE LIBOR USD 3 Month + 0.33%), 2.63%, 4/15/2020 (a) | | | 12,000,000 | | | | 12,011,613 | |
| | |
MUFG Bank Ltd. (Japan) 2.02%, 8/13/2020 | | | 35,000,000 | | | | 35,008,725 | |
| | |
National Bank of Canada (Canada) (ICE LIBOR USD 3 Month + 0.19%), 2.37%, 2/14/2020 (a) | | | 5,000,000 | | | | 5,003,091 | |
| | |
Nordea Bank Abp (Finland) (ICE LIBOR USD 3 Month + 0.30%), 2.78%, 6/5/2020 (a) | | | 4,000,000 | | | | 4,006,551 | |
| | |
Societe Generale SA (France) | | | | | | | | |
| | |
3.05%, 10/18/2019 | | | 12,000,000 | | | | 12,015,709 | |
| | |
2.19%, 7/31/2020 | | | 44,926,000 | | | | 45,055,323 | |
| | |
Sumitomo Mitsui Banking Corp. (Japan) (ICE LIBOR USD 3 Month + 0.37%), 2.63%, 1/31/2020 (a) | | | 6,959,000 | | | | 6,964,682 | |
| | |
US Bank NA 2.72%, 9/6/2019 | | | 12,080,000 | | | | 12,081,416 | |
| | |
Westpac Banking Corp. (Australia) 2.97%, 10/18/2019 | | | 16,600,000 | | | | 16,616,127 | |
| | | | | | | | |
| | |
Total Certificates of Deposit
(Cost $312,266,963) | | | | | | | 312,853,577 | |
| | | | | | | | |
|
Commercial Paper — 5.9% | |
| | |
AT&T, Inc. 2.75%, 12/10/2019 (b) (g) | | | 8,000,000 | | | | 7,946,507 | |
| | |
Bank of China Ltd. (China) 2.47%, 10/15/2019 (g) | | | 14,340,000 | | | | 14,298,094 | |
| | |
BNZ International Funding Ltd. (New Zealand) 2.98%,
10/11/2019 (b) (g) | | | 12,500,000 | | | | 12,469,025 | |
| | |
BP Capital Markets plc (United Kingdom) 3.03%, 10/10/2019 (b) (g) | | | 34,700,000 | | | | 34,615,270 | |
| | |
Campbell Soup Co. 2.35%,
9/23/2019 (b) (g) | | | 16,100,000 | | | | 16,075,335 | |
| | |
Enel Finance America LLC (Italy) 2.89%, 10/25/2019 (b) (g) | | | 11,200,000 | | | | 11,159,458 | |
| | |
Industrial & Commercial Bank of China Ltd. (China) 2.40%,
10/31/2019 (b) (g) | | | 143,500,000 | | | | 142,929,110 | |
| | |
Macquarie Bank Ltd. (Australia) 3.10%, 10/25/2019 (b) (g) | | | 14,000,000 | | | | 13,953,396 | |
| | |
Michelin Luxembourg SCS (France) 2.70%, 9/9/2019 (b) (g) | | | 1,917,000 | | | | 1,915,793 | |
| | |
Nutrien Ltd. (Canada) | | | | | | | | |
| | |
2.26%, 10/10/2019 (b) (g) | | | 9,400,000 | | | | 9,375,195 | |
| | |
2.26%, 10/11/2019 (b) (g) | | | 31,750,000 | | | | 31,664,138 | |
| | |
Reckitt Benckiser Treasury Services plc (United Kingdom) | | | | | | | | |
| | |
2.40%, 11/12/2019 (b) (g) | | | 5,500,000 | | | | 5,474,664 | |
| | | | | | | | |
| INVESTMENTS | | PRINCIPAL
AMOUNT ($) | | | VALUE ($) | |
| | | | | | | | |
|
Commercial Paper — continued | |
| | |
2.37%, 1/8/2020 (b) (g) | | | 25,000,000 | | | | 24,797,405 | |
| | |
2.40%, 2/6/2020 (b) (g) | | | 20,900,000 | | | | 20,692,579 | |
| | |
2.39%, 4/1/2020 (b) (g) | | | 29,000,000 | | | | 28,621,051 | |
| | |
Suncor Energy, Inc. (Canada) 2.61%, 9/19/2019 (b) (g) | | | 7,000,000 | | | | 6,991,094 | |
| | |
Toronto-Dominion Bank (The) (Canada) 3.09%, 10/18/2019 (b) (g) | | | 28,000,000 | | | | 27,919,890 | |
| | |
VW Credit, Inc. (Germany) | | | | | | | | |
| | |
2.94%, 10/17/2019 (b) (g) | | | 4,000,000 | | | | 3,987,616 | |
| | |
2.38%, 2/10/2020 (b) (g) | | | 32,600,000 | | | | 32,251,741 | |
| | |
Walgreens Boots Alliance, Inc. | | | | | | | | |
| | |
2.33%, 2/21/2020 (g) | | | 21,000,000 | | | | 20,760,921 | |
| | |
2.33%, 2/25/2020 (g) | | | 24,000,000 | | | | 23,720,760 | |
| | | | | | | | |
| | |
Total Commercial Paper
(Cost $491,504,819) | | | | | | | 491,619,042 | |
| | | | | | | | |
| | |
| | | SHARES | | | | |
|
Investment Companies — 4.1% | |
| | |
JPMorgan U.S. Government Money Market Fund Class Institutional Shares, 1.99% (h) (i)
(Cost $343,725,884) | | | 343,725,884 | | | | 343,725,884 | |
| | | | | | | | |
| | |
| | | PRINCIPAL
AMOUNT ($) | | | | |
|
Repurchase Agreements — 1.9% | |
| | |
Bofa Securities, Inc., 2.52%, dated 8/30/2019, due 12/09/2019, repurchase price $9,063,630, collateralized by Municipal Debt Securities, 0.00 — 6.50%, due 7/1/2026 — 7/1/2036, with the value of $9,720,000 | | | 9,000,000 | | | | 9,000,000 | |
| | |
Citigroup Global Markets, Inc., 2.62%, dated 8/30/2019, due 01/17/2020, repurchase price $12,122,458, collateralized by Collateralized Mortgage Obligations, 2.29% — 7.15%, due 1/25/2037 — 6/20/2041, Asset-Backed Securities, 2.26% — 4.89%, due 9/26/2034 — 5/25/2037, with the value of $13,199,993 | | | 12,000,000 | | | | 12,000,000 | |
SEE NOTES TO FINANCIAL STATEMENTS.
| | | | | | |
| | | |
| 142 | | | | J.P. MORGAN EXCHANGE-TRADED FUNDS | | AUGUST 31, 2019 |
| | | | | | | | |
| INVESTMENTS | | PRINCIPAL
AMOUNT ($) | | | VALUE ($) | |
Repurchase Agreements — continued | | | | | | | | |
| | |
Wells Fargo Securities LLC, 3.04%, dated 8/30/2019, due 11/13/2019, repurchase price $140,886,667, collateralized by Asset-Backed Securities, 0.00% — 7.39%, due 5/16/2022 — 12/15/2040 with the value of $156,392,819 | | | 140,000,000 | | | | 140,000,000 | |
| | | | | | | | |
| | |
Total Repurchase Agreements
(Cost $161,000,000) | | | | | | | 161,000,000 | |
| | | | | | | | |
| | |
TotalShort-Term Investments
(Cost $1,308,497,666) | | | | | | | 1,309,198,503 | |
| | | | | | | | |
| | |
| | | SHARES | | | | |
Investment of Cash Collateral from Securities Loaned — 0.1% | |
| | |
JPMorgan Securities Lending Money Market Fund Class Agency SL Shares, 2.29% (h) (i) | | | 1,999,800 | | | | 2,000,000 | |
| | |
JPMorgan U.S. Government Money Market Fund Class IM Shares,
2.05% (h) (i) | | | 5,021,090 | | | | 5,021,090 | |
| | | | | | | | |
| | |
Total Investment of Cash Collateral from Securities Loaned
(Cost $7,021,090) | | | | | | | 7,021,090 | |
| | | | | | | | |
| | |
Total Investments — 99.8%
(Cost $8,333,696,108) | | | | | | | 8,359,328,515 | |
| | |
Other Assets Less Liabilities — 0.2% | | | | | | | 18,023,115 | |
| | | | | | | | |
| | |
NET ASSETS — 100.0% | | | | | | | 8,377,351,630 | |
| | | | | | | | |
Percentages indicated are based on net assets.
Abbreviations
| | |
CIFC | | Commercial Industrial Finance Corp. |
CLO | | Collateralized Loan Obligations |
ICE | | Intercontinental Exchange |
LIBOR | | London Interbank Offered Rate |
REIT | | Real Estate Investment Trust |
SOFR | | Secured Overnight Financing Rate |
USD | | United States Dollar |
| |
| (a) | | Variable or floating rate security, linked to the referenced benchmark. The interest rate shown is the current rate as of August 31, 2019. |
| (b) | | Securities exempt from registration under Rule 144A or section 4(a)(2), of the Securities Act of 1933, as amended. |
(c) | | The security or a portion of this security is on loan at August 31, 2019. The total value of securities on loan at August 31, 2019 is $6,807,353. |
(d) | | Amount rounds to less than 0.1% of net assets. |
(e) | | Step bond. Interest rate is a fixed rate for an initial period that either resets at a specific date or may reset in the future contingent upon a predetermined trigger. The interest rate shown is the current rate as of August 31, 2019. |
(f) | | Variable or floating rate security, the interest rate of which adjusts periodically based on changes in current interest rates and prepayments on the underlying pool of assets. The interest rate shown is the current rate as of August 31, 2019. |
(g) | | The rate shown is the effective yield as of August 31, 2019. |
(h) | | Investment in an affiliated fund, which is registered under the Investment Company Act of 1940, as amended, and is advised by J.P. Morgan Investment Management Inc. |
(i) | | The rate shown is the current yield as of August 31, 2019. |
‡ | | Value determined using significant unobservable inputs. |
SEE NOTES TO FINANCIAL STATEMENTS.
| | | | | | | | |
| | | |
| AUGUST 31, 2019 | | J.P. MORGAN EXCHANGE-TRADED FUNDS | | | | | 143 | |
JPMorgan Ultra-Short Municipal Income ETF
SCHEDULE OF PORTFOLIO INVESTMENTS
AS OF AUGUST 31, 2019 (Unaudited)
| | | | | | | | |
| INVESTMENTS | | PRINCIPAL
AMOUNT ($) | | | VALUE ($) | |
Municipal Bonds — 98.6%(a) | | | | | | | | |
|
Alabama — 0.7% | |
|
Education — 0.0%(b) | |
| | |
Alabama Public School & College Authority Series B, Rev., 5.00%, 1/1/2020 | | | 20,000 | | | | 20,253 | |
| | | | | | | | |
|
Industrial Development Revenue/Pollution Control Revenue — 0.0%(b) | |
| | |
Madison County Public Building Authority, Department of Human Resources ProjectSeries 2019-0, Rev., 5.00%, 3/1/2020 | | | 30,000 | | | | 30,531 | |
| | | | | | | | |
|
Other Revenue — 0.2% | |
| | |
Alabama 21st Century Authority | | | | | | | | |
| | |
Series A, Rev., 5.00%, 6/1/2020 | | | 125,000 | | | | 128,412 | |
| | |
County of Jefferson Rev., 5.00%, 9/15/2019 | | | 55,000 | | | | 55,061 | |
| | | | | | | | |
| | |
| | | | | | | 183,473 | |
| | | | | | | | |
|
Prerefunded — 0.3% | |
| | |
City of Troy, Electric Water and Sewer System Rev., AGM, 4.75%, 10/1/2020 (c) | | | 20,000 | | | | 20,781 | |
| | |
South Alabama Gas District | | | | | | | | |
| | |
Rev., 3.40%, 8/1/2020 (c) | | | 300,000 | | | | 306,258 | |
| | | | | | | | |
| | |
| | | | | | | 327,039 | |
| | | | | | | | |
|
Special Tax — 0.0%(b) | |
| | |
Hoover City Board of Education | | | | | | | | |
| | |
Rev., 4.00%, 2/15/2020 | | | 25,000 | | | | 25,294 | |
| | | | | | | | |
|
Transportation — 0.1% | |
| | |
Alabama Federal Aid Highway Finance Authority Series 2012A, Rev., GAN, 5.00%, 9/1/2019 | | | 145,000 | | | | 145,000 | |
| | | | | | | | |
|
Utility — 0.1% | |
| | |
Black Belt Energy Gas District, Gas Prepay Series 2018A, Rev., 4.00%, 12/1/2023 (d) | | | 75,000 | | | | 81,907 | |
| | |
Black Belt Energy Gas District, Gas Supply Series 2016A, Rev., LIQ: Royal Bank of Canada, 4.00%, 6/1/2021 (d) | | | 50,000 | | | | 52,317 | |
| | |
City of Huntsville, Electric System | | | | | | | | |
| | |
Series 2017A, Rev., 5.00%, 12/1/2019 | | | 25,000 | | | | 25,237 | |
| | | | | | | | |
| | |
| | | | | | | 159,461 | |
| | | | | | | | |
| | |
Total Alabama | | | | | | | 891,051 | |
| | | | | | | | |
|
Alaska — 0.7% | |
|
Certificate of Participation/Lease — 0.3% | |
| | |
State of Alaska, Native Tribal Health Consortium housing facility project Series 2014, COP, 4.00%, 6/1/2022 | | | 280,000 | | | | 301,300 | |
| | | | | | | | |
| | | | | | | | |
| INVESTMENTS | | PRINCIPAL
AMOUNT ($) | | | VALUE ($) | |
| | | | | | | | |
|
Education — 0.2% | |
| | |
University of Alaska | | | | | | | | |
| | |
Series T, Rev., 5.00%, 10/1/2019 | | | 25,000 | | | | 25,066 | |
| | |
Series V-2, Rev., 5.00%, 10/1/2020 | | | 200,000 | | | | 207,512 | |
| | | | | | | | |
| | |
| | | | | | | 232,578 | |
| | | | | | | | |
|
General Obligation — 0.1% | |
| | |
Borough of North Slope Series 2018A, GO, 5.00%, 6/30/2021 | | | 20,000 | | | | 21,403 | |
| | |
Municipality of Anchorage Series C, GO, 5.00%, 9/1/2019 | | | 65,000 | | | | 65,000 | |
| | | | | | | | |
| | |
| | | | | | | 86,403 | |
| | | | | | | | |
|
Other Revenue — 0.0%(b) | |
| | |
Alaska Municipal Bond Bank Authority Series 2, Rev., 5.00%, 9/1/2019 | | | 30,000 | | | | 30,000 | |
| | | | | | | | |
|
Prerefunded — 0.0%(b) | |
| | |
Alaska Housing Finance Corp., Capital Project Series 2011A, Rev., 5.00%, 12/1/2020 (c) | | | 50,000 | | | | 52,428 | |
| | | | | | | | |
|
Utility — 0.1% | |
| | |
Alaska Energy Authority, Power Sixth Series, Bradley Lake Hydroelectric Project Series 6, Rev., 5.00%, 7/1/2020 | | | 115,000 | | | | 118,604 | |
| | | | | | | | |
| | |
Total Alaska | | | | | | | 821,313 | |
| | | | | | | | |
|
Arizona — 0.8% | |
|
Certificate of Participation/Lease — 0.3% | |
| | |
Arizona School Facilities BoardSeries A-1, COP, AGM, 3.25%, 9/1/2019 | | | 125,000 | | | | 125,000 | |
| | |
Arizona State University Series A, COP, 5.00%, 9/1/2019 | | | 35,000 | | | | 35,000 | |
| | |
City of Tucson COP, AGM, 4.00%, 7/1/2020 | | | 25,000 | | | | 25,579 | |
| | |
State of Arizona | | | | | | | | |
| | |
Series B, COP, 5.00%, 10/1/2019 | | | 25,000 | | | | 25,073 | |
| | |
Series A, COP, AGM, 5.25%, 10/1/2019 | | | 125,000 | | | | 125,373 | |
| | | | | | | | |
| | |
| | | | | | | 336,025 | |
| | | | | | | | |
|
General Obligation — 0.0%(b) | |
| | |
Pinal County, Florence Unified School District No. 1 GO, 4.00%, 7/1/2020 | | | 20,000 | | | | 20,475 | |
| | | | | | | | |
|
Hospital — 0.0%(b) | |
| | |
Arizona Health Facilities Authority, Banner Health Series 2015A, Rev., 5.00%, 1/1/2021 | | | 25,000 | | | | 26,274 | |
| | | | | | | | |
SEE NOTES TO FINANCIAL STATEMENTS.
| | | | | | |
| | | |
| 144 | | | | J.P. MORGAN EXCHANGE-TRADED FUNDS | | AUGUST 31, 2019 |
| | | | | | | | |
| INVESTMENTS | | PRINCIPAL
AMOUNT ($) | | | VALUE ($) | |
Municipal Bonds — continued | |
|
Industrial Development Revenue/Pollution Control Revenue — 0.3% | |
| | |
Chandler Industrial Development Authority, Intel Corp. Project Series 2018, Rev., 2.40%, 8/14/2023 (d) | | | 400,000 | | | | 417,904 | |
| | | | | | | | |
|
Other Revenue — 0.0%(b) | |
| | |
City of Phoenix Civic Improvement Corp., Civic Plaza Expansion Series B, Rev., NATL-RE, 5.50%, 7/1/2020 | | | 20,000 | | | | 20,694 | |
| | | | | | | | |
|
Transportation — 0.1% | |
| | |
City of Phoenix, Civic Improvement Corp., Light Rail Project Series 2013, Rev., 5.00%, 7/1/2020 | | | 25,000 | | | | 25,800 | |
| | |
Pima County Regional Transportation Authority Rev., 5.00%, 6/1/2020 | | | 40,000 | | | | 41,184 | |
| | |
Regional Public Transportation Authority, Transportation Excise Tax, Maricopa County Public Transportation Fund Rev., 5.25%, 7/1/2021 | | | 30,000 | | | | 32,284 | |
| | | | | | | | |
| | |
| | | | | | | 99,268 | |
| | | | | | | | |
|
Water & Sewer — 0.1% | |
| | |
Arizona Water Infrastructure Finance Authority Series 2010A, Rev., 5.00%, 10/1/2019 | | | 45,000 | | | | 45,134 | |
| | |
County of Pima, Sewer System Series 2011B, Rev., 5.00%, 7/1/2020 | | | 25,000 | | | | 25,801 | |
| | | | | | | | |
| | |
| | | | | | | 70,935 | |
| | | | | | | | |
| | |
Total Arizona | | | | | | | 991,575 | |
| | | | | | | | |
|
Arkansas — 0.3% | |
|
General Obligation — 0.3% | |
| | |
El Dorado Special School District No. 15 Series 2012, GO, 3.00%, 2/1/2020 | | | 20,000 | | | | 20,029 | |
| | |
Newport Special School District, Subordinate Construction GO, 2.45%, 2/1/2021 | | | 330,000 | | | | 330,280 | |
| | |
Pine Bluff School District No. 3 Series 2015, GO, 3.00%, 2/1/2020 | | | 35,000 | | | | 35,262 | |
| | | | | | | | |
| | |
| | | | | | | 385,571 | |
| | | | | | | | |
|
Utility — 0.0%(b) | |
| | |
Arkansas Development Finance Authority, Mt. Magazine Project Rev., AGM, 3.00%, 1/1/2020 | | | 25,000 | | | | 25,148 | |
| | | | | | | | |
| | |
Total Arkansas | | | | | | | 410,719 | |
| | | | | | | | |
|
California — 0.6% | |
|
Certificate of Participation/Lease — 0.4% | |
| | |
Sweetwater Union High School District Series 2017, COP, 4.00%, 9/1/2019 | | | 500,000 | | | | 500,000 | |
| | | | | | | | |
| | | | | | | | |
| INVESTMENTS | | PRINCIPAL
AMOUNT ($) | | | VALUE ($) | |
| | | | | | | | |
|
General Obligation — 0.1% | |
| | |
Mount San Antonio Community College District Series A, GO, 5.00%, 9/1/2019 | | | 20,000 | | | | 20,000 | |
| | |
State of California, Various Purpose Series 2009, GO, 5.25%, 10/1/2020 | | | 25,000 | | | | 25,083 | |
| | | | | | | | |
| | |
| | | | | | | 45,083 | |
| | | | | | | | |
|
Other Revenue — 0.1% | |
| | |
California Statewide Communities Development Authority, Southern California Edison Co. Series 2013B, Rev., VRDO, 1.90%, 4/1/2020 (d) | | | 100,000 | | | | 100,255 | |
| | |
Midpeninsula Regional Open Space District, Promissory Notes Series 2015, Rev., 5.00%, 9/1/2019 | | | 25,000 | | | | 25,000 | |
| | | | | | | | |
| | |
| | | | | | | 125,255 | |
| | | | | | | | |
|
Water & Sewer — 0.0% (b) | |
| | |
Bay Area Water Supply & Conservation Agency Series A, Rev., 4.00%, 10/1/2019 | | | 20,000 | | | | 20,047 | |
| | |
Los Angeles County Sanitation Districts Financing Authority, Sanitation Districts Financing Authority Capital Projects Series A, Rev., 5.00%, 10/1/2019 | | | 20,000 | | | | 20,062 | |
| | | | | | | | |
| | |
| | | | | | | 40,109 | |
| | | | | | | | |
| | |
Total California | | | | | | | 710,447 | |
| | | | | | | | |
|
Colorado — 0.6% | |
|
Certificate of Participation/Lease — 0.1% | |
| | |
Adams County, Colorado Refunding and Improvement Series 2015, COP, 4.00%, 12/1/2019 | | | 25,000 | | | | 25,172 | |
| | |
El Paso County School District No. 49 Series B, COP, 4.00%, 12/15/2019 | | | 25,000 | | | | 25,198 | |
| | |
Regional Transportation District Series 2015A, COP, 5.00%, 6/1/2020 | | | 25,000 | | | | 25,712 | |
| | |
State of Colorado, UCSC Fitzsimons Academic Projects Series A, COP, 5.00%, 11/1/2019 | | | 25,000 | | | | 25,154 | |
| | | | | | | | |
| | |
| | | | | | | 101,236 | |
| | | | | | | | |
|
Hospital — 0.3% | |
| | |
Colorado Health Facilities Authority, Catholic health Initiatives Series 2011A, Rev., 5.00%, 2/1/2020 (c) | | | 100,000 | | | | 101,581 | |
| | |
Colorado Health Facilities Authority, Catholic Health Initiatives Series A, Rev., 5.00%, 2/1/2021 (c) | | | 200,000 | | | | 210,774 | |
SEE NOTES TO FINANCIAL STATEMENTS.
| | | | | | | | |
| | | |
| AUGUST 31, 2019 | | J.P. MORGAN EXCHANGE-TRADED FUNDS | | | | | 145 | |
JPMorgan Ultra-Short Municipal Income ETF
SCHEDULE OF PORTFOLIO INVESTMENTS
AS OF AUGUST 31, 2019 (Unaudited) (continued)
| | | | | | | | |
| INVESTMENTS | | PRINCIPAL
AMOUNT ($) | | | VALUE ($) | |
Municipal Bonds — continued | |
| | |
Hospital — continued | | | | | | | | |
| | |
Colorado Health Facilities Authority, Covenant Retirement Communities, Inc. Series 2012C, Rev., 5.00%, 12/1/2021 | | | 75,000 | | | | 80,631 | |
| | | | | | | | |
| | |
| | | | | | | 392,986 | |
| | | | | | | | |
|
Prerefunded — 0.1% | |
| | |
Colorado Health Facilities Authority, Catholic health Initiatives Series 2011A, Rev., 5.00%, 2/1/2021 (c) | | | 50,000 | | | | 52,677 | |
| | | | | | | | |
|
Transportation — 0.1% | |
| | |
City & County of Denver, Airport System Series A, Rev., 5.00%, 11/15/2019 | | | 30,000 | | | | 30,233 | |
| | |
E-470 Public Highway Authority | | | | | | | | |
| | |
Series 2015A, Rev., 2.25%, 9/1/2019 | | | 25,000 | | | | 25,000 | |
| | |
Series 2015A, Rev., 5.00%, 9/1/2019 | | | 110,000 | | | | 110,000 | |
| | | | | | | | |
| | |
| | | | | | | 165,233 | |
| | | | | | | | |
| | |
Total Colorado | | | | | | | 712,132 | |
| | | | | | | | |
|
Connecticut — 0.5% | |
|
General Obligation — 0.2% | |
| | |
State of Connecticut Series C, GO, 5.00%, 6/1/2020 | | | 100,000 | | | | 102,791 | |
| | |
Town of Groton Series A, GO, BAN, 2.75%, 4/30/2020 | | | 25,000 | | | | 25,246 | |
| | |
Town of South Windsor GO, BAN, 3.00%, 2/13/2020 | | | 50,000 | | | | 50,384 | |
| | |
Town of Trumbull GO, 3.00%, 9/1/2019 | | | 50,000 | | | | 50,000 | |
| | | | | | | | |
| | |
| | | | | | | 228,421 | |
| | | | | | | | |
|
Hospital — 0.1% | |
| | |
Connecticut State Health and Educational Facilities Authority, Yale University Issue | | | | | | | | |
| | |
Series 2014A, Rev., VRDO, 1.30%, 2/3/2020 (d) | | | 200,000 | | | | 200,130 | |
| | | | | | | | |
|
Housing — 0.1% | |
| | |
Connecticut Housing Finance Authority, Housing Mortgage Finance Program Series C, Subseries C-1, Rev., 1.80%, 5/15/2020 | | | 110,000 | | | | 110,484 | |
| | | | | | | | |
|
Other Revenue — 0.0% (b) | |
| | |
State of Connecticut Series C, Rev., 5.00%, 10/1/2019 | | | 50,000 | | | | 50,149 | |
| | | | | | | | |
|
Special Tax — 0.1% | |
| | |
State of Connecticut, Special Tax Transportation Infrastructure Purposes Series 2014A, Rev., 5.00%, 9/1/2019 | | | 65,000 | | | | 65,000 | |
| | |
Series 2010C, Rev., 4.00%, 11/1/2019 | | | 25,000 | | | | 25,114 | |
| | | | | | | | |
| | |
| | | | | | | 90,114 | |
| | | | | | | | |
| | |
Total Connecticut | | | | | | | 679,298 | |
| | | | | | | | |
| | | | | | | | |
| INVESTMENTS | | PRINCIPAL
AMOUNT ($) | | | VALUE ($) | |
| | | | | | | | |
|
Delaware — 0.0%(b) | |
|
General Obligation — 0.0%(b) | |
| | |
State of DelawareSeries 2009-C, GO, 4.00%, 10/1/2019 | | | 25,000 | | | | 25,056 | |
| | | | | | | | |
|
District of Columbia — 0.3% | |
|
Other Revenue — 0.2% | |
| | |
District of Columbia, Income Tax | | | | | | | | |
| | |
Series 2010A, Rev., 5.00%, 12/1/2019 | | | 25,000 | | | | 25,238 | |
| | |
Series F, Rev., 4.00%, 12/1/2021 | | | 35,000 | | | | 37,265 | |
| | |
District of Columbia, Kipp DC Project Series 2017B, Rev., 4.00%, 7/1/2020 | | | 250,000 | | | | 254,795 | |
| | | | | | | | |
| | |
| | | | | | | 317,298 | |
| | | | | | | | |
|
Transportation — 0.1% | |
| | |
Metropolitan Washington Airports Authority | | | | | | | | |
| | |
Series C, Rev., 4.00%, 10/1/2019 | | | 60,000 | | | | 60,132 | |
| | |
Series 2009C, Rev., 5.00%, 10/1/2019 | | | 25,000 | | | | 25,074 | |
| | | | | | | | |
| | |
| | | | | | | 85,206 | |
| | | | | | | | |
|
Water & Sewer — 0.0%(b) | |
| | |
District of Columbia Water & Sewer Authority, Subordinate Lien Series A, Rev., 5.00%, 10/1/2019 | | | 25,000 | | | | 25,074 | |
| | | | | | | | |
| | |
Total District of Columbia | | | | | | | 427,578 | |
| | | | | | | | |
|
Florida — 12.2% | |
|
Certificate of Participation/Lease — 0.2% | |
| | |
Collier County School Board
Series 2005A, COP, AGM,
5.25%, 2/15/2021 | | | 25,000 | | | | 26,470 | |
| | |
Escambia County School Board COP, 5.00%, 2/1/2020 | | | 30,000 | | | | 30,469 | |
| | |
Palm Beach County School District | | | | | | | | |
| | |
Series 2014B, COP, 5.00%, 8/1/2020 | | | 35,000 | | | | 36,225 | |
| | |
Pasco County School Board Series 2013A, COP, 5.00%, 8/1/2021 | | | 50,000 | | | | 53,573 | |
| | |
School Board of Miami-Dade County (The) | | | | | | | | |
| | |
Series D, COP, 5.00%, 2/1/2021 | | | 100,000 | | | | 105,272 | |
| | |
South Florida Water Management District COP, 5.00%, 10/1/2019 | | | 25,000 | | | | 25,073 | |
| | |
St Lucie County School Board
Series 2015A, COP,
5.00%, 7/1/2021 | | | 30,000 | | | | 32,048 | |
| | | | | | | | |
| | |
| | | | | | | 309,130 | |
| | | | | | | | |
|
Education — 0.4% | |
| | |
Florida Higher Educational Facilities Financial Authority, Nova Southeastern University Project Series 2012A, Rev.,
5.00%, 4/1/2020 | | | 200,000 | | | | 204,138 | |
SEE NOTES TO FINANCIAL STATEMENTS.
| | | | | | |
| | | |
| 146 | | | | J.P. MORGAN EXCHANGE-TRADED FUNDS | | AUGUST 31, 2019 |
| | | | | | | | |
| INVESTMENTS | | PRINCIPAL
AMOUNT ($) | | | VALUE ($) | |
Municipal Bonds — continued | |
| | |
Education — continued | | | | | | | | |
| | |
Florida State University Housing Facility Series A, Rev., 5.00%, 5/1/2020 | | | 20,000 | | | | 20,500 | |
| | |
Manatee County School District, Sales Tax Series 2017, Rev., AGM, 4.00%, 10/1/2019 | | | 50,000 | | | | 50,110 | |
| | |
Pasco County School Board, Sales Tax | | | | | | | | |
| | |
Series 2013, Rev., 2.13%, 10/1/2019 | | | 100,000 | | | | 100,074 | |
| | |
State of Florida, State Board of Education, Lottery Series 2010E, Rev., 5.00%, 7/1/2020 | | | 20,000 | | | | 20,638 | |
| | |
Volusia County School Board, Sales Tax Series 2016, Rev., 5.00%, 10/1/2019 | | | 45,000 | | | | 45,133 | |
| | | | | | | | |
| | |
| | | | | | | 440,593 | |
| | | | | | | | |
|
General Obligation — 0.1% | |
| | |
Florida State Board of Education, Public Education Capital Outlay Series 2015C, GO, 5.00%, 6/1/2020 | | | 30,000 | | | | 30,865 | |
| | |
State of Florida, State Board of Education Series B, GO, 5.00%, 6/1/2020 | | | 40,000 | | | | 41,154 | |
| | | | | | | | |
| | |
| | | | | | | 72,019 | |
| | | | | | | | |
|
Hospital — 2.7% | |
| | |
Brevard County Health Facilities Authority, Health First, Inc. Project Series 2014, Rev., 5.00%, 4/1/2021 | | | 310,000 | | | | 327,202 | |
| | |
City of Jacksonville, Health Care Facilities, Baptist Health Series 2019 B, Rev., VRDO, 1.27%, 9/12/2019 (d) | | | 1,400,000 | | | | 1,400,000 | |
| | |
City of Tallahassee, Memorial Healthcare, Inc. Project Series 2016A, Rev., 5.00%, 12/1/2019 | | | 495,000 | | | | 499,232 | |
| | |
Miami Beach Health Facilities Authority Rev., 5.00%, 11/15/2019 | | | 320,000 | | | | 322,272 | |
| | |
Miami-Dade County Health Facilities Authority, Miami Children’s Hospital Project Rev., 4.00%, 8/1/2020 | | | 700,000 | | | | 717,332 | |
| | |
Palm Beach County Health Facilities Authority, Lifespace Communities Series 2015C, Rev., 5.00%, 5/15/2020 | | | 110,000 | | | | 112,015 | |
| | | | | | | | |
| | |
| | | | | | | 3,378,053 | |
| | | | | | | | |
|
Housing — 0.1% | |
| | |
Orange County Housing Finance Authority, Willow Key Apartments Series 2019A, Rev., 1.90%, 4/1/2021 (d) | | | 100,000 | | | | 100,812 | |
| | | | | | | | |
|
Industrial Development Revenue/Pollution Control Revenue — 2.2% | |
| | |
Florida Department of Environmental ProtectionSeries 2014-A, Rev., 5.00%, 7/1/2021 | | | 20,000 | | | | 21,429 | |
| | | | | | | | |
| INVESTMENTS | | PRINCIPAL
AMOUNT ($) | | | VALUE ($) | |
| | | | | | | | |
|
Industrial Development Revenue/Pollution Control Revenue — continued | |
| | |
Florida Department of Environmental Protection, Everglades Restoration Series A, Rev., VRDO, AGC, 1.31%, 9/11/2019 (d) | | | 2,325,000 | | | | 2,325,000 | |
| | |
Palm Beach County Solid Waste Authority | | | | | | | | |
| | |
Rev., 4.00%, 10/1/2019 | | | 25,000 | | | | 25,055 | |
| | |
Rev., 5.00%, 10/1/2019 | | | 350,000 | | | | 350,980 | |
| | |
State of Florida, Department of Environmental Protection Series A, Rev., 5.00%, 7/1/2020 | | | 25,000 | | | | 25,814 | |
| | | | | | | | |
| | |
| | | | | | | 2,748,278 | |
| | | | | | | | |
|
Other Revenue — 2.6% | |
| | |
City of Cape Coral Rev., 5.00%, 10/1/2020 | | | 50,000 | | | | 52,091 | |
| | |
City of Gulf Breeze, Local Government Loan Program, Remarketing Series 1985J, Rev., 4.50%, 12/1/2020 | | | 200,000 | | | | 208,362 | |
| | |
City of Jacksonville | | | | | | | | |
| | |
Series 2011B, Rev., 5.00%, 10/1/2019 | | | 30,000 | | | | 30,082 | |
| | |
Series C, Rev., 5.00%, 10/1/2019 | | | 415,000 | | | | 416,129 | |
| | |
City of Jacksonville, Excise Tax Series 2009B, Rev., 5.00%, 10/1/2019 | | | 25,000 | | | | 25,073 | |
| | |
City of Ocoee Rev., 4.00%, 10/1/2019 | | | 25,000 | | | | 25,053 | |
| | |
City of Orlando Series C, Rev., 5.00%, 10/1/2019 | | | 100,000 | | | | 100,295 | |
| | |
City of Pembroke Pines Rev., AGM, 4.00%, 12/1/2019 | | | 100,000 | | | | 100,698 | |
| | |
City of Tallahassee Rev., 5.00%, 10/1/2020 | | | 270,000 | | | | 281,021 | |
| | |
County of Broward, Half-Cent Sales Tax Series A, Rev., 5.00%, 10/1/2020 | | | 20,000 | | | | 20,826 | |
| | |
County of Collier Series 2010B, Rev., 5.00%, 10/1/2021 | | | 30,000 | | | | 32,440 | |
| | |
County of Miami-Dade Series A, Rev., 5.00%, 4/1/2021 | | | 125,000 | | | | 132,651 | |
| | |
County of Miami-Dade, Juvenile Courthouse Series B, Rev., VRDO, AMBAC, LOC: TD Bank NA, 1.25%, 9/11/2019 (d) | | | 1,375,000 | | | | 1,375,000 | |
| | |
County of Orange Rev., 5.00%, 10/1/2019 | | | 20,000 | | | | 20,057 | |
| | |
County of Orange, Sales Tax | | | | | | | | |
| | |
Series C, Rev., 5.00%, 1/1/2020 | | | 20,000 | | | | 20,251 | |
| | |
County of Tallahassee, City of Leon, Blueprint 2000 Intergovernmental Agency Series 2011, Rev., AGM, 5.00%, 10/1/2019 | | | 50,000 | | | | 50,143 | |
| | |
Rev., NATL-RE, 5.25%, 10/1/2019 | | | 30,000 | | | | 30,089 | |
| | |
Florida Department of Environmental Protection Series 2011B, Rev., 5.00%, 7/1/2021 | | | 100,000 | | | | 107,144 | |
| | |
Orange County Convention Center Rev., 5.00%, 10/1/2021 | | | 85,000 | | | | 91,655 | |
SEE NOTES TO FINANCIAL STATEMENTS.
| | | | | | | | |
| | | |
| AUGUST 31, 2019 | | J.P. MORGAN EXCHANGE-TRADED FUNDS | | | | | 147 | |
JPMorgan Ultra-Short Municipal Income ETF
SCHEDULE OF PORTFOLIO INVESTMENTS
AS OF AUGUST 31, 2019 (Unaudited) (continued)
| | | | | | | | |
| INVESTMENTS | | PRINCIPAL
AMOUNT ($) | | | VALUE ($) | |
Municipal Bonds — continued | |
|
Other Revenue — continued | |
| | |
St. Johns County, School Board Rev., 5.00%, 10/1/2019 | | | 40,000 | | | | 40,117 | |
| | | | | | | | |
| | |
| | | | | | | 3,159,177 | |
| | | | | | | | |
|
Prerefunded — 0.7% | |
| | |
Capital Trust Agency Inc., Alexander Apartments Project Series 2011A, Rev., 6.00%, 7/1/2021 (c) | | | 360,000 | | | | 387,652 | |
| | |
Capital Trust Agency, Inc., Mission Springs Apartments Project Series A, Rev., 4.25%, 12/1/2022 (c) | | | 295,000 | | | | 336,881 | |
| | |
City of JacksonvilleSeries B-1A, Rev., 5.00%, 10/1/2019 (c) | | | 20,000 | | | | 20,059 | |
| | |
County of Miami-Dade Series C, Rev., AGC, 5.38%, 10/1/2019 (c) | | | 25,000 | | | | 25,080 | |
| | |
JEA Electric SystemSeries 3-C, Rev., 3.25%, 4/1/2020 (c) | | | 25,000 | | | | 25,312 | |
| | |
Palm Beach County Solid Waste Authority Rev., BHAC-CR, 5.50%, 10/1/2019 (c) | | | 50,000 | | | | 50,165 | |
| | | | | | | | |
| | |
| | | | | | | 845,149 | |
| | | | | | | | |
|
Transportation — 0.4% | |
| | |
County of Miami-Dade Series A, Rev., 5.75%, 10/1/2019 | | | 40,000 | | | | 40,143 | |
| | |
County of Miami-Dade, Seaport Department Series 2013A, Rev., 5.00%, 10/1/2019 | | | 100,000 | | | | 100,266 | |
| | |
Greater Orlando Aviation Authority Series B, Rev., 5.00%, 10/1/2019 | | | 25,000 | | | | 25,073 | |
| | |
Miami-Dade County Expressway Authority, Toll System Series 2014B, Rev., 5.00%, 7/1/2022 | | | 340,000 | | | | 374,320 | |
| | | | | | | | |
| | |
| | | | | | | 539,802 | |
| | | | | | | | |
|
Utility — 2.7% | |
| | |
City of Palm Coast, Utility System Improvement Rev., 5.00%, 10/1/2019 | | | 50,000 | | | | 50,143 | |
| | |
City of Port St. Lucie, Utility Systems Rev., NATL-RE, 5.25%, 9/1/2019 | | | 25,000 | | | | 25,000 | |
| | |
City of Tallahassee, Energy System | | | | | | | | |
| | |
Rev., 5.00%, 10/1/2019 | | | 100,000 | | | | 100,295 | |
| | |
Rev., 5.00%, 10/1/2020 | | | 110,000 | | | | 114,620 | |
| | |
Rev., 5.00%, 10/1/2021 | | | 35,000 | | | | 37,823 | |
| | |
County of Charlotte, Utility System Rev., AGM, 5.00%, 10/1/2019 | | | 100,000 | | | | 100,293 | |
| | |
County of Martin, Consolidated Utilities System Series A, Rev., 4.00%, 10/1/2019 | | | 25,000 | | | | 25,055 | |
| | |
JEA Bulk Power Supply System, Scherer 4 Project Series A, Rev., 3.50%, 10/1/2019 | | | 20,000 | | | | 20,036 | |
| | | | | | | | |
| INVESTMENTS | | PRINCIPAL
AMOUNT ($) | | | VALUE ($) | |
| | | | | | | | |
| | |
Utility — continued | | | | | | | | |
| | |
JEA Electric System | | | | | | | | |
| | |
Series A, Rev., 4.00%, 10/1/2019 | | | 20,000 | | | | 20,039 | |
| | |
Series 2013D, Rev., 5.00%, 10/1/2019 | | | 50,000 | | | | 50,130 | |
| | |
Series 2014A, Rev., 5.00%, 10/1/2019 | | | 100,000 | | | | 100,285 | |
| | |
Series 2015A, Rev., 5.00%, 10/1/2019 | | | 30,000 | | | | 30,085 | |
| | |
Series 2015B, Rev., 5.00%, 10/1/2019 | | | 70,000 | | | | 70,199 | |
| | |
Series A, Rev., 5.00%, 10/1/2019 | | | 335,000 | | | | 335,955 | |
| | |
Series B, Rev., 5.00%, 10/1/2019 | | | 2,000,000 | | | | 2,005,200 | |
| | |
Series G, Rev., 5.00%, 10/1/2019 | | | 30,000 | | | | 30,093 | |
| | |
Miami-Dade County Industrial Development Authority, Waste Management Inc. of Florida Project Rev., VRDO, 1.75%, 11/1/2019 (d) | | | 155,000 | | | | 155,048 | |
| | |
St Johns River Power Park | | | | | | | | |
| | |
Series 6, Rev., 5.00%, 10/1/2019 | | | 15,000 | | | | 15,044 | |
| | |
Series 7, Rev., 5.00%, 10/1/2019 | | | 65,000 | | | | 65,189 | |
| | |
Tampa Bay Water Utility System Series 2005, Rev., 5.50%, 10/1/2019 | | | 20,000 | | | | 20,066 | |
| | | | | | | | |
| | |
| | | | | | | 3,370,598 | |
| | | | | | | | |
|
Water & Sewer — 0.1% | |
| | |
County of Indian River, Water & Sewer System Rev., 5.00%, 9/1/2019 | | | 65,000 | | | | 65,000 | |
| | |
County of Lee County Series 2013B, Rev., 5.00%, 10/1/2022 | | | 35,000 | | | | 39,130 | |
| | | | | | | | |
| | |
| | | | | | | 104,130 | |
| | | | | | | | |
| | |
Total Florida | | | | | | | 15,067,741 | |
| | | | | | | | |
|
Georgia — 2.0% | |
|
Education — 0.2% | |
| | |
Private Colleges & Universities Authority Series B, Rev., 5.00%, 9/1/2019 | | | 260,000 | | | | 260,000 | |
| | | | | | | | |
|
General Obligation — 0.1% | |
| | |
Clarke County School District, Sales Tax GO, 5.00%, 9/1/2021 | | | 30,000 | | | | 32,313 | |
| | |
Houston County School District GO, 4.00%, 9/1/2019 | | | 50,000 | | | | 50,000 | |
| | | | | | | | |
| | |
| | | | | | | 82,313 | |
| | | | | | | | |
|
Hospital — 0.1% | |
| | |
Floyd County Hospital Authority, Medical Center Project Rev., 5.00%, 7/1/2020 | | | 35,000 | | | | 36,084 | |
| | |
Glynn-Brunswick Memorial Hospital Authority, Southeast Georgia Health System Project Rev., RAN, 5.00%, 8/1/2021 | | | 50,000 | | | | 53,237 | |
| | | | | | | | |
| | |
| | | | | | | 89,321 | |
| | | | | | | | |
SEE NOTES TO FINANCIAL STATEMENTS.
| | | | | | |
| | | |
| 148 | | | | J.P. MORGAN EXCHANGE-TRADED FUNDS | | AUGUST 31, 2019 |
| | | | | | | | |
| INVESTMENTS | | PRINCIPAL
AMOUNT ($) | | | VALUE ($) | |
Municipal Bonds — continued | |
|
Housing — 0.0%(b) | |
| | |
South Regional Joint Development Authority, Auxiliary Service Real Estate Rev., 5.00%, 8/1/2020 | | | 75,000 | | | | 77,533 | |
| | | | | | | | |
|
Industrial Development Revenue/Pollution Control Revenue — 0.2% | |
| | |
Fulton County Development Authority Series A, Rev., 4.00%, 5/1/2021 | | | 200,000 | | | | 209,622 | |
| | | | | | | | |
|
Prerefunded — 0.0%(b) | |
| | |
County of Columbia, Water and Sewer Rev., 5.00%, 6/1/2020 (c) | | | 20,000 | | | | 20,579 | |
| | | | | | | | |
|
Utility — 1.4% | |
| | |
Main Street Natural Gas, Inc., Gas Supply | | | | | | | | |
| | |
Series 2019B, Rev., 4.00%, 6/1/2022 | | | 450,000 | | | | 481,414 | |
| | |
Series 2019B, Rev., 4.00%, 12/1/2022 | | | 345,000 | | | | 372,883 | |
| | |
Series 2019B, Rev., 4.00%, 6/1/2023 | | | 240,000 | | | | 262,121 | |
| | |
Series A, Rev., LIQ: Royal Bank of Canada, 4.00%, 9/1/2023 (d) | | | 90,000 | | | | 98,342 | |
| | |
Series 2018C, Rev., 4.00%, 12/1/2023 (d) | | | 65,000 | | | | 71,323 | |
| | |
Monroe County Development Authority, Gulf Power Co. Plant Scherer Project | | | | | | | | |
| | |
Rev., VRDO, 1.40%, 9/19/2019 (d) | | | 325,000 | | | | 324,824 | |
| | |
Valdosta Housing Authority, Brown Rural Development Portfolio Project | | | | | | | | |
| | |
Rev., 2.25%, 12/1/2020 (d) | | | 100,000 | | | | 101,100 | |
| | | | | | | | |
| | |
| | | | | | | 1,712,007 | |
| | | | | | | | |
|
Water & Sewer — 0.0%(b) | |
| | |
County of DeKalb, Water and Sewerage | | | | | | | | |
| | |
Series 2015, Rev., 5.00%, 10/1/2019 | | | 20,000 | | | | 20,058 | |
| | | | | | | | |
| | |
Total Georgia | | | | | | | 2,471,433 | |
| | | | | | | | |
| | | | | | | | |
|
Hawaii — 0.1% | |
|
General Obligation — 0.1% | |
| | |
City & County of Honolulu Series C, GO, 4.00%, 10/1/2019 | | | 75,000 | | | | 75,164 | |
| | | | | | | | |
|
Illinois — 1.5% | |
|
General Obligation — 0.7% | |
| | |
Cook County Series 2009C, GO, 5.00%, 11/15/2021 | | | 50,000 | | | | 50,342 | |
| | |
Cook County School District No. 81 Schiller Park, School Bonds GO, 4.00%, 12/1/2021 | | | 80,000 | | | | 84,693 | |
| | |
Fox Valley Park District Series 2015B, GO, 4.00%, 12/15/2019 | | | 20,000 | | | | 20,147 | |
| | |
Kane McHenry Cook and De Kalb Counties Unit School District No. 300, School Bonds GO, 4.00%, 1/1/2020 | | | 20,000 | | | | 20,176 | |
| | | | | | | | |
| INVESTMENTS | | PRINCIPAL
AMOUNT ($) | | | VALUE ($) | |
| | | | | | | | |
| | |
General Obligation — continued | | | | | | | | |
| | |
Lake County Township High School District No. 121 Series 2016A, GO, 3.00%, 1/1/2024 (c) | | | 370,000 | | | | 397,606 | |
| | |
Village of McCook | | | | | | | | |
| | |
Series 2019A, GO, AGM, 4.00%, 12/1/2019 | | | 75,000 | | | | 75,427 | |
| | |
Series 2019A, GO, AGM, 4.00%, 12/1/2020 | | | 100,000 | | | | 102,848 | |
| | |
Series 2019A, GO, AGM, 4.00%, 12/1/2021 | | | 135,000 | | | | 141,684 | |
| | | | | | | | |
| | |
| | | | | | | 892,923 | |
| | | | | | | | |
|
Hospital — 0.3% | |
| | |
Illinois Finance Authority, Advocate HealthcareSeries 2008A-2, Rev., 5.00%, 2/12/2020 (d) | | | 180,000 | | | | 182,787 | |
| | |
Illinois Finance Authority, Ascension Health Alliance Senior Credit GroupSeries E-2, Rev., 1.75%, 4/1/2021 (d) | | | 100,000 | | | | 100,829 | |
| | |
Illinois Finance Authority, Unitypoint Health Series 2016, Rev., 5.00%, 2/15/2024 | | | 90,000 | | | | 104,064 | |
| | | | | | | | |
| | |
| | | | | | | 387,680 | |
| | | | | | | | |
|
Other Revenue — 0.1% | |
| | |
Railsplitter Tobacco Settlement Authority Rev., 5.25%, 6/1/2020 | | | 100,000 | | | | 102,937 | |
| | |
State of Illinois Rev., 4.00%, 6/15/2020 | | | 45,000 | | | | 45,810 | |
| | | | | | | | |
| | |
| | | | | | | 148,747 | |
| | | | | | | | |
|
Prerefunded — 0.2% | |
| | |
Cook County School District No. 144 Prairie Hills, School Bonds Series 2010A, GO, AGM, 5.00%, 12/1/2020 (c) | | | 100,000 | | | | 104,882 | |
| | |
County of St Clair Series 2009, GO, 5.00%, 10/1/2019 (c) | | | 20,000 | | | | 20,059 | |
| | |
Macoupin County Community Unit School District No. 7 Gillespie, School Building GO, AGC, 6.00%, 12/1/2021 (c) | | | 50,000 | | | | 55,483 | |
| | | | | | | | |
| | |
| | | | | | | 180,424 | |
| | | | | | | | |
|
Transportation — 0.0%(b) | |
| | |
Regional Transportation Authority Series B, Rev., NATL-RE, 5.50%, 6/1/2020 | | | 45,000 | | | | 46,398 | |
| | | | | | | | |
|
Utility — 0.2% | |
| | |
City of Springfield, Senior Lien Electric Rev., 5.00%, 3/1/2020 | | | 50,000 | | | | 50,912 | |
| | |
Illinois Finance Authority, Prairie Power Inc. Series A, Rev., VRDO, 1.75%, 5/6/2020 (d) | | | 125,000 | | | | 124,677 | |
SEE NOTES TO FINANCIAL STATEMENTS.
| | | | | | | | |
| | | |
| AUGUST 31, 2019 | | J.P. MORGAN EXCHANGE-TRADED FUNDS | | | | | 149 | |
JPMorgan Ultra-Short Municipal Income ETF
SCHEDULE OF PORTFOLIO INVESTMENTS
AS OF AUGUST 31, 2019 (Unaudited) (continued)
| | | | | | | | |
| INVESTMENTS | | PRINCIPAL
AMOUNT ($) | | | VALUE ($) | |
Municipal Bonds — continued | | | | | | | | |
| | |
Utility — continued | | | | | | | | |
| | |
Illinois Municipal Electric Agency, Power Supply System Series 2015A, Rev., 5.00%, 2/1/2020 | | | 60,000 | | | | 60,915 | |
| | | | | | | | |
| | |
| | | | | | | 236,504 | |
| | | | | | | | |
| | |
Total Illinois | | | | | | | 1,892,676 | |
| | | | | | | | |
|
Indiana — 5.6% | |
|
Education — 0.6% | |
| | |
City of Evansville, Economic Development Lease Rental School Project Series 2015C, Rev., 5.00%, 2/15/2020 | | | 25,000 | | | | 25,409 | |
| | |
Danville School Building Corp., Ad Valorem Property Tax Series 2015B, Rev., 5.00%, 1/15/2020 | | | 100,000 | | | | 101,369 | |
| | |
East Porter County School Building Corp. Rev., 4.00%, 7/15/2020 | | | 125,000 | | | | 127,975 | |
| | |
Elkhart Community Schools Building Corp., First Mortgage Bonds Series 2018B, Rev., 5.00%, 1/15/2020 | | | 75,000 | | | | 76,017 | |
| | |
Hamilton Southeastern Consolidated School Building Corp., First Mortgage Series B, Rev., 5.00%, 7/15/2022 | | | 35,000 | | | | 38,705 | |
| | |
Jennings County School Building Corp., First Mortgage | | | | | | | | |
| | |
Series 2019A, Rev., 2.00%, 1/15/2021 | | | 90,000 | | | | 90,942 | |
| | |
Series 2019B, Rev., 3.00%, 1/15/2021 | | | 15,000 | | | | 15,359 | |
| | |
Series 2019B, Rev., 3.00%, 7/15/2021 | | | 50,000 | | | | 51,630 | |
| | |
Series 2019A, Rev., 2.00%, 1/15/2022 | | | 90,000 | | | | 91,615 | |
| | |
Series 2019B, Rev., 3.00%, 1/15/2022 | | | 40,000 | | | | 41,647 | |
| | |
Series 2019A, Rev., 2.00%, 1/15/2023 | | | 60,000 | | | | 61,513 | |
| | | | | | | | |
| | |
| | | | | | | 722,181 | |
| | | | | | | | |
| | | | | | | | |
|
Hospital — 3.9% | |
| | |
Indiana Finance Authority, Health Obligation Series H, Rev., 1.65%, 7/1/2022 (d) | | | 1,000,000 | | | | 1,013,430 | |
| | |
Indiana Finance Authority, Parkview Health Series 2017A, Rev., 5.00%, 11/1/2020 | | | 35,000 | | | | 36,549 | |
| | |
Indiana Finance Authority, University Health Obligated Group Series E, Rev., VRDO, LOC: Bank of America NA, 1.27%, 9/11/2019 (d) | | | 3,000,000 | | | | 3,000,000 | |
| | |
Indiana Health & Educational Facilities Financing Authority, Ascension Senior Credit Group | | | | | | | | |
| | |
Series A-10, Rev., VRDO, 1.50%, 5/1/2020 (d) | | | 250,000 | | | | 250,010 | |
| | |
Series B-3, Rev., 1.75%, 11/2/2021 (d) | | | 80,000 | | | | 80,525 | |
| | |
Indiana Health Facility Financing Authority, Ascension Health Credit Group Rev., VRDO, 1.37%, 5/1/2020 (d) | | | 455,000 | | | | 455,205 | |
| | | | | | | | |
| | |
| | | | | | | 4,835,719 | |
| | | | | | | | |
| | | | | | | | |
| INVESTMENTS | | PRINCIPAL
AMOUNT ($) | | | VALUE ($) | |
| | | | | | | | |
|
Other Revenue — 0.1% | |
| | |
Fort Wayne Redevelopment Authority Rev., 4.00%, 2/1/2022 | | | 50,000 | | | | 53,273 | |
| | |
Indiana Finance Authority, Revolving Fund Series 2010C, Rev., 5.00%, 2/1/2020 | | | 20,000 | | | | 20,322 | |
| | | | | | | | |
| | |
| | | | | | | 73,595 | |
| | | | | | | | |
|
Prerefunded — 0.0%(b) | |
| | |
County of Allen, Maplecrest Bridge of 2009 GO, 3.90%, 9/1/2019 (c) | | | 20,000 | | | | 20,000 | |
| | | | | | | | |
|
Utility — 1.0% | |
| | |
City of Rockport, Michigan Power Company Project Series D, Rev., 2.05%,
6/1/2021 (d) | | | 1,000,000 | | | | 1,011,600 | |
| | |
City of Whiting, BP Products North America Inc. Project Rev., VRDO, 1.85%, 10/1/2019 (d) | | | 200,000 | | | | 200,070 | |
| | |
Indiana Municipal Power Agency Series B, Rev., 5.00%, 1/1/2020 | | | 50,000 | | | | 50,628 | |
| | |
Indiana Municipal Power Agency, Power Supply System Series 2014A, Rev., 5.00%, 1/1/2021 | | | 20,000 | | | | 21,008 | |
| | | | | | | | |
| | |
| | | | | | | 1,283,306 | |
| | | | | | | | |
|
Water & Sewer — 0.0%(b) | |
| | |
City of Indianapolis, Department of Public Utilities Water System Series 2016B, Rev., 5.00%, 10/1/2019 | | | 25,000 | | | | 25,072 | |
| | |
Total Indiana | | | | | | | 6,959,873 | |
| | | | | | | | |
|
Iowa — 0.1% | |
|
General Obligation — 0.1% | |
| | |
Waukee Community School District GO, 5.00%, 6/1/2020
Series 2014C, GO, 5.00%, 6/1/2021 | |
| 30,000
40,000 |
| |
| 30,867
42,697 |
|
| | | | | | | | |
| | |
| | | | | | | 73,564 | |
| | | | | | | | |
|
Hospital — 0.0% (b) | |
| | |
Iowa State Board of Regents, University of Iowa Hospitals and Clinics Rev., 4.00%, 9/1/2020 | | | 25,000 | | | | 25,703 | |
| | | | | | | | |
| | |
Total Iowa | | | | | | | 99,267 | |
| | | | | | | | |
|
Kansas — 0.3% | |
|
General Obligation — 0.2% | |
| | |
City of Lawrence, Temporary Notes Series I, GO, 2.00%, 5/1/2021 | | | 120,000 | | | | 120,739 | |
| | |
City of Leawood, Temporary Notes Series 1, GO, 3.00%, 9/1/2019 | | | 100,000 | | | | 100,000 | |
| | |
City of Olathe Series 2018 231, GO, 5.00%, 10/1/2019 | | | 20,000 | | | | 20,059 | |
SEE NOTES TO FINANCIAL STATEMENTS.
| | | | | | |
| | | |
| 150 | | | | J.P. MORGAN EXCHANGE-TRADED FUNDS | | AUGUST 31, 2019 |
| | | | | | | | |
| INVESTMENTS | | PRINCIPAL
AMOUNT ($) | | | VALUE ($) | |
Municipal Bonds — continued | |
| | |
General Obligation — continued | | | | | | | | |
| | |
City of Overland Park Series 2013B, GO, 4.00%, 9/1/2019 | | | 35,000 | | | | 35,000 | |
| | | | | | | | |
| | |
| | | | | | | 275,798 | |
| | | | | | | | |
|
Other Revenue — 0.0%(b) | |
| | |
County of Shawnee, Public Building Commission, Expocentre Project Rev., 4.00%, 9/1/2019 | | | 25,000 | | | | 25,000 | |
| | | | | | | | |
|
Utility — 0.1% | |
| | |
Wyandotte County Unified Government, Kansas City, Utility System Series A, Rev., 5.00%, 9/1/2019 | | | 110,000 | | | | 110,000 | |
| | | | | | | | |
| | |
Total Kansas | | | | | | | 410,798 | |
| | | | | | | | |
|
Kentucky — 0.7% | |
|
General Obligation — 0.5% | |
| | |
City of Bowling Green Series 2016C, GO, 4.00%, 6/1/2020 | | | 100,000 | | | | 102,211 | |
| | |
County of Kenton | | | | | | | | |
| | |
Series B, GO, 5.00%, 10/1/2020 | | | 305,000 | | | | 317,173 | |
| | |
Series B, GO, 5.00%, 10/1/2021 | | | 215,000 | | | | 231,471 | |
| | | | | | | | |
| | |
| | | | | | | 650,855 | |
| | | | | | | | |
|
Housing — 0.2% | |
| | |
Kentucky Housing Corp., Westminster Village Project Series 2019, Rev., 2.00%, 3/1/2021 (d) | | | 200,000 | | | | 202,624 | |
| | | | | | | | |
|
Other Revenue — 0.0%(b) | |
| | |
Kentucky Association of Counties Finance Corp. Series C, Rev., 3.25%, 2/1/2021 | | | 50,000 | | | | 51,352 | |
| | | | | | | | |
|
Water & Sewer — 0.0%(b) | |
| | |
Louisville & Jefferson County Metropolitan Sewer District, Sewer and Drainage System Rev., BAN, 4.00%, 11/1/2019 | | | 25,000 | | | | 25,108 | |
| | | | | | | | |
| | |
Total Kentucky | | | | | | | 929,939 | |
| | | | | | | | |
|
Louisiana — 0.3% | |
|
General Obligation — 0.2% | |
| | |
City of Shreveport, Water & Sewer Improvement GO, 3.50%, 9/1/2019 | | | 250,000 | | | | 250,000 | |
| | | | | | | | |
|
Other Revenue — 0.1% | |
| | |
City of Lafayette, Public Improvement Sales Tax Rev., 5.00%, 5/1/2020 | | | 25,000 | | | | 25,633 | |
| | |
State of Louisiana, Gas and Fuels Tax Series 2010B, Rev., 5.00%, 5/1/2020 | | | 40,000 | | | | 41,026 | |
| | | | | | | | |
| | |
| | | | | | | 66,659 | |
| | | | | | | | |
|
Prerefunded — 0.0%(b) | |
| | |
State of Louisiana, Gas and Fuels Tax Series B, Rev., 5.00%, 5/1/2020 (c) | | | 20,000 | | | | 20,509 | |
| | | | | | | | |
| | | | | | | | |
| INVESTMENTS | | PRINCIPAL
AMOUNT ($) | | | VALUE ($) | |
| | | | | | | | |
|
Utility — 0.0%(b) | |
| | |
Louisiana Local Government Environmental Facilities & Community Development Authority, Parish of East Baton Rouge Road Improvements Project Rev., 5.00%, 8/1/2020 | | | 40,000 | | | | 41,384 | |
| | | | | | | | |
| | |
Total Louisiana | | | | | | | 378,552 | |
| | | | | | | | |
|
Maine — 0.0%(b) | |
|
Transportation — 0.0%(b) | |
| | |
Maine Municipal Bond Bank, Transportation Infrastructure Series 2011A, Rev., 5.00%, 9/1/2020 | | | 20,000 | | | | 20,772 | |
| | | | | | | | |
|
Maryland — 1.7% | |
|
General Obligation — 0.0%(b) | |
| | |
County of Prince George’s, Public Improvement Series 2011B, GO, 5.00%, 9/15/2019 | | | 40,000 | | | | 40,047 | |
| | |
Town of Ocean City, Mayor and City Council Series 2015, GO, 5.00%, 12/1/2019 | | | 20,000 | | | | 20,189 | |
| | | | | | | | |
| | |
| | | | | | | 60,236 | |
| | | | | | | | |
|
Hospital — 1.6% | |
| | |
Maryland Health and Higher Educational Facilities Authority, Pooled Loan Program Series B, Rev., VRDO, LOC: TD Bank NA, 1.25%, 9/11/2019 (d) | | | 1,955,000 | | | | 1,955,000 | |
| | | | | | | | |
|
Transportation — 0.1% | |
| | |
Maryland State Transportation Authority, Transportation Facilities Projects Rev., 5.00%, 7/1/2020 | | | 25,000 | | | | 25,813 | |
| | |
Montgomery County Revenue Authority Series 2015A, Rev., 4.00%, 11/1/2019 | | | 35,000 | | | | 35,159 | |
| | | | | | | | |
| | |
| | | | | | | 60,972 | |
| | | | | | | | |
| | |
Total Maryland | | | | | | | 2,076,208 | |
| | | | | | | | |
|
Massachusetts — 0.6% | |
|
Education — 0.2% | |
| | |
Massachusetts Development Finance Agency, Emerson College Rev., 5.00%, 1/1/2020 | | | 200,000 | | | | 202,288 | |
| | |
University of Massachusetts Building Authority Series 2, Rev., 5.00%, 11/1/2020 | | | 25,000 | | | | 26,121 | |
| | | | | | | | |
| | |
| | | | | | | 228,409 | |
| | | | | | | | |
|
General Obligation — 0.2% | |
| | |
City of Newburyport, Municipal Purpose Loan of 2013 GO, 4.00%, 1/15/2020 | | | 25,000 | | | | 25,275 | |
| | |
City of Springfield Series 2012, GO, 4.00%, 9/1/2019 | | | 40,000 | | | | 40,000 | |
SEE NOTES TO FINANCIAL STATEMENTS.
| | | | | | | | |
| | | |
| AUGUST 31, 2019 | | J.P. MORGAN EXCHANGE-TRADED FUNDS | | | | | 151 | |
JPMorgan Ultra-Short Municipal Income ETF
SCHEDULE OF PORTFOLIO INVESTMENTS
AS OF AUGUST 31, 2019 (Unaudited) (continued)
| | | | | | | | |
| INVESTMENTS | | PRINCIPAL
AMOUNT ($) | | | VALUE ($) | |
Municipal Bonds — continued | |
| | |
General Obligation — continued | | | | | | | | |
| | |
Commonwealth of Massachusetts Series D, GO, AMBAC, 5.50%, 10/1/2019 | | | 40,000 | | | | 40,133 | |
| | |
Commonwealth of Massachusetts, Consolidated Loan of 2001 Series 2001D, GO, AGM-CR, 5.50%, 11/1/2019 | | | 25,000 | | | | 25,179 | |
| | |
Town of Concord, Municipal Purpose Loan GO, 4.00%, 9/15/2019 | | | 20,000 | | | | 20,019 | |
| | |
Town of Dartmouth GO, 4.00%, 4/15/2020 | | | 20,000 | | | | 20,362 | |
| | |
Town of Stoneham Series 2010, GO, 5.00%, 11/15/2019 | | | 20,000 | | | | 20,154 | |
| | | | | | | | |
| | |
| | | | | | | 191,122 | |
| | | | | | | | |
|
Hospital — 0.2% | |
| | |
Massachusetts Development Finance Agency, Umass Memorial Health Care Obligated Group Series I, Rev., 5.00%, 7/1/2022 | | | 245,000 | | | | 269,008 | |
| | | | | | | | |
|
Prerefunded — 0.0%(b) | |
| | |
Massachusetts Development Finance Agency, Boston UniversitySeries V-1, Rev., 5.00%, 10/1/2019 (c) | | | 25,000 | | | | 25,074 | |
| | | | | | | | |
|
Transportation — 0.0%(b) | |
| | |
Massachusetts Bay Transportation Authority, Sales Tax Series 2010C, Rev., 5.00%, 7/1/2020 | | | 25,000 | | | | 25,812 | |
| | |
Massachusetts Department of Transportation Series A, Rev., 5.00%, 1/1/2020 (c) | | | 20,000 | | | | 20,277 | |
| | | | | | | | |
| | |
| | | | | | | 46,089 | |
| | | | | | | | |
| | |
Total Massachusetts | | | | | | | 759,702 | |
| | | | | | | | |
|
Michigan — 1.1% | |
|
General Obligation — 0.2% | |
| | |
Byron Center Public Schools GO, 3.50%, 5/1/2022 | | | 25,000 | | | | 25,390 | |
| | |
City of Warren Series B, GO, 4.00%, 10/1/2019 | | | 25,000 | | | | 25,052 | |
| | |
County of Kent GO, 5.00%, 1/1/2021 | | | 110,000 | | | | 115,680 | |
| | |
Novi Community School District, School Building and Site Bonds Series I, GO, 4.00%, 5/1/2021 | | | 25,000 | | | | 26,125 | |
| | |
State of Michigan, Environmental Program Series A, GO, 5.00%, 12/1/2019 | | | 30,000 | | | | 30,290 | |
| | | | | | | | |
| | |
| | | | | | | 222,537 | |
| | | | | | | | |
|
Hospital — 0.5% | |
| | |
Michigan Finance Authority, Bronson Healthcare Group, Inc. Series B, Rev., 3.50%, 9/11/2019 (d) (e) | | | 200,000 | | | | 212,344 | |
| | |
Michigan Finance Authority, Henry Ford Health System Rev., 5.00%, 11/15/2020 | | | 120,000 | | | | 125,380 | |
| | | | | | | | |
| INVESTMENTS | | PRINCIPAL
AMOUNT ($) | | | VALUE ($) | |
| | | | | | | | |
| | |
Hospital — continued | | | | | | | | |
| | |
Michigan State Hospital Finance Authority, Ascension Health Series 2010 F-1, Rev., 4.00%, 6/1/2023 (d) | | | 50,000 | | | | 55,049 | |
| | |
Michigan State Hospital Finance Authority, Ascension Health Senior Credit GroupSeries F-5, Rev., 2.40%, 3/15/2023 (d) | | | 140,000 | | | | 145,652 | |
| | |
Royal Oak Hospital Finance Authority, William Beaumont Hospital Obligated Group Series 2014D, Rev., 5.00%, 9/1/2020 | | | 25,000 | | | | 25,945 | |
| | | | | | | | |
| | |
| | | | | | | 564,370 | |
| | | | | | | | |
|
Other Revenue — 0.3% | |
| | |
Detroit Wayne County Stadium Authority Series 2012, Rev., AGM, 5.00%, 10/1/2019 | | | 175,000 | | | | 175,465 | |
| | |
Michigan State Building Authority, Facilities Program | | | | | | | | |
| | |
Series 2015I, Rev., 5.00%, 4/15/2020 | | | 20,000 | | | | 20,475 | |
| | |
Series I, Rev., 5.00%, 4/15/2021 | | | 100,000 | | | | 106,211 | |
| | |
State of Michigan Rev., GAN, 5.00%, 3/15/2020 | | | 75,000 | | | | 76,571 | |
| | | | | | | | |
| | |
| | | | | | | 378,722 | |
| | | | | | | | |
|
Transportation — 0.1% | |
| | |
State of Michigan, Trunk Line Rev., 5.00%, 11/1/2019 | | | 25,000 | | | | 25,158 | |
| | |
Wayne County Airport Authority, Junior Lien Series 2017A, Rev., 5.00%, 12/1/2020 | | | 100,000 | | | | 104,679 | |
| | | | | | | | |
| | |
| | | | | | | 129,837 | |
| | | | | | | | |
|
Water & Sewer — 0.0%(b) | |
| | |
Michigan Finance Authority, Revolving Fund Cleanwater Series 2011, Rev., 5.00%, 10/1/2020 | | | 20,000 | | | | 20,844 | |
| | |
Michigan Finance Authority, Revolving Fund Drinking water Series 2012, Rev., 5.00%, 10/1/2019 | | | 20,000 | | | | 20,060 | |
| | |
Michigan Municipal Bond Authority, Clean Water Rev., 5.00%, 10/1/2019 | | | 20,000 | | | | 20,059 | |
| | | | | | | | |
| | |
| | | | | | | 60,963 | |
| | | | | | | | |
| | |
Total Michigan | | | | | | | 1,356,429 | |
| | | | | | | | |
|
Minnesota — 2.2% | |
|
Certificate of Participation/Lease — 0.7% | |
| | |
Duluth Independent School District No. 709 | | | | | | | | |
| | |
Series 2019C, COP, 5.00%, 2/1/2020 | | | 145,000 | | | | 147,008 | |
| | |
Series 2019C, COP, 5.00%, 2/1/2022 | | | 130,000 | | | | 140,394 | |
| | |
Series A, COP, 5.00%, 2/1/2022 | | | 200,000 | | | | 215,990 | |
SEE NOTES TO FINANCIAL STATEMENTS.
| | | | | | |
| | | |
| 152 | | | | J.P. MORGAN EXCHANGE-TRADED FUNDS | | AUGUST 31, 2019 |
| | | | | | | | |
| INVESTMENTS | | PRINCIPAL
AMOUNT ($) | | | VALUE ($) | |
Municipal Bonds — continued | |
| |
Certificate of Participation/Lease — continued | | | | | |
| | |
Minnetonka Independent School District No. 276 | | | | | | | | |
| | |
Series E, COP, 3.00%, 10/1/2021 | | | 155,000 | | | | 160,556 | |
| | |
Series E, COP, 3.00%, 10/1/2022 | | | 85,000 | | | | 89,472 | |
| | |
Series E, COP, 4.00%, 10/1/2023 | | | 115,000 | | | | 127,459 | |
| | | | | | | | |
| | |
| | | | | | | 880,879 | |
| | | | | | | | |
|
Education — 0.0%(b) | |
| | |
Minnesota Higher Education Facilities Authority, St. Olaf CollegeSeries 8-G, Rev., 5.00%, 12/1/2019 | | | 25,000 | | | | 25,229 | |
| | | | | | | | |
|
General Obligation — 0.3% | |
| | |
City of Pipestone Series A, GO, 3.00%, 2/1/2020 | | | 80,000 | | | | 80,580 | |
| | |
Shakopee Independent School District No. 720, School Building Series 2013A, GO, 5.00%, 2/1/2020 | | | 200,000 | | | | 203,108 | |
| | |
State of Minnesota Series A, GO, 5.00%, 12/1/2019 | | | 25,000 | | | | 25,239 | |
| | |
State of Minnesota, Trunk Highway Series E, GO, 5.00%, 8/1/2020 | | | 35,000 | | | | 36,244 | |
| | | | | | | | |
| | |
| | | | | | | 345,171 | |
| | | | | | | | |
|
Housing — 0.2% | |
| | |
City of Maplewood, Maple Pond Apartments Project Series 2018A, Rev., 2.20%, 4/1/2020 (d) | | | 150,000 | | | | 150,830 | |
| | |
Housing and Redevelopment Authority of The City of St Paul Minnesota, Millberry Apartments Project Series 2018A, Rev., VRDO, 2.15%, 3/1/2020 (d) | | | 100,000 | | | | 100,048 | |
| | | | | | | | |
| | |
| | | | | | | 250,878 | |
| | | | | | | | |
|
Other Revenue — 0.0%(b) | |
| | |
State of Minnesota, General Fund Appropriation Series B, Rev., 5.00%, 3/1/2020 | | | 20,000 | | | | 20,392 | |
| | | | | | | | |
|
Transportation — 0.0%(b) | |
| | |
Minneapolis-St Paul Metropolitan Airports Commission, Subordinate Airport Series C, Rev., 5.00%, 1/1/2020 | | | 20,000 | | | | 20,254 | |
| | | | | | | | |
|
Utility — 0.5% | |
| | |
City of Minneapolis, 1500 Nicollet Apartments Project Rev., VRDO, 1.37%, 11/1/2019 (d) | | | 175,000 | | | | 174,996 | |
| | |
City of Rochester, Eastgate Apartments Project Rev., VRDO, 1.70%, 12/1/2019 (d) | | | 250,000 | | | | 250,225 | |
| | | | | | | | |
| INVESTMENTS | | PRINCIPAL
AMOUNT ($) | | | VALUE ($) | |
| | | | | | | | |
| | |
Utility — continued | | | | | | | | |
| | |
Housing and Redevelopment Authority of The City of St. Paul, Legends Berry Senior Apartments Project Series A, Rev., VRDO, 2.20%, 9/1/2020 (d) | | | 125,000 | | | | 125,488 | |
| | |
Minnesota Municipal Power Agency Series 2010A, Rev., 5.00%, 10/1/2019 | | | 25,000 | | | | 25,074 | |
| | | | | | | | |
| | |
| | | | | | | 575,783 | |
| | | | | | | | |
|
Water & Sewer — 0.5% | |
| | |
Minnesota Rural Water Finance Authority, Inc., Public Projects Construction Rev., 2.00%, 8/1/2020 | | | 610,000 | | | | 612,196 | |
| | | | | | | | |
| | |
Total Minnesota | | | | | | | 2,730,782 | |
| | | | | | | | |
|
Mississippi — 2.7% | |
|
General Obligation — 0.0%(b) | |
| | |
Rankin County School District GO, 5.00%, 10/1/2019 | | | 20,000 | | | | 20,058 | |
| | | | | | | | |
|
Industrial Development Revenue/Pollution Control Revenue — 2.6% | |
| | |
Mississippi Business Finance Corp., Gulf Opportunity Zone Industrial Development, Chevron USA, Inc. Project Series D, Rev., VRDO, 1.28%, 9/6/2019 (d) | | | 3,240,000 | | | | 3,240,000 | |
| | | | | | | | |
|
Water & Sewer — 0.1% | |
| | |
Mississippi Development Bank, Special Obligation, Water and Sewer System Project Rev., AGM, 3.00%, 12/1/2020 | | | 100,000 | | | | 102,047 | |
| | | | | | | | |
| | |
Total Mississippi | | | | | | | 3,362,105 | |
| | | | | | | | |
|
Missouri — 2.6% | |
|
Education — 1.3% | |
| | |
Health & Educational Facilities Authority of the State of Missouri, Bethesda Health Group Inc. Rev., 4.00%, 8/1/2020 | | | 110,000 | | | | 112,086 | |
| | |
Health and Educational Facilities Authority of the State of Missouri, BJC Health System Series C, Rev., VRDO, LIQ: BJC Health System, 1.25%, 9/12/2019 (d) | | | 815,000 | | | | 815,000 | |
| | |
Health and Educational Facilities Authority of the State of Missouri, Lutheran Senior Services Projects Series 2016A, Rev., 4.00%, 2/1/2020 | | | 20,000 | | | | 20,170 | |
| | |
Health and Educational Facilities Authority of the State of Missouri, SSM Health Series F, Rev., VRDO, 1.26%, 9/6/2019 (d) | | | 700,000 | | | | 700,000 | |
| | | | | | | | |
| | |
| | | | | | | 1,647,256 | |
| | | | | | | | |
|
General Obligation — 0.1% | |
| | |
Columbia School District GO, 4.00%, 3/1/2020 | | | 25,000 | | | | 25,350 | |
SEE NOTES TO FINANCIAL STATEMENTS.
| | | | | | | | |
| | | |
| AUGUST 31, 2019 | | J.P. MORGAN EXCHANGE-TRADED FUNDS | | | | | 153 | |
JPMorgan Ultra-Short Municipal Income ETF
SCHEDULE OF PORTFOLIO INVESTMENTS
AS OF AUGUST 31, 2019 (Unaudited) (continued)
| | | | | | | | |
| INVESTMENTS | | PRINCIPAL
AMOUNT ($) | | | VALUE ($) | |
Municipal Bonds — continued | | | | | | | | |
| | |
General Obligation — continued | | | | | | | | |
| | |
Jackson County Reorganized School District No. 7 GO, 4.00%, 3/1/2020 | | | 20,000 | | | | 20,279 | |
| | | | | | | | |
| | |
| | | | | | | 45,629 | |
| | | | | | | | |
|
Hospital — 0.1% | |
| | |
Health and Educational Facilities Authority of the State of Missouri, Coxhealth Series 2013A, Rev., 5.00%, 11/15/2022 | | | 50,000 | | | | 55,759 | |
| | |
Health and Educational Facilities Authority of the State of Missouri, Saint Luke’s Health System, Inc. Series 2010A, Rev., 4.00%, 11/15/2019 | | | 100,000 | | | | 100,544 | |
| | | | | | | | |
| | |
| | | | | | | 156,303 | |
| | | | | | | | |
|
Industrial Development Revenue/Pollution Control Revenue — 0.0%(b) | |
| | |
Kansas City Industrial Development Authority, Downtown Redevelopment District Series A, Rev., 5.00%, 9/1/2019 | | | 35,000 | | | | 35,000 | |
| | | | | | | | |
|
Other Revenue — 0.1% | |
| | |
City of Columbia Rev., 5.00%, 2/1/2020 | | | 25,000 | | | | 25,376 | |
| | |
County of Jackson Rev., 4.00%, 12/1/2019 | | | 70,000 | | | | 70,455 | |
| | | | | | | | |
| | |
| | | | | | | 95,831 | |
| | | | | | | | |
|
Utility — 0.9% | |
| | |
County of Jackson, Harry S. Truman Sports Complex Project Rev., 5.00%, 12/1/2019 | | | 300,000 | | | | 302,748 | |
| | |
Missouri Joint Municipal Electric Utility Commission Series 2014A, Rev., 5.00%, 1/1/2020 | | | 20,000 | | | | 20,252 | |
| | |
Missouri Joint Municipal Electric Utility Commission, Prairie State Project Series A, Rev., 5.00%, 12/1/2019 | | | 775,000 | | | | 782,137 | |
| | | | | | | | |
| | |
| | | | | | | 1,105,137 | |
| | | | | | | | |
|
Water & Sewer — 0.1% | |
| | |
City of Kansas City Series A, Rev., BHAC-CR, 5.00%, 9/9/2019 | | | 100,000 | | | | 100,054 | |
| | | | | | | | |
| | |
Total Missouri | | | | | | | 3,185,210 | |
| | | | | | | | |
|
Nebraska — 0.7% | |
|
General Obligation — 0.0%(b) | |
| | |
City of Omaha GO, 5.25%, 4/1/2021 | | | 25,000 | | | | 26,647 | |
| | | | | | | | |
|
Utility — 0.7% | |
| | |
Central Plains Energy Project, Gas Supply Rev., LIQ: Royal Bank of Canada, 5.00%, 12/1/2019 (d) | | | 770,000 | | | | 776,691 | |
| | |
Nebraska Public Power District Series A, Rev., 5.00%, 1/1/2021 | | | 50,000 | | | | 52,580 | |
| | | | | | | | |
| INVESTMENTS | | PRINCIPAL
AMOUNT ($) | | | VALUE ($) | |
| | | | | | | | |
| | |
Utility — continued | | | | | | | | |
| | |
Norris Public Power District, Electric System Series 2011B, Rev., 4.00%, 1/1/2020 | | | 50,000 | | | | 50,427 | |
| | | | | | | | |
| | |
| | | | | | | 879,698 | |
| | | | | | | | |
| | |
Total Nebraska | | | | | | | 906,345 | |
| | | | | | | | |
|
Nevada — 0.7% | |
|
General Obligation — 0.1% | |
| | |
Clark County GO, 5.00%, 6/1/2020 | | | 25,000 | | | | 25,705 | |
| | |
State of Nevada, Capital Improvement and Cultural Affairs Series 2012B, GO, 5.00%, 8/1/2021 | | | 30,000 | | | | 32,254 | |
| | | | | | | | |
| | |
| | | | | | | 57,959 | |
| | | | | | | | |
|
Prerefunded — 0.0%(b) | |
| | |
Washoe County School District, Limited Tax, School ImprovementSeries 2011-A, GO, 5.00%, 6/1/2021 (c) | | | 40,000 | | | | 42,690 | |
| | | | | | | | |
|
Transportation — 0.6% | |
| | |
Clark County, Passenger Facility Charge, Mccarran International AirportSeries F-2, Rev., VRDO, LOC: Union Bank NA, 1.31%, 9/11/2019 (d) | | | 720,000 | | | | 720,000 | |
| | | | | | | | |
| | |
Total Nevada | | | | | | | 820,649 | |
| | | | | | | | |
|
New Hampshire — 0.2% | |
|
Other Revenue — 0.0%(b) | |
| | |
New Hampshire Municipal Bond Bank Series 2014A, Rev., 5.00%, 8/15/2020 | | | 25,000 | | | | 25,939 | |
| | | | | | | | |
|
Prerefunded — 0.1% | |
| | |
New Hampshire Business Finance Authority, Elliot Hospital Obligation Series 2009A, Rev., 6.00%, 10/1/2019 (c) | | | 55,000 | | | | 55,200 | |
| | | | | | | | |
|
Transportation — 0.1% | |
| | |
State of New Hampshire, Federal Highway Grant Anticipation Bonds Rev., GAN, 5.00%, 9/1/2019 | | | 155,000 | | | | 155,000 | |
| | | | | | | | |
| | |
Total New Hampshire | | | | | | | 236,139 | |
| | | | | | | | |
|
New Jersey — 11.0% | |
|
Education — 0.3% | |
| | |
New Jersey Economic Development Authority, School Facilities Construction Series 2011EE, Rev., 5.25%, 9/1/2019 (c) | | | 25,000 | | | | 25,000 | |
| | |
Rev., 5.00%, 3/1/2020 | | | 390,000 | | | | 397,000 | |
| | | | | | | | |
| | |
| | | | | | | 422,000 | |
| | | | | | | | |
|
General Obligation — 8.8% | |
| | |
Bernards Township School District Series 2013B, GO, 5.00%, 1/1/2021 | | | 20,000 | | | | 21,045 | |
SEE NOTES TO FINANCIAL STATEMENTS.
| | | | | | |
| | | |
| 154 | | | | J.P. MORGAN EXCHANGE-TRADED FUNDS | | AUGUST 31, 2019 |
| | | | | | | | |
| INVESTMENTS | | PRINCIPAL
AMOUNT ($) | | | VALUE ($) | |
Municipal Bonds — continued | | | | | | | | |
| | |
General Obligation — continued | | | | | | | | |
| | |
Borough of Chatham Series 2019, GO, BAN, 2.50%, 5/22/2020 | | | 1,423,750 | | | | 1,436,692 | |
| | |
Borough of Haddon Heights Series A, GO, BAN, 2.00%, 8/6/2020 | | | 1,461,980 | | | | 1,468,150 | |
| | |
Borough of Kinnelon GO, BAN, 2.00%, 3/6/2020 | | | 908,000 | | | | 910,116 | |
| | |
Borough of North Haledon GO, BAN, 2.00%, 4/14/2020 | | | 857,000 | | | | 859,142 | |
| | |
Borough of Oakland GO, BAN, 3.25%, 12/13/2019 | | | 251,000 | | | | 252,431 | |
| | |
Borough of Ridgefield GO, BAN, 3.00%, 10/17/2019 | | | 900,000 | | | | 901,962 | |
| | |
City of Bridgeton GO, 3.00%, 6/11/2020 | | | 650,000 | | | | 657,306 | |
| | |
City of Orange Township GO, 3.00%, 12/5/2019 | | | 300,000 | | | | 301,386 | |
| | |
City of Somers Point GO, BAN, 3.00%, 12/3/2019 | | | 300,000 | | | | 301,464 | |
| | |
City of Woodbury, Water and Sewer Utility GO, 2.00%, 5/1/2020 | | | 45,000 | | | | 45,288 | |
| | |
County of Burlington, General ImprovementSeries 2016A-1, GO, 4.00%, 9/1/2019 | | | 25,000 | | | | 25,000 | |
| | |
Ocean Township Board of Education/Monmouth County GO, 4.00%, 3/1/2021 | | | 25,000 | | | | 25,352 | |
| | |
Township of Clark GO, BAN, 3.00%, 10/4/2019 | | | 900,000 | | | | 901,116 | |
| | |
Township of Edison, County of Middlesex Series 2011, GO, 5.00%, 2/1/2020 | | | 25,000 | | | | 25,399 | |
| | |
Township of Fairfield, Cumberland County Series 2019, GO, BAN, 2.50%, 3/25/2020 | | | 689,200 | | | | 693,059 | |
| | |
Township of Frelinghuysen Series 2019, GO, BAN, 2.50%, 6/4/2020 | | | 1,971,471 | | | | 1,987,755 | |
| | |
Township of Toms River Series 2015, GO, 4.00%, 12/1/2019 | | | 25,000 | | | | 25,177 | |
| | | | | | | | |
| | |
| | | | | | | 10,837,840 | |
| | | | | | | | |
|
Hospital — 0.0%(b) | |
| | |
Passaic County Improvement Authority, Preakness Healthcare Center Expansion Project Series 2015, Rev., 5.00%, 5/1/2020 | | | 25,000 | | | | 25,638 | |
| | | | | | | | |
|
Housing — 0.1% | |
| | |
New Jersey Housing & Mortgage Finance Agency, Oceanport Gardens Series B, Rev., 2.02%, 8/1/2020 (d) | | | 100,000 | | | | 100,548 | |
| | | | | | | | |
|
Other Revenue — 1.3% | |
| | |
Camden County Improvement Authority Series A, Rev., 4.00%, 12/15/2019 | | | 100,000 | | | | 100,812 | |
| | | | | | | | |
| INVESTMENTS | | PRINCIPAL
AMOUNT ($) | | | VALUE ($) | |
| | | | | | | | |
| | |
Other Revenue — continued | | | | | | | | |
| | |
Garden State Preservation Trust Series C, Rev., AGM, 5.13%, 11/1/2019 | | | 35,000 | | | | 35,222 | |
| | |
Tobacco Settlement Financing Corp. | | | | | | | | |
| | |
Series A, Rev., 5.00%, 6/1/2020 | | | 1,200,000 | | | | 1,232,580 | |
| | |
Series A, Rev., 5.00%, 6/1/2023 | | | 200,000 | | | | 225,226 | |
| | | | | | | | |
| | |
| | | | | | | 1,593,840 | |
| | | | | | | | |
|
Prerefunded — 0.0%(b) | |
| | |
New Jersey Educational Facilities Authority, Kean University Series 2009A, Rev., 5.00%, 9/1/2019 (c) | | | 25,000 | | | | 25,000 | |
| | | | | | | | |
|
Transportation — 0.2% | |
| | |
New Jersey Infrastructure Bank | | | | | | | | |
| | |
Series 2010A, Rev., 5.00%, 9/1/2019 | | | 25,000 | | | | 25,000 | |
| | |
Series 2012A, Rev., 5.00%, 9/1/2019 | | | 20,000 | | | | 20,000 | |
| | |
New Jersey Transportation Trust Fund Authority Series A, Rev., 4.00%, 12/15/2019 | | | 205,000 | | | | 206,533 | |
| | |
New Jersey Transportation Trust Fund Authority, Transportation System Series B, Rev., NATL-RE, 5.50%, 12/15/2019 | | | 20,000 | | | | 20,239 | |
| | | | | | | | |
| | |
| | | | | | | 271,772 | |
| | | | | | | | |
|
Utility — 0.3% | |
| | |
New Jersey Economic Development Authority, New Jersey Transit Corporation Projects Series B, Rev., 5.00%, 11/1/2019 | | | 335,000 | | | | 336,940 | |
| | | | | | | | |
| | |
Total New Jersey | | | | | | | 13,613,578 | |
| | | | | | | | |
|
New Mexico — 0.5% | |
|
Other Revenue — 0.3% | |
| | |
City of Farmington, Southern California Edison Co. Four Corners Project Series A, Rev., VRDO, 1.87%, 4/1/2020 (d) | | | 260,000 | | | | 260,674 | |
| | |
New Mexico Finance Authority, Senior Lien Public Project Revolving Fund Series 2013A, Rev., 4.00%, 6/1/2021 | | | 20,000 | | | | 21,008 | |
| | |
State of New Mexico, Severance Tax Permanent Fund Series 2010A, Rev., 5.00%, 7/1/2020 | | | 20,000 | | | | 20,645 | |
| | | | | | | | |
| | |
| | | | | | | 302,327 | |
| | | | | | | | |
|
Transportation — 0.0%(b) | |
| | |
New Mexico Finance Authority, Subordinate LienSeries 2010A-2, Rev., NATL-RE, 5.00%, 12/15/2020 | | | 25,000 | | | | 26,266 | |
| | | | | | | | |
SEE NOTES TO FINANCIAL STATEMENTS.
| | | | | | | | |
| | | |
| AUGUST 31, 2019 | | J.P. MORGAN EXCHANGE-TRADED FUNDS | | | | | 155 | |
JPMorgan Ultra-Short Municipal Income ETF
SCHEDULE OF PORTFOLIO INVESTMENTS
AS OF AUGUST 31, 2019 (Unaudited) (continued)
| | | | | | | | |
| INVESTMENTS | | PRINCIPAL
AMOUNT ($) | | | VALUE ($) | |
Municipal Bonds — continued | |
|
Utility — 0.2% | |
| | |
Silver City Joint Utility System Series B, Rev., 2.00%, 12/1/2019 | | | 265,000 | | | | 265,384 | |
| | | | | | | | |
| | |
Total New Mexico | | | | | | | 593,977 | |
| | | | | | | | |
|
New York — 13.2% | |
|
Education — 0.1% | |
| | |
New York State Dormitory Authority Series F, Rev., 5.00%, 10/1/2019 | | | 25,000 | | | | 25,074 | |
| | |
New York State Dormitory Authority, General Purpose | | | | | | | | |
| | |
Series 2016D, Rev., 5.00%, 2/15/2020 | | | 25,000 | | | | 25,442 | |
| | |
Series 2017A, Rev., 5.00%, 2/15/2020 | | | 35,000 | | | | 35,619 | |
| | |
New York State Dormitory Authority, State Personal Income Tax, General Purpose Series 2011A, Rev., 5.00%, 3/15/2020 | | | 25,000 | | | | 25,517 | |
| | | | | | | | |
| | |
| | | | | | | 111,652 | |
| | | | | | | | |
|
General Obligation — 11.0% | |
| | |
Cherry Valley-Springfield Central School District Series B, GO, 2.00%, 6/26/2020 | | | 1,500,000 | | | | 1,508,355 | |
| | |
City of New YorkSeries A-3, GO, VRDO, 1.26%, 9/6/2019 (d) | | | 1,700,000 | | | | 1,700,000 | |
| | |
Series A-1, GO, 5.00%, 10/1/2019 | | | 225,000 | | | | 225,664 | |
| | |
City of Ogdensburg Series 2019, GO, BAN, 3.00%, 4/24/2020 | | | 500,000 | | | | 503,860 | |
| | |
City of Troy GO, BAN, 3.00%, 2/7/2020 | | | 1,000,000 | | | | 1,008,860 | |
| | |
City of Yonkers Series 2019A, GO, BAN, 2.25%, 12/17/2019 | | | 1,200,000 | | | | 1,204,044 | |
| | |
County of Nassau Series C, GO, BAN, 4.00%, 12/10/2019 | | | 325,000 | | | | 327,389 | |
| | |
County of Onondaga GO, 5.00%, 2/15/2020 | | | 20,000 | | | | 20,365 | |
| | |
De Ruyter Central School District GO, BAN, 2.25%, 7/10/2020 | | | 1,862,800 | | | | 1,877,516 | |
| | |
Harpursville Central School District Series 2019, GO, BAN, 3.00%, 3/11/2020 | | | 887,000 | | | | 894,646 | |
| | |
Montgomery County GO, BAN, 3.00%, 10/11/2019 | | | 900,000 | | | | 901,737 | |
| | |
Town of Colonie GO, BAN, 3.00%, 3/13/2020 | | | 1,075,000 | | | | 1,085,083 | |
| | |
Town of Oyster Bay Series 2019, GO, BAN, 3.00%, 3/13/2020 | | | 700,000 | | | | 705,166 | |
| | |
Town of Watertown Series 2019, GO, BAN, 2.25%, 4/16/2020 | | | 900,000 | | | | 905,436 | |
| | |
Village of Clayton GO, BAN, 2.75%, 2/13/2020 | | | 680,000 | | | | 684,869 | |
| | | | | | | | |
| | |
| | | | | | | 13,552,990 | |
| | | | | | | | |
| | | | | | | | |
| INVESTMENTS | | PRINCIPAL
AMOUNT ($) | | | VALUE ($) | |
| | | | | | | | |
|
Other Revenue — 0.8% | |
| | |
City of Troy Capital Resources Corp., Rensselaer Polytechnic Institute Project Rev., 5.00%, 8/1/2020 | | | 20,000 | | | | 20,691 | |
| | |
Tender Option Bond Trust Receipts/CertificatesSeries 2018-XM0697, Rev., VRDO, LIQ: Bank of America NA, 1.50%, 9/13/2019 (d) (f) | | | 750,000 | | | | 750,000 | |
| | |
Westchester Tobacco Asset Securitization Corp. Series B, Rev., 5.00%, 6/1/2021 | | | 260,000 | | | | 274,477 | |
| | | | | | | | |
| | |
| | | | | | | 1,045,168 | |
| | | | | | | | |
|
Special Tax — 0.0%(b) | |
| | |
New York State Dormitory Authority, State Personal Income Tax Series C, Rev., 5.00%, 3/15/2020 | | | 20,000 | | | | 20,414 | |
| | | | | | | | |
|
Transportation — 1.3% | |
| | |
Metropolitan Transportation Authority Series 2019A, Rev., BAN, 4.00%, 2/3/2020 | | | 1,020,000 | | | | 1,031,312 | |
| | |
Series 2018B-1A, Rev., BAN, 5.00%, 5/15/2020 | | | 50,000 | | | | 51,333 | |
| | |
Subseries 2018B-2B, Rev., BAN, 5.00%, 5/15/2021 | | | 200,000 | | | | 212,560 | |
| | |
Subseries 2008B-4, Rev., 5.00%, 11/15/2021 | | | 20,000 | | | | 21,725 | |
| | |
Metropolitan Transportation Authority, Dedicated Tax Fund Series A, Rev., 5.00%, 11/15/2020 | | | 50,000 | | | | 52,359 | |
| | |
New York City Transitional Finance Authority, Future Tax Secured, Fiscal Year 2015 | | | | | | | | |
| | |
Series E-1, Rev., 5.00%, 2/1/2020 | | | 35,000 | | | | 35,556 | |
| | |
Port Authority of New York & New Jersey Rev., 5.00%, 10/15/2019 | | | 175,000 | | | | 175,792 | |
| | | | | | | | |
| | |
| | | | | | | 1,580,637 | |
| | | | | | | | |
|
Water & Sewer — 0.0%(b) | |
| | |
Nassau County Sewer & Storm Water Finance Authority Series A, Rev., 5.00%, 10/1/2019 | | | 25,000 | | | | 25,071 | |
| | | | | | | | |
| | |
Total New York | | | | | | | 16,335,932 | |
| | | | | | | | |
|
North Carolina — 1.7% | |
|
General Obligation — 0.1% | |
| | |
County of Durham GO, 5.00%, 11/1/2019 | | | 20,000 | | | | 20,125 | |
| | |
County of Guilford Series 2017, GO, 5.00%, 3/1/2020 | | | 40,000 | | | | 40,776 | |
| | | | | | | | |
| | |
| | | | | | | 60,901 | |
| | | | | | | | |
SEE NOTES TO FINANCIAL STATEMENTS.
| | | | | | |
| | | |
| 156 | | | | J.P. MORGAN EXCHANGE-TRADED FUNDS | | AUGUST 31, 2019 |
| | | | | | | | |
| INVESTMENTS | | PRINCIPAL
AMOUNT ($) | | | VALUE ($) | |
Municipal Bonds — continued | |
|
Hospital — 1.1% | |
| | |
North Carolina Medical Care Commission, Firsthealth Carolinas Series A, Rev., VRDO, LIQ: Branch Banking & Trust, 1.31%, 9/11/2019 (d) | | | 1,000,000 | | | | 1,000,000 | |
| | |
North Carolina Medical Care Commission, Health Care Facilities, Wake Forest Baptist Obligated Group Series 2012B, Rev., 5.00%, 12/1/2020 | | | 205,000 | | | | 214,307 | |
| | |
North Carolina Medical Care Commission, Moses Cone Health Systems Series A, Rev., 5.00%, 10/1/2019 | | | 25,000 | | | | 25,072 | |
| | |
North Carolina Medical Care Commission, Wake Forest Baptist Obligated Group Series 2019B, Rev., 2.20%, 12/1/2022 (d) | | | 60,000 | | | | 61,385 | |
| | | | | | | | |
| | |
| | | | | | | 1,300,764 | |
| | | | | | | | |
|
Housing — 0.4% | |
| | |
North Carolina Housing Finance Agency, Catawba Pines Apartments Rev., 2.00%, 9/1/2020 (d) | | | 350,000 | | | | 351,977 | |
| | |
Wilmington Housing Authority Rev., VRDO, 1.50%, 10/1/2019 (d) | | | 200,000 | | | | 200,002 | |
| | | | | | | | |
| | |
| | | | | | | 551,979 | |
| | | | | | | | |
|
Other Revenue — 0.0%(b) | |
| | |
County of Wake Series 2016A, Rev., 4.00%, 12/1/2019 | | | 25,000 | | | | 25,178 | |
| | | | | | | | |
|
Prerefunded — 0.1% | |
| | |
County of New Hanover, Regional Medical Project Series B, Rev., AGM, 5.13%, 10/1/2019 (c) | | | 50,000 | | | | 50,153 | |
| | |
County of Wake Rev., 4.30%, 1/1/2020 (c) | | | 30,000 | | | | 30,318 | |
| | | | | | | | |
| | |
| | | | | | | 80,471 | |
| | | | | | | | |
|
Transportation — 0.0%(b) | |
| | |
Raleigh Durham Airport Authority Series B, Rev., 5.00%, 11/1/2019 | | | 20,000 | | | | 20,126 | |
| | | | | | | | |
|
Water & Sewer — 0.0%(b) | |
| | |
Onslow Water and Sewer Authority, Combined Enterprise System Series 2016, Rev., 4.00%, 12/1/2019 | | | 25,000 | | | | 25,178 | |
| | | | | | | | |
| | |
Total North Carolina | | | | | | | 2,064,597 | |
| | | | | | | | |
|
North Dakota — 1.2% | |
|
General Obligation — 0.0%(b) | |
| | |
City of Fargo Series 2011A, GO, 4.00%, 5/1/2020 | | | 25,000 | | | | 25,472 | |
| | | | | | | | |
| | | | | | | | |
| INVESTMENTS | | PRINCIPAL
AMOUNT ($) | | | VALUE ($) | |
| | | | | | | | |
|
Housing — 0.7% | |
| | |
North Dakota Housing Finance Agency, Housing Finance Program, Home Mortgage Series C, Rev., 1.75%, 7/1/2021 | | | 900,000 | | | | 905,328 | |
| | | | | | | | |
|
Other Revenue — 0.4% | |
| | |
North Dakota Public Finance Authority | | | | | | | | |
| | |
Series A, Rev., 5.00%, 10/1/2019 | | | 25,000 | | | | 25,073 | |
| | |
Series A, Rev., 1.75%, 11/1/2023 | | | 430,000 | | | | 429,811 | |
| | | | | | | | |
| | |
| | | | | | | 454,884 | |
| | | | | | | | |
|
Utility — 0.1% | |
| | |
City of Grand Forks, The Alerus Project Series D, Rev., 5.00%, 12/15/2019 | | | 150,000 | | | | 151,626 | |
| | | | | | | | |
| | |
Total North Dakota | | | | | | | 1,537,310 | |
| | | | | | | | |
|
Ohio — 5.9% | |
|
Education — 0.2% | |
| | |
Bowling Green State University Series 2017B, Rev., 5.00%, 6/1/2020 | | | 35,000 | | | | 35,939 | |
| | |
Miami University/Oxford Rev., 5.00%, 9/1/2019 | | | 30,000 | | | | 30,000 | |
| | |
Ohio Higher Educational Facility Commission, Baldwin Wallace University 2012 Project Rev., 4.00%, 12/1/2019 | | | 50,000 | | | | 50,335 | |
| | |
Ohio State University, General Receipts Series 2014A, Rev., 5.00%, 12/1/2019 | | | 25,000 | | | | 25,239 | |
| | |
Youngstown State University Series 2016, Rev., 4.00%, 12/15/2019 | | | 50,000 | | | | 50,374 | |
| | | | | | | | |
| | |
| | | | | | | 191,887 | |
| | | | | | | | |
|
General Obligation — 2.5% | |
| | |
City of Reynoldsburg GO, 5.00%, 12/1/2020 | | | 60,000 | | | | 62,891 | |
| | |
City of Seven Hills, Capital Improvement Series 2019, GO, BAN, 3.00%, 4/9/2020 | | | 500,000 | | | | 504,960 | |
| | |
City of Willoughby | | | | | | | | |
| | |
Series 2019, GO, BAN, 2.50%, 5/22/2020 | | | 2,365,000 | | | | 2,386,357 | |
| | |
Geauga County Public Library, Unlimited Tax | | | | | | | | |
| | |
Series 2018A, GO, 3.00%, 12/1/2019 | | | 50,000 | | | | 50,234 | |
| | |
State of Ohio, Common Schools Series C, GO, 5.00%, 9/15/2019 | | | 25,000 | | | | 25,030 | |
| | |
State of Ohio, Infrastructure Improvement Bonds | | | | | | | | |
| | |
Series 2011A, GO, 5.00%, 9/1/2019 | | | 25,000 | | | | 25,000 | |
| | |
Series 2015A, GO, 5.00%, 9/1/2020 | | | 45,000 | | | | 46,738 | |
SEE NOTES TO FINANCIAL STATEMENTS.
| | | | | | | | |
| | | |
| AUGUST 31, 2019 | | J.P. MORGAN EXCHANGE-TRADED FUNDS | | | | | 157 | |
JPMorgan Ultra-Short Municipal Income ETF
SCHEDULE OF PORTFOLIO INVESTMENTS
AS OF AUGUST 31, 2019 (Unaudited) (continued)
| | | | | | | | |
| INVESTMENTS | | PRINCIPAL
AMOUNT ($) | | | VALUE ($) | |
Municipal Bonds — continued | |
|
General Obligation — continued | |
| | |
Vinton County Local School District, Galloa, Hocking and Jackson Counties | | | | | | | | |
| | |
Series A, GO, 2.00%, 12/1/2019 | | | 45,000 | | | | 45,094 | |
| | | | | | | | |
| | |
| | | | | | | 3,146,304 | |
| | | | | | | | |
|
Hospital — 0.9% | |
| | |
County of Allen, Catholic Healthcare Partners | | | | | | | | |
| | |
Series 2010B, Rev., 5.00%, 9/1/2019 | | | 260,000 | | | | 260,000 | |
| | |
Series 2012A, Rev., 5.00%, 5/1/2021 | | | 85,000 | | | | 90,258 | |
| | |
County of Allen, Hospital Facilities, Catholic Healthcare Partners Series B, Rev., 4.13%, 9/1/2020 | | | 40,000 | | | | 41,149 | |
| | |
County of Allen, Hospital Facilities, Mercy Health Series 2017A, Rev., 5.00%, 8/1/2021 | | | 480,000 | | | | 514,061 | |
| | |
County of Hamilton, Hospital Facilities, UC Health Rev., 5.00%, 2/1/2020 | | | 100,000 | | | | 101,559 | |
| | |
County of Lucas, Promedica Healthcare Obligated Group Series D, Rev., 5.00%, 11/15/2019 | | | 75,000 | | | | 75,532 | |
| | |
Ohio Higher Educational Facility Commission, Hospitals Health System Series 2010A, Rev., 5.00%, 1/15/2020 | | | 75,000 | | | | 76,002 | |
| | | | | | | | |
| | |
| | | | | | | 1,158,561 | |
| | | | | | | | |
|
Housing — 0.1% | |
| | |
Cuyahoga Metropolitan Housing Authority, Riverside Park Phase II Project Series 2019, Rev., 2.00%, 4/1/2021 (d) | | | 100,000 | | | | 101,460 | |
| | |
Ohio State Building Authority, Administrative Building Fund Projects Series 2011A, Rev., 4.00%, 10/1/2019 | | | 20,000 | | | | 20,044 | |
| | | | | | | | |
| | |
| | | | | | | 121,504 | |
| | | | | | | | |
|
Other Revenue — 1.7% | |
| | |
County of Hamilton Series 2016A, Rev., 5.00%, 12/1/2019 | | | 30,000 | | | | 30,287 | |
| | |
State of Ohio, Cultural & Sports Capital Facilities Series A, Rev., 5.00%, 10/1/2019 | | | 25,000 | | | | 25,074 | |
| | |
Tender Option Bond Trust Receipts/Certificates Series C, Rev., VRDO, LOC: Citibank NA, 1.44%, 9/12/2019 (d) (f) | | | 2,000,000 | | | | 2,000,000 | |
| | | | | | | | |
| | |
| | | | | | | 2,055,361 | |
| | | | | | | | |
|
Prerefunded — 0.1% | |
| | |
City of Mentor, Various Purpose GO, 4.50%, 12/1/2019 (c) | | | 50,000 | | | | 50,419 | |
| | |
Huber Heights City School District, School Improvement Series 2009, GO, 4.75%, 12/1/2019 (c) | | | 25,000 | | | | 25,225 | |
| | | | | | | | |
| INVESTMENTS | | PRINCIPAL
AMOUNT ($) | | | VALUE ($) | |
| | | | | | | | |
|
Prerefunded — continued | |
| | |
State of Ohio, Capital Facilities Lease-Appropriation Series 2013B, Rev., 5.00%, 4/1/2021 (c) | | | 25,000 | | | | 26,549 | |
| | | | | | | | |
| | |
| | | | | | | 102,193 | |
| | | | | | | | |
|
Utility — 0.4% | |
| | |
Lancaster Port Authority, Gas Supply | | | | | | | | |
| | |
Series 2019A, Rev., 5.00%, 8/1/2021 | | | 300,000 | | | | 320,409 | |
| | |
Series 2019A, Rev., 5.00%, 2/1/2022 | | | 190,000 | | | | 206,150 | |
| | | | | | | | |
| | |
| | | | | | | 526,559 | |
| | | | | | | | |
| | |
Total Ohio | | | | | | | 7,302,369 | |
| | | | | | | | |
|
Oklahoma — 0.3% | |
|
General Obligation — 0.2% | |
| | |
Oklahoma County Independent School District No. 12, Edmond School District GO, 3.00%, 3/1/2021 | | | 40,000 | | | | 41,131 | |
| | |
Tulsa County, Independent School District No. 1 Series B, GO, 2.00%, 1/1/2020 | | | 200,000 | | | | 200,542 | |
| | | | | | | | |
| | |
| | | | | | | 241,673 | |
| | | | | | | | |
|
Other Revenue — 0.0%(b) | |
| | |
Tulsa County Public Facilities Authority, Capital Improvements Series 2015, Rev., 4.00%, 11/1/2019 | | | 25,000 | | | | 25,112 | |
| | | | | | | | |
|
Utility — 0.1% | |
| | |
Oklahoma Development Finance Authority, Repair Project Rev., 3.00%, 6/1/2020 | | | 90,000 | | | | 91,077 | |
| | | | | | | | |
| | |
Total Oklahoma | | | | | | | 357,862 | |
| | | | | | | | |
|
Pennsylvania — 3.9% | |
|
Education — 0.3% | |
| | |
Allegheny County Higher Education Building Authority, Duquesne University of the Holy Spirit Rev., 5.00%, 3/1/2020 | | | 35,000 | | | | 35,650 | |
| | |
Pennsylvania Higher Educational Facilities Authority | | | | | | | | |
| | |
Series A, Rev., 5.00%, 9/1/2019 (c) | | | 45,000 | | | | 45,000 | |
| | |
Series 2015A, Rev., 5.00%, 11/1/2019 | | | 225,000 | | | | 226,114 | |
| | |
Pennsylvania State University Series 2016A, Rev., 5.00%, 9/1/2019 | | | 35,000 | | | | 35,000 | |
| | | | | | | | |
| | |
| | | | | | | 341,764 | |
| | | | | | | | |
|
General Obligation — 0.8% | |
| | |
Allentown City School District GO, 2.05%, 1/2/2020 | | | 250,000 | | | | 250,050 | |
| | |
Butler Area School District GO, AGM, 3.00%, 10/1/2019 | | | 295,000 | | | | 295,368 | |
| | |
Central Cambria School District Series A, GO, 3.00%, 9/1/2019 | | | 35,000 | | | | 35,000 | |
SEE NOTES TO FINANCIAL STATEMENTS.
| | | | | | |
| | | |
| 158 | | | | J.P. MORGAN EXCHANGE-TRADED FUNDS | | AUGUST 31, 2019 |
| | | | | | | | |
| INVESTMENTS | | PRINCIPAL
AMOUNT ($) | | | VALUE ($) | |
Municipal Bonds — continued | |
|
General Obligation — continued | |
| | |
Central York School District GO, 4.00%, 11/1/2019 | | | 55,000 | | | | 55,246 | |
| | |
Chambersburg Area School District Series A, GO, 5.00%, 3/1/2021 | | | 25,000 | | | | 26,420 | |
| | |
Commonwealth of Pennsylvania GO, 5.00%, 10/15/2019 | | | 100,000 | | | | 100,434 | |
| | |
County of Delaware GO, 5.00%, 10/1/2020 | | | 30,000 | | | | 31,242 | |
| | |
Palisades School District GO, 4.00%, 9/1/2019 | | | 100,000 | | | | 100,000 | |
| | |
Parkland School District GO, 4.00%, 4/15/2021 | | | 30,000 | | | | 31,347 | |
| | |
Southern Lehigh School District Series A, GO, 5.00%, 9/1/2019 | | | 20,000 | | | | 20,000 | |
| | |
Township of Dover GO, 3.00%, 9/1/2021 | | | 25,000 | | | | 25,854 | |
| | |
Trinity Area School District GO, AGM, 4.00%, 11/1/2020 (c) | | | 30,000 | | | | 30,989 | |
| | | | | | | | |
| | |
| | | | | | | 1,001,950 | |
| | | | | | | | |
|
Hospital — 0.2% | |
| | |
Beaver County Hospital Authority, Heritage Valley Health System, Inc. Rev., 5.00%, 5/15/2020 | | | 165,000 | | | | 169,087 | |
| | |
DuBois Hospital Authority, Penn Highlands Healthcare Series 2018, Rev., 5.00%, 7/15/2020 | | | 25,000 | | | | 25,818 | |
| | |
Montgomery County Industrial Development Authority, Jefferson Health System Series 2012A, Rev., 5.00%, 10/1/2019 | | | 30,000 | | | | 30,087 | |
| | | | | | | | |
| | |
| | | | | | | 224,992 | |
| | | | | | | | |
|
Housing — 0.4% | |
| | |
Pittsburgh Housing Authority, Larimer/East Liberty Phase II Apartments Rev., VRDO, 1.40%, 10/1/2019 (d) | | | 500,000 | | | | 500,095 | |
| | | | | | | | |
|
Industrial Development Revenue/Pollution Control Revenue — 0.4% | |
| | |
Montgomery County Industrial Development Authority, Waverly Heights Ltd. Project | | | | | | | | |
| | |
Series 2019, Rev., 4.00%, 12/1/2021 | | | 100,000 | | | | 105,321 | |
| | |
Series 2019, Rev., 4.00%, 12/1/2022 | | | 100,000 | | | | 107,576 | |
| | |
Series 2019, Rev., 4.00%, 12/1/2023 | | | 125,000 | | | | 137,156 | |
| | |
Pennsylvania Economic Development Financing Authority Series 2015B, Rev., 5.00%, 3/15/2020 | | | 25,000 | | | | 25,520 | |
| | |
Pennsylvania Economic Development Financing Authority, Waste Management, Inc. Project Rev., 2.80%, 12/1/2021 (d) | | | 100,000 | | | | 103,225 | |
| | | | | | | | |
| | |
| | | | | | | 478,798 | |
| | | | | | | | |
| | | | | | | | |
| INVESTMENTS | | PRINCIPAL
AMOUNT ($) | | | VALUE ($) | |
| | | | | | | | |
|
Other Revenue — 0.1% | |
| | |
Monroeville Finance Authority Rev., 5.00%, 2/15/2020 | | | 25,000 | | | | 25,438 | |
| | |
Urban Redevelopment Authority of Pittsburgh, Crawford Square Apartments Project Rev., VRDO, 2.25%, 6/1/2020 (d) | | | 85,000 | | | | 85,172 | |
| | | | | | | | |
| | |
| | | | | | | 110,610 | |
| | | | | | | | |
|
Prerefunded — 0.1% | |
| | |
County of AlleghenySeries 2009C-62B, GO, 5.00%, 11/1/2019 (c) | | | 20,000 | | | | 20,123 | |
| | |
Delaware River Port Authority Series 2010D, Rev., 5.00%, 1/1/2020 (c) | | | 25,000 | | | | 25,316 | |
| | |
Pennsylvania Higher Educational Facilities Authority Series 2009C, Rev., 5.00%, 9/1/2019 (c) | | | 30,000 | | | | 30,000 | |
| | |
Pennsylvania Turnpike Commission Series 2009D, Rev., 5.50%, 12/1/2019 (c) | | | 25,000 | | | | 25,265 | |
| | |
Pennsylvania Turnpike Commission, Motor License Fund-Enhanced Turnpike Series B, Rev., 5.00%, 12/1/2021 (c) | | | 50,000 | | | | 54,308 | |
| | |
South Fork Municipal Authority, Conemaugh Valley Memorial Hospital Series B, Rev., AGC, 5.38%, 7/1/2020 (c) | | | 30,000 | | | | 31,043 | |
| | |
Washington County Industrial Development Authority, Washington Jefferson College Rev., 4.00%, 5/1/2020 (c) | | | 25,000 | | | | 25,473 | |
| | | | | | | | |
| | |
| | | | | | | 211,528 | |
| | | | | | | | |
|
Transportation — 1.4% | |
| | |
Pennsylvania Turnpike Commission Series 2nd, Rev., VRDO, LOC: TD Bank NA, 1.25%, 9/12/2019 (d) | | | 1,645,000 | | | | 1,645,000 | |
| | |
Series A, Rev., AGM, 5.25%, 7/15/2020 | | | 50,000 | | | | 51,829 | |
| | |
Philadelphia Airport Parking Authority Rev., 5.00%, 9/1/2019 | | | 40,000 | | | | 40,000 | |
| | | | | | | | |
| | |
| | | | | | | 1,736,829 | |
| | | | | | | | |
|
Utility — 0.1% | |
| | |
Philadelphia Gas Works Co., 1998 General Ordinance Series 2016, Rev., 5.00%, 10/1/2019 | | | 95,000 | | | | 95,277 | |
| | | | | | | | |
|
Water & Sewer — 0.1% | |
| | |
West Goshen Sewer Authority Rev., 3.00%, 5/1/2020 | | | 95,000 | | | | 96,245 | |
| | |
West View Municipal Authority Water Rev., 4.00%, 11/15/2019 | | | 20,000 | | | | 20,115 | |
| | | | | | | | |
| | |
| | | | | | | 116,360 | |
| | | | | | | | |
| | |
Total Pennsylvania | | | | | | | 4,818,203 | |
| | | | | | | | |
SEE NOTES TO FINANCIAL STATEMENTS.
| | | | | | | | |
| | | |
| AUGUST 31, 2019 | | J.P. MORGAN EXCHANGE-TRADED FUNDS | | | | | 159 | |
JPMorgan Ultra-Short Municipal Income ETF
SCHEDULE OF PORTFOLIO INVESTMENTS
AS OF AUGUST 31, 2019 (Unaudited) (continued)
| | | | | | | | |
| INVESTMENTS | | PRINCIPAL
AMOUNT ($) | | | VALUE ($) | |
Municipal Bonds — continued | | | | | | | | |
|
Rhode Island — 0.1% | |
|
Prerefunded — 0.0%(b) | |
| | |
Rhode Island Infrastructure Bank Water Pollution Control Revolving Fund Series 2009A, Rev., 5.00%, 10/1/2019 (c) | | | 20,000 | | | | 20,059 | |
| | | | | | | | |
|
Transportation — 0.1% | |
| | |
Rhode Island Turnpike & Bridge Authority, Motor Fuel Tax Series A, Rev., 4.00%, 10/1/2019 | | | 100,000 | | | | 100,215 | |
| | | | | | | | |
| | |
Total Rhode Island | | | | | | | 120,274 | |
| | | | | | | | |
|
South Carolina — 0.4% | |
|
Education — 0.0%(b) | |
| | |
Charleston Educational Excellence Finance Corp., Installment Purchase Series 2013B, Rev., 5.00%, 12/1/2019 | | | 25,000 | | | | 25,238 | |
| | |
Dorchester County School District No. 2, Growth Installment Purchase Series B, Rev., 5.00%, 12/1/2019 | | | 25,000 | | | | 25,228 | |
| | | | | | | | |
| | |
| | | | | | | 50,466 | |
| | | | | | | | |
|
General Obligation — 0.1% | |
| | |
County of Richland Series 2019A, GO, BAN, 3.00%, 2/27/2020 | | | 50,000 | | | | 50,463 | |
| | |
Fort Mill School District No. 4 | | | | | | | | |
| | |
Series A, GO, 4.00%, 3/1/2020 | | | 35,000 | | | | 35,508 | |
| | |
Series 2013D, GO, 5.00%, 3/1/2020 | | | 20,000 | | | | 20,388 | |
| | |
State of South Carolina, Highway Series A, GO, 5.00%, 10/1/2020 | | | 25,000 | | | | 26,060 | |
| | | | | | | | |
| | |
| | | | | | | 132,419 | |
| | | | | | | | |
|
Other Revenue — 0.2% | |
| | |
Saxe Gotha-Lexington Public Facilities Corp. Rev., 2.50%, 5/8/2020 | | | 200,000 | | | | 201,452 | |
| | | | | | | | |
|
Transportation — 0.1% | |
| | |
South Carolina Transportation Infrastructure Bank Series A, Rev., 4.00%, 10/1/2019 | | | 55,000 | | | | 55,120 | |
| | | | | | | | |
| | | | | | | | |
|
Water & Sewer — 0.0%(b) | |
| | |
Anderson Regional Joint Water System Series 2011A, Rev., 5.00%, 7/15/2020 | | | 25,000 | | | | 25,826 | |
| | | | | | | | |
| | |
Total South Carolina | | | | | | | 465,283 | |
| | | | | | | | |
|
South Dakota — 0.1% | |
|
Hospital — 0.0%(b) | |
| | |
South Dakota Health and Educational Facilities Authority, Sanford Health Rev., 5.25%, 11/1/2019 | | | 50,000 | | | | 50,307 | |
| | | | | | | | |
| | | | | | | | |
| INVESTMENTS | | PRINCIPAL
AMOUNT ($) | | | VALUE ($) | |
| | | | | | | | |
|
Housing — 0.1% | |
| | |
South Dakota Board of Regents, Housing and Auxiliary Facility System Series 2013A, Rev., 5.00%, 4/1/2021 | | | 70,000 | | | | 74,155 | |
| | | | | | | | |
| | |
Total South Dakota | | | | | | | 124,462 | |
| | | | | | | | |
|
Tennessee — 3.4% | |
|
Education — 0.0%(b) | |
| | |
Metropolitan Government Nashville and Davidson County Health and Educational Facilities Board Series 2009A, Rev., 4.00%, 10/1/2019 | | | 45,000 | | | | 45,099 | |
| | | | | | | | |
|
General Obligation — 0.1% | |
| | |
County of Hamilton Series 2011A, GO, 5.00%, 1/1/2020 | | | 25,000 | | | | 25,323 | |
| | |
County of Rutherford Series 2010, GO, 4.00%, 4/1/2020 | | | 20,000 | | | | 20,334 | |
| | |
County of Shelby Series A, GO, 4.00%, 3/1/2020 | | | 20,000 | | | | 20,289 | |
| | |
State of Tennessee Series A, GO, 5.00%, 9/1/2020 | | | 30,000 | | | | 31,175 | |
| | | | | | | | |
| | |
| | | | | | | 97,121 | |
| | | | | | | | |
|
Hospital — 0.0%(b) | |
| | |
Greeneville Health and Educational Facilities Board, Ballad Health Obligated Group Series 2018A, Rev., 5.00%, 7/1/2020 | | | 50,000 | | | | 51,514 | |
| | | | | | | | |
|
Housing — 1.9% | |
| | |
Memphis Health Educational & Housing Facility Board, Forum Flats Apartments Project Series 2017, Rev., VRDO, 1.80%, 12/1/2019 (d) | | | 200,000 | | | | 200,136 | |
| | |
Metropolitan Government Nashville and Davidson County Health and Educational Facilities Board, Multifamily Housing, Dandridge Towers Project Rev., VRDO, 1.87%, 7/1/2020 (d) | | | 1,825,000 | | | | 1,830,420 | |
| | |
Metropolitan Government Nashville and Davidson County Health and Educational Facilities Board, Multifamily Housing, Trevecca Towers I/East Project | | | | | | | | |
| | |
Rev., 2.00%, 1/1/2021 (d) | | | 250,000 | | | | 252,310 | |
| | | | | | | | |
| | |
| | | | | | | 2,282,866 | |
| | | | | | | | |
|
Other Revenue — 0.6% | |
| | |
Montgomery County Public Building Authority, Pooled Financing Series 2002, Rev., VRDO, LOC: Bank of America NA, 1.28%, 9/6/2019 (d) | | | 685,000 | | | | 685,000 | |
| | | | | | | | |
SEE NOTES TO FINANCIAL STATEMENTS.
| | | | | | |
| | | |
| 160 | | | | J.P. MORGAN EXCHANGE-TRADED FUNDS | | AUGUST 31, 2019 |
| | | | | | | | |
| INVESTMENTS | | PRINCIPAL
AMOUNT ($) | | | VALUE ($) | |
Municipal Bonds — continued | | | | | | | | |
|
Prerefunded — 0.7% | |
| | |
Johnson City Health and Educational Facilities Board, Mountain States Health AllianceSeries 2010-A, Rev., 6.50%, 7/1/2020 (c) | | | 850,000 | | | | 887,868 | |
| | |
Metropolitan Government Nashville & Davidson County Health & Educational Facilities Board Series B, Rev., 5.00%, 10/1/2019 (c) | | | 30,000 | | | | 30,088 | |
| | | | | | | | |
| | |
| | | | | | | 917,956 | |
| | | | | | | | |
|
Utility — 0.1% | |
| | |
Tennessee Energy Acquisition Corp. Series C, Rev., 5.00%, 2/1/2020 | | | 95,000 | | | | 96,259 | |
| | | | | | | | |
| | |
Total Tennessee | | | | | | | 4,175,815 | |
| | | | | | | | |
|
Texas — 8.2% | |
|
Education — 0.5% | |
| | |
Alamo Community College District, Financing System Senior lien Series 2012A, Rev., 5.00%, 11/1/2020 | | | 20,000 | | | | 20,886 | |
| | |
Austin Community College District, Combined Fee Series 2014A, Rev., 5.00%, 2/1/2021 | | | 25,000 | | | | 26,354 | |
| | |
Clifton Higher Education Finance Corp., Baylor University Rev., 5.00%, 3/1/2020 | | | 45,000 | | | | 45,826 | |
| | |
Clifton Higher Education Finance Corp., Idea Public Schools Series 2014, Rev., PSF-GTD, 5.00%, 8/15/2020 | | | 60,000 | | | | 62,046 | |
| | |
Houston Independent School District Public Facility Corp. Rev., 5.00%, 9/15/2019 | | | 100,000 | | | | 100,115 | |
| | |
Permanent University Fund — Texas A&M University System Series A, Rev., 5.00%, 7/1/2020 | | | 35,000 | | | | 36,127 | |
| | |
Tarrant County Cultural Education Facilities Finance Corp., Buckner Retirement Services, Inc. Series 2017, Rev., 5.00%, 11/15/2019 | | | 240,000 | | | | 241,627 | |
| | |
University of Texas (The), Board of Regents, Financing System Series A, Rev., 5.00%, 8/15/2020 | | | 20,000 | | | | 20,738 | |
| | | | | | | | |
| | |
| | | | | | | 553,719 | |
| | | | | | | | |
|
General Obligation — 4.3% | |
| | |
Aledo Independent School District GO, PSF-GTD, 0.00%, 2/15/2022 | | | 85,000 | | | | 81,449 | |
| | |
Carrollton-Farmers Branch Independent School District Series 2012, GO, PSF-GTD, 5.00%, 2/15/2020 | | | 20,000 | | | | 20,354 | |
| | |
City of Abilene Series 2015, GO, 4.00%, 2/15/2020 | | | 20,000 | | | | 20,259 | |
| | | | | | | | |
| INVESTMENTS | | PRINCIPAL
AMOUNT ($) | | | VALUE ($) | |
| | | | | | | | |
| | |
General Obligation — continued | | | | | | | | |
| | |
City of Baytown Series 2014, GO, 4.00%, 2/1/2020 | | | 25,000 | | | | 25,299 | |
| | |
GO, 5.00%, 2/1/2020 | | | 80,000 | | | | 81,281 | |
| | |
City of College Station GO, 5.00%, 2/15/2020 | | | 25,000 | | | | 25,441 | |
| | |
City of Dallas GO, 5.00%, 2/15/2021 | | | 75,000 | | | | 79,115 | |
| | |
City of Denton | | | | | | | | |
| | |
Series 2015, GO, 4.00%, 2/15/2020 | | | 30,000 | | | | 30,387 | |
| | |
Series 2017, GO, 4.00%, 2/15/2020 | | | 25,000 | | | | 25,323 | |
| | |
City of El Paso GO, 5.00%, 8/15/2021 | | | 30,000 | | | | 32,201 | |
| | |
City of Fort Worth, Tarrant, Denton, Parker and Wise Counties GO, 3.50%, 3/1/2020 | | | 55,000 | | | | 55,669 | |
| | |
City of Frisco GO, 5.00%, 2/15/2021 | | | 25,000 | | | | 26,395 | |
| | |
City of Garland Series 2015, GO, 5.00%, 2/15/2020 | | | 25,000 | | | | 25,440 | |
| | |
City of Grand Prairie, Combination Tax Series 2013A, GO, 5.00%, 2/15/2021 | | | 65,000 | | | | 68,668 | |
| | |
City of Houston, Public Improvement | | | | | | | | |
| | |
Series 2010A, GO, 5.00%, 3/1/2020 | | | 20,000 | | | | 20,381 | |
| | |
City of League City Series 2015, GO, 4.00%, 2/15/2020 | | | 20,000 | | | | 20,254 | |
| | |
City of Lewisville GO, 5.00%, 2/15/2021 | | | 25,000 | | | | 26,392 | |
| | |
City of Lubbock, Waterworks System GO, 5.00%, 2/15/2020 | | | 20,000 | | | | 20,351 | |
| | |
City of Mesquite, Certificates Obligation GO, 4.00%, 2/15/2020 | | | 25,000 | | | | 25,326 | |
| | |
City of New Braunfels Series 2016, GO, 5.00%, 2/1/2020 | | | 20,000 | | | | 20,315 | |
| | |
City of Paris GO, 4.50%, 12/15/2020 | | | 30,000 | | | | 31,275 | |
| | |
City of Sugar Land Series 2019, GO, 4.00%, 2/15/2020 | | | 25,000 | | | | 25,328 | |
| | |
Counties of Collin and Denton, City of Frisco, Improvement Series 2015A, GO, 5.00%, 2/15/2020 | | | 25,000 | | | | 25,434 | |
| | |
County of Bell, Limited Tax GO, 4.00%, 2/15/2020 | | | 375,000 | | | | 379,800 | |
| | |
County of Bexar, Certificates of Obligation | | | | | | | | |
| | |
Series B, GO, 5.00%, 6/15/2020 | | | 20,000 | | | | 20,597 | |
| | |
Series B, GO, 5.00%, 6/15/2021 | | | 20,000 | | | | 21,354 | |
| | |
County of Chambers GO, 3.00%, 3/1/2020 | | | 150,000 | | | | 151,374 | |
| | |
County of Fort Bend GO, 5.00%, 3/1/2020 | | | 55,000 | | | | 56,068 | |
| | |
County of Webb, Limited Tax Series A, GO, 4.00%, 2/15/2020 | | | 50,000 | | | | 50,625 | |
| | |
County of Wichita GO, 5.00%, 9/15/2019 | | | 250,000 | | | | 250,303 | |
| | |
Dallas County Utility and Reclamation District, Unlimited Tax GO, 5.00%, 2/15/2020 | | | 80,000 | | | | 81,341 | |
SEE NOTES TO FINANCIAL STATEMENTS.
| | | | | | | | |
| | | |
| AUGUST 31, 2019 | | J.P. MORGAN EXCHANGE-TRADED FUNDS | | | | | 161 | |
JPMorgan Ultra-Short Municipal Income ETF
SCHEDULE OF PORTFOLIO INVESTMENTS
AS OF AUGUST 31, 2019 (Unaudited) (continued)
| | | | | | | | |
| INVESTMENTS | | PRINCIPAL
AMOUNT ($) | | | VALUE ($) | |
Municipal Bonds — continued | | | | | | | | |
| | |
General Obligation — continued | | | | | | | | |
| | |
Fort Bend County Municipal Utility District No. 35 GO, AGM, 3.00%, 9/1/2019 | | | 30,000 | | | | 30,000 | |
| | |
Hays Consolidated Independent School District, School Building Series 2018B, GO, PSF-GTD, 2.70%, 8/15/2023 (d) | | | 100,000 | | | | 104,519 | |
| | |
Hidalgo County Drain District No. 1, Improvement GO, 5.00%, 9/1/2022 | | | 100,000 | | | | 111,356 | |
| | |
Houston Community College System, Maintenance Tax Notes GO, 5.00%, 2/15/2020 | | | 20,000 | | | | 20,339 | |
| | |
Humble Independent School District Series 2012B, GO, 5.00%, 2/15/2020 | | | 20,000 | | | | 20,352 | |
| | |
Katy Independent School District GO, PSF-GTD, 5.00%, 2/15/2020 | | | 25,000 | | | | 25,437 | |
| | |
Keller Independent School District, Unlimited Tax Series A, GO, PSF-GTD, 5.00%, 8/15/2021 | | | 20,000 | | | | 21,490 | |
| | |
Northside Independent School District Series 2013, GO, PSF-GTD, 5.00%, 2/15/2020 | | | 20,000 | | | | 20,344 | |
| | |
Richardson Independent School District Series 2017, GO, PSF-GTD, 5.00%, 2/15/2020 | | | 30,000 | | | | 30,529 | |
| | |
Spring Branch Independent School District Series A, GO, PSF-GTD, 5.00%, 2/1/2020 | | | 30,000 | | | | 30,488 | |
| | |
State of Texas GO, VRDO, LIQ: State Street Bank & Trust, 1.36%, 9/11/2019 (d) | | | 3,000,000 | | | | 3,000,000 | |
| | |
Town of Trophy Club GO, 3.00%, 9/1/2019 | | | 85,000 | | | | 85,000 | |
| | | | | | | | |
| | |
| | | | | | | 5,323,653 | |
| | | | | | | | |
|
Housing — 0.4% | |
| | |
Las Varas Public Facility Corp., Wurzbach Manor Apartments Rev., VRDO, 1.70%, 12/1/2020 (d) | | | 100,000 | | | | 100,217 | |
| | |
Panhandle Regional Housing Finance Agency Rev., VRDO, 2.00%, 5/1/2020 (d) | | | 125,000 | | | | 125,514 | |
| | |
Texas State Affordable Housing Corp., Palladium Glenn Heights Apartments Rev., VRDO, 1.90%, 9/25/2019 (d) | | | 250,000 | | | | 250,072 | |
| | | | | | | | |
| | |
| | | | | | | 475,803 | |
| | | | | | | | |
|
Other Revenue — 0.7% | |
| | |
Harris County-Houston Sports Authority, 2nd Lien Series C, Rev., 5.00%, 11/15/2019 | | | 100,000 | | | | 100,671 | |
| | |
Harris County-Houston Sports Authority, Senior Lien Series 2014A, Rev., 5.00%, 11/15/2019 | | | 95,000 | | | | 95,674 | |
| | |
Lower Colorado River Authority | | | | | | | | |
| | |
Series 2010B, Rev., 4.00%, 5/15/2020 | | | 25,000 | | | | 25,493 | |
| | |
Series A, Rev., 5.00%, 5/15/2020 | | | 35,000 | | | | 35,929 | |
| | | | | | | | |
| INVESTMENTS | | PRINCIPAL
AMOUNT ($) | | | VALUE ($) | |
| | | | | | | | |
| | |
Other Revenue — continued | | | | | | | | |
| | |
Lower Colorado River Authority, Transmission Contract, LCRA Transmission Services Corp. Project Series 2010B, Rev., 5.00%, 5/15/2020 | | | 40,000 | | | | 41,044 | |
| | |
Red River Authority Rev., NATL-RE, 4.45%, 6/1/2020 | | | 500,000 | | | | 510,495 | |
| | |
State of Texas, Public Finance AuthoritySeries 2016-A, Rev., 4.00%, 12/1/2019 | | | 50,000 | | | | 50,337 | |
| | | | | | | | |
| | |
| | | | | | | 859,643 | |
| | | | | | | | |
|
Prerefunded — 0.5% | |
| | |
City of Annetta, Certificates of Obligation GO, 5.00%, 8/1/2020 (c) | | | 295,000 | | | | 304,974 | |
| | |
City of Killeen Series 2011, GO, 5.00%, 8/1/2020 (c) | | | 25,000 | | | | 25,866 | |
| | |
Conroe Independent School District, School Building Series 2012, GO, PSF-GTD, 5.00%, 2/15/2021 (c) | | | 20,000 | | | | 21,099 | |
| | |
Tarrant County Cultural Education Facilities Finance Corp. | | | | | | | | |
| | |
Rev., 5.00%, 8/15/2020 (c) | | | 20,000 | | | | 20,732 | |
| | |
Rev., 5.25%, 8/15/2020 (c) | | | 45,000 | | | | 46,747 | |
| | |
Travis County Health Facilities Development Corp. Rev., 7.13%, 11/1/2020 (c) | | | 220,000 | | | | 235,046 | |
| | | | | | | | |
| | |
| | | | | | | 654,464 | |
| | | | | | | | |
|
Transportation — 1.1% | |
| | |
Alamo Regional Mobility Authority, Vehicle Registration Fee Senior Lien Rev., 5.00%, 6/15/2021 | | | 25,000 | | | | 26,531 | |
| | |
Central Texas Regional Mobility Authority, Senior Lien Rev., 5.75%, 1/1/2020 | | | 1,250,000 | | | | 1,267,350 | |
| | |
Dallas Area Rapid Transit, Senior Lien Rev., 4.00%, 12/1/2020 | | | 20,000 | | | | 20,676 | |
| | |
Texas Transportation Commission, State Highway Fund Series 2016A, Rev., 5.00%, 10/1/2019 | | | 25,000 | | | | 25,074 | |
| | | | | | | | |
| | |
| | | | | | | 1,339,631 | |
| | | | | | | | |
|
Utility — 0.4% | |
| | |
City of Houston, Combined First Lien Series C, Rev., 4.00%, 11/15/2019 | | | 20,000 | | | | 20,114 | |
| | |
City of San Antonio, Electric and Gas Systems Series 2014, Rev., 5.00%, 2/1/2020 | | | 20,000 | | | | 20,313 | |
| | |
Sam Rayburn Municipal Power Agency Rev., 5.00%, 10/1/2019 | | | 150,000 | | | | 150,393 | |
| | |
Texas Municipal Power Agency | | | | | | | | |
| | |
Rev., 5.00%, 9/1/2019 | | | 50,000 | | | | 50,000 | |
| | |
Rev., 5.00%, 9/1/2020 | | | 255,000 | | | | 264,624 | |
| | | | | | | | |
| | |
| | | | | | | 505,444 | |
| | | | | | | | |
SEE NOTES TO FINANCIAL STATEMENTS.
| | | | | | |
| | | |
| 162 | | | | J.P. MORGAN EXCHANGE-TRADED FUNDS | | AUGUST 31, 2019 |
| | | | | | | | |
| INVESTMENTS | | PRINCIPAL
AMOUNT ($) | | | VALUE ($) | |
Municipal Bonds — continued | | | | | | | | |
|
Water & Sewer — 0.3% | |
| | |
City of Dallas, Waterworks and Sewer System Series 2016A, Rev., 5.00%, 10/1/2019 | | | 20,000 | | | | 20,059 | |
| | |
City of Garland, Water & Sewer System | | | | | | | | |
| | |
Rev., 4.00%, 3/1/2020 | | | 25,000 | | | | 25,367 | |
| | |
Series 2018, Rev., 5.00%, 3/1/2020 | | | 45,000 | | | | 45,881 | |
| | |
County of El Paso, Water and Sewer Rev., 4.00%, 3/1/2020 | | | 50,000 | | | | 50,663 | |
| | |
North Harris County, Regional Water Authority, Senior Lien Series 2016, Rev., 5.00%, 12/15/2019 | | | 75,000 | | | | 75,809 | |
| | |
North Texas Municipal Water District, Water System Rev., 5.00%, 9/1/2019 | | | 20,000 | | | | 20,000 | |
| | |
San Antonio Water System Series 2017A, Rev., 5.00%, 5/15/2021 | | | 20,000 | | | | 21,306 | |
| | |
San Antonio Water System, Junior Lien | | | | | | | | |
| | |
Series B, Rev., 5.00%, 5/15/2020 | | | 35,000 | | | | 35,944 | |
| | |
Trinity River Authority Central Regional Wastewater System | | | | | | | | |
| | |
Rev., 5.00%, 8/1/2021 | | | 60,000 | | | | 64,376 | |
| | |
Trinity River Authority, Tarrant County Water Project Rev., 5.00%, 2/1/2020 | | | 30,000 | | | | 30,467 | |
| | | | | | | | |
| | |
| | | | | | | 389,872 | |
| | | | | | | | |
| | |
Total Texas | | | | | | | 10,102,229 | |
| | | | | | | | |
|
Utah — 0.3% | |
|
Education — 0.3% | |
| | |
Utah Charter School Finance Authority | | | | | | | | |
| | |
Series A, Rev., 5.00%, 4/15/2021 | | | 35,000 | | | | 36,935 | |
| | |
Series A, Rev., 5.00%, 4/15/2022 | | | 30,000 | | | | 32,656 | |
| | |
Series A, Rev., 5.00%, 4/15/2023 | | | 80,000 | | | | 89,698 | |
| | |
Utah Charter School Finance Authority, Utah Charter Academies Project Rev., 3.00%, 10/15/2019 | | | 195,000 | | | | 195,290 | |
| | | | | | | | |
| | |
| | | | | | | 354,579 | |
| | | | | | | | |
|
Other Revenue — 0.0%(b) | |
| | |
Utah Transit Authority, Sales Tax Series A, Rev., 5.00%, 6/15/2020 | | | 25,000 | | | | 25,770 | |
| | | | | | | | |
|
Water & Sewer — 0.0%(b) | |
| | |
Jordan Valley Water Conservancy District Series A, Rev., 4.00%, 10/1/2019 | | | 30,000 | | | | 30,066 | |
| | | | | | | | |
| | |
Total Utah | | | | | | | 410,415 | |
| | | | | | | | |
|
Vermont — 0.1% | |
|
General Obligation — 0.1% | |
| | |
City of Burlington Series 2018D, GO, 5.00%, 11/1/2020 | | | 65,000 | | | | 67,906 | |
| | | | | | | | |
| | | | | | | | |
| INVESTMENTS | | PRINCIPAL
AMOUNT ($) | | | VALUE ($) | |
| | | | | | | | |
|
Virginia — 0.4% | |
|
Education — 0.2% | |
| | |
Virginia College Building Authority, 21st Century College and Equipment Programs Series A, Rev., 5.00%, 2/1/2020 | | | 70,000 | | | | 71,126 | |
| | |
Virginia College Building Authority, Public Higher Education Financing Program | | | | | | | | |
| | |
Series A, Rev., 5.00%, 9/1/2019 | | | 125,000 | | | | 125,000 | |
| | |
Series B, Rev., 5.00%, 9/1/2019 | | | 100,000 | | | | 100,000 | |
| | | | | | | | |
| | |
| | | | | | | 296,126 | |
| | | | | | | | |
|
General Obligation — 0.0%(b) | |
| | |
City of Norfolk, Capital Improvement Series 2016A, GO, 5.00%, 10/1/2019 | | | 35,000 | | | | 35,104 | |
| | | | | | | | |
|
Other Revenue — 0.1% | |
| | |
New River Valley Regional Jail Authority Rev., 3.00%, 10/1/2019 | | | 50,000 | | | | 50,071 | |
| | | | | | | | |
|
Prerefunded — 0.0%(b) | |
| | |
Virginia College Building Authority, Public Higher Education Financing Program Series B, Rev., 5.00%, 9/1/2019 (c) | | | 50,000 | | | | 50,000 | |
| | | | | | | | |
|
Transportation — 0.1% | |
| | |
Virginia Commonwealth Transportation Board | | | | | | | | |
| | |
Series 2013-A, Rev., GAN, 5.00%, 3/15/2020 | | | 25,000 | | | | 25,524 | |
| | |
Series A, Rev., 5.00%, 3/15/2020 | | | 35,000 | | | | 35,734 | |
| | | | | | | | |
| | |
| | | | | | | 61,258 | |
| | | | | | | | |
| | |
Total Virginia | | | | | | | 492,559 | |
| | | | | | | | |
|
Washington — 3.6% | |
|
Certificate of Participation/Lease — 0.0%(b) | |
| | |
State of Washington, Local Agency Real and Personal Property Series 2018C, COP, 5.00%, 7/1/2020 | | | 25,000 | | | | 25,810 | |
| | | | | | | | |
|
Education — 0.0%(b) | |
| | |
Washington State University Rev., 5.00%, 10/1/2020 | | | 35,000 | | | | 36,476 | |
| | | | | | | | |
|
General Obligation — 0.3% | |
| | |
City of Bellevue Series 2013, GO, 5.00%, 12/1/2019 | | | 30,000 | | | | 30,286 | |
| | |
City of Richland Series 2013A, GO, 4.00%, 12/1/2021 | | | 40,000 | | | | 42,613 | |
| | |
City of Seattle, Limited Tax | | | | | | | | |
| | |
GO, 5.00%, 9/1/2019 | | | 25,000 | | | | 25,000 | |
| | |
Series B, GO, 5.00%, 8/1/2020 | | | 35,000 | | | | 36,261 | |
| | |
City of Vancouver Series 2015B, GO, 4.00%, 12/1/2019 | | | 55,000 | | | | 55,389 | |
SEE NOTES TO FINANCIAL STATEMENTS.
| | | | | | | | |
| | | |
| AUGUST 31, 2019 | | J.P. MORGAN EXCHANGE-TRADED FUNDS | | | | | 163 | |
JPMorgan Ultra-Short Municipal Income ETF
SCHEDULE OF PORTFOLIO INVESTMENTS
AS OF AUGUST 31, 2019 (Unaudited) (continued)
| | | | | | | | |
| INVESTMENTS | | PRINCIPAL
AMOUNT ($) | | | VALUE ($) | |
Municipal Bonds — continued | |
| | |
General Obligation — continued | | | | | | | | |
| | |
County of Skagit, Limited Tax GO, 5.00%, 12/1/2021 | | | 20,000 | | | | 21,731 | |
| | |
King County Public Hospital District No. 2, Evergreenhealth GO, 5.00%, 12/1/2021 | | | 60,000 | | | | 64,947 | |
| | |
King County School District No. 405 Bellevue, Credit Enhancement Program GO, 5.00%, 12/1/2020 | | | 20,000 | | | | 20,978 | |
| | |
Pierce County School District No. 3 GO, 5.00%, 12/1/2019 | | | 20,000 | | | | 20,185 | |
| | |
Skagit County Public Hospital District No. 2, Refunding and Improvement-Limited Tax GO, 4.00%, 12/1/2019 | | | 50,000 | | | | 50,328 | |
| | |
State of Washington, Motor Vehicle Fuel Tax Series B, GO, 5.00%, 8/1/2020 | | | 20,000 | | | | 20,708 | |
| | | | | | | | |
| | |
| | | | | | | 388,426 | |
| | | | | | | | |
|
Hospital — 1.0% | |
| | |
Washington Health Care Facilities Authority, Commonspirit HealthSeries B-1, Rev., 5.00%, 8/1/2024 (d) | | | 1,000,000 | | | | 1,154,050 | |
| | |
Washington Health Care Facilities Authority, Providence Health and Service Series 2011B, Rev., 5.00%, 10/1/2019 | | | 25,000 | | | | 25,072 | |
| | | | | | | | |
| | |
| | | | | | | 1,179,122 | |
| | | | | | | | |
|
Housing — 2.0% | |
| | |
Washington State Housing Finance Commission Rev., VRDO, LIQ: State Street Bank & Trust, 1.27%, 9/12/2019 (d) | | | 2,450,000 | | | | 2,450,000 | |
| | | | | | | | |
|
Prerefunded — 0.1% | |
| | |
County of King, Sewer Rev., 5.00%, 1/1/2021 (c) | | | 25,000 | | | | 26,294 | |
| | |
Series 2011C, Rev., 5.00%, 1/1/2021 (c) | | | 25,000 | | | | 26,295 | |
| | |
Grant County Public Utility District No. 2, Electric SystemSeries 2011-I, Rev., 5.00%, 1/1/2021 (c) | | | 25,000 | | | | 26,294 | |
| | | | | | | | |
| | |
| | | | | | | 78,883 | |
| | | | | | | | |
|
Transportation — 0.1% | |
| | |
State of Washington, Federal Highway Grant | | | | | | | | |
| | |
Series 2012F, Rev., 5.00%, 9/1/2019 | | | 80,000 | | | | 80,000 | |
| | |
Series 2012F, Rev., 5.00%, 9/1/2020 | | | 20,000 | | | | 20,775 | |
| | | | | | | | |
| | |
| | | | | | | 100,775 | |
| | | | | | | | |
|
Utility — 0.1% | |
| | |
City of Tacoma, Electric System Series A, Rev., 4.00%, 1/1/2020 (c) | | | 30,000 | | | | 30,278 | |
| | |
Energy Northwest, Electric Series A, Rev., 5.00%, 7/1/2021 | | | 25,000 | | | | 26,760 | |
| | | | | | | | |
| INVESTMENTS | | PRINCIPAL
AMOUNT ($) | | | VALUE ($) | |
| | | | | | | | |
| | |
Utility — continued | | | | | | | | |
| | |
Grant County Public Utility District No. 2, Hydroelectric Project Series 2012A, Rev., 5.00%, 1/1/2020 | | | 20,000 | | | | 20,252 | |
| | |
Public Utility District No. 1 of Cowlitz County Rev., 5.00%, 9/1/2019 | | | 45,000 | | | | 45,000 | |
| | | | | | | | |
| | |
| | | | | | | 122,290 | |
| | | | | | | | |
|
Water & Sewer — 0.0%(b) | |
| | |
County of King, Sewer | | | | | | | | |
| | |
Series 2012C, Rev., 4.00%, 1/1/2020 | | | 20,000 | | | | 20,190 | |
| | |
Series 2010, Rev., 5.00%, 1/1/2020 | | | 25,000 | | | | 25,318 | |
| | | | | | | | |
| | |
| | | | | | | 45,508 | |
| | | | | | | | |
| | |
Total Washington | | | | | | | 4,427,290 | |
| | | | | | | | |
|
West Virginia — 0.7% | |
|
Hospital — 0.2% | |
| | |
Monongalia County Building Commission, Monongalia Health System Obligated Group Rev., 5.00%, 7/1/2020 | | | 200,000 | | | | 204,790 | |
| | | | | | | | |
|
Transportation — 0.1% | |
| | |
West Virginia Commissioner of Highways | | | | | | | | |
| | |
Series 2017A, Rev., 5.00%, 9/1/2019 | | | 50,000 | | | | 50,000 | |
| | |
Series 2017A, Rev., 5.00%, 9/1/2020 | | | 75,000 | | | | 77,841 | |
| | | | | | | | |
| | |
| | | | | | | 127,841 | |
| | | | | | | | |
|
Utility — 0.4% | |
| | |
West Virginia Economic Development Authority, Appalachian Power Co. — AMOS ProjectSeries 2009-B, Rev., 2.63%, 6/1/2022 (d) | | | 500,000 | | | | 515,140 | |
| | | | | | | | |
| | |
Total West Virginia | | | | | | | 847,771 | |
| | | | | | | | |
|
Wisconsin — 3.8% | |
|
Certificate of Participation/Lease — 0.0%(b) | |
| | |
State of Wisconsin Series 2015A, COP, 5.00%, 3/1/2020 | | | 35,000 | | | | 35,666 | |
| | | | | | | | |
|
Education — 0.8% | |
| | |
Milwaukee Redevelopment Authority, Milwaukee Public Schools | | | | | | | | |
| | |
Series 2017, Rev., 5.00%, 11/15/2022 | | | 365,000 | | | | 406,895 | |
| | |
Series 2017, Rev., 5.00%, 11/15/2023 | | | 130,000 | | | | 149,281 | |
| | |
Milwaukee Redevelopment Authority, Milwaukee Public Schools — Neighborhood Schools Initiative Rev., NATL-RE, 4.00%, 8/1/2023 | | | 400,000 | | | | 440,996 | |
| | | | | | | | |
| | |
| | | | | | | 997,172 | |
| | | | | | | | |
SEE NOTES TO FINANCIAL STATEMENTS.
| | | | | | |
| | | |
| 164 | | | | J.P. MORGAN EXCHANGE-TRADED FUNDS | | AUGUST 31, 2019 |
| | | | | | | | |
| INVESTMENTS | | PRINCIPAL
AMOUNT ($) | | | VALUE ($) | |
Municipal Bonds — continued | |
|
General Obligation — 1.6% | |
| | |
City of Kenosha Series 2012, GO, 5.00%, 9/1/2019 | | | 40,000 | | | | 40,000 | |
| | |
City of Oshkosh | | | | | | | | |
| | |
Series A, GO, 0.05%, 12/1/2022 | | | 70,000 | | | | 67,574 | |
| | |
Series A, GO, 2.00%, 12/1/2023 | | | 200,000 | | | | 206,842 | |
| | |
City of Shawano, Promissory Notes Series 2019, GO, 3.00%, 4/1/2022 | | | 140,000 | | | | 145,992 | |
| | |
City of Waukesha | | | | | | | | |
| | |
Series 2013A, GO, 4.00%, 10/1/2019 | | | 50,000 | | | | 50,107 | |
| | |
Series A, GO, 4.00%, 10/1/2020 | | | 20,000 | | | | 20,612 | |
| | |
City of West Allis, Corporate Purpose Series 2018A, GO, 4.00%, 4/1/2020 | | | 455,000 | | | | 462,053 | |
| | |
County of Milwaukee Series 2018D, GO, 3.00%, 8/1/2024 | | | 100,000 | | | | 109,156 | |
| | |
Ithaca School District, School Improvement Series 2014, GO, 3.00%, 3/1/2021 | | | 175,000 | | | | 179,118 | |
| | |
State of Wisconsin Series 3, GO, 5.00%, 11/1/2020 | | | 65,000 | | | | 67,932 | |
| | |
Village of Menomonee Falls | | | | | | | | |
| | |
Series B, GO, 3.50%, 2/1/2022 | | | 150,000 | | | | 157,786 | |
| | |
Series B, GO, 3.50%, 2/1/2023 | | | 155,000 | | | | 166,104 | |
| | |
Series B, GO, 3.50%, 2/1/2024 | | | 245,000 | | | | 267,168 | |
| | | | | | | | |
| | |
| | | | | | | 1,940,444 | |
| | | | | | | | |
|
Hospital — 1.3% | |
| | |
Public Finance Authority, Wakemed Series 2019 C, Rev., VRDO, LOC: Barclays Bank plc, 1.27%, 9/6/2019 (d) | | | 1,300,000 | | | | 1,300,000 | |
| | |
Wisconsin Health and Educational Facilities Authority, Advocate Aurora Health Credit GroupSeries 2018B-1, Rev., 5.00%, 1/26/2022 (d) | | | 55,000 | | | | 59,897 | |
| | |
Wisconsin Health and Educational Facilities Authority, Ascension Health Alliance Senior Credit GroupSeries 2013B-3, Rev., 5.00%, 6/1/2020 (d) | | | 150,000 | | | | 154,349 | |
| | |
Wisconsin Health and Educational Facilities Authority, Ministry Healthcare, Inc. Series 2010B, Rev., 4.25%, 8/15/2020 (c) | | | 20,000 | | | | 20,573 | |
| | |
Wisconsin Health and Educational Facilities Authority, SSM Health Care Series 2010A, Rev., 4.00%, 6/1/2020 (c) | | | 40,000 | | | | 40,849 | |
| | |
Wisconsin Health and Educational Facilities Authority, Unity Point Health Series 2014A, Rev., 5.00%, 12/1/2021 | | | 50,000 | | | | 54,209 | |
| | | | | | | | |
| | |
| | | | | | | 1,629,877 | |
| | | | | | | | |
| | | | | | | | |
| INVESTMENTS | | PRINCIPAL
AMOUNT ($) | | | VALUE ($) | |
| | | | | | | | |
|
Prerefunded — 0.1% | |
| | |
City of Waukesha Series 2009B, GO, 4.00%, 10/1/2019 (c) | | | 20,000 | | | | 20,043 | |
| | |
State of Wisconsin Series 1, GO, 5.00%, 5/1/2020 (c) | | | 20,000 | | | | 20,508 | |
| | |
Wisconsin Health & Educational Facilities Authority, St. John’s Communities, Inc. Series A, Rev., 7.63%, 9/15/2019 (c) | | | 30,000 | | | | 30,060 | |
| | | | | | | | |
| | |
| | | | | | | 70,611 | |
| | | | | | | | |
|
Transportation — 0.0%(b) | |
| | |
Wisconsin Department of Transportation Series 2012 1, Rev., 5.00%, 7/1/2020 | | | 25,000 | | | | 25,812 | |
| | | | | | | | |
| | |
Total Wisconsin | | | | | | | 4,699,582 | |
| | | | | | | | |
| | |
Total Municipal Bonds
(Cost $121,483,383) | | | | | | | 121,966,367 | |
| | | | | | | | |
| | |
| | | SHARES | | | | |
Short-term Investments — 1.4% | | | | | | | | |
| | |
Investment Companies — 1.4% | | | | | | | | |
| | |
JPMorgan Institutional Tax Free Money Market Fund Class IM Shares,
1.25% (g) (h)
(Cost $1,682,531) | | | 1,682,373 | | | | 1,682,541 | |
| | | | | | | | |
Total Investments — 100.0%
(Cost $123,165,914) | | | | | | | 123,648,908 | |
Other Assets Less Liabilities — 0.0%(b) | | | | | | | 20,292 | |
| | | | | | | | |
NET ASSETS — 100.0% | | | | | | | 123,669,200 | |
| | | | | | | | |
Percentages indicated are based on net assets.
SEE NOTES TO FINANCIAL STATEMENTS.
| | | | | | | | |
| | | |
| AUGUST 31, 2019 | | J.P. MORGAN EXCHANGE-TRADED FUNDS | | | | | 165 | |
JPMorgan Ultra-Short Municipal Income ETF
SCHEDULE OF PORTFOLIO INVESTMENTS
AS OF AUGUST 31, 2019 (Unaudited) (continued)
Abbreviations
| | |
AGC | | Insured by Assured Guaranty Corp. |
AGM | | Insured by Assured Guaranty Municipal Corp. |
AMBAC | | Insured by American Municipal Bond Assurance Corp. |
BAN | | Bond Anticipation Note |
BHAC | | Insured by Berkshire Hathaway Assurance Corp. |
COP | | Certificate of Participation |
CR | | Custodial Receipts |
GAN | | Grant Anticipation Notes |
GO | | General Obligation |
LIQ | | Liquidity Agreement |
LOC | | Letter of Credit |
NATL | | Insured by National Public Finance Guarantee Corp. |
PSF-GTD | | Permanent School Fund Guaranteed |
RE | | Reinsured |
Rev. | | Revenue |
VRDO | | Variable Rate Demand Obligation. The interest rate shown is the rate in effect as of August 31, 2019. |
| |
(a) | | The date shown represents the earliest of the prerefunded date, next put date or final maturity date. |
(b) | | Amount rounds to less than 0.1% of net assets. |
(c) | | Security is prerefunded or escrowed to maturity. |
(d) | | Variable or floating rate security, the interest rate of which adjusts periodically based on changes in current interest rates and prepayments on the underlying pool of assets. The interest rate shown is the current rate as of August 31, 2019. |
(e) | | All or a portion of the security is a when-issued security, delayed delivery security, or forward commitment. |
(f) | | Securities exempt from registration under Rule 144A or section 4(a)(2), of the Securities Act of 1933, as amended. |
(g) | | Investment in an affiliated fund, which is registered under the Investment Company Act of 1940, as amended, and is advised by J.P. Morgan Investment Management Inc. |
(h) | | The rate shown is the current yield as of August 31, 2019. |
SEE NOTES TO FINANCIAL STATEMENTS.
| | | | | | |
| | | |
| 166 | | | | J.P. MORGAN EXCHANGE-TRADED FUNDS | | AUGUST 31, 2019 |
JPMorgan USD Emerging Markets Sovereign Bond ETF
SCHEDULE OF PORTFOLIO INVESTMENTS
AS OF AUGUST 31, 2019 (Unaudited)
| | | | | | | | |
| INVESTMENTS | | PRINCIPAL
AMOUNT ($) | | | VALUE ($) | |
Foreign Government Securities — 85.2% | | | | | | | | |
|
Azerbaijan — 0.8% | |
| | |
Republic of Azerbaijan | | | | | | | | |
| | |
4.75%, 3/18/2024 (a) | | | 200,000 | | | | 214,500 | |
| | |
3.50%, 9/1/2032 (a) | | | 282,000 | | | | 278,034 | |
| | | | | | | | |
| | |
| | | | | | | 492,534 | |
| | | | | | | | |
|
Bolivia, Plurinational State of — 0.3% | |
| | |
Plurinational State of Bolivia 4.50%, 3/20/2028 (a) | | | 200,000 | | | | 192,187 | |
| | | | | | | | |
|
Brazil — 4.5% | |
| | |
Federative Republic of Brazil | | | | | | | | |
| | |
4.88%, 1/22/2021 | | | 237,000 | | | | 246,184 | |
| | |
2.63%, 1/5/2023 | | | 200,000 | | | | 200,187 | |
| | |
4.25%, 1/7/2025 | | | 520,000 | | | | 554,287 | |
| | |
6.00%, 4/7/2026 | | | 181,000 | | | | 211,940 | |
| | |
4.63%, 1/13/2028 | | | 220,000 | | | | 236,706 | |
| | |
8.25%, 1/20/2034 | | | 191,000 | | | | 266,266 | |
| | |
5.63%, 1/7/2041 | | | 279,000 | | | | 319,368 | |
| | |
5.63%, 2/21/2047 | | | 842,000 | | | | 965,932 | |
| | | | | | | | |
| | |
| | | | | | | 3,000,870 | |
| | | | | | | | |
|
Chile — 0.5% | |
| | |
Republic of Chile 3.50%, 1/25/2050 | | | 270,000 | | | | 307,884 | |
| | | | | | | | |
|
China — 0.6% | |
| | |
Export-Import Bank of China (The) 2.88%, 4/26/2026 (b) | | | 200,000 | | | | 206,347 | |
| | |
People’s Republic of China 2.13%, 11/2/2022 (b) | | | 200,000 | | | | 200,808 | |
| | | | | | | | |
| | |
| | | | | | | 407,155 | |
| | | | | | | | |
|
Colombia — 2.6% | |
| | |
Republic of Colombia | | | | | | | | |
| | |
8.13%, 5/21/2024 | | | 325,000 | | | | 407,062 | |
| | |
3.88%, 4/25/2027 | | | 216,000 | | | | 233,888 | |
| | |
7.38%, 9/18/2037 | | | 200,000 | | | | 291,875 | |
| | |
5.63%, 2/26/2044 | | | 205,000 | | | | 264,386 | |
| | |
5.00%, 6/15/2045 | | | 437,000 | | | | 528,333 | |
| | | | | | | | |
| | |
| | | | | | | 1,725,544 | |
| | | | | | | | |
|
Croatia — 1.2% | |
| | |
Republic of Croatia | | | | | | | | |
| | |
5.50%, 4/4/2023 (a) | | | 205,000 | | | | 228,063 | |
| | |
6.00%, 1/26/2024 (a) | | | 509,000 | | | | 588,849 | |
| | | | | | | | |
| | |
| | | | | | | 816,912 | |
| | | | | | | | |
|
Dominican Republic — 4.4% | |
| | |
Government of Dominican Republic | | | | | | | | |
| | |
5.88%, 4/18/2024 (a) | | | 225,000 | | | | 240,862 | |
| | | | | | | | |
| INVESTMENTS | | PRINCIPAL
AMOUNT ($) | | | VALUE ($) | |
| | | | | | | | |
| |
Dominican Republic — continued | | | | | |
| | |
5.50%, 1/27/2025 (a) | | | 116,000 | | | | 123,758 | |
| | |
5.95%, 1/25/2027 (b) | | | 612,000 | | | | 671,670 | |
| | |
5.95%, 1/25/2027 (a) | | | 198,000 | | | | 217,305 | |
| | |
6.00%, 7/19/2028 (a) | | | 260,000 | | | | 287,381 | |
| | |
7.45%, 4/30/2044 (a) | | | 319,000 | | | | 386,389 | |
| | |
6.85%, 1/27/2045 (a) | | | 660,000 | | | | 757,350 | |
| | |
6.40%, 6/5/2049 (a) | | | 230,000 | | | | 252,641 | |
| | | | | | | | |
| | |
| | | | | | | 2,937,356 | |
| | | | | | | | |
|
Ecuador — 4.2% | |
| | |
Republic of Ecuador | | | | | | | | |
| | |
8.75%, 6/2/2023 (a) | | | 200,000 | | | | 210,200 | |
| | |
7.95%, 6/20/2024 (a) | | | 1,000,000 | | | | 1,012,188 | |
| | |
9.65%, 12/13/2026 (a) | | | 864,000 | | | | 896,400 | |
| | |
8.88%, 10/23/2027 (a) | | | 201,000 | | | | 198,739 | |
| | |
7.88%, 1/23/2028 (a) | | | 500,000 | | | | 470,312 | |
| | | | | | | | |
| | |
| | | | | | | 2,787,839 | |
| | | | | | | | |
|
Egypt — 4.5% | |
| | |
Arab Republic of Egypt | | | | | | | | |
| | |
6.13%, 1/31/2022 (a) | | | 537,000 | | | | 558,648 | |
| | |
5.88%, 6/11/2025 (a) (c) | | | 464,000 | | | | 478,500 | |
| | |
7.50%, 1/31/2027 (a) | | | 740,000 | | | | 802,900 | |
| | |
8.50%, 1/31/2047 (a) | | | 800,000 | | | | 865,750 | |
| | |
7.90%, 2/21/2048 (a) | | | 225,000 | | | | 231,609 | |
| | | | | | | | |
| | |
| | | | | | | 2,937,407 | |
| | | | | | | | |
|
Ethiopia — 0.3% | |
| | |
Federal Democratic Republic of Ethiopia | | | | | | | | |
| | |
6.63%, 12/11/2024 (a) | | | 200,000 | | | | 208,062 | |
| | | | | | | | |
|
Gabon — 0.4% | |
| | |
Gabonese Republic 6.38%, 12/12/2024 (a) | | | 290,000 | | | | 280,031 | |
| | | | | | | | |
|
Ghana — 1.4% | |
| | |
Republic of Ghana | | | | | | | | |
| | |
8.13%, 1/18/2026 (a) | | | 223,000 | | | | 235,962 | |
| | |
7.63%, 5/16/2029 (a) | | | 200,000 | | | | 197,250 | |
| | |
8.63%, 6/16/2049 (a) | | | 235,000 | | | | 228,537 | |
| | |
8.95%, 3/26/2051 (a) | | | 275,000 | | | | 269,844 | |
| | | | | | | | |
| | |
| | | | | | | 931,593 | |
| | | | | | | | |
|
Hungary — 1.3% | |
| | |
Republic of Hungary | | | | | | | | |
| | |
5.38%, 2/21/2023 | | | 170,000 | | | | 187,956 | |
| | |
5.75%, 11/22/2023 | | | 300,000 | | | | 341,344 | |
| | |
7.63%, 3/29/2041 | | | 190,000 | | | | 319,437 | |
| | | | | | | | |
| | |
| | | | | | | 848,737 | |
| | | | | | | | |
SEE NOTES TO FINANCIAL STATEMENTS.
| | | | | | | | |
| | | |
| AUGUST 31, 2019 | | J.P. MORGAN EXCHANGE-TRADED FUNDS | | | | | 167 | |
JPMorgan USD Emerging Markets Sovereign Bond ETF
SCHEDULE OF PORTFOLIO INVESTMENTS
AS OF AUGUST 31, 2019 (Unaudited) (continued)
| | | | | | | | |
| INVESTMENTS | | PRINCIPAL
AMOUNT ($) | | | VALUE ($) | |
Foreign Government Securities — continued | |
|
India — 0.3% | |
| | |
Export-Import Bank of India 3.88%, 2/1/2028 (a) | | | 200,000 | | | | 213,250 | |
| | | | | | | | |
|
Indonesia — 2.2% | |
| | |
Perusahaan Penerbit SBSN Indonesia III 4.55%, 3/29/2026 (a) | | | 200,000 | | | | 219,938 | |
| | |
Republic of Indonesia | | | | | | | | |
| | |
4.75%, 1/8/2026 (a) | | | 200,000 | | | | 223,187 | |
| | |
3.50%, 1/11/2028 | | | 200,000 | | | | 209,688 | |
| | |
4.10%, 4/24/2028 | | | 200,000 | | | | 219,125 | |
| | |
6.75%, 1/15/2044 (a) | | | 401,000 | | | | 588,467 | |
| | | | | | | | |
| | |
| | | | | | | 1,460,405 | |
| | | | | | | | |
|
Iraq — 1.2% | |
| | |
Republic of Iraq | | | | | | | | |
| | |
6.75%, 3/9/2023 (a) | | | 300,000 | | | | 306,563 | |
| | |
5.80%, 1/15/2028 (a) | | | 520,000 | | | | 508,787 | |
| | | | | | | | |
| | |
| | | | | | | 815,350 | |
| | | | | | | | |
|
Ivory Coast — 1.4% | |
| | |
Republic of Cote d’Ivoire | | | | | | | | |
| | |
6.38%, 3/3/2028 (a) | | | 373,000 | | | | 376,264 | |
| | |
5.75%, 12/31/2032 (a) (d) | | | 363,440 | | | | 360,260 | |
| | |
6.13%, 6/15/2033 (a) | | | 200,000 | | | | 188,750 | |
| | | | | | | | |
| | |
| | | | | | | 925,274 | |
| | | | | | | | |
|
Jamaica — 1.8% | |
| | |
Jamaica Government International Bond | | | | | | | | |
| | |
6.75%, 4/28/2028 | | | 425,000 | | | | 497,250 | |
| | |
8.00%, 3/15/2039 | | | 290,000 | | | | 375,097 | |
| | |
7.88%, 7/28/2045 | | | 225,000 | | | | 292,008 | |
| | | | | | | | |
| | |
| | | | | | | 1,164,355 | |
| | | | | | | | |
|
Jordan — 1.1% | |
| | |
Kingdom of Jordan | | | | | | | | |
| | |
6.13%, 1/29/2026 (a) | | | 266,000 | | | | 277,139 | |
| | |
5.75%, 1/31/2027 (a) (c) | | | 202,000 | | | | 205,030 | |
| | |
7.38%, 10/10/2047 (a) | | | 225,000 | | | | 234,000 | |
| | | | | | | | |
| | |
| | | | | | | 716,169 | |
| | | | | | | | |
|
Kazakhstan — 0.6% | |
| | |
Republic of Kazakhstan 3.88%, 10/14/2024 (a) | | | 350,000 | | | | 373,100 | |
| | | | | | | | |
|
Kenya — 1.5% | |
| | |
Republic of Kenya | | | | | | | | |
| | |
6.88%, 6/24/2024 (a) | | | 394,000 | | | | 421,580 | |
| | |
7.25%, 2/28/2028 (a) | | | 260,000 | | | | 271,700 | |
| | |
8.25%, 2/28/2048 (a) | | | 280,000 | | | | 288,750 | |
| | | | | | | | |
| | |
| | | | | | | 982,030 | |
| | | | | | | | |
| | | | | | | | |
| INVESTMENTS | | PRINCIPAL
AMOUNT ($) | | | VALUE ($) | |
| | | | | | | | |
|
Kuwait — 0.3% | |
| | |
Kuwait Government Bond 3.50%, 3/20/2027 (a) | | | 200,000 | | | | 220,200 | |
| | | | | | | | |
|
Lithuania — 0.2% | |
| | |
Republic of Lithuania 6.13%, 3/9/2021 (a) | | | 100,000 | | | | 105,840 | |
| | | | | | | | |
|
Malaysia — 0.3% | |
| | |
Malaysia Sovereign Sukuk Bhd. 3.04%, 4/22/2025 (a) | | | 200,000 | | | | 208,875 | |
| | | | | | | | |
|
Mexico — 1.9% | |
| | |
United Mexican States | | | | | | | | |
| | |
4.00%, 10/2/2023 | | | 40,000 | | | | 42,450 | |
| | |
4.13%, 1/21/2026 | | | 725,000 | | | | 771,037 | |
| | |
6.05%, 1/11/2040 | | | 100,000 | | | | 127,900 | |
| | |
4.35%, 1/15/2047 | | | 200,000 | | | | 210,188 | |
| | |
5.75%, 10/12/2110 | | | 100,000 | | | | 118,281 | |
| | | | | | | | |
| | |
| | | | | | | 1,269,856 | |
| | | | | | | | |
|
Mongolia — 0.3% | |
| | |
Mongolia Government International Bond | | | | | | | | |
| | |
5.13%, 12/5/2022 (a) | | | 200,000 | | | | 199,750 | |
| | | | | | | | |
|
Morocco — 0.2% | |
| | |
Kingdom of Morocco 4.25%,
12/11/2022 (a) | | | 150,000 | | | | 157,359 | |
| | | | | | | | |
|
Nigeria — 0.9% | |
| | |
Federal Republic of Nigeria | | | | | | | | |
| | |
8.75%, 1/21/2031 (a) | | | 314,000 | | | | 345,106 | |
| | |
7.88%, 2/16/2032 (a) | | | 260,000 | | | | 267,150 | |
| | | | | | | | |
| | |
| | | | | | | 612,256 | |
| | | | | | | | |
|
Oman — 4.5% | |
| | |
Oman Government International Bond | | | | | | | | |
| | |
3.88%, 3/8/2022 (a) | | | 632,000 | | | | 627,892 | |
| | |
4.75%, 6/15/2026 (a) | | | 300,000 | | | | 289,875 | |
| | |
5.38%, 3/8/2027 (a) | | | 381,000 | | | | 373,618 | |
| | |
5.63%, 1/17/2028 (a) | | | 200,000 | | | | 196,500 | |
| | |
6.50%, 3/8/2047 (a) | | | 777,000 | | | | 720,668 | |
| | |
6.75%, 1/17/2048 (b) | | | 205,000 | | | | 192,764 | |
| | |
Oman Sovereign Sukuk SAOC 5.93%, 10/31/2025 (b) | | | 525,000 | | | | 556,008 | |
| | | | | | | | |
| | |
| | | | | | | 2,957,325 | |
| | | | | | | | |
|
Pakistan — 1.6% | |
| | |
Republic of Pakistan | | | | | | | | |
| | |
5.63%, 12/5/2022 (a) | | | 325,000 | | | | 327,437 | |
| | |
8.25%, 4/15/2024 (a) | | | 400,000 | | | | 435,375 | |
| | |
6.88%, 12/5/2027 (a) | | | 295,000 | | | | 295,369 | |
| | | | | | | | |
| | |
| | | | | | | 1,058,181 | |
| | | | | | | | |
SEE NOTES TO FINANCIAL STATEMENTS.
| | | | | | |
| | | |
| 168 | | | | J.P. MORGAN EXCHANGE-TRADED FUNDS | | AUGUST 31, 2019 |
| | | | | | | | |
| INVESTMENTS | | PRINCIPAL
AMOUNT ($) | | | VALUE ($) | |
Foreign Government Securities — continued | |
|
Panama — 1.6% | |
| | |
Republic of Panama | | | | | | | | |
| | |
3.88%, 3/17/2028 | | | 200,000 | | | | 221,937 | |
| | |
6.70%, 1/26/2036 | | | 384,000 | | | | 561,600 | |
| | |
4.50%, 5/15/2047 | | | 206,000 | | | | 256,084 | |
| | | | | | | | |
| | |
| | | | | | | 1,039,621 | |
| | | | | | | | |
|
Paraguay — 0.4% | |
| | |
Republic of Paraguay 6.10%, 8/11/2044 (a) | | | 200,000 | | | | 250,438 | |
| | | | | | | | |
|
Peru — 1.9% | |
| | |
Republic of Peru | | | | | | | | |
| | |
4.13%, 8/25/2027 | | | 500,000 | | | | 572,813 | |
| | |
8.75%, 11/21/2033 | | | 110,000 | | | | 187,859 | |
| | |
6.55%, 3/14/2037 | | | 100,000 | | | | 151,781 | |
| | |
5.63%, 11/18/2050 | | | 225,000 | | | | 343,969 | |
| | | | | | | | |
| | |
| | | | | | | 1,256,422 | |
| | | | | | | | |
|
Philippines — 2.5% | |
| | |
Republic of Philippines | | | | | | | | |
| | |
10.63%, 3/16/2025 | | | 180,000 | | | | 259,481 | |
| | |
5.50%, 3/30/2026 | | | 200,000 | | | | 240,375 | |
| | |
9.50%, 2/2/2030 | | | 30,000 | | | | 49,631 | |
| | |
6.38%, 1/15/2032 | | | 296,000 | | | | 416,158 | |
| | |
6.38%, 10/23/2034 | | | 147,000 | | | | 215,860 | |
| | |
3.70%, 3/1/2041 | | | 214,000 | | | | 251,584 | |
| | |
3.70%, 2/2/2042 | | | 200,000 | | | | 236,188 | |
| | | | | | | | |
| | |
| | | | | | | 1,669,277 | |
| | | | | | | | |
|
Poland — 1.4% | |
| | |
Republic of Poland | | | | | | | | |
| | |
3.00%, 3/17/2023 | | | 706,000 | | | | 734,461 | |
| | |
4.00%, 1/22/2024 | | | 150,000 | | | | 163,066 | |
| | | | | | | | |
| | |
| | | | | | | 897,527 | |
| | | | | | | | |
|
Qatar — 1.5% | |
| | |
State of Qatar | | | | | | | | |
| | |
3.88%, 4/23/2023 (a) | | | 415,000 | | | | 441,353 | |
| | |
5.10%, 4/23/2048 (b) | | | 400,000 | | | | 533,625 | |
| | | | | | | | |
| | |
| | | | | | | 974,978 | |
| | | | | | | | |
|
Romania — 1.1% | |
| | |
Republic of Romania | | | | | | | | |
| | |
6.75%, 2/7/2022 (a) | | | 136,000 | | | | 149,940 | |
| | |
4.38%, 8/22/2023 (a) | | | 100,000 | | | | 106,625 | |
| | |
4.88%, 1/22/2024 (a) | | | 190,000 | | | | 208,644 | |
| | |
6.13%, 1/22/2044 (a) | | | 100,000 | | | | 131,437 | |
| | |
5.13%, 6/15/2048 (a) | | | 100,000 | | | | 116,500 | |
| | | | | | | | |
| | |
| | | | | | | 713,146 | |
| | | | | | | | |
| | | | | | | | |
| INVESTMENTS | | PRINCIPAL
AMOUNT ($) | | | VALUE ($) | |
| | | | | | | | |
|
Russia — 2.5% | |
| | |
Russian Federation | | | | | | | | |
| | |
4.25%, 6/23/2027 (a) | | | 400,000 | | | | 426,000 | |
| | |
12.75%, 6/24/2028 (a) | | | 383,000 | | | | 648,227 | |
| | |
7.50%, 3/31/2030 (a) (d) | | | 82,125 | | | | 92,678 | |
| | |
5.88%, 9/16/2043 (a) | | | 200,000 | | | | 255,875 | |
| | |
5.25%, 6/23/2047 (a) | | | 200,000 | | | | 238,313 | |
| | | | | | | | |
| | |
| | | | | | | 1,661,093 | |
| | | | | | | | |
|
Saudi Arabia — 2.2% | |
| | |
Kingdom of Saudi Arabia | | | | | | | | |
| | |
2.88%, 3/4/2023 (a) | | | 320,000 | | | | 329,600 | |
| | |
3.63%, 3/4/2028 (b) | | | 308,000 | | | | 333,333 | |
| | |
4.50%, 4/17/2030 (a) | | | 217,000 | | | | 253,565 | |
| | |
4.50%, 10/26/2046 (b) | | | 267,000 | | | | 310,254 | |
| | |
5.00%, 4/17/2049 (b) | | | 200,000 | | | | 250,000 | |
| | | | | | | | |
| | |
| | | | | | | 1,476,752 | |
| | | | | | | | |
|
Serbia — 0.7% | |
| | |
Republic of Serbia 7.25%, 9/28/2021 (a) | | | 442,000 | | | | 483,106 | |
| | | | | | | | |
|
Slovakia — 0.3% | |
| | |
Slovak Republic 4.38%, 5/21/2022 (a) | | | 200,000 | | | | 211,313 | |
| | | | | | | | |
|
South Africa — 3.8% | |
| | |
Republic of South Africa | | | | | | | | |
| | |
5.88%, 5/30/2022 | | | 526,000 | | | | 562,820 | |
| | |
5.88%, 9/16/2025 | | | 284,000 | | | | 314,441 | |
| | |
4.30%, 10/12/2028 | | | 494,000 | | | | 491,357 | |
| | |
5.88%, 6/22/2030 | | | 461,000 | | | | 506,432 | |
| | |
5.38%, 7/24/2044 | | | 204,000 | | | | 208,845 | |
| | |
5.00%, 10/12/2046 | | | 205,000 | | | | 202,181 | |
| | |
5.65%, 9/27/2047 | | | 221,000 | | | | 232,326 | |
| | | | | | | | |
| | |
| | | | | | | 2,518,402 | |
| | | | | | | | |
|
Sri Lanka — 3.8% | |
| | |
Republic of Sri Lanka | | | | | | | | |
| | |
5.75%, 4/18/2023 (a) | | | 450,000 | | | | 446,063 | |
| | |
6.85%, 11/3/2025 (a) | | | 871,000 | | | | 871,272 | |
| | |
6.20%, 5/11/2027 (a) | | | 605,000 | | | | 566,998 | |
| | |
6.75%, 4/18/2028 (a) | | | 621,000 | | | | 593,055 | |
| | | | | | | | |
| | |
| | | | | | | 2,477,388 | |
| | | | | | | | |
|
Trinidad and Tobago — 0.3% | |
| | |
Republic of Trinidad & Tobago 4.50%, 8/4/2026 (a) | | | 200,000 | | | | 205,500 | |
| | | | | | | | |
|
Turkey — 6.4% | |
| | |
Hazine Mustesarligi Varlik Kiralama A/S | | | | | | | | |
| | |
5.00%, 4/6/2023 (a) | | | 200,000 | | | | 196,750 | |
SEE NOTES TO FINANCIAL STATEMENTS.
| | | | | | | | |
| | | |
| AUGUST 31, 2019 | | J.P. MORGAN EXCHANGE-TRADED FUNDS | | | | | 169 | |
JPMorgan USD Emerging Markets Sovereign Bond ETF
SCHEDULE OF PORTFOLIO INVESTMENTS
AS OF AUGUST 31, 2019 (Unaudited) (continued)
| | | | | | | | |
| INVESTMENTS | | PRINCIPAL
AMOUNT ($) | | | VALUE ($) | |
Foreign Government Securities — continued | |
|
Turkey — continued | |
| | |
4.49%, 11/25/2024 (a) | | | 203,000 | | | | 190,181 | |
| | |
Republic of Turkey | | | | | | | | |
| | |
6.25%, 9/26/2022 | | | 681,000 | | | | 687,810 | |
| | |
5.75%, 3/22/2024 | | | 275,000 | | | | 268,125 | |
| | |
7.38%, 2/5/2025 | | | 119,000 | | | | 123,016 | |
| | |
4.25%, 4/14/2026 | | | 220,000 | | | | 192,294 | |
| | |
6.00%, 3/25/2027 | | | 651,000 | | | | 619,874 | |
| | |
6.13%, 10/24/2028 | | | 290,000 | | | | 274,231 | |
| | |
11.88%, 1/15/2030 | | | 100,000 | | | | 133,500 | |
| | |
8.00%, 2/14/2034 | | | 200,000 | | | | 212,687 | |
| | |
6.88%, 3/17/2036 | | | 225,000 | | | | 215,508 | |
| | |
6.75%, 5/30/2040 | | | 315,000 | | | | 294,033 | |
| | |
4.88%, 4/16/2043 | | | 250,000 | | | | 191,563 | |
| | |
6.63%, 2/17/2045 | | | 455,000 | | | | 412,059 | |
| | |
5.75%, 5/11/2047 | | | 240,000 | | | | 196,650 | |
| | | | | | | | |
| | |
| | | | | | | 4,208,281 | |
| | | | | | | | |
|
Ukraine — 4.7% | |
| | |
Republic of Ukraine | | | | | | | | |
| | |
7.75%, 9/1/2021 (a) | | | 110,000 | | | | 114,620 | |
| | |
7.75%, 9/1/2022 (a) | | | 375,000 | | | | 396,938 | |
| | |
7.75%, 9/1/2023 (a) | | | 217,000 | | | | 230,671 | |
| | |
7.75%, 9/1/2024 (a) | | | 110,000 | | | | 117,700 | |
| | |
7.75%, 9/1/2025 (a) | | | 100,000 | | | | 106,250 | |
| | |
7.75%, 9/1/2026 (a) | | | 782,000 | | | | 828,920 | |
| | |
7.75%, 9/1/2027 (a) | | | 420,000 | | | | 444,675 | |
| | |
7.38%, 9/25/2032 (a) | | | 850,000 | | | | 874,225 | |
| | | | | | | | |
| | |
| | | | | | | 3,113,999 | |
| | | | | | | | |
|
United Arab Emirates — 0.5% | |
| | |
Abu Dhabi Government Bond 3.13%, 10/11/2027 (b) | | | 300,000 | | | | 325,125 | |
| | | | | | | | |
|
Uruguay — 2.0% | |
| | |
Republic of Uruguay | | | | | | | | |
| | |
4.50%, 8/14/2024 | | | 80,000 | | | | 86,925 | |
| | |
4.38%, 10/27/2027 | | | 282,000 | | | | 313,196 | |
| | |
7.63%, 3/21/2036 | | | 140,000 | | | | 212,188 | |
| | |
5.10%, 6/18/2050 | | | 450,000 | | | | 559,828 | |
| | |
4.98%, 4/20/2055 | | | 100,000 | | | | 123,156 | |
| | | | | | | | |
| | |
| | | | | | | 1,295,293 | |
| | | | | | | | |
|
Vietnam — 0.3% | |
| | |
Republic of Vietnam 4.80%, 11/19/2024 (a) | | | 200,000 | | | | 217,007 | |
| | | | | | | | |
| | |
Total Foreign Government Securities
(Cost $54,030,880) | | | | | | | 56,308,354 | |
| | | | | | | | |
| | | | | | | | |
| INVESTMENTS | | PRINCIPAL
AMOUNT ($) | | | VALUE ($) | |
| | | | | | | | |
Corporate Bonds — 13.2% | |
|
Azerbaijan — 1.3% | |
| | |
Southern Gas Corridor CJSC 6.88%, 3/24/2026 (a) | | | 401,000 | | | | 473,681 | |
| | |
State Oil Co. of the Azerbaijan Republic | | | | | | | | |
| | |
4.75%, 3/13/2023 (b) | | | 350,000 | | | | 366,735 | |
| | | | | | | | |
| | |
| | | | | | | 840,416 | |
| | | | | | | | |
|
Brazil — 0.5% | |
| | |
Banco Nacional de Desenvolvimento Economico e Social 5.75%, 9/26/2023 (a) | | | 280,000 | | | | 306,600 | |
| | | | | | | | |
|
Chile — 0.9% | |
| | |
Corp. Nacional del Cobre de Chile | | | | | | | | |
| | |
3.63%, 8/1/2027 (a) | | | 372,000 | | | | 398,389 | |
| | |
4.50%, 8/1/2047 (a) | | | 201,000 | | | | 236,112 | |
| | | | | | | | |
| | |
| | | | | | | 634,501 | |
| | | | | | | | |
|
China — 2.0% | |
| | |
CNAC HK Finbridge Co. Ltd. 3.50%, 7/19/2022 (b) | | | 200,000 | | | | 202,625 | |
| | |
CNOOC Curtis Funding No. 1 Pty. Ltd. 4.50%, 10/3/2023 (a) | | | 200,000 | | | | 215,750 | |
| | |
Sinopec Group Overseas Development Ltd. 3.63%, 4/12/2027 (a) | | | 400,000 | | | | 425,853 | |
| | |
State Grid Overseas Investment Ltd. | | | | | | | | |
| | |
3.13%, 5/22/2023 (a) | | | 200,000 | | | | 205,938 | |
| | |
3.50%, 5/4/2027 (a) | | | 250,000 | | | | 267,163 | |
| | | | | | | | |
| | |
| | | | | | | 1,317,329 | |
| | | | | | | | |
|
Indonesia — 1.1% | |
| | |
Indonesia Asahan Aluminium Persero PT 6.53%, 11/15/2028 (a) | | | 225,000 | | | | 278,719 | |
| | |
Pertamina Persero PT 4.30%,
5/20/2023 (a) | | | 220,000 | | | | 231,756 | |
| | |
Perusahaan Listrik Negara PT 5.25%, 10/24/2042 (a) | | | 200,000 | | | | 231,625 | |
| | | | | | | | |
| | |
| | | | | | | 742,100 | |
| | | | | | | | |
|
Kazakhstan — 1.7% | |
| | |
Kazakhstan Temir Zholy Finance BV 6.95%, 7/10/2042 (a) | | | 200,000 | | | | 273,062 | |
| | |
KazMunayGas National Co. JSC | | | | | | | | |
| | |
5.38%, 4/24/2030 (a) | | | 520,000 | | | | 602,550 | |
| | |
6.38%, 10/24/2048 (a) | | | 200,000 | | | | 252,563 | |
| | | | | | | | |
| | |
| | | | | | | 1,128,175 | |
| | | | | | | | |
|
Malaysia — 1.1% | |
| | |
Petronas Capital Ltd. | | | | | | | | |
| | |
7.88%, 5/22/2022 (a) | | | 180,000 | | | | 206,325 | |
SEE NOTES TO FINANCIAL STATEMENTS.
| | | | | | |
| | | |
| 170 | | | | J.P. MORGAN EXCHANGE-TRADED FUNDS | | AUGUST 31, 2019 |
| | | | | | | | |
| INVESTMENTS | | PRINCIPAL
AMOUNT ($) | | | VALUE ($) | |
Corporate Bonds — continued | |
|
Malaysia — continued | |
| | |
3.50%, 3/18/2025 (a) | | | 250,000 | | | | 265,781 | |
| | |
4.50%, 3/18/2045 (a) | | | 231,000 | | | | 295,536 | |
| | | | | | | | |
| | |
| | | | | | | 767,642 | |
| | | | | | | | |
|
Mexico — 2.0% | |
| | |
Comision Federal de Electricidad 4.75%, 2/23/2027 (a) | | | 100,000 | | | | 104,156 | |
| | |
Petroleos Mexicanos 4.88%, 1/24/2022 | | | 60,000 | | | | 60,975 | |
| | |
(ICE LIBOR USD 3 Month + 3.65%), 6.10%, 3/11/2022 (e) | | | 100,000 | | | | 100,865 | |
| | |
5.38%, 3/13/2022 | | | 150,000 | | | | 153,375 | |
| | |
4.63%, 9/21/2023 | | | 70,000 | | | | 70,164 | |
| | |
4.25%, 1/15/2025 | | | 75,000 | | | | 71,659 | |
| | |
5.50%, 6/27/2044 | | | 163,000 | | | | 139,153 | |
| | |
5.63%, 1/23/2046 | | | 767,000 | | | | 657,848 | |
| | | | | | | | |
| | |
| | | | | | | 1,358,195 | |
| | | | | | | | |
|
Oman — 0.3% | |
| | |
Lamar Funding Ltd. 3.96%, 5/7/2025 (a) | | | 200,000 | | | | 184,437 | |
| | | | | | | | |
|
Peru — 0.4% | |
| | |
Petroleos del Peru SA 5.63%, 6/19/2047 (a) | | | 200,000 | | | | 243,860 | |
| | | | | | | | |
|
Philippines — 0.2% | |
| | |
Power Sector Assets & Liabilities Management Corp. 7.39%,
12/2/2024 (a) | | | 100,000 | | | | 125,094 | |
| | | | | | | | |
|
Russia — 0.2% | |
| | |
Vnesheconombank Via VEB Finance plc 6.80%, 11/22/2025 (a) | | | 125,000 | | | | 143,438 | |
| | | | | | | | |
|
South Africa — 1.2% | |
| | |
Eskom Holdings SOC Ltd. | | | | | | | | |
| | |
6.75%, 8/6/2023 (a) | | | 260,000 | | | | 265,850 | |
| | |
7.13%, 2/11/2025 (a) | | | 294,000 | | | | 302,085 | |
| | |
Transnet SOC Ltd. 4.00%, 7/26/2022 (a) | | | 200,000 | | | | 201,250 | |
| | | | | | | | |
| | |
| | | | | | | 769,185 | |
| | | | | | | | |
|
Tunisia — 0.3% | |
| | |
Banque Centrale de Tunisie International Bond 5.75%, 1/30/2025 (a) | | | 200,000 | | | | 183,000 | |
| | | | | | | | |
| | |
Total Corporate Bonds
(Cost $8,302,704) | | | | | | | 8,743,972 | |
| | | | | | | | |
| | | | | | | | |
| | |
| INVESTMENTS | | SHARES | | | VALUE ($) | |
Short-term Investments — 0.4% | | | | | | | | |
| | |
Investment Companies — 0.4% | | | | | | | | |
| | |
JPMorgan U.S. Government Money Market Fund Class Institutional Shares, 1.99% (f) (g)
(Cost $256,588) | | | 256,588 | | | | 256,588 | |
| | | | | | | | |
Investment of Cash Collateral from Securities Loaned — 1.0% | |
| | |
JPMorgan U.S. Government Money Market Fund Class IM Shares, 2.05% (f) (g)
(Cost $676,237) | | | 676,237 | | | | 676,237 | |
| | | | | | | | |
Total Investments — 99.8%
(Cost $63,266,409) | | | | | | | 65,985,151 | |
Other Assets Less Liabilities — 0.2% | | | | | | | 119,688 | |
| | | | | | | | |
NET ASSETS — 100.0% | | | | | | | 66,104,839 | |
| | | | | | | | |
Percentages indicated are based on net assets.
Abbreviations
| | |
CJSC | | Closed Joint Stock Company |
ICE | | Intercontinental Exchange |
JSC | | Joint Stock Company |
LIBOR | | London Interbank Offered Rate |
PT | | Limited liability company |
USD | | United States Dollar |
| |
| (a) | | Securities exempt from registration under Rule 144A or section 4(a)(2), of the Securities Act of 1933, as amended. |
| (b) | | Security exempt from registration pursuant to Regulation S under the Securities Act of 1933, as amended. Regulation S applies to securities offerings that are made outside of the United States and do not involve direct selling efforts in the United States and as such may have restrictions on resale. |
| (c) | | The security or a portion of this security is on loan at August 31, 2019. The total value of securities on loan at August 31, 2019 is $656,831. |
| (d) | | Step bond. Interest rate is a fixed rate for an initial period that either resets at a specific date or may reset in the future contingent upon a predetermined trigger. The interest rate shown is the current rate as of August 31, 2019. |
| (e) | | Variable or floating rate security, linked to the referenced benchmark. The interest rate shown is the current rate as of August 31, 2019. |
| (f) | | Investment in an affiliated fund, which is registered under the Investment Company Act of 1940, as amended, and is advised by J.P. Morgan Investment Management Inc. |
| (g) | | The rate shown is the current yield as of August 31, 2019. |
SEE NOTES TO FINANCIAL STATEMENTS.
| | | | | | | | |
| | | |
| AUGUST 31, 2019 | | J.P. MORGAN EXCHANGE-TRADED FUNDS | | | | | 171 | |
STATEMENTS OF ASSETS AND LIABILITIES
AS OF AUGUST 31, 2019 (Unaudited)
| | | | | | | | | | | | |
| | | |
| | | JPMorgan
BetaBuilders 1-5
Year U.S.
Aggregate
Bond ETF | | | JPMorgan
Core Plus
Bond ETF | | | JPMorgan
Corporate Bond
Research
Enhanced ETF | |
ASSETS: | | | | | | | | | | | | |
Investments innon-affiliates, at value | | $ | 31,759,993 | | | $ | 30,572,787 | | | $ | 28,911,109 | |
Investments in affiliates, at value | | | 184,514 | | | | 1,751,366 | | | | 298,084 | |
Restricted cash | | | — | | | | 100 | | | | — | |
Cash | | | 15,592 | | | | — | | | | — | |
Deposits at broker for futures contracts | | | — | | | | 65,000 | | | | 26,000 | |
Deferred offering costs (See Note 2.I.) | | | — | | | | 4,410 | | | | 4,411 | |
Prepaid expenses | | | — | | | | 229 | | | | 178 | |
Receivables: | | | | | | | | | | | | |
Investment securities sold | | | 744,544 | | | | 1,475 | | | | — | |
Investment securities sold — delayed delivery securities | | | 12,192 | | | | — | | | | — | |
Interest fromnon-affiliates | | | 196,567 | | | | 148,811 | | | | 263,612 | |
Dividends from affiliates | | | 160 | | | | 4,368 | | | | 315 | |
Variation margin on futures contracts | | | — | | | | 6,437 | | | | — | |
Due from Adviser | | | 10 | | | | — | | | | 19,054 | |
| | | | | | | | | | | | |
Total Assets | | | 32,913,572 | | | | 32,554,983 | | | | 29,522,763 | |
| | | | | | | | | | | | |
LIABILITIES: | | | | | | | | | | | | |
Payables: | | | | | | | | | | | | |
Due to custodian | | | — | | | | 2,260 | | | | — | |
Distributions | | | 64,888 | | | | 73,044 | | | | 86,762 | |
Investment securities purchased | | | 811,081 | | | | 10,363 | | | | 12,146 | |
Investment securities purchased — delayed delivery securities | | | 46,179 | | | | 288,078 | | | | — | |
Variation margin on futures contracts | | | — | | | | — | | | | 1,184 | |
Accrued liabilities: | | | | | | | | | | | | |
Investment advisory fees | | | — | | | | 27,573 | | | | — | |
Management fees (See Note 3.A.) | | | 1,336 | | | | — | | | | — | |
Administration fees | | | — | | | | 2,030 | | | | 1,854 | |
Custodian, Accounting and Transfer Agent fees | | | — | | | | 5,132 | | | | 5,462 | |
Trustees’ and Chief Compliance Officer’s fees | | | — | | | | 106 | | | | 190 | |
Professional fees | | | — | | | | 57,421 | | | | 56,152 | |
Other | | | — | | | | 10,726 | | | | 14,090 | |
| | | | | | | | | | | | |
Total Liabilities | | | 923,484 | | | | 476,733 | | | | 177,840 | |
| | | | | | | | | | | | |
Net Assets | | $ | 31,990,088 | | | $ | 32,078,250 | | | $ | 29,344,923 | |
| | | | | | | | | | | | |
| | | |
NET ASSETS: | | | | | | | | | | | | |
Paid-in-Capital | | $ | 31,338,122 | | | $ | 30,304,831 | | | $ | 26,362,338 | |
Total distributable earnings (loss) | | | 651,966 | | | | 1,773,419 | | | | 2,982,585 | |
| | | | | | | | | | | | |
Total Net Assets | | $ | 31,990,088 | | | $ | 32,078,250 | | | $ | 29,344,923 | |
| | | | | | | | | | | | |
| | | |
Outstanding number of shares
(unlimited number of shares authorized — par value $0.0001) | | | 1,250,000 | | | | 600,000 | | | | 525,000 | |
| | | | | | | | | | | | |
Net asset value, per share | | $ | 25.59 | | | $ | 53.46 | | | $ | 55.90 | |
| | | | | | | | | | | | |
| | | |
Cost of investments innon-affiliates | | $ | 31,135,559 | | | $ | 29,104,604 | | | $ | 26,278,841 | |
Cost of investments in affiliates | | | 184,514 | | | | 1,751,366 | | | | 298,084 | |
SEE NOTES TO FINANCIAL STATEMENTS.
| | | | | | |
| | | |
| 172 | | | | J.P. MORGAN EXCHANGE-TRADED FUNDS | | AUGUST 31, 2019 |
| | | | | | | | | | | | |
| | | |
| | | JPMorgan
Global Bond
Opportunities
ETF | | | JPMorgan
High Yield
Research
Enhanced ETF
(formerly known
as JPMorgan
Disciplined High
Yield ETF) | | | JPMorgan
Municipal ETF | |
ASSETS: | | | | | | | | | | | | |
Investments innon-affiliates, at value | | $ | 182,896,505 | | | $ | 159,358,166 | | | $ | 34,835,325 | |
Investments in affiliates, at value | | | 5,760,227 | | | | 3,167,845 | | | | 933,602 | |
Investments of cash collateral received from securities loaned, at value (See Note 2.F.) | | | — | | | | 2,057,978 | | | | — | |
Restricted cash | | | — | | | | — | | | | 400 | |
Cash | | | 27,413 | | | | — | | | | — | |
Foreign currency, at value | | | 2,152,201 | | | | — | | | | — | |
Deposits at broker for futures contracts | | | 1,024,000 | | | | — | | | | — | |
Deposits at broker for centrally cleared swaps | | | 372,000 | | | | — | | | | — | |
Due from custodian | | | 5,548,399 | | | | — | | | | — | |
Deferred offering costs (See Note 2.I.) | | | — | | | | — | | | | 2,670 | |
Prepaid expenses | | | — | | | | — | | | | 117 | |
Receivables: | | | | | | | | | | | | |
Investment securities sold | | | 258,533 | | | | — | | | | — | |
Interest fromnon-affiliates | | | 2,029,638 | | | | 2,369,672 | | | | 333,337 | |
Dividends from affiliates | | | 10,831 | | | | 5,692 | | | | 2,849 | |
Tax reclaims | | | 44,850 | | | | — | | | | — | |
Securities lending income (See Note 2.F.) | | | — | | | | 1,928 | | | | — | |
Variation margin on futures contracts | | | 376,005 | | | | — | | | | — | |
Unrealized appreciation on forward foreign currency exchange contracts | | | 1,585,903 | | | | — | | | | — | |
Outstanding OTC swap contracts, at value (net upfront payments of $333,606, $0 and $0, respectively) | | | 285,349 | | | | — | | | | — | |
Due from Adviser | | | — | | | | — | | | | 40,433 | |
| | | | | | | | | | | | |
Total Assets | | | 202,371,854 | | | | 166,961,281 | | | | 36,148,733 | |
| | | | | | | | | | | | |
| | | |
LIABILITIES: | | | | | | | | | | | | |
Payables: | | | | | | | | | | | | |
Distributions | | | 551,722 | | | | 670,592 | | | | 67,152 | |
Investment securities purchased | | | 6,562,430 | | | | — | | | | 497,441 | |
Collateral received on securities loaned (See Note 2.F.) | | | — | | | | 2,057,978 | | | | — | |
Unrealized depreciation on forward foreign currency exchange contracts | | | 520,726 | | | | — | | | | — | |
Outstanding OTC swap contracts, at value (net upfront receipts of $12,064, $0 and $0, respectively) | | | 12,793 | | | | — | | | | — | |
Variation margin on centrally cleared swaps (net upfront receipts of $1,017,444, $0 and $0, respectively) | | | 53,119 | | | | — | | | | — | |
Accrued liabilities: | | | | | | | | | | | | |
Investment advisory fees | | | 51,674 | | | | 23,612 | | | | — | |
Administration fees | | | 12,342 | | | | 10,389 | | | | 2,259 | |
Custodian, Accounting and Transfer Agent fees | | | 2,486 | | | | 5,237 | | | | 11,352 | |
Collateral management fees | | | 3,105 | | | | — | | | | — | |
Trustees’ and Chief Compliance Officer’s fees | | | 2,122 | | | | 1,806 | | | | 310 | |
Deferred foreign capital gains tax | | | 10,030 | | | | — | | | | — | |
Professional fees | | | 82,004 | | | | 67,056 | | | | 28,033 | |
Other | | | 31,365 | | | | 17,135 | | | | 11,103 | |
| | | | | | | | | | | | |
Total Liabilities | | | 7,895,918 | | | | 2,853,805 | | | | 617,650 | |
| | | | | | | | | | | | |
Net Assets | | $ | 194,475,936 | | | $ | 164,107,476 | | | $ | 35,531,083 | |
| | | | | | | | | | | | |
| | | |
NET ASSETS: | | | | | | | | | | | | |
Paid-in-Capital | | $ | 192,694,372 | | | $ | 161,976,815 | | | $ | 32,816,606 | |
Total distributable earnings (loss) | | | 1,781,564 | | | | 2,130,661 | | | | 2,714,477 | |
| | | | | | | | | | | | |
Total Net Assets | | $ | 194,475,936 | | | $ | 164,107,476 | | | $ | 35,531,083 | |
| | | | | | | | | | | | |
| | | |
Outstanding number of shares
(unlimited number of shares authorized — par value $0.0001) | | | 3,800,000 | | | | 3,200,000 | | | | 650,000 | |
| | | | | | | | | | | | |
Net asset value, per share | | $ | 51.18 | | | $ | 51.28 | | | $ | 54.66 | |
| | | | | | | | | | | | |
| | | |
Cost of investments innon-affiliates | | $ | 179,842,111 | | | $ | 155,728,695 | | | $ | 32,630,239 | |
Cost of investments in affiliates | | | 5,760,227 | | | | 3,167,845 | | | | 933,510 | |
Cost of foreign currency | | | 2,380,292 | | | | — | | | | — | |
Investment securities on loan, at value (See Note 2.F.) | | | — | | | | 1,987,184 | | | | — | |
Cost of investment of cash collateral (See Note 2.F.) | | | — | | | | 2,057,978 | | | | — | |
SEE NOTES TO FINANCIAL STATEMENTS.
| | | | | | | | |
| | | |
| AUGUST 31, 2019 | | J.P. MORGAN EXCHANGE-TRADED FUNDS | | | | | 173 | |
STATEMENTS OF ASSETS AND LIABILITIES
AS OF AUGUST 31, 2019 (Unaudited) (continued)
| | | | | | | | | | | | | | | | |
| | | | |
| | | JPMorgan
U.S. Aggregate
Bond ETF | | | JPMorgan
Ultra-Short
Income ETF | | | JPMorgan
Ultra-Short
Municipal
Income ETF | | | JPMorgan USD
Emerging Markets
Sovereign Bond ETF | |
ASSETS: | | | | | | | | | | | | | | | | |
Investments innon-affiliates, at value | | $ | 188,699,831 | | | $ | 7,847,581,541 | | | $ | 121,966,367 | | | $ | 65,052,326 | |
Investments in affiliates, at value | | | 503,250 | | | | 343,725,884 | | | | 1,682,541 | | | | 256,588 | |
Investments of cash collateral received from securities loaned, at value (See Note 2.F.) | | | — | | | | 7,021,090 | | | | — | | | | 676,237 | |
Repurchase agreements, at value | | | — | | | | 161,000,000 | | | | — | | | | — | |
Restricted cash | | | 800 | | | | 2,850 | | | | 1,000 | | | | — | |
Cash | | | — | | | | 16,762 | | | | — | | | | — | |
Deferred offering costs (See Note 2.I.) | | | 6,498 | | | | — | | | | 2,333 | | | | — | |
Prepaid expenses | | | 2,066 | | | | 44,400 | | | | 567 | | | | — | |
Receivables: | | | | | | | | | | | | | | | | |
Investment securities sold | | | 3,231,388 | | | | — | | | | — | | | | 2,045,143 | |
Investment securities sold — delayed delivery securities | | | 1,360,585 | | | | — | | | | — | | | | — | |
Interest fromnon-affiliates | | | 1,210,622 | | | | 44,337,085 | | | | 1,055,883 | | | | 950,947 | |
Dividends from affiliates | | | 1,038 | | | | 493,960 | | | | 1,790 | | | | 326 | |
Securities lending income (See Note 2.F.) | | | — | | | | 904 | | | | — | | | | 130 | |
Due from Adviser | | | 40,535 | | | | — | | | | 43,642 | | | | 1,129 | |
| | | | | | | | | | | | | | | | |
Total Assets | | | 195,056,613 | | | | 8,404,224,476 | | | | 124,754,123 | | | | 68,982,826 | |
| | | | | | | | | | | | | | | | |
| | | | |
LIABILITIES: | | | | | | | | | | | | | | | | |
Payables: | | | | | | | | | | | | | | | | |
Due to custodian | | | 58,344 | | | | — | | | | — | | | | — | |
Distributions | | | 412,214 | | | | 17,992,812 | | | | 165,473 | | | | 256,646 | |
Investment securities purchased | | | 3,637,714 | | | | 745,559 | | | | 651,287 | | | | 1,840,030 | |
Investment securities purchased — delayed delivery securities | | | 1,001,439 | | | | — | | | | 212,620 | | | | — | |
Collateral received on securities loaned (See Note 2.F.) | | | — | | | | 7,021,090 | | | | — | | | | 676,237 | |
Accrued liabilities: | | | | | | | | | | | | | | | | |
Investment advisory fees | | | — | | | | 399,406 | | | | — | | | | — | |
Administration fees | | | 11,616 | | | | 516,039 | | | | 7,740 | | | | 4,170 | |
Custodian, Accounting and Transfer Agent fees | | | 9,040 | | | | 16,125 | | | | 11,319 | | | | — | |
Trustees’ and Chief Compliance Officer’s fees | | | — | | | | 12,801 | | | | 213 | | | | 741 | |
Professional fees | | | 52,377 | | | | 32,505 | | | | 28,674 | | | | 71,001 | |
Other | | | 14,960 | | | | 136,509 | | | | 7,597 | | | | 29,162 | |
| | | | | | | | | | | | | | | | |
Total Liabilities | | | 5,197,704 | | | | 26,872,846 | | | | 1,084,923 | | | | 2,877,987 | |
| | | | | | | | | | | | | | | | |
Net Assets | | $ | 189,858,909 | | | $ | 8,377,351,630 | | | $ | 123,669,200 | | | $ | 66,104,839 | |
| | | | | | | | | | | | | | | | |
| | | | |
NET ASSETS: | | | | | | | | | | | | | | | | |
Paid-in-Capital | | $ | 179,966,906 | | | $ | 8,349,782,204 | | | $ | 123,187,776 | | | $ | 64,284,140 | |
Total distributable earnings (loss) | | | 9,892,003 | | | | 27,569,426 | | | | 481,424 | | | | 1,820,699 | |
| | | | | | | | | | | | | | | | |
Total Net Assets | | $ | 189,858,909 | | | $ | 8,377,351,630 | | | $ | 123,669,200 | | | $ | 66,104,839 | |
| | | | | | | | | | | | | | | | |
Outstanding number of shares (unlimited number of shares authorized — par value $0.0001) | | | 7,050,000 | | | | 166,200,000 | | | | 2,450,000 | | | | 1,300,000 | |
| | | | | | | | | | | | | | | | |
Net asset value, per share | | $ | 26.93 | | | $ | 50.41 | | | $ | 50.48 | | | $ | 50.85 | |
| | | | | | | | | | | | | | | | |
| | | | |
Cost of investments innon-affiliates | | $ | 179,630,831 | | | $ | 7,821,949,134 | | | $ | 121,483,383 | | | $ | 62,333,584 | |
Cost of investments in affiliates | | | 503,250 | | | | 343,725,884 | | | | 1,682,531 | | | | 256,588 | |
Cost of repurchase agreements | | | — | | | | 161,000,000 | | | | — | | | | — | |
Investment securities on loan, at value (See Note 2.F.) | | | — | | | | 6,807,353 | | | | — | | | | 656,831 | |
Cost of investment of cash collateral (See Note 2.F.) | | | — | | | | 7,021,090 | | | | — | | | | 676,237 | |
SEE NOTES TO FINANCIAL STATEMENTS.
| | | | | | |
| | | |
| 174 | | | | J.P. MORGAN EXCHANGE-TRADED FUNDS | | AUGUST 31, 2019 |
STATEMENTS OF OPERATIONS
FOR THE SIX MONTHS ENDED AUGUST 31, 2019 (Unaudited)
| | | | | | | | | | | | |
| | | |
| | | JPMorgan
BetaBuilders 1-5
Year U.S.
Aggregate
Bond ETF(a) | | | JPMorgan
Core Plus
Bond ETF | | | JPMorgan
Corporate Bond
Research
Enhanced ETF | |
INVESTMENT INCOME: | | | | | | | | | | | | |
Interest income fromnon-affiliates | | $ | 342,260 | | | $ | 422,855 | | | $ | 538,266 | |
Interest income from affiliates | | | 6 | | | | 684 | | | | — | |
Dividend income from affiliates | | | 723 | | | | 30,099 | | | | 2,495 | |
Income from securities lending (net) (See Note 2.F.) | | | — | | | | 145 | | | | — | |
| | | | | | | | | | | | |
Total investment income | | | 342,989 | | | | 453,783 | | | | 540,761 | |
| | | | | | | | | | | | |
| | | |
EXPENSES: | | | | | | | | | | | | |
Investment advisory fees (See Note 3.A.) | | | — | | | | 41,396 | | | | 19,544 | |
Management fees (See Note 3.A.) | | | 6,713 | | | | — | | | | — | |
Administration fees (See Note 3.B.) | | | — | | | | 10,349 | | | | 10,470 | |
Interest expense tonon-affiliates | | | — | | | | 2 | | | | — | |
Interest expense to affiliates | | | — | | | | 2 | | | | 12 | |
Professional fees | | | — | | | | 51,970 | | | | 42,732 | |
Trustees’ and Chief Compliance Officer’s fees | | | — | | | | 274 | | | | 449 | |
Printing and mailing costs | | | — | | | | 261 | | | | 970 | |
Registration and filing fees | | | — | | | | 9,477 | | | | 11,680 | |
Custodian, Accounting and Transfer Agent fees (See Note 3.C.) | | | — | | | | 11,712 | | | | 19,983 | |
Insurance expense | | | — | | | | 97 | | | | 116 | |
Offering costs (See Note 2.I.) | | | — | | | | 5,411 | | | | 7,888 | |
Other | | | — | | | | 1,204 | | | | 1,202 | |
| | | | | | | | | | | | |
Total expenses | | | 6,713 | | | | 132,155 | | | | 115,046 | |
| | | | | | | | | | | | |
Less fee waived (See Note 3.E.) | | | (44 | ) | | | (51,745 | ) | | | (30,014 | ) |
Less expense reimbursements from affiliates (See Note 3.E.) | | | — | | | | (27,710 | ) | | | (65,440 | ) |
Less expense reimbursements fromnon-affiliates (See Note 3.C.) | | | — | | | | (100 | ) | | | (300 | ) |
| | | | | | | | | | | | |
Net expenses | | | 6,669 | | | | 52,600 | | | | 19,292 | |
| | | | | | | | | | | | |
Net investment income (loss) | | | 336,320 | | | | 401,183 | | | | 521,469 | |
| | | | | | | | | | | | |
| | | |
REALIZED/UNREALIZED GAINS (LOSSES): | | | | | | | | | | | | |
Net realized gain (loss) on transactions from: | | | | | | | | | | | | |
Investments innon-affiliates | | | 28,042 | | | | 107,211 | | | | 385,964 | |
Futures contracts | | | — | | | | 179,376 | | | | (70,151 | ) |
| | | | | | | | | | | | |
Net realized gain (loss) | | | 28,042 | | | | 286,587 | | | | 315,813 | |
| | | | | | | | | | | | |
Change in net unrealized appreciation/depreciation on: | | | | | | | | | | | | |
Investments innon-affiliates | | | 624,434 | | | | 1,372,046 | | | | 2,122,698 | |
Futures contracts | | | — | | | | 13,684 | | | | (1,108 | ) |
| | | | | | | | | | | | |
Change in net unrealized appreciation/depreciation | | | 624,434 | | | | 1,385,730 | | | | 2,121,590 | |
| | | | | | | | | | | | |
Net realized/unrealized gains (losses) | | | 652,476 | | | | 1,672,317 | | | | 2,437,403 | |
| | | | | | | | | | | | |
Change in net assets resulting from operations | | $ | 988,796 | | | $ | 2,073,500 | | | $ | 2,958,872 | |
| | | | | | | | | | | | |
| (a) | Commencement of operations was March 12, 2019. |
SEE NOTES TO FINANCIAL STATEMENTS.
| | | | | | | | |
| | | |
| AUGUST 31, 2019 | | J.P. MORGAN EXCHANGE-TRADED FUNDS | | | | | 175 | |
STATEMENTS OF OPERATIONS
FOR THE SIX MONTHS ENDED AUGUST 31, 2019 (Unaudited) (continued)
| | | | | | | | | | | | |
| | | |
| | | JPMorgan
Global Bond
Opportunities
ETF | | | JPMorgan
High Yield
Research
Enhanced ETF
(formerly known
as JPMorgan
Disciplined High
Yield ETF) | | | JPMorgan
Municipal ETF | |
INVESTMENT INCOME: | | | | | | | | | | | | |
Interest income fromnon-affiliates | | $ | 3,667,598 | | | $ | 4,219,174 | | | $ | 427,573 | |
Interest income from affiliates | | | 96 | | | | 2 | | | | — | |
Dividend income from affiliates | | | 57,742 | | | | 24,472 | | | | 10,934 | |
Income from securities lending (net) (See Note 2.F.) | | | — | | | | 19,898 | | | | — | |
Foreign taxes withheld | | | 31,825 | | | | — | | | | — | |
| | | | | | | | | | | | |
Total investment income | | | 3,757,261 | | | | 4,263,546 | | | | 438,507 | |
| | | | | | | | | | | | |
| | | |
EXPENSES: | | | | | | | | | | | | |
Investment advisory fees (See Note 3.A.) | | | 517,090 | | | | 242,222 | | | | 39,927 | |
Administration fees (See Note 3.B.) | | | 70,512 | | | | 60,556 | | | | 12,477 | |
Collateral management fees | | | 6,392 | | | | — | | | | — | |
Interest expense to affiliates | | | 1,878 | | | | — | | | | 552 | |
Professional fees | | | 58,981 | | | | 58,435 | | | | 23,398 | |
Trustees’ and Chief Compliance Officer’s fees | | | 2,769 | | | | 2,286 | | | | 476 | |
Printing and mailing costs | | | 2,725 | | | | 8,297 | | | | 506 | |
Registration and filing fees | | | 5,740 | | | | 6,035 | | | | 6,462 | |
Custodian, Accounting and Transfer Agent fees (See Note 3.C.) | | | 43,660 | | | | 25,183 | | | | 59,717 | |
Insurance expense | | | 5,093 | | | | 3,778 | | | | 159 | |
Offering costs (See Note 2.I.) | | | — | | | | — | | | | 8,277 | |
Other | | | 4,050 | | | | 4,095 | | | | 1,191 | |
| | | | | | | | | | | | |
Total expenses | | | 718,890 | | | | 410,887 | | | | 153,142 | |
| | | | | | | | | | | | |
Less fee waived (See Note 3.E.) | | | (206,753 | ) | | | (90,652 | ) | | | (52,404 | ) |
Less expense reimbursements from affiliates (See Note 3.E.) | | | — | | | | — | | | | (59,460 | ) |
Less expense reimbursements fromnon-affiliates (See Note 3.C.) | | | (1,100 | ) | | | (200 | ) | | | (1,800 | ) |
| | | | | | | | | | | | |
Net expenses | | | 511,037 | | | | 320,035 | | | | 39,478 | |
| | | | | | | | | | | | |
Net investment income (loss) | | | 3,246,224 | | | | 3,943,511 | | | | 399,029 | |
| | | | | | | | | | | | |
| | | |
REALIZED/UNREALIZED GAINS (LOSSES): | | | | | | | | | | | | |
Net realized gain (loss) on transactions from: | | | | | | | | | | | | |
Investments innon-affiliates | | | 1,185,953 | (a) | | | (254,834 | ) | | | 407,634 | |
Investments in affiliates | | | — | | | | — | | | | 700 | |
Futures contracts | | | (460,374 | ) | | | — | | | | — | |
Foreign currency transactions | | | (24,801 | ) | | | — | | | | — | |
Forward foreign currency exchange contracts | | | 2,176,844 | | | | — | | | | — | |
Swaps | | | (69,108 | ) | | | — | | | | — | |
| | | | | | | | | | | | |
Net realized gain (loss) | | | 2,808,514 | | | | (254,834 | ) | | | 408,334 | |
| | | | | | | | | | | | |
Change in net unrealized appreciation/depreciation on: | | | | | | | | | | | | |
Investments innon-affiliates | | | 5,250,984 | (b) | | | 4,802,656 | | | | 1,295,825 | |
Investments in affiliates | | | — | | | | — | | | | 92 | |
Futures contracts | | | (374,115 | ) | | | — | | | | — | |
Foreign currency translations | | | (49,134 | ) | | | — | | | | — | |
Forward foreign currency exchange contracts | | | 474,173 | | | | — | | | | — | |
Swaps | | | (157,558 | ) | | | — | | | | — | |
| | | | | | | | | | | | |
Change in net unrealized appreciation/depreciation | | | 5,144,350 | | | | 4,802,656 | | | | 1,295,917 | |
| | | | | | | | | | | | |
Net realized/unrealized gains (losses) | | | 7,952,864 | | | | 4,547,822 | | | | 1,704,251 | |
| | | | | | | | | | | | |
Change in net assets resulting from operations | | $ | 11,199,088 | | | $ | 8,491,333 | | | $ | 2,103,280 | |
| | | | | | | | | | | | |
| (a) | Net of foreign capital gains tax of $(10,195). |
| (b) | Net change in foreign capital gains tax of $(3,614). |
SEE NOTES TO FINANCIAL STATEMENTS.
| | | | | | |
| | | |
| 176 | | | | J.P. MORGAN EXCHANGE-TRADED FUNDS | | AUGUST 31, 2019 |
| | | | | | | | | | | | | | | | |
| | | | |
| | | JPMorgan
U.S. Aggregate
Bond ETF | | | JPMorgan
Ultra-Short
Income ETF | | | JPMorgan
Ultra-Short
Municipal
Income ETF | | | JPMorgan USD
Emerging Markets
Sovereign Bond ETF | |
INVESTMENT INCOME: | | | | | | | | | | | | | | | | |
Interest income fromnon-affiliates | | $ | 2,385,522 | | | $ | 106,216,838 | | | $ | 859,053 | | | $ | 1,659,279 | |
Interest income from affiliates | | | 6 | | | | 1,407 | | | | — | | | | 1 | |
Dividend income fromnon-affiliates | | | — | | | | 3 | | | | — | | | | — | |
Dividend income from affiliates | | | 7,651 | | | | 1,669,656 | | | | 14,570 | | | | 2,611 | |
Income from securities lending (net) (See Note 2.F.) | | | 45 | | | | 2,837 | | | | — | | | | 950 | |
| | | | | | | | | | | | | | | | |
Total investment income | | | 2,393,224 | | | | 107,890,741 | | | | 873,623 | | | | 1,662,841 | |
| | | | | | | | | | | | | | | | |
| | | | |
EXPENSES: | | | | | | | | | | | | | | | | |
Investment advisory fees (See Note 3.A.) | | | 55,910 | | | | 5,392,134 | | | | 69,819 | | | | 102,421 | |
Administration fees (See Note 3.B.) | | | 59,904 | | | | 2,696,067 | | | | 34,909 | | | | 24,005 | |
Interest expense to affiliates | | | 2,739 | | | | 10,889 | | | | 772 | | | | — | |
Professional fees | | | 41,821 | | | | 141,002 | | | | 25,311 | | | | 56,454 | |
Trustees’ and Chief Compliance Officer’s fees | | | 1,196 | | | | 98,783 | | | | 887 | | | | 790 | |
Printing and mailing costs | | | 5,830 | | | | 81,568 | | | | 489 | | | | 1,299 | |
Registration and filing fees | | | 20,268 | | | | 133,243 | | | | 7,662 | | | | 8,729 | |
Custodian, Accounting and Transfer Agent fees
(See Note 3.C.) | | | 37,551 | | | | 185,353 | | | | 67,450 | | | | 20,741 | |
Insurance expense | | | 397 | | | | 46,395 | | | | 243 | | | | 1,795 | |
Offering costs (See Note 2.I.) | | | 11,619 | | | | — | | | | 9,436 | | | | — | |
Other | | | 971 | | | | 25,988 | | | | 87 | | | | 766 | |
| | | | | | | | | | | | | | | | |
Total expenses | | | 238,206 | | | | 8,811,422 | | | | 217,065 | | | | 217,000 | |
| | | | | | | | | | | | | | | | |
Less fee waived (See Note 3.E.) | | | (115,814 | ) | | | (2,449,510 | ) | | | (104,728 | ) | | | (92,734 | ) |
Less expense reimbursements from affiliates
(See Note 3.E.) | | | (62,333 | ) | | | — | | | | (24,808 | ) | | | — | |
Less expense reimbursements fromnon-affiliates
(See Note 3.C.) | | | (2,100 | ) | | | (7,950 | ) | | | (4,600 | ) | | | — | |
| | | | | | | | | | | | | | | | |
Net expenses | | | 57,959 | | | | 6,353,962 | | | | 82,929 | | | | 124,266 | |
| | | | | | | | | | | | | | | | |
Net investment income (loss) | | | 2,335,265 | | | | 101,536,779 | | | | 790,694 | | | | 1,538,575 | |
| | | | | | | | | | | | | | | | |
| | | | |
REALIZED/UNREALIZED GAINS (LOSSES): | | | | | | | | | | | | | | | | |
Net realized gain (loss) on transactions from: | | | | | | | | | | | | | | | | |
Investments innon-affiliates | | | 798,940 | | | | 1,627,200 | | | | (593 | ) | | | (48,951 | ) |
Investments in affiliates | | | — | | | | — | | | | 348 | | | | — | |
| | | | | | | | | | | | | | | | |
Net realized gain (loss) | | | 798,940 | | | | 1,627,200 | | | | (245 | ) | | | (48,951 | ) |
| | | | | | | | | | | | | | | | |
Change in net unrealized appreciation/depreciation on: | | | | | | | | | | | | | | | | |
Investments innon-affiliates | | | 8,949,466 | | | | 22,950,067 | | | | 348,572 | | | | 4,379,683 | |
Investments in affiliates | | | — | | | | — | | | | 10 | | | | — | |
| | | | | | | | | | | | | | | | |
Change in net unrealized appreciation/depreciation | | | 8,949,466 | | | | 22,950,067 | | | | 348,582 | | | | 4,379,683 | |
| | | | | | | | | | | | | | | | |
Net realized/unrealized gains (losses) | | | 9,748,406 | | | | 24,577,267 | | | | 348,337 | | | | 4,330,732 | |
| | | | | | | | | | | | | | | | |
Change in net assets resulting from operations | | $ | 12,083,671 | | | $ | 126,114,046 | | | $ | 1,139,031 | | | $ | 5,869,307 | |
| | | | | | | | | | | | | | | | |
SEE NOTES TO FINANCIAL STATEMENTS.
| | | | | | | | |
| | | |
| AUGUST 31, 2019 | | J.P. MORGAN EXCHANGE-TRADED FUNDS | | | | | 177 | |
STATEMENTS OF CHANGES IN NET ASSETS
FOR THE PERIODS INDICATED
| | | | | | | | | | | | |
| | | JPMorgan BetaBuilders
1-5 Year U.S. Aggregate
Bond ETF | | | JPMorgan Core Plus Bond ETF | |
| | | Period Ended
August 31, 2019
(unaudited) (a) | | | Six Months Ended
August 31, 2019
(Unaudited) | | | Period Ended
February 28, 2019 (b) | |
CHANGE IN NET ASSETS RESULTING FROM OPERATIONS: | |
Net investment income (loss) | | $ | 336,320 | | | $ | 401,183 | | | $ | 65,409 | |
Net realized gain (loss) | | | 28,042 | | | | 286,587 | | | | 8,375 | |
Change in net unrealized appreciation/depreciation | | | 624,434 | | | | 1,385,730 | | | | 92,883 | |
| | | | | | | | | | | | |
Change in net assets resulting from operations | | | 988,796 | | | | 2,073,500 | | | | 166,667 | |
| | | | | | | | | | | | |
|
DISTRIBUTIONS TO SHAREHOLDERS: | |
Total distributions to shareholders | | | (336,830 | ) | | | (403,183 | ) | | | (63,565 | ) |
| | | | | | | | | | | | |
| | | |
CAPITAL TRANSACTIONS: | | | | | | | | | | | | |
Change in net assets resulting from capital transactions | | | 31,338,122 | | | | 5,229,831 | | | | 25,075,000 | |
| | | | | | | | | | | | |
|
NET ASSETS: | |
Change in net assets | | | 31,990,088 | | | | 6,900,148 | | | | 25,178,102 | |
Beginning of period | | | — | | | | 25,178,102 | | | | — | |
| | | | | | | | | | | | |
End of period | | $ | 31,990,088 | | | $ | 32,078,250 | | | $ | 25,178,102 | |
| | | | | | | | | | | | |
| | | |
CAPITAL TRANSACTIONS: | | | | | | | | | | | | |
Proceeds from shares issued | | $ | 31,338,122 | | | $ | 5,229,831 | | | $ | 25,075,000 | |
| | | | | | | | | | | | |
Total change in net assets resulting from capital transactions | | $ | 31,338,122 | | | $ | 5,229,831 | | | $ | 25,075,000 | |
| | | | | | | | | | | | |
|
SHARE TRANSACTIONS: | |
Issued | | | 1,250,000 | | | | 100,000 | | | | 500,000 | |
| | | | | | | | | | | | |
Net increase in shares from share transactions | | | 1,250,000 | | | | 100,000 | | | | 500,000 | |
| | | | | | | | | | | | |
| (a) | Commencement of operations was March 12, 2019. |
| (b) | Commencement of operations was January 28, 2019. |
SEE NOTES TO FINANCIAL STATEMENTS.
| | | | | | |
| | | |
| 178 | | | | J.P. MORGAN EXCHANGE-TRADED FUNDS | | AUGUST 31, 2019 |
| | | | | | | | | | | | | | | | |
| | | JPMorgan Corporate Bond Research
Enhanced ETF | | | JPMorgan Global Bond Opportunities ETF | |
| | | Six Months Ended
August 31, 2019
(Unaudited) | | | Period Ended February 28, 2019 (a) | | | Six Months Ended
August 31, 2019
(Unaudited) | | | Year Ended
February 28, 2019 | |
CHANGE IN NET ASSETS RESULTING FROM OPERATIONS: | |
Net investment income (loss) | | $ | 521,469 | | | $ | 218,413 | | | $ | 3,246,224 | | | $ | 6,692,618 | |
Net realized gain (loss) | | | 315,813 | | | | 36,262 | | | | 2,808,514 | | | | 271,962 | |
Change in net unrealized appreciation/depreciation | | | 2,121,590 | | | | 509,173 | | | | 5,144,350 | | | | (3,291,415 | ) |
| | | | | | | | | | | | | | | | |
Change in net assets resulting from operations | | | 2,958,872 | | | | 763,848 | | | | 11,199,088 | | | | 3,673,165 | |
| | | | | | | | | | | | | | | | |
|
DISTRIBUTIONS TO SHAREHOLDERS: | |
Total distributions to shareholders | | | (521,780 | ) | | | (218,355 | ) | | | (2,143,418 | ) | | | (9,983,877 | ) |
| | | | | | | | | | | | | | | | |
|
CAPITAL TRANSACTIONS: | |
Change in net assets resulting from capital transactions | | | 1,312,338 | | | | 25,050,000 | | | | 5,063,035 | | | | 35,033,711 | |
| | | | | | | | | | | | | | | | |
|
NET ASSETS: | |
Change in net assets | | | 3,749,430 | | | | 25,595,493 | | | | 14,118,705 | | | | 28,722,999 | |
Beginning of period | | | 25,595,493 | | | | — | | | | 180,357,231 | | | | 151,634,232 | |
| | | | | | | | | | | | | | | | |
End of period | | $ | 29,344,923 | | | $ | 25,595,493 | | | $ | 194,475,936 | | | $ | 180,357,231 | |
| | | | | | | | | | | | | | | | |
| | | | |
CAPITAL TRANSACTIONS: | | | | | | | | | | | | | | | | |
Proceeds from shares issued | | $ | 1,312,338 | | | $ | 25,050,000 | | | $ | 5,063,035 | | | $ | 35,033,711 | |
Cost of shares redeemed | | | — | | | | — | | | | — | | | | — | |
| | | | | | | | | | | | | | | | |
Total change in net assets resulting from capital transactions | | $ | 1,312,338 | | | $ | 25,050,000 | | | $ | 5,063,035 | | | $ | 35,033,711 | |
| | | | | | | | | | | | | | | | |
|
SHARE TRANSACTIONS: | |
Issued | | | 25,000 | | | | 500,000 | | | | 100,000 | | | | 700,000 | |
Redeemed | | | — | | | | — | | | | — | | | | — | |
| | | | | | | | | | | | | | | | |
Net increase in shares from share transactions | | | 25,000 | | | | 500,000 | | | | 100,000 | | | | 700,000 | |
| | | | | | | | | | | | | | | | |
| (a) | Commencement of operations was December 12, 2018. |
SEE NOTES TO FINANCIAL STATEMENTS.
| | | | | | | | |
| | | |
| AUGUST 31, 2019 | | J.P. MORGAN EXCHANGE-TRADED FUNDS | | | | | 179 | |
STATEMENTS OF CHANGES IN NET ASSETS
FOR THE PERIODS INDICATED (continued)
| | | | | | | | | | | | | | | | |
| | | JPMorgan High Yield Research Enhanced ETF
(formerly known as JPMorgan Disciplined
High Yield ETF) | | | JPMorgan Municipal ETF | |
| | | Six Months Ended
August 31, 2019
(Unaudited) | | | Year Ended
February 28, 2019 | | | Six Months Ended
August 31, 2019
(Unaudited) | | | Period Ended
February 28, 2019 (a) | |
CHANGE IN NET ASSETS RESULTING FROM OPERATIONS: | | | | | | | | | |
Net investment income (loss) | | $ | 3,943,511 | | | $ | 6,940,696 | | | $ | 399,029 | | | $ | 249,211 | |
Net realized gain (loss) | | | (254,834 | ) | | | (876,971 | ) | | | 408,334 | | | | 99,242 | |
Change in net unrealized appreciation/depreciation | | | 4,802,656 | | | | 742,057 | | | | 1,295,917 | | | | 909,793 | |
| | | | | | | | | | | | | | | | |
Change in net assets resulting from operations | | | 8,491,333 | | | | 6,805,782 | | | | 2,103,280 | | | | 1,258,246 | |
| | | | | | | | | | | | | | | | |
| | |
DISTRIBUTIONS TO SHAREHOLDERS: | | | | | | | | | |
Total distributions to shareholders | | | (4,034,980 | ) | | | (7,004,942 | ) | | | (398,244 | ) | | | (248,805 | ) |
| | | | | | | | | | | | | | | | |
| | |
CAPITAL TRANSACTIONS: | | | | | | | | | |
Change in net assets resulting from capital transactions | | | 5,080,738 | | | | 49,578,237 | | | | 2,672,489 | | | | 30,144,117 | |
| | | | | | | | | | | | | | | | |
| | |
NET ASSETS: | | | | | | | | | |
Change in net assets | | | 9,537,091 | | | | 49,379,077 | | | | 4,377,525 | | | | 31,153,558 | |
Beginning of period | | | 154,570,385 | | | | 105,191,308 | | | | 31,153,558 | | | | — | |
| | | | | | | | | | | | | | | | |
End of period | | $ | 164,107,476 | | | $ | 154,570,385 | | | $ | 35,531,083 | | | $ | 31,153,558 | |
| | | | | | | | | | | | | | | | |
| | | | |
CAPITAL TRANSACTIONS: | | | | | | | | | | | | | | | | |
Proceeds from shares issued | | $ | 5,080,738 | | | $ | 64,284,563 | | | $ | 13,354,178 | | | $ | 30,144,117 | |
Cost of shares redeemed | | | — | | | | (14,706,326 | ) | | | (10,681,689 | ) | | | — | |
| | | | | | | | | | | | | | | | |
Total change in net assets resulting from capital transactions | | $ | 5,080,738 | | | $ | 49,578,237 | | | $ | 2,672,489 | | | $ | 30,144,117 | |
| | | | | | | | | | | | | | | | |
| | |
SHARE TRANSACTIONS: | | | | | | | | | |
Issued | | | 100,000 | | | | 1,300,000 | | | | 250,000 | | | | 600,000 | |
Redeemed | | | — | | | | (300,000 | ) | | | (200,000 | ) | | | — | |
| | | | | | | | | | | | | | | | |
Net increase in shares from share transactions | | | 100,000 | | | | 1,000,000 | | | | 50,000 | | | | 600,000 | |
| | | | | | | | | | | | | | | | |
| (a) | Commencement of operations was October 29, 2018. |
SEE NOTES TO FINANCIAL STATEMENTS.
| | | | | | |
| | | |
| 180 | | | | J.P. MORGAN EXCHANGE-TRADED FUNDS | | AUGUST 31, 2019 |
| | | | | | | | | | | | | | | | |
| | | JPMorgan U.S. Aggregate Bond ETF | | | JPMorgan Ultra-Short Income ETF | |
| | | Six Months Ended
August 31, 2019
(Unaudited) | | | Period Ended
February 28, 2019 (a) | | | Six Months Ended
August 31, 2019
(Unaudited) | | | Year Ended
February 28, 2019 | |
CHANGE IN NET ASSETS RESULTING FROM OPERATIONS: | |
Net investment income (loss) | | $ | 2,335,265 | | | $ | 345,419 | | | $ | 101,536,779 | | | $ | 68,227,290 | |
Net realized gain (loss) | | | 798,940 | | | | 22,161 | | | | 1,627,200 | | | | 198,669 | |
Change in net unrealized appreciation/depreciation | | | 8,949,466 | | | | 119,461 | | | | 22,950,067 | | | | 2,890,875 | |
| | | | | | | | | | | | | | | | |
Change in net assets resulting from operations | | | 12,083,671 | | | | 487,041 | | | | 126,114,046 | | | | 71,316,834 | |
| | | | | | | | | | | | | | | | |
|
DISTRIBUTIONS TO SHAREHOLDERS: | |
Total distributions to shareholders | | | (2,342,087 | ) | | | (336,622 | ) | | | (101,555,326 | ) | | | (68,093,896 | ) |
| | | | | | | | | | | | | | | | |
|
CAPITAL TRANSACTIONS: | |
Change in net assets resulting from capital transactions | | | 81,387,243 | | | | 98,579,663 | | | | 2,649,730,635 | | | | 5,499,788,071 | |
| | | | | | | | | | | | | | | | |
|
NET ASSETS: | |
Change in net assets | | | 91,128,827 | | | | 98,730,082 | | | | 2,674,289,355 | | | | 5,503,011,009 | |
Beginning of period | | | 98,730,082 | | | | — | | | | 5,703,062,275 | | | | 200,051,266 | |
| | | | | | | | | | | | | | | | |
End of period | | $ | 189,858,909 | | | $ | 98,730,082 | | | $ | 8,377,351,630 | | | $ | 5,703,062,275 | |
| | | | | | | | | | | | | | | | |
| | | | |
CAPITAL TRANSACTIONS: | | | | | | | | | | | | | | | | |
Proceeds from shares issued | | $ | 103,466,673 | | | $ | 98,579,663 | | | $ | 2,876,883,673 | | | $ | 5,574,934,056 | |
Cost of shares redeemed | | | (22,079,430 | ) | | | — | | | | (227,153,038 | ) | | | (75,145,985 | ) |
| | | | | | | | | | | | | | | | |
Total change in net assets resulting from capital transactions | | $ | 81,387,243 | | | $ | 98,579,663 | | | $ | 2,649,730,635 | | | $ | 5,499,788,071 | |
| | | | | | | | | | | | | | | | |
|
SHARE TRANSACTIONS: | |
Issued | | | 4,000,000 | | | | 3,900,000 | | | | 57,100,000 | | | | 111,100,000 | |
Redeemed | | | (850,000 | ) | | | — | | | | (4,500,000 | ) | | | (1,500,000 | ) |
| | | | | | | | | | | | | | | | |
Net increase in shares from share transactions | | | 3,150,000 | | | | 3,900,000 | | | | 52,600,000 | | | | 109,600,000 | |
| | | | | | | | | | | | | | | | |
| (a) | Commencement of operations was December 12, 2018. |
SEE NOTES TO FINANCIAL STATEMENTS.
| | | | | | | | |
| | | |
| AUGUST 31, 2019 | | J.P. MORGAN EXCHANGE-TRADED FUNDS | | | | | 181 | |
STATEMENTS OF CHANGES IN NET ASSETS
FOR THE PERIODS INDICATED (continued)
| | | | | | | | | | | | | | | | |
| | | JPMorgan Ultra-Short Municipal Income ETF | | | JPMorgan USD Emerging Markets
Sovereign Bond ETF | |
| | | Six Months Ended
August 31, 2019
(Unaudited) | | | Period Ended
February 28, 2019 (a) | | | Six Months Ended
August 31, 2019
(Unaudited) | | | Year Ended
February 28, 2019 | |
CHANGE IN NET ASSETS RESULTING FROM OPERATIONS: | |
Net investment income (loss) | | $ | 790,694 | | | $ | 264,520 | | | $ | 1,538,575 | | | $ | 2,624,577 | |
Net realized gain (loss) | | | (245 | ) | | | 186 | | | | (48,951 | ) | | | (840,894 | ) |
Change in net unrealized appreciation/depreciation | | | 348,582 | | | | 134,833 | | | | 4,379,683 | | | | (334,291 | ) |
| | | | | | | | | | | | | | | | |
Change in net assets resulting from operations | | | 1,139,031 | | | | 399,539 | | | | 5,869,307 | | | | 1,449,392 | |
| | | | | | | | | | | | | | | | |
|
DISTRIBUTIONS TO SHAREHOLDERS: | |
Total distributions to shareholders | | | (794,107 | ) | | | (263,039 | ) | | | (1,541,215 | ) | | | (2,651,785 | ) |
| | | | | | | | | | | | | | | | |
|
CAPITAL TRANSACTIONS: | |
Change in net assets resulting from capital transactions | | | 65,524,685 | | | | 57,663,091 | | | | — | | | | 9,265,211 | |
| | | | | | | | | | | | | | | | |
|
NET ASSETS: | |
Change in net assets | | | 65,869,609 | | | | 57,799,591 | | | | 4,328,092 | | | | 8,062,818 | |
Beginning of period | | | 57,799,591 | | | | — | | | | 61,776,747 | | | | 53,713,929 | |
| | | | | | | | | | | | | | | | |
End of period | | $ | 123,669,200 | | | $ | 57,799,591 | | | $ | 66,104,839 | | | $ | 61,776,747 | |
| | | | | | | | | | | | | | | | |
| | | | |
CAPITAL TRANSACTIONS: | | | | | | | | | | | | | | | | |
Proceeds from shares issued | | $ | 68,042,902 | | | $ | 57,663,091 | | | $ | — | | | $ | 9,265,211 | |
Cost of shares redeemed | | | (2,518,217 | ) | | | — | | | | — | | | | — | |
| | | | | | | | | | | | | | | | |
Total change in net assets resulting from capital transactions | | $ | 65,524,685 | | | $ | 57,663,091 | | | $ | — | | | $ | 9,265,211 | |
| | | | | | | | | | | | | | | | |
|
SHARE TRANSACTIONS: | |
Issued | | | 1,350,000 | | | | 1,150,000 | | | | — | | | | 200,000 | |
Redeemed | | | (50,000 | ) | | | — | | | | — | | | | — | |
| | | | | | | | | | | | | | | | |
Net increase in shares from share transactions | | | 1,300,000 | | | | 1,150,000 | | | | — | | | | 200,000 | |
| | | | | | | | | | | | | | | | |
| (a) | Commencement of operations was October 16, 2018. |
SEE NOTES TO FINANCIAL STATEMENTS.
| | | | | | |
| | | |
| 182 | | | | J.P. MORGAN EXCHANGE-TRADED FUNDS | | AUGUST 31, 2019 |
THIS PAGE IS INTENTIONALLY LEFT BLANK
| | | | | | | | |
| | | |
| AUGUST 31, 2019 | | J.P. MORGAN EXCHANGE-TRADED FUNDS | | | | | 183 | |
FINANCIAL HIGHLIGHTS
FOR THE PERIODS INDICATED
| | | | | | | | | | | | | | | | | | | | | | | | | | | | |
| | | Per share operating performance | |
| | | | | | Investment Operations | | | Distributions | |
| | | Net asset
value,
beginning
of period | | | Net
investment
income
(loss) (b) | | | Net realized
and unrealized
gains
(losses) on
investments | | | Total from
investment
operations | | | Net
investment
income | | | Net
realized
gain | | | Total
distributions | |
| | | | | | | |
JPMorgan BetaBuilders 1-5 Year U.S. Aggregate Bond ETF | | | | | | | | | | | | | | | | | | | | | | | | | | | | |
March 12, 2019 (f) through August 31, 2019 (Unaudited) | | $ | 25.00 | | | $ | 0.30 | | | $ | 0.59 | | | $ | 0.89 | | | $ | (0.30 | ) | | $ | — | | | $ | (0.30 | ) |
| | | | | | | |
JPMorgan Core Plus Bond ETF | | | | | | | | | | | | | | | | | | | | | | | | | | | | |
Six Months Ended August 31, 2019 (Unaudited) | | | 50.36 | | | | 0.76 | | | | 3.10 | | | | 3.86 | | | | (0.76 | ) | | | — | | | | (0.76 | ) |
January 28, 2019 (f) through February 28, 2019 | | | 50.00 | | | | 0.13 | | | | 0.36 | | | | 0.49 | | | | (0.13 | ) | | | — | | | | (0.13 | ) |
| | | | | | | |
JPMorgan Corporate Bond Research Enhanced ETF | | | | | | | | | | | | | | | | | | | | | | | | | | | | |
Six Months Ended August 31, 2019 (Unaudited) | | | 51.19 | | | | 1.00 | | | | 4.71 | | | | 5.71 | | | | (1.00 | ) | | | — | | | | (1.00 | ) |
December 12, 2018 (f) through February 28, 2019 | | | 50.00 | | | | 0.44 | | | | 1.19 | | | | 1.63 | | | | (0.44 | ) | | | — | | | | (0.44 | ) |
| | | | | | | |
JPMorgan Global Bond Opportunities ETF | | | | | | | | | | | | | | | | | | | | | | | | | | | | |
Six Months Ended August 31, 2019 (Unaudited) | | | 48.75 | | | | 0.87 | | | | 2.13 | | | | 3.00 | | | | (0.57 | ) | | | — | | | | (0.57 | ) |
Year Ended February 28, 2019 | | | 50.54 | | | | 1.94 | | | | (0.97 | ) | | | 0.97 | | | | (2.56 | ) | | | (0.20 | ) | | | (2.76 | ) |
April 5, 2017 (f) through February 28, 2018 | | | 50.00 | | | | 1.83 | | | | 0.05 | (k) | | | 1.88 | | | | (1.34 | ) | | | — | | | | (1.34 | ) |
| | | | | | | |
JPMorgan High Yield Research Enhanced ETF (formerly known as JPMorgan Disciplined High Yield ETF) | | | | | | | | | | | | | | | | | | | | | | | | | | | | |
Six Months Ended August 31, 2019 (Unaudited) | | | 49.86 | | | | 1.25 | | | | 1.44 | | | | 2.69 | | | | (1.27 | ) | | | — | | | | (1.27 | ) |
Year Ended February 28, 2019 | | | 50.09 | | | | 2.47 | | | | (0.23 | ) | | | 2.24 | | | | (2.47 | ) | | | — | | | | (2.47 | ) |
Year Ended February 28, 2018 | | | 50.96 | | | | 2.44 | | | | (0.92 | ) | | | 1.52 | | | | (2.39 | ) | | | — | | | | (2.39 | ) |
September 14, 2016 (f) through February 28, 2017 | | | 50.00 | | | | 1.14 | | | | 0.96 | | | | 2.10 | | | | (1.14 | ) | | | — | (j) | | | (1.14 | ) |
| | | | | | | |
JPMorgan Municipal ETF | | | | | | | | | | | | | | | | | | | | | | | | | | | | |
Six Months Ended August 31, 2019 (Unaudited) | | | 51.92 | | | | 0.64 | | | | 2.75 | | | | 3.39 | | | | (0.65 | ) | | | — | | | | (0.65 | ) |
October 29, 2018 (f) through February 28, 2019 | | | 50.00 | | | | 0.46 | | | | 1.90 | | | | 2.36 | | | | (0.44 | ) | | | — | | | | (0.44 | ) |
| | | | | | | |
JPMorgan U.S. Aggregate Bond ETF | | | | | | | | | | | | | | | | | | | | | | | | | | | | |
Six Months Ended August 31, 2019 (Unaudited) | | | 25.32 | | | | 0.38 | | | | 1.60 | | | | 1.98 | | | | (0.37 | ) | | | — | | | | (0.37 | ) |
December 12, 2018 (f) through February 28, 2019 | | | 25.00 | | | | 0.18 | | | | 0.29 | | | | 0.47 | | | | (0.15 | ) | | | — | | | | (0.15 | ) |
| | | | | | | |
JPMorgan Ultra-Short Income ETF | | | | | | | | | | | | | | | | | | | | | | | | | | | | |
Six Months Ended August 31, 2019 (Unaudited) | | | 50.20 | | | | 0.72 | | | | 0.19 | | | | 0.91 | | | | (0.70 | ) | | | — | | | | (0.70 | ) |
Year Ended February 28, 2019 | | | 50.01 | | | | 1.37 | | | | (0.04 | )(k) | | | 1.33 | | | | (1.14 | ) | | | — | | | | (1.14 | ) |
May 17, 2017 (f) through February 28, 2018 | | | 50.00 | | | | 0.70 | | | | (0.08 | ) | | | 0.62 | | | | (0.61 | ) | | | — | | | | (0.61 | ) |
| | | | | | | |
JPMorgan Ultra-Short Municipal Income ETF | | | | | | | | | | | | | | | | | | | | | | | | | | | | |
Six Months Ended August 31, 2019 (Unaudited) | | | 50.26 | | | | 0.43 | | | | 0.20 | | | | 0.63 | | | | (0.41 | ) | | | — | | | | (0.41 | ) |
October 16, 2018 (f) through February 28, 2019 | | | 50.00 | | | | 0.35 | | | | 0.23 | | | | 0.58 | | | | (0.32 | ) | | | — | | | | (0.32 | ) |
| | | | | | | |
JPMorgan USD Emerging Markets Sovereign Bond ETF | | | | | | | | | | | | | | | | | | | | | | | | | | | | |
Six Months Ended August 31, 2019 (Unaudited) | | | 47.52 | | | | 1.18 | | | | 3.34 | | | | 4.52 | | | | (1.19 | ) | | | — | | | | (1.19 | ) |
Year Ended February 28, 2019 | | | 48.83 | | | | 2.31 | | | | (1.30 | ) | | | 1.01 | | | | (2.32 | ) | | | — | | | | (2.32 | ) |
January 29, 2018 (f) through February 28, 2018 | | | 50.00 | | | | 0.19 | | | | (1.21 | ) | | | (1.02 | ) | | | (0.15 | ) | | | — | | | | (0.15 | ) |
| (a) | Annualized for periods less than one year, unless otherwise indicated. |
| (b) | Calculated based upon average shares outstanding. |
| (c) | Not annualized for periods less than one year. |
| (d) | Includes adjustments in accordance with accounting principles generally accepted in the United States of America and as such, the net asset values for financial reporting purposes and the returns based upon those net asset values may differ from the net asset values and returns for shareholder transactions. |
| (e) | Market price total return is calculated assuming an initial investment made at the beginning of the period market price, reinvestment of all dividends and distributions at market price during the period, and sale at the market price on the last day of the period. The market price presented to calculate the market price total return is themid-point of the bid/ask spread at the close of business for the BetaBuilders1-5 Year U.S. Aggregate Bond ETF, Core Plus Bond ETF, Global Bond Opportunities ETF, High Yield Research Enhanced ETF, Municipal ETF, Ultra-Short Municipal Income ETF and Ultra-Short Income ETF on the Cboe BZX Exchange, Inc. and on the NYSE Arca, Inc. for the Corporate Bond Research Enhanced ETF, U.S. Aggregate Bond ETF and USD Emerging Markets Sovereign Bond ETF. |
| (f) | Commencement of operations. |
| (g) | Since the Shares of the Fund did not trade in the secondary market until the day after the Fund’s inception, for the period from the inception to the first day of secondary market trading, the NAV is used as a proxy for the secondary market trading price to calculate the market returns. |
| (h) | Certainnon-recurring expenses incurred by the Fund were not annualized for the period indicated. |
| (i) | Amount rounds to less than 0.5%. |
| (j) | Amount rounds to less than $0.005. |
| (k) | Calculation of the net realized and unrealized gains (losses) per share do not correlate with the Fund’s net realized and unrealized gains (losses) presented in the Statement of Operations due to the timing of capital transactions in relation to the fluctuating market values of the Fund’s investments. |
SEE NOTES TO FINANCIAL STATEMENTS.
| | | | | | |
| | | |
| 184 | | | | J.P. MORGAN EXCHANGE-TRADED FUNDS | | AUGUST 31, 2019 |
| | | | | | | | | | | | | | | | | | | | | | | | | | | | | | | | | | |
| Ratios /Supplemental data | |
| | | | | | | | | | | | | | | | Ratios to average net assets(a) | | | | |
Net asset
value,
end of
period | | | Market
price,
end of
period | | | Total
return (c)(d) | | | Market
price total
return (c)(e) | | | Net assets,
end of
period | | | Net
expenses | | | Net
investment
income
(loss) | | |
Expenses
without
waivers and
reimbursements | | | Portfolio
turnover
rate (c) | |
| | | | | | | | |
| | | | | | | | | | | | | | | | | | | | | | | | | | | | | | | | | | |
| | $25.59 | | | $ | 25.61 | | | | 3.56 | % | | | 3.64 | %(g) | | $ | 31,990,088 | | | | 0.05 | % | | | 2.49 | % | | | 0.05 | % | | | 18 | % |
| | | | | | | | |
| | | | | | | | | | | | | | | | | | | | | | | | | | | | | | | | | | |
| | 53.46 | | | | 53.57 | | | | 7.71 | | | | 7.68 | | | | 32,078,250 | | | | 0.38 | (h) | | | 2.91 | | | | 0.94 | (h) | | | 77 | |
| | 50.36 | | | | 50.48 | | | | 0.97 | | | | 1.21 | (g) | | | 25,178,102 | | | | 0.38 | (h) | | | 2.96 | | | | 5.38 | (h) | | | — | (i) |
| | | | | | | | |
| | | | | | | | | | | | | | | | | | | | | | | | | | | | | | | | | | |
| | 55.90 | | | | 56.00 | | | | 11.26 | | | | 11.21 | | | | 29,344,923 | | | | 0.14 | (h) | | | 3.74 | | | | 0.80 | (h) | | | 39 | |
| | 51.19 | | | | 51.30 | | | | 3.26 | | | | 3.48 | (g) | | | 25,595,493 | | | | 0.14 | (h) | | | 3.98 | | | | 2.13 | (h) | | | 12 | |
| | | | | | | | |
| | | | | | | | | | | | | | | | | | | | | | | | | | | | | | | | | | |
| | 51.18 | | | | 51.33 | | | | 6.18 | | | | 6.32 | | | | 194,475,936 | | | | 0.54 | | | | 3.46 | | | | 0.77 | | | | 40 | |
| | 48.75 | | | | 48.83 | | | | 2.09 | | | | 2.13 | | | | 180,357,231 | | | | 0.54 | | | | 3.92 | | | | 0.82 | | | | 73 | |
| | 50.54 | | | | 50.60 | | | | 3.76 | | | | 3.88 | (g) | | | 151,634,232 | | | | 0.53 | (h) | | | 3.98 | | | | 1.10 | (h) | | | 52 | |
| | | | | | | | |
| | | | | | | | | | | | | | | | | | | | | | | | | | | | | | | | | | |
| | 51.28 | | | | 51.36 | | | | 5.46 | | | | 5.71 | | | | 164,107,476 | | | | 0.40 | | | | 4.90 | | | | 0.51 | | | | 15 | |
| | 49.86 | | | | 49.82 | | | | 4.66 | | | | 4.00 | | | | 154,570,385 | | | | 0.40 | | | | 5.01 | | | | 0.57 | | | | 23 | |
| | 50.09 | | | | 50.36 | | | | 3.00 | | | | 3.12 | | | | 105,191,308 | | | | 0.40 | | | | 4.78 | | | | 0.98 | | | | 23 | |
| | 50.96 | | | | 51.16 | | | | 4.24 | | | | 4.64 | (g) | | | 30,574,068 | | | | 0.39 | (h) | | | 4.99 | | | | 1.74 | (h) | | | 8 | |
| | | | | | | | |
| | | | | | | | | | | | | | | | | | | | | | | | | | | | | | | | | | |
| | 54.66 | | | | 54.68 | | | | 6.56 | | | | 6.42 | | | | 35,531,083 | | | | 0.24 | (h) | | | 2.40 | | | | 0.90 | (h) | | | 34 | |
| | 51.92 | | | | 52.01 | | | | 4.74 | | | | 4.92 | (g) | | | 31,153,558 | | | | 0.23 | (h) | | | 2.65 | | | | 1.06 | (h) | | | 15 | |
| | | | | | | | |
| | | | | | | | | | | | | | | | | | | | | | | | | | | | | | | | | | |
| | 26.93 | | | | 27.00 | | | | 7.88 | | | | 8.07 | | | | 189,858,909 | | | | 0.07 | (h) | | | 2.92 | | | | 0.29 | (h) | | | 34 | |
| | 25.32 | | | | 25.34 | | | | 1.90 | | | | 1.98 | (g) | | | 98,730,082 | | | | 0.07 | (h) | | | 3.26 | | | | 1.14 | (h) | | | 53 | |
| | | | | | | | |
| | | | | | | | | | | | | | | | | | | | | | | | | | | | | | | | | | |
| | 50.41 | | | | 50.43 | | | | 1.83 | | | | 1.81 | | | | 8,377,351,630 | | | | 0.18 | | | | 2.83 | | | | 0.25 | | | | 17 | |
| | 50.20 | | | | 50.23 | | | | 2.68 | | | | 2.66 | | | | 5,703,062,275 | | | | 0.17 | | | | 2.74 | | | | 0.28 | | | | 43 | |
| | 50.01 | | | | 50.05 | | | | 1.25 | | | | 1.33 | (g) | | | 200,051,266 | | | | 0.16 | (h) | | | 1.77 | | | | 0.55 | (h) | | | 25 | |
| | | | | | | | |
| | | | | | | | | | | | | | | | | | | | | | | | | | | | | | | | | | |
| | 50.48 | | | | 50.51 | | | | 1.26 | | | | 1.26 | | | | 123,669,200 | | | | 0.18 | (h) | | | 1.70 | | | | 0.46 | (h) | | | 97 | |
| | 50.26 | | | | 50.29 | | | | 1.16 | | | | 1.22 | (g) | | | 57,799,591 | | | | 0.17 | (h) | | | 1.88 | | | | 0.79 | (h) | | | 61 | |
| | | | | | | | |
| | | | | | | | | | | | | | | | | | | | | | | | | | | | | | | | | | |
| | 50.85 | | | | 51.11 | | | | 9.62 | | | | 9.94 | | | | 66,104,839 | | | | 0.39 | | | | 4.82 | | | | 0.68 | | | | 25 | |
| | 47.52 | | | | 47.62 | | | | 2.29 | | | | 2.23 | | | | 61,776,747 | | | | 0.39 | | | | 4.96 | | | | 0.87 | | | | 28 | |
| | 48.83 | | | | 48.95 | | | | (2.03 | ) | | | (1.79 | )(g) | | | 53,713,929 | | | | 0.35 | (h) | | | 4.79 | | | | 2.74 | (h) | | | 2 | |
SEE NOTES TO FINANCIAL STATEMENTS.
| | | | | | | | |
| | | |
| AUGUST 31, 2019 | | J.P. MORGAN EXCHANGE-TRADED FUNDS | | | | | 185 | |
NOTES TO FINANCIAL STATEMENTS
AS OF AUGUST 31, 2019 (Unaudited)
1. Organization
J.P. Morgan Exchange-Traded Fund Trust (the “Trust”) was formed on February 25, 2010, and is governed by a Declaration of Trust as amended and restated February 19, 2014, and is registered under the Investment Company Act of 1940, as amended (the “1940 Act”), as anopen-end management investment company.
The following are 10 separate funds of the Trust (each, a “Fund” and collectively, the “Funds”) covered by this report:
| | |
| | | Diversification Classification |
| JPMorgan BetaBuilders1-5 Year U.S. Aggregate Bond ETF | | Diversified |
| JPMorgan Core Plus Bond ETF | | Diversified |
| JPMorgan Corporate Bond Research Enhanced ETF | | Diversified |
| JPMorgan Global Bond Opportunities ETF | | Diversified |
JPMorgan High Yield Research Enhanced ETF* | | Diversified |
| JPMorgan Municipal ETF | | Diversified |
| JPMorgan U.S. Aggregate Bond ETF | | Diversified |
| JPMorgan Ultra-Short Income ETF | | Diversified |
| JPMorgan Ultra-Short Municipal Income ETF | | Diversified |
| JPMorgan USD Emerging Markets Sovereign Bond ETF | | Diversified |
| * | Effective September 9, 2019, JPMorgan Disciplined High Yield ETF changed its name to JPMorgan High Yield Research Enhanced ETF. |
JPMorgan BetaBuilders1-5 Year U.S. Aggregate Bond ETF (the “BetaBuilders1-5 Year U.S. Aggregate Bond ETF”) commenced operations on March 12, 2019. The investment objective of the Fund is to seek investment results that closely correspond, before fees and expenses, to the performance of the Bloomberg Barclays Short-Term U.S. Aggregate Bond Index.
JPMorgan Core Plus Bond ETF (the “Core Plus Bond ETF”) commenced operations on January 28, 2019. The investment objective of the Fund is to seek a high level of current income by investing primarily in a diversified portfolio of high-, medium- andlow-grade debt securities.
JPMorgan Corporate Bond Research Enhanced ETF (the “Corporate Bond Research Enhanced ETF”) commenced operations on December 12, 2018. The investment objective of the Fund is to seek to provide total return.
The investment objective of JPMorgan High Yield Research Enhanced ETF (the “High Yield Research Enhanced ETF”) is to seek to provide a high level of income with capital appreciation as a secondary objective.
The investment objective of JPMorgan Global Bond Opportunities ETF (the “Global Bond Opportunities ETF”) is to seek to provide total return.
JPMorgan Municipal ETF (the “Municipal ETF”) commenced operations on October 29, 2018. The investment objective of the Fund is to seek to provide monthly dividends, which are excluded from gross income, and to protect the value of your investment by investing primarily in municipal obligations. For purposes of the Fund’s investment objective, “gross income” means gross income for federal income tax purposes.
JPMorgan U.S. Aggregate Bond ETF (the “U.S. Aggregate Bond ETF”) commenced operations on December 12, 2018. The investment objective of the Fund is to seek long-term total return.
The investment objective of JPMorgan Ultra-Short Income ETF (the “Ultra-Short Income ETF”) is to seek to provide current income while seeking to maintain a low volatility of principal.
JPMorgan Ultra-Short Municipal Income ETF (the “Ultra-Short Municipal Income ETF”) commenced operations on October 16, 2018. The investment objective of the Fund is to seek to provide as high a level of current income exempt from federal income tax as is consistent with relative stability of principal.
JPMorgan USD Emerging Markets Sovereign Bond ETF (the “USD Emerging Markets Sovereign Bond ETF”) commenced operations on January 29, 2018. The investment objective of the Fund is to seek investment results that closely correspond, before fees and expenses, to the performance of the JPMorgan Emerging Markets Risk-Aware Bond Index.
J.P. Morgan Investment Management Inc. (“JPMIM”), an indirect, wholly-owned subsidiary of JPMorgan Chase & Co. (“JPMorgan”), acts as Adviser (the “Adviser”) and Administrator (the “Administrator”) to the Funds.
| | | | | | |
| | | |
| 186 | | | | J.P. MORGAN EXCHANGE-TRADED FUNDS | | AUGUST 31, 2019 |
Shares of each Fund are listed and traded at market price on an exchange as follows:
| | |
| | | Listing Exchange |
| BetaBuilders1-5 Year U.S. Aggregate Bond ETF | | Cboe BZX Exchange, Inc. |
| Core Plus Bond ETF | | Cboe BZX Exchange, Inc. |
| Corporate Bond Research Enhanced ETF | | NYSE Arca, Inc. |
| Global Bond Opportunities ETF | | Cboe BZX Exchange, Inc. |
| High Yield Research Enhanced ETF | | Cboe BZX Exchange, Inc. |
| Municipal ETF | | Cboe BZX Exchange, Inc. |
| U.S. Aggregate Bond ETF | | NYSE Arca, Inc. |
| Ultra-Short Income ETF | | Cboe BZX Exchange, Inc. |
| Ultra-Short Municipal Income ETF | | Cboe BZX Exchange, Inc. |
| USD Emerging Markets Sovereign Bond ETF | | NYSE Arca, Inc. |
Market prices for the Funds’ shares may be different from their net asset value (“NAV”).
The Funds issue and redeem their shares on a continuous basis, through JPMorgan Distribution Services, Inc. (the “Distributor” or “JPMDS”), an indirect, wholly-owned subsidiary of JPMorgan, at NAV in large blocks of shares, referred to as “Creation Units” as shown in the table below:
| | | | |
| | | Shares per Creation Unit | |
BetaBuilders1-5 Year U.S. Aggregate Bond ETF | | | 50,000 | |
Core Plus Bond ETF | | | 100,000 | |
Corporate Bond Research Enhanced ETF | | | 25,000 | |
Global Bond Opportunities ETF | | | 100,000 | |
High Yield Research Enhanced ETF | | | 100,000 | |
Municipal ETF | | | 50,000 | |
U.S. Aggregate Bond ETF | | | 50,000 | |
Ultra-Short Income ETF | | | 50,000 | |
Ultra-Short Municipal Income ETF | | | 50,000 | |
USD Emerging Markets Sovereign Bond ETF | | | 100,000 | |
The Funds may elect creations and redemptions in cash or partially in cash. Shares are generally traded in the secondary market in amounts less than a Creation Unit at market prices that change throughout the day. Only individuals or institutions that have entered into an authorized participant agreement with the Distributor may do business directly with the Funds (each, an “Authorized Participant”).
2. Significant Accounting Policies
The following is a summary of significant accounting policies followed by the Funds in the preparation of their financial statements. The Funds are investment companies and, thus, follow the investment company accounting and reporting guidance of the Financial Accounting Standards Board (“FASB”) Accounting Standards Codification Topic 946— Investment Companies, which is part of U.S. generally accepted accounting principles (“GAAP”). The preparation of financial statements in conformity with GAAP requires management to make estimates and assumptions that affect the reported amounts of assets and liabilities and disclosure of contingent assets and liabilities at the date of the financial statements and the reported amounts of increases and decreases in net assets from operations during the reporting period. Actual results could differ from those estimates.
A. Valuation of Investments — The valuation of investments is in accordance with GAAP and the Funds’ valuation policies set forth by and under the supervision and responsibility of the Board of Trustees of the Trust (the “Board”), which established the following approach to valuation, as described more fully below: (i) investments for which market quotations are readily available shall be valued at their market value and (ii) all other investments for which market quotations are not readily available shall be valued at their fair value as determined in good faith by the Board.
The Administrator has established the J.P. Morgan Asset Management Americas Valuation Committee (“AVC”) to assist the Board with the oversight and monitoring of the valuation of the Funds’ investments. The Administrator implements the valuation policies of the Funds’ investments, as directed by the Board. The AVC oversees and carries out the policies for the valuation of investments held in the Funds. This includes monitoring the appropriateness of fair values based on results of ongoing valuation oversight including, but not limited to, consideration of macro or security specific events, market events and pricing vendor and broker due diligence. The Administrator is responsible for discussing and assessing the potential impacts to the fair values on an ongoing basis, and at least on a quarterly basis with the AVC and the Board.
A market-based approach is primarily used to value the Funds’ investments. Investments for which market quotations are not readily available are fair valued by approved affiliated and/or unaffiliated pricing vendors or third party broker-dealers (collectively referred to as “Pricing Services”) or may be internally fair valued using methods set forth by the valuation policies approved by the Board. This may include related or comparable assets or liabilities, recent transactions, market multiples, book values and other relevant information for the investment to determine the fair value of the investment. An income-based valuation approach may be used in which the anticipated future cash flows of the investment are discounted to calculate the fair value. Discounts may also be applied due to the nature or duration of any restrictions on the disposition of the investments. Valuations may be based upon current market prices of securities that are comparable in coupon, rating, maturity and industry. It is possible that the
| | | | | | | | |
| | | |
| AUGUST 31, 2019 | | J.P. MORGAN EXCHANGE-TRADED FUNDS | | | | | 187 | |
NOTES TO FINANCIAL STATEMENTS
AS OF AUGUST 31, 2019 (Unaudited) (continued)
estimated values may differ significantly from the values that would have been used, had a ready market for the investments existed, and such differences could be material.
Fixed income instruments are valued based on prices received from Pricing Services. The Pricing Services use multiple valuation techniques to determine the valuation of fixed income instruments. In instances where sufficient market activity exists, the Pricing Services may utilize a market based approach through which trades or quotes from market makers are used to determine the valuation of these instruments. In instances where sufficient market activity may not exist, the Pricing Services also utilize proprietary valuation models which may consider market transactions in comparable securities and the various relationships between securities in determining fair value and/or market characteristics in order to estimate the relevant cash flows, which are then discounted to calculate the fair values.
Investments inopen-end investment companies, excluding exchange traded funds (“ETFs”) ( “Underlying Funds”), are valued at each Underlying Fund’s NAV per share as of the report date.
Futures contracts are generally valued on the basis of available market quotations. Swaps and forward foreign currency exchange contracts are valued utilizing market quotations from approved Pricing Services.
See the table on “Quantitative Information about Level 3 Fair Value Measurements” for information on the valuation techniques and inputs used to value level 3 securities held by Global Bond Opportunities ETF at August 31, 2019.
Valuations reflected in this report are as of the report date. As a result, changes in valuation due to market events and/or issuer-related events after the report date and prior to issuance of the report are not reflected herein.
The various inputs that are used in determining the valuation of the Funds’ investments are summarized into the three broad levels listed below.
| • | | Level 1 — Unadjusted inputs using quoted prices in active markets for identical investments. |
| • | | Level 2 — Other significant observable inputs including, but not limited to, quoted prices for similar investments, inputs other than quoted prices that are observable for investments (such as interest rates, prepayment speeds, credit risk, etc.) or other market corroborated inputs. |
| • | | Level 3 — Significant inputs based on the best information available in the circumstances, to the extent observable inputs are not available (including the Funds’ assumptions in determining the fair value of investments). |
A financial instrument’s level within the fair value hierarchy is based on the lowest level of any input, both individually and in the aggregate, that is significant to the fair value measurement. The inputs or methodology used for valuing instruments are not necessarily an indication of the risk associated with investing in those instruments.
The following tables represent each valuation input as presented on the Schedules of Portfolio Investments (“SOIs”):
BetaBuilders1-5 Year U.S. Aggregate Bond ETF
| | | | | | | | | | | | | | | | |
| | | Level 1
Quoted prices | | | Level 2
Other significant
observable inputs | | | Level 3
Significant
unobservable inputs | | | Total | |
Investments in Securities | | | | | | | | | | | | | | | | |
Debt Securities | | | | | | | | | | | | | | | | |
Asset-Backed Securities | | $ | — | | | $ | 351,696 | | | $ | — | | | $ | 351,696 | |
Commercial Mortgage-Backed Securities | | | — | | | | 583,650 | | | | 36,183 | | | | 619,833 | |
Corporate Bonds | | | — | | | | 8,032,766 | | | | — | | | | 8,032,766 | |
Foreign Government Securities | | | — | | | | 438,694 | | | | — | | | | 438,694 | |
Mortgage-Backed Securities | | | — | | | | 2,149,549 | | | | — | | | | 2,149,549 | |
Municipal Bonds | | | — | | | | 43,562 | | | | — | | | | 43,562 | |
Supranational | | | — | | | | 920,079 | | | | — | | | | 920,079 | |
U.S. Government Agency Securities | | | — | | | | 723,597 | | | | — | | | | 723,597 | |
U.S. Treasury Obligations | | | — | | | | 18,480,217 | | | | — | | | | 18,480,217 | |
Short-Term Investments | | | | | | | | | |
Investment Companies | | | 184,514 | | | | — | | | | — | | | | 184,514 | |
| | | | | | | | | | | | | | | | |
Total Investments in Securities | | $ | 184,514 | | | $ | 31,723,810 | | | $ | 36,183 | | | $ | 31,944,507 | |
| | | | | | | | | | | | | | | | |
| | | | | | |
| | | |
| 188 | | | | J.P. MORGAN EXCHANGE-TRADED FUNDS | | AUGUST 31, 2019 |
Core Plus Bond ETF
| | | | | | | | | | | | | | | | |
| | | Level 1
Quoted prices | | | Level 2
Other significant
observable inputs | | | Level 3
Significant
unobservable inputs | | | Total | |
Investments in Securities | | | | | | | | | |
Debt Securities | | | | | | | | | |
Asset-Backed Securities | | $ | — | | | $ | 3,642,583 | | | $ | 561,161 | | | $ | 4,203,744 | |
Collateralized Mortgage Obligations | | | — | | | | 1,988,925 | | | | — | | | | 1,988,925 | |
Commercial Mortgage-Backed Securities | | | — | | | | 1,970,863 | | | | — | | | | 1,970,863 | |
Convertible Bonds | | | — | | | | 1,840 | | | | — | | | | 1,840 | |
Corporate Bonds | | | — | | | | 8,438,928 | | | | — | | | | 8,438,928 | |
Mortgage-Backed Securities | | | — | | | | 5,616,848 | | | | — | | | | 5,616,848 | |
Preferred Stocks | | | — | | | | 3,179 | | | | — | | | | 3,179 | |
U.S. Treasury Obligations | | | — | | | | 4,812,181 | | | | — | | | | 4,812,181 | |
Short-Term Investments | | | | | | | | | |
Investment Companies | | | 1,751,366 | | | | — | | | | — | | | | 1,751,366 | |
U.S. Treasury Obligations | | | — | | | | 3,536,279 | | | | — | | | | 3,536,279 | |
| | | | | | | | | | | | | | | | |
Total Short-Term Investments | | | 1,751,366 | | | | 3,536,279 | | | | — | | | | 5,287,645 | |
| | | | | | | | | | | | | | | | |
Total Investments in Securities | | $ | 1,751,366 | | | $ | 30,011,626 | | | $ | 561,161 | * | | $ | 32,324,153 | |
| | | | | | | | | | | | | | | | |
Appreciation in Other Financial Instruments | | | | | | | | | | | | | |
Futures Contracts | | $ | 11,329 | | | $ | — | | | $ | — | | | $ | 11,329 | |
| | | | | | | | | | | | | | | | |
Depreciation in Other Financial Instruments | | | | | | | | | | | | | |
Futures Contracts | | $ | (829 | ) | | $ | — | | | $ | — | | | $ | (829 | ) |
| | | | | | | | | | | | | | | | |
Corporate Bond Research Enhanced ETF
| | | | | | | | | | | | | | | | |
| | | Level 1
Quoted prices | | | Level 2
Other significant
observable inputs | | | Level 3
Significant
unobservable inputs | | | Total | |
Investments in Securities | | | | | | | | | | | | | | | | |
Debt Securities | | | | | | | | | | | | | | | | |
Asset-Backed Securities | | $ | — | | | $ | 50,881 | | | $ | — | | | $ | 50,881 | |
Corporate Bonds | | | — | | | | 28,524,782 | | | | — | | | | 28,524,782 | |
U.S. Treasury Obligations | | | — | | | | 335,446 | | | | — | | | | 335,446 | |
Short-Term Investments | | | | | | | | | |
Investment Companies | | | 298,084 | | | | — | | | | — | | | | 298,084 | |
| | | | | | | | | | | | | | | | |
Total Investments in Securities | | $ | 298,084 | | | $ | 28,911,109 | | | $ | — | | | $ | 29,209,193 | |
| | | | | | | | | | | | | | | | |
Appreciation in Other Financial Instruments | | | | | | | | | | | | | |
Futures Contracts | | $ | 2,056 | | | $ | — | | | $ | — | | | $ | 2,056 | |
| | | | | | | | | | | | | | | | |
Depreciation in Other Financial Instruments | | | | | | | | | | | | | |
Futures Contracts | | $ | (3,533 | ) | | $ | — | | | $ | — | | | $ | (3,533 | ) |
| | | | | | | | | | | | | | | | |
| | | | | | | | |
| | | |
| AUGUST 31, 2019 | | J.P. MORGAN EXCHANGE-TRADED FUNDS | | | | | 189 | |
NOTES TO FINANCIAL STATEMENTS
AS OF AUGUST 31, 2019 (Unaudited) (continued)
Global Bond Opportunities ETF
| | | | | | | | | | | | | | | | |
| | | Level 1
Quoted prices | | | Level 2
Other significant
observable inputs | | | Level 3
Significant
unobservable inputs | | | Total | |
Investments in Securities | | | | | | | | | | | | | | | | |
Debt Securities | | | | | | | | | | | | | | | | |
Asset-Backed Securities | | | | | | | | | | | | | | | | |
Cayman Islands | | $ | — | | | $ | 754,268 | | | $ | 346,452 | | | $ | 1,100,720 | |
United States | | | — | | | | 9,636,722 | | | | 4,061,649 | | | | 13,698,371 | |
| | | | | | | | | | | | | | | | |
Total Asset-Backed Securities | | | — | | | | 10,390,990 | | | | 4,408,101 | | | | 14,799,091 | |
| | | | | | | | | | | | | | | | |
Collateralized Mortgage Obligations | | | | | | | | | | | | | | | | |
United States | | | — | | | | 6,838,811 | | | | 153,348 | | | | 6,992,159 | |
Other Collateralized Mortgage Obligations | | | — | | | | 442,168 | | | | — | | | | 442,168 | |
| | | | | | | | | | | | | | | | |
Total Collateralized Mortgage Obligations | | | — | | | | 7,280,979 | | | | 153,348 | | | | 7,434,327 | |
| | | | | | | | | | | | | | | | |
Commercial Mortgage-Backed Securities | |
United States | | | — | | | | 8,202,589 | | | | 3,281,009 | | | | 11,483,598 | |
Corporate Bonds | |
United States | | | — | | | | 45,840,526 | | | | — | (a) | | | 45,840,526 | |
Other Corporate Bonds | | | — | | | | 42,772,834 | | | | — | | | | 42,772,834 | |
| | | | | | | | | | | | | | | | |
Total Corporate Bonds | | | — | | | | 88,613,360 | | | | — | (a) | | | 88,613,360 | |
| | | | | | | | | | | | | | | | |
Mortgage-Backed Securities | | | — | | | | 6,746,953 | | | | — | | | | 6,746,953 | |
Foreign Government Securities | | | — | | | | 49,761,979 | | | | — | | | | 49,761,979 | |
U.S. Treasury Obligations | | | — | | | | 2,302,641 | | | | — | | | | 2,302,641 | |
Warrants | | | — | | | | 86 | | | | — | | | | 86 | |
Short-Term Investments | | | | | | | | | | | | | | | | |
Foreign Government Treasury Bills | | | — | | | | 1,754,470 | | | | — | | | | 1,754,470 | |
Investment Companies | | | 5,760,227 | | | | — | | | | — | | | | 5,760,227 | |
| | | | | | | | | | | | | | | | |
Total Short-Term Investments | | | 5,760,227 | | | | 1,754,470 | | | | — | | | | 7,514,697 | |
| | | | | | | | | | | | | | | | |
Total Investments in Securities | | $ | 5,760,227 | | | $ | 175,054,047 | | | $ | 7,842,458 | | | $ | 188,656,732 | |
| | | | | | | | | | | | | | | | |
Appreciation in Other Financial Instruments | | | | | | | | | | | | | | | | |
Forward Foreign Currency Exchange Contracts | | $ | — | | | $ | 1,585,903 | | | $ | — | | | $ | 1,585,903 | |
Futures Contracts | | | 393,231 | | | | — | | | | — | | | | 393,231 | |
| | | | | | | | | | | | | | | | |
Total Appreciation in Other Financial Instruments | | $ | 393,231 | | | $ | 1,585,903 | | | $ | — | | | $ | 1,979,134 | |
| | | | | | | | | | | | | | | | |
Depreciation in Other Financial Instruments | | | | | | | | | | | | | | | | |
Forward Foreign Currency Exchange Contracts | | $ | — | | | $ | (520,726 | ) | | $ | — | | | $ | (520,726 | ) |
Futures Contracts | | | (1,021,137 | ) | | | — | | | | — | | | | (1,021,137 | ) |
Swaps | | | — | | | | (157,558 | ) | | | — | | | | (157,558 | ) |
| | | | | | | | | | | | | | | | |
Total Depreciation in Other Financial Instruments | | $ | (1,021,137 | ) | | $ | (678,284 | ) | | $ | — | | | $ | (1,699,421 | ) |
| | | | | | | | | | | | | | | | |
High Yield Research Enhanced ETF
| | | | | | | | | | | | | | | | |
| | | Level 1
Quoted prices | | | Level 2
Other significant
observable inputs | | | Level 3
Significant
unobservable inputs | | | Total | |
Investments in Securities | | | | | | | | | | | | | | | | |
Debt Securities | | | | | | | | | | | | | | | | |
Corporate Bonds | | | | | | | | | | | | | | | | |
Wireless Telecommunication Services | | $ | — | | | $ | 6,630,507 | | | $ | — | (a) | | $ | 6,630,507 | |
Other Corporate Bonds | | | — | | | | 152,727,659 | | | | — | | | | 152,727,659 | |
| | | | | | | | | | | | | | | | |
Total Corporate Bonds | | | — | | | | 159,358,166 | | | | — | (a) | | | 159,358,166 | |
| | | | | | | | | | | | | | | | |
Short-Term Investments | | | | | | | | | | | | | | | | |
Investment Companies | | | 3,167,845 | | | | — | | | | — | | | | 3,167,845 | |
Investment of cash collateral from securities loaned | | | 2,057,978 | | | | — | | | | — | | | | 2,057,978 | |
| | | | | | | | | | | | | | | | |
Total Investments in Securities | | $ | 5,225,823 | | | $ | 159,358,166 | | | $ | — | (a) | | $ | 164,583,989 | |
| | | | | | | | | | | | | | | | |
| | | | | | |
| | | |
| 190 | | | | J.P. MORGAN EXCHANGE-TRADED FUNDS | | AUGUST 31, 2019 |
Municipal ETF
| | | | | | | | | | | | | | | | |
| | | Level 1
Quoted prices | | | Level 2
Other significant
observable inputs | | | Level 3
Significant
unobservable inputs | | | Total | |
Total Investments in Securities (b) | | $ | 933,602 | | | $ | 34,835,325 | | | $ | — | | | $ | 35,768,927 | |
| | | | | | | | | | | | | | | | |
U.S. Aggregate Bond ETF
| | | | | | | | | | | | | | | | |
| | | Level 1
Quoted prices | | | Level 2
Other significant
observable inputs | | | Level 3
Significant
unobservable inputs | | | Total | |
Investments in Securities | | | | | | | | | | | | | | | | |
Debt Securities | | | | | | | | | | | | | | | | |
Asset-Backed Securities | | $ | — | | | $ | 837,510 | | | $ | — | | | $ | 837,510 | |
Commercial Mortgage-Backed Securities | | | — | | | | 3,623,070 | | | | 215,498 | | | | 3,838,568 | |
Corporate Bonds | | | — | | | | 48,808,117 | | | | — | | | | 48,808,117 | |
Foreign Government Securities | | | — | | | | 3,182,077 | | | | — | | | | 3,182,077 | |
Mortgage-Backed Securities | | | — | | | | 50,656,937 | | | | — | | | | 50,656,937 | |
Municipal Bonds | | | — | | | | 1,254,471 | | | | — | | | | 1,254,471 | |
Supranational | | | — | | | | 2,512,334 | | | | — | | | | 2,512,334 | |
U.S. Government Agency Securities | | | — | | | | 2,378,633 | | | | — | | | | 2,378,633 | |
U.S. Treasury Obligations | | | — | | | | 75,231,184 | | | | — | | | | 75,231,184 | |
Short-Term Investments | | | | | | | | | | | | | | | | |
Investment Companies | | | 503,250 | | | | — | | | | — | | | | 503,250 | |
| | | | | | | | | | | | | | | | |
Total Investments in Securities | | $ | 503,250 | | | $ | 188,484,333 | | | $ | 215,498 | | | $ | 189,203,081 | |
| | | | | | | | | | | | | | | | |
Ultra-Short Income ETF
| | | | | | | | | | | | | | | | |
| | | Level 1
Quoted prices | | | Level 2
Other significant
observable inputs | | | Level 3
Significant
unobservable inputs | | | Total | |
Investments in Securities | | | | | | | | | | | | | | | | |
Debt Securities | | | | | | | | | | | | | | | | |
Asset-Backed Securities | | $ | — | | | $ | 922,912,478 | | | $ | 10,562,798 | | | $ | 933,475,276 | |
Certificates of Deposit | | | — | | | | 104,960,998 | | | | — | | | | 104,960,998 | |
Commercial Mortgage-Backed Securities | | | — | | | | 51,268,522 | | | | — | | | | 51,268,522 | |
Corporate Bonds | | | — | | | | 5,430,143,382 | | | | — | | | | 5,430,143,382 | |
Foreign Government Securities | | | — | | | | 200,586 | | | | — | | | | 200,586 | |
U.S. Treasury Obligations | | | — | | | | 523,060,158 | | | | — | | | | 523,060,158 | |
Short-Term Investments | | | | | | | | | | | | | | | | |
Certificates of Deposit | | | — | | | | 312,853,577 | | | | — | | | | 312,853,577 | |
Commercial Paper | | | — | | | | 491,619,042 | | | | — | | | | 491,619,042 | |
Investment Companies | | | 343,725,884 | | | | — | | | | — | | | | 343,725,884 | |
Repurchase Agreements | | | — | | | | 161,000,000 | | | | — | | | | 161,000,000 | |
| | | | | | | | | | | | | | | | |
Total Short-Term Investments | | | 343,725,884 | | | | 965,472,619 | | | | — | | | | 1,309,198,503 | |
| | | | | | | | | | | | | | | | |
Investment of cash collateral from securities loaned | | | 7,021,090 | | | | — | | | | — | | | | 7,021,090 | |
| | | | | | | | | | | | | | | | |
Total Investments in Securities | | $ | 350,746,974 | | | $ | 7,998,018,743 | | | $ | 10,562,798 | | | $ | 8,359,328,515 | |
| | | | | | | | | | | | | | | | |
Ultra-Short Municipal Income ETF
| | | | | | | | | | | | | | | | |
| | | Level 1
Quoted prices | | | Level 2
Other significant
observable inputs | | | Level 3
Significant
unobservable inputs | | | Total | |
Total Investments in Securities (b) | | $ | 1,682,541 | | | $ | 121,966,367 | | | $ | — | | | $ | 123,648,908 | |
| | | | | | | | | | | | | | | | |
| | | | | | | | |
| | | |
| AUGUST 31, 2019 | | J.P. MORGAN EXCHANGE-TRADED FUNDS | | | | | 191 | |
NOTES TO FINANCIAL STATEMENTS
AS OF AUGUST 31, 2019 (Unaudited) (continued)
USD Emerging Markets Sovereign Bond ETF
| | | | | | | | | | | | | | | | |
| | | Level 1
Quoted prices | | | Level 2
Other significant
observable inputs | | | Level 3
Significant
unobservable inputs | | | Total | |
Investments in Securities | | | | | | | | | | | | | | | | |
Debt Securities | | | | | | | | | |
Corporate Bonds | | $ | — | | | $ | 8,743,972 | | | $ | — | | | $ | 8,743,972 | |
Foreign Government Securities | | | — | | | | 56,308,354 | | | | — | | | | 56,308,354 | |
Short-Term Investments | | | | | | | | | |
Investment Companies | | | 256,588 | | | | — | | | | — | | | | 256,588 | |
Investment of cash collateral from securities loaned | | | 676,237 | | | | — | | | | — | | | | 676,237 | |
| | | | | | | | | | | | | | | | |
Total Investments in Securities | | $ | 932,825 | | | $ | 65,052,326 | | | $ | — | | | $ | 65,985,151 | |
| | | | | | | | | | | | | | | | |
| (b) | All portfolio holdings designated as level 1 and level 2 are disclosed individually on the SOIs. Level 1 consists of a money market mutual fund that is held for daily investments of cash. Please refer to the SOIs for industry specifics of portfolio holdings. |
| * | Level 3 securities are valued by brokers and pricing services. At August 31, 2019, the value of these securities was $561,161. The inputs for these securities are not readily available or cannot be reasonably estimated and are generally those inputs described in Note 2.A. The appropriateness of fair values for these securities is monitored on an ongoing basis which may include results of back testing, results of broker and vendor due diligence, unchanged price review and consideration of macro or security specific events. |
Transfers between level 2 and level 3 are due to a decline or an increase in market activity (e.g. frequency of trades), which resulted in a lack or increase of available market inputs to determine the price for the six months ended August 31, 2019 for Global Bond Opportunities ETF.
Transfers from level 2 to level 3 are due to a decline in market activity (e.g. frequency of trades), which resulted in a lack of available market inputs to determine the price for the six months ended August 31, 2019 for Core Plus Bond ETF.
There were no transfers into and out of level 3 for the six months ended August 31, 2019 for BetaBuilders1-5 Year U.S. Aggregate Bond ETF, Corporate Bond Research Enhanced ETF, High Yield Research Enhanced ETF, Municipal ETF, U.S. Aggregate Bond ETF, Ultra-Short Income ETF, Ultra-Short Municipal Income ETF and USD Emerging Markets Sovereign Bond ETF.
The following is a summary of investments for which significant unobservable inputs (level 3) were used in determining fair value:
| | | | | | | | | | | | | | | | | | | | | | | | | | | | | | | | | | | | |
| Core Plus Bond ETF | | Balance as of
February 28,
2019 | | | Realized
gain (loss) | | | Change in
unrealized
appreciation
(depreciation) | | | Net
accretion
(amortization) | | | Purchases1 | | | Sales2 | | | Transfers
into Level 3 | | | Transfers
out
of Level 3 | | | Balance as of
August 31,
2019 | |
Investments in Securities | | | | | | | | | | | | | | | | | | | | | | | | | | | | | | | | | | | | |
Asset-Backed Securities | | $ | — | | | $ | 1,853 | | | $ | 16,691 | | | $ | 12 | | | $ | 131,016 | | | $ | (272,520 | ) | | $ | 684,109 | | | $ | — | | | $ | 561,161 | |
| | | | | | | | | | | | | | | | | | | | | | | | | | | | | | | | | | | | |
| | | | | | | | | | | | | | | | | | | | | | | | | | | | | | | | | | | | |
| Global Bond Opportunities ETF | | Balance as of
February 28,
2019 | | | Realized
gain
(loss) | | | Change in
unrealized
appreciation
(depreciation) | | | Net
accretion
(amortization) | | | Purchases1 | | | Sales2 | | | Transfers
into Level 3 | | | Transfers
out
of Level 3 | | | Balance as of
August 31,
2019 | |
Investments in Securities | | | | | | | | | | | | | | | | | | | | | | | | | | | | | | | | | | | | |
Asset-Backed Securities — Cayman Islands | | $ | 425,781 | | | $ | (1,269 | ) | | $ | (1,882 | ) | | $ | (6 | ) | | $ | — | | | $ | (76,172 | ) | | $ | — | | | $ | — | | | $ | 346,452 | |
Asset-Backed Securities — United States | | | 4,653,873 | | | | 2,118 | | | | 42,951 | | | | (309 | ) | | | 649,983 | | | | (1,524,835 | ) | | | 394,517 | | | | (156,649 | ) | | | 4,061,649 | |
Collateralized Mortgage Obligations — United States | | | — | | | | — | | | | 3,355 | | | | — | | | | 149,993 | | | | — | | | | — | | | | — | | | | 153,348 | |
Commercial Mortgage-Backed Securities — United States | | | 2,809,277 | | | | (1,723 | ) | | | 61,488 | | | | 1,196 | | | | 249,977 | | | | (629,270 | ) | | | 790,064 | | | | — | | | | 3,281,009 | |
Corporate Bonds — United States | | | — | (a) | | | — | | | | — | | | | — | | | | — | | | | — | | | | — | | | | — | | | | — | (a) |
| | | | | | | | | | | | | | | | | | | | | | | | | | | | | | | | | | | | |
Grand Total | | $ | 7,888,931 | | | $ | (874 | ) | | $ | 105,912 | | | $ | 881 | | | $ | 1,049,953 | | | $ | (2,230,277 | ) | | $ | 1,184,581 | | | $ | (156,649 | ) | | $ | 7,842,458 | |
| | | | | | | | | | | | | | | | | | | | | | | | | | | | | | | | | | | | |
| 1 | Purchases include all purchases of securities and securities received in corporate actions. |
| 2 | Sales include all sales of securities, maturities, paydowns and securities tendered in corporate actions. |
| | | | | | |
| | | |
| 192 | | | | J.P. MORGAN EXCHANGE-TRADED FUNDS | | AUGUST 31, 2019 |
The changes in net unrealized appreciation (depreciation) attributable to securities owned at August 31, 2019, which were valued using significant unobservable inputs (level 3) were as follows:
| | | | |
Core Plus Bond ETF | | $ | 16,691 | |
Global Bond Opportunities ETF | | | 102,055 | |
Global Bond Opportunities ETF
Quantitative Information about Level 3 Fair Value Measurements#
| | | | | | | | | | | | |
| | | Fair Value at
August 31, 2019 | | | Valuation Technique(s) | | Unobservable Input | | Range (Weighted Average) (a) | |
| | $ | 4,061,649 | | | Discounted Cash Flow | | Constant Prepayment Rate | | | 0.00% - 44.00% (17.12%) | |
| | | | | | | | Constant Default Rate | | | 0.00% - 3.01% (0.46%) | |
| | | | | | | | Yield (Discount Rate of Cash Flows) | | | 2.09% - 5.96% (4.17%) | |
| | | | | | | | | | | | |
| Asset-Backed Securities | | | 4,061,649 | | | | | | | | | |
| |
| | | 3,070,288 | | | Discounted Cash Flow | | Constant Prepayment Rate | | | 0.00% - 100.00% (8.03%) | |
| | | | | | | | Constant Default Rate | | | 0.00% - 2.00% (0.16%) | |
| | | | | | | | Yield (Discount Rate of Cash Flows) | | | 2.35% - 102.31% (8.11%) | |
| | | | | | | | | | | | |
| Commercial Mortgage-Backed Securities | | | 3,070,288 | | | | | | | | | |
| |
| | | 153,348 | | | Discounted Cash Flow | | Constant Prepayment Rate | | | 20.00% (20.00%) | |
| | | | | | | | Yield (Discount Rate of Cash Flows) | | | 3.39% (3.39%) | |
| | | | | | | | | | | | |
| Commercial Mortgage Obligations | | | 153,348 | | | | | | | | | |
| |
| Total | | $ | 7,285,285 | | | | | | | | | |
| |
| # | The table above does not include level 3 securities that are valued by brokers and pricing services. At August 31, 2019, the value of these securities was $557,173. The inputs for these securities are not readily available or cannot be reasonably estimated and are generally those inputs described in Note 2.A. |
| (a) | Unobservable inputs were weighted by the relative fair value of the instruments. |
The significant unobservable inputs used in the fair value measurement of the Fund’s investments are listed above. Generally, a change in the assumptions used in any input in isolation may be accompanied by a change in another input. Significant changes in any of the unobservable inputs may significantly impact the fair value measurement. The impact is based on the relationship between each unobservable input and the fair value measurement. Significant increases (decreases) in the default rate may decrease (increase) the fair value measurement. A significant change in the discount rate or prepayment rate (Constant Prepayment Rate or PSA Prepayment Model) may decrease or increase the fair value measurement.
B. Restricted Securities — Certain securities held by the Funds may be subject to legal or contractual restrictions on resale. Restricted securities generally are resold in transactions exempt from registration under the Securities Act of 1933, as amended (the “Securities Act”). Disposal of these securities may involve time-consuming negotiations and expense. Prompt sale at the current valuation may be difficult and could adversely affect the NAVs of the Funds.
As of August 31, 2019, the Funds had no investments in restricted securities other than securities sold to the Funds under Rule 144A and/or Regulation S under the Securities Act.
C. When-Issued Securities, Delayed Delivery Securities and Forward Commitments —BetaBuilders1-5 Year U.S. Aggregate Bond ETF, Core Plus Bond ETF, U.S. Aggregate Bond ETF and Ultra-Short Municipal Income ETF purchased when-issued securities, including To Be Announced (“TBA”) securities, and entered into contracts to purchase or sell securities for a fixed price that may be settled a month or more after the trade date. When-issued securities are securities that have been authorized, but not issued in the market. A forward commitment involves entering into a contract to purchase or sell securities for a fixed price at a future date that may be settled a month or more after the trade date. A delayed delivery security is agreed upon in advance between the buyer and the seller of the security and is generally delivered beyond seven days of the agreed upon date. The purchase of securities on a when-issued, delayed delivery or forward commitment basis involves the risk that the value of the security to be purchased declines before the settlement date. The sale of securities on a forward commitment basis involves the risk that the value of the securities sold may increase before the settlement date. The Fund may be exposed to credit risk if the counterparty fails to perform under the terms of the transaction. Interest income for securities purchased on a when-issued, delayed delivery or forward commitment basis is not accrued until the settlement date.
BetaBuilders1-5 Year U.S. Aggregate Bond ETF, Core Plus Bond ETF, U.S. Aggregate Bond ETF and Ultra-Short Municipal Income ETF had delayed delivery securities outstanding as of August 31, 2019, which are shown as a Receivable for Investment securities sold — delayed delivery securities and Payable for Investment securities purchased — delayed delivery securities, respectively, on the Statements of Assets and Liabilities (“SAL”). The values of these securities held at August 31, 2019 are detailed on the SOIs.
| | | | | | | | |
| | | |
| AUGUST 31, 2019 | | J.P. MORGAN EXCHANGE-TRADED FUNDS | | | | | 193 | |
NOTES TO FINANCIAL STATEMENTS
AS OF AUGUST 31, 2019 (Unaudited) (continued)
D. Repurchase Agreements — The Funds may enter into repurchase agreement transactions that meet the credit guidelines of JPMIM. Repurchase agreements involve the purchase of securities subject to the seller’s agreement to repurchase the securities at a mutually agreed upon date and price. The Funds require that the collateral received in a repurchase agreement transaction be transferred to a custodian in a manner sufficient to enable the Funds to obtain collateral in the event of a counterparty default. If the counterparty defaults and the fair value of the collateral declines, realization of the collateral by the Funds may be delayed or limited. Repurchase agreement collateral may be held in segregated accounts maintained by JPMorgan Chase Bank, N.A. (“JPMCB”), a wholly-owned subsidiary of JPMorgan.
The Funds’ repurchase agreements are not subject to master netting arrangements.
E. Derivatives — The Funds used derivative instruments including futures and forward foreign currency exchange contracts, in connection with their respective investment strategies. Derivative instruments may be used as substitutes for securities in which the Funds can invest, to hedge portfolio investments or to generate income or gain to the Funds. Derivatives may also be used to manage duration, sector and yield curve exposures and credit and spread volatility.
The Funds may be subject to various risks from the use of derivatives including the risk that changes in the value of a derivative may not correlate perfectly with the underlying asset, rate or index; counterparty credit risk related to derivatives counterparties’ failure to perform under contract terms; liquidity risk related to the lack of a liquid market for these contracts allowing a Fund to close out its position(s); and documentation risk relating to disagreement over contract terms. Investing in certain derivatives also results in a form of leverage and as such, the Funds’ risk of loss associated with these instruments may exceed their value, as recorded on the SAL.
The Funds are party to various derivative contracts governed by International Swaps and Derivatives Association master agreements (“ISDA agreements”). The Funds’ ISDA agreements, which are separately negotiated with each dealer counterparty, may contain provisions allowing, absent other considerations, a counterparty to exercise rights, to the extent not otherwise waived, against the Funds in the event the Funds’ net assets decline over time by apre-determined percentage or fall below apre-determined floor. The ISDA agreements may also contain provisions allowing, absent other conditions, the Funds to exercise rights, to the extent not otherwise waived, against a counterparty (e.g., decline in a counterparty’s credit rating below a specified level). Such rights for both a counterparty and the Funds often include the ability to terminate (i.e., close out) open contracts at prices which may favor a counterparty, which could have an adverse effect on the Funds. The ISDA agreements give the Funds and a counterparty the right, upon an event of default, to close out all transactions traded under such agreements and to net amounts owed or due across all transactions and offset such net payable or receivable with collateral posted to a segregated account by one party to the other.
Counterparty credit risk may be mitigated to the extent a counterparty posts collateral for mark to market gains to the Funds.
Notes (1) — (3) below describe the various derivatives used by the Funds.
(1). Futures Contracts — The Core Bond Plus ETF, Corporate Bond Research Enhanced ETF and Global Bond Opportunities ETF used treasury futures contracts to manage and hedge interest rate risk associated with portfolio investments. The Funds also bought futures contracts to immediately invest incoming cash in the market or sold futures in response to cash outflows, thereby simulating an invested position in the underlying index while maintaining a cash balance for liquidity.
Futures contracts provide for the delayed delivery of the underlying instrument at a fixed price or are settled for a cash amount based on the change in the value of the underlying instrument at a specific date in the future. Upon entering into a futures contract, the Funds are required to deposit with the broker, cash or securities in an amount equal to a certain percentage of the contract amount, which is referred to as the initial margin deposit. Subsequent payments, referred to as variation margin, are made or received by the Funds periodically and are based on changes in the market value of open futures contracts. Changes in the market value of open futures contracts are recorded as Change in net unrealized appreciation/depreciation on the Statements of Operations (“SOP”). Realized gains or losses, representing the difference between the value of the contract at the time it was opened and the value at the time it was closed, are reported on the SOP at the closing or expiration of the futures contract. Securities deposited as initial margin are designated on the SOIs, while cash deposited, which is considered restricted, is recorded on the SAL. A receivable from and/or a payable to brokers for the daily variation margin is also recorded on the SAL.
The use of futures contracts exposes the Funds to interest rate risk. The Funds may be subject to the risk that the change in the value of the futures contract may not correlate perfectly with the underlying instrument. Use of long futures contracts subjects the Funds to risk of loss in excess of the amounts shown on the SAL, up to the notional amount of the futures contracts. Use of short futures contracts subjects the Funds to unlimited risk of loss. The Funds may enter into futures contracts only on exchanges or boards of trade. The exchange or board of trade acts as the counterparty to each futures transaction; therefore, the Funds’ credit risk is limited to failure of the exchange or board of trade. Under some circumstances, futures exchanges may establish daily limits on the amount that the price of a futures contract can vary from the previous day’s settlement price, which could effectively prevent liquidation of positions.
The Funds’ futures contracts are not subject to master netting arrangements (the right to close out all transactions traded with a counterparty and net amounts owed or due across transactions).
(2). Forward Foreign Currency Exchange Contracts — The Global Bond Opportunities ETF may be exposed to foreign currency risks associated with some or all of the portfolio investments and used forward foreign currency exchange contracts to hedge or manage certain of these exposures as part of an investment strategy. The Fund also bought forward foreign currency exchange contracts to gain exposure to currencies. Forward foreign
| | | | | | |
| | | |
| 194 | | | | J.P. MORGAN EXCHANGE-TRADED FUNDS | | AUGUST 31, 2019 |
currency exchange contracts represent obligations to purchase or sell foreign currency on a specified future date at a price fixed at the time the contracts are entered into.Non-deliverable forward foreign currency exchange contracts are settled with the counterparty in U.S. Dollar without the delivery of foreign currency.
The values of the forward foreign currency exchange contracts are adjusted daily based on the applicable exchange rate of the underlying currency. Changes in the value of these contracts are recorded as unrealized appreciation or depreciation until the contract settlement date. When the forward foreign currency exchange contract is closed, the Fund records a realized gain or loss equal to the difference between the value at the time the contract was opened and the value at the time it was closed. The Fund also records a realized gain or loss when a forward foreign currency exchange contract offsets another forward foreign currency exchange contract with the same counterparty upon settlement.
The Fund’s forward foreign currency exchange contracts are subject to master netting arrangements (the right to close out all transactions with a counterparty and net amounts owed or due across transactions).
The Fund may be required to post or receive collateral fornon-deliverable forward foreign currency exchange contracts.
(3). Swaps —The Global Bond Opportunities ETF engaged in various swap transactions, including credit default swaps, to manage credit risks within its portfolio. The Fund also used swaps as alternatives to direct investments. Swap transactions are negotiated contracts over the counter (“OTC swaps”) between the fund and a counterparty or are centrally cleared (“centrally cleared swaps”) through a central clearinghouse managed by a Futures Commission Merchant (“FCM”) that exchange investment cash flows, assets, foreign currencies or market-linked returns at specified, future intervals.
Upfront payments made and/or received by the Fund are recorded as assets or liabilities, respectively, on the SAL and amortized over the term of the swap. The value of an OTC swap agreement is recorded as either an asset or a liability on the SAL at the beginning of the measurement period. Upon entering into a centrally cleared swap, the Fund is required to deposit with the FCM cash or securities, which is referred to as initial margin deposit. Securities deposited as initial margin are designated on the SOI, while cash deposited, which is considered restricted, is recorded on the SAL. Daily changes in valuation of centrally cleared swaps, if any, are recorded as a variation margin receivable or payable on the SAL. The change in the value of swaps, including accruals of periodic amounts of interest to be paid or received on swaps, is reported as Change in net unrealized appreciation/depreciation on the SOP. A realized gain or loss is recorded upon payment or receipt of a periodic payment or payment made upon termination of a swap agreement.
The Fund may be required to post or receive collateral based on the net value of the Fund’s outstanding OTC swap contracts with the counterparty in the form of cash or securities. Daily movement of collateral is subject to minimum threshold amounts. Collateral posted by the Fund is held in a segregated account at the Fund’s custodian bank. For certain counterparties, cash collateral posted by the Fund is invested in an affiliated money market fund, otherwise the cash collateral is included on the SAL as Restricted cash.
Credit Default Swaps
The Global Bond Opportunities ETF entered into credit default swaps to simulate long and/or short bond positions or to take an active long and/or short position with respect to the likelihood of a default or credit event by the issuer of the underlying reference obligation.
The underlying reference obligation may be a single issuer of corporate or sovereign debt, a basket of issuers or a credit index. A credit index is a list of credit instruments or exposures that reference a fixed number of obligors with shared characteristics that represents some part of the credit market as a whole. Index credit default swaps have standardized terms including a fixed spread and standard maturity dates. The composition of the obligations within a particular index changes periodically.
Credit default swaps involve one party, the protection buyer, making a stream of payments to another party, the protection seller, in exchange for the right to receive a contingent payment if there is a credit event related to the underlying reference obligation. In the event that the reference obligation matures prior to the termination date of the contract, a similar security will be substituted for the duration of the contract term. Credit events are defined under individual swap agreements and generally include bankruptcy, failure to pay, restructuring, repudiation/moratorium, obligation acceleration and obligation default.
If a credit event occurs, the Fund, as protection seller, would be obligated to make a payment, which may be either: (i) a net cash settlement equal to the notional amount of the swap less the auction value of the reference obligation or (ii) the notional amount of the swap in exchange for the delivery of the reference obligation. Selling protection effectively adds leverage to the Fund’s portfolio up to the notional amount of swap agreements. The notional amount represents the maximum potential liability under a contract and is not reflected on the Statement of Assets and Liabilities. Potential liabilities under these contracts may be reduced by: the auction rates of the underlying reference obligations; upfront payments received at the inception of a swap; and net amounts received from credit default swaps purchased with the identical reference obligation.
| | | | | | | | |
| | | |
| AUGUST 31, 2019 | | J.P. MORGAN EXCHANGE-TRADED FUNDS | | | | | 195 | |
NOTES TO FINANCIAL STATEMENTS
AS OF AUGUST 31, 2019 (Unaudited) (continued)
4. Summary of Derivatives Information
The following table presents the value of derivatives held as of August 31, 2019, by their primary underlying risk exposure and respective location on the SAL:
| | | | | | |
|
| Core Plus Bond ETF | |
| Derivative Contracts | | Statements of Assets and Liabilities Location | | | |
Gross Assets: | | | | Futures
Contracts (a) | |
| Interest rate contracts | | Receivables, Net assets — Unrealized Appreciation | | $ | 11,329 | |
| | | | | | |
| | |
Gross Liabilities: | | | | | |
| Interest rate contracts | | Payables, Net assets — Unrealized Depreciation | | $ | (829 | ) |
| | | | | | |
| (a) | This amount reflects the cumulative appreciation/depreciation of futures contracts as reported on the SOIs. The SAL only reflects the current day variation margin receivable/payable from/to brokers. |
| | | | | | |
|
| Corporate Bond Research Enhanced ETF | |
| Derivative Contracts | | Statements of Assets and Liabilities Location | | | |
| Gross Assets: | | | | Futures Contracts (a) | |
| Interest rate contracts | | Receivables, Net assets — Unrealized Appreciation | | $ | 2,056 | |
| | | | | | |
| | |
Gross Liabilities: | | | | | |
| Interest rate contracts | | Payables, Net assets — Unrealized Depreciation | | $ | (3,533 | ) |
| | | | | | |
| (a) | This amount reflects the cumulative appreciation/depreciation of futures contracts as reported on the SOIs. The SAL only reflects the current day variation margin receivable/payable from/to brokers. |
| | | | | | | | | | | | | | | | | | | | | | |
| Global Bond Opportunities ETF | |
| Derivative Contracts | | Statements of Assets and Liabilities Location | | | | |
| Gross Assets: | | | | Futures
Contracts (a) | | | Forward Foreign
Currency Exchange
Contracts | | | Centrally
Cleared
Swaps (b) | | | OTC Swaps | | | Total | |
| Credit contracts | | Receivables | | $ | — | | | $ | — | | | $ | — | | | $ | 285,349 | | | $ | 285,349 | |
| Foreign exchange contracts | | Receivables | | | — | | | | 1,585,903 | | | | — | | | | — | | | | 1,585,903 | |
| Interest rate contracts | | Receivables, Net assets — Unrealized Appreciation | | | 393,231 | | | | — | | | | — | | | | — | | | | 393,231 | |
| | | | | | | | | | | | | | | | | | | | | | |
Total | | | | $ | 393,231 | | | $ | 1,585,903 | | | $ | — | | | $ | 285,349 | | | $ | 2,264,483 | |
| | | | | | | | | | | | | | | | | | | | | | |
| | | | | | |
Gross Liabilities: | | | | | | | | | | | | | | | | | |
| Credit contracts | | Payables | | $ | — | | | $ | — | | | $ | (1,126,016 | ) | | $ | (12,793 | ) | | $ | (1,138,809 | ) |
| Foreign exchange contracts | | Payables | | | — | | | | (520,726 | ) | | | — | | | | — | | | | (520,726 | ) |
| Interest rate contracts | | Payables, Net assets — Unrealized Depreciation | | | (1,021,137 | ) | | | — | | | | — | | | | — | | | | (1,021,137 | ) |
| | | | | | | | | | | | | | | | | | | | | | |
Total | | | | $ | (1,021,137 | ) | | $ | (520,726 | ) | | $ | (1,126,016 | ) | | $ | (12,793 | ) | | $ | (2,680,672 | ) |
| | | | | | | | | | | | | | | | | | | | | | |
| (a) | This amount reflects the cumulative appreciation/depreciation of futures contracts as reported on the SOIs. The SAL only reflects the current day variation margin receivable/payable from/to brokers. |
| (b) | This amount represents the value of centrally cleared swaps as reported on the SOIs. The SAL only reflects the current day variation margin receivable/payable from/to brokers. |
| | | | | | |
| | | |
| 196 | | | | J.P. MORGAN EXCHANGE-TRADED FUNDS | | AUGUST 31, 2019 |
The following table presents the Fund’s gross derivative assets and liabilities by counterparty net of amounts available for offset under netting arrangements and any related collateral received or posted by the Fund as of August 31, 2019.
Global Bond Opportunities ETF
| | | | | | | | | | | | | | | | |
| Counterparty | | Gross Amount of Derivative Assets
Subject to Netting Arrangements
Presented on the
Statement of Assets and
Liabilities(a) | | | Derivatives
Available
for Offset | | | Collateral
Received | | | Net Amount Due
from Counterparty
(not less than zero) | |
Barclays Bank plc | | $ | 207,181 | | | $ | (14,812 | ) | | $ | — | | | $ | 192,369 | |
BNP Paribas | | | 39,456 | | | | (39,456 | ) | | | — | | | | — | |
Citibank, NA | | | 245,016 | | | | (76,328 | ) | | | — | | | | 168,688 | |
Credit Suisse International | | | 10,144 | | | | (7,083 | ) | | | — | | | | 3,061 | |
Deutsche Bank AG | | | 5,710 | | | | — | | | | — | | | | 5,710 | |
Goldman Sachs International | | | 1,135,609 | | | | (226,414 | ) | | | — | | | | 909,195 | |
HSBC Bank, NA | | | 172,351 | | | | (6,778 | ) | | | — | | | | 165,573 | |
Merrill Lynch International | | | 5,989 | | | | (5,989 | ) | | | — | | | | — | |
State Street Corp. | | | 49,051 | | | | (49,051 | ) | | | — | | | | — | |
TD Bank Financial Group | | | 745 | | | | (745 | ) | | | — | | | | — | |
| | | | | | | | | | | | | | | | |
Total | | $ | 1,871,252 | | | $ | (426,656 | ) | | $ | — | | | $ | 1,444,596 | |
| | | | | | | | | | | | | | | | |
| | | | |
| Counterparty | | Gross Amount of
Derivative Liabilities
Subject to Netting Arrangements
Presented on the
Statement of Assets and
Liabilities(a) | | | Derivatives
Available
for Offset | | | Collateral
Posted | | | Net Amount Due
to Counterparty
(not less than zero) | |
Barclays Bank plc | | $ | 14,812 | | | $ | (14,812 | ) | | $ | — | | | $ | — | |
BNP Paribas | | | 61,629 | | | | (39,456 | ) | | | — | | | | 22,173 | |
Citibank, NA | | | 76,328 | | | | (76,328 | ) | | | — | | | | — | |
Credit Suisse International | | | 7,083 | | | | (7,083 | ) | | | — | | | | — | |
Goldman Sachs International | | | 226,414 | | | | (226,414 | ) | | | — | | | | — | |
HSBC Bank, NA | | | 6,778 | | | | (6,778 | ) | | | — | | | | — | |
Merrill Lynch International | | | 6,280 | | | | (5,989 | ) | | | — | | | | 291 | |
Royal Bank of Canada | | | 3,406 | | | | — | | | | — | | | | 3,406 | |
State Street Corp. | | | 123,852 | | | | (49,051 | ) | | | — | | | | 74,801 | |
TD Bank Financial Group | | | 6,937 | | | | (745 | ) | | | — | | | | 6,192 | |
| | | | | | | | | | | | | | | | |
Total | | $ | 533,519 | | | $ | (426,656 | ) | | $ | — | | | $ | 106,863 | |
| | | | | | | | | | | | | | | | |
| (a) | For financial reporting purposes, the Fund does not offset derivative assets and derivative liabilities subject to master netting arrangements on the SAL. |
The following tables present the effect of derivatives on the SOP for the period ended August 31, 2019, by primary underlying risk exposure:
| | | | |
| Core Plus Bond ETF | |
| Amount of Realized Gain (Loss) on Derivatives Recognized on the Statements of Operations | |
| Derivative Contracts | | Futures
Contracts | |
Interest rate contracts | | $ | 179,376 | |
| | | | |
| Amount of Change in Unrealized Appreciation (Depreciation) on Derivatives Recognized on the Statements of Operations | |
| Derivative Contracts | | Futures
Contracts | |
Interest rate contracts | | $ | 13,684 | |
| | | | |
|
| Corporate Bond Research Enhanced ETF | |
| Amount of Realized Gain (Loss) on Derivatives Recognized on the Statements of Operations | |
| Derivative Contracts | | Futures
Contracts | |
Interest rate contracts | | $ | (70,151 | ) |
| | | | |
| | | | | | | | |
| | | |
| AUGUST 31, 2019 | | J.P. MORGAN EXCHANGE-TRADED FUNDS | | | | | 197 | |
NOTES TO FINANCIAL STATEMENTS
AS OF AUGUST 31, 2019 (Unaudited) (continued)
| | | | |
| Amount of Change in Unrealized Appreciation (Depreciation) on Derivatives Recognized on the Statements of Operations | |
| Derivative Contracts | | Futures
Contracts | |
Interest rate contracts | | $ | (1,108 | ) |
| | | | |
| | | | | | | | | | | | | | | | |
| Global Bond Opportunities ETF | |
| Amount of Realized Gain (Loss) on Derivatives Recognized on the Statements of Operations | |
| Derivative Contracts | | Futures
Contracts | | | Forward Foreign
Currency Exchange
Contracts | | | Swaps | | | Total | |
Credit contracts | | $ | — | | | $ | — | | | $ | (69,108 | ) | | $ | (69,108 | ) |
Foreign exchange contracts | | | — | | | | 2,176,844 | | | | — | | | | 2,176,844 | |
Interest rate contracts | | | (460,374 | ) | | | — | | | | — | | | | (460,374 | ) |
| | | | | | | | | | | | | | | | |
Total | | $ | (460,374 | ) | | $ | 2,176,844 | | | $ | (69,108 | ) | | $ | 1,647,362 | |
| | | | | | | | | | | | | | | | |
|
| Amount of Change in Unrealized Appreciation (Depreciation) on Derivatives Recognized on the Statements of Operations | |
| Derivative Contracts | | Futures
Contracts | | | Forward Foreign
Currency Exchange
Contracts | | | Swaps | | | Total | |
Credit contracts | | $ | — | | | $ | — | | | $ | (157,558 | ) | | $ | (157,558 | ) |
Foreign exchange contracts | | | — | | | | 474,173 | | | | — | | | | 474,173 | |
Interest rate contracts | | | (374,115 | ) | | | — | | | | — | | | | (374,115 | ) |
| | | | | | | | | | | | | | | | |
Total | | $ | (374,115 | ) | | $ | 474,173 | | | $ | (157,558 | ) | | $ | (57,500 | ) |
| | | | | | | | | | | | | | | | |
Derivatives Volume
The table below discloses the volume of the Funds’ futures contracts and forward foreign currency exchange contracts activity during the period ended August 31, 2019. Please refer to the tables in the Summary of Derivatives Information for derivative-related gains and losses associated with volume activity.
| | | | | | | | | | | | |
| | | Core Plus
Bond ETF | | | Corporate Bond Research
Enhanced ETF | | | Global Bond
Opportunities
ETF | |
Futures Contracts — Interest: | | | | | | | | | | | | |
Average Notional Balance Long | | $ | 4,003,227 | | | $ | 1,228,079 | | | $ | 32,661,612 | |
Average Notional Balance Short | | | 518,625 | (a) | | | 1,298,691 | | | | 94,497,589 | |
Ending Notional Balance Long | | | 6,873,203 | | | | 1,576,859 | | | | 24,702,682 | |
Ending Notional Balance Short | | | 527,125 | | | | 1,397,375 | | | | 74,741,370 | |
| | | |
Forward Foreign Currency Exchange Contracts: | | | | | | | | | | | | |
Average Settlement Value Purchased | | | — | | | | — | | | | 36,229,943 | |
Average Settlement Value Sold | | | — | | | | — | | | | 103,621,722 | |
Ending Settlement Value Purchased | | | — | | | | — | | | | 43,106,540 | |
Ending Settlement Value Sold | | | — | | | | — | | | | 119,786,494 | |
| | | |
Credit Default Swaps: | | | | | | | | | | | | |
Average Notional Balance — Buy Protection | | | — | | | | — | | | | 8,732,179 | (b) |
Ending Notional Balance — Buy Protection | | | — | | | | — | | | | 18,053,421 | |
| (a) | For the period July 1, 2019 through August 31, 2019. |
| (b) | For the period March 1, 2019 through August 31, 2019. |
The Funds’ derivatives contracts held at August 31, 2019 are not accounted for as hedging instruments under GAAP.
F. Securities Lending — The Funds, except Global Bond Opportunities ETF, are authorized to engage in securities lending in order to generate additional income. The Funds are able to lend to approved borrowers. Citibank N.A. (“Citibank”) serves as lending agent for the Funds, pursuant to a Securities Lending Agency Agreement (the “Securities Lending Agency Agreement”). Securities loaned are collateralized by cash equal to at least 100% of the market value plus accrued interest on the securities lent, which is invested in the IM Shares of JPMorgan U.S. Government Money Market Fund and the Agency SL Shares of the JPMorgan Securities Lending Money Market Fund. The Funds retain loan fees and the interest on cash collateral investments but are required to pay the borrower a rebate for the use of cash collateral. In cases where the lent security is of high value to
| | | | | | |
| | | |
| 198 | | | | J.P. MORGAN EXCHANGE-TRADED FUNDS | | AUGUST 31, 2019 |
borrowers, there may be a negative rebate (i.e., a net payment from the borrower to the Funds). Upon termination of a loan, the Funds are required to return to the borrower an amount equal to the cash collateral, plus any rebate owed to the borrowers. The remaining maturities of the securities lending transactions are considered overnight and continuous. Loans are subject to termination by the Funds or the borrower at any time.
The net income earned on the securities lending (after payment of rebates and Citibank’s fee) is included on the SOP as Income from securities lending (net). The Funds also receive payments from the borrower during the period of the loan, equivalent to dividends and interest earned on the securities loaned, which are recorded as Dividend or Interest income, respectively, on the SOP.
Under the Securities Lending Agency Agreement, Citibank marks to market the loaned securities on a daily basis. In the event the cash received
from the borrower is less than 102% of the value of the loaned securities (105% for loans ofnon-U.S. securities), Citibank requests additional cash from the borrower so as to maintain a collateralization level of at least 102% of the value of the loaned securities plus accrued interest (105% for loans ofnon-U.S. securities), subject to certaindeminimis amounts.
The value of securities out on loan is recorded as an asset on the SALs. The value of the cash collateral received is recorded as a liability on the SAL and details of collateral investments are disclosed on the SOIs.
The Funds bear the risk of loss associated with the collateral investments and are not entitled to additional collateral from the borrower to cover any such losses. To the extent that the value of the collateral investments declines below the amount owed to a borrower, the Funds may incur losses that exceed the amount they earned on lending the security. Upon termination of a loan, the Funds may use leverage (borrow money) to repay the borrower for cash collateral posted if the Adviser does not believe that it is prudent to sell the collateral investments to fund the payment of this liability.
The following table presents the Funds’ value of the securities on loan with Citibank, net of amounts available for offset under the master netting arrangements and any related collateral received or posted by the Funds as of August 31, 2019.
| | | | | | | | | | | | |
| | | Investment Securities
on Loan, at value,
Presented on the
Statements of Assets
and Liabilities | | | Cash Collateral
Posted by Borrower* | | | Net Amount Due
to Counterparty
(not less than zero) | |
High Yield Research Enhanced ETF | | $ | 1,987,184 | | | $ | (1,987,184 | ) | | $ | — | |
Ultra-Short Income ETF | | | 6,807,353 | | | | (6,807,353 | ) | | | — | |
USD Emerging Markets Sovereign Bond ETF | | | 656,831 | | | | (656,831 | ) | | | — | |
| * | Collateral posted reflects the value of securities on loan and does not include any additional amounts received from the borrower. |
Securities lending also involves counterparty risks, including the risk that the loaned securities may not be returned in a timely manner or at all. Subject to certain conditions, Citibank has agreed to indemnify the Funds from losses resulting from a borrower’s failure to return a loaned security.
JPMIM voluntarily waived investment advisory fees charged to the Funds to reduce the impact of the cash collateral investment in the JPMorgan U.S. Government Money Market Fund from 0.16% to 0.06%. JPMIM waived fees associated with the Funds’ investment in JPMorgan U.S. Government Money Market Fund as follows:
| | | | |
Core Plus Bond ETF | | $ | 12 | |
High Yield Research Enhanced ETF | | | 1,397 | |
U.S. Aggregate Bond ETF | | | 4 | |
Ultra-Short Income ETF | | | 416 | |
USD Emerging Markets Sovereign Bond ETF | | | 205 | |
The above waiver is included in the determination of earnings on cash collateral investment and in the calculation of Citibank’s compensation and is included on the SOP as Income from securities lending (net).
BetaBuilders1-5 Year U.S. Aggregate Bond ETF, Corporate Bond Research Enhanced ETF, Municipal ETF and Ultra-Short Municipal Income ETF did not lend out any securities during the period ended August 31, 2019.
G. Investment Transactions with Affiliates — The Funds invested in Underlying Funds which are advised by the Adviser. An issuer which is under common control with a Fund may be considered an affiliate. For the purposes of the financial statements, the Funds assume the issuers listed in the table below to be affiliated issuers. Underlying Funds’ distributions may be reinvested into the Underlying Funds. Reinvestment amounts are included in the purchase cost amounts in the tables below. Included in the purchases and sales amounts in the tables below are exchanges between certain shares of the Underlying Funds. Such exchanges are not treated as purchases and sales for the purpose of recognizing realized gains (losses) or calculating portfolio turnover.
| | | | | | | | |
| | | |
| AUGUST 31, 2019 | | J.P. MORGAN EXCHANGE-TRADED FUNDS | | | | | 199 | |
NOTES TO FINANCIAL STATEMENTS
AS OF AUGUST 31, 2019 (Unaudited) (continued)
BetaBuilders1-5 Year U.S. Aggregate Bond ETF
| | | | | | | | | | | | | | | | | | | | | | | | | | | | | | | | | | | | |
| For the period ended August 31, 2019 | |
| Security Description | | Value at
March 12,
2019 (a) | | | Purchases at Cost | | | Proceeds from Sales | | | Net
Realized
Gain
(Loss) | | | Change in
Unrealized
Appreciation/
(Depreciation) | | | Value at
August 31,
2019 | | | Shares at
August 31,
2019 | | | Dividend
Income | | | Capital Gain
Distributions | |
JPMorgan U.S. Government Money Market Fund Class Institutional Shares, 1.99% (b) (c) | | $ | — | | | $ | 1,742,179 | | | $ | 1,557,665 | | | $ | — | | | $ | — | | | $ | 184,514 | | | | 184,514 | | | $ | 723 | | | $ | — | |
| | | | | | | | | | | | | | | | | | | | | | | | | | | | | | | | | | | | |
|
Core Plus Bond ETF | |
|
| For the six months ended August 31, 2019 | |
| Security Description | | Value at
February 28,
2019 | | | Purchases at Cost | | | Proceeds from Sales | | | Net
Realized
Gain
(Loss) | | | Change in
Unrealized
Appreciation/
(Depreciation) | | | Value at
August 31,
2019 | | | Shares at
August 31,
2019 | | | Dividend
Income | | | Capital Gain
Distributions | |
JPMorgan U.S. Government Money Market Fund Class IM Shares (b) | | $ | — | | | $ | 2,078,531 | | | $ | 2,078,531 | | | $ | — | | | $ | — | | | $ | — | | | | — | | | $ | 342 | * | | $ | — | |
JPMorgan U.S. Government Money Market Fund Class Institutional Shares, 1.99% (b) (c) | | | 6,071,775 | | | | 14,373,896 | | | | 18,694,305 | | | | — | | | | — | | | | 1,751,366 | | | | 1,751,366 | | | | 30,099 | | | | — | |
| | | | | | | | | | | | | | | | | | | | | | | | | | | | | | | | | | | | |
| | $ | 6,071,775 | | | $ | 16,452,427 | | | $ | 20,772,836 | | | $ | — | | | $ | — | | | $ | 1,751,366 | | | | | | | $ | 30,441 | | | $ | — | |
| | | | | | | | | | | | | | | | | | | | | | | | | | | | | | | | | | | | |
|
Corporate Bond Research Enhanced ETF | |
|
| For the six months ended August 31, 2019 | |
| Security Description | | Value at
February 28,
2019 | | | Purchases at Cost | | | Proceeds from Sales | | | Net
Realized
Gain
(Loss) | | | Change in
Unrealized
Appreciation/
(Depreciation) | | | Value at
August 31,
2019 | | | Shares at
August 31,
2019 | | | Dividend
Income | | | Capital Gain
Distributions | |
JPMorgan U.S. Government Money Market Fund Class Institutional Shares, 1.99% (b) (c) | | $ | 307,539 | | | $ | 4,394,314 | | | $ | 4,403,769 | | | $ | — | | | $ | — | | | $ | 298,084 | | | | 298,084 | | | $ | 2,495 | | | $ | — | |
| | | | | | | | | | | | | | | | | | | | | | | | | | | | | | | | | | | | |
|
Global Bond Opportunities ETF | |
|
| For the six months ended August 31, 2019 | |
| Security Description | | Value at
February 28,
2019 | | | Purchases at Cost | | | Proceeds from Sales | | | Net
Realized
Gain
(Loss) | | | Change in
Unrealized
Appreciation/
(Depreciation) | | | Value at
August 31,
2019 | | | Shares at
August 31,
2019 | | | Dividend
Income | | | Capital Gain
Distributions | |
JPMorgan U.S. Government Money Market Fund Class Institutional Shares, 1.99% (b) (c) | | $ | 10,805,532 | | | $ | 42,662,981 | | | $ | 47,708,286 | | | $ | — | | | $ | — | | | $ | 5,760,227 | | | | 5,760,227 | | | $ | 57,742 | | | $ | — | |
| | | | | | | | | | | | | | | | | | | | | | | | | | | | | | | | | | | | |
| | | | | | |
| | | |
| 200 | | | | J.P. MORGAN EXCHANGE-TRADED FUNDS | | AUGUST 31, 2019 |
| | | | | | | | | | | | | | | | | | | | | | | | | | | | | | | | | | | | |
|
High Yield Research Enhanced ETF | |
|
| For the six months ended August 31, 2019 | |
| Security Description | | Value at
February 28,
2019 | | | Purchases at Cost | | | Proceeds from Sales | | | Net
Realized
Gain
(Loss) | | | Change in
Unrealized
Appreciation/
(Depreciation) | | | Value at
August 31,
2019 | | | Shares at
August 31,
2019 | | | Dividend
Income | | | Capital Gain
Distributions | |
JPMorgan U.S. Government Money Market Fund Class IM Shares, 2.05% (b) (c) | | $ | 4,202,920 | | | $ | 16,031,643 | | | $ | 18,176,585 | | | $ | — | | | $ | — | | | $ | 2,057,978 | | | | 2,057,978 | | | $ | 43,753 | * | | $ | — | |
JPMorgan U.S. Government Money Market Fund Class Institutional Shares, 1.99% (b) (c) | | | 2,621,250 | | | | 17,142,488 | | | | 16,595,893 | | | | — | | | | — | | | | 3,167,845 | | | | 3,167,845 | | | | 24,472 | | | | — | |
| | | | | | | | | | | | | | | | | | | | | | | | | | | | | | | | | | | | |
Total | | $ | 6,824,170 | | | $ | 33,174,131 | | | $ | 34,772,478 | | | $ | — | | | $ | — | | | $ | 5,225,823 | | | | | | | $ | 68,225 | | | $ | — | |
| | | | | | | | | | | | | | | | | | | | | | | | | | | | | | | | | | | | |
|
Municipal ETF | |
|
| For the six months ended August 31, 2019 | |
| Security Description | | Value at
February 28,
2019 | | | Purchases at Cost | | | Proceeds from Sales | | | Net
Realized
Gain
(Loss) | | | Change in
Unrealized
Appreciation/
(Depreciation) | | | Value at
August 31,
2019 | | | Shares at
August 31,
2019 | | | Dividend
Income | | | Capital Gain
Distributions | |
JPMorgan Institutional Tax Free Money Market Fund Class IM Shares, 1.25% (b) (c) | | $ | 1,050,773 | | | $ | 26,800,424 | | | $ | 26,918,387 | | | $ | 700 | | | $ | 92 | | | $ | 933,602 | | | | 933,508 | | | $ | 10,934 | | | $ | — | |
| | | | | | | | | | | | | | | | | | | | | | | | | | | | | | | | | | | | |
|
U.S. Aggregate Bond ETF | |
|
| For the six months ended August 31, 2019 | |
| Security Description | | Value at
February 28,
2019 | | | Purchases at Cost | | | Proceeds from Sales | | | Net
Realized
Gain
(Loss) | | | Change in
Unrealized
Appreciation/
(Depreciation) | | | Value at
August 31,
2019 | | | Shares at
August 31,
2019 | | | Dividend
Income | | | Capital Gain
Distributions | |
JPMorgan U.S. Government Money Market Fund Class IM Shares (b) | | $ | — | | | $ | 98,065 | | | $ | 98,065 | | | $ | — | | | $ | — | | | $ | — | | | | — | | | $ | 125 | * | | $ | — | |
JPMorgan U.S. Government Money Market Fund Class Institutional Shares, 1.99% (b) (c) | | | 337,456 | | | | 31,200,250 | | | | 31,034,456 | | | | — | | | | — | | | | 503,250 | | | | 503,250 | | | | 7,651 | | | | — | |
| | | | | | | | | | | | | | | | | | | | | | | | | | | | | | | | | | | | |
Total | | $ | 337,456 | | | $ | 31,298,315 | | | $ | 31,132,521 | | | $ | — | | | $ | — | | | $ | 503,250 | | | | | | | $ | 7,776 | | | $ | — | |
| | | | | | | | | | | | | | | | | | | | | | | | | | | | | | | | | | | | |
| | | | | | | | |
| | | |
| AUGUST 31, 2019 | | J.P. MORGAN EXCHANGE-TRADED FUNDS | | | | | 201 | |
NOTES TO FINANCIAL STATEMENTS
AS OF AUGUST 31, 2019 (Unaudited) (continued)
| | | | | | | | | | | | | | | | | | | | | | | | | | | | | | | | | | | | |
|
Ultra-Short Income ETF | |
|
| For the six months ended August 31, 2019 | |
| Security Description | | Value at
February 28,
2019 | | | Purchases at Cost | | | Proceeds from Sales | | | Net
Realized
Gain
(Loss) | | | Change in
Unrealized
Appreciation/
(Depreciation) | | | Value at
August 31,
2019 | | | Shares at
August 31,
2019 | | | Dividend
Income | | | Capital Gain
Distributions | |
JPMorgan Securities Lending Money Market Fund Class Agency SL Shares, 2.29% (b) (c) | | $ | — | | | $ | 2,000,000 | | | $ | — | | | $ | — | | | $ | — | | | $ | 2,000,000 | | | | 1,999,800 | | | $ | 4,885 | * | | $ | — | |
JPMorgan U.S. Government Money Market Fund Class IM Shares, 2.05% (b) (c) | | | — | | | | 18,217,493 | | | | 13,196,403 | | | | — | | | | — | | | | 5,021,090 | | | | 5,021,090 | | | | 15,940 | * | | | — | |
JPMorgan U.S. Government Money Market Fund Class Institutional Shares, 1.99% (b) (c) | | | 150,351,796 | | | | 2,389,366,487 | | | | 2,195,992,399 | | | | — | | | | — | | | | 343,725,884 | | | | 343,725,884 | | | | 1,669,656 | | | | — | |
| | | | | | | | | | | | | | | | | | | | | | | | | | | | | | | | | | | | |
Total | | $ | 150,351,796 | | | $ | 2,409,583,980 | | | $ | 2,209,188,802 | | | $ | — | | | $ | — | | | $ | 350,746,974 | | | | | | | $ | 1,690,481 | | | $ | — | |
| | | | | | | | | | | | | | | | | | | | | | | | | | | | | | | | | | | | |
|
Ultra-Short Municipal Income ETF | |
|
| For the six months ended August 31, 2019 | |
| Security Description | | Value at
February 28,
2019 | | | Purchases at Cost | | | Proceeds from Sales | | | Net
Realized
Gain
(Loss) | | | Change in
Unrealized
Appreciation/
(Depreciation) | | | Value at
August 31,
2019 | | | Shares at
August 31,
2019 | | | Dividend
Income | | | Capital Gain
Distributions | |
JPMorgan Institutional Tax Free Money Market Fund Class IM Shares, 1.25% (b) (c) | | $ | 146,947 | | | $ | 76,922,276 | | | $ | 75,387,040 | | | $ | 348 | | | $ | 10 | | | $ | 1,682,541 | | | | 1,682,373 | | | $ | 14,570 | | | $ | — | |
| | | | | | | | | | | | | | | | | | | | | | | | | | | | | | | | | | | | |
|
USD Emerging Markets Sovereign Bond ETF | |
| For the six months ended August 31, 2019 | |
| Security Description | | Value at
February 28,
2019 | | | Purchases at Cost | | | Proceeds from Sales | | | Net
Realized
Gain
(Loss) | | | Change in
Unrealized
Appreciation/
(Depreciation) | | | Value at
August 31,
2019 | | | Shares at
August 31,
2019 | | | Dividend
Income | | | Capital Gain
Distributions | |
JPMorgan U.S. Government Money Market Fund Class IM Shares, 2.05% (b) (c) | | $ | — | | | $ | 2,614,820 | | | $ | 1,938,583 | | | $ | — | | | $ | — | | | $ | 676,237 | | | | 676,237 | | | $ | 6,976 | * | | $ | — | |
JPMorgan U.S. Government Money Market Fund Class Institutional Shares, 1.99% (b) (c) | | | 353,654 | | | | 2,863,400 | | | | 2,960,466 | | | | — | | | | — | | | | 256,588 | | | | 256,588 | | | | 2,611 | | | | — | |
| | | | | | | | | | | | | | | | | | | | | | | | | | | | | | | | | | | | |
Total | | $ | 353,654 | | | $ | 5,478,220 | | | $ | 4,899,049 | | | $ | — | | | $ | — | | | $ | 932,825 | | | | | | | $ | 9,587 | | | $ | — | |
| | | | | | | | | | | | | | | | | | | | | | | | | | | | | | | | | | | | |
| (a) | Commencement of operations was March 12, 2019. |
| (b) | Investment in an affiliated fund, which is registered under the Investment Company Act of 1940, as amended, and is advised by J.P. Morgan Investment Management Inc. |
| (c) | The rate shown is the current yield as of August 31, 2019. |
| * | Amount is included on the SOP as Income from securities lending (net) (after payments of rebates and Citibank’s fee). |
| | | | | | |
| | | |
| 202 | | | | J.P. MORGAN EXCHANGE-TRADED FUNDS | | AUGUST 31, 2019 |
H. Foreign Currency Translation — The books and records of the Funds are maintained in U.S. dollars. Foreign currency amounts are translated into U.S. dollars at the prevailing exchange rates of such currencies against the U.S. dollar. The market value of investment securities and other assets and liabilities are translated at the exchange rate as of the valuation date. Purchases and sales of investment securities, income and expenses are translated at the exchange rate prevailing on the respective dates of such transactions.
The Funds do not isolate the effect of changes in foreign exchange rates from changes in market prices on securities held. Accordingly, such changes are included within Change in net unrealized appreciation/depreciation on investments on the SOP.
Reported realized foreign currency gains and losses arise from the disposition of foreign currency, currency gains or losses realized between the trade and settlement dates on securities transactions, and the difference between the amounts of dividends, interest and foreign withholding taxes recorded on each Fund’s books on the transaction date and the U.S. dollar equivalent of the amounts actually received or paid. These reported realized foreign currency gains and losses are included in Net realized gain (loss) on foreign currency transactions on the SOP. Unrealized foreign currency gains and losses arise from changes (due to changes in exchange rates) in the value of foreign currency and other assets and liabilities denominated in foreign currencies, which are held at year end and are included in Change in net unrealized appreciation/ depreciation on foreign currency translations on the SOP.
I. Offering and Organizational Costs — Total offering costs incurred in connection with the offering of shares of the Funds are amortized on a straight line basis over 12 months from the date the Funds commenced operations. Total offering costs incurred were as follows:
| | | | |
Core Plus Bond ETF | | $ | 10,733 | |
Corporate Bond Research Enhanced ETF | | | 15,480 | |
Municipal ETF | | | 16,242 | |
U.S. Aggregate Bond ETF | | | 22,802 | |
Ultra-Short Municipal Income ETF | | | 18,516 | |
Costs paid in connection with the organization of the Funds, if any, were recorded as an expense at the time the Funds commenced operations and are included as part of Professional fees on the SOP. For the six months ended August 31, 2019, total offering costs amortized were:
| | | | |
Core Plus Bond ETF | | $ | 5,411 | |
Corporate Bond Research Enhanced ETF | | | 7,888 | |
Municipal ETF | | | 8,277 | |
U.S. Aggregate Bond ETF | | | 11,619 | |
Ultra-Short Municipal Income ETF | | | 9,436 | |
J. Security Transactions and Investment Income — Investment transactions are accounted for on the trade date (the date the order to buy or sell is executed). Securities gains and losses are calculated on a specifically identified cost basis. Interest income is determined on the basis of coupon interest accrued using the effective interest method, which adjusts for amortization of premiums and accretion of discounts. Dividend income net of foreign taxes withheld, if any, is recorded on theex-dividend date or when a Fund first learns of the dividend.
K. Allocation of Expenses — Expenses directly attributable to a Fund are charged directly to that Fund, while the expenses attributable to more than one fund of the Trust are allocated among the applicable funds.
L. Federal Income Taxes — Each Fund is treated as a separate taxable entity for Federal income tax purposes. Each Fund’s policy is to comply with the provisions of the Internal Revenue Code (the “Code”) applicable to regulated investment companies and to distribute to shareholders all of its distributable net investment income and net realized capital gains on investments. Accordingly, no provision for Federal income tax is necessary. Management has reviewed the Funds’ tax positions for all open tax years and has determined that as of August 31, 2019, no liability for Federal income tax is required in the Funds’ financial statements for net unrecognized tax benefits. However, management’s conclusions may be subject to future review based on changes in, or the interpretation of, the accounting standards or tax laws and regulations. Each of the Funds’ Federal tax returns for the prior three fiscal years, or since inception if shorter, remains subject to examination by the Internal Revenue Service.
M. Foreign Taxes — The Funds may be subject to foreign taxes on income, gains on investments or currency purchases/repatriation, a portion of which may be recoverable. The Funds will accrue such taxes and recoveries as applicable, based upon their current interpretation of tax rules and regulations that exist in the markets in which they invest. When a capital gain tax is determined to apply, the Funds record an estimated deferred tax liability in an amount that would be payable if the securities were disposed of on the valuation date.
N. Distributions to Shareholders — Distributions from net investment income, if any, are generally declared and paid monthly. Net realized capital gains, if any, are distributed by each Fund at least annually. The amount of distributions from net investment income and net realized capital gains is determined in accordance with Federal income tax regulations, which may differ from GAAP. To the extent these “book/tax” differences are permanent in nature (i.e., that they result from other than timing of recognition — “temporary differences”), such amounts are reclassified within the capital accounts based on their Federaltax-basis treatment.
O. New Accounting Pronouncements — In March 2017, the FASB issuedAccounting Standards Update (“ASU”)2017-08 (“ASU2017-08”) Premium Amortization on Purchased Callable Debt Securities,which shortens the amortization period for certain callable debt securities held at a premium. Specifically, it required the premium to be amortized to the earliest call date. The Funds have adopted and applied ASU2017-08 on a modified
| | | | | | | | |
| | | |
| AUGUST 31, 2019 | | J.P. MORGAN EXCHANGE-TRADED FUNDS | | | | | 203 | |
NOTES TO FINANCIAL STATEMENTS
AS OF AUGUST 31, 2019 (Unaudited) (continued)
retrospective basis through a cumulative-effect adjustment as of the beginning of the period of adoption. As a result of the adoption of ASU2017-08, as of March 1, 2019, the amortized cost basis of investments and unrealized appreciation (depreciation) of investments of the Funds were increased (decreased) by the amounts presented in the following table. The adoption of ASU2017-08 had no impact on beginning net assets, the current period results from operations, or any prior period information presented in the financial statements.
| | | | | | | | |
| Fund | | Amortized Cost
Basis of
Investments | | | Unrealized
Appreciation
(Depreciation) of
Investments | |
Core Plus Bond ETF | | $ | (70 | ) | | $ | 70 | |
Corporate Bond Research Enhanced ETF | | | (28 | ) | | | 28 | |
Global Bond Opportunities ETF | | | (282,217 | ) | | | 282,217 | |
High Yield Research Enhanced ETF | | | (238,372 | ) | | | 238,372 | |
Municipal ETF | | | 532 | | | | (532 | ) |
U.S. Aggregate Bond ETF | | | (73 | ) | | | 73 | |
Ultra-Short Income ETF | | | (74,493 | ) | | | 74,493 | |
Ultra-Short Municipal Income ETF | | | 421 | | | | (421 | ) |
USD Emerging Markets Sovereign Bond ETF | | | (164 | ) | | | 164 | |
In August 2018, the FASB issued ASU2018-13 (“ASU2018-13”),Fair Value Measurement (Topic 820): Disclosure Framework — Changes to the DisclosureRequirements for Fair Value Measurement,which adds, removes, and modifies certain aspects of the fair value disclosure. ASU2018-13 amendments are the result of a broader disclosure project, FASB Concepts StatementConceptual Framework for Financial Reporting — Chapter 8: Notes to Financial Statements, to improve the effectiveness of the fair value disclosure requirements. ASU2018-13 is effective for the fiscal years, and interim periods within those fiscal years, beginning after December 15, 2019; early adoption is permitted. Management has evaluated the implications of these changes and the amendments are included in the financial statements, which had no effect to the Funds’ net assets or results of operation.
3. Fees and Other Transactions with Affiliates
A. Investment Advisory Fee — Pursuant to an Investment Advisory Agreement for all Funds, except the BetaBuilders1-5 Year U.S. Aggregate Bond ETF, and a Management Agreement for the BetaBuilders1-5 Year U.S. Aggregate Bond ETF, the Adviser manages the investments of each Fund. For such services, the Adviser is paid an investment advisory fee which is accrued daily and paid monthly based on each Fund’s respective average daily net assets. The annual rate for each Fund is as follows:
| | | | |
BetaBuilders1-5 Year U.S. Aggregate Bond ETF | | | 0.05 | % |
Core Plus Bond ETF | | | 0.30 | |
Corporate Bond Research Enhanced ETF | | | 0.14 | |
Global Bond Opportunities ETF | | | 0.55 | |
High Yield Research Enhanced ETF | | | 0.30 | |
Municipal ETF | | | 0.24 | |
U.S. Aggregate Bond ETF | | | 0.07 | |
Ultra-Short Income ETF | | | 0.15 | |
Ultra-Short Municipal Income ETF | | | 0.15 | |
USD Emerging Markets Sovereign Bond ETF | | | 0.32 | |
The Adviser waived investment advisory fees and/or reimbursed expenses as outlined in Note 3.E.
B. Administration Fee — Pursuant to an Administration Agreement for all Funds, except the BetaBuilders1-5 Year U.S. Aggregate Bond ETF, the Administrator provides certain administration services to the Funds. In consideration of these services, the Administrator receives a fee accrued daily and paid monthly at an annual rate of 0.075% of each Fund’s respective average daily net assets. The Administrator also provides administration services to the BetaBuilders1-5 Year U.S. Aggregate Bond ETF pursuant to the Management Agreement for that Fund; the Administrator is compensated as described in Note 3.A.
The Administrator waived administration fees as outlined in Note 3.E.
JPMorgan Chase Bank, N.A. (“JPMCB”), a wholly-owned subsidiary of JPMorgan, serves as the Funds’sub-administrator (the“Sub-administrator”). For its services asSub-administrator, JPMCB receives a portion of the fees payable to the Administrator.
C. Custodian, Accounting and Transfer Agent Fees — JPMCB provides custody, accounting and transfer agency services to the Funds. The amounts paid directly to JPMCB by the Funds, except the BetaBuilders1-5 Year U.S. Aggregate Bond ETF, which is paid as described in Note 3.A, for custody services are included in the Custodian, Accounting and Transfer Agent fees on the SOP. Interest income earned on cash balances at the custodian, if any, is included in Interest income from affiliates on the SOP. With respect to the transfer agency services provided by JPMCB for each creation or redemption transaction, the Authorized Participant will generally be responsible for such associated expenses; during the period ended August 31, 2019, the Funds paid no transfer agency fees to JPMCB.
| | | | | | |
| | | |
| 204 | | | | J.P. MORGAN EXCHANGE-TRADED FUNDS | | AUGUST 31, 2019 |
Additionally, Authorized Participants generally pay transaction fees associated with the creation and redemption of fund shares. These fees are used to offset certain custodian charges incurred by the Fund for these transactions. For the period ended August 31, 2019, the amount of transaction fees paid by the Authorized Participants that were used to reimburse custodian fees were as follows:
| | | | |
Core Plus Bond ETF | | $ | 100 | |
Corporate Bond Research Enhanced ETF | | | 300 | |
Global Bond Opportunities ETF | | | 1,100 | |
High Yield Research Enhanced ETF | | | 200 | |
Municipal ETF | | | 1,800 | |
U.S. Aggregate Bond ETF | | | 2,100 | |
Ultra-Short Income ETF | | | 7,950 | |
Ultra-Short Municipal Income ETF | | | 4,600 | |
Such amounts are included in expense reimbursements fromnon-affiliates in the SOP.
Restricted cash on the SAL is cash received from Authorized Participants for the reimbursement of creation and/or redemption of Fund shares.
Interest expense paid to the custodian related to cash overdrafts, if any, is included in Interest expense to affiliates on the SOP.
D. Collateral Management Fees — JPMCB provides derivatives collateral management services for Global Bond Opportunities ETF. The amount paid directly to JPMCB by the Fund for the services is included in Collateral management fees on the Statements of Operations.
E. Waivers and Reimbursements — The Adviser has contractually agreed to waive fees and/or reimburse the Funds to the extent that total annual operating expenses, (excluding acquired fund fees and expenses, dividend expenses related to short sales, interest, taxes, expenses related to litigation and potential litigation, and extraordinary expenses), exceed the percentages of the Funds’ respective average daily net assets as shown in the table below:
| | | | |
| | | Expense Cap | |
Core Plus Bond ETF | | | 0.40 | % |
Corporate Bond Research Enhanced ETF | | | 0.14 | |
Global Bond Opportunities ETF | | | 0.55 | |
High Yield Research Enhanced ETF | | | 0.40 | |
Municipal ETF | | | 0.24 | |
U.S. Aggregate Bond ETF | | | 0.07 | |
Ultra-Short Income ETF | | | 0.18 | |
Ultra-Short Municipal Income ETF | | | 0.18 | |
USD Emerging Markets Sovereign Bond ETF | | | 0.39 | |
The expense limitation agreements were in effect for the period ended August 31, 2019 and are in place until at least June 30, 2022. For the period ended August 31, 2019, the Funds’ service providers waived fees and/or reimbursed expenses for each of the Funds as follows. None of these parties expect the Funds to repay any such waived fees and/or reimbursed expenses in future years.
| | | | | | | | | | | | | | | | |
| | | Contractual Waivers | | | | |
| | | Investment
Advisory
Fees | | | Administration
Fees | | | Total | | | Contractual
Reimbursements | |
Core Plus Bond ETF | | $ | 38,873 | | | $ | 10,349 | | | $ | 49,222 | | | $ | 27,710 | |
Corporate Bond Research Enhanced ETF | | | 19,317 | | | | 10,470 | | | | 29,787 | | | | 65,440 | |
Global Bond Opportunities ETF | | | 130,276 | | | | 70,512 | | | | 200,788 | | | | — | |
High Yield Research Enhanced ETF | | | 53,102 | | | | 35,401 | | | | 88,503 | | | | — | |
Municipal ETF | | | 39,005 | | | | 12,477 | | | | 51,482 | | | | 59,460 | |
U.S. Aggregate Bond ETF | | | 55,199 | | | | 59,904 | | | | 115,103 | | | | 62,333 | |
Ultra-Short Income ETF | | | 1,395,940 | | | | 930,627 | | | | 2,326,567 | | | | — | |
Ultra-Short Municipal Income ETF | | | 68,100 | | | | 34,909 | | | | 103,009 | | | | 24,808 | |
USD Emerging Markets Sovereign Bond ETF | | | 68,462 | | | | 24,005 | | | | 92,467 | | | | — | |
Additionally, the Funds may invest in one or more money market funds advised by the Adviser (affiliated money market funds). For each Fund, except the BetaBuilders1-5 Year U.S. Aggregate Bond ETF, the Adviser has contractually agreed to waive fees and/or reimburse expenses in an amount sufficient to offset the respective fees and expenses of the affiliated money market funds on the applicable Fund’s investment in such affiliated money market fund, except for investments of securities lending cash collateral. For BetaBuilders1-5 Year U.S. Aggregate Bond ETF, these waivers are covered under the Management Agreement as described in Note 3.A.
| | | | | | | | |
| | | |
| AUGUST 31, 2019 | | J.P. MORGAN EXCHANGE-TRADED FUNDS | | | | | 205 | |
NOTES TO FINANCIAL STATEMENTS
AS OF AUGUST 31, 2019 (Unaudited) (continued)
The amounts of these waivers resulting from investments in these money market funds for the period ended August 31, 2019 were as follows:
| | | | |
BetaBuilders1-5 Year U.S. Aggregate Bond ETF | | $ | 44 | |
Core Plus Bond ETF | | | 2,523 | |
Corporate Bond Research Enhanced ETF | | | 227 | |
Global Bond Opportunities ETF | | | 5,965 | |
High Yield Research Enhanced ETF | | | 2,149 | |
Municipal ETF | | | 922 | |
U.S. Aggregate Bond ETF | | | 711 | |
Ultra-Short Income ETF | | | 122,943 | |
Ultra-Short Municipal Income ETF | | | 1,719 | |
USD Emerging Markets Sovereign Bond ETF | | | 267 | |
F. Distribution Services — The Distributor or its agent distributes Creation Units for each Fund on an agency basis. The Distributor does not maintain a secondary market in shares of each Fund. JPMDS receives no fees for their distribution services under their respective distribution agreements with the Trust (the “Distribution Agreements”). Although the Trust does not pay any fees under the Distribution Agreements, JPMIM pays JPMDS for certain distribution related services.
G. Other — Certain officers of the Trust are affiliated with the Adviser, the Administrator and JPMDS. Such officers, with the exception of the Chief Compliance Officer, receive no compensation from the Funds for serving in their respective roles.
The Board designated and appointed a Chief Compliance Officer to the Funds pursuant to Rule38a-1 under the 1940 Act. Each Fund, excluding the BetaBuilders1-5 Year U.S. Aggregate Bond ETF, along with affiliated funds, makes reimbursement payments, on apro-rata basis, to the Administrator for a portion of the fees associated with the office of the Chief Compliance Officer. Such fees are included in Trustees’ and Chief Compliance Officer’s fees on the SOP.
During the six months ended August 31, 2019, the High Yield Research Enhanced ETF and Global Bond Opportunities ETF purchased securities from an underwriting syndicate in which the principal underwriter or members of the syndicate were affiliated with the Adviser.
The Securities and Exchange Commission (“SEC”) has granted an exemptive order permitting the Funds to engage in principal transactions with J.P. Morgan Securities, Inc., an affiliated broker, involving taxable money market instruments, subject to certain conditions.
H. Management Fee — Under the Management Agreement, JPMIM is responsible for substantially all expenses of the BetaBuilders1-5 Year U.S. Aggregate Bond ETF, except for the management fees, payments under the BetaBuilders1-5 Year U.S. Aggregate Bond ETF’s12b-1 plan (if any), interest expenses, dividend and interest expenses related to short sales, taxes, acquired fund fees and expenses (other than fees for funds advised by the adviser and/or its affiliates), costs of holding shareholder meetings, litigation and potential litigation and other extraordinary expenses not incurred in the ordinary course of the BetaBuilders1-5 Year U.S. Aggregate Bond ETF’s business. Additionally, the BetaBuilders1-5 Year U.S. Aggregate Bond ETF shall be responsible for itsnon-operating expenses, including brokerage commissions and fees and expenses associated with the Fund’s securities lending program, if applicable.
Effective November 1, 2019, the Investment Advisory Agreement, Administration Agreement and Expense Limitation Agreement for each Fund will be replaced by a Management Agreement. Under the Management Agreement, JPMIM is responsible for substantially all expenses of each Fund, except for the management fees, payments under a Fund’s 12b-1 plan (if any), interest expenses, dividend and interest expenses related to short sales, taxes, acquired fund fees and expenses (other than fees for funds advised by the adviser and/or its affiliates), costs of holding shareholder meetings, the costs of any securities lending program, and litigation and potential litigation and other extraordinary expenses not incurred in the ordinary course of each Fund’s business. Additionally, each Fund shall be responsible for its non-operating expenses, including brokerage commissions and fees and expense associated with a Fund’s securities lending program, if applicable. For the avoidance of doubt, the Adviser’s payment of such expenses may be accomplished through a Fund’s payment of such expenses and a corresponding reduction in the fee payable to the Adviser, provided, however, that if the amount of expenses paid by a Fund exceeds the fee payable to the Adviser, the Adviser will reimburse that Fund for such amount. The management fee is accrued daily and paid no more frequently than monthly based on each Fund’s respective average daily net assets at following rate:
| | | | |
Core Plus Bond ETF | | | 0.40 | % |
Corporate Bond Research Enhanced ETF | | | 0.14 | |
Global Bond Opportunities ETF | | | 0.50 | |
High Yield Research Enhanced ETF | | | 0.40 | |
Municipal ETF | | | 0.24 | |
U.S. Aggregate Bond ETF | | | 0.07 | |
Ultra-Short Income ETF | | | 0.18 | |
Ultra-Short Municipal Income ETF | | | 0.18 | |
USD Emerging Markets Sovereign Bond ETF | | | 0.39 | |
| | | | | | |
| | | |
| 206 | | | | J.P. MORGAN EXCHANGE-TRADED FUNDS | | AUGUST 31, 2019 |
4. Investment Transactions
During the period ended August 31, 2019, purchases and sales of investments (excluding short-term investments) were as follows:
| | | | | | | | | | | | | | | | |
| | | Purchases
(excluding U.S.
Government) | | | Sales
(excluding U.S.
Government) | | | Purchases
of U.S.
Government | | | Sales of
U.S.
Government | |
BetaBuilders1-5 Year U.S. Aggregate Bond ETF | | $ | 15,617,143 | | | $ | 2,613,332 | | | $ | 20,638,346 | | | $ | 2,587,145 | |
Core Plus Bond ETF | | | 20,430,313 | | | | 18,033,866 | | | | 8,713 | | | | 9,426 | |
Corporate Bond Research Enhanced ETF | | | 9,841,559 | | | | 8,519,497 | | | | 1,795,038 | | | | 2,054,390 | |
Global Bond Opportunities ETF | | | 77,355,645 | | | | 70,401,246 | | | | — | | | | — | |
High Yield Research Enhanced ETF | | | 27,210,813 | | | | 22,962,676 | | | | — | | | | — | |
Municipal ETF | | | 14,139,693 | | | | 11,101,409 | | | | — | | | | — | |
U.S. Aggregate Bond ETF | | | 86,408,793 | | | | 38,438,150 | | | | 46,166,043 | | | | 13,533,672 | |
Ultra-Short Income ETF | | | 2,765,618,786 | | | | 910,902,287 | | | | 256,217,633 | | | | — | |
Ultra-Short Municipal Income ETF | | | 115,067,728 | | | | 64,388,000 | | | | — | | | | — | |
USD Emerging Markets Sovereign Bond ETF | | | 15,563,637 | | | | 15,498,337 | | | | — | | | | — | |
For the period ended August 31, 2019, there were noin-kind transactions associated with creations and redemptions.
5. Federal Income Tax Matters
For Federal income tax purposes, the estimated cost and unrealized appreciation (depreciation) in value of investments held at August 31, 2019 were as follows:
| | | | | | | | | | | | | | | | |
| | | Aggregate
Cost | | | Gross
Unrealized
Appreciation | | | Gross
Unrealized
Depreciation | | | Net Unrealized
Appreciation
(Depreciation) | |
BetaBuilders1-5 Year U.S. Aggregate Bond ETF | | $ | 31,320,073 | | | $ | 625,628 | | | $ | 1,194 | | | $ | 624,434 | |
Core Plus Bond ETF | | | 30,855,970 | | | | 1,528,612 | | | | 49,929 | | | | 1,478,683 | |
Corporate Bond Research Enhanced ETF | | | 26,576,925 | | | | 2,634,431 | | | | 3,640 | | | | 2,630,791 | |
Global Bond Opportunities ETF | | | 184,906,436 | | | | 8,010,867 | | | | 4,676,760 | | | | 3,334,107 | |
High Yield Research Enhanced ETF | | | 160,954,518 | | | | 5,171,225 | | | | 1,541,754 | | | | 3,629,471 | |
Municipal ETF | | | 33,563,749 | | | | 2,205,337 | | | | 159 | | | | 2,205,178 | |
U.S. Aggregate Bond ETF | | | 180,134,081 | | | | 9,091,331 | | | | 22,331 | | | | 9,069,000 | |
Ultra-Short Income ETF | | | 8,333,696,108 | | | | 26,293,898 | | | | 661,491 | | | | 25,632,407 | |
Ultra-Short Municipal Income ETF | | | 123,165,914 | | | | 484,106 | | | | 1,112 | | | | 482,994 | |
USD Emerging Markets Sovereign Bond ETF | | | 63,266,409 | | | | 3,392,505 | | | | 673,763 | | | | 2,718,742 | |
As of February 28, 2019, the following Funds had the following net capital loss carryforwards:
| | | | | | | | |
| | | Capital Loss Carryforward
Character | |
| | | Short-Term | | | Long-Term | |
Global Bond Opportunities ETF | | $ | 1,184,197 | | | $ | 415,777 | |
High Yield Research Enhanced ETF | | | 278,732 | | | | 77,763 | |
USD Emerging Markets Sovereign Bond ETF | | | 662,337 | | | | — | |
Net capital losses and specified ordinary losses incurred after October 31, and within the taxable year are deemed to arise on the first business day of the Funds’ next taxable year. For the year ended February 28, 2019, the Funds deferred to March 1, 2019 the following net capital losses and specified ordinary losses of:
| | | | | | | | | | | | |
| | | Net Capital Losses | | | Specified
Ordinary Losses | |
| | | Short-Term | | | Long-Term | |
Global Bond Opportunities ETF | | $ | 931,655 | | | $ | 1,099,030 | | | $ | 566,558 | |
High Yield Research Enhanced ETF | | | 361,803 | | | | 188,246 | | | | — | |
Ultra-Short Income ETF | | | — | | | | 19,191 | | | | — | |
USD Emerging Markets Sovereign Bond ETF | | | 123,967 | | | | 3,736 | | | | — | |
6. Capital Share Transactions
The Trust issues and redeems shares of the Funds only in Creation Units through the Distributor at NAV. Capital shares transactions detail can be found in the Statements of Changes in Net Assets.
Shares of the Funds may only be purchased or redeemed by Authorized Participants. Such Authorized Participants may from time to time hold, of record or beneficially, a substantial percentage of the Funds’ shares outstanding and act as executing or clearing broker for investment transactions
| | | | | | | | |
| | | |
| AUGUST 31, 2019 | | J.P. MORGAN EXCHANGE-TRADED FUNDS | | | | | 207 | |
NOTES TO FINANCIAL STATEMENTS
AS OF AUGUST 31, 2019 (Unaudited) (continued)
on behalf of the Funds. An Authorized Participant is either (1) a “Participating Party” or other participant in the clearing process through the Continuous Net Settlement System of the National Securities Clearing Corporation (“NSCC”); or (2) a DTC Participant; which, in either case, must have executed an agreement with the Distributor.
Creation Units of a Fund may be created in advance of receipt by the Trust of all or a portion of the applicable basket of equity securities and other instruments (“Deposit Instruments”) and cash as described in the Funds’ registration statement. In these instances, the initial Deposit Instruments and cash must be deposited in an amount equal to the sum of the cash amount, plus at least 105%, for BetaBuilders 1-5 Year U.S. Aggregate Bond ETF, Corporate Bond Research Enhanced ETF, Global Bond Opportunities ETF, High Yield Research Enhanced ETF, U.S. Aggregate Bond ETF, Ultra-Short Income ETF and USD Emerging Markets Sovereign Bond ETF, of the market value of undelivered Deposit Instruments. A transaction fee may be imposed to offset transfer and other transaction costs associated with the purchase or redemption of Creation Units.
Authorized Participants transacting in Creation Units for cash may also pay a variable fee to compensate the relevant fund for market impact expenses relating to investing in portfolio securities. Such variable fees, if any, are included in “Proceeds from shares issued” in the Statements of Changes in Net Assets.
7. Risks, Concentrations and Indemnifications
In the normal course of business, the Funds enter into contracts that contain a variety of representations which provide general indemnifications. Each Fund’s maximum exposure under these arrangements is unknown. The amount of exposure would depend on future claims that may be brought against each Fund. However, based on experience, the Funds expect the risk of loss to be remote.
As of August 31, 2019, the Adviser owns shares representing more than 10% of net assets of the following Funds:
| | | | |
| | | % of Ownership | |
BetaBuilders1-5 Year U.S. Aggregate Bond ETF | | | 78 | % |
Core Plus Bond ETF | | | 82 | |
Corporate Bond Research Enhanced ETF | | | 94 | |
Global Bond Opportunities ETF | | | 34 | |
Municipal ETF | | | 77 | |
USD Emerging Markets Sovereign Bond ETF | | | 77 | |
Significant shareholder transactions by the Adviser may impact the Funds’ performance.
The Core Plus Bond ETF, Global Bond Opportunities ETF, U.S. Aggregate Bond ETF and Ultra-Short Income ETF are subject to risks associated with securities with contractual cash flows including asset backed and mortgage-related securities such as collateralized mortgage obligations, mortgage-pass-through securities and commercial mortgage-backed securities, including securities backed bysub-prime mortgage loans. The value, liquidity and related income of these securities are sensitive to changes in economic conditions, including real estate value,pre-payments, delinquencies and/or defaults, and may be adversely affected by shifts in the market’s perception of the issuers and changes in interest rates.
The High Yield Research Enhanced ETF invests in high yield securities that are not rated or rated below investment grade (commonly known as “junk bonds.”) These securities are considered to be high risk investments. Investments in lower-rated securities or unrated securities of comparable quality tend to be more sensitive to economic conditions than higher rated securities. Junk bonds involve a greater risk of default by the issuer because such securities are generally unsecured and are often subordinated to other creditors’ claims. The market price of these securities can change suddenly and unexpectedly. As a result, the Fund is intended for investors who are able and willing to assume a high degree of risk.
Global Bond Opportunities ETF’s and USD Emerging Markets Sovereign Bond ETF’s investments in sovereign and corporate debt obligations within emerging market countries may be subject to potentially higher risks than investments in more developed markets and the prices of such investments may be volatile. The yields of emerging market debt obligations reflect, among other things, perceived credit risk. The consequences of political, social or economic instability in these markets may have disruptive effects on the market prices of the Funds’ investments and the income they generate, as well as the Funds’ ability to repatriate such amounts.
Derivatives may be riskier than other types of investments because they may be more sensitive to changes in economic and market conditions and could result in losses that significantly exceed the Funds’ original investment. Many derivatives create leverage thereby causing the Funds to be more volatile than they would have been if they had not used derivatives. Derivatives also expose the Funds to counterparty risk (the risk that the derivative counterparty will not fulfill its contractual obligations), including credit risk of the derivative counterparty. The possible lack of a liquid secondary market for derivatives and the resulting inability of the Funds to sell or otherwise close a derivatives position could expose the Funds to losses.
The Global Bond Opportunities ETF is also subject to counterparty credit risk, which is the risk that a counterparty fails to perform on agreements with the Fund such as swaps, forward foreign currency exchange contracts and TBA securities.
The Funds are subject to interest rate and credit risk. The value of debt securities may decline as interest rates increase. The Funds could lose money if the issuer of a fixed income security is unable to pay interest or repay principal when it is due. The Funds invest in floating rate loans and other floating rate debt securities. Although these investments are generally less sensitive to interest rate changes than other fixed rate instruments, the value of floating rate loans and other floating rate investments may decline if their interest rates do not rise as quickly, or as much, as
| | | | | | |
| | | |
| 208 | | | | J.P. MORGAN EXCHANGE-TRADED FUNDS | | AUGUST 31, 2019 |
general interest rates. Many factors can cause interest rates to rise. Some examples include central bank monetary policy, rising inflation rates and general economic conditions. The Funds may face a heightened level of interest rate risk due to certain changes in monetary policy, such as an interest rate increase by the Federal Reserve. The ability of the issuers of debt to meet their obligations may be affected by the economic and political developments in a specific industry or region.
The Funds may have elements of risk not typically associated with investments in the United States of America due to concentrated investments in a limited number of countries or regions, which may vary throughout the period depending on the Funds. Such concentrations may subject each Fund to additional risks resulting from political or economic conditions in such countries or regions and the possible imposition of adverse governmental laws or currency exchange restrictions could cause the securities and their markets to be less liquid and their prices to be more volatile than those of comparable U.S. securities.
Disruptions to creations and redemptions, the existence of significant market volatility or potential lack of an active trading market for the Shares (including through a trading halt), as well as other factors, may result in Shares trading significantly above (at a premium) or below (at a discount) to the NAV or to the intraday value of the Fund’s holdings. During such periods, investors may incur significant losses if shares are sold.
BetaBuilders 1-5 Year U.S. Aggregate Bond ETF and USD Emerging Markets Sovereign Bond ETF may not track the return of their underlying index for a number of reasons and therefore may not achieve their investment objective. For example, the Funds incur a number of operating expenses not applicable to their underlying index, and incur cost in buying and selling securities, especially when rebalancing the Funds’ securities holdings to reflect changes in the composition of the underlying index. In addition, each Fund’s return may differ from the return of its underlying index as a result of, among other things, pricing differences and the inability to purchase certain securities included in the underlying index due to regulatory or other restrictions. To the extent of the previously outlined items, the Funds’ return may differ from the return of the underlying index.
8. Subsequent Event
Effective September 9, 2019, the contractual expense limitation for High Yield Research Enhanced ETF was decreased from 0.40% to 0.24%.
| | | | | | | | |
| | | |
| AUGUST 31, 2019 | | J.P. MORGAN EXCHANGE-TRADED FUNDS | | | | | 209 | |
SCHEDULE OF SHAREHOLDER EXPENSES
(Unaudited)
Hypothetical $1,000 Investment
As a shareholder of the Funds excluding BetaBuilders 1-5 Year U.S. Aggregate Bond ETF, you incur two types of ongoing costs: (1) transaction costs, including brokerage commissions on your purchases and sales of Fund shares and (2) ongoing costs, including , investment advisory fees, administration fees and other Fund expenses, in addition to brokerage commissions on your purchases and sales of Fund shares. As a shareholder of BetaBuilders 1-5 Year U.S. Aggregate Bond ETF, you incur two types of costs: (1) transaction costs, including brokerage commissions on your purchase and sales of Fund Shares and (2) ongoing costs, primarily management fees. The examples assume that you had a $1,000 investment at the beginning of the reporting period, March 1, 2019 and continued to hold your shares at the end of the reporting period, August 31, 2019.
Actual Expenses
For the Fund in the table below, the first line provides information about actual account values and actual expenses. You may use the information in this line, together with the amount you invested, to estimate the expenses that you paid over the period. Simply divide your account value by $1,000
(for example, an $8,600 account value divided by $1,000 = 8.6), then multiply the result by the number under the heading entitled “Expenses Paid During the Period” to estimate the expenses you paid on your account during this period.
Hypothetical Example for Comparison Purposes
The second line in the table below provides information about hypothetical account values and hypothetical expenses based on the Fund’s actual expense ratio and an assumed rate of return of 5% per year before expenses, which is not the Fund’s actual return. The hypothetical account values and expenses may not be used to estimate the actual ending account balance or expenses you paid for the period. You may use this information to compare the ongoing costs of investing in the Fund and other Funds. To do so, compare this 5% hypothetical example with the 5% hypothetical examples that appear in the shareholder reports of other funds. The examples also assume all dividends and distributions have been reinvested. The examples do not take into account brokerage commissions that you pay when purchasing or selling shares of a Fund.
| | | | | | | | | | | | | | | | |
| | | Beginning
Account Value
March 1, 2019 | | | Ending
Account Value
August 31, 2019 | | | Annualized
Expense
Ratio | | | Expenses
Paid During
the Period | |
JPMorgan BetaBuilders1-5 Year U.S. Aggregate Bond ETF | |
Actual (1) | | $ | 1,000.00 | | | $ | 1,035.60 | | | | 0.05 | % | | $ | 0.24 | |
Hypothetical (2) | | | 1,000.00 | | | | 1,024.89 | | | | 0.05 | | | | 0.25 | |
|
JPMorgan Core Plus Bond ETF | |
Actual (2) | | | 1,000.00 | | | | 1,077.10 | | | | 0.38 | | | | 1.98 | |
Hypothetical (2) | | | 1,000.00 | | | | 1,023.23 | | | | 0.38 | | | | 1.93 | |
|
JPMorgan Corporate Bond Research Enhanced ETF | |
Actual (2) | | | 1,000.00 | | | | 1,112.60 | | | | 0.14 | | | | 0.74 | |
Hypothetical (2) | | | 1,000.00 | | | | 1,024.43 | | | | 0.14 | | | | 0.71 | |
|
JPMorgan Global Bond Opportunities ETF | |
Actual (2) | | | 1,000.00 | | | | 1,061.80 | | | | 0.54 | | | | 2.80 | |
Hypothetical (2) | | | 1,000.00 | | | | 1,022.42 | | | | 0.54 | | | | 2.75 | |
|
JPMorgan High Yield Research Enhanced ETF
(formerly known as JPMorgan Disciplined High Yield ETF) | |
Actual (2) | | | 1,000.00 | | | | 1,054.60 | | | | 0.40 | | | | 2.07 | |
Hypothetical (2) | | | 1,000.00 | | | | 1,023.13 | | | | 0.40 | | | | 2.03 | |
|
JPMorgan Municipal ETF | |
Actual (2) | | | 1,000.00 | | | | 1,065.60 | | | | 0.24 | | | | 1.25 | |
Hypothetical (2) | | | 1,000.00 | | | | 1,023.93 | | | | 0.24 | | | | 1.22 | |
|
JPMorgan U.S. Aggregate Bond ETF | |
Actual (2) | | | 1,000.00 | | | | 1,078.80 | | | | 0.07 | | | | 0.37 | |
Hypothetical (2) | | | 1,000.00 | | | | 1,024.78 | | | | 0.07 | | | | 0.36 | |
|
JPMorgan Ultra-Short Income ETF | |
Actual (2) | | | 1,000.00 | | | | 1,018.30 | | | | 0.18 | | | | 0.91 | |
Hypothetical (2) | | | 1,000.00 | | | | 1,024.23 | | | | 0.18 | | | | 0.92 | |
|
JPMorgan Ultra-Short Municipal Income ETF | |
Actual (2) | | | 1,000.00 | | | | 1,012.60 | | | | 0.18 | | | | 0.91 | |
Hypothetical (2) | | | 1,000.00 | | | | 1,024.23 | | | | 0.18 | | | | 0.92 | |
| | | | | | |
| | | |
| 210 | | | | J.P. MORGAN EXCHANGE-TRADED FUNDS | | AUGUST 31, 2019 |
| | | | | | | | | | | | | | | | |
| | | Beginning
Account Value
March 1, 2019 | | | Ending
Account Value
August 31, 2019 | | | Annualized
Expense
Ratio | | | Expenses
Paid During
the Period | |
|
JPMorgan USD Emerging Markets Sovereign Bond ETF | |
Actual (2) | | $ | 1,000.00 | | | $ | 1,096.20 | | | | 0.39 | % | | $ | 2.05 | |
Hypothetical (2) | | | 1,000.00 | | | | 1,023.18 | | | | 0.39 | | | | 1.98 | |
| (1) | Expenses are equal to each Fund’s annualized net expense ratio, multiplied by the average account value over the period, multiplied by 173/366 (to reflect the one-half year period). Commencement of operations was March 12, 2019. |
| (2) | Expenses are equal to each Fund’s annualized net expense ratio, multiplied by the average account value over the period, multiplied by 184/366 (to reflect the one-half year period). |
| | | | | | | | |
| | | |
| AUGUST 31, 2019 | | J.P. MORGAN EXCHANGE-TRADED FUNDS | | | | | 211 | |
SPECIAL SHAREHOLDER MEETING RESULTS
(Unaudited)
J.P. Morgan Exchange-Traded Trust (the “Trust”) held a special meeting of shareholders on August 22, 2019, for the purpose of considering and voting upon the approval of a new Management Agreement with J.P. Morgan Investment Management Inc. which will implement a unitary fee structure for each of the Funds covered by this report, except for BetaBuilders1-5 Year U.S. Aggregate Bond ETF.
The new Management Agreement was approved by shareholders of JPMorgan Core Plus Bond ETF, JPMorgan Corporate Bond Research Enhanced ETF, JPMorgan Global Bond Opportunities ETF, JPMorgan Municipal ETF, JPMorgan USD Emerging Markets Sovereign Bond ETF and JPMorgan Ultra-Short Municipal Income ETF.
The results of the voting for these Funds were as follows:
JPMorgan Core Plus Bond ETF
| | | | |
| | | Votes Received | |
For | | | 25,717,878 | |
Against | | | — | |
Abstain | | | 157 | |
JPMorgan Corporate Bond Research Enhanced ETF
| | | | |
| | | Votes Received | |
For | | | 26,908,567 | |
Against | | | — | |
Abstain | | | — | |
JPMorgan Global Bond Opportunities ETF
| | | | |
| | | Votes Received | |
For | | | 100,974,942 | |
Against | | | 69,713 | |
Abstain | | | 179,607 | |
JPMorgan Municipal ETF
| | | | |
| | | Votes Received | |
For | | | 27,036,940 | |
Against | | | 6,696 | |
Abstain | | | 429 | |
JPMorgan USD Emerging Markets Sovereign Bond ETF
| | | | |
| | | Votes Received | |
For | | | 52,518,785 | |
Against | | | — | |
Abstain | | | 895 | |
JPMorgan Ultra-Short Municipal Income ETF
| | | | |
| | | Votes Received | |
For | | | 56,910,324 | |
Against | | | 103,725 | |
Abstain | | | 592,737 | |
For JPMorgan High Yield Research Enhanced ETF (formerly known as JPMorgan Disciplined High Yield ETF), JPMorgan U.S. Aggregate Bond ETF and JPMorgan Ultra-Short Income ETF, the August 22, 2019 meeting was adjourned to September 17, 2019 to allow shareholders of these Funds additional time to vote on the proposal.
| | | | | | |
| | | |
| 212 | | | | J.P. MORGAN EXCHANGE-TRADED FUNDS | | AUGUST 31, 2019 |
The results of the voting for these Funds as of August 22, 2019, were as follows:
JPMorgan High Yield Research Enhanced ETF
| | | | |
| | | Votes Received | |
For | | | 47,664,885 | |
Against | | | 302,497 | |
Abstain | | | 4,991,285 | |
JPMorgan U.S. Aggregate Bond ETF
| | | | |
| | | Votes Received | |
For | | | 46,031,554 | |
Against | | | 144,894 | |
Abstain | | | 4,450,007 | |
JPMorgan Ultra-Short Income ETF
| | | | |
| | | Votes Received | |
For | | | 3,364,497,185 | |
Against | | | 16,941,568 | |
Abstain | | | 193,573,446 | |
The new Management Agreement was approved by shareholders of JPMorgan Ultra-Short Income ETF when the special meeting reconvened on September 17, 2019.
The results of the voting on September 17, 2019, were as follows:
JPMorgan Ultra-Short Income ETF
| | | | |
| | | Votes Received | |
For | | | 3,532,417,335 | |
Against | | | 20,539,221 | |
Abstain | | | 249,821,958 | |
For JPMorgan High Yield Research Enhanced ETF and JPMorgan U.S. Aggregate Bond ETF, the September 17, 2019 meeting was adjourned to October 10, 2019 to allow shareholders of these Funds additional time to vote on the proposal.
The results of the voting as of September 17, 2019, were as follows:
JPMorgan High Yield Research Enhanced ETF
| | | | |
| | | Votes Received | |
For | | | 63,917,801 | |
Against | | | 532,770 | |
Abstain | | | 12,510,377 | |
JPMorgan U.S. Aggregate Bond ETF
| | | | |
| | | Votes Received | |
For | | | 47,656,457 | |
Against | | | 182,520 | |
Abstain | | | 4,894,536 | |
The new Management Agreement was approved by shareholders of JPMorgan High Yield Research Enhanced ETF and JPMorgan U.S. Aggregate Bond ETF when the special meeting reconvened on October 10, 2019.
| | | | | | | | |
| | | |
| AUGUST 31, 2019 | | J.P. MORGAN EXCHANGE-TRADED FUNDS | | | | | 213 | |
SPECIAL SHAREHOLDER MEETING RESULTS
(Unaudited) (continued)
The results of the voting on October 10, 2019 were as follows:
JPMorgan High Yield Research Enhanced ETF
| | | | |
| | | Votes Received | |
For | | | 73,172,216 | |
Against | | | 682,508 | |
Abstain | | | 16,389,484 | |
JPMorgan U.S. Aggregate Bond ETF
| | | | |
| | | Votes Received | |
For | | | 75,726,344 | |
Against | | | 182,520 | |
Abstain | | | 8,201,400 | |
| | | | | | |
| | | |
| 214 | | | | J.P. MORGAN EXCHANGE-TRADED FUNDS | | AUGUST 31, 2019 |
BOARD APPROVAL OF INITIAL INVESTMENT ADVISORY AGREEMENTS
(Unaudited)
JPMorgan BetaBuilders1-5 Year U.S. Aggregate Bond ETF
On March5-6, 2019, the Board of Trustees heldin-person meetings and approved the initial management agreement (the “Management Agreement”) for the JPMorgan BetaBuilders1-5 Year U.S. Aggregate Bond ETF (the “Fund”). The Management Agreement was approved by a majority of the Trustees who are not “Interested Persons” (as defined in the 1940 Act) of any party to the Management Agreement or any of their affiliates. In connection with the approval of the Management Agreement, the Trustees reviewed written materials prepared by the Adviser and received oral presentations from Adviser personnel. Before voting on the proposed Management Agreement, the Trustees reviewed the Management Agreement with representatives of the Adviser and with counsel to the Trust and independent legal counsel to the Trustees and received a memorandum from independent legal counsel discussing the legal standards for their consideration of the proposed Management Agreement. They also considered information they received from the Adviser over the course of the year in connection with their oversight of other funds managed by the Adviser. The Trustees also discussed the proposed Management Agreement in executive session with independent legal counsel at which no representatives of the Adviser were present.
Set forth below is a summary of the material factors evaluated by the Trustees in determining whether to approve the Management Agreement. The Trustees considered information provided with respect to the Fund and the approval of the Management Agreement. Each Trustee attributed his or her own evaluation of the significance of the various factors, and no factor alone was considered determinative. The Trustees determined that the proposed compensation to be received by the Adviser from the Fund under the Management Agreement was fair and reasonable and that initial approval of the Management Agreement was in the best interests of the Fund and its potential shareholders.
Summarized below are the material factors considered and discussed by the Trustees in reaching their conclusions:
Nature, Extent and Quality of Services Provided by the Adviser
In connection with the approval of the initial Management Agreement, the Trustees considered the materials furnished specifically in connection with the approval of the Management Agreement, as well as other relevant information furnished for the Trustees, regarding the nature, extend, and quality of services provided by the adviser. Among other things, the Trustees considered the background and experience of the Adviser’s senior management and investment personnel. In addition, the Trustees reviewed the qualifications, backgrounds and responsibilities of the portfolio management team primarily responsible for theday-to-day management of the Fund. The Trustees also considered the investment strategy for the Fund,
and the infrastructure supporting the portfolio management teams. In addition, the Trustees considered information about the structure and distribution strategy of the Fund, how it fits within the Trust’s other fund offerings, and how it will be positioned against peer funds, as identified by management and/or Broadridge Investor Communications Solutions Inc. (“Broadridge”), an independent provider of investment company data. Further, the Trustees considered the administration services to be provided by the Adviser under the Management Agreement.
The Trustees also considered their knowledge of the nature and quality of the services provided by the Adviser and its affiliates gained from their experience as Trustees of the Trust and in the financial industry generally. In addition, they considered the overall reputation and capabilities of the Adviser and its affiliates, the commitment of the Adviser to provide high quality service to the Fund, their overall confidence in the Adviser’s integrity and the Adviser’s responsiveness to requests for additional information, questions or concerns raised by them.
Based upon these considerations and other factors, the Trustees concluded that they were satisfied with the nature, extent and quality of services to be provided to the Fund by the Adviser.
Fall-Out Benefits
The Trustees reviewed information regarding potential“fall-out” or ancillary benefits expected to be received by the Adviser and its affiliates as a result of their relationship with the Fund. Additionally, the Trustees considered that anyfall-out or ancillary benefits would be comparable to those related to the other funds in the complex.
The Trustees also considered the benefits the Adviser is expected to receive as the result of JPMorgan Chase Bank, N.A.’s roles as custodian, fund accountant and transfer agent for the Fund.
Investment Performance
The Trustees considered the Fund’s investment strategy and processes, the portfolio management team and competitive positioning against identified peer funds, and concluded that the prospects for competitive future performance were acceptable.
Management Fees and Expense Ratios
The Trustees considered that under the Management Agreement, the Adviser will provide advisory and administrative services and will be responsible for substantially all of the expenses of the Fund (“unitary fee structure”). The Trustees considered the contractual management fee rate that will be paid by the Fund to the Adviser and compared the rate to information prepared by Broadridge, providing management fee rates paid by other funds in the same Broadridge category as the Fund.
| | | | | | | | |
| | | |
| AUGUST 31, 2019 | | J.P. MORGAN EXCHANGE-TRADED FUNDS | | | | | 215 | |
BOARD APPROVAL OF INITIAL INVESTMENT ADVISORY AGREEMENTS
(Unaudited) (continued)
The Trustees also compared the management fee for the Fund to fees charged to mutual funds with similar investment objectives or in similar asset classes managed by the Adviser. The Trustees also considered the fees paid to JPMorgan Chase Bank, N.A., an affiliate of the Adviser, for custody, transfer agency and other related services for the Fund.
The Trustees noted that the Fund’s proposed management fee was in line with identified peer funds. The Trustees also noted that because the Fund was not yet operational, no profitability information was available. After considering the factors identified above and other factors, in light of the information, the Trustees concluded that the Fund’s proposed management fee was reasonable.
Economies of Scale
The Trustees considered the extent to which the Fund will benefit from economies of scale. The Trustees noted that the
proposed unitary management fee schedule for the Fund does not contain breakpoints. The Trustees also considered that shareholders would benefit because expenses would be limited even when the Fund was new and not achieving economies of scale. The Trustees also considered the fact that increases in assets would not lead to fee decreases even if economies of scale are achieved, but also that they would have the opportunity to further review the appropriateness of the fee payable to the Adviser under the Management Agreement in the future. After considering the factors identified above, the Trustees concluded that the Fund’s shareholders will receive the benefits of potential economies of scale.
| | | | | | |
| | | |
| 216 | | | | J.P. MORGAN EXCHANGE-TRADED FUNDS | | AUGUST 31, 2019 |
BOARD APPROVAL OF INVESTMENT ADVISORY AGREEMENTS
(Unaudited)
JPMorgan Core Plus Bond ETF, JPMorgan Corporate Bond Research Enhanced ETF, JPMorgan Global Bond Opportunities ETF, JPMorgan High Yield Research Enhanced ETF, JPMorgan Municipal ETF, JPMorgan U.S. Aggregate Bond ETF, JPMorgan Ultra-Short Income ETF, JPMorgan Ultra-Short Municipal Income ETF and JPMorgan USD Emerging Markets Sovereign Bond ETF
The Board meets regularly throughout the year and considers factors that are relevant to its consideration of investment advisory agreements at each meeting. The Board also meets for the specific purpose of considering approvals of amendments to and new investment advisory agreements for the Funds. At the June11-12, 2019 quarterly Board meeting, the Trustees, including a majority of the Trustees who are not “interested persons” (as defined in the 1940 Act) of the Trust, Adviser or any of its affiliates (“Independent Trustees”), approved the new Management Agreement on behalf of each Fund. The Board also recommended that the Fund’s shareholders approve the Management Agreement. Such approval was recently obtained, and the agreement will take effect November 1, 2019.
As part of their review of the Management Agreement, the Trustees considered and reviewed information received from the Adviser about the proposed changes to the advisory agreements to convert them to a “unitary fee” structure. They also considered information received in connection with the December 2018 board meeting when the Trustees last approved the Investment Advisory Agreement for certain Funds. This included comprehensive information concerning the nature and quality of services provided by the Adviser,“fall-out” benefits received by the Adviser, and information on profitability and performance of the Funds. For new Funds (for which the Investment Advisory Agreement has not been reapproved), information provided by the Adviser when each of these Funds was initially approved was considered. The Board noted that the possibility of proposing a unitary fee had been raised by the Adviser at an earlier meeting, and that prior to the June11-12, 2019 meeting, the Adviser and the Board had several discussions about unitary fees generally, industry practice, the potential impact on the Funds, and related matters. Before voting on the Management Agreement, the Trustees reviewed the agreement with representatives of the Adviser, counsel to the Trust and independent legal counsel and received a memorandum from independent legal counsel to the Trustees discussing the legal standards for their consideration of the Management Agreement. The Trustees also discussed the Management Agreement in executive sessions with independent legal counsel at which no representatives of the Adviser were present. A summary of the material factors evaluated by the Trustees in determining whether to approve Management Agreement is provided below.
The Trustees considered information provided with respect to the Funds over the course of the year, as well as the materials furnished specifically in connection with this approval process. Each Trustee attributed his or her own evaluation of the significance of the various factors and no factor alone was considered determinative. The Trustees determined that the proposed compensation to be received by the Adviser from each Fund under the Management Agreement was fair and reasonable and that the approval of the Management Agreement was in the best interests of each Fund and its shareholders.
The factors summarized below were considered and discussed by the Trustees in reaching their conclusions:
Nature, Extent and Quality of Services Provided by the Adviser
In connection with the approval of the Management Agreement on behalf of each Fund, the Trustees received and considered information regarding the nature, extent and quality of the services provided to each Fund under its Investment Advisory and Administration Agreements, as well as those that will be provided under the Management Agreement. They also considered management’s representation that the services provided to the Funds will not change as a result of the transition to the unitary fee structure. The Trustees also took into account information furnished throughout the year at Trustee meetings, including consideration of the background and experience of JPMIM’s senior management and the qualifications, backgrounds and responsibilities of the portfolio management team primarily responsible for theday-to-day management of each Fund. The Trustees also considered each Fund’s investment strategy, and the infrastructure supporting the portfolio management teams. In addition, the Trustees considered information about the structure and distribution strategies of the Funds, how they fit within the Trust’s fund offerings, and how each Fund is positioned against peer funds, as identified by management and/or Broadridge Investor Communication Solutions Inc. (“Broadridge”), an independent provider of investment company data. The Trustees reviewed information relating to the Adviser’s risk governance model and reports showing the Adviser’s compliance structure and ongoing compliance processes.
The Trustees also considered their knowledge of the nature and quality of services provided by the Adviser and its affiliates gained from their experience as Trustees of the Trust and in the financial industry in general. In addition, they considered the overall reputation and capabilities of the Adviser and its affiliates, the commitment of the Adviser to continue to provide high quality service to the Funds, their overall confidence in the Adviser’s integrity and the Adviser’s responsiveness to requests for additional information, questions or concerns raised by them.
| | | | | | | | |
| | | |
| AUGUST 31, 2019 | | J.P. MORGAN EXCHANGE-TRADED FUNDS | | | | | 217 | |
BOARD APPROVAL OF INVESTMENT ADVISORY AGREEMENTS
(Unaudited) (continued)
Based upon these considerations and other factors, the Trustees concluded that they were satisfied with the nature, extent and quality of services provided to each Fund by the Adviser.
Fall-Out Benefits
The Trustees reviewed information regarding potential“fall-out” or ancillary benefits received by the Adviser and its affiliates as a result of their relationships with the Funds, particularly those benefits potentially impacted by the implementation of the unitary fee structure. The Trustees also considered the benefits the Adviser receives as the result of JPMorgan Chase Bank, N.A.’s (“JPMCB”) roles as custodian, fund accountant and transfer agent for the Funds.
The Trustees considered that adopting the Management Agreement would benefit the Adviser by bringing the Funds in line with industry practice, which could potentially improve their marketability and ultimately increase the Adviser’s assets under management.
Costs of Services Provided and Profitability to the Adviser and its Affiliates
While information concerning the actual profitability to the Adviser and its affiliates with respect to the Management Agreement is not available (because the Management Agreement is not yet in effect), the Trustees received and considered information regarding the profitability to the Adviser in providing services to each Fund when renewing the Investment Advisory Agreement for each applicable Fund. In conjunction with the consideration of the Management Agreement, the Trustees also considered that the Adviser’s profitability was not expected to change in the near term as a result of the transition to the unitary fee structure. The Trustees reviewed and discussed the profitability information. The Trustees recognized that this information is not audited and represents the Adviser’s determination of its and its affiliates’ revenues from the contractual services provided to the Funds, less expenses of providing such services. Expenses include direct and indirect costs and are calculated using allocation methodologies developed by the Adviser. The Trustees also recognized that it is difficult to make direct comparisons of profitability from fund investment advisory contracts because comparative information is not generally publicly available and is affected by numerous factors, including the structure of the particular adviser, the types of funds it manages, its business mix, numerous assumptions regarding allocations and the fact that publicly-traded fund managers’ operating profits and net income are net of distribution and marketing expenses. Based upon their review, the Trustees concluded that the profitability to the Adviser under the Investment Advisory Agreement was not unreasonable in light of the services and benefits provided to each Fund.
The Trustees also considered the fees that the Adviser earned from the Funds for providing administrative services. The Trustees also considered the fees paid to JPMCB, also an affiliate of the Adviser, for custody, transfer agency and other related services for each Fund. It was noted that under the new fee structure, JPMIM will be responsible for providing the administrative services under the Management Agreement and for paying JPMCB for the services that it provides.
The Trustees also considered the fact that because each Fund’s total expense ratio would decrease, or stay the same, the Adviser’s profitability was not expected to change in the near term as a result of the transition to the unitary fee structure under the Management Agreement. They also noted, however, that if Fund assets increase, Fund fees will not necessarily decrease even if the Fund and JPMIM achieve economies of scale. In this regard, the Trustees noted that after the Management Agreement’s initialtwo-year term, the Trustees would have the opportunity to review the fee each year as part of the annual contract review process.
Based on these considerations and other factors, the Trustees concluded that the projected profitability to the Adviser under the Management Agreement would not be unreasonable in light of the anticipated services and benefits provided to each Fund under the new fee structure.
Economies of Scale
In connection with its review of the Investment Advisory Agreement, the Board discussed potential economies of scale or other efficiencies that may result from increases in the Funds’ asset levels. The Trustees noted that the management fees and other expenses paid by the Funds under the Management Agreement would be the same as or less than the amounts the Funds would have paid under the prior structure, which involved the Investment Advisory and Administration Agreements operating in conjunction with a terminable expense limitation agreement. The Trustees further considered that shareholders would benefit because expenses would be limited even when Funds are new or if assets decreased. The Trustees also considered the fact that increases in assets would not lead to fee decreases even if economies of scale were achieved, but that they will have the opportunity to further review the appropriateness of the fee payable to the Adviser under the Management Agreement in the future. In this regard, the Trustees noted that after the Management Agreement’s initialtwo-year term, the Trustees would have the opportunity to review the fee each year as part of the annual contract renewal process.
| | | | | | |
| | | |
| 218 | | | | J.P. MORGAN EXCHANGE-TRADED FUNDS | | AUGUST 31, 2019 |
Investment Performance
Except with respect to the JPMorgan Core Plus Bond ETF which commenced operations in January 2019, the Trustees considered each Fund’s investment strategy and process, portfolio management team and competitive positioning against identified peer funds and benchmark indexes (for actively managed Funds) and a comparison of Fund performance against the index the Fund seeks to track (for Funds managed against an index). Performance for each applicable Fund was considered by the Board in approving the continuation of the applicable Fund’s Investment Advisory Agreement in December 2018 and is also reviewed by the Trustees at regular Board Meetings. After considering such information, the Trustees concluded that the prospects for competitive future performance were acceptable.
For JPMorgan Core Plus Bond ETF, the Board considered the Fund’s investment strategy and processes, the portfolio management team and competitive positioning against identified peer funds, as well as the fact that the Fund had recently commenced operations, and concluded that the prospects for competitive future performance were acceptable.
Management Fees and Expense Ratios
The Trustees considered the contractual unitary management fee rate that will be paid by each Fund to the Adviser and compared that rate to the information prepared by Broadridge concerning management fee rates paid by other funds in the same Broadridge category as the Fund. The Trustees also considered additional fund comparisons proposed by the Adviser. The Trustees also considered information comparing the management fee for the Fund to the expense ratios of mutual funds with similar investment objectives or in similar asset classes managed by the Adviser.
The Trustees noted that each Fund’s estimated unitary management fees were in line with fees for identified peer funds. After considering the factors identified above, the Trustees concluded that the proposed management fees were reasonable.
Based on the foregoing, the Board, including all of the Independent Trustees, unanimously: (a) concluded that the terms of the Management Agreement are fair and reasonable; (b) concluded that the proposed fees were reasonable in light of the services that the Adviser will provide to each Fund; and (c) approved the Management Agreement.
| | | | | | | | |
| | | |
| AUGUST 31, 2019 | | J.P. MORGAN EXCHANGE-TRADED FUNDS | | | | | 219 | |
J.P. Morgan Exchange-Traded Funds are distributed by JPMorgan Distribution Services, Inc., an indirect, wholly-owned subsidiary of JPMorgan Chase & Co.
Contact J.P. Morgan Exchange-Traded Funds at 1-844-457-6383 (844-4JPM ETF) for a fund prospectus. You can also visit us at www.jpmorganfunds.com. Investors should carefully consider the investment objectives and risks as well as charges and expenses of the fund before investing. The prospectus contains this and other information about the fund. Read the prospectus carefully before investing.
Investors may obtain information about the Securities Investor Protection Corporation (SIPC), including the SIPC brochure, by visiting www.sipc.org or by calling SIPC at 202-371-8300.
Each Fund files a complete schedule of its fund holdings for the first and third quarters of its fiscal year with the SEC onForm N-PORT. Prior to March 31, 2019, each Fund filed a complete schedule of its fund holdings for the first and third quarters of its fiscal year with the SEC on Form N-Q. The Funds’ Form N-PORT and Form N-Q are available on the SEC’s website at http://www.sec.gov. Each Fund’s quarterly holdings can be found by visiting the J.P. Morgan Funds’ website at www.jpmorganfunds.com.
A description of each Fund’s policies and procedures with respect to the disclosure of each Fund’s holdings is available in the prospectus and Statement of Additional Information.
A copy of proxy policies and procedures is available without charge upon request by calling 1-844-457-6383 and on the Fund’s website at www.jpmorganfunds.com. A description of such policies and procedures is on the SEC’s website at www.sec.gov. The Trustees have delegated the authority to vote proxies for securities owned by the Fund to the Adviser. A copy of the Fund’s voting record for the most recent 12-month period ended June 30 is available on the SEC’s website at www.sec.gov or at the Fund’s website at www.jpmorganfunds.com no later than August 31 of each year. The Fund’s proxy voting record will include, among other things, a brief description of the matter voted on for each fund security, and will state how each vote was cast, for example, for or against the proposal.


J.P. Morgan Asset Management is the brand name for the asset management business of JPMorgan Chase & Co. and its affiliates worldwide.
| | | | |
| | © JPMorgan Chase & Co., 2019. All rights reserved. August 2019. | | SAN-FIETF-819 |
Semi-Annual Report
J.P. Morgan Exchange-Traded Funds
August 31, 2019 (Unaudited)
JPMorgan BetaBuilders MSCI US REIT ETF
Beginning on January 1, 2021, as permitted by regulations adopted by the Securities and Exchange Commission, paper copies of the Fund’s annual and semi-annual shareholder reports will no longer be sent by mail, unless you specifically request paper copies of the reports. Instead, the reports will be made available on the Fund’s website www.jpmorganfunds.com and you will be notified by mail each time a report is posted and provided with a website to access the report. If you already elected to receive shareholder reports electronically, you will not be affected by this change and you need not take any action.
You may elect to receive shareholder reports and other communications from the Fund’s electronically anytime by contacting your financial intermediary (such as a broker dealer, bank, or retirement plan).
Alternatively, you may elect to receive paper copies of all future reports free of charge by contacting your financial intermediary. Your election to receive paper reports will apply to all funds held within your account(s).
CONTENTS
Investments in a Fund are not bank deposits or obligations of, or guaranteed or endorsed by, any bank and are not insured or guaranteed by the FDIC, the Federal Reserve Board or any other government agency. You could lose money if you sell when the Fund’s share price is lower than when you invested.
Past performance is no guarantee of future performance. The general market views expressed in this report are opinions based on market and other conditions through the end of the reporting period and are subject to change without notice. These views are not intended to predict the future performance of a Fund or the securities markets. References to specific securities and their issuers are for illustrative purposes only and are not intended to be, and should not be interpreted as, recommendations to purchase or sell such securities. Such views are not meant as investment advice and may not be relied on as an indication of trading intent on behalf of any Fund.
Prospective investors should refer to the Fund’s prospectus for a discussion of the Fund’s investment objectives, strategies and risks. Call J.P. Morgan Exchange-Traded Funds at (844) 457-6383 for a prospectus containing more complete information about a Fund, including management fees and other expenses. Please read it carefully before investing.
Shares are bought and sold throughout the day on an exchange at market price (not at net asset value) through a brokerage account, and are not individually subscribed and redeemed from a Fund. Shares may only be subscribed and redeemed directly from a Fund by Authorized Participants, in very large creation/redemption units. Brokerage commissions will reduce returns.
PRESIDENT’S LETTER
OCTOBER 10, 2019 (Unaudited)
Dear Shareholder,
The upward trajectory of JPMorgan Exchange-Traded Funds’ growth has continued in 2019. So far this year, we’ve increased our assets under management to more than $27 billion; placing J.P. Morgan as a top five provider in ETF flows as of the end of September 2019.1 We continue to offer an expanding suite of liquid and transparent solutions for building well-diversified, well-priced portfolios. J.P. Morgan is proud to provide ETFs that can help each investor achieve their goals.
| | |
 | | “Amid changing market environments, we believe that investors should have all the tools to build a diversified ETF portfolio — J.P. Morgan ETFs span asset classes, management styles and portfolio needs to help investors build portfolios that endure over market cycles.” |
While our ETF business has been progressing, the U.S. economic expansion slowed but remained above global growth trends through the six months ended August 31, 2019. U.S. equity and bond markets provided positive returns amid growth in corporate profits and continued strength in consumer spending. In July, the U.S. Federal Reserve cut interest rates for the first time in more than a decade, which provided further support for both equity and bond prices. However, a slowing global economy and a sharp increase in reciprocal trade tariffs between the U.S. and China led to increased volatility in financial markets and downward pressure
on asset prices in August. For the six months, the S&P 500 returned 6.15% and the Bloomberg Barclays U.S. Aggregate Index returned 8.02%.
Amid an uncertain macro backdrop, we believe diversification is key — both across and within asset classes. For investors looking to diversify from traditional equity and fixed income markets, real estate investment trusts (REITs) have historically offered attractive yield and diversification benefits compared to other asset classes. Considering our current low rate environment, I’m pleased to report our JPMorgan BetaBuilders MSCI US REIT ETF (BBRE) provided a positive return for the six months ended August 31, 2019 and offered a 30 day SEC Yield of 3.73% (3.59% unsubsidized) as of September 30, 2019.
We are proud to bring a range of investment solutions to help you navigate a changing market landscape. We are committed to building solutions that address your needs and help you build stronger portfolios. Thank you for your belief in our Firm and our process.
Sincerely,

Joanna M. Gallegos
President, J.P. Morgan Exchange-Traded Funds
J.P Morgan Asset Management
1-844-4JPM-ETF or jpmorgan.com/etfs for more information
| 1 | Bloomberg L.P., September 30, 2019. |
| | | | | | | | |
| | | |
| AUGUST 31, 2019 | | J.P. MORGAN EXCHANGE-TRADED FUNDS | | | | | 1 | |
JPMorgan BetaBuilders MSCI US REIT ETF
FUND COMMENTARY
SIX MONTHS ENDED AUGUST 31, 2019 (Unaudited)
| | | | |
| REPORTING PERIOD RETURN: | |
| JPMorgan BetaBuilders MSCI US REIT ETF Net Asset Value* | | | 9.51% | |
| Market Price** | | | 9.47% | |
| MSCI US REIT Index | | | 9.57% | |
| |
Net Assets as of 8/31/2019 | | $ | 634,157,491 | |
INVESTMENT OBJECTIVE***
The JPMorgan BetaBuilders MSCI US REIT ETF (the “Fund”) seeks investment results that closely correspond, before fees and expenses, to the performance of the MSCI US REIT Index (the “Underlying Index”).
INVESTMENT APPROACH
The Underlying Index is a free-float adjustedmarket-cap weighted index made up of the stocks of publicly traded equity REITs. Using a passive investment approach, the Fund attempts to replicate the Underlying Index as closely as possible and invests at least 80% of its assets in securities included in the Underlying Index.
HOW DID THE MARKET PERFORM?
The real estate sector equity largely provided positive returns and outperformed the broader U.S. equity market during the reporting period. REITs benefitted from falling interest rates in 2019 as well as from investors seeking higher yielding assets.
For the six months ended August 31, 2019, the S&P 500 Index returned 6.15% and the MSCI US REIT Index returned 9.57%.
HOW DID THE FUND PERFORM?
For the six months ended August 31, 2019, the Fund performed in line with the Underlying Index, before considering the effects of operating expenses, fees and tax management of the Fund’s portfolio.
The Fund’s and the Underlying Index’s exposures to the specialized and residential REIT sectors were leading contributors to absolute performance. The Fund’s and the Underlying Index’s exposures to the retail and hotel & resort REIT sectors were leading detractors from absolute performance.
HOW WAS THE FUND POSITIONED?
At the end of the reporting period, the Fund’s and the Underlying Index’s largest allocations were in the specialized and residential REIT sectors and the smallest allocations were in the diversified and the hotel & resorts REIT sectors.
| | | | | | |
| | | |
| 2 | | | | J.P. MORGAN EXCHANGE-TRADED FUNDS | | AUGUST 31, 2019 |
| | | | | | | | |
| TOP TEN EQUITY HOLDINGS OF THE PORTFOLIO**** | |
| | 1. | | | Prologis, Inc. | | | 5.3 | % |
| | 2. | | | Equinix, Inc. | | | 4.7 | |
| | 3. | | | Simon Property Group, Inc. | | | 4.7 | |
| | 4. | | | Public Storage | | | 4.2 | |
| | 5. | | | Welltower, Inc. | | | 3.7 | |
| | 6. | | | Equity Residential | | | 3.2 | |
| | 7. | | | AvalonBay Communities, Inc. | | | 3.0 | |
| | 8. | | | Ventas, Inc. | | | 2.7 | |
| | 9. | | | Digital Realty Trust, Inc. | | | 2.6 | |
| | 10. | | | Realty Income Corp. | | | 2.4 | |
| | | | |
PORTFOLIO COMPOSITION BY SECTOR**** | |
| Apartments | | | 23.7 | % |
| Industrial | | | 16.8 | |
| Health Care | | | 12.7 | |
| Office | | | 11.9 | |
| Storage | | | 9.5 | |
| Diversified | | | 8.6 | |
| Shopping Centers | | | 5.5 | |
| Regional Malls | | | 5.5 | |
| Hotels | | | 4.9 | |
| Investment of cash collateral from securities loaned | | | 0.7 | |
| Short-Term Investments | | | 0.2 | |
| * | | The return shown is based on net asset value calculated for shareholder transactions and may differ from the return shown in the financial highlights, which reflects adjustments made to the net asset value in accordance with accounting principles generally accepted in the United States of America. The net asset value was $88.08 as of August 31, 2019. |
| ** | | Market price return is calculated assuming an initial investment made at the market price at the beginning of the reporting period, reinvestment of all dividends and distributions at market price during the period, and sale at the market price on the last day of the period. The price used to calculate the market price return is the midpoint of the bid/ask spread at the close of business on the Cboe BZX Exchange, Inc. The midpoint price was $88.06 as of August 31, 2019. |
| *** | | The adviser seeks to achieve the Fund’s objective. There can be no guarantee it will be achieved. |
| **** | | Percentages indicated are based on total investments as of August 31, 2019. The Fund’s composition is subject to change. |
| | | | | | | | |
| | | |
| AUGUST 31, 2019 | | J.P. MORGAN EXCHANGE-TRADED FUNDS | | | | | 3 | |
JPMorgan BetaBuilders MSCI US REIT ETF
FUND COMMENTARY
SIX MONTHS ENDED AUGUST 31, 2019 (Unaudited) (continued)
| | | | | | | | | | | | | | | | |
AVERAGE ANNUAL TOTAL RETURNSAS OF AUGUST 31, 2019 (Unaudited) | |
| | | INCEPTION DATE | | | SIX MONTHS* | | | 1 YEAR | | | SINCE INCEPTION | |
Net Asset Value | | | June 15, 2018 | | | | 9.51% | | | | 11.98% | | | | 16.09% | |
Market Price | | | | | | | 9.47% | | | | 18.82% | | | | 16.07% | |
LIFE OF FUND PERFORMANCE(6/15/18 TO 8/31/19)
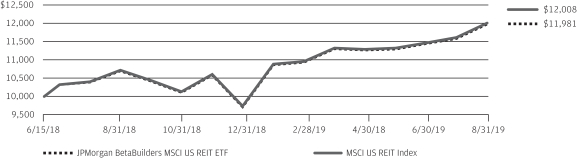
The performance quoted is past performance and is not a guarantee of future results. Exchange-traded funds are subject to certain market risks. Investment returns and principal value of an investment will fluctuate so that an investor’s shares, when sold or redeemed, may be worth more or less than their original cost. Current performance may be higher or lower than the performance data shown. For up-to-date, month-end performance information please call 1-844-457-6383.
Fund commenced operations on June 15, 2018.
The graph illustrates comparative performance for $10,000 invested in shares of the JPMorgan BetaBuilders MSCI US REIT ETF and the MSCI US REIT Index from June 15, 2018 to August 31, 2019. The performance of the Fund reflects the deduction of Fund expenses and assumes reinvestment of all dividends and capital gain distributions, if any. The performance of the MSCI US REIT Index does not reflect the deduction of expenses associated with an exchange-traded fund and has been adjusted to reflect reinvestment of all dividends and capital gain distributions of the securities included in the Index, if applicable. The Underlying Index is a free-float adjusted market-cap weighted index designed to measure the performance of U.S. equity real estate investment trust (REIT) securities. The Underlying Index is made up of the stocks of publicly traded U.S. equity REITs, as determined by MSCI Inc., the index provider. To be included
initially in the Underlying Index, an equity REIT must meet certain criteria established by the index provider, including meeting a minimum market capitalization threshold as well as a liquidity threshold based on a number of factors, including trading volume and frequency of trading. Equity REITs in the Underlying Index tend to be small- and mid-cap stocks, and may include Health Care REITs, Hotel & Resort REITs, Industrial REITs, Office REITs, Residential REITs, Retail REITs, Diversified REITs and certain Specialized REITs. Specialized REITs that may be included in the Underlying Index own and/or operate (i) storage and self-storage facilities, (ii) data centers, (iii) correctional facilities, (iv) theaters, (v) casinos and gaming facilities or (vi) restaurants.
Fund performance reflects the waiver of the Fund’s fees and reimbursement of expenses for certain periods since the inception date. Without these waivers and reimbursements, performance would have been lower. Also, performance shown in this section does not reflect the deduction of taxes that a shareholder may pay on Fund distributions or redemption or sale of Fund shares.
The returns shown are based on net asset values calculated for shareholder transactions and may differ from the returns shown in the financial highlights, which reflect adjustments made to the net asset values in accordance with accounting principles generally accepted in the United States of America.
| | | | | | |
| | | |
| 4 | | | | J.P. MORGAN EXCHANGE-TRADED FUNDS | | AUGUST 31, 2019 |
JPMorgan BetaBuilders MSCI US REIT ETF
SCHEDULE OF PORTFOLIO INVESTMENTS
AS OF AUGUST 31, 2019 (Unaudited)
| | | | | | | | |
| Investments | | Shares | | | Value ($) | |
COMMON STOCKS — 99.8% | |
|
Apartments — 23.8% | |
Agree Realty Corp., REIT | | | 24,878 | | | | 1,858,138 | |
American Campus Communities, Inc., REIT | | | 88,785 | | | | 4,126,727 | |
American Homes 4 Rent, Class A, REIT | | | 174,126 | | | | 4,454,143 | |
Apartment Investment & Management Co., Class A, REIT | | | 96,269 | | | | 4,909,719 | |
AvalonBay Communities, Inc., REIT | | | 90,174 | | | | 19,167,385 | |
Camden Property Trust, REIT | | | 62,537 | | | | 6,769,630 | |
Equity LifeStyle Properties, Inc., REIT | | | 55,266 | | | | 7,445,435 | |
Equity Residential, REIT | | | 239,684 | | | | 20,315,616 | |
Essential Properties Realty Trust, Inc., REIT | | | 47,173 | | | | 1,071,299 | |
Essex Property Trust, Inc., REIT | | | 42,516 | | | | 13,658,690 | |
Front Yard Residential Corp., REIT | | | 32,951 | | | | 365,427 | |
Getty Realty Corp., REIT | | | 22,537 | | | | 715,775 | |
Independence Realty Trust, Inc., REIT | | | 58,114 | | | | 808,366 | |
Investors Real Estate Trust, REIT | | | 7,598 | | | | 526,161 | |
Invitation Homes, Inc., REIT | | | 288,656 | | | | 8,301,747 | |
Mid-America Apartment Communities, Inc., REIT | | | 73,740 | | | | 9,341,383 | |
National Retail Properties, Inc., REIT | | | 105,227 | | | | 5,908,496 | |
NexPoint Residential Trust, Inc., REIT | | | 12,229 | | | | 567,426 | |
Preferred Apartment Communities, Inc., Class A, REIT | | | 28,040 | | | | 377,418 | |
Realty Income Corp., REIT | | | 204,715 | | | | 15,110,014 | |
Spirit Realty Capital, Inc., REIT | | | 63,935 | | | | 3,065,044 | |
STORE Capital Corp., REIT | | | 132,196 | | | | 4,991,721 | |
Sun Communities, Inc., REIT | | | 58,657 | | | | 8,669,505 | |
UDR, Inc., REIT | | | 182,285 | | | | 8,782,491 | |
| | | | | | | | |
| | | | | | | 151,307,756 | |
| | | | | | | | |
|
Diversified — 8.7% | |
Alexander & Baldwin, Inc., REIT | | | 44,330 | | | | 1,014,714 | |
American Assets Trust, Inc., REIT | | | 31,622 | | | | 1,481,807 | |
American Finance Trust, Inc., REIT (a) | | | 68,711 | | | | 822,471 | |
Armada Hoffler Properties, Inc., REIT | | | 33,912 | | | | 588,034 | |
Colony Capital, Inc., REIT | | | 298,077 | | | | 1,341,347 | |
CoreCivic, Inc., REIT | | | 77,015 | | | | 1,305,404 | |
CorePoint Lodging, Inc., REIT | | | 26,334 | | | | 239,639 | |
Cousins Properties, Inc., REIT | | | 94,024 | | | | 3,262,633 | |
Duke Realty Corp., REIT | | | 232,499 | | | | 7,735,242 | |
EPR Properties, REIT | | | 48,842 | | | | 3,821,887 | |
Four Corners Property Trust, Inc., REIT | | | 44,252 | | | | 1,260,739 | |
Gaming and Leisure Properties, Inc., REIT | | | 131,913 | | | | 5,160,437 | |
GEO Group, Inc. (The), REIT | | | 78,401 | | | | 1,345,361 | |
Gladstone Commercial Corp., REIT | | | 19,594 | | | | 444,196 | |
Global Net Lease, Inc., REIT | | | 54,229 | | | | 1,040,112 | |
Hannon Armstrong Sustainable Infrastructure Capital, Inc., REIT | | | 41,304 | | | | 1,141,230 | |
iStar, Inc., REIT | | | 41,844 | | | | 535,603 | |
Lexington Realty Trust, REIT | | | 136,739 | | | | 1,420,718 | |
NorthStar Realty Europe Corp., REIT | | | 26,031 | | | | 440,705 | |
One Liberty Properties, Inc., REIT | | | 9,548 | | | | 255,695 | |
PS Business Parks, Inc., REIT | | | 13,299 | | | | 2,388,633 | |
Spirit MTA REIT, REIT | | | 27,920 | | | | 234,528 | |
| | | | | | | | |
| Investments | | Shares | | | Value ($) | |
| |
|
Diversified — continued | |
UMH Properties, Inc., REIT | | | 23,004 | | | | 295,831 | |
VICI Properties, Inc., REIT | | | 265,629 | | | | 5,886,339 | |
Washington REIT, REIT | | | 51,775 | | | | 1,371,520 | |
Whitestone REIT, REIT | | | 23,181 | | | | 287,908 | |
WP Carey, Inc., REIT | | | 110,228 | | | | 9,898,474 | |
| | | | | | | | |
| | | | | | | 55,021,207 | |
| | | | | | | | |
|
Health Care — 12.8% | |
CareTrust REIT, Inc., REIT | | | 61,834 | | | | 1,471,031 | |
Community Healthcare Trust, Inc., REIT | | | 11,588 | | | | 494,112 | |
HCP, Inc., REIT | | | 309,198 | | | | 10,732,262 | |
Healthcare Realty Trust, Inc., REIT | | | 83,581 | | | | 2,777,397 | |
Healthcare Trust of America, Inc., Class A, REIT | | | 132,676 | | | | 3,762,691 | |
LTC Properties, Inc., REIT | | | 25,702 | | | | 1,254,258 | |
Medical Properties Trust, Inc., REIT | | | 284,356 | | | | 5,286,178 | |
National Health Investors, Inc., REIT | | | 27,944 | | | | 2,318,234 | |
New Senior Investment Group, Inc., REIT | | | 53,184 | | | | 332,400 | |
Omega Healthcare Investors, Inc., REIT | | | 138,772 | | | | 5,645,245 | |
Physicians Realty Trust, REIT | | | 119,851 | | | | 2,075,819 | |
Sabra Health Care REIT, Inc., REIT | | | 116,111 | | | | 2,510,320 | |
Senior Housing Properties Trust, REIT | | | 153,781 | | | | 1,305,601 | |
Universal Health Realty Income Trust, REIT | | | 8,443 | | | | 816,354 | |
Ventas, Inc., REIT | | | 231,831 | | | | 17,014,077 | |
Welltower, Inc., REIT | | | 261,936 | | | | 23,458,988 | |
| | | | | | | | |
| | | | | | | 81,254,967 | |
| | | | | | | | |
|
Hotels — 5.0% | |
Apple Hospitality REIT, Inc., REIT | | | 137,576 | | | | 2,191,586 | |
Ashford Hospitality Trust, Inc., REIT | | | 62,704 | | | | 175,571 | |
Braemar Hotels & Resorts, Inc., REIT | | | 18,080 | | | | 165,794 | |
Chatham Lodging Trust, REIT | | | 30,132 | | | | 499,890 | |
Chesapeake Lodging Trust, REIT | | | 39,301 | | | | 1,012,001 | |
DiamondRock Hospitality Co., REIT | | | 130,304 | | | | 1,233,979 | |
Hersha Hospitality Trust, REIT | | | 24,103 | | | | 335,032 | |
Hospitality Properties Trust, REIT | | | 106,366 | | | | 2,567,675 | |
Host Hotels & Resorts, Inc., REIT | | | 479,260 | | | | 7,687,330 | |
MGM Growth Properties LLC, Class A, REIT | | | 58,555 | | | | 1,805,836 | |
Park Hotels & Resorts, Inc., REIT | | | 130,398 | | | | 3,070,873 | |
Pebblebrook Hotel Trust, REIT | | | 84,497 | | | | 2,278,884 | |
RLJ Lodging Trust, REIT | | | 112,329 | | | | 1,820,853 | |
Ryman Hospitality Properties, Inc., REIT | | | 31,613 | | | | 2,518,291 | |
Summit Hotel Properties, Inc., REIT | | | 67,973 | | | | 758,579 | |
Sunstone Hotel Investors, Inc., REIT | | | 147,892 | | | | 1,943,301 | |
Xenia Hotels & Resorts, Inc., REIT | | | 72,864 | | | | 1,472,581 | |
| | | | | | | | |
| | | | | | | 31,538,056 | |
| | | | | | | | |
|
Industrial — 16.9% | |
CoreSite Realty Corp., REIT | | | 23,870 | | | | 2,773,217 | |
CyrusOne, Inc., REIT | | | 73,205 | | | | 5,377,639 | |
Digital Realty Trust, Inc., REIT | | | 134,734 | | | | 16,657,164 | |
EastGroup Properties, Inc., REIT | | | 23,781 | | | | 2,961,210 | |
Equinix, Inc., REIT | | | 54,385 | | | | 30,253,288 | |
SEE NOTES TO FINANCIAL STATEMENTS.
| | | | | | | | |
| | | |
| AUGUST 31, 2019 | | J.P. MORGAN EXCHANGE-TRADED FUNDS | | | | | 5 | |
JPMorgan BetaBuilders MSCI US REIT ETF
SCHEDULE OF PORTFOLIO INVESTMENTS
AS OF AUGUST 31, 2019 (Unaudited) (continued)
| | | | | | | | |
| Investments | | Shares | | | Value ($) | |
COMMON STOCKS — continued | |
|
Industrial — continued | |
First Industrial Realty Trust, Inc., REIT | | | 81,818 | | | | 3,186,811 | |
Industrial Logistics Properties Trust, REIT | | | 42,092 | | | | 900,348 | |
Innovative Industrial Properties, Inc., REIT (a) | | | 7,185 | | | | 640,615 | |
Liberty Property Trust, REIT | | | 95,915 | | | | 4,999,090 | |
Monmouth Real Estate Investment Corp., REIT | | | 57,882 | | | | 759,412 | |
Prologis, Inc., REIT | | | 408,043 | | | | 34,120,556 | |
STAG Industrial, Inc., REIT | | | 81,278 | | | | 2,363,564 | |
Terreno Realty Corp., REIT | | | 40,838 | | | | 2,064,769 | |
| | | | | | | | |
| | | | | | | 107,057,683 | |
| | | | | | | | |
|
Office — 12.0% | |
Alexandria Real Estate Equities, Inc., REIT | | | 73,059 | | | | 10,947,160 | |
Boston Properties, Inc., REIT | | | 99,953 | | | | 12,835,964 | |
Brandywine Realty Trust, REIT | | | 113,943 | | | | 1,635,082 | |
Columbia Property Trust, Inc., REIT | | | 75,599 | | | | 1,617,063 | |
Corporate Office Properties Trust, REIT | | | 72,391 | | | | 2,091,376 | |
Douglas Emmett, Inc., REIT | | | 104,639 | | | | 4,415,766 | |
Easterly Government Properties, Inc., REIT | | | 44,005 | | | | 904,303 | |
Empire State Realty Trust, Inc., Class A, REIT | | | 96,802 | | | | 1,361,036 | |
Equity Commonwealth, REIT | | | 78,856 | | | | 2,654,293 | |
Franklin Street Properties Corp., REIT | | | 69,367 | | | | 525,108 | |
Highwoods Properties, Inc., REIT | | | 67,077 | | | | 2,898,397 | |
Hudson Pacific Properties, Inc., REIT | | | 99,864 | | | | 3,395,376 | |
JBG SMITH Properties, REIT | | | 82,402 | | | | 3,152,700 | |
Kilroy Realty Corp., REIT | | | 65,320 | | | | 5,085,815 | |
Mack-Cali Realty Corp., REIT | | | 58,438 | | | | 1,190,382 | |
Office Properties Income Trust, REIT | | | 31,108 | | | | 843,338 | |
Paramount Group, Inc., REIT | | | 121,337 | | | | 1,599,222 | |
Piedmont Office Realty Trust, Inc., Class A, REIT (a) | | | 81,244 | | | | 1,603,757 | |
SL Green Realty Corp., REIT | | | 54,543 | | | | 4,375,439 | |
VEREIT, Inc., REIT | | | 629,600 | | | | 6,138,600 | |
Vornado Realty Trust, REIT | | | 111,063 | | | | 6,715,980 | |
| | | | | | | | |
| | | | | | | 75,986,157 | |
| | | | | | | | |
|
Regional Malls — 5.5% | |
Macerich Co. (The), REIT | | | 73,093 | | | | 2,085,343 | |
Pennsylvania REIT, REIT (a) | | | 47,553 | | | | 244,423 | |
Simon Property Group, Inc., REIT | | | 199,873 | | | | 29,769,085 | |
Tanger Factory Outlet Centers, Inc., REIT (a) | | | 60,867 | | | | 860,659 | |
Taubman Centers, Inc., REIT | | | 39,561 | | | | 1,544,857 | |
Washington Prime Group, Inc., REIT(a) | | | 120,640 | | | | 389,667 | |
| | | | | | | | |
| | | | | | | 34,894,034 | |
| | | | | | | | |
|
Shopping Centers — 5.5% | |
Acadia Realty Trust, REIT | | | 53,542 | | | | 1,464,374 | |
Alexander’s, Inc., REIT | | | 1,484 | | | | 560,314 | |
Brixmor Property Group, Inc., REIT | | | 192,754 | | | | 3,552,456 | |
Cedar Realty Trust, Inc., REIT | | | 57,588 | | | | 136,484 | |
Federal Realty Investment Trust, REIT | | | 48,451 | | | | 6,260,354 | |
| | | | | | | | |
| Investments | | Shares | | | Value ($) | |
| | | | | | | | |
|
Shopping Centers — continued | |
Kimco Realty Corp., REIT | | | 273,006 | | | | 5,017,850 | |
Kite Realty Group Trust, REIT | | | 54,289 | | | | 775,790 | |
Regency Centers Corp., REIT | | | 108,092 | | | | 6,973,015 | |
Retail Opportunity Investments Corp., REIT | | | 73,948 | | | | 1,294,829 | |
Retail Properties of America, Inc., Class A, REIT | | | 138,165 | | | | 1,569,554 | |
Retail Value, Inc., REIT | | | 9,858 | | | | 364,647 | |
RPT Realty, REIT | | | 51,971 | | | | 618,455 | |
Saul Centers, Inc., REIT | | | 8,853 | | | | 444,686 | |
Seritage Growth Properties, Class A, REIT (a) | | | 21,930 | | | | 857,244 | |
SITE Centers Corp., REIT | | | 93,426 | | | | 1,294,884 | |
Urban Edge Properties, REIT | | | 77,880 | | | | 1,363,679 | |
Urstadt Biddle Properties, Inc., Class A, REIT | | | 19,348 | | | | 406,115 | |
Weingarten Realty Investors, REIT | | | 79,049 | | | | 2,094,008 | |
| | | | | | | | |
| | | | | | | 35,048,738 | |
| | | | | | | | |
|
Storage — 9.6% | |
Americold Realty Trust, REIT | | | 117,704 | | | | 4,286,780 | |
CubeSmart, REIT | | | 121,912 | | | | 4,375,422 | |
Extra Space Storage, Inc., REIT | | | 82,442 | | | | 10,051,329 | |
Iron Mountain, Inc., REIT | | | 185,569 | | | | 5,910,373 | |
Life Storage, Inc., REIT | | | 30,169 | | | | 3,196,707 | |
National Storage Affiliates Trust, REIT | | | 36,799 | | | | 1,231,295 | |
Public Storage, REIT | | | 101,606 | | | | 26,899,172 | |
QTS Realty Trust, Inc., Class A, REIT | | | 35,802 | | | | 1,756,446 | |
Rexford Industrial Realty, Inc., REIT | | | 67,297 | | | | 2,973,854 | |
| | | | | | | | |
| | | | | | | 60,681,378 | |
| | | | | | | | |
TOTAL COMMON STOCKS
(Cost $611,433,522) | | | | 632,789,976 | |
| | | | | |
SHORT-TERM INVESTMENTS — 0.2% | |
|
INVESTMENT COMPANIES — 0.2% | |
JPMorgan U.S. Government Money Market Fund Class Institutional Shares, 1.99% (b)(c)
(Cost $1,025,580) | | | 1,025,580 | | | | 1,025,580 | |
| | | | | | | | |
|
INVESTMENT OF CASH COLLATERAL FROM SECURITIES LOANED — 0.7% | |
JPMorgan U.S. Government Money Market Fund Class IM Shares, 2.05% (b)(c)
(Cost $4,679,849) | | | 4,679,849 | | | | 4,679,849 | |
| | | | | | | | |
Total Investments—100.7%
(Cost $617,138,951) | | | | | | | 638,495,405 | |
Liabilities in Excess of Other Assets — (0.7)% | | | | (4,337,914 | ) |
| | | | | | | | |
Net Assets — 100.0% | | | $ | 634,157,491 | |
| | | | | | | | |
Percentages indicated are based on net assets.
SEE NOTES TO FINANCIAL STATEMENTS.
| | | | | | |
| | | |
| 6 | | | | J.P. MORGAN EXCHANGE-TRADED FUNDS | | AUGUST 31, 2019 |
| | |
| Abbreviations | | |
| REIT | | RealEstate Investment Trust |
| (a) | | Thesecurity or a portion of this security is on loan at August 31, 2019. The total value of securities on loan at August 31, 2019 is $4,360,525. |
| (b) | | Investmentin an affiliated fund, which is registered under the Investment Company Act of 1940, as amended, and is advised by J.P. Morgan Investment Management Inc. |
| (c) | | Therate shown is the current yield as of August 31, 2019. |
| | | | | | | | | | | | | | | | | | | | |
| Futures contracts outstanding as of August 31, 2019: | |
| Description | | Number of
Contracts | | | Expiration
Date | | | Trading Currency | | | Notional Amount
($) | | | Value and
Unrealized
Appreciation
(Depreciation) ($) | |
Long Contracts | |
DJ US Real Estate Index | | | 33 | | | | 09/2019 | | | | USD | | | | 1,196,910 | | | | 32,078 | |
| | | | | | | | | | | | | | | | | | | | |
| | |
| Abbreviations |
| USD | | UnitedStates Dollar |
SEE NOTES TO FINANCIAL STATEMENTS.
| | | | | | | | |
| | | |
| AUGUST 31, 2019 | | J.P. MORGAN EXCHANGE-TRADED FUNDS | | | | | 7 | |
STATEMENT OF ASSETS AND LIABILITIES
AS OF AUGUST 31, 2019 (Unaudited)
| | | | |
| | | JPMorgan
BetaBuilders MSCI
US REIT ETF | |
ASSETS: | | | | |
Investments innon-affiliates, at value | | $ | 632,789,976 | |
Investments in affiliates, at value | | | 1,025,580 | |
Investments of cash collateral received from securities loaned, at value (See Note 2.D.) | | | 4,679,849 | |
Restricted cash | | | 4,800 | |
Deposits at broker for futures contracts | | | 82,000 | |
Prepaid expenses | | | 687 | |
Receivables: | | | | |
Dividends fromnon-affiliates | | | 346,865 | |
Dividends from affiliates | | | 1,199 | |
Securities lending income (See Note 2.D.) | | | 2,768 | |
Variation margin on futures contracts | | | 330 | |
Due from Adviser | | | 1,430 | |
| | | | |
Total Assets | | | 638,935,484 | |
| | | | |
| |
LIABILITIES: | | | | |
Payables: | | | | |
Due to custodian | | | 9,580 | |
Collateral received on securities loaned (See Note 2.D.) | | | 4,679,849 | |
Accrued liabilities: | | | | |
Administration fees | | | 30,433 | |
Custodian, Accounting and Transfer Agent fees | | | 10,711 | |
Trustees’ and Chief Compliance Officer’s fees | | | 505 | |
Professional fees | | | 33,211 | |
Other | | | 13,704 | |
| | | | |
Total Liabilities | | | 4,777,993 | |
| | | | |
Net Assets | | $ | 634,157,491 | |
| | | | |
|
NET ASSETS: | |
Paid-in-Capital | | $ | 603,828,510 | |
Total distributable earnings (loss) | | | 30,328,981 | |
| | | | |
Total Net Assets | | $ | 634,157,491 | |
| | | | |
| |
Outstanding number of shares
(unlimited number of shares authorized — par value $0.0001) | | | 7,200,000 | |
| | | | |
Net asset value, per share | | $ | 88.08 | |
| | | | |
| |
Cost of investments innon-affiliates | | $ | 611,433,522 | |
Cost of investments in affiliates | | | 1,025,580 | |
Investment securities on loan, at value (See Note 2.D.) | | | 4,360,525 | |
Cost of investment of cash collateral (See Note 2.D.) | | | 4,679,849 | |
SEE NOTES TO FINANCIAL STATEMENTS.
| | | | | | |
| | | |
| 8 | | | | J.P. MORGAN EXCHANGE-TRADED FUNDS | | AUGUST 31, 2019 |
STATEMENT OF OPERATIONS
FOR THE SIX MONTHS ENDED AUGUST 31, 2019 (Unaudited)
| | | | |
| | | JPMorgan
BetaBuilders MSCI
US REIT ETF | |
INVESTMENT INCOME: | | | | |
Dividend income fromnon-affiliates | | $ | 3,513,336 | |
Dividend income from affiliates | | | 8,137 | |
Interest income fromnon-affiliates | | | 835 | |
Income from securities lending (net) (See Note 2.D.) | | | 9,430 | |
| | | | |
Total investment income | | | 3,531,738 | |
| | | | |
| |
EXPENSES: | | | | |
Investment advisory fees (See Note 3.A.) | | | 171,106 | |
Administration fees (See Note 3.B.) | | | 106,940 | |
Professional fees | | | 24,694 | |
Trustees’ and Chief Compliance Officer’s fees | | | 2,504 | |
Printing and mailing costs | | | 5,838 | |
Registration and filing fees | | | 7,556 | |
Custodian, Accounting and Transfer Agent fees (See Note 3.C.) | | | 25,516 | |
Insurance expense | | | 627 | |
Offering costs (See Note 2.F.) | | | 4,660 | |
Other | | | 1,493 | |
| | | | |
Total expenses | | | 350,934 | |
| | | | |
Less fee waived (See Note 3.D.) | | | (183,444 | ) |
Less expense reimbursements fromnon-affiliates (See Note 3.C.) | | | (9,600 | ) |
| | | | |
Net expenses | | | 157,890 | |
| | | | |
Net investment income (loss) | | | 3,373,848 | |
| | | | |
| |
REALIZED/UNREALIZED GAINS (LOSSES): | | | | |
Net realized gain (loss) on transactions from: | | | | |
Investments innon-affiliates | | | 657,251 | |
In-kind redemptions of investments innon-affiliates | | | 6,403,231 | |
Futures contracts | | | 80,379 | |
| | | | |
Net realized gain (loss) | | | 7,140,861 | |
| | | | |
Change in net unrealized appreciation/depreciation on: | | | | |
Investments innon-affiliates | | | 14,896,763 | |
Futures contracts | | | (15,946 | ) |
| | | | |
Change in net unrealized appreciation/depreciation | | | 14,880,817 | |
| | | | |
Net realized/unrealized gains (losses) | | | 22,021,678 | |
| | | | |
Change in net assets resulting from operations | | $ | 25,395,526 | |
| | | | |
SEE NOTES TO FINANCIAL STATEMENTS.
| | | | | | | | |
| | | |
| AUGUST 31, 2019 | | J.P. MORGAN EXCHANGE-TRADED FUNDS | | | | | 9 | |
STATEMENTS OF CHANGES IN NET ASSETS
FOR THE PERIODS INDICATED
| | | | | | | | |
| | | JPMorgan BetaBuilders MSCI US REIT ETF | |
| | | Six Months Ended
August 31, 2019
(Unaudited) | | | Period Ended
February 28, 2019 (a) | |
CHANGE IN NET ASSETS RESULTING FROM OPERATIONS: | | | | | | | | |
Net investment income (loss) | | $ | 3,373,848 | | | $ | 2,151,788 | |
Net realized gain (loss) | | | 7,140,861 | | | | 1,203,906 | |
Change in net unrealized appreciation/depreciation | | | 14,880,817 | | | | 6,507,715 | |
| | | | | | | | |
Change in net assets resulting from operations | | | 25,395,526 | | | | 9,863,409 | |
| | | | | | | | |
| | |
DISTRIBUTIONS TO SHAREHOLDERS: | | | | | | | | |
Total distributions to shareholders | | | (2,479,344 | ) | | | (1,574,130 | ) |
| | | | | | | | |
| | |
CAPITAL TRANSACTIONS: | | | | | | | | |
Change in net assets resulting from capital transactions | | | 475,212,385 | | | | 127,739,645 | |
| | | | | | | | |
| | |
NET ASSETS: | | | | | | | | |
Change in net assets | | | 498,128,567 | | | | 136,028,924 | |
Beginning of period | | | 136,028,924 | | | | — | |
| | | | | | | | |
End of period | | $ | 634,157,491 | | | $ | 136,028,924 | |
| | | | | | | | |
| | |
CAPITAL TRANSACTIONS: | | | | | | | | |
Proceeds from shares issued | | $ | 518,119,946 | | | $ | 141,407,612 | |
Cost of shares redeemed | | | (42,907,561 | ) | | | (13,667,967 | ) |
| | | | | | | | |
Total change in net assets resulting from capital transactions | | $ | 475,212,385 | | | $ | 127,739,645 | |
| | | | | | | | |
| | |
SHARE TRANSACTIONS: | | | | | | | | |
Issued | | | 6,025,000 | | | | 1,850,000 | |
Redeemed | | | (500,000 | ) | | | (175,000 | ) |
| | | | | | | | |
Net increase in shares from share transactions | | | 5,525,000 | | | | 1,675,000 | |
| | | | | | | | |
| (a) | Commencement of operations was June 15, 2018. |
SEE NOTES TO FINANCIAL STATEMENTS.
| | | | | | |
| | | |
| 10 | | | | J.P. MORGAN EXCHANGE-TRADED FUNDS | | AUGUST 31, 2019 |
THIS PAGE IS INTENTIONALLY LEFT BLANK
| | | | | | | | |
| | | |
| AUGUST 31, 2019 | | J.P. MORGAN EXCHANGE-TRADED FUNDS | | | | | 11 | |
FINANCIAL HIGHLIGHTS
FOR THE PERIODS INDICATED
| | | | | | | | | | | | | | | | | | | | | | | | | | | | |
| | | Per share operating performance | |
| | | | | | Investment operations | | | Distributions | |
| | | Net asset
value,
beginning
of period | | | Net
investment
income
(loss) (b) | | | Net realized and
unrealized gains
(losses) on
investments | | | Total from
investment
operations | | | Net
investment
income | | | Net
realized
gain | | | Total
distributions | |
| | | | | | | |
JPMorgan BetaBuilders MSCI US REIT ETF | | | | | | | | | | | | | | | | | | | | | | | | | | | | |
Six Months Ended August 31, 2019 (Unaudited) | | $ | 81.21 | | | $ | 1.01 | | | $ | 6.67 | | | $ | 7.68 | | | $ | (0.81 | ) | | $ | — | | | $ | (0.81 | ) |
June 15, 2018 (h) through February 28, 2019 | | | 75.67 | | | | 1.85 | | | | 5.10 | | | | 6.95 | | | | (1.35 | ) | | | (0.06 | ) | | | (1.41 | ) |
| (a) | Annualized for periods less than one year, unless otherwise indicated. |
| (b) | Calculated based upon average shares outstanding. |
| (c) | Not annualized for periods less than one year. |
| (d) | Includes adjustments in accordance with accounting principles generally accepted in the United States of America and as such, the net asset values for financial reporting purposes and the returns based upon those net asset values may differ from the net asset values and returns for shareholder transactions. |
| (e) | Market price total return is calculated assuming an initial investment made at the beginning of the period market price, reinvestment of all dividends and distributions at market price during the period, and sale at the market price on the last day of the period. The market price presented to calculate the market price total return is the mid-point of the bid/ask spread at the close of business on the Cboe BZX Exchange, Inc. |
| (f) | Since the Shares of the Fund did not trade in the secondary market until the day after the Fund’s inception, for the period from the inception to the first day of secondary market trading, the NAV is used as a proxy for the secondary market trading price to calculate the market returns. |
| (g) | Certain non-recurring expenses incurred by the Fund were not annualized for the periods indicated. |
| (h) | Commencement of operations. |
SEE NOTES TO FINANCIAL STATEMENTS.
| | | | | | |
| | | |
| 12 | | | | J.P. MORGAN EXCHANGE-TRADED FUNDS | | AUGUST 31, 2019 |
| | | | | | | | | | | | | | | | | | | | | | | | | | | | | | | | | | |
| Ratios/Supplemental data | |
| | | | | | | | | | | | | | | | Ratios to average net assets (a) | | | | |
Net asset
value,
end of
period | | | Market price, end
of period | | | Total return (c)(d) | | | Market price total
return (c)(e) | | | Net assets, end
of period | | | Net
expenses | | | Net
investment
income
(loss) | | | Expenses without
waivers and
reimbursements | | | Portfolio
turnover
rate (c) | |
| | | | | | | | |
| | | | | | | | | | | | | | | | | | | | | | | | | | | | | | | | | | |
| $ | 88.08 | | | $ | 88.06 | | | | 9.51 | % | | | 9.47 | % | | $ | 634,157,491 | | | | 0.11 | %(g) | | | 2.35 | % | | | 0.24 | %(g) | | | 3 | % |
| | 81.21 | | | | 81.22 | | | | 9.40 | | | | 9.41 | (f) | | | 136,028,924 | | | | 0.11 | (g) | | | 3.37 | | | | 0.40 | (g) | | | 5 | |
SEE NOTES TO FINANCIAL STATEMENTS.
| | | | | | | | |
| | | |
| AUGUST 31, 2019 | | J.P. MORGAN EXCHANGE-TRADED FUNDS | | | | | 13 | |
NOTES TO FINANCIAL STATEMENTS
AS OF AUGUST 31, 2019 (Unaudited)
1. Organization
J.P. Morgan Exchange-Traded Fund Trust (the “Trust”) was formed on February 25, 2010, and is governed by a Declaration of Trust as amended and restated February 19, 2014, and is registered under the Investment Company Act of 1940, as amended (the “1940 Act”), as an open-end management investment company. JPMorgan BetaBuilders MSCI US REIT ETF (the “Fund” or the “MSCI US REIT ETF”) is a separate diversified series of the Trust covered in this report.
The Fund commenced operations on June 15, 2018. The investment objective of the Fund is to seek investment results that closely correspond, before fees and expenses, to the performance of the MSCI US REIT Index.
J.P. Morgan Investment Management Inc. (“JPMIM”), an indirect, wholly-owned subsidiary of JPMorgan Chase & Co. (“JPMorgan”), acts as Adviser (the “Adviser”) and Administrator (the “Administrator”) to the Fund.
Shares of the Fund are listed and traded at market price on the Cboe BZX Exchange, Inc. Market prices for the Fund’s shares may be different from its net asset value (“NAV”). The Fund issues and redeems its shares on a continuous basis, through JPMorgan Distribution Services, Inc. (the “Distributor” or “JPMDS”), an indirect, wholly-owned subsidiary of JPMorgan, at NAV in large blocks of shares, typically 25,000 shares, referred to as “Creation Units”.
Creation Units are issued and redeemed principally in-kind for a basket of securities. A cash amount may be substituted if the Fund has sizeable exposure to market or sponsor restricted securities. Shares are generally traded in the secondary market in amounts less than a Creation Unit at market prices that change throughout the day. Only individuals or institutions that have entered into an authorized participant agreement with the Distributor may do business directly with the Fund (each, an “Authorized Participant”).
2. Significant Accounting Policies
The following is a summary of significant accounting policies followed by the Fund in the preparation of its financial statements. The Fund is an investment company and, accordingly, follows the investment company accounting and reporting guidance of the Financial Accounting Standards Board (“FASB”) Accounting Standards Codification Topic 946 — Investment Companies, which is part of U.S. generally accepted accounting principles (“GAAP”). The preparation of financial statements in conformity with GAAP requires management to make estimates and assumptions that affect the reported amounts of assets and liabilities and disclosure of contingent assets and liabilities at the date of the financial statements and the reported amounts of increases and decreases in net assets from operations during the reporting period. Actual results could differ from those estimates.
A. Valuation of Investments — The valuation of investments is in accordance with GAAP and the Fund’s valuation policies set forth by and under the supervision and responsibility of the Board of Trustees of the Trust (the “Board”), which established the following approach to valuation, as described more fully below: (i) investments for which market quotations are readily available shall be valued at their market value and (ii) all other investments for which market quotations are not readily available shall be valued at their fair value as determined in good faith by the Board.
The Administrator has established the J.P. Morgan Asset Management Americas Valuation Committee (“AVC”) to assist the Board with the oversight and monitoring of the valuation of the Fund’s investments. The Administrator implements the valuation policies of the Fund’s investments, as directed by the Board. The AVC oversees and carries out the policies for the valuation of investments held in the Fund. This includes monitoring the appropriateness of fair values based on results of ongoing valuation oversight including, but not limited to consideration of macro or security specific events, market events and pricing vendor and broker due diligence. The Administrator is responsible for discussing and assessing the potential impacts to the fair values on an ongoing basis, and at least on a quarterly basis with the AVC and the Board.
A market-based approach is primarily used to value the Fund’s investments. Investments for which market quotations are not readily available are fair valued by approved affiliated and/or unaffiliated pricing vendors or third party broker-dealers (collectively referred to as “Pricing Services”) or may be internally fair valued using methods set forth by the valuation policies approved by the Board. This may include related or comparable assets or liabilities, recent transactions, market multiples, book values and other relevant information for the investment to determine the fair value of the investment. An income-based valuation approach may be used in which the anticipated future cash flows of the investment are discounted to calculate the fair value. Discounts may also be applied due to the nature or duration of any restrictions on the disposition of the investments. Valuations may be based upon current market prices of securities that are comparable in coupon, rating, maturity and industry. It is possible that the estimated values may differ significantly from the values that would have been used, had a ready market for the investments existed, and such differences could be material.
Equities and other exchange-traded instruments are valued at the last sale price or official market closing price on the primary exchange on which the instrument is traded before the NAV of the Fund is calculated on a valuation date.
Investments in open-end investment companies excluding Exchange-Traded Funds (“ETFs”), (“Underlying Funds”) are valued at each Underlying Fund’s NAV per share as of the report date.
Futures contracts are generally valued on the basis of available market quotations.
Valuations reflected in this report are as of the report date. As a result, changes in valuation due to market events and/or issuer-related events after the report date and prior to issuance of the report are not reflected herein.
| | | | | | |
| | | |
| 14 | | | | J.P. MORGAN EXCHANGE-TRADED FUNDS | | AUGUST 31, 2019 |
The various inputs that are used in determining the valuation of the Fund’s investments are summarized into the three broad levels listed below.
| • | | Level 1 — Unadjusted inputs using quoted prices in active markets for identical investments. |
| • | | Level 2 — Other significant observable inputs including, but not limited to, quoted prices for similar investments, inputs other than quoted prices that are observable for investments (such as interest rates, prepayment speeds, credit risk, etc.) or other market corroborated inputs. |
| • | | Level 3 — Significant inputs based on the best information available in the circumstances, to the extent observable inputs are not available (including the Fund’s assumptions in determining the fair value of investments). |
A financial instrument’s level within the fair value hierarchy is based on the lowest level of any input, both individually and in the aggregate, that is significant to the fair value measurement. The inputs or methodology used for valuing instruments are not necessarily an indication of the risk associated with investing in those instruments.
The following table represents each valuation input as presented on the Schedule of Portfolio Investments (“SOI”):
| | | | | | | | | | | | | | | | |
| | | Level 1
Quoted prices | | | Level 2
Other significant
observable inputs | | | Level 3
Significant
unobservable inputs | | | Total | |
Total Investments in Securities (a) | | $ | 638,495,405 | | | $ | — | | | $ | — | | | $ | 638,495,405 | |
| | | | | | | | | | | | | | | | |
Appreciation in Other Financial Instruments | | | | | | | | | | | | | | | | |
Futures Contracts (a) | | $ | 32,078 | | | $ | — | | | $ | — | | | $ | 32,078 | |
| | | | | | | | | | | | | | | | |
| (a) | All portfolio holdings designated as level 1 are disclosed individually on the SOI. Please refer to the SOI for industry specifics of portfolio holdings. |
There were no transfers into and out of level 3 for the six months ended August 31, 2019.
B. Restricted Securities — Certain securities held by the Fund may be subject to legal or contractual restrictions on resale. Restricted securities generally are resold in transactions exempt from registration under the Securities Act of 1933 as amended (the “Securities Act”). Disposal of these securities may involve time-consuming negotiations and expense. Prompt sale at the current valuation may be difficult and could adversely affect the NAV of the Fund.
As of August 31, 2019, the Fund had no investments in restricted securities.
C. Futures Contracts — The Fund used index futures contracts to gain or reduce exposure to the stock market, maintain liquidity or minimize transaction costs. The Fund also bought futures contracts to invest incoming cash in the market or sold futures in response to cash outflows, thereby simulating an invested position in the underlying index while maintaining cash balance for liquidity.
Futures contracts provide for the delayed delivery of the underlying instrument at a fixed price or are settled for a cash amount based on the change in the value of the underlying instrument at a specific date in the future. Upon entering into a futures contract, the Fund is required to deposit with the broker, cash or securities in an amount equal to a certain percentage of the contract amount, which is referred to as the initial margin deposit. Subsequent payments, referred to as variation margin, are made or received by the Fund periodically and are based on changes in the market value of open futures contracts. Changes in the market value of open futures contracts are recorded as Change in net unrealized appreciation/depreciation on the Statement of Operations (“SOP”). Realized gains or losses, representing the difference between the value of the contract at the time it was opened and the value at the time it was closed, are reported on the SOP at the closing or expiration of the futures contract. Securities deposited as initial margin are designated on the SOI, while cash deposited, which is considered restricted, is recorded on the Statement of Assets and Liabilities (“SAL”). A receivable from and/or a payable to brokers for the daily variation margin is also recorded on the SAL.
The use of futures contracts exposes the Fund to equity price risk. The Fund may be subject to the risk that the change in the value of the futures contract may not correlate perfectly with the underlying instrument. Use of long futures contracts subjects the Fund to risk of loss in excess of the amounts shown on the SAL, up to the notional amount of the futures contracts. Use of short futures contracts subjects the Fund to unlimited risk of loss. The Fund may enter into futures contracts only on exchanges or boards of trade. The exchange or board of trade acts as the counterparty to each futures transaction; therefore, the Fund’s credit risk is limited to failure of the exchange or board of trade. Under some circumstances, futures exchanges may establish daily limits on the amount that the price of a futures contract can vary from the previous day’s settlement price, which could effectively prevent liquidation of positions.
Derivatives Volume
The table below discloses the volume of the Fund’s futures contracts activity during the six months ended August 31, 2019: Please refer to the tables in the Summary of Derivatives Information for derivative-related gains and losses associated with volume activity.
| | | | |
Futures Contracts — Equity: | | | | |
Average Notional Balance Long | | $ | 933,050 | |
Ending Notional Balance Long | | | 1,196,910 | |
| | | | | | | | |
| | | |
| AUGUST 31, 2019 | | J.P. MORGAN EXCHANGE-TRADED FUNDS | | | | | 15 | |
NOTES TO FINANCIAL STATEMENTS
AS OF AUGUST 31, 2019 (Unaudited) (continued)
The Fund’s futures contracts are not subject to master netting arrangements (the right to close out all transactions traded with a counterparty and net amounts owed or due across transactions).
D. Securities Lending — Effective June 18, 2018, the Fund became authorized to engage in securities lending in order to generate additional income. The Fund is able to lend to approved borrowers. Citibank N.A. (“Citibank”) serves as lending agent for the Fund, pursuant to a Securities Lending Agency Agreement (the “Securities Lending Agency Agreement”). Securities loaned are collateralized by cash equal to at least 100% of the market value plus accrued interest on the securities lent, which is invested in the IM Shares of JPMorgan U.S. Government Money Market Fund. The Fund retains loan fees and the interest on cash collateral investments but is required to pay the borrower a rebate for the use of cash collateral. In cases where the lent security is of high value to borrowers, there may be a negative rebate (i.e., a net payment from the borrower to the Fund). Upon termination of a loan, the Fund is required to return to the borrower an amount equal to the cash collateral, plus any rebate owed to the borrowers. The remaining maturities of the securities lending transactions are considered overnight and continuous. Loans are subject to termination by the Fund or the borrower at any time.
The net income earned on the securities lending (after payment of rebates and Citibank’s fee) is included on the SOP as Income from securities lending (net). The Fund also receives payments from the borrower during the period of the loan, equivalent to dividends and interest earned on the securities loaned, which are recorded as Dividend or Interest income, respectively, on the SOP.
Under the Securities Lending Agency Agreement, Citibank marks to market the loaned securities on a daily basis. In the event the cash received from the borrower is less than 102% of the value of the loaned securities (105% for loans of non-U.S. securities), Citibank requests additional cash from the borrower so as to maintain a collateralization level a of at least 102% of the value of the loaned securities plus accrued interest (105% for loans of non-U.S. securities), subject to certainde minimisamounts.
The value of securities out on loan is recorded as an asset on the SAL. The value of the cash collateral received is recorded as a liability on the SAL and details of collateral investments are disclosed on the SOI.
The Fund bears the risk of loss associated with the collateral investments and is not entitled to additional collateral from the borrower to cover any such losses. To the extent that the value of the collateral investments declines below the amount owed to a borrower, the Fund may incur losses that exceed the amount it earned on lending the security. Upon termination of a loan, the Fund may use leverage (borrow money) to repay the borrower for cash collateral posted if the Adviser does not believe that it is prudent to sell the collateral investments to fund the payment of this liability.
The following table presents the Fund’s value of the securities on loan with Citibank, net of amounts available for offset under the master netting arrangements and any related collated received or posted by the Fund as of August 31, 2019.
| | | | | | | | | | | | |
| | | Investment Securities
on Loan, at value,
Presented on the
Statement of Assets
and Liabilities | | | Cash Collateral
Posted by Borrower* | | | Net Amount Due
to Counterparty
(not less than zero) | |
| | $ | 4,360,525 | | | $ | (4,360,525 | ) | | $ | — | |
| * | Collateral posted reflects the value of securities on loan and does not include any additional amounts received from the borrower. |
Securities lending also involves counterparty risks, including the risk that the loaned securities may not be returned in a timely manner or at all. Subject to certain conditions, Citibank has agreed to indemnify the Fund from losses resulting from a borrower’s failure to return a loaned security.
JPMIM waived fees associated with the Fund’s investment in JPMorgan U.S. Government Money Market Fund in the amount of $415. JPMIM voluntarily waived investment advisory fees charged to the Fund to reduce the impact of the cash collateral investment in the JPMorgan U.S. Government Money Market Fund from 0.16% to 0.06%. The above waiver is included in the determination of earnings on cash collateral investment and in the calculation of Citibank’s compensation and is included on the SOP as Income from securities lending (net).
E. Investment Transactions with Affiliates— The Fund invested in Underlying Funds which are advised by the Adviser. An issuer which is under common control with a Fund may be considered an affiliate. For the purposes of the financial statements, the Fund assumes the issuers listed in the tables below to be affiliated issuers. The Underlying Funds’ distributions may be reinvested into the Underlying Funds. Reinvestment amounts are included in the purchase cost amounts in the tables below.
| | | | | | | | | | | | | | | | | | | | | | | | | | | | | | | | | | | | |
| For the six months ended August 31, 2019 | |
| Security Description | | Value at
February 28,
2019 | | | Purchases
at Cost | | | Proceeds
from Sales | | | Net
Realized
Gain
(Loss) | | | Change in
Unrealized
Appreciation/
(Depreciation) | | | Value at
August 31,
2019 | | | Shares at
August 31,
2019 | | | Dividend
Income | | | Capital Gain
Distributions | |
JPMorgan U.S. Government Money Market Fund Class IM Shares, 2.05% (a)(b) | | $ | 132,381 | | | $ | 21,862,980 | | | $ | 17,315,512 | | | $ | — | | | $ | — | | | $ | 4,679,849 | | | | 4,679,849 | | | $ | 22,916 | * | | $ | — | |
| | | | | | |
| | | |
| 16 | | | | J.P. MORGAN EXCHANGE-TRADED FUNDS | | AUGUST 31, 2019 |
| | | | | | | | | | | | | | | | | | | | | | | | | | | | | | | | | | | | |
| For the six months ended August 31, 2019 | |
| Security Description | | Value at
February 28,
2019 | | | Purchases
at Cost | | | Proceeds
from Sales | | | Net
Realized
Gain
(Loss) | | | Change in
Unrealized
Appreciation/
(Depreciation) | | | Value at
August 31,
2019 | | | Shares at
August 31,
2019 | | | Dividend
Income | | | Capital Gain
Distributions | |
JPMorgan U.S. Government Money Market Fund Class Institutional Shares, 1.99% (a)(b) | | $ | 1,275,554 | | | $ | 12,348,508 | | | $ | 12,598,482 | | | $ | — | | | $ | — | | | $ | 1,025,580 | | | | 1,025,580 | | | $ | 8,137 | | | $ | — | |
| | | | | | | | | | | | | | | | | | | | | | | | | | | | | | | | | | | | |
Total | | $ | 1,407,935 | | | $ | 34,211,488 | | | $ | 29,913,994 | | | $ | — | | | $ | — | | | $ | 5,705,429 | | | | | | | $ | 31,053 | | | $ | — | |
| | | | | | | | | | | | | | | | | | | | | | | | | | | | | | | | | | | | |
| (a) | Investment in an affiliated fund, which is registered under the Investment Company Act of 1940, as amended, and is advised by J.P. Morgan Investment Management Inc. |
| (b) | The rate shown is the current yield as of August 31, 2019. |
| * | Amount is included on the SOP as Income from securities lending (net) (after payments of rebates and Citibank’s fee). |
F. Offering and Organizational Costs — Total offering costs of $16,048 incurred in connection with the offering of shares of the Fund is amortized on a straight line basis over 12 months from the date the Fund commenced operations. Costs paid in connection with the organization of the Fund, if any, are recorded as an expense at the time the Fund commenced operations. For the six months ended August 31, 2019, total offering costs amortized were $4,660.
Costs paid in connection with the organization of the Fund, if any, were recorded as an expense at the time the Fund commenced operations and are included as part of Professional fees on the SOP.
G. Security Transactions and Investment Income — Investment transactions are accounted for on the trade date (the date the order to buy or sell is executed). Securities gains and losses are calculated on a specifically identified cost basis. Interest income is determined on the basis of coupon interest accrued using the effective interest method, which adjusts for amortization of premiums and accretion of discounts. Dividend income, net of foreign taxes withheld, if any, is recorded on the ex-dividend date or when the Fund first learns of the dividend.
To the extent such information is publicly available, the Fund records distributions received in excess of income earned from underlying investments as a reduction of cost of investments and/or realized gain. Such amounts are based on estimates if actual amounts are not available and actual amounts of income, realized gain and return of capital may differ from the estimated amounts. The Fund adjusts the estimated amounts of the components of distributions (and consequently its net investment income) as necessary once the issuers provide information about the actual composition of the distributions.
H. Allocation of Expenses — Expenses directly attributable to a fund are charged directly to the Fund, while the expenses attributable to more than one fund of the Trust are allocated among the applicable funds.
I. Federal Income Taxes — The Fund is treated as a separate taxable entity for Federal income tax purposes. The Fund’s policy is to comply with the provisions of the Internal Revenue Code (the “Code”) applicable to regulated investment companies and to distribute to shareholders all of its distributable net investment income and net realized capital gains on investments. Accordingly, no provision for Federal income tax is necessary. Management has reviewed the Fund’s tax positions for all open tax years and has determined that as of August 31, 2019, no liability for Federal income tax is required in the Fund’s financial statements for net unrecognized tax benefits. However, management’s conclusions may be subject to future review based on changes in, or the interpretation of, the accounting standards or tax laws and regulations. The Fund’s Federal tax returns since inception remain subject to examination by the Internal Revenue Service.
J. Distributions to Shareholders — Distributions from net investment income, if any, are generally declared and paid quarterly. Net realized capital gains, if any, are distributed by the Fund at least annually. The amount of distributions from net investment income and net realized capital gains is determined in accordance with Federal income tax regulations, which may differ from GAAP. To the extent these “book/tax” differences are permanent in nature (i.e., that they result from other than timing of recognition — “temporary differences”), such amounts are reclassified within the capital accounts based on their Federal tax-basis treatment.
K. New Accounting Pronouncement — In August 2018, the FASB issuedAccounting Standard Update (“ASU”) 2018-13 (“ASU 2018-13”), Fair Value Measurement (Topic 820): Disclosure Framework — Changes to the Disclosure Requirements for Fair Value Measurement, which adds, removes, and modifies certain aspects of the fair value disclosure. ASU 2018-13 amendments are the result of a broader disclosure project, FASB Concepts Statement Conceptual Framework for Financial Reporting — Chapter 8: Notes to Financial Statements, to improve the effectiveness of the fair value disclosure requirements. ASU 2018-13 is effective for the fiscal years, and interim periods within those fiscal years, beginning after December 15, 2019; early adoption is permitted. Management has evaluated the implications of these changes and the amendments are included in the financial statements, which had no effect to the Fund’s net assets or results of operation.
| | | | | | | | |
| | | |
| AUGUST 31, 2019 | | J.P. MORGAN EXCHANGE-TRADED FUNDS | | | | | 17 | |
NOTES TO FINANCIAL STATEMENTS
AS OF AUGUST 31, 2019 (Unaudited) (continued)
3. Fees and Other Transactions with Affiliates
A. Investment Advisory Fee — Pursuant to an Investment Advisory Agreement, the Adviser manages the investments of the Fund and for such services is paid a fee. The investment advisory fee is accrued daily and paid monthly at an annual rate of 0.12% of the Fund’s average daily net assets.
The Adviser waived investment advisory fees and/or reimbursed expenses as outlined in Note 3.D.
B. Administration Fee — Pursuant to an Administration Agreement, the Administrator provides certain administration services to the Fund. In consideration of these services, effective January 1, 2019, the Administrator received a fee that was accrued daily and paid monthly at an annual rate of 0.075% of the Fund’s net assets. Prior to January 1, 2019, the Administrator received a fee that was accrued daily and paid monthly at an annual rate of 0.085% of the Fund’s average daily net assets.
The Administrator waived administration fees as outlined in Note 3.D.
JPMorgan Chase Bank, N.A. (“JPMCB”), a wholly-owned subsidiary of JPMorgan, serves as the Fund’s sub-administrator (the “Sub-administrator”). For its services as Sub-administrator, JPMCB receives a portion of the fees payable to the Administrator.
C. Custodian, Accounting and Transfer Agent Fees — JPMCB provides custody, accounting and transfer agency services to the Fund. The amount paid directly to JPMCB by the Fund for custody services are included in the Custodian, Accounting and Transfer Agent fees on the SOP. Interest income earned on cash balances at the custodian, if any, is included in Interest income from affiliates on the SOP. With respect to the transfer agency services provided by JPMCB for each creation or redemption transaction, the Authorized Participant will generally be responsible for such associated expenses; during the six months ended August 31, 2019, the Fund paid no transfer agency fees to JPMCB.
Additionally, Authorized Participants generally pay transaction fees associated with the creation and redemption of fund shares. These fees are used to offset certain custodian charges incurred by the Fund for these transactions.
For the six months ended August 31, 2019, the amount of transaction fees paid by the Authorized Participants to the Fund that were used to reimburse custodian fees were $9,600.
Such amounts are included in expense reimbursements from non-affiliates on the SOP.
Restricted cash on the SAL is cash received from Authorized Participants for the reimbursement of creation and/or redemption of Fund shares.
Interest expense paid to the custodian related to cash overdrafts, if any, is included in Interest expense to affiliates on the SOP.
D. Waivers and Reimbursements — The Adviser has contractually agreed to waive fees and/or reimburse the Fund to the extent that total annual operating expenses, (excluding acquired fund fees and expenses, dividend expenses related to short sales, interest, taxes, expenses related to litigation and potential litigation, and extraordinary expenses), exceed 0.11% of the Fund’s average daily net assets.
The expense limitation agreement is in effect for the six months ended August 31, 2019 and the current agreement is in place until at least June 30, 2022.
For the six months ended August 31, 2019, the Fund’s service providers waived fees and/or reimbursed expenses for the Fund as follows. None of these parties expect the Fund to repay any such waived fees and/or reimbursed expenses in future years.
| | | | | | | | | | |
| | | Contractual Waivers | |
| | | Investment
Advisory Fees | | Administration
Fees | | | Total | |
| | $109,577 | | $ | 73,052 | | | $ | 182,629 | |
Additionally, the Fund may invest in one or more money market funds advised by the Adviser (affiliated money market funds). The Adviser has contractually agreed to waive fees and/or reimburse expenses in an amount sufficient to offset the respective fees and expenses of the affiliated money market funds incurred by the Fund because of the Fund’s investment in such money market funds, except for investments of securities lending collateral.
The amount of the waivers resulting from investments in the money market fund for the six months ended August 31, 2019 was $815.
E. Distribution Services— The Distributor or its agent distributes Creation Units for the Fund on an agency basis. The Distributor does not maintain a secondary market in shares of the Fund. JPMDS receives no fees for their distribution services under their respective distribution agreements with the Trust (the “Distribution Agreements”). Although the Trust does not pay any fees under the Distribution Agreements, JPMIM pays JPMDS for certain distribution related services.
F. Other— Certain officers of the Trust are affiliated with the Adviser, the Administrator and JPMDS. Such officers, with the exception of the Chief Compliance Officer, receive no compensation from the Fund for serving in their respective roles.
The Board designated and appointed a Chief Compliance Officer to the Fund pursuant to Rule 38a-1 under the 1940 Act. The Fund, along with affiliated funds, makes reimbursement payments, on a pro-rata basis, to the Administrator for a portion of the fees associated with the office of the Chief Compliance Officer. Such fees are included in Trustees’ and Chief Compliance Officer’s fees on the SOP.
| | | | | | |
| | | |
| 18 | | | | J.P. MORGAN EXCHANGE-TRADED FUNDS | | AUGUST 31, 2019 |
The Securities and Exchange Commission (“SEC”) has granted an exemptive order permitting the Fund to engage in principal transactions with J.P. Morgan Securities, Inc., an affiliated broker, involving taxable money market instruments, subject to certain conditions.
G. Management Fee— Effective November 1, 2019, the Investment Advisory Agreement, Administration Agreement and Expense Limitation Agreement were replaced by a Management Agreement. Under the Management Agreement, JPMIM is responsible for substantially all expenses of the Fund, except for the management fees, payments under the Funds 12b-1 plan (if any), interest expenses, dividend and interest expenses related to short sales, taxes, acquired fund fees and expenses (other than fees for funds advised by the adviser and/or its affiliates), brokers’ commissions and any other transaction-related expenses and fees arising out of transactions effected on behalf of the Fund, costs of holding shareholder meetings, the costs of any securities lending program, and litigation and potential litigation and other extraordinary expenses not incurred in the ordinary course of the Fund’s business. If the amount of expenses paid by the Fund exceeds the fee payable to the Adviser, the Adviser will reimburse the Fund for such amount. The management fee is accrued daily and paid no more frequently than monthly at an annual rate of 0.11% of the Fund’s average daily net assets.
4. Investment Transactions
During the six months ended August 31, 2019, purchases and sales of investments (excluding short-term investments) were as follows:
| | | | | | |
| | | Purchases
(excluding U.S.
Government) | | Sales
(excluding U.S.
Government) | |
| | $18,815,484 | | $ | 8,867,582 | |
During the six months ended August 31, 2019, there were no purchases or sales of U.S. Government securities.
For the six months ended August 31, 2019, in-kind transactions associated with creations and redemptions were as follows:
| | | | | | |
| | | In-Kind
Creations | | In-Kind
Redemptions | |
| | $509,566,515 | | $ | 42,380,725 | |
5. Federal Income Tax Matters
For Federal income tax purposes, the estimated cost and unrealized appreciation (depreciation) in value of investments held at August 31, 2019 were as follows:
| | | | | | | | | | | | | | |
| | | Aggregate
Cost | | Gross
Unrealized
Appreciation | | | Gross
Unrealized
Depreciation | | | Net Unrealized
Appreciation
(Depreciation) | |
| | $617,138,951 | | $ | 32,193,494 | | | $ | 10,804,962 | | | $ | 21,388,532 | |
At February 28, 2019, the Fund did not have any net capital loss carryforwards.
6. Capital Share Transactions
The Trust issues and redeems shares of the Fund only in Creation Units through the Distributor at NAV. Capital shares transactions detail can be found in the Statements of Changes in Net Assets.
Shares of the Fund may only be purchased or redeemed by Authorized Participants. Such Authorized Participants may from time to time hold, of record or beneficially, a substantial percentage of the Fund’s shares outstanding and act as executing or clearing broker for investment transactions on behalf of the Fund. An Authorized Participant is either (1) a “Participating Party” or other participant in the clearing process through the Continuous Net Settlement System of the National Securities Clearing Corporation (“NSCC”); or (2) a DTC Participant; which, in either case, must have executed an agreement with the Distributor.
7. Risks, Concentrations and Indemnifications
In the normal course of business, the Fund enters into contracts that contain a variety of representations which provide general indemnifications. The Fund’s maximum exposure under these arrangements is unknown. The amount of exposure would depend on future claims that may be made against the Fund that has not yet occurred. However, based on experience, the Fund expects the risk of loss to be remote.
Significant shareholder transactions by the Adviser may impact the Fund’s performance.
Because the Fund may invest a significant portion of its assets in REITs, the Fund may be subject to certain risks similar to those associated with direct investments in real estate. REITs may be affected by changes in the value of their underlying properties and by defaults by tenants. REITs depend generally on their ability to generate cash flow to make distributions to shareholders, and certain REITs have self-liquidation provisions by which mortgages held may be paid in full and distributions of capital returns may be made at any time.
Disruptions to creations and redemptions, the existence of significant market volatility or potential lack of an active trading market for the Shares (including through a trading halt), as well as other factors, may result in Shares trading significantly above (at a premium) or below (at a discount) to the NAV or to the intraday value of the Fund’s holdings. During such periods, investors may incur significant losses if shares are sold.
| | | | | | | | |
| | | |
| AUGUST 31, 2019 | | J.P. MORGAN EXCHANGE-TRADED FUNDS | | | | | 19 | |
NOTES TO FINANCIAL STATEMENTS
AS OF AUGUST 31, 2019 (Unaudited) (continued)
The Fund may not track the return of the underlying index for a number of reasons and therefore may not achieve its investment objective. For example, the Fund incurs a number of operating expenses not applicable to its underlying index, and incurs costs in buying and selling securities, especially when rebalancing the Fund’s securities holdings to reflect changes in the composition of the underlying index. In addition, a Fund’s return may differ from the return of its underlying index as a result of, among other things, pricing differences and the inability to purchase certain securities included in the underlying index due to regulatory or other restrictions. To the extent of the previously outlined items, the Fund’s return differs from the return of the underlying index.
Derivatives may be riskier than other types of investments because they may be more sensitive to changes in economic and market conditions and could result in losses that significantly exceed the Fund’s original investment. Derivatives also expose the Fund to counterparty risk (the risk that the derivative counterparty will not fulfill its contractual obligations), including credit risk of the derivative counterparty. The possible lack of a liquid secondary market for derivatives and the resulting inability of the Fund to sell or otherwise close a derivatives position could expose the Fund to losses.
| | | | | | |
| | | |
| 20 | | | | J.P. MORGAN EXCHANGE-TRADED FUNDS | | AUGUST 31, 2019 |
SCHEDULE OF SHAREHOLDER EXPENSES
(Unaudited)
Hypothetical $1,000 Investment
As a shareholder of the Fund, you incur two types of costs: (1) transaction costs, including brokerage commissions on your purchase and sales of Fund shares and (2) ongoing costs, including investment advisory fees, administration fees and other Fund expenses. The examples below are intended to help you understand your ongoing costs (in dollars) of investing in the Fund and to compare these ongoing costs with the ongoing costs of investing in other funds. The examples assume that you had a $1,000 investment at the beginning of the reporting period March 1, 2019 and continued to hold your shares at the end of the reporting period, August 31, 2019.
Actual Expenses
For the Fund in the table below, the first line provides information about actual account values and actual expenses. You may use the information in this line, together with the amount you invested, to estimate the expenses that you paid over the period. Simply divide your account value by $1,000 (for
example, an $8,600 account value divided by $1,000 = 8.6), then multiply the result by the number under the heading entitled “Expenses Paid During the Period” to estimate the expenses you paid on your account during this period.
Hypothetical Example for Comparison Purposes
The second line in the table below provides information about hypothetical account values and hypothetical expenses based on the Fund’s actual expense ratio and an assumed rate of return of 5% per year before expenses, which is not the Fund’s actual return. The hypothetical account values and expenses may not be used to estimate the actual ending account balance or expenses you paid for the period. You may use this information to compare the ongoing costs of investing in the Fund and other Funds. To do so, compare this 5% hypothetical example with the 5% hypothetical examples that appear in the shareholder reports of other funds. The examples also assume all dividends and distributions have been reinvested.
| | | | | | | | | | | | | | | | |
| | | Beginning Account Value March 1, 2019 | | | Ending Account Value August 31, 2019 | | | Annualized Expense Ratio | | | Expenses Paid During
the Period (1) | |
JPMorgan BetaBuilders MSCI US REIT ETF | | | | | | | | | | | | | | | | |
Actual | | $ | 1,000.00 | | | $ | 1,095.10 | | | | 0.11 | % | | $ | 0.58 | |
Hypothetical | | | 1,000.00 | | | | 1,024.58 | | | | 0.11 | | | | 0.56 | |
| (1) | Expenses are equal to each Fund’s annualized net expense ratio, multiplied by the average account value over the period, multiplied by 184/366 (to reflect the one-half year period). |
| | | | | | | | |
| | | |
| AUGUST 31, 2019 | | J.P. MORGAN EXCHANGE-TRADED FUNDS | | | | | 21 | |
SPECIAL SHAREHOLDER MEETING RESULTS
(Unaudited)
J.P. Morgan Exchange-Traded Trust (the “Trust”) held a special meeting of shareholders on August 22, 2019, for the purpose of considering and voting upon the approval of a new Management Agreement with J.P. Morgan Investment Management Inc. which will implement a unitary fee structure.
The new Management Agreement was approved by shareholders of the Fund.
The results of the voting were as follows:
| | | | |
| | | Votes Received | |
For | | | 329,196,766 | |
Against | | | 3,175 | |
Abstain | | | 106,074 | |
| | | | | | |
| | | |
| 22 | | | | J.P. MORGAN EXCHANGE-TRADED FUNDS | | AUGUST 31, 2019 |
BOARD APPROVAL OF INVESTMENT ADVISORY AGREEMENT
(Unaudited)
The Board meets regularly throughout the year and considers factors that are relevant to its consideration of investment advisory agreements at each meeting. The Board also meets for the specific purpose of considering approvals of amendments to and new investment advisory agreements for the Fund. At the June11-12, 2019 quarterly Board meeting, the Trustees, including a majority of the Trustees who are not “interested persons” (as defined in the 1940 Act) of the Trust, Adviser or any of its affiliates (“Independent Trustees”), approved the new Management Agreement on behalf of the Fund. The Board also recommended that the Fund’s shareholders approve the Management Agreement. Such approval was recently obtained, and the agreement will take effect November 1, 2019.
As part of their review of the Management Agreement, the Trustees considered and reviewed information received from the Adviser about the proposed changes to the Fund’s Investment Advisory Agreement to convert it to a “unitary fee” structure. They also considered information received in connection with the March 2018 Board meeting when the Trustees initially approved the Investment Advisory Agreement for the Fund. This included comprehensive information concerning the nature and quality of services provided by the Adviser and potential“fall-out” benefits expected to be received by the Adviser. The Board noted that the possibility of proposing a unitary fee had been raised by the Adviser at an earlier meeting, and that prior to the June11-12, 2019 meeting, the Adviser and the Board had several discussions about unitary fees generally, industry practice, the potential impact on the Fund, and related matters. Before voting on the Management Agreement, the Trustees reviewed the agreement with representatives of the Adviser, counsel to the Trust and independent legal counsel and received a memorandum from independent legal counsel to the Trustees discussing the legal standards for their consideration of the Management Agreement. The Trustees also discussed the Management Agreement in executive sessions with independent legal counsel at which no representatives of the Adviser were present. A summary of the material factors evaluated by the Trustees in determining whether to approve Management Agreement is provided below.
The Trustees considered information provided with respect to the Fund over the course of the year, as well as the materials furnished specifically in connection with this approval process. Each Trustee attributed his or her own evaluation of the significance of the various factors and no factor alone was considered determinative. The Trustees determined that the proposed compensation to be received by the Adviser from the Fund under the Management Agreement was fair and reasonable and that the approval of the Management Agreement was in the best interests of the Fund and its shareholders.
The factors summarized below were considered and discussed by the Trustees in reaching their conclusions:
Nature, Extent and Quality of Services Provided by the Adviser
In connection with the approval of the Management Agreement on behalf of the Fund, the Trustees received and considered information regarding the nature, extent and quality of services provided to the Fund under its Investment Advisory and Administration Agreements, as well as those that will be provided under the Management Agreement. They also considered management’s representation that the services provided to the Fund will not change as a result of the transition to the unitary fee structure. The Trustees also took into account information furnished throughout the year at Trustee meetings, including consideration of the background and experience of JPMIM’s senior management and the qualifications, backgrounds and responsibilities of the portfolio management team primarily responsible for theday-to-day management of the Fund. The Trustees also considered the Fund’s investment strategy, and the infrastructure supporting the portfolio management team. In addition, the Trustees considered information about the structure and distribution strategies of the Fund, how they fit within the Trust’s fund offerings, and how the Fund is positioned against peer funds, as identified by management and/or Broadridge Investor Communications Solutions Inc. (“Broadridge”), an independent provider of investment company data. The Trustees reviewed information relating to the Adviser’s risk governance model and reports showing the Adviser’s compliance structure and ongoing compliance processes.
The Trustees also considered their knowledge of the nature and quality of services provided by the Adviser and its affiliates gained from their experience as Trustees of the Trust and in the financial industry in general. In addition, they considered the overall reputation and capabilities of the Adviser and its affiliates, the commitment of the Adviser to continue to provide high quality service to the Fund, their overall confidence in the Adviser’s integrity and the Adviser’s responsiveness to requests for additional information, questions or concerns raised by them.
Based upon these considerations and other factors, the Trustees concluded that they were satisfied with the nature, extent and quality of services provided to the Fund by the Adviser.
Fall-Out Benefits
The Trustees reviewed information regarding potential“fall-out” or ancillary benefits received by the Adviser and its affiliates as a result of their relationships with the Fund, particularly those benefits potentially impacted by the implementation of the unitary fee structure. The Trustees also considered the benefits the Adviser receives as the result of JPMorgan Chase Bank, N.A.’s (“JPMCB”) roles as custodian, fund accountant and transfer agent for the Fund.
| | | | | | | | |
| | | |
| AUGUST 31, 2019 | | J.P. MORGAN EXCHANGE-TRADED FUNDS | | | | | 23 | |
BOARD APPROVAL OF INVESTMENT ADVISORY AGREEMENT
(Unaudited) (continued)
The Trustees considered that adopting the Management Agreement would benefit the Adviser by bringing the Fund in line with industry practice, which could potentially improve their marketability and ultimately increase the Adviser’s assets under management.
Costs of Services Provided and Profitability to the Adviser and its Affiliates
The Trustees considered the fees that the Adviser earned from the Fund for providing investment advisory and administrative services and that because the Fund was relatively new, it was not likely to be profitable under the Investment Advisory Agreement. The Trustees also considered the fees paid to JPMCB, also an affiliate of the Adviser, for custody, transfer agency and other related services for the Fund. It was noted that under the new fee structure, JPMIM will be responsible for providing the administrative services under the Management Agreement and for paying JPMCB for the services that it provides.
The Trustees also considered the fact that because the Fund’s total expense ratio would stay the same, the Adviser’s profitability was not expected to change in the near term as a result of the transition to the unitary fee structure under the new Management Agreement. They also noted, however, that if the Fund’s assets increase, Fund fees will not necessarily decrease even if the Fund and JPMIM achieve economies of scale. In this regard, the Trustees noted that after the Management Agreement’s initialtwo-year term, the Trustees would have the opportunity to review the fee each year as part of the annual contract review process.
Based on these considerations and other factors noted above, the Trustees concluded that the projected profitability to the Adviser under the Management Agreement would not be unreasonable in light of the anticipated services and benefits provided to the Fund under the new fee structure.
Economies of Scale
The Trustees considered the extent to which the Fund will benefit from economies of scale. The Trustees noted that the management fees and other expenses paid by the Fund under the Management Agreement would be the same as or less than the amounts the Fund would have paid under the prior structure, which involved the Investment Advisory and Administration Agreement operating in conjunction with a terminable
expense limitation agreement. The Trustees further considered that shareholders would benefit because expenses would be limited even when the Fund is new or if assets decreased. The Trustees also considered the fact that increases in assets would not lead to fee decreases even if economies of scale were achieved, but that they will have the opportunity to further review the appropriateness of the fee payable to the Adviser under the Management Agreement in the future. In this regard, The Trustees noted that after the Management Agreement’s initialtwo-year term, the Trustees would have the opportunity to review the fee each year as part of the annual contract renewal process.
Investment Performance
The Trustees considered the Fund’s investment strategy and process, portfolio management team and competitive positioning against identified peer funds and a comparison of Fund performance against the index the Fund seeks to track. The Trustees also considered Fund performance information reviewed at regular Board Meetings. After considering such information, the Trustees concluded that the prospects for competitive future performance were acceptable.
Management Fees and Expense Ratios
The Trustees considered the contractual unitary management fee rate that will be paid by the Fund to the Adviser and compared that rate to the information prepared by Broadridge concerning management fee rates paid by other funds in the same Broadridge category as the Fund. The Trustees also considered additional fund comparisons proposed by the Adviser. The Trustees also considered information comparing the management fee for the Fund to the expense ratios of mutual funds with similar investment objectives or in similar asset classes managed by the Adviser.
The Trustees noted that the Fund’s estimated unitary management fees were in line with fees for identified peer funds. After considering the factors identified above, the Trustees concluded that the proposed management fees were reasonable.
Based on the foregoing, the Board, including all of the Independent Trustees, unanimously: (a) concluded that the terms of the Management Agreement are fair and reasonable; (b) concluded that the proposed fees were reasonable in light of the services that the Adviser will provide to the Fund; and (c) approved the Management Agreement.
| | | | | | |
| | | |
| 24 | | | | J.P. MORGAN EXCHANGE-TRADED FUNDS | | AUGUST 31, 2019 |
J.P. Morgan Exchange-Traded Funds are distributed by JPMorgan Distribution Services, Inc., an indirect, wholly-owned subsidiary of JPMorgan Chase & Co.
Contact J.P. Morgan Exchange-Traded Funds at 1-844-457-6383 (844-4JPM ETF) for a fund prospectus. You can also visit us at www.jpmorganfunds.com. Investors should carefully consider the investment objectives and risks as well as charges and expenses of the fund before investing. The prospectus contains this and other information about the fund. Read the prospectus carefully before investing.
Investors may obtain information about the Securities Investor Protection Corporation (SIPC), including the SIPC brochure, by visiting www.sipc.org or by calling SIPC at 202-371-8300.
The Fund files a complete schedule of its fund holdings for the first and third quarters of its fiscal year with the SEC onForm N-PORT. Prior to March 31, 2019, the Fund filed a complete schedule of its fund holdings for the first and third quarters of its fiscal year with the SEC on Form N-Q. The Fund’s Form N-PORT and Form N-Q are available on the SEC’s website at http://www.sec.gov. The Fund’s quarterly holdings can be found by visiting the J.P. Morgan Funds’ website at www.jpmorganfunds.com.
A description of the Fund’s policies and procedures with respect to the disclosure of the Fund’s holdings is available in the prospectus and Statement of Additional Information.
A copy of proxy policies and procedures is available without charge upon request by calling 1-844-457-6383 and on the Fund’s website at www.jpmorganfunds.com. A description of such policies and procedures is on the SEC’s website at www.sec.gov. The Trustees have delegated the authority to vote proxies for securities owned by the Fund to the Adviser. A copy of the Fund’s voting record for the most recent 12-month period ended June 30 is available on the SEC’s website at www.sec.gov or at the Fund’s website at www.jpmorganfunds.com no later than August 31 of each year. The Fund’s proxy voting record will include, among other things, a brief description of the matter voted on for each fund security, and will state how each vote was cast, for example, for or against the proposal.


J.P. Morgan Asset Management is the brand name for the asset management businesses of JPMorgan Chase & Co. and its affiliates worldwide.
| | | | |
| | © JPMorgan Chase & Co., 2019. All rights reserved. August 2019. | | SAN-RETF-819 |
ITEM 2. CODE OF ETHICS.
Disclose whether, as of the end of the period covered by the report, the registrant has adopted a code of ethics that applies to the registrant’s principal executive officer, principal financial officer, principal accounting officer or controller, or persons performing similar functions, regardless of whether these individuals are employed by the registrant or a third party. If the registrant has not adopted such a code of ethics, explain why it has not done so.
The registrant must briefly describe the nature of any amendment, during the period covered by the report, to a provision of its code of ethics that applies to the registrant’s principal executive officer, principal financial officer, principal accounting officer or controller, or persons performing similar functions, regardless of whether these individuals are employed by the registrant or a third party, and that relates to any element of the code of ethics definition enumerated in paragraph (b) of this Item. The registrant must file a copy of any such amendment as an exhibit pursuant to Item 13(a)(1), unless the registrant has elected to satisfy paragraph (f) of this Item by positing its code of ethics on its website pursuant to paragraph (f)(2) of this Item, or by undertaking to provide its code of ethics to any person without charge, upon request, pursuant to paragraph (f)(3) of this Item.
If the registrant has, during the period covered by the report, granted a waiver, including an implicit waiver, from a provision of the code of ethics that applies to the registrant’s principal executive officer, principal financial officer, principal accounting officer or controller, or persons performing similar functions, regardless of whether these individuals are employed by the registrant or third party, that relates to one or more items set forth in paragraph (b) of this Item, the registrant must briefly describe the nature of the waiver, the name of the person to whom the waiver was granted, and the date of the waiver.
Not applicable to a semi-annual report.
ITEM 3. AUDIT COMMITTEE FINANCIAL EXPERT.
(a) (1) Disclose that the registrant’s board of directors has determined that the registrant either:
(i) Has at least one audit committee financial expert serving on its audit committee; or
(ii) Does not have an audit committee financial expert serving on its audit committee.
(2) If the registrant provides the disclosure required by paragraph (a)(1)(i) of this Item, it must disclose the name of the audit committee financial expert and whether that person is “independent.” In order to be considered “independent” for purposes of this Item, a member of an audit committee may not, other than in his or her capacity as a member of the audit committee, the board of directors, or any other board committee:
(i) Accept directly or indirectly any consulting, advisory, or other compensatory fee from the issuer; or
(ii) Be an “interested person” of the investment company as defined in Section 2(a)(19) of the Act (15 U.S.C. 80a-2(a)(19)).
(3) If the registrant provides the disclosure required by paragraph (a)(1)(ii) of this Item, it must explain why it does not have an audit committee financial expert.
Not applicable to a semi-annual report.
ITEM 4. PRINCIPAL ACCOUNTANT FEES AND SERVICES.
(a) Disclose, under the caption Audit Fees, the aggregate fees billed for each of the last two fiscal years for professional services rendered by the principal accountant for the audit of the registrant’s annual financial statements or services that are normally provided by the accountant in connection with statutory and regulatory filings or engagements for those fiscal years.
(b) Disclose, under the caption Audit-Related Fees, the aggregate fees billed in each of the last two fiscal years for assurance and related services by the principal accountant that are reasonably related to the performance of the audit of the registrant’s financial statements and are not reported under paragraph (a) of this Item. Registrants shall describe the nature of the services comprising the fees disclosed under this category.
(c) Disclose, under the caption Tax Fees, the aggregate fees billed in each of the last two fiscal years for professional services rendered by the principal accountant for tax compliance, tax advice, and tax planning. Registrants shall describe the nature of the services comprising the fees disclosed under this category.
(d) Disclose, under the caption All Other Fees, the aggregate fees billed in each of the last two fiscal years for products and services provided by the principal accountant, other than the services reported in paragraphs (a) through (c) of this Item. Registrants shall describe the nature of the services comprising the fees disclosed under this category.
(e) (1) Disclose the audit committee’s pre-approval policies and procedures described in paragraph (c)(7) of Rule 2-01 of Regulation S-X.
(2) Disclose the percentage of services described in each of paragraphs (b) through (d) of this Item that were approved by the audit committee pursuant to paragraph (c)(7)(i)(C) of Rule 2-01 of Regulation S-X.
(f) If greater than 50 percent, disclose the percentage of hours expended on the principal accountant’s engagement to audit the registrant’s financial statements for the most recent fiscal year that were attributed to work performed by persons other than the principal accountant’s full-time, permanent employees.
(g) Disclose the aggregate non-audit fees billed by the registrant’s accountant for services rendered to the registrant, and rendered to the registrant’s investment adviser (not including any sub-adviser whose role is primarily portfolio management and is subcontracted with or overseen by another investment adviser), and any entity controlling, controlled by, or under common control with the adviser that provides ongoing services to the registrant for each of the last two fiscal years of the registrant.
(h) Disclose whether the registrant’s audit committee of the board of directors has considered whether the provision of non-audit services that were rendered to the registrant’s investment adviser (not including any subadviser whose role is primarily portfolio management and is subcontracted with or overseen by another investment adviser), and any entity controlling, controlled by, or under common control with the investment adviser that provides ongoing services to the registrant that were not pre-approved pursuant to paragraph (c)(7)(ii) of Rule 2-01 of Regulation S-X is compatible with maintaining the principal accountant’s independence.
Not applicable to a semi-annual report.
ITEM 5. AUDIT COMMITTEE OF LISTED REGISTRANTS.
(a) If the registrant is a listed issuer as defined in Rule 10A-3 under the Exchange Act (17CFR 240.10A-3), state whether or not the registrant has a separately-designated standing audit committee established in accordance with Section 3(a)(58)(A) of the Exchange Act (15 U.S.C. 78c(a)(58)(A)). If the registrant has such a committee, however designated, identify each committee member. If the entire board of directors is acting as the registrant’s audit committee as specified in Section 3(a)(58)(B) of the Exchange Act (15 U.S.C. 78c(a)(58)(B)), so state.
(b) If applicable, provide the disclosure required by Rule 10A-3(d) under the Exchange Act (17CFR 240.10A-3(d)) regarding an exemption from the listing standards for all audit committees.
Not applicable to a semi-annual report.
ITEM 6. SCHEDULE OF INVESTMENTS.
File Schedule I – Investments in securities of unaffiliated issuers as of the close of the reporting period as set forth in Section 210.12-12 of Regulation S-X, unless the schedule is included as part of the report to shareholders filed under Item 1 of this Form.
Included in Item 1.
ITEM 7. DISCLOSURE OF PROXY VOTING POLICIES AND PROCEDURES FOR CLOSED-END MANAGEMENT INVESTMENT COMPANIES.
Not applicable.
ITEM 8. PORTFOLIO MANAGERS OF CLOSED-END MANAGEMENT INVESTMENT COMPANIES.
Not applicable.
ITEM 9. PURCHASE OF EQUITY SECURITIES BY CLOSED-END MANAGEMENT INVESTMENT COMPANY AND AFFILIATED PURCHASERS.
Not applicable.
ITEM 10. SUBMISSION OF MATTERS TO A VOTE OF SECURITY HOLDERS.
Describe any material changes to the procedures by which shareholders may recommend nominees to the registrant’s board of directors, where those changes were implemented after the registrant last provided disclosure in response to the requirements of Item 7(d)(2)(ii)(G) of Schedule 14A (17 CFR 240.14a-101), or this Item.
No material changes to report.
ITEM 11. CONTROLS AND PROCEDURES.
(a) Disclose the conclusions of the registrant’s principal executive and principal financial officers, or persons performing similar functions, regarding the effectiveness of the registrant’s disclosure controls and procedures (as defined in Rule 30a-3(c) under the Act (17 CFR 270.30a-3(c))) as of a date within 90 days of the filing date of the report that includes the disclosure required by this paragraph, based on the evaluation of these controls and procedures required by Rule 30a-3(b) under the Act (17 CFR 270.30a-3(b))and Rules 13a-15(b) or 15d-15(b) under the Exchange Act (17 CFR 240.13a-15(b) or 240.15d-15(b)).
The Registrant’s principal executive and principal financial officers have concluded, based on their evaluation of the Registrant’s disclosure controls and procedures as of a date within 90 days of the filing date of this report, that the Registrant’s disclosure controls and procedures are reasonably designed to ensure that information required to be disclosed by the Registrant on Form N-CSR is recorded, processed, summarized and reported within the required time periods and that information required to be disclosed by the Registrant in the reports that it files or submits on Form N-CSR is accumulated and communicated to the Registrant’s management, including its principal executive and principal financial officers, as appropriate to allow timely decisions regarding required disclosure.
(b) Disclose any change in the registrant’s internal control over financial reporting (as defined in Rule 30a-3(d) under the Act (17 CFR 270.30a-3(d)) that occurred during the registrant’s second fiscal quarter of the period covered by this report that has materially affected, or is reasonably likely to materially affect, the registrant’s internal control over financial reporting.
There were no changes in the Registrant’s internal control over financial reporting that occurred during the last fiscal quarter covered by this report that have materially affected, or are reasonably likely to materially affect, the Registrant’s internal control over financial reporting.
ITEM 12. DISCLOSURE OF SECURITIES LENDING ACTIVITIES FORCLOSED-END MANAGEMENT INVESTMENT COMPANIES.
Not applicable.
ITEM 13. EXHIBITS.
(a) File the exhibits listed below as part of this Form. Letter or number the exhibits in the sequence indicated.
(1) Any code of ethics, or amendment thereto, that is the subject of the disclosure required by Item 2, to the extent that the registrant intends to satisfy the Item 2 requirements through filing of an exhibit.
Not applicable.
(2) A separate certification for each principal executive officer and principal financial officer of the registrant as required by Rule 30a-2(a) under the Act (17 CFR 270.30a-2).
Certifications pursuant to Rule 30a-2(a) under the Investment Company Act of 1940 are attached hereto.
(3) Any written solicitation to purchase securities under Rule 23c-1 under the Act (17 CFR 270.23c-1) sent or given during the period covered by the report by or on behalf of the registrant to 10 or more persons.
Not applicable.
(b) A separate or combined certification for each principal executive officer and principal officer of the registrant as required by Rule 30a-2(b) under the Act of 1940.
Certifications pursuant to Rule 30a-2(b) under the Investment Company Act of 1940 are attached hereto.
SIGNATURES
Pursuant to the requirements of the Securities Exchange Act of 1934 and the Investment Company Act of 1940, the registrant has duly caused this report to be signed on its behalf by the undersigned, thereunto duly authorized.
| | |
| J.P. Morgan Exchange-Traded Fund Trust |
| |
| By: | | /s/ Joanna M. Gallegos |
| | Joanna M. Gallegos |
| | President and Principal Executive Officer |
| | November 4, 2019 |
Pursuant to the requirements of the Securities Exchange Act of 1934 and the Investment Company Act of 1940, this report has been signed below by the following persons on behalf of the registrant and in the capacities and on the dates indicated.
| | |
| By: | | /s/ Joanna M. Gallegos |
| | Joanna M. Gallegos |
| | President and Principal Executive Officer |
| | November 4, 2019 |
| | |
| By: | | /s/ Lauren A. Paino |
| | Lauren A. Paino |
| | Treasurer and Principal Financial Officer |
| | November 4, 2019 |