J.P. MORGAN EXCHANGE-TRADED FUND TRUST
277 PARK AVENUE
NEW YORK, NEW YORK 10172
VIA EDGAR
November 27, 2020
Alison White
Securities and Exchange Commission
100 F Street, NE
Washington, DC 20549
Re: J.P. Morgan Exchange-Traded Fund Trust (the “Trust”)
JPMorgan Carbon Transition U.S. Equity ETF (the “Fund”)
File Nos. 333-191837; 811-22903
Post-Effective Amendment No. 266
Dear Ms. White:
This letter is in response to the comments you provided telephonically with respect to the filing related to the Fund. Our responses to your comments are set forth below. Except as otherwise noted below, we will incorporate the changes referenced below into the Trust’s Registration Statement in a filing made pursuant to Rule 485(b) under the Securities Act of 1933. Capitalized terms used but not defined in this letter have the meanings given to them in the Fund’s Registration Statement.
PROSPECTUS
| 1. | Comment: Please update the series information on EDGAR with the Fund’s ticker. |
Response: The update will be made prior to the launch of the Fund.
| 2. | Comment: Please provide the methodology for the Fund’s underlying index, JPMAM Carbon Transition US Equity Index (the “Underlying Index”). |
Response: The methodology is attached as exhibit A to this letter.
| 3. | Comment: As currently written in the “What are the Fund’s main investment strategies?” section, the Fund will invest at least 80% of its assets in the Underlying Index. Given Rule 35d-1 under the Investment Company Act of 1940 (the “Names Rule”), please clarify how the Fund will meet the requirement that the Fund will invest at least 80% of its assets in U.S. equity securities. |
1
Response: The Fund has a policy to invest at least 80% of its assets in securities included in the JPMorgan Asset Management Carbon Transition U.S. Equity Index. The term “U.S. Equity” as used in the Fund’s name refers to the term “U.S. Equity” as used in the Underlying Index name. The Underlying Index consists entirely of the types of securities suggested by its name, namely U.S. equities and more specifically those in the Russell 1000 Index. Accordingly, the Fund believes that it will comply with the Names Rule and does not believe a separate 80% policy is required.
| 4. | Comment: The description of the Underlying Index in the Risk/Reward summary and in “More about the Fund” says that it allocates securities in part on how effectively companies manage reputational risk. Please clarify what type of reputational risk is referred to. |
Response: The following disclosure will be added to the prospectus in response to this comment: Reputational risk indicators may relate to positive client stewardship such as investments in sustainability or violations of client principles which may lead to environmental fines.
| 5. | Comment: Since preferred stock and real estate investment trusts (“REITs”) may be included in the Underlying Index for the Fund, please consider whether specific risk disclosure for preferred stock and REITs should be included in the Risk/Reward summary. |
Response: We have reviewed the anticipated amount that preferred stock and REITs will represent in the Underlying Index, and based on that amount, we do not believe the additional risk disclosure is necessary in the Risk/Reward Summary. As a result of this review, we will also remove the reference to preferred stock and REITs in the Risk/Reward summary.
| 6. | Comment: The disclosure in “Index Related Risk” states that transaction costs may be higher for funds investing in foreign securities. Please consider whether this statement is applicable and delete it if it is not applicable. |
Response: The statement will be deleted.
| 7. | Comment: Please reconcile the information on page 8 indicating that the Fund is subject to non-principal risk with respect to preferred stock and REITs with the Risk/Reward summary disclosure. |
Response: As indicated above, we have reviewed the anticipated amount that preferred stock and REITs will represent in the Underlying Index, and based on those amounts, we do not believe that these investments represent a principal or additional risk to the Fund and, therefore, we will remove those risks from the chart on page 8 and the following disclosure.
| 8. | Comment: Please clarify what is meant by the statement in the second paragraph on page 11 that “Given the nature of the relevant markets for certain of the securities for the Fund, |
2
| Shares may trade at a larger premium or discount to NAV than shares of other kinds of ETFs.” |
Response: After reviewing the statement, we will be removing the statement.
| 9. | Comment: Please confirm that the license agreement referenced in the disclaimer on page 14 will be filed. |
Response: The license agreement will be filed before the launch of the Fund.
| 10. | Comment: The fourth paragraph in the “Management and Administration” section states that “JPMIM uses the portfolio management, research and other resources of a foreign (non-U.S.) affiliate of JPMIM and may provide services to the Fund through a “participating affiliate” arrangement, as that term is used in relief granted by the staff of the SEC.” Please confirm that any participating affiliate arrangements will comply with the conditions set forth in prior staff no-action letters and in the March 2017 Division of Investment Management Information Update for advisers relying on the Unibanco line of no-action letters. |
Response: J.P. Morgan Investment Management Inc. (the “Adviser”) confirms that to the extent any participating affiliate arrangements are used, they will comply with the conditions set forth in prior staff no-action letters and in the March 2017 Division of Investment Management Information Update for advisers relying on the Unibanco line of no-action letters.
| 11. | Comment: Page Part I – 1 of the Fund’s SAI states that the Fund will offer and issue shares only in creation units. Please confirm that the number of shares in a creation unit will not be less than 25,000 shares and please consider stating the number of shares in each creation unit in the SAI. |
Response: The Fund confirms that creation units will not be less than 25,000 shares and the number of shares in each creation unit will be listed on Part I – Page 7 of the Fund’s SAI.
| 12. | Comment: The disclosure in the “Investment Policies” section states that the Fund’s “fundamental investment policy regarding industry concentration does not apply to securities issued by other investment companies...” The staff notes that each Fund should look through an investment in an affiliated investment company and should consider, to the extent feasible, an investment in an unaffiliated investment company for purposes of calculating the Fund’s industry concentration levels. The staff also cites Section 48(a) of the Investment Company Act of 1940 (the “1940 Act”), which makes unlawful anything done under the 1940 Act indirectly that would be unlawful if done directly. |
Comment: The Trust believes that each Fund’s current policy on concentration, as disclosed in the SAI, complies with applicable legal requirements, including applicable SEC Staff guidance. The policy sets meaningful, objective limits on the freedom of each Fund to concentrate its assets in any particular industry. Each Fund is not aware of a requirement to “look through” underlying investment companies in which the Fund invests for purposes of
3
administering its concentration policy. To the extent that either Fund determines that its investment in an underlying investment company exposes the Fund to a material risk, including significant exposure to a particular industry or group of industries, the Fund will take steps to ensure that it has appropriate risk disclosure relating to that investment. As the Trust believes that the current policy on concentration complies with applicable legal requirements, the Trust does not believe it is in violation of Section 48(a) of the 1940 Act.
We hope that the Staff finds this letter responsive to the Staff’s comments. Should members of the Staff have any questions or comments concerning this letter, please call the undersigned at (614) 213-4020.
Sincerely,
/s/ Elizabeth A. Davin
Elizabeth A. Davin
Secretary
4
Exhibit A
5
JPMorgan Asset Management
Carbon Transition U.S. Equity
Index Methodology
November 2020
 |
1.0 Introduction
This methodology document (this “Methodology”) sets out the rules for the construction and management of the JPMorgan Asset Management Carbon Transition U.S. Equity Index (the “Index”). The Index is a rules-based, proprietary index designed to reflect the performance of a subset of the large and mid-cap companies in U.S. market that, based on the Index rules, are determined to be best positioned to benefit from a transition to a low-carbon economy. The Index selects its components from the constituents of the Russell 1000 Index (the “Investable Universe”). The Investable Universe is owned and calculated by FTSE Russell. The Index is also calculated by FTSE Russell. The calculation of the Index makes use of certain methodologies and calculation formulas as described in the FTSE Global Equity Index Series Ground Rules and Corporate Actions and Events Guide for Non Market Cap Weighted Indexes (collectively, the “Calculation Agent Index Methodology Document”), which are available at www.ftserussell.com.
NOTHING IN THIS METHODOLOGY CONSTITUTES AN OFFER TO BUY OR SELL ANY SECURITIES, PARTICIPATE IN ANY TRANSACTION OR ADOPT ANY INVESTMENT STRATEGY. THIS METHODOLOGY DOES NOT CONSTITUTE INVESTMENT, LEGAL, TAX, REGULATORY, ACCOUNTING OR FINANCIAL ADVICE OR RECOMMENDATIONS.
1.1 J.P. Morgan Investment Management Inc.
J.P. Morgan Investment Management Inc. (the “Administrator”), an investment adviser registered with the Securities and Exchange Commission and an indirect wholly owned subsidiary of JPMorgan Chase & Co., is the administrator of the Index. The Administrator governs the Index pursuant to this Methodology in its capacity as an index administrator and not as a fiduciary in respect of any other person.
Neither the Administrator nor any of its affiliates or subsidiaries or any of their respective directors, officers, employees, representatives, delegates or agents (each, a “Relevant Person”) shall have any responsibility to any person (whether as a result of negligence or otherwise) for any determinations, interpretations and calculations made or anything done (or omitted to be determined or done) in respect of the Index or any use to which any person may put the Index. All determinations, interpretations and calculations of the Administrator in respect of the Index shall be at the Administrator’s discretion and shall be final, conclusive and binding and no person shall be entitled to make any claim against any of the Relevant Persons in respect thereof. Once a determination, interpretation or calculation is made or action is taken by the Index Administrator in respect of the Index, neither the Administrator nor any other Relevant Person shall be under any obligation to revise any determination, interpretation or calculation made or action taken for any reason.
1.2 FTSE Russell
FTSE Russell is the administrator of the Investable Universe (in such capacity, the “Investable Universe Administrator”). The constituent companies of the Investable Universe are eligible for inclusion in the index.
FTSE Russell also acts as (the “Calculation Agent”) and is responsible for the daily calculation of the Index. The Calculation Agent will use its best endeavors to use reasonable skill and care to ensure that the Index is calculated, published and maintained correctly pursuant to this Methodology.
|
1.3 The Investable Universe
The Index selects as its constituents certain securities that are included in the Russell 1000 Index. The Russell 1000 Index is a free float-adjusted market capitalization index compiled by FTSE Russell. It is comprised of large and mid-cap companies in the United States. The Russell 1000 Index covers the largest 1000 companies in the U.S. by free float-adjusted market capitalization. The Russell 1000 Index is rebalanced on the 3rd Friday of March, September, and December (each a “Rebalancing Date”). The June rebalance happens at the same time as the Russell U.S. Equity Indexes annual reconstitution which is the 4th Friday in June. The Rebalancing Dates may be adjusted by the Investable Universe Administrator at its sole discretion. Additional information regarding the methodology of the Russell 1000 Index may be obtained at www.ftserussell.com. We are not incorporating by reference into this Methodology the website or any material it includes.
1.4 Index Objective
The Index is designed to capture the performance of companies from the Investable Universe selected and weighted based on those that have been identified through its rules-based process as best positioned to benefit from a transition to a low-carbon economy by effectively managing their emissions, resources and climate-related risks. Companies are scored using metrics from 7 Indicator Groups. Companies with the highest scores relative to peers in the same Sector are prioritized for inclusion in the Index over those with lower scores. The Index aims to meet the requirements for EU Climate Transition Benchmarks as defined in the EU Commission’s Technical Expert Group on Sustainable Finance’s Final Report on Climate Benchmarks and Benchmarks’ ESG Disclosures1 and the EU Climate Benchmarks Final Delegated Acts2 (the “EU Climate Benchmarks Final Report”), including, amongst others, a requirement to select, weight or exclude assets in such a way that the resulting Index is on a decarbonization trajectory. A decarbonization trajectory means a measurable, science-based and time-bound movement towards alignment with the objectives of the Paris Agreement3.
No assurance can be given that the investment strategy used to construct the Index will be successful or that the Index will outperform any alternative basket or strategy that might be constructed from the securities selected by the Index.
1 The EU Technical Expert Group on Sustainable Finance. (2019). TEG Final Report on Climate Benchmarks and Benchmarks’ ESG Disclosures, available at
https://ec.europa.eu/info/sites/info/files/business_economy_euro/banking_and_finance/documents/ 190930-sustainable-finance-teg-final-report-climate-benchmarks-and-disclosures_en.pdf
2 https://ec.europa.eu/info/law/benchmarks-regulation-eu-2016-1011/amending-and-supplementary-acts/implementing-and-delegated-acts_en
3 UNFCCC. (2015) The Paris Agreement:
https://unfccc.int/files/essential_background/convention/application/pdf/english_paris_agreement.pdf
|
2.0 Index Administration
The Administrator is responsible for all activities related to the production and operation of the Index, including the maintenance of records of the index weightings of all constituents; approval and implementation of changes to the constituents and their weightings in accordance with the Methodology; periodic reviews of the Index and/or Methodology and application of any changes resulting from such reviews; and communication to the Calculation Agent of changes to the constituent weightings resulting from ongoing maintenance and periodic reviews.
2.1 JPMIM Index Governance Committee
Administration of the Index is overseen by the Administrator’s Index Governance Committee (the “Index Committee”). The Index Committee is responsible for the approval and oversight of all Administrator indices and consists of representatives of the Administrator’s indexing business as well as various risk and controls partners. Researchers and portfolio managers associated with J.P. Morgan Investment Management Inc. regularly advise the Committee with respect to new strategies and index performance.
2.2. Maintenance of the Russell 1000 Index
In order to maintain the representativeness of the Russell 1000 Index, FTSE Russell may make structural changes to the Russell 1000 Index as a whole. In addition, ongoing event-related changes to the Russell 1000 Index are made as the result of mergers, acquisitions, spin-offs, suspensions, delistings, bankruptcies, reorganizations and other similar corporate events. Further information about the FTSE Russell corporate events methodology may be obtained from other sources including, but not limited to, www.ftserussell.com. We are not incorporating by reference into this document the website or any material it includes. We do not make any representation that such publicly available information regarding the Russell 1000 Index is accurate or complete.
The results of the application of any such policies by FTSE Russell impacts the securities eligible for inclusion in the Index selection process.
2.3 Index Amendments
Changes to this Methodology are subject to approval by the Index Committee. In the event that the Index Committee makes the determination, in its discretion in accordance with its operating procedures, that an amendment to this Methodology is warranted and that an announcement of such is needed, then the Administrator will endeavor to announce the amendment as promptly as possible following such determination. The public announcement of the Methodology amendment may include a detailed description of the change, the proposed effective date for the change and a statement as to any impact to the index construction process.
If a Russell 1000 Index Change Event occurs, then the Index Committee may make any such determinations and/or adjustments to the Index Methodology that it considers necessary and appropriate in order to take into account such Russell 1000 Index Change Event and which determinations or adjustments are consistent with the objectives of the Index. An “Russell 1000 Index Change Event” means a material change is made by FTSE Russell, in respect of the Russell 1000 Index, the constituents or the constituent weights of the Russell 1000 Index, which could have a material
|
impact on the performance of the Index or could alter the ability of the Index to achieve the relevant objective, as determined by the Administrator of the Index, in its sole discretion.
2.4 Index Governance Policies
2.4.1 Expert Judgment
“Expert Judgment” refers to the exercise of discretion by the Administrator. The Administrator will exercise its own expert judgment in compiling the Index weightings in accordance with this Methodology. Determinations with respect to greenhouse gas emissions data may be made from time to time to correct for erroneous data. Exercises of expert judgment by the Administrator are generally overseen by the Index Committee.
2.4.2 Corporate Actions, Market Disruption Events
All corporate actions, market disruption events and/or other events affecting components of the Index and potential resulting adjustments are adopted from the Calculation Agent Index Methodology Document. See the Calculation Agent Index Methodology Document for information regarding the policies by which the Calculation Agent will monitor, and make adjustments for, corporate actions, market disruption and other events.
| 2.4.3 Error | Correction |
Subject to the oversight of the Index Committee, the Administrator may make corrections to this Index and/or this Methodology in accordance with its error handling procedures.
| 2.4.4 Complaints |
Any complaints about the Index should be raised to the Administrator at JPMAM.Indices@jpmchase.com.
|
3.0 Definitions, Constraints & Notations
“Carbon Transition Score” is the final company score determined by the process which combines the rankings of various metrics with materiality scores which apply to sub-industries.
“Carbon Intensity” is the Greenhouse Gas Emissions Rate per Dollar of EVIC of a company.
“Carbon Trajectory” is the path representing the maximum Index Carbon Intensity WACIP over time.
“Cut Weight” is the relative effective weight of a security in the Index on the Rebalancing Cutoff Date.
“Equity” is a stock issued by a company and is the primary reference instrument of the Index.
“Equity Price” is the closing price of an Equity on its primary trading venue.
“EVIC” is the Enterprise Value including cash of a company.
“Inception Date” is the first rebalance date of the Index. December 16th, 2016.
“Index Shares” is the number of shares of a company held in the index at a specific point in time.
“Investable Universe” is the list of the constituent securities eligible for inclusion in the Index as well as their respective weightings. It is the Pro-Forma universe delivered 9 business days prior to the Investible Universe’s quarterly Rebalancing Date representing what the expected Investible Universe will invest in on the Rebalancing Date.
“MDV” is the Median of the Daily Trading Volume of an Equity over the 22 days preceding and including the Rebalancing Cutoff Date.
“MktVal” is the total market value of a security based in the Investable Universe on the Rebalancing Cutoff Date.
“Rebalancing Cutoff Date” is the date on which data is gathered from the Investable Universe Administrator and used to determine the Market Cap Weights of each Sector, as well as the MDV and minimum and maximum weight assumptions for each Equity.
“Sector” is a broad grouping of Equities that are in similar lines of business. The Equities included in the Index are grouped into 12 Sectors as explained in Section 4.3.
“Sub-Sector” is the most granular grouping of Equities in the Index. They are used to apply Carbon Materiality in Section 4.8.
“Target WACI” is maximum Index Carbon Intensity WACIP on the Rebalance Date.
|
4.0 Index Construction
The Index is comprised of a subset of the securities included in the Investable Universe. Securities from the Investable Universe are selected by the Index based on the application of various additional filters, constraints and proprietary factors to select and weight securities based on those determined by the Index rules as best positioned to benefit from a transition to a low-carbon economy. Index weightings are determined by the iterative application of, rules-based algorithms which seek to overweight exposure to proprietary carbon transition scores across pre-determined target sector allocations. The weighting algorithm is applied to the Investable Universe at each quarterly Rebalance Cutoff Date by the Index Administrator.
4.1 Exclusions
Investment restrictions are placed on certain constituents of the Investable Universe. The maximum weight is set to 0 thereby not allowing any investment in those securities.
The Index excludes securities of issuers engaged in Controversial Weapons activities as defined by the United Nations Convention on Certain Controversial Weapons.4 In addition, the common stock of JPMorgan Chase & Co. is excluded from the Index to prevent funds advised by affiliates of JPMorgan Chase and Co. tracking the Index from not being able to properly track it.
4.2 Dual Listings
There are instances where multiple listings of the same company may exist in the Investable Universe. When this happens, the primary listing is determined as the listing with the highest MDV. The primary listing will take on the full MktVal and MDV for a company and the other listings will be excluded from further calculations.
4.3 Sectors
The securities of the Investable Universe are classified into 12 Sectors using the Investable Universe sector classification schema but breaking out the Automobiles & Components industry group into its own Autos Sector.
Table 1
Sectors
| ||||||||||
| Technology | Health Care | Real Estate | Autos | Industrials | Energy | |||||
| Telecommunications | Financials | Consumer Discretionary | Consumer Staples | Basic Materials | Utilities | |||||
4 United Nations Office for Disarmament Affairs: Convention on Prohibitions or Restrictions on the Use of Certain Conventional Weapons which may be deemed to be Excessively Injurious or to have Indiscriminate Effects: Status of the Treaty
|
4.4 Metric Scores
Companies are assigned a Metric rank within each Sector for each Metric. The top company or companies would get a rank of 1 and the last company or companies with get a rank of n. Companies with the same Metric value would receive the same Metric rank. A company’s Metric rank is then used to compute a company’s Metric Score which is the company’s percentile rank for a given Metric within a Sector.
4.5 Missing Data
The default score for companies with missing data is 0 (neutral).
4.5.1 Coverage/Penalty Consideration
A consideration is made for all Metrics to avoid both the ability of a company to score well due to non-disclosure of important issues and the unnecessary inclusion of less relevant data into the scoring. This is done as follows:
| a) | Assign a score of 0 to companies in sub-sector where the percentage of companies reporting the Metric is too low. Coverage is defined as the percentage of companies within the sub-sector that have reported the Metric or for non-reported data, where the Metric could be sourced or computed. |
| b) | Assign a penalty score if a company has not reported a Metric in a sub-sector where the coverage condition is met. This is referred to as the ‘penalty coverage’. The penalty will be given as -0.5 which is by definition the 75th percentile of the company’s peer group. Note: A value of >100% means that no penalty will be applied and the score for the missing metric will be 0. |
4.6 Pre Scaled Scores to Post Scaled Scores
In order to reflect a number of important considerations, the scores calculated in sections 4.4 and 4.5 are scaled by the Metric scale. For example ‘Water use/Sales’ will have a pre scaled range € (-1, 1). With a Metric scale of 2, the post scaled range will be € (-2, 2). Adjustments from a default scaling factor of 1 will occur for one of the following reasons:
| a) | The Metric is utilized in more than 1 indicator group. For example, ‘Climate Change Policy’ is a Metric under ‘Consumer Emissions and Opportunities’, ‘Site Emissions’, and ‘Indirect Emissions’. This is because it is applicable to all three indicators. In this case, the metric has scaling factor 1/3 to ensure the Index is not putting 3 times the weight overall in this metric. |
| b) | The Metric is a forward looking measure of carbon transition risk/opportunity as opposed to backward looking. When this is the case, a scaling factor of 2 is applied. |
| c) | As per EU Climate Transition Benchmark requirements on Weighted Average Carbon Intensity, the scaling factors for GHG Scope 1,2,3/Sales and GHG Scope 1,2,3/Sales YoY % Chg are designed to represent 10% and 30% of the scaling factors in their indicator groups respectively. |
|
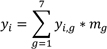
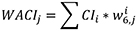
4.7 Indicator Group Scores
Indicator Group Scores are computed by adding the weighted sum of each company’s post scaled Metric Scores for each of the 7 Indicator groups g.
4.7.1 Normalizing Indicator Group Scores into percentiles
For each company and Indicator Group, an Indicator Score is calculated within a given Sector combination.
4.8 Materiality
An important factor in determining weighting of indicators is to consider the financial materiality of an indicator to a particular sub-industry. The following table prescribes a binary indicator of materiality based on the Sustainability Accounting Standard Board’s Sustainable Industry Classification System (SICS) Industry. These are then translated into the Sub-Sectors represented in the index.
Table 2
| SICS Industry | Site Emissions |
Consumer Opportunities
| Indirect Emissions | Water Management | Waste Management | Physical Risk | Reputational Risk | |||||||
| Consumer Goods - Apparel, Accessories & Footwear | 0 | 0 | 1 | 1 | 1 | 0 | 1 | |||||||
| Consumer Goods - Appliance Manufacturing | 0 | 0 | 1 | 1 | 1 | 0 | 1 | |||||||
| Consumer Goods - Building Products & Furnishings | 0 | 0 | 1 | 0 | 1 | 0 | 1 | |||||||
| Consumer Goods - E-Commerce | 0 | 0 | 1 | 0 | 0 | 0 | 1 | |||||||
| Consumer Goods - Household & Personal Products | 0 | 0 | 1 | 1 | 0 | 0 | 1 | |||||||
| Consumer Goods - Multiline and Specialty Retailers & Distributors | 0 | 0 | 1 | 0 | 0 | 0 | 1 | |||||||
| Consumer Goods - Toys & Sporting Goods | 0 | 0 | 1 | 0 | 1 | 0 | 1 | |||||||
| Extractives & Minerals Processing - Coal Operations | 1 | 0 | 1 | 1 | 1 | 0 | 1 | |||||||
| Extractives & Minerals Processing - Construction Materials | 1 | 0 | 1 | 1 | 1 | 0 | 1 | |||||||
| Extractives & Minerals Processing - Iron & Steel Producers | 1 | 0 | 1 | 1 | 1 | 0 | 1 | |||||||
| Extractives & Minerals Processing - Metals & Mining | 1 | 0 | 1 | 1 | 1 | 0 | 1 | |||||||
| Extractives & Minerals Processing - Oil & Gas – Exploration & Production | 1 | 0 | 1 | 1 | 0 | 0 | 1 | |||||||
| Extractives & Minerals Processing - Oil & Gas – Midstream | 1 | 0 | 1 | 0 | 0 | 0 | 1 | |||||||
| Extractives & Minerals Processing - Oil & Gas – Refining & Marketing | 1 | 0 | 1 | 1 | 1 | 0 | 1 | |||||||
| Extractives & Minerals Processing - Oil & Gas – Services | 1 | 0 | 1 | 1 | 1 | 0 | 1 | |||||||
| Financials - Asset Management & Custody Activities | 0 | 0 | 0 | 0 | 0 | 0 | 1 | |||||||
| Financials - Commercial Banks | 0 | 1 | 0 | 0 | 0 | 0 | 1 | |||||||
|
| Financials - Consumer Finance | 0 | 0 | 0 | 0 | 0 | 0 | 1 | |||||||
| Financials - Insurance | 0 | 1 | 0 | 0 | 0 | 1 | 1 | |||||||
| Financials - Investment Banking & Brokerage | 0 | 0 | 0 | 0 | 0 | 0 | 1 | |||||||
| Financials - Mortgage Finance | 0 | 1 | 0 | 0 | 0 | 1 | 1 | |||||||
| Financials - Equity & Commodity Exchanges | 0 | 0 | 0 | 0 | 0 | 0 | 1 | |||||||
| Food & Beverage - Agricultural Products | 1 | 1 | 1 | 1 | 1 | 1 | 1 | |||||||
| Food & Beverage - Alcoholic Beverages | 0 | 0 | 1 | 1 | 0 | 0 | 1 | |||||||
| Food & Beverage - Food Retailers & Distributors | 1 | 1 | 1 | 1 | 1 | 0 | 1 | |||||||
| Food & Beverage - Meat, Poultry & Dairy | 1 | 1 | 1 | 1 | 1 | 0 | 1 | |||||||
| Food & Beverage - Non-Alcoholic Beverages | 1 | 0 | 1 | 1 | 0 | 0 | 1 | |||||||
| Food & Beverage - Processed Foods | 0 | 1 | 1 | 1 | 0 | 0 | 1 | |||||||
| Food & Beverage - Restaurants | 0 | 0 | 1 | 1 | 1 | 1 | 1 | |||||||
| Food & Beverage - Tobacco | 0 | 0 | 0 | 1 | 0 | 0 | 1 | |||||||
| Health Care - Biotechnology & Pharmaceuticals | 0 | 0 | 1 | 0 | 0 | 1 | 1 | |||||||
| Health Care - Drug Retailers | 0 | 0 | 1 | 0 | 0 | 0 | 1 | |||||||
| Health Care - Health Care Delivery | 0 | 0 | 1 | 0 | 1 | 1 | 1 | |||||||
| Health Care - Health Care Distributors | 1 | 0 | 1 | 0 | 0 | 0 | 1 | |||||||
| Health Care - Managed Care | 0 | 0 | 0 | 0 | 0 | 1 | 1 | |||||||
| Health Care - Medical Equipment & Supplies | 0 | 0 | 0 | 0 | 1 | 0 | 1 | |||||||
| Infrastructure - Electric Utilities & Power Generators | 1 | 0 | 1 | 1 | 1 | 1 | 1 | |||||||
| Infrastructure - Engineering & Construction Services | 0 | 0 | 1 | 0 | 0 | 0 | 1 | |||||||
| Infrastructure - Gas Utilities & Distributors | 1 | 0 | 1 | 0 | 0 | 0 | 1 | |||||||
| Infrastructure - Home Builders | 0 | 0 | 0 | 0 | 0 | 1 | 1 | |||||||
| Infrastructure - Real Estate | 0 | 0 | 1 | 1 | 0 | 1 | 1 | |||||||
| Infrastructure - Real Estate Services | 0 | 0 | 0 | 0 | 0 | 0 | 1 | |||||||
| Infrastructure - Waste Management | 1 | 0 | 1 | 0 | 1 | 0 | 1 | |||||||
| Infrastructure - Water Utilities & Services | 0 | 0 | 1 | 1 | 0 | 1 | 1 | |||||||
| Renewable Resources & Alternative Energy - Biofuels | 0 | 1 | 0 | 1 | 0 | 0 | 1 | |||||||
| Renewable Resources & Alternative Energy - Forestry Management | 0 | 1 | 0 | 0 | 0 | 1 | 1 | |||||||
| Renewable Resources & Alternative Energy - Fuel Cells & Industrial Batteries | 0 | 1 | 1 | 0 | 0 | 0 | 1 | |||||||
| Renewable Resources & Alternative Energy - Pulp & Paper Products | 1 | 0 | 1 | 1 | 0 | 0 | 1 | |||||||
| Renewable Resources & Alternative Energy - Solar Technology & Project Developers | 0 | 1 | 1 | 1 | 1 | 1 | 1 | |||||||
| Renewable Resources & Alternative Energy - Wind Technology & Project Developers | 0 | 1 | 0 | 0 | 0 | 1 | 1 | |||||||
| Resource Transformation - Aerospace & Defense | 0 | 1 | 1 | 0 | 1 | 0 | 1 |
|
| Resource Transformation - Chemicals | 1 | 0 | 1 | 1 | 1 | 0 | 1 | |||||||
| Resource Transformation - Containers & Packaging | 1 | 1 | 1 | 1 | 1 | 0 | 1 | |||||||
| Resource Transformation - Electrical & Electronic Equipment | 0 | 0 | 1 | 0 | 1 | 0 | 1 | |||||||
| Resource Transformation - Industrial Machinery & Goods | 0 | 0 | 1 | 0 | 0 | 0 | 1 | |||||||
| Services - Advertising & Marketing | 0 | 0 | 0 | 0 | 0 | 0 | 1 | |||||||
| Services - Casinos & Gaming | 0 | 0 | 1 | 1 | 0 | 1 | 1 | |||||||
| Services - Education | 0 | 0 | 0 | 0 | 0 | 0 | 1 | |||||||
| Services - Hotels & Lodging | 0 | 0 | 1 | 1 | 0 | 1 | 1 | |||||||
| Services - Leisure Facilities | 0 | 0 | 1 | 0 | 0 | 1 | 1 | |||||||
| Services - Media & Entertainment | 0 | 0 | 0 | 0 | 0 | 0 | 1 | |||||||
| Services - Professional & Commercial Services | 0 | 0 | 0 | 0 | 0 | 0 | 1 | |||||||
| Technology & Communications - Electronic Manufacturing Services & Original Design Manufacturing | 0 | 0 | 1 | 1 | 1 | 0 | 1 | |||||||
| Technology & Communications - Hardware | 0 | 0 | 1 | 0 | 0 | 0 | 1 | |||||||
| Technology & Communications - Internet Media & Services | 0 | 0 | 1 | 0 | 0 | 0 | 1 | |||||||
| Technology & Communications - Semiconductors | 1 | 1 | 1 | 1 | 1 | 0 | 1 | |||||||
| Technology & Communications - Software & IT Services | 0 | 1 | 1 | 0 | 0 | 0 | 1 | |||||||
| Technology & Communications - Telecommunication Services | 0 | 0 | 1 | 0 | 0 | 0 | 1 | |||||||
| Transportation - Air Freight & Logistics | 1 | 0 | 0 | 0 | 0 | 0 | 1 | |||||||
| Transportation - Airlines | 1 | 1 | 0 | 0 | 0 | 0 | 1 | |||||||
| Transportation - Auto Parts | 0 | 0 | 1 | 0 | 1 | 0 | 1 | |||||||
| Transportation - Automobiles | 0 | 1 | 1 | 0 | 0 | 0 | 1 | |||||||
| Transportation - Car Rental & Leasing | 0 | 1 | 0 | 0 | 0 | 0 | 1 | |||||||
| Transportation - Cruise Lines | 1 | 1 | 0 | 0 | 0 | 0 | 1 | |||||||
| Transportation - Marine Transportation | 1 | 1 | 0 | 0 | 0 | 0 | 1 | |||||||
| Transportation - Rail Transportation | 1 | 0 | 0 | 0 | 0 | 0 | 1 | |||||||
| Transportation - Road Transportation | 1 | 0 | 0 | 0 | 0 | 0 | 1 |
4.8.1 Transforming materiality
These binary materiality metrics are then transformed into a materiality score depending on the pillar. The rationale is driven by which pillars are most applicable in determining the ability of a company to successfully transition to a low-carbon economy.
|
Table 3
| Starting Set | Transformation | End Set | |||||||||||||||
Site Emissions | {0,1} | *2+1 | {1,3} | ||||||||||||||
Consumer Emissions & Opportunities | {0,1} | *2+1 | {1,3} | ||||||||||||||
Indirect Emissions | {0,1} | *2+1 | {1,3} | ||||||||||||||
Water Management | {0,1} | +0.5 | {0.5,1.5} | ||||||||||||||
Waste Management | {0,1} | +0.5 | {0.5,1.5} | ||||||||||||||
Physical Risk | {0,1} | +0.5 | {0.5,1.5} | ||||||||||||||
Reputational Risk | {1} | - | {1} | ||||||||||||||
4.9 Carbon Transition Score
The Carbon Transition Score for each company i is calculated as the sum product of the indicator group g score vector from 4.7 and the materiality vector from 4.8.1.
4.10 Carbon Transition Percentile
The Carbon Transition Scores computed in step 4.9 are again ranked in each Sector. Similarly to step 4.4, the ranks are then used to create the final Carbon Transition Percentile.
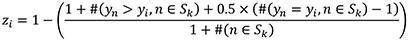
Companies with a higher Carbon Transition Percentile are more attractive than those with a lower Carbon Transition Percentile.
|
5.0 Weighted Average Carbon Intensity
The EU Climate Benchmarks Final Report and EC Delegated Regulation5 supplement lay out specific objectives for greenhouse gas emission (“GHG”) reductions and the transition to a low-carbon economy through the selection, weighting, and exclusion of index constituents. The Index must have a Weighted Average Carbon Intensity (“WACI”) below its Investable Universe of at least its Minimum Carbon Reduction and must reduce its WACI to be less than a trajectory which declines by an inflation adjusted 7% per annum geometrically since inception.
As discussed in the EU Climate Benchmarks Final Report6, it is necessary to estimate GHG emissions for companies that do not report, as otherwise high emitters would be incented to not report. The broad principle is to set values at the 75th percentile of their peers which reduces the likelihood of allocating to them, and encourages them to report their emissions if better than the default score. The penalty conditions for companies that do not report are laid out in section 5.3.
5.1 Enterprise Value including Cash
The EU Climate Benchmarks Final Report and EC Delegated Regulation supplement mandate Carbon Intensity be computed using an adjusted Enterprise Value (“EVIC”) calculation which includes cash

where,
 is the full market value of the company unadjusted for Free Float in USD.
 is the last reported Quarterly, Semi-Annual, or Annual Total Debt reported by the company on their last published filing. The number is computed to USD.
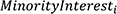 is the last reported Quarterly, Semi-Annual, or Annual Accumulated Minority Interest reported by the company on their last published filing. The number is computed to USD.
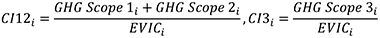
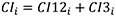
5.2 Carbon Intensity for a company
Carbon Intensity for each company is computed in 2 parts. Scope 1 & 2 GHG Emissions are used to compute CI12. Scope 3 GHG Emissions is used to compute CI3. CI12 and CI3 are summed back together to form the final company Carbon Intensity Scope 3 Carbon Intensity is only used in the Carbon Intensity Calculations for the Energy & Mining Sectors of the index at the time of this publication.
5 European Commission Delegated Regulation supplementing Regulation (EU) 2016/1011 of the European Parliament and of the Council as regards minimum standards for EU Climate Transition Benchmarks and EU
Paris-aligned Benchmarks
https://ec.europa.eu/finance/docs/level-2-measures/benchmarks-delegated-act-2020-4757_en.pdf
6 https://ec.europa.eu/info/sites/info/files/business_economy_euro/banking_and_finance/documents/192020-sustainable-finance-teg-benchmarks-handbook_en_0.pdf
|
5.3 Penalty for non-reporting
If a company fails to report GHG Scope 1 + 2 or GHG Scope 3, a penalty is assessed for the company. The rationale is to encourage disclosure by lowering the chances of investment in companies that have not disclosed GHG emissions in line with ‘GHG Protocol’ standards. The following is carried out for and
and
| i. | If more than 10 companies have a CI in the company’s peer group (Sector), assign a CI that is the 75th percentile of the company’s peer group (Sector). |
| ii. | Else if zero companies have a CI in the company’s Sector, assign a CI that is the 75th percentile of all companies in the Investable Universe. |
| iii. | Else assign a CI that is the maximum of all companies in the peer group (Sector). |
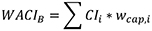
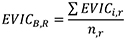
5.4 Benchmark WACI
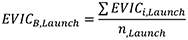
5.5 Launch WACI
The Launch WACI is the Target WACI computed on the inception date Index (December 16th, 2016). It is computed by reducing the WACI of the Investible Index by the Minimum Carbon Reduction (“MCR”).
MCR% is 20% from Index Inception to March 2018.
MCR% is 30% from June 2018 to Current7.

5.6 Carbon Trajectory
The carbon trajectory is the path representing the maximum Index Carbon Intensity over time. It is the minimum of (1-MCR%) of the Benchmark WACI
 and the inflation adjusted Launch WACI
 adjusted by 7% per annum.
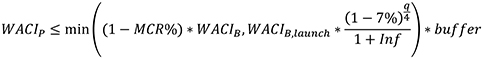
where
q is the number of quarterly rebalances since the Index inception date.
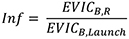
Inf is the benchmark inflation of average EVIC since Index inception. This accounts for changes in EVIC of the entire Investable Universe.
7 The index achieves full compliance with the EU Climate Transition Benchmarks rules in June of 2018.
|
buffer is a tolerance held to ensure the Index stays in compliance between quarterly rebalances and is set to 95%.
|
6.0 Index Rebalancing Methodology
Weights are assigned to Sectors and companies based on a multi-stage process which takes into consideration relative market capitalization weights, constraints on individual stock liquidity, Carbon Transition Percentiles and concentration risks while trying to minimize turnover and meet EU Climate Transition Benchmark rules.
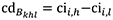
6.1 Establish Cut Weights
On the Rebalance Cutoff Date, the current effective weights of the securities in the Index, referred to as the “Cut Weights” are determined. The Cut Weights are used as the starting point for the weights for the Rebalancing Date immediately following such Rebalance Cutoff Date. The Cut Weights for each security is calculated based on the current Index Shares, Equity Price and the foreign exchange rate (if applicable).
The Cut Weights are calculated as follows:
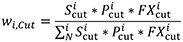
Where
 is the index shares
 is the Equity Price
 is the rate of quoted currency of the Equity against USD.
Note: Cut Weights on the inception date are set to 0.
6.2 Initialize Standard Weights, Caps and Floors
 is the cap on the pre-adjustment weight in any Equity (first standard weight), it is defined as a function of the free float adjusted market capitalization weights of each constituent i,

 is maximum adjusted weight per Equity (second standard weight)

 is the maximum position size at rebalance for stock i –

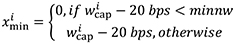
 is the minimum holding constraints in stock i:
|
Where,
 is the Market Cap Weight of Equity i in the Investable Universe.
 is the minimum new weight of an Equity. .2bps
Note: For exclusions noted in section 4.1, all weights above are set to 0.
6.3 Liquidity Constraints
The goal is to ensure the liquidity and capacity of any fund that might track the Index. There are liquidity needs of a tracking fund during both rebalancing and creation/redemption process. These constraints act respectively to limit the minimum liquidity of the Index as a whole, to limit the liquidity usage on rebalance days, and to limit the concentration of risk in any given Equity. The methodology then applies the tightest of these constraints.
The MDV is computed for each Equity by taking the median trading volume (adjusted for corporate actions) over the past 22 days preceding and including the Rebalancing Cutoff Date and multiplying it by the price on the Rebalancing Cutoff Date and FX Rate if applicable.
 | the maximum trade in days of median daily volume at hypothetical NAV – 1 day |
 | the maximum position size in days of median daily volume at hypothetical NAV – 4 days |
 | the fraction of universe total market capitalization represented by the hypothetical NAV – 10bps |
 | the total market capitalization of the universe |
 | the maximum weight constrained by liquidity |
 | the maximum weight change of an Equity |


Note: For the inception date, the maximum trade in days of MDV was set to 4 days.
6.4 Set Maximum Weight
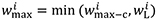
The maximum weight of an Equity I is set to the minimum of Maximum Weight and the Maximum Liquidity weight ..
|
6.5 Trim concentrated holdings and apply minimums
Positions larger than the first standard should be adjusted downward by the minimum of the cut weight the maximum trade size
 or first standard weight
 Adjust position upward to the minimum position size
 if it’s smaller.

6.6 Sector Weights
The Index tries to remain market cap neutral to Sectors. Compute the Market Capitalization weights, and current weights of the Sectors.
6.7 Populate Sectors
In this step, the Index begins by measuring the difference in Market Cap Weight of each Sector against its current weight
 ..
..
For Sectors that are underweight, the Index increases the weight of Equities with the highest Carbon Transition Percentile that have trading capacity. These Equities must have a Carbon Transition Factor Percentile higher than or equal to the Investable Threshold Percentile For Equities where the Index currently has no weight allocated
 the Index also ensures that the weight increase is above the Minimum New Investment Threshold
If the Index is overweight within a Sector, it lowers the weight of the Equities that have current weight within that Sector with the lowest Carbon Transition Percentiles that have trading capacity. The change in sector weight at this stage means that turnover is able to serve a double purpose: to ensure sector targets are met and to improve the average Carbon Transition Percentile.
 is the Investable Threshold Percentile – 20th percentile
Initialize to
to
6.7.1 Sectors that are underweight
For Sectors which are underweight, the Index increases the weight of Equities until the target weight is reached, starting with the companies with the highest Carbon Transition Percentile.
|
6.7.2 Sectors that are overweight
For each Sector which is overweight lower the weight of the Equities until the target is reached, starting with those with lowest Carbon Transition Percentile.
6.8 Constrained Reallocation
Where constraints prevent the Index from reaching 100% investment, the Index uses additional allocation rules. Most of the Index weight comprises allocations made from the previous step. In all but very extraordinary circumstances, these rules will only top up the allocation and ensure 100% investment.
Increase the weight of every Equity which is already held in proportion to their weight in a capitalization weighted index, until full investment is reached or every stock is constrained. Do not lower the weight of Equities which are breaching constraints at this stage.
6.9 Increase Factor Exposure
Since the turnover from weight reallocation in previous steps may be low, additional turnover may be required to ensure that Equities whose Carbon Transition Percentile has been reduced are removed from the Index.
 is the Minimum Turnover Threshold = 6%
 is the Two Way Turnover. It is computed as the absolute difference in current weights vs the cut weights plus 1 – the sum of the cut weights. This accounts for any Equities that are removed from the Investable Universe that the Index had an allocation in.
 is the best Carbon Transition Percentile at which the Index will reduce the weight of Equities – 60th percentile
Initialize
If the turnover up to this point is below the Minimum Turnover Threshold reduce the weight in the least attractive Equities (in order of their Carbon Transition Percentile) and increase the weight of the most attractive Equities until Minimum Turnover Threshold
 is reached. This step is subject to the same liquidity constraints. The final weights are also subject to the maximum underweight constraints.
Iterate until the Minimum Turnover threshold is met or there are no Equities left to reduce the weight of.
|
6.9.1 Find Equity to reduce the weight
Find the Equity with the lowest Carbon Transition Percentile that has capacity to reduce its allocation. The Carbon Transition Percentile must be lower than Its current weight must be greater than its minimum weight and it must not have in a Sector that has another Equity with a higher Carbon Transition Percentile that has capacity to increase the weight. For this Equity, compute its possible weight reduction.
6.9.2 Find Equity to increase the weight in the same Sector
Find the Equity in the same Sector as the Equity to reduce the weight that has the highest Carbon Transition Percentile and still has capacity to increase the weight. The Carbon Transition Percentile must be higher than the score of the Equity being reduced in weight. For this Equity, compute its possible increase in weight. The Equity must also be able pass the minimum new weight threshold if it currently has a weight of 0.
6.9.3 Re-compute Turnover
Notes:
In these reductions and increases in weight, all of the constraints in section 6.9 are active for both the Equity being increased and the Equity being decreased (in addition to a minimum size for new allocations in the Index). The total amount increased (decreased) is the first binding constraint of these. Then move on to the following company (either being increased or reduced). In this way for as long as there are names below the turnover score threshold available to reduce and there is sufficient liquidity in securities with score above this threshold to increase, continue adding trades increasing the average Carbon Transition Percentile of the Index until the minimum turnover is reached.
Sometimes constraints may mean that after cycling through every company the target turnover is not reached. In this case the Index’s Carbon Transition exposure is maximal subject to constraints and this step is complete even at the lower level of turnover.
6.10 Remove Small Allocations
Remove allocations so small as to be deemed unlikely to be essential to meeting the aims of the Index strategy. Note that this final step can lead to small violations in other constraints.
 is the Removal Threshold - .1bps
| a) | Set to zero any security weights smaller than the minimum threshold. |
| b) | Rescale pro-rata all other allocations to achieve 100% investment. |
|
6.11 Re-Allocate to High Impact Sectors
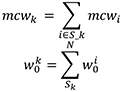
To prevent greenwashing, the EU Climate Benchmarks Final Report requires keeping the exposure to sectors that have a high impact on Climate Change in line with those of the Investable Universe. It defines high impact sectors using the NACE sector scheme8 which has been mapped to the sector scheme of the Investable Universe. In this step the Index measures the Total Market Cap Weight of the High Impact Sub-Sectors within the Investable Universe and the Total Current Weight of the High Impact Sub-Sectors of the Index. If the allocation to high impact sub-sectors is lower than the Investable Universe, scale up all the weights in the Index to match the high impact and reduce the weights of the low impact sub-sectors pro-rata.
| a) |  is the set of securities in high carbon intensity sub-sectors is the set of securities in high carbon intensity sub-sectors | |||
| b) | 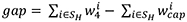 | |||
| c) | If then scale the allocations for companies in high carbon intensity sub-sectors and low carbon intensity sub-sectors respectively: then scale the allocations for companies in high carbon intensity sub-sectors and low carbon intensity sub-sectors respectively: | |||
| a. | 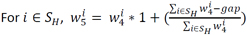 | |||
| b. | 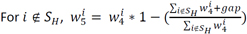 | |||
Else if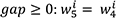 | ||||
6.12 Re-allocate to Low Carbon Intensity Equities
Section 5.6 measures the Carbon Trajectory. The Target WACI for the Rebalance period is the maximum WACI of the Index. If
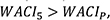 then the Index re-allocates from Equities with high Carbon Intensity to Equities with lower Carbon Intensity until the Index WACI matches the target or the Maximum Turnover Threshold
 is breached.
To achieve this goal, the Index attempts to minimize the number of transactions by finding the pair trade that will yield the largest impact on Index WACI given all trading constraints from previous steps. In addition to isolating the trades to a particular sector so previously implemented constraints are not breached, the Index also isolates the trades to high vs low impact sub-sectors.
is the Maximum Turnover Threshold = 10% as allowed in step 6.12
Initialize
For each iteration j, measure the Index WACI.
For each iteration, compute each Equity’s capacity to increase weight and capacity to reduce weight
8 List of NACE codes https://ec.europa.eu/competition/mergers/cases/index/nace_all.html
|


Additionally, for Equities where the Index currently has no allocation, = 0, it must also ensure that new allocations are above the Minimum New Investment Threshold
Next, compute the top pair in each combination of Sector and high/low impact by finding the Equity with the highest Carbon Intensity that has capacity to reduce weight and the Equity with the lowest Carbon Intensity with capacity to increase weight. The difference in Carbon Intensity between the Equity with the highest Carbon Intensity and the Equity with the lowest Carbon Intensity is noted as The trade size
 is the lower of the capacity to increase weight
 and capacity to reduce weight

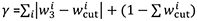
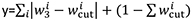
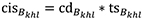
Compute the Carbon Intensity Change per Trade to measure the impact the trade will have on Index WACI
Reduce the Trade Size if the Index WACI minus the Target WACI is less than the Carbon Intensity Change
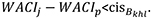 Compute the new trade size by dividing the gap in Carbon Intensity by the Carbon Difference of the trade

For security to reduce weight.
For security to increase weight.
6.13 Set Adjusted Shares
Use the Final Target Weights to calculate the Weight Adjustment Factor
 which is the ratio of Target Weight to the relative Market Cap Weights for each Equity in the Index.

7.0. Calculation of Index Value
The daily closing Index value will be based on the Index Shares & Free Float Assumptions from the Investible Universe Provider combined with the Weight Adjustment Factor computed in step 17.3 above. The index will be calculated by the Calculation Agent pursuant to the methodology and Divisor formula for calculating index values set forth in the Calculation Agent Index Methodology Document.
|