UNITED STATES
SECURITIES AND EXCHANGE COMMISSION
Washington, D.C. 20549
FORM N-CSR
CERTIFIED SHAREHOLDER REPORT OF REGISTERED
MANAGEMENT INVESTMENT COMPANIES
Investment Company Act file number: 811-22903
J.P. Morgan Exchange-Traded Fund Trust
(Exact name of registrant as specified in charter)
277 Park Avenue
New York, NY 10172
(Address of principal executive offices) (Zip code)
Gregory S. Samuels
J.P. Morgan Investment Management Inc.
277 Park Avenue
New York, NY 10172
(Name and Address of Agent for Service)
With copies to:
| | |
Elizabeth A. Davin, Esq. JPMorgan Chase & Co. 1111 Polaris Parkway Columbus, OH 43240 | | Jon S. Rand, Esq. Dechert LLP 1095 Avenue of the Americas New York, NY 10036 |
Registrant’s telephone number, including area code: 1-844-457-6383
Date of fiscal year end: October 31
Date of reporting period: November 1, 2021 through October 31, 2022
Form N-CSR is to be used by management investment companies to file reports with the Commission not later than 10 days after the transmission to stockholders of any report that is required to be transmitted to stockholders under Rule 30e-1 under the Investment Company Act of 1940 (17 CFR 270.30e-1). The Commission may use the information provided on Form N-CSR in its regulatory, disclosure review, inspection, and policymaking roles.
A registrant is required to disclose the information specified by Form N-CSR, and the Commission will make this information public. A registrant is not required to respond to the collection of information contained in Form N-CSR unless the Form displays a currently valid Office of Management and Budget (“OMB”) control number. Please direct comments concerning the accuracy of the information collection burden estimate and any suggestions for reducing the burden to Secretary, Securities and Exchange Commission, 450 Fifth Street, NW, Washington, DC 20549-0609. The OMB has reviewed this collection of information under the clearance requirements of 44 U.S.C. Section 3507.
ITEM 1. REPORTS TO STOCKHOLDERS.
a.) The following is a copy of the report transmitted to shareholders pursuant to Rule 30e-1 under the Investment Company Act of 1940 (17 CFR 270.30e-1).
b.) A copy of the notice transmitted to shareholders in reliance on Rule 30e-3 under the 1940 Act that contains disclosures specified by paragraph (c)(3) of that rule is included in the Annual Reports. Not Applicable. Notices do not incorporate disclosures from the shareholder report.
Annual Report
J.P. Morgan Exchange-Traded Funds
October 31, 2022
| | |
JPMorgan ActiveBuilders Emerging Markets Equity ETF | | |
JPMorgan ActiveBuilders International Equity ETF | | |
JPMorgan BetaBuilders Canada ETF | | |
JPMorgan BetaBuilders Developed Asia Pacific ex-Japan ETF (formerly known as JPMorgan BetaBuilders Developed Asia ex-Japan ETF) | | |
JPMorgan BetaBuilders Europe ETF | | |
JPMorgan BetaBuilders International Equity ETF | | |
JPMorgan BetaBuilders Japan ETF | | |
JPMorgan BetaBuilders U.S. Equity ETF | | |
JPMorgan BetaBuilders U.S. Mid Cap Equity ETF | | |
JPMorgan BetaBuilders U.S. Small Cap Equity ETF | | |
JPMorgan Carbon Transition U.S. Equity ETF | | |
JPMorgan Climate Change Solutions ETF | | |
JPMorgan Diversified Return Emerging Markets Equity ETF | | |
JPMorgan Diversified Return International Equity ETF | | |
JPMorgan Diversified Return U.S. Equity ETF | | |
JPMorgan Diversified Return U.S. Mid Cap Equity ETF | | |
JPMorgan Diversified Return U.S. Small Cap Equity ETF | | |
JPMorgan International Growth ETF | | |
JPMorgan U.S. Momentum Factor ETF | | |
JPMorgan U.S. Quality Factor ETF | | |
JPMorgan U.S. Value Factor ETF | | |
CONTENTS
Investments in a Fund are not deposits or obligations of, or guaranteed or endorsed by, any bank and are not insured or guaranteed by the FDIC, the Federal Reserve Board or any other government agency. You could lose money if you sell when a Fund’s share price is lower than when you invested.
Past performance is no guarantee of future performance. The general market views expressed in this report are opinions based on market and other conditions through the end of the reporting period and are subject to change without notice. These views are not intended to predict the future performance of a Fund or the securities markets.
Prospective investors should refer to the Funds’ prospectuses for a discussion of the Funds’ investment objectives, strategies and risks. Call J.P. Morgan Exchange-Traded Funds at (844) 457-6383 for a prospectus containing more complete information about a Fund, including management fees and other expenses. Please read it carefully before investing.
Shares are bought and sold throughout the day on an exchange at market price (not at net asset value) through a brokerage account, and are not individually subscribed and redeemed from a Fund. Shares may only be subscribed and redeemed directly from a Fund by Authorized Participants, in large creation/redemption units. Brokerage commissions will reduce returns.
President's Letter
December 15, 2022 (Unaudited)
Dear Shareholder,
Global financial markets reflected turmoil in the global economy in 2022, stirred by sharply higher inflation, rising interest rates, sporadic pandemic disruptions and the widening impact of the Russia-Ukraine conflict. Prices for both equities and bonds tumbled during the first half of the year and remained under pressure through the end of October.
|
“While investors seek to adapt to the current market environment, we believe a well-diversified portfolio and a patient outlook remain crucial components of a successful invest- ment approach.” — Brian S. Shlissel
|
Emerging market equities underperformed both the U.S. and other developed equity markets amid economic weakness in China and slowing global demand during the period. Across Europe, the war in Ukraine set off an energy crisis as a result of reduced imports of natural gas from Russia. U.S. equity markets also fell in 2022, but surprisingly strong corporate earnings and consumer spending helped leading U.S. indexes to rebound from their lowest levels. For the twelve month period ended October 31, 2022, the MSCI Emerging Markets Index returned -31.0%, the MSCI EAFE Index returned -23.0% and the S&P 500 Index returned -14.6%.
Notably, some recent U.S. inflationary data has indicated signs of easing price pressures and U.S. economic output as measured by gross domestic product turned positive in the third quarter of 2022, following two consecutive quarters of negative growth. Though the U.S. economy has lost momentum in 2022, it has not yet fallen into recession. Meanwhile, as the potential for a rapid resolution to the war in Ukraine appears to have faded, the European Union and its largest constituent
nations have moved to secure sufficient winter energy supplies while decreasing their dependence on imports of natural gas from Russia. In the U.K., a year-long political crisis was resolved with the accession of Rishi Sunak to prime minister in October 2022, which helped shore up the value of British pound and stabilize U.K. financial markets. China has eased some of the social restrictions under its “Zero Covid” policy and domestic equity indexes recently rose amid investor expectations that China’s economy may fully reopen in the coming months.
As 2022 comes to a close, financial markets are likely to remain volatile due to investor uncertainty regarding the outlook for inflation, interest rates and economic momentum. Increased geo-political tensions between Russia and Ukraine’s Western allies also remains a headwind for global financial markets.
Investors this year have confronted economic and financial market conditions not experienced in many years. While investors seek to adapt to the current market environment, we believe a well-diversified portfolio and a patient outlook remain crucial components of a successful investment approach. Our broad array of investment solutions seeks to provide investors with ability to build durable portfolios that can help them meet their financial goals.
Sincerely,
Brian S. Shlissel
President, J.P. Morgan Funds
J.P. Morgan Asset Management
1-844-457-6383 or www.jpmorganfunds.com for more information
| J.P. Morgan Exchange-Traded Funds | |
J.P. Morgan Exchange-Traded Funds
MARKET OVERVIEW
TWELVE MONTHS ENDED October 31, 2022 (Unaudited)
While developed market equities largely ended 2021 with positive returns, global prices for equities and bonds plummeted in 2022 amid accelerating inflation, rising interest rates, pandemic disruptions in China and the outbreak of conflict in Ukraine. Returns for both equity and bond markets broadly declined during the first half of 2022 and remained in negative territory through the end of October. Notably, global energy prices rose sharply in the first half of 2022 before receding somewhat in the third quarter.
In the EU, the war in Ukraine remained the focus of investors’ attention as energy supplies from Russia were constrained and the potential for a rapid resolution to the conflict receded. Both the EU and its individual constituent nations moved to build up reserves of natural gas and petroleum ahead of the winter months. By the end of October 2022, several European governments had sought to confront soaring inflation with spending plans to help households manage rising food and energy costs. The European Central Bank responded to the highest inflation rates in 40 years by sharply raising its policy interest rates in September 2022 and again in October. During the twelve month period, equity markets in Europe largely outperformed emerging markets equities but underperformed U.S. equity markets.
Political turmoil in the U.K. added to a weakening economic outlook that rattled financial markets and pushed the British pound to a 37-year low against the U.S. dollar. By late October 2022, the accession of Rishi Sunak to prime minister provided some support for both the pound and U.K. financial markets. The Bank of England was among the earliest developed market central banks to move to curb inflationary pressures, with an initial interest rate increase in December 2021, and seven more increases during the period.
Developed markets in the Asia-Pacific region also slumped during the period amid rising inflation, particularly soaring energy prices, and broad weakness in the semiconductors sector. Despite inflationary pressures, the Bank of Japan maintained its ultra-low interest rate policy. Meanwhile, equities in Hong Kong and Singapore largely underperformed other developed markets.
In the U.S., investors largely kept their focus on inflation data as indicators of short-term policy of the U.S. Federal Reserve. In mid-March 2022, the central bank initiated its first interest rate increase since late 2018, and then followed with four more rate raises by the end of September 2022. U.S. gross domestic product fell by 1.6% in the first quarter of 2022 and dropped 0.6% in the second quarter before rebounding to a 2.6% increase in the third quarter. Consumer spending declined but remained somewhat better than investors expected. By the end of June 2022, U.S. equity prices had tumbled more than 20% from the start of the year, which is generally considered a bear market. However, prices rebounded somewhat by the end of October 2022.
Meanwhile, emerging markets equities and bonds slumped throughout the twelve months ended in October 2022. China was among the worst performers as the government’s “zero covid” policy led to strict lockdowns in several large cities, which weighed on the services sector in particular and on economic growth in general. China’s technology sector remained under pressure amid increased scrutiny of large technology companies by government regulators. Across emerging markets rising interest rates weighed on government spending and higher energy prices hurt markets of regions dependent on petroleum imports.
For the twelve months ended October 31, 2022, the S&P 500 Index returned -14.6%, the MSCI EAFE Index returned -23.0% and the MSCI Emerging Markets Index returned -31.0%.
| J.P. Morgan Exchange-Traded Funds | |
JPMorgan ActiveBuilders Emerging Markets Equity ETF
FUND COMMENTARY
TWELVE MONTHS ENDED October 31, 2022 (Unaudited)
| |
| |
| |
MSCI Emerging Markets Index (net total return) | |
Net Assets as of 10/31/2022 | |
| |
INVESTMENT OBJECTIVE***
The JPMorgan ActiveBuilders Emerging Markets Equity ETF (the “Fund”) seeks to provide long term capital appreciation.
INVESTMENT APPROACH
The Fund invests primarily in equity securities and equity-related instruments that are tied economically to emerging markets and seeks to construct a portfolio of holdings that will outperform the MSCI Emerging Markets Index (the “Benchmark”) over time while maintaining similar risk characteristics. The Fund allocates investments to the adviser’s actively managed emerging market equity strategies across countries, regions and style strategies and may invest across all market capitalizations.
HOW DID THE FUND PERFORM?
For the twelve months ended October 31, 2022, the Fund had a negative absolute return and underperformed the Benchmark.
Relative to the Benchmark, the Fund’s security selection in the financials and materials sectors was a leading detractor from performance, while the Fund’s security selection in the consumer discretionary sector and its underweight position in the communication services sector were leading contributors to relative performance.
By country, the Fund’s security selections in India and Taiwan were leading detractors from performance relative to the Benchmark, while the Fund’s overweight positions in Mexico and Indonesia were leading contributors to relative performance.
Leading individual detractors from relative performance included the Fund’s overweight positions in Sberbank and China
Merchants Bank Co., and its out-of-Benchmark position in Sea Ltd. Shares of Sberbank, a Russian financial services provider no longer held by the Fund, fell after the imposition of multilateral economic sanctions in response to Russia’s invasion of Ukraine in late February 2022. At the end of the period, the Fund’s exposure to Russia was less than 0.01% of the portfolio. Shares of China Merchants Bank, a financial services provider based in Shenzhen, China, fell amid overall weakness in investor demand for Chinese equities. Shares of Sea, a Singapore-based internet and mobile platform provider, fell after Tencent Holdings Ltd. reduced its stake in the company.
Leading individual contributors to relative performance included the Fund’s overweight position in Wal-Mart de Mexico SAB and its underweight positions in Alibaba Group Holding Ltd. and Tencent Holdings Ltd. Shares of Wal-Mart de Mexico, a discount retailer, rose amid robust consumer demand supported by higher remittances from expatriates abroad. Shares of Alibaba, a China-based online retail market platform operator, fell amid tighter regulations on Chinese technology companies and slower growth in China’s economy.
HOW WAS THE FUND POSITIONED?
During the reporting period, the Fund’s largest overweight allocations relative to the Benchmark were to the information technology and consumer staples sectors and its largest underweight allocations were to the materials and communication services sectors. By country, the Fund’s largest overweight allocations were to Mexico and Taiwan and its
largest underweight positions were in Saudi Arabia and India.
| J.P. Morgan Exchange-Traded Funds | |
JPMorgan ActiveBuilders Emerging Markets Equity ETF
FUND COMMENTARY
TWELVE MONTHS ENDED October 31, 2022 (Unaudited) (continued)
*
The return shown is based on net asset value and may differ from the return shown in the financial highlights, which reflects adjustments made to the net asset value in accordance with accounting principles generally accepted in the United States of America. The net asset value was $31.07 as of October 31, 2022.
**
Market price return was calculated assuming an initial investment made at the market price at the beginning of the reporting period, reinvestment of all dividends and distributions at market price during the period, and sale at the market price on the last day of the period. The price used to calculate the market price return was the closing price on the Cboe BZX Exchange, Inc. As of October 31, 2022, the closing price was $31.15.
***
The adviser seeks to achieve the Fund’s objective. There can be no guarantee it will be achieved.
TOP TEN HOLDINGS OF THE
PORTFOLIO AS OF October 31, 2022 | PERCENT OF
TOTAL
INVESTMENTS |
| Taiwan Semiconductor Manufacturing Co. Ltd. (Taiwan) | |
| Samsung Electronics Co. Ltd. (South Korea) | |
| Tencent Holdings Ltd. (China) | |
| | |
| Housing Development Finance Corp. Ltd. (India) | |
| Wal-Mart de Mexico SAB de CV (Mexico) | |
| Alibaba Group Holding Ltd. (China) | |
| HDFC Bank Ltd., ADR (India) | |
| Grupo Financiero Banorte SAB de CV, Class O (Mexico) | |
| SK Hynix, Inc. (South Korea) | |
PORTFOLIO COMPOSITION BY COUNTRY
AS OF October 31, 2022 | PERCENT OF
TOTAL
INVESTMENTS |
| |
| |
| |
| |
| |
| |
| |
| |
| |
| |
| |
| |
| |
Others (each less than 1.0%) | |
| |
| J.P. Morgan Exchange-Traded Funds | |
AVERAGE ANNUAL TOTAL RETURNS AS OF October 31, 2022 (Unaudited)
| | | |
JPMorgan ActiveBuilders Emerging Markets Equity ETF | | | |
| | | |
| | | |
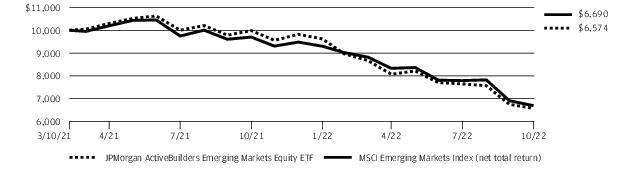
LIFE OF FUND PERFORMANCE (3/10/21 TO 10/31/22)
The performance quoted is past performance and is not a guarantee of future results. Exchange-traded funds are subject to certain market risks. Investment returns and principal value of an investment will fluctuate so that an investor’s shares, when sold or redeemed, may be worth more or less than their original cost. Current performance may be higher or lower than the performance data shown. For up-to-date month-end performance information, please call 1-844-457-6383.
Fund commenced operations on March 10, 2021.
The graph illustrates comparative performance for $10,000 invested in shares of the JPMorgan ActiveBuilders Emerging Markets Equity ETF and MSCI Emerging Markets Index (net total return) from March 10, 2021 to October 31, 2022. The performance of the Fund reflects the deduction of Fund expenses and assumes reinvestment of all dividends and capital gain distributions, if any. The performance of the MSCI Emerging Markets Index (net total return) does not reflect the deduction of expenses associated with an exchange-traded fund and has been adjusted to reflect reinvestment of all dividends and capital gain distributions of the securities included in the Index, if applicable. MSCI Emerging Markets Index (net total return) is a free float-adjusted market
capitalization-weighted index that is designed to measure the performance of large- and mid-cap stocks in emerging markets. Net total return figures assume the reinvestment of dividends after deduction of withholding tax, applying the maximum rate to nonresident individual investors who do not benefit from double taxation treaties. Investors cannot invest directly in an index.
Performance shown in this section does not reflect the deduction of taxes that a shareholder may pay on Fund distributions or on gains resulting from redemption or sale of Fund shares.
International investing involves a greater degree of risk and increased volatility. Changes in currency exchange rates and differences in accounting and taxation policies outside the United States can raise or lower returns. Also, some overseas markets may not be as politically and economically stable as the United States and other nations.
The returns shown are based on net asset values calculated for shareholder transactions and may differ from the returns shown in the financial highlights, which reflect adjustments made to the net asset values in accordance with accounting principles generally accepted in the United States of America.
| J.P. Morgan Exchange-Traded Funds | |
JPMorgan ActiveBuilders International Equity ETF
FUND COMMENTARY
TWELVE MONTHS ENDED October 31, 2022 (Unaudited)
| |
| |
| |
MSCI EAFE Index (net total return) | |
Net Assets as of 10/31/2022 | |
| |
INVESTMENT OBJECTIVE***
The JPMorgan ActiveBuilders International Equity ETF (the “Fund”) seeks to provide long term capital appreciation.
INVESTMENT APPROACH
The Fund invests primarily in equity securities and equity-related instruments of foreign companies across various market capitalizations and seeks to outperform the MSCI EAFE Index (the “Benchmark”) over time while maintaining similar risk characteristics. The Fund allocates investments in the adviser’s actively managed international equity strategies, including country, region and styles strategies.
HOW DID THE FUND PERFORM?
For the twelve months ended October 31, 2022, the Fund had a negative absolute return and outperformed the Benchmark.
Relative to the Benchmark, the Fund’s overweight positions in the energy and financials sectors were leading contributors to performance, while the Fund’s security selection in the consumer discretionary and communication services sectors was a leading detractor from relative performance.
By country, the Fund’s security selection in Sweden and Denmark was a leading contributor to performance relative to the Benchmark. The Fund’s security selection in the U.K. and its out-of-Benchmark position in China were leading detractors from relative performance.
Leading individual contributors to relative performance included the Fund’s overweight positions in TotalEnergies SE, DBS Group Holdings Ltd. and Novo Nordisk A/S. Shares of
TotalEnergies, a French integrated petroleum and natural gas company, rose amid higher global energy prices during the period. Shares of DBS Group Holdings, a Singapore financial services provider, rose after the company reported earnings and revenue growth during the period. Shares of Novo Nordisk, a Danish pharmaceuticals and health care products company, rose after legislative efforts to cap insulin prices failed in the U.S. Congress.
Leading individual detractors from relative performance included the Fund’s overweight positions in Adidas, Sea Ltd. and Adyen NV. Shares of Adidas, a German maker of footwear and sports apparel, fell amid supply-chain constraints and consumer backlash to the company’s former partnership with Kanye West. Shares of Sea, a Singapore-based internet and mobile platform provider, fell after Tencent Holdings Ltd. reduced its stake in the company. Shares of Adyen, a Dutch payments and e-commerce company, fell amid a broad sell-off in the information technology sector in the first quarter of 2022 and after the company reported lower-than-expected results for the first half of 2022.
HOW WAS THE FUND POSITIONED?
At the end of the reporting period, the Fund’s largest overweight allocations relative to the Benchmark were to the financials and energy sectors and its largest underweight allocations were to the real estate and industrials sectors. By country, the Fund’s largest overweight allocations were to Denmark and France and its largest underweight positions were in Australia and Japan.
| J.P. Morgan Exchange-Traded Funds | |
TOP TEN HOLDINGS OF THE
PORTFOLIO AS OF October 31, 2022 | PERCENT OF
TOTAL
INVESTMENTS |
| | |
| | |
| Novo Nordisk A/S, Class B (Denmark) | |
| | |
| LVMH Moet Hennessy Louis Vuitton SE (France) | |
| TotalEnergies SE (France) | |
| ASML Holding NV (Netherlands) | |
| BHP Group Ltd. (Australia) | |
| Diageo plc (United Kingdom) | |
| Novartis AG (Registered) (Switzerland) | |
PORTFOLIO COMPOSITION BY COUNTRY
AS OF October 31, 2022 | PERCENT OF
TOTAL
INVESTMENTS |
| |
| |
| |
| |
| |
| |
| |
| |
| |
| |
| |
| |
| |
| |
PORTFOLIO COMPOSITION BY COUNTRY AS OF October 31, 2022 | PERCENT OF TOTAL INVESTMENTS |
| |
Others (each less than 1.0%) | |
| |
*
The return shown is based on net asset value and may differ from the return shown in the financial highlights, which reflects adjustments made to the net asset value in accordance with accounting principles generally accepted in the United States of America. The net asset value was $37.38 as of October 31, 2022.
**
Market price return was calculated assuming an initial investment made at the market price at the beginning of the reporting period, reinvestment of all dividends and distributions at market price during the period, and sale at the market price on the last day of the period. The price used to calculate the market price return was the closing price on the NYSE Arca. As of October 31, 2022, the closing price was $37.36.
***
The adviser seeks to achieve the Fund’s objective. There can be no guarantee it will be achieved.
| J.P. Morgan Exchange-Traded Funds | |
JPMorgan ActiveBuilders International Equity ETF
FUND COMMENTARY
TWELVE MONTHS ENDED October 31, 2022 (Unaudited) (continued)
AVERAGE ANNUAL TOTAL RETURNS AS OF October 31, 2022 (Unaudited)
| | | |
JPMorgan ActiveBuilders International Equity ETF | | | |
| | | |
| | | |
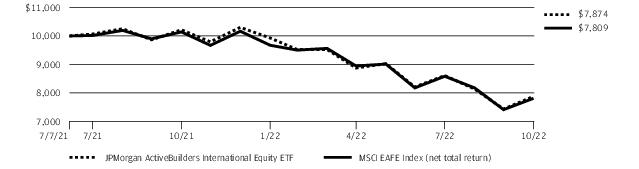
LIFE OF FUND PERFORMANCE (7/7/21 TO 10/31/22)
The performance quoted is past performance and is not a guarantee of future results. Exchange-traded funds are subject to certain market risks. Investment returns and principal value of an investment will fluctuate so that an investor’s shares, when sold or redeemed, may be worth more or less than their original cost. Current performance may be higher or lower than the performance data shown. For up-to-date month-end performance information, please call 1-844-457-6383.
Fund commenced operations on July 7, 2021.
The graph illustrates comparative performance for $10,000 invested in shares of the JPMorgan ActiveBuilders International Equity ETF and MSCI EAFE Index (net total return) from July 7, 2021 to October 31, 2022. The performance of the Fund reflects the deduction of Fund expenses and assumes reinvestment of all dividends and capital gain distributions, if any. The performance of the MSCI EAFE Index (net total return) does not reflect the deduction of expenses associated with an exchange-traded fund and has been adjusted to reflect reinvestment of all dividends and capital gain distributions of the securities included in the Index, if applicable. MSCI EAFE Index (net total return) is a free float-adjusted market capitalization-weighted index that is designed to measure
the performance of large- and mid-cap stocks in developed markets, excluding the U.S. and Canada. Net total return figures assume the reinvestment of dividends after deduction of withholding tax, applying the maximum rate to nonresident individual investors who do not benefit from double taxation treaties. Investors cannot invest directly in an index.
Performance shown in this section does not reflect the deduction of taxes that a shareholder may pay on Fund distributions or on gains resulting from redemption or sale of Fund shares.
International investing involves a greater degree of risk and increased volatility. Changes in currency exchange rates and differences in accounting and taxation policies outside the United States can raise or lower returns. Also, some overseas markets may not be as politically and economically stable as the United States and other nations.
The returns shown are based on net asset values calculated for shareholder transactions and may differ from the returns shown in the financial highlights, which reflect adjustments made to the net asset values in accordance with accounting principles generally accepted in the United States of America.
| J.P. Morgan Exchange-Traded Funds | |
JPMorgan BetaBuilders Canada ETF
FUND COMMENTARY
TWELVE MONTHS ENDED October 31, 2022 (Unaudited)
| |
| |
| |
Morningstar® Canada Target Market Exposure IndexSM (net total return) | |
Net Assets as of 10/31/2022 | |
| |
INVESTMENT OBJECTIVE***
The JPMorgan BetaBuilders Canada ETF (the “Fund”) seeks investment results that closely correspond, before fees and expenses, to the performance of the Morningstar® Canada Target Market Exposure IndexSM (the "Underlying Index").
INVESTMENT APPROACH
The Underlying Index is a free float adjusted, market capitalization weighted index, which consists of stocks traded primarily on the Toronto Stock Exchange. Using a "passive" investment approach, the Fund attempts to replicate the constituent securities of the Underlying Index as closely as possible, before considering fees and expenses, and invests in substantially all of the securities in the Underlying Index in approximately the same proportions as the Underlying Index.
HOW DID THE FUND PERFORM?
For the twelve months ended October 31, 2022, the Fund had a negative absolute return and performed in line with the Underlying Index, before considering the effects of differences in the timing of foreign exchange rate calculations, operating expenses, fees and tax management of the Fund’s portfolio.
The Fund’s and the Underlying Index’s exposures to the information technology and financials sectors were leading detractors from absolute performance, while their exposures to the energy and consumer staples sectors were leading contributors to absolute performance.
HOW WAS THE FUND POSITIONED?
During the reporting period, the Fund’s and the Underlying Index’s largest allocations were to the financials and energy sectors and their smallest allocations were to the health care and real estate sectors.
TOP TEN HOLDINGS OF THE
PORTFOLIO AS OF October 31, 2022 | PERCENT OF
TOTAL
INVESTMENTS |
| Royal Bank of Canada (Canada) | |
| Toronto-Dominion Bank (The) (Canada) | |
| | |
| Canadian National Railway Co. (Canada) | |
| Canadian Pacific Railway Ltd. (Canada) | |
| Canadian Natural Resources Ltd. (Canada) | |
| Bank of Montreal (Canada) | |
| Bank of Nova Scotia (The) (Canada) | |
| Brookfield Asset Management, Inc., Class A (Canada) | |
| Suncor Energy, Inc. (Canada) | |
PORTFOLIO COMPOSITION BY SECTOR
AS OF October 31, 2022 | PERCENT OF
TOTAL
INVESTMENTS |
| |
| |
| |
| |
| |
| |
| |
| |
| |
Others (each less than 1.0%) | |
| |
*
The return shown is based on net asset value and may differ from the return shown in the financial highlights, which reflects adjustments made to the net asset value in accordance with accounting principles generally accepted in the United States of America. The net asset value was $57.30 as of October 31, 2022.
**
Market price return was calculated assuming an initial investment made at the market price at the beginning of the reporting period, reinvestment of all dividends and distributions at market price during the period, and sale at the market price on
| J.P. Morgan Exchange-Traded Funds | |
JPMorgan BetaBuilders Canada ETF
FUND COMMENTARY
TWELVE MONTHS ENDED October 31, 2022 (Unaudited) (continued)
the last day of the period. The price used to calculate the market price return was the closing price on the Cboe BZX Exchange, Inc. As of October 31, 2022, the closing price was $57.35.
***
The adviser seeks to achieve the Fund’s objective. There can be no guarantee it will be achieved.
| J.P. Morgan Exchange-Traded Funds | |
AVERAGE ANNUAL TOTAL RETURNS AS OF October 31, 2022 (Unaudited)
| | | |
JPMorgan BetaBuilders Canada ETF | | | |
| | | |
| | | |
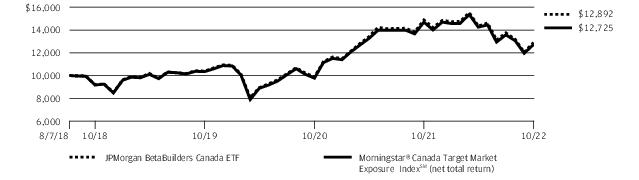
LIFE OF FUND PERFORMANCE (8/7/18 TO 10/31/22)
The performance quoted is past performance and is not a guarantee of future results. Exchange-traded funds are subject to certain market risks. Investment returns and principal value of an investment will fluctuate so that an investor’s shares, when sold or redeemed, may be worth more or less than their original cost. Current performance may be higher or lower than the performance data shown. For up-to-date month-end performance information, please call 1-844-457-6383.
Fund commenced operations on August 7, 2018.
The graph illustrates comparative performance for $10,000 invested in shares of the JPMorgan BetaBuilders Canada ETF and Morningstar® Canada Target Market Exposure IndexSM (net total return) from August 7, 2018 to October 31, 2022. The performance of the Fund reflects the deduction of Fund expenses and assumes reinvestment of all dividends and capital gain distributions, if any. The performance of the Morningstar® Canada Target Market Exposure IndexSM (net total return) does not reflect the deduction of expenses associated with an exchange-traded fund and has been adjusted to reflect reinvestment of all dividends and capital gain distributions of the securities included in the Index, if applicable. The Morningstar® Canada Target Market Exposure IndexSM (net total return) is a rules-based, float-adjusted market capitalization-weighted index designed to cover 85% of the equity float-adjusted market capitalization of the
Canada equity markets. Net total return figures assume the reinvestment of dividends after deduction of withholding tax, applying the maximum rate to nonresident individual investors who do not benefit from double taxation treaties. Investors cannot invest directly in an index.
For periods presented prior to November 1, 2019, the date on which a unitary fee structure was adopted, Fund performance reflects the waiver of the Fund’s fees and reimbursement of expenses for certain periods since the inception date. Without these waivers and reimbursements, performance would have been lower. Also, performance shown in this section does not reflect the deduction of taxes that a shareholder may pay on Fund distributions or on gains resulting from redemption or sale of Fund shares.
International investing involves a greater degree of risk and increased volatility. Changes in currency exchange rates and differences in accounting and taxation policies outside the United States can raise or lower returns.
The returns shown are based on net asset values calculated for shareholder transactions and may differ from the returns shown in the financial highlights, which reflect adjustments made to the net asset values in accordance with accounting principles generally accepted in the United States of America.
| J.P. Morgan Exchange-Traded Funds | |
JPMorgan BetaBuilders Developed Asia Pacific ex-Japan ETF
(formerly known as JPMorgan BetaBuilders Developed Asia ex-Japan ETF)
FUND COMMENTARY
TWELVE MONTHS ENDED October 31, 2022 (Unaudited)
| |
| |
| |
Morningstar® Developed Asia Pacific ex-Japan Target Market Exposure IndexSM (net total return) | |
Net Assets as of 10/31/2022 | |
| |
INVESTMENT OBJECTIVE***
The JPMorgan BetaBuilders Developed Asia Pacific ex-Japan ETF (the “Fund”) seeks investment results that closely correspond, before fees and expenses, to the performance of the Morningstar® Developed Asia Pacific ex-Japan Target Market Exposure IndexSM (the "Underlying Index").
INVESTMENT APPROACH
The Underlying Index is a free float adjusted, market capitalization weighted index that consists of equity securities from developed Asia-Pacific countries or regions other than Japan, including: Australia, Hong Kong, New Zealand and Singapore. Using a "passive" investment approach, the Fund attempts to replicate the constituent securities of the Underlying Index as closely as possible, before considering fees and expenses, and invests in substantially all of the securities in the Underlying Index in approximately the same proportions as the Underlying Index.
HOW DID THE FUND PERFORM?
For the twelve months ended October 31, 2022, the Fund had a negative absolute return and performed in line with the Underlying Index, before considering the effects of differences in the Fund’s net asset value calculations versus the Underlying Index’s valuation calculations, differences in the timing of foreign exchange rate calculations, as well as operating expenses, fees and tax management of the Fund’s portfolio.
The Fund’s and the Underlying Index’s exposures to the financials and health care sectors were leading detractors from absolute performance, while their exposures to the energy sector was the sole sector contributor to absolute performance.
By country or region, the Fund’s and the Underlying Index’s exposures to Australia and Hong Kong were leading detractors from absolute performance, while their exposures to Singapore and New Zealand were the smallest detractors from absolute performance and no country exposure made a positive contribution to absolute performance.
HOW WAS THE FUND POSITIONED?
During the reporting period, the Fund’s and the Underlying Index’s largest allocations were to the financials and materials
sectors and their smallest allocations were to the information technology and communication services sectors. The Fund and the Underlying Index’s largest allocations by country or region were to Australia and Hong Kong and the smallest allocations were to New Zealand and Singapore.
TOP TEN HOLDINGS OF THE
PORTFOLIO AS OF October 31, 2022 | PERCENT OF
TOTAL
INVESTMENTS |
| BHP Group Ltd. (Australia) | |
| Commonwealth Bank of Australia (Australia) | |
| AIA Group Ltd. (Hong Kong) | |
| | |
| National Australia Bank Ltd. (Australia) | |
| Westpac Banking Corp. (Australia) | |
| Australia & New Zealand Banking Group Ltd. (Australia) | |
| DBS Group Holdings Ltd. (Singapore) | |
| Woodside Energy Group Ltd. (Australia) | |
| Macquarie Group Ltd. (Australia) | |
PORTFOLIO COMPOSITION BY COUNTRY
AS OF October 31, 2022 | PERCENT OF
TOTAL
INVESTMENTS |
| |
| |
| |
| |
| |
| |
Others (each less than 1.0%) | |
| |
*
The return shown is based on net asset value and may differ from the return shown in the financial highlights, which reflects adjustments made to the net asset value in accordance with accounting principles generally accepted in the United States of America. The net asset value was $42.76 as of October 31, 2022.
**
Market price return was calculated assuming an initial investment made at the market price at the beginning of the reporting period, reinvestment of all dividends and distributions
| J.P. Morgan Exchange-Traded Funds | |
at market price during the period, and sale at the market price on the last day of the period. The price used to calculate the market price return was the closing price on the Cboe BZX Exchange, Inc. As of October 31, 2022, the closing price was $42.79.
***
The adviser seeks to achieve the Fund’s objective. There can be no guarantee it will be achieved.
| Amount rounds to less than 0.1%. |
| J.P. Morgan Exchange-Traded Funds | |
JPMorgan BetaBuilders Developed Asia Pacific ex-Japan ETF
(formerly known as JPMorgan BetaBuilders Developed Asia ex-Japan ETF)
FUND COMMENTARY
TWELVE MONTHS ENDED October 31, 2022 (Unaudited) (continued)
AVERAGE ANNUAL TOTAL RETURNS AS OF October 31, 2022 (Unaudited)
| | | |
JPMorgan BetaBuilders Developed Asia Pacific ex-Japan ETF (formerly known as JPMorgan BetaBuilders Developed Asia ex-Japan ETF) | | | |
| | | |
| | | |
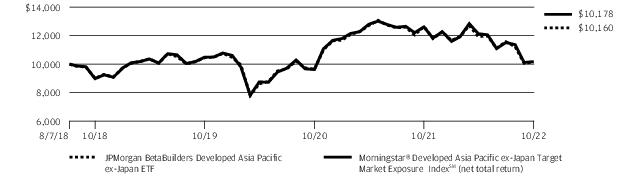
LIFE OF FUND PERFORMANCE (8/7/18 TO 10/31/22)
The performance quoted is past performance and is not a guarantee of future results. Exchange-traded funds are subject to certain market risks. Investment returns and principal value of an investment will fluctuate so that an investor’s shares, when sold or redeemed, may be worth more or less than their original cost. Current performance may be higher or lower than the performance data shown. For up-to-date month-end performance information, please call 1-844-457-6383.
Fund commenced operations on August 7, 2018.
The graph illustrates comparative performance for $10,000 invested in shares of the JPMorgan BetaBuilders Developed Asia Pacific ex-Japan ETF and Morningstar® Developed Asia Pacific ex-Japan Target Market Exposure IndexSM (net total return) from August 7, 2018 to October 31, 2022. The performance of the Fund reflects the deduction of Fund expenses and assumes reinvestment of all dividends and capital gain distributions, if any. The performance of the Morningstar® Developed Asia Pacific ex-Japan Target Market Exposure IndexSM (net total return) does not reflect the deduction of expenses associated with an exchange-traded fund and has been adjusted to reflect reinvestment of all dividends and capital gain distributions of the securities included in the Index, if applicable. The Morningstar® Developed Asia Pacific ex-Japan Target Market Exposure IndexSM (net total return) is a rules-based, float-adjusted market capitalization-weighted index designed to cover 85% of the equity float-adjusted market capitalization of the Developed Asia Pacific ex-Japan
equity markets. Net total return figures assume the reinvestment of dividends after deduction of withholding tax, applying the maximum rate to nonresident individual investors who do not benefit from double taxation treaties. Investors cannot invest directly in an index.
For periods presented prior to November 1, 2019, the date on which a unitary fee structure was adopted, Fund performance reflects the waiver of the Fund’s fees and reimbursement of expenses for certain periods since the inception date. Without these waivers and reimbursements, performance would have been lower. Also, performance shown in this section does not reflect the deduction of taxes that a shareholder may pay on Fund distributions or on gains resulting from redemption or sale of Fund shares.
International investing involves a greater degree of risk and increased volatility. Changes in currency exchange rates and differences in accounting and taxation policies outside the United States can raise or lower returns. Also, some overseas markets may not be as politically and economically stable as the United States and other nations.
The returns shown are based on net asset values calculated for shareholder transactions and may differ from the returns shown in the financial highlights, which reflect adjustments made to the net asset values in accordance with accounting principles generally accepted in the United States of America.
| J.P. Morgan Exchange-Traded Funds | |
JPMorgan BetaBuilders Europe ETF
FUND COMMENTARY
TWELVE MONTHS ENDED October 31, 2022 (Unaudited)
| |
| |
| |
Morningstar® Developed Europe Target Market Exposure IndexSM (net total return) | |
Net Assets as of 10/31/2022 | |
| |
INVESTMENT OBJECTIVE***
The JPMorgan BetaBuilders Europe ETF (the “Fund”) seeks investment results that closely correspond, before fees and expenses, to the performance of the Morningstar® Developed Europe Target Market Exposure IndexSM (the "Underlying Index").
INVESTMENT APPROACH
The Underlying Index is a free-float adjusted market capitalization weighted index consisting of equity securities from developed European countries or regions, including Austria, Belgium, Denmark, Finland, France, Germany, Ireland, Italy, the Netherlands, Norway, Poland, Portugal, Spain, Sweden, Switzerland and the U.K. Using a "passive" investment approach, the Fund attempts to replicate the constituent securities of the Underlying Index as closely as possible, before considering fees and expenses, and invests in substantially all of the securities in the Underlying Index in approximately the same proportions as the Underlying Index.
HOW DID THE FUND PERFORM?
For the twelve months ended October 31, 2022, the Fund had a negative absolute performance and performed in line with the Underlying Index, before considering the effects of differences in the Fund’s net asset value calculations versus the Underlying Index’s valuation calculations, differences in the timing of foreign exchange rate calculations, as well as operating expenses, fees and tax management of the Fund’s portfolio.
The Fund’s and the Underlying Index’s exposures to the financials and consumer discretionary sectors were leading detractors from absolute performance, while their exposure to the energy sector was the sole sector contributor to absolute performance.
By country, the Fund’s and the Underlying Index’s exposures to Germany and the U.K. were leading detractors from absolute performance, while their exposures to Portugal and Austria were the smallest detractors. No countries contributed to absolute performance.
HOW WAS THE FUND POSITIONED?
During the reporting period, the Fund’s and the Underlying Index’s largest allocations were to the financials and health
care sectors and their smallest allocations were to the communication services and real estate sectors. The Fund’s and the Underlying Index’s largest country allocations were to the U.K. and France and their smallest allocations were to Portugal
and Austria.
TOP TEN HOLDINGS OF THE
PORTFOLIO AS OF October 31, 2022 | PERCENT OF
TOTAL
INVESTMENTS |
| | |
| | |
| | |
| Novartis AG (Registered) (Switzerland) | |
| ASML Holding NV (Netherlands) | |
| AstraZeneca plc (United Kingdom) | |
| Novo Nordisk A/S, Class B (Denmark) | |
| LVMH Moet Hennessy Louis Vuitton SE (France) | |
| TotalEnergies SE (France) | |
| Unilever plc (United Kingdom) | |
PORTFOLIO COMPOSITION BY COUNTRY
AS OF October 31, 2022 | PERCENT OF
TOTAL
INVESTMENTS |
| |
| |
| |
| |
| |
| |
| |
| |
| |
| |
| |
| |
| |
| |
Others (each less than 1.0%) | |
| |
| J.P. Morgan Exchange-Traded Funds | |
JPMorgan BetaBuilders Europe ETF
FUND COMMENTARY
TWELVE MONTHS ENDED October 31, 2022 (Unaudited) (continued)
*
The return shown is based on net asset value and may differ from the return shown in the financial highlights, which reflects adjustments made to the net asset value in accordance with accounting principles generally accepted in the United States of America. The net asset value was $43.61 as of October 31, 2022.
**
Market price return was calculated assuming an initial investment made at the market price at the beginning of the reporting period, reinvestment of all dividends and distributions at market price during the period, and sale at the market price on the last day of the period. The price used to calculate the market price return was the closing price on the Cboe BZX Exchange, Inc. As of October 31, 2022, the closing price was $43.62.
***
The adviser seeks to achieve the Fund’s objective. There can be no guarantee it will be achieved.
| J.P. Morgan Exchange-Traded Funds | |
AVERAGE ANNUAL TOTAL RETURNS AS OF October 31, 2022 (Unaudited)
| | | |
JPMorgan BetaBuilders Europe ETF | | | |
| | | |
| | | |
LIFE OF FUND PERFORMANCE (6/15/18 TO 10/31/22)
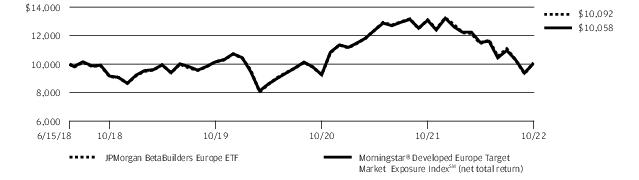
The performance quoted is past performance and is not a guarantee of future results. Exchange-traded funds are subject to certain market risks. Investment returns and principal value of an investment will fluctuate so that an investor’s shares, when sold or redeemed, may be worth more or less than their original cost. Current performance may be higher or lower than the performance data shown. For up-to-date month-end performance information, please call 1-844-457-6383.
Fund commenced operations on June 15, 2018.
The graph illustrates comparative performance for $10,000 invested in shares of the JPMorgan BetaBuilders Europe ETF and Morningstar® Developed Europe Target Market Exposure IndexSM (net total return) from June 15, 2018 to October 31, 2022. The performance of the Fund reflects the deduction of Fund expenses and assumes reinvestment of all dividends and capital gain distributions, if any. The performance of the Morningstar® Developed Europe Target Market Exposure IndexSM (net total return) does not reflect the deduction of expenses associated with an exchange-traded fund and has been adjusted to reflect reinvestment of all dividends and capital gain distributions of the securities included in the Index, if applicable. Morningstar® Developed Europe Target Market Exposure IndexSM (net total return) is a rules-based, float-adjusted market capitalization-weighted index designed to cover 85% of the equity float-adjusted market capitalization of the Developed Europe equity
markets. Net total return figures assume the reinvestment of dividends after deduction of withholding tax, applying the maximum rate to nonresident individual investors who do not benefit from double taxation treaties. Investors cannot invest directly in an index.
For periods presented prior to November 1, 2019, the date on which a unitary fee structure was adopted, Fund performance reflects the waiver of the Fund’s fees and reimbursement of expenses for certain periods since the inception date. Without these waivers and reimbursements, performance would have been lower. Also, performance shown in this section does not reflect the deduction of taxes that a shareholder may pay on Fund distributions or on gains resulting from redemption or sale of Fund shares.
International investing involves a greater degree of risk and increased volatility. Changes in currency exchange rates and differences in accounting and taxation policies outside the United States can raise or lower returns. Also, some overseas markets may not be as politically and economically stable as the United States and other nations.
The returns shown are based on net asset values calculated for shareholder transactions and may differ from the returns shown in the financial highlights, which reflect adjustments made to the net asset values in accordance with accounting principles generally accepted in the United States of America.
| J.P. Morgan Exchange-Traded Funds | |
JPMorgan BetaBuilders International Equity ETF
FUND COMMENTARY
TWELVE MONTHS ENDED October 31, 2022 (Unaudited)
| |
| |
| |
Morningstar® Developed Markets ex-North America Target Market Exposure IndexSM (net total return) | |
Net Assets as of 10/31/2022 | |
| |
INVESTMENT OBJECTIVE***
The JPMorgan BetaBuilders International Equity ETF (the “Fund”) seeks investment results that closely correspond, before fees and expenses, to the performance of the Morningstar® Developed Markets ex-North America Target Market Exposure IndexSM (the "Underlying Index").
INVESTMENT APPROACH
The Underlying Index is a free float adjusted, market capitalization weighted index, which consists of equity securities from developed countries or regions outside the U.S. and Canada. Using a "passive" investment approach, the Fund attempts to replicate the constituent securities of the Underlying Index as closely as possible, before considering fees and expenses, and invests in substantially all of the securities in the Underlying Index in approximately the same proportions as the Underlying Index.
HOW DID THE FUND PERFORM?
For the twelve months ended October 31, 2022, the Fund had a negative absolute return and performed in line with the Underlying Index, before considering the effects of differences in the Fund’s net asset value calculations versus the Underlying Index’s valuation calculations, differences in the timing of foreign exchange rate calculations, as well as operating expenses, fees and tax management of the Fund’s portfolio.
The Fund’s and the Underlying Index’s exposures to the consumer discretionary and industrials sectors were leading detractors from absolute performance, while their exposures to the energy sector was the sole sector contributor to absolute performance.
By country or region, the Fund’s and the Underlying Index’s exposures to Japan and Germany were leading detractors from absolute performance, while their exposures to Singapore and Israel were leading contributors to absolute performance.
HOW WAS THE FUND POSITIONED?
During the reporting period, the Fund’s and the Underlying Index’s largest sector allocations were to the financials and industrials sectors, while their smallest allocations were to the real estate and utilities sectors. The Fund’s and the Underlying Index’s largest country or region allocations were to Japan and the U.K. and their smallest allocations were to New Zealand and
Portugal.
TOP TEN HOLDINGS OF THE
PORTFOLIO AS OF October 31, 2022 | PERCENT OF
TOTAL
INVESTMENTS |
| | |
| | |
| | |
| Novartis AG (Registered) (Switzerland) | |
| ASML Holding NV (Netherlands) | |
| AstraZeneca plc (United Kingdom) | |
| Novo Nordisk A/S, Class B (Denmark) | |
| Toyota Motor Corp. (Japan) | |
| LVMH Moet Hennessy Louis Vuitton SE (France) | |
| TotalEnergies SE (France) | |
PORTFOLIO COMPOSITION BY COUNTRY
AS OF October 31, 2022 | PERCENT OF
TOTAL
INVESTMENTS |
| |
| |
| |
| |
| |
| |
| |
| |
| |
| |
| |
| |
| |
| |
| |
Others (each less than 1.0%) | |
| |
*
The return shown is based on net asset value and may differ from the return shown in the financial highlights, which reflects
| J.P. Morgan Exchange-Traded Funds | |
adjustments made to the net asset value in accordance with accounting principles generally accepted in the United States of America. The net asset value was $44.72 as of October 31, 2022.
**
Market price return was calculated assuming an initial investment made at the market price at the beginning of the reporting period, reinvestment of all dividends and distributions at market price during the period, and sale at the market price on the last day of the period. The price used to calculate the market price return was the closing price on the Cboe BZX Exchange, Inc. As of October 31, 2022, the closing price was $44.75.
***
The adviser seeks to achieve the Fund’s objective. There can be no guarantee it will be achieved.
| J.P. Morgan Exchange-Traded Funds | |
JPMorgan BetaBuilders International Equity ETF
FUND COMMENTARY
TWELVE MONTHS ENDED October 31, 2022 (Unaudited) (continued)
AVERAGE ANNUAL TOTAL RETURNS AS OF October 31, 2022 (Unaudited)
| | | |
JPMorgan BetaBuilders International Equity ETF | | | |
| | | |
| | | |
LIFE OF FUND PERFORMANCE (12/3/19 TO 10/31/22)
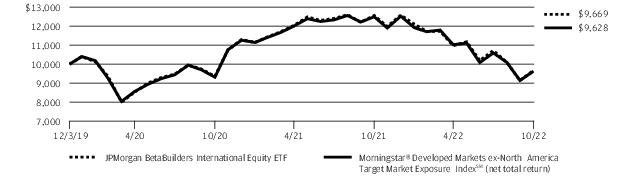
The performance quoted is past performance and is not a guarantee of future results. Exchange-traded funds are subject to certain market risks. Investment returns and principal value of an investment will fluctuate so that an investor’s shares, when sold or redeemed, may be worth more or less than their original cost. Current performance may be higher or lower than the performance data shown. For up-to-date month-end performance information, please call 1-844-457-6383.
Fund commenced operations on December 3, 2019.
The graph illustrates comparative performance for $10,000 invested in shares of the JPMorgan BetaBuilders International Equity ETF and Morningstar® Developed Markets ex-North America Target Market Exposure IndexSM (net total return) from December 3, 2019 to October 31, 2022. The performance of the Fund reflects the deduction of Fund expenses and assumes reinvestment of all dividends and capital gain distributions, if any. The performance of the Morningstar® Developed Markets ex-North America Target Market Exposure IndexSM (net total return) does not reflect the deduction of expenses associated with an exchange-traded fund and has been adjusted to reflect reinvestment of all dividends and capital gain distributions of the securities included in the Index, if applicable. The Morningstar® Developed Markets ex-North America Target Market Exposure IndexSM (net total return) is a rules-based,
float-adjusted market capitalization-weighted index designed to cover 85% of the equity float-adjusted market capitalization of the Developed Markets ex-North America equity markets. Net total return figures assume the reinvestment of dividends after deduction of withholding tax, applying the maximum rate to nonresident individual investors who do not benefit from double taxation treaties. Investors cannot invest directly in an index.
Performance shown in this section does not reflect the deduction of taxes that a shareholder may pay on Fund distributions or on gains resulting from redemption or sale of Fund shares.
International investing involves a greater degree of risk and increased volatility. Changes in currency exchange rates and differences in accounting and taxation policies outside the United States can raise or lower returns. Also, some foreign markets may not be as politically and economically stable as the United States and other nations.
The returns shown are based on net asset values calculated for shareholder transactions and may differ from the returns shown in the financial highlights, which reflect adjustments made to the net asset values in accordance with accounting principles generally accepted in the United States of America.
| J.P. Morgan Exchange-Traded Funds | |
JPMorgan BetaBuilders Japan ETF
FUND COMMENTARY
TWELVE MONTHS ENDED October 31, 2022 (Unaudited)
| |
| |
| |
Morningstar® Japan Target Market Exposure IndexSM (net total return) | |
Net Assets as of 10/31/2022 | |
| |
INVESTMENT OBJECTIVE***
The JPMorgan BetaBuilders Japan ETF (the “Fund”) seeks investment results that closely correspond, before fees and expenses, to the performance of the Morningstar® Japan Target Market Exposure IndexSM (the "Underlying Index").
INVESTMENT APPROACH
The Underlying Index is a free float adjusted market-capitalization weighted index, which consists stocks traded primarily on the Tokyo Stock Exchange or the Nagoya Stock Exchange. Using a "passive" investment approach, the Fund attempts to replicate the constituent securities of the Underlying Index as closely as possible, before considering fees and expenses, and invests in substantially all of the securities in the Underlying Index in approximately the same proportions as the Underlying Index.
HOW DID THE FUND PERFORM?
For the twelve months ended October 31, 2022, the Fund had a negative absolute return and performed in line with the Underlying Index, before considering the effects of differences in the Fund’s net asset value calculations versus the Underlying Index’s valuation calculations, differences in the timing of foreign exchange rate calculations, as well as operating expenses, fees and tax management of the Fund’s portfolio.
The Fund’s and the Underlying Index’s exposures to the industrials and consumer discretionary sectors were leading detractors from absolute performance, while their exposures to the energy and utilities sectors were the smallest detractors from absolute performance and no sector contributed to absolute performance.
HOW WAS THE FUND POSITIONED?
During the reporting period, the Fund’s and the Underlying Index’s largest allocations were to the industrials and consumer discretionary sectors and their smallest allocations were to the energy and utilities sectors.
TOP TEN HOLDINGS OF THE
PORTFOLIO AS OF October 31, 2022 | PERCENT OF
TOTAL
INVESTMENTS |
| Toyota Motor Corp. (Japan) | |
| | |
| | |
| Daiichi Sankyo Co. Ltd. (Japan) | |
| Mitsubishi UFJ Financial Group, Inc. (Japan) | |
| Recruit Holdings Co. Ltd. (Japan) | |
| SoftBank Group Corp. (Japan) | |
| Nintendo Co. Ltd. (Japan) | |
| | |
| | |
PORTFOLIO COMPOSITION BY SECTOR
AS OF October 31, 2022 | PERCENT OF
TOTAL
INVESTMENTS |
| |
| |
| |
| |
| |
| |
| |
| |
| |
Others (each less than 1.0%) | |
| |
*
The return shown is based on net asset value and may differ from the return shown in the financial highlights, which reflects adjustments made to the net asset value in accordance with accounting principles generally accepted in the United States of America. The net asset value was $41.69 as of October 31, 2022.
**
Market price return was calculated assuming an initial investment made at the market price at the beginning of the reporting period, reinvestment of all dividends and distributions at market price during the period, and sale at the market price on
| J.P. Morgan Exchange-Traded Funds | |
JPMorgan BetaBuilders Japan ETF
FUND COMMENTARY
TWELVE MONTHS ENDED October 31, 2022 (Unaudited) (continued)
the last day of the period. The price used to calculate the market price return was the closing price on the Cboe BZX Exchange, Inc. As of October 31, 2022, the closing price was $41.73.
***
The adviser seeks to achieve the Fund’s objective. There can be no guarantee it will be achieved.
| J.P. Morgan Exchange-Traded Funds | |
AVERAGE ANNUAL TOTAL RETURNS AS OF October 31, 2022 (Unaudited)
| | | |
JPMorgan BetaBuilders Japan ETF | | | |
| | | |
| | | |
LIFE OF FUND PERFORMANCE (6/15/18 TO 10/31/22)
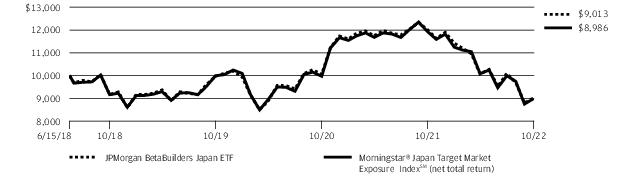
The performance quoted is past performance and is not a guarantee of future results. Exchange-traded funds are subject to certain market risks. Investment returns and principal value of an investment will fluctuate so that an investor’s shares, when sold or redeemed, may be worth more or less than their original cost. Current performance may be higher or lower than the performance data shown. For up-to-date month-end performance information, please call 1-844-457-6383.
Fund commenced operations on June 15, 2018.
The graph illustrates comparative performance for $10,000 invested in shares of the JPMorgan BetaBuilders Japan ETF and Morningstar® Japan Target Market Exposure IndexSM (net total return) from June 15, 2018 to October 31, 2022. The performance of the Fund reflects the deduction of Fund expenses and assumes reinvestment of all dividends and capital gain distributions, if any. The performance of the Morningstar® Japan Target Market Exposure IndexSM (net total return) does not reflect the deduction of expenses associated with an exchange-traded fund and has been adjusted to reflect reinvestment of all dividends and capital gain distributions of the securities included in the Index, if applicable. Morningstar® Japan Target Market Exposure IndexSM (net total return) is a rule based, float-adjusted market capitalization-weighted index designed to cover 85% of the equity float-adjusted market capitalization of the Japan equity markets. Net total return figures assume the reinvestment of
dividends after deduction of withholding tax, applying the maximum rate to nonresident individual investors who do not benefit from double taxation treaties. Investors cannot invest directly in an index.
For periods presented prior to November 1, 2019, the date on which a unitary fee structure was adopted, Fund performance reflects the waiver of the Fund’s fees and reimbursement of expenses for certain periods since the inception date. Without these waivers and reimbursements, performance would have been lower. Also, performance shown in this section does not reflect the deduction of taxes that a shareholder may pay on Fund distributions or on gains resulting from redemption or sale of Fund shares.
International investing involves a greater degree of risk and increased volatility. Changes in currency exchange rates and differences in accounting and taxation policies outside the United States can raise or lower returns. Also, some overseas markets may not be as politically and economically stable as the United States and other nations.
The returns shown are based on net asset values calculated for shareholder transactions and may differ from the returns shown in the financial highlights, which reflect adjustments made to the net asset values in accordance with accounting principles generally accepted in the United States of America.
| J.P. Morgan Exchange-Traded Funds | |
JPMorgan BetaBuilders U.S. Equity ETF
FUND COMMENTARY
TWELVE MONTHS ENDED October 31, 2022 (Unaudited)
| |
| |
| |
Morningstar® US Target Market Exposure IndexSM | |
Net Assets as of 10/31/2022 | |
| |
INVESTMENT OBJECTIVE***
The JPMorgan BetaBuilders U.S. Equity ETF (the “Fund”) seeks investment results that closely correspond, before fees and expenses, to the performance of the Morningstar® US Target Market Exposure IndexSM (the "Underlying Index").
INVESTMENT APPROACH
The Underlying Index is a free float adjusted market capitalization weighted index consisting of equity securities traded primarily in the U.S. It targets 85% of those stocks by market capitalization and primarily includes large- and mid-cap companies. Using a "passive" investment approach, the Fund attempts to closely correspond to the performance of the Underlying Index and invests in substantially all of the securities in the Underlying Index in approximately the same proportions as the Underlying Index.
HOW DID THE FUND PERFORM?
For the twelve months ended October 31, 2022, the Fund had a negative absolute return and performed in line with the Underlying Index, before considering the effects of operating expenses, fees and tax management of the Fund’s portfolio.
The Fund’s and the Underlying Index’s exposures to the information technology and communication services sectors were leading detractors from absolute performance, while their exposures to the energy and consumer staples sectors were leading contributors to absolute performance.
HOW WAS THE FUND POSITIONED?
During the reporting period, the Fund’s and the Underlying Index’s largest allocations were to the information technology and health care sectors, while their smallest allocations were to
the materials and utilities sectors.
TOP TEN HOLDINGS OF THE
PORTFOLIO AS OF October 31, 2022 | PERCENT OF
TOTAL
INVESTMENTS |
| | |
| | |
| | |
| | |
| | |
| Berkshire Hathaway, Inc., Class B | |
| | |
| | |
| | |
| | |
PORTFOLIO COMPOSITION BY SECTOR
AS OF October 31, 2022 | PERCENT OF
TOTAL
INVESTMENTS |
| |
| |
| |
| |
| |
| |
| |
| |
| |
| |
| |
| |
*
The return shown is based on net asset value and may differ from the return shown in the financial highlights, which reflects adjustments made to the net asset value in accordance with accounting principles generally accepted in the United States of America. The net asset value was $69.38 as of October 31, 2022.
**
Market price return was calculated assuming an initial investment made at the market price at the beginning of the reporting period, reinvestment of all dividends and distributions at market price during the period, and sale at the market price on
| J.P. Morgan Exchange-Traded Funds | |
the last day of the period. The price used to calculate the market price return was the closing price on the Cboe BZX Exchange, Inc. As of October 31, 2022, the closing price was $69.42.
***
The adviser seeks to achieve the Fund’s objective. There can be no guarantee it will be achieved.
| J.P. Morgan Exchange-Traded Funds | |
JPMorgan BetaBuilders U.S. Equity ETF
FUND COMMENTARY
TWELVE MONTHS ENDED October 31, 2022 (Unaudited) (continued)
AVERAGE ANNUAL TOTAL RETURNS AS OF October 31, 2022 (Unaudited)
| | | |
JPMorgan BetaBuilders U.S. Equity ETF | | | |
| | | |
| | | |
LIFE OF FUND PERFORMANCE (3/12/19 TO 10/31/22)
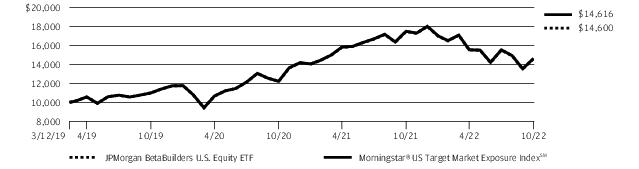
The performance quoted is past performance and is not a guarantee of future results. Exchange-traded funds are subject to certain market risks. Investment returns and principal value of an investment will fluctuate so that an investor’s shares, when sold or redeemed, may be worth more or less than their original cost. Current performance may be higher or lower than the performance data shown. For up-to-date month-end performance information, please call 1-844-457-6383.
Fund commenced operations on March 12, 2019.
The graph illustrates comparative performance for $10,000 invested in shares of the JPMorgan BetaBuilders U.S. Equity ETF and the Morningstar® US Target Market Exposure IndexSM from March 12, 2019 to October 31, 2022. The performance of the Fund reflects the deduction of Fund expenses and assumes reinvestment of all dividends and capital gain distributions, if any. The performance of the Morningstar® US Target Market Exposure IndexSM does not
reflect the deduction of expenses associated with an exchange-traded fund and has been adjusted to reflect reinvestment of all dividends and capital gain distributions of the securities included in the Index, if applicable. Morningstar® US Target Market Exposure IndexSM is a free float-adjusted market capitalization-weighted index which consists of stocks traded primarily on the U.S. stock exchanges. Investors cannot invest directly in an index.
Performance shown in this section does not reflect the deduction of taxes that a shareholder may pay on Fund distributions or on gains resulting from redemption or sale of Fund shares.
The returns shown are based on net asset values calculated for shareholder transactions and may differ from the returns shown in the financial highlights, which reflect adjustments made to the net asset values in accordance with accounting principles generally accepted in the United States of America.
| J.P. Morgan Exchange-Traded Funds | |
JPMorgan BetaBuilders U.S. Mid Cap Equity ETF
FUND COMMENTARY
TWELVE MONTHS ENDED October 31, 2022 (Unaudited)
| |
| |
| |
Morningstar® US Mid Cap Target Market Exposure Extended IndexSM | |
Net Assets as of 10/31/2022 | |
| |
INVESTMENT OBJECTIVE***
The JPMorgan BetaBuilders U.S. Mid Cap Equity ETF (the “Fund”) seeks investment results that closely correspond, before fees and expenses, to the performance of the Morningstar® US Mid Cap Target Market Exposure Extended IndexSM (the "Underlying Index").
INVESTMENT APPROACH
The Underlying Index consists of mid-cap equity securities traded in the U.S. It targets those securities that fall between the 85th and 95th percentiles in market capitalization of the free-float adjusted investable universe. Using a "passive" investment approach, the Fund attempts to closely correspond to the performance of the Underlying Index, and invests in substantially all of the securities in the Underlying Index in approximately the same proportions as the Underlying Index.
HOW DID THE FUND PERFORM?
For the twelve months ended October 31, 2022, the Fund had a negative absolute return and performed in line with the Underlying Index, before considering the effects of operating expenses, fees and tax management of the Fund’s portfolio.
The Fund’s and the Underlying Index’s exposures to the information technology and health care sectors were leading detractors from absolute performance, while their exposures to the energy and utilities sectors were leading contributors to absolute performance.
HOW WAS THE FUND POSITIONED?
During the reporting period, the Fund’s and the Underlying Index’s largest allocations were to the industrials and information technology sectors, while their smallest allocations
were to the utilities and communication services sectors.
TOP TEN HOLDINGS OF THE
PORTFOLIO AS OF October 31, 2022 | PERCENT OF
TOTAL
INVESTMENTS |
| LPL Financial Holdings, Inc. | |
| | |
| | |
| | |
| Booz Allen Hamilton Holding Corp. | |
| | |
| | |
| Gaming and Leisure Properties, Inc. | |
| Darling Ingredients, Inc. | |
| | |
PORTFOLIO COMPOSITION BY SECTOR
AS OF October 31, 2022 | PERCENT OF
TOTAL
INVESTMENTS |
| |
| |
| |
| |
| |
| |
| |
| |
| |
| |
| |
| |
*
The return shown is based on net asset value and may differ from the return shown in the financial highlights, which reflects adjustments made to the net asset value in accordance with accounting principles generally accepted in the United States of America. The net asset value was $74.06 as of October 31, 2022.
**
Market price return was calculated assuming an initial investment made at the market price at the beginning of the reporting period, reinvestment of all dividends and distributions at market price during the period, and sale at the market price on the last
| J.P. Morgan Exchange-Traded Funds | |
JPMorgan BetaBuilders U.S. Mid Cap Equity ETF
FUND COMMENTARY
TWELVE MONTHS ENDED October 31, 2022 (Unaudited) (continued)
day of the period. The price used to calculate the market price return was the closing price on the NYSE Arca. As of October 31, 2022, the closing price was $73.92.
***
The adviser seeks to achieve the Fund’s objective. There can be no guarantee it will be achieved.
| J.P. Morgan Exchange-Traded Funds | |
AVERAGE ANNUAL TOTAL RETURNS AS OF October 31, 2022 (Unaudited)
| | | |
JPMorgan BetaBuilders U.S. Mid Cap Equity ETF | | | |
| | | |
| | | |
LIFE OF FUND PERFORMANCE (4/14/20 TO 10/31/22)
The performance quoted is past performance and is not a guarantee of future results. Exchange-traded funds are subject to certain market risks. Investment returns and principal value of an investment will fluctuate so that an investor’s shares, when sold or redeemed, may be worth more or less than their original cost. Current performance may be higher or lower than the performance data shown. For up-to-date month-end performance information, please call 1-844-457-6383.
Fund commenced operations on April 14, 2020.
The graph illustrates comparative performance for $10,000 invested in shares of the JPMorgan BetaBuilders U.S. Mid Cap Equity ETF and Morningstar® US Mid Cap Target Market Exposure Extended IndexSM from April 14, 2020 to October 31, 2022. The performance of the Fund reflects the deduction of Fund expenses and assumes reinvestment of all dividends and capital gain distributions, if any. The performance of the Morningstar® US Mid Cap Target Market Exposure
Extended IndexSM does not reflect the deduction of expenses associated with an exchange-traded fund and has been adjusted to reflect reinvestment of all dividends and capital gain distributions of the securities included in the Index, if applicable. The Morningstar® US Mid Cap Target Market Exposure Extended IndexSM is a free float adjusted market capitalization weighted index that consists of mid cap U.S. equity securities. Investors cannot invest directly in an index.
Performance shown in this section does not reflect the deduction of taxes that a shareholder may pay on Fund distributions or on gains resulting from redemption or sale of Fund shares.
The returns shown are based on net asset values calculated for shareholder transactions and may differ from the returns shown in the financial highlights, which reflect adjustments made to the net asset values in accordance with accounting principles generally accepted in the United States of America.
| J.P. Morgan Exchange-Traded Funds | |
JPMorgan BetaBuilders U.S. Small Cap Equity ETF
FUND COMMENTARY
TWELVE MONTHS ENDED October 31, 2022 (Unaudited)
| |
| |
| |
Morningstar® US Small Cap Target Market Exposure Extended IndexSM | |
Net Assets as of 10/31/2022 | |
| |
INVESTMENT OBJECTIVE***
The JPMorgan BetaBuilders U.S. Small Cap Equity ETF (the “Fund”) seeks investment results that closely correspond, before fees and expenses, to the performance of the Morningstar® US Small Cap Target Market Exposure Extended IndexSM (the "Underlying Index").
INVESTMENT APPROACH
The Underlying Index primarily consists of small-cap equity securities traded in the U.S. It targets those securities that fall between the 95th and 99th percentiles in market capitalization of free float adjusted investable universe. Using a "passive" investment approach, the Fund attempts to closely correspond to the performance of the Underlying Index and invests in substantially all of the securities in the Underlying Index in approximately the same proportions as the Underlying Index.
HOW DID THE FUND PERFORM?
For the twelve months ended October 31, 2022, the Fund had a negative absolute return and performed in line with the Underlying Index, before considering the effects of operating expenses, fees and tax management of the Fund’s portfolio.
The Fund’s and the Underlying Index’s exposures to the health care and information technology sectors were leading detractors from absolute performance, while their exposures to the energy and consumer staples sectors were leading contributors to absolute performance.
HOW WAS THE FUND POSITIONED?
During the reporting period, the Fund’s and the Underlying Index’s largest allocations were to the financials and industrials sectors and their smallest allocations were to the utilities and
communication services sectors.
TOP TEN HOLDINGS OF THE
PORTFOLIO AS OF October 31, 2022 | PERCENT OF
TOTAL
INVESTMENTS |
| | |
| | |
| Karuna Therapeutics, Inc. | |
| | |
| Applied Industrial Technologies, Inc. | |
| PBF Energy, Inc., Class A | |
| | |
| Comfort Systems USA, Inc. | |
| Magnolia Oil & Gas Corp., Class A | |
| | |
PORTFOLIO COMPOSITION BY SECTOR
AS OF October 31, 2022 | PERCENT OF
TOTAL
INVESTMENTS |
| |
| |
| |
| |
| |
| |
| |
| |
| |
| |
| |
| |
*
The return shown is based on net asset value and may differ from the return shown in the financial highlights, which reflects adjustments made to the net asset value in accordance with accounting principles generally accepted in the United States of America. The net asset value was $54.67 as of October 31, 2022.
**
Market price return was calculated assuming an initial investment made at the market price at the beginning of the reporting period, reinvestment of all dividends and distributions at market price during the period, and sale at the market price on the last
| J.P. Morgan Exchange-Traded Funds | |
day of the period. The price used to calculate the market price return was the closing price on the NYSE Arca. As of October 31, 2022, the closing price was $54.38.
***
The adviser seeks to achieve the Fund’s objective. There can be no guarantee it will be achieved.
| J.P. Morgan Exchange-Traded Funds | |
JPMorgan BetaBuilders U.S. Small Cap Equity ETF
FUND COMMENTARY
TWELVE MONTHS ENDED October 31, 2022 (Unaudited) (continued)
AVERAGE ANNUAL TOTAL RETURNS AS OF October 31, 2022 (Unaudited)
| | | |
JPMorgan BetaBuilders U.S. Small Cap Equity ETF | | | |
| | | |
| | | |
LIFE OF FUND PERFORMANCE (11/16/20 TO 10/31/22)
The performance quoted is past performance and is not a guarantee of future results. Exchange-traded funds are subject to certain market risks. Investment returns and principal value of an investment will fluctuate so that an investor’s shares, when sold or redeemed, may be worth more or less than their original cost. Current performance may be higher or lower than the performance data shown. For up-to-date month-end performance information, please call 1-844-457-6383.
Fund commenced operations on November 16, 2020.
The graph illustrates comparative performance for $10,000 invested in shares
of the JPMorgan BetaBuilders U.S. Small Cap Equity ETF and Morningstar® US Small Cap Target Market Exposure Extended IndexSM from November 16, 2020 to October 31, 2022. The performance of the Fund reflects the deduction of Fund expenses and assumes reinvestment of all dividends and capital gain distributions, if any. The performance of the Morningstar® US Small Cap Target
Market Exposure Extended IndexSM does not reflect the deduction of expenses associated with an exchange-traded fund and has been adjusted to reflect reinvestment of all dividends and capital gain distributions of the securities included in the Index, if applicable. The Morningstar® US Small Cap Target Market Exposure Extended IndexSM is a free float-adjusted market capitalization-weighted index that consists of small cap U.S. equity securities. Investors cannot invest directly in an index.
Performance shown in this section does not reflect the deduction of taxes that a shareholder may pay on Fund distributions or on gains resulting from redemption or sale of Fund shares.
The returns shown are based on net asset values calculated for shareholder transactions and may differ from the returns shown in the financial highlights, which reflect adjustments made to the net asset values in accordance with accounting principles generally accepted in the United States of America.
| J.P. Morgan Exchange-Traded Funds | |
JPMorgan Carbon Transition U.S. Equity ETF
FUND COMMENTARY
TWELVE MONTHS ENDED October 31, 2022 (Unaudited)
| |
| |
| |
JPMorgan Asset Management Carbon Transition U.S. Equity Index | |
| |
Net Assets as of 10/31/2022 | |
| |
INVESTMENT OBJECTIVE***
The JPMorgan Carbon Transition U.S. Equity ETF (the “Fund”) seeks investment results that closely correspond, before fees and expenses, to the performance of the JPMorgan Asset Management Carbon Transition U.S. Equity Index (the “Underlying Index”).
INVESTMENT APPROACH
The Fund is passively managed to the Underlying Index, which primarily tracks large- and mid-cap equity securities of companies located in the U.S. and is designed to capture the performance of companies that have been identified through the Underlying Index’s rules-based process as better positioned to benefit from a transition to a lower carbon economy while also providing broader U.S. market exposure. Companies are then evaluated based on the rules-based process to determine how they effectively manage emissions, resources and carbon-related risks and are ranked within each sector.
HOW DID THE FUND PERFORM?
For the twelve months ended October 31, 2022, the Fund provided a negative absolute return and performed in line with the Underlying Index, before considering operating expenses, fees and tax management of the Fund’s portfolio. Both the Fund and the Underlying Index outperformed the Russell 1000 Index, which is a more traditional market capitalization-weighted index.
The Fund’s and the Underlying Index’s exposures to the information technology and consumer discretionary sectors were leading detractors from absolute performance, while their exposures to the energy and health care sectors were leading contributors to absolute performance.
Relative to the Russell 1000 Index, the Fund’s and the Underlying Index’s exposures within the health care and information technology sectors were leading contributors to performance, while their exposures within the financials and materials sectors were leading detractors from relative performance.
HOW WAS THE FUND POSITIONED?
During the reporting period, the Fund’s and the Underlying Index’s largest allocations were to the information technology and health care sectors, while their smallest allocations were to
the materials and utilities sectors.
TOP TEN HOLDINGS OF THE
PORTFOLIO AS OF October 31, 2022 | PERCENT OF
TOTAL
INVESTMENTS |
| | |
| | |
| | |
| | |
| | |
| | |
| | |
| | |
| | |
| | |
PORTFOLIO COMPOSITION BY SECTOR
AS OF October 31, 2022 | PERCENT OF
TOTAL
INVESTMENTS |
| |
| |
| |
| |
| |
| |
| |
| |
| |
| |
| |
| |
*
The return shown is based on net asset value and may differ from the return shown in the financial highlights, which reflects
| J.P. Morgan Exchange-Traded Funds | |
JPMorgan Carbon Transition U.S. Equity ETF
FUND COMMENTARY
TWELVE MONTHS ENDED October 31, 2022 (Unaudited) (continued)
adjustments made to the net asset value in accordance with accounting principles generally accepted in the United States of America. The net asset value was $52.37 as of October 31, 2022.
**
Market price return was calculated assuming an initial investment made at the market price at the beginning of the reporting period, reinvestment of all dividends and distributions at market price during the period, and sale at the market price on the last day of the period. The price used to calculate the market price return was the closing price on the NYSE Arca. As of October 31, 2022, the closing price was $52.38.
***
The adviser seeks to achieve the Fund’s objective. There can be no guarantee it will be achieved.
| J.P. Morgan Exchange-Traded Funds | |
AVERAGE ANNUAL TOTAL RETURNS AS OF October 31, 2022 (Unaudited)
| | | |
JPMorgan Carbon Transition U.S. Equity ETF | | | |
| | | |
| | | |
LIFE OF FUND PERFORMANCE (12/9/20 TO 10/31/22)
The performance quoted is past performance and is not a guarantee of future results. Exchange-traded funds are subject to certain market risks. Investment returns and principal value of an investment will fluctuate so that an investor’s shares, when sold or redeemed, may be worth more or less than their original cost. Current performance may be higher or lower than the performance data shown. For up-to-date month-end performance information, please call 1-844-457-6383.
Fund commenced operations on December 9, 2020.
The graph illustrates comparative performance for $10,000 invested in shares of the JPMorgan Carbon Transition U.S. Equity ETF, the JPMorgan Asset Management Carbon Transition U.S. Equity Index and the Russell 1000 Index from December 9, 2020 to October 31, 2022. The performance of the Fund reflects the deduction of Fund expenses and assumes reinvestment of all dividends and capital gain distributions, if any. The performance of the JPMorgan Asset Management Carbon Transition U.S. Equity Index and Russell 1000 Index does not reflect the deduction of expenses associated with an exchange-traded fund and has been adjusted to reflect reinvestment of all dividends and capital gain distributions of the securities included in the Index, if
applicable. The JPMorgan Asset Management Carbon Transition U.S. Equity Index is a rules-based, proprietary index built to achieve a meaningful reduction in carbon intensity without relying on exclusions or sector deviations. It is a proprietary index designed to reflect the performance of a subset of the U.S. large and midcap companies in developed markets that, based on the index rules, are determined to be best positioned to benefit from a transition to a low-carbon economy. The Russell 1000 Index is a market capitalization-weighted index, which measures the performance of the 1,000 largest companies in the Russell 3000 Index. Investors cannot invest directly in an index.
Performance shown in this section does not reflect the deduction of taxes that a shareholder may pay on Fund distributions or on gains resulting from redemption or sale of Fund shares.
The returns shown are based on net asset values calculated for shareholder transactions and may differ from the returns shown in the financial highlights, which reflect adjustments made to the net asset values in accordance with accounting principles generally accepted in the United States of America.
| J.P. Morgan Exchange-Traded Funds | |
JPMorgan Climate Change Solutions ETF
FUND COMMENTARY
FOR THE PERIOD December 13, 2021 (FUND INCEPTION) THROUGH October 31, 2022 (Unaudited)
| |
| |
| |
MSCI ACWI Index (net total return) | |
Net Assets as of 10/31/2022 | |
| |
INVESTMENT OBJECTIVE***
The JPMorgan Climate Change Solutions ETF (the “Fund”) seeks to achieve long-term capital appreciation by investing in companies that the adviser believes are developing solutions to address climate change.
INVESTMENT APPROACH
The Fund invests primarily in common stocks and depositary receipts that the adviser believes are currently, or in the process of, providing solutions to address climate change, or implementing business practices in response to climate change. The Fund uses a "thematic" investment approach that seeks to identify and invest in companies that are relevant to the theme of climate change solutions and selects companies within key sub-themes, including sustainable transportation, sustainable construction, sustainable food and water, renewable energy and electrification, recycling and re-use.
HOW DID THE FUND PERFORM?
For the period from inception on December 13, 2021 to October, 2022, the Fund had a negative absolute return and underperformed the MSCI All Cap World Index (the “Index”).
The Fund’s security selections in the industrials and materials sectors were leading detractors from absolute performance, while the Fund’s security selections in the energy and consumer staples sectors were the smallest detractors and no sectors contributed to performance.
Leading detractors from Fund performance included Contemporary Amperex Technology Co., Infineon Technologies AG and Koninklijke DSM NV. Shares of Contemporary Amperex Technology, a Chinese manufacturer of lithium-ion batteries,
fell amid general weakness in China’s equities market during the period. Shares of Infineon Technologies, a German semiconductor manufacturer, fell amid broad weakness in the semiconductor sector during the period. Shares of Koninklijke DSM, a Dutch specialty chemicals manufacturer, fell after the company reported lower-than-expected revenue for the first half of 2022.
Leading individual contributors to Fund performance included Enphase Energy Inc., Deere & Co. and it out-of-Index position in AGCO Corp. Shares of Enphase Energy, a U.S. solar energy products manufacturer, rose after the company reported consecutive quarters of better-than-expected earnings and revenue. Shares of Deere and AGCO, both U.S. agricultural and farm machinery manufacturers, rose amid better-than-expected earnings and revenue for the second quarter of 2022.
Relative to the Index, the Fund’s security selection in the industrials and its underweight position in the energy sector were leading detractors from relative performance. The Fund’s security selection and underweight position information technology sector and its underweight position in the communication services sector, where the Fund had no holdings, were leading contributors to performance.
HOW WAS THE FUND POSITIONED?
As a result of the adviser’s thematic investment approach, the Fund’s largest allocations were to the industrials and information technology sectors and the smallest allocations were to the energy and consumer staples sectors. The Fund had no holdings in the communication services, health care and financials sectors.
| J.P. Morgan Exchange-Traded Funds | |
TOP TEN HOLDINGS OF THE
PORTFOLIO AS OF October 31, 2022 | PERCENT OF
TOTAL
INVESTMENTS |
| | |
| | |
| | |
| | |
| | |
| | |
| | |
| | |
| | |
| | |
PORTFOLIO COMPOSITION BY COUNTRY
AS OF October 31, 2022 | PERCENT OF
TOTAL
INVESTMENTS |
| |
| |
| |
| |
| |
| |
| |
| |
| |
| |
| |
| |
| |
| |
PORTFOLIO COMPOSITION BY COUNTRY AS OF October 31, 2022 | PERCENT OF TOTAL INVESTMENTS |
| |
Others (each less than 1.0%) | |
*
The return shown is based on net asset value and may differ from the return shown in the financial highlights, which reflects adjustments made to the net asset value in accordance with accounting principles generally accepted in the United States of America. The net asset value was $35.56 as of October 31, 2022.
**
Market price return was calculated assuming an initial investment made at the inception date net asset value, reinvestment of all dividends and distributions at market price during the period, and sale at the market price on the last day of the period. The price used to calculate the market price return was the closing price on the NYSE Arca. As of October 31, 2022, the closing price was $35.71.
***
The adviser seeks to achieve the Fund’s objective. There can be no guarantee it will be achieved.
| J.P. Morgan Exchange-Traded Funds | |
JPMorgan Climate Change Solutions ETF
FUND COMMENTARY
FOR THE PERIOD December 13, 2021 (FUND INCEPTION) THROUGH October 31, 2022 (Unaudited) (continued)
TOTAL RETURNS AS OF October 31, 2022 (Unaudited)
| | CUMULATIVE SINCE INCEPTION |
JPMorgan Climate Change Solutions ETF | | |
| | |
| | |
LIFE OF FUND PERFORMANCE (12/13/21 TO 10/31/22)
The performance quoted is past performance and is not a guarantee of future results. Exchange-traded funds are subject to certain market risks. Investment returns and principal value of an investment will fluctuate so that an investor’s shares, when sold or redeemed, may be worth more or less than their original cost. Current performance may be higher or lower than the performance data shown. For up-to-date month-end performance information, please call 1-844-457-6383.
Fund commenced operations on December 13, 2021.
The graph illustrates comparative performance for $10,000 invested in shares of the JPMorgan Climate Change Solutions ETF and the MSCI All Country World Index (net total return) from December 13, 2021 to October 31, 2022. The performance of the Fund reflects the deduction of Fund expenses and assumes reinvestment of all dividends and capital gain distributions, if any. The performance of the MSCI All Country World Index (net total return) does not reflect the deduction of expenses associated with an exchange-traded fund and has been adjusted to reflect reinvestment of all dividends and capital gain distributions of the securities included in the Index, if applicable. The MSCI All Country World Index (net total return) is a free float-adjusted market capitalization-weighted index that is designed to measure the performance of
large- and mid-cap stocks in developed and emerging markets. Net total return figures assume the reinvestment of dividends after deduction of withholding tax, applying the maximum rate to nonresident individual investors who do not benefit from double taxation treaties. Investors cannot invest directly in an index.
Performance shown in this section does not reflect the deduction of taxes that a shareholder may pay on Fund distributions or on gains resulting from redemption or sale of Fund shares.
International investing involves a greater degree of risk and increased volatility. Changes in currency exchange rates and differences in accounting and taxation policies outside the United States can raise or lower returns. Also, some overseas markets may not be as politically and economically stable as the United States and other nations.
The returns shown are based on net asset values calculated for shareholder transactions and may differ from the returns shown in the financial highlights, which reflect adjustments made to the net asset values in accordance with accounting principles generally accepted in the United States of America.
| J.P. Morgan Exchange-Traded Funds | |
JPMorgan Diversified Return Emerging Markets Equity ETF
FUND COMMENTARY
TWELVE MONTHS ENDED October 31, 2022 (Unaudited)
| |
| |
| |
JP Morgan Diversified Factor Emerging Markets Equity Index (net total return) | |
FTSE Emerging Index (net total return) | |
Net Assets as of 10/31/2022 | |
| |
INVESTMENT OBJECTIVE***
The JPMorgan Diversified Return Emerging Markets Equity ETF (the “Fund”) seeks investment results that closely correspond, before fees and expenses, to the performance of the JP Morgan Diversified Factor Emerging Markets Equity Index (the “Underlying Index”).
INVESTMENT APPROACH
The Fund is passively managed to the Underlying Index, which tracks large- and mid-cap equity securities from emerging markets, diversified across regions, super-sectors and individual securities. The Underlying Index uses a proprietary multi-factor selection process that utilizes the following characteristics: value, momentum and quality. The Underlying Index’s methodology includes quarterly rebalancing.
HOW DID THE FUND PERFORM?
The Fund posted a negative absolute return for the twelve months ended October 31, 2022, and performed in line with the Underlying Index, before considering differences in the net asset value calculations and foreign exchange pricing between the Underlying Index and the Fund and fees and operating expenses incurred by the Fund. The Fund and the Underlying Index outperformed the FTSE Emerging Index, which is a more traditional market capitalization-weighted index.
From a super-sector perspective, the Fund’s and the Underlying Index’s positions in the consumer and financials super-sectors
were leading detractors from absolute performance, while their positions in the defensives and commodities super-sectors were the smallest detractors from absolute performance and no super-sectors contributed to absolute performance.
From a regional perspective, the Fund’s and the Underlying Index’s positions in China and in Asia-Pacific, excluding China, were leading detractors from absolute performance, while their positions in Latin America were the sole regional contributors to absolute performance.
Relative to the FTSE Emerging Index, the Fund’s and the Underlying Index’s underweight positions in China and their overweight positions in Latin America were leading contributors to performance, while their multi-factor security selections in the banks and defensives super-sectors and in the EMEA region were leading detractors from performance.
HOW WAS THE FUND POSITIONED?
During the reporting period, the Fund’s and the Underlying Index’s largest allocations were to the defensives and consumer super-sectors, while their smallest allocations were to the commodities and industrials super-sectors. The Fund’s and the Underlying Index’s largest regional allocations were to Asia Pacific, excluding China, and to EMEA. Their smallest allocations
were to China and Latin America.
| J.P. Morgan Exchange-Traded Funds | |
JPMorgan Diversified Return Emerging Markets Equity ETF
FUND COMMENTARY
TWELVE MONTHS ENDED October 31, 2022 (Unaudited) (continued)
TOP TEN HOLDINGS OF THE
PORTFOLIO AS OF October 31, 2022 | PERCENT OF
TOTAL
INVESTMENTS |
| | |
| | |
| Reliance Industries Ltd. (India) | |
| Hindustan Unilever Ltd. (India) | |
| Taiwan Semiconductor Manufacturing Co. Ltd. (Taiwan) | |
| Petroleo Brasileiro SA (Preference) (Brazil) | |
| Grupo Financiero Banorte SAB de CV, Class O (Mexico) | |
| Tata Consultancy Services Ltd. (India) | |
| Emirates Telecommunications Group Co. PJSC (United Arab Emirates) | |
| National Bank of Kuwait SAKP (Kuwait) | |
PORTFOLIO COMPOSITION BY COUNTRY
AS OF October 31, 2022 | PERCENT OF
TOTAL
INVESTMENTS |
| |
| |
| |
| |
| |
| |
| |
| |
| |
| |
| |
| |
| |
| |
PORTFOLIO COMPOSITION BY COUNTRY AS OF October 31, 2022 | PERCENT OF TOTAL INVESTMENTS |
| |
| |
Others (each less than 1.0%) | |
| |
*
The return shown is based on net asset value and may differ from the return shown in the financial highlights, which reflects adjustments made to the net asset value in accordance with accounting principles generally accepted in the United States of America. The net asset value was $45.54 as of October 31, 2022.
**
Market price return was calculated assuming an initial investment made at the market price at the beginning of the reporting period, reinvestment of all dividends and distributions at market price during the period, and sale at the market price on the last day of the period. The price used to calculate the market price return was the closing price on the NYSE Arca. As of October 31, 2022, the closing price was $45.81.
***
The adviser seeks to achieve the Fund’s objective. There can be no guarantee it will be achieved.
| J.P. Morgan Exchange-Traded Funds | |
AVERAGE ANNUAL TOTAL RETURNS AS OF October 31, 2022 (Unaudited)
| | | | |
JPMorgan Diversified Return Emerging Markets Equity ETF | | | | |
| | | | |
| | | | |
LIFE OF FUND PERFORMANCE (1/7/15 TO 10/31/22)
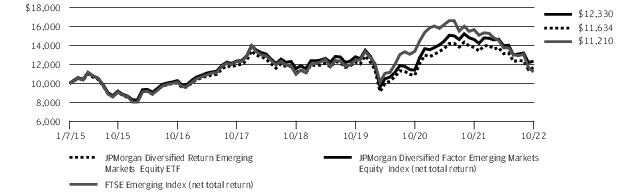
The performance quoted is past performance and is not a guarantee of future results. Exchange-traded funds are subject to certain market risks. Investment returns and principal value of an investment will fluctuate so that an investor’s shares, when sold or redeemed, may be worth more or less than their original cost. Current performance may be higher or lower than the performance data shown. For up-to-date month-end performance information, please call 1-844-457-6383.
Fund commenced operations on January 7, 2015.
The graph illustrates comparative performance for $10,000 invested in shares of the JPMorgan Diversified Return Emerging Markets Equity ETF, the JP Morgan Diversified Factor Emerging Markets Equity Index (net total return) and the FTSE Emerging Index (net total return) from January 7, 2015 to October 31, 2022. The performance of the Fund reflects the deduction of Fund expenses and assumes reinvestment of all dividends and capital gain distributions, if any. The performance of the JP Morgan Diversified Factor Emerging Markets Equity Index (net total return) and the FTSE Emerging Index (net total return) does not reflect the deduction of expenses associated with an exchange-traded fund and has been adjusted to reflect reinvestment of all dividends and capital gain distributions of the securities included in the Index, if applicable. The Fund’s adviser is a sponsor of the JP Morgan Diversified Factor Emerging Markets Equity Index (net total return) and developed the proprietary factors on which the index is based. FTSE Russell, the benchmark administrator, administers, calculates and governs the JP Morgan Diversified Factor Emerging Markets Equity Index (net total return). JP Morgan Diversified Factor Emerging Markets Equity Index (net total return) is comprised of large- and mid-cap equity securities selected from the FTSE Emerging Index (net total return). The index is
designed to reflect the performance of emerging market securities representing the following diversified set of factors: value, momentum and quality. The FTSE Emerging Index (net total return) provides investors with a comprehensive means of measuring the performance of the most liquid companies in the emerging markets. Net total return figures assume the reinvestment of dividends after deduction of withholding tax, applying the maximum rate to nonresident individual investors who do not benefit from double taxation treaties. Investors cannot invest directly in an index.
For periods presented prior to November 1, 2019, the date on which a unitary fee structure was adopted, Fund performance reflects the waiver of the Fund’s fees and reimbursement of expenses for certain periods since the inception date. Without these waivers and reimbursements, performance would have been lower. Also, performance shown in this section does not reflect the deduction of taxes that a shareholder may pay on Fund distributions or on gains resulting from redemption or sale of Fund shares.
International investing involves a greater degree of risk and increased volatility. Changes in currency exchange rates and differences in accounting and taxation policies outside the United States can raise or lower returns. Also, some overseas markets may not be as politically and economically stable as the United States and other nations.
The returns shown are based on net asset values calculated for shareholder transactions and may differ from the returns shown in the financial highlights, which reflect adjustments made to the net asset values in accordance with accounting principles generally accepted in the United States of America.
| J.P. Morgan Exchange-Traded Funds | |
JPMorgan Diversified Return International Equity ETF
FUND COMMENTARY
TWELVE MONTHS ENDED October 31, 2022 (Unaudited)
| |
| |
| |
JP Morgan Diversified Factor International Equity Index (net total return) | |
FTSE Developed ex North America Index (net total return) | |
Net Assets as of 10/31/2022 | |
| |
INVESTMENT OBJECTIVE***
The JPMorgan Diversified Return International Equity ETF (the “Fund”) seeks investment results that closely correspond, before fees and expenses, to the performance of the JP Morgan Diversified Factor International Equity Index (the “Underlying Index”).
INVESTMENT APPROACH
The Fund is passively managed to the Underlying Index, which tracks large- and mid-cap equity securities in developed markets outside of North America, diversified across regions, sectors and individual securities. The Underlying Index uses a proprietary multi-factor selection process that utilizes the following characteristics: value, momentum and quality. The Underlying Index’s methodology includes quarterly rebalancing.
HOW DID THE FUND PERFORM?
The Fund posted a negative absolute performance for the twelve months ended October 31, 2022, and performed in line with the Underlying Index, before considering the effects of differences in the Fund’s net asset value calculations versus the Underlying Index’s valuation calculations, as well as differences due to specific trading limits, the Fund’s small cash allocation and fees and operating expenses incurred by the Fund. The Fund and the Underlying Index outperformed the FTSE Developed ex North America Index, which is a more traditional market capitalization-weighted index.
From a sector perspective, the Fund’s and the Underlying Index’s positions in the real estate and technology sectors were leading detractors from absolute performance, while their positions in the energy sector were the sole sector contributors to absolute performance.
From a regional perspective, the Fund’s and Underlying Index’s positions in Japan and Europe, excluding the U.K., were leading detractors from absolute performance. Their positions in Asia-Pacific, excluding Japan, and the U.K. were the smallest detractors from absolute performance.
Relative to the FTSE Developed ex North America Index, the Fund’s and the Underlying Index’s multi-factor security selections in Japan and Asia-Pacific, excluding Japan, were leading contributors to performance, while the Fund’s and the Underlying Index’s multi-factor security selections in the U.K. were the sole detractors from performance.
The Fund’s and the Underlying Index’s multi-factor security selections and their underweight positions in the consumer discretionary sector were leading contributors to relative performance, while their multi-factor security selections in the health care sector and their overweight positions in the real estate sectors were leading detractors from relative performance.
HOW WAS THE FUND POSITIONED?
During the reporting period, the Fund’s and the Underlying Index’s largest allocations were to the consumer staples and utilities sectors, while their smallest allocations were to the energy and telecommunications sectors. By region, the Fund’s and the Underlying Index’s largest allocations were to Japan and Asia-Pacific, excluding Japan, and their smallest allocations were to Europe, excluding the U.K., and the U.K.
TOP TEN HOLDINGS OF THE
PORTFOLIO AS OF October 31, 2022 | PERCENT OF
TOTAL
INVESTMENTS |
| | |
| Imperial Brands plc (United Kingdom) | |
| | |
| Pearson plc (United Kingdom) | |
| | |
| BAE Systems plc (United Kingdom) | |
| Novo Nordisk A/S, Class B (Denmark) | |
| British American Tobacco plc (United Kingdom) | |
| AstraZeneca plc (United Kingdom) | |
| NN Group NV (Netherlands) | |
| J.P. Morgan Exchange-Traded Funds | |
PORTFOLIO COMPOSITION BY COUNTRY
AS OF October 31, 2022 | PERCENT OF
TOTAL
INVESTMENTS |
| |
| |
| |
| |
| |
| |
| |
| |
| |
| |
| |
| |
| |
| |
| |
| |
PORTFOLIO COMPOSITION BY COUNTRY AS OF October 31, 2022 | PERCENT OF TOTAL INVESTMENTS |
| |
Others (each less than 1.0%) | |
| |
*
The return shown is based on net asset value and may differ from the return shown in the financial highlights, which reflects adjustments made to the net asset value in accordance with accounting principles generally accepted in the United States of America. The net asset value was $44.44 as of October 31, 2022.
**
Market price return was calculated assuming an initial investment made at the market price at the beginning of the reporting period, reinvestment of all dividends and distributions at market price during the period, and sale at the market price on the last day of the period. The price used to calculate the market price return was the closing price on the NYSE Arca. As of October 31, 2022, the closing price was $44.54.
***
The adviser seeks to achieve the Fund’s objective. There can be no guarantee it will be achieved.
| J.P. Morgan Exchange-Traded Funds | |
JPMorgan Diversified Return International Equity ETF
FUND COMMENTARY
TWELVE MONTHS ENDED October 31, 2022 (Unaudited) (continued)
AVERAGE ANNUAL TOTAL RETURNS AS OF October 31, 2022 (Unaudited)
| | | | |
JPMorgan Diversified Return International Equity ETF | | | | |
| | | | |
| | | | |
LIFE OF FUND PERFORMANCE (11/5/14 TO 10/31/22)
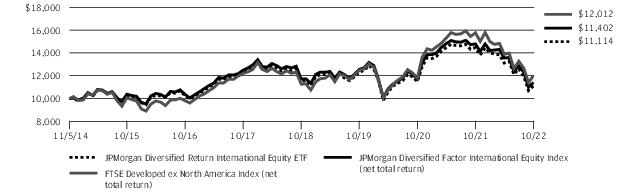
The performance quoted is past performance and is not a guarantee of future results. Exchange-traded funds are subject to certain market risks. Investment returns and principal value of an investment will fluctuate so that an investor’s shares, when sold or redeemed, may be worth more or less than their original cost. Current performance may be higher or lower than the performance data shown. For up-to-date month-end performance information, please call 1-844-457-6383.
Fund commenced operations on November 5, 2014.
The graph illustrates comparative performance for $10,000 invested in shares of the JPMorgan Diversified Return International Equity ETF, the JP Morgan Diversified Factor International Equity Index (net total return) and the FTSE Developed ex North America Index (net total return) from November 5, 2014 to October 31, 2022. The performance of the Fund reflects the deduction of Fund expenses and assumes reinvestment of all dividends and capital gain distributions, if any. The performance of the JP Morgan Diversified Factor International Equity Index (net total return) and the FTSE Developed ex North America Index (net total return) does not reflect the deduction of expenses associated with an exchange-traded fund and has been adjusted to reflect reinvestment of all dividends and capital gain distributions of the securities included in the Index, if applicable. The Fund’s adviser is a sponsor of the JP Morgan Diversified Factor International Equity Index (net total return) and developed the proprietary factors on which the index is based. FTSE Russell, the benchmark administrator, administers, calculates and governs the JP Morgan Diversified Factor International Equity Index (net total return). JP Morgan Diversified Factor International Equity Index (net total return) is comprised of large- and mid-cap equity securities selected from the FTSE Developed ex North America Index (net total return). The index is designed to reflect the performance of stocks representing the following diversified set of
factors: value, momentum and quality. The FTSE Developed ex North America Index (net total return) is part of a range of indices designed to help investors benchmark their international investments. The index comprises large- and mid-cap stocks providing coverage of developed markets, excluding the US and Canada. The index is derived from the FTSE Global Equity Index Series (GEIS), which covers 98% of the world's investable market capitalization. Net total return figures assume the reinvestment of dividends after deduction of withholding tax, applying the maximum rate to nonresident individual investors who do not benefit from double taxation treaties. Investors cannot invest directly in an index.
For periods presented prior to November 1, 2019, the date on which a unitary fee structure was adopted, Fund performance reflects the waiver of the Fund’s fees and reimbursement of expenses for certain periods since the inception date. Without these waivers and reimbursements, performance would have been lower. Also, performance shown in this section does not reflect the deduction of taxes that a shareholder may pay on Fund distributions or on gains resulting from redemption or sale of Fund shares.
International investing involves a greater degree of risk and increased volatility. Changes in currency exchange rates and differences in accounting and taxation policies outside the United States can raise or lower returns. Also, some overseas markets may not be as politically and economically stable as the United States and other nations.
The returns shown are based on net asset values calculated for shareholder transactions and may differ from the returns shown in the financial highlights, which reflect adjustments made to the net asset values in accordance with accounting principles generally accepted in the United States of America.
| J.P. Morgan Exchange-Traded Funds | |
JPMorgan Diversified Return U.S. Equity ETF
FUND COMMENTARY
TWELVE MONTHS ENDED October 31, 2022 (Unaudited)
| |
| |
| |
JP Morgan Diversified Factor US Equity Index | |
| |
Net Assets as of 10/31/2022 | |
| |
INVESTMENT OBJECTIVE***
The JPMorgan Diversified Return U.S. Equity ETF (the “Fund”) seeks investment results that closely correspond, before fees and expenses, to the performance of the JP Morgan Diversified Factor US Equity Index (the “Underlying Index”).
INVESTMENT APPROACH
The Fund is passively managed to the Underlying Index, which tracks large- and mid-cap equity securities of U.S. companies, diversified across sectors and individual securities. The Underlying Index uses a rules-based proprietary multi-factor selection process that utilizes the following characteristics: value, momentum and quality. The Underlying Index’s methodology includes quarterly rebalancing.
HOW DID THE FUND PERFORM?
The Fund posted a negative absolute performance for the twelve months ended October 31, 2022, and performed in line with the Underlying Index, before considering operating expenses, fees and tax management of the Fund’s portfolio. Both the Fund and the Underlying Index outperformed the Russell 1000 Index, which is a more traditional market capitalization-weighted index.
The Fund’s and the Underlying Index’s positions in the technology and consumer discretionary sectors were leading detractors from absolute performance, while their positions in the energy and consumer staples sectors were leading contributors to absolute performance.
Relative to the Russell 1000 Index, the Fund’s and the Underlying Index’s underweight positions in the technology sector and their overweight positions in the consumer staples sector were leading contributors to performance, while their multi-factor security selections in the energy and health care sectors were leading detractors from performance.
HOW WAS THE FUND POSITIONED?
During the reporting period, the Fund’s and the Underlying Index’s largest allocations were to the consumer staples and utilities sectors, while their smallest allocations were to the
energy and telecommunications sectors.
TOP TEN HOLDINGS OF THE
PORTFOLIO AS OF October 31, 2022 | PERCENT OF
TOTAL
INVESTMENTS |
| | |
| | |
| | |
| | |
| | |
| | |
| | |
| | |
| Vertex Pharmaceuticals, Inc. | |
| Archer-Daniels-Midland Co. | |
PORTFOLIO COMPOSITION BY SECTOR
AS OF October 31, 2022 | PERCENT OF
TOTAL
INVESTMENTS |
| |
| |
| |
| |
| |
| |
| |
| |
| |
| |
| |
| |
*
The return shown is based on net asset value and may differ from the return shown in the financial highlights, which reflects adjustments made to the net asset value in accordance with accounting principles generally accepted in the United States of America. The net asset value was $93.94 as of October 31, 2022.
**
Market price return was calculated assuming an initial investment made at the market price at the beginning of the reporting period, reinvestment of all dividends and distributions at market price during the period, and sale at the market price on the last
| J.P. Morgan Exchange-Traded Funds | |
JPMorgan Diversified Return U.S. Equity ETF
FUND COMMENTARY
TWELVE MONTHS ENDED October 31, 2022 (Unaudited) (continued)
day of the period. The price used to calculate the market price return was the closing price on the NYSE Arca. As of October 31, 2022, the closing price was $94.05.
***
The adviser seeks to achieve the Fund’s objective. There can be no guarantee it will be achieved.
| J.P. Morgan Exchange-Traded Funds | |
AVERAGE ANNUAL TOTAL RETURNS AS OF October 31, 2022 (Unaudited)
| | | | |
JPMorgan Diversified Return U.S. Equity ETF | | | | |
| | | | |
| | | | |
LIFE OF FUND PERFORMANCE (9/29/15 TO 10/31/22)
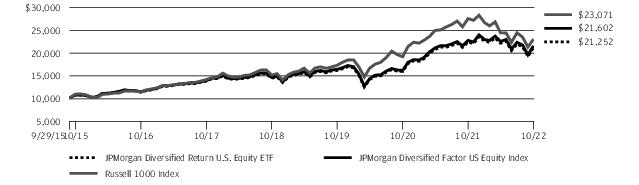
The performance quoted is past performance and is not a guarantee of future results. Exchange-traded funds are subject to certain market risks. Investment returns and principal value of an investment will fluctuate so that an investor’s shares, when sold or redeemed, may be worth more or less than their original cost. Current performance may be higher or lower than the performance data shown. For up-to-date month-end performance information, please call 1-844-457-6383.
Fund commenced operations on September 29, 2015.
The graph illustrates comparative performance for $10,000 invested in shares of the JPMorgan Diversified Return U.S. Equity ETF, the JP Morgan Diversified Factor US Equity Index, and the Russell 1000 Index from September 29, 2015 to October 31, 2022. The performance of the Fund reflects the deduction of Fund expenses and assumes reinvestment of all dividends and capital gain distributions, if any. The performance of the JP Morgan Diversified Factor US Equity Index and Russell 1000 Index does not reflect the deduction of expenses associated with an exchange-traded fund and has been adjusted to reflect reinvestment of all dividends and capital gain distributions of the securities included in the Index, if applicable. The Fund’s adviser is a sponsor of the JP Morgan Diversified Factor US Equity Index and developed the proprietary factors on which the index is based. FTSE Russell, the benchmark administrator,
administers, calculates and governs the JP Morgan Diversified Factor US Equity Index. JP Morgan Diversified Factor US Equity Index is comprised of U.S. large and mid-cap equity securities selected from the constituents of the Russell 1000 Index. The index is designed to reflect the performance of stocks representing the following diversified set of factors: value, momentum and quality. The Russell 1000 Index is a market capitalization-weighted index, which measures the performance of the 1,000 largest companies in the Russell 3000 Index. Investors cannot invest directly in an index.
For periods presented prior to November 1, 2019, the date on which a unitary fee structure was adopted, Fund performance reflects the waiver of the Fund’s fees and reimbursement of expenses for certain periods since the inception date. Without these waivers and reimbursements, performance would have been lower. Also, performance shown in this section does not reflect the deduction of taxes that a shareholder may pay on Fund distributions or on gains resulting from redemption or sale of Fund shares.
The returns shown are based on net asset values calculated for shareholder transactions and may differ from the returns shown in the financial highlights, which reflect adjustments made to the net asset values in accordance with accounting principles generally accepted in the United States of America.
| J.P. Morgan Exchange-Traded Funds | |
JPMorgan Diversified Return U.S. Mid Cap Equity ETF
FUND COMMENTARY
TWELVE MONTHS ENDED October 31, 2022 (Unaudited)
| |
| |
| |
JP Morgan Diversified Factor US Mid Cap Equity Index | |
| |
Net Assets as of 10/31/2022 | |
| |
INVESTMENT OBJECTIVE***
The JPMorgan Diversified Return U.S. Mid Cap Equity ETF (the “Fund”) seeks investment results that closely correspond, before fees and expenses, to the performance of the JP Morgan Diversified Factor US Mid Cap Equity Index (the “Underlying Index”).
INVESTMENT APPROACH
The Fund is passively managed to the Underlying Index, which tracks mid-cap U.S. equity securities diversified across sectors and individual securities. The Underlying Index uses a proprietary multi-factor selection process that utilizes the following characteristics: value, momentum and quality. The Underlying Index’s methodology includes quarterly rebalancing.
HOW DID THE FUND PERFORM?
The Fund posted a negative absolute performance for the twelve months ended October 31, 2022, and performed in line with the Underlying Index, before considering operating expenses, fees and tax management of the Fund’s portfolio. The Fund and the Underlying Index outperformed the Russell Midcap Index, which is a more traditional market capitalization weighted index.
The Fund’s and the Underlying Index’s positions the health care and technology sectors were leading detractors from absolute performance. The Fund’s and the Underlying Index’s positions in the energy and consumer staples sectors were leading contributors to absolute performance.
Relative to the Russell Midcap Index, the Fund’s and the Underlying Index’s multi-factor security selections in the technology sector and their overweight positions in the consumer staples sector were leading contributors to performance, while their multi-factor security selections in the consumer staples sector and their overweight positions in the telecommunications sector were leading detractors from performance.
HOW WAS THE FUND POSITIONED?
During the reporting period, the Fund’s and the Underlying Index’s largest allocations were to the health care and industrials sectors and their smallest allocations were to the
telecommunications and energy sectors.
TOP TEN HOLDINGS OF THE
PORTFOLIO AS OF October 31, 2022 | PERCENT OF
TOTAL
INVESTMENTS |
| | |
| Principal Financial Group, Inc. | |
| | |
| | |
| | |
| LPL Financial Holdings, Inc. | |
| | |
| | |
| | |
| | |
PORTFOLIO COMPOSITION BY SECTOR
AS OF October 31, 2022 | PERCENT OF
TOTAL
INVESTMENTS |
| |
| |
| |
| |
| |
| |
| |
| |
| |
| |
| |
| |
*
The return shown is based on net asset value and may differ from the return shown in the financial highlights, which reflects adjustments made to the net asset value in accordance with accounting principles generally accepted in the United States of America. The net asset value was $83.60 as of October 31, 2022.
**
Market price return was calculated assuming an initial investment made at the market price at the beginning of the reporting period, reinvestment of all dividends and distributions at market price during the period, and sale at the market price on the last
| J.P. Morgan Exchange-Traded Funds | |
day of the period. The price used to calculate the market price return was the closing price on the NYSE Arca. As of October 31, 2022, the closing price was $83.55.
***
The adviser seeks to achieve the Fund’s objective. There can be no guarantee it will be achieved.
| J.P. Morgan Exchange-Traded Funds | |
JPMorgan Diversified Return U.S. Mid Cap Equity ETF
FUND COMMENTARY
TWELVE MONTHS ENDED October 31, 2022 (Unaudited) (continued)
AVERAGE ANNUAL TOTAL RETURNS AS OF October 31, 2022 (Unaudited)
| | | | |
JPMorgan Diversified Return U.S. Mid Cap Equity ETF | | | | |
| | | | |
| | | | |
LIFE OF FUND PERFORMANCE (5/11/16 TO 10/31/22)
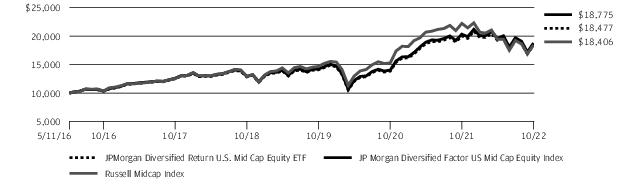
The performance quoted is past performance and is not a guarantee of future results. Exchange-traded funds are subject to certain market risks. Investment returns and principal value of an investment will fluctuate so that an investor’s shares, when sold or redeemed, may be worth more or less than their original cost. Current performance may be higher or lower than the performance data shown. For up-to-date month-end performance information, please call 1-844-457-6383.
Fund commenced operations on May 11, 2016.
The graph illustrates comparative performance for $10,000 invested in shares of the JPMorgan Diversified Return U.S. Mid Cap Equity ETF, JP Morgan Diversified Factor US Mid Cap Equity Index and the Russell Midcap Index from May 11, 2016 to October 31, 2022. The performance of the Fund reflects the deduction of Fund expenses and assumes reinvestment of all dividends and capital gain distributions, if any. The performance of the JP Morgan Diversified Factor US Mid Cap Equity Index and Russell Midcap Index does not reflect the deduction of expenses associated with an exchange-traded fund and has been adjusted to reflect reinvestment of all dividends and capital gain distributions of the securities included in the Index, if applicable. The Fund’s adviser is a sponsor of the JP Morgan Diversified Factor US Mid Cap Equity Index and developed the proprietary factors on which the index is based. FTSE Russell,
the benchmark administrator, administers, calculates and governs the JP Morgan Diversified Factor US Mid Cap Equity Index. The JP Morgan Diversified Factor US Mid Cap Equity Index is comprised of U.S. mid-cap equity securities selected from the Russell Midcap Index. The index is designed to reflect the performance of stocks representing the following diversified set of factors: value, momentum and quality. The Russell Midcap Index is a market capitalization-weighted index which measures the performance of the 800 smallest companies in the Russell 1000 Index. Investors cannot invest directly in an index.
For periods presented prior to November 1, 2019, the date on which a unitary fee structure was adopted, Fund performance reflects the waiver of the Fund’s fees and reimbursement of expenses for certain periods since the inception date. Without these waivers and reimbursements, performance would have been lower. Also, performance shown in this section does not reflect the deduction of taxes that a shareholder may pay on Fund distributions or on gains resulting from redemption or sale of Fund shares.
The returns shown are based on net asset values calculated for shareholder transactions and may differ from the returns shown in the financial highlights, which reflect adjustments made to the net asset values in accordance with accounting principles generally accepted in the United States of America.
| J.P. Morgan Exchange-Traded Funds | |
JPMorgan Diversified Return U.S. Small Cap Equity ETF
FUND COMMENTARY
TWELVE MONTHS ENDED October 31, 2022 (Unaudited)
| |
| |
| |
JP Morgan Diversified Factor US Small Cap Equity Index | |
| |
Net Assets as of 10/31/2022 | |
| |
INVESTMENT OBJECTIVE***
The JPMorgan Diversified Return U.S. Small Cap Equity ETF (the “Fund”) seeks investment results that closely correspond, before fees and expenses, to the performance of the JP Morgan Diversified Factor US Small Cap Equity Index (the “Underlying Index”).
INVESTMENT APPROACH
The Fund is passively managed to the Underlying Index, which tracks small-cap equity securities of U.S. companies, diversified across sectors and individual securities. The Underlying Index uses a proprietary multi-factor selection process that utilizes the following characteristics: value, momentum and quality. The Underlying Index’s methodology includes quarterly rebalancing.
HOW DID THE FUND PERFORM?
The Fund posted a negative absolute performance for the twelve months ended October 31, 2022, and performed in line with the Underlying Index, before considering operating expenses, fees and tax management of the Fund’s portfolio. Both the Fund and the Underlying Index outperformed the Russell 2000 Index, which is a more traditional market capitalization-weighted index.
The Fund’s and the Underlying Index’s positions in the real estate and consumer discretionary sectors were leading detractors from absolute performance, while their positions in the energy and telecommunications sectors were leading contributors to absolute performance.
Relative to the Russell 2000 Index, the Fund’s and the Underlying Index’s multi-factor security selections in the health care sector and their multi-factor security selection in the technology sector were leading contributors to performance, while their underweight positions in the financials and industrials sectors were leading detractors from performance.
HOW WAS THE FUND POSITIONED?
During the reporting period, the Fund’s and the Underlying Index’s largest allocations were to the financials and technology sectors, while their smallest allocations were to the
telecommunications and utilities sectors.
TOP TEN HOLDINGS OF THE
PORTFOLIO AS OF October 31, 2022 | PERCENT OF
TOTAL
INVESTMENTS |
| Prothena Corp. plc (Ireland) | |
| | |
| | |
| | |
| | |
| | |
| Comfort Systems USA, Inc. | |
| Applied Industrial Technologies, Inc. | |
| | |
| | |
PORTFOLIO COMPOSITION BY SECTOR
AS OF October 31, 2022 | PERCENT OF
TOTAL
INVESTMENTS |
| |
| |
| |
| |
| |
| |
| |
| |
| |
| |
| |
| |
*
The return shown is based on net asset value and may differ from the return shown in the financial highlights, which reflects adjustments made to the net asset value in accordance with accounting principles generally accepted in the United States of America. The net asset value was $39.85 as of October 31, 2022.
**
Market price return was calculated assuming an initial investment made at the market price at the beginning of the reporting period, reinvestment of all dividends and distributions at market price during the period, and sale at the market price on the last
| J.P. Morgan Exchange-Traded Funds | |
JPMorgan Diversified Return U.S. Small Cap Equity ETF
FUND COMMENTARY
TWELVE MONTHS ENDED October 31, 2022 (Unaudited) (continued)
day of the period. The price used to calculate the market price return was the closing price on the NYSE Arca. As of October 31, 2022, the closing price was $39.93.
***
The adviser seeks to achieve the Fund’s objective. There can be no guarantee it will be achieved.
| J.P. Morgan Exchange-Traded Funds | |
AVERAGE ANNUAL TOTAL RETURNS AS OF October 31, 2022 (Unaudited)
| | | | |
JPMorgan Diversified Return U.S. Small Cap Equity ETF | | | | |
| | | | |
| | | | |
LIFE OF FUND PERFORMANCE (11/15/16 TO 10/31/22)
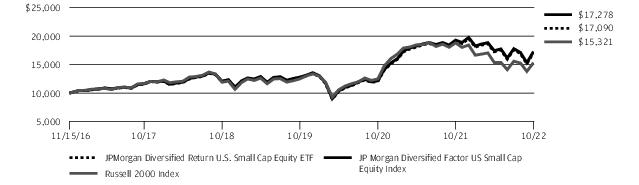
The performance quoted is past performance and is not a guarantee of future results. Exchange-traded funds are subject to certain market risks. Investment returns and principal value of an investment will fluctuate so that an investor’s shares, when sold or redeemed, may be worth more or less than their original cost. Current performance may be higher or lower than the performance data shown. For up-to-date month-end performance information, please call 1-844-457-6383.
Fund commenced operations on November 15, 2016.
The graph illustrates comparative performance for $10,000 invested in shares of the JPMorgan Diversified Return U.S. Small Cap Equity ETF, the JP Morgan Diversified Factor US Small Cap Equity Index and the Russell 2000 Index from November 15, 2016 to October 31, 2022. The performance of the Fund reflects the deduction of Fund expenses and assumes reinvestment of all dividends and capital gain distributions, if any. The performance of the JP Morgan Diversified Factor US Small Cap Equity Index and Russell 2000 Index does not reflect the deduction of expenses associated with an exchange-traded fund and has been adjusted to reflect reinvestment of all dividends and capital gain distributions of the securities included in the Index, if applicable. The Fund’s adviser is a sponsor of the JP Morgan Diversified Factor US Small Cap Equity Index and developed the proprietary factors on which the index is based. FTSE Russell,
the benchmark administrator, administers, calculates and governs the JP Morgan Diversified Factor US Small Cap Equity Index. The JP Morgan Diversified Factor US Small Cap Equity Index is comprised of U.S. large- and mid-cap equity securities are selected from the Russell 2000 Index. The index is designed to reflect the performance of stocks representing the following diversified set of factors: value, momentum and quality. The Russell 2000 Index is an unmanaged index, measuring performance of the 2000 smallest stocks (on the basis of capitalization) in the Russell 3000 Index. Investors cannot invest directly in an index.
For periods presented prior to November 1, 2019, the date on which a unitary fee structure was adopted, Fund performance reflects the waiver of the Fund’s fees and reimbursement of expenses for certain periods since the inception date. Without these waivers and reimbursements, performance would have been lower. Also, performance shown in this section does not reflect the deduction of taxes that a shareholder may pay on Fund distributions or on gains resulting from redemption or sale of Fund shares.
The returns shown are based on net asset values calculated for shareholder transactions and may differ from the returns shown in the financial highlights, which reflect adjustments made to the net asset values in accordance with accounting principles generally accepted in the United States of America.
| J.P. Morgan Exchange-Traded Funds | |
JPMorgan International Growth ETF
FUND COMMENTARY
TWELVE MONTHS ENDED October 31, 2022 (Unaudited)
| |
| |
| |
MSCI ACWI ex USA Growth Index (net total return) | |
Net Assets as of 10/31/2022 | |
| |
INVESTMENT OBJECTIVE***
The JPMorgan International Growth ETF (the “Fund”) seeks long-term capital appreciation.
INVESTMENT APPROACH
The Fund employs a fundamental bottom-up approach that seeks to identify companies with strong growth and quality characteristics. The Fund invests primarily in equity securities of foreign companies.
HOW DID THE FUND PERFORM?
For the twelve months ended October 31, 2022, the Fund underperformed the MSCI ACWI ex USA Growth Index (the “Benchmark”).
Relative to the Benchmark, the Fund’s security selection in the information technology and communication services sectors was a leading detractor from performance, while the Fund’s security selection in the consumer staples sector was the sole sector contributor to relative performance.
Leading individual detractors from relative performance included the Fund’s overweight positions in Sea Ltd. and Silergy Corp. and its out-of-Benchmark position in Unity Software Inc. Shares of Sea, a Singapore-based internet and mobile platform
provider, fell after Tencent Holdings Ltd. reduced its stake in the company. Shares of Silergy, a China-based semiconductor manufacturer, fell later in the period after the U.S. imposed tighter controls on technology exports to China’s semiconductor sector. Shares of Unity Software, a U.S. maker of design software, fell after AppLovin Corp. withdrew its acquisition offer for the company.
Leading individual contributors to relative performance included the Fund’s overweight positions in Argenx SE, Novo Nordisk A/S and PT Bank Central Asia. Shares of Argenx, a Dutch pharmaceuticals maker, rose after the company reported strong sales of Vyvgart, a treatment for certain neuromuscular diseases. Shares of Novo Nordisk, a Danish pharmaceuticals and health care products company, rose after legislative efforts to cap insulin prices failed in the U.S. Congress. Shares of Bank Central Asia, an Indonesian financial services provider, rose after the company reported consecutive quarter of earnings growth during the period.
HOW WAS THE FUND POSITIONED?
During the reporting period, the Fund’s largest allocations were to the health care and information technology sectors and the
smallest allocations were to the real estate and utilities sectors.
| J.P. Morgan Exchange-Traded Funds | |
TOP TEN HOLDINGS OF THE
PORTFOLIO AS OF October 31, 2022 | PERCENT OF
TOTAL
INVESTMENTS |
| | |
| | |
| Taiwan Semiconductor Manufacturing Co. Ltd., ADR (Taiwan) | |
| Novo Nordisk A/S, Class B (Denmark) | |
| LVMH Moet Hennessy Louis Vuitton SE (France) | |
| ASML Holding NV (Netherlands) | |
| Canadian National Railway Co. (Canada) | |
| Diageo plc (United Kingdom) | |
| RELX plc (United Kingdom) | |
| | |
PORTFOLIO COMPOSITION BY COUNTRY
AS OF October 31, 2022 | PERCENT OF
TOTAL
INVESTMENTS |
| |
| |
| |
| |
| |
| |
| |
| |
| |
| |
| |
| |
| |
| |
PORTFOLIO COMPOSITION BY COUNTRY AS OF October 31, 2022 | PERCENT OF TOTAL INVESTMENTS |
| |
| |
| |
| |
| |
| |
| |
| |
*
The return shown is based on net asset value and may differ from the return shown in the financial highlights, which reflects adjustments made to the net asset value in accordance with accounting principles generally accepted in the United States of America. The net asset value was $47.81 as of October 31, 2022.
**
Market price return was calculated assuming an initial investment made at the market price at the beginning of the reporting period, reinvestment of all dividends and distributions at market price during the period, and sale at the market price on the last day of the period. The price used to calculate the market price return was the closing price on the NYSE Arca. As of October 31, 2022, the closing price was $47.80.
***
The adviser seeks to achieve the Fund’s objective. There can be no guarantee it will be achieved.
| J.P. Morgan Exchange-Traded Funds | |
JPMorgan International Growth ETF
FUND COMMENTARY
TWELVE MONTHS ENDED October 31, 2022 (Unaudited) (continued)
AVERAGE ANNUAL TOTAL RETURNS AS OF October 31, 2022 (Unaudited)
| | | |
JPMorgan International Growth ETF | | | |
| | | |
| | | |
LIFE OF FUND PERFORMANCE (5/20/20 TO 10/31/22)
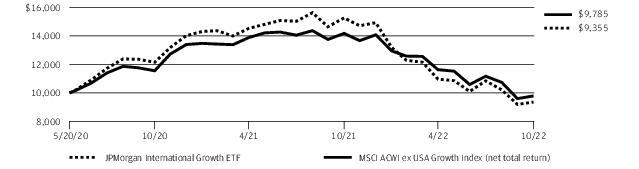
The performance quoted is past performance and is not a guarantee of future results. Exchange-traded funds are subject to certain market risks. Investment returns and principal value of an investment will fluctuate so that an investor’s shares, when sold or redeemed, may be worth more or less than their original cost. Current performance may be higher or lower than the performance data shown. For up-to-date month-end performance information, please call 1-844-457-6383.
Fund commenced operations on May 20, 2020.
The graph illustrates comparative performance for $10,000 invested in shares of the JPMorgan International Growth ETF and the MSCI ACWI ex USA Growth Index (net total return) from May 20, 2020 to October 31, 2022. The performance of the Fund reflects the deduction of Fund expenses and assumes reinvestment of all dividends and capital gain distributions, if any. The performance of the MSCI ACWI ex USA Growth Index (net total return) does not reflect the deduction of expenses associated with an exchange-traded fund and approximates the minimum possible dividend reinvestment of the securities included in the benchmarks, if applicable. The MSCI ACWI ex USA Growth Index (net total return) is a free float-adjusted market capitalization-weighted index that is designed to measure the performance of growth-oriented large- and
mid-cap stocks in developed and emerging markets, excluding the U.S. Net total return figures assume the reinvestment of dividends after deduction of withholding tax, applying the maximum rate to nonresident individual investors who do not benefit from double taxation treaties. Investors cannot invest directly in an index.
Performance shown in this section does not reflect the deduction of taxes that a shareholder may pay on Fund distributions or on gains resulting from redemption or sale of Fund shares.
International investing involves a greater degree of risk and increased volatility. Changes in currency exchange rates and differences in accounting and taxation policies outside the United States can raise or lower returns. Also, some overseas markets may not be as politically and economically stable as the United States and other nations.
The returns shown are based on net asset values calculated for shareholder transactions and may differ from the returns shown in the financial highlights, which reflect adjustments made to the net asset values in accordance with accounting principles generally accepted in the United States of America.
| J.P. Morgan Exchange-Traded Funds | |
JPMorgan U.S. Momentum Factor ETF
FUND COMMENTARY
TWELVE MONTHS ENDED October 31, 2022 (Unaudited)
| |
| |
| |
JP Morgan US Momentum Factor Index | |
Russell 1000 Growth Index | |
| |
Net Assets as of 10/31/2022 | |
| |
INVESTMENT OBJECTIVE***
The JPMorgan U.S. Momentum Factor ETF (the “Fund”) seeks investment results that closely correspond, before fees and expenses, to the performance of the JP Morgan US Momentum Factor Index (the “Underlying Index”).
INVESTMENT APPROACH
The Fund is passively managed to the Underlying Index, which tracks large- and mid-cap U.S. securities selected to represent positive momentum factor characteristics. The Underlying Index uses a proprietary selection process that utilizes a momentum factor to identify companies that have higher risk-adjusted returns relative to those of their sector peers over a twelve month period. The Underlying Index’s methodology includes quarterly rebalancing.
HOW DID THE FUND PERFORM?
The Fund posted a negative absolute performance for the twelve months ended October 31, 2022 and performed in line with the Underlying Index, before considering operating expenses, fees and tax management of the Fund’s portfolio. The Fund outperformed the Russell 1000 Growth Index and underperformed the Russell 1000 Index, which are more traditional market capitalization-weighted indexes.
On an absolute basis, the Fund’s and the Underlying Index’s positions in the information technology and consumer discretionary sectors were leading detractors from absolute performance, while their positions in the energy sector were the sole sector contributors to performance.
Relative to the Russell 1000 Growth Index, the Fund’s and the Underlying Index’s underweight positions in the communication services sector and their overweight positions in the energy sector were leading contributors to performance, while their security selections in the information technology and health care sectors were leading detractors from relative performance.
HOW WAS THE FUND POSITIONED?
During the reporting period, the Fund’s and Underlying Index’s largest allocations were to the information technology and health care sectors and their smallest allocations were to the
utilities and materials sectors.
TOP TEN HOLDINGS OF THE
PORTFOLIO AS OF October 31, 2022 | PERCENT OF
TOTAL
INVESTMENTS |
| | |
| | |
| | |
| | |
| | |
| | |
| | |
| | |
| Berkshire Hathaway, Inc., Class B | |
| | |
PORTFOLIO COMPOSITION BY SECTOR
AS OF October 31, 2022 | PERCENT OF
TOTAL
INVESTMENTS |
| |
| |
| |
| |
| |
| |
| |
| |
| |
| |
| |
| |
*
The return shown is based on net asset value and may differ from the return shown in the financial highlights, which reflects adjustments made to the net asset value in accordance with accounting principles generally accepted in the United States of America. The net asset value was $38.22 as of October 31, 2022.
**
Market price return was calculated assuming an initial investment made at the market price at the beginning of the reporting period, reinvestment of all dividends and distributions at market
| J.P. Morgan Exchange-Traded Funds | |
JPMorgan U.S. Momentum Factor ETF
FUND COMMENTARY
TWELVE MONTHS ENDED October 31, 2022 (Unaudited) (continued)
price during the period, and sale at the market price on the last day of the period. The price used to calculate the market price return was the closing price on the NYSE Arca. As of October 31, 2022, the closing price was $38.25.
***
The adviser seeks to achieve the Fund’s objective. There can be no guarantee it will be achieved.
| J.P. Morgan Exchange-Traded Funds | |
AVERAGE ANNUAL TOTAL RETURNS AS OF October 31, 2022 (Unaudited)
| | | |
JPMorgan U.S. Momentum Factor ETF | | | |
| | | |
| | | |
LIFE OF FUND PERFORMANCE (11/8/17 TO 10/31/22)
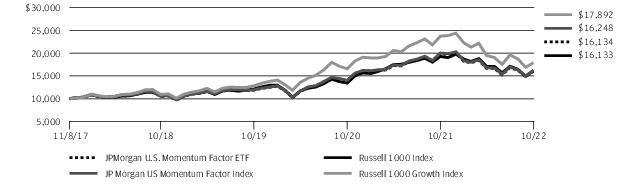
The performance quoted is past performance and is not a guarantee of future results. Exchange-traded funds are subject to certain market risks. Investment returns and principal value of an investment will fluctuate so that an investor’s shares, when sold or redeemed, may be worth more or less than their original cost. Current performance may be higher or lower than the performance data shown. For up-to-date month-end performance information, please call 1-844-457-6383.
Fund commenced operations on November 8, 2017.
The graph illustrates comparative performance for $10,000 invested in shares of the JPMorgan U.S. Momentum Factor ETF, the JP Morgan US Momentum Factor Index, the Russell 1000 Growth Index and the Russell 1000 Index from November 8, 2017 to October 31, 2022. The performance of the Fund reflects the deduction of Fund expenses and assumes reinvestment of all dividends and capital gain distributions, if any. The performance of the JP Morgan US Momentum Factor Index, Russell 1000 Growth Index and Russell 1000 Index does not reflect the deduction of expenses associated with an exchange-traded fund and has been adjusted to reflect reinvestment of all dividends and capital gain distributions of the securities included in the Index, if applicable. The Fund’s adviser is a sponsor of the JP Morgan US Momentum Factor Index and developed the proprietary factors on which the index is based. FTSE International Limited, the benchmark administrator, administers, calculates and governs the JP Morgan US Momentum Factor Index. The JP Morgan US
Momentum Factor Index contains U.S. large- and mid-cap equity securities selected from the Russell 1000 Index, using a rules-based risk allocation and factor selection process. It is designed to reflect a subset of U.S. securities selected utilizing a momentum factor to identify companies that have had better recent performance compared to other securities without undue concentration in individual securities. The Russell 1000 Growth Index is an unmanaged index measuring the performance of those Russell 1000 companies with higher price-to-book ratios and higher forecasted growth values. The Russell 1000 Index is a market capitalization-weighted index, which measures the performance of the 1,000 largest companies in the Russell 3000 Index. Investors cannot invest directly in an index.
For periods presented prior to November 1, 2019, the date on which a unitary fee structure was adopted, Fund performance reflects the waiver of the Fund’s fees and reimbursement of expenses for certain periods since the inception date. Without these waivers and reimbursements, performance would have been lower. Also, performance shown in this section does not reflect the deduction of taxes that a shareholder may pay on Fund distributions or on gains resulting from redemption or sale of Fund shares.
The returns shown are based on net asset values calculated for shareholder transactions and may differ from the returns shown in the financial highlights, which reflect adjustments made to the net asset values in accordance with accounting principles generally accepted in the United States of America.
| J.P. Morgan Exchange-Traded Funds | |
JPMorgan U.S. Quality Factor ETF
FUND COMMENTARY
TWELVE MONTHS ENDED October 31, 2022 (Unaudited)
| |
| |
| |
JP Morgan US Quality Factor Index | |
| |
Net Assets as of 10/31/2022 | |
| |
INVESTMENT OBJECTIVE***
The JPMorgan U.S. Quality Factor ETF (the “Fund”) seeks investment results that closely correspond, before fees and expenses, to the performance of the JP Morgan US Quality Factor Index (the “Underlying Index”).
INVESTMENT APPROACH
The Fund is passively managed to the Underlying Index, which tracks large- and mid-cap U.S. equity securities selected to represent quality factor characteristics. The Underlying Index uses a proprietary selection process that utilizes a quality factor to identify higher quality companies relative to their sector peers as measured by profitability, earnings quality and solvency/financial risk. The Underlying Index’s methodology includes quarterly rebalancing.
HOW DID THE FUND PERFORM?
The Fund posted a negative absolute performance for the twelve months ended October 31, 2022, and performed in line with the Underlying Index, before considering operating expenses, fees and tax management of the Fund’s portfolio. Both the Fund and the Underlying Index outperformed the Russell 1000 Index, which is a more traditional market capitalization-weighted index.
On an absolute basis, the Fund’s and the Underlying Index’s positions in the technology and consumer discretionary sectors were leading detractors from performance, while their positions in the energy and health care sectors were the largest contributors to performance.
Relative to the Russell 1000 Index, the Fund’s and the Underlying Index’s security selection in the consumer discretionary and industrials sectors was a leading contributor to performance. The Fund’s and the Underlying Index’s security selection in the technology and consumer staples sectors was a leading detractor from relative performance.
HOW WAS THE FUND POSITIONED?
During the reporting period, the Fund’s and the Underlying Index’s largest allocations were to the technology and consumer discretionary sectors, while their smallest allocations
were to the basic materials and telecommunications sectors.
TOP TEN HOLDINGS OF THE
PORTFOLIO AS OF October 31, 2022 | PERCENT OF
TOTAL
INVESTMENTS |
| | |
| | |
| Berkshire Hathaway, Inc., Class B | |
| | |
| | |
| | |
| | |
| Procter & Gamble Co. (The) | |
| Mastercard, Inc., Class A | |
| | |
PORTFOLIO COMPOSITION BY SECTOR
AS OF October 31, 2022 | PERCENT OF
TOTAL
INVESTMENTS |
| |
| |
| |
| |
| |
| |
| |
| |
| |
| |
| |
| |
*
The return shown is based on net asset value and may differ from the return shown in the financial highlights, which reflects adjustments made to the net asset value in accordance with accounting principles generally accepted in the United States of America. The net asset value was $38.14 as of October 31, 2022.
**
Market price return was calculated assuming an initial investment made at the market price at the beginning of the reporting period, reinvestment of all dividends and distributions at market price during the period, and sale at the market price on the last
| J.P. Morgan Exchange-Traded Funds | |
day of the period. The price used to calculate the market price return was the closing price on the NYSE Arca. As of October 31, 2022, the closing price was $38.16.
***
The adviser seeks to achieve the Fund’s objective. There can be no guarantee it will be achieved.
| J.P. Morgan Exchange-Traded Funds | |
JPMorgan U.S. Quality Factor ETF
FUND COMMENTARY
TWELVE MONTHS ENDED October 31, 2022 (Unaudited) (continued)
AVERAGE ANNUAL TOTAL RETURNS AS OF October 31, 2022 (Unaudited)
| | | |
JPMorgan U.S. Quality Factor ETF | | | |
| | | |
| | | |
LIFE OF FUND PERFORMANCE (11/8/17 TO 10/31/22)
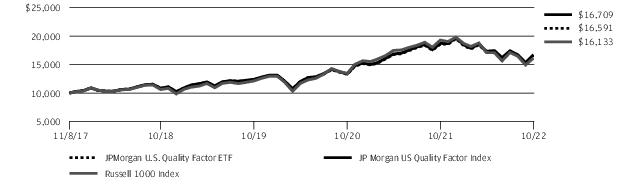
The performance quoted is past performance and is not a guarantee of future results. Exchange-traded funds are subject to certain market risks. Investment returns and principal value of an investment will fluctuate so that an investor’s shares, when sold or redeemed, may be worth more or less than their original cost. Current performance may be higher or lower than the performance data shown. For up-to-date month-end performance information, please call 1-844-457-6383.
Fund commenced operations on November 8, 2017.
The graph illustrates comparative performance for $10,000 invested in shares of the JPMorgan U.S. Quality Factor ETF, the JP Morgan US Quality Factor Index and the Russell 1000 Index from November 8, 2017 to October 31, 2022. The performance of the Fund reflects the deduction of Fund expenses and assumes reinvestment of all dividends and capital gain distributions, if any. The performance of the JP Morgan US Quality Factor Index and Russell 1000 Index does not reflect the deduction of expenses associated with an exchange-traded fund and has been adjusted to reflect reinvestment of all dividends and capital gain distributions of the securities included in the Index, if applicable. The Fund’s adviser is a sponsor of the JP Morgan US Quality Factor Index and developed the proprietary factors on which the index is based. FTSE International Limited, the benchmark administrator, administers, calculates and
governs the JP Morgan US Quality Factor Index. The JP Morgan US Quality Factor Index contains U.S. large- and mid-cap equity securities selected from the Russell 1000 Index, using a rules-based risk allocation and factor selection process. It is designed to reflect a sub-set of U.S. securities selected utilizing a quality factor to identifying higher quality companies as measured by profitability, solvency, and earnings quality without undue concentration in individual securities. The Russell 1000 Index is a market capitalization-weighted index, which measures the performance of the 1,000 largest companies in the Russell 3000 Index. Investors cannot invest directly in an index.
For periods presented prior to November 1, 2019, the date on which a unitary fee structure was adopted, Fund performance reflects the waiver of the Fund’s fees and reimbursement of expenses for certain periods since the inception date. Without these waivers and reimbursements, performance would have been lower. Also, performance shown in this section does not reflect the deduction of taxes that a shareholder may pay on Fund distributions or on gains resulting from redemption or sale of Fund shares.
The returns shown are based on net asset values calculated for shareholder transactions and may differ from the returns shown in the financial highlights, which reflect adjustments made to the net asset values in accordance with accounting principles generally accepted in the United States of America.
| J.P. Morgan Exchange-Traded Funds | |
JPMorgan U.S. Value Factor ETF
FUND COMMENTARY
TWELVE MONTHS ENDED October 31, 2022 (Unaudited)
| |
| |
| |
JP Morgan US Value Factor Index | |
| |
| |
Net Assets as of 10/31/2022 | |
| |
INVESTMENT OBJECTIVE***
The JPMorgan U.S. Value Factor ETF (the “Fund”) seeks investment results that closely correspond, before fees and expenses, to the performance of the JP Morgan US Value Factor Index (the “Underlying Index”).
INVESTMENT APPROACH
The Fund is passively managed to the Underlying Index, which tracks large- and mid-cap U.S. equity securities selected to represent value factor characteristics. The Underlying Index uses a proprietary selection process that utilizes a relative valuation factor to identify companies with attractive prices relative to their sector peers based on fundamental characteristics of book yield, earnings yield, dividend yield and cash flow yield. The Underlying Index’s methodology includes quarterly rebalancing.
HOW DID THE FUND PERFORM?
The Fund posted a negative absolute return for the twelve months ended October 31, 2022, and performed in line with the Underlying Index, before considering operating expenses, fees and tax management of the Fund’s portfolio. The Fund and the Underlying Index underperformed the Russell 1000 Value Index and outperformed the Russell 1000 Index, which are more traditional market capitalization-weighted indexes.
On an absolute basis, the Fund’s and the Underlying Index’s positions in the technology and consumer discretionary sectors were leading detractors from performance, while their positions in the health care and energy sectors were leading contributors to performance.
Relative to the Russell 1000 Value Index, the Fund’s and the Underlying Index’s overweight positions in the technology sector and their underweight positions in the energy sector were leading detractors from performance. The Fund’s and the Underlying Index’s security selection in the technology and health care sectors was a leading contributor to relative performance.
HOW WAS THE FUND POSITIONED?
During the reporting period, the Fund’s and the Underlying Index’s largest allocations were to the technology and consumer discretionary sectors, while their smallest allocations
were to the basic materials and telecommunication sectors.
TOP TEN HOLDINGS OF THE
PORTFOLIO AS OF October 31, 2022 | PERCENT OF
TOTAL
INVESTMENTS |
| | |
| | |
| | |
| | |
| | |
| | |
| | |
| | |
| | |
| | |
PORTFOLIO COMPOSITION BY SECTOR
AS OF October 31, 2022 | PERCENT OF
TOTAL
INVESTMENTS |
| |
| |
| |
| |
| |
| |
| |
| |
| |
| |
| |
| |
*
The return shown is based on net asset value and may differ from the return shown in the financial highlights, which reflects
| J.P. Morgan Exchange-Traded Funds | |
JPMorgan U.S. Value Factor ETF
FUND COMMENTARY
TWELVE MONTHS ENDED October 31, 2022 (Unaudited) (continued)
adjustments made to the net asset value in accordance with accounting principles generally accepted in the United States of America. The net asset value was $32.90 as of October 31, 2022.
**
Market price return was calculated assuming an initial investment made at the market price at the beginning of the reporting period, reinvestment of all dividends and distributions at market price during the period, and sale at the market price on the last day of the period. The price used to calculate the market price return was the closing price on the NYSE Arca. As of October 31, 2022, the closing price was $32.88.
***
The adviser seeks to achieve the Fund’s objective. There can be no guarantee it will be achieved.
| J.P. Morgan Exchange-Traded Funds | |
AVERAGE ANNUAL TOTAL RETURNS AS OF October 31, 2022 (Unaudited)
| | | |
JPMorgan U.S. Value Factor ETF | | | |
| | | |
| | | |
LIFE OF FUND PERFORMANCE (11/8/17 TO 10/31/22)
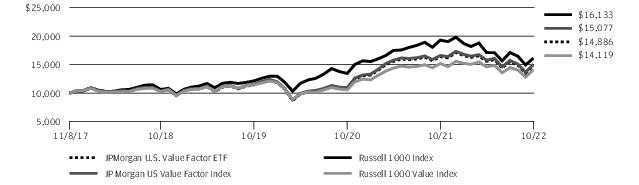
The performance quoted is past performance and is not a guarantee of future results. Exchange-traded funds are subject to certain market risks. Investment returns and principal value of an investment will fluctuate so that an investor’s shares, when sold or redeemed, may be worth more or less than their original cost. Current performance may be higher or lower than the performance data shown. For up-to-date month-end performance information, please call 1-844-457-6383.
Fund commenced operations on November 8, 2017.
The graph illustrates comparative performance for $10,000 invested in shares of the JPMorgan U.S. Value Factor ETF, the JP Morgan US Value Factor Index, the Russell 1000 Value Index and the Russell 1000 Index from November 8, 2017 to October 31, 2022. The performance of the Fund reflects the deduction of Fund expenses and assumes reinvestment of all dividends and capital gain distributions, if any. The performance of the JP Morgan US Value Factor Index, Russell 1000 Value Index and Russell 1000 Index does not reflect the deduction of expenses associated with an exchange-traded fund and has been adjusted to reflect reinvestment of all dividends and capital gain distributions of the securities included in the Index, if applicable. The Fund’s adviser is a sponsor of the JP Morgan US Value Factor Index and developed the proprietary factors on which the index is based. FTSE International Limited, the benchmark administrator, administers, calculates and governs the JP Morgan US Value Factor Index. The JP Morgan US Value Factor Index contains U.S. large- and
mid-cap equity securities selected from the Russell 1000 Index, using a rules-based risk allocation and factor selection process. It is designed to reflect a sub-set of U.S. securities selected utilizing a value factor to identify companies with attractive valuations without undue concentration in individual securities. The Russell 1000 Value Index is an unmanaged index measuring the performance of those Russell 1000 companies with lower price-to-book ratios and lower forecasted growth values. The Russell 1000 Index is a market capitalization-weighted index, which measures the performance of the 1,000 largest companies in the Russell 3000 Index. Investors cannot invest directly in an index.
For periods presented prior to November 1, 2019, the date on which a unitary fee structure was adopted, Fund performance reflects the waiver of the Fund’s fees and reimbursement of expenses for certain periods since the inception date. Without these waivers and reimbursements, performance would have been lower. Also, performance shown in this section does not reflect the deduction of taxes that a shareholder may pay on Fund distributions or on gains resulting from redemption or sale of Fund shares.
The returns shown are based on net asset values calculated for shareholder transactions and may differ from the returns shown in the financial highlights, which reflect adjustments made to the net asset values in accordance with accounting principles generally accepted in the United States of America.
| J.P. Morgan Exchange-Traded Funds | |
JPMorgan ActiveBuilders Emerging Markets Equity ETF
SCHEDULE OF PORTFOLIO INVESTMENTS
AS OF October 31, 2022
| | |
|
|
| | |
|
| | |
Arcos Dorados Holdings, Inc., Class A | | |
| | |
B3 SA - Brasil Bolsa Balcao | | |
Banco Bradesco SA (Preference) | | |
| | |
| | |
BB Seguridade Participacoes SA | | |
| | |
Caixa Seguridade Participacoes S/A | | |
Centrais Eletricas Brasileiras SA (Preference) | | |
Cia Energetica de Minas Gerais (Preference) | | |
EDP - Energias do Brasil SA | | |
| | |
Itau Unibanco Holding SA (Preference) * | | |
| | |
| | |
Locaweb Servicos de Internet SA * (a) | | |
| | |
| | |
Petroleo Brasileiro SA, ADR | | |
| | |
| | |
| | |
| | |
| | |
| | |
| | |
| | |
| | |
| | |
| | |
| | |
| | |
| | |
|
| | |
Ivanhoe Mines Ltd., Class A * | | |
| | |
| | |
|
|
| | |
| | |
| | |
|
Advanced Micro-Fabrication Equipment, Inc., Class A * | | |
Aier Eye Hospital Group Co. Ltd., Class A | | |
Airtac International Group | | |
Alibaba Group Holding Ltd. * | | |
Angel Yeast Co. Ltd., Class A | | |
Anjoy Foods Group Co. Ltd., Class A | | |
ANTA Sports Products Ltd. | | |
Bank of Ningbo Co. Ltd., Class A | | |
Baoshan Iron & Steel Co. Ltd., Class A | | |
Beijing Huafeng Test & Control Technology Co. Ltd., Class A | | |
Beijing Kingsoft Office Software, Inc., Class A | | |
BOC Hong Kong Holdings Ltd. | | |
BOE Technology Group Co. Ltd., Class A | | |
Bosideng International Holdings Ltd. | | |
Budweiser Brewing Co. APAC Ltd. (a) | | |
Centre Testing International Group Co. Ltd., Class A | | |
Chacha Food Co. Ltd., Class A | | |
Changzhou Xingyu Automotive Lighting Systems Co. Ltd., Class A | | |
China Construction Bank Corp., Class H | | |
China Lesso Group Holdings Ltd. | | |
China Longyuan Power Group Corp. Ltd., Class H | | |
China Merchants Bank Co. Ltd., Class H | | |
China Merchants Energy Shipping Co. Ltd., Class A | | |
China Overseas Land & Investment Ltd. | | |
China Petroleum & Chemical Corp., Class H | | |
China Railway Group Ltd., Class H | | |
China Resources Gas Group Ltd. | | |
China Resources Land Ltd. | | |
China Resources Mixc Lifestyle Services Ltd. (a) | | |
China Resources Pharmaceutical Group Ltd. (a) | | |
China Resources Sanjiu Medical & Pharmaceutical Co. Ltd., Class A | | |
China State Construction Engineering Corp. Ltd., Class A | | |
SEE NOTES TO FINANCIAL STATEMENTS.
| J.P. Morgan Exchange-Traded Funds | |
| | |
Common Stocks — continued |
|
China Vanke Co. Ltd., Class H | | |
China Yangtze Power Co. Ltd., Class A | | |
Chongqing Brewery Co. Ltd., Class A | | |
Chongqing Fuling Zhacai Group Co. Ltd., Class A | | |
CITIC Securities Co. Ltd., Class H | | |
Contemporary Amperex Technology Co. Ltd., Class A | | |
DaShenLin Pharmaceutical Group Co. Ltd., Class A | | |
| | |
ENN Natural Gas Co. Ltd., Class A | | |
Fangda Special Steel Technology Co. Ltd., Class A | | |
Foshan Haitian Flavouring & Food Co. Ltd., Class A | | |
Fuyao Glass Industry Group Co. Ltd., Class H (a) | | |
Guangdong Investment Ltd. | | |
Guangzhou Automobile Group Co. Ltd., Class H | | |
| | |
Haier Smart Home Co. Ltd., Class H | | |
Han's Laser Technology Industry Group Co. Ltd., Class A | | |
Hefei Meiya Optoelectronic Technology, Inc., Class A | | |
Huatai Securities Co. Ltd., Class H (a) | | |
Huayu Automotive Systems Co. Ltd., Class A | | |
Hubei Xingfa Chemicals Group Co. Ltd., Class A | | |
Hundsun Technologies, Inc., Class A | | |
Industrial & Commercial Bank of China Ltd., Class H | | |
Industrial Bank Co. Ltd., Class A | | |
Inner Mongolia Yili Industrial Group Co. Ltd., Class A | | |
Jade Bird Fire Co. Ltd., Class A | | |
JD Health International, Inc. * (a) | | |
| | |
| | |
Jiangsu Hengli Hydraulic Co. Ltd., Class A | | |
Joyoung Co. Ltd., Class A | | |
| | |
KE Holdings, Inc., Class A * | | |
Kingdee International Software Group Co. Ltd. * | | |
| | |
|
|
| | |
Kweichow Moutai Co. Ltd., Class A | | |
| | |
Livzon Pharmaceutical Group, Inc., Class H | | |
Longfor Group Holdings Ltd. (b) | | |
LONGi Green Energy Technology Co. Ltd., Class A | | |
| | |
Midea Group Co. Ltd., Class A | | |
Montage Technology Co. Ltd., Class A | | |
NARI Technology Co. Ltd., Class A | | |
| | |
| | |
Oppein Home Group, Inc., Class A | | |
PetroChina Co. Ltd., Class H | | |
Pharmaron Beijing Co. Ltd., Class H (a) | | |
PICC Property & Casualty Co. Ltd., Class H | | |
| | |
Ping An Bank Co. Ltd., Class A | | |
Ping An Insurance Group Co. of China Ltd., Class H | | |
Poly Developments and Holdings Group Co. Ltd., Class A | | |
Postal Savings Bank of China Co. Ltd., Class H (a) | | |
Qingdao Haier Biomedical Co. Ltd., Class A | | |
Sany Heavy Industry Co. Ltd., Class A | | |
Shanghai Baosight Software Co. Ltd., Class A | | |
Shanghai Liangxin Electrical Co. Ltd., Class A | | |
Shanghai Pharmaceuticals Holding Co. Ltd., Class H | | |
Shenzhen Inovance Technology Co. Ltd., Class A | | |
Shenzhen Mindray Bio-Medical Electronics Co. Ltd., Class A | | |
Shenzhou International Group Holdings Ltd. | | |
Sichuan Chuantou Energy Co. Ltd., Class A | | |
Sichuan Swellfun Co. Ltd., Class A | | |
| | |
SITC International Holdings Co. Ltd. | | |
Skshu Paint Co. Ltd., Class A * | | |
StarPower Semiconductor Ltd., Class A | | |
Suzhou Maxwell Technologies Co. Ltd., Class A | | |
| | |
| | |
SEE NOTES TO FINANCIAL STATEMENTS.
| J.P. Morgan Exchange-Traded Funds | |
JPMorgan ActiveBuilders Emerging Markets Equity ETF
SCHEDULE OF PORTFOLIO INVESTMENTS
AS OF October 31, 2022 (continued)
| | |
Common Stocks — continued |
|
Tingyi Cayman Islands Holding Corp. | | |
Tongwei Co. Ltd., Class A | | |
Topsports International Holdings Ltd. (a) | | |
| | |
Wanhua Chemical Group Co. Ltd., Class A | | |
Want Want China Holdings Ltd. | | |
Wuliangye Yibin Co. Ltd., Class A | | |
Wuxi Biologics Cayman, Inc. * (a) | | |
Xinyi Glass Holdings Ltd. | | |
Xinyi Solar Holdings Ltd. | | |
YTO Express Group Co. Ltd., Class A | | |
| | |
Yunnan Energy New Material Co. Ltd. | | |
Zhejiang Chint Electrics Co. Ltd., Class A | | |
Zhejiang Supor Co. Ltd., Class A | | |
Zhejiang Weixing New Building Materials Co. Ltd., Class A | | |
Zhuhai Huafa Properties Co. Ltd., Class A | | |
Zhuzhou CRRC Times Electric Co. Ltd. | | |
Zijin Mining Group Co. Ltd., Class H | | |
| | |
| | |
|
| | |
|
| | |
| | |
| | |
|
| | |
|
Hellenic Telecommunications Organization SA | | |
| | |
| | |
| | |
|
| | |
| | |
| | |
Hong Kong Exchanges & Clearing Ltd. | | |
| | |
| | |
|
|
Techtronic Industries Co. Ltd. | | |
| | |
| | |
|
MOL Hungarian Oil & Gas plc | | |
| | |
| | |
| | |
|
| | |
Aarti Pharmalabs Ltd. ‡ * | | |
Apollo Hospitals Enterprise Ltd. | | |
| | |
AU Small Finance Bank Ltd. (a) | | |
| | |
| | |
| | |
Britannia Industries Ltd. | | |
Colgate-Palmolive India Ltd. | | |
Computer Age Management Services Ltd. | | |
| | |
| | |
Dr Reddy's Laboratories Ltd. | | |
| | |
Embassy Office Parks, REIT | | |
| | |
| | |
| | |
| | |
HDFC Life Insurance Co. Ltd. (a) | | |
| | |
| | |
Housing Development Finance Corp. Ltd. | | |
| | |
ICICI Prudential Life Insurance Co. Ltd. (a) | | |
| | |
| | |
| | |
| | |
| | |
| | |
| | |
Lemon Tree Hotels Ltd. * (a) | | |
SEE NOTES TO FINANCIAL STATEMENTS.
| J.P. Morgan Exchange-Traded Funds | |
| | |
Common Stocks — continued |
|
| | |
Metropolis Healthcare Ltd. (a) | | |
Oil & Natural Gas Corp. Ltd. | | |
| | |
Power Grid Corp. of India Ltd. | | |
| | |
Shriram Transport Finance Co. Ltd. | | |
Tata Consultancy Services Ltd. | | |
Tata Power Co. Ltd. (The) | | |
| | |
| | |
| | |
| | |
| | |
|
Adaro Energy Indonesia Tbk. PT | | |
Astra International Tbk. PT | | |
Bank Central Asia Tbk. PT | | |
Bank Mandiri Persero Tbk. PT | | |
Bank Negara Indonesia Persero Tbk. PT | | |
Bank Rakyat Indonesia Persero Tbk. PT | | |
Charoen Pokphand Indonesia Tbk. PT | | |
| | |
Merdeka Copper Gold Tbk. PT * | | |
Telkom Indonesia Persero Tbk. PT | | |
Unilever Indonesia Tbk. PT | | |
| | |
| | |
|
National Bank of Kuwait SAKP | | |
|
| | |
|
| | |
| | |
| | |
| | |
| | |
Petronas Chemicals Group Bhd. | | |
Press Metal Aluminium Holdings Bhd. | | |
| | |
| | |
| | |
| | |
|
|
| | |
Arca Continental SAB de CV | | |
Corp. Inmobiliaria Vesta SAB de CV | | |
Fomento Economico Mexicano SAB de CV | | |
| | |
| | |
Grupo Aeroportuario del Centro Norte SAB de CV | | |
Grupo Aeroportuario del Pacifico SAB de CV, Class B | | |
Grupo Aeroportuario del Sureste SAB de CV, Class B | | |
Grupo Financiero Banorte SAB de CV, Class O | | |
| | |
Kimberly-Clark de Mexico SAB de CV, Class A | | |
Orbia Advance Corp. SAB de CV | | |
Qualitas Controladora SAB de CV | | |
| | |
Wal-Mart de Mexico SAB de CV | | |
| | |
|
| | |
|
Copa Holdings SA, Class A * | | |
|
| | |
| | |
| | |
|
| | |
| | |
| | |
Bank of the Philippine Islands | | |
| | |
International Container Terminal Services, Inc. | | |
| | |
| | |
| | |
|
| | |
Bank Polska Kasa Opieki SA | | |
| | |
SEE NOTES TO FINANCIAL STATEMENTS.
| J.P. Morgan Exchange-Traded Funds | |
JPMorgan ActiveBuilders Emerging Markets Equity ETF
SCHEDULE OF PORTFOLIO INVESTMENTS
AS OF October 31, 2022 (continued)
| | |
Common Stocks — continued |
|
Powszechna Kasa Oszczednosci Bank Polski SA | | |
Powszechny Zaklad Ubezpieczen SA | | |
| | |
|
| | |
|
| | |
Qatar Gas Transport Co. Ltd. | | |
| | |
| | |
| | |
|
| | |
| | |
Magnitogorsk Iron & Steel Works PJSC, GDR ‡ | | |
MMC Norilsk Nickel PJSC, ADR ‡ | | |
MMC Norilsk Nickel PJSC ‡ | | |
Moscow Exchange MICEX-RTS PJSC ‡ * | | |
| | |
Sberbank of Russia PJSC ‡ * | | |
| | |
| | |
X5 Retail Group NV, GDR ‡ (a) | | |
| | |
|
| | |
| | |
| | |
| | |
Dr Sulaiman Al Habib Medical Services Group Co. | | |
| | |
| | |
| | |
Mouwasat Medical Services Co. | | |
| | |
Sahara International Petrochemical Co. | | |
Saudi Arabian Mining Co. * | | |
Saudi Arabian Oil Co. (a) | | |
Saudi Basic Industries Corp. | | |
Saudi National Bank (The) | | |
Saudi Tadawul Group Holding Co. | | |
| | |
|
|
| | |
United International Transportation Co. | | |
| | |
|
| | |
|
| | |
African Rainbow Minerals Ltd. | | |
| | |
| | |
| | |
| | |
Capitec Bank Holdings Ltd. | | |
| | |
| | |
Foschini Group Ltd. (The) | | |
| | |
Impala Platinum Holdings Ltd. | | |
| | |
| | |
| | |
| | |
| | |
| | |
| | |
| | |
| | |
Truworths International Ltd. | | |
| | |
| | |
|
| | |
| | |
| | |
| | |
| | |
| | |
| | |
Dongjin Semichem Co. Ltd. | | |
| | |
Hana Financial Group, Inc. | | |
Hankook Tire & Technology Co. Ltd. | | |
| | |
SEE NOTES TO FINANCIAL STATEMENTS.
| J.P. Morgan Exchange-Traded Funds | |
| | |
Common Stocks — continued |
|
| | |
| | |
| | |
| | |
| | |
| | |
| | |
| | |
| | |
| | |
| | |
| | |
| | |
| | |
KIWOOM Securities Co. Ltd. | | |
| | |
Korea Investment Holdings Co. Ltd. | | |
| | |
| | |
LG Energy Solution Ltd. * | | |
| | |
| | |
| | |
| | |
| | |
| | |
| | |
Samsung Biologics Co. Ltd. * (a) | | |
Samsung Electro-Mechanics Co. Ltd. | | |
Samsung Electronics Co. Ltd. | | |
Samsung Engineering Co. Ltd. * | | |
Samsung Fire & Marine Insurance Co. Ltd. | | |
Samsung Life Insurance Co. Ltd. | | |
Shinhan Financial Group Co. Ltd. | | |
| | |
SK IE Technology Co. Ltd. * (a) | | |
| | |
| | |
| | |
| | |
| | |
| | |
| | |
| | |
|
|
| | |
| | |
| | |
ASE Technology Holding Co. Ltd. | | |
| | |
| | |
Cathay Financial Holding Co. Ltd. | | |
Chailease Holding Co. Ltd. | | |
China Development Financial Holding Corp. | | |
Compeq Manufacturing Co. Ltd. | | |
CTBC Financial Holding Co. Ltd. | | |
| | |
| | |
E.Sun Financial Holding Co. Ltd. | | |
| | |
| | |
| | |
Feng TAY Enterprise Co. Ltd. | | |
| | |
Fubon Financial Holding Co. Ltd. | | |
Giant Manufacturing Co. Ltd. | | |
| | |
Hon Hai Precision Industry Co. Ltd. | | |
Largan Precision Co. Ltd. | | |
| | |
| | |
Makalot Industrial Co. Ltd. | | |
| | |
Mega Financial Holding Co. Ltd. | | |
Micro-Star International Co. Ltd. | | |
| | |
Nien Made Enterprise Co. Ltd. | | |
Novatek Microelectronics Corp. | | |
| | |
Poya International Co. Ltd. | | |
President Chain Store Corp. | | |
| | |
| | |
Realtek Semiconductor Corp. | | |
| | |
Sinbon Electronics Co. Ltd. | | |
Taishin Financial Holding Co. Ltd. | | |
| | |
Taiwan Semiconductor Manufacturing Co. Ltd. | | |
SEE NOTES TO FINANCIAL STATEMENTS.
| J.P. Morgan Exchange-Traded Funds | |
JPMorgan ActiveBuilders Emerging Markets Equity ETF
SCHEDULE OF PORTFOLIO INVESTMENTS
AS OF October 31, 2022 (continued)
| | |
Common Stocks — continued |
|
Unimicron Technology Corp. | | |
Uni-President Enterprises Corp. | | |
United Microelectronics Corp. * | | |
Vanguard International Semiconductor Corp. | | |
Voltronic Power Technology Corp. | | |
| | |
| | |
Tanzania, United Republic of — 0.0% ^ |
| | |
|
Advanced Info Service PCL | | |
Airports of Thailand PCL * | | |
Bangkok Dusit Medical Services PCL, Class F | | |
Bangkok Expressway & Metro PCL, NVDR | | |
Central Pattana PCL, NVDR | | |
| | |
Delta Electronics Thailand PCL, NVDR | | |
Energy Absolute PCL, NVDR | | |
Gulf Energy Development PCL | | |
Intouch Holdings PCL, NVDR | | |
| | |
Krung Thai Bank PCL, NVDR | | |
PTT Exploration & Production PCL | | |
| | |
| | |
| | |
| | |
Siam Cement PCL (The) (Registered) | | |
| | |
| | |
United Arab Emirates — 1.1% |
Abu Dhabi Commercial Bank PJSC | | |
Abu Dhabi Islamic Bank PJSC | | |
Abu Dhabi National Oil Co. for Distribution PJSC | | |
| | |
Dubai Electricity & Water Authority PJSC | | |
| | |
| | |
Emirates Telecommunications Group Co. PJSC | | |
| | |
| | |
|
United Arab Emirates — continued |
First Abu Dhabi Bank PJSC | | |
| | |
| | |
|
| | |
| | |
| | |
JS Global Lifestyle Co. Ltd. (a) | | |
| | |
| | |
|
First Quantum Minerals Ltd. | | |
Total Common Stocks
(Cost $1,192,403,952) | | |
Short-Term Investments — 0.4% |
Investment Companies — 0.4% |
JPMorgan Prime Money Market Fund Class IM Shares, 3.18% (c) (d)(Cost $3,448,736) | | |
Total Investments — 99.9%
(Cost $1,195,852,688) | | |
Other Assets Less Liabilities — 0.1% | | |
| | |
Percentages indicated are based on net assets. |
| |
| American Depositary Receipt |
| |
| Brazilian Depositary Receipt |
| Global Depositary Receipt |
| |
| Non-Voting Depositary Receipt |
| Public Joint Stock Company |
| A special type of equity investment that shares in the earnings of the company, has limited voting rights, and may have a dividend preference. Preference shares may also have liquidation preference. |
| Limited liability company |
| Real Estate Investment Trust |
| |
| |
| Amount rounds to less than 0.1% of net assets. |
| Value determined using significant unobservable inputs. | |
| Non-income producing security. | |
SEE NOTES TO FINANCIAL STATEMENTS.
| J.P. Morgan Exchange-Traded Funds | |
| Security exempt from registration pursuant to Regulation S under the Securities Act of 1933, as amended. Regulation S applies to securities offerings that are made outside of the United States and do not involve direct selling efforts in the United States and as such may have restrictions on resale. | |
| Securities exempt from registration under Rule 144A or section 4(a)(2), of the Securities Act of 1933, as amended. | |
| Investment in an affiliated fund, which is registered under the Investment Company Act of 1940, as amended, and is advised by J.P. Morgan Investment Management Inc. | |
| The rate shown is the current yield as of October 31, 2022. | |
Summary of Investments by Industry, October 31, 2022
The following table represents the portfolio investments of the Fund by industry classifications as a percentage of total investments:
| PERCENT OF
TOTAL
INVESTMENTS |
| |
Semiconductors & Semiconductor Equipment | |
Technology Hardware, Storage & Peripherals | |
| |
Internet & Direct Marketing Retail | |
| |
Oil, Gas & Consumable Fuels | |
| |
| |
Electronic Equipment, Instruments & Components | |
Diversified Financial Services | |
| |
| |
Interactive Media & Services | |
| |
| |
| |
Real Estate Management & Development | |
| |
| |
Hotels, Restaurants & Leisure | |
Wireless Telecommunication Services | |
| |
| |
| |
Diversified Telecommunication Services | |
Transportation Infrastructure | |
| |
Textiles, Apparel & Luxury Goods | |
Others (each less than 1.0%) | |
| |
SEE NOTES TO FINANCIAL STATEMENTS.
| J.P. Morgan Exchange-Traded Funds | |
JPMorgan ActiveBuilders International Equity ETF
SCHEDULE OF PORTFOLIO INVESTMENTS
AS OF October 31, 2022
| | |
|
|
Australia & New Zealand Banking Group Ltd. | | |
| | |
| | |
Commonwealth Bank of Australia | | |
| | |
| | |
| | |
| | |
| | |
National Australia Bank Ltd. | | |
| | |
| | |
| | |
| | |
| | |
Woodside Energy Group Ltd. | | |
| | |
| | |
| | |
|
| | |
| | |
| | |
| | |
|
| | |
| | |
| | |
| | |
| | |
|
| | |
|
Alimentation Couche-Tard, Inc. | | |
Canadian National Railway Co. | | |
Toronto-Dominion Bank (The) | | |
| | |
|
BOC Hong Kong Holdings Ltd. | | |
| | |
| | |
|
|
| | |
Yangzijiang Shipbuilding Holdings Ltd. | | |
| | |
|
AP Moller - Maersk A/S, Class B | | |
| | |
| | |
| | |
Drilling Co. of 1972 A/S (The) * | | |
| | |
| | |
Novo Nordisk A/S, Class B | | |
| | |
| | |
| | |
| | |
| | |
| | |
|
| | |
| | |
| | |
| | |
| | |
| | |
|
| | |
| | |
| | |
| | |
| | |
| | |
| | |
| | |
| | |
| | |
| | |
| | |
| | |
LVMH Moet Hennessy Louis Vuitton SE | | |
| | |
| | |
| | |
SEE NOTES TO FINANCIAL STATEMENTS.
| J.P. Morgan Exchange-Traded Funds | |
| | |
Common Stocks — continued |
|
| | |
| | |
| | |
| | |
| | |
| | |
| | |
| | |
| | |
|
| | |
| | |
| | |
| | |
Bayerische Motoren Werke AG | | |
Daimler Truck Holding AG * | | |
| | |
Deutsche Post AG (Registered) | | |
Deutsche Telekom AG (Registered) | | |
| | |
| | |
| | |
| | |
| | |
Muenchener Rueckversicherungs-Gesellschaft AG (Registered) | | |
| | |
| | |
Sartorius AG (Preference) | | |
| | |
| | |
Volkswagen AG (Preference) | | |
| | |
| | |
|
| | |
Hong Kong Exchanges & Clearing Ltd. | | |
| | |
Pacific Basin Shipping Ltd. | | |
| | |
Techtronic Industries Co. Ltd. | | |
| | |
| | |
|
|
| | |
|
Bank Central Asia Tbk. PT | | |
|
Bank of Ireland Group plc | | |
| | |
| | |
|
Assicurazioni Generali SpA | | |
| | |
| | |
FinecoBank Banca Fineco SpA | | |
| | |
| | |
| | |
| | |
| | |
|
| | |
Asahi Group Holdings Ltd. | | |
| | |
| | |
| | |
Central Japan Railway Co. | | |
Cosmo Energy Holdings Co. Ltd. | | |
| | |
Dai-ichi Life Holdings, Inc. | | |
| | |
| | |
Daiwa House Industry Co. Ltd. | | |
| | |
| | |
| | |
| | |
| | |
Fuyo General Lease Co. Ltd. | | |
| | |
| | |
| | |
| | |
| | |
| | |
Japan Airlines Co. Ltd. * | | |
SEE NOTES TO FINANCIAL STATEMENTS.
| J.P. Morgan Exchange-Traded Funds | |
JPMorgan ActiveBuilders International Equity ETF
SCHEDULE OF PORTFOLIO INVESTMENTS
AS OF October 31, 2022 (continued)
| | |
Common Stocks — continued |
|
Japan Post Holdings Co. Ltd. | | |
Japan Post Insurance Co. Ltd. | | |
| | |
| | |
| | |
| | |
| | |
| | |
| | |
| | |
| | |
Mitsubishi UFJ Financial Group, Inc. | | |
| | |
| | |
Mizuho Financial Group, Inc. | | |
MS&AD Insurance Group Holdings, Inc. | | |
Murata Manufacturing Co. Ltd. | | |
| | |
| | |
NIPPON EXPRESS HOLDINGS, Inc. | | |
| | |
Nippon Telegraph & Telephone Corp. | | |
Nomura Real Estate Holdings, Inc. | | |
Nomura Research Institute Ltd. | | |
Ono Pharmaceutical Co. Ltd. | | |
| | |
| | |
Recruit Holdings Co. Ltd. | | |
| | |
| | |
| | |
| | |
Seven & i Holdings Co. Ltd. | | |
| | |
Shin-Etsu Chemical Co. Ltd. | | |
| | |
| | |
| | |
| | |
| | |
| | |
| | |
| | |
Sumitomo Electric Industries Ltd. | | |
| | |
|
|
Sumitomo Forestry Co. Ltd. | | |
Sumitomo Mitsui Financial Group, Inc. | | |
Sumitomo Mitsui Trust Holdings, Inc. | | |
Sumitomo Warehouse Co. Ltd. (The) | | |
| | |
| | |
Takeda Pharmaceutical Co. Ltd. | | |
| | |
Tokio Marine Holdings, Inc. | | |
| | |
Tokyu Fudosan Holdings Corp. | | |
| | |
| | |
| | |
| | |
|
| | |
|
ABN AMRO Bank NV, CVA (a) | | |
| | |
| | |
| | |
| | |
| | |
| | |
| | |
| | |
| | |
Koninklijke Ahold Delhaize NV | | |
Koninklijke BAM Groep NV * | | |
| | |
| | |
| | |
| | |
| | |
| | |
| | |
|
| | |
| | |
| | |
| | |
SEE NOTES TO FINANCIAL STATEMENTS.
| J.P. Morgan Exchange-Traded Funds | |
| | |
Common Stocks — continued |
|
| | |
| | |
| | |
|
| | |
Oversea-Chinese Banking Corp. Ltd. | | |
| | |
United Overseas Bank Ltd. | | |
| | |
|
| | |
|
| | |
Samsung Electronics Co. Ltd., GDR (a) | | |
| | |
|
Banco Bilbao Vizcaya Argentaria SA | | |
| | |
| | |
Corp. ACCIONA Energias Renovables SA | | |
| | |
Industria de Diseno Textil SA | | |
| | |
| | |
| | |
|
| | |
| | |
| | |
| | |
| | |
Skandinaviska Enskilda Banken AB, Class A | | |
| | |
| | |
Svenska Handelsbanken AB, Class A | | |
| | |
| | |
|
| | |
Accelleron Industries AG * | | |
Cie Financiere Richemont SA (Registered) | | |
| | |
| | |
|
|
| | |
Lonza Group AG (Registered) | | |
Mobilezone Holding AG (Registered) | | |
| | |
| | |
| | |
Straumann Holding AG (Registered) | | |
Swiss Life Holding AG (Registered) | | |
UBS Group AG (Registered) | | |
Zurich Insurance Group AG | | |
| | |
|
Taiwan Semiconductor Manufacturing Co. Ltd., ADR | | |
|
| | |
| | |
| | |
| | |
| | |
| | |
| | |
Berkeley Group Holdings plc | | |
| | |
British American Tobacco plc | | |
| | |
CK Hutchison Holdings Ltd. | | |
| | |
| | |
| | |
| | |
| | |
| | |
InterContinental Hotels Group plc | | |
| | |
| | |
| | |
Legal & General Group plc | | |
| | |
| | |
London Stock Exchange Group plc | | |
| | |
Marks & Spencer Group plc * | | |
| | |
| | |
SEE NOTES TO FINANCIAL STATEMENTS.
| J.P. Morgan Exchange-Traded Funds | |
JPMorgan ActiveBuilders International Equity ETF
SCHEDULE OF PORTFOLIO INVESTMENTS
AS OF October 31, 2022 (continued)
| | |
Common Stocks — continued |
United Kingdom — continued |
| | |
| | |
Reckitt Benckiser Group plc | | |
| | |
| | |
| | |
| | |
| | |
| | |
| | |
| | |
| | |
| | |
| | |
|
| | |
| | |
| | |
| | |
| | |
| | |
| | |
| | |
Total Common Stocks
(Cost $26,943,499) | | |
Short-Term Investments — 1.4% |
Investment Companies — 1.4% |
JPMorgan U.S. Government Money Market Fund Class IM Shares, 2.85% (b) (c)(Cost $316,955) | | |
Total Investments — 99.2%
(Cost $27,260,454) | | |
Other Assets Less Liabilities — 0.8% | | |
| | |
Percentages indicated are based on net assets. |
| |
| American Depositary Receipt |
| |
| Global Depositary Receipt |
| |
| A special type of equity investment that shares in the earnings of the company, has limited voting rights, and may have a dividend preference. Preference shares may also have liquidation preference. |
| Limited liability company |
| Real Estate Investment Trust |
| Non-income producing security. |
| Security exempt from registration pursuant to Regulation S under the Securities Act of 1933, as amended. Regulation S applies to securities offerings that are made outside of the United States and do not involve direct selling efforts in the United States and as such may have restrictions on resale. |
| Investment in an affiliated fund, which is registered under the Investment Company Act of 1940, as amended, and is advised by J.P. Morgan Investment Management Inc. |
| The rate shown is the current yield as of October 31, 2022. |
SEE NOTES TO FINANCIAL STATEMENTS.
| J.P. Morgan Exchange-Traded Funds | |
Summary of Investments by Industry, October 31, 2022
The following table represents the portfolio investments of the Fund by industry classifications as a percentage of total investments:
| PERCENT OF
TOTAL
INVESTMENTS |
| |
| |
Oil, Gas & Consumable Fuels | |
| |
| |
| |
Semiconductors & Semiconductor Equipment | |
| |
| |
Textiles, Apparel & Luxury Goods | |
| |
| |
| |
| |
Diversified Telecommunication Services | |
| |
| |
Trading Companies & Distributors | |
| |
Health Care Equipment & Supplies | |
Construction & Engineering | |
| |
| |
| |
| |
| |
Electronic Equipment, Instruments & Components | |
Others (each less than 1.0%) | |
| |
SEE NOTES TO FINANCIAL STATEMENTS.
| J.P. Morgan Exchange-Traded Funds | |
JPMorgan BetaBuilders Canada ETF
SCHEDULE OF PORTFOLIO INVESTMENTS
AS OF October 31, 2022
| | |
|
Aerospace & Defense — 0.4% |
| | |
|
| | |
|
Magna International, Inc. | | |
|
| | |
Bank of Nova Scotia (The) | | |
Canadian Imperial Bank of Commerce | | |
| | |
| | |
Toronto-Dominion Bank (The) | | |
| | |
|
Brookfield Asset Management, Inc., Class A | | |
| | |
| | |
| | |
| | |
|
| | |
Commercial Services & Supplies — 2.6% |
GFL Environmental, Inc. (a) | | |
Ritchie Bros Auctioneers, Inc. | | |
| | |
| | |
Construction & Engineering — 1.0% |
SNC-Lavalin Group, Inc. (a) | | |
| | |
| | |
Containers & Packaging — 0.4% |
CCL Industries, Inc., Class B | | |
Diversified Telecommunication Services — 1.3% |
| | |
| | |
| | |
Electric Utilities — 2.1% |
| | |
| | |
|
Electric Utilities — continued |
| | |
| | |
| | |
Equity Real Estate Investment Trusts (REITs) — 0.3% |
Canadian Apartment Properties | | |
| | |
| | |
Food & Staples Retailing — 4.1% |
Alimentation Couche-Tard, Inc. | | |
| | |
| | |
| | |
| | |
| | |
|
| | |
|
| | |
Hotels, Restaurants & Leisure — 1.0% |
Restaurant Brands International, Inc. | | |
Independent Power and Renewable Electricity Producers — 0.2% |
Brookfield Renewable Corp. | | |
|
Fairfax Financial Holdings Ltd. | | |
| | |
| | |
| | |
| | |
| | |
| | |
| | |
|
| | |
| | |
| | |
| | |
|
| | |
Shaw Communications, Inc., Class B | | |
| | |
SEE NOTES TO FINANCIAL STATEMENTS.
| J.P. Morgan Exchange-Traded Funds | |
| | |
Common Stocks — continued |
|
Agnico Eagle Mines Ltd. (a) | | |
| | |
First Quantum Minerals Ltd. | | |
| | |
Ivanhoe Mines Ltd., Class A * | | |
| | |
| | |
Teck Resources Ltd., Class B | | |
Wheaton Precious Metals Corp. | | |
| | |
|
Canadian Tire Corp. Ltd., Class A (a) | | |
| | |
| | |
|
Algonquin Power & Utilities Corp. (a) | | |
Canadian Utilities Ltd., Class A | | |
| | |
Oil, Gas & Consumable Fuels — 19.4% |
| | |
| | |
Canadian Natural Resources Ltd. | | |
| | |
| | |
| | |
| | |
Pembina Pipeline Corp. (a) | | |
| | |
| | |
| | |
| | |
Paper & Forest Products — 0.3% |
West Fraser Timber Co. Ltd. | | |
|
Bausch Health Cos., Inc. * (a) | | |
Professional Services — 1.0% |
| | |
Real Estate Management & Development — 0.3% |
| | |
|
Canadian National Railway Co. | | |
| | |
|
|
Canadian Pacific Railway Ltd. | | |
| | |
| | |
|
Constellation Software, Inc. | | |
| | |
| | |
Textiles, Apparel & Luxury Goods — 0.3% |
| | |
Trading Companies & Distributors — 0.2% |
Finning International, Inc. | | |
Wireless Telecommunication Services — 0.8% |
Rogers Communications, Inc., Class B | | |
Total Common Stocks
(Cost $5,041,664,833) | | |
Short-Term Investments — 8.0% |
Investment of Cash Collateral from Securities Loaned — 8.0% |
JPMorgan Securities Lending Money Market Fund Agency SL Class Shares, 3.23% (c) (d) | | |
JPMorgan U.S. Government Money Market Fund Class IM Shares, 2.85% (c) (d) | | |
Total Investment of Cash Collateral from Securities Loaned
(Cost $450,591,449) | | |
Total Investments — 107.4%
(Cost $5,492,256,282) | | |
Liabilities in Excess of Other Assets — (7.4)% | | |
| | |
Percentages indicated are based on net assets. |
| Non-income producing security. |
| The security or a portion of this security is on loan at October 31, 2022. The total value of securities on loan at October 31, 2022 is $267,554,005. |
| Security exempt from registration pursuant to Regulation S under the Securities Act of 1933, as amended. Regulation S applies to securities offerings that are made outside of the United States and do not involve direct selling efforts in the United States and as such may have restrictions on resale. |
SEE NOTES TO FINANCIAL STATEMENTS.
| J.P. Morgan Exchange-Traded Funds | |
JPMorgan BetaBuilders Canada ETF
SCHEDULE OF PORTFOLIO INVESTMENTS
AS OF October 31, 2022 (continued)
| Investment in an affiliated fund, which is registered under the Investment Company Act of 1940, as amended, and is advised by J.P. Morgan Investment Management Inc. |
| The rate shown is the current yield as of October 31, 2022. |
Futures contracts outstanding as of October 31, 2022:
| | | | | VALUE AND
UNREALIZED
APPRECIATION
(DEPRECIATION) ($) |
| | | | | |
| | | | | |
SEE NOTES TO FINANCIAL STATEMENTS.
| J.P. Morgan Exchange-Traded Funds | |
JPMorgan BetaBuilders Developed Asia Pacific ex-Japan ETF
(formerly known as JPMorgan BetaBuilders Developed Asia ex-Japan ETF)
SCHEDULE OF PORTFOLIO INVESTMENTS
AS OF October 31, 2022
| | |
|
|
| | |
| | |
| | |
| | |
| | |
| | |
Australia & New Zealand Banking Group Ltd. | | |
Bendigo & Adelaide Bank Ltd. | | |
| | |
| | |
| | |
| | |
| | |
| | |
Commonwealth Bank of Australia | | |
| | |
Domino's Pizza Enterprises Ltd. | | |
| | |
| | |
Fortescue Metals Group Ltd. | | |
| | |
| | |
Harvey Norman Holdings Ltd. | | |
| | |
| | |
| | |
Insurance Australia Group Ltd. | | |
| | |
| | |
| | |
| | |
| | |
National Australia Bank Ltd. | | |
| | |
Northern Star Resources Ltd. | | |
| | |
| | |
| | |
| | |
| | |
| | |
| | |
| | |
| | |
| | |
|
|
| | |
| | |
Seven Group Holdings Ltd. | | |
| | |
| | |
| | |
| | |
| | |
| | |
| | |
| | |
Treasury Wine Estates Ltd. | | |
| | |
Washington H Soul Pattinson & Co. Ltd. | | |
| | |
| | |
| | |
Woodside Energy Group Ltd. | | |
| | |
| | |
| | |
|
Budweiser Brewing Co. APAC Ltd. (a) | | |
| | |
Wharf Holdings Ltd. (The) | | |
Wilmar International Ltd. | | |
Wuxi Biologics Cayman, Inc. * (a) | | |
| | |
|
| | |
| | |
CK Infrastructure Holdings Ltd. | | |
| | |
DFI Retail Group Holdings Ltd. | | |
Hang Lung Properties Ltd. | | |
| | |
Henderson Land Development Co. Ltd. | | |
HK Electric Investments & HK Electric Investments Ltd. (a) | | |
| | |
Hong Kong & China Gas Co. Ltd. | | |
Hong Kong Exchanges & Clearing Ltd. | | |
Jardine Matheson Holdings Ltd. | | |
| | |
SEE NOTES TO FINANCIAL STATEMENTS.
| J.P. Morgan Exchange-Traded Funds | |
JPMorgan BetaBuilders Developed Asia Pacific ex-Japan ETF
(formerly known as JPMorgan BetaBuilders Developed Asia ex-Japan ETF)
SCHEDULE OF PORTFOLIO INVESTMENTS
AS OF October 31, 2022 (continued)
| | |
Common Stocks — continued |
|
| | |
New World Development Co. Ltd. | | |
Power Assets Holdings Ltd. | | |
| | |
Sun Hung Kai Properties Ltd. | | |
Swire Pacific Ltd., Class B | | |
Swire Pacific Ltd., Class A | | |
| | |
Techtronic Industries Co. Ltd. | | |
| | |
Wharf Real Estate Investment Co. Ltd. | | |
| | |
|
Galaxy Entertainment Group Ltd. | | |
| | |
| | |
|
Auckland International Airport Ltd. * | | |
| | |
Fisher & Paykel Healthcare Corp. Ltd. | | |
| | |
| | |
| | |
| | |
| | |
| | |
|
CapitaLand Ascendas REIT, REIT | | |
CapitaLand Integrated Commercial Trust, REIT | | |
Capitaland Investment Ltd. | | |
| | |
| | |
| | |
| | |
Great Eastern Holdings Ltd. | | |
Jardine Cycle & Carriage Ltd. | | |
| | |
Mapletree Pan Asia Commercial Trust, REIT | | |
| | |
Oversea-Chinese Banking Corp. Ltd. | | |
| | |
Singapore Airlines Ltd. * | | |
| | |
|
|
| | |
Singapore Technologies Engineering Ltd. | | |
Singapore Telecommunications Ltd. | | |
United Overseas Bank Ltd. | | |
| | |
| | |
| | |
|
CK Hutchison Holdings Ltd. | | |
|
| | |
| | |
James Hardie Industries plc, CHDI | | |
| | |
Total Common Stocks
(Cost $4,002,360,290) | | |
Short-Term Investments — 0.0% ^ |
Investment of Cash Collateral from Securities Loaned — 0.0% ^ |
JPMorgan Securities Lending Money Market Fund Agency SL Class Shares, 3.23% (c) (d) | | |
JPMorgan U.S. Government Money Market Fund Class IM Shares, 2.85% (c) (d) | | |
Total Investment of Cash Collateral from Securities Loaned
(Cost $189,705) | | |
Total Investments — 99.6%
(Cost $4,002,549,995) | | |
Other Assets Less Liabilities — 0.4% | | |
| | |
Percentages indicated are based on net assets. |
| |
| |
| Clearing House Electronic Subregister System (CHESS) Depository Interest |
| Real Estate Investment Trust |
| Amount rounds to less than 0.1% of net assets. |
| Non-income producing security. | |
SEE NOTES TO FINANCIAL STATEMENTS.
| J.P. Morgan Exchange-Traded Funds | |
| Security exempt from registration pursuant to Regulation S under the Securities Act of 1933, as amended. Regulation S applies to securities offerings that are made outside of the United States and do not involve direct selling efforts in the United States and as such may have restrictions on resale. | |
| The security or a portion of this security is on loan at October 31, 2022. The total value of securities on loan at October 31, 2022 is $228,806. | |
| Investment in an affiliated fund, which is registered under the Investment Company Act of 1940, as amended, and is advised by J.P. Morgan Investment Management Inc. | |
| The rate shown is the current yield as of October 31, 2022. | |
Summary of Investments by Industry, October 31, 2022
The following table represents the portfolio investments of the Fund by industry classifications as a percentage of total investments:
| PERCENT OF
TOTAL
INVESTMENTS |
| |
| |
| |
| |
| |
Equity Real Estate Investment Trusts (REITs) | |
Real Estate Management & Development | |
Oil, Gas & Consumable Fuels | |
| |
Hotels, Restaurants & Leisure | |
| |
| |
Diversified Telecommunication Services | |
| |
Transportation Infrastructure | |
Health Care Providers & Services | |
| |
| |
Life Sciences Tools & Services | |
Others (each less than 1.0%) | |
| |
|
| Amount rounds to less than 0.1%. |
SEE NOTES TO FINANCIAL STATEMENTS.
| J.P. Morgan Exchange-Traded Funds | |
JPMorgan BetaBuilders Developed Asia Pacific ex-Japan ETF
(formerly known as JPMorgan BetaBuilders Developed Asia ex-Japan ETF)
SCHEDULE OF PORTFOLIO INVESTMENTS
AS OF October 31, 2022 (continued)
Futures contracts outstanding as of October 31, 2022:
| | | | | VALUE AND
UNREALIZED
APPRECIATION
(DEPRECIATION) ($) |
| | | | | |
| | | | | |
| | | | | |
| | | | | |
| |
| |
| Morgan Stanley Capital International |
| |
| Australian Securities Exchange |
SEE NOTES TO FINANCIAL STATEMENTS.
| J.P. Morgan Exchange-Traded Funds | |
JPMorgan BetaBuilders Europe ETF
SCHEDULE OF PORTFOLIO INVESTMENTS
AS OF October 31, 2022
| | |
|
|
Flutter Entertainment plc * | | |
| | |
| | |
| | |
|
| | |
| | |
| | |
| | |
| | |
| | |
Raiffeisen Bank International AG | | |
| | |
| | |
| | |
Vienna Insurance Group AG Wiener Versicherung Gruppe | | |
| | |
| | |
|
Ackermans & van Haaren NV | | |
| | |
| | |
| | |
| | |
| | |
Etablissements Franz Colruyt NV | | |
Groupe Bruxelles Lambert NV | | |
| | |
| | |
| | |
| | |
| | |
| | |
| | |
Warehouses De Pauw CVA, REIT | | |
| | |
|
| | |
|
| | |
| | |
|
|
| | |
|
AP Moller - Maersk A/S, Class A | | |
AP Moller - Maersk A/S, Class B | | |
| | |
| | |
| | |
| | |
| | |
| | |
| | |
Novo Nordisk A/S, Class B | | |
| | |
| | |
| | |
| | |
| | |
| | |
|
| | |
| | |
| | |
| | |
| | |
| | |
| | |
| | |
| | |
| | |
| | |
| | |
| | |
Stora Enso OYJ, Class A (b) | | |
| | |
| | |
| | |
| | |
|
| | |
| | |
| | |
| | |
| | |
SEE NOTES TO FINANCIAL STATEMENTS.
| J.P. Morgan Exchange-Traded Funds | |
JPMorgan BetaBuilders Europe ETF
SCHEDULE OF PORTFOLIO INVESTMENTS
AS OF October 31, 2022 (continued)
| | |
Common Stocks — continued |
|
| | |
| | |
| | |
| | |
| | |
| | |
| | |
| | |
| | |
| | |
| | |
Cie Generale des Etablissements Michelin SCA | | |
| | |
| | |
| | |
| | |
| | |
| | |
| | |
| | |
| | |
| | |
| | |
| | |
| | |
| | |
| | |
| | |
| | |
LVMH Moet Hennessy Louis Vuitton SE | | |
| | |
| | |
| | |
| | |
| | |
| | |
| | |
| | |
| | |
| | |
| | |
Unibail-Rodamco-Westfield, REIT * | | |
| | |
| | |
| | |
|
|
| | |
| | |
| | |
|
| | |
| | |
| | |
| | |
| | |
Bayerische Motoren Werke AG | | |
Bayerische Motoren Werke AG (Preference) | | |
| | |
| | |
| | |
| | |
| | |
| | |
Daimler Truck Holding AG * | | |
Deutsche Bank AG (Registered) | | |
| | |
Deutsche Lufthansa AG (Registered) * | | |
Deutsche Post AG (Registered) | | |
Deutsche Telekom AG (Registered) | | |
| | |
| | |
| | |
Fresenius Medical Care AG & Co. KGaA | | |
| | |
| | |
| | |
| | |
| | |
Henkel AG & Co. KGaA (Preference) | | |
| | |
| | |
| | |
| | |
| | |
Muenchener Rueckversicherungs- Gesellschaft AG (Registered) | | |
Porsche Automobil Holding SE (Preference) | | |
| | |
| | |
| | |
SEE NOTES TO FINANCIAL STATEMENTS.
| J.P. Morgan Exchange-Traded Funds | |
| | |
Common Stocks — continued |
|
Sartorius AG (Preference) | | |
| | |
| | |
Siemens Healthineers AG (a) | | |
| | |
| | |
Telefonica Deutschland Holding AG | | |
| | |
| | |
Volkswagen AG (Preference) | | |
| | |
| | |
| | |
|
| | |
|
| | |
| | |
| | |
| | |
| | |
|
| | |
| | |
Assicurazioni Generali SpA | | |
| | |
| | |
| | |
| | |
| | |
| | |
| | |
| | |
| | |
| | |
FinecoBank Banca Fineco SpA | | |
| | |
Infrastrutture Wireless Italiane SpA (a) | | |
| | |
| | |
Mediobanca Banca di Credito Finanziario SpA | | |
| | |
| | |
|
|
| | |
| | |
| | |
| | |
Recordati Industria Chimica e Farmaceutica SpA | | |
| | |
| | |
| | |
Terna - Rete Elettrica Nazionale (b) | | |
| | |
UnipolSai Assicurazioni SpA | | |
| | |
|
Hikma Pharmaceuticals plc | | |
|
| | |
| | |
| | |
| | |
|
| | |
|
| | |
| | |
| | |
| | |
| | |
| | |
| | |
| | |
| | |
| | |
| | |
| | |
Koninklijke Ahold Delhaize NV | | |
| | |
| | |
| | |
| | |
| | |
| | |
SEE NOTES TO FINANCIAL STATEMENTS.
| J.P. Morgan Exchange-Traded Funds | |
JPMorgan BetaBuilders Europe ETF
SCHEDULE OF PORTFOLIO INVESTMENTS
AS OF October 31, 2022 (continued)
| | |
Common Stocks — continued |
|
| | |
| | |
| | |
|
| | |
| | |
AutoStore Holdings Ltd. * (b) | | |
| | |
| | |
Gjensidige Forsikring ASA | | |
| | |
| | |
| | |
| | |
| | |
| | |
| | |
| | |
| | |
| | |
| | |
| | |
| | |
|
| | |
Bank Polska Kasa Opieki SA | | |
| | |
| | |
| | |
| | |
| | |
PGE Polska Grupa Energetyczna SA * | | |
Polski Koncern Naftowy ORLEN SA | | |
Polskie Gornictwo Naftowe i Gazownictwo SA * | | |
Powszechna Kasa Oszczednosci Bank Polski SA | | |
Powszechny Zaklad Ubezpieczen SA | | |
| | |
| | |
|
EDP - Energias de Portugal SA | | |
| | |
|
|
| | |
| | |
| | |
|
| | |
|
| | |
|
| | |
|
Delivery Hero SE * (a) (b) | | |
|
| | |
ACS Actividades de Construccion y Servicios SA | | |
| | |
| | |
Banco Bilbao Vizcaya Argentaria SA | | |
| | |
| | |
| | |
Corp. ACCIONA Energias Renovables SA | | |
| | |
| | |
| | |
| | |
| | |
Grifols SA (Preference), Class B * | | |
| | |
Industria de Diseno Textil SA (b) | | |
| | |
| | |
| | |
| | |
Siemens Gamesa Renewable Energy SA * | | |
| | |
| | |
|
| | |
| | |
| | |
| | |
SEE NOTES TO FINANCIAL STATEMENTS.
| J.P. Morgan Exchange-Traded Funds | |
| | |
Common Stocks — continued |
|
| | |
| | |
| | |
| | |
Electrolux AB, Class B (b) | | |
| | |
| | |
| | |
| | |
| | |
| | |
| | |
| | |
Fastighets AB Balder, Class B * | | |
| | |
H & M Hennes & Mauritz AB, Class B (b) | | |
| | |
| | |
| | |
| | |
Industrivarden AB, Class A | | |
Industrivarden AB, Class C | | |
| | |
| | |
Investment AB Latour, Class B (b) | | |
| | |
| | |
| | |
| | |
L E Lundbergforetagen AB, Class B | | |
| | |
Nibe Industrier AB, Class B | | |
| | |
| | |
| | |
| | |
| | |
Samhallsbyggnadsbolaget i Norden AB (b) | | |
Samhallsbyggnadsbolaget i Norden AB, Class D (b) | | |
| | |
Securitas AB, Class B (b) | | |
Skandinaviska Enskilda Banken AB, Class C (b) | | |
Skandinaviska Enskilda Banken AB, Class A | | |
| | |
|
|
| | |
| | |
| | |
| | |
| | |
Storskogen Group AB, Class B | | |
Svenska Cellulosa AB SCA, Class A | | |
Svenska Cellulosa AB SCA, Class B | | |
Svenska Handelsbanken AB, Class B (b) | | |
Svenska Handelsbanken AB, Class A | | |
| | |
| | |
| | |
Telefonaktiebolaget LM Ericsson, Class A | | |
Telefonaktiebolaget LM Ericsson, Class B | | |
| | |
| | |
| | |
| | |
| | |
Volvo Car AB, Class B * (b) | | |
| | |
|
| | |
| | |
Baloise Holding AG (Registered) | | |
Barry Callebaut AG (Registered) | | |
Chocoladefabriken Lindt & Spruengli AG | | |
Chocoladefabriken Lindt & Spruengli AG (Registered) | | |
Cie Financiere Richemont SA (Registered) | | |
Credit Suisse Group AG (Registered) (b) | | |
EMS-Chemie Holding AG (Registered) | | |
| | |
| | |
| | |
| | |
Kuehne + Nagel International AG (Registered) | | |
Lonza Group AG (Registered) | | |
Mediclinic International plc | | |
| | |
Partners Group Holding AG | | |
| | |
SEE NOTES TO FINANCIAL STATEMENTS.
| J.P. Morgan Exchange-Traded Funds | |
JPMorgan BetaBuilders Europe ETF
SCHEDULE OF PORTFOLIO INVESTMENTS
AS OF October 31, 2022 (continued)
| | |
Common Stocks — continued |
|
Schindler Holding AG (Registered) | | |
| | |
| | |
Sonova Holding AG (Registered) | | |
Straumann Holding AG (Registered) | | |
| | |
Swatch Group AG (The) (Registered) | | |
Swiss Life Holding AG (Registered) | | |
| | |
| | |
UBS Group AG (Registered) | | |
Zurich Insurance Group AG | | |
| | |
United Arab Emirates — 0.0% ^ |
| | |
|
| | |
| | |
| | |
| | |
Associated British Foods plc | | |
| | |
Auto Trader Group plc (a) | | |
| | |
| | |
B&M European Value Retail SA | | |
| | |
| | |
| | |
Berkeley Group Holdings plc | | |
| | |
British American Tobacco plc | | |
British Land Co. plc (The), REIT | | |
| | |
| | |
| | |
| | |
| | |
Coca-Cola Europacific Partners plc | | |
| | |
| | |
| | |
| | |
| | |
| | |
|
United Kingdom — continued |
Dechra Pharmaceuticals plc | | |
| | |
| | |
Direct Line Insurance Group plc | | |
| | |
| | |
| | |
| | |
| | |
| | |
| | |
| | |
| | |
| | |
| | |
| | |
InterContinental Hotels Group plc | | |
Intermediate Capital Group plc | | |
International Distributions Services plc | | |
| | |
| | |
| | |
| | |
| | |
| | |
Land Securities Group plc, REIT | | |
Legal & General Group plc | | |
| | |
London Stock Exchange Group plc | | |
| | |
| | |
| | |
| | |
| | |
| | |
| | |
| | |
| | |
Phoenix Group Holdings plc | | |
Reckitt Benckiser Group plc | | |
| | |
| | |
| | |
Rolls-Royce Holdings plc * | | |
SEE NOTES TO FINANCIAL STATEMENTS.
| J.P. Morgan Exchange-Traded Funds | |
| | |
Common Stocks — continued |
United Kingdom — continued |
| | |
| | |
| | |
| | |
| | |
| | |
Spirax-Sarco Engineering plc | | |
| | |
| | |
| | |
| | |
| | |
| | |
| | |
| | |
United Utilities Group plc | | |
| | |
| | |
| | |
| | |
| | |
| | |
|
| | |
| | |
| | |
| | |
| | |
| | |
| | |
| | |
| | |
| | |
| | |
| | |
| | |
Total Common Stocks
(Cost $4,381,041,728) | | |
Short-Term Investments — 1.2% |
Investment of Cash Collateral from Securities Loaned — 1.2% |
JPMorgan Securities Lending Money Market Fund Agency SL Class Shares, 3.23% (c) (d) | | |
| | |
|
Investment of Cash Collateral from Securities Loaned — continued |
JPMorgan U.S. Government Money Market Fund Class IM Shares, 2.85% (c) (d) | | |
Total Investment of Cash Collateral from Securities Loaned
(Cost $40,419,170) | | |
Total Investments — 100.0%
(Cost $4,421,460,898) | | |
Other Assets Less Liabilities — 0.0% ^ | | |
| | |
Percentages indicated are based on net assets. |
| |
| |
| |
| A special type of equity investment that shares in the earnings of the company, has limited voting rights, and may have a dividend preference. Preference shares may also have liquidation preference. |
| Real Estate Investment Trust |
| Limited partnership with share capital |
| |
| Amount rounds to less than 0.1% of net assets. |
| Value determined using significant unobservable inputs. | |
| Non-income producing security. | |
| Security exempt from registration pursuant to Regulation S under the Securities Act of 1933, as amended. Regulation S applies to securities offerings that are made outside of the United States and do not involve direct selling efforts in the United States and as such may have restrictions on resale. | |
| The security or a portion of this security is on loan at October 31, 2022. The total value of securities on loan at October 31, 2022 is $36,958,615. | |
| Investment in an affiliated fund, which is registered under the Investment Company Act of 1940, as amended, and is advised by J.P. Morgan Investment Management Inc. | |
| The rate shown is the current yield as of October 31, 2022. | |
SEE NOTES TO FINANCIAL STATEMENTS.
| J.P. Morgan Exchange-Traded Funds | |
JPMorgan BetaBuilders Europe ETF
SCHEDULE OF PORTFOLIO INVESTMENTS
AS OF October 31, 2022 (continued)
Summary of Investments by Industry, October 31, 2022
The following table represents the portfolio investments of the Fund by industry classifications as a percentage of total investments:
| PERCENT OF
TOTAL
INVESTMENTS |
| |
| |
Oil, Gas & Consumable Fuels | |
| |
| |
Textiles, Apparel & Luxury Goods | |
| |
Semiconductors & Semiconductor Equipment | |
| |
| |
| |
| |
| |
| |
Diversified Telecommunication Services | |
| |
| |
Health Care Equipment & Supplies | |
| |
| |
| |
| |
| |
Hotels, Restaurants & Leisure | |
| |
| |
Construction & Engineering | |
| |
Others (each less than 1.0%) | |
| |
SEE NOTES TO FINANCIAL STATEMENTS.
| J.P. Morgan Exchange-Traded Funds | |
Futures contracts outstanding as of October 31, 2022:
| | | | | VALUE AND
UNREALIZED
APPRECIATION
(DEPRECIATION) ($) |
| | | | | |
| | | | | |
| | | | | |
| | | | | |
| |
| |
| Financial Times and the London Stock Exchange |
| |
SEE NOTES TO FINANCIAL STATEMENTS.
| J.P. Morgan Exchange-Traded Funds | |
JPMorgan BetaBuilders International Equity ETF
SCHEDULE OF PORTFOLIO INVESTMENTS
AS OF October 31, 2022
| | |
|
|
| | |
| | |
| | |
| | |
| | |
| | |
Australia & New Zealand Banking Group Ltd. | | |
Bendigo & Adelaide Bank Ltd. | | |
| | |
| | |
| | |
| | |
| | |
| | |
Commonwealth Bank of Australia | | |
| | |
Domino's Pizza Enterprises Ltd. | | |
| | |
| | |
Flutter Entertainment plc * | | |
Fortescue Metals Group Ltd. | | |
| | |
| | |
| | |
Harvey Norman Holdings Ltd. | | |
| | |
| | |
| | |
Insurance Australia Group Ltd. | | |
| | |
| | |
| | |
| | |
| | |
National Australia Bank Ltd. | | |
| | |
Northern Star Resources Ltd. | | |
| | |
| | |
| | |
| | |
| | |
| | |
| | |
| | |
|
|
| | |
| | |
| | |
| | |
| | |
Seven Group Holdings Ltd. | | |
| | |
| | |
| | |
| | |
| | |
| | |
| | |
| | |
Treasury Wine Estates Ltd. | | |
| | |
Washington H Soul Pattinson & Co. Ltd. | | |
| | |
| | |
| | |
Woodside Energy Group Ltd. | | |
| | |
| | |
| | |
|
| | |
| | |
| | |
| | |
| | |
| | |
Raiffeisen Bank International AG | | |
| | |
| | |
| | |
Vienna Insurance Group AG Wiener Versicherung Gruppe | | |
| | |
| | |
|
Ackermans & van Haaren NV | | |
| | |
| | |
| | |
SEE NOTES TO FINANCIAL STATEMENTS.
| J.P. Morgan Exchange-Traded Funds | |
| | |
Common Stocks — continued |
|
| | |
| | |
Etablissements Franz Colruyt NV | | |
Groupe Bruxelles Lambert NV | | |
| | |
| | |
| | |
| | |
| | |
| | |
| | |
Warehouses De Pauw CVA, REIT | | |
| | |
|
| | |
|
| | |
|
Budweiser Brewing Co. APAC Ltd. (b) | | |
| | |
| | |
Wharf Holdings Ltd. (The) | | |
Wilmar International Ltd. | | |
Wuxi Biologics Cayman, Inc. * (b) | | |
| | |
|
AP Moller - Maersk A/S, Class A | | |
AP Moller - Maersk A/S, Class B | | |
| | |
| | |
| | |
| | |
| | |
| | |
| | |
Novo Nordisk A/S, Class B | | |
| | |
| | |
| | |
| | |
| | |
| | |
| | |
|
|
| | |
| | |
| | |
| | |
| | |
| | |
| | |
| | |
| | |
| | |
| | |
| | |
| | |
Stora Enso OYJ, Class A (a) | | |
| | |
| | |
| | |
| | |
|
| | |
| | |
| | |
| | |
| | |
| | |
| | |
| | |
| | |
| | |
| | |
| | |
| | |
| | |
| | |
| | |
Cie Generale des Etablissements Michelin SCA | | |
| | |
| | |
| | |
| | |
| | |
| | |
| | |
SEE NOTES TO FINANCIAL STATEMENTS.
| J.P. Morgan Exchange-Traded Funds | |
JPMorgan BetaBuilders International Equity ETF
SCHEDULE OF PORTFOLIO INVESTMENTS
AS OF October 31, 2022 (continued)
| | |
Common Stocks — continued |
|
| | |
| | |
| | |
| | |
| | |
| | |
| | |
| | |
| | |
| | |
LVMH Moet Hennessy Louis Vuitton SE | | |
| | |
| | |
| | |
| | |
| | |
| | |
| | |
| | |
| | |
| | |
| | |
Unibail-Rodamco-Westfield, REIT * | | |
| | |
| | |
| | |
| | |
| | |
|
| | |
| | |
| | |
| | |
| | |
Bayerische Motoren Werke AG | | |
Bayerische Motoren Werke AG (Preference) | | |
| | |
| | |
| | |
| | |
| | |
| | |
Daimler Truck Holding AG * | | |
Deutsche Bank AG (Registered) | | |
| | |
|
|
| | |
Deutsche Lufthansa AG (Registered) * | | |
Deutsche Post AG (Registered) | | |
Deutsche Telekom AG (Registered) | | |
| | |
| | |
| | |
Fresenius Medical Care AG & Co. KGaA | | |
| | |
| | |
| | |
| | |
| | |
Henkel AG & Co. KGaA (Preference) | | |
| | |
| | |
| | |
| | |
| | |
Muenchener Rueckversicherungs- Gesellschaft AG (Registered) | | |
Porsche Automobil Holding SE (Preference) | | |
| | |
| | |
| | |
Sartorius AG (Preference) | | |
| | |
| | |
Siemens Healthineers AG (b) | | |
| | |
| | |
Telefonica Deutschland Holding AG | | |
| | |
| | |
Volkswagen AG (Preference) | | |
| | |
| | |
| | |
|
| | |
| | |
CK Infrastructure Holdings Ltd. | | |
| | |
DFI Retail Group Holdings Ltd. | | |
SEE NOTES TO FINANCIAL STATEMENTS.
| J.P. Morgan Exchange-Traded Funds | |
| | |
Common Stocks — continued |
|
Hang Lung Properties Ltd. | | |
| | |
Henderson Land Development Co. Ltd. | | |
HK Electric Investments & HK Electric Investments Ltd. (b) | | |
| | |
Hong Kong & China Gas Co. Ltd. | | |
Hong Kong Exchanges & Clearing Ltd. | | |
Jardine Matheson Holdings Ltd. | | |
| | |
| | |
New World Development Co. Ltd. | | |
Power Assets Holdings Ltd. | | |
| | |
| | |
Sun Hung Kai Properties Ltd. | | |
Swire Pacific Ltd., Class B | | |
Swire Pacific Ltd., Class A | | |
| | |
Techtronic Industries Co. Ltd. | | |
| | |
Wharf Real Estate Investment Co. Ltd. | | |
| | |
|
| | |
| | |
| | |
| | |
| | |
|
| | |
| | |
| | |
Bezeq The Israeli Telecommunication Corp. Ltd. | | |
| | |
| | |
Israel Discount Bank Ltd., Class A | | |
Mizrahi Tefahot Bank Ltd. | | |
| | |
Teva Pharmaceutical Industries Ltd. * | | |
| | |
| | |
|
|
| | |
| | |
Assicurazioni Generali SpA | | |
| | |
| | |
| | |
| | |
| | |
| | |
| | |
| | |
| | |
| | |
FinecoBank Banca Fineco SpA | | |
| | |
Infrastrutture Wireless Italiane SpA (b) | | |
| | |
| | |
Mediobanca Banca di Credito Finanziario SpA | | |
| | |
| | |
| | |
| | |
| | |
Recordati Industria Chimica e Farmaceutica SpA | | |
| | |
| | |
| | |
Terna - Rete Elettrica Nazionale | | |
| | |
UnipolSai Assicurazioni SpA | | |
| | |
|
| | |
| | |
Advance Residence Investment Corp., REIT | | |
| | |
| | |
| | |
| | |
| | |
| | |
SEE NOTES TO FINANCIAL STATEMENTS.
| J.P. Morgan Exchange-Traded Funds | |
JPMorgan BetaBuilders International Equity ETF
SCHEDULE OF PORTFOLIO INVESTMENTS
AS OF October 31, 2022 (continued)
| | |
Common Stocks — continued |
|
| | |
| | |
Asahi Group Holdings Ltd. | | |
| | |
| | |
| | |
| | |
Bandai Namco Holdings, Inc. | | |
| | |
| | |
| | |
| | |
| | |
Central Japan Railway Co. | | |
| | |
Chubu Electric Power Co., Inc. | | |
Chugai Pharmaceutical Co. Ltd. | | |
Concordia Financial Group Ltd. | | |
Cosmos Pharmaceutical Corp. | | |
| | |
Dai Nippon Printing Co. Ltd. | | |
| | |
Dai-ichi Life Holdings, Inc. | | |
| | |
| | |
Daito Trust Construction Co. Ltd. | | |
Daiwa House Industry Co. Ltd. | | |
Daiwa House REIT Investment Corp., REIT | | |
Daiwa Securities Group, Inc. | | |
| | |
| | |
| | |
| | |
| | |
| | |
| | |
| | |
| | |
| | |
| | |
Fukuoka Financial Group, Inc. | | |
| | |
GMO Payment Gateway, Inc. | | |
Hakuhodo DY Holdings, Inc. | | |
| | |
|
|
| | |
Hankyu Hanshin Holdings, Inc. | | |
| | |
| | |
| | |
| | |
Hitachi Construction Machinery Co. Ltd. | | |
| | |
| | |
| | |
| | |
| | |
| | |
| | |
| | |
Iida Group Holdings Co. Ltd. | | |
| | |
| | |
| | |
Itochu Techno-Solutions Corp. | | |
Japan Airlines Co. Ltd. * | | |
Japan Airport Terminal Co. Ltd. * | | |
Japan Exchange Group, Inc. | | |
Japan Metropolitan Fund Invest, REIT | | |
Japan Post Holdings Co. Ltd. | | |
Japan Post Insurance Co. Ltd. | | |
Japan Prime Realty Investment Corp., REIT | | |
Japan Real Estate Investment Corp., REIT | | |
| | |
| | |
| | |
| | |
| | |
Kansai Electric Power Co., Inc. (The) | | |
| | |
| | |
Kawasaki Heavy Industries Ltd. | | |
| | |
| | |
Keisei Electric Railway Co. Ltd. | | |
| | |
| | |
Kintetsu Group Holdings Co. Ltd. | | |
| | |
SEE NOTES TO FINANCIAL STATEMENTS.
| J.P. Morgan Exchange-Traded Funds | |
| | |
Common Stocks — continued |
|
Kobayashi Pharmaceutical Co. Ltd. | | |
| | |
Koei Tecmo Holdings Co. Ltd. | | |
Koito Manufacturing Co. Ltd. | | |
| | |
| | |
| | |
| | |
Kurita Water Industries Ltd. | | |
| | |
| | |
Kyushu Electric Power Co., Inc. | | |
| | |
| | |
| | |
| | |
| | |
| | |
| | |
| | |
| | |
| | |
| | |
McDonald's Holdings Co. Japan Ltd. | | |
| | |
| | |
| | |
| | |
Mitsubishi Chemical Group Corp. | | |
| | |
Mitsubishi Electric Corp. | | |
Mitsubishi Estate Co. Ltd. | | |
Mitsubishi Gas Chemical Co., Inc. | | |
Mitsubishi HC Capital, Inc. | | |
Mitsubishi Heavy Industries Ltd. | | |
Mitsubishi Motors Corp. * | | |
Mitsubishi UFJ Financial Group, Inc. | | |
| | |
| | |
| | |
| | |
Mizuho Financial Group, Inc. | | |
| | |
MS&AD Insurance Group Holdings, Inc. | | |
| | |
|
|
Murata Manufacturing Co. Ltd. | | |
| | |
| | |
| | |
| | |
| | |
| | |
| | |
Nihon M&A Center Holdings, Inc. | | |
| | |
| | |
Nippon Building Fund, Inc., REIT | | |
NIPPON EXPRESS HOLDINGS, Inc. | | |
Nippon Paint Holdings Co. Ltd. | | |
Nippon Prologis REIT, Inc., REIT | | |
Nippon Sanso Holdings Corp. | | |
| | |
| | |
Nippon Telegraph & Telephone Corp. | | |
| | |
| | |
| | |
Nisshin Seifun Group, Inc. | | |
Nissin Foods Holdings Co. Ltd. | | |
| | |
| | |
| | |
Nomura Real Estate Holdings, Inc. | | |
Nomura Real Estate Master Fund, Inc., REIT | | |
Nomura Research Institute Ltd. | | |
| | |
| | |
| | |
| | |
Odakyu Electric Railway Co. Ltd. | | |
| | |
| | |
| | |
Ono Pharmaceutical Co. Ltd. | | |
Open House Group Co. Ltd. | | |
| | |
| | |
| | |
| | |
SEE NOTES TO FINANCIAL STATEMENTS.
| J.P. Morgan Exchange-Traded Funds | |
JPMorgan BetaBuilders International Equity ETF
SCHEDULE OF PORTFOLIO INVESTMENTS
AS OF October 31, 2022 (continued)
| | |
Common Stocks — continued |
|
| | |
| | |
| | |
Pan Pacific International Holdings Corp. | | |
| | |
| | |
| | |
Recruit Holdings Co. Ltd. | | |
Renesas Electronics Corp. * | | |
| | |
| | |
| | |
| | |
Santen Pharmaceutical Co. Ltd. | | |
| | |
| | |
| | |
Sega Sammy Holdings, Inc. | | |
| | |
| | |
Sekisui Chemical Co. Ltd. | | |
| | |
Seven & i Holdings Co. Ltd. | | |
| | |
| | |
| | |
| | |
| | |
Shin-Etsu Chemical Co. Ltd. | | |
| | |
| | |
| | |
Shizuoka Financial Group, Inc. | | |
| | |
| | |
| | |
| | |
| | |
| | |
| | |
Square Enix Holdings Co. Ltd. | | |
Stanley Electric Co. Ltd. | | |
| | |
| | |
| | |
|
|
Sumitomo Chemical Co. Ltd. | | |
| | |
Sumitomo Electric Industries Ltd. | | |
Sumitomo Metal Mining Co. Ltd. | | |
Sumitomo Mitsui Financial Group, Inc. | | |
Sumitomo Mitsui Trust Holdings, Inc. | | |
| | |
Sumitomo Realty & Development Co. Ltd. | | |
Suntory Beverage & Food Ltd. | | |
| | |
| | |
| | |
| | |
Taisho Pharmaceutical Holdings Co. Ltd. | | |
Takeda Pharmaceutical Co. Ltd. | | |
| | |
| | |
| | |
| | |
| | |
Tokio Marine Holdings, Inc. | | |
| | |
Tokyo Electric Power Co. Holdings, Inc. * | | |
| | |
| | |
| | |
Tokyu Fudosan Holdings Corp. | | |
| | |
| | |
| | |
| | |
| | |
| | |
| | |
| | |
| | |
| | |
| | |
| | |
United Urban Investment Corp., REIT | | |
| | |
| | |
| | |
| | |
SEE NOTES TO FINANCIAL STATEMENTS.
| J.P. Morgan Exchange-Traded Funds | |
| | |
Common Stocks — continued |
|
| | |
| | |
| | |
| | |
| | |
| | |
| | |
| | |
|
Hikma Pharmaceuticals plc | | |
|
| | |
| | |
| | |
| | |
|
Galaxy Entertainment Group Ltd. | | |
| | |
| | |
|
| | |
|
| | |
| | |
| | |
| | |
| | |
| | |
| | |
| | |
| | |
| | |
| | |
| | |
Koninklijke Ahold Delhaize NV | | |
| | |
| | |
| | |
| | |
| | |
| | |
| | |
|
|
| | |
| | |
| | |
|
Auckland International Airport Ltd. * | | |
| | |
Fisher & Paykel Healthcare Corp. Ltd. | | |
| | |
| | |
| | |
| | |
| | |
| | |
|
| | |
| | |
AutoStore Holdings Ltd. * (a) | | |
| | |
| | |
Gjensidige Forsikring ASA | | |
| | |
| | |
| | |
| | |
| | |
| | |
| | |
| | |
| | |
| | |
| | |
| | |
| | |
|
| | |
Bank Polska Kasa Opieki SA | | |
| | |
| | |
| | |
| | |
| | |
PGE Polska Grupa Energetyczna SA * | | |
Polski Koncern Naftowy ORLEN SA | | |
SEE NOTES TO FINANCIAL STATEMENTS.
| J.P. Morgan Exchange-Traded Funds | |
JPMorgan BetaBuilders International Equity ETF
SCHEDULE OF PORTFOLIO INVESTMENTS
AS OF October 31, 2022 (continued)
| | |
Common Stocks — continued |
|
Polskie Gornictwo Naftowe i Gazownictwo SA * | | |
Powszechna Kasa Oszczednosci Bank Polski SA | | |
Powszechny Zaklad Ubezpieczen SA | | |
| | |
| | |
|
EDP - Energias de Portugal SA | | |
| | |
| | |
| | |
|
| | |
|
CapitaLand Ascendas REIT, REIT | | |
CapitaLand Integrated Commercial Trust, REIT | | |
Capitaland Investment Ltd. | | |
| | |
| | |
| | |
| | |
Great Eastern Holdings Ltd. | | |
Jardine Cycle & Carriage Ltd. | | |
| | |
Mapletree Pan Asia Commercial Trust, REIT | | |
| | |
Oversea-Chinese Banking Corp. Ltd. | | |
| | |
Singapore Airlines Ltd. * | | |
| | |
Singapore Technologies Engineering Ltd. | | |
Singapore Telecommunications Ltd. | | |
| | |
United Overseas Bank Ltd. | | |
| | |
| | |
| | |
|
| | |
|
| | |
| | |
|
|
| | |
ACS Actividades de Construccion y Servicios SA | | |
| | |
| | |
Banco Bilbao Vizcaya Argentaria SA | | |
| | |
| | |
| | |
Corp. ACCIONA Energias Renovables SA | | |
| | |
| | |
| | |
| | |
| | |
Grifols SA (Preference), Class B * | | |
| | |
Industria de Diseno Textil SA (a) | | |
| | |
| | |
| | |
| | |
Siemens Gamesa Renewable Energy SA * | | |
| | |
| | |
|
| | |
| | |
| | |
| | |
| | |
| | |
| | |
| | |
Electrolux AB, Class B (a) | | |
| | |
| | |
| | |
| | |
| | |
| | |
| | |
| | |
Fastighets AB Balder, Class B * | | |
SEE NOTES TO FINANCIAL STATEMENTS.
| J.P. Morgan Exchange-Traded Funds | |
| | |
Common Stocks — continued |
|
| | |
H & M Hennes & Mauritz AB, Class B (a) | | |
| | |
| | |
| | |
| | |
Industrivarden AB, Class A (a) | | |
Industrivarden AB, Class C | | |
| | |
| | |
Investment AB Latour, Class B | | |
| | |
| | |
| | |
| | |
L E Lundbergforetagen AB, Class B | | |
| | |
Nibe Industrier AB, Class B | | |
| | |
| | |
| | |
| | |
| | |
Samhallsbyggnadsbolaget i Norden AB (a) | | |
Samhallsbyggnadsbolaget i Norden AB, Class D (a) | | |
| | |
Securitas AB, Class B (a) | | |
Skandinaviska Enskilda Banken AB, Class C | | |
Skandinaviska Enskilda Banken AB, Class A | | |
| | |
| | |
| | |
| | |
| | |
Storskogen Group AB, Class B (a) | | |
Svenska Cellulosa AB SCA, Class A | | |
Svenska Cellulosa AB SCA, Class B | | |
Svenska Handelsbanken AB, Class B (a) | | |
Svenska Handelsbanken AB, Class A | | |
| | |
| | |
| | |
Telefonaktiebolaget LM Ericsson, Class A | | |
Telefonaktiebolaget LM Ericsson, Class B | | |
| | |
|
|
| | |
| | |
| | |
| | |
| | |
| | |
| | |
|
| | |
| | |
Baloise Holding AG (Registered) | | |
Barry Callebaut AG (Registered) | | |
Chocoladefabriken Lindt & Spruengli AG | | |
Chocoladefabriken Lindt & Spruengli AG (Registered) | | |
Cie Financiere Richemont SA (Registered) | | |
Credit Suisse Group AG (Registered) (a) | | |
EMS-Chemie Holding AG (Registered) | | |
| | |
| | |
| | |
| | |
Kuehne + Nagel International AG (Registered) | | |
Lonza Group AG (Registered) | | |
Mediclinic International plc | | |
| | |
Partners Group Holding AG | | |
| | |
Schindler Holding AG (Registered) | | |
| | |
| | |
Sonova Holding AG (Registered) | | |
Straumann Holding AG (Registered) | | |
| | |
Swatch Group AG (The) (Registered) | | |
Swiss Life Holding AG (Registered) | | |
| | |
| | |
UBS Group AG (Registered) | | |
Zurich Insurance Group AG | | |
| | |
United Arab Emirates — 0.0% ^ |
| | |
SEE NOTES TO FINANCIAL STATEMENTS.
| J.P. Morgan Exchange-Traded Funds | |
JPMorgan BetaBuilders International Equity ETF
SCHEDULE OF PORTFOLIO INVESTMENTS
AS OF October 31, 2022 (continued)
| | |
Common Stocks — continued |
|
| | |
| | |
| | |
| | |
Associated British Foods plc | | |
| | |
Auto Trader Group plc (b) | | |
| | |
| | |
B&M European Value Retail SA | | |
| | |
| | |
| | |
Berkeley Group Holdings plc | | |
| | |
British American Tobacco plc | | |
British Land Co. plc (The), REIT | | |
| | |
| | |
| | |
| | |
CK Hutchison Holdings Ltd. | | |
| | |
Coca-Cola Europacific Partners plc | | |
| | |
| | |
| | |
| | |
| | |
Dechra Pharmaceuticals plc | | |
| | |
| | |
Direct Line Insurance Group plc | | |
| | |
| | |
| | |
| | |
| | |
| | |
| | |
| | |
| | |
| | |
| | |
| | |
|
United Kingdom — continued |
| | |
InterContinental Hotels Group plc | | |
Intermediate Capital Group plc | | |
International Distributions Services plc | | |
| | |
| | |
| | |
| | |
| | |
| | |
Land Securities Group plc, REIT | | |
Legal & General Group plc | | |
| | |
London Stock Exchange Group plc | | |
| | |
| | |
| | |
| | |
| | |
| | |
| | |
| | |
| | |
Phoenix Group Holdings plc | | |
Reckitt Benckiser Group plc | | |
| | |
| | |
| | |
Rolls-Royce Holdings plc * | | |
| | |
| | |
| | |
| | |
| | |
| | |
Spirax-Sarco Engineering plc | | |
| | |
| | |
| | |
| | |
| | |
| | |
| | |
| | |
SEE NOTES TO FINANCIAL STATEMENTS.
| J.P. Morgan Exchange-Traded Funds | |
| | |
Common Stocks — continued |
United Kingdom — continued |
United Utilities Group plc | | |
| | |
| | |
| | |
| | |
| | |
| | |
|
| | |
| | |
| | |
| | |
| | |
James Hardie Industries plc, CHDI | | |
| | |
| | |
| | |
| | |
| | |
| | |
| | |
| | |
| | |
| | |
Total Common Stocks
(Cost $2,967,992,598) | | |
Short-Term Investments — 1.1% |
Investment Companies — 0.4% |
JPMorgan U.S. Government Money Market Fund Class IM Shares, 2.85% (c) (d)(Cost $12,102,999) | | |
Investment of Cash Collateral from Securities Loaned — 0.7% |
JPMorgan Securities Lending Money Market Fund Agency SL Class Shares, 3.23% (c) (d) | | |
JPMorgan U.S. Government Money Market Fund Class IM Shares, 2.85% (c) (d) | | |
Total Investment of Cash Collateral from Securities Loaned
(Cost $17,862,441) | | |
Total Short-Term Investments
(Cost $29,965,440) | | |
| | |
Total Investments — 100.1%
(Cost $2,997,958,038) | | |
Liabilities in Excess of Other Assets — (0.1)% | | |
| | |
Percentages indicated are based on net assets. |
| |
| |
| Clearing House Electronic Subregister System (CHESS) Depository Interest |
| |
| |
| A special type of equity investment that shares in the earnings of the company, has limited voting rights, and may have a dividend preference. Preference shares may also have liquidation preference. |
| Real Estate Investment Trust |
| Limited partnership with share capital |
| |
| Amount rounds to less than 0.1% of net assets. |
| Value determined using significant unobservable inputs. | |
| Non-income producing security. | |
| The security or a portion of this security is on loan at October 31, 2022. The total value of securities on loan at October 31, 2022 is $16,847,367. | |
| Security exempt from registration pursuant to Regulation S under the Securities Act of 1933, as amended. Regulation S applies to securities offerings that are made outside of the United States and do not involve direct selling efforts in the United States and as such may have restrictions on resale. | |
| Investment in an affiliated fund, which is registered under the Investment Company Act of 1940, as amended, and is advised by J.P. Morgan Investment Management Inc. | |
| The rate shown is the current yield as of October 31, 2022. | |
SEE NOTES TO FINANCIAL STATEMENTS.
| J.P. Morgan Exchange-Traded Funds | |
JPMorgan BetaBuilders International Equity ETF
SCHEDULE OF PORTFOLIO INVESTMENTS
AS OF October 31, 2022 (continued)
Summary of Investments by Industry, October 31, 2022
The following table represents the portfolio investments of the Fund by industry classifications as a percentage of total investments:
| PERCENT OF
TOTAL
INVESTMENTS |
| |
| |
Oil, Gas & Consumable Fuels | |
| |
| |
| |
| |
| |
| |
Textiles, Apparel & Luxury Goods | |
Semiconductors & Semiconductor Equipment | |
| |
Health Care Equipment & Supplies | |
| |
Diversified Telecommunication Services | |
| |
Trading Companies & Distributors | |
| |
| |
| |
| |
Electronic Equipment, Instruments & Components | |
| |
| |
| |
Real Estate Management & Development | |
Hotels, Restaurants & Leisure | |
| |
Equity Real Estate Investment Trusts (REITs) | |
Wireless Telecommunication Services | |
| |
| |
| |
| |
Others (each less than 1.0%) | |
| |
SEE NOTES TO FINANCIAL STATEMENTS.
| J.P. Morgan Exchange-Traded Funds | |
Futures contracts outstanding as of October 31, 2022:
| | | | | VALUE AND
UNREALIZED
APPRECIATION
(DEPRECIATION) ($) |
| | | | | |
| | | | | |
| |
| Europe, Australasia and Far East |
| Morgan Stanley Capital International |
| |
SEE NOTES TO FINANCIAL STATEMENTS.
| J.P. Morgan Exchange-Traded Funds | |
JPMorgan BetaBuilders Japan ETF
SCHEDULE OF PORTFOLIO INVESTMENTS
AS OF October 31, 2022
| | |
|
Air Freight & Logistics — 0.5% |
NIPPON EXPRESS HOLDINGS, Inc. | | |
| | |
| | |
| | |
|
| | |
Japan Airlines Co. Ltd. * | | |
| | |
|
| | |
| | |
| | |
Koito Manufacturing Co. Ltd. | | |
| | |
Stanley Electric Co. Ltd. | | |
Sumitomo Electric Industries Ltd. | | |
| | |
| | |
|
| | |
| | |
| | |
Mitsubishi Motors Corp. * | | |
| | |
| | |
| | |
| | |
| | |
| | |
|
| | |
| | |
Concordia Financial Group Ltd. | | |
Fukuoka Financial Group, Inc. | | |
Mitsubishi UFJ Financial Group, Inc. | | |
Mizuho Financial Group, Inc. | | |
| | |
| | |
Shizuoka Financial Group, Inc. | | |
Sumitomo Mitsui Financial Group, Inc. | | |
Sumitomo Mitsui Trust Holdings, Inc. | | |
| | |
| | |
|
|
Asahi Group Holdings Ltd. | | |
| | |
Suntory Beverage & Food Ltd. | | |
| | |
|
| | |
| | |
| | |
| | |
| | |
|
Daiwa Securities Group, Inc. | | |
Japan Exchange Group, Inc. | | |
| | |
| | |
| | |
|
| | |
| | |
| | |
| | |
Mitsubishi Chemical Group Corp. | | |
Mitsubishi Gas Chemical Co., Inc. | | |
| | |
Nippon Paint Holdings Co. Ltd. (a) | | |
Nippon Sanso Holdings Corp. | | |
| | |
| | |
Shin-Etsu Chemical Co. Ltd. | | |
| | |
Sumitomo Chemical Co. Ltd. | | |
| | |
| | |
| | |
Commercial Services & Supplies — 0.7% |
Dai Nippon Printing Co. Ltd. | | |
| | |
| | |
| | |
Construction & Engineering — 0.6% |
| | |
| | |
SEE NOTES TO FINANCIAL STATEMENTS.
| J.P. Morgan Exchange-Traded Funds | |
| | |
Common Stocks — continued |
Construction & Engineering — continued |
| | |
| | |
| | |
|
| | |
| | |
| | |
Diversified Financial Services — 0.7% |
Mitsubishi HC Capital, Inc. | | |
| | |
| | |
| | |
Diversified Telecommunication Services — 1.0% |
Nippon Telegraph & Telephone Corp. | | |
Electric Utilities — 0.5% |
Chubu Electric Power Co., Inc. | | |
Kansai Electric Power Co., Inc. (The) | | |
Kyushu Electric Power Co., Inc. | | |
Tokyo Electric Power Co. Holdings, Inc. * | | |
| | |
Electrical Equipment — 1.7% |
| | |
Mitsubishi Electric Corp. | | |
| | |
| | |
Electronic Equipment, Instruments & Components — 5.3% |
| | |
| | |
| | |
| | |
| | |
Murata Manufacturing Co. Ltd. | | |
| | |
| | |
| | |
| | |
| | |
|
| | |
Koei Tecmo Holdings Co. Ltd. | | |
| | |
| | |
|
Entertainment — continued |
| | |
| | |
Square Enix Holdings Co. Ltd. | | |
| | |
| | |
Equity Real Estate Investment Trusts (REITs) — 1.6% |
Advance Residence Investment Corp. | | |
Daiwa House REIT Investment Corp. | | |
| | |
Japan Metropolitan Fund Invest | | |
Japan Prime Realty Investment Corp. | | |
Japan Real Estate Investment Corp. | | |
Nippon Building Fund, Inc. | | |
Nippon Prologis REIT, Inc. | | |
Nomura Real Estate Master Fund, Inc. | | |
| | |
United Urban Investment Corp. | | |
| | |
Food & Staples Retailing — 1.9% |
| | |
Cosmos Pharmaceutical Corp. | | |
| | |
| | |
| | |
Seven & i Holdings Co. Ltd. | | |
| | |
| | |
|
| | |
| | |
| | |
| | |
Nisshin Seifun Group, Inc. | | |
Nissin Foods Holdings Co. Ltd. | | |
| | |
| | |
| | |
|
| | |
| | |
| | |
SEE NOTES TO FINANCIAL STATEMENTS.
| J.P. Morgan Exchange-Traded Funds | |
JPMorgan BetaBuilders Japan ETF
SCHEDULE OF PORTFOLIO INVESTMENTS
AS OF October 31, 2022 (continued)
| | |
Common Stocks — continued |
Health Care Equipment & Supplies — 3.0% |
Asahi Intecc Co. Ltd. (a) | | |
| | |
| | |
| | |
| | |
| | |
Health Care Providers & Services — 0.2% |
| | |
| | |
| | |
Health Care Technology — 0.4% |
| | |
Hotels, Restaurants & Leisure — 1.1% |
McDonald's Holdings Co. Japan Ltd. | | |
| | |
| | |
Household Durables — 4.1% |
| | |
Iida Group Holdings Co. Ltd. | | |
| | |
Open House Group Co. Ltd. | | |
| | |
| | |
Sekisui Chemical Co. Ltd. | | |
| | |
| | |
| | |
| | |
Household Products — 0.5% |
| | |
| | |
| | |
Industrial Conglomerates — 1.8% |
| | |
| | |
| | |
|
Dai-ichi Life Holdings, Inc. | | |
Japan Post Holdings Co. Ltd. | | |
Japan Post Insurance Co. Ltd. | | |
MS&AD Insurance Group Holdings, Inc. | | |
| | |
|
|
| | |
| | |
Tokio Marine Holdings, Inc. | | |
| | |
Interactive Media & Services — 0.3% |
| | |
| | |
| | |
Internet & Direct Marketing Retail — 0.2% |
| | |
| | |
| | |
|
| | |
GMO Payment Gateway, Inc. | | |
Itochu Techno-Solutions Corp. | | |
| | |
Nomura Research Institute Ltd. | | |
| | |
| | |
| | |
| | |
| | |
| | |
|
Bandai Namco Holdings, Inc. | | |
Sega Sammy Holdings, Inc. | | |
| | |
| | |
| | |
|
| | |
| | |
| | |
Hitachi Construction Machinery Co. Ltd. | | |
| | |
Kawasaki Heavy Industries Ltd. | | |
| | |
| | |
Kurita Water Industries Ltd. | | |
| | |
| | |
SEE NOTES TO FINANCIAL STATEMENTS.
| J.P. Morgan Exchange-Traded Funds | |
| | |
Common Stocks — continued |
|
| | |
Mitsubishi Heavy Industries Ltd. | | |
| | |
| | |
| | |
| | |
| | |
| | |
|
Mitsui OSK Lines Ltd. (a) | | |
| | |
| | |
|
| | |
| | |
Hakuhodo DY Holdings, Inc. | | |
| | |
|
| | |
| | |
| | |
Sumitomo Metal Mining Co. Ltd. | | |
| | |
|
Pan Pacific International Holdings Corp. | | |
Oil, Gas & Consumable Fuels — 0.8% |
| | |
| | |
| | |
| | |
Paper & Forest Products — 0.1% |
| | |
|
| | |
Kobayashi Pharmaceutical Co. Ltd. (a) | | |
| | |
| | |
| | |
|
| | |
Chugai Pharmaceutical Co. Ltd. | | |
| | |
|
Pharmaceuticals — continued |
| | |
| | |
| | |
| | |
Ono Pharmaceutical Co. Ltd. | | |
| | |
Santen Pharmaceutical Co. Ltd. | | |
| | |
| | |
Taisho Pharmaceutical Holdings Co. Ltd. | | |
Takeda Pharmaceutical Co. Ltd. | | |
| | |
Professional Services — 1.8% |
Nihon M&A Center Holdings, Inc. | | |
| | |
Recruit Holdings Co. Ltd. | | |
| | |
Real Estate Management & Development — 2.3% |
Daito Trust Construction Co. Ltd. | | |
Daiwa House Industry Co. Ltd. | | |
| | |
Mitsubishi Estate Co. Ltd. | | |
| | |
Nomura Real Estate Holdings, Inc. | | |
Sumitomo Realty & Development Co. Ltd. | | |
Tokyu Fudosan Holdings Corp. | | |
| | |
|
Central Japan Railway Co. | | |
| | |
Hankyu Hanshin Holdings, Inc. | | |
| | |
Keisei Electric Railway Co. Ltd. | | |
Kintetsu Group Holdings Co. Ltd. (a) | | |
| | |
| | |
Odakyu Electric Railway Co. Ltd. (a) | | |
| | |
| | |
| | |
| | |
| | |
SEE NOTES TO FINANCIAL STATEMENTS.
| J.P. Morgan Exchange-Traded Funds | |
JPMorgan BetaBuilders Japan ETF
SCHEDULE OF PORTFOLIO INVESTMENTS
AS OF October 31, 2022 (continued)
| | |
Common Stocks — continued |
Semiconductors & Semiconductor Equipment — 2.8% |
| | |
| | |
| | |
Renesas Electronics Corp. * | | |
| | |
| | |
| | |
| | |
|
| | |
| | |
| | |
|
| | |
| | |
| | |
| | |
| | |
| | |
Technology Hardware, Storage & Peripherals — 1.7% |
| | |
| | |
| | |
| | |
| | |
| | |
Textiles, Apparel & Luxury Goods — 0.1% |
| | |
|
| | |
Trading Companies & Distributors — 4.9% |
| | |
| | |
| | |
| | |
| | |
| | |
|
Trading Companies & Distributors — continued |
| | |
| | |
| | |
| | |
Transportation Infrastructure — 0.1% |
Japan Airport Terminal Co. Ltd. * | | |
Wireless Telecommunication Services — 3.8% |
| | |
| | |
| | |
| | |
Total Common Stocks
(Cost $7,775,017,695) | | |
Short-Term Investments — 0.3% |
Investment of Cash Collateral from Securities Loaned — 0.3% |
JPMorgan Securities Lending Money Market Fund Agency SL Class Shares, 3.23% (b) (c) | | |
JPMorgan U.S. Government Money Market Fund Class IM Shares, 2.85% (b) (c) | | |
Total Investment of Cash Collateral from Securities Loaned
(Cost $19,895,882) | | |
Total Investments — 99.2%
(Cost $7,794,913,577) | | |
Other Assets Less Liabilities — 0.8% | | |
| | |
Percentages indicated are based on net assets. |
| Non-income producing security. |
| The security or a portion of this security is on loan at October 31, 2022. The total value of securities on loan at October 31, 2022 is $18,722,079. |
| Investment in an affiliated fund, which is registered under the Investment Company Act of 1940, as amended, and is advised by J.P. Morgan Investment Management Inc. |
| The rate shown is the current yield as of October 31, 2022. |
SEE NOTES TO FINANCIAL STATEMENTS.
| J.P. Morgan Exchange-Traded Funds | |
Futures contracts outstanding as of October 31, 2022:
| | | | | VALUE AND
UNREALIZED
APPRECIATION
(DEPRECIATION) ($) |
| | | | | |
| | | | | |
SEE NOTES TO FINANCIAL STATEMENTS.
| J.P. Morgan Exchange-Traded Funds | |
JPMorgan BetaBuilders U.S. Equity ETF
SCHEDULE OF PORTFOLIO INVESTMENTS
AS OF October 31, 2022
| | |
|
Aerospace & Defense — 1.7% |
| | |
| | |
| | |
| | |
| | |
Huntington Ingalls Industries, Inc. | | |
L3Harris Technologies, Inc. | | |
| | |
| | |
Raytheon Technologies Corp. | | |
| | |
| | |
| | |
Air Freight & Logistics — 0.6% |
CH Robinson Worldwide, Inc. | | |
Expeditors International of Washington, Inc. | | |
| | |
United Parcel Service, Inc., Class B | | |
| | |
|
| | |
| | |
United Airlines Holdings, Inc. * | | |
| | |
|
| | |
| | |
| | |
| | |
|
| | |
| | |
| | |
Rivian Automotive, Inc., Class A * (a) | | |
| | |
| | |
|
| | |
| | |
Citizens Financial Group, Inc. | | |
| | |
| | |
| | |
|
|
| | |
| | |
Huntington Bancshares, Inc. | | |
| | |
| | |
| | |
PNC Financial Services Group, Inc. (The) | | |
| | |
| | |
| | |
| | |
| | |
| | |
| | |
| | |
|
Brown-Forman Corp., Class A | | |
Brown-Forman Corp., Class B | | |
| | |
Constellation Brands, Inc., Class A | | |
| | |
Molson Coors Beverage Co., Class B | | |
| | |
| | |
| | |
|
| | |
Alnylam Pharmaceuticals, Inc. * | | |
| | |
| | |
BioMarin Pharmaceutical, Inc. * | | |
| | |
| | |
Horizon Therapeutics plc * | | |
| | |
| | |
Neurocrine Biosciences, Inc. * | | |
Regeneron Pharmaceuticals, Inc. * | | |
| | |
Vertex Pharmaceuticals, Inc. * | | |
| | |
|
| | |
SEE NOTES TO FINANCIAL STATEMENTS.
| J.P. Morgan Exchange-Traded Funds | |
| | |
Common Stocks — continued |
Building Products — continued |
| | |
Fortune Brands Home & Security, Inc. | | |
Johnson Controls International plc | | |
Lennox International, Inc. | | |
| | |
| | |
| | |
| | |
|
Ameriprise Financial, Inc. | | |
Bank of New York Mellon Corp. (The) | | |
| | |
| | |
Carlyle Group, Inc. (The) | | |
Charles Schwab Corp. (The) | | |
| | |
Coinbase Global, Inc., Class A * | | |
FactSet Research Systems, Inc. | | |
| | |
Goldman Sachs Group, Inc. (The) | | |
Intercontinental Exchange, Inc. | | |
| | |
Jefferies Financial Group, Inc. | | |
| | |
MarketAxess Holdings, Inc. | | |
| | |
| | |
| | |
| | |
| | |
Raymond James Financial, Inc. | | |
| | |
| | |
| | |
T. Rowe Price Group, Inc. | | |
| | |
|
Air Products and Chemicals, Inc. | | |
| | |
| | |
CF Industries Holdings, Inc. | | |
| | |
| | |
| | |
|
|
| | |
| | |
| | |
| | |
International Flavors & Fragrances, Inc. | | |
Linde plc (United Kingdom) | | |
LyondellBasell Industries NV, Class A | | |
| | |
| | |
Sherwin-Williams Co. (The) | | |
| | |
| | |
Commercial Services & Supplies — 0.5% |
| | |
| | |
| | |
| | |
| | |
| | |
Communications Equipment — 0.8% |
| | |
| | |
| | |
| | |
| | |
| | |
Construction & Engineering — 0.1% |
| | |
Construction Materials — 0.1% |
Martin Marietta Materials, Inc. | | |
| | |
| | |
|
| | |
| | |
Capital One Financial Corp. | | |
Discover Financial Services | | |
| | |
| | |
Containers & Packaging — 0.3% |
| | |
| | |
SEE NOTES TO FINANCIAL STATEMENTS.
| J.P. Morgan Exchange-Traded Funds | |
JPMorgan BetaBuilders U.S. Equity ETF
SCHEDULE OF PORTFOLIO INVESTMENTS
AS OF October 31, 2022 (continued)
| | |
Common Stocks — continued |
Containers & Packaging — continued |
| | |
| | |
| | |
Packaging Corp. of America | | |
| | |
| | |
| | |
|
| | |
| | |
| | |
| | |
Diversified Financial Services — 1.7% |
Apollo Global Management, Inc. | | |
Berkshire Hathaway, Inc., Class B * | | |
| | |
| | |
| | |
Diversified Telecommunication Services — 0.9% |
| | |
| | |
Verizon Communications, Inc. | | |
| | |
Electric Utilities — 1.8% |
| | |
American Electric Power Co., Inc. | | |
| | |
Constellation Energy Corp. | | |
| | |
| | |
| | |
| | |
| | |
| | |
| | |
| | |
| | |
| | |
Pinnacle West Capital Corp. | | |
| | |
| | |
|
Electric Utilities — continued |
| | |
| | |
| | |
Electrical Equipment — 0.6% |
| | |
| | |
| | |
| | |
| | |
| | |
Rockwell Automation, Inc. | | |
Sensata Technologies Holding plc | | |
| | |
Electronic Equipment, Instruments & Components — 0.7% |
| | |
| | |
| | |
| | |
| | |
Keysight Technologies, Inc. * | | |
TE Connectivity Ltd. (Switzerland) | | |
Teledyne Technologies, Inc. * | | |
| | |
Zebra Technologies Corp., Class A * | | |
| | |
Energy Equipment & Services — 0.4% |
| | |
| | |
| | |
| | |
|
Activision Blizzard, Inc. | | |
AMC Entertainment Holdings, Inc., Class A * (a) | | |
| | |
Live Nation Entertainment, Inc. * | | |
| | |
| | |
| | |
Take-Two Interactive Software, Inc. * | | |
SEE NOTES TO FINANCIAL STATEMENTS.
| J.P. Morgan Exchange-Traded Funds | |
| | |
Common Stocks — continued |
Entertainment — continued |
| | |
Warner Bros Discovery, Inc. * | | |
| | |
Equity Real Estate Investment Trusts (REITs) — 2.6% |
Alexandria Real Estate Equities, Inc. | | |
| | |
AvalonBay Communities, Inc. | | |
| | |
| | |
| | |
Digital Realty Trust, Inc. | | |
| | |
Equity LifeStyle Properties, Inc. | | |
| | |
Essex Property Trust, Inc. | | |
Extra Space Storage, Inc. | | |
Federal Realty Investment Trust | | |
Healthpeak Properties, Inc. | | |
Host Hotels & Resorts, Inc. | | |
| | |
| | |
| | |
Mid-America Apartment Communities, Inc. | | |
| | |
| | |
| | |
| | |
| | |
Simon Property Group, Inc. | | |
| | |
| | |
| | |
| | |
| | |
| | |
| | |
| | |
| | |
Food & Staples Retailing — 1.5% |
Albertsons Cos., Inc., Class A | | |
| | |
| | |
| | |
| | |
|
Food & Staples Retailing — continued |
Walgreens Boots Alliance, Inc. | | |
| | |
| | |
|
Archer-Daniels-Midland Co. | | |
| | |
| | |
| | |
| | |
| | |
| | |
| | |
| | |
| | |
Lamb Weston Holdings, Inc. | | |
McCormick & Co., Inc. (Non-Voting) | | |
Mondelez International, Inc., Class A | | |
Tyson Foods, Inc., Class A | | |
| | |
|
| | |
| | |
| | |
Health Care Equipment & Supplies — 2.6% |
| | |
| | |
| | |
Baxter International, Inc. | | |
| | |
Boston Scientific Corp. * | | |
| | |
| | |
| | |
Edwards Lifesciences Corp. * | | |
| | |
IDEXX Laboratories, Inc. * | | |
| | |
Intuitive Surgical, Inc. * | | |
| | |
| | |
| | |
| | |
| | |
SEE NOTES TO FINANCIAL STATEMENTS.
| J.P. Morgan Exchange-Traded Funds | |
JPMorgan BetaBuilders U.S. Equity ETF
SCHEDULE OF PORTFOLIO INVESTMENTS
AS OF October 31, 2022 (continued)
| | |
Common Stocks — continued |
Health Care Equipment & Supplies — continued |
| | |
Zimmer Biomet Holdings, Inc. | | |
| | |
Health Care Providers & Services — 3.6% |
| | |
| | |
| | |
| | |
| | |
| | |
| | |
| | |
| | |
| | |
| | |
Laboratory Corp. of America Holdings | | |
| | |
Molina Healthcare, Inc. * | | |
| | |
| | |
Universal Health Services, Inc., Class B | | |
| | |
Health Care Technology — 0.1% |
Veeva Systems, Inc., Class A * | | |
Hotels, Restaurants & Leisure — 2.0% |
| | |
| | |
| | |
Caesars Entertainment, Inc. * | | |
| | |
Chipotle Mexican Grill, Inc. * | | |
| | |
| | |
| | |
Hilton Worldwide Holdings, Inc. | | |
| | |
Marriott International, Inc., Class A | | |
| | |
MGM Resorts International | | |
Royal Caribbean Cruises Ltd. * (a) | | |
| | |
| | |
| | |
|
Hotels, Restaurants & Leisure — continued |
| | |
| | |
| | |
Household Durables — 0.3% |
| | |
| | |
| | |
| | |
Mohawk Industries, Inc. * | | |
| | |
| | |
| | |
| | |
| | |
Household Products — 1.3% |
Church & Dwight Co., Inc. | | |
| | |
| | |
| | |
Procter & Gamble Co. (The) | | |
| | |
Independent Power and Renewable Electricity Producers — 0.1% |
| | |
| | |
| | |
Industrial Conglomerates — 0.9% |
| | |
| | |
Honeywell International, Inc. | | |
| | |
|
| | |
| | |
American Financial Group, Inc. | | |
American International Group, Inc. | | |
| | |
Arch Capital Group Ltd. * | | |
| | |
| | |
| | |
Cincinnati Financial Corp. | | |
| | |
SEE NOTES TO FINANCIAL STATEMENTS.
| J.P. Morgan Exchange-Traded Funds | |
| | |
Common Stocks — continued |
|
Fidelity National Financial, Inc. | | |
| | |
Hartford Financial Services Group, Inc. (The) | | |
| | |
| | |
| | |
Marsh & McLennan Cos., Inc. | | |
| | |
Principal Financial Group, Inc. | | |
| | |
Prudential Financial, Inc. | | |
Reinsurance Group of America, Inc. | | |
Travelers Cos., Inc. (The) | | |
| | |
| | |
| | |
Interactive Media & Services — 3.9% |
Alphabet, Inc., Class A * | | |
Alphabet, Inc., Class C * | | |
| | |
| | |
Meta Platforms, Inc., Class A * | | |
Pinterest, Inc., Class A * | | |
| | |
ZoomInfo Technologies, Inc., Class A * | | |
| | |
Internet & Direct Marketing Retail — 2.9% |
| | |
DoorDash, Inc., Class A * | | |
| | |
| | |
MercadoLibre, Inc. (Brazil) * | | |
| | |
|
| | |
Akamai Technologies, Inc. * | | |
Automatic Data Processing, Inc. | | |
| | |
Broadridge Financial Solutions, Inc. | | |
Cloudflare, Inc., Class A * | | |
Cognizant Technology Solutions Corp., Class A | | |
| | |
| | |
| | |
|
|
Fidelity National Information Services, Inc. | | |
| | |
FleetCor Technologies, Inc. * | | |
| | |
| | |
| | |
International Business Machines Corp. | | |
Jack Henry & Associates, Inc. | | |
Mastercard, Inc., Class A | | |
| | |
| | |
| | |
| | |
Snowflake, Inc., Class A * | | |
SS&C Technologies Holdings, Inc. | | |
| | |
| | |
| | |
| | |
Leisure Products — 0.0% ^ |
| | |
Life Sciences Tools & Services — 1.8% |
Agilent Technologies, Inc. | | |
| | |
Bio-Rad Laboratories, Inc., Class A * | | |
| | |
Charles River Laboratories International, Inc. * | | |
| | |
| | |
| | |
Mettler-Toledo International, Inc. * | | |
| | |
Thermo Fisher Scientific, Inc. | | |
| | |
West Pharmaceutical Services, Inc. | | |
| | |
|
| | |
| | |
| | |
| | |
| | |
| | |
SEE NOTES TO FINANCIAL STATEMENTS.
| J.P. Morgan Exchange-Traded Funds | |
JPMorgan BetaBuilders U.S. Equity ETF
SCHEDULE OF PORTFOLIO INVESTMENTS
AS OF October 31, 2022 (continued)
| | |
Common Stocks — continued |
|
Illinois Tool Works, Inc. | | |
| | |
| | |
| | |
| | |
| | |
| | |
Stanley Black & Decker, Inc. | | |
Westinghouse Air Brake Technologies Corp. | | |
| | |
| | |
|
Charter Communications, Inc., Class A * | | |
| | |
DISH Network Corp., Class A * | | |
| | |
| | |
Interpublic Group of Cos., Inc. (The) | | |
Liberty Broadband Corp., Class A * | | |
Liberty Broadband Corp., Class C * | | |
Liberty Media Corp.-Liberty SiriusXM, Class A * | | |
Liberty Media Corp.-Liberty SiriusXM, Class C * | | |
| | |
| | |
| | |
Paramount Global, Class A | | |
Paramount Global, Class B | | |
Sirius XM Holdings, Inc. (a) | | |
Trade Desk, Inc. (The), Class A * | | |
| | |
|
| | |
| | |
| | |
Southern Copper Corp. (Peru) | | |
| | |
| | |
Mortgage Real Estate Investment Trusts (REITs) — 0.0% ^ |
Annaly Capital Management, Inc. | | |
|
| | |
| | |
|
Multiline Retail — continued |
| | |
| | |
| | |
|
| | |
| | |
| | |
Consolidated Edison, Inc. | | |
| | |
| | |
| | |
Public Service Enterprise Group, Inc. | | |
| | |
| | |
| | |
Oil, Gas & Consumable Fuels — 4.8% |
| | |
| | |
| | |
Continental Resources, Inc. | | |
| | |
| | |
| | |
| | |
| | |
| | |
| | |
| | |
| | |
Occidental Petroleum Corp. | | |
| | |
| | |
Pioneer Natural Resources Co. | | |
| | |
| | |
| | |
Williams Cos., Inc. (The) | | |
| | |
|
Estee Lauder Cos., Inc. (The), Class A | | |
| | |
| | |
SEE NOTES TO FINANCIAL STATEMENTS.
| J.P. Morgan Exchange-Traded Funds | |
| | |
Common Stocks — continued |
|
| | |
| | |
Elanco Animal Health, Inc. * | | |
| | |
Jazz Pharmaceuticals plc * | | |
| | |
| | |
| | |
Royalty Pharma plc, Class A | | |
| | |
| | |
| | |
Professional Services — 0.4% |
| | |
| | |
Dun & Bradstreet Holdings, Inc. | | |
| | |
| | |
| | |
| | |
| | |
| | |
Real Estate Management & Development — 0.1% |
CBRE Group, Inc., Class A * | | |
Zillow Group, Inc., Class A * | | |
Zillow Group, Inc., Class C * | | |
| | |
|
| | |
JB Hunt Transport Services, Inc. | | |
| | |
| | |
Old Dominion Freight Line, Inc. | | |
Uber Technologies, Inc. * | | |
| | |
| | |
Semiconductors & Semiconductor Equipment — 4.6% |
Advanced Micro Devices, Inc. * | | |
| | |
| | |
| | |
| | |
| | |
|
Semiconductors & Semiconductor Equipment — continued |
| | |
| | |
| | |
| | |
| | |
Microchip Technology, Inc. | | |
| | |
Monolithic Power Systems, Inc. | | |
| | |
NXP Semiconductors NV (China) | | |
| | |
| | |
| | |
| | |
SolarEdge Technologies, Inc. * | | |
| | |
| | |
| | |
|
| | |
| | |
AppLovin Corp., Class A * | | |
| | |
Bentley Systems, Inc., Class B | | |
Bill.com Holdings, Inc. * | | |
Cadence Design Systems, Inc. * | | |
Ceridian HCM Holding, Inc. * | | |
Crowdstrike Holdings, Inc., Class A * | | |
| | |
| | |
| | |
| | |
| | |
| | |
| | |
| | |
| | |
Palantir Technologies, Inc., Class A * | | |
Palo Alto Networks, Inc. * | | |
| | |
Paylocity Holding Corp. * | | |
| | |
RingCentral, Inc., Class A * | | |
| | |
SEE NOTES TO FINANCIAL STATEMENTS.
| J.P. Morgan Exchange-Traded Funds | |
JPMorgan BetaBuilders U.S. Equity ETF
SCHEDULE OF PORTFOLIO INVESTMENTS
AS OF October 31, 2022 (continued)
| | |
Common Stocks — continued |
|
| | |
| | |
| | |
| | |
Tyler Technologies, Inc. * | | |
| | |
Unity Software, Inc. * (a) | | |
| | |
| | |
Zoom Video Communications, Inc., Class A * | | |
| | |
| | |
|
| | |
| | |
| | |
| | |
Burlington Stores, Inc. * | | |
| | |
| | |
| | |
O'Reilly Automotive, Inc. * | | |
| | |
| | |
| | |
| | |
| | |
Technology Hardware, Storage & Peripherals — 7.0% |
| | |
Dell Technologies, Inc., Class C | | |
Hewlett Packard Enterprise Co. | | |
| | |
| | |
Seagate Technology Holdings plc | | |
| | |
| | |
Textiles, Apparel & Luxury Goods — 0.5% |
Lululemon Athletica, Inc. * | | |
| | |
| | |
| | |
| | |
| | |
|
|
| | |
Philip Morris International, Inc. | | |
| | |
Trading Companies & Distributors — 0.2% |
| | |
| | |
| | |
| | |
| | |
|
American Water Works Co., Inc. | | |
Wireless Telecommunication Services — 0.3% |
| | |
Total Common Stocks
(Cost $1,332,143,636) | | |
Short-Term Investments — 1.0% |
Investment Companies — 0.7% |
JPMorgan U.S. Government Money Market Fund Class IM Shares, 2.85% (c) (d)
(Cost $8,865,488) | | |
Investment of Cash Collateral from Securities Loaned — 0.3% |
JPMorgan Securities Lending Money Market Fund Agency SL Class Shares, 3.23% (c) (d) | | |
JPMorgan U.S. Government Money Market Fund Class IM Shares, 2.85% (c) (d) | | |
Total Investment of Cash Collateral from Securities Loaned
(Cost $3,739,695) | | |
Total Short-Term Investments
(Cost $12,605,183) | | |
Total Investments — 100.2%
(Cost $1,344,748,819) | | |
Liabilities in Excess of Other Assets — (0.2)% | | |
| | |
Percentages indicated are based on net assets. |
| Amount rounds to less than 0.1% of net assets. |
| Non-income producing security. | |
| The security or a portion of this security is on loan at October 31, 2022. The total value of securities on loan at October 31, 2022 is $2,190,898. | |
SEE NOTES TO FINANCIAL STATEMENTS.
| J.P. Morgan Exchange-Traded Funds | |
| Investment in affiliate. This security is included in an index in which the Fund, as an index fund, tracks. | |
| Investment in an affiliated fund, which is registered under the Investment Company Act of 1940, as amended, and is advised by J.P. Morgan Investment Management Inc. | |
| The rate shown is the current yield as of October 31, 2022. | |
Futures contracts outstanding as of October 31, 2022:
| | | | | VALUE AND
UNREALIZED
APPRECIATION
(DEPRECIATION) ($) |
| | | | | |
| | | | | |
SEE NOTES TO FINANCIAL STATEMENTS.
| J.P. Morgan Exchange-Traded Funds | |
JPMorgan BetaBuilders U.S. Mid Cap Equity ETF
SCHEDULE OF PORTFOLIO INVESTMENTS
AS OF October 31, 2022
| | |
|
Aerospace & Defense — 1.4% |
| | |
| | |
| | |
| | |
| | |
| | |
| | |
Spirit AeroSystems Holdings, Inc., Class A | | |
| | |
| | |
Air Freight & Logistics — 0.2% |
| | |
|
| | |
| | |
American Airlines Group, Inc. * | | |
Frontier Group Holdings, Inc. * (a) | | |
| | |
Joby Aviation, Inc. * (a) | | |
| | |
|
| | |
| | |
| | |
Fox Factory Holding Corp. * | | |
| | |
Goodyear Tire & Rubber Co. (The) * | | |
Luminar Technologies, Inc. * (a) | | |
| | |
| | |
| | |
|
| | |
Thor Industries, Inc. (a) | | |
| | |
|
| | |
| | |
| | |
| | |
| | |
| | |
| | |
|
|
Commerce Bancshares, Inc. | | |
Cullen/Frost Bankers, Inc. | | |
First Citizens BancShares, Inc., Class A | | |
First Financial Bankshares, Inc. | | |
| | |
| | |
| | |
| | |
| | |
| | |
| | |
| | |
Pinnacle Financial Partners, Inc. | | |
Popular, Inc. (Puerto Rico) | | |
Prosperity Bancshares, Inc. | | |
ServisFirst Bancshares, Inc. | | |
| | |
| | |
Texas Capital Bancshares, Inc. * | | |
| | |
| | |
| | |
| | |
| | |
| | |
| | |
| | |
|
Boston Beer Co., Inc. (The), Class A * | | |
| | |
| | |
| | |
|
ACADIA Pharmaceuticals, Inc. * | | |
| | |
Apellis Pharmaceuticals, Inc. * | | |
Arrowhead Pharmaceuticals, Inc. * | | |
Beam Therapeutics, Inc. * | | |
Blueprint Medicines Corp. * | | |
Cerevel Therapeutics Holdings, Inc. * | | |
CRISPR Therapeutics AG (Switzerland) * (a) | | |
Denali Therapeutics, Inc. * | | |
| | |
SEE NOTES TO FINANCIAL STATEMENTS.
| J.P. Morgan Exchange-Traded Funds | |
| | |
Common Stocks — continued |
Biotechnology — continued |
Fate Therapeutics, Inc. * | | |
Halozyme Therapeutics, Inc. * | | |
Intellia Therapeutics, Inc. * | | |
Ionis Pharmaceuticals, Inc. * | | |
Iovance Biotherapeutics, Inc. * | | |
Mirati Therapeutics, Inc. * | | |
| | |
| | |
Relay Therapeutics, Inc. * | | |
Sarepta Therapeutics, Inc. * | | |
Ultragenyx Pharmaceutical, Inc. * | | |
United Therapeutics Corp. * | | |
Vir Biotechnology, Inc. * | | |
| | |
|
| | |
Advanced Drainage Systems, Inc. | | |
Armstrong World Industries, Inc. | | |
| | |
Builders FirstSource, Inc. * | | |
| | |
| | |
| | |
Simpson Manufacturing Co., Inc. | | |
| | |
| | |
| | |
|
Affiliated Managers Group, Inc. | | |
| | |
Artisan Partners Asset Management, Inc., Class A | | |
| | |
| | |
| | |
Forge Global Holdings, Inc. * | | |
| | |
Interactive Brokers Group, Inc., Class A | | |
Janus Henderson Group plc | | |
LPL Financial Holdings, Inc. | | |
| | |
| | |
|
Capital Markets — continued |
| | |
Tradeweb Markets, Inc., Class A | | |
| | |
|
| | |
| | |
Axalta Coating Systems Ltd. * | | |
| | |
| | |
| | |
| | |
| | |
Ginkgo Bioworks Holdings, Inc. * (a) | | |
| | |
| | |
| | |
| | |
| | |
Scotts Miracle-Gro Co. (The) | | |
Sensient Technologies Corp. | | |
| | |
| | |
Commercial Services & Supplies — 1.1% |
| | |
| | |
Driven Brands Holdings, Inc. * | | |
| | |
| | |
| | |
| | |
| | |
Communications Equipment — 0.7% |
| | |
Lumentum Holdings, Inc. * | | |
| | |
| | |
| | |
Construction & Engineering — 1.7% |
| | |
| | |
| | |
| | |
SEE NOTES TO FINANCIAL STATEMENTS.
| J.P. Morgan Exchange-Traded Funds | |
JPMorgan BetaBuilders U.S. Mid Cap Equity ETF
SCHEDULE OF PORTFOLIO INVESTMENTS
AS OF October 31, 2022 (continued)
| | |
Common Stocks — continued |
Construction & Engineering — continued |
MDU Resources Group, Inc. | | |
| | |
WillScot Mobile Mini Holdings Corp. * | | |
| | |
Construction Materials — 0.2% |
| | |
|
Bread Financial Holdings, Inc. | | |
Credit Acceptance Corp. * | | |
| | |
| | |
| | |
SoFi Technologies, Inc. * (a) | | |
Upstart Holdings, Inc. * (a) | | |
| | |
Containers & Packaging — 1.0% |
| | |
Berry Global Group, Inc. * | | |
Graphic Packaging Holding Co. | | |
| | |
| | |
| | |
Diversified Consumer Services — 1.2% |
| | |
Bright Horizons Family Solutions, Inc. * | | |
| | |
| | |
| | |
Graham Holdings Co., Class B | | |
Grand Canyon Education, Inc. * | | |
| | |
Mister Car Wash, Inc. * (a) | | |
PowerSchool Holdings, Inc., Class A * | | |
Service Corp. International | | |
| | |
Diversified Telecommunication Services — 0.4% |
Frontier Communications Parent, Inc. * | | |
Iridium Communications, Inc. * | | |
| | |
Electric Utilities — 1.0% |
| | |
Hawaiian Electric Industries, Inc. | | |
| | |
|
Electric Utilities — continued |
| | |
| | |
| | |
Portland General Electric Co. | | |
| | |
Electrical Equipment — 1.6% |
| | |
| | |
Bloom Energy Corp., Class A * | | |
ChargePoint Holdings, Inc. * (a) | | |
| | |
GrafTech International Ltd. | | |
| | |
| | |
| | |
| | |
| | |
| | |
Electronic Equipment, Instruments & Components — 1.8% |
Arrow Electronics, Inc. * | | |
| | |
| | |
| | |
| | |
| | |
| | |
National Instruments Corp. | | |
| | |
| | |
| | |
| | |
Energy Equipment & Services — 0.7% |
| | |
| | |
| | |
| | |
|
Liberty Media Corp.-Liberty Formula One, Class A * | | |
Liberty Media Corp.-Liberty Formula One, Class C * | | |
Lions Gate Entertainment Corp., Class A * | | |
Lions Gate Entertainment Corp., Class B * | | |
SEE NOTES TO FINANCIAL STATEMENTS.
| J.P. Morgan Exchange-Traded Funds | |
| | |
Common Stocks — continued |
Entertainment — continued |
Madison Square Garden Sports Corp. | | |
Warner Music Group Corp., Class A | | |
| | |
Equity Real Estate Investment Trusts (REITs) — 8.2% |
| | |
American Homes 4 Rent, Class A | | |
Americold Realty Trust, Inc. | | |
Apartment Income REIT Corp. | | |
Apple Hospitality REIT, Inc. | | |
Brixmor Property Group, Inc. | | |
Broadstone Net Lease, Inc. | | |
| | |
| | |
| | |
EastGroup Properties, Inc. | | |
| | |
| | |
First Industrial Realty Trust, Inc. | | |
Gaming and Leisure Properties, Inc. | | |
Healthcare Realty Trust, Inc. | | |
Highwoods Properties, Inc. | | |
Hudson Pacific Properties, Inc. | | |
Independence Realty Trust, Inc. | | |
Innovative Industrial Properties, Inc. | | |
| | |
| | |
| | |
Lamar Advertising Co., Class A | | |
| | |
Medical Properties Trust, Inc. | | |
National Health Investors, Inc. | | |
National Retail Properties, Inc. | | |
National Storage Affiliates Trust | | |
Omega Healthcare Investors, Inc. | | |
| | |
Park Hotels & Resorts, Inc. | | |
| | |
Phillips Edison & Co., Inc. | | |
Piedmont Office Realty Trust, Inc., Class A | | |
| | |
Rexford Industrial Realty, Inc. | | |
| | |
Ryman Hospitality Properties, Inc. | | |
Sabra Health Care REIT, Inc. | | |
| | |
|
Equity Real Estate Investment Trusts (REITs) — continued |
| | |
| | |
Spirit Realty Capital, Inc. | | |
| | |
| | |
Sunstone Hotel Investors, Inc. | | |
| | |
| | |
| | |
Food & Staples Retailing — 1.3% |
BJ's Wholesale Club Holdings, Inc. * | | |
Casey's General Stores, Inc. | | |
Performance Food Group Co. * | | |
| | |
Sprouts Farmers Market, Inc. * | | |
| | |
| | |
|
| | |
Darling Ingredients, Inc. * | | |
| | |
| | |
Hain Celestial Group, Inc. (The) * | | |
| | |
| | |
| | |
| | |
| | |
| | |
|
| | |
New Jersey Resources Corp. | | |
| | |
Southwest Gas Holdings, Inc. | | |
| | |
| | |
Health Care Equipment & Supplies — 3.0% |
| | |
| | |
| | |
Globus Medical, Inc., Class A * | | |
| | |
SEE NOTES TO FINANCIAL STATEMENTS.
| J.P. Morgan Exchange-Traded Funds | |
JPMorgan BetaBuilders U.S. Mid Cap Equity ETF
SCHEDULE OF PORTFOLIO INVESTMENTS
AS OF October 31, 2022 (continued)
| | |
Common Stocks — continued |
Health Care Equipment & Supplies — continued |
| | |
| | |
Inspire Medical Systems, Inc. * | | |
Integra LifeSciences Holdings Corp. * | | |
Lantheus Holdings, Inc. * | | |
| | |
| | |
| | |
| | |
| | |
| | |
| | |
Shockwave Medical, Inc. * | | |
| | |
Tandem Diabetes Care, Inc. * | | |
| | |
Health Care Providers & Services — 2.7% |
Acadia Healthcare Co., Inc. * | | |
| | |
AMN Healthcare Services, Inc. * | | |
Apollo Medical Holdings, Inc. * (a) | | |
| | |
| | |
| | |
| | |
| | |
LifeStance Health Group, Inc. * (a) | | |
Oak Street Health, Inc. * | | |
Option Care Health, Inc. * | | |
| | |
| | |
Privia Health Group, Inc. * | | |
| | |
| | |
Signify Health, Inc., Class A * | | |
| | |
| | |
| | |
Health Care Technology — 0.4% |
| | |
Definitive Healthcare Corp. * | | |
Doximity, Inc., Class A * (a) | | |
| | |
| | |
|
Health Care Technology — continued |
| | |
Teladoc Health, Inc. * (a) | | |
| | |
Hotels, Restaurants & Leisure — 3.2% |
| | |
Choice Hotels International, Inc. | | |
| | |
Cracker Barrel Old Country Store, Inc. | | |
DraftKings, Inc., Class A * (a) | | |
Hilton Grand Vacations, Inc. * | | |
Hyatt Hotels Corp., Class A * | | |
Life Time Group Holdings, Inc. * | | |
| | |
Marriott Vacations Worldwide Corp. | | |
Norwegian Cruise Line Holdings Ltd. * (a) | | |
Penn Entertainment, Inc. * | | |
Planet Fitness, Inc., Class A * | | |
SeaWorld Entertainment, Inc. * | | |
Six Flags Entertainment Corp. * | | |
| | |
| | |
| | |
| | |
Wyndham Hotels & Resorts, Inc. | | |
| | |
Household Durables — 0.8% |
| | |
| | |
Tempur Sealy International, Inc. | | |
| | |
| | |
| | |
Household Products — 0.2% |
| | |
Reynolds Consumer Products, Inc. | | |
Spectrum Brands Holdings, Inc. | | |
| | |
Independent Power and Renewable Electricity Producers — 0.2% |
Ormat Technologies, Inc. (a) | | |
Sunnova Energy International, Inc. * (a) | | |
| | |
SEE NOTES TO FINANCIAL STATEMENTS.
| J.P. Morgan Exchange-Traded Funds | |
| | |
Common Stocks — continued |
|
| | |
| | |
Axis Capital Holdings Ltd. | | |
Brighthouse Financial, Inc. * | | |
CNO Financial Group, Inc. | | |
| | |
Erie Indemnity Co., Class A | | |
First American Financial Corp. | | |
Hanover Insurance Group, Inc. (The) | | |
| | |
Kinsale Capital Group, Inc. | | |
| | |
Old Republic International Corp. | | |
| | |
RenaissanceRe Holdings Ltd. (Bermuda) | | |
| | |
Ryan Specialty Holdings, Inc., Class A * | | |
Selective Insurance Group, Inc. | | |
| | |
White Mountains Insurance Group Ltd. | | |
| | |
Interactive Media & Services — 0.4% |
| | |
| | |
| | |
| | |
| | |
| | |
Internet & Direct Marketing Retail — 0.2% |
Chewy, Inc., Class A * (a) | | |
Wayfair, Inc., Class A * (a) | | |
| | |
|
Affirm Holdings, Inc. * (a) | | |
| | |
DigitalOcean Holdings, Inc. * (a) | | |
Euronet Worldwide, Inc. * | | |
ExlService Holdings, Inc. * | | |
| | |
| | |
| | |
Rackspace Technology, Inc. * (a) | | |
| | |
| | |
|
|
| | |
Thoughtworks Holding, Inc. * | | |
| | |
| | |
| | |
|
| | |
| | |
Peloton Interactive, Inc., Class A * (a) | | |
| | |
Topgolf Callaway Brands Corp. * | | |
| | |
| | |
Life Sciences Tools & Services — 1.2% |
10X Genomics, Inc., Class A * | | |
| | |
| | |
Maravai LifeSciences Holdings, Inc., Class A * | | |
| | |
| | |
| | |
| | |
| | |
|
| | |
Allison Transmission Holdings, Inc. | | |
| | |
| | |
| | |
Evoqua Water Technologies Corp. * | | |
| | |
Gates Industrial Corp. plc * | | |
| | |
| | |
| | |
Lincoln Electric Holdings, Inc. | | |
| | |
| | |
| | |
| | |
| | |
| | |
| | |
SEE NOTES TO FINANCIAL STATEMENTS.
| J.P. Morgan Exchange-Traded Funds | |
JPMorgan BetaBuilders U.S. Mid Cap Equity ETF
SCHEDULE OF PORTFOLIO INVESTMENTS
AS OF October 31, 2022 (continued)
| | |
Common Stocks — continued |
|
| | |
Watts Water Technologies, Inc., Class A | | |
| | |
|
| | |
|
Altice USA, Inc., Class A * | | |
| | |
John Wiley & Sons, Inc., Class A | | |
New York Times Co. (The), Class A | | |
Nexstar Media Group, Inc., Class A | | |
| | |
| | |
|
| | |
| | |
| | |
Compass Minerals International, Inc. | | |
| | |
Reliance Steel & Aluminum Co. | | |
| | |
United States Steel Corp. | | |
Worthington Industries, Inc. | | |
| | |
Mortgage Real Estate Investment Trusts (REITs) — 0.7% |
| | |
Blackstone Mortgage Trust, Inc., Class A | | |
| | |
| | |
Starwood Property Trust, Inc. | | |
| | |
|
Dillard's, Inc., Class A (a) | | |
| | |
| | |
| | |
Ollie's Bargain Outlet Holdings, Inc. * (a) | | |
| | |
| | |
|
|
| | |
| | |
| | |
Oil, Gas & Consumable Fuels — 4.9% |
| | |
| | |
| | |
| | |
| | |
| | |
| | |
| | |
| | |
Equitrans Midstream Corp. | | |
| | |
| | |
| | |
New Fortress Energy, Inc. | | |
| | |
| | |
| | |
| | |
Southwestern Energy Co. * | | |
| | |
Paper & Forest Products — 0.2% |
| | |
|
Beauty Health Co. (The) * | | |
| | |
| | |
Herbalife Nutrition Ltd. * | | |
| | |
|
Intra-Cellular Therapies, Inc. * | | |
| | |
Pacira BioSciences, Inc. * | | |
| | |
Prestige Consumer Healthcare, Inc. * | | |
Tilray Brands, Inc. (Canada) * (a) | | |
| | |
Professional Services — 2.5% |
| | |
SEE NOTES TO FINANCIAL STATEMENTS.
| J.P. Morgan Exchange-Traded Funds | |
| | |
Common Stocks — continued |
Professional Services — continued |
| | |
Booz Allen Hamilton Holding Corp. | | |
CACI International, Inc., Class A * | | |
| | |
| | |
| | |
| | |
| | |
Robert Half International, Inc. | | |
Science Applications International Corp. | | |
| | |
| | |
| | |
Real Estate Management & Development — 0.6% |
Cushman & Wakefield plc * | | |
DigitalBridge Group, Inc. | | |
eXp World Holdings, Inc. (a) | | |
Howard Hughes Corp. (The) * | | |
Jones Lang LaSalle, Inc. * | | |
Opendoor Technologies, Inc. * | | |
| | |
| | |
|
| | |
Avis Budget Group, Inc. * | | |
Hertz Global Holdings, Inc. * | | |
Knight-Swift Transportation Holdings, Inc. | | |
| | |
| | |
| | |
TuSimple Holdings, Inc., Class A * | | |
| | |
| | |
Semiconductors & Semiconductor Equipment — 2.3% |
Allegro MicroSystems, Inc. (Japan) * | | |
| | |
| | |
| | |
| | |
Lattice Semiconductor Corp. * | | |
| | |
| | |
| | |
| | |
|
Semiconductors & Semiconductor Equipment — continued |
Silicon Laboratories, Inc. * | | |
| | |
| | |
| | |
| | |
| | |
|
| | |
| | |
| | |
| | |
| | |
| | |
| | |
| | |
Clear Secure, Inc., Class A * | | |
CommVault Systems, Inc. * | | |
| | |
| | |
| | |
Dolby Laboratories, Inc., Class A | | |
DoubleVerify Holdings, Inc. * | | |
| | |
Duck Creek Technologies, Inc. * | | |
| | |
| | |
| | |
| | |
Guidewire Software, Inc. * | | |
Informatica, Inc., Class A * (a) | | |
| | |
| | |
LiveRamp Holdings, Inc. * | | |
Manhattan Associates, Inc. * | | |
MicroStrategy, Inc., Class A * (a) | | |
| | |
| | |
| | |
| | |
| | |
| | |
Qualtrics International, Inc., Class A * | | |
| | |
| | |
SEE NOTES TO FINANCIAL STATEMENTS.
| J.P. Morgan Exchange-Traded Funds | |
JPMorgan BetaBuilders U.S. Mid Cap Equity ETF
SCHEDULE OF PORTFOLIO INVESTMENTS
AS OF October 31, 2022 (continued)
| | |
Common Stocks — continued |
|
SentinelOne, Inc., Class A * | | |
Smartsheet, Inc., Class A * | | |
Sprout Social, Inc., Class A * | | |
| | |
| | |
| | |
| | |
| | |
| | |
| | |
| | |
|
American Eagle Outfitters, Inc. | | |
| | |
| | |
Dick's Sporting Goods, Inc. | | |
| | |
Floor & Decor Holdings, Inc., Class A * | | |
| | |
GameStop Corp., Class A * (a) | | |
| | |
| | |
Lithia Motors, Inc., Class A | | |
| | |
National Vision Holdings, Inc. * | | |
Penske Automotive Group, Inc. | | |
Petco Health & Wellness Co., Inc. * (a) | | |
| | |
| | |
Victoria's Secret & Co. * | | |
Warby Parker, Inc., Class A * (a) | | |
| | |
| | |
Technology Hardware, Storage & Peripherals — 0.4% |
Pure Storage, Inc., Class A * | | |
| | |
| | |
Textiles, Apparel & Luxury Goods — 1.5% |
| | |
| | |
| | |
| | |
| | |
| | |
|
Textiles, Apparel & Luxury Goods — continued |
| | |
| | |
| | |
Skechers U.S.A., Inc., Class A * | | |
Under Armour, Inc., Class A * | | |
Under Armour, Inc., Class C * | | |
| | |
Thrifts & Mortgage Finance — 0.6% |
| | |
| | |
New York Community Bancorp, Inc. (a) | | |
| | |
| | |
| | |
Trading Companies & Distributors — 1.2% |
| | |
Beacon Roofing Supply, Inc. * | | |
Core & Main, Inc., Class A * | | |
| | |
| | |
MSC Industrial Direct Co., Inc., Class A | | |
SiteOne Landscape Supply, Inc. * | | |
| | |
WESCO International, Inc. * | | |
| | |
|
Essential Utilities, Inc. | | |
Total Common Stocks
(Cost $1,463,806,734) | | |
Short-Term Investments — 3.2% |
Investment Companies — 0.5% |
JPMorgan U.S. Government Money Market Fund Class IM Shares, 2.85% (b) (c)
(Cost $7,709,091) | | |
Investment of Cash Collateral from Securities Loaned — 2.7% |
JPMorgan Securities Lending Money Market Fund Agency SL Class Shares, 3.23% (b) (c) | | |
SEE NOTES TO FINANCIAL STATEMENTS.
| J.P. Morgan Exchange-Traded Funds | |
| | |
Short-Term Investments — continued |
Investment of Cash Collateral from Securities Loaned — continued |
JPMorgan U.S. Government Money Market Fund Class IM Shares, 2.85% (b) (c) | | |
Total Investment of Cash Collateral from Securities Loaned
(Cost $37,581,419) | | |
Total Short-Term Investments
(Cost $45,290,510) | | |
Total Investments — 102.6%
(Cost $1,509,097,244) | | |
Liabilities in Excess of Other Assets — (2.6)% | | |
| | |
Percentages indicated are based on net assets. |
| Non-income producing security. |
| The security or a portion of this security is on loan at October 31, 2022. The total value of securities on loan at October 31, 2022 is $36,819,568. |
| Investment in an affiliated fund, which is registered under the Investment Company Act of 1940, as amended, and is advised by J.P. Morgan Investment Management Inc. |
| The rate shown is the current yield as of October 31, 2022. |
Futures contracts outstanding as of October 31, 2022:
| | | | | VALUE AND
UNREALIZED
APPRECIATION
(DEPRECIATION) ($) |
| | | | | |
S&P Midcap 400 E-Mini Index | | | | | |
SEE NOTES TO FINANCIAL STATEMENTS.
| J.P. Morgan Exchange-Traded Funds | |
JPMorgan BetaBuilders U.S. Small Cap Equity ETF
SCHEDULE OF PORTFOLIO INVESTMENTS
AS OF October 31, 2022
| | |
|
Aerospace & Defense — 1.1% |
| | |
Aerojet Rocketdyne Holdings, Inc. * | | |
| | |
| | |
| | |
Kratos Defense & Security Solutions, Inc. * | | |
| | |
| | |
| | |
Virgin Galactic Holdings, Inc. * (a) | | |
| | |
Air Freight & Logistics — 0.7% |
Air Transport Services Group, Inc. * | | |
Atlas Air Worldwide Holdings, Inc. * | | |
| | |
Hub Group, Inc., Class A * | | |
| | |
|
Hawaiian Holdings, Inc. * | | |
| | |
| | |
Sun Country Airlines Holdings, Inc. * | | |
Wheels Up Experience, Inc. * | | |
| | |
|
American Axle & Manufacturing Holdings, Inc. * | | |
| | |
| | |
| | |
| | |
| | |
| | |
Standard Motor Products, Inc. | | |
| | |
| | |
| | |
|
| | |
Faraday Future Intelligent Electric, Inc. * (a) | | |
| | |
Winnebago Industries, Inc. | | |
| | |
| | |
|
|
| | |
| | |
| | |
Atlantic Union Bankshares Corp. | | |
| | |
| | |
| | |
Berkshire Hills Bancorp, Inc. | | |
| | |
| | |
Central Pacific Financial Corp. | | |
| | |
Columbia Banking System, Inc. | | |
Community Bank System, Inc. | | |
Community Trust Bancorp, Inc. | | |
Customers Bancorp, Inc. * | | |
| | |
Dime Community Bancshares, Inc. | | |
| | |
| | |
Enterprise Financial Services Corp. | | |
| | |
| | |
First BanCorp (Puerto Rico) | | |
| | |
First Commonwealth Financial Corp. | | |
| | |
| | |
First Interstate BancSystem, Inc., Class A | | |
| | |
| | |
| | |
German American Bancorp, Inc. | | |
Heartland Financial USA, Inc. | | |
| | |
| | |
| | |
Independent Bank Group, Inc. | | |
International Bancshares Corp. | | |
| | |
Live Oak Bancshares, Inc. | | |
National Bank Holdings Corp., Class A | | |
| | |
Northwest Bancshares, Inc. | | |
SEE NOTES TO FINANCIAL STATEMENTS.
| J.P. Morgan Exchange-Traded Funds | |
| | |
Common Stocks — continued |
|
OFG Bancorp (Puerto Rico) | | |
| | |
Pacific Premier Bancorp, Inc. | | |
| | |
| | |
| | |
| | |
Sandy Spring Bancorp, Inc. | | |
Seacoast Banking Corp. of Florida | | |
Silvergate Capital Corp., Class A * | | |
Simmons First National Corp., Class A | | |
Southside Bancshares, Inc. | | |
Stock Yards Bancorp, Inc. | | |
| | |
| | |
| | |
| | |
United Community Banks, Inc. | | |
| | |
| | |
Washington Trust Bancorp, Inc. | | |
| | |
| | |
| | |
|
Coca-Cola Consolidated, Inc. | | |
Duckhorn Portfolio, Inc. (The) * | | |
| | |
| | |
|
Agios Pharmaceuticals, Inc. * | | |
| | |
Allogene Therapeutics, Inc. * | | |
Amicus Therapeutics, Inc. * | | |
| | |
Arcus Biosciences, Inc. * | | |
Arcutis Biotherapeutics, Inc. * | | |
Atara Biotherapeutics, Inc. * | | |
| | |
Avidity Biosciences, Inc. * | | |
BioCryst Pharmaceuticals, Inc. * | | |
| | |
| | |
| | |
|
Biotechnology — continued |
Celldex Therapeutics, Inc. * | | |
Coherus Biosciences, Inc. * | | |
| | |
Deciphera Pharmaceuticals, Inc. * | | |
Dynavax Technologies Corp. * (a) | | |
Eagle Pharmaceuticals, Inc. * | | |
| | |
Emergent BioSolutions, Inc. * | | |
Enanta Pharmaceuticals, Inc. * | | |
| | |
| | |
| | |
GreenLight Biosciences Holdings PBC * (a) | | |
| | |
| | |
| | |
| | |
Ironwood Pharmaceuticals, Inc. * | | |
iTeos Therapeutics, Inc. * | | |
| | |
Karuna Therapeutics, Inc. * | | |
Keros Therapeutics, Inc. * | | |
| | |
| | |
Kymera Therapeutics, Inc. * | | |
Ligand Pharmaceuticals, Inc. * | | |
Madrigal Pharmaceuticals, Inc. * | | |
| | |
| | |
| | |
Organogenesis Holdings, Inc. * | | |
PMV Pharmaceuticals, Inc. * | | |
Prothena Corp. plc (Ireland) * | | |
| | |
| | |
| | |
REVOLUTION Medicines, Inc. * | | |
Rocket Pharmaceuticals, Inc. * | | |
| | |
Sage Therapeutics, Inc. * | | |
Sana Biotechnology, Inc. * | | |
Sangamo Therapeutics, Inc. * | | |
SpringWorks Therapeutics, Inc. * | | |
Stoke Therapeutics, Inc. * | | |
SEE NOTES TO FINANCIAL STATEMENTS.
| J.P. Morgan Exchange-Traded Funds | |
JPMorgan BetaBuilders U.S. Small Cap Equity ETF
SCHEDULE OF PORTFOLIO INVESTMENTS
AS OF October 31, 2022 (continued)
| | |
Common Stocks — continued |
Biotechnology — continued |
Tango Therapeutics, Inc. * | | |
| | |
Travere Therapeutics, Inc. * | | |
| | |
| | |
| | |
| | |
Verve Therapeutics, Inc. * | | |
| | |
Zentalis Pharmaceuticals, Inc. * | | |
| | |
|
| | |
American Woodmark Corp. * | | |
| | |
Gibraltar Industries, Inc. * | | |
| | |
Janus International Group, Inc. * | | |
Masonite International Corp. * | | |
Quanex Building Products Corp. | | |
Resideo Technologies, Inc. * | | |
| | |
Zurn Elkay Water Solutions Corp. | | |
| | |
|
AssetMark Financial Holdings, Inc. * | | |
B. Riley Financial, Inc. (a) | | |
BGC Partners, Inc., Class A | | |
| | |
Brightsphere Investment Group, Inc. | | |
| | |
Focus Financial Partners, Inc., Class A * | | |
Freedom Holding Corp. (Kazakhstan) * | | |
Hamilton Lane, Inc., Class A | | |
| | |
Open Lending Corp., Class A * | | |
| | |
PJT Partners, Inc., Class A | | |
StepStone Group, Inc., Class A | | |
| | |
| | |
Victory Capital Holdings, Inc., Class A | | |
Virtu Financial, Inc., Class A | | |
| | |
|
Capital Markets — continued |
Virtus Investment Partners, Inc. | | |
WisdomTree Investments, Inc. | | |
| | |
|
| | |
| | |
| | |
| | |
| | |
| | |
| | |
| | |
| | |
| | |
Minerals Technologies, Inc. | | |
| | |
PureCycle Technologies, Inc. * (a) | | |
| | |
| | |
| | |
Tronox Holdings plc, Class A | | |
| | |
Commercial Services & Supplies — 2.2% |
| | |
| | |
ACV Auctions, Inc., Class A * | | |
Aurora Innovation, Inc. * (a) | | |
| | |
BrightView Holdings, Inc. * | | |
Casella Waste Systems, Inc., Class A * | | |
| | |
| | |
| | |
GEO Group, Inc. (The), REIT * (a) | | |
| | |
Healthcare Services Group, Inc. | | |
| | |
| | |
KAR Auction Services, Inc. * | | |
Matthews International Corp., Class A | | |
| | |
Montrose Environmental Group, Inc. * | | |
| | |
SEE NOTES TO FINANCIAL STATEMENTS.
| J.P. Morgan Exchange-Traded Funds | |
| | |
Common Stocks — continued |
Commercial Services & Supplies — continued |
| | |
| | |
| | |
| | |
Communications Equipment — 1.1% |
| | |
| | |
CommScope Holding Co., Inc. * | | |
| | |
| | |
| | |
| | |
| | |
Construction & Engineering — 1.8% |
Ameresco, Inc., Class A * | | |
| | |
Comfort Systems USA, Inc. | | |
| | |
| | |
Granite Construction, Inc. | | |
| | |
| | |
| | |
| | |
Construction Materials — 0.2% |
Summit Materials, Inc., Class A * | | |
|
Atlanticus Holdings Corp. * | | |
Encore Capital Group, Inc. * | | |
Enova International, Inc. * | | |
Green Dot Corp., Class A * | | |
| | |
| | |
| | |
| | |
| | |
| | |
| | |
| | |
Containers & Packaging — 0.5% |
| | |
| | |
| | |
|
Containers & Packaging — continued |
| | |
| | |
| | |
| | |
| | |
Diversified Consumer Services — 0.9% |
| | |
Adtalem Global Education, Inc. * | | |
| | |
European Wax Center, Inc., Class A | | |
Laureate Education, Inc., Class A | | |
OneSpaWorld Holdings Ltd. (Bahamas) * | | |
| | |
Strategic Education, Inc. | | |
| | |
| | |
Vivint Smart Home, Inc. * | | |
| | |
| | |
Diversified Financial Services — 0.4% |
| | |
Compass Diversified Holdings | | |
Jackson Financial, Inc., Class A | | |
| | |
Diversified Telecommunication Services — 0.4% |
Cogent Communications Holdings, Inc. | | |
EchoStar Corp., Class A * | | |
| | |
Liberty Latin America Ltd., Class A (Chile) * | | |
Liberty Latin America Ltd., Class C (Chile) * | | |
| | |
Electric Utilities — 0.4% |
| | |
| | |
| | |
Electrical Equipment — 1.4% |
Array Technologies, Inc. * | | |
| | |
| | |
| | |
Energy Vault Holdings, Inc. * (a) | | |
| | |
SEE NOTES TO FINANCIAL STATEMENTS.
| J.P. Morgan Exchange-Traded Funds | |
JPMorgan BetaBuilders U.S. Small Cap Equity ETF
SCHEDULE OF PORTFOLIO INVESTMENTS
AS OF October 31, 2022 (continued)
| | |
Common Stocks — continued |
Electrical Equipment — continued |
| | |
FREYR Battery SA (Norway) * (a) | | |
FuelCell Energy, Inc. * (a) | | |
| | |
Shoals Technologies Group, Inc., Class A * | | |
| | |
Tritium DCFC Ltd. (Australia) * | | |
| | |
| | |
Electronic Equipment, Instruments & Components — 3.0% |
| | |
Advanced Energy Industries, Inc. | | |
Aeva Technologies, Inc. * | | |
| | |
Benchmark Electronics, Inc. | | |
| | |
| | |
| | |
FARO Technologies, Inc. * | | |
Insight Enterprises, Inc. * | | |
| | |
| | |
Lightwave Logic, Inc. * (a) | | |
Methode Electronics, Inc. | | |
| | |
Mirion Technologies, Inc. * | | |
| | |
| | |
| | |
| | |
| | |
| | |
| | |
| | |
| | |
Vishay Intertechnology, Inc. | | |
| | |
Energy Equipment & Services — 2.6% |
| | |
| | |
| | |
| | |
Liberty Energy, Inc., Class A * | | |
| | |
|
Energy Equipment & Services — continued |
| | |
NexTier Oilfield Solutions, Inc. * | | |
| | |
Oceaneering International, Inc. * | | |
Patterson-UTI Energy, Inc. | | |
| | |
| | |
| | |
| | |
US Silica Holdings, Inc. * | | |
| | |
Weatherford International plc * | | |
| | |
|
Cinemark Holdings, Inc. * | | |
| | |
Liberty Media Corp.-Liberty Braves, Class A * | | |
Liberty Media Corp.-Liberty Braves, Class C * | | |
Madison Square Garden Entertainment Corp. * | | |
| | |
World Wrestling Entertainment, Inc., Class A | | |
| | |
Equity Real Estate Investment Trusts (REITs) — 4.7% |
| | |
Alexander & Baldwin, Inc. | | |
| | |
American Assets Trust, Inc. | | |
Apartment Investment and Management Co., Class A | | |
| | |
| | |
CBL & Associates Properties, Inc. | | |
| | |
Corporate Office Properties Trust | | |
DiamondRock Hospitality Co. | | |
Diversified Healthcare Trust | | |
Easterly Government Properties, Inc. | | |
| | |
Empire State Realty Trust, Inc., Class A | | |
Essential Properties Realty Trust, Inc. | | |
Four Corners Property Trust, Inc. | | |
| | |
| | |
| | |
SEE NOTES TO FINANCIAL STATEMENTS.
| J.P. Morgan Exchange-Traded Funds | |
| | |
Common Stocks — continued |
Equity Real Estate Investment Trusts (REITs) — continued |
Industrial Logistics Properties Trust | | |
InvenTrust Properties Corp. | | |
| | |
| | |
| | |
| | |
Necessity Retail REIT, Inc. (The) | | |
NexPoint Residential Trust, Inc. | | |
Office Properties Income Trust | | |
| | |
| | |
| | |
Retail Opportunity Investments Corp. | | |
| | |
| | |
| | |
| | |
Summit Hotel Properties, Inc. | | |
Tanger Factory Outlet Centers, Inc. | | |
Universal Health Realty Income Trust | | |
| | |
Urstadt Biddle Properties, Inc., Class A | | |
Veris Residential, Inc. * | | |
Xenia Hotels & Resorts, Inc. | | |
| | |
Food & Staples Retailing — 0.9% |
| | |
Chefs' Warehouse, Inc. (The) * | | |
Grocery Outlet Holding Corp. * | | |
Ingles Markets, Inc., Class A | | |
| | |
United Natural Foods, Inc. * | | |
| | |
| | |
|
| | |
| | |
| | |
| | |
Fresh Del Monte Produce, Inc. | | |
| | |
| | |
| | |
| | |
|
Food Products — continued |
Simply Good Foods Co. (The) * | | |
| | |
Tattooed Chef, Inc. * (a) | | |
Tootsie Roll Industries, Inc. | | |
| | |
| | |
| | |
|
Chesapeake Utilities Corp. | | |
Northwest Natural Holding Co. | | |
South Jersey Industries, Inc. | | |
| | |
Health Care Equipment & Supplies — 3.0% |
| | |
| | |
| | |
| | |
BioLife Solutions, Inc. * | | |
Butterfly Network, Inc. * (a) | | |
Cardiovascular Systems, Inc. * | | |
| | |
| | |
Establishment Labs Holdings, Inc. (Costa Rica) * | | |
| | |
| | |
| | |
| | |
iRhythm Technologies, Inc. * | | |
Meridian Bioscience, Inc. * | | |
Merit Medical Systems, Inc. * | | |
| | |
| | |
| | |
PROCEPT BioRobotics Corp. * (a) | | |
| | |
Senseonics Holdings, Inc. * (a) | | |
Silk Road Medical, Inc. * | | |
Treace Medical Concepts, Inc. * (a) | | |
| | |
| | |
Health Care Providers & Services — 2.0% |
| | |
SEE NOTES TO FINANCIAL STATEMENTS.
| J.P. Morgan Exchange-Traded Funds | |
JPMorgan BetaBuilders U.S. Small Cap Equity ETF
SCHEDULE OF PORTFOLIO INVESTMENTS
AS OF October 31, 2022 (continued)
| | |
Common Stocks — continued |
Health Care Providers & Services — continued |
| | |
| | |
| | |
| | |
Alignment Healthcare, Inc. * | | |
Brookdale Senior Living, Inc. * | | |
| | |
Castle Biosciences, Inc. * | | |
Clover Health Investments Corp. * | | |
Community Health Systems, Inc. * | | |
| | |
| | |
Hims & Hers Health, Inc. * | | |
| | |
| | |
National HealthCare Corp. | | |
| | |
| | |
| | |
Pediatrix Medical Group, Inc. * | | |
| | |
Select Medical Holdings Corp. | | |
| | |
US Physical Therapy, Inc. | | |
| | |
Health Care Technology — 0.8% |
Allscripts Healthcare Solutions, Inc. * | | |
American Well Corp., Class A * | | |
Evolent Health, Inc., Class A * | | |
GoodRx Holdings, Inc., Class A * | | |
| | |
| | |
NextGen Healthcare, Inc. * | | |
| | |
| | |
| | |
| | |
Hotels, Restaurants & Leisure — 2.1% |
| | |
| | |
| | |
| | |
Brinker International, Inc. * | | |
| | |
|
Hotels, Restaurants & Leisure — continued |
Cheesecake Factory, Inc. (The) | | |
Dave & Buster's Entertainment, Inc. * | | |
| | |
| | |
Dutch Bros, Inc., Class A * | | |
| | |
F45 Training Holdings, Inc. * | | |
Golden Entertainment, Inc. * | | |
| | |
| | |
Monarch Casino & Resort, Inc. * | | |
Papa John's International, Inc. | | |
Portillo's, Inc., Class A * | | |
Red Rock Resorts, Inc., Class A | | |
Shake Shack, Inc., Class A * | | |
| | |
Sweetgreen, Inc., Class A * (a) | | |
| | |
| | |
Household Durables — 2.2% |
| | |
Century Communities, Inc. | | |
| | |
Installed Building Products, Inc. | | |
| | |
| | |
| | |
| | |
| | |
| | |
| | |
| | |
Snap One Holdings Corp. * | | |
| | |
Taylor Morrison Home Corp.���* | | |
| | |
Tupperware Brands Corp. * | | |
Vizio Holding Corp., Class A * | | |
| | |
Household Products — 0.3% |
Central Garden & Pet Co. * | | |
SEE NOTES TO FINANCIAL STATEMENTS.
| J.P. Morgan Exchange-Traded Funds | |
| | |
Common Stocks — continued |
Household Products — continued |
Central Garden & Pet Co., Class A * | | |
| | |
| | |
Independent Power and Renewable Electricity Producers — 0.3% |
| | |
| | |
Clearway Energy, Inc., Class C | | |
| | |
|
American Equity Investment Life Holding Co. | | |
| | |
Argo Group International Holdings Ltd. | | |
BRP Group, Inc., Class A * | | |
| | |
Genworth Financial, Inc., Class A * | | |
Goosehead Insurance, Inc., Class A * | | |
| | |
| | |
Horace Mann Educators Corp. | | |
James River Group Holdings Ltd. | | |
| | |
Oscar Health, Inc., Class A * | | |
| | |
| | |
Safety Insurance Group, Inc. | | |
SiriusPoint Ltd. (Bermuda) * | | |
Stewart Information Services Corp. | | |
| | |
| | |
Interactive Media & Services — 0.4% |
| | |
Eventbrite, Inc., Class A * | | |
| | |
MediaAlpha, Inc., Class A * | | |
| | |
| | |
| | |
ZipRecruiter, Inc., Class A * | | |
| | |
Internet & Direct Marketing Retail — 0.4% |
| | |
| | |
| | |
|
Internet & Direct Marketing Retail — continued |
ContextLogic, Inc., Class A * | | |
| | |
| | |
| | |
Stitch Fix, Inc., Class A * | | |
Vivid Seats, Inc., Class A * | | |
| | |
| | |
|
AvidXchange Holdings, Inc. * | | |
BigCommerce Holdings, Inc. * | | |
| | |
Core Scientific, Inc. * (a) | | |
CSG Systems International, Inc. | | |
Cyxtera Technologies, Inc. * | | |
EVERTEC, Inc. (Puerto Rico) | | |
| | |
Grid Dynamics Holdings, Inc. * | | |
| | |
| | |
| | |
| | |
| | |
| | |
| | |
Shift4 Payments, Inc., Class A * | | |
Squarespace, Inc., Class A * | | |
TaskUS, Inc., Class A (Philippines) * | | |
| | |
| | |
| | |
| | |
| | |
|
| | |
| | |
Malibu Boats, Inc., Class A * | | |
Smith & Wesson Brands, Inc. | | |
| | |
| | |
| | |
Life Sciences Tools & Services — 0.7% |
AbCellera Biologics, Inc. (Canada) * | | |
SEE NOTES TO FINANCIAL STATEMENTS.
| J.P. Morgan Exchange-Traded Funds | |
JPMorgan BetaBuilders U.S. Small Cap Equity ETF
SCHEDULE OF PORTFOLIO INVESTMENTS
AS OF October 31, 2022 (continued)
| | |
Common Stocks — continued |
Life Sciences Tools & Services — continued |
Adaptive Biotechnologies Corp. * | | |
| | |
| | |
NanoString Technologies, Inc. * | | |
| | |
Pacific Biosciences of California, Inc. * | | |
| | |
| | |
| | |
|
| | |
| | |
Albany International Corp., Class A | | |
Altra Industrial Motion Corp. | | |
| | |
| | |
Desktop Metal, Inc., Class A * (a) | | |
| | |
| | |
| | |
| | |
Franklin Electric Co., Inc. | | |
| | |
Greenbrier Cos., Inc. (The) | | |
Helios Technologies, Inc. | | |
| | |
Hillman Solutions Corp. * | | |
| | |
John Bean Technologies Corp. | | |
| | |
| | |
Markforged Holding Corp. * | | |
Microvast Holdings, Inc. * | | |
| | |
Mueller Water Products, Inc., Class A | | |
| | |
| | |
| | |
| | |
Standex International Corp. | | |
| | |
| | |
| | |
|
|
| | |
| | |
| | |
|
| | |
|
Advantage Solutions, Inc. * | | |
AMC Networks, Inc., Class A * | | |
| | |
Clear Channel Outdoor Holdings, Inc. * | | |
EW Scripps Co. (The), Class A * | | |
| | |
iHeartMedia, Inc., Class A * | | |
| | |
| | |
Sinclair Broadcast Group, Inc., Class A | | |
| | |
| | |
| | |
| | |
|
Alpha Metallurgical Resources, Inc. | | |
| | |
| | |
Carpenter Technology Corp. | | |
| | |
| | |
| | |
| | |
| | |
| | |
| | |
Schnitzer Steel Industries, Inc., Class A | | |
| | |
| | |
Mortgage Real Estate Investment Trusts (REITs) — 1.4% |
Apollo Commercial Real Estate Finance, Inc. | | |
| | |
ARMOUR Residential REIT, Inc. (a) | | |
Brightspire Capital, Inc. | | |
Broadmark Realty Capital, Inc. | | |
Hannon Armstrong Sustainable Infrastructure Capital, Inc. | | |
SEE NOTES TO FINANCIAL STATEMENTS.
| J.P. Morgan Exchange-Traded Funds | |
| | |
Common Stocks — continued |
Mortgage Real Estate Investment Trusts (REITs) — continued |
Invesco Mortgage Capital, Inc. (a) | | |
KKR Real Estate Finance Trust, Inc. | | |
| | |
| | |
New York Mortgage Trust, Inc. | | |
PennyMac Mortgage Investment Trust | | |
| | |
| | |
TPG RE Finance Trust, Inc. | | |
Two Harbors Investment Corp. | | |
| | |
|
| | |
| | |
| | |
|
| | |
Oil, Gas & Consumable Fuels — 4.5% |
| | |
| | |
Brigham Minerals, Inc., Class A | | |
California Resources Corp. | | |
| | |
| | |
Clean Energy Fuels Corp. * | | |
Comstock Resources, Inc. * | | |
| | |
| | |
| | |
| | |
| | |
| | |
| | |
Kosmos Energy Ltd. (Ghana) * | | |
| | |
Magnolia Oil & Gas Corp., Class A | | |
Northern Oil and Gas, Inc. | | |
PBF Energy, Inc., Class A * | | |
| | |
Permian Resources Corp. * | | |
| | |
| | |
|
Oil, Gas & Consumable Fuels — continued |
| | |
World Fuel Services Corp. | | |
| | |
Paper & Forest Products — 0.2% |
Mercer International, Inc. (Germany) | | |
| | |
| | |
|
Edgewell Personal Care Co. | | |
| | |
| | |
| | |
Nu Skin Enterprises, Inc., Class A | | |
USANA Health Sciences, Inc. * | | |
| | |
|
Aclaris Therapeutics, Inc. * | | |
Amneal Pharmaceuticals, Inc. * | | |
Amphastar Pharmaceuticals, Inc. * | | |
| | |
Axsome Therapeutics, Inc. * | | |
Cassava Sciences, Inc. * (a) | | |
CinCor Pharma, Inc. * (a) | | |
Corcept Therapeutics, Inc. * | | |
DICE Therapeutics, Inc. * | | |
Harmony Biosciences Holdings, Inc. * | | |
| | |
| | |
NGM Biopharmaceuticals, Inc. * | | |
Reata Pharmaceuticals, Inc., Class A * | | |
Revance Therapeutics, Inc. * | | |
Supernus Pharmaceuticals, Inc. * | | |
| | |
Professional Services — 1.1% |
| | |
| | |
Forrester Research, Inc. * | | |
HireRight Holdings Corp. * | | |
Huron Consulting Group, Inc. * | | |
| | |
Kelly Services, Inc., Class A | | |
| | |
SEE NOTES TO FINANCIAL STATEMENTS.
| J.P. Morgan Exchange-Traded Funds | |
JPMorgan BetaBuilders U.S. Small Cap Equity ETF
SCHEDULE OF PORTFOLIO INVESTMENTS
AS OF October 31, 2022 (continued)
| | |
Common Stocks — continued |
Professional Services — continued |
| | |
| | |
| | |
| | |
| | |
Real Estate Management & Development — 0.5% |
Anywhere Real Estate, Inc. * | | |
| | |
| | |
Kennedy-Wilson Holdings, Inc. | | |
| | |
Newmark Group, Inc., Class A | | |
Offerpad Solutions, Inc. * (a) | | |
| | |
| | |
| | |
|
| | |
| | |
| | |
Schneider National, Inc., Class B | | |
| | |
| | |
Semiconductors & Semiconductor Equipment — 2.3% |
ACM Research, Inc., Class A * | | |
Axcelis Technologies, Inc. * | | |
| | |
Credo Technology Group Holding Ltd. * | | |
| | |
| | |
| | |
| | |
indie Semiconductor, Inc., Class A (China) * | | |
Kulicke & Soffa Industries, Inc. (Singapore) | | |
MACOM Technology Solutions Holdings, Inc. * | | |
| | |
Navitas Semiconductor Corp. * (a) | | |
| | |
| | |
Rigetti Computing, Inc. * | | |
Ultra Clean Holdings, Inc. * | | |
Veeco Instruments, Inc. * | | |
| | |
| | |
|
|
| | |
| | |
Alarm.com Holdings, Inc. * | | |
Altair Engineering, Inc., Class A * | | |
Amplitude, Inc., Class A * | | |
Appfolio, Inc., Class A * | | |
| | |
| | |
| | |
Braze, Inc., Class A * (a) | | |
BTRS Holdings, Inc., Class 1 * | | |
| | |
| | |
Confluent, Inc., Class A * | | |
Consensus Cloud Solutions, Inc. * | | |
| | |
| | |
| | |
E2open Parent Holdings, Inc. * | | |
| | |
Embark Technology, Inc. * | | |
Enfusion, Inc., Class A * | | |
| | |
Freshworks, Inc., Class A * | | |
| | |
HashiCorp, Inc., Class A * | | |
| | |
| | |
| | |
Marathon Digital Holdings, Inc. * (a) | | |
| | |
| | |
| | |
| | |
| | |
| | |
| | |
| | |
| | |
| | |
Sprinklr, Inc., Class A * | | |
| | |
| | |
SEE NOTES TO FINANCIAL STATEMENTS.
| J.P. Morgan Exchange-Traded Funds | |
| | |
Common Stocks — continued |
|
Zeta Global Holdings Corp., Class A * | | |
| | |
| | |
|
| | |
Abercrombie & Fitch Co., Class A * | | |
Academy Sports & Outdoors, Inc. | | |
| | |
Asbury Automotive Group, Inc. * | | |
Bed Bath & Beyond, Inc. * (a) | | |
Boot Barn Holdings, Inc. * | | |
| | |
Camping World Holdings, Inc., Class A (a) | | |
Children's Place, Inc. (The) * | | |
Designer Brands, Inc., Class A | | |
| | |
| | |
| | |
| | |
| | |
Sally Beauty Holdings, Inc. * | | |
| | |
| | |
Sonic Automotive, Inc., Class A | | |
| | |
| | |
Technology Hardware, Storage & Peripherals — 0.4% |
| | |
| | |
| | |
Super Micro Computer, Inc. * | | |
| | |
Textiles, Apparel & Luxury Goods — 0.7% |
G-III Apparel Group Ltd. * | | |
| | |
Levi Strauss & Co., Class A | | |
| | |
| | |
Wolverine World Wide, Inc. | | |
| | |
Thrifts & Mortgage Finance — 1.5% |
| | |
| | |
|
Thrifts & Mortgage Finance — continued |
Capitol Federal Financial, Inc. | | |
Columbia Financial, Inc. * | | |
| | |
| | |
| | |
NMI Holdings, Inc., Class A * | | |
| | |
PennyMac Financial Services, Inc. | | |
Provident Financial Services, Inc. | | |
Rocket Cos., Inc., Class A (a) | | |
| | |
| | |
| | |
|
Turning Point Brands, Inc. | | |
| | |
| | |
| | |
Trading Companies & Distributors — 1.7% |
Applied Industrial Technologies, Inc. | | |
| | |
Custom Truck One Source, Inc. * (a) | | |
| | |
| | |
H&E Equipment Services, Inc. | | |
| | |
| | |
Rush Enterprises, Inc., Class A | | |
Triton International Ltd. (Bermuda) | | |
| | |
| | |
|
American States Water Co. | | |
California Water Service Group | | |
| | |
| | |
| | |
Wireless Telecommunication Services — 0.3% |
| | |
Shenandoah Telecommunications Co. | | |
SEE NOTES TO FINANCIAL STATEMENTS.
| J.P. Morgan Exchange-Traded Funds | |
JPMorgan BetaBuilders U.S. Small Cap Equity ETF
SCHEDULE OF PORTFOLIO INVESTMENTS
AS OF October 31, 2022 (continued)
| | |
Common Stocks — continued |
Wireless Telecommunication Services — continued |
Telephone and Data Systems, Inc. | | |
United States Cellular Corp. * | | |
| | |
Total Common Stocks
(Cost $543,796,972) | | |
| | |
|
|
Zogenix, Inc., CVR ‡ *(Cost $—) | | |
| | |
Short-Term Investments — 4.0% |
Investment Companies — 1.7% |
JPMorgan U.S. Government Money Market Fund Class IM Shares, 2.85% (c) (d)
(Cost $8,224,756) | | |
Investment of Cash Collateral from Securities Loaned — 2.3% |
JPMorgan Securities Lending Money Market Fund Agency SL Class Shares, 3.23% (c) (d) | | |
JPMorgan U.S. Government Money Market Fund Class IM Shares, 2.85% (c) (d) | | |
Total Investment of Cash Collateral from Securities Loaned
(Cost $11,617,499) | | |
Total Short-Term Investments
(Cost $19,842,255) | | |
Total Investments — 102.2%
(Cost $563,639,227) | | |
Liabilities in Excess of Other Assets — (2.2)% | | |
| | |
Percentages indicated are based on net assets. |
| |
| |
| Real Estate Investment Trust |
| Amount rounds to less than 0.1% of net assets. |
| Value determined using significant unobservable inputs. | |
| Non-income producing security. | |
| The security or a portion of this security is on loan at October 31, 2022. The total value of securities on loan at October 31, 2022 is $11,082,834. | |
| Security exempt from registration pursuant to Regulation S under the Securities Act of 1933, as amended. Regulation S applies to securities offerings that are made outside of the United States and do not involve direct selling efforts in the United States and as such may have restrictions on resale. | |
| Investment in an affiliated fund, which is registered under the Investment Company Act of 1940, as amended, and is advised by J.P. Morgan Investment Management Inc. | |
| The rate shown is the current yield as of October 31, 2022. | |
Futures contracts outstanding as of October 31, 2022:
| | | | | VALUE AND
UNREALIZED
APPRECIATION
(DEPRECIATION) ($) |
| | | | | |
Russell 2000 E-Mini Index | | | | | |
SEE NOTES TO FINANCIAL STATEMENTS.
| J.P. Morgan Exchange-Traded Funds | |
JPMorgan Carbon Transition U.S. Equity ETF
SCHEDULE OF PORTFOLIO INVESTMENTS
AS OF October 31, 2022
| | |
|
Aerospace & Defense — 0.2% |
L3Harris Technologies, Inc. | | |
Air Freight & Logistics — 0.3% |
CH Robinson Worldwide, Inc. | | |
Expeditors International of Washington, Inc. | | |
United Parcel Service, Inc., Class B | | |
| | |
|
| | |
| | |
| | |
|
| | |
| | |
| | |
| | |
|
| | |
| | |
| | |
PNC Financial Services Group, Inc. (The) | | |
| | |
| | |
| | |
| | |
|
Brown-Forman Corp., Class B | | |
| | |
| | |
| | |
| | |
| | |
|
| | |
| | |
| | |
| | |
| | |
Regeneron Pharmaceuticals, Inc. * | | |
| | |
Vertex Pharmaceuticals, Inc. * | | |
| | |
| | |
|
|
| | |
Lennox International, Inc. | | |
| | |
| | |
| | |
|
| | |
Bank of New York Mellon Corp. (The) | | |
| | |
| | |
Carlyle Group, Inc. (The) | | |
Charles Schwab Corp. (The) | | |
| | |
FactSet Research Systems, Inc. | | |
Goldman Sachs Group, Inc. (The) | | |
Intercontinental Exchange, Inc. | | |
| | |
| | |
LPL Financial Holdings, Inc. | | |
| | |
| | |
| | |
| | |
| | |
| | |
| | |
| | |
T. Rowe Price Group, Inc. | | |
| | |
|
Air Products and Chemicals, Inc. | | |
| | |
| | |
| | |
| | |
| | |
| | |
International Flavors & Fragrances, Inc. | | |
Linde plc (United Kingdom) | | |
| | |
| | |
Scotts Miracle-Gro Co. (The) | | |
SEE NOTES TO FINANCIAL STATEMENTS.
| J.P. Morgan Exchange-Traded Funds | |
JPMorgan Carbon Transition U.S. Equity ETF
SCHEDULE OF PORTFOLIO INVESTMENTS
AS OF October 31, 2022 (continued)
| | |
Common Stocks — continued |
|
Sherwin-Williams Co. (The) | | |
| | |
| | |
Commercial Services & Supplies — 0.8% |
| | |
| | |
| | |
| | |
| | |
| | |
| | |
Communications Equipment — 1.3% |
| | |
| | |
| | |
| | |
| | |
| | |
|
| | |
Capital One Financial Corp. | | |
| | |
| | |
Containers & Packaging — 0.1% |
| | |
|
| | |
Diversified Financial Services — 1.0% |
Apollo Global Management, Inc. | | |
Berkshire Hathaway, Inc., Class B * | | |
| | |
| | |
Diversified Telecommunication Services — 0.7% |
| | |
Verizon Communications, Inc. | | |
| | |
Electric Utilities — 1.4% |
| | |
| | |
| | |
| | |
| | |
|
Electric Utilities — continued |
| | |
| | |
| | |
| | |
| | |
Electrical Equipment — 0.6% |
| | |
| | |
Rockwell Automation, Inc. | | |
| | |
Electronic Equipment, Instruments & Components — 0.4% |
Keysight Technologies, Inc. * | | |
Teledyne Technologies, Inc. * | | |
| | |
Zebra Technologies Corp., Class A * | | |
| | |
Energy Equipment & Services — 0.6% |
| | |
| | |
| | |
|
Activision Blizzard, Inc. | | |
Liberty Media Corp.-Liberty Formula One, Class C * | | |
| | |
| | |
Take-Two Interactive Software, Inc. * | | |
| | |
| | |
Equity Real Estate Investment Trusts (REITs) — 2.9% |
American Homes 4 Rent, Class A | | |
| | |
AvalonBay Communities, Inc. | | |
| | |
Brixmor Property Group, Inc. | | |
| | |
| | |
| | |
| | |
Essex Property Trust, Inc. | | |
Extra Space Storage, Inc. | | |
Federal Realty Investment Trust | | |
Healthcare Realty Trust, Inc. | | |
SEE NOTES TO FINANCIAL STATEMENTS.
| J.P. Morgan Exchange-Traded Funds | |
| | |
Common Stocks — continued |
Equity Real Estate Investment Trusts (REITs) — continued |
Hudson Pacific Properties, Inc. | | |
| | |
| | |
| | |
National Retail Properties, Inc. | | |
Omega Healthcare Investors, Inc. | | |
| | |
| | |
| | |
| | |
| | |
Rexford Industrial Realty, Inc. | | |
| | |
Simon Property Group, Inc. | | |
| | |
| | |
| | |
| | |
Food & Staples Retailing — 1.1% |
| | |
| | |
| | |
| | |
|
| | |
McCormick & Co., Inc. (Non-Voting) | | |
Mondelez International, Inc., Class A | | |
| | |
|
| | |
| | |
| | |
| | |
Health Care Equipment & Supplies — 1.8% |
| | |
| | |
Boston Scientific Corp. * | | |
Edwards Lifesciences Corp. * | | |
| | |
| | |
| | |
|
Health Care Equipment & Supplies — continued |
| | |
| | |
| | |
Health Care Providers & Services — 4.4% |
| | |
| | |
| | |
| | |
| | |
| | |
| | |
| | |
Hotels, Restaurants & Leisure — 1.8% |
| | |
Chipotle Mexican Grill, Inc. * | | |
| | |
Planet Fitness, Inc., Class A * | | |
| | |
| | |
| | |
Household Products — 1.7% |
Church & Dwight Co., Inc. | | |
| | |
| | |
Procter & Gamble Co. (The) | | |
| | |
Industrial Conglomerates — 0.5% |
| | |
|
| | |
| | |
American International Group, Inc. | | |
| | |
Arch Capital Group Ltd. * | | |
| | |
| | |
| | |
Cincinnati Financial Corp. | | |
First American Financial Corp. | | |
Hartford Financial Services Group, Inc. (The) | | |
| | |
Marsh & McLennan Cos., Inc. | | |
SEE NOTES TO FINANCIAL STATEMENTS.
| J.P. Morgan Exchange-Traded Funds | |
JPMorgan Carbon Transition U.S. Equity ETF
SCHEDULE OF PORTFOLIO INVESTMENTS
AS OF October 31, 2022 (continued)
| | |
Common Stocks — continued |
|
| | |
Principal Financial Group, Inc. | | |
Prudential Financial, Inc. | | |
RenaissanceRe Holdings Ltd. (Bermuda) | | |
Travelers Cos., Inc. (The) | | |
| | |
| | |
Interactive Media & Services — 3.7% |
Alphabet, Inc., Class A * | | |
Meta Platforms, Inc., Class A * | | |
| | |
Internet & Direct Marketing Retail — 2.6% |
| | |
| | |
| | |
| | |
|
| | |
| | |
Automatic Data Processing, Inc. | | |
| | |
Cognizant Technology Solutions Corp., Class A | | |
Fidelity National Information Services, Inc. | | |
| | |
| | |
| | |
| | |
International Business Machines Corp. | | |
Jack Henry & Associates, Inc. | | |
Mastercard, Inc., Class A | | |
| | |
| | |
| | |
| | |
| | |
| | |
| | |
| | |
|
| | |
| | |
| | |
| | |
|
Life Sciences Tools & Services — 2.3% |
Agilent Technologies, Inc. | | |
| | |
| | |
| | |
Mettler-Toledo International, Inc. * | | |
| | |
Thermo Fisher Scientific, Inc. | | |
| | |
| | |
|
| | |
| | |
| | |
| | |
| | |
| | |
Illinois Tool Works, Inc. | | |
| | |
| | |
| | |
| | |
| | |
| | |
| | |
| | |
|
| | |
| | |
Interpublic Group of Cos., Inc. (The) | | |
Liberty Media Corp.-Liberty SiriusXM, Class C * | | |
| | |
Paramount Global, Class B | | |
| | |
|
| | |
Mortgage Real Estate Investment Trusts (REITs) — 0.0% ^ |
Annaly Capital Management, Inc. | | |
Multiline Retail — 0.0% ^ |
| | |
|
| | |
| | |
SEE NOTES TO FINANCIAL STATEMENTS.
| J.P. Morgan Exchange-Traded Funds | |
| | |
Common Stocks — continued |
Multi-Utilities — continued |
Consolidated Edison, Inc. | | |
| | |
Public Service Enterprise Group, Inc. | | |
| | |
| | |
| | |
Oil, Gas & Consumable Fuels — 4.7% |
| | |
| | |
| | |
| | |
| | |
| | |
Occidental Petroleum Corp. | | |
| | |
Williams Cos., Inc. (The) | | |
| | |
|
Estee Lauder Cos., Inc. (The), Class A | | |
|
| | |
| | |
| | |
| | |
| | |
| | |
| | |
Professional Services — 0.5% |
Booz Allen Hamilton Holding Corp. | | |
| | |
| | |
| | |
Robert Half International, Inc. | | |
Science Applications International Corp. | | |
| | |
| | |
| | |
Real Estate Management & Development — 0.2% |
CBRE Group, Inc., Class A * | | |
Howard Hughes Corp. (The) * | | |
| | |
|
Real Estate Management & Development — continued |
Jones Lang LaSalle, Inc. * | | |
Zillow Group, Inc., Class C * | | |
| | |
|
| | |
Uber Technologies, Inc. * | | |
| | |
| | |
Semiconductors & Semiconductor Equipment — 4.3% |
Advanced Micro Devices, Inc. * | | |
| | |
| | |
| | |
| | |
| | |
| | |
| | |
| | |
| | |
| | |
| | |
| | |
| | |
|
| | |
Atlassian Corp., Class A * | | |
| | |
Cadence Design Systems, Inc. * | | |
Confluent, Inc., Class A * | | |
Dolby Laboratories, Inc., Class A | | |
Guidewire Software, Inc. * | | |
| | |
| | |
| | |
| | |
Palo Alto Networks, Inc. * | | |
| | |
| | |
| | |
| | |
| | |
| | |
| | |
SEE NOTES TO FINANCIAL STATEMENTS.
| J.P. Morgan Exchange-Traded Funds | |
JPMorgan Carbon Transition U.S. Equity ETF
SCHEDULE OF PORTFOLIO INVESTMENTS
AS OF October 31, 2022 (continued)
| | |
Common Stocks — continued |
|
| | |
| | |
| | |
|
| | |
| | |
Lithia Motors, Inc., Class A | | |
| | |
| | |
| | |
| | |
| | |
Technology Hardware, Storage & Peripherals — 6.9% |
| | |
Dell Technologies, Inc., Class C | | |
| | |
| | |
Textiles, Apparel & Luxury Goods — 0.9% |
Lululemon Athletica, Inc. * | | |
| | |
| | |
| | |
| | |
| | |
| | |
Trading Companies & Distributors — 0.2% |
| | |
| | |
| | |
| | |
|
|
Essential Utilities, Inc. | | |
Wireless Telecommunication Services — 0.1% |
| | |
Total Common Stocks
(Cost $20,936,668) | | |
Short-Term Investments — 0.2% |
Investment Companies — 0.2% |
JPMorgan U.S. Government Money Market Fund Class IM Shares, 2.85% (a) (b)
(Cost $31,835) | | |
Total Investments — 99.9%
(Cost $20,968,503) | | |
Other Assets Less Liabilities — 0.1% | | |
| | |
Percentages indicated are based on net assets. |
| Amount rounds to less than 0.1% of net assets. |
| Non-income producing security. | |
| Investment in an affiliated fund, which is registered under the Investment Company Act of 1940, as amended, and is advised by J.P. Morgan Investment Management Inc. | |
| The rate shown is the current yield as of October 31, 2022. | |
Futures contracts outstanding as of October 31, 2022:
| | | | | VALUE AND
UNREALIZED
APPRECIATION
(DEPRECIATION) ($) |
| | | | | |
Micro E-Mini S&P 500 Index | | | | | |
SEE NOTES TO FINANCIAL STATEMENTS.
| J.P. Morgan Exchange-Traded Funds | |
JPMorgan Climate Change Solutions ETF
SCHEDULE OF PORTFOLIO INVESTMENTS
AS OF October 31, 2022
| | |
|
|
West Fraser Timber Co. Ltd. | | |
|
Contemporary Amperex Technology Co. Ltd., Class A | | |
NARI Technology Co. Ltd., Class A | | |
Tongwei Co. Ltd., Class A | | |
| | |
|
| | |
| | |
| | |
|
| | |
|
| | |
| | |
| | |
| | |
| | |
|
| | |
| | |
| | |
| | |
|
| | |
|
| | |
| | |
| | |
|
| | |
| | |
Kurita Water Industries Ltd. | | |
| | |
| | |
|
| | |
| | |
| | |
| | |
| | |
|
|
Aker Carbon Capture ASA * | | |
| | |
| | |
|
LG Energy Solution Ltd. * | | |
| | |
| | |
|
| | |
| | |
Solaria Energia y Medio Ambiente SA * | | |
| | |
|
| | |
Nibe Industrier AB, Class B | | |
| | |
|
| | |
| | |
| | |
| | |
|
| | |
| | |
| | |
| | |
|
| | |
Array Technologies, Inc. * | | |
| | |
Brookfield Renewable Corp. | | |
| | |
ChargePoint Holdings, Inc. * | | |
| | |
| | |
| | |
Evoqua Water Technologies Corp. * | | |
Johnson Controls International plc | | |
| | |
| | |
| | |
SEE NOTES TO FINANCIAL STATEMENTS.
JPMorgan Climate Change Solutions ETF
SCHEDULE OF PORTFOLIO INVESTMENTS
AS OF October 31, 2022 (continued)
| | |
Common Stocks — continued |
United States — continued |
Shoals Technologies Group, Inc., Class A * | | |
SolarEdge Technologies, Inc. * | | |
| | |
| | |
| | |
| | |
| | |
| | |
Total Common Stocks
(Cost $23,170,856) | | |
Total Investments — 98.5%
(Cost $23,170,856) | | |
Other Assets Less Liabilities — 1.5% | | |
| | |
Percentages indicated are based on net assets. |
| |
| |
| Real Estate Investment Trust |
| Non-income producing security. |
| Security exempt from registration pursuant to Regulation S under the Securities Act of 1933, as amended. Regulation S applies to securities offerings that are made outside of the United States and do not involve direct selling efforts in the United States and as such may have restrictions on resale. |
Summary of Investments by Industry, October 31, 2022
The following table represents the portfolio investments of the Fund by industry classifications as a percentage of total investments:
| PERCENT OF
TOTAL
INVESTMENTS |
| |
| |
| |
| |
Electronic Equipment, Instruments & Components | |
Semiconductors & Semiconductor Equipment | |
| |
Independent Power and Renewable Electricity Producers | |
| |
| |
Commercial Services & Supplies | |
| |
Equity Real Estate Investment Trusts (REITs) | |
Others (each less than 1.0%) | |
SEE NOTES TO FINANCIAL STATEMENTS.
JPMorgan Diversified Return Emerging Markets Equity ETF
SCHEDULE OF PORTFOLIO INVESTMENTS
AS OF October 31, 2022
| | |
|
|
| | |
| | |
Banco Bradesco SA (Preference) | | |
| | |
Banco Santander Brasil SA | | |
BB Seguridade Participacoes SA | | |
Bradespar SA (Preference) | | |
| | |
Centrais Eletricas Brasileiras SA | | |
Cia de Saneamento Basico do Estado de Sao Paulo * | | |
Cia de Transmissao de Energia Eletrica Paulista (Preference) | | |
Cia Energetica de Minas Gerais (Preference) | | |
Cia Paranaense de Energia (Preference) | | |
| | |
| | |
| | |
EDP - Energias do Brasil SA | | |
| | |
| | |
| | |
| | |
| | |
| | |
Itau Unibanco Holding SA (Preference) * | | |
| | |
| | |
| | |
Metalurgica Gerdau SA (Preference) | | |
| | |
Petroleo Brasileiro SA (Preference) | | |
| | |
| | |
| | |
| | |
| | |
Transmissora Alianca de Energia Eletrica SA | | |
Unipar Carbocloro SA (Preference), Class B | | |
| | |
| | |
|
| | |
| | |
| | |
|
|
| | |
| | |
Cia Cervecerias Unidas SA | | |
Cia Sud Americana de Vapores SA | | |
| | |
Embotelladora Andina SA (Preference), Class B | | |
| | |
| | |
|
Agile Group Holdings Ltd. * | | |
Agricultural Bank of China Ltd., Class A | | |
An Hui Wenergy Co. Ltd., Class A * | | |
Angang Steel Co. Ltd., Class H | | |
Anhui Conch Cement Co. Ltd., Class H | | |
Anhui Expressway Co. Ltd., Class A | | |
ANTA Sports Products Ltd. | | |
BAIC Motor Corp. Ltd., Class H (a) | | |
Bank of Beijing Co. Ltd., Class A | | |
Bank of China Ltd., Class H | | |
Bank of Communications Co. Ltd., Class A | | |
Bank of Hangzhou Co. Ltd., Class A | | |
Baoshan Iron & Steel Co. Ltd., Class A | | |
Beijing Enterprises Holdings Ltd. | | |
BGI Genomics Co. Ltd., Class A | | |
Bosideng International Holdings Ltd. | | |
BYD Electronic International Co. Ltd. | | |
CGN Power Co. Ltd., Class H (a) | | |
China CITIC Bank Corp. Ltd., Class H | | |
China Coal Energy Co. Ltd., Class H | | |
China Communications Services Corp. Ltd., Class H | | |
China Construction Bank Corp., Class H | | |
China Everbright Bank Co. Ltd., Class H | | |
| | |
China Hongqiao Group Ltd. | | |
China International Marine Containers Group Co. Ltd., Class A | | |
China Lesso Group Holdings Ltd. | | |
China Longyuan Power Group Corp. Ltd., Class H | | |
China Medical System Holdings Ltd. | | |
China Merchants Bank Co. Ltd., Class H | | |
China Merchants Energy Shipping Co. Ltd., Class A | | |
SEE NOTES TO FINANCIAL STATEMENTS.
| J.P. Morgan Exchange-Traded Funds | |
JPMorgan Diversified Return Emerging Markets Equity ETF
SCHEDULE OF PORTFOLIO INVESTMENTS
AS OF October 31, 2022 (continued)
| | |
Common Stocks — continued |
|
China Merchants Port Group Co. Ltd., Class A | | |
China Merchants Port Holdings Co. Ltd. | | |
China Minsheng Banking Corp. Ltd., Class H | | |
China National Building Material Co. Ltd., Class H | | |
China National Chemical Engineering Co. Ltd., Class A | | |
China National Nuclear Power Co. Ltd., Class A | | |
China Petroleum & Chemical Corp., Class H | | |
China Resources Cement Holdings Ltd. | | |
China Resources Double Crane Pharmaceutical Co. Ltd., Class A | | |
China Resources Gas Group Ltd. | | |
China Resources Land Ltd. | | |
China Resources Pharmaceutical Group Ltd. (a) | | |
China Resources Power Holdings Co. Ltd. | | |
China Resources Sanjiu Medical & Pharmaceutical Co. Ltd., Class A | | |
China Shenhua Energy Co. Ltd., Class H | | |
China South Publishing & Media Group Co. Ltd., Class A | | |
China Vanke Co. Ltd., Class H | | |
China Yangtze Power Co. Ltd., Class A | | |
Chinese Universe Publishing and Media Group Co. Ltd., Class A | | |
Chongqing Changan Automobile Co. Ltd., Class A | | |
Chongqing Rural Commercial Bank Co. Ltd., Class H | | |
| | |
Citic Pacific Special Steel Group Co. Ltd., Class A | | |
COSCO SHIPPING Energy Transportation Co. Ltd., Class H * | | |
COSCO SHIPPING Holdings Co. Ltd., Class H | | |
COSCO SHIPPING Ports Ltd. | | |
CSG Holding Co. Ltd., Class A | | |
CSPC Pharmaceutical Group Ltd. | | |
Daan Gene Co. Ltd., Class A | | |
Dali Foods Group Co. Ltd. (a) | | |
Daqin Railway Co. Ltd., Class A | | |
Datang International Power Generation Co. Ltd., Class H * | | |
Dongfeng Motor Group Co. Ltd., Class H | | |
Dongguan Development Holdings Co. Ltd., Class A | | |
| | |
|
|
| | |
| | |
Fujian Sunner Development Co. Ltd., Class A | | |
G-bits Network Technology Xiamen Co. Ltd., Class A | | |
GD Power Development Co. Ltd., Class A * | | |
Great Wall Motor Co. Ltd., Class H | | |
Guangdong Baolihua New Energy Stock Co. Ltd., Class A | | |
Guangxi Guiguan Electric Power Co. Ltd., Class A | | |
Guangzhou Baiyunshan Pharmaceutical Holdings Co. Ltd., Class H | | |
Guangzhou Shiyuan Electronic Technology Co. Ltd., Class A | | |
Haitian International Holdings Ltd. | | |
Heilongjiang Agriculture Co. Ltd., Class A | | |
Henan Shuanghui Investment & Development Co. Ltd., Class A | | |
Hopson Development Holdings Ltd. (b) | | |
Huabao Flavours & Fragrances Co. Ltd., Class A | | |
Huadian Power International Corp. Ltd., Class H (b) | | |
Huadong Medicine Co. Ltd., Class A | | |
Huaibei Mining Holdings Co. Ltd., Class A | | |
Huapont Life Sciences Co. Ltd., Class A | | |
Huaxin Cement Co. Ltd., Class H | | |
Huayu Automotive Systems Co. Ltd., Class A | | |
Hubei Energy Group Co. Ltd., Class A | | |
Hubei Jumpcan Pharmaceutical Co. Ltd., Class A | | |
Hunan Valin Steel Co. Ltd., Class A | | |
Industrial & Commercial Bank of China Ltd., Class H | | |
Inner Mongolia Dian Tou Energy Corp. Ltd., Class A | | |
Inner Mongolia Yitai Coal Co. Ltd., Class B | | |
Intco Medical Technology Co. Ltd., Class A | | |
Jiangling Motors Corp. Ltd., Class A | | |
Jiangsu Expressway Co. Ltd., Class A | | |
Jiangsu Hengli Hydraulic Co. Ltd., Class A | | |
Jiangsu Yuyue Medical Equipment & Supply Co. Ltd., Class A | | |
Jiangsu Zhongnan Construction Group Co. Ltd., Class A * | | |
SEE NOTES TO FINANCIAL STATEMENTS.
| J.P. Morgan Exchange-Traded Funds | |
| | |
Common Stocks — continued |
|
Jiangsu Zhongtian Technology Co. Ltd., Class A | | |
Joincare Pharmaceutical Group Industry Co. Ltd., Class A | | |
Jointo Energy Investment Co. Ltd. Hebei, Class A * | | |
Joyoung Co. Ltd., Class A | | |
| | |
| | |
KingClean Electric Co. Ltd., Class A | | |
| | |
Kweichow Moutai Co. Ltd., Class A | | |
LB Group Co. Ltd., Class A | | |
| | |
Livzon Pharmaceutical Group, Inc., Class A | | |
Longfor Group Holdings Ltd. (c) | | |
Luolai Lifestyle Technology Co. Ltd., Class A | | |
Maanshan Iron & Steel Co. Ltd., Class H | | |
Metallurgical Corp. of China Ltd., Class A | | |
Nanjing Iron & Steel Co. Ltd., Class A | | |
Ningbo Sanxing Medical Electric Co. Ltd., Class A | | |
Pharmaron Beijing Co. Ltd., Class H (a) | | |
Ping An Insurance Group Co. of China Ltd., Class H | | |
Postal Savings Bank of China Co. Ltd., Class H (a) | | |
Qinhuangdao Port Co. Ltd., Class A | | |
Sansteel Minguang Co. Ltd. Fujian, Class A | | |
Sany Heavy Industry Co. Ltd., Class A | | |
SDIC Power Holdings Co. Ltd., Class A | | |
| | |
Seazen Holdings Co. Ltd., Class A * | | |
Shaanxi Coal Industry Co. Ltd., Class A | | |
Shandong Buchang Pharmaceuticals Co. Ltd., Class A | | |
Shandong Chenming Paper Holdings Ltd., Class A * | | |
Shandong Hualu Hengsheng Chemical Co. Ltd., Class A | | |
Shandong Publishing & Media Co. Ltd., Class A | | |
Shandong Weigao Group Medical Polymer Co. Ltd., Class H | | |
Shanghai International Port Group Co. Ltd., Class A | | |
| | |
|
|
Shanghai Pharmaceuticals Holding Co. Ltd., Class H | | |
Shanghai Tunnel Engineering Co. Ltd., Class A | | |
Shanxi Lu'an Environmental Energy Development Co. Ltd., Class A | | |
Shenzhen Jinjia Group Co. Ltd., Class A | | |
Shenzhen Mindray Bio-Medical Electronics Co. Ltd., Class A | | |
Shenzhen New Nanshan Holding Group Co. Ltd., Class A * | | |
Shenzhen Overseas Chinese Town Co. Ltd., Class A | | |
Shenzhen Salubris Pharmaceuticals Co. Ltd., Class A | | |
Sinoma International Engineering Co., Class A | | |
Sino-Ocean Group Holding Ltd. | | |
Sinopharm Group Co. Ltd., Class H | | |
| | |
Tangshan Jidong Cement Co. Ltd., Class A ‡ | | |
TangShan Port Group Co. Ltd., Class A | | |
Tian Di Science & Technology Co. Ltd., Class A | | |
Tianhe Chemicals Group Ltd. ‡ * | | |
Wanxiang Qianchao Co. Ltd., Class A | | |
Weichai Power Co. Ltd., Class A | | |
Weifu High-Technology Group Co. Ltd., Class A | | |
Wuliangye Yibin Co. Ltd., Class A | | |
Xiamen C & D, Inc., Class A | | |
Xinhua Winshare Publishing and Media Co. Ltd., Class A | | |
Xinxing Ductile Iron Pipes Co. Ltd., Class A | | |
Yangzijiang Shipbuilding Holdings Ltd. | | |
Yankuang Energy Group Co. Ltd., Class H | | |
Yintai Gold Co. Ltd., Class A | | |
| | |
Yunnan Baiyao Group Co. Ltd., Class A | | |
Zhejiang Expressway Co. Ltd., Class H (b) | | |
Zhejiang Hisoar Pharmaceutical Co. Ltd., Class A | | |
Zhejiang Sanhua Intelligent Controls Co. Ltd., Class A | | |
Zhejiang Semir Garment Co. Ltd., Class A | | |
Zhejiang Weixing New Building Materials Co. Ltd., Class A | | |
Zhengzhou Coal Mining Machinery Group Co. Ltd., Class A | | |
Zhongsheng Group Holdings Ltd. | | |
SEE NOTES TO FINANCIAL STATEMENTS.
| J.P. Morgan Exchange-Traded Funds | |
JPMorgan Diversified Return Emerging Markets Equity ETF
SCHEDULE OF PORTFOLIO INVESTMENTS
AS OF October 31, 2022 (continued)
| | |
Common Stocks — continued |
|
Zhuzhou Kibing Group Co. Ltd., Class A | | |
Zijin Mining Group Co. Ltd., Class H | | |
Zoomlion Heavy Industry Science and Technology Co. Ltd., Class H | | |
| | |
|
Bancolombia SA (Preference) | | |
Grupo Aval Acciones y Valores SA (Preference) | | |
| | |
|
| | |
Moneta Money Bank A/S (a) | | |
| | |
|
Commercial International Bank Egypt SAE | | |
|
Hellenic Telecommunications Organization SA | | |
| | |
| | |
| | |
| | |
|
Kingboard Laminates Holdings Ltd. | | |
Nine Dragons Paper Holdings Ltd. | | |
| | |
|
Magyar Telekom Telecommunications plc | | |
MOL Hungarian Oil & Gas plc | | |
| | |
| | |
|
| | |
| | |
| | |
Bajaj Holdings & Investment Ltd. | | |
Bharat Petroleum Corp. Ltd. | | |
| | |
| | |
Colgate-Palmolive India Ltd. | | |
| | |
| | |
|
|
| | |
Dr Reddy's Laboratories Ltd. | | |
| | |
Glenmark Pharmaceuticals Ltd. | | |
| | |
| | |
Hindustan Petroleum Corp. Ltd. | | |
| | |
| | |
Housing Development Finance Corp. Ltd. | | |
ICICI Lombard General Insurance Co. Ltd. (a) | | |
| | |
| | |
| | |
| | |
Jindal Steel & Power Ltd. | | |
| | |
| | |
| | |
| | |
| | |
| | |
| | |
Oil & Natural Gas Corp. Ltd. | | |
| | |
| | |
| | |
Power Grid Corp. of India Ltd. | | |
| | |
| | |
Samvardhana Motherson International Ltd. | | |
Steel Authority of India Ltd. | | |
Sun Pharmaceutical Industries Ltd. | | |
Tata Consultancy Services Ltd. | | |
Tata Power Co. Ltd. (The) | | |
| | |
| | |
| | |
| | |
| | |
| | |
| | |
SEE NOTES TO FINANCIAL STATEMENTS.
| J.P. Morgan Exchange-Traded Funds | |
| | |
Common Stocks — continued |
|
| | |
| | |
| | |
|
Adaro Energy Indonesia Tbk. PT | | |
Astra International Tbk. PT | | |
Bank Central Asia Tbk. PT | | |
| | |
Charoen Pokphand Indonesia Tbk. PT | | |
| | |
Hanjaya Mandala Sampoerna Tbk. PT | | |
Indofood CBP Sukses Makmur Tbk. PT | | |
Indofood Sukses Makmur Tbk. PT | | |
| | |
Media Nusantara Citra Tbk. PT * | | |
Perusahaan Gas Negara Tbk. PT | | |
Sarana Menara Nusantara Tbk. PT | | |
Telkom Indonesia Persero Tbk. PT | | |
Unilever Indonesia Tbk. PT | | |
| | |
| | |
| | |
|
Agility Public Warehousing Co. KSC | | |
Humansoft Holding Co. KSC | | |
Kuwait Finance House KSCP | | |
Mobile Telecommunications Co. KSCP | | |
National Bank of Kuwait SAKP | | |
| | |
|
Astro Malaysia Holdings Bhd. | | |
| | |
| | |
| | |
Hong Leong Financial Group Bhd. | | |
| | |
| | |
| | |
| | |
Petronas Chemicals Group Bhd. | | |
| | |
| | |
| | |
| | |
|
|
| | |
| | |
| | |
|
| | |
| | |
Arca Continental SAB de CV | | |
| | |
| | |
Coca-Cola Femsa SAB de CV | | |
El Puerto de Liverpool SAB de CV, Class C1 | | |
Fibra Uno Administracion SA de CV, REIT | | |
Fomento Economico Mexicano SAB de CV | | |
| | |
Grupo Aeroportuario del Centro Norte SAB de CV | | |
Grupo Aeroportuario del Pacifico SAB de CV, Class B | | |
Grupo Aeroportuario del Sureste SAB de CV, Class B | | |
| | |
| | |
Grupo Financiero Banorte SAB de CV, Class O | | |
| | |
Kimberly-Clark de Mexico SAB de CV, Class A | | |
Megacable Holdings SAB de CV | | |
Orbia Advance Corp. SAB de CV | | |
Promotora y Operadora de Infraestructura SAB de CV | | |
Qualitas Controladora SAB de CV | | |
Sitios Latinoamerica SAB de CV * | | |
Wal-Mart de Mexico SAB de CV | | |
| | |
|
Oil & Gas Development Co. Ltd. | | |
|
BAC Holding International Corp. * | | |
|
| | |
| | |
Metro Pacific Investments Corp. | | |
SEE NOTES TO FINANCIAL STATEMENTS.
| J.P. Morgan Exchange-Traded Funds | |
JPMorgan Diversified Return Emerging Markets Equity ETF
SCHEDULE OF PORTFOLIO INVESTMENTS
AS OF October 31, 2022 (continued)
| | |
Common Stocks — continued |
|
| | |
Puregold Price Club, Inc. | | |
| | |
|
Commercial Bank PSQC (The) | | |
| | |
| | |
Mesaieed Petrochemical Holding Co. | | |
| | |
Qatar Electricity & Water Co. QSC | | |
| | |
Qatar Gas Transport Co. Ltd. | | |
Qatar International Islamic Bank QSC | | |
| | |
| | |
| | |
United Development Co. QSC | | |
| | |
|
| | |
Federal Grid Co. Unified Energy System PJSC ‡ * | | |
| | |
| | |
| | |
| | |
Magnitogorsk Iron & Steel Works PJSC ‡ | | |
MMC Norilsk Nickel PJSC ‡ | | |
Mobile TeleSystems PJSC ‡ | | |
| | |
| | |
| | |
| | |
| | |
Sberbank of Russia PJSC ‡ * | | |
| | |
| | |
Surgutneftegas PJSC (Preference) ‡ | | |
| | |
| | |
| | |
|
Abdullah Al Othaim Markets Co. | | |
| | |
|
|
| | |
| | |
| | |
| | |
| | |
Arabian Internet & Communications Services Co. | | |
| | |
| | |
Dr Sulaiman Al Habib Medical Services Group Co. | | |
| | |
| | |
| | |
Mouwasat Medical Services Co. | | |
| | |
| | |
Sahara International Petrochemical Co. | | |
Saudi Airlines Catering Co. * | | |
Saudi Arabian Mining Co. * | | |
Saudi Arabian Oil Co. (a) | | |
| | |
| | |
Saudi Ground Services Co. * | | |
Saudi Investment Bank (The) | | |
| | |
| | |
| | |
|
Yangzijiang Financial Holding Ltd. * | | |
|
African Rainbow Minerals Ltd. | | |
Anglo American Platinum Ltd. | | |
Aspen Pharmacare Holdings Ltd. | | |
| | |
| | |
| | |
Distell Group Holdings Ltd. * | | |
| | |
Foschini Group Ltd. (The) | | |
Impala Platinum Holdings Ltd. | | |
| | |
Life Healthcare Group Holdings Ltd. | | |
| | |
SEE NOTES TO FINANCIAL STATEMENTS.
| J.P. Morgan Exchange-Traded Funds | |
| | |
Common Stocks — continued |
|
| | |
| | |
| | |
| | |
| | |
Royal Bafokeng Platinum Ltd. | | |
| | |
| | |
| | |
| | |
Truworths International Ltd. | | |
| | |
| | |
| | |
|
| | |
| | |
Cheng Shin Rubber Industry Co. Ltd. | | |
Chicony Electronics Co. Ltd. | | |
| | |
| | |
| | |
Chunghwa Telecom Co. Ltd. | | |
CTBC Financial Holding Co. Ltd. | | |
E.Sun Financial Holding Co. Ltd. | | |
| | |
Evergreen Marine Corp. Taiwan Ltd. | | |
Far Eastern New Century Corp. | | |
Far EasTone Telecommunications Co. Ltd. | | |
Feng TAY Enterprise Co. Ltd. | | |
First Financial Holding Co. Ltd. | | |
Formosa Chemicals & Fibre Corp. | | |
| | |
Fubon Financial Holding Co. Ltd. | | |
| | |
| | |
| | |
Mega Financial Holding Co. Ltd. | | |
| | |
Nien Made Enterprise Co. Ltd. | | |
Novatek Microelectronics Corp. | | |
| | |
President Chain Store Corp. | | |
Realtek Semiconductor Corp. | | |
| | |
|
|
SinoPac Financial Holdings Co. Ltd. | | |
Taiwan Cooperative Financial Holding Co. Ltd. | | |
Taiwan Fertilizer Co. Ltd. | | |
| | |
Taiwan Semiconductor Manufacturing Co. Ltd. | | |
Uni-President Enterprises Corp. | | |
Yang Ming Marine Transport Corp. | | |
Yuanta Financial Holding Co. Ltd. | | |
| | |
| | |
|
Advanced Info Service PCL | | |
Bangkok Dusit Medical Services PCL, Class F | | |
| | |
Digital Telecommunications Infrastructure Fund, Class F | | |
Electricity Generating PCL | | |
| | |
Intouch Holdings PCL, NVDR | | |
| | |
PTT Exploration & Production PCL | | |
| | |
Sri Trang Gloves Thailand PCL, NVDR | | |
Thai Union Group PCL, Class F | | |
Total Access Communication PCL | | |
Total Access Communication PCL, NVDR | | |
| | |
|
AG Anadolu Grubu Holding A/S | | |
| | |
| | |
Anadolu Efes Biracilik ve Malt Sanayii A/S | | |
| | |
Aselsan Elektronik Sanayi ve Ticaret A/S | | |
| | |
BIM Birlesik Magazalar A/S | | |
| | |
Dogan Sirketler Grubu Holding A/S | | |
Dogus Otomotiv Servis ve Ticaret A/S | | |
EIS Eczacibasi Ilac ve Sinai ve Finansal Yatirimlar Sanayi ve Ticaret A/S | | |
| | |
Enka Insaat ve Sanayi A/S | | |
Eregli Demir ve Celik Fabrikalari TAS | | |
SEE NOTES TO FINANCIAL STATEMENTS.
| J.P. Morgan Exchange-Traded Funds | |
JPMorgan Diversified Return Emerging Markets Equity ETF
SCHEDULE OF PORTFOLIO INVESTMENTS
AS OF October 31, 2022 (continued)
| | |
Common Stocks — continued |
|
| | |
Haci Omer Sabanci Holding A/S | | |
Iskenderun Demir ve Celik A/S | | |
| | |
Koza Altin Isletmeleri A/S | | |
Koza Anadolu Metal Madencilik Isletmeleri A/S * | | |
Otokar Otomotiv ve Savunma Sanayi AS | | |
Oyak Cimento Fabrikalari A/S * | | |
TAV Havalimanlari Holding A/S * | | |
| | |
Tofas Turk Otomobil Fabrikasi A/S | | |
| | |
Turk Telekomunikasyon A/S | | |
Turk Traktor ve Ziraat Makineleri A/S | | |
Turkcell Iletisim Hizmetleri A/S | | |
Turkiye Sise ve Cam Fabrikalari A/S | | |
| | |
United Arab Emirates — 3.1% |
Abu Dhabi Commercial Bank PJSC | | |
Abu Dhabi Islamic Bank PJSC | | |
Abu Dhabi Ports Co. PJSC * | | |
| | |
| | |
Alpha Dhabi Holding PJSC * | | |
| | |
Emirates Telecommunications Group Co. PJSC | | |
First Abu Dhabi Bank PJSC | | |
| | |
|
| | |
Total Common Stocks
(Cost $175,358,922) | | |
| | |
|
|
Thai Union Group PCL, expiring 12/31/2022(Cost $—) | | |
| | |
Short-Term Investments — 0.1% |
Investment of Cash Collateral from Securities Loaned — 0.1% |
JPMorgan U.S. Government Money Market Fund Class IM Shares, 2.85% (d) (e)(Cost $182,157) | | |
Total Investments — 99.9%
(Cost $175,541,079) | | |
Other Assets Less Liabilities — 0.1% | | |
| | |
Percentages indicated are based on net assets. |
| |
| American Depositary Receipt |
| |
| Non-Voting Depositary Receipt |
| Public Joint Stock Company |
| A special type of equity investment that shares in the earnings of the company, has limited voting rights, and may have a dividend preference. Preference shares may also have liquidation preference. |
| Limited liability company |
| Real Estate Investment Trust |
| Amount rounds to less than 0.1% of net assets. |
| Value determined using significant unobservable inputs. | |
| Non-income producing security. | |
| Security exempt from registration pursuant to Regulation S under the Securities Act of 1933, as amended. Regulation S applies to securities offerings that are made outside of the United States and do not involve direct selling efforts in the United States and as such may have restrictions on resale. | |
| The security or a portion of this security is on loan at October 31, 2022. The total value of securities on loan at October 31, 2022 is $160,016. | |
| Securities exempt from registration under Rule 144A or section 4(a)(2), of the Securities Act of 1933, as amended. | |
| Investment in an affiliated fund, which is registered under the Investment Company Act of 1940, as amended, and is advised by J.P. Morgan Investment Management Inc. | |
| The rate shown is the current yield as of October 31, 2022. | |
SEE NOTES TO FINANCIAL STATEMENTS.
| J.P. Morgan Exchange-Traded Funds | |
Summary of Investments by Industry, October 31, 2022
The following table represents the portfolio investments of the Fund by industry classifications as a percentage of total investments:
| PERCENT OF
TOTAL
INVESTMENTS |
| |
Oil, Gas & Consumable Fuels | |
| |
Wireless Telecommunication Services | |
| |
| |
| |
Diversified Telecommunication Services | |
| |
Independent Power and Renewable Electricity Producers | |
| |
Transportation Infrastructure | |
| |
| |
| |
| |
| |
| |
Textiles, Apparel & Luxury Goods | |
| |
| |
Semiconductors & Semiconductor Equipment | |
Diversified Financial Services | |
Health Care Providers & Services | |
| |
| |
Others (each less than 1.0%) | |
| |
SEE NOTES TO FINANCIAL STATEMENTS.
| J.P. Morgan Exchange-Traded Funds | |
JPMorgan Diversified Return Emerging Markets Equity ETF
SCHEDULE OF PORTFOLIO INVESTMENTS
AS OF October 31, 2022 (continued)
Futures contracts outstanding as of October 31, 2022:
| | | | | VALUE AND
UNREALIZED
APPRECIATION
(DEPRECIATION) ($) |
| | | | | |
MSCI Emerging Markets E-Mini Index | | | | | |
| |
| Morgan Stanley Capital International |
| |
SEE NOTES TO FINANCIAL STATEMENTS.
| J.P. Morgan Exchange-Traded Funds | |
JPMorgan Diversified Return International Equity ETF
SCHEDULE OF PORTFOLIO INVESTMENTS
AS OF October 31, 2022
| | |
|
|
| | |
| | |
| | |
| | |
| | |
| | |
| | |
Australia & New Zealand Banking Group Ltd. | | |
| | |
| | |
| | |
| | |
| | |
| | |
| | |
| | |
Flutter Entertainment plc * | | |
Fortescue Metals Group Ltd. | | |
| | |
| | |
Harvey Norman Holdings Ltd. | | |
| | |
| | |
| | |
Lottery Corp. Ltd. (The) * | | |
| | |
| | |
| | |
| | |
| | |
| | |
| | |
| | |
| | |
| | |
| | |
| | |
| | |
| | |
| | |
Treasury Wine Estates Ltd. | | |
| | |
| | |
| | |
| | |
|
|
| | |
Woodside Energy Group Ltd. | | |
| | |
| | |
|
| | |
| | |
| | |
|
| | |
Etablissements Franz Colruyt NV | | |
Groupe Bruxelles Lambert NV | | |
| | |
| | |
|
| | |
|
| | |
|
| | |
|
Budweiser Brewing Co. APAC Ltd. (a) | | |
Chow Tai Fook Jewellery Group Ltd. | | |
| | |
SITC International Holdings Co. Ltd. | | |
Want Want China Holdings Ltd. | | |
Wilmar International Ltd. | | |
Xinyi Glass Holdings Ltd. | | |
| | |
|
| | |
| | |
Novo Nordisk A/S, Class B | | |
| | |
|
| | |
| | |
| | |
| | |
| | |
SEE NOTES TO FINANCIAL STATEMENTS.
| J.P. Morgan Exchange-Traded Funds | |
JPMorgan Diversified Return International Equity ETF
SCHEDULE OF PORTFOLIO INVESTMENTS
AS OF October 31, 2022 (continued)
| | |
Common Stocks — continued |
|
| | |
| | |
| | |
|
| | |
| | |
| | |
| | |
| | |
| | |
| | |
| | |
| | |
| | |
| | |
| | |
| | |
| | |
Unibail-Rodamco-Westfield, REIT * | | |
| | |
| | |
| | |
|
| | |
Bayerische Motoren Werke AG | | |
| | |
Daimler Truck Holding AG * | | |
Deutsche Telekom AG (Registered) | | |
| | |
| | |
Fresenius Medical Care AG & Co. KGaA | | |
| | |
| | |
| | |
| | |
| | |
| | |
| | |
Telefonica Deutschland Holding AG | | |
| | |
| | |
|
| | |
| | |
|
|
| | |
CK Infrastructure Holdings Ltd. | | |
| | |
Hong Kong & China Gas Co. Ltd. | | |
Hutchison Port Holdings Trust | | |
| | |
| | |
New World Development Co. Ltd. | | |
Orient Overseas International Ltd. | | |
| | |
Power Assets Holdings Ltd. | | |
Sun Hung Kai Properties Ltd. | | |
Swire Pacific Ltd., Class A | | |
| | |
Yue Yuen Industrial Holdings Ltd. | | |
| | |
|
| | |
Golden Agri-Resources Ltd. | | |
| | |
|
| | |
| | |
| | |
|
| | |
Assicurazioni Generali SpA | | |
| | |
| | |
| | |
| | |
| | |
| | |
Recordati Industria Chimica e Farmaceutica SpA | | |
| | |
| | |
Terna - Rete Elettrica Nazionale | | |
| | |
|
Activia Properties, Inc., REIT | | |
Advance Residence Investment Corp., REIT | | |
| | |
SEE NOTES TO FINANCIAL STATEMENTS.
| J.P. Morgan Exchange-Traded Funds | |
| | |
Common Stocks — continued |
|
| | |
AEON REIT Investment Corp., REIT | | |
| | |
| | |
| | |
| | |
| | |
Asahi Group Holdings Ltd. | | |
| | |
| | |
Canon Marketing Japan, Inc. | | |
| | |
| | |
| | |
Chubu Electric Power Co., Inc. | | |
Chugai Pharmaceutical Co. Ltd. | | |
| | |
Cosmo Energy Holdings Co. Ltd. | | |
Cosmos Pharmaceutical Corp. | | |
| | |
Dai Nippon Printing Co. Ltd. | | |
Daito Trust Construction Co. Ltd. | | |
Daiwa House REIT Investment Corp., REIT | | |
Daiwa Securities Group, Inc. | | |
| | |
| | |
| | |
Electric Power Development Co. Ltd. | | |
| | |
Fuji Media Holdings, Inc. | | |
| | |
| | |
Fukuoka Financial Group, Inc. | | |
H.U. Group Holdings, Inc. | | |
Hachijuni Bank Ltd. (The) | | |
| | |
| | |
| | |
Iida Group Holdings Co. Ltd. | | |
Industrial & Infrastructure Fund Investment Corp., REIT | | |
| | |
| | |
Itochu Techno-Solutions Corp. | | |
| | |
| | |
|
|
Japan Metropolitan Fund Invest, REIT | | |
Japan Post Holdings Co. Ltd. | | |
Japan Post Insurance Co. Ltd. | | |
Japan Real Estate Investment Corp., REIT | | |
| | |
| | |
Kaken Pharmaceutical Co. Ltd. | | |
| | |
Kansai Electric Power Co., Inc. (The) | | |
Kawasaki Kisen Kaisha Ltd. | | |
| | |
| | |
| | |
| | |
| | |
| | |
Kyushu Electric Power Co., Inc. | | |
| | |
| | |
| | |
| | |
Matsui Securities Co. Ltd. | | |
| | |
Mebuki Financial Group, Inc. | | |
| | |
| | |
Mitsubishi Chemical Group Corp. | | |
| | |
Mitsubishi Estate Co. Ltd. | | |
Mitsubishi Gas Chemical Co., Inc. | | |
Mitsubishi HC Capital, Inc. | | |
Mitsubishi UFJ Financial Group, Inc. | | |
| | |
| | |
Mitsui Fudosan Logistics Park, Inc., REIT | | |
Mitsui Mining & Smelting Co. Ltd. | | |
Morinaga Milk Industry Co. Ltd. | | |
MS&AD Insurance Group Holdings, Inc. | | |
| | |
| | |
| | |
Nippon Electric Glass Co. Ltd. | | |
| | |
| | |
SEE NOTES TO FINANCIAL STATEMENTS.
| J.P. Morgan Exchange-Traded Funds | |
JPMorgan Diversified Return International Equity ETF
SCHEDULE OF PORTFOLIO INVESTMENTS
AS OF October 31, 2022 (continued)
| | |
Common Stocks — continued |
|
| | |
Nippon Telegraph & Telephone Corp. | | |
| | |
Nisshin Seifun Group, Inc. | | |
Nissin Foods Holdings Co. Ltd. | | |
| | |
| | |
| | |
Nomura Real Estate Holdings, Inc. | | |
Nomura Research Institute Ltd. | | |
| | |
Ono Pharmaceutical Co. Ltd. | | |
Open House Group Co. Ltd. | | |
| | |
| | |
| | |
| | |
| | |
| | |
| | |
Sawai Group Holdings Co. Ltd. | | |
| | |
| | |
| | |
Sekisui Chemical Co. Ltd. | | |
| | |
Sekisui House REIT, Inc., REIT | | |
| | |
| | |
Ship Healthcare Holdings, Inc. | | |
Skylark Holdings Co. Ltd. | | |
| | |
| | |
| | |
| | |
| | |
Sumitomo Chemical Co. Ltd. | | |
Sumitomo Mitsui Financial Group, Inc. | | |
| | |
Suntory Beverage & Food Ltd. | | |
| | |
Taisho Pharmaceutical Holdings Co. Ltd. | | |
Takeda Pharmaceutical Co. Ltd. | | |
| | |
| | |
|
|
| | |
| | |
Tohoku Electric Power Co., Inc. | | |
Tokyo Electric Power Co. Holdings, Inc. * | | |
| | |
| | |
| | |
| | |
| | |
| | |
| | |
| | |
| | |
| | |
| | |
United Urban Investment Corp., REIT | | |
| | |
| | |
| | |
Yamaguchi Financial Group, Inc. | | |
| | |
Yokohama Rubber Co. Ltd. (The) | | |
| | |
| | |
|
Hikma Pharmaceuticals plc | | |
|
| | |
|
| | |
|
| | |
| | |
BE Semiconductor Industries NV | | |
| | |
Koninklijke Ahold Delhaize NV | | |
| | |
| | |
| | |
| | |
| | |
| | |
SEE NOTES TO FINANCIAL STATEMENTS.
| J.P. Morgan Exchange-Traded Funds | |
| | |
Common Stocks — continued |
|
| | |
| | |
| | |
|
Fisher & Paykel Healthcare Corp. Ltd. | | |
| | |
| | |
|
| | |
| | |
| | |
| | |
| | |
| | |
| | |
| | |
| | |
|
| | |
|
| | |
|
CapitaLand Ascendas REIT, REIT | | |
CapitaLand Integrated Commercial Trust, REIT | | |
| | |
| | |
| | |
Mapletree Pan Asia Commercial Trust, REIT | | |
Oversea-Chinese Banking Corp. Ltd. | | |
| | |
Singapore Telecommunications Ltd. | | |
| | |
| | |
| | |
| | |
|
| | |
|
| | |
Daewoo Engineering & Construction Co. Ltd. * | | |
| | |
| | |
|
|
| | |
| | |
GS Engineering & Construction Corp. | | |
| | |
| | |
Hana Financial Group, Inc. | | |
| | |
Hanwha Life Insurance Co. Ltd. * | | |
| | |
Hyundai Department Store Co. Ltd. | | |
| | |
| | |
| | |
| | |
Korea Electric Power Corp. * | | |
| | |
Korea Investment Holdings Co. Ltd. | | |
Korean Air Lines Co. Ltd. * | | |
| | |
| | |
| | |
| | |
Mirae Asset Securities Co. Ltd. | | |
| | |
NH Investment & Securities Co. Ltd. | | |
| | |
| | |
| | |
Samsung Electronics Co. Ltd. | | |
Samsung Engineering Co. Ltd. * | | |
Samsung Securities Co. Ltd. | | |
| | |
| | |
| | |
Woori Financial Group, Inc. | | |
| | |
| | |
|
| | |
Corp. ACCIONA Energias Renovables SA | | |
| | |
| | |
| | |
Merlin Properties Socimi SA, REIT | | |
SEE NOTES TO FINANCIAL STATEMENTS.
| J.P. Morgan Exchange-Traded Funds | |
JPMorgan Diversified Return International Equity ETF
SCHEDULE OF PORTFOLIO INVESTMENTS
AS OF October 31, 2022 (continued)
| | |
Common Stocks — continued |
|
| | |
| | |
| | |
|
| | |
| | |
Fastighets AB Balder, Class B * | | |
| | |
H & M Hennes & Mauritz AB, Class B (b) | | |
| | |
| | |
| | |
| | |
Securitas AB, Class B (b) | | |
| | |
| | |
| | |
| | |
| | |
| | |
|
EMS-Chemie Holding AG (Registered) | | |
Kuehne + Nagel International AG (Registered) | | |
Logitech International SA (Registered) (b) | | |
| | |
Sonova Holding AG (Registered) | | |
Swiss Prime Site AG (Registered) | | |
| | |
| | |
|
| | |
| | |
| | |
| | |
Associated British Foods plc | | |
| | |
Auto Trader Group plc (a) | | |
| | |
| | |
B&M European Value Retail SA | | |
| | |
| | |
| | |
| | |
|
United Kingdom — continued |
Berkeley Group Holdings plc | | |
| | |
British American Tobacco plc | | |
British Land Co. plc (The), REIT | | |
| | |
| | |
| | |
| | |
CK Hutchison Holdings Ltd. | | |
| | |
| | |
Dechra Pharmaceuticals plc | | |
| | |
| | |
Direct Line Insurance Group plc | | |
| | |
| | |
| | |
| | |
| | |
| | |
InterContinental Hotels Group plc | | |
| | |
| | |
| | |
Land Securities Group plc, REIT | | |
Legal & General Group plc | | |
| | |
| | |
| | |
| | |
| | |
| | |
Phoenix Group Holdings plc | | |
Reckitt Benckiser Group plc | | |
| | |
| | |
| | |
| | |
| | |
| | |
| | |
Spirax-Sarco Engineering plc | | |
| | |
SEE NOTES TO FINANCIAL STATEMENTS.
| J.P. Morgan Exchange-Traded Funds | |
| | |
Common Stocks — continued |
United Kingdom — continued |
| | |
| | |
| | |
| | |
| | |
| | |
| | |
United Utilities Group plc | | |
| | |
| | |
| | |
|
| | |
| | |
| | |
| | |
| | |
| | |
| | |
| | |
Total Common Stocks
(Cost $806,370,835) | | |
Short-Term Investments — 0.7% |
Investment Companies — 0.1% |
JPMorgan Prime Money Market Fund Class IM Shares, 3.18% (c) (d)(Cost $569,430) | | |
Investment of Cash Collateral from Securities Loaned — 0.6% |
JPMorgan Securities Lending Money Market Fund Agency SL Class Shares, 3.23% (c) (d) | | |
JPMorgan U.S. Government Money Market Fund Class IM Shares, 2.85% (c) (d) | | |
Total Investment of Cash Collateral from Securities Loaned
(Cost $4,047,394) | | |
Total Short-Term Investments
(Cost $4,616,824) | | |
Total Investments — 100.1%
(Cost $810,987,659) | | |
Liabilities in Excess of Other Assets — (0.1)% | | |
| | |
Percentages indicated are based on net assets. |
| |
| |
| |
| Real Estate Investment Trust |
| |
| Amount rounds to less than 0.1% of net assets. |
| Value determined using significant unobservable inputs. | |
| Non-income producing security. | |
| Security exempt from registration pursuant to Regulation S under the Securities Act of 1933, as amended. Regulation S applies to securities offerings that are made outside of the United States and do not involve direct selling efforts in the United States and as such may have restrictions on resale. | |
| The security or a portion of this security is on loan at October 31, 2022. The total value of securities on loan at October 31, 2022 is $3,818,777. | |
| Investment in an affiliated fund, which is registered under the Investment Company Act of 1940, as amended, and is advised by J.P. Morgan Investment Management Inc. | |
| The rate shown is the current yield as of October 31, 2022. | |
SEE NOTES TO FINANCIAL STATEMENTS.
| J.P. Morgan Exchange-Traded Funds | |
JPMorgan Diversified Return International Equity ETF
SCHEDULE OF PORTFOLIO INVESTMENTS
AS OF October 31, 2022 (continued)
Summary of Investments by Industry, October 31, 2022
The following table represents the portfolio investments of the Fund by industry classifications as a percentage of total investments:
| PERCENT OF
TOTAL
INVESTMENTS |
| |
| |
Equity Real Estate Investment Trusts (REITs) | |
| |
Oil, Gas & Consumable Fuels | |
Diversified Telecommunication Services | |
| |
| |
| |
| |
| |
Real Estate Management & Development | |
| |
| |
Trading Companies & Distributors | |
| |
Wireless Telecommunication Services | |
| |
Health Care Equipment & Supplies | |
Construction & Engineering | |
Electronic Equipment, Instruments & Components | |
Semiconductors & Semiconductor Equipment | |
Technology Hardware, Storage & Peripherals | |
| |
Health Care Providers & Services | |
| |
| |
| |
Diversified Financial Services | |
| |
| |
| |
| |
| |
| |
| |
Others (each less than 1.0%) | |
| |
SEE NOTES TO FINANCIAL STATEMENTS.
| J.P. Morgan Exchange-Traded Funds | |
Futures contracts outstanding as of October 31, 2022:
| | | | | VALUE AND
UNREALIZED
APPRECIATION
(DEPRECIATION) ($) |
| | | | | |
| | | | | |
| |
| Europe, Australasia and Far East |
| Morgan Stanley Capital International |
| |
SEE NOTES TO FINANCIAL STATEMENTS.
| J.P. Morgan Exchange-Traded Funds | |
JPMorgan Diversified Return U.S. Equity ETF
SCHEDULE OF PORTFOLIO INVESTMENTS
AS OF October 31, 2022
| | |
|
Aerospace & Defense — 1.0% |
| | |
L3Harris Technologies, Inc. | | |
| | |
| | |
Automobiles & Parts — 0.6% |
| | |
| | |
| | |
|
| | |
| | |
Citizens Financial Group, Inc. | | |
Discover Financial Services | | |
| | |
Huntington Bancshares, Inc. | | |
| | |
Popular, Inc. (Puerto Rico) | | |
| | |
| | |
| | |
| | |
|
Brown-Forman Corp., Class B | | |
| | |
Constellation Brands, Inc., Class A | | |
| | |
Molson Coors Beverage Co., Class B | | |
| | |
| | |
|
| | |
| | |
CF Industries Holdings, Inc. | | |
| | |
| | |
| | |
| | |
| | |
| | |
LyondellBasell Industries NV, Class A | | |
| | |
| | |
| | |
|
|
| | |
| | |
| | |
Construction & Materials — 1.6% |
| | |
| | |
| | |
Fortune Brands Home & Security, Inc. | | |
| | |
| | |
| | |
| | |
|
| | |
Service Corp. International | | |
| | |
|
| | |
American Electric Power Co., Inc. | | |
| | |
| | |
Consolidated Edison, Inc. | | |
| | |
| | |
| | |
| | |
| | |
| | |
| | |
Hawaiian Electric Industries, Inc. | | |
| | |
| | |
| | |
Pinnacle West Capital Corp. | | |
| | |
Public Service Enterprise Group, Inc. | | |
| | |
| | |
| | |
| | |
Electronic & Electrical Equipment — 0.8% |
| | |
SEE NOTES TO FINANCIAL STATEMENTS.
| J.P. Morgan Exchange-Traded Funds | |
| | |
Common Stocks — continued |
Electronic & Electrical Equipment — continued |
| | |
| | |
| | |
| | |
Finance & Credit Services — 0.4% |
| | |
FactSet Research Systems, Inc. | | |
| | |
| | |
|
Archer-Daniels-Midland Co. | | |
| | |
| | |
| | |
| | |
Darling Ingredients, Inc. * | | |
| | |
| | |
| | |
| | |
| | |
| | |
| | |
| | |
McCormick & Co., Inc. (Non-Voting) | | |
Mondelez International, Inc., Class A | | |
| | |
| | |
Tyson Foods, Inc., Class A | | |
| | |
Gas, Water & Multi-utilities — 2.9% |
| | |
American Water Works Co., Inc. | | |
| | |
| | |
| | |
| | |
| | |
| | |
| | |
| | |
| | |
|
General Industrials — 2.3% |
| | |
| | |
Honeywell International, Inc. | | |
Illinois Tool Works, Inc. | | |
| | |
Packaging Corp. of America | | |
| | |
| | |
Sherwin-Williams Co. (The) | | |
| | |
| | |
Health Care Providers — 2.7% |
| | |
| | |
| | |
| | |
| | |
| | |
| | |
Molina Healthcare, Inc. * | | |
| | |
Universal Health Services, Inc., Class B | | |
| | |
Household Goods & Home Construction — 0.9% |
| | |
| | |
| | |
| | |
| | |
| | |
| | |
Industrial Engineering — 0.6% |
| | |
| | |
| | |
| | |
Industrial Materials — 0.2% |
| | |
Industrial Metals & Mining — 3.2% |
| | |
| | |
| | |
SEE NOTES TO FINANCIAL STATEMENTS.
| J.P. Morgan Exchange-Traded Funds | |
JPMorgan Diversified Return U.S. Equity ETF
SCHEDULE OF PORTFOLIO INVESTMENTS
AS OF October 31, 2022 (continued)
| | |
Common Stocks — continued |
Industrial Metals & Mining — continued |
| | |
| | |
Reliance Steel & Aluminum Co. | | |
Southern Copper Corp. (Peru) | | |
| | |
| | |
United States Steel Corp. | | |
| | |
Industrial Support Services — 2.3% |
| | |
Booz Allen Hamilton Holding Corp. | | |
Capital One Financial Corp. | | |
MSC Industrial Direct Co., Inc., Class A | | |
Robert Half International, Inc. | | |
| | |
| | |
| | |
| | |
Industrial Transportation — 1.2% |
Allison Transmission Holdings, Inc. | | |
| | |
| | |
| | |
| | |
Schneider National, Inc., Class B | | |
| | |
United Parcel Service, Inc., Class B | | |
| | |
Investment Banking & Brokerage Services — 1.7% |
Ameriprise Financial, Inc. | | |
Broadridge Financial Solutions, Inc. | | |
Jefferies Financial Group, Inc. | | |
| | |
| | |
Raymond James Financial, Inc. | | |
| | |
Virtu Financial, Inc., Class A | | |
| | |
|
Activision Blizzard, Inc. | | |
| | |
| | |
| | |
|
Leisure Goods — continued |
| | |
| | |
| | |
|
| | |
| | |
| | |
Principal Financial Group, Inc. | | |
Prudential Financial, Inc. | | |
| | |
| | |
|
Interpublic Group of Cos., Inc. (The) | | |
Nexstar Media Group, Inc., Class A | | |
| | |
Medical Equipment & Services — 4.2% |
| | |
| | |
Bio-Rad Laboratories, Inc., Class A * | | |
| | |
| | |
| | |
Laboratory Corp. of America Holdings | | |
| | |
| | |
| | |
| | |
| | |
| | |
Thermo Fisher Scientific, Inc. | | |
West Pharmaceutical Services, Inc. | | |
| | |
Mortgage Real Estate Investment Trusts — 0.4% |
| | |
Starwood Property Trust, Inc. | | |
| | |
Non-life Insurance — 2.9% |
| | |
American Financial Group, Inc. | | |
| | |
| | |
| | |
SEE NOTES TO FINANCIAL STATEMENTS.
| J.P. Morgan Exchange-Traded Funds | |
| | |
Common Stocks — continued |
Non-life Insurance — continued |
Fidelity National Financial, Inc. | | |
Hanover Insurance Group, Inc. (The) | | |
Hartford Financial Services Group, Inc. (The) | | |
Marsh & McLennan Cos., Inc. | | |
Old Republic International Corp. | | |
| | |
| | |
| | |
Non-Renewable Energy — 5.5% |
| | |
| | |
| | |
Continental Resources, Inc. | | |
| | |
| | |
| | |
| | |
| | |
| | |
| | |
| | |
Pioneer Natural Resources Co. | | |
| | |
| | |
Williams Cos., Inc. (The) | | |
| | |
Personal Care, Drug & Grocery Stores — 4.6% |
Albertsons Cos., Inc., Class A | | |
| | |
Casey's General Stores, Inc. | | |
Church & Dwight Co., Inc. | | |
| | |
| | |
| | |
| | |
| | |
| | |
| | |
Procter & Gamble Co. (The) | | |
Spectrum Brands Holdings, Inc. | | |
| | |
Walgreens Boots Alliance, Inc. | | |
| | |
| | |
|
|
| | |
Estee Lauder Cos., Inc. (The), Class A | | |
| | |
| | |
Pharmaceuticals, Biotechnology & Marijuana Producers — 5.5% |
| | |
| | |
| | |
| | |
| | |
| | |
| | |
| | |
| | |
| | |
Regeneron Pharmaceuticals, Inc. * | | |
United Therapeutics Corp. * | | |
Vertex Pharmaceuticals, Inc. * | | |
| | |
| | |
Precious Metals & Mining — 0.3% |
| | |
SSR Mining, Inc. (Canada) | | |
| | |
Real Estate Investment & Services — 0.6% |
CBRE Group, Inc., Class A * | | |
Jones Lang LaSalle, Inc. * | | |
| | |
Real Estate Investment Trusts — 7.3% |
| | |
Brixmor Property Group, Inc. | | |
| | |
| | |
| | |
Digital Realty Trust, Inc. | | |
Extra Space Storage, Inc. | | |
First Industrial Realty Trust, Inc. | | |
Gaming and Leisure Properties, Inc. | | |
Host Hotels & Resorts, Inc. | | |
| | |
| | |
Lamar Advertising Co., Class A | | |
SEE NOTES TO FINANCIAL STATEMENTS.
| J.P. Morgan Exchange-Traded Funds | |
JPMorgan Diversified Return U.S. Equity ETF
SCHEDULE OF PORTFOLIO INVESTMENTS
AS OF October 31, 2022 (continued)
| | |
Common Stocks — continued |
Real Estate Investment Trusts — continued |
| | |
Medical Properties Trust, Inc. | | |
Mid-America Apartment Communities, Inc. | | |
Omega Healthcare Investors, Inc. | | |
| | |
| | |
| | |
Simon Property Group, Inc. | | |
Spirit Realty Capital, Inc. | | |
| | |
| | |
| | |
| | |
| | |
| | |
|
| | |
| | |
Dick's Sporting Goods, Inc. | | |
| | |
| | |
| | |
O'Reilly Automotive, Inc. * | | |
Penske Automotive Group, Inc. | | |
| | |
| | |
| | |
| | |
Software & Computer Services — 4.3% |
Alphabet, Inc., Class A * | | |
| | |
CACI International, Inc., Class A * | | |
Cadence Design Systems, Inc. * | | |
Cognizant Technology Solutions Corp., Class A | | |
Dolby Laboratories, Inc., Class A | | |
| | |
Hewlett Packard Enterprise Co. | | |
International Business Machines Corp. | | |
| | |
| | |
Meta Platforms, Inc., Class A * | | |
| | |
| | |
| | |
|
Software & Computer Services — continued |
| | |
| | |
Science Applications International Corp. | | |
SS&C Technologies Holdings, Inc. | | |
| | |
Technology Hardware & Equipment — 4.3% |
| | |
| | |
| | |
| | |
| | |
| | |
| | |
| | |
| | |
| | |
| | |
| | |
| | |
| | |
| | |
| | |
| | |
| | |
Telecommunications Equipment — 2.7% |
| | |
| | |
| | |
| | |
Lumentum Holdings, Inc. * | | |
| | |
| | |
| | |
Telecommunications Service Providers — 2.6% |
Altice USA, Inc., Class A * | | |
| | |
| | |
Charter Communications, Inc., Class A * | | |
| | |
DISH Network Corp., Class A * | | |
Frontier Communications Parent, Inc. * | | |
| | |
SEE NOTES TO FINANCIAL STATEMENTS.
| J.P. Morgan Exchange-Traded Funds | |
| | |
Common Stocks — continued |
Telecommunications Service Providers — continued |
| | |
Verizon Communications, Inc. | | |
| | |
|
| | |
Philip Morris International, Inc. | | |
| | |
|
| | |
Waste & Disposal Services — 1.1% |
| | |
| | |
| | |
| | |
| | |
Total Common Stocks
(Cost $470,387,088) | | |
Short-Term Investments — 0.3% |
Investment Companies — 0.2% |
JPMorgan U.S. Government Money Market Fund Class IM Shares, 2.85% (b) (c)(Cost $1,020,750) | | |
Investment of Cash Collateral from Securities Loaned — 0.1% |
JPMorgan Securities Lending Money Market Fund Class Agency SL Shares, 3.23% (b) (c) | | |
| | |
|
|
JPMorgan U.S. Government Money Market Fund Class IM Shares, 2.85% (b) (c) | | |
Total Investment of Cash Collateral from Securities Loaned
(Cost $391,775) | | |
Total Short-Term Investments
(Cost $1,412,525) | | |
Total Investments — 100.0%
(Cost $471,799,613) | | |
Liabilities in Excess of Other Assets — (0.0)% ^ | | |
| | |
Percentages indicated are based on net assets. |
| Amount rounds to less than 0.1% of net assets. |
| Non-income producing security. | |
| The security or a portion of this security is on loan at October 31, 2022. The total value of securities on loan at October 31, 2022 is $380,385. | |
| Investment in an affiliated fund, which is registered under the Investment Company Act of 1940, as amended, and is advised by J.P. Morgan Investment Management Inc. | |
| The rate shown is the current yield as of October 31, 2022. | |
Futures contracts outstanding as of October 31, 2022:
| | | | | VALUE AND
UNREALIZED
APPRECIATION
(DEPRECIATION) ($) |
| | | | | |
| | | | | |
SEE NOTES TO FINANCIAL STATEMENTS.
| J.P. Morgan Exchange-Traded Funds | |
JPMorgan Diversified Return U.S. Mid Cap Equity ETF
SCHEDULE OF PORTFOLIO INVESTMENTS
AS OF October 31, 2022
| | |
|
Aerospace & Defense — 0.1% |
| | |
Automobiles & Parts — 0.6% |
| | |
| | |
| | |
| | |
|
| | |
Citizens Financial Group, Inc. | | |
| | |
Discover Financial Services | | |
| | |
| | |
| | |
Huntington Bancshares, Inc. | | |
| | |
| | |
Popular, Inc. (Puerto Rico) | | |
Prosperity Bancshares, Inc. | | |
| | |
| | |
| | |
|
Brown-Forman Corp., Class B | | |
Molson Coors Beverage Co., Class B | | |
| | |
|
| | |
| | |
| | |
CF Industries Holdings, Inc. | | |
| | |
| | |
| | |
| | |
| | |
LyondellBasell Industries NV, Class A | | |
| | |
| | |
| | |
| | |
| | |
|
|
| | |
| | |
| | |
Construction & Materials — 2.4% |
| | |
Builders FirstSource, Inc. * | | |
| | |
Fortune Brands Home & Security, Inc. | | |
| | |
| | |
| | |
| | |
| | |
|
| | |
| | |
Service Corp. International | | |
| | |
|
| | |
| | |
| | |
Consolidated Edison, Inc. | | |
| | |
| | |
| | |
| | |
| | |
| | |
Hawaiian Electric Industries, Inc. | | |
| | |
| | |
| | |
Pinnacle West Capital Corp. | | |
| | |
Public Service Enterprise Group, Inc. | | |
| | |
| | |
| | |
Electronic & Electrical Equipment — 2.1% |
| | |
| | |
SEE NOTES TO FINANCIAL STATEMENTS.
| J.P. Morgan Exchange-Traded Funds | |
| | |
Common Stocks — continued |
Electronic & Electrical Equipment — continued |
| | |
| | |
Keysight Technologies, Inc. * | | |
| | |
| | |
| | |
| | |
Finance & Credit Services — 0.5% |
| | |
| | |
| | |
| | |
|
| | |
| | |
| | |
| | |
Darling Ingredients, Inc. * | | |
| | |
| | |
| | |
| | |
| | |
| | |
Lamb Weston Holdings, Inc. | | |
McCormick & Co., Inc. (Non-Voting) | | |
| | |
| | |
Tyson Foods, Inc., Class A | | |
| | |
Gas, Water & Multi-utilities — 2.6% |
| | |
| | |
| | |
Essential Utilities, Inc. | | |
| | |
| | |
| | |
| | |
| | |
General Industrials — 1.9% |
| | |
| | |
|
General Industrials — continued |
| | |
| | |
Packaging Corp. of America | | |
| | |
| | |
| | |
| | |
| | |
| | |
| | |
Health Care Providers — 3.3% |
Acadia Healthcare Co., Inc. * | | |
| | |
| | |
| | |
| | |
| | |
| | |
Molina Healthcare, Inc. * | | |
| | |
| | |
Universal Health Services, Inc., Class B | | |
Veeva Systems, Inc., Class A * | | |
| | |
Household Goods & Home Construction — 1.0% |
| | |
| | |
| | |
| | |
| | |
| | |
Industrial Engineering — 1.9% |
| | |
| | |
Lincoln Electric Holdings, Inc. | | |
| | |
| | |
| | |
| | |
Industrial Materials — 0.5% |
| | |
SEE NOTES TO FINANCIAL STATEMENTS.
| J.P. Morgan Exchange-Traded Funds | |
JPMorgan Diversified Return U.S. Mid Cap Equity ETF
SCHEDULE OF PORTFOLIO INVESTMENTS
AS OF October 31, 2022 (continued)
| | |
Common Stocks — continued |
Industrial Materials — continued |
| | |
| | |
| | |
Industrial Metals & Mining — 3.1% |
| | |
| | |
| | |
| | |
| | |
Reliance Steel & Aluminum Co. | | |
| | |
| | |
United States Steel Corp. | | |
| | |
Industrial Support Services — 1.8% |
| | |
Booz Allen Hamilton Holding Corp. | | |
| | |
MSC Industrial Direct Co., Inc., Class A | | |
| | |
Robert Half International, Inc. | | |
| | |
| | |
| | |
| | |
Industrial Transportation — 1.5% |
Allison Transmission Holdings, Inc. | | |
Expeditors International of Washington, Inc. | | |
| | |
Old Dominion Freight Line, Inc. | | |
| | |
| | |
Schneider National, Inc., Class B | | |
| | |
Investment Banking & Brokerage Services — 2.7% |
Ameriprise Financial, Inc. | | |
Broadridge Financial Solutions, Inc. | | |
| | |
Jefferies Financial Group, Inc. | | |
LPL Financial Holdings, Inc. | | |
| | |
Raymond James Financial, Inc. | | |
| | |
|
Investment Banking & Brokerage Services — continued |
| | |
Virtu Financial, Inc., Class A | | |
| | |
|
| | |
| | |
| | |
| | |
Take-Two Interactive Software, Inc. * | | |
| | |
|
| | |
Principal Financial Group, Inc. | | |
| | |
| | |
|
Interpublic Group of Cos., Inc. (The) | | |
Liberty Media Corp.-Liberty SiriusXM, Class A * | | |
Nexstar Media Group, Inc., Class A | | |
| | |
Medical Equipment & Services — 6.2% |
Agilent Technologies, Inc. | | |
Bio-Rad Laboratories, Inc., Class A * | | |
| | |
| | |
| | |
| | |
| | |
Globus Medical, Inc., Class A * | | |
| | |
| | |
| | |
Integra LifeSciences Holdings Corp. * | | |
Laboratory Corp. of America Holdings | | |
| | |
| | |
| | |
| | |
| | |
| | |
| | |
SEE NOTES TO FINANCIAL STATEMENTS.
| J.P. Morgan Exchange-Traded Funds | |
| | |
Common Stocks — continued |
Medical Equipment & Services — continued |
| | |
West Pharmaceutical Services, Inc. | | |
| | |
Mortgage Real Estate Investment Trusts — 0.6% |
Annaly Capital Management, Inc. | | |
| | |
Starwood Property Trust, Inc. | | |
| | |
Non-life Insurance — 3.2% |
American Financial Group, Inc. | | |
Arch Capital Group Ltd. * | | |
| | |
| | |
| | |
Axis Capital Holdings Ltd. | | |
| | |
| | |
| | |
Fidelity National Financial, Inc. | | |
First American Financial Corp. | | |
Hanover Insurance Group, Inc. (The) | | |
Hartford Financial Services Group, Inc. (The) | | |
Old Republic International Corp. | | |
Reinsurance Group of America, Inc. | | |
| | |
| | |
Non-Renewable Energy — 5.9% |
| | |
| | |
| | |
| | |
| | |
Continental Resources, Inc. | | |
| | |
| | |
| | |
| | |
| | |
| | |
| | |
| | |
| | |
|
Non-Renewable Energy — continued |
| | |
Williams Cos., Inc. (The) | | |
| | |
Personal Care, Drug & Grocery Stores — 2.9% |
Albertsons Cos., Inc., Class A | | |
| | |
Casey's General Stores, Inc. | | |
Church & Dwight Co., Inc. | | |
| | |
Grocery Outlet Holding Corp. * | | |
| | |
| | |
Reynolds Consumer Products, Inc. | | |
Spectrum Brands Holdings, Inc. | | |
| | |
|
| | |
| | |
| | |
Pharmaceuticals, Biotechnology & Marijuana Producers — 2.9% |
| | |
| | |
Horizon Therapeutics plc * | | |
| | |
Jazz Pharmaceuticals plc * | | |
Maravai LifeSciences Holdings, Inc., Class A * | | |
| | |
| | |
| | |
United Therapeutics Corp. * | | |
| | |
| | |
Precious Metals & Mining — 0.2% |
SSR Mining, Inc. (Canada) | | |
Real Estate Investment & Services — 0.7% |
CBRE Group, Inc., Class A * | | |
Jones Lang LaSalle, Inc. * | | |
| | |
Real Estate Investment Trusts — 8.1% |
American Homes 4 Rent, Class A | | |
Brixmor Property Group, Inc. | | |
| | |
SEE NOTES TO FINANCIAL STATEMENTS.
| J.P. Morgan Exchange-Traded Funds | |
JPMorgan Diversified Return U.S. Mid Cap Equity ETF
SCHEDULE OF PORTFOLIO INVESTMENTS
AS OF October 31, 2022 (continued)
| | |
Common Stocks — continued |
Real Estate Investment Trusts — continued |
| | |
| | |
Extra Space Storage, Inc. | | |
First Industrial Realty Trust, Inc. | | |
Gaming and Leisure Properties, Inc. | | |
Healthcare Realty Trust, Inc. | | |
Highwoods Properties, Inc. | | |
Host Hotels & Resorts, Inc. | | |
| | |
| | |
Lamar Advertising Co., Class A | | |
| | |
Medical Properties Trust, Inc. | | |
Mid-America Apartment Communities, Inc. | | |
National Retail Properties, Inc. | | |
Omega Healthcare Investors, Inc. | | |
| | |
| | |
Rexford Industrial Realty, Inc. | | |
Simon Property Group, Inc. | | |
| | |
Spirit Realty Capital, Inc. | | |
| | |
| | |
| | |
| | |
| | |
| | |
|
| | |
|
| | |
| | |
| | |
| | |
Dick's Sporting Goods, Inc. | | |
| | |
| | |
O'Reilly Automotive, Inc. * | | |
Penske Automotive Group, Inc. | | |
| | |
| | |
| | |
| | |
|
Software & Computer Services — 5.2% |
Akamai Technologies, Inc. * | | |
| | |
| | |
CACI International, Inc., Class A * | | |
Cadence Design Systems, Inc. * | | |
Dell Technologies, Inc., Class C | | |
Dolby Laboratories, Inc., Class A | | |
| | |
| | |
| | |
Hewlett Packard Enterprise Co. | | |
| | |
Manhattan Associates, Inc. * | | |
| | |
| | |
Science Applications International Corp. | | |
SS&C Technologies Holdings, Inc. | | |
| | |
Tyler Technologies, Inc. * | | |
| | |
Technology Hardware & Equipment — 4.5% |
| | |
| | |
| | |
| | |
| | |
| | |
| | |
| | |
Microchip Technology, Inc. | | |
Monolithic Power Systems, Inc. | | |
National Instruments Corp. | | |
| | |
| | |
| | |
| | |
| | |
| | |
| | |
Telecommunications Equipment — 2.4% |
| | |
| | |
| | |
SEE NOTES TO FINANCIAL STATEMENTS.
| J.P. Morgan Exchange-Traded Funds | |
| | |
Common Stocks — continued |
Telecommunications Equipment — continued |
Lumentum Holdings, Inc. * | | |
| | |
| | |
| | |
| | |
Telecommunications Service Providers — 1.4% |
Altice USA, Inc., Class A * | | |
| | |
DISH Network Corp., Class A * | | |
Frontier Communications Parent, Inc. * | | |
Liberty Broadband Corp., Class C * | | |
| | |
| | |
|
| | |
Choice Hotels International, Inc. | | |
Copa Holdings SA, Class A (Panama) * | | |
| | |
| | |
| | |
Waste & Disposal Services — 0.9% |
| | |
| | |
|
Waste & Disposal Services — continued |
| | |
| | |
| | |
Total Common Stocks
(Cost $257,200,919) | | |
Short-Term Investments — 0.1% |
Investment Companies — 0.1% |
JPMorgan U.S. Government Money Market Fund Class IM Shares, 2.85% (a) (b)(Cost $414,054) | | |
Total Investments — 99.8%
(Cost $257,614,973) | | |
Assets in Excess of Other Liabilities — 0.2% | | |
| | |
Percentages indicated are based on net assets. |
| Non-income producing security. |
| Investment in an affiliated fund, which is registered under the Investment Company Act of 1940, as amended, and is advised by J.P. Morgan Investment Management Inc. |
| The rate shown is the current yield as of October 31, 2022. |
Futures contracts outstanding as of October 31, 2022:
| | | | | VALUE AND
UNREALIZED
APPRECIATION
(DEPRECIATION) ($) |
| | | | | |
S&P Midcap 400 E-Mini Index | | | | | |
SEE NOTES TO FINANCIAL STATEMENTS.
| J.P. Morgan Exchange-Traded Funds | |
JPMorgan Diversified Return U.S. Small Cap Equity ETF
SCHEDULE OF PORTFOLIO INVESTMENTS
AS OF October 31, 2022
| | |
|
Aerospace & Defense — 0.1% |
| | |
National Presto Industries, Inc. | | |
| | |
Automobiles & Parts — 0.4% |
| | |
| | |
| | |
|
| | |
| | |
Atlantic Union Bankshares Corp. | | |
| | |
| | |
Bank of NT Butterfield & Son Ltd. (The) (Bermuda) | | |
| | |
| | |
Capital City Bank Group, Inc. | | |
| | |
Community Trust Bancorp, Inc. | | |
First BanCorp (Puerto Rico) | | |
| | |
| | |
First Financial Bankshares, Inc. | | |
| | |
| | |
| | |
| | |
| | |
| | |
| | |
| | |
Independent Bank Group, Inc. | | |
| | |
| | |
OceanFirst Financial Corp. | | |
OFG Bancorp (Puerto Rico) | | |
| | |
| | |
Republic Bancorp, Inc., Class A | | |
Sandy Spring Bancorp, Inc. | | |
Simmons First National Corp., Class A | | |
| | |
| | |
| | |
|
|
| | |
| | |
United Community Banks, Inc. | | |
| | |
| | |
| | |
| | |
|
| | |
| | |
Coca-Cola Consolidated, Inc. | | |
Duckhorn Portfolio, Inc. (The) * | | |
| | |
| | |
| | |
| | |
|
| | |
| | |
| | |
| | |
| | |
| | |
| | |
| | |
| | |
| | |
Orion Engineered Carbons SA (Germany) | | |
| | |
Rayonier Advanced Materials, Inc. * | | |
Sensient Technologies Corp. | | |
| | |
Tronox Holdings plc, Class A | | |
| | |
Construction & Materials — 1.7% |
Comfort Systems USA, Inc. | | |
| | |
| | |
| | |
| | |
Installed Building Products, Inc. | | |
Masonite International Corp. * | | |
Mueller Water Products, Inc., Class A | | |
SEE NOTES TO FINANCIAL STATEMENTS.
| J.P. Morgan Exchange-Traded Funds | |
| | |
Common Stocks — continued |
Construction & Materials — continued |
| | |
Quanex Building Products Corp. | | |
Simpson Manufacturing Co., Inc. | | |
| | |
|
| | |
Laureate Education, Inc., Class A | | |
Perdoceo Education Corp. * | | |
| | |
| | |
|
| | |
Clearway Energy, Inc., Class C | | |
| | |
| | |
NuScale Power Corp. * (a) | | |
Ormat Technologies, Inc. (a) | | |
| | |
Portland General Electric Co. | | |
| | |
| | |
Electronic & Electrical Equipment — 1.4% |
| | |
| | |
| | |
| | |
| | |
Watts Water Technologies, Inc., Class A | | |
| | |
Finance & Credit Services — 1.6% |
Encore Capital Group, Inc. * | | |
Enova International, Inc. * | | |
| | |
| | |
| | |
PennyMac Financial Services, Inc. | | |
| | |
| | |
| | |
|
| | |
| | |
| | |
|
Food Producers — continued |
| | |
| | |
Fresh Del Monte Produce, Inc. | | |
GrowGeneration Corp. * (a) | | |
Hain Celestial Group, Inc. (The) * | | |
Herbalife Nutrition Ltd. * | | |
| | |
| | |
John B Sanfilippo & Son, Inc. | | |
| | |
| | |
Nature's Sunshine Products, Inc. * | | |
Simply Good Foods Co. (The) * | | |
| | |
| | |
Tootsie Roll Industries, Inc. | | |
| | |
USANA Health Sciences, Inc. * | | |
| | |
| | |
Gas, Water & Multi-utilities — 4.1% |
American States Water Co. | | |
| | |
Aris Water Solution, Inc., Class A | | |
| | |
| | |
Brookfield Infrastructure Corp., Class A (Canada) | | |
California Water Service Group (a) | | |
Chesapeake Utilities Corp. | | |
Evoqua Water Technologies Corp. * | | |
Excelerate Energy, Inc., Class A | | |
| | |
New Jersey Resources Corp. | | |
Northwest Natural Holding Co. | | |
| | |
| | |
South Jersey Industries, Inc. (a) | | |
Southwest Gas Holdings, Inc. | | |
| | |
| | |
General Industrials — 1.4% |
| | |
| | |
SEE NOTES TO FINANCIAL STATEMENTS.
| J.P. Morgan Exchange-Traded Funds | |
JPMorgan Diversified Return U.S. Small Cap Equity ETF
SCHEDULE OF PORTFOLIO INVESTMENTS
AS OF October 31, 2022 (continued)
| | |
Common Stocks — continued |
General Industrials — continued |
| | |
| | |
| | |
| | |
| | |
| | |
Standex International Corp. | | |
| | |
| | |
| | |
Health Care Providers — 2.6% |
Addus HomeCare Corp. * (a) | | |
Apollo Medical Holdings, Inc. * (a) | | |
Brookdale Senior Living, Inc. * | | |
Computer Programs and Systems, Inc. * | | |
| | |
| | |
Healthcare Services Group, Inc. | | |
| | |
| | |
NextGen Healthcare, Inc. * | | |
| | |
Option Care Health, Inc. * | | |
Pennant Group, Inc. (The) * | | |
| | |
Select Medical Holdings Corp. | | |
Surgery Partners, Inc. * (a) | | |
US Physical Therapy, Inc. | | |
| | |
Household Goods & Home Construction — 1.5% |
| | |
Central Garden & Pet Co., Class A * | | |
CompX International, Inc. | | |
Ethan Allen Interiors, Inc. | | |
| | |
| | |
| | |
| | |
| | |
| | |
| | |
| | |
| | |
| | |
|
Household Goods & Home Construction — continued |
Taylor Morrison Home Corp. * | | |
| | |
| | |
Industrial Engineering — 1.3% |
Albany International Corp., Class A | | |
| | |
Columbus McKinnon Corp. (a) | | |
| | |
Franklin Electric Co., Inc. | | |
| | |
John Bean Technologies Corp. | | |
| | |
| | |
Zurn Elkay Water Solutions Corp. | | |
| | |
Industrial Materials — 2.0% |
| | |
| | |
| | |
| | |
| | |
| | |
Minerals Technologies, Inc. | | |
Resolute Forest Products, Inc. * | | |
| | |
| | |
| | |
| | |
Industrial Metals & Mining — 3.7% |
| | |
Carpenter Technology Corp. | | |
Century Aluminum Co. * (a) | | |
| | |
Compass Minerals International, Inc. | | |
| | |
| | |
GrafTech International Ltd. | | |
Haynes International, Inc. | | |
Kaiser Aluminum Corp. (a) | | |
| | |
| | |
| | |
| | |
SEE NOTES TO FINANCIAL STATEMENTS.
| J.P. Morgan Exchange-Traded Funds | |
| | |
Common Stocks — continued |
Industrial Metals & Mining — continued |
Schnitzer Steel Industries, Inc., Class A | | |
| | |
Uranium Energy Corp. * (a) | | |
US Silica Holdings, Inc. * | | |
Worthington Industries, Inc. | | |
| | |
Industrial Support Services — 2.4% |
| | |
Applied Industrial Technologies, Inc. | | |
| | |
| | |
| | |
Distribution Solutions Group, Inc. * | | |
| | |
EVERTEC, Inc. (Puerto Rico) (a) | | |
ExlService Holdings, Inc. * | | |
Forrester Research, Inc. * | | |
Heidrick & Struggles International, Inc. | | |
| | |
| | |
| | |
| | |
Resources Connection, Inc. | | |
| | |
| | |
| | |
| | |
| | |
Industrial Transportation — 2.8% |
| | |
Atlas Air Worldwide Holdings, Inc. * | | |
| | |
| | |
| | |
| | |
Frontline Ltd. (Norway) (a) | | |
| | |
Genco Shipping & Trading Ltd. | | |
Hub Group, Inc., Class A * | | |
| | |
| | |
| | |
Scorpio Tankers, Inc. (Monaco) | | |
| | |
|
Industrial Transportation — continued |
Triton International Ltd. (Bermuda) | | |
| | |
| | |
Investment Banking & Brokerage Services — 1.4% |
Artisan Partners Asset Management, Inc., Class A | | |
B. Riley Financial, Inc. (a) | | |
Brightsphere Investment Group, Inc. | | |
| | |
| | |
| | |
| | |
| | |
Virtus Investment Partners, Inc. | | |
| | |
|
Camping World Holdings, Inc., Class A | | |
Fox Factory Holding Corp. * | | |
| | |
Smith & Wesson Brands, Inc. | | |
| | |
| | |
Universal Electronics, Inc. * | | |
| | |
|
American Equity Investment Life Holding Co. | | |
CNO Financial Group, Inc. | | |
National Western Life Group, Inc., Class A | | |
| | |
|
| | |
| | |
| | |
| | |
| | |
Medical Equipment & Services — 3.2% |
| | |
Anika Therapeutics, Inc. * (a) | | |
| | |
| | |
| | |
| | |
SEE NOTES TO FINANCIAL STATEMENTS.
| J.P. Morgan Exchange-Traded Funds | |
JPMorgan Diversified Return U.S. Small Cap Equity ETF
SCHEDULE OF PORTFOLIO INVESTMENTS
AS OF October 31, 2022 (continued)
| | |
Common Stocks — continued |
Medical Equipment & Services — continued |
| | |
| | |
| | |
Lantheus Holdings, Inc. * | | |
Meridian Bioscience, Inc. * | | |
Merit Medical Systems, Inc. * | | |
| | |
| | |
OraSure Technologies, Inc. * | | |
| | |
| | |
| | |
| | |
| | |
| | |
| | |
| | |
Mortgage Real Estate Investment Trusts — 1.7% |
Apollo Commercial Real Estate Finance, Inc. | | |
Arbor Realty Trust, Inc. (a) | | |
Blackstone Mortgage Trust, Inc., Class A | | |
| | |
Ellington Financial, Inc. (a) | | |
Granite Point Mortgage Trust, Inc. | | |
| | |
KKR Real Estate Finance Trust, Inc. | | |
| | |
| | |
New York Mortgage Trust, Inc. (a) | | |
PennyMac Mortgage Investment Trust | | |
| | |
| | |
TPG RE Finance Trust, Inc. | | |
| | |
Non-life Insurance — 0.9% |
| | |
| | |
| | |
Horace Mann Educators Corp. | | |
Safety Insurance Group, Inc. | | |
Selective Insurance Group, Inc. | | |
Stewart Information Services Corp. | | |
| | |
| | |
|
Non-Renewable Energy — 6.9% |
Alpha Metallurgical Resources, Inc. | | |
| | |
| | |
| | |
Brigham Minerals, Inc., Class A | | |
| | |
| | |
| | |
| | |
| | |
| | |
| | |
| | |
Helix Energy Solutions Group, Inc. * | | |
Magnolia Oil & Gas Corp., Class A | | |
Matador Resources Co. (a) | | |
| | |
| | |
Newpark Resources, Inc. * | | |
Northern Oil and Gas, Inc. | | |
| | |
Oceaneering International, Inc. * | | |
Patterson-UTI Energy, Inc. | | |
PBF Energy, Inc., Class A * (a) | | |
Permian Resources Corp. * | | |
| | |
| | |
| | |
| | |
| | |
Solaris Oilfield Infrastructure, Inc., Class A | | |
| | |
| | |
World Fuel Services Corp. | | |
| | |
Personal Care, Drug & Grocery Stores — 3.5% |
| | |
Beauty Health Co. (The) * (a) | | |
Chefs' Warehouse, Inc. (The) * | | |
Edgewell Personal Care Co. | | |
| | |
Ingles Markets, Inc., Class A | | |
Nu Skin Enterprises, Inc., Class A | | |
| | |
SEE NOTES TO FINANCIAL STATEMENTS.
| J.P. Morgan Exchange-Traded Funds | |
| | |
Common Stocks — continued |
Personal Care, Drug & Grocery Stores — continued |
| | |
| | |
| | |
Sprouts Farmers Market, Inc. * | | |
United Natural Foods, Inc. * | | |
| | |
| | |
| | |
| | |
|
| | |
| | |
| | |
| | |
| | |
Pharmaceuticals, Biotechnology & Marijuana Producers — 4.3% |
Amphastar Pharmaceuticals, Inc. * | | |
ANI Pharmaceuticals, Inc. * | | |
Arcus Biosciences, Inc. * | | |
Arrowhead Pharmaceuticals, Inc. * | | |
| | |
Castle Biosciences, Inc. * | | |
Catalyst Pharmaceuticals, Inc. * | | |
Collegium Pharmaceutical, Inc. * | | |
Corcept Therapeutics, Inc. * | | |
Dynavax Technologies Corp. * (a) | | |
Eagle Pharmaceuticals, Inc. * | | |
Emergent BioSolutions, Inc. * | | |
Halozyme Therapeutics, Inc. * (a) | | |
| | |
| | |
Ligand Pharmaceuticals, Inc. * | | |
| | |
| | |
Pacira BioSciences, Inc. * | | |
| | |
Prestige Consumer Healthcare, Inc. * | | |
Prothena Corp. plc (Ireland) * | | |
Supernus Pharmaceuticals, Inc. * | | |
Travere Therapeutics, Inc. * | | |
Vanda Pharmaceuticals, Inc. * | | |
| | |
| | |
| | |
|
Precious Metals & Mining — 0.2% |
| | |
Real Estate Investment & Services — 1.0% |
Anywhere Real Estate, Inc. * | | |
Cushman & Wakefield plc * | | |
| | |
eXp World Holdings, Inc. (a) | | |
Kennedy-Wilson Holdings, Inc. | | |
| | |
Newmark Group, Inc., Class A | | |
| | |
| | |
Real Estate Investment Trusts — 8.4% |
| | |
Alexander & Baldwin, Inc. | | |
American Assets Trust, Inc. | | |
Apartment Investment and Management Co., Class A | | |
Apple Hospitality REIT, Inc. | | |
Ares Commercial Real Estate Corp. | | |
Bluerock Homes Trust, Inc. * | | |
| | |
Broadstone Net Lease, Inc. | | |
| | |
| | |
Community Healthcare Trust, Inc. | | |
Corporate Office Properties Trust | | |
DiamondRock Hospitality Co. | | |
DigitalBridge Group, Inc. | | |
Easterly Government Properties, Inc. | | |
| | |
| | |
Essential Properties Realty Trust, Inc. | | |
Four Corners Property Trust, Inc. | | |
GEO Group, Inc. (The) * (a) | | |
Global Net Lease, Inc. (a) | | |
Hannon Armstrong Sustainable Infrastructure Capital, Inc. (a) | | |
Independence Realty Trust, Inc. | | |
Industrial Logistics Properties Trust | | |
Innovative Industrial Properties, Inc. | | |
| | |
| | |
| | |
| | |
SEE NOTES TO FINANCIAL STATEMENTS.
| J.P. Morgan Exchange-Traded Funds | |
JPMorgan Diversified Return U.S. Small Cap Equity ETF
SCHEDULE OF PORTFOLIO INVESTMENTS
AS OF October 31, 2022 (continued)
| | |
Common Stocks — continued |
Real Estate Investment Trusts — continued |
National Health Investors, Inc. | | |
NexPoint Residential Trust, Inc. | | |
Office Properties Income Trust | | |
| | |
Phillips Edison & Co., Inc. | | |
| | |
Piedmont Office Realty Trust, Inc., Class A | | |
| | |
Retail Opportunity Investments Corp. | | |
| | |
Ryman Hospitality Properties, Inc. | | |
Sabra Health Care REIT, Inc. | | |
| | |
| | |
Summit Hotel Properties, Inc. | | |
Sunstone Hotel Investors, Inc. | | |
Tanger Factory Outlet Centers, Inc. (a) | | |
| | |
| | |
| | |
| | |
Xenia Hotels & Resorts, Inc. | | |
| | |
|
| | |
| | |
REX American Resources Corp. * | | |
| | |
|
Abercrombie & Fitch Co., Class A * | | |
Academy Sports & Outdoors, Inc. | | |
America's Car-Mart, Inc. * | | |
Asbury Automotive Group, Inc. * | | |
Big 5 Sporting Goods Corp. (a) | | |
| | |
| | |
| | |
| | |
Dillard's, Inc., Class A (a) | | |
| | |
| | |
| | |
Haverty Furniture Cos., Inc. (a) | | |
| | |
|
|
| | |
LL Flooring Holdings, Inc. * | | |
| | |
| | |
| | |
| | |
| | |
| | |
Software & Computer Services — 3.9% |
| | |
| | |
Alarm.com Holdings, Inc. * | | |
Allscripts Healthcare Solutions, Inc. * | | |
Appfolio, Inc., Class A * | | |
| | |
| | |
| | |
Consensus Cloud Solutions, Inc. * | | |
CSG Systems International, Inc. | | |
MicroStrategy, Inc., Class A * (a) | | |
| | |
| | |
| | |
| | |
| | |
| | |
| | |
Simulations Plus, Inc. (a) | | |
| | |
| | |
| | |
| | |
| | |
Technology Hardware & Equipment — 6.7% |
| | |
Advanced Energy Industries, Inc. | | |
Alpha & Omega Semiconductor Ltd. * | | |
| | |
Axcelis Technologies, Inc. * | | |
Benchmark Electronics, Inc. | | |
| | |
| | |
| | |
SEE NOTES TO FINANCIAL STATEMENTS.
| J.P. Morgan Exchange-Traded Funds | |
| | |
Common Stocks — continued |
Technology Hardware & Equipment — continued |
| | |
| | |
| | |
| | |
Insight Enterprises, Inc. * | | |
Kulicke & Soffa Industries, Inc. (Singapore) (a) | | |
| | |
Methode Electronics, Inc. (a) | | |
| | |
| | |
| | |
| | |
| | |
| | |
| | |
| | |
| | |
| | |
| | |
| | |
SMART Global Holdings, Inc. * | | |
Super Micro Computer, Inc. * | | |
| | |
| | |
Ultra Clean Holdings, Inc. * | | |
Vishay Intertechnology, Inc. | | |
| | |
| | |
Telecommunications Equipment — 3.1% |
| | |
| | |
| | |
| | |
| | |
Comtech Telecommunications Corp. | | |
EchoStar Corp., Class A * | | |
| | |
| | |
| | |
| | |
Lightwave Logic, Inc. * (a) | | |
| | |
| | |
|
Telecommunications Equipment — continued |
Ribbon Communications, Inc. * | | |
| | |
| | |
Telecommunications Service Providers — 2.4% |
| | |
Cogent Communications Holdings, Inc. | | |
Consolidated Communications Holdings, Inc. * | | |
| | |
| | |
| | |
Iridium Communications, Inc. * | | |
Liberty Latin America Ltd., Class C (Chile) * | | |
Shenandoah Telecommunications Co. | | |
Telephone and Data Systems, Inc. | | |
| | |
| | |
|
22nd Century Group, Inc. * (a) | | |
Turning Point Brands, Inc. | | |
| | |
| | |
| | |
|
Biglari Holdings, Inc., Class B * | | |
Chuy's Holdings, Inc. * (a) | | |
El Pollo Loco Holdings, Inc. | | |
Ruth's Hospitality Group, Inc. | | |
| | |
Waste & Disposal Services — 0.3% |
Casella Waste Systems, Inc., Class A * | | |
Total Common Stocks
(Cost $290,344,602) | | |
| | |
|
Pharmaceuticals, Biotechnology & Marijuana Producers — 0.0% ^ |
Achillion Pharmaceuticals, Inc. ‡ *(Cost $—) | | |
SEE NOTES TO FINANCIAL STATEMENTS.
| J.P. Morgan Exchange-Traded Funds | |
JPMorgan Diversified Return U.S. Small Cap Equity ETF
SCHEDULE OF PORTFOLIO INVESTMENTS
AS OF October 31, 2022 (continued)
| | |
Short-Term Investments — 7.9% |
Investment Companies — 0.1% |
JPMorgan U.S. Government Money Market Fund Class IM Shares, 2.85% (b) (c)(Cost $325,140) | | |
Investment of Cash Collateral from Securities Loaned — 7.8% |
JPMorgan Securities Lending Money Market Fund Class Agency SL Shares, 3.23% (b) (c) | | |
JPMorgan U.S. Government Money Market Fund Class IM Shares, 2.85% (b) (c) | | |
Total Investment of Cash Collateral from Securities Loaned
(Cost $22,242,620) | | |
Total Short-Term Investments
(Cost $22,567,760) | | |
Total Investments — 107.7%
(Cost $312,912,362) | | |
Liabilities in Excess of Other Assets — (7.7)% | | |
| | |
Percentages indicated are based on net assets. |
| |
| Real Estate Investment Trust |
| Amount rounds to less than 0.1% of net assets. |
| Value determined using significant unobservable inputs. | |
| Non-income producing security. | |
| The security or a portion of this security is on loan at October 31, 2022. The total value of securities on loan at October 31, 2022 is $21,395,218. | |
| Investment in an affiliated fund, which is registered under the Investment Company Act of 1940, as amended, and is advised by J.P. Morgan Investment Management Inc. | |
| The rate shown is the current yield as of October 31, 2022. | |
Futures contracts outstanding as of October 31, 2022:
| | | | | VALUE AND
UNREALIZED
APPRECIATION
(DEPRECIATION) ($) |
| | | | | |
Russell 2000 E-Mini Index | | | | | |
SEE NOTES TO FINANCIAL STATEMENTS.
| J.P. Morgan Exchange-Traded Funds | |
JPMorgan International Growth ETF
SCHEDULE OF PORTFOLIO INVESTMENTS
AS OF October 31, 2022
| | |
|
|
| | |
Woodside Energy Group Ltd. | | |
| | |
|
| | |
|
Alimentation Couche-Tard, Inc. | | |
Canadian National Railway Co. | | |
Canadian Pacific Railway Ltd. | | |
| | |
|
| | |
| | |
| | |
Wuxi Biologics Cayman, Inc. * (a) | | |
| | |
|
| | |
| | |
Novo Nordisk A/S, Class B | | |
| | |
|
| | |
LVMH Moet Hennessy Louis Vuitton SE | | |
| | |
|
| | |
| | |
Sartorius AG (Preference) | | |
| | |
| | |
| | |
|
| | |
Hong Kong Exchanges & Clearing Ltd. | | |
Techtronic Industries Co. Ltd. | | |
| | |
|
| | |
| | |
|
|
Bank Central Asia Tbk. PT | | |
Telkom Indonesia Persero Tbk. PT, ADR | | |
| | |
|
| | |
| | |
| | |
| | |
Shin-Etsu Chemical Co. Ltd. | | |
| | |
| | |
| | |
|
Wal-Mart de Mexico SAB de CV | | |
|
| | |
| | |
| | |
| | |
| | |
|
| | |
| | |
| | |
|
| | |
|
| | |
|
| | |
| | |
| | |
| | |
|
Lonza Group AG (Registered) | | |
Straumann Holding AG (Registered) | | |
| | |
|
Taiwan Semiconductor Manufacturing Co. Ltd., ADR | | |
SEE NOTES TO FINANCIAL STATEMENTS.
| J.P. Morgan Exchange-Traded Funds | |
JPMorgan International Growth ETF
SCHEDULE OF PORTFOLIO INVESTMENTS
AS OF October 31, 2022 (continued)
| | |
Common Stocks — continued |
|
| | |
| | |
| | |
| | |
London Stock Exchange Group plc | | |
Oxford Nanopore Technologies plc * | | |
| | |
Spirax-Sarco Engineering plc | | |
| | |
|
Cadence Design Systems, Inc. * | | |
| | |
| | |
| | |
| | |
| | |
Total Common Stocks
(Cost $61,114,176) | | |
Short-Term Investments — 5.9% |
Investment Companies — 4.5% |
JPMorgan U.S. Government Money Market Fund Class IM Shares, 2.85% (c) (d)(Cost $2,455,095) | | |
Investment of Cash Collateral from Securities Loaned — 1.4% |
JPMorgan U.S. Government Money Market Fund Class IM Shares, 2.85% (c) (d)(Cost $749,113) | | |
Total Short-Term Investments
(Cost $3,204,208) | | |
Total Investments — 101.2%
(Cost $64,318,384) | | |
Liabilities in Excess of Other Assets — (1.2)% | | |
| | |
Percentages indicated are based on net assets. |
| |
| American Depositary Receipt |
| A special type of equity investment that shares in the earnings of the company, has limited voting rights, and may have a dividend preference. Preference shares may also have liquidation preference. |
| Limited liability company |
| Non-income producing security. |
| Security exempt from registration pursuant to Regulation S under the Securities Act of 1933, as amended. Regulation S applies to securities offerings that are made outside of the United States and do not involve direct selling efforts in the United States and as such may have restrictions on resale. |
| The security or a portion of this security is on loan at October 31, 2022. The total value of securities on loan at October 31, 2022 is $704,050. |
| Investment in an affiliated fund, which is registered under the Investment Company Act of 1940, as amended, and is advised by J.P. Morgan Investment Management Inc. |
| The rate shown is the current yield as of October 31, 2022. |
SEE NOTES TO FINANCIAL STATEMENTS.
| J.P. Morgan Exchange-Traded Funds | |
Summary of Investments by Industry, October 31, 2022
The following table represents the portfolio investments of the Fund by industry classifications as a percentage of total investments:
| PERCENT OF
TOTAL
INVESTMENTS |
| |
Semiconductors & Semiconductor Equipment | |
| |
| |
| |
| |
| |
Health Care Equipment & Supplies | |
Textiles, Apparel & Luxury Goods | |
| |
| |
Life Sciences Tools & Services | |
| |
| |
| |
Electronic Equipment, Instruments & Components | |
| |
Interactive Media & Services | |
| |
Internet & Direct Marketing Retail | |
| |
| |
| |
| |
Oil, Gas & Consumable Fuels | |
| |
Others (each less than 1.0%) | |
| |
SEE NOTES TO FINANCIAL STATEMENTS.
| J.P. Morgan Exchange-Traded Funds | |
JPMorgan U.S. Momentum Factor ETF
SCHEDULE OF PORTFOLIO INVESTMENTS
AS OF October 31, 2022
| | |
|
Aerospace & Defense — 3.0% |
| | |
| | |
| | |
| | |
| | |
| | |
Raytheon Technologies Corp. | | |
| | |
| | |
Automobiles & Parts — 2.6% |
| | |
| | |
| | |
| | |
| | |
|
| | |
Discover Financial Services | | |
| | |
| | |
| | |
Pinnacle Financial Partners, Inc. | | |
Popular, Inc. (Puerto Rico) | | |
| | |
| | |
|
Constellation Brands, Inc., Class A | | |
|
| | |
| | |
CF Industries Holdings, Inc. | | |
| | |
| | |
| | |
| | |
| | |
| | |
Construction & Materials — 1.7% |
| | |
Advanced Drainage Systems, Inc. | | |
| | |
Builders FirstSource, Inc. * | | |
| | |
|
Construction & Materials — continued |
| | |
| | |
| | |
| | |
| | |
| | |
|
| | |
Avis Budget Group, Inc. * | | |
| | |
| | |
| | |
| | |
|
Consolidated Edison, Inc. | | |
| | |
| | |
| | |
| | |
| | |
| | |
Electronic & Electrical Equipment — 0.8% |
Keysight Technologies, Inc. * | | |
Mettler-Toledo International, Inc. * | | |
| | |
| | |
Finance & Credit Services — 0.3% |
| | |
| | |
| | |
| | |
|
Archer-Daniels-Midland Co. | | |
| | |
| | |
| | |
Darling Ingredients, Inc. * | | |
| | |
| | |
| | |
| | |
| | |
SEE NOTES TO FINANCIAL STATEMENTS.
| J.P. Morgan Exchange-Traded Funds | |
| | |
Common Stocks — continued |
Gas, Water & Multi-utilities — 0.9% |
| | |
| | |
| | |
| | |
| | |
| | |
General Industrials — 0.9% |
| | |
| | |
Graphic Packaging Holding Co. | | |
| | |
| | |
| | |
| | |
Health Care Providers — 3.0% |
Acadia Healthcare Co., Inc. * | | |
| | |
| | |
| | |
| | |
| | |
| | |
Household Goods & Home Construction — 0.3% |
| | |
| | |
Tempur Sealy International, Inc. | | |
| | |
Industrial Engineering — 0.7% |
| | |
Industrial Metals & Mining — 0.4% |
| | |
| | |
| | |
Industrial Support Services — 3.6% |
| | |
| | |
Automatic Data Processing, Inc. | | |
Bill.com Holdings, Inc. * | | |
| | |
| | |
Jack Henry & Associates, Inc. | | |
| | |
| | |
|
Industrial Support Services — continued |
Paylocity Holding Corp. * | | |
Robert Half International, Inc. | | |
| | |
| | |
Industrial Transportation — 2.3% |
CH Robinson Worldwide, Inc. | | |
JB Hunt Transport Services, Inc. | | |
| | |
Old Dominion Freight Line, Inc. | | |
| | |
United Parcel Service, Inc., Class B | | |
WillScot Mobile Mini Holdings Corp. * | | |
| | |
Investment Banking & Brokerage Services — 5.1% |
Ameriprise Financial, Inc. | | |
| | |
Berkshire Hathaway, Inc., Class B * | | |
| | |
Charles Schwab Corp. (The) | | |
Jefferies Financial Group, Inc. | | |
| | |
LPL Financial Holdings, Inc. | | |
| | |
| | |
| | |
|
| | |
|
| | |
|
Interpublic Group of Cos., Inc. (The) | | |
Liberty Media Corp.-Liberty Formula One, Class C * | | |
Nexstar Media Group, Inc., Class A | | |
Trade Desk, Inc. (The), Class A * | | |
World Wrestling Entertainment, Inc., Class A (a) | | |
| | |
Medical Equipment & Services — 4.2% |
Agilent Technologies, Inc. | | |
Bio-Rad Laboratories, Inc., Class A * | | |
| | |
| | |
SEE NOTES TO FINANCIAL STATEMENTS.
| J.P. Morgan Exchange-Traded Funds | |
JPMorgan U.S. Momentum Factor ETF
SCHEDULE OF PORTFOLIO INVESTMENTS
AS OF October 31, 2022 (continued)
| | |
Common Stocks — continued |
Medical Equipment & Services — continued |
| | |
| | |
| | |
| | |
| | |
| | |
Thermo Fisher Scientific, Inc. | | |
West Pharmaceutical Services, Inc. | | |
| | |
Non-life Insurance — 4.1% |
American Financial Group, Inc. | | |
| | |
Arch Capital Group Ltd. * | | |
| | |
| | |
| | |
| | |
Marsh & McLennan Cos., Inc. | | |
Old Republic International Corp. | | |
| | |
Ryan Specialty Holdings, Inc., Class A * | | |
| | |
| | |
Non-Renewable Energy — 5.4% |
| | |
| | |
| | |
| | |
| | |
Continental Resources, Inc. | | |
| | |
| | |
| | |
| | |
| | |
Occidental Petroleum Corp. | | |
Pioneer Natural Resources Co. | | |
| | |
| | |
Personal Care, Drug & Grocery Stores — 2.8% |
| | |
Casey's General Stores, Inc. | | |
Church & Dwight Co., Inc. | | |
| | |
|
Personal Care, Drug & Grocery Stores — continued |
| | |
Grocery Outlet Holding Corp. * | | |
| | |
| | |
Procter & Gamble Co. (The) | | |
Spectrum Brands Holdings, Inc. | | |
| | |
|
| | |
| | |
Estee Lauder Cos., Inc. (The), Class A | | |
| | |
| | |
Pharmaceuticals, Biotechnology & Marijuana Producers — 6.7% |
| | |
Alnylam Pharmaceuticals, Inc. * | | |
| | |
| | |
| | |
| | |
| | |
| | |
United Therapeutics Corp. * | | |
Vertex Pharmaceuticals, Inc. * | | |
| | |
Real Estate Investment & Services — 0.3% |
CBRE Group, Inc., Class A * | | |
Jones Lang LaSalle, Inc. * | | |
| | |
Real Estate Investment Trusts — 2.7% |
| | |
| | |
| | |
Extra Space Storage, Inc. | | |
Gaming and Leisure Properties, Inc. | | |
| | |
| | |
| | |
| | |
| | |
| | |
| | |
SEE NOTES TO FINANCIAL STATEMENTS.
| J.P. Morgan Exchange-Traded Funds | |
| | |
Common Stocks — continued |
|
| | |
| | |
BJ's Wholesale Club Holdings, Inc. * | | |
| | |
Dick's Sporting Goods, Inc. | | |
| | |
GameStop Corp., Class A * (a) | | |
| | |
| | |
| | |
O'Reilly Automotive, Inc. * | | |
Penske Automotive Group, Inc. | | |
| | |
| | |
| | |
| | |
Software & Computer Services — 12.7% |
Alphabet, Inc., Class A * | | |
| | |
Atlassian Corp., Class A * | | |
CACI International, Inc., Class A * | | |
Cadence Design Systems, Inc. * | | |
Cloudflare, Inc., Class A * | | |
Crowdstrike Holdings, Inc., Class A * | | |
| | |
Dell Technologies, Inc., Class C | | |
| | |
| | |
| | |
| | |
| | |
| | |
International Business Machines Corp. | | |
| | |
| | |
| | |
Manhattan Associates, Inc. * | | |
| | |
| | |
| | |
| | |
| | |
Palo Alto Networks, Inc. * | | |
| | |
| | |
|
Software & Computer Services — continued |
| | |
Science Applications International Corp. | | |
| | |
| | |
Tyler Technologies, Inc. * | | |
| | |
| | |
Technology Hardware & Equipment — 12.2% |
Advanced Micro Devices, Inc. * | | |
| | |
| | |
| | |
| | |
| | |
| | |
| | |
| | |
| | |
GLOBALFOUNDRIES, Inc. * (a) | | |
| | |
| | |
| | |
| | |
| | |
Monolithic Power Systems, Inc. | | |
| | |
| | |
| | |
Pure Storage, Inc., Class A * | | |
| | |
| | |
| | |
| | |
| | |
| | |
| | |
Telecommunications Equipment — 2.0% |
| | |
| | |
| | |
Lumentum Holdings, Inc. * | | |
| | |
| | |
SEE NOTES TO FINANCIAL STATEMENTS.
| J.P. Morgan Exchange-Traded Funds | |
JPMorgan U.S. Momentum Factor ETF
SCHEDULE OF PORTFOLIO INVESTMENTS
AS OF October 31, 2022 (continued)
| | |
Common Stocks — continued |
Telecommunications Service Providers — 0.6% |
| | |
| | |
| | |
|
| | |
Chipotle Mexican Grill, Inc. * | | |
Choice Hotels International, Inc. | | |
Hilton Worldwide Holdings, Inc. | | |
Hyatt Hotels Corp., Class A * | | |
| | |
| | |
Waste & Disposal Services — 0.8% |
| | |
| | |
| | |
Total Common Stocks
(Cost $241,340,048) | | |
Short-Term Investments — 0.6% |
Investment Companies — 0.1% |
JPMorgan U.S. Government Money Market Fund Class IM Shares, 2.85% (b) (c)(Cost $340,337) | | |
| | |
|
Investment of Cash Collateral from Securities Loaned — 0.5% |
JPMorgan U.S. Government Money Market Fund Class IM Shares, 2.85% (b) (c)(Cost $1,131,417) | | |
Total Short-Term Investments
(Cost $1,471,754) | | |
Total Investments — 100.4%
(Cost $242,811,802) | | |
Liabilities in Excess of Other Assets — (0.4)% | | |
| | |
Percentages indicated are based on net assets. |
| Non-income producing security. |
| The security or a portion of this security is on loan at October 31, 2022. The total value of securities on loan at October 31, 2022 is $1,103,874. |
| Investment in an affiliated fund, which is registered under the Investment Company Act of 1940, as amended, and is advised by J.P. Morgan Investment Management Inc. |
| The rate shown is the current yield as of October 31, 2022. |
Futures contracts outstanding as of October 31, 2022:
| | | | | VALUE AND
UNREALIZED
APPRECIATION
(DEPRECIATION) ($) |
| | | | | |
Micro E-Mini S&P 500 Index | | | | | |
SEE NOTES TO FINANCIAL STATEMENTS.
| J.P. Morgan Exchange-Traded Funds | |
JPMorgan U.S. Quality Factor ETF
SCHEDULE OF PORTFOLIO INVESTMENTS
AS OF October 31, 2022
| | |
|
Aerospace & Defense — 0.7% |
| | |
Automobiles & Parts — 0.6% |
| | |
| | |
| | |
|
| | |
Commerce Bancshares, Inc. | | |
| | |
| | |
|
Brown-Forman Corp., Class B | | |
| | |
| | |
|
| | |
CF Industries Holdings, Inc. | | |
| | |
| | |
| | |
Construction & Materials — 0.5% |
| | |
| | |
| | |
| | |
| | |
|
| | |
Grand Canyon Education, Inc. * | | |
| | |
| | |
| | |
|
| | |
| | |
Hawaiian Electric Industries, Inc. | | |
| | |
| | |
| | |
| | |
| | |
|
Electronic & Electrical Equipment — 1.6% |
| | |
| | |
| | |
Keysight Technologies, Inc. * | | |
Mettler-Toledo International, Inc. * | | |
| | |
| | |
Finance & Credit Services — 1.3% |
FactSet Research Systems, Inc. | | |
| | |
| | |
| | |
| | |
|
| | |
| | |
| | |
| | |
Gas, Water & Multi-utilities — 0.6% |
| | |
| | |
| | |
| | |
General Industrials — 1.1% |
| | |
Honeywell International, Inc. | | |
Illinois Tool Works, Inc. | | |
| | |
Health Care Providers — 0.4% |
| | |
| | |
| | |
| | |
Household Goods & Home Construction — 0.3% |
| | |
Industrial Engineering — 0.9% |
| | |
| | |
Lincoln Electric Holdings, Inc. | | |
| | |
| | |
SEE NOTES TO FINANCIAL STATEMENTS.
| J.P. Morgan Exchange-Traded Funds | |
JPMorgan U.S. Quality Factor ETF
SCHEDULE OF PORTFOLIO INVESTMENTS
AS OF October 31, 2022 (continued)
| | |
Common Stocks — continued |
Industrial Metals & Mining — 0.7% |
| | |
| | |
Southern Copper Corp. (Peru) | | |
| | |
Industrial Support Services — 7.1% |
| | |
Automatic Data Processing, Inc. | | |
| | |
Jack Henry & Associates, Inc. (a) | | |
Mastercard, Inc., Class A | | |
| | |
Robert Half International, Inc. | | |
| | |
| | |
| | |
| | |
| | |
Industrial Transportation — 1.1% |
Allison Transmission Holdings, Inc. | | |
| | |
| | |
United Parcel Service, Inc., Class B | | |
| | |
Investment Banking & Brokerage Services — 3.9% |
Berkshire Hathaway, Inc., Class B * | | |
| | |
Broadridge Financial Solutions, Inc. | | |
Intercontinental Exchange, Inc. | | |
MarketAxess Holdings, Inc. | | |
| | |
| | |
T. Rowe Price Group, Inc. | | |
Virtu Financial, Inc., Class A | | |
| | |
|
Activision Blizzard, Inc. | | |
Electronic Arts, Inc. (a) | | |
| | |
|
| | |
| | |
| | |
| | |
|
|
Interpublic Group of Cos., Inc. (The) | | |
| | |
Sirius XM Holdings, Inc. (a) | | |
World Wrestling Entertainment, Inc., Class A | | |
| | |
Medical Equipment & Services — 1.7% |
| | |
| | |
Edwards Lifesciences Corp. * | | |
| | |
IDEXX Laboratories, Inc. * | | |
| | |
| | |
| | |
Non-life Insurance — 4.4% |
| | |
| | |
Arch Capital Group Ltd. * | | |
| | |
| | |
| | |
Erie Indemnity Co., Class A | | |
Fidelity National Financial, Inc. | | |
Hanover Insurance Group, Inc. (The) | | |
Marsh & McLennan Cos., Inc. | | |
| | |
Travelers Cos., Inc. (The) (a) | | |
| | |
| | |
Non-Renewable Energy — 5.5% |
| | |
| | |
| | |
| | |
| | |
| | |
| | |
| | |
| | |
| | |
| | |
SEE NOTES TO FINANCIAL STATEMENTS.
| J.P. Morgan Exchange-Traded Funds | |
| | |
Common Stocks — continued |
Personal Care, Drug & Grocery Stores — 3.2% |
Albertsons Cos., Inc., Class A | | |
Church & Dwight Co., Inc. | | |
| | |
| | |
| | |
| | |
Procter & Gamble Co. (The) | | |
| | |
|
| | |
Estee Lauder Cos., Inc. (The), Class A | | |
| | |
| | |
Under Armour, Inc., Class A * (a) | | |
| | |
Pharmaceuticals, Biotechnology & Marijuana Producers — 12.1% |
| | |
| | |
| | |
| | |
| | |
| | |
| | |
| | |
| | |
| | |
Regeneron Pharmaceuticals, Inc. * | | |
Vertex Pharmaceuticals, Inc. * | | |
| | |
| | |
Precious Metals & Mining — 0.3% |
| | |
SSR Mining, Inc. (Canada) | | |
| | |
Real Estate Investment & Services — 0.3% |
CBRE Group, Inc., Class A * | | |
Real Estate Investment Trusts — 2.8% |
| | |
| | |
| | |
Equity LifeStyle Properties, Inc. | | |
| | |
| | |
|
Real Estate Investment Trusts — continued |
Extra Space Storage, Inc. | | |
Gaming and Leisure Properties, Inc. | | |
Lamar Advertising Co., Class A | | |
| | |
| | |
| | |
Simon Property Group, Inc. | | |
| | |
| | |
|
| | |
| | |
| | |
| | |
| | |
O'Reilly Automotive, Inc. * | | |
| | |
| | |
| | |
Victoria's Secret & Co. * (a) | | |
Williams-Sonoma, Inc. (a) | | |
| | |
Software & Computer Services — 14.6% |
| | |
Akamai Technologies, Inc. * (a) | | |
Alphabet, Inc., Class A * | | |
| | |
| | |
| | |
Cadence Design Systems, Inc. * | | |
Cognizant Technology Solutions Corp., Class A | | |
Crowdstrike Holdings, Inc., Class A * | | |
Dell Technologies, Inc., Class C (a) | | |
| | |
Dolby Laboratories, Inc., Class A | | |
| | |
| | |
| | |
| | |
| | |
International Business Machines Corp. | | |
| | |
Manhattan Associates, Inc. * | | |
SEE NOTES TO FINANCIAL STATEMENTS.
| J.P. Morgan Exchange-Traded Funds | |
JPMorgan U.S. Quality Factor ETF
SCHEDULE OF PORTFOLIO INVESTMENTS
AS OF October 31, 2022 (continued)
| | |
Common Stocks — continued |
Software & Computer Services — continued |
Meta Platforms, Inc., Class A * | | |
| | |
| | |
Palo Alto Networks, Inc. * | | |
| | |
Pinterest, Inc., Class A * | | |
| | |
| | |
SS&C Technologies Holdings, Inc. | | |
| | |
| | |
| | |
| | |
| | |
Technology Hardware & Equipment — 9.9% |
| | |
| | |
| | |
| | |
| | |
| | |
GLOBALFOUNDRIES, Inc. * (a) | | |
| | |
| | |
Lattice Semiconductor Corp. * | | |
Microchip Technology, Inc. | | |
| | |
| | |
| | |
Pure Storage, Inc., Class A * | | |
| | |
| | |
| | |
| | |
| | |
| | |
Telecommunications Equipment — 1.6% |
| | |
Lumentum Holdings, Inc. * | | |
| | |
| | |
| | |
| | |
|
Telecommunications Service Providers — 0.8% |
Charter Communications, Inc., Class A * | | |
Verizon Communications, Inc. | | |
| | |
|
| | |
Philip Morris International, Inc. | | |
| | |
|
Airbnb, Inc., Class A * (a) | | |
| | |
| | |
Choice Hotels International, Inc. | | |
Copa Holdings SA, Class A (Panama) * | | |
| | |
| | |
Live Nation Entertainment, Inc. * | | |
Madison Square Garden Sports Corp. | | |
Marriott International, Inc., Class A | | |
| | |
| | |
Wyndham Hotels & Resorts, Inc. | | |
| | |
| | |
Waste & Disposal Services — 1.0% |
| | |
| | |
| | |
| | |
Total Common Stocks
(Cost $594,885,184) | | |
Short-Term Investments — 3.6% |
Investment Companies — 0.1% |
JPMorgan U.S. Government Money Market Fund Class IM Shares, 2.85% (b) (c)(Cost $785,535) | | |
Investment of Cash Collateral from Securities Loaned — 3.5% |
JPMorgan Securities Lending Money Market Fund Class Agency SL Shares, 3.23% (b) (c) | | |
SEE NOTES TO FINANCIAL STATEMENTS.
| J.P. Morgan Exchange-Traded Funds | |
| | |
Short-Term Investments — continued |
Investment of Cash Collateral from Securities Loaned — continued |
JPMorgan U.S. Government Money Market Fund Class IM Shares, 2.85% (b) (c) | | |
Total Investment of Cash Collateral from Securities Loaned
(Cost $20,186,590) | | |
Total Short-Term Investments
(Cost $20,972,125) | | |
Total Investments — 103.4%
(Cost $615,857,309) | | |
Liabilities in Excess of Other Assets — (3.4)% | | |
| | |
Percentages indicated are based on net assets. |
| Non-income producing security. |
| The security or a portion of this security is on loan at October 31, 2022. The total value of securities on loan at October 31, 2022 is $19,486,422. |
| Investment in an affiliated fund, which is registered under the Investment Company Act of 1940, as amended, and is advised by J.P. Morgan Investment Management Inc. |
| The rate shown is the current yield as of October 31, 2022. |
Futures contracts outstanding as of October 31, 2022:
| | | | | VALUE AND
UNREALIZED
APPRECIATION
(DEPRECIATION) ($) |
| | | | | |
| | | | | |
SEE NOTES TO FINANCIAL STATEMENTS.
| J.P. Morgan Exchange-Traded Funds | |
JPMorgan U.S. Value Factor ETF
SCHEDULE OF PORTFOLIO INVESTMENTS
AS OF October 31, 2022
| | |
|
Aerospace & Defense — 1.7% |
| | |
Huntington Ingalls Industries, Inc. | | |
L3Harris Technologies, Inc. | | |
Raytheon Technologies Corp. | | |
| | |
| | |
Automobiles & Parts — 2.2% |
| | |
| | |
| | |
| | |
| | |
| | |
| | |
| | |
|
| | |
| | |
| | |
Citizens Financial Group, Inc. | | |
| | |
| | |
| | |
| | |
| | |
| | |
New York Community Bancorp, Inc. (a) | | |
| | |
Popular, Inc. (Puerto Rico) | | |
Prosperity Bancshares, Inc. | | |
| | |
| | |
| | |
| | |
| | |
| | |
| | |
|
| | |
Molson Coors Beverage Co., Class B | | |
| | |
| | |
|
|
| | |
| | |
| | |
LyondellBasell Industries NV, Class A | | |
| | |
Construction & Materials — 0.9% |
| | |
| | |
MDU Resources Group, Inc. | | |
Mohawk Industries, Inc. * | | |
| | |
| | |
|
| | |
| | |
Grand Canyon Education, Inc. * | | |
| | |
Service Corp. International | | |
| | |
|
| | |
Consolidated Edison, Inc. | | |
| | |
| | |
| | |
Hawaiian Electric Industries, Inc. | | |
| | |
| | |
Pinnacle West Capital Corp. | | |
| | |
| | |
| | |
Electronic & Electrical Equipment — 1.8% |
| | |
| | |
| | |
Johnson Controls International plc | | |
| | |
| | |
| | |
| | |
SEE NOTES TO FINANCIAL STATEMENTS.
| J.P. Morgan Exchange-Traded Funds | |
| | |
Common Stocks — continued |
Finance & Credit Services — 0.6% |
| | |
| | |
| | |
| | |
|
Archer-Daniels-Midland Co. | | |
| | |
| | |
| | |
| | |
| | |
| | |
| | |
| | |
| | |
| | |
Tyson Foods, Inc., Class A | | |
| | |
Gas, Water & Multi-utilities — 0.9% |
| | |
| | |
| | |
| | |
General Industrials — 2.8% |
| | |
| | |
Berry Global Group, Inc. * | | |
| | |
| | |
| | |
Packaging Corp. of America | | |
| | |
| | |
| | |
| | |
Health Care Providers — 5.1% |
| | |
| | |
| | |
| | |
| | |
| | |
| | |
|
Health Care Providers — continued |
| | |
| | |
Universal Health Services, Inc., Class B | | |
| | |
Household Goods & Home Construction — 1.7% |
| | |
| | |
| | |
| | |
| | |
| | |
| | |
| | |
Industrial Engineering — 1.8% |
| | |
| | |
| | |
| | |
| | |
Stanley Black & Decker, Inc. | | |
| | |
Industrial Materials — 0.2% |
| | |
Industrial Metals & Mining — 0.9% |
| | |
Reliance Steel & Aluminum Co. | | |
| | |
United States Steel Corp. | | |
| | |
Industrial Support Services — 1.6% |
| | |
Capital One Financial Corp. | | |
| | |
MSC Industrial Direct Co., Inc., Class A | | |
Robert Half International, Inc. | | |
| | |
| | |
| | |
Industrial Transportation — 2.5% |
Allison Transmission Holdings, Inc. | | |
| | |
Knight-Swift Transportation Holdings, Inc. | | |
SEE NOTES TO FINANCIAL STATEMENTS.
| J.P. Morgan Exchange-Traded Funds | |
JPMorgan U.S. Value Factor ETF
SCHEDULE OF PORTFOLIO INVESTMENTS
AS OF October 31, 2022 (continued)
| | |
Common Stocks — continued |
Industrial Transportation — continued |
| | |
| | |
| | |
| | |
Schneider National, Inc., Class B | | |
| | |
| | |
Investment Banking & Brokerage Services — 1.3% |
Bank of New York Mellon Corp. (The) | | |
| | |
| | |
Jefferies Financial Group, Inc. | | |
| | |
| | |
|
Activision Blizzard, Inc. | | |
| | |
| | |
| | |
| | |
| | |
| | |
|
| | |
| | |
Principal Financial Group, Inc. | | |
Prudential Financial, Inc. | | |
| | |
| | |
|
| | |
Interpublic Group of Cos., Inc. (The) | | |
Liberty Media Corp.-Liberty SiriusXM, Class C * | | |
| | |
Nexstar Media Group, Inc., Class A | | |
| | |
Paramount Global, Class B | | |
| | |
Medical Equipment & Services — 2.2% |
Baxter International, Inc. | | |
| | |
Laboratory Corp. of America Holdings | | |
| | |
|
Medical Equipment & Services — continued |
| | |
| | |
| | |
| | |
Zimmer Biomet Holdings, Inc. | | |
| | |
Mortgage Real Estate Investment Trusts — 0.7% |
| | |
Annaly Capital Management, Inc. | | |
| | |
Starwood Property Trust, Inc. | | |
| | |
Non-life Insurance — 1.8% |
American International Group, Inc. | | |
| | |
Axis Capital Holdings Ltd. | | |
| | |
Fidelity National Financial, Inc. | | |
First American Financial Corp. | | |
Hartford Financial Services Group, Inc. (The) | | |
Old Republic International Corp. | | |
Reinsurance Group of America, Inc. | | |
| | |
Non-Renewable Energy — 5.5% |
| | |
| | |
| | |
| | |
| | |
| | |
| | |
| | |
| | |
| | |
| | |
| | |
| | |
Personal Care, Drug & Grocery Stores — 1.6% |
Albertsons Cos., Inc., Class A | | |
| | |
SEE NOTES TO FINANCIAL STATEMENTS.
| J.P. Morgan Exchange-Traded Funds | |
| | |
Common Stocks — continued |
Personal Care, Drug & Grocery Stores — continued |
| | |
Walgreens Boots Alliance, Inc. | | |
| | |
|
| | |
| | |
| | |
| | |
| | |
| | |
| | |
| | |
| | |
Pharmaceuticals, Biotechnology & Marijuana Producers — 7.1% |
| | |
| | |
| | |
| | |
| | |
| | |
| | |
| | |
United Therapeutics Corp. * | | |
| | |
Real Estate Investment & Services — 0.2% |
Jones Lang LaSalle, Inc. * | | |
Real Estate Investment Trusts — 3.0% |
Brixmor Property Group, Inc. | | |
| | |
| | |
| | |
Gaming and Leisure Properties, Inc. | | |
Highwoods Properties, Inc. | | |
| | |
| | |
| | |
Medical Properties Trust, Inc. | | |
National Retail Properties, Inc. | | |
Omega Healthcare Investors, Inc. | | |
| | |
Simon Property Group, Inc. | | |
| | |
| | |
| | |
|
Real Estate Investment Trusts — continued |
| | |
| | |
| | |
| | |
| | |
| | |
|
| | |
| | |
| | |
| | |
Dick's Sporting Goods, Inc. | | |
| | |
| | |
Lithia Motors, Inc., Class A | | |
| | |
| | |
Penske Automotive Group, Inc. | | |
| | |
Victoria's Secret & Co. * | | |
| | |
| | |
| | |
Software & Computer Services — 11.4% |
Akamai Technologies, Inc. * | | |
Alphabet, Inc., Class A * | | |
| | |
| | |
CACI International, Inc., Class A * | | |
Cognizant Technology Solutions Corp., Class A | | |
Dell Technologies, Inc., Class C | | |
Dolby Laboratories, Inc., Class A | | |
Dun & Bradstreet Holdings, Inc. | | |
| | |
| | |
Hewlett Packard Enterprise Co. | | |
International Business Machines Corp. | | |
| | |
| | |
| | |
Meta Platforms, Inc., Class A * | | |
| | |
| | |
SEE NOTES TO FINANCIAL STATEMENTS.
| J.P. Morgan Exchange-Traded Funds | |
JPMorgan U.S. Value Factor ETF
SCHEDULE OF PORTFOLIO INVESTMENTS
AS OF October 31, 2022 (continued)
| | |
Common Stocks — continued |
Software & Computer Services — continued |
| | |
| | |
| | |
| | |
| | |
Science Applications International Corp. | | |
SS&C Technologies Holdings, Inc. | | |
| | |
| | |
Technology Hardware & Equipment — 13.3% |
| | |
| | |
| | |
| | |
Arrow Electronics, Inc. * | | |
| | |
| | |
| | |
| | |
| | |
| | |
| | |
| | |
| | |
| | |
| | |
| | |
| | |
| | |
| | |
| | |
Microchip Technology, Inc. | | |
| | |
National Instruments Corp. | | |
| | |
| | |
| | |
| | |
| | |
| | |
| | |
| | |
| | |
| | |
|
Technology Hardware & Equipment — continued |
| | |
| | |
| | |
Telecommunications Equipment — 1.0% |
| | |
| | |
| | |
Telecommunications Service Providers — 1.4% |
| | |
| | |
DISH Network Corp., Class A * | | |
| | |
Verizon Communications, Inc. | | |
| | |
|
| | |
Philip Morris International, Inc. | | |
| | |
|
| | |
Copa Holdings SA, Class A (Panama) * | | |
| | |
Marriott Vacations Worldwide Corp. | | |
MGM Resorts International | | |
Penn Entertainment, Inc. * | | |
| | |
| | |
Wyndham Hotels & Resorts, Inc. | | |
| | |
Total Common Stocks
(Cost $489,954,879) | | |
Short-Term Investments — 0.3% |
Investment Companies — 0.1% |
JPMorgan U.S. Government Money Market Fund Class IM Shares, 2.85% (b) (c)(Cost $377,263) | | |
Investment of Cash Collateral from Securities Loaned — 0.2% |
JPMorgan Securities Lending Money Market Fund Class Agency SL Shares, 3.23% (b) (c) | | |
SEE NOTES TO FINANCIAL STATEMENTS.
| J.P. Morgan Exchange-Traded Funds | |
| | |
Short-Term Investments — continued |
Investment of Cash Collateral from Securities Loaned — continued |
JPMorgan U.S. Government Money Market Fund Class IM Shares, 2.85% (b) (c) | | |
Total Investment of Cash Collateral from Securities Loaned
(Cost $919,884) | | |
Total Short-Term Investments
(Cost $1,297,147) | | |
Total Investments — 100.1%
(Cost $491,252,026) | | |
Liabilities in Excess of Other Assets — (0.1)% | | |
| | |
Percentages indicated are based on net assets. |
| Non-income producing security. |
| The security or a portion of this security is on loan at October 31, 2022. The total value of securities on loan at October 31, 2022 is $904,560. |
| Investment in an affiliated fund, which is registered under the Investment Company Act of 1940, as amended, and is advised by J.P. Morgan Investment Management Inc. |
| The rate shown is the current yield as of October 31, 2022. |
Futures contracts outstanding as of October 31, 2022:
| | | | | VALUE AND
UNREALIZED
APPRECIATION
(DEPRECIATION) ($) |
| | | | | |
| | | | | |
SEE NOTES TO FINANCIAL STATEMENTS.
| J.P. Morgan Exchange-Traded Funds | |
STATEMENTS OF ASSETS AND LIABILITIES
AS OF October 31, 2022
| JPMorgan
ActiveBuilders
Emerging Markets
Equity ETF | JPMorgan
ActiveBuilders
International
Equity ETF | JPMorgan
BetaBuilders
Canada ETF | JPMorgan
BetaBuilders
Developed Asia
Pacific ex-Japan ETF
(formerly known as
JPMorgan
BetaBuilders
Developed Asia
ex-Japan ETF) |
| | | | |
Investments in non-affiliates, at value | | | | |
Investments in affiliates, at value | | | | |
Investments of cash collateral received from securities loaned, at value (See Note 2.C.) | | | | |
| | | | |
Foreign currency, at value | | | | |
Deposits at broker for futures contracts | | | | |
| | | | |
Dividends from non-affiliates | | | | |
Dividends from affiliates | | | | |
| | | | |
Securities lending income (See Note 2.C.) | | | | |
Variation margin on futures contracts | | | | |
| | | | |
| | | | |
| | | | |
Investment securities purchased | | | | |
Collateral received on securities loaned (See Note 2.C.) | | | | |
| | | | |
Management fees (See Note 3.A.) | | | | |
Deferred foreign capital gains tax | | | | |
| | | | |
| | | | |
| | | | |
| | | | |
Total distributable earnings (loss) | | | | |
| | | | |
Outstanding number of shares
(unlimited number of shares authorized - par value $0.0001) | | | | |
Net asset value, per share | | | | |
Cost of investments in non-affiliates | | | | |
Cost of investments in affiliates | | | | |
| | | | |
Investment securities on loan, at value (See Note 2.C.) | | | | |
Cost of investment of cash collateral (See Note 2.C.) | | | | |
SEE NOTES TO FINANCIAL STATEMENTS.
| J.P. Morgan Exchange-Traded Funds | |
| JPMorgan
BetaBuilders
Europe ETF | JPMorgan
BetaBuilders
International
Equity ETF | JPMorgan
BetaBuilders
Japan ETF | JPMorgan
BetaBuilders
U.S. Equity ETF |
| | | | |
Investments in non-affiliates, at value | | | | |
Investments in affiliates, at value | | | | |
Investments of cash collateral received from securities loaned, at value (See Note 2.C.) | | | | |
| | | | |
Foreign currency, at value | | | | |
Deposits at broker for futures contracts | | | | |
| | | | |
| | | | |
Dividends from non-affiliates | | | | |
Dividends from affiliates | | | | |
| | | | |
Securities lending income (See Note 2.C.) | | | | |
Variation margin on futures contracts | | | | |
| | | | |
| | | | |
| | | | |
Collateral received on securities loaned (See Note 2.C.) | | | | |
Variation margin on futures contracts | | | | |
| | | | |
Management fees (See Note 3.A.) | | | | |
| | | | |
| | | | |
| | | | |
| | | | |
Total distributable earnings (loss) | | | | |
| | | | |
Outstanding number of shares
(unlimited number of shares authorized - par value $0.0001) | | | | |
Net asset value, per share | | | | |
Cost of investments in non-affiliates | | | | |
Cost of investments in affiliates | | | | |
| | | | |
Investment securities on loan, at value (See Note 2.C.) | | | | |
Cost of investment of cash collateral (See Note 2.C.) | | | | |
SEE NOTES TO FINANCIAL STATEMENTS.
| J.P. Morgan Exchange-Traded Funds | |
STATEMENTS OF ASSETS AND LIABILITIES
AS OF October 31, 2022 (continued)
| JPMorgan
BetaBuilders U.S.
Mid Cap Equity
ETF | JPMorgan
BetaBuilders U.S.
Small Cap
Equity ETF | JPMorgan
Carbon
Transition U.S.
Equity ETF | JPMorgan
Climate Change
Solutions ETF |
| | | | |
Investments in non-affiliates, at value | | | | |
Investments in affiliates, at value | | | | |
Investments of cash collateral received from securities loaned, at value (See Note 2.C.) | | | | |
| | | | |
Foreign currency, at value | | | | |
Deposits at broker for futures contracts | | | | |
| | | | |
Investment securities sold | | | | |
Dividends from non-affiliates | | | | |
Dividends from affiliates | | | | |
| | | | |
Securities lending income (See Note 2.C.) | | | | |
Variation margin on futures contracts | | | | |
| | | | |
| | | | |
| | | | |
| | | | |
Collateral received on securities loaned (See Note 2.C.) | | | | |
Variation margin on futures contracts | | | | |
| | | | |
Management fees (See Note 3.A.) | | | | |
| | | | |
| | | | |
| | | | |
| | | | |
Total distributable earnings (loss) | | | | |
| | | | |
Outstanding number of shares
(unlimited number of shares authorized - par value $0.0001) | | | | |
Net asset value, per share | | | | |
Cost of investments in non-affiliates | | | | |
Cost of investments in affiliates | | | | |
| | | | |
Investment securities on loan, at value (See Note 2.C.) | | | | |
Cost of investment of cash collateral (See Note 2.C.) | | | | |
SEE NOTES TO FINANCIAL STATEMENTS.
| J.P. Morgan Exchange-Traded Funds | |
| JPMorgan
Diversified
Return
Emerging
Markets Equity
ETF | JPMorgan
Diversified Return
International
Equity ETF | JPMorgan
Diversified
Return U.S.
Equity ETF | JPMorgan
Diversified
Return U.S. Mid
Cap Equity ETF |
| | | | |
Investments in non-affiliates, at value | | | | |
Investments in affiliates, at value | | | | |
Investments of cash collateral received from securities loaned, at value (See Note 2.C.) | | | | |
| | | | |
| | | | |
Foreign currency, at value | | | | |
Deposits at broker for futures contracts | | | | |
Segregated cash balance with Authorized Participant for deposit securities | | | | |
| | | | |
| | | | |
Investment securities sold | | | | |
| | | | |
Dividends from non-affiliates | | | | |
Dividends from affiliates | | | | |
| | | | |
Securities lending income (See Note 2.C.) | | | | |
Variation margin on futures contracts | | | | |
Due from Authorized Participant | | | | |
| | | | |
| | | | |
| | | | |
Due to Authorized Participant | | | | |
| | | | |
Foreign currency due to custodian, at value | | | | |
Investment securities purchased | | | | |
Collateral received on securities loaned (See Note 2.C.) | | | | |
Variation margin on futures contracts | | | | |
Collateral upon return of deposit securities | | | | |
| | | | |
Management fees (See Note 3.A.) | | | | |
Deferred foreign capital gains tax | | | | |
| | | | |
| | | | |
SEE NOTES TO FINANCIAL STATEMENTS.
| J.P. Morgan Exchange-Traded Funds | |
STATEMENTS OF ASSETS AND LIABILITIES
AS OF October 31, 2022 (continued)
| JPMorgan Diversified Return Emerging Markets Equity ETF | JPMorgan Diversified Return International Equity ETF | JPMorgan Diversified Return U.S. Equity ETF | JPMorgan Diversified Return U.S. Mid Cap Equity ETF |
| | | | |
| | | | |
Total distributable earnings (loss) | | | | |
| | | | |
Outstanding number of shares
(unlimited number of shares authorized - par value $0.0001) | | | | |
Net asset value, per share | | | | |
Cost of investments in non-affiliates | | | | |
Cost of investments in affiliates | | | | |
| | | | |
Investment securities on loan, at value (See Note 2.C.) | | | | |
Cost of investment of cash collateral (See Note 2.C.) | | | | |
SEE NOTES TO FINANCIAL STATEMENTS.
| J.P. Morgan Exchange-Traded Funds | |
| JPMorgan
Diversified
Return U.S. Small
Cap Equity ETF | JPMorgan
International
Growth ETF | JPMorgan U.S.
Momentum
Factor ETF |
| | | |
Investments in non-affiliates, at value | | | |
Investments in affiliates, at value | | | |
Investments of cash collateral received from securities loaned, at value (See Note 2.C.) | | | |
| | | |
Foreign currency, at value | | | |
Deposits at broker for futures contracts | | | |
| | | |
| | | |
Dividends from non-affiliates | | | |
Dividends from affiliates | | | |
| | | |
Securities lending income (See Note 2.C.) | | | |
Variation margin on futures contracts | | | |
| | | |
| | | |
| | | |
Investment securities purchased | | | |
Collateral received on securities loaned (See Note 2.C.) | | | |
Variation margin on futures contracts | | | |
| | | |
Management fees (See Note 3.A.) | | | |
| | | |
| | | |
| | | |
| | | |
Total distributable earnings (loss) | | | |
| | | |
Outstanding number of shares
(unlimited number of shares authorized - par value $0.0001) | | | |
Net asset value, per share | | | |
Cost of investments in non-affiliates | | | |
Cost of investments in affiliates | | | |
| | | |
Investment securities on loan, at value (See Note 2.C.) | | | |
Cost of investment of cash collateral (See Note 2.C.) | | | |
SEE NOTES TO FINANCIAL STATEMENTS.
| J.P. Morgan Exchange-Traded Funds | |
STATEMENTS OF ASSETS AND LIABILITIES
AS OF October 31, 2022 (continued)
| JPMorgan U.S.
Quality Factor
ETF | JPMorgan U.S.
Value Factor
ETF |
| | |
Investments in non-affiliates, at value | | |
Investments in affiliates, at value | | |
Investments of cash collateral received from securities loaned, at value (See Note 2.C.) | | |
| | |
Deposits at broker for futures contracts | | |
| | |
Investment securities sold | | |
| | |
Dividends from non-affiliates | | |
Dividends from affiliates | | |
Securities lending income (See Note 2.C.) | | |
| | |
| | |
| | |
Collateral received on securities loaned (See Note 2.C.) | | |
| | |
Variation margin on futures contracts | | |
| | |
Management fees (See Note 3.A.) | | |
| | |
| | |
| | |
| | |
Total distributable earnings (loss) | | |
| | |
Outstanding number of shares
(unlimited number of shares authorized - par value $0.0001) | | |
Net asset value, per share | | |
Cost of investments in non-affiliates | | |
Cost of investments in affiliates | | |
Investment securities on loan, at value (See Note 2.C.) | | |
Cost of investment of cash collateral (See Note 2.C.) | | |
SEE NOTES TO FINANCIAL STATEMENTS.
| J.P. Morgan Exchange-Traded Funds | |
STATEMENTS OF OPERATIONS
FOR THE YEAR ENDED October 31, 2022
| JPMorgan
ActiveBuilders
Emerging Markets
Equity ETF | JPMorgan
ActiveBuilders
International
Equity ETF | JPMorgan
BetaBuilders
Canada ETF | JPMorgan
BetaBuilders
Developed Asia
Pacific ex-Japan ETF
(formerly known as
JPMorgan
BetaBuilders
Developed Asia
|
| | | | |
Interest income from non-affiliates | | | | |
Interest income from affiliates | | | | |
Dividend income from non-affiliates | | | | |
Dividend income from affiliates | | | | |
Income from securities lending (net) (See Note 2.C.) | | | | |
Foreign taxes withheld (net) | | | | |
| | | | |
| | | | |
Management fees (See Note 3.A.) | | | | |
Interest expense to non-affiliates | | | | |
Interest expense to affiliates | | | | |
| | | | |
| | | | |
Net investment income (loss) | | | | |
REALIZED/UNREALIZED GAINS (LOSSES): | | | | |
Net realized gain (loss) on transactions from: | | | | |
Investments in non-affiliates | | | | |
Investments in affiliates | | | | |
In-kind redemptions of investments in non-affiliates (See Note 4) | | | | |
| | | | |
Foreign currency transactions | | | | |
| | | | |
Change in net unrealized appreciation/depreciation on: | | | | |
Investments in non-affiliates | | | | |
Investments in affiliates | | | | |
| | | | |
Foreign currency translations | | | | |
Change in net unrealized appreciation/depreciation | | | | |
Net realized/unrealized gains (losses) | | | | |
Change in net assets resulting from operations | | | | |
(a)
Net of foreign capital gains tax of $(4,890).
(b)
Net of change in foreign capital gains tax of $(122,300).
SEE NOTES TO FINANCIAL STATEMENTS.
| J.P. Morgan Exchange-Traded Funds | |
STATEMENTS OF OPERATIONS
FOR THE YEAR ENDED October 31, 2022 (continued)
| JPMorgan
BetaBuilders
Europe ETF | JPMorgan
BetaBuilders
International
Equity ETF | JPMorgan
BetaBuilders
Japan ETF | JPMorgan
BetaBuilders
U.S. Equity ETF |
| | | | |
Interest income from non-affiliates | | | | |
Interest income from affiliates | | | | |
Dividend income from non-affiliates | | | | |
Dividend income from affiliates | | | | |
Income from securities lending (net) (See Note 2.C.) | | | | |
Foreign taxes withheld (net) | | | | |
| | | | |
| | | | |
Management fees (See Note 3.A.) | | | | |
Interest expense to non-affiliates | | | | |
Interest expense to affiliates | | | | |
| | | | |
| | | | |
Net investment income (loss) | | | | |
REALIZED/UNREALIZED GAINS (LOSSES): | | | | |
Net realized gain (loss) on transactions from: | | | | |
Investments in non-affiliates | | | | |
Investments in affiliates | | | | |
In-kind redemptions of investments in non-affiliates (See Note 4) | | | | |
In-kind redemptions of investments in affiliates (See Note 4) | | | | |
| | | | |
Foreign currency transactions | | | | |
| | | | |
Change in net unrealized appreciation/depreciation on: | | | | |
Investments in non-affiliates | | | | |
Investments in affiliates | | | | |
| | | | |
Foreign currency translations | | | | |
Change in net unrealized appreciation/depreciation | | | | |
Net realized/unrealized gains (losses) | | | | |
Change in net assets resulting from operations | | | | |
SEE NOTES TO FINANCIAL STATEMENTS.
| J.P. Morgan Exchange-Traded Funds | |
| JPMorgan
BetaBuilders U.S.
Mid Cap Equity
ETF | JPMorgan
BetaBuilders U.S.
Small Cap
Equity ETF | JPMorgan
Carbon
Transition U.S.
Equity ETF | |
| | | | |
Interest income from non-affiliates | | | | |
Interest income from affiliates | | | | |
Dividend income from non-affiliates | | | | |
Dividend income from affiliates | | | | |
Non-cash dividend income from non-affiliates | | | | |
Income from securities lending (net) (See Note 2.C.) | | | | |
Foreign taxes withheld (net) | | | | |
| | | | |
| | | | |
Management fees (See Note 3.A.) | | | | |
Interest expense to non-affiliates | | | | |
Interest expense to affiliates | | | | |
| | | | |
| | | | |
Net investment income (loss) | | | | |
REALIZED/UNREALIZED GAINS (LOSSES): | | | | |
Net realized gain (loss) on transactions from: | | | | |
Investments in non-affiliates | | | | |
Investments in affiliates | | | | |
In-kind redemptions of investments in non-affiliates (See Note 4) | | | | |
| | | | |
Foreign currency transactions | | | | |
| | | | |
Distribution of capital gains received from investment company affiliates | | | | |
Change in net unrealized appreciation/depreciation on: | | | | |
Investments in non-affiliates | | | | |
Investments in affiliates | | | | |
| | | | |
Foreign currency translations | | | | |
Change in net unrealized appreciation/depreciation | | | | |
Net realized/unrealized gains (losses) | | | | |
Change in net assets resulting from operations | | | | |
(a)
Commencement of operations was December 13, 2021.
SEE NOTES TO FINANCIAL STATEMENTS.
| J.P. Morgan Exchange-Traded Funds | |
STATEMENTS OF OPERATIONS
FOR THE YEAR ENDED October 31, 2022 (continued)
| JPMorgan
Diversified
Return
Emerging
Markets Equity
ETF | JPMorgan
Diversified Return
International
Equity ETF | JPMorgan
Diversified
Return U.S.
Equity ETF | JPMorgan
Diversified
Return U.S. Mid
|
| | | | |
Interest income from non-affiliates | | | | |
Interest income from affiliates | | | | |
Dividend income from non-affiliates | | | | |
Dividend income from affiliates | | | | |
Income from securities lending (net) (See Note 2.C.) | | | | |
Foreign taxes withheld (net) | | | | |
| | | | |
| | | | |
Management fees (See Note 3.A.) | | | | |
Interest expense to non-affiliates | | | | |
Interest expense to affiliates | | | | |
| | | | |
| | | | |
Net investment income (loss) | | | | |
REALIZED/UNREALIZED GAINS (LOSSES): | | | | |
Net realized gain (loss) on transactions from: | | | | |
Investments in non-affiliates | | | | |
Investments in affiliates | | | | |
In-kind redemptions of investments in non-affiliates (See Note 4) | | | | |
| | | | |
Foreign currency transactions | | | | |
| | | | |
Distribution of capital gains received from investment company affiliates | | | | |
Change in net unrealized appreciation/depreciation on: | | | | |
Investments in non-affiliates | | | | |
Investments in affiliates | | | | |
| | | | |
Foreign currency translations | | | | |
Change in net unrealized appreciation/depreciation | | | | |
Net realized/unrealized gains (losses) | | | | |
Change in net assets resulting from operations | | | | |
(a)
Net of foreign capital gains tax of $(180,148).
(b)
Net of change in foreign capital gains tax of $385,507.
SEE NOTES TO FINANCIAL STATEMENTS.
| J.P. Morgan Exchange-Traded Funds | |
| JPMorgan
Diversified
Return U.S. Small
Cap Equity ETF | JPMorgan
International
Growth ETF | JPMorgan U.S.
Momentum
Factor ETF |
| | | |
Interest income from non-affiliates | | | |
Interest income from affiliates | | | |
Dividend income from non-affiliates | | | |
Dividend income from affiliates | | | |
Income from securities lending (net) (See Note 2.C.) | | | |
Foreign taxes withheld (net) | | | |
| | | |
| | | |
Management fees (See Note 3.A.) | | | |
Interest expense to affiliates | | | |
| | | |
| | | |
Net investment income (loss) | | | |
REALIZED/UNREALIZED GAINS (LOSSES): | | | |
Net realized gain (loss) on transactions from: | | | |
Investments in non-affiliates | | | |
In-kind redemptions of investments in non-affiliates (See Note 4) | | | |
| | | |
Foreign currency transactions | | | |
| | | |
Change in net unrealized appreciation/depreciation on: | | | |
Investments in non-affiliates | | | |
Investments in affiliates | | | |
| | | |
Foreign currency translations | | | |
Change in net unrealized appreciation/depreciation | | | |
Net realized/unrealized gains (losses) | | | |
Change in net assets resulting from operations | | | |
SEE NOTES TO FINANCIAL STATEMENTS.
| J.P. Morgan Exchange-Traded Funds | |
STATEMENTS OF OPERATIONS
FOR THE YEAR ENDED October 31, 2022 (continued)
| JPMorgan U.S.
Quality Factor
ETF | JPMorgan U.S.
Value Factor
ETF |
| | |
Interest income from non-affiliates | | |
Interest income from affiliates | | |
Dividend income from non-affiliates | | |
Dividend income from affiliates | | |
Income from securities lending (net) (See Note 2.C.) | | |
| | |
| | |
Management fees (See Note 3.A.) | | |
| | |
| | |
Net investment income (loss) | | |
REALIZED/UNREALIZED GAINS (LOSSES): | | |
Net realized gain (loss) on transactions from: | | |
Investments in non-affiliates | | |
In-kind redemptions of investments in non-affiliates (See Note 4) | | |
| | |
| | |
Distribution of capital gains received from investment company affiliates | | |
Change in net unrealized appreciation/depreciation on: | | |
Investments in non-affiliates | | |
Investments in affiliates | | |
| | |
Change in net unrealized appreciation/depreciation | | |
Net realized/unrealized gains (losses) | | |
Change in net assets resulting from operations | | |
SEE NOTES TO FINANCIAL STATEMENTS.
| J.P. Morgan Exchange-Traded Funds | |
STATEMENTS OF CHANGES IN NET ASSETS
FOR THE PERIODS INDICATED
| JPMorgan ActiveBuilders
Emerging Markets Equity
ETF | JPMorgan ActiveBuilders
International Equity ETF |
| Year Ended
October 31, 2022 | Period Ended
October 31, 2021 (a) | Year Ended
October 31, 2022 | |
CHANGE IN NET ASSETS RESULTING FROM OPERATIONS: | | | | |
Net investment income (loss) | | | | |
| | | | |
Change in net unrealized appreciation/depreciation | | | | |
Change in net assets resulting from operations | | | | |
DISTRIBUTIONS TO SHAREHOLDERS: | | | | |
Total distributions to shareholders | | | | |
| | | | |
Change in net assets resulting from capital transactions | | | | |
| | | | |
| | | | |
| | | | |
| | | | |
| | | | |
Proceeds from shares issued | | | | |
Total change in net assets resulting from capital transactions | | | | |
| | | | |
| | | | |
Net increase (decrease) in shares from share transactions | | | | |
(a)
Commencement of operations was March 10, 2021.
(b)
Commencement of operations was July 7, 2021.
SEE NOTES TO FINANCIAL STATEMENTS.
| J.P. Morgan Exchange-Traded Funds | |
STATEMENTS OF CHANGES IN NET ASSETS
FOR THE PERIODS INDICATED (continued)
| JPMorgan BetaBuilders
Canada ETF | JPMorgan BetaBuilders Developed
Asia Pacific ex-Japan ETF (formerly
known as JPMorgan BetaBuilders
Developed Asia ex-Japan ETF) |
| Year Ended
October 31, 2022 | Year Ended
October 31, 2021 | Year Ended
October 31, 2022 | |
CHANGE IN NET ASSETS RESULTING FROM OPERATIONS: | | | | |
Net investment income (loss) | | | | |
| | | | |
Change in net unrealized appreciation/depreciation | | | | |
Change in net assets resulting from operations | | | | |
DISTRIBUTIONS TO SHAREHOLDERS: | | | | |
Total distributions to shareholders | | | | |
| | | | |
Change in net assets resulting from capital transactions | | | | |
| | | | |
| | | | |
| | | | |
| | | | |
| | | | |
Proceeds from shares issued | | | | |
| | | | |
Total change in net assets resulting from capital transactions | | | | |
| | | | |
| | | | |
| | | | |
Net increase (decrease) in shares from share transactions | | | | |
(a)
Reflects a 1:2 reverse stock split that occurred on April 12, 2021. See Note 1.
SEE NOTES TO FINANCIAL STATEMENTS.
| J.P. Morgan Exchange-Traded Funds | |
| JPMorgan BetaBuilders
Europe ETF | JPMorgan BetaBuilders
International Equity ETF |
| Year Ended
October 31, 2022 | Year Ended
October 31, 2021 | Year Ended
October 31, 2022 | |
CHANGE IN NET ASSETS RESULTING FROM OPERATIONS: | | | | |
Net investment income (loss) | | | | |
| | | | |
Change in net unrealized appreciation/depreciation | | | | |
Change in net assets resulting from operations | | | | |
DISTRIBUTIONS TO SHAREHOLDERS: | | | | |
Total distributions to shareholders | | | | |
| | | | |
Change in net assets resulting from capital transactions | | | | |
| | | | |
| | | | |
| | | | |
| | | | |
| | | | |
Proceeds from shares issued | | | | |
| | | | |
Total change in net assets resulting from capital transactions | | | | |
| | | | |
| | | | |
| | | | |
Net increase (decrease) in shares from share transactions | | | | |
(a)
Reflects a 1:2 reverse stock split that occurred on April 12, 2021. See Note 1.
SEE NOTES TO FINANCIAL STATEMENTS.
| J.P. Morgan Exchange-Traded Funds | |
STATEMENTS OF CHANGES IN NET ASSETS
FOR THE PERIODS INDICATED (continued)
| JPMorgan BetaBuilders
Japan ETF | JPMorgan BetaBuilders
U.S. Equity ETF |
| Year Ended
October 31, 2022 | Year Ended
October 31, 2021 | Year Ended
October 31, 2022 | |
CHANGE IN NET ASSETS RESULTING FROM OPERATIONS: | | | | |
Net investment income (loss) | | | | |
| | | | |
Change in net unrealized appreciation/depreciation | | | | |
Change in net assets resulting from operations | | | | |
DISTRIBUTIONS TO SHAREHOLDERS: | | | | |
Total distributions to shareholders | | | | |
| | | | |
Change in net assets resulting from capital transactions | | | | |
| | | | |
| | | | |
| | | | |
| | | | |
| | | | |
Proceeds from shares issued | | | | |
| | | | |
Total change in net assets resulting from capital transactions | | | | |
| | | | |
| | | | |
| | | | |
Net increase (decrease) in shares from share transactions | | | | |
(a)
Reflects a 1:2 reverse stock split that occurred on April 12, 2021. See Note 1.
SEE NOTES TO FINANCIAL STATEMENTS.
| J.P. Morgan Exchange-Traded Funds | |
| JPMorgan BetaBuilders U.S.
Mid Cap Equity ETF | JPMorgan BetaBuilders U.S. Small
Cap Equity ETF |
| Year Ended
October 31, 2022 | Year Ended
October 31, 2021 | Year Ended
October 31, 2022 | |
CHANGE IN NET ASSETS RESULTING FROM OPERATIONS: | | | | |
Net investment income (loss) | | | | |
| | | | |
Distributions of capital gains received from investment company affiliates | | | | |
Change in net unrealized appreciation/depreciation | | | | |
Change in net assets resulting from operations | | | | |
DISTRIBUTIONS TO SHAREHOLDERS: | | | | |
Total distributions to shareholders | | | | |
| | | | |
Change in net assets resulting from capital transactions | | | | |
| | | | |
| | | | |
| | | | |
| | | | |
| | | | |
Proceeds from shares issued | | | | |
| | | | |
Total change in net assets resulting from capital transactions | | | | |
| | | | |
| | | | |
| | | | |
Net increase (decrease) in shares from share transactions | | | | |
(a)
Commencement of operations was November 16, 2020.
SEE NOTES TO FINANCIAL STATEMENTS.
| J.P. Morgan Exchange-Traded Funds | |
STATEMENTS OF CHANGES IN NET ASSETS
FOR THE PERIODS INDICATED (continued)
| JPMorgan Carbon Transition
U.S. Equity ETF | JPMorgan
Climate Change Solutions ETF |
| Year Ended
October 31, 2022 | Period Ended
October 31, 2021 (a) | |
CHANGE IN NET ASSETS RESULTING FROM OPERATIONS: | | | |
Net investment income (loss) | | | |
| | | |
Change in net unrealized appreciation/depreciation | | | |
Change in net assets resulting from operations | | | |
DISTRIBUTIONS TO SHAREHOLDERS: | | | |
Total distributions to shareholders | | | |
| | | |
Change in net assets resulting from capital transactions | | | |
| | | |
| | | |
| | | |
| | | |
| | | |
Proceeds from shares issued | | | |
| | | |
Total change in net assets resulting from capital transactions | | | |
| | | |
| | | |
| | | |
Net increase (decrease) in shares from share transactions | | | |
(a)
Commencement of operations was December 9, 2020.
(b)
Commencement of operations was December 13, 2021.
SEE NOTES TO FINANCIAL STATEMENTS.
| J.P. Morgan Exchange-Traded Funds | |
| JPMorgan Diversified Return
Emerging Markets Equity ETF | JPMorgan Diversified Return
International Equity ETF |
| Year Ended
October 31, 2022 | Year Ended
October 31, 2021 | Year Ended
October 31, 2022 | Year Ended
October 31, 2021 |
CHANGE IN NET ASSETS RESULTING FROM OPERATIONS: | | | | |
Net investment income (loss) | | | | |
| | | | |
Distributions of capital gains received from investment company affiliates | | | | |
Change in net unrealized appreciation/depreciation | | | | |
Change in net assets resulting from operations | | | | |
DISTRIBUTIONS TO SHAREHOLDERS: | | | | |
Total distributions to shareholders | | | | |
| | | | |
Change in net assets resulting from capital transactions | | | | |
| | | | |
| | | | |
| | | | |
| | | | |
| | | | |
Proceeds from shares issued | | | | |
| | | | |
Total change in net assets resulting from capital transactions | | | | |
| | | | |
| | | | |
| | | | |
Net increase (decrease) in shares from share transactions | | | | |
SEE NOTES TO FINANCIAL STATEMENTS.
| J.P. Morgan Exchange-Traded Funds | |
STATEMENTS OF CHANGES IN NET ASSETS
FOR THE PERIODS INDICATED (continued)
| JPMorgan Diversified Return
U.S. Equity ETF | JPMorgan Diversified Return
U.S. Mid Cap Equity ETF |
| Year Ended
October 31, 2022 | Year Ended
October 31, 2021 | Year Ended
October 31, 2022 | Year Ended
October 31, 2021 |
CHANGE IN NET ASSETS RESULTING FROM OPERATIONS: | | | | |
Net investment income (loss) | | | | |
| | | | |
Change in net unrealized appreciation/depreciation | | | | |
Change in net assets resulting from operations | | | | |
DISTRIBUTIONS TO SHAREHOLDERS: | | | | |
Total distributions to shareholders | | | | |
| | | | |
Change in net assets resulting from capital transactions | | | | |
| | | | |
| | | | |
| | | | |
| | | | |
| | | | |
Proceeds from shares issued | | | | |
| | | | |
Total change in net assets resulting from capital transactions | | | | |
| | | | |
| | | | |
| | | | |
Net increase (decrease) in shares from share transactions | | | | |
SEE NOTES TO FINANCIAL STATEMENTS.
| J.P. Morgan Exchange-Traded Funds | |
| JPMorgan Diversified Return
U.S. Small Cap Equity ETF | JPMorgan
International Growth ETF |
| Year Ended
October 31, 2022 | Year Ended
October 31, 2021 | Year Ended
October 31, 2022 | Year Ended
October 31, 2021 |
CHANGE IN NET ASSETS RESULTING FROM OPERATIONS: | | | | |
Net investment income (loss) | | | | |
| | | | |
Change in net unrealized appreciation/depreciation | | | | |
Change in net assets resulting from operations | | | | |
DISTRIBUTIONS TO SHAREHOLDERS: | | | | |
Total distributions to shareholders | | | | |
| | | | |
Change in net assets resulting from capital transactions | | | | |
| | | | |
| | | | |
| | | | |
| | | | |
| | | | |
Proceeds from shares issued | | | | |
| | | | |
Total change in net assets resulting from capital transactions | | | | |
| | | | |
| | | | |
| | | | |
Net increase (decrease) in shares from share transactions | | | | |
SEE NOTES TO FINANCIAL STATEMENTS.
| J.P. Morgan Exchange-Traded Funds | |
STATEMENTS OF CHANGES IN NET ASSETS
FOR THE PERIODS INDICATED (continued)
| JPMorgan
U.S. Momentum Factor ETF | JPMorgan
U.S. Quality Factor ETF |
| Year Ended
October 31, 2022 | Year Ended
October 31, 2021 | Year Ended
October 31, 2022 | Year Ended
October 31, 2021 |
CHANGE IN NET ASSETS RESULTING FROM OPERATIONS: | | | | |
Net investment income (loss) | | | | |
| | | | |
Change in net unrealized appreciation/depreciation | | | | |
Change in net assets resulting from operations | | | | |
DISTRIBUTIONS TO SHAREHOLDERS: | | | | |
Total distributions to shareholders | | | | |
| | | | |
Change in net assets resulting from capital transactions | | | | |
| | | | |
| | | | |
| | | | |
| | | | |
| | | | |
Proceeds from shares issued | | | | |
| | | | |
Total change in net assets resulting from capital transactions | | | | |
| | | | |
| | | | |
| | | | |
Net increase (decrease) in shares from share transactions | | | | |
SEE NOTES TO FINANCIAL STATEMENTS.
| J.P. Morgan Exchange-Traded Funds | |
| JPMorgan
U.S. Value Factor ETF |
| Year Ended
October 31, 2022 | Year Ended
October 31, 2021 |
CHANGE IN NET ASSETS RESULTING FROM OPERATIONS: | | |
Net investment income (loss) | | |
| | |
Distributions of capital gains received from investment company affiliates | | |
Change in net unrealized appreciation/depreciation | | |
Change in net assets resulting from operations | | |
DISTRIBUTIONS TO SHAREHOLDERS: | | |
Total distributions to shareholders | | |
| | |
Change in net assets resulting from capital transactions | | |
| | |
| | |
| | |
| | |
| | |
Proceeds from shares issued | | |
| | |
Total change in net assets resulting from capital transactions | | |
| | |
| | |
| | |
Net increase (decrease) in shares from share transactions | | |
SEE NOTES TO FINANCIAL STATEMENTS.
| J.P. Morgan Exchange-Traded Funds | |
FINANCIAL HIGHLIGHTS
FOR THE PERIODS INDICATED
| Per share operating performance |
| | | |
| Net asset
value,
beginning
of period | Net investment
income
(loss) (b) | Net realized
and unrealized
gains
(losses)
on investments | Total from
investment
operations | | |
JPMorgan ActiveBuilders Emerging Markets Equity ETF | | | | | | |
Year Ended October 31, 2022 | | | | | | |
March 10, 2021 (f) through October 31, 2021 | | | | | | |
JPMorgan ActiveBuilders International Equity ETF | | | | | | |
Year Ended October 31, 2022 | | | | | | |
July 7, 2021 (f) through October 31, 2021 | | | | | | |
JPMorgan BetaBuilders Canada ETF | | | | | | |
Year Ended October 31, 2022 | | | | | | |
Year Ended October 31, 2021 (i) | | | | | | |
Year Ended October 31, 2020 (i) | | | | | | |
Year Ended October 31, 2019 (i) | | | | | | |
August 7, 2018 (f) through October 31, 2018 (i) | | | | | | |
JPMorgan BetaBuilders Developed Asia Pacific ex-Japan ETF (formerly known as JPMorgan BetaBuilders Developed Asia ex-Japan ETF) | | | | | | |
Year Ended October 31, 2022 | | | | | | |
Year Ended October 31, 2021 (i) | | | | | | |
Year Ended October 31, 2020 (i) | | | | | | |
Year Ended October 31, 2019 (i) | | | | | | |
August 7, 2018 (f) through October 31, 2018 (i) | | | | | | |
JPMorgan BetaBuilders Europe ETF | | | | | | |
Year Ended October 31, 2022 | | | | | | |
Year Ended October 31, 2021 (i) | | | | | | |
Year Ended October 31, 2020 (i) | | | | | | |
Year Ended October 31, 2019 (i) | | | | | | |
June 15, 2018 (f) through October 31, 2018 (i) | | | | | | |
|
| Annualized for periods less than one year, unless otherwise noted. |
| Calculated based upon average shares outstanding. |
| Not annualized for periods less than one year. |
| Includes adjustments in accordance with accounting principles generally accepted in the United States of America and as such, the net asset values for financial reporting purposes and the returns based upon those net asset values may differ from the net asset values and returns for shareholder transactions. |
| Prior to December 9, 2019, market price return was calculated assuming an initial investment made at the market price at the beginning of the reporting period, reinvestment of all dividends and distributions at market price during the period, and sale at the market price on the last day of the period. The price used to calculate the market price return was the midpoint of the bid/ask spread at the close of business on the listing exchange of the fund. Effective December 9, 2019, the closing price was used to calculate the market price return; however, any prices used in the calculation for market price return prior to December 9, 2019, would have used the midpoint of the bid/ask spread at the close of business on the exchange. |
| Commencement of operations. |
| Since the Shares of the Fund did not trade in the secondary market until the day after the Fund’s inception, for the period from the inception to the first day of secondary market trading, the net asset value is used as a proxy for the secondary market trading price to calculate the market returns. |
| Does not include expenses of unaffiliated Underlying Funds. |
| Per share amounts reflects a 1:2 reverse stock split that occurred on April 12, 2021. See Note 1. |
| Prior to November 1, 2019, the Fund may have waived fees if expenses exceeded the expense cap. On November 1, 2019, the Fund adopted a unitary fee structure where a management fee is accrued by the fund based on prior day net assets and other expenses are paid by the Advisor. |
| Certain non-recurring expenses incurred by the Fund were not annualized for the period indicated. |
SEE NOTES TO FINANCIAL STATEMENTS.
| J.P. Morgan Exchange-Traded Funds | |
| |
| | | | | | Ratios to average net assets (a) | |
| Net asset
value,
end of
period | | | Market
price
total
return (c)(e) | | | Net
investment
income
(loss) | Expenses
without waivers
and reimbursements | Portfolio
turnover
rate (c) |
| | | | | | | | | |
| | | | | | | | | |
| | | | | | | | | |
| | | | | | | | | |
| | | | | | | | | |
| | | | | | | | | |
| | | | | | | | | |
| | | | | | | | | |
| | | | | | | | | |
| | | | | | | | | |
| | | | | | | | | |
| | | | | | | | | |
| | | | | | | | | |
| | | | | | | | | |
| | | | | | | | | |
| | | | | | | | | |
| | | | | | | | | |
| | | | | | | | | |
| | | | | | | | | |
| | | | | | | | | |
| | | | | | | | | |
| | | | | | | | | |
| | | | | | | | | |
| | | | | | | | | |
SEE NOTES TO FINANCIAL STATEMENTS.
| J.P. Morgan Exchange-Traded Funds | |
FINANCIAL HIGHLIGHTS
FOR THE PERIODS INDICATED (continued)
| Per share operating performance |
| | | |
| Net asset
value,
beginning
of period | Net investment
income
(loss) (b) | Net realized
and unrealized
gains
(losses)
on investments | Total from
investment
operations | |
JPMorgan BetaBuilders International Equity ETF | | | | | |
Year Ended October 31, 2022 | | | | | |
Year Ended October 31, 2021 | | | | | |
December 3, 2019 (f) through October 31, 2020 | | | | | |
JPMorgan BetaBuilders Japan ETF | | | | | |
Year Ended October 31, 2022 | | | | | |
Year Ended October 31, 2021 (i) | | | | | |
Year Ended October 31, 2020 (i) | | | | | |
Year Ended October 31, 2019 (i) | | | | | |
June 15, 2018 (f) through October 31, 2018 (i) | | | | | |
JPMorgan BetaBuilders U.S. Equity ETF | | | | | |
Year Ended October 31, 2022 | | | | | |
Year Ended October 31, 2021 | | | | | |
Year Ended October 31, 2020 | | | | | |
March 12, 2019 (f) through October 31, 2019 | | | | | |
JPMorgan BetaBuilders U.S. Mid Cap Equity ETF | | | | | |
Year Ended October 31, 2022 | | | | | |
Year Ended October 31, 2021 | | | | | |
April 14, 2020 (f) through October 31, 2020 | | | | | |
JPMorgan BetaBuilders U.S. Small Cap Equity ETF | | | | | |
Year Ended October 31, 2022 | | | | | |
November 16, 2020 (f) through October 31, 2021 | | | | | |
|
| Annualized for periods less than one year, unless otherwise noted. |
| Calculated based upon average shares outstanding. |
| Not annualized for periods less than one year. |
| Includes adjustments in accordance with accounting principles generally accepted in the United States of America and as such, the net asset values for financial reporting purposes and the returns based upon those net asset values may differ from the net asset values and returns for shareholder transactions. |
| Prior to December 9, 2019, market price return was calculated assuming an initial investment made at the market price at the beginning of the reporting period, reinvestment of all dividends and distributions at market price during the period, and sale at the market price on the last day of the period. The price used to calculate the market price return was the midpoint of the bid/ask spread at the close of business on the listing exchange of the fund. Effective December 9, 2019, the closing price was used to calculate the market price return; however, any prices used in the calculation for market price return prior to December 9, 2019, would have used the midpoint of the bid/ask spread at the close of business on the exchange. |
| Commencement of operations. |
| Calculation of the net realized and unrealized gains (losses) per share do not correlate with the Fund’s net realized and unrealized gains (losses) presented in the Statement of Operations due to the timing of capital transactions in relation to the fluctuating market values of the Fund’s investments. |
| Since the Shares of the Fund did not trade in the secondary market until the day after the Fund’s inception, for the period from the inception to the first day of secondary market trading, the net asset value is used as a proxy for the secondary market trading price to calculate the market returns. |
| Per share amounts reflects a 1:2 reverse stock split that occurred on April 12, 2021. See Note 1. |
| Prior to November 1, 2019, the Fund may have waived fees if expenses exceeded the expense cap. On November 1, 2019, the Fund adopted a unitary fee structure where a management fee is accrued by the fund based on prior day net assets and other expenses are paid by the Advisor. |
| Certain non-recurring expenses incurred by the Fund were not annualized for the period indicated. |
SEE NOTES TO FINANCIAL STATEMENTS.
| J.P. Morgan Exchange-Traded Funds | |
| |
| | | | | Ratios to average net assets (a) | |
Net asset
value,
end of
period | | | Market
price
total
return (c)(e) | | | Net
investment
income
(loss) | Expenses
without waivers
and reimbursements | Portfolio
turnover
rate (c) |
| | | | | | | | |
| | | | | | | | |
| | | | | | | | |
| | | | | | | | |
| | | | | | | | |
| | | | | | | | |
| | | | | | | | |
| | | | | | | | |
| | | | | | | | |
| | | | | | | | |
| | | | | | | | |
| | | | | | | | |
| | | | | | | | |
| | | | | | | | |
| | | | | | | | |
| | | | | | | | |
| | | | | | | | |
| | | | | | | | |
| | | | | | | | |
| | | | | | | | |
| | | | | | | | |
| | | | | | | | |
SEE NOTES TO FINANCIAL STATEMENTS.
| J.P. Morgan Exchange-Traded Funds | |
FINANCIAL HIGHLIGHTS
FOR THE PERIODS INDICATED (continued)
| Per share operating performance |
| | | |
| Net asset
value,
beginning
of period | Net investment
income
(loss) (b) | Net realized
and unrealized
gains
(losses)
on investments | Total from
investment
operations | |
JPMorgan Carbon Transition U.S. Equity ETF | | | | | |
Year Ended October 31, 2022 | | | | | |
December 9, 2020 (f) through October 31, 2021 | | | | | |
JPMorgan Climate Change Solutions ETF | | | | | |
December 13, 2021 (f) through October 31, 2022 | | | | | |
JPMorgan Diversified Return Emerging Markets Equity ETF | | | | | |
Year Ended October 31, 2022 | | | | | |
Year Ended October 31, 2021 | | | | | |
Year Ended October 31, 2020 | | | | | |
Year Ended October 31, 2019 | | | | | |
Year Ended October 31, 2018 | | | | | |
JPMorgan Diversified Return International Equity ETF | | | | | |
Year Ended October 31, 2022 | | | | | |
Year Ended October 31, 2021 | | | | | |
Year Ended October 31, 2020 | | | | | |
Year Ended October 31, 2019 | | | | | |
Year Ended October 31, 2018 | | | | | |
JPMorgan Diversified Return U.S. Equity ETF | | | | | |
Year Ended October 31, 2022 | | | | | |
Year Ended October 31, 2021 | | | | | |
Year Ended October 31, 2020 | | | | | |
Year Ended October 31, 2019 | | | | | |
Year Ended October 31, 2018 | | | | | |
|
| Annualized for periods less than one year, unless otherwise noted. |
| Calculated based upon average shares outstanding. |
| Not annualized for periods less than one year. |
| Includes adjustments in accordance with accounting principles generally accepted in the United States of America and as such, the net asset values for financial reporting purposes and the returns based upon those net asset values may differ from the net asset values and returns for shareholder transactions. |
| Prior to December 9, 2019, market price return was calculated assuming an initial investment made at the market price at the beginning of the reporting period, reinvestment of all dividends and distributions at market price during the period, and sale at the market price on the last day of the period. The price used to calculate the market price return was the midpoint of the bid/ask spread at the close of business on the listing exchange of the fund. Effective December 9, 2019, the closing price was used to calculate the market price return; however, any prices used in the calculation for market price return prior to December 9, 2019, would have used the midpoint of the bid/ask spread at the close of business on the exchange. |
| Commencement of operations. |
| Since the Shares of the Fund did not trade in the secondary market until the day after the Fund’s inception, for the period from the inception to the first day of secondary market trading, the net asset value is used as a proxy for the secondary market trading price to calculate the market returns. |
| Prior to November 1, 2019, the Fund may have waived fees if expenses exceeded the expense cap. On November 1, 2019, the Fund adopted a unitary fee structure where a management fee is accrued by the fund based on prior day net assets and other expenses are paid by the Advisor. |
SEE NOTES TO FINANCIAL STATEMENTS.
| J.P. Morgan Exchange-Traded Funds | |
| |
| | | | | Ratios to average net assets (a) | |
Net asset
value,
end of
period | | | Market
price
total
return (c)(e) | | | Net
investment
income
(loss) | Expenses
without waivers
and reimbursements | Portfolio
turnover
rate (c) |
| | | | | | | | |
| | | | | | | | |
| | | | | | | | |
| | | | | | | | |
| | | | | | | | |
| | | | | | | | |
| | | | | | | | |
| | | | | | | | |
| | | | | | | | |
| | | | | | | | |
| | | | | | | | |
| | | | | | | | |
| | | | | | | | |
| | | | | | | | |
| | | | | | | | |
| | | | | | | | |
| | | | | | | | |
| | | | | | | | |
| | | | | | | | |
| | | | | | | | |
| | | | | | | | |
| | | | | | | | |
| | | | | | | | |
SEE NOTES TO FINANCIAL STATEMENTS.
| J.P. Morgan Exchange-Traded Funds | |
FINANCIAL HIGHLIGHTS
FOR THE PERIODS INDICATED (continued)
| Per share operating performance |
| | | |
| Net asset
value,
beginning
of period | Net investment
income
(loss) (b) | Net realized
and unrealized
gains
(losses)
on investments | Total from
investment
operations | | |
JPMorgan Diversified Return U.S. Mid Cap Equity ETF | | | | | | |
Year Ended October 31, 2022 | | | | | | |
Year Ended October 31, 2021 | | | | | | |
Year Ended October 31, 2020 | | | | | | |
Year Ended October 31, 2019 | | | | | | |
Year Ended October 31, 2018 | | | | | | |
JPMorgan Diversified Return U.S. Small Cap Equity ETF | | | | | | |
Year Ended October 31, 2022 | | | | | | |
Year Ended October 31, 2021 | | | | | | |
Year Ended October 31, 2020 | | | | | | |
Year Ended October 31, 2019 | | | | | | |
Year Ended October 31, 2018 | | | | | | |
JPMorgan International Growth ETF | | | | | | |
Year Ended October 31, 2022 | | | | | | |
Year Ended October 31, 2021 | | | | | | |
May 20, 2020 (g) through October 31, 2020 | | | | | | |
|
| Annualized for periods less than one year, unless otherwise noted. |
| Calculated based upon average shares outstanding. |
| Not annualized for periods less than one year. |
| Includes adjustments in accordance with accounting principles generally accepted in the United States of America and as such, the net asset values for financial reporting purposes and the returns based upon those net asset values may differ from the net asset values and returns for shareholder transactions. |
| Prior to December 9, 2019, market price return was calculated assuming an initial investment made at the market price at the beginning of the reporting period, reinvestment of all dividends and distributions at market price during the period, and sale at the market price on the last day of the period. The price used to calculate the market price return was the midpoint of the bid/ask spread at the close of business on the listing exchange of the fund. Effective December 9, 2019, the closing price was used to calculate the market price return; however, any prices used in the calculation for market price return prior to December 9, 2019, would have used the midpoint of the bid/ask spread at the close of business on the exchange. |
| Prior to November 1, 2019, the Fund may have waived fees if expenses exceeded the expense cap. On November 1, 2019, the Fund adopted a unitary fee structure where a management fee is accrued by the fund based on prior day net assets and other expenses are paid by the Advisor. |
| Commencement of operations. |
| Since the Shares of the Fund did not trade in the secondary market until the day after the Fund’s inception, for the period from the inception to the first day of secondary market trading, the net asset value is used as a proxy for the secondary market trading price to calculate the market returns. |
SEE NOTES TO FINANCIAL STATEMENTS.
| J.P. Morgan Exchange-Traded Funds | |
| |
| | | | | | Ratios to average net assets (a) | |
| Net asset
value,
end of
period | | | Market
price
total
return (c)(e) | | | Net
investment
income
(loss) | Expenses
without waivers
and reimbursements | Portfolio
turnover
rate (c) |
| | | | | | | | | |
| | | | | | | | | |
| | | | | | | | | |
| | | | | | | | | |
| | | | | | | | | |
| | | | | | | | | |
| | | | | | | | | |
| | | | | | | | | |
| | | | | | | | | |
| | | | | | | | | |
| | | | | | | | | |
| | | | | | | | | |
| | | | | | | | | |
| | | | | | | | | |
| | | | | | | | | |
| | | | | | | | | |
SEE NOTES TO FINANCIAL STATEMENTS.
| J.P. Morgan Exchange-Traded Funds | |
FINANCIAL HIGHLIGHTS
FOR THE PERIODS INDICATED (continued)
| Per share operating performance |
| | | |
| Net asset
value,
beginning
of period | Net investment
income
(loss) (b) | Net realized
and unrealized
gains
(losses)
on investments | Total from
investment
operations | |
JPMorgan U.S. Momentum Factor ETF | | | | | |
Year Ended October 31, 2022 | | | | | |
Year Ended October 31, 2021 | | | | | |
Year Ended October 31, 2020 | | | | | |
Year Ended October 31, 2019 | | | | | |
November 8, 2017 (g) through October 31, 2018 | | | | | |
JPMorgan U.S. Quality Factor ETF | | | | | |
Year Ended October 31, 2022 | | | | | |
Year Ended October 31, 2021 | | | | | |
Year Ended October 31, 2020 | | | | | |
Year Ended October 31, 2019 | | | | | |
November 8, 2017 (g) through October 31, 2018 | | | | | |
JPMorgan U.S. Value Factor ETF | | | | | |
Year Ended October 31, 2022 | | | | | |
Year Ended October 31, 2021 | | | | | |
Year Ended October 31, 2020 | | | | | |
Year Ended October 31, 2019 | | | | | |
November 8, 2017 (g) through October 31, 2018 | | | | | |
|
| Annualized for periods less than one year, unless otherwise noted. |
| Calculated based upon average shares outstanding. |
| Not annualized for periods less than one year. |
| Includes adjustments in accordance with accounting principles generally accepted in the United States of America and as such, the net asset values for financial reporting purposes and the returns based upon those net asset values may differ from the net asset values and returns for shareholder transactions. |
| Prior to December 9, 2019, market price return was calculated assuming an initial investment made at the market price at the beginning of the reporting period, reinvestment of all dividends and distributions at market price during the period, and sale at the market price on the last day of the period. The price used to calculate the market price return was the midpoint of the bid/ask spread at the close of business on the listing exchange of the fund. Effective December 9, 2019, the closing price was used to calculate the market price return; however, any prices used in the calculation for market price return prior to December 9, 2019, would have used the midpoint of the bid/ask spread at the close of business on the exchange. |
| Prior to November 1, 2019, the Fund may have waived fees if expenses exceeded the expense cap. On November 1, 2019, the Fund adopted a unitary fee structure where a management fee is accrued by the fund based on prior day net assets and other expenses are paid by the Advisor. |
| Commencement of operations. |
| Since the Shares of the Fund did not trade in the secondary market until the day after the Fund’s inception, for the period from the inception to the first day of secondary market trading, the net asset value is used as a proxy for the secondary market trading price to calculate the market returns. |
| Certain non-recurring expenses incurred by the Fund were not annualized for the period indicated. |
SEE NOTES TO FINANCIAL STATEMENTS.
| J.P. Morgan Exchange-Traded Funds | |
| |
| | | | | Ratios to average net assets (a) | |
Net asset
value,
end of
period | | | Market
price
total
return (c)(e) | | | Net
investment
income
(loss) | Expenses
without waivers
and reimbursements | Portfolio
turnover
rate (c) |
| | | | | | | | |
| | | | | | | | |
| | | | | | | | |
| | | | | | | | |
| | | | | | | | |
| | | | | | | | |
| | | | | | | | |
| | | | | | | | |
| | | | | | | | |
| | | | | | | | |
| | | | | | | | |
| | | | | | | | |
| | | | | | | | |
| | | | | | | | |
| | | | | | | | |
| | | | | | | | |
| | | | | | | | |
| | | | | | | | |
SEE NOTES TO FINANCIAL STATEMENTS.
| J.P. Morgan Exchange-Traded Funds | |
NOTES TO FINANCIAL STATEMENTS
AS OF October 31, 2022
1. Organization
J.P. Morgan Exchange-Traded Fund Trust (the “Trust”) was formed on February 25, 2010, and is governed by a Declaration of Trust as amended and restated February 19, 2014, and is registered under the Investment Company Act of 1940, as amended (the “1940 Act”), as an open-end management investment company.
The following are 21 separate funds of the Trust (each, a "Fund" and collectively, the "Funds") covered by this report:
| Diversification Classification |
JPMorgan ActiveBuilders Emerging Markets Equity ETF | |
JPMorgan ActiveBuilders International Equity ETF | |
JPMorgan BetaBuilders Canada ETF | |
JPMorgan BetaBuilders Developed Asia Pacific ex-Japan ETF (formerly known as JPMorgan BetaBuilders Developed | |
JPMorgan BetaBuilders Europe ETF | |
JPMorgan BetaBuilders International Equity ETF | |
JPMorgan BetaBuilders Japan ETF | |
JPMorgan BetaBuilders U.S. Equity ETF | |
JPMorgan BetaBuilders U.S. Mid Cap Equity ETF | |
JPMorgan BetaBuilders U.S. Small Cap Equity ETF | |
JPMorgan Carbon Transition U.S. Equity ETF | |
JPMorgan Climate Change Solutions ETF(2) | |
JPMorgan Diversified Return Emerging Markets Equity ETF | |
JPMorgan Diversified Return International Equity ETF | |
JPMorgan Diversified Return U.S. Equity ETF | |
JPMorgan Diversified Return U.S. Mid Cap Equity ETF | |
JPMorgan Diversified Return U.S. Small Cap Equity ETF | |
JPMorgan International Growth ETF | |
JPMorgan U.S. Momentum Factor ETF | |
JPMorgan U.S. Quality Factor ETF | |
JPMorgan U.S. Value Factor ETF | |
|
| Effective March 1, 2022, JPMorgan BetaBuilders Developed Asia ex-Japan ETF changed its name to JPMorgan BetaBuilders Developed Asia Pacific ex-Japan ETF. |
| Commencement of operations was December 13, 2021. |
The investment objective of JPMorgan ActiveBuilders Emerging Markets Equity ETF (“ActiveBuilders Emerging Markets Equity ETF”) and JPMorgan ActiveBuilders International Equity ETF (“ActiveBuilders International Equity ETF”) is to seek to provide long-term capital appreciation.
The investment objective of JPMorgan International Growth ETF (“International Growth ETF”) is to seek long-term capital appreciation.
The investment objective of JPMorgan BetaBuilders Canada ETF (“BetaBuilders Canada ETF”) is to seek investment results that closely correspond, before fees and expenses, to the performance of the Morningstar® Canada Target Market Exposure IndexSM.
The investment objective of JPMorgan BetaBuilders Developed Asia Pacific ex-Japan ETF (“BetaBuilders Developed Asia Pacific ex-Japan ETF”) is to seek investment results that closely correspond, before fees and expenses, to the performance of the Morningstar® Developed Asia Pacific ex-Japan Target Market Exposure IndexSM.
The investment objective of JPMorgan BetaBuilders Europe ETF (“BetaBuilders Europe ETF”) is to seek investment results that closely correspond, before fees and expenses, to the performance of the Morningstar® Developed Europe Target Market Exposure IndexSM.
The investment objective of JPMorgan BetaBuilders International Equity ETF (“BetaBuilders International Equity ETF”) is to seek investment results that closely correspond, before fees and expenses, to the performance of the Morningstar® Developed Markets ex-North America Target Market Exposure IndexSM.
The investment objective of JPMorgan BetaBuilders Japan ETF (“BetaBuilders Japan ETF”) is to seek investment results that closely correspond, before fees and expenses, to the performance of the Morningstar® Japan Target Market Exposure IndexSM.
The investment objective of JPMorgan BetaBuilders U.S. Equity ETF (“BetaBuilders U.S. Equity ETF”) is to seek investment results that closely correspond, before fees and expenses, to the performance of the Morningstar® US Target Market Exposure IndexSM.
| J.P. Morgan Exchange-Traded Funds | |
The investment objective of JPMorgan BetaBuilders U.S. Mid Cap Equity ETF (“BetaBuilders U.S. Mid Cap Equity ETF”) is to seek investment results that closely correspond, before fees and expenses, to the performance of the Morningstar® US Mid Cap Target Market Exposure Extended IndexSM.
The investment objective of JPMorgan BetaBuilders U.S. Small Cap Equity ETF (“BetaBuilders U.S. Small Cap Equity ETF”) is to seek investment results that closely correspond, before fees and expenses, to the performance of the Morningstar® US Small Cap Target Market Exposure Extended IndexSM.
The investment objective of JPMorgan Carbon Transition U.S. Equity ETF (“Carbon Transition U.S. Equity ETF”) is to seek investment results that closely correspond, before fees and expenses, to the performance of the JPMorgan Asset Management Carbon Transition U.S. Equity Index.
The investment objective of JPMorgan Climate Change Solutions ETF (“Climate Change Solutions ETF”) is to seek to achieve long-term capital appreciation by investing in companies that the adviser believes are developing solutions to address climate change.
The investment objective of JPMorgan Diversified Return Emerging Markets Equity ETF (“Emerging Markets Equity ETF”) is to seek investment results that closely correspond, before fees and expenses, to the performance of the JP Morgan Diversified Factor Emerging Markets Equity Index.
The investment objective of JPMorgan Diversified Return International Equity ETF (“International Equity ETF”) is to seek investment results that closely correspond, before fees and expenses, to the performance of the JP Morgan Diversified Factor International Equity Index.
The investment objective of JPMorgan Diversified Return U.S. Equity ETF (“U.S. Equity ETF”) is to seek investment results that closely correspond, before fees and expenses, to the performance of the JP Morgan Diversified Factor US Equity Index.
The investment objective of JPMorgan Diversified Return U.S. Mid Cap Equity ETF (“U.S. Mid Cap Equity ETF”) is to seek investment results that closely correspond, before fees and expenses, to the performance of the JP Morgan Diversified Factor US Mid Cap Equity Index.
The investment objective of JPMorgan Diversified Return U.S. Small Cap Equity ETF (“U.S. Small Cap Equity ETF”) is to seek investment results that closely correspond, before fees and expenses, to the performance of the JP Morgan Diversified Factor US Small Cap Equity Index.
The investment objective of JPMorgan U.S. Momentum Factor ETF (“U.S. Momentum Factor ETF”) is to seek investment results that closely correspond, before fees and expenses, to the performance of the JP Morgan US Momentum Factor Index.
The investment objective of JPMorgan U.S. Quality Factor ETF (“U.S. Quality Factor ETF”) is to seek investment results that closely correspond, before fees and expenses, to the performance of the JP Morgan US Quality Factor Index.
The investment objective of JPMorgan U.S. Value Factor ETF (“U.S. Value Factor ETF”) is to seek investment results that closely correspond, before fees and expenses, to the performance of the JP Morgan US Value Factor Index.
J.P. Morgan Investment Management Inc. (“JPMIM”), an indirect, wholly-owned subsidiary of JPMorgan Chase & Co. (“JPMorgan”), acts as Adviser (the “Adviser”) and Administrator (the “Administrator”) to the Funds.
| J.P. Morgan Exchange-Traded Funds | |
NOTES TO FINANCIAL STATEMENTS
AS OF October 31, 2022 (continued)
Shares of each Fund are listed and traded at market price on an exchange as follows:
| |
ActiveBuilders Emerging Markets Equity ETF | |
ActiveBuilders International Equity ETF | |
| |
BetaBuilders Developed Asia Pacific ex-Japan ETF | |
| |
BetaBuilders International Equity ETF | |
| |
BetaBuilders U.S. Equity ETF | |
BetaBuilders U.S. Mid Cap Equity ETF | |
BetaBuilders U.S. Small Cap Equity ETF | |
Carbon Transition U.S. Equity ETF | |
Climate Change Solutions ETF | |
Emerging Markets Equity ETF | |
| |
| |
| |
U.S. Small Cap Equity ETF | |
| |
| |
| |
| |
Market prices for the Funds’ shares may be different from their net asset value (“NAV”).
Effective April 12, 2021, BetaBuilders Canada ETF, BetaBuilders Developed Asia Pacific ex-Japan ETF, BetaBuilders Europe ETF and BetaBuilders Japan ETF each underwent a 1:2 reverse stock split which resulted in a decrease to each Fund’s shares outstanding and an increase to each Fund’s NAV per share. There was no change to the net assets of each Fund or the value of a shareholder’s investment as a result of this reverse stock split, except to the extent that shareholders held quantities of shares that were not an exact multiple of the reverse split ratio as described below.
The historical share transactions presented in the Statements of Changes in Net Assets and the per share data presented in the Financial Highlights have been adjusted accordingly to give effect to the reverse stock splits.
For shareholders who held quantities of shares that were not an exact multiple of the reverse split ratio (for example, not a multiple of two for a 1:2 reverse split), the reverse split resulted in the creation of a fractional share. Post-split fractional shares were redeemed for cash and sent to the broker of record.
| J.P. Morgan Exchange-Traded Funds | |
The Funds issue and redeem their shares on a continuous basis, through JPMorgan Distribution Services, Inc. (the “Distributor” or “JPMDS”), an indirect, wholly-owned subsidiary of JPMorgan, at NAV in large blocks of shares, referred to as “Creation Units” as shown in the table below:
| |
ActiveBuilders Emerging Markets Equity ETF | |
ActiveBuilders International Equity ETF | |
| |
BetaBuilders Developed Asia Pacific ex-Japan ETF | |
| |
BetaBuilders International Equity ETF | |
| |
BetaBuilders U.S. Equity ETF | |
BetaBuilders U.S. Mid Cap Equity ETF | |
BetaBuilders U.S. Small Cap Equity ETF | |
Carbon Transition U.S. Equity ETF | |
Climate Change Solutions ETF | |
Emerging Markets Equity ETF | |
| |
| |
| |
U.S. Small Cap Equity ETF | |
| |
| |
| |
| |
Prior to April 12, 2021, the Shares per Creation Unit amounts for BetaBuilders Canada ETF, BetaBuilders Developed Asia-ex Japan ETF, BetaBuilders Europe ETF and BetaBuilders Japan ETF were 100,000, 200,000, 200,000 and 400,000, respectively. These amounts were reduced in connection with the reverse stock split mentioned above.
Creation Units are issued and redeemed principally in-kind for a basket of securities. A cash amount may be substituted if a Fund has sizeable exposure to market or sponsor restricted securities. Shares are generally traded in the secondary market in amounts less than a Creation Unit at market prices that change throughout the day. Only individuals or institutions that have entered into an authorized participant agreement with the Distributor may do business directly with the Funds (each, an “Authorized Participant”).
2. Significant Accounting Policies
The following is a summary of significant accounting policies followed by the Funds in the preparation of their financial statements. The Funds are investment companies and, accordingly, follow the investment company accounting and reporting guidance of the Financial Accounting Standards Board (“FASB”) Accounting Standards Codification Topic 946 — Investment Companies, which is part of U.S. generally accepted accounting principles (“GAAP”). The preparation of financial statements in conformity with GAAP requires management to make estimates and assumptions that affect (i) the reported amounts of assets and liabilities, (ii) disclosure of contingent assets and liabilities at the date of the financial statements, and (iii) the reported amounts of increases and decreases in net assets from operations during the reporting period. Actual results could differ from those estimates.
A. Valuation of Investments — Investments are valued in accordance with GAAP and the Funds' valuation policies set forth by, and under the supervision and responsibility of, the Board of Trustees of the Trust (the "Board"), which established the following approach to valuation, as described more fully below: (i) investments for which market quotations are readily available shall be valued at their market value and (ii) all other investments for which market quotations are not readily available shall be valued at their fair value as determined in good faith by the Board.
Under Section 2(a)(41) of the 1940 Act, the Board is required to determine fair value for securities that do not have readily available market quotations. Under SEC Rule 2a-5 (Good Faith Determinations of Fair Value), the Board may designate the performance of these fair valuation determinations to a valuation designee. The Board has designated the Adviser as the “Valuation Designee” to perform fair valuation determinations for the Funds on behalf of the Board subject to appropriate oversight by the Board. The Adviser, as Valuation Designee, leverages the J.P. Morgan Asset Management Americas Valuation Committee (“AVC”) to help oversee and carry out the policies for the valuation of Investments held in the Funds. The Adviser, as Valuation Designee, remains responsible for the valuation determinations.
| J.P. Morgan Exchange-Traded Funds | |
NOTES TO FINANCIAL STATEMENTS
AS OF October 31, 2022 (continued)
This oversight by the AVC includes monitoring the appropriateness of fair values based on results of ongoing valuation oversight including, but not limited to, consideration of macro or security specific events, market events, and pricing vendor and broker due diligence. The Administrator is responsible for discussing and assessing the potential impacts to the fair values on an ongoing basis, and, at least on a quarterly basis, with the AVC and the Board.
A market-based approach is primarily used to value the Funds' investments. Investments for which market quotations are not readily available are fair valued using prices supplied by approved affiliated and/or unaffiliated pricing vendors or third party broker-dealers (collectively referred to as “Pricing Services”) or may be internally fair valued using methods set forth by the valuation policies approved by the Boards. This may include the use of related or comparable assets or liabilities, recent transactions, market multiples, book values and other relevant information for the investment. An income-based valuation approach may be used in which the anticipated future cash flows of the investment are discounted to calculate the fair value. Discounts may also be applied due to the nature or duration of any restrictions on the disposition of the investments. Valuations may be based upon current market prices of securities that are comparable in coupon, rating, maturity and industry. It is possible that the estimated values may differ significantly from the values that would have been used had a ready market for the investments existed, and such differences could be material.
Equities and other exchange-traded instruments are valued at the last sale price or official market closing price on the primary exchange on which the instrument is traded before the NAVs of the Funds are calculated on a valuation date. Certain foreign equity instruments are valued by applying international fair value factors provided by approved Pricing Services. The factors seek to adjust the local closing price for movements of local markets post-closing, but prior to the time the NAVs are calculated.
Investments in open-end investment companies (“Underlying Funds”) are valued at each Underlying Fund’s NAV per share as of the report date.
Futures contracts are generally valued on the basis of available market quotations.
Valuations reflected in this report are as of the report date. As a result, changes in valuation due to market events and/or issuer-related events after the report date and prior to issuance of the report are not reflected herein.
The various inputs that are used in determining the valuation of the Funds' investments are summarized into the three broad levels listed below.
•
Level 1 — Unadjusted inputs using quoted prices in active markets for identical investments.
•
Level 2 — Other significant observable inputs including, but not limited to, quoted prices for similar investments, inputs other than quoted prices that are observable for investments (such as interest rates, prepayment speeds, credit risk, etc.) or other market corroborated inputs.
•
Level 3 — Significant inputs based on the best information available in the circumstances, to the extent observable inputs are not available (including the Funds' assumptions in determining the fair value of investments).
A financial instrument’s level within the fair value hierarchy is based on the lowest level of any input, both individually and in the aggregate, that is significant to the fair value measurement. The inputs or methodology used for valuing instruments are not necessarily an indication of the risk associated with investing in those instruments.
The following tables represent each valuation input as presented on the Schedules of Portfolio Investments ("SOIs"):
ActiveBuilders Emerging Markets Equity ETF | | |
| | Level 2
Other significant
observable inputs | Level 3
Significant
unobservable inputs | |
Investments in Securities | | | | |
| | | | |
| | | | |
| | | | |
| | | | |
| | | | |
| | | | |
| | | | |
| | | | |
| | | | |
| | | | |
| | | | |
| | | | |
| | | | |
| | | | |
| J.P. Morgan Exchange-Traded Funds | |
ActiveBuilders Emerging Markets Equity ETF (continued) | | |
| | Level 2 Other significant observable inputs | Level 3 Significant unobservable inputs | |
| | | | |
| | | | |
| | | | |
| | | | |
| | | | |
| | | | |
| | | | |
| | | | |
| | | | |
| | | | |
| | | | |
| | | | |
| | | | |
| | | | |
| | | | |
| | | | |
| | | | |
Tanzania, United Republic of | | | | |
| | | | |
| | | | |
| | | | |
| | | | |
| | | | |
| | | | |
| | | | |
Total Investments in Securities | | | | |
Transfers between level 2 and level 3 are due to a decline or an increase in market activity (e.g. frequency of trades), which resulted in a lack or increase of available market inputs to determine the price for the year ended October 31, 2022.
ActiveBuilders International Equity ETF | | |
| | Level 2
Other significant
observable inputs | Level 3
Significant
unobservable inputs | |
Investments in Securities | | | | |
| | | | |
| | | | |
| | | | |
| | | | |
| | | | |
| | | | |
| | | | |
| | | | |
| | | | |
| | | | |
| | | | |
| | | | |
| | | | |
| | | | |
| J.P. Morgan Exchange-Traded Funds | |
NOTES TO FINANCIAL STATEMENTS
AS OF October 31, 2022 (continued)
ActiveBuilders International Equity ETF (continued) | | |
| | Level 2 Other significant observable inputs | Level 3 Significant unobservable inputs | |
| | | | |
| | | | |
| | | | |
| | | | |
| | | | |
| | | | |
| | | | |
| | | | |
| | | | |
| | | | |
| | | | |
| | | | |
| | | | |
| | | | |
| | | | |
| | | | |
| | | | |
| | | | |
Total Investments in Securities | | | | |
| | | | |
| | Level 2
Other significant
observable inputs | Level 3
Significant
unobservable inputs | |
Total Investments in Securities (a) | | | | |
Appreciation in Other Financial Instruments | | | | |
| | | | |
|
| Please refer to the SOI for specifics of portfolio holdings. |
BetaBuilders Developed Asia Pacific ex-Japan ETF | | |
| | Level 2
Other significant
observable inputs | Level 3
Significant
unobservable inputs | |
Investments in Securities | | | | |
| | | | |
| | | | |
| | | | |
| | | | |
| | | | |
| | | | |
| | | | |
| | | | |
| | | | |
| | | | |
| J.P. Morgan Exchange-Traded Funds | |
BetaBuilders Developed Asia Pacific ex-Japan ETF (continued) | | |
| | Level 2 Other significant observable inputs | Level 3 Significant unobservable inputs | |
| | | | |
Investment of Cash Collateral from Securities Loaned | | | | |
Total Investments in Securities | | | | |
Appreciation in Other Financial Instruments | | | | |
| | | | |
| | |
| | Level 2
Other significant
observable inputs | Level 3
Significant
unobservable inputs | |
Investments in Securities | | | | |
| | | | |
| | | | |
| | | | |
| | | | |
| | | | |
| | | | |
| | | | |
| | | | |
| | | | |
| | | | |
| | | | |
| | | | |
| | | | |
| | | | |
| | | | |
| | | | |
| | | | |
| | | | |
| | | | |
| | | | |
| | | | |
| | | | |
| | | | |
| | | | |
| | | | |
| | | | |
| | | | |
| | | | |
| | | | |
| | | | |
| | | | |
| | | | |
| | | | |
Investment of Cash Collateral from Securities Loaned | | | | |
| J.P. Morgan Exchange-Traded Funds | |
NOTES TO FINANCIAL STATEMENTS
AS OF October 31, 2022 (continued)
BetaBuilders Europe ETF (continued) | | |
| | Level 2 Other significant observable inputs | Level 3 Significant unobservable inputs | |
Total Investments in Securities | | | | |
Appreciation in Other Financial Instruments | | | | |
| | | | |
Depreciation in Other Financial Instruments | | | | |
| | | | |
Total Net Appreciation/ Depreciation in Other Financial Instruments | | | | |
There were no significant transfers into or out of level 3 for the year ended October 31, 2022.
BetaBuilders International Equity ETF | | |
| | Level 2
Other significant
observable inputs | Level 3
Significant
unobservable inputs | |
Investments in Securities | | | | |
| | | | |
| | | | |
| | | | |
| | | | |
| | | | |
| | | | |
| | | | |
| | | | |
| | | | |
| | | | |
| | | | |
| | | | |
| | | | |
| | | | |
| | | | |
| | | | |
| | | | |
| | | | |
| | | | |
| | | | |
| | | | |
| | | | |
| | | | |
| | | | |
| | | | |
| | | | |
| | | | |
| | | | |
| | | | |
| | | | |
| | | | |
| | | | |
| | | | |
| J.P. Morgan Exchange-Traded Funds | |
BetaBuilders International Equity ETF (continued) | | |
| | Level 2 Other significant observable inputs | Level 3 Significant unobservable inputs | |
| | | | |
| | | | |
| | | | |
| | | | |
| | | | |
Investment of Cash Collateral from Securities Loaned | | | | |
Total Short-Term Investments | | | | |
Total Investments in Securities | | | | |
Depreciation in Other Financial Instruments | | | | |
| | | | |
There were no significant transfers into or out of level 3 for the year ended October 31, 2022.
| | | | |
| | Level 2
Other significant
observable inputs | Level 3
Significant
unobservable inputs | |
Investments in Securities | | | | |
| | | | |
| | | | |
Investment of Cash Collateral from Securities Loaned | | | | |
Total Investments in Securities | | | | |
Appreciation in Other Financial Instruments | | | | |
| | | | |
BetaBuilders U.S. Equity ETF | | | | |
| | Level 2
Other significant
observable inputs | Level 3
Significant
unobservable inputs | |
Total Investments in Securities (a) | | | | |
Depreciation in Other Financial Instruments | | | | |
| | | | |
|
| Please refer to the SOI for specifics of portfolio holdings. |
BetaBuilders U.S. Mid Cap Equity ETF | | | | |
| | Level 2
Other significant
observable inputs | Level 3
Significant
unobservable inputs | |
Total Investments in Securities (a) | | | | |
Appreciation in Other Financial Instruments | | | | |
| | | | |
|
| Please refer to the SOI for specifics of portfolio holdings. |
| J.P. Morgan Exchange-Traded Funds | |
NOTES TO FINANCIAL STATEMENTS
AS OF October 31, 2022 (continued)
BetaBuilders U.S. Small Cap Equity ETF | | | | |
| | Level 2
Other significant
observable inputs | Level 3
Significant
unobservable inputs | |
Investments in Securities | | | | |
| | | | |
| | | | |
| | | | |
| | | | |
Investment of Cash Collateral from Securities Loaned | | | | |
Total Short-Term Investments | | | | |
Total Investments in Securities | | | | |
Appreciation in Other Financial Instruments | | | | |
| | | | |
Carbon Transition U.S. Equity ETF | | | | |
| | Level 2
Other significant
observable inputs | Level 3
Significant
unobservable inputs | |
Total Investments in Securities (a) | | | | |
Appreciation in Other Financial Instruments | | | | |
| | | | |
|
| Please refer to the SOI for specifics of portfolio holdings. |
Climate Change Solutions ETF | | |
| | Level 2
Other significant
observable inputs | Level 3
Significant
unobservable inputs | |
Investments in Securities | | | | |
| | | | |
| | | | |
| | | | |
| | | | |
| | | | |
| | | | |
| | | | |
| | | | |
| | | | |
| | | | |
| | | | |
| | | | |
| | | | |
| | | | |
| | | | |
| | | | |
| | | | |
| | | | |
| | | | |
Total Investments in Securities | | | | |
| J.P. Morgan Exchange-Traded Funds | |
Emerging Markets Equity ETF | | |
| | Level 2
Other significant
observable inputs | Level 3
Significant
unobservable inputs | |
Investments in Securities | | | | |
| | | | |
| | | | |
| | | | |
| | | | |
| | | | |
| | | | |
| | | | |
| | | | |
| | | | |
| | | | |
| | | | |
| | | | |
| | | | |
| | | | |
| | | | |
| | | | |
| | | | |
| | | | |
| | | | |
| | | | |
| | | | |
| | | | |
| | | | |
| | | | |
| | | | |
| | | | |
| | | | |
| | | | |
| | | | |
| | | | |
| | | | |
| | | | |
Investment of Cash Collateral from Securities Loaned | | | | |
Total Investments in Securities | | | | |
Appreciation in Other Financial Instruments | | | | |
| | | | |
Transfers between level 1 and level 3 are due to a decline or an increase in market activity (e.g. frequency of trades), which resulted in a lack or increase of available market inputs to determine the price for the year ended October 31, 2022.
| | |
| | Level 2
Other significant
observable inputs | Level 3
Significant
unobservable inputs | |
Investments in Securities | | | | |
| | | | |
| | | | |
| J.P. Morgan Exchange-Traded Funds | |
NOTES TO FINANCIAL STATEMENTS
AS OF October 31, 2022 (continued)
International Equity ETF (continued) | | |
| | Level 2 Other significant observable inputs | Level 3 Significant unobservable inputs | |
| | | | |
| | | | |
| | | | |
| | | | |
| | | | |
| | | | |
| | | | |
| | | | |
| | | | |
| | | | |
| | | | |
| | | | |
| | | | |
| | | | |
| | | | |
| | | | |
| | | | |
| | | | |
| | | | |
| | | | |
| | | | |
| | | | |
| | | | |
| | | | |
| | | | |
| | | | |
| | | | |
| | | | |
| | | | |
| | | | |
| | | | |
| | | | |
| | | | |
| | | | |
Investment of Cash Collateral from Securities Loaned | | | | |
Total Short-Term Investments | | | | |
Total Investments in Securities | | | | |
Appreciation in Other Financial Instruments | | | | |
| | | | |
There were no significant transfers into or out of level 3 for the year ended October 31, 2022.
| | |
| | Level 2
Other significant
observable inputs | Level 3
Significant
unobservable inputs | |
Total Investments in Securities (a) | | | | |
| J.P. Morgan Exchange-Traded Funds | |
U.S. Equity ETF (continued) | | |
| | Level 2 Other significant observable inputs | Level 3 Significant unobservable inputs | |
Appreciation in Other Financial Instruments | | | | |
| | | | |
|
| Please refer to the SOI for specifics of portfolio holdings. |
| | |
| | Level 2
Other significant
observable inputs | Level 3
Significant
unobservable inputs | |
Total Investments in Securities (a) | | | | |
Appreciation in Other Financial Instruments | | | | |
| | | | |
|
| Please refer to the SOI for specifics of portfolio holdings. |
U.S. Small Cap Equity ETF | | |
| | Level 2
Other significant
observable inputs | Level 3
Significant
unobservable inputs | |
Investments in Securities | | | | |
| | | | |
| | | | |
| | | | |
| | | | |
| | | | |
| | | | |
| | | | |
| | | | |
| | | | |
Electronic & Electrical Equipment | | | | |
Finance & Credit Services | | | | |
| | | | |
Gas, Water & Multi-utilities | | | | |
| | | | |
| | | | |
Household Goods & Home Construction | | | | |
| | | | |
| | | | |
Industrial Metals & Mining | | | | |
Industrial Support Services | | | | |
Industrial Transportation | | | | |
Investment Banking & Brokerage Services | | | | |
| | | | |
| | | | |
| | | | |
Medical Equipment & Services | | | | |
Mortgage Real Estate Investment Trusts | | | | |
| | | | |
| J.P. Morgan Exchange-Traded Funds | |
NOTES TO FINANCIAL STATEMENTS
AS OF October 31, 2022 (continued)
U.S. Small Cap Equity ETF (continued) | | |
| | Level 2 Other significant observable inputs | Level 3 Significant unobservable inputs | |
| | | | |
Personal Care, Drug & Grocery Stores | | | | |
| | | | |
Pharmaceuticals, Biotechnology & Marijuana Producers | | | | |
| | | | |
Real Estate Investment & Services | | | | |
Real Estate Investment Trusts | | | | |
| | | | |
| | | | |
Software & Computer Services | | | | |
Technology Hardware & Equipment | | | | |
Telecommunications Equipment | | | | |
Telecommunications Service Providers | | | | |
| | | | |
| | | | |
Waste & Disposal Services | | | | |
| | | | |
| | | | |
| | | | |
| | | | |
Investment of Cash Collateral from Securities Loaned | | | | |
Total Short-Term Investments | | | | |
Total Investments in Securities | | | | |
Appreciation in Other Financial Instruments | | | | |
| | | | |
| | |
| | Level 2
Other significant
observable inputs | Level 3
Significant
unobservable inputs | |
Investments in Securities | | | | |
| | | | |
| | | | |
| | | | |
| | | | |
| | | | |
| | | | |
| | | | |
| | | | |
| | | | |
| | | | |
| | | | |
| | | | |
| | | | |
| | | | |
| | | | |
| J.P. Morgan Exchange-Traded Funds | |
International Growth ETF (continued) | | |
| | Level 2 Other significant observable inputs | Level 3 Significant unobservable inputs | |
| | | | |
| | | | |
| | | | |
| | | | |
| | | | |
| | | | |
| | | | |
| | | | |
| | | | |
| | | | |
Investment of Cash Collateral from Securities Loaned | | | | |
Total Short-Term Investments | | | | |
Total Investments in Securities | | | | |
| | |
| | Level 2
Other significant
observable inputs | Level 3
Significant
unobservable inputs | |
Total Investments in Securities (a) | | | | |
Appreciation in Other Financial Instruments | | | | |
| | | | |
|
| Please refer to the SOI for specifics of portfolio holdings. |
| | |
| | Level 2
Other significant
observable inputs | Level 3
Significant
unobservable inputs | |
Total Investments in Securities (a) | | | | |
Appreciation in Other Financial Instruments | | | | |
| | | | |
|
| Please refer to the SOI for specifics of portfolio holdings. |
| | |
| | Level 2
Other significant
observable inputs | Level 3
Significant
unobservable inputs | |
Total Investments in Securities (a) | | | | |
Appreciation in Other Financial Instruments | | | | |
| | | | |
|
| Please refer to the SOI for specifics of portfolio holdings. |
| J.P. Morgan Exchange-Traded Funds | |
NOTES TO FINANCIAL STATEMENTS
AS OF October 31, 2022 (continued)
B. Restricted Securities — Certain securities held by the Funds may be subject to legal or contractual restrictions on resale. Restricted securities generally are resold in transactions exempt from registration under the Securities Act of 1933, as amended (the “Securities Act”). Disposal of these securities may involve time-consuming negotiations and expense. Prompt sale at the current valuation may be difficult and could adversely affect the NAVs of the Funds.
As of October 31, 2022, the Funds had no investments in restricted securities other than securities sold to the Funds under Rule 144A and/or Regulation S under the Securities Act.
C. Securities Lending — The Funds are authorized to engage in securities lending in order to generate additional income. The Funds are able to lend to approved borrowers. Citibank N.A. (“Citibank”) serves as lending agent for the Funds, pursuant to a Securities Lending Agency Agreement (the “Securities Lending Agency Agreement”). Securities loaned are collateralized by cash equal to at least 100% of the market value plus accrued interest on the securities lent, which is invested in the Class IM Shares of the JPMorgan U.S. Government Money Market Fund and the Agency SL Class Shares of the JPMorgan Securities Lending Money Market Fund. The Funds retain the interest earned on cash collateral investments but are required to pay the borrower a rebate for the use of the cash collateral. In cases where the lent security is of high value to borrowers, there may be a negative rebate (i.e., a net payment from the borrower to the Funds). Upon termination of a loan, the Funds are required to return to the borrower an amount equal to the cash collateral, plus any rebate owed to the borrowers. The remaining maturities of the securities lending transactions are considered overnight and continuous. Loans are subject to termination by the Funds or the borrower at any time.
The net income earned on the securities lending (after payment of rebates and Citibank’s fee) is included on the Statements of Operations as Income from securities lending (net). The Funds also receive payments from the borrower during the period of the loan, equivalent to dividends and interest earned on the securities loaned, which are recorded as Dividend or Interest income, respectively, on the Statements of Operations.
Under the Securities Lending Agency Agreement, Citibank marks to market the loaned securities on a daily basis. In the event the cash received from the borrower is less than 102% of the value of the loaned securities (105% for loans of non-U.S. securities), Citibank requests additional cash from the borrower so as to maintain a collateralization level of at least 102% of the value of the loaned securities plus accrued interest (105% for loans of non-U.S. securities), subject to certain de minimis amounts.
The value of securities out on loan is recorded as an asset on the Statements of Assets and Liabilities. The value of the cash collateral received is recorded as a liability on the Statements of Assets and Liabilities and details of collateral investments are disclosed on the SOIs.
The Funds bear the risk of loss associated with the collateral investments and are not entitled to additional collateral from the borrower to cover any such losses. To the extent that the value of the collateral investments declines below the amount owed to a borrower, the Funds may incur losses that exceed the amount they earned on lending the security. Upon termination of a loan, the Funds may use leverage (borrow money) to repay the borrower for cash collateral posted if the Adviser does not believe that it is prudent to sell the collateral investments to fund the payment of this liability. Securities lending activity is subject to master netting arrangements.
The following table presents for each lending Fund, the value of the securities on loan with Citibank, net of amounts available for offset under the master netting arrangements and any related collateral received or posted by the Funds as of October 31, 2022.
| Investment Securities
on Loan, at value,
Presented on the
Statements of Assets
and Liabilities | Cash Collateral
Posted by Borrower* | Net Amount Due
to Counterparty
(not less than zero) |
| | | |
BetaBuilders Developed Asia Pacific ex-Japan ETF | | | |
| | | |
BetaBuilders International Equity ETF | | | |
| | | |
BetaBuilders U.S. Equity ETF | | | |
BetaBuilders U.S. Mid Cap Equity ETF | | | |
BetaBuilders U.S. Small Cap Equity ETF | | | |
Emerging Markets Equity ETF | | | |
| | | |
| | | |
U.S. Small Cap Equity ETF | | | |
| | | |
| | | |
| | | |
| J.P. Morgan Exchange-Traded Funds | |
| Investment Securities on Loan, at value, Presented on the Statements of Assets and Liabilities | Cash Collateral Posted by Borrower* | Net Amount Due to Counterparty (not less than zero) |
| | | |
|
| Collateral posted reflects the value of securities on loan and does not include any additional amounts received from the borrower. |
| Subsequent to October 31, 2022, additional collateral was received. |
Securities lending also involves counterparty risks, including the risk that the loaned securities may not be returned in a timely manner or at all. Subject to certain conditions, Citibank has agreed to indemnify the Funds from losses resulting from a borrower’s failure to return a loaned security.
JPMIM voluntarily waived management fees charged to the Funds to reduce the impact of the cash collateral investment in the JPMorgan U.S. Government Money Market Fund from 0.13% to 0.06%. For the year ended October 31, 2022, JPMIM waived fees associated with the Funds' investment in the JPMorgan U.S. Government Money Market Fund as follows:
ActiveBuilders Emerging Markets Equity ETF | |
ActiveBuilders International Equity ETF | |
| |
BetaBuilders Developed Asia Pacific ex-Japan ETF | |
| |
BetaBuilders International Equity ETF | |
| |
BetaBuilders U.S. Equity ETF | |
BetaBuilders U.S. Mid Cap Equity ETF | |
BetaBuilders U.S. Small Cap Equity ETF | |
Emerging Markets Equity ETF | |
| |
| |
| |
U.S. Small Cap Equity ETF | |
| |
| |
| |
| |
The above waiver is included in the determination of earnings on cash collateral investment and in the calculation of Citibank’s compensation and is included on the Statements of Operations as Income from securities lending (net).
ActiveBuilders Emerging Markets Equity ETF, ActiveBuilders International Equity ETF and Diversified Return U.S. Mid Cap Equity ETF did not have any securities out on loan at October 31, 2022. Carbon Transition U.S. Equity ETF and Climate Change Solutions ETF did not lend out any securities during the year ended October 31, 2022.
| J.P. Morgan Exchange-Traded Funds | |
NOTES TO FINANCIAL STATEMENTS
AS OF October 31, 2022 (continued)
D. Investment Transactions with Affiliates — The Funds invested in Underlying Funds, which are advised by the Adviser. An issuer which is under common control with a Fund may be considered an affiliate. For the purposes of the financial statements, the Funds assume the issuers listed in the tables below to be affiliated issuers. The Underlying Funds’ distributions may be reinvested into such Underlying Funds. Reinvestment amounts are included in the purchases at cost amounts in the tables below.
ActiveBuilders Emerging Markets Equity ETF |
For the year ended October 31, 2022 |
| | | | | Change in
Unrealized
Appreciation/
(Depreciation) | | | | Capital Gain
Distributions |
JPMorgan Prime Money Market Fund Class IM Shares, 3.18% (a) (b) | | | | | | | | | |
JPMorgan U.S. Government Money Market Fund Class IM Shares, 2.85% (a) (b) | | | | | | | | | |
| | | | | | | | | |
|
| Investment in an affiliated fund, which is registered under the Investment Company Act of 1940, as amended, and is advised by J.P. Morgan Investment Management Inc. |
| The rate shown is the current yield as of October 31, 2022. |
| Amount is included on the Statements of Operations as Income from securities lending (net) (after payments of rebates and Citibank’s fee). |
ActiveBuilders International Equity ETF |
For the year ended October 31, 2022 |
| | | | | Change in
Unrealized
Appreciation/
(Depreciation) | | | | Capital Gain
Distributions |
JPMorgan U.S. Government Money Market Fund Class IM Shares, 2.85% (a) (b) | | | | | | | | | |
JPMorgan U.S. Government Money Market Fund Class IM Shares, 2.85% (a) (b) | | | | | | | | | |
| | | | | | | | | |
|
| Investment in an affiliated fund, which is registered under the Investment Company Act of 1940, as amended, and is advised by J.P. Morgan Investment Management Inc. |
| The rate shown is the current yield as of October 31, 2022. |
| Amount is included on the Statements of Operations as Income from securities lending (net) (after payments of rebates and Citibank’s fee). |
| J.P. Morgan Exchange-Traded Funds | |
|
For the year ended October 31, 2022 |
| | | | | Change in
Unrealized
Appreciation/
(Depreciation) | | | | Capital Gain
Distributions |
JPMorgan Securities Lending Money Market Fund Agency SL Class Shares, 3.23% (a) (b) | | | | | | | | | |
JPMorgan U.S. Government Money Market Fund Class IM Shares, 2.85% (a) (b) | | | | | | | | | |
| | | | | | | | | |
|
| Investment in an affiliated fund, which is registered under the Investment Company Act of 1940, as amended, and is advised by J.P. Morgan Investment Management Inc. |
| The rate shown is the current yield as of October 31, 2022. |
| Amount is included on the Statements of Operations as Income from securities lending (net) (after payments of rebates and Citibank’s fee). |
BetaBuilders Developed Asia Pacific ex-Japan ETF |
For the year ended October 31, 2022 |
| | | | | Change in
Unrealized
Appreciation/
(Depreciation) | | | | Capital Gain
Distributions |
JPMorgan Securities Lending Money Market Fund Agency SL Class Shares, 3.23% (a) (b) | | | | | | | | | |
JPMorgan U.S. Government Money Market Fund Class IM Shares, 2.85% (a) (b) | | | | | | | | | |
| | | | | | | | | |
|
| Investment in an affiliated fund, which is registered under the Investment Company Act of 1940, as amended, and is advised by J.P. Morgan Investment Management Inc. |
| The rate shown is the current yield as of October 31, 2022. |
| Amount is included on the Statements of Operations as Income from securities lending (net) (after payments of rebates and Citibank’s fee). |
| J.P. Morgan Exchange-Traded Funds | |
NOTES TO FINANCIAL STATEMENTS
AS OF October 31, 2022 (continued)
|
For the year ended October 31, 2022 |
| | | | | Change in
Unrealized
Appreciation/
(Depreciation) | | | | Capital Gain
Distributions |
JPMorgan Securities Lending Money Market Fund Agency SL Class Shares, 3.23% (a) (b) | | | | | | | | | |
JPMorgan U.S. Government Money Market Fund Class IM Shares, 2.85% (a) (b) | | | | | | | | | |
| | | | | | | | | |
|
| Investment in an affiliated fund, which is registered under the Investment Company Act of 1940, as amended, and is advised by J.P. Morgan Investment Management Inc. |
| The rate shown is the current yield as of October 31, 2022. |
| Amount is included on the Statements of Operations as Income from securities lending (net) (after payments of rebates and Citibank’s fee). |
BetaBuilders International Equity ETF |
For the year ended October 31, 2022 |
| | | | | Change in
Unrealized
Appreciation/
(Depreciation) | | | | Capital Gain
Distributions |
JPMorgan Securities Lending Money Market Fund Agency SL Class Shares, 3.23% (a) (b) | | | | | | | | | |
JPMorgan U.S. Government Money Market Fund Class IM Shares, 2.85% (a) (b) | | | | | | | | | |
JPMorgan U.S. Government Money Market Fund Class IM Shares, 2.85% (a) (b) | | | | | | | | | |
| | | | | | | | | |
|
| Investment in an affiliated fund, which is registered under the Investment Company Act of 1940, as amended, and is advised by J.P. Morgan Investment Management Inc. |
| The rate shown is the current yield as of October 31, 2022. |
| Amount is included on the Statements of Operations as Income from securities lending (net) (after payments of rebates and Citibank’s fee). |
| J.P. Morgan Exchange-Traded Funds | |
|
For the year ended October 31, 2022 |
| | | | | Change in
Unrealized
Appreciation/
(Depreciation) | | | | Capital Gain
Distributions |
JPMorgan Securities Lending Money Market Fund Agency SL Class Shares, 3.23% (a) (b) | | | | | | | | | |
JPMorgan U.S. Government Money Market Fund Class IM Shares, 2.85% (a) (b) | | | | | | | | | |
| | | | | | | | | |
|
| Investment in an affiliated fund, which is registered under the Investment Company Act of 1940, as amended, and is advised by J.P. Morgan Investment Management Inc. |
| The rate shown is the current yield as of October 31, 2022. |
| Amount is included on the Statements of Operations as Income from securities lending (net) (after payments of rebates and Citibank’s fee). |
BetaBuilders U.S. Equity ETF |
For the year ended October 31, 2022 |
| | | | | Change in
Unrealized
Appreciation/
(Depreciation) | | | | Capital Gain
Distributions |
| | | | | | | | | |
JPMorgan Securities Lending Money Market Fund Agency SL Class Shares, 3.23% (b) (c) | | | | | | | | | |
JPMorgan U.S. Government Money Market Fund Class IM Shares, 2.85% (b) (c) | | | | | | | | | |
JPMorgan U.S. Government Money Market Fund Class IM Shares, 2.85% (b) (c) | | | | | | | | | |
| | | | | | | | | |
|
| Investment in affiliate. This security is included in an index in which the Fund, as an index fund, tracks. |
| Investment in an affiliated fund, which is registered under the Investment Company Act of 1940, as amended, and is advised by J.P. Morgan Investment Management Inc. |
| The rate shown is the current yield as of October 31, 2022. |
| Amount is included on the Statements of Operations as Income from securities lending (net) (after payments of rebates and Citibank’s fee). |
BetaBuilders U.S. Mid Cap Equity ETF |
For the year ended October 31, 2022 |
| | | | | Change in
Unrealized
Appreciation/
(Depreciation) | | | | Capital Gain
Distributions |
JPMorgan Securities Lending Money Market Fund Agency SL Class Shares, 3.23% (a) (b) | | | | | | | | | |
| J.P. Morgan Exchange-Traded Funds | |
NOTES TO FINANCIAL STATEMENTS
AS OF October 31, 2022 (continued)
BetaBuilders U.S. Mid Cap Equity ETF (continued) |
For the year ended October 31, 2022 |
| | | | | Change in Unrealized Appreciation/ (Depreciation) | | | | Capital Gain Distributions |
JPMorgan U.S. Government Money Market Fund Class IM Shares, 2.85% (a) (b) | | | | | | | | | |
JPMorgan U.S. Government Money Market Fund Class IM Shares, 2.85% (a) (b) | | | | | | | | | |
| | | | | | | | | |
|
| Investment in an affiliated fund, which is registered under the Investment Company Act of 1940, as amended, and is advised by J.P. Morgan Investment Management Inc. |
| The rate shown is the current yield as of October 31, 2022. |
| Amount is included on the Statements of Operations as Income from securities lending (net) (after payments of rebates and Citibank’s fee). |
BetaBuilders U.S. Small Cap Equity ETF |
For the year ended October 31, 2022 |
| | | | | Change in
Unrealized
Appreciation/
(Depreciation) | | | | Capital Gain
Distributions |
JPMorgan Securities Lending Money Market Fund Agency SL Class Shares, 3.23% (a) (b) | | | | | | | | | |
JPMorgan U.S. Government Money Market Fund Class IM Shares, 2.85% (a) (b) | | | | | | | | | |
JPMorgan U.S. Government Money Market Fund Class IM Shares, 2.85% (a) (b) | | | | | | | | | |
| | | | | | | | | |
|
| Investment in an affiliated fund, which is registered under the Investment Company Act of 1940, as amended, and is advised by J.P. Morgan Investment Management Inc. |
| The rate shown is the current yield as of October 31, 2022. |
| Amount is included on the Statements of Operations as Income from securities lending (net) (after payments of rebates and Citibank’s fee). |
Carbon Transition U.S. Equity ETF |
For the year ended October 31, 2022 |
| | | | | Change in
Unrealized
Appreciation/
(Depreciation) | | | | Capital Gain
Distributions |
JPMorgan U.S. Government Money Market Fund Class IM Shares, 2.85% (a) (b) | | | | | | | | | |
|
| Investment in an affiliated fund, which is registered under the Investment Company Act of 1940, as amended, and is advised by J.P. Morgan Investment Management Inc. |
| The rate shown is the current yield as of October 31, 2022. |
| J.P. Morgan Exchange-Traded Funds | |
Climate Change Solutions ETF |
For the period ended October 31, 2022 |
| Value at
December 13,
2021(a) | | | | Change in
Unrealized
Appreciation/
(Depreciation) | | | | Capital Gain
Distributions |
JPMorgan Prime Money Market Fund Class IM Shares, 3.18% (b) (c) | | | | | | | | | |
|
| Commencement of operations was December 13, 2021. |
| Investment in an affiliated fund, which is registered under the Investment Company Act of 1940, as amended, and is advised by J.P. Morgan Investment Management Inc. |
| The rate shown is the current yield as of October 31, 2022. |
Emerging Markets Equity ETF |
For the year ended October 31, 2022 |
| | | | | Change in
Unrealized
Appreciation/
(Depreciation) | | | | Capital Gain
Distributions |
JPMorgan Securities Lending Money Market Fund Agency SL Class Shares, 3.23% (a) (b) | | | | | | | | | |
JPMorgan U.S. Government Money Market Fund Class IM Shares, 2.85% (a) (b) | | | | | | | | | |
JPMorgan U.S. Government Money Market Fund Class IM Shares, 2.85% (a) (b) | | | | | | | | | |
| | | | | | | | | |
|
| Investment in an affiliated fund, which is registered under the Investment Company Act of 1940, as amended, and is advised by J.P. Morgan Investment Management Inc. |
| The rate shown is the current yield as of October 31, 2022. |
| Amount is included on the Statements of Operations as Income from securities lending (net) (after payments of rebates and Citibank’s fee). |
|
For the year ended October 31, 2022 |
| | | | | Change in
Unrealized
Appreciation/
(Depreciation) | | | | Capital Gain
Distributions |
JPMorgan Prime Money Market Fund Class IM Shares, 3.18% (a) (b) | | | | | | | | | |
JPMorgan Securities Lending Money Market Fund Agency SL Class Shares, 3.23% (a) (b) | | | | | | | | | |
JPMorgan U.S. Government Money Market Fund Class IM Shares, 2.85% (a) (b) | | | | | | | | | |
| | | | | | | | | |
|
| Investment in an affiliated fund, which is registered under the Investment Company Act of 1940, as amended, and is advised by J.P. Morgan Investment Management Inc. |
| The rate shown is the current yield as of October 31, 2022. |
| Amount is included on the Statements of Operations as Income from securities lending (net) (after payments of rebates and Citibank’s fee). |
| J.P. Morgan Exchange-Traded Funds | |
NOTES TO FINANCIAL STATEMENTS
AS OF October 31, 2022 (continued)
|
For the year ended October 31, 2022 |
| | | | | Change in
Unrealized
Appreciation/
(Depreciation) | | | | Capital Gain
Distributions |
JPMorgan Securities Lending Money Market Fund Agency SL Class Shares, 3.23% (a) (b) | | | | | | | | | |
JPMorgan U.S. Government Money Market Fund Class IM Shares, 2.85% (a) (b) | | | | | | | | | |
JPMorgan U.S. Government Money Market Fund Class IM Shares, 2.85% (a) (b) | | | | | | | | | |
| | | | | | | | | |
|
| Investment in an affiliated fund, which is registered under the Investment Company Act of 1940, as amended, and is advised by J.P. Morgan Investment Management Inc. |
| The rate shown is the current yield as of October 31, 2022. |
| Amount is included on the Statements of Operations as Income from securities lending (net) (after payments of rebates and Citibank’s fee). |
|
For the year ended October 31, 2022 |
| | | | | Change in
Unrealized
Appreciation/
(Depreciation) | | | | Capital Gain
Distributions |
JPMorgan Securities Lending Money Market Fund Agency SL Class Shares, 3.23% (a) (b) | | | | | | | | | |
JPMorgan U.S. Government Money Market Fund Class IM Shares, 2.85% (a) (b) | | | | | | | | | |
JPMorgan U.S. Government Money Market Fund Class IM Shares, 2.85% (a) (b) | | | | | | | | | |
| | | | | | | | | |
|
| Investment in an affiliated fund, which is registered under the Investment Company Act of 1940, as amended, and is advised by J.P. Morgan Investment Management Inc. |
| The rate shown is the current yield as of October 31, 2022. |
| Amount is included on the Statements of Operations as Income from securities lending (net) (after payments of rebates and Citibank’s fee). |
U.S. Small Cap Equity ETF |
For the year ended October 31, 2022 |
| | | | | Change in
Unrealized
Appreciation/
(Depreciation) | | | | Capital Gain
Distributions |
JPMorgan Securities Lending Money Market Fund Agency SL Class Shares, 3.23% (a) (b) | | | | | | | | | |
| J.P. Morgan Exchange-Traded Funds | |
U.S. Small Cap Equity ETF (continued) |
For the year ended October 31, 2022 |
| | | | | Change in Unrealized Appreciation/ (Depreciation) | | | | Capital Gain Distributions |
JPMorgan U.S. Government Money Market Fund Class IM Shares, 2.85% (a) (b) | | | | | | | | | |
JPMorgan U.S. Government Money Market Fund Class IM Shares, 2.85% (a) (b) | | | | | | | | | |
| | | | | | | | | |
|
| Investment in an affiliated fund, which is registered under the Investment Company Act of 1940, as amended, and is advised by J.P. Morgan Investment Management Inc. |
| The rate shown is the current yield as of October 31, 2022. |
| Amount is included on the Statements of Operations as Income from securities lending (net) (after payments of rebates and Citibank’s fee). |
|
For the year ended October 31, 2022 |
| | | | | Change in
Unrealized
Appreciation/
(Depreciation) | | | | Capital Gain
Distributions |
JPMorgan U.S. Government Money Market Fund Class IM Shares, 2.85% (a) (b) | | | | | | | | | |
JPMorgan U.S. Government Money Market Fund Class IM Shares, 2.85% (a) (b) | | | | | | | | | |
| | | | | | | | | |
|
| Investment in an affiliated fund, which is registered under the Investment Company Act of 1940, as amended, and is advised by J.P. Morgan Investment Management Inc. |
| The rate shown is the current yield as of October 31, 2022. |
| Amount is included on the Statements of Operations as Income from securities lending (net) (after payments of rebates and Citibank’s fee). |
| J.P. Morgan Exchange-Traded Funds | |
NOTES TO FINANCIAL STATEMENTS
AS OF October 31, 2022 (continued)
|
For the year ended October 31, 2022 |
| | | | | Change in
Unrealized
Appreciation/
(Depreciation) | | | | Capital Gain
Distributions |
JPMorgan Securities Lending Money Market Fund Agency SL Class Shares, 3.23% (a) (b) | | | | | | | | | |
JPMorgan U.S. Government Money Market Fund Class IM Shares, 2.85% (a) (b) | | | | | | | | | |
JPMorgan U.S. Government Money Market Fund Class IM Shares, 2.85% (a) (b) | | | | | | | | | |
| | | | | | | | | |
|
| Investment in an affiliated fund, which is registered under the Investment Company Act of 1940, as amended, and is advised by J.P. Morgan Investment Management Inc. |
| The rate shown is the current yield as of October 31, 2022. |
| Amount is included on the Statements of Operations as Income from securities lending (net) (after payments of rebates and Citibank’s fee). |
|
For the year ended October 31, 2022 |
| | | | | Change in
Unrealized
Appreciation/
(Depreciation) | | | | Capital Gain
Distributions |
JPMorgan Securities Lending Money Market Fund Agency SL Class Shares, 3.23% (a) (b) | | | | | | | | | |
JPMorgan U.S. Government Money Market Fund Class IM Shares, 2.85% (a) (b) | | | | | | | | | |
JPMorgan U.S. Government Money Market Fund Class IM Shares, 2.85% (a) (b) | | | | | | | | | |
| | | | | | | | | |
|
| Investment in an affiliated fund, which is registered under the Investment Company Act of 1940, as amended, and is advised by J.P. Morgan Investment Management Inc. |
| The rate shown is the current yield as of October 31, 2022. |
| Amount is included on the Statements of Operations as Income from securities lending (net) (after payments of rebates and Citibank’s fee). |
E. Foreign Currency Translation — The books and records of the Funds are maintained in U.S. dollars. Foreign currency amounts are translated into U.S. dollars at the prevailing exchange rates of such currencies against the U.S. dollar. The market value of investment securities and other assets and liabilities are translated at the exchange rate as of the valuation date. Purchases and sales of investment securities, income and expenses are translated at the exchange rate prevailing on the respective dates of such transactions.
The Funds do not isolate the effect of changes in foreign exchange rates from changes in market prices on securities held. Accordingly, such changes are included within Change in net unrealized appreciation/depreciation on investments in non-affiliates on the Statements of Operations.
Reported realized foreign currency gains and losses arise from the disposition of foreign currency, currency gains or losses realized between the trade and settlement dates on securities transactions, and the difference between the amounts of dividends, interest and foreign withholding taxes recorded on each Fund's books on the transaction date and the U.S. dollar equivalent of the amounts actually received or paid. These reported realized foreign currency gains and losses are included in Net realized gain (loss) on foreign currency transactions on the Statements of Operations. Unrealized foreign currency gains and losses arise from changes (due to changes in exchange rates) in the value of foreign currency and other assets
| J.P. Morgan Exchange-Traded Funds | |
and liabilities denominated in foreign currencies, which are held at year end and are included in Change in net unrealized appreciation/depreciation on foreign currency translations on the Statements of Operations.
F. Futures Contracts — The Funds, except for ActiveBuilders Emerging Markets Equity ETF, ActiveBuilders International Equity ETF, Climate Change Solutions ETF and International Growth ETF, used index futures contracts to obtain long exposure to gain or reduce exposure to the stock market, to gain or reduce exposure to particular countries or regions, maintain liquidity, minimize transaction costs or to manage and hedge interest rate risk associated with portfolio investments.
Futures contracts provide for the delayed delivery of the underlying instrument at a fixed price or are settled for a cash amount based on the change in the value of the underlying instrument at a specific date in the future. Upon entering into a futures contract, the Funds are required to deposit with the broker, cash or securities in an amount equal to a certain percentage of the contract amount, which is referred to as the initial margin deposit. Subsequent payments, referred to as variation margin, are made or received by the Funds periodically and are based on changes in the market value of open futures contracts. Changes in the market value of open futures contracts are recorded as Change in net unrealized appreciation/depreciation on futures contracts on the Statements of Operations. Realized gains or losses, representing the difference between the value of the contract at the time it was opened and the value at the time it was closed, are reported on the Statements of Operations at the closing or expiration of the futures contract. Securities deposited as initial margin are designated on the SOIs, while cash deposited, which is considered restricted, is recorded on the Statements of Assets and Liabilities. A receivable from and/or a payable to brokers for the daily variation margin is also recorded on the Statements of Assets and Liabilities.
The use of futures contracts exposes the Funds to equity price risks. The Funds may be subject to the risk that the change in the value of the futures contract may not correlate perfectly with the underlying instrument. Use of long futures contracts subjects the Funds to risk of loss in excess of the amounts shown on the Statements of Assets and Liabilities, up to the notional amount of the futures contracts. Use of short futures contracts subjects the Funds to unlimited risk of loss. The Funds may enter into futures contracts only on exchanges or boards of trade. The exchange or board of trade acts as the counterparty to each futures transaction; therefore, the Funds' credit risk is limited to failure of the exchange or board of trade. Under some circumstances, futures exchanges may establish daily limits on the amount that the price of a futures contract can vary from the previous day’s settlement price, which could effectively prevent liquidation of positions.
The Funds' futures contracts are not subject to master netting arrangements (the right to close out all transactions traded with a counterparty and net amounts owed or due across transactions).
The table below discloses the volume of the Funds' futures contracts activity during the year ended October 31, 2022:
| | BetaBuilders
Developed
Asia Pacific
ex-Japan
ETF | | BetaBuilders
International
Equity ETF | | BetaBuilders
U.S. Equity ETF |
| | | | | | |
Average Notional Balance Long | | | | | | |
Ending Notional Balance Long | | | | | | |
| BetaBuilders U.S.
Mid Cap Equity
ETF | BetaBuilders U.S.
Small Cap
Equity ETF | Carbon
Transition U.S.
Equity ETF | Emerging
Markets
Equity ETF | | |
| | | | | | |
Average Notional Balance Long | | | | | | |
Ending Notional Balance Long | | | | | | |
| | | | | |
| | | | | |
Average Notional Balance Long | | | | | |
Ending Notional Balance Long | | | | | |
G. Security Transactions and Investment Income — Investment transactions are accounted for on the trade date (the date the order to buy or sell is executed). Securities gains and losses are calculated on a specifically identified cost basis.
Dividend income, net of foreign taxes withheld, if any, is recorded on the ex-dividend date or when a Fund first learns of the dividend.
To the extent such information is publicly available, the Funds record distributions received in excess of income earned from underlying investments as a reduction of cost of investments and/or realized gain. Such amounts are based on estimates if actual amounts are not available and actual amounts of income, realized gain and return of capital may differ from the estimated amounts. The Funds adjust the estimated amounts of the
| J.P. Morgan Exchange-Traded Funds | |
NOTES TO FINANCIAL STATEMENTS
AS OF October 31, 2022 (continued)
components of distributions (and consequently their net investment income) as necessary, once the issuers provide information about the actual composition of the distributions.
H. Federal Income Taxes — Each Fund is treated as a separate taxable entity for Federal income tax purposes. Each Fund's policy is to comply with the provisions of the Internal Revenue Code (the “Code”) applicable to regulated investment companies and to distribute to shareholders all of its distributable net investment income and net realized capital gains on investments. Accordingly, no provision for Federal income tax is necessary. Management has reviewed the Funds' tax positions for all open tax years and has determined that as of October 31, 2022, no liability for Federal income tax is required in the Funds' financial statements for net unrecognized tax benefits. However, management’s conclusions may be subject to future review based on changes in, or the interpretation of, the accounting standards or tax laws and regulations. Each Fund's Federal tax returns for the prior three fiscal years, or since inception if shorter, remain subject to examination by the Internal Revenue Service.
I. Foreign Taxes —The Funds may be subject to foreign taxes on income, gains on investments or currency purchases/repatriation, a portion of which may be recoverable. The Funds will accrue such taxes and recoveries as applicable, based upon their current interpretation of tax rules and regulations that exist in the markets in which they invest. When a capital gains tax is determined to apply, the Funds record an estimated deferred tax liability in an amount that would be payable if the securities were disposed of on the valuation date.
As a result of a court ruling in Sweden, during the year ended October 31, 2022, the tax authority of Sweden, paid International Equity ETF tax reclaims for prior tax withholding. These tax reclaim payments are included in Foreign withholding tax reclaims on the Statements of Operations. Interest income, if any, related to these tax reclaim payments is included in Interest income from non-affiliates on the Statements of Operations.
J. Distributions to Shareholders — Distributions from net investment income, if any, are generally declared and paid at least quarterly, except for ActiveBuilders Emerging Markets Equity ETF, ActiveBuilders International Equity ETF, BetaBuilders Japan ETF, Climate Change Solutions ETF and International Growth ETF, for which distributions are generally declared and paid at least annually. Net realized capital gains, if any, are distributed by each Fund at least annually. The amount of distributions from net investment income and net realized capital gains is determined in accordance with Federal income tax regulations, which may differ from GAAP. To the extent these “book/tax” differences are permanent in nature (i.e., that they result from other than timing of recognition — “temporary differences”), such amounts are reclassified within the capital accounts based on their Federal tax basis treatment.
The following amounts were reclassified within the capital accounts:
| | Accumulated
undistributed
(distributions in
excess of)
net investment
income | Accumulated
net realized
gains (losses) |
ActiveBuilders Emerging Markets Equity ETF | | | |
ActiveBuilders International Equity ETF | | | |
| | | |
BetaBuilders Developed Asia Pacific ex-Japan ETF | | | |
| | | |
BetaBuilders International Equity ETF | | | |
| | | |
BetaBuilders U.S. Equity ETF | | | |
BetaBuilders U.S. Mid Cap Equity ETF | | | |
BetaBuilders U.S. Small Cap Equity ETF | | | |
Carbon Transition U.S. Equity ETF | | | |
Climate Change Solutions ETF | | | |
Emerging Markets Equity ETF | | | |
| | | |
| | | |
| | | |
U.S. Small Cap Equity ETF | | | |
| | | |
| | | |
| | | |
| | | |
| J.P. Morgan Exchange-Traded Funds | |
The reclassifications for the Funds relate primarily to tax adjustments on certain investments, foreign currency gains or losses, foreign taxes and redemptions in-kind.
3. Fees and Other Transactions with Affiliates
A. Management Fee— JPMIM manages the investments of each Fund pursuant to a Management Agreement. For such services, JPMIM is paid a fee which is accrued daily and paid no more frequently than monthly based on each Fund's respective average daily net assets at the following rate:
| |
ActiveBuilders Emerging Markets Equity ETF | |
ActiveBuilders International Equity ETF | |
| |
BetaBuilders Developed Asia Pacific ex-Japan ETF | |
| |
BetaBuilders International Equity ETF | |
| |
BetaBuilders U.S. Equity ETF | |
BetaBuilders U.S. Mid Cap Equity ETF | |
BetaBuilders U.S. Small Cap Equity ETF | |
Carbon Transition U.S. Equity ETF | |
Climate Change Solutions ETF | |
Emerging Markets Equity ETF | |
| |
| |
| |
U.S. Small Cap Equity ETF | |
| |
| |
| |
| |
Under each Management Agreement, JPMIM is responsible for substantially all expenses of each Fund, (including expenses of the Trust relating to each Fund), except for the management fees, payments under the Funds' 12b-1 plan (if any), interest expenses, dividend and interest expenses related to short sales, taxes, acquired fund fees and expenses (other than fees for funds advised by the Adviser and/or its affiliates), costs of holding shareholder meetings, and litigation and potential litigation and other extraordinary expenses not incurred in the ordinary course of each Fund’s business. Additionally, each Fund is responsible for its non-operating expenses, including brokerage commissions and fees and expenses associated with each Fund’s securities lending program, if applicable. For the avoidance of doubt, the Adviser’s payment of such expenses may be accomplished through a Fund’s payment of such expenses and a corresponding reduction in the fee payable to the Adviser, provided, however, that if the amount of expenses paid by a Fund exceeds the fee payable to the Adviser, the Adviser will reimburse that Fund for such amount.
In the case of ActiveBuilders Emerging Markets Equity ETF, the Adviser has contractually agreed to waive fees through February 28, 2023 in the amount of the acquired fund fees and expenses for any unaffiliated investment company that the Fund invests in so that the total operating expenses do not exceed 0.33%. For the year ended October 31, 2022, the Fund did not waive any fees.
B. Administration Fee — JPMIM provides administration services to the Funds. Pursuant to each Management Agreement, JPMIM is compensated as described in Note 3.A.
JPMorgan Chase Bank, N.A. (“JPMCB”), a wholly-owned subsidiary of JPMorgan, serves as the Funds' sub-administrator (the “Sub-administrator”). For its services as Sub-administrator, JPMCB receives a portion of the management fees payable to JPMIM.
C. Custodian, Accounting and Transfer Agent Fees— JPMCB provides custody, accounting and transfer agency services to the Funds. For performing these services, JPMIM pays JPMCB transaction and asset-based fees that vary according to the number of transactions and positions, plus out-of-pocket expenses.
Additionally, Authorized Participants generally pay transaction fees associated with the creation and redemption of Fund shares. These fees are paid to JPMIM to offset certain custodian charges that are covered by each Management Agreement.
Interest income earned on cash balances at the custodian, if any, is included in Interest income from affiliates on the Statements of Operations.
Interest expense paid to the custodian related to cash overdrafts, if any, is included in Interest expense to affiliates on the Statements of Operations.
| J.P. Morgan Exchange-Traded Funds | |
NOTES TO FINANCIAL STATEMENTS
AS OF October 31, 2022 (continued)
D. Distribution Services — The Distributor or its agent distributes Creation Units for each Fund on an agency basis. The Distributor does not maintain a secondary market in shares of each Fund. JPMDS receives no fees for their distribution services under the distribution agreement with the Trust (the “Distribution Agreement”). Although the Trust does not pay any fees under the Distribution Agreement, JPMIM pays JPMDS for certain distribution related services.
E. Waivers and Reimbursements — The Funds may invest in one or more money market funds advised by the Adviser (affiliated money market funds). The fees for the affiliated money market funds, except for investments of securities lending cash collateral, are covered under each Management Agreement as described in Note 3.A.
F. Other — Certain officers of the Trust are affiliated with the Adviser, the Administrator and JPMDS. Such officers receive no compensation from the Funds for serving in their respective roles.
The Board designated and appointed a Chief Compliance Officer to the Funds pursuant to Rule 38a-1 under the 1940 Act. The fees associated with the office of the Chief Compliance Officer are paid for by JPMIM as described in Note 3.A.
The Securities and Exchange Commission (“SEC”) has granted an exemptive order permitting the Funds to engage in principal transactions with J.P. Morgan Securities LLC, an affiliated broker, involving taxable money market instruments, subject to certain conditions.
4. Investment Transactions
During the year ended October 31, 2022, purchases and sales of investments (excluding short-term investments) were as follows:
| Purchases
(excluding
U.S. Government) | Sales
(excluding
U.S. Government) |
ActiveBuilders Emerging Markets Equity ETF | | |
ActiveBuilders International Equity ETF | | |
| | |
BetaBuilders Developed Asia Pacific ex-Japan ETF | | |
| | |
BetaBuilders International Equity ETF | | |
| | |
BetaBuilders U.S. Equity ETF | | |
BetaBuilders U.S. Mid Cap Equity ETF | | |
BetaBuilders U.S. Small Cap Equity ETF | | |
Carbon Transition U.S. Equity ETF | | |
Climate Change Solutions ETF | | |
Emerging Markets Equity ETF | | |
| | |
| | |
| | |
U.S. Small Cap Equity ETF | | |
| | |
| | |
| | |
| | |
During the year ended October 31, 2022, there were no purchases or sales of U.S. Government securities.
For the year ended October 31, 2022, in-kind transactions associated with creations and redemptions were as follows:
| | |
ActiveBuilders Emerging Markets Equity ETF | | |
| | |
BetaBuilders Developed Asia Pacific ex-Japan ETF | | |
| | |
BetaBuilders International Equity ETF | | |
| | |
| J.P. Morgan Exchange-Traded Funds | |
| | |
BetaBuilders U.S. Equity ETF | | |
BetaBuilders U.S. Mid Cap Equity ETF | | |
BetaBuilders U.S. Small Cap Equity ETF | | |
Carbon Transition U.S. Equity ETF | | |
Climate Change Solutions ETF | | |
Emerging Markets Equity ETF | | |
| | |
| | |
| | |
U.S. Small Cap Equity ETF | | |
| | |
| | |
| | |
| | |
During the year ended October 31, 2022, the Funds delivered portfolio securities for the redemption of Fund Shares (in-kind redemptions). Cash and portfolio securities were transferred for redemptions at fair value. For financial reporting purposes, the Funds recorded net realized gains and losses in connection with each in-kind redemption transaction.
5. Federal Income Tax Matters
For Federal income tax purposes, the estimated cost and unrealized appreciation (depreciation) in value of investments held at October 31, 2022 were as follows:
| | Gross
Unrealized
Appreciation | Gross
Unrealized
Depreciation | Net Unrealized
Appreciation
(Depreciation) |
ActiveBuilders Emerging Markets Equity ETF | | | | |
ActiveBuilders International Equity ETF | | | | |
| | | | |
BetaBuilders Developed Asia Pacific ex-Japan ETF | | | | |
| | | | |
BetaBuilders International Equity ETF | | | | |
| | | | |
BetaBuilders U.S. Equity ETF | | | | |
BetaBuilders U.S. Mid Cap Equity ETF | | | | |
BetaBuilders U.S. Small Cap Equity ETF | | | | |
Carbon Transition U.S. Equity ETF | | | | |
Climate Change Solutions ETF | | | | |
Emerging Markets Equity ETF | | | | |
| | | | |
| | | | |
| | | | |
U.S. Small Cap Equity ETF | | | | |
| | | | |
| | | | |
| | | | |
| | | | |
The difference between book and tax basis appreciation (depreciation) on tax adjustments on certain investments is primarily attributed to investments and wash sale loss deferrals.
| J.P. Morgan Exchange-Traded Funds | |
NOTES TO FINANCIAL STATEMENTS
AS OF October 31, 2022 (continued)
The tax character of distributions paid during the year ended October 31, 2022 was as follows:
| | Net
Long-Term
Capital Gains | |
ActiveBuilders Emerging Markets Equity ETF | | | |
ActiveBuilders International Equity ETF | | | |
| | | |
BetaBuilders Developed Asia Pacific ex-Japan ETF | | | |
| | | |
BetaBuilders International Equity ETF | | | |
| | | |
BetaBuilders U.S. Equity ETF | | | |
BetaBuilders U.S. Mid Cap Equity ETF | | | |
BetaBuilders U.S. Small Cap Equity ETF | | | |
Carbon Transition U.S. Equity ETF | | | |
Climate Change Solutions ETF | | | |
Emerging Markets Equity ETF | | | |
| | | |
| | | |
| | | |
U.S. Small Cap Equity ETF | | | |
| | | |
| | | |
| | | |
| | | |
|
| Short-term gain distributions are treated as ordinary income for income tax purposes. |
| J.P. Morgan Exchange-Traded Funds | |
The tax character of distributions paid during the year ended October 31, 2021 was as follows:
| | |
| | |
BetaBuilders Developed Asia Pacific ex-Japan ETF | | |
| | |
BetaBuilders International Equity ETF | | |
| | |
BetaBuilders U.S. Equity ETF | | |
BetaBuilders U.S. Mid Cap Equity ETF | | |
BetaBuilders U.S. Small Cap Equity ETF | | |
Carbon Transition U.S. Equity ETF | | |
Emerging Markets Equity ETF | | |
| | |
| | |
| | |
U.S. Small Cap Equity ETF | | |
| | |
| | |
| | |
| | |
|
| Short-term gain distributions are treated as ordinary income for income tax purposes. |
| J.P. Morgan Exchange-Traded Funds | |
NOTES TO FINANCIAL STATEMENTS
AS OF October 31, 2022 (continued)
As of October 31, 2022, the estimated components of net assets (excluding paid-in-capital) on a tax basis were as follows:
| Current
Distributable
Ordinary
Income | Current
Distributable
Long-Term
Capital Gain
(Tax Basis Capital
Loss Carryover) | Unrealized
Appreciation
(Depreciation) |
ActiveBuilders Emerging Markets Equity ETF | | | |
ActiveBuilders International Equity ETF | | | |
| | | |
BetaBuilders Developed Asia Pacific ex-Japan ETF | | | |
| | | |
BetaBuilders International Equity ETF | | | |
| | | |
BetaBuilders U.S. Equity ETF | | | |
BetaBuilders U.S. Mid Cap Equity ETF | | | |
BetaBuilders U.S. Small Cap Equity ETF | | | |
Carbon Transition U.S. Equity ETF | | | |
Climate Change Solutions ETF | | | |
Emerging Markets Equity ETF | | | |
| | | |
| | | |
| | | |
U.S. Small Cap Equity ETF | | | |
| | | |
| | | |
| | | |
| | | |
The cumulative timing differences primarily consist of tax adjustments on certain investments, trustee deferred compensation, derivatives and wash sale loss deferrals.
| J.P. Morgan Exchange-Traded Funds | |
At October 31, 2022, the following Funds had net capital loss carryforwards which are available to offset future realized gains:
| Capital Loss Carryforward Character |
| | |
ActiveBuilders Emerging Markets Equity ETF | | |
ActiveBuilders International Equity ETF | | |
| | |
BetaBuilders Developed Asia Pacific ex-Japan ETF | | |
| | |
BetaBuilders International Equity ETF | | |
| | |
BetaBuilders U.S. Equity ETF | | |
BetaBuilders U.S. Mid Cap Equity ETF | | |
BetaBuilders U.S. Small Cap Equity ETF | | |
Carbon Transition U.S. Equity ETF | | |
Climate Change Solutions ETF | | |
Emerging Markets Equity ETF | | |
| | |
| | |
| | |
U.S. Small Cap Equity ETF | | |
| | |
| | |
| | |
| | |
During the year ended October 31, 2022, the following Funds utilized capital loss carryforwards as follows:
6. Capital Share Transactions
The Trust issues and redeems shares of the Funds only in Creation Units through the Distributor at NAV. Capital shares transactions detail can be found in the Statements of Changes in Net Assets.
Shares of the Funds may only be purchased or redeemed by Authorized Participants. Such Authorized Participants may from time to time hold, of record or beneficially, a substantial percentage of the Funds' shares outstanding and act as executing or clearing broker for investment transactions on behalf of the Funds. An Authorized Participant is either (1) a “Participating Party” or other participant in the clearing process through the Continuous Net Settlement System of the National Securities Clearing Corporation (“NSCC”); or (2) a DTC Participant; which, in either case, must have executed an agreement with the Distributor.
Creation Units of a Fund may be created in advance of receipt by the Trust of all or a portion of the applicable basket of equity securities and other instruments (“Deposit Instruments”) and cash as described in the Funds’ registration statement. In these instances, the initial Deposit Instruments and cash must be deposited in an amount equal to the sum of the cash amount, plus at least 105% for ActiveBuilders International Equity ETF, BetaBuilders Canada ETF, BetaBuilders Developed Asia Pacific ex-Japan ETF, BetaBuilders Europe ETF, BetaBuilders International Equity ETF, BetaBuilders Japan ETF, BetaBuilders U.S. Small Cap Equity ETF, Carbon Transition U.S. Equity ETF, Climate Change Solutions ETF, International Equity ETF and International Growth ETF, and plus at least 110% for ActiveBuilders Emerging Markets Equity ETF and Emerging Markets Equity ETF of the market value of undelivered Deposit Instruments. A transaction fee may be imposed to offset transfer and other transaction costs associated with the purchase or redemption of Creation Units.
| J.P. Morgan Exchange-Traded Funds | |
NOTES TO FINANCIAL STATEMENTS
AS OF October 31, 2022 (continued)
7. Risks, Concentrations and Indemnifications
In the normal course of business, the Funds enter into contracts that contain a variety of representations which provide general indemnifications. Each Fund's maximum exposure under these arrangements is unknown. The amount of exposure would depend on future claims that may be brought against each Fund. However, based on experience, the Funds expect the risk of loss to be remote.
As of October 31, 2022, JPMorgan SmartRetirement Funds and JPMorgan SmartRetirement Blend Funds, which are affiliated fund of funds, each owned in the aggregate, shares representing more than 10% of the net assets of the Funds as follows:
| JPMorgan
SmartRetirement
Funds | JPMorgan
SmartRetirement
Blend Funds |
ActiveBuilders Emerging Markets Equity ETF | | |
BetaBuilders International Equity ETF | | |
BetaBuilders U.S. Mid Cap Equity ETF | | |
BetaBuilders U.S. Small Cap Equity ETF | | |
Significant shareholder transactions by these shareholders may impact the Funds' performance and liquidity.
As of October 31, 2022, the Adviser owned shares representing more than 10% of net assets of the following Funds:
| |
ActiveBuilders International Equity ETF | |
Carbon Transition U.S. Equity ETF | |
Climate Change Solutions ETF | |
Significant shareholder transactions by the Adviser may impact the Funds' performance and liquidity.
ActiveBuilders Emerging Markets Equity ETF, ActiveBuilders International Equity ETF, BetaBuilders Canada ETF, BetaBuilders Developed Asia Pacific ex-Japan ETF, BetaBuilders Europe ETF, BetaBuilders International Equity ETF, BetaBuilders Japan ETF, Climate Change Solutions ETF, Emerging Markets Equity ETF, International Equity ETF and International Growth ETF may have elements of risk not typically associated with investments in the United States of America due to concentrated investments in a limited number of foreign countries or regions, which may vary throughout the period. Such concentrations may subject each of these Funds to additional risks resulting from political or economic conditions in such countries or regions and the possible imposition of adverse governmental laws or currency exchange restrictions could cause the securities and their markets to be less liquid and their prices to be more volatile than those of comparable U.S. securities.
Investing in securities of foreign countries may include certain risks and considerations not typically associated with investing in U.S. securities. These risks include revaluation of currencies, high rates of inflation, repatriation restrictions on income and currencies, and future and adverse political, social and economic developments.
| J.P. Morgan Exchange-Traded Funds | |
As of October 31, 2022, the following Funds had non-U.S. country allocations representing greater than 10% of total investments (excluding investment of cash collateral from securities loaned) as follows:
| ActiveBuilders
Emerging
Markets
Equity ETF | ActiveBuilders
International
Equity ETF | | BetaBuilders
Developed
Asia Pacific
ex-Japan
ETF | | BetaBuilders
International
Equity ETF | |
| | | | | | | |
| | | | | | | |
| | | | | | | |
| | | | | | | |
| | | | | | | |
| | | | | | | |
| | | | | | | |
| | | | | | | |
| | | | | | | |
| | | | | | | |
| | | | | | | |
| | | | | | | |
| Emerging
Markets
Equity ETF | | |
| | | |
| | | |
| | | |
| | | |
| | | |
As of October 31, 2022, a significant portion of the investments of the ActiveBuilders Emerging Markets Equity ETF, ActiveBuilders International Equity ETF, BetaBuilders Canada ETF, BetaBuilders Developed Asia Pacific ex-Japan ETF, BetaBuilders Europe ETF, BetaBuilders International Equity ETF, BetaBuilders Japan ETF, Emerging Markets Equity ETF, International Equity ETF and International Growth ETF consisted of securities that were denominated in foreign currencies. Changes in currency exchange rates will affect the value of, and investment income from, such securities.
Derivatives may be riskier than other types of investments because they may be more sensitive to changes in economic and market conditions and could result in losses that significantly exceed the Funds’ original investment. Many derivatives create leverage thereby causing the Funds to be more volatile than they would have been if they had not used derivatives. Derivatives also expose the Funds to counterparty risk (the risk that the derivative counterparty will not fulfill its contractual obligations), including credit risk of the derivative counterparty. The possible lack of a liquid secondary market for derivatives and the resulting inability of the Funds to sell or otherwise close a derivatives position could expose the Funds to losses.
Disruptions to creations and redemptions, the existence of significant market volatility or potential lack of an active trading market for the Shares (including through a trading halt), as well as other factors, may result in Shares trading significantly above (at a premium) or below (at a discount) to the NAV or to the intraday value of the Funds’ holdings. During such periods, investors may incur significant losses if shares are sold.
The Funds, except for ActiveBuilders Emerging Markets Equity ETF, ActiveBuilders International Equity ETF, Climate Change Solutions ETF and International Growth ETF, may not track the return of their underlying index for a number of reasons and therefore may not achieve their investment objective. For example, the Funds incur a number of operating expenses not applicable to their underlying index, and incur costs in buying and selling securities, especially when rebalancing the Funds’ securities holdings to reflect changes in the composition of the underlying index. In addition, each Fund’s return may differ from the return of its underlying index as a result of, among other things, pricing differences and the inability to purchase certain securities included in the underlying index due to regulatory or other restrictions. To the extent of the previously outlined items, each Fund’s return may differ from the return of the underlying index.
ActiveBuilders Emerging Market Equity ETF, ActiveBuilders International Equity ETF, BetaBuilders Canada ETF, BetaBuilders Developed Asia Pacific ex-Japan ETF, BetaBuilders Europe ETF, BetaBuilders International Equity ETF, BetaBuilders Japan ETF, Climate Change Solutions ETF, Diversified Return Emerging Markets Equity ETF, Diversified International Equity ETF and International Growth ETF invest in foreign issuers and foreign securities (including depositary receipts) that are subject to additional risks, including political and economic risks, civil conflicts and war, greater volatility, expropriation and nationalization risks, sanctions or other measures by the United States or other governments, currency fluctuations, higher transaction costs, delayed settlement, possible foreign controls on investment, liquidity risks and less stringent investor protection and
| J.P. Morgan Exchange-Traded Funds | |
NOTES TO FINANCIAL STATEMENTS
AS OF October 31, 2022 (continued)
disclosure standards of foreign markets. In certain markets where securities and other instruments are not traded “delivery versus payment,” a Fund may not receive timely payment for securities or other instruments it has delivered or receive delivery of securities paid for and may be subject to increased risk that the counterparty will fail to make payments or delivery when due or default completely.
Events and evolving conditions in certain economies or markets may alter the risks associated with investments tied to countries or regions that historically were perceived as comparatively stable becoming riskier and more volatile ActiveBuilders Emerging Market Equity ETF and Diversified Return Emerging Markets Equity ETF each invests a substantial portion of their assets in emerging market countries. These risks are magnified in countries in emerging markets. Emerging market countries typically have less established market economies than developed countries and may face greater social, economic, regulatory and political uncertainties. In addition, emerging markets typically present greater illiquidity and price volatility concerns due to smaller or limited local capital markets and greater difficulty in determining market valuations of securities due to limited public information on issuers. Certain emerging market countries may be subject to less stringent requirements regarding accounting, auditing, financial reporting and record keeping and therefore, material information related to an investment may not be available or reliable.
Climate Change Solutions ETF’s investment strategy may result in the Climate Change Solutions ETF investing in securities or industry sectors that underperform the market. The Climate Change Solutions ETF’s focus on securities of issuers that, in the Adviser’s opinion, are developing solutions to address climate change and benefit from growing demand for such solutions will result in exposure to certain market segments including transportation, construction, food and water, renewable energy and electrification and recycling and reuse. Climate Change Solutions ETF will be more susceptible to events or factors affecting such market segments, and the market prices of its portfolio securities may be more volatile than those of funds that are more diversified. Climate Change Solutions ETF is particularly exposed to, and may be negatively impacted by changes in global and regional climates, environmental protection regulatory actions, changes in government standards and subsidy levels, changes in taxation and other domestic and international political, regulatory and economic developments. Companies involved in renewable energy and electrification also may be adversely affected by the increased use of, or decreases in prices for, oil or other fossil fuels. In addition, scientific developments, such as breakthroughs in the remediation of climate change, and changes in governmental policies relating to the effects of pollution may affect investments in pollution control, which could in turn affect these companies. Such companies also may be significantly affected by technological changes in industries focusing on energy, pollution control and mitigation of climate change. Because society’s focus on climate change issues is relatively new, the emphasis and direction of governmental policies is subject to significant change, and rapid technological change could render even new approaches and products obsolete. The Adviser may consider certain factors related to climate change that may cause it to perform differently compared to funds that do not have such considerations. The consideration of these factors may result in the Climate Change Solutions ETF forgoing opportunities to buy certain securities when it might otherwise be advantageous to do so, or selling securities for climate change reasons when it might otherwise be disadvantageous for it to do so. In addition, there is a risk that the companies identified by the Adviser do not operate as expected when addressing climate changes issues. There are significant differences in interpretations of what it means for a company to have solutions that address climate change.
In addition, a Fund is limited in its ability to exercise its legal rights or enforce a counterparty’s legal obligations in certain jurisdictions outside of the United States, in particular, in emerging market countries.
The Funds are subject to infectious disease epidemics/pandemics risk. The worldwide outbreak of COVID-19 has negatively affected economies, markets and individual companies throughout the world. The effects of this COVID-19 pandemic to public health, and business and market conditions, including among other things, reduced consumer demand and economic output, supply chain disruptions and increased government spending may continue to have a significant negative impact on the performance of a Fund’s investments, increase a Fund’s volatility, negatively impact a Fund’s arbitrage and pricing mechanisms, exacerbate other pre-existing political, social and economic risks to the Funds and negatively impact broad segments of businesses and populations. In addition, governments, their regulatory agencies, or self-regulatory organizations have taken or may take actions in response to the pandemic that affect the instruments in which the Funds invest, or the issuers of such instruments, in ways that could also have a significant negative impact on a Fund’s investment performance. The duration and extent of COVID-19 and associated economic and market conditions and uncertainty over the long-term cannot be reasonably estimated at this time. The ultimate impact of COVID-19 and the extent to which the associated conditions impact a Fund will also depend on future developments, which are highly uncertain, difficult to accurately predict and subject to frequent changes.
8. Subsequent Event
Effective November 1, 2022, the Funds rely upon an exemptive order granted by the SEC (the “Order”) permitting the establishment and operation of an Interfund Lending Facility (the “Facility”). The Facility allows the Funds to directly lend and borrow money to or from any other fund relying upon the Order at rates beneficial to both the borrowing and lending funds. Advances under the Facility are taken primarily for temporary or emergency purposes, including the meeting of redemption requests that otherwise might require the untimely disposition of securities, and are subject to each Fund's borrowing restrictions. The Interfund loan rate is determined, as specified in the Order, by averaging the current repurchase agreement rate and the current bank loan rate. The Order was granted to JPMorgan Trust II and may be relied upon by the Funds because the Funds and the series of JPMorgan Trust II are all investment companies in the same “group of investment companies” (as defined in Section 12(d)(1)(G) of the 1940 Act).
| J.P. Morgan Exchange-Traded Funds | |
REPORT OF INDEPENDENT REGISTERED PUBLIC ACCOUNTING FIRM
To the Board of Trustees of J.P. Morgan Exchange-Traded Fund Trust and Shareholders of each of the twenty-one funds listed in the table below
Opinions on the Financial Statements
We have audited the accompanying statements of assets and liabilities, including the schedules of portfolio investments, of each of the funds listed in the table below (twenty-one of the funds constituting J.P. Morgan Exchange-Traded Fund Trust, hereafter collectively referred to as the "Funds") as of October 31, 2022, the related statements of operations and of changes in net assets for each of the periods indicated in the table below, including the related notes, and the financial highlights for each of the periods indicated therein (collectively referred to as the “financial statements”). In our opinion, the financial statements present fairly, in all material respects, the financial position of each of the Funds as of October 31, 2022, the results of each of their operations and the changes in each of their net assets for the periods indicated in the table below, and each of the financial highlights for each of the periods indicated therein, in conformity with accounting principles generally accepted in the United States of America.
Fund
JPMorgan ActiveBuilders Emerging Markets Equity ETF(1) |
JPMorgan ActiveBuilders International Equity ETF(2) |
JPMorgan BetaBuilders Canada ETF(3) |
JPMorgan BetaBuilders Developed Asia Pacific ex-Japan ETF (formerly known as JPMorgan BetaBuilders Developed Asia ex-Japan ETF)(3) |
JPMorgan BetaBuilders Europe ETF(3) |
JPMorgan BetaBuilders International Equity ETF(3) |
JPMorgan BetaBuilders Japan ETF(3) |
JPMorgan BetaBuilders U.S. Equity ETF(3) |
JPMorgan BetaBuilders U.S. Mid Cap Equity ETF(3) |
JPMorgan BetaBuilders U.S. Small Cap Equity ETF(4) |
JPMorgan Carbon Transition U.S. Equity ETF(5) |
JPMorgan Climate Change Solutions ETF(6) |
JPMorgan Diversified Return Emerging Markets Equity ETF(3) |
JPMorgan Diversified Return International Equity ETF(3) |
JPMorgan Diversified Return U.S. Equity ETF(3) |
JPMorgan Diversified Return U.S. Mid Cap Equity ETF(3) |
JPMorgan Diversified Return U.S. Small Cap Equity ETF(3) |
JPMorgan International Growth ETF(3) |
JPMorgan U.S. Momentum Factor ETF(3) |
JPMorgan U.S. Quality Factor ETF(3) |
JPMorgan U.S. Value Factor ETF(3) |
| Statement of operations for the year ended October 31, 2022, and statement of changes in net assets for the year ended October 31, 2022 and the period March 10, 2021 (commencement of operations) through October 31, 2021 |
| Statement of operations for the year ended October 31, 2022, and statement of changes in net assets for the year ended October 31, 2022 and the period July 7, 2021 (commencement of operations) through October 31, 2021 |
| Statement of operations for the year ended October 31, 2022 and statement of changes in net assets for the years ended October 31, 2022 and October 31, 2021 |
| Statement of operations for the year ended October 31, 2022, and statement of changes in net assets for the year ended October 31, 2022 and the period November 16, 2020 (commencement of operations) through October 31, 2021 |
| Statement of operations for the year ended October 31, 2022, and statement of changes in net assets for the year ended October 31, 2022 and the period December 9, 2020 (commencement of operations) through October 31, 2021 |
| Statement of operations and statement of changes in net assets for the period December 13, 2021 (commencement of operations) through October 31, 2022 |
Basis for Opinions
These financial statements are the responsibility of the Funds’ management. Our responsibility is to express an opinion on the Funds’ financial statements based on our audits. We are a public accounting firm registered with the Public Company Accounting Oversight Board (United States) (PCAOB) and are required to be independent with respect to the Funds in accordance with the U.S. federal securities laws and the applicable rules and regulations of the Securities and Exchange Commission and the PCAOB.
| J.P. Morgan Exchange-Traded Funds | |
REPORT OF INDEPENDENT REGISTERED PUBLIC ACCOUNTING FIRM
We conducted our audits of these financial statements in accordance with the standards of the PCAOB. Those standards require that we plan and perform the audit to obtain reasonable assurance about whether the financial statements are free of material misstatement, whether due to error or fraud.
Our audits included performing procedures to assess the risks of material misstatement of the financial statements, whether due to error or fraud, and performing procedures that respond to those risks. Such procedures included examining, on a test basis, evidence regarding the amounts and disclosures in the financial statements. Our audits also included evaluating the accounting principles used and significant estimates made by management, as well as evaluating the overall presentation of the financial statements. Our procedures included confirmation of securities owned as of October 31, 2022 by correspondence with the custodian, transfer agent and brokers; when replies were not received from brokers, we performed other auditing procedures. We believe that our audits provide a reasonable basis for our opinions.
/s/ PricewaterhouseCoopers LLP
New York, New York
December 22, 2022
We have served as the auditor of one or more investment companies in the JPMorgan Funds complex since 1993.
| J.P. Morgan Exchange-Traded Funds | |
The Funds’ Statement of Additional Information includes additional information about the Funds’ Trustees and is available, without charge, upon request by calling 1-844-457-6383 or on the J.P. Morgan Funds’ website at www.jpmorganfunds.com.
Name (Year of Birth);
Positions With
the Funds (1) | Principal Occupation
During Past 5 Years | Number of
Funds in Fund
Complex Overseen
by Trustee (2) | Other Directorships Held
During the Past 5 Years |
| | | |
John F. Finn (1947); Chair
since 2020; Trustee since 1998. | Chairman, Gardner, Inc. (supply chain management company serving industrial and consumer markets) (serving in various roles 1974-present). | | Director, Greif, Inc. (GEF) (industrial package products and services) (2007-present); Trustee, Columbus Association for the Performing Arts (1988-present). |
Stephen P. Fisher (1959);
Trustee since 2018. | Retired; Chairman and Chief Executive Officer, NYLIFE Distributors LLC (registered broker-dealer) (serving in various roles 2008-2013); Chairman, NYLIM Service Company LLC (transfer agent) (2008-2017); New York Life Investment Management LLC (registered investment adviser) (serving in various roles 2005-2017); Chairman, IndexIQ Advisors LLC (registered investment adviser for ETFs) (2014-2017); President, MainStay VP Funds Trust (2007-2017), MainStay DefinedTerm Municipal Opportunities Fund (2011-2017) and MainStay Funds Trust (2007-2017) (registered investment companies). | | Honors Program Advisory Board Member, The Zicklin School of Business, Baruch College, The City University of New York (2017-present). |
Gary L. French (1951);
Trustee since 2014. | Real Estate Investor (2011-2020); Investment management industry Consultant and Expert Witness (2011-present); Senior Consultant for The Regulatory Fundamentals Group LLC (2011-2017). | | Independent Trustee, The China Fund, Inc. (2013-2019); Exchange Traded Concepts Trust II (2012-2014); Exchange Traded Concepts Trust I (2011-2014). |
Kathleen M. Gallagher (1958);
Trustee since 2018. | Retired; Chief Investment Officer — Benefit Plans, Ford Motor Company (serving in various roles 1985-2016). | | Non- Executive Director, Legal & General Investment Management (Holdings) (2018-present); Non-Executive Director, Legal & General Investment Management America (U.S. Holdings) (financial services and insurance) (2017-present); Advisory Board Member, State Street Global Advisors Total Portfolio Solutions (2017-present); Member, Client Advisory Council, Financial Engines, LLC (registered investment adviser) (2011-2016); Director, Ford Pension Funds Investment Management Ltd. (2007-2016). |
Robert J. Grassi (1957);
Trustee since 2014. | Sole Proprietor, Academy Hills Advisors LLC (2012-present); Pension Director, Corning Incorporated (2002-2012). | | |
| J.P. Morgan Exchange-Traded Funds | |
TRUSTEES
(Unaudited) (continued)
Name (Year of Birth); Positions With the Funds (1) | Principal Occupation During Past 5 Years | Number of Funds in Fund Complex Overseen by Trustee (2) | Other Directorships Held During the Past 5 Years |
Frankie D. Hughes (1952);
Trustee since 2008. | President, Ashland Hughes Properties (property management) (2014-present); President and Chief Investment Officer, Hughes Capital Management, Inc. (fixed income asset management) (1993-2014). | | |
Raymond Kanner (1953);
Trustee since 2017. | Retired; Managing Director and Chief Investment Officer, IBM Retirement Funds (2007-2016). | | Advisory Board Member, Penso Advisors, LLC (2020-present); Advisory Board Member, Los Angeles Capital (2018-present); Advisory Board Member, State Street Global Advisors Total Portfolio Solutions (2017- present); Acting Executive Director, Committee on Investment of Employee Benefit Assets (CIEBA) (2016-2017); Advisory Board Member, Betterment for Business (robo advisor) (2016- 2017); Advisory Board Member, BlueStar Indexes (index creator) (2013-2017); Director, Emerging Markets Growth Fund (registered investment company) (1997-2016); Member, Russell Index Client Advisory Board (2001-2015). |
Thomas P. Lemke (1954);
Trustee since 2014. | | | (1) Independent Trustee of Advisors’ Inner Circle III fund platform, consisting of the following: (i) the Advisors’ Inner Circle Fund III, (ii) the Gallery Trust, (iii) the Schroder Series Trust, (iv) the Delaware Wilshire Private Markets Fund (since 2020), (v) Chiron Capital Allocation Fund Ltd., and (vi) formerly the Winton Diversified Opportunities Fund (2014-2018); and (2) Independent Trustee of the Symmetry Panoramic Trust (since 2018). |
Lawrence R. Maffia (1950);
Trustee since 2014 | Retired; Director and President, ICI Mutual Insurance Company (2006-2013). | | Director, ICI Mutual Insurance Company (1999-2013). |
Mary E. Martinez (1960); Vice
Chair since 2021; Trustee since 2013. | Associate, Special Properties, a Christie’s International Real Estate Affiliate (2010-present); Managing Director, Bank of America (asset management) (2007-2008); Chief Operating Officer, U.S. Trust Asset Management, U.S. Trust Company (asset management) (2003-2007); President, Excelsior Funds (registered investment companies) (2004-2005). | | |
Marilyn McCoy (1948);
Trustee since 2005. | Vice President of Administration and Planning, Northwestern University (1985-present). | | |
| J.P. Morgan Exchange-Traded Funds | |
Name (Year of Birth); Positions With the Funds (1) | Principal Occupation During Past 5 Years | Number of Funds in Fund Complex Overseen by Trustee (2) | Other Directorships Held During the Past 5 Years |
Dr. Robert A. Oden, Jr. (1946); Trustee
since 2005. | Retired; President, Carleton College (2002-2010); President, Kenyon College (1995-2002). | | Trustee, The Coldwater Conservation Fund (2017-present); Trustee, American Museum of Fly Fishing (2013-present); Trustee and Vice Chair, Trout Unlimited (2017-2021);Trustee, Dartmouth- Hitchcock MedicalCenter (2011-2020). |
Marian U. Pardo* (1946);
Trustee since 2013. | Managing Director and Founder, Virtual Capital Management LLC (investment consulting) (2007-present); Managing Director, Credit Suisse Asset Management (portfolio manager) (2003-2006). | | Board Chair and Member, Board of Governors, Columbus Citizens Foundation (not-for-profit supporting philanthropic and cultural programs) (2006-present). |
Emily A. Youssouf (1951);
Trustee since 2022. | Adjunct Professor (2011-present) and Clinical Professor (2009-2011), NYU Schack Institute of Real Estate; Board Member and Member of the Audit Committee (2013–present), Chair of Finance Committee (2019-present), Member of Related Parties Committee (2013-2018) and Member of the Enterprise Risk Committee (2015-2018), PennyMac Financial Services, Inc.; Board Member (2005-2018), Chair of Capital Committee (2006-2016), Chair of Audit Committee (2005-2018), Member of Finance Committee (2005-2018) and Chair of IT Committee (2016-2018), NYC Health and Hospitals Corporation. | | Trustee, NYC School Construction Authority (2009-present); Board Member, NYS Job Development Authority (2008-present); Trustee and Chair of the Audit Committee of the Transit Center Foundation (2015-2019). |
| | | |
Robert F. Deutsch** (1957);
Trustee since 2014. | Retired; Head of ETF Business for JPMorgan Asset Management (2013-2017); Head of Global Liquidity Business for JPMorgan Asset Management (2003-2013). | | Treasurer and Director of the JUST Capital Foundation (2017-present). |
Nina O. Shenker** (1957);
Trustee since 2022. | Vice Chair (2017-2021), General Counsel and Managing Director (2008-2016), Associate General Counsel and Managing Director (2004-2008), J.P. Morgan Asset & Wealth Management. | | Director and Member of Legal and Human Resources Subcommittees, American Jewish Joint Distribution Committee (2018-present). |
|
| The year shown is the first year in which a Trustee became a member of any of the following: the Mutual Fund Board, the ETF Board, the heritage J.P. Morgan Funds or the heritage One Group Mutual Funds. Trustees serve an indefinite term, until resignation, retirement, removal or death. The Board’s current retirement policy sets retirement at the end of the calendar year in which the Trustee attains the age of 75, provided that any Board member who was a member of the Mutual Fund Board prior to January 1, 2022 and was born prior to January 1, 1950 shall retire from the Board at the end of the calendar year in which the Trustee attains the age of 78. |
| A Fund Complex means two or more registered investment companies that hold themselves out to investors as related companies for purposes of investment and investor services or have a common investment adviser or have an investment adviser that is an affiliated person of the investment adviser of any of the other registered investment companies. The J.P. Morgan Funds Complex for which the Board of Trustees serves currently includes nine registered investment companies (166 J.P. Morgan Funds). |
| In connection with prior employment with JPMorgan Chase, Ms. Pardo was the recipient of non-qualified pension plan payments from JPMorgan Chase in the amount of approximately $2,055 per month, which she irrevocably waived effective January 1, 2013, and deferred compensation payments from JPMorgan Chase in the amount of approximately $7,294 per year, which ended in January 2013. In addition, Ms. Pardo receives payments from a fully-funded qualified plan, which is not an obligation of JPMorgan Chase. |
| Designation as an “Interested Trustee” is based on prior employment by the Adviser or an affiliate of the Adviser or interests in a control person of the Adviser. |
| J.P. Morgan Exchange-Traded Funds | |
TRUSTEES
(Unaudited) (continued)
| The contact address for each of the Trustees is 277 Park Avenue, New York, NY 10172. |
| J.P. Morgan Exchange-Traded Funds | |
Name (Year of Birth),
Positions Held with
the Trust (Since) | Principal Occupations During Past 5 Years |
Brian S. Shlissel (1964),
President and Principal Executive
Officer (2021)* | Managing Director and Chief Administrative Officer for J.P. Morgan pooled vehicles, J.P. Morgan Investment Management Inc. since 2014. |
Timothy J. Clemens (1975),
Treasurer and Principal Financial
Officer (2020) | Executive Director, J.P. Morgan Investment Management Inc. since February 2016. Mr. Clemens has been with J.P. Morgan Investment Management Inc. since 2013. |
Gregory S. Samuels (1980),
Secretary (2022) **(formerly Assistant
Secretary 2014-2022) | Managing Director and Assistant General Counsel, JPMorgan Chase & Co. Mr. Samuels has been with JPMorgan Chase & Co. since 2010. |
Stephen M. Ungerman (1953),
Chief Compliance Officer (2014) | Managing Director, JPMorgan Chase & Co. Mr. Ungerman has been with JPMorgan Chase & Co. since 2000. |
Kiesha Astwood-Smith (1973),
Assistant Secretary (2021)** | Vice President and Assistant General Counsel, JPMorgan Chase & Co. since June 2021; Senior Director and Counsel, Equitable Financial Life Insurance Company (formerly, AXA Equitable Life Insurance Company) from September 2015 through June 2021. |
Matthew Beck (1988),
Assistant Secretary (2021)*** | Vice President and Assistant General Counsel, JPMorgan Chase & Co. since May 2021; Senior Legal Counsel, Ultimus Fund Solutions from May 2018 through May 2021; General Counsel, The Nottingham Company from April 2014 through May 2018. |
Elizabeth A. Davin (1964),
Assistant Secretary (2022)***
(formerly Secretary 2018-2022) | Executive Director and Assistant General Counsel, JPMorgan Chase & Co. Ms. Davin has been with JPMorgan Chase & Co. (formerly Bank One Corporation) since 2004. |
Jessica K. Ditullio (1962),
Assistant Secretary (2014)*** | Executive Director and Assistant General Counsel, JPMorgan Chase & Co. Ms. Ditullio has been with JPMorgan Chase & Co. (formerly Bank One Corporation) since 1990. |
Anthony Geron (1971),
Assistant Secretary (2019)** | Vice President and Assistant General Counsel, JPMorgan Chase & Co. since September 2018; Lead Director and Counsel, AXA Equitable Life Insurance Company from 2015 to 2018 and Senior Director and Counsel, AXA Equitable Life Insurance Company from 2014 to 2015. |
Carmine Lekstutis (1980),
Assistant Secretary (2014)** | Executive Director and Assistant General Counsel, JPMorgan Chase & Co. Mr. Lekstutis has been with JPMorgan Chase & Co. since 2011. |
Max Vogel (1990),
Assistant Secretary (2021)** | Vice President and Assistant General Counsel, JPMorgan Chase & Co. since June 2021; Associate, Proskauer Rose LLP (law firm) from March 2017 to June 2021. |
Zachary E. Vonnegut-Gabovitch
(1986),
Assistant Secretary (2017)** | Vice President and Assistant General Counsel, JPMorgan Chase & Co. since September 2016. |
Frederick J. Cavaliere (1978),
Assistant Treasurer (2015)* | Executive Director, J.P. Morgan Investment Management Inc. Mr. Cavaliere has been with JPMorgan Chase & Co. since May 2006. |
Michael M. D’Ambrosio (1969),
Assistant Treasurer (2014) | Managing Director, J.P. Morgan Investment Management Inc. Mr. D’Ambrosio has been with J.P. Morgan Investment Management Inc. since 2012. |
Shannon Gaines (1977),
Assistant Treasurer (2019)*** | Vice President, J.P. Morgan Investment Management Inc. since January 2014. |
Nektarios E. Manolakakis (1972),
Assistant Treasurer (2020) | Executive Director, J.P. Morgan Investment Management Inc. since February 2021, formerly Vice President, J.P. Morgan Investment Mangement Inc. since 2014; Vice President, J.P. Morgan Corporate & Investment Bank 2010-2014. |
Todd McEwen (1981),
Assistant Treasurer (2020)*** | Vice President, J.P. Morgan Investment Management Inc. Mr. McEwen has been with J.P. Morgan Investment Management Inc. since 2010. |
|
The contact address for each of the officers, unless otherwise noted, is 277 Park Avenue, New York, NY 10172. |
| The contact address for the officer is 575 Washington Boulevard, Jersey City, NJ 07310. |
| The contact address for the officer is 4 New York Plaza, New York, NY 10004. |
| J.P. Morgan Exchange-Traded Funds | |
OFFICERS
(Unaudited) (continued)
| The contact address for the officer is 1111 Polaris Parkway, Columbus, OH 43240. |
| J.P. Morgan Exchange-Traded Funds | |
SCHEDULE OF SHAREHOLDER EXPENSES
(Unaudited)
Hypothetical $1,000 Investment
As a shareholder of the Funds, you incur two types of costs: (1) transaction costs, including brokerage commissions on your purchase and sales of Fund shares and (2) ongoing costs, primarily management fees. The examples below are intended to help you understand your ongoing costs (in dollars) of investing in the Funds and to compare these ongoing costs with the ongoing costs of investing in other funds. The examples assume that you had a $1,000 investment at the beginning of the reporting period, May 1, 2022, and continued to hold your shares at the end of the reporting period, October 31, 2022.
Actual Expenses
For each Fund in the table below, the first line provides information about actual account values and actual expenses. You may use the information in this line, together with the amount you invested, to estimate the expenses that you paid over the period. Simply divide your account value by $1,000 (for example, an $8,600 account value divided by $1,000 = 8.6), then multiply the result by the number in the first line of each Fund under the heading titled “Expenses Paid During the
Period” to estimate the expenses you paid on your account during this period.
Hypothetical Example for Comparison Purposes
The second line of each Fund in the table below provides information about hypothetical account values and hypothetical expenses based on the actual expense ratio and an assumed rate of return of 5% per year before expenses, which is not the Fund's actual return. The hypothetical account values and expenses may not be used to estimate the actual ending account balance or expenses you paid for the period. You may use this information to compare the ongoing costs of investing in the Fund and other funds. To do so, compare this 5% hypothetical example with the 5% hypothetical examples that appear in the shareholder reports of the other funds. The examples also assume all dividends and distributions have been reinvested. The examples do not take into account brokerage commissions that you pay when purchasing or selling shares of a Fund.
| Beginning Account Value May 1, 2022 | Ending Account Value October 31, 2022 | | |
JPMorgan ActiveBuilders Emerging Markets Equity ETF | | | | |
| | | | |
| | | | |
JPMorgan ActiveBuilders International Equity ETF | | | | |
| | | | |
| | | | |
JPMorgan BetaBuilders Canada ETF | | | | |
| | | | |
| | | | |
JPMorgan BetaBuilders Developed Asia Pacific ex-Japan ETF (formerly known as JPMorgan BetaBuilders Developed Asia ex-Japan ETF) | | | | |
| | | | |
| | | | |
JPMorgan BetaBuilders Europe ETF | | | | |
| | | | |
| | | | |
JPMorgan BetaBuilders International Equity ETF | | | | |
| | | | |
| | | | |
JPMorgan BetaBuilders Japan ETF | | | | |
| | | | |
| | | | |
JPMorgan BetaBuilders U.S. Equity ETF | | | | |
| | | | |
| | | | |
| J.P. Morgan Exchange-Traded Funds | |
SCHEDULE OF SHAREHOLDER EXPENSES
(Unaudited) (continued)
Hypothetical $1,000 Investment
| Beginning Account Value May 1, 2022 | Ending Account Value October 31, 2022 | Expenses Paid During the Period* | |
JPMorgan BetaBuilders U.S. Mid Cap Equity ETF | | | | |
| | | | |
| | | | |
JPMorgan BetaBuilders U.S. Small Cap Equity ETF | | | | |
| | | | |
| | | | |
JPMorgan Carbon Transition U.S. Equity ETF | | | | |
| | | | |
| | | | |
JPMorgan Climate Change Solutions ETF | | | | |
| | | | |
| | | | |
JPMorgan Diversified Return Emerging Markets Equity ETF | | | | |
| | | | |
| | | | |
JPMorgan Diversified Return International Equity ETF | | | | |
| | | | |
| | | | |
JPMorgan Diversified Return U.S. Equity ETF | | | | |
| | | | |
| | | | |
JPMorgan Diversified Return U.S. Mid Cap Equity ETF | | | | |
| | | | |
| | | | |
JPMorgan Diversified Return U.S. Small Cap Equity ETF | | | | |
| | | | |
| | | | |
JPMorgan International Growth ETF | | | | |
| | | | |
| | | | |
JPMorgan U.S. Momentum Factor ETF | | | | |
| | | | |
| | | | |
JPMorgan U.S. Quality Factor ETF | | | | |
| | | | |
| | | | |
JPMorgan U.S. Value Factor ETF | | | | |
| | | | |
| | | | |
|
| Expenses are equal to the Fund’s annualized expense ratio, multiplied by the average account value over the period, multiplied by 184/365 (to reflect the one-half year period). |
| J.P. Morgan Exchange-Traded Funds | |
BOARD APPROVAL OF MANAGEMENT AGREEMENTS
(Unaudited)
The Board of Trustees (the “Board” or the “Trustees”) has established various standing committees composed of Trustees with diverse backgrounds, to which the Board has assigned specific subject matter responsibilities to further enhance the effectiveness of the Board’s oversight and decision making. Effective January 2022, the Board consolidated with the J.P. Morgan Exchange-Traded Fund Trust Board, and now consists of Trustees from both Boards. The Board and its investment committees (money market and alternative products, equity, and fixed income) met regularly throughout the year and, at each meeting, considered factors that are relevant to their annual consideration of the continuation of the management agreements. The Board also met for the specific purpose of considering management agreement annual renewals. The Board held meetings on June 21-22, 2022 and August 9-11, 2022, at which the Trustees considered the continuation of the management agreements for each Fund whose semi-annual report is contained herein (each a “Management Agreement” and collectively, the “Management Agreements”). At the June meeting, the Board’s investment committees met to review and consider performance, expense and related information for the J.P. Morgan Funds. Each investment committee reported to the full Board, which then considered each investment committee’s preliminary findings. At the August meeting, the Trustees continued their review and consideration. The Trustees, including a majority of the Trustees who are not parties to a Management Agreement or “interested persons” (as defined in the Investment Company Act of 1940) of any party to a Management Agreement or any of their affiliates, approved the continuation of each Management Agreement on August 11, 2022.
As part of their review of the Management Agreements, the Trustees considered and reviewed performance and other information about the Funds received from the Adviser. This information included the Funds’ performance as compared to the performance of their peers and benchmarks, and analyses by the Adviser of the Funds’ performance. In addition, at each of their regular meetings throughout the year, the Trustees considered reports on the performance of certain J.P. Morgan Funds (including certain ETFs, beginning in February 2022) provided by an independent investment consulting firm (“independent consultant”). In addition, in preparation for the June and August meetings, the Trustees requested, received and evaluated extensive materials from the Adviser, including performance and expense information compiled by Broadridge, using data from Lipper Inc. and/or Morningstar Inc., independent providers of investment company data (together, “Broadridge”). The Trustees’ independent consultant also provided additional quantitative and statistical analyses of certain Funds, including risk and performance return assessments as compared to the Funds’ objectives, benchmarks, and peers. Before voting on the Management Agreements, the Trustees reviewed the Management Agreements with represen
tatives of the Adviser, counsel to the Trusts, and independent legal counsel, and received a memorandum from independent legal counsel to the Trustees discussing the legal standards for their consideration of the Management Agreements. The Trustees also discussed the Management Agreements with independent legal counsel in executive sessions at which no representatives of the Adviser were present.
A summary of the material factors evaluated by the Trustees in determining whether to approve each Management Agreement is provided below. The Trustees considered information provided with respect to the Funds over the course of the year, as well as the materials furnished specifically in connection with this annual renewal process. Each Trustee attributed different weights to the various factors and no factor alone was considered determinative. The Trustees considered information provided with respect to the Funds throughout the year, including additional reporting and information provided in connection with the COVID-19 pandemic, as well as materials furnished specifically in connection with the annual review process. From year to year, the Trustees consider and place emphasis on relevant information in light of changing circumstances in market and economic conditions. The Trustees determined that the compensation received by the Adviser from each Fund under the Management Agreement was fair and reasonable and that the continuance of the Management Agreement was in the best interests of each Fund and its shareholders.
The factors summarized below were considered and discussed by the Trustees in reaching their conclusions:
Nature, Extent and Quality of Services Provided by the Adviser
The Trustees received and considered information regarding the nature, extent and quality of the services provided to each Fund under its respective Management Agreement. The Trustees took into account information furnished throughout the year at Trustee meetings, as well as the materials furnished specifically in connection with this annual review process. Among other things, the Trustees considered:
(i)
The background and experience of the Adviser’s senior management and investment personnel, including personnel changes, if any;
(ii)
The qualifications, backgrounds and responsibilities of the portfolio management team primarily responsible for the day-to-day management each of the Funds, including personnel changes, if any;
(iii)
The investment strategy for each Fund, and the infrastructure supporting the portfolio management teams;
(iv)
Information about the structure and distribution strategy for each Fund and how it fits with the Trusts’ other fund offerings;
| J.P. Morgan Exchange-Traded Funds | |
BOARD APPROVAL OF MANAGEMENT AGREEMENTS
(Unaudited) (continued)
(v)
The administration services provided by the Adviser in its role as Administrator;
(vi)
Their knowledge of the nature and quality of the services provided by the Adviser and its affiliates gained from their experience as Trustees of the Trusts and in the financial industry generally;
(vii)
The overall reputation and capabilities of the Adviser and its affiliates;
(viii)
The commitment of the Adviser to provide high quality service to the Funds;
(ix)
Their overall confidence in the Adviser’s integrity;
(x)
The Adviser’s responsiveness to requests for additional information, questions or concerns raised by them, including the Adviser’s willingness to consider and implement organizational and operational changes designed to improve investment results and the services provided to each Fund; and
(xi)
The Adviser’s business continuity plan and steps the Adviser and its affiliates have taken to provide ongoing services to the Funds during the COVID-19 pandemic, and the Adviser’s and its affiliates’ success in continuing to provide services to the Funds and their shareholders throughout this period.
Based upon these considerations and other factors, the Trustees concluded that they were satisfied with the nature, extent and quality of services to be provided to the Funds by the Adviser.
Costs of Services Provided and Profitability to the Adviser and its Affiliates
The Trustees received, reviewed, considered and discussed information regarding the profitability to the Adviser and its affiliates from providing services to the Funds. The Trustees recognized that this information is not audited and represents the Adviser’s determination of its and its affiliates’ revenues from the contractual services provided to the Funds, less expenses of providing such services. Expenses include direct and indirect costs and are calculated using allocation methodologies developed by the Adviser and reviewed with the Board. The Trustees also recognized that it is difficult to make direct comparisons of profitability from fund management contracts because comparative information is not generally publicly available and is affected by numerous factors, including the structure of the particular adviser, the types of funds it manages, its business mix, numerous assumptions regarding allocations and the fact that publicly-traded fund managers’ operating profits and net income are net of distribution and marketing expenses. Based upon their review, the Trustees
concluded that the profitability to the Adviser under each Management Agreement was not unreasonable in light of the services and benefits provided to each Fund.
The Trustees also considered the fees earned by JPMorgan Chase Bank, N.A. (“JPMCB”), an affiliate of the Adviser, for custody, fund accounting and other related services for each Fund, and the profitability of these arrangements to JPMCB.
Fall-Out Benefits
The Trustees reviewed information regarding potential “fall-out” or ancillary benefits received by the Adviser and its affiliates as a result of their relationship with the Funds. The Trustees considered that certain J.P. Morgan Funds' operating accounts are held at JPMCB, which, as a result, will receive float benefits for certain J.P. Morgan Funds, as applicable. The Trustees also noted that the Adviser supports a diverse set of products and services, which benefits the Adviser by allowing it to leverage its infrastructure to serve additional clients, including benefits that may be received by the Adviser and its affiliates in connection with the Fund’s potential investments in other funds advised by the Adviser. The Trustees also reviewed the Adviser’s allocation of fund brokerage for the J.P. Morgan Funds complex, including allocations to brokers who provide research to the Adviser, as well as the Adviser’s use of affiliates to provide other services and the benefits to such affiliates of doing so.
Economies of Scale
The Trustees considered the extent to which each Fund will benefit from potential economies of scale. The Trustees noted that the management fee schedule for the Funds does not contain breakpoints. The Trustees considered that shareholders would benefit because expenses are limited even when a Fund is new and not achieving economies of scale. The Trustees considered the fact that increases in assets would not lead to management fee decreases even if economies of scale are achieved, but also that the Trustees would have the opportunity to further review the appropriateness of the fee payable to the Adviser under the Management Agreement in the future. The Trustees also concluded that all Funds benefited from the Adviser’s reinvestment in its operations to serve the Funds and their shareholders. The Trustees noted that the Adviser’s reinvestment ensures sufficient resources in terms of personnel and infrastructure to support the Funds. After considering the factors identified above, the Trustees concluded that the Fund’s shareholders will receive the benefits of potential economies of scale.
Fees Relative to Adviser’s Other Clients
The Trustees received and considered information about the nature and extent of management services and fee rates offered to other clients of the Adviser, including, to the extent
| J.P. Morgan Exchange-Traded Funds | |
applicable, institutional separate accounts, collective investment trusts, other registered investment companies and/or private funds sub-advised by the Adviser, for investment management styles substantially similar to that of each Fund. The Trustees considered the complexity of investment management for registered investment companies relative to the Adviser’s other clients and noted differences, as applicable, in the fee structure and the regulatory, legal and other risks and responsibilities of providing services to the different clients. The Trustees considered that serving as an adviser to a registered investment company involves greater responsibilities and risks than acting as a sub-adviser and observed that sub-advisory fees may be lower than those charged by the Adviser to each Fund, as applicable. The Trustees also noted that the adviser, not the applicable registered investment company, typically bears the sub-advisory fee and that many responsibilities related to the advisory function are typically retained by the primary adviser. The Trustees concluded that the fee rates charged to each Fund in comparison to those charged to the Adviser’s other clients were reasonable.
Investment Performance
The Trustees receive and consider information about each Fund’s performance throughout the year.
For all Funds with the exception of the JPMorgan ActiveBuilders International Equity ETF, JPMorgan ActiveBuilders Emerging Markets Equity ETF, JPMorgan Climate Change Solutions ETF and JPMorgan International Growth ETF, the Trustees considered each Fund’s investment strategy and processes, portfolio management teams and competitive positioning against peer funds, as identified by Broadridge and/or management. As part of this review, the Trustees also reviewed each Fund’s performance against its benchmark index. The Trustees also discussed the performance and the investment strategy of each Fund with the Adviser. Based on these discussions and various other factors, the Trustee concluded each Fund’s performance was satisfactory.
For JPMorgan ActiveBuilders International Equity ETF, JPMorgan ActiveBuilders Emerging Markets Equity ETF and JPMorgan Climate Change Solutions ETF, each of which launched in 2021, the Trustees discussed each Fund’s performance (on both a relative and absolute basis). The Trustees also considered each Fund’s investment strategy and processes, portfolio management teams and competitive positioning against peer funds. The Trustees also discussed the performance and the investment strategy of each Fund with the Adviser. Based on these discussions and various other factors, the Trustees concluded each Fund’s performance was satisfactory.
For the JPMorgan International Growth ETF (the “IG Fund”), the Trustees received and considered absolute and relative performance information for the IG Fund in a report prepared
by Broadridge. The Trustees considered the total return performance information, which included ranking the IG Fund within a performance universe comprised of funds with the same Morningstar investment classification and objective (the “Universe”), as well as a subset of funds within the Universe (the “Peer Group”), by total return for applicable one-year periods. The Trustees reviewed a description of Broadridge’s methodology for selecting exchange-traded funds in the IG Fund’s Peer Group and Universe and noted that the Peer Group quintile rankings were not calculated if the number of funds in the Peer Group did not meet a predetermined minimum. The Trustees also considered the IG Fund’s investment strategy and processes, portfolio management teams and competitive positioning against peer funds, as identified by Broadridge and/or management. As part of this review, the Trustees reviewed the IG Fund’s performance against its benchmark and considered the IG Fund’s performance information provided at regular Board meetings by the Adviser. After consideration, the Trustees determined that the IG Fund’s performance was consistent with its investment objective. The Broadridge performance data noted by the Trustees as part of their review and the determinations made by the Trustees with respect to the IG Fund’s performance are summarized below:
The Trustees noted that the IG Fund’s performance was in the fourth quintile of the Universe for the one-year period ended December 31, 2021. Broadridge did not calculate quintile rankings for the Peer Group for the IG Fund due to the limited number of funds in the Peer Group. The Trustees discussed the performance and investment strategy of the IG Fund with the Adviser and reviewed the performance analysis and evaluation prepared by the independent consultant. Based upon these discussions and various other factors, the Trustees concluded that the IG Fund’s performance was satisfactory under the circumstances.
Management Fees and Expense Ratios
The Trustees considered the contractual management fee rate paid by each Fund to the Adviser and compared the rate to the information prepared by Broadridge concerning management fee rates paid by other funds in the same Morningstar category as each Fund. This review included ranking of each Fund within an expense universe comprised of funds with the same Morningstar investment classification and objective (the “Universe”), as well as a subset of funds within the Universe (the “Peer Group”). The Trustees reviewed a description of Broadridge’s methodology for selecting funds in the Peer Group and Universe, as applicable, and noted that the Peer Group quintile rankings were not calculated if the number of funds in the Peer Group did not meet a predetermined minimum. The Trustees also reviewed information about other expenses and the total expense ratio for each Fund. The Trustees compared the management fee for each Fund to fees charged to mutual funds and/or institutional accounts with similar investment
| J.P. Morgan Exchange-Traded Funds | |
BOARD APPROVAL OF MANAGEMENT AGREEMENTS
(Unaudited) (continued)
objectives or in similar asset classes managed by the Adviser. The Trustees recognized that it is difficult to make comparisons of management fees because there are variations in the services that are included in the fees paid by other accounts. The Trustees considered how the Funds are positioned against peer funds, as identified by management and/or Broadridge and noted that each Fund’s management fee was appropriate as compared to identified peer funds. The Trustees’ determinations as a result of the review of each Fund’s management fees and expense ratios are summarized below:
The Trustees noted that the JPMorgan ActiveBuilders Emerging Markets Equity ETF’s net management fee was in the first and second quintiles of the Peer Group and Universe, respectively, and that the actual total expenses were in the first and second quintiles of the Peer Group and Universe, respectively. After considering the factors identified above, in light of this information, the Trustees concluded that the management fee was satisfactory in light of the services provided to the Fund.
The Trustees noted that the JPMorgan ActiveBuilders International Equity ETF’s net management fee was in the first and third quintiles of the Peer Group and Universe, respectively, and that the actual total expenses were in the first and second quintiles of the Peer Group and Universe, respectively. After considering the factors identified above, in light of this information, the Trustees concluded that the management fee was satisfactory in light of the services provided to the Fund.
The Trustees noted that the JPMorgan BetaBuilders Canada ETF’s net management fee and actual total expenses were in the first quintile of the Universe. Broadridge did not calculate quintile rankings for the Peer Group for this Fund due to the limited number of funds in the Peer Group. After considering the factors identified above, in light of this information, the Trustees concluded that the management fee was satisfactory in light of the services provided to the Fund.
The Trustees noted that the JPMorgan BetaBuilders Developed Asia Pacific ex-Japan ETF’s net management fee and actual total expenses were in the first quintile of both the Peer Group and Universe. After considering the factors identified above, in light of this information, the Trustees concluded that the management fee was satisfactory in light of the services provided to the Fund.
The Trustees noted that the JPMorgan BetaBuilders Europe ETF’s net management fee and actual total expenses were in the first quintile of both the Peer Group and Universe. After considering the factors identified above, in light of this information, the Trustees concluded that the management fee was satisfactory in light of the services provided to the Fund.
The Trustees noted that the JPMorgan BetaBuilders International Equity ETF’s net management fee and actual total expenses were in the second and first quintiles of the Peer
Group and Universe, respectively. After considering the factors identified above, in light of this information, the Trustees concluded that the management fee was satisfactory in light of the services provided to the Fund.
The Trustees noted that the JPMorgan BetaBuilders Japan ETF’s net management fee and actual total expenses were in the first and second quintiles of the Peer Group and Universe, respectively. After considering the factors identified above, in light of this information, the Trustees concluded that the management fee was satisfactory in light of the services provided to the Fund.
The Trustees noted that the JPMorgan BetaBuilders U.S. Equity ETF’s net management fee and actual total expenses were in the first quintile of both the Peer Group and Universe. After considering the factors identified above, in light of this information, the Trustees concluded that the management fee was satisfactory in light of the services provided to the Fund.
The Trustees noted that the JPMorgan BetaBuilders U.S. Mid Cap Equity ETF’s net management fee and actual total expenses were in the second and first quintiles of the Peer Group and Universe, respectively. After considering the factors identified above, in light of this information, the Trustees concluded that the management fee was satisfactory in light of the services provided to the Fund.
The Trustees noted that the JPMorgan BetaBuilders U.S. Small Cap Equity ETF’s net management fee was in the fourth and first quintiles of the Peer Group and Universe, respectively, and that the actual total expenses were in the third and first quintiles of the Peer Group and Universe, respectively. After considering the factors identified above, in light of this information, the Trustees concluded that the management fee was satisfactory in light of the services provided to the Fund.
The Trustees noted that the JPMorgan Carbon Transition U.S. Equity ETF’s net management fee and actual total expenses were in the third and second quintiles of the Peer Group and Universe, respectively. After considering the factors identified above, in light of this information, the Trustees concluded that the management fee was satisfactory in light of the services provided to the Fund.
The Trustees noted that the JPMorgan Climate Change Solutions ETF’s net management fee and actual total expenses were in the fourth and third quintiles of the Universe, respectively. Broadridge did not calculate quintile rankings for the Peer Group for this Fund due to the limited number of funds in the Peer Group. After considering the factors identified above, in light of this information, the Trustees concluded that the management fee was satisfactory in light of the services provided to the Fund.
| J.P. Morgan Exchange-Traded Funds | |
The Trustees noted that the JPMorgan Diversified Return Emerging Markets Equity ETF’s net management fee was in the third quintile of both the Peer Group and Universe, and that the actual total expenses were in the first and third quintiles of the Peer Group and Universe, respectively. After considering the factors identified above, in light of this information, the Trustees concluded that the management fee was satisfactory in light of the services provided to the Fund.
The Trustees noted that the JPMorgan Diversified Return International Equity ETF’s net management fee and actual total expenses were in the third and fourth quintiles of the Peer Group and Universe, respectively. After considering the factors identified above, in light of this information, the Trustees concluded that the management fee was satisfactory in light of the services provided to the Fund.
The Trustees noted that the JPMorgan Diversified Return U.S. Equity ETF’s net management fee and actual total expenses were in the second quintile of both the Peer Group and Universe. After considering the factors identified above, in light of this information, the Trustees concluded that the management fee was satisfactory in light of the services provided to the Fund .
The Trustees noted that the JPMorgan Diversified Return U.S. Mid Cap Equity ETF’s net management fee was in the first and third quintiles of the Peer Group and Universe, respectively, and that the actual total expenses were in the first and second quintiles of the Peer Group and Universe, respectively. After considering the factors identified above, in light of this information, the Trustees concluded that the management fee was satisfactory in light of the services provided to the Fund.
The Trustees noted that the JPMorgan Diversified Return U.S. Small Cap Equity ETF’s net management fee and actual total expenses were in the second and third quintiles of the
Peer Group and Universe, respectively. After considering the factors identified above, in light of this information, the Trustees concluded that the management fee was satisfactory in light of the services provided to the Fund.
The Trustees noted that the JPMorgan International Growth ETF’s net management fee and actual total expenses were in the third quintile of the Universe. Broadridge did not calculate quintile rankings for the Peer Group for this Fund due to the limited number of funds in the Peer Group. After considering the factors identified above, in light of this information, the Trustees concluded that the management fee was satisfactory in light of the services provided to the Fund.
The Trustees noted that the JPMorgan U.S. Momentum Factor ETF’s net management fee and actual total expenses were in the first quintile of the Universe. Broadridge did not calculate quintile rankings for the Peer Group for this Fund due to the limited number of funds in the Peer Group. After considering the factors identified above, in light of this information, the Trustees concluded that the management fee was satisfactory in light of the services provided to the Fund.
The Trustees noted that the JPMorgan U.S. Quality Factor ETF’s net management fee and actual total expenses were in the first quintile of both the Peer Group and Universe. After considering the factors identified above, in light of this information, the Trustees concluded that the management fee was satisfactory in light of the services provided to the Fund.
The Trustees noted that the JPMorgan U.S. Value Factor ETF’s net management fee and actual total expenses were in the second and first quintiles of the Peer Group and Universe, respectively. After considering the factors identified above, in light of this information, the Trustees concluded that the management fee was satisfactory in light of the services provided to the Fund.
| J.P. Morgan Exchange-Traded Funds | |
Certain tax information for the J.P. Morgan Funds is required to be provided to shareholders based upon the Funds’ income and distributions for the taxable year ended October 31, 2022. The information and distributions reported in this letter may differ from the information and taxable distributions reported to the shareholders for the calendar year ending December 31, 2022. The information necessary to complete your income tax returns for the calendar year ending December 31, 2022 will be provided under separate cover.
Dividends Received Deduction (DRD)
Each Fund listed below had the following percentage, or maximum allowable percentage, of ordinary income distributions eligible for the dividends received deduction for corporate shareholders for the fiscal year ended October 31, 2022:
| Dividends
Received
Deduction |
JPMorgan BetaBuilders U.S. Equity ETF | |
JPMorgan BetaBuilders U.S. Mid Cap Equity ETF | |
JPMorgan BetaBuilders U.S. Small Cap Equity ETF | |
JPMorgan Carbon Transition U.S. Equity ETF | |
JPMorgan Climate Change Solutions ETF | |
JPMorgan Diversified Return U.S. Equity ETF | |
JPMorgan Diversified Return U.S. Mid Cap Equity ETF | |
JPMorgan Diversified Return U.S. Small Cap Equity ETF | |
JPMorgan U.S. Momentum Factor ETF | |
JPMorgan U.S. Quality Factor ETF | |
JPMorgan U.S. Value Factor ETF | |
Long Term Capital Gain
Each Fund listed below distributed the following amount, or maximum allowable amount, of long-term capital gain dividends for the fiscal year ended October 31, 2022:
| Long-Term
Capital Gain
Distribution |
JPMorgan International Growth ETF | |
Qualified Dividend Income (QDI)
Each Fund listed below had the following amount, or maximum allowable amount, of ordinary income distributions treated as qualified dividends for the fiscal year ended October 31, 2022:
| |
JPMorgan ActiveBuilders Emerging Markets Equity ETF | |
JPMorgan ActiveBuilders International Equity ETF | |
JPMorgan BetaBuilders Canada ETF | |
JPMorgan BetaBuilders Developed Asia Pacific ex-Japan ETF | |
JPMorgan BetaBuilders Europe ETF | |
JPMorgan BetaBuilders International Equity ETF | |
JPMorgan BetaBuilders Japan ETF | |
JPMorgan BetaBuilders U.S. Equity ETF | |
JPMorgan BetaBuilders U.S. Mid Cap Equity ETF | |
JPMorgan BetaBuilders U.S. Small Cap Equity ETF | |
JPMorgan Carbon Transition U.S. Equity ETF | |
JPMorgan Climate Change Solutions ETF | |
JPMorgan Diversified Return Emerging Markets Equity ETF | |
JPMorgan Diversified Return International Equity ETF | |
JPMorgan Diversified Return U.S. Equity ETF | |
JPMorgan Diversified Return U.S. Mid Cap Equity ETF | |
JPMorgan Diversified Return U.S. Small Cap Equity ETF | |
JPMorgan International Growth ETF | |
JPMorgan U.S. Momentum Factor ETF | |
JPMorgan U.S. Quality Factor ETF | |
JPMorgan U.S. Value Factor ETF | |
Section 199A Income
The following funds had the following amount, or maximum allowable amount, of ordinary income distributions treated as 199A dividends for the fiscal year ended October 31, 2021.
| |
JPMorgan BetaBuilders U.S. Small Cap Equity ETF | |
JPMorgan Diversified Return U.S. Equity ETF | |
JPMorgan Diversified Return U.S. Mid Cap Equity ETF | |
JPMorgan Diversified Return U.S. Small Cap Equity ETF | |
JPMorgan U.S. Momentum Factor ETF | |
| J.P. Morgan Exchange-Traded Funds | |
Foreign Source Income and Foreign Tax Credit Pass Through
For the fiscal year ended October 31, 2022, the following Funds intend to elect to pass through to shareholders taxes paid to foreign countries. Gross income and foreign tax expenses are as follows or amounts as finally determined:
| Total Foreign
Source Income | |
JPMorgan ActiveBuilders Emerging Markets Equity ETF | | |
JPMorgan ActiveBuilders International Equity ETF | | |
JPMorgan BetaBuilders Canada ETF | | |
JPMorgan BetaBuilders Developed Asia Pacific ex-Japan ETF | | |
JPMorgan BetaBuilders Europe ETF | | |
JPMorgan BetaBuilders International Equity ETF | | |
JPMorgan BetaBuilders Japan ETF | | |
JPMorgan Climate Change Solutions ETF | | |
JPMorgan Diversified Return Emerging Markets Equity ETF | | |
| Total Foreign Source Income | |
JPMorgan Diversified Return International Equity ETF | | |
JPMorgan International Growth ETF | | |
| J.P. Morgan Exchange-Traded Funds | |
THIS PAGE IS INTENTIONALLY LEFT BLANK
THIS PAGE IS INTENTIONALLY LEFT BLANK
J.P. Morgan Exchange-Traded Funds are distributed by JPMorgan Distribution Services, Inc., an indirect, wholly-owned subsidiary of JPMorgan Chase & Co.
Contact J.P. Morgan Exchange-Traded Funds at 1-844-457-6383 (844-4JPM ETF) for a fund prospectus. You can also visit us at www.jpmorganfunds.com. Investors should carefully consider the investment objectives and risks as well as charges and expenses of the fund before investing. The prospectus contains this and other information about the fund. Read the prospectus carefully before investing.
Investors may obtain information about the Securities Investor Protection Corporation (SIPC), including the SIPC brochure, by visiting www.sipc.org or by calling SIPC at 202-371-8300.
Each Fund files a complete schedule of its fund holdings for the first and third quarters of its fiscal year with the SEC as an exhibit to its report on Form N-PORT. The Funds' Form N-PORT reports are available on the SEC’s website at http://www.sec.gov. The Funds' quarterly holdings can be found by visiting the J.P. Morgan Funds’ website at www.jpmorganfunds.com.
A description of each Fund's policies and procedures with respect to the disclosure of each Fund's holdings is available in the prospectuses and Statement of Additional Information.
A copy of proxy policies and procedures is available without charge upon request by calling 1-844-457-6383 and on the Funds' website at www.jpmorganfunds.com. A description of such policies and procedures is on the SEC’s website at www.sec.gov. The Trustees have delegated the authority to vote proxies for securities owned by the Funds to the Adviser. A copy of the Funds' voting record for the most recent 12-month period ended June 30 is available on the SEC’s website at www.sec.gov or at the Funds' website at www.jpmorganfunds.com no later than August 31 of each year. The Funds' proxy voting record will include, among other things, a brief description of the matter voted on for each portfolio security, and will state how each vote was cast, for example, for or against the proposal.
J.P. Morgan Asset Management is the brand name for the asset management business of JPMorgan Chase & Co. and its affiliates worldwide.
© JPMorgan Chase & Co., 2022. All rights reserved. October 2022.
AN-ETF-1022
Annual Report
J.P. Morgan Exchange-Traded Funds
October 31, 2022
| | |
JPMorgan Social Advancement ETF | | |
JPMorgan Sustainable Consumption ETF | | |
JPMorgan Sustainable Infrastructure ETF | | |
CONTENTS
Investments in a Fund are not deposits or obligations of, or guaranteed or endorsed by, any bank and are not insured or guaranteed by the FDIC, the Federal Reserve Board or any other government agency. You could lose money if you sell when a Fund’s share price is lower than when you invested.
Past performance is no guarantee of future performance. The general market views expressed in this report are opinions based on market and other conditions through the end of the reporting period and are subject to change without notice. These views are not intended to predict the future performance of a Fund or the securities markets.
Prospective investors should refer to the Funds’ prospectuses for a discussion of the Funds’ investment objectives, strategies and risks. Call J.P. Morgan Exchange-Traded Funds at (844) 457-6383 for a prospectus containing more complete information about a Fund, including management fees and other expenses. Please read it carefully before investing.
Shares are bought and sold throughout the day on an exchange at market price (not at net asset value) through a brokerage account, and are not individually subscribed and redeemed from a Fund. Shares may only be subscribed and redeemed directly from a Fund by Authorized Participants, in large creation/redemption units. Brokerage commissions will reduce returns.
President's Letter
December 15, 2022 (Unaudited)
Dear Shareholder,
Global financial markets reflected turmoil in the global economy in 2022, stirred by sharply higher inflation, rising interest rates, sporadic pandemic disruptions and the widening impact of the Russia-Ukraine conflict. Prices for both equities and bonds tumbled during the first half of the year and remained under pressure through the end of October.
|
“While investors seek to adapt to the current market environment, we believe a well-diversified portfolio and a patient outlook remain crucial components of a successful invest- ment approach.” — Brian S. Shlissel
|
Emerging market equities underperformed both the U.S. and other developed equity markets amid economic weakness in China and slowing global demand during the period. Across Europe, the war in Ukraine set off an energy crisis as a result of reduced imports of natural gas from Russia. U.S. equity markets also fell in 2022, but surprisingly strong corporate earnings and consumer spending helped leading U.S. indexes to rebound from their lowest levels. For the twelve month period ended October 31, 2022, the MSCI Emerging Markets Index returned -31.0%, the MSCI EAFE Index returned -23.0% and the S&P 500 Index returned -14.6%.
Notably, some recent U.S. inflationary data has indicated signs of easing price pressures and U.S. economic output as measured by gross domestic product turned positive in the third quarter of 2022, following two consecutive quarters of negative growth. Though the U.S. economy has lost momentum in 2022, it has not yet fallen into recession. Meanwhile, as the potential for a rapid resolution to the war in Ukraine appears to have faded, the European Union and its largest constituent
nations have moved to secure sufficient winter energy supplies while decreasing their dependence on imports of natural gas from Russia. In the U.K., a year-long political crisis was resolved with the accession of Rishi Sunak to prime minister in October 2022, which helped shore up the value of British pound and stabilize U.K. financial markets. China has eased some of the social restrictions under its “Zero Covid” policy and domestic equity indexes recently rose amid investor expectations that China’s economy may fully reopen in the coming months.
As 2022 comes to a close, financial markets are likely to remain volatile due to investor uncertainty regarding the outlook for inflation, interest rates and economic momentum. Increased geo-political tensions between Russia and Ukraine’s Western allies also remains a headwind for global financial markets.
Investors this year have confronted economic and financial market conditions not experienced in many years. While investors seek to adapt to the current market environment, we believe a well-diversified portfolio and a patient outlook remain crucial components of a successful investment approach. Our broad array of investment solutions seeks to provide investors with ability to build durable portfolios that can help them meet their financial goals.
Sincerely,
Brian S. Shlissel
President, J.P. Morgan Funds
J.P. Morgan Asset Management
1-844-457-6383 or www.jpmorganfunds.com for more information
| J.P. Morgan Exchange-Traded Funds | |
J.P. Morgan Exchange-Traded Funds
MARKET OVERVIEW
TWELVE MONTHS ENDED October 31, 2022 (Unaudited)
While developed market equities largely ended 2021 with positive returns, global prices for equities and bonds plummeted in 2022 amid accelerating inflation, rising interest rates, pandemic disruptions in China and the outbreak of conflict in Ukraine. Returns for both equity and bond markets broadly declined during the first half of 2022 and remained in negative territory through the end of October. Notably, global energy prices rose sharply in the first half of 2022 before receding somewhat in the third quarter.
In the EU, the war in Ukraine remained the focus of investors’ attention as energy supplies from Russia were constrained and the potential for a rapid resolution to the conflict receded. Both the EU and its individual constituent nations moved to build up reserves of natural gas and petroleum ahead of the winter months. By the end of October 2022, several European governments had sought to confront soaring inflation with spending plans to help households manage rising food and energy costs. The European Central Bank responded to the highest inflation rates in 40 years by sharply raising its policy interest rates in September 2022 and again in October. During the twelve month period, equity markets in Europe largely outperformed emerging markets equities but underperformed U.S. equity markets.
Political turmoil in the U.K. added to a weakening economic outlook that rattled financial markets and pushed the British pound to a 37-year low against the U.S. dollar. By late October 2022, the accession of Rishi Sunak to prime minister provided some support for both the pound and U.K. financial markets. The Bank of England was among the earliest developed market central banks to move to curb inflationary pressures, with an initial interest rate increase in December 2021, and seven more increases during the period.
Developed markets in the Asia-Pacific region also slumped during the period amid rising inflation, particularly soaring
energy prices, and broad weakness in the semiconductors sector. Despite inflationary pressures, the Bank of Japan maintained its ultra-low interest rate policy. Meanwhile, equities in Hong Kong and Singapore largely underperformed other developed markets.
In the U.S., investors largely kept their focus on inflation data as indicators of short-term policy of the U.S. Federal Reserve. In mid-March 2022, the central bank initiated its first interest rate increase since late 2018, and then followed with four more rate raises by the end of September 2022. U.S. gross domestic product fell by 1.6% in the first quarter of 2022 and dropped 0.6% in the second quarter before rebounding to a 2.6% increase in the third quarter. Consumer spending declined but remained somewhat better than investors expected. By the end of June 2022, U.S. equity prices had tumbled more than 20% from the start of the year, which is generally considered a bear market. However, prices rebounded somewhat by the end of October 2022.
Meanwhile, emerging markets equities and bonds slumped throughout the twelve months ended in October 2022. China was among the worst performers as the government’s “zero covid” policy led to strict lockdowns in several large cities, which weighed on the services sector in particular and on economic growth in general. China’s technology sector remained under pressure amid increased scrutiny of large technology companies by government regulators. Across emerging markets rising interest rates weighed on government spending and higher energy prices hurt markets of regions dependent on petroleum imports.
For the twelve months ended October 31, 2022, the S&P 500 Index returned -14.6%, the MSCI EAFE Index returned -23.0 and the MSCI Emerging Markets Index returned -31.0%.
| J.P. Morgan Exchange-Traded Funds | |
JPMorgan Social Advancement ETF
FUND COMMENTARY
FOR THE PERIOD September 7, 2022 (FUND INCEPTION) THROUGH October 31, 2022 (Unaudited)
| |
| |
| |
MSCI ACWI Index (net total return) | |
Net Assets as of 10/31/2022 | |
| |
INVESTMENT OBJECTIVE ***
The JPMorgan Social Advancement ETF (the “Fund”) seeks to achieve long-term capital appreciation by investing in companies that the adviser believes are facilitating social and economic advancement.
INVESTMENT APPROACH
The Fund invests primarily in common stocks, depositary receipts and real estate investment trusts (REITs) of companies that the adviser believes are facilitating the social and economic empowerment of people and communities across all levels of society through access to goods and services that allow them to survive and thrive. The Fund uses a "thematic" investment approach that seeks to identify and invest in companies that are relevant to the theme of social advancement, and selects companies within key sub-themes, such as essential amenities, affordable housing and infrastructure, health care and wellbeing, education and training talent, attainable financing, and accessing the digital ecosystem.
HOW DID THE FUND PERFORM?
For the period from inception September 7, 2022 to October 31, 2022, the Fund provided a negative absolute return and outperformed the MSCI ACWI Index (the “Index”).
The Fund’s security selections in the information technology and communication services sectors were leading detractors from absolute performance, while the Fund’s security selections in the health care and financials sectors were leading contributors to performance.
Leading individual detractors from Fund performance included Microsoft Corp., Alphabet Inc. and AIA Group Ltd. Shares of
Microsoft, a U.S. software and technology provider, and Alphabet, a U.S. technology provider and parent of Google Inc, both fell amid a broad sell-off in the technology sector during the period. Shares of AIA Group, a Hong Kong insurance and financial services provider, fell late in the period amid investor expectations for weaker-than-expected results for the third quarter of 2022.
Leading individual contributors to Fund performance included Intuitive Surgical Inc., FinecoBank SpA and Eli Lilly & Co. Shares of Intuitive Surgical, a U.S. medical equipment manufacturer, rose after the company reported better-than-expected earnings and revenue for the third quarter of 2022. Shares of FinecoBank, an Italian financial technology provider, rose after the company reported consecutive quarters of better-than-expected earnings. Shares of Eli Lilly, a U.S. pharmaceuticals maker, rose as the company launched several new drugs during the period.
Relative to the Index, the Fund’s security selections in the health care and financials sectors were leading contributors to performance, while the Fund’s underweight position in the energy sector, where it had no holdings, and its security selection in the industrials sector were the leading detractors from relative performance.
HOW WAS THE FUND POSITIONED?
As a result of the adviser’s thematic investment process, the Fund’s largest allocations during the period were to the health care and information technology sectors and its smallest allocations were to the materials and real estate sectors. The
Fund had no allocations to the utilities and energy sectors.
| J.P. Morgan Exchange-Traded Funds | |
JPMorgan Social Advancement ETF
FUND COMMENTARY
FOR THE PERIOD September 7, 2022 (FUND INCEPTION) THROUGH October 31, 2022 (Unaudited) (continued)
*
The return shown is based on net asset value and may differ from the return shown in the financial highlights, which reflects adjustments made to the net asset value in accordance with accounting principles generally accepted in the United States of America. The net asset value was $47.35 as of October 31, 2022.
**
Market price return was calculated assuming an initial investment made at the inception date net asset value, reinvestment of all dividends and distributions at market price during the period, and sale at the market price on the last day of the period. The price used to calculate the market price return was the closing price on the Nasdaq Stock Market® LLC. As of October 31, 2022, the closing price was $47.44.
***
The adviser seeks to achieve the Fund’s objective. There can be no guarantee it will be achieved.
TOP TEN HOLDINGS OF THE
PORTFOLIO AS OF October 31, 2022 | PERCENT OF
TOTAL
INVESTMENTS |
| | |
| | |
| | |
| RELX plc (United Kingdom) | |
| HDFC Bank Ltd., ADR (India) | |
| | |
| | |
| Wal-Mart de Mexico SAB de CV (Mexico) | |
| Mastercard, Inc., Class A | |
| Novo Nordisk A/S, Class B (Denmark) | |
PORTFOLIO COMPOSITION BY COUNTRY
AS OF October 31, 2022 | PERCENT OF
TOTAL
INVESTMENTS |
| |
| |
| |
| |
| |
| |
| |
| |
| |
| |
| |
| |
| |
| |
| |
| |
| |
| |
Others (each less than 1.0%) | |
| |
| J.P. Morgan Exchange-Traded Funds | |
TOTAL RETURNS AS OF October 31, 2022 (Unaudited)
| | CUMULATIVE SINCE INCEPTION |
JPMorgan Social Advancement ETF | | |
| | |
| | |
LIFE OF FUND PERFORMANCE (9/7/22 TO 10/31/22)
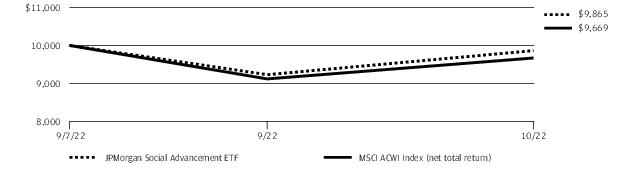
The performance quoted is past performance and is not a guarantee of future results. Exchange-traded funds are subject to certain market risks. Investment returns and principal value of an investment will fluctuate so that an investor’s shares, when sold or redeemed, may be worth more or less than their original cost. Current performance may be higher or lower than the performance data shown. For up-to-date month-end performance information, please call 1-844-457-6383.
Fund commenced operations on September 7, 2022.
The graph illustrates comparative performance for $10,000 invested in shares of the JPMorgan Social Advancement ETF and the MSCI ACWI Index (net total return) from September 7, 2022 to October 31, 2022. The performance of the Fund reflects the deduction of Fund expenses and assumes reinvestment of all dividends and capital gain distributions, if any. The performance of the MSCI ACWI Index (net total return) does not reflect the deduction of expenses associated with an exchange-traded fund and has been adjusted to reflect
reinvestment of all dividends and capital gain distributions of the securities included in the Index, if applicable. The MSCI ACWI Index (net total return) is a free float-adjusted market capitalization-weighted index that is designed to measure the performance of large- and mid-cap stocks in developed and emerging markets. Net total return figures assume the reinvestment of dividends after deduction of withholding tax, applying the maximum rate to nonresident individual investors who do not benefit from double taxation treaties. Investors cannot invest directly in an index.
Performance shown in this section does not reflect the deduction of taxes that a shareholder may pay on Fund distributions or on gains resulting from redemption or sale of Fund shares.
The returns shown are based on net asset values calculated for shareholder transactions and may differ from the returns shown in the financial highlights, which reflect adjustments made to the net asset values in accordance with accounting principles generally accepted in the United States of America.
| J.P. Morgan Exchange-Traded Funds | |
JPMorgan Sustainable Consumption ETF
FUND COMMENTARY
FOR THE PERIOD September 7, 2022 (FUND INCEPTION) THROUGH October 31, 2022 (Unaudited)
| |
| |
| |
MSCI ACWI Index (net total return) | |
Net Assets as of 10/31/2022 | |
| |
INVESTMENT OBJECTIVE ***
The JPMorgan Sustainable Consumption ETF (the “Fund”) seeks to achieve long-term capital appreciation by investing in companies that the adviser believes are developing solutions that help preserve natural resources, improve resource use, or reduce waste.
INVESTMENT APPROACH
The Fund invests primarily in common stocks, and depositary receipts and real estate investment trusts (REITs) of companies that the adviser believes are developing solutions that reduce human impact on natural resources in specific communities, regions or around the globe. The Fund uses a "thematic" investment approach that seeks to identify and invest in companies that are relevant to the theme of sustainable consumption and selects companies within key sub-themes, such as sustainable water systems, sustainable agriculture and food, sustainable production technologies, sustainable materials and design, and recycling and re-use.
HOW DID THE FUND PERFORM?
For the period from inception on September 7, 2022 to October 31, 2022, the Fund had a negative absolute return and outperformed the MSCI ACWI Index (the “Index”).
The Fund’s security selections in the materials and information technology sectors were leading detractors from absolute performance, while the Fund’s security selections in the industrials and health care sectors were leading contributors to performance.
Leading individual detractors from relative performance included the Fund’s overweight positions in SIG Group AG, Taiwan Semiconductor Manufacturing Co. and Nike Inc. Shares of SIG Group, a Swiss maker of food packaging, fell amid rising
materials costs during the period. Shares of Taiwan Semiconductor Manufacturing fell amid investor concerns that the company’s business could be hurt by tighter controls on U.S. technology exports to China. Shares of Nike, a U.S. footwear and apparel maker, fell after the company said rising inventories, shrinking consumer demand and a stronger U.S. dollar may hurt earnings in 2022.
Leading individual contributors to Fund performance included Deere & Co., Valmont Industries Inc. and Eli Lilly & Co. Shares of Deere, a U.S. agricultural machines and tractors maker, rose after the company raised its quarterly dividend and reported better-than-expected revenue for the second quarter and third quarters of 2022. Shares of Valmont Industries, a U.S. manufacturer of fabricated metal products, rose after the company reported consecutive quarters of better-than-expected earnings and revenue during the period. Shares of Eli Lilly, a U.S. pharmaceuticals maker, rose as the company launched several new drugs during the period.
Relative to the Index, the Fund’s security selection and overweight position in the industrials sector were leading contributors to performance, while the Fund’s underweight position in the energy sector and its security selection in the materials sector were leading detractors from relative performance.
HOW WAS THE FUND POSITIONED?
As a result of the adviser’s thematic investment approach, the Fund’s largest allocations during the period were to the industrials and information technology sectors and the smallest allocations were to the energy and consumer discretionary sectors. The Fund had no allocations to the utilities, financials and communication services sectors.
| J.P. Morgan Exchange-Traded Funds | |
*
The return shown is based on net asset value and may differ from the return shown in the financial highlights, which reflects adjustments made to the net asset value in accordance with accounting principles generally accepted in the United States of America. The net asset value was $47.01 as of October 31, 2022.
**
Market price return was calculated assuming an initial investment made at the inception date net asset value, reinvestment of all dividends and distributions at market price during the period, and sale at the market price on the last day of the period. The price used to calculate the market price return was the closing price on the Nasdaq Stock Market® LLC. As of October 31, 2022, the closing price was $47.15.
***
The adviser seeks to achieve the Fund’s objective. There can be no guarantee it will be achieved.
TOP TEN HOLDINGS OF THE
PORTFOLIO AS OF October 31, 2022 | PERCENT OF
TOTAL
INVESTMENTS |
| | |
| | |
| | |
| | |
| | |
| | |
| Koninklijke DSM NV (Netherlands) | |
| | |
| | |
| Brambles Ltd. (Australia) | |
PORTFOLIO COMPOSITION BY COUNTRY
AS OF October 31, 2022 | PERCENT OF
TOTAL
INVESTMENTS |
| |
| |
| |
| |
| |
| |
| |
| |
| |
| |
| |
| |
| |
| |
Others (each less than 1.0%) | |
| |
| J.P. Morgan Exchange-Traded Funds | |
JPMorgan Sustainable Consumption ETF
FUND COMMENTARY
FOR THE PERIOD September 7, 2022 (FUND INCEPTION) THROUGH October 31, 2022 (Unaudited) (continued)
TOTAL RETURNS AS OF October 31, 2022 (Unaudited)
| | CUMULATIVE SINCE INCEPTION |
JPMorgan Sustainable Consumption ETF | | |
| | |
| | |
LIFE OF FUND PERFORMANCE (9/7/22 TO 10/31/22)
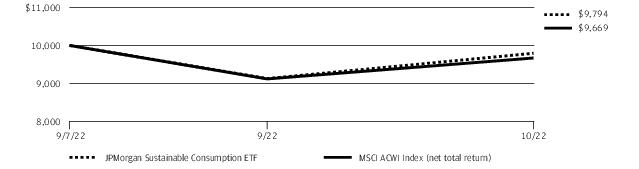
The performance quoted is past performance and is not a guarantee of future results. Exchange-traded funds are subject to certain market risks. Investment returns and principal value of an investment will fluctuate so that an investor’s shares, when sold or redeemed, may be worth more or less than their original cost. Current performance may be higher or lower than the performance data shown. For up-to-date month-end performance information, please call 1-844-457-6383.
Fund commenced operations on September 7, 2022.
The graph illustrates comparative performance for $10,000 invested in shares of the JPMorgan Sustainable Consumption ETF and the MSCI ACWI Index (net total return) from September 7, 2022 to October 31, 2022. The performance of the Fund reflects the deduction of Fund expenses and assumes reinvestment of all dividends and capital gain distributions, if any. The performance of the MSCI ACWI Index (net total return) does not reflect the deduction of expenses associated with an exchange-traded fund and has been adjusted to reflect
reinvestment of all dividends and capital gain distributions of the securities included in the Index, if applicable. The MSCI ACWI Index (net total return) is a free float-adjusted market capitalization-weighted index that is designed to measure the performance of large- and mid-cap stocks in developed and emerging markets. Net total return figures assume the reinvestment of dividends after deduction of withholding tax, applying the maximum rate to nonresident individual investors who do not benefit from double taxation treaties. Investors cannot invest directly in an index.
Performance shown in this section does not reflect the deduction of taxes that a shareholder may pay on Fund distributions or on gains resulting from redemption or sale of Fund shares.
The returns shown are based on net asset values calculated for shareholder transactions and may differ from the returns shown in the financial highlights, which reflect adjustments made to the net asset values in accordance with accounting principles generally accepted in the United States of America.
| J.P. Morgan Exchange-Traded Funds | |
JPMorgan Sustainable Infrastructure ETF
FUND COMMENTARY
FOR THE PERIOD September 7, 2022 (FUND INCEPTION) THROUGH October 31, 2022 (Unaudited)
| |
| |
| |
MSCI ACWI Index (net total return) | |
Net Assets as of 10/31/2022 | |
| |
INVESTMENT OBJECTIVE ***
The JPMorgan Sustainable Infrastructure ETF (the “Fund”) seeks to achieve long-term capital appreciation by investing in companies that the adviser believes are well-positioned to develop the infrastructure required to facilitate a sustainable and inclusive economy.
INVESTMENT APPROACH
The Fund invests primarily in common stocks, real estate investment trusts (REITs) and depositary receipts of companies that the adviser believes are facilitating access to essential goods and services, improved connectivity, social infrastructure, and environmental resilience, or are in the process of developing products or services to facilitate such access. The Fund uses a "thematic" investment approach that seeks to identify and invest in companies that are relevant to the theme of sustainable infrastructure and selects companies within key sub-themes, such as electricity infrastructure, renewables infrastructure, transport infrastructure, water infrastructure, digital infrastructure, sustainable logistics, medical infrastructure, and social housing and education infrastructure.
HOW DID THE FUND PERFORM?
For the period from inception on September 7, 2022 to October 31, 2022, the Fund had a negative absolute return and underperformed the MSCI ACWI Index (the “Index”).
The Fund’s security selections in the real estate and utilities sectors were leading detractors from performance, while the Fund’s security selections in the health care and consumer discretionary sectors were leading contributors to performance.
Leading individual detractors from Fund performance included SolarEdge Technologies Inc., Welltower Inc. and NextEra Energy Inc. Shares of SolarEdge Technologies, an Israeli maker
of solar power systems and devices, fell late in the period amid investor uncertainty about U.S. renewable energy policy ahead of congressional midterm elections in early November 2022. Shares of Welltower, a U.S. health care sector real estate investment trust, fell late in the period after the company reported lower-than-expected forecasts of cash flow. Shares of NextEra Energy, a U.S. electric utility, fell amid investor expectations that damage from Hurricane Ian would hurt operations.
Leading individual contributors to Fund performance included Samsung SDI Co., Xylem Inc. and HCA Healthcare Inc. Shares of Samsung SDI, a South Korean maker of batteries and related materials, rose amid the company’s push into the U.S. electric vehicle battery market. Shares of Xylem, a U.S. maker of industrial machinery for water and wastewater treatment, rose after the company reported better-than-expected earnings and revenue for the second quarter of 2022 and raised its earnings forecast for the year. Shares of HCA Healthcare, a U.S. operator of hospitals and related facilities and services, rose after the company reported better-than-expected earnings and revenue for the second quarter of 2022.
Relative to the Index, the Fund’s overweight positions in the real estate and utilities sectors were leading detractors from performance, while the Fund’s underweight positions in the consumer discretionary and communication services sectors were leading contributors to relative performance.
HOW WAS THE FUND POSITIONED?
As a result of the adviser’s thematic investment process, the Fund’s largest allocations during the period were to the utilities and real estate sectors and the smallest allocations were to the consumer discretionary and financials sectors. The Fund has no allocations to the materials, energy and consumer staples sectors.
| J.P. Morgan Exchange-Traded Funds | |
JPMorgan Sustainable Infrastructure ETF
FUND COMMENTARY
FOR THE PERIOD September 7, 2022 (FUND INCEPTION) THROUGH October 31, 2022 (Unaudited) (continued)
*
The return shown is based on net asset value and may differ from the return shown in the financial highlights, which reflects adjustments made to the net asset value in accordance with accounting principles generally accepted in the United States of America. The net asset value was $42.96 as of October 31, 2022.
**
Market price return was calculated assuming an initial investment made at the inception date net asset value, reinvestment of all dividends and distributions at market price during the period, and sale at the market price on the last day of the period. The price used to calculate the market price return was the closing price on the Nasdaq Stock Market® LLC. As of October 31, 2022, the closing price was $43.06.
***
The adviser seeks to achieve the Fund’s objective. There can be no guarantee it will be achieved.
TOP TEN HOLDINGS OF THE
PORTFOLIO AS OF October 31, 2022 | PERCENT OF
TOTAL
INVESTMENTS |
| | |
| | |
| | |
| | |
| Alexandria Real Estate Equities, Inc. | |
| | |
| | |
| | |
| | |
| | |
PORTFOLIO COMPOSITION BY COUNTRY
AS OF October 31, 2022 | PERCENT OF
TOTAL
INVESTMENTS |
| |
| |
| |
| |
| |
| |
| |
| |
| |
| |
| |
| |
| |
| |
| |
| |
| J.P. Morgan Exchange-Traded Funds | |
TOTAL RETURNS AS OF October 31, 2022 (Unaudited)
| | CUMULATIVE SINCE INCEPTION |
JPMorgan Sustainable Infrastructure ETF | | |
| | |
| | |
LIFE OF FUND PERFORMANCE (9/7/22 TO 10/31/22)
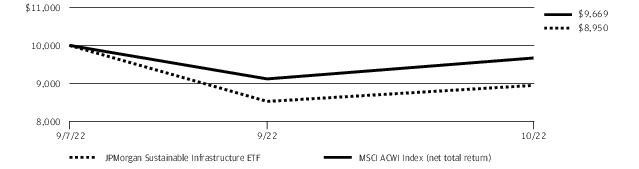
The performance quoted is past performance and is not a guarantee of future results. Exchange-traded funds are subject to certain market risks. Investment returns and principal value of an investment will fluctuate so that an investor’s shares, when sold or redeemed, may be worth more or less than their original cost. Current performance may be higher or lower than the performance data shown. For up-to-date month-end performance information, please call 1-844-457-6383.
Fund commenced operations on September 7, 2022.
The graph illustrates comparative performance for $10,000 invested in shares of the JPMorgan Sustainable Infrastructure ETF and the MSCI ACWI Index (net total return) from September 7, 2022 to October 31, 2022. The performance of the Fund reflects the deduction of Fund expenses and assumes reinvestment of all dividends and capital gain distributions, if any. The performance of the MSCI ACWI Index (net total return) does not reflect the deduction of expenses associated with an exchange-traded fund and has been adjusted to reflect
reinvestment of all dividends and capital gain distributions of the securities included in the Index, if applicable. The MSCI ACWI Index (net total return) is a free float-adjusted market capitalization-weighted index that is designed to measure the performance of large- and mid-cap stocks in developed and emerging markets. Net total return figures assume the reinvestment of dividends after deduction of withholding tax, applying the maximum rate to nonresident individual investors who do not benefit from double taxation treaties. Investors cannot invest directly in an index.
Performance shown in this section does not reflect the deduction of taxes that a shareholder may pay on Fund distributions or on gains resulting from redemption or sale of Fund shares.
The returns shown are based on net asset values calculated for shareholder transactions and may differ from the returns shown in the financial highlights, which reflect adjustments made to the net asset values in accordance with accounting principles generally accepted in the United States of America.
| J.P. Morgan Exchange-Traded Funds | |
JPMorgan Social Advancement ETF
SCHEDULE OF PORTFOLIO INVESTMENTS
AS OF October 31, 2022
| | |
|
|
| | |
|
| | |
|
| | |
|
| | |
|
Novo Nordisk A/S, Class B | | |
|
| | |
|
| | |
|
| | |
|
Bank Rakyat Indonesia Persero Tbk. PT | | |
|
| | |
| | |
| | |
|
FinecoBank Banca Fineco SpA | | |
|
| | |
Recruit Holdings Co. Ltd. | | |
| | |
Tokio Marine Holdings, Inc. | | |
| | |
| | |
|
Wal-Mart de Mexico SAB de CV | | |
|
| | |
Koninklijke Ahold Delhaize NV | | |
| | |
| | |
| | |
|
| | |
| | |
|
|
| | |
|
| | |
|
| | |
|
| | |
|
| | |
|
| | |
|
Reckitt Benckiser Group plc | | |
| | |
| | |
| | |
|
| | |
Alphabet, Inc., Class A * | | |
| | |
Boston Scientific Corp. * | | |
Charles Schwab Corp. (The) | | |
| | |
| | |
| | |
| | |
| | |
| | |
Intuitive Surgical, Inc. * | | |
| | |
| | |
Mastercard, Inc., Class A | | |
| | |
| | |
| | |
| | |
| | |
| | |
| | |
Sun Communities, Inc., REIT | | |
Thermo Fisher Scientific, Inc. | | |
| | |
SEE NOTES TO FINANCIAL STATEMENTS.
| J.P. Morgan Exchange-Traded Funds | |
| | |
Common Stocks — continued |
United States — continued |
| | |
Vertex Pharmaceuticals, Inc. * | | |
| | |
| | |
| | |
Total Common Stocks
(Cost $10,209,868) | | |
Short-Term Investments — 4.0% |
Investment Companies — 4.0% |
JPMorgan Prime Money Market Fund Class IM Shares, 3.18% (b) (c)(Cost $422,009) | | |
Total Investments — 99.4%
(Cost $10,631,877) | | |
Other Assets Less Liabilities — 0.6% | | |
| | |
Percentages indicated are based on net assets. |
| |
| American Depositary Receipt |
| Limited liability company |
| Real Estate Investment Trust |
| |
| Non-income producing security. |
| Security exempt from registration pursuant to Regulation S under the Securities Act of 1933, as amended. Regulation S applies to securities offerings that are made outside of the United States and do not involve direct selling efforts in the United States and as such may have restrictions on resale. |
| Investment in an affiliated fund, which is registered under the Investment Company Act of 1940, as amended, and is advised by J.P. Morgan Investment Management Inc. |
| The rate shown is the current yield as of October 31, 2022. |
Summary of Investments by Industry, October 31, 2022
The following table represents the portfolio investments of the Fund by industry classifications as a percentage of total investments:
| PERCENT OF
TOTAL
INVESTMENTS |
| |
Semiconductors & Semiconductor Equipment | |
| |
| |
| |
| |
Health Care Equipment & Supplies | |
Health Care Providers & Services | |
| |
| |
| |
| |
Construction & Engineering | |
Interactive Media & Services | |
Equity Real Estate Investment Trusts (REITs) | |
| |
| |
Commercial Services & Supplies | |
| |
Wireless Telecommunication Services | |
Textiles, Apparel & Luxury Goods | |
Life Sciences Tools & Services | |
| |
| |
Real Estate Management & Development | |
| |
| |
Others (each less than 1.0%) | |
| |
SEE NOTES TO FINANCIAL STATEMENTS.
| J.P. Morgan Exchange-Traded Funds | |
JPMorgan Sustainable Consumption ETF
SCHEDULE OF PORTFOLIO INVESTMENTS
AS OF October 31, 2022
| | |
|
|
| | |
|
Ritchie Bros Auctioneers, Inc. | | |
West Fraser Timber Co. Ltd. | | |
| | |
|
| | |
|
Novo Nordisk A/S, Class B | | |
|
| | |
| | |
| | |
|
| | |
|
| | |
| | |
| | |
| | |
| | |
|
| | |
| | |
| | |
|
| | |
| | |
| | |
| | |
Kurita Water Industries Ltd. | | |
| | |
| | |
|
| | |
| | |
| | |
| | |
|
|
| | |
| | |
| | |
|
| | |
|
| | |
| | |
| | |
|
Taiwan Semiconductor Manufacturing Co. Ltd., ADR | | |
|
| | |
| | |
| | |
|
| | |
| | |
Cadence Design Systems, Inc. * | | |
| | |
| | |
Darling Ingredients, Inc. * | | |
| | |
| | |
| | |
| | |
| | |
Evoqua Water Technologies Corp. * | | |
| | |
Gladstone Land Corp., REIT | | |
International Flavors & Fragrances, Inc. | | |
| | |
| | |
| | |
| | |
| | |
Rockwell Automation, Inc. | | |
| | |
Sprouts Farmers Market, Inc. * | | |
| | |
| | |
| | |
SEE NOTES TO FINANCIAL STATEMENTS.
| J.P. Morgan Exchange-Traded Funds | |
| | |
Common Stocks — continued |
United States — continued |
| | |
| | |
| | |
| | |
| | |
| | |
| | |
Total Common Stocks
(Cost $10,387,736) | | |
Short-Term Investments — 2.8% |
Investment Companies — 2.8% |
JPMorgan Prime Money Market Fund Class IM Shares, 3.18% (b) (c)(Cost $296,047) | | |
Total Investments — 99.4%
(Cost $10,683,783) | | |
Other Assets Less Liabilities — 0.6% | | |
| | |
Percentages indicated are based on net assets. |
| |
| American Depositary Receipt |
| |
| Real Estate Investment Trust |
| Non-income producing security. |
| Securities exempt from registration under Rule 144A or section 4(a)(2), of the Securities Act of 1933, as amended. |
| Investment in an affiliated fund, which is registered under the Investment Company Act of 1940, as amended, and is advised by J.P. Morgan Investment Management Inc. |
| The rate shown is the current yield as of October 31, 2022. |
Summary of Investments by Industry, October 31, 2022
The following table represents the portfolio investments of the Fund by industry classifications as a percentage of total investments:
| PERCENT OF
TOTAL
INVESTMENTS |
| |
| |
| |
| |
Commercial Services & Supplies | |
| |
Semiconductors & Semiconductor Equipment | |
Electronic Equipment, Instruments & Components | |
Health Care Providers & Services | |
| |
| |
| |
Equity Real Estate Investment Trusts (REITs) | |
Life Sciences Tools & Services | |
Construction & Engineering | |
| |
| |
Textiles, Apparel & Luxury Goods | |
Oil, Gas & Consumable Fuels | |
Others (each less than 1.0%) | |
| |
SEE NOTES TO FINANCIAL STATEMENTS.
| J.P. Morgan Exchange-Traded Funds | |
JPMorgan Sustainable Infrastructure ETF
SCHEDULE OF PORTFOLIO INVESTMENTS
AS OF October 31, 2022
| | |
|
|
| | |
| | |
| | |
| | |
|
| | |
Warehouses De Pauw CVA, REIT | | |
| | |
|
Canadian National Railway Co. | | |
|
China Longyuan Power Group Corp. Ltd., Class H | | |
Contemporary Amperex Technology Co. Ltd., Class A | | |
NARI Technology Co. Ltd., Class A | | |
SF Holding Co. Ltd., Class A | | |
| | |
|
| | |
|
| | |
| | |
| | |
| | |
|
| | |
| | |
| | |
| | |
|
| | |
Terna - Rete Elettrica Nazionale | | |
| | |
|
Kurita Water Industries Ltd. | | |
|
| | |
|
| | |
|
| | |
| | |
|
|
| | |
Corp. ACCIONA Energias Renovables SA | | |
| | |
| | |
Solaria Energia y Medio Ambiente SA * | | |
| | |
|
| | |
| | |
| | |
| | |
| | |
| | |
Tritax Big Box REIT plc, REIT | | |
UNITE Group plc (The), REIT | | |
United Utilities Group plc | | |
| | |
|
Alexandria Real Estate Equities, Inc., REIT | | |
| | |
American Tower Corp., REIT | | |
American Water Works Co., Inc. | | |
ChargePoint Holdings, Inc. * | | |
| | |
| | |
| | |
Hannon Armstrong Sustainable Infrastructure Capital, Inc., REIT | | |
| | |
| | |
Medical Properties Trust, Inc., REIT | | |
| | |
| | |
| | |
SBA Communications Corp., REIT | | |
| | |
SolarEdge Technologies, Inc. * | | |
| | |
| | |
| | |
| | |
SEE NOTES TO FINANCIAL STATEMENTS.
| J.P. Morgan Exchange-Traded Funds | |
| | |
Common Stocks — continued |
United States — continued |
| | |
| | |
| | |
Total Common Stocks
(Cost $10,492,786) | | |
Short-Term Investments — 1.1% |
Investment Companies — 1.1% |
JPMorgan Prime Money Market Fund Class IM Shares, 3.18% (b) (c)(Cost $109,226) | | |
Total Investments — 99.4%
(Cost $10,602,012) | | |
Other Assets Less Liabilities — 0.6% | | |
| | |
Percentages indicated are based on net assets. |
| |
| |
| Real Estate Investment Trust |
| Non-income producing security. |
| Security exempt from registration pursuant to Regulation S under the Securities Act of 1933, as amended. Regulation S applies to securities offerings that are made outside of the United States and do not involve direct selling efforts in the United States and as such may have restrictions on resale. |
| Investment in an affiliated fund, which is registered under the Investment Company Act of 1940, as amended, and is advised by J.P. Morgan Investment Management Inc. |
| The rate shown is the current yield as of October 31, 2022. |
Summary of Investments by Industry, October 31, 2022
The following table represents the portfolio investments of the Fund by industry classifications as a percentage of total investments:
| PERCENT OF
TOTAL
INVESTMENTS |
Equity Real Estate Investment Trusts (REITs) | |
| |
| |
| |
Independent Power and Renewable Electricity Producers | |
| |
| |
Health Care Providers & Services | |
Semiconductors & Semiconductor Equipment | |
Real Estate Management & Development | |
Electronic Equipment, Instruments & Components | |
Transportation Infrastructure | |
Diversified Telecommunication Services | |
| |
Others (each less than 1.0%) | |
| |
SEE NOTES TO FINANCIAL STATEMENTS.
| J.P. Morgan Exchange-Traded Funds | |
STATEMENTS OF ASSETS AND LIABILITIES
AS OF October 31, 2022
| JPMorgan Social
Advancement ETF | JPMorgan Sustainable
Consumption ETF | JPMorgan Sustainable
Infrastructure ETF |
| | | |
Investments in non-affiliates, at value | | | |
Investments in affiliates, at value | | | |
| | | |
Foreign currency, at value | | | |
Segregated cash balance with Authorized Participant for deposit securities | | | |
| | | |
Dividends from non-affiliates | | | |
Dividends from affiliates | | | |
| | | |
| | | |
| | | |
| | | |
Foreign currency due to custodian, at value | | | |
Collateral upon return of deposit securities | | | |
| | | |
Management fees (See Note 3.A.) | | | |
| | | |
| | | |
| | | |
| | | |
Total distributable earnings (loss) | | | |
| | | |
Outstanding number of shares
(unlimited number of shares authorized - par value $0.0001) | | | |
Net asset value, per share | | | |
Cost of investments in non-affiliates | | | |
Cost of investments in affiliates | | | |
| | | |
SEE NOTES TO FINANCIAL STATEMENTS.
| J.P. Morgan Exchange-Traded Funds | |
STATEMENTS OF OPERATIONS
FOR THE YEAR ENDED October 31, 2022
| JPMorgan Social
Advancement ETF (a) | JPMorgan Sustainable
Consumption ETF (a) | |
| | | |
Interest income from non-affiliates | | | |
Interest income from affiliates | | | |
Dividend income from non-affiliates | | | |
Dividend income from affiliates | | | |
Foreign taxes withheld (net) | | | |
| | | |
| | | |
Management fees (See Note 3.A.) | | | |
| | | |
Net investment income (loss) | | | |
REALIZED/UNREALIZED GAINS (LOSSES): | | | |
Net realized gain (loss) on transactions from: | | | |
Investments in non-affiliates | | | |
Investments in affiliates | | | |
Foreign currency transactions | | | |
| | | |
Change in net unrealized appreciation/depreciation on: | | | |
Investments in non-affiliates | | | |
Investments in affiliates | | | |
Foreign currency translations | | | |
Change in net unrealized appreciation/depreciation | | | |
Net realized/unrealized gains (losses) | | | |
Change in net assets resulting from operations | | | |
(a)
Commencement of operations was September 7, 2022.
SEE NOTES TO FINANCIAL STATEMENTS.
| J.P. Morgan Exchange-Traded Funds | |
STATEMENTS OF CHANGES IN NET ASSETS
FOR THE PERIODS INDICATED
| JPMorgan Social
Advancement ETF | JPMorgan Sustainable
Consumption ETF | JPMorgan Sustainable
Infrastructure ETF |
| Period Ended
October 31, 2022 (a) | Period Ended
October 31, 2022 (a) | |
CHANGE IN NET ASSETS RESULTING FROM OPERATIONS: | | | |
Net investment income (loss) | | | |
| | | |
Change in net unrealized appreciation/depreciation | | | |
Change in net assets resulting from operations | | | |
| | | |
Change in net assets resulting from capital transactions | | | |
| | | |
| | | |
| | | |
| | | |
| | | |
Proceeds from shares issued | | | |
Total change in net assets resulting from capital transactions | | | |
| | | |
| | | |
Net increase in shares from transactions | | | |
(a)
Commencement of operations was September 7, 2022.
SEE NOTES TO FINANCIAL STATEMENTS.
| J.P. Morgan Exchange-Traded Funds | |
THIS PAGE IS INTENTIONALLY LEFT BLANK
FINANCIAL HIGHLIGHTS
FOR THE PERIODS INDICATED
| Per share operating performance |
| | |
| Net asset
value,
beginning
of period | Net investment
income
(loss) (b) | Net realized
and unrealized
gains
(losses)
on investments | Total from
investment
operations | Net asset
value,
end of
period |
JPMorgan Social Advancement ETF | | | | | |
September 7, 2022 (f) through October 31, 2022 | | | | | |
JPMorgan Sustainable Consumption ETF | | | | | |
September 7, 2022 (f) through October 31, 2022 | | | | | |
JPMorgan Sustainable Infrastructure ETF | | | | | |
September 7, 2022 (f) through October 31, 2022 | | | | | |
|
| Annualized for periods less than one year, unless otherwise noted. |
| Calculated based upon average shares outstanding. |
| Not annualized for periods less than one year. |
| Includes adjustments in accordance with accounting principles generally accepted in the United States of America and as such, the net asset values for financial reporting purposes and the returns based upon those net asset values may differ from the net asset values and returns for shareholder transactions. |
| Market price return was calculated assuming an initial investment made at the market price at the beginning of the reporting period, reinvestment of all dividends and distributions at market price during the period, and sale at the market price on the last day of the period. The closing price was used to calculate the market price return. |
| Commencement of operations. |
| Since the Shares of the Fund did not trade in the secondary market until the day after the Fund’s inception, for the period from the inception to the first day of secondary market trading, the net asset value is used as a proxy for the secondary market trading price to calculate the market returns. |
SEE NOTES TO FINANCIAL STATEMENTS.
| J.P. Morgan Exchange-Traded Funds | |
| |
| | | | Ratios to average net assets (a) | |
| | Market
price
total
return (c)(e) | | | Net
investment
income
(loss) | Portfolio
turnover
rate (c) |
| | | | | | |
| | | | | | |
| | | | | | |
| | | | | | |
| | | | | | |
| | | | | | |
SEE NOTES TO FINANCIAL STATEMENTS.
| J.P. Morgan Exchange-Traded Funds | |
NOTES TO FINANCIAL STATEMENTS
AS OF October 31, 2022
1. Organization
J.P. Morgan Exchange-Traded Fund Trust (the “Trust”) was formed on February 25, 2010, and is governed by a Declaration of Trust as amended and restated February 19, 2014, and is registered under the Investment Company Act of 1940, as amended (the “1940 Act”), as an open-end management investment company.
The following are 3 separate funds of the Trust (each, a "Fund" and collectively, the "Funds") covered by this report:
| Diversification Classification |
JPMorgan Social Advancement ETF(1) | |
JPMorgan Sustainable Consumption ETF(1) | |
JPMorgan Sustainable Infrastructure ETF(1) | |
|
| Commenced operations on September 7, 2022. |
The investment objective of JPMorgan Social Advancement ETF ("Social Advancement ETF") is to seek to achieve long-term capital appreciation by investing in companies that the adviser believes are facilitating social and economic advancement.
The investment objective of JPMorgan Sustainable Consumption ETF ("Sustainable Consumption ETF") is to seek to achieve long-term capital appreciation by investing in companies that the adviser believes are developing solutions that help preserve natural resources, improve resource use, or reduce waste.
The investment objective of JPMorgan Sustainable Infrastructure ETF ("Sustainable Infrastructure ETF") is to seek to achieve long-term capital appreciation by investing in companies that the adviser believes are well-positioned to develop the infrastructure required to facilitate a sustainable and inclusive economy.
J.P. Morgan Investment Management Inc. (“JPMIM”), an indirect, wholly-owned subsidiary of JPMorgan Chase & Co. (“JPMorgan”), acts as Adviser (the “Adviser”) and Administrator (the “Administrator”) to the Funds.
Shares of each Fund are listed and traded at market price on the Nasdaq Stock Market LLC.
Market prices for the Funds’ shares may be different from their net asset value (“NAV”).
The Funds issue and redeem their shares on a continuous basis, through JPMorgan Distribution Services, Inc. (the “Distributor” or “JPMDS”), an indirect, wholly-owned subsidiary of JPMorgan, at NAV in large blocks of shares, referred to as “Creation Units” as shown in the table below:
| |
| |
Sustainable Consumption ETF | |
Sustainable Infrastructure ETF | |
Creation Units are issued and redeemed principally in-kind for a basket of securities. A cash amount may be substituted if the Fund has sizable exposure to market or sponsor restricted securities. Shares are generally traded in the secondary market in amounts less than a Creation Unit at market prices that change throughout the day. Only individuals or institutions that have entered into an authorized participant agreement with the Distributor may do business directly with the Funds (each, an “Authorized Participant”).
2. Significant Accounting Policies
The following is a summary of significant accounting policies followed by the Funds in the preparation of their financial statements. The Funds are investment companies and, accordingly, follow the investment company accounting and reporting guidance of the Financial Accounting Standards Board (“FASB”) Accounting Standards Codification Topic 946 — Investment Companies, which is part of U.S. generally accepted accounting principles (“GAAP”). The preparation of financial statements in conformity with GAAP requires management to make estimates and assumptions that affect (i) the reported amounts of assets and liabilities, (ii) disclosure of contingent assets and liabilities at the date of the financial statements, and (iii) the reported amounts of increases and decreases in net assets from operations during the reporting period. Actual results could differ from those estimates.
| J.P. Morgan Exchange-Traded Funds | |
A. Valuation of Investments — Investments are valued in accordance with GAAP and the Funds' valuation policies set forth by, and under the supervision and responsibility of, the Board of Trustees of the Trust (the "Board"), which established the following approach to valuation, as described more fully below: (i) investments for which market quotations are readily available shall be valued at their market value and (ii) all other investments for which market quotations are not readily available shall be valued at their fair value as determined in good faith by the Board.
Under Section 2(a)(41) of the 1940 Act, the Board is required to determine fair value for securities that do not have readily available market quotations. Under SEC Rule 2a-5 (Good Faith Determinations of Fair Value), the Board may designate the performance of these fair valuation determinations to a valuation designee. The Board has designated the Adviser as the “Valuation Designee” to perform fair valuation determinations for the Funds on behalf of the Board subject to appropriate oversight by the Board. The Adviser, as Valuation Designee, leverages the J.P. Morgan Asset Management Americas Valuation Committee (“AVC”) to help oversee and carry out the policies for the valuation of Investments held in the Funds. The Adviser, as Valuation Designee, remains responsible for the valuation determinations.
This oversight by the AVC includes monitoring the appropriateness of fair values based on results of ongoing valuation oversight including, but not limited to, consideration of macro or security specific events, market events, and pricing vendor and broker due diligence. The Administrator is responsible for discussing and assessing the potential impacts to the fair values on an ongoing basis, and, at least on a quarterly basis, with the AVC and the Board.
Equities and other exchange-traded instruments are valued at the last sale price or official market closing price on the primary exchange on which the instrument is traded before the NAVs of the Funds are calculated on a valuation date. Certain foreign equity instruments are valued by applying international fair value factors provided by approved Pricing Services. The factors seek to adjust the local closing price for movements of local markets post-closing, but prior to the time the NAV is calculated.
Investments in open-end investment companies (“Underlying Funds”) are valued at each Underlying Fund’s NAV per share as of the report date.
Valuations reflected in this report are as of the report date. As a result, changes in valuation due to market events and/or issuer-related events after the report date and prior to issuance of the report are not reflected herein.
The various inputs that are used in determining the valuation of the Funds' investments are summarized into the three broad levels listed below.
•
Level 1 — Unadjusted inputs using quoted prices in active markets for identical investments.
•
Level 2 — Other significant observable inputs including, but not limited to, quoted prices for similar investments, inputs other than quoted prices that are observable for investments (such as interest rates, prepayment speeds, credit risk, etc.) or other market corroborated inputs.
•
Level 3 — Significant inputs based on the best information available in the circumstances, to the extent observable inputs are not available (including the Funds' assumptions in determining the fair value of investments).
A financial instrument’s level within the fair value hierarchy is based on the lowest level of any input, both individually and in the aggregate, that is significant to the fair value measurement. The inputs or methodology used for valuing instruments are not necessarily an indication of the risk associated with investing in those instruments.
The following tables represent each valuation input as presented on the Schedules of Portfolio Investments ("SOIs"):
| | |
| | Level 2
Other significant
observable inputs | Level 3
Significant
unobservable inputs | |
Investments in Securities | | | | |
| | | | |
| | | | |
| | | | |
| | | | |
| | | | |
| | | | |
| | | | |
| | | | |
| | | | |
| | | | |
| | | | |
| | | | |
| | | | |
| | | | |
| J.P. Morgan Exchange-Traded Funds | |
NOTES TO FINANCIAL STATEMENTS
AS OF October 31, 2022 (continued)
Social Advancement ETF (continued) | | |
| | Level 2 Other significant observable inputs | Level 3 Significant unobservable inputs | |
| | | | |
| | | | |
| | | | |
| | | | |
| | | | |
| | | | |
| | | | |
| | | | |
| | | | |
| | | | |
| | | | |
| | | | |
| | | | |
Total Investments in Securities | | | | |
Sustainable Consumption ETF | | |
| | Level 2
Other significant
observable inputs | Level 3
Significant
unobservable inputs | |
Investments in Securities | | | | |
| | | | |
| | | | |
| | | | |
| | | | |
| | | | |
| | | | |
| | | | |
| | | | |
| | | | |
| | | | |
| | | | |
| | | | |
| | | | |
| | | | |
| | | | |
| | | | |
| | | | |
| | | | |
| | | | |
| | | | |
Total Investments in Securities | | | | |
| J.P. Morgan Exchange-Traded Funds | |
Sustainable Infrastructure ETF | | |
| | Level 2
Other significant
observable inputs | Level 3
Significant
unobservable inputs | |
Investments in Securities | | | | |
| | | | |
| | | | |
| | | | |
| | | | |
| | | | |
| | | | |
| | | | |
| | | | |
| | | | |
| | | | |
| | | | |
| | | | |
| | | | |
| | | | |
| | | | |
| | | | |
| | | | |
| | | | |
| | | | |
Total Investments in Securities | | | | |
B. Restricted Securities — Certain securities held by the Funds may be subject to legal or contractual restrictions on resale. Restricted securities generally are resold in transactions exempt from registration under the Securities Act of 1933, as amended (the “Securities Act”). Disposal of these securities may involve time-consuming negotiations and expense. Prompt sale at the current valuation may be difficult and could adversely affect the NAVs of the Funds.
As of October 31, 2022, the Funds had no investments in restricted securities other than securities sold to the Funds under Rule 144A and/or Regulation S under the Securities Act.
C. Securities Lending — The Funds are authorized to engage in securities lending in order to generate additional income. The Funds are able to lend to approved borrowers. Citibank N.A. (“Citibank”) serves as lending agent for the Funds, pursuant to a Securities Lending Agency Agreement (the “Securities Lending Agency Agreement”). Securities loaned are collateralized by cash equal to at least 100% of the market value plus accrued interest on the securities lent, which is invested in the Class IM Shares of the JPMorgan U.S. Government Money Market Fund and the Agency SL Class Shares of the JPMorgan Securities Lending Money Market Fund. The Funds retain the interest earned on cash collateral investments but are required to pay the borrower a rebate for the use of the cash collateral. In cases where the lent security is of high value to borrowers, there may be a negative rebate (i.e., a net payment from the borrower to the Funds). Upon termination of a loan, the Funds are required to return to the borrower an amount equal to the cash collateral, plus any rebate owed to the borrowers. The remaining maturities of the securities lending transactions are considered overnight and continuous. Loans are subject to termination by the Funds or the borrower at any time.
The net income earned on the securities lending (after payment of rebates and Citibank’s fee) is included on the Statements of Operations as Income from securities lending (net). The Funds also receive payments from the borrower during the period of the loan, equivalent to dividends and interest earned on the securities loaned, which are recorded as Dividend or Interest income, respectively, on the Statements of Operations.
Under the Securities Lending Agency Agreement, Citibank marks to market the loaned securities on a daily basis. In the event the cash received from the borrower is less than 102% of the value of the loaned securities (105% for loans of non-U.S. securities), Citibank requests additional cash from the borrower so as to maintain a collateralization level of at least 102% of the value of the loaned securities plus accrued interest (105% for loans of non-U.S. securities), subject to certain de minimis amounts.
The value of securities out on loan is recorded as an asset on the Statements of Assets and Liabilities. The value of the cash collateral received is recorded as a liability on the Statements of Assets and Liabilities and details of collateral investments are disclosed on the SOIs.
| J.P. Morgan Exchange-Traded Funds | |
NOTES TO FINANCIAL STATEMENTS
AS OF October 31, 2022 (continued)
The Funds bear the risk of loss associated with the collateral investments and are not entitled to additional collateral from the borrower to cover any such losses. To the extent that the value of the collateral investments declines below the amount owed to a borrower, the Funds may incur losses that exceed the amount they earned on lending the security. Upon termination of a loan, the Funds may use leverage (borrow money) to repay the borrower for cash collateral posted if the Adviser does not believe that it is prudent to sell the collateral investments to fund the payment of this liability. Securities lending activity is subject to master netting arrangements.
Securities lending also involves counterparty risks, including the risk that the loaned securities may not be returned in a timely manner or at all. Subject to certain conditions, Citibank has agreed to indemnify the Funds from losses resulting from a borrower’s failure to return a loaned security.
The Funds did not lend out any securities during the year ended October 31, 2022.
D. Investment Transactions with Affiliates — The Funds invested in Underlying Funds, which are advised by the Adviser. An issuer which is under common control with a Fund may be considered an affiliate. For the purposes of the financial statements, the Funds assume the issuers listed in the tables below to be affiliated issuers. The Underlying Funds’ distributions may be reinvested into such Underlying Funds. Reinvestment amounts are included in the purchases at cost amounts in the tables below.
|
For the year ended October 31, 2022 |
| Value at
September 7,
2022(a) | | | | Change in
Unrealized
Appreciation/
(Depreciation) | | | | Capital Gain
Distributions |
JPMorgan Prime Money Market Fund Class IM Shares, 3.18% (b) (c) | | | | | | | | | |
|
| Commencement of operations was September 7, 2022. |
| Investment in an affiliated fund, which is registered under the Investment Company Act of 1940, as amended, and is advised by J.P. Morgan Investment Management Inc. |
| The rate shown is the current yield as of October 31, 2022. |
Sustainable Consumption ETF |
For the year ended October 31, 2022 |
| Value at
September 7,
2022(a) | | | | Change in
Unrealized
Appreciation/
(Depreciation) | | | | Capital Gain
Distributions |
JPMorgan Prime Money Market Fund Class IM Shares, 3.18% (b) (c) | | | | | | | | | |
|
| Commencement of operations was September 7, 2022. |
| Investment in an affiliated fund, which is registered under the Investment Company Act of 1940, as amended, and is advised by J.P. Morgan Investment Management Inc. |
| The rate shown is the current yield as of October 31, 2022. |
Sustainable Infrastructure ETF |
For the year ended October 31, 2022 |
| Value at
September 7,
2022(a) | | | | Change in
Unrealized
Appreciation/
(Depreciation) | | | | Capital Gain
Distributions |
JPMorgan Prime Money Market Fund Class IM Shares, 3.18% (b) (c) | | | | | | | | | |
|
| Commencement of operations was September 7, 2022. |
| Investment in an affiliated fund, which is registered under the Investment Company Act of 1940, as amended, and is advised by J.P. Morgan Investment Management Inc. |
| The rate shown is the current yield as of October 31, 2022. |
| J.P. Morgan Exchange-Traded Funds | |
E. Foreign Currency Translation — The books and records of the Funds are maintained in U.S. dollars. Foreign currency amounts are translated into U.S. dollars at the prevailing exchange rates of such currencies against the U.S. dollar. The market value of investment securities and other assets and liabilities are translated at the exchange rate as of the valuation date. Purchases and sales of investment securities, income and expenses are translated at the exchange rate prevailing on the respective dates of such transactions.
The Funds do not isolate the effect of changes in foreign exchange rates from changes in market prices on securities held. Accordingly, such changes are included within Change in net unrealized appreciation/depreciation on investments in non-affiliates on the Statements of Operations.
Reported realized foreign currency gains and losses arise from the disposition of foreign currency, currency gains or losses realized between the trade and settlement dates on securities transactions, and the difference between the amounts of dividends, interest and foreign withholding taxes recorded on each Fund's books on the transaction date and the U.S. dollar equivalent of the amounts actually received or paid. These reported realized foreign currency gains and losses are included in Net realized gain (loss) on foreign currency transactions on the Statements of Operations. Unrealized foreign currency gains and losses arise from changes (due to changes in exchange rates) in the value of foreign currency and other assets and liabilities denominated in foreign currencies, which are held at year end and are included in Change in net unrealized appreciation/depreciation on foreign currency translations on the Statements of Operations.
F. Security Transactions and Investment Income — Investment transactions are accounted for on the trade date (the date the order to buy or sell is executed). Securities gains and losses are calculated on a specifically identified cost basis.
Dividend income, net of foreign taxes withheld, if any, is recorded on the ex-dividend date or when a Fund first learns of the dividend.
To the extent such information is publicly available, the Funds record distributions received in excess of income earned from underlying investments as a reduction of cost of investments and/or realized gain. Such amounts are based on estimates if actual amounts are not available and actual amounts of income, realized gain and return of capital may differ from the estimated amounts. The Funds adjust the estimated amounts of the components of distributions (and consequently their net investment income) as necessary, once the issuers provide information about the actual composition of the distributions.
G. Federal Income Taxes — Each Fund is treated as a separate taxable entity for Federal income tax purposes. Each Fund's policy is to comply with the provisions of the Internal Revenue Code (the “Code”) applicable to regulated investment companies and to distribute to shareholders all of its distributable net investment income and net realized capital gains on investments. Accordingly, no provision for Federal income tax is necessary. Management has reviewed the Funds' tax positions for all open tax years and has determined that as of October 31, 2022, no liability for Federal income tax is required in the Funds' financial statements for net unrecognized tax benefits. However, management’s conclusions may be subject to future review based on changes in, or the interpretation of, the accounting standards or tax laws and regulations. Each Fund's Federal tax returns for the prior three fiscal years, or since inception if shorter, remain subject to examination by the Internal Revenue Service.
H. Foreign Taxes —The Funds may be subject to foreign taxes on income, gains on investments or currency purchases/repatriation, a portion of which may be recoverable. The Funds will accrue such taxes and recoveries as applicable, based upon their current interpretation of tax rules and regulations that exist in the markets in which they invest. When a capital gains tax is determined to apply, the Funds record an estimated deferred tax liability in an amount that would be payable if the securities were disposed of on the valuation date.
I. Distributions to Shareholders — Distributions from net investment income, if any, are generally declared and paid at least annually. Net realized capital gains, if any, are distributed by each Fund at least annually. The amount of distributions from net investment income and net realized capital gains is determined in accordance with Federal income tax regulations, which may differ from GAAP. To the extent these “book/tax” differences are permanent in nature (i.e., that they result from other than timing of recognition — “temporary differences”), such amounts are reclassified within the capital accounts based on their Federal tax basis treatment.
The following amounts were reclassified within the capital accounts:
| | Accumulated
undistributed
(distributions in
excess of)
net investment
income | Accumulated
net realized
gains (losses) |
| | | |
Sustainable Consumption ETF | | | |
Sustainable Infrastructure ETF | | | |
The reclassifications for the Funds relate primarily to foreign currency gains or losses.
| J.P. Morgan Exchange-Traded Funds | |
NOTES TO FINANCIAL STATEMENTS
AS OF October 31, 2022 (continued)
3. Fees and Other Transactions with Affiliates
A. Management Fee— JPMIM manages the investments of each Fund pursuant to a Management Agreement. For such services, JPMIM is paid a fee which is accrued daily and paid no more frequently than monthly based on each Fund's respective average daily net assets at the following rate:
| |
| |
Sustainable Consumption ETF | |
Sustainable Infrastructure ETF | |
Under each Management Agreement, JPMIM is responsible for substantially all expenses of each Fund, (including expenses of the Trust relating to each Fund), except for the management fees, payments under the Funds' 12b-1 plan (if any), interest expenses, dividend and interest expenses related to short sales, taxes, acquired fund fees and expenses (other than fees for funds advised by the Adviser and/or its affiliates), costs of holding shareholder meetings, and litigation and potential litigation and other extraordinary expenses not incurred in the ordinary course of each Fund’s business. Additionally, each Fund is responsible for its non-operating expenses, including brokerage commissions and fees and expenses associated with each Fund’s securities lending program, if applicable. For the avoidance of doubt, the Adviser’s payment of such expenses may be accomplished through a Fund’s payment of such expenses and a corresponding reduction in the fee payable to the Adviser, provided, however, that if the amount of expenses paid by a Fund exceeds the fee payable to the Adviser, the Adviser will reimburse that Fund for such amount.
B. Administration Fee — JPMIM provides administration services to the Funds. Pursuant to each Management Agreement, JPMIM is compensated as described in Note 3.A.
JPMorgan Chase Bank, N.A. (“JPMCB”), a wholly-owned subsidiary of JPMorgan, serves as the Funds' sub-administrator (the “Sub-administrator”). For its services as Sub-administrator, JPMCB receives a portion of the management fees payable to JPMIM.
C. Custodian, Accounting and Transfer Agent Fees— JPMCB provides custody, accounting and transfer agency services to the Funds. For performing these services, JPMIM pays JPMCB transaction and asset-based fees that vary according to the number of transactions and positions, plus out-of-pocket expenses.
Additionally, Authorized Participants generally pay transaction fees associated with the creation and redemption of Fund shares. These fees are paid to JPMIM to offset certain custodian charges that are covered by each Management Agreement.
Interest income earned on cash balances at the custodian, if any, is included in Interest income from affiliates on the Statements of Operations.
Interest expense paid to the custodian related to cash overdrafts, if any, is included in Interest expense to affiliates on the Statements of Operations.
D. Distribution Services — The Distributor or its agent distributes Creation Units for each Fund on an agency basis. The Distributor does not maintain a secondary market in shares of each Fund. JPMDS receives no fees for their distribution services under the distribution agreement with the Trust (the “Distribution Agreement”). Although the Trust does not pay any fees under the Distribution Agreement, JPMIM pays JPMDS for certain distribution related services.
E. Waivers and Reimbursements — The Funds may invest in one or more money market funds advised by the Adviser (affiliated money market funds). The fees for the affiliated money market funds, except for investments of securities lending cash collateral, are covered under each Management Agreement as described in Note 3.A.
F. Other — Certain officers of the Trust are affiliated with the Adviser, the Administrator and JPMDS. Such officers receive no compensation from the Funds for serving in their respective roles.
The Board designated and appointed a Chief Compliance Officer to the Funds pursuant to Rule 38a-1 under the 1940 Act. The fees associated with the office of the Chief Compliance Officer are paid for by JPMIM as described in Note 3.A.
The Securities and Exchange Commission (“SEC”) has granted an exemptive order permitting the Funds to engage in principal transactions with J.P. Morgan Securities LLC, an affiliated broker, involving taxable money market instruments, subject to certain conditions.
4. Investment Transactions
During the year ended October 31, 2022, purchases and sales of investments (excluding short-term investments) were as follows:
| Purchases
(excluding
U.S. Government) | Sales
(excluding
U.S. Government) |
| | |
Sustainable Consumption ETF | | |
Sustainable Infrastructure ETF | | |
| J.P. Morgan Exchange-Traded Funds | |
During the year ended October 31, 2022, there were no purchases or sales of U.S. Government securities.
For the year ended October 31, 2022, in-kind transactions associated with creations and redemptions were as follows:
| | |
| | |
Sustainable Consumption ETF | | |
Sustainable Infrastructure ETF | | |
5. Federal Income Tax Matters
For Federal income tax purposes, the estimated cost and unrealized appreciation (depreciation) in value of investments held at October 31, 2022 were as follows:
| | Gross
Unrealized
Appreciation | Gross
Unrealized
Depreciation | Net Unrealized
Appreciation
(Depreciation) |
| | | | |
Sustainable Consumption ETF | | | | |
Sustainable Infrastructure ETF | | | | |
The difference between book and tax basis appreciation (depreciation) on investments is primarily attributed to tax adjustments on investments and wash sale loss deferrals.
As of October 31, 2022, the estimated components of net assets (excluding paid-in-capital) on a tax basis were as follows:
| Current
Distributable
Ordinary
Income | Current
Distributable
Long-Term
Capital Gain
(Tax Basis Capital
Loss Carryover) | Unrealized
Appreciation
(Depreciation) |
| | | |
Sustainable Consumption ETF | | | |
Sustainable Infrastructure ETF | | | |
The cumulative timing differences primarily consist of tax adjustments on certain investments.
At October 31, 2022, the following Funds had net capital loss carryforwards which are available to offset future realized gains:
| Capital Loss Carryforward Character |
| | |
| | |
Sustainable Consumption ETF | | |
6. Capital Share Transactions
The Trust issues and redeems shares of the Funds only in Creation Units through the Distributor at NAV. Capital shares transactions detail can be found in the Statements of Changes in Net Assets.
Shares of the Funds may only be purchased or redeemed by Authorized Participants. Such Authorized Participants may from time to time hold, of record or beneficially, a substantial percentage of the Funds' shares outstanding and act as executing or clearing broker for investment transactions on behalf of the Funds. An Authorized Participant is either (1) a “Participating Party” or other participant in the clearing process through the Continuous Net Settlement System of the National Securities Clearing Corporation (“NSCC”); or (2) a DTC Participant; which, in either case, must have executed an agreement with the Distributor.
| J.P. Morgan Exchange-Traded Funds | |
NOTES TO FINANCIAL STATEMENTS
AS OF October 31, 2022 (continued)
7. Risks, Concentrations and Indemnifications
In the normal course of business, the Funds enter into contracts that contain a variety of representations which provide general indemnifications. Each Fund's maximum exposure under these arrangements is unknown. The amount of exposure would depend on future claims that may be brought against each Fund. However, based on experience, the Funds expect the risk of loss to be remote.
Significant shareholder transactions by these shareholders may impact the Funds' performance and liquidity.
As of October 31, 2022, the Adviser owned shares representing more than 10% of net assets of the following Funds:
| |
| |
Sustainable Consumption ETF | |
Sustainable Infrastructure ETF | |
Social Advancement ETF’s investment strategy and the Adviser’s determinations of what is considered social advancement may result in Social Advancement ETF investing in securities or industry sectors that underperform the market and other funds that do not have the same considerations. Social Advancement ETF's focus on securities of issuers that, in the Adviser’s opinion, are facilitating social and economic advancement and benefit from growing demand for investments that are furthering social advancement will result in exposure to certain market segments, including essential amenities, housing and infrastructure, healthcare and wellbeing, education and training, financing, and digital technology. Such focus may result in Social Advancement ETF’s forgoing opportunities to buy certain securities when it might otherwise be advantageous to do so, or selling securities for social advancement reasons when it might otherwise be disadvantageous for it to do so. In addition, there is a risk that the companies selected for their relation to the sub-themes do not operate as expected when addressing social advancement issues. Social Advancement ETF will be more susceptible to events or factors affecting such market segments, and the market prices of its portfolio securities may be more volatile than those of funds that are more diversified. The factors that the Adviser considers in evaluating social advancement and exposure to a sub-theme may change over time. There may also be differences in interpretations of what it means for a company to “facilitate social and economic advancement.” The portfolio decisions that the Adviser makes may differ with other investors’ or investment managers’ views. Social Advancement ETF is particularly exposed to, and may be negatively impacted by changes in global and regional standards, environmental protection regulatory actions, government regulation of affordable housing and medical facilities, changes in government standards and subsidy levels, changes in taxation and other domestic and international political, regulatory and economic developments. In addition, scientific developments, such as breakthroughs in electrical and water engineering and advancements in technology, including digital technology and changes in governmental policies relating to Social Advancement ETF’s sub-themes, may affect investments which could in turn affect these companies. Such companies also may be significantly affected by technological changes in industries focusing on essential amenities, affordable housing, education and training, medical and wellbeing, and digital infrastructure.
Sustainable Consumption ETF’s investment strategy and the Adviser’s determinations of what is considered sustainable consumption may result in Sustainable Consumption ETF investing in securities or industry sectors that underperform the market and other funds that do not have the same considerations. Sustainable Consumption ETF’s focus on securities of issuers that, in the Adviser’s opinion, are developing solutions to facilitate sustainable consumption and benefit from growing demand for such investments will result in exposure to certain market segments, including water, agriculture, production materials and design, and recycling and reuse. Such focus may result in Sustainable Consumption ETF’s forgoing opportunities to buy certain securities when it might otherwise be advantageous to do so, or selling securities for sustainability reasons when it might otherwise be disadvantageous for it to do so. In addition, there is a risk that the companies selected for their relation to the sub-themes do not operate as expected when addressing sustainability issues. Sustainable Consumption ETF will be more susceptible to events or factors affecting such market segments, and the market prices of its portfolio securities may be more volatile than those of funds that are more diversified. The factors that the Adviser considers in evaluating sustainable consumption and exposure to a sub-theme may change over time. There may also be differences in interpretations of what it means for a company to help “preserve natural resources, improve resource use, or reduce waste.” The portfolio decisions that the Adviser makes may differ with other investors’ or investment managers’ views. Sustainable Consumption ETF is particularly exposed to, and may be negatively impacted by changes in global and regional standards, environmental protection regulatory actions, government regulation of natural resources, agriculture and manufacturing, changes in government standards and subsidy levels, changes in taxation and other domestic and international political, regulatory and economic developments. In addition, scientific developments, such as breakthroughs in water, agricultural, or industrial engineering and advancements in technology, including digital technology and changes in governmental policies relating to Sustainable Consumption ETF’s sub-themes, may affect investments which could in turn affect these companies. Such companies also may be significantly affected by technological changes in industries focusing on water systems, agriculture, production materials and design, and recycling and reuse.
Sustainable Infrastructure ETF’s investment strategy and the Adviser’s determinations of what is considered sustainable infrastructure may result in Sustainable Infrastructure ETF investing in securities or industry sectors that underperform the market and other funds that do not have the same considerations. Sustainable Infrastructure ETF’s focus on securities of issuers that, in the Adviser’s opinion, are developing solutions to address sustainable infrastructure and benefit from growing demand for such solutions will result in exposure to certain market segments, including certain types of utilities, electricity, renewables, transportation, water, digital, sustainable logistics, and medical. Such focus may result in Sustainable
| J.P. Morgan Exchange-Traded Funds | |
Infrastructure ETF’s forgoing opportunities to buy certain securities when it might otherwise be advantageous to do so, or selling securities for sustainability reasons when it might otherwise be disadvantageous for it to do so. In addition, there is a risk that the companies selected for their relation to the sub-themes do not operate as expected when addressing sustainability issues. Sustainable Infrastructure ETF will be more susceptible to events or factors affecting such market segments, and the market prices of its portfolio securities may be more volatile than those of funds that are more diversified. The factors that the Adviser considers in evaluating sustainable infrastructure may change over time. There may also be differences in interpretations of what it means for a company to “facilitate a sustainable and inclusive economy.” The portfolio decisions that the Adviser makes may differ with other investors’ or investment managers’ views. Sustainable Infrastructure ETF is particularly exposed to, and may be negatively impacted by changes in global and regional standards, environmental protection regulatory actions, government regulation of medical facilities, changes in government standards and subsidy levels, changes in taxation and other domestic and international political, regulatory and economic developments. In addition, scientific developments, such as breakthroughs in electrical and water engineering and advancements in technology, including digital technology and changes in governmental policies relating to infrastructure, may affect investments in infrastructure which could in turn affect these companies. Such companies also may be significantly affected by technological changes in industries focusing on energy, transportation, and digital infrastructure.
The Funds may have elements of risk not typically associated with investments in the United States of America due to concentrated investments in a limited number of foreign countries or regions, which may vary throughout the period. Such concentrations may subject each of these Funds to additional risks resulting from political or economic conditions in such countries or regions and the possible imposition of adverse governmental laws or currency exchange restrictions could cause the securities and their markets to be less liquid and their prices to be more volatile than those of comparable U.S. securities.
As of October 31, 2022, the following Fund had non-U.S. country allocations representing greater than 10% of total investments as follows:
| Sustainable
Infrastructure ETF |
| |
Investing in securities of foreign countries may include certain risks and considerations not typically associated with investing in U.S. securities. These risks include revaluation of currencies, high rates of inflation, repatriation restrictions on income and currencies, and future and adverse political, social and economic developments.
The Funds invest in foreign issuers and foreign securities (including depositary receipts) that are subject to additional risks, including political and economic risks, civil and war, greater volatility, expropriation and nationalization risks, sanctions or other measures by the United States or other governments, currency fluctuations, higher transaction costs, delayed settlement, possible foreign controls on investment, liquidity risks and less stringent investor protection and disclosure standards of foreign markets. In certain markets where securities and other instruments are not traded “delivery versus payment,” a Fund may not receive timely payment for securities or other instruments it has delivered or receive delivery of securities paid for and may be subject to increased risk that the counterparty will fail to make payments or delivery when due or default completely.
Events and evolving conditions in certain economies or markets may alter the risks associated with investments tied to countries or regions that historically were perceived as comparatively stable becoming riskier and more volatile. The Funds each invest a substantial portion of their assets in emerging market countries. These risks are magnified in countries in emerging markets. Emerging market countries typically have less established market economies than developed countries and may face greater social, economic, regulatory and political uncertainties. In addition, emerging markets typically present greater illiquidity and price volatility concerns due to smaller or limited local capital markets and greater difficulty in determining market valuations of securities due to limited public information on issuers. Certain emerging market countries may be subject to less stringent requirements regarding accounting, auditing, financial reporting and record keeping and therefore, material information related to an investment may not be available or reliable. In addition, a Fund is limited in its ability to exercise its legal rights or enforce a counterparty’s legal obligations in certain jurisdictions outside of the United States, in particular, in emerging market countries.
The Funds are subject to infectious disease epidemics/pandemics risk. The worldwide outbreak of COVID-19 has negatively affected economies, markets and individual companies throughout the world. The effects of this COVID-19 pandemic to public health, and business and market conditions, including among other things, reduced consumer demand and economic output, supply chain disruptions and increased government spending may continue to have a significant negative impact on the performance of a Fund's investments, increase a Fund's volatility, exacerbate other pre-existing political, social and economic risks to the Funds and negatively impact broad segments of businesses and populations. In addition, governments, their regulatory agencies, or self-regulatory organizations have taken or may take actions in response to the pandemic that affect the instruments in which the Funds invest, or the issuers of such instruments, in ways that could also have a significant negative impact on a Fund’s investment performance. The duration and extent of COVID-19 and associated economic and market conditions and uncertainty over the long-term cannot be reasonably estimated at this time. The ultimate impact of COVID-19 and the extent to which the associated conditions impact a Fund will also depend on future developments, which are highly uncertain, difficult to accurately predict and subject to frequent changes.
8. Subsequent Event
Effective November 1, 2022, the Funds rely upon an exemptive order granted by the SEC (the “Order”) permitting the establishment and operation of an Interfund Lending Facility (the “Facility”). The Facility allows the Funds to directly lend and borrow money to or from any other fund relying upon
| J.P. Morgan Exchange-Traded Funds | |
NOTES TO FINANCIAL STATEMENTS
AS OF October 31, 2022 (continued)
the Order at rates beneficial to both the borrowing and lending funds. Advances under the Facility are taken primarily for temporary or emergency purposes, including the meeting of redemption requests that otherwise might require the untimely disposition of securities, and are subject to each Fund's borrowing restrictions. The interfund loan rate is determined, as specified in the Order, by averaging the current repurchase agreement rate and the current bank loan rate. The Order was granted to JPMorgan Trust II and may be relied upon by the Funds because the Funds and the series of JPMorgan Trust II are all investment companies in the same “group of investment companies” (as defined in Section 12(d)(1)(G) of the 1940 Act).
| J.P. Morgan Exchange-Traded Funds | |
REPORT OF INDEPENDENT REGISTERED PUBLIC ACCOUNTING FIRM
To the Board of Trustees of J.P. Morgan Exchange-Traded Fund Trust and Shareholders of JPMorgan Social Advancement ETF, JPMorgan Sustainable Consumption ETF and JPMorgan Sustainable Infrastructure ETF
Opinions on the Financial Statements
We have audited the accompanying statements of assets and liabilities, including the schedules of portfolio investments, of JPMorgan Social Advancement ETF, JPMorgan Sustainable Consumption ETF and JPMorgan Sustainable Infrastructure ETF (three of the funds constituting J.P. Morgan Exchange-Traded Fund Trust, hereafter collectively referred to as the "Funds") as of October 31, 2022, the related statements of operations and changes in net assets, including the related notes, and the financial highlights for the period September 7, 2022 (commencement of operations) through October 31, 2022 (collectively referred to as the “financial statements”). In our opinion, the financial statements present fairly, in all material respects, the financial position of each of the Funds as of October 31, 2022, and the results of each of their operations, changes in each of their net assets, and each of the financial highlights for the period September 7, 2022 (commencement of operations) through October 31, 2022 in conformity with accounting principles generally accepted in the United States of America.
Basis for Opinions
These financial statements are the responsibility of the Funds’ management. Our responsibility is to express an opinion on the Funds’ financial statements based on our audits. We are a public accounting firm registered with the Public Company Accounting Oversight Board (United States) (PCAOB) and are required to be independent with respect to the Funds in accordance with the U.S. federal securities laws and the applicable rules and regulations of the Securities and Exchange Commission and the PCAOB.
We conducted our audits of these financial statements in accordance with the standards of the PCAOB. Those standards require that we plan and perform the audit to obtain reasonable assurance about whether the financial statements are free of material misstatement, whether due to error or fraud.
Our audits included performing procedures to assess the risks of material misstatement of the financial statements, whether due to error or fraud, and performing procedures that respond to those risks. Such procedures included examining, on a test basis, evidence regarding the amounts and disclosures in the financial statements. Our audits also included evaluating the accounting principles used and significant estimates made by management, as well as evaluating the overall presentation of the financial statements. Our procedures included confirmation of securities owned as of October 31, 2022 by correspondence with the custodian and transfer agent. We believe that our audits provide a reasonable basis for our opinions.
/s/ PricewaterhouseCoopers LLP
New York, New York
December 22, 2022
We have served as the auditor of one or more investment companies in the JPMorgan Funds complex since 1993.
| J.P. Morgan Exchange-Traded Funds | |
The Funds’ Statement of Additional Information includes additional information about the Funds’ Trustees and is available, without charge, upon request by calling 1-844-457-6383 or on the J.P. Morgan Funds’ website at www.jpmorganfunds.com.
Name (Year of Birth);
Positions With
the Funds (1) | Principal Occupation
During Past 5 Years | Number of
Funds in Fund
Complex Overseen
by Trustee (2) | Other Directorships Held
During the Past 5 Years |
| | | |
John F. Finn (1947); Chair
since 2020; Trustee since 1998. | Chairman, Gardner, Inc. (supply chain management company serving industrial and consumer markets) (serving in various roles 1974-present). | | Director, Greif, Inc. (GEF) (industrial package products and services) (2007-present); Trustee, Columbus Association for the Performing Arts (1988-present). |
Stephen P. Fisher (1959);
Trustee since 2018. | Retired; Chairman and Chief Executive Officer, NYLIFE Distributors LLC (registered broker-dealer) (serving in various roles 2008-2013); Chairman, NYLIM Service Company LLC (transfer agent) (2008-2017); New York Life Investment Management LLC (registered investment adviser) (serving in various roles 2005-2017); Chairman, IndexIQ Advisors LLC (registered investment adviser for ETFs) (2014-2017); President, MainStay VP Funds Trust (2007-2017), MainStay DefinedTerm Municipal Opportunities Fund (2011-2017) and MainStay Funds Trust (2007-2017) (registered investment companies). | | Honors Program Advisory Board Member, The Zicklin School of Business, Baruch College, The City University of New York (2017-present). |
Gary L. French (1951);
Trustee since 2014. | Real Estate Investor (2011-2020); Investment management industry Consultant and Expert Witness (2011-present); Senior Consultant for The Regulatory Fundamentals Group LLC (2011-2017). | | Independent Trustee, The China Fund, Inc. (2013-2019); Exchange Traded Concepts Trust II (2012-2014); Exchange Traded Concepts Trust I (2011-2014). |
Kathleen M. Gallagher (1958);
Trustee since 2018. | Retired; Chief Investment Officer — Benefit Plans, Ford Motor Company (serving in various roles 1985-2016). | | Non- Executive Director, Legal & General Investment Management (Holdings) (2018-present); Non-Executive Director, Legal & General Investment Management America (U.S. Holdings) (financial services and insurance) (2017-present); Advisory Board Member, State Street Global Advisors Total Portfolio Solutions (2017-present); Member, Client Advisory Council, Financial Engines, LLC (registered investment adviser) (2011-2016); Director, Ford Pension Funds Investment Management Ltd. (2007-2016). |
Robert J. Grassi (1957);
Trustee since 2014. | Sole Proprietor, Academy Hills Advisors LLC (2012-present); Pension Director, Corning Incorporated (2002-2012). | | |
Frankie D. Hughes (1952);
Trustee since 2008. | President, Ashland Hughes Properties (property management) (2014-present); President and Chief Investment Officer, Hughes Capital Management, Inc. (fixed income asset management) (1993-2014). | | |
| J.P. Morgan Exchange-Traded Funds | |
Name (Year of Birth); Positions With the Funds (1) | Principal Occupation During Past 5 Years | Number of Funds in Fund Complex Overseen by Trustee (2) | Other Directorships Held During the Past 5 Years |
Raymond Kanner (1953);
Trustee since 2017. | Retired; Managing Director and Chief Investment Officer, IBM Retirement Funds (2007-2016). | | Advisory Board Member, Penso Advisors, LLC (2020-present); Advisory Board Member, Los Angeles Capital (2018-present); Advisory Board Member, State Street Global Advisors Total Portfolio Solutions (2017- present); Acting Executive Director, Committee on Investment of Employee Benefit Assets (CIEBA) (2016-2017); Advisory Board Member, Betterment for Business (robo advisor) (2016- 2017); Advisory Board Member, BlueStar Indexes (index creator) (2013-2017); Director, Emerging Markets Growth Fund (registered investment company) (1997-2016); Member, Russell Index Client Advisory Board (2001-2015). |
Thomas P. Lemke (1954);
Trustee since 2014. | | | (1) Independent Trustee of Advisors’ Inner Circle III fund platform, consisting of the following: (i) the Advisors’ Inner Circle Fund III, (ii) the Gallery Trust, (iii) the Schroder Series Trust, (iv) the Delaware Wilshire Private Markets Fund (since 2020), (v) Chiron Capital Allocation Fund Ltd., and (vi) formerly the Winton Diversified Opportunities Fund (2014-2018); and (2) Independent Trustee of the Symmetry Panoramic Trust (since 2018). |
Lawrence R. Maffia (1950);
Trustee since 2014 | Retired; Director and President, ICI Mutual Insurance Company (2006-2013). | | Director, ICI Mutual Insurance Company (1999-2013). |
Mary E. Martinez (1960); Vice
Chair since 2021; Trustee since 2013. | Associate, Special Properties, a Christie’s International Real Estate Affiliate (2010-present); Managing Director, Bank of America (asset management) (2007-2008); Chief Operating Officer, U.S. Trust Asset Management, U.S. Trust Company (asset management) (2003-2007); President, Excelsior Funds (registered investment companies) (2004-2005). | | |
Marilyn McCoy (1948);
Trustee since 2005. | Vice President of Administration and Planning, Northwestern University (1985-present). | | |
Dr. Robert A. Oden, Jr. (1946); Trustee
since 2005. | Retired; President, Carleton College (2002-2010); President, Kenyon College (1995-2002). | | Trustee, The Coldwater Conservation Fund (2017-present); Trustee, American Museum of Fly Fishing (2013-present); Trustee and Vice Chair, Trout Unlimited (2017-2021);Trustee, Dartmouth- Hitchcock MedicalCenter (2011-2020). |
| J.P. Morgan Exchange-Traded Funds | |
TRUSTEES
(Unaudited) (continued)
Name (Year of Birth); Positions With the Funds (1) | Principal Occupation During Past 5 Years | Number of Funds in Fund Complex Overseen by Trustee (2) | Other Directorships Held During the Past 5 Years |
Marian U. Pardo* (1946);
Trustee since 2013. | Managing Director and Founder, Virtual Capital Management LLC (investment consulting) (2007-present); Managing Director, Credit Suisse Asset Management (portfolio manager) (2003-2006). | | Board Chair and Member, Board of Governors, Columbus Citizens Foundation (not-for-profit supporting philanthropic and cultural programs) (2006-present). |
Emily A. Youssouf (1951);
Trustee since 2022. | Adjunct Professor (2011-present) and Clinical Professor (2009-2011), NYU Schack Institute of Real Estate; Board Member and Member of the Audit Committee (2013–present), Chair of Finance Committee (2019-present), Member of Related Parties Committee (2013-2018) and Member of the Enterprise Risk Committee (2015-2018), PennyMac Financial Services, Inc.; Board Member (2005-2018), Chair of Capital Committee (2006-2016), Chair of Audit Committee (2005-2018), Member of Finance Committee (2005-2018) and Chair of IT Committee (2016-2018), NYC Health and Hospitals Corporation. | | Trustee, NYC School Construction Authority (2009-present); Board Member, NYS Job Development Authority (2008-present); Trustee and Chair of the Audit Committee of the Transit Center Foundation (2015-2019). |
| | | |
Robert F. Deutsch** (1957);
Trustee since 2014. | Retired; Head of ETF Business for JPMorgan Asset Management (2013-2017); Head of Global Liquidity Business for JPMorgan Asset Management (2003-2013). | | Treasurer and Director of the JUST Capital Foundation (2017-present). |
Nina O. Shenker** (1957);
Trustee since 2022. | Vice Chair (2017-2021), General Counsel and Managing Director (2008-2016), Associate General Counsel and Managing Director (2004-2008), J.P. Morgan Asset & Wealth Management. | | Director and Member of Legal and Human Resources Subcommittees, American Jewish Joint Distribution Committee (2018-present). |
|
| The year shown is the first year in which a Trustee became a member of any of the following: the Mutual Fund Board, the ETF Board, the heritage J.P. Morgan Funds or the heritage One Group Mutual Funds. Trustees serve an indefinite term, until resignation, retirement, removal or death. The Board’s current retirement policy sets retirement at the end of the calendar year in which the Trustee attains the age of 75, provided that any Board member who was a member of the Mutual Fund Board prior to January 1, 2022 and was born prior to January 1, 1950 shall retire from the Board at the end of the calendar year in which the Trustee attains the age of 78. |
| A Fund Complex means two or more registered investment companies that hold themselves out to investors as related companies for purposes of investment and investor services or have a common investment adviser or have an investment adviser that is an affiliated person of the investment adviser of any of the other registered investment companies. The J.P. Morgan Funds Complex for which the Board of Trustees serves currently includes nine registered investment companies (166 J.P. Morgan Funds). |
| In connection with prior employment with JPMorgan Chase, Ms. Pardo was the recipient of non-qualified pension plan payments from JPMorgan Chase in the amount of approximately $2,055 per month, which she irrevocably waived effective January 1, 2013, and deferred compensation payments from JPMorgan Chase in the amount of approximately $7,294 per year, which ended in January 2013. In addition, Ms. Pardo receives payments from a fully-funded qualified plan, which is not an obligation of JPMorgan Chase. |
| Designation as an “Interested Trustee” is based on prior employment by the Adviser or an affiliate of the Adviser or interests in a control person of the Adviser. |
| The contact address for each of the Trustees is 277 Park Avenue, New York, NY 10172. |
| J.P. Morgan Exchange-Traded Funds | |
Name (Year of Birth),
Positions Held with
the Trust (Since) | Principal Occupations During Past 5 Years |
Brian S. Shlissel (1964),
President and Principal Executive
Officer (2021)* | Managing Director and Chief Administrative Officer for J.P. Morgan pooled vehicles, J.P. Morgan Investment Management Inc. since 2014. |
Timothy J. Clemens (1975),
Treasurer and Principal Financial
Officer (2020) | Executive Director, J.P. Morgan Investment Management Inc. since February 2016. Mr. Clemens has been with J.P. Morgan Investment Management Inc. since 2013. |
Gregory S. Samuels (1980),
Secretary (2022) **(formerly Assistant
Secretary 2014-2022) | Managing Director and Assistant General Counsel, JPMorgan Chase & Co. Mr. Samuels has been with JPMorgan Chase & Co. since 2010. |
Stephen M. Ungerman (1953),
Chief Compliance Officer (2014) | Managing Director, JPMorgan Chase & Co. Mr. Ungerman has been with JPMorgan Chase & Co. since 2000. |
Kiesha Astwood-Smith (1973),
Assistant Secretary (2021)** | Vice President and Assistant General Counsel, JPMorgan Chase & Co. since June 2021; Senior Director and Counsel, Equitable Financial Life Insurance Company (formerly, AXA Equitable Life Insurance Company) from September 2015 through June 2021. |
Matthew Beck (1988),
Assistant Secretary (2021)*** | Vice President and Assistant General Counsel, JPMorgan Chase & Co. since May 2021; Senior Legal Counsel, Ultimus Fund Solutions from May 2018 through May 2021; General Counsel, The Nottingham Company from April 2014 through May 2018. |
Elizabeth A. Davin (1964),
Assistant Secretary (2022)***
(formerly Secretary 2018-2022) | Executive Director and Assistant General Counsel, JPMorgan Chase & Co. Ms. Davin has been with JPMorgan Chase & Co. (formerly Bank One Corporation) since 2004. |
Jessica K. Ditullio (1962),
Assistant Secretary (2014)*** | Executive Director and Assistant General Counsel, JPMorgan Chase & Co. Ms. Ditullio has been with JPMorgan Chase & Co. (formerly Bank One Corporation) since 1990. |
Anthony Geron (1971),
Assistant Secretary (2019)** | Vice President and Assistant General Counsel, JPMorgan Chase & Co. since September 2018; Lead Director and Counsel, AXA Equitable Life Insurance Company from 2015 to 2018 and Senior Director and Counsel, AXA Equitable Life Insurance Company from 2014 to 2015. |
Carmine Lekstutis (1980),
Assistant Secretary (2014)** | Executive Director and Assistant General Counsel, JPMorgan Chase & Co. Mr. Lekstutis has been with JPMorgan Chase & Co. since 2011. |
Max Vogel (1990),
Assistant Secretary (2021)** | Vice President and Assistant General Counsel, JPMorgan Chase & Co. since June 2021; Associate, Proskauer Rose LLP (law firm) from March 2017 to June 2021. |
Zachary E. Vonnegut-Gabovitch
(1986),
Assistant Secretary (2017)** | Vice President and Assistant General Counsel, JPMorgan Chase & Co. since September 2016. |
Frederick J. Cavaliere (1978),
Assistant Treasurer (2015)* | Executive Director, J.P. Morgan Investment Management Inc. Mr. Cavaliere has been with JPMorgan Chase & Co. since May 2006. |
Michael M. D’Ambrosio (1969),
Assistant Treasurer (2014) | Managing Director, J.P. Morgan Investment Management Inc. Mr. D’Ambrosio has been with J.P. Morgan Investment Management Inc. since 2012. |
Shannon Gaines (1977),
Assistant Treasurer (2019)*** | Vice President, J.P. Morgan Investment Management Inc. since January 2014. |
Nektarios E. Manolakakis (1972),
Assistant Treasurer (2020) | Executive Director, J.P. Morgan Investment Management Inc. since February 2021, formerly Vice President, J.P. Morgan Investment Mangement Inc. since 2014; Vice President, J.P. Morgan Corporate & Investment Bank 2010-2014. |
Todd McEwen (1981),
Assistant Treasurer (2020)*** | Vice President, J.P. Morgan Investment Management Inc. Mr. McEwen has been with J.P. Morgan Investment Management Inc. since 2010. |
|
The contact address for each of the officers, unless otherwise noted, is 277 Park Avenue, New York, NY 10172. |
| The contact address for the officer is 575 Washington Boulevard, Jersey City, NJ 07310. |
| The contact address for the officer is 4 New York Plaza, New York, NY 10004. |
| The contact address for the officer is 1111 Polaris Parkway, Columbus, OH 43240. |
| J.P. Morgan Exchange-Traded Funds | |
SCHEDULE OF SHAREHOLDER EXPENSES
(Unaudited)
Hypothetical $1,000 Investment
As a shareholder of the Funds, you incur two types of costs: (1) transaction costs, including brokerage commissions on your purchase and sales of Fund shares and (2) ongoing costs, primarily management fees. The examples below are intended to help you understand your ongoing costs (in dollars) of investing in the Funds and to compare these ongoing costs with the ongoing costs of investing in other funds. The examples assume that you had a $1,000 investment at the beginning of the reporting period, May 1, 2022, and continued to hold your shares at the end of the reporting period, October 31, 2022.
Actual Expenses
For each Fund in the table below, the first line provides information about actual account values and actual expenses. You may use the information in this line, together with the amount you invested, to estimate the expenses that you paid over the period. Simply divide your account value by $1,000 (for example, an $8,600 account value divided by $1,000 = 8.6), then multiply the result by the number in the first line of each Fund under the heading titled “Expenses Paid During the
Period” to estimate the expenses you paid on your account during this period.
Hypothetical Example for Comparison Purposes
The second line of each Fund in the table below provides information about hypothetical account values and hypothetical expenses based on the actual expense ratio and an assumed rate of return of 5% per year before expenses, which is not the Fund's actual return. The hypothetical account values and expenses may not be used to estimate the actual ending account balance or expenses you paid for the period. You may use this information to compare the ongoing costs of investing in the Fund and other funds. To do so, compare this 5% hypothetical example with the 5% hypothetical examples that appear in the shareholder reports of the other funds. The examples also assume all dividends and distributions have been reinvested. The examples do not take into account brokerage commissions that you pay when purchasing or selling shares of a Fund.
| Beginning Account Value May 1, 2022 | Ending Account Value October 31, 2022 | Expenses Paid During the Period | |
JPMorgan Social Advancement ETF | | | | |
| | | | |
| | | | |
JPMorgan Sustainable Consumption ETF | | | | |
| | | | |
| | | | |
JPMorgan Sustainable Infrastructure ETF | | | | |
| | | | |
| | | | |
|
| Expenses are equal to the Fund’s annualized expense ratio, multiplied by the average account value over the period, multiplied by 54/365 (to reflect the actual period). The Fund commenced operations on September 7, 2022. |
| Expenses are equal to each Fund's respective annualized expense ratio, multiplied by the average account value over the period, multiplied by 184/365 (to reflect the one-half year period). |
| J.P. Morgan Exchange-Traded Funds | |
Board Approval of Initial Management Agreements
(Unaudited)
On February 8-10, 2022, the Board of Trustees (the “Board” or the “Trustees”) of J.P. Morgan Exchange-Traded Fund Trust (the “Trust”) held meetings and approved the initial management agreements (each an “Advisory Agreement” and collectively, the “Management Agreements”) for the JPMorgan Social Advancement ETF, JPMorgan Sustainable Consumption ETF and JPMorgan Sustainable Infrastructure ETF (each a “Fund,” and collectively, the “Funds”). The meetings were held by videoconference in reliance upon the Division of Investment Management Staff Statement on Fund Board Meetings and Unforeseen or Emergency Circumstances Related to Coronavirus Disease 2019. The Management Agreements were approved by a majority of the Trustees who are not “Interested Persons” (as defined in the Investment Company Act of 1940) of any party to each Management Agreement or any of their affiliates. In connection with the approval of each Management Agreement, the Trustees reviewed written materials prepared by the Adviser and received oral presentations from Adviser personnel. Before voting on the proposed Management Agreements, the Trustees reviewed each Management Agreement with representatives of the Adviser and with counsel to the Trust and independent legal counsel to the Trustees and received a memorandum from independent legal counsel discussing the legal standards for their consideration of the proposed Management Agreements. They also considered information they received from the Adviser over the course of the year in connection with their oversight of other funds managed by the Adviser. The Trustees also discussed each proposed Management Agreement with independent legal counsel in executive session at which no representatives of the Adviser were present.
A summary of the material factors evaluated by the Trustees in determining whether to approve each Management Agreement is provided below. The Trustees considered information provided with respect to the Funds and the approval of the Management Agreements. Each Trustee attributed his or her own evaluation of the significance of the various factors, and no factor alone was considered determinative. The Trustees determined that the proposed compensation to be received by the Adviser from each Fund under its Management Agreement was fair and reasonable and that initial approval of the Management Agreements was in the best interests of each Fund and its potential shareholders.
Summarized below are the material factors considered and discussed by the Trustees in reaching their conclusions:
Nature, Extent and Quality of Services Provided by the Adviser
In connection with the approval of each Fund’s initial Management Agreement, the Trustees considered the materials furnished specifically in connection with the approval of the applicable Management Agreement, as well as other relevant
information furnished for the Trustees, regarding the nature, extent, and quality of services provided by the adviser. Among other things, the Trustees considered:
(i) The background and experience of the Adviser’s senior management and investment personnel;
(ii) The qualifications, backgrounds and responsibilities of the portfolio management team to be primarily responsible for the day-to-day management of each of the Funds;
(iii) The investment strategy for each Fund, and the infrastructure supporting the portfolio management teams;
(iv) Information about the structure and distribution strategy of each Fund and how it fits within the Trust’s other fund offerings;
(v) The administration services to be provided by the Adviser under the Management Agreement;
(vi) Their knowledge of the nature and quality of the services provided by the Adviser and its affiliates gained from their experience as Trustees of the Trust and in the financial industry generally;
(vii) The overall reputation and capabilities of the Adviser and its affiliates;
(viii) The commitment of the Adviser to provide high quality service to the Funds;
(ix) Their overall confidence in the Adviser’s integrity;
(x) The Adviser’s responsiveness to requests for additional information, questions or concerns raised by them; and
(xi) The Adviser’s business continuity plan, steps the Adviser and its affiliates have taken to provide services to the Funds during the COVID-19 pandemic and the Adviser’s and its affiliates’ success in continuing to provide services to the other J.P. Morgan ETFs and their shareholders throughout this period.
Based upon these considerations and other factors, the Trustees concluded that they were satisfied with the nature, extent and quality of services to be provided to the Funds by the Adviser.
Fall-Out Benefits
The Trustees reviewed information regarding potential “fall-out” or ancillary benefits expected to be received by the Adviser and its affiliates as a result of their relationship with the Funds. Additionally, the Trustees considered that any fall-out or ancillary benefits would be comparable to those related to the other funds in the complex.
The Trustees also considered the benefits the Adviser is expected to receive as the result of JPMorgan Chase Bank, N.A.’s (“JPMCB”), an affiliate of the Adviser, roles as custodian, fund accountant and transfer agent for the Fund, including the profitability of those arrangements to JPMCB.
| J.P. Morgan Exchange-Traded Funds | |
Board Approval of Initial Management Agreements
(Unaudited) (continued)
Economies of Scale
The Trustees considered the extent to which the Funds may benefit from potential economies of scale. The Trustees noted that the proposed unitary management fee schedule for the Funds does not contain breakpoints. The Trustees considered that shareholders would benefit because expenses would be limited even when a Fund is new and not achieving economies of scale. The Trustees considered the fact that increases in assets would not lead to management fee decreases even if economies of scale are achieved, but also that the Trustees would have the opportunity to further review the appropriateness of the fee payable to the Adviser under its Management Agreement in the future. After considering the factors identified above, the Trustees concluded that each Fund’s shareholders will receive the benefits of potential economies of scale.
Fees Relative to Adviser’s Other Clients
The Trustees considered the Adviser’s view that it does not manage other accounts with a substantially similar investment strategy as that of each Fund.
Investment Performance
The Trustees considered each Fund’s investment strategy and processes, the portfolio management team and competitive positioning against identified peer funds and concluded that the prospects for competitive future performance were acceptable.
Management Fees and Expense Ratios
The Trustees considered that under the Management Agreement, the Adviser will provide advisory and administrative services and will be responsible for substantially all expenses of each Fund (“unitary fee structure”). The Trustees considered the contractual management fee rate that will be paid by each Fund to the Adviser and compared that rate to information prepared by Broadridge Investor Communications Solutions Inc. (“Broadridge”), an independent provider of investment company data, providing management fee rates paid by other funds in the same Morningstar category as each Fund. The Trustees also considered the fees paid to JPMCB, for custody, transfer agency and other related services for each Fund and the profitability of these arrangements to JPMCB.
The Trustees considered how the Fund will be positioned against peer funds, as identified by management and/or Broadridge and noted that the Fund’s proposed management fee compared favorably with identified peer funds. The Trustees also noted that because the Funds were not yet operational, no profitability information was available. After considering the factors identified above and other factors, in light of the information, the Trustees concluded that each Fund’s proposed management fee was reasonable.
| J.P. Morgan Exchange-Traded Funds | |
THIS PAGE IS INTENTIONALLY LEFT BLANK
THIS PAGE IS INTENTIONALLY LEFT BLANK
J.P. Morgan Exchange-Traded Funds are distributed by JPMorgan Distribution Services, Inc., an indirect, wholly-owned subsidiary of JPMorgan Chase & Co.
Contact J.P. Morgan Exchange-Traded Funds at 1-844-457-6383 (844-4JPM ETF) for a fund prospectus. You can also visit us at www.jpmorganfunds.com. Investors should carefully consider the investment objectives and risks as well as charges and expenses of the fund before investing. The prospectus contains this and other information about the fund. Read the prospectus carefully before investing.
Investors may obtain information about the Securities Investor Protection Corporation (SIPC), including the SIPC brochure, by visiting www.sipc.org or by calling SIPC at 202-371-8300.
Each Fund files a complete schedule of its fund holdings for the first and third quarters of its fiscal year with the SEC as an exhibit to its report on Form N-PORT. The Funds' Form N-PORT reports are available on the SEC’s website at http://www.sec.gov. The Funds' quarterly holdings can be found by visiting the J.P. Morgan Funds’ website at www.jpmorganfunds.com.
A description of each Fund's policies and procedures with respect to the disclosure of each Fund's holdings is available in the prospectuses and Statement of Additional Information.
A copy of proxy policies and procedures is available without charge upon request by calling 1-844-457-6383 and on the Funds' website at www.jpmorganfunds.com. A description of such policies and procedures is on the SEC’s website at www.sec.gov. The Trustees have delegated the authority to vote proxies for securities owned by the Funds to the Adviser. A copy of the Funds' voting record for the most recent 12-month period ended June 30 is available on the SEC’s website at www.sec.gov or at the Funds' website at www.jpmorganfunds.com no later than August 31 of each year. The Funds' proxy voting record will include, among other things, a brief description of the matter voted on for each portfolio security, and will state how each vote was cast, for example, for or against the proposal.
J.P. Morgan Asset Management is the brand name for the asset management business of JPMorgan Chase & Co. and its affiliates worldwide.
© JPMorgan Chase & Co., 2022. All rights reserved. October 2022.
AN-SUS-ETF-1022
Annual Report
J.P. Morgan Exchange-Traded Funds
October 31, 2022
| | |
JPMorgan International Research Enhanced Equity ETF | | |
CONTENTS
Investments in a Fund are not deposits or obligations of, or guaranteed or endorsed by, any bank and are not insured or guaranteed by the FDIC, the Federal Reserve Board or any other government agency. You could lose money if you sell when a Fund’s share price is lower than when you invested.
Past performance is no guarantee of future performance. The general market views expressed in this report are opinions based on market and other conditions through the end of the reporting period and are subject to change without notice. These views are not intended to predict the future performance of a Fund or the securities markets.
Prospective investors should refer to the Fund's prospectus for a discussion of the Fund's investment objectives, strategies and risks. Call J.P. Morgan Exchange-Traded Funds at (844) 457-6383 for a prospectus containing more complete information about the Fund, including management fees and other expenses. Please read it carefully before investing.
Shares are bought and sold throughout the day on an exchange at market price (not at net asset value) through a brokerage account, and are not individually subscribed and redeemed from a Fund. Shares may only be subscribed and redeemed directly from a Fund by Authorized Participants, in large creation/redemption units. Brokerage commissions will reduce returns.
President's Letter
December 15, 2022 (Unaudited)
Dear Shareholder,
We are pleased to continue to provide you with investment opportunities through our conversion this year of the JPMorgan International Research Enhanced Equity ETF (JIRE) from a mutual fund. While JIRE was listed on June 13, 2022, its legacy as a mutual fund dates to October 1992.
|
“While investors seek to adapt to the current market environment, we believe a well-diversified portfolio and a patient outlook remain crucial components of a successful invest- ment approach.” — Brian S. Shlissel
|
Global financial markets reflected turmoil in the global economy in 2022, stirred by sharply higher inflation, rising interest rates, sporadic pandemic disruptions and the widening impact of the Russia-Ukraine conflict. Prices for both equities and bonds tumbled during the first half of the year and remained under pressure through the end of October.
Emerging market equities underperformed both the U.S. and other developed equity markets amid economic weakness in China and slowing global demand during the period. Across Europe, the war in Ukraine set off an energy crisis as a result of reduced imports of natural gas from Russia. U.S. equity markets also fell in 2022, but surprisingly strong corporate earnings and consumer spending helped leading U.S. indexes to rebound from their lowest levels. For the twelve month period ended October 31, 2022, the MSCI Emerging Markets Index returned -31.0%, the MSCI EAFE Index returned -23.0% and the S&P 500 Index returned -14.6%.
Notably, some recent U.S. inflationary data has indicated signs of easing price pressures and U.S. economic output as measured by gross domestic product turned positive in the third quarter of 2022, following two consecutive quarters of negative growth. Though the U.S. economy has lost momentum
in 2022, it has not yet fallen into recession. Meanwhile, as the potential for a rapid resolution to the war in Ukraine appears to have faded, the European Union and its largest constituent nations have moved to secure sufficient winter energy supplies while decreasing their dependence on imports of natural gas from Russia. In the U.K., a year-long political crisis was resolved with the accession of Rishi Sunak to prime minister in October 2022, which helped shore up the value of British pound and stabilize U.K. financial markets. China has eased some of the social restrictions under its “Zero Covid” policy and domestic equity indexes recently rose amid investor expectations that China’s economy may fully reopen in the coming months.
As 2022 comes to a close, financial markets are likely to remain volatile due to investor uncertainty regarding the outlook for inflation, interest rates and economic momentum. Increased geo-political tensions between Russia and Ukraine’s Western allies also remains a headwind for global financial markets.
Investors this year have confronted economic and financial market conditions not experienced in many years. While investors seek to adapt to the current market environment, we believe a well-diversified portfolio and a patient outlook remain crucial components of a successful investment approach. Our broad array of investment solutions seeks to provide investors with ability to build durable portfolios that can help them meet their financial goals.
Sincerely,
Brian S. Shlissel
President, J.P. Morgan Funds
J.P. Morgan Asset Management
1-844-457-6383 or www.jpmorganfunds.com for more information
| J.P. Morgan Exchange-Traded Funds | |
JPMorgan International Research Enhanced Equity ETF
FUND COMMENTARY
TWELVE MONTHS ENDED October 31, 2022 (Unaudited)
| |
| |
| |
MSCI EAFE Index (net total return) | |
Net Assets as of 10/31/2022 | |
| |
INVESTMENT OBJECTIVE***
The JPMorgan International Research Enhanced Equity Fund ETF1 (the “Fund”) seeks to provide long-term capital appreciation.
INVESTMENT APPROACH
The Fund invests primarily in companies domiciled in foreign countries and may modestly overweight equity securities that the adviser considers undervalued, while modestly underweighting or not holding equity securities that appear overvalued. The Fund seeks to outperform the MSCI Europe, Australasia, Far East (EAFE) Index (net total return) (the “Benchmark”) over time, while maintaining similar risk characteristics, including sector and geographic risks.
HOW DID MARKETS PERFORM?
In the EU, the war in Ukraine remained the focus of investors’ attention as energy supplies from Russia were constrained and the potential for a rapid resolution to the conflict receded. Both the EU and its individual constituent nations moved to build up reserves of natural gas and petroleum ahead of the winter months. By the end of October 2022, several European governments had sought to confront soaring inflation with spending plans to help households manage rising food and energy costs. The European Central Bank responded to the highest inflation rates in 40 years by sharply raising its policy interest rates in September 2022 and again in October. During the twelve month period, equity markets in Europe largely outperformed emerging markets equities but underperformed U.S. equity markets.
Political turmoil in the U.K. added to a weakening economic outlook that rattled financial markets and pushed the British pound to a 37-year low against the U.S. dollar. By late October 2022, the accession of Rishi Sunak to prime minister provided some support for both the pound and U.K. financial markets. The Bank of England was among the earliest developed market central banks to move to curb inflationary pressures, with an initial interest rate increase in December 2021, and seven more increases during the period.
Developed markets in the Asia-Pacific region also slumped during the period amid rising inflation, particularly soaring energy prices, and broad weakness in the semiconductors
sector. Despite inflationary pressures, the Bank of Japan maintained its ultra-low interest rate policy. Meanwhile, equities in Hong Kong and Singapore largely underperformed other developed markets.
In the U.S., investors largely kept their focus on inflation data as indicators of short-term policy of the U.S. Federal Reserve. In mid-March 2022, the central bank initiated its first interest rate increase since late 2018, and then followed with four more rate raises by the end of September 2022. U.S. gross domestic product fell by 1.6% in the first quarter of 2022 and dropped 0.6% in the second quarter before rebounding to a 2.6% increase in the third quarter. Consumer spending declined but remained somewhat better than investors expected. By the end of June 2022, U.S. equity prices had tumbled more than 20% from the start of the year, which is generally considered a bear market. However, prices rebounded somewhat by the end of October 2022.
Meanwhile, emerging markets equities and bonds slumped throughout the twelve months ended in October 2022. China was among the worst performers as the government’s “zero covid” policy led to strict lockdowns in several large cities, which weighed on the services sector in particular and on economic growth in general. China’s technology sector remained under pressure amid increased scrutiny of large technology companies by government regulators. Across emerging markets rising interest rates weighed on government spending and higher energy prices hurt markets of regions dependent on petroleum imports.
HOW DID THE FUND PERFORM?
The Fund outperformed the Benchmark for the twelve months ended October 31, 2022.
By sector, the Fund’s security selection in the media and pharmaceutical/medical technology sectors was a leading contributor to performance relative to the Benchmark, while the Fund’s security selection in the basic industries and the technology – semiconductor & hardware sectors was a leading detractor from relative performance.
By region, the Fund’s security selection in Europe, excluding the U.K., and in Japan was a leading contributor to performance
| J.P. Morgan Exchange-Traded Funds | |
relative to the Benchmark, while the Fund’s security selection in the U.K. marginally detracted from relative performance.
Due to the Fund holding a relatively large number of securities during the reporting period, the impact of individual holdings on the Fund’s relative performance tended to be small.
HOW WAS THE FUND POSITIONED?
Using the fundamental equity insights generated by analysts, the Fund’s adviser took overweight positions in securities included within the universe of the Benchmark that it considered undervalued, while underweighting or not holding securities in the Benchmark that the adviser considered overvalued.
1On June 10, 2022, the Fund acquired the assets and liabilities, and assumed the performance, financial and other historical information, of the JPMorgan International Research Enhanced Equity Fund (the "Predecessor Fund"), an open-end mutual fund which had operated since October 28, 1992. The Fund's performance prior to the close of business on June 10, 2022 is linked to the mutual fund's Class R6 Shares.
TOP TEN HOLDINGS OF THE
PORTFOLIO AS OF October 31, 2022 | PERCENT OF
TOTAL
INVESTMENTS |
| | |
| | |
| LVMH Moet Hennessy Louis Vuitton SE (France) | |
| Novo Nordisk A/S, Class B (Denmark) | |
| ASML Holding NV (Netherlands) | |
| | |
| Novartis AG (Registered) (Switzerland) | |
| | |
| AstraZeneca plc (United Kingdom) | |
| TotalEnergies SE (France) | |
PORTFOLIO COMPOSITION BY COUNTRY
AS OF October 31, 2022 | PERCENT OF
TOTAL
INVESTMENTS |
| |
| |
| |
| |
| |
| |
| |
| |
| |
| |
| |
| |
| |
Others (each less than 1.0%) | |
| |
*
The return shown is based on net asset value and may differ from the return shown in the financial highlights, which reflects adjustments made to the net asset value in accordance with accounting principles generally accepted in the United States of America. The net asset value was $46.27 as of October 31, 2022.
**
Market price return was calculated assuming an initial investment made at the market price at the beginning of the reporting period, reinvestment of all dividends and distributions at market price during the period, and sale at the market price on the last day of the period. Prior to the Fund's listing on June 13, 2022, the NAV performance of the Fund and the Class R6 Shares of the Predecessor Fund are used as proxy market price returns. The price used to calculate the market price return was the closing price on the NYSE Arca. As of October 31, 2022, the closing price was $46.28.
***
The adviser seeks to achieve the Fund’s objective. There can be no guarantee it will be achieved.
| J.P. Morgan Exchange-Traded Funds | |
JPMorgan International Research Enhanced Equity ETF
FUND COMMENTARY
TWELVE MONTHS ENDED October 31, 2022 (Unaudited) (continued)
AVERAGE ANNUAL TOTAL RETURNS AS OF October 31, 2022 (Unaudited)
| | | | |
JPMorgan International Research Enhanced Equity ETF | | | | |
| | | | |
| | | | |
|
| Inception date for Class R6 Shares of the Predecessor Fund (as defined below). |
TEN YEAR FUND PERFORMANCE (10/31/12 TO 10/31/22)
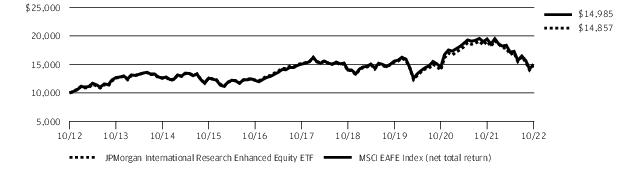
The performance quoted is past performance and is not a guarantee of future results. Exchange-traded funds are subject to certain market risks. Investment returns and principal value of an investment will fluctuate so that an investor’s shares, when sold or redeemed, may be worth more or less than their original cost. Current performance may be higher or lower than the performance data shown. For up-to-date month-end performance information, please call 1-844-457-6383.
JPMorgan International Research Enhanced Equity ETF (the “Fund”) acquired the assets and liabilities of the JPMorgan International Research Enhanced Equity Fund (“Predecessor Fund”) in a reorganization that occurred as of the close of business on June 10, 2022. Performance and financial history of the Predecessor Fund’s Class R6 Shares have been adopted by the Fund and will be used going forward. As a result, the performance for the Fund prior to close of business on June 10, 2022 is the performance of the Predecessor Fund’s Class R6 Shares. Inception date for the Predecessor Fund’s Class R6 Shares is November 1, 2017. Returns for the Predecessor Fund’s Class R6 Shares prior to their inception date are based on the performance of the Predecessors Fund’s Class I Shares. The actual returns of the Predecessor Fund’s Class R6 Shares would have been different than those shown because the Predecessor Fund’s Class R6 Shares had different expenses than the Predecessor Fund’s Class I Shares. Inception date for the Predecessor Fund’s Class I Shares is October 28, 1992.
Performance for the Fund’s shares has not been adjusted to reflect the Fund’s shares’ lower expenses than those of the Predecessor Fund’s Class R6 Shares and Class I Shares. Had the Predecessor Fund been structured as an exchange-traded fund (“ETF”), its performance may have differed. Performance for the Predecessor Fund is based on the net asset value ("NAV") per share of the Predecessor Fund Shares rather than on market-determined prices. Prior to
the Fund’s listing on June 13, 2022, the NAV performance of the Fund and the Class R6 Shares of the Predecessor Fund are used as proxy market price returns.
The graph illustrates comparative performance for $10,000 invested in shares of the Fund and the MSCI EAFE Index (net total return) from October 31, 2012 to October 31, 2022. The performance of the Fund assumes reinvestment of all dividends and capital gain distributions, if any. The performance of the MSCI EAFE Index (net total return) does not reflect the deduction of expenses associated with an ETF and approximates the minimum possible dividend reinvestment of the securities included in the benchmark, if applicable. The MSCI EAFE (Europe, Australia, Far East) Index (net total return) is a free float-adjusted market capitalization weighted index that is designed to measure the performance of large- and mid- cap stocks in developed markets, excluding the U.S. and Canada. Net total return figures assume the reinvestment of dividends after deduction of withholding tax, applying the maximum rate to nonresident individual investors who do not benefit from double taxation treaties. Investors cannot invest directly in an index.
Fund performance may reflect the waiver of the Fund’s fees and reimbursement of expenses for certain periods since the applicable inception date. Without these waivers and reimbursements, performance would have been lower. Also, performance shown in this section does not reflect the deduction of taxes that a shareholder would pay on Fund distributions or on gains resulting from redemption or sale of Fund shares.
The returns shown are based on NAVs calculated for shareholder transactions and may differ from the returns shown in the financial highlights, which reflect adjustments made to the NAVs in accordance with accounting principles generally accepted in the United States of America.
| J.P. Morgan Exchange-Traded Funds | |
JPMorgan International Research Enhanced Equity ETF
SCHEDULE OF PORTFOLIO INVESTMENTS
AS OF October 31, 2022
| | |
|
|
| | |
| | |
Commonwealth Bank of Australia | | |
| | |
| | |
| | |
| | |
Insurance Australia Group Ltd. | | |
| | |
| | |
| | |
National Australia Bank Ltd. | | |
| | |
| | |
| | |
| | |
| | |
| | |
| | |
Woodside Energy Group Ltd. | | |
| | |
| | |
|
| | |
|
BOC Hong Kong Holdings Ltd. | | |
| | |
Xinyi Glass Holdings Ltd. | | |
| | |
|
| | |
| | |
Novo Nordisk A/S, Class B | | |
| | |
| | |
| | |
|
| | |
| | |
| | |
| | |
| | |
|
|
| | |
| | |
| | |
| | |
| | |
| | |
| | |
| | |
LVMH Moet Hennessy Louis Vuitton SE | | |
| | |
| | |
| | |
| | |
| | |
| | |
| | |
| | |
|
| | |
| | |
| | |
| | |
| | |
Deutsche Post AG (Registered) | | |
Deutsche Telekom AG (Registered) | | |
| | |
| | |
| | |
Muenchener Rueckversicherungs- Gesellschaft AG (Registered) | | |
| | |
| | |
| | |
| | |
Volkswagen AG (Preference) | | |
| | |
| | |
|
| | |
| | |
| | |
Hong Kong Exchanges & Clearing Ltd. | | |
| | |
| | |
SEE NOTES TO FINANCIAL STATEMENTS.
| J.P. Morgan Exchange-Traded Funds | |
JPMorgan International Research Enhanced Equity ETF
SCHEDULE OF PORTFOLIO INVESTMENTS
AS OF October 31, 2022 (continued)
| | |
Common Stocks — continued |
|
Sun Hung Kai Properties Ltd. | | |
Techtronic Industries Co. Ltd. | | |
| | |
|
| | |
|
| | |
FinecoBank Banca Fineco SpA | | |
| | |
| | |
|
| | |
Asahi Group Holdings Ltd. | | |
| | |
| | |
| | |
Central Japan Railway Co. | | |
| | |
| | |
Daito Trust Construction Co. Ltd. | | |
Daiwa House Industry Co. Ltd. | | |
| | |
| | |
| | |
| | |
| | |
| | |
| | |
Japan Airlines Co. Ltd. * | | |
| | |
| | |
| | |
| | |
| | |
| | |
Mitsubishi UFJ Financial Group, Inc. | | |
| | |
Murata Manufacturing Co. Ltd. | | |
| | |
| | |
NIPPON EXPRESS HOLDINGS, Inc. | | |
Nippon Paint Holdings Co. Ltd. | | |
| | |
| | |
|
|
Nippon Telegraph & Telephone Corp. | | |
Nomura Research Institute Ltd. | | |
Ono Pharmaceutical Co. Ltd. | | |
| | |
| | |
Recruit Holdings Co. Ltd. | | |
| | |
Seven & i Holdings Co. Ltd. | | |
| | |
Shin-Etsu Chemical Co. Ltd. | | |
| | |
| | |
| | |
Sumitomo Electric Industries Ltd. | | |
Sumitomo Metal Mining Co. Ltd. | | |
Sumitomo Mitsui Financial Group, Inc. | | |
| | |
| | |
Takeda Pharmaceutical Co. Ltd. | | |
| | |
Tokio Marine Holdings, Inc. | | |
| | |
| | |
| | |
|
| | |
|
| | |
|
| | |
| | |
| | |
Koninklijke Ahold Delhaize NV | | |
| | |
| | |
| | |
| | |
| | |
| | |
|
| | |
Oversea-Chinese Banking Corp. Ltd. | | |
SEE NOTES TO FINANCIAL STATEMENTS.
| J.P. Morgan Exchange-Traded Funds | |
| | |
Common Stocks — continued |
|
| | |
United Overseas Bank Ltd. | | |
| | |
|
| | |
|
Banco Bilbao Vizcaya Argentaria SA (b) | | |
| | |
| | |
Industria de Diseno Textil SA (b) | | |
| | |
|
| | |
| | |
| | |
| | |
| | |
|
Cie Financiere Richemont SA (Registered) | | |
| | |
| | |
Lonza Group AG (Registered) | | |
| | |
| | |
| | |
UBS Group AG (Registered) | | |
Zurich Insurance Group AG | | |
| | |
|
| | |
| | |
| | |
Berkeley Group Holdings plc | | |
| | |
British American Tobacco plc | | |
CK Hutchison Holdings Ltd. | | |
| | |
| | |
| | |
InterContinental Hotels Group plc | | |
| | |
| | |
| | |
|
United Kingdom — continued |
London Stock Exchange Group plc | | |
Reckitt Benckiser Group plc | | |
| | |
| | |
| | |
| | |
| | |
| | |
| | |
|
| | |
| | |
| | |
| | |
| | |
| | |
| | |
| | |
Total Common Stocks
(Cost $5,006,339,694) | | |
Short-Term Investments — 3.7% |
Investment Companies — 2.5% |
JPMorgan Prime Money Market Fund Class IM Shares, 3.18% (c) (d)(Cost $124,257,477) | | |
Investment of Cash Collateral from Securities Loaned — 1.2% |
JPMorgan Securities Lending Money Market Fund Agency SL Class Shares, 3.23% (c) (d) | | |
JPMorgan U.S. Government Money Market Fund Class IM Shares, 2.85% (c) (d) | | |
Total Investment of Cash Collateral from Securities Loaned
(Cost $63,784,588) | | |
Total Short-Term Investments
(Cost $188,042,065) | | |
Total Investments — 100.6%
(Cost $5,194,381,759) | | |
Liabilities in Excess of Other Assets — (0.6)% | | |
| | |
Percentages indicated are based on net assets. |
SEE NOTES TO FINANCIAL STATEMENTS.
| J.P. Morgan Exchange-Traded Funds | |
JPMorgan International Research Enhanced Equity ETF
SCHEDULE OF PORTFOLIO INVESTMENTS
AS OF October 31, 2022 (continued)
| |
| American Depositary Receipt |
| |
| A special type of equity investment that shares in the earnings of the company, has limited voting rights, and may have a dividend preference. Preference shares may also have liquidation preference. |
| Real Estate Investment Trust |
| Amount rounds to less than 0.1% of net assets. |
| Value determined using significant unobservable inputs. | |
| Non-income producing security. | |
| Security exempt from registration pursuant to Regulation S under the Securities Act of 1933, as amended. Regulation S applies to securities offerings that are made outside of the United States and do not involve direct selling efforts in the United States and as such may have restrictions on resale. | |
| The security or a portion of this security is on loan at October 31, 2022. The total value of securities on loan at October 31, 2022 is $59,541,857. | |
| Investment in an affiliated fund, which is registered under the Investment Company Act of 1940, as amended, and is advised by J.P. Morgan Investment Management Inc. | |
| The rate shown is the current yield as of October 31, 2022. | |
Summary of Investments by Industry, October 31, 2022
The following table represents the portfolio investments of the Fund by industry classifications as a percentage of total investments:
INDUSTRY October 31, 2022 | PERCENT OF
TOTAL
INVESTMENTS |
| |
| |
| |
Oil, Gas & Consumable Fuels | |
| |
Semiconductors & Semiconductor Equipment | |
| |
Textiles, Apparel & Luxury Goods | |
| |
| |
| |
| |
| |
Diversified Telecommunication Services | |
| |
| |
| |
| |
| |
| |
| |
| |
Electronic Equipment, Instruments & Components | |
Real Estate Management & Development | |
Trading Companies & Distributors | |
| |
| |
Health Care Equipment & Supplies | |
Equity Real Estate Investment Trusts (REITs) | |
Construction & Engineering | |
Life Sciences Tools & Services | |
Others (each less than 1.0%) | |
| |
SEE NOTES TO FINANCIAL STATEMENTS.
| J.P. Morgan Exchange-Traded Funds | |
Futures contracts outstanding as of October 31, 2022:
| | | | | VALUE AND
UNREALIZED
APPRECIATION
(DEPRECIATION) ($) |
| | | | | |
| | | | | |
| |
| |
| Australian Securities Exchange |
SEE NOTES TO FINANCIAL STATEMENTS.
| J.P. Morgan Exchange-Traded Funds | |
STATEMENT OF ASSETS AND LIABILITIES
AS OF October 31, 2022
| JPMorgan
International
Research
Enhanced
|
| |
Investments in non-affiliates, at value | |
Investments in affiliates, at value | |
Investments of cash collateral received from securities loaned, at value (See Note 2.C.) | |
| |
Foreign currency, at value | |
Deposits at broker for futures contracts | |
| |
Dividends from non-affiliates | |
Dividends from affiliates | |
| |
Securities lending income (See Note 2.C.) | |
Variation margin on futures contracts | |
| |
| |
| |
Collateral received on securities loaned (See Note 2.C.) | |
| |
| |
| |
Printing and mailing costs | |
Custodian and accounting fees | |
Trustees’ and Chief Compliance Officer’s fees | |
| |
| |
| |
| |
| |
Total distributable earnings (loss) | |
| |
Outstanding number of shares
(unlimited number of shares authorized - par value $0.0001) (a) | |
Net asset value, per share | |
Cost of investments in non-affiliates | |
Cost of investments in affiliates | |
| |
Investment securities on loan, at value (See Note 2.C.) | |
Cost of investment of cash collateral (See Note 2.C.) | |
(a)
JPMorgan International Research Enhanced Equity ETF acquired all of the assets and liabilities of the JPMorgan International Research Enhanced Equity Fund ("Predecessor Fund") in a reorganization that occurred as of the close of business on June 10, 2022. Performance and financial history of the Predecessor Fund’s Class R6 Shares have been adopted by JPMorgan International Research Enhanced Equity ETF and will be used going forward. As a result, the information prior to close of business on June 10, 2022, reflects that of the Predecessor Fund's Class R6 Shares. The Predecessor Fund ceased operations as of the date of the reorganization. (See Note 1).
SEE NOTES TO FINANCIAL STATEMENTS.
| J.P. Morgan Exchange-Traded Funds | |
STATEMENT OF OPERATIONS
FOR THE YEAR ENDED October 31, 2022
| JPMorgan
International
Research
Enhanced
|
| |
Interest income from non-affiliates | |
Interest income from affiliates | |
Dividend income from non-affiliates | |
Dividend income from affiliates | |
Income from securities lending (net) (See Note 2.C.) | |
Foreign taxes withheld (net) | |
| |
| |
| |
| |
Distribution fees (See Note 3.F.) | |
Service fees (See Note 3.D.) | |
Custodian and accounting fees | |
Interest expense to non-affiliates | |
Interest expense to affiliates | |
| |
Trustees’ and Chief Compliance Officer’s fees | |
Printing and mailing costs | |
Registration and filing fees | |
Transfer agency fees (See Note 2.H.) | |
| |
| |
| |
Less expense reimbursements | |
| |
Net investment income (loss) | |
(a)
JPMorgan International Research Enhanced Equity ETF acquired all of the assets and liabilities of the JPMorgan International Research Enhanced Equity Fund ("Predecessor Fund") in a reorganization that occurred as of the close of business on June 10, 2022. Performance and financial history of the Predecessor Fund’s Class R6 Shares have been adopted by JPMorgan International Research Enhanced Equity ETF and will be used going forward. As a result, the information prior to close of business on June 10, 2022, reflects that of the Predecessor Fund's Class R6 Shares. The Predecessor Fund ceased operations as of the date of the reorganization. (See Note 1).
SEE NOTES TO FINANCIAL STATEMENTS.
| J.P. Morgan Exchange-Traded Funds | |
STATEMENT OF OPERATIONS
FOR THE YEAR ENDED October 31, 2022 (continued)
| JPMorgan International Research Enhanced |
REALIZED/UNREALIZED GAINS (LOSSES): | |
Net realized gain (loss) on transactions from: | |
Investments in non-affiliates | |
Investments in affiliates | |
In-kind redemptions of investments in non-affiliates (See Note 4) | |
| |
Foreign currency transactions | |
| |
Change in net unrealized appreciation/depreciation on: | |
Investments in non-affiliates | |
Investments in affiliates | |
| |
Foreign currency translations | |
Change in net unrealized appreciation/depreciation | |
Net realized/unrealized gains (losses) | |
Change in net assets resulting from operations | |
(a)
JPMorgan International Research Enhanced Equity ETF acquired all of the assets and liabilities of the JPMorgan International Research Enhanced Equity Fund ("Predecessor Fund") in a reorganization that occurred as of the close of business on June 10, 2022. Performance and financial history of the Predecessor Fund’s Class R6 Shares have been adopted by JPMorgan International Research Enhanced Equity ETF and will be used going forward. As a result, the information prior to close of business on June 10, 2022, reflects that of the Predecessor Fund's Class R6 Shares. The Predecessor Fund ceased operations as of the date of the reorganization. (See Note 1).
SEE NOTES TO FINANCIAL STATEMENTS.
| J.P. Morgan Exchange-Traded Funds | |
STATEMENTS OF CHANGES IN NET ASSETS
FOR THE PERIODS INDICATED
| JPMorgan International Research
Enhanced Equity ETF |
| Year Ended
October 31, 2022 (a) | |
CHANGE IN NET ASSETS RESULTING FROM OPERATIONS: | | |
Net investment income (loss) | | |
| | |
Change in net unrealized appreciation/depreciation | | |
Change in net assets resulting from operations | | |
Total distributions to shareholders | | |
| | |
Change in net assets resulting from capital transactions | | |
| | |
| | |
| | |
| | |
(a)
JPMorgan International Research Enhanced Equity ETF acquired all of the assets and liabilities of the JPMorgan International Research Enhanced Equity Fund ("Predecessor Fund") in a reorganization that occurred as of the close of business on June 10, 2022. Performance and financial history of the Predecessor Fund’s Class R6 Shares have been adopted by JPMorgan International Research Enhanced Equity ETF and will be used going forward. As a result, the information prior to close of business on June 10, 2022, reflects that of the Predecessor Fund's Class R6 Shares. The Predecessor Fund ceased operations as of the date of the reorganization. (See Note 1).
SEE NOTES TO FINANCIAL STATEMENTS.
| J.P. Morgan Exchange-Traded Funds | |
STATEMENTS OF CHANGES IN NET ASSETS
FOR THE PERIODS INDICATED (continued)
| JPMorgan International Research
Enhanced Equity ETF |
| Year Ended October 31, 2022(a) | |
CAPITAL TRANSACTIONS: (b) | | |
Proceeds from shares issued | | |
| | |
| | |
Change in net assets resulting from capital transactions | | |
| | |
Proceeds from shares issued | | |
| | |
| | |
Change in net assets resulting from Class A capital transactions | | |
| | |
Proceeds from shares issued | | |
| | |
| | |
Change in net assets resulting from Class I capital transactions | | |
Total change in net assets resulting from capital transactions | | |
(a)
JPMorgan International Research Enhanced Equity ETF (the “Fund”) acquired all of the assets and liabilities of the JPMorgan International Research Enhanced Equity Fund (“Predecessor Fund”) in a reorganization that occurred as of the close of business on June 10, 2022. Performance and financial history of the Predecessor Fund’s Class R6 Shares have been adopted by the Fund and will be used going forward. As a result, the financial highlight information reflects that of the Predecessor Fund’s Class R6 Shares for the period November 1, 2017 up through the reorganization.
(b)
Reflects reorganization from JPMorgan International Research Enhanced Equity Fund on June 10, 2022. See Note 1.
SEE NOTES TO FINANCIAL STATEMENTS.
| J.P. Morgan Exchange-Traded Funds | |
| JPMorgan International Research Enhanced Equity ETF |
| Year Ended October 31, 2022(a) | |
| | |
| | |
| | |
| | |
| | |
| | |
| | |
| | |
| | |
| | |
| | |
| | |
| | |
| | |
| | |
(a)
JPMorgan International Research Enhanced Equity ETF (the “Fund”) acquired all of the assets and liabilities of the JPMorgan International Research Enhanced Equity Fund (“Predecessor Fund”) in a reorganization that occurred as of the close of business on June 10, 2022. Performance and financial history of the Predecessor Fund’s Class R6 Shares have been adopted by the Fund and will be used going forward. As a result, the financial highlight information reflects that of the Predecessor Fund’s Class R6 Shares for the period November 1, 2017 up through the reorganization.
(b)
Reflects reorganization from JPMorgan International Research Enhanced Equity Fund on June 10, 2022. See Note 1.
SEE NOTES TO FINANCIAL STATEMENTS.
| J.P. Morgan Exchange-Traded Funds | |
FINANCIAL HIGHLIGHTS
FOR THE PERIODS INDICATED
| Per share operating performance (a) |
| | | |
| Net
asset
value
beginning of
period | Net
investment
income
loss(b) | Net
realized
and unrealized
gains (losses)
on investments | Total
from
investment
operations | | | |
JPMorgan International Research Enhanced Equity ETF (e) | | | | | | | |
Year Ended October 31, 2022 | | | | | | | |
Year Ended October 31, 2021 | | | | | | | |
Year Ended October 31, 2020 | | | | | | | |
Year Ended October 31, 2019 | | | | | | | |
November 1, 2017 through (g) October 31, 2018 | | | | | | | |
|
| Per share amounts reflect the conversion of the Predecessor Fund into the Fund as of the close of business on June 10, 2022. See Note 1. |
| Calculated based upon average shares outstanding. |
| Includes adjustments in accordance with accounting principles generally accepted in the United States of America and as such, the net asset values for financial reporting purposes and the returns based upon those net asset values may differ from the net asset values and returns for shareholder transactions. |
| JPMorgan International Research Enhanced Equity ETF acquired all of the assets and liabilities of the JPMorgan International Research Enhanced Equity Fund (“Predecessor Fund”) in a reorganization that occurred as of the close of business on June 10, 2022. Market price returns are calculated using the official closing price of the JPMorgan International Research Enhanced Equity ETF on the listing exchange as of the time that the JPMorgan International Research Enhanced Equity ETF's NAV is calculated. Prior to the JPMorgan International Research Enhanced Equity ETF's listing on June 13, 2022, the NAV performance of the Class R6 Shares of the Predecessor Fund are used as proxy market price returns. |
| JPMorgan International Research Enhanced Equity ETF (the “Fund”) acquired all of the assets and liabilities of the JPMorgan International Research Enhanced Equity Fund (“Predecessor Fund”) in a reorganization that occurred as of the close of business on June 10, 2022. Performance and financial history of the Predecessor Fund’s Class R6 Shares have been adopted by the Fund and will be used going forward. As a result, the financial highlight information reflects that of the Predecessor Fund’s Class R6 Shares for the period November 1, 2017 up through the reorganization. |
| Reflects income from foreign withholding tax claims, including related interest income. Had the Fund not received these proceeds, the net investment income (loss) per share would have remained the same and the net investment income (loss) ratio would have been 2.44%. |
| Commencement of offering of class of shares. |
SEE NOTES TO FINANCIAL STATEMENTS.
| J.P. Morgan Exchange-Traded Funds | |
| |
| | | | | Ratios to average net assets |
Net asset
value,
end of
period | | | Market
price
total
return(d) | | | Net
investment
income (loss) | Expenses
without waivers
and
reimbursements | |
| | | | | | | | |
| | | | | | | | |
| | | | | | | | |
| | | | | | | | |
| | | | | | | | |
| | | | | | | | |
SEE NOTES TO FINANCIAL STATEMENTS.
| J.P. Morgan Exchange-Traded Funds | |
NOTES TO FINANCIAL STATEMENTS
AS OF October 31, 2022
1. Organization
J.P. Morgan Exchange-Traded Fund Trust (the “Trust”) was formed on February 25, 2010, and is governed by a Declaration of Trust as amended and restated February 19, 2014, and is registered under the Investment Company Act of 1940, as amended (the “1940 Act”), as an open-end management investment company. JPMorgan International Research Enhanced Equity ETF (the "Fund") is a separate diversified series of the Trust covered in this report.
As of the close of business on June 10, 2022 (the "Closing Date"), pursuant to an Agreement and Plan of Reorganization and Liquidation previously approved by the Board of Trustees of the Trust, JPMorgan International Research Enhanced Equity Fund (a mutual fund) (the “Acquired Fund” or “International Research Enhanced Equity Fund”), a series of JPMorgan Trust II, was reorganized (the "Reorganization") into the Fund, a newly created exchange-traded fund. Following the Reorganization, the Acquired Fund’s performance (Class R6 Shares) and financial history were adopted by the Fund. In connection with the Reorganization, each shareholder of the Acquired Fund (except as noted below) received shares of the Fund equal in value to the number of shares of the Acquired Fund they owned on the Closing Date, including a cash payment in lieu of fractional shares of the Fund, which cash payment might have been taxable. Shareholders of the Acquired Fund who did not hold their shares through a brokerage account that could accept shares of the Fund on the Closing Date had their Acquired Fund shares liquidated, and such shareholders received cash equal in value to their Acquired Fund shares, which cash payment might have been taxable. Shareholders of the Acquired Fund who held their shares through a fund direct individual retirement account and did not take action prior to the Reorganization had their Acquired Fund shares exchanged for Morgan Shares of JPMorgan U.S. Government Money Market Fund equal in value to their Acquired Fund shares. The Fund has the same investment adviser, investment objective and fundamental investment policies and substantially similar investment strategies as the Acquired Fund. Effective as of the close of business on the Closing Date, the Acquired Fund ceased operations in connection with the consummation of the Reorganization.
Costs incurred by the Fund and the Acquired Fund associated with the Reorganization (including the legal costs associated with the Reorganization) were borne by the Adviser by waiving fees or reimbursing expenses to offset the costs incurred by the Fund and Acquired Fund associated with the Reorganization, including any brokerage fees and expenses incurred by the Fund and Acquired Fund related to the disposition and acquisition of assets as part of a Reorganization. Brokerage fees and expenses related to the disposition and acquisition of assets (including any disposition to raise cash to pay redemption proceeds) that were incurred in the ordinary course of business were borne by the Fund and the Acquired Fund. The management fee of the Fund is the same as the management fee of the Acquired Fund. The total annual fund operating expenses of the Fund are expected to be lower than the net expenses of each share class of the Acquired Fund after taking into consideration the expense limitation agreement the Adviser has entered into with the Fund for a term ending on June 30, 2025. The Reorganization did not result in the material change to the Acquired Fund's portfolio holdings. There are no material differences in accounting policies of the Acquired Fund as compared to those of the Fund.
The Fund did not purchase or sell securities following the Reorganization for purposes of realigning its investment portfolio. Accordingly, the Reorganization of the Acquired Fund did not affect the Fund’s portfolio turnover ratio for the year ended October 31, 2022.
The investment objective of the Fund is to seek to provide long-term capital appreciation.
J.P. Morgan Investment Management Inc. (“JPMIM”), an indirect, wholly-owned subsidiary of JPMorgan Chase & Co. (“JPMorgan”), acts as Adviser (the “Adviser”) and Administrator (the “Administrator”) to the Fund.
Shares of the Fund are listed and traded at market price on the NYSE Arca. Market prices for the Fund’s shares may be different from its net asset value (“NAV”). The Fund issues and redeems its shares on a continuous basis, through JPMorgan Distribution Services, Inc. (the “Distributor” or “JPMDS”), an indirect, wholly-owned subsidiary of JPMorgan, at NAV in large blocks of shares, typically 50,000 shares, referred to as “Creation Units".
Creation Units are issued and redeemed principally in-kind for a basket of securities. A cash amount may be substituted if the Fund has sizable exposure to market or sponsor restricted securities. Shares are generally traded in the secondary market in amounts less than a Creation Unit at market prices that change throughout the day. Only individuals or institutions that have entered into an authorized participant agreement with the Distributor may do business directly with the Fund (each, an “Authorized Participant”).
2. Significant Accounting Policies
The following is a summary of significant accounting policies followed by the Fund in the preparation of its financial statements. The Fund is an investment company and, accordingly, follows the investment company accounting and reporting guidance of the Financial Accounting Standards Board (“FASB”) Accounting Standards Codification Topic 946 — Investment Companies, which is part of U.S. generally accepted accounting principles (“GAAP”). The preparation of financial statements in conformity with GAAP requires management to make estimates and assumptions that affect (i) the reported amounts of assets and liabilities, (ii) disclosure of contingent assets and liabilities at the date of the financial statements, and (iii) the reported amounts of increases and decreases in net assets from operations during the reporting period. Actual results could differ from those estimates.
| J.P. Morgan Exchange-Traded Funds | |
A. Valuation of Investments — Investments are valued in accordance with GAAP and the Fund's valuation policies set forth by, and under the supervision and responsibility of, the Board of Trustees of the Trust (the "Board"), which established the following approach to valuation, as described more fully below: (i) investments for which market quotations are readily available shall be valued at their market value and (ii) all other investments for which market quotations are not readily available shall be valued at their fair value as determined in good faith by the Board.
Under the Section 2(a)(41) of the 1940 Act, the Board is required to determine fair value for securities that do not have readily available market quotations. Under the SEC Rule 2a-5 (Good Faith Determinations of Fair Value), the Board may designate the performance of these fair valuation determinations to a valuation designee. The Board has designated the Adviser as the “Valuation Designee” to perform fair valuation determinations for the Fund on behalf of the Board subject to appropriate oversight by the Board. The Adviser, as Valuation Designee, leverages the J.P. Morgan Asset Management Americas Valuation Committee (“AVC”) to help oversee and carry out the policies for the valuation of Investments held in the Funds. The Adviser, as Valuation Designee, remains responsible for the valuation determinations.
This oversight by the AVC includes monitoring the appropriateness of fair values based on results of ongoing valuation oversight including, but not limited to, consideration of macro or security specific events, market events, and pricing vendor and broker due diligence. The Administrator is responsible for discussing and assessing the potential impacts to the fair values on an ongoing basis, and, at least on a quarterly basis, with the AVC and the Board.
A market-based approach is primarily used to value the Fund's investments. Investments for which market quotations are not readily available are fair valued using prices supplied by approved affiliated and/or unaffiliated pricing vendors or third party broker-dealers (collectively referred to as “Pricing Services”) or may be internally fair valued using methods set forth by the valuation policies approved by the Board. This may include the use of related or comparable assets or liabilities, recent transactions, market multiples, book values and other relevant information for the investment. An income-based valuation approach may be used in which the anticipated future cash flows of the investment are discounted to calculate the fair value. Discounts may also be applied due to the nature or duration of any restrictions on the disposition of the investments. Valuations may be based upon current market prices of securities that are comparable in coupon, rating, maturity and industry. It is possible that the estimated values may differ significantly from the values that would have been used had a ready market for the investments existed, and such differences could be material.
Equities and other exchange-traded instruments are valued at the last sale price or official market closing price on the primary exchange on which the instrument is traded before the NAV of the Fund are calculated on a valuation date. Certain foreign equity instruments are valued by applying international fair value factors provided by approved Pricing Services. The factors seek to adjust the local closing price for movements of local markets post-closing, but prior to the time the NAV is calculated.
Investments in open-end investment companies (“Underlying Funds”) are valued at each Underlying Fund’s NAV per share as of the report date.
Futures contracts are generally valued on the basis of available market quotations.
Valuations reflected in this report are as of the report date. As a result, changes in valuation due to market events and/or issuer-related events after the report date and prior to issuance of the report are not reflected herein.
The various inputs that are used in determining the valuation of the investments are summarized into the three broad levels listed below.
•
Level 1 — Unadjusted inputs using quoted prices in active markets for identical investments.
•
Level 2 — Other significant observable inputs including, but not limited to, quoted prices for similar investments, inputs other than quoted prices that are observable for investments (such as interest rates, prepayment speeds, credit risk, etc.) or other market corroborated inputs.
•
Level 3 — Significant inputs based on the best information available in the circumstances, to the extent observable inputs are not available (including the assumptions in determining the fair value of investments).
A financial instrument’s level within the fair value hierarchy is based on the lowest level of any input, both individually and in the aggregate, that is significant to the fair value measurement. The inputs or methodology used for valuing instruments are not necessarily an indication of the risk associated with investing in those instruments.
The following table represents each valuation input as presented on the Schedule of Portfolio Investments ("SOI"):
| | |
| | Level 2
Other significant
observable inputs | Level 3
Significant
unobservable inputs | |
Investments in Securities | | | | |
| | | | |
| | | | |
| | | | |
| | | | |
| J.P. Morgan Exchange-Traded Funds | |
NOTES TO FINANCIAL STATEMENTS
AS OF October 31, 2022 (continued)
| | |
| | Level 2 Other significant observable inputs | Level 3 Significant unobservable inputs | |
| | | | |
| | | | |
| | | | |
| | | | |
| | | | |
| | | | |
| | | | |
| | | | |
| | | | |
| | | | |
| | | | |
| | | | |
| | | | |
| | | | |
| | | | |
| | | | |
| | | | |
| | | | |
| | | | |
| | | | |
| | | | |
Investment of Cash Collateral from Securities Loaned | | | | |
Total Short-Term Investments | | | | |
Total Investments in Securities | | | | |
Depreciation in Other Financial Instruments | | | | |
| | | | |
B. Restricted Securities — Certain securities held by the Fund may be subject to legal or contractual restrictions on resale. Restricted securities generally are resold in transactions exempt from registration under the Securities Act of 1933, as amended (the “Securities Act”). Disposal of these securities may involve time-consuming negotiations and expense. Prompt sale at the current valuation may be difficult and could adversely affect the NAVs of the Fund.
As of October 31, 2022, the Fund had no investments in restricted securities other than securities sold to the Fund under Rule 144A and/or Regulation S under the Securities Act.
C. Securities Lending — The Fund is authorized to engage in securities lending in order to generate additional income. The Fund is able to lend to approved borrowers. Citibank N.A. (“Citibank”) serves as lending agent for the Fund, pursuant to a Securities Lending Agency Agreement (the “Securities Lending Agency Agreement”). Securities loaned are collateralized by cash equal to at least 100% of the market value plus accrued interest on the securities lent, which is invested in the Class IM Shares of the JPMorgan U.S. Government Money Market Fund and the Agency SL Class Shares of the JPMorgan Securities Lending Money Market Fund. The Fund retains the interest earned on cash collateral investments but is required to pay the borrower a rebate for the use of the cash collateral. In cases where the lent security is of high value to borrowers, there may be a negative rebate (i.e., a net payment from the borrower to the Fund). Upon termination of a loan, the Fund is required to return to the borrower an amount equal to the cash collateral, plus any rebate owed to the borrowers. The remaining maturities of the securities lending transactions are considered overnight and continuous. Loans are subject to termination by the Fund or the borrower at any time.
The net income earned on the securities lending (after payment of rebates and Citibank’s fee) is included on the Statement of Operations as Income from securities lending (net). The Fund also receives payments from the borrower during the period of the loan, equivalent to dividends and interest earned on the securities loaned, which are recorded as Dividend or Interest income, respectively, on the Statement of Operations.
| J.P. Morgan Exchange-Traded Funds | |
Under the Securities Lending Agency Agreement, Citibank marks to market the loaned securities on a daily basis. In the event the cash received from the borrower is less than 102% of the value of the loaned securities (105% for loans of non-U.S. securities), Citibank requests additional cash from the borrower so as to maintain a collateralization level of at least 102% of the value of the loaned securities plus accrued interest (105% for loans of non-U.S. securities), subject to certain de minimis amounts.
The value of securities out on loan is recorded as an asset on the Statement of Assets and Liabilities. The value of the cash collateral received is recorded as a liability on the Statement of Assets and Liabilities and details of collateral investments are disclosed on the SOI.
The Fund bears the risk of loss associated with the collateral investments and is not entitled to additional collateral from the borrower to cover any such losses. To the extent that the value of the collateral investments declines below the amount owed to a borrower, the Fund may incur losses that exceed the amount it earned on lending the security. Upon termination of a loan, the Fund may use leverage (borrow money) to repay the borrower for cash collateral posted if the Adviser does not believe that it is prudent to sell the collateral investments to fund the payment of this liability. Securities lending activity is subject to master netting arrangements.
The following table presents the Fund's value of the securities on loan with Citibank, net of amounts available for offset under the master netting arrangements and any related collateral received or posted by the Fund as of October 31, 2022.
| Investment Securities
on Loan, at value,
Presented on the
Statement of Assets
and Liabilities | Cash Collateral
Posted by Borrower* | Net Amount Due
to Counterparty
(not less than zero) |
| | | |
|
| Collateral posted reflects the value of securities on loan and does not include any additional amounts received from the borrower. |
Securities lending also involves counterparty risks, including the risk that the loaned securities may not be returned in a timely manner or at all. Subject to certain conditions, Citibank has agreed to indemnify the Fund from losses resulting from a borrower’s failure to return a loaned security.
JPMIM voluntarily waived management fees charged to the Fund to reduce the impact of the cash collateral investment in the JPMorgan U.S. Government Money Market Fund from 0.13% to 0.06%. For the year ended October 31, 2022, JPMIM waived fees associated with the Fund's investment in the JPMorgan U.S. Government Money Market Fund as follows:
The above waiver is included in the determination of earnings on cash collateral investment and in the calculation of Citibank’s compensation and is included on the Statement of Operations as Income from securities lending (net).
D. Investment Transactions with Affiliates — The Fund invested in Underlying Funds, which are advised by the Adviser. An issuer which is under common control with the Fund may be considered an affiliate. For the purposes of the financial statements, the Fund assumes the issuers listed in the table below to be affiliated issuers. The Underlying Funds’ distributions may be reinvested into such Underlying Funds. Reinvestment amounts are included in the purchases at cost amounts in the table below.
|
For the year ended October 31, 2022** |
| | | | | Change in
Unrealized
Appreciation/
(Depreciation) | | | | Capital Gain
Distributions |
JPMorgan Prime Money Market Fund Class IM Shares, 3.18% (a) (b) | | | | | | | | | |
JPMorgan Prime Money Market Fund Class Institutional Shares, 3.12% (a) (b) | | | | | | | | | |
| J.P. Morgan Exchange-Traded Funds | |
NOTES TO FINANCIAL STATEMENTS
AS OF October 31, 2022 (continued)
|
For the year ended October 31, 2022** |
| | | | | Change in Unrealized Appreciation/ (Depreciation) | | | | Capital Gain Distributions |
JPMorgan Securities Lending Money Market Fund Agency SL Class Shares, 3.23% (a) (b) | | | | | | | | | |
JPMorgan U.S. Government Money Market Fund Class IM Shares, 2.85% (a) (b) | | | | | | | | | |
| | | | | | | | | |
|
| Investment in an affiliated fund, which is registered under the Investment Company Act of 1940, as amended, and is advised by J.P. Morgan Investment Management Inc. |
| The rate shown is the current yield as of October 31, 2022. |
| Amount is included on the Statement of Operations as Income from securities lending (net) (after payments of rebates and Citibank’s fee). |
| As of the close of business on June 10, 2022, JPMorgan International Research Enhanced Equity Fund (the "Acquired fund"), a series of JPMorgan Trust II, reorganized ("the Reorganization") into a newly created exchange-traded fund, JPMorgan International Research Enhanced Equity ETF (the "Fund"). Following the Reorganization, the Acquired Fund's performance and financial history were adopted by the Fund. The table includes transactions from the Acquired Fund for the period November 1, 2021 through June 10, 2022. |
E. Foreign Currency Translation — The books and records of the Fund are maintained in U.S. dollars. Foreign currency amounts are translated into U.S. dollars at the prevailing exchange rates of such currencies against the U.S. dollar. The market value of investment securities and other assets and liabilities are translated at the exchange rate as of the valuation date. Purchases and sales of investment securities, income and expenses are translated at the exchange rate prevailing on the respective dates of such transactions.
The Fund does not isolate the effect of changes in foreign exchange rates from changes in market prices on securities held. Accordingly, such changes are included within Change in net unrealized appreciation/depreciation on investments in non-affiliates on the Statement of Operations.
Reported realized foreign currency gains and losses arise from the disposition of foreign currency, currency gains or losses realized between the trade and settlement dates on securities transactions, and the difference between the amounts of dividends, interest and foreign withholding taxes recorded on the Fund books on the transaction date and the U.S. dollar equivalent of the amounts actually received or paid. These reported realized foreign currency gains and losses are included in Net realized gain (loss) on foreign currency transactions on the Statement of Operations. Unrealized foreign currency gains and losses arise from changes (due to changes in exchange rates) in the value of foreign currency and other assets and liabilities denominated in foreign currencies, which are held at year end and are included in Change in net unrealized appreciation/depreciation on foreign currency translations on the Statement of Operations.
F. Futures Contracts — The Fund used index futures contracts to gain or reduce exposure to the stock market, or maintain liquidity or minimize transaction costs. The Fund also purchased futures contracts to invest incoming cash in the market or sold futures in response to cash outflows, thereby simulating an invested position in the underlying index while maintaining a cash balance for liquidity.
Futures contracts provide for the delayed delivery of the underlying instrument at a fixed price or are settled for a cash amount based on the change in the value of the underlying instrument at a specific date in the future. Upon entering into a futures contract, the Fund is required to deposit with the broker, cash or securities in an amount equal to a certain percentage of the contract amount, which is referred to as the initial margin deposit. Subsequent payments, referred to as variation margin, are made or received by the Fund periodically and are based on changes in the market value of open futures contracts. Changes in the market value of open futures contracts are recorded as Change in net unrealized appreciation/depreciation on futures contracts on the Statement of Operations. Realized gains or losses, representing the difference between the value of the contract at the time it was opened and the value at the time it was closed, are reported on the Statement of Operations at the closing or expiration of the futures contract. Securities deposited as initial margin are designated on the SOI, while cash deposited, which is considered restricted, is recorded on the Statement of Assets and Liabilities. A receivable from and/or a payable to brokers for the daily variation margin is also recorded on the Statement of Assets and Liabilities.
The use of futures contracts exposes the Fund to equity price and foreign exchange risk. The Fund may be subject to the risk that the change in the value of the futures contract may not correlate perfectly with the underlying instrument. Use of long futures contracts subjects the Fund to risk of
| J.P. Morgan Exchange-Traded Funds | |
loss in excess of the amounts shown on the Statement of Assets and Liabilities, up to the notional amount of the futures contracts. Use of short futures contracts subjects the Fund to unlimited risk of loss. The Fund may enter into futures contracts only on exchanges or boards of trade. The exchange or board of trade acts as the counterparty to each futures transaction; therefore, the Fund's credit risk is limited to failure of the exchange or board of trade. Under some circumstances, futures exchanges may establish daily limits on the amount that the price of a futures contract can vary from the previous day’s settlement price, which could effectively prevent liquidation of positions.
The Fund's futures contracts are not subject to master netting arrangements (the right to close out all transactions traded with a counterparty and net amounts owed or due across transactions).
The table below discloses the volume of the Fund's futures contracts activity during the year ended October 31, 2022:
| |
| |
Average Notional Balance Long | |
Ending Notional Balance Long | |
G. Security Transactions and Investment Income — Investment transactions are accounted for on the trade date (the date the order to buy or sell is executed). Securities gains and losses are calculated on a specifically identified cost basis.
Dividend income, net of foreign taxes withheld, if any, is recorded on the ex-dividend date or when a Fund first learns of the dividend.
To the extent such information is publicly available, the Fund records distributions received in excess of income earned from underlying investments as a reduction of cost of investments and/or realized gain. Such amounts are based on estimates if actual amounts are not available and actual amounts of income, realized gain and return of capital may differ from the estimated amounts. The Fund adjusts the estimated amounts of the components of distributions (and consequently its net investment income) as necessary, once the issuers provide information about the actual composition of the distributions.
H. Allocation of Income and Expenses — Expenses directly attributable to the Fund are charged directly to the Fund, while the expenses attributable to more than one fund of the Trust are allocated among the applicable funds. Investment income, realized and unrealized gains and losses and expenses, other than class-specific expenses (which are only applicable to the fees and expenses of the Acquired Fund for the period prior to the Reorganization), are allocated daily to each class of shares based upon the proportion of net assets of each class at the beginning of each day.
Transfer agency fees charged to the Acquired Fund were class-specific expenses. The amount of the transfer agency fees charged to each share class of the Acquired Fund for the period November 1, 2021 through the Closing Date were as follows:
| J.P. Morgan Exchange-Traded Funds | |
NOTES TO FINANCIAL STATEMENTS
AS OF October 31, 2022 (continued)
I. Federal Income Taxes — The Fund is treated as a separate taxable entity for Federal income tax purposes. The Fund's policy is to comply with the provisions of the Internal Revenue Code (the “Code”) applicable to regulated investment companies and to distribute to shareholders all of its distributable net investment income and net realized capital gains on investments. Accordingly, no provision for Federal income tax is necessary. Management has reviewed the Fund's tax positions for all open tax years and has determined that as of October 31, 2022, no liability for Federal income tax is required in the Fund's financial statements for net unrecognized tax benefits. However, management’s conclusions may be subject to future review based on changes in, or the interpretation of, the accounting standards or tax laws and regulations. The Fund's Federal tax returns for the prior three fiscal years remain subject to examination by the Internal Revenue Service.
J. Foreign Taxes —The Fund may be subject to foreign taxes on income, gains on investments or currency purchases/repatriation, a portion of which may be recoverable. The Fund will accrue such taxes and recoveries as applicable, based upon its current interpretation of tax rules and regulations that exist in the markets in which it invests. When a capital gains tax is determined to apply, the Fund records an estimated deferred tax liability in an amount that would be payable if the securities were disposed of on the valuation date.
K. Distributions to Shareholders — Distributions from net investment income, if any, are generally declared and paid at least annually. Net realized capital gains, if any, are distributed at least annually. The amount of distributions from net investment income and net realized capital gains is determined in accordance with Federal income tax regulations, which may differ from GAAP. To the extent these “book/tax” differences are permanent in nature (i.e., that they result from other than timing of recognition — “temporary differences”), such amounts are reclassified within the capital accounts based on their Federal tax basis treatment.
The following amounts were reclassified within the capital accounts:
| | Accumulated
undistributed
(distributions in
excess of)
net investment
income | Accumulated
net realized
gains (losses) |
| | | |
The reclassifications for the Fund relate primarily to investments, foreign currency gains or losses and redemptions in-kind.
3. Fees and Other Transactions with Affiliates
A. Investment Advisory Fee — Pursuant to an Investment Advisory Agreement, the Adviser manages the investments of the Fund and for such services is paid a fee. The investment advisory fee is accrued daily and paid monthly at an annual rate of 0.20% of the Fund's average daily net assets.
The Adviser waived investment advisory fees and/or reimbursed expenses as outlined in Note 3.G.
B. Administration Fee — Pursuant to an Administration Agreement, the Administrator provides certain administration services to the Fund. In consideration of these services, the Administrator receives a fee accrued daily and paid monthly at an annual rate of 0.075% of the first $10 billion of the Fund's average daily net assets, plus 0.050% of the Fund's average daily net assets between $10 billion and $20 billion, plus 0.025% of the Fund's average daily net assets between $20 billion and $25 billion, plus 0.010% of the Fund's average daily net assets in excess of $25 billion. For the year ended October 31, 2022, the effective rate was 0.075% of the Fund's average daily net assets, notwithstanding any fee waivers and/or expense reimbursements.
The Administrator waived administration fees as outlined in Note 3.G.
JPMorgan Chase Bank, N.A. (“JPMCB”), a wholly-owned subsidiary of JPMorgan, serves as the Fund's sub-administrator (the “Sub-administrator”). For its services as Sub-administrator, JPMCB receives a portion of the fees paid to the Administrator.
C. Distribution Fees — Up through the Closing Date, pursuant to a Distribution Agreement, JPMorgan Distribution Services, Inc. (“JPMDS”), an indirect, wholly-owned subsidiary of JPMorgan, served as the Acquired Fund’s principal underwriter and promoted and arranged for the sale of the Acquired Fund’s shares.
Up through the Closing Date, the Acquired Fund’s Board of Trustees had adopted a Distribution Plan (the “Distribution Plan”) for Class A Shares pursuant to Rule 12b-1 under the 1940 Act. Class I and Class R6 Shares of the Acquired Fund did not charge a distribution fee. The Distribution Plan provided that the Acquired Fund shall pay, with respect to the applicable share classes, distribution fees, including payments to JPMDS, at an annual rate of the average daily net assets as shown in the table below:
| J.P. Morgan Exchange-Traded Funds | |
In addition, up through the Closing Date, JPMDS was entitled to receive the front-end sales charges from purchases of Class A Shares and the contingent deferred sales charge ("CDSC") from redemptions of Class C Shares and certain Class A Shares of the Acquired Fund for which front-end sales charges have been waived. For the period July 1, 2021 through the Closing Date, JPMDS retained front-end sales charges of $51 and CDSC of $0.
D. Service Fees — Up through the Closing Date, JPMorgan Trust II, on behalf of the Acquired Fund, had entered into a Shareholder Servicing Agreement with JPMDS under which JPMDS provided certain support services to fund shareholders. For performing these services, JPMDS received a fee with respect to all share classes of the Acquired Fund, except Class R6 Shares which did not charge a service fee, that was accrued daily and paid monthly equal to a percentage of the average daily net assets as shown in the table below:
Prior to the Closing Date, JPMDS had entered into shareholder services contracts with affiliated and unaffiliated financial intermediaries who provide shareholder services and other related services to their clients or customers who invested in the Acquired Fund. Pursuant to such contracts, JPMDS paid all or a portion of such fees earned to financial intermediaries for performing such services.
JPMDS waived service fees as outlined in Note 3.G.
E. Custodian, Accounting and Transfer Agent Fees — JPMCB provides portfolio custody, accounting and transfer agency (effective as of the Closing Date) services to the Fund. For performing these services, the Fund pays JPMCB transaction and asset-based fees that vary according to the number of transactions and positions, plus out-of-pocket expenses. The amounts paid directly to JPMCB by the Fund for custody and accounting services are included in Custodian and accounting fees on the Statement of Operations. The amounts paid directly to JPMCB by the Fund for transfer agency services are included in Transfer agency fees on the Statement of Operations.
Additionally, Authorized Participants generally pay transaction fees associated with the creation and redemption of Fund shares. These fees are used to offset certain custodian charges incurred by the Fund for these transactions.
Interest income earned on cash balances at the custodian, if any, is included in Interest income from affiliates on the Statement of Operations.
Interest expense paid to the custodian related to cash overdrafts, if any, is included in Interest expense to affiliates on the Statement of Operations.
F. Distribution Services — The Distributor or its agent distributes Creation Units for the Fund on an agency basis. The Distributor does not maintain a secondary market in shares of the Fund. JPMDS receives no fees for their distribution services under the distribution agreement with the Trust (the “Distribution Agreement”). Although the Trust does not pay any fees under the Distribution Agreement, JPMIM pays JPMDS for certain distribution related services.
G. Waivers and Reimbursements — The Adviser and/or its affiliates have contractually agreed to waive fees and/or reimburse the Fund to the extent that total annual operating expenses (excluding acquired fund fees and expenses other than certain money market fund fees as described below, dividend and interest expenses related to short sales, interest, taxes, expenses related to litigation and potential litigation, costs of shareholder meetings, and extraordinary expenses) exceed 0.24% of the Fund’s average daily net assets.
Prior to the Closing Date, the Adviser, Administrator and/or JPMDS had contractually agreed to waive fees and/or reimburse the Acquired Fund to the extent that total annual operating expenses (excluding acquired fund fees and expenses other than certain money market fund fees as described below, dividend and interest expenses related to short sales, interest, taxes, expenses related to litigation and potential litigation, expenses related to trustee elections and extraordinary expenses) exceeded the percentages of the Acquired Funds’ respective average daily net assets as shown in the table below:
For the year ended October 31, 2022, the service providers waived fees and/or reimbursed expenses for the Fund as follows. None of these parties expect the Fund to repay any such waived fees and/or reimbursed expenses in future years.
| | | |
| | | | | Contractual
Reimbursements | |
| | | | | | |
| J.P. Morgan Exchange-Traded Funds | |
NOTES TO FINANCIAL STATEMENTS
AS OF October 31, 2022 (continued)
Additionally, the Fund may invest in one or more money market funds advised by the Adviser (affiliated money market funds). The Adviser has contractually agreed to waive fees and/or reimburse expenses in an amount sufficient to offset the fees and expenses of the affiliated money market funds incurred by the Fund because of the Fund’s investment in such affiliated money market funds. To the extent that the Fund engages in securities lending, affiliated money market fund fees and expenses resulting from the Fund's investment of cash received from securities lending borrowers are not included in Total Annual Fund Operating Expenses and therefore, the above waivers do not apply to such investments. None of these parties expect the Funds to repay any such waived fees and/ or reimbursed expenses in future years.
The amount of these waivers resulting from investments in these money market funds for the year ended October 31, 2022 was $180,478.
Effective January 1, 2022, JPMIM voluntarily agreed to reimburse the Fund for the Trustee Fees paid to one of the interested Trustees. For the period January 1, 2022 through October 31, 2022 the amount of this waiver was $1,910.
H. Other — Certain officers of the Trust are affiliated with the Adviser, the Administrator and JPMDS. Such officers, with the exception of the Chief Compliance Officer, receive no compensation from the Fund for serving in their respective roles.
The Board designated and appointed a Chief Compliance Officer to the Fund pursuant to Rule 38a-1 under the 1940 Act. The Fund, along with certain other affiliated funds, makes reimbursement payments, on a pro-rata basis, to the Administrator for a portion of the fees associated with the office of the Chief Compliance Officer. Such fees are included in Trustees’ and Chief Compliance Officer’s fees on the Statement of Operations.
The Trust adopted a Trustee Deferred Compensation Plan (the “Plan”) which allows the independent Trustees to defer the receipt of all or a portion of compensation related to performance of their duties as Trustees. The deferred fees are invested in various J.P. Morgan Funds until distribution in accordance with the Plan.
The Securities and Exchange Commission ("SEC") has granted an exemptive order permitting the Fund to engage in principal transactions with J.P. Morgan Securities LLC, an affiliated broker, involving taxable money market instruments, subject to certain conditions.
4. Investment Transactions
During the year ended October 31, 2022, purchases and sales of investments (excluding short-term investments) were as follows:
| Purchases
(excluding
U.S. Government) | Sales
(excluding
U.S. Government) |
| | |
For the year ended October 31, 2022, in-kind transactions associated with creations and redemptions were as follows:
During the year ended October 31, 2022, the Fund delivered portfolio securities for the redemption of Fund Shares (in-kind redemptions). Cash and portfolio securities were transferred for redemptions at fair value. For financial reporting purposes, the Fund recorded net realized gains and losses in connection with each in-kind redemption transaction.
5. Federal Income Tax Matters
For Federal income tax purposes, the estimated cost and unrealized appreciation (depreciation) in value of investments held at October 31, 2022 were as follows:
| | Gross
Unrealized
Appreciation | Gross
Unrealized
Depreciation | Net Unrealized
Appreciation
(Depreciation) |
| | | | |
The difference between book and tax basis appreciation (depreciation) on investments is primarily attributed to tax adjustments on certain investments and wash sale loss deferrals.
| J.P. Morgan Exchange-Traded Funds | |
The tax character of distributions paid during the year ended October 31, 2022 was as follows:
|
| Short-term gain distributions are treated as ordinary income for income tax purposes. |
The tax character of distributions paid during the year ended October 31, 2021 was as follows:
|
| Short-term gain distributions are treated as ordinary income for income tax purposes. |
As of October 31, 2022, the estimated components of net assets (excluding paid-in-capital) on a tax basis were as follows:
| Current
Distributable
Ordinary
Income | Current
Distributable
Long-Term
Capital Gain
(Tax Basis Capital
Loss Carryover) | Unrealized
Appreciation
(Depreciation) |
| | | |
The cumulative timing differences primarily consist of wash sale loss deferrals and investments.
At October 31, 2022, the Fund had net capital loss carryforwards which are available to offset future realized gains:
| Capital Loss Carryforward Character |
| | |
| | |
During the year ended October 31, 2022, the Fund utilized capital loss carryforwards as follows:
6. Capital Share Transactions
The Trust issues and redeems shares of the Fund only in Creation Units through the Distributor at NAV. Capital shares transactions detail can be found in the Statement of Changes in Net Assets.
Shares of the Fund may only be purchased or redeemed by Authorized Participants. Such Authorized Participants may from time to time hold, of record or beneficially, a substantial percentage of the shares outstanding and act as executing or clearing broker for investment transactions on behalf of the Fund. An Authorized Participant is either (1) a “Participating Party” or other participant in the clearing process through the Continuous Net Settlement System of the National Securities Clearing Corporation (“NSCC”); or (2) a DTC Participant; which, in either case, must have executed an agreement with the Distributor.
Creation Units of a Fund may be created in advance of receipt by the Trust of all or a portion of the applicable basket of equity securities and other instruments (“Deposit Instruments”) and cash as described in the Fund's registration statement. In these instances, the initial Deposit Instruments and cash must be deposited in an amount equal to the sum of the cash amount, plus at least 105% for the Fund of the market value of undelivered Deposit Instruments. A transaction fee may be imposed to offset transfer and other transaction costs associated with the purchase or redemption of Creation Units
| J.P. Morgan Exchange-Traded Funds | |
NOTES TO FINANCIAL STATEMENTS
AS OF October 31, 2022 (continued)
7. Risks, Concentrations and Indemnifications
In the normal course of business, the Fund enters into contracts that contain a variety of representations which provide general indemnifications. The Fund's maximum exposure under these arrangements is unknown. The amount of exposure would depend on future claims that may be brought against the Fund. However, based on experience, the Fund expects the risk of loss to be remote.
As of October 31, 2022, J.P. Morgan Investor Funds and JPMorgan SmartRetirement Funds, which are affiliated funds of funds, each owned in the aggregate, shares representing more than 10% of the net assets of the Fund as follows:
| | JPMorgan
SmartRetirement
Funds |
| | |
Significant shareholder transactions by the Adviser may impact the Fund's performance and liquidity.
The Fund may have elements of risk not typically associated with investments in the United States of America due to concentrated investments in a limited number of foreign countries or regions, which may vary throughout the period. Such concentrations may subject the Fund to additional risks resulting from political or economic conditions in such countries or regions and the possible imposition of adverse governmental laws or currency exchange restrictions could cause the securities and their markets to be less liquid and their prices to be more volatile than those of comparable U.S. securities.
As of October 31, 2022, the Fund had non-U.S. country allocations representing greater than 10% of total investments (excluding investment of cash collateral from securities loaned) as follows:
Disruptions to creations and redemptions, the existence of significant market volatility or potential lack of an active trading market for the Shares (including through a trading halt), as well as other factors, may result in Shares trading significantly above (at a premium) or below (at a discount) to the NAV or to the intraday value of the Fund's holdings. During such periods, investors may incur significant losses if shares are sold.
The Fund is subject to infectious disease epidemics/pandemics risk. The worldwide outbreak of COVID-19 has negatively affected economies, markets and individual companies throughout the world. The effects of this COVID-19 pandemic to public health, and business and market conditions, including among other things, reduced consumer demand and economic output, supply chain disruptions and increased government spending may continue to have a significant negative impact on the performance of the Fund’s investments, increase the Fund’s volatility, negatively impact the Fund’s arbitrage and pricing mechanisms, exacerbate other pre-existing political, social and economic risks to the Fund and negatively impact broad segments of businesses and populations. In addition, governments, their regulatory agencies, or self-regulatory organizations have taken or may take actions in response to the pandemic that affect the instruments in which the Fund invests, or the issuers of such instruments, in ways that could also have a significant negative impact on the Fund’s investment performance. The duration and extent of COVID-19 and associated economic and market conditions and uncertainty over the long-term cannot be reasonably estimated at this time. The ultimate impact of COVID-19 and the extent to which the associated conditions impact a Fund will also depend on future developments, which are highly uncertain, difficult to accurately predict and subject to frequent changes.
8. Subsequent Event
Effective November 1, 2022, the Fund relies upon an exemptive order granted by the SEC (the “Order”) permitting the establishment and operation of an Interfund Lending Facility (the “Facility”). The Facility allows the Fund to directly lend and borrow money to or from any other fund relying upon the Order at rates beneficial to both the borrowing and lending funds. Advances under the Facility are taken primarily for temporary or emergency purposes, including the meeting of redemption requests that otherwise might require the untimely disposition of securities, and are subject to the Fund's borrowing restrictions. The interfund loan rate is determined, as specified in the Order, by averaging the current repurchase agreement rate and the current bank loan rate. The Order was granted to JPMorgan Trust II and may be relied upon by the Fund because the Fund and the series of JPMorgan Trust II are all investment companies in the same “group of investment companies” (as defined in Section 12(d)(1)(G) of the 1940 Act).
| J.P. Morgan Exchange-Traded Funds | |
REPORT OF INDEPENDENT REGISTERED PUBLIC ACCOUNTING FIRM
To the Board of Trustees of J.P. Morgan Exchange-Traded Fund Trust and Shareholders of JPMorgan International Research Enhanced Equity ETF
Opinion on the Financial Statements
We have audited the accompanying statement of assets and liabilities, including the schedule of portfolio investments, of JPMorgan International Research Enhanced Equity ETF (one of the funds constituting J.P. Morgan Exchange-Traded Fund Trust, referred to hereafter as the “Fund”) as of October 31, 2022, the related statement of operations for the year ended October 31, 2022, the statements of changes in net assets for each of the two years in the period ended October 31, 2022, including the related notes, and the financial highlights for each of the five years in the period ended October 31, 2022 (collectively referred to as the “financial statements”). In our opinion, the financial statements present fairly, in all material respects, the financial position of the Fund as of October 31, 2022, the results of its operations for the year then ended, the changes in its net assets for each of the two years in the period ended October 31, 2022 and the financial highlights for each of the five years in the period ended October 31, 2022 in conformity with accounting principles generally accepted in the United States of America.
Basis for Opinion
These financial statements are the responsibility of the Fund’s management. Our responsibility is to express an opinion on the Fund’s financial statements based on our audits. We are a public accounting firm registered with the Public Company Accounting Oversight Board (United States) (PCAOB) and are required to be independent with respect to the Fund in accordance with the U.S. federal securities laws and the applicable rules and regulations of the Securities and Exchange Commission and the PCAOB.
We conducted our audits of these financial statements in accordance with the standards of the PCAOB. Those standards require that we plan and perform the audit to obtain reasonable assurance about whether the financial statements are free of material misstatement, whether due to error or fraud.
Our audits included performing procedures to assess the risks of material misstatement of the financial statements, whether due to error or fraud, and performing procedures that respond to those risks. Such procedures included examining, on a test basis, evidence regarding the amounts and disclosures in the financial statements. Our audits also included evaluating the accounting principles used and significant estimates made by management, as well as evaluating the overall presentation of the financial statements. Our procedures included confirmation of securities owned as of October 31, 2022 by correspondence with the custodian and transfer agent. We believe that our audits provide a reasonable basis for our opinion.
/s/ PricewaterhouseCoopers LLP
New York, New York
December 22, 2022
We have served as the auditor of one or more investment companies in the JPMorgan Funds complex since 1993.
| J.P. Morgan Exchange-Traded Funds | |
Name (Year of Birth);
Positions With
the Funds (1) | Principal Occupation
During Past 5 Years | Number of
Funds in Fund
Complex Overseen
by Trustee (2) | Other Directorships Held
During the Past 5 Years |
| | | |
John F. Finn (1947); Chair
since 2020; Trustee since 1998. | Chairman, Gardner, Inc. (supply chain management company serving industrial and consumer markets) (serving in various roles 1974-present). | | Director, Greif, Inc. (GEF) (industrial package products and services) (2007-present); Trustee, Columbus Association for the Performing Arts (1988-present). |
Stephen P. Fisher (1959);
Trustee since 2018. | Retired; Chairman and Chief Executive Officer, NYLIFE Distributors LLC (registered broker-dealer) (serving in various roles 2008-2013); Chairman, NYLIM Service Company LLC (transfer agent) (2008-2017); New York Life Investment Management LLC (registered investment adviser) (serving in various roles 2005-2017); Chairman, IndexIQ Advisors LLC (registered investment adviser for ETFs) (2014-2017); President, MainStay VP Funds Trust (2007-2017), MainStay DefinedTerm Municipal Opportunities Fund (2011-2017) and MainStay Funds Trust (2007-2017) (registered investment companies). | | Honors Program Advisory Board Member, The Zicklin School of Business, Baruch College, The City University of New York (2017-present). |
Gary L. French (1951);
Trustee since 2014. | Real Estate Investor (2011-2020); Investment management industry Consultant and Expert Witness (2011-present); Senior Consultant for The Regulatory Fundamentals Group LLC (2011-2017). | | Independent Trustee, The China Fund, Inc. (2013-2019); Exchange Traded Concepts Trust II (2012-2014); Exchange Traded Concepts Trust I (2011-2014). |
Kathleen M. Gallagher (1958);
Trustee since 2018. | Retired; Chief Investment Officer — Benefit Plans, Ford Motor Company (serving in various roles 1985-2016). | | Non- Executive Director, Legal & General Investment Management (Holdings) (2018-present); Non-Executive Director, Legal & General Investment Management America (U.S. Holdings) (financial services and insurance) (2017-present); Advisory Board Member, State Street Global Advisors Total Portfolio Solutions (2017-present); Member, Client Advisory Council, Financial Engines, LLC (registered investment adviser) (2011-2016); Director, Ford Pension Funds Investment Management Ltd. (2007-2016). |
Robert J. Grassi (1957);
Trustee since 2014. | Sole Proprietor, Academy Hills Advisors LLC (2012-present); Pension Director, Corning Incorporated (2002-2012). | | |
Frankie D. Hughes (1952);
Trustee since 2008. | President, Ashland Hughes Properties (property management) (2014-present); President and Chief Investment Officer, Hughes Capital Management, Inc. (fixed income asset management) (1993-2014). | | |
| J.P. Morgan Exchange-Traded Funds | |
Name (Year of Birth); Positions With the Funds (1) | Principal Occupation During Past 5 Years | Number of Funds in Fund Complex Overseen by Trustee (2) | Other Directorships Held During the Past 5 Years |
Raymond Kanner (1953);
Trustee since 2017. | Retired; Managing Director and Chief Investment Officer, IBM Retirement Funds (2007-2016). | | Advisory Board Member, Penso Advisors, LLC (2020-present); Advisory Board Member, Los Angeles Capital (2018-present); Advisory Board Member, State Street Global Advisors Total Portfolio Solutions (2017- present); Acting Executive Director, Committee on Investment of Employee Benefit Assets (CIEBA) (2016-2017); Advisory Board Member, Betterment for Business (robo advisor) (2016- 2017); Advisory Board Member, BlueStar Indexes (index creator) (2013-2017); Director, Emerging Markets Growth Fund (registered investment company) (1997-2016); Member, Russell Index Client Advisory Board (2001-2015). |
Thomas P. Lemke (1954);
Trustee since 2014. | | | (1) Independent Trustee of Advisors’ Inner Circle III fund platform, consisting of the following: (i) the Advisors’ Inner Circle Fund III, (ii) the Gallery Trust, (iii) the Schroder Series Trust, (iv) the Delaware Wilshire Private Markets Fund (since 2020), (v) Chiron Capital Allocation Fund Ltd., and (vi) formerly the Winton Diversified Opportunities Fund (2014-2018); and (2) Independent Trustee of the Symmetry Panoramic Trust (since 2018). |
Lawrence R. Maffia (1950);
Trustee since 2014 | Retired; Director and President, ICI Mutual Insurance Company (2006-2013). | | Director, ICI Mutual Insurance Company (1999-2013). |
Mary E. Martinez (1960); Vice
Chair since 2021; Trustee since 2013. | Associate, Special Properties, a Christie’s International Real Estate Affiliate (2010-present); Managing Director, Bank of America (asset management) (2007-2008); Chief Operating Officer, U.S. Trust Asset Management, U.S. Trust Company (asset management) (2003-2007); President, Excelsior Funds (registered investment companies) (2004-2005). | | |
Marilyn McCoy (1948);
Trustee since 2005. | Vice President of Administration and Planning, Northwestern University (1985-present). | | |
Dr. Robert A. Oden, Jr. (1946); Trustee
since 2005. | Retired; President, Carleton College (2002-2010); President, Kenyon College (1995-2002). | | Trustee, The Coldwater Conservation Fund (2017-present); Trustee, American Museum of Fly Fishing (2013-present); Trustee and Vice Chair, Trout Unlimited (2017-2021);Trustee, Dartmouth- Hitchcock MedicalCenter (2011-2020). |
| J.P. Morgan Exchange-Traded Funds | |
TRUSTEES
(Unaudited) (continued)
Name (Year of Birth); Positions With the Funds (1) | Principal Occupation During Past 5 Years | Number of Funds in Fund Complex Overseen by Trustee (2) | Other Directorships Held During the Past 5 Years |
Marian U. Pardo* (1946);
Trustee since 2013. | Managing Director and Founder, Virtual Capital Management LLC (investment consulting) (2007-present); Managing Director, Credit Suisse Asset Management (portfolio manager) (2003-2006). | | Board Chair and Member, Board of Governors, Columbus Citizens Foundation (not-for-profit supporting philanthropic and cultural programs) (2006-present). |
Emily A. Youssouf (1951);
Trustee since 2022. | Adjunct Professor (2011-present) and Clinical Professor (2009-2011), NYU Schack Institute of Real Estate; Board Member and Member of the Audit Committee (2013–present), Chair of Finance Committee (2019-present), Member of Related Parties Committee (2013-2018) and Member of the Enterprise Risk Committee (2015-2018), PennyMac Financial Services, Inc.; Board Member (2005-2018), Chair of Capital Committee (2006-2016), Chair of Audit Committee (2005-2018), Member of Finance Committee (2005-2018) and Chair of IT Committee (2016-2018), NYC Health and Hospitals Corporation. | | Trustee, NYC School Construction Authority (2009-present); Board Member, NYS Job Development Authority (2008-present); Trustee and Chair of the Audit Committee of the Transit Center Foundation (2015-2019). |
| | | |
Robert F. Deutsch** (1957);
Trustee since 2014. | Retired; Head of ETF Business for JPMorgan Asset Management (2013-2017); Head of Global Liquidity Business for JPMorgan Asset Management (2003-2013). | | Treasurer and Director of the JUST Capital Foundation (2017-present). |
Nina O. Shenker** (1957);
Trustee since 2022. | Vice Chair (2017-2021), General Counsel and Managing Director (2008-2016), Associate General Counsel and Managing Director (2004-2008), J.P. Morgan Asset & Wealth Management. | | Director and Member of Legal and Human Resources Subcommittees, American Jewish Joint Distribution Committee (2018-present). |
|
| The year shown is the first year in which a Trustee became a member of any of the following: the Mutual Fund Board, the ETF Board, the heritage J.P. Morgan Funds or the heritage One Group Mutual Funds. Trustees serve an indefinite term, until resignation, retirement, removal or death. The Board’s current retirement policy sets retirement at the end of the calendar year in which the Trustee attains the age of 75, provided that any Board member who was a member of the Mutual Fund Board prior to January 1, 2022 and was born prior to January 1, 1950 shall retire from the Board at the end of the calendar year in which the Trustee attains the age of 78. |
| A Fund Complex means two or more registered investment companies that hold themselves out to investors as related companies for purposes of investment and investor services or have a common investment adviser or have an investment adviser that is an affiliated person of the investment adviser of any of the other registered investment companies. The J.P. Morgan Funds Complex for which the Board of Trustees serves currently includes nine registered investment companies (166 J.P. Morgan Funds). |
| In connection with prior employment with JPMorgan Chase, Ms. Pardo was the recipient of non-qualified pension plan payments from JPMorgan Chase in the amount of approximately $2,055 per month, which she irrevocably waived effective January 1, 2013, and deferred compensation payments from JPMorgan Chase in the amount of approximately $7,294 per year, which ended in January 2013. In addition, Ms. Pardo receives payments from a fully-funded qualified plan, which is not an obligation of JPMorgan Chase. |
| Designation as an “Interested Trustee” is based on prior employment by the Adviser or an affiliate of the Adviser or interests in a control person of the Adviser. |
| The contact address for each of the Trustees is 277 Park Avenue, New York, NY 10172. |
| J.P. Morgan Exchange-Traded Funds | |
Name (Year of Birth),
Positions Held with
the Trust (Since) | Principal Occupations During Past 5 Years |
Brian S. Shlissel (1964),
President and Principal Executive
Officer (2021)* | Managing Director and Chief Administrative Officer for J.P. Morgan pooled vehicles, J.P. Morgan Investment Management Inc. since 2014. |
Timothy J. Clemens (1975),
Treasurer and Principal Financial
Officer (2020) | Executive Director, J.P. Morgan Investment Management Inc. since February 2016. Mr. Clemens has been with J.P. Morgan Investment Management Inc. since 2013. |
Gregory S. Samuels (1980),
Secretary (2022) **(formerly Assistant
Secretary 2014-2022) | Managing Director and Assistant General Counsel, JPMorgan Chase & Co. Mr. Samuels has been with JPMorgan Chase & Co. since 2010. |
Stephen M. Ungerman (1953),
Chief Compliance Officer (2014) | Managing Director, JPMorgan Chase & Co. Mr. Ungerman has been with JPMorgan Chase & Co. since 2000. |
Kiesha Astwood-Smith (1973),
Assistant Secretary (2021)** | Vice President and Assistant General Counsel, JPMorgan Chase & Co. since June 2021; Senior Director and Counsel, Equitable Financial Life Insurance Company (formerly, AXA Equitable Life Insurance Company) from September 2015 through June 2021. |
Matthew Beck (1988),
Assistant Secretary (2021)*** | Vice President and Assistant General Counsel, JPMorgan Chase & Co. since May 2021; Senior Legal Counsel, Ultimus Fund Solutions from May 2018 through May 2021; General Counsel, The Nottingham Company from April 2014 through May 2018. |
Elizabeth A. Davin (1964),
Assistant Secretary (2022)***
(formerly Secretary 2018-2022) | Executive Director and Assistant General Counsel, JPMorgan Chase & Co. Ms. Davin has been with JPMorgan Chase & Co. (formerly Bank One Corporation) since 2004. |
Jessica K. Ditullio (1962),
Assistant Secretary (2014)*** | Executive Director and Assistant General Counsel, JPMorgan Chase & Co. Ms. Ditullio has been with JPMorgan Chase & Co. (formerly Bank One Corporation) since 1990. |
Anthony Geron (1971),
Assistant Secretary (2019)** | Vice President and Assistant General Counsel, JPMorgan Chase & Co. since September 2018; Lead Director and Counsel, AXA Equitable Life Insurance Company from 2015 to 2018 and Senior Director and Counsel, AXA Equitable Life Insurance Company from 2014 to 2015. |
Carmine Lekstutis (1980),
Assistant Secretary (2014)** | Executive Director and Assistant General Counsel, JPMorgan Chase & Co. Mr. Lekstutis has been with JPMorgan Chase & Co. since 2011. |
Max Vogel (1990),
Assistant Secretary (2021)** | Vice President and Assistant General Counsel, JPMorgan Chase & Co. since June 2021; Associate, Proskauer Rose LLP (law firm) from March 2017 to June 2021. |
Zachary E. Vonnegut-Gabovitch
(1986),
Assistant Secretary (2017)** | Vice President and Assistant General Counsel, JPMorgan Chase & Co. since September 2016. |
Frederick J. Cavaliere (1978),
Assistant Treasurer (2015)* | Executive Director, J.P. Morgan Investment Management Inc. Mr. Cavaliere has been with JPMorgan Chase & Co. since May 2006. |
Michael M. D’Ambrosio (1969),
Assistant Treasurer (2014) | Managing Director, J.P. Morgan Investment Management Inc. Mr. D’Ambrosio has been with J.P. Morgan Investment Management Inc. since 2012. |
Shannon Gaines (1977),
Assistant Treasurer (2019)*** | Vice President, J.P. Morgan Investment Management Inc. since January 2014. |
Nektarios E. Manolakakis (1972),
Assistant Treasurer (2020) | Executive Director, J.P. Morgan Investment Management Inc. since February 2021, formerly Vice President, J.P. Morgan Investment Mangement Inc. since 2014; Vice President, J.P. Morgan Corporate & Investment Bank 2010-2014. |
Todd McEwen (1981),
Assistant Treasurer (2020)*** | Vice President, J.P. Morgan Investment Management Inc. Mr. McEwen has been with J.P. Morgan Investment Management Inc. since 2010. |
|
The contact address for each of the officers, unless otherwise noted, is 277 Park Avenue, New York, NY 10172. |
| The contact address for the officer is 575 Washington Boulevard, Jersey City, NJ 07310. |
| The contact address for the officer is 4 New York Plaza, New York, NY 10004. |
| J.P. Morgan Exchange-Traded Funds | |
OFFICERS
(Unaudited) (continued)
| The contact address for the officer is 1111 Polaris Parkway, Columbus, OH 43240. |
| J.P. Morgan Exchange-Traded Funds | |
SCHEDULE OF SHAREHOLDER EXPENSES
(Unaudited)
Hypothetical $1,000 Investment
As a shareholder of the Fund, you incur two types of costs: (1) transaction costs, including brokerage commissions on your purchase and sales of Fund shares and (2) ongoing costs, primarily management fees. The examples below are intended to help you understand your ongoing costs (in dollars) of investing in the Fund and to compare these ongoing costs with the ongoing costs of investing in other funds. The examples assume that you had a $1,000 investment at the beginning of the reporting period, May 1, 2022, and continued to hold your shares at the end of the reporting period, October 31, 2022.
Actual Expenses
For the Fund in the table below, the first line provides information about actual account values and actual expenses. You may use the information in this line, together with the amount you invested, to estimate the expenses that you paid over the period. Simply divide your account value by $1,000 (for example, an $8,600 account value divided by $1,000 = 8.6), then multiply the result by the number in the first line of the Fund under the heading titled “Expenses Paid During the
Period” to estimate the expenses you paid on your account during this period.
Hypothetical Example for Comparison Purposes
The second line of the Fund in the table below provides information about hypothetical account values and hypothetical expenses based on the actual expense ratio and an assumed rate of return of 5% per year before expenses, which is not the Fund's actual return. The hypothetical account values and expenses may not be used to estimate the actual ending account balance or expenses you paid for the period. You may use this information to compare the ongoing costs of investing in the Fund and other funds. To do so, compare this 5% hypothetical example with the 5% hypothetical examples that appear in the shareholder reports of the other funds. The examples also assume all dividends and distributions have been reinvested. The examples do not take into account brokerage commissions that you pay when purchasing or selling shares of the Fund.
| Beginning Account Value May 1, 2022 | Ending Account Value October 31, 2022 | | |
JPMorgan International Research Enhanced Equity ETF | | | | |
| | | | |
| | | | |
|
| Expenses are equal to Fund’s annualized net expense ratio, multiplied by the average account value over the period, multiplied by 184/365 (to reflect the one-half year period). |
| J.P. Morgan Exchange-Traded Funds | |
Certain tax information for the J.P. Morgan Funds is required to be provided to shareholders based upon the Funds’ income and distributions for the taxable year ended October 31, 2022. The information and distributions reported in this letter may differ from the information and taxable distributions reported to the shareholders for the calendar year ending December 31, 2022. The information necessary to complete your income tax returns for the calendar year ending December 31, 2022 will be provided under separate cover.
Qualified Dividend Income (QDI)
The Fund had $152,767,972, or maximum allowable amount, of ordinary income distributions treated as qualified dividends for the fiscal year ended October 31, 2022.
Foreign Source Income and Foreign Tax Credit Pass Through
For the fiscal year ended October 31, 2022, the Fund intends to elect to pass through to shareholders taxes paid to foreign countries. The Fund had $167,406,212 and $15,304,864 in gross income and foreign tax expenses or amounts as finally determined.
| J.P. Morgan Exchange-Traded Funds | |
BOARD APPROVAL OF INITIAL MANAGEMENT AGREEMENT
(Unaudited)
JPMorgan International Research Enhanced Equity ETF
On July 29, 2021, the Board of Trustees (the “Board” or the “Trustees”) of J.P. Morgan Exchange-Traded Fund Trust (the “Trust”) held meetings and approved the initial advisory agreement (the “Advisory Agreement”) for the JPMorgan International Research Enhanced Equity ETF (the “Fund”). The meetings were held by videoconference in reliance upon the Division of Investment Management Staff Statement on Fund Board Meetings and Unforeseen or Emergency Circumstances Related to Coronavirus Disease 2019. The Advisory Agreement was approved by a majority of the Trustees who are not “Interested Persons” (as defined in the Investment Company Act of 1940) of any party to that Advisory Agreement or any of their affiliates. In connection with the approval of the Advisory Agreement, the Trustees reviewed written materials prepared by the Adviser and received oral presentations from Adviser personnel. The Trustees noted that the Fund was anticipated to commence operations by acquiring the assets of a mutual fund for which the Adviser serves as investment adviser (the “Acquired Fund”). Before voting on the proposed Advisory Agreement, the Trustees reviewed the Advisory Agreement with representatives of the Adviser and with counsel to the Trust and independent legal counsel to the Trustees and received a memorandum from independent legal counsel discussing the legal standards for their consideration of the proposed Advisory Agreement. They also considered information they received from the Adviser over the course of the year in connection with their oversight of other funds managed by the Adviser. The Trustees also discussed the proposed Advisory Agreement with independent legal counsel in executive session at which no representatives of the Adviser were present.
A summary of the material factors evaluated by the Trustees in determining whether to approve the Advisory Agreement is provided below. The Trustees considered information provided with respect to the Fund and the approval of the Advisory Agreement. Each Trustee attributed his or her own evaluation of the significance of the various factors, and no factor alone was considered determinative. The Trustees determined that the proposed compensation to be received by the Adviser from the Fund under its Advisory Agreement was fair and reasonable and that initial approval of the Advisory Agreement was in the best interests of the Fund and its potential shareholders.
Summarized below are the material factors considered and discussed by the Trustees in reaching their conclusions:
Nature, Extent and Quality of Services Provided by the Adviser
In connection with the approval of the Fund’s initial Advisory Agreement, the Trustees considered the materials furnished specifically in connection with the approval of the Advisory Agreement, as well as other relevant information furnished for
the Trustees, regarding the nature, extent, and quality of services provided by the adviser. Among other things, the Trustees considered:
(i)
The background and experience of the Adviser’s senior management and investment personnel;
(ii)
The qualifications, backgrounds and responsibilities of the portfolio management team to be primarily responsible for the day-to-day management of the Fund;
(iii)
The investment strategy for the Fund, and the infrastructure supporting the portfolio management team;
(iv)
Information about the structure and distribution strategy of the Fund and how it fits within the Trust’s other fund offerings;
(v)
Their knowledge of the nature and quality of the services provided by the Adviser and its affiliates gained from their experience as Trustees of the Trust and in the financial industry generally;
(vi)
The overall reputation and capabilities of the Adviser and its affiliates;
(vii)
The commitment of the Adviser to provide high quality service to the Fund;
(viii)
Their overall confidence in the Adviser’s integrity;
(ix)
The Adviser’s responsiveness to requests for additional information, questions or concerns raised by them; and
(x)
The Adviser’s business continuity plan, steps the Adviser and its affiliates would be taking to provide services to the Fund during the COVID-19 pandemic and the Adviser’s and its affiliates’ success in continuing to provide services to the other J.P. Morgan ETFs and their shareholders throughout this period.
Based upon these considerations and other factors, the Trustees concluded that they were satisfied with the nature, extent and quality of services to be provided to the Fund by the Adviser.
Fall-Out Benefits
The Trustees reviewed information regarding potential “fall-out” or ancillary benefits expected to be received by the Adviser and its affiliates as a result of their relationship with the Fund. Additionally, the Trustees considered that any fall-out or ancillary benefits would be comparable to those related to the other funds in the complex. The Trustees also considered the benefits to the Adviser and its affiliates from the conversion of a mutual fund to an ETF, for example, through the expansion of the Adviser’s ETF offerings.
| J.P. Morgan Exchange-Traded Funds | |
BOARD APPROVAL OF INITIAL MANAGEMENT AGREEMENT
(Unaudited) (continued)
The Trustees also considered the benefits the Adviser is expected to receive as the result of JPMorgan Chase Bank, N.A.’s (“JPMCB”), an affiliate of the Adviser, roles as custodian, fund accountant and transfer agent for the Fund, including the profitability of those arrangements to JPMCB.
Economies of Scale
The Trustees considered the extent to which the Fund may benefit from potential economies of scale. The Trustees considered that there may not be a direct relationship between economies of scale realized by the Fund and those realized by the Adviser as assets increase. The Trustees considered the extent to which the Fund was priced to scale and whether it would be appropriate to add advisory fee breakpoints, but noted that the Fund has implemented a contractual expense limitation and fee waiver (“Fee Cap”) which allows the Fund’s shareholders to share potential economies of scale, and that the proposed fees are satisfactory relative to peer funds. The Trustees considered the benefits to the Fund of the use of an affiliated distributor and custodian, including the ability to rely on existing infrastructure supporting distribution, custodial and transfer agent services and the ability to negotiate competitive fees for the Fund. The Trustees further considered the Adviser’s ongoing investments in its business in support of the Fund, including the Adviser’s investments in trading systems, technology (including improvements to the J.P. Morgan Funds’ website, and cybersecurity improvements), retention of key talent, and regulatory support enhancements. The Trustees concluded that the current fee structure for the Fund, including the Fee Cap that the Adviser has in place that serves to limit the overall net expense ratio of the Fund at a competitive level, was reasonable. The Trustees concluded that the Fund’s shareholders will receive the benefits of potential economies of scale through the Fee Cap and the Adviser’s reinvestment in its operations to serve the Fund and its shareholders. The Trustees noted that the Adviser’s reinvestment ensures sufficient resources in terms of personnel and infrastructure to support the Fund.
Fees Relative to Adviser’s Other Clients
The Trustees considered the Adviser’s view that it manages five accounts (including the Acquired Fund) with a substantially similar investment strategy as that of the Fund. The Trustees concluded that the fees charged to the Fund in comparison to those charged to such other clients were reasonable. The Trustees also considered the benefits to Acquired Fund shareholders from the fact that the total expense ratio of the
Fund, after application of the Fee Cap, would be lower than those of the Acquired Fund.
Investment Performance
The Trustees considered the Fund’s investment strategy and processes, the portfolio management team and competitive positioning against identified peer funds and concluded that the prospects for competitive future performance were acceptable. In addition, because the Fund was anticipated to commence operations by acquiring the assets of the Acquired Fund, and the Fund was to be the accounting survivor to the Acquired Fund, the Trustees were provided with performance information for the Acquired Fund.
Advisory Fees and Expense Ratios
The Trustees considered the contractual advisory fee rate that will be paid by the Fund to the Adviser and compared that rate to information prepared by Broadridge Investor Communications Solutions Inc. (“Broadridge”), an independent provider of investment company data, providing management fee rates paid by other funds in the same Morningstar category as the Fund. The Trustees also reviewed information about other projected expenses and the expense ratios for the Fund. The Trustees considered the projected Fee Cap proposed for the Fund, and the net advisory fee rate and net expense ratio for the Fund, after taking into account any projected waivers and/or reimbursements. The Trustees recognized that it is difficult to make comparisons of advisory fees because there are variations in the services that are included in the fees paid by other funds. The Trustees noted that the Fund’s estimated net advisory fees and total expenses were in line with identified peer funds. The Trustees also considered the fees paid to JPMCB, for custody, transfer agency and other related services for the Fund and the profitability of these arrangements to JPMCB.
The Trustees considered how the Fund will be positioned against peer funds, as identified by management and/or Broadridge and noted that the Fund’s proposed advisory fee compared favorably with identified peer funds. The Trustees also noted that because the Fund was not yet operational, no profitability information was available. After considering the factors identified above and other factors, in light of the information, the Trustees concluded that the Fund’s proposed advisory fee was reasonable.
| J.P. Morgan Exchange-Traded Funds | |
THIS PAGE IS INTENTIONALLY LEFT BLANK
THIS PAGE IS INTENTIONALLY LEFT BLANK
J.P. Morgan Exchange-Traded Funds are distributed by JPMorgan Distribution Services, Inc., an indirect, wholly-owned subsidiary of JPMorgan Chase & Co.
Contact J.P. Morgan Exchange-Traded Funds at 1-844-457-6383 (844-4JPM ETF) for a fund prospectus. You can also visit us at www.jpmorganfunds.com. Investors should carefully consider the investment objectives and risks as well as charges and expenses of the fund before investing. The prospectus contains this and other information about the fund. Read the prospectus carefully before investing.
Investors may obtain information about the Securities Investor Protection Corporation (SIPC), including the SIPC brochure, by visiting www.sipc.org or by calling SIPC at 202-371-8300.
The Fund files a complete schedule of its fund holdings for the first and third quarters of its fiscal year with the SEC as an exhibit to its report on Form N-PORT. The Fund's Form N-PORT reports are available on the SEC’s website at http://www.sec.gov. The Fund's quarterly holdings can be found by visiting the J.P. Morgan Funds’ website at www.jpmorganfunds.com.
A description of the Fund's policies and procedures with respect to the disclosure of the Fund's holdings is available in the prospectuses and Statement of Additional Information.
A copy of proxy policies and procedures is available without charge upon request by calling 1-844-457-6383 and on the Fund's website at www.jpmorganfunds.com. A description of such policies and procedures is on the SEC’s website at www.sec.gov. The Trustees have delegated the authority to vote proxies for securities owned by the Fund to the Adviser. A copy of the Fund's voting record for the most recent 12-month period ended June 30 is available on the SEC’s website at www.sec.gov or at the Fund's website at www.jpmorganfunds.com no later than August 31 of each year. The Fund's proxy voting record will include, among other things, a brief description of the matter voted on for each portfolio security, and will state how each vote was cast, for example, for or against the proposal.
J.P. Morgan Asset Management is the brand name for the asset management business of JPMorgan Chase & Co. and its affiliates worldwide.
© JPMorgan Chase & Co., 2022. All rights reserved. October 2022.
AN-CONV-ETF-1022
ITEM 2. CODE OF ETHICS.
Disclose whether, as of the end of the period covered by the report, the registrant has adopted a code of ethics that applies to the registrant’s principal executive officer, principal financial officer, principal accounting officer or controller, or persons performing similar functions, regardless of whether these individuals are employed by the registrant or a third party. If the registrant has not adopted such a code of ethics, explain why it has not done so.
The registrant must briefly describe the nature of any amendment, during the period covered by the report, to a provision of its code of ethics that applies to the registrant’s principal executive officer, principal financial officer, principal accounting officer or controller, or persons performing similar functions, regardless of whether these individuals are employed by the registrant or a third party, and that relates to any element of the code of ethics definition enumerated in paragraph (b) of this Item. The registrant must file a copy of any such amendment as an exhibit pursuant to Item 13(a)(1), unless the registrant has elected to satisfy paragraph (f) of this Item by positing its code of ethics on its website pursuant to paragraph (f)(2) of this Item, or by undertaking to provide its code of ethics to any person without charge, upon request, pursuant to paragraph (f)(3) of this Item.
If the registrant has, during the period covered by the report, granted a waiver, including an implicit waiver, from a provision of the code of ethics that applies to the registrant’s principal executive officer, principal financial officer, principal accounting officer or controller, or persons performing similar functions, regardless of whether these individuals are employed by the registrant or third party, that relates to one or more items set forth in paragraph (b) of this Item, the registrant must briefly describe the nature of the waiver, the name of the person to whom the waiver was granted, and the date of the waiver.
The Registrant has adopted a code of ethics that applies to the Registrant’s principal executive officer and principal financial officer. There were no amendments to the code of ethics or waivers granted with respect to the code of ethics in the period covered by the report.
ITEM 3. AUDIT COMMITTEE FINANCIAL EXPERT.
(a) (1) Disclose that the registrant’s board of directors has determined that the registrant either:
(i) Has at least one audit committee financial expert serving on its audit committee; or
(ii) Does not have an audit committee financial expert serving on its audit committee.
The Registrant’s Board of Trustees has determined that the Registrant has at least one audit committee financial expert serving on its audit committee. The Securities and Exchange Commission has stated that the designation or identification of a person as an audit committee financial expert pursuant to this Item 3 of Form N-CSR does not impose on such person any duties, obligations or liabilities that are greater than the duties, obligations and liabilities imposed on such person as a member of the Audit Committee and the Board of Trustees in the absence of such designation or identification.
(2) If the registrant provides the disclosure required by paragraph (a)(1)(i) of this Item, it must disclose the name of the audit committee financial expert and whether that person is “independent.” In order to be considered “independent” for purposes of this Item, a member of an audit committee may not, other than in his or her capacity as a member of the audit committee, the board of directors, or any other board committee:
| | (i) | Accept directly or indirectly any consulting, advisory, or other compensatory fee from the issuer; or |
| | (ii) | Be an “interested person” of the investment company as defined in Section 2(a)(19) of the Act (15 U.S.C. 80a-2(a)(19)). |
The audit committee financial expert is Gary L. French for purposes of audit committee financial expert determinations. Mr. French is not an “interested person” of the Registrant and is also “independent” as defined by the U.S. Securities and Exchange Commission for the purposes of the audit committee financial expert determination.
(3) If the registrant provides the disclosure required by paragraph (a)(1)(ii) of this Item, it must explain why it does not have an audit committee financial expert.
Not applicable.
ITEM 4. PRINCIPAL ACCOUNTANT FEES AND SERVICES.
(a) Disclose, under the caption Audit Fees, the aggregate fees billed for each of the last two fiscal years for professional services rendered by the principal accountant for the audit of the registrant’s annual financial statements or services that are normally provided by the accountant in connection with statutory and regulatory filings or engagements for those fiscal years.
AUDIT FEES
2022 – $641,349
2021 – $505,466
(b) Disclose, under the caption Audit-Related Fees, the aggregate fees billed in each of the last two fiscal years for assurance and related services by the principal accountant that are reasonably related to the performance of the audit of the registrant’s financial statements and are not reported under paragraph (a) of this Item. Registrants shall describe the nature of the services comprising the fees disclosed under this category.
AUDIT-RELATED FEES
2022 – $175,911
2021 – $147,185
Audit-related fees consist of security count procedures performed as required under Rule 17f-2 of the Investment Company Act of 1940 during the Registrant’s fiscal year.
(c) Disclose, under the caption Tax Fees, the aggregate fees billed in each of the last two fiscal years for professional services rendered by the principal accountant for tax compliance, tax advice, and tax planning. Registrants shall describe the nature of the services comprising the fees disclosed under this category.
TAX FEES
2022 – $276,692
2021 – $224,838
The tax fees consist of fees billed in connection with preparing the federal regulated investment company income tax returns for the Registrant for the tax years ended October 31, 2022 and 2021, respectively.
For the last fiscal year, no tax fees were required to be approved pursuant to paragraph (c)(7)(ii) of Rule 2-01 of Regulation S-X.
(d) Disclose, under the caption All Other Fees, the aggregate fees billed in each of the last two fiscal years for products and services provided by the principal accountant, other than the services reported in paragraphs (a) through (c) of this Item. Registrants shall describe the nature of the services comprising the fees disclosed under this category.
ALL OTHER FEES
2022 – $0
2021 – $0
(e)(1) Disclose the audit committee’s pre-approval policies and procedures described in paragraph (c)(7) of Rule 2-01 of Regulation S-X.
Pursuant to the Registrant’s Audit Committee Charter and written policies and procedures for the pre-approval of audit and non-audit services (the “Pre-approval Policy”), the Audit Committee pre-approves all audit and non-audit services performed by the Registrant’s independent public registered accounting firm for the Registrant. In addition, the Audit
Committee pre-approves the auditor’s engagement for non-audit services with the Registrant’s investment adviser (not including a sub-adviser whose role is primarily portfolio management and is sub-contracted or overseen by another investment adviser) and any Service Affiliate in accordance with paragraph (c)(7)(ii) of Rule 2-01 of Regulation S-X, if the engagement relates directly to the operations and financial reporting of the Registrant. Proposed services may be pre-approved either 1) without consideration of specific case-by- case services or 2) require the specific pre-approval of the Audit Committee. Therefore, initially the Pre-approval Policy listed a number of audit and non-audit services that have been approved by the Audit Committee, or which were not subject to pre- approval under the transition provisions of Sarbanes-Oxley Act of 2002 (the “Pre-approval List”). The Audit Committee annually reviews and pre-approves the services included on the Pre-approval List that may be provided by the independent public registered accounting firm without obtaining additional specific pre-approval of individual services from the Audit Committee. The Audit Committee adds to, or subtracts from, the list of general pre-approved services from time to time, based on subsequent determinations. All other audit and non-audit services not on the Pre-approval List must be specifically pre-approved by the Audit Committee.
One or more members of the Audit Committee may be appointed as the Committee’s delegate for the purposes of considering whether to approve such services. Any pre-approvals granted by the delegate will be reported, for informational purposes only, to the Audit Committee at its next scheduled meeting. The Audit Committee’s responsibilities to pre-approve services performed by the independent public registered accounting firm are not delegated to management.
(2) Disclose the percentage of services described in each of paragraphs (b) through (d) of this Item that were approved by the audit committee pursuant to paragraph (c)(7)(i)(C) of Rule 2-01 of Regulation S-X.
2022 – 0.0%
2021 – 0.0%
(f) If greater than 50 percent, disclose the percentage of hours expended on the principal accountant’s engagement to audit the registrant’s financial statements for the most recent fiscal year that were attributed to work performed by persons other than the principal accountant’s full-time, permanent employees.
Not applicable.
(g) Disclose the aggregate non-audit fees billed by the registrant’s accountant for services rendered to the registrant, and rendered to the registrant’s investment adviser (not including any sub-adviser whose role is primarily portfolio management and is subcontracted with or overseen by another investment adviser), and any entity controlling, controlled by, or under common control with the adviser that provides ongoing services to the registrant for each of the last two fiscal years of the registrant.
The aggregate non-audit fees billed by the independent registered public accounting firm for services rendered to the Registrant, and rendered to Service Affiliates, for the last two calendar year ends were:
2021 – $30.5 million
2020 – $30.4 million
(h) Disclose whether the registrant’s audit committee of the board of directors has considered whether the provision of non-audit services that were rendered to the registrant’s investment adviser (not including any subadviser whose role is primarily portfolio management and is subcontracted with or overseen by another investment adviser), and any entity controlling, controlled by, or under common control with the investment adviser that provides ongoing services to the registrant that were not pre-approved pursuant to paragraph (c)(7)(ii) of Rule 2-01 of Regulation S-X is compatible with maintaining the principal accountant’s independence.
The Registrant’s Audit Committee has considered whether the provision of the non-audit services that were rendered to Service Affiliates that were not pre-approved (not requiring pre-approval) is compatible with maintaining the independent public registered accounting firm’s independence. All services provided by the independent public registered accounting firm to the Registrant or to Service Affiliates that were required to be pre-approved were pre-approved as required.
(i) A registrant identified by the Commission pursuant to Section 104(i)(2)(A) of the Sarbanes-Oxley Act of 2002 (15 U.S.C. 7214(i)(2)(A)), as having retained, for the preparation of the audit report on its financial statements included in the Form NCSR, a registered public accounting firm that has a branch or office that is located in a foreign jurisdiction and that the Public Company Accounting Oversight Board has determined it is unable to inspect or investigate completely because of a position taken by an authority in the foreign jurisdiction must electronically submit to the Commission on a supplemental basis documentation that establishes that the registrant is not owned or controlled by a governmental entity in the foreign jurisdiction. The registrant must submit this documentation on or before the due date for this form. A registrant that is owned or controlled by a foreign governmental entity is not required to submit such documentation.
Not applicable.
(j) A registrant that is a foreign issuer, as defined in 17 CFR 240.3b-4, identified by the Commission pursuant to Section 104(i)(2)(A) of the Sarbanes-Oxley Act of 2002 (15 U.S.C. 7214(i)(2)(A)), as having retained, for the preparation of the audit report on its financial statements included in the Form N-CSR, a registered public accounting firm that has a branch or office that is located in a foreign jurisdiction and that the Public Company Accounting Oversight Board has determined it is unable to inspect or investigate completely because of a position taken by an authority in the foreign jurisdiction, for each year in which the registrant is so identified, must provide the below disclosures. Also, any such identified foreign issuer that uses a variable-interest entity or any similar structure that results in additional foreign entities being consolidated in the financial statements of the registrant is required to provide the below disclosures for itself and its consolidated foreign operating entity or entities. A registrant must disclose:
| | (1) | That, for the immediately preceding annual financial statement period, a registered public accounting firm that the PCAOB was unable to inspect or investigate completely, because of a position taken by an authority in the foreign jurisdiction, issued an audit report for the registrant; |
| | (2) | The percentage of shares of the registrant owned by governmental entities in the foreign jurisdiction in which the registrant is incorporated or otherwise organized; |
| | (3) | Whether governmental entities in the applicable foreign jurisdiction with respect to that registered public accounting firm have a controlling financial interest with respect to the registrant; |
| | (4) | The name of each official of the Chinese Communist Party who is a member of the board of directors of the registrant or the operating entity with respect to the registrant; and |
| | (5) | Whether the articles of incorporation of the registrant (or equivalent organizing document) contains any charter of the Chinese Communist Party, including the text of any such charter. |
Not applicable.
ITEM 5. AUDIT COMMITTEE OF LISTED REGISTRANTS.
(a) If the registrant is a listed issuer as defined in Rule 10A-3 under the Exchange Act (17CFR 240.10A-3), state whether or not the registrant has a separately-designated standing audit committee established in accordance with Section 3(a)(58)(A) of the Exchange Act (15 U.S.C. 78c(a)(58)(A)). If the registrant has such a committee, however designated, identify each committee member. If the entire board of directors is acting as the registrant’s audit committee as specified in Section 3(a)(58)(B) of the Exchange Act (15
U.S.C. 78c(a)(58)(B)), so state.
The registrant has a separately designated Audit Committee established in accordance with Section 3(a)(58)(A) of the Exchange Act. The members of the Audit Committee are Gary L. French, Kathleen M. Gallagher, Raymond Kanner and Lawrence R. Maffia.
(b) If applicable, provide the disclosure required by Rule 10A-3(d) under the Exchange Act (17CFR 240.10A-3(d)) regarding an exemption from the listing standards for all audit committees.
Not applicable.
ITEM 6. SCHEDULE OF INVESTMENTS.
File Schedule I – Investments in securities of unaffiliated issuers as of the close of the reporting period as set forth in Section 210.12-12 of Regulation S-X, unless the schedule is included as part of the report to shareholders filed under Item 1 of this Form.
Included in Item 1.
ITEM 7. DISCLOSURE OF PROXY VOTING POLICIES AND PROCEDURES FOR CLOSED-END MANAGEMENT INVESTMENT COMPANIES.
A closed-end management investment company that is filing an annual report on this Form N-CSR must, unless it invests exclusively in non-voting securities, describe the policies and procedures that it uses to determine how to vote proxies relating to portfolio securities, including the procedures that the company uses when a vote presents a conflict between the interests of its shareholders, on the one hand, and those of the company’s investment adviser; principal underwriter; or any affiliated person (as defined in Section 2(a)(3) of the Investment Company Act of 1940 (15 U.S.C. 80a-2(a)(3)) and the rules thereunder) of the company, its investment adviser, or its principal underwriter, on the other. Include any policies and procedures of the company’s investment adviser, or any other third party, that the company uses, or that are used on the company’s behalf, to determine how to vote proxies relating to portfolio securities.
Not applicable.
ITEM 8. PORTFOLIO MANAGERS OF CLOSED-END MANAGEMENT INVESTMENT COMPANIES.
Not applicable.
ITEM 9. PURCHASE OF EQUITY SECURITIES BY CLOSED-END MANAGEMENT INVESTMENT COMPANY AND AFFILIATED PURCHASERS.
(a) If the registrant is a closed-end management investment company, provide the information specified in paragraph (b) of this Item with respect to any purchase made by or on behalf of the registrant or any “affiliated purchaser,” as defined in Rule 10b-18(a)(3) under the Exchange Act (17 CFR 240.10b-18(a)(3)), of shares or other units of any class of the registrant’s equity securities that is registered by the registrant pursuant to Section 12 of the Exchange Act (15 U.S.C. 781).
Not applicable.
ITEM 10. SUBMISSION OF MATTERS TO A VOTE OF SECURITY HOLDERS.
Describe any material changes to the procedures by which shareholders may recommend nominees to the registrant’s board of directors, where those changes were implemented after the registrant last provided disclosure in response to the requirements of Item 7(d)(2)(ii)(G) of Schedule 14A (17 CFR 240.14a-101), or this Item.
No material changes to report.
ITEM 11. CONTROLS AND PROCEDURES.
(a) Disclose the conclusions of the registrant’s principal executive and principal financial officers, or persons performing similar functions, regarding the effectiveness of the registrant’s disclosure controls and procedures (as defined in Rule 30a-3(c) under the Act (17 CFR 270.30a-3(c))) as of a date within 90 days of the filing date of the report that includes the disclosure required by this paragraph, based on the evaluation of these controls and procedures required by Rule 30a-3(b) under the Act (17 CFR 270.30a-3(b)) and Rules 13a-15(b) or 15d-15(b) under the Exchange Act (17 CFR 240.13a-15(b) or 240.15d-15(b)).
The Registrant’s principal executive and principal financial officers have concluded, based on their evaluation of the Registrant’s disclosure controls and procedures as of a date within 90 days of the filing date of this report, that the Registrant’s disclosure controls and procedures are reasonably designed to ensure that information required to be disclosed by the Registrant on Form N-CSR is recorded, processed, summarized and reported within the required time
periods and that information required to be disclosed by the Registrant in the reports that it files or submits on Form N-CSR is accumulated and communicated to the Registrant’s management, including its principal executive and principal financial officers, as appropriate to allow timely decisions regarding required disclosure.
(b) Disclose any change in the registrant’s internal control over financial reporting (as defined in Rule 30a-3(d) under the Act (17 CFR 270.30a-3(d)) that occurred during the period covered by this report that has materially affected, or is reasonably likely to materially affect, the registrant’s internal control over financial reporting.
There were no changes in the Registrant’s internal control over financial reporting that occurred during the reporting period covered by this report that have materially affected, or are reasonably likely to materially affect, the Registrant’s internal control over financial reporting.
ITEM 12. DISCLOSURE OF SECURITIES LENDING ACTIVITIES FOR CLOSED-END MANAGEMENT INVESTMENT COMPANIES.
Not applicable.
ITEM 13. EXHIBITS.
| | (a) | File the exhibits listed below as part of this Form. Letter or number the exhibits in the sequence indicated. |
(1) Any code of ethics, or amendment thereto, that is the subject of the disclosure required by Item 2, to the extent that the registrant intends to satisfy the Item 2 requirements through filing of an exhibit.
Code of Ethics applicable to its Principal Executive and Principal Financial Officers pursuant to Section 406 of the Sarbanes-Oxley Act of 2002 attached hereto.
(2) A separate certification for each principal executive officer and principal financial officer of the registrant as required by Rule 30a-2(a) under the Act (17 CFR 270.30a-2), exactly as set forth below:
Certifications pursuant to Rule 30a-2(a) under the Investment Company Act of 1940 are attached hereto.
(1) Any written solicitation to purchase securities under Rule 23c-1 under the Act (17 CFR 270.23c-1) sent or given during the period covered by the report by or on behalf of the registrant to 10 or more persons.
Not applicable.
(2) Change in the registrant’s independent public accountant. Provide the information called for by Item 4 of Form 8-K under the Exchange Act (17 CFR 249.308). Unless otherwise specified by Item 4, or related to and necessary for a complete understanding of information not previously disclosed, the information should relate to events occurring during the reporting period.
Not applicable.
| | (b) | A separate or combined certification for each principal executive officer and principal officer of the registrant as required by Rule 30a-2(b) under the Act of 1940. |
Certifications pursuant to Rule 30a-2(b) under the Investment Company Act of 1940 are attached hereto.
SIGNATURES
Pursuant to the requirements of the Securities Exchange Act of 1934 and the Investment Company Act of 1940, the registrant has duly caused this report to be signed on its behalf by the undersigned, thereunto duly authorized.
J.P. Morgan Exchange-Traded Fund Trust
| | |
| By: | | /s/ Brian S. Shlissel |
| | Brian S. Shlissel |
| | President and Principal Executive Officer |
| | December 29, 2022 |
Pursuant to the requirements of the Securities Exchange Act of 1934 and the Investment Company Act of 1940, this report has been signed below by the following persons on behalf of the registrant and in the capacities and on the dates indicated.
| | |
| By: | | /s/ Brian S. Shlissel |
| | Brian S. Shlissel |
| | President and Principal Executive Officer |
| | December 29, 2022 |
| |
| By: | | /s/ Timothy J. Clemens |
| | Timothy J. Clemens |
| | Treasurer and Principal Financial Officer |
| | December 29, 2022 |