UNITED STATES
SECURITIES AND EXCHANGE COMMISSION
Washington, D.C. 20549
FORM N-CSR
CERTIFIED SHAREHOLDER REPORT OF REGISTERED
MANAGEMENT INVESTMENT COMPANIES
Investment Company Act file number: 811-22903
J.P. Morgan Exchange-Traded Fund Trust
(Exact name of registrant as specified in charter)
277 Park Avenue
New York, NY 10172
(Address of principal executive offices) (Zip code)
Gregory S. Samuels
J.P. Morgan Investment Management Inc.
277 Park Avenue
New York, NY 10172
(Name and Address of Agent for Service)
With copies to:
| Elizabeth A. Davin, Esq. | Jon S. Rand, Esq. | |
| JPMorgan Chase & Co. | Dechert LLP | |
| 1111 Polaris Parkway | 1095 Avenue of the Americas | |
| Columbus, OH 43240 | New York, NY 10036 |
Registrant’s telephone number, including area code: 1-844-457-6383
Date of fiscal year end: Last day of February
Date of reporting period: March 1, 2023 through August 31, 2023
Form N-CSR is to be used by management investment companies to file reports with the Commission not later than 10 days after the transmission to stockholders of any report that is required to be transmitted to stockholders under Rule 30e-1 under the Investment Company Act of 1940 (17 CFR 270.30e-1). The Commission may use the information provided on Form N-CSR in its regulatory, disclosure review, inspection, and policymaking roles.
A registrant is required to disclose the information specified by Form N-CSR, and the Commission will make this information public. A registrant is not required to respond to the collection of information contained in Form N-CSR unless the Form displays a currently valid Office of Management and Budget (“OMB”) control number. Please direct comments concerning the accuracy of the information collection burden estimate and any suggestions for reducing the burden to Secretary, Securities and Exchange Commission, 450 Fifth Street, NW, Washington, DC 20549-0609. The OMB has reviewed this collection of information under the clearance requirements of 44 U.S.C. Section 3507.
ITEM 1. REPORTS TO STOCKHOLDERS.
a.) The following is a copy of the report transmitted to shareholders pursuant to Rule 30e-1 under the Investment Company Act of 1940 (17 CFR 270.30e-1).
b.) A copy of the notice transmitted to shareholders in reliance on Rule 30e-3 under the 1940 Act that contains disclosures specified by paragraph (c)(3) of that rule is included in the Annual Reports. Not Applicable. Notices do not incorporate disclosures from the shareholder report.
Fund | Ticker | Listing Exchange |
JPMorgan Core Plus Bond ETF | JCPB | Cboe BZX Exchange, Inc. |
JPMorgan Income ETF | JPIE | NYSE Arca |
JPMorgan International Bond Opportunities ETF | JPIB | Cboe BZX Exchange, Inc. |
JPMorgan Municipal ETF | JMUB | Cboe BZX Exchange, Inc. |
JPMorgan Short Duration Core Plus ETF | JSCP | NYSE Arca |
JPMorgan Ultra-Short Income ETF | JPST | NYSE Arca |
JPMorgan Ultra-Short Municipal Income ETF | JMST | Cboe BZX Exchange, Inc. |

1 | |
2 | |
3 | |
6 | |
8 | |
11 | |
13 | |
16 | |
18 | |
20 | |
218 | |
228 | |
232 | |
258 | |
259 | |
260 |
October 19, 2023 (Unaudited)
 | “A properly diversified portfolio together with a long-term approach may help investors weather economic and geopolitical uncertainties.” — Brian S. Shlissel |

President, J.P. Morgan Exchange-Traded Funds
J.P. Morgan Asset Management
1-844-4JPM-ETF or jpmorgan.com/etfs for more information
August 31, 2023 | J.P. Morgan Exchange-Traded Funds | 1 |
SIX MONTHS ENDED August 31, 2023 (Unaudited)
Fitch Ratings Inc. downgraded U.S. sovereign debt, citing rising government spending and political uncertainty surrounding the ability of Congress to lift the U.S. debt ceiling.
2 | J.P. Morgan Exchange-Traded Funds | August 31, 2023 |
SIX MONTHS ENDED August 31, 2023 (Unaudited)
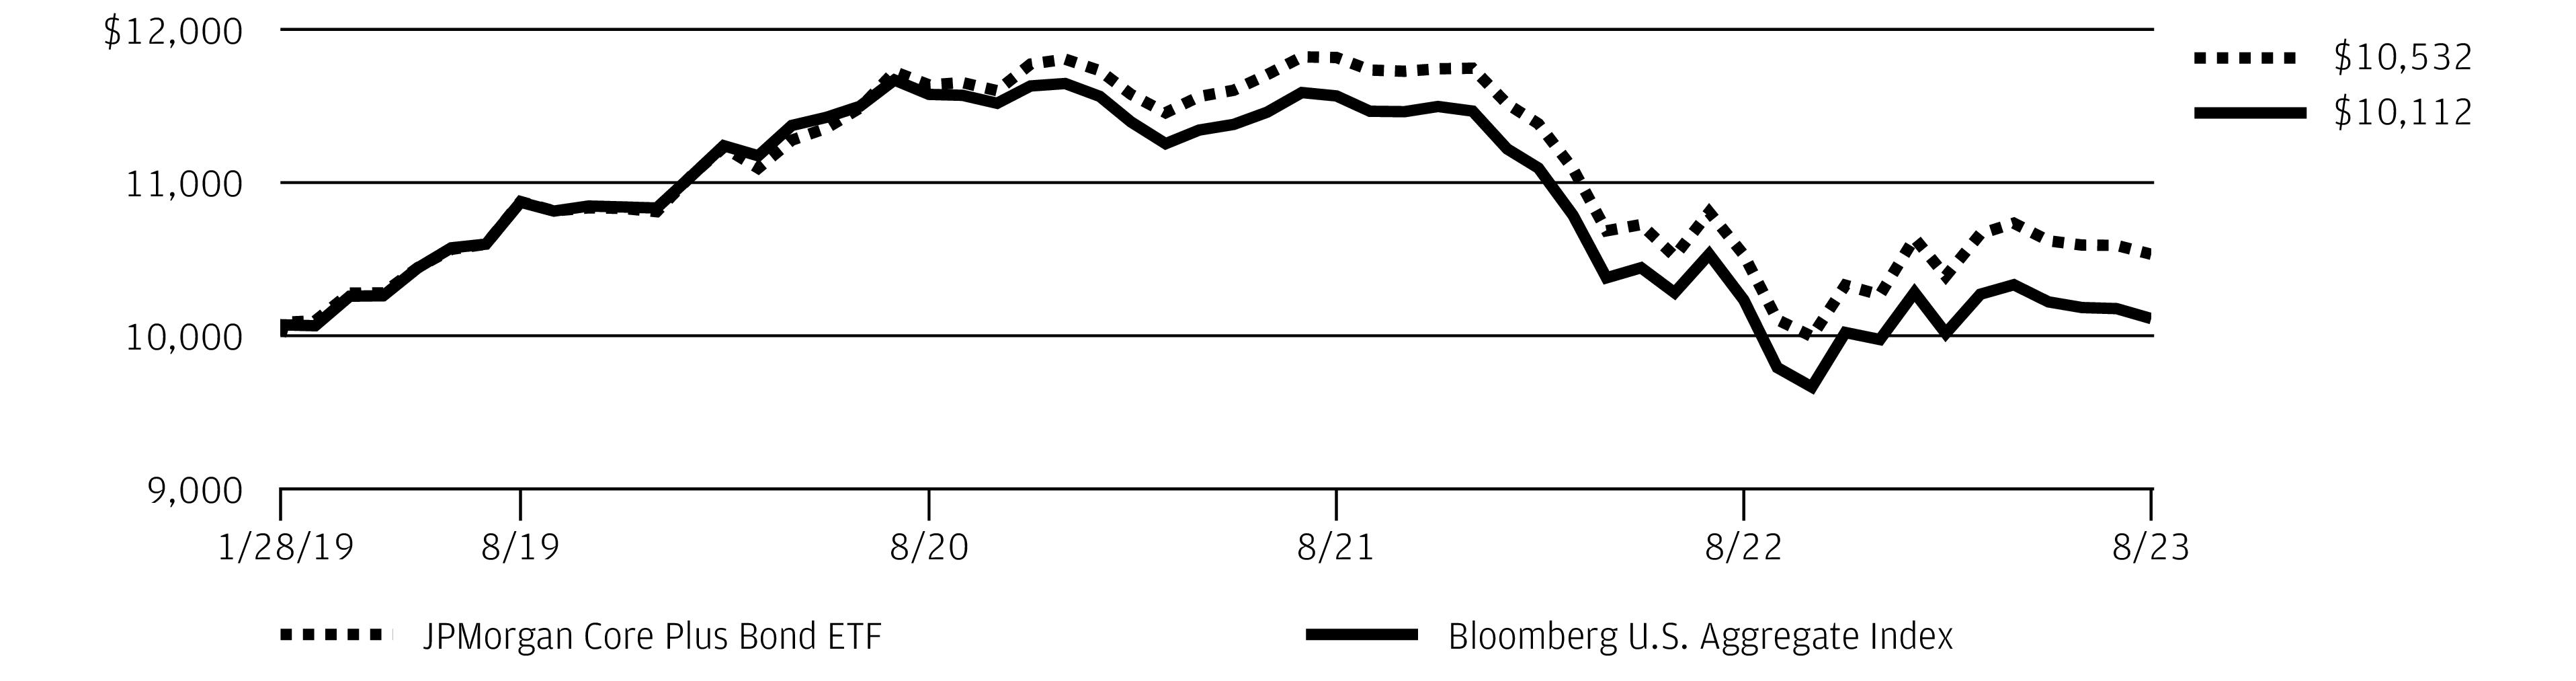
REPORTING PERIOD RETURN: | |
Net Asset Value * | 1.37% |
Market Price ** | 1.52% |
Bloomberg U.S. Aggregate Index | 0.95% |
Net Assets as of 8/31/2023 | $1,449,941,701 |
Duration as of 8/31/2023 | 6.4 Years |
Fund Ticker | JCPB |
PORTFOLIO COMPOSITION AS OF August 31, 2023 | PERCENT OF TOTAL INVESTMENTS |
Corporate Bonds | 28.4% |
Mortgage-Backed Securities | 19.5 |
Asset-Backed Securities | 15.3 |
U.S. Treasury Obligations | 12.1 |
Commercial Mortgage-Backed Securities | 4.9 |
Collateralized Mortgage Obligations | 3.4 |
Others (each less than 1.0%) | 0.4 |
Short-Term Investments | 16.0 |
August 31, 2023 | J.P. Morgan Exchange-Traded Funds | 3 |
SIX MONTHS ENDED August 31, 2023 (Unaudited) (continued)
4 | J.P. Morgan Exchange-Traded Funds | August 31, 2023 |
INCEPTION DATE | SIX MONTHS* | 1 YEAR | SINCE INCEPTION | |
JPMorgan Core Plus Bond ETF | ||||
Net Asset Value | January 28, 2019 | 1.37 % | 0.03 % | 1.14 % |
Market Price | 1.52 | 0.12 | 1.20 |
* | Not annualized. |
August 31, 2023 | J.P. Morgan Exchange-Traded Funds | 5 |
SIX MONTHS ENDED August 31, 2023 (Unaudited)
REPORTING PERIOD RETURN: | |
Net Asset Value * | 2.41% |
Market Price ** | 2.01% |
Bloomberg U.S. Aggregate Index | 0.95% |
Net Assets as of 8/31/2023 | $605,270,908 |
Duration as of 8/31/2023 | 3.5 Years |
Fund Ticker | JPIE |
PORTFOLIO COMPOSITION AS OF August 31, 2023 | PERCENT OF TOTAL INVESTMENTS |
Corporate Bonds | 34.3% |
Asset-Backed Securities | 24.3 |
Mortgage-Backed Securities | 19.4 |
Commercial Mortgage-Backed Securities | 12.3 |
Collateralized Mortgage Obligations | 6.8 |
Foreign Government Securities | 2.4 |
Others (each less than 1.0%) | 0.1 |
Short-Term Investments | 0.4 |
6 | J.P. Morgan Exchange-Traded Funds | August 31, 2023 |
INCEPTION DATE | SIX MONTHS* | 1 YEAR | SINCE INCEPTION | |
JPMorgan Income ETF | ||||
Net Asset Value | October 28, 2021 | 2.41 % | 3.32 % | (1.55 )% |
Market Price | 2.01 | 2.86 | (1.37 ) |
* | Not annualized. |
August 31, 2023 | J.P. Morgan Exchange-Traded Funds | 7 |
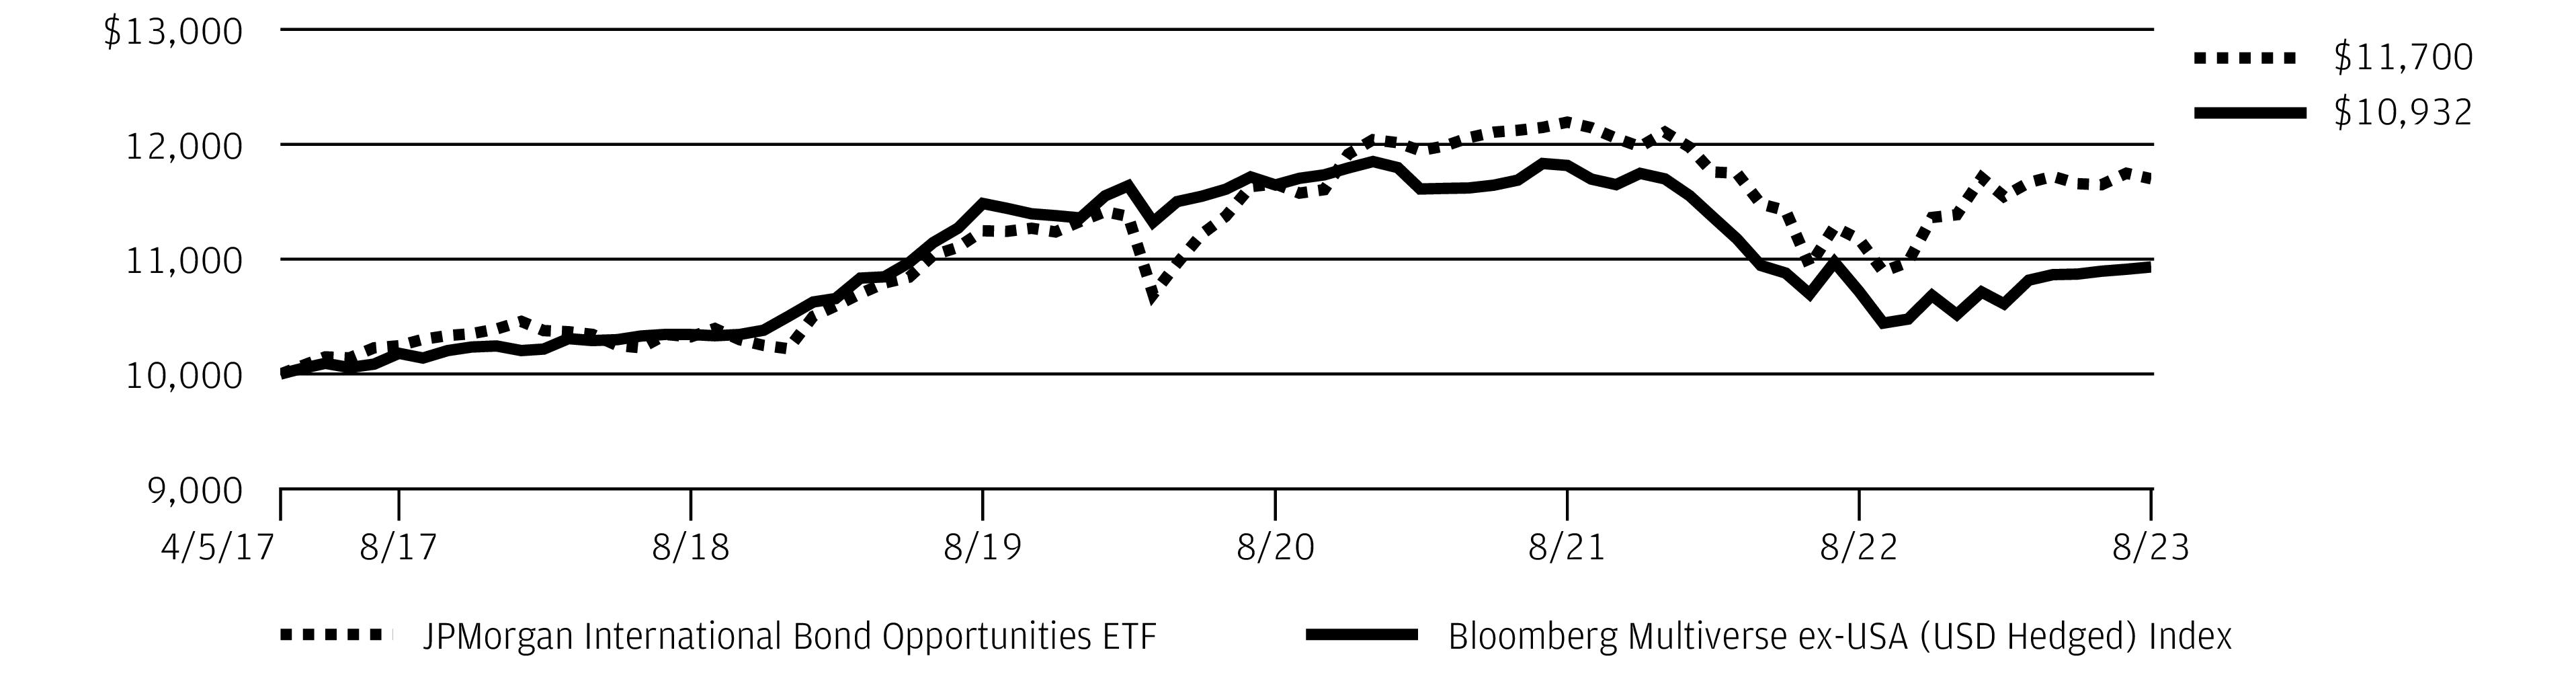
SIX MONTHS ENDED August 31, 2023 (Unaudited)
REPORTING PERIOD RETURN: | |
Net Asset Value * | 1.33% |
Market Price ** | 1.50% |
Bloomberg Multiverse ex-USA (USD Hedged) Index | 3.02% |
Net Assets as of 8/31/2023 | $359,448,013 |
Duration as of 8/31/2023 | 4.3 Years |
Fund Ticker | JPIB |
8 | J.P. Morgan Exchange-Traded Funds | August 31, 2023 |
PORTFOLIO COMPOSITION AS OF August 31, 2023 | PERCENT OF TOTAL INVESTMENTS |
Corporate Bonds | 58.2% |
Foreign Government Securities | 33.9 |
Asset-Backed Securities | 1.5 |
Commercial Mortgage-Backed Securities | 1.0 |
Others (each less than 1.0%) | 1.1 |
Short-Term Investments | 4.3 |
PORTFOLIO COMPOSITION BY COUNTRY AS OF August 31, 2023 | PERCENT OF TOTAL INVESTMENTS |
United States | 12.1% |
Spain | 9.7 |
United Kingdom | 9.5 |
France | 8.8 |
Canada | 7.6 |
Italy | 6.2 |
Brazil | 5.4 |
Mexico | 5.1 |
Germany | 5.1 |
Australia | 3.6 |
South Africa | 2.3 |
Portugal | 2.1 |
Netherlands | 2.1 |
Luxembourg | 1.6 |
Switzerland | 1.5 |
Ireland | 1.3 |
Czech Republic | 1.0 |
Belgium | 1.0 |
Others (each less than 1.0%) | 9.7 |
Short-Term Investments | 4.3 |
August 31, 2023 | J.P. Morgan Exchange-Traded Funds | 9 |
SIX MONTHS ENDED August 31, 2023 (Unaudited) (continued)
INCEPTION DATE | SIX MONTHS* | 1 YEAR | 5 YEAR | SINCE INCEPTION | |
JPMorgan International Bond Opportunities ETF | |||||
Net Asset Value | April 5, 2017 | 1.33 % | 4.72 % | 2.53 % | 2.48 % |
Market Price | 1.50 | 4.90 | 2.65 | 2.57 |
* | Not annualized. |
10 | J.P. Morgan Exchange-Traded Funds | August 31, 2023 |
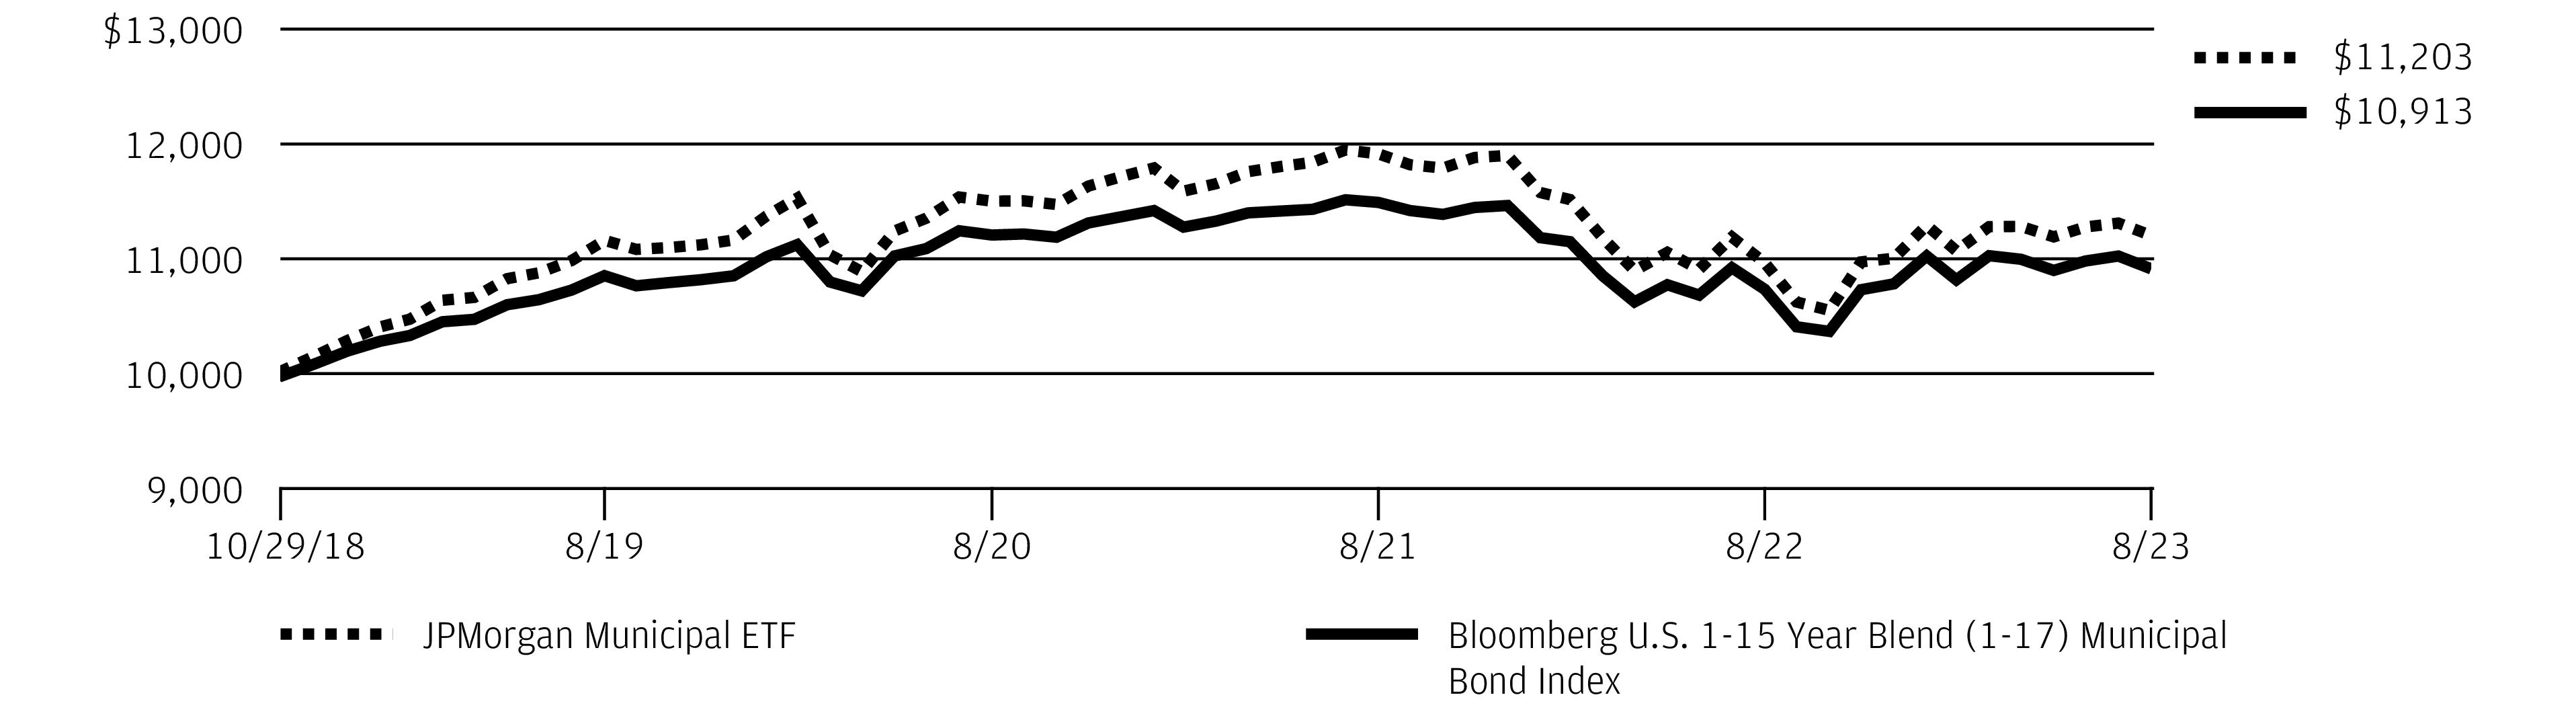
SIX MONTHS ENDED August 31, 2023 (Unaudited)
REPORTING PERIOD RETURN: | |
Net Asset Value * | 1.21% |
Market Price ** | 1.03% |
Bloomberg U.S. 1-15 Year Blend (1-17) Municipal Bond Index | 0.89% |
Net Assets as of 8/31/2023 | $642,102,252 |
Duration as of 8/31/2023 | 5.7 Years |
Fund Ticker | JMUB |
CREDIT QUALITY ALLOCATIONS AS OF AUGUST 31, 2023 | PERCENT OF TOTAL INVESTMENTS |
AAA | 25.7% |
AA | 42.9 |
A | 17.1 |
BBB | 7.9 |
BB | 1.2 |
NR | 5.2 |
August 31, 2023 | J.P. Morgan Exchange-Traded Funds | 11 |
SIX MONTHS ENDED August 31, 2023 (Unaudited) (continued)
INCEPTION DATE | SIX MONTHS* | 1 YEAR | SINCE INCEPTION | |
JPMorgan Municipal ETF | ||||
Net Asset Value | October 29, 2018 | 1.21 % | 2.18 % | 2.38 % |
Market Price | 1.03 | 2.05 | 2.35 |
* | Not annualized. |
12 | J.P. Morgan Exchange-Traded Funds | August 31, 2023 |
SIX MONTHS ENDED August 31, 2023 (Unaudited)
REPORTING PERIOD RETURN: | |
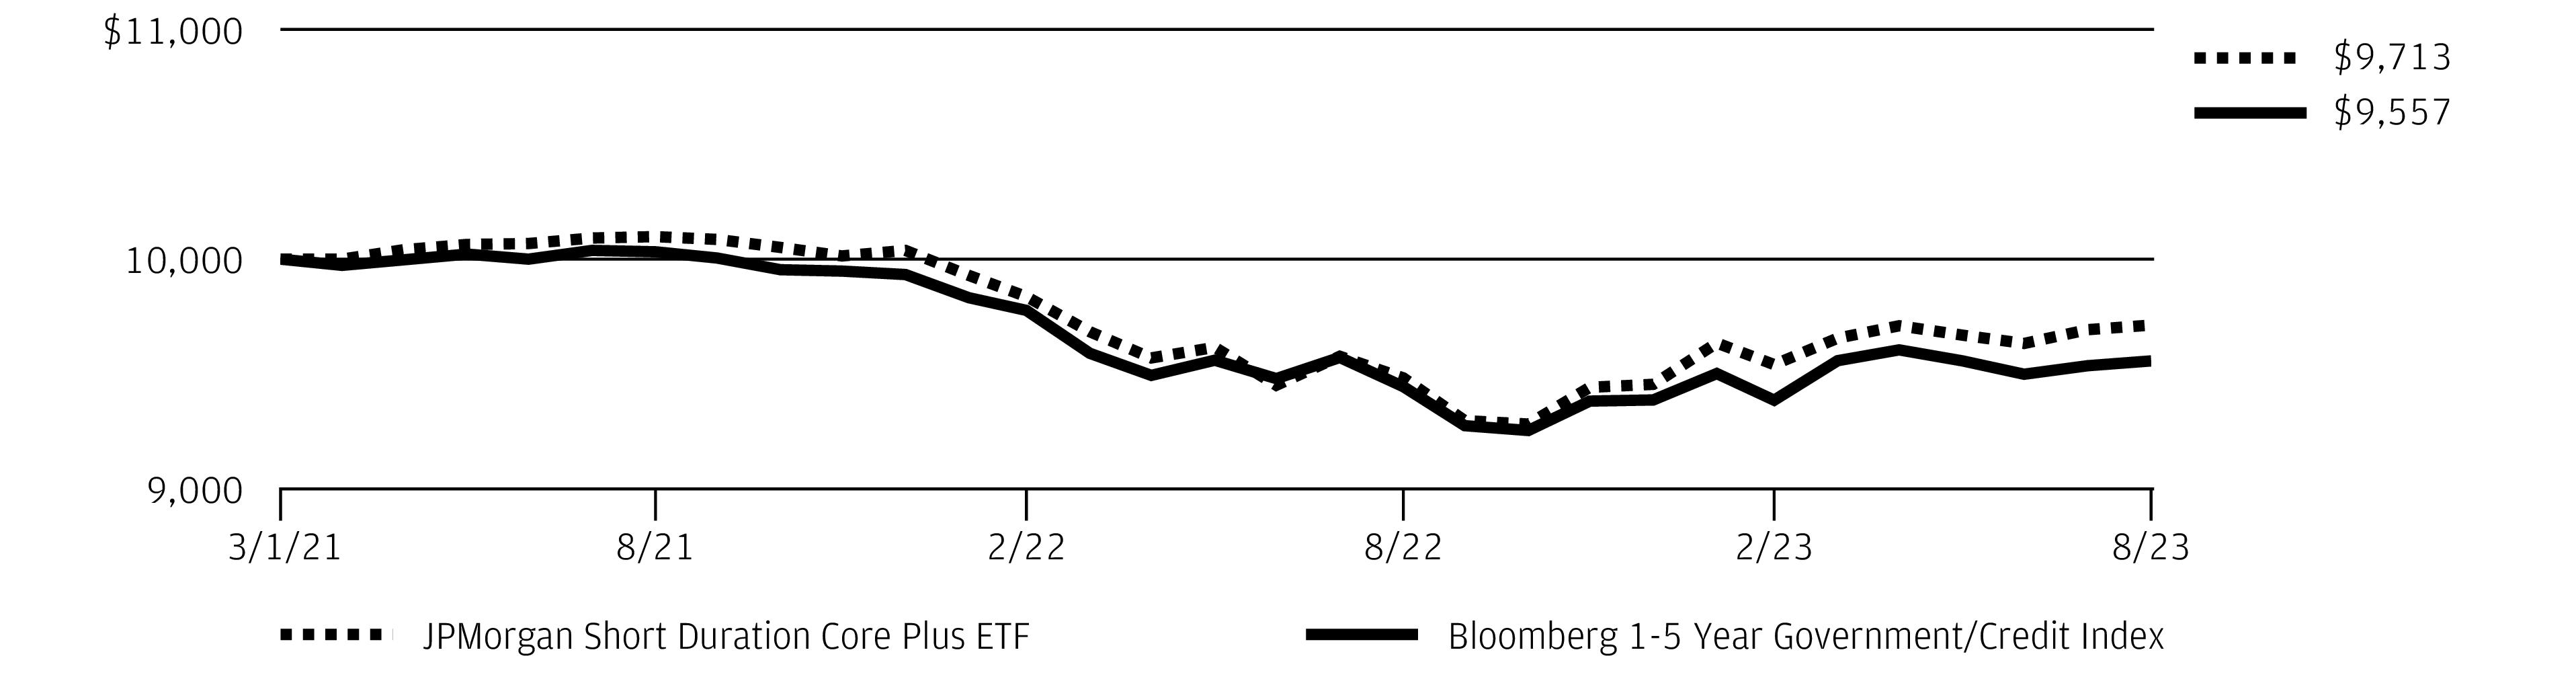
Net Asset Value * | 1.80% |
Market Price ** | 2.03% |
Bloomberg 1-5 Year Government/Credit Index | 1.83% |
Net Assets as of 8/31/2023 | $257,739,411 |
Duration as of 8/31/2023 | 2.8 Years |
Fund Ticker | JSCP |
PORTFOLIO COMPOSITION AS OF August 31, 2023 | PERCENT OF TOTAL INVESTMENTS |
Corporate Bonds | 35.5% |
Asset-Backed Securities | 21.2 |
U.S. Treasury Obligations | 16.7 |
Mortgage-Backed Securities | 13.8 |
Commercial Mortgage-Backed Securities | 4.7 |
Collateralized Mortgage Obligations | 3.0 |
Others (each less than 1.0%) | 0.7 |
Short-Term Investments | 4.4 |
August 31, 2023 | J.P. Morgan Exchange-Traded Funds | 13 |
SIX MONTHS ENDED August 31, 2023 (Unaudited) (continued)
14 | J.P. Morgan Exchange-Traded Funds | August 31, 2023 |
INCEPTION DATE | SIX MONTHS* | 1 YEAR | SINCE INCEPTION | |
JPMorgan Short Duration Core Plus ETF | ||||
Net Asset Value | March 1, 2021 | 1.80 % | 2.42 % | (1.16 )% |
Market Price | 2.03 | 2.49 | (1.11 ) |
* | Not annualized. |
August 31, 2023 | J.P. Morgan Exchange-Traded Funds | 15 |
SIX MONTHS ENDED August 31, 2023 (Unaudited)
REPORTING PERIOD RETURN: | |
Net Asset Value * | 2.19% |
Market Price ** | 2.17% |
ICE BofAML 3-Month US Treasury Bill Index | 2.48% |
Net Assets as of 8/31/2023 | $22,756,203,756 |
Duration as of 8/31/2023 | 0.6 Years |
Fund Ticker | JPST |
PORTFOLIO COMPOSITION BY SECTOR AS OF August 31, 2023 | PERCENT OF TOTAL INVESTMENTS |
Financials | 28.8% |
Asset-Backed Securities | 8.5 |
U.S. Treasury Obligations | 2.3 |
Utilities | 1.9 |
Information Technology | 1.5 |
Energy | 1.5 |
Industrials | 1.4 |
Consumer Discretionary | 1.4 |
Health Care | 1.2 |
Others (each less than 1.0%) | 2.7 |
Short-Term Investments | 48.8 |
16 | J.P. Morgan Exchange-Traded Funds | August 31, 2023 |
INCEPTION DATE | SIX MONTHS* | 1 YEAR | 5 YEAR | SINCE INCEPTION | |
JPMorgan Ultra-Short Income ETF | |||||
Net Asset Value | May 17, 2017 | 2.19 % | 4.08 % | 2.07 % | 2.05 % |
Market Price | 2.17 | 4.06 | 2.06 | 2.05 |
* | Not annualized. |

August 31, 2023 | J.P. Morgan Exchange-Traded Funds | 17 |
SIX MONTHS ENDED August 31, 2023 (Unaudited)
REPORTING PERIOD RETURN: | |
Net Asset Value * | 1.54% |
Market Price ** | 1.54% |
Bloomberg 1-Year Municipal Bond Index | 1.48% |
Net Assets as of 8/31/2023 | $2,572,334,409 |
Duration as of 8/31/2023 | 0.7 Years |
Fund Ticker | JMST |
CREDIT QUALITY ALLOCATIONS AS OF AUGUST 31, 2023 | PERCENT OF TOTAL INVESTMENTS |
AAA | 22.4% |
AA | 34.8 |
A | 19.9 |
BBB | 1.6 |
B | 0.2 |
NR | 21.1 |
18 | J.P. Morgan Exchange-Traded Funds | August 31, 2023 |
INCEPTION DATE | SIX MONTHS* | 1 YEAR | SINCE INCEPTION | |
JPMorgan Ultra-Short Municipal Income ETF | ||||
Net Asset Value | October 16, 2018 | 1.54 % | 2.61 % | 1.48 % |
Market Price | 1.54 | 2.77 | 1.47 |
* | Not annualized. |
August 31, 2023 | J.P. Morgan Exchange-Traded Funds | 19 |
AS OF August 31, 2023 (Unaudited)
INVESTMENTS | PRINCIPAL AMOUNT($) | VALUE($) |
Corporate Bonds — 28.8% | ||
Aerospace & Defense — 0.5% | ||
Boeing Co. (The) | ||
2.75%, 2/1/2026 | 14,000 | 13,139 |
2.20%, 2/4/2026 | 95,000 | 87,638 |
3.10%, 5/1/2026 | 35,000 | 32,967 |
2.70%, 2/1/2027 | 65,000 | 59,438 |
3.75%, 2/1/2050 | 675,000 | 492,161 |
5.93%, 5/1/2060 | 40,000 | 38,611 |
Bombardier, Inc. (Canada) 6.00%, 2/15/2028 (a) | 330,000 | 308,427 |
BWX Technologies, Inc. 4.13%, 4/15/2029 (a) | 310,000 | 275,853 |
Howmet Aerospace, Inc. | ||
5.13%, 10/1/2024 | 122,000 | 120,777 |
5.95%, 2/1/2037 | 304,000 | 299,288 |
L3Harris Technologies, Inc. | ||
5.40%, 1/15/2027 | 855,000 | 857,077 |
5.40%, 7/31/2033 | 205,000 | 205,344 |
5.60%, 7/31/2053 | 217,000 | 218,382 |
Lockheed Martin Corp. | ||
4.50%, 5/15/2036 | 125,000 | 118,481 |
4.70%, 5/15/2046 | 100,000 | 93,522 |
4.15%, 6/15/2053 | 350,000 | 295,014 |
Precision Castparts Corp. 4.38%, 6/15/2045 | 154,000 | 132,763 |
RTX Corp. | ||
4.13%, 11/16/2028 | 1,735,000 | 1,655,788 |
1.90%, 9/1/2031 | 450,000 | 352,375 |
2.38%, 3/15/2032 | 95,000 | 76,446 |
5.15%, 2/27/2033 | 165,000 | 163,118 |
4.50%, 6/1/2042 | 100,000 | 87,214 |
3.03%, 3/15/2052 | 350,000 | 230,131 |
5.38%, 2/27/2053 | 144,000 | 140,362 |
Spirit AeroSystems, Inc. | ||
7.50%, 4/15/2025 (a) | 33,000 | 32,591 |
9.38%, 11/30/2029 (a) | 253,000 | 263,655 |
TransDigm, Inc. | ||
6.25%, 3/15/2026 (a) | 530,000 | 524,949 |
6.75%, 8/15/2028 (a) | 165,000 | 165,578 |
Triumph Group, Inc. 7.75%, 8/15/2025 | 16,000 | 15,096 |
Wesco Aircraft Holdings, Inc. 9.00%, 11/15/2026 (a) (b) | 20,000 | 1,900 |
7,358,085 | ||
Automobile Components — 0.3% | ||
Adient Global Holdings Ltd. | ||
4.88%, 8/15/2026 (a) | 200,000 | 192,610 |
INVESTMENTS | PRINCIPAL AMOUNT($) | VALUE($) |
Automobile Components — continued | ||
7.00%, 4/15/2028 (a) | 210,000 | 212,161 |
Allison Transmission, Inc. | ||
5.88%, 6/1/2029 (a) | 406,000 | 392,125 |
3.75%, 1/30/2031 (a) | 75,000 | 62,645 |
American Axle & Manufacturing, Inc. | ||
6.50%, 4/1/2027 | 275,000 | 260,629 |
6.88%, 7/1/2028 | 350,000 | 321,027 |
5.00%, 10/1/2029 | 75,000 | 61,744 |
Aptiv plc 5.40%, 3/15/2049 | 25,000 | 21,941 |
Clarios Global LP 6.25%, 5/15/2026 (a) | 427,000 | 422,890 |
Cooper-Standard Automotive, Inc. | ||
13.50% (Blend (Cash 9.00% + PIK 4.50%)), 3/31/2027 (a) (c) | 44,250 | 44,947 |
10.63% (PIK), 5/15/2027 (a) (c) | 31,221 | 19,608 |
Dana, Inc. | ||
5.38%, 11/15/2027 | 365,000 | 345,299 |
4.50%, 2/15/2032 | 40,000 | 32,296 |
Goodyear Tire & Rubber Co. (The) | ||
4.88%, 3/15/2027 | 120,000 | 112,884 |
5.00%, 7/15/2029 | 521,000 | 462,386 |
5.25%, 7/15/2031 | 660,000 | 568,425 |
Icahn Enterprises LP | ||
6.38%, 12/15/2025 | 247,000 | 235,485 |
5.25%, 5/15/2027 | 315,000 | 276,412 |
Lear Corp. 2.60%, 1/15/2032 | 10,000 | 7,796 |
4,053,310 | ||
Automobiles — 0.1% | ||
Ford Motor Co. | ||
9.63%, 4/22/2030 | 590,000 | 682,368 |
4.75%, 1/15/2043 | 380,000 | 284,090 |
General Motors Co. 5.95%, 4/1/2049 | 25,000 | 22,418 |
Hyundai Capital America | ||
0.80%, 1/8/2024 (a) | 170,000 | 167,039 |
1.50%, 6/15/2026 (a) | 440,000 | 393,559 |
3.00%, 2/10/2027 (a) | 200,000 | 182,855 |
Nissan Motor Acceptance Co. LLC 2.00%, 3/9/2026 (a) | 305,000 | 271,799 |
2,004,128 | ||
Banks — 5.3% | ||
ABN AMRO Bank NV (Netherlands) | ||
(US Treasury Yield Curve Rate T Note Constant Maturity 1 Year + 1.10%), 2.47%, 12/13/2029 (a) (d) | 500,000 | 421,642 |
20 | J.P. Morgan Exchange-Traded Funds | August 31, 2023 |
INVESTMENTS | PRINCIPAL AMOUNT($) | VALUE($) |
Corporate Bonds — continued | ||
Banks — continued | ||
(US Treasury Yield Curve Rate T Note Constant Maturity 5 Year + 1.90%), 3.32%, 3/13/2037 (a) (d) | 200,000 | 154,141 |
ANZ New Zealand Int'l Ltd. (New Zealand) 5.36%, 8/14/2028 (a) | 600,000 | 597,851 |
ASB Bank Ltd. (New Zealand) 2.38%, 10/22/2031 (a) | 200,000 | 158,801 |
Banco Bilbao Vizcaya Argentaria SA (Spain) 0.88%, 9/18/2023 | 200,000 | 199,642 |
Banco Santander SA (Spain) | ||
2.75%, 5/28/2025 | 200,000 | 189,220 |
5.59%, 8/8/2028 | 2,800,000 | 2,774,919 |
Bank of America Corp. | ||
(SOFR + 0.41%), 5.78%, 6/14/2024 (d) | 400,000 | 398,730 |
3.88%, 8/1/2025 | 203,000 | 197,586 |
(SOFR + 1.01%), 1.20%, 10/24/2026 (d) | 2,600,000 | 2,356,160 |
(3-MONTH CME TERM SOFR + 1.32%), 3.56%, 4/23/2027 (d) | 40,000 | 37,897 |
(3-MONTH CME TERM SOFR + 1.84%), 3.82%, 1/20/2028 (d) | 936,000 | 882,417 |
(3-MONTH CME TERM SOFR + 1.77%), 3.71%, 4/24/2028 (d) | 1,205,000 | 1,127,971 |
(3-MONTH CME TERM SOFR + 1.63%), 3.59%, 7/21/2028 (d) | 261,000 | 242,933 |
(SOFR + 2.04%), 4.95%, 7/22/2028 (d) | 390,000 | 381,850 |
(3-MONTH CME TERM SOFR + 1.30%), 3.42%, 12/20/2028 (d) | 454,000 | 416,321 |
(SOFR + 1.63%), 5.20%, 4/25/2029 (d) | 140,000 | 137,883 |
(SOFR + 1.06%), 2.09%, 6/14/2029 (d) | 635,000 | 541,785 |
(SOFR + 1.53%), 1.90%, 7/23/2031 (d) | 660,000 | 520,999 |
(SOFR + 1.37%), 1.92%, 10/24/2031 (d) | 50,000 | 39,171 |
Series N, (SOFR + 1.22%), 2.65%, 3/11/2032 (d) | 2,740,000 | 2,239,744 |
(SOFR + 1.22%), 2.30%, 7/21/2032 (d) | 1,900,000 | 1,498,440 |
(SOFR + 1.21%), 2.57%, 10/20/2032 (d) | 140,000 | 112,219 |
(3-MONTH CME TERM SOFR + 1.58%), 4.08%, 4/23/2040 (d) | 112,000 | 94,136 |
(SOFR + 1.93%), 2.68%, 6/19/2041 (d) | 150,000 | 103,289 |
INVESTMENTS | PRINCIPAL AMOUNT($) | VALUE($) |
Banks — continued | ||
Bank of America NA 5.53%, 8/18/2026 | 500,000 | 502,432 |
Bank of Ireland Group plc (Ireland) (US Treasury Yield Curve Rate T Note Constant Maturity 1 Year + 2.65%), 6.25%, 9/16/2026 (a) (d) | 259,000 | 258,383 |
Bank of Montreal (Canada) | ||
1.50%, 1/10/2025 | 370,000 | 350,017 |
5.30%, 6/5/2026 | 300,000 | 298,962 |
Bank of New Zealand (New Zealand) 3.50%, 2/20/2024 (a) | 250,000 | 247,186 |
Bank of Nova Scotia (The) (Canada) | ||
(3-MONTH CME TERM SOFR + 2.91%), 8.21%, 10/12/2023 (d) (e) (f) (g) | 50,000 | 44,500 |
2.20%, 2/3/2025 | 112,000 | 106,663 |
3.45%, 4/11/2025 | 300,000 | 289,788 |
2.15%, 8/1/2031 | 250,000 | 198,824 |
Banque Federative du Credit Mutuel SA (France) | ||
4.52%, 7/13/2025 (a) | 320,000 | 312,594 |
4.94%, 1/26/2026 (a) | 200,000 | 196,025 |
5.90%, 7/13/2026 (a) | 200,000 | 200,610 |
1.60%, 10/4/2026 (a) | 200,000 | 177,038 |
5.79%, 7/13/2028 (a) | 605,000 | 607,675 |
Barclays plc (United Kingdom) | ||
5.20%, 5/12/2026 | 200,000 | 194,069 |
(US Treasury Yield Curve Rate T Note Constant Maturity 1 Year + 3.30%), 7.39%, 11/2/2028 (d) | 900,000 | 936,930 |
BNP Paribas SA (France) (SOFR + 1.61%), 1.90%, 9/30/2028 (a) (d) | 450,000 | 386,104 |
BPCE SA (France) | ||
3.50%, 10/23/2027 (a) | 850,000 | 776,138 |
5.13%, 1/18/2028 (a) | 745,000 | 730,631 |
(SOFR + 1.73%), 3.12%, 10/19/2032 (a) (d) | 250,000 | 193,270 |
Canadian Imperial Bank of Commerce (Canada) 3.30%, 4/7/2025 | 105,000 | 101,201 |
Citigroup, Inc. | ||
Series P, (3-MONTH CME TERM SOFR + 4.17%), 5.95%, 5/15/2025 (d) (f) (g) | 115,000 | 110,874 |
(SOFR + 1.37%), 4.14%, 5/24/2025 (d) | 81,000 | 79,912 |
(SOFR + 0.69%), 2.01%, 1/25/2026 (d) | 444,000 | 420,035 |
(SOFR + 1.55%), 5.61%, 9/29/2026 (d) | 408,000 | 406,138 |
August 31, 2023 | J.P. Morgan Exchange-Traded Funds | 21 |
AS OF August 31, 2023 (Unaudited) (continued)
INVESTMENTS | PRINCIPAL AMOUNT($) | VALUE($) |
Corporate Bonds — continued | ||
Banks — continued | ||
(SOFR + 0.77%), 1.46%, 6/9/2027 (d) | 650,000 | 578,799 |
(3-MONTH CME TERM SOFR + 1.82%), 3.89%, 1/10/2028 (d) | 550,000 | 519,574 |
Series VAR, (SOFR + 1.28%), 3.07%, 2/24/2028 (d) | 645,000 | 592,084 |
(3-MONTH CME TERM SOFR + 1.65%), 3.67%, 7/24/2028 (d) | 1,200,000 | 1,115,971 |
(3-MONTH CME TERM SOFR + 1.45%), 4.08%, 4/23/2029 (d) | 1,045,000 | 979,780 |
(3-MONTH CME TERM SOFR + 1.60%), 3.98%, 3/20/2030 (d) | 500,000 | 460,470 |
(SOFR + 3.91%), 4.41%, 3/31/2031 (d) | 155,000 | 143,920 |
(SOFR + 2.11%), 2.57%, 6/3/2031 (d) | 120,000 | 99,101 |
(SOFR + 1.17%), 2.56%, 5/1/2032 (d) | 660,000 | 531,753 |
(SOFR + 1.18%), 2.52%, 11/3/2032 (d) | 1,065,000 | 845,135 |
(SOFR + 2.34%), 6.27%, 11/17/2033 (d) | 750,000 | 782,067 |
(SOFR + 1.38%), 2.90%, 11/3/2042 (d) | 55,000 | 37,775 |
Cooperatieve Rabobank UA (Netherlands) (US Treasury Yield Curve Rate T Note Constant Maturity 1 Year + 1.22%), 3.65%, 4/6/2028 (a) (d) | 890,000 | 826,254 |
Credit Agricole SA (France) | ||
(SOFR + 1.68%), 1.91%, 6/16/2026 (a) (d) | 550,000 | 511,982 |
5.59%, 7/5/2026 (a) | 565,000 | 564,818 |
(SOFR + 0.89%), 1.25%, 1/26/2027 (a) (d) | 250,000 | 224,083 |
5.30%, 7/12/2028 (a) | 990,000 | 988,164 |
(USD Swap Semi 5 Year + 1.64%), 4.00%, 1/10/2033 (a) (d) | 250,000 | 224,212 |
Danske Bank A/S (Denmark) | ||
(US Treasury Yield Curve Rate T Note Constant Maturity 1 Year + 1.45%), 3.77%, 3/28/2025 (a) (d) | 450,000 | 442,867 |
(ICE LIBOR USD 3 Month + 1.59%), 3.24%, 12/20/2025 (a) (d) | 200,000 | 191,597 |
(US Treasury Yield Curve Rate T Note Constant Maturity 1 Year + 2.10%), 6.47%, 1/9/2026 (a) (d) | 271,000 | 271,124 |
HSBC Holdings plc (United Kingdom) | ||
(SOFR + 1.29%), 1.59%, 5/24/2027 (d) | 200,000 | 177,701 |
(SOFR + 1.57%), 5.89%, 8/14/2027 (d) | 1,015,000 | 1,011,817 |
INVESTMENTS | PRINCIPAL AMOUNT($) | VALUE($) |
Banks — continued | ||
(SOFR + 1.10%), 2.25%, 11/22/2027 (d) | 200,000 | 178,349 |
(3-MONTH CME TERM SOFR + 1.81%), 4.04%, 3/13/2028 (d) | 800,000 | 751,346 |
(SOFR + 2.61%), 5.21%, 8/11/2028 (d) | 305,000 | 297,620 |
(SOFR + 1.73%), 2.01%, 9/22/2028 (d) | 1,370,000 | 1,177,401 |
(SOFR + 3.35%), 7.39%, 11/3/2028 (d) | 250,000 | 262,656 |
(SOFR + 1.29%), 2.21%, 8/17/2029 (d) | 1,200,000 | 1,005,310 |
(3-MONTH CME TERM SOFR + 1.87%), 3.97%, 5/22/2030 (d) | 200,000 | 180,042 |
(SOFR + 1.19%), 2.80%, 5/24/2032 (d) | 1,250,000 | 998,417 |
(SOFR + 1.41%), 2.87%, 11/22/2032 (d) | 250,000 | 198,951 |
(SOFR + 2.39%), 6.25%, 3/9/2034 (d) | 400,000 | 404,351 |
6.10%, 1/14/2042 | 230,000 | 240,722 |
(SOFR + 2.65%), 6.33%, 3/9/2044 (d) | 265,000 | 267,219 |
ING Groep NV (Netherlands) (SOFR + 1.01%), 1.73%, 4/1/2027 (d) | 200,000 | 179,851 |
Intesa Sanpaolo SpA (Italy) (US Treasury Yield Curve Rate T Note Constant Maturity 1 Year + 2.75%), 4.95%, 6/1/2042 (a) (d) | 200,000 | 133,283 |
Lloyds Banking Group plc (United Kingdom) | ||
(US Treasury Yield Curve Rate T Note Constant Maturity 1 Year + 1.60%), 3.51%, 3/18/2026 (d) | 200,000 | 192,187 |
(US Treasury Yield Curve Rate T Note Constant Maturity 1 Year + 2.30%), 4.98%, 8/11/2033 (d) | 250,000 | 231,407 |
Mitsubishi UFJ Financial Group, Inc. (Japan) | ||
(US Treasury Yield Curve Rate T Note Constant Maturity 1 Year + 0.68%), 0.85%, 9/15/2024 (d) | 200,000 | 199,706 |
3.78%, 3/2/2025 | 269,000 | 261,223 |
(US Treasury Yield Curve Rate T Note Constant Maturity 1 Year + 1.55%), 5.06%, 9/12/2025 (d) | 565,000 | 559,725 |
(US Treasury Yield Curve Rate T Note Constant Maturity 1 Year + 0.75%), 1.54%, 7/20/2027 (d) | 560,000 | 499,234 |
Series 8NC7, (US Treasury Yield Curve Rate T Note Constant Maturity 1 Year + 1.53%), 5.48%, 2/22/2031 (d) | 200,000 | 198,386 |
22 | J.P. Morgan Exchange-Traded Funds | August 31, 2023 |
INVESTMENTS | PRINCIPAL AMOUNT($) | VALUE($) |
Corporate Bonds — continued | ||
Banks — continued | ||
(US Treasury Yield Curve Rate T Note Constant Maturity 1 Year + 1.10%), 2.85%, 1/19/2033 (d) | 775,000 | 633,991 |
Mizuho Financial Group, Inc. (Japan) | ||
(US Treasury Yield Curve Rate T Note Constant Maturity 1 Year + 1.65%), 5.78%, 7/6/2029 (d) | 580,000 | 580,941 |
(US Treasury Yield Curve Rate T Note Constant Maturity 1 Year + 0.87%), 2.17%, 5/22/2032 (d) | 225,000 | 173,955 |
(US Treasury Yield Curve Rate T Note Constant Maturity 1 Year + 1.90%), 5.75%, 7/6/2034 (d) | 830,000 | 821,923 |
Morgan Stanley Bank NA 4.75%, 4/21/2026 | 255,000 | 251,698 |
National Australia Bank Ltd. (Australia) | ||
3.38%, 1/14/2026 | 250,000 | 239,700 |
4.90%, 6/13/2028 | 250,000 | 247,034 |
NatWest Group plc (United Kingdom) | ||
(ICE LIBOR USD 3 Month + 1.76%), 4.27%, 3/22/2025 (d) | 300,000 | 296,616 |
(US Treasury Yield Curve Rate T Note Constant Maturity 1 Year + 2.85%), 7.47%, 11/10/2026 (d) | 1,950,000 | 2,007,680 |
(US Treasury Yield Curve Rate T Note Constant Maturity 1 Year + 1.35%), 5.85%, 3/2/2027 (d) | 500,000 | 497,032 |
(US Treasury Yield Curve Rate T Note Constant Maturity 1 Year + 2.55%), 3.07%, 5/22/2028 (d) | 200,000 | 180,329 |
(ICE LIBOR USD 3 Month + 1.91%), 5.08%, 1/27/2030 (d) | 200,000 | 190,494 |
NatWest Markets plc (United Kingdom) 0.80%, 8/12/2024 (a) | 200,000 | 190,835 |
Nordea Bank Abp (Finland) 5.38%, 9/22/2027 (a) | 400,000 | 396,460 |
PNC Financial Services Group, Inc. (The) | ||
2.55%, 1/22/2030 | 639,000 | 535,972 |
(SOFR + 0.98%), 2.31%, 4/23/2032 (d) | 50,000 | 40,265 |
(SOFR + 1.95%), 5.94%, 8/18/2034 (d) | 350,000 | 354,015 |
Royal Bank of Canada (Canada) | ||
1.60%, 1/21/2025 | 250,000 | 236,995 |
4.65%, 1/27/2026 (e) | 245,000 | 240,299 |
4.24%, 8/3/2027 | 425,000 | 409,045 |
INVESTMENTS | PRINCIPAL AMOUNT($) | VALUE($) |
Banks — continued | ||
Santander UK Group Holdings plc (United Kingdom) | ||
(SOFR + 2.75%), 6.83%, 11/21/2026 (d) | 700,000 | 708,791 |
(SOFR + 0.99%), 1.67%, 6/14/2027 (d) | 200,000 | 176,030 |
(SOFR + 2.60%), 6.53%, 1/10/2029 (d) | 1,625,000 | 1,637,797 |
Societe Generale SA (France) | ||
4.25%, 4/14/2025 (a) | 200,000 | 192,764 |
4.75%, 11/24/2025 (a) | 200,000 | 192,421 |
(US Treasury Yield Curve Rate T Note Constant Maturity 1 Year + 1.10%), 1.49%, 12/14/2026 (a) (d) | 1,200,000 | 1,075,301 |
(US Treasury Yield Curve Rate T Note Constant Maturity 1 Year + 2.30%), 6.45%, 1/12/2027 (a) (d) | 200,000 | 200,936 |
(US Treasury Yield Curve Rate T Note Constant Maturity 1 Year + 1.00%), 1.79%, 6/9/2027 (a) (d) | 200,000 | 177,412 |
(US Treasury Yield Curve Rate T Note Constant Maturity 1 Year + 1.30%), 2.80%, 1/19/2028 (a) (d) | 1,200,000 | 1,074,925 |
(US Treasury Yield Curve Rate T Note Constant Maturity 1 Year + 2.55%), 6.45%, 1/10/2029 (a) (d) | 970,000 | 976,877 |
Standard Chartered plc (United Kingdom) | ||
(US Treasury Yield Curve Rate T Note Constant Maturity 1 Year + 0.78%), 0.99%, 1/12/2025 (a) (d) | 200,000 | 195,830 |
(US Treasury Yield Curve Rate T Note Constant Maturity 1 Year + 1.00%), 1.46%, 1/14/2027 (a) (d) | 610,000 | 545,919 |
(US Treasury Yield Curve Rate T Note Constant Maturity 1 Year + 3.45%), 7.77%, 11/16/2028 (a) (d) | 1,400,000 | 1,482,696 |
(US Treasury Yield Curve Rate T Note Constant Maturity 1 Year + 2.45%), 6.30%, 1/9/2029 (a) (d) | 893,000 | 901,580 |
Sumitomo Mitsui Financial Group, Inc. (Japan) | ||
5.52%, 1/13/2028 | 255,000 | 254,903 |
5.71%, 1/13/2030 | 255,000 | 256,395 |
5.77%, 1/13/2033 | 200,000 | 202,863 |
Sumitomo Mitsui Trust Bank Ltd. (Japan) | ||
1.05%, 9/12/2025 (a) | 60,000 | 54,592 |
4.95%, 9/15/2027 (a) | 200,000 | 197,211 |
August 31, 2023 | J.P. Morgan Exchange-Traded Funds | 23 |
AS OF August 31, 2023 (Unaudited) (continued)
INVESTMENTS | PRINCIPAL AMOUNT($) | VALUE($) |
Corporate Bonds — continued | ||
Banks — continued | ||
Svenska Handelsbanken AB (Sweden) 5.50%, 6/15/2028 (a) | 970,000 | 955,662 |
Swedbank AB (Sweden) 5.34%, 9/20/2027 (a) | 200,000 | 196,518 |
Toronto-Dominion Bank (The) (Canada) | ||
5.10%, 1/9/2026 | 270,000 | 267,862 |
5.53%, 7/17/2026 | 265,000 | 265,585 |
5.52%, 7/17/2028 | 100,000 | 100,493 |
2.00%, 9/10/2031 | 385,000 | 305,111 |
4.46%, 6/8/2032 | 120,000 | 111,777 |
Truist Bank 4.05%, 11/3/2025 | 60,000 | 57,622 |
Truist Financial Corp. | ||
(SOFR + 2.05%), 6.05%, 6/8/2027 (d) | 300,000 | 299,790 |
(SOFR + 1.85%), 5.12%, 1/26/2034 (d) | 290,000 | 272,018 |
UniCredit SpA (Italy) (US Treasury Yield Curve Rate T Note Constant Maturity 1 Year + 1.20%), 1.98%, 6/3/2027 (a) (d) | 200,000 | 177,658 |
Wells Fargo & Co. | ||
3.55%, 9/29/2025 | 227,000 | 217,783 |
(3-MONTH CME TERM SOFR + 1.01%), 2.16%, 2/11/2026 (d) | 913,000 | 863,210 |
(SOFR + 1.32%), 3.91%, 4/25/2026 (d) | 600,000 | 580,068 |
3.00%, 10/23/2026 | 360,000 | 333,448 |
(3-MONTH CME TERM SOFR + 1.57%), 3.58%, 5/22/2028 (d) | 1,481,000 | 1,374,938 |
(SOFR + 1.98%), 4.81%, 7/25/2028 (d) | 320,000 | 310,392 |
(US Treasury Yield Curve Rate T Note Constant Maturity 5 Year + 3.61%), 7.63%, 9/15/2028 (d) (f) (g) | 430,000 | 440,213 |
(SOFR + 1.74%), 5.57%, 7/25/2029 (d) | 860,000 | 856,438 |
(3-MONTH CME TERM SOFR + 1.26%), 2.57%, 2/11/2031 (d) | 250,000 | 208,664 |
(SOFR + 1.50%), 3.35%, 3/2/2033 (d) | 1,790,000 | 1,507,384 |
(SOFR + 2.02%), 5.39%, 4/24/2034 (d) | 1,740,000 | 1,694,773 |
(SOFR + 1.99%), 5.56%, 7/25/2034 (d) | 865,000 | 853,623 |
4.90%, 11/17/2045 | 25,000 | 21,462 |
Wells Fargo Bank NA 5.45%, 8/7/2026 | 250,000 | 250,793 |
Westpac Banking Corp. (Australia) | ||
2.85%, 5/13/2026 | 175,000 | 165,051 |
INVESTMENTS | PRINCIPAL AMOUNT($) | VALUE($) |
Banks — continued | ||
1.95%, 11/20/2028 | 30,000 | 25,804 |
(USD SOFR Spread-Adjusted ICE Swap Rate 5 Year + 2.24%), 4.32%, 11/23/2031 (d) (e) | 375,000 | 350,203 |
76,585,045 | ||
Beverages — 0.2% | ||
Anheuser-Busch Cos. LLC (Belgium) 4.70%, 2/1/2036 | 540,000 | 516,839 |
Anheuser-Busch InBev Worldwide, Inc. (Belgium) 4.38%, 4/15/2038 | 295,000 | 270,113 |
Coca-Cola Co. (The) | ||
2.60%, 6/1/2050 | 200,000 | 133,061 |
2.50%, 3/15/2051 | 300,000 | 194,118 |
Constellation Brands, Inc. | ||
4.65%, 11/15/2028 | 345,000 | 335,390 |
4.50%, 5/9/2047 | 120,000 | 100,080 |
Diageo Capital plc (United Kingdom) 3.88%, 4/29/2043 | 430,000 | 353,307 |
Keurig Dr Pepper, Inc. 3.40%, 11/15/2025 | 38,000 | 36,345 |
Molson Coors Beverage Co. 4.20%, 7/15/2046 | 190,000 | 150,576 |
PepsiCo, Inc. 2.75%, 10/21/2051 | 415,000 | 280,564 |
2,370,393 | ||
Biotechnology — 0.3% | ||
AbbVie, Inc. | ||
2.95%, 11/21/2026 | 73,000 | 68,333 |
3.20%, 11/21/2029 | 421,000 | 379,469 |
4.05%, 11/21/2039 | 1,797,000 | 1,540,233 |
4.63%, 10/1/2042 | 75,000 | 66,557 |
4.25%, 11/21/2049 | 230,000 | 193,697 |
Amgen, Inc. | ||
5.25%, 3/2/2030 | 175,000 | 175,242 |
3.15%, 2/21/2040 | 477,000 | 355,883 |
Emergent BioSolutions, Inc. 3.88%, 8/15/2028 (a) | 28,000 | 13,440 |
Gilead Sciences, Inc. | ||
2.95%, 3/1/2027 | 195,000 | 181,772 |
1.65%, 10/1/2030 | 118,000 | 94,799 |
4.60%, 9/1/2035 | 1,000,000 | 948,998 |
2.60%, 10/1/2040 | 525,000 | 366,783 |
Grifols SA (Spain) 4.75%, 10/15/2028 (a) | 200,000 | 175,466 |
Regeneron Pharmaceuticals, Inc. 1.75%, 9/15/2030 | 200,000 | 159,169 |
4,719,841 | ||
24 | J.P. Morgan Exchange-Traded Funds | August 31, 2023 |
INVESTMENTS | PRINCIPAL AMOUNT($) | VALUE($) |
Corporate Bonds — continued | ||
Broadline Retail — 0.2% | ||
Amazon.com, Inc. | ||
3.15%, 8/22/2027 | 201,000 | 189,009 |
1.50%, 6/3/2030 | 410,000 | 333,310 |
3.60%, 4/13/2032 | 600,000 | 552,102 |
3.10%, 5/12/2051 | 40,000 | 28,569 |
3.95%, 4/13/2052 | 315,000 | 262,759 |
Go Daddy Operating Co. LLC | ||
5.25%, 12/1/2027 (a) | 220,000 | 210,650 |
3.50%, 3/1/2029 (a) | 175,000 | 150,420 |
Macy's Retail Holdings LLC 5.88%, 4/1/2029 (a) | 435,000 | 393,232 |
Nordstrom, Inc. | ||
2.30%, 4/8/2024 | 85,000 | 82,238 |
4.38%, 4/1/2030 | 335,000 | 267,657 |
Shutterfly Finance LLC 8.50% (Blend (Cash 4.25% + PIK 4.25%)), 10/1/2027 (a) (c) | 11,700 | 7,606 |
2,477,552 | ||
Building Products — 0.3% | ||
Builders FirstSource, Inc. 4.25%, 2/1/2032 (a) | 790,000 | 671,634 |
Emerald Debt Merger Sub LLC 6.63%, 12/15/2030 (a) | 735,000 | 723,549 |
Griffon Corp. 5.75%, 3/1/2028 | 615,000 | 573,182 |
James Hardie International Finance DAC 5.00%, 1/15/2028 (a) | 200,000 | 188,654 |
JELD-WEN, Inc. 4.88%, 12/15/2027 (a) | 340,000 | 302,593 |
Masco Corp. 1.50%, 2/15/2028 | 125,000 | 106,380 |
PGT Innovations, Inc. 4.38%, 10/1/2029 (a) | 285,000 | 264,463 |
Standard Industries, Inc. | ||
5.00%, 2/15/2027 (a) | 20,000 | 18,960 |
4.75%, 1/15/2028 (a) | 300,000 | 276,300 |
4.38%, 7/15/2030 (a) | 555,000 | 475,754 |
Summit Materials LLC 5.25%, 1/15/2029 (a) | 420,000 | 393,433 |
3,994,902 | ||
Capital Markets — 1.8% | ||
Ameriprise Financial, Inc. 4.00%, 10/15/2023 | 47,000 | 46,876 |
Bank of New York Mellon Corp. (The) | ||
(SOFR + 1.03%), 4.95%, 4/26/2027 (d) | 250,000 | 246,085 |
3.25%, 5/16/2027 | 160,000 | 150,028 |
INVESTMENTS | PRINCIPAL AMOUNT($) | VALUE($) |
Capital Markets — continued | ||
(SOFR + 1.42%), 4.29%, 6/13/2033 (d) | 180,000 | 165,613 |
Charles Schwab Corp. (The) | ||
0.90%, 3/11/2026 | 30,000 | 26,793 |
2.75%, 10/1/2029 | 46,000 | 39,563 |
Credit Suisse AG (Switzerland) 3.70%, 2/21/2025 | 310,000 | 298,831 |
Credit Suisse USA, Inc. (Switzerland) 7.13%, 7/15/2032 | 53,000 | 59,140 |
Deutsche Bank AG (Germany) | ||
(SOFR + 2.16%), 2.22%, 9/18/2024 (d) | 150,000 | 149,765 |
(SOFR + 2.52%), 7.15%, 7/13/2027 (d) | 315,000 | 319,712 |
Goldman Sachs Group, Inc. (The) | ||
3.50%, 4/1/2025 | 280,000 | 270,131 |
(3-MONTH CME TERM SOFR + 1.46%), 3.27%, 9/29/2025 (d) | 201,000 | 194,928 |
(SOFR + 1.08%), 5.80%, 8/10/2026 (d) | 800,000 | 797,534 |
3.50%, 11/16/2026 | 771,000 | 724,687 |
3.85%, 1/26/2027 | 135,000 | 128,129 |
(SOFR + 0.80%), 1.43%, 3/9/2027 (d) | 1,085,000 | 972,857 |
(SOFR + 1.51%), 4.39%, 6/15/2027 (d) | 117,000 | 113,550 |
(SOFR + 1.11%), 2.64%, 2/24/2028 (d) | 150,000 | 135,752 |
(3-MONTH CME TERM SOFR + 1.77%), 3.69%, 6/5/2028 (d) | 820,000 | 767,646 |
(3-MONTH CME TERM SOFR + 1.42%), 3.81%, 4/23/2029 (d) | 1,820,000 | 1,684,055 |
(3-MONTH CME TERM SOFR + 1.56%), 4.22%, 5/1/2029 (d) | 1,500,000 | 1,413,232 |
(SOFR + 1.28%), 2.62%, 4/22/2032 (d) | 1,640,000 | 1,327,001 |
(SOFR + 1.41%), 3.10%, 2/24/2033 (d) | 940,000 | 781,836 |
(SOFR + 1.51%), 3.21%, 4/22/2042 (d) | 160,000 | 115,327 |
(SOFR + 1.63%), 3.44%, 2/24/2043 (d) | 18,000 | 13,251 |
LPL Holdings, Inc. 4.00%, 3/15/2029 (a) | 295,000 | 262,235 |
Macquarie Group Ltd. (Australia) (ICE LIBOR USD 3 Month + 1.75%), 5.03%, 1/15/2030 (a) (d) | 200,000 | 194,895 |
Morgan Stanley | ||
(SOFR + 1.16%), 3.62%, 4/17/2025 (d) | 590,000 | 580,966 |
August 31, 2023 | J.P. Morgan Exchange-Traded Funds | 25 |
AS OF August 31, 2023 (Unaudited) (continued)
INVESTMENTS | PRINCIPAL AMOUNT($) | VALUE($) |
Corporate Bonds — continued | ||
Capital Markets — continued | ||
3.88%, 1/27/2026 | 330,000 | 317,621 |
3.13%, 7/27/2026 | 130,000 | 121,652 |
3.63%, 1/20/2027 | 191,000 | 180,467 |
(SOFR + 0.88%), 1.59%, 5/4/2027 (d) | 210,000 | 188,399 |
(SOFR + 1.00%), 2.48%, 1/21/2028 (d) | 914,000 | 824,536 |
3.59%, 7/22/2028 (h) | 760,000 | 703,093 |
(SOFR + 1.73%), 5.12%, 2/1/2029 (d) | 260,000 | 254,834 |
(SOFR + 1.59%), 5.16%, 4/20/2029 (d) | 1,945,000 | 1,907,714 |
(SOFR + 1.63%), 5.45%, 7/20/2029 (d) | 440,000 | 437,417 |
(3-MONTH CME TERM SOFR + 1.89%), 4.43%, 1/23/2030 (d) | 573,000 | 544,151 |
(SOFR + 1.14%), 2.70%, 1/22/2031 (d) | 70,000 | 58,917 |
(SOFR + 1.03%), 1.79%, 2/13/2032 (d) | 350,000 | 269,152 |
(SOFR + 1.18%), 2.24%, 7/21/2032 (d) | 80,000 | 62,930 |
(SOFR + 1.29%), 2.94%, 1/21/2033 (d) | 1,265,000 | 1,036,199 |
(SOFR + 1.88%), 5.42%, 7/21/2034 (d) | 430,000 | 422,785 |
(US Treasury Yield Curve Rate T Note Constant Maturity 5 Year + 2.43%), 5.95%, 1/19/2038 (d) | 380,000 | 369,511 |
(SOFR + 1.49%), 3.22%, 4/22/2042 (d) | 285,000 | 209,920 |
MSCI, Inc. 4.00%, 11/15/2029 (a) | 115,000 | 103,458 |
Northern Trust Corp. 3.95%, 10/30/2025 | 60,000 | 58,088 |
Nuveen LLC 4.00%, 11/1/2028 (a) | 160,000 | 150,423 |
S&P Global, Inc. | ||
2.70%, 3/1/2029 | 456,000 | 407,585 |
1.25%, 8/15/2030 | 500,000 | 393,324 |
2.90%, 3/1/2032 | 112,000 | 95,925 |
3.25%, 12/1/2049 | 223,000 | 159,881 |
State Street Corp. (SOFR + 1.72%), 5.82%, 11/4/2028 (d) | 335,000 | 340,147 |
UBS Group AG (Switzerland) | ||
(SOFRINDX + 0.98%), 1.31%, 2/2/2027 (a) (d) | 250,000 | 222,266 |
(US Treasury Yield Curve Rate T Note Constant Maturity 1 Year + 0.85%), 1.49%, 8/10/2027 (a) (d) | 585,000 | 514,412 |
INVESTMENTS | PRINCIPAL AMOUNT($) | VALUE($) |
Capital Markets — continued | ||
(US Treasury Yield Curve Rate T Note Constant Maturity 1 Year + 1.75%), 4.75%, 5/12/2028 (a) (d) | 200,000 | 192,023 |
(ICE LIBOR USD 3 Month + 1.47%), 3.13%, 8/13/2030 (a) (d) | 2,350,000 | 2,014,460 |
(US Treasury Yield Curve Rate T Note Constant Maturity 1 Year + 2.40%), 4.99%, 8/5/2033 (a) (d) | 700,000 | 652,345 |
4.88%, 5/15/2045 | 250,000 | 222,731 |
25,416,784 | ||
Chemicals — 0.3% | ||
Avient Corp. 7.13%, 8/1/2030 (a) | 410,000 | 409,608 |
Axalta Coating Systems LLC 4.75%, 6/15/2027 (a) | 300,000 | 282,304 |
CF Industries, Inc. | ||
5.15%, 3/15/2034 | 260,000 | 245,438 |
4.95%, 6/1/2043 | 70,000 | 59,168 |
Chemours Co. (The) | ||
5.38%, 5/15/2027 | 23,000 | 21,651 |
5.75%, 11/15/2028 (a) | 545,000 | 489,584 |
4.63%, 11/15/2029 (a) | 123,000 | 102,256 |
CVR Partners LP 6.13%, 6/15/2028 (a) | 70,000 | 62,669 |
Ecolab, Inc. 2.13%, 2/1/2032 | 75,000 | 61,064 |
EIDP, Inc. 4.80%, 5/15/2033 | 320,000 | 307,696 |
Element Solutions, Inc. 3.88%, 9/1/2028 (a) | 350,000 | 307,692 |
INEOS Quattro Finance 2 plc (United Kingdom) 3.38%, 1/15/2026 (a) | 400,000 | 365,896 |
International Flavors & Fragrances, Inc. | ||
1.83%, 10/15/2027 (a) | 116,000 | 97,567 |
2.30%, 11/1/2030 (a) | 13,000 | 10,087 |
3.27%, 11/15/2040 (a) | 25,000 | 16,630 |
LYB International Finance III LLC 3.38%, 10/1/2040 | 40,000 | 28,748 |
NOVA Chemicals Corp. (Canada) 5.25%, 6/1/2027 (a) | 310,000 | 275,608 |
Nutrien Ltd. (Canada) | ||
4.90%, 3/27/2028 | 186,000 | 181,761 |
2.95%, 5/13/2030 | 80,000 | 68,970 |
3.95%, 5/13/2050 | 190,000 | 142,030 |
Olin Corp. 5.13%, 9/15/2027 | 290,000 | 277,640 |
Scotts Miracle-Gro Co. (The) 4.50%, 10/15/2029 | 910,000 | 761,051 |
Sherwin-Williams Co. (The) 4.50%, 6/1/2047 | 15,000 | 12,788 |
26 | J.P. Morgan Exchange-Traded Funds | August 31, 2023 |
INVESTMENTS | PRINCIPAL AMOUNT($) | VALUE($) |
Corporate Bonds — continued | ||
Chemicals — continued | ||
Trinseo Materials Operating SCA 5.38%, 9/1/2025 (a) | 145,000 | 135,081 |
WR Grace Holdings LLC 4.88%, 6/15/2027 (a) | 350,000 | 326,424 |
5,049,411 | ||
Commercial Services & Supplies — 0.3% | ||
ACCO Brands Corp. 4.25%, 3/15/2029 (a) | 492,000 | 420,325 |
ADT Security Corp. (The) | ||
4.13%, 8/1/2029 (a) | 540,000 | 471,323 |
4.88%, 7/15/2032 (a) | 20,000 | 17,252 |
Allied Universal Holdco LLC 4.63%, 6/1/2028 (a) | 200,000 | 170,000 |
Aramark Services, Inc. 5.00%, 2/1/2028 (a) | 270,000 | 251,887 |
Brink's Co. (The) 4.63%, 10/15/2027 (a) | 200,000 | 185,974 |
Clean Harbors, Inc. 4.88%, 7/15/2027 (a) | 370,000 | 353,537 |
Garda World Security Corp. (Canada) 4.63%, 2/15/2027 (a) | 230,000 | 212,775 |
GFL Environmental, Inc. (Canada) | ||
3.75%, 8/1/2025 (a) | 105,000 | 99,966 |
5.13%, 12/15/2026 (a) | 55,000 | 53,219 |
4.00%, 8/1/2028 (a) | 455,000 | 406,187 |
4.75%, 6/15/2029 (a) | 205,000 | 185,713 |
Interface, Inc. 5.50%, 12/1/2028 (a) | 160,000 | 136,648 |
Madison IAQ LLC 4.13%, 6/30/2028 (a) | 745,000 | 659,126 |
Prime Security Services Borrower LLC | ||
5.75%, 4/15/2026 (a) | 282,000 | 276,739 |
3.38%, 8/31/2027 (a) | 440,000 | 391,337 |
Stericycle, Inc. | ||
5.38%, 7/15/2024 (a) | 85,000 | 84,702 |
3.88%, 1/15/2029 (a) | 335,000 | 291,678 |
Waste Management, Inc. 1.50%, 3/15/2031 | 170,000 | 132,508 |
4,800,896 | ||
Communications Equipment — 0.1% | ||
Ciena Corp. 4.00%, 1/31/2030 (a) | 305,000 | 263,063 |
CommScope Technologies LLC 6.00%, 6/15/2025 (a) | 105,000 | 96,107 |
CommScope, Inc. 6.00%, 3/1/2026 (a) | 472,000 | 428,937 |
788,107 | ||
Construction & Engineering — 0.1% | ||
Dycom Industries, Inc. 4.50%, 4/15/2029 (a) | 465,000 | 415,189 |
INVESTMENTS | PRINCIPAL AMOUNT($) | VALUE($) |
Construction & Engineering — continued | ||
Global Infrastructure Solutions, Inc. 5.63%, 6/1/2029 (a) | 485,000 | 407,306 |
MasTec, Inc. 4.50%, 8/15/2028 (a) | 305,000 | 278,279 |
Weekley Homes LLC 4.88%, 9/15/2028 (a) | 385,000 | 339,763 |
1,440,537 | ||
Construction Materials — 0.0% ^ | ||
Knife River Corp. 7.75%, 5/1/2031 (a) | 245,000 | 250,777 |
Martin Marietta Materials, Inc. 2.40%, 7/15/2031 | 70,000 | 56,623 |
307,400 | ||
Consumer Finance — 1.0% | ||
AerCap Ireland Capital DAC (Ireland) | ||
1.15%, 10/29/2023 | 450,000 | 446,552 |
2.45%, 10/29/2026 | 510,000 | 458,871 |
5.75%, 6/6/2028 | 400,000 | 396,507 |
3.00%, 10/29/2028 | 450,000 | 389,953 |
Ally Financial, Inc. 5.75%, 11/20/2025 | 400,000 | 387,988 |
American Express Co. | ||
1.65%, 11/4/2026 | 130,000 | 115,972 |
2.55%, 3/4/2027 | 540,000 | 491,020 |
5.85%, 11/5/2027 | 270,000 | 275,805 |
(SOFR + 1.28%), 5.28%, 7/27/2029 (d) | 1,325,000 | 1,310,632 |
Avolon Holdings Funding Ltd. (Ireland) | ||
5.13%, 10/1/2023 (a) | 170,000 | 169,725 |
5.25%, 5/15/2024 (a) | 250,000 | 246,806 |
2.88%, 2/15/2025 (a) | 478,000 | 451,016 |
5.50%, 1/15/2026 (a) | 60,000 | 58,413 |
2.13%, 2/21/2026 (a) | 275,000 | 247,092 |
4.25%, 4/15/2026 (a) | 1,265,000 | 1,192,970 |
2.53%, 11/18/2027 (a) | 1,635,000 | 1,395,762 |
Capital One Financial Corp. (SOFR + 1.27%), 2.62%, 11/2/2032 (d) | 100,000 | 76,174 |
Ford Motor Credit Co. LLC | ||
4.39%, 1/8/2026 | 200,000 | 189,023 |
4.27%, 1/9/2027 | 1,290,000 | 1,192,717 |
4.13%, 8/17/2027 | 1,350,000 | 1,224,948 |
7.20%, 6/10/2030 | 550,000 | 558,635 |
4.00%, 11/13/2030 | 250,000 | 211,537 |
3.63%, 6/17/2031 | 200,000 | 162,048 |
General Motors Financial Co., Inc. | ||
3.80%, 4/7/2025 | 35,000 | 33,809 |
3.60%, 6/21/2030 | 60,000 | 51,503 |
August 31, 2023 | J.P. Morgan Exchange-Traded Funds | 27 |
AS OF August 31, 2023 (Unaudited) (continued)
INVESTMENTS | PRINCIPAL AMOUNT($) | VALUE($) |
Corporate Bonds — continued | ||
Consumer Finance — continued | ||
2.70%, 6/10/2031 | 690,000 | 543,974 |
John Deere Capital Corp. 4.70%, 6/10/2030 | 400,000 | 395,030 |
Navient Corp. | ||
6.13%, 3/25/2024 | 130,000 | 129,442 |
5.88%, 10/25/2024 | 20,000 | 19,700 |
OneMain Finance Corp. | ||
6.88%, 3/15/2025 | 285,000 | 283,568 |
7.13%, 3/15/2026 | 1,029,000 | 1,012,272 |
6.63%, 1/15/2028 | 95,000 | 88,825 |
Park Aerospace Holdings Ltd. (Ireland) 5.50%, 2/15/2024 (a) | 208,000 | 206,612 |
14,414,901 | ||
Consumer Staples Distribution & Retail — 0.2% | ||
7-Eleven, Inc. | ||
0.95%, 2/10/2026 (a) | 65,000 | 58,366 |
1.80%, 2/10/2031 (a) | 325,000 | 254,898 |
2.50%, 2/10/2041 (a) | 14,000 | 9,055 |
2.80%, 2/10/2051 (a) | 50,000 | 30,470 |
Albertsons Cos., Inc. | ||
4.63%, 1/15/2027 (a) | 1,350,000 | 1,274,975 |
3.50%, 3/15/2029 (a) | 480,000 | 415,210 |
4.88%, 2/15/2030 (a) | 20,000 | 18,350 |
Alimentation Couche-Tard, Inc. (Canada) | ||
3.44%, 5/13/2041 (a) | 5,000 | 3,490 |
3.63%, 5/13/2051 (a) | 10,000 | 6,586 |
Performance Food Group, Inc. 5.50%, 10/15/2027 (a) | 391,000 | 376,497 |
Rite Aid Corp. 8.00%, 11/15/2026 (a) | 125,000 | 79,375 |
Sysco Corp. 2.40%, 2/15/2030 | 250,000 | 211,221 |
Target Corp. 4.80%, 1/15/2053 | 380,000 | 350,168 |
3,088,661 | ||
Containers & Packaging — 0.3% | ||
Ardagh Packaging Finance plc 4.13%, 8/15/2026 (a) | 600,000 | 561,189 |
Ball Corp. 3.13%, 9/15/2031 | 480,000 | 388,616 |
Canpack SA (Poland) 3.88%, 11/15/2029 (a) | 200,000 | 163,026 |
Crown Americas LLC 4.25%, 9/30/2026 | 13,000 | 12,213 |
Graphic Packaging International LLC | ||
4.75%, 7/15/2027 (a) | 108,000 | 102,588 |
3.50%, 3/15/2028 (a) | 180,000 | 160,350 |
LABL, Inc. 6.75%, 7/15/2026 (a) | 405,000 | 395,860 |
INVESTMENTS | PRINCIPAL AMOUNT($) | VALUE($) |
Containers & Packaging — continued | ||
Mauser Packaging Solutions Holding Co. 7.88%, 8/15/2026 (a) | 670,000 | 659,779 |
Owens-Brockway Glass Container, Inc. 6.63%, 5/13/2027 (a) | 530,000 | 523,894 |
Packaging Corp. of America 3.05%, 10/1/2051 | 85,000 | 54,177 |
Pactiv Evergreen Group Issuer, Inc. 4.00%, 10/15/2027 (a) | 600,000 | 539,652 |
Sealed Air Corp. | ||
4.00%, 12/1/2027 (a) | 115,000 | 105,248 |
6.13%, 2/1/2028 (a) | 205,000 | 201,428 |
TriMas Corp. 4.13%, 4/15/2029 (a) | 227,000 | 198,058 |
Trivium Packaging Finance BV (Netherlands) 5.50%, 8/15/2026 (a) (i) | 450,000 | 424,422 |
WRKCo, Inc. 4.65%, 3/15/2026 | 30,000 | 29,201 |
4,519,701 | ||
Distributors — 0.0% ^ | ||
American Builders & Contractors Supply Co., Inc. | ||
4.00%, 1/15/2028 (a) | 250,000 | 226,340 |
3.88%, 11/15/2029 (a) | 155,000 | 133,621 |
Ritchie Bros Holdings, Inc. (Canada) | ||
6.75%, 3/15/2028 (a) | 235,000 | 237,879 |
7.75%, 3/15/2031 (a) | 65,000 | 67,228 |
665,068 | ||
Diversified Consumer Services — 0.0% ^ | ||
Service Corp. International 5.13%, 6/1/2029 | 385,000 | 362,381 |
University of Miami Series 2022, 4.06%, 4/1/2052 | 40,000 | 32,861 |
395,242 | ||
Diversified REITs — 0.1% | ||
Goodman US Finance Three LLC (Australia) 3.70%, 3/15/2028 (a) | 90,000 | 81,684 |
Simon Property Group LP | ||
2.45%, 9/13/2029 | 500,000 | 423,194 |
3.25%, 9/13/2049 | 31,000 | 20,254 |
VICI Properties LP | ||
5.63%, 5/1/2024 (a) | 67,000 | 66,476 |
3.50%, 2/15/2025 (a) | 90,000 | 86,215 |
4.50%, 9/1/2026 (a) | 95,000 | 89,920 |
4.25%, 12/1/2026 (a) | 30,000 | 28,262 |
28 | J.P. Morgan Exchange-Traded Funds | August 31, 2023 |
INVESTMENTS | PRINCIPAL AMOUNT($) | VALUE($) |
Corporate Bonds — continued | ||
Diversified REITs — continued | ||
4.63%, 12/1/2029 (a) | 20,000 | 18,067 |
WP Carey, Inc. 2.25%, 4/1/2033 | 145,000 | 107,710 |
921,782 | ||
Diversified Telecommunication Services — 0.8% | ||
Altice France Holding SA (Luxembourg) 10.50%, 5/15/2027 (a) | 200,000 | 108,520 |
Altice France SA (France) 5.13%, 7/15/2029 (a) | 200,000 | 141,385 |
AT&T, Inc. | ||
1.65%, 2/1/2028 | 450,000 | 384,756 |
2.55%, 12/1/2033 | 870,000 | 663,833 |
5.40%, 2/15/2034 | 750,000 | 728,325 |
3.50%, 6/1/2041 | 260,000 | 190,693 |
3.65%, 6/1/2051 | 65,000 | 44,582 |
CCO Holdings LLC | ||
5.13%, 5/1/2027 (a) | 785,000 | 737,971 |
5.00%, 2/1/2028 (a) | 545,000 | 502,215 |
5.38%, 6/1/2029 (a) | 100,000 | 91,015 |
4.75%, 3/1/2030 (a) | 2,089,000 | 1,796,107 |
4.50%, 8/15/2030 (a) | 1,029,000 | 865,592 |
4.25%, 2/1/2031 (a) | 1,415,000 | 1,160,702 |
4.75%, 2/1/2032 (a) | 1,025,000 | 848,187 |
4.50%, 6/1/2033 (a) | 135,000 | 106,565 |
Embarq Corp. 8.00%, 6/1/2036 | 13,000 | 7,919 |
ESC Co., Escrow 8.50%, 10/15/2024 ‡ (b) | 28,000 | 3 |
Frontier Communications Holdings LLC 5.88%, 10/15/2027 (a) | 235,000 | 214,038 |
Intelsat Jackson Holdings SA (Luxembourg) 6.50%, 3/15/2030 (a) | 614,000 | 562,984 |
Lumen Technologies, Inc. | ||
5.13%, 12/15/2026 (a) | 130,000 | 67,343 |
4.00%, 2/15/2027 (a) | 1,000,000 | 630,220 |
Sprint Capital Corp. | ||
6.88%, 11/15/2028 | 258,000 | 272,552 |
8.75%, 3/15/2032 | 240,000 | 286,046 |
Telecom Italia Capital SA (Italy) 6.00%, 9/30/2034 | 134,000 | 112,275 |
Telecom Italia SpA (Italy) 5.30%, 5/30/2024 (a) | 200,000 | 197,403 |
Verizon Communications, Inc. | ||
2.10%, 3/22/2028 | 12,000 | 10,487 |
4.33%, 9/21/2028 | 75,000 | 71,830 |
4.02%, 12/3/2029 | 184,000 | 171,065 |
3.40%, 3/22/2041 | 385,000 | 285,888 |
INVESTMENTS | PRINCIPAL AMOUNT($) | VALUE($) |
Diversified Telecommunication Services — continued | ||
2.88%, 11/20/2050 | 75,000 | 45,995 |
3.70%, 3/22/2061 | 30,000 | 20,438 |
11,326,934 | ||
Electric Utilities — 2.1% | ||
AEP Transmission Co. LLC | ||
Series N, 2.75%, 8/15/2051 | 50,000 | 30,954 |
Series O, 4.50%, 6/15/2052 | 200,000 | 172,489 |
Alabama Power Co. 3.05%, 3/15/2032 | 200,000 | 171,619 |
American Electric Power Co., Inc. 2.03%, 3/15/2024 | 40,000 | 39,135 |
Baltimore Gas and Electric Co. | ||
3.20%, 9/15/2049 | 295,000 | 199,694 |
2.90%, 6/15/2050 | 50,000 | 32,050 |
5.40%, 6/1/2053 | 305,000 | 300,781 |
Commonwealth Edison Co. 5.30%, 2/1/2053 | 618,000 | 605,124 |
Connecticut Light and Power Co. (The) 4.00%, 4/1/2048 | 46,000 | 37,449 |
DTE Electric Co. | ||
Series A, 4.00%, 4/1/2043 | 90,000 | 72,685 |
5.40%, 4/1/2053 | 80,000 | 79,557 |
Duke Energy Carolinas LLC 3.20%, 8/15/2049 | 34,000 | 23,367 |
Duke Energy Indiana LLC | ||
Series YYY, 3.25%, 10/1/2049 | 125,000 | 85,142 |
2.75%, 4/1/2050 | 395,000 | 240,874 |
5.40%, 4/1/2053 | 580,000 | 563,743 |
Duke Energy Ohio, Inc. 5.25%, 4/1/2033 | 624,000 | 625,504 |
Duke Energy Progress LLC 5.25%, 3/15/2033 | 340,000 | 340,256 |
Duquesne Light Holdings, Inc. 2.53%, 10/1/2030 (a) | 148,000 | 117,951 |
Edison International | ||
5.25%, 11/15/2028 | 100,000 | 97,628 |
6.95%, 11/15/2029 | 245,000 | 258,275 |
Emera US Finance LP (Canada) | ||
2.64%, 6/15/2031 | 660,000 | 526,017 |
4.75%, 6/15/2046 | 50,000 | 39,135 |
Enel Finance International NV (Italy) 2.25%, 7/12/2031 (a) | 200,000 | 155,494 |
Entergy Arkansas LLC | ||
4.00%, 6/1/2028 | 13,000 | 12,403 |
2.65%, 6/15/2051 | 274,000 | 163,569 |
Entergy Louisiana LLC | ||
2.40%, 10/1/2026 | 69,000 | 63,261 |
August 31, 2023 | J.P. Morgan Exchange-Traded Funds | 29 |
AS OF August 31, 2023 (Unaudited) (continued)
INVESTMENTS | PRINCIPAL AMOUNT($) | VALUE($) |
Corporate Bonds — continued | ||
Electric Utilities — continued | ||
1.60%, 12/15/2030 | 500,000 | 387,156 |
2.90%, 3/15/2051 | 823,000 | 514,555 |
Entergy Mississippi LLC | ||
5.00%, 9/1/2033 | 375,000 | 363,248 |
3.50%, 6/1/2051 | 20,000 | 13,894 |
Entergy Texas Restoration Funding LLC Series A-2, 3.70%, 12/15/2035 | 215,000 | 193,649 |
Entergy Texas, Inc. 1.75%, 3/15/2031 | 535,000 | 418,964 |
Eversource Energy | ||
4.60%, 7/1/2027 | 31,000 | 30,170 |
5.45%, 3/1/2028 | 100,000 | 100,335 |
5.13%, 5/15/2033 | 365,000 | 353,171 |
Fells Point Funding Trust 3.05%, 1/31/2027 (a) | 1,570,000 | 1,435,682 |
FirstEnergy Transmission LLC | ||
2.87%, 9/15/2028 (a) | 965,000 | 846,957 |
4.55%, 4/1/2049 (a) | 90,000 | 72,735 |
Florida Power & Light Co. | ||
5.10%, 4/1/2033 | 288,000 | 288,002 |
4.80%, 5/15/2033 | 260,000 | 253,988 |
3.70%, 12/1/2047 | 60,000 | 46,775 |
5.30%, 4/1/2053 | 70,000 | 69,364 |
Indiana Michigan Power Co. | ||
Series K, 4.55%, 3/15/2046 | 50,000 | 43,452 |
5.63%, 4/1/2053 | 150,000 | 151,214 |
ITC Holdings Corp. | ||
4.95%, 9/22/2027 (a) | 432,000 | 424,991 |
2.95%, 5/14/2030 (a) | 405,000 | 346,148 |
5.40%, 6/1/2033 (a) | 300,000 | 294,751 |
Kentucky Utilities Co. 5.13%, 11/1/2040 | 74,000 | 69,318 |
MidAmerican Energy Co. 3.65%, 4/15/2029 | 46,000 | 42,865 |
Mid-Atlantic Interstate Transmission LLC 4.10%, 5/15/2028 (a) | 430,000 | 407,319 |
Monongahela Power Co. 4.10%, 4/15/2024 (a) | 40,000 | 39,589 |
NextEra Energy Capital Holdings, Inc. | ||
5.75%, 9/1/2025 | 430,000 | 431,019 |
5.00%, 7/15/2032 | 60,000 | 57,974 |
5.05%, 2/28/2033 | 1,320,000 | 1,277,557 |
5.25%, 2/28/2053 | 80,000 | 74,072 |
Northern States Power Co. | ||
2.60%, 6/1/2051 | 70,000 | 42,768 |
4.50%, 6/1/2052 | 50,000 | 43,140 |
INVESTMENTS | PRINCIPAL AMOUNT($) | VALUE($) |
Electric Utilities — continued | ||
NRG Energy, Inc. | ||
6.63%, 1/15/2027 | 21,000 | 20,739 |
2.45%, 12/2/2027 (a) | 60,000 | 50,933 |
5.75%, 1/15/2028 | 560,000 | 529,802 |
3.38%, 2/15/2029 (a) | 210,000 | 173,096 |
5.25%, 6/15/2029 (a) | 795,000 | 715,581 |
Ohio Power Co. | ||
Series P, 2.60%, 4/1/2030 | 50,000 | 42,337 |
Series R, 2.90%, 10/1/2051 | 290,000 | 183,391 |
Oklahoma Gas and Electric Co. 5.40%, 1/15/2033 | 100,000 | 100,007 |
Oncor Electric Delivery Co. LLC | ||
3.10%, 9/15/2049 | 50,000 | 33,955 |
4.95%, 9/15/2052 (a) | 400,000 | 371,042 |
Pacific Gas and Electric Co. | ||
1.70%, 11/15/2023 | 30,000 | 29,723 |
3.25%, 2/16/2024 | 75,000 | 74,050 |
3.45%, 7/1/2025 | 17,000 | 16,139 |
2.95%, 3/1/2026 | 110,000 | 101,490 |
4.65%, 8/1/2028 | 2,200,000 | 2,053,129 |
6.10%, 1/15/2029 | 605,000 | 597,895 |
6.40%, 6/15/2033 | 335,000 | 330,430 |
4.50%, 7/1/2040 | 130,000 | 100,113 |
4.20%, 6/1/2041 | 30,000 | 21,706 |
4.25%, 3/15/2046 | 418,000 | 285,314 |
6.75%, 1/15/2053 | 1,250,000 | 1,214,933 |
PacifiCorp | ||
4.15%, 2/15/2050 | 198,000 | 145,242 |
3.30%, 3/15/2051 | 710,000 | 452,502 |
5.50%, 5/15/2054 | 5,000 | 4,428 |
PG&E Corp. | ||
5.00%, 7/1/2028 | 471,000 | 433,276 |
5.25%, 7/1/2030 | 300,000 | 266,527 |
PG&E Recovery Funding LLC Series A-3, 5.54%, 7/15/2047 | 185,000 | 185,475 |
PG&E Wildfire Recovery Funding LLC | ||
Series A-2, 4.26%, 6/1/2036 | 25,000 | 23,244 |
Series A-4, 5.21%, 12/1/2047 | 40,000 | 38,525 |
Series A-5, 5.10%, 6/1/2052 | 70,000 | 67,550 |
PPL Electric Utilities Corp. | ||
6.25%, 5/15/2039 | 382,000 | 407,510 |
5.25%, 5/15/2053 | 70,000 | 67,985 |
Public Service Co. of Colorado | ||
Series 36, 2.70%, 1/15/2051 | 45,000 | 27,124 |
5.25%, 4/1/2053 | 138,000 | 127,436 |
30 | J.P. Morgan Exchange-Traded Funds | August 31, 2023 |
INVESTMENTS | PRINCIPAL AMOUNT($) | VALUE($) |
Corporate Bonds — continued | ||
Electric Utilities — continued | ||
Public Service Co. of Oklahoma | ||
5.25%, 1/15/2033 | 155,000 | 152,101 |
Series K, 3.15%, 8/15/2051 | 150,000 | 97,985 |
Public Service Electric and Gas Co. | ||
3.00%, 5/15/2027 | 50,000 | 46,853 |
4.65%, 3/15/2033 | 200,000 | 193,832 |
2.05%, 8/1/2050 | 68,000 | 38,228 |
SCE Recovery Funding LLC Series A-1, 4.70%, 6/15/2040 | 50,000 | 48,332 |
Sigeco Securitization I LLC | ||
Series A1, 5.03%, 11/15/2036 | 53,000 | 52,169 |
Series A2, 5.17%, 5/15/2041 | 49,000 | 46,917 |
Southern California Edison Co. | ||
5.30%, 3/1/2028 | 719,000 | 721,686 |
Series G, 2.50%, 6/1/2031 | 775,000 | 637,342 |
Series C, 3.60%, 2/1/2045 | 35,000 | 25,388 |
Series C, 4.13%, 3/1/2048 | 238,000 | 187,573 |
Series 20A, 2.95%, 2/1/2051 | 430,000 | 273,074 |
5.88%, 12/1/2053 | 706,000 | 702,460 |
Southwestern Electric Power Co. | ||
Series N, 1.65%, 3/15/2026 | 45,000 | 40,931 |
5.30%, 4/1/2033 | 130,000 | 127,258 |
3.25%, 11/1/2051 | 210,000 | 135,807 |
Southwestern Public Service Co. | ||
3.30%, 6/15/2024 | 29,000 | 28,467 |
4.50%, 8/15/2041 | 74,000 | 62,132 |
Tucson Electric Power Co. | ||
1.50%, 8/1/2030 | 448,000 | 349,660 |
4.85%, 12/1/2048 | 232,000 | 198,498 |
5.50%, 4/15/2053 | 115,000 | 110,644 |
Union Electric Co. | ||
3.90%, 4/1/2052 | 45,000 | 35,359 |
5.45%, 3/15/2053 | 395,000 | 388,217 |
Virginia Electric and Power Co. 5.70%, 8/15/2053 | 250,000 | 248,171 |
Vistra Operations Co. LLC | ||
5.50%, 9/1/2026 (a) | 65,000 | 62,697 |
5.63%, 2/15/2027 (a) | 735,000 | 707,592 |
5.00%, 7/31/2027 (a) | 420,000 | 395,014 |
4.38%, 5/1/2029 (a) | 275,000 | 242,468 |
4.30%, 7/15/2029 (a) | 90,000 | 79,834 |
Wisconsin Public Service Corp. 4.75%, 11/1/2044 | 69,000 | 60,172 |
29,978,468 | ||
INVESTMENTS | PRINCIPAL AMOUNT($) | VALUE($) |
Electrical Equipment — 0.1% | ||
Eaton Corp. 4.15%, 3/15/2033 | 200,000 | 188,569 |
EnerSys 4.38%, 12/15/2027 (a) | 65,000 | 59,475 |
Regal Rexnord Corp. | ||
6.05%, 2/15/2026 (a) | 68,000 | 67,633 |
6.05%, 4/15/2028 (a) | 135,000 | 133,570 |
6.30%, 2/15/2030 (a) | 57,000 | 56,749 |
6.40%, 4/15/2033 (a) | 79,000 | 78,259 |
Sensata Technologies BV | ||
5.00%, 10/1/2025 (a) | 40,000 | 38,984 |
4.00%, 4/15/2029 (a) | 250,000 | 219,579 |
Vertiv Group Corp. 4.13%, 11/15/2028 (a) | 365,000 | 327,683 |
1,170,501 | ||
Electronic Equipment, Instruments & Components — 0.0% ^ | ||
Arrow Electronics, Inc. 2.95%, 2/15/2032 | 20,000 | 16,052 |
Coherent Corp. 5.00%, 12/15/2029 (a) | 465,000 | 413,013 |
Corning, Inc. 3.90%, 11/15/2049 | 75,000 | 56,316 |
Sensata Technologies, Inc. 4.38%, 2/15/2030 (a) | 255,000 | 225,765 |
711,146 | ||
Energy Equipment & Services — 0.1% | ||
Archrock Partners LP 6.88%, 4/1/2027 (a) | 155,000 | 152,388 |
Baker Hughes Holdings LLC 2.06%, 12/15/2026 | 70,000 | 63,316 |
Halliburton Co. 3.80%, 11/15/2025 | 12,000 | 11,702 |
Nabors Industries, Inc. 7.38%, 5/15/2027 (a) | 225,000 | 219,578 |
Oceaneering International, Inc. 4.65%, 11/15/2024 | 390,000 | 381,849 |
Precision Drilling Corp. (Canada) 7.13%, 1/15/2026 (a) | 335,000 | 332,069 |
Schlumberger Holdings Corp. 3.90%, 5/17/2028 (a) | 214,000 | 202,932 |
Transocean, Inc. 8.75%, 2/15/2030 (a) | 223,250 | 228,388 |
USA Compression Partners LP 6.88%, 4/1/2026 | 255,000 | 252,136 |
1,844,358 | ||
Entertainment — 0.6% | ||
Activision Blizzard, Inc. | ||
1.35%, 9/15/2030 | 230,000 | 183,750 |
2.50%, 9/15/2050 | 259,000 | 164,698 |
Cinemark USA, Inc. | ||
8.75%, 5/1/2025 (a) | 79,000 | 79,798 |
August 31, 2023 | J.P. Morgan Exchange-Traded Funds | 31 |
AS OF August 31, 2023 (Unaudited) (continued)
INVESTMENTS | PRINCIPAL AMOUNT($) | VALUE($) |
Corporate Bonds — continued | ||
Entertainment — continued | ||
5.88%, 3/15/2026 (a) | 295,000 | 283,204 |
5.25%, 7/15/2028 (a) | 40,000 | 35,530 |
Live Nation Entertainment, Inc. | ||
5.63%, 3/15/2026 (a) | 2,000 | 1,940 |
6.50%, 5/15/2027 (a) | 735,000 | 735,570 |
4.75%, 10/15/2027 (a) | 365,000 | 340,034 |
Netflix, Inc. 5.38%, 11/15/2029 (a) | 88,000 | 87,513 |
Take-Two Interactive Software, Inc. 3.70%, 4/14/2027 | 115,000 | 108,976 |
Walt Disney Co. (The) | ||
3.80%, 3/22/2030 | 650,000 | 608,662 |
3.50%, 5/13/2040 | 350,000 | 280,650 |
5.40%, 10/1/2043 | 840,000 | 836,642 |
Warnermedia Holdings, Inc. | ||
3.76%, 3/15/2027 | 3,150,000 | 2,954,441 |
4.28%, 3/15/2032 | 1,290,000 | 1,138,347 |
5.05%, 3/15/2042 | 1,500,000 | 1,233,048 |
5.14%, 3/15/2052 | 80,000 | 63,769 |
WMG Acquisition Corp. 3.88%, 7/15/2030 (a) | 100,000 | 86,780 |
9,223,352 | ||
Financial Services — 0.3% | ||
Block, Inc. | ||
2.75%, 6/1/2026 | 309,000 | 280,991 |
3.50%, 6/1/2031 | 430,000 | 352,585 |
EDP Finance BV (Portugal) 1.71%, 1/24/2028 (a) | 250,000 | 213,292 |
Fidelity National Information Services, Inc. 2.25%, 3/1/2031 | 195,000 | 157,411 |
Fiserv, Inc. 3.20%, 7/1/2026 | 170,000 | 160,245 |
Global Payments, Inc. | ||
3.20%, 8/15/2029 | 160,000 | 139,285 |
2.90%, 5/15/2030 | 40,000 | 33,790 |
2.90%, 11/15/2031 | 75,000 | 61,451 |
LSEGA Financing plc (United Kingdom) 2.00%, 4/6/2028 (a) | 400,000 | 345,571 |
Nationstar Mortgage Holdings, Inc. 6.00%, 1/15/2027 (a) | 475,000 | 452,437 |
PayPal Holdings, Inc. 5.05%, 6/1/2052 | 100,000 | 96,827 |
Rocket Mortgage LLC | ||
2.88%, 10/15/2026 (a) | 530,000 | 471,037 |
3.63%, 3/1/2029 (a) | 410,000 | 348,964 |
Shell International Finance BV (Netherlands) | ||
2.88%, 11/26/2041 | 350,000 | 250,927 |
INVESTMENTS | PRINCIPAL AMOUNT($) | VALUE($) |
Financial Services — continued | ||
3.63%, 8/21/2042 | 200,000 | 160,697 |
3.75%, 9/12/2046 | 141,000 | 110,911 |
3.13%, 11/7/2049 | 25,000 | 17,430 |
3.00%, 11/26/2051 | 200,000 | 133,885 |
Visa, Inc. 2.70%, 4/15/2040 | 300,000 | 223,425 |
4,011,161 | ||
Food Products — 0.1% | ||
Bunge Ltd. Finance Corp. 2.75%, 5/14/2031 | 385,000 | 322,014 |
Campbell Soup Co. 4.15%, 3/15/2028 | 170,000 | 161,850 |
Cargill, Inc. 4.38%, 4/22/2052 (a) | 150,000 | 129,186 |
Darling Ingredients, Inc. | ||
5.25%, 4/15/2027 (a) | 50,000 | 48,616 |
6.00%, 6/15/2030 (a) | 315,000 | 307,861 |
General Mills, Inc. 4.15%, 2/15/2043 | 200,000 | 165,177 |
Lamb Weston Holdings, Inc. 4.13%, 1/31/2030 (a) | 285,000 | 250,640 |
Mead Johnson Nutrition Co. (United Kingdom) 4.13%, 11/15/2025 | 64,000 | 62,302 |
Post Holdings, Inc. | ||
5.75%, 3/1/2027 (a) | 82,000 | 80,139 |
5.50%, 12/15/2029 (a) | 635,000 | 587,409 |
2,115,194 | ||
Gas Utilities — 0.1% | ||
AmeriGas Partners LP | ||
5.50%, 5/20/2025 | 168,000 | 164,877 |
5.88%, 8/20/2026 | 10,000 | 9,487 |
5.75%, 5/20/2027 | 80,000 | 73,977 |
Atmos Energy Corp. | ||
5.50%, 6/15/2041 | 52,000 | 50,744 |
5.75%, 10/15/2052 | 35,000 | 36,469 |
Boston Gas Co. 3.00%, 8/1/2029 (a) | 37,000 | 31,883 |
CenterPoint Energy Resources Corp. 5.40%, 3/1/2033 | 420,000 | 420,153 |
Piedmont Natural Gas Co., Inc. 5.05%, 5/15/2052 | 100,000 | 88,185 |
Southern California Gas Co. Series XX, 2.55%, 2/1/2030 | 33,000 | 28,060 |
Southwest Gas Corp. 4.05%, 3/15/2032 | 480,000 | 430,210 |
Superior Plus LP (Canada) 4.50%, 3/15/2029 (a) | 270,000 | 237,595 |
1,571,640 | ||
32 | J.P. Morgan Exchange-Traded Funds | August 31, 2023 |
INVESTMENTS | PRINCIPAL AMOUNT($) | VALUE($) |
Corporate Bonds — continued | ||
Ground Transportation — 0.4% | ||
Avis Budget Car Rental LLC | ||
5.75%, 7/15/2027 (a) | 440,000 | 420,104 |
4.75%, 4/1/2028 (a) | 95,000 | 86,397 |
5.38%, 3/1/2029 (a) | 55,000 | 50,557 |
Burlington Northern Santa Fe LLC | ||
3.55%, 2/15/2050 | 78,000 | 59,685 |
3.05%, 2/15/2051 | 155,000 | 105,984 |
5.20%, 4/15/2054 | 850,000 | 836,327 |
Canadian Pacific Railway Co. (Canada) | ||
2.88%, 11/15/2029 | 1,125,000 | 989,901 |
3.10%, 12/2/2051 | 250,000 | 169,708 |
CSX Corp. | ||
3.25%, 6/1/2027 | 20,000 | 18,823 |
4.50%, 11/15/2052 | 100,000 | 86,950 |
First Student Bidco, Inc. 4.00%, 7/31/2029 (a) | 300,000 | 255,002 |
Hertz Corp. (The) 4.63%, 12/1/2026 (a) | 520,000 | 470,803 |
Norfolk Southern Corp. 3.95%, 10/1/2042 | 50,000 | 40,109 |
Penske Truck Leasing Co. LP 1.20%, 11/15/2025 (a) | 46,000 | 41,413 |
Triton Container International Ltd. (Bermuda) 1.15%, 6/7/2024 (a) | 400,000 | 382,964 |
Uber Technologies, Inc. | ||
7.50%, 5/15/2025 (a) | 155,000 | 156,496 |
7.50%, 9/15/2027 (a) | 435,000 | 444,158 |
Union Pacific Corp. | ||
2.40%, 2/5/2030 | 200,000 | 172,149 |
4.95%, 5/15/2053 | 120,000 | 115,240 |
XPO Escrow Sub LLC 7.50%, 11/15/2027 (a) | 240,000 | 244,022 |
XPO, Inc. | ||
6.25%, 6/1/2028 (a) | 115,000 | 112,686 |
7.13%, 6/1/2031 (a) | 405,000 | 407,153 |
5,666,631 | ||
Health Care Equipment & Supplies — 0.2% | ||
Abbott Laboratories 4.75%, 11/30/2036 | 290,000 | 287,902 |
Avantor Funding, Inc. 4.63%, 7/15/2028 (a) | 426,000 | 395,449 |
Becton Dickinson & Co. 3.70%, 6/6/2027 | 200,000 | 189,629 |
Boston Scientific Corp. 6.50%, 11/15/2035 (i) | 700,000 | 759,791 |
DH Europe Finance II SARL 3.25%, 11/15/2039 | 250,000 | 198,372 |
Hologic, Inc. 3.25%, 2/15/2029 (a) | 115,000 | 99,887 |
INVESTMENTS | PRINCIPAL AMOUNT($) | VALUE($) |
Health Care Equipment & Supplies — continued | ||
Medline Borrower LP | ||
3.88%, 4/1/2029 (a) | 880,000 | 768,218 |
5.25%, 10/1/2029 (a) | 55,000 | 48,841 |
Teleflex, Inc. 4.25%, 6/1/2028 (a) | 85,000 | 78,083 |
Varex Imaging Corp. 7.88%, 10/15/2027 (a) | 64,000 | 63,680 |
2,889,852 | ||
Health Care Providers & Services — 1.1% | ||
Acadia Healthcare Co., Inc. | ||
5.50%, 7/1/2028 (a) | 411,000 | 389,361 |
5.00%, 4/15/2029 (a) | 175,000 | 160,997 |
AdaptHealth LLC 4.63%, 8/1/2029 (a) | 85,000 | 69,453 |
Aetna, Inc. | ||
4.13%, 11/15/2042 | 70,000 | 55,558 |
4.75%, 3/15/2044 | 200,000 | 172,241 |
3.88%, 8/15/2047 | 735,000 | 551,447 |
Centene Corp. 4.63%, 12/15/2029 | 916,000 | 842,262 |
Cigna Group (The) 2.38%, 3/15/2031 | 135,000 | 111,094 |
CommonSpirit Health | ||
1.55%, 10/1/2025 | 13,000 | 11,962 |
2.78%, 10/1/2030 | 13,000 | 10,919 |
3.91%, 10/1/2050 | 15,000 | 11,274 |
Community Health Systems, Inc. | ||
8.00%, 3/15/2026 (a) | 255,000 | 248,920 |
5.63%, 3/15/2027 (a) | 735,000 | 646,759 |
4.75%, 2/15/2031 (a) | 85,000 | 63,325 |
CVS Health Corp. | ||
4.30%, 3/25/2028 | 237,000 | 227,629 |
5.13%, 2/21/2030 | 100,000 | 98,497 |
5.25%, 1/30/2031 | 145,000 | 143,283 |
5.25%, 2/21/2033 | 70,000 | 68,455 |
5.30%, 6/1/2033 | 500,000 | 489,701 |
4.78%, 3/25/2038 | 290,000 | 259,712 |
2.70%, 8/21/2040 | 50,000 | 33,580 |
DaVita, Inc. 4.63%, 6/1/2030 (a) | 815,000 | 699,069 |
Encompass Health Corp. | ||
4.50%, 2/1/2028 | 180,000 | 167,199 |
4.75%, 2/1/2030 | 675,000 | 614,819 |
4.63%, 4/1/2031 | 75,000 | 65,770 |
Envision Healthcare Corp. 8.75%, 10/15/2026 (a) (b) | 20,000 | 575 |
Hackensack Meridian Health, Inc. Series 2020, 2.68%, 9/1/2041 | 50,000 | 33,995 |
August 31, 2023 | J.P. Morgan Exchange-Traded Funds | 33 |
AS OF August 31, 2023 (Unaudited) (continued)
INVESTMENTS | PRINCIPAL AMOUNT($) | VALUE($) |
Corporate Bonds — continued | ||
Health Care Providers & Services — continued | ||
HCA, Inc. | ||
5.25%, 6/15/2026 | 570,000 | 563,073 |
5.38%, 9/1/2026 | 155,000 | 153,876 |
4.50%, 2/15/2027 | 210,000 | 203,070 |
5.63%, 9/1/2028 | 1,997,000 | 1,994,384 |
3.50%, 9/1/2030 | 37,000 | 32,317 |
2.38%, 7/15/2031 | 1,130,000 | 892,032 |
5.50%, 6/15/2047 | 300,000 | 273,124 |
3.50%, 7/15/2051 | 35,000 | 23,332 |
MultiCare Health System 2.80%, 8/15/2050 | 10,000 | 6,008 |
MyMichigan Health Series 2020, 3.41%, 6/1/2050 | 10,000 | 6,878 |
New York and Presbyterian Hospital (The) 2.61%, 8/1/2060 | 5,000 | 2,790 |
Northwell Healthcare, Inc. 4.26%, 11/1/2047 | 110,000 | 87,085 |
Owens & Minor, Inc. 4.50%, 3/31/2029 (a) | 580,000 | 491,550 |
Quest Diagnostics, Inc. 2.95%, 6/30/2030 | 55,000 | 47,762 |
Tenet Healthcare Corp. | ||
4.88%, 1/1/2026 | 260,000 | 252,039 |
5.13%, 11/1/2027 | 510,000 | 484,926 |
4.63%, 6/15/2028 | 1,040,000 | 957,651 |
4.25%, 6/1/2029 | 2,193,000 | 1,957,925 |
UnitedHealth Group, Inc. | ||
3.38%, 4/15/2027 | 91,000 | 86,300 |
4.63%, 11/15/2041 | 232,000 | 212,588 |
3.25%, 5/15/2051 | 485,000 | 344,437 |
5.88%, 2/15/2053 | 254,000 | 271,654 |
5.05%, 4/15/2053 | 900,000 | 859,085 |
16,451,742 | ||
Health Care REITs — 0.0% ^ | ||
Healthpeak OP LLC | ||
2.13%, 12/1/2028 | 64,000 | 54,683 |
3.00%, 1/15/2030 | 87,000 | 75,281 |
Sabra Health Care LP 3.20%, 12/1/2031 | 120,000 | 91,656 |
221,620 | ||
Health Care Technology — 0.0% ^ | ||
IQVIA, Inc. | ||
5.00%, 5/15/2027 (a) | 200,000 | 192,518 |
6.50%, 5/15/2030 (a) | 200,000 | 201,070 |
393,588 | ||
INVESTMENTS | PRINCIPAL AMOUNT($) | VALUE($) |
Hotel & Resort REITs — 0.0% ^ | ||
RHP Hotel Properties LP | ||
4.75%, 10/15/2027 | 390,000 | 362,597 |
7.25%, 7/15/2028 (a) | 345,000 | 346,724 |
709,321 | ||
Hotels, Restaurants & Leisure — 0.8% | ||
1011778 BC ULC (Canada) | ||
5.75%, 4/15/2025 (a) | 50,000 | 49,630 |
3.88%, 1/15/2028 (a) | 257,000 | 233,753 |
4.00%, 10/15/2030 (a) | 290,000 | 245,674 |
Boyd Gaming Corp. 4.75%, 12/1/2027 | 403,000 | 377,289 |
Boyne USA, Inc. 4.75%, 5/15/2029 (a) | 327,000 | 295,120 |
Caesars Entertainment, Inc. | ||
6.25%, 7/1/2025 (a) | 615,000 | 610,226 |
8.13%, 7/1/2027 (a) | 285,000 | 289,370 |
Carnival Corp. | ||
5.75%, 3/1/2027 (a) | 310,000 | 291,745 |
9.88%, 8/1/2027 (a) | 110,000 | 116,272 |
4.00%, 8/1/2028 (a) | 810,000 | 724,794 |
Carnival Holdings Bermuda Ltd. 10.38%, 5/1/2028 (a) | 385,000 | 418,720 |
Cedar Fair LP | ||
6.50%, 10/1/2028 | 668,000 | 645,767 |
5.25%, 7/15/2029 | 250,000 | 225,043 |
Hilton Domestic Operating Co., Inc. | ||
5.38%, 5/1/2025 (a) | 25,000 | 24,728 |
5.75%, 5/1/2028 (a) | 285,000 | 279,628 |
3.75%, 5/1/2029 (a) | 345,000 | 303,944 |
4.88%, 1/15/2030 | 290,000 | 270,544 |
International Game Technology plc 6.25%, 1/15/2027 (a) | 200,000 | 198,031 |
Las Vegas Sands Corp. 2.90%, 6/25/2025 | 205,000 | 193,595 |
Marriott Ownership Resorts, Inc. 4.50%, 6/15/2029 (a) | 170,000 | 143,653 |
McDonald's Corp. 5.45%, 8/14/2053 | 430,000 | 430,286 |
MGM Resorts International | ||
6.75%, 5/1/2025 | 130,000 | 130,216 |
5.50%, 4/15/2027 | 521,000 | 497,769 |
Royal Caribbean Cruises Ltd. | ||
11.50%, 6/1/2025 (a) | 4,000 | 4,224 |
11.63%, 8/15/2027 (a) | 200,000 | 217,925 |
8.25%, 1/15/2029 (a) | 502,000 | 522,843 |
9.25%, 1/15/2029 (a) | 762,000 | 812,175 |
Sands China Ltd. (Macau) | ||
5.38%, 8/8/2025 (i) | 400,000 | 386,670 |
34 | J.P. Morgan Exchange-Traded Funds | August 31, 2023 |
INVESTMENTS | PRINCIPAL AMOUNT($) | VALUE($) |
Corporate Bonds — continued | ||
Hotels, Restaurants & Leisure — continued | ||
4.30%, 1/8/2026 (i) | 250,000 | 234,062 |
2.80%, 3/8/2027 (i) | 200,000 | 173,250 |
Six Flags Theme Parks, Inc. 7.00%, 7/1/2025 (a) | 253,000 | 252,936 |
Starbucks Corp. 3.35%, 3/12/2050 | 5,000 | 3,509 |
Station Casinos LLC 4.50%, 2/15/2028 (a) | 535,000 | 478,825 |
Travel + Leisure Co. 5.65%, 4/1/2024 (i) | 25,000 | 24,821 |
Vail Resorts, Inc. 6.25%, 5/15/2025 (a) | 139,000 | 138,512 |
Wynn Las Vegas LLC | ||
5.50%, 3/1/2025 (a) | 75,000 | 74,091 |
5.25%, 5/15/2027 (a) | 125,000 | 118,315 |
Wynn Macau Ltd. (Macau) 5.63%, 8/26/2028 (a) | 200,000 | 175,250 |
Wynn Resorts Finance LLC 5.13%, 10/1/2029 (a) | 1,000,000 | 895,206 |
Yum! Brands, Inc. | ||
4.75%, 1/15/2030 (a) | 215,000 | 197,986 |
4.63%, 1/31/2032 | 585,000 | 523,423 |
12,229,820 | ||
Household Durables — 0.2% | ||
CD&R Smokey Buyer, Inc. 6.75%, 7/15/2025 (a) | 210,000 | 203,232 |
Lennar Corp. 4.50%, 4/30/2024 | 6,000 | 5,952 |
MDC Holdings, Inc. | ||
3.85%, 1/15/2030 | 30,000 | 25,941 |
2.50%, 1/15/2031 | 116,000 | 89,971 |
Newell Brands, Inc. | ||
4.70%, 4/1/2026 (i) | 595,000 | 570,073 |
6.63%, 9/15/2029 | 540,000 | 534,418 |
5.87%, 4/1/2036 (i) | 310,000 | 275,538 |
Tempur Sealy International, Inc. 4.00%, 4/15/2029 (a) | 675,000 | 579,812 |
2,284,937 | ||
Household Products — 0.1% | ||
Central Garden & Pet Co. | ||
5.13%, 2/1/2028 | 145,000 | 135,707 |
4.13%, 10/15/2030 | 165,000 | 142,013 |
Colgate-Palmolive Co. 3.70%, 8/1/2047 | 100,000 | 83,550 |
Energizer Holdings, Inc. | ||
4.75%, 6/15/2028 (a) | 405,000 | 357,593 |
4.38%, 3/31/2029 (a) | 275,000 | 235,535 |
INVESTMENTS | PRINCIPAL AMOUNT($) | VALUE($) |
Household Products — continued | ||
Spectrum Brands, Inc. | ||
5.00%, 10/1/2029 (a) | 300,000 | 275,129 |
5.50%, 7/15/2030 (a) | 320,000 | 297,668 |
1,527,195 | ||
Independent Power and Renewable Electricity Producers — 0.1% | ||
Calpine Corp. | ||
5.25%, 6/1/2026 (a) | 338,000 | 331,637 |
4.50%, 2/15/2028 (a) | 260,000 | 240,689 |
5.13%, 3/15/2028 (a) | 55,000 | 50,109 |
Constellation Energy Generation LLC | ||
3.25%, 6/1/2025 | 187,000 | 178,990 |
5.80%, 3/1/2033 | 240,000 | 244,482 |
6.25%, 10/1/2039 | 85,000 | 86,077 |
5.75%, 10/1/2041 | 120,000 | 114,405 |
5.60%, 6/15/2042 | 215,000 | 202,683 |
1,449,072 | ||
Industrial REITs — 0.1% | ||
Prologis LP | ||
1.75%, 7/1/2030 | 149,000 | 118,968 |
4.75%, 6/15/2033 | 640,000 | 613,350 |
732,318 | ||
Insurance — 0.3% | ||
AIA Group Ltd. (Hong Kong) 3.20%, 3/11/2025 (a) | 200,000 | 193,118 |
Alleghany Corp. 3.25%, 8/15/2051 | 50,000 | 34,940 |
Aon Corp. 5.35%, 2/28/2033 | 165,000 | 164,734 |
Athene Global Funding | ||
1.45%, 1/8/2026 (a) | 20,000 | 17,828 |
2.95%, 11/12/2026 (a) | 44,000 | 39,779 |
Berkshire Hathaway Finance Corp. | ||
2.85%, 10/15/2050 | 60,000 | 40,339 |
2.50%, 1/15/2051 | 200,000 | 124,581 |
3.85%, 3/15/2052 | 445,000 | 354,495 |
Equitable Financial Life Global Funding 1.70%, 11/12/2026 (a) | 25,000 | 21,915 |
F&G Global Funding 1.75%, 6/30/2026 (a) | 10,000 | 8,892 |
Great-West Lifeco Finance 2018 LP (Canada) 4.58%, 5/17/2048 (a) | 20,000 | 17,122 |
Manulife Financial Corp. (Canada) 4.15%, 3/4/2026 | 42,000 | 40,799 |
Marsh & McLennan Cos., Inc. 5.45%, 3/15/2053 | 155,000 | 152,997 |
MetLife, Inc. | ||
4.13%, 8/13/2042 | 79,000 | 65,485 |
August 31, 2023 | J.P. Morgan Exchange-Traded Funds | 35 |
AS OF August 31, 2023 (Unaudited) (continued)
INVESTMENTS | PRINCIPAL AMOUNT($) | VALUE($) |
Corporate Bonds — continued | ||
Insurance — continued | ||
5.00%, 7/15/2052 | 350,000 | 320,006 |
Metropolitan Life Global Funding I 5.15%, 3/28/2033 (a) | 880,000 | 860,416 |
New York Life Global Funding 3.00%, 1/10/2028 (a) | 51,000 | 46,672 |
New York Life Insurance Co. 4.45%, 5/15/2069 (a) | 50,000 | 39,889 |
Pacific Life Global Funding II 5.50%, 8/28/2026 (a) | 135,000 | 135,459 |
Pacific Life Insurance Co. (ICE LIBOR USD 3 Month + 2.80%), 4.30%, 10/24/2067 (a) (d) | 27,000 | 20,204 |
Pricoa Global Funding I 5.55%, 8/28/2026 (a) | 175,000 | 176,281 |
Principal Financial Group, Inc. 3.70%, 5/15/2029 | 45,000 | 41,189 |
Progressive Corp. (The) | ||
3.00%, 3/15/2032 | 200,000 | 173,798 |
4.35%, 4/25/2044 | 42,000 | 35,342 |
Prudential Financial, Inc. | ||
3.88%, 3/27/2028 | 32,000 | 30,473 |
3.91%, 12/7/2047 | 250,000 | 193,854 |
Teachers Insurance & Annuity Association of America 4.27%, 5/15/2047 (a) | 420,000 | 339,843 |
Travelers Cos., Inc. (The) 5.35%, 11/1/2040 | 16,000 | 15,906 |
W R Berkley Corp. 3.55%, 3/30/2052 | 45,000 | 30,683 |
3,737,039 | ||
Interactive Media & Services — 0.1% | ||
Alphabet, Inc. 2.05%, 8/15/2050 | 200,000 | 119,718 |
Meta Platforms, Inc. | ||
4.60%, 5/15/2028 | 500,000 | 495,633 |
4.80%, 5/15/2030 | 210,000 | 209,160 |
5.60%, 5/15/2053 | 205,000 | 205,843 |
TripAdvisor, Inc. 7.00%, 7/15/2025 (a) | 175,000 | 174,583 |
1,204,937 | ||
IT Services — 0.1% | ||
Arches Buyer, Inc. 4.25%, 6/1/2028 (a) | 310,000 | 269,653 |
Gartner, Inc. 3.75%, 10/1/2030 (a) | 130,000 | 112,262 |
Presidio Holdings, Inc. 4.88%, 2/1/2027 (a) | 410,000 | 383,330 |
Twilio, Inc. 3.63%, 3/15/2029 | 290,000 | 248,801 |
1,014,046 | ||
Leisure Products — 0.0% ^ | ||
Hasbro, Inc. 3.90%, 11/19/2029 | 15,000 | 13,602 |
INVESTMENTS | PRINCIPAL AMOUNT($) | VALUE($) |
Life Sciences Tools & Services — 0.1% | ||
Charles River Laboratories International, Inc. 3.75%, 3/15/2029 (a) | 120,000 | 105,916 |
Syneos Health, Inc. 3.63%, 1/15/2029 (a) | 180,000 | 179,550 |
Thermo Fisher Scientific, Inc. | ||
4.98%, 8/10/2030 | 500,000 | 498,793 |
5.09%, 8/10/2033 | 585,000 | 587,995 |
1,372,254 | ||
Machinery — 0.2% | ||
Caterpillar, Inc. | ||
4.30%, 5/15/2044 | 278,000 | 249,071 |
3.25%, 4/9/2050 | 200,000 | 151,463 |
Chart Industries, Inc. 7.50%, 1/1/2030 (a) | 720,000 | 737,744 |
Deere & Co. 3.90%, 6/9/2042 | 120,000 | 105,443 |
Hillenbrand, Inc. 3.75%, 3/1/2031 | 289,000 | 242,687 |
Illinois Tool Works, Inc. 3.90%, 9/1/2042 | 15,000 | 12,907 |
Otis Worldwide Corp. | ||
2.06%, 4/5/2025 | 190,000 | 180,038 |
5.25%, 8/16/2028 | 450,000 | 452,913 |
Parker-Hannifin Corp. | ||
3.25%, 3/1/2027 | 92,000 | 86,559 |
4.25%, 9/15/2027 | 300,000 | 291,022 |
Stanley Black & Decker, Inc. 2.75%, 11/15/2050 | 10,000 | 5,819 |
Terex Corp. 5.00%, 5/15/2029 (a) | 275,000 | 252,491 |
TK Elevator US Newco, Inc. (Germany) 5.25%, 7/15/2027 (a) | 250,000 | 234,350 |
Trinity Industries, Inc. 7.75%, 7/15/2028 (a) | 200,000 | 203,487 |
Xylem, Inc. 1.95%, 1/30/2028 | 30,000 | 26,319 |
3,232,313 | ||
Media — 1.4% | ||
Charter Communications Operating LLC | ||
2.25%, 1/15/2029 | 665,000 | 552,424 |
2.30%, 2/1/2032 | 1,250,000 | 943,357 |
3.50%, 6/1/2041 | 85,000 | 56,335 |
3.50%, 3/1/2042 | 575,000 | 375,909 |
3.70%, 4/1/2051 | 40,000 | 24,857 |
3.90%, 6/1/2052 | 95,000 | 60,787 |
Clear Channel Outdoor Holdings, Inc. 5.13%, 8/15/2027 (a) | 867,000 | 776,522 |
Comcast Corp. | ||
2.65%, 2/1/2030 | 230,000 | 200,007 |
4.25%, 10/15/2030 | 1,344,000 | 1,278,690 |
1.95%, 1/15/2031 | 80,000 | 64,685 |
36 | J.P. Morgan Exchange-Traded Funds | August 31, 2023 |
INVESTMENTS | PRINCIPAL AMOUNT($) | VALUE($) |
Corporate Bonds — continued | ||
Media — continued | ||
1.50%, 2/15/2031 | 450,000 | 352,097 |
5.50%, 11/15/2032 | 210,000 | 215,458 |
3.90%, 3/1/2038 | 95,000 | 81,049 |
3.25%, 11/1/2039 | 313,000 | 241,039 |
4.00%, 3/1/2048 | 45,000 | 36,212 |
2.89%, 11/1/2051 | 1,520,000 | 974,702 |
2.45%, 8/15/2052 | 110,000 | 64,376 |
5.35%, 5/15/2053 | 1,690,000 | 1,653,785 |
2.94%, 11/1/2056 | 2,598,000 | 1,616,675 |
CSC Holdings LLC | ||
5.25%, 6/1/2024 | 397,000 | 376,583 |
5.38%, 2/1/2028 (a) | 470,000 | 385,291 |
6.50%, 2/1/2029 (a) | 825,000 | 681,993 |
4.50%, 11/15/2031 (a) | 200,000 | 142,213 |
Directv Financing LLC 5.88%, 8/15/2027 (a) | 556,000 | 492,737 |
Discovery Communications LLC 4.00%, 9/15/2055 | 45,000 | 29,348 |
DISH DBS Corp. | ||
5.88%, 11/15/2024 | 916,000 | 851,988 |
5.25%, 12/1/2026 (a) | 175,000 | 147,515 |
DISH Network Corp. 11.75%, 11/15/2027 (a) | 755,000 | 766,054 |
Gannett Holdings LLC 6.00%, 11/1/2026 (a) | 235,000 | 201,583 |
Gray Escrow II, Inc. 5.38%, 11/15/2031 (a) | 135,000 | 94,250 |
Gray Television, Inc. | ||
7.00%, 5/15/2027 (a) | 155,000 | 139,122 |
4.75%, 10/15/2030 (a) | 100,000 | 69,823 |
iHeartCommunications, Inc. | ||
6.38%, 5/1/2026 | 495,000 | 431,892 |
8.38%, 5/1/2027 | 25,000 | 17,311 |
5.25%, 8/15/2027 (a) | 260,000 | 205,589 |
Lamar Media Corp. | ||
3.75%, 2/15/2028 | 215,000 | 195,306 |
4.00%, 2/15/2030 | 305,000 | 266,875 |
News Corp. 3.88%, 5/15/2029 (a) | 450,000 | 395,185 |
Nexstar Media, Inc. | ||
5.63%, 7/15/2027 (a) | 515,000 | 484,071 |
4.75%, 11/1/2028 (a) | 285,000 | 250,005 |
Outfront Media Capital LLC | ||
6.25%, 6/15/2025 (a) | 25,000 | 24,562 |
5.00%, 8/15/2027 (a) | 181,000 | 163,805 |
INVESTMENTS | PRINCIPAL AMOUNT($) | VALUE($) |
Media — continued | ||
Paramount Global | ||
3.70%, 6/1/2028 | 200,000 | 179,192 |
4.95%, 1/15/2031 | 50,000 | 44,599 |
Scripps Escrow II, Inc. 3.88%, 1/15/2029 (a) | 270,000 | 216,767 |
Scripps Escrow, Inc. 5.88%, 7/15/2027 (a) | 115,000 | 92,918 |
Sinclair Television Group, Inc. 4.13%, 12/1/2030 (a) | 150,000 | 96,666 |
Sirius XM Radio, Inc. | ||
5.00%, 8/1/2027 (a) | 110,000 | 101,704 |
4.00%, 7/15/2028 (a) | 1,810,000 | 1,567,317 |
5.50%, 7/1/2029 (a) | 160,000 | 144,041 |
4.13%, 7/1/2030 (a) | 485,000 | 395,387 |
Stagwell Global LLC 5.63%, 8/15/2029 (a) | 395,000 | 329,879 |
TEGNA, Inc. | ||
4.63%, 3/15/2028 | 415,000 | 370,663 |
5.00%, 9/15/2029 | 340,000 | 299,200 |
Univision Communications, Inc. | ||
6.63%, 6/1/2027 (a) | 260,000 | 251,711 |
4.50%, 5/1/2029 (a) | 280,000 | 241,006 |
Videotron Ltd. (Canada) | ||
5.38%, 6/15/2024 (a) | 37,000 | 36,721 |
5.13%, 4/15/2027 (a) | 215,000 | 205,862 |
20,955,700 | ||
Metals & Mining — 0.3% | ||
Alcoa Nederland Holding BV | ||
5.50%, 12/15/2027 (a) | 200,000 | 193,187 |
6.13%, 5/15/2028 (a) | 200,000 | 197,672 |
ATI, Inc. 5.88%, 12/1/2027 | 460,000 | 447,350 |
BHP Billiton Finance USA Ltd. (Australia) 4.90%, 2/28/2033 | 100,000 | 98,673 |
Big River Steel LLC 6.63%, 1/31/2029 (a) | 290,000 | 288,309 |
Carpenter Technology Corp. 6.38%, 7/15/2028 | 240,000 | 234,481 |
Cleveland-Cliffs, Inc. | ||
6.75%, 3/15/2026 (a) | 125,000 | 125,039 |
5.88%, 6/1/2027 | 430,000 | 414,097 |
4.63%, 3/1/2029 (a) | 310,000 | 274,850 |
FMG Resources August 2006 Pty. Ltd. (Australia) | ||
4.50%, 9/15/2027 (a) | 100,000 | 92,259 |
5.88%, 4/15/2030 (a) | 135,000 | 125,273 |
Freeport-McMoRan, Inc. | ||
4.25%, 3/1/2030 | 97,000 | 88,040 |
4.63%, 8/1/2030 | 300,000 | 277,453 |
August 31, 2023 | J.P. Morgan Exchange-Traded Funds | 37 |
AS OF August 31, 2023 (Unaudited) (continued)
INVESTMENTS | PRINCIPAL AMOUNT($) | VALUE($) |
Corporate Bonds — continued | ||
Metals & Mining — continued | ||
5.40%, 11/14/2034 | 183,000 | 173,417 |
Glencore Funding LLC (Australia) | ||
4.63%, 4/29/2024 (a) | 290,000 | 287,473 |
3.88%, 10/27/2027 (a) | 40,000 | 37,448 |
2.50%, 9/1/2030 (a) | 37,000 | 30,094 |
2.85%, 4/27/2031 (a) | 435,000 | 354,545 |
2.63%, 9/23/2031 (a) | 102,000 | 81,180 |
Kaiser Aluminum Corp. 4.63%, 3/1/2028 (a) | 205,000 | 181,287 |
Novelis Corp. 4.75%, 1/30/2030 (a) | 255,000 | 228,210 |
Nucor Corp. 2.98%, 12/15/2055 | 50,000 | 30,491 |
Rio Tinto Finance USA Ltd. (Australia) 5.20%, 11/2/2040 | 20,000 | 19,642 |
Rio Tinto Finance USA plc (Australia) 4.13%, 8/21/2042 | 370,000 | 316,563 |
Teck Resources Ltd. (Canada) 5.40%, 2/1/2043 | 20,000 | 17,469 |
United States Steel Corp. 6.88%, 3/1/2029 | 147,000 | 146,434 |
Vale Overseas Ltd. (Brazil) 3.75%, 7/8/2030 | 20,000 | 17,484 |
4,778,420 | ||
Mortgage Real Estate Investment Trusts (REITs) — 0.1% | ||
Great Ajax Operating Partnership LP Series QIB, 8.88%, 9/1/2027 (a) | 1,000,000 | 950,602 |
Multi-Utilities — 0.3% | ||
Ameren Corp. | ||
1.95%, 3/15/2027 | 20,000 | 17,979 |
3.50%, 1/15/2031 | 291,000 | 256,862 |
Ameren Illinois Co. 4.95%, 6/1/2033 | 750,000 | 734,567 |
Berkshire Hathaway Energy Co. | ||
5.15%, 11/15/2043 | 194,000 | 178,347 |
2.85%, 5/15/2051 | 40,000 | 24,770 |
4.60%, 5/1/2053 | 20,000 | 16,479 |
Consolidated Edison Co. of New York, Inc. | ||
Series E, 4.65%, 12/1/2048 | 225,000 | 193,470 |
Series A, 4.13%, 5/15/2049 | 41,000 | 32,447 |
Consumers Energy Co. 4.63%, 5/15/2033 | 205,000 | 198,764 |
DTE Energy Co. 4.88%, 6/1/2028 | 500,000 | 488,904 |
NiSource, Inc. 5.25%, 3/30/2028 | 275,000 | 273,847 |
PG&E Energy Recovery Funding LLC Series A-3, 2.82%, 7/15/2046 | 70,000 | 47,886 |
Puget Sound Energy, Inc. | ||
5.76%, 7/15/2040 | 140,000 | 133,472 |
5.45%, 6/1/2053 | 30,000 | 29,310 |
INVESTMENTS | PRINCIPAL AMOUNT($) | VALUE($) |
Multi-Utilities — continued | ||
San Diego Gas & Electric Co. | ||
4.95%, 8/15/2028 | 350,000 | 346,452 |
2.95%, 8/15/2051 | 170,000 | 110,958 |
5.35%, 4/1/2053 | 200,000 | 193,714 |
Southern Co. Gas Capital Corp. | ||
4.40%, 5/30/2047 | 100,000 | 80,095 |
Series 21A, 3.15%, 9/30/2051 | 460,000 | 297,263 |
3,655,586 | ||
Office REITs — 0.0% ^ | ||
Alexandria Real Estate Equities, Inc. | ||
1.88%, 2/1/2033 | 53,000 | 39,108 |
5.15%, 4/15/2053 | 30,000 | 26,714 |
Corporate Office Properties LP 2.25%, 3/15/2026 | 94,000 | 84,897 |
150,719 | ||
Oil, Gas & Consumable Fuels — 2.6% | ||
Aker BP ASA (Norway) 3.10%, 7/15/2031 (a) | 250,000 | 206,241 |
Antero Midstream Partners LP | ||
7.88%, 5/15/2026 (a) | 390,000 | 396,781 |
5.75%, 3/1/2027 (a) | 110,000 | 106,614 |
5.75%, 1/15/2028 (a) | 395,000 | 378,244 |
Antero Resources Corp. | ||
7.63%, 2/1/2029 (a) | 478,000 | 489,858 |
5.38%, 3/1/2030 (a) | 125,000 | 116,872 |
Apache Corp. 4.38%, 10/15/2028 | 179,000 | 164,977 |
Baytex Energy Corp. (Canada) | ||
8.75%, 4/1/2027 (a) | 310,000 | 317,255 |
8.50%, 4/30/2030 (a) | 319,000 | 323,449 |
Blue Racer Midstream LLC 6.63%, 7/15/2026 (a) | 195,000 | 191,647 |
BP Capital Markets America, Inc. | ||
3.02%, 1/16/2027 | 106,000 | 99,427 |
1.75%, 8/10/2030 | 730,000 | 591,595 |
2.72%, 1/12/2032 | 557,000 | 466,198 |
4.81%, 2/13/2033 | 3,360,000 | 3,252,266 |
4.89%, 9/11/2033 | 350,000 | 340,502 |
3.00%, 2/24/2050 | 174,000 | 115,914 |
2.77%, 11/10/2050 | 55,000 | 34,683 |
2.94%, 6/4/2051 | 67,000 | 43,744 |
3.00%, 3/17/2052 | 695,000 | 456,064 |
38 | J.P. Morgan Exchange-Traded Funds | August 31, 2023 |
INVESTMENTS | PRINCIPAL AMOUNT($) | VALUE($) |
Corporate Bonds — continued | ||
Oil, Gas & Consumable Fuels — continued | ||
BP Capital Markets plc (United Kingdom) | ||
(US Treasury Yield Curve Rate T Note Constant Maturity 5 Year + 4.04%), 4.38%, 6/22/2025 (d) (f) (g) | 85,000 | 81,324 |
(US Treasury Yield Curve Rate T Note Constant Maturity 5 Year + 4.40%), 4.88%, 3/22/2030 (d) (f) (g) | 155,000 | 140,370 |
Buckeye Partners LP | ||
3.95%, 12/1/2026 | 540,000 | 498,074 |
4.13%, 12/1/2027 | 175,000 | 159,126 |
California Resources Corp. 7.13%, 2/1/2026 (a) | 325,000 | 325,835 |
Cameron LNG LLC 3.70%, 1/15/2039 (a) | 20,000 | 16,085 |
Cheniere Corpus Christi Holdings LLC 5.88%, 3/31/2025 | 200,000 | 199,320 |
Cheniere Energy Partners LP | ||
4.50%, 10/1/2029 | 319,000 | 294,340 |
4.00%, 3/1/2031 | 135,000 | 119,185 |
3.25%, 1/31/2032 | 240,000 | 198,319 |
Chesapeake Energy Corp. | ||
5.88%, 2/1/2029 (a) | 370,000 | 354,117 |
6.75%, 4/15/2029 (a) | 115,000 | 114,163 |
Chevron Corp. 2.00%, 5/11/2027 | 171,000 | 155,030 |
Chord Energy Corp. 6.38%, 6/1/2026 (a) | 260,000 | 256,261 |
Civitas Resources, Inc. | ||
8.38%, 7/1/2028 (a) | 290,000 | 298,700 |
8.75%, 7/1/2031 (a) | 517,000 | 535,095 |
CNX Resources Corp. 7.25%, 3/14/2027 (a) | 182,000 | 181,814 |
Columbia Pipelines Operating Co. LLC | ||
6.04%, 11/15/2033 (a) | 360,000 | 363,690 |
6.50%, 8/15/2043 (a) | 210,000 | 212,855 |
Comstock Resources, Inc. | ||
6.75%, 3/1/2029 (a) | 570,000 | 533,336 |
5.88%, 1/15/2030 (a) | 35,000 | 30,913 |
ConocoPhillips Co. | ||
5.05%, 9/15/2033 | 600,000 | 596,283 |
3.80%, 3/15/2052 | 300,000 | 230,999 |
5.55%, 3/15/2054 | 780,000 | 781,927 |
4.03%, 3/15/2062 | 233,000 | 178,263 |
Coterra Energy, Inc. 3.90%, 5/15/2027 | 30,000 | 28,523 |
Crescent Energy Finance LLC 7.25%, 5/1/2026 (a) | 378,000 | 372,375 |
INVESTMENTS | PRINCIPAL AMOUNT($) | VALUE($) |
Oil, Gas & Consumable Fuels — continued | ||
Crestwood Midstream Partners LP | ||
5.75%, 4/1/2025 | 100,000 | 99,153 |
5.63%, 5/1/2027 (a) | 295,000 | 286,150 |
8.00%, 4/1/2029 (a) | 215,000 | 222,163 |
DT Midstream, Inc. | ||
4.13%, 6/15/2029 (a) | 360,000 | 318,931 |
4.38%, 6/15/2031 (a) | 180,000 | 155,828 |
4.30%, 4/15/2032 (a) | 80,000 | 69,996 |
Encino Acquisition Partners Holdings LLC 8.50%, 5/1/2028 (a) | 235,000 | 222,827 |
Energy Transfer LP | ||
4.15%, 9/15/2029 | 1,150,000 | 1,057,541 |
5.75%, 2/15/2033 | 120,000 | 119,308 |
5.80%, 6/15/2038 | 100,000 | 94,790 |
5.35%, 5/15/2045 | 45,000 | 38,460 |
EnLink Midstream LLC 5.38%, 6/1/2029 | 250,000 | 238,351 |
EnLink Midstream Partners LP | ||
4.85%, 7/15/2026 | 280,000 | 268,800 |
5.60%, 4/1/2044 | 9,000 | 7,674 |
Enterprise Products Operating LLC | ||
2.80%, 1/31/2030 | 237,000 | 205,389 |
5.35%, 1/31/2033 | 110,000 | 110,613 |
3.30%, 2/15/2053 | 30,000 | 20,515 |
EQM Midstream Partners LP | ||
4.13%, 12/1/2026 | 420,000 | 394,316 |
7.50%, 6/1/2027 (a) | 160,000 | 161,490 |
6.50%, 7/1/2027 (a) | 405,000 | 402,437 |
5.50%, 7/15/2028 | 365,000 | 348,715 |
4.50%, 1/15/2029 (a) | 215,000 | 195,346 |
4.75%, 1/15/2031 (a) | 335,000 | 296,032 |
Exxon Mobil Corp. | ||
4.23%, 3/19/2040 | 400,000 | 357,496 |
3.10%, 8/16/2049 | 220,000 | 154,755 |
Flex Intermediate Holdco LLC | ||
3.36%, 6/30/2031 (a) | 64,000 | 50,665 |
4.32%, 12/30/2039 (a) | 20,000 | 14,308 |
Genesis Energy LP | ||
6.25%, 5/15/2026 | 275,000 | 266,538 |
8.00%, 1/15/2027 | 265,000 | 261,245 |
Gray Oak Pipeline LLC | ||
2.00%, 9/15/2023 (a) | 44,000 | 43,952 |
2.60%, 10/15/2025 (a) | 112,000 | 103,570 |
Gulfport Energy Corp. 8.00%, 5/17/2026 (a) | 485,000 | 492,532 |
August 31, 2023 | J.P. Morgan Exchange-Traded Funds | 39 |
AS OF August 31, 2023 (Unaudited) (continued)
INVESTMENTS | PRINCIPAL AMOUNT($) | VALUE($) |
Corporate Bonds — continued | ||
Oil, Gas & Consumable Fuels — continued | ||
Hess Midstream Operations LP | ||
5.63%, 2/15/2026 (a) | 105,000 | 102,746 |
5.50%, 10/15/2030 (a) | 275,000 | 257,447 |
Hilcorp Energy I LP 5.75%, 2/1/2029 (a) | 839,000 | 778,173 |
Holly Energy Partners LP 6.38%, 4/15/2027 (a) | 240,000 | 238,744 |
Kinder Morgan, Inc. 3.25%, 8/1/2050 | 75,000 | 47,213 |
Kinetik Holdings LP 5.88%, 6/15/2030 (a) | 555,000 | 537,523 |
MEG Energy Corp. (Canada) 5.88%, 2/1/2029 (a) | 430,000 | 410,792 |
MPLX LP | ||
2.65%, 8/15/2030 | 70,000 | 58,095 |
4.95%, 3/14/2052 | 55,000 | 45,324 |
NGL Energy Operating LLC 7.50%, 2/1/2026 (a) | 215,000 | 214,049 |
NGPL PipeCo LLC 3.25%, 7/15/2031 (a) | 10,000 | 8,203 |
NuStar Logistics LP | ||
5.75%, 10/1/2025 | 250,000 | 245,161 |
5.63%, 4/28/2027 | 395,000 | 383,249 |
Occidental Petroleum Corp. | ||
8.88%, 7/15/2030 | 150,000 | 171,968 |
6.63%, 9/1/2030 | 385,000 | 397,441 |
Permian Resources Operating LLC 5.38%, 1/15/2026 (a) | 315,000 | 303,934 |
Pioneer Natural Resources Co. 1.13%, 1/15/2026 | 50,000 | 45,325 |
Range Resources Corp. | ||
4.88%, 5/15/2025 | 45,000 | 43,988 |
8.25%, 1/15/2029 | 615,000 | 638,462 |
Rockies Express Pipeline LLC | ||
3.60%, 5/15/2025 (a) | 385,000 | 363,163 |
4.95%, 7/15/2029 (a) | 170,000 | 155,598 |
Sabine Pass Liquefaction LLC | ||
5.63%, 3/1/2025 | 90,000 | 89,707 |
5.88%, 6/30/2026 | 420,000 | 421,947 |
5.00%, 3/15/2027 | 1,225,000 | 1,204,273 |
4.50%, 5/15/2030 | 894,000 | 841,301 |
SM Energy Co. | ||
6.75%, 9/15/2026 | 250,000 | 248,950 |
6.63%, 1/15/2027 | 375,000 | 370,313 |
Southwestern Energy Co. | ||
5.70%, 1/23/2025 (i) | 2,000 | 1,981 |
8.38%, 9/15/2028 | 305,000 | 317,459 |
5.38%, 2/1/2029 | 320,000 | 303,609 |
5.38%, 3/15/2030 | 370,000 | 346,389 |
INVESTMENTS | PRINCIPAL AMOUNT($) | VALUE($) |
Oil, Gas & Consumable Fuels — continued | ||
Spectra Energy Partners LP 4.50%, 3/15/2045 | 15,000 | 12,068 |
Summit Midstream Holdings LLC 9.00%, 10/15/2026 (a) (i) | 185,000 | 178,525 |
Suncor Energy, Inc. (Canada) 6.80%, 5/15/2038 | 83,000 | 86,690 |
Sunoco LP | ||
6.00%, 4/15/2027 | 185,000 | 183,066 |
5.88%, 3/15/2028 | 100,000 | 97,130 |
4.50%, 5/15/2029 | 180,000 | 162,783 |
Tallgrass Energy Partners LP | ||
7.50%, 10/1/2025 (a) | 45,000 | 45,274 |
6.00%, 3/1/2027 (a) | 395,000 | 378,505 |
5.50%, 1/15/2028 (a) | 55,000 | 51,082 |
6.00%, 12/31/2030 (a) | 280,000 | 250,486 |
6.00%, 9/1/2031 (a) | 40,000 | 35,525 |
Targa Resources Corp. 5.20%, 7/1/2027 | 31,000 | 30,692 |
TotalEnergies Capital International SA (France) | ||
3.46%, 7/12/2049 | 234,000 | 174,178 |
3.13%, 5/29/2050 | 80,000 | 55,297 |
TransCanada PipeLines Ltd. (Canada) 5.10%, 3/15/2049 | 48,000 | 42,145 |
Valero Energy Corp. 2.15%, 9/15/2027 | 25,000 | 22,261 |
Venture Global Calcasieu Pass LLC 3.88%, 8/15/2029 (a) | 570,000 | 493,063 |
Venture Global LNG, Inc. 8.13%, 6/1/2028 (a) | 1,620,000 | 1,634,165 |
Vital Energy, Inc. 9.50%, 1/15/2025 | 255,000 | 256,275 |
Williams Cos., Inc. (The) | ||
2.60%, 3/15/2031 | 1,525,000 | 1,251,530 |
5.40%, 3/4/2044 | 50,000 | 45,070 |
37,506,876 | ||
Passenger Airlines — 0.3% | ||
American Airlines, Inc. | ||
11.75%, 7/15/2025 (a) | 345,000 | 377,617 |
5.50%, 4/20/2026 (a) | 508,750 | 499,228 |
7.25%, 2/15/2028 (a) | 225,000 | 221,022 |
5.75%, 4/20/2029 (a) | 1,375,000 | 1,315,024 |
Continental Airlines Pass-Through Trust Series 2012-2, Class A Shares, 4.00%, 10/29/2024 | 26,881 | 26,220 |
Delta Air Lines, Inc. | ||
7.38%, 1/15/2026 | 105,000 | 108,029 |
4.38%, 4/19/2028 | 140,000 | 132,230 |
40 | J.P. Morgan Exchange-Traded Funds | August 31, 2023 |
INVESTMENTS | PRINCIPAL AMOUNT($) | VALUE($) |
Corporate Bonds — continued | ||
Passenger Airlines — continued | ||
Mileage Plus Holdings LLC 6.50%, 6/20/2027 (a) | 452,000 | 450,423 |
United Airlines Holdings, Inc. | ||
5.00%, 2/1/2024 | 20,000 | 19,859 |
4.88%, 1/15/2025 | 16,000 | 15,609 |
United Airlines, Inc. 4.63%, 4/15/2029 (a) | 695,000 | 617,960 |
VistaJet Malta Finance plc (Switzerland) 9.50%, 6/1/2028 (a) | 270,000 | 249,156 |
4,032,377 | ||
Personal Care Products — 0.2% | ||
Edgewell Personal Care Co. | ||
5.50%, 6/1/2028 (a) | 295,000 | 278,037 |
4.13%, 4/1/2029 (a) | 70,000 | 60,665 |
Estee Lauder Cos., Inc. (The) 2.60%, 4/15/2030 | 258,000 | 222,645 |
Kenvue, Inc. | ||
4.90%, 3/22/2033 (a) | 1,960,000 | 1,949,115 |
5.10%, 3/22/2043 (a) | 300,000 | 294,256 |
Prestige Brands, Inc. 5.13%, 1/15/2028 (a) | 265,000 | 250,440 |
3,055,158 | ||
Pharmaceuticals — 0.8% | ||
Astrazeneca Finance LLC (United Kingdom) | ||
4.90%, 3/3/2030 | 1,130,000 | 1,124,035 |
4.88%, 3/3/2033 | 500,000 | 500,149 |
AstraZeneca plc (United Kingdom) 1.38%, 8/6/2030 | 180,000 | 143,168 |
Bausch Health Americas, Inc. | ||
9.25%, 4/1/2026 (a) | 263,000 | 238,220 |
8.50%, 1/31/2027 (a) | 88,000 | 48,950 |
Bausch Health Cos., Inc. | ||
5.50%, 11/1/2025 (a) | 1,047,000 | 942,886 |
5.75%, 8/15/2027 (a) | 30,000 | 18,782 |
5.00%, 1/30/2028 (a) | 30,000 | 13,036 |
4.88%, 6/1/2028 (a) | 280,000 | 166,150 |
5.00%, 2/15/2029 (a) | 175,000 | 72,625 |
Bayer US Finance II LLC (Germany) 3.38%, 7/15/2024 (a) | 70,000 | 68,467 |
Bristol-Myers Squibb Co. | ||
4.13%, 6/15/2039 | 329,000 | 290,567 |
2.35%, 11/13/2040 | 480,000 | 324,315 |
3.70%, 3/15/2052 | 260,000 | 199,956 |
Catalent Pharma Solutions, Inc. 3.13%, 2/15/2029 (a) | 225,000 | 189,356 |
INVESTMENTS | PRINCIPAL AMOUNT($) | VALUE($) |
Pharmaceuticals — continued | ||
Elanco Animal Health, Inc. 6.65%, 8/28/2028 (i) | 215,000 | 212,044 |
Eli Lilly & Co. | ||
2.25%, 5/15/2050 | 70,000 | 43,206 |
4.95%, 2/27/2063 | 450,000 | 439,577 |
Jazz Securities DAC 4.38%, 1/15/2029 (a) | 400,000 | 358,375 |
Merck & Co., Inc. | ||
2.75%, 12/10/2051 | 170,000 | 111,560 |
5.00%, 5/17/2053 | 235,000 | 229,529 |
5.15%, 5/17/2063 | 105,000 | 102,493 |
Organon & Co. | ||
4.13%, 4/30/2028 (a) | 400,000 | 361,985 |
5.13%, 4/30/2031 (a) | 400,000 | 340,801 |
Pfizer Investment Enterprises Pte. Ltd. | ||
4.75%, 5/19/2033 | 380,000 | 373,940 |
5.30%, 5/19/2053 | 315,000 | 315,115 |
5.34%, 5/19/2063 | 315,000 | 310,377 |
Pfizer, Inc. 4.40%, 5/15/2044 | 500,000 | 455,235 |
Royalty Pharma plc 1.20%, 9/2/2025 | 166,000 | 151,211 |
Shire Acquisitions Investments Ireland DAC 3.20%, 9/23/2026 | 145,000 | 136,200 |
Takeda Pharmaceutical Co. Ltd. (Japan) | ||
5.00%, 11/26/2028 | 1,000,000 | 991,962 |
3.03%, 7/9/2040 | 400,000 | 290,733 |
Zoetis, Inc. | ||
2.00%, 5/15/2030 | 245,000 | 201,682 |
5.60%, 11/16/2032 | 64,000 | 66,025 |
4.70%, 2/1/2043 | 1,230,000 | 1,115,134 |
10,947,846 | ||
Real Estate Management & Development — 0.0% ^ | ||
Kennedy-Wilson, Inc. 4.75%, 3/1/2029 | 75,000 | 60,264 |
Realogy Group LLC 5.75%, 1/15/2029 (a) | 105,000 | 75,200 |
135,464 | ||
Residential REITs — 0.0% ^ | ||
AvalonBay Communities, Inc. 3.35%, 5/15/2027 | 32,000 | 29,918 |
Camden Property Trust 3.15%, 7/1/2029 | 130,000 | 116,836 |
ERP Operating LP 3.25%, 8/1/2027 | 31,000 | 28,616 |
Essex Portfolio LP 2.65%, 3/15/2032 | 45,000 | 35,846 |
Mid-America Apartments LP 4.20%, 6/15/2028 | 100,000 | 95,062 |
UDR, Inc. 2.10%, 8/1/2032 | 45,000 | 33,754 |
340,032 | ||
August 31, 2023 | J.P. Morgan Exchange-Traded Funds | 41 |
AS OF August 31, 2023 (Unaudited) (continued)
INVESTMENTS | PRINCIPAL AMOUNT($) | VALUE($) |
Corporate Bonds — continued | ||
Retail REITs — 0.0% ^ | ||
NNN REIT, Inc. | ||
3.60%, 12/15/2026 | 39,000 | 36,384 |
5.60%, 10/15/2033 | 100,000 | 97,992 |
Realty Income Corp. | ||
4.13%, 10/15/2026 | 44,000 | 42,522 |
3.25%, 1/15/2031 | 9,000 | 7,783 |
Regency Centers LP 3.70%, 6/15/2030 | 135,000 | 121,010 |
Scentre Group Trust 1 (Australia) 3.50%, 2/12/2025 (a) | 150,000 | 144,841 |
450,532 | ||
Semiconductors & Semiconductor Equipment — 0.5% | ||
Amkor Technology, Inc. 6.63%, 9/15/2027 (a) | 485,000 | 484,699 |
ams-OSRAM AG (Austria) 7.00%, 7/31/2025 (a) | 250,000 | 229,200 |
Analog Devices, Inc. | ||
3.50%, 12/5/2026 | 25,000 | 23,937 |
2.95%, 10/1/2051 | 107,000 | 71,909 |
Entegris Escrow Corp. 5.95%, 6/15/2030 (a) | 490,000 | 469,232 |
Entegris, Inc. 3.63%, 5/1/2029 (a) | 180,000 | 154,706 |
Intel Corp. | ||
5.20%, 2/10/2033 | 400,000 | 399,675 |
5.63%, 2/10/2043 | 550,000 | 547,424 |
5.70%, 2/10/2053 | 85,000 | 84,175 |
KLA Corp. | ||
4.65%, 7/15/2032 | 280,000 | 275,134 |
5.00%, 3/15/2049 | 100,000 | 94,445 |
3.30%, 3/1/2050 | 280,000 | 201,240 |
Marvell Technology, Inc. 2.95%, 4/15/2031 | 85,000 | 70,925 |
Microchip Technology, Inc. 0.97%, 2/15/2024 | 25,000 | 24,425 |
NVIDIA Corp. | ||
2.00%, 6/15/2031 | 455,000 | 376,945 |
3.50%, 4/1/2040 | 100,000 | 83,240 |
NXP BV (China) | ||
3.25%, 5/11/2041 | 270,000 | 191,789 |
3.13%, 2/15/2042 | 330,000 | 225,908 |
ON Semiconductor Corp. 3.88%, 9/1/2028 (a) | 555,000 | 494,050 |
QUALCOMM, Inc. | ||
4.25%, 5/20/2032 | 55,000 | 52,893 |
4.50%, 5/20/2052 | 235,000 | 205,087 |
Synaptics, Inc. 4.00%, 6/15/2029 (a) | 295,000 | 250,951 |
INVESTMENTS | PRINCIPAL AMOUNT($) | VALUE($) |
Semiconductors & Semiconductor Equipment — continued | ||
Texas Instruments, Inc. 5.05%, 5/18/2063 | 221,000 | 211,737 |
TSMC Arizona Corp. (Taiwan) 2.50%, 10/25/2031 | 960,000 | 793,267 |
TSMC Global Ltd. (Taiwan) 1.00%, 9/28/2027 (a) | 380,000 | 323,452 |
Xilinx, Inc. 2.38%, 6/1/2030 | 239,000 | 204,392 |
6,544,837 | ||
Software — 0.4% | ||
Black Knight InfoServ LLC 3.63%, 9/1/2028 (a) | 220,000 | 202,926 |
Clarivate Science Holdings Corp. 3.88%, 7/1/2028 (a) | 260,000 | 229,099 |
Microsoft Corp. | ||
2.92%, 3/17/2052 | 490,000 | 347,473 |
2.68%, 6/1/2060 | 250,000 | 160,812 |
NCR Corp. | ||
5.75%, 9/1/2027 (a) | 115,000 | 116,112 |
5.00%, 10/1/2028 (a) | 680,000 | 624,101 |
5.13%, 4/15/2029 (a) | 270,000 | 245,549 |
6.13%, 9/1/2029 (a) | 161,000 | 165,819 |
Oracle Corp. | ||
2.65%, 7/15/2026 | 583,000 | 541,470 |
2.30%, 3/25/2028 | 15,000 | 13,200 |
4.90%, 2/6/2033 | 1,245,000 | 1,189,277 |
3.80%, 11/15/2037 | 150,000 | 120,966 |
3.65%, 3/25/2041 | 115,000 | 86,824 |
3.95%, 3/25/2051 | 375,000 | 274,080 |
5.55%, 2/6/2053 | 150,000 | 139,438 |
4.38%, 5/15/2055 | 55,000 | 42,256 |
RingCentral, Inc. 8.50%, 8/15/2030 (a) | 170,000 | 167,450 |
Roper Technologies, Inc. 1.75%, 2/15/2031 | 355,000 | 278,652 |
SS&C Technologies, Inc. 5.50%, 9/30/2027 (a) | 570,000 | 548,739 |
VMware, Inc. 4.65%, 5/15/2027 | 105,000 | 102,070 |
Workday, Inc. 3.70%, 4/1/2029 | 172,000 | 158,932 |
5,755,245 | ||
Specialized REITs — 0.3% | ||
American Tower Corp. | ||
1.45%, 9/15/2026 | 85,000 | 75,316 |
2.95%, 1/15/2051 | 25,000 | 15,132 |
Crown Castle, Inc. | ||
2.90%, 3/15/2027 | 270,000 | 247,850 |
5.10%, 5/1/2033 | 2,000,000 | 1,924,577 |
42 | J.P. Morgan Exchange-Traded Funds | August 31, 2023 |
INVESTMENTS | PRINCIPAL AMOUNT($) | VALUE($) |
Corporate Bonds — continued | ||
Specialized REITs — continued | ||
Equinix, Inc. 3.90%, 4/15/2032 | 80,000 | 71,203 |
Extra Space Storage LP 2.20%, 10/15/2030 | 88,000 | 70,211 |
Iron Mountain, Inc. | ||
4.88%, 9/15/2027 (a) | 315,000 | 296,550 |
5.00%, 7/15/2028 (a) | 610,000 | 564,898 |
Public Storage Operating Co. | ||
2.25%, 11/9/2031 | 90,000 | 72,805 |
5.10%, 8/1/2033 | 304,000 | 301,417 |
SBA Communications Corp. 3.13%, 2/1/2029 | 930,000 | 796,256 |
4,436,215 | ||
Specialty Retail — 0.5% | ||
Asbury Automotive Group, Inc. | ||
4.50%, 3/1/2028 | 297,000 | 270,931 |
4.63%, 11/15/2029 (a) | 300,000 | 264,655 |
AutoZone, Inc. 1.65%, 1/15/2031 | 150,000 | 116,494 |
Bath & Body Works, Inc. | ||
5.25%, 2/1/2028 | 175,000 | 167,901 |
7.50%, 6/15/2029 | 768,000 | 774,311 |
6.88%, 11/1/2035 | 235,000 | 219,734 |
Gap, Inc. (The) 3.63%, 10/1/2029 (a) | 430,000 | 327,352 |
Group 1 Automotive, Inc. 4.00%, 8/15/2028 (a) | 300,000 | 266,370 |
Home Depot, Inc. (The) | ||
1.88%, 9/15/2031 | 770,000 | 619,322 |
4.50%, 9/15/2032 | 350,000 | 341,821 |
4.25%, 4/1/2046 | 301,000 | 258,081 |
3.63%, 4/15/2052 | 150,000 | 114,219 |
4.95%, 9/15/2052 | 206,000 | 196,370 |
Lithia Motors, Inc. 3.88%, 6/1/2029 (a) | 480,000 | 412,106 |
Lowe's Cos., Inc. | ||
1.70%, 10/15/2030 | 170,000 | 134,979 |
4.25%, 4/1/2052 | 465,000 | 367,856 |
5.63%, 4/15/2053 | 585,000 | 568,141 |
O'Reilly Automotive, Inc. | ||
1.75%, 3/15/2031 | 73,000 | 57,489 |
4.70%, 6/15/2032 | 90,000 | 86,053 |
Penske Automotive Group, Inc. 3.75%, 6/15/2029 | 494,000 | 423,888 |
PetSmart, Inc. 4.75%, 2/15/2028 (a) | 1,000,000 | 897,030 |
Sonic Automotive, Inc. 4.63%, 11/15/2029 (a) | 400,000 | 341,958 |
SRS Distribution, Inc. 4.63%, 7/1/2028 (a) | 410,000 | 364,909 |
INVESTMENTS | PRINCIPAL AMOUNT($) | VALUE($) |
Specialty Retail — continued | ||
Staples, Inc. | ||
7.50%, 4/15/2026 (a) | 290,000 | 239,945 |
10.75%, 4/15/2027 (a) | 23,000 | 12,544 |
7,844,459 | ||
Technology Hardware, Storage & Peripherals — 0.3% | ||
Apple, Inc. | ||
4.38%, 5/13/2045 | 429,000 | 394,929 |
2.65%, 2/8/2051 | 650,000 | 432,139 |
4.85%, 5/10/2053 | 490,000 | 483,510 |
2.85%, 8/5/2061 | 750,000 | 488,251 |
Dell International LLC 5.30%, 10/1/2029 | 375,000 | 370,246 |
Seagate HDD Cayman | ||
4.09%, 6/1/2029 | 150,000 | 132,164 |
3.13%, 7/15/2029 | 335,000 | 253,916 |
8.25%, 12/15/2029 (a) | 924,000 | 969,277 |
4.13%, 1/15/2031 | 114,000 | 93,110 |
8.50%, 7/15/2031 (a) | 230,000 | 240,972 |
9.63%, 12/1/2032 (a) | 140,000 | 155,079 |
4,013,593 | ||
Textiles, Apparel & Luxury Goods — 0.0% ^ | ||
Hanesbrands, Inc. 4.88%, 5/15/2026 (a) | 130,000 | 121,524 |
William Carter Co. (The) 5.63%, 3/15/2027 (a) | 205,000 | 198,735 |
320,259 | ||
Tobacco — 0.6% | ||
Altria Group, Inc. | ||
2.45%, 2/4/2032 | 80,000 | 62,440 |
3.40%, 2/4/2041 | 145,000 | 98,798 |
3.88%, 9/16/2046 | 95,000 | 65,416 |
BAT Capital Corp. (United Kingdom) | ||
3.56%, 8/15/2027 | 38,000 | 35,252 |
2.26%, 3/25/2028 | 1,045,000 | 898,498 |
4.74%, 3/16/2032 | 1,000,000 | 904,128 |
6.42%, 8/2/2033 | 1,890,000 | 1,886,637 |
4.39%, 8/15/2037 | 600,000 | 475,147 |
4.54%, 8/15/2047 | 665,000 | 483,583 |
Imperial Brands Finance plc (United Kingdom) 6.13%, 7/27/2027 (a) | 285,000 | 288,120 |
Philip Morris International, Inc. | ||
3.13%, 3/2/2028 | 49,000 | 44,990 |
5.75%, 11/17/2032 | 820,000 | 831,666 |
5.38%, 2/15/2033 | 1,545,000 | 1,525,631 |
August 31, 2023 | J.P. Morgan Exchange-Traded Funds | 43 |
AS OF August 31, 2023 (Unaudited) (continued)
INVESTMENTS | PRINCIPAL AMOUNT($) | VALUE($) |
Corporate Bonds — continued | ||
Tobacco — continued | ||
4.38%, 11/15/2041 | 345,000 | 285,323 |
4.13%, 3/4/2043 | 100,000 | 79,437 |
7,965,066 | ||
Trading Companies & Distributors — 0.3% | ||
Air Lease Corp. | ||
3.38%, 7/1/2025 | 92,000 | 87,651 |
1.88%, 8/15/2026 | 50,000 | 44,740 |
Aviation Capital Group LLC 4.13%, 8/1/2025 (a) | 110,000 | 104,775 |
Herc Holdings, Inc. 5.50%, 7/15/2027 (a) | 565,000 | 543,290 |
Imola Merger Corp. 4.75%, 5/15/2029 (a) | 740,000 | 657,754 |
United Rentals North America, Inc. | ||
4.88%, 1/15/2028 | 235,000 | 223,591 |
5.25%, 1/15/2030 | 890,000 | 845,785 |
3.88%, 2/15/2031 | 185,000 | 158,242 |
WESCO Distribution, Inc. | ||
7.13%, 6/15/2025 (a) | 85,000 | 85,376 |
7.25%, 6/15/2028 (a) | 935,000 | 951,582 |
3,702,786 | ||
Transportation Infrastructure — 0.0% ^ | ||
Transurban Finance Co. Pty. Ltd. (Australia) 2.45%, 3/16/2031 (a) | 212,000 | 172,621 |
Wireless Telecommunication Services — 0.5% | ||
Hughes Satellite Systems Corp. | ||
5.25%, 8/1/2026 | 185,000 | 170,056 |
6.63%, 8/1/2026 | 215,000 | 186,513 |
Rogers Communications, Inc. (Canada) 4.55%, 3/15/2052 | 40,000 | 30,994 |
Sprint LLC | ||
7.88%, 9/15/2023 | 8,000 | 8,003 |
7.13%, 6/15/2024 | 30,000 | 30,238 |
7.63%, 3/1/2026 | 296,000 | 306,812 |
T-Mobile USA, Inc. | ||
4.80%, 7/15/2028 | 2,140,000 | 2,092,137 |
2.63%, 2/15/2029 | 28,000 | 24,246 |
3.38%, 4/15/2029 | 3,250,000 | 2,913,176 |
2.55%, 2/15/2031 | 67,000 | 55,209 |
5.20%, 1/15/2033 | 350,000 | 342,978 |
5.05%, 7/15/2033 | 940,000 | 907,041 |
7,067,403 | ||
Total Corporate Bonds (Cost $431,098,311) | 417,236,583 | |
INVESTMENTS | PRINCIPAL AMOUNT($) | VALUE($) |
Mortgage-Backed Securities — 19.7% | ||
FHLMC Gold Pools, 30 Year Pool # G60855, 4.50%, 12/1/2045 | 66,282 | 64,240 |
FHLMC Gold Pools, Other | ||
Pool # WN1158, 1.80%, 11/1/2028 | 4,000,000 | 3,445,024 |
Pool # WN2203, 3.75%, 8/1/2032 | 1,200,000 | 1,100,825 |
Pool # WN3233, 3.19%, 7/1/2033 | 4,000,000 | 3,515,316 |
Pool # N31271, 4.50%, 1/1/2036 | 13,185 | 12,580 |
FHLMC UMBS, 20 Year Pool # SC0310, 2.00%, 8/1/2042 | 937,311 | 782,868 |
FHLMC UMBS, 30 Year | ||
Pool # QA5045, 4.00%, 11/1/2049 | 43,639 | 40,766 |
Pool # QB1397, 2.50%, 7/1/2050 | 2,194,285 | 1,830,586 |
Pool # SD8089, 2.50%, 7/1/2050 | 4,404,367 | 3,685,820 |
Pool # QC7968, 2.50%, 10/1/2051 | 4,269,780 | 3,543,213 |
Pool # RA6222, 3.00%, 11/1/2051 | 3,520,698 | 3,039,898 |
Pool # SD2301, 3.50%, 3/1/2052 | 1,401,958 | 1,254,386 |
Pool # SD1464, 3.00%, 5/1/2052 | 1,047,945 | 905,078 |
Pool # SD1303, 4.50%, 7/1/2052 | 1,593,750 | 1,515,057 |
Pool # QE8091, 4.00%, 8/1/2052 | 1,727,448 | 1,596,705 |
Pool # SD1725, 4.00%, 10/1/2052 | 1,936,373 | 1,789,813 |
Pool # QF3433, 5.00%, 11/1/2052 | 1,955,053 | 1,903,269 |
Pool # RA8766, 5.00%, 3/1/2053 | 1,944,746 | 1,885,684 |
Pool # SD3567, 4.50%, 5/1/2053 | 4,000,000 | 3,794,644 |
Pool # RA9669, 5.00%, 8/1/2053 | 4,000,000 | 3,878,617 |
FNMA UMBS, 20 Year Pool # MA3004, 4.00%, 5/1/2037 | 324,377 | 307,487 |
FNMA UMBS, 30 Year | ||
Pool # AL2374, 4.00%, 12/1/2041 | 94,535 | 89,812 |
Pool # AL4244, 4.00%, 7/1/2042 | 109,523 | 104,050 |
Pool # BM1164, 3.50%, 12/1/2045 | 76,368 | 69,585 |
Pool # MA3073, 4.50%, 7/1/2047 | 18,105 | 17,514 |
Pool # BK4769, 5.00%, 8/1/2048 | 312,264 | 308,458 |
Pool # BN5013, 5.00%, 1/1/2049 | 110,950 | 109,586 |
Pool # BO1073, 4.50%, 6/1/2049 | 27,767 | 26,581 |
Pool # BO3039, 3.00%, 7/1/2049 | 159,809 | 139,265 |
Pool # BN6475, 4.00%, 7/1/2049 | 7,720 | 7,231 |
Pool # BO2562, 4.00%, 7/1/2049 | 81,231 | 76,084 |
Pool # BO4519, 4.00%, 8/1/2049 | 3,475 | 3,242 |
Pool # BO2203, 3.50%, 9/1/2049 | 233,295 | 211,549 |
Pool # FS1186, 3.50%, 1/1/2050 | 1,724,568 | 1,565,396 |
Pool # FM3365, 3.00%, 3/1/2050 | 3,011,452 | 2,617,782 |
Pool # CA5702, 2.50%, 5/1/2050 | 1,334,637 | 1,120,442 |
Pool # CB1411, 3.00%, 8/1/2051 | 4,005,662 | 3,471,826 |
Pool # BU0070, 2.50%, 10/1/2051 | 928,845 | 771,592 |
Pool # FS0009, 3.50%, 11/1/2051 | 3,175,258 | 2,843,387 |
Pool # FM9961, 3.00%, 12/1/2051 | 458,368 | 395,333 |
44 | J.P. Morgan Exchange-Traded Funds | August 31, 2023 |
INVESTMENTS | PRINCIPAL AMOUNT($) | VALUE($) |
Mortgage-Backed Securities — continued | ||
Pool # CB2637, 2.50%, 1/1/2052 | 469,042 | 389,896 |
Pool # BV0273, 3.00%, 1/1/2052 | 296,384 | 256,771 |
Pool # CB2670, 3.00%, 1/1/2052 | 439,137 | 378,440 |
Pool # MA4548, 2.50%, 2/1/2052 | 6,539,154 | 5,418,457 |
Pool # BV3930, 3.00%, 2/1/2052 | 552,586 | 476,886 |
Pool # BV0295, 3.50%, 2/1/2052 | 623,521 | 570,504 |
Pool # FS0957, 3.00%, 3/1/2052 | 272,149 | 234,500 |
Pool # FS1954, 3.00%, 3/1/2052 | 1,787,577 | 1,565,218 |
Pool # FS4393, 3.00%, 3/1/2052 | 3,352,012 | 2,907,283 |
Pool # CB3132, 3.50%, 3/1/2052 | 2,914,437 | 2,605,045 |
Pool # BW6017, 3.50%, 5/1/2052 | 588,477 | 529,933 |
Pool # CB3608, 3.50%, 5/1/2052 | 4,939,288 | 4,418,115 |
Pool # FS2588, 4.50%, 8/1/2052 | 1,625,392 | 1,545,133 |
Pool # FS3536, 4.50%, 8/1/2052 | 1,863,633 | 1,767,357 |
Pool # CB4830, 4.50%, 9/1/2052 | 1,408,485 | 1,338,507 |
Pool # FS3829, 4.50%, 9/1/2052 | 1,369,723 | 1,302,052 |
Pool # CB4628, 5.00%, 9/1/2052 | 2,342,626 | 2,271,522 |
Pool # FS2982, 5.00%, 9/1/2052 | 2,936,739 | 2,850,100 |
Pool # CB4837, 5.00%, 10/1/2052 | 1,481,131 | 1,446,710 |
Pool # BX0627, 5.00%, 11/1/2052 | 1,975,898 | 1,920,892 |
Pool # CB5413, 4.00%, 12/1/2052 | 1,972,700 | 1,822,114 |
Pool # CB5428, 4.50%, 12/1/2052 | 1,977,578 | 1,877,794 |
Pool # BX3808, 5.00%, 3/1/2053 | 988,738 | 963,859 |
Pool # BX3811, 5.00%, 3/1/2053 | 1,608,441 | 1,560,388 |
Pool # CB5896, 5.00%, 3/1/2053 | 1,937,114 | 1,878,284 |
Pool # BX3824, 5.50%, 3/1/2053 | 362,701 | 358,452 |
Pool # CB5907, 5.50%, 3/1/2053 | 1,126,984 | 1,117,857 |
Pool # BY4714, 5.00%, 6/1/2053 | 3,190,970 | 3,094,153 |
Pool # BY4776, 5.00%, 7/1/2053 | 2,995,853 | 2,904,910 |
Pool # BY4736, 5.50%, 7/1/2053 | 2,817,189 | 2,784,184 |
FNMA, Other | ||
Pool # AM8846, 2.68%, 5/1/2025 | 138,866 | 132,707 |
Pool # AM0414, 2.87%, 9/1/2027 | 394,965 | 366,853 |
Pool # AN7560, 2.90%, 12/1/2027 | 181,276 | 167,158 |
Pool # BS8981, 5.04%, 2/1/2029 | 3,822,000 | 3,852,844 |
Pool # BL2367, 3.48%, 5/1/2029 | 531,617 | 496,480 |
Pool # BS6079, 3.52%, 7/1/2029 | 2,500,000 | 2,330,236 |
Pool # AN6730, 3.01%, 9/1/2029 | 2,012,358 | 1,832,215 |
Pool # BS7011, 4.81%, 9/1/2029 | 2,981,314 | 2,946,846 |
Pool # BS8075, 5.00%, 9/1/2029 | 1,500,000 | 1,506,313 |
Pool # BS1577, 1.82%, 2/1/2030 | 850,685 | 713,166 |
Pool # BS6827, 4.19%, 5/1/2030 | 909,521 | 874,139 |
Pool # BS4878, 2.44%, 6/1/2030 | 589,442 | 509,226 |
Pool # BS8846, 4.09%, 7/1/2030 | 2,500,000 | 2,388,813 |
Pool # BS9022, 4.46%, 7/1/2030 | 2,640,000 | 2,579,344 |
INVESTMENTS | PRINCIPAL AMOUNT($) | VALUE($) |
Pool # 387898, 3.71%, 8/1/2030 | 738,711 | 685,664 |
Pool # BS5171, 2.51%, 10/1/2030 | 1,925,000 | 1,649,899 |
Pool # BS5985, 3.99%, 11/1/2030 | 425,000 | 401,800 |
Pool # BS8033, 4.43%, 11/1/2030 | 3,090,000 | 3,004,136 |
Pool # BS8306, 4.52%, 12/1/2030 | 2,991,100 | 2,924,073 |
Pool # BS9296, 4.80%, 12/1/2030 | 2,505,000 | 2,486,817 |
Pool # BL9645, 1.50%, 1/1/2031 | 100,000 | 78,794 |
Pool # BL9627, 1.56%, 1/1/2031 | 500,000 | 395,832 |
Pool # BS1731, 1.82%, 1/1/2031 | 964,839 | 790,452 |
Pool # BS1304, 1.54%, 3/1/2031 | 1,500,000 | 1,180,191 |
Pool # BS2422, 1.67%, 7/1/2031 | 1,200,000 | 945,976 |
Pool # BS2898, 1.56%, 9/1/2031 | 1,000,000 | 777,699 |
Pool # BS4116, 2.28%, 10/1/2031 | 769,441 | 636,830 |
Pool # BS3612, 1.93%, 11/1/2031 | 1,500,000 | 1,199,190 |
Pool # BS4505, 1.93%, 1/1/2032 | 8,000,000 | 6,438,872 |
Pool # BS4563, 2.01%, 1/1/2032 | 1,100,000 | 887,312 |
Pool # BS3464, 2.03%, 1/1/2032 | 1,112,000 | 898,288 |
Pool # BS4709, 2.22%, 2/1/2032 | 2,000,000 | 1,624,559 |
Pool # BM7037, 1.75%, 3/1/2032 (h) | 1,099,323 | 868,050 |
Pool # BS4654, 2.39%, 3/1/2032 | 1,460,464 | 1,220,479 |
Pool # BL6367, 1.82%, 4/1/2032 | 327,966 | 262,757 |
Pool # BS5130, 2.55%, 4/1/2032 | 488,166 | 414,184 |
Pool # BS5463, 3.34%, 5/1/2032 | 1,756,302 | 1,577,204 |
Pool # BS5597, 3.59%, 5/1/2032 | 1,175,000 | 1,064,323 |
Pool # BS5195, 2.80%, 6/1/2032 | 2,042,650 | 1,749,702 |
Pool # BS5875, 3.66%, 6/1/2032 | 2,122,147 | 1,933,848 |
Pool # BS6301, 3.67%, 8/1/2032 | 945,000 | 864,865 |
Pool # BS6385, 3.89%, 8/1/2032 | 2,462,370 | 2,298,213 |
Pool # BS6448, 3.93%, 8/1/2032 | 1,550,000 | 1,447,657 |
Pool # BS6502, 3.41%, 9/1/2032 | 2,982,702 | 2,687,997 |
Pool # BS6335, 3.75%, 9/1/2032 | 1,030,000 | 950,632 |
Pool # BS6339, 3.80%, 9/1/2032 | 1,056,986 | 976,108 |
Pool # BS6347, 4.03%, 9/1/2032 | 350,000 | 324,569 |
Pool # BS6759, 3.97%, 10/1/2032 | 896,590 | 841,778 |
Pool # BL8708, 1.40%, 11/1/2032 | 200,000 | 148,237 |
Pool # BS6995, 4.18%, 11/1/2032 | 1,015,000 | 965,579 |
Pool # BS6849, 4.23%, 11/1/2032 | 791,688 | 757,170 |
Pool # BS6815, 4.71%, 11/1/2032 | 1,283,000 | 1,267,920 |
Pool # BS6994, 4.85%, 11/1/2032 | 661,000 | 660,383 |
Pool # BS7203, 4.98%, 11/1/2032 | 1,249,000 | 1,254,878 |
Pool # BS7095, 4.80%, 12/1/2032 | 1,023,597 | 1,018,732 |
Pool # BS7663, 4.71%, 1/1/2033 | 2,000,000 | 1,976,030 |
Pool # BS7671, 4.76%, 2/1/2033 | 2,177,000 | 2,159,726 |
Pool # BS8334, 4.71%, 3/1/2033 | 2,368,369 | 2,333,051 |
Pool # BS7740, 4.11%, 4/1/2033 | 2,000,000 | 1,879,563 |
August 31, 2023 | J.P. Morgan Exchange-Traded Funds | 45 |
AS OF August 31, 2023 (Unaudited) (continued)
INVESTMENTS | PRINCIPAL AMOUNT($) | VALUE($) |
Mortgage-Backed Securities — continued | ||
Pool # BS8277, 4.39%, 4/1/2033 | 3,014,000 | 2,904,896 |
Pool # BS8157, 4.51%, 4/1/2033 | 2,750,000 | 2,675,952 |
Pool # BS8256, 4.53%, 4/1/2033 | 2,000,000 | 1,949,012 |
Pool # BS8055, 4.71%, 4/1/2033 | 1,500,000 | 1,481,915 |
Pool # BS8152, 4.55%, 5/1/2033 | 2,000,000 | 1,952,361 |
Pool # BS8703, 4.48%, 6/1/2033 | 3,000,000 | 2,912,378 |
Pool # AN6000, 3.21%, 7/1/2033 | 959,914 | 848,603 |
Pool # AN9725, 3.76%, 7/1/2033 | 101,109 | 93,607 |
Pool # BS8883, 4.58%, 7/1/2033 | 2,558,000 | 2,501,527 |
Pool # BS9146, 4.35%, 8/1/2033 | 2,000,000 | 1,919,043 |
Pool # BS8897, IO, 4.55%, 9/1/2033 (j) | 3,000,000 | 3,017,812 |
Pool # BS9470, 4.45%, 10/1/2033 (j) | 3,000,000 | 2,979,375 |
Pool # BS4197, 2.14%, 12/1/2033 | 500,000 | 399,310 |
Pool # BS6427, 3.75%, 9/1/2034 | 1,010,000 | 908,514 |
Pool # BL3772, 2.92%, 10/1/2034 | 681,685 | 582,997 |
Pool # BS5018, 2.88%, 10/1/2035 | 750,000 | 594,855 |
Pool # AN7345, 3.21%, 11/1/2037 | 623,932 | 542,636 |
Pool # MA1072, 3.50%, 5/1/2042 | 9,893 | 9,043 |
Pool # BF0533, 2.50%, 11/1/2050 | 1,220,443 | 1,021,888 |
Pool # BF0230, 5.50%, 1/1/2058 | 389,633 | 396,870 |
Pool # BF0300, 4.00%, 8/1/2058 (j) | 5,774,972 | 5,387,496 |
Pool # BF0400, 4.00%, 8/1/2059 | 657,956 | 606,856 |
Pool # BF0497, 3.00%, 7/1/2060 | 70,186 | 58,566 |
Pool # BF0520, 3.00%, 1/1/2061 | 3,344,843 | 2,890,446 |
Pool # BF0560, 2.50%, 9/1/2061 | 899,664 | 723,036 |
Pool # BF0562, 3.50%, 9/1/2061 | 873,615 | 775,396 |
Pool # BF0583, 4.00%, 12/1/2061 | 885,091 | 816,905 |
Pool # BF0586, 5.00%, 12/1/2061 | 883,767 | 859,558 |
Pool # BF0617, 2.50%, 3/1/2062 | 3,174,479 | 2,545,338 |
Pool # BF0677, 4.00%, 9/1/2062 | 3,126,295 | 2,885,444 |
FNMA/FHLMC UMBS, Single Family, 30 Year | ||
TBA, 4.00%, 9/25/2053 (j) | 1,825,000 | 1,684,418 |
TBA, 2.50%, 10/25/2053 (j) | 2,143,153 | 1,777,729 |
GNMA I, 30 Year | ||
Pool # CO1928, 5.50%, 10/15/2052 | 1,278,634 | 1,285,660 |
Pool # CR2369, 6.00%, 1/15/2053 | 1,803,482 | 1,880,997 |
GNMA II | ||
Pool # CJ7125, ARM, 6.74%, 10/20/2071 (h) | 455,490 | 466,411 |
Pool # CJ7141, ARM, 6.70%, 11/20/2071 (h) | 447,234 | 456,647 |
Pool # CE9384, ARM, 6.75%, 11/20/2071 (h) | 741,625 | 759,983 |
Pool # CE5557, ARM, 6.89%, 11/20/2071 (h) | 103,082 | 106,276 |
INVESTMENTS | PRINCIPAL AMOUNT($) | VALUE($) |
Pool # CK2792, ARM, 6.89%, 3/20/2072 (h) | 824,712 | 851,440 |
Pool # CO0363, ARM, 7.07%, 7/20/2072 (h) | 785,735 | 820,579 |
GNMA II, 30 Year | ||
Pool # AJ9020, 4.50%, 10/20/2044 | 33,141 | 31,600 |
Pool # BB3525, 4.00%, 9/20/2047 | 23,728 | 22,416 |
Pool # BM2418, 4.00%, 8/20/2049 | 15,922 | 15,234 |
Pool # BN7049, 4.50%, 8/20/2049 | 136,700 | 131,695 |
Pool # BP7160, 4.50%, 9/20/2049 | 85,672 | 84,633 |
Pool # CC9803, 4.00%, 4/20/2051 | 285,657 | 266,989 |
Pool # MA7534, 2.50%, 8/20/2051 | 4,379,234 | 3,728,420 |
Pool # MA7705, 2.50%, 11/20/2051 | 6,029,214 | 5,132,984 |
Pool # CH7863, 3.50%, 12/20/2051 | 662,553 | 604,759 |
Pool # CI2080, 3.50%, 12/20/2051 | 838,415 | 744,536 |
Pool # CH0876, 3.00%, 1/20/2052 | 109,101 | 96,343 |
Pool # CH0877, 3.00%, 1/20/2052 | 270,317 | 238,622 |
Pool # CH0878, 3.00%, 1/20/2052 | 304,687 | 268,769 |
Pool # CJ3916, 3.00%, 1/20/2052 | 736,279 | 663,151 |
Pool # CK2608, 3.00%, 1/20/2052 | 466,451 | 410,892 |
Pool # CK4909, 3.00%, 1/20/2052 | 96,836 | 85,302 |
Pool # CK4916, 3.00%, 1/20/2052 | 210,830 | 185,329 |
Pool # CJ8184, 3.50%, 1/20/2052 | 608,265 | 552,196 |
Pool # CK4918, 3.50%, 1/20/2052 | 71,225 | 65,101 |
Pool # CK7137, 4.00%, 1/20/2052 | 467,236 | 428,324 |
Pool # CK2667, 3.00%, 2/20/2052 | 604,828 | 531,668 |
Pool # CK2672, 3.50%, 2/20/2052 | 583,097 | 532,951 |
Pool # CM2154, 3.00%, 3/20/2052 | 753,772 | 661,385 |
Pool # CM2278, 3.50%, 4/20/2052 | 848,845 | 774,793 |
Pool # CO4826, 5.00%, 6/20/2052 | 564,176 | 548,967 |
Pool # CO4847, 5.00%, 7/20/2052 | 842,363 | 819,655 |
Pool # MA8200, 4.00%, 8/20/2052 | 1,886,240 | 1,757,124 |
Pool # CO1924, 4.50%, 10/20/2052 | 1,191,646 | 1,147,264 |
Pool # CP8517, 4.50%, 10/20/2052 | 986,866 | 927,555 |
Pool # CO1925, 5.00%, 10/20/2052 | 988,263 | 981,139 |
Pool # CS4305, 5.50%, 6/20/2053 | 2,494,289 | 2,484,457 |
Pool # CV0175, 6.50%, 6/20/2053 | 1,661,166 | 1,722,079 |
Pool # CS4391, 5.50%, 7/20/2053 | 2,996,757 | 2,984,941 |
GNMA II, Single Family, 30 Year TBA, 5.50%, 9/15/2053 (j) | 11,000,000 | 10,888,281 |
Total Mortgage-Backed Securities (Cost $296,389,740) | 285,853,595 | |
Asset-Backed Securities — 15.5% | ||
ACC Trust Series 2022-1, Class C, 3.24%, 10/20/2025 (a) | 1,000,000 | 709,091 |
46 | J.P. Morgan Exchange-Traded Funds | August 31, 2023 |
INVESTMENTS | PRINCIPAL AMOUNT($) | VALUE($) |
Asset-Backed Securities — continued | ||
ACHV ABS TRUST | ||
Series 2023-1PL, Class C, 7.42%, 3/18/2030 (a) | 1,977,000 | 1,991,324 |
Series 2023-2PL, Class C, 7.27%, 5/20/2030 (a) | 2,900,000 | 2,912,056 |
Series 2023-3PL, Class C, 7.35%, 8/19/2030 (a) | 1,750,000 | 1,766,132 |
ACRE Commercial Mortgage Ltd. Series 2021-FL4, Class B, 6.83%, 12/18/2037 (a) (h) | 250,000 | 240,048 |
Air Canada Pass-Through Trust (Canada) Series 2017-1, Class AA, 3.30%, 1/15/2030 (a) | 372,000 | 327,775 |
Ajax Mortgage Loan Trust Series 2021-B, Class A, 2.24%, 6/25/2066 (a) (i) | 239,118 | 226,814 |
American Airlines Pass-Through Trust Series 2015-2, Class A, 4.00%, 9/22/2027 | 180,469 | 164,003 |
American Credit Acceptance Receivables Trust | ||
Series 2020-2, Class C, 3.88%, 4/13/2026 (a) | 47,009 | 46,929 |
Series 2022-2, Class E, 6.57%, 6/13/2028 (a) | 300,000 | 285,928 |
Series 2022-3, Class D, 5.83%, 10/13/2028 (a) | 506,000 | 493,562 |
Series 2023-3, Class D, 6.82%, 10/12/2029 (a) | 1,955,000 | 1,956,656 |
American Homes 4 Rent Trust | ||
Series 2014-SFR3, Class B, 4.20%, 12/17/2036 (a) | 125,000 | 121,840 |
Series 2015-SFR1, Class E, 5.64%, 4/17/2052 (a) | 150,000 | 147,328 |
Series 2015-SFR1, Class F, 5.89%, 4/17/2052 (a) | 400,000 | 391,614 |
Series 2015-SFR2, Class A, 3.73%, 10/17/2052 (a) | 88,649 | 85,218 |
AMSR Trust | ||
Series 2020-SFR1, Class E, 3.22%, 4/17/2037 (a) | 500,000 | 468,084 |
Series 2020-SFR2, Class E2, 4.28%, 7/17/2037 (a) | 375,000 | 355,062 |
Series 2020-SFR3, Class E1, 2.56%, 9/17/2037 (a) | 2,082,000 | 1,904,190 |
Series 2020-SFR3, Class E2, 2.76%, 9/17/2037 (a) | 350,000 | 320,173 |
Series 2020-SFR4, Class A, 1.36%, 11/17/2037 (a) | 1,500,000 | 1,365,106 |
Series 2020-SFR5, Class D, 2.18%, 11/17/2037 (a) | 3,000,000 | 2,734,710 |
INVESTMENTS | PRINCIPAL AMOUNT($) | VALUE($) |
Series 2020-SFR4, Class E2, 2.46%, 11/17/2037 (a) | 425,000 | 385,974 |
Series 2021-SFR3, Class C, 1.80%, 10/17/2038 (a) | 1,000,000 | 868,236 |
Series 2022-SFR1, Class F, 6.02%, 3/17/2039 (a) | 750,000 | 674,727 |
Series 2022-SFR3, Class D, 4.00%, 10/17/2039 (a) | 2,120,000 | 1,904,483 |
Series 2022-SFR3, Class E2, 4.00%, 10/17/2039 (a) | 1,000,000 | 869,803 |
Series 2023-SFR1, Class E2, 4.00%, 4/17/2040 (a) | 2,085,000 | 1,781,515 |
Aqua Finance Trust Series 2019-A, Class B, 3.47%, 7/16/2040 (a) | 206,290 | 190,432 |
Avid Automobile Receivables Trust Series 2019-1, Class D, 4.03%, 7/15/2026 (a) | 300,000 | 297,837 |
British Airways Pass-Through Trust (United Kingdom) Series 2013-1, Class A, 4.63%, 6/20/2024 (a) | 90,676 | 89,621 |
Business Jet Securities LLC | ||
Series 2020-1A, Class A, 2.98%, 11/15/2035 ‡ (a) | 396,692 | 374,335 |
Series 2020-1A, Class B, 3.97%, 11/15/2035 ‡ (a) | 2,655,342 | 2,481,682 |
Series 2021-1A, Class A, 2.16%, 4/15/2036 ‡ (a) | 178,583 | 161,619 |
Series 2021-1A, Class B, 2.92%, 4/15/2036 ‡ (a) | 415,278 | 369,548 |
Series 2021-1A, Class C, 5.07%, 4/15/2036 ‡ (a) | 175,033 | 163,023 |
BXG Receivables Note Trust | ||
Series 2020-A, Class C, 4.22%, 2/28/2036 (a) | 2,159,095 | 1,978,230 |
Series 2022-A, Class A, 4.12%, 9/28/2037 (a) | 4,591,944 | 4,369,753 |
Series 2023-A, Class C, 7.38%, 11/15/2038 (a) | 2,419,086 | 2,349,472 |
CarNow Auto Receivables Trust Series 2021-1A, Class C, 2.16%, 2/17/2026 (a) | 106,072 | 105,064 |
Carvana Auto Receivables Trust | ||
Series 2019-4A, Class D, 3.07%, 7/15/2025 (a) | 43,185 | 42,883 |
Series 2023-P2, Class A4, 5.38%, 3/12/2029 (a) | 2,000,000 | 1,955,636 |
Series 2023-P3, Class A4, 5.71%, 7/10/2029 (a) | 709,000 | 708,842 |
August 31, 2023 | J.P. Morgan Exchange-Traded Funds | 47 |
AS OF August 31, 2023 (Unaudited) (continued)
INVESTMENTS | PRINCIPAL AMOUNT($) | VALUE($) |
Asset-Backed Securities — continued | ||
Cascade MH Asset Trust | ||
Series 2019-MH1, Class B, 5.00%, 11/25/2044 ‡ (a) (h) | 401,843 | 370,593 |
Series 2021-MH1, Class A1, 1.75%, 2/25/2046 (a) | 849,789 | 722,598 |
Series 2022-MH1, Class M, 4.25%, 8/25/2054 ‡ (a) (i) | 955,468 | 753,278 |
Continental Finance Credit Card ABS Master Trust Series 2022-A, Class A, 6.19%, 10/15/2030 (a) | 825,000 | 793,198 |
CoreVest American Finance Trust | ||
Series 2019-1, Class E, 5.78%, 3/15/2052 (a) (h) | 551,000 | 508,483 |
Series 2019-2, Class E, 5.42%, 6/15/2052 (a) (h) | 1,043,000 | 922,370 |
Series 2019-3, Class E, 4.90%, 10/15/2052 (a) (h) | 570,000 | 487,743 |
CPS Auto Receivables Trust | ||
Series 2022-D, Class D, 8.73%, 1/16/2029 (a) | 1,000,000 | 1,040,450 |
Series 2023-A, Class D, 6.44%, 4/16/2029 (a) | 723,000 | 715,377 |
Series 2022-C, Class C, 5.28%, 4/15/2030 (a) | 1,000,000 | 979,368 |
Credit Acceptance Auto Loan Trust | ||
Series 2022-3A, Class D, 9.00%, 4/18/2033 (a) | 1,000,000 | 995,467 |
Series 2023-1A, Class C, 7.71%, 7/15/2033 (a) | 1,675,000 | 1,690,066 |
Series 2023-2A, Class C, 7.15%, 9/15/2033 (a) | 1,500,000 | 1,482,519 |
Series 2023-3A, Class C, 7.62%, 12/15/2033 (a) | 2,700,000 | 2,703,063 |
DataBank Issuer Series 2021-1A, Class A2, 2.06%, 2/27/2051 (a) | 250,000 | 220,584 |
Delta Air Lines Pass-Through Trust Series 2019-1, Class AA, 3.20%, 4/25/2024 | 15,000 | 14,724 |
Diamond Resorts Owner Trust | ||
Series 2021-1A, Class A, 1.51%, 11/21/2033 (a) | 178,147 | 162,845 |
Series 2021-1A, Class D, 3.83%, 11/21/2033 (a) | 156,269 | 141,017 |
DLLAA LLC Series 2023-1A, Class A3, 5.64%, 2/22/2028 (a) | 1,265,000 | 1,270,229 |
Drive Auto Receivables Trust Series 2020-2, Class D, 3.05%, 5/15/2028 | 750,000 | 736,942 |
DT Auto Owner Trust | ||
Series 2020-2A, Class D, 4.73%, 3/16/2026 (a) | 500,000 | 494,041 |
INVESTMENTS | PRINCIPAL AMOUNT($) | VALUE($) |
Series 2022-3A, Class C, 7.69%, 7/17/2028 (a) | 1,350,000 | 1,372,281 |
Series 2023-1A, Class D, 6.44%, 11/15/2028 (a) | 1,440,000 | 1,428,199 |
Series 2023-2A, Class D, 6.62%, 2/15/2029 (a) | 1,600,000 | 1,593,009 |
Elara HGV Timeshare Issuer LLC | ||
Series 2021-A, Class C, 2.09%, 8/27/2035 (a) | 386,974 | 341,809 |
Series 2021-A, Class D, 3.32%, 8/27/2035 (a) | 138,205 | 121,715 |
Exeter Automobile Receivables Trust | ||
Series 2020-2A, Class D, 4.73%, 4/15/2026 (a) | 308,357 | 306,481 |
Series 2023-2A, Class C, 5.75%, 7/17/2028 | 969,000 | 957,140 |
Series 2022-3A, Class D, 6.76%, 9/15/2028 | 1,000,000 | 998,941 |
Series 2022-5A, Class D, 7.40%, 2/15/2029 | 1,000,000 | 1,013,710 |
Series 2022-6A, Class D, 8.03%, 4/6/2029 | 1,291,000 | 1,337,320 |
Series 2023-4A, Class D, 6.95%, 12/17/2029 | 1,205,000 | 1,226,882 |
Series 2022-4A, Class E, 8.23%, 3/15/2030 (a) | 1,000,000 | 954,422 |
Series 2023-4A, Class E, 9.57%, 2/18/2031 (a) | 1,120,000 | 1,142,836 |
FHF Trust | ||
Series 2021-1A, Class A, 1.27%, 3/15/2027 (a) | 136,309 | 131,466 |
Series 2022-2A, Class A, 6.14%, 12/15/2027 (a) | 983,650 | 973,613 |
FirstKey Homes Trust | ||
Series 2020-SFR1, Class E, 2.79%, 8/17/2037 (a) | 2,300,000 | 2,117,670 |
Series 2020-SFR1, Class F1, 3.64%, 8/17/2037 (a) | 2,201,000 | 2,043,943 |
Series 2020-SFR2, Class E, 2.67%, 10/19/2037 (a) | 1,500,000 | 1,368,623 |
Series 2020-SFR2, Class F1, 3.02%, 10/19/2037 (a) | 1,000,000 | 910,528 |
Series 2020-SFR2, Class F2, 3.12%, 10/19/2037 (a) | 560,000 | 511,945 |
Series 2022-SFR3, Class D, 3.50%, 7/17/2038 (a) | 1,250,000 | 1,133,384 |
Series 2022-SFR3, Class E1, 3.50%, 7/17/2038 (a) | 1,500,000 | 1,340,439 |
48 | J.P. Morgan Exchange-Traded Funds | August 31, 2023 |
INVESTMENTS | PRINCIPAL AMOUNT($) | VALUE($) |
Asset-Backed Securities — continued | ||
Series 2021-SFR1, Class E1, 2.39%, 8/17/2038 (a) | 500,000 | 430,371 |
Series 2021-SFR1, Class F1, 3.24%, 8/17/2038 (a) | 600,000 | 519,154 |
Series 2021-SFR2, Class E1, 2.26%, 9/17/2038 (a) | 635,000 | 547,073 |
Series 2021-SFR2, Class E2, 2.36%, 9/17/2038 (a) | 814,000 | 698,849 |
Series 2022-SFR1, Class E2, 5.00%, 5/17/2039 (a) | 2,000,000 | 1,807,160 |
Series 2022-SFR2, Class E2, 4.50%, 7/17/2039 (a) | 492,000 | 438,108 |
Flagship Credit Auto Trust | ||
Series 2020-4, Class D, 2.18%, 2/16/2027 (a) | 280,000 | 261,584 |
Series 2021-4, Class C, 1.96%, 12/15/2027 (a) | 500,000 | 464,668 |
Series 2023-2, Class C, 5.81%, 5/15/2029 (a) | 535,000 | 525,580 |
FMC GMSR Issuer Trust | ||
Series 2021-GT1, Class B, 4.36%, 7/25/2026 (a) (h) | 900,000 | 698,267 |
Series 2022-GT1, Class A, 6.19%, 4/25/2027 (a) | 2,000,000 | 1,870,612 |
Series 2022-GT1, Class B, 7.17%, 4/25/2027 (a) | 600,000 | 538,592 |
Series 2022-GT2, Class B, 10.07%, 7/25/2027 (a) | 1,000,000 | 945,656 |
FNMA, Grantor Trust Series 2017-T1, Class A, 2.90%, 6/25/2027 | 1,091,841 | 1,009,524 |
Foundation Finance Trust | ||
Series 2020-1A, Class B, 4.62%, 7/16/2040 (a) | 300,000 | 282,080 |
Series 2020-1A, Class C, 5.75%, 7/16/2040 (a) | 1,450,000 | 1,347,223 |
Series 2021-1A, Class C, 2.99%, 5/15/2041 (a) | 536,000 | 465,330 |
Series 2023-1A, Class D, 9.18%, 12/15/2043 (a) | 2,000,000 | 1,933,644 |
FREED ABS Trust | ||
Series 2021-2, Class C, 1.94%, 6/19/2028 (a) | 106,594 | 105,102 |
Series 2022-1FP, Class D, 3.35%, 3/19/2029 (a) | 700,000 | 649,976 |
Series 2022-3FP, Class C, 7.05%, 8/20/2029 (a) | 500,000 | 498,019 |
Series 2022-4FP, Class C, 8.59%, 12/18/2029 (a) | 1,000,000 | 1,017,965 |
INVESTMENTS | PRINCIPAL AMOUNT($) | VALUE($) |
FRTKL Series 2021-SFR1, Class D, 2.17%, 9/17/2038 (a) | 1,000,000 | 865,356 |
GLS Auto Receivables Issuer Trust | ||
Series 2022-1A, Class D, 3.97%, 1/18/2028 (a) | 4,000,000 | 3,785,926 |
Series 2021-2A, Class E, 2.87%, 5/15/2028 (a) | 1,500,000 | 1,362,148 |
Series 2022-3A, Class E, 8.35%, 10/15/2029 (a) | 750,000 | 723,140 |
Series 2023-2A, Class E, 9.37%, 1/15/2030 (a) | 2,000,000 | 1,986,249 |
Series 2023-1A, Class E, 11.42%, 3/15/2030 (a) | 1,500,000 | 1,599,458 |
GLS Auto Select Receivables Trust Series 2023-1A, Class A2, 6.27%, 8/16/2027 (a) | 3,000,000 | 2,993,844 |
Hertz Vehicle Financing LLC Series 2023-3A, Class A, 5.94%, 2/25/2028 (a) | 1,397,000 | 1,404,013 |
HGI CRE CLO Ltd. (Cayman Islands) | ||
Series 2022-FL3, Class B, 7.81%, 4/20/2037 (a) (h) | 1,000,000 | 972,590 |
Series 2022-FL3, Class E, 9.51%, 4/20/2037 (a) (h) | 663,500 | 636,618 |
Hilton Grand Vacations Trust | ||
Series 2022-1D, Class D, 6.79%, 6/20/2034 (a) | 269,072 | 254,521 |
Series 2022-2A, Class D, 8.73%, 1/25/2037 (a) | 473,369 | 463,800 |
Series 2020-AA, Class C, 6.42%, 2/25/2039 (a) | 176,187 | 172,105 |
HIN Timeshare Trust | ||
Series 2020-A, Class D, 5.50%, 10/9/2039 (a) | 75,106 | 69,449 |
Series 2020-A, Class E, 6.50%, 10/9/2039 (a) | 337,977 | 311,475 |
HINNT LLC Series 2022-A, Class D, 6.50%, 5/15/2041 (a) | 557,113 | 525,040 |
Home Partners of America Trust Series 2022-1, Class D, 4.73%, 4/17/2039 (a) | 956,234 | 877,728 |
John Deere Owner Trust Series 2023-B, Class A4, 5.11%, 5/15/2030 | 2,200,000 | 2,182,237 |
Lending Funding Trust Series 2020-2A, Class A, 2.32%, 4/21/2031 (a) | 3,750,000 | 3,354,850 |
Lendingpoint Asset Securitization Trust Series 2022-A, Class D, 4.54%, 6/15/2029 (a) | 1,000,000 | 819,801 |
August 31, 2023 | J.P. Morgan Exchange-Traded Funds | 49 |
AS OF August 31, 2023 (Unaudited) (continued)
INVESTMENTS | PRINCIPAL AMOUNT($) | VALUE($) |
Asset-Backed Securities — continued | ||
Lendmark Funding Trust | ||
Series 2021-1A, Class D, 5.05%, 11/20/2031 (a) | 870,000 | 678,377 |
Series 2021-2A, Class B, 2.37%, 4/20/2032 (a) | 1,000,000 | 838,523 |
Series 2023-1A, Class D, 8.69%, 5/20/2033 (a) | 530,000 | 543,431 |
LP LMS Asset Securitization Trust | ||
6.17%, 10/15/2028 ‡ | 550,000 | 543,015 |
Series 2023-1A, Class B, 7.48%, 10/17/2033 ‡ (a) | 1,500,000 | 1,406,476 |
Series 2023-1A, Class A, 8.18%, 10/17/2033 ‡ (a) | 1,049,339 | 1,042,964 |
Mariner Finance Issuance Trust | ||
Series 2019-AA, Class D, 5.44%, 7/20/2032 (a) | 1,500,000 | 1,417,035 |
Series 2020-AA, Class D, 5.75%, 8/21/2034 (a) | 2,070,000 | 1,859,039 |
Series 2021-AA, Class D, 3.83%, 3/20/2036 (a) | 351,000 | 295,528 |
Series 2022-AA, Class D, 9.10%, 10/20/2037 (a) | 650,000 | 651,202 |
Series 2022-AA, Class E, 10.98%, 10/20/2037 ‡ (a) | 3,000,000 | 3,000,057 |
Marlette Funding Trust | ||
Series 2023-1A, Class C, 7.20%, 4/15/2033 (a) | 980,000 | 982,041 |
Series 2023-2A, Class C, 6.96%, 6/15/2033 (a) | 375,000 | 373,868 |
Mercury Financial Credit Card Master Trust Series 2023-1A, Class A, 8.04%, 9/20/2027 (a) | 2,584,000 | 2,594,917 |
MVW LLC | ||
Series 2020-1A, Class C, 4.21%, 10/20/2037 (a) | 105,879 | 99,789 |
Series 2020-1A, Class D, 7.14%, 10/20/2037 (a) | 1,058,793 | 1,015,126 |
Series 2019-2A, Class B, 2.44%, 10/20/2038 (a) | 50,109 | 46,413 |
Series 2023-1A, Class C, 6.54%, 10/20/2040 (a) | 2,733,403 | 2,672,870 |
Series 2022-2A, Class C, 7.62%, 10/21/2041 (a) | 799,298 | 799,176 |
Series 2022-2A, Class D, 9.00%, 10/21/2041 (a) | 1,940,695 | 1,912,246 |
MVW Owner Trust Series 2019-1A, Class C, 3.33%, 11/20/2036 (a) | 29,827 | 28,075 |
INVESTMENTS | PRINCIPAL AMOUNT($) | VALUE($) |
New Residential Mortgage LLC Series 2020-FNT1, Class A, 5.44%, 6/25/2025 (a) | 1,867,335 | 1,792,093 |
New Residential Mortgage Loan Trust | ||
Series 2022-SFR1, Class D, 3.30%, 2/17/2039 (a) | 340,000 | 300,895 |
Series 2022-SFR1, Class E1, 3.55%, 2/17/2039 (a) | 420,000 | 363,651 |
Nissan Auto Lease Trust Series 2023-B, Class A4, 5.61%, 11/15/2027 | 800,000 | 801,823 |
NMEF Funding LLC Series 2021-A, Class C, 2.58%, 12/15/2027 (a) | 600,000 | 573,228 |
NRZ Excess Spread-Collateralized Notes | ||
Series 2020-PLS1, Class A, 3.84%, 12/25/2025 (a) | 163,177 | 152,152 |
Series 2021-FNT1, Class A, 2.98%, 3/25/2026 (a) | 632,958 | 576,081 |
Series 2021-FNT2, Class A, 3.23%, 5/25/2026 (a) | 178,381 | 162,219 |
Series 2021-GNT1, Class A, 3.47%, 11/25/2026 (a) | 2,573,085 | 2,321,140 |
NRZ FHT Excess LLC Series 2020-FHT1, Class A, 4.21%, 11/25/2025 (a) | 2,082,413 | 1,933,723 |
Octane Receivables Trust | ||
Series 2020-1A, Class C, 2.89%, 3/20/2026 (a) | 350,000 | 338,833 |
Series 2022-2A, Class C, 6.29%, 7/20/2028 (a) | 1,390,000 | 1,368,504 |
Series 2022-2A, Class D, 7.70%, 2/20/2030 (a) | 2,000,000 | 1,993,173 |
OneMain Direct Auto Receivables Trust Series 2019-1A, Class B, 3.95%, 11/14/2028 (a) | 1,000,000 | 945,731 |
Oportun Funding XIV LLC | ||
Series 2021-A, Class A, 1.21%, 3/8/2028 (a) | 1,118,197 | 1,073,163 |
Series 2021-A, Class C, 3.44%, 3/8/2028 (a) | 265,572 | 255,806 |
Oportun Issuance Trust | ||
Series 2022-2, Class C, 9.36%, 10/9/2029 (a) | 1,500,000 | 1,502,057 |
Series 2022-3, Class C, 10.15%, 1/8/2030 (a) | 1,912,000 | 1,955,043 |
Series 2021-B, Class B, 1.96%, 5/8/2031 (a) | 400,000 | 362,702 |
Series 2021-B, Class C, 3.65%, 5/8/2031 (a) | 100,000 | 92,231 |
Series 2022-A, Class C, 7.40%, 6/9/2031 (a) | 755,000 | 719,612 |
50 | J.P. Morgan Exchange-Traded Funds | August 31, 2023 |
INVESTMENTS | PRINCIPAL AMOUNT($) | VALUE($) |
Asset-Backed Securities — continued | ||
Series 2021-C, Class A, 2.18%, 10/8/2031 (a) | 3,663,000 | 3,332,696 |
Pagaya AI Debt Selection Trust Series 2021-1, Class B, 2.13%, 11/15/2027 (a) | 441,319 | 436,079 |
PFP Ltd. (Cayman Islands) | ||
Series 2021-7, Class C, 7.08%, 4/14/2038 (a) (h) | 164,992 | 159,111 |
Series 2021-7, Class D, 7.83%, 4/14/2038 (a) (h) | 169,992 | 161,918 |
Porsche Financial Auto Securitization Trust Series 2023-1A, Class A3, 4.81%, 9/22/2028 (a) | 1,500,000 | 1,484,951 |
Prestige Auto Receivables Trust Series 2022-1A, Class C, 7.09%, 8/15/2028 (a) | 1,200,000 | 1,201,685 |
PRET LLC | ||
Series 2021-NPL6, Class A1, 2.49%, 7/25/2051 (a) (i) | 443,024 | 423,286 |
Series 2021-RN3, Class A1, 1.84%, 9/25/2051 (a) (i) | 737,822 | 673,389 |
Pretium Mortgage Credit Partners I LLC Series 2021-NPL1, Class A1, 2.24%, 9/27/2060 (a) (i) | 269,629 | 260,515 |
Progress Residential | ||
Series 2021-SFR3, Class E1, 2.54%, 5/17/2026 (a) | 450,000 | 394,187 |
Series 2021-SFR3, Class E2, 2.69%, 5/17/2026 (a) | 645,000 | 563,763 |
Progress Residential Trust | ||
Series 2022-SFR2, Class E2, 4.80%, 4/17/2027 (a) | 651,000 | 598,149 |
Series 2020-SFR3, Class E, 2.30%, 10/17/2027 (a) | 2,300,000 | 2,085,812 |
Series 2020-SFR3, Class G, 4.11%, 10/17/2027 (a) | 500,000 | 460,964 |
Series 2020-SFR1, Class C, 2.18%, 4/17/2037 (a) | 2,100,000 | 1,957,780 |
Series 2020-SFR1, Class E, 3.03%, 4/17/2037 (a) | 425,000 | 398,839 |
Series 2020-SFR1, Class F, 3.43%, 4/17/2037 (a) | 450,000 | 421,407 |
Series 2020-SFR2, Class D, 3.87%, 6/17/2037 (a) | 750,000 | 713,296 |
Series 2021-SFR2, Class E2, 2.65%, 4/19/2038 (a) | 500,000 | 439,608 |
Series 2021-SFR5, Class E1, 2.21%, 7/17/2038 (a) | 950,000 | 817,866 |
Series 2021-SFR5, Class E2, 2.36%, 7/17/2038 (a) | 270,000 | 232,494 |
INVESTMENTS | PRINCIPAL AMOUNT($) | VALUE($) |
Series 2021-SFR8, Class E1, 2.38%, 10/17/2038 (a) | 2,650,000 | 2,290,500 |
Series 2022-SFR3, Class D, 4.45%, 4/17/2039 (a) | 1,090,000 | 1,005,596 |
Series 2022-SFR3, Class F, 6.60%, 4/17/2039 (a) | 665,000 | 619,938 |
Series 2022-SFR5, Class E2, 6.86%, 6/17/2039 (a) | 388,000 | 374,328 |
Series 2023-SFR1, Class E2, 6.60%, 3/17/2040 (a) | 796,000 | 744,918 |
Series 2021-SFR7, Class E1, 2.59%, 8/17/2040 (a) | 793,000 | 637,490 |
Series 2022-SFR1, Class E2, 3.99%, 2/17/2041 (a) | 750,000 | 635,659 |
PRPM LLC Series 2021-2, Class A1, 2.12%, 3/25/2026 (a) (h) | 130,052 | 125,261 |
RCO VI Mortgage LLC Series 2022-1, Class A1, 3.00%, 1/25/2027 (a) (i) | 322,102 | 305,231 |
ReadyCap Lending Small Business Loan Trust Series 2019-2, Class A, 8.00%, 12/27/2044 (a) (h) | 55,792 | 53,611 |
Regional Management Issuance Trust | ||
Series 2020-1, Class C, 3.80%, 10/15/2030 (a) | 1,900,000 | 1,713,805 |
Series 2021-1, Class D, 5.07%, 3/17/2031 (a) | 500,000 | 423,195 |
Series 2022-2B, Class B, 8.51%, 11/17/2032 (a) | 1,227,000 | 1,248,011 |
Renew Series 2023-1A, Class A, 5.90%, 11/20/2058 ‡ (a) | 1,351,847 | 1,274,073 |
Santander Drive Auto Receivables Trust Series 2023-2, Class C, 5.47%, 12/16/2030 | 1,500,000 | 1,477,660 |
Santander Revolving Auto Loan Trust Series 2019-A, Class D, 3.45%, 1/26/2032 (a) | 150,000 | 141,542 |
SCF Equipment Leasing LLC Series 2022-2A, Class E, 6.50%, 6/20/2035 (a) | 1,112,000 | 958,750 |
Sierra Timeshare Receivables Funding LLC | ||
Series 2020-2A, Class D, 6.59%, 7/20/2037 (a) | 454,639 | 434,961 |
Series 2021-1A, Class D, 3.17%, 11/20/2037 (a) | 206,219 | 188,808 |
Series 2022-1A, Class D, 6.00%, 10/20/2038 (a) | 382,367 | 360,352 |
Series 2022-3A, Class D, 10.52%, 7/20/2039 (a) | 593,929 | 603,985 |
Series 2023-1A, Class D, 9.80%, 1/20/2040 (a) | 1,377,438 | 1,385,787 |
August 31, 2023 | J.P. Morgan Exchange-Traded Funds | 51 |
AS OF August 31, 2023 (Unaudited) (continued)
INVESTMENTS | PRINCIPAL AMOUNT($) | VALUE($) |
Asset-Backed Securities — continued | ||
Series 2023-2A, Class D, 9.72%, 4/20/2040 (a) | 1,159,824 | 1,168,173 |
Series 2022-2A, Class D, 9.22%, 6/20/2040 (a) | 372,044 | 368,739 |
SpringCastle America Funding LLC Series 2020-AA, Class A, 1.97%, 9/25/2037 (a) | 543,114 | 493,213 |
Theorem Funding Trust Series 2022-2A, Class A, 6.06%, 12/15/2028 (a) | 269,230 | 266,822 |
Tricon American Homes Series 2020-SFR1, Class E, 3.54%, 7/17/2038 (a) | 300,000 | 275,468 |
United Airlines Pass-Through Trust | ||
Series 2014-1, Class A, 4.00%, 4/11/2026 | 112,362 | 107,074 |
Series 2016-2, Class A, 3.10%, 10/7/2028 | 7,093 | 6,152 |
Series 2018-1, Class A, 3.70%, 3/1/2030 | 11,765 | 10,196 |
United Auto Credit Securitization Trust | ||
Series 2022-2, Class C, 5.81%, 5/10/2027 (a) | 856,000 | 846,820 |
Series 2022-2, Class E, 10.00%, 4/10/2029 (a) | 1,000,000 | 953,612 |
UOG ABS Issuer I LLC Series 2023-1, Class A1, 8.35%, 6/5/2040 ‡ (a) | 989,717 | 984,768 |
Upstart Securitization Trust Series 2022-4, Class A, 5.98%, 8/20/2032 (a) | 664,024 | 659,354 |
Upstart Structured Pass-Through Trust Series 2022-4A, Class A, 7.01%, 11/15/2030 (a) | 783,572 | 784,036 |
US Airways Pass-Through Trust Series 2011-1, Class A, 7.13%, 10/22/2023 | 11,209 | 11,205 |
US Auto Funding Trust Series 2022-1A, Class D, 9.14%, 7/15/2027 ‡ (a) | 1,000,000 | 519,346 |
USASF Receivables LLC Series 2020-1A, Class D, 9.35%, 3/15/2027 (a) | 750,000 | 750,664 |
VCAT LLC | ||
Series 2021-NPL1, Class A1, 2.29%, 12/26/2050 (a) (i) | 132,914 | 128,617 |
Series 2021-NPL5, Class A1, 1.87%, 8/25/2051 (a) (i) | 765,275 | 728,490 |
Veros Auto Receivables Trust Series 2021-1, Class B, 1.49%, 10/15/2026 (a) | 300,000 | 293,352 |
VOLT CV LLC Series 2021-CF2, Class A1, 2.49%, 11/27/2051 (a) (i) | 1,509,062 | 1,389,196 |
VOLT XCII LLC Series 2021-NPL1, Class A1, 1.89%, 2/27/2051 (a) (i) | 869,835 | 818,694 |
VOLT XCIII LLC Series 2021-NPL2, Class A1, 1.89%, 2/27/2051 (a) (i) | 1,292,862 | 1,201,966 |
INVESTMENTS | PRINCIPAL AMOUNT($) | VALUE($) |
VOLT XCIV LLC Series 2021-NPL3, Class A1, 2.24%, 2/27/2051 (a) (i) | 181,629 | 171,448 |
Westgate Resorts LLC | ||
Series 2020-1A, Class C, 6.21%, 3/20/2034 (a) | 60,061 | 59,271 |
Series 2022-1A, Class B, 2.29%, 8/20/2036 (a) | 144,547 | 136,477 |
Series 2022-1A, Class D, 3.84%, 8/20/2036 (a) | 578,189 | 537,053 |
Series 2023-1A, Class C, 7.49%, 12/20/2037 (a) | 2,833,958 | 2,781,672 |
Westlake Automobile Receivables Trust | ||
Series 2021-3A, Class D, 2.12%, 1/15/2027 (a) | 500,000 | 465,547 |
Series 2021-3A, Class E, 3.42%, 4/15/2027 (a) | 2,500,000 | 2,316,647 |
Series 2022-2A, Class D, 5.48%, 9/15/2027 (a) | 1,000,000 | 979,631 |
Series 2023-3A, Class C, 6.02%, 9/15/2028 (a) | 2,100,000 | 2,096,883 |
Series 2023-1A, Class D, 6.79%, 11/15/2028 (a) | 905,000 | 902,478 |
Series 2023-2A, Class D, 7.01%, 11/15/2028 (a) | 1,219,000 | 1,217,077 |
Total Asset-Backed Securities (Cost $228,565,727) | 225,117,979 | |
U.S. Treasury Obligations — 12.3% | ||
U.S. Treasury Bonds | ||
4.50%, 8/15/2039 | 3,319,000 | 3,420,904 |
1.13%, 5/15/2040 | 2,073,000 | 1,283,883 |
4.38%, 5/15/2040 | 370,000 | 374,481 |
1.13%, 8/15/2040 | 6,437,100 | 3,952,027 |
1.38%, 11/15/2040 | 2,866,000 | 1,829,650 |
4.75%, 2/15/2041 | 1,421,000 | 1,501,264 |
2.25%, 5/15/2041 | 4,977,000 | 3,667,233 |
4.38%, 5/15/2041 | 811,000 | 817,178 |
3.13%, 11/15/2041 | 1,743,000 | 1,470,452 |
3.13%, 2/15/2042 | 1,953,000 | 1,641,130 |
2.75%, 11/15/2042 | 1,571,000 | 1,231,762 |
4.00%, 11/15/2042 | 32,686,000 | 31,012,119 |
3.63%, 8/15/2043 | 2,027,000 | 1,811,710 |
3.75%, 11/15/2043 | 2,226,000 | 2,024,877 |
2.88%, 8/15/2045 | 809,000 | 633,011 |
2.38%, 11/15/2049 | 7,721,000 | 5,399,573 |
2.00%, 2/15/2050 | 358,000 | 229,246 |
1.88%, 2/15/2051 | 2,622,000 | 1,617,549 |
2.38%, 5/15/2051 | 13,009,000 | 9,041,763 |
52 | J.P. Morgan Exchange-Traded Funds | August 31, 2023 |
INVESTMENTS | PRINCIPAL AMOUNT($) | VALUE($) |
U.S. Treasury Obligations — continued | ||
2.25%, 2/15/2052 | 1,775,000 | 1,197,432 |
4.00%, 11/15/2052 | 7,080,000 | 6,831,370 |
3.63%, 2/15/2053 | 1,682,000 | 1,515,377 |
U.S. Treasury Notes | ||
2.13%, 2/29/2024 | 156,000 | 153,495 |
1.13%, 2/28/2025 | 565,000 | 532,932 |
0.25%, 8/31/2025 | 1,548,000 | 1,413,397 |
3.88%, 1/15/2026 | 7,383,000 | 7,243,415 |
1.13%, 10/31/2026 | 10,471,000 | 9,439,443 |
0.50%, 8/31/2027 | 6,112,000 | 5,251,545 |
3.13%, 8/31/2027 | 1,895,000 | 1,808,245 |
0.63%, 11/30/2027 | 2,224,000 | 1,905,864 |
1.25%, 3/31/2028 | 180,000 | 157,310 |
1.25%, 4/30/2028 | 4,100,000 | 3,575,648 |
1.25%, 9/30/2028 | 16,718,000 | 14,427,765 |
3.13%, 8/31/2029 | 1,870,000 | 1,760,064 |
0.88%, 11/15/2030 | 430,000 | 344,202 |
1.88%, 2/15/2032 | 5,701,000 | 4,791,735 |
2.88%, 5/15/2032 | 8,205,000 | 7,456,614 |
2.75%, 8/15/2032 | 5,487,000 | 4,925,226 |
4.13%, 11/15/2032 | 14,864,000 | 14,857,033 |
U.S. Treasury STRIPS Bonds | ||
2.58%, 5/15/2032 (k) | 2,200,000 | 1,524,432 |
1.67%, 5/15/2033 (k) | 3,205,000 | 2,122,604 |
3.70%, 2/15/2034 (k) | 4,986,000 | 3,190,905 |
4.03%, 8/15/2039 (k) | 511,000 | 250,956 |
4.16%, 2/15/2040 (k) | 2,155,000 | 1,032,579 |
2.43%, 11/15/2040 (k) | 3,172,000 | 1,459,946 |
4.03%, 5/15/2041 (k) | 10,019,000 | 4,493,278 |
2.31%, 8/15/2041 (k) | 207,000 | 91,459 |
2.26%, 11/15/2041 (k) | 845,000 | 384,229 |
2.65%, 2/15/2042 (k) | 1,065,000 | 459,954 |
1.40%, 2/15/2045 (k) | 649,000 | 252,894 |
Total U.S. Treasury Obligations (Cost $194,404,366) | 177,811,160 | |
Commercial Mortgage-Backed Securities — 4.9% | ||
BAMLL Re-REMIC Trust Series 2014-FRR5, Class AK37, 1.99%, 1/27/2047 (a) (h) | 770,000 | 740,441 |
BBCMS Mortgage Trust Series 2016-ETC, Class E, 3.73%, 8/14/2036 (a) (h) | 4,913,000 | 3,546,160 |
BB-UBS Trust Series 2012-SHOW, Class E, 4.16%, 11/5/2036 (a) (h) | 225,000 | 193,787 |
BMD2 Re-Remic Trust Series 2019-FRR1, Class 5B13, 2.20%, 5/25/2052 (a) (h) | 4,000,000 | 2,867,343 |
BXP Trust Series 2017-GM, Class A, 3.38%, 6/13/2039 (a) | 2,000,000 | 1,808,217 |
INVESTMENTS | PRINCIPAL AMOUNT($) | VALUE($) |
Cascade Funding Mortgage Trust | ||
Series 2021-FRR1, Class DK45, 0.00%, 2/28/2025 (a) | 380,000 | 323,817 |
Series 2021-FRR1, Class CK45, 1.38%, 2/28/2025 (a) (h) | 500,000 | 448,986 |
Series 2021-FRR1, Class BK45, 2.08%, 2/28/2025 (a) (h) | 600,000 | 545,863 |
Series 2021-FRR1, Class CK54, 0.00%, 2/28/2026 (a) | 480,000 | 379,765 |
Series 2021-FRR1, Class DKW1, 0.00%, 2/28/2026 (a) | 430,000 | 331,357 |
Series 2021-FRR1, Class BK98, 0.00%, 8/29/2029 (a) | 1,150,000 | 685,316 |
Series 2021-FRR1, Class AK99, 0.00%, 9/29/2029 (a) | 3,000,000 | 1,900,155 |
Series 2021-FRR1, Class BK99, 0.00%, 9/29/2029 (a) | 400,000 | 228,029 |
CSMC OA LLC Series 2014-USA, Class D, 4.37%, 9/15/2037 (a) | 239,000 | 176,088 |
FHLMC, Multi-Family Structured Credit Risk | ||
Series 2021-MN1, Class M1, 7.29%, 1/25/2051 (a) (h) | 1,567,339 | 1,522,559 |
Series 2021-MN1, Class M2, 9.04%, 1/25/2051 (a) (h) | 685,000 | 656,233 |
Series 2021-MN3, Class M1, 7.59%, 11/25/2051 (a) (h) | 473,111 | 457,373 |
Series 2022-MN4, Class M1, 9.54%, 5/25/2052 (a) (h) | 983,637 | 990,974 |
Series 2022-MN4, Class M2, 11.79%, 5/25/2052 (a) (h) | 750,000 | 767,174 |
FHLMC, Multi-Family Structured Pass-Through Certificates | ||
Series KW06, Class A2, 3.80%, 6/25/2028 (h) | 1,750,000 | 1,666,564 |
Series K088, Class A2, 3.69%, 1/25/2029 | 350,000 | 332,282 |
Series K128, Class X3, IO, 2.88%, 4/25/2031 (h) | 550,000 | 85,586 |
Series K136, Class A2, 2.13%, 11/25/2031 | 3,500,000 | 2,866,736 |
Series K142, Class A2, 2.40%, 3/25/2032 | 1,250,000 | 1,040,573 |
Series K-151, Class A2, 3.80%, 10/25/2032 (h) | 1,050,000 | 971,510 |
Series K-153, Class A2, 3.82%, 12/25/2032 (h) | 1,000,000 | 925,673 |
Series K-1520, Class X1, IO, 0.58%, 2/25/2036 (h) | 4,485,179 | 173,097 |
August 31, 2023 | J.P. Morgan Exchange-Traded Funds | 53 |
AS OF August 31, 2023 (Unaudited) (continued)
INVESTMENTS | PRINCIPAL AMOUNT($) | VALUE($) |
Commercial Mortgage-Backed Securities — continued | ||
Series K-1520, Class X3, IO, 3.20%, 4/25/2039 (h) | 550,000 | 132,377 |
Series K145, Class AM, 2.58%, 6/25/2055 | 1,100,000 | 919,191 |
Series Q014, Class X, IO, 2.79%, 10/25/2055 (h) | 1,878,407 | 330,530 |
FNMA ACES | ||
Series 2017-M3, Class A2, 2.55%, 12/25/2026 (h) | 260,930 | 242,196 |
Series 2021-M11, Class A2, 1.51%, 3/25/2031 (h) | 300,000 | 234,871 |
Series 2023-M2, Class PT, 3.24%, 4/25/2031 (h) | 4,004,443 | 3,625,818 |
Series 2022-M1G, Class A2, 1.58%, 9/25/2031 (h) | 2,700,000 | 2,134,309 |
Series 2022-M1, Class A1, 1.72%, 10/25/2031 (h) | 477,762 | 413,342 |
Series 2022-M3, Class A2, 1.76%, 11/25/2031 (h) | 1,400,000 | 1,113,916 |
Series 2022-M8, Class A2, 2.00%, 12/25/2031 (h) | 2,500,000 | 2,003,898 |
Series 2022-M2S, Class A1, 3.88%, 5/25/2032 (h) | 983,913 | 933,658 |
Series 2022-M13, Class A2, 2.68%, 6/25/2032 (h) | 1,372,000 | 1,161,231 |
Series 2020-M53, Class A2, 1.74%, 11/25/2032 (h) | 1,250,000 | 970,122 |
Series 2021-M3, Class 1A1, 1.00%, 11/25/2033 | 42,927 | 40,372 |
Series 2021-M3, Class X1, IO, 2.05%, 11/25/2033 (h) | 522,351 | 44,095 |
FREMF Mortgage Trust | ||
Series 2018-KL3W, Class CW, 4.23%, 8/25/2025 (a) (h) | 250,000 | 229,529 |
Series 2018-KBX1, Class B, 3.69%, 1/25/2026 (a) (h) | 500,000 | 423,940 |
Series 2021-KHG3, Class BFX, 2.48%, 9/25/2028 (a) (h) | 1,000,000 | 826,761 |
Series 2015-K44, Class B, 3.85%, 1/25/2048 (a) (h) | 200,000 | 193,010 |
Series 2015-K45, Class B, 3.73%, 4/25/2048 (a) (h) | 199,293 | 191,379 |
Series 2015-K48, Class B, 3.77%, 8/25/2048 (a) (h) | 200,000 | 191,017 |
Series 2015-K50, Class B, 3.91%, 10/25/2048 (a) (h) | 200,000 | 191,125 |
Series 2015-K51, Class B, 4.09%, 10/25/2048 (a) (h) | 381,860 | 365,707 |
INVESTMENTS | PRINCIPAL AMOUNT($) | VALUE($) |
Series 2016-K52, Class B, 4.07%, 1/25/2049 (a) (h) | 250,000 | 237,851 |
Series 2016-K53, Class C, 4.16%, 3/25/2049 (a) (h) | 70,000 | 66,302 |
Series 2016-K57, Class B, 4.05%, 8/25/2049 (a) (h) | 1,000,000 | 942,418 |
Series 2017-K729, Class B, 3.80%, 11/25/2049 (a) (h) | 300,000 | 289,717 |
Series 2018-K80, Class B, 4.38%, 8/25/2050 (a) (h) | 1,000,000 | 937,486 |
Series 2019-K88, Class C, 4.53%, 2/25/2052 (a) (h) | 1,975,000 | 1,813,209 |
FRR Re-REMIC Trust Series 2018-C1, Class CK43, PO, 2/27/2048 (a) | 612,660 | 525,216 |
GAM Re-REMIC Trust | ||
Series 2021-FRR1, Class 1B, PO, 11/29/2050 (a) | 5,000,000 | 3,523,964 |
Series 2022-FRR3, Class BK89, PO, 1/27/2052 ‡ (a) | 4,000,000 | 2,458,638 |
GS Mortgage Securities Corp. II Series 2023-SHIP, Class A, 4.47%, 9/15/2038 (a) (h) | 4,140,000 | 3,982,082 |
Hudson Yards Mortgage Trust Series 2019-30HY, Class A, 3.23%, 7/10/2039 (a) | 3,000,000 | 2,588,126 |
JPMCC Re-REMIC Trust Series 2015-FRR2, Class AK39, 2.70%, 8/27/2047 (a) (h) | 944,000 | 882,844 |
MHC Commercial Mortgage Trust Series 2021-MHC, Class F, 8.03%, 4/15/2038 (a) (h) | 600,000 | 583,447 |
Multi-Family Connecticut Avenue Securities Trust | ||
Series 2019-01, Class M10, 8.65%, 10/25/2049 (a) (h) | 3,409,063 | 3,319,372 |
Series 2020-01, Class M7, 7.35%, 3/25/2050 (a) (h) | 63,938 | 63,564 |
Series 2020-01, Class M10, 9.15%, 3/25/2050 (a) (h) | 4,255,000 | 4,138,447 |
RFM Reremic Trust Series 2022-FRR1, Class BK64, 1.76%, 3/1/2050 (a) (h) | 2,328,481 | 1,845,015 |
Total Commercial Mortgage-Backed Securities (Cost $74,423,910) | 71,741,750 | |
Collateralized Mortgage Obligations — 3.5% | ||
Anchor Mortgage Trust Series 2021-1, Class A2, 3.65%, 10/25/2026 (a) (i) | 476,191 | 435,151 |
Connecticut Avenue Securities Trust Series 2023-R06, Class 1M2, 7.99%, 7/25/2043 (a) (h) | 1,500,000 | 1,508,445 |
54 | J.P. Morgan Exchange-Traded Funds | August 31, 2023 |
INVESTMENTS | PRINCIPAL AMOUNT($) | VALUE($) |
Collateralized Mortgage Obligations — continued | ||
CSMC Trust | ||
Series 2021-JR1, Class A1, 2.46%, 9/27/2066 (a) (h) | 384,081 | 372,043 |
Series 2022-JR1, Class A1, 4.27%, 10/25/2066 (a) (i) | 587,386 | 570,450 |
FHLMC, REMIC | ||
Series 5200, Class YV, 2.50%, 7/25/2033 | 4,055,526 | 3,596,518 |
Series 2708, Class ZD, 5.50%, 11/15/2033 | 75,355 | 75,050 |
Series 4302, Class PA, 4.00%, 12/15/2043 | 57,223 | 54,450 |
Series 4281, Class BC, 4.50%, 12/15/2043 (h) | 85,768 | 83,095 |
Series 5141, Class AH, 2.25%, 11/25/2047 | 1,342,086 | 1,165,633 |
Series 5200, Class MA, 2.50%, 8/25/2048 | 3,434,894 | 3,008,022 |
Series 5028, Class JG, 1.50%, 8/25/2050 | 3,025,055 | 2,357,755 |
Series 5155, Class JD, 1.25%, 10/25/2051 | 1,503,022 | 1,141,253 |
FNMA, REMIC | ||
Series 2003-7, Class FA, 6.15%, 2/25/2033 (h) | 74,610 | 74,768 |
Series 2013-108, Class GU, 3.00%, 10/25/2033 | 406,528 | 379,310 |
Series 2005-110, Class TY, 5.50%, 12/25/2035 | 46,165 | 46,054 |
Series 2007-89, Class F, 5.98%, 9/25/2037 (h) | 84,240 | 83,638 |
Series 2011-112, Class PB, 4.00%, 11/25/2041 | 109,768 | 103,395 |
Series 2014-57, Class PE, 3.00%, 9/25/2044 | 1,129,000 | 914,952 |
Series 2021-14, Class CB, 1.00%, 11/25/2049 | 3,957,153 | 2,979,758 |
GNMA | ||
Series 2012-61, Class FM, 5.83%, 5/16/2042 (h) | 356,769 | 350,685 |
Series 2020-165, Class UD, 1.50%, 11/20/2050 | 736,011 | 549,749 |
Series 2010-H24, Class FA, 5.61%, 10/20/2060 (h) | 45,754 | 45,450 |
Series 2014-H03, Class FA, 5.82%, 1/20/2064 (h) | 24,917 | 24,822 |
Series 2015-H05, Class FC, 5.70%, 2/20/2065 (h) | 231,520 | 230,098 |
INVESTMENTS | PRINCIPAL AMOUNT($) | VALUE($) |
Series 2021-H14, Class CF, 6.64%, 9/20/2071 (h) | 2,898,672 | 2,951,263 |
GS Mortgage-Backed Securities Corp. Trust Series 2021-RPL1, Class A1, 1.75%, 12/25/2060 (a) (h) | 2,973,526 | 2,680,244 |
Home RE Ltd. (Bermuda) Series 2022-1, Class M1C, 10.79%, 10/25/2034 (a) (h) | 750,000 | 768,132 |
LHOME Mortgage Trust | ||
Series 2021-RTL1, Class A1, 2.09%, 2/25/2026 (a) (h) | 79,386 | 78,835 |
Series 2023-RTL1, Class A1, 7.87%, 1/25/2028 (a) (i) | 1,320,000 | 1,313,459 |
Series 2023-RTL2, Class A1, 8.00%, 6/25/2028 (a) (i) | 2,000,000 | 1,994,277 |
PMT Credit Risk Transfer Trust Series 2021-1R, Class A, 8.34%, 2/27/2024 (a) (h) | 2,391,337 | 2,377,504 |
Prairie Lake, 4.52%, 10/1/2033 (j) | 1,200,000 | 1,175,825 |
Radnor RE Ltd. (Bermuda) Series 2022-1, Class M1B, 12.04%, 9/25/2032 (a) (h) | 400,000 | 424,281 |
Seasoned Credit Risk Transfer Trust | ||
Series 2018-1, Class MA, 3.00%, 5/25/2057 | 386,619 | 351,850 |
Series 2018-1, Class M60C, 3.50%, 5/25/2057 | 140,875 | 130,248 |
Series 2018-3, Class MA, 3.50%, 8/25/2057 (h) | 56,265 | 52,614 |
Series 2018-3, Class M55D, 4.00%, 8/25/2057 (h) | 264,873 | 247,532 |
Series 2018-2, Class MT, 3.50%, 11/25/2057 | 585,188 | 508,171 |
Series 2018-2, Class M55D, 4.00%, 11/25/2057 | 291,211 | 272,382 |
Series 2019-1, Class MA, 3.50%, 7/25/2058 | 2,849,648 | 2,652,903 |
Series 2019-2, Class MA, 3.50%, 8/25/2058 | 1,478,991 | 1,372,334 |
Series 2020-1, Class MA, 2.50%, 8/25/2059 | 4,415,791 | 3,966,342 |
Series 2020-3, Class M5TW, 3.00%, 5/25/2060 | 472,275 | 416,520 |
Series 2020-3, Class TTW, 3.00%, 5/25/2060 | 444,922 | 405,761 |
Series 2021-1, Class BXS, 13.28%, 9/25/2060 (a) (h) | 149,407 | 103,424 |
Series 2022-1, Class MTU, 3.25%, 11/25/2061 | 486,082 | 411,521 |
Series 2023-1, Class MT, 3.00%, 10/25/2062 | 3,100,000 | 2,596,450 |
August 31, 2023 | J.P. Morgan Exchange-Traded Funds | 55 |
AS OF August 31, 2023 (Unaudited) (continued)
INVESTMENTS | PRINCIPAL AMOUNT($) | VALUE($) |
Collateralized Mortgage Obligations — continued | ||
Towd Point Mortgage Trust Series 2021-R1, Class A2C, 3.31%, 11/30/2060 (a) | 754,000 | 690,044 |
Two Harbors Msr Frn, 7.25%, 4/15/2024 ‡ (a) | 1,500,000 | 1,500,000 |
VM Master Issuer LLC Series 2022-1, Class B, 6.88%, 5/24/2025 ‡ (a) (h) | 800,000 | 717,680 |
Total Collateralized Mortgage Obligations (Cost $51,368,746) | 50,310,140 | |
Loan Assignments — 0.3% (d) (l) | ||
Broadline Retail — 0.0% ^ | ||
GoodRx, Inc., 1st Lien Term Loan (1-MONTH CME TERM SOFR + 2.75%), 8.18%, 10/10/2025 | 623,349 | 621,903 |
Machinery — 0.0% ^ | ||
Alliance Laundry Systems LLC, 1st Lien Term Loan B (1-MONTH CME TERM SOFR + 3.50%; 3-MONTH CME TERM SOFR + 3.50%), 8.91%, 10/8/2027 (m) | 600,000 | 600,462 |
Personal Care Products — 0.1% | ||
Nestle Skin Health SA, Term Loan B (Luxembourg) (3-MONTH CME TERM SOFR + 3.75%), 9.09%, 10/1/2026 | 623,406 | 623,755 |
Semiconductors & Semiconductor Equipment — 0.1% | ||
Brooks Automation, 1st Lien Term Loan B (1-MONTH SOFR + 3.10%; 6-MONTH SOFR + 3.10%), 8.26%, 2/1/2029 (m) | 650,000 | 646,477 |
Software — 0.0% ^ | ||
Genesys Telecom Holdings US, Inc., 1st Lien Term Loan B (1-MONTH CME TERM SOFR + 4.00%), 9.45%, 12/1/2027 (m) | 623,402 | 623,015 |
Specialty Retail — 0.1% | ||
AppleCaramel Buyer LLC, 1st Lien Term Loan B (1-MONTH CME TERM SOFR + 3.75%), 9.08%, 10/19/2027 (m) | 498,734 | 497,901 |
Petco Health and Wellness Co., Inc., Term Loan B (3-MONTH CME TERM SOFR + 3.25%), 8.75%, 3/3/2028 | 495,342 | 492,063 |
989,964 | ||
Total Loan Assignments (Cost $4,088,653) | 4,105,576 | |
U.S. Government Agency Securities — 0.1% | ||
Resolution Funding Corp. STRIPS DN, 4.39%, 4/15/2030 (k) (Cost $1,648,899) | 2,195,000 | 1,612,300 |
INVESTMENTS | PRINCIPAL AMOUNT($) | VALUE($) |
Municipal Bonds — 0.0% (n) ^ | ||
Ohio — 0.0% ^ | ||
Ohio University, General Receipts, Federally Taxable Rev., 5.59%, 12/1/2114 | 25,000 | 23,077 |
Texas — 0.0% ^ | ||
Texas Natural Gas Securitization Finance Corp., Winter Storm URI Series 2023A-2, Rev., 5.17%, 4/1/2041 | 45,000 | 44,839 |
Total Municipal Bonds (Cost $77,770) | 67,916 | |
SHARES | ||
Common Stocks — 0.0% ^ | ||
Diversified Telecommunication Services — 0.0% ^ | ||
Windstream Holdings, Inc. ‡ * | 16 | 172 |
Oil, Gas & Consumable Fuels — 0.0% ^ | ||
Chesapeake Energy Corp. | 185 | 16,319 |
EP Energy Corp. ‡ * | 275 | 1,925 |
18,244 | ||
Professional Services — 0.0% ^ | ||
NMG, Inc. ‡ * | 1 | 115 |
Wireless Telecommunication Services — 0.0% ^ | ||
Intelsat SA (Luxembourg) ‡ * | 270 | 6,210 |
Total Common Stocks (Cost $10,146) | 24,741 | |
Preferred Stocks — 0.0% ^ | ||
Broadline Retail — 0.0% ^ | ||
MYT Holding LLC Series A, 10.00%, 6/6/2029 ‡ (Cost $2,753) | 2,868 | 2,223 |
NO. OF WARRANTS | ||
Warrants — 0.0% ^ | ||
Media — 0.0% ^ | ||
Nmg Research Ltd. expiring 9/24/2027, price 1.00 USD (United Kingdom) ‡ * (Cost $1) | 78 | 1,365 |
NO. OF RIGHTS | ||
Rights — 0.0% ^ | ||
Diversified Telecommunication Services — 0.0% ^ | ||
Intelsat Jackson Holdings SA, expiring 12/5/2025 (Luxembourg) ‡ * (Cost $1 ) | 56 | 1 |
56 | J.P. Morgan Exchange-Traded Funds | August 31, 2023 |
INVESTMENTS | SHARES | VALUE($) |
Short-Term Investments — 16.2% | ||
Investment Companies — 16.2% | ||
JPMorgan U.S. Government Money Market Fund Class IM Shares, 5.27% (o) (p) (Cost $235,103,925) | 235,103,925 | 235,103,925 |
Total Investments — 101.3% (Cost $1,517,182,948) | 1,468,989,254 | |
Liabilities in Excess of Other Assets — (1.3)% | (19,047,553 ) | |
NET ASSETS — 100.0% | 1,449,941,701 | |
Percentages indicated are based on net assets. |
Abbreviations | |
ABS | Asset-Backed Securities |
ACES | Alternative Credit Enhancement Securities |
ARM | Adjustable Rate Mortgage. The interest rate shown is the rate in effect as of August 31, 2023. |
CME | Chicago Mercantile Exchange |
CSMC | Credit Suisse Mortgage Trust |
DN | Discount Notes |
FHLMC | Federal Home Loan Mortgage Corp. |
FNMA | Federal National Mortgage Association |
FRN | Floating Rate Note |
GNMA | Government National Mortgage Association |
ICE | Intercontinental Exchange |
IO | Interest Only represents the right to receive the monthly interest payments on an underlying pool of mortgage loans. The principal amount shown represents the par value on the underlying pool. The yields on these securities are subject to accelerated principal paydowns as a result of prepayment or refinancing of the underlying pool of mortgage instruments. As a result, interest income may be reduced considerably. |
LIBOR | London Interbank Offered Rate |
PIK | Payment In Kind |
PO | Principal Only represents the right to receive the principal portion only on an underlying pool of mortgage loans. The market value of these securities is extremely volatile in response to changes in market interest rates. As prepayments on the underlying mortgages of these securities increase, the yield on these securities increases. |
PT | Limited liability company |
RE | Reinsured |
REIT | Real Estate Investment Trust |
REMIC | Real Estate Mortgage Investment Conduit |
Re-REMIC | Combined Real Estate Mortgage Investment Conduit |
Rev. | Revenue |
SCA | Limited partnership with share capital |
SOFR | Secured Overnight Financing Rate |
SOFRINDX | Compounding index of the Secured Overnight Financing Rate |
STRIPS | Separate Trading of Registered Interest and Principal of Securities. The STRIPS Program lets investors hold and trade individual interest and principal components of eligible notes and bonds as separate securities. |
TBA | To Be Announced; Security is subject to delayed delivery. |
UMBS | Uniform Mortgage-Backed Securities |
USD | United States Dollar |
^ | Amount rounds to less than 0.1% of net assets. | |
‡ | Value determined using significant unobservable inputs. | |
* | Non-income producing security. | |
(a) | Securities exempt from registration under Rule 144A or section 4(a)(2), of the Securities Act of 1933, as amended. | |
(b) | Defaulted security. | |
(c) | Security has the ability to pay in kind (“PIK”) or pay income in cash. When applicable, separate rates of such payments are disclosed. | |
(d) | Variable or floating rate security, linked to the referenced benchmark. The interest rate shown is the current rate as of August 31, 2023. | |
(e) | Contingent Capital security (“CoCo”). CoCos are hybrid debt securities that may be convertible into equity or may be written down if a pre-specified trigger event occurs. The total value of aggregate CoCo holdings at August 31, 2023 is $635,002 or 0.04% of the Fund’s net assets as of August 31, 2023. | |
(f) | Security is an interest bearing note with preferred security characteristics. | |
(g) | Security is perpetual and thus, does not have a predetermined maturity date. The coupon rate for this security is fixed for a period of time and may be structured to adjust thereafter. The date shown, if applicable, reflects the next call date. The coupon rate shown is the rate in effect as of August 31, 2023. | |
(h) | Variable or floating rate security, the interest rate of which adjusts periodically based on changes in current interest rates and prepayments on the underlying pool of assets. The interest rate shown is the current rate as of August 31, 2023. | |
(i) | Step bond. Interest rate is a fixed rate for an initial period that either resets at a specific date or may reset in the future contingent upon a predetermined trigger. The interest rate shown is the current rate as of August 31, 2023. | |
(j) | All or a portion of the security is a when-issued security, delayed delivery security, or forward commitment. | |
(k) | The rate shown is the effective yield as of August 31, 2023. | |
(l) | Loan assignments are presented by obligor. Each series or loan tranche underlying each obligor may have varying terms. | |
August 31, 2023 | J.P. Morgan Exchange-Traded Funds | 57 |
AS OF August 31, 2023 (Unaudited) (continued)
(m) | All or a portion of this security is unsettled as of August 31, 2023. Unless otherwise indicated, the coupon rate is undetermined. The coupon rate shown may not be accrued for the entire position. | |
(n) | The date shown represents the earliest of the prerefunded date, next put date or final maturity date. |
(o) | Investment in an affiliated fund, which is registered under the Investment Company Act of 1940, as amended, and is advised by J.P. Morgan Investment Management Inc. | |
(p) | The rate shown is the current yield as of August 31, 2023. |
DESCRIPTION | NUMBER OF CONTRACTS | EXPIRATION DATE | TRADING CURRENCY | NOTIONAL AMOUNT ($) | VALUE AND UNREALIZED APPRECIATION (DEPRECIATION) ($) |
Long Contracts | |||||
U.S. Treasury 10 Year Note | 724 | 12/19/2023 | USD | 80,375,313 | 626,612 |
U.S. Treasury 10 Year Ultra Note | 3 | 12/19/2023 | USD | 348,234 | 3,651 |
U.S. Treasury Long Bond | 271 | 12/19/2023 | USD | 32,943,438 | 348,884 |
U.S. Treasury Ultra Bond | 442 | 12/19/2023 | USD | 57,211,375 | 694,097 |
U.S. Treasury 2 Year Note | 596 | 12/29/2023 | USD | 121,495,531 | 243,650 |
U.S. Treasury 5 Year Note | 992 | 12/29/2023 | USD | 106,097,500 | 540,118 |
2,457,012 | |||||
Short Contracts | |||||
U.S. Treasury 10 Year Note | (2 ) | 12/19/2023 | USD | (222,031 ) | (1,770 ) |
U.S. Treasury 10 Year Ultra Note | (92 ) | 12/19/2023 | USD | (10,679,188 ) | (74,420 ) |
U.S. Treasury Long Bond | (3 ) | 12/19/2023 | USD | (364,688 ) | (3,897 ) |
U.S. Treasury 5 Year Note | (1 ) | 12/29/2023 | USD | (106,953 ) | (588 ) |
(80,675 ) | |||||
2,376,337 |
Abbreviations | |
USD | United States Dollar |
CURRENCY PURCHASED | CURRENCY SOLD | COUNTERPARTY | SETTLEMENT DATE | UNREALIZED APPRECIATION (DEPRECIATION) ($) | ||
JPY | 349,102,134 | USD | 2,470,150 | BNP Paribas | 9/15/2023 | (66,952 ) |
JPY | 139,470,662 | USD | 968,572 | HSBC Bank, NA | 9/15/2023 | (8,465 ) |
Net unrealized depreciation | (75,417 ) | |||||
Abbreviations | |
JPY | Japanese Yen |
USD | United States Dollar |
58 | J.P. Morgan Exchange-Traded Funds | August 31, 2023 |
REFERENCE OBLIGATION/INDEX | FINANCING RATE PAID BY THE FUND (%) | PAYMENT FREQUENCY | COUNTERPARTY | MATURITY DATE | IMPLIED CREDIT SPREAD (%)(a) | NOTIONAL AMOUNT(b) | UPFRONT PAYMENTS (RECEIPTS) ($)(c) | UNREALIZED APPRECIATION (DEPRECIATION) ($) | VALUE ($) |
Bank of America Corp., 3.50%, 4/19/2026 | 1.00 | Quarterly | Morgan Stanley | 6/20/2028 | 0.77 | USD2,300,000 | 18,462 | (45,255 ) | (26,793 ) |
Bank of America Corp., 3.50%, 4/19/2026 | 1.00 | Quarterly | Morgan Stanley | 6/20/2028 | 0.77 | USD3,000,000 | 21,501 | (56,448 ) | (34,947 ) |
Bank of America Corp., 3.50%, 4/19/2026 | 1.00 | Quarterly | Morgan Stanley | 6/20/2028 | 0.77 | USD2,900,000 | 9,798 | (43,580 ) | (33,782 ) |
Bank of America Corp., 3.50%, 4/19/2026 | 1.00 | Quarterly | Morgan Stanley | 6/20/2028 | 0.77 | USD210,000 | 2,125 | (4,571 ) | (2,446 ) |
51,886 | (149,854 ) | (97,968 ) |
(*) | The Fund, as a buyer of credit protection, is generally obligated to make periodic payments and may also pay or receive an upfront premium to or from the protection seller, in exchange for the right to receive a contingent payment, upon occurrence of a credit event with respect to an underlying reference obligation, as defined under the terms of individual swap contracts. | ||||||||
(a) | Implied credit spreads are an indication of the seller's performance risk, related to the likelihood of a credit event occurring that would require a seller to make payment to a buyer. Implied credit spreads are used to determine the value of swap contracts and reflect the cost of buying/selling protection, which may include upfront payments made to enter into the contract. Therefore, higher spreads would indicate a greater likelihood that a seller will be obligated to perform (i.e. make payment) under the swap contract. Increasing values, in absolute terms and relative to notional amounts, are also indicative of greater performance risk. Implied credit spreads for credit default swaps on credit indices are linked to the weighted average spread across the underlying reference obligations included in a particular index. | ||||||||
(b) | The notional amount is the maximum amount that a seller of credit protection would be obligated to pay and a buyer of credit protection would receive, upon occurrence of a credit event. | ||||||||
(c) | Upfront payments and receipts generally represent premiums paid or received at the initiation of the agreement to compensate the differences between the stated terms of the swap agreement and current market conditions (credit spreads, interest rates and other relevant factors). | ||||||||
Abbreviations | |||||||||
USD | United States Dollar | ||||||||
REFERENCE OBLIGATION/INDEX | FINANCING RATE PAID BY THE FUND (%) | PAYMENT FREQUENCY | MATURITY DATE | IMPLIED CREDIT SPREAD (%)(a) | NOTIONAL AMOUNT(b) | UPFRONT PAYMENTS (RECEIPTS) ($)(c) | UNREALIZED APPRECIATION (DEPRECIATION) ($) | VALUE ($) |
CDX.NA.IG.38-V1 | 1.00 | Quarterly | 6/20/2027 | 0.54 | USD11,000,000 | (4,374 ) | 202,600 | 198,226 |
CDX.NA.IG.39-V1 | 1.00 | Quarterly | 12/20/2027 | 0.61 | USD7,250,000 | 71,753 | 52,059 | 123,812 |
67,379 | 254,659 | 322,038 |
(**) | The Fund, as a seller of credit protection, receives periodic payments and may also receive or pay an upfront premium from or to the protection buyer, and is obligated to make a contingent payment, upon occurrence of a credit event with respect to an underlying reference obligation, as defined under the terms of individual swap contracts. | ||||||||
(a) | Implied credit spreads are an indication of the seller's performance risk, related to the likelihood of a credit event occurring that would require a seller to make payment to a buyer. Implied credit spreads are used to determine the value of swap contracts and reflect the cost of buying/selling protection, which may include upfront payments made to enter into the contract. Therefore, higher spreads would indicate a greater likelihood that a seller will be obligated to perform (i.e. make payment) under the swap contract.Increasing values, in absolute terms and relative to notional amounts, are also indicative of greater performance risk. Implied credit spreads for credit default swaps on credit indices are linked to the weighted average spread across the underlying reference obligations included in a particular index. | ||||||||
August 31, 2023 | J.P. Morgan Exchange-Traded Funds | 59 |
AS OF August 31, 2023 (Unaudited) (continued)
(b) | The notional amount is the maximum amount that a seller of credit protection would be obligated to pay and a buyer of credit protection would receive, upon occurrence of a credit event. | ||||||||
(c) | Upfront payments and receipts generally represent premiums paid or received at the initiation of the agreement to compensate the differences between the stated terms of the swap agreement and current market conditions (credit spreads, interest rates and other relevant factors). | ||||||||
Abbreviations | |
CDX | Credit Default Swap Index |
USD | United States Dollar |
NET UPFRONT PAYMENTS (RECEIPTS) ($) | VALUE ($) | |
Liabilities | ||
OTC Credit default swap contracts outstanding - buy protection | 51,886 | (97,968 ) |
60 | J.P. Morgan Exchange-Traded Funds | August 31, 2023 |
AS OF August 31, 2023 (Unaudited)
INVESTMENTS | PRINCIPAL AMOUNT($) | VALUE($) |
Corporate Bonds — 38.6% | ||
Aerospace & Defense — 0.3% | ||
Bombardier, Inc. (Canada) | ||
7.50%, 3/15/2025 (a) | 64,000 | 64,038 |
7.88%, 4/15/2027 (a) | 455,000 | 453,824 |
BWX Technologies, Inc. 4.13%, 6/30/2028 (a) | 100,000 | 90,996 |
Spirit AeroSystems, Inc. 9.38%, 11/30/2029 (a) | 377,000 | 392,877 |
TransDigm, Inc. 6.25%, 3/15/2026 (a) | 490,000 | 485,330 |
Triumph Group, Inc. 9.00%, 3/15/2028 (a) | 146,000 | 146,988 |
1,634,053 | ||
Automobile Components — 1.1% | ||
Adient Global Holdings Ltd. | ||
4.88%, 8/15/2026 (a) | 600,000 | 577,830 |
7.00%, 4/15/2028 (a) | 145,000 | 146,492 |
8.25%, 4/15/2031 (a) | 120,000 | 123,024 |
Allison Transmission, Inc. | ||
4.75%, 10/1/2027 (a) | 25,000 | 23,471 |
5.88%, 6/1/2029 (a) | 515,000 | 497,400 |
3.75%, 1/30/2031 (a) | 390,000 | 325,753 |
American Axle & Manufacturing, Inc. | ||
6.25%, 3/15/2026 | 10,000 | 9,727 |
6.50%, 4/1/2027 | 263,000 | 249,256 |
6.88%, 7/1/2028 | 390,000 | 357,716 |
5.00%, 10/1/2029 | 75,000 | 61,744 |
Clarios Global LP | ||
6.75%, 5/15/2025 (a) | 135,000 | 134,948 |
6.25%, 5/15/2026 (a) | 1,085,000 | 1,074,556 |
8.50%, 5/15/2027 (a) | 795,000 | 803,003 |
Cooper-Standard Automotive, Inc. 13.50% (Blend (Cash 9.00% + PIK 4.50%)), 3/31/2027 (a) (b) | 101,725 | 103,327 |
Dana, Inc. | ||
5.38%, 11/15/2027 | 140,000 | 132,443 |
5.63%, 6/15/2028 | 185,000 | 174,152 |
4.25%, 9/1/2030 | 40,000 | 32,890 |
Dornoch Debt Merger Sub, Inc. 6.63%, 10/15/2029 (a) | 80,000 | 68,968 |
Goodyear Tire & Rubber Co. (The) 5.00%, 7/15/2029 | 1,334,000 | 1,183,923 |
Icahn Enterprises LP 6.25%, 5/15/2026 | 500,000 | 463,230 |
6,543,853 | ||
Banks — 1.7% | ||
Banco do Brasil SA (Brazil) (US Treasury Yield Curve Rate T Note Constant Maturity 10 Year + 6.36%), 9.00%, 6/18/2024 (c) (d) (e) (f) (g) | 200,000 | 200,180 |
INVESTMENTS | PRINCIPAL AMOUNT($) | VALUE($) |
Banks — continued | ||
Banco Mercantil del Norte SA (Mexico) (US Treasury Yield Curve Rate T Note Constant Maturity 10 Year + 5.47%), 7.50%, 6/27/2029 (c) (d) (e) (f) (g) | 400,000 | 364,536 |
Bank of Nova Scotia (The) (Canada) (US Treasury Yield Curve Rate T Note Constant Maturity 5 Year + 4.39%), 8.63%, 10/27/2082 (c) (g) | 600,000 | 611,625 |
BPCE SA (France) | ||
(SOFR + 2.10%), 5.97%, 1/18/2027 (a) (g) | 4,678,000 | 4,654,299 |
5.13%, 1/18/2028 (a) | 725,000 | 711,016 |
Citigroup, Inc. | ||
Series U, (SOFR + 3.81%), 5.00%, 9/12/2024 (d) (e) (g) | 95,000 | 90,934 |
(US Treasury Yield Curve Rate T Note Constant Maturity 5 Year + 3.42%), 3.88%, 2/18/2026 (d) (e) (g) | 100,000 | 87,504 |
Danske Bank A/S (Denmark) (US Treasury Yield Curve Rate T Note Constant Maturity 1 Year + 2.10%), 6.47%, 1/9/2026 (a) (g) | 200,000 | 200,092 |
HSBC Holdings plc (United Kingdom) | ||
(SOFR + 3.35%), 7.39%, 11/3/2028 (g) | 290,000 | 304,681 |
(US Treasury Yield Curve Rate T Note Constant Maturity 5 Year + 3.65%), 4.60%, 12/17/2030 (c) (d) (e) (g) | 200,000 | 154,745 |
ING Groep NV (Netherlands) (USD ICE Swap Rate 5 Year + 4.20%), 6.75%, 4/16/2024 (c) (d) (e) (f) (g) | 200,000 | 195,149 |
Nordea Bank Abp (Finland) (US Treasury Yield Curve Rate T Note Constant Maturity 5 Year + 4.11%), 6.63%, 3/26/2026 (a) (c) (d) (e) (g) | 200,000 | 188,999 |
Santander UK Group Holdings plc (United Kingdom) (SOFR + 2.60%), 6.53%, 1/10/2029 (g) | 720,000 | 725,670 |
Societe Generale SA (France) (US Treasury Yield Curve Rate T Note Constant Maturity 1 Year + 2.30%), 6.45%, 1/12/2027 (a) (g) | 315,000 | 316,474 |
Toronto-Dominion Bank (The) (US Treasury Yield Curve Rate T Note Constant Maturity 5 Year + 4.08%), 8.13%, 10/31/2082 (c) (g) | 950,000 | 954,770 |
August 31, 2023 | 61 |
AS OF August 31, 2023 (Unaudited) (continued)
INVESTMENTS | PRINCIPAL AMOUNT($) | VALUE($) |
Corporate Bonds — continued | ||
Banks — continued | ||
Wells Fargo & Co. | ||
Series BB, (US Treasury Yield Curve Rate T Note Constant Maturity 5 Year + 3.45%), 3.90%, 3/15/2026 (d) (e) (g) | 162,000 | 143,613 |
(US Treasury Yield Curve Rate T Note Constant Maturity 5 Year + 3.61%), 7.63%, 9/15/2028 (d) (e) (g) | 165,000 | 168,919 |
10,073,206 | ||
Biotechnology — 0.1% | ||
Grifols SA (Spain) 4.75%, 10/15/2028 (a) | 400,000 | 350,932 |
Broadline Retail — 0.2% | ||
NMG Holding Co., Inc. 7.13%, 4/1/2026 (a) | 1,065,000 | 1,012,193 |
Nordstrom, Inc. | ||
4.00%, 3/15/2027 | 100,000 | 87,232 |
4.25%, 8/1/2031 | 110,000 | 82,751 |
Shutterfly Finance LLC | ||
8.50% (Blend (Cash 4.25% + PIK 4.25%)), 10/1/2027 (a) (b) | 189,000 | 122,866 |
9.75%, 10/1/2027 (a) | 22,913 | 22,684 |
1,327,726 | ||
Building Products — 0.6% | ||
Builders FirstSource, Inc. 6.38%, 6/15/2032 (a) | 500,000 | 487,468 |
Emerald Debt Merger Sub LLC 6.63%, 12/15/2030 (a) | 830,000 | 817,069 |
Griffon Corp. 5.75%, 3/1/2028 | 85,000 | 79,220 |
JELD-WEN, Inc. 4.88%, 12/15/2027 (a) | 125,000 | 111,248 |
Masonite International Corp. 5.38%, 2/1/2028 (a) | 100,000 | 94,750 |
MIWD Holdco II LLC 5.50%, 2/1/2030 (a) | 150,000 | 127,143 |
Standard Industries, Inc. | ||
4.75%, 1/15/2028 (a) | 1,695,000 | 1,561,094 |
4.38%, 7/15/2030 (a) | 250,000 | 214,303 |
3,492,295 | ||
Capital Markets — 0.5% | ||
Coinbase Global, Inc. 3.38%, 10/1/2028 (a) | 30,000 | 22,068 |
Goldman Sachs Group, Inc. (The) | ||
Series R, (US Treasury Yield Curve Rate T Note Constant Maturity 5 Year + 3.22%), 4.95%, 2/10/2025 (d) (e) (g) | 95,000 | 88,525 |
(SOFR + 1.08%), 5.80%, 8/10/2026 (g) | 1,150,000 | 1,146,456 |
INVESTMENTS | PRINCIPAL AMOUNT($) | VALUE($) |
Capital Markets — continued | ||
Series W, (US Treasury Yield Curve Rate T Note Constant Maturity 5 Year + 3.16%), 7.50%, 2/10/2029 (d) (e) (g) | 390,000 | 391,950 |
Nasdaq, Inc. 5.35%, 6/28/2028 | 1,160,000 | 1,160,481 |
2,809,480 | ||
Chemicals — 1.2% | ||
Axalta Coating Systems LLC | ||
4.75%, 6/15/2027 (a) | 200,000 | 188,203 |
3.38%, 2/15/2029 (a) | 900,000 | 763,318 |
Braskem Idesa SAPI 6.99%, 2/20/2032 (a) | 400,000 | 238,348 |
Braskem Netherlands Finance BV (Brazil) 7.25%, 2/13/2033 (a) | 200,000 | 188,690 |
Celanese US Holdings LLC 1.40%, 8/5/2026 | 240,000 | 209,774 |
Chemours Co. (The) | ||
5.75%, 11/15/2028 (a) | 1,295,000 | 1,163,324 |
4.63%, 11/15/2029 (a) | 75,000 | 62,351 |
Element Solutions, Inc. 3.88%, 9/1/2028 (a) | 365,000 | 320,879 |
NOVA Chemicals Corp. (Canada) | ||
5.25%, 6/1/2027 (a) | 1,405,000 | 1,249,124 |
4.25%, 5/15/2029 (a) | 25,000 | 20,306 |
Scotts Miracle-Gro Co. (The) | ||
5.25%, 12/15/2026 | 20,000 | 18,944 |
4.50%, 10/15/2029 | 1,070,000 | 894,862 |
4.00%, 4/1/2031 | 320,000 | 251,514 |
Trinseo Materials Operating SCA | ||
5.38%, 9/1/2025 (a) | 45,000 | 41,922 |
5.13%, 4/1/2029 (a) | 220,000 | 118,858 |
WR Grace Holdings LLC | ||
4.88%, 6/15/2027 (a) | 790,000 | 736,786 |
5.63%, 8/15/2029 (a) | 795,000 | 672,331 |
7,139,534 | ||
Commercial Services & Supplies — 1.2% | ||
ACCO Brands Corp. 4.25%, 3/15/2029 (a) | 805,000 | 687,728 |
ADT Security Corp. (The) | ||
4.13%, 8/1/2029 (a) | 490,000 | 427,682 |
4.88%, 7/15/2032 (a) | 180,000 | 155,268 |
Allied Universal Holdco LLC 6.63%, 7/15/2026 (a) | 925,000 | 879,809 |
Aramark Services, Inc. 5.00%, 2/1/2028 (a) | 785,000 | 732,339 |
Brink's Co. (The) 4.63%, 10/15/2027 (a) | 235,000 | 218,519 |
Garda World Security Corp. 4.63%, 2/15/2027 (a) | 50,000 | 46,255 |
GFL Environmental, Inc. (Canada) | ||
62 | August 31, 2023 |
INVESTMENTS | PRINCIPAL AMOUNT($) | VALUE($) |
Corporate Bonds — continued | ||
Commercial Services & Supplies — continued | ||
3.75%, 8/1/2025 (a) | 890,000 | 847,333 |
5.13%, 12/15/2026 (a) | 25,000 | 24,190 |
4.00%, 8/1/2028 (a) | 610,000 | 544,558 |
4.38%, 8/15/2029 (a) | 60,000 | 53,071 |
Madison IAQ LLC 4.13%, 6/30/2028 (a) | 1,420,000 | 1,256,320 |
Prime Security Services Borrower LLC | ||
5.75%, 4/15/2026 (a) | 385,000 | 377,818 |
3.38%, 8/31/2027 (a) | 940,000 | 836,038 |
Stericycle, Inc. 3.88%, 1/15/2029 (a) | 250,000 | 217,671 |
7,304,599 | ||
Communications Equipment — 0.3% | ||
CommScope, Inc. | ||
6.00%, 3/1/2026 (a) | 1,170,000 | 1,063,256 |
8.25%, 3/1/2027 (a) | 710,000 | 470,382 |
4.75%, 9/1/2029 (a) | 625,000 | 464,461 |
1,998,099 | ||
Construction & Engineering — 0.2% | ||
Bioceanico Sovereign Certificate Ltd. (Paraguay) Zero Coupon, 6/5/2034 (f) | 133,586 | 93,317 |
Dycom Industries, Inc. 4.50%, 4/15/2029 (a) | 90,000 | 80,359 |
International Airport Finance SA (Ecuador) 12.00%, 3/15/2033 (f) | 194,529 | 182,371 |
MasTec, Inc. 4.50%, 8/15/2028 (a) | 275,000 | 250,907 |
Mexico City Airport Trust (Mexico) 5.50%, 10/31/2046 (f) | 400,000 | 329,800 |
936,754 | ||
Consumer Finance — 1.4% | ||
AerCap Ireland Capital DAC 3.00%, 10/29/2028 | 810,000 | 701,915 |
Avolon Holdings Funding Ltd. (Ireland) 2.88%, 2/15/2025 (a) | 1,140,000 | 1,075,645 |
Ford Motor Credit Co. LLC | ||
2.30%, 2/10/2025 | 1,755,000 | 1,648,784 |
5.13%, 6/16/2025 | 400,000 | 389,405 |
3.38%, 11/13/2025 | 200,000 | 186,457 |
4.39%, 1/8/2026 | 200,000 | 189,022 |
6.95%, 6/10/2026 | 200,000 | 200,255 |
4.54%, 8/1/2026 | 200,000 | 188,510 |
4.27%, 1/9/2027 | 725,000 | 670,326 |
4.13%, 8/17/2027 | 2,735,000 | 2,481,654 |
2.90%, 2/10/2029 | 200,000 | 165,058 |
7.20%, 6/10/2030 | 200,000 | 203,140 |
INVESTMENTS | PRINCIPAL AMOUNT($) | VALUE($) |
Consumer Finance — continued | ||
OneMain Finance Corp. | ||
7.13%, 3/15/2026 | 75,000 | 73,781 |
3.88%, 9/15/2028 | 625,000 | 512,500 |
8,686,452 | ||
Consumer Staples Distribution & Retail — 0.9% | ||
Albertsons Cos., Inc. | ||
4.63%, 1/15/2027 (a) | 1,620,000 | 1,529,971 |
5.88%, 2/15/2028 (a) | 795,000 | 771,580 |
3.50%, 3/15/2029 (a) | 485,000 | 419,535 |
4.88%, 2/15/2030 (a) | 315,000 | 289,015 |
Performance Food Group, Inc. | ||
5.50%, 10/15/2027 (a) | 830,000 | 799,213 |
4.25%, 8/1/2029 (a) | 790,000 | 695,247 |
Rite Aid Corp. | ||
7.50%, 7/1/2025 (a) | 248,000 | 156,267 |
8.00%, 11/15/2026 (a) | 225,000 | 142,875 |
US Foods, Inc. | ||
4.75%, 2/15/2029 (a) | 619,000 | 564,974 |
4.63%, 6/1/2030 (a) | 116,000 | 103,103 |
5,471,780 | ||
Containers & Packaging — 1.1% | ||
Ardagh Packaging Finance plc | ||
4.13%, 8/15/2026 (a) | 800,000 | 748,252 |
5.25%, 8/15/2027 (a) | 800,000 | 685,424 |
LABL, Inc. 6.75%, 7/15/2026 (a) | 1,120,000 | 1,094,724 |
Mauser Packaging Solutions Holding Co. | ||
7.88%, 8/15/2026 (a) | 1,420,000 | 1,398,338 |
9.25%, 4/15/2027 (a) | 85,000 | 77,018 |
Owens-Brockway Glass Container, Inc. 6.63%, 5/13/2027 (a) | 355,000 | 350,911 |
Pactiv Evergreen Group Issuer, Inc. 4.00%, 10/15/2027 (a) | 1,720,000 | 1,547,002 |
TriMas Corp. 4.13%, 4/15/2029 (a) | 65,000 | 56,712 |
Trivium Packaging Finance BV (Netherlands) | ||
5.50%, 8/15/2026 (a) (h) | 200,000 | 188,632 |
8.50%, 8/15/2027 (a) (h) | 250,000 | 238,263 |
6,385,276 | ||
Distributors — 0.0% ^ | ||
Ritchie Bros Holdings, Inc. 6.75%, 3/15/2028 (a) | 145,000 | 146,776 |
Diversified Consumer Services — 0.1% | ||
Service Corp. International 3.38%, 8/15/2030 | 960,000 | 792,476 |
August 31, 2023 | 63 |
AS OF August 31, 2023 (Unaudited) (continued)
INVESTMENTS | PRINCIPAL AMOUNT($) | VALUE($) |
Corporate Bonds — continued | ||
Diversified REITs — 0.2% | ||
VICI Properties LP | ||
4.50%, 9/1/2026 (a) | 200,000 | 189,304 |
4.25%, 12/1/2026 (a) | 345,000 | 325,015 |
3.75%, 2/15/2027 (a) | 245,000 | 224,916 |
3.88%, 2/15/2029 (a) | 675,000 | 595,964 |
4.63%, 12/1/2029 (a) | 37,000 | 33,424 |
1,368,623 | ||
Diversified Telecommunication Services — 2.4% | ||
Altice France Holding SA 10.50%, 5/15/2027 (a) | 400,000 | 217,040 |
Altice France SA (France) | ||
8.13%, 2/1/2027 (a) | 400,000 | 338,056 |
5.13%, 7/15/2029 (a) | 650,000 | 459,502 |
CCO Holdings LLC | ||
5.00%, 2/1/2028 (a) | 275,000 | 253,411 |
5.38%, 6/1/2029 (a) | 1,976,000 | 1,798,454 |
6.38%, 9/1/2029 (a) | 640,000 | 605,893 |
4.75%, 3/1/2030 (a) | 3,115,000 | 2,678,254 |
4.50%, 8/15/2030 (a) | 3,167,000 | 2,664,072 |
4.25%, 2/1/2031 (a) | 1,409,000 | 1,155,780 |
Frontier Communications Holdings LLC | ||
5.88%, 10/15/2027 (a) | 795,000 | 724,087 |
5.00%, 5/1/2028 (a) | 305,000 | 261,340 |
Intelsat Jackson Holdings SA 6.50%, 3/15/2030 (a) | 1,350,000 | 1,237,832 |
Level 3 Financing, Inc. | ||
4.63%, 9/15/2027 (a) | 745,000 | 560,266 |
4.25%, 7/1/2028 (a) | 450,000 | 295,046 |
Lumen Technologies, Inc. | ||
5.13%, 12/15/2026 (a) | 100,000 | 51,802 |
4.00%, 2/15/2027 (a) | 1,975,000 | 1,244,685 |
Sitios Latinoamerica SAB de CV (Brazil) 5.38%, 4/4/2032 (a) | 200,000 | 178,225 |
Telecom Italia Capital SA (Italy) | ||
6.38%, 11/15/2033 | 43,000 | 37,787 |
6.00%, 9/30/2034 | 29,000 | 24,298 |
14,785,830 | ||
Electric Utilities — 1.0% | ||
Electricidad Firme de Mexico Holdings SA de CV (Mexico) 4.90%, 11/20/2026 (a) | 200,000 | 175,888 |
Energuate Trust (Guatemala) 5.88%, 5/3/2027 (f) | 200,000 | 184,046 |
Eskom Holdings SOC Ltd. (South Africa) 7.13%, 2/11/2025 (f) | 700,000 | 689,724 |
INVESTMENTS | PRINCIPAL AMOUNT($) | VALUE($) |
Electric Utilities — continued | ||
Instituto Costarricense de Electricidad (Costa Rica) 6.75%, 10/7/2031 (a) | 200,000 | 194,612 |
Minejesa Capital BV (Indonesia) 4.63%, 8/10/2030 (f) | 200,000 | 180,582 |
NRG Energy, Inc. | ||
6.63%, 1/15/2027 | 20,000 | 19,751 |
5.75%, 1/15/2028 | 1,595,000 | 1,508,990 |
5.25%, 6/15/2029 (a) | 100,000 | 90,010 |
3.63%, 2/15/2031 (a) | 410,000 | 319,976 |
Tierra Mojada Luxembourg II SARL (Mexico) 5.75%, 12/1/2040 (f) | 182,793 | 154,278 |
Trinidad Generation UnLtd (Trinidad and Tobago) 5.25%, 11/4/2027 (f) | 200,000 | 192,400 |
Vistra Operations Co. LLC | ||
5.13%, 5/13/2025 (a) | 740,000 | 720,816 |
5.00%, 7/31/2027 (a) | 1,698,000 | 1,596,984 |
6,028,057 | ||
Electrical Equipment — 0.1% | ||
Regal Rexnord Corp. | ||
6.05%, 2/15/2026 (a) | 80,000 | 79,568 |
6.05%, 4/15/2028 (a) | 260,000 | 257,246 |
6.30%, 2/15/2030 (a) | 69,000 | 68,696 |
6.40%, 4/15/2033 (a) | 97,000 | 96,090 |
501,600 | ||
Electronic Equipment, Instruments & Components — 0.3% | ||
Coherent Corp. 5.00%, 12/15/2029 (a) | 787,000 | 699,013 |
Sensata Technologies, Inc. 3.75%, 2/15/2031 (a) | 1,440,000 | 1,206,626 |
1,905,639 | ||
Energy Equipment & Services — 0.2% | ||
Archrock Partners LP 6.88%, 4/1/2027 (a) | 240,000 | 235,956 |
Guara Norte SARL (Brazil) 5.20%, 6/15/2034 (f) | 176,852 | 154,745 |
Nabors Industries, Inc. | ||
5.75%, 2/1/2025 | 115,000 | 112,862 |
7.38%, 5/15/2027 (a) | 85,000 | 82,952 |
Precision Drilling Corp. (Canada) | ||
7.13%, 1/15/2026 (a) | 150,000 | 148,688 |
6.88%, 1/15/2029 (a) | 75,000 | 71,298 |
Transocean, Inc. 8.75%, 2/15/2030 (a) | 104,500 | 106,905 |
913,406 | ||
64 | August 31, 2023 |
INVESTMENTS | PRINCIPAL AMOUNT($) | VALUE($) |
Corporate Bonds — continued | ||
Entertainment — 0.6% | ||
Live Nation Entertainment, Inc. | ||
5.63%, 3/15/2026 (a) | 25,000 | 24,248 |
6.50%, 5/15/2027 (a) | 1,105,000 | 1,105,856 |
4.75%, 10/15/2027 (a) | 1,810,000 | 1,686,196 |
3.75%, 1/15/2028 (a) | 140,000 | 124,665 |
Warnermedia Holdings, Inc. 3.76%, 3/15/2027 | 720,000 | 675,301 |
WMG Acquisition Corp. | ||
3.75%, 12/1/2029 (a) | 48,000 | 41,614 |
3.88%, 7/15/2030 (a) | 307,000 | 266,415 |
3,924,295 | ||
Financial Services — 0.4% | ||
Block, Inc. 3.50%, 6/1/2031 | 895,000 | 733,869 |
Corebridge Financial, Inc. (US Treasury Yield Curve Rate T Note Constant Maturity 5 Year + 3.85%), 6.88%, 12/15/2052 (g) | 500,000 | 486,134 |
Nationstar Mortgage Holdings, Inc. 5.50%, 8/15/2028 (a) | 220,000 | 199,360 |
Rocket Mortgage LLC | ||
2.88%, 10/15/2026 (a) | 130,000 | 115,537 |
3.63%, 3/1/2029 (a) | 788,000 | 670,693 |
2,205,593 | ||
Food Products — 0.6% | ||
Lamb Weston Holdings, Inc. 4.13%, 1/31/2030 (a) | 1,445,000 | 1,270,787 |
Post Holdings, Inc. | ||
5.63%, 1/15/2028 (a) | 650,000 | 623,274 |
4.63%, 4/15/2030 (a) | 1,820,000 | 1,612,489 |
Sigma Holdco BV (Netherlands) 7.88%, 5/15/2026 (a) | 200,000 | 170,119 |
3,676,669 | ||
Gas Utilities — 0.1% | ||
AmeriGas Partners LP | ||
5.88%, 8/20/2026 | 165,000 | 156,535 |
5.75%, 5/20/2027 | 215,000 | 198,813 |
9.38%, 6/1/2028 (a) | 112,000 | 114,804 |
470,152 | ||
Ground Transportation — 0.8% | ||
Avis Budget Car Rental LLC | ||
5.75%, 7/15/2027 (a) | 225,000 | 214,826 |
4.75%, 4/1/2028 (a) | 970,000 | 882,164 |
EquipmentShare.com, Inc. 9.00%, 5/15/2028 (a) | 385,000 | 382,113 |
INVESTMENTS | PRINCIPAL AMOUNT($) | VALUE($) |
Ground Transportation — continued | ||
First Student Bidco, Inc. 4.00%, 7/31/2029 (a) | 180,000 | 153,001 |
Hertz Corp. (The) | ||
4.63%, 12/1/2026 (a) | 100,000 | 90,539 |
5.00%, 12/1/2029 (a) | 1,325,000 | 1,089,407 |
NESCO Holdings II, Inc. 5.50%, 4/15/2029 (a) | 105,000 | 95,220 |
Transnet SOC Ltd. (South Africa) 8.25%, 2/6/2028 (a) | 200,000 | 194,158 |
Uber Technologies, Inc. | ||
7.50%, 5/15/2025 (a) | 410,000 | 413,958 |
7.50%, 9/15/2027 (a) | 760,000 | 775,999 |
4.50%, 8/15/2029 (a) | 545,000 | 499,009 |
XPO, Inc. 6.25%, 6/1/2028 (a) | 175,000 | 171,478 |
4,961,872 | ||
Health Care Equipment & Supplies — 0.7% | ||
Avantor Funding, Inc. 4.63%, 7/15/2028 (a) | 1,485,000 | 1,378,502 |
Hologic, Inc. 3.25%, 2/15/2029 (a) | 1,139,000 | 989,318 |
Medline Borrower LP | ||
3.88%, 4/1/2029 (a) | 1,425,000 | 1,243,990 |
5.25%, 10/1/2029 (a) | 755,000 | 670,459 |
4,282,269 | ||
Health Care Providers & Services — 1.9% | ||
Acadia Healthcare Co., Inc. | ||
5.50%, 7/1/2028 (a) | 90,000 | 85,261 |
5.00%, 4/15/2029 (a) | 35,000 | 32,199 |
Centene Corp. 4.63%, 12/15/2029 | 760,000 | 698,820 |
Community Health Systems, Inc. | ||
8.00%, 3/15/2026 (a) | 1,236,000 | 1,206,529 |
5.63%, 3/15/2027 (a) | 370,000 | 325,579 |
6.00%, 1/15/2029 (a) | 345,000 | 288,938 |
5.25%, 5/15/2030 (a) | 109,000 | 85,961 |
DaVita, Inc. 3.75%, 2/15/2031 (a) | 1,710,000 | 1,361,746 |
Encompass Health Corp. | ||
4.50%, 2/1/2028 | 710,000 | 659,507 |
4.75%, 2/1/2030 | 490,000 | 446,314 |
4.63%, 4/1/2031 | 350,000 | 306,926 |
HCA, Inc. 5.88%, 2/15/2026 | 305,000 | 305,416 |
McKesson Corp. 5.25%, 2/15/2026 | 395,000 | 393,536 |
Owens & Minor, Inc. | ||
4.50%, 3/31/2029 (a) | 190,000 | 161,025 |
6.63%, 4/1/2030 (a) | 260,000 | 236,525 |
Tenet Healthcare Corp. | ||
4.88%, 1/1/2026 | 835,000 | 809,434 |
6.25%, 2/1/2027 | 132,000 | 129,979 |
August 31, 2023 | 65 |
AS OF August 31, 2023 (Unaudited) (continued)
INVESTMENTS | PRINCIPAL AMOUNT($) | VALUE($) |
Corporate Bonds — continued | ||
Health Care Providers & Services — continued | ||
5.13%, 11/1/2027 | 2,150,000 | 2,044,296 |
4.63%, 6/15/2028 | 1,555,000 | 1,431,872 |
6.13%, 6/15/2030 | 183,000 | 177,329 |
6.75%, 5/15/2031 (a) | 384,000 | 382,099 |
11,569,291 | ||
Health Care Technology — 0.0% ^ | ||
IQVIA, Inc. 5.00%, 5/15/2027 (a) | 200,000 | 192,517 |
Hotel & Resort REITs — 0.3% | ||
RHP Hotel Properties LP | ||
4.75%, 10/15/2027 | 1,590,000 | 1,478,279 |
4.50%, 2/15/2029 (a) | 70,000 | 61,446 |
1,539,725 | ||
Hotels, Restaurants & Leisure — 2.2% | ||
1011778 BC ULC (Canada) | ||
3.88%, 1/15/2028 (a) | 1,070,000 | 973,212 |
4.38%, 1/15/2028 (a) | 185,000 | 169,803 |
4.00%, 10/15/2030 (a) | 315,000 | 266,853 |
Boyne USA, Inc. 4.75%, 5/15/2029 (a) | 225,000 | 203,064 |
Caesars Entertainment, Inc. | ||
6.25%, 7/1/2025 (a) | 1,140,000 | 1,131,150 |
8.13%, 7/1/2027 (a) | 540,000 | 548,280 |
4.63%, 10/15/2029 (a) | 140,000 | 122,547 |
Carnival Corp. | ||
5.75%, 3/1/2027 (a) | 55,000 | 51,761 |
9.88%, 8/1/2027 (a) | 210,000 | 221,974 |
Carnival Holdings Bermuda Ltd. 10.38%, 5/1/2028 (a) | 495,000 | 538,354 |
Cedar Fair LP | ||
5.50%, 5/1/2025 (a) | 440,000 | 436,531 |
5.25%, 7/15/2029 | 190,000 | 171,033 |
Hilton Domestic Operating Co., Inc. 3.75%, 5/1/2029 (a) | 610,000 | 537,408 |
Hilton Worldwide Finance LLC 4.88%, 4/1/2027 | 820,000 | 790,289 |
MGM Resorts International | ||
6.75%, 5/1/2025 | 875,000 | 876,453 |
5.75%, 6/15/2025 | 325,000 | 320,492 |
4.63%, 9/1/2026 | 220,000 | 207,210 |
5.50%, 4/15/2027 | 45,000 | 42,993 |
Royal Caribbean Cruises Ltd. | ||
11.50%, 6/1/2025 (a) | 36,000 | 38,020 |
11.63%, 8/15/2027 (a) | 409,000 | 445,657 |
8.25%, 1/15/2029 (a) | 263,000 | 273,920 |
9.25%, 1/15/2029 (a) | 65,000 | 69,280 |
INVESTMENTS | PRINCIPAL AMOUNT($) | VALUE($) |
Hotels, Restaurants & Leisure — continued | ||
Six Flags Entertainment Corp. 5.50%, 4/15/2027 (a) | 815,000 | 767,119 |
Six Flags Theme Parks, Inc. 7.00%, 7/1/2025 (a) | 15,000 | 14,996 |
Station Casinos LLC 4.50%, 2/15/2028 (a) | 490,000 | 438,550 |
Studio City Finance Ltd. (Macau) 5.00%, 1/15/2029 (f) | 200,000 | 149,508 |
Vail Resorts, Inc. 6.25%, 5/15/2025 (a) | 625,000 | 622,807 |
Wynn Las Vegas LLC 5.50%, 3/1/2025 (a) | 140,000 | 138,303 |
Wynn Macau Ltd. (Macau) 5.63%, 8/26/2028 (f) | 200,000 | 175,250 |
Wynn Resorts Finance LLC 5.13%, 10/1/2029 (a) | 1,640,000 | 1,468,137 |
Yum! Brands, Inc. 4.75%, 1/15/2030 (a) | 970,000 | 893,241 |
13,104,195 | ||
Household Durables — 0.5% | ||
CD&R Smokey Buyer, Inc. 6.75%, 7/15/2025 (a) | 535,000 | 517,757 |
Newell Brands, Inc. | ||
4.88%, 6/1/2025 | 100,000 | 97,046 |
4.70%, 4/1/2026 (h) | 1,180,000 | 1,130,565 |
Tempur Sealy International, Inc. 4.00%, 4/15/2029 (a) | 1,510,000 | 1,297,062 |
3,042,430 | ||
Household Products — 0.5% | ||
Central Garden & Pet Co. | ||
5.13%, 2/1/2028 | 325,000 | 304,171 |
4.13%, 10/15/2030 | 300,000 | 258,205 |
Energizer Holdings, Inc. | ||
4.75%, 6/15/2028 (a) | 657,000 | 580,095 |
4.38%, 3/31/2029 (a) | 827,000 | 708,317 |
Spectrum Brands, Inc. | ||
5.00%, 10/1/2029 (a) | 620,000 | 568,600 |
5.50%, 7/15/2030 (a) | 170,000 | 158,137 |
3.88%, 3/15/2031 (a) | 470,000 | 393,785 |
2,971,310 | ||
Independent Power and Renewable Electricity Producers — 0.1% | ||
Calpine Corp. 4.63%, 2/1/2029 (a) | 460,000 | 399,737 |
Termocandelaria Power Ltd. (Colombia) 7.88%, 1/30/2029 (f) | 155,000 | 144,508 |
544,245 | ||
IT Services — 0.2% | ||
Gartner, Inc. 4.50%, 7/1/2028 (a) | 1,276,000 | 1,189,917 |
66 | August 31, 2023 |
INVESTMENTS | PRINCIPAL AMOUNT($) | VALUE($) |
Corporate Bonds — continued | ||
Leisure Products — 0.1% | ||
Mattel, Inc. 5.88%, 12/15/2027 (a) | 530,000 | 519,825 |
Vista Outdoor, Inc. 4.50%, 3/15/2029 (a) | 185,000 | 154,192 |
674,017 | ||
Machinery — 0.1% | ||
Chart Industries, Inc. 7.50%, 1/1/2030 (a) | 560,000 | 573,801 |
Terex Corp. 5.00%, 5/15/2029 (a) | 80,000 | 73,452 |
TK Elevator US Newco, Inc. (Germany) 5.25%, 7/15/2027 (a) | 200,000 | 187,480 |
834,733 | ||
Marine Transportation — 0.0% ^ | ||
MV24 Capital BV (Brazil) 6.75%, 6/1/2034 (f) | 168,118 | 151,160 |
Media — 4.1% | ||
Charter Communications Operating LLC 5.38%, 4/1/2038 | 100,000 | 84,685 |
Clear Channel Outdoor Holdings, Inc. | ||
5.13%, 8/15/2027 (a) | 1,385,000 | 1,240,464 |
7.75%, 4/15/2028 (a) | 287,000 | 225,738 |
9.00%, 9/15/2028 (a) | 1,160,000 | 1,165,800 |
CSC Holdings LLC 6.50%, 2/1/2029 (a) | 1,695,000 | 1,401,186 |
Directv Financing LLC 5.88%, 8/15/2027 (a) | 1,440,000 | 1,276,154 |
Discovery Communications LLC 4.95%, 5/15/2042 | 60,000 | 47,479 |
DISH DBS Corp. | ||
5.88%, 11/15/2024 | 4,431,000 | 4,121,354 |
7.75%, 7/1/2026 | 540,000 | 403,866 |
5.25%, 12/1/2026 (a) | 249,000 | 209,894 |
DISH Network Corp. 11.75%, 11/15/2027 (a) | 1,342,000 | 1,361,648 |
GCI LLC 4.75%, 10/15/2028 (a) | 253,000 | 219,477 |
Gray Escrow II, Inc. 5.38%, 11/15/2031 (a) | 63,000 | 43,983 |
Gray Television, Inc. | ||
7.00%, 5/15/2027 (a) | 355,000 | 318,633 |
4.75%, 10/15/2030 (a) | 1,259,000 | 879,071 |
iHeartCommunications, Inc. | ||
6.38%, 5/1/2026 | 595,000 | 519,143 |
5.25%, 8/15/2027 (a) | 1,630,000 | 1,288,884 |
Lamar Media Corp. 4.88%, 1/15/2029 | 140,000 | 130,200 |
Midcontinent Communications 5.38%, 8/15/2027 (a) | 40,000 | 37,850 |
News Corp. 3.88%, 5/15/2029 (a) | 935,000 | 821,108 |
Nexstar Media, Inc. | ||
5.63%, 7/15/2027 (a) | 385,000 | 361,878 |
4.75%, 11/1/2028 (a) | 2,635,000 | 2,311,452 |
INVESTMENTS | PRINCIPAL AMOUNT($) | VALUE($) |
Media — continued | ||
Paramount Global (US Treasury Yield Curve Rate T Note Constant Maturity 5 Year + 4.00%), 6.38%, 3/30/2062 (g) | 151,000 | 124,575 |
Sirius XM Radio, Inc. | ||
5.00%, 8/1/2027 (a) | 1,400,000 | 1,294,411 |
4.00%, 7/15/2028 (a) | 995,000 | 861,592 |
5.50%, 7/1/2029 (a) | 920,000 | 828,235 |
Stagwell Global LLC 5.63%, 8/15/2029 (a) | 605,000 | 505,259 |
TEGNA, Inc. 4.63%, 3/15/2028 | 385,000 | 343,868 |
Univision Communications, Inc. | ||
6.63%, 6/1/2027 (a) | 505,000 | 488,899 |
8.00%, 8/15/2028 (a) | 191,000 | 190,895 |
4.50%, 5/1/2029 (a) | 708,000 | 609,402 |
Videotron Ltd. 5.13%, 4/15/2027 (a) | 1,015,000 | 971,862 |
24,688,945 | ||
Metals & Mining — 0.4% | ||
Alcoa Nederland Holding BV 6.13%, 5/15/2028 (a) | 200,000 | 197,672 |
ATI, Inc. | ||
5.88%, 12/1/2027 | 25,000 | 24,313 |
4.88%, 10/1/2029 | 25,000 | 22,571 |
Big River Steel LLC 6.63%, 1/31/2029 (a) | 55,000 | 54,679 |
Cleveland-Cliffs, Inc. 4.63%, 3/1/2029 (a) | 270,000 | 239,386 |
CSN Inova Ventures (Brazil) 6.75%, 1/28/2028 (f) | 200,000 | 187,332 |
FMG Resources August 2006 Pty. Ltd. 4.38%, 4/1/2031 (a) | 315,000 | 263,951 |
Nexa Resources SA (Brazil) 5.38%, 5/4/2027 (f) | 200,000 | 185,998 |
Novelis Corp. | ||
4.75%, 1/30/2030 (a) | 1,014,000 | 907,470 |
3.88%, 8/15/2031 (a) | 266,000 | 220,238 |
2,303,610 | ||
Oil, Gas & Consumable Fuels — 4.3% | ||
AI Candelaria Spain SA (Colombia) 5.75%, 6/15/2033 (a) | 250,000 | 181,340 |
Antero Midstream Partners LP | ||
7.88%, 5/15/2026 (a) | 30,000 | 30,522 |
5.75%, 3/1/2027 (a) | 265,000 | 256,842 |
5.75%, 1/15/2028 (a) | 1,145,000 | 1,096,428 |
5.38%, 6/15/2029 (a) | 330,000 | 309,225 |
Antero Resources Corp. | ||
8.38%, 7/15/2026 (a) | 20,000 | 20,750 |
7.63%, 2/1/2029 (a) | 120,000 | 122,977 |
5.38%, 3/1/2030 (a) | 260,000 | 243,093 |
August 31, 2023 | 67 |
AS OF August 31, 2023 (Unaudited) (continued)
INVESTMENTS | PRINCIPAL AMOUNT($) | VALUE($) |
Corporate Bonds — continued | ||
Oil, Gas & Consumable Fuels — continued | ||
Baytex Energy Corp. 8.50%, 4/30/2030 (a) | 430,000 | 435,997 |
BP Capital Markets plc (United Kingdom) (US Treasury Yield Curve Rate T Note Constant Maturity 5 Year + 4.40%), 4.88%, 3/22/2030 (d) (e) (g) | 75,000 | 67,921 |
Buckeye Partners LP | ||
3.95%, 12/1/2026 | 702,000 | 647,497 |
4.13%, 12/1/2027 | 20,000 | 18,186 |
4.50%, 3/1/2028 (a) | 50,000 | 45,376 |
California Resources Corp. 7.13%, 2/1/2026 (a) | 100,000 | 100,257 |
Cheniere Energy Partners LP 4.50%, 10/1/2029 | 215,000 | 198,380 |
Cheniere Energy, Inc. 4.63%, 10/15/2028 | 485,000 | 456,534 |
Chesapeake Energy Corp. 6.75%, 4/15/2029 (a) | 1,305,000 | 1,295,499 |
Chord Energy Corp. 6.38%, 6/1/2026 (a) | 175,000 | 172,483 |
Civitas Resources, Inc. | ||
8.38%, 7/1/2028 (a) | 305,000 | 314,150 |
8.75%, 7/1/2031 (a) | 267,000 | 276,345 |
Columbia Pipelines Holding Co. LLC 6.06%, 8/15/2026 (a) | 705,000 | 712,100 |
Comstock Resources, Inc. 5.88%, 1/15/2030 (a) | 1,075,000 | 949,474 |
Crestwood Midstream Partners LP | ||
5.75%, 4/1/2025 | 125,000 | 123,941 |
5.63%, 5/1/2027 (a) | 420,000 | 407,400 |
8.00%, 4/1/2029 (a) | 180,000 | 185,997 |
DT Midstream, Inc. 4.13%, 6/15/2029 (a) | 1,025,000 | 908,068 |
Ecopetrol SA (Colombia) | ||
8.63%, 1/19/2029 | 140,000 | 142,450 |
4.63%, 11/2/2031 | 100,000 | 78,555 |
8.88%, 1/13/2033 | 280,000 | 283,087 |
Encino Acquisition Partners Holdings LLC 8.50%, 5/1/2028 (a) | 25,000 | 23,705 |
Energean Israel Finance Ltd. (Israel) 5.38%, 3/30/2028 (f) | 50,000 | 45,439 |
Energian Israel Finance Ltd. (Israel) 4.88%, 3/30/2026 (f) | 100,000 | 93,579 |
Energy Transfer LP 3.90%, 5/15/2024 (h) | 1,155,000 | 1,137,891 |
EQM Midstream Partners LP | ||
6.00%, 7/1/2025 (a) | 98,000 | 97,106 |
6.50%, 7/1/2027 (a) | 555,000 | 551,488 |
5.50%, 7/15/2028 | 225,000 | 214,961 |
4.75%, 1/15/2031 (a) | 225,000 | 198,827 |
Genesis Energy LP 8.00%, 1/15/2027 | 665,000 | 655,576 |
INVESTMENTS | PRINCIPAL AMOUNT($) | VALUE($) |
Oil, Gas & Consumable Fuels — continued | ||
Gray Oak Pipeline LLC 2.00%, 9/15/2023 (a) | 210,000 | 209,769 |
Greenko Solar Mauritius Ltd. (India) 5.55%, 1/29/2025 (f) | 200,000 | 193,472 |
Greensaif Pipelines Bidco Sarl (Saudi Arabia) 6.51%, 2/23/2042 (f) | 200,000 | 201,946 |
Gulfport Energy Corp. 8.00%, 5/17/2026 (a) | 280,000 | 284,349 |
Hess Midstream Operations LP | ||
5.63%, 2/15/2026 (a) | 965,000 | 944,282 |
5.13%, 6/15/2028 (a) | 25,000 | 23,451 |
4.25%, 2/15/2030 (a) | 240,000 | 210,984 |
KazMunayGas National Co. JSC (Kazakhstan) | ||
4.75%, 4/19/2027 (f) | 200,000 | 187,934 |
5.38%, 4/24/2030 (f) | 200,000 | 181,888 |
Kinetik Holdings LP 5.88%, 6/15/2030 (a) | 427,000 | 413,554 |
Leviathan Bond Ltd. (Israel) | ||
6.13%, 6/30/2025 (f) | 250,000 | 244,575 |
6.50%, 6/30/2027 (f) | 150,000 | 144,645 |
6.75%, 6/30/2030 (f) | 50,000 | 46,761 |
Medco Bell Pte. Ltd. (Indonesia) 6.38%, 1/30/2027 (f) | 200,000 | 185,690 |
NuStar Logistics LP | ||
5.63%, 4/28/2027 | 455,000 | 441,464 |
6.38%, 10/1/2030 | 315,000 | 303,187 |
Occidental Petroleum Corp. 8.88%, 7/15/2030 | 390,000 | 447,115 |
Oil and Gas Holding Co. BSCC (The) (Bahrain) 8.38%, 11/7/2028 (f) | 200,000 | 210,648 |
Peru LNG Srl (Peru) 5.38%, 3/22/2030 (f) | 400,000 | 308,564 |
Petroleos del Peru SA (Peru) 5.63%, 6/19/2047 (a) | 200,000 | 127,956 |
Petroleos Mexicanos (Mexico) | ||
4.88%, 1/18/2024 | 150,000 | 148,080 |
4.25%, 1/15/2025 | 200,000 | 188,150 |
6.88%, 8/4/2026 | 250,000 | 227,213 |
6.50%, 3/13/2027 | 400,000 | 349,230 |
5.35%, 2/12/2028 | 300,000 | 239,918 |
5.95%, 1/28/2031 | 330,000 | 238,372 |
10.00%, 2/7/2033 (a) | 550,000 | 497,640 |
10.00%, 2/7/2033 (f) | 200,000 | 180,960 |
6.38%, 1/23/2045 | 410,000 | 249,382 |
Range Resources Corp. | ||
8.25%, 1/15/2029 | 458,000 | 475,472 |
4.75%, 2/15/2030 (a) | 8,000 | 7,224 |
Rockies Express Pipeline LLC 3.60%, 5/15/2025 (a) | 200,000 | 188,656 |
SM Energy Co. 6.75%, 9/15/2026 | 280,000 | 278,824 |
68 | August 31, 2023 |
INVESTMENTS | PRINCIPAL AMOUNT($) | VALUE($) |
Corporate Bonds — continued | ||
Oil, Gas & Consumable Fuels — continued | ||
Southwestern Energy Co. | ||
8.38%, 9/15/2028 | 160,000 | 166,536 |
5.38%, 2/1/2029 | 245,000 | 232,451 |
5.38%, 3/15/2030 | 315,000 | 294,898 |
State Oil Co. of the Azerbaijan Republic (Azerbaijan) 6.95%, 3/18/2030 (f) | 200,000 | 205,306 |
Sunoco LP | ||
4.50%, 5/15/2029 | 390,000 | 352,696 |
4.50%, 4/30/2030 | 315,000 | 280,851 |
Tallgrass Energy Partners LP | ||
7.50%, 10/1/2025 (a) | 770,000 | 774,689 |
6.00%, 3/1/2027 (a) | 65,000 | 62,285 |
5.50%, 1/15/2028 (a) | 445,000 | 413,298 |
6.00%, 12/31/2030 (a) | 250,000 | 223,649 |
Targa Resources Partners LP | ||
6.50%, 7/15/2027 | 285,000 | 286,468 |
5.50%, 3/1/2030 | 25,000 | 23,965 |
Transcanada Trust (Canada) (SOFR + 4.42%), 5.50%, 9/15/2079 (g) | 100,000 | 84,002 |
Venture Global LNG, Inc. 8.13%, 6/1/2028 (a) | 757,000 | 763,619 |
25,845,514 | ||
Paper & Forest Products — 0.0% ^ | ||
Suzano Austria GmbH (Brazil) 7.00%, 3/16/2047 (f) | 200,000 | 199,046 |
Passenger Airlines — 0.4% | ||
American Airlines, Inc. | ||
11.75%, 7/15/2025 (a) | 85,000 | 93,036 |
5.50%, 4/20/2026 (a) | 1,801,250 | 1,767,537 |
5.75%, 4/20/2029 (a) | 350,000 | 334,733 |
Mileage Plus Holdings LLC 6.50%, 6/20/2027 (a) | 267,879 | 266,945 |
United Airlines, Inc. 4.38%, 4/15/2026 (a) | 260,000 | 245,032 |
2,707,283 | ||
Personal Care Products — 0.4% | ||
Coty, Inc. | ||
5.00%, 4/15/2026 (a) | 696,000 | 669,051 |
4.75%, 1/15/2029 (a) | 60,000 | 54,975 |
Edgewell Personal Care Co. 5.50%, 6/1/2028 (a) | 1,300,000 | 1,225,250 |
Prestige Brands, Inc. 5.13%, 1/15/2028 (a) | 240,000 | 226,814 |
2,176,090 | ||
INVESTMENTS | PRINCIPAL AMOUNT($) | VALUE($) |
Pharmaceuticals — 1.1% | ||
Bausch Health Americas, Inc. 9.25%, 4/1/2026 (a) | 1,065,000 | 964,656 |
Bausch Health Cos., Inc. | ||
5.50%, 11/1/2025 (a) | 1,625,000 | 1,463,410 |
9.00%, 12/15/2025 (a) | 1,090,000 | 997,388 |
5.75%, 8/15/2027 (a) | 715,000 | 447,632 |
5.00%, 2/15/2029 (a) | 450,000 | 186,750 |
5.25%, 1/30/2030 (a) | 70,000 | 29,546 |
Catalent Pharma Solutions, Inc. | ||
5.00%, 7/15/2027 (a) | 40,000 | 37,350 |
3.13%, 2/15/2029 (a) | 155,000 | 130,445 |
Cheplapharm Arzneimittel GmbH (Germany) 5.50%, 1/15/2028 (a) | 250,000 | 226,324 |
Elanco Animal Health, Inc. 6.65%, 8/28/2028 (h) | 470,000 | 463,538 |
Jazz Securities DAC 4.38%, 1/15/2029 (a) | 200,000 | 179,188 |
Organon & Co. 4.13%, 4/30/2028 (a) | 1,740,000 | 1,574,633 |
Teva Pharmaceutical Finance Netherlands III BV (Israel) 3.15%, 10/1/2026 | 50,000 | 45,061 |
6,745,921 | ||
Real Estate Management & Development — 0.0% ^ | ||
Realogy Group LLC | ||
5.75%, 1/15/2029 (a) | 218,000 | 156,130 |
5.25%, 4/15/2030 (a) | 125,000 | 86,770 |
242,900 | ||
Semiconductors & Semiconductor Equipment — 0.3% | ||
Amkor Technology, Inc. 6.63%, 9/15/2027 (a) | 215,000 | 214,867 |
Entegris Escrow Corp. | ||
4.75%, 4/15/2029 (a) | 155,000 | 144,204 |
5.95%, 6/15/2030 (a) | 515,000 | 493,172 |
Entegris, Inc. | ||
4.38%, 4/15/2028 (a) | 290,000 | 264,395 |
3.63%, 5/1/2029 (a) | 35,000 | 30,082 |
ON Semiconductor Corp. 3.88%, 9/1/2028 (a) | 440,000 | 391,679 |
1,538,399 | ||
Software — 0.8% | ||
ACI Worldwide, Inc. 5.75%, 8/15/2026 (a) | 25,000 | 24,456 |
AthenaHealth Group, Inc. 6.50%, 2/15/2030 (a) | 525,000 | 455,947 |
Clarivate Science Holdings Corp. 3.88%, 7/1/2028 (a) | 1,115,000 | 982,483 |
NCR Corp. | ||
5.75%, 9/1/2027 (a) | 65,000 | 65,628 |
August 31, 2023 | 69 |
AS OF August 31, 2023 (Unaudited) (continued)
INVESTMENTS | PRINCIPAL AMOUNT($) | VALUE($) |
Corporate Bonds — continued | ||
Software — continued | ||
5.13%, 4/15/2029 (a) | 2,115,000 | 1,923,463 |
6.13%, 9/1/2029 (a) | 25,000 | 25,748 |
SS&C Technologies, Inc. 5.50%, 9/30/2027 (a) | 1,250,000 | 1,203,375 |
4,681,100 | ||
Specialized REITs — 0.1% | ||
Iron Mountain, Inc. | ||
5.25%, 3/15/2028 (a) | 225,000 | 210,952 |
5.00%, 7/15/2028 (a) | 115,000 | 106,497 |
SBA Communications Corp. 3.88%, 2/15/2027 | 620,000 | 573,234 |
890,683 | ||
Specialty Retail — 1.0% | ||
Asbury Automotive Group, Inc. | ||
4.50%, 3/1/2028 | 65,000 | 59,295 |
4.63%, 11/15/2029 (a) | 875,000 | 771,911 |
4.75%, 3/1/2030 | 70,000 | 61,367 |
Bath & Body Works, Inc. | ||
7.50%, 6/15/2029 | 105,000 | 105,863 |
6.75%, 7/1/2036 | 115,000 | 106,158 |
Gap, Inc. (The) 3.63%, 10/1/2029 (a) | 385,000 | 293,094 |
Group 1 Automotive, Inc. 4.00%, 8/15/2028 (a) | 30,000 | 26,637 |
Lithia Motors, Inc. 3.88%, 6/1/2029 (a) | 660,000 | 566,646 |
Penske Automotive Group, Inc. 3.75%, 6/15/2029 | 304,000 | 260,854 |
PetSmart, Inc. 4.75%, 2/15/2028 (a) | 2,150,000 | 1,928,615 |
Sonic Automotive, Inc. 4.63%, 11/15/2029 (a) | 413,000 | 353,071 |
SRS Distribution, Inc. | ||
4.63%, 7/1/2028 (a) | 866,000 | 770,759 |
6.13%, 7/1/2029 (a) | 45,000 | 39,127 |
6.00%, 12/1/2029 (a) | 124,000 | 106,020 |
Staples, Inc. 7.50%, 4/15/2026 (a) | 1,100,000 | 910,138 |
6,359,555 | ||
Technology Hardware, Storage & Peripherals — 0.1% | ||
Seagate HDD Cayman | ||
4.09%, 6/1/2029 | 430,000 | 378,869 |
8.25%, 12/15/2029 (a) | 190,000 | 199,310 |
8.50%, 7/15/2031 (a) | 32,000 | 33,527 |
611,706 | ||
INVESTMENTS | PRINCIPAL AMOUNT($) | VALUE($) |
Tobacco — 0.0% ^ | ||
BAT International Finance plc (United Kingdom) 4.45%, 3/16/2028 | 310,000 | 293,889 |
Trading Companies & Distributors — 1.0% | ||
Air Lease Corp. 5.85%, 12/15/2027 | 540,000 | 539,991 |
Herc Holdings, Inc. 5.50%, 7/15/2027 (a) | 605,000 | 581,753 |
Imola Merger Corp. 4.75%, 5/15/2029 (a) | 1,825,000 | 1,622,164 |
United Rentals North America, Inc. | ||
4.88%, 1/15/2028 | 1,401,000 | 1,332,983 |
6.00%, 12/15/2029 (a) | 214,000 | 212,662 |
WESCO Distribution, Inc. | ||
7.13%, 6/15/2025 (a) | 1,200,000 | 1,205,301 |
7.25%, 6/15/2028 (a) | 470,000 | 478,336 |
5,973,190 | ||
Wireless Telecommunication Services — 0.4% | ||
Kenbourne Invest SA (Chile) 4.70%, 1/22/2028 (f) | 200,000 | 123,000 |
Millicom International Cellular SA (Guatemala) 5.13%, 1/15/2028 (f) | 180,000 | 161,325 |
Sprint LLC | ||
7.13%, 6/15/2024 | 25,000 | 25,199 |
7.63%, 2/15/2025 | 275,000 | 280,412 |
7.63%, 3/1/2026 | 1,680,000 | 1,741,367 |
Vodafone Group plc (United Kingdom) (US Treasury Yield Curve Rate T Note Constant Maturity 5 Year + 2.77%), 4.13%, 6/4/2081 (g) | 100,000 | 78,083 |
2,409,386 | ||
Total Corporate Bonds (Cost $238,518,383) | 233,598,053 | |
Asset-Backed Securities — 27.3% | ||
ACHV ABS TRUST Series 2023-1PL, Class A, 6.42%, 3/18/2030 (a) | 61,227 | 61,239 |
Affirm Asset Securitization Trust | ||
Series 2022-A, Class 1D, 5.53%, 5/17/2027 (a) | 595,000 | 571,995 |
Series 2023-A, Class 1A, 6.61%, 1/18/2028 (a) | 1,030,000 | 1,023,425 |
Series 2023-A, Class A, 6.61%, 1/18/2028 (a) | 500,000 | 497,505 |
Air Canada Pass-Through Trust (Canada) Series 2020-2, Class B, 9.00%, 10/1/2025 (a) | 5,568 | 5,634 |
American Airlines Pass-Through Trust Series 2021-1, Class B, 3.95%, 7/11/2030 | 45,500 | 39,684 |
70 | August 31, 2023 |
INVESTMENTS | PRINCIPAL AMOUNT($) | VALUE($) |
Asset-Backed Securities — continued | ||
American Credit Acceptance Receivables Trust | ||
Series 2019-4, Class E, 3.85%, 12/12/2025 (a) | 2,000,000 | 1,990,670 |
Series 2023-1, Class A, 5.45%, 9/14/2026 (a) | 289,329 | 288,140 |
Series 2022-3, Class B, 4.55%, 10/13/2026 (a) | 500,000 | 495,671 |
Series 2022-4, Class B, 6.75%, 10/13/2026 (a) | 200,000 | 200,423 |
Series 2021-3, Class E, 2.56%, 11/15/2027 (a) | 800,000 | 743,441 |
Series 2021-1, Class F, 4.01%, 11/15/2027 (a) | 900,000 | 877,300 |
Series 2021-2, Class F, 3.73%, 1/13/2028 (a) | 1,200,000 | 1,129,397 |
Series 2021-3, Class F, 3.64%, 5/15/2028 (a) | 2,000,000 | 1,854,069 |
Series 2022-2, Class D, 4.85%, 6/13/2028 (a) | 230,000 | 220,664 |
Series 2022-2, Class E, 6.57%, 6/13/2028 (a) | 190,000 | 181,088 |
Series 2021-4, Class F, 4.21%, 7/13/2028 (a) | 500,000 | 448,547 |
Series 2022-3, Class C, 4.86%, 10/13/2028 (a) | 290,000 | 284,418 |
Series 2022-3, Class D, 5.83%, 10/13/2028 (a) | 267,000 | 260,437 |
Series 2022-4, Class C, 7.86%, 2/15/2029 (a) | 210,000 | 212,778 |
Series 2023-1, Class C, 5.59%, 4/12/2029 (a) | 400,000 | 392,800 |
Series 2023-1, Class D, 6.35%, 4/12/2029 (a) | 395,000 | 389,376 |
Series 2023-2, Class C, 5.96%, 8/13/2029 (a) | 900,000 | 889,492 |
Series 2023-3, Class C, 6.44%, 10/12/2029 (a) | 1,083,000 | 1,083,339 |
Series 2023-3, Class D, 6.82%, 10/12/2029 (a) | 1,800,000 | 1,801,525 |
AmeriCredit Automobile Receivables Trust Series 2022-2, Class C, 5.32%, 4/18/2028 | 1,600,000 | 1,579,305 |
AMSR Trust Series 2020-SFR1, Class H, 5.30%, 4/17/2037 (a) | 100,000 | 94,068 |
Apidos CLO (Cayman Islands) | ||
Series 2019-31A, Class A1R, 6.67%, 4/15/2031 (a) (i) | 1,000,000 | 995,000 |
Series XXXA, Class A1A, 6.71%, 10/18/2031 (a) (i) | 990,000 | 985,069 |
INVESTMENTS | PRINCIPAL AMOUNT($) | VALUE($) |
Applebee's Funding LLC Series 2019-1A, Class A2II, 4.72%, 6/5/2049 (a) | 495,000 | 459,957 |
Ares CLO Ltd. (Cayman Islands) | ||
Series 2016-40A, Class A1RR, 6.44%, 1/15/2029 (a) (i) | 777,255 | 773,435 |
Series 2016-39A, Class A1R2, 6.62%, 4/18/2031 (a) (i) | 1,440,000 | 1,435,620 |
Series 2019-52A, Class A1R, 6.66%, 4/22/2031 (a) (i) | 1,400,000 | 1,391,739 |
Avis Budget Rental Car Funding AESOP LLC | ||
Series 2020-1A, Class C, 3.02%, 8/20/2026 (a) | 461,000 | 427,999 |
Series 2022-3A, Class A, 4.62%, 2/20/2027 (a) | 943,000 | 915,158 |
Series 2023-4A, Class A, 5.49%, 6/20/2029 (a) | 800,000 | 787,341 |
Bain Capital Credit CLO (Cayman Islands) | ||
Series 2018-1A, Class A1, 6.57%, 4/23/2031 (a) (i) | 943,766 | 940,910 |
Series 2020-1A, Class A1, 6.76%, 4/18/2033 (a) (i) | 560,000 | 556,196 |
Bain Capital Credit CLO Ltd. (Cayman Islands) | ||
Series 2020-3A, Class A1R, 6.77%, 10/23/2034 (a) (i) | 250,000 | 247,811 |
Series 2021-7A, Class A1, 6.75%, 1/22/2035 (a) (i) | 270,000 | 267,406 |
Ballyrock CLO Ltd. (Cayman Islands) Series 2019-1A, Class A1R, 6.60%, 7/15/2032 (a) (i) | 800,000 | 791,451 |
Benefit Street Partners CLO Ltd. (Cayman Islands) Series 2019-18A, Class A1R, 6.74%, 10/15/2034 (a) (i) | 1,000,000 | 992,446 |
British Airways Pass-Through Trust (United Kingdom) Series 2020-1, Class B, 8.38%, 11/15/2028 (a) | 8,298 | 8,405 |
BSPRT Issuer Ltd. (Cayman Islands) | ||
Series 2021-FL7, Class D, 8.17%, 12/15/2038 (a) (i) | 275,000 | 255,373 |
Series 2021-FL7, Class E, 8.82%, 12/15/2038 (a) (i) | 265,000 | 242,636 |
Business Jet Securities LLC Series 2020-1A, Class A, 2.98%, 11/15/2035 ‡ (a) | 52,971 | 49,985 |
Carlyle Global Market Strategies CLO Ltd. (Cayman Islands) | ||
Series 2014-1A, Class A1R2, 6.54%, 4/17/2031 (a) (i) | 993,434 | 989,542 |
Series 2014-3RA, Class A1A, 6.67%, 7/27/2031 (a) (i) | 1,487,749 | 1,484,034 |
August 31, 2023 | 71 |
AS OF August 31, 2023 (Unaudited) (continued)
INVESTMENTS | PRINCIPAL AMOUNT($) | VALUE($) |
Asset-Backed Securities — continued | ||
Series 2015-4A, Class A1R, 6.93%, 7/20/2032 (a) (i) | 850,000 | 848,132 |
Carlyle US CLO Ltd. (Cayman Islands) Series 2018-1A, Class A1, 6.61%, 4/20/2031 (a) (i) | 1,340,912 | 1,331,016 |
CIFC Funding Ltd. (Cayman Islands) | ||
Series 2014-5A, Class A1R2, 6.77%, 10/17/2031 (a) (i) | 595,000 | 594,294 |
Series 2021-4A, Class A, 6.62%, 7/15/2033 (a) (i) | 2,000,000 | 1,989,718 |
Conn's Receivables Funding LLC | ||
Series 2022-A, Class B, 9.52%, 12/15/2026 (a) | 689,249 | 692,052 |
Series 2023-A, Class A, 8.01%, 1/17/2028 (a) | 696,000 | 696,347 |
Series 2023-A, Class B, 10.00%, 1/17/2028 (a) | 508,000 | 499,115 |
CoreVest American Finance Trust | ||
Series 2019-1, Class E, 5.78%, 3/15/2052 (a) (i) | 300,000 | 276,851 |
Series 2019-2, Class E, 5.42%, 6/15/2052 (a) (i) | 350,000 | 309,520 |
Series 2019-3, Class E, 4.90%, 10/15/2052 (a) (i) | 350,000 | 299,491 |
CPS Auto Receivables Trust | ||
Series 2021-B, Class E, 3.41%, 6/15/2028 (a) | 1,500,000 | 1,402,375 |
Series 2022-C, Class D, 6.45%, 4/15/2030 (a) | 240,000 | 237,824 |
Credit Acceptance Auto Loan Trust | ||
Series 2022-3A, Class A, 6.57%, 10/15/2032 (a) | 250,000 | 250,901 |
Series 2023-1A, Class A, 6.48%, 3/15/2033 (a) | 700,000 | 702,766 |
Series 2022-3A, Class D, 9.00%, 4/18/2033 (a) | 300,000 | 298,640 |
Series 2023-2A, Class A, 5.92%, 5/16/2033 (a) | 900,000 | 888,356 |
Series 2023-3A, Class B, 7.09%, 10/17/2033 (a) | 391,000 | 391,374 |
DB Master Finance LLC Series 2021-1A, Class A23, 2.79%, 11/20/2051 (a) | 294,750 | 233,421 |
Dewolf Park CLO Ltd. Series 2017-1A, Class AR, 6.49%, 10/15/2030 (a) (i) | 1,596,717 | 1,588,831 |
Domino's Pizza Master Issuer LLC Series 2015-1A, Class A2II, 4.47%, 10/25/2045 (a) | 559,500 | 535,947 |
INVESTMENTS | PRINCIPAL AMOUNT($) | VALUE($) |
Driven Brands Funding LLC | ||
Series 2019-1A, Class A2, 4.64%, 4/20/2049 (a) | 257,850 | 243,905 |
Series 2020-1A, Class A2, 3.79%, 7/20/2050 (a) | 485,000 | 434,043 |
Series 2021-1A, Class A2, 2.79%, 10/20/2051 (a) | 1,965,000 | 1,630,262 |
Series 2022-1A, Class A2, 7.39%, 10/20/2052 (a) | 595,500 | 596,933 |
Dryden CLO Ltd. (Cayman Islands) | ||
Series 2018-64A, Class A, 6.54%, 4/18/2031 (a) (i) | 990,306 | 982,801 |
Series 2018-58A, Class A1, 6.57%, 7/17/2031 (a) (i) | 450,000 | 448,209 |
Series 2019-68A, Class AR, 6.74%, 7/15/2035 (a) (i) | 1,790,000 | 1,774,873 |
Dryden Senior Loan Fund (Cayman Islands) | ||
Series 2017-47A, Class A1R, 6.55%, 4/15/2028 (a) (i) | 901,907 | 898,786 |
Series 2013-26A, Class AR, 6.47%, 4/15/2029 (a) (i) | 1,122,795 | 1,118,788 |
Series 2015-41A, Class AR, 6.54%, 4/15/2031 (a) (i) | 902,961 | 896,995 |
Series 2016-43A, Class AR2, 6.63%, 4/20/2034 (a) (i) | 600,000 | 593,425 |
DT Auto Owner Trust | ||
Series 2019-2A, Class E, 4.46%, 5/15/2026 (a) | 718,482 | 716,619 |
Series 2021-3A, Class D, 1.31%, 5/17/2027 (a) | 2,420,000 | 2,205,717 |
Series 2021-4A, Class D, 1.99%, 9/15/2027 (a) | 1,500,000 | 1,371,452 |
Series 2021-2A, Class E, 2.97%, 7/17/2028 (a) | 1,080,000 | 1,000,312 |
Series 2021-4A, Class E, 3.34%, 7/17/2028 (a) | 1,600,000 | 1,417,105 |
Series 2022-3A, Class C, 7.69%, 7/17/2028 (a) | 374,000 | 380,173 |
Series 2023-1A, Class B, 5.19%, 10/16/2028 (a) | 467,000 | 459,910 |
Series 2023-1A, Class C, 5.55%, 10/16/2028 (a) | 525,000 | 516,937 |
Series 2022-1A, Class E, 5.53%, 3/15/2029 (a) | 2,400,000 | 2,254,350 |
Series 2023-3A, Class C, 6.40%, 5/15/2029 (a) | 1,349,000 | 1,351,003 |
Elmwood CLO Ltd. (Cayman Islands) | ||
Series 2020-1A, Class A, 6.81%, 4/15/2033 (a) (i) | 1,200,000 | 1,196,712 |
72 | August 31, 2023 |
INVESTMENTS | PRINCIPAL AMOUNT($) | VALUE($) |
Asset-Backed Securities — continued | ||
Series 2021-3A, Class A, 6.63%, 10/20/2034 (a) (i) | 890,000 | 884,304 |
Exeter Automobile Receivables Trust | ||
Series 2020-3A, Class E, 3.44%, 8/17/2026 (a) | 2,000,000 | 1,920,142 |
Series 2021-2A, Class D, 1.40%, 4/15/2027 | 2,000,000 | 1,854,224 |
Series 2023-1A, Class B, 5.72%, 4/15/2027 | 149,000 | 148,027 |
Series 2021-3A, Class D, 1.55%, 6/15/2027 | 500,000 | 460,163 |
Series 2020-3A, Class F, 5.56%, 6/15/2027 (a) | 1,500,000 | 1,463,959 |
Series 2023-1A, Class C, 5.82%, 2/15/2028 | 176,000 | 174,192 |
Series 2023-3A, Class C, 6.21%, 6/15/2028 | 1,827,000 | 1,824,310 |
Series 2021-2A, Class E, 2.90%, 7/17/2028 (a) | 750,000 | 697,133 |
Series 2023-2A, Class C, 5.75%, 7/17/2028 | 500,000 | 493,880 |
Series 2023-4A, Class C, 6.51%, 8/15/2028 | 920,000 | 923,608 |
Series 2022-3A, Class D, 6.76%, 9/15/2028 | 400,000 | 399,576 |
Series 2021-3A, Class E, 3.04%, 12/15/2028 (a) | 900,000 | 809,977 |
Series 2022-4A, Class D, 5.98%, 12/15/2028 | 168,000 | 165,364 |
Series 2022-6A, Class D, 8.03%, 4/6/2029 | 375,000 | 388,455 |
Series 2023-3A, Class D, 6.68%, 4/16/2029 | 954,000 | 952,805 |
Series 2023-1A, Class D, 6.69%, 6/15/2029 | 500,000 | 500,095 |
Series 2023-2A, Class D, 6.32%, 8/15/2029 | 500,000 | 495,273 |
Series 2022-1A, Class E, 5.02%, 10/15/2029 (a) | 1,070,000 | 953,966 |
Series 2023-1A, Class E, 12.07%, 9/16/2030 (a) | 900,000 | 968,826 |
FirstKey Homes Trust Series 2020-SFR1, Class F1, 3.64%, 8/17/2037 (a) | 500,000 | 464,321 |
Flagship Credit Auto Trust | ||
Series 2023-1, Class A3, 5.01%, 8/16/2027 (a) | 133,000 | 131,404 |
Series 2023-1, Class B, 5.05%, 1/18/2028 (a) | 100,000 | 98,029 |
INVESTMENTS | PRINCIPAL AMOUNT($) | VALUE($) |
Flatiron CLO Ltd. (Cayman Islands) | ||
Series 2018-1A, Class A, 6.52%, 4/17/2031 (a) (i) | 232,820 | 231,674 |
Series 2019-1A, Class AR, 6.71%, 11/16/2034 (a) (i) | 450,000 | 448,009 |
FMC GMSR Issuer Trust Series 2022-GT1, Class B, 7.17%, 4/25/2027 (a) | 300,000 | 269,296 |
Foundation Finance Trust Series 2023-1A, Class D, 9.18%, 12/15/2043 (a) | 438,000 | 423,468 |
FREED ABS Trust | ||
Series 2022-1FP, Class D, 3.35%, 3/19/2029 (a) | 200,000 | 185,707 |
Series 2022-3FP, Class C, 7.05%, 8/20/2029 (a) | 100,000 | 99,604 |
Series 2022-4FP, Class B, 7.58%, 12/18/2029 (a) | 391,215 | 393,153 |
Galaxy CLO Ltd. (Cayman Islands) | ||
Series 2015-21A, Class AR, 6.61%, 4/20/2031 (a) (i) | 316,334 | 315,171 |
Series 2016-22A, Class ARR, 6.77%, 4/16/2034 (a) (i) | 2,200,000 | 2,185,531 |
GLS Auto Receivables Issuer Trust | ||
Series 2023-1A, Class A2, 5.98%, 8/17/2026 (a) | 520,000 | 518,730 |
Series 2023-1A, Class B, 6.19%, 6/15/2027 (a) | 484,000 | 482,622 |
Series 2021-4A, Class D, 2.48%, 10/15/2027 (a) | 250,000 | 230,625 |
Series 2021-1A, Class E, 3.14%, 1/18/2028 (a) | 650,000 | 612,224 |
Series 2022-1A, Class D, 3.97%, 1/18/2028 (a) | 250,000 | 236,620 |
Series 2022-2A, Class D, 6.15%, 4/17/2028 (a) | 420,000 | 412,982 |
Series 2021-3A, Class E, 3.20%, 10/16/2028 (a) | 1,000,000 | 909,163 |
Series 2023-1A, Class C, 6.38%, 12/15/2028 (a) | 203,000 | 202,727 |
Series 2023-1A, Class D, 7.01%, 1/16/2029 (a) | 652,000 | 655,240 |
Series 2022-2A, Class E, 5.50%, 6/15/2029 (a) | 1,250,000 | 1,126,691 |
Goldentree Loan Management US CLO Ltd. (Cayman Islands) Series 2017-2A, Class AR, 6.50%, 11/20/2030 (a) (i) | 1,358,555 | 1,352,799 |
GoldenTree Loan Opportunities Ltd. Series 2015-10A, Class AR, 6.71%, 7/20/2031 (a) (i) | 250,000 | 248,999 |
August 31, 2023 | 73 |
AS OF August 31, 2023 (Unaudited) (continued)
INVESTMENTS | PRINCIPAL AMOUNT($) | VALUE($) |
Asset-Backed Securities — continued | ||
Goldman Home Improvement Trust Issuer Trust Series 2022-GRN1, Class A, 4.50%, 6/25/2052 (a) | 235,391 | 226,524 |
Greenwood Park CLO Ltd. Series 2018-1A, Class A2, 6.58%, 4/15/2031 (a) (i) | 305,000 | 303,591 |
Hertz Vehicle Financing LLC | ||
Series 2022-3A, Class B, 3.86%, 3/25/2025 (a) | 500,000 | 495,103 |
Series 2021-1A, Class A, 1.21%, 12/26/2025 (a) | 263,000 | 248,946 |
Series 2022-4A, Class D, 6.56%, 9/25/2026 (a) | 300,000 | 285,363 |
Series 2023-1A, Class A, 5.49%, 6/25/2027 (a) | 400,000 | 395,434 |
Series 2023-1A, Class C, 6.91%, 6/25/2027 (a) | 292,000 | 288,182 |
Series 2023-3A, Class A, 5.94%, 2/25/2028 (a) | 595,000 | 597,987 |
Series 2023-3A, Class D, 9.43%, 2/25/2028 (a) | 1,600,000 | 1,609,622 |
HGI CRE CLO Ltd. (Cayman Islands) Series 2022-FL3, Class E, 9.51%, 4/20/2037 (a) (i) | 195,500 | 187,579 |
Hilton Grand Vacations Trust Series 2022-1D, Class D, 6.79%, 6/20/2034 (a) | 269,072 | 254,521 |
HINNT LLC Series 2022-A, Class D, 6.50%, 5/15/2041 (a) | 474,971 | 447,627 |
LCM Ltd. (Cayman Islands) Series 26A, Class A1, 6.66%, 1/20/2031 (a) (i) | 541,813 | 539,918 |
LendingClub Loan Certificate Issuer Trust | ||
Series 2022-NP1, Class CERT, 0.00%, 3/16/2037 ‡ (a) | 50,000 | 607,295 |
Series 2022-P1, Class CERT, 0.00%, 3/16/2037 ‡ (a) | 50,000 | 554,015 |
Series 2022-P2, Class CERT, 0.00%, 4/15/2037 ‡ (a) | 50,000 | 611,850 |
Lendingpoint Asset Securitization Trust | ||
Series 2022-A, Class D, 4.54%, 6/15/2029 (a) | 2,250,000 | 1,844,551 |
Series 2022-B, Class A, 4.77%, 10/15/2029 (a) | 101,124 | 99,808 |
Series 2022-C, Class C, 8.68%, 2/15/2030 (a) | 200,000 | 195,493 |
Lendmark Funding Trust | ||
Series 2021-1A, Class B, 2.47%, 11/20/2031 (a) | 2,000,000 | 1,687,111 |
Series 2021-1A, Class D, 5.05%, 11/20/2031 (a) | 500,000 | 389,872 |
INVESTMENTS | PRINCIPAL AMOUNT($) | VALUE($) |
Madison Park Funding Ltd. (Cayman Islands) | ||
Series 2014-13A, Class AR2, 6.53%, 4/19/2030 (a) (i) | 277,726 | 276,822 |
Series 2018-32A, Class A1R, 6.61%, 1/22/2031 (a) (i) | 500,000 | 497,554 |
Series 2017-23A, Class AR, 6.59%, 7/27/2031 (a) (i) | 1,221,607 | 1,215,625 |
Series 2019-34A, Class AR, 6.73%, 4/25/2032 (a) (i) | 530,000 | 528,179 |
Series 2019-33A, Class AR, 6.60%, 10/15/2032 (a) (i) | 1,500,000 | 1,488,905 |
Series 2019-37A, Class AR, 6.64%, 7/15/2033 (a) (i) | 1,150,000 | 1,143,888 |
Magnetite Ltd. (Cayman Islands) | ||
Series 2012-7A, Class A1R2, 6.37%, 1/15/2028 (a) (i) | 334,809 | 333,545 |
Series 2016-18A, Class AR2, 6.51%, 11/15/2028 (a) (i) | 1,657,811 | 1,651,948 |
Series 2019-22A, Class AR, 6.63%, 4/15/2031 (a) (i) | 1,000,000 | 995,700 |
Series 2015-15A, Class AR, 6.62%, 7/25/2031 (a) (i) | 400,000 | 398,252 |
Series 2015-12A, Class ARR, 6.67%, 10/15/2031 (a) (i) | 700,000 | 697,882 |
Marlette Funding Trust | ||
Series 2023-1A, Class A, 6.07%, 4/15/2033 (a) | 467,193 | 465,975 |
Series 2023-1A, Class B, 6.50%, 4/15/2033 (a) | 700,000 | 699,702 |
Series 2023-1A, Class C, 7.20%, 4/15/2033 (a) | 350,000 | 350,729 |
ME Funding LLC Series 2019-1, Class A2, 6.45%, 7/30/2049 (a) | 173,250 | 169,093 |
Neuberger Berman CLO (Cayman Islands) Series 2013-15A, Class A1R2, 6.49%, 10/15/2029 (a) (i) | 242,969 | 241,923 |
Neuberger Berman CLO Ltd. (Cayman Islands) Series 2013-14A, Class AR2, 6.66%, 1/28/2030 (a) (i) | 732,413 | 730,668 |
Neuberger Berman Loan Advisers CLO Ltd. (Cayman Islands) | ||
Series 2017-26A, Class AR, 6.49%, 10/18/2030 (a) (i) | 501,665 | 499,258 |
Series 2019-34A, Class A1R, 6.57%, 1/20/2035 (a) (i) | 1,950,000 | 1,933,638 |
New Residential Mortgage LLC Series 2020-FNT2, Class A, 5.44%, 7/25/2025 (a) | 613,932 | 588,706 |
74 | August 31, 2023 |
INVESTMENTS | PRINCIPAL AMOUNT($) | VALUE($) |
Asset-Backed Securities — continued | ||
New Residential Mortgage Loan Trust Series 2022-SFR1, Class E1, 3.55%, 2/17/2039 (a) | 168,000 | 145,460 |
NRZ Excess Spread-Collateralized Notes | ||
Series 2021-FNT1, Class A, 2.98%, 3/25/2026 (a) | 352,805 | 321,103 |
Series 2021-FNT2, Class A, 3.23%, 5/25/2026 (a) | 182,419 | 165,891 |
Series 2021-FHT1, Class A, 3.10%, 7/25/2026 (a) | 329,023 | 293,463 |
Series 2021-GNT1, Class A, 3.47%, 11/25/2026 (a) | 166,163 | 149,893 |
OCP CLO Ltd. (Cayman Islands) | ||
Series 2018-15A, Class A1, 6.69%, 7/20/2031 (a) (i) | 350,000 | 348,947 |
Series 2020-18A, Class AR, 6.68%, 7/20/2032 (a) (i) | 320,000 | 317,663 |
Series 2015-9A, Class A1R2, 6.56%, 1/15/2033 (a) (i) | 1,500,000 | 1,484,144 |
Octagon Investment Partners 35 Ltd. (Cayman Islands) Series 2018-1A, Class A1A, 6.65%, 1/20/2031 (a) (i) | 1,034,976 | 1,032,424 |
Octagon Loan Funding Ltd. (Cayman Islands) Series 2014-1A, Class ARR, 6.82%, 11/18/2031 (a) (i) | 1,530,000 | 1,526,940 |
OHA Credit Partners Ltd. (Cayman Islands) Series 2012-7A, Class AR3, 6.71%, 2/20/2034 (a) (i) | 1,500,000 | 1,490,037 |
OnDeck Asset Securitization Trust IV LLC Series 2023-1A, Class A, 7.00%, 8/19/2030 (a) | 468,000 | 468,115 |
OneMain Direct Auto Receivables Trust Series 2022-1A, Class A1, 4.65%, 3/14/2029 (a) | 294,000 | 287,695 |
OneMain Financial Issuance Trust | ||
Series 2018-2A, Class A, 3.57%, 3/14/2033 (a) | 186,509 | 184,145 |
Series 2023-2A, Class A2, 6.75%, 9/15/2036 (a) (i) | 1,780,000 | 1,781,125 |
Oportun Issuance Trust | ||
Series 2022-2, Class A, 5.94%, 10/9/2029 (a) | 48,075 | 47,909 |
Series 2022-2, Class D, 11.34%, 10/9/2029 | 863,000 | 854,373 |
Series 2022-3, Class A, 7.45%, 1/8/2030 (a) | 421,604 | 422,058 |
Pagaya AI Debt Selection Trust Series 2021-3, Class C, 3.27%, 5/15/2029 (a) | 1,499,918 | 1,265,583 |
Palmer Square CLO Ltd. (Cayman Islands) | ||
Series 2014-1A, Class A1R2, 6.70%, 1/17/2031 (a) (i) | 1,113,437 | 1,111,385 |
INVESTMENTS | PRINCIPAL AMOUNT($) | VALUE($) |
Series 2018-2A, Class A1A, 6.67%, 7/16/2031 (a) (i) | 850,000 | 847,283 |
Series 2015-1A, Class A1A4, 6.77%, 5/21/2034 (a) (i) | 510,000 | 507,760 |
Palmer Square Loan Funding Ltd. (Cayman Islands) Series 2022-1A, Class A1, 6.36%, 4/15/2030 (a) (i) | 547,006 | 543,582 |
Planet Fitness Master Issuer LLC Series 2018-1A, Class A2II, 4.67%, 9/5/2048 (a) | 666,750 | 640,238 |
PMT Issuer Trust-FMSR | ||
Series 2021-FT1, Class A, 8.43%, 3/25/2026 (a) (i) | 600,000 | 579,924 |
Series 2022-FT1, Class A, 9.49%, 6/25/2027 (a) (i) | 1,200,000 | 1,197,050 |
PNMAC GMSR Issuer Trust Series 2022-GT1, Class A, 9.54%, 5/25/2027 (a) (i) | 343,000 | 341,713 |
PRET LLC Series 2022-NPL4, Class A1, 6.56%, 8/25/2052 (a) (h) | 151,112 | 149,257 |
Progress Residential Trust Series 2023-SFR1, Class E1, 6.15%, 3/17/2040 (a) | 736,000 | 696,020 |
PRPM LLC Series 2021-11, Class A2, 4.58%, 11/25/2026 (a) (h) | 1,000,000 | 894,673 |
RCO VI Mortgage LLC Series 2022-1, Class A1, 3.00%, 1/25/2027 (a) (h) | 134,209 | 127,180 |
Republic Finance Issuance Trust Series 2021-A, Class D, 5.23%, 12/22/2031 (a) | 800,000 | 673,158 |
Santander Bank Auto Credit-Linked Notes | ||
Series 2022-C, Class B, 6.45%, 12/15/2032 (a) | 253,792 | 253,140 |
Series 2022-C, Class C, 6.99%, 12/15/2032 (a) | 219,954 | 220,080 |
Series 2022-C, Class D, 8.20%, 12/15/2032 (a) | 203,034 | 204,737 |
Series 2022-C, Class E, 11.37%, 12/15/2032 (a) | 168,332 | 169,587 |
Santander Drive Auto Receivables Trust | ||
Series 2021-3, Class D, 1.33%, 9/15/2027 | 2,000,000 | 1,879,916 |
Series 2023-4, Class B, 5.77%, 12/15/2028 | 428,000 | 429,679 |
Series 2022-2, Class C, 3.76%, 7/16/2029 | 1,550,000 | 1,483,382 |
Series 2022-4, Class C, 5.00%, 11/15/2029 | 1,130,000 | 1,105,182 |
Series 2023-3, Class C, 5.77%, 11/15/2030 | 220,000 | 218,834 |
Series 2022-7, Class C, 6.69%, 3/17/2031 | 174,000 | 176,394 |
SBA Small Business Investment Cos. Series 2023-10A, Class 1, 5.17%, 3/10/2033 | 2,400,000 | 2,376,355 |
Service Experts Issuer LLC Series 2021-1A, Class A, 2.67%, 2/2/2032 (a) | 248,395 | 226,582 |
August 31, 2023 | 75 |
AS OF August 31, 2023 (Unaudited) (continued)
INVESTMENTS | PRINCIPAL AMOUNT($) | VALUE($) |
Asset-Backed Securities — continued | ||
SoFi Consumer Loan Program Trust Series 2023-1S, Class A, 5.81%, 5/15/2031 (a) | 167,572 | 167,255 |
Symphony CLO Ltd. (Cayman Islands) | ||
Series 2018-19A, Class A, 6.53%, 4/16/2031 (a) (i) | 1,052,830 | 1,045,955 |
Series 2020-23A, Class AR, 6.59%, 1/15/2034 (a) (i) | 600,000 | 595,504 |
Tesla Auto Lease Trust Series 2021-B, Class B, 0.91%, 9/22/2025 (a) | 770,000 | 736,768 |
Theorem Funding Trust | ||
Series 2022-2A, Class B, 9.27%, 12/15/2028 (a) | 400,000 | 412,243 |
Series 2022-3A, Class A, 7.60%, 4/15/2029 (a) | 184,945 | 186,021 |
Tricon Residential Trust Series 2022-SFR1, Class E2, 5.74%, 4/17/2039 (a) | 101,000 | 93,434 |
United Airlines Pass-Through Trust | ||
Series 2016-2, Class B, 3.65%, 10/7/2025 | 31,736 | 29,910 |
Series 2016-1, Class B, 3.65%, 1/7/2026 | 26,447 | 24,546 |
Upstart Pass-Through Trust | ||
Series 2022-PT2, Class A, 17.81%, 2/20/2030 (a) (i) | 493,765 | 493,765 |
Series 2022-PT3, Class A, 19.73%, 4/20/2030 ‡ (a) (i) | 315,335 | 318,967 |
Upstart Securitization Trust | ||
Series 2021-2, Class C, 3.61%, 6/20/2031 (a) | 1,500,000 | 1,392,428 |
Series 2022-2, Class B, 6.10%, 5/20/2032 (a) | 500,000 | 493,674 |
Voya CLO Ltd. (Cayman Islands) Series 2020-2A, Class A1R, 6.74%, 7/19/2034 (a) (i) | 1,000,000 | 993,584 |
Westlake Automobile Receivables Trust | ||
Series 2022-2A, Class C, 4.85%, 9/15/2027 (a) | 504,000 | 493,761 |
Series 2022-2A, Class D, 5.48%, 9/15/2027 (a) | 432,000 | 423,201 |
Series 2023-1A, Class B, 5.41%, 1/18/2028 (a) | 375,000 | 370,889 |
Series 2023-1A, Class C, 5.74%, 8/15/2028 (a) | 405,000 | 399,701 |
Series 2023-3A, Class C, 6.02%, 9/15/2028 (a) | 920,000 | 918,634 |
Series 2023-1A, Class D, 6.79%, 11/15/2028 (a) | 437,000 | 435,782 |
Series 2023-3A, Class D, 6.47%, 3/15/2029 (a) | 632,000 | 629,425 |
Total Asset-Backed Securities (Cost $166,442,198) | 164,957,182 | |
INVESTMENTS | PRINCIPAL AMOUNT($) | VALUE($) |
Mortgage-Backed Securities — 21.8% | ||
FHLMC Gold Pools, Other | ||
Pool # WN1250, 4.40%, 5/1/2028 | 1,500,000 | 1,448,342 |
Pool # WN2184, 2.50%, 4/1/2032 | 330,000 | 271,811 |
Pool # WN2270, 3.95%, 10/1/2032 | 600,000 | 545,171 |
Pool # WN2271, 3.95%, 10/1/2032 | 450,000 | 408,881 |
Pool # WN2290, 3.80%, 11/1/2032 | 470,000 | 423,373 |
Pool # WN2298, 4.35%, 11/1/2032 | 580,000 | 539,806 |
Pool # WA3236, 4.75%, 11/1/2032 | 577,222 | 546,566 |
Pool # WN1205, 4.60%, 1/1/2033 | 390,000 | 365,746 |
Pool # WN1206, 4.60%, 1/1/2033 | 537,000 | 504,351 |
Pool # WN2308, 4.90%, 1/1/2033 | 200,000 | 190,041 |
FNMA UMBS, 30 Year Pool # MA5073, 6.00%, 7/1/2053 | 18,678,293 | 18,726,245 |
FNMA, Other Pool # BS9065, 4.62%, 7/1/2028 | 1,500,000 | 1,465,502 |
FNMA/FHLMC UMBS, Single Family, 30 Year TBA, 3.50%, 9/25/2053 (j) | 25,850,000 | 23,104,447 |
GNMA II, 30 Year | ||
Pool # MA8151, 4.50%, 7/20/2052 | 30 | 29 |
Pool # MA8493, 6.50%, 12/20/2052 | 11,910,938 | 12,065,821 |
Pool # MA8573, 7.00%, 1/20/2053 | 7,519,349 | 7,681,013 |
Pool # MA8649, 6.00%, 2/20/2053 | 498,903 | 501,800 |
Pool # MA8651, 7.00%, 2/20/2053 | 200,000 | 204,307 |
Pool # MA8729, 7.00%, 3/20/2053 | 1,000,001 | 1,023,932 |
Pool # MA9109, 7.00%, 8/20/2053 | 2,159,114 | 2,231,524 |
Pool # MA9110, 7.50%, 8/20/2053 | 560,000 | 579,183 |
GNMA II, Single Family, 30 Year | ||
TBA, 5.50%, 9/15/2053 (j) | 6,883,000 | 6,813,095 |
TBA, 6.00%, 9/15/2053 (j) | 25,897,000 | 25,980,963 |
TBA, 6.50%, 9/15/2053 (j) | 26,000,000 | 26,332,109 |
Total Mortgage-Backed Securities (Cost $132,020,737) | 131,954,058 | |
Commercial Mortgage-Backed Securities — 13.8% | ||
BANK | ||
Series 2022-BNK39, Class XA, IO, 0.53%, 2/15/2055 (i) | 8,064,600 | 220,918 |
Series 2019-BN20, Class D, 2.50%, 9/15/2062 (a) | 700,000 | 403,554 |
Series 2020-BN28, Class XA, IO, 1.88%, 3/15/2063 (i) | 4,136,987 | 380,068 |
Series 2020-BN26, Class E, 2.50%, 3/15/2063 (a) | 320,000 | 137,613 |
BBCMS Mortgage Trust | ||
Series 2021-C11, Class XB, IO, 1.08%, 9/15/2054 (i) | 4,500,000 | 287,392 |
Series 2023-C20, Class XA, IO, 1.07%, 7/15/2056 (i) | 13,298,636 | 747,456 |
76 | August 31, 2023 |
INVESTMENTS | PRINCIPAL AMOUNT($) | VALUE($) |
Commercial Mortgage-Backed Securities — continued | ||
Benchmark Mortgage Trust | ||
Series 2021-B26, Class ASB, 2.26%, 6/15/2054 | 800,000 | 682,414 |
Series 2022-B33, Class A5, 3.46%, 3/15/2055 | 800,000 | 692,195 |
Series 2022-B36, Class A5, 4.47%, 7/15/2055 (i) | 800,000 | 740,278 |
Series 2022-B37, Class A5, 5.94%, 11/15/2055 (i) | 604,000 | 618,856 |
BHMS Series 2018-ATLS, Class A, 6.86%, 7/15/2035 (a) (i) | 1,580,000 | 1,551,969 |
BX Series 2021-MFM1, Class A, 6.12%, 1/15/2034 (a) (i) | 632,972 | 623,029 |
BX Commercial Mortgage Trust | ||
Series 2021-21M, Class A, 6.15%, 10/15/2036 (a) (i) | 372,506 | 364,474 |
Series 2021-VINO, Class A, 6.08%, 5/15/2038 (a) (i) | 272,098 | 266,802 |
Series 2021-XL2, Class A, 6.11%, 10/15/2038 (a) (i) | 664,641 | 648,585 |
Series 2021-ACNT, Class A, 6.27%, 11/15/2038 (a) (i) | 850,000 | 834,275 |
BX Trust | ||
Series 2022-LBA6, Class A, 6.31%, 1/15/2039 (a) (i) | 155,000 | 151,694 |
Series 2022-FOX2, Class A2, 6.06%, 4/15/2039 (a) (i) | 543,570 | 526,186 |
CD Mortgage Trust Series 2018-CD7, Class C, 5.00%, 8/15/2051 (i) | 580,000 | 472,833 |
Citigroup Commercial Mortgage Trust | ||
Series 2013-GC17, Class B, 5.10%, 11/10/2046 (i) | 100,000 | 98,649 |
Series 2018-C5, Class XA, IO, 0.83%, 6/10/2051 (i) | 1,482,636 | 39,905 |
Series 2018-C6, Class XA, IO, 0.93%, 11/10/2051 (i) | 2,140,543 | 65,522 |
Series 2015-GC33, Class B, 4.73%, 9/10/2058 (i) | 65,000 | 53,982 |
Commercial Mortgage Trust | ||
Series 2015-CR22, Class D, 4.20%, 3/10/2048 (a) (i) | 500,000 | 388,389 |
Series 2015-PC1, Class B, 4.42%, 7/10/2050 (i) | 65,000 | 59,216 |
Credit Suisse Mortgage Capital Certificates Series 2019-ICE4, Class A, 6.34%, 5/15/2036 (a) (i) | 588,536 | 587,862 |
FHLMC Series K-153, Class X1, IO, 0.60%, 12/25/2032 (i) | 16,500,000 | 581,896 |
INVESTMENTS | PRINCIPAL AMOUNT($) | VALUE($) |
FHLMC Multiclass Certificates | ||
Series 2020-RR12, Class X, IO, 2.10%, 10/27/2027 (i) | 2,000,000 | 135,733 |
Series 2020-RR06, Class AX, IO, 1.88%, 10/27/2028 (i) | 2,000,000 | 140,216 |
Series 2020-RR14, Class X, IO, 2.13%, 3/27/2034 (i) | 2,500,000 | 379,941 |
Series 2021-RR16, Class X, IO, 0.96%, 10/27/2034 (i) | 5,600,000 | 426,550 |
FHLMC, Multi-Family Structured Pass-Through Certificates | ||
Series K038, Class X1, IO, 1.23%, 3/25/2024 (i) | 59,306,271 | 200,770 |
Series KC06, Class X1, IO, 1.01%, 6/25/2026 (i) | 5,582,276 | 69,184 |
Series K738, Class X1, IO, 1.51%, 1/25/2027 (i) | 14,846,257 | 604,217 |
Series K740, Class X1, IO, 0.83%, 9/25/2027 (i) | 15,765,278 | 400,236 |
Series K072, Class X1, IO, 0.49%, 12/25/2027 (i) | 15,390,520 | 209,403 |
Series K741, Class X1, IO, 0.65%, 12/25/2027 (i) | 1,442,695 | 28,542 |
Series K742, Class X1, IO, 0.87%, 3/25/2028 (i) | 2,766,878 | 65,263 |
Series K742, Class X3, IO, 2.68%, 4/25/2028 (i) | 5,000,000 | 475,373 |
Series K743, Class X1, IO, 1.03%, 5/25/2028 (i) | 1,651,826 | 59,744 |
Series K745, Class X1, IO, 0.77%, 8/25/2028 (i) | 15,956,731 | 435,603 |
Series K084, Class X3, IO, 2.31%, 11/25/2028 (i) | 751,485 | 72,963 |
Series K091, Class X1, IO, 0.71%, 3/25/2029 (i) | 8,814,443 | 234,099 |
Series K096, Class X3, IO, 2.11%, 7/25/2029 (i) | 8,380,000 | 789,228 |
Series K100, Class X1, IO, 0.77%, 9/25/2029 (i) | 54,839,095 | 1,780,198 |
Series K104, Class X1, IO, 1.25%, 1/25/2030 (i) | 9,320,112 | 517,439 |
Series K109, Class X1, IO, 1.70%, 4/25/2030 (i) | 5,950,127 | 479,503 |
Series K110, Class X1, IO, 1.81%, 4/25/2030 (i) | 8,851,093 | 747,674 |
Series K115, Class X1, IO, 1.43%, 6/25/2030 (i) | 7,968,779 | 557,691 |
Series K119, Class X1, IO, 1.02%, 9/25/2030 (i) | 7,347,458 | 369,495 |
August 31, 2023 | 77 |
AS OF August 31, 2023 (Unaudited) (continued)
INVESTMENTS | PRINCIPAL AMOUNT($) | VALUE($) |
Commercial Mortgage-Backed Securities — continued | ||
Series K120, Class X1, IO, 1.13%, 10/25/2030 (i) | 21,761,559 | 1,194,916 |
Series K123, Class X1, IO, 0.86%, 12/25/2030 (i) | 18,421,238 | 792,837 |
Series K129, Class X3, IO, 3.27%, 5/25/2031 (i) | 8,000,000 | 1,462,796 |
Series K133, Class X1, IO, 0.44%, 9/25/2031 (i) | 7,471,894 | 170,585 |
Series K-154, Class X1, IO, 0.53%, 1/25/2033 (i) | 192 | 6 |
Series K157, Class X3, IO, 3.33%, 9/25/2033 (i) | 1,800,000 | 389,525 |
Series K-1514, Class X1, IO, 0.70%, 10/25/2034 (i) | 1,187,651 | 53,040 |
Series Q012, Class X, IO, 4.09%, 9/25/2035 (i) | 408,724 | 74,341 |
Series K-1520, Class X1, IO, 0.58%, 2/25/2036 (i) | 412,676 | 15,927 |
Series K067, Class X3, IO, 2.19%, 9/25/2044 (i) | 1,575,428 | 108,171 |
Series K060, Class X3, IO, 1.96%, 12/25/2044 (i) | 11,950,000 | 640,576 |
Series K071, Class X3, IO, 2.08%, 11/25/2045 (i) | 8,700,000 | 639,711 |
Series K085, Class X3, IO, 2.39%, 12/25/2045 (i) | 1,850,000 | 178,549 |
Series K097, Class X3, IO, 2.09%, 9/25/2046 (i) | 3,000,000 | 284,468 |
Series K083, Class X3, IO, 2.37%, 11/25/2046 (i) | 621,062 | 59,199 |
Series K737, Class X3, IO, 1.83%, 1/25/2048 (i) | 11,779,376 | 590,697 |
Series K121, Class X3, IO, 2.87%, 11/25/2048 (i) | 5,000,000 | 758,513 |
Series K126, Class X3, IO, 2.72%, 1/25/2049 (i) | 2,950,000 | 434,769 |
Series K124, Class X3, IO, 2.71%, 2/25/2049 (i) | 5,000,000 | 719,916 |
Series K741, Class X3, IO, 2.53%, 3/25/2049 (i) | 13,766,615 | 1,160,012 |
Series K743, Class X3, IO, 3.06%, 6/25/2049 (i) | 13,000,000 | 1,446,205 |
Series 2021-MN3, Class M2, 9.29%, 11/25/2051 (a) (i) | 3,200,000 | 3,053,251 |
FIVE Mortgage Trust Series 2023-V1, Class XA, IO, 1.04%, 2/10/2056 (i) | 5,685,871 | 175,746 |
FNMA ACES | ||
Series 2020-M3, Class X1, IO, 0.44%, 2/25/2030 (i) | 3,554,169 | 62,178 |
INVESTMENTS | PRINCIPAL AMOUNT($) | VALUE($) |
Series 2022-M2, Class X2, IO, 0.30%, 1/25/2032 (i) | 2,833,478 | 38,707 |
Series 2020-M31, Class AB, 0.50%, 10/25/2032 | 73,297 | 57,549 |
FREMF Mortgage Trust | ||
Series 2017-KF31, Class B, 8.12%, 4/25/2024 (a) (i) | 145,324 | 143,937 |
Series 2017-KF36, Class B, 7.87%, 8/25/2024 (a) (i) | 902,075 | 879,913 |
Series 2017-KF38, Class B, 7.72%, 9/25/2024 (a) (i) | 828,828 | 809,338 |
Series 2018-KF45, Class B, 7.17%, 3/25/2025 (a) (i) | 768,233 | 734,247 |
Series 2018-KF47, Class B, 7.22%, 5/25/2025 (a) (i) | 243,085 | 235,335 |
Series 2018-KC02, Class B, 4.23%, 7/25/2025 (a) (i) | 25,000 | 23,380 |
Series 2018-KF53, Class B, 7.27%, 10/25/2025 (i) | 24,588 | 23,593 |
Series 2019-KF60, Class B, 7.57%, 2/25/2026 (a) (i) | 807,494 | 773,967 |
Series 2019-KF62, Class B, 7.27%, 4/25/2026 (a) (i) | 5,755 | 5,332 |
Series 2019-K735, Class B, 4.16%, 5/25/2026 (a) (i) | 150,000 | 141,592 |
Series 2019-KF72, Class B, 7.32%, 11/25/2026 (a) (i) | 730,796 | 682,154 |
Series 2017-KF40, Class B, 7.92%, 11/25/2027 (a) (i) | 943,700 | 868,281 |
Series 2018-KF43, Class B, 7.37%, 1/25/2028 (a) (i) | 21,473 | 20,229 |
Series 2018-KF50, Class B, 7.12%, 7/25/2028 (a) (i) | 3,383 | 2,996 |
Series 2018-KF54, Class B, 7.42%, 11/25/2028 (i) | 679,860 | 622,054 |
Series 2019-KF59, Class B, 7.57%, 2/25/2029 (a) (i) | 675,975 | 633,812 |
Series 2019-KW09, Class X2A, IO, 0.10%, 5/25/2029 (a) | 19,784,415 | 74,031 |
Series 2019-KW09, Class C, PO, 6/25/2029 (a) | 790,000 | 462,070 |
Series 2019-KW09, Class X2B, IO, 0.10%, 6/25/2029 (a) | 10,000,000 | 42,933 |
Series 2019-KF67, Class C, 11.22%, 8/25/2029 (a) (i) | 3,247,611 | 2,696,532 |
Series 2020-KF76, Class B, 7.97%, 1/25/2030 (a) (i) | 811,471 | 753,135 |
Series 2018-KW07, Class B, 4.22%, 10/25/2031 (a) (i) | 300,000 | 248,105 |
78 | August 31, 2023 |
INVESTMENTS | PRINCIPAL AMOUNT($) | VALUE($) |
Commercial Mortgage-Backed Securities — continued | ||
Series 2023-KF149, Class CS, 11.25%, 12/25/2032 (a) (i) | 499,921 | 510,350 |
Series 19K-1513, Class X2A, IO, 0.10%, 8/25/2034 (a) | 64,933,479 | 438,859 |
Series 2014-K38, Class B, 4.37%, 6/25/2047 (a) (i) | 335,000 | 329,465 |
Series 2015-K46, Class C, 3.82%, 4/25/2048 (a) (i) | 100,000 | 95,474 |
Series 2017-K724, Class D, PO, 12/25/2049 (a) | 500,000 | 483,940 |
Series 2017-K62, Class B, 4.01%, 1/25/2050 (a) (i) | 415,000 | 387,706 |
Series 2018-K730, Class B, 3.92%, 2/25/2050 (a) (i) | 200,000 | 192,469 |
Series 2019-K91, Class C, 4.40%, 4/25/2051 (a) (i) | 250,000 | 227,563 |
GNMA | ||
Series 2015-93, IO, 0.28%, 11/16/2054 (i) | 30,740,960 | 247,428 |
Series 2015-33, IO, 0.26%, 2/16/2056 (i) | 48,270,890 | 417,674 |
Series 2017-53, IO, 0.53%, 11/16/2056 (i) | 4,422,141 | 136,497 |
Series 2017-158, IO, 0.46%, 9/16/2057 (i) | 3,530,385 | 91,782 |
Series 2018-45, IO, 0.54%, 3/16/2059 (i) | 12,724,724 | 420,469 |
Series 2023-108, IO, 0.70%, 8/16/2059 (i) | 13,547,220 | 487,173 |
Series 2019-109, IO, 0.80%, 4/16/2060 (i) | 5,688,058 | 309,464 |
Series 2020-184, IO, 0.91%, 11/16/2060 (i) | 9,403,222 | 571,458 |
Series 2021-90, IO, 0.83%, 5/16/2061 (i) | 18,068,692 | 1,095,579 |
Series 2021-147, IO, 0.99%, 6/16/2061 (i) | 3,017,463 | 208,785 |
Series 2019-154, IO, 0.58%, 9/16/2061 (i) | 7,312,962 | 303,699 |
Series 2021-218, IO, 0.96%, 10/16/2061 (i) | 333,061 | 23,257 |
Series 2020-120, IO, 0.76%, 5/16/2062 (i) | 5,977,635 | 337,277 |
Series 2020-100, IO, 0.78%, 5/16/2062 (i) | 5,757,596 | 328,101 |
Series 2020-194, IO, 1.08%, 6/16/2062 (i) | 8,555,725 | 612,520 |
Series 2020-161, IO, 1.05%, 8/16/2062 (i) | 5,045,690 | 344,115 |
Series 2021-71, IO, 0.87%, 10/16/2062 (i) | 3,642,774 | 227,155 |
INVESTMENTS | PRINCIPAL AMOUNT($) | VALUE($) |
Series 2021-35, IO, 1.03%, 12/16/2062 (i) | 3,239,793 | 232,431 |
Series 2021-11, Class IX, IO, 1.16%, 12/16/2062 (i) | 6,483,857 | 507,301 |
Series 2021-40, IO, 0.82%, 2/16/2063 (i) | 3,168,887 | 193,554 |
Series 2021-120, IO, 0.99%, 2/16/2063 (i) | 6,512,881 | 454,882 |
Series 2021-62, Class SA, IF, IO, 3.37%, 2/16/2063 (i) | 3,304,675 | 197,950 |
Series 2021-106, IO, 0.86%, 4/16/2063 (i) | 5,022,103 | 327,417 |
Series 2021-151, IO, 0.92%, 4/16/2063 (i) | 8,043,804 | 544,475 |
Series 2021-60, IO, 0.83%, 5/16/2063 (i) | 2,266,027 | 134,455 |
Series 2021-126, IO, 0.85%, 5/16/2063 (i) | 9,847,732 | 640,444 |
Series 2021-10, IO, 0.99%, 5/16/2063 (i) | 4,975,446 | 343,841 |
Series 2021-170, IO, 0.99%, 5/16/2063 (i) | 2,352,621 | 167,411 |
Series 2021-141, Class SA, IF, IO, 3.65%, 6/16/2063 (i) | 1,738,108 | 85,669 |
Series 2021-133, IO, 0.88%, 7/16/2063 (i) | 9,079,034 | 599,052 |
Series 2021-61, IO, 1.03%, 8/16/2063 (i) | 1,400,201 | 96,944 |
Series 2023-15, Class AB, 4.00%, 8/16/2063 (i) | 745,055 | 693,235 |
Series 2021-110, IO, 0.87%, 11/16/2063 (i) | 5,781,058 | 372,937 |
Series 2021-200, IO, 0.88%, 11/16/2063 (i) | 1,996,646 | 136,032 |
Series 2021-180, IO, 0.91%, 11/16/2063 (i) | 8,996,031 | 617,566 |
Series 2021-185, IO, 1.10%, 11/16/2063 (i) | 1,512,973 | 120,218 |
Series 2021-220, IO, 0.83%, 12/16/2063 (i) | 11,193,754 | 707,615 |
Series 2022-7, Class SA, IF, IO, 3.37%, 2/16/2064 (i) | 1,257,817 | 72,890 |
Series 2021-224, IO, 0.78%, 4/16/2064 (i) | 1,950,480 | 126,614 |
Series 2022-149, IO, 0.45%, 6/16/2064 (i) | 13,347,109 | 600,854 |
Series 2022-134, IO, 0.51%, 6/16/2064 (i) | 2,961,132 | 138,818 |
Series 2022-165, IO, 0.59%, 6/16/2064 (i) | 9,653,859 | 531,523 |
Series 2022-80, IO, 0.59%, 6/16/2064 (i) | 1,171,765 | 58,267 |
Series 2022-62, IO, 0.62%, 6/16/2064 (i) | 1,957,902 | 104,401 |
Series 2022-52, IO, 0.77%, 6/16/2064 (i) | 9,787,166 | 563,381 |
August 31, 2023 | 79 |
AS OF August 31, 2023 (Unaudited) (continued)
INVESTMENTS | PRINCIPAL AMOUNT($) | VALUE($) |
Commercial Mortgage-Backed Securities — continued | ||
Series 2022-141, IO, 0.78%, 6/16/2064 (i) | 2,973,272 | 209,683 |
Series 2022-210, IO, 0.70%, 7/16/2064 (i) | 2,183,642 | 141,067 |
Series 2022-199, IO, 0.76%, 7/16/2064 (i) | 3,968,374 | 260,590 |
Series 2023-15, IO, 0.92%, 8/16/2064 (i) | 1,790,088 | 134,008 |
Series 2023-36, IO, 0.95%, 10/16/2064 (i) | 6,014,403 | 418,038 |
Series 2023-26, IO, 0.97%, 4/16/2065 (i) | 4,977,853 | 359,775 |
Series 2023-51, IO, 1.11%, 5/16/2065 (i) | 11,950,784 | 1,026,564 |
GS Mortgage Securities Trust | ||
Series 2016-GS2, Class D, 2.75%, 5/10/2049 (a) | 750,000 | 575,990 |
Series 2019-GC40, Class E, 3.00%, 7/10/2052 (a) | 800,000 | 392,147 |
ILPT Commercial Mortgage Trust | ||
Series 2022-LPF2, Class A, 7.56%, 10/15/2039 (a) (i) | 104,962 | 104,600 |
Series 2022-LPF2, Class E, 11.25%, 10/15/2039 (a) (i) | 240,000 | 237,561 |
JPMBB Commercial Mortgage Securities Trust Series 2015-C33, Class C, 4.79%, 12/15/2048 (i) | 150,000 | 121,281 |
JPMCC Commercial Mortgage Securities Trust | ||
Series 2017-JP5, Class C, 3.90%, 3/15/2050 (i) | 1,050,000 | 832,325 |
Series 2017-JP5, Class B, 4.08%, 3/15/2050 (i) | 850,000 | 719,330 |
JPMorgan Chase Commercial Mortgage Securities Trust Series 2013-C16, Class D, 5.13%, 12/15/2046 (a) (i) | 1,500,000 | 1,278,794 |
Morgan Stanley Bank of America Merrill Lynch Trust | ||
Series 2014-C15, Class D, 5.01%, 4/15/2047 (a) (i) | 1,337,000 | 1,208,645 |
Series 2014-C16, Class AS, 4.09%, 6/15/2047 | 600,000 | 571,944 |
Series 2014-C18, Class B, 4.58%, 10/15/2047 (i) | 100,000 | 95,025 |
Series 2016-C31, Class C, 4.40%, 11/15/2049 (i) | 100,000 | 77,216 |
Series 2015-C23, Class B, 4.28%, 7/15/2050 (i) | 900,000 | 825,550 |
Morgan Stanley Capital I Trust Series 2020-L4, Class D, 2.50%, 2/15/2053 (a) | 500,000 | 250,442 |
MRCD MARK Mortgage Trust Series 2019-PARK, Class E, 2.72%, 12/15/2036 (a) | 400,000 | 247,536 |
INVESTMENTS | PRINCIPAL AMOUNT($) | VALUE($) |
MSC Trust Series 2021-ILP, Class A, 6.20%, 11/15/2023 (a) (i) | 239,209 | 233,806 |
MTN Commercial Mortgage Trust Series 2022-LPFL, Class A, 6.72%, 3/15/2039 (a) (i) | 1,190,000 | 1,174,332 |
Multi-Family Connecticut Avenue Securities Trust | ||
Series 2019-01, Class M10, 8.65%, 10/25/2049 (a) (i) | 1,892,893 | 1,843,092 |
Series 2020-01, Class M10, 9.15%, 3/25/2050 (a) (i) | 3,900,000 | 3,793,171 |
TPGI Trust Series 2021-DGWD, Class A, 6.12%, 6/15/2026 (a) (i) | 335,592 | 329,166 |
Velocity Commercial Capital Loan Trust | ||
Series 2018-1, Class A, 3.59%, 4/25/2048 (a) | 153,264 | 143,008 |
Series 2022-3, Class A, 5.22%, 6/25/2052 (a) (i) | 255,871 | 242,556 |
Series 2022-4, Class A, 5.63%, 8/25/2052 (a) (i) | 534,801 | 509,613 |
Wells Fargo Commercial Mortgage Trust | ||
Series 2018-C44, Class D, 3.00%, 5/15/2051 (a) | 250,000 | 150,664 |
Series 2022-C62, Class C, 4.50%, 4/15/2055 (i) | 100,000 | 73,445 |
WFRBS Commercial Mortgage Trust | ||
Series 2013-C13, Class C, 3.91%, 5/15/2045 (i) | 18,560 | 17,762 |
Series 2014-C22, Class C, 3.91%, 9/15/2057 (i) | 100,000 | 78,236 |
Series 2014-C22, Class B, 4.37%, 9/15/2057 (i) | 100,000 | 87,389 |
Total Commercial Mortgage-Backed Securities (Cost $88,331,956) | 83,807,020 | |
Collateralized Mortgage Obligations — 7.6% | ||
Angel Oak Mortgage Trust I LLC Series 2019-4, Class B2, 5.66%, 7/26/2049 (a) (i) | 800,000 | 712,154 |
CHL Mortgage Pass-Through Trust Series 2006-OA5, Class 2A1, 5.83%, 4/25/2046 (i) | 149,361 | 123,810 |
COLT Mortgage Loan Trust Series 2023-2, Class A1, 6.60%, 7/25/2068 (a) (h) | 392,451 | 395,221 |
Connecticut Avenue Securities Trust | ||
Series 2019-R01, Class 2B1, 9.75%, 7/25/2031 (a) (i) | 1,500,000 | 1,587,729 |
Series 2019-R04, Class 2B1, 10.65%, 6/25/2039 (a) (i) | 716,662 | 755,818 |
Series 2019-R07, Class 1B1, 8.80%, 10/25/2039 (a) (i) | 670,000 | 679,925 |
80 | August 31, 2023 |
INVESTMENTS | PRINCIPAL AMOUNT($) | VALUE($) |
Collateralized Mortgage Obligations — continued | ||
Series 2020-R01, Class 1B1, 8.65%, 1/25/2040 (a) (i) | 1,500,000 | 1,502,959 |
Series 2022-R06, Class 1M2, 9.14%, 5/25/2042 (a) (i) | 1,100,000 | 1,141,222 |
Series 2023-R02, Class 1M1, 7.59%, 1/25/2043 (a) (i) | 292,175 | 295,827 |
Series 2023-R02, Class 1M2, 8.64%, 1/25/2043 (a) (i) | 550,000 | 563,372 |
Series 2023-R02, Class 1B1, 10.84%, 1/25/2043 (a) (i) | 350,000 | 371,875 |
Series 2023-R04, Class 1M1, 7.60%, 5/25/2043 (a) (i) | 1,139,816 | 1,157,659 |
Series 2023-R04, Class 1M2, 8.85%, 5/25/2043 (a) (i) | 500,000 | 518,750 |
Series 2023-R06, Class 1M2, 7.99%, 7/25/2043 (a) (i) | 680,000 | 683,828 |
Deephaven Residential Mortgage Trust Series 2022-2, Class A1, 4.30%, 3/25/2067 (a) (i) | 117,683 | 109,258 |
FHLMC STACR REMIC Trust | ||
Series 2021-HQA1, Class M2, 7.54%, 8/25/2033 (a) (i) | 1,864,815 | 1,843,835 |
Series 2022-DNA3, Class M1B, 8.19%, 4/25/2042 (a) (i) | 500,000 | 508,528 |
FHLMC STACR Trust | ||
Series 2019-HQA1, Class B1, 9.80%, 2/25/2049 (a) (i) | 750,000 | 809,768 |
Series 2019-DNA2, Class B1, 9.75%, 3/25/2049 (a) (i) | 1,000,000 | 1,071,880 |
FHLMC Structured Agency Credit Risk Debt Notes | ||
Series 2017-DNA2, Class B1, 10.55%, 10/25/2029 (i) | 250,000 | 273,125 |
Series 2017-DNA3, Class B1, 9.85%, 3/25/2030 (i) | 1,550,000 | 1,681,295 |
FHLMC, REMIC Series 5164, Class J, 2.50%, 5/25/2049 | 1,367,063 | 1,163,333 |
FNMA, Connecticut Avenue Securities | ||
Series 2017-C01, Class 1B1, 11.15%, 7/25/2029 (i) | 2,400,000 | 2,702,549 |
Series 2017-C02, Class 2B1, 10.90%, 9/25/2029 (i) | 2,120,000 | 2,340,678 |
Series 2017-C03, Class 1B1, 10.25%, 10/25/2029 (i) | 780,000 | 855,261 |
Series 2017-C04, Class 2B1, 10.45%, 11/25/2029 (i) | 1,650,000 | 1,803,831 |
Series 2017-C05, Class 1B1, 9.00%, 1/25/2030 (i) | 1,090,558 | 1,149,964 |
INVESTMENTS | PRINCIPAL AMOUNT($) | VALUE($) |
Series 2017-C06, Class 1B1, 9.55%, 2/25/2030 (i) | 450,000 | 481,524 |
Series 2017-C07, Class 1B1, 9.40%, 5/25/2030 (i) | 790,000 | 843,325 |
Series 2018-C01, Class 1B1, 8.95%, 7/25/2030 (i) | 1,346,000 | 1,423,395 |
Series 2018-C03, Class 1B1, 9.15%, 10/25/2030 (i) | 3,647,000 | 3,909,363 |
Series 2021-R02, Class 2B1, 8.59%, 11/25/2041 (a) (i) | 64,000 | 64,000 |
Series 2021-R02, Class 2B2, 11.49%, 11/25/2041 (a) (i) | 26,000 | 26,071 |
FWD Securitization Trust Series 2020-INV1, Class A1, 2.24%, 1/25/2050 (a) (i) | 479,317 | 431,725 |
GNMA | ||
Series 2014-181, Class SL, IF, IO, 0.17%, 12/20/2044 (i) | 507,469 | 41,879 |
Series 2021-78, Class IB, IO, 3.00%, 5/20/2051 | 969,822 | 136,041 |
Series 2021-107, Class XI, IO, 3.00%, 6/20/2051 | 1,460,260 | 199,507 |
Series 2021-117, Class ES, IF, IO, 0.87%, 7/20/2051 (i) | 1,695,233 | 176,876 |
Series 2021-142, Class XI, IO, 3.00%, 8/20/2051 | 151,627 | 23,530 |
Series 2021-188, Class IJ, IO, 3.00%, 10/20/2051 | 3,038,416 | 428,817 |
0.43%, 7/16/2057 (i) | 50,000,000 | 839,845 |
1.16%, 7/16/2065 (i) | 4,500,000 | 372,798 |
LHOME Mortgage Trust | ||
Series 2023-RTL1, Class A1, 7.87%, 1/25/2028 (a) (h) | 1,160,000 | 1,154,252 |
Series 2023-RTL2, Class A1, 8.00%, 6/25/2028 (a) (h) | 500,000 | 498,569 |
MFA Trust | ||
Series 2022-RTL1, Class A1, 5.07%, 4/26/2027 (a) (h) | 270,000 | 259,622 |
Series 2023-RTL1, Class A1, 7.58%, 8/25/2027 (a) (h) | 260,000 | 256,093 |
Series 2021-NQM1, Class A1, 1.15%, 4/25/2065 (a) (i) | 132,629 | 115,915 |
New Residential Mortgage Loan Trust | ||
Series 2018-3A, Class A1C, 3.00%, 5/25/2058 (a) (i) | 277,769 | 249,421 |
Series 2019-NQM5, Class A1, 2.71%, 11/25/2059 (a) (i) | 197,059 | 176,925 |
OBX Trust | ||
Series 2023-NQM3, Class A1, 5.95%, 2/25/2063 (a) (h) | 635,028 | 630,382 |
August 31, 2023 | 81 |
AS OF August 31, 2023 (Unaudited) (continued)
INVESTMENTS | PRINCIPAL AMOUNT($) | VALUE($) |
Collateralized Mortgage Obligations — continued | ||
Series 2023-NQM6, Class A1, 6.52%, 7/25/2063 (a) (h) | 393,319 | 395,076 |
PNMAC GMSR Issuer Trust Series 2018-GT2, Class A, 8.08%, 8/25/2025 (a) (i) | 280,000 | 278,114 |
PRPM LLC Series 2020-6, Class A1, 2.36%, 11/25/2025 (a) (h) | 661,230 | 644,783 |
STACR Trust | ||
Series 2018-HRP2, Class M3, 7.80%, 2/25/2047 (a) (i) | 1,183,586 | 1,205,044 |
Series 2018-HRP2, Class B1, 9.60%, 2/25/2047 (a) (i) | 600,000 | 637,500 |
Series 2018-DNA3, Class B1, 9.30%, 9/25/2048 (a) (i) | 300,000 | 321,000 |
Starwood Mortgage Residential Trust Series 2020-INV1, Class B2, 4.26%, 11/25/2055 (a) | 250,000 | 185,495 |
Verus Securitization Trust | ||
Series 2023-1, Class A1, 5.85%, 12/25/2067 (a) (h) | 822,903 | 813,417 |
Series 2023-2, Class A1, 6.19%, 3/25/2068 (a) (h) | 647,108 | 644,773 |
Series 2023-4, Class A1, 5.81%, 5/25/2068 (a) (h) | 957,488 | 947,248 |
VM Master Issuer LLC Series 2022-1, Class B, 6.88%, 5/24/2025 ‡ (a) (i) | 500,000 | 448,550 |
Total Collateralized Mortgage Obligations (Cost $45,658,532) | 46,064,329 | |
Foreign Government Securities — 2.7% | ||
Banque Centrale de Tunisie 5.75%, 1/30/2025 (f) | 200,000 | 136,084 |
Dominican Republic Government Bond | ||
5.50%, 2/22/2029 (f) | 350,000 | 326,840 |
7.05%, 2/3/2031 (a) | 510,000 | 505,945 |
7.05%, 2/3/2031 (f) | 200,000 | 198,410 |
6.00%, 2/22/2033 (a) | 150,000 | 138,288 |
6.00%, 2/22/2033 (f) | 500,000 | 460,960 |
6.40%, 6/5/2049 (f) | 150,000 | 125,304 |
5.88%, 1/30/2060 (f) | 150,000 | 115,007 |
Federal Republic of Nigeria | ||
7.63%, 11/21/2025 (f) | 600,000 | 569,616 |
6.50%, 11/28/2027 (f) | 800,000 | 685,456 |
7.38%, 9/28/2033 (f) | 400,000 | 304,988 |
8.25%, 9/28/2051 (a) | 200,000 | 142,458 |
Federative Republic of Brazil 3.75%, 9/12/2031 | 200,000 | 171,936 |
Hashemite Kingdom of Jordan | ||
5.85%, 7/7/2030 (f) | 400,000 | 368,068 |
INVESTMENTS | PRINCIPAL AMOUNT($) | VALUE($) |
7.38%, 10/10/2047 (f) | 200,000 | 174,442 |
Islamic Republic of Pakistan 6.00%, 4/8/2026 (f) | 200,000 | 102,910 |
Kingdom of Bahrain | ||
7.38%, 5/14/2030 (f) | 200,000 | 204,670 |
5.45%, 9/16/2032 (f) | 200,000 | 178,960 |
7.50%, 9/20/2047 (f) | 200,000 | 183,978 |
Kingdom of Morocco 6.50%, 9/8/2033 (f) | 400,000 | 400,924 |
Magyar Export-Import Bank Zrt. 6.13%, 12/4/2027 (a) | 200,000 | 198,562 |
Republic of Angola | ||
9.50%, 11/12/2025 (f) | 400,000 | 392,748 |
8.25%, 5/9/2028 (f) | 200,000 | 174,540 |
8.00%, 11/26/2029 (f) | 400,000 | 329,644 |
9.13%, 11/26/2049 (f) | 200,000 | 147,932 |
Republic of Armenia 3.60%, 2/2/2031 (f) | 200,000 | 157,292 |
Republic of Colombia 3.00%, 1/30/2030 | 200,000 | 158,690 |
Republic of Costa Rica | ||
6.13%, 2/19/2031 (f) | 200,000 | 199,170 |
6.55%, 4/3/2034 (a) | 620,000 | 623,683 |
7.00%, 4/4/2044 (f) | 400,000 | 395,244 |
Republic of Cote d'Ivoire | ||
6.38%, 3/3/2028 (f) | 400,000 | 376,660 |
5.75%, 12/31/2032 (f) (h) | 283,473 | 256,098 |
6.13%, 6/15/2033 (f) | 600,000 | 511,152 |
Republic of El Salvador | ||
6.38%, 1/18/2027 (f) | 250,000 | 194,505 |
7.12%, 1/20/2050 (f) | 150,000 | 99,395 |
Republic of Ghana | ||
6.38%, 2/11/2027 (f) (k) | 200,000 | 86,278 |
8.75%, 3/11/2061 (f) (k) | 200,000 | 82,258 |
Republic of Guatemala 6.60%, 6/13/2036 (a) | 400,000 | 401,000 |
Republic of Honduras 6.25%, 1/19/2027 (f) | 150,000 | 141,673 |
Republic of Iraq 5.80%, 1/15/2028 (f) | 731,250 | 671,931 |
Republic of Kenya | ||
7.00%, 5/22/2027 (f) | 200,000 | 177,008 |
8.00%, 5/22/2032 (f) | 200,000 | 165,138 |
Republic of Namibia 5.25%, 10/29/2025 (f) | 200,000 | 189,000 |
Republic of Panama 6.40%, 2/14/2035 | 200,000 | 205,142 |
Republic of Paraguay | ||
5.85%, 8/21/2033 (a) | 200,000 | 196,718 |
6.10%, 8/11/2044 (f) | 400,000 | 369,980 |
5.40%, 3/30/2050 (a) | 200,000 | 166,886 |
Republic of Rwanda 5.50%, 8/9/2031 (a) | 200,000 | 153,810 |
Republic of Senegal | ||
6.25%, 5/23/2033 (f) | 500,000 | 408,255 |
82 | August 31, 2023 |
INVESTMENTS | PRINCIPAL AMOUNT($) | VALUE($) |
Foreign Government Securities — continued | ||
6.75%, 3/13/2048 (f) | 200,000 | 138,884 |
Republic of Serbia 6.50%, 9/26/2033 (a) | 200,000 | 197,014 |
Republic of South Africa | ||
4.30%, 10/12/2028 | 200,000 | 176,384 |
5.88%, 4/20/2032 | 200,000 | 176,616 |
6.25%, 3/8/2041 | 100,000 | 81,005 |
Republic of Turkey | ||
9.38%, 3/14/2029 | 200,000 | 207,210 |
9.38%, 1/19/2033 | 200,000 | 208,222 |
Republic of Uzbekistan 5.38%, 2/20/2029 (f) | 200,000 | 182,428 |
Romania Government Bond 6.63%, 2/17/2028 (f) | 200,000 | 206,492 |
State of Mongolia | ||
3.50%, 7/7/2027 (f) | 200,000 | 167,402 |
4.45%, 7/7/2031 (f) | 200,000 | 154,618 |
Sultanate of Oman Government Bond | ||
6.25%, 1/25/2031 (f) | 400,000 | 404,332 |
6.50%, 3/8/2047 (f) | 400,000 | 374,760 |
6.75%, 1/17/2048 (f) | 200,000 | 193,052 |
Turkiye Ihracat Kredi Bankasi A/S 9.38%, 1/31/2026 (a) | 400,000 | 407,768 |
Total Foreign Government Securities (Cost $17,470,693) | 16,401,823 | |
Municipal Bonds — 0.1% (a) (i) (j) (l) | ||
California — 0.1% | ||
California Infrastructure and Economic Development Bank, Academy of Motion Picture Series 2020A-3, Rev., AMT, 8.00%, 9/14/2023 (Cost $600,000) | 600,000 | 600,044 |
SHARES | ||
Short-Term Investments — 0.4% | ||
Investment Companies — 0.4% | ||
JPMorgan Prime Money Market Fund Class IM Shares, 5.46% (m) (n) (Cost $2,637,620) | 2,636,829 | 2,637,620 |
Total Investments — 112.3% (Cost $691,680,119) | 680,020,129 | |
Liabilities in Excess of Other Assets — (12.3)% | (74,749,221 ) | |
NET ASSETS — 100.0% | 605,270,908 | |
Percentages indicated are based on net assets. |
Abbreviations | |
ABS | Asset-Backed Securities |
ACES | Alternative Credit Enhancement Securities |
AMT | Alternative Minimum Tax |
CIFC | Commercial Industrial Finance Corp. |
FHLMC | Federal Home Loan Mortgage Corp. |
FNMA | Federal National Mortgage Association |
GNMA | Government National Mortgage Association |
ICE | Intercontinental Exchange |
IF | Inverse Floaters represent securities that pay interest at a rate that increases (decreases) with a decline (incline) in a specified index or have an interest rate that adjusts periodically based on changes in current interest rates and prepayments on the underlying pool of assets. The interest rate shown is the rate in effect as of August 31, 2023. The rate may be subject to a cap and floor. |
IO | Interest Only represents the right to receive the monthly interest payments on an underlying pool of mortgage loans. The principal amount shown represents the par value on the underlying pool. The yields on these securities are subject to accelerated principal paydowns as a result of prepayment or refinancing of the underlying pool of mortgage instruments. As a result, interest income may be reduced considerably. |
JSC | Joint Stock Company |
PIK | Payment In Kind |
PO | Principal Only represents the right to receive the principal portion only on an underlying pool of mortgage loans. The market value of these securities is extremely volatile in response to changes in market interest rates. As prepayments on the underlying mortgages of these securities increase, the yield on these securities increases. |
REIT | Real Estate Investment Trust |
REMIC | Real Estate Mortgage Investment Conduit |
Rev. | Revenue |
SCA | Limited partnership with share capital |
SOFR | Secured Overnight Financing Rate |
TBA | To Be Announced; Security is subject to delayed delivery. |
UMBS | Uniform Mortgage-Backed Securities |
USD | United States Dollar |
^ | Amount rounds to less than 0.1% of net assets. | |
‡ | Value determined using significant unobservable inputs. | |
(a) | Securities exempt from registration under Rule 144A or section 4(a)(2), of the Securities Act of 1933, as amended. | |
(b) | Security has the ability to pay in kind (“PIK”) or pay income in cash. When applicable, separate rates of such payments are disclosed. | |
(c) | Contingent Capital security (“CoCo”). CoCos are hybrid debt securities that may be convertible into equity or may be written down if a pre-specified trigger event occurs. The total value of aggregate CoCo holdings at August 31, 2023 is $2,670,004 or 0.44% of the Fund’s net assets as of August 31, 2023. | |
(d) | Security is an interest bearing note with preferred security characteristics. | |
August 31, 2023 | 83 |
AS OF August 31, 2023 (Unaudited) (continued)
(e) | Security is perpetual and thus, does not have a predetermined maturity date. The coupon rate for this security is fixed for a period of time and may be structured to adjust thereafter. The date shown, if applicable, reflects the next call date. The coupon rate shown is the rate in effect as of August 31, 2023. | |
(f) | Security exempt from registration pursuant to Regulation S under the Securities Act of 1933, as amended. Regulation S applies to securities offerings that are made outside of the United States and do not involve direct selling efforts in the United States and as such may have restrictions on resale. | |
(g) | Variable or floating rate security, linked to the referenced benchmark. The interest rate shown is the current rate as of August 31, 2023. | |
(h) | Step bond. Interest rate is a fixed rate for an initial period that either resets at a specific date or may reset in the future contingent upon a predetermined trigger. The interest rate shown is the current rate as of August 31, 2023. |
(i) | Variable or floating rate security, the interest rate of which adjusts periodically based on changes in current interest rates and prepayments on the underlying pool of assets. The interest rate shown is the current rate as of August 31, 2023. | |
(j) | All or a portion of the security is a when-issued security, delayed delivery security, or forward commitment. | |
(k) | Defaulted security. | |
(l) | The date shown represents the earliest of the prerefunded date, next put date or final maturity date. | |
(m) | Investment in an affiliated fund, which is registered under the Investment Company Act of 1940, as amended, and is advised by J.P. Morgan Investment Management Inc. | |
(n) | The rate shown is the current yield as of August 31, 2023. |
DESCRIPTION | NUMBER OF CONTRACTS | EXPIRATION DATE | TRADING CURRENCY | NOTIONAL AMOUNT ($) | VALUE AND UNREALIZED APPRECIATION (DEPRECIATION) ($) |
Long Contracts | |||||
U.S. Treasury 10 Year Note | 194 | 12/19/2023 | USD | 21,537,031 | 167,905 |
U.S. Treasury Long Bond | 4 | 12/19/2023 | USD | 486,250 | 5,132 |
U.S. Treasury Ultra Bond | 10 | 12/19/2023 | USD | 1,294,375 | 15,611 |
U.S. Treasury 2 Year Note | 160 | 12/29/2023 | USD | 32,616,250 | 65,414 |
U.S. Treasury 5 Year Note | 604 | 12/29/2023 | USD | 64,599,688 | 352,846 |
606,908 | |||||
Short Contracts | |||||
U.S. Treasury 10 Year Ultra Note | (112 ) | 12/19/2023 | USD | (13,000,749 ) | (102,162 ) |
U.S. Treasury Ultra Bond | (47 ) | 12/19/2023 | USD | (6,083,563 ) | (73,799 ) |
(175,961 ) | |||||
430,947 |
Abbreviations | |
USD | United States Dollar |
CURRENCY PURCHASED | CURRENCY SOLD | COUNTERPARTY | SETTLEMENT DATE | UNREALIZED APPRECIATION (DEPRECIATION) ($) | ||
JPY | 762,680,703 | USD | 5,396,518 | BNP Paribas | 9/15/2023 | (146,271 ) |
JPY | 69,831,790 | USD | 484,956 | HSBC Bank, NA | 9/15/2023 | (4,238 ) |
Net unrealized depreciation | (150,509 ) | |||||
84 | August 31, 2023 |
Abbreviations | |
JPY | Japanese Yen |
USD | United States Dollar |
REFERENCE OBLIGATION/INDEX | FINANCING RATE PAID BY THE FUND (%) | PAYMENT FREQUENCY | COUNTERPARTY | MATURITY DATE | IMPLIED CREDIT SPREAD (%)(a) | NOTIONAL AMOUNT(b) | UPFRONT PAYMENTS (RECEIPTS) ($)(c) | UNREALIZED APPRECIATION (DEPRECIATION) ($) | VALUE ($) |
Bank of America Corp., 3.50%, 4/19/2026 | 1.00 | Quarterly | Morgan Stanley | 6/20/2028 | 0.77 | USD2,200,000 | 17,660 | (43,288 ) | (25,628 ) |
Bank of America Corp., 3.50%, 4/19/2026 | 1.00 | Quarterly | Morgan Stanley | 6/20/2028 | 0.77 | USD5,000,000 | 8,422 | (66,667 ) | (58,245 ) |
26,082 | (109,955 ) | (83,873 ) |
(*) | The Fund, as a buyer of credit protection, is generally obligated to make periodic payments and may also pay or receive an upfront premium to or from the protection seller, in exchange for the right to receive a contingent payment, upon occurrence of a credit event with respect to an underlying reference obligation, as defined under the terms of individual swap contracts. | ||||||||
(a) | Implied credit spreads are an indication of the seller's performance risk, related to the likelihood of a credit event occurring that would require a seller to make payment to a buyer. Implied credit spreads are used to determine the value of swap contracts and reflect the cost of buying/selling protection, which may include upfront payments made to enter into the contract. Therefore, higher spreads would indicate a greater likelihood that a seller will be obligated to perform (i.e. make payment) under the swap contract. Increasing values, in absolute terms and relative to notional amounts, are also indicative of greater performance risk. Implied credit spreads for credit default swaps on credit indices are linked to the weighted average spread across the underlying reference obligations included in a particular index. | ||||||||
(b) | The notional amount is the maximum amount that a seller of credit protection would be obligated to pay and a buyer of credit protection would receive, upon occurrence of a credit event. | ||||||||
(c) | Upfront payments and receipts generally represent premiums paid or received at the initiation of the agreement to compensate the differences between the stated terms of the swap agreement and current market conditions (credit spreads, interest rates and other relevant factors). | ||||||||
Abbreviations | |||||||||
USD | United States Dollar | ||||||||
REFERENCE OBLIGATION/INDEX | FINANCING RATE PAID BY THE FUND (%) | PAYMENT FREQUENCY | MATURITY DATE | IMPLIED CREDIT SPREAD (%)(a) | NOTIONAL AMOUNT(b) | UPFRONT PAYMENTS (RECEIPTS) ($)(c) | UNREALIZED APPRECIATION (DEPRECIATION) ($) | VALUE ($) |
CDX.NA.HY.40-V1 | 5.00 | Quarterly | 6/20/2028 | 4.26 | USD12,188,000 | (43,775 ) | (424,141 ) | (467,916 ) |
CDX.NA.HY.40-V1 | 5.00 | Quarterly | 6/20/2028 | 4.26 | USD14,112,000 | (85,297 ) | (456,484 ) | (541,781 ) |
CDX.NA.HY.40-V1 | 5.00 | Quarterly | 6/20/2028 | 4.26 | USD31,100,000 | (704,717 ) | (489,260 ) | (1,193,977 ) |
(833,789 ) | (1,369,885 ) | (2,203,674 ) |
(*) | The Fund, as a buyer of credit protection, is generally obligated to make periodic payments and may also pay or receive an upfront premium to or from the protection seller, in exchange for the right to receive a contingent payment, upon occurrence of a credit event with respect to an underlying reference obligation, as defined under the terms of individual swap contracts. | ||||||||
(a) | Implied credit spreads are an indication of the seller's performance risk, related to the likelihood of a credit event occurring that would require a seller to make payment to a buyer. Implied credit spreads are used to determine the value of swap contracts and reflect the cost of buying/selling protection, which may include upfront payments made to enter into the contract. Therefore, higher spreads would indicate a greater likelihood that a seller will be obligated to perform (i.e. make payment) under the swap contract. Increasing values, in absolute terms and relative to notional amounts, are also indicative of greater performance risk. Implied credit spreads for credit default swaps on credit indices are linked to the weighted average spread across the underlying reference obligations included in a particular index. | ||||||||
August 31, 2023 | 85 |
AS OF August 31, 2023 (Unaudited) (continued)
(b) | The notional amount is the maximum amount that a seller of credit protection would be obligated to pay and a buyer of credit protection would receive, upon occurrence of a credit event. | ||||||||
(c) | Upfront payments and receipts generally represent premiums paid or received at the initiation of the agreement to compensate the differences between the stated terms of the swap agreement and current market conditions (credit spreads, interest rates and other relevant factors). | ||||||||
Abbreviations | |
CDX | Credit Default Swap Index |
USD | United States Dollar |
REFERENCE OBLIGATION/INDEX | FINANCING RATE PAID BY THE FUND (%) | PAYMENT FREQUENCY | MATURITY DATE | IMPLIED CREDIT SPREAD (%)(a) | NOTIONAL AMOUNT(b) | UPFRONT PAYMENTS (RECEIPTS) ($)(c) | UNREALIZED APPRECIATION (DEPRECIATION) ($) | VALUE ($) |
CDX.NA.HY.40-V1 | 5.00 | Quarterly | 6/20/2028 | 4.26 | USD1,800,000 | 9,359 | 59,746 | 69,105 |
(**) | The Fund, as a seller of credit protection, receives periodic payments and may also receive or pay an upfront premium from or to the protection buyer, and is obligated to make a contingent payment, upon occurrence of a credit event with respect to an underlying reference obligation, as defined under the terms of individual swap contracts. | ||||||||
(a) | Implied credit spreads are an indication of the seller's performance risk, related to the likelihood of a credit event occurring that would require a seller to make payment to a buyer. Implied credit spreads are used to determine the value of swap contracts and reflect the cost of buying/selling protection, which may include upfront payments made to enter into the contract. Therefore, higher spreads would indicate a greater likelihood that a seller will be obligated to perform (i.e. make payment) under the swap contract.Increasing values, in absolute terms and relative to notional amounts, are also indicative of greater performance risk. Implied credit spreads for credit default swaps on credit indices are linked to the weighted average spread across the underlying reference obligations included in a particular index. | ||||||||
(b) | The notional amount is the maximum amount that a seller of credit protection would be obligated to pay and a buyer of credit protection would receive, upon occurrence of a credit event. | ||||||||
(c) | Upfront payments and receipts generally represent premiums paid or received at the initiation of the agreement to compensate the differences between the stated terms of the swap agreement and current market conditions (credit spreads, interest rates and other relevant factors). | ||||||||
Abbreviations | |
CDX | Credit Default Swap Index |
USD | United States Dollar |
NET UPFRONT PAYMENTS (RECEIPTS) ($) | VALUE ($) | |
Liabilities | ||
OTC Credit default swap contracts outstanding - buy protection | 26,082 | (83,873 ) |
86 | August 31, 2023 |
AS OF August 31, 2023 (Unaudited)
INVESTMENTS | PRINCIPAL AMOUNT($) | VALUE($) |
Corporate Bonds — 56.3% | ||
Australia — 0.8% | ||
APA Infrastructure Ltd. 2.00%, 7/15/2030 (a) | EUR150,000 | 139,064 |
Commonwealth Bank of Australia 2.69%, 3/11/2031 (b) (c) | 1,250,000 | 979,381 |
Glencore Funding LLC | ||
5.40%, 5/8/2028 (b) | 450,000 | 445,653 |
2.85%, 4/27/2031 (b) | 450,000 | 366,771 |
2.63%, 9/23/2031 (b) | 1,099,000 | 874,680 |
5.70%, 5/8/2033 (b) | 96,000 | 94,061 |
2,899,610 | ||
Austria — 0.2% | ||
ams-OSRAM AG 6.00%, 7/31/2025 (a) | EUR200,000 | 199,087 |
Benteler International AG | ||
9.38%, 5/15/2028 (b) | EUR116,000 | 128,021 |
9.38%, 5/15/2028 (a) | EUR200,000 | 220,539 |
547,647 | ||
Belgium — 0.9% | ||
Azelis Finance NV 5.75%, 3/15/2028 (a) | EUR400,000 | 440,946 |
KBC Group NV | ||
(US Treasury Yield Curve Rate T Note Constant Maturity 1 Year + 2.10%), 5.80%, 1/19/2029 (b) (d) | 200,000 | 198,005 |
(EUR Swap Annual 5 Year + 1.25%), 1.63%, 9/18/2029 (a) (d) | EUR300,000 | 311,640 |
Ontex Group NV 3.50%, 7/15/2026 (a) | EUR700,000 | 688,112 |
Sarens Finance Co. NV 5.75%, 2/21/2027 (a) | EUR300,000 | 281,389 |
Solvay Finance SACA (EUR Swap Annual 5 Year + 3.70%), 5.43%, 11/12/2023 (a) (d) (e) (f) | EUR100,000 | 108,183 |
Solvay SA (EUR Swap Annual 5 Year + 3.92%), 4.25%, 12/4/2023 (a) (d) (e) (f) | EUR800,000 | 863,143 |
Telenet Finance Luxembourg Notes SARL 3.50%, 3/1/2028 (a) | EUR500,000 | 504,727 |
3,396,145 | ||
Brazil — 0.3% | ||
Braskem Netherlands Finance BV 7.25%, 2/13/2033 (a) | 350,000 | 330,208 |
INVESTMENTS | PRINCIPAL AMOUNT($) | VALUE($) |
Brazil — continued | ||
Guara Norte SARL 5.20%, 6/15/2034 (b) | 287,384 | 251,461 |
Klabin Austria GmbH 7.00%, 4/3/2049 (a) | 200,000 | 193,348 |
Suzano Austria GmbH | ||
3.75%, 1/15/2031 | 48,000 | 40,625 |
7.00%, 3/16/2047 (a) | 200,000 | 199,046 |
Vale Overseas Ltd. 6.13%, 6/12/2033 | 130,000 | 128,704 |
1,143,392 | ||
Canada — 0.9% | ||
Bank of Nova Scotia (The) | ||
2.45%, 2/2/2032 | 420,000 | 340,302 |
(US Treasury Yield Curve Rate T Note Constant Maturity 5 Year + 2.05%), 4.59%, 5/4/2037 (c) (d) | 570,000 | 492,096 |
Canadian Pacific Railway Co. 3.50%, 5/1/2050 | 90,000 | 66,191 |
Emera US Finance LP 2.64%, 6/15/2031 | 1,272,000 | 1,013,778 |
Emera, Inc. Series 16-A, (ICE LIBOR USD 3 Month + 5.44%), 6.75%, 6/15/2076 (d) | 236,000 | 226,560 |
Federation des Caisses Desjardins du Quebec (SOFRINDX + 1.09%), 5.28%, 1/23/2026 (b) (d) | 510,000 | 503,571 |
TransCanada PipeLines Ltd. 2.50%, 10/12/2031 | 500,000 | 398,394 |
Transcanada Trust Series 16-A, (ICE LIBOR USD 3 Month + 4.64%), 5.88%, 8/15/2076 (d) | 57,000 | 52,563 |
3,093,455 | ||
Chile — 0.1% | ||
Alfa Desarrollo SpA 4.55%, 9/27/2051 (b) | 338,324 | 243,079 |
Kenbourne Invest SA 6.88%, 11/26/2024 (b) | 200,000 | 167,718 |
410,797 | ||
China — 0.8% | ||
Country Garden Holdings Co. Ltd. 3.13%, 10/22/2025 (a) | 530,000 | 45,050 |
Huarong Finance 2017 Co. Ltd. 4.25%, 11/7/2027 (a) | 200,000 | 150,022 |
August 31, 2023 | J.P. Morgan Exchange-Traded Funds | 87 |
AS OF August 31, 2023 (Unaudited) (continued)
INVESTMENTS | PRINCIPAL AMOUNT($) | VALUE($) |
Corporate Bonds — continued | ||
China — continued | ||
Huarong Finance 2019 Co. Ltd. 2.13%, 9/30/2023 (a) | 200,000 | 198,528 |
Longfor Group Holdings Ltd. 4.50%, 1/16/2028 (a) | 300,000 | 192,858 |
NXP BV | ||
5.55%, 12/1/2028 | 1,472,000 | 1,469,311 |
2.50%, 5/11/2031 | 485,000 | 390,348 |
2.65%, 2/15/2032 | 40,000 | 31,898 |
TI Automotive Finance plc 3.75%, 4/15/2029 (a) | EUR500,000 | 453,336 |
2,931,351 | ||
Colombia — 0.1% | ||
AI Candelaria Spain SA 5.75%, 6/15/2033 (b) | 250,000 | 181,340 |
Denmark — 0.2% | ||
Danske Bank A/S | ||
(US Treasury Yield Curve Rate T Note Constant Maturity 1 Year + 2.10%), 6.47%, 1/9/2026 (b) (d) | 262,000 | 262,120 |
(EURIBOR ICE Swap Rate 1 Year + 0.88%), 0.75%, 6/9/2029 (a) (d) | EUR500,000 | 456,950 |
719,070 | ||
France — 8.5% | ||
Accor SA 3.00%, 2/4/2026 (a) (g) | EUR700,000 | 728,361 |
Airbus SE | ||
1.63%, 6/9/2030 (a) | EUR1,100,000 | 1,047,814 |
1.38%, 5/13/2031 (a) | EUR300,000 | 279,600 |
Altice France SA 3.38%, 1/15/2028 (a) | EUR1,000,000 | 759,099 |
Autoroutes du Sud de la France SA | ||
1.13%, 4/20/2026 (a) | EUR800,000 | 815,214 |
3.25%, 1/19/2033 (a) | EUR600,000 | 625,253 |
AXA SA (EURIBOR 3 Month + 3.75%), 3.38%, 7/6/2047 (a) (d) | EUR600,000 | 616,983 |
Banijay Entertainment SASU 3.50%, 3/1/2025 (a) | EUR725,000 | 771,413 |
BPCE SA | ||
5.15%, 7/21/2024 (b) | 600,000 | 592,610 |
4.88%, 4/1/2026 (b) | 450,000 | 434,066 |
(SOFR + 2.10%), 5.97%, 1/18/2027 (b) (d) | 2,038,000 | 2,027,675 |
INVESTMENTS | PRINCIPAL AMOUNT($) | VALUE($) |
France — continued | ||
(EURIBOR 3 Month + 1.00%), 0.50%, 9/15/2027 (a) (d) | EUR400,000 | 385,563 |
4.38%, 7/13/2028 (a) | EUR500,000 | 542,536 |
(SOFR + 1.31%), 2.28%, 1/20/2032 (b) (d) | 480,000 | 370,942 |
(SOFR + 1.73%), 3.12%, 10/19/2032 (b) (d) | 250,000 | 193,270 |
Burger King France SAS (EURIBOR 3 Month + 4.75%), 8.48%, 11/1/2026 (a) (d) | EUR250,000 | 272,297 |
Casino Guichard Perrachon SA 4.50%, 3/7/2024 (a) (g) | EUR300,000 | 4,229 |
Cerba Healthcare SACA 3.50%, 5/31/2028 (a) | EUR739,000 | 696,159 |
CGG SA 7.75%, 4/1/2027 (a) | EUR434,000 | 407,076 |
Credit Agricole SA | ||
(SOFR + 0.89%), 1.25%, 1/26/2027 (b) (d) | 1,000,000 | 896,333 |
(U.K. Government Bonds 1 Year Note Generic Bid Yield + 2.60%), 5.75%, 11/29/2027 (a) (d) | GBP500,000 | 620,109 |
2.00%, 3/25/2029 (a) | EUR200,000 | 188,423 |
Credit Mutuel Arkea SA (EURIBOR ICE Swap Rate 5 Year + 1.45%), 1.88%, 10/25/2029 (a) (d) | EUR300,000 | 311,704 |
Electricite de France SA | ||
(EUR Swap Annual 6 Year + 3.44%), 4.00%, 7/4/2024 (a) (d) (e) (f) | EUR1,000,000 | 1,050,464 |
(EUR Swap Annual 5 Year + 3.97%), 3.38%, 6/15/2030 (a) (d) (e) (f) | EUR1,000,000 | 840,371 |
6.25%, 5/23/2033 (b) | 500,000 | 514,480 |
Elis SA 1.63%, 4/3/2028 (a) | EUR1,100,000 | 1,049,866 |
Forvia SE | ||
2.63%, 6/15/2025 (a) | EUR300,000 | 314,996 |
3.13%, 6/15/2026 (a) | EUR600,000 | 616,433 |
2.38%, 6/15/2027 (a) | EUR600,000 | 577,481 |
3.75%, 6/15/2028 (a) | EUR700,000 | 692,629 |
iliad SA | ||
5.38%, 6/14/2027 (a) | EUR400,000 | 428,969 |
1.88%, 2/11/2028 (a) | EUR700,000 | 649,981 |
5.63%, 2/15/2030 (a) | EUR500,000 | 527,122 |
Loxam SAS | ||
2.88%, 4/15/2026 (a) | EUR300,000 | 301,252 |
88 | J.P. Morgan Exchange-Traded Funds | August 31, 2023 |
INVESTMENTS | PRINCIPAL AMOUNT($) | VALUE($) |
Corporate Bonds — continued | ||
France — continued | ||
4.50%, 2/15/2027 (b) | EUR288,000 | 296,678 |
Lune Holdings SARL 5.63%, 11/15/2028 (a) | EUR375,000 | 333,852 |
Orange SA | ||
(EUR Swap Annual 5 Year + 2.36%), 2.38%, 1/15/2025 (a) (d) (e) (f) | EUR200,000 | 206,306 |
(EUR Swap Annual 5 Year + 3.99%), 5.00%, 10/1/2026 (a) (d) (e) (f) | EUR400,000 | 431,593 |
(EUR Swap Annual 5 Year + 2.10%), 1.75%, 7/15/2028 (a) (d) (e) (f) | EUR700,000 | 638,507 |
Paprec Holding SA | ||
4.00%, 3/31/2025 (a) | EUR100,000 | 106,402 |
3.50%, 7/1/2028 (a) | EUR473,000 | 464,173 |
Parts Europe SA 6.50%, 7/16/2025 (a) | EUR400,000 | 432,990 |
Renault SA | ||
1.25%, 6/24/2025 (a) | EUR500,000 | 508,967 |
2.00%, 9/28/2026 (a) | EUR600,000 | 598,041 |
1.13%, 10/4/2027 (a) | EUR800,000 | 747,016 |
Rexel SA 2.13%, 6/15/2028 (a) | EUR600,000 | 580,365 |
Societe Generale SA | ||
(US Treasury Yield Curve Rate T Note Constant Maturity 5 Year + 4.51%), 5.38%, 11/18/2030 (b) (c) (d) (e) (f) | 525,000 | 394,895 |
(US Treasury Yield Curve Rate T Note Constant Maturity 1 Year + 1.60%), 3.34%, 1/21/2033 (b) (d) | 501,000 | 404,120 |
(US Treasury Yield Curve Rate T Note Constant Maturity 1 Year + 2.95%), 6.69%, 1/10/2034 (b) (d) | 580,000 | 590,757 |
7.37%, 1/10/2053 (b) | 336,000 | 326,066 |
SPIE SA 2.63%, 6/18/2026 (a) | EUR600,000 | 618,802 |
TotalEnergies Capital International SA 3.13%, 5/29/2050 | 50,000 | 34,561 |
TotalEnergies SE (EUR Swap Annual 5 Year + 1.77%), 1.75%, 4/4/2024 (a) (d) (e) (f) | EUR750,000 | 790,507 |
Vallourec SA 8.50%, 6/30/2026 (a) | EUR500,000 | 541,508 |
INVESTMENTS | PRINCIPAL AMOUNT($) | VALUE($) |
France — continued | ||
Veolia Environnement SA (EURIBOR ICE Swap Rate 5 Year + 2.15%), 1.63%, 6/1/2026 (a) (d) (e) (f) | EUR400,000 | 380,607 |
Vinci SA 1.75%, 9/26/2030 (a) | EUR100,000 | 96,785 |
30,674,271 | ||
Germany — 4.6% | ||
Adler Pelzer Holding GmbH 9.50%, 4/1/2027 (b) | EUR308,000 | 307,479 |
BK LC Lux Finco1 SARL 5.25%, 4/30/2029 (a) | EUR800,000 | 833,345 |
Cheplapharm Arzneimittel GmbH | ||
3.50%, 2/11/2027 (a) | EUR300,000 | 294,727 |
4.38%, 1/15/2028 (a) | EUR450,000 | 445,182 |
Commerzbank AG (EUR Swap Annual 5 Year + 4.35%), 4.00%, 12/5/2030 (a) (d) | EUR500,000 | 516,387 |
CT Investment GmbH 5.50%, 4/15/2026 (a) | EUR206,000 | 208,689 |
Deutsche Bank AG | ||
(SOFR + 2.16%), 2.22%, 9/18/2024 (d) | 1,075,000 | 1,073,316 |
(SOFR + 2.26%), 3.74%, 1/7/2033 (d) | 450,000 | 337,918 |
Deutsche Lufthansa AG | ||
2.88%, 2/11/2025 (a) | EUR1,200,000 | 1,260,692 |
3.00%, 5/29/2026 (a) | EUR1,000,000 | 1,025,036 |
Douglas GmbH 6.00%, 4/8/2026 (a) | EUR700,000 | 724,888 |
IHO Verwaltungs GmbH | ||
3.75% (Cash), 9/15/2026 (a) (h) | EUR325,000 | 332,150 |
3.88% (Cash), 5/15/2027 (a) (h) (i) | EUR500,000 | 491,357 |
8.75% (Cash), 5/15/2028 (b) (h) | EUR263,169 | 296,508 |
Kirk Beauty SUN GmbH 9.00% (PIK), 10/1/2026 (a) (h) | EUR100,000 | 95,407 |
Nidda Healthcare Holding GmbH 7.50%, 8/21/2026 (a) | EUR1,000,000 | 1,089,930 |
Renk AG 5.75%, 7/15/2025 (a) | EUR300,000 | 321,692 |
Schaeffler AG | ||
2.88%, 3/26/2027 (a) | EUR550,000 | 565,082 |
3.38%, 10/12/2028 (a) | EUR200,000 | 197,081 |
Techem Verwaltungsgesellschaft 674 mbH 6.00%, 7/30/2026 (a) | EUR747,318 | 792,122 |
August 31, 2023 | J.P. Morgan Exchange-Traded Funds | 89 |
AS OF August 31, 2023 (Unaudited) (continued)
INVESTMENTS | PRINCIPAL AMOUNT($) | VALUE($) |
Corporate Bonds — continued | ||
Germany — continued | ||
Techem Verwaltungsgesellschaft 675 mbH 2.00%, 7/15/2025 (a) | EUR400,000 | 416,390 |
thyssenkrupp AG | ||
2.88%, 2/22/2024 (a) | EUR600,000 | 645,691 |
2.50%, 2/25/2025 (a) | EUR300,000 | 318,262 |
TK Elevator Midco GmbH 4.38%, 7/15/2027 (a) | EUR300,000 | 295,214 |
TUI Cruises GmbH 6.50%, 5/15/2026 (a) | EUR350,000 | 360,053 |
Volkswagen International Finance NV | ||
(EUR Swap Annual 5 Year + 3.75%), 3.50%, 6/17/2025 (a) (d) (e) (f) | EUR400,000 | 408,258 |
(EUR Swap Annual 10 Year + 3.98%), 4.63%, 6/27/2028 (a) (d) (e) (f) | EUR500,000 | 485,247 |
3.25%, 11/18/2030 (a) | EUR600,000 | 604,406 |
ZF Europe Finance BV | ||
2.00%, 2/23/2026 (a) | EUR900,000 | 896,622 |
2.50%, 10/23/2027 (a) | EUR400,000 | 382,409 |
ZF Finance GmbH | ||
2.25%, 5/3/2028 (a) | EUR200,000 | 184,914 |
3.75%, 9/21/2028 (a) | EUR500,000 | 491,211 |
16,697,665 | ||
India — 0.2% | ||
Greenko Dutch BV 3.85%, 3/29/2026 (b) | 188,000 | 169,480 |
Greenko Power II Ltd. 4.30%, 12/13/2028 (b) | 394,188 | 342,324 |
NTPC Ltd. 3.75%, 4/3/2024 (a) | 200,000 | 197,348 |
709,152 | ||
Indonesia — 0.2% | ||
Indonesia Asahan Aluminium PT 5.45%, 5/15/2030 (b) | 200,000 | 192,068 |
Pertamina Persero PT 3.65%, 7/30/2029 (b) | 400,000 | 363,744 |
Perusahaan Perseroan Persero PT Perusahaan Listrik Negara 4.13%, 5/15/2027 (a) | 200,000 | 189,958 |
745,770 | ||
Ireland — 1.3% | ||
AerCap Ireland Capital DAC | ||
2.45%, 10/29/2026 | 300,000 | 269,924 |
INVESTMENTS | PRINCIPAL AMOUNT($) | VALUE($) |
Ireland — continued | ||
3.30%, 1/30/2032 | 600,000 | 487,582 |
AIB Group plc | ||
(EUR Swap Annual 1 Year + 1.95%), 4.63%, 7/23/2029 (a) (d) | EUR300,000 | 324,385 |
(EUR Swap Annual 5 Year + 2.15%), 1.88%, 11/19/2029 (a) (d) | EUR750,000 | 773,486 |
Avolon Holdings Funding Ltd. | ||
3.95%, 7/1/2024 (b) | 126,000 | 122,903 |
2.88%, 2/15/2025 (b) | 265,000 | 250,040 |
2.13%, 2/21/2026 (b) | 940,000 | 844,604 |
4.25%, 4/15/2026 (b) | 125,000 | 117,882 |
4.38%, 5/1/2026 (b) | 60,000 | 56,562 |
Bank of Ireland Group plc (EUR Swap Annual 5 Year + 7.92%), 7.50%, 5/19/2025 (a) (c) (d) (e) (f) | EUR300,000 | 318,897 |
eircom Finance DAC 3.50%, 5/15/2026 (a) | EUR1,100,000 | 1,127,182 |
4,693,447 | ||
Israel — 0.2% | ||
Energean Israel Finance Ltd. 5.38%, 3/30/2028 (a) | 150,475 | 136,749 |
Energian Israel Finance Ltd. 4.88%, 3/30/2026 (a) | 156,000 | 145,983 |
Leviathan Bond Ltd. | ||
6.13%, 6/30/2025 (a) | 200,000 | 195,660 |
6.50%, 6/30/2027 (a) | 165,554 | 159,644 |
638,036 | ||
Italy — 4.6% | ||
Assicurazioni Generali SpA | ||
2.43%, 7/14/2031 (a) | EUR200,000 | 178,723 |
(EURIBOR 3 Month + 5.35%), 5.50%, 10/27/2047 (a) (d) | EUR200,000 | 218,748 |
Autostrade per l'Italia SpA 1.88%, 9/26/2029 (a) | EUR900,000 | 826,003 |
Enel Finance International NV | ||
1.38%, 7/12/2026 (b) | 1,460,000 | 1,294,836 |
3.50%, 4/6/2028 (b) | 200,000 | 182,008 |
1.88%, 7/12/2028 (b) | 425,000 | 358,803 |
0.50%, 6/17/2030 (a) | EUR200,000 | 172,444 |
0.88%, 1/17/2031 (a) | EUR493,000 | 426,444 |
2.25%, 7/12/2031 (b) | 536,000 | 416,723 |
5.00%, 6/15/2032 (b) | 200,000 | 187,020 |
90 | J.P. Morgan Exchange-Traded Funds | August 31, 2023 |
INVESTMENTS | PRINCIPAL AMOUNT($) | VALUE($) |
Corporate Bonds — continued | ||
Italy — continued | ||
Enel SpA | ||
Series 63.5, (EUR Swap Annual 5 Year + 2.58%), 3.38%, 8/24/2026 (a) (d) (e) (f) | EUR800,000 | 804,588 |
Series 9.5Y, (EUR Swap Annual 5 Year + 2.01%), 1.88%, 6/8/2030 (a) (d) (e) (f) | EUR300,000 | 240,732 |
Eni SpA 4.25%, 5/9/2029 (b) | 250,000 | 237,220 |
Guala Closures SpA 3.25%, 6/15/2028 (a) | EUR484,000 | 455,286 |
Infrastrutture Wireless Italiane SpA | ||
1.88%, 7/8/2026 (a) | EUR500,000 | 507,445 |
1.63%, 10/21/2028 (a) | EUR100,000 | 95,729 |
Intesa Sanpaolo SpA | ||
(EUR Swap Annual 5 Year + 7.19%), 7.75%, 1/11/2027 (a) (c) (d) (e) (f) | EUR276,000 | 292,513 |
5.25%, 1/13/2030 (a) | EUR145,000 | 162,173 |
6.63%, 6/20/2033 (b) | 1,220,000 | 1,203,986 |
(US Treasury Yield Curve Rate T Note Constant Maturity 1 Year + 2.75%), 4.95%, 6/1/2042 (b) (d) | 200,000 | 133,283 |
Lottomatica SpA 7.13%, 6/1/2028 (b) | EUR237,000 | 262,773 |
Mundys SpA | ||
1.63%, 2/3/2025 (a) | EUR300,000 | 311,519 |
1.88%, 7/13/2027 (a) | EUR450,000 | 436,494 |
1.88%, 2/12/2028 (a) | EUR500,000 | 466,580 |
Pro-Gest SpA 3.25%, 12/15/2024 (a) | EUR477,000 | 357,786 |
Rossini SARL 6.75%, 10/30/2025 (a) | EUR450,000 | 490,074 |
Saipem Finance International BV | ||
3.75%, 9/8/2023 (a) | EUR200,000 | 216,451 |
2.63%, 1/7/2025 (a) | EUR600,000 | 627,365 |
Shiba Bidco SpA 4.50%, 10/31/2028 (a) | EUR650,000 | 634,345 |
TeamSystem SpA 3.50%, 2/15/2028 (a) | EUR300,000 | 278,913 |
Telecom Italia SpA | ||
2.88%, 1/28/2026 (a) | EUR200,000 | 205,565 |
3.63%, 5/25/2026 (a) | EUR400,000 | 419,925 |
2.38%, 10/12/2027 (a) | EUR1,350,000 | 1,271,695 |
INVESTMENTS | PRINCIPAL AMOUNT($) | VALUE($) |
Italy — continued | ||
6.88%, 2/15/2028 (a) | EUR500,000 | 546,941 |
1.63%, 1/18/2029 (a) | EUR200,000 | 169,701 |
UniCredit SpA | ||
(US Treasury Yield Curve Rate T Note Constant Maturity 1 Year + 1.20%), 1.98%, 6/3/2027 (b) (d) | 200,000 | 177,658 |
(EURIBOR 3 Month + 0.85%), 0.93%, 1/18/2028 (a) (d) | EUR600,000 | 580,572 |
(EURIBOR 3 Month + 1.90%), 4.80%, 1/17/2029 (a) (d) | EUR200,000 | 219,092 |
(US Treasury Yield Curve Rate T Note Constant Maturity 1 Year + 1.55%), 3.13%, 6/3/2032 (b) (d) | 410,000 | 324,164 |
16,392,320 | ||
Japan — 0.8% | ||
Mitsubishi UFJ Financial Group, Inc. (US Treasury Yield Curve Rate T Note Constant Maturity 1 Year + 0.83%), 2.34%, 1/19/2028 (d) | 707,000 | 634,343 |
Takeda Pharmaceutical Co. Ltd. | ||
5.00%, 11/26/2028 | 1,110,000 | 1,101,078 |
1.00%, 7/9/2029 | EUR363,000 | 336,505 |
2.05%, 3/31/2030 | 546,000 | 449,224 |
3.00%, 11/21/2030 (a) | EUR200,000 | 204,385 |
3.03%, 7/9/2040 | 270,000 | 196,245 |
2,921,780 | ||
Kazakhstan — 0.1% | ||
KazMunayGas National Co. JSC 5.75%, 4/19/2047 (a) | 380,000 | 305,303 |
Kuwait — 0.1% | ||
MEGlobal Canada ULC 5.00%, 5/18/2025 (b) | 200,000 | 195,970 |
Luxembourg — 1.5% | ||
Altice Finco SA 4.75%, 1/15/2028 (a) | EUR500,000 | 353,015 |
Altice France Holding SA | ||
8.00%, 5/15/2027 (a) | EUR450,000 | 231,332 |
8.00%, 5/15/2027 (b) | EUR123,000 | 63,231 |
ARD Finance SA 5.00% (Cash), 6/30/2027 (a) (h) (i) | EUR300,000 | 246,971 |
Herens Midco SARL 5.25%, 5/15/2029 (a) | EUR403,000 | 235,976 |
August 31, 2023 | J.P. Morgan Exchange-Traded Funds | 91 |
AS OF August 31, 2023 (Unaudited) (continued)
INVESTMENTS | PRINCIPAL AMOUNT($) | VALUE($) |
Corporate Bonds — continued | ||
Luxembourg — continued | ||
INEOS Finance plc | ||
3.38%, 3/31/2026 (a) | EUR347,000 | 355,575 |
6.63%, 5/15/2028 (a) | EUR200,000 | 215,786 |
Matterhorn Telecom SA | ||
3.13%, 9/15/2026 (a) | EUR775,000 | 787,848 |
4.00%, 11/15/2027 (a) | EUR100,000 | 102,064 |
Monitchem HoldCo 3 SA 8.75%, 5/1/2028 (a) | EUR300,000 | 321,662 |
PLT VII Finance SARL 4.63%, 1/5/2026 (a) | EUR750,000 | 787,124 |
SELP Finance SARL, REIT 0.88%, 5/27/2029 (a) | EUR900,000 | 777,941 |
SES SA | ||
(EUR Swap Annual 5 Year + 3.19%), 2.88%, 5/27/2026 (a) (d) (e) (f) | EUR400,000 | 375,359 |
0.88%, 11/4/2027 (a) | EUR130,000 | 122,863 |
Summer BC Holdco A SARL 9.25%, 10/31/2027 (a) | EUR90,105 | 78,505 |
Summer BC Holdco B SARL 5.75%, 10/31/2026 (a) | EUR500,000 | 492,664 |
5,547,916 | ||
Malaysia — 0.1% | ||
Petronas Capital Ltd. 3.40%, 4/28/2061 (b) | 436,000 | 293,075 |
Mexico — 0.6% | ||
BBVA Bancomer SA (US Treasury Yield Curve Rate T Note Constant Maturity 5 Year + 2.65%), 5.13%, 1/18/2033 (b) (c) (d) | 200,000 | 172,752 |
Cemex SAB de CV (US Treasury Yield Curve Rate T Note Constant Maturity 5 Year + 4.53%), 5.13%, 6/8/2026 (b) (d) (e) (f) | 488,000 | 452,315 |
Fomento Economico Mexicano SAB de CV 3.50%, 1/16/2050 | 150,000 | 108,132 |
Petroleos Mexicanos 5.95%, 1/28/2031 | 1,908,000 | 1,378,225 |
Southern Copper Corp. 5.88%, 4/23/2045 | 140,000 | 136,812 |
2,248,236 | ||
Morocco — 0.1% | ||
OCP SA 6.88%, 4/25/2044 (a) | 200,000 | 178,890 |
INVESTMENTS | PRINCIPAL AMOUNT($) | VALUE($) |
Netherlands — 2.0% | ||
ABN AMRO Bank NV | ||
4.75%, 7/28/2025 (b) | 200,000 | 194,193 |
(EUR Swap Annual 5 Year + 4.67%), 4.38%, 9/22/2025 (a) (c) (d) (e) (f) | EUR200,000 | 196,656 |
4.80%, 4/18/2026 (b) | 200,000 | 192,494 |
Cooperatieve Rabobank UA | ||
3.88%, 9/26/2023 (b) | 250,000 | 249,675 |
(US Treasury Yield Curve Rate T Note Constant Maturity 1 Year + 0.73%), 1.00%, 9/24/2026 (b) (d) | 365,000 | 330,016 |
(EUR Swap Annual 5 Year + 4.68%), 4.38%, 6/29/2027 (a) (c) (d) (e) (f) | EUR400,000 | 383,137 |
(US Treasury Yield Curve Rate T Note Constant Maturity 1 Year + 1.22%), 3.65%, 4/6/2028 (b) (d) | 890,000 | 826,254 |
Q-Park Holding I BV 2.00%, 3/1/2027 (a) | EUR500,000 | 476,436 |
Sigma Holdco BV 5.75%, 5/15/2026 (a) | EUR800,000 | 745,748 |
Titan Holdings II BV 5.13%, 7/15/2029 (a) | EUR568,000 | 505,663 |
Trivium Packaging Finance BV 3.75%, 8/15/2026 (a) (g) | EUR550,000 | 541,226 |
UPC Holding BV 3.88%, 6/15/2029 (a) | EUR600,000 | 538,471 |
Versuni Group BV 3.13%, 6/15/2028 (a) | EUR436,000 | 378,221 |
VZ Vendor Financing II BV 2.88%, 1/15/2029 (a) | EUR100,000 | 84,176 |
Wolters Kluwer NV 3.75%, 4/3/2031 (a) | EUR500,000 | 541,053 |
Ziggo Bond Co. BV 3.38%, 2/28/2030 (a) | EUR1,200,000 | 974,252 |
7,157,671 | ||
New Zealand — 0.1% | ||
ANZ New Zealand Int'l Ltd. 2.55%, 2/13/2030 (b) | 490,000 | 412,197 |
92 | J.P. Morgan Exchange-Traded Funds | August 31, 2023 |
INVESTMENTS | PRINCIPAL AMOUNT($) | VALUE($) |
Corporate Bonds — continued | ||
Norway — 0.5% | ||
DNB Bank ASA | ||
(U.K. Government Bonds 1 Year Note Generic Bid Yield + 1.35%), 2.63%, 6/10/2026 (a) (d) | GBP1,000,000 | 1,190,566 |
(US Treasury Yield Curve Rate T Note Constant Maturity 1 Year + 0.85%), 1.13%, 9/16/2026 (b) (d) | 841,000 | 759,879 |
1,950,445 | ||
Portugal — 0.8% | ||
EDP - Energias de Portugal SA | ||
(EUR Swap Annual 5 Year + 1.84%), 1.70%, 7/20/2080 (a) (d) | EUR1,000,000 | 997,923 |
Series NC5., (EUR Swap Annual 5 Year + 1.89%), 1.50%, 3/14/2082 (a) (d) | EUR400,000 | 370,188 |
(EUR Swap Annual 5 Year + 3.18%), 5.94%, 4/23/2083 (a) (d) | EUR200,000 | 214,445 |
EDP Finance BV | ||
3.63%, 7/15/2024 (b) | 675,000 | 660,848 |
1.50%, 11/22/2027 (a) | EUR750,000 | 743,834 |
2,987,238 | ||
South Africa — 0.4% | ||
Anglo American Capital plc | ||
4.00%, 9/11/2027 (b) | 500,000 | 469,710 |
5.50%, 5/2/2033 (b) | 1,170,000 | 1,124,475 |
1,594,185 | ||
Spain — 4.8% | ||
Abertis Infraestructuras Finance BV | ||
(EUR Swap Annual 5 Year + 3.69%), 3.25%, 11/24/2025 (a) (d) (e) (f) | EUR900,000 | 881,068 |
(EUR Swap Annual 5 Year + 3.27%), 2.63%, 1/26/2027 (a) (d) (e) (f) | EUR100,000 | 90,977 |
Banco de Sabadell SA (EUR Swap Annual 1 Year + 0.97%), 0.63%, 11/7/2025 (a) (d) | EUR300,000 | 310,571 |
Banco Santander SA | ||
5.15%, 8/18/2025 | 1,400,000 | 1,377,154 |
INVESTMENTS | PRINCIPAL AMOUNT($) | VALUE($) |
Spain — continued | ||
(US Treasury Yield Curve Rate T Note Constant Maturity 1 Year + 0.90%), 1.72%, 9/14/2027 (d) | 800,000 | 703,171 |
CaixaBank SA | ||
(EUR Swap Annual 5 Year + 6.50%), 6.75%, 6/13/2024 (a) (c) (d) (e) (f) | EUR400,000 | 426,249 |
1.13%, 3/27/2026 (a) | EUR1,000,000 | 1,008,007 |
(EUR Swap Annual 5 Year + 3.62%), 3.75%, 2/15/2029 (a) (d) | EUR800,000 | 860,564 |
Cellnex Finance Co. SA 2.25%, 4/12/2026 (a) | EUR500,000 | 512,919 |
Cellnex Telecom SA | ||
1.00%, 4/20/2027 (a) | EUR600,000 | 578,166 |
1.88%, 6/26/2029 (a) | EUR600,000 | 556,454 |
1.75%, 10/23/2030 (a) | EUR600,000 | 533,734 |
Cirsa Finance International SARL 4.75%, 5/22/2025 (a) | EUR950,000 | 1,014,681 |
eDreams ODIGEO SA | ||
5.50%, 7/15/2027 (b) | EUR307,000 | 304,747 |
5.50%, 7/15/2027 (a) | EUR400,000 | 397,065 |
Grifols SA | ||
1.63%, 2/15/2025 (a) | EUR550,000 | 577,905 |
2.25%, 11/15/2027 (a) | EUR1,000,000 | 975,011 |
3.88%, 10/15/2028 (a) | EUR200,000 | 188,284 |
Grupo Antolin-Irausa SA | ||
3.38%, 4/30/2026 (a) | EUR100,000 | 90,679 |
3.50%, 4/30/2028 (a) | EUR200,000 | 159,883 |
Iberdrola International BV | ||
(EUR Swap Annual 5 Year + 2.06%), 2.63%, 12/26/2023 (a) (d) (e) (f) | EUR800,000 | 854,478 |
Series NC5, (EUR Swap Annual 5 Year + 2.32%), 1.87%, 1/28/2026 (a) (d) (e) (f) | EUR300,000 | 293,879 |
Kaixo Bondco Telecom SA 5.13%, 9/30/2029 (a) | EUR392,000 | 372,945 |
Lorca Telecom Bondco SA 4.00%, 9/18/2027 (a) | EUR1,066,000 | 1,069,223 |
Naturgy Finance BV (EUR Swap Annual 9 Year + 3.08%), 3.38%, 4/24/2024 (a) (d) (e) (f) | EUR200,000 | 212,262 |
August 31, 2023 | J.P. Morgan Exchange-Traded Funds | 93 |
AS OF August 31, 2023 (Unaudited) (continued)
INVESTMENTS | PRINCIPAL AMOUNT($) | VALUE($) |
Corporate Bonds — continued | ||
Spain — continued | ||
Repsol International Finance BV (EUR Swap Annual 10 Year + 4.20%), 4.50%, 3/25/2075 (a) (d) | EUR800,000 | 841,528 |
Telefonica Emisiones SA 5.21%, 3/8/2047 | 150,000 | 125,716 |
Telefonica Europe BV | ||
Series NC5, (EUR Swap Annual 5 Year + 2.45%), 3.00%, 10/9/2023 (a) (d) (e) (f) | EUR100,000 | 107,515 |
(EUR Swap Annual 8 Year + 2.97%), 3.88%, 6/22/2026 (a) (d) (e) (f) | EUR900,000 | 907,601 |
(EUR Swap Annual 6 Year + 2.87%), 2.88%, 2/24/2028 (a) (d) (e) (f) | EUR1,000,000 | 927,119 |
17,259,555 | ||
Sweden — 0.7% | ||
Svenska Handelsbanken AB (US Treasury Yield Curve Rate T Note Constant Maturity 5 Year + 4.05%), 4.75%, 3/1/2031 (a) (c) (d) (e) (f) | 200,000 | 155,000 |
Verisure Holding AB | ||
3.88%, 7/15/2026 (a) | EUR275,000 | 279,962 |
3.25%, 2/15/2027 (a) | EUR1,100,000 | 1,072,015 |
Verisure Midholding AB 5.25%, 2/15/2029 (a) | EUR300,000 | 282,007 |
Volvo Car AB | ||
2.00%, 1/24/2025 (a) | EUR200,000 | 208,217 |
2.50%, 10/7/2027 (a) | EUR400,000 | 392,535 |
2,389,736 | ||
Switzerland — 1.5% | ||
Dufry One BV | ||
2.50%, 10/15/2024 (a) | EUR700,000 | 740,248 |
2.00%, 2/15/2027 (a) | EUR400,000 | 383,405 |
Holcim Finance Luxembourg SA 0.50%, 4/23/2031 (a) | EUR400,000 | 329,035 |
Holcim Sterling Finance Netherlands BV 2.25%, 4/4/2034 (a) | GBP300,000 | 265,669 |
Swiss Re Finance Luxembourg SA (US Treasury Yield Curve Rate T Note Constant Maturity 5 Year + 3.58%), 5.00%, 4/2/2049 (b) (d) | 200,000 | 189,000 |
INVESTMENTS | PRINCIPAL AMOUNT($) | VALUE($) |
Switzerland — continued | ||
UBS Group AG | ||
(SOFR + 3.34%), 6.37%, 7/15/2026 (b) (d) | 300,000 | 301,248 |
(US Treasury Yield Curve Rate T Note Constant Maturity 1 Year + 2.05%), 4.70%, 8/5/2027 (b) (d) | 322,000 | 312,156 |
4.28%, 1/9/2028 (b) | 550,000 | 514,505 |
(SOFR + 3.73%), 4.19%, 4/1/2031 (b) (d) | 274,000 | 246,717 |
(US Treasury Yield Curve Rate T Note Constant Maturity 1 Year + 1.00%), 2.10%, 2/11/2032 (b) (d) | 280,000 | 215,860 |
(SOFR + 1.73%), 3.09%, 5/14/2032 (b) (d) | 561,000 | 462,312 |
(US Treasury Yield Curve Rate T Note Constant Maturity 1 Year + 1.10%), 2.75%, 2/11/2033 (b) (d) | 430,000 | 338,744 |
(US Treasury Yield Curve Rate T Note Constant Maturity 1 Year + 2.40%), 4.99%, 8/5/2033 (b) (d) | 200,000 | 186,384 |
Zurich Insurance Co. Ltd. (EURIBOR 3 Month + 3.95%), 3.50%, 10/1/2046 (a) (d) | EUR700,000 | 722,080 |
5,207,363 | ||
Taiwan — 0.4% | ||
TSMC Arizona Corp. 4.25%, 4/22/2032 | 380,000 | 359,826 |
TSMC Global Ltd. | ||
1.25%, 4/23/2026 (b) | 700,000 | 630,490 |
2.25%, 4/23/2031 (b) | 700,000 | 575,463 |
1,565,779 | ||
United Kingdom — 9.2% | ||
888 Acquisitions Ltd. | ||
7.56%, 7/15/2027 (b) | EUR230,000 | 236,494 |
7.56%, 7/15/2027 (a) | EUR100,000 | 102,945 |
AstraZeneca plc | ||
0.38%, 6/3/2029 (a) | EUR700,000 | 639,307 |
4.00%, 9/18/2042 | 490,000 | 421,806 |
Barclays plc | ||
(US Treasury Yield Curve Rate T Note Constant Maturity 1 Year + 0.80%), 1.01%, 12/10/2024 (d) | 630,000 | 621,291 |
94 | J.P. Morgan Exchange-Traded Funds | August 31, 2023 |
INVESTMENTS | PRINCIPAL AMOUNT($) | VALUE($) |
Corporate Bonds — continued | ||
United Kingdom — continued | ||
(US Treasury Yield Curve Rate T Note Constant Maturity 1 Year + 2.30%), 5.30%, 8/9/2026 (d) | 398,000 | 392,124 |
BAT Capital Corp. | ||
6.34%, 8/2/2030 | 380,000 | 382,417 |
7.08%, 8/2/2043 | 1,005,000 | 999,333 |
Bellis Acquisition Co. plc | ||
3.25%, 2/16/2026 (a) | GBP100,000 | 108,470 |
4.50%, 2/16/2026 (a) | GBP200,000 | 221,690 |
BP Capital Markets plc | ||
(US Treasury Yield Curve Rate T Note Constant Maturity 5 Year + 4.04%), 4.38%, 6/22/2025 (d) (e) (f) | 204,000 | 195,177 |
(EUR Swap Annual 5 Year + 3.52%), 3.25%, 3/22/2026 (a) (d) (e) (f) | EUR800,000 | 810,010 |
(EUR Swap Annual 5 Year + 3.78%), 3.63%, 3/22/2029 (a) (d) (e) (f) | EUR200,000 | 190,579 |
(US Treasury Yield Curve Rate T Note Constant Maturity 5 Year + 4.40%), 4.88%, 3/22/2030 (d) (e) (f) | 94,000 | 85,128 |
Centrica plc 4.38%, 3/13/2029 (a) | GBP200,000 | 235,336 |
CPUK Finance Ltd. 4.50%, 8/28/2027 (a) | GBP400,000 | 437,553 |
EC Finance plc 3.00%, 10/15/2026 (a) | EUR899,000 | 914,017 |
eG Global Finance plc 4.38%, 2/7/2025 (a) | EUR184,955 | 193,995 |
Eversholt Funding plc 2.74%, 6/30/2040 (a) | GBP697,440 | 689,002 |
Gatwick Funding Ltd. 2.50%, 4/15/2030 (a) | GBP700,000 | 718,512 |
Heathrow Funding Ltd. | ||
1.50%, 10/12/2025 (a) | EUR800,000 | 821,745 |
6.75%, 12/3/2026 (a) | GBP300,000 | 386,242 |
1.50%, 2/11/2030 (a) | EUR300,000 | 277,408 |
1.88%, 3/14/2034 (a) | EUR250,000 | 215,351 |
5.88%, 5/13/2041 (a) | GBP100,000 | 121,619 |
HSBC Holdings plc | ||
(SOFR + 1.54%), 1.64%, 4/18/2026 (d) | 490,000 | 456,415 |
(SOFR + 3.03%), 7.34%, 11/3/2026 (d) | 720,000 | 741,091 |
INVESTMENTS | PRINCIPAL AMOUNT($) | VALUE($) |
United Kingdom — continued | ||
5.75%, 12/20/2027 (a) | GBP200,000 | 247,224 |
(SOFR + 2.61%), 5.21%, 8/11/2028 (d) | 380,000 | 370,805 |
(SOFR + 1.73%), 2.01%, 9/22/2028 (d) | 1,270,000 | 1,091,460 |
(3-MONTH CME TERM SOFR + 1.87%), 3.97%, 5/22/2030 (d) | 374,000 | 336,678 |
(SOFR + 1.41%), 2.87%, 11/22/2032 (d) | 440,000 | 350,154 |
Iceland Bondco plc 10.88%, 12/15/2027 (b) | GBP120,000 | 153,596 |
INEOS Quattro Finance 1 plc 3.75%, 7/15/2026 (a) | EUR400,000 | 384,022 |
INEOS Quattro Finance 2 plc 2.50%, 1/15/2026 (a) | EUR200,000 | 197,165 |
INEOS Styrolution Group GmbH 2.25%, 1/16/2027 (a) | EUR300,000 | 279,762 |
International Consolidated Airlines Group SA | ||
2.75%, 3/25/2025 (a) | EUR100,000 | 104,368 |
1.50%, 7/4/2027 (a) | EUR600,000 | 559,850 |
Jaguar Land Rover Automotive plc | ||
2.20%, 1/15/2024 (a) | EUR200,000 | 214,094 |
4.50%, 1/15/2026 (a) | EUR500,000 | 521,187 |
Lloyds Banking Group plc | ||
4.58%, 12/10/2025 | 200,000 | 192,552 |
(US Treasury Yield Curve Rate T Note Constant Maturity 1 Year + 1.48%), 5.99%, 8/7/2027 (d) | 410,000 | 409,580 |
National Grid plc | ||
2.18%, 6/30/2026 (a) | EUR900,000 | 932,251 |
0.25%, 9/1/2028 (a) | EUR800,000 | 725,253 |
NatWest Group plc | ||
(ICE LIBOR USD 3 Month + 1.76%), 4.27%, 3/22/2025 (d) | 780,000 | 771,202 |
(US Treasury Yield Curve Rate T Note Constant Maturity 5 Year + 5.63%), 6.00%, 12/29/2025 (c) (d) (e) (f) | 250,000 | 229,743 |
(US Treasury Yield Curve Rate T Note Constant Maturity 1 Year + 2.27%), 5.52%, 9/30/2028 (d) | 400,000 | 392,874 |
August 31, 2023 | J.P. Morgan Exchange-Traded Funds | 95 |
AS OF August 31, 2023 (Unaudited) (continued)
INVESTMENTS | PRINCIPAL AMOUNT($) | VALUE($) |
Corporate Bonds — continued | ||
United Kingdom — continued | ||
(EURIBOR 3 Month + 0.89%), 0.67%, 9/14/2029 (a) (d) | EUR1,200,000 | 1,072,887 |
NGG Finance plc (EUR Swap Annual 5 Year + 2.53%), 2.13%, 9/5/2082 (a) (d) | EUR730,000 | 688,751 |
Nomad Foods Bondco plc 2.50%, 6/24/2028 (a) | EUR600,000 | 572,374 |
Pinnacle Bidco plc 5.50%, 2/15/2025 (a) | EUR500,000 | 538,625 |
Punch Finance plc 6.13%, 6/30/2026 (a) | GBP438,000 | 483,420 |
RAC Bond Co. plc 5.25%, 11/4/2027 (a) | GBP554,000 | 557,375 |
RELX Finance BV 0.88%, 3/10/2032 (a) | EUR500,000 | 432,292 |
Rolls-Royce plc | ||
0.88%, 5/9/2024 (a) | EUR600,000 | 632,120 |
4.63%, 2/16/2026 (a) | EUR400,000 | 428,860 |
Santander UK Group Holdings plc | ||
(SOFR + 2.75%), 6.83%, 11/21/2026 (d) | 285,000 | 288,579 |
(SOFR + 0.99%), 1.67%, 6/14/2027 (d) | 900,000 | 792,136 |
(SOFR + 2.60%), 6.53%, 1/10/2029 (d) | 665,000 | 670,237 |
South Eastern Power Networks plc 5.63%, 9/30/2030 (a) | GBP400,000 | 503,297 |
Standard Chartered plc | ||
(US Treasury Yield Curve Rate T Note Constant Maturity 1 Year + 0.78%), 0.99%, 1/12/2025 (b) (d) | 312,000 | 305,494 |
(US Treasury Yield Curve Rate T Note Constant Maturity 1 Year + 1.65%), 3.97%, 3/30/2026 (b) (d) | 395,000 | 381,140 |
(US Treasury Yield Curve Rate T Note Constant Maturity 1 Year + 3.45%), 7.77%, 11/16/2028 (b) (d) | 670,000 | 709,576 |
(US Treasury Yield Curve Rate T Note Constant Maturity 1 Year + 2.45%), 6.30%, 1/9/2029 (b) (d) | 214,000 | 216,056 |
(US Treasury Yield Curve Rate T Note Constant Maturity 1 Year + 3.85%), 4.64%, 4/1/2031 (b) (d) | 306,000 | 283,974 |
INVESTMENTS | PRINCIPAL AMOUNT($) | VALUE($) |
United Kingdom — continued | ||
Synthomer plc 3.88%, 7/1/2025 (a) | EUR200,000 | 200,898 |
Thames Water Utilities Finance plc 4.38%, 1/18/2031 (a) | EUR400,000 | 407,313 |
Virgin Media Finance plc 3.75%, 7/15/2030 (a) | EUR800,000 | 699,892 |
Vmed O2 UK Financing I plc 3.25%, 1/31/2031 (a) | EUR500,000 | 450,584 |
Vodafone Group plc | ||
(EUR Swap Annual 5 Year + 3.43%), 4.20%, 10/3/2078 (a) (d) | EUR300,000 | 299,982 |
(USD Swap Semi 5 Year + 4.87%), 7.00%, 4/4/2079 (d) | 429,000 | 432,095 |
(EUR Swap Annual 5 Year + 3.48%), 3.00%, 8/27/2080 (a) (d) | EUR925,000 | 819,972 |
32,946,806 | ||
United States — 8.7% | ||
AbbVie, Inc. | ||
2.63%, 11/15/2028 | EUR500,000 | 514,373 |
4.25%, 11/21/2049 | 220,000 | 185,275 |
AES Corp. (The) | ||
3.30%, 7/15/2025 (b) | 31,000 | 29,477 |
3.95%, 7/15/2030 (b) | 42,000 | 37,332 |
Air Lease Corp. 3.13%, 12/1/2030 | 256,000 | 213,356 |
Alexander Funding Trust 1.84%, 11/15/2023 (b) | 70,000 | 69,276 |
American Express Co. (US Treasury Yield Curve Rate T Note Constant Maturity 5 Year + 2.85%), 3.55%, 9/15/2026 (d) (e) (f) | 104,000 | 86,580 |
American Medical Systems Europe BV 1.63%, 3/8/2031 | EUR100,000 | 92,530 |
Amgen, Inc. | ||
4.20%, 3/1/2033 | 94,000 | 86,542 |
5.25%, 3/2/2033 | 374,000 | 372,055 |
Ardagh Metal Packaging Finance USA LLC 2.00%, 9/1/2028 (a) | EUR200,000 | 179,430 |
AT&T, Inc. | ||
3.50%, 9/15/2053 | 130,000 | 85,567 |
3.55%, 9/15/2055 | 99,000 | 64,614 |
96 | J.P. Morgan Exchange-Traded Funds | August 31, 2023 |
INVESTMENTS | PRINCIPAL AMOUNT($) | VALUE($) |
Corporate Bonds — continued | ||
United States — continued | ||
Bank of America Corp. | ||
(SOFR + 1.29%), 5.08%, 1/20/2027 (d) | 210,000 | 207,240 |
(SOFR + 1.05%), 2.55%, 2/4/2028 (d) | 175,000 | 158,271 |
(SOFR + 1.63%), 5.20%, 4/25/2029 (d) | 500,000 | 492,441 |
Series N, (SOFR + 1.22%), 2.65%, 3/11/2032 (d) | 560,000 | 457,758 |
(SOFR + 1.32%), 2.69%, 4/22/2032 (d) | 249,000 | 203,735 |
(SOFR + 1.22%), 2.30%, 7/21/2032 (d) | 470,000 | 370,667 |
Baxter International, Inc. | ||
2.54%, 2/1/2032 | 315,000 | 252,850 |
3.13%, 12/1/2051 | 181,000 | 115,114 |
Berkshire Hathaway Energy Co. 4.60%, 5/1/2053 | 47,000 | 38,724 |
Boeing Co. (The) 5.81%, 5/1/2050 | 205,000 | 199,442 |
BP Capital Markets America, Inc. 2.72%, 1/12/2032 | 881,000 | 737,379 |
Broadcom, Inc. 3.47%, 4/15/2034 (b) | 400,000 | 326,843 |
Capital One Financial Corp. Series M, (US Treasury Yield Curve Rate T Note Constant Maturity 5 Year + 3.16%), 3.95%, 9/1/2026 (d) (e) (f) | 310,000 | 237,925 |
CCO Holdings LLC 5.13%, 5/1/2027 (b) | 140,000 | 131,613 |
Cencora, Inc. 2.70%, 3/15/2031 | 839,000 | 705,743 |
CenterPoint Energy, Inc. 2.95%, 3/1/2030 | 280,000 | 241,028 |
CF Industries, Inc. 4.95%, 6/1/2043 | 224,000 | 189,338 |
Charter Communications Operating LLC | ||
3.70%, 4/1/2051 | 308,000 | 191,400 |
3.90%, 6/1/2052 | 282,000 | 180,443 |
Cheniere Energy Partners LP 5.95%, 6/30/2033 (b) | 540,000 | 538,901 |
INVESTMENTS | PRINCIPAL AMOUNT($) | VALUE($) |
United States — continued | ||
Citigroup, Inc. | ||
Series W, (US Treasury Yield Curve Rate T Note Constant Maturity 5 Year + 3.60%), 4.00%, 12/10/2025 (d) (e) (f) | 160,000 | 143,207 |
(US Treasury Yield Curve Rate T Note Constant Maturity 5 Year + 3.42%), 3.88%, 2/18/2026 (d) (e) (f) | 686,000 | 600,277 |
(SOFR + 1.17%), 2.56%, 5/1/2032 (d) | 320,000 | 257,820 |
(SOFR + 1.18%), 2.52%, 11/3/2032 (d) | 140,000 | 111,098 |
Columbia Pipelines Operating Co. LLC | ||
5.93%, 8/15/2030 (b) | 800,000 | 806,989 |
6.04%, 11/15/2033 (b) | 200,000 | 202,050 |
Comcast Corp. | ||
2.80%, 1/15/2051 | 130,000 | 82,460 |
5.35%, 5/15/2053 | 1,365,000 | 1,335,750 |
2.94%, 11/1/2056 | 290,000 | 180,460 |
Constellation Energy Generation LLC | ||
5.80%, 3/1/2033 | 200,000 | 203,736 |
5.60%, 6/15/2042 | 210,000 | 197,969 |
Crown Castle, Inc., REIT | ||
4.80%, 9/1/2028 | 190,000 | 184,451 |
2.10%, 4/1/2031 | 280,000 | 220,747 |
CVS Health Corp. 5.25%, 2/21/2033 | 286,000 | 279,689 |
Danaher Corp. 2.80%, 12/10/2051 | 85,000 | 55,956 |
Diamondback Energy, Inc. 3.13%, 3/24/2031 | 277,000 | 238,167 |
Discovery Communications LLC 3.63%, 5/15/2030 | 50,000 | 43,914 |
Duke Energy Indiana LLC 5.40%, 4/1/2053 | 35,000 | 34,019 |
Duke Energy Ohio, Inc. | ||
5.25%, 4/1/2033 | 45,000 | 45,108 |
5.65%, 4/1/2053 | 15,000 | 14,921 |
Duquesne Light Holdings, Inc. 2.78%, 1/7/2032 (b) | 140,000 | 108,023 |
Entergy Texas, Inc. 1.75%, 3/15/2031 | 115,000 | 90,058 |
Fells Point Funding Trust 3.05%, 1/31/2027 (b) | 274,000 | 250,558 |
August 31, 2023 | J.P. Morgan Exchange-Traded Funds | 97 |
AS OF August 31, 2023 (Unaudited) (continued)
INVESTMENTS | PRINCIPAL AMOUNT($) | VALUE($) |
Corporate Bonds — continued | ||
United States — continued | ||
FirstEnergy Transmission LLC 2.87%, 9/15/2028 (b) | 705,000 | 618,761 |
Ford Motor Credit Co. LLC | ||
4.27%, 1/9/2027 | 200,000 | 184,917 |
3.63%, 6/17/2031 | 467,000 | 378,383 |
Freeport-McMoRan, Inc. | ||
4.25%, 3/1/2030 | 218,000 | 197,864 |
5.40%, 11/14/2034 | 55,000 | 52,120 |
General Electric Co. 4.13%, 9/19/2035 (a) | EUR100,000 | 107,987 |
Global Payments, Inc. 2.90%, 11/15/2031 | 265,000 | 217,127 |
Goldman Sachs Group, Inc. (The) | ||
Series T, (US Treasury Yield Curve Rate T Note Constant Maturity 5 Year + 2.97%), 3.80%, 5/10/2026 (d) (e) (f) | 10,000 | 8,395 |
(SOFR + 0.91%), 1.95%, 10/21/2027 (d) | 355,000 | 315,920 |
Series W, (US Treasury Yield Curve Rate T Note Constant Maturity 5 Year + 3.16%), 7.50%, 2/10/2029 (d) (e) (f) | 510,000 | 512,550 |
(SOFR + 1.28%), 2.62%, 4/22/2032 (d) | 290,000 | 234,653 |
(SOFR + 1.25%), 2.38%, 7/21/2032 (d) | 190,000 | 150,185 |
(SOFR + 1.26%), 2.65%, 10/21/2032 (d) | 300,000 | 240,739 |
Gray Oak Pipeline LLC 2.60%, 10/15/2025 (b) | 50,000 | 46,237 |
HCA, Inc. | ||
5.88%, 2/15/2026 | 185,000 | 185,252 |
5.20%, 6/1/2028 | 170,000 | 167,516 |
2.38%, 7/15/2031 | 370,000 | 292,081 |
5.50%, 6/15/2047 | 91,000 | 82,848 |
5.25%, 6/15/2049 | 120,000 | 104,734 |
3.50%, 7/15/2051 | 150,000 | 99,995 |
4.63%, 3/15/2052 | 687,000 | 551,242 |
5.90%, 6/1/2053 | 335,000 | 321,277 |
Healthpeak OP LLC, REIT 5.25%, 12/15/2032 | 367,000 | 354,751 |
Hyundai Capital America | ||
3.50%, 11/2/2026 (b) | 555,000 | 519,919 |
3.50%, 11/2/2026 (a) | 150,000 | 140,519 |
INVESTMENTS | PRINCIPAL AMOUNT($) | VALUE($) |
United States — continued | ||
International Game Technology plc 2.38%, 4/15/2028 (a) | EUR200,000 | 193,242 |
JBS USA LUX SA 4.38%, 2/2/2052 | 120,000 | 85,062 |
Kinder Morgan, Inc. 5.20%, 6/1/2033 | 230,000 | 220,320 |
Kraft Heinz Foods Co. 4.88%, 10/1/2049 | 250,000 | 221,614 |
Lowe's Cos., Inc. 4.80%, 4/1/2026 | 225,000 | 222,393 |
Metropolitan Life Global Funding I 3.30%, 3/21/2029 (b) | 185,000 | 167,032 |
Morgan Stanley | ||
(SOFR + 0.46%), 5.79%, 1/25/2024 (d) | 598,000 | 597,872 |
(SOFR + 0.88%), 1.59%, 5/4/2027 (d) | 690,000 | 619,026 |
(SOFR + 1.61%), 4.21%, 4/20/2028 (d) | 315,000 | 301,157 |
(SOFR + 1.73%), 5.12%, 2/1/2029 (d) | 455,000 | 445,959 |
(SOFR + 1.59%), 5.16%, 4/20/2029 (d) | 575,000 | 563,977 |
(SOFR + 1.63%), 5.45%, 7/20/2029 (d) | 870,000 | 864,894 |
(SOFR + 1.18%), 2.24%, 7/21/2032 (d) | 220,000 | 173,059 |
(SOFR + 1.20%), 2.51%, 10/20/2032 (d) | 173,000 | 137,761 |
(SOFR + 1.88%), 5.42%, 7/21/2034 (d) | 290,000 | 285,134 |
(US Treasury Yield Curve Rate T Note Constant Maturity 5 Year + 2.43%), 5.95%, 1/19/2038 (d) | 125,000 | 121,550 |
Netflix, Inc. 5.38%, 11/15/2029 (b) | 357,000 | 355,025 |
OI European Group BV 6.25%, 5/15/2028 (b) | EUR180,000 | 199,547 |
Oracle Corp. 5.55%, 2/6/2053 | 250,000 | 232,396 |
Pacific Gas and Electric Co. | ||
3.30%, 3/15/2027 | 366,000 | 333,363 |
6.15%, 1/15/2033 | 460,000 | 447,968 |
6.40%, 6/15/2033 | 360,000 | 355,089 |
Par Pharmaceutical, Inc. 7.50%, 4/1/2027 (b) (g) (j) | 9,000 | 6,407 |
Pfizer Investment Enterprises Pte. Ltd. 5.30%, 5/19/2053 | 112,000 | 112,041 |
98 | J.P. Morgan Exchange-Traded Funds | August 31, 2023 |
INVESTMENTS | PRINCIPAL AMOUNT($) | VALUE($) |
Corporate Bonds — continued | ||
United States — continued | ||
PNC Financial Services Group, Inc. (The) Series T, (US Treasury Yield Curve Rate T Note Constant Maturity 5 Year + 2.60%), 3.40%, 9/15/2026 (d) (e) (f) | 321,000 | 245,578 |
Regency Centers LP, REIT 2.95%, 9/15/2029 | 95,000 | 82,091 |
Roper Technologies, Inc. 2.95%, 9/15/2029 | 160,000 | 141,503 |
Take-Two Interactive Software, Inc. | ||
3.55%, 4/14/2025 | 60,000 | 58,010 |
5.00%, 3/28/2026 | 57,000 | 56,388 |
3.70%, 4/14/2027 | 210,000 | 199,000 |
4.00%, 4/14/2032 | 70,000 | 63,017 |
Texas Instruments, Inc. 5.05%, 5/18/2063 | 85,000 | 81,437 |
Thermo Fisher Scientific, Inc. 0.88%, 10/1/2031 | EUR100,000 | 87,131 |
T-Mobile USA, Inc. | ||
2.63%, 2/15/2029 | 34,000 | 29,441 |
2.55%, 2/15/2031 | 81,000 | 66,746 |
UGI International LLC 2.50%, 12/1/2029 (a) | EUR250,000 | 212,820 |
Union Electric Co. 3.90%, 4/1/2052 | 80,000 | 62,861 |
Warnermedia Holdings, Inc. | ||
4.28%, 3/15/2032 | 822,000 | 725,365 |
5.05%, 3/15/2042 | 155,000 | 127,415 |
5.14%, 3/15/2052 | 508,000 | 404,932 |
Wells Fargo & Co. | ||
Series BB, (US Treasury Yield Curve Rate T Note Constant Maturity 5 Year + 3.45%), 3.90%, 3/15/2026 (d) (e) (f) | 340,000 | 301,410 |
(SOFR + 1.74%), 5.57%, 7/25/2029 (d) | 780,000 | 776,770 |
(SOFR + 1.99%), 5.56%, 7/25/2034 (d) | 500,000 | 493,423 |
Welltower OP LLC, REIT 2.80%, 6/1/2031 | 220,000 | 181,470 |
31,425,357 | ||
Total Corporate Bonds (Cost $223,733,506) | 202,460,970 | |
INVESTMENTS | PRINCIPAL AMOUNT($) | VALUE($) |
Foreign Government Securities — 32.8% | ||
Angola — 0.2% | ||
Republic of Angola | ||
8.00%, 11/26/2029 (a) | 210,000 | 173,063 |
8.75%, 4/14/2032 (b) | 483,000 | 396,075 |
569,138 | ||
Australia — 2.7% | ||
Commonwealth of Australia | ||
1.25%, 5/21/2032 | AUD16,638,000 | 8,614,567 |
3.00%, 3/21/2047 (a) | AUD2,140,000 | 1,100,661 |
9,715,228 | ||
Bahrain — 0.1% | ||
Kingdom of Bahrain 6.00%, 9/19/2044 (a) | 335,000 | 268,871 |
Brazil — 5.0% | ||
Notas do Tesouro Nacional | ||
10.00%, 1/1/2025 (j) | BRL40,000,000 | 8,019,825 |
10.00%, 1/1/2027 | BRL49,300,000 | 9,837,866 |
17,857,691 | ||
Canada — 6.4% | ||
Canada Government Bond | ||
0.50%, 11/1/2023 | CAD4,969,000 | 3,651,325 |
0.75%, 2/1/2024 | CAD7,000,000 | 5,090,749 |
0.25%, 4/1/2024 | CAD8,600,000 | 6,196,493 |
2.50%, 6/1/2024 | CAD4,300,000 | 3,123,769 |
2.75%, 8/1/2024 | CAD7,000,000 | 5,074,275 |
23,136,611 | ||
Colombia — 0.2% | ||
Republic of Colombia | ||
3.13%, 4/15/2031 | 460,000 | 354,200 |
5.20%, 5/15/2049 | 520,000 | 365,607 |
719,807 | ||
Costa Rica — 0.1% | ||
Republic of Costa Rica 6.13%, 2/19/2031 (a) | 300,000 | 298,755 |
Czech Republic — 1.0% | ||
Czech Republic | ||
4.90%, 4/14/2034 | CZK49,480,000 | 2,316,492 |
1.95%, 7/30/2037 | CZK37,240,000 | 1,250,939 |
3,567,431 | ||
August 31, 2023 | J.P. Morgan Exchange-Traded Funds | 99 |
AS OF August 31, 2023 (Unaudited) (continued)
INVESTMENTS | PRINCIPAL AMOUNT($) | VALUE($) |
Foreign Government Securities — continued | ||
Dominican Republic — 0.3% | ||
Dominican Republic Government Bond | ||
6.88%, 1/29/2026 (b) | 280,000 | 281,126 |
5.30%, 1/21/2041 (b) | 375,000 | 293,029 |
6.85%, 1/27/2045 (a) | 660,000 | 589,868 |
1,164,023 | ||
Germany — 0.3% | ||
Bundesrepublik Deutschland 2.30%, 2/15/2033 (a) | EUR1,090,000 | 1,169,016 |
Hungary — 0.1% | ||
Hungary Government Bond 6.75%, 9/25/2052 (b) | 394,000 | 399,461 |
Israel — 0.1% | ||
State of Israel Government Bond 3.38%, 1/15/2050 | 570,000 | 403,030 |
Italy — 1.4% | ||
Italian Republic Government Bond | ||
0.88%, 5/6/2024 | 962,000 | 928,621 |
2.38%, 10/17/2024 | 3,295,000 | 3,164,880 |
2.88%, 10/17/2029 | 1,135,000 | 986,996 |
5,080,497 | ||
Ivory Coast — 0.4% | ||
Republic of Cote d'Ivoire | ||
6.38%, 3/3/2028 (a) | 270,000 | 254,246 |
6.13%, 6/15/2033 (a) | 570,000 | 485,594 |
6.88%, 10/17/2040 (b) | EUR730,000 | 593,959 |
1,333,799 | ||
Kazakhstan — 0.1% | ||
Republic of Kazakhstan 1.50%, 9/30/2034 (b) | EUR370,000 | 292,558 |
Lebanon — 0.0% ^ | ||
Lebanese Republic | ||
6.65%, 4/22/2024 (a) (j) | 227,000 | 17,876 |
6.65%, 11/3/2028 (a) (j) | 226,000 | 17,508 |
35,384 | ||
Mexico — 4.4% | ||
Mex Bonos Desarr Fix Rt | ||
7.75%, 5/29/2031 | MXN125,280,000 | 6,694,330 |
7.50%, 5/26/2033 | MXN70,230,000 | 3,647,198 |
8.00%, 5/24/2035 | MXN72,630,000 | 3,863,686 |
INVESTMENTS | PRINCIPAL AMOUNT($) | VALUE($) |
Mexico—continued | ||
United Mexican States | ||
6.35%, 2/9/2035 | 325,000 | 336,219 |
3.77%, 5/24/2061 | 392,000 | 257,230 |
3.75%, 4/19/2071 | 1,433,000 | 915,687 |
15,714,350 | ||
New Zealand — 0.6% | ||
New Zealand Government Bond | ||
4.50%, 4/15/2027 (a) | NZD952,000 | 558,192 |
2.75%, 4/15/2037 (a) | NZD3,201,000 | 1,485,890 |
2,044,082 | ||
Nigeria — 0.1% | ||
Federal Republic of Nigeria | ||
7.63%, 11/21/2025 (a) | 300,000 | 284,808 |
7.38%, 9/28/2033 (b) | 327,000 | 249,328 |
534,136 | ||
Oman — 0.3% | ||
Sultanate of Oman Government Bond | ||
5.63%, 1/17/2028 (a) | 300,000 | 296,178 |
6.25%, 1/25/2031 (a) | 550,000 | 555,957 |
6.75%, 1/17/2048 (a) | 320,000 | 308,883 |
1,161,018 | ||
Paraguay — 0.2% | ||
Republic of Paraguay | ||
5.00%, 4/15/2026 (a) | 232,000 | 226,529 |
4.95%, 4/28/2031 (b) | 550,000 | 519,140 |
745,669 | ||
Philippines — 0.1% | ||
Republic of Philippines | ||
2.95%, 5/5/2045 | 330,000 | 227,495 |
5.50%, 1/17/2048 | 200,000 | 201,346 |
428,841 | ||
Portugal — 1.2% | ||
Portuguese Republic 5.13%, 10/15/2024 (a) | 4,260,000 | 4,226,329 |
Qatar — 0.1% | ||
State of Qatar | ||
5.10%, 4/23/2048 (a) | 245,000 | 234,869 |
4.40%, 4/16/2050 (b) | 200,000 | 175,856 |
410,725 | ||
100 | J.P. Morgan Exchange-Traded Funds | August 31, 2023 |
INVESTMENTS | PRINCIPAL AMOUNT($) | VALUE($) |
Foreign Government Securities — continued | ||
Romania — 0.4% | ||
Romania Government Bond | ||
6.63%, 9/27/2029 (b) | EUR776,000 | 874,138 |
4.63%, 4/3/2049 (b) | EUR276,000 | 236,114 |
7.63%, 1/17/2053 (b) | 148,000 | 158,893 |
1,269,145 | ||
Saudi Arabia — 0.1% | ||
Kingdom of Saudi Arabia 5.00%, 1/18/2053 (b) | 566,000 | 502,189 |
Senegal — 0.1% | ||
Republic of Senegal 6.25%, 5/23/2033 (a) | 660,000 | 538,897 |
Serbia — 0.1% | ||
Republic of Serbia 1.50%, 6/26/2029 (b) | EUR410,000 | 348,851 |
South Africa — 1.7% | ||
Republic of South Africa | ||
4.30%, 10/12/2028 | 490,000 | 432,141 |
8.25%, 3/31/2032 | ZAR29,250,000 | 1,312,254 |
8.88%, 2/28/2035 | ZAR88,692,132 | 3,862,093 |
5.75%, 9/30/2049 | 710,000 | 501,736 |
6,108,224 | ||
Spain — 4.6% | ||
Bonos and Obligaciones del Estado | ||
0.25%, 7/30/2024 | EUR3,000,000 | 3,155,608 |
2.75%, 10/31/2024 (a) | EUR5,480,000 | 5,889,109 |
1.60%, 4/30/2025 (a) | EUR7,070,000 | 7,452,463 |
16,497,180 | ||
Turkey — 0.1% | ||
Republic of Turkey 9.88%, 1/15/2028 | 350,000 | 369,743 |
United Arab Emirates — 0.3% | ||
United Arab Emirates Government Bond | ||
4.05%, 7/7/2032 (b) | 441,000 | 420,833 |
4.00%, 7/28/2050 (b) | 400,000 | 245,688 |
4.95%, 7/7/2052 (b) | 305,000 | 288,265 |
954,786 | ||
INVESTMENTS | PRINCIPAL AMOUNT($) | VALUE($) |
Uruguay — 0.0% ^ | ||
Oriental Republic of Uruguay 5.10%, 6/18/2050 | 88,906 | 85,742 |
Total Foreign Government Securities (Cost $124,095,332) | 117,951,207 | |
Asset-Backed Securities — 1.4% | ||
Cayman Islands — 0.3% | ||
Bain Capital Credit CLO Ltd. Series 2021-7A, Class A1, 6.75%, 1/22/2035 (b) (i) | 250,000 | 247,598 |
Dryden CLO Ltd. Series 2019-68A, Class AR, 6.74%, 7/15/2035 (b) (i) | 290,000 | 287,550 |
Galaxy CLO Ltd. Series 2013-15A, Class ARR, 6.54%, 10/15/2030 (b) (i) | 236,029 | 235,218 |
Neuberger Berman CLO Series 2013-15A, Class A1R2, 6.49%, 10/15/2029 (b) (i) | 242,969 | 241,923 |
1,012,289 | ||
United States — 1.1% | ||
Accelerated Assets LLC Series 2018-1, Class C, 6.65%, 12/2/2033 (b) | 77,209 | 74,792 |
American Credit Acceptance Receivables Trust | ||
Series 2023-1, Class A, 5.45%, 9/14/2026 (b) | 173,598 | 172,884 |
Series 2023-1, Class C, 5.59%, 4/12/2029 (b) | 267,000 | 262,194 |
BMW Vehicle Lease Trust Series 2023-1, Class A3, 5.16%, 11/25/2025 | 81,000 | 80,468 |
Chase Funding Trust Series 2003-6, Class 1A7, 4.83%, 11/25/2034 (g) | 60,404 | 57,882 |
Credit-Based Asset Servicing and Securitization LLC Series 2004-CB5, Class M1, 6.34%, 1/25/2034 (i) | 71,384 | 71,160 |
Flagship Credit Auto Trust | ||
Series 2023-1, Class A3, 5.01%, 8/16/2027 (b) | 88,000 | 86,944 |
Series 2023-1, Class B, 5.05%, 1/18/2028 (b) | 66,000 | 64,699 |
FREED ABS Trust Series 2022-3FP, Class B, 5.79%, 8/20/2029 (b) | 496,038 | 494,998 |
August 31, 2023 | J.P. Morgan Exchange-Traded Funds | 101 |
AS OF August 31, 2023 (Unaudited) (continued)
INVESTMENTS | PRINCIPAL AMOUNT($) | VALUE($) |
Asset-Backed Securities — continued | ||
United States — continued | ||
GM Financial Automobile Leasing Trust | ||
Series 2023-1, Class A2B, 5.79%, 6/20/2025 (i) | 106,349 | 106,377 |
Series 2023-1, Class A3, 5.16%, 4/20/2026 | 172,000 | 170,918 |
GoldenTree Loan Opportunities Ltd. Series 2015-10A, Class AR, 6.71%, 7/20/2031 (b) (i) | 275,000 | 273,899 |
JetBlue Pass-Through Trust | ||
Series 2019-1, Class B, 8.00%, 11/15/2027 | 126,546 | 127,617 |
Series 2019-1, Class A, 2.95%, 5/15/2028 | 42,075 | 36,391 |
Series 2020-1, Class B, 7.75%, 11/15/2028 | 34,740 | 35,252 |
Progress Residential Series 2021-SFR1, Class E, 2.11%, 4/17/2038 (b) | 250,000 | 218,773 |
Santander Revolving Auto Loan Trust | ||
Series 2019-A, Class C, 3.00%, 1/26/2032 (b) | 150,000 | 142,465 |
Series 2019-A, Class D, 3.45%, 1/26/2032 (b) | 650,000 | 613,351 |
Structured Asset Investment Loan Trust Series 2005-HE3, Class M1, 6.15%, 9/25/2035 (i) | 19,500 | 19,024 |
US Auto Funding Series 2021-1A, Class C, 2.20%, 5/15/2026 (b) | 1,125,000 | 1,061,723 |
4,171,811 | ||
Total Asset-Backed Securities (Cost $5,332,584) | 5,184,100 | |
Commercial Mortgage-Backed Securities — 1.0% | ||
United States — 1.0% | ||
BANK Series 2018-BN13, Class C, 4.68%, 8/15/2061 (i) | 118,000 | 94,743 |
Benchmark Mortgage Trust Series 2019-B11, Class C, 3.75%, 5/15/2052 (i) | 315,000 | 221,493 |
BHMS Series 2018-ATLS, Class A, 6.86%, 7/15/2035 (b) (i) | 130,000 | 127,694 |
INVESTMENTS | PRINCIPAL AMOUNT($) | VALUE($) |
United States — continued | ||
Cascade Funding Mortgage Trust Series 2021-FRR1, Class BK45, 2.08%, 2/28/2025 (b) (i) | 1,000,000 | 909,772 |
CCUBS Commercial Mortgage Trust Series 2017-C1, Class C, 4.58%, 11/15/2050 (i) | 28,000 | 22,784 |
CD Mortgage Trust Series 2016-CD2, Class C, 4.11%, 11/10/2049 (i) | 21,000 | 15,866 |
FHLMC, Multi-Family Structured Pass-Through Certificates | ||
Series K739, Class X1, IO, 1.31%, 9/25/2027 (i) | 2,096,704 | 76,373 |
Series K153, Class X3, IO, 3.91%, 4/25/2035 (i) | 340,000 | 75,264 |
Series K036, Class X3, IO, 2.22%, 12/25/2041 (i) | 2,640,000 | 6,202 |
Series K041, Class X3, IO, 1.70%, 11/25/2042 (i) | 3,470,000 | 50,504 |
Series K054, Class X3, IO, 1.65%, 4/25/2043 (i) | 1,365,000 | 48,549 |
Series K050, Class X3, IO, 1.61%, 10/25/2043 (i) | 1,010,000 | 25,861 |
Series K051, Class X3, IO, 1.67%, 10/25/2043 (i) | 1,395,000 | 43,553 |
Series K052, Class X3, IO, 1.67%, 1/25/2044 (i) | 750,000 | 22,826 |
Series K726, Class X3, IO, 2.22%, 7/25/2044 (i) | 2,290,000 | 28,453 |
Series K067, Class X3, IO, 2.19%, 9/25/2044 (i) | 1,385,000 | 95,096 |
Series K072, Class X3, IO, 2.21%, 12/25/2045 (i) | 400,000 | 30,246 |
Series K089, Class X3, IO, 2.38%, 1/25/2046 (i) | 850,000 | 86,601 |
Series K078, Class X3, IO, 2.29%, 6/25/2046 (i) | 1,820,000 | 158,364 |
Series K088, Class X3, IO, 2.43%, 2/25/2047 (i) | 880,000 | 91,058 |
FREMF Series 2018-KF46, Class B, 7.17%, 3/25/2028 (b) (i) | 241,539 | 220,004 |
FREMF Mortgage Trust | ||
Series 2017-KF31, Class B, 8.12%, 4/25/2024 (b) (i) | 38,243 | 37,878 |
Series 2017-KF36, Class B, 7.87%, 8/25/2024 (b) (i) | 30,220 | 29,478 |
102 | J.P. Morgan Exchange-Traded Funds | August 31, 2023 |
INVESTMENTS | PRINCIPAL AMOUNT($) | VALUE($) |
Commercial Mortgage-Backed Securities — continued | ||
United States — continued | ||
Series 2017-KF38, Class B, 7.72%, 9/25/2024 (b) (i) | 19,725 | 19,261 |
Series 2018-KF47, Class B, 7.22%, 5/25/2025 (b) (i) | 9,422 | 9,121 |
Series 2018-KF49, Class B, 7.12%, 6/25/2025 (b) (i) | 133,319 | 127,682 |
Series 2017-K728, Class C, 3.77%, 11/25/2050 (b) (i) | 105,000 | 101,404 |
GS Mortgage Securities Trust | ||
Series 2012-GCJ9, Class D, 4.77%, 11/10/2045 (b) (i) | 265,413 | 239,532 |
Series 2015-GC30, Class C, 4.20%, 5/10/2050 (i) | 36,000 | 31,769 |
JPMBB Commercial Mortgage Securities Trust | ||
Series 2015-C30, Class C, 4.37%, 7/15/2048 (i) | 62,000 | 52,631 |
Series 2015-C31, Class C, 4.78%, 8/15/2048 (i) | 23,000 | 18,094 |
JPMorgan Chase Commercial Mortgage Securities Trust Series 2016-JP4, Class C, 3.52%, 12/15/2049 (i) | 28,000 | 22,757 |
LB-UBS Commercial Mortgage Trust Series 2006-C6, Class AJ, 5.45%, 9/15/2039 (i) | 134,898 | 50,722 |
Morgan Stanley Bank of America Merrill Lynch Trust | ||
Series 2014-C14, Class C, 5.22%, 2/15/2047 (i) | 21,000 | 20,276 |
Series 2015-C24, Class C, 4.47%, 5/15/2048 (i) | 36,000 | 31,171 |
Morgan Stanley Capital I Trust | ||
Series 2005-HQ7, Class E, 5.49%, 11/14/2042 (i) | 35,173 | 33,558 |
Series 2015-MS1, Class B, 4.16%, 5/15/2048 (i) | 28,000 | 25,743 |
UBS Commercial Mortgage Trust Series 2017-C7, Class B, 4.29%, 12/15/2050 (i) | 106,000 | 92,123 |
INVESTMENTS | PRINCIPAL AMOUNT($) | VALUE($) |
United States — continued | ||
Velocity Commercial Capital Loan Trust | ||
Series 2018-2, Class A, 4.05%, 10/26/2048 (b) (i) | 75,502 | 71,269 |
Series 2019-1, Class M1, 3.94%, 3/25/2049 (b) (i) | 85,453 | 73,998 |
Total Commercial Mortgage-Backed Securities (Cost $4,039,104) | 3,539,773 | |
Collateralized Mortgage Obligations — 0.8% | ||
United States — 0.8% | ||
Alternative Loan Trust | ||
Series 2004-25CB, Class A1, 6.00%, 12/25/2034 | 80,369 | 70,558 |
Series 2005-6CB, Class 1A6, 5.50%, 4/25/2035 | 53,171 | 45,103 |
Series 2005-80CB, Class 5A1, 6.00%, 2/25/2036 | 60,292 | 56,124 |
Series 2007-2CB, Class 1A6, 5.75%, 3/25/2037 | 113,956 | 62,754 |
Chase Mortgage Finance Trust Series 2007-A1, Class 1A5, 4.52%, 2/25/2037 (i) | 11,866 | 11,528 |
CHL Mortgage Pass-Through Trust Series 2007-16, Class A1, 6.50%, 10/25/2037 | 40,871 | 18,129 |
Connecticut Avenue Securities Trust Series 2023-R02, Class 1M1, 7.59%, 1/25/2043 (b) (i) | 339,397 | 343,640 |
FHLMC, REMIC | ||
Series 4305, Class SK, IF, IO, 1.30%, 2/15/2044 (i) | 376,577 | 40,112 |
Series 4689, Class SD, IF, IO, 0.85%, 6/15/2047 (i) | 250,850 | 29,971 |
Series 5022, IO, 3.00%, 9/25/2050 | 380,399 | 62,195 |
Series 5023, Class MI, IO, 3.00%, 10/25/2050 | 690,613 | 111,059 |
Series 4839, Class WS, IF, IO, 0.80%, 8/15/2056 (i) | 1,719,247 | 203,482 |
FNMA, REMIC | ||
Series 2012-146, Class AI, IO, 3.00%, 1/25/2028 | 454,191 | 17,171 |
Series 2016-68, Class BI, IO, 3.00%, 10/25/2031 | 422,097 | 30,262 |
August 31, 2023 | J.P. Morgan Exchange-Traded Funds | 103 |
AS OF August 31, 2023 (Unaudited) (continued)
INVESTMENTS | PRINCIPAL AMOUNT($) | VALUE($) |
Collateralized Mortgage Obligations — continued | ||
United States — continued | ||
Series 2012-93, Class SE, IF, IO, 0.70%, 9/25/2042 (i) | 75,926 | 7,244 |
Series 2012-124, Class UI, IO, 4.00%, 11/25/2042 | 78,323 | 14,082 |
Series 2015-40, Class LS, IF, IO, 0.77%, 6/25/2045 (i) | 193,288 | 17,277 |
Series 2017-31, Class SG, IF, IO, 0.70%, 5/25/2047 (i) | 645,814 | 66,838 |
Series 2017-39, Class ST, IF, IO, 0.70%, 5/25/2047 (i) | 180,709 | 20,387 |
Series 2017-69, Class SH, IF, IO, 0.80%, 9/25/2047 (i) | 290,566 | 33,184 |
Series 2019-42, Class SK, IF, IO, 0.65%, 8/25/2049 (i) | 484,245 | 47,722 |
FNMA, STRIPS Series 409, Class 27, IO, 4.00%, 4/25/2027 (i) | 48,276 | 1,439 |
GNMA | ||
Series 2017-107, Class KS, IF, IO, 0.77%, 7/20/2047 (i) | 977 | 104 |
Series 2015-H13, Class GI, IO, 1.55%, 4/20/2065 (i) | 82,934 | 1,691 |
Merrill Lynch Mortgage Investors Trust Series 2004-C, Class A1, 5.99%, 7/25/2029 (i) | 18,198 | 17,038 |
MFA Trust Series 2023-RTL1, Class A1, 7.58%, 8/25/2027 (b) (g) | 230,000 | 226,544 |
PNMAC GMSR Issuer Trust Series 2018-GT2, Class A, 8.08%, 8/25/2025 (b) (i) | 210,000 | 208,586 |
Structured Adjustable Rate Mortgage Loan Trust Series 2004-8, Class 3A, 6.17%, 7/25/2034 (i) | 10,521 | 10,067 |
VM Master Issuer LLC Series 2022-1, Class A1, 5.16%, 5/24/2025 ‡ (b) (i) | 1,200,000 | 1,180,200 |
Total Collateralized Mortgage Obligations (Cost $3,449,329) | 2,954,491 | |
Supranational — 0.2% | ||
European Union, 0.10%, 10/4/2040 (a) (Cost $1,214,714) | EUR1,070,000 | 680,823 |
INVESTMENTS | PRINCIPAL AMOUNT($) | VALUE($) |
U.S. Treasury Obligations — 0.0% ^ | ||
United States — 0.0% ^ | ||
U.S. Treasury Bonds , 3.63%, 5/15/2053 (Cost $8,707) | 10,000 | 9,019 |
SHARES | ||
Common Stocks — 0.0% ^ | ||
United States — 0.0% ^ | ||
Windstream Holdings, Inc. ‡ *(Cost $—) | 16 | 172 |
Short-Term Investments — 4.2% | ||
Investment Companies — 4.2% | ||
JPMorgan U.S. Government Money Market Fund Class IM Shares, 5.27% (k) (l)(Cost $14,922,581) | 14,922,581 | 14,922,581 |
Total Investments — 96.7% (Cost $376,795,857) | 347,703,136 | |
Other Assets Less Liabilities — 3.3% | 11,744,877 | |
NET ASSETS — 100.0% | 359,448,013 | |
Percentages indicated are based on net assets. |
Abbreviations | |
ABS | Asset-Backed Securities |
AUD | Australian Dollar |
BRL | Brazilian Real |
CAD | Canadian Dollar |
CLO | Collateralized Loan Obligations |
CME | Chicago Mercantile Exchange |
CZK | Czech Republic Koruna |
EUR | Euro |
EURIBOR | Euro Interbank Offered Rate |
FHLMC | Federal Home Loan Mortgage Corp. |
FNMA | Federal National Mortgage Association |
GBP | British Pound |
GNMA | Government National Mortgage Association |
ICE | Intercontinental Exchange |
IF | Inverse Floaters represent securities that pay interest at a rate that increases (decreases) with a decline (incline) in a specified index or have an interest rate that adjusts periodically based on changes in current interest rates and prepayments on the underlying pool of assets. The interest rate shown is the rate in effect as of August 31, 2023. The rate may be subject to a cap and floor. |
104 | J.P. Morgan Exchange-Traded Funds | August 31, 2023 |
IO | Interest Only represents the right to receive the monthly interest payments on an underlying pool of mortgage loans. The principal amount shown represents the par value on the underlying pool. The yields on these securities are subject to accelerated principal paydowns as a result of prepayment or refinancing of the underlying pool of mortgage instruments. As a result, interest income may be reduced considerably. |
JSC | Joint Stock Company |
LIBOR | London Interbank Offered Rate |
MXN | Mexican Peso |
NZD | New Zealand Dollar |
PIK | Payment In Kind |
PT | Limited liability company |
REIT | Real Estate Investment Trust |
REMIC | Real Estate Mortgage Investment Conduit |
SOFR | Secured Overnight Financing Rate |
SOFRINDX | Compounding index of the Secured Overnight Financing Rate |
STRIPS | Separate Trading of Registered Interest and Principal of Securities. The STRIPS Program lets investors hold and trade individual interest and principal components of eligible notes and bonds as separate securities. |
USD | United States Dollar |
ZAR | South African Rand |
^ | Amount rounds to less than 0.1% of net assets. | |
‡ | Value determined using significant unobservable inputs. | |
* | Non-income producing security. | |
(a) | Security exempt from registration pursuant to Regulation S under the Securities Act of 1933, as amended. Regulation S applies to securities offerings that are made outside of the United States and do not involve direct selling efforts in the United States and as such may have restrictions on resale. | |
(b) | Securities exempt from registration under Rule 144A or section 4(a)(2), of the Securities Act of 1933, as amended. | |
(c) | Contingent Capital security (“CoCo”). CoCos are hybrid debt securities that may be convertible into equity or may be written down if a pre-specified trigger event occurs. The total value of aggregate CoCo holdings at August 31, 2023 is $4,041,319 or 1.12% of the Fund’s net assets as of August 31, 2023. | |
(d) | Variable or floating rate security, linked to the referenced benchmark. The interest rate shown is the current rate as of August 31, 2023. | |
(e) | Security is an interest bearing note with preferred security characteristics. | |
(f) | Security is perpetual and thus, does not have a predetermined maturity date. The coupon rate for this security is fixed for a period of time and may be structured to adjust thereafter. The date shown, if applicable, reflects the next call date. The coupon rate shown is the rate in effect as of August 31, 2023. | |
(g) | Step bond. Interest rate is a fixed rate for an initial period that either resets at a specific date or may reset in the future contingent upon a predetermined trigger. The interest rate shown is the current rate as of August 31, 2023. | |
(h) | Security has the ability to pay in kind (“PIK”) or pay income in cash. When applicable, separate rates of such payments are disclosed. | |
(i) | Variable or floating rate security, the interest rate of which adjusts periodically based on changes in current interest rates and prepayments on the underlying pool of assets. The interest rate shown is the current rate as of August 31, 2023. | |
(j) | Defaulted security. | |
(k) | Investment in an affiliated fund, which is registered under the Investment Company Act of 1940, as amended, and is advised by J.P. Morgan Investment Management Inc. | |
(l) | The rate shown is the current yield as of August 31, 2023. |
DESCRIPTION | NUMBER OF CONTRACTS | EXPIRATION DATE | TRADING CURRENCY | NOTIONAL AMOUNT ($) | VALUE AND UNREALIZED APPRECIATION (DEPRECIATION) ($) |
Long Contracts | |||||
Euro-Bund | 33 | 09/07/2023 | EUR | 4,764,580 | (23,994 ) |
Euro-Buxl 30 Year Bond | 23 | 09/07/2023 | EUR | 3,332,988 | (91,065 ) |
Australia 10 Year Bond | 150 | 09/15/2023 | AUD | 11,291,077 | 77,629 |
U.S. Treasury 10 Year Note | 292 | 12/19/2023 | USD | 32,416,562 | 252,723 |
Long Gilt | 82 | 12/27/2023 | GBP | 9,927,582 | 90,714 |
U.S. Treasury 2 Year Note | 332 | 12/29/2023 | USD | 67,678,719 | 135,727 |
U.S. Treasury 5 Year Note | 464 | 12/29/2023 | USD | 49,626,250 | 269,689 |
711,423 |
August 31, 2023 | J.P. Morgan Exchange-Traded Funds | 105 |
AS OF August 31, 2023 (Unaudited) (continued)
DESCRIPTION | NUMBER OF CONTRACTS | EXPIRATION DATE | TRADING CURRENCY | NOTIONAL AMOUNT ($) | VALUE AND UNREALIZED APPRECIATION (DEPRECIATION) ($) |
Short Contracts | |||||
Euro-Bobl | (200 ) | 09/07/2023 | EUR | (25,185,113 ) | 180,798 |
Euro-Schatz | (244 ) | 09/07/2023 | EUR | (27,816,766 ) | (66,879 ) |
Japan 10 Year Bond | (24 ) | 09/12/2023 | JPY | (24,243,307 ) | 173,366 |
U.S. Treasury 10 Year Note | (9 ) | 12/19/2023 | USD | (999,141 ) | (1,658 ) |
U.S. Treasury 10 Year Ultra Note | (178 ) | 12/19/2023 | USD | (20,661,906 ) | (171,421 ) |
U.S. Treasury Long Bond | (3 ) | 12/19/2023 | USD | (364,687 ) | (3,897 ) |
U.S. Treasury Ultra Bond | (53 ) | 12/19/2023 | USD | (6,860,187 ) | (83,210 ) |
U.S. Treasury 2 Year Note | (12 ) | 12/29/2023 | USD | (2,446,219 ) | (5,086 ) |
U.S. Treasury 5 Year Note | (89 ) | 12/29/2023 | USD | (9,518,828 ) | (52,412 ) |
(30,399 ) | |||||
681,024 |
Abbreviations | |
AUD | Australian Dollar |
EUR | Euro |
GBP | British Pound |
JPY | Japanese Yen |
USD | United States Dollar |
106 | J.P. Morgan Exchange-Traded Funds | August 31, 2023 |
CURRENCY PURCHASED | CURRENCY SOLD | COUNTERPARTY | SETTLEMENT DATE | UNREALIZED APPRECIATION (DEPRECIATION) ($) | ||
USD | 564,457 | EUR | 516,143 | BNP Paribas | 9/5/2023 | 4,777 |
USD | 1,096,266 | EUR | 985,001 | Citibank, NA | 9/5/2023 | 28,180 |
USD | 108,086,193 | EUR | 98,023,848 | Morgan Stanley | 9/5/2023 | 1,794,032 |
USD | 98,628 | EUR | 90,682 | Royal Bank of Canada | 9/5/2023 | 296 |
USD | 1,690,161 | EUR | 1,556,436 | TD Bank Financial Group | 9/5/2023 | 2,440 |
USD | 7,595,733 | GBP | 5,907,488 | HSBC Bank, NA | 9/5/2023 | 112,126 |
USD | 151,919 | GBP | 119,045 | State Street Corp. | 9/5/2023 | 1,113 |
AUD | 229,447 | USD | 148,600 | BNP Paribas | 9/26/2023 | 186 |
CNY | 12,622,149 | USD | 1,730,082 | Citibank, NA** | 9/26/2023 | 23,042 |
IDR | 14,997,380,903 | USD | 983,338 | BNP Paribas** | 9/26/2023 | 1,390 |
IDR | 11,903,552,638 | USD | 774,920 | Goldman Sachs International** | 9/26/2023 | 6,667 |
INR | 125,411,475 | USD | 1,500,478 | Goldman Sachs International** | 9/26/2023 | 15,958 |
KRW | 6,767,302,271 | USD | 5,063,982 | BNP Paribas** | 9/26/2023 | 48,526 |
KRW | 2,375,579,436 | USD | 1,775,470 | Goldman Sachs International** | 9/26/2023 | 19,213 |
MXN | 6,397,272 | USD | 371,741 | Barclays Bank plc | 9/26/2023 | 2,077 |
MXN | 28,415,084 | USD | 1,656,484 | State Street Corp. | 9/26/2023 | 3,922 |
PHP | 101,458,153 | USD | 1,786,518 | Barclays Bank plc** | 9/26/2023 | 5,850 |
SGD | 2,391,461 | USD | 1,770,377 | Goldman Sachs International | 9/26/2023 | 841 |
THB | 122,709,592 | USD | 3,476,783 | Goldman Sachs International | 9/26/2023 | 34,786 |
USD | 23,189,540 | CAD | 31,181,085 | Citibank, NA | 9/26/2023 | 105,588 |
USD | 222,321 | CZK | 4,916,457 | BNP Paribas | 9/26/2023 | 1,002 |
USD | 24,742,268 | EUR | 22,605,907 | Citibank, NA | 9/26/2023 | 204,895 |
USD | 13,635 | EUR | 12,345 | Merrill Lynch International | 9/26/2023 | 236 |
USD | 111,596 | EUR | 102,357 | Morgan Stanley | 9/26/2023 | 494 |
USD | 118,207 | EUR | 108,050 | State Street Corp. | 9/26/2023 | 926 |
USD | 3,484,489 | GBP | 2,744,533 | BNP Paribas | 9/26/2023 | 7,369 |
USD | 2,123,462 | NZD | 3,557,996 | BNP Paribas | 9/26/2023 | 1,728 |
USD | 1,792,640 | PHP | 101,024,210 | Goldman Sachs International** | 9/26/2023 | 7,938 |
USD | 363,845 | PHP | 20,452,833 | Merrill Lynch International** | 9/26/2023 | 2,524 |
USD | 1,799,278 | THB | 62,713,830 | Citibank, NA | 9/26/2023 | 4,602 |
USD | 109,796,334 | EUR | 100,757,112 | HSBC Bank, NA | 10/4/2023 | 387,805 |
USD | 7,471,914 | GBP | 5,888,199 | Morgan Stanley | 10/4/2023 | 11,728 |
Total unrealized appreciation | 2,842,257 | |||||
EUR | 207,481 | USD | 227,262 | Royal Bank of Canada | 9/5/2023 | (2,280 ) |
EUR | 799,983 | USD | 880,086 | Standard Chartered Bank | 9/5/2023 | (12,625 ) |
GBP | 138,334 | USD | 177,709 | BNP Paribas | 9/5/2023 | (2,468 ) |
USD | 640,810 | EUR | 592,464 | State Street Corp. | 9/5/2023 | (1,628 ) |
BRL | 8,750,239 | USD | 1,763,272 | Citibank, NA** | 9/26/2023 | (2,071 ) |
BRL | 15,147,400 | USD | 3,067,504 | Goldman Sachs International** | 9/26/2023 | (18,716 ) |
EUR | 1,634,463 | USD | 1,779,247 | Barclays Bank plc | 9/26/2023 | (5,134 ) |
EUR | 174,207 | USD | 190,689 | Morgan Stanley | 9/26/2023 | (1,599 ) |
IDR | 20,031,431,794 | USD | 1,318,638 | Citibank, NA** | 9/26/2023 | (3,374 ) |
JPY | 56,918,278 | USD | 399,734 | BNP Paribas | 9/26/2023 | (7,216 ) |
JPY | 961,089,642 | USD | 6,633,035 | Citibank, NA | 9/26/2023 | (5,192 ) |
PHP | 97,679,224 | USD | 1,739,752 | Merrill Lynch International** | 9/26/2023 | (14,143 ) |
USD | 9,856,792 | AUD | 15,219,484 | BNP Paribas | 9/26/2023 | (12,316 ) |
USD | 1,803,511 | AUD | 2,787,153 | Goldman Sachs International | 9/26/2023 | (3,825 ) |
USD | 15,686,935 | BRL | 78,466,804 | BNP Paribas** | 9/26/2023 | (106,445 ) |
USD | 1,770,377 | CNY | 12,829,127 | Merrill Lynch International** | 9/26/2023 | (11,495 ) |
USD | 1,670,382 | COP | 6,940,423,252 | BNP Paribas** | 9/26/2023 | (14,024 ) |
USD | 13,447 | EUR | 12,420 | HSBC Bank, NA | 9/26/2023 | (34 ) |
August 31, 2023 | J.P. Morgan Exchange-Traded Funds | 107 |
AS OF August 31, 2023 (Unaudited) (continued)
CURRENCY PURCHASED | CURRENCY SOLD | COUNTERPARTY | SETTLEMENT DATE | UNREALIZED APPRECIATION (DEPRECIATION) ($) | ||
USD | 1,695,786 | HUF | 607,065,900 | Goldman Sachs International | 9/26/2023 | (23,058 ) |
USD | 3,075,633 | IDR | 47,289,393,660 | BNP Paribas** | 9/26/2023 | (29,389 ) |
USD | 1,744,733 | IDR | 26,579,261,560 | Merrill Lynch International** | 9/26/2023 | (461 ) |
USD | 1,758,091 | KRW | 2,345,749,860 | Goldman Sachs International** | 9/26/2023 | (14,058 ) |
USD | 156,995 | MXN | 2,699,273 | BNP Paribas | 9/26/2023 | (734 ) |
USD | 413,081 | MXN | 7,106,425 | Citibank, NA | 9/26/2023 | (2,175 ) |
USD | 15,856,075 | MXN | 273,556,431 | Goldman Sachs International | 9/26/2023 | (128,902 ) |
USD | 3,073,642 | PHP | 174,905,615 | Goldman Sachs International** | 9/26/2023 | (16,254 ) |
USD | 1,778,794 | SGD | 2,413,343 | Barclays Bank plc | 9/26/2023 | (8,631 ) |
USD | 1,777,104 | SGD | 2,407,532 | Goldman Sachs International | 9/26/2023 | (6,017 ) |
USD | 5,043,545 | ZAR | 97,090,351 | BNP Paribas | 9/26/2023 | (88,121 ) |
GBP | 202,929 | USD | 257,358 | BNP Paribas | 10/4/2023 | (252 ) |
Total unrealized depreciation | (542,637 ) | |||||
Net unrealized appreciation | 2,299,620 | |||||
Abbreviations | |
AUD | Australian Dollar |
BRL | Brazilian Real |
CAD | Canadian Dollar |
CNY | China Yuan |
COP | Columbian Peso |
CZK | Czech Republic Koruna |
EUR | Euro |
GBP | British Pound |
HUF | Hungarian Forint |
IDR | Indonesian Rupiah |
INR | Indian Rupee |
JPY | Japanese Yen |
KRW | Korean Republic Won |
MXN | Mexican Peso |
NZD | New Zealand Dollar |
PHP | Philippines Peso |
SGD | Singapore Dollar |
THB | Thai Baht |
USD | United States Dollar |
ZAR | South African Rand |
** | Non-deliverable forward. |
REFERENCE OBLIGATION/INDEX | FINANCING RATE PAID BY THE FUND (%) | PAYMENT FREQUENCY | MATURITY DATE | IMPLIED CREDIT SPREAD (%)(a) | NOTIONAL AMOUNT(b) | UPFRONT PAYMENTS (RECEIPTS) ($)(c) | UNREALIZED APPRECIATION (DEPRECIATION) ($) | VALUE ($) |
iTraxx.Europe.Crossover.39-V1 | 5.00 | Quarterly | 6/20/2028 | 3.96 | EUR14,164,071 | (113,646 ) | (659,331 ) | (772,977 ) |
(*) | The Fund, as a buyer of credit protection, is generally obligated to make periodic payments and may also pay or receive an upfront premium to or from the protection seller, in exchange for the right to receive a contingent payment, upon occurrence of a credit event with respect to an underlying reference obligation, as defined under the terms of individual swap contracts. | ||||||||
108 | J.P. Morgan Exchange-Traded Funds | August 31, 2023 |
(a) | Implied credit spreads are an indication of the seller's performance risk, related to the likelihood of a credit event occurring that would require a seller to make payment to a buyer. Implied credit spreads are used to determine the value of swap contracts and reflect the cost of buying/selling protection, which may include upfront payments made to enter into the contract. Therefore, higher spreads would indicate a greater likelihood that a seller will be obligated to perform (i.e. make payment) under the swap contract. Increasing values, in absolute terms and relative to notional amounts, are also indicative of greater performance risk. Implied credit spreads for credit default swaps on credit indices are linked to the weighted average spread across the underlying reference obligations included in a particular index. | ||||||||
(b) | The notional amount is the maximum amount that a seller of credit protection would be obligated to pay and a buyer of credit protection would receive, upon occurrence of a credit event. | ||||||||
(c) | Upfront payments and receipts generally represent premiums paid or received at the initiation of the agreement to compensate the differences between the stated terms of the swap agreement and current market conditions (credit spreads, interest rates and other relevant factors). | ||||||||
FLOATING RATE INDEX (a) | FIXED RATE | PAY/ RECEIVE FLOATING RATE | MATURITY DATE | NOTIONAL AMOUNT | UPFRONT PAYMENTS (RECEIPTS) ($) | UNREALIZED APPRECIATION (DEPRECIATION) ($) | VALUE ($) |
1 day SOFR annually | 2.95 annually | Receive | 12/17/2035 | USD3,750,000 | — | 176,116 | 176,116 |
1 day SOFR annually | 3.03 annually | Receive | 12/4/2035 | USD7,500,000 | — | 304,620 | 304,620 |
1 day SOFR annually | 3.60 annually | Pay | 7/14/2028 | USD53,000,000 | (144 ) | 136,441 | 136,297 |
(144 ) | 617,177 | 617,033 | |||||
1 day SOFR annually | 2.74 annually | Pay | 12/17/2027 | USD17,000,000 | — | (209,106 ) | (209,106 ) |
1 day SOFR annually | 2.87 annually | Pay | 12/4/2027 | USD34,000,000 | — | (344,040 ) | (344,040 ) |
1 day SOFR annually | 3.71 annually | Receive | 7/14/2036 | USD12,000,000 | 3,807 | (117,448 ) | (113,641 ) |
3,807 | (670,594 ) | (666,787 ) | |||||
3,663 | (53,417 ) | (49,754 ) |
(a) | Value of floating rate index at August 31, 2023 was as follows: | |||||||
FLOATING RATE INDEX | VALUE |
1 day SOFR | 5.31% |
Abbreviations | |
EUR | Euro |
SOFR | Secured Overnight Financing Rate |
USD | United States Dollar |
August 31, 2023 | J.P. Morgan Exchange-Traded Funds | 109 |
AS OF August 31, 2023 (Unaudited)
INVESTMENTS | PRINCIPAL AMOUNT($) | VALUE($) |
Municipal Bonds — 89.7% (a) | ||
Alabama — 5.4% | ||
Alabama Federal Aid Highway Finance Authority Series 2015, Rev., 4.00%, 9/1/2024 (b) | 3,000,000 | 3,018,796 |
Black Belt Energy Gas District, Gas Project | ||
Series 2022E, Rev., 5.00%, 6/1/2028 (c) | 1,750,000 | 1,795,080 |
Series 2023D-1, Rev., 5.50%, 2/1/2029 (c) (d) | 1,335,000 | 1,392,721 |
Series 2022C-1, Rev., 5.25%, 6/1/2029 (c) | 4,500,000 | 4,665,426 |
Series 2023A, Rev., 5.25%, 10/1/2030 (c) | 2,000,000 | 2,077,607 |
Series 2023B-2, Rev., LIQ : Royal Bank of Canada, 5.25%, 12/1/2030 (c) | 1,000,000 | 1,054,014 |
Series 2021A, Rev., 4.00%, 12/1/2031 (c) | 2,535,000 | 2,471,320 |
Black Belt Energy Gas District, Gas Project No. 8 Series 2022A, Rev., 4.00%, 12/1/2029 (c) | 970,000 | 931,181 |
City of Pell City, Warrants Series 2015A, GO, 5.00%, 2/1/2025 | 100,000 | 102,146 |
Energy Southeast A Cooperative District Series 2023A-1, Rev., 5.50%, 1/1/2031 (c) | 5,000,000 | 5,276,597 |
Lower Alabama Gas District (The), Gas Project Series 2016A, Rev., 5.00%, 9/1/2031 | 1,250,000 | 1,282,897 |
Selma Industrial Development Board, International Paper Co. Project Series 2020A, Rev., 1.38%, 6/16/2025 (c) | 100,000 | 95,381 |
Southeast Alabama Gas Supply District (The), Project No. 1 Series 2018A, Rev., 4.00%, 4/1/2024 (c) | 25,000 | 24,927 |
Southeast Energy Authority A Cooperative District Project No.06 Series 2023B, Rev., LIQ : Royal Bank of Canada, 5.00%, 6/1/2030 (c) | 5,870,000 | 6,086,486 |
Southeast Energy Authority A Cooperative District, Project No. 2 Series 2021B, Rev., 4.00%, 12/1/2031 (c) | 2,115,000 | 2,015,328 |
Southeast Energy Authority A Cooperative District, Project No. 3 Series 2022A-1, Rev., 5.50%, 12/1/2029 (c) | 1,000,000 | 1,048,457 |
Southeast Energy Authority A Cooperative District, Project No. 4 Series 2022B-1, Rev., 5.00%, 8/1/2028 (c) | 1,250,000 | 1,274,959 |
University of Alabama (The), Huntsville General Fee Series 2018B-2, Rev., 5.00%, 9/1/2031 | 95,000 | 103,318 |
Total Alabama | 34,716,641 | |
INVESTMENTS | PRINCIPAL AMOUNT($) | VALUE($) |
Alaska — 0.0% ^ | ||
Alaska Industrial Development and Export Authority, Tanana Chiefs Conference Project Series 2019A, Rev., 5.00%, 10/1/2026 | 200,000 | 206,814 |
Alaska Municipal Bond Bank Authority Series 2014-3, Rev., 5.00%, 10/1/2025 | 20,000 | 20,285 |
Total Alaska | 227,099 | |
Arizona — 1.8% | ||
Arizona Board of Regents Series 2020A, Rev., 5.00%, 7/1/2030 | 105,000 | 117,861 |
Arizona Board of Regents, Tax-Exempt Series 2020A Series 2020A, Rev., 5.00%, 7/1/2033 | 430,000 | 479,474 |
Arizona Industrial Development Authority, Academies of Math and Science Projects | ||
Rev., 5.00%, 7/1/2032 (e) | 120,000 | 121,130 |
Rev., 4.50%, 7/1/2033 (e) | 510,000 | 496,151 |
Arizona Industrial Development Authority, Cadence Campus Project | ||
Series 2020A, Rev., 4.00%, 7/15/2030 (e) | 105,000 | 99,076 |
Series 2020A, Rev., 4.00%, 7/15/2040 (e) | 125,000 | 102,637 |
Arizona Industrial Development Authority, Equitable School Revolving Fund LLC Series 2022A, Rev., 5.00%, 11/1/2033 | 440,000 | 475,318 |
Arizona Industrial Development Authority, Great Lakes Senior Living Communities LLC Project Series 2019A, Rev., 5.00%, 1/1/2036 | 250,000 | 175,804 |
Arizona Industrial Development Authority, KIPP Nashville Project | ||
Series 2022A, Rev., 5.00%, 7/1/2028 | 225,000 | 230,370 |
Series 2022A, Rev., 5.00%, 7/1/2029 | 235,000 | 241,618 |
Arizona Industrial Development Authority, Macombs Facility Project Series 2021A, Rev., 4.00%, 7/1/2051 | 125,000 | 101,556 |
Arizona Industrial Development Authority, National Charter School Revolving Loan Fund Series 2020A, Rev., 4.00%, 11/1/2038 | 200,000 | 187,726 |
Arizona Industrial Development Authority, Phoenix Children's Hospital Series 2020A, Rev., 5.00%, 2/1/2031 | 150,000 | 165,850 |
Arizona Industrial Development Authority, Pinecrest Academy of Northern Nevada Project Series 2022A, Rev., 4.50%, 7/15/2029 (e) | 250,000 | 240,630 |
City of Mesa, Excise Tax Rev., 5.00%, 7/1/2031 | 75,000 | 84,435 |
110 | J.P. Morgan Exchange-Traded Funds | August 31, 2023 |
INVESTMENTS | PRINCIPAL AMOUNT($) | VALUE($) |
Municipal Bonds — continued | ||
Arizona — continued | ||
City of Phoenix Civic Improvement Corp., Junior Lien, Airport System | ||
Series 2017D, Rev., 5.00%, 7/1/2026 | 160,000 | 167,897 |
Series 2019A, Rev., 5.00%, 7/1/2044 | 2,000,000 | 2,084,618 |
City of Phoenix Civic Improvement Corp., Senior Lien, Airport System | ||
Series 2023, Rev., AMT, 5.00%, 7/1/2024 | 375,000 | 378,265 |
Series 2023, Rev., AMT, 5.00%, 7/1/2025 | 500,000 | 510,076 |
Industrial Development Authority of the County of Pima (The), La Posada at Pusch Ridge Project Series 2022B-3, Rev., 5.13%, 11/15/2029 (e) | 750,000 | 736,883 |
Maricopa County Industrial Development Authority, Banner Health | ||
Series 2023A-1, Rev., 5.00%, 5/15/2026 (c) | 1,235,000 | 1,279,751 |
Series A, Rev., 4.00%, 1/1/2041 | 1,500,000 | 1,446,313 |
Maricopa County Industrial Development Authority, Valley Christian Schools Project | ||
Series 2023A, Rev., 5.25%, 7/1/2033 (e) | 360,000 | 355,635 |
Series 2023A, Rev., 6.00%, 7/1/2043 (e) | 945,000 | 933,037 |
Maricopa County School District No. 3, Tempe Elementary, School Improvement, Project of 2016 Series 2017A, GO, 5.00%, 7/1/2027 | 30,000 | 32,047 |
Maricopa County Unified School District No. 60 Higley COP, AGM, 5.00%, 6/1/2036 | 200,000 | 220,342 |
Salt Verde Financial Corp. Series 2007-1, Rev., 5.25%, 12/1/2026 | 100,000 | 102,639 |
Total Arizona | 11,567,139 | |
Arkansas — 0.1% | ||
City of Fort Smith, Water and Sewer Construction Rev., 5.00%, 10/1/2024 | 75,000 | 76,026 |
County of Pulaski | ||
Rev., 5.00%, 3/1/2037 | 500,000 | 539,654 |
Rev., 4.25%, 3/1/2048 | 250,000 | 237,272 |
Total Arkansas | 852,952 | |
California — 6.2% | ||
Azusa Unified School District, Election of 2014 | ||
Series 2022D, GO, 5.00%, 8/1/2029 | 125,000 | 139,698 |
Series 2022D, GO, 5.00%, 8/1/2032 | 175,000 | 201,324 |
Brentwood Infrastructure Financing Authority, Civic Center Project Rev., 5.00%, 10/1/2025 | 45,000 | 46,421 |
California Community Choice Financing Authority, Clean Energy Project | ||
Series 2023A-1, Rev., 5.00%, 8/1/2029 (c) | 2,500,000 | 2,574,493 |
INVESTMENTS | PRINCIPAL AMOUNT($) | VALUE($) |
California — continued | ||
Series 2023E-1, Rev., 5.00%, 3/1/2031 (c) | 2,565,000 | 2,686,539 |
Series 2021B-1, Rev., 4.00%, 8/1/2031 (c) | 4,250,000 | 4,157,486 |
California Enterprise Development Authority, Riverside County, Rocketship Public Schools-Obligated Group No. 2 Series 2022A, Rev., 4.00%, 6/1/2027 (e) | 260,000 | 247,976 |
California Health Facilities Financing Authority, Kaiser Permanente Series 2006C, Rev., 5.00%, 11/1/2029 (c) | 300,000 | 331,520 |
California Health Facilities Financing Authority, On Lok Senior Health Service Rev., 5.00%, 8/1/2040 | 100,000 | 101,879 |
California Infrastructure and Economic Development Bank, Academy of Motion Picture Series 2020A-3, Rev., AMT, 8.00%, 9/14/2023 (c) (d) (e) | 1,000,000 | 1,000,072 |
California Municipal Finance Authority, Community Health System Series 2021A, Rev., 5.00%, 2/1/2033 | 800,000 | 858,290 |
California Municipal Finance Authority, San Antonio Gardens Project Rev., 5.00%, 11/15/2039 | 150,000 | 141,096 |
California Municipal Finance Authority, Waste Management, Inc. Project Series 2022A, Rev., AMT, 4.13%, 10/1/2025 (c) | 1,500,000 | 1,502,407 |
California Pollution Control Financing Authority, Poseidon Resources Channelside LP Desalination Project Rev., AMT, 5.00%, 7/1/2036 (e) | 770,000 | 797,769 |
California Public Finance Authority, Enso Village Project | ||
Series 2021B-3, Rev., 2.13%, 11/15/2027 (e) | 1,500,000 | 1,454,371 |
Series 2021B-1, Rev., 3.13%, 5/15/2029 (e) | 200,000 | 189,106 |
California School Finance Authority, Kipp SoCal Public Schools Series 2019A, Rev., 5.00%, 7/1/2039 (e) | 500,000 | 509,316 |
City of Aliso Viejo COP, 4.00%, 11/1/2028 | 175,000 | 184,581 |
City of Los Angeles Department of Airports, International Airport Subordinate | ||
Series 2019E, Rev., AMT, 5.00%, 5/15/2026 | 10,000 | 10,531 |
Series 2021A, Rev., AMT, 5.00%, 5/15/2039 | 1,740,000 | 1,830,615 |
City of Roseville, 316 Vernon Street Project COP, 5.00%, 8/1/2025 | 70,000 | 72,132 |
City of Santa Rosa, Courthouse Square Project and Lease COP, 4.00%, 10/1/2024 | 90,000 | 90,473 |
August 31, 2023 | J.P. Morgan Exchange-Traded Funds | 111 |
AS OF August 31, 2023 (Unaudited) (continued)
INVESTMENTS | PRINCIPAL AMOUNT($) | VALUE($) |
Municipal Bonds — continued | ||
California — continued | ||
County of San Joaquin, California Refunding Certificates of Participation COP, AGM, 5.00%, 11/15/2027 | 50,000 | 53,976 |
CSCDA Community Improvement Authority, Essential Housing, Pasadena Portfolio Series 2021A-1, Rev., 2.65%, 12/1/2046 (e) | 255,000 | 188,029 |
CSCDA Community Improvement Authority, Essential Housing, Towne at Glendale Apartments Series 2022B, Rev., 5.00%, 9/1/2037 (e) | 100,000 | 97,254 |
Downey Unified School District Series A, GO, 4.00%, 8/1/2052 | 2,500,000 | 2,377,842 |
El Centro Financing Authority, Police Station Project | ||
Series 2023A, Rev., 5.00%, 10/1/2023 | 180,000 | 180,169 |
Series 2023A, Rev., 5.00%, 10/1/2024 | 260,000 | 263,119 |
Series 2023A, Rev., 5.00%, 10/1/2025 | 545,000 | 561,223 |
El Monte City School District, Election of 2014 Series A, GO, 5.00%, 8/1/2025 | 55,000 | 56,624 |
Golden State Tobacco Securitization Corp., Enhanced Tobacco Settlement Series 2018A-1, Rev., 5.00%, 6/1/2028 (b) | 250,000 | 274,714 |
Indio Finance Authority, City of Indio | ||
Series 2022A, Rev., 5.00%, 11/1/2028 | 275,000 | 299,162 |
Series 2022A, Rev., 5.00%, 11/1/2029 | 325,000 | 358,764 |
Series 2022A, Rev., 5.00%, 11/1/2030 | 400,000 | 448,004 |
Series 2022A, Rev., 5.00%, 11/1/2034 | 200,000 | 229,071 |
Los Angeles County Development Authority, West LA Building 156 & 157 Apartments Series 2023C, Rev., 3.75%, 12/1/2026 (c) | 3,000,000 | 2,985,808 |
Los Angeles Department of Water and Power, Power System Series 2022A, Rev., 5.00%, 7/1/2030 | 235,000 | 268,141 |
Los Angeles Unified School District Series 2021A, GO, 5.00%, 7/1/2030 | 110,000 | 125,439 |
Ontario Public Financing Authority, Civic Center Improvements Series 2022A, Rev., AGM, 5.00%, 11/1/2033 | 140,000 | 162,678 |
Orange County Community Facilities District No. 2021-1, Rienda Series 2021-1, Rev., 5.00%, 8/15/2037 | 500,000 | 514,850 |
Petaluma Public Financing Authority, Road Improvement Projects Rev., 5.00%, 5/1/2026 | 150,000 | 157,279 |
Redding Joint Powers Financing Authority Series 2019A, Rev., 5.00%, 4/1/2026 | 150,000 | 156,185 |
INVESTMENTS | PRINCIPAL AMOUNT($) | VALUE($) |
California — continued | ||
River Islands Public Financing Authority, Facilities District No. 2003 | ||
Series 2022A-1, Rev., AGM, 5.00%, 9/1/2029 | 210,000 | 231,980 |
Series 2022A-1, Rev., AGM, 5.00%, 9/1/2030 | 330,000 | 370,050 |
Salinas Union High School District, Election of 2020 Series A, GO, 4.00%, 8/1/2047 | 1,000,000 | 964,818 |
San Diego Redevelopment Agency Successor Agency Series A, Rev., 5.00%, 9/1/2023 | 130,000 | 130,000 |
San Dieguito Union High School District, Election of 2012 Series A-2, GO, 5.00%, 8/1/2024 | 150,000 | 150,122 |
San Francisco City and County Public Utilities Commission Wastewater Series 2022B, Rev., 5.00%, 10/1/2034 | 2,000,000 | 2,342,259 |
San Jose Evergreen Community College District Series C, GO, 4.00%, 9/1/2043 | 2,000,000 | 1,990,314 |
Sanger Unified School District COP, AGM, 5.00%, 6/1/2034 | 400,000 | 449,236 |
Santa Cruz County Capital Financing Authority Series 2020A, Rev., 4.00%, 6/1/2025 | 100,000 | 101,174 |
Solano Irrigation District, Water COP, 4.00%, 8/1/2031 | 285,000 | 293,494 |
South San Francisco Public Facilities Financing Authority, Community Civic Campus and Multiple Capital Projects Series 2021A, Rev., 4.00%, 6/1/2029 | 220,000 | 232,879 |
South San Francisco Public Facilities Financing Authority, Multiple Capital Project Series 2022A, Rev., 5.00%, 6/1/2029 | 270,000 | 299,990 |
State of California, Various Purpose GO, 5.00%, 11/1/2032 | 335,000 | 380,549 |
Tobacco Securitization Authority of Northern California Series 2021A, Class 1, Rev., 5.00%, 6/1/2032 | 110,000 | 121,501 |
Tracy Public Financing Authority, Legacy Fields Series 2022A, Rev., 5.00%, 11/1/2036 | 1,035,000 | 1,138,348 |
University of California Series 2018AZ, Rev., 4.00%, 5/15/2029 | 130,000 | 136,165 |
Vallecito Union School District Series A, GO, 5.00%, 8/1/2031 | 595,000 | 669,023 |
Yucaipa Valley Water District Financing Authority, Water & Sewer Revenue Series 2022A, Rev., 5.00%, 9/1/2034 | 500,000 | 575,157 |
Total California | 39,463,485 | |
112 | J.P. Morgan Exchange-Traded Funds | August 31, 2023 |
INVESTMENTS | PRINCIPAL AMOUNT($) | VALUE($) |
Municipal Bonds — continued | ||
Colorado — 2.6% | ||
Board of Water Commissioners City and County of Denver (The) Series 2020B, Rev., 4.00%, 9/15/2034 | 2,015,000 | 2,101,445 |
Boulder Valley School District No. Re-2 Boulder GO, 4.13%, 12/1/2046 | 1,000,000 | 954,693 |
City and County of Denver Series 2020B, GO, 5.00%, 8/1/2029 | 220,000 | 244,982 |
City and County of Denver, Airport System | ||
Series 2018A, Rev., AMT, 5.00%, 12/1/2029 | 2,845,000 | 3,001,579 |
Series 2022A, Rev., AMT, 5.00%, 11/15/2032 | 1,000,000 | 1,098,589 |
Series 2018A, Rev., AMT, 5.00%, 12/1/2035 | 505,000 | 527,370 |
Series 2022A, Rev., AMT, 5.50%, 11/15/2042 | 1,500,000 | 1,630,672 |
Colorado Educational and Cultural Facilities Authority, Aspen View Academy Project Rev., 4.00%, 5/1/2036 | 85,000 | 77,685 |
Colorado Educational and Cultural Facilities Authority, Vega Collegiate Academy Project Series 2021A, Rev., 5.00%, 2/1/2051 (e) | 150,000 | 128,685 |
Colorado Health Facilities Authority, Tax Exempt Series 2021B-3, Rev., 2.13%, 5/15/2028 | 295,000 | 266,338 |
Colorado Higher Education, Capital Construction, Lease Purchase Financing Program | ||
Series 2014A, COP, 5.00%, 11/1/2025 | 10,000 | 10,371 |
COP, 4.00%, 9/1/2034 | 335,000 | 342,048 |
Colorado Housing and Finance Authority, Single Family Mortgage Series 2023L, Rev., GNMA COLL, 5.75%, 11/1/2053 (d) | 3,000,000 | 3,185,002 |
County of Adams | ||
COP, 5.00%, 12/1/2023 | 60,000 | 60,226 |
COP, 5.00%, 12/1/2024 | 150,000 | 152,912 |
Dominion Water and Sanitation District Rev., 5.00%, 12/1/2027 | 500,000 | 494,890 |
Regional Transportation District, Denver Transit Partners | ||
Series 2020A, Rev., 5.00%, 7/15/2029 | 130,000 | 139,434 |
Series 2020A, Rev., 5.00%, 1/15/2030 | 170,000 | 183,041 |
Series 2020A, Rev., 5.00%, 7/15/2030 | 115,000 | 124,489 |
Series 2020A, Rev., 5.00%, 1/15/2031 | 250,000 | 271,568 |
Series 2020A, Rev., 4.00%, 7/15/2036 | 185,000 | 183,511 |
Southlands Metropolitan District No. 1 Series A-1, GO, 5.00%, 12/1/2037 | 250,000 | 242,840 |
INVESTMENTS | PRINCIPAL AMOUNT($) | VALUE($) |
Colorado — continued | ||
State of Colorado, Building Excellent Schools Today Series S, COP, 4.00%, 3/15/2037 | 1,000,000 | 1,003,292 |
University of Colorado, Enterprise System Series 2017A-2, Rev., 5.00%, 6/1/2026 | 40,000 | 41,926 |
Total Colorado | 16,467,588 | |
Connecticut — 0.7% | ||
City of Meriden | ||
Series 2023, GO, 4.00%, 6/15/2041 | 890,000 | 857,238 |
GO, 4.00%, 6/15/2043 | 1,080,000 | 1,023,793 |
City of Norwalk | ||
Series 2023, GO, 4.00%, 8/15/2042 | 700,000 | 682,985 |
Series 2023, GO, 4.00%, 8/15/2043 | 500,000 | 485,625 |
Metropolitan District (The) Series 2021A, GO, 5.00%, 9/1/2030 | 200,000 | 225,750 |
Stamford Housing Authority, The Dogwoods Project Rev., BAN, 11.00%, 12/1/2027 (e) | 1,000,000 | 1,054,207 |
State of Connecticut Series A, GO, 5.00%, 4/15/2033 | 135,000 | 143,274 |
University of Connecticut Series 2017A, Rev., 5.00%, 1/15/2028 | 125,000 | 132,013 |
Total Connecticut | 4,604,885 | |
Delaware — 0.4% | ||
Delaware State Economic Development Authority, Newark Charter School, Inc. Project | ||
Rev., 4.00%, 9/1/2025 | 100,000 | 99,172 |
Rev., 4.00%, 9/1/2026 | 140,000 | 138,631 |
Delaware State Economic Development Authority, St. Andrews School Project Rev., 4.00%, 7/1/2041 | 2,190,000 | 2,121,967 |
Total Delaware | 2,359,770 | |
District of Columbia — 2.2% | ||
District of Columbia Series 2023A, GO, 5.00%, 1/1/2036 | 3,000,000 | 3,437,306 |
District of Columbia, Income Tax Series 2019A, Rev., 5.00%, 3/1/2029 | 100,000 | 110,440 |
District of Columbia, International School | ||
Rev., 5.00%, 7/1/2028 | 115,000 | 119,006 |
Rev., 5.00%, 7/1/2039 | 125,000 | 125,492 |
District of Columbia, Kipp DC Project Rev., 4.00%, 7/1/2039 | 100,000 | 90,269 |
District of Columbia, Water and Sewer Authority, Public Utility, Senior Lien Series B, Rev., 5.00%, 10/1/2025 | 65,000 | 67,330 |
August 31, 2023 | J.P. Morgan Exchange-Traded Funds | 113 |
AS OF August 31, 2023 (Unaudited) (continued)
INVESTMENTS | PRINCIPAL AMOUNT($) | VALUE($) |
Municipal Bonds — continued | ||
District of Columbia — continued | ||
District of Columbia, Water and Sewer Authority, Public Utility, Subordinate Lien Series 2022C1, Rev., 4.00%, 10/1/2040 | 2,000,000 | 1,972,672 |
Metropolitan Washington Airports Authority Aviation | ||
Series 2023A, Rev., AMT, 5.00%, 10/1/2025 | 875,000 | 893,485 |
Series 2021A, Rev., AMT, 5.00%, 10/1/2028 | 2,000,000 | 2,123,877 |
Series 2021A, Rev., AMT, 5.00%, 10/1/2031 | 1,360,000 | 1,481,965 |
Series 2020A, Rev., AMT, 4.00%, 10/1/2035 | 1,750,000 | 1,745,319 |
Washington Metropolitan Area Transit Authority Dedicated, Sustainability Climate Transition Bonds Series 2023A, Rev., 5.00%, 7/15/2037 | 1,500,000 | 1,676,979 |
Total District of Columbia | 13,844,140 | |
Florida — 3.1% | ||
Central Florida Tourism Oversight District Series 2016A, GO, 5.00%, 6/1/2026 | 50,000 | 51,915 |
Charlotte County Industrial Development Authority, Town and Country Utilities Project Series 2021A, Rev., AMT, 4.00%, 10/1/2041 (e) | 100,000 | 83,884 |
City of Cape Coral, Florida Special Obligation Rev., 5.00%, 10/1/2024 | 110,000 | 111,760 |
City of Jacksonville Series 2022A, Rev., 5.00%, 10/1/2031 | 250,000 | 281,517 |
City of Kissimmee, Sales Tax Rev., 4.00%, 10/1/2025 | 170,000 | 172,747 |
City of Lakeland, Lakeland Regional Health Systems Rev., 5.00%, 11/15/2023 | 40,000 | 40,079 |
City of Miami Beach, Water and Sewer Rev., 5.00%, 9/1/2033 | 25,000 | 26,868 |
City of Orlando, Capital Improvement Series B, Rev., 5.00%, 10/1/2024 | 60,000 | 61,068 |
City of Pompano Beach, John Knox Village Project Rev., 3.50%, 9/1/2030 | 200,000 | 181,273 |
City of Tampa, H. Lee Moffitt Cancer Center Project Series 2016B, Rev., 5.00%, 7/1/2024 | 35,000 | 35,313 |
Collier County Educational Facilities Authority Series 2023, Rev., 5.00%, 6/1/2027 | 1,930,000 | 1,961,350 |
County of Broward, Port Facilities Series 2019A, Rev., 5.00%, 9/1/2030 | 50,000 | 55,162 |
County of Hillsborough, Communications Services Tax Rev., 5.00%, 10/1/2024 | 40,000 | 40,716 |
INVESTMENTS | PRINCIPAL AMOUNT($) | VALUE($) |
Florida — continued | ||
County of Lee, Airport Series 2021A, Rev., AMT, 5.00%, 10/1/2031 | 400,000 | 432,681 |
County of Miami-Dade, Aviation System Series A, Rev., AMT, 5.00%, 10/1/2034 | 1,000,000 | 1,005,192 |
County of Miami-Dade, Jackson Health System Series 2015A, Rev., 5.00%, 6/1/2025 | 140,000 | 143,441 |
County of Okaloosa, Sales Tax Rev., 5.00%, 10/1/2024 | 30,000 | 30,525 |
County of Osceola, Sales Tax Series 2016A, Rev., 4.00%, 10/1/2023 | 10,000 | 10,003 |
County of Pasco | ||
Series 2023A, Rev., AGM, 5.25%, 9/1/2026 | 275,000 | 288,764 |
Series 2023A, Rev., AGM, 5.25%, 9/1/2027 | 300,000 | 319,803 |
Series 2023A, Rev., AGM, 5.25%, 9/1/2028 | 300,000 | 324,107 |
County of Seminole, Special Obligation Rev., 4.00%, 10/1/2024 | 90,000 | 90,615 |
Duval County Public Schools Series 2022-A, COP, AGM, 5.00%, 7/1/2034 | 500,000 | 549,842 |
East Central Regional Wastewater Treatment Facilities Operation Board, Biosolids Project Rev., 5.00%, 10/1/2024 | 30,000 | 30,525 |
Florida Atlantic University Finance Corp., Student Housing Project Series 2019B, Rev., 5.00%, 7/1/2032 | 250,000 | 271,388 |
Florida Department of Children and Families, Evaluation Treatment Center Financing Corp. Project Series 2021B, COP, 5.00%, 10/1/2028 | 210,000 | 230,236 |
Florida Development Finance Corp., Educational Facilities, River City Science Academy Projects | ||
Series 2022A-1, Rev., 4.00%, 7/1/2031 | 175,000 | 168,437 |
Series 2021A, Rev., 4.00%, 7/1/2035 | 325,000 | 301,115 |
Series 2022A-1, Rev., 5.00%, 7/1/2042 | 215,000 | 207,611 |
Florida Development Finance Corp., IDEA Florida, Inc., Jacksonville IV Project Rev., 5.25%, 6/15/2029 (e) | 150,000 | 147,208 |
Florida Housing Finance Corp. | ||
Series 2023E, Rev., 5.00%, 5/1/2025 (c) | 1,320,000 | 1,341,021 |
Series 2023C, Rev., 5.00%, 12/1/2025 (c) | 1,410,000 | 1,437,628 |
Series 2023B, Rev., GNMA COLL, 5.00%, 2/1/2026 (c) | 1,000,000 | 1,022,728 |
Florida Municipal Loan Council, Village of Palmetto Bay Series 2021A, Rev., 4.00%, 10/1/2028 | 75,000 | 77,430 |
Florida Municipal Power Agency, All-Requirements Power Supply Project Series 2016A, Rev., 5.00%, 10/1/2024 | 130,000 | 132,121 |
114 | J.P. Morgan Exchange-Traded Funds | August 31, 2023 |
INVESTMENTS | PRINCIPAL AMOUNT($) | VALUE($) |
Municipal Bonds — continued | ||
Florida — continued | ||
Florida State Board of Governors, University of Florida Mandatory Student Fee Series 2021A, Rev., AGM, 5.00%, 11/1/2028 | 100,000 | 108,291 |
Lee County School Board (The) Series 2023A, COP, 4.00%, 8/1/2048 | 1,500,000 | 1,397,240 |
Middleton Community Development District A, City of Wildwood, Florida Special Assessment | ||
5.45%, 5/1/2032 | 250,000 | 258,837 |
5.85%, 5/1/2037 | 250,000 | 258,983 |
Monroe County School District Series 2018A, COP, 4.00%, 6/1/2025 | 45,000 | 45,452 |
Orange County Health Facilities Authority, Orlando Health Obligated Group Series 2023A, Rev., 5.00%, 10/1/2036 | 750,000 | 815,238 |
Orange County Health Facilities Authority, The Nemours Foundation Project Series 2009C-2, Rev., VRDO, LOC : TD Bank NA, 3.90%, 9/12/2023 (c) | 1,120,000 | 1,120,000 |
Orange County School Board Series 2015D, COP, 5.00%, 8/1/2025 | 25,000 | 25,761 |
Palm Beach County Health Facilities Authority, Acts Retirement Life Communities, Inc., Obligated Group Rev., 5.00%, 11/15/2032 | 240,000 | 242,096 |
Palm Beach County Health Facilities Authority, Jupiter Medical Center Series 2022, Rev., 5.00%, 11/1/2030 | 100,000 | 104,672 |
Pinellas County Industrial Development Authority, Drs. Kiran & Pallavi Patel 2017 Foundation for Global Understanding, Inc., Project Rev., 5.00%, 7/1/2029 | 125,000 | 127,104 |
School District of Broward County Series A, COP, 5.00%, 7/1/2028 | 2,000,000 | 2,174,209 |
Seminole County Industrial Development Authority, Galileo Schools for Gifted Learning Series 2021A, Rev., 4.00%, 6/15/2036 (e) | 155,000 | 133,850 |
State of Florida Board of Education, Public Education Capital Outlay | ||
Series 2015B, GO, 5.00%, 6/1/2024 | 30,000 | 30,368 |
Series 2016B, GO, 5.00%, 6/1/2026 | 20,000 | 21,012 |
Series 2017B, GO, 5.00%, 6/1/2031 | 75,000 | 80,467 |
State of Florida, State Board of Education, Lottery Series 2016A, Rev., 5.00%, 7/1/2026 | 75,000 | 78,598 |
Tampa Bay Water, Regional Water Supply Authority, Utility System Series 2016C, Rev., 5.00%, 10/1/2025 | 55,000 | 56,849 |
Tampa-Hillsborough County Expressway Authority Series 2017B, Rev., 5.00%, 7/1/2031 | 40,000 | 43,192 |
INVESTMENTS | PRINCIPAL AMOUNT($) | VALUE($) |
Florida — continued | ||
Tohopekaliga Water Authority, Utility System Rev., 5.00%, 10/1/2025 | 10,000 | 10,371 |
University of Florida Department of Housing & Residence Education Hsg Sys Rev Series 2021A, Rev., 5.00%, 7/1/2026 | 125,000 | 130,825 |
Village Community Development District No. 15 | ||
4.25%, 5/1/2028 (e) | 350,000 | 349,981 |
4.38%, 5/1/2033 (e) | 500,000 | 500,781 |
Total Florida | 19,780,250 | |
Georgia — 3.4% | ||
Bartow County Development Authority Series 2009-1, Rev., 3.95%, 3/8/2028 (c) | 2,000,000 | 1,970,301 |
City of Atlanta Series 2019B, Rev., AMT, 5.00%, 7/1/2031 | 1,810,000 | 1,931,655 |
City of Atlanta, Airport Passenger Facility Charge Series 2019D, Rev., AMT, 4.00%, 7/1/2037 | 2,350,000 | 2,316,995 |
Clayton County Development Authority, Clayton State University Rev., 5.00%, 7/1/2034 | 225,000 | 247,979 |
County of DeKalb, Water and Sewerage Series 2006B, Rev., 5.25%, 10/1/2026 | 25,000 | 26,606 |
Development Authority of Monroe County (The) Series 2009-2, Rev., 3.88%, 3/6/2026 (c) | 1,250,000 | 1,237,422 |
Georgia Higher Education Facilities Authority, USG Real Estate Foundation II LLC Projects Rev., 4.00%, 6/15/2038 | 1,425,000 | 1,388,416 |
Georgia Ports Authority Rev., 4.00%, 7/1/2052 | 1,300,000 | 1,236,349 |
Glynn-Brunswick Memorial Hospital Authority, Southeast Georgia Health System Project Rev., 4.00%, 8/1/2037 | 255,000 | 231,433 |
Lee County School District Series 2022, GO, 5.00%, 2/1/2028 | 315,000 | 340,086 |
Main Street Natural Gas, Inc., Gas Supply | ||
Series 2021A, Rev., 4.00%, 9/1/2027 (c) | 2,250,000 | 2,230,560 |
Series 2022B, Rev., 5.00%, 6/1/2029 (c) | 1,500,000 | 1,533,837 |
Series 2023A, Rev., 5.00%, 6/1/2030 (c) | 2,500,000 | 2,562,975 |
Series 2023C, Rev., 5.00%, 9/1/2030 (c) | 2,500,000 | 2,595,215 |
Metropolitan Atlanta Rapid Transit Authority, Sales Tax | ||
Series 2017D, Rev., 4.00%, 7/1/2028 | 35,000 | 36,327 |
Series 2023A, Rev., 5.00%, 7/1/2036 | 490,000 | 559,601 |
Series 2023A, Rev., 5.00%, 7/1/2039 | 900,000 | 999,493 |
August 31, 2023 | J.P. Morgan Exchange-Traded Funds | 115 |
AS OF August 31, 2023 (Unaudited) (continued)
INVESTMENTS | PRINCIPAL AMOUNT($) | VALUE($) |
Municipal Bonds — continued | ||
Georgia — continued | ||
Walton County Water and Sewer Authority, Hard Labor Creek Reservoir Water Treatment Facility Project | ||
Rev., 5.25%, 2/1/2034 | 100,000 | 117,235 |
Rev., 5.25%, 2/1/2035 | 135,000 | 157,286 |
Total Georgia | 21,719,771 | |
Hawaii — 0.0% ^ | ||
City and County of Honolulu Series D, GO, 5.00%, 9/1/2032 | 45,000 | 48,074 |
State of Hawaii | ||
Series B, Rev., 5.00%, 1/1/2027 | 25,000 | 26,196 |
Series FK, GO, 5.00%, 5/1/2033 | 30,000 | 31,858 |
Total Hawaii | 106,128 | |
Idaho — 0.1% | ||
Idaho Health Facilities Authority, St. Luke's Health System Project Series 2021A, Rev., 5.00%, 3/1/2029 | 35,000 | 37,769 |
Idaho Housing and Finance Association, Transportation Expansion and Congestion Mitigation Fund Series 2022A, Rev., 5.00%, 8/15/2035 | 500,000 | 566,625 |
Total Idaho | 604,394 | |
Illinois — 6.1% | ||
Champaign County Community Unit School District No. 4 Champaign, School Building GO, 5.00%, 1/1/2027 | 45,000 | 46,562 |
Chicago O'Hare International Airport, Customer Facility Charge Senior Lien | ||
Series 2023, Rev., 5.00%, 1/1/2036 | 1,265,000 | 1,370,387 |
Series 2023, Rev., 5.00%, 1/1/2037 | 825,000 | 885,651 |
Chicago O'Hare International Airport, General Airport, Senior Lien | ||
Series 2020B, Rev., 5.00%, 1/1/2024 | 210,000 | 210,939 |
Series B, Rev., 5.00%, 1/1/2034 | 40,000 | 41,924 |
Chicago O'Hare International Airport, Senior Lien Series 2020A, Rev., 5.00%, 1/1/2034 | 200,000 | 219,087 |
City of Chicago, Waterworks, Second Lien | ||
Series 2023B, Rev., 5.00%, 11/1/2024 | 625,000 | 633,806 |
Series 2023B, Rev., AGM, 5.00%, 11/1/2037 | 200,000 | 216,633 |
Series 2023B, Rev., AGM, 5.00%, 11/1/2038 | 835,000 | 896,949 |
Series 2023A, Rev., AGM, 5.25%, 11/1/2053 | 365,000 | 388,864 |
City of Decatur GO, 5.00%, 3/1/2027 | 130,000 | 134,606 |
City of Highland Park GO, 4.00%, 12/30/2028 | 35,000 | 36,658 |
INVESTMENTS | PRINCIPAL AMOUNT($) | VALUE($) |
Illinois — continued | ||
Cook County School District No. 87 Berkeley GO, AGM, 4.00%, 12/1/2030 | 35,000 | 36,578 |
County of Cook, Sales Tax Rev., 5.00%, 11/15/2034 | 2,000,000 | 2,105,996 |
County of Lake, Sales Tax GO, 4.00%, 11/30/2027 | 100,000 | 103,521 |
Illinois Finance Authority, Clark-Lindsey Village Series 2022A, Rev., 5.13%, 6/1/2032 | 185,000 | 178,110 |
Illinois Finance Authority, Clean Water Initiative Revolving Fund Rev., 5.00%, 7/1/2032 | 35,000 | 37,116 |
Illinois Finance Authority, Depaul College Prep Project | ||
Series 2023A, Rev., 4.50%, 8/1/2033 (e) | 500,000 | 491,356 |
Series 2023A, Rev., 5.25%, 8/1/2038 (e) | 650,000 | 652,948 |
Illinois Finance Authority, Lake Forest College | ||
Series 2022A, Rev., 5.00%, 10/1/2029 | 320,000 | 327,012 |
Series 2022A, Rev., 5.00%, 10/1/2030 | 205,000 | 209,813 |
Series 2022A, Rev., 5.00%, 10/1/2031 | 235,000 | 240,887 |
Illinois Finance Authority, Plymouth Place, Inc. | ||
Series 2022B-3, Rev., 4.75%, 11/15/2027 | 200,000 | 198,413 |
Series 2022B-2, Rev., 5.25%, 11/15/2027 | 200,000 | 198,797 |
Series 2022B-1, Rev., 6.00%, 11/15/2027 | 100,000 | 100,043 |
Illinois Finance Authority, Smith Crossing Rev., 4.00%, 10/15/2028 | 350,000 | 326,866 |
Illinois Finance Authority, Social Bonds-Learn Chapter School Project Rev., 4.00%, 11/1/2024 | 135,000 | 134,334 |
Illinois Finance Authority, Uchicago Medicine Series 2022B-2, Rev., 5.00%, 8/15/2027 (c) | 1,000,000 | 1,054,508 |
Illinois Finance Authority, Unitypoint Health Series 2016D, Rev., 5.00%, 2/15/2024 (b) | 115,000 | 115,820 |
Illinois Finance Authority, University of Chicago Series 2015A, Rev., 5.00%, 10/1/2025 (b) | 3,250,000 | 3,353,977 |
Illinois Housing Development Authority Rev., FHA, 4.00%, 6/1/2025 (c) | 2,815,000 | 2,807,976 |
Illinois State Toll Highway Authority | ||
Series 2014D, Rev., 5.00%, 1/1/2024 | 25,000 | 25,126 |
Series 2019A, Rev., 5.00%, 1/1/2036 | 250,000 | 270,038 |
Kane McHenry Cook and De Kalb Counties Unit School District No. 300 GO, 5.00%, 1/1/2024 | 35,000 | 35,162 |
Kendall and Kane Counties Community Unit School District No. 115 Series 2017B, GO, 5.00%, 1/1/2027 | 25,000 | 26,256 |
Lake County Community Consolidated School District No. 3 Beach Park GO, AGM, 4.00%, 2/1/2032 | 175,000 | 181,112 |
116 | J.P. Morgan Exchange-Traded Funds | August 31, 2023 |
INVESTMENTS | PRINCIPAL AMOUNT($) | VALUE($) |
Municipal Bonds — continued | ||
Illinois — continued | ||
Lake County Forest Preserve District GO, 5.00%, 12/15/2028 | 165,000 | 179,519 |
McLean and Woodford Counties Community Unit School District No. 5 Normal Series 2017A, GO, 4.00%, 12/1/2023 | 80,000 | 80,062 |
Metropolitan Water Reclamation District of Greater Chicago, Limited Tax Series 2021C, GO, 5.00%, 12/1/2023 | 20,000 | 20,068 |
Northern Illinois University, Auxiliary Facilities System Series 2020B, Rev., 5.00%, 4/1/2034 | 200,000 | 208,792 |
Northern Illinois University, Board of Trustees, Auxiliary Facilities System | ||
Rev., 5.00%, 10/1/2029 | 300,000 | 317,817 |
Rev., 5.00%, 10/1/2030 | 325,000 | 345,319 |
Peoria Tazewell Etc Counties Community College District No. 514 GO, 4.00%, 12/1/2023 | 35,000 | 35,056 |
Sales Tax Securitization Corp., Second Lien Series 2020A, Rev., 4.00%, 1/1/2040 | 1,750,000 | 1,687,275 |
Sales Tax Securitization Corp., Senior Lien Series 2023C, Rev., 5.00%, 1/1/2033 | 1,000,000 | 1,078,437 |
Southern Illinois University | ||
Series 2022A, Rev., 5.00%, 4/1/2029 | 675,000 | 717,525 |
Series 2022A, Rev., 5.00%, 4/1/2030 | 800,000 | 857,064 |
Series 2022A, Rev., 5.00%, 4/1/2031 | 575,000 | 622,029 |
Series 2022A, Rev., 5.00%, 4/1/2032 | 510,000 | 555,037 |
Southwestern Illinois Development Authority, Flood Prevention District Council Project Rev., 5.00%, 4/15/2030 | 625,000 | 692,965 |
State of Illinois | ||
GO, 5.00%, 4/1/2024 | 30,000 | 30,206 |
Series 2018A, GO, 5.00%, 10/1/2024 | 30,000 | 30,390 |
Series 2023D, GO, 5.00%, 7/1/2025 | 1,145,000 | 1,170,222 |
Series 2017D, GO, 5.00%, 11/1/2025 | 2,550,000 | 2,616,911 |
Series 2022A, GO, 5.00%, 3/1/2029 | 500,000 | 534,864 |
Series 2018B, GO, 5.00%, 10/1/2029 | 2,000,000 | 2,128,228 |
GO, 4.00%, 6/1/2032 | 1,000,000 | 989,957 |
Series 2018A, GO, 5.00%, 10/1/2033 | 1,000,000 | 1,054,444 |
GO, 4.00%, 6/1/2035 | 3,735,000 | 3,681,903 |
Series 2023B, GO, 5.50%, 5/1/2047 | 375,000 | 402,258 |
Series 2023B, GO, 4.50%, 5/1/2048 | 65,000 | 62,291 |
University of Illinois Series 2021A, Rev., 5.00%, 4/1/2029 | 450,000 | 492,074 |
Village of Bolingbrook Series 2018A, GO, AGM, 5.00%, 1/1/2033 | 125,000 | 133,901 |
INVESTMENTS | PRINCIPAL AMOUNT($) | VALUE($) |
Illinois — continued | ||
Village of Elk Grove GO, 5.00%, 1/1/2029 | 25,000 | 26,497 |
Village of Wilmette Series 2020B, GO, 5.00%, 12/1/2026 | 140,000 | 148,196 |
Total Illinois | 39,193,138 | |
Indiana — 1.4% | ||
Adams Central Elementary School Building Corp., Ad Valorem Property Tax First Mortgage Rev., 5.00%, 1/15/2027 | 20,000 | 21,039 |
Ball State University, Student Fee Series R, Rev., 5.00%, 7/1/2024 | 35,000 | 35,444 |
City of Goshen, Multi-Family, Green Oaks of Goshen Project Series 2021A, Rev., 5.00%, 8/1/2041 (e) | 250,000 | 197,454 |
City of Valparaiso Rev., 5.38%, 12/1/2041 (e) | 200,000 | 152,240 |
Decatur County, Jail Building Corp. Rev., 5.00%, 7/15/2028 | 250,000 | 268,128 |
Indiana Finance Authority | ||
Series 2016C, Rev., 5.00%, 12/1/2025 | 35,000 | 36,255 |
Series 2023A, Rev., 5.00%, 10/1/2037 | 800,000 | 888,656 |
Series 2023A, Rev., 5.00%, 6/1/2038 | 400,000 | 409,263 |
Series 2023A, Rev., 5.00%, 6/1/2043 | 430,000 | 434,595 |
Series 2023A, Rev., 5.00%, 6/1/2053 | 790,000 | 790,766 |
Indiana Finance Authority, DePauw University Series 2022A, Rev., 5.00%, 7/1/2031 | 730,000 | 767,807 |
Indiana Finance Authority, Educational Facilities, Valparaiso University Project Rev., 4.00%, 10/1/2035 | 215,000 | 199,784 |
Indiana Finance Authority, Franciscan Alliance, Inc., Obligated Group Series 2017C, Rev., 4.00%, 11/1/2034 | 115,000 | 113,664 |
Indiana Finance Authority, Parkview Health System, Inc. Series 2017A, Rev., 5.00%, 11/1/2023 | 50,000 | 50,106 |
Indiana Finance Authority, Rose-Hulman Institute of Technology Project Rev., 5.00%, 6/1/2030 | 200,000 | 217,088 |
Indiana Housing and Community Development Authority, Vita of New Whiteland Project Rev., 6.75%, 1/1/2043 | 1,000,000 | 968,469 |
Indiana State University, Housing and Dining System Rev., 5.00%, 4/1/2031 | 75,000 | 78,057 |
Indiana University, Student Fee Series Y, Rev., 5.00%, 8/1/2028 | 25,000 | 26,709 |
IPS Multi-School Building Corp., Indiana Unlimited Ad Valorem Property Tax, First Mortgage Rev., 5.00%, 7/15/2029 | 50,000 | 54,790 |
Monroe County Community School Corp. GO, 5.00%, 7/15/2027 | 250,000 | 265,608 |
August 31, 2023 | J.P. Morgan Exchange-Traded Funds | 117 |
AS OF August 31, 2023 (Unaudited) (continued)
INVESTMENTS | PRINCIPAL AMOUNT($) | VALUE($) |
Municipal Bonds — continued | ||
Indiana — continued | ||
Perry Township Multi School Building Corp., Ad Valorem Property Tax First Mortgage Rev., 5.00%, 7/15/2025 | 35,000 | 35,963 |
Vinton-Tecumseh School Building Corp., Ad Valorem Property Tax | ||
Rev., 5.00%, 1/15/2030 | 1,125,000 | 1,234,734 |
Rev., 5.00%, 7/15/2030 | 1,150,000 | 1,270,610 |
Wheeler-Union Township School Building Corp. Rev., 4.00%, 7/15/2034 | 400,000 | 413,449 |
Total Indiana | 8,930,678 | |
Iowa — 0.3% | ||
City of West Des Moines, Urban Renewal Series 2016B, GO, 5.00%, 6/1/2024 | 35,000 | 35,414 |
Des Moines Independent Community School District, Sales Services and Use Tax Rev., 5.00%, 6/1/2028 | 175,000 | 189,226 |
Iowa Finance Authority, State Revolving Fund Rev., 5.00%, 8/1/2027 | 30,000 | 32,203 |
Iowa Student Loan Liquidity Corp., Student Loan | ||
Series 2023B, Rev., AMT, 5.00%, 12/1/2026 | 600,000 | 615,724 |
Series 2023B, Rev., AMT, 5.00%, 12/1/2027 | 900,000 | 932,741 |
Total Iowa | 1,805,308 | |
Kansas — 0.9% | ||
City of Manhattan, Meadowlark Hills Series 2022B-2, Rev., 2.38%, 6/1/2027 | 200,000 | 187,485 |
City of Topeka, Kansas Health Care Facilities | ||
Series 2022B, Rev., 5.13%, 12/1/2026 | 250,000 | 246,685 |
Series 2022A, Rev., 5.75%, 12/1/2033 | 250,000 | 246,557 |
Johnson County Community College Foundation, Inc. COP, 5.00%, 10/1/2024 | 105,000 | 106,880 |
Johnson County Water District No. 1 Series 2017A, Rev., 5.00%, 1/1/2025 | 50,000 | 51,019 |
Kansas Development Finance Authority, AdventHealth Series 2021B, Rev., 5.00%, 11/15/2031 (c) | 200,000 | 221,706 |
University of Kansas Hospital Authority, Health System Rev., VRDO, LOC : US Bank NA, 3.95%, 9/1/2023 (c) | 5,000,000 | 5,000,000 |
Total Kansas | 6,060,332 | |
Kentucky — 0.2% | ||
City of Henderson, Pratt Paper LLC Project Series 2022A, Rev., AMT, 4.45%, 1/1/2042 (e) | 165,000 | 156,270 |
INVESTMENTS | PRINCIPAL AMOUNT($) | VALUE($) |
Kentucky — continued | ||
County of Boone, Duke Energy Kentucky, Inc. Series 2008A, Rev., 3.70%, 8/1/2027 | 500,000 | 487,327 |
Kentucky Economic Development Finance Authority, Baptist Healthcare System Obligated Group Series 2017B, Rev., 5.00%, 8/15/2029 | 165,000 | 173,037 |
Louisville and Jefferson County Metropolitan Government, Norton Healthcare, Inc. Series 2016A, Rev., 4.00%, 10/1/2036 | 65,000 | 61,354 |
Louisville and Jefferson County Metropolitan Sewer District, Sewer and Drainage System | ||
Series 2017B, Rev., 5.00%, 5/15/2024 | 25,000 | 25,273 |
Series 2017A, Rev., 5.00%, 5/15/2027 | 40,000 | 42,305 |
Total Kentucky | 945,566 | |
Louisiana — 1.3% | ||
Louisiana Local Government Environmental Facilities and Community Development Authority, Calcasieu Parish Projects Rev., 5.00%, 12/1/2030 | 250,000 | 273,153 |
Louisiana Public Facilities Authority, Materra Campus Project Series 2021C, Rev., 4.00%, 6/1/2031 (e) | 245,000 | 222,795 |
Louisiana Public Facilities Authority, Tulane University Project Series 2020A, Rev., 5.00%, 4/1/2029 | 145,000 | 158,635 |
Parish of St. John the Baptist, Marathon Oil Corp., Project Series 2017A-1, Rev., 4.05%, 7/1/2026 (c) | 2,750,000 | 2,722,422 |
State of Louisiana Series 2016-B, GO, 4.00%, 8/1/2026 | 30,000 | 30,581 |
State of Louisiana Gasoline and Fuels Tax Series A, Rev., 4.50%, 5/1/2025 (b) | 5,000,000 | 5,085,753 |
Total Louisiana | 8,493,339 | |
Maine — 0.4% | ||
Maine Health and Higher Educational Facilities Authority | ||
Series 2023A, Rev., AGM, 5.00%, 7/1/2038 | 250,000 | 266,880 |
Series 2023A, Rev., AGM, 5.00%, 7/1/2039 | 295,000 | 313,330 |
Maine Municipal Bond Bank Series C, Rev., 5.00%, 11/1/2024 | 75,000 | 76,441 |
Maine Turnpike Authority Rev., 4.00%, 7/1/2040 | 2,100,000 | 2,045,508 |
Total Maine | 2,702,159 | |
Maryland — 1.0% | ||
County of Howard, Consolidated Public Improvement Series 2022B, GO, 5.00%, 8/15/2030 | 160,000 | 181,332 |
118 | J.P. Morgan Exchange-Traded Funds | August 31, 2023 |
INVESTMENTS | PRINCIPAL AMOUNT($) | VALUE($) |
Municipal Bonds — continued | ||
Maryland — continued | ||
County of Montgomery, Consolidated Public Improvement Project Series 2021A, GO, 5.00%, 8/1/2031 | 2,000,000 | 2,298,779 |
County of St. Mary's, Public Improvement GO, 4.00%, 7/15/2027 | 70,000 | 72,435 |
Maryland Economic Development Corp., Annapolis Mobility and Resilience Project Series 2022A, Rev., 5.00%, 12/31/2037 | 500,000 | 516,422 |
Maryland Economic Development Corp., Bowie State University Project Rev., 4.00%, 7/1/2040 | 200,000 | 183,181 |
Maryland Economic Development Corp., Morgan State University Project Series 2022A, Rev., 5.25%, 7/1/2031 | 585,000 | 645,650 |
Maryland Health and Higher Educational Facilities Authority, Stevenson University Project | ||
Series 2021A, Rev., 5.00%, 6/1/2033 | 200,000 | 214,467 |
Series 2021A, Rev., 4.00%, 6/1/2051 | 250,000 | 212,841 |
State of Maryland, Department of Transportation Rev., 5.00%, 9/1/2026 | 75,000 | 79,076 |
State of Maryland, State and Local Facilities Loan of 2017 | ||
Series 2017A, GO, 5.00%, 8/1/2025 | 45,000 | 46,548 |
Series 2017B, GO, 5.00%, 8/1/2026 | 205,000 | 216,120 |
State of Maryland, State and Local Facilities Loan of 2021 Series 2021A, GO, 5.00%, 3/1/2031 | 400,000 | 456,753 |
State of Maryland, State and Local Facilities Loan of 2022 Series 2022A, GO, 5.00%, 6/1/2033 | 1,000,000 | 1,161,295 |
Total Maryland | 6,284,899 | |
Massachusetts — 0.5% | ||
City of Boston Series 2017A, GO, 5.00%, 4/1/2025 | 10,000 | 10,277 |
Commonwealth of Massachusetts Series C, GO, 5.00%, 10/1/2026 | 25,000 | 26,484 |
Massachusetts Development Finance Agency, Boston Medical Center Issue | ||
Series 2023G, Rev., 5.00%, 7/1/2029 | 750,000 | 810,214 |
Series 2023G, Rev., 4.38%, 7/1/2052 | 700,000 | 638,752 |
Series 2023G, Rev., 5.25%, 7/1/2052 | 1,000,000 | 1,023,231 |
Massachusetts Development Finance Agency, Milford Regional Medical Center Series 2020G, Rev., 5.00%, 7/15/2037 (e) | 245,000 | 218,753 |
Massachusetts Development Finance Agency, Salem Community Corp. Rev., 5.00%, 1/1/2030 | 235,000 | 226,230 |
INVESTMENTS | PRINCIPAL AMOUNT($) | VALUE($) |
Massachusetts — continued | ||
Massachusetts Development Finance Agency, Southcoast Health System Obligated Group Issue Series 2021G, Rev., 5.00%, 7/1/2035 | 200,000 | 211,899 |
Massachusetts Development Finance Agency, Wellforce Issue Series 2020C, Rev., AGM, 5.00%, 10/1/2030 | 175,000 | 191,468 |
Massachusetts State College Building Authority Series 2017D, Rev., 5.00%, 5/1/2027 | 45,000 | 48,125 |
Town of Hopkinton, Municipal Purpose Loan GO, 5.00%, 11/15/2024 | 30,000 | 30,628 |
Total Massachusetts | 3,436,061 | |
Michigan — 1.2% | ||
Berrien Springs Public Schools, School Building and Site, Unlimited Tax GO, Q-SBLF, 5.00%, 5/1/2030 | 250,000 | 274,143 |
City of Ann Arbor | ||
Rev., 4.00%, 4/1/2042 | 1,515,000 | 1,465,822 |
Rev., 4.00%, 4/1/2045 | 1,705,000 | 1,616,949 |
City of Detroit, Unlimited Tax | ||
Series 2021A, GO, 5.00%, 4/1/2031 | 480,000 | 500,595 |
Series 2021A, GO, 5.00%, 4/1/2035 | 400,000 | 412,530 |
Series 2023C, GO, 6.00%, 5/1/2043 | 1,200,000 | 1,317,400 |
Series 2021A, GO, 5.00%, 4/1/2046 | 1,015,000 | 993,059 |
Grand Traverse County Hospital Finance Authority, Munson Healthcare Obligated Group Rev., 5.00%, 7/1/2026 | 175,000 | 181,812 |
Michigan Finance Authority, Lawrence Technological University Obligated Group Rev., 4.00%, 2/1/2032 | 95,000 | 88,353 |
Michigan State Building Authority, Facilities Program Series 2023-II, Rev., 4.00%, 10/15/2047 | 675,000 | 637,009 |
Michigan State Hospital Finance Authority, Trinity Health Credit Group Series 2008C, Rev., 5.00%, 12/1/2025 | 25,000 | 25,793 |
State of Michigan Trunk Line, Rebuilding Michigan Program Series 2021A, Rev., 4.00%, 11/15/2036 | 395,000 | 401,905 |
Western Michigan University, Tax Exempt Series 2021A, Rev., AGM, 5.00%, 11/15/2031 | 25,000 | 27,622 |
Total Michigan | 7,942,992 | |
Minnesota — 1.3% | ||
City of Mankato | ||
Series 2022B, GO, 5.00%, 2/1/2027 | 250,000 | 265,257 |
Series 2022B, GO, 5.00%, 2/1/2029 | 755,000 | 831,479 |
August 31, 2023 | J.P. Morgan Exchange-Traded Funds | 119 |
AS OF August 31, 2023 (Unaudited) (continued)
INVESTMENTS | PRINCIPAL AMOUNT($) | VALUE($) |
Municipal Bonds — continued | ||
Minnesota — continued | ||
City of Minneapolis, Health Care System, Fairview Health Services Series 2018A, Rev., 5.00%, 11/15/2033 | 180,000 | 188,718 |
City of Woodbury, Charter School Lease, Woodbury Leadership Academy Project Series 2021A, Rev., 4.00%, 7/1/2031 | 175,000 | 158,795 |
Duluth Economic Development Authority, Benedictine Health System Series 2021A, Rev., 3.00%, 7/1/2024 | 100,000 | 98,373 |
Metropolitan Council Series 2023C, GO, 4.00%, 3/1/2041 | 2,800,000 | 2,753,899 |
Minnesota Housing Finance Agency Series 2023F, Rev., GNMA / FNMA / FHLMC, 5.75%, 7/1/2053 | 2,500,000 | 2,657,836 |
Minnesota Municipal Gas Agency Subseries, 2022A, Rev., LIQ : Royal Bank of Canada, 4.00%, 6/1/2027 | 1,000,000 | 994,431 |
State of Minnesota, Various Purpose Series 2020A, GO, 5.00%, 8/1/2030 | 350,000 | 395,006 |
University of Minnesota Series 2017B, Rev., 5.00%, 12/1/2025 | 15,000 | 15,545 |
Total Minnesota | 8,359,339 | |
Mississippi — 0.1% | ||
Mississippi Development Bank, Ranking County Project Rev., 5.00%, 3/1/2026 | 205,000 | 213,731 |
Mississippi State University Educational Building Corp., New Facilities and Refinancing Project Rev., 5.00%, 8/1/2025 | 35,000 | 35,981 |
State of Mississippi | ||
Series 2015F, GO, 5.00%, 11/1/2025 (b) | 35,000 | 36,319 |
Series 2016B, GO, 5.00%, 12/1/2025 | 20,000 | 20,744 |
Series 2018A, GO, 5.00%, 11/1/2026 (b) | 60,000 | 63,410 |
University of Mississippi Educational Building Corp., Facilities Refinancing Project Series 2016A, Rev., 5.00%, 10/1/2030 | 40,000 | 41,795 |
Total Mississippi | 411,980 | |
Missouri — 0.9% | ||
Bi-State Development Agency of the Missouri-Illinois Metropolitan District, Combined Lien Mass Transit Sales Rev., 5.00%, 10/1/2023 | 280,000 | 280,305 |
Bi-State Development Agency of the Missouri-Illinois Metropolitan District, St. Clair County Metrolink Project Rev., AGM, 5.25%, 7/1/2024 | 40,000 | 40,591 |
City of Excelsior Springs Series 2020B, COP, 4.00%, 3/1/2030 | 115,000 | 119,289 |
INVESTMENTS | PRINCIPAL AMOUNT($) | VALUE($) |
Missouri — continued | ||
City of Kansas City, Sanitary Sewer System Series 2018B, Rev., 5.00%, 1/1/2033 | 25,000 | 26,990 |
Health and Educational Facilities Authority of the State of Missouri, City Art Institute Rev., 5.00%, 9/1/2030 | 200,000 | 213,076 |
Health and Educational Facilities Authority of the State of Missouri, Lake Regional Health System | ||
Rev., 5.00%, 2/15/2027 | 225,000 | 231,276 |
Rev., 4.00%, 2/15/2035 | 390,000 | 370,746 |
Rev., 4.00%, 2/15/2036 | 580,000 | 541,137 |
Health and Educational Facilities Authority of the State of Missouri, Lutheran Senior Services Projects Series 2016A, Rev., 5.00%, 2/1/2036 | 1,000,000 | 988,129 |
Health and Educational Facilities Authority of the State of Missouri, Mercy Health Series 2018A, Rev., 5.00%, 6/1/2028 | 180,000 | 192,341 |
Health and Educational Facilities Authority of the State of Missouri, St. Luke's Episcopal-Presbyterian Hospitals Series 2015B, Rev., 5.00%, 12/1/2026 | 165,000 | 168,556 |
Health and Educational Facilities Authority of the State of Missouri, St. Luke's Health System, Inc. Rev., 5.00%, 11/15/2029 | 300,000 | 309,755 |
Health and Educational Facilities Authority of the State of Missouri, Wright Memorial Hospital Rev., 5.00%, 9/1/2026 | 200,000 | 202,140 |
Industrial Development Authority of the City of St Louis Missouri (The), Innovation District Rev., 5.00%, 5/15/2041 | 285,000 | 278,114 |
Metropolitan St. Louis Sewer District, Wastewater System Improvement Series 2017A, Rev., 5.00%, 5/1/2027 | 45,000 | 47,916 |
Missouri Development Finance Board, Fulton State Hospital Project Rev., 5.00%, 10/1/2025 | 25,000 | 25,447 |
Springfield School District No. R-12 GO, 4.00%, 3/1/2042 | 1,800,000 | 1,742,934 |
Total Missouri | 5,778,742 | |
Montana — 0.3% | ||
County of Missoula GO, 4.00%, 7/1/2025 | 50,000 | 50,611 |
Yellowstone and Carbon Counties School District No. 7-70 Laurel Series 2023, GO, 5.00%, 7/1/2039 | 1,675,000 | 1,824,067 |
Total Montana | 1,874,678 | |
120 | J.P. Morgan Exchange-Traded Funds | August 31, 2023 |
INVESTMENTS | PRINCIPAL AMOUNT($) | VALUE($) |
Municipal Bonds — continued | ||
Nebraska — 0.6% | ||
Central Plains Energy Project, Gas Project No. 3 Series 2017A, Rev., 5.00%, 9/1/2030 | 320,000 | 333,241 |
Central Plains Energy Project, Gas Project No. 4 Series 2018A, Rev., 5.00%, 1/1/2024 (c) | 3,000,000 | 3,007,548 |
City of Lincoln, Electric System | ||
Rev., 5.00%, 9/1/2026 | 85,000 | 89,347 |
Rev., 5.00%, 9/1/2028 | 50,000 | 53,099 |
City of Omaha, Sanitary Sewerage System Rev., 5.00%, 4/1/2027 | 50,000 | 52,216 |
Nebraska Educational Health Cultural and Social Services Finance Authority, Immanuel Retirement Communities Obligated Group Series 2019A, Rev., 4.00%, 1/1/2033 | 250,000 | 253,171 |
Omaha Public Power District, Electric System | ||
Series B, Rev., 5.00%, 2/1/2025 | 20,000 | 20,298 |
Series 2016A, Rev., 5.00%, 2/1/2026 | 40,000 | 41,636 |
Series 2016A, Rev., 5.00%, 2/1/2027 | 30,000 | 31,261 |
Public Power Generation Agency, Whelan Energy Center Unit 2 Series 2015A, Rev., 5.00%, 1/1/2024 | 155,000 | 155,618 |
University of Nebraska Facilities Corp., UNMC Global Center Project Rev., 5.00%, 12/15/2025 | 35,000 | 36,320 |
Total Nebraska | 4,073,755 | |
Nevada — 0.8% | ||
Clark County School District, Limited Tax | ||
Series 2018A, GO, 5.00%, 6/15/2032 | 95,000 | 101,708 |
Series 2018A, GO, 4.00%, 6/15/2035 | 90,000 | 90,767 |
Clark County Water Reclamation District Series 2023, GO, 5.00%, 7/1/2043 | 4,000,000 | 4,306,753 |
County of Clark Department of Aviation, Jet Aviation Fuel tax Series 2022A, Rev., AMT, 5.00%, 7/1/2026 | 500,000 | 514,446 |
County of Clark, Indexed Fuel Tax and Subordinate Motor Vehicle Fuel Tax Rev., 5.00%, 7/1/2028 | 25,000 | 26,627 |
County of Clark, Passenger Facility Charge, Las Vegas-McCarran International Airport Passenger Facility Series 2019E, Rev., 5.00%, 7/1/2033 | 155,000 | 168,355 |
County of Clark, Transporation Improvement Series 2018B, GO, 5.00%, 12/1/2027 | 120,000 | 129,205 |
Truckee Meadows Water Authority Rev., 5.00%, 7/1/2029 | 50,000 | 53,162 |
Total Nevada | 5,391,023 | |
INVESTMENTS | PRINCIPAL AMOUNT($) | VALUE($) |
New Hampshire — 1.1% | ||
New Hampshire Business Finance Authority, Springpoint Senior Living Project Rev., 4.00%, 1/1/2025 | 290,000 | 287,009 |
New Hampshire Business Finance Authority, University of Nevada Reno Project | ||
Series 2023A, Rev., 5.00%, 12/1/2036 | 715,000 | 774,968 |
Series 2023A, Rev., 5.00%, 12/1/2037 | 860,000 | 923,264 |
Series 2023A, Rev., 5.00%, 12/1/2038 | 665,000 | 706,302 |
Series 2023A, Rev., 5.25%, 12/1/2039 | 790,000 | 850,456 |
Series 2023A, Rev., 5.25%, 6/1/2051 | 2,400,000 | 2,518,194 |
Series 2023A, Rev., 4.50%, 6/1/2053 | 1,075,000 | 1,003,636 |
Total New Hampshire | 7,063,829 | |
New Jersey — 2.7% | ||
Borough of North Haledon GO, BAN, 4.50%, 6/26/2024 | 5,000,000 | 5,025,915 |
Burlington County Bridge Commission,Government Leasing Program Rev., 4.50%, 8/7/2024 | 1,750,000 | 1,764,924 |
City of New Brunswick GO, 4.00%, 3/15/2024 | 10,000 | 10,036 |
New Jersey Economic Development Authority Series 2024SSS, Rev., 5.00%, 6/15/2026 (d) | 1,000,000 | 1,021,227 |
New Jersey Economic Development Authority, Biomedical Research Facilities Series 2016A, Rev., 5.00%, 7/15/2028 | 160,000 | 166,015 |
New Jersey Transportation Trust Fund Authority, Transportation System | ||
Series 2018A, Rev., 4.00%, 12/15/2031 | 250,000 | 255,181 |
Series 2018A, Rev., 5.00%, 12/15/2033 | 2,000,000 | 2,136,387 |
New Jersey Turnpike Authority | ||
Series 2020D, Rev., 5.00%, 1/1/2028 | 200,000 | 208,044 |
Series 2022B, Rev., 5.00%, 1/1/2042 | 1,500,000 | 1,624,309 |
Passaic County Improvement Authority (The), City of Paterson Project Rev., 5.00%, 6/15/2025 | 10,000 | 10,283 |
Township of Raritan GO, BAN, 4.50%, 4/29/2024 | 5,000,000 | 5,020,314 |
Total New Jersey | 17,242,635 | |
New Mexico — 0.8% | ||
Albuquerque Municipal School District No. 12 Series 2023B, GO, 5.00%, 8/1/2024 | 590,000 | 598,308 |
City of Albuquerque, Gross Receipts Tax Series 2015A, Rev., 5.00%, 7/1/2026 | 240,000 | 247,106 |
Loving Municipal School District No. 10 Series 2023, GO, 5.00%, 9/15/2024 | 3,875,000 | 3,928,539 |
August 31, 2023 | J.P. Morgan Exchange-Traded Funds | 121 |
AS OF August 31, 2023 (Unaudited) (continued)
INVESTMENTS | PRINCIPAL AMOUNT($) | VALUE($) |
Municipal Bonds — continued | ||
New Mexico — continued | ||
New Mexico Finance Authority, Senior Lien Public Project Revolving Fund Series 2016E, Rev., 5.00%, 6/1/2024 | 25,000 | 25,301 |
New Mexico Finance Authority, State Transportation, Subordinate Lien Series 2018A, Rev., 5.00%, 6/15/2027 | 100,000 | 106,917 |
New Mexico Hospital Equipment Loan Council, Presbyterian Health Care Services Series 2015A, Rev., 5.00%, 8/1/2025 (b) | 25,000 | 25,682 |
State of New Mexico, Capital Projects GO, 5.00%, 3/1/2024 | 305,000 | 307,504 |
Total New Mexico | 5,239,357 | |
New York — 10.1% | ||
Broome County Local Development Corp., Good Shepherd Village at Endwell, Inc. Rev., 3.50%, 7/1/2026 | 210,000 | 200,836 |
Build NYC Resource Corp., Grand Concourse Academy Charter School Series 2022A, Rev., 5.00%, 7/1/2032 | 100,000 | 103,864 |
Build NYC Resource Corp., Kipp NYC Public School Facilities - Canal West Project | ||
Rev., 5.00%, 7/1/2033 | 585,000 | 621,498 |
Rev., 5.00%, 7/1/2034 | 205,000 | 216,886 |
Build NYC Resource Corp., New World Preparatory Charter School Project | ||
Series 2021A, Rev., 4.00%, 6/15/2041 (e) | 100,000 | 79,715 |
Series 2021A, Rev., 4.00%, 6/15/2051 (e) | 150,000 | 107,609 |
City of New York | ||
Series 2023E, SubseriesE-1, GO, 4.00%, 4/1/2045 | 760,000 | 727,560 |
Series 2023E, Subseries E-1, GO, 4.00%, 4/1/2050 | 1,290,000 | 1,215,067 |
City of New York, Fiscal Year 2018 Series 2018F-1, GO, 5.00%, 4/1/2033 | 105,000 | 112,673 |
City of New York, Fiscal Year 2019 Series 2019E, GO, 5.00%, 8/1/2033 | 100,000 | 108,618 |
City of New York, Fiscal Year 2020 Series 2020C-1, GO, 5.00%, 8/1/2033 | 160,000 | 177,732 |
City of New York, Fiscal Year 2021 | ||
Series 2021A-1, GO, 5.00%, 8/1/2031 | 185,000 | 206,285 |
Series 2021-1, GO, 5.00%, 4/1/2033 | 235,000 | 263,311 |
Series 2021F-1, GO, 5.00%, 3/1/2037 | 1,000,000 | 1,088,591 |
City of New York, Fiscal Year 2022 Series 2022B-1, GO, 5.00%, 8/1/2033 | 1,650,000 | 1,878,779 |
City of New York, Fiscal Year 2024 Series 2024A, GO, 4.13%, 8/1/2053 | 1,225,000 | 1,157,472 |
INVESTMENTS | PRINCIPAL AMOUNT($) | VALUE($) |
New York — continued | ||
County of Erie, Public Improvement Series 2019A, GO, 5.00%, 9/15/2025 | 25,000 | 25,940 |
County of Onondaga GO, 5.00%, 3/15/2026 | 20,000 | 20,177 |
Dutchess County Local Development Corp., The Culinary Institute of America Project Rev., 5.00%, 7/1/2025 | 100,000 | 101,014 |
Erie County Water Authority Rev., 5.00%, 12/1/2027 | 30,000 | 31,804 |
Falconer Central School District GO, 4.00%, 12/15/2034 | 1,145,000 | 1,166,566 |
Longwood Central School District, Suffolk County GO, 5.00%, 6/15/2025 | 175,000 | 180,442 |
Malone Central School District GO, BAN, 4.50%, 6/27/2024 | 5,000,000 | 5,022,895 |
New York City Municipal Water Finance Authority, Second General Resolution Series 2023, Subseries AA-3, Rev., 5.00%, 6/15/2047 | 725,000 | 771,021 |
New York City Municipal Water Finance Authority, Water and Sewer System Second General Resolution Series 2019FF-1, Rev., 4.00%, 6/15/2049 | 1,530,000 | 1,451,209 |
New York City Transitional Finance Authority Building Aid, Fiscal Year 2018 Series 2018S-4A, Rev., 5.00%, 7/15/2033 | 105,000 | 113,404 |
New York City Transitional Finance Authority Building Aid, Subordinate | ||
Series 2019 S-2A, Rev., 5.00%, 7/15/2025 (b) | 45,000 | 46,400 |
Series 2019S-2A, Rev., 5.00%, 7/15/2025 | 5,000 | 5,154 |
Series 2023, Subseries S-1A, Rev., 5.00%, 7/15/2035 | 800,000 | 909,780 |
Series 2020S-1B, Rev., 4.00%, 7/15/2042 | 1,500,000 | 1,439,889 |
New York City Transitional Finance Authority, Future Tax Secured | ||
Series 2021C, Subseries C-1, Rev., 4.00%, 5/1/2035 | 750,000 | 768,340 |
Series 2020A, Subseries A-2, Rev., 5.00%, 5/1/2039 | 265,000 | 278,966 |
Series 2023F, Subseries F-1, Rev., 4.00%, 2/1/2051 | 1,250,000 | 1,173,180 |
New York City Transitional Finance Authority, Future Tax Secured, Fiscal Year 2017 | ||
Series 2017E1-1, Rev., 5.00%, 2/1/2030 | 150,000 | 158,112 |
Series 2017F-1, Rev., 5.00%, 5/1/2030 | 550,000 | 582,257 |
New York City Transitional Finance Authority, Future Tax Secured, Fiscal Year 2018 Series 2018 -1, Rev., 5.00%, 11/1/2026 | 25,000 | 26,483 |
122 | J.P. Morgan Exchange-Traded Funds | August 31, 2023 |
INVESTMENTS | PRINCIPAL AMOUNT($) | VALUE($) |
Municipal Bonds — continued | ||
New York — continued | ||
New York City Transitional Finance Authority, Future Tax Secured, Tax-Exempt, Fiscal Year 2022 Series 2022F, SubseriesF-1, Rev., 5.00%, 2/1/2036 | 525,000 | 582,487 |
New York State Dormitory Authority, Columbia University Series 2018B, Rev., 5.00%, 10/1/2038 | 25,000 | 26,806 |
New York State Dormitory Authority, Cornell University Series 2019D, Rev., 5.00%, 7/1/2033 | 135,000 | 160,760 |
New York State Dormitory Authority, Northwell Health Obligated Group Series 2019A, Rev., 5.00%, 5/1/2029 | 70,000 | 74,839 |
New York State Dormitory Authority, Personal Income Tax | ||
Series 2019D, Rev., 5.00%, 2/15/2034 | 2,000,000 | 2,204,529 |
Series 2021A, Rev., 4.00%, 3/15/2037 | 990,000 | 1,000,334 |
Series 2021E, Rev., 4.00%, 3/15/2040 | 3,000,000 | 2,954,750 |
New York State Dormitory Authority, State Personal Income Tax, General Purpose | ||
Series 2018A, Rev., 5.00%, 3/15/2031 | 25,000 | 27,123 |
Series 2021E, Rev., 5.00%, 3/15/2033 | 1,610,000 | 1,826,641 |
New York State Dormitory Authority, State Supported Debt University Facilities Series 2019A, Rev., 5.00%, 7/1/2024 | 25,000 | 25,350 |
New York State Environmental Facilities Corp., State Clean Water and Drinking Water Revolving Funds, Municipal Water Finance Authority Projects - Second Resolution Series 2019B, Rev., 5.00%, 6/15/2031 | 100,000 | 111,456 |
New York State Housing Finance Agency, 160 Madison Avenue LLC Series 2013A, Rev., VRDO, LOC : Landesbank Hessen-Thuringen Girozentrale, 3.89%, 9/1/2023 (c) | 5,000,000 | 5,000,000 |
New York State Urban Development Corp., State Personal Income Tax, General Purpose | ||
Series 2016A, Rev., 5.00%, 3/15/2026 (b) | 30,000 | 31,356 |
Series 2017A, Rev., 5.00%, 3/15/2028 | 150,000 | 158,915 |
Series A-1, Rev., 5.00%, 3/15/2028 | 25,000 | 25,039 |
Series 2020A, Rev., 4.00%, 3/15/2045 | 500,000 | 479,029 |
New York State Urban Development Corp., State Sales Tax Series 2021A, Rev., 4.00%, 3/15/2046 | 2,500,000 | 2,388,806 |
New York Transportation Development Corp., Delta Air Lines, Inc., LaGuardia Airport Terminals C&D Redevelopment Project Series 2018, Rev., AMT, 5.00%, 1/1/2031 | 1,430,000 | 1,471,610 |
INVESTMENTS | PRINCIPAL AMOUNT($) | VALUE($) |
New York — continued | ||
Onondaga Civic Development Corp., Le Moyne College Project | ||
Rev., 5.00%, 7/1/2027 | 100,000 | 103,464 |
Rev., 5.00%, 7/1/2031 | 360,000 | 380,858 |
Series 2020B, Rev., 5.00%, 7/1/2032 | 250,000 | 261,916 |
Port Authority of New York and New Jersey, Consolidated | ||
Series 214, Rev., AMT, 5.00%, 9/1/2036 | 1,975,000 | 2,070,815 |
Series 223, Rev., AMT, 4.00%, 7/15/2037 | 510,000 | 499,432 |
Port Washington Union Free School District GO, 4.00%, 8/1/2036 | 1,370,000 | 1,418,950 |
Smithtown Central School District | ||
GO, 4.00%, 6/1/2035 | 2,465,000 | 2,558,509 |
GO, 4.00%, 6/1/2036 | 2,125,000 | 2,189,737 |
GO, 4.00%, 6/1/2037 | 2,000,000 | 2,024,684 |
Suffolk County Economic Development Corp., St. Johnland Assisted Living Inc., Project Rev., 5.13%, 11/1/2041 (e) | 340,000 | 277,118 |
Syracuse Industrial Development Agency, Syracuse City School District Project Series 2020A, Rev., 4.00%, 5/1/2036 | 1,275,000 | 1,291,469 |
Town of Stony Point GO, 5.00%, 8/15/2027 | 75,000 | 80,515 |
Triborough Bridge and Tunnel Authority Sales Tax, TBTA Capital Lockbox Series 2023A, Rev., 4.13%, 5/15/2053 | 2,250,000 | 2,152,666 |
Triborough Bridge and Tunnel Authority, Payroll Mobility Tax Senior Lien Series 2022D-1A, Rev., 5.00%, 11/15/2037 | 1,000,000 | 1,108,448 |
Tully Central School District GO, BAN, 4.50%, 6/27/2024 | 5,000,000 | 5,026,405 |
Westchester County Local Development Corp., Kendal on Hudson Project Series 2022B, Rev., 5.00%, 1/1/2032 | 240,000 | 242,328 |
Westchester County Local Development Corp., Purchase Senior Learning Community, Inc. Project | ||
Series 2021D, Rev., 2.88%, 7/1/2026 (e) | 250,000 | 238,133 |
Series 2021C-EFRB, Rev., 3.20%, 7/1/2028 (e) | 250,000 | 233,075 |
Yonkers Industrial Development Agency, New Community School Project Rev., 5.00%, 5/1/2042 | 1,445,000 | 1,541,061 |
Total New York | 64,788,942 | |
North Carolina — 0.9% | ||
City of Sanford | ||
Series 2023, Rev., 5.00%, 4/1/2034 | 390,000 | 448,012 |
Series 2023, Rev., 5.00%, 4/1/2036 | 390,000 | 437,250 |
August 31, 2023 | J.P. Morgan Exchange-Traded Funds | 123 |
AS OF August 31, 2023 (Unaudited) (continued)
INVESTMENTS | PRINCIPAL AMOUNT($) | VALUE($) |
Municipal Bonds — continued | ||
North Carolina — continued | ||
County of Davidson GO, 5.00%, 6/1/2027 | 35,000 | 37,417 |
County of Duplin Rev., 5.00%, 6/1/2028 | 65,000 | 70,076 |
County of New Hanover, Limited Obligation Series 2022, Rev., 5.00%, 6/1/2027 | 480,000 | 513,151 |
County of Wayne, Limited Obligation Rev., 5.00%, 6/1/2024 | 25,000 | 25,298 |
North Carolina Turnpike Authority, Triangle Expressway System, Senior Lien Series NTS2020, Rev., BAN, 5.00%, 2/1/2024 (b) | 400,000 | 402,191 |
State of North Carolina, Build NC Programs, Limited Obligation | ||
Series 2014C, Rev., 5.00%, 5/1/2024 | 25,000 | 25,271 |
Series 2020B, Rev., 5.00%, 5/1/2029 | 100,000 | 110,625 |
University of North Carolina, Hospital at Chapel Hill Series A, Rev., VRDO, LIQ : TD Bank NA, 3.93%, 9/1/2023 (c) | 2,900,000 | 2,900,000 |
Winston-Salem State University Foundation LLC, The Board of Governors of The University of North Carolina Rev., 5.00%, 4/1/2031 | 945,000 | 1,035,335 |
Total North Carolina | 6,004,626 | |
North Dakota — 0.7% | ||
North Dakota Building Authority, Facilities Improvement Series 2020A, Rev., 5.00%, 12/1/2023 | 115,000 | 115,392 |
North Dakota Housing Finance Agency, Home Mortgage Finance Program | ||
Series 2017H, Rev., VRDO, LIQ : Royal Bank of Canada, 4.05%, 9/8/2023 (c) | 1,725,000 | 1,725,000 |
Series 2023A, Rev., 5.75%, 7/1/2053 | 2,250,000 | 2,377,911 |
Total North Dakota | 4,218,303 | |
Ohio — 2.0% | ||
Akron Bath Copley Joint Township Hospital District, Summa Health Obligated Group Rev., 5.00%, 11/15/2029 | 330,000 | 348,301 |
American Municipal Power, Inc., Greenup Hydroelectric Projects Series 2016A, Rev., 5.00%, 2/15/2030 | 25,000 | 25,829 |
Bowling Green State University, General Receipts Series 2016A, Rev., 5.00%, 6/1/2024 | 25,000 | 25,268 |
Buckeye Tobacco Settlement Financing Authority Series 2020A-2, Class 1, Rev., 4.00%, 6/1/2048 | 250,000 | 221,206 |
City of Akron, Income Tax Series 2019, Rev., 4.00%, 12/1/2023 | 175,000 | 175,144 |
INVESTMENTS | PRINCIPAL AMOUNT($) | VALUE($) |
Ohio — continued | ||
City of Cleveland Series 2022A, GO, 5.00%, 12/1/2035 | 460,000 | 517,747 |
City of Reynoldsburg, Limited Tax, Capital Facilities GO, 5.00%, 12/1/2026 | 15,000 | 15,845 |
County of Cuyahoga, Eliza Jennings Senior Care Network Series 2022A, Rev., 5.00%, 5/15/2032 | 340,000 | 324,056 |
County of Summit, Various Purpose Improvement Series 2022, GO, 5.00%, 12/1/2031 | 100,000 | 114,363 |
County of Warren, Healthcare Facilities, Otterbein Homes Obligated Group Series 2019A, Rev., 4.00%, 7/1/2033 | 205,000 | 202,408 |
Northeast Ohio Medical University Series 2022, Rev., 5.00%, 12/1/2035 | 1,000,000 | 1,075,610 |
Ohio Air Quality Development Authority, Duke Energy Corp. | ||
Series 2022B, Rev., 4.00%, 6/1/2027 (c) | 2,000,000 | 1,986,812 |
Series 2022A, Rev., AMT, 4.25%, 6/1/2027 (c) | 1,500,000 | 1,490,149 |
Ohio Higher Educational Facility Commission, Capital University 2022 Project | ||
Rev., 5.00%, 9/1/2031 | 400,000 | 408,690 |
Rev., 5.75%, 9/1/2037 | 500,000 | 516,328 |
Ohio Higher Educational Facility Commission, Denison University Project Series 2017A, Rev., 5.00%, 11/1/2025 | 75,000 | 77,305 |
Ohio Higher Educational Facility Commission, John Carroll university Rev., 4.00%, 10/1/2034 | 440,000 | 420,034 |
Ohio Higher Educational Facility Commission, Tiffin University 2019 Project Rev., 5.00%, 11/1/2034 | 125,000 | 121,278 |
Ohio Higher Educational Facility Commission, University of Findlay 2019 Project | ||
Rev., 5.00%, 3/1/2027 | 55,000 | 55,212 |
Rev., 5.00%, 3/1/2034 | 160,000 | 160,677 |
Ohio Turnpike and Infrastructure Commission, Junior Lien | ||
Series 2018A, Rev., 5.00%, 2/15/2027 | 135,000 | 143,170 |
Series 2022A, Rev., 5.00%, 2/15/2033 | 500,000 | 580,147 |
Ohio Water Development Authority Water Pollution Control Loan Fund Series 2023B, Rev., 5.00%, 12/1/2038 | 1,500,000 | 1,679,649 |
Ohio Water Development Authority, Drinking Water Assistance Fund Series 2022A, Rev., 5.00%, 12/1/2041 | 1,000,000 | 1,100,576 |
124 | J.P. Morgan Exchange-Traded Funds | August 31, 2023 |
INVESTMENTS | PRINCIPAL AMOUNT($) | VALUE($) |
Municipal Bonds — continued | ||
Ohio — continued | ||
Ohio Water Development Authority, Fresh Water Series 2016B, Rev., 5.00%, 6/1/2026 | 30,000 | 31,493 |
Ohio Water Development Authority, Water Pollution Control Loan Fund Series 2017A, Rev., 5.00%, 12/1/2026 | 45,000 | 47,720 |
State of Ohio Series 2021B, GO, 5.00%, 9/15/2031 | 210,000 | 240,356 |
State of Ohio, Capital Facilities Lease Appropriation, Administrative Building Fund Projects, Tax Exempt Series 2018A, Rev., 5.00%, 10/1/2034 | 220,000 | 238,335 |
State of Ohio, Cleveland Clinic Health System Obligated Group Series 2017A, Rev., 5.00%, 1/1/2028 | 25,000 | 26,865 |
State of Ohio, Infrastructure Improvement Series 2018A, GO, 5.00%, 9/1/2028 | 25,000 | 27,360 |
State of Ohio, Natural Resources Series 2017V, GO, 5.00%, 10/1/2027 | 35,000 | 37,667 |
Youngstown State University, General Receipts Rev., AGM, 4.00%, 12/15/2030 | 490,000 | 508,364 |
Total Ohio | 12,943,964 | |
Oklahoma — 0.8% | ||
Cleveland County Educational Facilities Authority, Norman Public Schools Project Rev., 5.00%, 6/1/2025 | 150,000 | 153,891 |
Oklahoma Capitol Improvement Authority Series 2014A, Rev., 5.00%, 7/1/2025 | 1,000,000 | 1,010,695 |
Oklahoma Capitol Improvement Authority, Capitol Repair Project | ||
Series 2018C, Rev., 5.00%, 1/1/2030 | 10,000 | 10,662 |
Series 2018C, Rev., 5.00%, 1/1/2036 | 45,000 | 47,679 |
Oklahoma Capitol Improvement Authority, State Highway, Capital Improvement Rev., 5.00%, 7/1/2024 | 100,000 | 101,236 |
Oklahoma Water Resources Board Series 2023A, Rev., 4.00%, 10/1/2043 | 3,720,000 | 3,629,797 |
Total Oklahoma | 4,953,960 | |
Oregon — 0.4% | ||
Salem Hospital Facility Authority, Capital Manor Project Rev., 4.00%, 5/15/2040 | 375,000 | 308,334 |
Salem Hospital Facility Authority, Multi Model, Salem Health Project Series 2019A, Rev., 5.00%, 5/15/2028 | 75,000 | 79,752 |
Southeastern Pennsylvania Transportation Authority GO, 5.00%, 6/15/2028 | 25,000 | 26,680 |
INVESTMENTS | PRINCIPAL AMOUNT($) | VALUE($) |
Oregon — continued | ||
Tri-County Metropolitan Transportation District of Oregon, Senior Lien Payroll Tax | ||
Series 2018A, Rev., 5.00%, 9/1/2027 (b) | 45,000 | 48,353 |
Series 2021A, Rev., 5.00%, 9/1/2035 | 1,060,000 | 1,199,467 |
Union County Hospital Facility Authority, Grande Ronde Hospital, Inc. | ||
Series 2022, Rev., 5.00%, 7/1/2026 | 300,000 | 306,093 |
Series 2022, Rev., 5.00%, 7/1/2028 | 400,000 | 414,641 |
Total Oregon | 2,383,320 | |
Pennsylvania — 5.9% | ||
Aliquippa School District, Limited Tax GO, 3.88%, 12/1/2037 | 200,000 | 183,632 |
Allegheny County Higher Education Building Authority, Carnegie Mellon University Series 2008A, Rev., VRDO, LIQ : Bank of New York Mellon (The), 3.70%, 9/1/2023 (c) | 6,000,000 | 6,000,000 |
Allegheny County Higher Education Building Authority, Chatham University | ||
Rev., 5.00%, 9/1/2024 | 130,000 | 130,285 |
Rev., 5.00%, 9/1/2025 | 225,000 | 225,719 |
Rev., 5.00%, 9/1/2026 | 135,000 | 136,183 |
Rev., 5.00%, 9/1/2027 | 250,000 | 252,844 |
Berks County Industrial Development Authority, The Highlands at Wyomissing Series 2017A, Rev., 5.00%, 5/15/2037 | 250,000 | 241,092 |
Bucks County Community College Authority Series 2019A, Rev., GTD, 5.00%, 6/15/2033 | 35,000 | 37,764 |
Bucks County Water and Sewer Authority | ||
Series 2022A, Rev., AGM, 5.00%, 12/1/2032 | 115,000 | 132,997 |
Series 2022A, Rev., AGM, 5.00%, 12/1/2033 | 105,000 | 121,099 |
Series 2022A, Rev., AGM, 5.00%, 12/1/2036 | 380,000 | 424,779 |
City of Philadelphia, Airport System Series 2017B, Rev., AMT, 5.00%, 7/1/2035 | 2,000,000 | 2,070,681 |
Commonwealth Financing Authority, Tobacco Master Settlement Payment Rev., 5.00%, 6/1/2035 | 225,000 | 237,391 |
Commonwealth of Pennsylvania Series 1, GO, 4.00%, 4/1/2033 | 2,000,000 | 2,000,728 |
County of Chester GO, 5.00%, 11/15/2027 | 30,000 | 32,484 |
County of Lehigh, Lehigh Valley Health Network Hospital Series 2016A, Rev., 4.00%, 7/1/2035 | 175,000 | 171,747 |
August 31, 2023 | J.P. Morgan Exchange-Traded Funds | 125 |
AS OF August 31, 2023 (Unaudited) (continued)
INVESTMENTS | PRINCIPAL AMOUNT($) | VALUE($) |
Municipal Bonds — continued | ||
Pennsylvania — continued | ||
Delaware Valley Regional Finance Authority, Local Government | ||
Series 2022D, Rev., 4.00%, 3/1/2029 | 1,000,000 | 1,032,988 |
Series 2021A, Rev., 2.00%, 10/1/2029 | 25,000 | 21,750 |
Geisinger Authority, Health System Series 2020B, Rev., 5.00%, 2/15/2027 (c) | 250,000 | 260,055 |
General Authority of Southcentral Pennsylvania, WellSpan Health Obligated Group Series D, Rev., VRDO, LIQ : Bank of America NA, 4.05%, 9/1/2023 (c) | 5,000,000 | 5,000,000 |
Montgomery County Higher Education and Health Authority, Thomas Jefferson University | ||
Rev., 5.00%, 9/1/2027 | 265,000 | 277,428 |
Series 2018A, Rev., 4.00%, 9/1/2038 | 135,000 | 129,475 |
Montgomery County Industrial Development Authority, Constellation Energy Generation LLC Series 2023A, Rev., 4.10%, 4/3/2028 (c) | 2,250,000 | 2,268,641 |
Northampton County General Purpose Authority, Moravian College Project Rev., 5.00%, 10/1/2027 | 185,000 | 187,791 |
Pennsylvania Economic Development Financing Authority, The Penndot Major Bridges Rev., AMT, AGM, 5.00%, 12/31/2057 | 425,000 | 429,312 |
Pennsylvania Higher Educational Facilities Authority, State System of Higher Education Series 2017AU-1, Rev., 5.00%, 6/15/2026 | 70,000 | 73,049 |
Pennsylvania Housing Finance Agency, Single Family Mortgage Series 2023-141A, Rev., 5.75%, 10/1/2053 | 5,000,000 | 5,284,458 |
Pennsylvania Turnpike Commission | ||
Series A-1, Rev., 5.00%, 12/1/2029 | 105,000 | 113,092 |
Series A-1, Rev., 5.00%, 12/1/2031 | 60,000 | 64,222 |
Series 2016B, Rev., 4.00%, 6/1/2033 | 575,000 | 581,079 |
Series 2022A, Rev., 5.00%, 12/1/2033 | 1,000,000 | 1,140,376 |
Series 2023-1, Rev., 5.00%, 12/1/2036 | 750,000 | 825,321 |
Series 2023, Rev., 5.00%, 12/1/2039 | 500,000 | 538,946 |
Series 2022B, Rev., 5.25%, 12/1/2041 | 1,000,000 | 1,098,628 |
Philadelphia Authority for Industrial Development, Holy Family University Project Rev., 5.00%, 9/1/2027 | 610,000 | 632,879 |
Philadelphia Energy Authority (The), Philadelphia Street Lighting Project | ||
Series 2023A, Rev., 5.00%, 11/1/2037 | 835,000 | 913,455 |
Series 2023A, Rev., 5.00%, 11/1/2038 | 850,000 | 920,620 |
Series 2023A, Rev., 5.00%, 11/1/2041 | 1,265,000 | 1,345,887 |
INVESTMENTS | PRINCIPAL AMOUNT($) | VALUE($) |
Pennsylvania — continued | ||
State Public School Building Authority, Delaware County Community College Project Rev., 5.00%, 10/1/2027 | 25,000 | 26,112 |
Township of Hampton | ||
GO, 5.00%, 1/1/2035 | 150,000 | 166,524 |
GO, 5.00%, 1/1/2037 | 175,000 | 191,183 |
GO, 4.00%, 1/1/2042 | 970,000 | 941,830 |
GO, 4.00%, 1/1/2047 | 700,000 | 658,307 |
Township of Palmer Series 2020C, GO, 4.00%, 11/15/2031 | 175,000 | 181,975 |
Township of Upper St. Clair Series 2016A, GO, 4.00%, 6/1/2025 | 20,000 | 20,238 |
Total Pennsylvania | 37,725,046 | |
Rhode Island — 0.0% ^ | ||
State of Rhode Island and Providence Plantations Consolidated Capital Development Loan Series 2018A, GO, 5.00%, 4/1/2029 | 75,000 | 81,349 |
South Carolina — 0.5% | ||
Charleston County Airport District Rev., 5.00%, 7/1/2035 | 250,000 | 269,555 |
County of Dorchester, Waterworks and Sewer System Series 2023, Rev., 4.25%, 10/1/2048 | 2,320,000 | 2,240,107 |
South Carolina Jobs-Economic Development Authority, Episcopal Home at Still Hopes Series 2018A, Rev., 5.00%, 4/1/2033 | 125,000 | 119,406 |
South Carolina Jobs-Economic Development Authority, Wofford College Project Rev., 5.00%, 4/1/2029 | 10,000 | 10,703 |
University of South Carolina, Athletic Facilities Series 2022A, Rev., 5.00%, 5/1/2034 | 415,000 | 467,781 |
Total South Carolina | 3,107,552 | |
South Dakota — 0.0% ^ | ||
City of Rapid City, Sales Tax Rev., 5.00%, 12/1/2023 | 25,000 | 25,094 |
South Dakota Board of Regents Housing and Auxiliary Facilities System Rev., 5.00%, 4/1/2027 | 35,000 | 36,685 |
South Dakota Conservancy District, State Revolving Fund Program Rev., 5.00%, 8/1/2025 | 35,000 | 36,164 |
South Dakota Health and Educational Facilities Authority, Sanford Obligated Group Rev., 5.00%, 11/1/2023 | 145,000 | 145,262 |
Total South Dakota | 243,205 | |
126 | J.P. Morgan Exchange-Traded Funds | August 31, 2023 |
INVESTMENTS | PRINCIPAL AMOUNT($) | VALUE($) |
Municipal Bonds — continued | ||
Tennessee — 4.6% | ||
City of Clarksville | ||
Series 2021A, Rev., 4.00%, 2/1/2041 | 3,950,000 | 3,897,081 |
Series 2021A, Rev., 4.00%, 2/1/2051 | 1,000,000 | 948,005 |
City of Knoxville, Wastewater System Series 2022B, Rev., 4.00%, 4/1/2045 | 2,765,000 | 2,692,503 |
City of Lenoir City, Electric System Series 2022, Rev., 5.00%, 6/1/2033 | 165,000 | 188,329 |
City of Murfreesboro GO, 4.00%, 4/1/2025 | 25,000 | 25,082 |
County of Coffee, Rural High School Series 2021A, GO, 5.00%, 6/1/2028 | 125,000 | 135,563 |
County of Montgomery, Public Improvement GO, 5.00%, 4/1/2027 | 25,000 | 26,647 |
County of Robertson GO, 5.00%, 6/1/2025 | 25,000 | 25,734 |
County of Shelby, Public Improvement Series 2019A, GO, 5.00%, 4/1/2027 | 105,000 | 111,882 |
County of Sullivan GO, 5.00%, 5/1/2026 | 30,000 | 31,401 |
County of Washington Series 2016A, GO, 4.00%, 6/1/2027 | 50,000 | 51,104 |
County of Williamson GO, 5.00%, 4/1/2024 | 20,000 | 20,195 |
Johnson City Health and Educational Facilities Board, Ballad Health Series 2023A, Rev., 5.00%, 7/1/2024 | 625,000 | 630,796 |
Knox County Health Educational and Housing Facility Board, East Tennessee Children's Hospital Rev., 5.00%, 11/15/2023 | 50,000 | 50,123 |
Memphis-Shelby County Airport Authority Series 2021A, Rev., AMT, 5.00%, 7/1/2045 | 1,000,000 | 1,023,618 |
Metropolitan Government Nashville and Davidson County, Health and Educational Facilities Board, Belmont University | ||
Rev., 5.00%, 5/1/2026 | 450,000 | 467,404 |
Series 2023, Rev., 5.00%, 5/1/2038 | 400,000 | 427,925 |
Series 2023, Rev., 5.00%, 5/1/2041 | 500,000 | 527,735 |
Metropolitan Government Nashville and Davidson County, Health and Educational Facilities Board, Trevecca Nazarene University Project Series 2021B, Rev., 4.00%, 10/1/2041 | 355,000 | 300,706 |
Metropolitan Government of Nashville and Davidson County | ||
Series A, GO, 5.00%, 7/1/2025 | 10,000 | 10,310 |
GO, 5.00%, 7/1/2031 | 2,000,000 | 2,167,510 |
Metropolitan Government of Nashville and Davidson County, Electric System Series 2014A, Rev., 5.00%, 5/15/2024 | 10,000 | 10,117 |
Metropolitan Government of Nashville and Davidson County, Water and Sewer Series 2021A, Rev., 4.00%, 7/1/2035 | 1,805,000 | 1,865,937 |
INVESTMENTS | PRINCIPAL AMOUNT($) | VALUE($) |
Tennessee — continued | ||
Metropolitan Nashville Airport Authority (The) | ||
Series 2022B, Rev., AMT, 5.50%, 7/1/2036 | 600,000 | 671,286 |
Series 2022B, Rev., AMT, 5.25%, 7/1/2047 | 630,000 | 659,044 |
Series 2022B, Rev., AMT, 5.00%, 7/1/2052 | 500,000 | 511,148 |
Shelby County Health Educational and Housing Facilities Board, Methodist Le Bonheur Healthcare | ||
Series 2017A, Rev., 5.00%, 5/1/2024 | 155,000 | 156,195 |
Series 2017A, Rev., 5.00%, 5/1/2027 | 200,000 | 210,342 |
Shelby County Health Educational and Housing Facilities Board, The Farms at Bailey Station Project | ||
Series 2019A, Rev., 5.00%, 10/1/2029 | 150,000 | 138,285 |
Series 2019A, Rev., 5.50%, 10/1/2034 | 150,000 | 135,208 |
State of Tennessee | ||
Series A, GO, 5.00%, 9/1/2024 (b) | 25,000 | 25,422 |
Series 2023A, GO, 5.00%, 5/1/2038 | 10,000,000 | 11,163,107 |
Total Tennessee | 29,305,744 | |
Texas — 6.8% | ||
Alamo Community College District, Limited Tax GO, 5.00%, 2/15/2024 | 75,000 | 75,555 |
Aledo Independent School District, Unlimited Tax | ||
Series 2023, GO, PSF-GTD, 5.00%, 2/15/2042 | 500,000 | 535,267 |
Series 2023, GO, PSF-GTD, 5.00%, 2/15/2048 | 5,615,000 | 5,936,495 |
Angleton Independent School District, Unlimited Tax GO, 5.00%, 2/15/2036 | 2,140,000 | 2,373,506 |
Arlington Higher Education Finance Corp., Trinity Basin Preparatory, Inc. | ||
Rev., PSF-GTD, 5.00%, 8/15/2026 | 160,000 | 167,622 |
Rev., PSF-GTD, 5.00%, 8/15/2027 | 145,000 | 154,717 |
Rev., PSF-GTD, 5.00%, 8/15/2028 | 150,000 | 162,938 |
Rev., PSF-GTD, 5.00%, 8/15/2029 | 130,000 | 143,362 |
Rev., PSF-GTD, 5.00%, 8/15/2030 | 100,000 | 111,929 |
Rev., PSF-GTD, 5.00%, 8/15/2031 | 120,000 | 136,278 |
Rev., PSF-GTD, 5.00%, 8/15/2032 | 125,000 | 140,846 |
Austin Independent School District, Unlimited Tax Series 2022B, GO, PSF-GTD, 5.00%, 8/1/2028 | 50,000 | 54,583 |
Board of Regents of the University of Texas System, Financing System Series 2016D, Rev., 5.00%, 8/15/2024 | 50,000 | 50,759 |
Brushy Creek Regional Utility Authority, Inc., Brushy Creek Regional Water Treatment and Distribution Project Rev., 5.00%, 8/1/2026 | 85,000 | 88,695 |
August 31, 2023 | J.P. Morgan Exchange-Traded Funds | 127 |
AS OF August 31, 2023 (Unaudited) (continued)
INVESTMENTS | PRINCIPAL AMOUNT($) | VALUE($) |
Municipal Bonds — continued | ||
Texas — continued | ||
City of Austin, Airport System | ||
Series 2019B, Rev., AMT, 5.00%, 11/15/2029 | 240,000 | 255,887 |
Rev., AMT, 5.00%, 11/15/2035 | 1,000,000 | 1,075,784 |
Series 2017B, Rev., AMT, 5.00%, 11/15/2046 | 1,000,000 | 1,006,877 |
City of Corpus Christi, Certificates of Obligation Series 2016A, GO, 4.00%, 3/1/2026 | 100,000 | 101,478 |
City of Corpus Christi, Utility System Series 2022B, Rev., 5.00%, 7/15/2032 | 325,000 | 367,956 |
City of Dallas Housing Finance Corp., Rosemont At Ash Creek Apartments Series 2023, Rev., FHA, 5.00%, 12/1/2025 (c) | 1,375,000 | 1,402,828 |
City of Georgetown, Utilities System | ||
Series 2023, Rev., 5.00%, 8/15/2025 | 520,000 | 534,505 |
Series 2023, Rev., 5.00%, 8/15/2038 | 1,375,000 | 1,491,297 |
City of Houston, Airport System, Subordinate Lien Series 2021A, Rev., AMT, 5.00%, 7/1/2033 | 150,000 | 161,679 |
City of Houston, Combined Utility System, First Lien Series 2018D, Rev., 5.00%, 11/15/2030 | 45,000 | 48,956 |
City of League City, Combination Tax GO, 5.00%, 2/15/2027 | 20,000 | 20,723 |
City of Pflugerville, Limited Tax GO, 5.00%, 8/1/2026 | 25,000 | 26,207 |
City of San Angelo GO, 5.00%, 2/15/2027 | 20,000 | 21,204 |
City of San Antonio, Electric and Gas Systems Series 2023B, Rev., 5.25%, 2/1/2041 | 1,560,000 | 1,723,747 |
City of San Marcos, Combination Tax, Certificates of Obligation GO, 5.00%, 8/15/2031 | 170,000 | 180,721 |
City of Temple, Utility System Series 2021, Rev., 5.00%, 8/1/2029 | 245,000 | 268,500 |
Clifton Higher Education Finance Corp., Idea Public Schools Series 2022A, Rev., 5.00%, 8/15/2031 | 250,000 | 265,413 |
Clifton Higher Education Finance Corp., Yes Prep Public Schools, Inc. | ||
Series 2023, Rev., PSF-GTD, 5.00%, 4/1/2025 | 195,000 | 199,315 |
Series 2023, Rev., PSF-GTD, 5.00%, 4/1/2026 | 250,000 | 258,559 |
Rev., PSF-GTD, 5.00%, 4/1/2029 | 100,000 | 107,550 |
Rev., PSF-GTD, 5.00%, 4/1/2030 | 185,000 | 201,227 |
Rev., PSF-GTD, 4.00%, 4/1/2031 | 175,000 | 180,675 |
Series 2023, Rev., PSF-GTD, 5.00%, 4/1/2038 | 265,000 | 281,400 |
INVESTMENTS | PRINCIPAL AMOUNT($) | VALUE($) |
Texas — continued | ||
Series 2023, Rev., PSF-GTD, 4.25%, 4/1/2048 | 1,000,000 | 945,889 |
Clint Independent School District, Unlimited Tax Series 2015A, GO, PSF-GTD, 5.00%, 2/15/2024 | 25,000 | 25,184 |
County of Harris, Unlimited Tax Series 2017A, GO, 5.00%, 10/1/2026 | 25,000 | 26,326 |
County of Hays, Limited Tax GO, 5.00%, 2/15/2026 | 20,000 | 20,801 |
County of Montgomery, Unlimited Tax GO, 5.00%, 3/1/2025 | 25,000 | 25,592 |
County of Williamson, Limited Tax GO, 5.00%, 2/15/2026 | 40,000 | 41,630 |
Crandall Independent School District, Unlimited Tax | ||
Series 2023, GO, PSF-GTD, 5.00%, 8/15/2048 | 1,000,000 | 1,066,653 |
Series 2023, GO, PSF-GTD, 5.00%, 8/15/2053 | 595,000 | 628,910 |
Cypress-Fairbanks Independent School District, Unlimited Tax Series 2015A, GO, PSF-GTD, 5.00%, 2/15/2025 | 20,000 | 20,465 |
Dallas Area Rapid Transit, Sales Tax, Senior Lien Series 2014A, Rev., 5.00%, 12/1/2024 (b) | 200,000 | 203,882 |
Denton Independent School District Series 2023, GO, PSF-GTD, 5.00%, 8/15/2043 | 1,805,000 | 1,969,600 |
Fort Worth Independent School District, Unlimited Tax Series 2019A, GO, PSF-GTD, 5.00%, 2/15/2029 | 285,000 | 313,017 |
Glen Rose Independent School District, Unlimited tax | ||
Series 2023, GO, PSF-GTD, 5.00%, 8/15/2035 | 1,000,000 | 1,100,137 |
Series 2023, GO, PSF-GTD, 5.00%, 8/15/2036 | 1,000,000 | 1,088,982 |
Harris County Cultural Education Facilities Finance Corp., Baylor Medical Project Rev., 5.00%, 11/15/2023 | 25,000 | 25,055 |
Laredo Independent School District, Unlimited Tax GO, PSF-GTD, 5.00%, 8/1/2024 | 25,000 | 25,363 |
Lower Colorado River Authority, LCRA Transmission Services Corp. Project Rev., 5.00%, 5/15/2035 | 155,000 | 164,505 |
Melissa Independent School District, Unlimited Tax Series 2023, GO, PSF-GTD, 5.00%, 2/1/2041 (d) | 1,000,000 | 1,089,781 |
128 | J.P. Morgan Exchange-Traded Funds | August 31, 2023 |
INVESTMENTS | PRINCIPAL AMOUNT($) | VALUE($) |
Municipal Bonds — continued | ||
Texas — continued | ||
Metropolitan Transit Authority of Harris County, Sales and Use Tax | ||
Series 2017A, Rev., 5.00%, 11/1/2023 | 150,000 | 150,371 |
Series 2017A, Rev., 5.00%, 11/1/2025 | 45,000 | 46,478 |
Metropolitan Transit Authority of Harris County, Sales and Use Tax, Contractual Obligations Series B, Rev., 5.00%, 11/1/2029 | 25,000 | 26,688 |
New Hope Cultural Education Facilities Finance Corp, Outlook at Windhaven Forefront Living Series 2022B-3, Rev., 4.25%, 10/1/2026 | 800,000 | 784,194 |
North East Independent School District, Unlimited Tax GO, PSF-GTD, 5.00%, 8/1/2025 | 20,000 | 20,583 |
North Texas Municipal Water District, Wastewater System Rev., 5.00%, 6/1/2027 | 20,000 | 21,396 |
Northside Independent School District, Unlimited Tax GO, PSF-GTD, 5.00%, 8/15/2024 | 65,000 | 65,974 |
Northwest Independent School District, Unlimited Tax Series 2023, GO, PSF-GTD, 5.00%, 2/15/2039 | 2,500,000 | 2,727,153 |
Permanent University Fund - University of Texas System Series 2016A, Rev., 5.00%, 7/1/2024 | 85,000 | 86,189 |
Prosper Independent School District, Unlimited Tax School Building GO, PSF-GTD, 5.00%, 2/15/2037 | 25,000 | 26,370 |
San Antonio Education Facilities Corp., Hallmark University Project Series 2021A, Rev., 5.00%, 10/1/2041 | 100,000 | 83,066 |
San Antonio Water System, Junior Lien Series 2017A, Rev., 5.00%, 5/15/2025 | 25,000 | 25,714 |
Sherman Independent School District, Unlimited Tax Series 2018A, GO, PSF-GTD, 5.00%, 2/15/2030 | 25,000 | 26,977 |
State of Texas, Transportation Commission Mobility Fund Series 2015-A, GO, 5.00%, 10/1/2024 | 50,000 | 50,837 |
Stephen F Austin State University, Financing System Series 2019A, Rev., 5.00%, 10/15/2026 | 60,000 | 62,739 |
Tarrant County Cultural Education Facilities Finance Corp., Baylor Scott & White Health Project Series 2022F, Rev., 5.00%, 11/15/2030 (c) | 2,000,000 | 2,185,209 |
Tarrant Regional, Water Control and Improvement District, Water System Rev., 5.00%, 3/1/2025 | 25,000 | 25,592 |
Texas A&M University, Financing System Series 2017E, Rev., 5.00%, 5/15/2030 | 155,000 | 164,557 |
INVESTMENTS | PRINCIPAL AMOUNT($) | VALUE($) |
Texas — continued | ||
Texas Public Finance Authority, Texas Southern University | ||
Series 2023, Rev., 5.00%, 5/1/2026 | 500,000 | 515,618 |
Series 2023, Rev., 5.00%, 5/1/2027 | 625,000 | 653,167 |
Texas State Affordable Housing Corp., Juniper Creek Apartments Project Series 2023, Rev., 3.75%, 7/1/2026 (c) | 3,000,000 | 2,961,391 |
Texas Tech University System Series 2017A, Rev., 5.00%, 2/15/2024 | 35,000 | 35,257 |
Trinity River Authority of Texas, Livingston Regional Water Supply System Project | ||
Series 2023, Rev., 5.00%, 8/1/2036 | 1,120,000 | 1,227,447 |
Series 2023, Rev., 5.00%, 8/1/2037 | 1,175,000 | 1,273,732 |
Trinity River Authority, Tarrant County Water Project | ||
Series 2023, Rev., 5.00%, 2/1/2041 | 700,000 | 751,658 |
Series 2023, Rev., 5.00%, 2/1/2042 | 675,000 | 721,452 |
Trinity River Authority, Water Project Rev., 5.00%, 2/1/2026 | 60,000 | 62,384 |
Total Texas | 43,879,005 | |
Utah — 1.3% | ||
City of Salt Lake City, Airport System | ||
Series 2021A, Rev., AMT, 5.00%, 7/1/2029 | 2,350,000 | 2,496,625 |
Series 2023A, Rev., AMT, 5.25%, 7/1/2040 | 1,060,000 | 1,139,251 |
Series 2023A, Rev., AMT, 5.25%, 7/1/2048 | 1,750,000 | 1,840,408 |
City of Salt Lake City, Sales and Excise Tax Series 2022A, Rev., 4.00%, 10/1/2030 | 155,000 | 164,031 |
City of South Jordan, Sales Tax Rev., 5.00%, 8/15/2029 | 45,000 | 50,012 |
County of Summit, Sales Tax Rev., 5.00%, 12/15/2023 | 70,000 | 70,327 |
Metropolitan Water District of Salt Lake and Sandy Series 2021A, Rev., 4.00%, 7/1/2030 | 365,000 | 387,807 |
Snyderville Basin Special Recreation District GO, 4.00%, 12/15/2025 | 100,000 | 101,748 |
Utah Charter School Finance Authority, The Freedom Academy Foundation, St. George Campus Project Series 2021A, Rev., 5.00%, 6/15/2041 (e) | 150,000 | 133,576 |
Utah Infrastructure Agency, Tax-Exempt Telecommunications | ||
Rev., 5.00%, 10/15/2027 | 130,000 | 131,655 |
Rev., 5.00%, 10/15/2032 | 310,000 | 318,035 |
Utah Telecommunication Open Infrastructure Agency, Sales Tax and Telecomunications | ||
Rev., 5.25%, 6/1/2033 | 250,000 | 284,051 |
August 31, 2023 | J.P. Morgan Exchange-Traded Funds | 129 |
AS OF August 31, 2023 (Unaudited) (continued)
INVESTMENTS | PRINCIPAL AMOUNT($) | VALUE($) |
Municipal Bonds — continued | ||
Utah — continued | ||
Rev., 5.25%, 6/1/2034 | 325,000 | 369,004 |
Rev., 5.25%, 6/1/2035 | 580,000 | 654,055 |
Utah Transit Authority, Sales Tax Series 2007A, Rev., BHAC - CR, MBIA, 5.00%, 6/15/2035 | 295,000 | 337,495 |
Total Utah | 8,478,080 | |
Virgin Islands — 0.0% ^ | ||
Matching Fund Special Purpose Securitization Corp. Series 2022A, Rev., 5.00%, 10/1/2025 | 150,000 | 151,658 |
Virginia — 2.4% | ||
City of Richmond, Public Improvement Series 2017B, GO, 5.00%, 7/15/2027 | 175,000 | 187,814 |
Commonwealth of Virginia Series 2018A, GO, 5.00%, 6/1/2030 | 25,000 | 27,314 |
County of Fairfax, Public Improvement | ||
Series 2023A, GO, 4.00%, 10/1/2038 | 2,000,000 | 2,024,383 |
Series 2023A, GO, 4.00%, 10/1/2039 | 2,000,000 | 2,007,772 |
County of Spotsylvania, Public Improvement GO, 5.00%, 7/15/2029 | 85,000 | 93,145 |
Loudoun County Economic Development Authority, Howard Hughes Medical Institute Series E, Rev., VRDO, 4.06%, 9/12/2023 (c) | 4,000,000 | 4,000,000 |
Northern Virginia Transportation Commission, Transforming Rail in Virginia Program Rev., 5.00%, 6/1/2040 | 640,000 | 700,061 |
Virginia College Building Authority, Virginia Educational Facilities, Public Higher Education Financing Program Series 2023A, Rev., 4.00%, 9/1/2040 | 1,485,000 | 1,476,343 |
Virginia Commonwealth Transportation Board, US Route 58 Corridor Development Rev., 4.00%, 5/15/2045 | 2,000,000 | 1,933,338 |
Virginia Public Building Authority, Public Facilities | ||
Series 2021A-1, Rev., 5.00%, 8/1/2030 | 145,000 | 163,163 |
Series 2022A, Rev., 5.00%, 8/1/2030 | 345,000 | 388,215 |
Virginia Resources Authority, Infrastructure Pooled Financing Program Series 2013C, Rev., 5.00%, 11/1/2023 | 35,000 | 35,089 |
Virginia Small Business Financing Authority, Senior Lien, Elizabeth River Crossing Opco, LLC Project | ||
Rev., AMT, 4.00%, 7/1/2032 | 250,000 | 245,456 |
Rev., AMT, 4.00%, 1/1/2036 | 2,000,000 | 1,912,747 |
Total Virginia | 15,194,840 | |
INVESTMENTS | PRINCIPAL AMOUNT($) | VALUE($) |
Washington — 3.3% | ||
Auburn School District No. 408 of King and Pierce Counties, Unlimited Tax GO, 4.00%, 12/1/2036 | 1,000,000 | 1,007,190 |
Central Puget Sound Regional Transit Authority Series 2021S-1, Rev., 4.00%, 11/1/2040 | 2,000,000 | 1,961,455 |
Central Puget Sound Regional Transit Authority, Sales and Use Tax Series 2015S-1, Rev., 5.00%, 11/1/2024 | 30,000 | 30,559 |
City of Bonney Lake, Water and Sewer System Rev., 4.00%, 12/1/2030 | 10,000 | 10,174 |
City of Seattle, Drainage and Wastewater System Improvement Rev., 4.00%, 4/1/2026 | 20,000 | 20,395 |
City of Seattle, Water System Rev., 5.00%, 8/1/2024 | 35,000 | 35,540 |
City of Tacoma, Solid Waste Utility Rev., 5.00%, 12/1/2031 | 700,000 | 797,803 |
City of University Place, Limited Tax GO, 5.00%, 12/1/2026 | 85,000 | 88,974 |
Clark County School District No. 101 La Center, Unlimited Tax GO, 5.00%, 12/1/2029 | 50,000 | 54,300 |
County of King, Limited Tax | ||
Series 2015A, GO, 5.00%, 7/1/2025 | 50,000 | 51,140 |
Series 2013B, GO, 5.00%, 12/1/2025 | 20,000 | 20,075 |
County of Snohomish, Limited Tax GO, 5.00%, 12/1/2025 | 10,000 | 10,285 |
County of Spokane, Limited Tax Series 2022A, GO, 5.00%, 12/1/2042 | 900,000 | 972,584 |
Energy Northwest, Bonneville Power Administrator Series 2016-A, Rev., 5.00%, 7/1/2028 | 25,000 | 26,237 |
Energy Northwest, Columbia Generating Station Series 2021A, Rev., 4.00%, 7/1/2042 | 3,760,000 | 3,677,123 |
Energy Northwest, Project 1 Series 2017A, Rev., 5.00%, 7/1/2028 | 55,000 | 58,723 |
Franklin County School District No. 1 Pasco, Unlimited Tax GO, 5.00%, 12/1/2030 | 35,000 | 37,595 |
King County Public Hospital District No. 2, Evergreen Healthcare, Limited Tax GO, 5.00%, 12/1/2024 (b) | 105,000 | 107,102 |
King County School District No. 403 Renton, Unlimited Tax GO, 4.00%, 12/1/2023 | 160,000 | 160,258 |
King County School District No. 405 Bellevue, Unlimited Tax GO, 5.00%, 12/1/2026 | 20,000 | 21,190 |
King County School District No. 411 Issaquah, Unlimited Tax GO, 5.00%, 12/1/2024 | 35,000 | 35,731 |
Mason County School District No. 309 Shelton, Unlimited Tax GO, 5.00%, 12/1/2029 | 45,000 | 47,834 |
130 | J.P. Morgan Exchange-Traded Funds | August 31, 2023 |
INVESTMENTS | PRINCIPAL AMOUNT($) | VALUE($) |
Municipal Bonds — continued | ||
Washington — continued | ||
North Thurston Public Schools, Unlimited Tax GO, 4.00%, 12/1/2036 | 2,100,000 | 2,143,677 |
Pierce County School District No. 403 Bethel, Unlimited Tax GO, 4.00%, 12/1/2023 | 20,000 | 20,032 |
Pierce County School District No. 416 White River, Unlimited Tax GO, 5.00%, 12/1/2025 | 50,000 | 51,936 |
Port of Seattle, Intermediate Lien Series 2022B, Rev., AMT, 4.00%, 8/1/2047 | 400,000 | 358,055 |
Snohomish County School District No. 15 Edmonds, Unlimited Tax GO, 5.00%, 12/1/2025 | 25,000 | 25,968 |
Snohomish County School District No. 4 Lake Stevens, Unlimited Tax GO, 5.00%, 12/1/2024 | 25,000 | 25,522 |
Snohomish County School District No. 6 Mukilteo, Unlimited Tax GO, 5.00%, 12/1/2023 | 105,000 | 105,421 |
Spokane County School District No. 354 Mead, Unlimited Tax GO, 5.00%, 12/1/2024 | 20,000 | 20,400 |
State of Washington, State and Local Agency Real and Personal Property Series 2015-C, COP, 5.00%, 1/1/2029 | 55,000 | 57,146 |
State of Washington, Various Purpose | ||
Series 2021B, GO, 5.00%, 6/1/2033 | 1,000,000 | 1,118,611 |
Series 2020C, GO, 5.00%, 2/1/2043 | 700,000 | 743,803 |
Series 2023B, GO, 5.00%, 2/1/2043 | 2,000,000 | 2,172,515 |
Series 2022A, GO, 5.00%, 8/1/2043 | 1,170,000 | 1,257,339 |
Series 2024B, GO, 5.00%, 6/1/2044 | 3,000,000 | 3,256,785 |
Washington Health Care Facilities Authority, Providence St. Joseph Health Series 2018B, Rev., 5.00%, 10/1/2028 | 30,000 | 31,801 |
Washington State Housing Finance Commission, Emerald Heights Project | ||
Series 2023A, Rev., 5.00%, 7/1/2026 | 285,000 | 292,136 |
Series 2023A, Rev., 5.00%, 7/1/2027 | 350,000 | 363,026 |
Total Washington | 21,276,440 | |
West Virginia — 0.3% | ||
West Virginia Hospital Finance Authority, West Virginia University Health System Obligation Series 2023A, Rev., 5.00%, 6/1/2038 | 1,800,000 | 1,904,692 |
Wisconsin — 1.8% | ||
City of Oshkosh, Sewer | ||
Series 2022E, Rev., 5.00%, 5/1/2027 | 550,000 | 585,441 |
Series 2022E, Rev., 5.00%, 5/1/2029 | 605,000 | 663,665 |
City of Oshkosh, Water | ||
Series 2022D, Rev., 5.00%, 1/1/2027 | 165,000 | 174,517 |
Series 2022D, Rev., 5.00%, 1/1/2028 | 180,000 | 193,580 |
INVESTMENTS | PRINCIPAL AMOUNT($) | VALUE($) |
Wisconsin — continued | ||
Hamilton School District, School Building and Improvement GO, 5.00%, 4/1/2025 | 60,000 | 61,606 |
Public Finance Authority | ||
Series 2023, Rev., AMT, 5.00%, 7/1/2025 | 265,000 | 267,132 |
Series 2023, Rev., AMT, 5.00%, 7/1/2026 | 450,000 | 457,104 |
Series 2023, Rev., AMT, 5.00%, 7/1/2027 | 790,000 | 808,363 |
Series 2022, Rev., 4.00%, 4/1/2032 (e) | 225,000 | 211,709 |
Public Finance Authority, Acts Retirement Life Communities, Inc., Obligated Group Series 2020A, Rev., 4.00%, 11/15/2037 | 300,000 | 262,235 |
Public Finance Authority, Eastern Michigan University Student Housing Project Series 2022A-1, Rev., 5.00%, 7/1/2032 | 500,000 | 559,357 |
Public Finance Authority, Entrance Fee Principal Redemption, Searstone CCRC Project Series 2021B2, Rev., 2.25%, 6/1/2027 (e) | 250,000 | 231,647 |
Public Finance Authority, Lenoir-Rhyne University | ||
Series 2022, Rev., 5.00%, 4/1/2029 | 1,155,000 | 1,175,367 |
Series 2022, Rev., 5.00%, 4/1/2030 | 1,215,000 | 1,237,820 |
Series 2022, Rev., 5.00%, 4/1/2031 | 1,275,000 | 1,300,810 |
Series 2022, Rev., 5.00%, 4/1/2032 | 665,000 | 678,274 |
Public Finance Authority, Piedmont Community Charter School Rev., 5.00%, 6/15/2039 | 200,000 | 195,294 |
Public Finance Authority, Scotland Healthcare System Series 2021A, Rev., 5.00%, 10/1/2027 | 500,000 | 524,586 |
Public Finance Authority, Triad Educational Services, Inc. | ||
Rev., 5.00%, 6/15/2032 | 365,000 | 369,687 |
Rev., 5.00%, 6/15/2042 | 380,000 | 353,272 |
Public Finance Authority, Ultimate Medical Academy Project Series 2019A, Rev., 5.00%, 10/1/2029 (e) | 150,000 | 150,540 |
State of Wisconsin | ||
Series 2016-1, GO, 5.00%, 11/1/2024 | 40,000 | 40,773 |
Series 2016-2, GO, 5.00%, 11/1/2026 | 50,000 | 52,361 |
State of Wisconsin, Clean Water Fund Leveraged Loan Portfolio Series 20161, Rev., 5.00%, 6/1/2024 (b) | 65,000 | 65,697 |
State of Wisconsin, Environmental Improvement Fund | ||
Series 2018A, Rev., 5.00%, 6/1/2025 | 35,000 | 36,021 |
Series 2018A, Rev., 5.00%, 6/1/2026 | 20,000 | 20,990 |
Village of Pleasant Prairie GO, 4.00%, 8/1/2024 | 10,000 | 10,041 |
August 31, 2023 | J.P. Morgan Exchange-Traded Funds | 131 |
AS OF August 31, 2023 (Unaudited) (continued)
INVESTMENTS | PRINCIPAL AMOUNT($) | VALUE($) |
Municipal Bonds — continued | ||
Wisconsin — continued | ||
Wisconsin Department of Transportation | ||
Series 2017 2, Rev., 5.00%, 7/1/2031 | 180,000 | 190,266 |
Series 2017 2, Rev., 5.00%, 7/1/2032 | 50,000 | 52,824 |
Wisconsin Health and Educational Facilities Authority, Oakwood Lutheran Senior Ministries | ||
Rev., 4.00%, 1/1/2026 | 175,000 | 170,154 |
Rev., 4.00%, 1/1/2027 | 175,000 | 167,731 |
Wisconsin Health and Educational Facilities Authority, St. Camillus Health System Series 2019A, Rev., 5.00%, 11/1/2029 | 150,000 | 141,625 |
WPPI Energy Series 2016A, Rev., 5.00%, 7/1/2024 | 170,000 | 172,101 |
Total Wisconsin | 11,582,590 | |
Total Municipal Bonds (Cost $583,340,582) | 575,767,368 | |
U.S. Treasury Obligations — 0.6% | ||
U.S. Treasury Notes 3.88%, 4/30/2025 (Cost $3,986,352) | 4,000,000 | 3,927,344 |
SHARES | ||
Short-Term Investments — 10.2% | ||
Investment Companies — 10.2% | ||
JPMorgan Institutional Tax Free Money Market Fund Class IM Shares, 3.71% (f) (g) (Cost $65,306,566) | 65,303,708 | 65,310,239 |
Total Investments — 100.5% (Cost $652,633,500) | 645,004,951 | |
Liabilities in Excess of Other Assets — (0.5)% | (2,902,699 ) | |
NET ASSETS — 100.0% | 642,102,252 | |
Percentages indicated are based on net assets. |
Abbreviations | |
AGM | Insured by Assured Guaranty Municipal Corp. |
AMT | Alternative Minimum Tax |
BAN | Bond Anticipation Note |
BHAC | Insured by Berkshire Hathaway Assurance Corp. |
CCRC | Congregate Care Retirement Center |
COLL | Collateral |
COP | Certificate of Participation |
CR | Custodial Receipts |
FHA | Federal Housing Administration |
FHLMC | Federal Home Loan Mortgage Corp. |
FNMA | Federal National Mortgage Association |
GNMA | Government National Mortgage Association |
GO | General Obligation |
GTD | Guaranteed |
LIQ | Liquidity Agreement |
LOC | Letter of Credit |
MBIA | Insured by Municipal Bond Insurance Corp. |
PSF-GTD | Permanent School Fund Guaranteed |
Q-SBLF | Qualified School Bond Loan Fund |
Rev. | Revenue |
VRDO | Variable Rate Demand Obligation |
^ | Amount rounds to less than 0.1% of net assets. | |
(a) | The date shown represents the earliest of the prerefunded date, next put date or final maturity date. | |
(b) | Security is prerefunded or escrowed to maturity. | |
(c) | Variable or floating rate security, the interest rate of which adjusts periodically based on changes in current interest rates and prepayments on the underlying pool of assets. The interest rate shown is the current rate as of August 31, 2023. | |
(d) | All or a portion of the security is a when-issued security, delayed delivery security, or forward commitment. | |
(e) | Securities exempt from registration under Rule 144A or section 4(a)(2), of the Securities Act of 1933, as amended. | |
(f) | Investment in an affiliated fund, which is registered under the Investment Company Act of 1940, as amended, and is advised by J.P. Morgan Investment Management Inc. | |
(g) | The rate shown is the current yield as of August 31, 2023. | |
132 | J.P. Morgan Exchange-Traded Funds | August 31, 2023 |
DESCRIPTION | NUMBER OF CONTRACTS | EXPIRATION DATE | TRADING CURRENCY | NOTIONAL AMOUNT ($) | VALUE AND UNREALIZED APPRECIATION (DEPRECIATION) ($) |
Long Contracts | |||||
U.S. Treasury 2 Year Note | 30 | 12/29/2023 | USD | 6,115,547 | 12,262 |
U.S. Treasury 5 Year Note | 67 | 12/29/2023 | USD | 7,165,859 | 38,944 |
51,206 |
Abbreviations | |
USD | United States Dollar |
REFERENCE OBLIGATION/INDEX | FINANCING RATE PAID BY THE FUND (%) | PAYMENT FREQUENCY | MATURITY DATE | IMPLIED CREDIT SPREAD (%)(a) | NOTIONAL AMOUNT(b) | UPFRONT PAYMENTS (RECEIPTS) ($)(c) | UNREALIZED APPRECIATION (DEPRECIATION) ($) | VALUE ($) |
CDX.NA.HY.40-V1 | 5.00 | Quarterly | 6/20/2028 | 4.26 | USD9,350,000 | (221,496 ) | (137,465 ) | (358,961 ) |
(*) | The Fund, as a buyer of credit protection, is generally obligated to make periodic payments and may also pay or receive an upfront premium to or from the protection seller, in exchange for the right to receive a contingent payment, upon occurrence of a credit event with respect to an underlying reference obligation, as defined under the terms of individual swap contracts. | ||||||||
(a) | Implied credit spreads are an indication of the seller's performance risk, related to the likelihood of a credit event occurring that would require a seller to make payment to a buyer. Implied credit spreads are used to determine the value of swap contracts and reflect the cost of buying/selling protection, which may include upfront payments made to enter into the contract. Therefore, higher spreads would indicate a greater likelihood that a seller will be obligated to perform (i.e. make payment) under the swap contract. Increasing values, in absolute terms and relative to notional amounts, are also indicative of greater performance risk. Implied credit spreads for credit default swaps on credit indices are linked to the weighted average spread across the underlying reference obligations included in a particular index. | ||||||||
(b) | The notional amount is the maximum amount that a seller of credit protection would be obligated to pay and a buyer of credit protection would receive, upon occurrence of a credit event. | ||||||||
(c) | Upfront payments and receipts generally represent premiums paid or received at the initiation of the agreement to compensate the differences between the stated terms of the swap agreement and current market conditions (credit spreads, interest rates and other relevant factors). | ||||||||
Abbreviations | |
CDX | Credit Default Swap Index |
USD | United States Dollar |
August 31, 2023 | J.P. Morgan Exchange-Traded Funds | 133 |
AS OF August 31, 2023 (Unaudited)
INVESTMENTS | PRINCIPAL AMOUNT($) | VALUE($) |
Corporate Bonds — 35.3% | ||
Aerospace & Defense — 0.1% | ||
Boeing Co. (The) 2.20%, 2/4/2026 | 125,000 | 115,313 |
Bombardier, Inc. (Canada) | ||
7.88%, 4/15/2027 (a) | 41,000 | 40,894 |
6.00%, 2/15/2028 (a) | 49,000 | 45,797 |
Spirit AeroSystems, Inc. | ||
7.50%, 4/15/2025 (a) | 38,000 | 37,529 |
9.38%, 11/30/2029 (a) | 29,000 | 30,221 |
TransDigm, Inc. 6.25%, 3/15/2026 (a) | 95,000 | 94,095 |
363,849 | ||
Automobile Components — 0.2% | ||
Adient Global Holdings Ltd. 7.00%, 4/15/2028 (a) | 50,000 | 50,515 |
Allison Transmission, Inc. 5.88%, 6/1/2029 (a) | 89,000 | 85,958 |
American Axle & Manufacturing, Inc. | ||
6.50%, 4/1/2027 | 68,000 | 64,446 |
6.88%, 7/1/2028 (b) | 44,000 | 40,358 |
Clarios Global LP 6.25%, 5/15/2026 (a) | 32,000 | 31,692 |
Dana, Inc. | ||
5.38%, 11/15/2027 | 62,000 | 58,654 |
4.50%, 2/15/2032 | 23,000 | 18,570 |
Goodyear Tire & Rubber Co. (The) 5.25%, 4/30/2031 (b) | 112,000 | 98,245 |
Icahn Enterprises LP 5.25%, 5/15/2027 | 80,000 | 70,200 |
518,638 | ||
Automobiles — 0.2% | ||
Ford Motor Co. 9.63%, 4/22/2030 | 36,000 | 41,636 |
Hyundai Capital America 1.80%, 10/15/2025 (a) | 200,000 | 184,473 |
Volkswagen Group of America Finance LLC (Germany) 3.35%, 5/13/2025 (a) | 200,000 | 192,440 |
418,549 | ||
Banks — 16.4% | ||
ABN AMRO Bank NV (Netherlands) (US Treasury Yield Curve Rate T Note Constant Maturity 1 Year + 0.80%), 1.54%, 6/16/2027 (a) (c) | 400,000 | 352,841 |
AIB Group plc (Ireland) (ICE LIBOR USD 3 Month + 1.87%), 4.26%, 4/10/2025 (a) (c) | 645,000 | 635,420 |
ASB Bank Ltd. (New Zealand) 5.35%, 6/15/2026 (a) | 1,000,000 | 993,075 |
INVESTMENTS | PRINCIPAL AMOUNT($) | VALUE($) |
Banks — continued | ||
Banco Bilbao Vizcaya Argentaria SA (Spain) (US Treasury Yield Curve Rate T Note Constant Maturity 1 Year + 2.30%), 5.86%, 9/14/2026 (c) | 800,000 | 793,391 |
Banco Continental SAECA (Paraguay) 2.75%, 12/10/2025 (a) | 150,000 | 136,488 |
Banco Santander SA (Spain) | ||
2.75%, 5/28/2025 | 600,000 | 567,661 |
(US Treasury Yield Curve Rate T Note Constant Maturity 1 Year + 0.90%), 1.72%, 9/14/2027 (c) | 200,000 | 175,793 |
(US Treasury Yield Curve Rate T Note Constant Maturity 1 Year + 2.00%), 4.18%, 3/24/2028 (c) | 200,000 | 187,538 |
Bank of America Corp. | ||
(3-MONTH CME TERM SOFR + 0.90%), 2.02%, 2/13/2026 (c) | 585,000 | 551,606 |
(SOFR + 1.33%), 3.38%, 4/2/2026 (c) | 380,000 | 365,194 |
(SOFR + 0.96%), 1.73%, 7/22/2027 (c) | 230,000 | 205,802 |
(SOFR + 1.05%), 2.55%, 2/4/2028 (c) | 345,000 | 312,021 |
(SOFR + 2.04%), 4.95%, 7/22/2028 (c) | 475,000 | 465,074 |
(SOFR + 1.99%), 6.20%, 11/10/2028 (c) | 400,000 | 409,195 |
(SOFR + 1.63%), 5.20%, 4/25/2029 (c) | 870,000 | 856,847 |
Bank of Ireland Group plc (Ireland) | ||
(US Treasury Yield Curve Rate T Note Constant Maturity 1 Year + 2.65%), 6.25%, 9/16/2026 (a) (c) | 335,000 | 334,202 |
(US Treasury Yield Curve Rate T Note Constant Maturity 1 Year + 1.10%), 2.03%, 9/30/2027 (a) (c) | 245,000 | 215,556 |
Bank of Montreal (Canada) 5.20%, 2/1/2028 | 585,000 | 580,086 |
Bank of Nova Scotia (The) (Canada) 5.25%, 6/12/2028 | 500,000 | 495,603 |
Banque Federative du Credit Mutuel SA (France) | ||
5.90%, 7/13/2026 (a) | 500,000 | 501,525 |
4.75%, 7/13/2027 (a) | 530,000 | 514,369 |
Barclays plc (United Kingdom) (US Treasury Yield Curve Rate T Note Constant Maturity 1 Year + 1.05%), 2.28%, 11/24/2027 (c) | 820,000 | 728,191 |
BNP Paribas SA (France) | ||
(SOFR + 2.07%), 2.22%, 6/9/2026 (a) (c) | 795,000 | 742,719 |
(US Treasury Yield Curve Rate T Note Constant Maturity 1 Year + 1.50%), 5.34%, 6/12/2029 (a) (c) | 500,000 | 492,672 |
BPCE SA (France) | ||
5.70%, 10/22/2023 (a) | 400,000 | 399,269 |
5.15%, 7/21/2024 (a) | 285,000 | 281,490 |
134 | J.P. Morgan Exchange-Traded Funds | August 31, 2023 |
INVESTMENTS | PRINCIPAL AMOUNT($) | VALUE($) |
Corporate Bonds — continued | ||
Banks — continued | ||
(SOFR + 1.52%), 1.65%, 10/6/2026 (a) (c) | 750,000 | 681,714 |
(SOFR + 2.10%), 5.97%, 1/18/2027 (a) (c) | 500,000 | 497,467 |
4.75%, 7/19/2027 (a) | 500,000 | 483,266 |
Canadian Imperial Bank of Commerce (Canada) 5.00%, 4/28/2028 | 505,000 | 494,531 |
Citigroup, Inc. | ||
(SOFR + 0.67%), 0.98%, 5/1/2025 (c) | 85,000 | 82,090 |
(SOFR + 0.69%), 2.01%, 1/25/2026 (c) | 455,000 | 430,441 |
(SOFR + 2.84%), 3.11%, 4/8/2026 (c) | 200,000 | 191,403 |
(SOFR + 1.55%), 5.61%, 9/29/2026 (c) | 1,750,000 | 1,742,011 |
(SOFR + 0.77%), 1.12%, 1/28/2027 (c) | 85,000 | 76,178 |
(3-MONTH CME TERM SOFR + 1.82%), 3.89%, 1/10/2028 (c) | 370,000 | 349,532 |
Series VAR, (SOFR + 1.28%), 3.07%, 2/24/2028 (c) | 500,000 | 458,980 |
Cooperatieve Rabobank UA (Netherlands) | ||
(US Treasury Yield Curve Rate T Note Constant Maturity 1 Year + 1.22%), 3.65%, 4/6/2028 (a) (c) | 535,000 | 496,681 |
(US Treasury Yield Curve Rate T Note Constant Maturity 1 Year + 1.40%), 5.56%, 2/28/2029 (a) (c) | 500,000 | 494,040 |
Credit Agricole SA (France) | ||
(SOFR + 1.68%), 1.91%, 6/16/2026 (a) (c) | 765,000 | 712,121 |
5.59%, 7/5/2026 (a) | 825,000 | 824,735 |
Danske Bank A/S (Denmark) (US Treasury Yield Curve Rate T Note Constant Maturity 1 Year + 0.55%), 0.98%, 9/10/2025 (a) (c) | 805,000 | 761,521 |
DNB Bank ASA (Norway) (SOFRINDX + 1.95%), 5.90%, 10/9/2026 (a) (c) | 500,000 | 500,853 |
Federation des Caisses Desjardins du Quebec (Canada) | ||
4.40%, 8/23/2025 (a) | 200,000 | 194,111 |
5.70%, 3/14/2028 (a) | 325,000 | 325,465 |
HSBC Holdings plc (United Kingdom) | ||
(3-MONTH CME TERM SOFR + 1.47%), 3.80%, 3/11/2025 (c) | 250,000 | 246,871 |
(SOFR + 0.71%), 0.98%, 5/24/2025 (c) | 350,000 | 336,401 |
(SOFR + 1.29%), 1.59%, 5/24/2027 (c) | 569,000 | 505,560 |
(SOFR + 1.57%), 5.89%, 8/14/2027 (c) | 855,000 | 852,319 |
(SOFR + 1.10%), 2.25%, 11/22/2027 (c) | 385,000 | 343,322 |
(SOFR + 2.61%), 5.21%, 8/11/2028 (c) | 420,000 | 409,837 |
ING Groep NV (Netherlands) | ||
(US Treasury Yield Curve Rate T Note Constant Maturity 1 Year + 1.10%), 1.40%, 7/1/2026 (a) (c) | 500,000 | 459,763 |
(SOFR + 1.01%), 1.73%, 4/1/2027 (c) | 200,000 | 179,851 |
INVESTMENTS | PRINCIPAL AMOUNT($) | VALUE($) |
Banks — continued | ||
KBC Group NV (Belgium) (US Treasury Yield Curve Rate T Note Constant Maturity 1 Year + 2.10%), 5.80%, 1/19/2029 (a) (c) | 200,000 | 198,005 |
Lloyds Banking Group plc (United Kingdom) | ||
(US Treasury Yield Curve Rate T Note Constant Maturity 1 Year + 1.00%), 2.44%, 2/5/2026 (c) | 200,000 | 189,435 |
(US Treasury Yield Curve Rate T Note Constant Maturity 1 Year + 1.70%), 5.87%, 3/6/2029 (c) | 755,000 | 749,188 |
Mitsubishi UFJ Financial Group, Inc. (Japan) | ||
(US Treasury Yield Curve Rate T Note Constant Maturity 1 Year + 1.13%), 3.84%, 4/17/2026 (c) | 258,000 | 249,720 |
(US Treasury Yield Curve Rate T Note Constant Maturity 1 Year + 0.75%), 1.54%, 7/20/2027 (c) | 512,000 | 456,442 |
(US Treasury Yield Curve Rate T Note Constant Maturity 1 Year + 0.83%), 2.34%, 1/19/2028 (c) | 400,000 | 358,893 |
(US Treasury Yield Curve Rate T Note Constant Maturity 1 Year + 1.38%), 5.42%, 2/22/2029 (c) | 500,000 | 497,883 |
Mizuho Financial Group, Inc. (Japan) | ||
(3-MONTH CME TERM SOFR + 1.24%), 2.84%, 7/16/2025 (c) | 200,000 | 194,098 |
(US Treasury Yield Curve Rate T Note Constant Maturity 1 Year + 0.90%), 2.65%, 5/22/2026 (b) (c) | 470,000 | 442,670 |
(US Treasury Yield Curve Rate T Note Constant Maturity 1 Year + 1.65%), 5.78%, 7/6/2029 (c) | 750,000 | 751,217 |
NatWest Group plc (United Kingdom) | ||
4.80%, 4/5/2026 | 500,000 | 486,808 |
(US Treasury Yield Curve Rate T Note Constant Maturity 1 Year + 2.85%), 7.47%, 11/10/2026 (c) | 350,000 | 360,353 |
(US Treasury Yield Curve Rate T Note Constant Maturity 1 Year + 1.35%), 5.85%, 3/2/2027 (c) | 750,000 | 745,547 |
Nordea Bank Abp (Finland) 1.50%, 9/30/2026 (a) | 500,000 | 441,327 |
Royal Bank of Canada (Canada) 5.20%, 8/1/2028 | 620,000 | 615,733 |
Santander UK Group Holdings plc (United Kingdom) | ||
(SOFR + 0.79%), 1.09%, 3/15/2025 (c) | 645,000 | 625,277 |
August 31, 2023 | J.P. Morgan Exchange-Traded Funds | 135 |
AS OF August 31, 2023 (Unaudited) (continued)
INVESTMENTS | PRINCIPAL AMOUNT($) | VALUE($) |
Corporate Bonds — continued | ||
Banks — continued | ||
(US Treasury Yield Curve Rate T Note Constant Maturity 1 Year + 1.25%), 1.53%, 8/21/2026 (c) | 655,000 | 594,532 |
(SOFR + 2.60%), 6.53%, 1/10/2029 (c) | 275,000 | 277,166 |
Societe Generale SA (France) | ||
(US Treasury Yield Curve Rate T Note Constant Maturity 1 Year + 1.05%), 2.23%, 1/21/2026 (a) (c) | 365,000 | 343,377 |
(US Treasury Yield Curve Rate T Note Constant Maturity 1 Year + 1.10%), 1.49%, 12/14/2026 (a) (c) | 570,000 | 510,768 |
(US Treasury Yield Curve Rate T Note Constant Maturity 1 Year + 2.30%), 6.45%, 1/12/2027 (a) (c) | 805,000 | 808,766 |
Standard Chartered plc (United Kingdom) | ||
(US Treasury Yield Curve Rate T Note Constant Maturity 1 Year + 0.78%), 0.99%, 1/12/2025 (a) (c) | 250,000 | 244,787 |
(ICE LIBOR USD 3 Month + 1.21%), 2.82%, 1/30/2026 (a) (c) | 200,000 | 190,398 |
(US Treasury Yield Curve Rate T Note Constant Maturity 1 Year + 1.65%), 3.97%, 3/30/2026 (a) (c) | 310,000 | 299,123 |
(US Treasury Yield Curve Rate T Note Constant Maturity 1 Year + 1.85%), 6.19%, 7/6/2027 (a) (c) | 470,000 | 470,982 |
Sumitomo Mitsui Financial Group, Inc. (Japan) | ||
5.88%, 7/13/2026 | 585,000 | 589,610 |
5.52%, 1/13/2028 | 775,000 | 774,705 |
Sumitomo Mitsui Trust Bank Ltd. (Japan) 0.85%, 3/25/2024 (a) | 200,000 | 194,494 |
Svenska Handelsbanken AB (Sweden) 5.50%, 6/15/2028 (a) | 750,000 | 738,914 |
Toronto-Dominion Bank (The) (Canada) | ||
5.10%, 1/9/2026 | 575,000 | 570,447 |
5.53%, 7/17/2026 | 620,000 | 621,368 |
Wells Fargo & Co. | ||
(3-MONTH CME TERM SOFR + 1.01%), 2.16%, 2/11/2026 (c) | 150,000 | 141,820 |
(SOFR + 1.56%), 4.54%, 8/15/2026 (c) | 535,000 | 522,414 |
(SOFR + 1.51%), 3.53%, 3/24/2028 (c) | 285,000 | 265,170 |
(SOFR + 1.98%), 4.81%, 7/25/2028 (c) | 945,000 | 916,627 |
(SOFR + 1.74%), 5.57%, 7/25/2029 (c) | 475,000 | 473,033 |
42,335,789 | ||
INVESTMENTS | PRINCIPAL AMOUNT($) | VALUE($) |
Biotechnology — 0.2% | ||
Amgen, Inc. 5.15%, 3/2/2028 | 510,000 | 509,467 |
Emergent BioSolutions, Inc. 3.88%, 8/15/2028 (a) | 39,000 | 18,720 |
528,187 | ||
Broadline Retail — 0.0% ^ | ||
NMG Holding Co., Inc. 7.13%, 4/1/2026 (a) | 72,000 | 68,430 |
Nordstrom, Inc. 4.38%, 4/1/2030 | 44,000 | 35,155 |
103,585 | ||
Building Products — 0.2% | ||
Builders FirstSource, Inc. 4.25%, 2/1/2032 (a) | 64,000 | 54,411 |
Emerald Debt Merger Sub LLC 6.63%, 12/15/2030 (a) | 55,000 | 54,143 |
Griffon Corp. 5.75%, 3/1/2028 | 80,000 | 74,561 |
JELD-WEN, Inc. 4.88%, 12/15/2027 (a) | 44,000 | 39,159 |
PGT Innovations, Inc. 4.38%, 10/1/2029 (a) | 49,000 | 45,469 |
Standard Industries, Inc. 4.75%, 1/15/2028 (a) | 64,000 | 58,944 |
Summit Materials LLC 5.25%, 1/15/2029 (a) | 54,000 | 50,584 |
377,271 | ||
Capital Markets — 4.0% | ||
Bank of New York Mellon Corp. (The) (SOFR + 1.03%), 4.95%, 4/26/2027 (c) | 380,000 | 374,050 |
Credit Suisse AG (Switzerland) 7.50%, 2/15/2028 | 270,000 | 288,766 |
Deutsche Bank AG (Germany) | ||
(SOFR + 2.16%), 2.22%, 9/18/2024 (c) | 150,000 | 149,765 |
(SOFR + 1.87%), 2.13%, 11/24/2026 (c) | 500,000 | 453,634 |
(SOFR + 2.52%), 7.15%, 7/13/2027 (c) | 350,000 | 355,235 |
5.37%, 9/9/2027 | 320,000 | 317,318 |
(SOFR + 3.18%), 6.72%, 1/18/2029 (c) | 240,000 | 242,990 |
Goldman Sachs Group, Inc. (The) | ||
(SOFR + 0.73%), 1.76%, 1/24/2025 (c) | 500,000 | 490,725 |
(SOFR + 0.91%), 1.95%, 10/21/2027 (c) | 423,000 | 376,434 |
(SOFR + 1.11%), 2.64%, 2/24/2028 (c) | 390,000 | 352,955 |
(SOFR + 1.85%), 3.62%, 3/15/2028 (c) | 720,000 | 673,215 |
Macquarie Bank Ltd. (Australia) 5.21%, 6/15/2026 (a) | 1,000,000 | 992,355 |
Macquarie Group Ltd. (Australia) | ||
6.21%, 11/22/2024 (a) | 490,000 | 490,047 |
(SOFR + 0.91%), 1.63%, 9/23/2027 (a) (c) | 140,000 | 122,881 |
(SOFR + 2.13%), 4.10%, 6/21/2028 (a) (c) | 380,000 | 356,712 |
Morgan Stanley | ||
(SOFR + 0.72%), 0.98%, 12/10/2026 (c) | 150,000 | 134,571 |
136 | J.P. Morgan Exchange-Traded Funds | August 31, 2023 |
INVESTMENTS | PRINCIPAL AMOUNT($) | VALUE($) |
Corporate Bonds — continued | ||
Capital Markets — continued | ||
(SOFR + 0.86%), 1.51%, 7/20/2027 (c) | 335,000 | 297,424 |
(SOFR + 1.00%), 2.48%, 1/21/2028 (c) | 400,000 | 360,847 |
(SOFR + 2.24%), 6.30%, 10/18/2028 (c) | 985,000 | 1,010,396 |
(SOFR + 1.59%), 5.16%, 4/20/2029 (c) | 565,000 | 554,169 |
Nomura Holdings, Inc. (Japan) 1.85%, 7/16/2025 | 200,000 | 184,811 |
UBS Group AG (Switzerland) | ||
(SOFR + 1.56%), 2.59%, 9/11/2025 (a) (c) | 250,000 | 241,053 |
(SOFR + 3.34%), 6.37%, 7/15/2026 (a) (c) | 405,000 | 406,685 |
(US Treasury Yield Curve Rate T Note Constant Maturity 1 Year + 1.55%), 5.71%, 1/12/2027 (a) (c) | 297,000 | 295,798 |
(US Treasury Yield Curve Rate T Note Constant Maturity 1 Year + 2.05%), 4.70%, 8/5/2027 (a) (c) | 410,000 | 397,466 |
(SOFR + 3.70%), 6.44%, 8/11/2028 (a) (c) | 370,000 | 376,764 |
10,297,066 | ||
Chemicals — 0.2% | ||
Avient Corp. 5.75%, 5/15/2025 (a) | 44,000 | 43,415 |
Braskem Netherlands Finance BV (Brazil) 4.50%, 1/31/2030 (d) | 200,000 | 167,560 |
Chemours Co. (The) | ||
5.38%, 5/15/2027 | 26,000 | 24,475 |
5.75%, 11/15/2028 (a) | 54,000 | 48,509 |
Element Solutions, Inc. 3.88%, 9/1/2028 (a) | 62,000 | 54,505 |
NOVA Chemicals Corp. (Canada) 4.25%, 5/15/2029 (a) | 67,000 | 54,421 |
Scotts Miracle-Gro Co. (The) 4.50%, 10/15/2029 | 108,000 | 90,323 |
Trinseo Materials Operating SCA 5.38%, 9/1/2025 (a) | 49,000 | 45,648 |
WR Grace Holdings LLC 4.88%, 6/15/2027 (a) | 64,000 | 59,689 |
588,545 | ||
Commercial Services & Supplies — 0.3% | ||
ACCO Brands Corp. 4.25%, 3/15/2029 (a) | 67,000 | 57,239 |
Allied Universal Holdco LLC 6.63%, 7/15/2026 (a) | 31,000 | 29,486 |
APi Group DE, Inc. 4.13%, 7/15/2029 (a) | 50,000 | 43,001 |
Aramark Services, Inc. 5.00%, 2/1/2028 (a) | 59,000 | 55,042 |
Brink's Co. (The) 4.63%, 10/15/2027 (a) | 31,000 | 28,826 |
Garda World Security Corp. (Canada) 4.63%, 2/15/2027 (a) | 85,000 | 78,634 |
GFL Environmental, Inc. (Canada) | ||
4.00%, 8/1/2028 (a) | 40,000 | 35,709 |
4.75%, 6/15/2029 (a) | 71,000 | 64,320 |
INVESTMENTS | PRINCIPAL AMOUNT($) | VALUE($) |
Commercial Services & Supplies — continued | ||
Madison IAQ LLC 4.13%, 6/30/2028 (a) | 126,000 | 111,476 |
Prime Security Services Borrower LLC 5.75%, 4/15/2026 (a) | 130,000 | 127,575 |
631,308 | ||
Communications Equipment — 0.1% | ||
CommScope, Inc. | ||
6.00%, 3/1/2026 (a) | 85,000 | 77,245 |
4.75%, 9/1/2029 (a) | 95,000 | 70,598 |
147,843 | ||
Construction & Engineering — 0.1% | ||
Dycom Industries, Inc. 4.50%, 4/15/2029 (a) | 44,000 | 39,287 |
Global Infrastructure Solutions, Inc. 5.63%, 6/1/2029 (a) | 54,000 | 45,349 |
Pike Corp. 5.50%, 9/1/2028 (a) | 35,000 | 31,497 |
Weekley Homes LLC 4.88%, 9/15/2028 (a) | 59,000 | 52,067 |
168,200 | ||
Consumer Finance — 1.5% | ||
AerCap Ireland Capital DAC (Ireland) | ||
4.88%, 1/16/2024 | 450,000 | 447,746 |
2.88%, 8/14/2024 | 200,000 | 193,911 |
5.75%, 6/6/2028 | 500,000 | 495,634 |
Avolon Holdings Funding Ltd. (Ireland) | ||
5.25%, 5/15/2024 (a) | 450,000 | 444,252 |
5.50%, 1/15/2026 (a) | 125,000 | 121,694 |
Capital One Financial Corp. | ||
(SOFR + 0.69%), 1.34%, 12/6/2024 (c) | 270,000 | 266,126 |
(SOFR + 2.06%), 4.93%, 5/10/2028 (c) | 400,000 | 384,786 |
(SOFR + 2.08%), 5.47%, 2/1/2029 (c) | 345,000 | 334,674 |
Ford Motor Credit Co. LLC 4.27%, 1/9/2027 | 425,000 | 392,950 |
General Motors Financial Co., Inc. 5.00%, 4/9/2027 | 380,000 | 370,334 |
Navient Corp. 7.25%, 9/25/2023 | 19,000 | 19,000 |
OneMain Finance Corp. | ||
7.13%, 3/15/2026 | 67,000 | 65,911 |
6.63%, 1/15/2028 | 23,000 | 21,505 |
5.38%, 11/15/2029 | 23,000 | 19,867 |
Park Aerospace Holdings Ltd. (Ireland) 5.50%, 2/15/2024 (a) | 150,000 | 148,999 |
3,727,389 | ||
Consumer Staples Distribution & Retail — 0.1% | ||
Albertsons Cos., Inc. | ||
4.63%, 1/15/2027 (a) | 216,000 | 203,996 |
3.50%, 3/15/2029 (a) | 59,000 | 51,036 |
August 31, 2023 | J.P. Morgan Exchange-Traded Funds | 137 |
AS OF August 31, 2023 (Unaudited) (continued)
INVESTMENTS | PRINCIPAL AMOUNT($) | VALUE($) |
Corporate Bonds — continued | ||
Consumer Staples Distribution & Retail — continued | ||
Performance Food Group, Inc. 5.50%, 10/15/2027 (a) | 22,000 | 21,184 |
Rite Aid Corp. 8.00%, 11/15/2026 (a) | 85,000 | 53,975 |
330,191 | ||
Containers & Packaging — 0.3% | ||
Ardagh Packaging Finance plc 4.13%, 8/15/2026 (a) | 200,000 | 187,063 |
Graphic Packaging International LLC 1.51%, 4/15/2026 (a) | 70,000 | 62,779 |
LABL, Inc. 6.75%, 7/15/2026 (a) | 100,000 | 97,743 |
Mauser Packaging Solutions Holding Co. 7.88%, 8/15/2026 (a) | 113,000 | 111,276 |
Owens-Brockway Glass Container, Inc. 6.63%, 5/13/2027 (a) | 62,000 | 61,286 |
Pactiv Evergreen Group Issuer, Inc. 4.00%, 10/15/2027 (a) | 49,000 | 44,072 |
Trivium Packaging Finance BV (Netherlands) 5.50%, 8/15/2026 (a) (e) | 200,000 | 188,632 |
752,851 | ||
Diversified Consumer Services — 0.0% ^ | ||
Service Corp. International 5.13%, 6/1/2029 | 41,000 | 38,591 |
Diversified Telecommunication Services — 0.5% | ||
Altice France SA (France) 5.13%, 7/15/2029 (a) | 200,000 | 141,385 |
CCO Holdings LLC | ||
5.00%, 2/1/2028 (a) | 137,000 | 126,245 |
4.75%, 3/1/2030 (a) | 257,000 | 220,967 |
4.50%, 8/15/2030 (a) | 285,000 | 239,741 |
4.75%, 2/1/2032 (a) | 13,000 | 10,757 |
Frontier Communications Holdings LLC 5.88%, 10/15/2027 (a) | 77,000 | 70,132 |
Intelsat Jackson Holdings SA (Luxembourg) 6.50%, 3/15/2030 (a) | 62,000 | 56,849 |
Lumen Technologies, Inc. | ||
5.13%, 12/15/2026 (a) | 41,000 | 21,239 |
4.00%, 2/15/2027 (a) | 216,000 | 136,127 |
NBN Co. Ltd. (Australia) 1.45%, 5/5/2026 (a) | 200,000 | 180,212 |
Telecom Italia Capital SA (Italy) 6.38%, 11/15/2033 | 31,000 | 27,242 |
1,230,896 | ||
Electric Utilities — 1.7% | ||
Enel Finance America LLC (Italy) 7.10%, 10/14/2027 (a) | 200,000 | 208,843 |
Enel Finance International NV (Italy) 4.63%, 6/15/2027 (a) | 445,000 | 429,361 |
INVESTMENTS | PRINCIPAL AMOUNT($) | VALUE($) |
Electric Utilities — continued | ||
Eskom Holdings SOC Ltd. (South Africa) 7.13%, 2/11/2025 (d) | 200,000 | 197,064 |
Exelon Corp. 5.15%, 3/15/2028 | 305,000 | 302,796 |
Fells Point Funding Trust 3.05%, 1/31/2027 (a) | 535,000 | 489,229 |
ITC Holdings Corp. 3.65%, 6/15/2024 | 745,000 | 731,513 |
Metropolitan Edison Co. 5.20%, 4/1/2028 (a) | 240,000 | 237,007 |
NextEra Energy Capital Holdings, Inc. | ||
5.75%, 9/1/2025 | 445,000 | 446,054 |
4.90%, 2/28/2028 | 600,000 | 589,612 |
NRG Energy, Inc. | ||
3.38%, 2/15/2029 (a) | 46,000 | 37,916 |
5.25%, 6/15/2029 (a) | 67,000 | 60,307 |
Pennsylvania Electric Co. 5.15%, 3/30/2026 (a) | 225,000 | 221,354 |
PG&E Corp. 5.00%, 7/1/2028 (b) | 60,000 | 55,194 |
Vistra Operations Co. LLC | ||
3.55%, 7/15/2024 (a) | 350,000 | 340,566 |
5.00%, 7/31/2027 (a) | 90,000 | 84,646 |
4.38%, 5/1/2029 (a) | 27,000 | 23,806 |
4,455,268 | ||
Electrical Equipment — 0.0% ^ | ||
Vertiv Group Corp. 4.13%, 11/15/2028 (a) | 44,000 | 39,502 |
Electronic Equipment, Instruments & Components — 0.0% ^ | ||
Coherent Corp. 5.00%, 12/15/2029 (a) | 41,000 | 36,416 |
Energy Equipment & Services — 0.1% | ||
Guara Norte SARL (Brazil) 5.20%, 6/15/2034 (a) | 176,852 | 154,745 |
Nabors Industries, Inc. 7.38%, 5/15/2027 (a) | 40,000 | 39,036 |
Precision Drilling Corp. (Canada) 7.13%, 1/15/2026 (a) | 54,000 | 53,528 |
Transocean, Inc. 8.75%, 2/15/2030 (a) | 33,250 | 34,015 |
281,324 | ||
Entertainment — 0.5% | ||
Cinemark USA, Inc. | ||
5.88%, 3/15/2026 (a) | 31,000 | 29,760 |
5.25%, 7/15/2028 (a) (b) | 28,000 | 24,871 |
Live Nation Entertainment, Inc. 4.75%, 10/15/2027 (a) | 85,000 | 79,186 |
Take-Two Interactive Software, Inc. 5.00%, 3/28/2026 | 103,000 | 101,894 |
Warnermedia Holdings, Inc. 3.76%, 3/15/2027 | 975,000 | 914,470 |
1,150,181 | ||
138 | J.P. Morgan Exchange-Traded Funds | August 31, 2023 |
INVESTMENTS | PRINCIPAL AMOUNT($) | VALUE($) |
Corporate Bonds — continued | ||
Financial Services — 1.1% | ||
Block, Inc. | ||
2.75%, 6/1/2026 | 15,000 | 13,640 |
3.50%, 6/1/2031 | 38,000 | 31,159 |
Element Fleet Management Corp. (Canada) | ||
1.60%, 4/6/2024 (a) | 145,000 | 141,093 |
3.85%, 6/15/2025 (a) | 200,000 | 191,078 |
Fondo MIVIVIENDA SA (Peru) 4.63%, 4/12/2027 (a) | 200,000 | 191,324 |
Global Payments, Inc. | ||
1.20%, 3/1/2026 | 415,000 | 371,219 |
4.95%, 8/15/2027 | 335,000 | 326,466 |
National Rural Utilities Cooperative Finance Corp. 5.05%, 9/15/2028 | 615,000 | 613,698 |
Nationstar Mortgage Holdings, Inc. 6.00%, 1/15/2027 (a) | 72,000 | 68,580 |
Nationwide Building Society (United Kingdom) (SOFR + 1.29%), 2.97%, 2/16/2028 (a) (c) | 850,000 | 768,081 |
Rocket Mortgage LLC | ||
2.88%, 10/15/2026 (a) | 17,000 | 15,109 |
3.63%, 3/1/2029 (a) | 44,000 | 37,450 |
4.00%, 10/15/2033 (a) | 5,000 | 3,953 |
2,772,850 | ||
Food Products — 0.3% | ||
Post Holdings, Inc. | ||
5.63%, 1/15/2028 (a) | 63,000 | 60,410 |
4.63%, 4/15/2030 (a) | 31,000 | 27,465 |
Viterra Finance BV (Netherlands) | ||
2.00%, 4/21/2026 (a) | 200,000 | 180,587 |
4.90%, 4/21/2027 (a) | 570,000 | 551,491 |
819,953 | ||
Gas Utilities — 0.0% ^ | ||
AmeriGas Partners LP 5.88%, 8/20/2026 | 49,000 | 46,486 |
Superior Plus LP (Canada) 4.50%, 3/15/2029 (a) | 35,000 | 30,800 |
77,286 | ||
Ground Transportation — 0.1% | ||
Avis Budget Car Rental LLC | ||
5.75%, 7/15/2027 (a) (b) | 64,000 | 61,106 |
4.75%, 4/1/2028 (a) | 31,000 | 28,193 |
First Student Bidco, Inc. 4.00%, 7/31/2029 (a) | 59,000 | 50,150 |
Hertz Corp. (The) 4.63%, 12/1/2026 (a) | 108,000 | 97,782 |
Uber Technologies, Inc. 7.50%, 9/15/2027 (a) | 40,000 | 40,842 |
XPO Escrow Sub LLC 7.50%, 11/15/2027 (a) | 50,000 | 50,838 |
INVESTMENTS | PRINCIPAL AMOUNT($) | VALUE($) |
Ground Transportation — continued | ||
XPO, Inc. | ||
6.25%, 6/1/2028 (a) | 20,000 | 19,598 |
7.13%, 6/1/2031 (a) | 20,000 | 20,106 |
368,615 | ||
Health Care Equipment & Supplies — 0.1% | ||
Medline Borrower LP | ||
3.88%, 4/1/2029 (a) | 90,000 | 78,568 |
5.25%, 10/1/2029 (a) | 90,000 | 79,922 |
158,490 | ||
Health Care Providers & Services — 0.5% | ||
Acadia Healthcare Co., Inc. 5.50%, 7/1/2028 (a) | 41,000 | 38,841 |
AdaptHealth LLC 4.63%, 8/1/2029 (a) | 54,000 | 44,123 |
Community Health Systems, Inc. | ||
8.00%, 3/15/2026 (a) | 98,000 | 95,663 |
5.63%, 3/15/2027 (a) | 23,000 | 20,239 |
6.00%, 1/15/2029 (a) | 67,000 | 56,113 |
4.75%, 2/15/2031 (a) | 77,000 | 57,365 |
DaVita, Inc. 4.63%, 6/1/2030 (a) | 103,000 | 88,349 |
Encompass Health Corp. 4.75%, 2/1/2030 | 81,000 | 73,778 |
HCA, Inc. 5.20%, 6/1/2028 | 520,000 | 512,403 |
Owens & Minor, Inc. 4.50%, 3/31/2029 (a) | 45,000 | 38,138 |
Tenet Healthcare Corp. | ||
5.13%, 11/1/2027 | 59,000 | 56,099 |
4.25%, 6/1/2029 | 198,000 | 176,776 |
1,257,887 | ||
Hotel & Resort REITs — 0.0% ^ | ||
RHP Hotel Properties LP 4.75%, 10/15/2027 | 67,000 | 62,292 |
Hotels, Restaurants & Leisure — 0.6% | ||
1011778 BC ULC (Canada) 3.88%, 1/15/2028 (a) | 46,000 | 41,839 |
Boyd Gaming Corp. 4.75%, 12/1/2027 | 59,000 | 55,236 |
Boyne USA, Inc. 4.75%, 5/15/2029 (a) | 85,000 | 76,713 |
Caesars Entertainment, Inc. 6.25%, 7/1/2025 (a) | 95,000 | 94,263 |
Carnival Corp. 9.88%, 8/1/2027 (a) | 162,000 | 171,237 |
Cedar Fair LP 5.25%, 7/15/2029 (b) | 85,000 | 76,515 |
Gohl Capital Ltd. (Malaysia) 4.25%, 1/24/2027 (d) | 200,000 | 185,476 |
Hilton Domestic Operating Co., Inc. 4.88%, 1/15/2030 | 72,000 | 67,170 |
Marriott Ownership Resorts, Inc. 4.50%, 6/15/2029 (a) | 49,000 | 41,406 |
MGM Resorts International 5.50%, 4/15/2027 | 78,000 | 74,522 |
August 31, 2023 | J.P. Morgan Exchange-Traded Funds | 139 |
AS OF August 31, 2023 (Unaudited) (continued)
INVESTMENTS | PRINCIPAL AMOUNT($) | VALUE($) |
Corporate Bonds — continued | ||
Hotels, Restaurants & Leisure — continued | ||
Royal Caribbean Cruises Ltd. | ||
8.25%, 1/15/2029 (a) | 75,000 | 78,114 |
9.25%, 1/15/2029 (a) | 70,000 | 74,609 |
Sands China Ltd. (Macau) 5.38%, 8/8/2025 (e) | 200,000 | 193,335 |
Six Flags Entertainment Corp. 5.50%, 4/15/2027 (a) | 56,000 | 52,710 |
Six Flags Theme Parks, Inc. 7.00%, 7/1/2025 (a) | 22,000 | 21,994 |
Station Casinos LLC 4.50%, 2/15/2028 (a) | 49,000 | 43,855 |
Wynn Las Vegas LLC 5.50%, 3/1/2025 (a) | 49,000 | 48,406 |
Wynn Resorts Finance LLC 5.13%, 10/1/2029 (a) | 60,000 | 53,712 |
Yum! Brands, Inc. | ||
4.75%, 1/15/2030 (a) | 28,000 | 25,784 |
4.63%, 1/31/2032 | 8,000 | 7,158 |
1,484,054 | ||
Household Durables — 0.1% | ||
CD&R Smokey Buyer, Inc. 6.75%, 7/15/2025 (a) | 54,000 | 52,260 |
Newell Brands, Inc. 6.38%, 9/15/2027 | 80,000 | 78,371 |
Tempur Sealy International, Inc. 4.00%, 4/15/2029 (a) | 90,000 | 77,308 |
207,939 | ||
Household Products — 0.1% | ||
Central Garden & Pet Co. | ||
4.13%, 10/15/2030 | 59,000 | 50,780 |
4.13%, 4/30/2031 (a) | 31,000 | 26,325 |
Energizer Holdings, Inc. | ||
4.75%, 6/15/2028 (a) | 41,000 | 36,201 |
4.38%, 3/31/2029 (a) | 44,000 | 37,686 |
Spectrum Brands, Inc. 5.00%, 10/1/2029 (a) | 90,000 | 82,539 |
233,531 | ||
Independent Power and Renewable Electricity Producers — 0.2% | ||
Calpine Corp. 4.50%, 2/15/2028 (a) | 85,000 | 78,687 |
Constellation Energy Generation LLC 5.60%, 3/1/2028 | 355,000 | 357,349 |
Termocandelaria Power Ltd. (Colombia) 7.88%, 1/30/2029 (d) | 155,000 | 144,508 |
580,544 | ||
Industrial REITs — 0.3% | ||
Prologis LP 4.88%, 6/15/2028 | 685,000 | 677,903 |
INVESTMENTS | PRINCIPAL AMOUNT($) | VALUE($) |
Insurance — 1.1% | ||
Athene Global Funding | ||
0.95%, 1/8/2024 (a) | 259,000 | 254,051 |
0.91%, 8/19/2024 (a) | 295,000 | 280,185 |
2.50%, 1/14/2025 (a) | 308,000 | 291,473 |
Equitable Financial Life Global Funding 0.80%, 8/12/2024 (a) | 230,000 | 219,005 |
Jackson National Life Global Funding | ||
3.88%, 6/11/2025 (a) | 150,000 | 143,184 |
5.50%, 1/9/2026 (a) | 575,000 | 564,188 |
Met Tower Global Funding 5.40%, 6/20/2026 (a) | 1,000,000 | 998,044 |
2,750,130 | ||
IT Services — 0.0% ^ | ||
Arches Buyer, Inc. 4.25%, 6/1/2028 (a) | 49,000 | 42,623 |
Presidio Holdings, Inc. 4.88%, 2/1/2027 (a) | 52,000 | 48,617 |
91,240 | ||
Leisure Products — 0.0% ^ | ||
Vista Outdoor, Inc. 4.50%, 3/15/2029 (a) | 59,000 | 49,175 |
Life Sciences Tools & Services — 0.0% ^ | ||
Syneos Health, Inc. 3.63%, 1/15/2029 (a) | 54,000 | 53,865 |
Machinery — 0.0% ^ | ||
Chart Industries, Inc. 7.50%, 1/1/2030 (a) | 62,000 | 63,528 |
Terex Corp. 5.00%, 5/15/2029 (a) | 41,000 | 37,644 |
101,172 | ||
Media — 0.6% | ||
Clear Channel Outdoor Holdings, Inc. | ||
5.13%, 8/15/2027 (a) | 131,000 | 117,329 |
7.75%, 4/15/2028 (a) | 26,000 | 20,450 |
CSC Holdings LLC | ||
5.25%, 6/1/2024 | 44,000 | 41,737 |
6.50%, 2/1/2029 (a) | 200,000 | 165,332 |
Directv Financing LLC 5.88%, 8/15/2027 (a) | 49,000 | 43,425 |
DISH DBS Corp. | ||
5.88%, 11/15/2024 | 44,000 | 40,925 |
7.75%, 7/1/2026 | 76,000 | 56,840 |
5.25%, 12/1/2026 (a) | 98,000 | 82,609 |
DISH Network Corp. 11.75%, 11/15/2027 (a) | 49,000 | 49,717 |
Gannett Holdings LLC 6.00%, 11/1/2026 (a) | 41,000 | 35,170 |
Gray Escrow II, Inc. 5.38%, 11/15/2031 (a) | 90,000 | 62,833 |
iHeartCommunications, Inc. | ||
8.38%, 5/1/2027 (b) | 22,500 | 15,580 |
5.25%, 8/15/2027 (a) | 100,000 | 79,073 |
News Corp. 3.88%, 5/15/2029 (a) | 46,000 | 40,397 |
140 | J.P. Morgan Exchange-Traded Funds | August 31, 2023 |
INVESTMENTS | PRINCIPAL AMOUNT($) | VALUE($) |
Corporate Bonds — continued | ||
Media — continued | ||
Nexstar Media, Inc. 5.63%, 7/15/2027 (a) | 97,000 | 91,174 |
Scripps Escrow II, Inc. 3.88%, 1/15/2029 (a) | 36,000 | 28,902 |
Scripps Escrow, Inc. 5.88%, 7/15/2027 (a) | 18,000 | 14,544 |
Sinclair Television Group, Inc. 4.13%, 12/1/2030 (a) | 59,000 | 38,022 |
Sirius XM Radio, Inc. | ||
5.00%, 8/1/2027 (a) | 49,000 | 45,304 |
5.50%, 7/1/2029 (a) | 190,000 | 171,049 |
Stagwell Global LLC 5.63%, 8/15/2029 (a) | 67,000 | 55,954 |
TEGNA, Inc. 4.63%, 3/15/2028 | 50,000 | 44,658 |
Univision Communications, Inc. | ||
6.63%, 6/1/2027 (a) | 26,000 | 25,171 |
4.50%, 5/1/2029 (a) | 53,000 | 45,619 |
Videotron Ltd. (Canada) 5.13%, 4/15/2027 (a) | 41,000 | 39,258 |
1,451,072 | ||
Metals & Mining — 0.2% | ||
ATI, Inc. 5.88%, 12/1/2027 | 108,000 | 105,030 |
Big River Steel LLC 6.63%, 1/31/2029 (a) | 41,000 | 40,761 |
Carpenter Technology Corp. 6.38%, 7/15/2028 | 67,000 | 65,459 |
Cleveland-Cliffs, Inc. | ||
6.75%, 3/15/2026 (a) | 62,000 | 62,019 |
5.88%, 6/1/2027 | 8,000 | 7,704 |
4.63%, 3/1/2029 (a) | 13,000 | 11,526 |
CSN Inova Ventures (Brazil) 6.75%, 1/28/2028 (d) | 200,000 | 187,332 |
FMG Resources August 2006 Pty. Ltd. (Australia) 4.50%, 9/15/2027 (a) | 62,000 | 57,201 |
Novelis Corp. 4.75%, 1/30/2030 (a) | 77,000 | 68,911 |
605,943 | ||
Oil, Gas & Consumable Fuels — 1.7% | ||
Antero Midstream Partners LP | ||
7.88%, 5/15/2026 (a) | 48,000 | 48,835 |
5.38%, 6/15/2029 (a) | 26,000 | 24,363 |
Antero Resources Corp. | ||
7.63%, 2/1/2029 (a) | 27,000 | 27,670 |
5.38%, 3/1/2030 (a) | 59,000 | 55,163 |
APA Infrastructure Ltd. (Australia) 4.20%, 3/23/2025 (a) | 350,000 | 341,402 |
Baytex Energy Corp. (Canada) 8.75%, 4/1/2027 (a) | 44,000 | 45,030 |
Blue Racer Midstream LLC 6.63%, 7/15/2026 (a) | 27,000 | 26,536 |
Buckeye Partners LP 4.13%, 12/1/2027 | 80,000 | 72,743 |
INVESTMENTS | PRINCIPAL AMOUNT($) | VALUE($) |
Oil, Gas & Consumable Fuels — continued | ||
California Resources Corp. 7.13%, 2/1/2026 (a) | 35,000 | 35,090 |
Chesapeake Energy Corp. 6.75%, 4/15/2029 (a) | 72,000 | 71,476 |
Chord Energy Corp. 6.38%, 6/1/2026 (a) | 36,000 | 35,482 |
Civitas Resources, Inc. | ||
8.38%, 7/1/2028 (a) | 23,000 | 23,690 |
8.75%, 7/1/2031 (a) | 20,000 | 20,700 |
CNX Resources Corp. 6.00%, 1/15/2029 (a) | 54,000 | 51,428 |
Comstock Resources, Inc. 6.75%, 3/1/2029 (a) | 98,000 | 91,696 |
Crestwood Midstream Partners LP | ||
5.63%, 5/1/2027 (a) | 49,000 | 47,530 |
8.00%, 4/1/2029 (a) | 36,000 | 37,199 |
DT Midstream, Inc. 4.13%, 6/15/2029 (a) | 85,000 | 75,303 |
Ecopetrol SA (Colombia) | ||
5.38%, 6/26/2026 | 150,000 | 144,787 |
8.63%, 1/19/2029 | 50,000 | 50,875 |
Energian Israel Finance Ltd. (Israel) | ||
4.50%, 3/30/2024 (d) | 12,000 | 11,868 |
4.88%, 3/30/2026 (d) | 180,000 | 168,442 |
Energy Transfer LP 5.55%, 2/15/2028 | 410,000 | 408,507 |
EQM Midstream Partners LP | ||
4.00%, 8/1/2024 | 10,000 | 9,757 |
5.50%, 7/15/2028 | 85,000 | 81,208 |
Genesis Energy LP 8.00%, 1/15/2027 | 46,000 | 45,348 |
Gray Oak Pipeline LLC 2.60%, 10/15/2025 (a) | 475,000 | 439,247 |
Greenko Dutch BV (India) 3.85%, 3/29/2026 (a) | 188,000 | 169,480 |
Gulfport Energy Corp. 8.00%, 5/17/2026 (a) | 76,436 | 77,623 |
Hilcorp Energy I LP 5.75%, 2/1/2029 (a) | 72,000 | 66,780 |
Kinetik Holdings LP 5.88%, 6/15/2030 (a) | 54,000 | 52,300 |
Leviathan Bond Ltd. (Israel) | ||
6.13%, 6/30/2025 (d) | 50,000 | 48,915 |
6.50%, 6/30/2027 (d) | 150,000 | 144,645 |
MEG Energy Corp. (Canada) 5.88%, 2/1/2029 (a) | 54,000 | 51,588 |
NGL Energy Operating LLC 7.50%, 2/1/2026 (a) | 28,000 | 27,876 |
NuStar Logistics LP 5.63%, 4/28/2027 | 55,000 | 53,364 |
Petroleos Mexicanos (Mexico) | ||
4.25%, 1/15/2025 | 150,000 | 141,113 |
4.50%, 1/23/2026 | 100,000 | 87,850 |
6.88%, 8/4/2026 | 180,000 | 163,593 |
6.49%, 1/23/2027 | 270,000 | 235,478 |
August 31, 2023 | J.P. Morgan Exchange-Traded Funds | 141 |
AS OF August 31, 2023 (Unaudited) (continued)
INVESTMENTS | PRINCIPAL AMOUNT($) | VALUE($) |
Corporate Bonds — continued | ||
Oil, Gas & Consumable Fuels — continued | ||
Range Resources Corp. | ||
8.25%, 1/15/2029 | 54,000 | 56,060 |
4.75%, 2/15/2030 (a) | 24,000 | 21,671 |
SM Energy Co. | ||
6.75%, 9/15/2026 | 26,000 | 25,891 |
6.63%, 1/15/2027 | 54,000 | 53,325 |
Southwestern Energy Co. | ||
8.38%, 9/15/2028 | 31,000 | 32,266 |
5.38%, 3/15/2030 | 45,000 | 42,128 |
Sunoco LP 5.88%, 3/15/2028 | 54,000 | 52,450 |
Tallgrass Energy Partners LP | ||
6.00%, 3/1/2027 (a) | 44,000 | 42,163 |
6.00%, 12/31/2030 (a) | 32,000 | 28,627 |
Venture Global LNG, Inc. 8.13%, 6/1/2028 (a) | 60,000 | 60,525 |
Vital Energy, Inc. 9.50%, 1/15/2025 | 31,000 | 31,155 |
4,258,241 | ||
Passenger Airlines — 0.1% | ||
American Airlines, Inc. | ||
5.50%, 4/20/2026 (a) | 110,917 | 108,841 |
5.75%, 4/20/2029 (a) | 48,750 | 46,624 |
United Airlines, Inc. 4.38%, 4/15/2026 (a) | 47,000 | 44,294 |
VistaJet Malta Finance plc (Switzerland) 9.50%, 6/1/2028 (a) | 40,000 | 36,912 |
236,671 | ||
Personal Care Products — 0.1% | ||
Edgewell Personal Care Co. 5.50%, 6/1/2028 (a) | 108,000 | 101,790 |
Prestige Brands, Inc. 5.13%, 1/15/2028 (a) | 54,000 | 51,033 |
152,823 | ||
Pharmaceuticals — 0.1% | ||
Bausch Health Americas, Inc. 9.25%, 4/1/2026 (a) | 88,000 | 79,709 |
Bausch Health Cos., Inc. | ||
5.50%, 11/1/2025 (a) | 59,000 | 53,133 |
4.88%, 6/1/2028 (a) | 257,000 | 152,502 |
Elanco Animal Health, Inc. 6.65%, 8/28/2028 (b) (e) | 54,000 | 53,257 |
338,601 | ||
Real Estate Management & Development — 0.0% ^ | ||
Kennedy-Wilson, Inc. 4.75%, 3/1/2029 | 67,000 | 53,836 |
Realogy Group LLC 5.75%, 1/15/2029 (a) | 49,000 | 35,093 |
88,929 | ||
INVESTMENTS | PRINCIPAL AMOUNT($) | VALUE($) |
Semiconductors & Semiconductor Equipment — 0.1% | ||
Amkor Technology, Inc. 6.63%, 9/15/2027 (a) | 54,000 | 53,967 |
Entegris Escrow Corp. 5.95%, 6/15/2030 (a) | 90,000 | 86,185 |
Marvell Technology, Inc. 1.65%, 4/15/2026 | 125,000 | 113,439 |
Synaptics, Inc. 4.00%, 6/15/2029 (a) | 35,000 | 29,774 |
283,365 | ||
Software — 0.2% | ||
Clarivate Science Holdings Corp. 3.88%, 7/1/2028 (a) | 64,000 | 56,394 |
NCR Corp. | ||
5.00%, 10/1/2028 (a) | 62,000 | 56,903 |
5.13%, 4/15/2029 (a) | 48,000 | 43,653 |
6.13%, 9/1/2029 (a) | 26,000 | 26,778 |
Oracle Corp. 4.50%, 5/6/2028 | 395,000 | 383,205 |
RingCentral, Inc. 8.50%, 8/15/2030 (a) | 15,000 | 14,775 |
581,708 | ||
Specialized REITs — 0.0% ^ | ||
Iron Mountain, Inc. 4.88%, 9/15/2027 (a) | 52,000 | 48,954 |
Specialty Retail — 0.3% | ||
Asbury Automotive Group, Inc. 4.50%, 3/1/2028 | 59,000 | 53,821 |
Bath & Body Works, Inc. | ||
5.25%, 2/1/2028 | 41,000 | 39,337 |
7.50%, 6/15/2029 | 76,000 | 76,624 |
6.75%, 7/1/2036 | 23,000 | 21,232 |
Gap, Inc. (The) 3.63%, 10/1/2029 (a) | 85,000 | 64,709 |
Group 1 Automotive, Inc. 4.00%, 8/15/2028 (a) | 49,000 | 43,507 |
Lithia Motors, Inc. | ||
4.63%, 12/15/2027 (a) | 31,000 | 28,633 |
4.38%, 1/15/2031 (a) | 31,000 | 26,376 |
Penske Automotive Group, Inc. 3.75%, 6/15/2029 | 64,000 | 54,917 |
PetSmart, Inc. 4.75%, 2/15/2028 (a) | 250,000 | 224,257 |
Sonic Automotive, Inc. 4.63%, 11/15/2029 (a) | 49,000 | 41,890 |
SRS Distribution, Inc. 4.63%, 7/1/2028 (a) | 49,000 | 43,611 |
Staples, Inc. 7.50%, 4/15/2026 (a) | 95,000 | 78,603 |
797,517 | ||
Technology Hardware, Storage & Peripherals — 0.0% ^ | ||
Seagate HDD Cayman | ||
8.25%, 12/15/2029 (a) | 18,000 | 18,882 |
142 | J.P. Morgan Exchange-Traded Funds | August 31, 2023 |
INVESTMENTS | PRINCIPAL AMOUNT($) | VALUE($) |
Corporate Bonds — continued | ||
Technology Hardware, Storage & Peripherals — continued | ||
8.50%, 7/15/2031 (a) | 6,000 | 6,286 |
9.63%, 12/1/2032 (a) | 44,000 | 48,739 |
73,907 | ||
Tobacco — 0.2% | ||
BAT International Finance plc (United Kingdom) 4.45%, 3/16/2028 | 475,000 | 450,314 |
Trading Companies & Distributors — 0.2% | ||
Air Lease Corp. 4.25%, 2/1/2024 | 150,000 | 148,819 |
Aviation Capital Group LLC 4.38%, 1/30/2024 (a) | 200,000 | 197,877 |
Herc Holdings, Inc. 5.50%, 7/15/2027 (a) | 54,000 | 51,925 |
Imola Merger Corp. 4.75%, 5/15/2029 (a) | 36,000 | 31,999 |
United Rentals North America, Inc. 4.88%, 1/15/2028 | 64,000 | 60,893 |
WESCO Distribution, Inc. 7.25%, 6/15/2028 (a) | 68,000 | 69,206 |
560,719 | ||
Wireless Telecommunication Services — 0.3% | ||
Hughes Satellite Systems Corp. 6.63%, 8/1/2026 (b) | 67,000 | 58,123 |
Kenbourne Invest SA (Chile) 4.70%, 1/22/2028 (d) | 200,000 | 123,000 |
T-Mobile USA, Inc. | ||
3.50%, 4/15/2025 | 150,000 | 145,005 |
3.38%, 4/15/2029 | 600,000 | 537,817 |
863,945 | ||
Total Corporate Bonds (Cost $94,489,433) | 91,061,074 | |
Asset-Backed Securities — 21.1% | ||
Accelerated LLC Series 2021-1H, Class B, 1.90%, 10/20/2040 (a) | 155,297 | 139,530 |
ACM Auto Trust Series 2023-1A, Class B, 7.26%, 1/22/2030 (a) | 383,000 | 381,381 |
Aligned Data Centers Issuer LLC Series 2021-1A, Class A2, 1.94%, 8/15/2046 (a) | 263,000 | 230,777 |
American Credit Acceptance Receivables Trust | ||
Series 2020-1, Class E, 3.32%, 3/13/2026 (a) | 450,000 | 443,815 |
Series 2022-1, Class D, 2.46%, 3/13/2028 (a) | 1,500,000 | 1,415,436 |
Series 2022-3, Class D, 5.83%, 10/13/2028 (a) | 584,000 | 569,645 |
Series 2023-1, Class D, 6.35%, 4/12/2029 (a) | 375,000 | 369,661 |
INVESTMENTS | PRINCIPAL AMOUNT($) | VALUE($) |
AMSR Trust | ||
Series 2021-SFR3, Class E1, 2.33%, 10/17/2038 (a) | 300,000 | 255,731 |
Series 2021-SFR4, Class E1, 2.97%, 12/17/2038 (a) | 400,000 | 345,283 |
Series 2023-SFR2, Class B, 3.95%, 6/17/2040 (a) | 1,500,000 | 1,360,486 |
Aqua Finance Trust Series 2021-A, Class B, 2.40%, 7/17/2046 (a) | 313,000 | 251,797 |
AREIT Trust Series 2021-CRE5, Class C, 7.68%, 11/17/2038 ‡ (a) (f) | 336,000 | 317,912 |
Atlas Senior Loan Fund (Cayman Islands) Series 2019-13A, Class A1NR, 6.69%, 4/22/2031 (a) (f) | 198,732 | 197,419 |
Bain Capital Credit CLO Ltd. (Cayman Islands) Series 2017-1A, Class A1R, 6.56%, 7/20/2030 (a) (f) | 281,975 | 280,159 |
BSPRT Issuer Ltd. (Cayman Islands) Series 2021-FL7, Class B, 7.47%, 12/15/2038 (a) (f) | 475,000 | 462,058 |
Business Jet Securities LLC | ||
Series 2020-1A, Class A, 2.98%, 11/15/2035 ‡ (a) | 211,883 | 199,941 |
Series 2021-1A, Class A, 2.16%, 4/15/2036 ‡ (a) | 524,090 | 474,307 |
CarNow Auto Receivables Trust | ||
Series 2021-1A, Class C, 2.16%, 2/17/2026 (a) | 103,950 | 102,963 |
Series 2021-2A, Class C, 1.69%, 3/15/2027 (a) | 500,000 | 488,525 |
Series 2022-1A, Class D, 5.79%, 9/15/2027 (a) | 397,000 | 390,549 |
Carvana Auto Receivables Trust Series 2019-3A, Class E, 4.60%, 7/15/2026 (a) | 750,000 | 738,297 |
Continental Finance Credit Card ABS Master Trust Series 2021-A, Class A, 2.55%, 12/17/2029 (a) | 400,000 | 370,296 |
CPS Auto Receivables Trust | ||
Series 2019-B, Class E, 5.00%, 3/17/2025 (a) | 295,037 | 293,988 |
Series 2019-A, Class E, 5.81%, 3/16/2026 (a) | 355,505 | 355,303 |
Series 2021-D, Class D, 2.31%, 12/15/2027 (a) | 200,000 | 186,219 |
Series 2022-A, Class D, 2.84%, 4/16/2029 (a) | 1,021,000 | 946,434 |
Series 2023-A, Class D, 6.44%, 4/16/2029 (a) | 750,000 | 742,093 |
Series 2023-C, Class C, 6.27%, 10/15/2029 (a) | 881,000 | 880,937 |
August 31, 2023 | J.P. Morgan Exchange-Traded Funds | 143 |
AS OF August 31, 2023 (Unaudited) (continued)
INVESTMENTS | PRINCIPAL AMOUNT($) | VALUE($) |
Asset-Backed Securities — continued | ||
Series 2022-C, Class D, 6.45%, 4/15/2030 (a) | 240,000 | 237,824 |
Credit Acceptance Auto Loan Trust | ||
Series 2021-3A, Class C, 1.63%, 9/16/2030 (a) | 250,000 | 233,003 |
Series 2022-1A, Class C, 5.70%, 10/15/2032 (a) | 467,000 | 449,851 |
Crossroads Asset Trust Series 2021-A, Class C, 1.44%, 1/20/2026 (a) | 125,000 | 123,123 |
Dext ABS LLC Series 2021-1, Class A, 1.12%, 2/15/2028 (a) | 125,128 | 120,640 |
DT Auto Owner Trust | ||
Series 2021-1A, Class D, 1.16%, 11/16/2026 (a) | 250,000 | 233,278 |
Series 2021-3A, Class D, 1.31%, 5/17/2027 (a) | 250,000 | 227,863 |
Series 2023-1A, Class C, 5.55%, 10/16/2028 (a) | 300,000 | 295,392 |
Series 2023-1A, Class D, 6.44%, 11/15/2028 (a) | 307,000 | 304,484 |
Series 2023-3A, Class C, 6.40%, 5/15/2029 (a) | 1,606,000 | 1,608,385 |
Exeter Automobile Receivables Trust | ||
Series 2019-3A, Class D, 3.11%, 8/15/2025 (a) | 60,487 | 59,956 |
Series 2020-1A, Class E, 3.74%, 1/15/2027 (a) | 635,000 | 615,219 |
Series 2021-2A, Class D, 1.40%, 4/15/2027 | 210,000 | 194,694 |
Series 2022-5A, Class C, 6.51%, 12/15/2027 | 345,000 | 344,173 |
Series 2021-4A, Class D, 1.96%, 1/17/2028 | 480,000 | 444,535 |
Series 2023-3A, Class C, 6.21%, 6/15/2028 | 1,410,000 | 1,407,924 |
Series 2022-2A, Class D, 4.56%, 7/17/2028 | 800,000 | 763,879 |
Series 2022-5A, Class D, 7.40%, 2/15/2029 | 500,000 | 506,855 |
Series 2022-6A, Class D, 8.03%, 4/6/2029 | 500,000 | 517,939 |
FCI Funding LLC Series 2021-1A, Class A, 1.13%, 4/15/2033 ‡ (a) | 27,532 | 26,607 |
FHF Trust | ||
Series 2021-2A, Class A, 0.83%, 12/15/2026 (a) | 145,439 | 139,142 |
Series 2021-1A, Class A, 1.27%, 3/15/2027 (a) | 48,328 | 46,611 |
INVESTMENTS | PRINCIPAL AMOUNT($) | VALUE($) |
FirstKey Homes Trust | ||
Series 2021-SFR3, Class E1, 2.99%, 12/17/2038 (a) | 500,000 | 440,713 |
Series 2022-SFR2, Class D, 4.50%, 7/17/2039 (a) | 615,000 | 560,546 |
Flagship Credit Auto Trust | ||
Series 2021-1, Class D, 1.27%, 3/15/2027 (a) | 225,000 | 206,028 |
Series 2021-3, Class C, 1.46%, 9/15/2027 (a) | 143,000 | 132,041 |
Series 2022-1, Class D, 3.64%, 3/15/2028 (a) | 536,000 | 496,104 |
Series 2022-2, Class C, 5.30%, 4/17/2028 (a) | 750,000 | 731,720 |
Series 2022-3, Class C, 4.99%, 7/17/2028 (a) | 858,000 | 830,689 |
Series 2022-3, Class D, 6.00%, 7/17/2028 (a) | 600,000 | 584,177 |
Foundation Finance Trust Series 2021-1A, Class A, 1.27%, 5/15/2041 (a) | 77,555 | 69,133 |
FRTKL Series 2021-SFR1, Class D, 2.17%, 9/17/2038 (a) | 238,000 | 205,955 |
Galaxy CLO Ltd. (Cayman Islands) Series 2015-19A, Class A1RR, 6.56%, 7/24/2030 (a) (f) | 237,748 | 236,149 |
GLS Auto Receivables Issuer Trust | ||
Series 2019-4A, Class C, 3.06%, 8/15/2025 (a) | 69,842 | 69,207 |
Series 2021-3A, Class D, 1.48%, 7/15/2027 (a) | 200,000 | 183,787 |
Series 2020-4A, Class E, 3.51%, 10/15/2027 (a) | 1,000,000 | 948,799 |
Series 2022-1A, Class D, 3.97%, 1/18/2028 (a) | 750,000 | 709,861 |
GLS Auto Select Receivables Trust | ||
Series 2023-1A, Class A3, 5.96%, 10/16/2028 (a) | 757,000 | 752,568 |
Series 2023-1A, Class B, 6.09%, 3/15/2029 (a) | 722,000 | 715,593 |
Goldman Home Improvement Trust Issuer Trust Series 2021-GRN2, Class A, 1.15%, 6/25/2051 (a) | 78,022 | 72,180 |
Hilton Grand Vacations Trust Series 2023-1A, Class A, 5.72%, 1/25/2038 (a) | 1,086,000 | 1,097,852 |
Home Partners of America Trust Series 2021-3, Class E1, 3.20%, 1/17/2041 (a) | 461,007 | 383,864 |
LCM LP (Cayman Islands) Series 14A, Class AR, 6.63%, 7/20/2031 (a) (f) | 400,000 | 396,953 |
144 | J.P. Morgan Exchange-Traded Funds | August 31, 2023 |
INVESTMENTS | PRINCIPAL AMOUNT($) | VALUE($) |
Asset-Backed Securities — continued | ||
LCM Ltd. (Cayman Islands) Series 26A, Class A1, 6.66%, 1/20/2031 (a) (f) | 215,005 | 214,253 |
Lendbuzz Securitization Trust Series 2021-1A, Class A, 1.46%, 6/15/2026 (a) | 73,182 | 70,551 |
Lendingpoint Asset Securitization Trust Series 2022-A, Class C, 2.82%, 6/15/2029 (a) | 300,000 | 292,864 |
LendingPoint Asset Securitization Trust Series 2020-REV1, Class B, 4.49%, 10/15/2028 (a) | 300,000 | 296,608 |
LendingPoint Pass-Through Trust Series 2022-ST1, Class A, 2.50%, 3/15/2028 (a) | 84,176 | 82,827 |
Lendmark Funding Trust Series 2021-1A, Class A, 1.90%, 11/20/2031 (a) | 950,000 | 826,786 |
LL ABS Trust Series 2021-1A, Class A, 1.07%, 5/15/2029 (a) | 43,918 | 43,145 |
LMREC LLC Series 2021-CRE4, Class A, 6.48%, 4/22/2037 (a) (f) | 22,995 | 22,674 |
LP LMS Asset Securitization Trust Series 2023-1A, Class A, 8.18%, 10/17/2033 ‡ (a) | 361,841 | 359,643 |
Mariner Finance Issuance Trust Series 2021-AA, Class A, 1.86%, 3/20/2036 (a) | 192,000 | 170,527 |
Mercury Financial Credit Card Master Trust Series 2023-1A, Class A, 8.04%, 9/20/2027 (a) | 408,000 | 409,724 |
Mission Lane Credit Card Master Trust Series 2023-A, Class A, 7.23%, 7/17/2028 (a) | 200,000 | 198,832 |
MVW LLC | ||
Series 2021-1WA, Class A, 1.14%, 1/22/2041 (a) | 99,533 | 90,504 |
Series 2021-1WA, Class B, 1.44%, 1/22/2041 (a) | 42,718 | 38,548 |
Neuberger Berman Loan Advisers CLO Ltd. (Cayman Islands) Series 2020-37A, Class AR, 6.56%, 7/20/2031 (a) (f) | 354,000 | 351,538 |
New Residential Mortgage Loan Trust Series 2022-SFR1, Class E1, 3.55%, 2/17/2039 (a) | 520,000 | 450,235 |
NMEF Funding LLC Series 2021-A, Class B, 1.85%, 12/15/2027 (a) | 169,214 | 166,346 |
NRZ Excess Spread-Collateralized Notes Series 2021-FNT1, Class A, 2.98%, 3/25/2026 (a) | 97,971 | 89,167 |
Octane Receivables Trust Series 2023-1A, Class D, 7.76%, 3/20/2030 (a) | 500,000 | 498,712 |
Oportun Funding XIV LLC Series 2021-A, Class A, 1.21%, 3/8/2028 (a) | 120,206 | 115,365 |
Pagaya AI Debt Selection Trust | ||
Series 2021-HG1, Class A, 1.22%, 1/16/2029 (a) | 110,749 | 106,722 |
INVESTMENTS | PRINCIPAL AMOUNT($) | VALUE($) |
Series 2021-3, Class A, 1.15%, 5/15/2029 (a) | 18,022 | 17,929 |
Palmer Square Loan Funding Ltd. (Cayman Islands) Series 2021-2A, Class A1, 6.44%, 5/20/2029 (a) (f) | 100,752 | 100,231 |
PFP Ltd. (Cayman Islands) Series 2021-7, Class C, 7.08%, 4/14/2038 (a) (f) | 166,492 | 160,557 |
PRET LLC | ||
Series 2021-NPL3, Class A1, 1.87%, 7/25/2051 (a) (e) | 1,125,705 | 1,051,303 |
Series 2021-NPL6, Class A1, 2.49%, 7/25/2051 (a) (e) | 183,609 | 175,428 |
Series 2021-RN4, Class A1, 2.49%, 10/25/2051 (a) (f) | 398,486 | 365,976 |
Pretium Mortgage Credit Partners I LLC | ||
Series 2021-NPL2, Class A1, 1.99%, 6/27/2060 (a) (e) | 171,280 | 159,504 |
Series 2021-NPL1, Class A1, 2.24%, 9/27/2060 (a) (e) | 122,559 | 118,416 |
Series 2021-NPL4, Class A1, 2.36%, 10/27/2060 (a) (e) | 826,030 | 777,588 |
Progress Residential Series 2021-SFR3, Class E1, 2.54%, 5/17/2026 (a) | 200,000 | 175,194 |
Progress Residential Trust | ||
Series 2021-SFR8, Class E1, 2.38%, 10/17/2038 (a) | 350,000 | 302,519 |
Series 2022-SFR3, Class D, 4.45%, 4/17/2039 (a) | 562,000 | 518,482 |
PRPM LLC | ||
Series 2021-2, Class A1, 2.12%, 3/25/2026 (a) (f) | 96,238 | 92,693 |
Series 2021-5, Class A1, 1.79%, 6/25/2026 (a) (e) | 742,592 | 692,720 |
Series 2021-6, Class A1, 1.79%, 7/25/2026 (a) (e) | 230,656 | 217,786 |
Series 2021-7, Class A1, 1.87%, 8/25/2026 (a) (e) | 202,955 | 187,681 |
Series 2021-11, Class A1, 2.49%, 11/25/2026 (a) (e) | 206,895 | 197,192 |
Reach ABS Trust Series 2023-1A, Class A, 7.05%, 2/18/2031 (a) | 812,251 | 812,551 |
Republic Finance Issuance Trust Series 2021-A, Class A, 2.30%, 12/22/2031 (a) | 500,000 | 462,325 |
Santander Drive Auto Receivables Trust | ||
Series 2021-3, Class D, 1.33%, 9/15/2027 | 300,000 | 281,987 |
Series 2022-4, Class C, 5.00%, 11/15/2029 | 1,250,000 | 1,222,546 |
SCF Equipment Leasing LLC Series 2021-1A, Class D, 1.93%, 9/20/2030 (a) | 535,000 | 478,364 |
August 31, 2023 | J.P. Morgan Exchange-Traded Funds | 145 |
AS OF August 31, 2023 (Unaudited) (continued)
INVESTMENTS | PRINCIPAL AMOUNT($) | VALUE($) |
Asset-Backed Securities — continued | ||
Sierra Timeshare Receivables Funding LLC Series 2023-2A, Class A, 5.80%, 4/20/2040 (a) | 1,172,082 | 1,178,129 |
Skopos Auto Receivables Trust Series 2019-1A, Class D, 5.24%, 4/15/2025 (a) | 142,417 | 142,236 |
Sound Point CLO Ltd. (Cayman Islands) Series 2019-1A, Class AR, 6.67%, 1/20/2032 (a) (f) | 400,000 | 397,393 |
Stratus CLO Ltd. (Cayman Islands) Series 2021-1A, Class A, 6.39%, 12/29/2029 (a) (f) | 371,168 | 368,860 |
Symphony CLO Ltd. (Cayman Islands) Series 2016-18A, Class A1RR, 6.71%, 7/23/2033 (a) (f) | 250,000 | 248,468 |
Tricon Residential Trust | ||
Series 2021-SFR1, Class E1, 2.79%, 7/17/2038 (a) | 240,000 | 213,397 |
Series 2023-SFR1, Class B, 5.10%, 7/17/2040 (a) | 800,000 | 766,611 |
Upstart Pass-Through Trust | ||
Series 2021-ST4, Class A, 2.00%, 7/20/2027 (a) | 68,603 | 65,542 |
Series 2021-ST5, Class A, 2.00%, 7/20/2027 (a) | 78,364 | 74,895 |
Series 2021-ST8, Class A, 1.75%, 10/20/2029 (a) | 94,320 | 91,636 |
Series 2021-ST9, Class A, 1.70%, 11/20/2029 ‡ (a) | 79,090 | 76,590 |
Series 2021-ST10, Class A, 2.25%, 1/20/2030 (a) | 157,918 | 153,259 |
Series 2022-ST1, Class A, 2.60%, 3/20/2030 (a) | 247,421 | 238,402 |
Upstart Securitization Trust | ||
Series 2021-2, Class B, 1.75%, 6/20/2031 (a) | 218,332 | 214,789 |
Series 2021-3, Class A, 0.83%, 7/20/2031 (a) | 10,077 | 10,028 |
Series 2021-4, Class B, 1.84%, 9/20/2031 (a) | 231,000 | 219,953 |
Series 2021-5, Class B, 2.49%, 11/20/2031 (a) | 225,000 | 213,883 |
Series 2022-4, Class A, 5.98%, 8/20/2032 (a) | 354,794 | 352,299 |
US Auto Funding Series 2021-1A, Class B, 1.49%, 3/17/2025 (a) | 53,160 | 52,694 |
US Auto Funding Trust Series 2022-1A, Class B, 5.13%, 12/15/2025 (a) | 574,000 | 530,471 |
VCAT LLC | ||
Series 2021-NPL2, Class A1, 2.12%, 3/27/2051 (a) (e) | 115,477 | 110,014 |
INVESTMENTS | PRINCIPAL AMOUNT($) | VALUE($) |
Series 2021-NPL3, Class A1, 1.74%, 5/25/2051 (a) (e) | 129,209 | 120,739 |
Series 2021-NPL4, Class A1, 1.87%, 8/25/2051 (a) (e) | 174,789 | 163,427 |
Venture CLO Ltd. (Cayman Islands) Series 2018-32A, Class A2A, 6.64%, 7/18/2031 (a) (f) | 150,000 | 148,990 |
Veros Auto Receivables Trust | ||
Series 2022-1, Class A, 3.47%, 12/15/2025 (a) | 127,147 | 125,730 |
Series 2021-1, Class A, 0.92%, 10/15/2026 (a) | 2,751 | 2,748 |
VOLT CIII LLC Series 2021-CF1, Class A1, 1.99%, 8/25/2051 (a) (e) | 223,610 | 206,498 |
VOLT CV LLC Series 2021-CF2, Class A1, 2.49%, 11/27/2051 (a) (e) | 377,266 | 347,299 |
VOLT XCIX LLC Series 2021-NPL8, Class A1, 2.12%, 4/25/2051 (a) (e) | 116,407 | 108,483 |
VOLT XCVI LLC Series 2021-NPL5, Class A1, 2.12%, 3/27/2051 (a) (e) | 88,131 | 83,391 |
VOLT XCVII LLC Series 2021-NPL6, Class A1, 2.24%, 4/25/2051 (a) (e) | 118,859 | 110,969 |
Westlake Automobile Receivables Trust | ||
Series 2019-3A, Class E, 3.59%, 3/17/2025 (a) | 83,295 | 83,221 |
Series 2021-1A, Class D, 1.23%, 4/15/2026 (a) | 250,000 | 237,599 |
Series 2021-3A, Class D, 2.12%, 1/15/2027 (a) | 1,000,000 | 931,095 |
Series 2023-1A, Class D, 6.79%, 11/15/2028 (a) | 500,000 | 498,606 |
Total Asset-Backed Securities (Cost $55,696,618) | 54,269,125 | |
U.S. Treasury Obligations — 16.7% | ||
U.S. Treasury Notes | ||
4.63%, 2/28/2025 | 32,500 | 32,275 |
3.88%, 3/31/2025 | 125,000 | 122,739 |
2.88%, 6/15/2025 | 5,820,000 | 5,613,799 |
3.00%, 7/15/2025 | 2,847,800 | 2,750,574 |
3.13%, 8/15/2025 | 195,000 | 188,655 |
3.50%, 9/15/2025 | 657,700 | 640,590 |
4.25%, 10/15/2025 | 4,970,000 | 4,914,282 |
4.50%, 11/15/2025 | 5,285,000 | 5,252,795 |
4.00%, 12/15/2025 | 4,635,000 | 4,560,043 |
3.88%, 1/15/2026 | 2,475,000 | 2,428,207 |
4.00%, 2/15/2026 | 6,605,000 | 6,500,765 |
0.50%, 2/28/2026 | 15,000 | 13,543 |
4.63%, 3/15/2026 | 586,100 | 585,665 |
146 | J.P. Morgan Exchange-Traded Funds | August 31, 2023 |
INVESTMENTS | PRINCIPAL AMOUNT($) | VALUE($) |
U.S. Treasury Obligations — continued | ||
3.75%, 4/15/2026 | 425,000 | 415,819 |
0.75%, 5/31/2026 | 290,000 | 261,544 |
4.13%, 6/15/2026 | 1,480,000 | 1,462,887 |
4.38%, 8/15/2026 | 2,575,000 | 2,563,332 |
0.75%, 8/31/2026 | 1,180,000 | 1,056,423 |
0.88%, 9/30/2026 | 65,000 | 58,330 |
4.00%, 2/29/2028 | 172,700 | 170,575 |
3.63%, 3/31/2028 | 3,040,000 | 2,955,213 |
3.63%, 5/31/2028 | 420,000 | 408,483 |
Total U.S. Treasury Obligations (Cost $43,404,762) | 42,956,538 | |
Mortgage-Backed Securities — 13.8% | ||
FHLMC Pool # 841368 ARM, 3.31%, 9/1/2047 (f) | 1,805,467 | 1,804,819 |
FHLMC Gold Pools, 30 Year Pool # G08878, 4.50%, 5/1/2049 | 251,862 | 243,192 |
FHLMC UMBS, 10 Year Pool # RD5034, 2.00%, 9/1/2030 | 424,919 | 386,191 |
FHLMC UMBS, 15 Year | ||
Pool # ZS6689, 2.50%, 4/1/2028 | 150,675 | 143,315 |
Pool # SB0725, 4.00%, 8/1/2037 | 954,127 | 918,938 |
Pool # SB8184, 4.00%, 10/1/2037 | 726,197 | 697,152 |
Pool # SB8189, 4.00%, 11/1/2037 | 2,030,575 | 1,950,277 |
Pool # SB8222, 4.50%, 4/1/2038 | 1,382,817 | 1,346,932 |
Pool # SB8229, 4.50%, 5/1/2038 | 1,886,684 | 1,837,699 |
FHLMC UMBS, 30 Year | ||
Pool # ZT1703, 4.00%, 1/1/2049 | 826,945 | 777,302 |
Pool # SD8231, 4.50%, 7/1/2052 | 837,983 | 794,618 |
Pool # SD8343, 6.00%, 7/1/2053 | 4,184,057 | 4,194,799 |
FNMA Pool # BM4562 ARM, 6.12%, 5/1/2047���(f) | 1,133,967 | 1,141,743 |
FNMA UMBS, 15 Year | ||
Pool # FM1156, 2.50%, 4/1/2033 | 749,525 | 689,985 |
Pool # MA4361, 2.50%, 6/1/2036 | 353,540 | 318,552 |
Pool # CB1216, 2.50%, 7/1/2036 | 661,737 | 596,300 |
Pool # FS1563, 2.50%, 7/1/2036 | 497,670 | 448,456 |
Pool # FS1329, 2.00%, 2/1/2037 | 906,766 | 797,401 |
Pool # MA4640, 3.50%, 6/1/2037 | 672,299 | 633,957 |
Pool # MA4944, 4.50%, 3/1/2038 | 2,700,288 | 2,630,246 |
FNMA UMBS, 20 Year | ||
Pool # FM3075, 3.50%, 11/1/2039 | 982,588 | 906,402 |
Pool # CA8310, 2.50%, 12/1/2040 | 250,209 | 216,992 |
Pool # MA4780, 4.50%, 10/1/2042 | 2,544,385 | 2,445,648 |
FNMA UMBS, 30 Year | ||
Pool # FM2972, 4.00%, 12/1/2044 | 858,826 | 815,899 |
Pool # FS2237, 4.00%, 10/1/2046 | 2,017,100 | 1,915,157 |
INVESTMENTS | PRINCIPAL AMOUNT($) | VALUE($) |
Pool # BM1285, 4.50%, 5/1/2047 | 135,739 | 131,394 |
Pool # FS1847, 4.00%, 1/1/2049 | 251,377 | 236,401 |
Pool # FS1891, 4.00%, 1/1/2050 | 836,765 | 786,909 |
Pool # FS0085, 4.00%, 11/1/2050 | 908,696 | 853,102 |
Pool # MA4733, 4.50%, 9/1/2052 | 846,033 | 802,207 |
Pool # MA5039, 5.50%, 6/1/2053 | 2,148,828 | 2,121,254 |
GNMA II, 30 Year | ||
Pool # MA8201, 4.50%, 8/20/2052 | 715,015 | 681,916 |
Pool # MA8429, 5.50%, 11/20/2052 | 1,244,221 | 1,231,654 |
Total Mortgage-Backed Securities (Cost $36,543,755) | 35,496,809 | |
Commercial Mortgage-Backed Securities — 4.6% | ||
Beast Mortgage Trust Series 2021-1818, Class B, 6.88%, 3/15/2036 (a) (f) | 179,000 | 150,284 |
BX Commercial Mortgage Trust Series 2021-VOLT, Class D, 7.07%, 9/15/2036 (a) (f) | 275,000 | 261,289 |
BX Trust | ||
Series 2021-RISE, Class D, 7.17%, 11/15/2036 (a) (f) | 341,171 | 332,182 |
Series 2022-LBA6, Class D, 7.31%, 1/15/2039 (a) (f) | 525,000 | 507,878 |
Series 2022-FOX2, Class A2, 6.06%, 4/15/2039 (a) (f) | 416,737 | 403,410 |
Citigroup Commercial Mortgage Trust | ||
Series 2021-PRM2, Class F, 9.18%, 10/15/2038 (a) (f) | 275,000 | 260,263 |
Series 2015-GC27, Class B, 3.77%, 2/10/2048 | 200,000 | 186,109 |
Series 2015-GC27, Class C, 4.57%, 2/10/2048 (f) | 440,000 | 401,953 |
Series 2015-GC29, Class C, 4.28%, 4/10/2048 (f) | 400,000 | 362,981 |
Series 2015-GC31, Class C, 4.17%, 6/10/2048 (f) | 250,000 | 191,274 |
Commercial Mortgage Trust | ||
Series 2019-WCM, Class G, 8.12%, 10/15/2034 (a) (f) | 385,000 | 380,641 |
Series 2014-UBS5, Class C, 4.76%, 9/10/2047 (f) | 500,000 | 441,614 |
Series 2014-CR20, Class C, 4.60%, 11/10/2047 (f) | 100,000 | 88,918 |
Series 2015-CR26, Class B, 4.61%, 10/10/2048 (f) | 200,000 | 181,879 |
Series 2015-PC1, Class B, 4.42%, 7/10/2050 (f) | 200,000 | 182,203 |
CSAIL Commercial Mortgage Trust Series 2015-C4, Class E, 3.71%, 11/15/2048 (f) | 325,000 | 246,184 |
August 31, 2023 | J.P. Morgan Exchange-Traded Funds | 147 |
AS OF August 31, 2023 (Unaudited) (continued)
INVESTMENTS | PRINCIPAL AMOUNT($) | VALUE($) |
Commercial Mortgage-Backed Securities — continued | ||
FHLMC, Multi-Family Structured Pass-Through Certificates | ||
Series K068, Class X1, IO, 0.55%, 8/25/2027 (f) | 3,540,185 | 50,376 |
Series K111, Class X3, IO, 3.29%, 4/25/2048 (f) | 405,000 | 66,487 |
Series K110, Class X3, IO, 3.52%, 6/25/2048 (f) | 380,000 | 65,420 |
Series K115, Class X3, IO, 3.06%, 9/25/2048 (f) | 430,000 | 65,987 |
Series K125, Class X3, IO, 2.74%, 2/25/2049 (f) | 460,000 | 67,200 |
FREMF Mortgage Trust | ||
Series 2018-K732, Class C, 4.19%, 5/25/2025 (a) (f) | 200,000 | 191,010 |
Series 2014-K41, Class C, 3.96%, 11/25/2047 (a) (f) | 100,000 | 96,488 |
Series 2016-K57, Class C, 4.05%, 8/25/2049 (a) (f) | 185,000 | 173,870 |
Series 2016-K58, Class C, 3.87%, 9/25/2049 (a) (f) | 110,000 | 102,694 |
GS Mortgage Securities Trust | ||
Series 2016-GS2, Class B, 3.76%, 5/10/2049 (f) | 100,000 | 89,100 |
Series 2017-GS5, Class D, 3.51%, 3/10/2050 (a) (f) | 250,000 | 147,417 |
Independence Plaza Trust Series 2018-INDP, Class C, 4.16%, 7/10/2035 (a) | 150,000 | 138,723 |
JPMBB Commercial Mortgage Securities Trust | ||
Series 2015-C31, Class C, 4.78%, 8/15/2048 (f) | 150,000 | 118,005 |
Series 2016-C1, Class D1, 4.36%, 3/17/2049 (a) (f) | 400,000 | 326,449 |
JPMCC Commercial Mortgage Securities Trust | ||
Series 2017-JP5, Class C, 3.90%, 3/15/2050 (f) | 800,000 | 634,152 |
Series 2017-JP5, Class D, 4.65%, 3/15/2050 (a) (f) | 275,000 | 186,951 |
JPMorgan Chase Commercial Mortgage Securities Trust Series 2013-C16, Class D, 5.13%, 12/15/2046 (a) (f) | 200,000 | 170,506 |
KKR Industrial Portfolio Trust Series 2021-KDIP, Class D, 6.67%, 12/15/2037 (a) (f) | 108,467 | 106,899 |
Life Mortgage Trust Series 2021-BMR, Class C, 6.52%, 3/15/2038 (a) (f) | 191,679 | 186,141 |
MHC Commercial Mortgage Trust Series 2021-MHC, Class D, 7.03%, 4/15/2038 (a) (f) | 250,000 | 244,983 |
INVESTMENTS | PRINCIPAL AMOUNT($) | VALUE($) |
Morgan Stanley Bank of America Merrill Lynch Trust | ||
Series 2014-C14, Class D, 5.22%, 2/15/2047 (a) (f) | 175,023 | 165,796 |
Series 2015-C24, Class D, 3.26%, 5/15/2048 (a) | 220,000 | 181,850 |
Series 2015-C25, Class B, 4.67%, 10/15/2048 (f) | 500,000 | 460,296 |
SG Commercial Mortgage Securities Trust Series 2016-C5, Class B, 3.93%, 10/10/2048 | 225,000 | 189,604 |
SMRT Series 2022-MINI, Class E, 8.01%, 1/15/2039 (a) (f) | 350,000 | 328,929 |
STWD Mortgage Trust (Cayman Islands) Series 2021-LIH, Class B, 7.01%, 11/15/2036 (a) (f) | 400,000 | 386,589 |
Velocity Commercial Capital Loan Trust Series 2021-2, Class A, 1.52%, 8/25/2051 (a) (f) | 130,046 | 106,861 |
Wells Fargo Commercial Mortgage Trust | ||
Series 2015-NXS4, Class B, 4.22%, 12/15/2048 (f) | 500,000 | 451,148 |
Series 2015-LC22, Class D, 4.70%, 9/15/2058 (f) | 205,000 | 166,841 |
WFRBS Commercial Mortgage Trust | ||
Series 2013-C11, Class C, 4.08%, 3/15/2045 (f) | 117,000 | 94,117 |
Series 2014-C25, Class B, 4.24%, 11/15/2047 (f) | 160,000 | 148,386 |
Series 2014-C22, Class C, 3.91%, 9/15/2057 (f) | 725,000 | 567,211 |
Series 2014-C22, Class AS, 4.07%, 9/15/2057 (f) | 1,000,000 | 910,984 |
Total Commercial Mortgage-Backed Securities (Cost $13,317,102) | 11,966,532 | |
Collateralized Mortgage Obligations — 2.9% | ||
Connecticut Avenue Securities Trust | ||
Series 2022-R01, Class 1M2, 7.19%, 12/25/2041 (a) (f) | 521,000 | 511,240 |
Series 2022-R02, Class 2M2, 8.29%, 1/25/2042 (a) (f) | 225,000 | 225,141 |
FHLMC STACR REMIC Trust | ||
Series 2022-DNA1, Class M1A, 6.29%, 1/25/2042 (a) (f) | 677,390 | 670,226 |
Series 2020-DNA1, Class M2, 7.10%, 1/25/2050 (a) (f) | 49,954 | 49,954 |
Series 2020-HQA3, Class B1, 11.15%, 7/25/2050 (a) (f) | 178,079 | 193,200 |
FHLMC Structured Agency Credit Risk Debt Notes Series 2021-DNA2, Class M2, 7.59%, 8/25/2033 (a) (f) | 93,584 | 93,759 |
148 | J.P. Morgan Exchange-Traded Funds | August 31, 2023 |
INVESTMENTS | PRINCIPAL AMOUNT($) | VALUE($) |
Collateralized Mortgage Obligations — continued | ||
FHLMC, REMIC | ||
Series 2673, Class PE, 5.50%, 9/15/2033 | 89,909 | 90,034 |
Series 4754, Class VG, 4.00%, 12/15/2036 | 625,000 | 604,441 |
Series 3878, Class PL, 4.50%, 11/15/2040 | 375,136 | 365,288 |
Series 4376, Class A, 4.00%, 7/15/2041 | 1,176,034 | 1,148,460 |
Series 4718, Class DA, 3.00%, 2/15/2047 | 250,449 | 226,823 |
Series 5021, Class MI, IO, 3.00%, 10/25/2050 | 436,562 | 67,786 |
FNMA, REMIC | ||
Series 2012-136, Class DL, 3.50%, 12/25/2042 | 227,436 | 214,171 |
Series 2022-42, Class EA, 3.75%, 6/25/2052 | 2,264,621 | 2,128,131 |
Series 2022-43, Class P, 4.00%, 7/25/2052 | 523,467 | 494,068 |
GNMA Series 2021-9, Class MI, IO, 2.50%, 1/20/2051 | 229,389 | 29,341 |
Legacy Mortgage Asset Trust Series 2021-GS3, Class A1, 1.75%, 7/25/2061 (a) (e) | 111,912 | 105,767 |
LHOME Mortgage Trust Series 2021-RTL1, Class A1, 2.09%, 2/25/2026 (a) (f) | 58,527 | 58,121 |
NYMT Loan Trust Series 2021-SP1, Class A1, 1.67%, 8/25/2061 (a) (e) | 254,042 | 232,829 |
Verus Securitization Trust Series 2021-2, Class M1, 2.19%, 2/25/2066 (a) (f) | 144,000 | 97,201 |
Total Collateralized Mortgage Obligations (Cost $7,964,491) | 7,605,981 | |
Foreign Government Securities — 0.7% | ||
Arab Republic of Egypt 6.20%, 3/1/2024 (d) | 200,000 | 187,664 |
Dominican Republic Government Bond | ||
6.00%, 7/19/2028 (d) | 300,000 | 289,490 |
4.50%, 1/30/2030 (a) | 150,000 | 130,439 |
Federal Republic of Nigeria | ||
7.63%, 11/21/2025 (d) | 200,000 | 189,872 |
6.50%, 11/28/2027 (d) | 200,000 | 171,364 |
8.38%, 3/24/2029 (a) | 200,000 | 176,156 |
Republic of Angola 8.25%, 5/9/2028 (d) | 200,000 | 174,540 |
Republic of Cote d'Ivoire | ||
6.38%, 3/3/2028 (d) | 200,000 | 188,330 |
5.75%, 12/31/2032 (d) (e) | 56,694 | 51,220 |
Republic of Iraq 5.80%, 1/15/2028 (d) | 140,625 | 129,218 |
Turkiye Ihracat Kredi Bankasi A/S 9.38%, 1/31/2026 (a) | 200,000 | 203,884 |
Total Foreign Government Securities (Cost $2,052,648) | 1,892,177 | |
INVESTMENTS | PRINCIPAL AMOUNT($) | VALUE($) |
Municipal Bonds — 0.0% (g) ^ | ||
California — 0.0% ^ | ||
California Housing Finance Agency Series 2021-1, Class X, Rev., 0.80%, 11/20/2035 (Cost $111,849) | 2,126,682 | 107,038 |
SHARES | ||
Short-Term Investments — 4.4% | ||
Investment Companies — 2.2% | ||
JPMorgan Prime Money Market Fund Class IM Shares, 5.46% (h) (i) (Cost $5,674,175) | 5,672,852 | 5,674,554 |
Investment of Cash Collateral from Securities Loaned — 0.3% | ||
JPMorgan U.S. Government Money Market Fund Class IM Shares, 5.27% (h) (i) (Cost $607,965) | 607,965 | 607,965 |
PRINCIPAL AMOUNT($) | ||
U.S. Treasury Obligations — 1.9% | ||
U.S. Treasury Bills | ||
5.14%, 9/14/2023 (j) | 4,370,000 | 4,361,727 |
5.42%, 2/15/2024 (j) (k) | 588,000 | 573,577 |
Total U.S. Treasury Obligations (Cost $4,935,599) | 4,935,304 | |
Total Short-Term Investments (Cost $11,217,739) | 11,217,823 | |
Total Investments — 99.5% (Cost $264,798,397) | 256,573,097 | |
Other Assets Less Liabilities — 0.5% | 1,166,314 | |
NET ASSETS — 100.0% | 257,739,411 | |
Percentages indicated are based on net assets. |
Abbreviations | |
ABS | Asset-Backed Securities |
ARM | Adjustable Rate Mortgage. The interest rate shown is the rate in effect as of August 31, 2023. |
CLO | Collateralized Loan Obligations |
CME | Chicago Mercantile Exchange |
FHLMC | Federal Home Loan Mortgage Corp. |
FNMA | Federal National Mortgage Association |
GNMA | Government National Mortgage Association |
ICE | Intercontinental Exchange |
August 31, 2023 | J.P. Morgan Exchange-Traded Funds | 149 |
AS OF August 31, 2023 (Unaudited) (continued)
IO | Interest Only represents the right to receive the monthly interest payments on an underlying pool of mortgage loans. The principal amount shown represents the par value on the underlying pool. The yields on these securities are subject to accelerated principal paydowns as a result of prepayment or refinancing of the underlying pool of mortgage instruments. As a result, interest income may be reduced considerably. |
LIBOR | London Interbank Offered Rate |
REIT | Real Estate Investment Trust |
REMIC | Real Estate Mortgage Investment Conduit |
Rev. | Revenue |
SCA | Limited partnership with share capital |
SOFR | Secured Overnight Financing Rate |
SOFRINDX | Compounding index of the Secured Overnight Financing Rate |
UMBS | Uniform Mortgage-Backed Securities |
USD | United States Dollar |
^ | Amount rounds to less than 0.1% of net assets. | |
‡ | Value determined using significant unobservable inputs. | |
(a) | Securities exempt from registration under Rule 144A or section 4(a)(2), of the Securities Act of 1933, as amended. | |
(b) | The security or a portion of this security is on loan at August 31, 2023. The total value of securities on loan at August 31, 2023 is $589,233. | |
(c) | Variable or floating rate security, linked to the referenced benchmark. The interest rate shown is the current rate as of August 31, 2023. | |
(d) | Security exempt from registration pursuant to Regulation S under the Securities Act of 1933, as amended. Regulation S applies to securities offerings that are made outside of the United States and do not involve direct selling efforts in the United States and as such may have restrictions on resale. | |
(e) | Step bond. Interest rate is a fixed rate for an initial period that either resets at a specific date or may reset in the future contingent upon a predetermined trigger. The interest rate shown is the current rate as of August 31, 2023. | |
(f) | Variable or floating rate security, the interest rate of which adjusts periodically based on changes in current interest rates and prepayments on the underlying pool of assets. The interest rate shown is the current rate as of August 31, 2023. | |
(g) | The date shown represents the earliest of the prerefunded date, next put date or final maturity date. | |
(h) | Investment in an affiliated fund, which is registered under the Investment Company Act of 1940, as amended, and is advised by J.P. Morgan Investment Management Inc. | |
(i) | The rate shown is the current yield as of August 31, 2023. | |
(j) | The rate shown is the effective yield as of August 31, 2023. | |
(k) | All or a portion of this security is deposited with the broker as initial margin for futures contracts or centrally cleared swaps. |
DESCRIPTION | NUMBER OF CONTRACTS | EXPIRATION DATE | TRADING CURRENCY | NOTIONAL AMOUNT ($) | VALUE AND UNREALIZED APPRECIATION (DEPRECIATION) ($) |
Long Contracts | |||||
U.S. Treasury 2 Year Note | 99 | 12/29/2023 | USD | 20,181,305 | 24,573 |
U.S. Treasury 5 Year Note | 380 | 12/29/2023 | USD | 40,642,187 | 200,083 |
224,656 | |||||
Short Contracts | |||||
U.S. Treasury 10 Year Note | (67 ) | 12/19/2023 | USD | (7,438,047 ) | (59,219 ) |
U.S. Treasury 10 Year Ultra Note | (33 ) | 12/19/2023 | USD | (3,830,578 ) | (31,780 ) |
U.S. Treasury Long Bond | (11 ) | 12/19/2023 | USD | (1,337,188 ) | (14,289 ) |
(105,288 ) | |||||
119,368 |
Abbreviations | |
USD | United States Dollar |
150 | J.P. Morgan Exchange-Traded Funds | August 31, 2023 |
REFERENCE OBLIGATION/INDEX | FINANCING RATE PAID BY THE FUND (%) | PAYMENT FREQUENCY | MATURITY DATE | IMPLIED CREDIT SPREAD (%)(a) | NOTIONAL AMOUNT(b) | UPFRONT PAYMENTS (RECEIPTS) ($)(c) | UNREALIZED APPRECIATION (DEPRECIATION) ($) | VALUE ($) |
CDX.NA.HY.40-V1 | 5.00 | Quarterly | 6/20/2028 | 4.26 | USD1,530,000 | (5,495 ) | (53,244 ) | (58,739 ) |
(*) | The Fund, as a buyer of credit protection, is generally obligated to make periodic payments and may also pay or receive an upfront premium to or from the protection seller, in exchange for the right to receive a contingent payment, upon occurrence of a credit event with respect to an underlying reference obligation, as defined under the terms of individual swap contracts. | ||||||||
(a) | Implied credit spreads are an indication of the seller's performance risk, related to the likelihood of a credit event occurring that would require a seller to make payment to a buyer. Implied credit spreads are used to determine the value of swap contracts and reflect the cost of buying/selling protection, which may include upfront payments made to enter into the contract. Therefore, higher spreads would indicate a greater likelihood that a seller will be obligated to perform (i.e. make payment) under the swap contract. Increasing values, in absolute terms and relative to notional amounts, are also indicative of greater performance risk. Implied credit spreads for credit default swaps on credit indices are linked to the weighted average spread across the underlying reference obligations included in a particular index. | ||||||||
(b) | The notional amount is the maximum amount that a seller of credit protection would be obligated to pay and a buyer of credit protection would receive, upon occurrence of a credit event. | ||||||||
(c) | Upfront payments and receipts generally represent premiums paid or received at the initiation of the agreement to compensate the differences between the stated terms of the swap agreement and current market conditions (credit spreads, interest rates and other relevant factors). | ||||||||
Abbreviations | |
CDX | Credit Default Swap Index |
USD | United States Dollar |
August 31, 2023 | J.P. Morgan Exchange-Traded Funds | 151 |
AS OF August 31, 2023 (Unaudited)
INVESTMENTS | PRINCIPAL AMOUNT($) | VALUE($) |
Corporate Bonds — 39.6% | ||
Aerospace & Defense — 0.3% | ||
Airbus SE (France) 3.15%, 4/10/2027 (a) | 10,000,000 | 9,409,181 |
L3Harris Technologies, Inc. | ||
3.85%, 12/15/2026 | 2,902,000 | 2,773,363 |
5.40%, 1/15/2027 | 34,681,000 | 34,765,245 |
RTX Corp. 3.20%, 3/15/2024 | 20,734,000 | 20,458,113 |
67,405,902 | ||
Automobile Components — 0.1% | ||
Magna International, Inc. (Canada) 3.63%, 6/15/2024 | 16,015,000 | 15,742,714 |
Automobiles — 1.3% | ||
BMW US Capital LLC (Germany) | ||
2.25%, 9/15/2023 (a) | 3,130,000 | 3,126,733 |
(SOFRINDX + 0.53%), 5.88%, 4/1/2024 (a) (b) | 22,838,000 | 22,852,185 |
(SOFRINDX + 0.62%), 5.94%, 8/11/2025 (a) (b) | 9,237,000 | 9,255,964 |
Hyundai Capital America | ||
1.25%, 9/18/2023 (a) | 2,506,000 | 2,501,128 |
0.80%, 1/8/2024 (a) | 48,000,000 | 47,164,017 |
4.30%, 2/1/2024 (a) | 876,000 | 869,594 |
0.88%, 6/14/2024 (a) | 47,002,000 | 45,169,857 |
1.00%, 9/17/2024 (a) | 5,566,000 | 5,290,690 |
2.65%, 2/10/2025 (a) | 8,000,000 | 7,647,587 |
5.80%, 6/26/2025 (a) | 24,390,000 | 24,419,300 |
6.00%, 7/11/2025 (a) | 28,960,000 | 28,997,494 |
1.80%, 10/15/2025 (a) | 1,792,000 | 1,652,877 |
5.50%, 3/30/2026 (a) | 1,961,000 | 1,952,751 |
1.50%, 6/15/2026 (a) | 2,659,000 | 2,378,351 |
1.65%, 9/17/2026 (a) | 1,451,000 | 1,288,578 |
Kia Corp. (South Korea) 1.00%, 4/16/2024 (a) | 12,580,000 | 12,200,902 |
Mercedes-Benz Finance North America LLC (Germany) 0.75%, 3/1/2024 (a) | 1,065,000 | 1,039,017 |
Volkswagen Group of America Finance LLC (Germany) | ||
4.25%, 11/13/2023 (a) | 39,386,000 | 39,252,299 |
0.88%, 11/22/2023 (a) | 14,938,000 | 14,778,927 |
2.85%, 9/26/2024 (a) | 5,725,000 | 5,546,845 |
4.63%, 11/13/2025 (a) | 1,960,000 | 1,931,708 |
3.20%, 9/26/2026 (a) | 9,504,000 | 8,887,801 |
288,204,605 | ||
INVESTMENTS | PRINCIPAL AMOUNT($) | VALUE($) |
Banks — 16.7% | ||
ASB Bank Ltd. (New Zealand) 3.13%, 5/23/2024 (a) | 6,755,000 | 6,626,293 |
Australia & New Zealand Banking Group Ltd. (Australia) | ||
4.83%, 2/3/2025 (a) | 23,413,000 | 23,234,962 |
5.38%, 7/3/2025 | 72,769,000 | 72,811,568 |
Banco Bilbao Vizcaya Argentaria SA (Spain) 0.88%, 9/18/2023 | 1,200,000 | 1,197,852 |
Banco Santander SA (Spain) | ||
2.71%, 6/27/2024 | 11,635,000 | 11,318,027 |
(US Treasury Yield Curve Rate T Note Constant Maturity 1 Year + 0.45%), 5.74%, 6/30/2024 (b) | 47,257,000 | 47,111,624 |
3.50%, 3/24/2025 | 10,215,000 | 9,844,302 |
Bank of America Corp. | ||
(SOFR + 0.41%), 5.78%, 6/14/2024 (b) | 85,060,000 | 84,789,881 |
(3-MONTH CME TERM SOFR + 1.23%), 3.46%, 3/15/2025 (b) | 2,992,000 | 2,949,379 |
(SOFR + 0.69%), 0.98%, 4/22/2025 (b) | 42,672,000 | 41,222,159 |
(SOFR + 1.11%), 3.84%, 4/25/2025 (b) | 75,312,000 | 74,226,272 |
(SOFR + 1.29%), 5.08%, 1/20/2027 (b) | 110,000,000 | 108,554,044 |
Bank of America NA (SOFR + 0.78%), 6.09%, 8/18/2025 (b) | 5,320,000 | 5,322,438 |
Bank of Montreal (Canada) | ||
(SOFRINDX + 0.35%), 5.71%, 12/8/2023 (b) | 14,990,000 | 14,989,533 |
5.30%, 6/5/2026 | 99,000,000 | 98,657,491 |
Bank of New Zealand (New Zealand) 4.85%, 2/7/2028 (a) | 80,000,000 | 78,008,503 |
Bank of Nova Scotia (The) (Canada) | ||
0.55%, 9/15/2023 | 166,000 | 165,764 |
(SOFR + 0.26%), 5.62%, 9/15/2023 (b) | 6,667,000 | 6,667,048 |
(SOFRINDX + 0.55%), 5.91%, 9/15/2023 (b) | 47,576,000 | 47,581,971 |
5.45%, 6/12/2025 | 74,090,000 | 73,657,391 |
4.75%, 2/2/2026 | 67,362,000 | 66,160,937 |
1.30%, 9/15/2026 | 8,539,000 | 7,566,373 |
Banque Federative du Credit Mutuel SA (France) | ||
0.65%, 2/27/2024 (a) | 7,485,000 | 7,301,009 |
4.94%, 1/26/2026 (a) | 78,781,000 | 77,215,077 |
5.90%, 7/13/2026 (a) | 106,402,000 | 106,726,567 |
152 | J.P. Morgan Exchange-Traded Funds | August 31, 2023 |
INVESTMENTS | PRINCIPAL AMOUNT($) | VALUE($) |
Corporate Bonds — continued | ||
Banks — continued | ||
Barclays plc (United Kingdom) | ||
(US Treasury Yield Curve Rate T Note Constant Maturity 1 Year + 0.80%), 1.01%, 12/10/2024 (b) | 29,647,000 | 29,237,185 |
(ICE LIBOR USD 3 Month + 1.61%), 3.93%, 5/7/2025 (b) | 34,200,000 | 33,700,021 |
BNP Paribas SA (France) 3.80%, 1/10/2024 (a) | 44,645,000 | 44,261,277 |
BPCE SA (France) | ||
4.00%, 9/12/2023 (a) | 19,526,000 | 19,517,409 |
5.03%, 1/15/2025 (a) | 119,399,000 | 117,439,650 |
Canadian Imperial Bank of Commerce (Canada) | ||
(SOFRINDX + 0.40%), 5.76%, 12/14/2023 (b) | 50,032,000 | 50,019,378 |
(SOFR + 0.94%), 6.28%, 4/7/2025 (b) | 95,598,000 | 95,855,127 |
5.14%, 4/28/2025 | 80,000,000 | 79,318,086 |
Citigroup, Inc. (SOFR + 0.69%), 0.78%, 10/30/2024 (b) | 10,270,000 | 10,176,693 |
Citizens Bank NA (SOFR + 1.02%), 5.28%, 1/26/2026 (b) | 241,889,000 | 230,370,101 |
Cooperatieve Rabobank UA (Netherlands) | ||
3.88%, 9/26/2023 (a) | 2,850,000 | 2,846,297 |
0.38%, 1/12/2024 | 650,000 | 637,990 |
(SOFRINDX + 0.30%), 5.64%, 1/12/2024 (b) | 60,834,000 | 60,824,022 |
Credit Agricole SA (France) | ||
5.57%, 2/28/2025 (a) (c) | 112,332,000 | 111,737,514 |
5.59%, 7/5/2026 (a) | 74,257,000 | 74,233,132 |
DNB Bank ASA (Norway) (SOFRINDX + 1.95%), 5.90%, 10/9/2026 (a) (b) | 17,680,000 | 17,710,162 |
Federation des Caisses Desjardins du Quebec (Canada) | ||
0.70%, 5/21/2024 (a) (c) | 26,044,000 | 25,097,010 |
(SOFR + 0.43%), 5.74%, 5/21/2024 (a) (b) | 41,345,000 | 41,289,590 |
(SOFRINDX + 1.09%), 5.28%, 1/23/2026 (a) (b) | 203,120,000 | 200,559,532 |
Fifth Third Bancorp | ||
3.65%, 1/25/2024 (c) | 2,742,000 | 2,716,094 |
2.55%, 5/5/2027 | 12,223,000 | 10,926,545 |
HSBC Holdings plc (United Kingdom) (SOFR + 0.71%), 0.98%, 5/24/2025 (b) | 59,681,000 | 57,362,095 |
HSBC USA, Inc. 5.63%, 3/17/2025 | 1,560,000 | 1,555,988 |
INVESTMENTS | PRINCIPAL AMOUNT($) | VALUE($) |
Banks — continued | ||
ING Groep NV (Netherlands) | ||
4.10%, 10/2/2023 | 14,532,000 | 14,510,520 |
3.55%, 4/9/2024 | 34,170,000 | 33,681,238 |
KeyBank NA | ||
(SOFRINDX + 0.34%), 5.69%, 1/3/2024 (b) (c) | 1,546,000 | 1,539,114 |
(SOFRINDX + 0.32%), 5.68%, 6/14/2024 (b) | 68,003,000 | 66,629,203 |
5.85%, 11/15/2027 (c) | 1,510,000 | 1,456,509 |
Mitsubishi UFJ Financial Group, Inc. (Japan) | ||
2.53%, 9/13/2023 | 1,247,000 | 1,246,115 |
(US Treasury Yield Curve Rate T Note Constant Maturity 1 Year + 0.68%), 0.85%, 9/15/2024 (b) | 47,145,000 | 47,075,574 |
2.19%, 2/25/2025 | 10,504,000 | 9,963,498 |
(US Treasury Yield Curve Rate T Note Constant Maturity 1 Year + 0.55%), 0.95%, 7/19/2025 (b) | 26,701,000 | 25,518,670 |
(US Treasury Yield Curve Rate T Note Constant Maturity 1 Year + 0.45%), 0.96%, 10/11/2025 (b) | 33,780,000 | 31,861,196 |
(US Treasury Yield Curve Rate T Note Constant Maturity 1 Year + 1.08%), 5.72%, 2/20/2026 (b) | 59,401,000 | 59,227,240 |
Mizuho Financial Group, Inc. (Japan) | ||
(3-MONTH CME TERM SOFR + 0.87%), 0.85%, 9/8/2024 (b) | 63,901,000 | 63,878,987 |
(3-MONTH CME TERM SOFR + 1.26%), 3.92%, 9/11/2024 (b) (c) | 27,646,000 | 27,632,781 |
MUFG Bank Ltd. (Japan) 4.10%, 9/9/2023 (a) | 200,000 | 199,959 |
National Bank of Canada (Canada) | ||
Series FXD, 0.75%, 8/6/2024 | 7,390,000 | 7,051,111 |
5.25%, 1/17/2025 | 198,389,000 | 197,566,455 |
(SOFR + 1.01%), 3.75%, 6/9/2025 (b) | 60,344,000 | 59,181,491 |
NatWest Group plc (United Kingdom) | ||
3.88%, 9/12/2023 | 73,172,000 | 73,145,684 |
(ICE LIBOR USD 3 Month + 1.76%), 4.27%, 3/22/2025 (b) | 10,045,000 | 9,931,697 |
(US Treasury Yield Curve Rate T Note Constant Maturity 1 Year + 1.35%), 5.85%, 3/2/2027 (b) | 50,000,000 | 49,703,161 |
NatWest Markets plc (United Kingdom) (SOFR + 0.53%), 5.84%, 8/12/2024 (a) (b) | 19,015,000 | 18,945,679 |
August 31, 2023 | J.P. Morgan Exchange-Traded Funds | 153 |
AS OF August 31, 2023 (Unaudited) (continued)
INVESTMENTS | PRINCIPAL AMOUNT($) | VALUE($) |
Corporate Bonds — continued | ||
Banks — continued | ||
PNC Financial Services Group, Inc. (The) | ||
3.50%, 1/23/2024 | 9,103,000 | 9,004,697 |
(SOFR + 1.09%), 4.76%, 1/26/2027 (b) | 81,210,000 | 79,723,317 |
Royal Bank of Canada (Canada) (SOFRINDX + 0.45%), 5.78%, 10/26/2023 (b) | 33,530,000 | 33,538,778 |
Skandinaviska Enskilda Banken AB (Sweden) 0.55%, 9/1/2023 (a) | 1,060,000 | 1,059,830 |
Societe Generale SA (France) | ||
4.25%, 9/14/2023 (a) | 11,607,000 | 11,601,440 |
3.88%, 3/28/2024 (a) | 10,000,000 | 9,858,967 |
2.63%, 10/16/2024 (a) | 10,595,000 | 10,193,263 |
Standard Chartered plc (United Kingdom) | ||
(US Treasury Yield Curve Rate T Note Constant Maturity 1 Year + 0.78%), 0.99%, 1/12/2025 (a) (b) | 10,000,000 | 9,791,480 |
(US Treasury Yield Curve Rate T Note Constant Maturity 1 Year + 0.88%), 1.21%, 3/23/2025 (a) (b) | 12,000,000 | 11,635,515 |
(SOFR + 1.74%), 7.09%, 3/30/2026 (a) (b) | 10,609,000 | 10,663,993 |
(US Treasury Yield Curve Rate T Note Constant Maturity 1 Year + 1.85%), 6.19%, 7/6/2027 (a) (b) | 45,000,000 | 45,094,023 |
Sumitomo Mitsui Financial Group, Inc. (Japan) | ||
3.94%, 10/16/2023 | 10,000,000 | 9,976,817 |
5.46%, 1/13/2026 | 25,879,000 | 25,796,358 |
Sumitomo Mitsui Trust Bank Ltd. (Japan) | ||
0.80%, 9/12/2023 (a) | 27,871,000 | 27,843,684 |
0.85%, 3/25/2024 (a) | 48,302,000 | 46,972,266 |
(SOFR + 0.44%), 5.80%, 9/16/2024 (a) (b) | 33,827,000 | 33,734,651 |
5.65%, 3/9/2026 (a) | 20,516,000 | 20,539,952 |
Svenska Handelsbanken AB (Sweden) 5.25%, 6/15/2026 (a) | 137,014,000 | 136,136,403 |
Toronto-Dominion Bank (The) (Canada) 0.45%, 9/11/2023 | 548,000 | 547,549 |
Wells Fargo & Co. | ||
3.75%, 1/24/2024 | 894,000 | 886,867 |
(SOFR + 0.51%), 0.80%, 5/19/2025 (b) (c) | 19,800,000 | 19,059,011 |
(SOFR + 1.32%), 3.91%, 4/25/2026 (b) | 24,500,000 | 23,686,113 |
INVESTMENTS | PRINCIPAL AMOUNT($) | VALUE($) |
Banks — continued | ||
(SOFR + 2.00%), 2.19%, 4/30/2026 (b) | 7,656,000 | 7,199,830 |
(SOFR + 1.56%), 4.54%, 8/15/2026 (b) | 500,000 | 488,237 |
Westpac New Zealand Ltd. (New Zealand) 4.90%, 2/15/2028 (a) | 35,000,000 | 34,184,465 |
3,810,460,751 | ||
Beverages — 0.1% | ||
Constellation Brands, Inc. | ||
3.60%, 5/9/2024 | 22,819,000 | 22,467,727 |
3.70%, 12/6/2026 | 3,941,000 | 3,755,133 |
Keurig Dr Pepper, Inc. 3.13%, 12/15/2023 | 5,785,000 | 5,740,156 |
31,963,016 | ||
Biotechnology — 0.5% | ||
AbbVie, Inc. | ||
2.60%, 11/21/2024 | 894,000 | 862,572 |
3.80%, 3/15/2025 | 45,025,000 | 43,842,262 |
Amgen, Inc. | ||
1.90%, 2/21/2025 (c) | 983,000 | 934,762 |
5.25%, 3/2/2025 | 66,086,000 | 65,804,515 |
2.60%, 8/19/2026 | 631,000 | 586,670 |
Gilead Sciences, Inc. 3.70%, 4/1/2024 | 4,950,000 | 4,891,936 |
116,922,717 | ||
Building Products — 0.0% ^ | ||
Carlisle Cos., Inc. 0.55%, 9/1/2023 | 2,027,000 | 2,027,000 |
Capital Markets — 2.9% | ||
Bank of New York Mellon Corp. (The) (SOFR + 1.35%), 4.41%, 7/24/2026 (b) | 11,494,000 | 11,236,560 |
Charles Schwab Corp. (The) (SOFRINDX + 0.50%), 5.86%, 3/18/2024 (b) | 16,307,000 | 16,289,032 |
Goldman Sachs Group, Inc. (The) | ||
4.00%, 3/3/2024 | 25,257,000 | 25,006,531 |
3.00%, 3/15/2024 | 64,873,000 | 63,871,208 |
(SOFR + 0.49%), 0.92%, 10/21/2024 (b) | 38,732,000 | 38,427,821 |
(SOFR + 0.61%), 0.86%, 2/12/2026 (b) | 2,575,000 | 2,388,583 |
3.75%, 2/25/2026 | 13,456,000 | 12,906,249 |
(SOFR + 1.07%), 6.38%, 8/10/2026 (b) | 34,982,000 | 34,980,920 |
Series VAR, (SOFR + 0.79%), 1.09%, 12/9/2026 (b) | 7,025,000 | 6,305,756 |
154 | J.P. Morgan Exchange-Traded Funds | August 31, 2023 |
INVESTMENTS | PRINCIPAL AMOUNT($) | VALUE($) |
Corporate Bonds — continued | ||
Capital Markets — continued | ||
3.85%, 1/26/2027 | 60,000,000 | 56,946,175 |
Intercontinental Exchange, Inc. 3.65%, 5/23/2025 | 5,000,000 | 4,839,790 |
Mizuho Markets Cayman LP (Japan) 5.83%, 1/17/2024 (a) | 33,500,000 | 33,502,844 |
Morgan Stanley | ||
(SOFR + 0.47%), 5.79%, 11/10/2023 (b) | 22,354,000 | 22,355,763 |
(SOFR + 0.46%), 5.79%, 1/25/2024 (b) | 8,363,000 | 8,361,212 |
(SOFR + 0.51%), 0.79%, 1/22/2025 (b) | 2,958,000 | 2,893,462 |
(SOFR + 1.16%), 3.62%, 4/17/2025 (b) | 85,300,000 | 83,993,857 |
(SOFR + 0.53%), 0.79%, 5/30/2025 (b) | 76,634,000 | 73,475,257 |
(SOFR + 1.30%), 5.05%, 1/28/2027 (b) | 50,000,000 | 49,468,796 |
State Street Corp. 3.70%, 11/20/2023 | 6,479,000 | 6,452,525 |
UBS AG (Switzerland) | ||
(SOFR + 0.36%), 5.68%, 2/9/2024 (a) (b) | 23,894,000 | 23,883,987 |
(SOFR + 0.45%), 5.77%, 8/9/2024 (a) (b) | 30,423,000 | 30,366,214 |
UBS Group AG (Switzerland) (US Treasury Yield Curve Rate T Note Constant Maturity 1 Year + 1.60%), 4.49%, 8/5/2025 (a) (b) | 56,499,000 | 55,580,456 |
663,532,998 | ||
Chemicals — 0.3% | ||
Air Liquide Finance SA (France) 2.25%, 9/27/2023 (a) | 17,489,000 | 17,446,505 |
LyondellBasell Industries NV 5.75%, 4/15/2024 | 31,974,000 | 31,909,810 |
Nutrien Ltd. (Canada) 5.90%, 11/7/2024 | 726,000 | 725,761 |
Sherwin-Williams Co. (The) | ||
3.13%, 6/1/2024 | 1,881,000 | 1,843,907 |
4.05%, 8/8/2024 | 13,400,000 | 13,183,615 |
Westlake Corp. | ||
0.88%, 8/15/2024 | 4,583,000 | 4,365,191 |
3.60%, 8/15/2026 (c) | 2,915,000 | 2,764,604 |
72,239,393 | ||
Consumer Finance — 3.7% | ||
AerCap Ireland Capital DAC (Ireland) 1.15%, 10/29/2023 | 57,979,000 | 57,534,735 |
INVESTMENTS | PRINCIPAL AMOUNT($) | VALUE($) |
Consumer Finance — continued | ||
American Express Co. | ||
0.75%, 11/3/2023 | 514,000 | 509,991 |
3.38%, 5/3/2024 | 13,210,000 | 12,996,171 |
3.30%, 5/3/2027 | 49,917,000 | 46,527,254 |
5.85%, 11/5/2027 | 24,076,000 | 24,593,627 |
American Honda Finance Corp. | ||
(SOFRINDX + 0.62%), 5.94%, 6/7/2024 (b) | 79,056,000 | 79,126,756 |
Series A, 4.60%, 4/17/2025 | 17,885,000 | 17,649,396 |
5.00%, 5/23/2025 | 134,270,000 | 133,034,821 |
Capital One Financial Corp. | ||
(SOFR + 0.69%), 1.34%, 12/6/2024 (b) | 20,097,000 | 19,808,654 |
(SOFR + 0.69%), 6.07%, 12/6/2024 (b) | 12,130,000 | 11,999,360 |
(SOFR + 1.29%), 2.64%, 3/3/2026 (b) | 27,974,000 | 26,438,509 |
(SOFR + 2.16%), 4.98%, 7/24/2026 (b) | 8,298,000 | 8,110,725 |
(SOFR + 0.86%), 1.88%, 11/2/2027 (b) | 21,014,000 | 18,421,820 |
Caterpillar Financial Services Corp. 3.75%, 11/24/2023 | 971,000 | 967,488 |
General Motors Financial Co., Inc. | ||
(SOFR + 1.20%), 6.51%, 11/17/2023 (b) | 23,000,000 | 23,030,110 |
5.10%, 1/17/2024 | 7,000,000 | 6,977,313 |
1.05%, 3/8/2024 | 18,436,000 | 17,971,400 |
3.95%, 4/13/2024 | 15,000,000 | 14,803,200 |
Hyundai Capital Services, Inc. (South Korea) 0.75%, 9/15/2023 (a) | 13,858,000 | 13,834,441 |
John Deere Capital Corp. (SOFR + 0.50%), 5.84%, 7/3/2025 (b) | 52,201,000 | 52,402,723 |
Toyota Motor Credit Corp. | ||
0.45%, 1/11/2024 | 881,000 | 865,461 |
(SOFRINDX + 0.33%), 5.67%, 1/11/2024 (b) | 41,950,000 | 41,954,687 |
(SOFR + 0.38%), 5.69%, 2/22/2024 (b) | 107,172,000 | 107,202,137 |
(SOFR + 0.52%), 5.82%, 8/22/2024 (b) | 113,611,000 | 113,707,115 |
850,467,894 | ||
August 31, 2023 | J.P. Morgan Exchange-Traded Funds | 155 |
AS OF August 31, 2023 (Unaudited) (continued)
INVESTMENTS | PRINCIPAL AMOUNT($) | VALUE($) |
Corporate Bonds — continued | ||
Consumer Staples Distribution & Retail — 0.0% ^ | ||
7-Eleven, Inc. 0.80%, 2/10/2024 (a) | 10,000,000 | 9,773,307 |
Dollar General Corp. 3.88%, 4/15/2027 | 519,000 | 495,542 |
10,268,849 | ||
Diversified Telecommunication Services — 0.1% | ||
AT&T, Inc. 0.90%, 3/25/2024 | 3,381,000 | 3,288,160 |
British Telecommunications plc (United Kingdom) 4.50%, 12/4/2023 | 157,000 | 156,351 |
Telstra Corp. Ltd. (Australia) 3.13%, 4/7/2025 (a) | 14,950,000 | 14,392,135 |
Verizon Communications, Inc. 3.38%, 2/15/2025 | 631,000 | 612,124 |
18,448,770 | ||
Electric Utilities — 1.3% | ||
American Electric Power Co., Inc. Series M, 0.75%, 11/1/2023 | 9,684,000 | 9,604,200 |
Arizona Public Service Co. 2.55%, 9/15/2026 | 1,170,000 | 1,070,340 |
Cleveland Electric Illuminating Co. (The) 5.50%, 8/15/2024 | 26,109,000 | 26,006,454 |
Duke Energy Corp. | ||
3.95%, 10/15/2023 | 22,900,000 | 22,839,106 |
2.65%, 9/1/2026 | 747,000 | 691,143 |
Emera US Finance LP (Canada) 0.83%, 6/15/2024 | 11,121,000 | 10,588,551 |
Enel Finance International NV (Italy) | ||
2.65%, 9/10/2024 (a) | 5,000,000 | 4,836,673 |
6.80%, 10/14/2025 (a) | 4,522,000 | 4,611,104 |
1.38%, 7/12/2026 (a) | 3,005,000 | 2,665,056 |
Entergy Corp. 2.95%, 9/1/2026 | 699,000 | 649,404 |
Entergy Louisiana LLC 0.62%, 11/17/2023 | 9,363,000 | 9,267,417 |
Evergy, Inc. 2.45%, 9/15/2024 | 14,641,000 | 14,120,648 |
Eversource Energy | ||
Series N, 3.80%, 12/1/2023 | 174,000 | 173,108 |
4.20%, 6/27/2024 | 9,000,000 | 8,871,623 |
Exelon Corp. 2.75%, 3/15/2027 | 3,246,000 | 2,979,222 |
Florida Power & Light Co. (SOFRINDX + 0.38%), 5.72%, 1/12/2024 (b) | 49,271,000 | 49,271,554 |
NextEra Energy Capital Holdings, Inc. | ||
(SOFRINDX + 0.40%), 5.72%, 11/3/2023 (b) | 20,524,000 | 20,531,019 |
4.20%, 6/20/2024 | 1,088,000 | 1,073,272 |
4.26%, 9/1/2024 | 27,414,000 | 26,978,133 |
6.05%, 3/1/2025 | 14,645,000 | 14,702,736 |
INVESTMENTS | PRINCIPAL AMOUNT($) | VALUE($) |
Electric Utilities — continued | ||
5.75%, 9/1/2025 | 35,823,000 | 35,907,861 |
1.88%, 1/15/2027 | 6,424,000 | 5,741,483 |
3.55%, 5/1/2027 | 5,944,000 | 5,602,401 |
Niagara Mohawk Power Corp. 3.51%, 10/1/2024 (a) | 8,320,000 | 8,069,961 |
Pinnacle West Capital Corp. 1.30%, 6/15/2025 | 190,000 | 175,392 |
Southwestern Electric Power Co. Series K, 2.75%, 10/1/2026 | 460,000 | 425,379 |
287,453,240 | ||
Electronic Equipment, Instruments & Components — 0.3% | ||
Amphenol Corp. 3.20%, 4/1/2024 | 15,475,000 | 15,249,844 |
TD SYNNEX Corp. 1.25%, 8/9/2024 | 24,822,000 | 23,661,675 |
Teledyne Technologies, Inc. 0.95%, 4/1/2024 | 31,122,000 | 30,220,768 |
69,132,287 | ||
Energy Equipment & Services — 0.0% ^ | ||
Schlumberger Holdings Corp. 4.00%, 12/21/2025 (a) | 5,937,000 | 5,779,300 |
Entertainment — 0.1% | ||
Take-Two Interactive Software, Inc. | ||
3.30%, 3/28/2024 (c) | 968,000 | 954,264 |
3.55%, 4/14/2025 | 8,715,000 | 8,425,933 |
5.00%, 3/28/2026 | 1,924,000 | 1,903,332 |
11,283,529 | ||
Financial Services — 0.9% | ||
Citigroup Global Markets Holdings, Inc. 0.75%, 6/7/2024 | 29,285,000 | 28,049,887 |
Element Fleet Management Corp. (Canada) | ||
1.60%, 4/6/2024 (a) | 15,298,000 | 14,885,765 |
6.27%, 6/26/2026 (a) | 67,601,000 | 67,912,276 |
Fidelity National Information Services, Inc. 0.60%, 3/1/2024 | 961,000 | 936,343 |
Fiserv, Inc. | ||
2.75%, 7/1/2024 | 5,697,000 | 5,555,307 |
3.20%, 7/1/2026 | 10,000,000 | 9,426,188 |
Jackson Financial, Inc. 1.13%, 11/22/2023 | 50,194,000 | 49,677,593 |
National Rural Utilities Cooperative Finance Corp. 0.35%, 2/8/2024 | 15,017,000 | 14,676,505 |
156 | J.P. Morgan Exchange-Traded Funds | August 31, 2023 |
INVESTMENTS | PRINCIPAL AMOUNT($) | VALUE($) |
Corporate Bonds — continued | ||
Financial Services — continued | ||
NTT Finance Corp. (Japan) 0.58%, 3/1/2024 (a) | 320,000 | 311,769 |
Siemens Financieringsmaatschappij NV (Germany) (SOFR + 0.43%), 5.79%, 3/11/2024 (a) (b) | 23,914,000 | 23,942,427 |
215,374,060 | ||
Food Products — 0.3% | ||
Campbell Soup Co. | ||
3.95%, 3/15/2025 | 7,004,000 | 6,817,595 |
3.30%, 3/19/2025 | 1,695,000 | 1,634,144 |
Conagra Brands, Inc. 4.30%, 5/1/2024 | 4,409,000 | 4,359,493 |
Danone SA (France) 2.59%, 11/2/2023 (a) | 56,688,000 | 56,392,959 |
General Mills, Inc. 4.00%, 4/17/2025 | 1,271,000 | 1,238,845 |
Mondelez International Holdings Netherlands BV 0.75%, 9/24/2024 (a) | 1,410,000 | 1,337,721 |
71,780,757 | ||
Ground Transportation — 0.4% | ||
ERAC USA Finance LLC 2.70%, 11/1/2023 (a) | 1,816,000 | 1,806,458 |
Penske Truck Leasing Co. LP | ||
3.90%, 2/1/2024 (a) | 4,900,000 | 4,854,400 |
2.70%, 11/1/2024 (a) | 13,854,000 | 13,295,231 |
3.95%, 3/10/2025 (a) | 2,754,000 | 2,662,836 |
5.75%, 5/24/2026 (a) | 54,563,000 | 54,185,085 |
3.40%, 11/15/2026 (a) | 4,558,000 | 4,229,097 |
81,033,107 | ||
Health Care Equipment & Supplies — 0.1% | ||
Baxter International, Inc. | ||
0.87%, 12/1/2023 | 8,190,000 | 8,091,457 |
2.60%, 8/15/2026 | 5,000,000 | 4,616,769 |
Stryker Corp. 0.60%, 12/1/2023 | 3,486,000 | 3,442,844 |
Zimmer Biomet Holdings, Inc. 1.45%, 11/22/2024 | 585,000 | 555,373 |
16,706,443 | ||
Health Care Providers & Services — 0.2% | ||
Cardinal Health, Inc. 3.08%, 6/15/2024 | 26,892,000 | 26,303,074 |
Cigna Group (The) | ||
3.50%, 6/15/2024 | 14,584,000 | 14,337,881 |
3.25%, 4/15/2025 | 3,050,000 | 2,936,581 |
CVS Health Corp. 5.00%, 2/20/2026 | 792,000 | 785,907 |
INVESTMENTS | PRINCIPAL AMOUNT($) | VALUE($) |
Health Care Providers & Services — continued | ||
Laboratory Corp. of America Holdings | ||
4.00%, 11/1/2023 | 1,900,000 | 1,893,628 |
3.25%, 9/1/2024 | 1,356,000 | 1,321,107 |
47,578,178 | ||
Health Care REITs — 0.1% | ||
Welltower OP LLC 3.63%, 3/15/2024 | 13,150,000 | 12,980,330 |
Insurance — 4.4% | ||
Athene Global Funding | ||
1.20%, 10/13/2023 (a) (c) | 32,955,000 | 32,775,952 |
0.95%, 1/8/2024 (a) | 9,598,000 | 9,414,618 |
1.00%, 4/16/2024 (a) | 21,061,000 | 20,333,663 |
(SOFRINDX + 0.70%), 6.01%, 5/24/2024 (a) (b) | 43,521,000 | 43,203,576 |
Brighthouse Financial Global Funding | ||
1.20%, 12/15/2023 (a) | 43,419,000 | 42,830,414 |
1.00%, 4/12/2024 (a) | 7,007,000 | 6,793,803 |
1.75%, 1/13/2025 (a) | 18,888,000 | 17,798,621 |
Corebridge Global Funding | ||
0.40%, 9/13/2023 (a) | 39,623,000 | 39,569,314 |
(SOFR + 0.38%), 5.74%, 12/15/2023 (a) (b) (c) | 48,943,000 | 48,925,438 |
0.65%, 6/17/2024 (a) | 24,078,000 | 23,055,526 |
5.75%, 7/2/2026 (a) | 34,554,000 | 34,393,603 |
Equitable Financial Life Global Funding 1.10%, 11/12/2024 (a) | 4,277,000 | 4,036,572 |
Jackson National Life Global Funding | ||
3.25%, 1/30/2024 (a) | 21,256,000 | 20,994,966 |
2.65%, 6/21/2024 (a) | 1,302,000 | 1,266,232 |
1.75%, 1/12/2025 (a) | 4,116,000 | 3,860,264 |
MassMutual Global Funding II (SOFR + 0.98%), 6.31%, 7/10/2026 (a) (b) | 113,952,000 | 114,046,521 |
Mutual of Omaha Cos. Global Funding 5.80%, 7/27/2026 (a) | 22,341,000 | 22,301,981 |
New York Life Global Funding 3.86%, 8/26/2024 (a) | 179,360,000 | 176,183,147 |
Pacific Life Global Funding II | ||
(SOFRINDX + 1.05%), 6.38%, 7/28/2026 (a) (b) | 54,040,000 | 54,225,494 |
5.50%, 8/28/2026 (a) | 45,284,000 | 45,437,996 |
Pricoa Global Funding I 5.55%, 8/28/2026 (a) | 12,602,000 | 12,694,224 |
Principal Life Global Funding II | ||
0.50%, 1/8/2024 (a) | 1,046,000 | 1,026,523 |
(SOFR + 0.90%), 6.20%, 8/28/2025 (a) (b) | 63,245,000 | 63,284,698 |
August 31, 2023 | J.P. Morgan Exchange-Traded Funds | 157 |
AS OF August 31, 2023 (Unaudited) (continued)
INVESTMENTS | PRINCIPAL AMOUNT($) | VALUE($) |
Corporate Bonds — continued | ||
Insurance — continued | ||
Reliance Standard Life Global Funding II | ||
3.85%, 9/19/2023 (a) | 4,360,000 | 4,356,075 |
2.50%, 10/30/2024 (a) | 3,544,000 | 3,385,645 |
5.24%, 2/2/2026 (a) | 169,725,000 | 165,812,177 |
1,012,007,043 | ||
Life Sciences Tools & Services — 0.1% | ||
Thermo Fisher Scientific, Inc. 0.80%, 10/18/2023 | 26,013,000 | 25,855,368 |
Machinery — 0.7% | ||
Daimler Truck Finance North America LLC (Germany) | ||
1.13%, 12/14/2023 (a) | 25,477,000 | 25,133,037 |
(SOFR + 1.00%), 6.34%, 4/5/2024 (a) (b) | 58,479,000 | 58,576,877 |
1.63%, 12/13/2024 (a) | 2,399,000 | 2,277,189 |
5.20%, 1/17/2025 (a) | 38,702,000 | 38,433,226 |
5.60%, 8/8/2025 (a) | 17,943,000 | 17,913,274 |
5.15%, 1/16/2026 (a) | 5,604,000 | 5,561,572 |
2.00%, 12/14/2026 (a) | 10,000,000 | 8,989,562 |
3.65%, 4/7/2027 (a) | 2,950,000 | 2,795,334 |
Stanley Black & Decker, Inc. 2.30%, 2/24/2025 | 5,000,000 | 4,760,096 |
164,440,167 | ||
Media — 0.1% | ||
Cox Communications, Inc. 3.35%, 9/15/2026 (a) | 515,000 | 484,496 |
Fox Corp. 4.03%, 1/25/2024 | 17,827,000 | 17,685,877 |
18,170,373 | ||
Metals & Mining — 0.3% | ||
Anglo American Capital plc (South Africa) 3.63%, 9/11/2024 (a) | 5,501,000 | 5,355,114 |
Glencore Funding LLC (Australia) | ||
4.13%, 3/12/2024 (a) | 20,800,000 | 20,608,662 |
4.63%, 4/29/2024 (a) | 45,008,000 | 44,615,823 |
70,579,599 | ||
Multi-Utilities — 0.6% | ||
Ameren Corp. 1.95%, 3/15/2027 | 7,702,000 | 6,923,597 |
Berkshire Hathaway Energy Co. 3.75%, 11/15/2023 | 2,000,000 | 1,992,289 |
CenterPoint Energy, Inc. (SOFRINDX + 0.65%), 5.96%, 5/13/2024 (b) | 35,739,000 | 35,729,973 |
Centrica plc (United Kingdom) 4.00%, 10/16/2023 (a) | 11,634,000 | 11,606,860 |
CMS Energy Corp. 3.88%, 3/1/2024 | 1,503,000 | 1,487,249 |
INVESTMENTS | PRINCIPAL AMOUNT($) | VALUE($) |
Multi-Utilities — continued | ||
Consolidated Edison, Inc. Series A, 0.65%, 12/1/2023 | 329,000 | 324,940 |
Dominion Energy, Inc. Series D, (ICE LIBOR USD 3 Month + 0.53%), 6.08%, 9/15/2023 (b) | 31,071,000 | 31,070,965 |
DTE Energy Co. | ||
4.22%, 11/1/2024 (d) | 3,385,000 | 3,320,051 |
2.85%, 10/1/2026 | 3,215,000 | 2,976,331 |
NiSource, Inc. 3.49%, 5/15/2027 | 4,155,000 | 3,897,360 |
WEC Energy Group, Inc. | ||
0.55%, 9/15/2023 | 15,845,000 | 15,820,997 |
0.80%, 3/15/2024 | 32,578,000 | 31,736,533 |
146,887,145 | ||
Oil, Gas & Consumable Fuels — 1.5% | ||
ConocoPhillips Co. 2.40%, 3/7/2025 | 547,000 | 524,274 |
Enbridge, Inc. (Canada) 3.50%, 6/10/2024 | 19,971,000 | 19,608,360 |
Energy Transfer LP 4.90%, 2/1/2024 | 26,434,000 | 26,297,245 |
Eni SpA (Italy) Series X-R, 4.00%, 9/12/2023 (a) | 55,705,000 | 55,682,593 |
Kinder Morgan Energy Partners LP 4.30%, 5/1/2024 | 3,463,000 | 3,423,830 |
Kinder Morgan, Inc. 5.63%, 11/15/2023 (a) | 4,000,000 | 3,996,406 |
Magellan Midstream Partners LP 5.00%, 3/1/2026 | 3,435,000 | 3,394,582 |
Phillips 66 3.85%, 4/9/2025 | 392,000 | 381,423 |
Pioneer Natural Resources Co. 5.10%, 3/29/2026 | 28,294,000 | 28,074,021 |
Sabine Pass Liquefaction LLC 5.75%, 5/15/2024 | 6,796,000 | 6,785,896 |
Saudi Arabian Oil Co. (Saudi Arabia) 1.25%, 11/24/2023 (a) | 8,000,000 | 7,912,480 |
Spectra Energy Partners LP | ||
4.75%, 3/15/2024 | 24,217,000 | 24,063,671 |
3.50%, 3/15/2025 | 3,762,000 | 3,629,285 |
TransCanada PipeLines Ltd. (Canada) | ||
3.75%, 10/16/2023 | 29,316,000 | 29,245,431 |
1.00%, 10/12/2024 | 1,618,000 | 1,534,445 |
Williams Cos., Inc. (The) | ||
4.30%, 3/4/2024 | 28,883,000 | 28,624,846 |
4.55%, 6/24/2024 | 88,179,000 | 87,232,553 |
330,411,341 | ||
158 | J.P. Morgan Exchange-Traded Funds | August 31, 2023 |
INVESTMENTS | PRINCIPAL AMOUNT($) | VALUE($) |
Corporate Bonds — continued | ||
Personal Care Products — 0.1% | ||
Haleon UK Capital plc 3.13%, 3/24/2025 | 16,322,000 | 15,698,920 |
Pharmaceuticals — 0.3% | ||
Bayer US Finance II LLC (Germany) | ||
3.88%, 12/15/2023 (a) | 32,500,000 | 32,316,869 |
3.38%, 7/15/2024 (a) | 3,651,000 | 3,571,048 |
4.25%, 12/15/2025 (a) | 6,140,000 | 5,946,478 |
Bayer US Finance LLC (Germany) 3.38%, 10/8/2024 (a) | 3,000,000 | 2,918,874 |
Pfizer Investment Enterprises Pte. Ltd. 4.65%, 5/19/2025 | 14,348,000 | 14,193,873 |
Shire Acquisitions Investments Ireland DAC 2.88%, 9/23/2023 | 130,000 | 129,759 |
Takeda Pharmaceutical Co. Ltd. (Japan) 4.40%, 11/26/2023 | 325,000 | 323,787 |
59,400,688 | ||
Semiconductors & Semiconductor Equipment — 0.5% | ||
Microchip Technology, Inc. | ||
0.97%, 2/15/2024 | 47,575,000 | 46,480,099 |
4.25%, 9/1/2025 | 13,591,000 | 13,226,341 |
NXP BV (China) | ||
4.88%, 3/1/2024 | 61,066,000 | 60,641,591 |
3.88%, 6/18/2026 | 168,000 | 160,868 |
120,508,899 | ||
Software — 0.1% | ||
Oracle Corp. | ||
2.40%, 9/15/2023 | 3,827,000 | 3,821,642 |
2.50%, 4/1/2025 | 11,687,000 | 11,127,652 |
Roper Technologies, Inc. 2.35%, 9/15/2024 | 1,175,000 | 1,135,287 |
VMware, Inc. 1.00%, 8/15/2024 | 7,113,000 | 6,798,048 |
22,882,629 | ||
Specialized REITs — 0.1% | ||
American Tower Corp. | ||
2.95%, 1/15/2025 | 2,868,000 | 2,756,867 |
2.40%, 3/15/2025 | 6,264,000 | 5,944,824 |
4.40%, 2/15/2026 | 1,960,000 | 1,907,230 |
1.60%, 4/15/2026 | 1,221,000 | 1,102,628 |
11,711,549 | ||
Specialty Retail — 0.0% ^ | ||
AutoZone, Inc. | ||
3.63%, 4/15/2025 | 534,000 | 517,977 |
INVESTMENTS | PRINCIPAL AMOUNT($) | VALUE($) |
Specialty Retail — continued | ||
3.75%, 6/1/2027 | 3,204,000 | 3,046,912 |
Lowe's Cos., Inc. 3.38%, 9/15/2025 | 2,000,000 | 1,919,287 |
5,484,176 | ||
Technology Hardware, Storage & Peripherals — 0.6% | ||
Dell International LLC | ||
4.00%, 7/15/2024 | 2,000,000 | 1,969,417 |
6.02%, 6/15/2026 | 3,129,000 | 3,161,969 |
4.90%, 10/1/2026 | 1,941,000 | 1,906,266 |
Hewlett Packard Enterprise Co. | ||
1.45%, 4/1/2024 | 37,209,000 | 36,267,647 |
5.90%, 10/1/2024 | 86,671,000 | 86,748,566 |
130,053,865 | ||
Textiles, Apparel & Luxury Goods — 0.0% ^ | ||
VF Corp. | ||
2.40%, 4/23/2025 | 1,300,000 | 1,225,295 |
2.80%, 4/23/2027 | 1,679,000 | 1,525,241 |
2,750,536 | ||
Tobacco — 0.3% | ||
Altria Group, Inc. 2.35%, 5/6/2025 | 4,665,000 | 4,416,407 |
BAT Capital Corp. (United Kingdom) | ||
3.22%, 8/15/2024 | 8,102,000 | 7,901,026 |
2.79%, 9/6/2024 | 9,067,000 | 8,795,529 |
Reynolds American, Inc. (United Kingdom) 4.85%, 9/15/2023 | 45,368,000 | 45,352,463 |
66,465,425 | ||
Wireless Telecommunication Services — 0.2% | ||
Rogers Communications, Inc. (Canada) 4.10%, 10/1/2023 | 39,643,000 | 39,580,702 |
Total Corporate Bonds (Cost $9,084,450,407) | 9,009,674,265 | |
Asset-Backed Securities — 8.5% | ||
522 Funding CLO Ltd. (Cayman Islands) Series 2019-4A, Class AR, 6.67%, 4/20/2030 (a) (e) | 39,951,772 | 39,792,244 |
Aimco CLO Ltd. (Cayman Islands) | ||
Series 2020-12A, Class XR, 6.16%, 1/17/2032 (a) (e) | 3,166,667 | 3,164,890 |
Series 2020-12A, Class AR, 6.48%, 1/17/2032 (a) (e) | 3,689,000 | 3,666,630 |
AIMCO CLO Ltd. (Cayman Islands) Series 2019-10A, Class AR, 6.67%, 7/22/2032 (a) (e) | 10,000,000 | 9,939,080 |
August 31, 2023 | J.P. Morgan Exchange-Traded Funds | 159 |
AS OF August 31, 2023 (Unaudited) (continued)
INVESTMENTS | PRINCIPAL AMOUNT($) | VALUE($) |
Asset-Backed Securities — continued | ||
Anchorage Capital CLO Ltd. (Cayman Islands) Series 2016-9A, Class XR, 6.52%, 7/15/2032 (a) (e) | 500,000 | 499,849 |
Apidos CLO (Cayman Islands) | ||
Series 2016-24A, Class A1AL, 6.54%, 10/20/2030 (a) (e) | 35,000,000 | 34,809,250 |
Series 2019-31A, Class A1R, 6.67%, 4/15/2031 (a) (e) | 28,565,000 | 28,422,175 |
Ares CLO Ltd. (Cayman Islands) | ||
Series 2016-40A, Class A1RR, 6.44%, 1/15/2029 (a) (e) | 20,458,834 | 20,358,299 |
Series 2013-2A, Class XR2, 6.58%, 10/28/2034 (a) (e) | 3,250,000 | 3,249,688 |
Atlas Senior Loan Fund (Cayman Islands) Series 2019-13A, Class A1NR, 6.69%, 4/22/2031 (a) (e) | 9,613,641 | 9,550,162 |
Atlas Senior Loan Fund Ltd. (Cayman Islands) Series 2021-18A, Class X, 6.42%, 1/18/2035 (a) (e) | 1,333,333 | 1,332,408 |
Bain Capital Credit CLO (Cayman Islands) Series 2019-1A, Class X, 6.41%, 4/19/2034 (a) (e) | 3,300,000 | 3,298,320 |
Bain Capital Credit CLO Ltd. (Cayman Islands) Series 2020-3A, Class X, 6.46%, 10/23/2034 (a) (e) | 2,346,667 | 2,345,747 |
Ballyrock CLO Ltd. (Cayman Islands) | ||
Series 2020-2A, Class A1R, 6.60%, 10/20/2031 (a) (e) | 20,955,000 | 20,830,318 |
Series 2019-1A, Class A1R, 6.60%, 7/15/2032 (a) (e) | 42,764,000 | 42,307,024 |
Benefit Street Partners CLO Ltd. (Cayman Islands) | ||
Series 2013-IIA, Class A1R2, 6.44%, 7/15/2029 (a) (e) | 6,892,984 | 6,870,520 |
Series 2013-IIIA, Class A1R2, 6.59%, 7/20/2029 (a) (e) | 13,939,667 | 13,904,358 |
Series 2015-6BR, Class X, 6.29%, 7/20/2034 (a) (e) | 600,000 | 599,873 |
BMW Vehicle Owner Trust Series 2023-A, Class A2A, 5.72%, 4/27/2026 | 41,730,000 | 41,729,729 |
Buckhorn Park CLO Ltd. (Cayman Islands) Series 2019-1A, Class XR, 6.22%, 7/18/2034 (a) (e) | 1,666,664 | 1,665,921 |
Capital One Prime Auto Receivables Trust Series 2021-1, Class A3, 0.77%, 9/15/2026 | 15,357,078 | 14,715,210 |
INVESTMENTS | PRINCIPAL AMOUNT($) | VALUE($) |
Carlyle Global Market Strategies CLO Ltd. (Cayman Islands) | ||
Series 2015-1A, Class AR3, 6.57%, 7/20/2031 (a) (e) | 7,481,028 | 7,450,198 |
Series 2015-5A, Class A1RR, 6.67%, 1/20/2032 (a) (e) | 7,458,161 | 7,422,645 |
Series 2015-4A, Class A1R, 6.93%, 7/20/2032 (a) (e) | 5,000,000 | 4,989,010 |
CarMax Auto Owner Trust Series 2022-2, Class A2A, 2.81%, 5/15/2025 | 4,325,267 | 4,308,018 |
Carvana Auto Receivables Trust Series 2022-P1, Class A2, 2.57%, 5/12/2025 | 12,907,233 | 12,862,282 |
Cedar Funding II CLO Ltd. (Cayman Islands) Series 2013-1A, Class AXR, 6.44%, 4/20/2034 (a) (e) | 1,919,643 | 1,911,726 |
CIFC Funding Ltd. (Cayman Islands) | ||
Series 2017-1A, Class AR, 6.61%, 4/23/2029 (a) (e) | 1,491,847 | 1,488,741 |
Series 2017-5A, Class A1, 6.75%, 11/16/2030 (a) (e) | 24,291,600 | 24,243,794 |
Dell Equipment Finance Trust | ||
Series 2022-1, Class A3, 2.49%, 8/23/2027 (a) | 12,911,000 | 12,661,521 |
Series 2023-2, Class A2, 5.84%, 1/22/2029 (a) | 23,413,000 | 23,405,866 |
Dewolf Park CLO Ltd. Series 2017-1A, Class AR, 6.49%, 10/15/2030 (a) (e) | 12,848,580 | 12,785,121 |
Dryden Senior Loan Fund (Cayman Islands) | ||
Series 2017-47A, Class A1R, 6.55%, 4/15/2028 (a) (e) | 40,809,466 | 40,668,266 |
Series 2013-30A, Class AR, 6.45%, 11/15/2028 (a) (e) | 1,701,272 | 1,692,160 |
Series 2013-26A, Class AR, 6.47%, 4/15/2029 (a) (e) | 6,237,750 | 6,215,487 |
Series 2014-36A, Class AR3, 6.59%, 4/15/2029 (a) (e) | 34,408,530 | 34,284,212 |
Series 2015-41A, Class AR, 6.54%, 4/15/2031 (a) (e) | 5,422,648 | 5,386,821 |
Elmwood CLO Ltd. (Cayman Islands) | ||
Series 2022-5A, Class AR, 6.96%, 7/17/2033 (a) (e) | 39,000,000 | 38,986,194 |
Series 2021-3A, Class A, 6.63%, 10/20/2034 (a) (e) | 10,000,000 | 9,936,000 |
Enterprise Fleet Financing LLC Series 2022-4, Class A2, 5.76%, 10/22/2029 (a) | 36,158,000 | 36,075,332 |
160 | J.P. Morgan Exchange-Traded Funds | August 31, 2023 |
INVESTMENTS | PRINCIPAL AMOUNT($) | VALUE($) |
Asset-Backed Securities — continued | ||
Enterprise Fleet Funding LLC Series 2021-1, Class A2, 0.44%, 12/21/2026 (a) | 19,031,057 | 18,717,646 |
Flatiron CLO Ltd. (Cayman Islands) Series 2018-1A, Class A, 6.52%, 4/17/2031 (a) (e) | 3,941,169 | 3,921,779 |
Ford Credit Auto Lease Trust Series 2023-A, Class A2A, 5.19%, 6/15/2025 | 11,775,912 | 11,747,485 |
Ford Credit Auto Owner Trust Series 2019-1, Class A, 3.52%, 7/15/2030 (a) | 14,586,000 | 14,452,000 |
Galaxy CLO Ltd. (Cayman Islands) | ||
Series 2015-19A, Class A1RR, 6.56%, 7/24/2030 (a) (e) | 9,509,922 | 9,445,968 |
Series 2013-15A, Class ARR, 6.54%, 10/15/2030 (a) (e) | 30,285,894 | 30,181,832 |
Series 2016-22A, Class XRR, 6.47%, 4/16/2034 (a) (e) | 2,315,789 | 2,314,666 |
GM Financial Automobile Leasing Trust Series 2022-2, Class A2, 2.93%, 10/21/2024 | 18,999,566 | 18,916,139 |
GM Financial Consumer Automobile Receivables Trust | ||
Series 2022-1, Class A2, 0.76%, 2/18/2025 | 1,379,431 | 1,376,495 |
Series 2023-3, Class A2A, 5.74%, 9/16/2026 | 49,810,000 | 49,825,247 |
Goldentree Loan Management US CLO Ltd. (Cayman Islands) | ||
Series 2022-12A, Class X, 6.33%, 4/20/2034 (a) (e) | 3,000,000 | 2,998,176 |
Series 2022-14A, Class X, 6.53%, 7/20/2035 (a) (e) | 1,845,000 | 1,844,875 |
Greenwood Park CLO Ltd. Series 2018-1A, Class A1, 6.60%, 4/15/2031 (a) (e) | 2,500,000 | 2,484,155 |
Harriman Park CLO Ltd. (Cayman Islands) Series 2020-1A, Class XR, 6.19%, 4/20/2034 (a) (e) | 1,249,997 | 1,249,536 |
Honda Auto Receivables Owner Trust Series 2023-1, Class A2, 5.22%, 10/21/2025 | 66,361,000 | 66,120,415 |
Hyundai Auto Lease Securitization Trust Series 2022-C, Class A2A, 4.34%, 1/15/2025 (a) | 30,865,938 | 30,726,159 |
Hyundai Auto Receivables Trust | ||
Series 2021-A, Class A3, 0.38%, 9/15/2025 | 2,220,458 | 2,171,808 |
INVESTMENTS | PRINCIPAL AMOUNT($) | VALUE($) |
Series 2023-B, Class A2A, 5.77%, 5/15/2026 | 67,662,000 | 67,648,853 |
Series 2021-A, Class A4, 0.62%, 5/17/2027 | 12,390,000 | 11,656,412 |
ICG US CLO Ltd. (Cayman Islands) | ||
Series 2016-1A, Class XRR, 6.53%, 4/29/2034 (a) (e) | 2,105,266 | 2,105,066 |
Series 2014-1A, Class XR, 6.39%, 10/20/2034 (a) (e) | 1,166,667 | 1,166,255 |
KKR CLO Ltd. (Cayman Islands) | ||
Series 13, Class A1R, 6.37%, 1/16/2028 (a) (e) | 1,540,038 | 1,536,642 |
Series 28A, Class A, 6.69%, 3/15/2031 (a) (e) | 13,139,507 | 13,055,664 |
Series 32A, Class A1, 6.89%, 1/15/2032 (a) (e) | 18,000,000 | 17,955,954 |
Series 24, Class A1R, 6.67%, 4/20/2032 (a) (e) | 10,000,000 | 9,955,210 |
Series 16, Class X, 6.34%, 10/20/2034 (a) (e) | 875,000 | 874,846 |
LCM LP (Cayman Islands) | ||
Series 20A, Class AR, 6.63%, 10/20/2027 (a) (e) | 158,907 | 158,785 |
Series 14A, Class AR, 6.63%, 7/20/2031 (a) (e) | 20,980,000 | 20,820,195 |
LCM Ltd. (Cayman Islands) | ||
Series 24A, Class AR, 6.57%, 3/20/2030 (a) (e) | 25,701,149 | 25,542,779 |
Series 25A, Class AR, 6.43%, 7/20/2030 (a) (e) | 22,269,397 | 22,107,276 |
Series 26A, Class A1, 6.66%, 1/20/2031 (a) (e) | 13,115,326 | 13,069,448 |
Series 29A, Class AR, 6.64%, 4/15/2031 (a) (e) | 20,000,000 | 19,821,040 |
Madison Park Funding Ltd. (Cayman Islands) Series 2015-18A, Class ARR, 6.54%, 10/21/2030 (a) (e) | 21,530,697 | 21,440,763 |
Magnetite Ltd. (Cayman Islands) | ||
Series 2012-7A, Class A1R2, 6.37%, 1/15/2028 (a) (e) | 32,026,862 | 31,905,960 |
Series 2016-18A, Class AR2, 6.51%, 11/15/2028 (a) (e) | 39,399,478 | 39,260,122 |
Series 2014-8A, Class AR2, 6.55%, 4/15/2031 (a) (e) | 10,246,518 | 10,211,731 |
Series 2016-17A, Class AR, 6.69%, 7/20/2031 (a) (e) | 8,500,000 | 8,490,004 |
Series 2015-15A, Class AR, 6.62%, 7/25/2031 (a) (e) | 4,000,000 | 3,982,520 |
August 31, 2023 | J.P. Morgan Exchange-Traded Funds | 161 |
AS OF August 31, 2023 (Unaudited) (continued)
INVESTMENTS | PRINCIPAL AMOUNT($) | VALUE($) |
Asset-Backed Securities — continued | ||
Series 2020-25A, Class A, 6.81%, 1/25/2032 (a) (e) | 20,250,000 | 20,197,978 |
Series 2017-19A, Class X, 6.27%, 4/17/2034 (a) (e) | 1,250,000 | 1,247,061 |
Marathon CLO Ltd. (Cayman Islands) Series 2019-1A, Class AANR, 6.89%, 4/15/2032 (a) (e) | 35,000,000 | 34,911,765 |
Marlette Funding Trust Series 2022-1A, Class A, 1.36%, 4/15/2032 (a) | 133,978 | 133,722 |
Mercedes-Benz Auto Receivables Trust Series 2023-1, Class A2, 5.09%, 1/15/2026 | 37,516,176 | 37,362,240 |
Neuberger Berman CLO (Cayman Islands) Series 2013-15A, Class A1R2, 6.49%, 10/15/2029 (a) (e) | 34,597,322 | 34,448,346 |
Neuberger Berman CLO Ltd. (Cayman Islands) | ||
Series 2013-14A, Class AR2, 6.66%, 1/28/2030 (a) (e) | 16,479,294 | 16,440,040 |
Series 2017-16SA, Class XR, 6.37%, 4/15/2034 (a) (e) | 3,750,000 | 3,727,901 |
Neuberger Berman Loan Advisers CLO Ltd. (Cayman Islands) | ||
Series 2017-26A, Class AR, 6.49%, 10/18/2030 (a) (e) | 27,212,658 | 27,082,064 |
Series 2020-37A, Class AR, 6.56%, 7/20/2031 (a) (e) | 26,036,000 | 25,854,920 |
Newark BSL CLO 2 Ltd. (Cayman Islands) Series 2017-1A, Class A1R, 6.58%, 7/25/2030 (a) (e) | 28,365,359 | 28,172,248 |
Newark BSL CLO Ltd. (Cayman Islands) Series 2016-1A, Class A1R, 6.72%, 12/21/2029 (a) (e) | 19,494,598 | 19,425,275 |
OCP CLO Ltd. (Cayman Islands) | ||
Series 2017-13A, Class A1AR, 6.53%, 7/15/2030 (a) (e) | 5,881,130 | 5,853,195 |
Series 2018-15A, Class A1, 6.69%, 7/20/2031 (a) (e) | 1,715,000 | 1,709,841 |
Series 2020-8RA, Class A1, 6.79%, 1/17/2032 (a) (e) | 35,000,000 | 34,879,110 |
Series 2019-17A, Class A1R, 6.63%, 7/20/2032 (a) (e) | 13,000,000 | 12,891,463 |
Series 2020-18A, Class AR, 6.68%, 7/20/2032 (a) (e) | 1,750,000 | 1,737,220 |
Series 2015-9A, Class X, 6.06%, 1/15/2033 (a) (e) | 2,000,000 | 1,998,148 |
INVESTMENTS | PRINCIPAL AMOUNT($) | VALUE($) |
Octagon Investment Partners 30 Ltd. (Cayman Islands) Series 2017-1A, Class A1R, 6.59%, 3/17/2030 (a) (e) | 32,988,782 | 32,835,978 |
Octagon Investment Partners 35 Ltd. (Cayman Islands) Series 2018-1A, Class A1A, 6.65%, 1/20/2031 (a) (e) | 9,173,472 | 9,150,850 |
OHA Credit Funding 7 Ltd. (Cayman Islands) Series 2020-7A, Class XR, 6.02%, 2/24/2037 (a) (e) | 312,500 | 312,075 |
OHA Credit Partners Ltd. (Cayman Islands) Series 2016-13A, Class XR, 6.45%, 10/25/2034 (a) (e) | 1,125,000 | 1,115,851 |
OSD CLO Ltd. (Cayman Islands) | ||
Series 2021-23A, Class A, 6.44%, 4/17/2031 (a) (e) | 8,757,270 | 8,669,680 |
Series 2023-27A, Class A, 6.65%, 4/16/2035 (a) (e) | 12,000,000 | 11,944,680 |
Palmer Square CLO Ltd. (Cayman Islands) Series 2018-2A, Class A1A, 6.67%, 7/16/2031 (a) (e) | 12,500,000 | 12,460,050 |
Palmer Square Loan Funding Ltd. (Cayman Islands) | ||
Series 2020-4A, Class A1, 6.65%, 11/25/2028 (a) (e) | 15,604,294 | 15,562,755 |
Series 2021-1A, Class A1, 6.49%, 4/20/2029 (a) (e) | 833,037 | 828,576 |
Series 2021-2A, Class A1, 6.44%, 5/20/2029 (a) (e) | 20,150,346 | 20,046,290 |
Series 2021-4A, Class A1, 6.37%, 10/15/2029 (a) (e) | 21,953,994 | 21,840,843 |
Series 2022-1A, Class A1, 6.36%, 4/15/2030 (a) (e) | 31,030,911 | 30,836,657 |
Porsche Financial Auto Securitization Trust Series 2023-1A, Class A2, 5.42%, 12/22/2026 (a) | 35,740,000 | 35,643,995 |
Santander Drive Auto Receivables Trust | ||
Series 2022-6, Class A2, 4.37%, 5/15/2025 | 8,778,373 | 8,769,741 |
Series 2023-1, Class A2, 5.36%, 5/15/2026 | 9,691,551 | 9,673,312 |
Sculptor CLO Ltd. (Cayman Islands) Series 27A, Class X, 6.64%, 7/20/2034 (a) (e) | 4,000,000 | 3,968,436 |
Sound Point CLO II Ltd. (Cayman Islands) Series 2013-1A, Class A1R, 6.68%, 1/26/2031 (a) (e) | 2,380,147 | 2,366,123 |
162 | J.P. Morgan Exchange-Traded Funds | August 31, 2023 |
INVESTMENTS | PRINCIPAL AMOUNT($) | VALUE($) |
Asset-Backed Securities — continued | ||
Sound Point CLO Ltd. (Cayman Islands) Series 2019-1A, Class AR, 6.67%, 1/20/2032 (a) (e) | 7,268,000 | 7,220,634 |
Stratus CLO Ltd. (Cayman Islands) Series 2021-1A, Class A, 6.39%, 12/29/2029 (a) (e) | 927,919 | 922,150 |
Symphony CLO Ltd. (Cayman Islands) | ||
Series 2018-20A, Class X, 6.57%, 1/16/2032 (a) (e) | 250,000 | 249,988 |
Series 2020-24A, Class A, 6.81%, 1/23/2032 (a) (e) | 28,550,000 | 28,443,480 |
Symphony Static CLO Ltd. (Cayman Islands) Series 2021-1A, Class A, 6.44%, 10/25/2029 (a) (e) | 24,494,574 | 24,327,203 |
TCI-Symphony CLO Ltd. (Cayman Islands) Series 2017-1A, Class AR, 6.50%, 7/15/2030 (a) (e) | 18,499,038 | 18,390,800 |
Venture CLO Ltd. (Cayman Islands) | ||
Series 2019-36A, Class XR, 6.29%, 4/20/2032 (a) (e) | 1,375,000 | 1,369,558 |
Series 2021-43A, Class X, 6.62%, 4/15/2034 (a) (e) | 4,583,333 | 4,581,101 |
Volkswagen Auto Loan Enhanced Trust Series 2023-1, Class A2A, 5.50%, 12/21/2026 | 102,380,000 | 102,081,112 |
Voya CLO Ltd. (Cayman Islands) | ||
Series 2015-1A, Class A1R, 6.47%, 1/18/2029 (a) (e) | 6,467,717 | 6,450,558 |
Series 2017-3A, Class XR, 6.44%, 4/20/2034 (a) (e) | 2,095,238 | 2,094,212 |
Westlake Automobile Receivables Trust Series 2021-3A, Class A3, 0.95%, 6/16/2025 (a) | 10,101,019 | 10,033,585 |
Total Asset-Backed Securities (Cost $1,945,469,300) | 1,941,347,805 | |
U.S. Treasury Obligations — 2.3% | ||
U.S. Treasury Notes | ||
1.50%, 2/29/2024 | 20,260,000 | 19,873,794 |
0.38%, 7/15/2024 | 528,400,000 | 505,963,639 |
Total U.S. Treasury Obligations (Cost $529,469,590) | 525,837,433 | |
U.S. Government Agency Securities — 0.6% | ||
FFCB Funding Corp. 4.88%, 9/25/2023 | 5,200,000 | 5,197,583 |
INVESTMENTS | PRINCIPAL AMOUNT($) | VALUE($) |
FHLB | ||
5.20%, 9/7/2023 | 4,000,000 | 3,999,760 |
4.90%, 11/22/2023 | 121,670,000 | 121,421,000 |
Total U.S. Government Agency Securities (Cost $130,861,609) | 130,618,343 | |
Commercial Mortgage-Backed Securities — 0.1% | ||
Benchmark Mortgage Trust Series 2018-B3, Class A2, 3.85%, 4/10/2051 | 1,287,988 | 1,248,701 |
Citigroup Commercial Mortgage Trust Series 2018-B2, Class A2, 3.79%, 3/10/2051 | 3,096,650 | 3,089,279 |
UBS Commercial Mortgage Trust Series 2018-C11, Class A2, 3.99%, 6/15/2051 | 228,761 | 228,099 |
Wells Fargo Commercial Mortgage Trust Series 2018-C46, Class A2, 4.06%, 8/15/2051 | 2,935,183 | 2,926,775 |
WFRBS Commercial Mortgage Trust Series 2013-UBS1, Class AS, 4.31%, 3/15/2046 (e) | 6,584,641 | 6,561,328 |
Total Commercial Mortgage-Backed Securities (Cost $14,533,481) | 14,054,182 | |
Foreign Government Securities — 0.0% ^ | ||
Province of Ontario 3.05%, 1/29/2024 (Cost $4,858,182) | 4,895,000 | 4,844,089 |
Short-Term Investments — 48.7% | ||
Certificates of Deposits — 14.5% | ||
Bank of Montreal (Canada) , 5.00%, 10/6/2023 | 25,000,000 | 24,984,041 |
Bank of Nova Scotia (The) (Canada) | ||
(SOFR + 0.64%), 5.95%, 5/31/2024 (b) | 43,016,000 | 43,061,057 |
6.05%, 6/28/2024 | 3,636,000 | 3,638,749 |
Barclays Bank plc (United Kingdom) | ||
5.70%, 12/8/2023 | 110,000,000 | 109,950,173 |
6.00%, 8/8/2024 | 103,000,000 | 102,934,889 |
BNP Paribas SA (France) , 5.32%, 2/6/2024 | 135,295,000 | 134,967,571 |
Canadian Imperial Bank of Commerce (Canada) | ||
5.60%, 3/7/2024 | 31,908,000 | 31,864,184 |
6.01%, 6/28/2024 | 89,201,000 | 89,281,236 |
Citibank NA | ||
5.63%, 3/1/2024 | 115,569,000 | 115,424,735 |
5.80%, 3/5/2024 | 16,352,000 | 16,344,918 |
August 31, 2023 | J.P. Morgan Exchange-Traded Funds | 163 |
AS OF August 31, 2023 (Unaudited) (continued)
INVESTMENTS | PRINCIPAL AMOUNT($) | VALUE($) |
Short-Term Investments — continued | ||
Certificates of Deposits — continued | ||
5.84%, 4/30/2024 | 101,301,000 | 101,308,531 |
Cooperatieve Rabobank UA (Netherlands) | ||
5.41%, 2/20/2024 | 174,909,000 | 174,814,899 |
5.57%, 3/1/2024 | 65,572,000 | 65,450,589 |
Credit Agricole Corporate and Investment Bank (France) | ||
5.41%, 11/17/2023 | 84,786,000 | 84,763,713 |
5.42%, 11/20/2023 | 17,899,000 | 17,894,096 |
5.30%, 1/11/2024 | 139,018,000 | 138,781,604 |
DNB Bank ASA (Norway) | ||
5.39%, 11/16/2023 | 27,948,000 | 27,942,237 |
5.48%, 11/24/2023 | 45,823,000 | 45,820,142 |
Kookmin Bank (South Korea) | ||
(SOFR + 0.73%), 6.04%, 1/22/2024 (b) | 59,465,000 | 59,536,011 |
(SOFR + 0.73%), 6.04%, 1/26/2024 (b) | 38,932,000 | 38,978,443 |
6.00%, 5/20/2024 | 111,963,000 | 111,952,028 |
Lloyds Bank Corporate Markets plc (United Kingdom) | ||
5.49%, 12/14/2023 | 61,071,000 | 61,007,496 |
5.31%, 1/18/2024 | 72,299,000 | 72,139,922 |
Lloyds Bank Corporate Markets PLC (United Kingdom) (SOFR + 0.66%), 5.97%, 8/15/2024 (b) | 28,414,000 | 28,435,304 |
Mizuho Bank Ltd. (Japan) , 5.40%, 12/14/2023 | 105,860,000 | 105,741,028 |
Natixis SA (France) , 4.29%, 9/8/2023 | 85,666,000 | 85,642,666 |
Nordea Bank Abp (Finland) | ||
4.14%, 9/5/2023 | 93,036,000 | 93,018,784 |
5.17%, 1/31/2024 | 205,870,000 | 205,345,392 |
Norinchukin Bank (The) (Japan) , 5.71%, 1/17/2024 | 195,021,000 | 195,025,688 |
Royal Bank of Canada (Canada) , 4.87%, 9/22/2023 | 81,567,000 | 81,533,400 |
Standard Chartered Bank (United Kingdom) , 5.44%, 1/12/2024 | 145,077,000 | 144,888,958 |
Sumitomo Mitsui Banking Corp. (Japan) | ||
(SOFR + 0.70%), 6.01%, 6/6/2024 (b) | 226,669,000 | 226,920,827 |
(SOFR + 0.72%), 6.03%, 8/7/2024 (b) | 48,274,000 | 48,300,037 |
Toronto-Dominion Bank (The) (Canada) | ||
4.35%, 9/12/2023 | 180,015,000 | 179,946,277 |
5.37%, 12/15/2023 | 74,200,000 | 74,114,991 |
INVESTMENTS | PRINCIPAL AMOUNT($) | VALUE($) |
Certificates of Deposits — continued | ||
Wells Fargo Bank NA | ||
(SOFR + 0.60%), 5.90%, 9/1/2023 (b) | 9,466,000 | 9,467,170 |
(SOFR + 0.60%), 5.91%, 8/2/2024 (b) | 27,552,000 | 27,555,402 |
Westpac Banking Corp. (Australia) | ||
5.33%, 1/11/2024 | 17,800,000 | 17,773,605 |
5.18%, 2/1/2024 | 110,036,000 | 109,757,209 |
Total Certificates of Deposit (Cost $3,308,485,760) | 3,306,308,002 | |
Commercial Paper — 27.4% | ||
3M Co. | ||
5.55%, 9/7/2023 (f) | 142,458,000 | 142,311,743 |
5.50%, 2/5/2024 (f) | 29,029,000 | 28,334,515 |
ABN AMRO Funding USA LLC (Netherlands) 5.47%, 11/22/2023 (f) | 51,300,000 | 50,650,552 |
AT&T, Inc. | ||
5.68%, 12/20/2023 (f) | 76,529,000 | 75,197,688 |
5.92%, 2/21/2024 (f) | 38,550,000 | 37,480,495 |
Australia & New Zealand Banking Group Ltd. (Australia) | ||
5.39%, 9/12/2023 (f) | 67,235,000 | 67,115,680 |
5.38%, 11/17/2023 (f) | 100,210,000 | 99,047,965 |
5.52%, 11/20/2023 (f) | 68,765,000 | 67,936,622 |
5.52%, 11/22/2023 (f) | 98,754,000 | 97,534,758 |
5.39%, 12/15/2023 (f) | 129,378,000 | 127,328,127 |
Aviation Capital Group LLC 6.19%, 9/6/2023 (f) | 37,400,000 | 37,365,162 |
Banco Santander Chile (Chile) | ||
5.93%, 10/24/2023 (f) | 10,000,000 | 9,911,980 |
6.14%, 1/26/2024 (f) | 4,942,000 | 4,817,639 |
6.23%, 2/7/2024 (f) | 27,198,000 | 26,455,434 |
6.21%, 2/9/2024 (f) | 24,520,000 | 23,841,850 |
Banco Santander SA (Spain) | ||
5.55%, 11/17/2023 (f) | 84,219,000 | 83,218,310 |
5.63%, 2/22/2024 (f) | 120,440,000 | 117,164,283 |
Bank Montana System 5.50%, 11/17/2023 (f) | 83,809,000 | 82,816,813 |
Bank of Montreal | ||
5.55%, 11/6/2023 (f) | 168,723,000 | 167,011,948 |
5.47%, 1/4/2024 (f) | 29,203,000 | 28,639,207 |
Bell Canada, Inc. (Canada) 5.60%, 10/3/2023 (f) | 2,400,000 | 2,387,777 |
BNP Paribas SA (France) 5.29%, 10/2/2023 (f) | 191,424,000 | 190,523,712 |
164 | J.P. Morgan Exchange-Traded Funds | August 31, 2023 |
INVESTMENTS | PRINCIPAL AMOUNT($) | VALUE($) |
Short-Term Investments — continued | ||
Commercial Paper — continued | ||
BPCE SA (France) | ||
5.41%, 10/6/2023 (f) | 63,131,000 | 62,789,714 |
5.17%, 10/20/2023 (f) | 7,000,000 | 6,947,082 |
5.33%, 11/7/2023 (f) | 257,310,000 | 254,641,209 |
Brookfield Corporate Treasury Ltd. (Canada) 5.76%, 9/6/2023 (f) | 100,000,000 | 99,907,883 |
Citigroup Global Markets, Inc. | ||
5.52%, 11/27/2023 (f) | 10,460,000 | 10,317,914 |
5.43%, 1/8/2024 (f) | 23,541,000 | 23,064,949 |
Cnh Industrial Capital 5.93%, 2/5/2024 (f) | 35,000,000 | 34,089,547 |
Commonwealth Bank of Australia (Australia) 5.93%, 7/22/2024 (f) | 132,398,000 | 125,658,772 |
Cooperatieve Rabobank UA (Netherlands) 5.19%, 10/31/2023 (f) | 59,006,000 | 58,477,493 |
Credit Agricole Corporate and Investment Bank (France) 5.65%, 11/27/2023 (f) | 3,996,000 | 3,943,350 |
Credit Industriel et Commercial (France) | ||
5.38%, 11/10/2023 (f) | 137,202,000 | 135,755,951 |
5.59%, 11/22/2023 (f) | 55,099,000 | 54,418,353 |
DNB Bank ASA (Norway) | ||
5.47%, 11/17/2023 (f) | 158,329,000 | 156,497,133 |
5.51%, 11/22/2023 (f) | 75,690,000 | 74,756,210 |
5.38%, 12/19/2023 (f) | 112,419,000 | 110,567,865 |
Duke Energy Corp. 5.90%, 2/22/2024 (f) | 50,356,000 | 48,933,303 |
EIDP, Inc. | ||
5.76%, 11/17/2023 (f) | 10,970,000 | 10,844,218 |
5.94%, 12/1/2023 (f) | 10,519,000 | 10,375,558 |
Enel Finance America LLC (Italy) 5.63%, 9/15/2023 (f) | 1,068,000 | 1,065,558 |
General Dynamics Corp. 5.59%, 9/27/2023 (f) | 2,600,000 | 2,589,534 |
Glencore Funding LLC (Australia) | ||
5.87%, 11/10/2023 (f) | 18,694,000 | 18,483,775 |
6.01%, 2/20/2024 (f) | 73,687,000 | 71,638,846 |
GTA Funding LLC 5.75%, 1/10/2024 (f) | 80,139,000 | 78,500,532 |
HSBC USA, Inc. | ||
6.07%, 12/8/2023 (f) | 97,500,000 | 96,000,645 |
6.34%, 5/1/2024 (f) | 5,050,000 | 4,847,337 |
5.99%, 5/20/2024 (f) | 25,000,000 | 23,912,020 |
6.25%, 6/6/2024 (f) | 52,663,000 | 50,213,585 |
6.50%, 8/1/2024 (f) | 2,870,000 | 2,708,396 |
INVESTMENTS | PRINCIPAL AMOUNT($) | VALUE($) |
Commercial Paper — continued | ||
ING US Funding LLC (Netherlands) 5.27%, 9/21/2023 (f) | 271,850,000 | 271,002,869 |
L3Harris Technologies, Inc. 6.32%, 8/27/2024 (f) | 33,020,000 | 31,087,227 |
Leidos, Inc. 6.02%, 9/1/2023 (f) | 28,600,000 | 28,595,475 |
Lloyds Bank Corporate Markets plc (United Kingdom) 5.22%, 10/20/2023 (f) | 3,000,000 | 2,977,125 |
Lloyds Bank plc (United Kingdom) 5.90%, 4/22/2024 (f) | 121,445,000 | 116,970,629 |
LSEGA Financing PLC (United Kingdom) 5.55%, 9/29/2023 (f) | 9,500,000 | 9,456,923 |
Macquarie Bank Ltd. (Australia) | ||
5.63%, 11/21/2023 (f) | 84,979,000 | 83,902,595 |
5.58%, 12/1/2023 (f) | 11,600,000 | 11,434,199 |
5.15%, 4/5/2024 (f) | 120,000,000 | 115,889,974 |
5.93%, 5/17/2024 (f) | 58,200,000 | 55,818,812 |
6.00%, 8/20/2024 (f) | 19,877,000 | 18,782,092 |
MUFG Bank Ltd. (Japan) 5.82%, 1/19/2024 (f) | 110,645,000 | 108,227,720 |
National Australia Bank Ltd. (Australia) | ||
5.46%, 12/1/2023 (f) | 56,925,000 | 56,119,068 |
5.62%, 12/11/2023 (f) | 192,846,000 | 189,818,960 |
National Bank of Canada (Canada) | ||
5.81%, 2/26/2024 (f) | 35,852,000 | 34,855,682 |
5.77%, 3/15/2024 (f) | 9,761,000 | 9,462,200 |
Natixis SA (France) | ||
5.46%, 9/1/2023 (f) | 50,000,000 | 49,992,703 |
5.53%, 11/17/2023 (f) | 2,000,000 | 1,976,375 |
NatWest Markets plc (United Kingdom) 5.63%, 2/6/2024 (a) (f) | 83,924,000 | 81,826,040 |
Nordea Bank Abp (Finland) 5.38%, 11/13/2023 (f) | 56,456,000 | 55,830,267 |
Philip Morris International, Inc. 5.19%, 10/24/2023 (f) | 2,750,000 | 2,727,741 |
Quanta Services, Inc. 5.83%, 9/5/2023 (f) | 16,350,000 | 16,336,913 |
Royal Bank of Canada (Canada) | ||
5.61%, 11/22/2023 (f) | 103,570,000 | 102,273,151 |
5.48%, 12/8/2023 (f) | 37,000,000 | 36,445,259 |
5.39%, 12/15/2023 (f) | 136,186,000 | 133,996,182 |
Sempra | ||
5.61%, 9/5/2023 (f) | 51,525,000 | 51,485,927 |
5.61%, 9/6/2023 (f) | 11,895,000 | 11,884,176 |
August 31, 2023 | J.P. Morgan Exchange-Traded Funds | 165 |
AS OF August 31, 2023 (Unaudited) (continued)
INVESTMENTS | PRINCIPAL AMOUNT($) | VALUE($) |
Short-Term Investments — continued | ||
Commercial Paper — continued | ||
Skandinaviska Enskilda Banken AB (Sweden) | ||
5.35%, 10/2/2023 (f) | 110,210,000 | 109,695,784 |
5.17%, 10/23/2023 (f) | 11,000,000 | 10,914,704 |
5.39%, 11/17/2023 (f) | 241,108,000 | 238,290,694 |
Societe Generale SA (France) | ||
5.44%, 12/15/2023 (f) | 205,985,000 | 202,655,858 |
6.00%, 5/13/2024 (f) | 33,394,000 | 32,037,580 |
5.90%, 6/21/2024 (f) | 31,600,000 | 30,123,240 |
Standard Chartered Bank (United Kingdom) | ||
5.58%, 2/21/2024 (f) | 24,395,000 | 23,724,922 |
6.05%, 8/13/2024 (f) | 40,071,000 | 37,885,942 |
6.08%, 8/27/2024 (f) | 6,290,000 | 5,933,842 |
Sumitomo Mitsui Banking Corp. (Japan) 5.52%, 1/5/2024 (f) | 36,002,000 | 35,311,209 |
Suncor Energy, Inc. (Canada) 5.87%, 11/2/2023 (f) | 42,523,000 | 42,108,433 |
Svenska Handelsbanken AB (Sweden) | ||
5.36%, 10/10/2023 (f) | 104,101,000 | 103,496,520 |
5.33%, 1/9/2024 (f) | 133,099,000 | 130,454,061 |
6.00%, 8/22/2024 (f) | 67,788,000 | 64,040,312 |
TELUS Corp. (Canada) | ||
5.58%, 9/14/2023 (f) | 31,454,000 | 31,386,882 |
5.74%, 10/5/2023 (f) | 13,965,000 | 13,889,620 |
5.74%, 10/10/2023 (f) | 40,395,000 | 40,145,763 |
5.90%, 1/9/2024 (f) | 2,884,000 | 2,823,782 |
Toronto-Dominion Bank (The) (Canada) 5.98%, 8/23/2024 (f) | 93,960,000 | 88,762,044 |
TransCanada PipeLines Ltd. (Canada) | ||
5.72%, 9/27/2023 (f) | 38,918,000 | 38,756,354 |
5.87%, 12/20/2023 (f) | 10,874,000 | 10,682,722 |
Westpac Banking Corp. (Australia) 5.36%, 2/9/2024 (f) | 7,000,000 | 6,826,844 |
Westpac Securities NZ Ltd. (New Zealand) 5.61%, 11/30/2023 (f) | 54,000,000 | 53,257,031 |
Total Commercial Paper (Cost $6,245,019,010) | 6,241,419,419 | |
SHARES | ||
Investment Companies — 5.8% | ||
JPMorgan U.S. Government Money Market Fund Class IM Shares, 5.27% (g) (h) (Cost $1,325,392,391) | 1,325,392,391 | 1,325,392,391 |
INVESTMENTS | SHARES | VALUE($) |
Investment of Cash Collateral from Securities Loaned — 0.1% | ||
JPMorgan Securities Lending Money Market Fund Agency SL Class Shares, 5.50% (g) (h) | 6,709,568 | 6,710,910 |
JPMorgan U.S. Government Money Market Fund Class IM Shares, 5.27% (g) (h) | 1,799,874 | 1,799,874 |
Total Investment of Cash Collateral from Securities Loaned (Cost $8,510,784) | 8,510,784 | |
PRINCIPAL AMOUNT($) | ||
Repurchase Agreements — 0.9% | ||
Wells Fargo Securities LLC, 5.73%, dated 8/31/2023, due 9/19/2023, repurchase price $200,604,833, collateralized by Asset-Backed Securities, 0.00% - 13.50%, due 11/20/2023 - 3/25/2068, with the value of $223,151,501. (Cost $200,000,000) | 200,000,000 | 200,000,000 |
Total Short-Term Investments (Cost $11,087,407,945) | 11,081,630,596 | |
Total Investments — 99.8% (Cost $22,797,050,514) | 22,708,006,713 | |
Other Assets Less Liabilities — 0.2% | 48,197,043 | |
NET ASSETS — 100.0% | 22,756,203,756 | |
Percentages indicated are based on net assets. |
Abbreviations | |
CIFC | Commercial Industrial Finance Corp. |
CLO | Collateralized Loan Obligations |
CME | Chicago Mercantile Exchange |
FFCB | Federal Farm Credit Bank |
FHLB | Federal Home Loan Bank |
ICE | Intercontinental Exchange |
LIBOR | London Interbank Offered Rate |
REIT | Real Estate Investment Trust |
SOFR | Secured Overnight Financing Rate |
SOFRINDX | Compounding index of the Secured Overnight Financing Rate |
USD | United States Dollar |
^ | Amount rounds to less than 0.1% of net assets. | |
(a) | Securities exempt from registration under Rule 144A or section 4(a)(2), of the Securities Act of 1933, as amended. | |
(b) | Variable or floating rate security, linked to the referenced benchmark. The interest rate shown is the current rate as of August 31, 2023. | |
166 | J.P. Morgan Exchange-Traded Funds | August 31, 2023 |
(c) | The security or a portion of this security is on loan at August 31, 2023. The total value of securities on loan at August 31, 2023 is $8,275,241. | |
(d) | Step bond. Interest rate is a fixed rate for an initial period that either resets at a specific date or may reset in the future contingent upon a predetermined trigger. The interest rate shown is the current rate as of August 31, 2023. | |
(e) | Variable or floating rate security, the interest rate of which adjusts periodically based on changes in current interest rates and prepayments on the underlying pool of assets. The interest rate shown is the current rate as of August 31, 2023. |
(f) | The rate shown is the effective yield as of August 31, 2023. | |
(g) | Investment in an affiliated fund, which is registered under the Investment Company Act of 1940, as amended, and is advised by J.P. Morgan Investment Management Inc. | |
(h) | The rate shown is the current yield as of August 31, 2023. |
August 31, 2023 | J.P. Morgan Exchange-Traded Funds | 167 |
AS OF August 31, 2023 (Unaudited)
INVESTMENTS | PRINCIPAL AMOUNT($) | VALUE($) |
Municipal Bonds — 96.2% (a) | ||
Alabama — 4.6% | ||
Alabama Federal Aid Highway Finance Authority | ||
Series A, Rev., 5.00%, 9/1/2023 (b) | 90,000 | 90,000 |
Series B, Rev., 5.00%, 9/1/2023 (b) | 25,000 | 25,000 |
Series 2015, Rev., 4.00%, 9/1/2024 (b) | 46,810,000 | 47,103,279 |
Series 2015, Rev., 5.00%, 9/1/2024 (b) | 75,000 | 76,193 |
Alabama Public School and College Authority Series 2014B, Rev., 5.00%, 1/1/2026 | 90,000 | 91,102 |
Alabama Public School and College Authority, Capital Improvement | ||
Series 2013-C, Rev., 5.00%, 9/1/2023 | 125,000 | 125,000 |
Series 2013A, Rev., 3.25%, 6/1/2024 | 40,000 | 39,973 |
Series 2014-B, Rev., 5.00%, 1/1/2025 | 75,000 | 76,037 |
Alabama Special Care Facilities Financing Authority-Birmingham Series 2015, Rev., 5.00%, 6/1/2024 | 255,000 | 257,774 |
Autauga County Board of Education Rev., 5.00%, 4/1/2024 | 30,000 | 30,267 |
Birmingham Airport Authority Rev., 5.00%, 7/1/2026 | 20,000 | 20,960 |
Black Belt Energy Gas District, Gas Prepay Series 2018A, Rev., 4.00%, 12/1/2023 (c) | 165,000 | 164,830 |
Black Belt Energy Gas District, Gas Prepay Project No. 4 Series 2019A-1, Rev., 4.00%, 12/1/2025 (c) | 40,000,000 | 39,671,296 |
Black Belt Energy Gas District, Gas Project No. 6 Series 2021B, Rev., 4.00%, 12/1/2026 (c) | 60,000 | 58,647 |
Black Belt Energy Gas District, Gas Supply Series 2022D-2, Rev., LIQ : Royal Bank of Canada, (SOFR + 1.40%), 4.96%, 9/6/2023 (d) | 25,575,000 | 25,326,235 |
City of Hoover, Warrants GO, 2.00%, 3/1/2025 | 30,000 | 29,087 |
City of Huntsville, Warrants | ||
Series 2020B, GO, 5.00%, 9/1/2023 | 30,000 | 30,000 |
Series 2013-C, GO, 5.00%, 11/1/2023 (b) | 25,000 | 25,065 |
City of Huntsville, Warrants, Water Revenue Series 2015, Rev., 5.00%, 5/1/2025 (b) | 1,400,000 | 1,438,594 |
City of Trussville, Warrants Series 2014A, GO, 5.00%, 10/1/2023 (b) | 25,000 | 25,030 |
City of Tuscaloosa Series 2019A, GO, 4.00%, 7/1/2024 | 35,000 | 35,208 |
County of Mobile, Warrants GO, 5.00%, 8/1/2025 (b) | 25,000 | 25,822 |
INVESTMENTS | PRINCIPAL AMOUNT($) | VALUE($) |
Alabama — continued | ||
Industrial Development Board of The City of Mobile, Alabama Power Control, Barry Plant Project Series 2007A, Rev., 1.00%, 6/26/2025 (c) | 100,000 | 94,862 |
Limestone County Water and Sewer Authority Series 2014B, Rev., 4.00%, 12/1/2023 (b) | 30,000 | 30,050 |
Madison County Board of Education, Tax Anticipation Warrants Rev., 5.00%, 9/1/2023 | 20,000 | 20,000 |
Southeast Alabama Gas Supply District (The), Project No. 1 Series 2018A, Rev., 4.00%, 4/1/2024 (c) | 245,000 | 244,286 |
Southeast Energy Authority A Cooperative District, Project No. 4 Series 2022B-1, Rev., 5.00%, 8/1/2024 | 1,160,000 | 1,167,662 |
UAB Medicine Finance Authority Series 2016B, Rev., 5.00%, 9/1/2023 | 1,000,000 | 1,000,000 |
University of Alabama (The) | ||
Series 2012-A, Rev., 5.00%, 7/1/2024 | 310,000 | 310,340 |
Series 2014B, Rev., 5.00%, 7/1/2024 (b) | 50,000 | 50,618 |
Series 2017A, Rev., 5.00%, 7/1/2024 | 20,000 | 20,255 |
Total Alabama | 117,703,472 | |
Alaska — 0.6% | ||
Alaska Housing Finance Corp. | ||
Series 2017A-II, Rev., 5.00%, 12/1/2023 | 50,000 | 50,177 |
Series 2014D-II, Rev., 5.00%, 12/1/2024 | 2,800,000 | 2,847,183 |
Alaska Housing Finance Corp., General Mortgage Series 2019A, Rev., 1.50%, 6/1/2024 | 305,000 | 299,695 |
Alaska Municipal Bond Bank Authority | ||
Series 2020 ONE, Rev., 5.00%, 12/1/2023 | 150,000 | 150,497 |
Series 2012-2, Rev., 5.00%, 9/1/2024 | 60,000 | 60,063 |
Series 1, Rev., 5.00%, 12/1/2024 | 190,000 | 193,364 |
Series 1, Rev., 5.00%, 12/1/2025 | 85,000 | 87,732 |
Rev., 5.00%, 12/1/2026 | 25,000 | 26,212 |
Borough of Matanuska-Susitna | ||
Rev., 5.25%, 9/1/2027 | 1,550,000 | 1,596,574 |
Series 2015, Rev., 5.25%, 9/1/2028 | 3,000,000 | 3,088,982 |
Borough of Matanuska-Susitna, Goose Creek Correctional Center Project | ||
Rev., 5.00%, 9/1/2024 | 560,000 | 567,546 |
Rev., 5.00%, 9/1/2025 | 165,000 | 169,461 |
168 | J.P. Morgan Exchange-Traded Funds | August 31, 2023 |
INVESTMENTS | PRINCIPAL AMOUNT($) | VALUE($) |
Municipal Bonds — continued | ||
Alaska — continued | ||
Rev., 5.25%, 9/1/2026 | 135,000 | 139,030 |
Borough of North Slope | ||
Series B, GO, 5.00%, 10/30/2023 | 20,000 | 20,045 |
Series 2020A, GO, 5.00%, 6/30/2025 | 35,000 | 35,996 |
City of Anchorage Series 2014A, Rev., 5.00%, 12/1/2024 (b) | 4,575,000 | 4,663,809 |
Municipality of Anchorage | ||
Series 2018D, GO, 4.00%, 9/1/2023 | 155,000 | 155,000 |
Series D, GO, 5.00%, 9/1/2023 | 25,000 | 25,000 |
State of Alaska Series 2016B, GO, 5.00%, 8/1/2028 | 20,000 | 20,566 |
University of Alaska Series 2015T, Rev., 5.00%, 10/1/2023 | 90,000 | 90,062 |
Total Alaska | 14,286,994 | |
Arizona — 2.4% | ||
Arizona Health Facilities Authority Series 2014A, Rev., 5.00%, 12/1/2026 | 25,000 | 25,354 |
Arizona Health Facilities Authority, Banner Health Series 2015B, Rev., (SIFMA Municipal Swap Index Yield + 0.25%), 4.31%, 9/7/2023 (d) | 9,400,000 | 9,274,626 |
Arizona Health Facilities Authority, Phoenix children's Hospitals Series 2013B, Rev., 5.00%, 2/1/2026 | 1,065,000 | 1,065,513 |
Arizona Industrial Development Authority Series 2021A, Rev., 5.00%, 2/1/2024 | 1,450,000 | 1,457,473 |
Arizona Industrial Development Authority, Equitable School Revolving Fund LLC Series 2019A, Rev., 5.00%, 11/1/2024 | 95,000 | 96,177 |
Arizona School Facilities Board Series 2015A, COP, 5.00%, 9/1/2023 (b) | 20,000 | 20,000 |
Arizona State University Series 2015B, Rev., 5.00%, 7/1/2026 | 45,000 | 46,377 |
Arizona Transportation Board, Excise Tax, Maricopa County Regional Area Road Fund Rev., 5.00%, 7/1/2025 | 40,000 | 41,269 |
City of Buckeye, Excise Tax Series 2015, Rev., 5.00%, 7/1/2024 | 25,000 | 25,329 |
City of Mesa Series 2013, Rev., 5.00%, 7/1/2024 | 110,000 | 111,404 |
City of Phoenix Series 2014, GO, 4.00%, 7/1/2024 | 35,000 | 35,211 |
City of Phoenix Civic Improvement Corp., Junior Lien, Wastewater System Rev., 5.00%, 7/1/2024 | 230,000 | 230,277 |
City of Scottsdale Series 2015, GO, 4.00%, 7/1/2024 | 35,000 | 35,194 |
INVESTMENTS | PRINCIPAL AMOUNT($) | VALUE($) |
Arizona — continued | ||
County of Maricopa Series 2018A, COP, 5.00%, 7/1/2024 | 25,000 | 25,321 |
County of Navajo Rev., 4.00%, 7/1/2025 | 20,000 | 20,202 |
Maricopa County Industrial Development Authority, Banner Health | ||
Series C, Rev., 5.00%, 10/18/2024 (c) | 150,000 | 152,310 |
Series 2023A-1, Rev., 5.00%, 5/15/2026 (c) | 5,000,000 | 5,181,180 |
Maricopa County Unified School District No. 41 Gilbert Series 2019C, GO, 5.00%, 7/1/2024 | 65,000 | 65,883 |
Pima County Regional Transportation Authority, Excise Tax | ||
Rev., 5.00%, 6/1/2024 | 60,000 | 60,758 |
Series 2014, Rev., 5.00%, 6/1/2025 | 330,000 | 330,315 |
RBC Municipal Products, Inc. Trust, Floater Certificates Series E-147, Rev., VRDO, LOC : Royal Bank of Canada, 4.09%, 9/8/2023 (c) (e) | 11,000,000 | 11,000,000 |
Salt River Project Agricultural Improvement and Power District Series 2015A, Rev., 5.00%, 12/1/2045 | 29,000,000 | 29,717,683 |
Tempe Industrial Development Authority, Friendship Village of Tempe Project Series 2021C-2, Rev., 1.13%, 12/1/2026 | 1,880,000 | 1,750,946 |
Total Arizona | 60,768,802 | |
Arkansas — 0.3% | ||
City of Little Rock, Water Reclamation System Rev., 4.00%, 11/1/2023 | 250,000 | 250,095 |
State of Arkansas, Federal Highway GO, 5.00%, 10/1/2023 | 70,000 | 70,082 |
University of Arkansas, Various Facility Fayetteville Campus | ||
Series 2019A, Rev., 5.00%, 9/15/2023 | 35,000 | 35,015 |
Series 2015A, Rev., 5.00%, 11/1/2024 (b) | 6,060,000 | 6,169,491 |
Total Arkansas | 6,524,683 | |
California — 1.7% | ||
Alameda County Joint Powers Authority, Multiple Capital Projects Series 2013A, Rev., 5.00%, 12/1/2023 | 50,000 | 50,199 |
Anaheim Public Financing Authority, Public Improvement Project Series 1997C, Rev., AGM, Zero Coupon, 9/1/2023 | 1,350,000 | 1,350,000 |
Antelope Valley Community College District GO, 5.00%, 2/15/2025 (b) | 70,000 | 71,873 |
August 31, 2023 | J.P. Morgan Exchange-Traded Funds | 169 |
AS OF August 31, 2023 (Unaudited) (continued)
INVESTMENTS | PRINCIPAL AMOUNT($) | VALUE($) |
Municipal Bonds — continued | ||
California — continued | ||
Brentwood Infrastructure Financing Authority Series 2012A, AGM, 3.50%, 9/2/2023 | 50,000 | 50,000 |
Brentwood Infrastructure Financing Authority, Civic Center Project Rev., 5.00%, 10/1/2024 | 40,000 | 40,627 |
California County Tobacco Securitization Agency, Gold Country Settlement Funding Corp. Series 2020A, Rev., 5.00%, 6/1/2026 | 1,090,000 | 1,129,403 |
California Educational Facilities Authority, University of Southern California Series 2012A, Rev., 5.00%, 10/1/2023 (b) | 35,000 | 35,043 |
California Health Facilities Financing Authority, Adventist Health System | ||
Series 2011A, Rev., 3.00%, 3/1/2024 (c) | 480,000 | 477,783 |
Series 2013A, Rev., 5.00%, 3/1/2024 | 110,000 | 110,056 |
California Health Facilities Financing Authority, Cedars-Sinai Medical Center Rev., 5.00%, 11/15/2024 | 375,000 | 382,630 |
California Health Facilities Financing Authority, Health System | ||
Series 2014A, Rev., 5.00%, 10/1/2023 | 125,000 | 125,127 |
Series 2016A, Rev., 5.00%, 10/1/2023 | 25,000 | 25,025 |
Series 2017, Rev., 5.00%, 2/1/2025 | 30,000 | 30,611 |
California Health Facilities Financing Authority, Providence St. Joseph Health Series 2016B-2, Rev., 4.00%, 10/1/2024 (c) | 275,000 | 275,669 |
California Health Facilities Financing Authority, St. Joseph Health System | ||
Series 2019C, Rev., 5.00%, 10/1/2025 (c) | 420,000 | 428,873 |
Series 2013A, Rev., 5.00%, 7/1/2026 | 80,000 | 80,089 |
California Infrastructure and Economic Development Bank, Colburn School (The) Rev., (SIFMA Municipal Swap Index Yield + 0.90%), 4.96%, 9/7/2023 (d) | 28,500,000 | 27,668,960 |
California Infrastructure and Economic Development Bank, Infrastructure State Revolving Fund Series 2014A, Rev., 5.00%, 10/1/2023 (b) | 25,000 | 25,032 |
California Infrastructure and Economic Development Bank, The Broad Sustainability Bonds Series 2018C, Rev., (SIFMA Municipal Swap Index Yield + 0.35%), 4.41%, 9/7/2023 (d) | 5,250,000 | 5,200,077 |
INVESTMENTS | PRINCIPAL AMOUNT($) | VALUE($) |
California — continued | ||
California Pollution Control Financing Authority, American Water Capital Corp. Project Rev., VRDO, 0.60%, 9/1/2023 (c) | 145,000 | 145,000 |
California State Public Works Board Series B, Rev., 5.00%, 10/1/2023 | 45,000 | 45,060 |
California State Public Works Board, Various Capital Projects Series 2013I, Rev., 5.00%, 11/1/2026 | 40,000 | 40,103 |
California State University, Systemwide Series 2016A, Rev., 5.00%, 11/1/2023 | 20,000 | 20,059 |
California Statewide Communities Development Authority, Southern California Edison Co. Series D, Rev., 2.63%, 12/1/2023 (c) | 290,000 | 289,524 |
Camarillo Community Development Commission Successor Agency, Camarillo Corridor Project Rev., AGM, 5.00%, 9/1/2023 | 25,000 | 25,000 |
Chula Vista Elementary School District COP, AGM, 5.00%, 9/1/2023 | 30,000 | 30,000 |
Chula Vista Municipal Financing Authority | ||
Series 2015B, 5.00%, 9/1/2023 | 45,000 | 45,000 |
Rev., 5.00%, 5/1/2024 | 10,000 | 10,108 |
City of Livermore Series 2020B, COP, 4.00%, 10/1/2023 | 40,000 | 40,018 |
City of Long Beach Harbor, Private Activity Series 2020A, Rev., 4.00%, 5/15/2024 | 20,000 | 20,114 |
City of Los Angeles Department of Airports, International Airport Subordinate Series 2018E, Rev., 5.00%, 5/15/2024 | 15,000 | 15,185 |
City of Los Angeles, Wastewater System | ||
Series 2013-A, Rev., 5.00%, 6/1/2025 | 75,000 | 75,066 |
Series 2013A, Rev., 5.00%, 6/1/2026 | 50,000 | 50,045 |
Series 2013A, Rev., 5.00%, 6/1/2027 | 75,000 | 75,067 |
City of Petaluma Series 2019, Rev., 5.00%, 5/1/2024 | 30,000 | 30,315 |
City of San Francisco, Public Utilities Commission Water Series 2017A, Rev., 5.00%, 11/1/2024 (b) | 30,000 | 30,645 |
City of Vernon, Electric System Series 2021A, Rev., 5.00%, 10/1/2025 | 200,000 | 203,428 |
Colton Joint Unified School District, Election of 2008 Series 2010B, GO, AGM, 5.80%, 8/21/2026 (b) | 25,000 | 26,870 |
Corona-Norco Unified School District Public Financing Authority, Senior Lien Series A, Rev., 5.00%, 9/1/2023 (b) | 20,000 | 20,000 |
170 | J.P. Morgan Exchange-Traded Funds | August 31, 2023 |
INVESTMENTS | PRINCIPAL AMOUNT($) | VALUE($) |
Municipal Bonds — continued | ||
California — continued | ||
Folsom Cordova Unified School District School Facilities Improvement Dist No. 4, Election of 2012 Series A, GO, 5.00%, 10/1/2023 (b) | 20,000 | 20,025 |
Fontana Redevelopment Agency, Successor Agency, Tax Allocation Series 2017A, Rev., 5.00%, 10/1/2023 | 70,000 | 70,081 |
Fremont Public Financing Authority Series 2017B, Rev., 5.00%, 10/1/2023 (b) | 25,000 | 25,029 |
Garden Grove Agency Community Development Successor Agency, Tax Allocation Rev., 5.00%, 10/1/2023 | 20,000 | 20,021 |
Grossmont Healthcare District Series C, GO, 5.00%, 7/15/2024 | 25,000 | 25,260 |
Hermosa Beach Public Financing Authority Rev., 4.00%, 11/1/2024 | 25,000 | 25,185 |
Los Angeles County Facilities, Inc., Vermont Corridor County Administration Building Series 2018A, Rev., 5.00%, 12/1/2023 | 80,000 | 80,317 |
Los Angeles County Public Works Financing Authority Series 2019E1, Rev., 4.00%, 12/1/2023 | 85,000 | 85,184 |
Madera County Board of Education COP, 4.00%, 10/1/2023 | 20,000 | 20,006 |
Merced Union High School District GO, AGM, Zero Coupon, 2/18/2025 (b) | 350,000 | 107,071 |
Municipal Improvement Corp. of Los Angeles, Real Property Series 2016B, Rev., 5.00%, 11/1/2023 | 25,000 | 25,068 |
Orange County Water District Series 2021A, COP, 4.00%, 2/15/2025 | 175,000 | 177,130 |
Orcutt Union School District Series 2021, GO, BAN, 5.00%, 10/1/2023 | 75,000 | 75,090 |
Otay Water District Financing Authority Series 2018A, Rev., 5.00%, 9/1/2023 | 30,000 | 30,000 |
Padre Dam Municipal Water District Series 2017A, COP, 5.00%, 10/1/2024 | 50,000 | 50,864 |
Palmdale Community Redevelopment Agency Successor Agency Series 2016A, Rev., 5.00%, 9/1/2023 | 45,000 | 45,000 |
Palomar Community College District GO, 5.00%, 5/1/2024 | 50,000 | 50,616 |
Perris Union High School District GO, 5.00%, 9/1/2023 | 10,000 | 10,000 |
Pismo Beach Public Financing Agency, Beach Municipal Pier Project Rev., 5.00%, 12/1/2023 | 30,000 | 30,120 |
INVESTMENTS | PRINCIPAL AMOUNT($) | VALUE($) |
California — continued | ||
Poway Unified School District Public Financing Authority, Special Tax Community Facilities District No. 2 Series 2015C, Rev., AGM, 5.00%, 9/1/2023 | 40,000 | 40,000 |
Rancho Santiago Community College District Series 2013, GO, 4.00%, 9/1/2023 | 85,000 | 85,000 |
Sacramento County Sanitation Districts Financing Authority Series 2014A, Rev., 5.00%, 12/1/2023 | 35,000 | 35,149 |
Sacramento Municipal Utility District, Electric Series 2019B, Rev., 5.00%, 10/15/2025 (c) | 285,000 | 291,433 |
San Diego Redevelopment Agency Successor Agency Series 2017A, Rev., 5.00%, 9/1/2023 | 10,000 | 10,000 |
San Francisco City and County Airport Commission, San Francisco International Airport | ||
Series 2019D, Rev., 5.00%, 5/1/2024 (b) | 45,000 | 45,516 |
Series 2016A, Rev., 4.00%, 5/1/2025 | 25,000 | 25,354 |
San Francisco City and County Public Utilities Commission Wastewater Series 2016B, Rev., 5.00%, 10/1/2023 | 35,000 | 35,045 |
San Joaquin Hills Transportation Corridor Agency, Toll Road, Senior Lien Series 1993, Rev., Zero Coupon, 1/1/2025 (b) | 120,000 | 115,057 |
San Juan Water District Rev., 5.00%, 2/1/2025 | 45,000 | 45,997 |
San Marcos Unified School, District No. 4, Community Facilities, Special Tax Rev., 4.00%, 9/1/2023 | 25,000 | 25,000 |
Sanger Public Financing Authority Series 2014, Rev., AGM, 4.00%, 6/15/2024 (b) | 20,000 | 20,526 |
Sequoia Union High School District GO, 5.00%, 7/1/2024 (b) | 40,000 | 40,628 |
Silicon Valley Clean Water, Wastewater Series 2019A, Rev., 3.00%, 3/1/2024 | 625,000 | 624,041 |
Southern California Public Power Authority, Windy Point/Windy Flats Project Series 2020-1, Rev., 5.00%, 4/1/2024 | 75,000 | 75,455 |
State of California Department of Water Resources, Central Valley Project, Water System Series AW, Rev., 5.00%, 12/1/2023 | 45,000 | 45,196 |
State of California, Various Purpose | ||
GO, 5.00%, 12/1/2023 | 25,000 | 25,117 |
August 31, 2023 | J.P. Morgan Exchange-Traded Funds | 171 |
AS OF August 31, 2023 (Unaudited) (continued)
INVESTMENTS | PRINCIPAL AMOUNT($) | VALUE($) |
Municipal Bonds — continued | ||
California — continued | ||
GO, 5.00%, 11/1/2024 | 60,000 | 60,176 |
GO, 5.00%, 9/1/2025 | 135,000 | 135,207 |
GO, 5.00%, 10/1/2025 | 1,705,000 | 1,769,949 |
GO, 5.00%, 11/1/2025 | 40,000 | 40,110 |
GO, 5.00%, 12/1/2025 | 50,000 | 50,179 |
Suisun City Redevelopment Agency, Redevelopment Project Series B, Rev., 5.00%, 10/1/2023 | 40,000 | 40,043 |
Sulphur Springs Union School District, Community Facilities District No. 2002-1, Special Tax Series 2014A, Rev., 3.00%, 9/1/2023 (b) | 25,000 | 25,000 |
Tahoe-Truckee Sanitation Agency, Wastewater Rev., 5.00%, 7/1/2024 | 30,000 | 30,432 |
Tobacco Securitization Authority of Southern California Series 2019A, Class 1, Rev., 5.00%, 6/1/2025 | 55,000 | 56,386 |
Tustin Unified School District, School Facilities Improvement Districts No. 2002-1 and 2008-1 GO, 5.00%, 8/1/2025 | 30,000 | 31,066 |
Twin Rivers Unified School District Series 2014A, GO, Zero Coupon, 2/1/2024 (b) | 350,000 | 169,130 |
Ventura County Public Financing Authority Series 2016A, Rev., 5.00%, 11/1/2024 | 25,000 | 25,480 |
West Hollywood Public Financing Authority, Hollywood Park Phase II Rev., 5.00%, 4/1/2024 | 75,000 | 75,689 |
Total California | 43,859,112 | |
Colorado — 2.4% | ||
Adams 12 Five Star Schools, The City and County of Broomfield | ||
GO, 4.00%, 12/15/2023 | 100,000 | 100,049 |
GO, 5.00%, 12/15/2024 | 30,000 | 30,037 |
Apex Park and Recreation District GO, 3.00%, 12/1/2024 | 50,000 | 49,754 |
Aspen Fire Protection District COP, 4.00%, 12/1/2023 | 125,000 | 125,133 |
Board of Governors of Colorado State University System Series 2015A, Rev., 5.00%, 3/1/2025 (b) | 45,000 | 46,145 |
Boulder Larimer and Weld Counties St. Vrain Valley School District Re1J Series 2014A, GO, 5.00%, 12/15/2023 | 40,000 | 40,181 |
City and County of Broomfield, Sales and Use Tax Series A, Rev., 5.00%, 12/1/2024 | 180,000 | 180,214 |
INVESTMENTS | PRINCIPAL AMOUNT($) | VALUE($) |
Colorado — continued | ||
City and County of Denver, Airport System | ||
Series B, Rev., 5.00%, 11/15/2024 | 125,000 | 127,529 |
Series B, Rev., 5.25%, 11/15/2026 | 25,000 | 25,069 |
City of Colorado Springs Series B-2, Rev., 5.00%, 11/29/2023 | 25,000 | 25,076 |
City of Colorado Springs, Utilities System Improvement | ||
Series 2015A, Rev., 5.00%, 11/15/2023 | 40,000 | 40,119 |
Series 2018A-1, Rev., 5.00%, 11/15/2023 | 35,000 | 35,104 |
Series A-1, Rev., 5.00%, 11/15/2023 | 25,000 | 25,074 |
Series A-2, Rev., 5.00%, 11/15/2023 | 25,000 | 25,074 |
City of Longmont, Wastewater Rev., 5.00%, 11/1/2023 | 25,000 | 25,064 |
City of Northglenn Series 2017, COP, 5.00%, 12/1/2024 | 20,000 | 20,388 |
Colorado Health Facilities Authority | ||
Series 2019A, Rev., 5.00%, 11/1/2023 | 430,000 | 430,778 |
Series 2016C, Rev., 5.00%, 11/15/2023 (b) | 130,000 | 130,410 |
Series C, Rev., 5.00%, 12/1/2023 | 50,000 | 50,187 |
Series 2019A-1, Rev., 5.00%, 8/1/2026 | 145,000 | 149,399 |
Series 2016C, Rev., 5.00%, 11/15/2026 (c) | 60,000 | 62,585 |
Series 2019B, Rev., 5.00%, 11/19/2026 (b) | 590,000 | 624,036 |
Series 2019B, Rev., 5.00%, 11/19/2026 (c) | 1,280,000 | 1,335,365 |
Series C, Rev., 5.00%, 12/1/2026 | 20,000 | 20,741 |
Series 2022C, Rev., 5.00%, 8/15/2028 (c) | 18,060,000 | 19,420,458 |
Colorado Health Facilities Authority, Advent Health Obligated Group Series 2016C, Rev., 5.00%, 11/15/2023 (c) | 370,000 | 371,168 |
Colorado Health Facilities Authority, Adventist Health System/Sunbelt Obligated Group Series 2018B, Rev., 5.00%, 11/20/2025 (c) | 570,000 | 587,174 |
Colorado Health Facilities Authority, Children's Hospital Colorado Project Series C, Rev., 5.00%, 12/1/2024 | 75,000 | 76,154 |
Colorado Health Facilities Authority, Commonspirit Health Series 2019A-1, Rev., 5.00%, 8/1/2025 | 175,000 | 177,931 |
172 | J.P. Morgan Exchange-Traded Funds | August 31, 2023 |
INVESTMENTS | PRINCIPAL AMOUNT($) | VALUE($) |
Municipal Bonds — continued | ||
Colorado — continued | ||
Colorado Health Facilities Authority, CommonSpirit Health | ||
Series 2019B-2, Rev., 5.00%, 8/1/2026 (c) | 745,000 | 762,791 |
Series 2019A-2, Rev., 5.00%, 8/1/2027 | 5,000,000 | 5,217,033 |
Colorado Health Facilities Authority, CommonSpirit Health Obligated Group | ||
Series 2022A, Rev., 5.00%, 11/1/2024 | 40,000 | 40,518 |
Series 2022A, Rev., 5.00%, 11/1/2028 | 700,000 | 741,988 |
Colorado Health Facilities Authority, NCMC, Inc., Project Rev., 4.00%, 5/15/2026 (b) | 280,000 | 285,284 |
Colorado Health Facilities Authority, School Health System Series 2019A, Rev., 5.00%, 1/1/2025 | 1,210,000 | 1,232,932 |
Colorado State Board for Community Colleges and Occupational Educational System, Arapahoe Commnunity Collage Series 2017A, Rev., 3.00%, 11/1/2023 | 20,000 | 19,986 |
County of Adams COP, 5.00%, 12/1/2023 | 860,000 | 863,242 |
County of Jefferson COP, 5.00%, 12/1/2023 | 20,000 | 20,072 |
Denver Convention Center Hotel Authority Rev., 5.00%, 12/1/2023 | 30,000 | 30,043 |
Denver Health and Hospital Authority Series 2017A, Rev., 5.00%, 12/1/2023 (e) | 4,530,000 | 4,538,144 |
E-470 Public Highway Authority Series 2000B, Rev., NATL - RE, Zero Coupon, 9/1/2023 | 16,445,000 | 16,445,000 |
Eagle County School District No. Re50J GO, 3.00%, 12/1/2023 (b) | 20,000 | 19,985 |
El Paso County Facilities Corp. Series 2011A, COP, 4.00%, 12/1/2023 | 25,000 | 25,035 |
El Paso County School District No. 20 Academy Series 2017, GO, 5.00%, 12/15/2023 | 20,000 | 20,094 |
El Paso County School District No. 49 Falcon Series 2017B, COP, 5.00%, 12/15/2023 | 10,000 | 10,042 |
Jefferson County School District R-1 GO, 5.00%, 12/15/2023 | 20,000 | 20,087 |
Larimer Weld and Boulder County School District, R-2J Thompson GO, 4.00%, 12/15/2023 | 35,000 | 35,017 |
Mesa County Valley School District No. 51 Grand Junction GO, 5.00%, 12/1/2023 | 35,000 | 35,125 |
Regional Transportation District, Denver Transit Partners | ||
Series 2020A, Rev., 5.00%, 1/15/2024 | 475,000 | 475,939 |
Series 2020A, Rev., 5.00%, 7/15/2025 | 45,000 | 45,855 |
INVESTMENTS | PRINCIPAL AMOUNT($) | VALUE($) |
Colorado — continued | ||
Serenity Ridge Metropolitan District No. 2, Limited Tax Series 2018B, GO, 7.25%, 12/15/2023 (b) | 636,000 | 660,726 |
State of Colorado Series 2019O, COP, 5.00%, 3/15/2024 | 20,000 | 20,176 |
State of Colorado, Tax-Exempt Series 2020A, COP, 5.00%, 9/1/2023 | 35,000 | 35,000 |
State of Colorado, UCDHSC Fitzsimons Academic Series 2013A, COP, 5.00%, 11/1/2023 (b) | 25,000 | 25,063 |
Town of Castle Rock, Sales and Use Tax Rev., 5.00%, 6/1/2025 | 25,000 | 25,687 |
University of Colorado, Enterprise System | ||
Series B-1, Rev., 4.00%, 6/1/2024 (b) | 25,000 | 25,115 |
Series A, Rev., 5.00%, 6/1/2024 (b) | 60,000 | 60,710 |
Series 2021C-3B, Rev., 2.00%, 10/15/2026 (c) | 6,250,000 | 5,900,066 |
Total Colorado | 61,993,151 | |
Connecticut — 0.2% | ||
City of New Haven Series 2013B, GO, AGM, 3.75%, 9/1/2023 (b) | 25,000 | 25,000 |
Connecticut State Health & Educational Facilities Authority., Yale New Heaven Health Series A, Rev., 5.00%, 7/1/2026 | 75,000 | 75,659 |
Connecticut State Health and Educational Facilities Authority, Connecticut State University System Series L, Rev., 4.00%, 11/1/2023 | 100,000 | 100,040 |
Connecticut State Health and Educational Facilities Authority, Trinity Health Credit Group Series 2016CT, Rev., 3.00%, 12/1/2023 | 100,000 | 99,838 |
Connecticut State Health and Educational Facilities Authority, University System Issue Series L, Rev., 3.00%, 11/1/2026 | 120,000 | 119,231 |
Connecticut State Health and Educational Facilities Authority, Yale New Haven Health Issue Series 2010A3, Rev., 0.25%, 2/9/2024 (c) | 950,000 | 934,494 |
Connecticut State Health and Educational Facilities Authority, Yale University Series X-2, Rev., 0.25%, 2/9/2024 (c) | 635,000 | 624,635 |
South Central Connecticut Regional Water Authority Series 29, Rev., 5.00%, 8/1/2024 | 65,000 | 65,072 |
State of Connecticut | ||
Series 2014E, GO, 5.00%, 9/1/2023 | 375,000 | 375,000 |
Series 2018F, GO, 5.00%, 9/15/2023 | 215,000 | 215,099 |
August 31, 2023 | J.P. Morgan Exchange-Traded Funds | 173 |
AS OF August 31, 2023 (Unaudited) (continued)
INVESTMENTS | PRINCIPAL AMOUNT($) | VALUE($) |
Municipal Bonds — continued | ||
Connecticut — continued | ||
Series A, GO, 5.00%, 4/15/2024 | 35,000 | 35,364 |
State of Connecticut, GAAP Conversion Series 2013A, GO, 5.00%, 10/15/2023 (b) | 415,000 | 415,720 |
State of Connecticut, SIFMA Index Series 2013A, GO, (SIFMA Municipal Swap Index Yield + 0.99%), 5.05%, 9/7/2023 (d) | 175,000 | 175,018 |
State of Connecticut, Special Tax Transportation Infrastructure Purposes | ||
Series A, Rev., 5.00%, 9/1/2023 | 50,000 | 50,000 |
Series B, Rev., 5.00%, 9/1/2023 | 25,000 | 25,000 |
Series 2013, Rev., 5.00%, 10/1/2023 | 525,000 | 525,590 |
Series 2018A, Rev., 5.00%, 1/1/2024 | 20,000 | 20,102 |
Series 2013, Rev., 5.00%, 10/1/2024 | 55,000 | 55,063 |
Series 2018C, Rev., 5.00%, 10/1/2024 | 85,000 | 86,468 |
Series 2013, Rev., 5.00%, 10/1/2028 | 40,000 | 40,039 |
University of Connecticut | ||
Series 2013A, Rev., 5.00%, 2/15/2024 | 120,000 | 120,133 |
Series 2015A, Rev., 5.00%, 2/15/2026 | 25,000 | 25,557 |
Total Connecticut | 4,208,122 | |
Delaware — 0.0% ^ | ||
County of New Castle GO, 5.00%, 4/1/2024 | 25,000 | 25,247 |
Delaware River and Bay Authority | ||
Series C, Rev., 5.00%, 1/1/2025 | 35,000 | 35,172 |
Series C, Rev., 5.00%, 1/1/2027 | 85,000 | 85,369 |
Delaware State Economic Development Authority, Delmarva Power and Light Co. Project Series 2020A, Rev., 1.05%, 7/1/2025 (c) | 715,000 | 674,425 |
Total Delaware | 820,213 | |
District of Columbia — 1.2% | ||
District of Columbia Housing Finance Agency Rev., 4.00%, 12/1/2023 (c) | 3,940,000 | 3,755,609 |
District of Columbia Housing Finance Agency, Multi-Family Development Program Series 2019B-1, Rev., VRDO, FHA, 1.75%, 9/1/2023 (c) | 545,000 | 545,000 |
District of Columbia Housing Finance Agency, Paxton Project Series 2022, Rev., 4.00%, 9/1/2025 (c) | 4,005,000 | 4,006,170 |
District of Columbia Water and Sewer Authority Series A, Rev., 5.00%, 10/1/2023 | 130,000 | 130,155 |
District of Columbia Water and Sewer Authority, Public Utility, Subordinate Lien Series 2014C, Rev., 5.00%, 10/1/2023 | 55,000 | 55,066 |
INVESTMENTS | PRINCIPAL AMOUNT($) | VALUE($) |
District of Columbia — continued | ||
District of Columbia, Children's Hospital Series 2015, Rev., 5.00%, 7/15/2024 | 375,000 | 378,456 |
District of Columbia, Federal Highway Rev., 5.00%, 12/1/2024 | 320,000 | 320,429 |
District of Columbia, Gallery Place Project Rev., 5.00%, 6/1/2024 | 100,000 | 100,121 |
District of Columbia, Water and Sewer Authority, Public Utility, Senior Lien Rev., AGM, 5.50%, 10/1/2023 | 80,000 | 80,123 |
District of Columbia, Water and Sewer Authority, Public Utility, Subordinate Lien Series 2014C, Rev., 5.00%, 10/1/2024 | 25,000 | 25,445 |
Metropolitan Washington Airports Authority Aviation Series 2010C-2, Rev., VRDO, LOC : TD Bank NA, 4.02%, 9/12/2023 (c) | 20,000,000 | 20,000,000 |
Metropolitan Washington Airports Authority Dulles Toll Road Series 2009B, Rev., AGC, Zero Coupon, 10/1/2023 | 20,000 | 19,945 |
Washington Convention and Sports Authority, Senior Lien Dedicated Tax Series 2018A, Rev., 5.00%, 10/1/2023 | 1,500,000 | 1,501,300 |
Washington Metropolitan Area Transit Authority Series 2017B, Rev., 5.00%, 7/1/2024 | 20,000 | 20,263 |
Total District of Columbia | 30,938,082 | |
Florida — 5.6% | ||
Brevard County Health Facilities Authority, Health First, Inc., Project Rev., 5.00%, 4/1/2039 | 500,000 | 502,754 |
Brevard County School District Series 2014, COP, 5.00%, 7/1/2027 | 220,000 | 222,415 |
Capital Trust Agency, Inc., Sustainability Bonds -The Marie | ||
Rev., 4.00%, 6/15/2024 (e) | 1,000,000 | 991,578 |
Rev., 4.00%, 6/15/2025 (e) | 340,000 | 333,135 |
Central Florida Expressway Authority, Senior Lien Series 2016B, Rev., 5.00%, 7/1/2025 | 25,000 | 25,726 |
Central Florida Tourism Oversight District Series 2017A, GO, 5.00%, 6/1/2025 | 100,000 | 102,254 |
Central Florida Tourism Oversight District Utility Series 2013-1, Rev., 5.00%, 10/1/2023 | 50,000 | 50,056 |
City of Apopka, Utility System Rev., 5.00%, 10/1/2023 | 30,000 | 30,037 |
City of Clearwater, Water and Sewer Rev., 5.00%, 12/1/2023 | 50,000 | 50,187 |
174 | J.P. Morgan Exchange-Traded Funds | August 31, 2023 |
INVESTMENTS | PRINCIPAL AMOUNT($) | VALUE($) |
Municipal Bonds — continued | ||
Florida — continued | ||
City of Deltona, Utility System Rev., 5.00%, 10/1/2023 (b) | 25,000 | 25,028 |
City of Gainesville, Utilities System Series 2017A, Rev., 5.00%, 10/1/2024 | 95,000 | 96,540 |
City of Hallandale Beach Rev., 5.00%, 10/1/2023 | 55,000 | 55,057 |
City of Jacksonville | ||
Rev., 5.00%, 10/1/2023 | 10,000 | 10,011 |
Series 2018, Rev., 5.00%, 10/1/2023 | 275,000 | 275,313 |
Series A, Rev., 5.00%, 10/1/2023 | 200,000 | 200,215 |
Series 2013A, Rev., 5.00%, 10/1/2024 | 50,000 | 50,055 |
Series B, Rev., 5.00%, 10/1/2025 (b) | 75,000 | 77,628 |
City of Lakeland Department of Electric Utilities Series 2018, Rev., 5.00%, 10/1/2023 | 280,000 | 280,311 |
City of Lakeland, Department of Electric Utilities | ||
Rev., 5.00%, 10/1/2023 | 25,000 | 25,028 |
Rev., 5.00%, 10/1/2026 | 20,000 | 20,731 |
City of Orlando, Capital Improvement Series 2016B, Rev., 5.00%, 10/1/2024 | 25,000 | 25,445 |
City of Orlando, Florida Contract Tourist Development Tax Payments Series 2014A, Rev., 5.00%, 5/1/2024 (b) | 20,000 | 20,210 |
City of Pompano Beach, John Knox Village Project Series 2021B-2, Rev., 1.45%, 1/1/2027 | 760,000 | 678,549 |
City of Sarasota, St. Armands Paid Parking Area Improvements Series 2017A, Rev., 4.00%, 10/1/2023 | 25,000 | 25,009 |
City of St Augustine, Capital Improvement Series 2017, Rev., 4.00%, 10/1/2023 | 25,000 | 25,007 |
City of St. Petersburg, Public Utility Series 2014B, Rev., 5.00%, 10/1/2023 | 30,000 | 30,035 |
City of Tallahassee, Energy System | ||
Series 2015, Rev., 5.00%, 10/1/2023 (b) | 310,000 | 310,303 |
Series 2020, Rev., 5.00%, 10/1/2023 | 65,000 | 65,068 |
Series 2020, Rev., 5.00%, 10/1/2027 | 65,000 | 69,515 |
City of Tallahassee, Utility System | ||
Rev., 5.00%, 10/1/2023 | 30,000 | 30,032 |
Series 2015, Rev., 5.00%, 10/1/2023 (b) | 70,000 | 70,079 |
City of West Palm Beach Series C, Rev., 5.00%, 10/1/2023 | 35,000 | 35,039 |
Ciy of Jacksonville Series 2016, Rev., 5.00%, 10/1/2025 | 25,000 | 25,785 |
INVESTMENTS | PRINCIPAL AMOUNT($) | VALUE($) |
Florida — continued | ||
County of Brevard, Water and Wastewater Utility Rev., 5.00%, 9/1/2023 | 40,000 | 40,000 |
County of Broward, Airport System | ||
Series P-2, Rev., 5.00%, 10/1/2023 | 440,000 | 440,365 |
Series Q-1, Rev., 5.00%, 10/1/2023 | 740,000 | 740,614 |
Series Q-1, Rev., 5.00%, 10/1/2024 | 280,000 | 280,229 |
Series Q-1, Rev., 5.00%, 10/1/2025 | 195,000 | 195,140 |
Series 2013C, Rev., 5.25%, 10/1/2026 | 100,000 | 100,100 |
County of Broward, Half-Cent Sales Tax Rev., 5.00%, 10/1/2023 | 30,000 | 30,034 |
County of Broward, Senior Series 2019C, Rev., 5.00%, 9/1/2023 | 1,000,000 | 1,000,000 |
County of Escambia Series 2018, Rev., 5.00%, 10/1/2023 | 100,000 | 100,115 |
County of Hillsborough, Communications Services Tax Rev., 5.00%, 10/1/2024 | 35,000 | 35,627 |
County of Hillsborough, Community Investment Tax Rev., 5.00%, 11/1/2025 | 25,000 | 25,858 |
County of Lee Series A, Rev., 5.00%, 10/1/2024 | 145,000 | 145,163 |
County of Lee FL Transportation Facilities Revenue Series 2014, Rev., AGM, 5.00%, 10/1/2027 | 2,550,000 | 2,578,091 |
County of Lee, Tourist Development Tax Series 2019A, Rev., 5.00%, 10/1/2024 | 25,000 | 25,427 |
County of Lee, Transportation Facilities Rev., AGM, 5.00%, 10/1/2024 | 1,500,000 | 1,520,363 |
County of Lee, Water and Sewer | ||
Series A, Rev., 4.25%, 10/1/2023 (b) | 25,000 | 25,017 |
Series A, Rev., 5.00%, 10/1/2023 (b) | 40,000 | 40,048 |
Series B, Rev., 5.00%, 10/1/2023 | 55,000 | 55,061 |
County of Miami-Dade Aviation | ||
Series 2017B, Rev., 5.00%, 10/1/2023 | 500,000 | 500,525 |
Series A, Rev., 5.00%, 10/1/2023 | 350,000 | 350,301 |
Series 2019B, Rev., 5.00%, 4/1/2024 | 115,000 | 116,076 |
Series A, Rev., 5.00%, 10/1/2025 | 60,000 | 61,810 |
Series 2015B, GO, 5.00%, 7/1/2026 | 145,000 | 147,052 |
Series B, Rev., 5.00%, 10/1/2026 | 110,000 | 113,327 |
Series 2016B, Rev., 5.00%, 4/1/2027 | 175,000 | 181,351 |
Series A, Rev., 5.00%, 10/1/2027 | 35,000 | 36,653 |
Series A, Rev., 5.00%, 10/1/2028 | 50,000 | 52,313 |
County of Miami-Dade, Aviation System | ||
Series B, Rev., 4.00%, 10/1/2023 | 585,000 | 585,088 |
Series 2020A, Rev., 5.00%, 10/1/2023 | 90,000 | 90,077 |
Series 2020A, Rev., 5.00%, 10/1/2024 | 300,000 | 304,041 |
Series B, Rev., 5.00%, 10/1/2024 | 400,000 | 400,351 |
August 31, 2023 | J.P. Morgan Exchange-Traded Funds | 175 |
AS OF August 31, 2023 (Unaudited) (continued)
INVESTMENTS | PRINCIPAL AMOUNT($) | VALUE($) |
Municipal Bonds — continued | ||
Florida — continued | ||
County of Miami-Dade, Building Better Communities Program Series 2016A, GO, 5.00%, 7/1/2024 | 30,000 | 30,395 |
County of Miami-Dade, Building Better Community Program GO, 5.00%, 7/1/2028 | 20,000 | 20,858 |
County of Miami-Dade, Water and Sewer System | ||
Rev., 5.00%, 10/1/2023 | 305,000 | 305,321 |
Series B, Rev., 5.00%, 10/1/2023 (b) | 370,000 | 370,443 |
Series B, Rev., 5.25%, 10/1/2023 (b) | 110,000 | 110,151 |
Series 2015, Rev., 5.00%, 10/1/2024 | 250,000 | 254,185 |
County of Okaloosa, Sales Tax Rev., 5.00%, 10/1/2023 | 25,000 | 25,028 |
County of Osceola Series 2019A-1, Rev., 5.00%, 10/1/2023 | 640,000 | 640,389 |
County of Palm Beach Rev., 5.00%, 11/1/2023 | 30,000 | 30,078 |
County of Pasco, Fire-Rescue Projects Series 2019B, GO, 5.00%, 10/1/2023 | 170,000 | 170,179 |
County of Polk, Utility System Rev., 5.00%, 10/1/2023 (b) | 10,000,000 | 10,011,983 |
County of Sarasota | ||
Series 2013, Rev., 4.75%, 10/1/2023 (b) | 25,000 | 25,025 |
Rev., 5.00%, 10/1/2023 | 335,000 | 335,401 |
Series 2015, Rev., 5.00%, 10/1/2023 | 65,000 | 65,078 |
County of Sarasota, Utility System Rev., 5.00%, 10/1/2023 (b) | 25,000 | 25,030 |
County of St. Johns, Sales Tax Rev., AGM, 5.00%, 10/1/2023 | 35,000 | 35,041 |
County of St. Lucie, Power and Light Co. Project Rev., VRDO, 4.05%, 9/1/2023 (c) | 45,750,000 | 45,750,000 |
Escambia County School Board Series 2020A, COP, 5.00%, 2/1/2026 | 50,000 | 51,542 |
Florida Department of Environmental Protection | ||
Series 2014A, Rev., 5.00%, 7/1/2024 | 60,000 | 60,785 |
Series 2016A, Rev., 5.00%, 7/1/2024 | 65,000 | 65,851 |
Series 2016A, Rev., 5.00%, 7/1/2027 | 720,000 | 751,274 |
Florida Department of Management Services | ||
Series 2015A, COP, 5.00%, 8/1/2024 | 140,000 | 141,984 |
Series 2017A, Rev., 5.00%, 9/1/2024 | 200,000 | 203,280 |
Series 2018A, COP, 5.00%, 11/1/2024 | 25,000 | 25,455 |
Series 2018A, COP, 5.00%, 11/1/2026 | 20,000 | 21,124 |
INVESTMENTS | PRINCIPAL AMOUNT($) | VALUE($) |
Florida — continued | ||
Florida Development Finance Corp. Series 2020A, Rev., 5.00%, 4/1/2024 | 225,000 | 226,952 |
Florida Gulf Coast University Financing Corp., Housing Project Series 2008A, Rev., VRDO, LOC : TD Bank NA, 4.01%, 9/8/2023 (c) | 9,825,000 | 9,825,000 |
Florida Higher Educational Facilities Financial Authority, Rollins College Project Series 2012B, Rev., 3.13%, 12/1/2025 | 100,000 | 97,659 |
Florida Housing Finance Corp. | ||
Series 2023E, Rev., 5.00%, 5/1/2025 (c) | 2,530,000 | 2,570,291 |
Series 2023C, Rev., 5.00%, 12/1/2025 (c) | 4,665,000 | 4,756,408 |
Florida Municipal Power Agency, All-Requirements Power Supply Project | ||
Series 2016A, Rev., 5.00%, 10/1/2023 | 665,000 | 665,723 |
Series 2017A, Rev., 5.00%, 10/1/2025 | 60,000 | 61,822 |
Series 2015B, Rev., 5.00%, 10/1/2026 | 25,000 | 25,702 |
Series 2016A, Rev., 5.00%, 10/1/2026 | 545,000 | 570,654 |
Series 2018A, Rev., 4.00%, 10/1/2028 | 25,000 | 25,713 |
Series 2016A, Rev., 5.00%, 10/1/2028 | 155,000 | 162,142 |
FSU Financial Assistance, Inc. Series 2012C, Rev., 3.00%, 10/1/2025 | 100,000 | 98,561 |
Hillsborough County School Board, Sales Tax Series 2015B, Rev., AGM, 5.00%, 10/1/2023 | 665,000 | 665,704 |
Hillsborough County, Aviation Authority, Tampa International Airport Series 2015B, Rev., 5.00%, 10/1/2024 (b) | 5,160,000 | 5,251,850 |
Jacksonville Transportation Authority, Senior Lien Gas Tax Rev., 5.00%, 8/1/2024 | 25,000 | 25,343 |
JEA Electric System Rev., 5.00%, 10/1/2023 (b) | 60,000 | 60,065 |
JEA Water and Sewer System Series 2008A-1, Rev., VRDO, LIQ : US Bank NA, 4.20%, 9/1/2023 (c) | 13,200,000 | 13,200,000 |
Key West Utility Board, Electric System Rev., 5.00%, 10/1/2023 | 125,000 | 125,145 |
Lee County School Board (The) | ||
Series 2014B, COP, 5.00%, 8/1/2024 | 25,000 | 25,319 |
Series 2019A, COP, 5.00%, 8/1/2026 | 35,000 | 36,620 |
Lee Memorial Health System Series A-1, Rev., 5.00%, 4/1/2024 | 115,000 | 115,796 |
Manatee County School District, Sales Tax Rev., AGM, 5.00%, 10/1/2023 | 65,000 | 65,066 |
176 | J.P. Morgan Exchange-Traded Funds | August 31, 2023 |
INVESTMENTS | PRINCIPAL AMOUNT($) | VALUE($) |
Municipal Bonds — continued | ||
Florida — continued | ||
Martin County School District Series 2021, COP, 5.00%, 10/1/2023 | 30,000 | 30,027 |
Miami Beach Redevelopment Agency Series A, Rev., 5.00%, 2/1/2028 | 400,000 | 401,900 |
Miami-Dade County Educational Facilities Authority Series B, Rev., AMBAC, 5.25%, 4/1/2024 | 100,000 | 100,860 |
Miami-Dade County Expressway Authority | ||
Series 2014B, Rev., 5.00%, 7/1/2027 | 1,000,000 | 1,010,003 |
Series 2016A, Rev., 5.00%, 7/1/2028 | 20,000 | 20,625 |
Miami-Dade County Housing Finance Authority | ||
Series 2023, Rev., 5.00%, 9/1/2025 (c) | 2,250,000 | 2,282,738 |
Series 2023, Rev., 5.00%, 10/1/2025 (c) | 4,625,000 | 4,720,275 |
Monroe County School District Series 2017, Rev., AGM, 5.00%, 10/1/2023 | 50,000 | 50,054 |
Orange County Convention Center, Tourist Development Tax Series 2015, Rev., 5.00%, 10/1/2023 | 525,000 | 525,416 |
Orange County Health Facilities Authority, Orlando Health Obligated Group | ||
Series 2016A, Rev., 5.00%, 10/1/2023 | 115,000 | 115,095 |
Series 2019B, Rev., 5.00%, 10/1/2025 | 525,000 | 540,522 |
Orange County School Board | ||
Series 2015D, COP, 5.00%, 8/1/2024 | 100,000 | 101,408 |
Series 2015C, COP, 5.00%, 8/1/2025 (b) | 20,000 | 20,658 |
Series 2015D, COP, 5.00%, 8/1/2025 (b) | 25,000 | 25,752 |
Orlando Utilities Commission | ||
Series 2019A, Rev., 5.00%, 10/1/2023 | 165,000 | 165,188 |
Series 2013A, Rev., 5.00%, 10/1/2025 | 500,000 | 517,620 |
Orlando Utilities Commission, Utility System | ||
Series 2012A, Rev., 5.00%, 10/1/2023 | 20,000 | 20,023 |
Series 2016A, Rev., 5.00%, 10/1/2023 | 25,000 | 25,029 |
Series 2018A, Rev., 5.00%, 10/1/2023 | 25,000 | 25,028 |
Series 2013A, Rev., 5.00%, 10/1/2024 | 260,000 | 264,408 |
Palm Beach County Health Facilities Authority, Baptist Health South Florida Obligated Group Rev., 5.00%, 8/15/2024 | 1,135,000 | 1,150,634 |
Palm Beach County School District | ||
Series 2015B, COP, 5.00%, 8/1/2024 | 50,000 | 50,659 |
Series 2018B, COP, 5.00%, 8/1/2024 | 50,000 | 50,659 |
Series 2014B, COP, 5.00%, 8/1/2025 | 45,000 | 46,287 |
Series 2017B, COP, 5.00%, 8/1/2025 | 155,000 | 159,432 |
INVESTMENTS | PRINCIPAL AMOUNT($) | VALUE($) |
Florida — continued | ||
Pasco County School Board | ||
Series 2013A, COP, 5.00%, 8/1/2024 | 1,315,000 | 1,316,394 |
Series 2013, Rev., 5.00%, 10/1/2024 | 500,000 | 508,106 |
Pasco County School Board, Sales Tax Rev., 5.00%, 10/1/2023 | 375,000 | 375,394 |
Polk County School District Series 2019B, COP, 5.00%, 1/1/2025 | 125,000 | 127,434 |
Polk County School District, Sales Tax | ||
Rev., 5.00%, 10/1/2023 | 335,000 | 335,327 |
Rev., 5.00%, 10/1/2024 | 30,000 | 30,518 |
Sarasota County Public Hospital District, Sarasota Memorial Hospital Series 1998B, Rev., NATL - RE, 5.25%, 7/1/2024 | 345,000 | 349,506 |
School Board of Miami-Dade County (The) | ||
Series 2014D, COP, 5.00%, 11/1/2024 | 95,000 | 96,749 |
Series 2015D, COP, 5.00%, 2/1/2025 | 865,000 | 884,521 |
Series 2014D, COP, 5.00%, 11/1/2025 | 585,000 | 594,104 |
COP, 5.00%, 5/1/2026 | 70,000 | 71,374 |
Series 2014D, COP, 5.00%, 11/1/2026 | 275,000 | 279,186 |
Series 2015A, COP, AGM, 5.00%, 5/1/2027 | 190,000 | 194,445 |
School Board of Miami-Dade County (The), Florida Certificates Of Participation | ||
Series 2015D, COP, 5.00%, 2/1/2024 | 3,930,000 | 3,955,178 |
Series 2014A, COP, 5.00%, 5/1/2024 (b) (c) | 1,455,000 | 1,467,445 |
COP, 5.00%, 7/1/2026 | 70,000 | 71,754 |
COP, 5.00%, 8/1/2027 | 60,000 | 62,681 |
COP, 5.00%, 5/1/2028 | 175,000 | 178,547 |
School District of Broward County | ||
Series 2015A, COP, 5.00%, 7/1/2024 | 80,000 | 80,924 |
Series 2015B, COP, 5.00%, 7/1/2024 | 215,000 | 217,832 |
Series 2015B, COP, 5.00%, 7/1/2025 | 185,000 | 189,878 |
School District of Broward County (The) COP, 5.00%, 7/1/2025 | 80,000 | 82,109 |
School District of Broward County, Florida Certificates Of Participation | ||
Series C, COP, 5.00%, 7/1/2024 | 200,000 | 202,309 |
COP, 5.00%, 7/1/2026 | 20,000 | 20,943 |
Series A, COP, 5.00%, 7/1/2026 | 40,000 | 41,886 |
COP, 5.00%, 7/1/2027 | 25,000 | 26,045 |
Series 2015B, COP, 5.00%, 7/1/2027 | 25,000 | 25,689 |
COP, 5.00%, 7/1/2028 | 230,000 | 239,675 |
COP, 5.00%, 7/1/2028 | 365,000 | 373,562 |
COP, AGM, 5.00%, 7/1/2028 | 270,000 | 276,573 |
August 31, 2023 | J.P. Morgan Exchange-Traded Funds | 177 |
AS OF August 31, 2023 (Unaudited) (continued)
INVESTMENTS | PRINCIPAL AMOUNT($) | VALUE($) |
Municipal Bonds — continued | ||
Florida — continued | ||
Seacoast Utility Authority Series B, Rev., 5.00%, 3/1/2024 | 75,000 | 75,612 |
South Broward Hospital District, Memorial Healthcare System | ||
Series 2016, Rev., 5.00%, 5/1/2024 | 40,000 | 40,436 |
Rev., 4.00%, 5/1/2026 | 195,000 | 198,530 |
South Florida Water Management District Series 29, COP, 5.00%, 10/1/2023 | 175,000 | 175,216 |
St Lucie County School Board, Sales Tax Series 2015, Rev., AGM, 5.00%, 10/1/2023 | 150,000 | 150,163 |
St. Johns County Industrial Development Authority, Vicar's Landing Project | ||
Series 2021A, Rev., 4.00%, 12/15/2023 | 120,000 | 119,587 |
Series 2021A, Rev., 4.00%, 12/15/2024 | 145,000 | 142,761 |
St. Johns County School Board, Sales Tax Rev., 5.00%, 10/1/2024 | 70,000 | 71,135 |
State of Florida Series 2023A, GO, 5.00%, 6/1/2026 | 125,000 | 131,322 |
State of Florida Board of Education, Public Education Capital Outlay Series 2015A, GO, 5.00%, 6/1/2026 | 35,000 | 35,514 |
State of Florida Department of Education | ||
Series 2021A, Rev., 5.00%, 7/1/2024 | 1,000,000 | 1,010,976 |
Series 2018A, Rev., 5.00%, 7/1/2025 | 1,000,000 | 1,026,187 |
State of Florida Department of Transportation Rev., 5.00%, 7/1/2024 | 35,000 | 35,475 |
State of Florida Department of Transportation Turnpike System Series 2016B, Rev., 2.50%, 7/1/2026 | 20,000 | 19,392 |
State of Florida, State Board of Education, Lottery Series 2014A, Rev., 3.00%, 7/1/2025 | 70,000 | 69,424 |
Sunshine State Governmental Financing Commission, Miami Dade Country Program Series 2010A-1, Rev., 5.00%, 9/1/2023 (b) | 25,000 | 25,000 |
Sunshine State Governmental Financing Commission, Miami Dade County Program | ||
Series 2011B-1, Rev., 3.75%, 9/1/2023 (b) | 50,000 | 50,000 |
Series 2011B-1, Rev., 4.00%, 9/1/2023 (b) | 30,000 | 30,000 |
Series 2010A-1, Rev., 4.13%, 9/1/2023 (b) | 25,000 | 25,000 |
INVESTMENTS | PRINCIPAL AMOUNT($) | VALUE($) |
Florida — continued | ||
Series 2011B-1, Rev., 5.00%, 9/1/2023 (b) | 20,000 | 20,000 |
Series 2011B-1, Rev., 5.50%, 9/1/2023 (b) | 30,000 | 30,000 |
Series 2011C-1, Rev., 5.50%, 9/1/2023 (b) | 45,000 | 45,000 |
Tampa Bay Water, Regional Water Supply Authority, Utility System Series 2013, Rev., 5.00%, 10/1/2023 | 550,000 | 550,538 |
Tampa Bay Water, Water Supply Rev., NATL - RE, 5.50%, 10/1/2023 | 510,000 | 510,789 |
Volusia County School Board Series 2016, Rev., 5.00%, 10/1/2023 | 55,000 | 55,065 |
Total Florida | 143,073,277 | |
Georgia — 0.4% | ||
Atlanta and Fulton County Recreation Authority, Park Improvement Series A, Rev., 5.00%, 12/1/2023 | 25,000 | 25,097 |
Braselton Urban Redevelopment Agency, Municipal Facilities Project Rev., GTD, 4.00%, 7/1/2024 | 30,000 | 30,094 |
City of Atlanta Series 2014A, Rev., AMT, 5.00%, 1/1/2028 | 30,000 | 30,129 |
City of Atlanta Airport Passenger Facility Charge, Sub Lien | ||
Series 2014A, Rev., AMT, 5.00%, 1/1/2024 | 25,000 | 25,123 |
Series 2014A, Rev., AMT, 5.00%, 1/1/2025 | 20,000 | 20,102 |
Series 2014A, Rev., AMT, 5.00%, 1/1/2026 | 265,000 | 266,035 |
City of Atlanta Airport Passenger Facility Charge, Subordinate Lien Series 2014A, Rev., AMT, 5.00%, 1/1/2027 | 40,000 | 40,159 |
City of Atlanta, Public Improvement GO, 4.75%, 12/1/2024 (b) | 30,000 | 30,474 |
City of Atlanta, Water and Wastewater | ||
Series 2013B, Rev., 5.25%, 11/1/2023 (b) | 35,000 | 35,104 |
Rev., 5.00%, 11/1/2026 | 25,000 | 25,693 |
Cobb County Kennestone Hospital Authority Rev., 5.00%, 4/1/2024 | 80,000 | 80,102 |
Cobb-Marietta Coliseum and Exhibit Hall Authority, Performing Arts Center Project Rev., GTD, 4.00%, 1/1/2024 | 85,000 | 85,044 |
178 | J.P. Morgan Exchange-Traded Funds | August 31, 2023 |
INVESTMENTS | PRINCIPAL AMOUNT($) | VALUE($) |
Municipal Bonds — continued | ||
Georgia — continued | ||
Columbus Medical Center Hospital Authority, Piedmont Healthcare Inc., Project Series 2019A, Rev., 5.00%, 7/1/2026 (c) | 235,000 | 241,251 |
County of DeKalb, Special Transportation, Parks and Greenspace and Libraries Tax GO, 5.00%, 12/1/2025 | 40,000 | 41,557 |
County of DeKalb, Water and Sewerage Rev., 5.00%, 10/1/2023 | 70,000 | 70,079 |
Gainesville and Hall County Development Authority, Hall County Facilities Project Rev., 5.00%, 5/1/2024 | 20,000 | 20,213 |
Gainesville and Hall County Hospital Authority, Northeast Georgia Health System, Inc. | ||
Series 2020A, Rev., 5.00%, 2/15/2024 | 240,000 | 240,813 |
Series 2014A, Rev., GTD, 5.25%, 2/15/2025 (b) | 330,000 | 338,806 |
Georgia Municipal Association, Inc. Series 2018, COP, 5.00%, 12/1/2023 | 75,000 | 75,286 |
Main Street Natural Gas, Inc., Gas Supply | ||
Series 2018A, Rev., VRDO, LIQ : Royal Bank of Canada, 4.00%, 9/1/2023 (c) | 1,400,000 | 1,400,000 |
Series 2018B, Rev., VRDO, 4.39%, 9/1/2023 (c) | 370,000 | 370,000 |
Series 2018E, Rev., LIQ : Royal Bank of Canada, (SIFMA Municipal Swap Index Yield + 0.57%), 4.63%, 9/7/2023 (d) | 6,590,000 | 6,586,522 |
Series 2018C, Rev., LIQ : Royal Bank of Canada, 4.00%, 12/1/2023 | 100,000 | 100,070 |
Municipal Gas Authority of Georgia, Gas Portfolio IV Project Series A, Rev., 5.00%, 10/1/2023 | 25,000 | 25,024 |
Paulding County School District GO, 5.00%, 2/1/2025 (b) | 50,000 | 51,163 |
Richmond County Board of Education Series 2021, GO, 5.00%, 10/1/2024 | 430,000 | 437,426 |
State of Georgia Series 2013A, GO, 5.00%, 10/10/2023 | 50,000 | 50,076 |
Valdosta & Lowndes County Hospital Authority Series 2019A, Rev., 5.00%, 10/1/2023 | 210,000 | 210,246 |
Total Georgia | 10,951,688 | |
Hawaii — 0.0% ^ | ||
City and County Honolulu, Wastewater System Series B, Rev., 5.00%, 7/1/2024 | 25,000 | 25,319 |
INVESTMENTS | PRINCIPAL AMOUNT($) | VALUE($) |
Hawaii — continued | ||
City and County of Honolulu | ||
Series C, GO, 4.00%, 10/1/2023 | 20,000 | 20,008 |
Series C, GO, 5.00%, 10/1/2023 | 40,000 | 40,043 |
Series C, GO, 5.00%, 10/1/2024 | 25,000 | 25,432 |
Series 2012C, GO, 3.00%, 11/1/2025 | 175,000 | 173,645 |
County of Hawaii Series 2013B, GO, 3.00%, 9/1/2023 | 45,000 | 45,000 |
State of Hawaii | ||
Series FG, GO, 4.00%, 10/1/2023 | 45,000 | 45,019 |
Series FE, GO, 5.00%, 10/1/2023 | 170,000 | 170,194 |
Series FG, GO, 5.00%, 10/1/2024 | 25,000 | 25,432 |
Series FH, GO, 5.00%, 10/1/2024 | 105,000 | 106,813 |
Total Hawaii | 676,905 | |
Idaho — 0.5% | ||
Ada & Canyon Counties Joint School District No. 2 Meridian Series 2015, GO, 5.00%, 8/15/2025 (b) | 2,515,000 | 2,599,382 |
Canyon County School District No. 134 Middleton GO, 5.00%, 9/15/2023 | 10,000 | 10,005 |
Idaho Housing and Finance Association, Federal Highway Trust | ||
Series 2015A, Rev., 5.00%, 7/15/2025 | 30,000 | 30,864 |
Series 2015A, Rev., 5.00%, 7/15/2026 | 70,000 | 73,219 |
Idaho Housing and Finance Association, Single Family Mortgage Series 2009A, Class I, Rev., VRDO, 4.24%, 9/12/2023 (c) | 2,640,000 | 2,640,000 |
Twin Falls County School District No. 411 Twin Falls | ||
Series A, GO, 4.25%, 9/15/2024 (b) | 4,025,000 | 4,063,285 |
Series A, GO, 4.50%, 9/15/2024 (b) | 2,235,000 | 2,261,859 |
Total Idaho | 11,678,614 | |
Illinois — 6.4% | ||
Champaign County Community Unit School District No. 4 Champaign Series 2017, GO, 5.00%, 1/1/2025 | 25,000 | 25,506 |
Chicago Board of Education, Capital Appreciation School Reform Series 1999A, GO, NATL - RE, Zero Coupon, 12/1/2023 | 3,440,000 | 3,405,302 |
Chicago Board of Education, Unlimited Tax Series 2018A, GO, AGM, 5.00%, 12/1/2024 | 275,000 | 278,499 |
Chicago Midway International Airport Series 2014A, Rev., AMT, 5.00%, 1/1/2025 | 3,000,000 | 3,005,379 |
August 31, 2023 | J.P. Morgan Exchange-Traded Funds | 179 |
AS OF August 31, 2023 (Unaudited) (continued)
INVESTMENTS | PRINCIPAL AMOUNT($) | VALUE($) |
Municipal Bonds — continued | ||
Illinois — continued | ||
Chicago Midway International Airport, Second Lien | ||
Series 2013B, Rev., 5.00%, 1/1/2025 | 720,000 | 720,799 |
Series 2013B, Rev., 5.00%, 1/1/2026 | 360,000 | 360,269 |
Chicago O'Hare International Airport Series C, Rev., 5.00%, 1/1/2028 | 20,000 | 21,029 |
Chicago O'Hare International Airport, General Airport Senior Lien Series A, Rev., 5.00%, 1/1/2027 | 40,000 | 42,230 |
Chicago O'Hare International Airport, General Airport, Senior Lien | ||
Series B, Rev., 5.00%, 1/1/2024 | 50,000 | 50,224 |
Series 2020B, Rev., 5.00%, 1/1/2026 | 40,000 | 41,524 |
Chicago O'Hare International Airport, Senior Lien Series E, Rev., 5.00%, 1/1/2026 | 30,000 | 31,143 |
Chicago Park District Series 2015A, GO, 5.00%, 1/1/2024 (b) | 35,000 | 35,179 |
City of Chicago, Second Lien Waterworks Project Series 2012, Rev., 4.00%, 11/1/2023 | 500,000 | 500,061 |
City of Chicago, Waterworks, Second Lien Series 2014, Rev., 5.00%, 11/1/2023 | 30,000 | 30,054 |
City of Decatur | ||
GO, 4.00%, 3/1/2024 | 120,000 | 120,033 |
GO, 4.00%, 3/1/2025 | 195,000 | 196,304 |
GO, 4.00%, 3/1/2026 | 170,000 | 172,431 |
GO, 4.00%, 3/1/2027 | 200,000 | 204,524 |
Cook County Community College District No. 508,Unlimited Tax Series 2013, GO, 5.00%, 12/1/2023 | 25,000 | 25,072 |
Cook County Community High School District No. 229 Oak Lawn Series 2016, GO, 4.00%, 12/1/2023 | 25,000 | 25,027 |
Cook County High School District No. 205, Thornton Township, Limited Tax Series 2017C, GO, 5.00%, 12/1/2023 | 30,000 | 30,083 |
County of Cook | ||
Series 2021B, GO, 4.00%, 11/15/2023 | 390,000 | 390,218 |
Series 2022A, GO, 5.00%, 11/15/2024 | 1,000,000 | 1,016,695 |
Series 2021B, GO, 4.00%, 11/15/2026 | 120,000 | 122,304 |
County of Cook, Sales Tax Series 2022A, Rev., 5.00%, 11/15/2023 | 270,000 | 270,773 |
Du Page and Will Counties Community School District No. 204 Indian Prairie GO, 4.00%, 12/30/2024 | 50,000 | 50,410 |
DuPage & Cook Counties Community Unit School District No. 205 Elmhurst Series 2015, GO, 5.00%, 1/1/2024 | 140,000 | 140,626 |
INVESTMENTS | PRINCIPAL AMOUNT($) | VALUE($) |
Illinois — continued | ||
DuPage County Forest Preserve District Series 2015, GO, 5.00%, 1/1/2024 | 60,000 | 60,317 |
Illinois Finance Authority, Advocate Health and Hospital Corp. Obligated Group | ||
Series 2013A, Rev., 5.00%, 6/1/2024 | 50,000 | 50,027 |
Series 2014, Rev., 5.00%, 8/1/2024 (b) | 19,225,000 | 19,469,913 |
Series 2021A, Rev., 5.00%, 8/15/2025 | 40,000 | 41,032 |
Illinois Finance Authority, Ascension Health Credit Group Series 2016C, Rev., 4.00%, 2/15/2024 | 240,000 | 240,494 |
Illinois Finance Authority, Clean Water Initiative Revolving Fund | ||
Series 2016, Rev., 4.00%, 7/1/2026 | 60,000 | 61,035 |
Series 2016, Rev., 5.00%, 1/1/2028 | 160,000 | 166,157 |
Illinois Finance Authority, Northwestern University | ||
Series 2015, Rev., 5.00%, 12/1/2023 | 90,000 | 90,350 |
Series 2015, Rev., 5.00%, 12/1/2026 | 20,000 | 20,674 |
Illinois Finance Authority, OSF Healthcare System Series 2015A, Rev., 5.00%, 11/15/2024 | 140,000 | 141,878 |
Illinois Finance Authority, Presbyterian Homes Obligated Group Series 2021B, Rev., (SIFMA Municipal Swap Index Yield + 0.70%), 4.76%, 9/7/2023 (d) | 5,790,000 | 5,654,655 |
Illinois Finance Authority, Riverside Health System | ||
Rev., 5.00%, 11/15/2023 | 215,000 | 215,255 |
Rev., 5.00%, 11/15/2024 | 1,680,000 | 1,681,879 |
Illinois Finance Authority, Rush University Medical Center Series 2015A, Rev., 5.00%, 11/15/2027 | 20,000 | 20,387 |
Illinois Finance Authority, Rush University Medical Center Obligated Group | ||
Series 2015A, Rev., 5.00%, 11/15/2024 | 20,000 | 20,268 |
Series 2015A, Rev., 5.00%, 11/15/2025 | 190,000 | 194,177 |
Illinois Finance Authority, Social Bonds-Learn Chapter School Project Rev., 4.00%, 11/1/2023 | 135,000 | 134,901 |
Illinois Finance Authority, Southern Illinois Healthcare Enterprises, Inc. Series 2017C, Rev., 5.00%, 3/1/2027 | 1,210,000 | 1,255,898 |
Illinois Finance Authority, Swedish Covenant Hospital Series 2016A, Rev., 5.00%, 8/15/2026 (b) | 355,000 | 371,546 |
180 | J.P. Morgan Exchange-Traded Funds | August 31, 2023 |
INVESTMENTS | PRINCIPAL AMOUNT($) | VALUE($) |
Municipal Bonds — continued | ||
Illinois — continued | ||
Illinois Finance Authority, The University Medical Center Series 2015A, Rev., 5.00%, 11/15/2023 | 40,000 | 40,083 |
Illinois Finance Authority, The University of Chicago Medical Center Series A, Rev., 5.00%, 8/15/2024 | 235,000 | 237,974 |
Illinois Finance Authority, Unitypoint Health Series 2016D, Rev., 5.00%, 2/15/2024 (b) | 745,000 | 750,311 |
Illinois Finance Authority, University of Chicago Series 2015A, Rev., 5.00%, 10/1/2025 (b) | 27,000,000 | 27,863,806 |
Illinois Housing Development Authority Rev., FHA, 4.00%, 6/1/2025 (c) | 2,785,000 | 2,778,051 |
Illinois Municipal Electric Agency, Power Supply System Series 2015A, Rev., 5.00%, 2/1/2024 | 590,000 | 593,470 |
Illinois State Toll Highway Authority | ||
Series 2014B, Rev., 5.00%, 1/1/2026 | 25,000 | 25,088 |
Series 2013A, Rev., 5.00%, 1/1/2027 | 65,000 | 65,072 |
Series 2014B, Rev., 5.00%, 1/1/2028 | 95,000 | 95,393 |
Lake County School District No. 112 North Shore Series 2022, GO, 5.00%, 12/1/2024 | 335,000 | 341,421 |
Lake County Township High School District No. 121 Warren Series 2016A, GO, 3.00%, 1/1/2024 (b) | 370,000 | 369,668 |
McHenry County Conservation District GO, 5.00%, 2/1/2024 | 20,000 | 20,127 |
McLean and Woodford Counties Community Unit School District No. 5 Normal Series 2017A, GO, 4.00%, 12/1/2023 | 445,000 | 445,344 |
Metropolitan Water Reclamation District of Greater Chicago | ||
Series A, GO, 5.00%, 12/1/2023 | 25,000 | 25,085 |
Series B, GO, 5.00%, 12/1/2023 | 100,000 | 100,341 |
Public Building Commission of Chicago Series 2006, Rev., AMBAC, 5.25%, 3/1/2024 | 1,000,000 | 1,005,444 |
Railsplitter Tobacco Settlement Authority | ||
Rev., 5.00%, 6/1/2025 | 255,000 | 260,964 |
Series 2017, Rev., 5.00%, 6/1/2026 | 565,000 | 587,086 |
Regional Transportation Authority Series 2017A, Rev., 5.00%, 7/1/2024 | 50,000 | 50,606 |
Rock Island County Community Unit School District No. 40 Moline, Alternative Revenue Source GO, 3.00%, 2/1/2024 | 20,000 | 19,973 |
INVESTMENTS | PRINCIPAL AMOUNT($) | VALUE($) |
Illinois — continued | ||
South Suburban College Community School District No. 510, Limited Tax GO, AGC, Zero Coupon, 12/1/2023 | 25,000 | 24,750 |
Southwestern Illinois Development Authority, Memorial Group Inc. Series 2013, Rev., 7.13%, 11/1/2023 (b) | 2,405,000 | 2,417,341 |
Southwestern Illinois Development Authority, Memorial Group, Inc. Rev., 7.13%, 11/1/2023 (b) | 3,220,000 | 3,236,523 |
State of Illinois | ||
Series 2018A, GO, 5.00%, 10/1/2023 | 25,000 | 25,020 |
Series 2018B, GO, 5.00%, 10/1/2023 | 175,000 | 175,138 |
Series 2017D, GO, 5.00%, 11/1/2023 | 1,470,000 | 1,472,551 |
Series 2019A, GO, 5.00%, 11/1/2023 | 19,500,000 | 19,533,844 |
Series 2017A, GO, 5.00%, 12/1/2023 | 100,000 | 100,272 |
Series 2017B, GO, 5.00%, 12/1/2023 | 200,000 | 200,544 |
GO, 5.00%, 2/1/2024 | 120,000 | 120,575 |
Series 2021C, GO, 4.00%, 3/1/2024 | 950,000 | 951,032 |
Series 2021B, GO, 5.00%, 3/1/2024 | 300,000 | 301,765 |
Series 2022A, GO, 5.00%, 3/1/2024 | 5,300,000 | 5,331,189 |
Series 2022B, GO, 5.00%, 3/1/2024 | 5,760,000 | 5,793,896 |
Series 2018A, GO, 4.00%, 5/1/2024 | 25,000 | 25,037 |
Series 2018A, GO, 5.00%, 10/1/2024 | 50,000 | 50,650 |
Series 2022B, GO, 5.00%, 3/1/2025 | 1,400,000 | 1,425,311 |
Series 2018B, GO, 5.00%, 10/1/2025 | 35,000 | 35,882 |
Series 2020B, GO, 5.00%, 10/1/2025 | 40,000 | 41,008 |
Series 2017D, GO, 5.00%, 11/1/2025 | 20,700,000 | 21,243,162 |
Series 2017A, GO, 5.00%, 12/1/2025 | 250,000 | 256,824 |
GO, 5.00%, 2/1/2026 | 25,000 | 25,736 |
Series 2021A, GO, 5.00%, 3/1/2026 | 50,000 | 51,528 |
Series 2016-6, GO, 5.00%, 6/1/2026 | 450,000 | 465,190 |
Series 2018B, GO, 5.00%, 10/1/2026 | 125,000 | 129,768 |
Series 2020B, GO, 5.00%, 10/1/2026 | 1,305,000 | 1,354,772 |
Series 2017D, GO, 5.00%, 11/1/2026 | 2,760,000 | 2,868,198 |
Series 2022A, GO, 5.00%, 3/1/2027 | 50,000 | 52,180 |
Series 2020B, GO, 5.00%, 10/1/2028 | 40,000 | 42,574 |
Series 2017D, GO, 5.00%, 11/1/2028 | 170,000 | 178,647 |
State of Illinois, Sales Tax | ||
Rev., 5.00%, 6/15/2024 | 510,000 | 510,340 |
Series 2016A, Rev., 5.00%, 6/15/2024 | 115,000 | 116,129 |
Series 2002-4, Rev., NATL - RE, 6.00%, 6/15/2024 | 300,000 | 305,227 |
Taylorville Community Unit School District No. 3 Series 2013, GO, 5.75%, 12/1/2023 (b) | 1,000,000 | 1,005,290 |
August 31, 2023 | J.P. Morgan Exchange-Traded Funds | 181 |
AS OF August 31, 2023 (Unaudited) (continued)
INVESTMENTS | PRINCIPAL AMOUNT($) | VALUE($) |
Municipal Bonds — continued | ||
Illinois — continued | ||
Tender Option Bond Trust Receipts/ Certificates Series 2017-XF2500, Rev., VRDO, LIQ : Citibank NA, 4.11%, 9/12/2023 (c) (e) | 10,220,000 | 10,220,000 |
Village of Midlothian | ||
GO, AGM, 4.00%, 1/1/2024 | 70,000 | 70,058 |
GO, AGM, 4.00%, 1/1/2025 | 40,000 | 40,164 |
Village of Rantoul GO, 4.00%, 1/1/2025 | 350,000 | 352,108 |
Village of Streamwood GO, 5.00%, 12/1/2023 | 20,000 | 20,064 |
Village of Villa Park, Alternative Revenue Source Series 2018C, GO, 4.00%, 12/15/2023 | 50,000 | 50,050 |
Will County Community Unit School District No. 201-U Crete-Monee GO, AGM, Zero Coupon, 11/1/2023 | 300,000 | 298,165 |
Will County School District No. 86 Joliet Series 2015C, GO, AGM-CR, 5.00%, 3/1/2024 | 6,005,000 | 6,046,448 |
Will Grundy Etc Counties Community College District No. 525 Series 2013B, GO, 5.25%, 12/1/2023 (b) | 25,000 | 25,115 |
Total Illinois | 163,867,913 | |
Indiana — 0.5% | ||
Avon Community School Building Corp., Ad Valorem Property Tax First Mortgage Rev., 4.00%, 7/15/2024 | 25,000 | 25,103 |
Brownsburg 1999 School Building Corp., Ad Valorem Property Tax First Mortgage Series 2015B, Rev., 5.00%, 7/15/2024 | 30,000 | 30,343 |
Carmel Local Public Improvement Bond Bank Series 2021A, Rev., 4.00%, 7/15/2025 | 65,000 | 65,604 |
Carmel Redevelopment Authority, Option Income Tax Lease Rental | ||
Series 2014B, Rev., 5.00%, 1/1/2024 | 35,000 | 35,168 |
Series 2014B, Rev., 5.00%, 7/1/2024 | 70,000 | 70,865 |
City of Indianapolis, Department of Public Utilities Water System | ||
Series 2018A, Rev., 5.00%, 10/1/2023 | 160,000 | 160,168 |
Series 2018A, Rev., 5.00%, 10/1/2026 | 25,000 | 26,304 |
City of Indianapolis,Thermal Energy System, First Lien Series 2016A, Rev., 5.00%, 10/1/2023 | 45,000 | 45,049 |
Clark Pleasant Middle School Corp., Ad Valorem Property Tax First Mortgage Rev., 4.00%, 1/15/2025 | 35,000 | 35,195 |
INVESTMENTS | PRINCIPAL AMOUNT($) | VALUE($) |
Indiana — continued | ||
East Allen Multi School Building Corp., Indiana Ad Valorem Property Tax, First Mortgage Rev., 4.00%, 1/15/2024 | 40,000 | 40,074 |
Fishers Industrial Redevelopment District, Income Tax | ||
Rev., 4.00%, 1/15/2024 | 25,000 | 25,033 |
Rev., 4.00%, 7/15/2024 | 35,000 | 35,112 |
Fort Wayne Redevelopment Authority Lease Rental Series 2014A, Rev., 3.00%, 8/1/2024 | 50,000 | 49,624 |
GCS School Building Corp. One, Unlimited Ad Valorem Property Tax First Mortgage Rev., 5.00%, 1/15/2026 | 45,000 | 46,531 |
Hamilton Southeastern Consolidated School Building Corp., Ad Valorem Property Tax First Mortgage Rev., 4.00%, 1/15/2024 | 25,000 | 25,046 |
Indiana Finance Authority | ||
Series 2016A, Rev., 5.00%, 12/1/2023 | 175,000 | 175,516 |
Series 2021-2, Rev., 5.00%, 10/1/2024 | 25,000 | 25,419 |
Series 2016C, Rev., 5.00%, 12/1/2024 | 40,000 | 40,830 |
Series 2015A, Rev., 4.00%, 3/1/2025 (b) | 25,000 | 25,203 |
Series 2021-2, Rev., 5.00%, 10/1/2025 | 70,000 | 72,339 |
Series 2016, Rev., 5.00%, 9/1/2026 | 40,000 | 41,697 |
Indiana Finance Authority, First Lien Wastewater, CWA Authority Project Series 2021-1, Rev., 5.00%, 10/1/2023 | 560,000 | 560,609 |
Indiana Finance Authority, Franciscan Alliance, Inc., Obligated Group Series 2016B, Rev., 5.00%, 11/1/2024 | 345,000 | 350,840 |
Indiana Finance Authority, Goshen Health Series 2019B, Rev., 2.10%, 11/1/2026 (c) | 60,000 | 56,101 |
Indiana Finance Authority, Indiana University Health Obligated Group | ||
Series 2019C, Rev., 5.00%, 12/1/2024 | 75,000 | 76,191 |
Series 2019B, Rev., 2.25%, 7/1/2025 (c) | 150,000 | 145,501 |
Indiana Finance Authority, Major Hospital Project Series 2014A, Rev., 5.00%, 10/1/2023 (b) | 570,000 | 570,641 |
Indiana Health Facility Financing Authority, Ascension Health Credit Group Series 2005A-7, Rev., 4.00%, 10/1/2025 | 30,000 | 30,257 |
Indiana Municipal Power Agency | ||
Series 2017A, Rev., 5.00%, 1/1/2024 | 30,000 | 30,151 |
Series 2014A, Rev., 5.00%, 1/1/2027 | 25,000 | 25,406 |
Series 2016C, Rev., 5.00%, 1/1/2027 | 40,000 | 41,641 |
182 | J.P. Morgan Exchange-Traded Funds | August 31, 2023 |
INVESTMENTS | PRINCIPAL AMOUNT($) | VALUE($) |
Municipal Bonds — continued | ||
Indiana — continued | ||
Series 2016C, Rev., 5.00%, 1/1/2028 | 50,000 | 52,023 |
Indiana State University, Student Fee Series T, Rev., 5.00%, 10/1/2023 | 50,000 | 50,042 |
Indianapolis Local Public Improvement Bond Bank Series 2021A, Rev., 5.00%, 6/1/2024 | 200,000 | 201,971 |
Indianapolis Local Public Improvement Bond Bank, Stormwater Project Series 2013D, Rev., 3.25%, 1/1/2025 | 100,000 | 99,899 |
Ivy Tech Community College of Indiana, Student Fee | ||
Series W, Rev., 5.00%, 7/1/2024 | 30,000 | 30,361 |
Series W, Rev., 5.00%, 7/1/2025 | 25,000 | 25,681 |
Jackson County Building Corp. Rev., 2.00%, 1/15/2025 | 125,000 | 121,436 |
Merrillville Community School Corp. GO, 2.00%, 1/15/2024 | 1,040,000 | 1,030,615 |
New Prairie United School District Building Corp., First Mortgage Rev., 4.00%, 1/15/2025 | 35,000 | 35,256 |
Perry Township Schools | ||
Series 2022A, GO, 4.00%, 1/15/2024 | 2,800,000 | 2,799,509 |
Series 2022B, GO, 4.00%, 1/15/2024 | 2,950,000 | 2,949,483 |
Series 2022C, GO, 4.00%, 1/15/2024 | 2,375,000 | 2,374,584 |
Pike Township Multi-School Building Corp., First Mortgage Rev., 5.00%, 7/15/2024 | 350,000 | 354,682 |
South Gibson School Building Corp., First Mortgage Rev., 4.00%, 1/10/2025 | 40,000 | 40,299 |
Southmont School Building Corp., Ad Valorem Property Tax, First Mortgage Rev., 5.00%, 1/15/2025 | 20,000 | 20,420 |
Twin Lakes School Building Corp., First Mortgage Rev., 4.00%, 7/15/2024 | 35,000 | 35,130 |
Whitestown Redevelopment Authority Rev., 3.00%, 1/15/2024 | 25,000 | 24,916 |
Winfield Building Corp., Indiana Lease Rental, Sewage Works Treatment Plant Project | ||
Series 2020B, Rev., 4.00%, 1/15/2024 | 35,000 | 35,039 |
Series 2020B, Rev., 4.00%, 7/15/2024 | 35,000 | 35,100 |
Series 2020B, Rev., 4.00%, 1/15/2025 | 40,000 | 40,197 |
Series 2020B, Rev., 4.00%, 7/15/2025 | 40,000 | 40,292 |
Series 2020A, Rev., 4.00%, 1/15/2026 | 110,000 | 111,172 |
INVESTMENTS | PRINCIPAL AMOUNT($) | VALUE($) |
Indiana — continued | ||
Series 2020B, Rev., 4.00%, 1/15/2026 | 40,000 | 40,426 |
Zionsville Community Schools Building Corp., First Mortgage, Capital Appreciation Series 2003Z, Rev., NATL - RE, Zero Coupon, 1/15/2025 | 25,000 | 23,763 |
Total Indiana | 13,555,857 | |
Iowa — 1.5% | ||
County of Linn Series 2019, COP, 5.00%, 6/1/2024 | 90,000 | 91,012 |
Iowa Finance Authority, Health System Series 2018A, Rev., (SIFMA Municipal Swap Index Yield + 0.50%), 4.64%, 9/7/2023 (d) (e) | 14,220,000 | 14,211,057 |
Iowa Finance Authority, UnityPoint Health Series 2018B, Rev., 5.00%, 2/15/2024 | 30,000 | 30,148 |
State of Iowa Board of Regents, University of Iowa, Hospitals and Clinics Series 2019, Rev., 5.00%, 9/1/2025 | 25,000 | 25,773 |
University of Iowa (The), Parking System Bond Anticipation Project Series 2023, Rev., BAN, 3.50%, 7/1/2026 | 24,140,000 | 23,716,514 |
Waukee Community School District Infrastructure Sales Services & Use Tax Series 2017A, Rev., 4.00%, 6/1/2024 | 1,220,000 | 1,223,839 |
Total Iowa | 39,298,343 | |
Kansas — 0.1% | ||
Blue Valley Recreation Commission Series B, COP, AGM, 5.00%, 10/1/2023 | 30,000 | 30,034 |
Butler County Unified School District No. 375 Circle, School Building Series 2013-1, GO, AGM, 3.38%, 9/1/2023 (b) | 20,000 | 20,000 |
City of Manhattan, Temporary Notes Series 2020-03, GO, 0.75%, 6/15/2024 | 100,000 | 96,759 |
City of Olathe GO, 5.00%, 10/1/2023 | 25,000 | 25,028 |
County of Shawnee COP, 3.00%, 9/1/2024 | 35,000 | 34,737 |
Johnson County Public Building Commission Series 2018A, Rev., 5.00%, 9/1/2023 | 55,000 | 55,000 |
Johnson County Unified School District No. 233 Olathe | ||
Series 2016C, GO, 5.00%, 9/1/2023 | 50,000 | 50,000 |
Series 2016A, GO, 4.00%, 9/1/2024 (b) | 25,000 | 25,145 |
Neosho County Unified School District No. 413 GO, AGM, 4.00%, 9/1/2023 (b) | 25,000 | 25,000 |
Reno County Unified School District No. 308 Hutchinson Series 2015, GO, 4.00%, 9/1/2023 | 100,000 | 100,000 |
August 31, 2023 | J.P. Morgan Exchange-Traded Funds | 183 |
AS OF August 31, 2023 (Unaudited) (continued)
INVESTMENTS | PRINCIPAL AMOUNT($) | VALUE($) |
Municipal Bonds — continued | ||
Kansas — continued | ||
Rice County Unified School District No. 376 Sterling Series 2015, GO, AGM, 4.00%, 9/1/2025 (b) | 1,200,000 | 1,213,748 |
Sedgwick County Unified School District No. 266 Maize Series 2015A, GO, 4.00%, 9/1/2023 (b) | 25,000 | 25,000 |
Seward County Unified School District No. 480 Liberal Series 2017-B, GO, 5.00%, 9/1/2023 | 10,000 | 10,000 |
State of Kansas Department of Transportation Series 2015A, Rev., 5.00%, 9/1/2023 | 45,000 | 45,000 |
Wyandotte County-Kansas City Unified Government Utility System Series 2014A, Rev., 5.00%, 9/1/2023 | 725,000 | 725,000 |
Total Kansas | 2,480,451 | |
Kentucky — 0.9% | ||
County of Daviess Series 2012A, GO, 2.00%, 9/1/2023 | 50,000 | 50,000 |
Fayette County School District Finance Corp. Series 2013A, Rev., 5.00%, 10/1/2023 (b) | 25,000 | 25,028 |
Kenton County Public Properties Corp., Court Facilities Project Rev., 3.00%, 3/1/2024 | 500,000 | 497,773 |
Kentucky Asset Liability Commission | ||
Series 2021A, Rev., 5.00%, 11/1/2023 | 60,000 | 60,127 |
Series 2021A, Rev., 5.00%, 11/1/2024 | 615,000 | 625,061 |
Kentucky Asset Liability Commission, Federal Highway Trust Fund | ||
Series A, Rev., 5.00%, 9/1/2023 | 100,000 | 100,000 |
Series 2013A, Rev., 5.25%, 9/1/2023 | 520,000 | 520,000 |
Kentucky Economic Development Finance Authority, Catholic Health Initiatives Series 2011B-3, Rev., (SIFMA Municipal Swap Index Yield + 1.40%), 5.46%, 9/7/2023 (d) | 12,715,000 | 12,728,253 |
Kentucky Economic Development Finance Authority, CommonSpirit Health Obligated Group Series 2019A-1, Rev., 5.00%, 8/1/2025 | 685,000 | 696,474 |
Kentucky Infrastructure Authority, Wastewater and Drinking Water Revolving Fund Series 2018A, Rev., 3.00%, 2/1/2024 | 25,000 | 24,939 |
Kentucky Municipal Power Agency, Prairie State Project | ||
Series 2015A, Rev., NATL - RE, 5.00%, 9/1/2023 | 1,930,000 | 1,930,000 |
INVESTMENTS | PRINCIPAL AMOUNT($) | VALUE($) |
Kentucky — continued | ||
Series 2015A, Rev., NATL - RE, 5.00%, 9/1/2024 | 310,000 | 313,996 |
Kentucky Public Energy Authority, Gas Supply | ||
Series 2022A-1, Rev., 4.00%, 2/1/2024 | 2,500,000 | 2,498,422 |
Series 2018A, Rev., 4.00%, 4/1/2024 (c) | 155,000 | 155,057 |
Series 2020A, Rev., 4.00%, 6/1/2026 (c) | 710,000 | 703,763 |
Kentucky State Property and Building Commission, Project No. 106 Series 2013A, Rev., 5.00%, 10/1/2023 (b) | 55,000 | 55,062 |
Kentucky State Property and Building Commission, Project No. 108 | ||
Series B, Rev., 5.00%, 8/1/2026 | 45,000 | 47,045 |
Series A, Rev., 5.00%, 8/1/2028 | 75,000 | 77,137 |
Kentucky State Property and Building Commission, Project No. 115 Rev., 5.00%, 4/1/2028 | 20,000 | 21,019 |
Kentucky State Property and Building Commission, Project No. 122 Series A, Rev., 5.00%, 11/1/2027 | 50,000 | 53,250 |
Kentucky Turnpike Authority Series 2016A, Rev., 5.00%, 7/1/2027 | 25,000 | 26,065 |
Kentucky Turnpike Authority, Revitalization Projects | ||
Series 2014A, Rev., 5.00%, 7/1/2024 | 105,000 | 106,170 |
Series B, Rev., 5.00%, 7/1/2025 | 265,000 | 271,987 |
Series B, Rev., 4.00%, 7/1/2027 | 100,000 | 102,304 |
Lexington-Fayette Urban County Government, Various Purpose Series 2012B, GO, 3.00%, 7/1/2024 | 100,000 | 99,565 |
Louisville and Jefferson County Metropolitan Government, Norton Healthcare, Inc. | ||
Series 2016A, Rev., 5.00%, 10/1/2023 | 50,000 | 50,045 |
Series 2020B, Rev., 5.00%, 10/1/2023 (c) | 1,780,000 | 1,781,608 |
Louisville Water Co., Metro Government Waterworks Board | ||
Rev., 5.00%, 11/15/2023 | 25,000 | 25,079 |
Series 2019, Rev., 5.00%, 11/15/2023 | 40,000 | 40,126 |
Scott County School District Finance Corp. Rev., 5.00%, 6/1/2025 | 20,000 | 20,434 |
184 | J.P. Morgan Exchange-Traded Funds | August 31, 2023 |
INVESTMENTS | PRINCIPAL AMOUNT($) | VALUE($) |
Municipal Bonds — continued | ||
Kentucky — continued | ||
University of Kentucky, General Receipt Series 2014A, Rev., 4.00%, 4/1/2024 (b) | 175,000 | 175,477 |
University of Kentucky, General Receipts Series 2015B, Rev., 5.00%, 10/1/2024 | 20,000 | 20,329 |
Total Kentucky | 23,901,595 | |
Louisiana — 2.1% | ||
Ascension Parish School Board Series 2020, GO, 4.00%, 3/1/2024 | 25,000 | 25,059 |
City of Shreveport, Water and Sewer, Junior Lien Series 2018C, Rev., 5.00%, 12/1/2023 | 1,175,000 | 1,178,835 |
Jefferson Parish School Board Series 2015, GO, 5.00%, 3/1/2024 | 50,000 | 50,377 |
Louisiana Local Government Environmental Facilities and Community Development Authority, LCTCS Act 360 Project Series 2014, Rev., 5.00%, 10/1/2024 (b) | 100,000 | 101,621 |
Louisiana Local Government Environmental Facilities and Community Development Authority, LCTCS Act 391 Project Series 2017, Rev., 5.00%, 10/1/2024 | 250,000 | 253,262 |
Louisiana Public Facilities Authority, Hurricane Recovery Program Series 2014, Rev., 5.00%, 6/1/2024 | 120,000 | 121,358 |
Louisiana Public Facilities Authority, Tulane University Project | ||
Series 2016A, Rev., 5.00%, 12/15/2023 | 50,000 | 50,186 |
Series 2016A, Rev., 5.00%, 12/15/2026 | 70,000 | 73,574 |
Louisiana State University and Agricultural and Mechanical College, Auxiliary Facilities System Series 2016A, Rev., 5.00%, 7/1/2024 | 75,000 | 75,683 |
State of Louisiana | ||
Rev., 5.00%, 9/1/2023 | 15,000 | 15,000 |
Series 2014C, GO, 5.00%, 8/1/2025 | 65,000 | 65,955 |
Series 2014A, GO, 4.00%, 2/1/2034 | 12,095,000 | 12,125,228 |
State of Louisiana Gasoline and Fuels Tax | ||
Series 2014B, Rev., 5.00%, 5/1/2024 (b) | 30,000 | 30,315 |
Series A, Rev., 4.50%, 5/1/2025 (b) | 31,500,000 | 32,040,247 |
State of Louisiana Gasoline and Fuels Tax, Second Lien Series 2022A, Rev., (SOFR + 0.50%), 4.22%, 9/6/2023 (d) | 7,880,000 | 7,722,425 |
Total Louisiana | 53,929,125 | |
INVESTMENTS | PRINCIPAL AMOUNT($) | VALUE($) |
Maine — 0.0% ^ | ||
Maine Governmental Facilities Authority, Lease Rental Series 2015B, Rev., 2.00%, 10/1/2023 | 10,000 | 9,986 |
Maine Health and Higher Educational Facilities Authority, Mainehealth Series 2020A, Rev., 5.00%, 7/1/2026 | 35,000 | 36,248 |
Maine Municipal Bond Bank | ||
Series 2016C, Rev., 4.00%, 11/1/2023 | 25,000 | 25,025 |
Series 2018B, Rev., 5.00%, 11/1/2023 | 20,000 | 20,050 |
Series 2021A, Rev., 5.00%, 11/1/2023 | 500,000 | 501,259 |
Series 2014C, Rev., 5.00%, 11/1/2024 | 25,000 | 25,480 |
Maine School Administrative District No. 51 GO, 4.00%, 8/1/2025 | 50,000 | 50,672 |
University of Maine System Rev., 5.00%, 3/1/2025 | 55,000 | 56,336 |
Total Maine | 725,056 | |
Maryland — 0.4% | ||
County of Baltimore, Consolidated Public Improvement GO, 5.00%, 2/1/2025 | 25,000 | 25,588 |
County of Montgomery Series 2017C, GO, 5.00%, 10/1/2023 | 55,000 | 55,062 |
County of Montgomery, College Foundation, Inc. Series 2016A, COP, 5.00%, 11/1/2023 | 150,000 | 150,354 |
County of Montgomery, Consolidated Public Improvement Series 2015B, GO, 5.00%, 12/1/2023 | 115,000 | 115,447 |
County of Prince George's, Consol Public Improvement Series 2014A, GO, 4.00%, 9/1/2024 | 30,000 | 30,217 |
County of Prince George's, Consolidated Public Improvement Series 2013A, GO, 3.00%, 3/1/2024 | 30,000 | 29,943 |
Maryland Community Development Administration, Housing and Community Development Series 2019A, Rev., 2.10%, 3/1/2024 | 20,000 | 19,845 |
Maryland Health and Higher Educational Facilities Authority, Lifebridge Health Issue Rev., 5.00%, 7/1/2025 | 45,000 | 46,018 |
Maryland Health and Higher Educational Facilities Authority, Medstar Health Issue | ||
Series 2013A, Rev., 5.00%, 8/15/2024 | 570,000 | 570,346 |
Series 2020B-1, Rev., 5.00%, 7/1/2025 (c) | 150,000 | 152,396 |
August 31, 2023 | J.P. Morgan Exchange-Traded Funds | 185 |
AS OF August 31, 2023 (Unaudited) (continued)
INVESTMENTS | PRINCIPAL AMOUNT($) | VALUE($) |
Municipal Bonds — continued | ||
Maryland — continued | ||
Maryland Health and Higher Educational Facilities Authority, Peninsula Regional Medical Center Series 2015, Rev., 5.00%, 7/1/2024 (b) | 9,320,000 | 9,423,807 |
Maryland Stadium Authority, Construction and Revitalization Program Series 2018A, Rev., 5.00%, 5/1/2024 | 25,000 | 25,274 |
State of Maryland Series 2016, GO, 4.00%, 6/1/2028 | 25,000 | 25,022 |
State of Maryland Department of Transportation, Second Issue Rev., 5.00%, 6/1/2025 | 65,000 | 65,049 |
State of Maryland, Department of Transportation Rev., 5.00%, 11/1/2023 | 40,000 | 40,101 |
Total Maryland | 10,774,469 | |
Massachusetts — 2.1% | ||
Boston Water and Sewer Commission Series B, Rev., 5.00%, 11/1/2023 (b) | 25,000 | 25,065 |
Bristol-Plymouth Regional Vocational Technical School District GO, BAN, 4.50%, 2/28/2024 | 6,000,000 | 6,036,548 |
City of Boston Series 2013B, GO, 4.00%, 1/1/2024 | 20,000 | 20,011 |
City of Chicopee Series 2016, GO, 4.00%, 8/15/2024 | 30,000 | 30,195 |
City of Quincy GO, BAN, 4.50%, 9/15/2023 | 100,000 | 100,036 |
City of Woburn, Municipal Purpose Loan GO, 2.63%, 11/15/2025 | 100,000 | 97,377 |
Commonwealth of Massachusetts | ||
Series 2006B, GO, AGM, 5.25%, 9/1/2023 | 50,000 | 50,000 |
Series C, GO, 5.00%, 10/1/2023 | 25,000 | 25,030 |
Series 2015A, GO, 5.00%, 5/1/2024 | 80,000 | 80,097 |
Commonwealth of Massachusetts Federal Highway, Accelerated Bridge Program Series 2014A, Rev., GAN, 5.00%, 6/15/2024 | 25,000 | 25,329 |
Massachusetts Development Finance Agency, Boston University Issue Series 2019DD-1, Rev., 5.00%, 10/2/2023 (c) | 5,110,000 | 5,115,969 |
Massachusetts Development Finance Agency, Caregroup Issue | ||
Series 2015H-1, Rev., 5.00%, 7/1/2024 | 500,000 | 504,394 |
Series 2015H-1, Rev., 5.00%, 7/1/2025 | 35,000 | 35,805 |
Massachusetts Development Finance Agency, Children's Hospital Corp Obligated Group Series 2014P, Rev., 5.00%, 10/1/2024 (b) | 17,000,000 | 17,266,636 |
INVESTMENTS | PRINCIPAL AMOUNT($) | VALUE($) |
Massachusetts — continued | ||
Massachusetts Development Finance Agency, North Hill Community Issue Series 2013A, Rev., 6.50%, 11/15/2023 (b) (e) | 675,000 | 678,665 |
Massachusetts Development Finance Agency, Partners Healthcare System Issue | ||
Series 2019T-1, Rev., (SIFMA Municipal Swap Index Yield + 0.60%), 4.66%, 9/7/2023 (d) (e) | 1,075,000 | 1,064,144 |
Series 2017S-4, Rev., 5.00%, 1/25/2024 (c) | 200,000 | 201,017 |
Series 2017S-2, Rev., 5.00%, 1/30/2025 (c) | 345,000 | 351,486 |
Massachusetts Development Finance Agency, Salem Community Corp. | ||
Rev., 5.00%, 1/1/2024 | 345,000 | 344,510 |
Rev., 5.00%, 1/1/2025 | 365,000 | 362,812 |
Massachusetts Development Finance Agency, Trustees of Boston University | ||
Series X, Rev., 5.00%, 10/1/2023 | 4,000,000 | 4,004,498 |
Series 2019DD-2, Rev., 5.00%, 10/2/2023 (c) | 40,000 | 40,047 |
Massachusetts Housing Finance Agency, Sustainability Bonds Series 2020A-3, Rev., FHA, 0.88%, 12/1/2023 | 180,000 | 178,786 |
Massachusetts School Building Authority, Dedicated Sales Tax | ||
Series 2018A, Rev., 5.00%, 2/15/2024 (b) | 20,000 | 20,143 |
Series 2018A, Rev., 5.00%, 2/15/2028 | 30,000 | 30,190 |
Massachusetts State College Building Authority | ||
Series 2017D, Rev., 5.00%, 5/1/2024 | 45,000 | 45,505 |
Series 2016A, Rev., 4.00%, 5/1/2025 | 20,000 | 20,271 |
Massachusetts Transportation Trust Fund Metropolitan Highway System, Senior Series 2019A, Rev., 5.00%, 1/1/2024 | 30,000 | 30,158 |
Massachusetts Water Resources Authority | ||
Series 2014F, Rev., 5.00%, 8/1/2024 (b) | 30,000 | 30,443 |
Series 2014F, Rev., 5.00%, 8/1/2024 | 5,000 | 5,080 |
Montachusett Regional Transit Authority Rev., RAN, GTD, 4.50%, 7/26/2024 | 11,000,000 | 11,056,663 |
Town of Hatfield GO, BAN, 4.50%, 5/16/2024 | 2,290,000 | 2,304,467 |
Town of Marshfield, Municipal Purpose Loan GO, 5.00%, 11/1/2024 | 25,000 | 25,032 |
186 | J.P. Morgan Exchange-Traded Funds | August 31, 2023 |
INVESTMENTS | PRINCIPAL AMOUNT($) | VALUE($) |
Municipal Bonds — continued | ||
Massachusetts — continued | ||
Town of Medfield, Municipal Purpose Loan GO, 2.13%, 9/15/2023 | 100,000 | 99,966 |
Town of Middleton, Municipal Purpose Loan GO, 2.50%, 8/15/2025 | 40,000 | 38,807 |
Town of Randolph GO, BAN, 4.75%, 6/27/2024 | 3,303,800 | 3,326,986 |
Town of Tewksbury, Municipal Purpose Loan GO, 4.00%, 1/15/2025 | 25,000 | 25,242 |
Town of West Springfield GO, BAN, 4.75%, 6/20/2024 | 1,430,000 | 1,438,642 |
Total Massachusetts | 55,136,052 | |
Michigan — 3.3% | ||
Charter Township of Lyon Series 2006-A, GO, XLCA, 4.13%, 11/1/2023 | 45,000 | 45,057 |
City of Ann Arbor, Limited Tax GO, 3.00%, 10/1/2023 | 25,000 | 24,989 |
City of Brighton Series 2021, GO, 4.00%, 10/1/2024 | 80,000 | 80,504 |
City of Detroit Series 2004A, Rev., AGM, 5.25%, 7/1/2024 | 25,000 | 25,369 |
City of Grand Rapids, Capital Improvement, Limited Tax GO, 5.00%, 4/1/2024 | 50,000 | 50,448 |
City of Lathrup Village, Limited Tax GO, 5.00%, 10/1/2025 | 45,000 | 46,485 |
City of South Haven, Limited Tax GO, 4.00%, 10/1/2023 | 70,000 | 70,021 |
County of Jackson, Transportation GO, 2.00%, 5/1/2024 | 250,000 | 246,581 |
Dearborn School District, School Building and Site Series 2014A, GO, Q-SBLF, 4.00%, 11/1/2023 (b) | 35,000 | 35,029 |
Grand Valley State University | ||
Series 2014B, Rev., 5.00%, 12/1/2023 | 310,000 | 311,094 |
Series 2016A, Rev., 5.00%, 12/1/2024 | 670,000 | 682,188 |
Series 2016A, Rev., 5.00%, 12/1/2027 | 1,590,000 | 1,648,778 |
Great Lakes Water Authority, Water Supply System, Second Lien Series 2018A, Rev., 5.00%, 7/1/2024 | 55,000 | 55,653 |
Kalamazoo Hospital Finance Authority, Bronson Healthcare Group, Inc. Rev., 5.00%, 5/15/2024 (b) | 5,000 | 5,052 |
Karegnondi Water Authority, Water and Supply System Series 2014A, Rev., 5.00%, 11/1/2026 | 125,000 | 125,171 |
Kent Hospital Finance Authority, Mary Free Bed Rehabilitation Hospital | ||
Series 2021A, Rev., 5.00%, 4/1/2024 | 540,000 | 542,214 |
Series 2021A, Rev., 5.00%, 4/1/2025 | 565,000 | 571,885 |
INVESTMENTS | PRINCIPAL AMOUNT($) | VALUE($) |
Michigan — continued | ||
Lake Michigan College District, Building and Site, Limited Tax | ||
GO, 4.00%, 9/1/2023 (b) | 25,000 | 25,000 |
GO, 4.25%, 9/1/2023 (b) | 20,000 | 20,000 |
Linden Community School District, School Building and Site, Unlimited Tax Series 2021I, GO, Q-SBLF, 4.00%, 5/1/2025 | 30,000 | 30,246 |
Livonia Municipal Building Authority, Limited Tax Rev., 4.00%, 5/1/2024 | 40,000 | 40,148 |
Michigan Finance Authority, Ascension Senior Credit Group Series 2016E-1, Rev., 4.00%, 8/15/2024 (c) | 60,000 | 60,086 |
Michigan Finance Authority, Beaumont Health Credit Group | ||
Series 2022A, Rev., 5.00%, 4/15/2024 | 500,000 | 504,294 |
Series 2015A, Rev., 5.00%, 8/1/2024 (b) | 100,000 | 101,273 |
Michigan Finance Authority, Clean Water Revolving Fund | ||
Series 2016B, Rev., 5.00%, 10/1/2023 | 25,000 | 25,029 |
Series 2016B, Rev., 5.00%, 10/1/2024 | 150,000 | 152,638 |
Michigan Finance Authority, Detroit Regional Convention Facility Authority Series 2014H-1, Rev., 5.00%, 10/1/2024 | 680,000 | 680,676 |
Michigan Finance Authority, Henry Ford Health System | ||
Rev., 5.00%, 11/15/2023 | 20,000 | 20,045 |
Series 2016, Rev., 5.00%, 11/15/2025 | 40,000 | 40,950 |
Michigan Finance Authority, Hospital Trinity Health Credit Group | ||
Series 2015MI, Rev., 5.50%, 12/1/2026 | 635,000 | 654,496 |
Series 2017A-MI, Rev., 5.00%, 12/1/2027 | 30,000 | 32,006 |
Series 2015MI, Rev., 5.50%, 12/1/2027 | 1,435,000 | 1,481,620 |
Michigan Finance Authority, Local Government Loan Program, Detroit Water and Sewerage Department, Sewage Disposal Series 2014C-3, Rev., AGM, 5.00%, 7/1/2027 | 175,000 | 176,835 |
Michigan Finance Authority, Midmichigan Health Series 2014, Rev., 5.00%, 6/1/2024 (b) | 40,000 | 40,444 |
Michigan Finance Authority, Trinity Health Credit Group | ||
Series 2015MI, Rev., 5.00%, 12/1/2023 | 100,000 | 100,348 |
Series 2019MI-1, Rev., 5.00%, 12/1/2023 | 125,000 | 125,453 |
August 31, 2023 | J.P. Morgan Exchange-Traded Funds | 187 |
AS OF August 31, 2023 (Unaudited) (continued)
INVESTMENTS | PRINCIPAL AMOUNT($) | VALUE($) |
Municipal Bonds — continued | ||
Michigan — continued | ||
Series 2017A-MI, Rev., 5.00%, 12/1/2024 | 285,000 | 290,497 |
Series 2019MI-2, Rev., 5.00%, 2/1/2025 (c) | 5,910,000 | 6,032,754 |
Series 2017A-MI, Rev., 5.00%, 12/1/2026 | 25,000 | 26,219 |
Michigan State Building Authority, Facilities Program | ||
Series 2023-I, Rev., VRDO, 4.18%, 9/1/2023 (c) | 20,000,000 | 20,000,000 |
Series 2013 1-A, Rev., 5.00%, 10/15/2023 (b) | 25,000 | 25,038 |
Michigan State Building Authority, Multi Modal Program Series III, Rev., VRDO, 4.18%, 9/12/2023 (c) | 8,635,000 | 8,635,000 |
Michigan State Building Authority,Facility Program Series 2013 1-A, Rev., 5.00%, 10/15/2023 | 8,385,000 | 8,397,654 |
Michigan State Hospital Finance Authority, Ascension Health Credit Group Series 2010F-3, Rev., 4.00%, 7/1/2024 (c) | 100,000 | 100,135 |
Michigan State Hospital Finance Authority, Trinity Health Credit Group Series 2008C, Rev., 5.00%, 12/1/2024 | 255,000 | 259,919 |
Michigan Strategic Fund Limited Obligation, Facility For Rare Isotope Beams Projects At Michigan State University | ||
Series 2014, Rev., 5.00%, 3/1/2025 | 45,000 | 45,308 |
Series 2014, Rev., 5.00%, 3/1/2026 | 235,000 | 236,588 |
North Kent Sewer Authority Series 2016, Rev., 5.00%, 11/1/2024 | 755,000 | 768,813 |
Northern Michigan University Series 2018A, Rev., 5.00%, 12/1/2023 | 310,000 | 311,169 |
Portage Public Schools Series 2016, GO, 5.00%, 11/1/2024 | 25,000 | 25,472 |
RIB Floater Trust Various States Series 46, Rev., VRDO, LOC : Barclays Bank plc, 4.07%, 9/1/2023 (c) (e) | 30,000,000 | 30,000,000 |
Royal Oak Hospital Finance Authority Series 2014D, Rev., 5.00%, 3/1/2024 (b) | 1,145,000 | 1,153,458 |
Saginaw City School District, Unlimited Tax GO, Q-SBLF, 5.00%, 5/1/2024 | 35,000 | 35,333 |
Schoolcraft Community College District, Limited Tax GO, 3.00%, 5/1/2024 | 115,000 | 114,472 |
South Lake Schools, School Building and Site GO, Q-SBLF, 4.00%, 11/1/2024 | 25,000 | 25,076 |
State of Michigan Trunk Line Series 2020A, Rev., 5.00%, 11/15/2023 | 50,000 | 50,161 |
INVESTMENTS | PRINCIPAL AMOUNT($) | VALUE($) |
Michigan — continued | ||
Troy School District, Unlimited Tax, School Building and Site GO, Q-SBLF, 5.00%, 11/1/2023 (b) | 20,000 | 20,049 |
Walled Lake Consolidated School District, School Building and Site GO, Q-SBLF, 5.00%, 11/1/2023 (b) | 30,000 | 30,071 |
Wayne State University | ||
Series 2013A, Rev., 5.00%, 11/15/2023 | 100,000 | 100,237 |
Series 2019A, Rev., 5.00%, 11/15/2024 | 210,000 | 213,457 |
Western Michigan University Series 2015A, Rev., 5.00%, 11/15/2024 | 40,000 | 40,701 |
Total Michigan | 85,815,686 | |
Minnesota — 1.5% | ||
City of Minneapolis, Improvement and Various Purpose GO, 4.00%, 12/1/2023 | 45,000 | 45,069 |
City of New Hope, Hennepin County Series 2018A, GO, 4.00%, 2/1/2024 | 50,000 | 50,121 |
City of Rochester Series 2015B, GO, 5.00%, 12/1/2023 | 20,000 | 20,067 |
City of St Cloud Series 2014B, Rev., 5.00%, 5/1/2024 | 210,000 | 211,905 |
City of St. Cloud, Infrastructure Management Fund Series 2013A, GO, 3.00%, 2/1/2025 | 45,000 | 44,864 |
City of St. Paul, Sales Tax Series 2019C, Rev., 3.00%, 11/1/2023 | 25,000 | 24,972 |
City of West St. Paul Series 2017A, GO, 4.00%, 2/1/2025 | 30,000 | 30,236 |
County of Anoka, Capital Improvement Series 2020A, GO, 5.00%, 2/1/2024 | 40,000 | 40,264 |
County of Clay Series 2017A, GO, 5.00%, 2/1/2025 | 50,000 | 51,184 |
County of Lyon Series 2015A, GO, 5.00%, 2/1/2024 | 25,000 | 25,166 |
County of Martin Series 2021A, GO, 3.00%, 12/15/2023 | 40,000 | 39,930 |
County of St. Louis, Capital Improvement | ||
Series 2015B, GO, 3.00%, 12/1/2023 | 75,000 | 74,911 |
Series 2016B, GO, 5.00%, 12/1/2023 | 35,000 | 35,137 |
Duluth Independent School District No. 709 | ||
COP, 4.00%, 2/1/2027 | 50,000 | 50,352 |
COP, 4.00%, 2/1/2028 | 2,750,000 | 2,769,824 |
Series 2019B, COP, 5.00%, 2/1/2028 | 395,000 | 421,085 |
188 | J.P. Morgan Exchange-Traded Funds | August 31, 2023 |
INVESTMENTS | PRINCIPAL AMOUNT($) | VALUE($) |
Municipal Bonds — continued | ||
Minnesota — continued | ||
Minneapolis-St. Paul Metropolitan Airports Commission Series 2014A, Rev., 5.00%, 1/1/2026 | 70,000 | 70,273 |
Minnesota Housing Finance Agency Series 2020D, Rev., 4.00%, 8/1/2024 | 125,000 | 125,434 |
Minnesota Municipal Gas Agency Series 2022B, Rev., LIQ : Royal Bank of Canada, (SOFR + 1.00%), 4.56%, 9/6/2023 (d) | 35,000,000 | 34,422,801 |
Minnesota State Colleges and Universities Foundation Series 2019A, Rev., 5.00%, 10/1/2023 | 25,000 | 25,029 |
Minnetonka Independent School District No. 276 Series E, COP, 4.00%, 10/1/2023 | 115,000 | 115,022 |
Northern Municipal Power Agency Series 2013A, Rev., 5.00%, 1/1/2024 | 50,000 | 50,049 |
Rochester Independent School District No. 535 Series 2014A, COP, 3.00%, 2/1/2024 | 25,000 | 24,928 |
Rosemount-Apple Valley-Eagan Independent School District No. 196 Series 2016A, GO, 5.00%, 2/1/2025 | 35,000 | 35,809 |
Sartell-St Stephen Independent School District No. 748 Series 2016A, GO, 5.00%, 2/1/2024 | 30,000 | 30,187 |
Southern Minnesota Municipal Power Agency Series 1994A, Rev., NATL - RE, Zero Coupon, 1/1/2024 | 70,000 | 69,161 |
St Paul Port Authority Series 2013-2, Rev., 5.00%, 12/1/2023 | 200,000 | 200,754 |
St. Cloud Independent School District No. 742 Series 2021A, COP, 3.00%, 2/1/2025 | 125,000 | 123,780 |
State of Minnesota Series 2014B, GO, 4.00%, 8/1/2025 | 75,000 | 75,533 |
Total Minnesota | 39,303,847 | |
Mississippi — 0.2% | ||
City of Ridgeland GO, 4.00%, 8/1/2024 | 25,000 | 25,142 |
Madison County School District GO, 5.00%, 3/1/2024 | 25,000 | 25,193 |
Mississippi Business Finance Corp., Waste Management, Inc. Project Rev., 0.70%, 9/1/2026 (c) | 1,250,000 | 1,122,758 |
Mississippi Development Bank, Department of Corrections Walnut Grove Correctional Facility Refunding Bonds Project Series A, Rev., 5.00%, 8/1/2026 | 35,000 | 36,394 |
Mississippi Development Bank, Harrison County Series 2013A, Rev., 5.00%, 1/1/2026 | 2,190,000 | 2,266,005 |
INVESTMENTS | PRINCIPAL AMOUNT($) | VALUE($) |
Mississippi — continued | ||
Mississippi Development Bank, Hinds County Project Rev., 5.00%, 11/1/2023 | 105,000 | 105,165 |
Mississippi Development Bank, Madison County, Mississippi Highway Refunding Project Series 2013C, Rev., 5.00%, 1/1/2024 | 20,000 | 20,092 |
Mississippi Development Bank, Rankin County School District Project | ||
Rev., 5.00%, 6/1/2024 | 30,000 | 30,311 |
Rev., 5.00%, 6/1/2025 | 35,000 | 35,819 |
Rankin County School District, Limited Tax GO, 5.00%, 8/1/2025 | 25,000 | 25,761 |
State of Mississippi | ||
Series 2013B, GO, 5.00%, 12/1/2023 (b) | 200,000 | 200,802 |
Series 2020B, GO, 5.00%, 9/1/2024 | 150,000 | 152,460 |
Series 2015F, GO, 5.00%, 11/1/2025 (b) | 70,000 | 72,639 |
State of Mississippi, Tax-Exempt | ||
Series 2012H, GO, 4.00%, 12/1/2023 | 25,000 | 25,011 |
Series 2017A, GO, 5.00%, 10/1/2024 | 25,000 | 25,432 |
University of Mississippi Educational Building Corp., Campus Improvement Project Series 2015C, Rev., 5.00%, 11/1/2023 | 35,000 | 35,090 |
University of Mississippi Educational Building Corp., Facilities Refinancing Project Rev., 5.00%, 10/1/2024 | 195,000 | 198,471 |
Total Mississippi | 4,402,545 | |
Missouri — 1.0% | ||
Cape Girardeau School District No. 63 GO, 4.00%, 3/1/2025 | 25,000 | 25,185 |
City of Chesterfield COP, 5.00%, 12/1/2023 | 75,000 | 75,286 |
City of Kansas City | ||
Series 2019A, Rev., 5.00%, 12/1/2023 | 35,000 | 35,143 |
Series 2017C, Rev., 5.00%, 9/1/2027 | 20,000 | 21,274 |
City of Kansas City, Downtown Arena Project Series E, Rev., 5.00%, 4/1/2028 | 30,000 | 30,667 |
City of Kansas City, Special Obligation Series E, Rev., Zero Coupon, 2/1/2024 | 275,000 | 270,467 |
City of Kansas City,Missouri Special Obligation Refunding and Improvement, Main Streetcar Extention Project Series 2022C, Rev., 5.00%, 9/1/2025 | 40,000 | 41,144 |
City of St Louis Airport Series 2005, Rev., NATL - RE, 5.50%, 7/1/2027 | 75,000 | 80,955 |
August 31, 2023 | J.P. Morgan Exchange-Traded Funds | 189 |
AS OF August 31, 2023 (Unaudited) (continued)
INVESTMENTS | PRINCIPAL AMOUNT($) | VALUE($) |
Municipal Bonds — continued | ||
Missouri — continued | ||
County of Clay Series 2018A, COP, 4.00%, 5/1/2024 (b) | 30,000 | 30,142 |
County of Dunklin Rev., 3.00%, 12/1/2026 | 400,000 | 391,985 |
County of Jackson, Special Obligation Rev., 4.00%, 12/1/2023 | 35,000 | 35,050 |
Fort Zumwalt School District Series 2022, GO, 5.00%, 3/1/2024 | 100,000 | 100,763 |
Health and Educational Facilities Authority of the State of Missouri, BJC Health System Series 2021B, Rev., 4.00%, 5/1/2026 (c) | 5,510,000 | 5,564,962 |
Health and Educational Facilities Authority of the State of Missouri, Children's Mercy Hospital Obligated Group | ||
Series 2016, Rev., 5.00%, 5/15/2024 | 680,000 | 686,953 |
Rev., 5.00%, 5/15/2025 | 60,000 | 61,266 |
Health and Educational Facilities Authority of the State of Missouri, Mercy Health Series 2018A, Rev., 5.00%, 6/1/2027 | 25,000 | 26,328 |
Health and Educational Facilities Authority of the State of Missouri, SSM Health Care Obligated Group Series 2014A, Rev., 5.00%, 6/1/2024 (b) | 25,000 | 25,268 |
Health and Educational Facilities Authority of the State of Missouri, St Luke's Health System Rev., 5.00%, 11/15/2028 | 110,000 | 113,612 |
Health and Educational Facilities Authority of the State of Missouri, St. Luke's Health System, Inc. Rev., 5.00%, 11/15/2023 | 125,000 | 125,321 |
Jasper County Reorganized School District No. R-IX Carthage, Missouri Direct Deposit Program Series 2013, GO, 4.00%, 3/1/2024 | 2,625,000 | 2,633,168 |
Joplin Schools, Missouri Direct Deposit Program GO, 4.00%, 3/1/2025 | 100,000 | 100,015 |
Missouri Development Finance Board, Office Building Project Series 2013A, Rev., 3.00%, 10/1/2023 | 50,000 | 49,982 |
Missouri Housing Development Commission, Single Family Mortgage, First Place Homeownership Loan Program Series 2021C, Rev., GNMA / FNMA / FHLMC, 0.35%, 11/1/2023 | 480,000 | 477,498 |
Missouri Joint Municipal Electric Utility Commission, IATAN 2 Project | ||
Series 2014A, Rev., 5.00%, 1/1/2025 | 2,500,000 | 2,508,744 |
Series 2014A, Rev., 5.00%, 1/1/2027 | 2,000,000 | 2,007,333 |
INVESTMENTS | PRINCIPAL AMOUNT($) | VALUE($) |
Missouri — continued | ||
Missouri Joint Municipal Electric Utility Commission, Prairie State Project | ||
Series 2015A, Rev., 5.00%, 12/1/2024 | 20,000 | 20,347 |
Series 2015A, Rev., 5.00%, 6/1/2028 | 100,000 | 102,093 |
Missouri State Board of Public Buildings | ||
Series 2014A, Rev., 4.00%, 10/1/2023 | 95,000 | 95,046 |
Series 2020B, Rev., 5.00%, 10/1/2023 | 375,000 | 375,449 |
Missouri State Environmental Improvement and Energy Resources Authority, Water Pollution Control and Drinking Water Series 2013A, Rev., 5.00%, 7/1/2024 | 60,000 | 60,072 |
St. Charles County Public Water Supply District No. 2 | ||
COP, 3.00%, 12/1/2023 | 45,000 | 44,912 |
Series 2016B, COP, 5.00%, 12/1/2023 | 50,000 | 50,055 |
St. Louis County Library District COP, 4.00%, 4/1/2027 | 2,010,000 | 2,010,521 |
Tender Option Bond Trust Receipts/ Certificates Series 2018-XG0176, Rev., VRDO, LIQ : Royal Bank of Canada, 4.19%, 9/12/2023 (c) (e) | 6,315,000 | 6,315,000 |
Total Missouri | 24,592,006 | |
Nebraska — 0.8% | ||
City of Lincoln, Electric System Rev., 2.70%, 9/1/2023 | 10,000 | 10,000 |
City of Lincoln, Stormwater Drainage and Flood Management System GO, 3.00%, 12/15/2023 | 40,000 | 39,939 |
City of Omaha, Sanitary Sewerage System Series 2020A, Rev., 4.00%, 4/1/2025 | 35,000 | 35,420 |
County of Douglas, Creighton University Projects Series 2021B, Rev., (SIFMA Municipal Swap Index Yield + 0.53%), 4.59%, 9/7/2023 (d) | 15,935,000 | 15,705,745 |
Douglas County Hospital Authority No. 2, Children's Obligated Group Series 2020B, Rev., 5.00%, 11/15/2025 (c) | 2,100,000 | 2,140,739 |
Nebraska Public Power District | ||
Series B, Rev., 5.00%, 1/1/2024 | 60,000 | 60,297 |
Series 2012B, Rev., 5.00%, 1/1/2025 | 10,000 | 10,011 |
Series A-1, Rev., 5.00%, 1/1/2025 | 35,000 | 35,727 |
Series 2016A, Rev., 5.00%, 1/1/2026 | 75,000 | 77,739 |
Papillion-La Vista School District No. 27 Series 2020B, GO, 4.00%, 12/1/2023 | 35,000 | 35,056 |
Public Power Generation Agency, Whelan Energy Center Unit 2 Series 2015A, Rev., 5.00%, 1/1/2026 | 845,000 | 859,806 |
190 | J.P. Morgan Exchange-Traded Funds | August 31, 2023 |
INVESTMENTS | PRINCIPAL AMOUNT($) | VALUE($) |
Municipal Bonds — continued | ||
Nebraska — continued | ||
Southern Public Power District Series 2015, Rev., 5.00%, 12/15/2024 (b) | 1,615,000 | 1,649,352 |
State of Nebraska Series 2020A, COP, 3.00%, 9/1/2023 | 45,000 | 45,000 |
University of Nebraska, OMAHA Student Housing Project Rev., 3.25%, 5/15/2024 (b) | 60,000 | 59,941 |
Total Nebraska | 20,764,772 | |
Nevada — 0.1% | ||
Clark County School District | ||
Series 2015D, GO, 5.00%, 6/15/2024 | 30,000 | 30,311 |
Series 2016B, GO, 5.00%, 6/15/2024 | 165,000 | 166,712 |
Series 2016E, GO, 5.00%, 6/15/2024 | 50,000 | 50,519 |
Series 2018A, GO, 5.00%, 6/15/2024 | 60,000 | 60,623 |
Series 2015C, GO, 5.00%, 6/15/2025 | 35,000 | 35,911 |
Series 2021C, GO, 5.00%, 6/15/2026 | 25,000 | 26,109 |
Clark County School District, Limited Tax | ||
Series 2015C, GO, 5.00%, 6/15/2028 | 260,000 | 268,769 |
Series 2017C, GO, 5.00%, 6/15/2028 | 120,000 | 128,523 |
Clark County School District, Limited Tax, Various Purpose Series 2016F, GO, 3.00%, 6/15/2026 | 100,000 | 98,349 |
County of Clark Passenger Facility Charge, Las Vegas Mccarran International Series 2019E, Rev., 5.00%, 7/1/2026 | 45,000 | 47,221 |
County of Clark, Department of Aviation, Nevada Airport System, Subordinate Lien | ||
Series 2019D, Rev., 5.00%, 7/1/2024 | 400,000 | 404,845 |
Series 2019D, Rev., 5.00%, 7/1/2025 | 40,000 | 41,105 |
County of Clark, Limited Tax | ||
Series 2016B, GO, 5.00%, 11/1/2023 | 25,000 | 25,061 |
Series 2016B, GO, 5.00%, 11/1/2024 | 45,000 | 45,839 |
County of Clark, Park Improvement, Limited Tax GO, 5.00%, 12/1/2024 | 25,000 | 25,501 |
County of Clark, Transportation Improvement, Limited Tax | ||
Series 2018B, GO, 5.00%, 12/1/2023 | 20,000 | 20,075 |
Series 2018B, GO, 5.00%, 12/1/2025 | 35,000 | 36,316 |
State of Nevada Highway Improvement, Motor Vehicle Fuel Tax Rev., 5.00%, 12/1/2023 | 40,000 | 40,168 |
State of Nevada, Capital Improvement and Cultural Affairs | ||
Series 2015B, GO, 5.00%, 11/1/2024 | 25,000 | 25,494 |
INVESTMENTS | PRINCIPAL AMOUNT($) | VALUE($) |
Nevada — continued | ||
Series 2015B, GO, 5.00%, 11/1/2025 | 20,000 | 20,549 |
State of Nevada, Limited Tax Series 2012-A, GO, 4.00%, 11/1/2024 | 55,000 | 55,026 |
Total Nevada | 1,653,026 | |
New Hampshire — 0.0% ^ | ||
Windham School District Series 2014A, GO, 5.00%, 7/15/2024 | 60,000 | 60,767 |
New Jersey — 10.3% | ||
Bergen County Improvement Authority (The) Series 2023, Rev., GTD, 4.50%, 5/31/2024 | 3,983,229 | 4,019,123 |
Borough of Bellmawr County of Camden, New Jersey Bond, General Improvement Water Utility Note GO, BAN, 4.50%, 8/6/2024 | 6,693,506 | 6,746,143 |
Borough of Carteret Series 2023, GO, BAN, 4.75%, 5/31/2024 | 18,334,000 | 18,499,611 |
Borough of Chatham GO, BAN, 4.50%, 5/17/2024 | 4,571,630 | 4,602,605 |
Borough of Emerson GO, BAN, 4.50%, 7/26/2024 | 3,701,000 | 3,713,560 |
Borough of Englewood Cliffs GO, BAN, 4.50%, 8/8/2024 | 1,885,830 | 1,896,957 |
Borough of Essex Fells GO, BAN, 4.50%, 9/8/2023 | 3,822,500 | 3,822,333 |
Borough of Glen Ridge GO, BAN, 4.50%, 7/11/2024 | 2,380,625 | 2,392,460 |
Borough of High Bridge GO, BAN, 5.00%, 6/13/2024 | 1,272,625 | 1,282,982 |
Borough of Kenilworth GO, BAN, 4.50%, 3/1/2024 | 7,632,000 | 7,653,760 |
Borough of Lebanon GO, BAN, 3.75%, 9/11/2023 | 1,063,100 | 1,063,027 |
Borough of Montvale GO, BAN, 4.50%, 4/11/2024 | 5,080,000 | 5,098,686 |
Borough of Mountainside GO, BAN, 5.00%, 7/19/2024 | 3,568,000 | 3,597,699 |
Borough of North Caldwell GO, BAN, 4.50%, 7/12/2024 | 2,885,000 | 2,907,460 |
Borough of Ogdensburg GO, BAN, 4.50%, 7/26/2024 | 1,475,000 | 1,479,353 |
Borough of Palisades Park GO, BAN, 4.50%, 3/15/2024 | 5,363,000 | 5,372,024 |
Borough of Pitman GO, BAN, 4.50%, 9/8/2023 | 4,198,135 | 4,197,977 |
Borough of Riverdale GO, BAN, 3.75%, 9/7/2023 | 8,496,000 | 8,495,560 |
August 31, 2023 | J.P. Morgan Exchange-Traded Funds | 191 |
AS OF August 31, 2023 (Unaudited) (continued)
INVESTMENTS | PRINCIPAL AMOUNT($) | VALUE($) |
Municipal Bonds — continued | ||
New Jersey — continued | ||
Borough of Sussex GO, BAN, 4.50%, 7/19/2024 | 3,034,000 | 3,047,142 |
Borough of Union Beach GO, BAN, 4.50%, 4/23/2024 | 3,901,509 | 3,909,848 |
Borough of Woodcliff Lake GO, BAN, 4.50%, 9/21/2023 | 4,221,000 | 4,220,728 |
Brick Township Board of Education GO, 4.00%, 1/1/2025 | 35,000 | 35,256 |
Burlington County Bridge Commission County Guaranteed Bridge System Bond Series 2013, Rev., GTD, 5.00%, 10/1/2023 | 50,000 | 50,062 |
Burlington County Bridge Commission, Governmental Loan Program Series 2013A, Rev., GTD, 5.00%, 12/1/2023 | 80,000 | 80,099 |
Camden County Improvement Authority (The) | ||
Series 2017B, Rev., GTD, 4.00%, 1/15/2024 | 25,000 | 25,057 |
Series 2015A, Rev., GTD, 5.00%, 9/1/2024 | 25,000 | 25,403 |
Camden County Improvement Authority (The), City Hall Project Rev., GTD, 5.00%, 12/1/2025 | 30,000 | 31,128 |
Camden County Improvement Authority (The), Rowan University School Osteopathic Series 2013A, Rev., 5.00%, 12/1/2023 | 240,000 | 240,755 |
City of Clifton GO, 3.00%, 10/15/2023 | 20,000 | 19,988 |
City of Jersey City Series 2014, GO, 5.00%, 12/1/2023 | 50,000 | 50,188 |
City of Linwood GO, BAN, 4.50%, 7/26/2024 | 1,862,600 | 1,869,567 |
City of Long Branch Series 2020A, GO, 5.00%, 9/15/2025 | 30,000 | 30,937 |
City of Newark Series 2020A, GO, AGM, 5.00%, 10/1/2023 | 1,375,000 | 1,376,344 |
City of Ocean City, General Improvement | ||
GO, 4.00%, 9/15/2023 | 120,000 | 120,022 |
GO, 4.00%, 9/15/2025 | 40,000 | 40,479 |
City of Rahway GO, 4.00%, 10/1/2023 | 25,000 | 25,010 |
City of Sea Isle City GO, 3.00%, 9/1/2023 | 45,000 | 45,000 |
City of Ventnor City GO, BAN, 4.50%, 7/10/2024 | 7,225,000 | 7,265,042 |
City of Vineland GO, BAN, 5.00%, 11/8/2023 | 24,407,000 | 24,463,622 |
County of Atlantic GO, 0.50%, 6/1/2024 | 1,805,000 | 1,747,856 |
INVESTMENTS | PRINCIPAL AMOUNT($) | VALUE($) |
New Jersey — continued | ||
County of Essex Series A, GO, 4.00%, 9/1/2023 | 20,000 | 20,000 |
County of Hudson | ||
GO, 5.00%, 12/1/2023 | 25,000 | 25,100 |
Series B, GO, 4.00%, 7/1/2025 | 40,000 | 40,376 |
Glen Rock School District GO, 4.00%, 9/1/2023 | 25,000 | 25,000 |
Gloucester County Improvement Authority (The) | ||
Series 2013A, Rev., GTD, 5.00%, 9/1/2023 | 40,000 | 40,000 |
Series 2013A, Rev., GTD, 5.00%, 9/1/2024 | 15,000 | 15,016 |
Hainesport Township School District GO, 5.00%, 1/15/2024 | 35,000 | 35,195 |
Hopewell Valley Regional School District GO, 3.25%, 1/15/2025 | 25,000 | 24,865 |
Hudson County Improvement Authority, Courthouse Project Rev., 4.00%, 10/1/2025 | 40,000 | 40,534 |
Jersey City Municipal Utilities Authority, Sewer Project Notes Series 2023A, Rev., 4.00%, 5/3/2024 | 32,500,000 | 32,575,270 |
Jersey City Municipal Utilities Authority, Water Project Notes Series 2023B, Rev., 4.00%, 5/3/2024 | 23,500,000 | 23,554,426 |
Middlesex County Improvement Authority, Open Space Trust Fund Series 2011, Rev., GTD, 3.00%, 9/15/2023 | 30,000 | 29,997 |
Middletown Township Board of Education GO, 2.25%, 8/1/2024 | 720,000 | 709,079 |
New Brunswick Parking Authority Series 2016, Rev., GTD, 5.00%, 9/1/2023 | 240,000 | 240,000 |
New Jersey Economic Development Authority | ||
Series 2015A, Rev., 5.00%, 6/15/2024 | 350,000 | 353,551 |
Series 2023RRR, Rev., 5.00%, 3/1/2026 | 40,000 | 41,396 |
Series 2024SSS, Rev., 5.00%, 6/15/2026 (f) | 2,730,000 | 2,787,948 |
Series 2024SSS, Rev., 5.00%, 6/15/2027 (f) | 1,600,000 | 1,653,057 |
New Jersey Economic Development Authority, School Facilities Construction | ||
Series 2005N-1, Rev., NATL - RE, 5.50%, 9/1/2023 | 75,000 | 75,000 |
Series 2012-II, Rev., 3.00%, 3/1/2024 | 350,000 | 348,886 |
192 | J.P. Morgan Exchange-Traded Funds | August 31, 2023 |
INVESTMENTS | PRINCIPAL AMOUNT($) | VALUE($) |
Municipal Bonds — continued | ||
New Jersey — continued | ||
Series 2018FFF, Rev., 5.00%, 6/15/2024 | 50,000 | 50,507 |
Series XX, Rev., 5.00%, 6/15/2024 | 800,000 | 808,117 |
Series 2019GGG, Rev., 5.25%, 9/1/2024 (e) | 7,000,000 | 7,107,767 |
Series 2014PP, Rev., AGM-CR, 5.00%, 6/15/2025 | 3,500,000 | 3,539,908 |
Series 2005N-1, Rev., AGM, 5.50%, 9/1/2025 | 95,000 | 98,709 |
New Jersey Economic Development Authority, Transit Corporation Projects Series B, Rev., 5.00%, 11/1/2023 | 350,000 | 350,688 |
New Jersey Educational Facilities Authority, College of New Jersey Series 2015G, Rev., 5.00%, 7/1/2025 (b) | 35,000 | 36,035 |
New Jersey Educational Facilities Authority, Higher Educational Capital Improvement Series 2014A, Rev., 5.00%, 9/1/2024 | 75,000 | 75,974 |
New Jersey Health Care Facilities Financing Authority, Barnabas Health Obligated Group Series 2019B-2, Rev., 5.00%, 7/1/2025 (c) | 235,000 | 240,485 |
New Jersey Health Care Facilities Financing Authority, Greystone Park Psychiatric Series 2013B, Rev., 5.00%, 9/15/2023 | 65,000 | 65,022 |
New Jersey Health Care Facilities Financing Authority, Hospital Asset Transformation Program Series 2017, Rev., 5.00%, 10/1/2024 | 1,000,000 | 1,014,102 |
New Jersey Health Care Facilities Financing Authority, RWJ Barnabas Health Obligated Group | ||
Series 2019B-1, Rev., 5.00%, 7/1/2024 (c) | 1,260,000 | 1,274,136 |
Series 2016A, Rev., 5.00%, 7/1/2026 | 55,000 | 57,367 |
New Jersey Health Care Facilities Financing Authority, Valley Health System Obligated Rev., 5.00%, 7/1/2026 | 50,000 | 52,056 |
New Jersey Health Care Facilities Financing Authority, Virtua Health Obligated Group Series 2013, Rev., 5.00%, 7/1/2027 | 45,000 | 45,206 |
New Jersey Health Care Facilities Financing Authority, Virtual Health, Inc. | ||
Rev., 5.00%, 1/1/2024 (b) | 30,000 | 30,150 |
Rev., 5.00%, 7/1/2024 | 200,000 | 200,828 |
Rev., 5.00%, 7/1/2025 | 135,000 | 135,675 |
Rev., 5.00%, 7/1/2026 | 185,000 | 185,778 |
INVESTMENTS | PRINCIPAL AMOUNT($) | VALUE($) |
New Jersey — continued | ||
New Jersey Higher Education Student Assistance Authority, Senior Student Loan Series 2019A, Rev., 5.00%, 12/1/2024 | 40,000 | 40,655 |
New Jersey Housing and Mortgage Finance Agency, NBA-New Brunswick LLC Series 2022C-2, Rev., 3.13%, 8/1/2024 (c) | 5,100,000 | 5,022,365 |
New Jersey Infrastructure Bank, Environmental Infrastructure | ||
Series 2020A-R1, Rev., 3.00%, 9/1/2023 | 40,000 | 40,000 |
Series 2015A-R1, Rev., GTD, 5.00%, 9/1/2023 | 510,000 | 510,000 |
Series 2015A-R1, Rev., GTD, 5.00%, 9/1/2024 | 35,000 | 35,591 |
New Jersey Sports and Exposition Authority Series 2018A, Rev., 5.00%, 9/1/2024 | 210,000 | 212,585 |
New Jersey Transportation Trust Fund Authority, Transportation Program | ||
Series 2014AA, Rev., 5.00%, 6/15/2025 | 125,000 | 126,329 |
Series 2023AA, Rev., 5.00%, 6/15/2025 | 2,000,000 | 2,047,895 |
New Jersey Transportation Trust Fund Authority, Transportation System | ||
Series 2008A, Rev., Zero Coupon, 12/15/2023 | 140,000 | 138,570 |
Series 2010D, Rev., 5.00%, 12/15/2023 | 1,545,000 | 1,550,586 |
Series 2005B, Rev., AMBAC, 5.25%, 12/15/2023 | 105,000 | 105,451 |
Series 2006A, Rev., 5.25%, 12/15/2023 | 150,000 | 150,645 |
Series 2010D, Rev., 5.25%, 12/15/2023 | 1,020,000 | 1,024,383 |
Series 2006A, Rev., 5.50%, 12/15/2023 | 125,000 | 125,622 |
Series 2013A, Rev., 5.00%, 6/15/2024 | 150,000 | 151,522 |
Series 2006C, Rev., AMBAC, Zero Coupon, 12/15/2024 | 2,515,000 | 2,397,503 |
New Jersey Turnpike Authority Series 2014A, Rev., 5.00%, 1/1/2027 | 1,100,000 | 1,112,346 |
Passaic County Utilities Authority, Solid Waste Disposal Rev., GTD, 4.50%, 3/1/2024 | 75,000 | 75,410 |
Penns Grove-Carneys Point Regional School District GO, GAN, 4.50%, 7/3/2024 | 3,713,000 | 3,729,428 |
Pequannock Township Board of Education GO, 4.00%, 1/15/2025 | 50,000 | 50,411 |
August 31, 2023 | J.P. Morgan Exchange-Traded Funds | 193 |
AS OF August 31, 2023 (Unaudited) (continued)
INVESTMENTS | PRINCIPAL AMOUNT($) | VALUE($) |
Municipal Bonds — continued | ||
New Jersey — continued | ||
Rutgers the State University of New Jersey, Tax-Exempt Series 2016M, Rev., 5.00%, 5/1/2024 | 25,000 | 25,246 |
South Brunswick Township Board of Education GO, 5.00%, 8/1/2024 | 45,000 | 45,286 |
State of New Jersey, Various Purpose | ||
GO, 5.00%, 6/1/2024 | 20,000 | 20,245 |
GO, 4.00%, 6/1/2026 | 40,000 | 40,020 |
GO, 5.00%, 6/1/2026 | 65,000 | 66,850 |
Tobacco Settlement Financing Corp. | ||
Series 2018A, Rev., 5.00%, 6/1/2026 | 265,000 | 274,860 |
Series 2018A, Rev., 5.00%, 6/1/2028 | 490,000 | 523,795 |
Township of Bloomfield, General Improvement and Water Utility GO, 5.00%, 2/1/2024 | 40,000 | 40,260 |
Township of Bridgewater GO, 4.00%, 9/1/2023 | 25,000 | 25,000 |
Township of Colts Neck GO, 4.00%, 11/15/2025 | 40,000 | 40,630 |
Township of Eastampton GO, BAN, 4.50%, 7/24/2024 | 3,232,000 | 3,247,957 |
Township of Hamilton Series 2013, GO, 4.00%, 8/1/2024 | 50,000 | 50,018 |
Township of Harrison GO, 4.00%, 8/1/2025 | 50,000 | 50,515 |
Township of Hillsborough Series 2023A, GO, BAN, 5.00%, 2/15/2024 | 4,803,000 | 4,825,850 |
Township of Lawrence GO, BAN, 5.00%, 6/7/2024 | 2,710,000 | 2,729,265 |
Township of Little Falls, General Improvement GO, 4.00%, 8/15/2025 | 30,000 | 30,289 |
Township of Lopatcong GO, 4.00%, 9/1/2023 | 30,000 | 30,000 |
Township of Middle, General Improvement Sewer Utility GO, BAN, 4.50%, 9/5/2024 (f) | 6,155,000 | 6,196,344 |
Township of Millburn GO, BAN, 5.00%, 1/26/2024 | 4,030,000 | 4,053,457 |
Township of Pennsauken GO, BAN, 4.50%, 7/12/2024 | 2,089,900 | 2,100,326 |
Township of Readington, General Improvement GO, 5.00%, 1/15/2025 | 25,000 | 25,539 |
Township of Rochelle Park GO, BAN, 4.50%, 8/9/2024 | 3,024,000 | 3,038,864 |
Township of South Brunswick Series 2020, GO, 4.00%, 10/1/2024 | 200,000 | 200,528 |
Township of Tewksbury Series 2023A, GO, 4.50%, 5/14/2024 | 2,595,000 | 2,610,352 |
INVESTMENTS | PRINCIPAL AMOUNT($) | VALUE($) |
New Jersey — continued | ||
Township of Toms River, General Improvement, Golf Utility Improvement GO, 3.00%, 12/15/2023 | 45,000 | 44,916 |
Township of Verona GO, BAN, 4.50%, 10/26/2023 | 2,839,800 | 2,842,689 |
Township of Washington GO, 4.00%, 3/1/2025 | 30,000 | 30,218 |
Township of West Deptford GO, 3.00%, 9/1/2026 | 100,000 | 99,455 |
Total New Jersey | 265,520,130 | |
New Mexico — 0.0% ^ | ||
Albuquerque Municipal School District No. 12, School Building Series 2018, GO, 5.00%, 8/1/2024 | 100,000 | 101,408 |
City of Santa Fe, Wastewater Utility System Series 2019, Rev., 5.00%, 6/1/2024 | 125,000 | 126,570 |
New Mexico Finance Authority, Senior Lien Public Project Revolving Fund Series 2016C, Rev., 5.00%, 6/1/2024 | 25,000 | 25,301 |
New Mexico Finance Authority, Subordinate Lien Public Project Revolving Fund, Tax-Exempt | ||
Series 2017B, Rev., 3.50%, 6/15/2024 | 50,000 | 50,091 |
Series 2018C-1, Rev., 4.00%, 6/15/2024 | 30,000 | 30,169 |
New Mexico Hospital Equipment Loan Council, Presbyterian Health Care Services Series 2019B, Rev., 5.00%, 8/1/2025 (c) | 100,000 | 102,265 |
State of New Mexico Severance Tax Permanent Fund Series B, Rev., 4.00%, 7/1/2024 | 75,000 | 75,379 |
State of New Mexico, Capital Projects GO, 5.00%, 3/1/2025 | 55,000 | 56,392 |
University of New Mexico (The), Subordinate Lien System Series 2014C, Rev., 5.00%, 6/1/2024 | 25,000 | 25,290 |
Total New Mexico | 592,865 | |
New York — 17.9% | ||
Battery Park City Authority Series 2013A, Rev., 5.00%, 11/1/2023 | 75,000 | 75,183 |
Bedford Central School District, Boces Project GO, 3.00%, 11/15/2023 | 25,000 | 24,978 |
Broome County Local Development Corp., Good Shepherd Village at Endwell, Inc. | ||
Rev., 3.00%, 7/1/2024 | 610,000 | 599,881 |
Series 2021, Rev., 3.50%, 7/1/2025 | 455,000 | 442,230 |
194 | J.P. Morgan Exchange-Traded Funds | August 31, 2023 |
INVESTMENTS | PRINCIPAL AMOUNT($) | VALUE($) |
Municipal Bonds — continued | ||
New York — continued | ||
Canton Central School District GO, BAN, 4.50%, 7/5/2024 | 14,850,000 | 14,938,252 |
Chenango Forks Central School District GO, BAN, 4.50%, 6/28/2024 | 14,065,000 | 14,131,608 |
City of New York | ||
Series G, GO, 5.00%, 8/1/2024 | 35,000 | 35,247 |
Series 2014J, GO, 5.00%, 8/1/2025 | 60,000 | 60,973 |
Series 2014I-1, GO, 5.00%, 3/1/2026 | 50,000 | 50,357 |
City of New York, Fiscal Year 2014 Series 2014I-1, GO, 5.00%, 3/1/2024 | 75,000 | 75,638 |
City of New York, Fiscal Year 2015 Series 2015A, GO, 5.00%, 8/1/2026 | 30,000 | 30,396 |
City of New York, Fiscal Year 2016 Series E, GO, 5.00%, 8/1/2024 | 90,000 | 91,412 |
City of New York, Fiscal Year 2017 Series C, GO, 5.00%, 8/1/2025 | 40,000 | 41,346 |
City of New York, Fiscal Year 2018 Series 2018F-1, GO, 4.00%, 4/1/2025 | 30,000 | 30,374 |
City of New York, Tax-Exempt Series 2015C, GO, 5.00%, 8/1/2025 | 30,000 | 30,750 |
City of Rochester Series 2023I, GO, BAN, 4.50%, 2/28/2024 | 30,350,000 | 30,502,812 |
City of Troy GO, BAN, 4.50%, 7/26/2024 | 5,971,812 | 6,002,549 |
Clarence Central School District GO, BAN, 4.50%, 6/20/2024 | 14,200,000 | 14,285,311 |
County of Livingston, Public Improvement GO, 4.00%, 2/1/2024 | 35,000 | 35,097 |
County of Nassau, General Improvement | ||
Series 2017C, GO, 5.00%, 10/1/2023 | 325,000 | 325,389 |
Series 2016A, GO, 5.00%, 1/1/2025 | 50,000 | 51,123 |
County of Saratoga GO, BAN, 4.00%, 9/22/2023 | 10,000,000 | 10,000,892 |
County of Suffolk Series 2017D, GO, 5.00%, 10/15/2023 | 50,000 | 50,088 |
County of Washington Series 2023, GO, BAN, 4.50%, 3/22/2024 | 2,496,000 | 2,503,369 |
Deposit Central School District GO, BAN, 4.75%, 6/28/2024 (f) | 2,497,050 | 2,511,258 |
East Islip Union Free School District GO, BAN, 4.50%, 6/26/2024 | 21,379,277 | 21,510,678 |
Erie County Industrial Development Agency (The), City School District of the City of Buffalo Project | ||
Series 2013A, Rev., 5.00%, 5/1/2026 | 195,000 | 195,198 |
Series 2013A, Rev., 5.00%, 5/1/2027 | 75,000 | 75,076 |
Evans-Brant Central School District GO, BAN, 4.50%, 6/20/2024 | 23,608,239 | 23,737,008 |
INVESTMENTS | PRINCIPAL AMOUNT($) | VALUE($) |
New York — continued | ||
Fonda-Fultonville Central School District GO, BAN, 4.50%, 7/12/2024 | 3,750,000 | 3,774,406 |
Frewsburg Central School District GO, BAN, 4.50%, 7/9/2024 | 3,545,000 | 3,562,216 |
Geneva Development Corp., Hobart And William Smith College Project Series 2014, Rev., 5.00%, 9/1/2023 (b) | 100,000 | 100,000 |
Greenwich Central School District GO, BAN, 4.50%, 6/25/2024 | 2,000,000 | 2,009,385 |
Guilderland Central School District GO, BAN, 4.50%, 7/26/2024 | 14,683,569 | 14,777,263 |
Hempstead Union Free School District GO, RAN, 5.00%, 6/28/2024 | 10,400,000 | 10,494,501 |
Hudson Yards Infrastructure Corp., Second Indenture Series 2017A, Rev., 5.00%, 2/15/2025 | 20,000 | 20,525 |
Iroquois Central School District GO, 5.00%, 6/15/2025 | 25,000 | 25,638 |
Lafayette Central School District | ||
GO, RAN, 5.00%, 6/14/2024 | 2,330,000 | 2,349,399 |
GO, BAN, 4.50%, 6/28/2024 | 4,375,000 | 4,393,724 |
Lakeland Central School District GO, BAN, 4.50%, 8/16/2024 | 3,416,000 | 3,438,615 |
Le Roy Central School District GO, BAN, 4.75%, 6/28/2024 | 6,290,000 | 6,336,896 |
Letchworth Central School District of Gainesville GO, BAN, 4.75%, 6/21/2024 | 8,820,000 | 8,883,285 |
Long Island Power Authority, Electric System | ||
Series 2020B, Rev., 0.85%, 9/1/2025 (c) | 125,000 | 117,182 |
Rev., 1.00%, 9/1/2025 | 315,000 | 293,457 |
Lyncourt Union Free School District GO, BAN, 4.50%, 6/27/2024 | 2,825,000 | 2,837,735 |
Malone Central School District GO, BAN, 4.50%, 6/27/2024 | 10,335,250 | 10,382,575 |
Massena Central School District GO, BAN, 4.50%, 6/28/2024 | 14,070,000 | 14,152,595 |
Metropolitan Transportation Authority | ||
Series 2005D-2, Rev., VRDO, LOC : Bank of Montreal, 4.00%, 9/1/2023 (c) | 16,950,000 | 16,950,000 |
Series 2008B-3, Rev., 5.00%, 11/15/2023 | 70,000 | 70,182 |
Series 2013E, Rev., 5.00%, 11/15/2023 (b) | 25,000 | 25,081 |
Series 2014C, Rev., 5.00%, 11/15/2023 | 395,000 | 396,029 |
August 31, 2023 | J.P. Morgan Exchange-Traded Funds | 195 |
AS OF August 31, 2023 (Unaudited) (continued)
INVESTMENTS | PRINCIPAL AMOUNT($) | VALUE($) |
Municipal Bonds — continued | ||
New York — continued | ||
Series 2017B, Rev., 5.00%, 11/15/2023 | 225,000 | 225,584 |
Series A-1, Rev., 5.00%, 11/15/2023 | 285,000 | 285,742 |
Series A-2, Rev., 5.00%, 11/15/2023 | 445,000 | 446,160 |
Series 2013D, Rev., 5.25%, 11/15/2023 (b) | 25,000 | 25,093 |
Series 2016D, Rev., 4.00%, 11/15/2024 | 125,000 | 125,428 |
Series 2016B, Rev., 5.00%, 11/15/2024 | 75,000 | 76,124 |
Series 2017B, Rev., 5.00%, 11/15/2024 | 250,000 | 253,747 |
Series D-1, Rev., 5.00%, 11/15/2024 | 30,000 | 30,450 |
Metropolitan Transportation Authority, Dedicated Tax Fund | ||
Series 2016A, Rev., 5.00%, 11/15/2023 | 100,000 | 100,326 |
Series 2017A, Rev., 5.00%, 11/15/2023 | 10,000 | 10,033 |
Series 2013B-1, Rev., 5.00%, 11/15/2024 | 125,000 | 125,328 |
Monroe County Industrial Development Corp., Rochester Schools Modernization Project Series 2015, Rev., 5.00%, 5/1/2024 | 50,000 | 50,525 |
Monroe County Industrial Development Corp., The Rochester General Hospital Project Series 2013B, Rev., 4.00%, 12/1/2023 | 500,000 | 499,992 |
Mount Vernon City School District GO, 5.00%, 9/15/2023 | 25,000 | 25,011 |
New York City Health and Hospitals Corp., Health System Series 2008C, Rev., VRDO, LOC : TD Bank NA, 4.10%, 9/12/2023 (c) | 25,000,000 | 25,000,000 |
New York City Industrial Development Agency, Queens Baseball Stadium Project Series 2021A, Rev., AGM, 5.00%, 1/1/2028 | 1,250,000 | 1,327,143 |
New York City Municipal Water Finance Authority, Second General Resolution, Fiscal year 2023 Series 2023B-1, Rev., VRDO, LIQ : Mizuho Bank Ltd., 3.70%, 9/1/2023 (c) | 20,000,000 | 20,000,000 |
New York City Municipal Water Finance Authority, Water and Sewer System, Second General Resolution, Fiscal year 2021 Series 2021EE-2, Rev., VRDO, LIQ : State Street Bank & Trust Co., 4.25%, 9/1/2023 (c) | 25,000,000 | 25,000,000 |
INVESTMENTS | PRINCIPAL AMOUNT($) | VALUE($) |
New York — continued | ||
New York City Transitional Finance Authority Future Tax Secured | ||
Series 2021A, Rev., 5.00%, 11/1/2023 | 120,000 | 120,268 |
Series B-1, Rev., 5.00%, 8/1/2024 | 25,000 | 25,388 |
New York City Transitional Finance Authority, Future Tax Secured Series 2014D-1, Rev., 5.00%, 2/1/2026 | 20,000 | 20,108 |
New York City Transitional Finance Authority, Future Tax Secured, Fiscal Year 2014 | ||
Series 2014B-1, Rev., 5.00%, 11/1/2024 | 25,000 | 25,284 |
Series 2014C, Rev., 5.00%, 11/1/2026 | 20,000 | 20,175 |
New York City Transitional Finance Authority, Future Tax Secured, Fiscal Year 2017 Series 2017F-1, Rev., 5.00%, 5/1/2024 | 25,000 | 25,280 |
New York City Transitional Finance Authority, Future Tax Secured, Fiscal Year 2018 | ||
Series 2018B-1, Rev., 5.00%, 8/1/2024 (b) | 30,000 | 30,449 |
Series 2018B-1, Rev., 5.00%, 8/1/2024 | 10,000 | 10,155 |
New York City Transitional Finance Authority, Future Tax Secured, Fiscal Year 2021 | ||
Series 2021C, Subseries C-1, Rev., 5.00%, 5/1/2024 | 25,000 | 25,280 |
Series 2021-1, Rev., 5.00%, 11/1/2025 | 40,000 | 41,508 |
New York City Transitional Finance Authority, Future Tax Secured, Fiscal Year 2022 Series 2022B-1, Rev., 5.00%, 8/1/2024 | 530,000 | 538,222 |
New York City Transitional Finance Authority, Future Tax Secured, Tax-Exempt, Fiscal Year 2016 Series 2016, Subseries E-1, Rev., 5.00%, 2/1/2025 | 125,000 | 128,029 |
New York City Water and Sewer System, Second General Resolution, Fiscal Year 2019 Series 2019DD-2, Rev., 5.00%, 6/15/2025 | 55,000 | 55,273 |
New York State Dormitory Authority, Hospitals Center, Langone Hospitals Obligated Group Series 2016A, Rev., 5.00%, 7/1/2024 | 40,000 | 40,429 |
New York State Dormitory Authority, Icahn School of Medicine at Mount Sinai Series 2015A, Rev., 5.00%, 7/1/2025 | 35,000 | 35,892 |
196 | J.P. Morgan Exchange-Traded Funds | August 31, 2023 |
INVESTMENTS | PRINCIPAL AMOUNT($) | VALUE($) |
Municipal Bonds — continued | ||
New York — continued | ||
New York State Dormitory Authority, Northwell Health Obligated Group Series 2019B2, Rev., 5.00%, 5/1/2024 (c) | 240,000 | 240,453 |
New York State Dormitory Authority, Pratt institute Series 2015A, Rev., 5.00%, 7/1/2024 (b) | 105,000 | 106,255 |
New York State Dormitory Authority, School District Financing Program Series A, Rev., 5.00%, 10/1/2023 | 150,000 | 150,169 |
New York State Dormitory Authority, School District Financing Progrram Series 2017G, Rev., 5.00%, 10/1/2023 | 100,000 | 100,121 |
New York State Dormitory Authority, School Districts Financing Program | ||
Series 2017G, Rev., 4.00%, 10/1/2023 | 20,000 | 20,010 |
Series 2014A, Rev., AGM, 5.00%, 10/1/2023 | 25,000 | 25,030 |
Series 2015D, Rev., 5.00%, 10/1/2023 | 120,000 | 120,144 |
Series 2017F, Rev., 5.00%, 10/1/2023 | 20,000 | 20,023 |
Series D, Rev., AGM, 5.00%, 10/1/2023 | 300,000 | 300,360 |
Series G, Rev., 5.00%, 10/1/2023 | 40,000 | 40,048 |
Series H, Rev., 5.00%, 10/1/2023 | 10,000 | 10,012 |
Series 2017G, Rev., 5.00%, 10/1/2024 | 65,000 | 66,192 |
Series 2018A, Rev., 5.00%, 10/1/2024 | 50,000 | 50,917 |
Series C, Rev., 5.00%, 10/1/2024 | 15,000 | 15,016 |
Series H, Rev., 5.00%, 10/1/2025 | 10,000 | 10,009 |
New York State Dormitory Authority, State Personal Income Tax Series 2015B, Rev., 5.00%, 2/15/2024 (b) | 20,000 | 20,151 |
New York State Dormitory Authority, State Personal Income Tax, General Purpose | ||
Series 2014A, Rev., 4.00%, 2/15/2024 (b) | 35,000 | 35,112 |
Series 2014A, Rev., 5.00%, 2/15/2024 (b) | 60,000 | 60,454 |
Series 2019D, Rev., 5.00%, 2/15/2024 | 40,000 | 40,289 |
New York State Dormitory Authority, State Sales Tax | ||
Series 2016A, Rev., 5.00%, 3/15/2024 (b) | 50,000 | 50,451 |
Series 2015A, Rev., 5.00%, 3/15/2025 (b) | 25,000 | 25,675 |
New York State Environmental Facilities Corp., State Revolving Funds, Master Financing Program Series 2012E, Rev., 5.00%, 5/15/2024 | 15,000 | 15,019 |
INVESTMENTS | PRINCIPAL AMOUNT($) | VALUE($) |
New York — continued | ||
New York State Housing Finance Agency, Historic Front Street Series 2003A, Rev., VRDO, LOC : Landesbank Hessen-Thuringen Girozentrale, 4.12%, 9/8/2023 (c) | 22,000,000 | 22,000,000 |
New York State Thruway Authority | ||
Series J, Rev., 5.00%, 1/1/2024 | 75,000 | 75,418 |
Series K, Rev., 5.00%, 1/1/2024 | 50,000 | 50,279 |
Series L, Rev., 5.00%, 1/1/2024 | 40,000 | 40,223 |
Series J, Rev., 5.00%, 1/1/2026 | 200,000 | 200,920 |
New York State Thruway Authority, State Personal Income Tax, Transportation Series 2013A, Rev., 5.00%, 11/10/2023 | 125,000 | 125,354 |
New York State Urban Development Corp., Personal Income Tax Series 2016A, Rev., 5.00%, 3/15/2025 | 30,000 | 30,784 |
New York State Urban Development Corp., State Personal Income Tax, General Purpose Series 2014A, Rev., 5.00%, 3/15/2024 (b) | 50,000 | 50,451 |
New York Transportation Development Corp., Terminal 4 John F. Kennedy International Airport Project, Tax-Exempt Series 2020C, Rev., 5.00%, 12/1/2023 | 340,000 | 341,077 |
Onondaga Central School District GO, BAN, 4.50%, 6/28/2024 | 11,160,000 | 11,202,966 |
Onondaga County Industrial Development Agency, Series 2022, Rev., 4.00%, 12/1/2023 (c) | 1,415,000 | 1,414,267 |
Onondaga County Water Authority Series 2015A, Rev., 2.25%, 9/15/2023 | 40,000 | 39,982 |
Oriskany Central School District GO, BAN, 4.50%, 7/5/2024 | 4,870,000 | 4,891,283 |
Otego-Unadilla Central School District, New York General Obligation Anticipation GO, BAN, 4.50%, 7/18/2024 | 7,500,000 | 7,538,820 |
Owego Apalachin Central School District GO, BAN, 4.50%, 7/5/2024 | 5,765,000 | 5,799,849 |
Port Authority of New York and New Jersey Series 185, Rev., AMT, 5.00%, 9/1/2023 | 95,000 | 95,000 |
Port Authority of New York and New Jersey, Consolidated | ||
Series 189, Rev., 5.00%, 5/1/2025 | 45,000 | 46,211 |
Series 175, Rev., 5.00%, 12/1/2025 | 100,000 | 100,124 |
Series 179, Rev., 5.00%, 12/1/2025 | 175,000 | 175,639 |
Series 175, Rev., 4.00%, 12/1/2026 | 105,000 | 105,036 |
August 31, 2023 | J.P. Morgan Exchange-Traded Funds | 197 |
AS OF August 31, 2023 (Unaudited) (continued)
INVESTMENTS | PRINCIPAL AMOUNT($) | VALUE($) |
Municipal Bonds — continued | ||
New York — continued | ||
Sales Tax Asset Receivable Corp., Fiscal Year 2015 | ||
Series 2015A, Rev., 5.00%, 10/15/2023 (b) | 40,000 | 40,072 |
Series 2015A, Rev., 5.00%, 10/15/2024 (b) | 45,000 | 45,830 |
Saranac Lake Central School District GO, BAN, 4.50%, 6/21/2024 | 2,855,000 | 2,868,138 |
Schenectady City School District GO, BAN, 4.50%, 7/19/2024 | 11,220,000 | 11,295,732 |
Shenendehowa Central School District GO, BAN, 4.50%, 6/28/2024 | 10,100,000 | 10,158,486 |
South Country Central School District at Brookhaven GO, 5.00%, 10/15/2023 | 35,000 | 35,059 |
Spencer Van Etten Central School GO, BAN, 4.50%, 6/28/2024 | 8,752,842 | 8,790,078 |
Three Village Central School District Brookhaven & Smithtown GO, 5.00%, 5/15/2025 | 30,000 | 30,812 |
Town of Brookhaven Series 2016, GO, 4.00%, 3/15/2028 | 60,000 | 60,348 |
Town of Lancaster GO, BAN, 4.50%, 7/19/2024 | 6,469,500 | 6,504,803 |
Town of Monroe GO, BAN, 4.50%, 8/2/2024 | 2,700,000 | 2,715,858 |
Town of Orchard Park GO, BAN, 4.50%, 8/16/2024 | 3,658,000 | 3,686,316 |
Town of Oyster Bay Series 2023, GO, 5.00%, 3/8/2024 | 20,000 | 20,175 |
Town of Oyster Bay, Public Improvement GO, 4.00%, 11/1/2023 | 200,000 | 200,213 |
Town of Riverhead GO, BAN, 4.50%, 8/15/2024 | 2,850,000 | 2,869,857 |
Town of Southampton Series 2021, GO, 5.00%, 9/1/2023 | 150,000 | 150,000 |
Town of Stillwater Series 2023, GO, BAN, 4.50%, 5/31/2024 | 2,940,000 | 2,961,468 |
Town of Wawarsing GO, BAN, 4.50%, 7/25/2024 | 4,200,000 | 4,220,420 |
Triborough Bridge and Tunnel Authority | ||
Series 2008B-1, Rev., 5.00%, 11/15/2023 (b) | 25,000 | 25,081 |
Series 2022A, Rev., BAN, 5.00%, 8/15/2024 | 55,000 | 55,829 |
Triborough Bridge and Tunnel Authority, MTA Bridges and Tunnels | ||
Series 2013A, Rev., 5.00%, 11/15/2023 | 85,000 | 85,094 |
INVESTMENTS | PRINCIPAL AMOUNT($) | VALUE($) |
New York — continued | ||
Series 2016A, Rev., 5.00%, 11/15/2023 | 20,000 | 20,062 |
Triborough Bridge and Tunnel Authority,Payroll Mobility Tax Series 2022B, Rev., BAN, 5.00%, 12/16/2024 | 90,000 | 91,933 |
Tully Central School District GO, BAN, 4.50%, 6/27/2024 | 1,519,528 | 1,527,553 |
Utility Debt Securitization Authority Series 2016A, Rev., 5.00%, 12/15/2025 | 25,000 | 25,096 |
Vestal Central School District GO, BAN, 4.00%, 9/29/2023 | 639,740 | 639,766 |
Victor Central School District Series B, GO, BAN, 3.75%, 9/15/2023 | 2,267,382 | 2,267,238 |
Village of Frankfort, Public Improvement GO, AGM, 3.00%, 11/15/2023 | 25,000 | 24,960 |
Village of Lancaster Series 2023, GO, BAN, 4.50%, 5/24/2024 | 1,400,000 | 1,408,748 |
Village of Skaneateles GO, BAN, 5.00%, 6/14/2024 | 1,550,000 | 1,562,905 |
Warwick Valley Central School District GO, BAN, 4.75%, 6/28/2024 | 5,017,154 | 5,056,599 |
Wayne Central School District GO, BAN, 4.50%, 7/26/2024 | 2,900,000 | 2,912,618 |
Westchester County Local Development Corp., Purchase Senior Learning Community, Inc. Project Series 2021D, Rev., 2.88%, 7/1/2026 (e) | 1,885,000 | 1,795,520 |
Westfield Central School District GO, BAN, 5.00%, 6/13/2024 | 2,245,000 | 2,263,627 |
Windsor Central School District GO, BAN, 4.50%, 7/26/2024 | 6,464,000 | 6,495,563 |
Total New York | 461,341,038 | |
North Carolina — 0.3% | ||
Charlotte-Mecklenburg Hospital Authority (The) Series 2016A, Rev., 5.00%, 1/15/2024 | 250,000 | 251,294 |
Charlotte-Mecklenburg Hospital Authority (The), Atrium Health Variable Rate, Health Care Series 2021B, Rev., 5.00%, 12/2/2024 (c) | 1,430,000 | 1,451,544 |
City of Charlotte, Airport Special Facilities Series A, Rev., 5.00%, 7/1/2024 | 35,000 | 35,432 |
City of Charlotte, Convention Facility Project Series 2019A, COP, 5.00%, 6/1/2024 | 60,000 | 60,723 |
City of Charlotte, Equipment Acquisition and Public Facilities Series 2016A, COP, 5.00%, 12/1/2023 | 30,000 | 30,115 |
City of Durham GO, 5.00%, 9/1/2023 | 10,000 | 10,000 |
198 | J.P. Morgan Exchange-Traded Funds | August 31, 2023 |
INVESTMENTS | PRINCIPAL AMOUNT($) | VALUE($) |
Municipal Bonds — continued | ||
North Carolina — continued | ||
City of Raleigh, Limited Obligation Rev., 5.00%, 2/1/2024 | 50,000 | 50,334 |
County of Forsyth GO, 5.00%, 12/1/2023 | 50,000 | 50,199 |
County of Iredell Series 2021, GO, 5.00%, 12/1/2023 | 100,000 | 100,404 |
County of New Hanover Series 2017, Rev., 5.00%, 10/1/2023 (b) | 225,000 | 225,253 |
County of Wake, Hospital System Rev., NATL - RE, 5.13%, 10/1/2026 (b) | 100,000 | 102,119 |
North Carolina Capital Facilities Finance Agency, Duke University Project Series 2015B, Rev., 5.00%, 10/1/2025 (b) | 20,000 | 20,701 |
North Carolina Housing Finance Agency, Homeownership Series 44, Rev., 1.50%, 7/1/2024 | 230,000 | 225,560 |
North Carolina Medical Care Commission, Caromont Health Series 2021B, Rev., 5.00%, 2/1/2026 (c) | 325,000 | 336,615 |
North Carolina Medical Care Commission, Novant Health Series 2013A, Rev., 5.00%, 11/1/2024 | 160,000 | 160,166 |
North Carolina Medical Care Commission, Wake Forest Baptist Obligated Group Series 2012B, Rev., 5.00%, 12/1/2023 | 240,000 | 240,256 |
North Carolina Municipal Power Agency No. 1, Catawba Electric Series A, Rev., 5.00%, 1/1/2024 | 25,000 | 25,116 |
North Carolina State University at Raleigh Series 2013A, Rev., 5.00%, 10/1/2023 (b) | 20,000 | 20,023 |
North Carolina Turnpike Authority, Triangle Expressway System, Senior Lien | ||
Rev., AGM, 5.00%, 1/1/2024 | 1,150,000 | 1,155,033 |
Series NTS2020, Rev., BAN, 5.00%, 2/1/2024 (b) | 600,000 | 603,286 |
Orange County Public Facilities Co., Limited Obligation Rev., 5.00%, 10/1/2023 | 40,000 | 40,047 |
Raleigh Durham Airport Authority Series 2020A, Rev., AMT, 5.00%, 5/1/2025 | 940,000 | 957,085 |
State of North Carolina | ||
Rev., 5.00%, 3/1/2024 | 40,000 | 40,286 |
Series 2022A, Rev., 5.00%, 5/1/2025 | 435,000 | 446,992 |
State of North Carolina, Limited Obligation Series 2013A, Rev., 2.25%, 5/1/2026 | 10,000 | 9,582 |
University of North Carolina at Greensboro Series 2014, Rev., 4.00%, 4/1/2039 | 200,000 | 200,432 |
Total North Carolina | 6,848,597 | |
INVESTMENTS | PRINCIPAL AMOUNT($) | VALUE($) |
North Dakota — 0.1% | ||
City of Grand Forks, Altru Health System Rev., 5.00%, 12/1/2024 | 120,000 | 120,373 |
County of Grand Forks Series 2022, GO, 4.00%, 10/1/2023 | 1,075,000 | 1,075,367 |
County of Stutsman Series 2014A, GO, 4.00%, 10/1/2023 | 25,000 | 25,006 |
Minot Public School District No. 1 GO, 4.00%, 8/1/2025 | 25,000 | 25,350 |
North Dakota Housing Finance Agency, Home Mortgage Finance Program Series 2020B, Rev., 1.05%, 7/1/2026 | 125,000 | 115,228 |
North Dakota Public Finance Authority, Capital Financing Program Series 2019A, Rev., 1.75%, 11/1/2023 | 430,000 | 428,285 |
North Dakota Public Finance Authority, State Revolving Fund Program Series 2012A, Rev., 5.00%, 10/1/2023 | 35,000 | 35,042 |
University of North Dakota COP, AGM, 5.00%, 6/1/2024 | 580,000 | 586,224 |
West Fargo Public School District No. 6, School Building GO, 4.00%, 8/1/2024 | 40,000 | 40,227 |
Total North Dakota | 2,451,102 | |
Ohio — 6.4% | ||
Akron Bath Copley Joint Township Hospital District Series 2022A, Rev., 5.00%, 11/15/2024 | 75,000 | 76,199 |
Akron Bath Copley Joint Township Hospital District, Children's Hospital Medical Center of Akron | ||
Series 2022A, Rev., 5.00%, 11/15/2026 | 355,000 | 371,713 |
Series 2022A, Rev., 5.00%, 11/15/2027 | 470,000 | 499,924 |
American Municipal Power, Inc. | ||
Series 2017A, Rev., 5.00%, 2/15/2024 | 1,120,000 | 1,126,256 |
Series 2020A, Rev., 5.00%, 2/15/2024 | 220,000 | 221,229 |
American Municipal Power, Inc., Electric System Improvement, City of Wapakoneta Project Rev., BAN, 4.50%, 6/21/2024 | 1,970,000 | 1,979,845 |
American Municipal Power, Inc., Prairie State Energy Campus Project | ||
Series 2019B, Rev., 5.00%, 2/15/2024 | 1,200,000 | 1,206,703 |
Series 2015A, Rev., 5.00%, 2/15/2026 | 5,290,000 | 5,319,317 |
Big Walnut Local School District, Unlimited Tax Series 2015, GO, 5.00%, 6/1/2025 (b) | 670,000 | 690,012 |
Central Ohio Solid Waste Authority Series 2016, GO, 5.00%, 12/1/2024 | 1,000,000 | 1,019,168 |
August 31, 2023 | J.P. Morgan Exchange-Traded Funds | 199 |
AS OF August 31, 2023 (Unaudited) (continued)
INVESTMENTS | PRINCIPAL AMOUNT($) | VALUE($) |
Municipal Bonds — continued | ||
Ohio — continued | ||
Central Ohio Solid Waste Authority, Solid Waste Facilities, Limited Tax GO, 5.00%, 12/1/2023 | 45,000 | 45,170 |
Cincinnati City School District Series 2014, COP, 5.00%, 12/15/2024 (b) | 3,260,000 | 3,325,234 |
City of Akron Income Tax, Various Purpose Series 2014, Rev., 5.00%, 12/1/2023 | 1,155,000 | 1,158,659 |
City of Akron, Income Tax Rev., 5.00%, 12/1/2023 | 20,000 | 20,063 |
City of Akron, Various Purpose GO, 4.00%, 12/1/2023 | 200,000 | 200,061 |
City of Athens, Swimming Pool Facilities GO, 3.00%, 12/1/2023 | 25,000 | 24,948 |
City of Blue Ash GO, BAN, 4.25%, 3/28/2024 | 5,400,000 | 5,406,710 |
City of Cincinnati Series 2019, GO, 5.00%, 12/1/2023 | 30,000 | 30,117 |
City of Cincinnati, Unlimited Tax | ||
Series 2015A, GO, 5.00%, 12/1/2023 (b) | 15,000 | 15,057 |
Series 2015A, GO, 5.00%, 12/1/2023 | 20,000 | 20,078 |
City of Cleveland Series 2017A-3, Rev., 4.00%, 10/1/2023 | 55,000 | 55,023 |
City of Cleveland Income Tax, Subordinate Lien Series A-2, Rev., AGM-CR, 5.00%, 10/1/2023 (b) | 400,000 | 400,479 |
City of Columbus,Variour Purpose Unlimited Tax Series 2014A, GO, 4.00%, 2/15/2028 | 145,000 | 145,350 |
City of Delaware GO, BAN, 4.38%, 1/18/2024 | 2,675,000 | 2,679,088 |
City of Sandusky, Variour Purpose Limited Tax GO, BAN, 4.50%, 9/6/2024 (f) | 12,270,000 | 12,344,372 |
City of Springfield GO, BAN, 4.25%, 4/3/2024 | 4,480,000 | 4,485,153 |
City of Strongsville Series 2023, GO, BAN, 4.50%, 6/7/2024 | 2,740,000 | 2,760,368 |
City of Westerville, Special Obligation Rev., 5.00%, 12/1/2023 | 25,000 | 25,097 |
Columbus Metropolitan Library, Ohio Library Facilities, Special Obligation Series 2020, Rev., 4.00%, 12/1/2024 | 20,000 | 20,141 |
County of Allen | ||
Series 2020A, Rev., 5.00%, 12/1/2023 | 1,295,000 | 1,299,102 |
Series 2017A, Rev., 5.00%, 8/1/2025 | 95,000 | 97,504 |
County of Allen, Hospital Facilities, Mercy Health Series 2017A, Rev., 5.00%, 8/1/2024 | 720,000 | 728,851 |
INVESTMENTS | PRINCIPAL AMOUNT($) | VALUE($) |
Ohio — continued | ||
County of Cuyahoga Series 2020D, Rev., 4.00%, 12/1/2023 | 800,000 | 801,041 |
County of Cuyahoga, Ohio Economic Development Series 2020D, Rev., 4.00%, 12/1/2024 | 1,850,000 | 1,860,984 |
County of Franklin Series 2016C, Rev., 5.00%, 11/1/2024 | 45,000 | 45,762 |
County of Greene, Sewer System Series 2007A, Rev., AMBAC, 5.00%, 12/1/2023 | 50,000 | 50,189 |
County of Hamilton, Cincinnati Children's Hospital Medical Center Obligated Group Series 2014S, Rev., 5.00%, 5/15/2026 | 1,040,000 | 1,048,378 |
County of Hamilton, Hospital Facility Cincinnati Children Hospital Series 2014S, Rev., 5.00%, 5/15/2027 | 2,000,000 | 2,016,794 |
County of Hamilton, Parking Facilities, Limited Tax Series 2021A, GO, 5.00%, 12/1/2023 | 25,000 | 25,095 |
County of Hamilton, Sales tax Series 2016A, Rev., 5.00%, 12/1/2026 | 620,000 | 654,337 |
County of Hamilton, Sales Tax | ||
Series 2016A, Rev., 5.00%, 12/1/2023 | 25,000 | 25,088 |
Series 2016A, Rev., 5.00%, 12/1/2024 | 35,000 | 35,658 |
County of Hamilton, Sewer System | ||
Series 2013A, Rev., 5.00%, 12/1/2023 (b) | 275,000 | 276,103 |
Series 2014A, Rev., 5.00%, 12/1/2023 | 175,000 | 175,664 |
Series 2014A, Rev., 5.00%, 12/1/2027 | 370,000 | 377,227 |
County of Montgomery, Catholic Health Initiatives Series 2008D-2, Rev., 5.45%, 11/13/2023 (b) | 140,000 | 140,533 |
Cuyahoga Community College District, Facilities Construction Improvement, Unlimited Tax GO, 3.00%, 12/1/2023 | 20,000 | 19,976 |
Cuyahoga Metropolitan Housing Authority Rev., FHA, 4.75%, 12/1/2025 (c) | 4,350,000 | 4,391,784 |
Cuyahoga Metropolitan Housing Authority, Carver Park Phase III Project Rev., FHA, 4.00%, 6/1/2025 (c) | 7,200,000 | 7,165,117 |
Dayton Metro Library, Unlimited Tax GO, 4.00%, 12/1/2024 | 40,000 | 40,325 |
Dublin City School District, School Facilities Construction and Improvement Series 2019C, GO, 4.00%, 12/1/2024 | 20,000 | 20,172 |
Franklin County Convention Facilities Authority, Tax Lease | ||
Rev., 5.00%, 12/1/2023 (b) | 50,000 | 50,182 |
Rev., 5.00%, 12/1/2024 (b) | 75,000 | 76,456 |
200 | J.P. Morgan Exchange-Traded Funds | August 31, 2023 |
INVESTMENTS | PRINCIPAL AMOUNT($) | VALUE($) |
Municipal Bonds — continued | ||
Ohio — continued | ||
Lakewood City School District Series 2014B, GO, 5.00%, 11/1/2023 | 115,000 | 115,293 |
Licking County Career and Technology Education Centers GO, 3.13%, 12/1/2023 | 50,000 | 49,952 |
Licking Heights Local School District Series 2022, GO, 5.00%, 10/1/2023 | 50,000 | 50,057 |
Lucas-Plaza Housing Development Corp. Series B, Rev., FHA, Zero Coupon, 6/1/2024 (b) | 970,000 | 944,566 |
Miami Valley Career Technology Center Series 2018, GO, 4.00%, 12/1/2023 | 200,000 | 200,308 |
Miamisburg City School District Series 2016, GO, 5.00%, 12/1/2025 (b) | 390,000 | 404,497 |
Northwest Local School District, School Improvement, Unlimited Tax GO, 5.00%, 12/1/2023 (b) | 45,000 | 45,175 |
Oak Hills Local School District, School Improvement GO, 5.00%, 12/1/2023 | 20,000 | 20,071 |
Ohio Higher Educational Facility Commission, Case Western University Project | ||
Series 2021B, Rev., (SIFMA Municipal Swap Index Yield + 0.23%), 4.29%, 9/7/2023 (d) | 5,500,000 | 5,389,845 |
Rev., 5.00%, 12/1/2023 (b) | 45,000 | 45,159 |
Rev., 5.00%, 12/1/2023 | 100,000 | 100,365 |
Ohio Housing Finance Agency, Marianna Terrace Apartments Series 2022A, Rev., 1.30%, 3/1/2024 (c) | 1,000,000 | 985,106 |
Ohio Housing Finance Agency, RAD Post Oak LLC Series 2022, Rev., 3.35%, 7/1/2024 (c) | 4,740,000 | 4,683,485 |
Ohio Housing Finance Agency, Riverview San Macro LLC Series 2023, Rev., 5.00%, 8/1/2025 (c) | 3,916,000 | 3,973,697 |
Ohio State University (The), General Receipts | ||
Series 2010D, Rev., 5.00%, 12/1/2023 | 40,000 | 40,141 |
Series 2020A, Rev., 5.00%, 12/1/2023 | 30,000 | 30,100 |
Ohio Water Development Authority Drinking Water Assistance Fund Series 2016, Rev., 5.00%, 12/1/2023 | 125,000 | 125,501 |
Orange City School District, Unlimited Tax GO, 5.00%, 12/1/2023 | 40,000 | 40,153 |
Perrysburg Exempted Village School District, Unlimited Tax GO, 5.00%, 12/1/2023 | 30,000 | 30,102 |
INVESTMENTS | PRINCIPAL AMOUNT($) | VALUE($) |
Ohio — continued | ||
Rocky River City School District Series 2014, GO, 4.00%, 12/1/2023 (b) | 140,000 | 140,233 |
State of Ohio | ||
Series 2018D, Rev., 5.00%, 9/15/2023 (c) | 13,775,000 | 13,779,138 |
Series 2017B, Rev., 5.00%, 10/1/2023 | 650,000 | 650,745 |
Series 2020A, Rev., 5.00%, 10/1/2023 | 30,000 | 30,034 |
Series 2016A, GO, 5.00%, 12/15/2023 | 35,000 | 35,157 |
Series 2019A, Rev., 5.00%, 4/1/2024 | 20,000 | 20,187 |
Series 2018A, Rev., 5.00%, 6/1/2024 | 25,000 | 25,301 |
Series A, Rev., 5.00%, 6/1/2024 | 25,000 | 25,301 |
Series 2016A, Rev., 5.00%, 2/1/2025 | 50,000 | 51,163 |
Series 2017B, GO, 5.00%, 9/15/2025 | 450,000 | 465,660 |
State of Ohio Department of Administrative Services Series 2016, COP, 5.00%, 9/1/2023 | 145,000 | 145,000 |
State of Ohio, Adult Correctional Building Fund Projects Series 2013A, Rev., 5.00%, 10/1/2024 | 35,000 | 35,616 |
State of Ohio, Capital Facilities Lease Appropriation | ||
Series 2017A, Rev., 5.00%, 12/1/2023 | 25,000 | 25,096 |
Series 2017A, Rev., 5.00%, 12/1/2024 | 55,000 | 56,121 |
State of Ohio, Capital Facilities Lease Appropriation Cultural and Sports Facilities Building Fund Projects Series 2016A, Rev., 5.00%, 10/1/2023 | 50,000 | 50,057 |
State of Ohio, Capital Facilities Lease Appropriation Mental Health Facilities Improvement Fund Projects Series 2015A, Rev., 5.00%, 2/1/2024 | 55,000 | 55,364 |
State of Ohio, Cleveland Clinic Health System | ||
Series 2019F, Rev., VRDO, LIQ : US Bank NA, 3.65%, 9/1/2023 (c) | 10,000,000 | 10,000,000 |
Series 2019D-2, Rev., VRDO, 4.05%, 9/12/2023 (c) | 20,890,000 | 20,890,000 |
State of Ohio, Higher Education Series 2014A, GO, 4.00%, 5/1/2024 | 80,000 | 80,342 |
State of Ohio, Highway Improvement Series T, GO, 5.00%, 11/1/2023 | 95,000 | 95,242 |
State of Ohio, Infrastructure Improvement | ||
Series 2012C, GO, 5.00%, 9/1/2023 | 125,000 | 125,000 |
Series 2015A, GO, 5.00%, 9/1/2023 | 25,000 | 25,000 |
Series 2015B, GO, 5.00%, 9/1/2023 | 25,000 | 25,000 |
Series 2016A, GO, 5.00%, 9/1/2023 | 20,000 | 20,000 |
Series 2017B, GO, 5.00%, 9/1/2025 | 30,000 | 31,021 |
August 31, 2023 | J.P. Morgan Exchange-Traded Funds | 201 |
AS OF August 31, 2023 (Unaudited) (continued)
INVESTMENTS | PRINCIPAL AMOUNT($) | VALUE($) |
Municipal Bonds — continued | ||
Ohio — continued | ||
State of Ohio, Juvenile Correctional Building Fund Projects Series 2019B, Rev., 5.00%, 10/1/2023 | 35,000 | 35,040 |
State of Ohio, Major New Infrastructure Project | ||
Series 2016-1, Rev., 5.00%, 12/15/2023 | 25,000 | 25,112 |
Series 2018-1, Rev., 5.00%, 12/15/2023 | 120,000 | 120,538 |
Series 2019-1, Rev., 5.00%, 12/15/2023 | 25,000 | 25,112 |
Series 2018-1, Rev., 5.00%, 12/15/2024 | 30,000 | 30,632 |
State of Ohio, University Hospitals Health System, Inc. | ||
Series 2021B, Rev., VRDO, 4.44%, 9/1/2023 (c) | 15,500,000 | 15,500,000 |
Series 2014B, Rev., VRDO, 4.44%, 9/12/2023 (c) | 14,000,000 | 14,000,000 |
Series 2020B, Rev., 5.00%, 1/15/2025 (c) | 295,000 | 299,585 |
State of Ohio,University Hospital Health System Series 2016A, Rev., 5.00%, 1/15/2027 | 40,000 | 40,993 |
Tender Option Bond Trust Receipts/ Certificates Series 2018-XF2659, Rev., VRDO, LIQ : Citibank NA, 4.13%, 9/12/2023 (c) (e) | 4,000,000 | 4,000,000 |
Toledo City School District, School Facilities Improvement GO, 5.00%, 12/1/2023 (b) | 20,000 | 20,078 |
University of Cincinnati Series D, Rev., 5.00%, 6/1/2024 | 40,000 | 40,429 |
Westerville City School District, School Facilities Project COP, 5.00%, 12/1/2023 | 30,000 | 30,118 |
Wright State University Series 2021A, Rev., 4.00%, 5/1/2024 | 550,000 | 549,929 |
Total Ohio | 165,966,773 | |
Oklahoma — 0.8% | ||
Canadian County Independent School District No. 69 Mustang Series 2023, GO, 4.00%, 6/1/2027 | 3,530,000 | 3,607,258 |
Grady County School Finance Authority, Educational Facilities Lease, Tuttle Public Schools Project Rev., 5.00%, 9/1/2023 | 10,000 | 10,000 |
Grand River Dam Authority | ||
Series 2016A, Rev., 4.00%, 6/1/2024 | 50,000 | 50,201 |
INVESTMENTS | PRINCIPAL AMOUNT($) | VALUE($) |
Oklahoma — continued | ||
Series 2014A, Rev., 5.00%, 6/1/2028 | 115,000 | 116,158 |
Oklahoma County Finance Authority, Educational Facilities, Lease Midwest City-Del City Public Schools Project | ||
Rev., 5.00%, 10/1/2024 | 100,000 | 101,421 |
Rev., 5.00%, 10/1/2025 | 30,000 | 30,808 |
Oklahoma County Finance Authority, Western Heights Public Schools Project Series 2018A, Rev., 5.00%, 9/1/2023 | 10,000 | 10,000 |
Oklahoma Development Finance Authority, Health System, Integris Obligated Group | ||
Series 2020C, Rev., VRDO, 4.60%, 9/12/2023 (c) | 15,610,000 | 15,610,000 |
Series 2015A, Rev., 5.00%, 8/15/2024 | 30,000 | 30,246 |
Oklahoma Development Finance Authority, State System Higher Education Master Real Property Series 2014A, Rev., 5.00%, 6/1/2024 | 50,000 | 50,537 |
Oklahoma Turnpike Authority, Second Senior Series 2020A, Rev., 5.00%, 1/1/2025 | 125,000 | 127,646 |
Tulsa County Industrial Authority Educational Facilities Lease, Broken Arrow Public Schools Project Rev., 5.00%, 9/1/2025 | 35,000 | 35,036 |
Total Oklahoma | 19,779,311 | |
Oregon — 0.1% | ||
City of Eugene, Electric Utility System Rev., 4.00%, 8/1/2024 | 140,000 | 140,052 |
City of Portland, Water System, Second Lien Series 2013A, Rev., 5.00%, 10/1/2023 | 20,000 | 20,014 |
Hospital Facilities Authority of Multnomah County Oregon, Adventist Health System Rev., 5.00%, 3/1/2025 (c) | 260,000 | 262,344 |
Medford Hospital Facilities Authority, Rogue Valley Manor Series 2013A, Rev., 5.00%, 10/1/2023 | 1,000,000 | 1,001,125 |
Metro, Oregon Convention Center Hotel Project Rev., 5.00%, 6/15/2025 | 20,000 | 20,566 |
Oregon State Facilities Authority, Providence Health & Services | ||
Series 2013A, Rev., 5.00%, 10/1/2023 | 200,000 | 200,203 |
Series 2013A, Rev., 5.00%, 10/1/2024 | 110,000 | 110,113 |
State of Oregon, Housing and Community Services Department, Single-Family Mortgage Program | ||
Series 2020A, Rev., 0.88%, 1/1/2024 | 325,000 | 321,851 |
Series A, Rev., 3.00%, 1/1/2024 | 200,000 | 199,341 |
202 | J.P. Morgan Exchange-Traded Funds | August 31, 2023 |
INVESTMENTS | PRINCIPAL AMOUNT($) | VALUE($) |
Municipal Bonds — continued | ||
Oregon — continued | ||
Series 2020A, Rev., 0.90%, 7/1/2024 | 435,000 | 424,513 |
Tri-County Metropolitan Transportation District of Oregon | ||
Series 2017A, Rev., 5.00%, 10/1/2023 | 110,000 | 110,118 |
Series 2017A, Rev., 5.00%, 10/1/2025 | 50,000 | 51,569 |
Washington County Clean Water Services, Senior Lien Rev., 5.00%, 10/1/2023 | 20,000 | 20,024 |
Total Oregon | 2,881,833 | |
Pennsylvania — 6.7% | ||
Allegheny County Hospital Development Authority | ||
Series 1997B, Rev., NATL - RE, 6.00%, 7/1/2024 | 50,000 | 50,917 |
Series 2019A, Rev., 5.00%, 7/15/2024 | 255,000 | 257,761 |
Allegheny County Hospital Development Authority, UPMC Series 2021B, Rev., 5.00%, 10/15/2023 | 330,000 | 330,442 |
Allegheny County Sanitary Authority Rev., 5.00%, 12/1/2026 | 65,000 | 65,236 |
Allegheny County Sanitary Authority, Sewer Series 2015, Rev., 5.00%, 12/1/2024 | 955,000 | 974,939 |
Ambridge Borough Water Authority Series 2019, Rev., 4.00%, 11/15/2024 | 25,000 | 25,107 |
Bethel Park School District GO, 5.00%, 8/1/2025 | 35,000 | 36,079 |
Borough of Hanover Series 2020B, GO, 4.00%, 10/1/2024 | 25,000 | 25,171 |
Borough of Lansdale Series 2020, GO, 4.00%, 10/1/2023 | 25,000 | 25,009 |
Boyertown Area School District Series 2019, GO, 4.00%, 9/1/2023 | 20,000 | 20,000 |
Canon McMillan School District Series 2014C, GO, AGM, 5.00%, 12/15/2023 (b) | 1,500,000 | 1,506,594 |
Carlisle Area School District, Limited Tax GO, 3.00%, 9/1/2024 | 25,000 | 24,845 |
Centennial School District Bucks County | ||
Series 2017C, GO, 5.00%, 12/15/2023 | 55,000 | 55,246 |
Series 2017A, GO, 5.00%, 12/15/2024 | 25,000 | 25,473 |
Central Dauphin School District Series 2016, GO, 5.00%, 2/1/2026 | 25,000 | 25,940 |
Chambersburg Area School District Series A, GO, 5.00%, 3/1/2025 | 150,000 | 150,180 |
Cheltenham Township School District | ||
GO, 4.00%, 9/15/2023 | 25,000 | 25,004 |
Series 2019A, GO, 4.00%, 2/15/2025 | 20,000 | 20,148 |
INVESTMENTS | PRINCIPAL AMOUNT($) | VALUE($) |
Pennsylvania — continued | ||
City of Philadelphia | ||
Series 2019B, GO, 5.00%, 2/1/2024 | 150,000 | 150,852 |
Series 2017A, GO, 5.00%, 8/1/2024 | 100,000 | 101,274 |
Series 2021A, GO, 5.00%, 5/1/2028 | 40,000 | 43,044 |
City of Philadelphia, Airport System | ||
Series 2017A, Rev., 5.00%, 7/1/2024 | 300,000 | 303,341 |
Series 2020A, Rev., 5.00%, 7/1/2024 | 125,000 | 126,392 |
City of Philadelphia, Water and Wastewater Series 2017B, Rev., 5.00%, 11/1/2023 | 455,000 | 456,074 |
City of Philadelphia, Water and Wastewater System Rev., 5.00%, 10/1/2023 | 575,000 | 575,626 |
Commonwealth Financing Authority | ||
Series B-1, Rev., 5.00%, 6/1/2024 | 45,000 | 45,480 |
Series 2019B, Rev., 5.00%, 6/1/2027 | 20,000 | 21,192 |
Commonwealth Financing Authority, Tobacco Master Settlement Payment | ||
Rev., 5.00%, 6/1/2025 | 40,000 | 40,915 |
Rev., 5.00%, 6/1/2027 | 25,000 | 26,230 |
Rev., 5.00%, 6/1/2028 | 125,000 | 133,007 |
Commonwealth of Pennsylvania | ||
Series 2013, GO, 5.00%, 10/15/2023 | 110,000 | 110,196 |
Series 2014-1, GO, 5.00%, 6/15/2024 | 40,000 | 40,511 |
GO, 5.00%, 7/1/2024 | 25,000 | 25,337 |
Series 2016, GO, 5.00%, 9/15/2024 | 635,000 | 645,768 |
GO, 5.00%, 9/15/2026 | 20,000 | 21,109 |
Series 2018A, COP, 5.00%, 7/1/2028 | 400,000 | 430,614 |
Series 2013, GO, 4.00%, 10/15/2028 | 40,000 | 40,024 |
Council Rock School District | ||
GO, 4.00%, 11/15/2023 | 120,000 | 120,140 |
Series 2019A, GO, 4.00%, 11/15/2025 | 35,000 | 35,470 |
County of Adams Series 2017B, GO, 5.00%, 11/15/2023 | 25,000 | 25,074 |
County of Allegheny | ||
Series C-69, GO, 5.00%, 12/1/2023 | 50,000 | 50,058 |
Series C-75, GO, 5.00%, 11/1/2027 | 20,000 | 21,009 |
County of Dauphin | ||
Series 2016C, GO, 4.00%, 10/1/2023 | 25,000 | 25,011 |
GO, 4.00%, 11/15/2023 | 35,000 | 35,041 |
County of Montgomery | ||
Series 2019C, GO, 5.00%, 9/1/2023 | 50,000 | 50,000 |
Series 2009C, GO, 5.00%, 12/15/2023 | 25,000 | 25,029 |
County of York Series 2016A, GO, 3.00%, 12/1/2023 | 30,000 | 29,947 |
Cumberland County Municipal Authority Series 2015, Rev., 5.00%, 1/1/2025 (b) | 1,620,000 | 1,653,231 |
August 31, 2023 | J.P. Morgan Exchange-Traded Funds | 203 |
AS OF August 31, 2023 (Unaudited) (continued)
INVESTMENTS | PRINCIPAL AMOUNT($) | VALUE($) |
Municipal Bonds — continued | ||
Pennsylvania — continued | ||
Daniel Boone Area School District | ||
Series 2017, GO, 5.00%, 4/1/2024 | 40,000 | 40,331 |
Series 2017, GO, 5.00%, 4/1/2024 (b) | 20,000 | 20,189 |
Delaware County Authority, Villanova University Rev., 5.00%, 8/1/2024 | 55,000 | 55,770 |
Delaware County Industrial Development Authority, United Parcel Service Project Rev., VRDO, 4.10%, 9/1/2023 (c) | 40,000,000 | 40,000,000 |
Delaware River Port Authority Series 2018B, Rev., 5.00%, 1/1/2024 | 55,000 | 55,287 |
Delaware Valley Regional Finance Authority, Local Government | ||
Series 2020D, Rev., VRDO, LOC : TD Bank NA, 4.00%, 9/8/2023 (c) | 19,500,000 | 19,500,000 |
Series 2020B, Rev., 5.00%, 11/1/2024 | 100,000 | 101,761 |
Derry Township Industrial and Commercial Development Authority, Derry Township Municipal Center Project Rev., 1.00%, 11/15/2023 | 160,000 | 158,713 |
East Penn School District GO, 4.00%, 11/15/2023 | 45,000 | 45,042 |
Easton Area School District Series 2020A, GO, 4.00%, 4/1/2025 | 20,000 | 20,216 |
Elizabeth Forward School District | ||
Series 2021B, GO, AGM, 2.00%, 12/1/2023 | 20,000 | 19,878 |
Series 2021C, GO, AGM, 2.00%, 12/1/2023 | 10,000 | 9,939 |
Garnet Valley School District Series 2017, GO, 4.00%, 4/1/2027 | 35,000 | 35,363 |
Geisinger Authority, Health System Series 2020B, Rev., 5.00%, 2/15/2027 (c) | 145,000 | 150,832 |
Gettysburg Area School District GO, 5.00%, 1/15/2024 | 20,000 | 20,106 |
Halifax Area School District Series 2020, GO, 5.00%, 9/1/2023 | 125,000 | 125,000 |
Hamburg Area School District Series 2020A, GO, 4.00%, 4/1/2024 | 60,000 | 60,214 |
Methacton School District GO, 4.00%, 9/15/2025 | 75,000 | 75,943 |
Monroeville Finance Authority, University of Pittsburg Medical Center Rev., 5.00%, 2/15/2026 | 55,000 | 56,888 |
Montgomery County Higher Education and Health Authority, Thomas Jefferson University Series 2018A, Rev., 5.00%, 9/1/2023 | 50,000 | 50,000 |
INVESTMENTS | PRINCIPAL AMOUNT($) | VALUE($) |
Pennsylvania — continued | ||
Montgomery County Industrial Development Authority, Waverly Heights Ltd. Project Rev., 4.00%, 12/1/2023 | 125,000 | 124,885 |
North Allegheny School District, Unlimited Tax Series 2019A, GO, 4.00%, 5/1/2024 | 50,000 | 50,175 |
North Penn School District Series 2019A, GO, 3.00%, 1/15/2025 | 30,000 | 29,749 |
North Penn Water Authority Rev., (SIFMA Municipal Swap Index Yield + 0.56%), 4.62%, 9/7/2023 (d) | 1,225,000 | 1,225,106 |
Northampton County General Purpose Authority, Lafayette College Rev., 5.00%, 11/1/2023 | 30,000 | 30,073 |
Oxford Area School District Series 2019A, GO, 4.00%, 9/1/2023 | 90,000 | 90,000 |
Parkland School District Series 2020A, GO, 4.00%, 1/15/2024 | 20,000 | 20,040 |
Pennsylvania Economic Development Financing Authority Rev., 5.00%, 3/15/2026 | 50,000 | 51,787 |
Pennsylvania Economic Development Financing Authority, PPL Electric Utilities Corp. Project Rev., 0.40%, 10/1/2023 | 800,000 | 797,252 |
Pennsylvania Economic Development Financing Authority, University of Pittsburgh Medical Center | ||
Series 2017C, Subseries C1, Rev., (SIFMA Municipal Swap Index Yield + 0.37%), 4.43%, 9/7/2023 (d) | 1,500,000 | 1,499,283 |
Series 2017A, Rev., 5.00%, 11/15/2023 | 1,730,000 | 1,734,100 |
Series 2014A, Rev., 5.00%, 2/1/2025 | 50,000 | 50,585 |
Series 2017A, Rev., 5.00%, 11/15/2026 | 25,000 | 26,185 |
Pennsylvania Economic Development Financing Authority, UPMC Obligated Group Series 2016, Rev., 5.00%, 3/15/2024 | 175,000 | 176,166 |
Pennsylvania Higher Educational Facilities Authority Series AW, Rev., 5.00%, 6/15/2024 | 200,000 | 202,214 |
Pennsylvania Higher Educational Facilities Authority, BRYN MAWR College | ||
Rev., 5.00%, 12/1/2023 | 25,000 | 25,088 |
Rev., 5.00%, 12/1/2024 | 70,000 | 71,316 |
Pennsylvania Higher Educational Facilities Authority, Trustees of the University Series A, Rev., 5.00%, 10/1/2023 | 25,000 | 25,029 |
204 | J.P. Morgan Exchange-Traded Funds | August 31, 2023 |
INVESTMENTS | PRINCIPAL AMOUNT($) | VALUE($) |
Municipal Bonds — continued | ||
Pennsylvania — continued | ||
Pennsylvania Higher Educational Facilities Authority, University of Pennsylvania Health System Series 2019, Rev., 5.00%, 8/15/2028 | 30,000 | 32,359 |
Pennsylvania Housing Finance Agency, Single Family Mortgage Series 2019-130A, Rev., 1.40%, 4/1/2024 | 260,000 | 256,339 |
Pennsylvania Turnpike Commission | ||
Series 2018A-1, Rev., (SIFMA Municipal Swap Index Yield + 0.60%), 4.66%, 9/7/2023 (d) | 25,000 | 25,006 |
Rev., VRDO, LOC : TD Bank NA, 4.01%, 9/8/2023 (c) | 33,000,000 | 33,000,000 |
Series 2021C, Rev., 4.00%, 12/1/2023 | 275,000 | 275,325 |
Series 2011A, Rev., 5.00%, 12/1/2023 | 35,000 | 35,124 |
Series 2013C, Rev., 5.00%, 12/1/2023 (b) | 970,000 | 973,423 |
Series 2019, Rev., 5.00%, 12/1/2023 | 725,000 | 727,558 |
Series A-1, Rev., 5.00%, 12/1/2023 | 25,000 | 25,088 |
Series A-1, Rev., 5.00%, 12/1/2025 | 750,000 | 770,568 |
Series B-2, Rev., 5.00%, 6/1/2026 | 100,000 | 104,255 |
Series 2016A-1, Rev., 5.00%, 12/1/2027 | 70,000 | 73,551 |
Series 2016A-3, Rev., 5.00%, 12/1/2027 | 30,000 | 31,482 |
Series 2017, Rev., 5.00%, 12/1/2028 | 100,000 | 107,203 |
Series 2021A, Rev., 5.00%, 12/1/2028 | 20,000 | 21,956 |
Series 2014, Rev., 5.00%, 12/1/2031 | 3,680,000 | 3,735,750 |
Series 2014A, Rev., 5.00%, 12/1/2038 | 2,685,000 | 2,724,407 |
Series 2014C, Rev., 5.00%, 12/1/2039 | 6,660,000 | 6,753,458 |
Pennsylvania Turnpike Commission, Senior Lien Series 2012A, Rev., 5.00%, 12/1/2023 | 175,000 | 175,184 |
Perkiomen Valley School District GO, 5.00%, 3/1/2024 | 25,000 | 25,188 |
Peters Township School District Washington County GO, 5.00%, 1/15/2026 | 20,000 | 20,736 |
Philadelphia Authority for Industrial Development | ||
Series B-2, Rev., VRDO, LOC : TD Bank NA, 4.01%, 9/8/2023 (c) | 25,000,000 | 25,000,000 |
Series 2019, Rev., 5.00%, 10/1/2023 | 3,265,000 | 3,268,239 |
Series 2016, Rev., 5.00%, 4/1/2028 | 320,000 | 327,359 |
Philadelphia Gas Works Co. Series 13, Rev., 5.00%, 8/1/2024 | 750,000 | 759,823 |
Pittsburgh School District GO, AGM, 5.00%, 9/1/2023 | 25,000 | 25,000 |
INVESTMENTS | PRINCIPAL AMOUNT($) | VALUE($) |
Pennsylvania — continued | ||
Pittsburgh Water & Sewer Authority, First Lien Series B, Rev., 5.25%, 9/1/2023 (b) | 200,000 | 200,000 |
Reading Area Water Authority Rev., AGM, 4.00%, 12/1/2023 | 75,000 | 75,021 |
Salisbury Township School District Series 2021A, GO, 4.00%, 10/15/2023 | 590,000 | 590,207 |
School District of Philadelphia (The) | ||
Series 2018A, GO, 5.00%, 9/1/2023 | 600,000 | 600,000 |
Series 2019A, GO, 5.00%, 9/1/2023 | 1,945,000 | 1,945,000 |
Series 2020, GO, 5.00%, 9/1/2023 | 2,200,000 | 2,200,000 |
Series 2021A, GO, 5.00%, 9/1/2023 | 590,000 | 590,000 |
Series F, GO, 5.00%, 9/1/2023 | 500,000 | 500,000 |
Series F, GO, 5.00%, 9/1/2024 | 5,545,000 | 5,617,023 |
Southeastern Pennsylvania Transportation Authority | ||
Rev., 5.00%, 3/1/2025 | 45,000 | 46,073 |
Series 2020, Rev., 5.00%, 6/1/2026 | 130,000 | 135,427 |
Series 2020, Rev., 5.00%, 6/1/2028 | 30,000 | 32,370 |
Southeastern Pennsylvania Transportation Authority, Capital Grant Receipts Rev., 5.00%, 6/1/2024 | 20,000 | 20,204 |
Southern Lehigh School District Series A, GO, 5.00%, 9/1/2023 | 35,000 | 35,000 |
Sports and Exhibition Authority of Pittsburgh and Allegheny County Series 2020, Rev., AGM, 4.00%, 2/1/2024 | 75,000 | 75,112 |
State Public School Building Authority, The School District of the City of Harrisburg Project Series 2016A, Rev., AGM, 4.00%, 12/1/2026 (b) | 15,000 | 15,396 |
State Public School Building Authority, Westmoreland County Community College Series 2016A, Rev., AGM, 5.00%, 10/15/2023 | 35,000 | 35,061 |
Township of Hampden Series 2020, GO, 4.00%, 5/15/2024 | 25,000 | 25,069 |
Township of Hempfield GO, 5.00%, 10/15/2023 | 35,000 | 35,059 |
Township of Lower Paxton GO, 4.00%, 4/1/2024 | 30,000 | 30,090 |
Township of Palmer Series 2020A, GO, 5.00%, 11/15/2023 | 30,000 | 30,089 |
Upper Dublin School District Series 2017, GO, 5.00%, 11/15/2024 | 25,000 | 25,464 |
West Jefferson Hills School District | ||
GO, 3.00%, 8/1/2024 | 25,000 | 24,855 |
August 31, 2023 | J.P. Morgan Exchange-Traded Funds | 205 |
AS OF August 31, 2023 (Unaudited) (continued)
INVESTMENTS | PRINCIPAL AMOUNT($) | VALUE($) |
Municipal Bonds — continued | ||
Pennsylvania — continued | ||
Series 2017A, GO, 5.00%, 8/1/2024 | 25,000 | 25,350 |
West View Municipal Authority Water Series 2014, Rev., 5.00%, 11/15/2024 (b) | 2,995,000 | 3,052,652 |
Total Pennsylvania | 171,116,495 | |
Rhode Island — 0.1% | ||
Rhode Island Commerce Corp. | ||
Series 2016A, Rev., 5.00%, 6/15/2024 | 75,000 | 75,830 |
Series 2016B, Rev., 5.00%, 6/15/2028 | 60,000 | 62,268 |
Rhode Island Commerce Corp., Grant Rhode Island Department Of Transportation Series 2016B, Rev., 5.00%, 6/15/2027 | 70,000 | 72,778 |
Rhode Island Health and Educational Building Corp. | ||
Series 2013A, Rev., 5.00%, 9/1/2023 (b) | 20,000 | 20,000 |
Series 2016A, Rev., 5.00%, 5/15/2024 | 125,000 | 126,390 |
Rhode Island Health and Educational Building Corp., Higher Education Facilities, Brown University Rev., 5.00%, 9/1/2023 | 25,000 | 25,000 |
Rhode Island Health and Educational Building Corp., Providence College Series 2012B, Rev., 5.00%, 11/1/2023 | 125,000 | 125,131 |
State of Rhode Island Series 2013E, COP, 4.00%, 10/1/2023 | 1,465,000 | 1,465,554 |
State of Rhode Island and Providence Plantations, Courthouse Project Series 2013A, COP, 5.00%, 10/1/2023 | 45,000 | 45,049 |
Total Rhode Island | 2,018,000 | |
South Carolina — 0.9% | ||
Beaufort County School District Series 2015B, GO, SCSDE, 5.00%, 3/1/2024 | 30,000 | 30,239 |
Berkeley County School District, Securing Assets for Education Series 2015A, Rev., 5.00%, 12/1/2025 | 95,000 | 95,272 |
Charleston Educational Excellence Finance Corp. Series 2013B, Rev., 5.00%, 12/1/2023 | 815,000 | 818,269 |
Dorchester County School District No. 2 Series 2013B, Rev., 5.00%, 12/1/2027 | 1,075,000 | 1,077,810 |
Dorchester County School District No. 2, Growth Installment Purchase Series 2013B, Rev., 4.00%, 12/1/2024 | 6,320,000 | 6,323,419 |
Greenwood Fifty Schools Facilities, Inc. Series 2016, Rev., 5.00%, 12/1/2023 | 25,000 | 25,088 |
INVESTMENTS | PRINCIPAL AMOUNT($) | VALUE($) |
South Carolina — continued | ||
Lancaster Educational Assistance Program, Inc., School District Project Series 2013B, Rev., 5.00%, 12/1/2023 | 35,000 | 35,124 |
Patriots Energy Group Financing Agency Series 2018A, Rev., LIQ : Royal Bank of Canada, 4.00%, 2/1/2024 (c) | 4,395,000 | 4,384,726 |
Piedmont Municipal Power Agency | ||
Series 2017A, Rev., 5.00%, 1/1/2024 | 110,000 | 110,457 |
Series 2017B, Rev., 5.00%, 1/1/2024 | 50,000 | 50,219 |
Rev., NATL - RE, 5.38%, 1/1/2025 | 105,000 | 107,414 |
Series 2015A, Rev., 5.00%, 1/1/2026 | 1,700,000 | 1,724,432 |
SCAGO Educational Facilities Corp. for Pickens School District Series 2015, Rev., 5.00%, 12/1/2023 | 50,000 | 50,158 |
South Carolina Jobs-Economic Development Authority, Anmed Health Project Rev., 5.00%, 2/1/2024 | 25,000 | 25,122 |
South Carolina Jobs-Economic Development Authority, Bon Secours Mercy Health, Inc. Series 2020B, Rev., 5.00%, 10/1/2025 (c) | 990,000 | 1,012,301 |
South Carolina Jobs-Economic Development Authority, York Preparatory Academy Project Series 2014A, Rev., 7.25%, 11/1/2024 (b) (e) | 5,250,000 | 5,456,238 |
South Carolina Public Service Authority | ||
Series 2014C, Rev., 5.00%, 12/1/2024 | 50,000 | 50,758 |
Series 2022A, Rev., 5.00%, 12/1/2026 | 465,000 | 483,912 |
South Carolina Public Service Authority, Santee Cooper | ||
Series 2013A, Rev., 5.75%, 12/1/2023 (b) | 40,000 | 40,226 |
Series A, Rev., 5.00%, 12/1/2026 | 1,170,000 | 1,195,219 |
South Carolina Transportation Infrastructure Bank Series 2015A, Rev., 5.00%, 10/1/2024 | 125,000 | 127,027 |
University of South Carolina, Higher Education Facilities Rev., 5.00%, 5/1/2025 | 70,000 | 72,021 |
Total South Carolina | 23,295,451 | |
South Dakota — 0.0% ^ | ||
County of Pennington, Limited Tax Series 2017A, COP, 3.00%, 12/1/2023 | 100,000 | 99,841 |
South Dakota Board of Regents Housing and Auxiliary Facilities System Series 2015, Rev., 5.00%, 4/1/2024 | 20,000 | 20,172 |
206 | J.P. Morgan Exchange-Traded Funds | August 31, 2023 |
INVESTMENTS | PRINCIPAL AMOUNT($) | VALUE($) |
Municipal Bonds — continued | ||
South Dakota — continued | ||
South Dakota State Building Authority | ||
Series 2019A, Rev., 4.00%, 6/1/2024 | 30,000 | 30,116 |
Series D, Rev., 5.00%, 9/1/2024 | 25,000 | 25,374 |
Total South Dakota | 175,503 | |
Tennessee — 0.2% | ||
City of Bristol Electric System Series 2013, Rev., 4.00%, 9/1/2023 (b) | 1,325,000 | 1,325,000 |
City of Chattanooga GO, 3.13%, 10/1/2025 | 140,000 | 138,855 |
City of Knoxville, Wastewater System Series 2020A, Rev., 5.00%, 4/1/2024 | 35,000 | 35,322 |
County of Maury GO, 5.00%, 4/1/2024 | 30,000 | 30,286 |
County of Wilson GO, 4.00%, 4/1/2025 | 750,000 | 750,205 |
Johnson City Health and Educational Facilities Board, Ballad Health Series 2023A, Rev., 5.00%, 7/1/2025 | 755,000 | 770,482 |
Knox County Health Educational and Housing Facility Board, Covenant Health | ||
Series 2012A, Rev., 5.00%, 1/1/2024 | 85,000 | 85,071 |
Series 2012A, Rev., 5.00%, 1/1/2026 | 25,000 | 25,222 |
Metropolitan Government Nashville and Davidson County Health and Educational Facilities Board, Trevecca Nazarene University Project | ||
Series 2021B, Rev., 4.00%, 10/1/2023 | 130,000 | 129,935 |
Series 2021B, Rev., 4.00%, 10/1/2024 | 170,000 | 168,286 |
State of Tennessee Series A, GO, 5.00%, 8/1/2025 (b) | 610,000 | 629,492 |
Tennessee Energy Acquisition Corp., Commodity Project | ||
Series 2021A, Rev., 5.00%, 11/1/2025 | 350,000 | 355,299 |
Series 2021A, Rev., 5.00%, 11/1/2026 | 500,000 | 511,468 |
Tennessee State School Bond Authority, Higher Educational Facilities Second Program | ||
Series B, Rev., 5.00%, 11/1/2023 | 50,000 | 50,126 |
Series B, Rev., 5.00%, 11/1/2024 | 20,000 | 20,384 |
Series 2015B, Rev., 5.00%, 11/1/2025 (b) | 25,000 | 25,942 |
Town of Smyrna GO, 5.00%, 4/1/2024 | 30,000 | 30,284 |
Total Tennessee | 5,081,659 | |
Texas — 7.4% | ||
Arlington Higher Education Finance Corp. Series 2014A, Rev., PSF-GTD, 5.00%, 8/15/2024 (b) | 1,000,000 | 1,013,291 |
INVESTMENTS | PRINCIPAL AMOUNT($) | VALUE($) |
Texas — continued | ||
Austin Independent School District Series A, GO, PSF-GTD, 4.00%, 8/1/2025 (b) | 1,905,000 | 1,925,682 |
Bay City Independent School District, Unlimited Tax GO, PSF-GTD, 5.00%, 2/15/2025 | 40,000 | 40,941 |
Bexar County Hospital District, Limited Tax GO, 5.00%, 2/15/2025 | 55,000 | 56,223 |
Brazosport Water Authority Series 2015C, Rev., 5.00%, 9/1/2024 | 40,000 | 40,574 |
Cameron County Housing Finance Corp.Sunland Country Apartments Series 2021, Rev., 3.95%, 2/1/2024 | 3,500,000 | 3,496,955 |
Central Texas Regional Mobility Authority, Subordinated Lien Series 2020F, Rev., BAN, 5.00%, 1/1/2025 | 55,000 | 55,492 |
City of Abilene GO, 5.00%, 2/15/2024 | 25,000 | 25,174 |
City of Austin | ||
GO, 5.00%, 9/1/2023 | 25,000 | 25,000 |
Series 2022, Rev., 5.00%, 11/15/2023 | 60,000 | 60,192 |
Series 2019B, Rev., 5.00%, 11/15/2024 | 100,000 | 101,952 |
City of Austin Airport System Series 2017A, Rev., 5.00%, 11/15/2027 | 205,000 | 215,419 |
City of Austin, Public Improvement GO, 5.00%, 9/1/2023 | 70,000 | 70,000 |
City of Austin, Water and Wastewater System | ||
Series 2013A, Rev., 5.00%, 11/15/2023 | 5,000 | 5,006 |
Series 2013A, Rev., 5.00%, 11/15/2024 | 15,000 | 15,018 |
City of Brownsville | ||
Rev., AGM, 5.00%, 9/1/2025 | 1,265,000 | 1,299,203 |
Series 2013A, Rev., 5.00%, 9/1/2025 | 200,000 | 200,189 |
City of Brownsville, Utilities System Series 2013A, Rev., 5.00%, 9/1/2024 | 275,000 | 275,266 |
City of Buda GO, 5.00%, 8/15/2024 | 20,000 | 20,285 |
City of Cedar Hill, Refunding and Improvement GO, 5.00%, 2/15/2025 | 40,000 | 40,963 |
City of Conroe | ||
Series 2018B, GO, 5.00%, 11/15/2024 | 110,000 | 112,108 |
Series 2019A, GO, 5.00%, 3/1/2025 | 35,000 | 35,845 |
City of Copperas Cove GO, 4.00%, 8/15/2025 | 25,000 | 25,241 |
City of Dallas | ||
Series 2013, Rev., 5.00%, 10/1/2023 | 275,000 | 275,299 |
GO, 5.00%, 2/15/2024 | 55,000 | 55,404 |
August 31, 2023 | J.P. Morgan Exchange-Traded Funds | 207 |
AS OF August 31, 2023 (Unaudited) (continued)
INVESTMENTS | PRINCIPAL AMOUNT($) | VALUE($) |
Municipal Bonds — continued | ||
Texas — continued | ||
Series 2013A, GO, 5.00%, 2/15/2025 | 25,000 | 25,030 |
City of Dallas, Waterworks and Sewer System Series 2012A, Rev., 5.00%, 10/1/2023 | 120,000 | 120,131 |
City of Deer Park GO, 3.00%, 3/15/2024 | 25,000 | 24,929 |
City of Denton Series 2022, GO, 5.00%, 2/15/2024 | 1,200,000 | 1,208,823 |
City of Denton Utility System Series 2017, Rev., 5.00%, 12/1/2027 | 50,000 | 52,079 |
City of Denton, Utility System Rev., 5.00%, 12/1/2023 | 525,000 | 526,916 |
City of Farmers Branch GO, 4.00%, 2/15/2025 | 35,000 | 35,324 |
City of Friendswood, Waterworks & Sewer System Revenue Series 2018, Rev., 5.00%, 3/1/2024 | 25,000 | 25,180 |
City of Frisco, Collin and Denton Counties GO, 5.00%, 2/15/2025 | 35,000 | 35,853 |
City of Garland, Electric Utility System Series 2016B, Rev., 5.00%, 3/1/2025 | 415,000 | 423,863 |
City of Georgetown Series 2018, GO, 5.00%, 8/15/2024 | 40,000 | 40,581 |
City of Granbury Series 2016A, GO, 4.00%, 8/15/2025 | 35,000 | 35,449 |
City of Heath, Combination Tax and Surplus GO, 5.00%, 2/15/2025 | 40,000 | 40,912 |
City of Houston | ||
Series 2016A, GO, 5.00%, 3/1/2024 | 35,000 | 35,272 |
Series 2021A, GO, 5.00%, 3/1/2026 | 20,000 | 20,721 |
City of Houston, Airport System, Subordinate Lien | ||
Series 2018D, Rev., 5.00%, 7/1/2026 | 45,000 | 47,122 |
Series 2020B, Rev., 5.00%, 7/1/2026 | 35,000 | 36,650 |
Series 2020B, Rev., 5.00%, 7/1/2027 | 50,000 | 53,282 |
Series 2023B, Rev., AGM, 5.00%, 7/1/2028 | 35,000 | 37,951 |
City of Houston, Combined Utility System, First Lien | ||
Series 2013B, Rev., 4.00%, 11/15/2023 | 25,000 | 25,028 |
Series 2002C, Rev., 5.00%, 11/15/2023 | 25,000 | 25,075 |
City of Houston, Combined Utility System, Junior Lien Series A, Rev., AGM, Zero Coupon, 12/1/2024 | 85,000 | 81,194 |
City of Houston, Convention and Entertainment Facilities Series 2015, Rev., 5.00%, 9/1/2023 | 1,005,000 | 1,005,000 |
INVESTMENTS | PRINCIPAL AMOUNT($) | VALUE($) |
Texas — continued | ||
City of Houston, Water and Sewer System Series 1998A, Rev., AGM, Zero Coupon, 12/1/2023 (b) | 80,000 | 79,304 |
City of Kenedy, Combination Tax GO, 4.00%, 5/1/2025 | 25,000 | 25,237 |
City of Lakeway GO, 4.00%, 2/1/2024 | 45,000 | 45,085 |
City of Laredo | ||
GO, 5.00%, 2/15/2024 | 50,000 | 50,053 |
GO, 5.00%, 2/15/2024 | 25,000 | 25,167 |
City of Laredo, Combination Tax GO, 5.00%, 2/15/2025 | 40,000 | 40,884 |
City of Lubbock GO, 5.00%, 2/15/2027 | 20,000 | 20,468 |
City of Lubbock, Electric Light and Power System | ||
Rev., 5.00%, 4/15/2024 | 425,000 | 428,650 |
Series 2018, Rev., 5.00%, 4/15/2024 | 500,000 | 504,294 |
Series 2021, Rev., 5.00%, 4/15/2028 | 35,000 | 37,450 |
City of Mansfield, Combination Tax GO, 2.00%, 2/15/2024 | 25,000 | 24,794 |
City of McKinney GO, 5.00%, 8/15/2025 | 25,000 | 25,783 |
City of Midland Series 2018A, GO, 5.00%, 3/1/2025 | 70,000 | 71,710 |
City of Midland, Certificates of Obligation GO, 5.00%, 3/1/2025 | 40,000 | 40,977 |
City of Midlothian, Combination Tax, Navarro College District GO, 3.00%, 8/15/2024 | 25,000 | 24,774 |
City of Missouri City GO, 5.00%, 6/15/2024 | 30,000 | 30,339 |
City of Missouri City, Combination Tax, Certificates of Obligation Series 2018B, GO, 4.00%, 6/15/2025 | 25,000 | 25,241 |
City of Mont Belvieu, Certificates of Obligation Series 2017A, GO, 5.00%, 8/15/2024 | 25,000 | 25,356 |
City of New Braunfels Series 2016, Rev., 5.00%, 7/1/2024 | 150,000 | 151,976 |
City of New Braunfels, Combination Tax, Certificates of Obligation GO, 5.00%, 2/1/2025 | 40,000 | 40,831 |
City of Odessa Series 2015, GO, 5.00%, 3/1/2024 | 250,000 | 251,847 |
City of Pasadena Series 2012A, GO, 5.00%, 2/15/2024 | 55,000 | 55,069 |
City of Pearland, Permanent Improvement | ||
GO, 5.00%, 3/1/2024 | 40,000 | 40,321 |
Series 2016B, GO, 5.00%, 3/1/2024 | 25,000 | 25,200 |
208 | J.P. Morgan Exchange-Traded Funds | August 31, 2023 |
INVESTMENTS | PRINCIPAL AMOUNT($) | VALUE($) |
Municipal Bonds — continued | ||
Texas — continued | ||
City of Plano | ||
GO, 5.00%, 9/1/2023 | 30,000 | 30,000 |
Series 2022, GO, 4.00%, 9/1/2024 | 1,370,000 | 1,378,583 |
City of Port Aransas, Combination Tax, Certificates of Obligation GO, 4.00%, 2/1/2025 | 25,000 | 25,227 |
City of Round Rock Series 2017, GO, 5.00%, 8/15/2024 | 30,000 | 30,469 |
City of Sachse, Combination Tax and Limited Surplus Series 2017A, GO, 4.00%, 2/15/2025 | 65,000 | 65,610 |
City of San Antonio, Drainage Utility System | ||
Rev., 5.00%, 2/1/2024 | 100,000 | 100,115 |
Rev., 5.00%, 2/1/2027 | 50,000 | 50,057 |
City of San Antonio, Electric and Gas Systems Rev., 5.25%, 2/1/2024 | 155,000 | 156,097 |
City of San Marcos, Combination Tax, Certificates of Obligation GO, 5.00%, 8/15/2024 | 35,000 | 35,469 |
City of Sherman, Combination Tax, Certificates of Obligation GO, 5.00%, 8/15/2024 | 25,000 | 25,326 |
City of Waco, Combination Tax, Certificates of Obligation | ||
GO, 5.00%, 2/1/2024 | 20,000 | 20,131 |
GO, 5.00%, 2/1/2025 | 30,000 | 30,694 |
City of Waxahachie Series 2016A, GO, 5.00%, 8/1/2024 | 60,000 | 60,754 |
City of Waxahachie, Combination Tax, Certificates of Obligation GO, 4.00%, 8/1/2024 | 25,000 | 25,093 |
City of Weatherford GO, 4.00%, 3/1/2025 | 30,000 | 30,253 |
City of Weslaco, Certificates of Obligation GO, 5.00%, 2/15/2024 | 20,000 | 20,125 |
Columbia-Brazoria Independent School District, Unlimited Tax GO, PSF-GTD, 3.00%, 2/1/2025 | 200,000 | 197,885 |
Comal Independent School District Series 2017, GO, PSF-GTD, 5.00%, 2/1/2024 | 100,000 | 100,628 |
Comal Independent School District, Unlimited Tax | ||
GO, PSF-GTD, 5.00%, 2/1/2025 | 55,000 | 56,218 |
Series B, GO, PSF-GTD, 5.00%, 2/1/2025 | 25,000 | 25,161 |
Conroe Independent School District Series 2014, GO, PSF-GTD, 5.00%, 2/15/2026 | 20,000 | 20,127 |
County of Bexar Series 2016, GO, 4.00%, 6/15/2025 (b) | 25,000 | 25,291 |
INVESTMENTS | PRINCIPAL AMOUNT($) | VALUE($) |
Texas — continued | ||
County of Bexar, Combination Tax, Certficates of Obligation Series 2014, GO, 5.00%, 6/15/2024 (b) | 65,000 | 65,874 |
County of Bexar, Flood Control Tax GO, 5.00%, 6/15/2024 | 45,000 | 45,578 |
County of Comal, Limited Tax GO, 4.00%, 2/1/2025 | 35,000 | 35,313 |
County of El Paso Series 2015, GO, 5.00%, 2/15/2024 | 20,000 | 20,116 |
County of Fort Bend Series 2014, GO, 4.50%, 3/1/2024 | 35,000 | 35,024 |
County of Galveston, Limited Tax GO, 5.00%, 2/1/2025 | 30,000 | 30,648 |
County of Harris | ||
Series 2022A, GO, 5.00%, 10/1/2023 | 1,500,000 | 1,501,687 |
Series 2022A, GO, 5.00%, 10/1/2024 | 2,240,000 | 2,278,687 |
County of Harris, Permanent Improvement Series 2017A, GO, 5.00%, 10/1/2023 | 25,000 | 25,028 |
County of Harris, Unlimited Tax Series 2022A, GO, 5.00%, 10/1/2024 | 220,000 | 223,800 |
County of Hays, Limited Tax GO, 5.00%, 2/15/2025 | 35,000 | 35,788 |
County of Nueces, Combination Tax, Certificates of Obligation | ||
GO, 4.00%, 2/15/2025 (b) | 15,000 | 15,106 |
GO, 4.00%, 2/15/2025 | 10,000 | 10,076 |
County of Taylor, Limited Tax GO, 5.00%, 2/15/2025 | 30,000 | 30,671 |
County of Tom Green, Combination Tax and Limited Surplus GO, 5.00%, 2/1/2025 | 35,000 | 35,732 |
County of Williamson Series 2014, GO, 5.00%, 2/15/2024 (b) | 3,640,000 | 3,665,145 |
Cypress-Fairbanks Independent School District Series 2014C, GO, PSF-GTD, 5.00%, 2/15/2027 | 30,000 | 30,198 |
Dallas Area Rapid Transit, Sales Tax, Senior Lien | ||
Rev., 5.00%, 12/1/2024 | 105,000 | 107,000 |
Series 2014A, Rev., 5.00%, 12/1/2024 | 210,000 | 214,000 |
Dallas County Park Cities Municipal Utility District Rev., 4.00%, 8/1/2025 | 25,000 | 25,285 |
Dallas County Utility and Reclamation District Series 2016, GO, 5.00%, 2/15/2028 | 210,000 | 223,922 |
Dallas Fort Worth International Airport | ||
Series 2013F, Rev., 5.00%, 11/1/2023 | 870,000 | 872,053 |
Series 2014C, Rev., 5.00%, 11/1/2023 | 600,000 | 601,227 |
Series 2013F, Rev., 5.13%, 11/1/2023 | 540,000 | 541,378 |
August 31, 2023 | J.P. Morgan Exchange-Traded Funds | 209 |
AS OF August 31, 2023 (Unaudited) (continued)
INVESTMENTS | PRINCIPAL AMOUNT($) | VALUE($) |
Municipal Bonds — continued | ||
Texas — continued | ||
Series 2021B, Rev., 5.00%, 11/1/2024 | 50,000 | 50,773 |
Series 2020B, Rev., 5.00%, 11/1/2025 | 30,000 | 30,973 |
Series 2023B, Rev., 5.00%, 11/1/2026 (f) | 1,600,000 | 1,680,625 |
Series 2023B, Rev., 5.00%, 11/1/2027 (f) | 1,500,000 | 1,604,265 |
Series 2023B, Rev., 5.00%, 11/1/2028 (f) | 1,000,000 | 1,086,075 |
Dallas Independent School District, Unlimited Tax | ||
Series 2016A, GO, PSF-GTD, 4.00%, 2/15/2025 (b) | 25,000 | 25,177 |
GO, PSF-GTD, 5.00%, 2/15/2025 | 50,000 | 51,247 |
Denton County Housing Finance Corp., THF Pathway on Woodrow LP Series 2022, Rev., 5.00%, 2/1/2025 (c) | 3,250,000 | 3,296,062 |
DeSoto Independent School District Series 2013, GO, PSF-GTD, Zero Coupon, 8/15/2025 | 500,000 | 460,983 |
El Paso Housing Finance Corp., Columbia Housing Partners LP Rev., 4.50%, 3/1/2025 (c) | 3,500,000 | 3,521,774 |
Floresville Independent School District, Unlimited Tax GO, PSF-GTD, 3.00%, 2/1/2025 | 35,000 | 34,644 |
Frisco Independent School District Series 2016A, GO, PSF-GTD, 5.00%, 8/15/2025 | 2,500,000 | 2,574,486 |
Galveston Public Facility Corp., The Oleanders at Broadway Rev., 0.47%, 8/1/2024 (c) | 3,775,000 | 3,640,033 |
Garland Independent School District, Unlimited Tax, School Building | ||
Series 2016, GO, PSF-GTD, 5.00%, 2/15/2025 | 20,000 | 20,487 |
Series A, GO, PSF-GTD, 5.00%, 2/15/2025 | 50,000 | 51,219 |
Grand Parkway Transportation Corp. Series 2013B, Rev., 5.25%, 10/1/2023 (b) | 550,000 | 550,635 |
Hallsville Independent School District Series 2020, GO, PSF-GTD, 5.00%, 2/15/2025 | 100,000 | 102,295 |
Harris County Cultural Education Facilities Finance Corp., Memorial Hermann Health System | ||
Series 2019C-2, Rev., (SIFMA Municipal Swap Index Yield + 0.57%), 4.63%, 9/7/2023 (d) | 575,000 | 575,204 |
Series 2019A, Rev., 5.00%, 12/1/2023 | 130,000 | 130,427 |
Series 2014A, Rev., 5.00%, 12/1/2024 | 25,000 | 25,440 |
INVESTMENTS | PRINCIPAL AMOUNT($) | VALUE($) |
Texas — continued | ||
Series 2019A, Rev., 5.00%, 12/1/2024 | 385,000 | 391,769 |
Series 2020C-2, Rev., 5.00%, 12/1/2024 (c) | 160,000 | 162,210 |
Series 2014A, Rev., 5.00%, 12/1/2025 | 20,000 | 20,325 |
Series 2014A, Rev., 5.00%, 12/1/2027 | 25,000 | 25,433 |
Harris County Cultural Education Facilities Finance Corp., Texas Children's Hospital Series 2019A, Rev., 5.00%, 10/1/2023 | 20,000 | 20,020 |
Harris County Flood Control District Series 2021A, GO, 5.00%, 10/1/2023 | 30,000 | 30,035 |
Harris County Health Facilities Development Corp., Sisters of Charity of the Incarnate Word Series 1997B, Rev., 5.75%, 7/1/2027 (b) | 5,995,000 | 6,272,918 |
Hidalgo County Regional Mobility Authority Series 2013, Rev., 5.00%, 12/1/2023 (b) | 50,000 | 50,194 |
Housing Options, Inc., Brooks Manor - The Oaks Project Rev., 0.50%, 3/1/2025 (c) | 6,250,000 | 5,862,710 |
Houston Housing Finance Corp. Multi Family Housing Sunset Garden Apartments Series 2022, Rev., FHA, 4.00%, 10/1/2024 (c) | 300,000 | 299,387 |
Houston Independent School District Series 2014B, GO, PSF-GTD, 4.00%, 2/15/2027 | 25,000 | 25,066 |
Houston Independent School District, Limited Tax Schoolhouse GO, PSF-GTD, 5.00%, 2/15/2025 | 155,000 | 158,711 |
Humble Independent School District, Unlimited Tax School Building Series 2020A, GO, PSF-GTD, 5.00%, 2/15/2025 | 35,000 | 35,838 |
Klein Independent School District, Unlimited Tax | ||
Series 2015A, GO, PSF-GTD, 5.00%, 8/1/2024 | 65,000 | 65,997 |
GO, PSF-GTD, 5.00%, 2/1/2025 | 50,000 | 51,156 |
Lewisville Independent School District, Unlimited Tax | ||
Series 2023, GO, PSF-GTD, 5.00%, 8/15/2024 | 8,500,000 | 8,628,969 |
Series 2023, GO, PSF-GTD, 5.00%, 8/15/2026 | 925,000 | 973,048 |
Lower Colorado River Authority, LCRA Transmission Services Corp. Project | ||
Series 2016, Rev., 5.00%, 5/15/2024 | 100,000 | 101,084 |
Series 2019, Rev., 5.00%, 5/15/2024 | 25,000 | 25,271 |
Series 2022, Rev., 5.00%, 5/15/2024 | 285,000 | 288,091 |
210 | J.P. Morgan Exchange-Traded Funds | August 31, 2023 |
INVESTMENTS | PRINCIPAL AMOUNT($) | VALUE($) |
Municipal Bonds — continued | ||
Texas — continued | ||
Series 2022A, Rev., 5.00%, 5/15/2024 | 650,000 | 657,049 |
Rev., 5.00%, 5/15/2025 | 140,000 | 143,860 |
Rev., 5.00%, 5/15/2026 | 1,100,000 | 1,108,906 |
Series 2019A, Rev., 5.00%, 5/15/2026 | 150,000 | 155,944 |
Series 2019, Rev., 5.00%, 5/15/2028 | 40,000 | 42,857 |
Metropolitan Transit Authority of Harris County, Sales and Use Tax | ||
Series 2016D, Rev., 5.00%, 11/1/2023 | 440,000 | 441,087 |
Series 2017B, Rev., 5.00%, 11/1/2023 | 25,000 | 25,062 |
Series 2017B, Rev., 5.00%, 11/1/2025 | 3,040,000 | 3,139,838 |
Series 2018, Rev., 5.00%, 11/1/2026 | 550,000 | 577,876 |
Metropolitan Transit Authority of Harris County, Sales and Use Tax, Contractual Obligations | ||
Rev., 5.00%, 11/1/2023 | 30,000 | 30,074 |
Series 2015B, Rev., 5.00%, 11/1/2023 | 25,000 | 25,062 |
New Hope Cultural Education Facilities Finance Corp., Jubilee Academic Center Rev., 4.00%, 8/15/2024 (e) | 1,475,000 | 1,456,193 |
New Hope Cultural Education Facilities Finance Corp., Student Housing Texas A&M University Series 2017A, Rev., 5.00%, 4/1/2025 (b) | 1,105,000 | 1,132,176 |
North Harris County Regional Water Authority Series 2016, Rev., 5.00%, 12/15/2023 | 135,000 | 135,582 |
North Texas Municipal Water District Water System | ||
Series 2019A, Rev., 3.00%, 9/1/2024 | 40,000 | 39,798 |
Rev., 5.00%, 9/1/2024 | 30,000 | 30,486 |
North Texas Tollway Authority | ||
Series 2015B, Rev., 5.00%, 1/1/2024 | 100,000 | 100,512 |
Series A, Rev., 5.00%, 1/1/2024 | 130,000 | 130,640 |
Series 2020A, Rev., 5.00%, 1/1/2026 | 70,000 | 72,699 |
North Texas Tollway Authority, First Tier | ||
Series 2016A, Rev., 5.00%, 1/1/2024 | 200,000 | 201,024 |
Series 2019A, Rev., 5.00%, 1/1/2024 | 20,000 | 20,102 |
Series A, Rev., 5.00%, 1/1/2024 | 60,000 | 60,068 |
Series A, Rev., 5.00%, 1/1/2025 | 100,000 | 100,115 |
Series 2016A, Rev., 5.00%, 1/1/2026 | 110,000 | 110,478 |
Series A, Rev., 5.00%, 1/1/2026 | 55,000 | 55,050 |
Series 2016A, Rev., 5.00%, 1/1/2027 | 370,000 | 371,643 |
Series A, Rev., 5.00%, 1/1/2028 | 55,000 | 57,159 |
North Texas Tollway Authority, Second Tier | ||
Series B, Rev., 5.00%, 1/1/2024 | 20,000 | 20,021 |
Series B, Rev., 5.00%, 1/1/2025 | 50,000 | 50,054 |
INVESTMENTS | PRINCIPAL AMOUNT($) | VALUE($) |
Texas — continued | ||
Series B, Rev., 5.00%, 1/1/2026 | 260,000 | 260,170 |
Northwest Independent School District, Unlimited Tax Series 2016A, GO, PSF-GTD, 5.00%, 2/15/2026 (b) | 600,000 | 625,218 |
RBC Municipal Products, Inc. Trust, Floater Certificates Series 2023-G-124, Rev., VRDO, LOC : Royal Bank of Canada, 4.26%, 9/7/2023 (c) (e) | 7,500,000 | 7,500,000 |
Red River Education Finance Corp., Christian University Project Series 2016A, Rev., 5.00%, 3/15/2025 | 50,000 | 51,097 |
Richardson Independent School District, Unlimited Tax Series 2015B, GO, 5.00%, 2/15/2025 | 30,000 | 30,727 |
Robstown Independent School District Series 2016, GO, PSF-GTD, 4.00%, 2/15/2026 | 305,000 | 306,862 |
Rockwall Independent School District, Unlimited Tax GO, PSF-GTD, Zero Coupon, 2/15/2025 | 50,000 | 47,470 |
San Antonio Housing Trust Finance Corp. Series 2010, Rev., FHLMC COLL, LIQ : FHLMC, 3.50%, 10/1/2024 (b) (c) | 2,020,000 | 1,966,705 |
San Antonio Independent School District GO, PSF-GTD, 5.00%, 8/15/2024 | 100,000 | 101,573 |
San Antonio Water System, Junior Lien | ||
Series 2013E, Rev., 5.00%, 9/19/2023 | 20,000 | 20,012 |
Series 2016A, Rev., 5.00%, 5/15/2024 | 25,000 | 25,283 |
Series 2014A, Rev., 5.00%, 5/15/2025 | 45,000 | 45,148 |
San Elizario Independent School District Series 2015, GO, PSF-GTD, 5.00%, 5/1/2025 (b) | 310,000 | 317,790 |
San Jacinto Community College District, Limited Tax GO, 5.00%, 2/15/2025 | 30,000 | 30,727 |
Southwest Higher Education Authority, Inc. Series 2016A, Rev., 5.00%, 10/1/2023 | 80,000 | 80,084 |
Southwest Higher Education Authority, Inc., Southern Methodist University Project Series 2016A, Rev., 5.00%, 10/1/2024 | 20,000 | 20,314 |
State of Texas, Transport Commission GO, 5.00%, 4/1/2024 (b) | 35,000 | 35,322 |
State of Texas, Transportation Commission Series A, GO, 5.00%, 10/1/2023 | 85,000 | 85,102 |
State of Texas, Transportation Commission Mobility Fund GO, 5.00%, 10/1/2024 | 20,000 | 20,180 |
State of Texas, Veterans | ||
Series 2015A, GO, VRDO, LIQ : State Street Bank & Trust Co., 4.15%, 9/8/2023 (c) | 16,570,000 | 16,570,000 |
August 31, 2023 | J.P. Morgan Exchange-Traded Funds | 211 |
AS OF August 31, 2023 (Unaudited) (continued)
INVESTMENTS | PRINCIPAL AMOUNT($) | VALUE($) |
Municipal Bonds — continued | ||
Texas — continued | ||
Series 2013A, GO, VRDO, LIQ : State Street Bank & Trust Co., 4.15%, 9/12/2023 (c) | 10,025,000 | 10,025,000 |
Tarrant County Cultural Education Facilities Finance Corp., Cook Children's Medical Center | ||
Series 2014, Rev., 5.00%, 12/1/2023 | 300,000 | 301,023 |
Series 2014, Rev., 5.00%, 12/1/2026 | 90,000 | 90,214 |
Rev., 5.00%, 12/1/2028 | 345,000 | 345,910 |
Series 2014, Rev., 5.00%, 12/1/2033 | 165,000 | 165,340 |
Series 2013A, Rev., 5.25%, 12/1/2039 | 170,000 | 170,299 |
Tarrant County Cultural Education Facilities Finance Corp., Methodist Hospitals of Dallas Project Series 2013, Rev., 5.00%, 10/1/2023 (b) | 1,775,000 | 1,776,932 |
Tarrant County Cultural Education Facilities Finance Corp., Texas Health Resources System Series 2016A, Rev., 5.00%, 2/15/2024 | 145,000 | 145,906 |
Tender Option Bond Trust Receipts/ Certificates Series 2015-XF0228, Rev., VRDO, LIQ : TD Bank NA, 4.21%, 9/12/2023 (c) (e) | 50,745,000 | 50,745,000 |
Texas A&M University, Financing System Series 2017C, Rev., 5.00%, 5/15/2028 | 80,000 | 85,064 |
Texas Department of Housing & Community Affairs, Fishpond at Corpus Christi Apartments Series 2020, Rev., 4.00%, 12/1/2023 (c) | 1,150,000 | 1,150,054 |
Texas Department of Housing & Community Affairs, Socorro Village Series 2023, Rev., 4.75%, 8/1/2024 (c) | 940,000 | 943,223 |
Texas Department of Housing & Community Affairs, Socorro Village 34 LLC Series 2022, Rev., 4.00%, 8/1/2024 (c) | 3,175,000 | 3,164,302 |
Texas Public Finance Authority Rev., 5.00%, 2/1/2025 | 25,000 | 25,592 |
Texas State University System Series 2017A, Rev., 5.00%, 3/15/2025 | 60,000 | 61,496 |
Texas State University, Financing System Series 2019A, Rev., 5.00%, 3/15/2025 | 40,000 | 40,997 |
Texas Transportation Commission State Highway Fund, First Tier | ||
Rev., 5.00%, 10/1/2023 | 110,000 | 110,132 |
Series 2016B, Rev., 0.56%, 4/1/2026 | 10,135,000 | 9,161,397 |
Texas Water Development Board, State Revolving Fund Series 2020, Rev., 5.00%, 8/1/2025 | 100,000 | 103,214 |
INVESTMENTS | PRINCIPAL AMOUNT($) | VALUE($) |
Texas — continued | ||
Texas Water Development Board, Water Implementation Fund Series 2018A, Rev., 5.00%, 10/15/2024 | 50,000 | 50,846 |
Tomball Independent School District, Unlimited Tax School Building GO, PSF-GTD, 5.00%, 2/15/2025 | 35,000 | 35,873 |
Trinity River Authority, Denton Creek Wastewater Treatment System Rev., 5.00%, 2/1/2024 | 40,000 | 40,245 |
Trinity River Authority, Water Project | ||
Rev., 5.00%, 2/1/2024 | 25,000 | 25,153 |
Rev., 5.00%, 2/1/2025 | 75,000 | 76,610 |
University of Houston Series 2017A, Rev., 5.00%, 2/15/2025 | 45,000 | 46,046 |
University of North Texas System, Financing System | ||
Series 2017A, Rev., 5.00%, 4/15/2025 | 25,000 | 25,638 |
Series 2020A, Rev., 5.00%, 4/15/2025 | 500,000 | 512,770 |
Weatherford Independent School District, Unlimited Tax GO, PSF-GTD, Zero Coupon, 2/15/2025 | 50,000 | 47,530 |
Total Texas | 189,822,607 | |
Utah — 0.2% | ||
City of Salt Lake City, Sales and Excise Tax Series 2016A, Rev., 4.00%, 10/1/2023 | 30,000 | 30,015 |
City of Sandy City, Sales Tax Rev., 5.00%, 3/1/2024 | 25,000 | 25,209 |
City of St. George, Franchise Tax Rev., 5.00%, 12/1/2023 | 40,000 | 40,151 |
City of Woods Cross City Series 2017, Rev., 4.00%, 12/15/2023 | 20,000 | 20,036 |
County of Utah, IHC Health Services, Inc. Series 2020B-1, Rev., 5.00%, 8/1/2024 (c) | 3,775,000 | 3,819,048 |
State of Utah GO, 5.00%, 7/1/2024 | 75,000 | 76,061 |
University of Utah (The) Series 2017A, Rev., 5.00%, 8/1/2024 | 45,000 | 45,654 |
Utah Associated Municipal Power Systems, Horse Butte Wind Series 2017A, Rev., 5.00%, 9/1/2026 | 725,000 | 758,072 |
Utah State Building Ownership Authority, Master Lease Program Series 2012A, Rev., 3.00%, 5/15/2025 | 35,000 | 34,677 |
Total Utah | 4,848,923 | |
Vermont — 0.0% ^ | ||
Vermont Municipal Bond Bank Series 3, Rev., 5.00%, 12/1/2023 | 25,000 | 25,102 |
212 | J.P. Morgan Exchange-Traded Funds | August 31, 2023 |
INVESTMENTS | PRINCIPAL AMOUNT($) | VALUE($) |
Municipal Bonds — continued | ||
Virgin Islands — 0.0% ^ | ||
Matching Fund Special Purpose Securitization Corp. Series 2022A, Rev., 5.00%, 10/1/2025 | 1,000,000 | 1,011,055 |
Virginia — 1.3% | ||
Chesapeake Bay Bridge and Tunnel District General Resolution Series 2019, Rev., BAN, 5.00%, 11/1/2023 | 25,640,000 | 25,682,724 |
City of Chesapeake Series A, Rev., AGM-CR, 4.00%, 7/15/2024 | 25,000 | 25,011 |
City of Hampton Series 2015B, GO, 5.00%, 9/1/2024 (b) | 30,000 | 30,448 |
City of Norfolk | ||
Series A, GO, 5.00%, 10/1/2023 | 10,000 | 10,012 |
Rev., 5.00%, 11/1/2024 | 100,000 | 101,875 |
Commonwealth of Virginia Series 2013B, GO, 4.00%, 6/1/2025 | 20,000 | 20,011 |
County of Chesterfield COP, 4.00%, 11/1/2023 | 100,000 | 100,041 |
County of Fairfax, Public Improvement Series 2015A, GO, 5.00%, 10/1/2023 | 40,000 | 40,047 |
County of Loudoun Series 2016A, GO, 5.00%, 12/1/2023 | 75,000 | 75,301 |
County of Pulaski GO, 5.00%, 2/1/2024 | 40,000 | 40,266 |
Culpeper County Economic Development Authority, Capital Projects Rev., 5.00%, 6/1/2024 | 330,000 | 334,024 |
Henry County Industrial Development Authority Rev., GAN, 2.00%, 9/5/2023 | 1,040,000 | 1,040,000 |
Louisa Industrial Development Authority, Electric and Power Co. Project Series 2008B, Rev., 0.75%, 9/2/2025 (c) | 100,000 | 91,863 |
Virginia College Building Authority Series 2021A, Rev., 5.00%, 9/1/2023 | 2,200,000 | 2,200,000 |
Virginia College Building Authority, Virginia Educational Facilities, Public Higher Education Financing Program | ||
Series 2014B, Rev., 5.00%, 9/1/2023 | 25,000 | 25,000 |
Series 2016A, Rev., 5.00%, 9/1/2023 | 55,000 | 55,000 |
Virginia Commonwealth Transportation Board, Capital Projects | ||
Rev., 5.00%, 5/15/2024 | 35,000 | 35,406 |
Series 2017A, Rev., 5.00%, 5/15/2025 | 40,000 | 41,156 |
Virginia Commonwealth Transportation Board, Federal Highway Transportation Rev., GAN, 5.00%, 3/15/2028 | 20,000 | 21,007 |
Virginia Commonwealth Transportation Board, Federal Transportation Rev., GAN, 5.00%, 3/15/2025 | 30,000 | 30,780 |
INVESTMENTS | PRINCIPAL AMOUNT($) | VALUE($) |
Virginia — continued | ||
Virginia Commonwealth University Health System Authority Series B, Rev., 5.00%, 7/1/2025 | 45,000 | 46,202 |
Virginia Housing Development Authority Series 2020B, Rev., 0.99%, 3/1/2024 | 62,898 | 61,839 |
Virginia Public Building Authority, Public Facilities Series C, Rev., 4.00%, 8/1/2026 | 25,000 | 25,117 |
Virginia Public School Authority, School Financing 1997 Resolution Series 2015A, Rev., 5.00%, 8/1/2024 | 25,000 | 25,388 |
Virginia Resources Authority, Infrastructure Moral Obligation Series 2012B, Rev., 4.00%, 11/1/2024 | 15,000 | 15,007 |
Wise County Industrial Development Authority, Electric and Power Co. Project Series 2010A, Rev., 1.20%, 5/31/2024 (c) | 2,110,000 | 2,055,185 |
Total Virginia | 32,228,710 | |
Washington — 1.5% | ||
Auburn School District No. 408 of King and Pierce Counties, Unlimited Tax GO, 5.00%, 12/1/2024 | 25,000 | 25,510 |
Benton County School District No. 17 Kennewick, Unlimited Tax GO, 5.00%, 12/1/2023 | 60,000 | 60,238 |
Central Washington University Rev., 4.00%, 5/1/2026 | 270,000 | 270,002 |
City of Auburn, Utility System Rev., 5.00%, 12/1/2023 | 35,000 | 35,129 |
City of Edmonds, Water and Sewer Rev., 5.00%, 12/1/2023 | 25,000 | 25,018 |
City of Everett, Water and Sewer Rev., 5.00%, 12/1/2023 | 25,000 | 25,096 |
City of Lynnwood, Utility System Rev., 4.00%, 12/1/2023 | 30,000 | 30,048 |
City of Olympia, Limited Tax GO, 5.00%, 12/1/2024 | 25,000 | 25,510 |
City of Redmond, Utility System Series 2014, Rev., 5.00%, 12/1/2024 (b) | 1,600,000 | 1,632,036 |
City of Richland, Waterworks Utility Rev., 4.00%, 11/1/2023 | 20,000 | 20,018 |
City of Seattle, Drainage and Wastewater System Improvement Series 2021, Rev., 5.00%, 9/1/2023 | 90,000 | 90,000 |
City of Seattle, Limited Tax Series 2013A, GO, 4.00%, 10/1/2023 | 25,000 | 25,007 |
August 31, 2023 | J.P. Morgan Exchange-Traded Funds | 213 |
AS OF August 31, 2023 (Unaudited) (continued)
INVESTMENTS | PRINCIPAL AMOUNT($) | VALUE($) |
Municipal Bonds — continued | ||
Washington — continued | ||
City of Seattle, Municipal Light and Power Improvement Series 2016C, Rev., 5.00%, 10/1/2023 | 45,000 | 45,055 |
City of Spokane, Water and Wastewater System Rev., 5.00%, 12/1/2023 | 20,000 | 20,079 |
City of University Place, Limited Tax GO, 4.00%, 12/1/2023 | 35,000 | 35,054 |
City of Walla Walla, Unlimited Tax GO, 3.00%, 12/1/2023 | 25,000 | 24,965 |
Clark County Public Utility District No. 1 Electric Rev., 5.00%, 1/1/2024 | 15,000 | 15,073 |
Clark County School District No. 37 Vancouver, Unlimited Tax GO, 5.00%, 12/1/2023 | 30,000 | 30,120 |
Clark County, Vancouver School District No. 37 GO, 3.00%, 12/1/2023 | 25,000 | 24,974 |
County of Benton, Limited Tax GO, 3.00%, 12/1/2023 | 30,000 | 29,947 |
County of King, Junior Lien, Sewer Series 2020A, Rev., 0.63%, 1/1/2024 (c) | 1,545,000 | 1,526,474 |
County of King, Sewer, Junior Lien Series 2020B, Rev., 0.88%, 1/1/2026 (c) | 60,000 | 55,918 |
County of Pierce Series A, GO, 5.00%, 8/1/2024 | 20,000 | 20,317 |
County of Skagit, Limited Tax GO, 5.00%, 12/1/2024 | 60,000 | 61,165 |
Eastern Washington University, Services and Activities Fee Series 2016A, Rev., 5.00%, 10/1/2023 | 35,000 | 35,037 |
Energy Northwest, Project 1 Series 2014C, Rev., 5.00%, 7/1/2026 | 90,000 | 91,149 |
Energy Northwest, Project 3 Electric Series 2018C, Rev., 5.00%, 7/1/2025 | 25,000 | 25,766 |
FYI Properties, State of Washington District Project Series 2019, Rev., 5.00%, 6/1/2024 | 55,000 | 55,590 |
King and Snohomish Counties School District No. 417 Northshore, Unlimited Tax GO, 5.00%, 12/1/2024 | 25,000 | 25,522 |
King County Fire Protection District No. 2, Unlimited Tax Series 2016, GO, 4.00%, 12/1/2023 | 100,000 | 100,154 |
King County Fire Protection District No. 39, Unlimited Tax Series 2015A, GO, 5.00%, 12/1/2024 | 40,000 | 40,825 |
King County Public Hospital District No. 1, Valley Medical Center Series 2016, GO, 5.00%, 12/1/2023 | 300,000 | 301,023 |
INVESTMENTS | PRINCIPAL AMOUNT($) | VALUE($) |
Washington — continued | ||
King County Public Hospital District No. 2, Evergreen Healthcare, Limited Tax Series 2015B, GO, 5.00%, 12/1/2024 (b) | 20,000 | 20,400 |
King County School District No. 403 Renton, Unlimited Tax GO, 4.00%, 12/1/2024 | 65,000 | 65,575 |
King County School District No. 405 Bellevue, Unlimited Tax | ||
GO, 5.00%, 12/1/2023 | 45,000 | 45,181 |
GO, 5.00%, 12/1/2024 | 160,000 | 163,399 |
King County School District No. 409 Tahoma Series 2013, GO, 5.00%, 12/1/2028 | 25,000 | 25,092 |
King County School District No. 415 Kent, Unlimited Tax GO, 5.00%, 12/1/2023 | 30,000 | 30,119 |
Lewis County Public Utility District No. 1, Cowlitz Falls Hydro Electric Project Rev., 5.00%, 10/1/2023 | 100,000 | 100,117 |
Port of Seattle | ||
Series 2016, Rev., 5.00%, 2/1/2026 | 80,000 | 83,235 |
Rev., 5.00%, 2/1/2028 | 20,000 | 20,760 |
Port of Seattle Intermediate Lien Series 2022A, Rev., 5.00%, 8/1/2026 | 35,000 | 36,769 |
RBC Municipal Products, Inc. Trust, Floater Certificates Series G-123, Rev., VRDO, LIQ : Royal Bank of Canada, 4.26%, 9/7/2023 (c) (e) | 5,860,000 | 5,860,000 |
Spokane County School District No. 356 Central Valley, Unlimited Tax GO, 5.00%, 12/1/2023 | 45,000 | 45,180 |
State of Washington Series R-2022C, GO, 4.00%, 7/1/2027 | 15,000,000 | 15,514,425 |
State of Washington, Senior 520 Corridor Program, Federal Highway Series 2014C, Rev., 5.00%, 9/1/2024 | 245,000 | 245,160 |
State of Washington, State and Local Agency Personal Property Series 2014B, COP, 5.00%, 7/1/2024 | 50,000 | 50,642 |
State of Washington, State and Local Agency Real and Personal Property Series 2018C, COP, 5.00%, 7/1/2024 | 35,000 | 35,450 |
State of Washington, Various Purpose | ||
Series 2014C, Rev., 5.00%, 9/1/2023 | 70,000 | 70,000 |
Series R-2015E, GO, 5.00%, 7/1/2024 | 25,000 | 25,348 |
Series 2018A, GO, 5.00%, 8/1/2024 | 40,000 | 40,613 |
Series R-2018C, GO, 5.00%, 8/1/2024 | 35,000 | 35,537 |
Series 2021C, COP, 5.00%, 1/1/2025 | 1,000,000 | 1,020,904 |
University of Washington Series 2020C, Rev., 5.00%, 4/1/2026 | 25,000 | 26,050 |
214 | J.P. Morgan Exchange-Traded Funds | August 31, 2023 |
INVESTMENTS | PRINCIPAL AMOUNT($) | VALUE($) |
Municipal Bonds — continued | ||
Washington — continued | ||
Washington Health Care Facilities Authority, Multicare Health System Series B, Rev., 5.00%, 8/15/2026 | 390,000 | 398,338 |
Washington Health Care Facilities Authority, Providence Health and Services | ||
Series 2012A, Rev., 5.00%, 10/1/2023 | 1,430,000 | 1,431,058 |
Series 2012A, Rev., 5.00%, 10/1/2024 | 55,000 | 55,024 |
Series 2012A, Rev., 5.00%, 10/1/2025 | 25,000 | 25,019 |
Series 2012A, Rev., 5.00%, 10/1/2026 | 1,030,000 | 1,030,260 |
Washington Health Care Facilities Authority, Seattle Cancer Care Alliance Rev., 5.00%, 3/1/2026 | 500,000 | 508,271 |
Washington State Housing Finance Commission, Herons Key Senior Living Series A, Rev., 7.00%, 7/1/2025 (b) (e) | 6,530,000 | 6,879,756 |
Washington State Housing Finance Commission, Rockwood Retirement Communities Project Series A, Rev., 7.00%, 7/1/2025 (b) (e) | 1,100,000 | 1,158,918 |
Washington State University Series 2014, Rev., 5.00%, 4/1/2024 (b) | 30,000 | 30,284 |
Total Washington | 39,904,703 | |
West Virginia — 0.0% ^ | ||
West Virginia Economic Development Authority, Appalachian Power Co. Series 2015A, Rev., 2.55%, 4/1/2024 (c) | 135,000 | 133,362 |
West Virginia Economic Development Authority, Correctional Juvenile and Public Safety Facilities | ||
Series 2012A, Rev., 5.00%, 6/1/2024 | 125,000 | 125,123 |
Series 2012A, Rev., 5.00%, 6/1/2025 | 805,000 | 805,828 |
West Virginia Economic Development Authority, Solid Waste Disposal Facilities, Appalachian Power Co. Amos Project Series 2010A, Rev., 0.63%, 12/15/2025 (c) | 100,000 | 91,119 |
Total West Virginia | 1,155,432 | |
Wisconsin — 1.2% | ||
City of De Pere Series 2013A, GO, 3.38%, 12/1/2026 | 460,000 | 457,607 |
City of Madison, Promissory Notes GO, 4.00%, 10/1/2023 | 30,000 | 30,012 |
City of Madison, Water Utility Rev., BAN, 1.50%, 11/1/2024 | 1,075,000 | 1,039,986 |
City of Oak Creek Series 2021B, Rev., 2.00%, 9/21/2023 | 5,020,000 | 5,016,774 |
INVESTMENTS | PRINCIPAL AMOUNT($) | VALUE($) |
Wisconsin — continued | ||
City of Oshkosh, Street Improvement Series 2019A, GO, 2.00%, 12/1/2023 | 200,000 | 199,000 |
County of Milwaukee, Corporate Purpose Series 2018D, GO, 3.00%, 8/1/2024 | 100,000 | 99,195 |
County of Waushara Series 2023A, Rev., 4.75%, 12/1/2023 | 10,200,000 | 10,207,178 |
Milwaukee Redevelopment Authority, Public Schools | ||
Rev., 5.00%, 11/15/2023 | 130,000 | 130,375 |
Series 2016A, Rev., 5.00%, 11/15/2023 | 40,000 | 40,115 |
Public Finance Authority Series 2014A, Rev., 5.75%, 11/15/2024 (b) (e) | 2,550,000 | 2,604,717 |
Public Finance Authority, Coral Academy of Science Series 2021A, Rev., 4.00%, 7/1/2025 | 315,000 | 309,500 |
Public Finance Authority, Entrance Fee Principal Redemption, Searstone CCRC Project Series 2021B2, Rev., 2.25%, 6/1/2027 (e) | 1,975,000 | 1,830,010 |
State of Wisconsin | ||
Series 2016-2, GO, 5.00%, 11/1/2024 | 20,000 | 20,387 |
Series 2014-4, GO, 5.00%, 5/1/2025 | 90,000 | 91,775 |
State of Wisconsin Clean Water Fund Leveraged Loan Portfolio | ||
Series 2015-1, Rev., 5.00%, 6/1/2024 (b) | 530,000 | 535,687 |
Series 20161, Rev., 5.00%, 6/1/2024 (b) | 50,000 | 50,537 |
Village of Fox Crossing, Corporate Purpose GO, 3.00%, 4/1/2024 | 185,000 | 184,131 |
Village of Menomonee Falls, Corporate Purpose Series 2019B, GO, 3.50%, 2/1/2024 | 245,000 | 245,084 |
Wauwatosa School District, School Building and Improvement Series 2019B, GO, 5.00%, 9/1/2024 | 30,000 | 30,480 |
Wisconsin Health and Educational Facilities Authority, Advocate Aurora Health Credit Series 2018B-4, Rev., 5.00%, 1/29/2025 (c) | 420,000 | 427,592 |
Wisconsin Health and Educational Facilities Authority, Advocate Aurora Health Credit Group | ||
Series 2018B-2, Rev., 5.00%, 6/24/2026 (c) | 75,000 | 77,794 |
Series 2018C1, Rev., 5.00%, 7/29/2026 (c) | 630,000 | 654,320 |
August 31, 2023 | J.P. Morgan Exchange-Traded Funds | 215 |
AS OF August 31, 2023 (Unaudited) (continued)
INVESTMENTS | PRINCIPAL AMOUNT($) | VALUE($) |
Municipal Bonds — continued | ||
Wisconsin — continued | ||
Wisconsin Health and Educational Facilities Authority, Ascension Health Alliance Senior Credit Group | ||
Series 2016A, Rev., 5.00%, 11/15/2024 | 375,000 | 381,437 |
Series 2016A, Rev., 5.00%, 11/15/2026 | 2,000,000 | 2,075,341 |
Series 2016A, Rev., 5.00%, 11/15/2028 | 95,000 | 98,738 |
Wisconsin Health and Educational Facilities Authority, Ascension Health Credit | ||
Series 2013A, Rev., 5.00%, 11/15/2023 (b) | 20,000 | 20,053 |
Series 2013B-5, Rev., 5.00%, 12/3/2024 (c) | 1,100,000 | 1,115,137 |
Wisconsin Health and Educational Facilities Authority, Ascension Senior Credit Group Series 2019A, Rev., 5.00%, 11/15/2024 | 250,000 | 254,291 |
Wisconsin Health and Educational Facilities Authority, Mercy Alliance, Inc. Rev., 5.00%, 6/1/2026 | 160,000 | 160,096 |
Wisconsin Health and Educational Facilities Authority, Oakwood Lutheran Senior Ministries | ||
Rev., 4.00%, 1/1/2024 | 160,000 | 159,383 |
Rev., 4.00%, 1/1/2025 | 210,000 | 206,729 |
Wisconsin Health and Educational Facilities Authority, St. John's Community, Inc. Projects Series 2018A, Rev., 4.25%, 9/15/2023 (b) | 1,500,000 | 1,500,297 |
Wisconsin Health and Educational Facilities Authority, The Monroe Clinic, Inc. | ||
Rev., 3.00%, 8/15/2025 (b) | 25,000 | 24,797 |
Rev., 4.00%, 8/15/2025 (b) | 30,000 | 30,332 |
Wisconsin Health and Educational Facilities Authority, Unity Point Health | ||
Series 2014A, Rev., 5.00%, 12/1/2023 | 25,000 | 25,064 |
Series 2014A, Rev., 5.00%, 12/1/2024 | 185,000 | 187,409 |
Series 2014A, Rev., 5.00%, 12/1/2025 | 600,000 | 606,932 |
Total Wisconsin | 31,128,292 | |
Wyoming — 0.0% ^ | ||
Wyoming State Loan and Investment Board, Capital Facilities Series 2012A, Rev., 5.00%, 10/1/2023 | 30,000 | 30,035 |
Total Municipal Bonds (Cost $2,486,408,106) | 2,474,968,241 | |
INVESTMENTS | SHARES | VALUE($) |
Short-Term Investments — 4.0% | ||
Investment Companies — 4.0% | ||
JPMorgan Institutional Tax Free Money Market Fund Class IM Shares, 3.71% (g) (h) (Cost $102,975,787) | 102,969,821 | 102,980,118 |
Total Investments — 100.2% (Cost $2,589,383,893) | 2,577,948,359 | |
Liabilities in Excess of Other Assets — (0.2)% | (5,613,950 ) | |
NET ASSETS — 100.0% | 2,572,334,409 | |
Percentages indicated are based on net assets. |
Abbreviations | |
AGC | Insured by Assured Guaranty Corp. |
AGM | Insured by Assured Guaranty Municipal Corp. |
AMBAC | Insured by American Municipal Bond Assurance Corp. |
AMT | Alternative Minimum Tax |
BAN | Bond Anticipation Note |
CCRC | Congregate Care Retirement Center |
COLL | Collateral |
COP | Certificate of Participation |
CR | Custodial Receipts |
FHA | Federal Housing Administration |
FHLMC | Federal Home Loan Mortgage Corp. |
FNMA | Federal National Mortgage Association |
GAN | Grant Anticipation Notes |
GNMA | Government National Mortgage Association |
GO | General Obligation |
GTD | Guaranteed |
LIQ | Liquidity Agreement |
LOC | Letter of Credit |
MTA | Metropolitan Transportation Authority |
NATL | Insured by National Public Finance Guarantee Corp. |
PSF-GTD | Permanent School Fund Guaranteed |
Q-SBLF | Qualified School Bond Loan Fund |
RAN | Revenue Anticipation Note |
RE | Reinsured |
Rev. | Revenue |
SCSDE | South Carolina School District Enhancement |
SIFMA | The Securities Industry and Financial Markets Association |
SOFR | Secured Overnight Financing Rate |
VRDO | Variable Rate Demand Obligation |
XLCA | Insured by XL Capital Assurance |
^ | Amount rounds to less than 0.1% of net assets. | |
(a) | The date shown represents the earliest of the prerefunded date, next put date or final maturity date. | |
(b) | Security is prerefunded or escrowed to maturity. | |
216 | J.P. Morgan Exchange-Traded Funds | August 31, 2023 |
(c) | Variable or floating rate security, the interest rate of which adjusts periodically based on changes in current interest rates and prepayments on the underlying pool of assets. The interest rate shown is the current rate as of August 31, 2023. | |
(d) | Variable or floating rate security, linked to the referenced benchmark. The interest rate shown is the current rate as of August 31, 2023. | |
(e) | Securities exempt from registration under Rule 144A or section 4(a)(2), of the Securities Act of 1933, as amended. |
(f) | All or a portion of the security is a when-issued security, delayed delivery security, or forward commitment. | |
(g) | Investment in an affiliated fund, which is registered under the Investment Company Act of 1940, as amended, and is advised by J.P. Morgan Investment Management Inc. | |
(h) | The rate shown is the current yield as of August 31, 2023. |
August 31, 2023 | J.P. Morgan Exchange-Traded Funds | 217 |
AS OF August 31, 2023 (Unaudited)
JPMorgan Core Plus Bond ETF | JPMorgan Income ETF | JPMorgan International Bond Opportunities ETF | JPMorgan Municipal ETF | |
ASSETS: | ||||
Investments in non-affiliates, at value | $1,233,885,329 | $677,382,509 | $332,780,555 | $579,694,712 |
Investments in affiliates, at value | 235,103,925 | 2,637,620 | 14,922,581 | 65,310,239 |
Cash | — | 26,404 | 47,538 | 13,111 |
Foreign currency, at value | 30 | 37 | 359,753 | — |
Deposits at broker for futures contracts | 7,318,000 | 1,790,000 | 3,513,730 | 210,000 |
Deposits at broker for centrally cleared swaps | 1,028,000 | 3,347,000 | 1,432,000 | — |
Receivables: | ||||
Due from custodian | 97,468 | 204,833 | — | — |
Investment securities sold | 11,881,092 | 2,688,017 | 490,756 | — |
Interest from non-affiliates | 9,086,801 | 5,447,539 | 4,117,031 | 5,584,397 |
Dividends from non-affiliates | 106 | — | — | — |
Dividends from affiliates | 33,973 | 395 | 2,156 | 170,406 |
Tax reclaims | — | — | 17,542 | — |
Variation margin on futures contracts | 437,568 | 131,573 | 702,265 | 12,988 |
Variation margin on centrally cleared swaps | — | 26,731 | 21,687 | 601,618 |
Unrealized appreciation on forward foreign currency exchange contracts | — | — | 2,842,257 | — |
Total Assets | 1,498,872,292 | 693,682,658 | 361,249,851 | 651,597,471 |
LIABILITIES: | ||||
Payables: | ||||
Investment securities purchased | 21,049,049 | 5,772,032 | 1,096,757 | 1,707,184 |
Investment securities purchased — delayed delivery securities | 26,738,580 | 82,209,531 | — | 7,700,959 |
Unrealized depreciation on forward foreign currency exchange contracts | 75,417 | 150,509 | 542,637 | — |
Variation margin on centrally cleared swaps | 529,001 | — | — | — |
Outstanding OTC swap contracts, at value | 97,968 | 83,873 | — | — |
Accrued liabilities: | ||||
Management fees (See Note 3.A.) | 440,576 | 195,805 | 148,890 | 87,076 |
Deferred foreign capital gains tax | — | — | 13,554 | — |
Total Liabilities | 48,930,591 | 88,411,750 | 1,801,838 | 9,495,219 |
Net Assets | $1,449,941,701 | $605,270,908 | $359,448,013 | $642,102,252 |
218 | J.P. Morgan Exchange-Traded Funds | August 31, 2023 |
JPMorgan Core Plus Bond ETF | JPMorgan Income ETF | JPMorgan International Bond Opportunities ETF | JPMorgan Municipal ETF | |
NET ASSETS: | ||||
Paid-in-Capital | $1,513,375,630 | $627,365,878 | $396,061,184 | $654,110,351 |
Total distributable earnings (loss) | (63,433,929 ) | (22,094,970 ) | (36,613,171 ) | (12,008,099 ) |
Total Net Assets | $1,449,941,701 | $605,270,908 | $359,448,013 | $642,102,252 |
Outstanding number of shares (unlimited number of shares authorized - par value $0.0001) | 31,600,000 | 13,530,000 | 7,800,000 | 12,950,000 |
Net asset value, per share | $45.88 | $44.74 | $46.08 | $49.58 |
Cost of investments in non-affiliates | $1,282,079,023 | $689,042,499 | $361,873,276 | $587,326,934 |
Cost of investments in affiliates | 235,103,925 | 2,637,620 | 14,922,581 | 65,306,566 |
Cost of foreign currency | 28 | 37 | 747,342 | — |
Net upfront payments/(receipts) on centrally cleared swaps | 67,379 | (824,430 ) | (109,983 ) | (221,496 ) |
Net upfront payments on OTC swap contracts | 51,886 | 26,082 | — | — |
August 31, 2023 | J.P. Morgan Exchange-Traded Funds | 219 |
AS OF August 31, 2023 (Unaudited) (continued)
JPMorgan Short Duration Core Plus ETF | JPMorgan Ultra-Short Income ETF | JPMorgan Ultra-Short Municipal Income ETF | |
ASSETS: | |||
Investments in non-affiliates, at value | $250,290,578 | $21,174,103,538 | $2,474,968,241 |
Investments in affiliates, at value | 5,674,554 | 1,325,392,391 | 102,980,118 |
Investments of cash collateral received from securities loaned, at value (See Note 2.E.) | 607,965 | 8,510,784 | — |
Repurchase agreements, at value | — | 200,000,000 | — |
Cash | 28,338 | 9,114,694 | 140,174 |
Foreign currency, at value | 42 | — | — |
Deposits at broker for futures contracts | — | 240,800 | — |
Receivables: | |||
Investment securities sold | 70,526 | 19,023,554 | — |
Fund shares sold | 1,831,345 | — | 4,943 |
Interest from non-affiliates | 1,745,614 | 165,060,354 | 25,310,622 |
Dividends from affiliates | 849 | 191,521 | 292,220 |
Securities lending income (See Note 2.E.) | 942 | 12,783 | — |
Variation margin on futures contracts | 35,136 | — | — |
Variation margin on centrally cleared swaps | 1,988 | — | — |
Total Assets | 260,287,877 | 22,901,650,419 | 2,603,696,318 |
LIABILITIES: | |||
Payables: | |||
Investment securities purchased | 1,869,939 | 133,576,413 | 1,116,952 |
Investment securities purchased — delayed delivery securities | — | — | 29,877,585 |
Collateral received on securities loaned (See Note 2.E.) | 607,965 | 8,510,784 | — |
Accrued liabilities: | |||
Management fees (See Note 3.A.) | 70,562 | 3,359,466 | 367,372 |
Total Liabilities | 2,548,466 | 145,446,663 | 31,361,909 |
Net Assets | $257,739,411 | $22,756,203,756 | $2,572,334,409 |
NET ASSETS: | |||
Paid-in-Capital | $275,075,371 | $22,864,624,379 | $2,596,213,512 |
Total distributable earnings (loss) | (17,335,960 ) | (108,420,623 ) | (23,879,103 ) |
Total Net Assets | $257,739,411 | $22,756,203,756 | $2,572,334,409 |
Outstanding number of shares (unlimited number of shares authorized - par value $0.0001) | 5,630,000 | 452,950,000 | 50,800,000 |
Net asset value, per share | $45.78 | $50.24 | $50.64 |
Cost of investments in non-affiliates | $258,516,257 | $21,263,147,339 | $2,486,408,106 |
Cost of investments in affiliates | 5,674,175 | 1,325,392,391 | 102,975,787 |
Cost of repurchase agreements | — | 200,000,000 | — |
Cost of foreign currency | 42 | — | — |
Investment securities on loan, at value (See Note 2.E.) | 589,233 | 8,275,241 | — |
Cost of investment of cash collateral (See Note 2.E.) | 607,965 | 8,510,784 | — |
Net upfront receipts on centrally cleared swaps | (5,495 ) | — | — |
220 | J.P. Morgan Exchange-Traded Funds | August 31, 2023 |
FOR THE SIX MONTHS ENDED August 31, 2023 (Unaudited)
JPMorgan Core Plus Bond ETF | JPMorgan Income ETF | JPMorgan International Bond Opportunities ETF | JPMorgan Municipal ETF | |
INVESTMENT INCOME: | ||||
Interest income from non-affiliates | $23,141,552 | $15,291,664 | $7,713,096 | $8,114,474 |
Interest income from affiliates | — | 1,024 | 1,656 | — |
Dividend income from non-affiliates | 563 | — | — | — |
Dividend income from affiliates | 3,693,503 | 220,558 | 173,337 | 692,293 |
Total investment income | 26,835,618 | 15,513,246 | 7,888,089 | 8,806,767 |
EXPENSES: | ||||
Management fees (See Note 3.A.) | 2,061,529 | 929,908 | 799,839 | 420,154 |
Interest expense to non-affiliates | 10,882 | 3,946 | 1,810 | 59 |
Interest expense to affiliates | — | 57 | 3,537 | 1,583 |
Total expenses | 2,072,411 | 933,911 | 805,186 | 421,796 |
Net investment income (loss) | 24,763,207 | 14,579,335 | 7,082,903 | 8,384,971 |
REALIZED/UNREALIZED GAINS (LOSSES): | ||||
Net realized gain (loss) on transactions from: | ||||
Investments in non-affiliates | (4,240,707 ) | (3,159,842 ) | (2,868,915 )(a) | (760,604 ) |
Investments in affiliates | — | (735 ) | — | (2,943 ) |
Futures contracts | (8,935,953 ) | (3,921,051 ) | (2,831,302 ) | (153,788 ) |
Foreign currency transactions | — | 5 | 614,724 | — |
Forward foreign currency exchange contracts | (260,895 ) | (526,200 ) | (2,839,612 ) | — |
Swaps | 82,518 | (538,889 ) | (228,990 ) | (724,631 ) |
Net realized gain (loss) | (13,355,037 ) | (8,146,712 ) | (8,154,095 ) | (1,641,966 ) |
Change in net unrealized appreciation/depreciation on: | ||||
Investments in non-affiliates | (6,857,184 ) | 2,350,037 | 7,437,835 | (2,831,120 ) |
Investments in affiliates | — | 14 | — | 1,897 |
Futures contracts | 2,544,712 | 564,983 | (585,219 ) | 50,893 |
Foreign currency translations | — | — | (157,838 ) | — |
Forward foreign currency exchange contracts | 34,463 | 78,571 | (1,510,628 ) | — |
Swaps | 88,147 | (1,261,264 ) | (592,492 ) | 425,403 |
Change in net unrealized appreciation/depreciation | (4,189,862 ) | 1,732,341 | 4,591,658 | (2,352,927 ) |
Net realized/unrealized gains (losses) | (17,544,899 ) | (6,414,371 ) | (3,562,437 ) | (3,994,893 ) |
Change in net assets resulting from operations | $7,218,308 | $8,164,964 | $3,520,466 | $4,390,078 |
August 31, 2023 | J.P. Morgan Exchange-Traded Funds | 221 |
FOR THE SIX MONTHS ENDED August 31, 2023 (Unaudited) (continued)
JPMorgan Short Duration Core Plus ETF | JPMorgan Ultra-Short Income ETF | JPMorgan Ultra-Short Municipal Income ETF | |
INVESTMENT INCOME: | |||
Interest income from non-affiliates | $4,733,621 | $507,739,884 | $38,762,889 |
Interest income from affiliates | 507 | 7,744 | — |
Dividend income from affiliates | 155,882 | 80,742,294 | 2,458,936 |
Income from securities lending (net) (See Note 2.E.) | 8,067 | 81,544 | — |
Total investment income | 4,898,077 | 588,571,466 | 41,221,825 |
EXPENSES: | |||
Management fees (See Note 3.A.) | 360,068 | 19,897,650 | 2,156,562 |
Interest expense to non-affiliates | 1,051 | — | 3,743 |
Interest expense to affiliates | 416 | 15,077 | 10,547 |
Total expenses | 361,535 | 19,912,727 | 2,170,852 |
Net investment income (loss) | 4,536,542 | 568,658,739 | 39,050,973 |
REALIZED/UNREALIZED GAINS (LOSSES): | |||
Net realized gain (loss) on transactions from: | |||
Investments in non-affiliates | (1,447,057 ) | (58,402,225 ) | (1,402,866 ) |
Investments in affiliates | (1,604 ) | — | (6,836 ) |
Futures contracts | (716,468 ) | (42,712,853 ) | (1,776,264 ) |
Foreign currency transactions | 115 | — | — |
Forward foreign currency exchange contracts | (113 ) | — | — |
Swaps | (46,463 ) | — | — |
Net realized gain (loss) | (2,211,590 ) | (101,115,078 ) | (3,185,966 ) |
Change in net unrealized appreciation/depreciation on: | |||
Investments in non-affiliates | 1,426,189 | 52,547,870 | 2,194,330 |
Investments in affiliates | 379 | 1,000 | (6,380 ) |
Futures contracts | 133,271 | — | 325,334 |
Foreign currency translations | (1 ) | — | — |
Swaps | (9,036 ) | — | — |
Change in net unrealized appreciation/depreciation | 1,550,802 | 52,548,870 | 2,513,284 |
Net realized/unrealized gains (losses) | (660,788 ) | (48,566,208 ) | (672,682 ) |
Change in net assets resulting from operations | $3,875,754 | $520,092,531 | $38,378,291 |
222 | J.P. Morgan Exchange-Traded Funds | August 31, 2023 |
FOR THE PERIODS INDICATED
JPMorgan Core Plus Bond ETF | JPMorgan Income ETF | |||
Six Months Ended August 31, 2023 (Unaudited) | Year Ended February 28, 2023 | Six Months Ended August 31, 2023 (Unaudited) | Year Ended February 28, 2023 | |
CHANGE IN NET ASSETS RESULTING FROM OPERATIONS: | ||||
Net investment income (loss) | $24,763,207 | $15,449,243 | $14,579,335 | $9,509,946 |
Net realized gain (loss) | (13,355,037 ) | (8,263,378 ) | (8,146,712 ) | (5,053,206 ) |
Change in net unrealized appreciation/depreciation | (4,189,862 ) | (34,402,057 ) | 1,732,341 | (10,704,366 ) |
Change in net assets resulting from operations | 7,218,308 | (27,216,192 ) | 8,164,964 | (6,247,626 ) |
DISTRIBUTIONS TO SHAREHOLDERS: | ||||
Total distributions to shareholders | (21,310,110 ) | (13,633,852 ) | (12,228,022 ) | (8,447,314 ) |
CAPITAL TRANSACTIONS: | ||||
Change in net assets resulting from capital transactions | 701,359,922 | 526,669,693 | 260,423,076 | 225,744,829 |
NET ASSETS: | ||||
Change in net assets | 687,268,120 | 485,819,649 | 256,360,018 | 211,049,889 |
Beginning of period | 762,673,581 | 276,853,932 | 348,910,890 | 137,861,001 |
End of period | $1,449,941,701 | $762,673,581 | $605,270,908 | $348,910,890 |
CAPITAL TRANSACTIONS: | ||||
Proceeds from shares issued | $701,359,922 | $526,669,693 | $260,423,076 | $225,744,829 |
Total change in net assets resulting from capital transactions | $701,359,922 | $526,669,693 | $260,423,076 | $225,744,829 |
SHARE TRANSACTIONS: | ||||
Issued | 15,100,000 | 11,200,000 | 5,760,000 | 4,950,000 |
Net increase (decrease) in shares from share transactions | 15,100,000 | 11,200,000 | 5,760,000 | 4,950,000 |
August 31, 2023 | J.P. Morgan Exchange-Traded Funds | 223 |
FOR THE PERIODS INDICATED (continued)
JPMorgan International Bond Opportunities ETF | JPMorgan Municipal ETF | |||
Six Months Ended August 31, 2023 (Unaudited) | Year Ended February 28, 2023 | Six Months Ended August 31, 2023 (Unaudited) | Year Ended February 28, 2023 | |
CHANGE IN NET ASSETS RESULTING FROM OPERATIONS: | ||||
Net investment income (loss) | $7,082,903 | $10,187,081 | $8,384,971 | $6,193,320 |
Net realized gain (loss) | (8,154,095 ) | (4,176,011 ) | (1,641,966 ) | (4,252,858 ) |
Distributions of capital gains received from investment company affiliates | — | — | — | 1,815 |
Change in net unrealized appreciation/depreciation | 4,591,658 | (12,105,884 ) | (2,352,927 ) | (4,719,224 ) |
Change in net assets resulting from operations | 3,520,466 | (6,094,814 ) | 4,390,078 | (2,776,947 ) |
DISTRIBUTIONS TO SHAREHOLDERS: | ||||
Total distributions to shareholders | (8,103,088 ) | (9,201,940 ) | (7,578,061 ) | (5,243,802 ) |
CAPITAL TRANSACTIONS: | ||||
Change in net assets resulting from capital transactions | 79,523,199 | (23,314,375 ) | 237,147,692 | 315,520,744 |
NET ASSETS: | ||||
Change in net assets | 74,940,577 | (38,611,129 ) | 233,959,709 | 307,499,995 |
Beginning of period | 284,507,436 | 323,118,565 | 408,142,543 | 100,642,548 |
End of period | $359,448,013 | $284,507,436 | $642,102,252 | $408,142,543 |
CAPITAL TRANSACTIONS: | ||||
Proceeds from shares issued | $79,523,199 | $37,437,091 | $237,147,692 | $346,910,716 |
Cost of shares redeemed | — | (60,751,466 ) | — | (31,389,972 ) |
Total change in net assets resulting from capital transactions | $79,523,199 | $(23,314,375 ) | $237,147,692 | $315,520,744 |
SHARE TRANSACTIONS: | ||||
Issued | 1,700,000 | 800,000 | 4,750,000 | 6,950,000 |
Redeemed | — | (1,300,000 ) | — | (650,000 ) |
Net increase (decrease) in shares from share transactions | 1,700,000 | (500,000 ) | 4,750,000 | 6,300,000 |
224 | J.P. Morgan Exchange-Traded Funds | August 31, 2023 |
JPMorgan Short Duration Core Plus ETF | JPMorgan Ultra-Short Income ETF | |||
Six Months Ended August 31, 2023 (Unaudited) | Year Ended February 28, 2023 | Six Months Ended August 31, 2023 (Unaudited) | Year Ended February 28, 2023 | |
CHANGE IN NET ASSETS RESULTING FROM OPERATIONS: | ||||
Net investment income (loss) | $4,536,542 | $5,819,211 | $568,658,739 | $495,099,163 |
Net realized gain (loss) | (2,211,590 ) | (7,004,929 ) | (101,115,078 ) | 18,789,084 |
Change in net unrealized appreciation/depreciation | 1,550,802 | (4,603,014 ) | 52,548,870 | (52,916,345 ) |
Change in net assets resulting from operations | 3,875,754 | (5,788,732 ) | 520,092,531 | 460,971,902 |
DISTRIBUTIONS TO SHAREHOLDERS: | ||||
Total distributions to shareholders | (4,365,870 ) | (5,562,119 ) | (547,437,731 ) | (471,003,120 ) |
CAPITAL TRANSACTIONS: | ||||
Change in net assets resulting from capital transactions | 67,807,530 | 9,311,169 | (2,360,951,811 ) | 6,468,357,505 |
NET ASSETS: | ||||
Change in net assets | 67,317,414 | (2,039,682 ) | (2,388,297,011 ) | 6,458,326,287 |
Beginning of period | 190,421,997 | 192,461,679 | 25,144,500,767 | 18,686,174,480 |
End of period | $257,739,411 | $190,421,997 | $22,756,203,756 | $25,144,500,767 |
CAPITAL TRANSACTIONS: | ||||
Proceeds from shares issued | $67,807,530 | $74,909,941 | $1,038,666,963 | $9,164,313,805 |
Cost of shares redeemed | — | (65,598,772 ) | (3,399,618,774 ) | (2,695,956,300 ) |
Total change in net assets resulting from capital transactions | $67,807,530 | $9,311,169 | $(2,360,951,811 ) | $6,468,357,505 |
SHARE TRANSACTIONS: | ||||
Issued | 1,480,000 | 1,620,000 | 20,700,000 | 182,650,000 |
Redeemed | — | (1,430,000 ) | (67,800,000 ) | (53,750,000 ) |
Net increase (decrease) in shares from share transactions | 1,480,000 | 190,000 | (47,100,000 ) | 128,900,000 |
August 31, 2023 | J.P. Morgan Exchange-Traded Funds | 225 |
FOR THE PERIODS INDICATED (continued)
JPMorgan Ultra-Short Municipal Income ETF | ||
Six Months Ended August 31, 2023 (Unaudited) | Year Ended February 28, 2023 | |
CHANGE IN NET ASSETS RESULTING FROM OPERATIONS: | ||
Net investment income (loss) | $39,050,973 | $42,193,863 |
Net realized gain (loss) | (3,185,966 ) | (16,769,517 ) |
Distributions of capital gains received from investment company affiliates | — | 13,700 |
Change in net unrealized appreciation/depreciation | 2,513,284 | (2,836,541 ) |
Change in net assets resulting from operations | 38,378,291 | 22,601,505 |
DISTRIBUTIONS TO SHAREHOLDERS: | ||
Total distributions to shareholders | (37,154,845 ) | (37,164,875 ) |
CAPITAL TRANSACTIONS: | ||
Change in net assets resulting from capital transactions | 50,649,462 | (581,594,995 ) |
NET ASSETS: | ||
Change in net assets | 51,872,908 | (596,158,365 ) |
Beginning of period | 2,520,461,501 | 3,116,619,866 |
End of period | $2,572,334,409 | $2,520,461,501 |
CAPITAL TRANSACTIONS: | ||
Proceeds from shares issued | $235,383,262 | $980,178,647 |
Cost of shares redeemed | (184,733,800 ) | (1,561,773,642 ) |
Total change in net assets resulting from capital transactions | $50,649,462 | $(581,594,995 ) |
SHARE TRANSACTIONS: | ||
Issued | 4,650,000 | 19,300,000 |
Redeemed | (3,650,000 ) | (30,900,000 ) |
Net increase (decrease) in shares from share transactions | 1,000,000 | (11,600,000 ) |
226 | J.P. Morgan Exchange-Traded Funds | August 31, 2023 |
FOR THE PERIODS INDICATED
Per share operating performance | |||||||
Investment operations | Distributions | ||||||
Net asset value, beginning of period | Net investment income (loss) (b) | Net realized and unrealized gains (losses) on investments | Total from investment operations | Net investment income | Net realized gain | Total distributions | |
JPMorgan Core Plus Bond ETF | |||||||
Six Months Ended August 31, 2023 (Unaudited) | $46.22 | $1.08 | $(0.44 ) | $0.64 | $(0.98 ) | $— | $(0.98 ) |
Year Ended February 28, 2023 | 52.24 | 1.68 | (6.23 ) | (4.55 ) | (1.47 ) | — | (1.47 ) |
Year Ended February 28, 2022 | 54.31 | 1.09 | (1.96 ) | (0.87 ) | (1.09 ) | (0.11 ) | (1.20 ) |
Year Ended February 28, 2021 | 54.17 | 0.97 | 0.70 (f) | 1.67 | (0.88 ) | (0.65 ) | (1.53 ) |
Year Ended February 29, 2020 | 50.36 | 1.45 | 4.13 | 5.58 | (1.44 ) | (0.33 ) | (1.77 ) |
January 28, 2019 (h) through February 28, 2019 | 50.00 | 0.13 | 0.36 | 0.49 | (0.13 ) | — | (0.13 ) |
JPMorgan Income ETF | |||||||
Six Months Ended August 31, 2023 (Unaudited) | 44.90 | 1.41 | (0.34 ) | 1.07 | (1.23 ) | — | (1.23 ) |
Year Ended February 28, 2023 | 48.89 | 2.36 | (4.24 ) | (1.88 ) | (2.10 ) | (0.01 ) | (2.11 ) |
October 28, 2021 (h) through February 28, 2022 | 50.00 | 0.58 | (1.24 ) | (0.66 ) | (0.45 ) | — | (0.45 ) |
JPMorgan International Bond Opportunities ETF | |||||||
Six Months Ended August 31, 2023 (Unaudited) | 46.64 | 1.03 | (0.41 ) | 0.62 | (1.18 ) | — | (1.18 ) |
Year Ended February 28, 2023 | 48.96 | 1.57 | (2.48 ) | (0.91 ) | (1.41 ) | — | (1.41 ) |
Year Ended February 28, 2022 | 51.04 | 1.16 | (1.92 ) | (0.76 ) | (1.32 ) | — | (1.32 ) |
Year Ended February 28, 2021 | 49.98 | 1.45 | 1.00 (f) | 2.45 | (1.39 ) | — | (1.39 ) |
Year Ended February 29, 2020 | 48.75 | 1.71 | 1.86 | 3.57 | (2.34 ) | — | (2.34 ) |
Year Ended February 28, 2019 | 50.54 | 1.94 | (0.97 ) | 0.97 | (2.56 ) | (0.20 ) | (2.76 ) |
JPMorgan Municipal ETF | |||||||
Six Months Ended August 31, 2023 (Unaudited) | 49.77 | 0.85 | (0.24 ) | 0.61 | (0.80 ) | — | (0.80 ) |
Year Ended February 28, 2023 | 52.97 | 1.37 | (3.44 ) | (2.07 ) | (1.13 ) | — | (1.13 ) |
Year Ended February 28, 2022 | 54.37 | 0.85 | (1.18 ) | (0.33 ) | (0.85 ) | (0.22 ) | (1.07 ) |
Year Ended February 28, 2021 | 55.15 | 1.00 | (0.71 ) | 0.29 | (0.94 ) | (0.13 ) | (1.07 ) |
Year Ended February 29, 2020 | 51.92 | 1.24 | 3.91 | 5.15 | (1.22 ) | (0.70 ) | (1.92 ) |
October 29, 2018 (h) through February 28, 2019 | 50.00 | 0.46 | 1.90 | 2.36 | (0.44 ) | — | (0.44 ) |
(a) | Annualized for periods less than one year, unless otherwise noted. |
(b) | Calculated based upon average shares outstanding. |
(c) | Not annualized for periods less than one year. |
(d) | Includes adjustments in accordance with accounting principles generally accepted in the United States of America and as such, the net asset values for financial reporting purposes and the returns based upon those net asset values may differ from the net asset values and returns for shareholder transactions. |
(e) | Prior to December 9, 2019, market price return was calculated assuming an initial investment made at the market price at the beginning of the reporting period, reinvestment of all dividends and distributions at market price during the period, and sale at the market price on the last day of the period. The price used to calculate the market price return was the midpoint of the bid/ask spread at the close of business on the listing exchange of the Fund. Effective December 9, 2019, the closing price was used to calculate the market price return; however, any prices used in the calculation for market price return prior to December 9, 2019, would have used the midpoint of the bid/ask spread at the close of business on the exchange. |
(f) | Calculation of the net realized and unrealized gains (losses) per share does not correlate with the Fund’s net realized and unrealized gains (losses) presented in the Statement of Operations due to the timing of capital transactions in relation to the fluctuating market values of the Fund’s investments. |
(g) | Prior to November 1, 2019, the Fund may have waived fees if expenses exceeded the expense cap. On November 1, 2019, the Fund adopted a unitary fee structure where a management fee is accrued by the Fund based on prior day net assets and other expenses are paid by the Advisor. |
(h) | Commencement of operations. |
(i) | Since the shares of the Fund did not trade in the secondary market until the day after the Fund’s inception, for the period from the inception to the first day of secondary market trading, the net asset value is used as a proxy for the secondary market trading price to calculate the market returns. |
(j) | Certain non-recurring expenses incurred by the Fund were not annualized for the period indicated. |
(k) | Amount rounds to less than 0.5%. |
228 | J.P. Morgan Exchange-Traded Funds | August 31, 2023 |
Ratios/Supplemental data | ||||||||
Ratios to average net assets (a) | ||||||||
Net asset value, end of period | Market price, end of period | Total return (c)(d) | Market price total return (c)(e) | Net assets, end of period | Net expenses | Net investment income (loss) | Expenses without waivers and reimbursements | Portfolio turnover rate (c) |
$45.88 | $46.03 | 1.37 % | 1.52 % | $1,449,941,701 | 0.39 % | 4.62 % | 0.39 % | 14 % |
46.22 | 46.30 | (8.76 ) | (8.84 ) | 762,673,581 | 0.39 | 3.55 | 0.39 | 36 |
52.24 | 52.37 | (1.66 ) | (1.73 ) | 276,853,932 | 0.40 | 2.02 | 0.40 | 81 |
54.31 | 54.48 | 3.08 | 2.87 | 146,648,110 | 0.36 | 1.76 | 0.36 | 272 |
54.17 | 54.44 | 11.24 | 11.52 | 54,168,824 | 0.38 | 2.76 | 0.69 (g) | 91 |
50.36 | 50.48 | 0.97 | 1.21 (i) | 25,178,102 | 0.38 (j) | 2.96 | 5.38 (g)(j) | — (k) |
44.74 | 44.92 | 2.41 | 2.01 | 605,270,908 | 0.40 | 6.24 | 0.40 | 100 |
44.90 | 45.25 | (3.84 ) | (3.52 ) | 348,910,890 | 0.40 | 5.17 | 0.40 | 216 |
48.89 | 49.09 | (1.34 ) | (0.94 )(i) | 137,861,001 | 0.39 | 3.47 | 0.39 | 13 |
46.08 | 46.36 | 1.33 | 1.50 | 359,448,013 | 0.50 | 4.39 | 0.50 | 12 |
46.64 | 46.84 | (1.81 ) | (1.43 ) | 284,507,436 | 0.50 | 3.39 | 0.50 | 71 |
48.96 | 48.98 | (1.56 ) | (2.10 ) | 323,118,565 | 0.50 | 2.28 | 0.50 | 52 |
51.04 | 51.34 | 5.02 | 5.95 | 250,097,283 | 0.50 | 2.90 | 0.50 | 136 |
49.98 | 49.83 | 7.39 | 6.89 | 169,928,839 | 0.53 | 3.40 | 0.69 (g) | 88 |
48.75 | 48.83 | 2.09 | 2.13 | 180,357,231 | 0.54 | 3.92 | 0.82 (g) | 73 |
49.58 | 49.53 | 1.21 | 1.03 | 642,102,252 | 0.17 | 3.36 | 0.17 | 7 |
49.77 | 49.81 | (3.89 ) | (3.88 ) | 408,142,543 | 0.16 | 2.74 | 0.16 | 33 |
52.97 | 53.01 | (0.66 ) | (0.55 ) | 100,642,548 | 0.18 | 1.56 | 0.18 | 48 |
54.37 | 54.35 | 0.54 | 0.67 | 76,120,305 | 0.23 | 1.84 | 0.23 | 56 |
55.15 | 55.06 | 10.09 | 9.71 | 52,390,882 | 0.23 | 2.31 | 0.67 (g) | 51 |
51.92 | 52.01 | 4.74 | 4.92 (i) | 31,153,558 | 0.23 (j) | 2.65 | 1.06 (g)(j) | 15 |
August 31, 2023 | J.P. Morgan Exchange-Traded Funds | 229 |
FOR THE PERIODS INDICATED (continued)
Per share operating performance | |||||||
Investment operations | Distributions | ||||||
Net asset value, beginning of period | Net investment income (loss) (b) | Net realized and unrealized gains (losses) on investments | Total from investment operations | Net investment income | Net realized gain | Total distributions | |
JPMorgan Short Duration Core Plus ETF | |||||||
Six Months Ended August 31, 2023 (Unaudited) | $45.88 | $0.95 | $(0.12 ) | $0.83 | $(0.93 ) | $— | $(0.93 ) |
Year Ended February 28, 2023 | 48.60 | 1.31 | (2.78 ) | (1.47 ) | (1.25 ) | — | (1.25 ) |
March 1, 2021 (f) through February 28, 2022 | 50.00 | 0.62 | (1.42 ) | (0.80 ) | (0.59 ) | (0.01 ) | (0.60 ) |
JPMorgan Ultra-Short Income ETF | |||||||
Six Months Ended August 31, 2023 (Unaudited) | 50.28 | 1.18 | (0.09 ) | 1.09 | (1.13 ) | — | (1.13 ) |
Year Ended February 28, 2023 | 50.35 | 1.17 | (0.18 ) | 0.99 | (0.97 ) | (0.09 ) | (1.06 ) |
Year Ended February 28, 2022 | 50.78 | 0.28 | (0.35 ) | (0.07 ) | (0.32 ) | (0.04 ) | (0.36 ) |
Year Ended February 28, 2021 | 50.51 | 0.58 | 0.28 | 0.86 | (0.59 ) | —(h ) | (0.59 ) |
Year Ended February 29, 2020 | 50.20 | 1.28 | 0.32 | 1.60 | (1.29 ) | — | (1.29 ) |
Year Ended February 28, 2019 | 50.01 | 1.37 | (0.04 )(j) | 1.33 | (1.14 ) | — | (1.14 ) |
JPMorgan Ultra-Short Municipal Income ETF | |||||||
Six Months Ended August 31, 2023 (Unaudited) | 50.61 | 0.78 | (0.01 ) | 0.77 | (0.74 ) | — | (0.74 ) |
Year Ended February 28, 2023 | 50.76 | 0.70 | (0.19 ) | 0.51 | (0.66 ) | — | (0.66 ) |
Year Ended February 28, 2022 | 51.01 | 0.13 | (0.25 ) | (0.12 ) | (0.13 ) | — | (0.13 ) |
Year Ended February 28, 2021 | 50.53 | 0.32 | 0.52 | 0.84 | (0.36 ) | — | (0.36 ) |
Year Ended February 29, 2020 | 50.26 | 0.78 | 0.26 | 1.04 | (0.77 ) | — | (0.77 ) |
October 16, 2018 (f) through February 28, 2019 | 50.00 | 0.35 | 0.23 | 0.58 | (0.32 ) | — | (0.32 ) |
(a) | Annualized for periods less than one year, unless otherwise noted. |
(b) | Calculated based upon average shares outstanding. |
(c) | Not annualized for periods less than one year. |
(d) | Includes adjustments in accordance with accounting principles generally accepted in the United States of America and as such, the net asset values for financial reporting purposes and the returns based upon those net asset values may differ from the net asset values and returns for shareholder transactions. |
(e) | Prior to December 9, 2019, market price return was calculated assuming an initial investment made at the market price at the beginning of the reporting period, reinvestment of all dividends and distributions at market price during the period, and sale at the market price on the last day of the period. The price used to calculate the market price return was the midpoint of the bid/ask spread at the close of business on the listing exchange of the Fund. Effective December 9, 2019, the closing price was used to calculate the market price return; however, any prices used in the calculation for market price return prior to December 9, 2019, would have used the midpoint of the bid/ask spread at the close of business on the exchange. |
(f) | Commencement of operations. |
(g) | Since the shares of the Fund did not trade in the secondary market until the day after the Fund’s inception, for the period from the inception to the first day of secondary market trading, the net asset value is used as a proxy for the secondary market trading price to calculate the market returns. |
(h) | Amount rounds to less than $0.005. |
(i) | Prior to November 1, 2019, the Fund may have waived fees if expenses exceeded the expense cap. On November 1, 2019, the Fund adopted a unitary fee structure where a management fee is accrued by the Fund based on prior day net assets and other expenses are paid by the Advisor. |
(j) | Calculation of the net realized and unrealized gains (losses) per share does not correlate with the Fund’s net realized and unrealized gains (losses) presented in the Statement of Operations due to the timing of capital transactions in relation to the fluctuating market values of the Fund’s investments. |
(k) | Certain non-recurring expenses incurred by the Fund were not annualized for the period indicated. |
230 | J.P. Morgan Exchange-Traded Funds | August 31, 2023 |
Ratios/Supplemental data | ||||||||
Ratios to average net assets (a) | ||||||||
Net asset value, end of period | Market price, end of period | Total return (c)(d) | Market price total return (c)(e) | Net assets, end of period | Net expenses | Net investment income (loss) | Expenses without waivers and reimbursements | Portfolio turnover rate (c) |
$45.78 | $45.84 | 1.83 % | 2.03 % | $257,739,411 | 0.33 % | 4.11 % | 0.33 % | 25 % |
45.88 | 45.85 | (3.03 ) | (3.11 ) | 190,421,997 | 0.32 | 2.82 | 0.32 | 199 |
48.60 | 48.61 | (1.63 ) | (1.61 )(g) | 192,461,679 | 0.32 | 1.26 | 0.32 | 175 |
50.24 | 50.25 | 2.19 | 2.17 | 22,756,203,756 | 0.16 | 4.67 | 0.16 | 38 |
50.28 | 50.30 | 2.01 | 2.00 | 25,144,500,767 | 0.17 | 2.34 | 0.17 | 57 |
50.35 | 50.37 | (0.14 ) | (0.12 ) | 18,686,174,480 | 0.18 | 0.56 | 0.18 | 70 |
50.78 | 50.79 | 1.72 | 1.67 | 16,144,037,713 | 0.17 | 1.14 | 0.17 | 94 |
50.51 | 50.54 | 3.22 | 3.22 | 11,591,489,504 | 0.18 | 2.53 | 0.22 (i) | 46 |
50.20 | 50.23 | 2.68 | 2.66 | 5,703,062,275 | 0.17 | 2.74 | 0.28 (i) | 43 |
50.64 | 50.61 | 1.54 | 1.54 | 2,572,334,409 | 0.17 | 3.07 | 0.17 | 54 |
50.61 | 50.58 | 1.01 | 0.97 | 2,520,461,501 | 0.17 | 1.39 | 0.17 | 94 |
50.76 | 50.75 | (0.23 ) | (0.29 ) | 3,116,619,866 | 0.17 | 0.26 | 0.17 | 50 |
51.01 | 51.03 | 1.66 | 1.64 | 1,410,311,158 | 0.16 | 0.63 | 0.16 | 67 |
50.53 | 50.56 | 2.09 | 2.09 | 207,185,582 | 0.18 | 1.55 | 0.34 (i) | 153 |
50.26 | 50.29 | 1.16 | 1.22 (g) | 57,799,591 | 0.17 (k) | 1.88 | 0.79 (i)(k) | 61 |
August 31, 2023 | J.P. Morgan Exchange-Traded Funds | 231 |
AS OF August 31, 2023 (Unaudited)
Diversification Classification | |
JPMorgan Core Plus Bond ETF | Diversified |
JPMorgan Income ETF | Diversified |
JPMorgan International Bond Opportunities ETF | Diversified |
JPMorgan Municipal ETF | Diversified |
JPMorgan Short Duration Core Plus ETF | Diversified |
JPMorgan Ultra-Short Income ETF | Diversified |
JPMorgan Ultra-Short Municipal Income ETF | Diversified |
Listing Exchange | |
Core Plus Bond ETF | Cboe BZX Exchange, Inc. |
Income ETF | NYSE Arca |
International Bond Opportunities ETF | Cboe BZX Exchange, Inc. |
Municipal ETF | Cboe BZX Exchange, Inc. |
Short Duration Core Plus ETF | NYSE Arca |
Ultra-Short Income ETF | NYSE Arca |
Ultra-Short Municipal Income ETF | Cboe BZX Exchange, Inc. |
232 |
233 |
AS OF August 31, 2023 (Unaudited) (continued)
Core Plus Bond ETF | ||||
Level 1 Quoted prices | Level 2 Other significant observable inputs | Level 3 Significant unobservable inputs | Total | |
Investments in Securities | ||||
Asset-Backed Securities | $— | $211,673,202 | $13,444,777 | $225,117,979 |
Collateralized Mortgage Obligations | — | 48,092,460 | 2,217,680 | 50,310,140 |
Commercial Mortgage-Backed Securities | — | 69,283,112 | 2,458,638 | 71,741,750 |
Common Stocks | ||||
Diversified Telecommunication Services | — | — | 172 | 172 |
Oil, Gas & Consumable Fuels | 16,319 | — | 1,925 | 18,244 |
Professional Services | — | — | 115 | 115 |
Wireless Telecommunication Services | — | — | 6,210 | 6,210 |
Total Common Stocks | 16,319 | — | 8,422 | 24,741 |
Corporate Bonds | ||||
Aerospace & Defense | — | 7,358,085 | — | 7,358,085 |
Automobile Components | — | 4,053,310 | — | 4,053,310 |
Automobiles | — | 2,004,128 | — | 2,004,128 |
Banks | — | 76,585,045 | — | 76,585,045 |
Beverages | — | 2,370,393 | — | 2,370,393 |
Biotechnology | — | 4,719,841 | — | 4,719,841 |
Broadline Retail | — | 2,477,552 | — | 2,477,552 |
Building Products | — | 3,994,902 | — | 3,994,902 |
Capital Markets | — | 25,416,784 | — | 25,416,784 |
Chemicals | — | 5,049,411 | — | 5,049,411 |
Commercial Services & Supplies | — | 4,800,896 | — | 4,800,896 |
Communications Equipment | — | 788,107 | — | 788,107 |
Construction & Engineering | — | 1,440,537 | — | 1,440,537 |
Construction Materials | — | 307,400 | — | 307,400 |
Consumer Finance | — | 14,414,901 | — | 14,414,901 |
Consumer Staples Distribution & Retail | — | 3,088,661 | — | 3,088,661 |
Containers & Packaging | — | 4,519,701 | — | 4,519,701 |
Distributors | — | 665,068 | — | 665,068 |
Diversified Consumer Services | — | 395,242 | — | 395,242 |
Diversified REITs | — | 921,782 | — | 921,782 |
Diversified Telecommunication Services | — | 11,326,931 | 3 | 11,326,934 |
Electric Utilities | — | 29,978,468 | — | 29,978,468 |
Electrical Equipment | — | 1,170,501 | — | 1,170,501 |
Electronic Equipment, Instruments & Components | — | 711,146 | — | 711,146 |
Energy Equipment & Services | — | 1,844,358 | — | 1,844,358 |
Entertainment | — | 9,223,352 | — | 9,223,352 |
Financial Services | — | 4,011,161 | — | 4,011,161 |
Food Products | — | 2,115,194 | — | 2,115,194 |
234 |
Core Plus Bond ETF (continued) | ||||
Level 1 Quoted prices | Level 2 Other significant observable inputs | Level 3 Significant unobservable inputs | Total | |
Gas Utilities | $— | $1,571,640 | $— | $1,571,640 |
Ground Transportation | — | 5,666,631 | — | 5,666,631 |
Health Care Equipment & Supplies | — | 2,889,852 | — | 2,889,852 |
Health Care Providers & Services | — | 16,451,742 | — | 16,451,742 |
Health Care REITs | — | 221,620 | — | 221,620 |
Health Care Technology | — | 393,588 | — | 393,588 |
Hotel & Resort REITs | — | 709,321 | — | 709,321 |
Hotels, Restaurants & Leisure | — | 12,229,820 | — | 12,229,820 |
Household Durables | — | 2,284,937 | — | 2,284,937 |
Household Products | — | 1,527,195 | — | 1,527,195 |
Independent Power and Renewable Electricity Producers | — | 1,449,072 | — | 1,449,072 |
Industrial REITs | — | 732,318 | — | 732,318 |
Insurance | — | 3,737,039 | — | 3,737,039 |
Interactive Media & Services | — | 1,204,937 | — | 1,204,937 |
IT Services | — | 1,014,046 | — | 1,014,046 |
Leisure Products | — | 13,602 | — | 13,602 |
Life Sciences Tools & Services | — | 1,372,254 | — | 1,372,254 |
Machinery | — | 3,232,313 | — | 3,232,313 |
Media | — | 20,955,700 | — | 20,955,700 |
Metals & Mining | — | 4,778,420 | — | 4,778,420 |
Mortgage Real Estate Investment Trusts (REITs) | — | 950,602 | — | 950,602 |
Multi-Utilities | — | 3,655,586 | — | 3,655,586 |
Office REITs | — | 150,719 | — | 150,719 |
Oil, Gas & Consumable Fuels | — | 37,506,876 | — | 37,506,876 |
Passenger Airlines | — | 4,032,377 | — | 4,032,377 |
Personal Care Products | — | 3,055,158 | — | 3,055,158 |
Pharmaceuticals | — | 10,947,846 | — | 10,947,846 |
Real Estate Management & Development | — | 135,464 | — | 135,464 |
Residential REITs | — | 340,032 | — | 340,032 |
Retail REITs | — | 450,532 | — | 450,532 |
Semiconductors & Semiconductor Equipment | — | 6,544,837 | — | 6,544,837 |
Software | — | 5,755,245 | — | 5,755,245 |
Specialized REITs | — | 4,436,215 | — | 4,436,215 |
Specialty Retail | — | 7,844,459 | — | 7,844,459 |
Technology Hardware, Storage & Peripherals | — | 4,013,593 | — | 4,013,593 |
Textiles, Apparel & Luxury Goods | — | 320,259 | — | 320,259 |
Tobacco | — | 7,965,066 | — | 7,965,066 |
Trading Companies & Distributors | — | 3,702,786 | — | 3,702,786 |
Transportation Infrastructure | — | 172,621 | — | 172,621 |
Wireless Telecommunication Services | — | 7,067,403 | — | 7,067,403 |
Total Corporate Bonds | — | 417,236,580 | 3 | 417,236,583 |
Loan Assignments | — | 4,105,576 | — | 4,105,576 |
Mortgage-Backed Securities | — | 285,853,595 | — | 285,853,595 |
Municipal Bonds | — | 67,916 | — | 67,916 |
Preferred Stocks | — | — | 2,223 | 2,223 |
Rights | — | — | 1 | 1 |
U.S. Government Agency Securities | — | 1,612,300 | — | 1,612,300 |
235 |
AS OF August 31, 2023 (Unaudited) (continued)
Core Plus Bond ETF (continued) | ||||
Level 1 Quoted prices | Level 2 Other significant observable inputs | Level 3 Significant unobservable inputs | Total | |
U.S. Treasury Obligations | $— | $177,811,160 | $— | $177,811,160 |
Warrants | — | — | 1,365 | 1,365 |
Short-Term Investments | ||||
Investment Companies | 235,103,925 | — | — | 235,103,925 |
Total Investments in Securities | $235,120,244 | $1,215,735,901 | $18,133,109 | $1,468,989,254 |
Appreciation in Other Financial Instruments | ||||
Futures Contracts | $2,457,012 | $— | $— | $2,457,012 |
Swaps | — | 254,659 | — | 254,659 |
Depreciation in Other Financial Instruments | ||||
Forward Foreign Currency Exchange Contracts | — | (75,417 ) | — | (75,417 ) |
Futures Contracts | (80,675 ) | — | — | (80,675 ) |
Swaps | — | (149,854 ) | — | (149,854 ) |
Total Net Appreciation/ Depreciation in Other Financial Instruments | $2,376,337 | $29,388 | $— | $2,405,725 |
Income ETF | ||||
Level 1 Quoted prices | Level 2 Other significant observable inputs | Level 3 Significant unobservable inputs | Total | |
Investments in Securities | ||||
Asset-Backed Securities | $— | $162,815,070 | $2,142,112 | $164,957,182 |
Collateralized Mortgage Obligations | — | 45,615,779 | 448,550 | 46,064,329 |
Commercial Mortgage-Backed Securities | — | 83,807,020 | — | 83,807,020 |
Corporate Bonds | — | 233,598,053 | — | 233,598,053 |
Foreign Government Securities | — | 16,401,823 | — | 16,401,823 |
Mortgage-Backed Securities | — | 131,954,058 | — | 131,954,058 |
Municipal Bonds | — | 600,044 | — | 600,044 |
Short-Term Investments | ||||
Investment Companies | 2,637,620 | — | — | 2,637,620 |
Total Investments in Securities | $2,637,620 | $674,791,847 | $2,590,662 | $680,020,129 |
Appreciation in Other Financial Instruments | ||||
Futures Contracts | $606,908 | $— | $— | $606,908 |
Swaps | — | 59,746 | — | 59,746 |
Depreciation in Other Financial Instruments | ||||
Forward Foreign Currency Exchange Contracts | — | (150,509 ) | — | (150,509 ) |
Futures Contracts | (175,961 ) | — | — | (175,961 ) |
Swaps | — | (1,479,840 ) | — | (1,479,840 ) |
Total Net Appreciation/ Depreciation in Other Financial Instruments | $430,947 | $(1,570,603 ) | $— | $(1,139,656 ) |
International Bond Opportunities ETF | ||||
Level 1 Quoted prices | Level 2 Other significant observable inputs | Level 3 Significant unobservable inputs | Total | |
Investments in Securities | ||||
Asset-Backed Securities | $— | $5,184,100 | $— | $5,184,100 |
236 |
International Bond Opportunities ETF (continued) | ||||
Level 1 Quoted prices | Level 2 Other significant observable inputs | Level 3 Significant unobservable inputs | Total | |
Collateralized Mortgage Obligations | ||||
United States | $— | $1,774,291 | $1,180,200 | $2,954,491 |
Commercial Mortgage-Backed Securities | — | 3,539,773 | — | 3,539,773 |
Common Stocks | — | — | 172 | 172 |
Corporate Bonds | — | 202,460,970 | — | 202,460,970 |
Foreign Government Securities | — | 117,951,207 | — | 117,951,207 |
Supranational | — | 680,823 | — | 680,823 |
U.S. Treasury Obligations | — | 9,019 | — | 9,019 |
Short-Term Investments | ||||
Investment Companies | 14,922,581 | — | — | 14,922,581 |
Total Investments in Securities | $14,922,581 | $331,600,183 | $1,180,372 | $347,703,136 |
Appreciation in Other Financial Instruments | ||||
Forward Foreign Currency Exchange Contracts | $— | $2,842,257 | $— | $2,842,257 |
Futures Contracts | 1,103,017 | 77,629 | — | 1,180,646 |
Swaps | — | 617,177 | — | 617,177 |
Depreciation in Other Financial Instruments | ||||
Forward Foreign Currency Exchange Contracts | — | (542,637 ) | — | (542,637 ) |
Futures Contracts | (499,622 ) | — | — | (499,622 ) |
Swaps | — | (1,329,925 ) | — | (1,329,925 ) |
Total Net Appreciation/ Depreciation in Other Financial Instruments | $603,395 | $1,664,501 | $— | $2,267,896 |
Municipal ETF | ||||
Level 1 Quoted prices | Level 2 Other significant observable inputs | Level 3 Significant unobservable inputs | Total | |
Investments in Securities | ||||
Municipal Bonds | $— | $575,767,368 | $— | $575,767,368 |
U.S. Treasury Obligations | — | 3,927,344 | — | 3,927,344 |
Short-Term Investments | ||||
Investment Companies | 65,310,239 | — | — | 65,310,239 |
Total Investments in Securities | $65,310,239 | $579,694,712 | $— | $645,004,951 |
Appreciation in Other Financial Instruments | ||||
Futures Contracts | $51,206 | $— | $— | $51,206 |
Depreciation in Other Financial Instruments | ||||
Swaps | — | (137,465 ) | — | (137,465 ) |
Total Net Appreciation/ Depreciation in Other Financial Instruments | $51,206 | $(137,465 ) | $— | $(86,259 ) |
Short Duration Core Plus ETF | ||||
Level 1 Quoted prices | Level 2 Other significant observable inputs | Level 3 Significant unobservable inputs | Total | |
Investments in Securities | ||||
Asset-Backed Securities | $— | $52,814,125 | $1,455,000 | $54,269,125 |
Collateralized Mortgage Obligations | — | 7,605,981 | — | 7,605,981 |
Commercial Mortgage-Backed Securities | — | 11,966,532 | — | 11,966,532 |
237 |
AS OF August 31, 2023 (Unaudited) (continued)
Short Duration Core Plus ETF (continued) | ||||
Level 1 Quoted prices | Level 2 Other significant observable inputs | Level 3 Significant unobservable inputs | Total | |
Corporate Bonds | $— | $91,061,074 | $— | $91,061,074 |
Foreign Government Securities | — | 1,892,177 | — | 1,892,177 |
Mortgage-Backed Securities | — | 35,496,809 | — | 35,496,809 |
Municipal Bonds | — | 107,038 | — | 107,038 |
U.S. Treasury Obligations | — | 42,956,538 | — | 42,956,538 |
Short-Term Investments | ||||
Investment Companies | 5,674,554 | — | — | 5,674,554 |
Investment of Cash Collateral from Securities Loaned | 607,965 | — | — | 607,965 |
U.S. Treasury Obligations | — | 4,935,304 | — | 4,935,304 |
Total Short-Term Investments | 6,282,519 | 4,935,304 | — | 11,217,823 |
Total Investments in Securities | $6,282,519 | $248,835,578 | $1,455,000 | $256,573,097 |
Appreciation in Other Financial Instruments | ||||
Futures Contracts | $224,656 | $— | $— | $224,656 |
Depreciation in Other Financial Instruments | ||||
Futures Contracts | (105,288 ) | — | — | (105,288 ) |
Swaps | — | (53,244 ) | — | (53,244 ) |
Total Net Appreciation/ Depreciation in Other Financial Instruments | $119,368 | $(53,244 ) | $— | $66,124 |
Ultra-Short Income ETF | ||||
Level 1 Quoted prices | Level 2 Other significant observable inputs | Level 3 Significant unobservable inputs | Total | |
Investments in Securities | ||||
Asset-Backed Securities | $— | $1,941,347,805 | $— | $1,941,347,805 |
Commercial Mortgage-Backed Securities | — | 14,054,182 | — | 14,054,182 |
Corporate Bonds | — | 9,009,674,265 | — | 9,009,674,265 |
Foreign Government Securities | — | 4,844,089 | — | 4,844,089 |
U.S. Government Agency Securities | — | 130,618,343 | — | 130,618,343 |
U.S. Treasury Obligations | — | 525,837,433 | — | 525,837,433 |
Short-Term Investments | ||||
Certificates of Deposits | — | 3,306,308,002 | — | 3,306,308,002 |
Commercial Paper | — | 6,241,419,419 | — | 6,241,419,419 |
Investment Companies | 1,325,392,391 | — | — | 1,325,392,391 |
Investment of Cash Collateral from Securities Loaned | 8,510,784 | — | — | 8,510,784 |
Repurchase Agreements | — | 200,000,000 | — | 200,000,000 |
Total Short-Term Investments | 1,333,903,175 | 9,747,727,421 | — | 11,081,630,596 |
Total Investments in Securities | $1,333,903,175 | $21,374,103,538 | $— | $22,708,006,713 |
Ultra-Short Municipal Income ETF | ||||
Level 1 Quoted prices | Level 2 Other significant observable inputs | Level 3 Significant unobservable inputs | Total | |
Investments in Securities | ||||
Municipal Bonds | $— | $2,474,968,241 | $— | $2,474,968,241 |
238 |
Ultra-Short Municipal Income ETF (continued) | ||||
Level 1 Quoted prices | Level 2 Other significant observable inputs | Level 3 Significant unobservable inputs | Total | |
Short-Term Investments | ||||
Investment Companies | $102,980,118 | $— | $— | $102,980,118 |
Total Investments in Securities | $102,980,118 | $2,474,968,241 | $— | $2,577,948,359 |
Core Plus Bond ETF | Balance as of February 28, 2023 | Realized gain (loss) | Change in net unrealized appreciation (depreciation) | Net accretion (amortization) | Purchases1 | Sales2 | Transfers into Level 3 | Transfers out of Level 3 | Other(a) | Balance as of August 31, 2023 |
Investments in Securities: | ||||||||||
Asset-Backed Securities | $2,208,139 | $185 | $(352,398 ) | $18,973 | $11,137,465 | $(1,274,779 ) | $931,367 | $— | $775,825 | $13,444,777 |
Collateralized Mortgage Obligations | 3,547,824 | — | (10,226 ) | 1 | 1,500,000 | (50,465 ) | — | (1,993,629 ) | (775,825 ) | 2,217,680 |
Commercial Mortgage-Backed Securities | 825,407 | 2,786 | (74,587 ) | 1,945 | 2,539,257 | (836,170 ) | — | — | — | 2,458,638 |
Common Stocks | 8,693 | 275 | (271 ) | — | — | (275 ) | — | — | — | 8,422 |
Corporate Bonds | 3 | 6 | — | — | — | (6 ) | — | — | — | 3 |
Preferred Stocks | 2,567 | — | (344 ) | — | — | — | — | — | — | 2,223 |
Rights | 1 | — | — | — | — | — | — | — | — | 1 |
Warrants | 2,460 | — | (1,095 ) | — | — | — | — | — | — | 1,365 |
Total | $6,595,094 | $3,252 | $(438,921 ) | $20,919 | $15,176,722 | $(2,161,695 ) | $931,367 | $(1,993,629 ) | $— | $18,133,109 |
1 | Purchases include all purchases of securities and securities received in corporate actions. | ||||||||
2 | Sales include all sales of securities, maturities, paydowns and securities tendered in corporate actions. | ||||||||
(a) | Certain Level 3 investments were re-classified between Collateralized Mortgage Obligations and Asset-Backed Securities. |
Income ETF | Balance as of February 28, 2023 | Realized gain (loss) | Change in net unrealized appreciation (depreciation) | Net accretion (amortization) | Purchases1 | Sales2 | Transfers into Level 3 | Transfers out of Level 3 | Balance as of August 31, 2023 |
Investments in Securities: | |||||||||
Asset-Backed Securities | $3,524,503 | $— | $3,120 | $(170 ) | $— | $(710,825 ) | $— | $(674,516 ) | $2,142,112 |
Collateralized Mortgage Obligations | 1,620,029 | — | (6,350 ) | — | — | — | — | (1,165,129 ) | 448,550 |
Total | $5,144,532 | $— | $(3,230 ) | $(170 ) | $— | $(710,825 ) | $— | $(1,839,645 ) | $2,590,662 |
1 | Purchases include all purchases of securities and securities received in corporate actions. | ||||||||
2 | Sales include all sales of securities, maturities, paydowns and securities tendered in corporate actions. | ||||||||
239 |
AS OF August 31, 2023 (Unaudited) (continued)
International Bond Opportunities ETF | Balance as of February 28, 2023 | Realized gain (loss) | Change in net unrealized appreciation (depreciation) | Net accretion (amortization) | Purchases1 | Sales2 | Transfers into Level 3 | Transfers out of Level 3 | Balance as of August 31, 2023 |
Investments in Securities: | |||||||||
Collateralized Mortgage Obligations | $1,124,280 | $— | $55,919 | $1 | $— | $— | $— | $— | $1,180,200 |
Commercial Mortgage-Backed Securities | 394,851 | 2,742 | 81 | (360 ) | 2,686 | (400,000 ) | — | — | — |
Common Stocks | — | — | 172 | — | — | — | — | — | 172 |
Warrants | 120 | — | (120 ) | — | — | — | — | — | — |
Total | $1,519,251 | $2,742 | $56,052 | $(359 ) | $2,686 | $(400,000 ) | $— | $— | $1,180,372 |
1 | Purchases include all purchases of securities and securities received in corporate actions. | ||||||||
2 | Sales include all sales of securities, maturities, paydowns and securities tendered in corporate actions. | ||||||||
Short Duration Core Plus ETF | Balance as of February 28, 2023 | Realized gain (loss) | Change in net unrealized appreciation (depreciation) | Net accretion (amortization) | Purchases1 | Sales2 | Transfers into Level 3 | Transfers out of Level 3 | Balance as of August 31, 2023 |
Investments in Securities: | |||||||||
Asset-Backed Securities | $1,755,429 | $— | $14,650 | $1,408 | $499,999 | $(380,436 ) | $116,625 | $(552,675 ) | $1,455,000 |
1 | Purchases include all purchases of securities and securities received in corporate actions. | ||||||||
2 | Sales include all sales of securities, maturities, paydowns and securities tendered in corporate actions. | ||||||||
Bond ETF
Fair Value at August 31, 2023 | Valuation Technique(s) | Unobservable Input | Range (Weighted Average) (a) | |
$8,714 | Discounted Cash Flow | Constant Prepayment Rate | 0.00% - 30.00% (12.09%) | |
Constant Default Rate | 0.00% - 37.00% (2.25%) | |||
Yield (Discount Rate of Cash Flows) | 6.88% - 15.00% (9.45%) | |||
Asset-Backed Securities | 8,714 |
240 |
Fair Value at August 31, 2023 | Valuation Technique(s) | Unobservable Input | Range (Weighted Average) (a) | |
718 | Discounted Cash Flow | Yield (Discount Rate of Cash Flows) | 15.68% (15.68%) | |
Collateralized Mortgage Obligations | 718 | |||
- (b) | Pending Distribution Amount | Expected Recovery | $0.01 ($0.01) | |
Rights | - | |||
Total | $9,432 |
# | The table above does not include certain level 3 investments that are valued by brokers and Pricing Services. At August 31 2023, the value of these investments was $8,701. The inputs for these investments are not readily available or cannot be reasonably estimated and are generally those inputs described in Note 2.A. |
(a) | Unobservable inputs were weighted by the relative fair value of the instruments. |
(b) | Amount rounds to less than one thousand. |
Duration
Core Plus
ETF
Fair Value at August 31, 2023 | Valuation Technique(s) | Unobservable Input | Range (Weighted Average) (a) | |
$777 | Discounted Cash Flow | Constant Prepayment Rate | 0.00% - 100.00% (6.38%) | |
Yield (Discount Rate of Cash Flows) | 6.01% - 7.79% (7.07%) | |||
Asset-Backed Securities | 777 | |||
Total | $777 |
# | The table above does not include certain level 3 investments that are valued by brokers and Pricing Services. At August 31, 2023, the value of these investments was $678. The inputs for these investments are not readily available or cannot be reasonably estimated and are generally those inputs described in Note 2.A. |
(a) | Unobservable inputs were weighted by the relative fair value of the instruments. |
241 |
AS OF August 31, 2023 (Unaudited) (continued)
242 |
Investment Securities on Loan, at value, Presented on the Statements of Assets and Liabilities | Cash Collateral Posted by Borrower* | Net Amount Due to Counterparty (not less than zero) | |
Short Duration Core Plus ETF | $589,233 | $(589,233 ) | $— |
Ultra-Short Income ETF | 8,275,241 | (8,275,241 ) | — |
* | Collateral posted reflects the value of securities on loan and does not include any additional amounts received from the borrower. |
Short Duration Core Plus ETF | $330 |
Ultra-Short Income ETF | 1,315 |
Core Plus Bond ETF | |||||||||
For the six months ended August 31, 2023 | |||||||||
Security Description | Value at February 28, 2023 | Purchases at Cost | Proceeds from Sales | Net Realized Gain (Loss) | Change in Unrealized Appreciation/ (Depreciation) | Value at August 31, 2023 | Shares at August 31, 2023 | Dividend Income | Capital Gain Distributions |
JPMorgan U.S. Government Money Market Fund Class IM Shares, 5.27% (a) (b) | $111,022,635 | $429,174,071 | $305,092,781 | $— | $— | $235,103,925 | 235,103,925 | $3,693,503 | $— |
(a) | Investment in an affiliated fund, which is registered under the Investment Company Act of 1940, as amended, and is advised by J.P. Morgan Investment Management Inc. |
(b) | The rate shown is the current yield as of August 31, 2023. |
243 |
AS OF August 31, 2023 (Unaudited) (continued)
Income ETF | |||||||||
For the six months ended August 31, 2023 | |||||||||
Security Description | Value at February 28, 2023 | Purchases at Cost | Proceeds from Sales | Net Realized Gain (Loss) | Change in Unrealized Appreciation/ (Depreciation) | Value at August 31, 2023 | Shares at August 31, 2023 | Dividend Income | Capital Gain Distributions |
JPMorgan Prime Money Market Fund Class IM Shares, 5.46% (a) (b) | $4,011,385 | $202,279,402 | $203,652,446 | $(735 ) | $14 | $2,637,620 | 2,636,829 | $220,558 | $— |
(a) | Investment in an affiliated fund, which is registered under the Investment Company Act of 1940, as amended, and is advised by J.P. Morgan Investment Management Inc. |
(b) | The rate shown is the current yield as of August 31, 2023. |
International Bond Opportunities ETF | |||||||||
For the six months ended August 31, 2023 | |||||||||
Security Description | Value at February 28, 2023 | Purchases at Cost | Proceeds from Sales | Net Realized Gain (Loss) | Change in Unrealized Appreciation/ (Depreciation) | Value at August 31, 2023 | Shares at August 31, 2023 | Dividend Income | Capital Gain Distributions |
JPMorgan U.S. Government Money Market Fund Class IM Shares, 5.27% (a) (b) | $486,978 | $96,878,300 | $82,442,697 | $— | $— | $14,922,581 | 14,922,581 | $173,337 | $— |
(a) | Investment in an affiliated fund, which is registered under the Investment Company Act of 1940, as amended, and is advised by J.P. Morgan Investment Management Inc. |
(b) | The rate shown is the current yield as of August 31, 2023. |
Municipal ETF | |||||||||
For the six months ended August 31, 2023 | |||||||||
Security Description | Value at February 28, 2023 | Purchases at Cost | Proceeds from Sales | Net Realized Gain (Loss) | Change in Unrealized Appreciation/ (Depreciation) | Value at August 31, 2023 | Shares at August 31, 2023 | Dividend Income | Capital Gain Distributions |
JPMorgan Institutional Tax Free Money Market Fund Class IM Shares, 3.71% (a) (b) | $28,406,555 | $213,530,595 | $176,625,865 | $(2,943 ) | $1,897 | $65,310,239 | 65,303,708 | $692,293 | $— |
(a) | Investment in an affiliated fund, which is registered under the Investment Company Act of 1940, as amended, and is advised by J.P. Morgan Investment Management Inc. |
(b) | The rate shown is the current yield as of August 31, 2023. |
244 |
Short Duration Core Plus ETF | |||||||||
For the six months ended August 31, 2023 | |||||||||
Security Description | Value at February 28, 2023 | Purchases at Cost | Proceeds from Sales | Net Realized Gain (Loss) | Change in Unrealized Appreciation/ (Depreciation) | Value at August 31, 2023 | Shares at August 31, 2023 | Dividend Income | Capital Gain Distributions |
JPMorgan Prime Money Market Fund Class IM Shares, 5.46% (a) (b) | $— | $65,810,247 | $60,134,468 | $(1,604 ) | $379 | $5,674,554 | 5,672,852 | $155,882 | $— |
JPMorgan U.S. Government Money Market Fund Class IM Shares, 5.27% (a) (b) | 805,328 | 7,109,522 | 7,306,885 | — | — | 607,965 | 607,965 | 22,300 | — |
Total | $805,328 | $72,919,769 | $67,441,353 | $(1,604 ) | $379 | $6,282,519 | $178,182 | $— | |
(a) | Investment in an affiliated fund, which is registered under the Investment Company Act of 1940, as amended, and is advised by J.P. Morgan Investment Management Inc. |
(b) | The rate shown is the current yield as of August 31, 2023. |
Ultra-Short Income ETF | |||||||||
For the six months ended August 31, 2023 | |||||||||
Security Description | Value at February 28, 2023 | Purchases at Cost | Proceeds from Sales | Net Realized Gain (Loss) | Change in Unrealized Appreciation/ (Depreciation) | Value at August 31, 2023 | Shares at August 31, 2023 | Dividend Income | Capital Gain Distributions |
JPMorgan Securities Lending Money Market Fund Agency SL Class Shares, 5.50% (a) (b) | $14,713,952 | $88,999,999 | $97,000,000 | $(4,041 )* | $1,000 | $6,710,910 | 6,709,568 | $472,928 * | $— |
JPMorgan U.S. Government Money Market Fund Class IM Shares, 5.27% (a) (b) | 1,401,082 | 53,013,390 | 52,614,598 | — | — | 1,799,874 | 1,799,874 | 85,373 * | — |
JPMorgan U.S. Government Money Market Fund Class IM Shares, 5.27% (a) (b) | 2,751,326,315 | 7,078,735,106 | 8,504,669,030 | — | — | 1,325,392,391 | 1,325,392,391 | 80,742,294 | — |
Total | $2,767,441,349 | $7,220,748,495 | $8,654,283,628 | $(4,041 ) | $1,000 | $1,333,903,175 | $81,300,595 | $— | |
(a) | Investment in an affiliated fund, which is registered under the Investment Company Act of 1940, as amended, and is advised by J.P. Morgan Investment Management Inc. |
(b) | The rate shown is the current yield as of August 31, 2023. |
* | Amount is included on the Statements of Operations as Income from securities lending (net) (after payments of rebates and Citibank’s fee). |
245 |
AS OF August 31, 2023 (Unaudited) (continued)
Ultra-Short Municipal Income ETF | |||||||||
For the six months ended August 31, 2023 | |||||||||
Security Description | Value at February 28, 2023 | Purchases at Cost | Proceeds from Sales | Net Realized Gain (Loss) | Change in Unrealized Appreciation/ (Depreciation) | Value at August 31, 2023 | Shares at August 31, 2023 | Dividend Income | Capital Gain Distributions |
JPMorgan Institutional Tax Free Money Market Fund Class IM Shares, 3.71% (a) (b) | $143,883,279 | $1,471,672,526 | $1,512,562,471 | $(6,836 ) | $(6,380 ) | $102,980,118 | 102,969,821 | $2,458,936 | $— |
(a) | Investment in an affiliated fund, which is registered under the Investment Company Act of 1940, as amended, and is advised by J.P. Morgan Investment Management Inc. |
(b) | The rate shown is the current yield as of August 31, 2023. |
246 |
247 |
AS OF August 31, 2023 (Unaudited) (continued)
Core Plus Bond ETF | Income ETF | International Bond Opportunities ETF | Municipal ETF | Short Duration Core Plus ETF | |
Foreign Exchange Rate Risk Exposure: | |||||
Unrealized Appreciation on Forward Foreign Currency Exchange Contracts | $— | $— | $2,842,257 | $— | $— |
Unrealized Depreciation on Forward Foreign Currency Exchange Contracts | (75,417 ) | (150,509 ) | (542,637 ) | — | — |
Interest Rate Risk Exposure: | |||||
Unrealized Appreciation on Futures Contracts * | 2,457,012 | 606,908 | 1,180,646 | 51,206 | 224,656 |
Swaps at Value (Assets) ** | — | — | 617,033 | — | — |
Unrealized Depreciation on Futures Contracts * | (80,675 ) | (175,961 ) | (499,622 ) | — | (105,288 ) |
Swaps at Value (Liabilities) ** | — | — | (666,787 ) | — | — |
Credit Risk Exposure: | |||||
Swaps at Value (Assets) ** | 322,038 | 69,105 | — | — | — |
Swaps at Value (Liabilities) ** | (97,968 ) | (2,287,547 ) | (772,977 ) | (358,961 ) | (58,739 ) |
248 |
Core Plus Bond ETF | Income ETF | International Bond Opportunities ETF | Municipal ETF | Short Duration Core Plus ETF | |
Net Fair Value of Derivative Contracts: | |||||
Unrealized Appreciation (Depreciation) on Futures Contracts * | $2,376,337 | $430,947 | $681,024 | $51,206 | $119,368 |
Swaps at Value ** | 224,070 | (2,218,442 ) | (822,731 ) | (358,961 ) | (58,739 ) |
Unrealized Appreciation (Depreciation) on Forward Foreign Currency Exchange Contracts | (75,417 ) | (150,509 ) | 2,299,620 | — | — |
* | Includes cumulative appreciation/(depreciation) on futures contracts, if any, as reported on the SOIs. Only current day’s variation margin is reported within the Statements of Assets and Liabilities. |
** | Includes the fair value of centrally cleared swap contracts as reported on the SOIs. Only current day’s variation margin is reported within the Statements of Assets and Liabilities. |
Counterparty | Gross Amount of Derivative Assets Subject to Netting Arrangements Presented on the Statement of Assets and Liabilities (a) | Derivatives Available for Offset | Collateral Received | Net Amount Due From Counterparty (Not less than zero) |
Barclays Bank plc | $7,927 | $(7,927 ) | $— | $— |
BNP Paribas | 64,978 | (64,978 ) | — | — |
Citibank, NA | 366,307 | (12,812 ) | — | 353,495 |
Goldman Sachs International | 85,403 | (85,403 ) | — | — |
HSBC Bank, NA | 499,931 | (34 ) | — | 499,897 |
Merrill Lynch International | 2,760 | (2,760 ) | — | — |
Morgan Stanley | 1,806,254 | (1,599 ) | — | 1,804,655 |
Royal Bank of Canada | 296 | (296 ) | — | — |
State Street Corp. | 5,961 | (1,628 ) | — | 4,333 |
TD Bank Financial Group | 2,440 | — | — | 2,440 |
$2,842,257 | $(177,437 ) | $— | $2,664,820 |
Counterparty | Gross Amount of Derivative Liabilities Subject to Netting Arrangements Presented on the Statement of Assets and Liabilities (a) | Derivative Available for Offset | Collateral Posted | Net Amount Due to Counterparty (Not less than zero) |
Barclays Bank plc | $13,765 | $(7,927 ) | $— | $5,838 |
BNP Paribas | 260,965 | (64,978 ) | — | 195,987 |
Citibank, NA | 12,812 | (12,812 ) | — | — |
Goldman Sachs International | 210,830 | (85,403 ) | — | 125,427 |
HSBC Bank, NA | 34 | (34 ) | — | — |
Merrill Lynch International | 26,099 | (2,760 ) | — | 23,339 |
Morgan Stanley | 1,599 | (1,599 ) | — | — |
Royal Bank of Canada | 2,280 | (296 ) | — | 1,984 |
Standard Chartered Bank | 12,625 | — | — | 12,625 |
State Street Corp. | 1,628 | (1,628 ) | — | — |
$542,637 | $(177,437 ) | $— | $365,200 |
(a) | For financial reporting purposes the Fund does not offset derivative assets and derivative liabilities subject to master netting arrangements on the Statement of Assets and Liabilities. |
249 |
AS OF August 31, 2023 (Unaudited) (continued)
Core Plus Bond ETF | Income ETF | International Bond Opportunities ETF | Municipal ETF | Short Duration Core Plus ETF | Ultra-Short Income ETF | Ultra-Short Municipal Income ETF | |
Realized Gain (Loss) on Derivatives Recognized as a Result From Operations: | |||||||
Foreign Exchange Rate Risk Exposure: | |||||||
Forward Foreign Currency Exchange Contracts | $(260,895 ) | $(526,200 ) | $(2,839,612 ) | $— | $(113 ) | $— | $— |
Interest Rate Risk Exposure: | |||||||
Futures Contracts | (8,935,953 ) | (3,921,051 ) | (2,831,302 ) | (153,788 ) | (716,468 ) | (42,712,853 ) | (1,776,264 ) |
Credit Exposure Risk: | |||||||
Swap Contracts | 82,518 | (538,889 ) | (228,990 ) | (724,631 ) | (46,463 ) | — | — |
Net Change in Unrealized Appreciation (Depreciation) on Derivatives Recognized as a Result of Operations: | |||||||
Foreign Exchange Rate Risk Exposure: | |||||||
Forward Foreign Currency Exchange Contracts | 34,463 | 78,571 | (1,510,628 ) | — | — | — | — |
Interest Rate Risk Exposure: | |||||||
Futures Contracts | 2,544,712 | 564,983 | (585,219 ) | 50,893 | 133,271 | — | 325,334 |
Swap Contracts | — | — | 66,839 | — | — | — | — |
Credit Exposure Risk: | |||||||
Swap Contracts | 88,147 | (1,261,264 ) | (659,331 ) | 425,403 | (9,036 ) | — | — |
Core Plus Bond ETF | Income ETF | International Bond Opportunities ETF | Municipal ETF | |
Futures Contracts: | ||||
Average Notional Balance Long | $271,934,719 | $161,361,125 | $110,270,345 | $9,130,962 |
Average Notional Balance Short | (26,505,621 ) | (13,916,991 ) | (85,923,771 ) | (1,275,556 ) |
Ending Notional Balance Long | 398,471,391 | 120,533,594 | 179,037,758 | 13,281,406 |
Ending Notional Balance Short | (11,372,860 ) | (19,084,312 ) | (118,096,154 ) | — |
Forward Foreign Currency Exchange Contracts: | ||||
Average Settlement Value Purchased | (2,962,051 ) | (5,532,332 ) | (49,405,109 ) | — |
Average Settlement Value Sold | 248,108 | 491,063 | 272,489,506 | — |
Ending Settlement Value Purchased | (3,438,722 ) | (5,881,474 ) | (39,473,059 ) | — |
Ending Settlement Value Sold | — | — | 362,328,619 | — |
Interest Rate-Related Swaps : | ||||
Average Notional Balance - Pays Fixed Rate | — | — | 65,000,000 | — |
Average Notional Balance - Receives Fixed Rate | — | — | 6,535,714 | — |
Ending Notional Balance - Pays Fixed Rate | — | — | 104,000,000 | — |
Ending Notional Balance - Receives Fixed Rate | — | — | 23,250,000 | — |
250 |
Core Plus Bond ETF | Income ETF | International Bond Opportunities ETF | Municipal ETF | |
Credit Default Swaps: | ||||
Average Notional Balance - Buy Protection | $8,815,714 | $42,197,000 | $13,213,763 | $9,350,000 |
Average Notional Balance -Sell Protection | 18,250,000 | 2,285,714 | — | — |
Ending Notional Balance - Buy Protection | 8,410,000 | 64,600,000 | 15,358,810 | 9,350,000 |
Ending Notional Balance - Sell Protection | 18,250,000 | 1,800,000 | — | — |
Short Duration Core Plus ETF | Ultra-Short Income ETF | Ultra-Short Municipal Income ETF | |
Futures Contracts: | |||
Average Notional Balance Long | $46,670,104 | $1,381,480,010 | $106,330,287 |
Average Notional Balance Short | (12,128,013 ) | — | — |
Ending Notional Balance Long | 60,823,492 | — | — |
Ending Notional Balance Short | (12,605,813 ) | — | — |
Forward Foreign Currency Exchange Contracts: | |||
Average Settlement Value Purchased | (108,513 ) | — | — |
Average Settlement Value Sold | 108,469 | — | — |
Credit Default Swaps: | |||
Average Notional Balance - Buy Protection | 2,722,857 | — | — |
Average Notional Balance -Sell Protection | 571,429 | — | — |
Ending Notional Balance - Buy Protection | 1,530,000 | — | — |
Fund | Fund Counterparty | Value of swap contracts | Collateral amount | |
International Bond Opportunities ETF | Collateral Received | Goldman Sachs International | $— | $(280,000 ) |
251 |
AS OF August 31, 2023 (Unaudited) (continued)
Core Plus Bond ETF | 0.40 % |
Income ETF | 0.40 |
International Bond Opportunities ETF | 0.50 |
Municipal ETF | 0.18 |
Short Duration Core Plus ETF | 0.33 |
Ultra-Short Income ETF | 0.18 |
Ultra-Short Municipal Income ETF | 0.18 |
252 |
Purchases (excluding U.S. Government) | Sales (excluding U.S. Government) | Purchases of U.S. Government | Sales of U.S. Government | |
Core Plus Bond ETF | $605,651,037 | $103,541,751 | $90,236,800 | $23,248,534 |
Income ETF | 685,443,384 | 369,499,293 | — | — |
International Bond Opportunities ETF | 97,136,722 | 35,202,930 | 8,706 | — |
Municipal ETF | 237,198,744 | 31,218,553 | 3,984,023 | — |
Short Duration Core Plus ETF | 69,528,021 | 26,399,018 | 44,459,286 | 27,389,988 |
Ultra-Short Income ETF | 3,681,317,258 | 5,498,121,893 | 532,930,547 | 522,848,984 |
Ultra-Short Municipal Income ETF | 1,216,841,133 | 1,182,442,030 | — | — |
Aggregate Cost | Gross Unrealized Appreciation | Gross Unrealized Depreciation | Net Unrealized Appreciation (Depreciation) | |
Core Plus Bond ETF | $1,517,302,213 | $6,614,633 | $52,402,602 | $(45,787,969 ) |
Income ETF | 690,881,771 | 4,170,224 | 16,969,870 | (12,799,646 ) |
International Bond Opportunities ETF | 376,685,874 | 7,448,363 | 34,273,188 | (26,824,825 ) |
Municipal ETF | 652,412,004 | 1,903,874 | 9,618,682 | (7,714,808 ) |
Short Duration Core Plus ETF | 264,792,902 | 527,188 | 8,686,364 | (8,159,176 ) |
Ultra-Short Income ETF | 22,797,050,514 | 8,146,843 | 97,190,644 | (89,043,801 ) |
Ultra-Short Municipal Income ETF | 2,589,383,893 | 606,385 | 12,041,919 | (11,435,534 ) |
253 |
AS OF August 31, 2023 (Unaudited) (continued)
Capital Loss Carryforward Character | ||
Short-Term | Long-Term | |
Core Plus Bond ETF | $4,248,680 | $3,612,550 |
Income ETF | 2,129,264 | 324,114 |
International Bond Opportunities ETF | 1,218,196 | 4,707,351 |
Municipal ETF | 2,687,809 | 1,536,830 |
Short Duration Core Plus ETF | 3,729,251 | 399,954 |
Ultra-Short Municipal Income ETF | 8,097,767 | 7,457,996 |
Net Capital Losses (Gains) | Specified Ordinary Losses | ||
Short-Term | Long-Term | ||
Core Plus Bond ETF | $645,515 | $1,099,281 | $174,661 |
Income ETF | 931,969 | 1,826,186 | 1 |
International Bond Opportunities ETF | (120,254 ) | 2,507,917 | — |
Municipal ETF | 211,373 | 53,428 | — |
Short Duration Core Plus ETF | 233,434 | 3,207,638 | — |
Ultra-Short Income ETF | 3,619,486 | 11,643,452 | — |
Ultra-Short Municipal Income ETF | 762,814 | 1,030,672 | — |
Capital Loss Utilized | ||
Short-Term | Long-Term | |
International Bond Opportunities ETF | $31,785 | $— |
254 |
255 |
AS OF August 31, 2023 (Unaudited) (continued)
256 |
Ultra-Short Income ETF | |
Canada | 11.3 % |
257 |
(Unaudited)
Hypothetical $1,000 Investment
Beginning Account Value March 1, 2023 | Ending Account Value August 31, 2023 | Expenses Paid During the Period* | Annualized Expense Ratio | |
JPMorgan Core Plus Bond ETF | ||||
Actual | $1,000.00 | $1,013.70 | $1.97 | 0.39 % |
Hypothetical | 1,000.00 | 1,023.18 | 1.98 | 0.39 |
JPMorgan Income ETF | ||||
Actual | 1,000.00 | 1,024.10 | 2.03 | 0.40 |
Hypothetical | 1,000.00 | 1,023.13 | 2.03 | 0.40 |
JPMorgan International Bond Opportunities ETF | ||||
Actual | 1,000.00 | 1,013.30 | 2.52 | 0.50 |
Hypothetical | 1,000.00 | 1,022.62 | 2.54 | 0.50 |
JPMorgan Municipal ETF | ||||
Actual | 1,000.00 | 1,012.10 | 0.86 | 0.17 |
Hypothetical | 1,000.00 | 1,024.28 | 0.86 | 0.17 |
JPMorgan Short Duration Core Plus ETF | ||||
Actual | 1,000.00 | 1,018.30 | 1.67 | 0.33 |
Hypothetical | 1,000.00 | 1,023.48 | 1.67 | 0.33 |
JPMorgan Ultra-Short Income ETF | ||||
Actual | 1,000.00 | 1,021.90 | 0.81 | 0.16 |
Hypothetical | 1,000.00 | 1,024.33 | 0.81 | 0.16 |
JPMorgan Ultra-Short Municipal Income ETF | ||||
Actual | 1,000.00 | 1,015.40 | 0.86 | 0.17 |
Hypothetical | 1,000.00 | 1,024.28 | 0.86 | 0.17 |
* | Expenses are equal to each Fund's annualized net expense ratio, multiplied by the average account value over the period, multiplied by 184/366 (to reflect the one-half year period). |
258 | J.P. Morgan Exchange-Traded Funds | August 31, 2023 |
(Unaudited)
August 31, 2023 | J.P. Morgan Exchange-Traded Funds | 259 |
(Unaudited)
260 | J.P. Morgan Exchange-Traded Funds | August 31, 2023 |
August 31, 2023 | J.P. Morgan Exchange-Traded Funds | 261 |
(Unaudited) (continued)
262 | J.P. Morgan Exchange-Traded Funds | August 31, 2023 |
August 31, 2023 | J.P. Morgan Exchange-Traded Funds | 263 |

Fund | Ticker | Listing Exchange |
JPMorgan BetaBuilders MSCI US REIT ETF | BBRE | Cboe BZX Exchange, Inc. |

1 | |
2 | |
5 | |
8 | |
12 | |
14 | |
21 | |
22 | |
23 |
October 19, 2023 (Unaudited)
 | “A properly diversified portfolio together with a long-term approach may help investors weather economic and geopolitical uncertainties.” — Brian S. Shlissel |

President, J.P. Morgan Exchange-Traded Funds
J.P. Morgan Asset Management
1-844-4JPM-ETF or jpmorgan.com/etfs for more information
August 31, 2023 | J.P. Morgan Exchange-Traded Funds | 1 |
SIX MONTHS ENDED August 31, 2023 (Unaudited)
REPORTING PERIOD RETURN: | |
Net Asset Value * | (0.15)% |
Market Price ** | (0.19)% |
MSCI US REIT Custom Capped Index | (0.08)% |
Net Assets as of 8/31/2023 | $744,773,226 |
Fund Ticker | BBRE |
2 | J.P. Morgan Exchange-Traded Funds | August 31, 2023 |
TOP TEN HOLDINGS OF THE PORTFOLIO AS OF August 31, 2023 | PERCENT OF TOTAL INVESTMENTS | |
1. | Prologis, Inc. | 11.3 % |
2. | Equinix, Inc. | 7.1 |
3. | Public Storage | 4.0 |
4. | Welltower, Inc. | 3.9 |
5. | Digital Realty Trust, Inc. | 3.8 |
6. | Simon Property Group, Inc. | 3.7 |
7. | Realty Income Corp. | 3.5 |
8. | VICI Properties, Inc. | 2.9 |
9. | Extra Space Storage, Inc. | 2.7 |
10. | AvalonBay Communities, Inc. | 2.5 |
PORTFOLIO COMPOSITION BY SECTOR AS OF August 31, 2023 | PERCENT OF TOTAL INVESTMENTS |
Diversified | 18.5% |
Apartments | 17.4 |
Industrial | 16.0 |
Health Care | 9.9 |
Storage | 9.7 |
Office | 6.2 |
Single Tenant | 5.9 |
Shopping Centers | 5.5 |
Regional Malls | 4.2 |
Hotels | 3.3 |
Short-Term Investments | 3.4 |
August 31, 2023 | J.P. Morgan Exchange-Traded Funds | 3 |
SIX MONTHS ENDED August 31, 2023 (Unaudited) (continued)
INCEPTION DATE | SIX MONTHS* | 1 YEAR | 5 YEAR | SINCE INCEPTION | |
JPMorgan BetaBuilders MSCI US REIT ETF | |||||
Net Asset Value | June 15, 2018 | (0.15 )% | (2.84 )% | 3.65 % | 4.85 % |
Market Price | (0.19 ) | (2.88 ) | 4.89 | 4.85 |
* | Not annualized. |
4 | J.P. Morgan Exchange-Traded Funds | August 31, 2023 |
AS OF August 31, 2023 (Unaudited)
INVESTMENTS | SHARES | VALUE($) |
Common Stocks — 99.8% | ||
Apartments — 18.0% | ||
American Homes 4 Rent, Class A, REIT | 241,520 | 8,704,381 |
Apartment Income REIT Corp., REIT | 114,340 | 3,894,420 |
Apartment Investment and Management Co., Class A, REIT | 117,481 | 894,030 |
AvalonBay Communities, Inc., REIT | 106,266 | 19,533,816 |
Camden Property Trust, REIT | 76,976 | 8,284,157 |
Centerspace, REIT | 11,774 | 762,249 |
Equity LifeStyle Properties, Inc., REIT (a) | 134,456 | 9,003,174 |
Equity Residential, REIT | 272,750 | 17,682,383 |
Essex Property Trust, Inc., REIT | 49,229 | 11,735,701 |
Independence Realty Trust, Inc., REIT | 171,230 | 2,881,801 |
Invitation Homes, Inc., REIT | 464,528 | 15,835,760 |
Mid-America Apartment Communities, Inc., REIT | 87,759 | 12,745,240 |
NexPoint Residential Trust, Inc., REIT | 17,940 | 673,647 |
Sun Communities, Inc., REIT | 94,158 | 11,526,822 |
UDR, Inc., REIT | 247,518 | 9,875,968 |
134,033,549 | ||
Diversified — 19.1% | ||
Alexander & Baldwin, Inc., REIT | 56,166 | 1,011,550 |
American Assets Trust, Inc., REIT | 40,130 | 859,183 |
Armada Hoffler Properties, Inc., REIT | 53,187 | 605,800 |
Broadstone Net Lease, Inc., REIT | 132,629 | 2,144,611 |
Digital Realty Trust, Inc., REIT | 218,377 | 28,764,618 |
Elme Communities, REIT | 67,655 | 1,040,534 |
EPR Properties, REIT | 57,416 | 2,571,089 |
Equinix, Inc., REIT | 70,243 | 54,886,475 |
Farmland Partners, Inc., REIT (a) | 41,280 | 458,208 |
Gaming and Leisure Properties, Inc., REIT | 195,807 | 9,281,252 |
Gladstone Commercial Corp., REIT | 31,888 | 419,327 |
Gladstone Land Corp., REIT | 26,373 | 414,847 |
Global Net Lease, Inc., REIT (a) | 80,660 | 915,491 |
InvenTrust Properties Corp., REIT | 52,099 | 1,245,687 |
LXP Industrial Trust, REIT | 211,308 | 2,075,045 |
Necessity Retail REIT, Inc. (The), REIT | 105,916 | 794,370 |
One Liberty Properties, Inc., REIT | 13,823 | 271,622 |
Safehold, Inc., REIT | 35,630 | 758,206 |
UMH Properties, Inc., REIT | 41,471 | 619,991 |
VICI Properties, Inc., REIT | 731,419 | 22,556,962 |
WP Carey, Inc., REIT | 158,138 | 10,286,877 |
141,981,745 | ||
Health Care — 10.2% | ||
CareTrust REIT, Inc., REIT | 74,652 | 1,504,238 |
Community Healthcare Trust, Inc., REIT | 18,812 | 624,370 |
INVESTMENTS | SHARES | VALUE($) |
Health Care — continued | ||
Diversified Healthcare Trust, REIT | 62,342 | 169,259 |
Global Medical REIT, Inc., REIT | 49,530 | 479,450 |
Healthcare Realty Trust, Inc., REIT | 289,824 | 5,077,717 |
Healthpeak Properties, Inc., REIT | 408,859 | 8,414,318 |
LTC Properties, Inc., REIT | 31,349 | 1,030,128 |
Medical Properties Trust, Inc., REIT (a) | 456,208 | 3,293,822 |
National Health Investors, Inc., REIT | 33,310 | 1,703,140 |
Omega Healthcare Investors, Inc., REIT | 178,400 | 5,676,688 |
Physicians Realty Trust, REIT | 174,633 | 2,429,145 |
Sabra Health Care REIT, Inc., REIT | 177,061 | 2,218,574 |
Universal Health Realty Income Trust, REIT | 10,407 | 485,278 |
Ventas, Inc., REIT | 303,740 | 13,267,363 |
Welltower, Inc., REIT | 358,804 | 29,737,676 |
76,111,166 | ||
Hotels — 3.4% | ||
Apple Hospitality REIT, Inc., REIT | 166,207 | 2,496,429 |
Chatham Lodging Trust, REIT | 37,244 | 364,246 |
DiamondRock Hospitality Co., REIT | 161,335 | 1,300,360 |
Host Hotels & Resorts, Inc., REIT | 543,747 | 8,585,765 |
Park Hotels & Resorts, Inc., REIT | 172,156 | 2,208,762 |
Pebblebrook Hotel Trust, REIT (a) | 101,180 | 1,464,075 |
RLJ Lodging Trust, REIT | 124,861 | 1,247,361 |
Ryman Hospitality Properties, Inc., REIT | 39,979 | 3,399,414 |
Service Properties Trust, REIT | 128,087 | 1,057,999 |
Summit Hotel Properties, Inc., REIT | 84,096 | 488,598 |
Sunstone Hotel Investors, Inc., REIT | 161,621 | 1,451,357 |
Xenia Hotels & Resorts, Inc., REIT | 88,008 | 1,038,494 |
25,102,860 | ||
Industrial — 16.6% | ||
Americold Realty Trust, Inc., REIT | 205,085 | 6,901,110 |
EastGroup Properties, Inc., REIT | 33,185 | 5,961,021 |
First Industrial Realty Trust, Inc., REIT | 100,642 | 5,227,345 |
Innovative Industrial Properties, Inc., REIT | 21,513 | 1,877,655 |
Plymouth Industrial REIT, Inc., REIT | 33,475 | 766,912 |
Prologis, Inc., REIT | 697,593 | 86,641,050 |
Rexford Industrial Realty, Inc., REIT (a) | 139,593 | 7,464,038 |
STAG Industrial, Inc., REIT | 136,570 | 4,988,902 |
Terreno Realty Corp., REIT | 58,049 | 3,534,604 |
123,362,637 | ||
Office — 6.4% | ||
Alexandria Real Estate Equities, Inc., REIT | 118,452 | 13,780,706 |
Boston Properties, Inc., REIT | 113,404 | 7,571,985 |
Brandywine Realty Trust, REIT | 135,652 | 678,260 |
August 31, 2023 | J.P. Morgan Exchange-Traded Funds | 5 |
AS OF August 31, 2023 (Unaudited) (continued)
INVESTMENTS | SHARES | VALUE($) |
Common Stocks — continued | ||
Office — continued | ||
Corporate Office Properties Trust, REIT | 86,165 | 2,229,950 |
Cousins Properties, Inc., REIT | 115,903 | 2,723,720 |
Douglas Emmett, Inc., REIT (a) | 135,185 | 1,847,979 |
Easterly Government Properties, Inc., REIT | 66,938 | 894,961 |
Empire State Realty Trust, Inc., Class A, REIT | 107,060 | 934,634 |
Equity Commonwealth, REIT | 84,036 | 1,599,205 |
Highwoods Properties, Inc., REIT | 80,776 | 1,924,892 |
Hudson Pacific Properties, Inc., REIT | 111,327 | 758,137 |
JBG SMITH Properties, REIT (a) | 79,074 | 1,239,880 |
Kilroy Realty Corp., REIT | 80,540 | 2,975,953 |
Office Properties Income Trust, REIT | 40,194 | 297,436 |
Orion Office REIT, Inc., REIT | 46,384 | 270,419 |
Paramount Group, Inc., REIT | 138,025 | 709,449 |
Peakstone Realty Trust, REIT | 8,945 | 175,769 |
Piedmont Office Realty Trust, Inc., Class A, REIT | 96,777 | 664,858 |
SL Green Realty Corp., REIT (a) | 49,768 | 1,953,892 |
Veris Residential, Inc., REIT * | 60,004 | 1,116,674 |
Vornado Realty Trust, REIT (a) | 125,243 | 3,008,337 |
47,357,096 | ||
Regional Malls — 4.3% | ||
CBL & Associates Properties, Inc., REIT (a) | 10,572 | 226,135 |
Macerich Co. (The), REIT (a) | 165,104 | 1,930,066 |
Simon Property Group, Inc., REIT (a) | 248,275 | 28,176,730 |
Tanger Factory Outlet Centers, Inc., REIT | 80,256 | 1,865,952 |
32,198,883 | ||
Shopping Centers — 5.7% | ||
Acadia Realty Trust, REIT | 73,616 | 1,096,142 |
Alexander's, Inc., REIT | 1,863 | 357,230 |
Brixmor Property Group, Inc., REIT | 228,570 | 5,023,969 |
Federal Realty Investment Trust, REIT | 55,682 | 5,453,495 |
Kimco Realty Corp., REIT | 470,420 | 8,909,755 |
Kite Realty Group Trust, REIT | 167,251 | 3,774,855 |
NETSTREIT Corp., REIT | 42,781 | 724,282 |
Phillips Edison & Co., Inc., REIT (a) | 89,549 | 3,032,129 |
Regency Centers Corp., REIT | 126,987 | 7,898,591 |
Retail Opportunity Investments Corp., REIT | 96,139 | 1,294,031 |
RPT Realty, REIT | 66,975 | 759,497 |
Saul Centers, Inc., REIT | 11,485 | 431,377 |
SITE Centers Corp., REIT | 146,883 | 1,960,888 |
Urban Edge Properties, REIT | 90,552 | 1,481,431 |
Whitestone, REIT | 38,006 | 380,060 |
42,577,732 | ||
INVESTMENTS | SHARES | VALUE($) |
Single Tenant — 6.1% | ||
Agree Realty Corp., REIT | 67,516 | 4,173,839 |
Essential Properties Realty Trust, Inc., REIT | 108,858 | 2,614,769 |
Four Corners Property Trust, Inc., REIT | 64,448 | 1,621,512 |
Getty Realty Corp., REIT | 30,745 | 922,965 |
NNN REIT, Inc., REIT | 136,085 | 5,360,388 |
Realty Income Corp., REIT | 476,206 | 26,686,584 |
Spirit Realty Capital, Inc., REIT | 106,508 | 4,112,274 |
45,492,331 | ||
Storage — 10.0% | ||
CubeSmart, REIT | 170,853 | 7,126,279 |
Extra Space Storage, Inc., REIT | 159,607 | 20,538,229 |
Iron Mountain, Inc., REIT | 220,959 | 14,039,735 |
National Storage Affiliates Trust, REIT | 66,041 | 2,218,977 |
Public Storage, REIT | 111,905 | 30,928,304 |
74,851,524 | ||
Total Common Stocks (Cost $899,230,601) | 743,069,523 | |
Short-Term Investments — 3.5% | ||
Investment Companies — 0.4% | ||
JPMorgan U.S. Government Money Market Fund Class IM Shares, 5.27% (b) (c) (Cost $2,856,947) | 2,856,947 | 2,856,947 |
Investment of Cash Collateral from Securities Loaned — 3.1% | ||
JPMorgan Securities Lending Money Market Fund Agency SL Class Shares, 5.50% (b) (c) | 19,996,201 | 20,000,200 |
JPMorgan U.S. Government Money Market Fund Class IM Shares, 5.27% (b) (c) | 3,561,277 | 3,561,277 |
Total Investment of Cash Collateral from Securities Loaned (Cost $23,561,477) | 23,561,477 | |
Total Short-Term Investments (Cost $26,418,424) | 26,418,424 | |
Total Investments — 103.3% (Cost $925,649,025) | 769,487,947 | |
Liabilities in Excess of Other Assets — (3.3)% | (24,714,721 ) | |
NET ASSETS — 100.0% | 744,773,226 | |
Percentages indicated are based on net assets. |
6 | J.P. Morgan Exchange-Traded Funds | August 31, 2023 |
Abbreviations | |
REIT | Real Estate Investment Trust |
* | Non-income producing security. |
(a) | The security or a portion of this security is on loan at August 31, 2023. The total value of securities on loan at August 31, 2023 is $22,938,482. |
(b) | Investment in an affiliated fund, which is registered under the Investment Company Act of 1940, as amended, and is advised by J.P. Morgan Investment Management Inc. |
(c) | The rate shown is the current yield as of August 31, 2023. |
DESCRIPTION | NUMBER OF CONTRACTS | EXPIRATION DATE | TRADING CURRENCY | NOTIONAL AMOUNT ($) | VALUE AND UNREALIZED APPRECIATION (DEPRECIATION) ($) |
Long Contracts | |||||
DJ US Real Estate Index | 44 | 09/15/2023 | USD | 1,434,840 | 8,479 |
Abbreviations | |
USD | United States Dollar |
August 31, 2023 | J.P. Morgan Exchange-Traded Funds | 7 |
AS OF August 31, 2023 (Unaudited)
JPMorgan BetaBuilders MSCI US REIT ETF | |
ASSETS: | |
Investments in non-affiliates, at value | $743,069,523 |
Investments in affiliates, at value | 2,856,947 |
Investments of cash collateral received from securities loaned, at value (See Note 2.B.) | 23,561,477 |
Cash | 9,600 |
Deposits at broker for futures contracts | 365,000 |
Receivables: | |
Investment securities sold | 133,141 |
Fund shares sold | 15,763 |
Dividends from non-affiliates | 533,349 |
Dividends from affiliates | 413 |
Securities lending income (See Note 2.B.) | 5,423 |
Total Assets | 770,550,636 |
LIABILITIES: | |
Payables: | |
Investment securities purchased | 2,113,649 |
Collateral received on securities loaned (See Note 2.B.) | 23,561,477 |
Variation margin on futures contracts | 36,458 |
Accrued liabilities: | |
Management fees (See Note 3.A.) | 65,826 |
Total Liabilities | 25,777,410 |
Net Assets | $744,773,226 |
NET ASSETS: | |
Paid-in-Capital | $957,295,087 |
Total distributable earnings (loss) | (212,521,861 ) |
Total Net Assets | $744,773,226 |
Outstanding number of shares (unlimited number of shares authorized - par value $0.0001) | 8,850,000 |
Net asset value, per share | $84.16 |
Cost of investments in non-affiliates | $899,230,601 |
Cost of investments in affiliates | 2,856,947 |
Investment securities on loan, at value (See Note 2.B.) | 22,938,482 |
Cost of investment of cash collateral (See Note 2.B.) | 23,561,477 |
8 | J.P. Morgan Exchange-Traded Funds | August 31, 2023 |
FOR THE SIX MONTHS ENDED August 31, 2023 (Unaudited)
JPMorgan BetaBuilders MSCI US REIT ETF | |
INVESTMENT INCOME: | |
Interest income from non-affiliates | $11,991 |
Interest income from affiliates | 29 |
Dividend income from non-affiliates | 13,066,118 |
Dividend income from affiliates | 82,755 |
Income from securities lending (net) (See Note 2.B.) | 34,527 |
Total investment income | 13,195,420 |
EXPENSES: | |
Management fees (See Note 3.A.) | 404,420 |
Interest expense to affiliates | 27 |
Total expenses | 404,447 |
Net investment income (loss) | 12,790,973 |
REALIZED/UNREALIZED GAINS (LOSSES): | |
Net realized gain (loss) on transactions from: | |
Investments in non-affiliates | (2,716,915 ) |
In-kind redemptions of investments in non-affiliates (See Note 4) | 4,469,702 |
Futures contracts | 512 |
Net realized gain (loss) | 1,753,299 |
Change in net unrealized appreciation/depreciation on: | |
Investments in non-affiliates | (14,623,998 ) |
Futures contracts | (45,109 ) |
Change in net unrealized appreciation/depreciation | (14,669,107 ) |
Net realized/unrealized gains (losses) | (12,915,808 ) |
Change in net assets resulting from operations | $(124,835 ) |
August 31, 2023 | J.P. Morgan Exchange-Traded Funds | 9 |
FOR THE PERIODS INDICATED
JPMorgan BetaBuilders MSCI US REIT ETF | ||
Six Months Ended August 31, 2023 (Unaudited) | Year Ended February 28, 2023 | |
CHANGE IN NET ASSETS RESULTING FROM OPERATIONS: | ||
Net investment income (loss) | $12,790,973 | $31,860,013 |
Net realized gain (loss) | 1,753,299 | 22,039,086 |
Change in net unrealized appreciation/depreciation | (14,669,107 ) | (193,289,538 ) |
Change in net assets resulting from operations | (124,835 ) | (139,390,439 ) |
DISTRIBUTIONS TO SHAREHOLDERS: | ||
Total distributions to shareholders | (14,191,491 ) | (24,640,292 ) |
CAPITAL TRANSACTIONS: | ||
Change in net assets resulting from capital transactions | 17,725,227 | (451,881,328 ) |
NET ASSETS: | ||
Change in net assets | 3,408,901 | (615,912,059 ) |
Beginning of period | 741,364,325 | 1,357,276,384 |
End of period | $744,773,226 | $741,364,325 |
CAPITAL TRANSACTIONS: | ||
Proceeds from shares issued | $92,974,421 | $456,973,055 |
Cost of shares redeemed | (75,249,194 ) | (908,854,383 ) |
Total change in net assets resulting from capital transactions | $17,725,227 | $(451,881,328 ) |
SHARE TRANSACTIONS: | ||
Issued | 1,125,000 | 4,900,000 |
Redeemed | (900,000 ) | (9,850,000 ) |
Net increase (decrease) in shares from share transactions | 225,000 | (4,950,000 ) |
10 | J.P. Morgan Exchange-Traded Funds | August 31, 2023 |
FOR THE PERIODS INDICATED
Per share operating performance | |||||||
Investment operations | Distributions | ||||||
Net asset value, beginning of period | Net investment income (loss) (b) | Net realized and unrealized gains (losses) on investments | Total from investment operations | Net investment income | Net realized gain | Total distributions | |
JPMorgan BetaBuilders MSCI US REIT ETF | |||||||
Six Months Ended August 31, 2023 (Unaudited) | $85.96 | $1.45 | $(1.63 ) | $(0.18 ) | $(1.62 ) | $— | $(1.62 ) |
Year Ended February 28, 2023 | 99.98 | 2.75 | (14.63 ) | (11.88 ) | (2.14 ) | — | (2.14 ) |
Year Ended February 28, 2022 | 82.46 | 1.93 | 17.48 | 19.41 | (1.89 ) | — | (1.89 ) |
Year Ended February 28, 2021 | 82.62 | 2.07 | 0.28 (f) | 2.35 | (2.51 ) | — | (2.51 ) |
Year Ended February 29, 2020 | 81.21 | 2.55 | 0.80 (f) | 3.35 | (1.85 ) | (0.09 ) | (1.94 ) |
June 15, 2018 (h) through February 28, 2019 | 75.67 | 1.85 | 5.10 | 6.95 | (1.35 ) | (0.06 ) | (1.41 ) |
(a) | Annualized for periods less than one year, unless otherwise noted. |
(b) | Calculated based upon average shares outstanding. |
(c) | Not annualized for periods less than one year. |
(d) | Includes adjustments in accordance with accounting principles generally accepted in the United States of America and as such, the net asset values for financial reporting purposes and the returns based upon those net asset values may differ from the net asset values and returns for shareholder transactions. |
(e) | Prior to December 9, 2019, market price return was calculated assuming an initial investment made at the market price at the beginning of the reporting period, reinvestment of all dividends and distributions at market price during the period, and sale at the market price on the last day of the period. The price used to calculate the market price return was the midpoint of the bid/ask spread at the close of business on the listing exchange of the Fund. Effective December 9, 2019, the closing price was used to calculate the market price return; however, any prices used in the calculation for market price return prior to December 9, 2019, would have used the midpoint of the bid/ask spread at the close of business on the exchange. |
(f) | Calculation of the net realized and unrealized gains (losses) per share does not correlate with the Fund’s net realized and unrealized gains (losses) presented in the Statement of Operations due to the timing of capital transactions in relation to the fluctuating market values of the Fund’s investments. |
(g) | Prior to November 1, 2019, the Fund may have waived fees if expenses exceeded the expense cap. On November 1, 2019, the Fund adopted a unitary fee structure where a management fee is accrued by the Fund based on prior day net assets and other expenses are paid by the Advisor. |
(h) | Commencement of operations. |
(i) | Since the shares of the Fund did not trade in the secondary market until the day after the Fund’s inception, for the period from the inception to the first day of secondary market trading, the net asset value is used as a proxy for the secondary market trading price to calculate the market returns. |
(j) | Certain non-recurring expenses incurred by the Fund were not annualized for the period indicated. |
12 | J.P. Morgan Exchange-Traded Funds | August 31, 2023 |
Ratios/Supplemental data | ||||||||
Ratios to average net assets (a) | ||||||||
Net asset value, end of period | Market price, end of period | Total return (c)(d) | Market price total return (c)(e) | Net assets, end of period | Net expenses | Net investment income (loss) | Expenses without waivers and reimbursements | Portfolio turnover rate (c) |
$84.16 | $84.15 | (0.14 )% | (0.19 )% | $744,773,226 | 0.11 % | 3.46 % | 0.11 % | 2 % |
85.96 | 85.99 | (11.84 ) | (11.85 ) | 741,364,325 | 0.11 | 3.03 | 0.11 | 8 |
99.98 | 100.02 | 23.55 | 23.45 | 1,357,276,384 | 0.11 | 1.96 | 0.11 | 5 |
82.46 | 82.56 | 3.37 | 3.36 | 944,122,915 | 0.11 | 2.82 | 0.11 | 7 |
82.62 | 82.73 | 4.06 | 4.18 | 1,206,297,493 | 0.11 | 2.88 | 0.16 (g) | 5 |
81.21 | 81.22 | 9.40 | 9.41 (i) | 136,028,924 | 0.11 (j) | 3.37 | 0.40 (g)(j) | 5 |
August 31, 2023 | J.P. Morgan Exchange-Traded Funds | 13 |
AS OF August 31, 2023 (Unaudited)
14 | J.P. Morgan Exchange-Traded Funds | August 31, 2023 |
Level 1 Quoted prices | Level 2 Other significant observable inputs | Level 3 Significant unobservable inputs | Total | |
Total Investments in Securities (a) | $769,487,947 | $— | $— | $769,487,947 |
Appreciation in Other Financial Instruments | ||||
Futures Contracts (a) | $8,479 | $— | $— | $8,479 |
(a) | Please refer to the SOI for specifics of portfolio holdings. |
Investment Securities on Loan, at value, Presented on the Statement of Assets and Liabilities | Cash Collateral Posted by Borrower* | Net Amount Due to Counterparty (not less than zero) | |
$22,938,482 | $(22,938,482 ) | $— |
* | Collateral posted reflects the value of securities on loan and does not include any additional amounts received from the borrower. |
August 31, 2023 | J.P. Morgan Exchange-Traded Funds | 15 |
AS OF August 31, 2023 (Unaudited) (continued)
$1,335 |
For the six months ended August 31, 2023 | |||||||||
Security Description | Value at February 28, 2023 | Purchases at Cost | Proceeds from Sales | Net Realized Gain (Loss) | Change in Unrealized Appreciation/ (Depreciation) | Value at August 31, 2023 | Shares at August 31, 2023 | Dividend Income | Capital Gain Distributions |
JPMorgan Securities Lending Money Market Fund Agency SL Class Shares, 5.50% (a) (b) | $20 | $148,000,000 | $127,999,320 | $(500 )* | $— | $20,000,200 | 19,996,201 | $537,882 * | $— |
JPMorgan U.S. Government Money Market Fund Class IM Shares, 5.27% (a) (b) | 3,129,388 | 95,899,962 | 95,468,073 | — | — | 3,561,277 | 3,561,277 | 95,386 * | — |
JPMorgan U.S. Government Money Market Fund Class IM Shares, 5.27% (a) (b) | 2,659,750 | 26,693,885 | 26,496,688 | — | — | 2,856,947 | 2,856,947 | 82,755 | — |
Total | $5,789,158 | $270,593,847 | $249,964,081 | $(500 ) | $— | $26,418,424 | $716,023 | $— | |
(a) | Investment in an affiliated fund, which is registered under the Investment Company Act of 1940, as amended, and is advised by J.P. Morgan Investment Management Inc. |
(b) | The rate shown is the current yield as of August 31, 2023. |
* | Amount is included on the Statement of Operations as Income from securities lending (net) (after payments of rebates and Citibank’s fee). |
16 | J.P. Morgan Exchange-Traded Funds | August 31, 2023 |
Futures Contracts: | |
Average Notional Balance Long | $4,084,469 |
Ending Notional Balance Long | 1,434,840 |
August 31, 2023 | J.P. Morgan Exchange-Traded Funds | 17 |
AS OF August 31, 2023 (Unaudited) (continued)
Purchases (excluding U.S. Government) | Sales (excluding U.S. Government) | |
$15,857,545 | $12,125,371 |
In-Kind Purchases | In-Kind Sales | |
$92,212,373 | $74,682,389 |
Aggregate Cost | Gross Unrealized Appreciation | Gross Unrealized Depreciation | Net Unrealized Appreciation (Depreciation) | |
$925,649,025 | $11,909,096 | $168,061,695 | $(156,152,599 ) |
Capital Loss Carryforward Character | ||
Short-Term | Long-Term | |
$25,400,113 | $13,434,169 | |
18 | J.P. Morgan Exchange-Traded Funds | August 31, 2023 |
Net Capital Losses (Gains) | ||
Short-Term | Long-Term | |
$7,936,103 | $12,275,324 | |
August 31, 2023 | J.P. Morgan Exchange-Traded Funds | 19 |
AS OF August 31, 2023 (Unaudited) (continued)
JPMorgan SmartRetirement Funds | JPMorgan SmartRetirement Blend Funds | |
12.0 % | 29.0 % |
20 | J.P. Morgan Exchange-Traded Funds | August 31, 2023 |
(Unaudited)
Hypothetical $1,000 Investment
Beginning Account Value March 1, 2023 | Ending Account Value August 31, 2023 | Expenses Paid During the Period* | Annualized Expense Ratio | |
JPMorgan BetaBuilders MSCI US REIT ETF | ||||
Actual | $1,000.00 | $998.60 | $0.55 | 0.11 % |
Hypothetical | 1,000.00 | 1,024.58 | 0.56 | 0.11 |
* | Expenses are equal to the Fund’s annualized net expense ratio, multiplied by the average account value over the period, multiplied by 184/366 (to reflect the one-half year period). |
August 31, 2023 | J.P. Morgan Exchange-Traded Funds | 21 |
(Unaudited)
22 | J.P. Morgan Exchange-Traded Funds | August 31, 2023 |
(Unaudited)
August 31, 2023 | J.P. Morgan Exchange-Traded Funds | 23 |
(Unaudited) (continued)
24 | J.P. Morgan Exchange-Traded Funds | August 31, 2023 |
August 31, 2023 | J.P. Morgan Exchange-Traded Funds | 25 |


Fund | Ticker | Listing Exchange |
JPMorgan High Yield Municipal ETF | JMHI | NYSE Arca |
JPMorgan Inflation Managed Bond ETF | JCPI | Cboe BZX Exchange, Inc. |
JPMorgan Limited Duration Bond ETF | JPLD | Cboe BZX Exchange, Inc. |
JPMorgan Realty Income ETF | JPRE | NYSE Arca |
JPMorgan Sustainable Municipal Income ETF | JMSI | NYSE Arca |

1 | |
2 | |
3 | |
3 | |
6 | |
9 | |
12 | |
15 | |
18 | |
68 | |
86 | |
92 | |
112 | |
113 | |
114 | |
118 |
October 19, 2023 (Unaudited)
 | “A properly diversified portfolio together with a long-term approach may help investors weather economic and geopolitical uncertainties.” — Brian S. Shlissel |

President, J.P. Morgan Exchange-Traded Funds
J.P. Morgan Asset Management
1-844-4JPM-ETF or jpmorgan.com/etfs for more information
August 31, 2023 | J.P. Morgan Exchange-Traded Funds | 1 |
SIX MONTHS ENDED August 31, 2023 (Unaudited)
2 | J.P. Morgan Exchange-Traded Funds | August 31, 2023 |
SIX MONTHS ENDED August 31, 2023 (Unaudited)
REPORTING PERIOD RETURN: | |
Net Asset Value * | 0.17% |
Market Price ** | (0.34)% |
Bloomberg U.S. Municipal Index | 1.04% |
Bloomberg High Yield Municipal Bond Index | 2.33% |
Net Assets as of 8/31/2023 | $220,649,324 |
Duration as of 8/31/2023 | 8.1 Years |
Fund Ticker | JMHI |
August 31, 2023 | J.P. Morgan Exchange-Traded Funds | 3 |
SIX MONTHS ENDED August 31, 2023 (Unaudited) (continued)
CREDIT QUALITY ALLOCATIONS AS OF AUGUST 31, 2023 | PERCENT OF TOTAL INVESTMENTS |
AAA | 17.1% |
AA | 12.5 |
A | 6.3 |
BBB | 10.1 |
BB | 10.9 |
CCC | 1.9 |
NR | 41.2 |
4 | J.P. Morgan Exchange-Traded Funds | August 31, 2023 |
INCEPTION DATE | SIX MONTHS* | 1 YEAR | 5 YEAR | 10 YEAR | |
JPMorgan High Yield Municipal ETF | |||||
Net Asset Value | September 17, 2007** | 0.17 % | (2.39 )% | 0.66 % | 2.14 % |
Market Price | (0.34 ) | (2.89 ) | 0.55 | 2.09 |
* | Not annualized. |
** | Inception date for Class I Shares of the Predecessor Fund (as defined below). |
August 31, 2023 | J.P. Morgan Exchange-Traded Funds | 5 |
SIX MONTHS ENDED August 31, 2023 (Unaudited)
REPORTING PERIOD RETURN: | |
Net Asset Value * | 1.09% |
Market Price ** | 0.19% |
Bloomberg 1-10 Year U.S. TIPS Index | 1.35% |
Bloomberg U.S. Intermediate Aggregate Index | 1.25% |
Net Assets as of 8/31/2023 | $486,535,910 |
Duration as of 8/31/2023 | 5.0 Years |
Fund Ticker | JCPI |
PORTFOLIO COMPOSITION AS OF August 31, 2023 | PERCENT OF TOTAL INVESTMENTS |
Corporate Bonds | 26.2% |
U.S. Treasury Obligations | 17.9 |
Mortgage-Backed Securities | 17.8 |
Asset-Backed Securities | 15.8 |
Collateralized Mortgage Obligations | 9.7 |
Commercial Mortgage-Backed Securities | 8.8 |
U.S. Government Agency Securities | 2.2 |
Others (each less than 1.0%) | 0.3 |
Short-Term Investments | 1.3 |
6 | J.P. Morgan Exchange-Traded Funds | August 31, 2023 |
August 31, 2023 | J.P. Morgan Exchange-Traded Funds | 7 |
SIX MONTHS ENDED August 31, 2023 (Unaudited) (continued)
INCEPTION DATE | SIX MONTHS* | 1 YEAR | 5 YEAR | 10 YEAR | |
JPMorgan Inflation Managed Bond ETF | |||||
Net Asset Value | November 30, 2010** | 1.09 % | (1.72 )% | 1.94 % | 1.67 % |
Market Price | 0.19 | (2.22 ) | 1.78 | 1.60 |
* | Not annualized. |
** | Inception date for Class R6 Shares of the Predecessor Fund (as defined below). |
8 | J.P. Morgan Exchange-Traded Funds | August 31, 2023 |
SIX MONTHS ENDED August 31, 2023 (Unaudited)
REPORTING PERIOD RETURN: | |
Net Asset Value * | 2.23% |
Market Price ** | 2.03% |
Bloomberg 1-3 Year U.S. Government/Credit Bond Index | 1.86% |
Net Assets as of 8/31/2023 | $826,346,989 |
Duration as of 8/31/2023 | 1.5 Years |
Fund Ticker | JPLD |
August 31, 2023 | J.P. Morgan Exchange-Traded Funds | 9 |
SIX MONTHS ENDED August 31, 2023 (Unaudited) (continued)
PORTFOLIO COMPOSITION AS OF August 31, 2023 | PERCENT OF TOTAL INVESTMENTS |
Asset-Backed Securities | 39.4% |
Collateralized Mortgage Obligations | 28.1 |
Mortgage-Backed Securities | 9.2 |
Commercial Mortgage-Backed Securities | 8.9 |
Corporate Bonds | 6.8 |
Short-Term Investments | 7.6 |
10 | J.P. Morgan Exchange-Traded Funds | August 31, 2023 |
INCEPTION DATE | SIX MONTHS* | 1 YEAR | 5 YEAR | 10 YEAR | |
JPMorgan Limited Duration Bond ETF | |||||
Net Asset Value | February 22, 2005 | 2.23 % | 3.33 % | 1.65 % | 1.69 % |
Market Price | 2.03 | 3.12 | 1.61 | 1.67 |
* | Not annualized. |
August 31, 2023 | J.P. Morgan Exchange-Traded Funds | 11 |
SIX MONTHS ENDED August 31, 2023 (Unaudited)
REPORTING PERIOD RETURN: | |
Net Asset Value * | (1.04)% |
Market Price ** | (1.18)% |
MSCI US REIT Index | (0.14)% |
FTSE NAREIT All Equity REITs Index | (1.94)% |
Net Assets as of 8/31/2023 | $335,759,488 |
Fund Ticker | JPRE |
12 | J.P. Morgan Exchange-Traded Funds | August 31, 2023 |
TOP TEN HOLDINGS OF THE PORTFOLIO AS OF August 31, 2023 | PERCENT OF TOTAL INVESTMENTS | |
1. | American Tower Corp. | 9.3 % |
2. | Digital Realty Trust, Inc. | 8.1 |
3. | Equinix, Inc. | 8.1 |
4. | Prologis, Inc. | 7.0 |
5. | Realty Income Corp. | 6.2 |
6. | Welltower, Inc. | 5.5 |
7. | UDR, Inc. | 4.4 |
8. | Ventas, Inc. | 4.2 |
9. | WP Carey, Inc. | 4.1 |
10. | Public Storage | 4.1 |
PORTFOLIO COMPOSITION BY SECTOR AS OF August 31, 2023 | PERCENT OF TOTAL INVESTMENTS |
Diversified | 31.8% |
Apartments | 17.4 |
Health Care | 12.7 |
Industrial | 12.0 |
Single Tenant | 6.2 |
Shopping Centers | 5.5 |
Storage | 5.0 |
Office | 3.1 |
Hotels | 2.0 |
Short-Term Investments | 4.3 |
August 31, 2023 | J.P. Morgan Exchange-Traded Funds | 13 |
SIX MONTHS ENDED August 31, 2023 (Unaudited) (continued)
INCEPTION DATE | SIX MONTHS* | 1 YEAR | 5 YEAR | 10 YEAR | |
JPMorgan Realty Income ETF | |||||
Net Asset Value | May 15, 2006** | (1.04 )% | (4.50 )% | 4.47 % | 6.82 % |
Market Price | (1.18 ) | (4.48 ) | 4.47 | 6.82 |
* | Not annualized. |
** | Inception date for Class R5 Shares of the Predecessor Fund (as defined below). |
14 | J.P. Morgan Exchange-Traded Funds | August 31, 2023 |
SIX MONTHS ENDED August 31, 2023 (Unaudited)
REPORTING PERIOD RETURN: | |
Net Asset Value * | 1.24% |
Market Price ** | 0.98% |
Bloomberg U.S. 1-15 Year Blend (1-17) Municipal Bond Index | 0.89% |
Net Assets as of 8/31/2023 | $235,658,686 |
Duration as of 8/31/2023 | 6.0 Years |
Fund Ticker | JMSI |
August 31, 2023 | J.P. Morgan Exchange-Traded Funds | 15 |
SIX MONTHS ENDED August 31, 2023 (Unaudited) (continued)
CREDIT QUALITY ALLOCATIONS AS OF AUGUST 31, 2023 | PERCENT OF TOTAL INVESTMENTS |
AAA | 11.2% |
AA | 30.2 |
A | 14.5 |
BBB | 25.0 |
BB | 7.2 |
NR | 11.9 |
16 | J.P. Morgan Exchange-Traded Funds | August 31, 2023 |
INCEPTION DATE | SIX MONTHS* | 1 YEAR | 5 YEAR | 10 YEAR | |
JPMorgan Sustainable Municipal Income ETF | |||||
Net Asset Value | February 9, 1993** | 1.24 % | 0.97 % | 1.17 % | 2.09 % |
Market Price | 0.98 | 0.71 | 1.12 | 2.06 |
* | Not annualized. |
** | Inception date for Class I Shares of the Predecessor Fund (as defined below). |
August 31, 2023 | J.P. Morgan Exchange-Traded Funds | 17 |
AS OF August 31, 2023 (Unaudited)
INVESTMENTS | PRINCIPAL AMOUNT($) | VALUE($) |
Municipal Bonds — 86.2% (a) | ||
Alabama — 1.6% | ||
Black Belt Energy Gas District, Gas Project Series 2023A, Rev., 5.25%, 10/1/2030 (b) | 2,000,000 | 2,077,607 |
Southeast Energy Authority A Cooperative District Project No.06 Series 2023B, Rev., LIQ : Royal Bank of Canada, 5.00%, 6/1/2030 (b) | 1,385,000 | 1,436,079 |
Total Alabama | 3,513,686 | |
Arizona — 2.8% | ||
Arizona Industrial Development Authority, Academies of Math and Science Projects Rev., 4.00%, 7/1/2029 (c) | 400,000 | 382,910 |
Arizona Industrial Development Authority, Doral Academy of Northern Nevada Project Series 2021A, Rev., 4.00%, 7/15/2041 (c) | 660,000 | 528,275 |
Arizona Industrial Development Authority, Great Lakes Senior Living Communities LLC Project | ||
Series 2019A, Rev., 5.00%, 1/1/2029 | 1,500,000 | 1,241,687 |
Series 2019A, Rev., 5.00%, 1/1/2037 | 1,000,000 | 686,874 |
Series 2019A, Rev., 5.00%, 1/1/2038 | 1,000,000 | 684,638 |
Series 2019A, Rev., 4.25%, 1/1/2039 | 1,000,000 | 616,542 |
Series 2019A, Rev., 4.50%, 1/1/2049 | 2,000,000 | 1,117,955 |
Glendale Industrial Development Authority, Terraces of Phoenix Project | ||
Series 2018A, Rev., 4.00%, 7/1/2028 | 450,000 | 413,117 |
Series 2018A, Rev., 5.00%, 7/1/2038 | 300,000 | 258,079 |
Maricopa County Industrial Development Authority, Ottawa University | ||
Rev., 5.00%, 10/1/2026 (c) | 125,000 | 124,504 |
Rev., 5.13%, 10/1/2030 (c) | 210,000 | 209,192 |
Total Arizona | 6,263,773 | |
Arkansas — 0.5% | ||
Arkansas Development Finance Authority, Industrial Development , Hybar Steel Project Series 2023B, Rev., 12.00%, 7/1/2048 (c) | 1,000,000 | 1,052,933 |
California — 6.5% | ||
California Community Choice Financing Authority, Clean Energy Project Series 2023E-1, Rev., 5.00%, 3/1/2031 (b) | 1,280,000 | 1,340,651 |
California Community College Financing Authority, Orange Coast Properties LLC - Orange Coast College Project | ||
Rev., 5.00%, 5/1/2037 | 750,000 | 762,085 |
Rev., 5.00%, 5/1/2038 | 400,000 | 404,607 |
INVESTMENTS | PRINCIPAL AMOUNT($) | VALUE($) |
California — continued | ||
California Community Housing Agency, Fountains at Emerald Park Series 2021A-2, Rev., 4.00%, 8/1/2046 (c) | 495,000 | 394,719 |
California Community Housing Agency, Glendale Properties Series 2021A-2, Rev., 4.00%, 8/1/2047 (c) | 1,500,000 | 1,165,049 |
California Infrastructure and Economic Development Bank, Academy of Motion Picture Series 2020A-3, Rev., AMT, 8.00%, 9/14/2023 (b) (c) (d) | 2,000,000 | 2,000,145 |
California Municipal Finance Authority, Linxs Apartments Project, Senior Lien | ||
Series 2018A, Rev., AMT, AGM, 3.25%, 12/31/2032 | 245,000 | 225,437 |
Series 2018A, Rev., AMT, AGM, 3.50%, 12/31/2035 | 240,000 | 216,921 |
California Public Finance Authority, Enso Village Project Series 2021A, Rev., 5.00%, 11/15/2056 (c) | 500,000 | 427,699 |
California Public Finance Authority, Laverne Elementary Preparatory Academy | ||
Series 2019A, Rev., 4.25%, 6/15/2029 (c) | 675,000 | 637,823 |
Series 2019A, Rev., 5.00%, 6/15/2039 (c) | 785,000 | 724,402 |
California School Facilities Financing Authority, Capital Appreciation, Azusa Unified School District Series 2009A, Rev., AGM, Zero Coupon, 8/1/2030 | 200,000 | 157,207 |
CMFA Special Finance Agency VIII Junior, Elan Hunting Beach Series 2021A-2, Rev., 4.00%, 8/1/2047 (c) | 900,000 | 730,870 |
CSCDA Community Improvement Authority, Essential Housing, Mezzanine Lien Series 2021B, Rev., 4.00%, 2/1/2057 (c) | 1,500,000 | 1,046,465 |
CSCDA Community Improvement Authority, Essential Housing, Oceanaire-Long Beach Series 2021A-2, Rev., 4.00%, 9/1/2056 (c) | 2,115,000 | 1,522,023 |
CSCDA Community Improvement Authority, Essential Housing, Orange Portfolio Series 2021A-1, Rev., 2.80%, 3/1/2047 (c) | 500,000 | 373,345 |
CSCDA Community Improvement Authority, Essential Housing, Parallel-Anaheim Series 2021A, Rev., 4.00%, 8/1/2056 (c) | 1,400,000 | 1,028,425 |
18 |
INVESTMENTS | PRINCIPAL AMOUNT($) | VALUE($) |
Municipal Bonds — continued | ||
California — continued | ||
CSCDA Community Improvement Authority, Essential Housing, Towne at Glendale Apartments Series 2022B, Rev., 5.00%, 9/1/2037 (c) | 225,000 | 218,822 |
Golden State Tobacco Securitization Corp. Series 2021B-2, Rev., Zero Coupon, 6/1/2066 | 10,000,000 | 990,306 |
Total California | 14,367,001 | |
Colorado — 8.9% | ||
Bradburn Metropolitan District No. 2, Limited Tax | ||
Series 2018A, GO, 5.00%, 12/1/2038 | 500,000 | 479,430 |
Series 2018B, GO, 7.25%, 12/15/2047 | 500,000 | 475,334 |
Canyon Pines Metropolitan District Special Improvement District No. 1 Series 2021A-2, 3.75%, 12/1/2040 | 1,325,000 | 1,016,280 |
City and County of Denver Airport System Series 2022A, Rev., AMT, 5.00%, 11/15/2047 | 2,000,000 | 2,058,209 |
Colorado Educational and Cultural Facilities Authority, Aspen View Academy Project Rev., 4.00%, 5/1/2051 | 175,000 | 135,123 |
Colorado Educational and Cultural Facilities Authority, Global Village Academy Northglenn Project | ||
Rev., 5.00%, 12/1/2040 (c) | 555,000 | 496,382 |
Rev., 5.00%, 12/1/2050 (c) | 735,000 | 614,589 |
Colorado Educational and Cultural Facilities Authority, Stargate Charter School Project Series 2018A, Rev., 4.00%, 12/1/2048 | 500,000 | 423,649 |
Colorado Educational and Cultural Facilities Authority, Vega Collegiate Academy Project Series 2021A, Rev., 5.00%, 2/1/2051 (c) | 750,000 | 643,427 |
Colorado Housing and Finance Authority, Single Family Mortgage Series 2023L, Rev., GNMA COLL, 5.75%, 11/1/2053 (d) | 1,000,000 | 1,061,667 |
DIATC Metropolitan District, Limited Tax and Improvement GO, 3.25%, 12/1/2029 (c) | 590,000 | 539,885 |
Dominion Water and Sanitation District Rev., 5.25%, 12/1/2032 | 515,000 | 507,555 |
Jefferson Center Metropolitan District No. 1 Series 2020A-2, Rev., 4.13%, 12/1/2040 | 285,000 | 236,277 |
Peak Metropolitan District No. 1 Series 2021A, GO, 5.00%, 12/1/2051 (c) | 600,000 | 510,892 |
Public Authority for Colorado Energy, Natural Gas Purchase Series 2008, Rev., 6.13%, 11/15/2023 | 25,000 | 25,094 |
INVESTMENTS | PRINCIPAL AMOUNT($) | VALUE($) |
Colorado — continued | ||
Raindance Metropolitan District No. 1, Non-Potable Water System Rev., 5.00%, 12/1/2040 | 750,000 | 687,388 |
Reunion Metropolitan District Series 2021A, Rev., 3.63%, 12/1/2044 | 490,602 | 354,794 |
Rocky Mountain Rail Park Metropolitan District, Limited Tax Series 2021A, GO, 5.00%, 12/1/2041 (c) | 1,250,000 | 836,945 |
Sky Ranch Community Authority Board, Metropolitan District No. 3 Series 2022A, Rev., 5.75%, 12/1/2052 | 500,000 | 460,295 |
STC Metropolitan District No. 2, Limited Tax Improvement Series 2019A, GO, 3.00%, 12/1/2025 | 555,000 | 528,630 |
Sterling Ranch Community Authority Board, Limited Tax Supported District No. 2 | ||
Series 2020A, Rev., 3.38%, 12/1/2030 | 500,000 | 446,626 |
Series 2020A, Rev., 3.75%, 12/1/2040 | 500,000 | 417,587 |
Third Creek Metropolitan District No. 1, Limited Tax | ||
Series 2022A-1, GO, 4.50%, 12/1/2037 | 825,000 | 698,920 |
Series 2022A-1, GO, 4.75%, 12/1/2051 | 760,000 | 573,673 |
Trails at Crowfoot Metropolitan District No. 3, Limited Tax | ||
Series 2019A, GO, 4.38%, 12/1/2030 | 620,000 | 576,535 |
Series 2019A, GO, 5.00%, 12/1/2039 | 1,000,000 | 942,574 |
Transport Metropolitan District No. 3, Limited Tax Series 2021A-1, GO, 5.00%, 12/1/2041 | 1,000,000 | 881,854 |
Verve Metropolitan District No. 1 GO, 5.00%, 12/1/2041 | 1,125,000 | 894,111 |
Westerly Metropolitan District No. 4, Limited Tax Series 2021A, GO, 5.00%, 12/1/2040 | 700,000 | 632,345 |
Windler Public Improvement Authority, Limited Tax Series 2021A-1, Rev., 4.00%, 12/1/2036 | 1,865,000 | 1,397,563 |
Total Colorado | 19,553,633 | |
Connecticut — 0.7% | ||
Stamford Housing Authority, The Dogwoods Project Rev., BAN, 11.00%, 12/1/2027 (c) | 1,500,000 | 1,581,311 |
19 |
AS OF August 31, 2023 (Unaudited) (continued)
INVESTMENTS | PRINCIPAL AMOUNT($) | VALUE($) |
Municipal Bonds — continued | ||
Delaware — 0.5% | ||
Delaware State Economic Development Authority, Aspria of Delaware Charter Series 2022A, Rev., 4.00%, 6/1/2042 | 250,000 | 194,645 |
Delaware State Economic Development Authority, Delmarva Power and Light Co. Project Series 2020A, Rev., 1.05%, 7/1/2025 (b) | 1,000,000 | 943,252 |
Total Delaware | 1,137,897 | |
District of Columbia — 0.1% | ||
District of Columbia, Kipp DC Project Rev., 4.00%, 7/1/2039 | 200,000 | 180,537 |
Florida — 3.6% | ||
Capital Trust Agency, Inc., Franklin Academy Project | ||
Rev., 4.00%, 12/15/2025 (c) | 300,000 | 290,804 |
Rev., 5.00%, 12/15/2027 (c) | 330,000 | 324,989 |
Rev., 5.00%, 12/15/2028 (c) | 345,000 | 339,767 |
Rev., 5.00%, 12/15/2029 (c) | 365,000 | 359,172 |
Rev., 5.00%, 12/15/2030 (c) | 510,000 | 499,900 |
Capital Trust Agency, Inc., Legends Academy Project Series 2021A, Rev., 5.00%, 12/1/2045 (c) | 1,625,000 | 1,295,840 |
Charlotte County Industrial Development Authority, Town and Country Utilities Project Series 2021A, Rev., AMT, 4.00%, 10/1/2041 (c) | 400,000 | 335,536 |
County of Lake, Imagine South Lake Charter School Project Series 2019A, Rev., 5.00%, 1/15/2029 (c) | 500,000 | 501,241 |
Florida Development Finance Corp., Educational Facilities, UCP Charter Schools Project Series 2020A, Rev., 5.00%, 6/1/2040 | 830,000 | 741,400 |
Florida Development Finance Corp., IDEA Florida, Inc., Jacksonville IV Project Rev., 5.25%, 6/15/2029 (c) | 650,000 | 637,902 |
Florida Higher Educational Facilities Financial Authority, St. Leo University Project Rev., 5.00%, 3/1/2039 | 750,000 | 672,930 |
Middleton Community Development District A, City of Wildwood, Florida Special Assessment Series 2022, 6.10%, 5/1/2042 | 1,000,000 | 1,034,414 |
Palm Beach County Health Facilities Authority, Jupiter Medical Center Series 2022, Rev., 5.00%, 11/1/2052 | 1,000,000 | 943,259 |
Total Florida | 7,977,154 | |
INVESTMENTS | PRINCIPAL AMOUNT($) | VALUE($) |
Georgia — 2.6% | ||
City of Atlanta Airport Passenger Facility Charge, Subordinate Lien Series 2023E, Rev., AMT, 5.00%, 7/1/2024 | 1,000,000 | 1,007,819 |
City of Atlanta Department of Aviation Series 2023C, Rev., AMT, 5.00%, 7/1/2048 | 1,000,000 | 1,028,887 |
George L Smith II Congress Center Authority, Convention Center Hotel Second | ||
Series 2021B, Rev., 5.00%, 1/1/2036 (c) | 500,000 | 463,274 |
Series 2021B, Rev., 5.00%, 1/1/2054 (c) | 855,000 | 695,544 |
Municipal Electric Authority of Georgia Series 2019B, Rev., 5.00%, 1/1/2059 | 2,500,000 | 2,495,544 |
Total Georgia | 5,691,068 | |
Idaho — 0.1% | ||
Idaho Housing and Finance Association, Compass Public Charter School, Inc., Project Series 2018A, Rev., 4.63%, 7/1/2029 (c) | 150,000 | 150,313 |
Illinois — 3.7% | ||
Chicago O'Hare International Airport, General Airport, Senior Lien Series 2018B, Rev., 5.00%, 1/1/2053 | 2,500,000 | 2,565,515 |
Chicago Transit Authority Sales Tax Receipts Fund Series 2014, Rev., 5.25%, 12/1/2049 | 3,000,000 | 3,022,981 |
Illinois Finance Authority, Clark-Lindsey Village Series 2022A, Rev., 5.25%, 6/1/2037 | 175,000 | 163,751 |
Illinois Finance Authority, Plymouth Place, Inc. Series 2022B-1, Rev., 6.00%, 11/15/2027 | 200,000 | 200,087 |
State of Illinois | ||
Series 2020C, GO, 4.25%, 10/1/2045 | 2,250,000 | 2,103,991 |
Series 2023B, GO, 4.50%, 5/1/2048 | 160,000 | 153,332 |
Total Illinois | 8,209,657 | |
Indiana — 3.0% | ||
City of Goshen, Multi-Family, Green Oaks of Goshen Project Series 2021A, Rev., 5.00%, 8/1/2041 (c) | 1,000,000 | 789,818 |
City of Valparaiso Rev., 5.38%, 12/1/2041 (c) | 1,550,000 | 1,179,861 |
Indiana Finance Authority, Educational Facilities, Kipp Indianapolis, Inc., Project | ||
Series 2020A, Rev., 4.00%, 7/1/2030 | 105,000 | 98,006 |
Series 2020A, Rev., 5.00%, 7/1/2040 | 170,000 | 160,025 |
Series 2020A, Rev., 5.00%, 7/1/2055 | 455,000 | 402,379 |
Indiana Finance Authority, Lease Appropriation Stadium Project Series 2022A, Rev., 4.00%, 2/1/2036 | 1,985,000 | 2,022,152 |
20 |
INVESTMENTS | PRINCIPAL AMOUNT($) | VALUE($) |
Municipal Bonds — continued | ||
Indiana — continued | ||
Indiana Finance Authority, Marian University Project Series 2019A, Rev., 4.00%, 9/15/2044 | 1,090,000 | 896,833 |
Indiana Housing and Community Development Authority, Vita of Marion Project Series 2021A, Rev., 5.25%, 4/1/2041 (c) | 1,250,000 | 974,683 |
Total Indiana | 6,523,757 | |
Iowa — 0.4% | ||
Iowa Finance Authority, PHS Council Bluffs, Inc., Project | ||
Series 2018, Rev., 4.45%, 8/1/2028 | 250,000 | 229,638 |
Series 2018, Rev., 5.00%, 8/1/2033 | 485,000 | 427,257 |
Series 2018, Rev., 5.00%, 8/1/2038 | 370,000 | 296,600 |
Total Iowa | 953,495 | |
Kansas — 0.4% | ||
City of Wichita, Health Care Facilities, Presbyterian Manors, Inc. | ||
Series 2018 I, Rev., 5.00%, 5/15/2033 | 500,000 | 431,365 |
Series 2018I, Rev., 5.00%, 5/15/2038 | 500,000 | 388,277 |
Total Kansas | 819,642 | |
Louisiana — 1.2% | ||
Louisiana Public Facilities Authority, Lincoln Preparatory School Project Series 2021A, Rev., 5.25%, 6/1/2051 (c) | 1,145,000 | 928,338 |
Louisiana Public Facilities Authority, Materra Campus Project Series 2021C, Rev., 4.00%, 6/1/2041 (c) | 440,000 | 343,477 |
Louisiana Public Facilities Authority, Mentorship Steam Academy Project | ||
Series 2021A, Rev., 5.00%, 6/1/2051 (c) | 700,000 | 541,483 |
Series 2021A, Rev., 5.00%, 6/1/2056 (c) | 740,000 | 556,743 |
Louisiana Public Facilities Authority, School Master Project Series 2021A, Rev., 4.00%, 6/1/2031 (c) | 290,000 | 263,716 |
Total Louisiana | 2,633,757 | |
Maryland — 0.1% | ||
Maryland Health and Higher Educational Facilities Authority, Frederick Health System Issue Rev., 3.25%, 7/1/2039 | 175,000 | 137,218 |
Michigan — 5.3% | ||
City of Detroit, Unlimited Tax | ||
GO, 5.00%, 4/1/2037 | 500,000 | 506,718 |
Series 2023C, GO, 6.00%, 5/1/2043 | 2,300,000 | 2,525,017 |
INVESTMENTS | PRINCIPAL AMOUNT($) | VALUE($) |
Michigan — continued | ||
Detroit Downtown Development Authority, Tax Increment Catalyst Development Project Series 2018A, Rev., AGM, 5.00%, 7/1/2048 | 1,500,000 | 1,502,809 |
Kalamazoo Economic Development Corp., Heritage Community of Kalamazoo Project Rev., 5.00%, 5/15/2037 | 1,230,000 | 1,116,126 |
Michigan Finance Authority, Aqunias College Project Rev., 4.00%, 5/1/2031 | 540,000 | 476,269 |
Michigan Finance Authority, Universal Learning Academy Rev., 6.00%, 11/1/2032 | 750,000 | 764,887 |
Michigan Strategic Fund, United Methodist Retirement Communities Obligated Group, Porter Hills Presbyterian Village Project | ||
Rev., 5.00%, 5/15/2037 | 670,000 | 630,632 |
Rev., 5.00%, 5/15/2044 | 1,000,000 | 880,129 |
State of Michigan Trunk Line, Rebuilding Michigan Program Series 2023, Rev., 5.25%, 11/15/2049 (d) | 3,000,000 | 3,290,504 |
Total Michigan | 11,693,091 | |
Missouri — 0.7% | ||
Industrial Development Authority of the City of St Louis Missouri (The), Innovation District Rev., 5.00%, 5/15/2041 | 575,000 | 561,108 |
Joplin Industrial Development Authority, 32nd Street Place Community Improvement District Project Series 2021, Rev., 4.25%, 11/1/2050 | 1,250,000 | 1,024,853 |
Total Missouri | 1,585,961 | |
Montana — 0.4% | ||
County of Gallatin, Bozeman Fiber Project Series 2021A, Rev., 4.00%, 10/15/2032 (c) | 1,000,000 | 902,080 |
Nevada — 0.6% | ||
City of Las Vegas, Special Improvement District No. 611, Local Improvement | ||
Series 2020, 3.50%, 6/1/2030 | 200,000 | 182,378 |
Series 2020, 3.50%, 6/1/2031 | 160,000 | 141,558 |
Series 2020, 3.75%, 6/1/2032 | 260,000 | 230,535 |
4.00%, 6/1/2033 | 180,000 | 166,080 |
4.00%, 6/1/2034 | 185,000 | 168,750 |
4.00%, 6/1/2035 | 185,000 | 166,875 |
4.00%, 6/1/2040 | 445,000 | 385,479 |
Total Nevada | 1,441,655 | |
21 |
AS OF August 31, 2023 (Unaudited) (continued)
INVESTMENTS | PRINCIPAL AMOUNT($) | VALUE($) |
Municipal Bonds — continued | ||
New Hampshire — 0.5% | ||
New Hampshire Business Finance Authority, The Vista Project | ||
Series 2019A, Rev., 5.25%, 7/1/2039 (c) | 200,000 | 178,772 |
Series 2019A, Rev., 5.63%, 7/1/2046 (c) | 1,000,000 | 890,035 |
Total New Hampshire | 1,068,807 | |
New Jersey — 2.5% | ||
New Jersey Economic Development Authority, Black Horse EHT Urban Renewal LLC Project Series 2019A, Rev., 5.00%, 10/1/2039 (c) | 2,000,000 | 1,408,813 |
New Jersey Economic Development Authority, Marion P. Thomas Charter School, Inc., Project Series 2018A, Rev., 5.00%, 10/1/2033 (c) | 1,000,000 | 942,483 |
New Jersey Economic Development Authority, White Horse HMT Urban Renewal LLC Project Rev., 5.00%, 1/1/2040 (c) | 3,000,000 | 2,100,280 |
Tobacco Settlement Financing Corp. Series 2018B, Rev., 5.00%, 6/1/2046 | 1,000,000 | 982,590 |
Total New Jersey | 5,434,166 | |
New York — 6.1% | ||
Build NYC Resource Corp., New World Preparatory Charter School Project Series 2021A, Rev., 4.00%, 6/15/2051 (c) | 395,000 | 283,371 |
Build NYC Resource Corp., Richmond Charter Schools Series 2021A, Rev., 5.00%, 6/1/2051 (c) | 575,000 | 511,877 |
City of New York, Fiscal Year 2024 Series 2024A, GO, 4.13%, 8/1/2053 | 1,025,000 | 968,497 |
Jefferson County Civic Facility Development Corp., Samaritan Medical Center Project Series 2017A, Rev., 4.00%, 11/1/2042 | 1,000,000 | 710,541 |
Monroe County Industrial Development Corp.,Rochester Regional Health Project Series 2020A, Rev., 4.00%, 12/1/2036 | 2,800,000 | 2,620,554 |
New York City Transitional Finance Authority Future Tax Secured Series 2024B, Rev., 5.00%, 5/1/2038 | 1,000,000 | 1,100,718 |
New York City Transitional Finance Authority, Building Aid Fiscal 2021 Series 2020S1, Rev., 4.00%, 7/15/2046 | 1,800,000 | 1,706,846 |
New York Transportation Development Corp., Delta Air Lines, Inc., LaGuardia Airport Terminals C&D Redevelopment Project | ||
Rev., AMT, 5.00%, 1/1/2028 | 500,000 | 513,979 |
Rev., AMT, 5.00%, 1/1/2034 | 375,000 | 385,180 |
Rev., AMT, 4.38%, 10/1/2045 | 2,000,000 | 1,878,381 |
INVESTMENTS | PRINCIPAL AMOUNT($) | VALUE($) |
New York — continued | ||
Suffolk County Economic Development Corp., St. Johnland Assisted Living Inc., Project Rev., 5.13%, 11/1/2041 (c) | 750,000 | 611,291 |
Triborough Bridge and Tunnel Authority, MTA Bridges and Tunnels Series 2023B-1, Rev., 5.00%, 11/15/2044 | 1,500,000 | 1,609,819 |
Yonkers Economic Development Corp., Charter School of Educational Excellence Project | ||
Series 2019A, Rev., 4.00%, 10/15/2029 | 200,000 | 187,763 |
Series 2019A, Rev., 5.00%, 10/15/2039 | 315,000 | 292,880 |
Total New York | 13,381,697 | |
Ohio — 2.5% | ||
Buckeye Tobacco Settlement Financing Authority | ||
Series 2020B-2, Rev., 5.00%, 6/1/2055 | 1,000,000 | 914,092 |
Series 2020B-3, Rev., Zero Coupon, 6/1/2057 | 10,000,000 | 1,151,586 |
County of Cuyahoga, Eliza Jennings Senior Care Network Series 2022A, Rev., 5.00%, 5/15/2032 | 460,000 | 438,428 |
County of Hardin, Economic Development Facilities Improvement, Ohio Northern University Rev., 5.00%, 5/1/2030 | 250,000 | 236,034 |
Northeast Ohio Medical University | ||
Series 2021A, Rev., 3.00%, 12/1/2040 | 125,000 | 92,792 |
Series 2021A, Rev., 4.00%, 12/1/2045 | 120,000 | 99,678 |
Ohio Higher Educational Facility Commission, The Cleveland Institute of Art 2018 Project Rev., 5.00%, 12/1/2038 | 685,000 | 631,293 |
Ohio Higher Educational Facility Commission, University of Findlay 2019 Project Rev., 5.00%, 3/1/2034 | 2,000,000 | 2,008,467 |
Total Ohio | 5,572,370 | |
Oklahoma — 1.1% | ||
Oklahoma Development Finance Authority Health System, OU Medicine Project | ||
Series 2018B, Rev., 5.50%, 8/15/2052 | 1,600,000 | 1,529,205 |
Series 2018B, Rev., 5.50%, 8/15/2057 | 1,000,000 | 945,719 |
Total Oklahoma | 2,474,924 | |
Oregon — 0.0% ^ | ||
Linn County Community School District No. 9 Lebanon Series 2005, GO, NATL - RE, 5.50%, 6/15/2030 | 20,000 | 22,523 |
22 |
INVESTMENTS | PRINCIPAL AMOUNT($) | VALUE($) |
Municipal Bonds — continued | ||
Pennsylvania — 2.8% | ||
Berks County Industrial Development Authority, The Highlands at Wyomissing Series 2017A, Rev., 5.00%, 5/15/2037 | 250,000 | 241,092 |
Bucks County Industrial Development Authority, Grand View Hospital Project Rev., 4.00%, 7/1/2046 | 890,000 | 665,483 |
Franklin County Industrial Development Authority, Menno-Haven, Inc., Project Rev., 5.00%, 12/1/2049 | 500,000 | 386,478 |
Pennsylvania Turnpike Commission Oil Franchise Tax Series 2021A, Rev., 4.00%, 12/1/2051 | 2,500,000 | 2,294,192 |
Philadelphia Authority for Industrial Development, Independence Charter School West Project Rev., 4.00%, 6/15/2029 | 355,000 | 335,477 |
Philadelphia Authority for Industrial Development, International Education and Community Initiatives Project Series 2018A, Rev., 4.50%, 6/1/2029 (c) | 600,000 | 587,492 |
Philadelphia Authority for Industrial Development, Philadelphia Electrical and Technology Charter School Project Series 2021A, Rev., 4.00%, 6/1/2041 | 200,000 | 162,519 |
West Cornwall Township Municipal Authority, Pleasant View Retirement Community Project Rev., 5.00%, 12/15/2038 | 750,000 | 690,388 |
Wilkes-Barre Area School District GO, 3.75%, 4/15/2044 | 1,000,000 | 877,839 |
Total Pennsylvania | 6,240,960 | |
Puerto Rico — 3.0% | ||
Commonwealth of Puerto Rico GO, Zero Coupon, 11/1/2043 (b) | 237,064 | 122,088 |
Puerto Rico Highway and Transportation Authority,Puerto Rico Commonwealth Highway Transport Authorized Restructured Series 2022C, Rev., Zero Coupon, 7/1/2053 | 2,000,000 | 1,262,501 |
Puerto Rico Sales Tax Financing Corp. Sales Tax (Puerto Rico) | ||
Series A-1, Rev., Zero Coupon, 7/1/2051 | 11,500,000 | 2,362,531 |
Series A-1, Rev., 5.00%, 7/1/2058 | 3,000,000 | 2,903,716 |
Total Puerto Rico | 6,650,836 | |
Rhode Island — 0.0% ^ | ||
Rhode Island Student Loan Authority Series 2017A, Rev., AMT, 5.00%, 12/1/2024 | 100,000 | 100,971 |
INVESTMENTS | PRINCIPAL AMOUNT($) | VALUE($) |
Tennessee — 1.8% | ||
Nashville Metropolitan Development and Housing Agency, Tax Increment, Fifth Broadway Development Project | ||
Series 2018, Rev., 4.50%, 6/1/2028 (c) | 300,000 | 300,152 |
Series 2018, Rev., 5.13%, 6/1/2036 (c) | 425,000 | 427,540 |
Shelby County Health Educational and Housing Facilities Board Retirement Facility The Farm At Bailey Station Series 2019A, Rev., 5.50%, 10/1/2039 | 3,000,000 | 2,418,442 |
Shelby County Health Educational and Housing Facilities Board, The Farms at Bailey Station Project Series 2019A, Rev., 5.75%, 10/1/2049 | 1,000,000 | 755,937 |
Total Tennessee | 3,902,071 | |
Texas — 9.4% | ||
Arlington Higher Education Finance Corp., Newman International Academy Series 2021A, Rev., 5.00%, 8/15/2051 | 850,000 | 701,716 |
Arlington Higher Education Finance Corp., TGP Public Schools, Gathering Place Series 2022A, Rev., 5.25%, 8/15/2032 | 410,000 | 385,155 |
Arlington Higher Education Finance Corp., Winfree Academy Charter Schools Series 2019A, Rev., 5.75%, 8/15/2043 | 1,000,000 | 964,354 |
Baytown Municipal Development District, Baytown Convention Center Hotel, First Lien Series 2021A, Rev., 4.00%, 10/1/2050 | 875,000 | 707,952 |
City of Houston Airport System Series 2023A, Rev., AMT, AGM, 5.25%, 7/1/2048 | 2,000,000 | 2,103,323 |
City of Houston, Combined Utility System, Junior Lien Series A, Rev., AGM, Zero Coupon, 12/1/2027 (e) | 30,000 | 25,945 |
Conroe Local Government Corp., Conroe Convention Center Hotel Series 2021A, Rev., 4.00%, 10/1/2050 | 550,000 | 421,046 |
Dallas Fort Worth International Airport Series 2023B, Rev., 5.00%, 11/1/2047 (d) | 1,000,000 | 1,055,524 |
Grand Parkway Transportation Corp. Series 2023, Rev., 5.00%, 4/1/2028 (b) | 1,000,000 | 1,065,988 |
New Hope Cultural Education Facilities Finance Corp., Beta Academy | ||
Series 2019A, Rev., 3.38%, 8/15/2029 (c) | 250,000 | 224,661 |
Series 2019A, Rev., 5.00%, 8/15/2039 (c) | 425,000 | 400,463 |
Series 2019A, Rev., 5.00%, 8/15/2049 (c) | 670,000 | 591,190 |
New Hope Cultural Education Facilities Finance Corp., Legacy Midtown Park Project Series 2018A, Rev., 5.50%, 7/1/2054 | 1,000,000 | 756,966 |
23 |
AS OF August 31, 2023 (Unaudited) (continued)
INVESTMENTS | PRINCIPAL AMOUNT($) | VALUE($) |
Municipal Bonds — continued | ||
Texas — continued | ||
New Hope Cultural Education Facilities Finance Corp., Morningside Ministries Project | ||
Series 2020A, Rev., 5.00%, 1/1/2035 | 500,000 | 449,773 |
Rev., 4.00%, 1/1/2037 | 625,000 | 486,149 |
Series 2020A, Rev., 5.00%, 1/1/2040 | 790,000 | 679,637 |
Series 2020A, Rev., 5.00%, 1/1/2055 | 2,000,000 | 1,563,198 |
New Hope Cultural Education Facilities Finance Corp., Presbyterian Village North Project Rev., 5.00%, 10/1/2039 | 1,000,000 | 842,024 |
New Hope Cultural Education Facilities Finance Corp., Quality Senior Housing Foundation Series 2019A-1, Rev., 5.00%, 12/1/2039 | 1,420,000 | 1,325,477 |
New Hope Cultural Education Facilities Finance Corp., Wesleyan Homes, Inc., Project | ||
Rev., 4.00%, 1/1/2029 | 300,000 | 262,131 |
Rev., 5.00%, 1/1/2039 | 205,000 | 161,281 |
San Antonio Education Facilities Corp., Hallmark University Project Series 2021A, Rev., 5.00%, 10/1/2051 | 500,000 | 383,804 |
San Antonio Education Facilities Corp., University of The Incarnate Word Series 2021A, Rev., 4.00%, 4/1/2051 | 1,000,000 | 792,457 |
State of Texas, College Student Loan Series 2023A, GO, AMT, 5.25%, 8/1/2029 | 2,000,000 | 2,188,131 |
Tarrant County Cultural Education Facilities Finance Corp., Retirement Facility, MRC Stevenson Oaks Project Series 2020A, Rev., 6.25%, 11/15/2031 | 500,000 | 478,648 |
Texas Private Activity Bond Surface Transportation Corp., North Tarrant Express Mobility Partners Segments 3 LLC Segment 3C Project Series 2019, Rev., AMT, 5.00%, 6/30/2058 | 1,625,000 | 1,625,697 |
Total Texas | 20,642,690 | |
Utah — 5.3% | ||
City of Salt Lake City, Airport System Series 2023A, Rev., AMT, 5.25%, 7/1/2053 | 3,500,000 | 3,660,924 |
Mida Golf and Equestrian Center Public Infrastructure District, Limited Tax GO, 4.25%, 6/1/2041 (c) | 1,100,000 | 831,785 |
Mida Mountain Village Public Infrastructure District, Mountain Village Assessment Area | ||
Series 2020B, Rev., 6.25%, 8/1/2030 (c) | 1,000,000 | 916,805 |
Series 2020A, Rev., 4.50%, 8/1/2040 (c) | 1,000,000 | 833,987 |
Mida Mountain Village Public Infrastructure District, Mountain Village Assessment Area #2 Rev., 4.00%, 8/1/2050 (c) | 1,750,000 | 1,291,829 |
INVESTMENTS | PRINCIPAL AMOUNT($) | VALUE($) |
Utah — continued | ||
Military Installation Development Authority, Tax Allocation and Hotel Tax Series 2021A-1, Rev., 4.00%, 6/1/2036 | 500,000 | 419,295 |
Utah Charter School Finance Authority, Mountain West Montessori Academy Project | ||
Series 2020A, Rev., 3.13%, 6/15/2029 (c) | 570,000 | 513,713 |
Series 2020A, Rev., 5.00%, 6/15/2049 (c) | 825,000 | 730,172 |
Utah Charter School Finance Authority, Wallace Stegner Academy | ||
Series 2022A, Rev., 5.25%, 6/15/2032 (c) | 250,000 | 246,014 |
Series 2022A, Rev., 5.63%, 6/15/2042 (c) | 400,000 | 382,980 |
Utah Infrastructure Agency, Tax-Exempt Telecommunications | ||
Rev., 4.00%, 10/15/2033 | 500,000 | 468,451 |
Rev., 4.00%, 10/15/2036 | 500,000 | 443,203 |
Rev., 4.00%, 10/15/2039 | 700,000 | 588,711 |
Rev., 4.00%, 10/15/2042 | 475,000 | 381,234 |
Total Utah | 11,709,103 | |
Vermont — 0.1% | ||
Vermont Student Assistance Corp., Education Loan | ||
Series 2018A, Rev., AMT, 4.00%, 6/15/2032 | 70,000 | 69,359 |
Series 2018A, Rev., AMT, 4.00%, 6/15/2033 | 90,000 | 89,143 |
Series 2018A, Rev., AMT, 4.00%, 6/15/2034 | 70,000 | 69,338 |
Total Vermont | 227,840 | |
Virginia — 3.1% | ||
Danville Industrial Development Authority, Averett University Series 2017A, Rev., 4.75%, 10/1/2032 | 760,000 | 674,185 |
Fredericksburg Economic Development Authority, Stadium Project | ||
Series 2021A, Rev., 7.00%, 11/15/2026 (c) | 580,000 | 580,180 |
Series 2019B, Rev., 6.13%, 9/1/2029 (c) | 1,695,000 | 1,566,258 |
Series 2019B, Rev., 7.00%, 9/1/2044 (c) | 1,000,000 | 822,926 |
Roanoke County Economic Development Authority, Residential Care Facility, Richfield Living | ||
Series 2019A, Rev., 4.75%, 9/1/2029 (f) | 1,000,000 | 600,000 |
Series 2020, Rev., 4.30%, 9/1/2030 (f) | 770,000 | 462,000 |
Series 2019A, Rev., 5.00%, 9/1/2034 (f) | 2,000,000 | 1,200,000 |
Series 2020, Rev., 5.00%, 9/1/2040 (f) | 1,640,000 | 984,000 |
Total Virginia | 6,889,549 | |
24 |
INVESTMENTS | PRINCIPAL AMOUNT($) | VALUE($) |
Municipal Bonds — continued | ||
Washington — 0.3% | ||
Washington State Housing Finance Commission, Judson Park Project | ||
Rev., 4.00%, 7/1/2028 (c) | 535,000 | 491,150 |
Rev., 5.00%, 7/1/2038 (c) | 300,000 | 257,823 |
Total Washington | 748,973 | |
Wisconsin — 4.0% | ||
Public Finance Authority Series 2022, Rev., 4.00%, 4/1/2042 (c) | 500,000 | 405,348 |
Public Finance Authority, Cedars Obligated Group Series 2019, Rev., 4.25%, 5/1/2029 (c) | 855,000 | 756,920 |
Public Finance Authority, Community School of Davidson Project Series 2018, Rev., 3.75%, 10/1/2023 | 80,000 | 79,943 |
Public Finance Authority, ENO River Academy Project | ||
Series 2020A, Rev., 4.00%, 6/15/2030 (c) | 235,000 | 222,913 |
Series 2020A, Rev., 5.00%, 6/15/2040 (c) | 410,000 | 386,406 |
Public Finance Authority, First Mortgage Southminster, Inc. Series 2018, Rev., 4.25%, 10/1/2038 (c) | 935,000 | 785,643 |
Public Finance Authority, Minnesota College of Osteopathic Medicine | ||
Series 2019A-1, Rev., 5.50%, 12/1/2048 (c) (f) | 17,498 | 5,424 |
Series 2019A-2, Rev., 7.25%, 12/1/2048 (c) (f) | 45,647 | 14,150 |
Public Finance Authority, Presbyterian Villages of Michigan Obligated Group Series 2020A, Rev., 4.00%, 11/15/2042 (c) | 3,955,000 | 2,754,306 |
Public Finance Authority, Ripple Ranch, LLC Obligate Series 2021A, Rev., 5.25%, 12/1/2051 (c) | 800,000 | 538,457 |
Public Finance Authority, Senior Lien, Grand Hyatt Series 2022A, Rev., 3.75%, 2/1/2032 | 300,000 | 277,420 |
Public Finance Authority, The Franklin School of Innovation Rev., 5.00%, 1/1/2042 (c) | 250,000 | 221,401 |
Public Finance Authority, Viticus Group Project | ||
Series 2022B, Rev., 5.00%, 12/1/2024 (c) | 215,000 | 210,831 |
Series 2022A, Rev., 4.00%, 12/1/2031 (c) | 400,000 | 359,664 |
Public Finance Authority, Wilson Preparatory Academy | ||
Series 2019A, Rev., 4.13%, 6/15/2029 (c) | 400,000 | 376,273 |
INVESTMENTS | PRINCIPAL AMOUNT($) | VALUE($) |
Wisconsin — continued | ||
Series 2019A, Rev., 5.00%, 6/15/2039 (c) | 500,000 | 469,796 |
Series 2019A, Rev., 5.00%, 6/15/2049 (c) | 1,100,000 | 966,950 |
Total Wisconsin | 8,831,845 | |
Total Municipal Bonds (Cost $217,238,006) | 190,268,944 | |
SHARES | ||
Short-Term Investments — 15.9% | ||
Investment Companies — 15.9% | ||
JPMorgan Institutional Tax Free Money Market Fund Class Institutional Shares, 3.66% (g) (h) (Cost $35,111,891) | 35,105,985 | 35,111,891 |
Total Investments — 102.1% (Cost $252,349,897) | 225,380,835 | |
Liabilities in Excess of Other Assets — (2.1)% | (4,731,511 ) | |
NET ASSETS — 100.0% | 220,649,324 | |
Percentages indicated are based on net assets. |
Abbreviations | |
AGM | Insured by Assured Guaranty Municipal Corp. |
AMT | Alternative Minimum Tax |
BAN | Bond Anticipation Note |
COLL | Collateral |
GNMA | Government National Mortgage Association |
GO | General Obligation |
LIQ | Liquidity Agreement |
MTA | Metropolitan Transportation Authority |
NATL | Insured by National Public Finance Guarantee Corp. |
RE | Reinsured |
Rev. | Revenue |
^ | Amount rounds to less than 0.1% of net assets. | |
(a) | The date shown represents the earliest of the prerefunded date, next put date or final maturity date. | |
(b) | Variable or floating rate security, the interest rate of which adjusts periodically based on changes in current interest rates and prepayments on the underlying pool of assets. The interest rate shown is the current rate as of August 31, 2023. | |
(c) | Securities exempt from registration under Rule 144A or section 4(a)(2), of the Securities Act of 1933, as amended. | |
(d) | All or a portion of the security is a when-issued security, delayed delivery security, or forward commitment. | |
(e) | Security is prerefunded or escrowed to maturity. | |
(f) | Defaulted security. | |
25 |
AS OF August 31, 2023 (Unaudited) (continued)
(g) | Investment in an affiliated fund, which is registered under the Investment Company Act of 1940, as amended, and is advised by J.P. Morgan Investment Management Inc. | |
(h) | The rate shown is the current yield as of August 31, 2023. |
REFERENCE OBLIGATION/INDEX | FINANCING RATE PAID BY THE FUND (%) | PAYMENT FREQUENCY | MATURITY DATE | IMPLIED CREDIT SPREAD (%)(a) | NOTIONAL AMOUNT(b) | UPFRONT PAYMENTS (RECEIPTS) ($)(c) | UNREALIZED APPRECIATION (DEPRECIATION) ($) | VALUE ($) |
CDX.NA.HY.40-V1 | 5.00 | Quarterly | 6/20/2028 | 4.26 | USD6,520,000 | (154,455 ) | (95,858 ) | (250,313 ) |
(*) | The Fund, as a buyer of credit protection, is generally obligated to make periodic payments and may also pay or receive an upfront premium to or from the protection seller, in exchange for the right to receive a contingent payment, upon occurrence of a credit event with respect to an underlying reference obligation, as defined under the terms of individual swap contracts. | ||||||||
(a) | Implied credit spreads are an indication of the seller's performance risk, related to the likelihood of a credit event occurring that would require a seller to make payment to a buyer. Implied credit spreads are used to determine the value of swap contracts and reflect the cost of buying/selling protection, which may include upfront payments made to enter into the contract. Therefore, higher spreads would indicate a greater likelihood that a seller will be obligated to perform (i.e. make payment) under the swap contract. Increasing values, in absolute terms and relative to notional amounts, are also indicative of greater performance risk. Implied credit spreads for credit default swaps on credit indices are linked to the weighted average spread across the underlying reference obligations included in a particular index. | ||||||||
(b) | The notional amount is the maximum amount that a seller of credit protection would be obligated to pay and a buyer of credit protection would receive, upon occurrence of a credit event. | ||||||||
(c) | Upfront payments and receipts generally represent premiums paid or received at the initiation of the agreement to compensate the differences between the stated terms of the swap agreement and current market conditions (credit spreads, interest rates and other relevant factors). | ||||||||
Abbreviations | |
CDX | Credit Default Swap Index |
USD | United States Dollar |
26 |
AS OF August 31, 2023 (Unaudited)
INVESTMENTS | PRINCIPAL AMOUNT($) | VALUE($) |
Corporate Bonds — 26.1% | ||
Aerospace & Defense — 0.6% | ||
BAE Systems plc (United Kingdom) 3.40%, 4/15/2030 (a) | 400,000 | 357,314 |
Boeing Co. (The) | ||
2.75%, 2/1/2026 | 782,000 | 733,880 |
3.10%, 5/1/2026 | 931,000 | 876,923 |
L3Harris Technologies, Inc. 3.85%, 12/15/2026 | 425,000 | 406,161 |
Leidos, Inc. 2.30%, 2/15/2031 | 467,000 | 369,858 |
Northrop Grumman Corp. 2.93%, 1/15/2025 | 50,000 | 48,320 |
RTX Corp. 3.15%, 12/15/2024 | 216,000 | 209,383 |
3,001,839 | ||
Automobile Components — 0.0% ^ | ||
Lear Corp. 2.60%, 1/15/2032 | 222,000 | 173,070 |
Automobiles — 0.7% | ||
Honda Motor Co. Ltd. (Japan) 2.53%, 3/10/2027 | 50,000 | 45,970 |
Hyundai Capital America | ||
0.80%, 1/8/2024 (a) | 50,000 | 49,129 |
3.00%, 2/10/2027 (a) | 903,000 | 825,590 |
2.38%, 10/15/2027 (a) | 419,000 | 367,122 |
Mercedes-Benz Finance North America LLC (Germany) 2.13%, 3/10/2025 (a) | 590,000 | 561,073 |
Nissan Motor Co. Ltd. (Japan) | ||
4.35%, 9/17/2027 (a) | 800,000 | 732,781 |
4.81%, 9/17/2030 (a) | 800,000 | 706,042 |
Stellantis Finance US, Inc. 2.69%, 9/15/2031 (a) | 378,000 | 296,238 |
3,583,945 | ||
Banks — 6.9% | ||
ABN AMRO Bank NV (Netherlands) (US Treasury Yield Curve Rate T Note Constant Maturity 1 Year + 1.10%), 2.47%, 12/13/2029 (a) (b) | 600,000 | 505,970 |
Australia & New Zealand Banking Group Ltd. (Australia) 4.40%, 5/19/2026 (a) (c) | 750,000 | 720,945 |
Banco Santander SA (Spain) | ||
(US Treasury Yield Curve Rate T Note Constant Maturity 1 Year + 0.90%), 1.72%, 9/14/2027 (b) | 200,000 | 175,793 |
2.75%, 12/3/2030 | 600,000 | 464,957 |
Bank of America Corp. | ||
(SOFR + 1.15%), 1.32%, 6/19/2026 (b) | 21,000 | 19,325 |
Series N, (SOFR + 0.91%), 1.66%, 3/11/2027 (b) | 178,000 | 160,840 |
INVESTMENTS | PRINCIPAL AMOUNT($) | VALUE($) |
Banks — continued | ||
(3-MONTH CME TERM SOFR + 1.84%), 3.82%, 1/20/2028 (b) | 937,000 | 883,359 |
(SOFR + 1.63%), 5.20%, 4/25/2029 (b) | 547,000 | 538,730 |
(SOFR + 1.53%), 1.90%, 7/23/2031 (b) | 1,977,000 | 1,560,629 |
Bank of Ireland Group plc (Ireland) (US Treasury Yield Curve Rate T Note Constant Maturity 1 Year + 1.10%), 2.03%, 9/30/2027 (a) (b) | 925,000 | 813,834 |
Bank of Montreal (Canada) | ||
2.65%, 3/8/2027 | 40,000 | 36,484 |
(USD Swap Semi 5 Year + 1.28%), 4.34%, 10/5/2028 (b) (c) | 512,000 | 511,157 |
Bank of New Zealand (New Zealand) 3.50%, 2/20/2024 (a) | 330,000 | 326,285 |
Banque Federative du Credit Mutuel SA (France) 5.90%, 7/13/2026 (a) | 357,000 | 358,089 |
Barclays plc (United Kingdom) (ICE LIBOR USD 3 Month + 1.61%), 3.93%, 5/7/2025 (b) | 855,000 | 842,501 |
BNP Paribas SA (France) | ||
(3-MONTH CME TERM SOFR + 2.50%), 4.71%, 1/10/2025 (a) (b) | 500,000 | 497,214 |
(SOFR + 2.07%), 2.22%, 6/9/2026 (a) (b) | 500,000 | 467,119 |
BPCE SA (France) | ||
(SOFR + 1.09%), 2.05%, 10/19/2027 (a) (b) | 964,000 | 853,657 |
(SOFR + 1.31%), 2.28%, 1/20/2032 (a) (b) | 694,000 | 536,320 |
Citigroup, Inc. | ||
(SOFR + 0.77%), 1.12%, 1/28/2027 (b) | 1,056,000 | 946,395 |
4.45%, 9/29/2027 | 472,000 | 451,167 |
(3-MONTH CME TERM SOFR + 1.82%), 3.89%, 1/10/2028 (b) | 90,000 | 85,021 |
(3-MONTH CME TERM SOFR + 1.43%), 3.88%, 1/24/2039 (b) | 456,000 | 374,490 |
Commonwealth Bank of Australia (Australia) 2.30%, 3/14/2025 (a) | 40,000 | 38,301 |
Cooperatieve Rabobank UA (Netherlands) | ||
2.63%, 7/22/2024 (a) | 250,000 | 243,058 |
(US Treasury Yield Curve Rate T Note Constant Maturity 1 Year + 0.73%), 1.98%, 12/15/2027 (a) (b) | 750,000 | 661,941 |
(US Treasury Yield Curve Rate T Note Constant Maturity 1 Year + 1.40%), 5.56%, 2/28/2029 (a) (b) | 250,000 | 247,020 |
Credit Agricole SA (France) (SOFR + 1.68%), 1.91%, 6/16/2026 (a) (b) | 1,500,000 | 1,396,316 |
August 31, 2023 | J.P. Morgan Exchange-Traded Funds | 27 |
AS OF August 31, 2023 (Unaudited) (continued)
INVESTMENTS | PRINCIPAL AMOUNT($) | VALUE($) |
Corporate Bonds — continued | ||
Banks — continued | ||
Danske Bank A/S (Denmark) (US Treasury Yield Curve Rate T Note Constant Maturity 1 Year + 2.10%), 6.47%, 1/9/2026 (a) (b) | 407,000 | 407,186 |
Discover Bank | ||
2.45%, 9/12/2024 | 650,000 | 623,230 |
3.45%, 7/27/2026 | 447,000 | 409,291 |
DNB Bank ASA (Norway) (US Treasury Yield Curve Rate T Note Constant Maturity 1 Year + 0.68%), 1.61%, 3/30/2028 (a) (b) | 1,000,000 | 867,861 |
Fifth Third Bank NA 2.25%, 2/1/2027 | 250,000 | 221,545 |
HSBC Holdings plc (United Kingdom) | ||
(3-MONTH CME TERM SOFR + 1.61%), 4.29%, 9/12/2026 (b) | 1,250,000 | 1,205,703 |
(SOFR + 1.73%), 2.01%, 9/22/2028 (b) | 300,000 | 257,825 |
(3-MONTH CME TERM SOFR + 1.87%), 3.97%, 5/22/2030 (b) | 640,000 | 576,133 |
(SOFR + 2.39%), 2.85%, 6/4/2031 (b) | 1,141,000 | 941,013 |
Huntington Bancshares, Inc. (SOFR + 2.05%), 5.02%, 5/17/2033 (b) | 944,000 | 874,172 |
ING Groep NV (Netherlands) (SOFR + 1.01%), 1.73%, 4/1/2027 (b) | 480,000 | 431,643 |
KeyBank NA 3.30%, 6/1/2025 | 250,000 | 234,214 |
KeyCorp (SOFRINDX + 1.25%), 3.88%, 5/23/2025 (b) | 184,000 | 175,577 |
Lloyds Banking Group plc (United Kingdom) | ||
(US Treasury Yield Curve Rate T Note Constant Maturity 1 Year + 1.00%), 2.44%, 2/5/2026 (b) | 550,000 | 520,947 |
3.75%, 1/11/2027 | 469,000 | 440,932 |
Mitsubishi UFJ Financial Group, Inc. (Japan) (US Treasury Yield Curve Rate T Note Constant Maturity 1 Year + 0.83%), 2.34%, 1/19/2028 (b) | 600,000 | 538,339 |
Mizuho Financial Group Cayman 3 Ltd. (Japan) 4.60%, 3/27/2024 (a) (c) | 800,000 | 791,538 |
Morgan Stanley Bank NA 4.75%, 4/21/2026 | 520,000 | 513,266 |
National Australia Bank Ltd. (Australia) 2.33%, 8/21/2030 (a) (c) | 250,000 | 194,823 |
NatWest Group plc (United Kingdom) (US Treasury Yield Curve Rate T Note Constant Maturity 1 Year + 0.90%), 1.64%, 6/14/2027 (b) | 286,000 | 253,901 |
NatWest Markets plc (United Kingdom) 0.80%, 8/12/2024 (a) | 777,000 | 741,393 |
PNC Financial Services Group, Inc. (The) (SOFR + 1.09%), 4.76%, 1/26/2027 (b) | 573,000 | 562,510 |
INVESTMENTS | PRINCIPAL AMOUNT($) | VALUE($) |
Banks — continued | ||
Santander UK Group Holdings plc (United Kingdom) | ||
(US Treasury Yield Curve Rate T Note Constant Maturity 1 Year + 1.25%), 1.53%, 8/21/2026 (b) | 200,000 | 181,536 |
(SOFR + 2.75%), 6.83%, 11/21/2026 (b) | 200,000 | 202,512 |
(SOFR + 2.60%), 6.53%, 1/10/2029 (b) | 750,000 | 755,907 |
Societe Generale SA (France) | ||
2.63%, 1/22/2025 (a) | 700,000 | 665,926 |
4.25%, 4/14/2025 (a) | 400,000 | 385,528 |
(US Treasury Yield Curve Rate T Note Constant Maturity 1 Year + 1.00%), 1.79%, 6/9/2027 (a) (b) | 937,000 | 831,174 |
Sumitomo Mitsui Financial Group, Inc. (Japan) 2.70%, 7/16/2024 | 1,112,000 | 1,082,235 |
Toronto-Dominion Bank (The) (Canada) 1.15%, 6/12/2025 | 40,000 | 37,095 |
Truist Bank 3.30%, 5/15/2026 | 200,000 | 185,826 |
UniCredit SpA (Italy) | ||
(US Treasury Yield Curve Rate T Note Constant Maturity 1 Year + 1.20%), 1.98%, 6/3/2027 (a) (b) | 835,000 | 741,722 |
(USD ICE Swap Rate 5 Year + 3.70%), 5.86%, 6/19/2032 (a) (b) | 600,000 | 552,215 |
Wachovia Corp. 7.57%, 8/1/2026 (d) | 366,000 | 382,784 |
Wells Fargo & Co. (3-MONTH CME TERM SOFR + 1.43%), 2.88%, 10/30/2030 (b) | 637,000 | 545,111 |
Westpac Banking Corp. (Australia) (US Treasury Yield Curve Rate T Note Constant Maturity 5 Year + 1.35%), 2.89%, 2/4/2030 (b) (c) | 540,000 | 509,971 |
33,559,501 | ||
Beverages — 0.1% | ||
Constellation Brands, Inc. 3.15%, 8/1/2029 | 370,000 | 330,582 |
Biotechnology — 0.3% | ||
AbbVie, Inc. 2.95%, 11/21/2026 | 1,277,000 | 1,195,365 |
Gilead Sciences, Inc. 3.50%, 2/1/2025 | 35,000 | 34,069 |
Regeneron Pharmaceuticals, Inc. 1.75%, 9/15/2030 | 181,000 | 144,048 |
1,373,482 | ||
Broadline Retail — 0.0% ^ | ||
eBay, Inc. 2.60%, 5/10/2031 | 50,000 | 41,352 |
Capital Markets — 2.0% | ||
Brookfield Finance, Inc. (Canada) 4.25%, 6/2/2026 | 362,000 | 348,295 |
28 | J.P. Morgan Exchange-Traded Funds | August 31, 2023 |
INVESTMENTS | PRINCIPAL AMOUNT($) | VALUE($) |
Corporate Bonds — continued | ||
Capital Markets — continued | ||
Credit Suisse AG (Switzerland) | ||
3.63%, 9/9/2024 | 1,920,000 | 1,867,585 |
1.25%, 8/7/2026 | 250,000 | 219,013 |
Deutsche Bank AG (Germany) | ||
(SOFR + 2.16%), 2.22%, 9/18/2024 (b) | 360,000 | 359,436 |
(SOFR + 2.52%), 7.15%, 7/13/2027 (b) | 190,000 | 192,842 |
(SOFR + 1.32%), 2.55%, 1/7/2028 (b) | 700,000 | 618,812 |
(SOFR + 1.72%), 3.04%, 5/28/2032 (b) | 626,000 | 497,971 |
Goldman Sachs Group, Inc. (The) | ||
4.25%, 10/21/2025 | 237,000 | 229,979 |
3.50%, 11/16/2026 | 1,185,000 | 1,113,818 |
(SOFR + 1.09%), 1.99%, 1/27/2032 (b) | 512,000 | 398,753 |
Invesco Finance plc 3.75%, 1/15/2026 | 386,000 | 371,456 |
Macquarie Group Ltd. (Australia) (ICE LIBOR USD 3 Month + 1.75%), 5.03%, 1/15/2030 (a) (b) | 200,000 | 194,895 |
Morgan Stanley | ||
(SOFR + 1.99%), 2.19%, 4/28/2026 (b) | 40,000 | 37,698 |
4.35%, 9/8/2026 | 1,163,000 | 1,119,913 |
(SOFR + 1.02%), 1.93%, 4/28/2032 (b) | 110,000 | 84,818 |
Nasdaq, Inc. 5.55%, 2/15/2034 | 138,000 | 137,760 |
Nomura Holdings, Inc. (Japan) | ||
2.33%, 1/22/2027 | 800,000 | 708,707 |
2.68%, 7/16/2030 | 453,000 | 367,261 |
UBS Group AG (Switzerland) | ||
(SOFR + 2.04%), 2.19%, 6/5/2026 (a) (b) | 250,000 | 232,862 |
(SOFRINDX + 0.98%), 1.31%, 2/2/2027 (a) (b) | 900,000 | 800,158 |
9,902,032 | ||
Chemicals — 0.2% | ||
Albemarle Corp. 5.05%, 6/1/2032 | 540,000 | 508,316 |
International Flavors & Fragrances, Inc. 1.83%, 10/15/2027 (a) | 310,000 | 260,740 |
RPM International, Inc. 2.95%, 1/15/2032 | 238,000 | 191,052 |
960,108 | ||
Commercial Services & Supplies — 0.0% ^ | ||
Republic Services, Inc. 5.00%, 4/1/2034 | 166,000 | 163,024 |
Construction & Engineering — 0.1% | ||
Quanta Services, Inc. 2.35%, 1/15/2032 | 446,000 | 352,808 |
Construction Materials — 0.0% ^ | ||
Martin Marietta Materials, Inc. Series CB, 2.50%, 3/15/2030 | 40,000 | 33,610 |
INVESTMENTS | PRINCIPAL AMOUNT($) | VALUE($) |
Consumer Finance — 1.9% | ||
AerCap Ireland Capital DAC (Ireland) | ||
2.45%, 10/29/2026 | 1,404,000 | 1,263,244 |
3.00%, 10/29/2028 | 1,235,000 | 1,070,204 |
Avolon Holdings Funding Ltd. (Ireland) | ||
2.13%, 2/21/2026 (a) | 692,000 | 621,773 |
4.25%, 4/15/2026 (a) | 832,000 | 784,625 |
4.38%, 5/1/2026 (a) | 1,063,000 | 1,002,086 |
2.53%, 11/18/2027 (a) | 2,793,000 | 2,384,319 |
Capital One Financial Corp. | ||
(SOFR + 1.37%), 4.17%, 5/9/2025 (b) | 394,000 | 386,565 |
(SOFR + 1.27%), 2.62%, 11/2/2032 (b) | 409,000 | 311,552 |
General Motors Financial Co., Inc. | ||
1.20%, 10/15/2024 | 420,000 | 398,192 |
2.35%, 1/8/2031 | 890,000 | 691,278 |
Park Aerospace Holdings Ltd. (Ireland) 5.50%, 2/15/2024 (a) | 392,000 | 389,384 |
9,303,222 | ||
Consumer Staples Distribution & Retail — 0.0% ^ | ||
7-Eleven, Inc. 1.80%, 2/10/2031 (a) | 205,000 | 160,782 |
Containers & Packaging — 0.2% | ||
Graphic Packaging International LLC 1.51%, 4/15/2026 (a) | 453,000 | 406,273 |
Packaging Corp. of America 3.00%, 12/15/2029 | 280,000 | 244,452 |
WRKCo, Inc. 4.90%, 3/15/2029 | 150,000 | 144,378 |
795,103 | ||
Diversified REITs — 0.3% | ||
Goodman US Finance Three LLC (Australia) 3.70%, 3/15/2028 (a) | 163,000 | 147,939 |
Safehold GL Holdings LLC 2.80%, 6/15/2031 | 682,000 | 525,269 |
WP Carey, Inc. 2.25%, 4/1/2033 | 893,000 | 663,343 |
1,336,551 | ||
Diversified Telecommunication Services — 0.5% | ||
AT&T, Inc. 1.65%, 2/1/2028 | 781,000 | 667,765 |
NBN Co. Ltd. (Australia) 2.63%, 5/5/2031 (a) | 800,000 | 661,382 |
Sprint Capital Corp. 6.88%, 11/15/2028 | 155,000 | 163,742 |
Verizon Communications, Inc. | ||
2.63%, 8/15/2026 | 793,000 | 738,432 |
1.68%, 10/30/2030 | 70,000 | 54,721 |
2,286,042 | ||
Electric Utilities — 1.8% | ||
American Electric Power Co., Inc. 2.03%, 3/15/2024 | 179,000 | 175,131 |
August 31, 2023 | J.P. Morgan Exchange-Traded Funds | 29 |
AS OF August 31, 2023 (Unaudited) (continued)
INVESTMENTS | PRINCIPAL AMOUNT($) | VALUE($) |
Corporate Bonds — continued | ||
Electric Utilities — continued | ||
Arizona Public Service Co. 3.35%, 6/15/2024 | 322,000 | 314,633 |
Atlantic City Electric Co. 4.00%, 10/15/2028 | 20,000 | 18,973 |
CenterPoint Energy Houston Electric LLC Series AA, 3.00%, 2/1/2027 | 10,000 | 9,339 |
Cleveland Electric Illuminating Co. (The) | ||
5.50%, 8/15/2024 | 10,000 | 9,961 |
3.50%, 4/1/2028 (a) | 386,000 | 354,759 |
4.55%, 11/15/2030 (a) | 290,000 | 271,976 |
Connecticut Light and Power Co. (The) Series A, 3.20%, 3/15/2027 | 20,000 | 18,801 |
Duke Energy Carolinas LLC 6.45%, 10/15/2032 | 50,000 | 53,499 |
Duke Energy Ohio, Inc. 5.25%, 4/1/2033 | 73,000 | 73,176 |
Duquesne Light Holdings, Inc. | ||
2.53%, 10/1/2030 (a) | 421,000 | 335,523 |
2.78%, 1/7/2032 (a) | 254,000 | 195,984 |
Edison International 3.55%, 11/15/2024 | 714,000 | 693,462 |
Evergy, Inc. 2.90%, 9/15/2029 | 218,000 | 189,667 |
Fells Point Funding Trust 3.05%, 1/31/2027 (a) | 864,000 | 790,082 |
Fortis, Inc. (Canada) 3.06%, 10/4/2026 | 421,000 | 390,488 |
Interstate Power and Light Co. 4.10%, 9/26/2028 | 30,000 | 28,560 |
ITC Holdings Corp. 2.95%, 5/14/2030 (a) | 251,000 | 214,526 |
Kentucky Utilities Co. 3.30%, 10/1/2025 | 200,000 | 190,669 |
NextEra Energy Capital Holdings, Inc. 2.25%, 6/1/2030 | 200,000 | 164,403 |
Niagara Mohawk Power Corp. 3.51%, 10/1/2024 (a) | 640,000 | 620,766 |
NRG Energy, Inc. 2.45%, 12/2/2027 (a) | 405,000 | 343,801 |
Oncor Electric Delivery Co. LLC 5.75%, 3/15/2029 | 260,000 | 267,842 |
Pacific Gas and Electric Co. | ||
2.95%, 3/1/2026 | 458,000 | 422,568 |
4.55%, 7/1/2030 | 778,999 | 700,525 |
Pennsylvania Electric Co. 3.25%, 3/15/2028 (a) | 256,000 | 233,079 |
PG&E Wildfire Recovery Funding LLC Series A-2, 4.26%, 6/1/2036 | 848,000 | 788,428 |
SCE Recovery Funding LLC Series A-2, 1.94%, 5/15/2038 | 285,000 | 200,978 |
Southwestern Electric Power Co. Series M, 4.10%, 9/15/2028 | 10,000 | 9,474 |
INVESTMENTS | PRINCIPAL AMOUNT($) | VALUE($) |
Electric Utilities — continued | ||
Virginia Electric and Power Co. Series A, 3.50%, 3/15/2027 | 10,000 | 9,447 |
Vistra Operations Co. LLC 4.88%, 5/13/2024 (a) | 680,000 | 669,317 |
8,759,837 | ||
Electrical Equipment — 0.0% ^ | ||
Eaton Corp. 3.10%, 9/15/2027 | 50,000 | 46,876 |
Electronic Equipment, Instruments & Components — 0.1% | ||
Arrow Electronics, Inc. 3.88%, 1/12/2028 | 458,000 | 423,937 |
Energy Equipment & Services — 0.0% ^ | ||
Halliburton Co. 2.92%, 3/1/2030 | 200,000 | 174,399 |
Schlumberger Holdings Corp. 3.90%, 5/17/2028 (a) | 39,000 | 36,983 |
211,382 | ||
Entertainment — 0.1% | ||
Walt Disney Co. (The) 7.43%, 10/1/2026 | 268,000 | 284,902 |
Financial Services — 0.4% | ||
Global Payments, Inc. | ||
2.15%, 1/15/2027 | 501,000 | 446,504 |
3.20%, 8/15/2029 | 200,000 | 174,106 |
LSEGA Financing plc (United Kingdom) 2.00%, 4/6/2028 (a) | 490,000 | 423,325 |
Mitsubishi HC Capital, Inc. (Japan) 3.96%, 9/19/2023 (a) | 420,000 | 419,576 |
Nationwide Building Society (United Kingdom) 4.85%, 7/27/2027 (a) | 300,000 | 292,815 |
1,756,326 | ||
Food Products — 0.2% | ||
Cargill, Inc. 2.13%, 4/23/2030 (a) | 250,000 | 209,625 |
General Mills, Inc. 4.95%, 3/29/2033 | 151,000 | 147,296 |
Mead Johnson Nutrition Co. (United Kingdom) 4.13%, 11/15/2025 | 89,000 | 86,639 |
Smithfield Foods, Inc. 5.20%, 4/1/2029 (a) | 376,000 | 348,978 |
792,538 | ||
Gas Utilities — 0.0% ^ | ||
Eastern Energy Gas Holdings LLC Series A, 2.50%, 11/15/2024 | 50,000 | 48,101 |
ONE Gas, Inc. 2.00%, 5/15/2030 | 248,000 | 203,221 |
251,322 | ||
Ground Transportation — 0.5% | ||
ERAC USA Finance LLC 3.85%, 11/15/2024 (a) | 416,000 | 406,762 |
30 | J.P. Morgan Exchange-Traded Funds | August 31, 2023 |
INVESTMENTS | PRINCIPAL AMOUNT($) | VALUE($) |
Corporate Bonds — continued | ||
Ground Transportation — continued | ||
Penske Truck Leasing Co. LP | ||
5.75%, 5/24/2026 (a) | 219,000 | 217,483 |
5.55%, 5/1/2028 (a) | 818,000 | 802,480 |
Triton Container International Ltd. (Bermuda) | ||
2.05%, 4/15/2026 (a) | 637,000 | 567,357 |
3.25%, 3/15/2032 | 508,000 | 393,639 |
2,387,721 | ||
Health Care Equipment & Supplies — 0.0% ^ | ||
Abbott Laboratories 3.88%, 9/15/2025 | 40,000 | 39,041 |
Becton Dickinson & Co. 3.36%, 6/6/2024 | 46,000 | 45,127 |
84,168 | ||
Health Care Providers & Services — 0.4% | ||
CommonSpirit Health | ||
3.35%, 10/1/2029 | 455,000 | 405,510 |
2.78%, 10/1/2030 | 171,000 | 143,627 |
CVS Health Corp. 1.88%, 2/28/2031 | 281,000 | 220,578 |
HCA, Inc. | ||
5.25%, 6/15/2026 | 20,000 | 19,757 |
4.13%, 6/15/2029 | 764,000 | 705,712 |
Humana, Inc. 3.95%, 3/15/2027 | 292,000 | 280,352 |
Quest Diagnostics, Inc. | ||
2.95%, 6/30/2030 | 93,000 | 80,761 |
2.80%, 6/30/2031 | 287,000 | 243,238 |
UnitedHealth Group, Inc. 3.38%, 4/15/2027 | 20,000 | 18,967 |
2,118,502 | ||
Health Care REITs — 0.4% | ||
Healthcare Realty Holdings LP | ||
3.10%, 2/15/2030 | 269,000 | 229,144 |
2.00%, 3/15/2031 | 429,000 | 330,374 |
Healthpeak OP LLC 2.13%, 12/1/2028 | 270,000 | 230,695 |
Physicians Realty LP 2.63%, 11/1/2031 | 409,000 | 317,719 |
Sabra Health Care LP 3.20%, 12/1/2031 | 440,000 | 336,071 |
Ventas Realty LP | ||
3.50%, 2/1/2025 | 110,000 | 105,802 |
4.13%, 1/15/2026 | 45,000 | 43,277 |
3.25%, 10/15/2026 | 229,000 | 211,771 |
Welltower OP LLC 2.75%, 1/15/2032 | 404,000 | 326,633 |
2,131,486 | ||
Hotels, Restaurants & Leisure — 0.1% | ||
Expedia Group, Inc. 3.25%, 2/15/2030 | 755,000 | 658,139 |
Industrial REITs — 0.1% | ||
Prologis LP 4.75%, 6/15/2033 | 407,000 | 390,052 |
INVESTMENTS | PRINCIPAL AMOUNT($) | VALUE($) |
Insurance — 0.9% | ||
AIA Group Ltd. (Hong Kong) 3.60%, 4/9/2029 (a) | 595,000 | 550,012 |
Assurant, Inc. 4.20%, 9/27/2023 | 23,000 | 22,957 |
Athene Global Funding 2.72%, 1/7/2029 (a) | 711,000 | 592,929 |
Brighthouse Financial Global Funding 1.00%, 4/12/2024 (a) | 258,000 | 250,150 |
CNA Financial Corp. 3.95%, 5/15/2024 | 439,000 | 433,238 |
CNO Global Funding | ||
1.75%, 10/7/2026 (a) | 531,000 | 471,374 |
2.65%, 1/6/2029 (a) | 200,000 | 169,532 |
F&G Global Funding 2.30%, 4/11/2027 (a) | 604,000 | 534,064 |
Guardian Life Global Funding 0.88%, 12/10/2025 (a) | 512,000 | 459,450 |
Manulife Financial Corp. (Canada) 4.15%, 3/4/2026 | 389,000 | 377,875 |
Marsh & McLennan Cos., Inc. 3.88%, 3/15/2024 | 30,000 | 29,687 |
Principal Financial Group, Inc. | ||
3.10%, 11/15/2026 | 20,000 | 18,604 |
3.70%, 5/15/2029 | 30,000 | 27,459 |
Prudential Insurance Co. of America (The) 8.30%, 7/1/2025 (a) | 650,000 | 670,800 |
4,608,131 | ||
Leisure Products — 0.1% | ||
Hasbro, Inc. 3.90%, 11/19/2029 | 392,000 | 355,458 |
Media — 0.6% | ||
Charter Communications Operating LLC 4.91%, 7/23/2025 | 814,000 | 799,398 |
Comcast Corp. 4.15%, 10/15/2028 | 544,000 | 524,567 |
Discovery Communications LLC 3.95%, 3/20/2028 | 652,000 | 606,391 |
Paramount Global 2.90%, 1/15/2027 | 469,000 | 422,706 |
Time Warner Cable Enterprises LLC 8.38%, 7/15/2033 | 346,000 | 385,529 |
2,738,591 | ||
Metals & Mining — 0.2% | ||
Glencore Funding LLC (Australia) | ||
2.50%, 9/1/2030 (a) | 260,000 | 211,471 |
2.85%, 4/27/2031 (a) | 350,000 | 285,266 |
Steel Dynamics, Inc. 1.65%, 10/15/2027 | 324,000 | 277,875 |
774,612 | ||
Multi-Utilities — 0.3% | ||
CenterPoint Energy, Inc. 1.45%, 6/1/2026 | 288,000 | 258,827 |
CMS Energy Corp. 2.95%, 2/15/2027 | 170,000 | 155,643 |
August 31, 2023 | J.P. Morgan Exchange-Traded Funds | 31 |
AS OF August 31, 2023 (Unaudited) (continued)
INVESTMENTS | PRINCIPAL AMOUNT($) | VALUE($) |
Corporate Bonds — continued | ||
Multi-Utilities — continued | ||
Consolidated Edison Co. of New York, Inc. 3.80%, 5/15/2028 | 10,000 | 9,461 |
NiSource, Inc. 5.25%, 3/30/2028 | 166,000 | 165,304 |
PG&E Energy Recovery Funding LLC Series A-2, 2.28%, 1/15/2036 | 225,000 | 170,018 |
Public Service Enterprise Group, Inc. 1.60%, 8/15/2030 | 369,000 | 290,578 |
Puget Energy, Inc. 2.38%, 6/15/2028 | 234,000 | 201,925 |
1,251,756 | ||
Office REITs — 0.2% | ||
Alexandria Real Estate Equities, Inc. 3.38%, 8/15/2031 | 483,000 | 417,029 |
Corporate Office Properties LP 2.00%, 1/15/2029 | 257,000 | 202,374 |
Kilroy Realty LP 2.65%, 11/15/2033 | 592,000 | 411,034 |
1,030,437 | ||
Oil, Gas & Consumable Fuels — 1.9% | ||
Aker BP ASA (Norway) 2.00%, 7/15/2026 (a) | 222,000 | 199,277 |
APA Infrastructure Ltd. (Australia) 4.25%, 7/15/2027 (a) | 424,000 | 404,184 |
Cameron LNG LLC 2.90%, 7/15/2031 (a) | 146,000 | 124,861 |
Cheniere Corpus Christi Holdings LLC 5.88%, 3/31/2025 | 272,000 | 271,075 |
Coterra Energy, Inc. 3.90%, 5/15/2027 | 424,000 | 403,120 |
Ecopetrol SA (Colombia) | ||
4.13%, 1/16/2025 | 313,000 | 302,352 |
5.38%, 6/26/2026 | 295,000 | 284,749 |
Enbridge, Inc. (Canada) 5.70%, 3/8/2033 | 399,000 | 399,184 |
Energy Transfer LP | ||
5.95%, 12/1/2025 | 446,000 | 446,510 |
5.50%, 6/1/2027 | 244,000 | 242,580 |
Eni SpA (Italy) Series X-R, 4.00%, 9/12/2023 (a) | 695,000 | 694,720 |
Enterprise Products Operating LLC 3.95%, 2/15/2027 | 392,000 | 376,913 |
Flex Intermediate Holdco LLC 3.36%, 6/30/2031 (a) | 1,116,000 | 883,462 |
Gray Oak Pipeline LLC | ||
2.60%, 10/15/2025 (a) | 312,000 | 288,516 |
3.45%, 10/15/2027 (a) | 637,000 | 569,774 |
HF Sinclair Corp. | ||
2.63%, 10/1/2023 | 95,000 | 94,695 |
5.88%, 4/1/2026 | 300,000 | 301,465 |
MPLX LP | ||
4.13%, 3/1/2027 | 458,000 | 438,510 |
INVESTMENTS | PRINCIPAL AMOUNT($) | VALUE($) |
Oil, Gas & Consumable Fuels — continued | ||
4.25%, 12/1/2027 | 118,000 | 112,284 |
5.00%, 3/1/2033 | 350,000 | 330,375 |
NGPL PipeCo LLC 3.25%, 7/15/2031 (a) | 271,000 | 222,311 |
Ovintiv, Inc. 5.38%, 1/1/2026 | 420,000 | 416,830 |
Phillips 66 2.15%, 12/15/2030 | 206,000 | 166,808 |
Pioneer Natural Resources Co. 1.13%, 1/15/2026 | 448,000 | 406,116 |
Plains All American Pipeline LP 4.65%, 10/15/2025 | 357,000 | 348,162 |
Sabine Pass Liquefaction LLC 4.50%, 5/15/2030 | 250,000 | 235,263 |
Suncor Energy, Inc. (Canada) 5.95%, 12/1/2034 | 216,000 | 213,754 |
Targa Resources Partners LP 4.00%, 1/15/2032 | 153,000 | 131,996 |
9,309,846 | ||
Passenger Airlines — 0.0% ^ | ||
Continental Airlines Pass-Through Trust Series 2012-2, Class A Shares, 4.00%, 10/29/2024 | 106,999 | 104,367 |
Personal Care Products — 0.1% | ||
Kenvue, Inc. 5.00%, 3/22/2030 (a) | 428,000 | 428,332 |
Pharmaceuticals — 0.3% | ||
Bristol-Myers Squibb Co. 3.40%, 7/26/2029 | 30,000 | 27,788 |
Merck & Co., Inc. 4.50%, 5/17/2033 | 200,000 | 194,924 |
Mylan, Inc. 4.55%, 4/15/2028 | 20,000 | 18,830 |
Takeda Pharmaceutical Co. Ltd. (Japan) 2.05%, 3/31/2030 | 1,300,000 | 1,069,582 |
1,311,124 | ||
Real Estate Management & Development — 0.1% | ||
Mitsui Fudosan Co. Ltd. (Japan) 3.65%, 7/20/2027 (a) | 219,000 | 206,908 |
Ontario Teachers' Cadillac Fairview Properties Trust (Canada) 3.88%, 3/20/2027 (a) | 325,000 | 300,816 |
507,724 | ||
Residential REITs — 0.2% | ||
Essex Portfolio LP 1.65%, 1/15/2031 | 279,000 | 210,646 |
Mid-America Apartments LP 1.70%, 2/15/2031 | 187,000 | 147,429 |
UDR, Inc. | ||
3.20%, 1/15/2030 | 260,000 | 228,960 |
2.10%, 8/1/2032 | 266,000 | 199,524 |
2.10%, 6/15/2033 | 350,000 | 257,045 |
1,043,604 | ||
32 | J.P. Morgan Exchange-Traded Funds | August 31, 2023 |
INVESTMENTS | PRINCIPAL AMOUNT($) | VALUE($) |
Corporate Bonds — continued | ||
Retail REITs — 0.4% | ||
Brixmor Operating Partnership LP | ||
3.85%, 2/1/2025 | 375,000 | 361,730 |
2.25%, 4/1/2028 | 186,000 | 158,055 |
2.50%, 8/16/2031 | 140,000 | 110,114 |
NNN REIT, Inc. | ||
3.60%, 12/15/2026 | 247,000 | 230,429 |
4.30%, 10/15/2028 | 370,000 | 347,148 |
Regency Centers LP 3.70%, 6/15/2030 | 350,000 | 313,729 |
Scentre Group Trust 1 (Australia) 3.50%, 2/12/2025 (a) | 350,000 | 337,963 |
SITE Centers Corp. 3.63%, 2/1/2025 | 100,000 | 95,143 |
1,954,311 | ||
Semiconductors & Semiconductor Equipment — 0.4% | ||
Broadcom, Inc. 4.11%, 9/15/2028 | 792,000 | 745,174 |
Marvell Technology, Inc. 2.95%, 4/15/2031 | 422,000 | 352,120 |
Microchip Technology, Inc. 0.97%, 2/15/2024 | 546,000 | 533,434 |
NXP BV (China) 2.50%, 5/11/2031 | 658,000 | 529,585 |
2,160,313 | ||
Software — 0.3% | ||
Oracle Corp. | ||
2.65%, 7/15/2026 | 60,000 | 55,726 |
4.50%, 5/6/2028 | 295,000 | 286,191 |
2.88%, 3/25/2031 | 502,000 | 424,127 |
6.50%, 4/15/2038 | 50,000 | 52,742 |
Roper Technologies, Inc. 3.80%, 12/15/2026 | 427,000 | 407,558 |
1,226,344 | ||
Specialized REITs — 0.7% | ||
American Tower Corp. 1.45%, 9/15/2026 | 1,378,000 | 1,221,013 |
Crown Castle, Inc. 4.45%, 2/15/2026 | 578,000 | 562,928 |
Equinix, Inc. 2.90%, 11/18/2026 | 605,000 | 559,112 |
Extra Space Storage LP | ||
2.20%, 10/15/2030 | 510,000 | 406,902 |
2.35%, 3/15/2032 | 467,000 | 363,279 |
Public Storage Operating Co. 2.25%, 11/9/2031 | 255,000 | 206,280 |
3,319,514 | ||
Specialty Retail — 0.2% | ||
Advance Auto Parts, Inc. 3.50%, 3/15/2032 | 460,000 | 371,615 |
AutoZone, Inc. 1.65%, 1/15/2031 | 265,000 | 205,805 |
Home Depot, Inc. (The) 2.95%, 6/15/2029 | 50,000 | 45,410 |
Lowe's Cos., Inc. | ||
3.75%, 4/1/2032 | 20,000 | 17,919 |
INVESTMENTS | PRINCIPAL AMOUNT($) | VALUE($) |
Specialty Retail — continued | ||
5.15%, 7/1/2033 | 200,000 | 197,583 |
O'Reilly Automotive, Inc. 3.60%, 9/1/2027 | 203,000 | 192,284 |
1,030,616 | ||
Technology Hardware, Storage & Peripherals — 0.1% | ||
Dell International LLC | ||
4.90%, 10/1/2026 | 434,000 | 426,234 |
5.30%, 10/1/2029 | 232,000 | 229,059 |
655,293 | ||
Tobacco — 0.3% | ||
Altria Group, Inc. 2.45%, 2/4/2032 | 532,000 | 415,224 |
BAT Capital Corp. (United Kingdom) | ||
3.22%, 8/15/2024 | 116,000 | 113,123 |
2.26%, 3/25/2028 | 816,000 | 701,602 |
1,229,949 | ||
Trading Companies & Distributors — 0.6% | ||
Air Lease Corp. | ||
3.00%, 9/15/2023 | 1,063,000 | 1,062,116 |
1.88%, 8/15/2026 | 504,000 | 450,980 |
3.63%, 4/1/2027 | 757,000 | 695,543 |
Aviation Capital Group LLC 5.50%, 12/15/2024 (a) | 422,000 | 415,562 |
BOC Aviation Ltd. (China) 3.50%, 10/10/2024 (a) | 200,000 | 194,436 |
2,818,637 | ||
Water Utilities — 0.0% ^ | ||
American Water Capital Corp. 3.85%, 3/1/2024 | 20,000 | 19,794 |
Wireless Telecommunication Services — 0.3% | ||
Rogers Communications, Inc. (Canada) 3.80%, 3/15/2032 | 474,000 | 405,400 |
T-Mobile USA, Inc. | ||
4.95%, 3/15/2028 | 440,000 | 433,874 |
3.88%, 4/15/2030 | 684,000 | 624,304 |
1,463,578 | ||
Total Corporate Bonds (Cost $141,053,941) | 126,996,572 | |
U.S. Treasury Obligations — 17.8% | ||
U.S. Treasury Inflation Indexed Notes | ||
0.25%, 1/15/2025 (e) | 30,382,778 | 29,199,116 |
0.63%, 1/15/2026 | 2,498,800 | 2,382,767 |
0.13%, 4/15/2027 | 27,961,907 | 25,856,572 |
August 31, 2023 | J.P. Morgan Exchange-Traded Funds | 33 |
AS OF August 31, 2023 (Unaudited) (continued)
INVESTMENTS | PRINCIPAL AMOUNT($) | VALUE($) |
U.S. Treasury Obligations — continued | ||
0.38%, 7/15/2027 | 17,071,658 | 15,966,835 |
0.63%, 7/15/2032 | 14,737,244 | 13,226,820 |
Total U.S. Treasury Obligations (Cost $90,854,835) | 86,632,110 | |
Mortgage-Backed Securities — 17.8% | ||
FHLMC Gold Pools, 15 Year Pool # G13603, 5.50%, 2/1/2024 | 6 | 6 |
FHLMC Gold Pools, 20 Year | ||
Pool # C91030, 5.50%, 5/1/2027 | 19,388 | 19,398 |
Pool # C91802, 3.50%, 1/1/2035 | 2,014,023 | 1,916,675 |
FHLMC Gold Pools, 30 Year | ||
Pool # A15232, 5.00%, 10/1/2033 | 96,623 | 95,679 |
Pool # A57681, 6.00%, 12/1/2036 | 588 | 608 |
Pool # G06493, 4.50%, 5/1/2041 | 398,203 | 388,403 |
FHLMC Gold Pools, Other | ||
Pool # WN1157, 1.80%, 11/1/2028 | 1,000,000 | 861,256 |
Pool # U90690, 3.50%, 6/1/2042 | 415,581 | 380,189 |
FHLMC UMBS, 30 Year | ||
Pool # ZM6956, 4.50%, 6/1/2048 | 828,276 | 799,605 |
Pool # RA5276, 2.50%, 5/1/2051 | 4,011,545 | 3,343,466 |
Pool # QC3244, 3.00%, 6/1/2051 | 2,510,666 | 2,169,611 |
Pool # QC7410, 2.50%, 9/1/2051 | 1,562,854 | 1,308,153 |
Pool # RA5906, 2.50%, 9/1/2051 | 1,422,671 | 1,190,810 |
Pool # RA6702, 3.00%, 2/1/2052 | 3,600,431 | 3,119,658 |
Pool # RA7937, 5.00%, 9/1/2052 | 3,726,729 | 3,615,343 |
FNMA UMBS, 15 Year Pool # 995381, 6.00%, 1/1/2024 | 14 | 14 |
FNMA UMBS, 20 Year | ||
Pool # MA1138, 3.50%, 8/1/2032 | 334,680 | 317,626 |
Pool # AP9584, 3.00%, 10/1/2032 | 1,593,308 | 1,486,738 |
FNMA UMBS, 30 Year | ||
Pool # AL0045, 6.00%, 12/1/2032 | 147,337 | 150,600 |
Pool # 735503, 6.00%, 4/1/2035 | 38,224 | 39,128 |
Pool # 888460, 6.50%, 10/1/2036 | 245,537 | 257,077 |
Pool # 888890, 6.50%, 10/1/2037 | 5,394 | 5,662 |
Pool # 949320, 7.00%, 10/1/2037 | 19,958 | 20,016 |
Pool # 995149, 6.50%, 10/1/2038 | 12,410 | 12,844 |
Pool # 994410, 7.00%, 11/1/2038 | 127,660 | 130,869 |
Pool # AD9151, 5.00%, 8/1/2040 | 204,624 | 204,507 |
Pool # AE0681, 4.50%, 12/1/2040 | 466,687 | 454,637 |
Pool # BM3500, 4.00%, 9/1/2047 | 812,512 | 778,210 |
Pool # BM3499, 4.00%, 12/1/2047 | 1,005,765 | 945,800 |
Pool # BE8354, 4.00%, 3/1/2048 | 420,493 | 394,351 |
Pool # CB1878, 3.00%, 10/1/2051 | 2,825,853 | 2,445,757 |
Pool # CB2637, 2.50%, 1/1/2052 | 2,389,460 | 1,986,263 |
INVESTMENTS | PRINCIPAL AMOUNT($) | VALUE($) |
Pool # CB2670, 3.00%, 1/1/2052 | 2,233,060 | 1,924,407 |
Pool # FS0882, 2.50%, 3/1/2052 | 904,022 | 757,712 |
Pool # CB3629, 4.00%, 5/1/2052 | 4,701,344 | 4,345,545 |
FNMA, Other | ||
Pool # AM4716, 3.38%, 12/1/2023 | 1,351,492 | 1,337,861 |
Pool # AM8674, 2.81%, 4/1/2025 | 2,200,000 | 2,111,248 |
Pool # AM8846, 2.68%, 5/1/2025 | 1,767,386 | 1,688,997 |
Pool # AN1413, 2.49%, 5/1/2026 | 785,015 | 735,022 |
Pool # AN1497, 2.61%, 6/1/2026 | 860,000 | 805,363 |
Pool # AN1243, 2.64%, 6/1/2026 | 1,600,000 | 1,499,876 |
Pool # AN1247, 2.64%, 6/1/2026 | 1,576,000 | 1,477,378 |
Pool # AN6732, 2.83%, 5/1/2027 | 1,179,054 | 1,094,462 |
Pool # AN7338, 3.06%, 11/1/2027 | 953,865 | 889,878 |
Pool # AN7943, 3.10%, 1/1/2028 | 2,389,408 | 2,225,625 |
Pool # AN1161, 3.05%, 4/1/2028 | 940,991 | 871,978 |
Pool # BS8224, 4.10%, 5/1/2028 | 3,775,000 | 3,650,073 |
Pool # AN9486, 3.57%, 6/1/2028 | 3,707,066 | 3,500,608 |
Pool # AN2069, 2.35%, 8/1/2028 | 1,386,806 | 1,239,592 |
Pool # BL0907, 3.88%, 12/1/2028 | 700,000 | 669,161 |
Pool # BM4162, 3.12%, 10/1/2029 (f) | 127,917 | 117,978 |
Pool # BL4333, 2.52%, 11/1/2029 | 1,141,262 | 1,002,089 |
Pool # BS8252, 4.36%, 4/1/2030 | 3,495,000 | 3,396,383 |
Pool # BM7037, 1.75%, 3/1/2032 (f) | 999,385 | 789,137 |
Pool # BS5117, 2.58%, 3/1/2032 | 2,393,690 | 2,004,451 |
Pool # BS8503, 4.62%, 5/1/2033 | 1,000,000 | 981,449 |
Pool # BS2933, 1.82%, 9/1/2033 | 3,400,000 | 2,583,349 |
Pool # MA1125, 4.00%, 7/1/2042 | 541,752 | 511,002 |
Pool # MA1437, 3.50%, 5/1/2043 | 754,946 | 689,810 |
Pool # MA1463, 3.50%, 6/1/2043 | 717,159 | 655,390 |
Pool # BF0669, 4.00%, 6/1/2052 | 2,308,838 | 2,171,237 |
Pool # BF0230, 5.50%, 1/1/2058 | 3,229,056 | 3,289,033 |
Pool # BM6734, 4.00%, 8/1/2059 | 3,792,459 | 3,519,583 |
Pool # BF0497, 3.00%, 7/1/2060 | 1,821,501 | 1,519,938 |
Pool # BF0546, 2.50%, 7/1/2061 | 874,450 | 702,777 |
Pool # BF0617, 2.50%, 3/1/2062 | 2,135,471 | 1,712,249 |
GNMA II, 30 Year | ||
Pool # 4245, 6.00%, 9/20/2038 | 62,765 | 65,917 |
Pool # BA7567, 4.50%, 5/20/2048 | 687,402 | 653,372 |
Pool # BI0416, 4.50%, 11/20/2048 | 74,167 | 71,227 |
Pool # BM9692, 4.50%, 7/20/2049 | 305,063 | 291,699 |
Total Mortgage-Backed Securities (Cost $92,969,221) | 86,391,815 | |
Asset-Backed Securities — 15.7% | ||
ACM Auto Trust Series 2023-1A, Class A, 6.61%, 1/22/2030 (a) | 166,731 | 166,480 |
34 | J.P. Morgan Exchange-Traded Funds | August 31, 2023 |
INVESTMENTS | PRINCIPAL AMOUNT($) | VALUE($) |
Asset-Backed Securities — continued | ||
Air Canada Pass-Through Trust (Canada) | ||
Series 2013-1, Class A, 4.13%, 5/15/2025 (a) | 275,093 | 262,517 |
Series 2017-1, Class AA, 3.30%, 1/15/2030 (a) | 367,536 | 323,842 |
Aligned Data Centers Issuer LLC Series 2021-1A, Class A2, 1.94%, 8/15/2046 (a) | 1,966,000 | 1,725,122 |
American Airlines Pass-Through Trust | ||
Series 2016-3, Class AA, 3.00%, 10/15/2028 | 76,702 | 68,380 |
Series 2021-1, Class B, 3.95%, 7/11/2030 | 1,012,830 | 883,371 |
American Credit Acceptance Receivables Trust | ||
Series 2023-2, Class A, 5.89%, 10/13/2026 (a) | 341,136 | 340,106 |
Series 2023-1, Class C, 5.59%, 4/12/2029 (a) | 799,000 | 784,617 |
AmeriCredit Automobile Receivables Trust | ||
Series 2021-1, Class A3, 0.37%, 8/18/2025 | 127,121 | 126,502 |
Series 2020-3, Class B, 0.76%, 12/18/2025 | 716,674 | 704,575 |
Series 2021-2, Class B, 0.69%, 1/19/2027 | 704,000 | 666,564 |
AMSR Trust | ||
Series 2020-SFR4, Class A, 1.36%, 11/17/2037 (a) | 2,019,000 | 1,837,432 |
Series 2020-SFR5, Class A, 1.38%, 11/17/2037 (a) | 526,971 | 479,778 |
Amur Equipment Finance Receivables X LLC Series 2022-1A, Class A2, 1.64%, 10/20/2027 (a) | 950,716 | 914,974 |
Avis Budget Rental Car Funding AESOP LLC Series 2020-1A, Class A, 2.33%, 8/20/2026 (a) | 710,000 | 665,407 |
Business Jet Securities LLC | ||
Series 2020-1A, Class A, 2.98%, 11/15/2035 ‡ (a) | 116,536 | 109,968 |
Series 2022-1A, Class A, 4.46%, 6/15/2037 ‡ (a) | 978,656 | 917,979 |
CarMax Auto Owner Trust | ||
Series 2020-1, Class A3, 1.89%, 12/16/2024 | 31,396 | 31,317 |
Series 2020-3, Class A3, 0.62%, 3/17/2025 | 52,845 | 52,587 |
Series 2021-1, Class A3, 0.34%, 12/15/2025 | 1,049,495 | 1,022,956 |
Carvana Auto Receivables Trust | ||
Series 2021-P3, Class A3, 0.70%, 11/10/2026 | 1,067,983 | 1,023,047 |
INVESTMENTS | PRINCIPAL AMOUNT($) | VALUE($) |
Series 2023-N1, Class A, 6.36%, 4/12/2027 (a) | 789,609 | 790,995 |
Series 2022-P3, Class A3, 4.61%, 11/10/2027 | 245,000 | 239,727 |
Series 2021-P4, Class A4, 1.64%, 12/10/2027 | 2,700,000 | 2,440,461 |
CIG Auto Receivables Trust Series 2021-1A, Class A, 0.69%, 4/14/2025 (a) | 22,023 | 21,981 |
CoreVest American Finance Trust | ||
Series 2019-3, Class A, 2.71%, 10/15/2052 (a) | 153,731 | 146,179 |
Series 2022-1, Class A, 4.74%, 6/17/2055 (a) (f) | 532,113 | 519,474 |
CPS Auto Receivables Trust | ||
Series 2023-A, Class C, 5.54%, 4/16/2029 (a) | 651,000 | 638,530 |
Series 2022-C, Class B, 4.88%, 4/15/2030 (a) | 2,200,000 | 2,169,369 |
Credit Acceptance Auto Loan Trust | ||
Series 2020-3A, Class A, 1.24%, 10/15/2029 (a) | 265,038 | 264,144 |
Series 2021-2A, Class A, 0.96%, 2/15/2030 (a) | 606,690 | 597,762 |
Series 2021-3A, Class A, 1.00%, 5/15/2030 (a) | 517,462 | 506,516 |
Series 2023-1A, Class B, 7.02%, 5/16/2033 (a) | 2,100,000 | 2,108,827 |
Drive Auto Receivables Trust Series 2021-3, Class B, 1.11%, 5/15/2026 | 197,977 | 196,384 |
DT Auto Owner Trust | ||
Series 2022-2A, Class A, 2.88%, 6/15/2026 (a) | 393,301 | 389,699 |
Series 2021-3A, Class C, 0.87%, 5/17/2027 (a) | 1,292,000 | 1,242,515 |
Series 2021-4A, Class D, 1.99%, 9/15/2027 (a) | 760,000 | 694,869 |
Series 2023-1A, Class C, 5.55%, 10/16/2028 (a) | 1,798,000 | 1,770,385 |
Series 2023-2A, Class B, 5.41%, 2/15/2029 (a) | 756,000 | 746,704 |
Exeter Automobile Receivables Trust | ||
Series 2022-3A, Class A3, 4.21%, 1/15/2026 | 225,282 | 224,595 |
Series 2022-5A, Class B, 5.97%, 3/15/2027 | 1,392,000 | 1,385,036 |
Series 2022-4A, Class C, 4.92%, 12/15/2028 | 1,076,000 | 1,055,054 |
Series 2023-1A, Class D, 6.69%, 6/15/2029 | 243,000 | 243,046 |
August 31, 2023 | J.P. Morgan Exchange-Traded Funds | 35 |
AS OF August 31, 2023 (Unaudited) (continued)
INVESTMENTS | PRINCIPAL AMOUNT($) | VALUE($) |
Asset-Backed Securities — continued | ||
FHF Trust Series 2023-1A, Class A2, 6.57%, 6/15/2028 (a) | 629,000 | 623,249 |
FirstKey Homes Trust | ||
Series 2020-SFR2, Class A, 1.27%, 10/19/2037 (a) | 1,062,854 | 965,740 |
Series 2021-SFR1, Class E1, 2.39%, 8/17/2038 (a) | 600,000 | 516,445 |
Series 2021-SFR2, Class D, 2.06%, 9/17/2038 (a) | 2,900,000 | 2,514,943 |
Flagship Credit Auto Trust | ||
Series 2019-4, Class C, 2.77%, 12/15/2025 (a) | 74,895 | 74,599 |
Series 2021-4, Class A, 0.81%, 7/17/2026 (a) | 408,706 | 399,657 |
Series 2022-1, Class A, 1.79%, 10/15/2026 (a) | 914,010 | 893,337 |
Series 2023-1, Class A2, 5.38%, 12/15/2026 (a) | 165,771 | 164,941 |
Series 2023-2, Class A2, 5.76%, 4/15/2027 (a) | 1,300,000 | 1,294,238 |
Series 2023-1, Class C, 5.43%, 5/15/2029 (a) | 1,800,000 | 1,765,303 |
FRTKL Series 2021-SFR1, Class A, 1.57%, 9/17/2038 (a) | 2,118,000 | 1,859,146 |
GLS Auto Receivables Issuer Trust | ||
Series 2021-4A, Class A, 0.84%, 7/15/2025 (a) | 57,345 | 57,269 |
Series 2021-3A, Class C, 1.11%, 9/15/2026 (a) | 815,000 | 783,285 |
GM Financial Consumer Automobile Receivables Trust Series 2021-1, Class A3, 0.35%, 10/16/2025 | 164,145 | 160,240 |
HERO Funding (Cayman Islands) Series 2017-3A, Class A2, 3.95%, 9/20/2048 ‡ (a) | 124,874 | 109,351 |
Hertz Vehicle Financing LLC Series 2022-1A, Class A, 1.99%, 6/25/2026 (a) | 922,000 | 863,446 |
Home Partners of America Trust Series 2022-1, Class D, 4.73%, 4/17/2039 (a) | 1,159,072 | 1,063,913 |
Kubota Credit Owner Trust Series 2023-1A, Class A3, 5.02%, 6/15/2027 (a) | 1,063,000 | 1,053,004 |
Lendmark Funding Trust Series 2022-1A, Class A, 5.12%, 7/20/2032 (a) | 177,000 | 172,556 |
LP LMS Asset Securitization Trust Series 2023-1A, Class A, 8.18%, 10/17/2033 ‡ (a) | 723,682 | 719,286 |
MVW LLC | ||
Series 2021-2A, Class A, 1.43%, 5/20/2039 (a) | 711,881 | 647,482 |
INVESTMENTS | PRINCIPAL AMOUNT($) | VALUE($) |
Series 2021-1WA, Class A, 1.14%, 1/22/2041 (a) | 137,552 | 125,074 |
Octane Receivables Trust Series 2020-1A, Class A, 1.71%, 2/20/2025 (a) | 1,603 | 1,601 |
OneMain Direct Auto Receivables Trust Series 2023-1A, Class A, 5.41%, 11/14/2029 (a) | 1,534,000 | 1,520,893 |
PRET LLC Series 2021-NPL6, Class A1, 2.49%, 7/25/2051 (a) (d) | 642,385 | 613,764 |
Progress Residential Trust | ||
Series 2020-SFR3, Class B, 1.50%, 10/17/2027 (a) | 785,000 | 715,139 |
Series 2021-SFR2, Class E1, 2.55%, 4/19/2038 (a) | 350,000 | 308,796 |
Series 2021-SFR8, Class E1, 2.38%, 10/17/2038 (a) | 1,144,000 | 988,804 |
Series 2021-SFR11, Class A, 2.28%, 1/17/2039 (a) | 1,995,577 | 1,687,109 |
Series 2023-SFR1, Class A, 4.30%, 3/17/2040 (a) | 1,255,000 | 1,184,439 |
Series 2021-SFR9, Class E1, 2.81%, 11/17/2040 (a) | 1,048,000 | 846,234 |
PRPM LLC Series 2021-10, Class A1, 2.49%, 10/25/2026 (a) (d) | 615,300 | 576,897 |
Santander Consumer Auto Receivables Trust Series 2021-AA, Class A3, 0.33%, 10/15/2025 (a) | 83,131 | 82,533 |
Santander Drive Auto Receivables Trust | ||
Series 2021-2, Class C, 0.90%, 6/15/2026 | 418,243 | 413,849 |
Series 2022-5, Class B, 4.43%, 3/15/2027 | 562,000 | 550,893 |
Series 2023-1, Class B, 4.98%, 2/15/2028 | 440,000 | 432,227 |
Santander Retail Auto Lease Trust Series 2022-A, Class A3, 1.34%, 7/21/2025 (a) | 611,000 | 592,656 |
SCF Equipment Leasing LLC Series 2022-2A, Class A3, 6.50%, 10/21/2030 (a) | 1,780,000 | 1,794,574 |
Sierra Timeshare Receivables Funding LLC Series 2022-2A, Class A, 4.73%, 6/20/2040 (a) | 89,023 | 86,586 |
Spirit Airlines Pass-Through Trust Series 2017-1, Class AA, 3.38%, 2/15/2030 | 106,636 | 93,939 |
SpringCastle America Funding LLC Series 2020-AA, Class A, 1.97%, 9/25/2037 (a) | 199,142 | 180,845 |
Theorem Funding Trust Series 2021-1A, Class A, 1.21%, 12/15/2027 (a) | 21,363 | 21,315 |
Toyota Auto Receivables Owner Trust | ||
Series 2021-A, Class A3, 0.26%, 5/15/2025 | 528,440 | 518,358 |
Series 2020-C, Class A4, 0.57%, 10/15/2025 | 532,000 | 518,912 |
36 | J.P. Morgan Exchange-Traded Funds | August 31, 2023 |
INVESTMENTS | PRINCIPAL AMOUNT($) | VALUE($) |
Asset-Backed Securities — continued | ||
United Airlines Pass-Through Trust | ||
Series 2016-1, Class AA, 3.10%, 7/7/2028 | 726,459 | 662,952 |
Series 2016-2, Class AA, 2.88%, 10/7/2028 | 753,943 | 672,662 |
Series 2018-1, Class AA, 3.50%, 3/1/2030 | 480,035 | 430,640 |
Series 2018-1, Class A, 3.70%, 3/1/2030 | 802,843 | 695,782 |
US Auto Funding Trust Series 2022-1A, Class A, 3.98%, 4/15/2025 (a) | 351,620 | 342,301 |
VOLT C LLC Series 2021-NPL9, Class A1, 1.99%, 5/25/2051 (a) (d) | 376,152 | 345,510 |
VOLT CI LLC Series 2021-NP10, Class A1, 1.99%, 5/25/2051 (a) (d) | 788,879 | 722,913 |
VOLT CV LLC Series 2021-CF2, Class A1, 2.49%, 11/27/2051 (a) (d) | 739,440 | 680,706 |
VOLT XCIII LLC Series 2021-NPL2, Class A1, 1.89%, 2/27/2051 (a) (d) | 706,221 | 656,570 |
VOLT XCIV LLC Series 2021-NPL3, Class A1, 2.24%, 2/27/2051 (a) (d) | 955,477 | 901,920 |
VOLT XCIX LLC Series 2021-NPL8, Class A1, 2.12%, 4/25/2051 (a) (d) | 546,215 | 509,033 |
VOLT XCVI LLC Series 2021-NPL5, Class A1, 2.12%, 3/27/2051 (a) (d) | 914,813 | 865,608 |
VOLT XCVII LLC Series 2021-NPL6, Class A1, 2.24%, 4/25/2051 (a) (d) | 1,171,848 | 1,094,064 |
Westgate Resorts LLC Series 2022-1A, Class A, 1.79%, 8/20/2036 (a) | 789,806 | 746,262 |
Westlake Automobile Receivables Trust | ||
Series 2021-3A, Class A3, 0.95%, 6/16/2025 (a) | 270,462 | 268,656 |
Series 2022-3A, Class A3, 5.49%, 7/15/2026 (a) | 2,196,000 | 2,185,537 |
Series 2021-3A, Class D, 2.12%, 1/15/2027 (a) | 806,000 | 750,462 |
Series 2023-1A, Class A3, 5.21%, 1/18/2028 (a) | 450,000 | 446,419 |
Series 2023-1A, Class C, 5.74%, 8/15/2028 (a) | 180,000 | 177,645 |
World Omni Auto Receivables Trust | ||
Series 2021-A, Class A3, 0.30%, 1/15/2026 | 665,100 | 648,197 |
Series 2021-C, Class A3, 0.44%, 8/17/2026 | 563,616 | 542,670 |
Total Asset-Backed Securities (Cost $80,551,869) | 76,403,149 | |
Collateralized Mortgage Obligations — 9.7% | ||
CHL Mortgage Pass-Through Trust Series 2004-8, Class 2A1, 4.50%, 6/25/2019 ‡ | 414 | 244 |
INVESTMENTS | PRINCIPAL AMOUNT($) | VALUE($) |
Citigroup Mortgage Loan Trust Series 2004-HYB4, Class WA, 4.25%, 12/25/2034 (f) | 9,286 | 8,873 |
Citigroup Mortgage Loan Trust, Inc. Series 2003-1, Class 3A4, 5.25%, 9/25/2033 | 3,883 | 3,598 |
CSFB Mortgage-Backed Pass-Through Certificates Series 2003-27, Class 5A4, 5.25%, 11/25/2033 | 729 | 708 |
CSMC Trust Series 2022-JR1, Class A1, 4.27%, 10/25/2066 (a) (d) | 822,340 | 798,631 |
FHLMC, REMIC | ||
Series 1578, Class K, 6.90%, 9/15/2023 | 14 | 14 |
Series 2685, Class DT, 5.00%, 10/15/2023 | 590 | 589 |
Series 2687, Class JH, 5.00%, 10/15/2023 | 452 | 450 |
Series 2701, Class AC, 5.00%, 11/15/2023 | 7,140 | 7,113 |
Series 3521, Class B, 4.00%, 4/15/2024 | 22,192 | 21,994 |
Series 3544, Class BC, 4.00%, 6/15/2024 | 1,984 | 1,967 |
Series 3546, Class NB, 4.00%, 6/15/2024 | 105,106 | 104,200 |
Series 3562, Class JC, 4.00%, 8/15/2024 | 69,172 | 68,445 |
Series 3563, Class BD, 4.00%, 8/15/2024 | 39,327 | 38,984 |
Series 3571, Class MY, 4.00%, 9/15/2024 | 18,033 | 17,845 |
Series 3575, Class EB, 4.00%, 9/15/2024 | 33,495 | 33,149 |
Series 3577, Class B, 4.00%, 9/15/2024 | 77,873 | 77,012 |
Series 3578, Class KB, 4.00%, 9/15/2024 | 10,107 | 9,994 |
Series 2989, Class TG, 5.00%, 6/15/2025 | 64,487 | 63,915 |
Series 2988, Class TY, 5.50%, 6/15/2025 | 3,610 | 3,571 |
Series 3816, Class HA, 3.50%, 11/15/2025 | 421,786 | 411,279 |
Series 3087, Class KX, 5.50%, 12/15/2025 | 10,782 | 10,639 |
Series 3787, Class AY, 3.50%, 1/15/2026 | 151,842 | 148,092 |
Series 3794, Class LB, 3.50%, 1/15/2026 | 117,698 | 114,791 |
Series 3102, Class CE, 5.50%, 1/15/2026 | 86,119 | 85,153 |
Series 3123, Class HT, 5.00%, 3/15/2026 | 15,796 | 15,551 |
Series 3121, Class JD, 5.50%, 3/15/2026 | 5,482 | 5,407 |
Series 3150, Class EQ, 5.00%, 5/15/2026 | 42,294 | 41,792 |
Series 3898, Class KH, 3.50%, 6/15/2026 | 194,494 | 189,232 |
Series 3885, Class AC, 4.00%, 6/15/2026 | 55,124 | 54,452 |
Series 3911, Class B, 3.50%, 8/15/2026 | 193,661 | 188,255 |
Series 3959, Class PB, 3.00%, 11/15/2026 | 1,228,463 | 1,188,643 |
Series 3337, Class MD, 5.50%, 6/15/2027 | 15,169 | 15,061 |
Series 2110, Class PG, 6.00%, 1/15/2029 | 40,712 | 40,744 |
Series 3563, Class LB, 4.00%, 8/15/2029 | 6,548 | 6,358 |
Series 3653, Class B, 4.50%, 4/15/2030 | 59,025 | 57,749 |
Series 3824, Class EY, 3.50%, 3/15/2031 | 154,021 | 146,877 |
Series 2525, Class AM, 4.50%, 4/15/2032 | 317,773 | 308,702 |
Series 2441, Class GF, 6.50%, 4/15/2032 | 10,733 | 10,956 |
Series 2436, Class MC, 7.00%, 4/15/2032 | 5,657 | 5,753 |
August 31, 2023 | J.P. Morgan Exchange-Traded Funds | 37 |
AS OF August 31, 2023 (Unaudited) (continued)
INVESTMENTS | PRINCIPAL AMOUNT($) | VALUE($) |
Collateralized Mortgage Obligations — continued | ||
Series 2760, Class KT, 4.50%, 9/15/2032 | 41,400 | 39,880 |
Series 2505, Class D, 5.50%, 9/15/2032 | 43,701 | 43,627 |
Series 2544, Class KE, 5.50%, 12/15/2032 | 30,739 | 30,741 |
Series 2557, Class HL, 5.30%, 1/15/2033 | 75,447 | 74,846 |
Series 2575, Class PE, 5.50%, 2/15/2033 | 22,911 | 22,929 |
Series 2586, Class WG, 4.00%, 3/15/2033 | 94,716 | 91,149 |
Series 2596, Class QD, 4.00%, 3/15/2033 | 81,394 | 77,652 |
Series 2621, Class QH, 5.00%, 5/15/2033 | 96,636 | 95,581 |
Series 2624, Class QH, 5.00%, 6/15/2033 | 113,154 | 111,925 |
Series 2648, Class BK, 5.00%, 7/15/2033 | 10,237 | 10,140 |
Series 4238, Class UY, 3.00%, 8/15/2033 | 2,313,970 | 2,158,530 |
Series 2673, Class PE, 5.50%, 9/15/2033 | 182,865 | 183,119 |
Series 2696, Class DG, 5.50%, 10/15/2033 | 164,233 | 164,469 |
Series 2725, Class TA, 4.50%, 12/15/2033 | 284,000 | 275,245 |
Series 2733, Class ME, 5.00%, 1/15/2034 | 160,274 | 158,597 |
Series 2768, Class PK, 5.00%, 3/15/2034 | 153,772 | 148,592 |
Series 2934, Class KG, 5.00%, 2/15/2035 | 119,150 | 118,055 |
Series 3077, Class TO, PO, 4/15/2035 | 3,172 | 3,066 |
Series 2960, Class JH, 5.50%, 4/15/2035 | 343,813 | 344,014 |
Series 3082, Class PW, 5.50%, 12/15/2035 | 24,544 | 24,638 |
Series 3084, Class BH, 5.50%, 12/15/2035 | 504,373 | 507,255 |
Series 3098, Class KG, 5.50%, 1/15/2036 | 535,554 | 538,991 |
Series 3136, Class CO, PO, 4/15/2036 | 10,204 | 8,722 |
Series 3145, Class AJ, 5.50%, 4/15/2036 | 19,691 | 19,839 |
Series 3819, Class ZQ, 6.00%, 4/15/2036 | 356,303 | 363,298 |
Series 3200, PO, 8/15/2036 | 40,499 | 32,781 |
Series 3270, Class AT, 5.50%, 1/15/2037 | 13,501 | 13,552 |
Series 3272, Class PA, 6.00%, 2/15/2037 | 3,699 | 3,813 |
Series 3348, Class HT, 6.00%, 7/15/2037 | 34,871 | 36,017 |
Series 3501, Class A, 4.50%, 1/15/2039 | 90,016 | 84,648 |
Series 3508, Class PK, 4.00%, 2/15/2039 | 2,294 | 2,130 |
Series 3513, Class A, 4.50%, 2/15/2039 | 8,142 | 7,719 |
Series 3653, Class HJ, 5.00%, 4/15/2040 | 387,670 | 384,697 |
Series 3677, Class KB, 4.50%, 5/15/2040 | 695,459 | 675,781 |
Series 3677, Class PB, 4.50%, 5/15/2040 | 334,012 | 321,307 |
Series 3715, Class PC, 4.50%, 8/15/2040 | 114,508 | 110,039 |
Series 3955, Class HB, 3.00%, 12/15/2040 | 66,366 | 63,481 |
Series 3828, Class PU, 4.50%, 3/15/2041 | 39,907 | 38,796 |
Series 3852, Class TP, IF, 5.50%, 5/15/2041 (f) | 129,402 | 129,145 |
Series 3956, Class EB, 3.25%, 11/15/2041 | 719,428 | 653,282 |
Series 3963, Class JB, 4.50%, 11/15/2041 | 1,105,272 | 1,070,354 |
Series 4026, Class MQ, 4.00%, 4/15/2042 | 40,719 | 38,587 |
Series 4616, Class HP, 3.00%, 9/15/2046 | 998,808 | 890,604 |
Series 3688, Class GT, 7.54%, 11/15/2046 (f) | 19,513 | 20,704 |
INVESTMENTS | PRINCIPAL AMOUNT($) | VALUE($) |
FHLMC, STRIPS Series 262, Class 35, 3.50%, 7/15/2042 | 438,950 | 405,120 |
FNMA, REMIC | ||
Series 2004-44, Class KT, 6.00%, 6/25/2024 | 138 | 138 |
Series 2004-53, Class NC, 5.50%, 7/25/2024 | 526 | 522 |
Series 2004-70, Class EB, 5.00%, 10/25/2024 | 237 | 236 |
Series 2010-49, Class KB, 4.00%, 5/25/2025 | 62,031 | 61,187 |
Series 2010-41, Class DC, 4.50%, 5/25/2025 | 2,586 | 2,549 |
Series 1997-57, Class PN, 5.00%, 9/18/2027 | 39,236 | 38,437 |
Series 2009-39, Class LB, 4.50%, 6/25/2029 | 44,093 | 42,644 |
Series 2009-96, Class DB, 4.00%, 11/25/2029 | 50,270 | 48,758 |
Series 2010-28, Class DE, 5.00%, 4/25/2030 | 147,436 | 144,192 |
Series 2001-63, Class TC, 6.00%, 12/25/2031 | 31,327 | 31,687 |
Series 2001-81, Class HE, 6.50%, 1/25/2032 | 76,333 | 77,543 |
Series 2002-75, Class GB, 5.50%, 11/25/2032 | 35,837 | 35,056 |
Series 2011-39, Class ZA, 6.00%, 11/25/2032 | 320,413 | 322,699 |
Series 2002-85, Class PE, 5.50%, 12/25/2032 | 25,882 | 25,843 |
Series 2003-21, Class OU, 5.50%, 3/25/2033 | 20,657 | 20,646 |
Series 2003-26, Class EB, 3.50%, 4/25/2033 | 509,218 | 472,576 |
Series 2003-23, Class CH, 5.00%, 4/25/2033 | 19,757 | 19,412 |
Series 2003-63, Class YB, 5.00%, 7/25/2033 | 69,031 | 67,830 |
Series 2003-69, Class N, 5.00%, 7/25/2033 | 130,102 | 127,871 |
Series 2003-80, Class QG, 5.00%, 8/25/2033 | 175,323 | 172,263 |
Series 2003-85, Class QD, 5.50%, 9/25/2033 | 72,214 | 72,186 |
Series 2003-94, Class CE, 5.00%, 10/25/2033 | 9,891 | 9,699 |
Series 2005-5, Class CK, 5.00%, 1/25/2035 | 108,005 | 105,277 |
38 | J.P. Morgan Exchange-Traded Funds | August 31, 2023 |
INVESTMENTS | PRINCIPAL AMOUNT($) | VALUE($) |
Collateralized Mortgage Obligations — continued | ||
Series 2005-29, Class WC, 4.75%, 4/25/2035 | 183,642 | 178,415 |
Series 2005-48, Class TD, 5.50%, 6/25/2035 | 178,369 | 178,803 |
Series 2005-53, Class MJ, 5.50%, 6/25/2035 | 173,218 | 173,517 |
Series 2005-58, Class EP, 5.50%, 7/25/2035 | 11,433 | 11,457 |
Series 2005-68, Class BE, 5.25%, 8/25/2035 | 188,918 | 185,364 |
Series 2005-68, Class PG, 5.50%, 8/25/2035 | 66,671 | 66,297 |
Series 2005-102, Class PG, 5.00%, 11/25/2035 | 228,902 | 226,355 |
Series 2005-110, Class GL, 5.50%, 12/25/2035 | 291,092 | 291,888 |
Series 2006-49, Class PA, 6.00%, 6/25/2036 | 31,715 | 32,359 |
Series 2009-19, Class PW, 4.50%, 10/25/2036 | 183,485 | 176,178 |
Series 2006-114, Class HE, 5.50%, 12/25/2036 | 215,553 | 216,005 |
Series 2007-33, Class HE, 5.50%, 4/25/2037 | 15,869 | 15,978 |
Series 2007-65, Class KI, IF, IO, 1.22%, 7/25/2037 (f) | 3,958 | 326 |
Series 2007-71, Class KP, 5.50%, 7/25/2037 | 13,948 | 13,518 |
Series 2007-71, Class GB, 6.00%, 7/25/2037 | 124,761 | 128,379 |
Series 2009-86, Class OT, PO, 10/25/2037 | 23,465 | 18,900 |
Series 2008-72, Class BX, 5.50%, 8/25/2038 | 11,051 | 11,072 |
Series 2008-74, Class B, 5.50%, 9/25/2038 | 4,834 | 4,849 |
Series 2009-37, Class KI, IF, IO, 0.60%, 6/25/2039 (f) | 2,790 | 123 |
Series 2009-86, Class IP, IO, 5.50%, 10/25/2039 | 7,245 | 1,336 |
Series 2009-92, Class AD, 6.00%, 11/25/2039 | 306,256 | 303,381 |
Series 2009-112, Class ST, IF, IO, 0.85%, 1/25/2040 (f) | 53,241 | 3,994 |
Series 2010-22, Class PE, 5.00%, 3/25/2040 | 1,143,589 | 1,133,511 |
Series 2010-35, Class SB, IF, IO, 1.02%, 4/25/2040 (f) | 19,798 | 1,231 |
Series 2010-37, Class CY, 5.00%, 4/25/2040 | 676,999 | 668,709 |
INVESTMENTS | PRINCIPAL AMOUNT($) | VALUE($) |
Series 2010-54, Class EA, 4.50%, 6/25/2040 | 20,724 | 20,055 |
Series 2010-64, Class DM, 5.00%, 6/25/2040 | 2,966 | 2,930 |
Series 2010-71, Class HJ, 5.50%, 7/25/2040 | 75,367 | 76,205 |
Series 2010-123, Class BP, 4.50%, 11/25/2040 | 1,671,828 | 1,612,483 |
Series 2011-41, Class KL, 4.00%, 5/25/2041 | 874,674 | 808,040 |
Series 2011-50, Class LP, 4.00%, 6/25/2041 | 380,538 | 356,155 |
Series 2012-137, Class CF, 5.70%, 8/25/2041 (f) | 87,289 | 86,457 |
Series 2012-103, Class DA, 3.50%, 10/25/2041 | 9,484 | 9,233 |
Series 2012-14, Class DE, 3.50%, 3/25/2042 | 583,896 | 540,122 |
Series 2012-139, Class JA, 3.50%, 12/25/2042 | 287,224 | 264,328 |
Series 2013-104, Class CY, 5.00%, 10/25/2043 | 2,250,000 | 2,158,916 |
Series 2019-65, Class PA, 2.50%, 5/25/2048 | 215,738 | 191,036 |
Series 2009-96, Class CB, 4.00%, 11/25/2049 | 13,629 | 12,532 |
Series 2019-7, Class CA, 3.50%, 11/25/2057 | 2,496,778 | 2,325,652 |
FNMA, STRIPS | ||
Series 293, Class 1, PO, 12/25/2024 | 570 | 565 |
Series 314, Class 1, PO, 7/25/2031 | 23,351 | 20,636 |
GNMA | ||
Series 2003-29, Class PD, 5.50%, 4/16/2033 | 142,916 | 142,139 |
Series 2003-65, Class AP, 5.50%, 8/20/2033 | 48,652 | 48,552 |
Series 2003-77, Class TK, 5.00%, 9/16/2033 | 197,119 | 195,691 |
Series 2004-16, Class GC, 5.50%, 2/20/2034 | 515,102 | 514,239 |
Series 2004-54, Class BG, 5.50%, 7/20/2034 | 10,850 | 10,779 |
Series 2004-93, Class PD, 5.00%, 11/16/2034 | 301,334 | 295,560 |
Series 2004-101, Class BE, 5.00%, 11/20/2034 | 260,104 | 256,310 |
Series 2005-11, Class PL, 5.00%, 2/20/2035 | 122,027 | 120,748 |
August 31, 2023 | J.P. Morgan Exchange-Traded Funds | 39 |
AS OF August 31, 2023 (Unaudited) (continued)
INVESTMENTS | PRINCIPAL AMOUNT($) | VALUE($) |
Collateralized Mortgage Obligations — continued | ||
Series 2005-26, Class XY, 5.50%, 3/20/2035 | 473,662 | 473,487 |
Series 2005-33, Class AY, 5.50%, 4/16/2035 | 119,050 | 118,550 |
Series 2005-49, Class B, 5.50%, 6/20/2035 | 40,378 | 40,366 |
Series 2005-51, Class DC, 5.00%, 7/20/2035 | 97,506 | 97,872 |
Series 2005-56, Class BD, 5.00%, 7/20/2035 | 15,146 | 14,880 |
Series 2006-7, Class ND, 5.50%, 8/20/2035 | 15,218 | 15,104 |
Series 2007-37, Class LB, 5.50%, 6/16/2037 | 124,785 | 124,144 |
Series 2007-79, Class BL, 5.75%, 8/20/2037 | 86,309 | 86,067 |
Series 2009-106, Class ST, IF, IO, 0.57%, 2/20/2038 (f) | 81,858 | 2,985 |
Series 2008-7, Class PQ, 5.00%, 2/20/2038 | 254,797 | 249,400 |
Series 2008-9, Class PW, 5.25%, 2/20/2038 | 269,835 | 267,033 |
Series 2008-23, Class YA, 5.25%, 3/20/2038 | 62,947 | 61,782 |
Series 2008-35, Class NF, 5.00%, 4/20/2038 | 64,961 | 63,966 |
Series 2008-34, Class PG, 5.25%, 4/20/2038 | 74,952 | 74,515 |
Series 2008-33, Class PB, 5.50%, 4/20/2038 | 217,997 | 218,374 |
Series 2008-38, Class BG, 5.00%, 5/16/2038 | 361,692 | 357,859 |
Series 2008-43, Class NB, 5.50%, 5/20/2038 | 109,910 | 109,449 |
Series 2008-56, Class PX, 5.50%, 6/20/2038 | 211,753 | 209,885 |
Series 2008-58, Class PE, 5.50%, 7/16/2038 | 568,963 | 567,113 |
Series 2008-62, Class SA, IF, IO, 0.72%, 7/20/2038 (f) | 1,627 | 19 |
Series 2008-76, Class US, IF, IO, 0.47%, 9/20/2038 (f) | 46,894 | 1,148 |
Series 2011-97, Class WA, 6.11%, 11/20/2038 (f) | 448,131 | 457,484 |
Series 2008-95, Class DS, IF, IO, 1.87%, 12/20/2038 (f) | 43,973 | 1,465 |
Series 2009-14, Class AG, 4.50%, 3/20/2039 | 75,786 | 73,766 |
Series 2009-72, Class SM, IF, IO, 0.82%, 8/16/2039 (f) | 103,004 | 5,300 |
INVESTMENTS | PRINCIPAL AMOUNT($) | VALUE($) |
Series 2009-61, Class AP, 4.00%, 8/20/2039 | 7,886 | 7,593 |
Series 2010-130, Class BD, 4.00%, 12/20/2039 | 231,804 | 224,259 |
Series 2010-157, Class OP, PO, 12/20/2040 | 73,478 | 60,395 |
Series 2014-H11, Class VA, 5.72%, 6/20/2064 (f) | 957,421 | 950,593 |
Series 2015-H20, Class FA, 5.69%, 8/20/2065 (f) | 1,385,662 | 1,376,101 |
Series 2015-H26, Class FG, 5.74%, 10/20/2065 (f) | 972,886 | 967,212 |
GSR Mortgage Loan Trust Series 2004-6F, Class 2A4, 5.50%, 5/25/2034 | 43,260 | 41,681 |
JPMorgan Mortgage Trust | ||
Series 2006-A2, Class 5A3, 4.59%, 11/25/2033 (f) | 71,592 | 68,841 |
Series 2007-A1, Class 5A5, 4.09%, 7/25/2035 (f) | 20,099 | 19,695 |
MASTR Adjustable Rate Mortgages Trust Series 2004-13, Class 2A1, 4.71%, 4/21/2034 (f) | 30,969 | 29,348 |
Merrill Lynch Mortgage Investors Trust | ||
Series 2003-F, Class A1, 6.07%, 10/25/2028 (f) | 31,775 | 29,645 |
Series 2004-B, Class A1, 5.93%, 5/25/2029 (f) | 40,911 | 39,185 |
Morgan Stanley Mortgage Loan Trust Series 2004-3, Class 4A, 5.65%, 4/25/2034 (f) | 17,844 | 17,321 |
PHH Mortgage Trust Series 2008-CIM2, Class 5A1, 6.00%, 7/25/2038 | 7,082 | 6,674 |
Seasoned Credit Risk Transfer Trust | ||
Series 2018-1, Class M60C, 3.50%, 5/25/2057 | 1,408,749 | 1,302,479 |
Series 2017-4, Class M60C, 3.50%, 6/25/2057 | 1,396,820 | 1,289,445 |
Series 2017-4, Class MT, 3.50%, 6/25/2057 | 348,421 | 305,005 |
Series 2018-2, Class M55D, 4.00%, 11/25/2057 | 1,456,053 | 1,361,908 |
Series 2019-3, Class M55D, 4.00%, 10/25/2058 | 329,946 | 308,598 |
Series 2020-1, Class M55G, 3.00%, 8/25/2059 | 3,344,140 | 3,012,758 |
Seasoned Loans Structured Transaction Series 2018-2, Class A1, 3.50%, 11/25/2028 | 391,990 | 369,135 |
Sequoia Mortgage Trust Series 2004-11, Class A1, 6.03%, 12/20/2034 (f) | 123,677 | 110,343 |
40 | J.P. Morgan Exchange-Traded Funds | August 31, 2023 |
INVESTMENTS | PRINCIPAL AMOUNT($) | VALUE($) |
Collateralized Mortgage Obligations — continued | ||
Structured Asset Mortgage Investments II Trust Series 2003-AR4, Class A1, 6.13%, 1/19/2034 (f) | 73,767 | 69,356 |
Thornburg Mortgage Securities Trust Series 2004-4, Class 3A, 3.75%, 12/25/2044 (f) | 96,148 | 89,332 |
Vendee Mortgage Trust Series 2003-2, Class Z, 5.00%, 5/15/2033 | 268,473 | 265,251 |
WaMu Mortgage Pass-Through Certificates Trust Series 2003-AR11, Class A6, 4.25%, 10/25/2033 (f) | 58,657 | 54,378 |
Total Collateralized Mortgage Obligations (Cost $50,979,219) | 46,983,342 | |
Commercial Mortgage-Backed Securities — 8.8% | ||
20 Times Square Trust Series 2018-20TS, Class A, 3.20%, 5/15/2035 (a) (f) | 1,162,000 | 989,034 |
BB-UBS Trust Series 2012-SHOW, Class A, 3.43%, 11/5/2036 (a) | 1,400,000 | 1,275,783 |
BXP Trust Series 2017-GM, Class A, 3.38%, 6/13/2039 (a) | 1,500,000 | 1,356,162 |
FHLMC, Multi-Family Structured Pass-Through Certificates | ||
Series J22F, Class A2, 4.09%, 9/25/2024 | 55,506 | 54,598 |
Series KL3L, Class ALNZ, 3.46%, 4/25/2025 (f) | 2,000,000 | 1,920,248 |
Series KLU2, Class A7, 2.23%, 9/25/2025 (f) | 334,333 | 312,448 |
Series K737, Class AM, 2.10%, 10/25/2026 | 3,110,000 | 2,844,121 |
Series K072, Class A2, 3.44%, 12/25/2027 | 473,000 | 446,721 |
Series K083, Class A2, 4.05%, 9/25/2028 (f) | 594,000 | 574,774 |
Series K145, Class AM, 2.58%, 6/25/2055 | 880,000 | 735,353 |
FNMA ACES | ||
Series 2014-M2, Class A2, 3.51%, 12/25/2023 (f) | 1,741,471 | 1,727,489 |
Series 2014-M3, Class A2, 3.50%, 1/25/2024 (f) | 186,041 | 184,004 |
Series 2014-M8, Class A2, 3.06%, 6/25/2024 (f) | 2,262,170 | 2,210,537 |
Series 2014-M13, Class A2, 3.02%, 8/25/2024 (f) | 922,537 | 899,478 |
Series 2016-M6, Class A2, 2.49%, 5/25/2026 | 652,127 | 610,711 |
Series 2015-M10, Class A2, 3.09%, 4/25/2027 (f) | 931,321 | 879,351 |
Series 2017-M8, Class A2, 3.06%, 5/25/2027 (f) | 1,202,220 | 1,128,103 |
Series 2017-M12, Class A2, 3.16%, 6/25/2027 (f) | 2,723,592 | 2,558,127 |
INVESTMENTS | PRINCIPAL AMOUNT($) | VALUE($) |
Series 2017-M13, Class A2, 3.03%, 9/25/2027 (f) | 358,418 | 333,670 |
Series 2018-M2, Class A2, 3.00%, 1/25/2028 (f) | 3,213,322 | 2,972,256 |
Series 2018-M4, Class A2, 3.17%, 3/25/2028 (f) | 1,841,880 | 1,718,112 |
Series 2018-M9, Class APT2, 3.21%, 4/25/2028 (f) | 2,963,789 | 2,766,279 |
Series 2018-M14, Class A2, 3.70%, 8/25/2028 (f) | 381,830 | 362,693 |
Series 2017-M5, Class A2, 3.17%, 4/25/2029 (f) | 2,466,215 | 2,284,317 |
Series 2018-M3, Class A2, 3.17%, 2/25/2030 (f) | 1,207,896 | 1,101,519 |
Series 2020-M50, Class A2, 1.20%, 10/25/2030 | 411,101 | 363,271 |
Series 2020-M50, Class X1, IO, 1.93%, 10/25/2030 (f) | 5,690,262 | 349,600 |
Series 2021-M11, Class A2, 1.51%, 3/25/2031 (f) | 1,517,000 | 1,187,663 |
Series 2022-M1G, Class A2, 1.58%, 9/25/2031 (f) | 5,000,000 | 3,952,424 |
Series 2021-M3, Class 1A1, 1.00%, 11/25/2033 | 27,596 | 25,954 |
Series 2021-M3, Class X1, IO, 2.05%, 11/25/2033 (f) | 341,213 | 28,804 |
FREMF Mortgage Trust Series 2015-K44, Class B, 3.85%, 1/25/2048 (a) (f) | 1,500,000 | 1,447,577 |
Morgan Stanley Capital I Trust Series 2021-PLZA, Class A, 2.57%, 11/9/2043 ‡ (a) | 1,958,000 | 1,494,791 |
MRCD MARK Mortgage Trust Series 2019-PARK, Class A, 2.72%, 12/15/2036 (a) | 300,000 | 270,786 |
SLG Office Trust Series 2021-OVA, Class A, 2.59%, 7/15/2041 (a) | 1,770,000 | 1,419,192 |
UBS-BAMLL Trust Series 2012-WRM, Class A, 3.66%, 6/10/2030 (a) | 27,444 | 25,467 |
Total Commercial Mortgage-Backed Securities (Cost $46,495,258) | 42,811,417 | |
U.S. Government Agency Securities — 2.2% | ||
FNMA 0.50%, 6/17/2025 (Cost $11,576,755) | 11,566,000 | 10,686,878 |
Foreign Government Securities — 0.3% | ||
Republic of Colombia 7.38%, 9/18/2037 | 300,000 | 290,337 |
Republic of Panama 3.16%, 1/23/2030 | 200,000 | 174,064 |
August 31, 2023 | J.P. Morgan Exchange-Traded Funds | 41 |
AS OF August 31, 2023 (Unaudited) (continued)
INVESTMENTS | PRINCIPAL AMOUNT($) | VALUE($) |
Foreign Government Securities — continued | ||
United Mexican States | ||
4.13%, 1/21/2026 | 332,000 | 326,582 |
2.66%, 5/24/2031 | 1,000,000 | 827,960 |
Total Foreign Government Securities (Cost $1,859,616) | 1,618,943 | |
SHARES | ||
Short-Term Investments — 1.2% | ||
Investment Companies — 1.2% | ||
JPMorgan Prime Money Market Fund Class IM Shares, 5.46% (g) (h) (Cost $6,084,997) | 6,083,821 | 6,085,646 |
Total Investments — 99.6% (Cost $522,425,711) | 484,609,872 | |
Other Assets Less Liabilities — 0.4% | 1,926,038 | |
NET ASSETS — 100.0% | 486,535,910 | |
Percentages indicated are based on net assets. |
Abbreviations | |
ACES | Alternative Credit Enhancement Securities |
CME | Chicago Mercantile Exchange |
CSMC | Credit Suisse Mortgage Trust |
FHLMC | Federal Home Loan Mortgage Corp. |
FNMA | Federal National Mortgage Association |
GNMA | Government National Mortgage Association |
ICE | Intercontinental Exchange |
IF | Inverse Floaters represent securities that pay interest at a rate that increases (decreases) with a decline (incline) in a specified index or have an interest rate that adjusts periodically based on changes in current interest rates and prepayments on the underlying pool of assets. The interest rate shown is the rate in effect as of August 31, 2023. The rate may be subject to a cap and floor. |
IO | Interest Only represents the right to receive the monthly interest payments on an underlying pool of mortgage loans. The principal amount shown represents the par value on the underlying pool. The yields on these securities are subject to accelerated principal paydowns as a result of prepayment or refinancing of the underlying pool of mortgage instruments. As a result, interest income may be reduced considerably. |
LIBOR | London Interbank Offered Rate |
PO | Principal Only represents the right to receive the principal portion only on an underlying pool of mortgage loans. The market value of these securities is extremely volatile in response to changes in market interest rates. As prepayments on the underlying mortgages of these securities increase, the yield on these securities increases. |
REIT | Real Estate Investment Trust |
REMIC | Real Estate Mortgage Investment Conduit |
SOFR | Secured Overnight Financing Rate |
SOFRINDX | Compounding index of the Secured Overnight Financing Rate |
STRIPS | Separate Trading of Registered Interest and Principal of Securities. The STRIPS Program lets investors hold and trade individual interest and principal components of eligible notes and bonds as separate securities. |
UMBS | Uniform Mortgage-Backed Securities |
USD | United States Dollar |
^ | Amount rounds to less than 0.1% of net assets. | |
‡ | Value determined using significant unobservable inputs. | |
(a) | Securities exempt from registration under Rule 144A or section 4(a)(2), of the Securities Act of 1933, as amended. | |
(b) | Variable or floating rate security, linked to the referenced benchmark. The interest rate shown is the current rate as of August 31, 2023. | |
(c) | Contingent Capital security (“CoCo”). CoCos are hybrid debt securities that may be convertible into equity or may be written down if a pre-specified trigger event occurs. The total value of aggregate CoCo holdings at August 31, 2023 is $2,728,434 or 0.56% of the Fund’s net assets as of August 31, 2023. | |
(d) | Step bond. Interest rate is a fixed rate for an initial period that either resets at a specific date or may reset in the future contingent upon a predetermined trigger. The interest rate shown is the current rate as of August 31, 2023. | |
(e) | All or a portion of this security is deposited with the broker as initial margin for futures contracts or centrally cleared swaps. | |
(f) | Variable or floating rate security, the interest rate of which adjusts periodically based on changes in current interest rates and prepayments on the underlying pool of assets. The interest rate shown is the current rate as of August 31, 2023. | |
(g) | Investment in an affiliated fund, which is registered under the Investment Company Act of 1940, as amended, and is advised by J.P. Morgan Investment Management Inc. | |
(h) | The rate shown is the current yield as of August 31, 2023. | |
42 | J.P. Morgan Exchange-Traded Funds | August 31, 2023 |
DESCRIPTION | NUMBER OF CONTRACTS | EXPIRATION DATE | TRADING CURRENCY | NOTIONAL AMOUNT ($) | VALUE AND UNREALIZED APPRECIATION (DEPRECIATION) ($) |
Long Contracts | |||||
U.S. Treasury 10 Year Note | 438 | 12/19/2023 | USD | 48,624,844 | 325,288 |
U.S. Treasury 10 Year Ultra Note | 424 | 12/19/2023 | USD | 49,217,125 | 406,547 |
U.S. Treasury 2 Year Note | 37 | 12/29/2023 | USD | 7,542,508 | 23,929 |
U.S. Treasury 5 Year Note | 435 | 12/29/2023 | USD | 46,524,609 | 252,896 |
1,008,660 | |||||
Short Contracts | |||||
U.S. Treasury Long Bond | (86 ) | 12/19/2023 | USD | (10,454,375 ) | (111,685 ) |
U.S. Treasury Ultra Bond | (3 ) | 12/19/2023 | USD | (388,313 ) | (4,702 ) |
(116,387 ) | |||||
892,273 |
Abbreviations | |
USD | United States Dollar |
FLOATING RATE INDEX(a) | FIXED RATE | PAY/ RECEIVE FLOATING RATE | MATURITY DATE | NOTIONAL AMOUNT | UPFRONT PAYMENTS (RECEIPTS) $ | UNREALIZED APPRECIATION (DEPRECIATION) ($) | VALUE ($) |
CPI-U at termination | 2.47% at termination | Receive | 8/4/2025 | USD10,649,000 | (2,584 ) | 2,394 | (190 ) |
CPI-U at termination | 2.48% at termination | Receive | 7/21/2030 | USD7,912,000 | 5,481 | 26,312 | 31,793 |
CPI-U at termination | 2.48% at termination | Receive | 5/3/2033 | USD7,809,000 | — | 50,095 | 50,095 |
CPI-U at termination | 2.48% at termination | Receive | 6/6/2033 | USD3,581,000 | — | 25,859 | 25,859 |
CPI-U at termination | 2.49% at termination | Receive | 9/5/2028 | USD32,781,000 | 31,846 | 17 | 31,863 |
CPI-U at termination | 2.52% at termination | Receive | 6/20/2033 | USD5,049,000 | 2,787 | 14,351 | 17,138 |
CPI-U at termination | 2.53% at termination | Receive | 6/7/2033 | USD1,907,000 | — | 5,278 | 5,278 |
37,530 | 124,306 | 161,836 | |||||
CPI-U at termination | 2.48% at termination | Receive | 8/4/2026 | USD90,903,000 | 8,216 | (53,445 ) | (45,229 ) |
CPI-U at termination | 2.55% at termination | Receive | 5/26/2033 | USD56,513,000 | 103,125 | (43,128 ) | 59,997 |
CPI-U at termination | 2.58% at termination | Receive | 8/4/2028 | USD56,384,000 | 9,208 | (169,265 ) | (160,057 ) |
CPI-U at termination | 2.59% at termination | Receive | 8/15/2028 | USD8,076,000 | — | (31,943 ) | (31,943 ) |
CPI-U at termination | 2.59% at termination | Receive | 7/11/2033 | USD25,736,000 | 24,152 | (116,690 ) | (92,538 ) |
CPI-U at termination | 2.62% at termination | Receive | 8/4/2033 | USD37,399,000 | 15,729 | (228,737 ) | (213,008 ) |
CPI-U at termination | 2.63% at termination | Receive | 8/2/2033 | USD5,569,000 | 12,602 | (48,707 ) | (36,105 ) |
CPI-U at termination | 2.63% at termination | Receive | 8/4/2033 | USD1,000,000 | — | (6,347 ) | (6,347 ) |
CPI-U at termination | 2.64% at termination | Receive | 7/31/2033 | USD1,096,000 | — | (7,460 ) | (7,460 ) |
CPI-U at termination | 2.64% at termination | Receive | 8/2/2033 | USD12,317,000 | — | (88,961 ) | (88,961 ) |
173,032 | (794,683 ) | (621,651 ) | |||||
210,562 | (670,377 ) | (459,815 ) |
August 31, 2023 | J.P. Morgan Exchange-Traded Funds | 43 |
AS OF August 31, 2023 (Unaudited) (continued)
Abbreviations | |
CPI-U | Consumer Price Index for All Urban Consumers |
USD | United States Dollar |
(a) Value of floating rate index at August 31, 2023 was as follows: |
FLOATING RATE INDEX | VALUE |
CPI-U | 3.07% |
REFERENCE OBLIGATION/INDEX | FINANCING RATE PAID BY THE FUND (%) | PAYMENT FREQUENCY | MATURITY DATE | IMPLIED CREDIT SPREAD (%)(a) | NOTIONAL AMOUNT(b) | UPFRONT PAYMENTS (RECEIPTS) ($)(c) | UNREALIZED APPRECIATION (DEPRECIATION) ($) | VALUE ($) |
CDX.NA.IG.40-V1 | 1.00 | Quarterly | 6/20/2028 | 0.64 | USD23,560,000 | (126,432 ) | (286,317 ) | (412,749 ) |
CDX.NA.IG.40-V1 | 1.00 | Quarterly | 6/20/2028 | 0.64 | USD39,607,000 | (369,144 ) | (324,732 ) | (693,876 ) |
(495,576 ) | (611,049 ) | (1,106,625 ) |
(*) | The Fund, as a buyer of credit protection, is generally obligated to make periodic payments and may also pay or receive an upfront premium to or from the protection seller, in exchange for the right to receive a contingent payment, upon occurrence of a credit event with respect to an underlying reference obligation, as defined under the terms of individual swap contracts. | ||||||||
(a) | Implied credit spreads are an indication of the seller's performance risk, related to the likelihood of a credit event occurring that would require a seller to make payment to a buyer. Implied credit spreads are used to determine the value of swap contracts and reflect the cost of buying/selling protection, which may include upfront payments made to enter into the contract. Therefore, higher spreads would indicate a greater likelihood that a seller will be obligated to perform (i.e. make payment) under the swap contract. Increasing values, in absolute terms and relative to notional amounts, are also indicative of greater performance risk. Implied credit spreads for credit default swaps on credit indices are linked to the weighted average spread across the underlying reference obligations included in a particular index. | ||||||||
(b) | The notional amount is the maximum amount that a seller of credit protection would be obligated to pay and a buyer of credit protection would receive, upon occurrence of a credit event. | ||||||||
(c) | Upfront payments and receipts generally represent premiums paid or received at the initiation of the agreement to compensate the differences between the stated terms of the swap agreement and current market conditions (credit spreads, interest rates and other relevant factors). | ||||||||
Abbreviations | |
CDX | Credit Default Swap Index |
USD | United States Dollar |
44 | J.P. Morgan Exchange-Traded Funds | August 31, 2023 |
AS OF August 31, 2023 (Unaudited)
INVESTMENTS | PRINCIPAL AMOUNT($) | VALUE($) |
Asset-Backed Securities — 39.7% | ||
ACHV ABS TRUST Series 2023-1PL, Class A, 6.42%, 3/18/2030 (a) | 171,434 | 171,469 |
ACRE Commercial Mortgage Ltd. Series 2021-FL4, Class A, 6.26%, 12/18/2037 (a) (b) | 999,916 | 985,700 |
American Credit Acceptance Receivables Trust Series 2023-1, Class A, 5.45%, 9/14/2026 (a) | 1,903,788 | 1,895,964 |
Ameriquest Mortgage Securities, Inc. Asset-Backed Pass-Through Certificates Series 2003-7, Class M1, 4.96%, 8/25/2033 (b) | 10,977 | 11,067 |
Amortizing Residential Collateral Trust Series 2002-BC9, Class M1, 7.08%, 12/25/2032 (b) | 1,224,845 | 1,128,948 |
AMSR Trust | ||
Series 2020-SFR3, Class A, 1.36%, 9/17/2037 (a) | 7,104,240 | 6,496,179 |
Series 2021-SFR2, Class A, 1.53%, 8/17/2038 (a) | 4,000,000 | 3,537,346 |
Apidos CLO (Cayman Islands) Series 2019-31A, Class A1R, 6.67%, 4/15/2031 (a) (b) | 4,350,000 | 4,328,250 |
Arivo Acceptance Auto Loan Receivables Trust Series 2021-1A, Class A, 1.19%, 1/15/2027 (a) | 158,509 | 155,178 |
Ballyrock CLO Ltd. (Cayman Islands) | ||
Series 2020-2A, Class A1R, 6.60%, 10/20/2031 (a) (b) | 3,244,000 | 3,224,698 |
Series 2019-1A, Class A1R, 6.60%, 7/15/2032 (a) (b) | 6,415,000 | 6,346,449 |
Bear Stearns Asset-Backed Securities I Trust Series 2005-HE1, Class M2, 5.32%, 1/25/2035 (b) | 375,528 | 374,853 |
Bear Stearns Asset-Backed Securities Trust Series 2003-SD1, Class A, 6.33%, 12/25/2033 (b) | 398,284 | 377,051 |
BRE Grand Islander Timeshare Issuer LLC Series 2019-A, Class A, 3.28%, 9/26/2033 (a) | 1,276,367 | 1,201,299 |
BSPRT Issuer Ltd. (Cayman Islands) Series 2022-FL8, Class A, 6.69%, 2/15/2037 (a) (b) | 5,000,000 | 4,919,250 |
Business Jet Securities LLC | ||
Series 2020-1A, Class A, 2.98%, 11/15/2035 ‡ (a) | 832,230 | 785,325 |
Series 2021-1A, Class A, 2.16%, 4/15/2036 ‡ (a) | 1,542,065 | 1,395,584 |
Series 2022-1A, Class A, 4.46%, 6/15/2037 ‡ (a) | 8,155,468 | 7,649,829 |
INVESTMENTS | PRINCIPAL AMOUNT($) | VALUE($) |
BXG Receivables Note Trust Series 2018-A, Class A, 3.77%, 2/2/2034 (a) | 899,214 | 865,449 |
BXMT Ltd. (Cayman Islands) Series 2020-FL3, Class A, 6.83%, 11/15/2037 (a) (b) | 7,417,714 | 7,203,157 |
CarMax Auto Owner Trust | ||
Series 2020-3, Class A3, 0.62%, 3/17/2025 | 245,946 | 244,748 |
Series 2020-4, Class A3, 0.50%, 8/15/2025 | 879,724 | 862,998 |
Series 2022-2, Class A3, 3.49%, 2/16/2027 | 4,720,000 | 4,602,238 |
Carvana Auto Receivables Trust | ||
Series 2020-P1, Class A3, 0.44%, 6/9/2025 | 43,562 | 43,527 |
Series 2020-P1, Class A4, 0.61%, 10/8/2026 | 2,220,000 | 2,132,869 |
Centex Home Equity Loan Trust Series 2002-A, Class MV1, 6.28%, 1/25/2032 (b) | 68,034 | 67,722 |
CF Hippolyta Issuer LLC Series 2020-1, Class A1, 1.69%, 7/15/2060 (a) | 2,307,094 | 2,086,026 |
CoreVest American Finance Trust | ||
Series 2019-1, Class A, 3.32%, 3/15/2052 (a) | 237,661 | 236,090 |
Series 2020-2, Class A, 3.38%, 5/15/2052 (a) | 685,716 | 656,252 |
Series 2020-4, Class A, 1.17%, 12/15/2052 (a) | 4,072,200 | 3,698,606 |
Countrywide Asset-Backed Certificates | ||
Series 2003-BC2, Class 2A1, 6.03%, 6/25/2033 (b) | 258,043 | 234,556 |
Series 2004-S1, Class M2, 5.58%, 2/25/2035 (c) | 14,789 | 14,553 |
CPS Auto Receivables Trust | ||
Series 2023-A, Class A, 5.54%, 3/16/2026 (a) | 2,034,736 | 2,029,093 |
Series 2022-C, Class A, 4.18%, 4/15/2030 (a) | 3,441,885 | 3,419,391 |
Credit Acceptance Auto Loan Trust | ||
Series 2020-3A, Class A, 1.24%, 10/15/2029 (a) | 1,445,122 | 1,440,242 |
Series 2021-2A, Class A, 0.96%, 2/15/2030 (a) | 2,425,020 | 2,389,337 |
Series 2023-3A, Class A, 6.39%, 8/15/2033 (a) | 2,375,000 | 2,379,405 |
Diamond Resorts Owner Trust | ||
Series 2019-1A, Class A, 2.89%, 2/20/2032 (a) | 1,265,443 | 1,200,113 |
Series 2021-1A, Class A, 1.51%, 11/21/2033 (a) | 525,065 | 479,963 |
45 |
AS OF August 31, 2023 (Unaudited) (continued)
INVESTMENTS | PRINCIPAL AMOUNT($) | VALUE($) |
Asset-Backed Securities — continued | ||
DLLST LLC Series 2022-1A, Class A3, 3.40%, 1/21/2025 (a) | 4,510,000 | 4,465,070 |
DT Auto Owner Trust | ||
Series 2022-2A, Class A, 2.88%, 6/15/2026 (a) | 1,179,153 | 1,168,354 |
Series 2021-1A, Class C, 0.84%, 10/15/2026 (a) | 961,618 | 942,378 |
Series 2023-1A, Class A, 5.48%, 4/15/2027 (a) | 3,375,412 | 3,364,069 |
Elmwood CLO Ltd. (Cayman Islands) Series 2020-2A, Class AR, 6.74%, 10/20/2034 (a) (b) | 7,500,000 | 7,433,947 |
Enterprise Fleet Financing LLC Series 2022-1, Class A2, 3.03%, 1/20/2028 (a) | 2,672,109 | 2,610,112 |
Exeter Automobile Receivables Trust | ||
Series 2022-3A, Class A3, 4.21%, 1/15/2026 | 3,379,228 | 3,368,925 |
Series 2023-4A, Class C, 6.51%, 8/15/2028 | 2,500,000 | 2,509,804 |
First Franklin Mortgage Loan Trust | ||
Series 2002-FF1, Class M1, 6.48%, 4/25/2032 (b) | 60,264 | 59,692 |
Series 2002-FF4, Class M1, 7.00%, 2/25/2033 (b) | 578,174 | 475,629 |
Series 2003-FFH1, Class M2, 8.05%, 9/25/2033 (b) | 226,723 | 198,647 |
Series 2004-FF8, Class M4, 7.04%, 10/25/2034 (b) | 205,363 | 189,027 |
FirstKey Homes Trust Series 2021-SFR1, Class A, 1.54%, 8/17/2038 (a) | 6,924,023 | 6,103,327 |
Fremont Home Loan Trust Series 2005-C, Class M2, 6.16%, 7/25/2035 (b) | 21,820 | 21,748 |
FS Rialto (Cayman Islands) Series 2021-FL3, Class A, 6.68%, 11/16/2036 (a) (b) | 5,290,000 | 5,195,674 |
Galaxy CLO Ltd. (Cayman Islands) Series 2013-15A, Class ARR, 6.54%, 10/15/2030 (a) (b) | 1,863,686 | 1,857,282 |
Goodgreen (Cayman Islands) | ||
Series 2018-1A, Class A, 3.93%, 10/15/2053 ‡ (a) (b) | 2,095,660 | 1,870,607 |
Series 2019-1A, Class A, 3.86%, 10/15/2054 ‡ (a) | 1,525,526 | 1,338,042 |
Goodgreen Trust Series 2017-2A, Class A, 3.26%, 10/15/2053 ‡ (a) | 1,308,759 | 1,155,169 |
GreenPoint Mortgage Funding Trust Series 2005-HE3, Class A, 5.60%, 9/15/2030 (b) | 8,501 | 8,198 |
HERO Funding (Cayman Islands) Series 2017-3A, Class A2, 3.95%, 9/20/2048 ‡ (a) | 858,442 | 751,729 |
INVESTMENTS | PRINCIPAL AMOUNT($) | VALUE($) |
Hilton Grand Vacations Trust | ||
Series 2018-AA, Class A, 3.54%, 2/25/2032 (a) | 387,751 | 375,327 |
Series 2022-2A, Class A, 4.30%, 1/25/2037 (a) | 2,090,714 | 1,998,010 |
Series 2020-AA, Class A, 2.74%, 2/25/2039 (a) | 843,935 | 792,208 |
Hyundai Auto Lease Securitization Trust Series 2021-B, Class B, 0.62%, 3/16/2026 (a) | 4,635,000 | 4,560,694 |
LCM Ltd. (Cayman Islands) Series 29A, Class AR, 6.64%, 4/15/2031 (a) (b) | 5,000,000 | 4,955,260 |
Lendingpoint Asset Securitization Trust | ||
Series 2022-B, Class A, 4.77%, 10/15/2029 (a) | 2,182,530 | 2,154,122 |
Series 2022-C, Class A, 6.56%, 2/15/2030 (a) | 2,333,079 | 2,331,797 |
LendingPoint Asset Securitization Trust Series 2020-REV1, Class A, 2.73%, 10/15/2028 (a) | 255,717 | 255,201 |
Lendmark Funding Trust Series 2022-1A, Class A, 5.12%, 7/20/2032 (a) | 3,000,000 | 2,924,681 |
LP LMS Asset Securitization Trust | ||
Series 2021-2A, Class A, 1.75%, 1/15/2029 (a) | 752,907 | 741,685 |
Series 2023-1A, Class A, 8.18%, 10/17/2033 ‡ (a) | 2,894,729 | 2,877,143 |
Mariner Finance Issuance Trust | ||
Series 2020-AA, Class A, 2.19%, 8/21/2034 (a) | 2,571,727 | 2,493,869 |
Series 2021-AA, Class A, 1.86%, 3/20/2036 (a) | 3,000,000 | 2,664,483 |
Marlin Receivables LLC Series 2022-1A, Class A2, 4.53%, 9/20/2025 (a) | 3,064,534 | 3,040,491 |
MF1 Ltd. (Cayman Islands) | ||
Series 2021-FL7, Class A, 6.51%, 10/16/2036 (a) (b) | 3,500,000 | 3,455,869 |
Series 2022-FL8, Class A, 6.66%, 2/19/2037 (a) (b) | 5,000,000 | 4,923,670 |
Neuberger Berman Loan Advisers CLO Ltd. (Cayman Islands) Series 2020-37A, Class AR, 6.56%, 7/20/2031 (a) (b) | 4,425,000 | 4,394,224 |
New Century Home Equity Loan Trust Series 2003-5, Class AII, 3.98%, 11/25/2033 (b) | 173,053 | 149,532 |
OCP CLO Ltd. (Cayman Islands) Series 2015-9A, Class A1R2, 6.56%, 1/15/2033 (a) (b) | 5,000,000 | 4,947,145 |
OneMain Financial Issuance Trust | ||
Series 2020-1A, Class A, 3.84%, 5/14/2032 (a) | 431,693 | 430,570 |
46 |
INVESTMENTS | PRINCIPAL AMOUNT($) | VALUE($) |
Asset-Backed Securities — continued | ||
Series 2021-1A, Class A1, 1.55%, 6/16/2036 (a) | 5,000,000 | 4,367,813 |
Oportun Issuance Trust Series 2022-A, Class A, 5.05%, 6/9/2031 (a) | 5,000,000 | 4,866,590 |
Pagaya AI Debt Selection Trust Series 2021-3, Class A, 1.15%, 5/15/2029 (a) | 331,582 | 329,878 |
Palmer Square Loan Funding Ltd. (Cayman Islands) | ||
Series 2021-3A, Class A1, 6.39%, 7/20/2029 (a) (b) | 2,126,705 | 2,115,652 |
Series 2021-4A, Class A1, 6.37%, 10/15/2029 (a) (b) | 3,599,015 | 3,580,466 |
Series 2022-2A, Class A1, 6.58%, 10/15/2030 (a) (b) | 4,318,414 | 4,287,080 |
PRET LLC Series 2021-NPL6, Class A1, 2.49%, 7/25/2051 (a) (c) | 2,067,445 | 1,975,333 |
Progress Residential | ||
Series 2021-SFR1, Class A, 1.05%, 4/17/2038 (a) | 3,013,624 | 2,665,645 |
Series 2021-SFR4, Class A, 1.56%, 5/17/2038 (a) | 4,988,847 | 4,448,430 |
Progress Residential Trust | ||
Series 2020-SFR3, Class A, 1.29%, 10/17/2027 (a) | 8,935,185 | 8,133,351 |
Series 2019-SFR4, Class A, 2.69%, 10/17/2036 (a) | 8,461,765 | 8,147,392 |
Series 2020-SFR2, Class A, 2.08%, 6/17/2037 (a) | 5,048,763 | 4,723,728 |
Series 2021-SFR8, Class A, 1.51%, 10/17/2038 (a) | 4,466,301 | 3,915,845 |
Series 2023-SFR1, Class A, 4.30%, 3/17/2040 (a) | 3,400,000 | 3,208,838 |
PRPM LLC Series 2021-10, Class A1, 2.49%, 10/25/2026 (a) (c) | 1,244,576 | 1,166,898 |
RASC Trust Series 2003-KS4, Class MI2, 5.01%, 6/25/2033 (c) | 522,587 | 397,720 |
Santander Consumer Auto Receivables Trust Series 2021-AA, Class B, 0.71%, 8/17/2026 (a) | 2,750,000 | 2,584,978 |
Santander Drive Auto Receivables Trust | ||
Series 2022-5, Class A2, 3.98%, 1/15/2025 | 53,083 | 53,050 |
Series 2022-6, Class A2, 4.37%, 5/15/2025 | 785,053 | 784,281 |
Series 2022-4, Class A3, 4.14%, 2/16/2027 | 7,340,000 | 7,268,936 |
SCF Equipment Leasing LLC Series 2022-2A, Class A3, 6.50%, 10/21/2030 (a) | 5,900,000 | 5,948,307 |
INVESTMENTS | PRINCIPAL AMOUNT($) | VALUE($) |
Sierra Timeshare Receivables Funding LLC | ||
Series 2019-2A, Class A, 2.59%, 5/20/2036 (a) | 400,524 | 387,632 |
Series 2020-2A, Class A, 1.33%, 7/20/2037 (a) | 566,253 | 526,186 |
SoFi Professional Loan Program Trust | ||
Series 2021-B, Class AFX, 1.14%, 2/15/2047 (a) | 3,089,680 | 2,576,765 |
Series 2018-B, Class A2FX, 3.34%, 8/25/2047 (a) | 830,971 | 804,396 |
Structured Asset Investment Loan Trust Series 2003-BC2, Class A3, 6.13%, 4/25/2033 (b) | 12,784 | 12,682 |
Symphony CLO Ltd. (Cayman Islands) Series 2016-18A, Class A1RR, 6.71%, 7/23/2033 (a) (b) | 5,000,000 | 4,969,355 |
Tesla Auto Lease Trust | ||
Series 2021-A, Class A3, 0.56%, 3/20/2025 (a) | 402,396 | 401,336 |
Series 2021-B, Class A4, 0.63%, 9/22/2025 (a) | 2,680,000 | 2,579,813 |
Toyota Auto Receivables Owner Trust Series 2020-C, Class A4, 0.57%, 10/15/2025 | 5,300,000 | 5,169,610 |
Tricon American Homes Series 2020-SFR1, Class A, 1.50%, 7/17/2038 (a) | 5,977,900 | 5,331,513 |
Tricon American Homes Trust Series 2019-SFR1, Class A, 2.75%, 3/17/2038 (a) | 3,261,059 | 3,040,755 |
Upstart Securitization Trust | ||
Series 2021-4, Class A, 0.84%, 9/20/2031 (a) | 651,827 | 643,763 |
Series 2022-4, Class A, 5.98%, 8/20/2032 (a) | 2,654,882 | 2,636,208 |
Series 2023-1, Class A, 6.59%, 2/20/2033 (a) | 3,450,213 | 3,443,514 |
US Auto Funding Trust Series 2022-1A, Class A, 3.98%, 4/15/2025 (a) | 2,197,623 | 2,139,380 |
VCAT LLC Series 2021-NPL1, Class A1, 2.29%, 12/26/2050 (a) (c) | 660,235 | 638,893 |
Verdant Receivables LLC Series 2023-1A, Class A2, 6.24%, 1/13/2031 (a) | 2,810,000 | 2,805,277 |
VOLT C LLC Series 2021-NPL9, Class A1, 1.99%, 5/25/2051 (a) (c) | 1,504,213 | 1,381,677 |
VOLT XCII LLC Series 2021-NPL1, Class A1, 1.89%, 2/27/2051 (a) (c) | 1,222,308 | 1,150,443 |
VOLT XCIII LLC Series 2021-NPL2, Class A1, 1.89%, 2/27/2051 (a) (c) | 4,242,910 | 3,944,607 |
VOLT XCIV LLC Series 2021-NPL3, Class A1, 2.24%, 2/27/2051 (a) (c) | 3,520,179 | 3,322,862 |
47 |
AS OF August 31, 2023 (Unaudited) (continued)
INVESTMENTS | PRINCIPAL AMOUNT($) | VALUE($) |
Asset-Backed Securities — continued | ||
VOLT XCIX LLC Series 2021-NPL8, Class A1, 2.12%, 4/25/2051 (a) (c) | 1,164,064 | 1,084,825 |
VOLT XCV LLC Series 2021-NPL4, Class A1, 2.24%, 3/27/2051 (a) (c) | 1,820,423 | 1,746,406 |
VOLT XCVI LLC Series 2021-NPL5, Class A1, 2.12%, 3/27/2051 (a) (c) | 2,409,438 | 2,279,841 |
VOLT XCVII LLC Series 2021-NPL6, Class A1, 2.24%, 4/25/2051 (a) (c) | 3,348,137 | 3,125,897 |
Westgate Resorts LLC Series 2020-1A, Class A, 2.71%, 3/20/2034 (a) | 713,924 | 699,600 |
Westlake Automobile Receivables Trust | ||
Series 2022-3A, Class A2, 5.24%, 7/15/2025 (a) | 6,946,457 | 6,932,758 |
Series 2022-2A, Class A3, 3.75%, 4/15/2026 (a) | 5,350,000 | 5,269,152 |
Series 2023-3A, Class A3, 5.82%, 5/17/2027 (a) | 4,000,000 | 3,994,830 |
World Omni Select Auto Trust Series 2020-A, Class B, 0.84%, 6/15/2026 | 3,363,456 | 3,320,682 |
Total Asset-Backed Securities (Cost $341,703,790) | 328,155,054 | |
Collateralized Mortgage Obligations — 28.2% | ||
Alternative Loan Trust | ||
Series 2004-J4, Class 1A6, 5.33%, 6/25/2034 (c) | 296 | 286 |
Series 2004-33, Class 3A3, 3.72%, 12/25/2034 (b) | 105,343 | 97,729 |
Banc of America Funding Trust Series 2006-1, Class 2A1, 5.50%, 1/25/2036 | 91,822 | 77,639 |
Banc of America Mortgage Trust Series 2004-D, Class 2A2, 4.66%, 5/25/2034 (b) | 92,721 | 86,723 |
Bear Stearns Asset-Backed Securities I Trust Series 2004-AC6, Class M1, 6.43%, 11/25/2034 (b) | 117,969 | 24,851 |
Connecticut Avenue Securities Trust | ||
Series 2021-R01, Class 1M1, 6.04%, 10/25/2041 (a) (b) | 628,005 | 626,045 |
Series 2021-R03, Class 1M1, 6.14%, 12/25/2041 (a) (b) | 4,083,894 | 4,063,009 |
Series 2022-R01, Class 1M1, 6.29%, 12/25/2041 (a) (b) | 2,298,633 | 2,283,554 |
Series 2022-R06, Class 1M1, 8.04%, 5/25/2042 (a) (b) | 3,012,714 | 3,081,497 |
Series 2022-R07, Class 1M1, 8.25%, 6/25/2042 (a) (b) | 4,460,122 | 4,565,814 |
Series 2022-R08, Class 1M1, 7.84%, 7/25/2042 (a) (b) | 1,682,514 | 1,714,438 |
INVESTMENTS | PRINCIPAL AMOUNT($) | VALUE($) |
Credit Suisse First Boston Mortgage Securities Corp. (Switzerland) | ||
Series 2005-5, Class 1A1, 5.00%, 3/25/2029 | 2,833 | 2,710 |
Series 2004-5, Class 4A1, 6.00%, 9/25/2034 | 241,529 | 230,524 |
CSFB Mortgage-Backed Pass-Through Certificates Series 2003-AR24, Class 2A4, 5.45%, 10/25/2033 (b) | 153,352 | 146,805 |
Deutsche Alt-A Securities, Inc. Mortgage Loan Trust Series 2005-1, Class 2A1, 3.73%, 2/25/2020 (b) | 24,777 | 24,235 |
FHLMC STACR REMIC Trust Series 2021-DNA3, Class M1, 6.04%, 10/25/2033 (a) (b) | 1,829,683 | 1,821,102 |
FHLMC, REMIC | ||
Series 1974, Class ZA, 7.00%, 7/15/2027 | 13,231 | 13,229 |
Series 3737, Class DG, 5.00%, 10/15/2030 | 102,305 | 100,939 |
Series 4120, Class KI, IO, 3.00%, 10/15/2032 | 788,609 | 47,759 |
Series 5000, Class CB, 1.25%, 1/25/2035 | 4,580,187 | 3,931,764 |
Series 3300, Class FA, 5.60%, 8/15/2035 (b) | 107,936 | 106,502 |
Series 3085, Class VS, IF, 7.51%, 12/15/2035 (b) | 103,354 | 106,967 |
Series 4867, Class WF, 4.57%, 4/15/2037 (b) | 7,650,745 | 7,392,692 |
Series 4350, Class AF, 4.45%, 12/15/2037 (b) | 1,992,598 | 1,918,824 |
Series 4350, Class FK, 4.35%, 6/15/2038 (b) | 2,384,401 | 2,294,393 |
Series 4515, Class FA, 4.31%, 8/15/2038 (b) | 1,240,049 | 1,212,613 |
Series 4350, Class KF, 4.55%, 1/15/2039 (b) | 402,248 | 386,493 |
Series 4448, Class TF, 4.67%, 5/15/2040 (b) | 2,395,949 | 2,308,136 |
Series 4480, Class FM, 4.38%, 6/15/2040 (b) | 2,922,634 | 2,804,494 |
Series 4457, Class KF, 4.52%, 10/15/2040 (b) | 3,784,299 | 3,638,050 |
Series 4363, Class FA, 4.84%, 9/15/2041 (b) | 1,844,259 | 1,767,334 |
Series 4413, Class WF, 4.52%, 10/15/2041 (b) | 1,682,366 | 1,619,236 |
Series 4559, Class AF, 4.50%, 3/15/2042 (b) | 1,227,373 | 1,199,001 |
Series 4074, Class FE, 5.70%, 7/15/2042 (b) | 1,327,341 | 1,296,838 |
48 |
INVESTMENTS | PRINCIPAL AMOUNT($) | VALUE($) |
Collateralized Mortgage Obligations — continued | ||
Series 4150, Class F, 5.67%, 1/15/2043 (b) | 3,577,689 | 3,438,990 |
Series 4161, Class YF, 5.67%, 2/15/2043 (b) | 2,674,250 | 2,572,299 |
Series 4281, Class FB, 5.85%, 12/15/2043 (b) | 1,892,346 | 1,835,567 |
Series 4606, Class FL, 5.80%, 12/15/2044 (b) | 3,792,836 | 3,665,646 |
Series 4594, Class GN, 2.50%, 2/15/2045 | 1,829,327 | 1,639,146 |
Series 5072, Class QC, 1.00%, 10/25/2050 | 5,410,284 | 4,101,452 |
FHLMC, STRIPS | ||
Series 343, Class F4, 5.56%, 10/15/2037 (b) | 2,020,611 | 1,980,564 |
Series 328, Class S4, IF, IO, 1.82%, 2/15/2038 (b) | 3,673,644 | 174,320 |
FHLMC, Structured Pass-Through Certificates, Whole Loan | ||
Series T-51, Class 1A, PO, 9/25/2042 | 38,178 | 28,308 |
Series T-54, Class 4A, 4.08%, 2/25/2043 (b) | 781,702 | 698,719 |
First Horizon Mortgage Pass-Through Trust Series 2004-AR6, Class 2A1, 4.15%, 12/25/2034 (b) | 74,837 | 70,342 |
Flagstar Mortgage Trust Series 2019-2, Class A2, 3.50%, 12/25/2049 (a) (b) | 1,460,261 | 1,289,656 |
FNMA Trust, Whole Loan Series 2004-W2, Class 4A, 3.85%, 2/25/2044 (b) | 116,548 | 111,223 |
FNMA, Grantor Trust, Whole Loan | ||
Series 2002-T6, Class A4, 4.83%, 3/25/2041 (b) | 385,580 | 360,991 |
Series 2001-T8, Class A1, 7.50%, 7/25/2041 | 130,401 | 128,913 |
FNMA, REMIC | ||
Series G94-9, Class PJ, 6.50%, 8/17/2024 | 4,566 | 4,551 |
Series 2013-43, Class YH, 2.50%, 5/25/2033 | 757,775 | 708,440 |
Series 2004-17, Class BF, 5.75%, 1/25/2034 (b) | 104,148 | 103,806 |
Series 2006-3, Class SB, IF, IO, 1.30%, 7/25/2035 (b) | 106,691 | 1,220 |
Series 2006-16, Class HZ, 5.50%, 3/25/2036 | 110,264 | 108,371 |
Series 2006-124, Class FC, 5.75%, 1/25/2037 (b) | 568,785 | 552,956 |
Series 2014-23, Class FA, 4.69%, 10/25/2039 (b) | 8,504,483 | 8,198,361 |
Series 2012-38, Class PA, 2.00%, 9/25/2041 | 886,938 | 800,821 |
INVESTMENTS | PRINCIPAL AMOUNT($) | VALUE($) |
Series 2013-54, Class HF, 5.60%, 10/25/2041 (b) | 49,730 | 49,689 |
Series 2012-93, Class ME, 2.50%, 1/25/2042 | 1,066,758 | 970,363 |
Series 2012-13, Class FA, 5.98%, 2/25/2042 (b) | 5,059,094 | 4,922,772 |
Series 2012-31, Class FB, 5.95%, 4/25/2042 (b) | 4,054,565 | 3,941,587 |
Series 2013-23, Class KJ, 2.25%, 5/25/2042 | 1,689,260 | 1,509,430 |
Series 2012-119, Class FB, 5.75%, 11/25/2042 (b) | 2,637,812 | 2,531,197 |
Series 2012-139, Class JA, 3.50%, 12/25/2042 | 1,991,423 | 1,832,677 |
Series 2013-6, Class FL, 5.80%, 2/25/2043 (b) | 656,410 | 632,727 |
Series 2014-49, Class AF, 4.77%, 8/25/2044 (b) | 115,182 | 111,306 |
Series 2015-42, Class BF, 5.04%, 6/25/2045 (b) | 2,708,940 | 2,622,522 |
Series 2016-25, Class LA, 3.00%, 7/25/2045 | 7,207,790 | 6,523,366 |
Series 2016-33, Class JA, 3.00%, 7/25/2045 | 2,523,568 | 2,298,608 |
Series 2015-91, Class AF, 4.63%, 12/25/2045 (b) | 2,642,063 | 2,560,583 |
Series 2016-58, Class SA, IO, 1.33%, 8/25/2046 (b) | 6,819,421 | 242,209 |
Series 2017-108, Class PA, 3.00%, 6/25/2047 | 1,553,822 | 1,403,426 |
Series 2017-104, Class LA, 3.00%, 11/25/2047 | 1,075,620 | 964,653 |
Series 2019-38, Class PC, 3.00%, 2/25/2048 | 2,452,338 | 2,225,770 |
Series 2019-77, Class FP, 5.95%, 1/25/2050 (b) | 9,443,585 | 9,078,037 |
Series 2014-66, Class WF, 4.63%, 10/25/2054 (b) | 1,118,105 | 1,105,007 |
Series 2019-74, Class BF, 5.95%, 12/25/2059 (b) | 4,767,138 | 4,545,032 |
FNMA, REMIC Trust, Whole Loan | ||
Series 2003-W4, Class 5A, 3.96%, 10/25/2042 (b) | 365,444 | 320,192 |
Series 2003-W15, Class 3A, 4.38%, 12/25/2042 (b) | 406,799 | 371,267 |
Series 2003-W1, Class 2A, 5.21%, 12/25/2042 (b) | 114,347 | 108,900 |
Series 2009-W1, Class A, 6.00%, 12/25/2049 | 135,246 | 134,968 |
49 |
AS OF August 31, 2023 (Unaudited) (continued)
INVESTMENTS | PRINCIPAL AMOUNT($) | VALUE($) |
Collateralized Mortgage Obligations — continued | ||
GNMA | ||
Series 2011-158, Class EB, 4.00%, 12/20/2026 | 2,168,064 | 2,105,759 |
Series 2010-166, Class GP, 3.00%, 4/20/2039 | 284,661 | 278,506 |
Series 2012-61, Class FM, 5.83%, 5/16/2042 (b) | 3,532,370 | 3,472,132 |
Series 2012-H21, Class FA, 5.76%, 7/20/2062 (b) | 1,183,670 | 1,177,341 |
Series 2012-H29, Class FA, 5.77%, 10/20/2062 (b) | 914,325 | 909,890 |
Series 2013-H16, Class FA, 5.80%, 7/20/2063 (b) | 2,741,990 | 2,729,496 |
Series 2014-H07, Class FC, 5.82%, 5/20/2064 (b) | 8,947,608 | 8,900,197 |
Series 2014-H11, Class JA, 5.72%, 6/20/2064 (b) | 2,393,699 | 2,377,891 |
Series 2014-H17, Class FM, 5.64%, 8/20/2064 (b) | 6,839,834 | 6,791,850 |
Series 2015-H03, Class FD, 4.40%, 1/20/2065 (b) | 3,683,147 | 3,650,732 |
Series 2015-H04, Class FL, 5.63%, 2/20/2065 (b) | 5,967,699 | 5,928,554 |
Series 2015-H12, Class FJ, 5.65%, 5/20/2065 (b) | 3,891,914 | 3,869,194 |
Series 2015-H14, Class FB, 5.65%, 5/20/2065 (b) | 4,452,434 | 4,428,941 |
Series 2015-H12, Class FA, 5.70%, 5/20/2065 (b) | 4,436,098 | 4,409,777 |
Series 2015-H15, Class FB, 5.82%, 6/20/2065 (b) | 6,429,787 | 6,403,807 |
Series 2015-H19, Class FN, 5.66%, 7/20/2065 (b) | 6,821,650 | 6,772,108 |
Series 2015-H23, Class TA, 5.69%, 9/20/2065 (b) | 9,146,578 | 9,082,240 |
GSAA Trust Series 2004-CW1, Class 1A1, 5.50%, 4/1/2034 | 364,765 | 336,227 |
GSR Mortgage Loan Trust Series 2004-10F, Class 7A1, 5.50%, 9/25/2034 | 79,166 | 77,089 |
Impac CMB Trust | ||
Series 2004-6, Class 1A2, 6.21%, 10/25/2034 (b) | 35,060 | 34,119 |
Series 2005-5, Class A1, 6.07%, 8/25/2035 (b) | 302,543 | 277,618 |
IndyMac INDA Mortgage Loan Trust Series 2007-AR1, Class 1A1, 3.55%, 3/25/2037 (b) | 205,935 | 173,528 |
JPMorgan Mortgage Trust Series 2003-A1, Class 1A1, 3.90%, 10/25/2033 (b) | 18,845 | 17,207 |
INVESTMENTS | PRINCIPAL AMOUNT($) | VALUE($) |
MASTR Adjustable Rate Mortgages Trust | ||
Series 2004-13, Class 2A1, 4.71%, 4/21/2034 (b) | 55,537 | 52,631 |
Series 2004-13, Class 3A7B, 7.37%, 11/21/2034 (b) | 181,327 | 169,489 |
MASTR Seasoned Securitization Trust Series 2003-1, Class 3A2, 5.83%, 2/25/2033 (b) | 34,844 | 32,610 |
Mellon Residential Funding Corp. Mortgage Pass-Through Certificates | ||
Series 2002-TBC1, Class B1, 6.42%, 9/15/2030 (b) | 17,576 | 16,460 |
Series 2002-TBC1, Class B2, 6.82%, 9/15/2030 (b) | 7,392 | 5,829 |
Series 2001-TBC1, Class B1, 6.30%, 11/15/2031 (b) | 70,108 | 64,554 |
Merrill Lynch Mortgage Investors Trust | ||
Series 2004-D, Class A1, 6.09%, 9/25/2029 (b) | 86,659 | 77,316 |
Series 2004-1, Class 2A3, 4.39%, 12/25/2034 (b) | 71,986 | 66,001 |
Metlife Securitization Trust | ||
Series 2017-1A, Class A, 3.00%, 4/25/2055 (a) (b) | 606,700 | 556,022 |
Series 2018-1A, Class A, 3.75%, 3/25/2057 (a) (b) | 1,805,046 | 1,680,202 |
Morgan Stanley Dean Witter Capital I, Inc. Trust | ||
Series 2003-HYB1, Class A4, 5.71%, 3/25/2033 (b) | 43,870 | 38,428 |
Series 2003-HYB1, Class B1, 5.71%, 3/25/2033 (b) | 47,202 | 27,313 |
Morgan Stanley Mortgage Loan Trust | ||
Series 2004-3, Class 4A, 5.65%, 4/25/2034 (b) | 594,796 | 577,350 |
Series 2004-5AR, Class 3A3, 4.86%, 7/25/2034 (b) | 78,145 | 69,558 |
Series 2004-5AR, Class 3A5, 4.86%, 7/25/2034 (b) | 440,382 | 412,022 |
Series 2004-11AR, Class 1A2A, 5.74%, 1/25/2035 (b) | 178,822 | 160,795 |
MRFC Mortgage Pass-Through Trust Series 2002-TBC2, Class B1, 6.27%, 8/15/2032 (b) | 32,451 | 29,495 |
NAAC Reperforming Loan REMIC Trust Certificates Series 2004-R3, Class AF, 5.88%, 2/25/2035 (a) (b) | 535,398 | 451,597 |
New Residential Mortgage Loan Trust Series 2018-4A, Class A1S, 6.18%, 1/25/2048 (a) (b) | 1,206,196 | 1,171,071 |
50 |
INVESTMENTS | PRINCIPAL AMOUNT($) | VALUE($) |
Collateralized Mortgage Obligations — continued | ||
Nomura Asset Acceptance Corp. Alternative Loan Trust Series 2003-A3, Class A1, 5.50%, 8/25/2033 (c) | 141,009 | 137,474 |
Prime Mortgage Trust Series 2005-2, Class 2A1, 5.90%, 10/25/2032 (b) | 183,313 | 178,220 |
PRPM LLC Series 2020-6, Class A1, 2.36%, 11/25/2025 (a) (c) | 1,944,795 | 1,896,420 |
RFMSI Trust | ||
Series 2005-SA2, Class 2A2, 4.99%, 6/25/2035 (b) | 314,669 | 297,005 |
Series 2006-SA4, Class 2A1, 5.25%, 11/25/2036 (b) | 147,687 | 124,892 |
Seasoned Credit Risk Transfer Trust Series 2020-1, Class M55G, 3.00%, 8/25/2059 | 7,245,635 | 6,527,641 |
Sequoia Mortgage Trust | ||
Series 11, Class A, 6.33%, 12/20/2032 (b) | 7,760 | 6,921 |
Series 2003-3, Class A2, 6.37%, 7/20/2033 (b) | 62,734 | 55,731 |
Series 2004-11, Class A2, 6.07%, 12/20/2034 (b) | 331,947 | 288,819 |
Structured Asset Mortgage Investments II Trust Series 2004-AR1, Class 1A1, 6.13%, 3/19/2034 (b) | 26,852 | 24,811 |
Structured Asset Mortgage Investments Trust Series 2002-AR2, Class A3, 6.18%, 7/19/2032 (b) | 127,271 | 72,589 |
Structured Asset Securities Corp. Mortgage Pass-Through Certificates | ||
Series 2003-24A, Class 2A, 6.60%, 7/25/2033 (b) | 246,738 | 236,422 |
Series 2003-40A, Class 4A, 7.16%, 1/25/2034 (b) | 122,802 | 113,842 |
Thornburg Mortgage Securities Trust Series 2004-4, Class 5A, 2.57%, 12/25/2044 (b) | 1,246,971 | 1,086,006 |
Towd Point Mortgage Trust Series 2018-4, Class A1, 3.00%, 6/25/2058 (a) (b) | 2,953,839 | 2,694,137 |
Two Harbors Msr Frn, 7.25%, 4/15/2024 ‡ (a) | 5,000,000 | 5,000,000 |
WaMu Mortgage Pass-Through Certificates Trust | ||
Series 2004-AR3, Class A1, 4.52%, 6/25/2034 (b) | 245,137 | 222,365 |
Series 2004-AR11, Class A, 5.27%, 10/25/2034 (b) | 122,335 | 110,965 |
Total Collateralized Mortgage Obligations (Cost $243,784,521) | 233,510,381 | |
Mortgage-Backed Securities — 9.3% | ||
FHLMC Gold Pools, Other Pool # U49009, 3.00%, 8/1/2028 | 918,808 | 875,038 |
FHLMC UMBS, 30 Year | ||
Pool # RA2459, 4.00%, 4/1/2050 | 5,050,009 | 4,718,623 |
INVESTMENTS | PRINCIPAL AMOUNT($) | VALUE($) |
Pool # RA2904, 3.00%, 6/1/2050 | 4,875,189 | 4,234,060 |
Pool # RA2970, 2.50%, 7/1/2050 | 5,559,047 | 4,644,185 |
Pool # SD1787, 5.00%, 10/1/2052 | 3,741,216 | 3,704,485 |
Pool # SD8277, 5.50%, 12/1/2052 (d) | 4,699,301 | 4,642,754 |
FNMA UMBS, 15 Year Pool # AD1969, 4.00%, 2/1/2025 | 133,817 | 131,539 |
FNMA UMBS, 20 Year | ||
Pool # 254911, 5.00%, 10/1/2023 | 1,867 | 1,862 |
Pool # MA1338, 3.00%, 2/1/2033 | 876,263 | 817,344 |
Pool # MA1401, 3.00%, 4/1/2033 | 340,955 | 318,025 |
Pool # MA1490, 3.00%, 7/1/2033 | 1,127,427 | 1,051,583 |
FNMA UMBS, 30 Year | ||
Pool # 995724, 6.00%, 4/1/2039 | 153,462 | 158,315 |
Pool # AD0588, 5.00%, 12/1/2039 | 742,753 | 742,252 |
Pool # AD9721, 5.50%, 8/1/2040 | 172,346 | 170,222 |
Pool # BM3048, 4.00%, 10/1/2042 | 3,129,673 | 2,973,246 |
Pool # AS4592, 4.00%, 2/1/2045 | 5,167,662 | 4,898,965 |
Pool # BM5560, 4.00%, 1/1/2046 | 3,706,560 | 3,521,308 |
Pool # CA0411, 4.00%, 9/1/2047 | 3,539,570 | 3,354,834 |
Pool # CA2489, 4.50%, 10/1/2048 | 628,076 | 600,095 |
Pool # BP7345, 3.00%, 6/1/2050 | 6,233,543 | 5,409,846 |
Pool # BQ7436, 3.00%, 9/1/2051 | 4,340,755 | 3,746,966 |
Pool # BQ7454, 3.00%, 12/1/2051 | 5,855,242 | 5,055,380 |
Pool # FS2898, 4.50%, 9/1/2052 | 5,589,094 | 5,302,308 |
Pool # FS3051, 5.00%, 10/1/2052 | 3,645,674 | 3,609,881 |
Pool # CB4839, 5.50%, 10/1/2052 (d) | 3,806,822 | 3,765,766 |
FNMA, Other Pool # BK7908, 4.00%, 11/1/2048 | 355,562 | 327,940 |
GNMA I, 15 Year Pool # 723171, 4.50%, 10/15/2024 | 54,226 | 52,909 |
GNMA II, 30 Year | ||
Pool # 1429, 7.50%, 10/20/2023 | 32 | 32 |
Pool # CG5224, 3.50%, 8/20/2051 | 9,077,445 | 8,061,095 |
Total Mortgage-Backed Securities (Cost $86,642,482) | 76,890,858 | |
Commercial Mortgage-Backed Securities — 9.0% | ||
20 Times Square Trust Series 2018-20TS, Class A, 3.20%, 5/15/2035 (a) (b) | 3,291,000 | 2,801,128 |
BAMLL Commercial Mortgage Securities Trust Series 2015-200P, Class A, 3.22%, 4/14/2033 (a) | 3,500,000 | 3,263,642 |
BANK Series 2021-BN35, Class A2, 1.87%, 6/15/2064 | 2,650,000 | 2,368,574 |
Bayview Commercial Asset Trust | ||
Series 2005-2A, Class A2, 5.95%, 8/25/2035 (a) (b) | 394,125 | 358,656 |
51 |
AS OF August 31, 2023 (Unaudited) (continued)
INVESTMENTS | PRINCIPAL AMOUNT($) | VALUE($) |
Commercial Mortgage-Backed Securities — continued | ||
Series 2005-2A, Class M1, 6.07%, 8/25/2035 (a) (b) | 78,715 | 72,712 |
Series 2007-3, Class A2, 5.86%, 7/25/2037 (a) (b) | 379,636 | 334,107 |
BBCMS Mortgage Trust Series 2020-C7, Class A2, 2.02%, 4/15/2053 | 1,000,000 | 921,056 |
BBCMS Trust Series 2015-VFM, Class A1, 2.47%, 3/10/2036 (a) | 842,791 | 781,944 |
BHMS Series 2018-ATLS, Class A, 6.86%, 7/15/2035 (a) (b) | 6,000,000 | 5,893,552 |
BPR Trust Series 2021-KEN, Class A, 6.67%, 2/15/2029 (a) (b) | 2,115,000 | 2,086,087 |
BX Series 2021-MFM1, Class A, 6.12%, 1/15/2034 (a) (b) | 3,616,981 | 3,560,163 |
BX Trust | ||
Series 2021-BXMF, Class A, 6.06%, 10/15/2026 (a) (b) | 8,000,000 | 7,816,782 |
Series 2021-LBA, Class AJV, 6.23%, 2/15/2036 (a) (b) | 6,500,000 | 6,371,557 |
Commercial Mortgage Trust Series 2020-CBM, Class A1, 2.31%, 2/10/2037 (a) (b) | 6,000,000 | 5,605,289 |
FHLMC, Multi-Family Structured Credit Risk Series 2021-MN1, Class M1, 7.29%, 1/25/2051 (a) (b) | 170,983 | 166,098 |
FHLMC, Multi-Family Structured Pass-Through Certificates | ||
Series Q007, Class APT2, 3.37%, 10/25/2047 (b) | 1,034,989 | 1,003,984 |
Series Q013, Class APT1, 1.76%, 5/25/2050 (b) | 2,925,783 | 2,790,992 |
ILPT Commercial Mortgage Trust Series 2022-LPF2, Class A, 7.56%, 10/15/2039 (a) (b) | 3,000,000 | 2,989,655 |
OAKST Commercial Mortgage Trust Series 2023-NLP, Class A, 6.30%, 3/15/2040 (a) (b) | 2,000,000 | 1,979,637 |
One Bryant Park Trust Series 2019-OBP, Class A, 2.52%, 9/15/2054 (a) | 5,000,000 | 4,061,088 |
ONE Mortgage Trust Series 2021-PARK, Class A, 6.12%, 3/15/2036 (a) (b) | 7,000,000 | 6,648,539 |
SMR Mortgage Trust Series 2022-IND, Class A, 6.96%, 2/15/2039 (a) (b) | 7,421,798 | 7,087,055 |
STWD Mortgage Trust (Cayman Islands) Series 2021-LIH, Class B, 7.01%, 11/15/2036 (a) (b) | 2,300,000 | 2,222,884 |
UBS-BAMLL Trust Series 2012-WRM, Class A, 3.66%, 6/10/2030 (a) | 36,602 | 33,965 |
INVESTMENTS | PRINCIPAL AMOUNT($) | VALUE($) |
Wells Fargo Commercial Mortgage Trust | ||
Series 2021-SAVE, Class A, 6.58%, 2/15/2040 (a) (b) | 3,095,349 | 2,951,552 |
Series 2020-C58, Class A1, 0.55%, 7/15/2053 | 26,190 | 26,121 |
Total Commercial Mortgage-Backed Securities (Cost $78,261,669) | 74,196,819 | |
Corporate Bonds — 6.8% | ||
Banks — 2.7% | ||
BNP Paribas SA (France) (SOFR + 1.00%), 1.32%, 1/13/2027 (a) (e) | 6,470,000 | 5,817,912 |
Cooperatieve Rabobank UA (Netherlands) (SOFRINDX + 0.30%), 5.64%, 1/12/2024 (e) | 10,000,000 | 9,998,360 |
Sumitomo Mitsui Financial Group, Inc. (Japan) 0.95%, 1/12/2026 | 2,900,000 | 2,605,880 |
Truist Financial Corp. 1.20%, 8/5/2025 | 4,000,000 | 3,670,024 |
22,092,176 | ||
Capital Markets — 0.5% | ||
Credit Suisse AG (Switzerland) 7.95%, 1/9/2025 | 4,000,000 | 4,078,203 |
Consumer Finance — 1.2% | ||
American Honda Finance Corp. (3-MONTH CME TERM SOFR + 0.54%), 5.84%, 1/12/2024 (e) | 10,000,000 | 10,005,201 |
Diversified Telecommunication Services — 0.4% | ||
AT&T, Inc. 1.65%, 2/1/2028 | 4,335,000 | 3,706,482 |
Independent Power and Renewable Electricity Producers — 0.2% | ||
Southern Power Co. 0.90%, 1/15/2026 | 1,780,000 | 1,606,208 |
Insurance — 1.8% | ||
Metropolitan Life Global Funding I (SOFR + 0.32%), 5.66%, 1/7/2024 (a) (e) | 10,000,000 | 10,000,229 |
Protective Life Global Funding 1.17%, 7/15/2025 (a) | 5,190,000 | 4,759,072 |
14,759,301 | ||
Total Corporate Bonds (Cost $58,662,452) | 56,247,571 | |
52 |
INVESTMENTS | SHARES | VALUE($) |
Short-Term Investments — 7.7% | ||
Investment Companies — 7.7% | ||
JPMorgan Prime Money Market Fund Class IM Shares, 5.46% (f) (g) (Cost $63,431,941) | 63,417,617 | 63,436,642 |
Total Investments — 100.7% (Cost $872,486,855) | 832,437,325 | |
Liabilities in Excess of Other Assets — (0.7)% | (6,090,336 ) | |
NET ASSETS — 100.0% | 826,346,989 | |
Percentages indicated are based on net assets. |
Abbreviations | |
ABS | Asset-Backed Securities |
CLO | Collateralized Loan Obligations |
CME | Chicago Mercantile Exchange |
FHLMC | Federal Home Loan Mortgage Corp. |
FNMA | Federal National Mortgage Association |
FRN | Floating Rate Note |
GNMA | Government National Mortgage Association |
IF | Inverse Floaters represent securities that pay interest at a rate that increases (decreases) with a decline (incline) in a specified index or have an interest rate that adjusts periodically based on changes in current interest rates and prepayments on the underlying pool of assets. The interest rate shown is the rate in effect as of August 31, 2023. The rate may be subject to a cap and floor. |
IO | Interest Only represents the right to receive the monthly interest payments on an underlying pool of mortgage loans. The principal amount shown represents the par value on the underlying pool. The yields on these securities are subject to accelerated principal paydowns as a result of prepayment or refinancing of the underlying pool of mortgage instruments. As a result, interest income may be reduced considerably. |
PO | Principal Only represents the right to receive the principal portion only on an underlying pool of mortgage loans. The market value of these securities is extremely volatile in response to changes in market interest rates. As prepayments on the underlying mortgages of these securities increase, the yield on these securities increases. |
REMIC | Real Estate Mortgage Investment Conduit |
SOFR | Secured Overnight Financing Rate |
SOFRINDX | Compounding index of the Secured Overnight Financing Rate |
STRIPS | Separate Trading of Registered Interest and Principal of Securities. The STRIPS Program lets investors hold and trade individual interest and principal components of eligible notes and bonds as separate securities. |
UMBS | Uniform Mortgage-Backed Securities |
‡ | Value determined using significant unobservable inputs. |
(a) | Securities exempt from registration under Rule 144A or section 4(a)(2), of the Securities Act of 1933, as amended. |
(b) | Variable or floating rate security, the interest rate of which adjusts periodically based on changes in current interest rates and prepayments on the underlying pool of assets. The interest rate shown is the current rate as of August 31, 2023. |
(c) | Step bond. Interest rate is a fixed rate for an initial period that either resets at a specific date or may reset in the future contingent upon a predetermined trigger. The interest rate shown is the current rate as of August 31, 2023. |
(d) | All or a portion of the security is a when-issued security, delayed delivery security, or forward commitment. |
(e) | Variable or floating rate security, linked to the referenced benchmark. The interest rate shown is the current rate as of August 31, 2023. |
(f) | Investment in an affiliated fund, which is registered under the Investment Company Act of 1940, as amended, and is advised by J.P. Morgan Investment Management Inc. |
(g) | The rate shown is the current yield as of August 31, 2023. |
53 |
AS OF August 31, 2023 (Unaudited)
INVESTMENTS | SHARES | VALUE($) |
Common Stocks — 96.5% | ||
Apartments — 17.5% | ||
American Homes 4 Rent, Class A, REIT | 354,503 | 12,776,288 |
Apartment Income REIT Corp., REIT | 184,868 | 6,296,604 |
Equity LifeStyle Properties, Inc., REIT (a) | 31,469 | 2,107,164 |
Equity Residential, REIT | 154,915 | 10,043,139 |
Sun Communities, Inc., REIT | 102,144 | 12,504,469 |
UDR, Inc., REIT | 377,959 | 15,080,564 |
58,808,228 | ||
Diversified — 32.1% | ||
American Tower Corp., REIT | 173,139 | 31,393,563 |
Digital Realty Trust, Inc., REIT | 207,767 | 27,367,069 |
Equinix, Inc., REIT | 34,958 | 27,315,482 |
SBA Communications Corp., REIT | 26,084 | 5,856,641 |
Weyerhaeuser Co., REIT | 50,713 | 1,660,851 |
WP Carey, Inc., REIT | 215,965 | 14,048,523 |
107,642,129 | ||
Health Care — 12.8% | ||
CareTrust REIT, Inc., REIT | 208,349 | 4,198,232 |
Sabra Health Care REIT, Inc., REIT | 476,190 | 5,966,661 |
Ventas, Inc., REIT | 322,500 | 14,086,800 |
Welltower, Inc., REIT (a) | 224,618 | 18,616,340 |
42,868,033 | ||
Hotels — 2.0% | ||
DiamondRock Hospitality Co., REIT | 415,720 | 3,350,703 |
Host Hotels & Resorts, Inc., REIT | 218,998 | 3,457,979 |
6,808,682 | ||
Industrial — 12.1% | ||
First Industrial Realty Trust, Inc., REIT | 125,540 | 6,520,548 |
Prologis, Inc., REIT | 190,010 | 23,599,242 |
Rexford Industrial Realty, Inc., REIT | 198,897 | 10,635,022 |
40,754,812 | ||
Office — 3.1% | ||
Alexandria Real Estate Equities, Inc., REIT | 42,403 | 4,933,165 |
Boston Properties, Inc., REIT | 83,847 | 5,598,464 |
10,531,629 | ||
Shopping Centers — 5.6% | ||
Federal Realty Investment Trust, REIT | 59,703 | 5,847,312 |
Kimco Realty Corp., REIT | 678,068 | 12,842,608 |
18,689,920 | ||
INVESTMENTS | SHARES | VALUE($) |
Single Tenant — 6.2% | ||
Realty Income Corp., REIT | 374,476 | 20,985,635 |
Storage — 5.1% | ||
Extra Space Storage, Inc., REIT | 24,761 | 3,186,246 |
Public Storage, REIT | 50,069 | 13,838,070 |
17,024,316 | ||
Total Common Stocks (Cost $318,584,912) | 324,113,384 | |
Short-Term Investments — 4.3% | ||
Investment Companies — 2.5% | ||
JPMorgan Prime Money Market Fund Class IM Shares, 5.46% (b) (c) (Cost $8,370,575) | 8,369,108 | 8,371,618 |
Investment of Cash Collateral from Securities Loaned — 1.8% | ||
JPMorgan Securities Lending Money Market Fund Agency SL Class Shares, 5.50% (b) (c) | 4,002,799 | 4,003,600 |
JPMorgan U.S. Government Money Market Fund Class IM Shares, 5.27% (b) (c) | 2,035,207 | 2,035,207 |
Total Investment of Cash Collateral from Securities Loaned (Cost $6,038,807) | 6,038,807 | |
Total Short-Term Investments (Cost $14,409,382) | 14,410,425 | |
Total Investments — 100.8% (Cost $332,994,294) | 338,523,809 | |
Liabilities in Excess of Other Assets — (0.8)% | (2,764,321 ) | |
NET ASSETS — 100.0% | 335,759,488 | |
Percentages indicated are based on net assets. |
Abbreviations | |
REIT | Real Estate Investment Trust |
(a) | The security or a portion of this security is on loan at August 31, 2023. The total value of securities on loan at August 31, 2023 is $5,897,227. |
(b) | Investment in an affiliated fund, which is registered under the Investment Company Act of 1940, as amended, and is advised by J.P. Morgan Investment Management Inc. |
(c) | The rate shown is the current yield as of August 31, 2023. |
54 | Realty Income ETF | August 31, 2023 |
AS OF August 31, 2023 (Unaudited)
INVESTMENTS | PRINCIPAL AMOUNT($) | VALUE($) |
Municipal Bonds — 98.3% (a) | ||
Alabama — 0.3% | ||
Black Belt Energy Gas District, Gas Project No. 8 Series 2022A, Rev., 4.00%, 12/1/2029 (b) | 645,000 | 619,187 |
Alaska — 0.1% | ||
Alaska Housing Finance Corp., General Mortgage Series 2016A, Rev., 3.50%, 6/1/2046 | 240,000 | 237,237 |
Arizona — 5.3% | ||
Arizona Industrial Development Authority, Academies of Math and Science Projects Rev., 5.00%, 7/1/2032 (c) | 280,000 | 282,636 |
Arizona Industrial Development Authority, Aliante and Skye Canyon Campus Project | ||
Series 2021A, Rev., 3.00%, 12/15/2031 (c) | 260,000 | 222,539 |
Series 2021A, Rev., 4.00%, 12/15/2051 (c) | 250,000 | 180,179 |
Arizona Industrial Development Authority, Equitable School Revolving Fund LLC | ||
Series 2022A, Rev., 5.00%, 11/1/2033 | 1,000,000 | 1,080,268 |
Series 2022A, Rev., 5.00%, 11/1/2037 | 900,000 | 938,909 |
Arizona Industrial Development Authority, KIPP Nashville Project | ||
Series 2022A, Rev., 5.00%, 7/1/2030 | 245,000 | 252,541 |
Series 2022A, Rev., 5.00%, 7/1/2031 | 260,000 | 267,625 |
Series 2022A, Rev., 5.00%, 7/1/2032 | 270,000 | 277,063 |
Arizona Industrial Development Authority, Macombs Facility Project | ||
Series 2021A, Rev., 5.00%, 7/1/2033 | 310,000 | 325,580 |
Series 2021A, Rev., 4.00%, 7/1/2035 | 370,000 | 353,416 |
Series 2021A, Rev., 4.00%, 7/1/2036 | 155,000 | 145,701 |
Series 2021A, Rev., 4.00%, 7/1/2041 | 400,000 | 352,367 |
Arizona Industrial Development Authority, Pebble Campus Project Series 2020A, Rev., 4.00%, 7/15/2030 (c) | 250,000 | 238,275 |
Arizona Industrial Development Authority, Pinecrest Academy of Northern Nevada Project Series 2022A, Rev., 4.50%, 7/15/2029 (c) | 750,000 | 721,891 |
Industrial Development Authority of the County of Pima (The), La Posada at Pusch Ridge Project Series 2022B-3, Rev., 5.13%, 11/15/2029 (c) | 750,000 | 736,883 |
La Paz County Industrial Development Authority, Harmony Public School Project | ||
Series 2021A, Rev., 4.00%, 2/15/2041 | 420,000 | 350,804 |
Series 2021A, Rev., 4.00%, 2/15/2046 | 335,000 | 263,987 |
INVESTMENTS | PRINCIPAL AMOUNT($) | VALUE($) |
Arizona — continued | ||
Maricopa County Industrial Development Authority, Arizona Autism Charter School Project Series 2021A, Rev., 4.00%, 7/1/2041 (c) | 935,000 | 763,044 |
Maricopa County Industrial Development Authority, Arizona Autism Charter Schools Project Series 2021A, Rev., 4.00%, 7/1/2031 (c) | 250,000 | 235,822 |
Maricopa County Industrial Development Authority, Banner Health Series A, Rev., 4.00%, 1/1/2041 | 4,450,000 | 4,290,729 |
Maricopa County Industrial Development Authority, HonorHealth Series 2019A, Rev., 5.00%, 9/1/2032 | 200,000 | 213,323 |
Total Arizona | 12,493,582 | |
California — 6.1% | ||
California Community Choice Financing Authority, Clean Energy Project Series 2023E-1, Rev., 5.00%, 3/1/2031 (b) | 1,090,000 | 1,141,648 |
California Community Housing Agency, Fountains at Emerald Park Series 2021A-2, Rev., 4.00%, 8/1/2046 (c) | 300,000 | 239,224 |
California Community Housing Agency, Glendale Properties Series 2021A-2, Rev., 4.00%, 8/1/2047 (c) | 500,000 | 388,350 |
California Enterprise Development Authority, Riverside County, Rocketship Public Schools-Obligated Group No. 2 Series 2022A, Rev., 4.00%, 6/1/2027 (c) | 300,000 | 286,126 |
California Health Facilities Financing Authority, On Lok Senior Health Service Rev., 3.00%, 8/1/2025 | 50,000 | 48,933 |
California Infrastructure and Economic Development Bank, Equitable School Revolving Fund LLC Series 2022B, Rev., 5.00%, 11/1/2034 | 210,000 | 227,512 |
California Municipal Finance Authority, Community Health Centers of The Central Coast, Inc. | ||
Series 2021A, Rev., 4.00%, 12/1/2026 (c) | 100,000 | 97,258 |
Series 2021A, Rev., 5.00%, 12/1/2027 (c) | 50,000 | 50,767 |
Series 2021A, Rev., 5.00%, 12/1/2028 (c) | 60,000 | 61,272 |
Series 2021A, Rev., 5.00%, 12/1/2029 (c) | 100,000 | 102,526 |
Series 2021A, Rev., 5.00%, 12/1/2031 (c) | 65,000 | 66,834 |
California Municipal Finance Authority, Eisenhower Medical Center Series 2017B, Rev., 5.00%, 7/1/2026 | 410,000 | 420,412 |
55 |
AS OF August 31, 2023 (Unaudited) (continued)
INVESTMENTS | PRINCIPAL AMOUNT($) | VALUE($) |
Municipal Bonds — continued | ||
California — continued | ||
California Municipal Finance Authority, San Antonio Gardens Project Series 2022B2, Rev., 2.13%, 11/15/2026 | 410,000 | 386,797 |
California Pollution Control Financing Authority, Poseidon Resources Channelside LP Desalination Project | ||
Rev., AMT, 5.00%, 7/1/2036 (c) | 250,000 | 259,016 |
Rev., AMT, 5.00%, 7/1/2037 (c) | 1,100,000 | 1,136,146 |
Rev., AMT, 5.00%, 7/1/2038 (c) | 500,000 | 513,641 |
California Public Finance Authority, Enso Village Project | ||
Series 2021B-3, Rev., 2.13%, 11/15/2027 (c) | 500,000 | 484,790 |
Series 2021B-1, Rev., 3.13%, 5/15/2029 (c) | 300,000 | 283,659 |
Series 2021A, Rev., 5.00%, 11/15/2036 (c) | 300,000 | 289,854 |
California School Finance Authority, Classical Academies Oceanside Project | ||
Series 2022A, Rev., 4.00%, 10/1/2027 (c) | 500,000 | 492,462 |
Series 2022A, Rev., 5.00%, 10/1/2032 (c) | 700,000 | 727,624 |
California School Finance Authority, Green Dot Public Schools Project Series 2022A, Rev., 5.00%, 8/1/2032 (c) | 350,000 | 360,099 |
California School Finance Authority, John Adams Academies Series 2022A, Rev., 4.50%, 7/1/2032 (c) | 835,000 | 805,456 |
California School Finance Authority, Kipp SoCal Public Schools Series 2019A, Rev., 5.00%, 7/1/2039 (c) | 500,000 | 509,315 |
California School Finance Authority, Kipp Social Projects | ||
Series 2020A, Rev., 5.00%, 7/1/2027 (c) | 80,000 | 82,657 |
Series 2020A, Rev., 5.00%, 7/1/2028 (c) | 110,000 | 114,710 |
Series 2020A, Rev., 5.00%, 7/1/2029 (c) | 140,000 | 147,018 |
Series 2020A, Rev., 5.00%, 7/1/2030 (c) | 100,000 | 105,605 |
Series 2020A, Rev., 4.00%, 7/1/2040 (c) | 295,000 | 268,349 |
California Statewide Communities Development Authority, Emanate Health, Tax-Exempt Series 2020A, Rev., 3.00%, 4/1/2050 | 2,645,000 | 1,851,886 |
California Statewide Communities Development Authority, Front Porch Communities Series 2021A, Rev., 4.00%, 4/1/2039 | 1,000,000 | 940,153 |
CSCDA Community Improvement Authority, Essential Housing, Parallel-Anaheim Series 2021A, Rev., 4.00%, 8/1/2056 (c) | 500,000 | 367,295 |
INVESTMENTS | PRINCIPAL AMOUNT($) | VALUE($) |
California — continued | ||
CSCDA Community Improvement Authority, Essential Housing, Towne at Glendale Apartments Series 2022B, Rev., 5.00%, 9/1/2037 (c) | 175,000 | 170,195 |
Orange County Community Facilities District No. 2021-1, Rienda Rev., 5.00%, 8/15/2042 | 400,000 | 402,572 |
River Islands Public Financing Authority, Facilities District No. 2003 Series 2022A-1, Rev., AGM, 5.00%, 9/1/2028 | 230,000 | 250,262 |
State of California, Department of Veterans Affairs, Farm and Home Purchase Program Series 2016B, Rev., 3.50%, 12/1/2045 | 185,000 | 183,184 |
Total California | 14,263,607 | |
Colorado — 3.7% | ||
Aspen Fire Protection District | ||
COP, 4.00%, 12/1/2034 | 200,000 | 204,156 |
COP, 4.00%, 12/1/2035 | 225,000 | 227,883 |
COP, 4.00%, 12/1/2036 | 350,000 | 350,639 |
Colorado Educational and Cultural Facilities Authority, Aspen View Academy Project | ||
Rev., 4.00%, 5/1/2029 | 35,000 | 34,021 |
Rev., 4.00%, 5/1/2030 | 30,000 | 28,972 |
Rev., 4.00%, 5/1/2031 | 30,000 | 28,815 |
Rev., 4.00%, 5/1/2041 | 90,000 | 76,150 |
Colorado Educational and Cultural Facilities Authority, Global Village Academy Northglenn Project Rev., 4.00%, 12/1/2030 (c) | 595,000 | 544,253 |
Colorado Educational and Cultural Facilities Authority, Golden View Classical Academy Projects | ||
Rev., 4.00%, 1/1/2026 | 200,000 | 195,782 |
Rev., 4.00%, 1/1/2032 | 475,000 | 452,325 |
Colorado Educational and Cultural Facilities Authority, Vega Collegiate Academy Project Series 2021A, Rev., 5.00%, 2/1/2034 (c) | 300,000 | 296,395 |
Colorado Health Facilities Authority, Tax Exempt Series 2021B-3, Rev., 2.13%, 5/15/2028 | 300,000 | 270,852 |
Colorado Housing and Finance Authority, Single Family Mortgage | ||
Series 2019F, Rev., GNMA COLL, 4.25%, 11/1/2049 | 185,000 | 183,675 |
Series 2020H, Rev., GNMA COLL, 3.00%, 5/1/2050 | 755,000 | 728,815 |
Series 2020B, Rev., 3.75%, 5/1/2050 | 1,390,000 | 1,364,571 |
Series 2023L, Rev., GNMA COLL, 5.75%, 11/1/2053 (d) | 2,500,000 | 2,654,169 |
56 |
INVESTMENTS | PRINCIPAL AMOUNT($) | VALUE($) |
Municipal Bonds — continued | ||
Colorado — continued | ||
Dominion Water and Sanitation District | ||
Rev., 5.00%, 12/1/2027 | 590,000 | 583,971 |
Rev., 5.25%, 12/1/2032 | 500,000 | 492,772 |
Total Colorado | 8,718,216 | |
Connecticut — 0.9% | ||
Connecticut Housing Finance Authority, Housing Mortgage Finance Program | ||
Series A-1, Rev., 4.00%, 11/15/2045 | 70,000 | 69,745 |
Series A-1, Rev., 4.00%, 11/15/2047 | 135,000 | 133,797 |
Series D-1, Rev., GNMA / FNMA / FHLMC, 4.00%, 11/15/2047 | 425,000 | 421,194 |
Connecticut State Health and Educational Facilities Authority, Yale New Haven Health Series B, Rev., 1.80%, 7/1/2024 (b) | 225,000 | 220,168 |
Connecticut State Higher Education Supplemental Loan Authority, CHESLA Loan Program Series 2019B, Rev., AMT, 5.00%, 11/15/2027 | 250,000 | 261,926 |
Stamford Housing Authority, The Dogwoods Project Rev., BAN, 11.00%, 12/1/2027 (c) | 1,000,000 | 1,054,207 |
Total Connecticut | 2,161,037 | |
Delaware — 1.1% | ||
Delaware State Economic Development Authority, Aspria of Delaware Charter Series 2022A, Rev., 4.00%, 6/1/2042 | 250,000 | 194,645 |
Delaware State Economic Development Authority, Newark Charter School, Inc. Project Rev., 4.00%, 9/1/2028 | 225,000 | 222,581 |
Delaware State Health Facilities Authority, Beebe Medical Center Project Rev., 5.00%, 6/1/2034 | 2,200,000 | 2,292,148 |
Total Delaware | 2,709,374 | |
District of Columbia — 1.8% | ||
District of Columbia, Gallaudet University Project Series 2021A, Rev., 4.00%, 4/1/2036 | 200,000 | 194,274 |
District of Columbia, Rocketship Obligated Group Series 2021A, Rev., 5.00%, 6/1/2031 (c) | 400,000 | 396,681 |
District of Columbia, Two Rivers Public Charter School, Inc. | ||
Rev., 3.00%, 6/1/2030 | 1,000,000 | 884,517 |
INVESTMENTS | PRINCIPAL AMOUNT($) | VALUE($) |
District of Columbia — continued | ||
Rev., 5.00%, 6/1/2050 | 1,500,000 | 1,313,639 |
District of Columbia, Water and Sewer Authority, Public Utility, Subordinate Lien Series A, Rev., 5.00%, 10/1/2045 | 1,500,000 | 1,521,462 |
Total District of Columbia | 4,310,573 | |
Florida — 10.5% | ||
Capital Trust Agency, Inc., Sustainability Bonds -The Marie Rev., 4.00%, 6/15/2031 (c) | 150,000 | 135,641 |
City of Pompano Beach, John Knox Village Project | ||
Series 2020, Rev., 3.50%, 9/1/2035 | 1,375,000 | 1,153,087 |
Series 2021A, Rev., 4.00%, 9/1/2041 | 1,000,000 | 815,148 |
City of Port St. Lucie, Utility System Rev., NATL - RE, 5.25%, 9/1/2024 | 5,000,000 | 5,093,086 |
Collier County Educational Facilities Authority | ||
Series 2023, Rev., 5.00%, 6/1/2028 | 775,000 | 792,338 |
Series 2023, Rev., 5.00%, 6/1/2029 | 565,000 | 579,824 |
Florida Development Finance Corp., Central Charter School Project | ||
Series 2022, Rev., 5.00%, 8/15/2032 (c) | 225,000 | 220,390 |
Series 2022, Rev., 5.25%, 8/15/2037 (c) | 350,000 | 329,201 |
Series 2022, Rev., 5.63%, 8/15/2042 (c) | 1,515,000 | 1,421,830 |
Florida Development Finance Corp., Cornerstone Charter Academy Project Series 2022, Rev., 5.00%, 10/1/2032 (c) | 460,000 | 467,686 |
Florida Development Finance Corp., Educational Facilities, River City Science Academy Projects | ||
Series 2021A, Rev., 4.00%, 7/1/2027 | 290,000 | 284,130 |
Series 2021A, Rev., 4.00%, 7/1/2028 | 150,000 | 146,562 |
Series 2021A, Rev., 4.00%, 7/1/2029 | 155,000 | 150,717 |
Series 2021A, Rev., 4.00%, 7/1/2030 | 215,000 | 207,992 |
Series 2022B, Rev., 5.00%, 7/1/2031 | 165,000 | 169,227 |
Series 2022B, Rev., 5.00%, 7/1/2042 | 230,000 | 222,096 |
Florida Development Finance Corp., IDEA Florida, Inc., Jacksonville IV Project Rev., 5.25%, 6/15/2029 (c) | 300,000 | 294,416 |
Florida Development Finance Corp., Mater Academy Project | ||
Series 2022A, Rev., 5.00%, 6/15/2032 | 270,000 | 276,813 |
Series 2022A, Rev., 5.00%, 6/15/2033 | 380,000 | 389,196 |
Series 2022A, Rev., 5.00%, 6/15/2034 | 400,000 | 408,888 |
Series 2022A, Rev., 5.00%, 6/15/2036 | 1,325,000 | 1,341,767 |
Series 2020A, Rev., 5.00%, 6/15/2040 | 500,000 | 500,003 |
57 |
AS OF August 31, 2023 (Unaudited) (continued)
INVESTMENTS | PRINCIPAL AMOUNT($) | VALUE($) |
Municipal Bonds — continued | ||
Florida — continued | ||
Florida Development Finance Corp., The Glenridge on Palmer Ranch Project Rev., 4.00%, 6/1/2026 (c) | 110,000 | 106,174 |
Lee County Industrial Development Authority, Cypress Cove at Healthpeak Florida, Inc. Project Series 2022B2, Rev., 3.25%, 10/1/2026 | 500,000 | 476,173 |
Lee County School Board (The) | ||
COP, 5.00%, 8/1/2042 | 2,715,000 | 2,887,181 |
Series 2023A, COP, 4.00%, 8/1/2046 | 2,000,000 | 1,876,749 |
Series 2023A, COP, 4.00%, 8/1/2048 | 500,000 | 465,747 |
Lee Memorial Health System Series A-1, Rev., 5.00%, 4/1/2036 | 1,000,000 | 1,053,724 |
Middleton Community Development District A, City of Wildwood, Florida Special Assessment | ||
5.20%, 5/1/2027 | 225,000 | 227,423 |
5.85%, 5/1/2037 | 500,000 | 517,966 |
Palm Beach County Health Facilities Authority, Jupiter Medical Center | ||
Series 2022, Rev., 5.00%, 11/1/2031 | 100,000 | 105,289 |
Series 2022, Rev., 5.00%, 11/1/2032 | 100,000 | 105,689 |
Series 2022, Rev., 5.00%, 11/1/2047 | 500,000 | 481,825 |
Seminole County Industrial Development Authority, Galileo Schools for Gifted Learning Series 2021A, Rev., 4.00%, 6/15/2041 (c) | 210,000 | 168,798 |
Village Community Development District No. 15 | ||
4.25%, 5/1/2028 (c) | 350,000 | 349,981 |
4.38%, 5/1/2033 (c) | 500,000 | 500,781 |
Total Florida | 24,723,538 | |
Georgia — 1.3% | ||
Cherokee County Water and Sewer Authority | ||
Series 2023, Rev., 5.00%, 8/1/2035 | 135,000 | 155,682 |
Series 2023, Rev., 5.00%, 8/1/2036 | 165,000 | 188,131 |
Series 2023, Rev., 5.00%, 8/1/2037 | 135,000 | 151,998 |
Series 2023, Rev., 5.00%, 8/1/2039 | 375,000 | 416,755 |
Columbus Medical Center Hospital Authority, Piedmont Healthcare Inc., Project Series 2019B, Rev., 5.00%, 7/1/2029 (b) | 500,000 | 532,891 |
Gainesville and Hall County Hospital Authority, Northeast Georgia Health System, Inc., Project Series A, Rev., 5.00%, 2/15/2026 | 860,000 | 884,029 |
Georgia Housing and Finance Authority, Single Family Mortgage | ||
Series 2017A, Rev., 4.00%, 12/1/2047 | 220,000 | 218,419 |
Series 2017B, Rev., 4.00%, 12/1/2047 | 440,000 | 436,188 |
Total Georgia | 2,984,093 | |
INVESTMENTS | PRINCIPAL AMOUNT($) | VALUE($) |
Illinois — 5.0% | ||
City of Aurora, Single Family Mortgage | ||
Series 2007B, Rev., GNMA / FNMA / FHLMC, 5.45%, 12/1/2039 | 44,802 | 44,753 |
Series 2007-A, Rev., AMT, GNMA / FNMA / FHLMC, 5.50%, 12/1/2039 | 48,693 | 48,668 |
City of Chicago, Waterworks, Second Lien | ||
Series 2023B, Rev., AGM, 5.00%, 11/1/2035 | 500,000 | 550,017 |
Series 2023B, Rev., AGM, 5.00%, 11/1/2039 | 1,500,000 | 1,607,458 |
Series 2023B, Rev., AGM, 4.00%, 11/1/2040 | 665,000 | 647,539 |
Illinois Finance Authority, Clark-Lindsey Village Series 2022A, Rev., 4.60%, 6/1/2027 | 165,000 | 160,463 |
Illinois Finance Authority, Lake Forest College | ||
Series 2022A, Rev., 5.00%, 10/1/2032 | 215,000 | 220,154 |
Series 2022A, Rev., 5.00%, 10/1/2035 | 475,000 | 477,808 |
Series 2022A, Rev., 5.50%, 10/1/2039 | 380,000 | 384,583 |
Illinois Finance Authority, Plymouth Place, Inc. | ||
Series 2022B-3, Rev., 4.75%, 11/15/2027 | 100,000 | 99,207 |
Series 2022B-2, Rev., 5.25%, 11/15/2027 | 100,000 | 99,398 |
Series 2022B-1, Rev., 6.00%, 11/15/2027 | 100,000 | 100,043 |
Series 2021A, Rev., 5.00%, 5/15/2032 | 135,000 | 126,293 |
Series 2021A, Rev., 5.00%, 5/15/2033 | 145,000 | 134,647 |
Illinois Finance Authority, Social Bonds-Learn Chapter School Project | ||
Rev., 4.00%, 11/1/2030 | 130,000 | 127,180 |
Rev., 4.00%, 11/1/2031 | 135,000 | 131,546 |
Rev., 4.00%, 11/1/2041 | 375,000 | 325,378 |
Illinois Finance Authority, Southern Illinois Healthcare Enterprises, Inc. Series 2017C, Rev., 5.00%, 3/1/2033 | 365,000 | 376,411 |
Illinois Housing Development Authority, Homeowner Mortgage Series C, Rev., 3.50%, 8/1/2046 | 340,000 | 333,768 |
Peoria City School District No. 150 Series 2020A, GO, AGM, 4.00%, 12/1/2027 | 505,000 | 517,577 |
Southern Illinois University, Housing and Auxiliary Facilities System Series 2021A, Rev., 5.00%, 4/1/2033 | 300,000 | 320,890 |
Southwestern Illinois Development Authority, Flood Prevention District Council Project | ||
Rev., 5.00%, 4/15/2026 | 250,000 | 260,176 |
Rev., 5.00%, 4/15/2028 | 390,000 | 420,756 |
Rev., 5.00%, 4/15/2029 | 290,000 | 317,446 |
State of Illinois Series 2023B, GO, 4.50%, 5/1/2048 | 160,000 | 153,332 |
58 |
INVESTMENTS | PRINCIPAL AMOUNT($) | VALUE($) |
Municipal Bonds — continued | ||
Illinois — continued | ||
Will County Forest Preservation District, Limited Tax | ||
GO, 5.00%, 12/15/2035 | 1,170,000 | 1,301,495 |
GO, 5.00%, 12/15/2036 | 1,460,000 | 1,611,046 |
GO, 4.00%, 12/15/2037 | 1,000,000 | 982,585 |
Total Illinois | 11,880,617 | |
Indiana — 2.8% | ||
City of Goshen, Multi-Family, Green Oaks of Goshen Project Series 2021A, Rev., 5.00%, 8/1/2041 (c) | 500,000 | 394,909 |
City of Jeffersonville, Vivera Senior Living of Jeffersonville Project Series 2020A, Rev., 4.75%, 11/1/2030 (c) | 570,000 | 493,777 |
County of St. Joseph, Economic Development, St. Mary's College Project Series 2017A, Rev., 5.00%, 4/1/2026 | 1,880,000 | 1,931,323 |
Indiana Finance Authority Series 2023A, Rev., 5.00%, 6/1/2053 | 150,000 | 150,145 |
Indiana Finance Authority, DePauw University Series 2022A, Rev., 5.00%, 7/1/2032 | 350,000 | 368,899 |
Indiana Finance Authority, Educational Facilities, Valparaiso University Project Rev., 4.00%, 10/1/2035 | 220,000 | 204,430 |
Indiana Finance Authority, Rose-Hulman Institute of Technology Project Series 2021, Rev., 5.00%, 6/1/2031 | 100,000 | 108,375 |
Indiana Health Facility Financing Authority, Ascension Health Credit Group Series 2001A-1, Rev., 5.00%, 11/15/2034 | 1,670,000 | 1,716,858 |
Indiana Housing and Community Development Authority Series 2020A, Rev., 3.75%, 1/1/2049 | 670,000 | 657,157 |
Indiana Housing and Community Development Authority, Vita of Marion Project Series 2021B, Rev., 4.00%, 4/1/2024 | 500,000 | 492,087 |
Total Indiana | 6,517,960 | |
Iowa — 0.8% | ||
Iowa Finance Authority, Senior Living Facility, Sunrise Retirement Community Project | ||
Rev., 5.00%, 9/1/2028 | 195,000 | 183,020 |
Rev., 5.00%, 9/1/2030 | 110,000 | 100,501 |
Rev., 5.00%, 9/1/2031 | 105,000 | 94,636 |
Rev., 5.00%, 9/1/2036 | 445,000 | 378,335 |
Iowa Student Loan Liquidity Corp., Student Loan Series 2015A, Rev., AMT, 5.00%, 12/1/2025 | 1,000,000 | 1,019,165 |
Total Iowa | 1,775,657 | |
INVESTMENTS | PRINCIPAL AMOUNT($) | VALUE($) |
Kansas — 0.3% | ||
City of Manhattan, Meadowlark Hills | ||
Series 2022B-2, Rev., 2.38%, 6/1/2027 | 225,000 | 210,921 |
Series 2021A, Rev., 4.00%, 6/1/2036 | 300,000 | 248,955 |
City of Topeka, Kansas Health Care Facilities Series 2022B, Rev., 5.13%, 12/1/2026 | 250,000 | 246,684 |
Total Kansas | 706,560 | |
Louisiana — 1.0% | ||
Louisiana Local Government Environmental Facilities and Community Development Authority, LCTCS Act 391 Project Rev., 5.00%, 10/1/2028 | 670,000 | 723,410 |
Louisiana Public Facilities Authority, Lincoln Preparatory School Project | ||
Series 2021A, Rev., 5.00%, 6/1/2031 (c) | 450,000 | 427,229 |
Series 2021A, Rev., 5.00%, 6/1/2041 (c) | 525,000 | 438,862 |
Louisiana Public Facilities Authority, Mentorship Steam Academy Project | ||
Series 2021A, Rev., 5.00%, 6/1/2036 (c) | 385,000 | 334,844 |
Series 2021A, Rev., 5.00%, 6/1/2042 (c) | 440,000 | 360,784 |
Total Louisiana | 2,285,129 | |
Maine — 0.2% | ||
City of Portland, General Airport Rev., 5.00%, 1/1/2031 | 370,000 | 406,880 |
Maine State Housing Authority, Mortgage Purchase Series 2016A, Rev., 4.00%, 11/15/2045 | 150,000 | 149,513 |
Total Maine | 556,393 | |
Maryland — 0.8% | ||
County of Baltimore, Riderwood Village, Inc., Project | ||
Rev., 4.00%, 1/1/2032 | 475,000 | 467,089 |
Rev., 4.00%, 1/1/2033 | 600,000 | 588,794 |
Maryland Health and Higher Educational Facilities Authority, Stevenson University Project | ||
Series 2021A, Rev., 5.00%, 6/1/2029 | 150,000 | 159,312 |
Series 2021A, Rev., 5.00%, 6/1/2031 | 175,000 | 188,636 |
Montgomery County Housing Opportunities Commission, Single Family Mortgage Series A, Rev., 4.00%, 7/1/2048 | 470,000 | 465,528 |
Total Maryland | 1,869,359 | |
Massachusetts — 4.8% | ||
Massachusetts Clean Water Trust (The), Poll Program Rev., 5.25%, 8/1/2024 | 3,000,000 | 3,052,908 |
59 |
AS OF August 31, 2023 (Unaudited) (continued)
INVESTMENTS | PRINCIPAL AMOUNT($) | VALUE($) |
Municipal Bonds — continued | ||
Massachusetts — continued | ||
Massachusetts Development Finance Agency, Boston Medical Center Issue | ||
Series 2023G, Rev., 5.25%, 7/1/2048 | 1,000,000 | 1,030,906 |
Series 2023G, Rev., 4.38%, 7/1/2052 | 700,000 | 638,752 |
Massachusetts Development Finance Agency, Salem Community Corp. | ||
Rev., 5.00%, 1/1/2026 | 285,000 | 281,606 |
Rev., 5.00%, 1/1/2027 | 305,000 | 299,136 |
Rev., 5.00%, 1/1/2028 | 265,000 | 258,059 |
Rev., 5.00%, 1/1/2029 | 500,000 | 484,085 |
Rev., 5.00%, 1/1/2031 | 240,000 | 229,899 |
Rev., 5.13%, 1/1/2040 | 510,000 | 460,475 |
Massachusetts Development Finance Agency, Southcoast Health System Obligated Group Issue | ||
Series 2021G, Rev., 5.00%, 7/1/2029 | 150,000 | 160,654 |
Series 2021G, Rev., 5.00%, 7/1/2030 | 150,000 | 162,402 |
Massachusetts Health and Educational Facilities Authority, Massachusetts Institute of Technology Series L, Rev., 5.25%, 7/1/2033 | 820,000 | 997,931 |
Massachusetts Housing Finance Agency, Single Family Housing | ||
Series 183, Rev., 3.50%, 12/1/2046 | 65,000 | 64,129 |
Series 214, Rev., GNMA / FNMA / FHLMC, 3.75%, 12/1/2049 | 850,000 | 834,460 |
Massachusetts Water Resources Authority Series B, Rev., AGM, 5.25%, 8/1/2029 | 2,000,000 | 2,271,505 |
Total Massachusetts | 11,226,907 | |
Michigan — 3.2% | ||
City of Detroit, Unlimited Tax | ||
Series 2021A, GO, 5.00%, 4/1/2030 | 475,000 | 494,280 |
Series 2021A, GO, 5.00%, 4/1/2031 | 215,000 | 224,225 |
Series 2021A, GO, 5.00%, 4/1/2033 | 770,000 | 798,160 |
Series 2023A, GO, 6.00%, 5/1/2039 | 3,225,000 | 3,557,727 |
Eastern Michigan University Series 2017A, Rev., 5.00%, 3/1/2030 | 575,000 | 602,889 |
Michigan Finance Authority, Trinity Health Credit Group Series 2013MI-4, Rev., 4.00%, 12/1/2038 | 1,000,000 | 978,270 |
Michigan State Building Authority, Facilities Program Series 2023-II, Rev., 4.00%, 10/15/2047 | 650,000 | 613,417 |
Michigan State Housing Development Authority, Single Family Mortgage Series B, Rev., AMT, 3.50%, 6/1/2047 | 325,000 | 320,072 |
Total Michigan | 7,589,040 | |
INVESTMENTS | PRINCIPAL AMOUNT($) | VALUE($) |
Minnesota — 3.0% | ||
City of Ramsey, PACT Charter School Project Series 2022A, Rev., 5.00%, 6/1/2032 | 535,000 | 531,595 |
City of Rochester, Mayo Clinic Series 2022, Rev., 4.00%, 11/15/2039 | 1,425,000 | 1,417,493 |
City of Woodbury, Charter School Lease, Woodbury Leadership Academy Project | ||
Series 2021A, Rev., 4.00%, 7/1/2031 | 175,000 | 158,795 |
Series 2021A, Rev., 4.00%, 7/1/2041 | 445,000 | 347,946 |
Minneapolis-St. Paul Housing Finance Board, Single Family Mortgage, City Living Home Programs Series 2007A-2, Rev., GNMA / FNMA / FHLMC, 5.52%, 3/1/2041 | 105,000 | 104,888 |
Minnesota Housing Finance Agency Series 2022M, Rev., GNMA / FNMA / FHLMC COLL, 6.00%, 1/1/2053 | 1,250,000 | 1,332,086 |
Minnesota Housing Finance Agency, Non Profit Housing, State Appropriation | ||
Rev., 5.25%, 8/1/2024 | 1,015,000 | 1,016,766 |
Rev., 5.25%, 8/1/2025 | 1,070,000 | 1,071,481 |
Rev., 5.25%, 8/1/2026 | 825,000 | 826,196 |
Minnesota Housing Finance Agency, Residential Housing Finance Series 2017B, Rev., AMT, GNMA / FNMA / FHLMC COLL, 4.00%, 7/1/2047 | 245,000 | 242,733 |
Total Minnesota | 7,049,979 | |
Mississippi — 0.4% | ||
Mississippi Home Corp., Single Family Mortgage Series 2019A, Rev., GNMA / FNMA / FHLMC, 4.00%, 12/1/2048 | 840,000 | 830,572 |
Missouri — 0.6% | ||
Health and Educational Facilities Authority of the State of Missouri, Mercy Health Series 2018A, Rev., 5.00%, 6/1/2031 | 1,000,000 | 1,066,303 |
Industrial Development Authority of the City of St Louis Missouri (The), Innovation District Rev., 5.00%, 5/15/2041 | 425,000 | 414,732 |
Total Missouri | 1,481,035 | |
Nebraska — 0.7% | ||
Madison County Hospital Authority No. 1, Faith Regional Health Services Project | ||
Rev., 5.00%, 7/1/2030 | 1,020,000 | 1,036,611 |
Rev., 5.00%, 7/1/2031 | 720,000 | 731,922 |
Total Nebraska | 1,768,533 | |
60 |
INVESTMENTS | PRINCIPAL AMOUNT($) | VALUE($) |
Municipal Bonds — continued | ||
Nevada — 0.5% | ||
Carson City Nevada Hospital | ||
Rev., 5.00%, 9/1/2026 | 555,000 | 570,292 |
Rev., 5.00%, 9/1/2029 | 620,000 | 644,427 |
Total Nevada | 1,214,719 | |
New Hampshire — 2.5% | ||
City of Manchester, School Facilities | ||
Rev., NATL - RE, 5.50%, 6/1/2024 | 3,545,000 | 3,598,181 |
Rev., NATL - RE, 5.50%, 6/1/2027 | 900,000 | 969,689 |
New Hampshire Business Finance Authority, Springpoint Senior Living Project | ||
Rev., 4.00%, 1/1/2027 | 250,000 | 243,090 |
Rev., 4.00%, 1/1/2029 | 300,000 | 285,980 |
Rev., 4.00%, 1/1/2031 | 290,000 | 270,525 |
Rev., 4.00%, 1/1/2041 | 750,000 | 613,638 |
Total New Hampshire | 5,981,103 | |
New Jersey — 1.5% | ||
Atlantic County Improvement Authority (The), Atlantic City Campus Phase II Project | ||
Series 2021A, Rev., AGM, 5.00%, 7/1/2034 | 60,000 | 65,912 |
Series 2021A, Rev., AGM, 5.00%, 7/1/2035 | 75,000 | 81,829 |
Series 2021A, Rev., AGM, 4.00%, 7/1/2037 | 75,000 | 74,349 |
Camden County Improvement Authority (The), Camden Prep High School Project | ||
Rev., 4.00%, 7/15/2027 (c) | 215,000 | 209,603 |
Rev., 5.00%, 7/15/2032 (c) | 285,000 | 293,327 |
Rev., 5.00%, 7/15/2042 (c) | 590,000 | 573,132 |
Essex County Improvement Authority, North Star Academy Charter School of Newark, Inc., 2020 Project | ||
Rev., 4.00%, 7/15/2027 (c) | 400,000 | 395,092 |
Rev., 4.00%, 7/15/2029 (c) | 430,000 | 422,178 |
Rev., 4.00%, 7/15/2030 (c) | 200,000 | 195,647 |
New Jersey Housing and Mortgage Finance Agency, Single Family Housing Series 2018A, Rev., 4.50%, 10/1/2048 | 585,000 | 584,124 |
Passaic County Improvement Authority (The), Paterson arts and Science Charter School Projects Rev., 5.25%, 7/1/2043 | 670,000 | 660,582 |
Total New Jersey | 3,555,775 | |
New Mexico — 0.3% | ||
New Mexico Mortgage Finance Authority, Single Family Mortgage Program Series 2019C, Class I, Rev., GNMA / FNMA / FHLMC, 4.00%, 1/1/2050 | 715,000 | 705,743 |
INVESTMENTS | PRINCIPAL AMOUNT($) | VALUE($) |
New York — 4.3% | ||
Broome County Local Development Corp., Good Shepherd Village at Endwell, Inc. | ||
Rev., 3.50%, 7/1/2026 | 500,000 | 478,180 |
Rev., 4.00%, 7/1/2031 | 780,000 | 714,299 |
Build NYC Resource Corp., Global Community Charter School | ||
Series 2022A, Rev., 4.00%, 6/15/2032 | 135,000 | 127,515 |
Series 2022A, Rev., 5.00%, 6/15/2042 | 360,000 | 341,886 |
Series 2022A, Rev., 5.00%, 6/15/2052 | 640,000 | 580,290 |
Build NYC Resource Corp., Grand Concourse Academy Charter School | ||
Series 2022A, Rev., 3.40%, 7/1/2027 | 245,000 | 237,447 |
Series 2022A, Rev., 5.00%, 7/1/2032 | 100,000 | 103,864 |
Series 2022A, Rev., 5.00%, 7/1/2042 | 300,000 | 296,379 |
Build NYC Resource Corp., Kipp NYC Public School Facilities - Canal West Project | ||
Rev., 5.00%, 7/1/2029 | 460,000 | 483,791 |
Rev., 5.00%, 7/1/2031 | 535,000 | 568,939 |
Rev., 5.00%, 7/1/2032 | 550,000 | 586,365 |
Rev., 5.00%, 7/1/2035 | 530,000 | 555,291 |
Build NYC Resource Corp., New World Preparatory Charter School Project | ||
Series 2021A, Rev., 4.00%, 6/15/2031 (c) | 150,000 | 139,232 |
Series 2021A, Rev., 4.00%, 6/15/2041 (c) | 135,000 | 107,615 |
Monroe County Industrial Development Corp., Academy of Health Sciences Charter School Project Series 2022A, Rev., 5.00%, 7/1/2032 (c) | 250,000 | 240,997 |
New York City Water and Sewer System, Second General Resolution, Fiscal Year 2015 Series 2015FF, Rev., 5.00%, 6/15/2031 | 1,000,000 | 1,028,647 |
New York Transportation Development Corp., Delta Air Lines, Inc., LaGuardia Airport Terminals C&D Redevelopment Project Series 2018, Rev., AMT, 5.00%, 1/1/2025 | 1,750,000 | 1,764,815 |
State of New York Mortgage Agency, Homeowner Mortgage | ||
Series 197, Rev., 3.50%, 10/1/2044 | 390,000 | 384,818 |
Series 195, Rev., 4.00%, 10/1/2046 | 350,000 | 348,133 |
Westchester County Local Development Corp., Kendal on Hudson Project | ||
Series 2022B, Rev., 5.00%, 1/1/2027 | 140,000 | 142,172 |
Series 2022B, Rev., 5.00%, 1/1/2037 | 265,000 | 262,441 |
61 |
AS OF August 31, 2023 (Unaudited) (continued)
INVESTMENTS | PRINCIPAL AMOUNT($) | VALUE($) |
Municipal Bonds — continued | ||
New York — continued | ||
Series 2022B, Rev., 5.00%, 1/1/2041 | 250,000 | 241,824 |
Yonkers Economic Development Corp., Charter School of Educational Excellence Project Series 2020A, Rev., 4.00%, 10/15/2030 | 355,000 | 330,730 |
Total New York | 10,065,670 | |
North Carolina — 0.5% | ||
North Carolina Housing Finance Agency, Homeownership Series 43, Rev., GNMA / FNMA / FHLMC, 4.00%, 7/1/2050 | 445,000 | 439,143 |
North Carolina Medical Care Commission, Lutheran Services for The Aging Series 2021A, Rev., 4.00%, 3/1/2031 | 290,000 | 263,756 |
North Carolina Medical Care Commission, The Forest at Duke Project | ||
Rev., 4.00%, 9/1/2033 | 180,000 | 170,184 |
Rev., 4.00%, 9/1/2041 | 415,000 | 347,817 |
Total North Carolina | 1,220,900 | |
North Dakota — 0.4% | ||
North Dakota Housing Finance Agency, Home Mortgage Finance Program | ||
Series 2016D, Rev., 3.50%, 7/1/2046 | 175,000 | 171,870 |
Series 2015D, Rev., 4.00%, 7/1/2046 | 370,000 | 368,275 |
Series D, Rev., FHA, 4.00%, 1/1/2048 | 520,000 | 514,966 |
Total North Dakota | 1,055,111 | |
Ohio — 4.5% | ||
American Municipal Power, Inc., Solar Electricity Prepayment Project Series 2019A, Rev., 5.00%, 2/15/2035 | 825,000 | 883,797 |
Butler County Port Authority, Community First Solutions | ||
Series 2021A, Rev., 4.00%, 5/15/2037 | 210,000 | 200,657 |
Series 2021A, Rev., 4.00%, 5/15/2038 | 110,000 | 103,281 |
Series 2021A, Rev., 4.00%, 5/15/2039 | 115,000 | 106,732 |
Series 2021A, Rev., 4.00%, 5/15/2040 | 115,000 | 106,033 |
Series 2021A, Rev., 4.00%, 5/15/2041 | 125,000 | 114,302 |
County of Cuyahoga, Eliza Jennings Senior Care Network Series 2022A, Rev., 5.00%, 5/15/2032 | 460,000 | 438,428 |
County of Hardin, Economic Development Facilities Improvement, Ohio Northern University | ||
Rev., 4.00%, 5/1/2026 | 165,000 | 157,348 |
Rev., 5.00%, 5/1/2030 | 250,000 | 236,034 |
Lakota Local School District Series 2005, GO, NATL - RE, 5.25%, 12/1/2025 | 1,500,000 | 1,565,109 |
INVESTMENTS | PRINCIPAL AMOUNT($) | VALUE($) |
Ohio — continued | ||
Northeast Ohio Medical University | ||
Series 2021A, Rev., 5.00%, 12/1/2028 | 125,000 | 129,596 |
Series 2021A, Rev., 5.00%, 12/1/2030 | 65,000 | 67,948 |
Series 2022, Rev., 5.00%, 12/1/2034 | 950,000 | 1,036,597 |
Series 2021A, Rev., 4.00%, 12/1/2035 | 150,000 | 140,947 |
Series 2022, Rev., 5.00%, 12/1/2037 | 1,100,000 | 1,160,149 |
Ohio Higher Educational Facility Commission, Capital University 2022 Project | ||
Rev., 5.00%, 9/1/2027 | 325,000 | 329,405 |
Rev., 5.00%, 9/1/2028 | 340,000 | 346,283 |
Rev., 5.00%, 9/1/2029 | 355,000 | 362,300 |
Rev., 5.00%, 9/1/2030 | 275,000 | 281,213 |
Rev., 5.75%, 9/1/2037 | 500,000 | 516,328 |
Ohio Higher Educational Facility Commission, Cleveland Institute of Music 2 | ||
Rev., 5.00%, 12/1/2027 | 275,000 | 278,274 |
Rev., 5.00%, 12/1/2032 | 100,000 | 103,102 |
Ohio Higher Educational Facility Commission, Kenyon College Rev., 4.00%, 7/1/2044 | 1,340,000 | 1,218,426 |
Ohio Housing Finance Agency, Mortgage-Backed Securities Program Series 2016D, Rev., GNMA / FNMA / FHLMC, 4.00%, 3/1/2047 | 310,000 | 307,496 |
Ohio Water Development Authority Water Pollution Control Loan Fund Series 2020A, Rev., 5.00%, 12/1/2036 | 150,000 | 165,256 |
Port of Greater Cincinnati Development Authority, FC Cincinnati Public Improvements Project Rev., 3.75%, 12/1/2031 (c) | 245,000 | 224,045 |
Total Ohio | 10,579,086 | |
Oklahoma — 0.8% | ||
Oklahoma Water Resources Board, State Loan Program Series 2021D, Rev., 4.00%, 10/1/2046 | 2,035,000 | 1,973,701 |
Oregon — 1.0% | ||
Salem Hospital Facility Authority, Capital Manor Project | ||
Rev., 5.00%, 5/15/2028 | 155,000 | 155,955 |
Rev., 4.00%, 5/15/2029 | 130,000 | 124,130 |
Rev., 4.00%, 5/15/2047 | 400,000 | 303,219 |
62 |
INVESTMENTS | PRINCIPAL AMOUNT($) | VALUE($) |
Municipal Bonds — continued | ||
Oregon — continued | ||
Union County Hospital Facility Authority, Grande Ronde Hospital, Inc. Series 2022, Rev., 5.00%, 7/1/2035 | 1,360,000 | 1,410,758 |
Yamhill County Hospital Authority, Friendsview, Tax Exempt Series 2021A, Rev., 5.00%, 11/15/2046 | 500,000 | 391,777 |
Total Oregon | 2,385,839 | |
Other — 0.4% | ||
Multi-Family Housing, Bond Pass-Through Certificates, Grand Reserve Apartments Series 8, Rev., 5.95%, 11/1/2023 (b) | 845,000 | 844,661 |
Pennsylvania — 5.9% | ||
Allegheny County Higher Education Building Authority, Chatham University Rev., 5.00%, 9/1/2031 | 465,000 | 467,660 |
Allegheny County Hospital Development Authority, Pittsburgh Medical Center Series 2019A, Rev., 5.00%, 7/15/2033 | 600,000 | 648,479 |
Bucks County Industrial Development Authority, Grand View Hospital Project Rev., 5.00%, 7/1/2032 | 500,000 | 494,053 |
Bucks County Water and Sewer Authority | ||
Series 2022A, Rev., AGM, 5.00%, 12/1/2037 | 360,000 | 397,019 |
Series 2022A, Rev., AGM, 5.00%, 12/1/2038 | 525,000 | 574,785 |
Series 2022A, Rev., AGM, 5.00%, 12/1/2039 | 425,000 | 462,772 |
Cambria County General Financing Authority, Mount Aloysius Project Series 2021TT-4, Rev., 4.00%, 11/1/2036 | 535,000 | 483,284 |
Chester County Industrial Development Authority, Longwood Gardens Project | ||
Rev., 5.00%, 12/1/2035 | 175,000 | 192,696 |
Rev., 5.00%, 12/1/2036 | 185,000 | 202,290 |
Rev., 5.00%, 12/1/2037 | 200,000 | 217,454 |
City of Erie, Higher Education Building Authority, Gannon University Project - AICUP Financing Program Series 2021TT-1, Rev., 4.00%, 5/1/2036 | 100,000 | 89,733 |
Delaware County Authority, Neumann University Rev., 5.00%, 10/1/2023 | 240,000 | 240,023 |
Lancaster Industrial Development Authority, Landis Homes Retirement Community Project | ||
Rev., 4.00%, 7/1/2031 | 390,000 | 358,559 |
Rev., 4.00%, 7/1/2037 | 170,000 | 143,472 |
INVESTMENTS | PRINCIPAL AMOUNT($) | VALUE($) |
Pennsylvania — continued | ||
Lehigh County Industrial Development Authority, Seven Generation Charter School | ||
Series 2021A, Rev., 4.00%, 5/1/2031 | 340,000 | 315,704 |
Series 2021A, Rev., 4.00%, 5/1/2041 | 885,000 | 703,696 |
Pennsylvania Economic Development Financing Authority, Presbyterian Senior Living Homes Series 2021, Rev., 4.00%, 7/1/2046 | 750,000 | 618,284 |
Pennsylvania Higher Educational Facilities Authority, University of Pennsylvania Health System Rev., 4.00%, 8/15/2034 | 175,000 | 178,991 |
Pennsylvania Housing Finance Agency, Single Family Mortgage | ||
Series 2016-121, Rev., 3.50%, 10/1/2046 | 420,000 | 416,131 |
Series 2017-122, Rev., AMT, 4.00%, 10/1/2046 | 155,000 | 153,973 |
Philadelphia Authority for Industrial Development, City Service Agreement, Affordable Housing Preservation Programs Project | ||
Rev., AGM, 5.00%, 12/1/2026 | 1,550,000 | 1,634,864 |
Rev., AGM, 5.00%, 12/1/2027 | 680,000 | 722,760 |
Philadelphia Authority for Industrial Development, Electrical and Charter School Project Series 2021A, Rev., 4.00%, 6/1/2031 | 330,000 | 308,411 |
Philadelphia Authority for Industrial Development, Holy Family University Project Rev., 5.00%, 9/1/2026 | 775,000 | 794,817 |
Philadelphia Authority for Industrial Development, Philadelphia Electrical and Technology Charter School Project Series 2021A, Rev., 4.00%, 6/1/2041 | 175,000 | 142,204 |
Philadelphia Authority for Industrial Development, Russell Byers Charter School Project Series 2020A, Rev., 5.00%, 5/1/2030 | 1,015,000 | 1,019,878 |
Philadelphia Energy Authority (The), Philadelphia Street Lighting Project Series 2023A, Rev., 5.00%, 11/1/2043 | 750,000 | 793,314 |
West Cornwall Township Municipal Authority, Lebanon Valley Brethren Home Project | ||
Series 2021A, Rev., 4.00%, 11/15/2029 | 135,000 | 126,642 |
Series 2021A, Rev., 4.00%, 11/15/2030 | 190,000 | 176,125 |
Series 2021A, Rev., 4.00%, 11/15/2031 | 195,000 | 178,923 |
Series 2021A, Rev., 4.00%, 11/15/2036 | 365,000 | 311,316 |
Series 2021A, Rev., 4.00%, 11/15/2041 | 370,000 | 295,011 |
Total Pennsylvania | 13,863,323 | |
63 |
AS OF August 31, 2023 (Unaudited) (continued)
INVESTMENTS | PRINCIPAL AMOUNT($) | VALUE($) |
Municipal Bonds — continued | ||
South Carolina — 0.2% | ||
South Carolina State Housing Finance and Development Authority | ||
Series 2017A, Rev., 4.00%, 1/1/2047 | 105,000 | 104,333 |
Series 2017B, Rev., FHA, GNMA / FNMA / FHLMC, 4.00%, 7/1/2047 | 285,000 | 282,521 |
Total South Carolina | 386,854 | |
South Dakota — 0.7% | ||
South Dakota Housing Development Authority, Homeownership Mortgage | ||
Series 2015D, Rev., 4.00%, 11/1/2045 | 440,000 | 437,474 |
Series 2019A, Rev., 4.00%, 5/1/2049 | 1,170,000 | 1,156,893 |
Total South Dakota | 1,594,367 | |
Tennessee — 1.2% | ||
Metropolitan Government Nashville and Davidson County Health and Educational Facilities Board, Blakeford at Green Hills Series 2020A, Rev., 4.00%, 11/1/2038 | 1,305,000 | 1,099,438 |
Metropolitan Government Nashville and Davidson County Health and Educational Facilities Board, Trevecca Nazarene University Project | ||
Series 2021B, Rev., 4.00%, 10/1/2030 | 105,000 | 101,497 |
Series 2021B, Rev., 4.00%, 10/1/2031 | 220,000 | 211,549 |
Metropolitan Government Nashville and Davidson County, Health and Educational Facilities Board, Trevecca Nazarene University Project Series 2021B, Rev., 4.00%, 10/1/2041 | 850,000 | 720,001 |
Shelby County Health Educational and Housing Facilities Board, The Farms at Bailey Station Project Series 2019A, Rev., 5.75%, 10/1/2049 | 1,000,000 | 755,937 |
Tennessee Housing Development Agency, Residential Finance Program Series 2B, Rev., AMT, 4.00%, 7/1/2043 | 5,000 | 4,990 |
Total Tennessee | 2,893,412 | |
Texas — 6.4% | ||
Arlington Higher Education Finance Corp. | ||
Series 2021A, Rev., 5.00%, 8/15/2027 | 100,000 | 99,926 |
Series 2021A, Rev., 5.00%, 8/15/2028 | 40,000 | 39,999 |
Series 2021A, Rev., 4.00%, 8/15/2029 | 40,000 | 37,747 |
Series 2021A, Rev., 4.00%, 8/15/2030 | 40,000 | 37,408 |
Series 2021A, Rev., 4.00%, 8/15/2031 | 45,000 | 41,660 |
Arlington Higher Education Finance Corp., Newman International Academy | ||
Series 2021A, Rev., 4.00%, 8/15/2031 | 200,000 | 179,699 |
INVESTMENTS | PRINCIPAL AMOUNT($) | VALUE($) |
Texas — continued | ||
Series 2021A, Rev., 5.00%, 8/15/2041 | 300,000 | 263,106 |
Baytown Municipal Development District, Baytown Convention Center Hotel, First Lien Series 2021A, Rev., 2.50%, 10/1/2031 | 275,000 | 236,688 |
Clifton Higher Education Finance Corp., Yes Prep Public Schools, Inc. Series 2023, Rev., PSF-GTD, 4.25%, 4/1/2048 | 1,000,000 | 945,889 |
Conroe Local Government Corp., Conroe Convention Center Hotel Series 2021A, Rev., 2.50%, 10/1/2031 | 225,000 | 186,493 |
Denton Independent School District | ||
Series 2023, GO, PSF-GTD, 5.00%, 8/15/2041 | 1,055,000 | 1,159,168 |
Series 2023, GO, PSF-GTD, 5.00%, 8/15/2043 | 1,250,000 | 1,363,989 |
Houston Higher Education Finance Corp., Houston Baptist University Rev., 3.38%, 10/1/2037 | 250,000 | 206,544 |
Irving Hospital Authority, Baylor Scott and White Medical Center | ||
Series 2017A, Rev., 5.00%, 10/15/2026 | 250,000 | 257,033 |
Series 2017A, Rev., 5.00%, 10/15/2027 | 500,000 | 515,199 |
Midtown Redevelopment Authority, Tax Increment Contract | ||
Rev., 4.00%, 1/1/2031 | 365,000 | 375,265 |
Rev., 4.00%, 1/1/2032 | 500,000 | 511,225 |
New Hope Cultural Education Facilities Finance Corp, Outlook at Windhaven Forefront Living Series 2022B-3, Rev., 4.25%, 10/1/2026 | 1,750,000 | 1,715,425 |
New Hope Cultural Education Facilities Finance Corp., Morningside Ministries Project Rev., 4.00%, 1/1/2032 | 420,000 | 356,436 |
New Hope Cultural Education Facilities Finance Corp., Westminster Project Rev., 4.00%, 11/1/2055 | 550,000 | 410,907 |
Newark Higher Education Finance Corp., The Hughen Center, Inc. | ||
Series 2021A, Rev., PSF-GTD, 5.00%, 8/15/2030 | 180,000 | 200,283 |
Series 2021A, Rev., PSF-GTD, 5.00%, 8/15/2031 | 200,000 | 225,626 |
Series 2022A, Rev., PSF-GTD, 5.00%, 8/15/2037 | 250,000 | 274,932 |
Series 2022A, Rev., PSF-GTD, 5.00%, 8/15/2042 | 345,000 | 370,790 |
San Antonio Education Facilities Corp., University of The Incarnate Word Series 2021A, Rev., 4.00%, 4/1/2051 | 500,000 | 396,229 |
64 |
INVESTMENTS | PRINCIPAL AMOUNT($) | VALUE($) |
Municipal Bonds — continued | ||
Texas — continued | ||
State of Texas, Water Financial Assistance Series 2015D, GO, 5.00%, 5/15/2033 | 450,000 | 461,158 |
Tarrant County Cultural Education Facilities Finance Corp., CHRISTUS Health Series 2022A, Rev., 4.00%, 7/1/2053 | 750,000 | 668,602 |
Texas State Affordable Housing Corp., Single Family Mortgage, Heroes Home Loan Program Series 2019A, Rev., GNMA COLL, 4.25%, 3/1/2049 | 390,000 | 387,574 |
Texas Water Development Board, Water Implementation, Master Trust Rev., 4.00%, 10/15/2045 | 3,000,000 | 2,843,423 |
Uptown Development Authority, Tax Increment Contract Rev., 4.00%, 9/1/2033 | 400,000 | 383,775 |
Total Texas | 15,152,198 | |
Utah — 2.2% | ||
Military Installation Development Authority, Tax Allocation and Hotel Tax Series 2021A-1, Rev., 4.00%, 6/1/2036 | 250,000 | 209,647 |
Utah Associated Municipal Power System, Horse Butte Wind Project Series 2017B, Rev., 5.00%, 9/1/2033 | 1,700,000 | 1,805,880 |
Utah Charter School Finance Authority, The Freedom Academy Foundation, St. George Campus Project Series 2021A, Rev., 3.25%, 6/15/2031 (c) | 535,000 | 469,242 |
Utah Charter School Finance Authority, Wallace Stegner Academy | ||
Series 2022A, Rev., 5.25%, 6/15/2032 (c) | 250,000 | 246,014 |
Series 2022A, Rev., 5.63%, 6/15/2042 (c) | 400,000 | 382,980 |
Utah Housing Corp., Single Family Mortgage Series D-2, Class III, Rev., FHA, 4.00%, 1/1/2045 | 520,000 | 515,113 |
Utah Infrastructure Agency, Tax-Exempt Telecommunications | ||
Rev., 5.00%, 10/15/2027 | 130,000 | 131,655 |
Rev., 5.00%, 10/15/2032 | 310,000 | 318,035 |
Utah Transit Authority, Sales Tax Series 2006C, Rev., AGM, 5.25%, 6/15/2029 | 970,000 | 1,071,273 |
Total Utah | 5,149,839 | |
Vermont — 1.6% | ||
Vermont Housing Finance Agency, Multiple Purpose Series B, Rev., AMT, 3.75%, 11/1/2045 | 200,000 | 198,819 |
INVESTMENTS | PRINCIPAL AMOUNT($) | VALUE($) |
Vermont — continued | ||
Vermont Student Assistance Corp., Education Loan | ||
Series 2016A, Rev., AMT, 5.00%, 6/15/2024 | 1,400,000 | 1,410,450 |
Series 2016A, Rev., AMT, 5.00%, 6/15/2025 | 2,150,000 | 2,179,247 |
Total Vermont | 3,788,516 | |
Virginia — 0.5% | ||
Henrico County Economic Development Authority, Westminster Canterbury Richmond | ||
Rev., 3.00%, 10/1/2029 | 500,000 | 462,996 |
Rev., 3.00%, 10/1/2030 | 500,000 | 458,509 |
Virginia College Building Authority, Education Facilities, Regent University Project Rev., 5.00%, 6/1/2031 | 160,000 | 167,873 |
Total Virginia | 1,089,378 | |
Washington — 4.0% | ||
FYI Properties, State of Washington District Project Rev., 5.00%, 6/1/2039 | 5,000,000 | 5,259,027 |
King County Housing Authority, Highland Village Project | ||
Rev., 5.00%, 1/1/2027 | 125,000 | 130,842 |
Rev., 5.00%, 1/1/2028 | 125,000 | 131,279 |
Rev., 5.00%, 1/1/2029 | 125,000 | 132,416 |
Rev., 4.00%, 1/1/2031 | 330,000 | 331,275 |
Rev., 4.00%, 1/1/2034 | 500,000 | 497,039 |
North Thurston Public Schools, Unlimited Tax GO, 4.00%, 12/1/2036 | 1,000,000 | 1,020,798 |
Washington Health Care Facilities Authority, Multi-care Health System Series 2017B, Rev., 5.00%, 8/15/2035 | 1,850,000 | 1,889,144 |
Washington State Housing Finance Commission, Single Family Program Series 2016 2A-R, Rev., AMT, 3.50%, 12/1/2046 | 65,000 | 64,312 |
Total Washington | 9,456,132 | |
West Virginia — 0.2% | ||
West Virginia Hospital Finance Authority, West Virginia University Health System Obligation Series 2023A, Rev., 5.00%, 6/1/2039 | 500,000 | 526,198 |
Wisconsin — 3.9% | ||
Public Finance Authority Series 2022, Rev., 4.00%, 4/1/2032 (c) | 225,000 | 211,709 |
Public Finance Authority, Carson Valley Medical Center Series 2021A, Rev., 4.00%, 12/1/2041 | 250,000 | 206,686 |
65 |
AS OF August 31, 2023 (Unaudited) (continued)
INVESTMENTS | PRINCIPAL AMOUNT($) | VALUE($) |
Municipal Bonds — continued | ||
Wisconsin — continued | ||
Public Finance Authority, College Achieve Central Charter School Project | ||
Series 2021A, Rev., 5.00%, 6/15/2027 (c) | 260,000 | 259,273 |
Series 2021A, Rev., 5.00%, 6/15/2029 (c) | 285,000 | 280,769 |
Series 2021A, Rev., 5.00%, 6/15/2031 (c) | 315,000 | 306,279 |
Public Finance Authority, Coral Academy of Science Series 2021A, Rev., 4.00%, 7/1/2041 | 500,000 | 414,544 |
Public Finance Authority, Ripple Ranch, LLC Obligate Series 2021A, Rev., 5.25%, 12/1/2051 (c) | 200,000 | 134,614 |
Public Finance Authority, Senior Lien, Grand Hyatt Series 2022A, Rev., 3.75%, 2/1/2032 | 200,000 | 184,947 |
Public Finance Authority, The Carmelite System, Inc., Obligated Group Rev., 3.25%, 1/1/2026 | 1,545,000 | 1,495,859 |
Public Finance Authority, The Franklin School of Innovation Rev., 5.00%, 1/1/2042 (c) | 145,000 | 128,413 |
Public Finance Authority, Viticus Group Project Series 2022A, Rev., 4.00%, 12/1/2031 (c) | 240,000 | 215,799 |
Wisconsin Health and Educational Facilities Authority, Agnesian Healthcare, Inc. | ||
Rev., 5.00%, 7/1/2024 | 250,000 | 252,683 |
Rev., 5.00%, 7/1/2025 | 250,000 | 255,259 |
Wisconsin Health and Educational Facilities Authority, Franciscan Sisters of Christian Charity Sponsored Ministries, Inc. | ||
Series 2017A, Rev., 5.00%, 9/1/2024 (e) | 580,000 | 588,380 |
Series 2017A, Rev., 5.00%, 9/1/2025 (e) | 235,000 | 241,946 |
Series 2017A, Rev., 5.00%, 9/1/2026 (e) | 385,000 | 403,344 |
Series 2017A, Rev., 5.00%, 9/1/2027 (e) | 785,000 | 837,402 |
Wisconsin Health and Educational Facilities Authority, Marshfield Clinic Health System, Inc. | ||
Series 2017C, Rev., 5.00%, 2/15/2027 | 400,000 | 412,584 |
Series 2017C, Rev., 5.00%, 2/15/2029 | 375,000 | 385,396 |
Wisconsin Health and Educational Facilities Authority, Milwaukee Regional Medical Center Thermal Service Rev., 5.00%, 4/1/2035 | 1,165,000 | 1,240,944 |
Wisconsin Health and Educational Facilities Authority, Three Pillars Senior Living Communities Series 2021A, Rev., 4.00%, 8/15/2041 | 825,000 | 674,317 |
Total Wisconsin | 9,131,147 | |
INVESTMENTS | PRINCIPAL AMOUNT($) | VALUE($) |
Wyoming — 0.1% | ||
Wyoming Community Development Authority Series 2017-5, Rev., 4.00%, 12/1/2046 | 360,000 | 356,756 |
Total Municipal Bonds (Cost $245,901,693) | 231,728,613 | |
SHARES | ||
Short-Term Investments — 1.2% | ||
Investment Companies — 1.2% | ||
JPMorgan Institutional Tax Free Money Market Fund Class IM Shares, 3.71% (f) (g) (Cost $2,684,493) | 2,684,485 | 2,684,754 |
Total Investments — 99.5% (Cost $248,586,186) | 234,413,367 | |
Other Assets Less Liabilities — 0.5% | 1,245,319 | |
NET ASSETS — 100.0% | 235,658,686 | |
Percentages indicated are based on net assets. |
Abbreviations | |
AGM | Insured by Assured Guaranty Municipal Corp. |
AMT | Alternative Minimum Tax |
BAN | Bond Anticipation Note |
CHESLA | Connecticut Higher Education Supplemental Loan Authority |
COLL | Collateral |
COP | Certificate of Participation |
FHA | Federal Housing Administration |
FHLMC | Federal Home Loan Mortgage Corp. |
FNMA | Federal National Mortgage Association |
GNMA | Government National Mortgage Association |
GO | General Obligation |
NATL | Insured by National Public Finance Guarantee Corp. |
PSF-GTD | Permanent School Fund Guaranteed |
RE | Reinsured |
Rev. | Revenue |
(a) | The date shown represents the earliest of the prerefunded date, next put date or final maturity date. |
(b) | Variable or floating rate security, the interest rate of which adjusts periodically based on changes in current interest rates and prepayments on the underlying pool of assets. The interest rate shown is the current rate as of August 31, 2023. |
(c) | Securities exempt from registration under Rule 144A or section 4(a)(2), of the Securities Act of 1933, as amended. |
(d) | All or a portion of the security is a when-issued security, delayed delivery security, or forward commitment. |
(e) | Security is prerefunded or escrowed to maturity. |
(f) | Investment in an affiliated fund, which is registered under the Investment Company Act of 1940, as amended, and is advised by J.P. Morgan Investment Management Inc. |
(g) | The rate shown is the current yield as of August 31, 2023. |
66 |
REFERENCE OBLIGATION/INDEX | FINANCING RATE PAID BY THE FUND (%) | PAYMENT FREQUENCY | MATURITY DATE | IMPLIED CREDIT SPREAD (%)(a) | NOTIONAL AMOUNT(b) | UPFRONT PAYMENTS (RECEIPTS) ($)(c) | UNREALIZED APPRECIATION (DEPRECIATION) ($) | VALUE ($) |
CDX.NA.HY.40-V1 | 5.00 | Quarterly | 6/20/2028 | 4.26 | USD10,550,000 | (249,923 ) | (155,108 ) | (405,031 ) |
(*) | The Fund, as a buyer of credit protection, is generally obligated to make periodic payments and may also pay or receive an upfront premium to or from the protection seller, in exchange for the right to receive a contingent payment, upon occurrence of a credit event with respect to an underlying reference obligation, as defined under the terms of individual swap contracts. | ||||||||
(a) | Implied credit spreads are an indication of the seller's performance risk, related to the likelihood of a credit event occurring that would require a seller to make payment to a buyer. Implied credit spreads are used to determine the value of swap contracts and reflect the cost of buying/selling protection, which may include upfront payments made to enter into the contract. Therefore, higher spreads would indicate a greater likelihood that a seller will be obligated to perform (i.e. make payment) under the swap contract. Increasing values, in absolute terms and relative to notional amounts, are also indicative of greater performance risk. Implied credit spreads for credit default swaps on credit indices are linked to the weighted average spread across the underlying reference obligations included in a particular index. | ||||||||
(b) | The notional amount is the maximum amount that a seller of credit protection would be obligated to pay and a buyer of credit protection would receive, upon occurrence of a credit event. | ||||||||
(c) | Upfront payments and receipts generally represent premiums paid or received at the initiation of the agreement to compensate the differences between the stated terms of the swap agreement and current market conditions (credit spreads, interest rates and other relevant factors). | ||||||||
Abbreviations | |
CDX | Credit Default Swap Index |
USD | United States Dollar |
67 |
AS OF August 31, 2023 (Unaudited)
JPMorgan High Yield Municipal ETF | JPMorgan Inflation Managed Bond ETF | JPMorgan Limited Duration Bond ETF | |
ASSETS: | |||
Investments in non-affiliates, at value | $190,268,944 | $478,524,226 | $769,000,683 |
Investments in affiliates, at value | 35,111,891 | 6,085,646 | 63,436,642 |
Cash | 50,778 | 43,367 | 186,401 |
Deposits at broker for centrally cleared swaps | 425,000 | 40,000 | — |
Receivables: | |||
Investment securities sold | — | 41,858 | — |
Fund shares sold | 586 | — | — |
Interest from non-affiliates | 2,152,300 | 2,079,367 | 1,856,716 |
Dividends from affiliates | 97,383 | 911 | 405,617 |
Variation margin on futures contracts | — | 207,885 | — |
Variation margin on centrally cleared swaps | 3,219 | — | — |
Due from adviser | — | 2,895 | — |
Total Assets | 228,110,101 | 487,026,155 | 834,886,059 |
LIABILITIES: | |||
Payables: | |||
Investment securities purchased — delayed delivery securities | 7,356,380 | — | 8,346,465 |
Variation margin on centrally cleared swaps | — | 181,060 | — |
Accrued liabilities: | |||
Investment advisory fees | 29,403 | 61,250 | 89,993 |
Administration fees | 14,141 | 31,090 | 52,629 |
Printing and mailing costs | — | 85,593 | 1,697 |
Custodian and accounting fees | 23,589 | 64,638 | 13,466 |
Other | 37,264 | 66,614 | 34,820 |
Total Liabilities | 7,460,777 | 490,245 | 8,539,070 |
Net Assets | $220,649,324 | $486,535,910 | $826,346,989 |
68 | J.P. Morgan Exchange-Traded Funds | August 31, 2023 |
JPMorgan High Yield Municipal ETF | JPMorgan Inflation Managed Bond ETF | JPMorgan Limited Duration Bond ETF | |
NET ASSETS: | |||
Paid-in-Capital | $285,720,679 | $580,203,852 | $883,907,082 |
Total distributable earnings (loss) | (65,071,355 ) | (93,667,942 ) | (57,560,093 ) |
Total Net Assets | $220,649,324 | $486,535,910 | $826,346,989 |
Outstanding number of shares (unlimited number of shares authorized - par value $0.0001) (a) (b) | 4,500,360 | 10,593,210 | 16,453,170 |
Net asset value, per share | $49.03 | $45.93 | $50.22 |
Cost of investments in non-affiliates | $217,238,006 | $516,340,714 | $809,054,914 |
Cost of investments in affiliates | 35,111,891 | 6,084,997 | 63,431,941 |
Net upfront receipts on centrally cleared swaps | (154,455 ) | (285,014 ) | — |
August 31, 2023 | J.P. Morgan Exchange-Traded Funds | 69 |
AS OF August 31, 2023 (Unaudited) (continued)
JPMorgan Realty Income ETF | JPMorgan Sustainable Municipal Income ETF | |
ASSETS: | ||
Investments in non-affiliates, at value | $324,113,384 | $231,728,613 |
Investments in affiliates, at value | 8,371,618 | 2,684,754 |
Investments of cash collateral received from securities loaned, at value (See Note 2.D.) | 6,038,807 | — |
Cash | 43,717 | 45,264 |
Deposits at broker for centrally cleared swaps | — | 584,000 |
Receivables: | ||
Investment securities sold | 3,290,103 | 638,950 |
Interest from non-affiliates | — | 2,686,818 |
Dividends from non-affiliates | 246,692 | — |
Dividends from affiliates | 1,253 | 12,162 |
Securities lending income (See Note 2.D.) | 864 | — |
Variation margin on centrally cleared swaps | — | 5,210 |
Total Assets | 342,106,438 | 238,385,771 |
LIABILITIES: | ||
Payables: | ||
Investment securities purchased — delayed delivery securities | — | 2,669,275 |
Collateral received on securities loaned (See Note 2.D.) | 6,038,807 | — |
Accrued liabilities: | ||
Investment advisory fees | 106,497 | 1,196 |
Administration fees | 21,329 | 15,014 |
Printing and mailing costs | 81,944 | 587 |
Custodian and accounting fees | 27,262 | 15,674 |
Other | 71,111 | 25,339 |
Total Liabilities | 6,346,950 | 2,727,085 |
Net Assets | $335,759,488 | $235,658,686 |
NET ASSETS: | ||
Paid-in-Capital | $334,367,082 | $258,925,663 |
Total distributable earnings (loss) | 1,392,406 | (23,266,977 ) |
Total Net Assets | $335,759,488 | $235,658,686 |
Outstanding number of shares (unlimited number of shares authorized - par value $0.0001) (a) | 7,997,859 | 4,756,783 |
Net asset value, per share | $41.98 | $49.54 |
Cost of investments in non-affiliates | $318,584,912 | $245,901,693 |
Cost of investments in affiliates | 8,370,575 | 2,684,493 |
Investment securities on loan, at value (See Note 2.D.) | 5,897,227 | — |
Cost of investment of cash collateral (See Note 2.D.) | 6,038,807 | — |
Net upfront receipts on centrally cleared swaps | — | (249,923 ) |
70 | J.P. Morgan Exchange-Traded Funds | August 31, 2023 |
FOR THE SIX MONTHS ENDED August 31, 2023 (Unaudited)
JPMorgan High Yield Municipal ETF (a) | JPMorgan Inflation Managed Bond ETF | JPMorgan Limited Duration Bond ETF (b) | |
INVESTMENT INCOME: | |||
Interest income from non-affiliates | $5,892,451 | $13,507,392 | $19,689,987 |
Interest income from affiliates | 94 | 687 | 791 |
Dividend income from affiliates | 156,244 | 378,956 | 1,932,771 |
Total investment income | 6,048,789 | 13,887,035 | 21,623,549 |
EXPENSES: | |||
Investment advisory fees | 468,598 | 890,528 | 1,021,783 |
Administration fees | 100,414 | 238,536 | 383,166 |
Distribution fees (See Note 3.C.) | 162,173 | — | 187,512 |
Service fees (See Note 3.D.) | 248,391 | — | 382,999 |
Custodian and accounting fees | 56,536 | 46,824 | 39,799 |
Interest expense to non-affiliates | — | 908 | — |
Interest expense to affiliates | 602 | 4,848 | 27 |
Professional fees | 46,130 | 44,714 | 43,272 |
Trustees’ and Chief Compliance Officer’s fees | 13,342 | 12,555 | 14,710 |
Printing and mailing costs | 35,611 | 5,999 | 67,474 |
Registration and filing fees | 13,924 | 14,771 | 35,755 |
Transfer agency fees (See Note 2.H.) | 2,656 | — | 10,329 |
Other | 6,566 | 11,788 | 6,516 |
Total expenses | 1,154,943 | 1,271,471 | 2,193,342 |
Less fees waived | (477,910 ) | (11,735 ) | (632,324 ) |
Less expense reimbursements | (86,029 ) | (476,468 ) | (55,849 ) |
Net expenses | 591,004 | 783,268 | 1,505,169 |
Net investment income (loss) | 5,457,785 | 13,103,767 | 20,118,380 |
August 31, 2023 | J.P. Morgan Exchange-Traded Funds | 71 |
FOR THE SIX MONTHS ENDED August 31, 2023 (Unaudited) (continued)
JPMorgan High Yield Municipal ETF (a) | JPMorgan Inflation Managed Bond ETF | JPMorgan Limited Duration Bond ETF (b) | |
REALIZED/UNREALIZED GAINS (LOSSES): | |||
Net realized gain (loss) on transactions from: | |||
Investments in non-affiliates | $(20,703,817 ) | $(14,595,761 ) | $(7,709,493 ) |
Investments in affiliates | (3,707 ) | 330 | 13,438 |
In-kind redemptions of investments in non-affiliates (See Note 4) | — | (1,802,263 ) | — |
Futures contracts | — | (1,787,288 ) | — |
Swaps | (1,005,251 ) | 1,247,736 | — |
Net realized gain (loss) | (21,712,775 ) | (16,937,246 ) | (7,696,055 ) |
Change in net unrealized appreciation/depreciation on: | |||
Investments in non-affiliates | 16,966,303 | 20,888,082 | 9,534,808 |
Investments in affiliates | — | (1,783 ) | (32,128 ) |
Futures contracts | — | 750,710 | — |
Swaps | 690,660 | (3,533,686 ) | — |
Change in net unrealized appreciation/depreciation | 17,656,963 | 18,103,323 | 9,502,680 |
Net realized/unrealized gains (losses) | (4,055,812 ) | 1,166,077 | 1,806,625 |
Change in net assets resulting from operations | $1,401,973 | $14,269,844 | $21,925,005 |
72 | J.P. Morgan Exchange-Traded Funds | August 31, 2023 |
JPMorgan Realty Income ETF | JPMorgan Sustainable Municipal Income ETF (a) | |
INVESTMENT INCOME: | ||
Interest income from non-affiliates | $— | $4,461,223 |
Interest income from affiliates | 101 | 426 |
Dividend income from non-affiliates | 6,852,161 | — |
Dividend income from affiliates | 318,549 | 112,072 |
Income from securities lending (net) (See Note 2.D.) | 8,068 | — |
Total investment income | 7,178,879 | 4,573,721 |
EXPENSES: | ||
Investment advisory fees | 1,250,710 | 388,342 |
Administration fees | 156,339 | 97,085 |
Distribution fees (See Note 3.C.) | — | 83,166 |
Service fees (See Note 3.D.) | — | 187,631 |
Custodian and accounting fees | 5,000 | 48,271 |
Interest expense to non-affiliates | 817 | 292 |
Professional fees | 30,750 | 35,137 |
Trustees’ and Chief Compliance Officer’s fees | 11,992 | 12,902 |
Printing and mailing costs | 35,395 | 24,360 |
Registration and filing fees | 8,785 | 45,305 |
Transfer agency fees (See Note 2.H.) | — | 1,702 |
Other | 13,157 | 4,402 |
Total expenses | 1,512,945 | 928,595 |
Less fees waived | (9,367 ) | (364,916 ) |
Less expense reimbursements | (475,877 ) | (92,370 ) |
Net expenses | 1,027,701 | 471,309 |
Net investment income (loss) | 6,151,178 | 4,102,412 |
August 31, 2023 | J.P. Morgan Exchange-Traded Funds | 73 |
FOR THE SIX MONTHS ENDED August 31, 2023 (Unaudited) (continued)
JPMorgan Realty Income ETF | JPMorgan Sustainable Municipal Income ETF (a) | |
REALIZED/UNREALIZED GAINS (LOSSES): | ||
Net realized gain (loss) on transactions from: | ||
Investments in non-affiliates | $(15,882,824 ) | $(1,810,156 ) |
Investments in affiliates | (2,072 ) | 1,753 |
In-kind redemptions of investments in non-affiliates (See Note 4) | 34,288,569 | — |
Futures contracts | — | (41,110 ) |
Swaps | — | (810,110 ) |
Net realized gain (loss) | 18,403,673 | (2,659,623 ) |
Change in net unrealized appreciation/depreciation on: | ||
Investments in non-affiliates | (29,699,718 ) | 1,148,644 |
Investments in affiliates | 1,282 | 85 |
Futures contracts | — | (537 ) |
Swaps | — | 508,033 |
Change in net unrealized appreciation/depreciation | (29,698,436 ) | 1,656,225 |
Net realized/unrealized gains (losses) | (11,294,763 ) | (1,003,398 ) |
Change in net assets resulting from operations | $(5,143,585 ) | $3,099,014 |
74 | J.P. Morgan Exchange-Traded Funds | August 31, 2023 |
FOR THE PERIODS INDICATED
JPMorgan High Yield Municipal ETF | JPMorgan Inflation Managed Bond ETF | |||
Six Months Ended August 31, 2023 (Unaudited)(a) | Year Ended February 28, 2023 (a) | Six Months Ended August 31, 2023 (Unaudited) | Year Ended February 28, 2023 (b) | |
CHANGE IN NET ASSETS RESULTING FROM OPERATIONS: | ||||
Net investment income (loss) | $5,457,785 | $13,708,808 | $13,103,767 | $33,443,609 |
Net realized gain (loss) | (21,712,775 ) | (16,687,330 ) | (16,937,246 ) | (37,445,587 ) |
Distributions of capital gains received from investment company affiliates | — | 28 | — | — |
Change in net unrealized appreciation/depreciation | 17,656,963 | (49,939,278 ) | 18,103,323 | (71,525,471 ) |
Change in net assets resulting from operations | 1,401,973 | (52,917,772 ) | 14,269,844 | (75,527,449 ) |
DISTRIBUTIONS TO SHAREHOLDERS: | ||||
Total distributions to shareholders | (4,420,793 ) | (13,587,353 ) | (12,352,100 ) | (35,607,004 ) |
CAPITAL TRANSACTIONS: | ||||
Change in net assets resulting from capital transactions | (81,713,964 ) | (120,748,861 ) | (419,988,691 ) | (151,417,047 ) |
NET ASSETS: | ||||
Change in net assets | (84,732,784 ) | (187,253,986 ) | (418,070,947 ) | (262,551,500 ) |
Beginning of period | 305,382,108 | 492,636,094 | 904,606,857 | 1,167,158,357 |
End of period | $220,649,324 | $305,382,108 | $486,535,910 | $904,606,857 |
August 31, 2023 | J.P. Morgan Exchange-Traded Funds | 75 |
FOR THE PERIODS INDICATED (continued)
JPMorgan Limited Duration Bond ETF | JPMorgan Realty Income ETF | |||
Six Months Ended August 31, 2023 (Unaudited)(a) | Year Ended February 28, 2023 (a) | Six Months Ended August 31, 2023 (Unaudited) | Year Ended February 28, 2023 (b) | |
CHANGE IN NET ASSETS RESULTING FROM OPERATIONS: | ||||
Net investment income (loss) | $20,118,380 | $27,564,224 | $6,151,178 | $18,195,067 |
Net realized gain (loss) | (7,696,055 ) | (923,264 ) | 18,403,673 | 318,623,424 |
Change in net unrealized appreciation/depreciation | 9,502,680 | (38,858,941 ) | (29,698,436 ) | (488,183,699 ) |
Change in net assets resulting from operations | 21,925,005 | (12,217,981 ) | (5,143,585 ) | (151,365,208 ) |
DISTRIBUTIONS TO SHAREHOLDERS: | ||||
Total distributions to shareholders | (17,648,971 ) | (27,004,700 ) | (7,857,983 ) | (209,509,368 ) |
CAPITAL TRANSACTIONS: | ||||
Change in net assets resulting from capital transactions | (301,617,136 ) | (107,791,299 ) | (160,793,179 ) | (671,849,490 ) |
NET ASSETS: | ||||
Change in net assets | (297,341,102 ) | (147,013,980 ) | (173,794,747 ) | (1,032,724,066 ) |
Beginning of period | 1,123,688,091 | 1,270,702,071 | 509,554,235 | 1,542,278,301 |
End of period | $826,346,989 | $1,123,688,091 | $335,759,488 | $509,554,235 |
76 | J.P. Morgan Exchange-Traded Funds | August 31, 2023 |
JPMorgan Sustainable Municipal Income ETF | ||
Six Months Ended August 31, 2023 (Unaudited)(a) | Year Ended February 28, 2023 (a) | |
CHANGE IN NET ASSETS RESULTING FROM OPERATIONS: | ||
Net investment income (loss) | $4,102,412 | $7,078,485 |
Net realized gain (loss) | (2,659,623 ) | (6,883,359 ) |
Distributions of capital gains received from investment company affiliates | — | 1,336 |
Change in net unrealized appreciation/depreciation | 1,656,225 | (18,415,859 ) |
Change in net assets resulting from operations | 3,099,014 | (18,219,397 ) |
DISTRIBUTIONS TO SHAREHOLDERS: | ||
Total distributions to shareholders | (3,241,183 ) | (7,029,156 ) |
CAPITAL TRANSACTIONS: | ||
Change in net assets resulting from capital transactions | (25,852,699 ) | (26,017,228 ) |
NET ASSETS: | ||
Change in net assets | (25,994,868 ) | (51,265,781 ) |
Beginning of period | 261,653,554 | 312,919,335 |
End of period | $235,658,686 | $261,653,554 |
August 31, 2023 | J.P. Morgan Exchange-Traded Funds | 77 |
FOR THE PERIODS INDICATED (continued)
JPMorgan High Yield Municipal ETF | JPMorgan Inflation Managed Bond ETF | |||
Six Months Ended August 31, 2023 (Unaudited)(a) | Year Ended February 28, 2023(a) | Six Months Ended August 31, 2023 (Unaudited) | Year Ended February 28, 2023(b) | |
CAPITAL TRANSACTIONS: (c) (d) | ||||
Proceeds from shares issued | $3,264,542 | $3,722,949 | $4,866,875 | $143,694,884 |
Distributions reinvested | 182,983 | 582,535 | — | 2,379,990 |
Cost of shares redeemed | (8,853,160 ) | (8,295,343 ) | (424,855,566 ) | (280,551,196 ) |
Change in net assets resulting from capital transactions | (5,405,635 ) | (3,989,859 ) | (419,988,691 ) | (134,476,322 ) |
Class A | ||||
Proceeds from shares issued | 799,749 | 44,304,291 | — | 327,168 |
Distributions reinvested | 1,789,218 | 5,573,975 | — | 112,969 |
Cost of shares redeemed | (23,938,145 ) | (80,866,511 ) | — | (4,796,467 ) |
Change in net assets resulting from Class A capital transactions | (21,349,178 ) | (30,988,245 ) | — | (4,356,330 ) |
Class C | ||||
Proceeds from shares issued | 287,941 | 6,148,812 | — | 368,640 |
Distributions reinvested | 202,030 | 610,915 | — | 12,667 |
Cost of shares redeemed | (6,182,391 ) | (15,721,448 ) | — | (394,486 ) |
Change in net assets resulting from Class C capital transactions | (5,692,420 ) | (8,961,721 ) | — | (13,179 ) |
Class I | ||||
Proceeds from shares issued | 19,683,850 | 149,484,047 | — | 8,724,880 |
Distributions reinvested | 1,622,857 | 6,717,825 | — | 477,895 |
Cost of shares redeemed | (70,573,438 ) | (233,010,908 ) | — | (18,917,128 ) |
Change in net assets resulting from Class I capital transactions | (49,266,731 ) | (76,809,036 ) | — | (9,714,353 ) |
Class R5 | ||||
Proceeds from shares issued | — | — | — | 218,011 |
Distributions reinvested | — | — | — | 6,602 |
Cost of shares redeemed | — | — | — | (3,081,476 ) |
Change in net assets resulting from Class R5 capital transactions | — | — | — | (2,856,863 ) |
Total change in net assets resulting from capital transactions | $(81,713,964 ) | $(120,748,861 ) | $(419,988,691 ) | $(151,417,047 ) |
78 | J.P. Morgan Exchange-Traded Funds | August 31, 2023 |
JPMorgan High Yield Municipal ETF | JPMorgan Inflation Managed Bond ETF | |||
Six Months Ended August 31, 2023 (Unaudited)(a) | Year Ended February 28, 2023(a) | Six Months Ended August 31, 2023 (Unaudited) | Year Ended February 28, 2023(b) | |
SHARES TRANSACTIONS: (c) (d) | ||||
Issued | 64,935 | 370,970 | 100,000 | 2,978,252 |
Reinvested | 3,670 | 58,472 | — | 47,051 |
Redeemed | (177,902 ) | (826,488 ) | (9,050,000 ) | (5,844,105 ) |
Change in Shares | (109,297 ) | (397,046 ) | (8,950,000 ) | (2,818,802 ) |
Class A | ||||
Issued | 15,954 | 4,428,926 | — | 6,350 |
Reinvested | 35,889 | 560,662 | — | 2,233 |
Redeemed | (478,669 ) | (8,023,241 ) | — | (94,521 ) |
Change in Class A Shares | (426,826 ) | (3,033,653 ) | — | (85,938 ) |
Class C | ||||
Issued | 5,740 | 627,847 | — | 7,128 |
Reinvested | 4,052 | 61,373 | — | 250 |
Redeemed | (124,088 ) | (1,571,853 ) | — | (7,815 ) |
Change in Class C Shares | (114,296 ) | (882,633 ) | — | (437 ) |
Class I | ||||
Issued | 391,412 | 15,019,403 | — | 170,457 |
Reinvested | 32,524 | 673,901 | — | 9,449 |
Redeemed | (1,411,135 ) | (23,155,741 ) | — | (372,698 ) |
Change in Class I Shares | (987,199 ) | (7,462,437 ) | — | (192,792 ) |
Class R5 | ||||
Issued | — | — | — | 4,219 |
Reinvested | — | — | — | 131 |
Redeemed | — | — | — | (61,097 ) |
Change in Class R5 Shares | — | — | — | (56,747 ) |
August 31, 2023 | J.P. Morgan Exchange-Traded Funds | 79 |
FOR THE PERIODS INDICATED (continued)
JPMorgan Limited Duration Bond ETF | JPMorgan Realty Income ETF | |||
Six Months Ended August 31, 2023 (Unaudited)(a) | Year Ended February 28, 2023(a) | Six Months Ended August 31, 2023 (Unaudited) | Year Ended February 28, 2023(b) | |
CAPITAL TRANSACTIONS: (c) (d) | ||||
Proceeds from shares issued | $12,884,430 | $60,324,732 | $12,573,132 | $85,385,444 |
Distributions reinvested | 11,437,344 | 17,722,105 | — | 116,182,036 |
Cost of shares redeemed | (232,827,184 ) | (157,664,853 ) | (173,366,311 ) | (771,368,525 ) |
Redemptions in-kind (See Note 9) | — | — | — | (231,616,311 ) |
Change in net assets resulting from capital transactions | (208,505,410 ) | (79,618,016 ) | (160,793,179 ) | (801,417,356 ) |
Class A | ||||
Proceeds from shares issued | 3,342,075 | 67,818,108 | — | 556,975 |
Distributions reinvested | 2,367,196 | 3,417,443 | — | 2,660,213 |
Cost of shares redeemed | (47,922,575 ) | (92,530,834 ) | — | (3,873,369 ) |
Change in net assets resulting from Class A capital transactions | (42,213,304 ) | (21,295,283 ) | — | (656,181 ) |
Class C | ||||
Proceeds from shares issued | 301,486 | 4,733,358 | — | 112,851 |
Distributions reinvested | 143,219 | 166,895 | — | 425,744 |
Cost of shares redeemed | (3,598,701 ) | (7,663,998 ) | — | (405,113 ) |
Change in net assets resulting from Class C capital transactions | (3,153,996 ) | (2,763,745 ) | — | 133,482 |
Class I | ||||
Proceeds from shares issued | 26,567,546 | 142,752,290 | — | 129,926,978 |
Distributions reinvested | 2,914,658 | 4,604,734 | — | 13,727,046 |
Cost of shares redeemed | (77,226,630 ) | (151,471,279 ) | — | (3,968,685 ) |
Change in net assets resulting from Class I capital transactions | (47,744,426 ) | (4,114,255 ) | — | 139,685,339 |
Class L | ||||
Proceeds from shares issued | — | — | — | 454,227 |
Distributions reinvested | — | — | — | 3,503,082 |
Cost of shares redeemed | — | — | — | (8,909,073 ) |
Change in net assets resulting from Class L capital transactions | — | — | — | (4,951,764 ) |
80 | J.P. Morgan Exchange-Traded Funds | August 31, 2023 |
JPMorgan Limited Duration Bond ETF | JPMorgan Realty Income ETF | |||
Six Months Ended August 31, 2023 (Unaudited)(a) | Year Ended February 28, 2023(a) | Six Months Ended August 31, 2023 (Unaudited) | Year Ended February 28, 2023(b) | |
CAPITAL TRANSACTIONS: (c) (d) (continued) | ||||
Class R5 | ||||
Proceeds from shares issued | $— | $— | $— | $290,370 |
Distributions reinvested | — | — | — | 1,343,475 |
Cost of shares redeemed | — | — | — | (6,276,855 ) |
Change in net assets resulting from Class R5 capital transactions | — | — | — | (4,643,010 ) |
Total change in net assets resulting from capital transactions | $(301,617,136 ) | $(107,791,299 ) | $(160,793,179 ) | $(671,849,490 ) |
August 31, 2023 | J.P. Morgan Exchange-Traded Funds | 81 |
FOR THE PERIODS INDICATED (continued)
JPMorgan Limited Duration Bond ETF | JPMorgan Realty Income ETF | |||
Six Months Ended August 31, 2023 (Unaudited)(a) | Year Ended February 28, 2023(a) | Six Months Ended August 31, 2023 (Unaudited) | Year Ended February 28, 2023(b) | |
SHARES TRANSACTIONS: (c) (d) | ||||
Issued | 256,744 | 6,202,110 | 300,000 | 1,646,419 |
Reinvested | 228,552 | 1,829,077 | — | 2,310,713 |
Redeemed | (4,641,909 ) | (16,288,548 ) | (4,100,000 ) | (15,158,501 ) |
Redemptions in-kind (See Note 9) | — | — | — | (3,574,267 ) |
Change in Shares | (4,156,613 ) | (8,257,361 ) | (3,800,000 ) | (14,775,636 ) |
Class A | ||||
Issued | 66,595 | 6,977,379 | — | 8,864 |
Reinvested | 47,292 | 353,475 | — | 53,046 |
Redeemed | (956,310 ) | (9,526,980 ) | — | (73,337 ) |
Change in Class A Shares | (842,423 ) | (2,196,126 ) | — | (11,427 ) |
Class C | ||||
Issued | 6,005 | 493,981 | — | 1,671 |
Reinvested | 2,862 | 17,482 | — | 8,495 |
Redeemed | (71,843 ) | (799,173 ) | — | (7,226 ) |
Change in Class C Shares | (62,976 ) | (287,710 ) | — | 2,940 |
Class I | ||||
Issued | 529,419 | 14,707,094 | — | 1,964,395 |
Reinvested | 58,259 | 476,284 | — | 274,216 |
Redeemed | (1,539,450 ) | (15,640,007 ) | — | (69,363 ) |
Change in Class I Shares | (951,772 ) | (456,629 ) | — | 2,169,248 |
Class L | ||||
Issued | — | — | — | 6,979 |
Reinvested | — | — | — | 69,818 |
Redeemed | — | — | — | (170,346 ) |
Change in Class L Shares | — | — | — | (93,549 ) |
82 | J.P. Morgan Exchange-Traded Funds | August 31, 2023 |
JPMorgan Limited Duration Bond ETF | JPMorgan Realty Income ETF | |||
Six Months Ended August 31, 2023 (Unaudited)(a) | Year Ended February 28, 2023(a) | Six Months Ended August 31, 2023 (Unaudited) | Year Ended February 28, 2023(b) | |
SHARES TRANSACTIONS: (c) (d) (continued) | ||||
Class R5 | ||||
Issued | — | — | — | 4,497 |
Reinvested | — | — | — | 26,820 |
Redeemed | — | — | — | (120,979 ) |
Change in Class R5 Shares | — | — | — | (89,662 ) |
August 31, 2023 | J.P. Morgan Exchange-Traded Funds | 83 |
FOR THE PERIODS INDICATED (continued)
JPMorgan Sustainable Municipal Income ETF | ||
Six Months Ended August 31, 2023 (Unaudited)(a) | Year Ended February 28, 2023(a) | |
CAPITAL TRANSACTIONS: (b) | ||
Proceeds from shares issued | $3,493,853 | $67,591,023 |
Distributions reinvested | 672,386 | 1,868,499 |
Cost of shares redeemed | (17,577,030 ) | (78,283,703 ) |
Change in net assets resulting from capital transactions | (13,410,791 ) | (8,824,181 ) |
Class A | ||
Proceeds from shares issued | 412,669 | 15,363,046 |
Distributions reinvested | 763,534 | 2,071,500 |
Cost of shares redeemed | (10,107,211 ) | (38,051,879 ) |
Change in net assets resulting from Class A capital transactions | (8,931,008 ) | (20,617,333 ) |
Class C | ||
Proceeds from shares issued | 11,317 | 314,322 |
Distributions reinvested | 44,105 | 94,302 |
Cost of shares redeemed | (315,902 ) | (2,583,600 ) |
Change in net assets resulting from Class C capital transactions | (260,480 ) | (2,174,976 ) |
Class I | ||
Proceeds from shares issued | 28,984,690 | 151,500,951 |
Distributions reinvested | 1,249,534 | 2,928,191 |
Cost of shares redeemed | (33,484,644 ) | (148,829,880 ) |
Change in net assets resulting from Class I capital transactions | (3,250,420 ) | 5,599,262 |
Total change in net assets resulting from capital transactions | $(25,852,699 ) | $(26,017,228 ) |
84 | J.P. Morgan Exchange-Traded Funds | August 31, 2023 |
JPMorgan Sustainable Municipal Income ETF | ||
Six Months Ended August 31, 2023 (Unaudited)(a) | Year Ended February 28, 2023(a) | |
SHARES TRANSACTIONS: (b) | ||
Issued | 70,384 | 7,508,375 |
Reinvested | 13,475 | 208,900 |
Redeemed | (353,151 ) | (8,786,046 ) |
Change in Shares | (269,292 ) | (1,068,771 ) |
Class A | ||
Issued | 8,221 | 1,703,245 |
Reinvested | 15,299 | 230,157 |
Redeemed | (202,526 ) | (4,198,555 ) |
Change in Class A Shares | (179,006 ) | (2,265,153 ) |
Class C | ||
Issued | 226 | 35,148 |
Reinvested | 884 | 10,586 |
Redeemed | (6,312 ) | (288,123 ) |
Change in Class C Shares | (5,202 ) | (242,389 ) |
Class I | ||
Issued | 578,020 | 16,822,311 |
Reinvested | 25,029 | 327,918 |
Redeemed | (671,881 ) | (16,576,175 ) |
Change in Class I Shares | (68,832 ) | 574,054 |
August 31, 2023 | J.P. Morgan Exchange-Traded Funds | 85 |
FOR THE PERIODS INDICATED
Per share operating performance (a) | ||||||
Investment operations | Distributions | |||||
Net asset value beginning of period | Net investment income (loss)(c) | Net realized and unrealized gains (losses) on investments | Total from investment operations | Net investment income | Net realized gain | |
JPMorgan High Yield Municipal ETF (h) | ||||||
Six Months Ended August 31, 2023 (Unaudited) | $49.76 | $1.08 | $(0.99 ) | $0.09 | $(0.82 ) | $— |
Year Ended February 28, 2023 | 58.54 | 2.02 | (8.78 ) | (6.77 ) | (2.02 ) | — |
Year Ended February 28, 2022 | 59.42 | 1.86 | (0.88 ) | 0.98 | (1.86 ) | — |
Year Ended February 28, 2021 | 61.64 | 1.86 | (2.22 ) | (0.36 ) | (1.81 ) | (0.05 ) |
Year Ended February 29, 2020 | 56.17 | 1.81 | 5.48 | 7.29 | (1.76 ) | (0.05 ) |
November 1, 2018 through February 28, 2019 | 54.41 | 0.72 | 1.71 | 2.43 | (0.67 ) | — |
Year Ended February 28, 2019 | 55.71 | 1.91 | 0.41 | 2.33 | (1.86 ) | — |
JPMorgan Inflation Managed Bond ETF (i) | ||||||
Six Months Ended August 31, 2023 (Unaudited) | 46.29 | 0.97 | (0.46 ) | 0.51 | (0.87 ) | — |
Year Ended February 28, 2023 | 51.43 | 1.63 | (5.05 ) | (3.42 ) | (1.58 ) | (0.14 ) |
Year Ended February 28, 2022 | 50.58 | 1.27 | 0.85 | 2.12 | (1.27 ) | — |
Year Ended February 28, 2021 | 49.26 | 0.94 | 1.32 | 2.26 | (0.94 ) | — |
Year Ended February 29, 2020 | 47.33 | 1.27 | 1.93 | 3.20 | (1.27 ) | — |
Year Ended February 28, 2019 | 47.85 | 1.18 | (0.52 ) | 0.66 | (1.18 ) | — |
(a) | Per share amounts reflect the conversion of the JPMorgan High Yield Municipal Fund into the JPMorgan High Yield Municipal ETF as of the close of business on July 14, 2023 and the conversion of the JPMorgan Inflation Managed Bond Fund into the JPMorgan Inflation Managed Bond ETF as of the close of business on April 8, 2022. See Note 1. |
(b) | Annualized for periods less than one year, unless otherwise noted. |
(c) | Calculated based upon average shares outstanding. |
(d) | Not annualized for periods less than one year. |
(e) | Includes adjustments in accordance with accounting principles generally accepted in the United States of America and as such, the net asset values for financial reporting purposes and the returns based upon those net asset values may differ from the net asset values and returns for shareholder transactions. |
(f) | JPMorgan High Yield Municipal ETF acquired all of the assets and liabilities of the JPMorgan High Yield Municipal Fund (“Predecessor Fund”) in a reorganization that occurred as of the close of business on July 14, 2023. Market price returns are calculated using the official closing price of the JPMorgan High Yield Municipal ETF on the listing exchange as of the time that the JPMorgan High Yield Municipal ETF's NAV is calculated. Prior to the JPMorgan High Yield Municipal ETF's listing on July 17, 2023, the NAV performance of the Class I and Class R6 Shares of the Predecessor Fund are used as proxy market price returns. |
(g) | JPMorgan Inflation Managed Bond ETF acquired all of the assets and liabilities of the JPMorgan Inflation Managed Bond Fund (“Predecessor Fund”) in a reorganization that occurred as of the close of business on April 8, 2022. Market price returns are calculated using the official closing price of the JPMorgan Inflation Managed Bond ETF on the listing exchange as of the time that the JPMorgan Inflation Managed Bond ETF's NAV is calculated. Prior to the JPMorgan Inflation Managed Bond ETF's listing on April, 11, 2022, the NAV performance of the Class R6 Shares of the Predecessor Fund are used as proxy market price returns. |
(h) | JPMorgan High Yield Municipal ETF (the “Fund”) acquired all of the assets and liabilities of the JPMorgan High Yield Municipal Fund (“Predecessor Fund”) in a reorganization that occurred as of the close of business on July 14, 2023. Performance and financial history of the Predecessor Fund’s Class R6 Shares have been adopted by the Fund and will be used going forward. As a result, the financial highlight information reflects that of the Predecessor Fund’s Class R6 Shares for the period November 1, 2018 ("Predecessor Fund's Class R6 Shares inception date") up through the reorganization and the Predecessor Fund's Class I Shares for the period March 1, 2018 through February 28, 2019. |
(i) | JPMorgan Inflation Managed Bond ETF (the “Fund”) acquired all of the assets and liabilities of the JPMorgan Inflation Managed Bond Fund (“Predecessor Fund”) in a reorganization that occurred as of the close of business on April 8, 2022. Performance and financial history of the Predecessor Fund’s Class R6 Shares have been adopted by the Fund and will be used going forward. As a result, the financial highlight information reflects that of the Predecessor Fund’s Class R6 Shares for the period March 1, 2018 up through the reorganization. |
86 | J.P. Morgan Exchange-Traded Funds | August 31, 2023 |
Ratios/Supplemental data | |||||||||
Ratios to average net assets (b) | |||||||||
Total Distributions | Net asset value, end of period | Market price, end of period | Total Return(d)(e) | Market price total return(d)(f)(g) | Net assets, end of period | Net expenses | Net investment income (loss) | Expenses without waivers and reimbursements | Portfolio turnover rate(d) |
$(0.82 ) | $49.03 | $48.78 | 0.17 % | (0.34 )% | $220,649,324 | 0.37 % | 4.36 % | 0.55 % | 35 % |
(2.02 ) | 49.76 | 49.76 | (11.62 ) | (11.62 ) | 13,436,450 | 0.45 | 3.82 | 0.52 | 21 |
(1.86 ) | 58.54 | 58.54 | 1.60 | 1.60 | 20,315,531 | 0.45 | 3.07 | 0.51 | 24 |
(1.86 ) | 59.42 | 59.42 | (0.41 ) | (0.41 ) | 21,168,811 | 0.45 | 3.16 | 0.51 | 39 |
(1.81 ) | 61.64 | 61.64 | 13.12 | 13.12 | 6,060,120 | 0.44 | 3.01 | 0.56 | 18 |
(0.67 ) | 56.17 | 56.17 | 4.46 | 4.46 | 1,337,989 | 0.39 | 4.09 | 1.23 | 130 |
(1.86 ) | 56.17 | 56.17 | 4.29 | 4.29 | 95,662,383 | 0.54 | 3.45 | 0.97 | 130 |
(0.87 ) | 45.93 | 45.59 | 1.09 | 0.19 | 486,535,910 | 0.25 | 4.15 | 0.40 | 7 |
(1.72 ) | 46.29 | 46.36 | (6.73 ) | (6.59 ) | 904,606,857 | 0.26 | 3.38 | 0.41 | 107 |
(1.27 ) | 51.43 | 51.43 | 4.23 | 4.23 | 897,545,065 | 0.34 | 2.49 | 0.39 | 159 |
(0.94 ) | 50.58 | 50.58 | 4.70 | 4.70 | 1,172,320,983 | 0.34 | 1.93 | 0.38 | 89 |
(1.27 ) | 49.26 | 49.26 | 6.84 | 6.84 | 1,169,195,274 | 0.42 | 2.62 | 0.44 | 146 |
(1.18 ) | 47.33 | 47.33 | 1.41 | 1.41 | 859,081,298 | 0.47 | 2.46 | 0.47 | 74 |
August 31, 2023 | J.P. Morgan Exchange-Traded Funds | 87 |
FOR THE PERIODS INDICATED (continued)
Per share operating performance (a) | ||||||
Investment operations | Distributions | |||||
Net asset value beginning of period | Net investment income (loss)(c) | Net realized and unrealized gains (losses) on investments | Total from investment operations | Net investment income | Net realized gain | |
JPMorgan Limited Duration Bond ETF (h) | ||||||
Six Months Ended August 31, 2023 (Unaudited) | $50.00 | $1.00 | $0.10 | $1.10 | $(0.88 ) | $— |
Year Ended February 28, 2023 | 51.60 | 1.19 | (1.60 ) | (0.41 ) | (1.19 ) | — |
Year Ended February 28, 2022 | 52.68 | 0.57 | (1.08 ) | (0.52 ) | (0.57 ) | — |
Year Ended February 28, 2021 | 52.63 | 0.83 | 0.05 | 0.88 | (0.83 ) | — |
Year Ended February 29, 2020 | 51.70 | 1.39 | 0.93 | 2.32 | (1.39 ) | — |
Year Ended February 28, 2019 | 51.60 | 1.34 | 0.10 | 1.45 | (1.34 ) | — |
JPMorgan Realty Income ETF (j) | ||||||
Six Months Ended August 31, 2023 (Unaudited) | 43.19 | 0.62 | (1.09 ) | (0.47 ) | (0.74 ) | — |
Year Ended February 28, 2023 | 62.71 | 0.98 (k) | (9.14 ) | (8.16 ) | (0.76 ) | (10.60 ) |
Year Ended February 28, 2022 | 54.76 | 0.64 | 13.05 | 13.69 | (0.80 ) | (4.94 ) |
Year Ended February 28, 2021 | 54.40 | 0.84 | 1.89 | 2.73 | (0.72 ) | (1.65 ) |
Year Ended February 29, 2020 | 54.92 | 1.12 | 3.53 | 4.65 | (1.20 ) | (3.97 ) |
September 1, 2018 through (l) February 28, 2019 | 54.44 | 0.52 | 0.60 | 1.12 | (0.64 ) | — |
Year Ended August 31, 2018 | 53.24 | 1.20 | 1.24 | 2.44 | (1.24 ) | — |
(a) | Per share amounts reflect the conversion of the JPMorgan Limited Duration Bond Fund into the JPMorgan Limited Duration Bond ETF as of the close of business on July 28, 2023 and the conversion of the JPMorgan Realty Income Fund into the JPMorgan Realty Income ETF as of the close of business on May 20, 2022. See Note 1. |
(b) | Annualized for periods less than one year, unless otherwise noted. |
(c) | Calculated based upon average shares outstanding. |
(d) | Not annualized for periods less than one year. |
(e) | Includes adjustments in accordance with accounting principles generally accepted in the United States of America and as such, the net asset values for financial reporting purposes and the returns based upon those net asset values may differ from the net asset values and returns for shareholder transactions. |
(f) | JPMorgan Limited Duration Bond ETF acquired all of the assets and liabilities of the JPMorgan Limited Duration Bond Fund (“Predecessor Fund”) in a reorganization that occurred as of the close of business on July 28, 2023. Market price returns are calculated using the official closing price of the JPMorgan Limited Duration Bond ETF on the listing exchange as of the time that the JPMorgan Limited Duration Bond ETF's NAV is calculated. Prior to the JPMorgan Limited Duration Bond ETF's listing on July 31, 2023, the NAV performance of the Class R6 Shares of the Predecessor Fund are used as proxy market price returns. |
(g) | JPMorgan Realty Income ETF acquired all of the assets and liabilities of the JPMorgan Realty Income Fund (“Predecessor Fund”) in a reorganization that occurred as of the close of business on May 20, 2022. Market price returns are calculated using the official closing price of the JPMorgan Realty Income ETF on the listing exchange as of the time that the JPMorgan Realty Income ETF's NAV is calculated. Prior to the JPMorgan Realty Income ETF's listing on May 23, 2022, the NAV performance of the Class R6 Shares of the Predecessor Fund are used as proxy market price returns. |
(h) | JPMorgan Limited Duration Bond ETF (the “Fund”) acquired all of the assets and liabilities of the JPMorgan Limited Duration Bond Fund (“Predecessor Fund”) in a reorganization that occurred as of the close of business on July 28, 2023. Performance and financial history of the Predecessor Fund’s Class R6 Shares have been adopted by the Fund and will be used going forward. As a result, the financial highlight information reflects that of the Predecessor Fund’s Class R6 Shares for the period March 1, 2018 up through the reorganization. |
(i) | Includes interest expense, if applicable, which is less than 0.005% unless otherwise noted. |
(j) | JPMorgan Realty Income ETF (the “Fund”) acquired all of the assets and liabilities of the JPMorgan Realty Income Fund (“Predecessor Fund”) in a reorganization that occurred as of the close of business on May 20, 2022. Performance and financial history of the Predecessor Fund’s Class R6 Shares have been adopted by the Fund and will be used going forward. As a result, the financial highlight information reflects that of the Predecessor Fund’s Class R6 Shares for the period September 1, 2018 up through the reorganization. |
(k) | Reflects special dividends paid out during the period by several of the Fund’s holdings. Had the Fund not received the special dividends, the net investment income (loss) per share would have been $0.81 and the net investment income (loss) ratio would have been 1.59%, |
(l) | The Fund changed its fiscal year end from August 31st to the last day of February. |
88 | J.P. Morgan Exchange-Traded Funds | August 31, 2023 |
Ratios/Supplemental data | |||||||||
Ratios to average net assets (b) | |||||||||
Total Distributions | Net asset value, end of period | Market price, end of period | Total Return(d)(e) | Market price total return(d)(f)(g) | Net assets, end of period | Net expenses | Net investment income (loss) | Expenses without waivers and reimbursements | Portfolio turnover rate(d) |
$(0.88 ) | $50.22 | $50.12 | 2.23 % | 2.03 % | $826,346,989 | 0.23 %(i) | 3.98 % | 0.32 % | 3 % |
(1.19 ) | 50.00 | 50.00 | (0.74 ) | (0.74 ) | 716,175,584 | 0.23 (i) | 2.41 | 0.31 | 26 |
(0.57 ) | 51.60 | 51.60 | (0.95 ) | (0.95 ) | 821,093,668 | 0.24 (i) | 1.10 | 0.30 | 24 |
(0.83 ) | 52.68 | 52.68 | 1.70 | 1.70 | 859,503,428 | 0.23 (i) | 1.55 | 0.30 | 35 |
(1.39 ) | 52.63 | 52.63 | 4.53 | 4.53 | 743,296,676 | 0.24 (i) | 2.63 | 0.35 | 27 |
(1.34 ) | 51.70 | 51.70 | 2.79 | 2.79 | 652,842,882 | 0.23 (i) | 2.58 | 0.37 | 28 |
(0.74 ) | 41.98 | 41.98 | (1.04 ) | (1.18 ) | 335,759,488 | 0.50 | 2.97 | 0.73 | 53 |
(11.36 ) | 43.19 | 43.25 | (13.43 ) | (13.31 ) | 509,554,235 | 0.55 | 1.93 (k) | 0.72 | 84 |
(5.74 ) | 62.71 | 62.71 | 24.69 | 24.69 | 1,450,453,154 | 0.68 | 0.98 | 0.70 | 59 |
(2.37 ) | 54.76 | 54.76 | 5.38 | 5.38 | 1,663,701,422 | 0.68 | 1.67 | 0.70 | 90 |
(5.17 ) | 54.40 | 54.40 | 8.23 | 8.23 | 1,289,280,883 | 0.68 | 1.92 | 0.76 | 71 |
(0.64 ) | 54.92 | 54.92 | 2.13 | 2.13 | 2,238,096,452 | 0.67 | 1.99 | 0.85 | 50 |
(1.24 ) | 54.44 | 54.44 | 4.79 | 4.79 | 2,325,640,388 | 0.68 | 2.34 | 0.85 | 107 |
August 31, 2023 | J.P. Morgan Exchange-Traded Funds | 89 |
FOR THE PERIODS INDICATED (continued)
Per share operating performance (a) | ||||||
Investment operations | Distributions | |||||
Net asset value beginning of period | Net investment income (loss)(c) | Net realized and unrealized gains (losses) on investments | Total from investment operations | Net investment income | Net realized gain | |
JPMorgan Sustainable Municipal Income ETF (g) | ||||||
Six Months Ended August 31, 2023 (Unaudited) | $49.56 | $0.84 | $(0.23 ) | $0.61 | $(0.63 ) | $— |
Year Ended February 28, 2023 | 53.82 | 1.35 | (4.21 ) | (2.86 ) | (1.40 ) | — |
Year Ended February 28, 2022 | 55.45 | 1.18 | (1.63 ) | (0.45 ) | (1.18 ) | — |
Year Ended February 28, 2021 | 55.79 | 1.12 | (0.34 ) | 0.79 | (1.12 ) | — |
Year Ended February 29, 2020 | 53.20 | 1.29 | 2.58 | 3.87 | (1.29 ) | — |
Year Ended February 28, 2019 | 53.04 | 1.40 | 0.45 | 1.85 | (1.40 ) | (0.28 ) |
(a) | Per share amounts reflect the conversion of the JPMorgan Sustainable Municipal Income Fund into the JPMorgan Sustainable Municipal Income ETF as of the close of business on July 14, 2023. See Note 1. |
(b) | Annualized for periods less than one year, unless otherwise noted. |
(c) | Calculated based upon average shares outstanding. |
(d) | Not annualized for periods less than one year. |
(e) | Includes adjustments in accordance with accounting principles generally accepted in the United States of America and as such, the net asset values for financial reporting purposes and the returns based upon those net asset values may differ from the net asset values and returns for shareholder transactions. |
(f) | JPMorgan Sustainable Municipal Income ETF acquired all of the assets and liabilities of the JPMorgan Sustainable Municipal Income Fund (“Predecessor Fund”) in a reorganization that occurred as of the close of business on July 14, 2023. Market price returns are calculated using the official closing price of the JPMorgan Sustainable Municipal Income ETF on the listing exchange as of the time that the JPMorgan Sustainable Municipal Income ETF's NAV is calculated. Prior to the JPMorgan Sustainable Municipal Income ETF's listing on July 17, 2023, the NAV performance of the Class R6 Shares of the Predecessor Fund are used as proxy market price returns. |
(g) | JPMorgan Sustainable Municipal Income ETF (the “Fund”) acquired all of the assets and liabilities of the JPMorgan Sustainable Municipal Income Fund (“Predecessor Fund”) in a reorganization that occurred as of the close of business on July 14, 2023. Performance and financial history of the Predecessor Fund’s Class R6 Shares have been adopted by the Fund and will be used going forward. As a result, the financial highlight information reflects that of the Predecessor Fund’s Class R6 Shares for the period March 1, 2018 up through the reorganization. |
90 | J.P. Morgan Exchange-Traded Funds | August 31, 2023 |
Ratios/Supplemental data | |||||||||
Ratios to average net assets (b) | |||||||||
Total Distributions | Net asset value, end of period | Market price, end of period | Total Return(d)(e) | Market price total return(d)(f) | Net assets, end of period | Net expenses | Net investment income (loss) | Expenses without waivers and reimbursements | Portfolio turnover rate(d) |
$(0.63 ) | $49.54 | $49.41 | 1.24 % | 0.98 % | $235,658,686 | 0.25 % | 3.33 % | 0.49 % | 14 % |
(1.40 ) | 49.56 | 49.56 | (5.36 ) | (5.36 ) | 65,552,740 | 0.35 | 2.69 | 0.49 | 37 |
(1.18 ) | 53.82 | 53.82 | (0.82 ) | (0.82 ) | 81,399,139 | 0.35 | 2.14 | 0.46 | 18 |
(1.12 ) | 55.45 | 55.45 | 1.46 | 1.46 | 62,415,473 | 0.34 | 2.06 | 0.46 | 22 |
(1.29 ) | 55.79 | 55.79 | 7.36 | 7.36 | 60,936,135 | 0.34 | 2.38 | 0.49 | 7 |
(1.68 ) | 53.20 | 53.20 | 3.54 | 3.54 | 51,261,065 | 0.35 | 2.61 | 0.50 | 13 |
August 31, 2023 | J.P. Morgan Exchange-Traded Funds | 91 |
AS OF August 31, 2023 (Unaudited)
Diversification Classification | |
JPMorgan High Yield Municipal ETF | Diversified |
JPMorgan Inflation Managed Bond ETF | Diversified |
JPMorgan Limited Duration Bond ETF | Diversified |
JPMorgan Realty Income ETF | Non-Diversified |
JPMorgan Sustainable Municipal Income ETF | Diversified |
Acquired Fund | Fund | Closing Date |
JPMorgan High Yield Municipal Fund | JPMorgan High Yield Municipal ETF | July 14, 2023 |
JPMorgan Inflation Managed Bond Fund | JPMorgan Inflation Managed Bond ETF | April 8, 2022 |
JPMorgan Limited Duration Bond Fund | JPMorgan Limited Duration Bond ETF | July 28, 2023 |
JPMorgan Realty Income Fund | JPMorgan Realty Income ETF | May 20, 2022 |
JPMorgan Sustainable Municipal Income Fund | JPMorgan Sustainable Municipal Income ETF | July 14, 2023 |
92 | J.P. Morgan Exchange-Traded Funds | August 31, 2023 |
Listing Exchange | |
High Yield Municipal ETF | NYSE Arca |
Inflation Managed Bond ETF | Cboe BZX Exchange, Inc. |
Limited Duration Bond ETF | Cboe BZX Exchange, Inc. |
Realty Income ETF | NYSE Arca |
Sustainable Municipal Income ETF | NYSE Arca |
August 31, 2023 | J.P. Morgan Exchange-Traded Funds | 93 |
AS OF August 31, 2023 (Unaudited) (continued)
High Yield Municipal ETF | ||||
Level 1 Quoted prices | Level 2 Other significant observable inputs | Level 3 Significant unobservable inputs | Total | |
Investments in Securities | ||||
Municipal Bonds | $— | $190,268,944 | $— | $190,268,944 |
Short-Term Investments | ||||
Investment Companies | 35,111,891 | — | — | 35,111,891 |
Total Investments in Securities | $35,111,891 | $190,268,944 | $— | $225,380,835 |
Depreciation in Other Financial Instruments | ||||
Swaps | $— | $(95,858 ) | $— | $(95,858 ) |
Inflation Managed Bond ETF | ||||
Level 1 Quoted prices | Level 2 Other significant observable inputs | Level 3 Significant unobservable inputs | Total | |
Investments in Securities | ||||
Asset-Backed Securities | $— | $74,546,565 | $1,856,584 | $76,403,149 |
Collateralized Mortgage Obligations | — | 46,983,098 | 244 | 46,983,342 |
Commercial Mortgage-Backed Securities | — | 41,316,626 | 1,494,791 | 42,811,417 |
Corporate Bonds | — | 126,996,572 | — | 126,996,572 |
Foreign Government Securities | — | 1,618,943 | — | 1,618,943 |
Mortgage-Backed Securities | — | 86,391,815 | — | 86,391,815 |
U.S. Government Agency Securities | — | 10,686,878 | — | 10,686,878 |
94 | J.P. Morgan Exchange-Traded Funds | August 31, 2023 |
Inflation Managed Bond ETF (continued) | ||||
Level 1 Quoted prices | Level 2 Other significant observable inputs | Level 3 Significant unobservable inputs | Total | |
U.S. Treasury Obligations | $— | $86,632,110 | $— | $86,632,110 |
Short-Term Investments | ||||
Investment Companies | 6,085,646 | — | — | 6,085,646 |
Total Investments in Securities | $6,085,646 | $475,172,607 | $3,351,619 | $484,609,872 |
Appreciation in Other Financial Instruments | ||||
Futures Contracts | $1,008,660 | $— | $— | $1,008,660 |
Swaps | — | 124,306 | — | 124,306 |
Depreciation in Other Financial Instruments | ||||
Futures Contracts | (116,387 ) | — | — | (116,387 ) |
Swaps | — | (1,405,732 ) | — | (1,405,732 ) |
Total Net Appreciation/ Depreciation in Other Financial Instruments | $892,273 | $(1,281,426 ) | $— | $(389,153 ) |
Limited Duration Bond ETF | ||||
Level 1 Quoted prices | Level 2 Other significant observable inputs | Level 3 Significant unobservable inputs | Total | |
Investments in Securities | ||||
Asset-Backed Securities | $— | $310,331,626 | $17,823,428 | $328,155,054 |
Collateralized Mortgage Obligations | — | 228,510,381 | 5,000,000 | 233,510,381 |
Commercial Mortgage-Backed Securities | — | 74,196,819 | — | 74,196,819 |
Corporate Bonds | — | 56,247,571 | — | 56,247,571 |
Mortgage-Backed Securities | — | 76,890,858 | — | 76,890,858 |
Short-Term Investments | ||||
Investment Companies | 63,436,642 | — | — | 63,436,642 |
Total Investments in Securities | $63,436,642 | $746,177,255 | $22,823,428 | $832,437,325 |
Realty Income ETF | ||||
Level 1 Quoted prices | Level 2 Other significant observable inputs | Level 3 Significant unobservable inputs | Total | |
Total Investments in Securities (a) | $338,523,809 | $— | $— | $338,523,809 |
(a) | Please refer to the SOI for specifics of portfolio holdings. |
Sustainable Municipal Income ETF | ||||
Level 1 Quoted prices | Level 2 Other significant observable inputs | Level 3 Significant unobservable inputs | Total | |
Investments in Securities | ||||
Municipal Bonds | $— | $231,728,613 | $— | $231,728,613 |
Short-Term Investments | ||||
Investment Companies | 2,684,754 | — | — | 2,684,754 |
Total Investments in Securities | $2,684,754 | $231,728,613 | $— | $234,413,367 |
Depreciation in Other Financial Instruments | ||||
Swaps | $— | $(155,108 ) | $— | $(155,108 ) |
August 31, 2023 | J.P. Morgan Exchange-Traded Funds | 95 |
AS OF August 31, 2023 (Unaudited) (continued)
Inflation Managed Bond ETF | Balance as of February 28, 2023 | Realized gain (loss) | Change in net unrealized appreciation (depreciation) | Net accretion (amortization) | Purchases1 | Sales2 | Transfers into Level 3 | Transfers out of Level 3 | Balance as of August 31, 2023 |
Investments in Securities: | |||||||||
Asset-Backed Securities | $1,279,429 | $— | $(3,903 ) | $702 | $999,995 | $(419,639 ) | $— | $— | $1,856,584 |
Collateralized Mortgage Obligations | 935,153 | — | — | — | — | — | — | (934,909 ) | 244 |
Commercial Mortgage-Backed Securities | 1,508,498 | — | (12,656 ) | (1,051 ) | — | — | — | — | 1,494,791 |
Total | $3,723,080 | $— | $(16,559 ) | $(349 ) | $999,995 | $(419,639 ) | $— | $(934,909 ) | $3,351,619 |
1 | Purchases include all purchases of securities and securities received in corporate actions. | ||||||||
2 | Sales include all sales of securities, maturities, paydowns and securities tendered in corporate actions. | ||||||||
Limited Duration Bond ETF1 | Balance as of February 28, 2023 | Realized gain (loss) | Change in net unrealized appreciation (depreciation) | Net accretion (amortization) | Purchases2 | Sales3 | Transfers into Level 3 | Transfers out of Level 3 | Balance as of August 31, 2023 |
Investments in Securities: | |||||||||
Asset-Backed Securities | $18,725,809 | $— | $(22,081 ) | $5,902 | $3,999,978 | $(4,886,180 ) | $— | $18,725,809 | $17,823,428 |
Collateralized Mortgage Obligations | — | — | — | — | 5,000,000 | — | — | — | 5,000,000 |
Total | $18,725,809 | $— | $(22,081 ) | $5,902 | $8,999,978 | $(4,886,180 ) | $— | $18,725,809 | $22,823,428 |
1 | As of the close of business on July 28, 2023, JPMorgan Limited Duration Bond Fund (the “Acquired Fund”), a series of Trust II Funds, reorganized (the “Reorganization”) into a newly created exchange-traded fund, JPMorgan Limited Duration Bond ETF (the “Fund”). Following the Reorganization, the Acquired Fund’s performance and financial history were adopted by the Fund. The table includes transactions from the Acquired Fund for the period March 1, 2023 through July 28, 2023. | ||||||||
2 | Purchases include all purchases of securities and securities received in corporate actions. | ||||||||
3 | Sales include all sales of securities, maturities, paydowns and securities tendered in corporate actions. | ||||||||
96 | J.P. Morgan Exchange-Traded Funds | August 31, 2023 |
Managed
Bond ETF
Fair Value at August 31, 2023 | Valuation Technique(s) | Unobservable Input | Range (Weighted Average) (a) | |
$1,137,299 | Discounted Cash Flow | Constant Prepayment Rate | 0.00% - 10.00% (0.96%) | |
Yield (Discount Rate of Cash Flows) | 6.49% - 7.68% (6.70%) | |||
Asset-Backed Securities | 1,137,299 | |||
Total | $1,137,299 |
# | The table above does not include certain level 3 investments that are valued by brokers and Pricing Services. At August 31, 2023, the value ofthese investments was $2,214,320. The inputs for these investments are not readily available or cannot be reasonably estimated and are generallythose inputs described in Note 2.A. |
(a) | Unobservable inputs were weighted by the relative fair value of the instruments. |
Duration Bond ETF
Fair Value at August 31, 2023 | Valuation Technique(s) | Unobservable Input | Range (Weighted Average) (a) | |
$14,946,285 | Discounted Cash Flow | Constant Prepayment Rate | 0.00% - 12.00% (4.01%) | |
Yield (Discount Rate of Cash Flows) | 6.49% - 8.20% (7.14%) | |||
Asset-Backed Securities | 14,946,285 | |||
Total | $14,946,285 |
# | The table above does not include certain level 3 investments that are valued by brokers and Pricing Services. At August 31, 2023, the value ofthese investments was $7,877,143. The inputs for these investments are not readily available or cannot be reasonably estimated and are generallythose inputs described in Note 2.A. |
(a) | Unobservable inputs were weighted by the relative fair value of the instruments. |
August 31, 2023 | J.P. Morgan Exchange-Traded Funds | 97 |
AS OF August 31, 2023 (Unaudited) (continued)
Investment Securities on Loan, at value, Presented on the Statements of Assets and Liabilities | Cash Collateral Posted by Borrower* | Net Amount Due to Counterparty (not less than zero) | |
Realty Income ETF | $5,897,227 | $(5,897,227 ) | $— |
* | Collateral posted reflects the value of securities on loan and does not include any additional amounts received from the borrower. |
98 | J.P. Morgan Exchange-Traded Funds | August 31, 2023 |
Realty Income ETF | $689 |
High Yield Municipal ETF | |||||||||
For the six months ended August 31, 2023* | |||||||||
Security Description | Value at February 28, 2023 | Purchases at Cost | Proceeds from Sales | Net Realized Gain (Loss) | Change in Unrealized Appreciation/ (Depreciation) | Value at August 31, 2023 | Shares at August 31, 2023 | Dividend Income | Capital Gain Distributions |
JPMorgan Institutional Tax Free Money Market Fund Class IM Shares, 3.71% (a) (b) | $— | $38,161,125 | $38,160,409 | $(716 ) | $— | $— | — | $15,746 | $— |
JPMorgan Institutional Tax Free Money Market Fund Class Institutional Shares, 3.66% (a) (b) | — | 91,073,730 | 55,958,848 | (2,991 ) | — | 35,111,891 | 35,105,985 | 140,498 | — |
Total | $— | $129,234,855 | $94,119,257 | $(3,707 ) | $— | $35,111,891 | $156,244 | $— | |
(a) | Investment in an affiliated fund, which is registered under the Investment Company Act of 1940, as amended, and is advised by J.P. Morgan Investment Management Inc. |
(b) | The rate shown is the current yield as of August 31, 2023. |
* | As of the close of business on July 14, 2023, JPMorgan High Yield Municipal Fund (the "Acquired Fund"), a series of Trust I Funds, reorganized ("the Reorganization") into a newly created exchange-traded fund, JPMorgan High Yield Municipal ETF (the "Fund"). Following the Reorganization, the Acquired Fund's performance and financial history were adopted by the Fund. The table includes transactions from the Acquired Fund for the period March 1, 2023 through July 14, 2023. |
Inflation Managed Bond ETF | |||||||||
For the six months ended August 31, 2023 | |||||||||
Security Description | Value at February 28, 2023 | Purchases at Cost | Proceeds from Sales | Net Realized Gain (Loss) | Change in Unrealized Appreciation/ (Depreciation) | Value at August 31, 2023 | Shares at August 31, 2023 | Dividend Income | Capital Gain Distributions |
JPMorgan Prime Money Market Fund Class IM Shares, 5.46% (a) (b) | $16,176,982 | $228,563,703 | $238,653,586 | $330 | $(1,783 ) | $6,085,646 | 6,083,821 | $378,956 | $— |
(a) | Investment in an affiliated fund, which is registered under the Investment Company Act of 1940, as amended, and is advised by J.P. Morgan Investment Management Inc. |
(b) | The rate shown is the current yield as of August 31, 2023. |
August 31, 2023 | J.P. Morgan Exchange-Traded Funds | 99 |
AS OF August 31, 2023 (Unaudited) (continued)
Limited Duration Bond ETF | |||||||||
For the six months ended August 31, 2023* | |||||||||
Security Description | Value at February 28, 2023 | Purchases at Cost | Proceeds from Sales | Net Realized Gain (Loss) | Change in Unrealized Appreciation/ (Depreciation) | Value at August 31, 2023 | Shares at August 31, 2023 | Dividend Income | Capital Gain Distributions |
JPMorgan Prime Money Market Fund Class IM Shares, 5.46% (a) (b) | $— | $77,765,640 | $14,333,699 | $— | $4,701 | $63,436,642 | 63,417,617 | $272,159 | $— |
JPMorgan Prime Money Market Fund Class Institutional Shares, 5.38% (a) (b) | 98,193,083 | 216,149,340 | 314,319,032 | 13,438 | (36,829 ) | — | — | 1,660,612 | — |
Total | $98,193,083 | $293,914,980 | $328,652,731 | $13,438 | $(32,128 ) | $63,436,642 | $1,932,771 | $— | |
(a) | Investment in an affiliated fund, which is registered under the Investment Company Act of 1940, as amended, and is advised by J.P. Morgan Investment Management Inc. |
(b) | The rate shown is the current yield as of August 31, 2023. |
* | As of the close of business on July 28, 2023, JPMorgan Limited Duration Bond Fund (the "Acquired Fund"), a series of Trust II Funds, reorganized ("the Reorganization") into a newly created exchange-traded fund, JPMorgan Limited Duration Bond ETF (the "Fund"). Following the Reorganization, the Acquired Fund's performance and financial history were adopted by the Fund. The table includes transactions from the Acquired Fund for the period March 1, 2023 through July 28, 2023. |
Realty Income ETF | |||||||||
For the six months ended August 31, 2023 | |||||||||
Security Description | Value at February 28, 2023 | Purchases at Cost | Proceeds from Sales | Net Realized Gain (Loss) | Change in Unrealized Appreciation/ (Depreciation) | Value at August 31, 2023 | Shares at August 31, 2023 | Dividend Income | Capital Gain Distributions |
JPMorgan Prime Money Market Fund Class IM Shares, 5.46% (a) (b) | $21,218,437 | $72,025,472 | $84,871,501 | $(2,072 ) | $1,282 | $8,371,618 | 8,369,108 | $318,549 | $— |
JPMorgan Securities Lending Money Market Fund Agency SL Class Shares, 5.50% (a) (b) | — | 63,000,000 | 59,000,000 | 3,600 * | — | 4,003,600 | 4,002,799 | 154,798 * | — |
JPMorgan U.S. Government Money Market Fund Class IM Shares, 5.27% (a) (b) | — | 32,849,682 | 30,814,475 | — | — | 2,035,207 | 2,035,207 | 25,571 * | — |
Total | $21,218,437 | $167,875,154 | $174,685,976 | $1,528 | $1,282 | $14,410,425 | $498,918 | $— | |
(a) | Investment in an affiliated fund, which is registered under the Investment Company Act of 1940, as amended, and is advised by J.P. Morgan Investment Management Inc. |
(b) | The rate shown is the current yield as of August 31, 2023. |
* | Amount is included on the Statements of Operations as Income from securities lending (net) (after payments of rebates and Citibank’s fee). |
Sustainable Municipal Income ETF | |||||||||
For the six months ended August 31, 2023* | |||||||||
Security Description | Value at February 28, 2023 | Purchases at Cost | Proceeds from Sales | Net Realized Gain (Loss) | Change in Unrealized Appreciation/ (Depreciation) | Value at August 31, 2023 | Shares at August 31, 2023 | Dividend Income | Capital Gain Distributions |
JPMorgan Institutional Tax Free Money Market Fund Class IM Shares, 3.71% (a) (b) | $10,265,129 | $52,880,774 | $60,462,987 | $1,753 | $85 | $2,684,754 | 2,684,485 | $112,072 | $— |
(a) | Investment in an affiliated fund, which is registered under the Investment Company Act of 1940, as amended, and is advised by J.P. Morgan Investment Management Inc. |
100 | J.P. Morgan Exchange-Traded Funds | August 31, 2023 |
(b) | The rate shown is the current yield as of August 31, 2023. |
* | As of the close of business on July 14, 2023, JPMorgan Sustainable Municipal Income Fund (the "Acquired Fund"), a series of Trust II Funds, reorganized ("the Reorganization") into a newly created exchange-traded fund, JPMorgan Sustainable Municipal Income ETF (the "Fund"). Following the Reorganization, the Acquired Fund's performance and financial history were adopted by the Fund. The table includes transactions from the Acquired Fund for the period March 1, 2023 through July 14, 2023. |
August 31, 2023 | J.P. Morgan Exchange-Traded Funds | 101 |
AS OF August 31, 2023 (Unaudited) (continued)
102 | J.P. Morgan Exchange-Traded Funds | August 31, 2023 |
High Yield Municipal ETF | Inflation Managed Bond ETF | Sustainable Municipal Income ETF | |
Interest Rate Risk Exposure: | |||
Unrealized Appreciation on Futures Contracts * | $— | $1,008,660 | $— |
Swaps at Value (Assets) ** | — | 222,023 | — |
Unrealized Depreciation on Futures Contracts * | — | (116,387 ) | — |
Swaps at Value (Liabilities) ** | — | (681,838 ) | — |
Credit Risk Exposure: | |||
Swaps at Value (Liabilities) ** | (250,313 ) | (1,106,625 ) | (405,031 ) |
Net Fair Value of Derivative Contracts: | |||
Unrealized Appreciation (Depreciation) on Futures Contracts | — | 892,273 | — |
Swaps at Value | (250,313 ) | (1,566,440 ) | (405,031 ) |
* | Includes cumulative appreciation/(depreciation) on futures contracts, if any, as reported on the SOIs. Only current day’s variation margin is reported within the Statements of Assets and Liabilities. |
** | Includes the fair value of centrally cleared swap contracts as reported on the SOIs. Only current day’s variation margin is reported within the Statements of Assets and Liabilities. |
High Yield Municipal ETF | Inflation Managed Bond ETF | Sustainable Municipal Income ETF | |
Realized Gain (Loss) on Derivatives Recognized as a Result From Operations: | |||
Interest Rate Risk Exposure: | |||
Futures Contracts | $— | $(1,787,288 ) | $— |
Swap Contracts | — | 1,592,211 | — |
Credit Exposure Risk: | |||
Swap Contracts | (1,005,251 ) | (344,475 ) | (810,109 ) |
Net Change in Unrealized Appreciation (Depreciation) on Derivatives Recognized as a Result of Operations: | |||
Interest Rate Risk Exposure: | |||
Futures Contracts | — | 750,710 | (537 ) |
Swap Contracts | — | (3,100,194 ) | — |
Credit Exposure Risk: | |||
Swap Contracts | 690,660 | (433,492 ) | 508,033 |
August 31, 2023 | J.P. Morgan Exchange-Traded Funds | 103 |
AS OF August 31, 2023 (Unaudited) (continued)
High Yield Municipal ETF | Inflation Managed Bond ETF | Sustainable Municipal Income ETF | |
Futures Contracts: | |||
Average Notional Balance Long | $— | $218,632,284 | $— |
Average Notional Balance Short | — | (37,094,566 ) | (408,991 ) |
Ending Notional Balance Long | — | 151,909,086 | — |
Ending Notional Balance Short | — | (10,842,688 ) | — |
Interest Rate-Related Swaps (Inflation-Linked Swaps): | |||
Average Notional Balance - Pays Fixed Rate | — | 473,296,857 | — |
Ending Notional Balance - Pays Fixed Rate | — | 364,681,000 | — |
Credit Default Swaps: | |||
Average Notional Balance - Buy Protection | 12,117,143 | 73,737,857 | 10,550,000 |
Ending Notional Balance - Buy Protection | 6,520,000 | 63,167,000 | 10,550,000 |
Class A | Class C | Class I | ETF Shares | Total | |
High Yield Municipal ETF | |||||
Transfer agency fees | $1,739 | $163 | $703 | $51 | $2,656 |
Limited Duration Bond ETF | |||||
Transfer agency fees | 5,050 | 175 | 1,170 | 3,934 | 10,329 |
Sustainable Municipal Income ETF | |||||
Transfer agency fees | 810 | 75 | 607 | 210 | 1,702 |
104 | J.P. Morgan Exchange-Traded Funds | August 31, 2023 |
High Yield Municipal ETF | 0.35 % |
Inflation Managed Bond ETF | 0.28 |
Limited Duration Bond ETF | 0.20 |
Realty Income ETF | 0.60 |
Sustainable Municipal Income ETF | 0.30 |
Class A | Class C | |
High Yield Municipal ETF | 0.25 % | 0.75 % |
Inflation Managed Bond ETF | 0.25 | 0.75 |
Limited Duration Bond ETF | 0.25 | 0.75 |
Realty Income ETF | 0.25 | 0.75 |
Sustainable Municipal Income ETF | 0.25 | 0.75 |
August 31, 2023 | J.P. Morgan Exchange-Traded Funds | 105 |
AS OF August 31, 2023 (Unaudited) (continued)
Class A | Class C | Class I | Class L | Class R5 | |
High Yield Municipal ETF | 0.25 % | 0.25 % | 0.25 % | n/a | n/a |
Inflation Managed Bond ETF | 0.25 | 0.25 | 0.25 | n/a | 0.10 % |
Limited Duration Bond ETF | 0.25 | 0.25 | 0.25 | n/a | n/a |
Realty Income ETF | 0.25 | 0.25 | 0.25 | 0.10 % | 0.10 |
Sustainable Municipal Income ETF | 0.25 | 0.25 | 0.25 | n/a | n/a |
106 | J.P. Morgan Exchange-Traded Funds | August 31, 2023 |
Class A | Class C | Class I | Class L | Class R5 | Class R6 | |
High Yield Municipal ETF | 0.65 % | 1.15 % | 0.55 % | n/a | n/a | 0.45 % |
Inflation Managed Bond ETF | 0.75 | 1.40 | 0.55 | n/a | 0.45 % | n/a |
Limited Duration Bond ETF | 0.70 | 1.20 | 0.45 | n/a | n/a | 0.25 |
Realty Income ETF | 1.18 | 1.68 | 0.93 | 0.78 % | 0.78 | n/a |
Sustainable Municipal Income ETF | 0.70 | 1.25 | 0.45 | n/a | n/a | 0.35 |
Contractual Waivers | Voluntary Waivers | |||||
Investment Advisory Fees | Administration Fees | Service Fees | Total | Contractual Reimbursements | 12b-1 | |
High Yield Municipal ETF | $68,653 | $42,963 | $203,249 | $314,865 | $85,225 | $162,173 |
Inflation Managed Bond ETF | — | — | — | — | 475,630 | — |
Limited Duration Bond ETF | 178,259 | 115,414 | 80,850 | 374,523 | 55,124 | 187,512 |
Realty Income ETF | — | — | — | — | 475,060 | — |
Sustainable Municipal Income ETF | 100,824 | 63,527 | 112,568 | 276,919 | 91,701 | 83,166 |
High Yield Municipal ETF | $872 |
Inflation Managed Bond ETF | 11,735 |
Limited Duration Bond ETF | 70,289 |
Realty Income ETF | 9,367 |
Sustainable Municipal Income ETF | 4,831 |
High Yield Municipal ETF | $804 |
Inflation Managed Bond ETF | 838 |
Limited Duration Bond ETF | 725 |
Realty Income ETF | 817 |
Sustainable Municipal Income ETF | 669 |
August 31, 2023 | J.P. Morgan Exchange-Traded Funds | 107 |
AS OF August 31, 2023 (Unaudited) (continued)
Purchases (excluding U.S. Government) | Sales (excluding U.S. Government) | Sales of U.S. Government | |
High Yield Municipal ETF | $76,419,378 | $105,024,316 | $— |
Inflation Managed Bond ETF | 42,565,689 | 203,216,489 | 168,653,108 |
Limited Duration Bond ETF | 28,993,575 | 299,766,301 | — |
Realty Income ETF | 221,097,671 | 215,966,788 | — |
Sustainable Municipal Income ETF | 35,875,732 | 57,175,097 | — |
In-Kind Purchases | In-Kind Sales | |
Inflation Managed Bond ETF | $— | $94,022,696 |
Realty Income ETF | 12,231,978 | 168,686,387 |
Aggregate Cost | Gross Unrealized Appreciation | Gross Unrealized Depreciation | Net Unrealized Appreciation (Depreciation) | |
High Yield Municipal ETF | $252,195,442 | $335,983 | $27,400,903 | $(27,064,920 ) |
Inflation Managed Bond ETF | 522,140,697 | 1,235,846 | 39,440,838 | (38,204,992 ) |
Limited Duration Bond ETF | 872,486,855 | 531,896 | 40,581,426 | (40,049,530 ) |
Realty Income ETF | 332,994,294 | 30,690,565 | 25,161,050 | 5,529,515 |
Sustainable Municipal Income ETF | 248,336,263 | 527,559 | 14,855,486 | (14,327,927 ) |
Capital Loss Carryforward Character | ||
Short-Term | Long-Term | |
High Yield Municipal ETF | $2,497,743 | $12,279,785 |
Inflation Managed Bond ETF | — | 30,326,602 |
Limited Duration Bond ETF | 2,771 | 12,324,638 |
Sustainable Municipal Income ETF | 1,266,465 | 5,076,325 |
108 | J.P. Morgan Exchange-Traded Funds | August 31, 2023 |
Net Capital Losses (Gains) | ||
Short-Term | Long-Term | |
High Yield Municipal ETF | $217,836 | $2,607,336 |
Inflation Managed Bond ETF | 6,615,022 | 2,031,487 |
Realty Income ETF | 18,675,027 | (11,007,839 ) |
Sustainable Municipal Income ETF | 226,717 | 585,757 |
August 31, 2023 | J.P. Morgan Exchange-Traded Funds | 109 |
AS OF August 31, 2023 (Unaudited) (continued)
J.P. Morgan Investor Funds | JPMorgan SmartRetirement Funds | JPMorgan SmartRetirement Blend Funds | |
Inflation Managed Bond ETF | — % | 38.4 % | 21.7 % |
Limited Duration Bond ETF | 52.6 | — | — |
Realty Income ETF | — | 77.4 | — |
110 | J.P. Morgan Exchange-Traded Funds | August 31, 2023 |
Fund | Class | Date | Value | Gain/Loss | Type |
Realty Income ETF | R6 | March 21, 2022 | $231,616,311 (a) | $46,870,934 | Redemption-in-kind |
(a) | This amount includes cash of approximately $4,856,743 associated with the redemption in-kind. |
August 31, 2023 | J.P. Morgan Exchange-Traded Funds | 111 |
(Unaudited)
Hypothetical $1,000 Investment
Beginning Account Value March 1, 2023 | Ending Account Value August 31, 2023 | Expenses Paid During the Period* | Annualized Expense Ratio | |
JPMorgan High Yield Municipal ETF | ||||
Actual | $1,000.00 | $1,001.70 | $1.86 | 0.37 % |
Hypothetical | 1,000.00 | 1,023.28 | 1.88 | 0.37 |
JPMorgan Inflation Managed Bond ETF | ||||
Actual | 1,000.00 | 1,010.90 | 1.26 | 0.25 |
Hypothetical | 1,000.00 | 1,023.88 | 1.27 | 0.25 |
JPMorgan Limited Duration Bond ETF | ||||
Actual | 1,000.00 | 1,022.30 | 1.17 | 0.23 |
Hypothetical | 1,000.00 | 1,023.98 | 1.17 | 0.23 |
JPMorgan Realty Income ETF | ||||
Actual | 1,000.00 | 989.60 | 2.50 | 0.50 |
Hypothetical | 1,000.00 | 1,022.62 | 2.54 | 0.50 |
JPMorgan Sustainable Municipal Income ETF | ||||
Actual | 1,000.00 | 1,012.40 | 1.26 | 0.25 |
Hypothetical | 1,000.00 | 1,023.88 | 1.27 | 0.25 |
* | Expenses are equal to each Fund's annualized net expense ratio, multiplied by the average account value over the period, multiplied by 184/366 (to reflect the one-half year period). |
112 | J.P. Morgan Exchange-Traded Funds | August 31, 2023 |
(Unaudited)
August 31, 2023 | J.P. Morgan Exchange-Traded Funds | 113 |
(Unaudited)
114 | J.P. Morgan Exchange-Traded Funds | August 31, 2023 |
August 31, 2023 | J.P. Morgan Exchange-Traded Funds | 115 |
(Unaudited) (continued)
116 | J.P. Morgan Exchange-Traded Funds | August 31, 2023 |
August 31, 2023 | J.P. Morgan Exchange-Traded Funds | 117 |
(Unaudited)
118 | J.P. Morgan Exchange-Traded Funds | August 31, 2023 |
Investment Performance
August 31, 2023 | J.P. Morgan Exchange-Traded Funds | 119 |


Fund | Ticker | Listing Exchange |
JPMorgan BetaBuilders 1-5 Year U.S. Aggregate Bond ETF | BBSA | Cboe BZX Exchange, Inc. |
JPMorgan BetaBuilders U.S. Aggregate Bond ETF | BBAG | NYSE Arca |
JPMorgan BetaBuilders U.S. TIPS 0-5 Year ETF | BBIP | Cboe BZX Exchange, Inc. |
JPMorgan BetaBuilders U.S. Treasury Bond 1-3 Year ETF | BBSB | Cboe BZX Exchange, Inc. |
JPMorgan BetaBuilders U.S. Treasury Bond 20+ Year ETF | BBLB | Cboe BZX Exchange, Inc. |
JPMorgan BetaBuilders U.S. Treasury Bond 3-10 Year ETF | BBIB | Cboe BZX Exchange, Inc. |
JPMorgan BetaBuilders USD High Yield Corporate Bond ETF | BBHY | Cboe BZX Exchange, Inc. |
JPMorgan BetaBuilders USD Investment Grade Corporate Bond ETF | BBCB | NYSE Arca |
JPMorgan USD Emerging Markets Sovereign Bond ETF | JPMB | NYSE Arca |

1 | |
2 | |
3 | |
5 | |
7 | |
9 | |
11 | |
13 | |
15 | |
18 | |
20 | |
23 | |
133 | |
144 | |
148 | |
163 | |
165 | |
166 | |
170 |
October 19, 2023 (Unaudited)
 | “A properly diversified portfolio together with a long-term approach may help investors weather economic and geopolitical uncertainties.” — Brian S. Shlissel |

President, J.P. Morgan Exchange-Traded Funds
J.P. Morgan Asset Management
1-844-4JPM-ETF or jpmorgan.com/etfs for more information
August 31, 2023 | J.P. Morgan Exchange-Traded Funds | 1 |
SIX MONTHS ENDED August 31, 2023 (Unaudited)
2 | J.P. Morgan Exchange-Traded Funds | August 31, 2023 |
SIX MONTHS ENDED August 31, 2023 (Unaudited)
REPORTING PERIOD RETURN: | |
Net Asset Value * | 1.65% |
Market Price ** | 1.58% |
Bloomberg Short-Term U.S. Aggregate Bond Index | 1.77% |
Net Assets as of 8/31/2023 | $15,294,006 |
Duration as of 8/31/2023 | 2.7 Years |
Fund Ticker | BBSA |
PORTFOLIO COMPOSITION AS OF August 31, 2023 | PERCENT OF TOTAL INVESTMENTS |
U.S. Treasury Obligations | 57.8% |
Corporate Bonds | 25.6 |
Mortgage-Backed Securities | 6.6 |
Supranational | 2.7 |
Commercial Mortgage-Backed Securities | 2.1 |
U.S. Government Agency Securities | 1.9 |
Others (each less than 1.0%) | 1.9 |
Short-Term Investments | 1.4 |
August 31, 2023 | J.P. Morgan Exchange-Traded Funds | 3 |
SIX MONTHS ENDED August 31, 2023 (Unaudited) (continued)
INCEPTION DATE | SIX MONTHS* | 1 YEAR | SINCE INCEPTION | |
JPMorgan BetaBuilders 1-5 Year U.S. Aggregate Bond ETF | ||||
Net Asset Value | March 12, 2019 | 1.65 % | 1.00 % | 0.67 % |
Market Price | 1.58 | 1.06 | 0.68 |
* | Not annualized. |
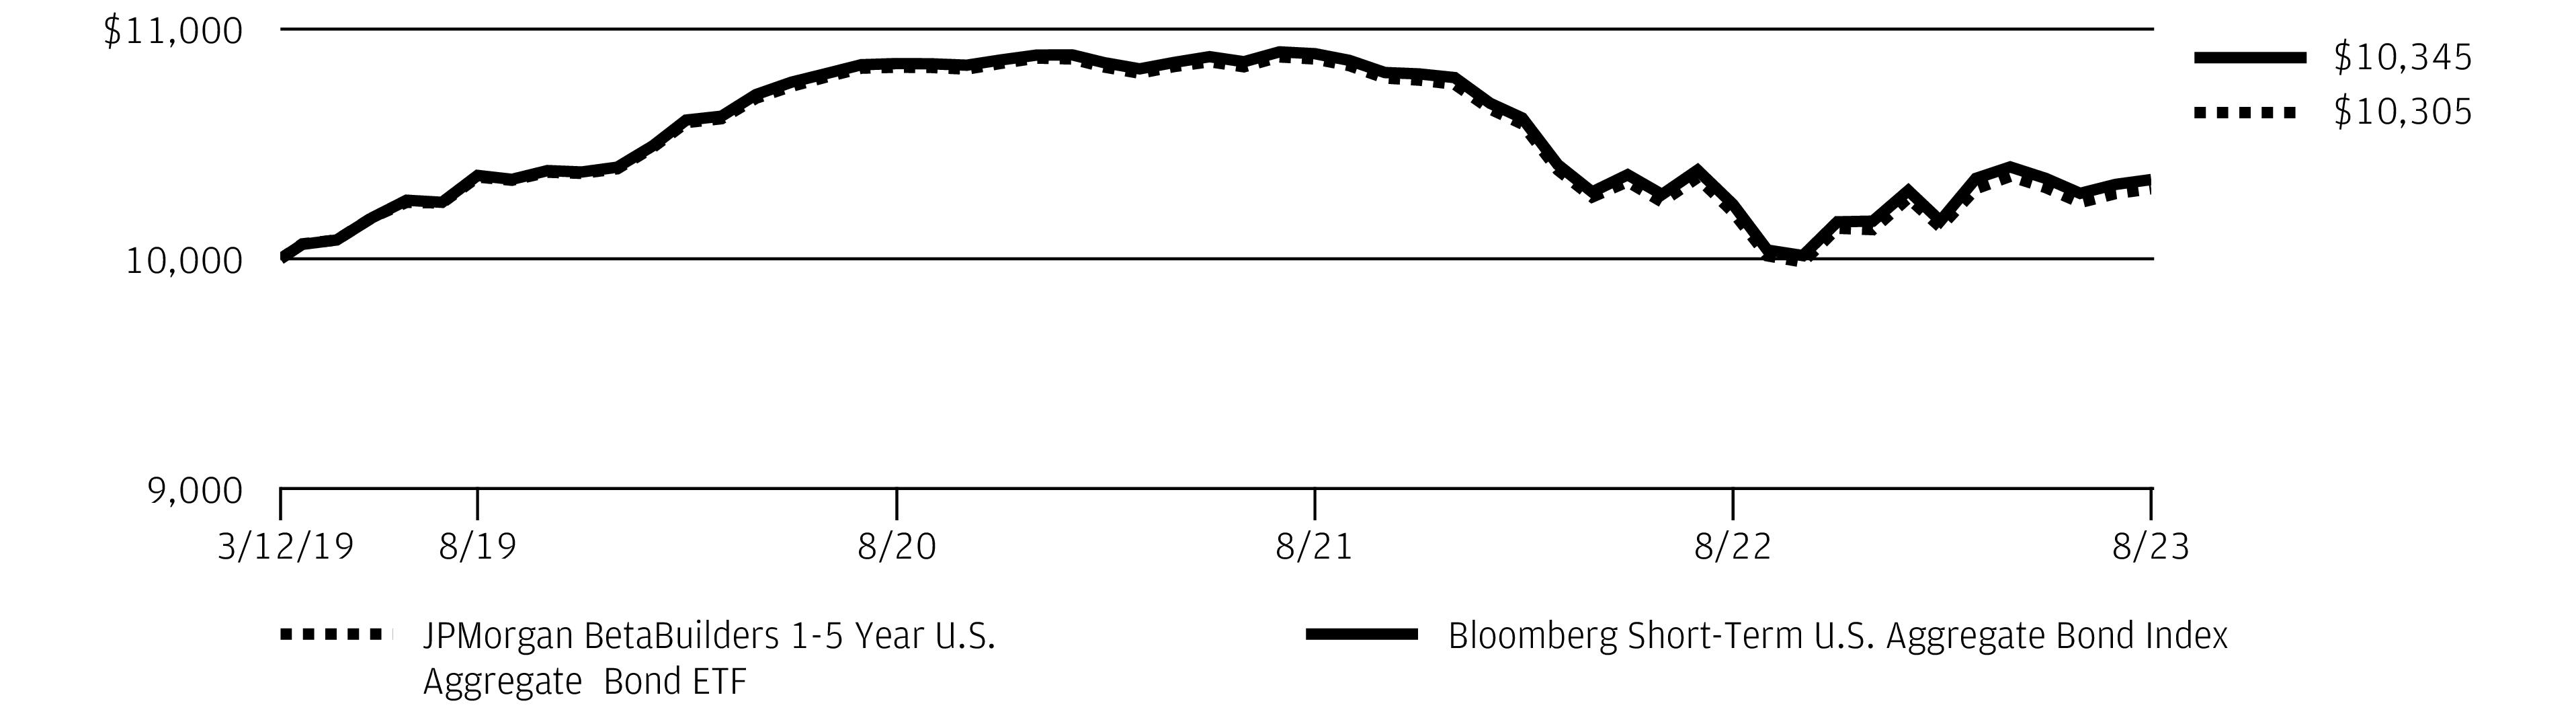
4 | J.P. Morgan Exchange-Traded Funds | August 31, 2023 |
SIX MONTHS ENDED August 31, 2023 (Unaudited)
REPORTING PERIOD RETURN: | |
Net Asset Value * | 0.87% |
Market Price ** | 1.00% |
Bloomberg U.S. Aggregate Index | 0.95% |
Net Assets as of 8/31/2023 | $2,000,114,114 |
Duration as of 8/31/2023 | 6.1 Years |
Fund Ticker | BBAG |
PORTFOLIO COMPOSITION AS OF August 31, 2023 | PERCENT OF TOTAL INVESTMENTS |
U.S. Treasury Obligations | 37.7% |
Mortgage-Backed Securities | 24.6 |
Corporate Bonds | 22.8 |
Commercial Mortgage-Backed Securities | 1.7 |
Foreign Government Securities | 1.6 |
Supranational | 1.2 |
U.S. Government Agency Securities | 1.1 |
Others (each less than 1.0%) | 0.7 |
Short-Term Investments | 8.6 |
August 31, 2023 | J.P. Morgan Exchange-Traded Funds | 5 |
SIX MONTHS ENDED August 31, 2023 (Unaudited) (continued)
INCEPTION DATE | SIX MONTHS* | 1 YEAR | SINCE INCEPTION | |
JPMorgan BetaBuilders U.S. Aggregate Bond ETF | ||||
Net Asset Value | December 12, 2018 | 0.87 % | (1.36 )% | 0.29 % |
Market Price | 1.00 | (1.32 ) | 0.32 |
* | Not annualized. |

6 | J.P. Morgan Exchange-Traded Funds | August 31, 2023 |
FOR THE PERIOD May 10, 2023 (FUND INCEPTION) THROUGH August 31, 2023 (Unaudited)
REPORTING PERIOD RETURN: | |
Net Asset Value * | (0.42)% |
Market Price ** | (0.33)% |
ICE 0-5 Year US Inflation-Linked Treasury Index Total Return in USD | (0.39)% |
Net Assets as of 8/31/2023 | $7,579,078 |
Duration as of 8/31/2023 | 2.6 Years |
Fund Ticker | BBIP |
PORTFOLIO COMPOSITION AS OF August 31, 2023 | PERCENT OF TOTAL INVESTMENTS |
U.S. Treasury Obligations | 99.8% |
Short-Term Investments | 0.2 |
August 31, 2023 | J.P. Morgan Exchange-Traded Funds | 7 |
FOR THE PERIOD May 10, 2023 (FUND INCEPTION) THROUGH August 31, 2023 (Unaudited) (continued)
INCEPTION DATE | CUMULATIVE SINCE INCEPTION | |
JPMorgan BetaBuilders U.S. TIPS 0-5 Year ETF | ||
Net Asset Value | May 10, 2023 | (0.42 )% |
Market Price | (0.33 ) |
8 | J.P. Morgan Exchange-Traded Funds | August 31, 2023 |
FOR THE PERIOD April 19, 2023 (FUND INCEPTION) THROUGH August 31, 2023 (Unaudited)
REPORTING PERIOD RETURN: | |
Net Asset Value * | 0.30% |
Market Price ** | 0.35% |
ICE US Treasury 1-3 Year Bond Index | 0.32% |
Net Assets as of 8/31/2023 | $4,421,762 |
Duration as of 8/31/2023 | 1.9 Years |
Fund Ticker | BBSB |
PORTFOLIO COMPOSITION AS OF August 31, 2023 | PERCENT OF TOTAL INVESTMENTS |
U.S. Treasury Obligations | 99.7% |
Short-Term Investments | 0.3 |
August 31, 2023 | J.P. Morgan Exchange-Traded Funds | 9 |
FOR THE PERIOD April 19, 2023 (FUND INCEPTION) THROUGH August 31, 2023 (Unaudited) (continued)
INCEPTION DATE | CUMULATIVE SINCE INCEPTION | |
JPMorgan BetaBuilders U.S. Treasury Bond 1-3 Year ETF | ||
Net Asset Value | April 19, 2023 | 0.30 % |
Market Price | 0.35 |
10 | J.P. Morgan Exchange-Traded Funds | August 31, 2023 |
FOR THE PERIOD April 19, 2023 (FUND INCEPTION) THROUGH August 31, 2023 (Unaudited)
REPORTING PERIOD RETURN: | |
Net Asset Value * | (6.02)% |
Market Price ** | (5.95)% |
ICE US Treasury 20+ Year Bond Index | (6.05)% |
Net Assets as of 8/31/2023 | $52,270,987 |
Duration as of 8/31/2023 | 17.2 Years |
Fund Ticker | BBLB |
PORTFOLIO COMPOSITION AS OF August 31, 2023 | PERCENT OF TOTAL INVESTMENTS |
U.S. Treasury Obligations | 100.0% |
Short-Term Investments | 0.0**** |
August 31, 2023 | J.P. Morgan Exchange-Traded Funds | 11 |
FOR THE PERIOD April 19, 2023 (FUND INCEPTION) THROUGH August 31, 2023 (Unaudited) (continued)
INCEPTION DATE | CUMULATIVE SINCE INCEPTION | |
JPMorgan BetaBuilders U.S. Treasury Bond 20+ Year ETF | ||
Net Asset Value | April 19, 2023 | (6.02 )% |
Market Price | (5.95 ) |

12 | J.P. Morgan Exchange-Traded Funds | August 31, 2023 |
FOR THE PERIOD April 19, 2023 (FUND INCEPTION) THROUGH August 31, 2023 (Unaudited)
REPORTING PERIOD RETURN: | |
Net Asset Value * | (1.39)% |
Market Price ** | (1.35)% |
ICE U.S. Treasury 3-10 Year Bond Index Total Return in USD | (1.38)% |
Net Assets as of 8/31/2023 | $4,368,957 |
Duration as of 8/31/2023 | 5.1 Years |
Fund Ticker | BBIB |
PORTFOLIO COMPOSITION AS OF August 31, 2023 | PERCENT OF TOTAL INVESTMENTS |
U.S. Treasury Obligations | 99.5% |
Short-Term Investments | 0.5 |
August 31, 2023 | J.P. Morgan Exchange-Traded Funds | 13 |
FOR THE PERIOD April 19, 2023 (FUND INCEPTION) THROUGH August 31, 2023 (Unaudited) (continued)
INCEPTION DATE | CUMULATIVE SINCE INCEPTION | |
JPMorgan BetaBuilders U.S. Treasury Bond 3-10 Year ETF | ||
Net Asset Value | April 19, 2023 | (1.39 )% |
Market Price | (1.35 ) |
14 | J.P. Morgan Exchange-Traded Funds | August 31, 2023 |
SIX MONTHS ENDED August 31, 2023 (Unaudited)
REPORTING PERIOD RETURN: | |
Net Asset Value * | 3.96% |
Market Price ** | 4.27% |
ICE BofA U.S. High Yield Total Return Index | 4.58% |
Net Assets as of 8/31/2023 | $433,254,754 |
Duration as of 8/31/2023 | 3.7 Years |
Fund Ticker | BBHY |
PORTFOLIO COMPOSITION BY INDUSTRY AS OF August 31, 2023 | PERCENT OF TOTAL INVESTMENTS |
Oil, Gas & Consumable Fuels | 9.7% |
Hotels, Restaurants & Leisure | 8.6 |
Media | 6.6 |
Diversified Telecommunication Services | 5.2 |
Consumer Finance | 4.3 |
Health Care Providers & Services | 4.0 |
Commercial Services & Supplies | 3.5 |
Specialty Retail | 3.3 |
Software | 2.9 |
Chemicals | 2.9 |
Containers & Packaging | 2.9 |
Aerospace & Defense | 2.2 |
Automobile Components | 2.2 |
Financial Services | 2.0 |
Metals & Mining | 2.0 |
Passenger Airlines | 1.8 |
Trading Companies & Distributors | 1.7 |
Insurance | 1.7 |
Energy Equipment & Services | 1.6 |
Electric Utilities | 1.6 |
Pharmaceuticals | 1.6 |
Building Products | 1.4 |
Household Durables | 1.4 |
Machinery | 1.4 |
Automobiles | 1.3 |
Broadline Retail | 1.3 |
Ground Transportation | 1.2 |
Food Products | 1.2 |
Consumer Staples Distribution & Retail | 1.1 |
Wireless Telecommunication Services | 1.1 |
Others (each less than 1.0%) | 15.4 |
Short-Term Investments | 0.9 |
August 31, 2023 | J.P. Morgan Exchange-Traded Funds | 15 |
SIX MONTHS ENDED August 31, 2023 (Unaudited) (continued)
16 | J.P. Morgan Exchange-Traded Funds | August 31, 2023 |
INCEPTION DATE | SIX MONTHS* | 1 YEAR | 5 YEAR | SINCE INCEPTION | |
JPMorgan BetaBuilders USD High Yield Corporate Bond ETF | |||||
Net Asset Value | September 14, 2016 | 3.96 % | 6.86 % | 2.93 % | 3.42 % |
Market Price | 4.27 | 7.62 | 2.93 | 3.46 |
* | Not annualized. |
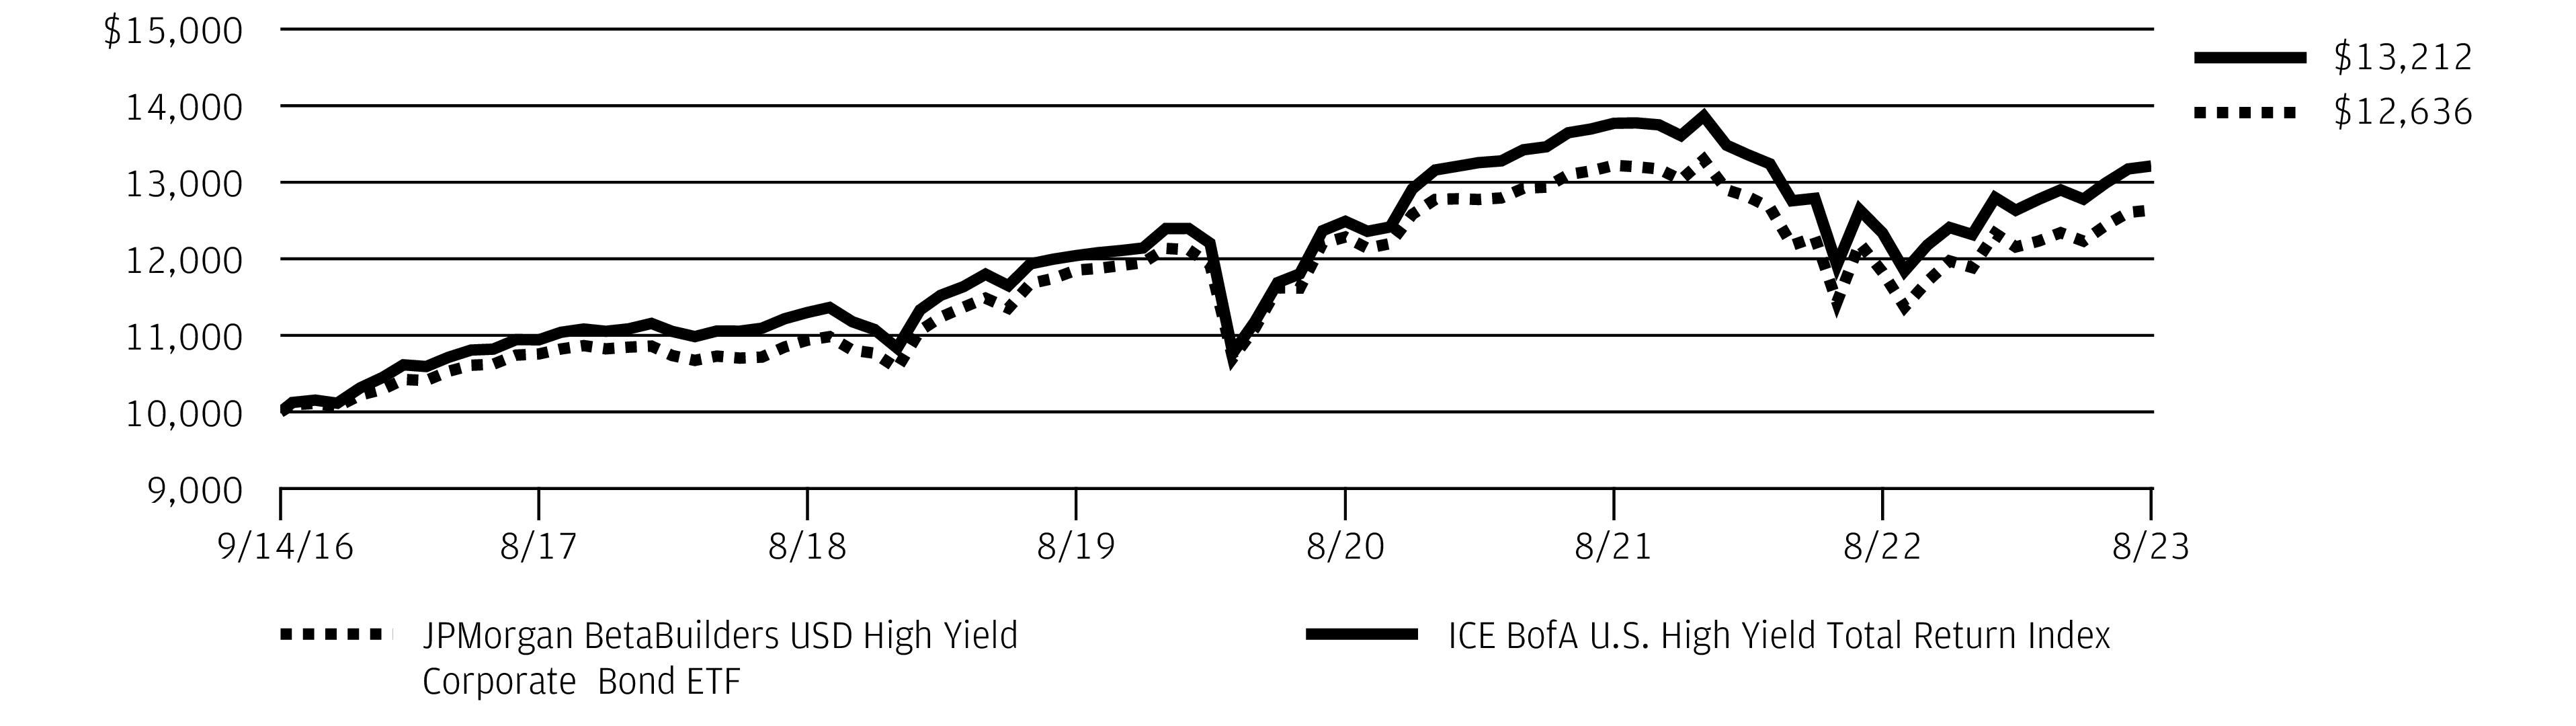
August 31, 2023 | J.P. Morgan Exchange-Traded Funds | 17 |
SIX MONTHS ENDED August 31, 2023 (Unaudited)
REPORTING PERIOD RETURN: | |
Net Asset Value * | 1.86% |
Market Price ** | 1.88% |
Bloomberg U.S. Corporate Index | 2.05% |
Net Assets as of 8/31/2023 | $51,253,356 |
Duration as of 8/31/2023 | 7.0 Years |
Fund Ticker | BBCB |
PORTFOLIO COMPOSITION AS OF August 31, 2023 | PERCENT OF TOTAL INVESTMENTS |
Corporate Bonds | 99.0% |
Others (each less than 1.0%) | 0.2 |
Short-Term Investments | 0.8 |
18 | J.P. Morgan Exchange-Traded Funds | August 31, 2023 |
INCEPTION DATE | SIX MONTHS* | 1 YEAR | SINCE INCEPTION | |
JPMorgan BetaBuilders USD Investment Grade Corporate Bond ETF | ||||
Net Asset Value | December 12, 2018 | 1.86 % | 0.83 % | 1.57 % |
Market Price | 1.88 | 1.11 | 1.57 |
* | Not annualized. |
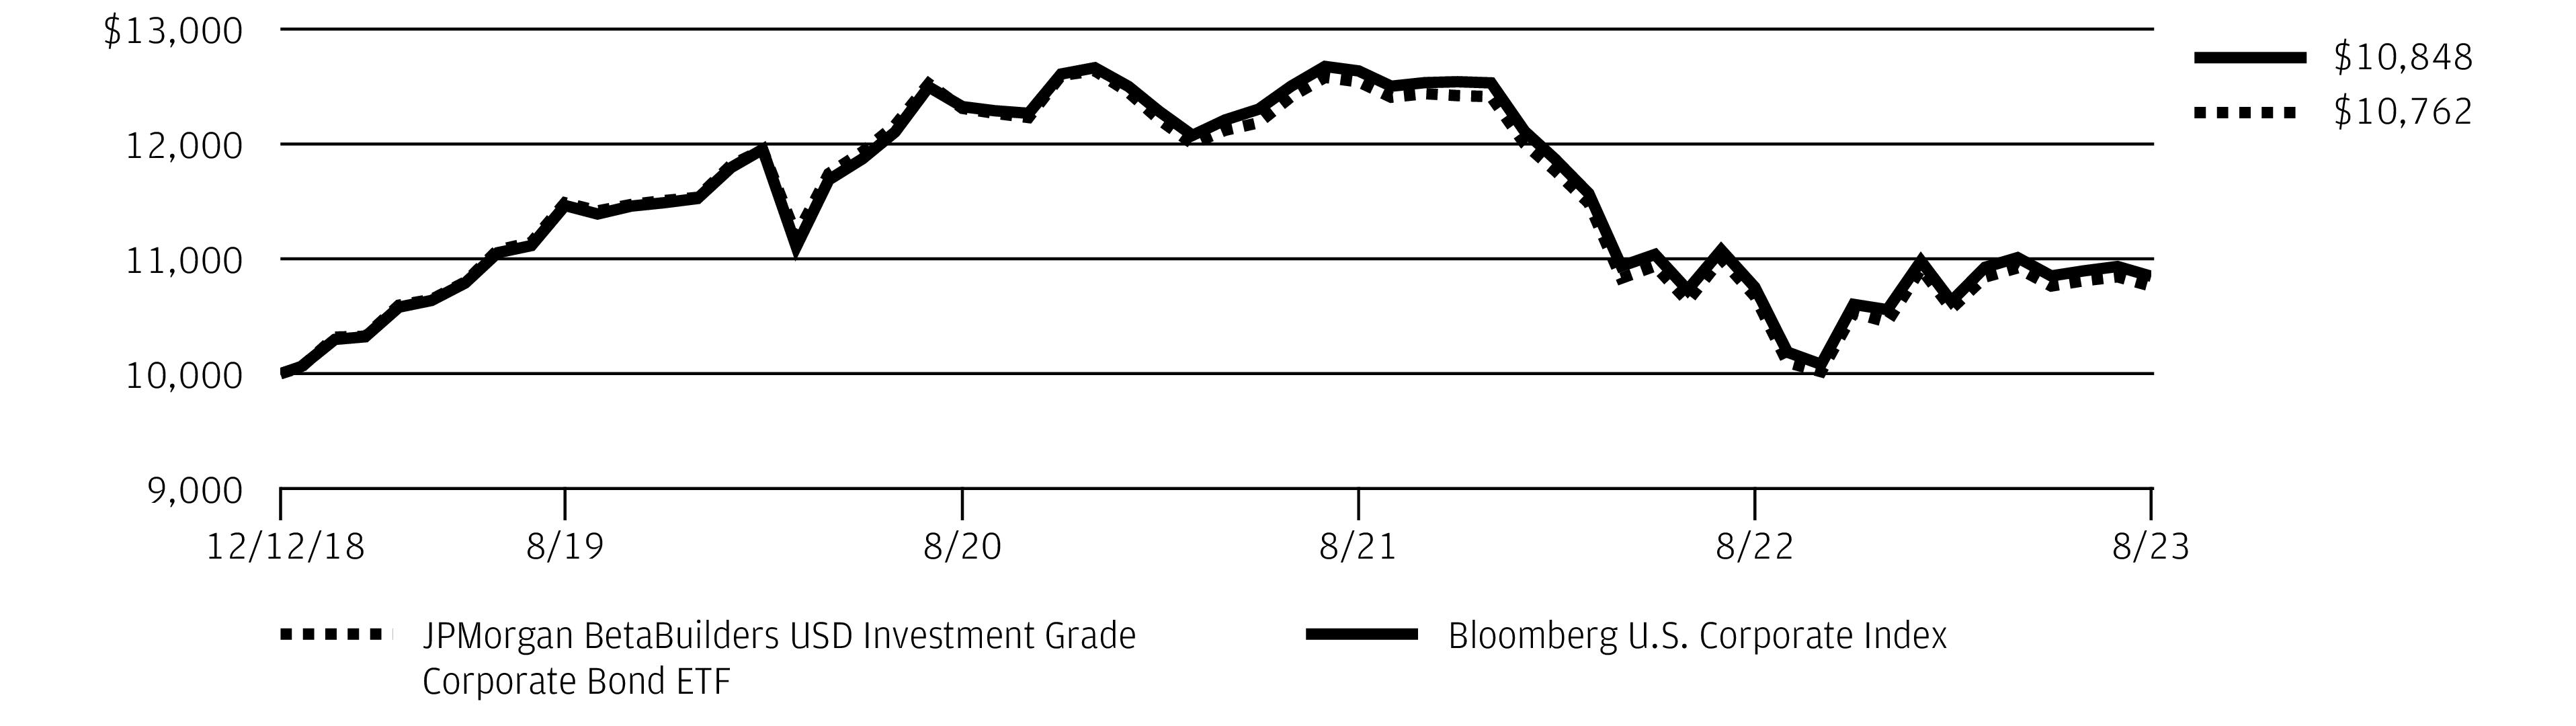
August 31, 2023 | J.P. Morgan Exchange-Traded Funds | 19 |
SIX MONTHS ENDED August 31, 2023 (Unaudited)
REPORTING PERIOD RETURN: | |
Net Asset Value * | 2.75% |
Market Price ** | 2.52% |
JPMorgan Emerging Markets Risk-Aware Bond Index | 3.07% |
Net Assets as of 8/31/2023 | $634,543,691 |
Duration as of 8/31/2023 | 6.8 Years |
Fund Ticker | JPMB |
PORTFOLIO COMPOSITION BY COUNTRY AS OF August 31, 2023 | PERCENT OF TOTAL INVESTMENTS |
Turkey | 8.1% |
Oman | 7.8 |
Brazil | 7.5 |
Dominican Republic | 7.1 |
Colombia | 6.7 |
South Africa | 6.6 |
Bahrain | 4.6 |
Mexico | 3.6 |
Saudi Arabia | 3.5 |
Indonesia | 3.3 |
United Arab Emirates | 3.0 |
Qatar | 2.5 |
China | 2.5 |
Philippines | 2.2 |
Chile | 2.0 |
Kenya | 2.0 |
Jamaica | 1.9 |
Peru | 1.9 |
Panama | 1.9 |
Angola | 1.7 |
Uruguay | 1.5 |
Jordan | 1.5 |
Hungary | 1.5 |
Malaysia | 1.5 |
Romania | 1.4 |
Morocco | 1.4 |
Costa Rica | 1.2 |
Azerbaijan | 1.0 |
Paraguay | 1.0 |
Others (each less than 1.0%) | 5.5 |
Short-Term Investments | 2.1 |
20 | J.P. Morgan Exchange-Traded Funds | August 31, 2023 |
August 31, 2023 | J.P. Morgan Exchange-Traded Funds | 21 |
SIX MONTHS ENDED August 31, 2023 (Unaudited) (continued)
INCEPTION DATE | SIX MONTHS* | 1 YEAR | 5 YEAR | SINCE INCEPTION | |
JPMorgan USD Emerging Markets Sovereign Bond ETF | |||||
Net Asset Value | January 29, 2018 | 2.75 % | 4.84 % | 1.24 % | 0.02 % |
Market Price | 2.52 | 5.34 | 1.16 | 0.08 |
* | Not annualized. |
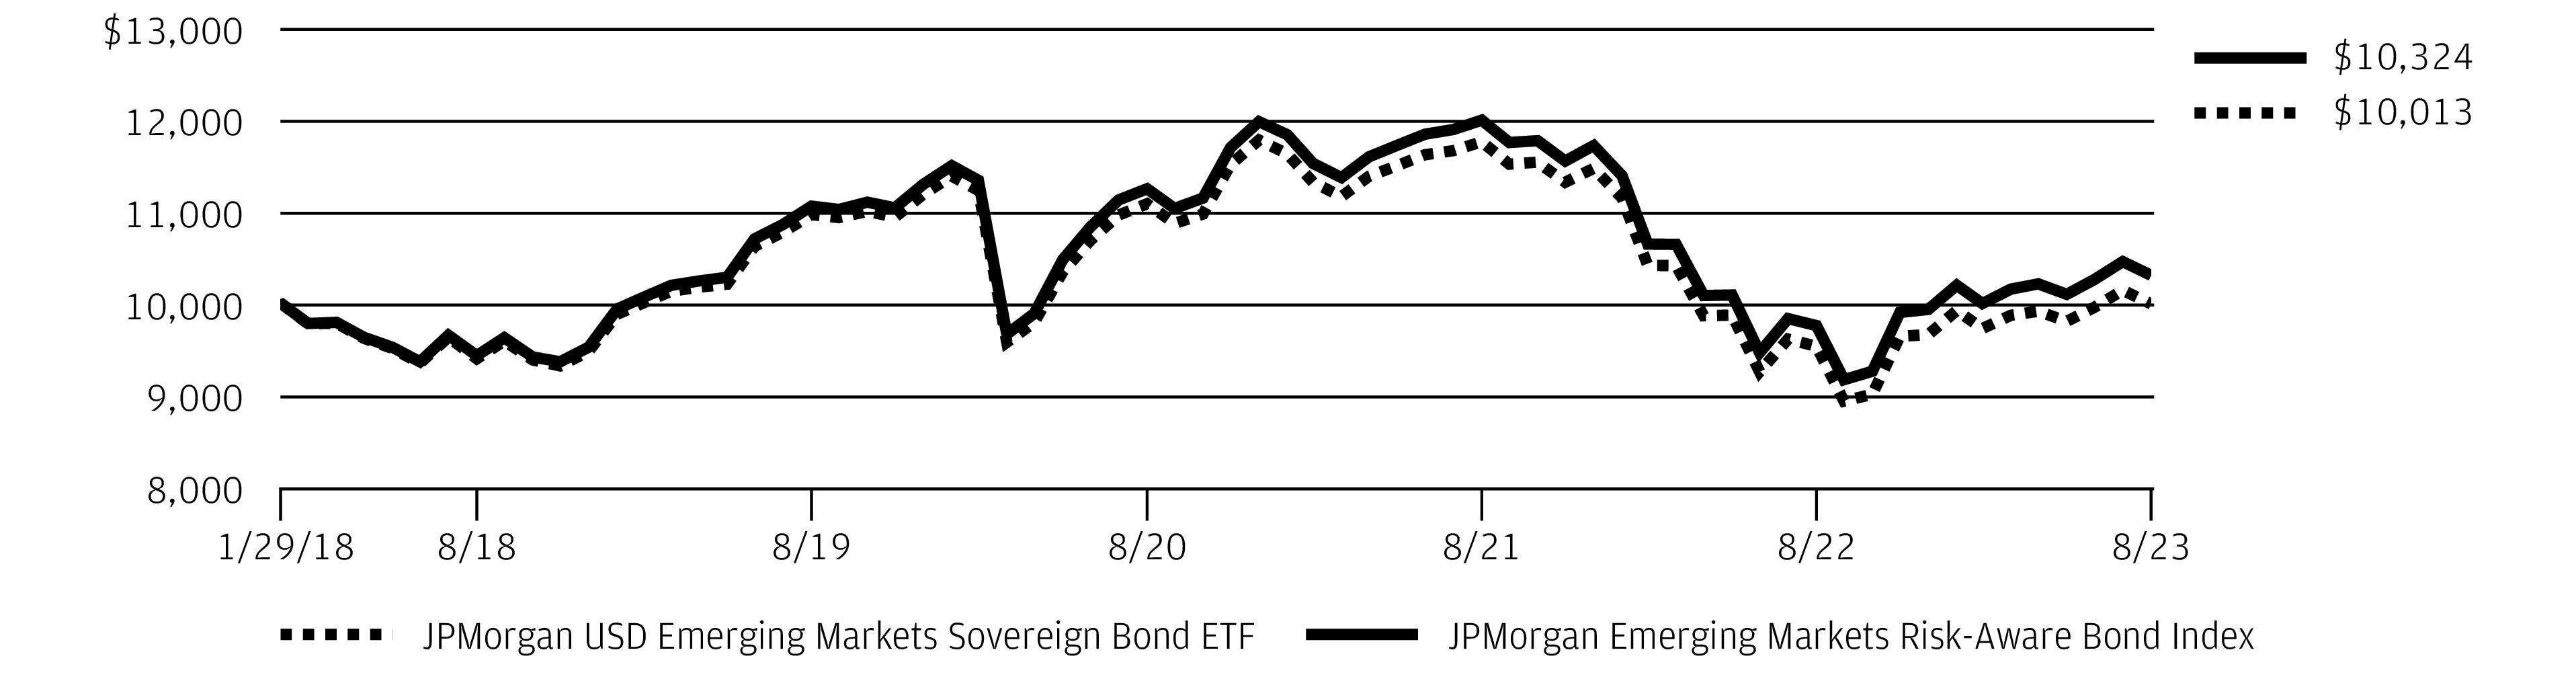
22 | J.P. Morgan Exchange-Traded Funds | August 31, 2023 |
AS OF August 31, 2023 (Unaudited)
INVESTMENTS | PRINCIPAL AMOUNT($) | VALUE($) |
U.S. Treasury Obligations — 58.0% | ||
U.S. Treasury Bonds | ||
7.63%, 2/15/2025 | 118,000 | 121,932 |
6.00%, 2/15/2026 | 268,000 | 275,161 |
6.50%, 11/15/2026 | 72,000 | 76,067 |
6.38%, 8/15/2027 | 323,000 | 345,232 |
U.S. Treasury Notes | ||
1.75%, 7/31/2024 | 111,000 | 107,388 |
2.38%, 8/15/2024 | 193,000 | 187,557 |
0.38%, 9/15/2024 | 8,000 | 7,600 |
1.50%, 9/30/2024 | 287,000 | 275,542 |
0.63%, 10/15/2024 | 9,000 | 8,545 |
1.50%, 10/31/2024 | 258,000 | 247,065 |
0.75%, 11/15/2024 | 86,000 | 81,498 |
2.25%, 11/15/2024 | 12,000 | 11,576 |
1.00%, 12/15/2024 | 141,000 | 133,631 |
1.75%, 12/31/2024 | 153,000 | 146,235 |
2.25%, 12/31/2024 | 159,000 | 152,982 |
1.13%, 1/15/2025 | 88,000 | 83,311 |
1.50%, 2/15/2025 | 100,000 | 94,926 |
2.00%, 2/15/2025 | 5,000 | 4,782 |
0.50%, 3/31/2025 | 7,000 | 6,519 |
0.38%, 4/30/2025 | 153,000 | 141,764 |
0.25%, 5/31/2025 | 1,066,000 | 982,177 |
2.88%, 5/31/2025 | 118,000 | 113,838 |
0.25%, 7/31/2025 | 21,000 | 19,231 |
2.00%, 8/15/2025 | 5,000 | 4,733 |
0.25%, 8/31/2025 | 87,000 | 79,415 |
2.25%, 11/15/2025 | 9,000 | 8,525 |
0.38%, 11/30/2025 | 1,460,000 | 1,325,064 |
0.38%, 1/31/2026 | 7,000 | 6,317 |
0.50%, 2/28/2026 | 8,000 | 7,223 |
0.75%, 3/31/2026 | 5,000 | 4,538 |
0.75%, 4/30/2026 | 5,000 | 4,522 |
0.75%, 5/31/2026 | 6,000 | 5,411 |
1.50%, 8/15/2026 | 5,000 | 4,583 |
0.75%, 8/31/2026 | 731,000 | 654,531 |
0.88%, 9/30/2026 | 5,000 | 4,486 |
1.13%, 10/31/2026 | 259,000 | 233,484 |
1.25%, 11/30/2026 | 339,000 | 306,159 |
1.25%, 12/31/2026 | 5,000 | 4,509 |
1.50%, 1/31/2027 | 34,000 | 30,842 |
2.38%, 5/15/2027 | 5,000 | 4,654 |
0.50%, 5/31/2027 | 157,000 | 135,989 |
0.50%, 6/30/2027 | 391,000 | 337,848 |
0.38%, 7/31/2027 | 177,000 | 151,708 |
INVESTMENTS | PRINCIPAL AMOUNT($) | VALUE($) |
2.75%, 7/31/2027 | 150,000 | 141,211 |
2.25%, 8/15/2027 | 100,000 | 92,320 |
0.50%, 8/31/2027 | 300,000 | 257,766 |
4.13%, 10/31/2027 | 100,000 | 99,078 |
3.88%, 12/31/2027 | 20,000 | 19,636 |
0.75%, 1/31/2028 | 75,000 | 64,318 |
3.50%, 1/31/2028 | 350,000 | 338,516 |
2.75%, 2/15/2028 | 200,000 | 187,344 |
1.13%, 2/29/2028 | 75,000 | 65,285 |
3.63%, 3/31/2028 | 50,000 | 48,606 |
1.25%, 4/30/2028 | 160,000 | 139,525 |
2.88%, 5/15/2028 | 91,000 | 85,533 |
1.25%, 5/31/2028 | 100,000 | 87,047 |
1.25%, 6/30/2028 | 104,000 | 90,350 |
1.00%, 7/31/2028 | 178,000 | 152,343 |
4.13%, 7/31/2028 | 5,000 | 4,971 |
2.88%, 8/15/2028 | 56,000 | 52,504 |
Total U.S. Treasury Obligations (Cost $9,246,656) | 8,865,453 | |
Corporate Bonds — 25.7% | ||
Aerospace & Defense — 0.3% | ||
Boeing Co. (The) | ||
4.88%, 5/1/2025 | 5,000 | 4,930 |
2.75%, 2/1/2026 | 15,000 | 14,071 |
2.70%, 2/1/2027 | 2,000 | 1,829 |
General Dynamics Corp. 2.38%, 11/15/2024 | 7,000 | 6,745 |
HEICO Corp. 5.25%, 8/1/2028 | 8,000 | 7,934 |
Leidos, Inc. 3.63%, 5/15/2025 | 4,000 | 3,854 |
Lockheed Martin Corp. 3.55%, 1/15/2026 | 2,000 | 1,935 |
41,298 | ||
Air Freight & Logistics — 0.2% | ||
GXO Logistics, Inc. 1.65%, 7/15/2026 | 32,000 | 28,328 |
Automobiles — 0.2% | ||
Toyota Motor Corp. (Japan) 1.34%, 3/25/2026 | 28,000 | 25,502 |
Banks — 7.3% | ||
Bangko Sentral ng Pilipinas International Bond (Philippines) 8.60%, 6/15/2027 | 13,000 | 14,606 |
Bank of America Corp. | ||
Series L, 3.95%, 4/21/2025 | 33,000 | 31,965 |
(3-MONTH CME TERM SOFR + 0.90%), 2.02%, 2/13/2026 (a) | 30,000 | 28,297 |
(SOFR + 1.15%), 1.32%, 6/19/2026 (a) | 78,000 | 71,760 |
(SOFR + 1.01%), 1.20%, 10/24/2026 (a) | 31,000 | 28,095 |
(SOFR + 0.96%), 1.73%, 7/22/2027 (a) | 5,000 | 4,474 |
August 31, 2023 | J.P. Morgan Exchange-Traded Funds | 23 |
AS OF August 31, 2023 (Unaudited) (continued)
INVESTMENTS | PRINCIPAL AMOUNT($) | VALUE($) |
Corporate Bonds — continued | ||
Banks — continued | ||
(SOFR + 1.58%), 4.38%, 4/27/2028 (a) | 6,000 | 5,754 |
Bank of Montreal (Canada) | ||
(SOFR + 0.60%), 0.95%, 1/22/2027 (a) | 11,000 | 9,872 |
2.65%, 3/8/2027 | 48,000 | 43,809 |
BankUnited, Inc. 4.88%, 11/17/2025 | 32,000 | 30,197 |
Barclays plc (United Kingdom) 3.65%, 3/16/2025 | 40,000 | 38,595 |
Citigroup, Inc. (3-MONTH CME TERM SOFR + 1.45%), 4.08%, 4/23/2029 (a) | 117,000 | 109,703 |
HSBC Holdings plc (United Kingdom) | ||
(3-MONTH CME TERM SOFR + 1.40%), 2.63%, 11/7/2025 (a) | 30,000 | 28,766 |
(SOFR + 1.29%), 1.59%, 5/24/2027 (a) | 25,000 | 22,226 |
KeyCorp 2.25%, 4/6/2027 | 1,000 | 859 |
Kreditanstalt fuer Wiederaufbau (Germany) | ||
2.63%, 2/28/2024 | 33,000 | 32,558 |
0.38%, 7/18/2025 | 17,000 | 15,621 |
1.00%, 10/1/2026 | 75,000 | 67,398 |
Landwirtschaftliche Rentenbank (Germany) | ||
Series 40, 0.50%, 5/27/2025 | 5,000 | 4,621 |
0.88%, 3/30/2026 | 39,000 | 35,383 |
Mitsubishi UFJ Financial Group, Inc. (Japan) | ||
3.68%, 2/22/2027 | 45,000 | 42,829 |
3.96%, 3/2/2028 | 21,000 | 19,991 |
Oesterreichische Kontrollbank AG (Austria) 0.50%, 2/2/2026 | 5,000 | 4,511 |
PNC Financial Services Group, Inc. (The) (SOFR + 1.84%), 5.58%, 6/12/2029 (a) | 6,000 | 5,950 |
Regions Financial Corp. 2.25%, 5/18/2025 | 33,000 | 30,843 |
Royal Bank of Canada (Canada) 1.40%, 11/2/2026 | 70,000 | 62,001 |
Santander Holdings USA, Inc. | ||
(SOFR + 2.33%), 5.81%, 9/9/2026 (a) | 6,000 | 5,933 |
(SOFR + 1.25%), 2.49%, 1/6/2028 (a) | 39,000 | 34,180 |
Sumitomo Mitsui Financial Group, Inc. (Japan) | ||
3.01%, 10/19/2026 | 61,000 | 56,535 |
3.94%, 7/19/2028 | 8,000 | 7,477 |
Toronto-Dominion Bank (The) (Canada) | ||
0.75%, 9/11/2025 | 5,000 | 4,559 |
2.80%, 3/10/2027 | 6,000 | 5,502 |
(USD Swap Semi 5 Year + 2.21%), 3.62%, 9/15/2031 (a) (b) | 7,000 | 6,533 |
Truist Financial Corp. | ||
3.70%, 6/5/2025 | 6,000 | 5,782 |
1.20%, 8/5/2025 | 6,000 | 5,504 |
(SOFR + 1.37%), 4.12%, 6/6/2028 (a) | 17,000 | 16,034 |
INVESTMENTS | PRINCIPAL AMOUNT($) | VALUE($) |
Banks — continued | ||
(SOFR + 0.86%), 1.89%, 6/7/2029 (a) | 15,000 | 12,521 |
US Bancorp (SOFR + 0.73%), 2.22%, 1/27/2028 (a) | 35,000 | 31,226 |
Wells Fargo & Co. | ||
3.00%, 4/22/2026 | 8,000 | 7,493 |
(SOFR + 1.32%), 3.91%, 4/25/2026 (a) | 10,000 | 9,672 |
(SOFR + 2.00%), 2.19%, 4/30/2026 (a) | 63,000 | 59,254 |
(3-MONTH CME TERM SOFR + 1.43%), 3.20%, 6/17/2027 (a) | 18,000 | 16,826 |
Westpac Banking Corp. (Australia) | ||
5.46%, 11/18/2027 | 9,000 | 9,132 |
3.40%, 1/25/2028 | 35,000 | 32,919 |
1,117,766 | ||
Beverages — 0.4% | ||
Anheuser-Busch Cos. LLC (Belgium) 3.65%, 2/1/2026 | 16,000 | 15,462 |
Coca-Cola Co. (The) 1.45%, 6/1/2027 | 40,000 | 35,715 |
Keurig Dr Pepper, Inc. 3.40%, 11/15/2025 | 2,000 | 1,913 |
PepsiCo, Inc. 2.85%, 2/24/2026 | 10,000 | 9,522 |
62,612 | ||
Biotechnology — 0.5% | ||
AbbVie, Inc. | ||
2.60%, 11/21/2024 | 9,000 | 8,687 |
3.80%, 3/15/2025 | 42,000 | 40,895 |
Amgen, Inc. 1.65%, 8/15/2028 | 23,000 | 19,619 |
Baxalta, Inc. 4.00%, 6/23/2025 | 4,000 | 3,890 |
73,091 | ||
Broadline Retail — 0.1% | ||
eBay, Inc. | ||
1.90%, 3/11/2025 | 2,000 | 1,894 |
1.40%, 5/10/2026 | 14,000 | 12,620 |
14,514 | ||
Building Products — 0.0% ^ | ||
Lennox International, Inc. 1.35%, 8/1/2025 | 2,000 | 1,843 |
Capital Markets — 2.7% | ||
Ameriprise Financial, Inc. | ||
3.70%, 10/15/2024 | 2,000 | 1,957 |
2.88%, 9/15/2026 | 2,000 | 1,871 |
Ares Capital Corp. | ||
3.25%, 7/15/2025 | 16,000 | 15,000 |
2.88%, 6/15/2028 | 21,000 | 17,743 |
Bank of New York Mellon Corp. (The) | ||
1.60%, 4/24/2025 | 10,000 | 9,392 |
24 | J.P. Morgan Exchange-Traded Funds | August 31, 2023 |
INVESTMENTS | PRINCIPAL AMOUNT($) | VALUE($) |
Corporate Bonds — continued | ||
Capital Markets — continued | ||
1.05%, 10/15/2026 | 39,000 | 34,311 |
1.65%, 7/14/2028 | 17,000 | 14,517 |
Blue Owl Capital Corp. 2.88%, 6/11/2028 | 25,000 | 20,732 |
CME Group, Inc. 3.00%, 3/15/2025 | 24,000 | 23,190 |
Franklin Resources, Inc. 2.85%, 3/30/2025 | 2,000 | 1,918 |
Goldman Sachs Group, Inc. (The) | ||
3.50%, 4/1/2025 | 29,000 | 27,991 |
4.25%, 10/21/2025 | 6,000 | 5,817 |
(SOFR + 0.91%), 1.95%, 10/21/2027 (a) | 52,000 | 46,271 |
(SOFR + 1.11%), 2.64%, 2/24/2028 (a) | 19,000 | 17,190 |
(3-MONTH CME TERM SOFR + 1.42%), 3.81%, 4/23/2029 (a) | 15,000 | 13,875 |
(3-MONTH CME TERM SOFR + 1.56%), 4.22%, 5/1/2029 (a) | 7,000 | 6,589 |
Intercontinental Exchange, Inc. 3.75%, 12/1/2025 | 7,000 | 6,757 |
Janus Henderson US Holdings, Inc. 4.88%, 8/1/2025 | 28,000 | 27,427 |
Morgan Stanley | ||
3.70%, 10/23/2024 | 21,000 | 20,549 |
Series I, (SOFR + 0.75%), 0.86%, 10/21/2025 (a) | 65,000 | 61,164 |
5.00%, 11/24/2025 | 14,000 | 13,782 |
State Street Corp. (SOFR + 0.73%), 2.20%, 2/7/2028 (a) | 29,000 | 26,323 |
414,366 | ||
Chemicals — 0.1% | ||
Air Products and Chemicals, Inc. 1.85%, 5/15/2027 | 9,000 | 8,100 |
DuPont de Nemours, Inc. 4.49%, 11/15/2025 | 10,000 | 9,795 |
17,895 | ||
Consumer Finance — 1.3% | ||
American Express Co. 1.65%, 11/4/2026 | 25,000 | 22,297 |
American Honda Finance Corp. | ||
1.20%, 7/8/2025 | 15,000 | 13,904 |
1.00%, 9/10/2025 | 17,000 | 15,583 |
Capital One Financial Corp. | ||
3.30%, 10/30/2024 | 48,000 | 46,631 |
(SOFR + 2.06%), 4.93%, 5/10/2028 (a) | 11,000 | 10,574 |
Caterpillar Financial Services Corp. 1.10%, 9/14/2027 | 6,000 | 5,191 |
John Deere Capital Corp. 1.70%, 1/11/2027 | 44,000 | 39,669 |
PACCAR Financial Corp. 2.00%, 2/4/2027 | 2,000 | 1,813 |
Synchrony Financial 3.95%, 12/1/2027 | 24,000 | 21,421 |
INVESTMENTS | PRINCIPAL AMOUNT($) | VALUE($) |
Consumer Finance — continued | ||
Toyota Motor Credit Corp. | ||
0.80%, 10/16/2025 | 3,000 | 2,736 |
3.05%, 3/22/2027 | 17,000 | 15,954 |
195,773 | ||
Consumer Staples Distribution & Retail — 0.2% | ||
Costco Wholesale Corp. 1.38%, 6/20/2027 | 3,000 | 2,652 |
Dollar General Corp. 3.88%, 4/15/2027 | 12,000 | 11,453 |
Kroger Co. (The) 3.50%, 2/1/2026 | 2,000 | 1,910 |
Walgreens Boots Alliance, Inc. 3.45%, 6/1/2026 | 9,000 | 8,500 |
Walmart, Inc. 3.90%, 9/9/2025 | 7,000 | 6,850 |
31,365 | ||
Containers & Packaging — 0.2% | ||
Berry Global, Inc. 1.57%, 1/15/2026 | 34,000 | 30,908 |
WRKCo, Inc. 4.65%, 3/15/2026 | 3,000 | 2,918 |
33,826 | ||
Diversified REITs — 0.2% | ||
Simon Property Group LP 3.50%, 9/1/2025 | 38,000 | 36,613 |
Diversified Telecommunication Services — 0.3% | ||
Verizon Communications, Inc. | ||
0.85%, 11/20/2025 | 31,000 | 28,110 |
3.00%, 3/22/2027 | 13,000 | 12,085 |
2.10%, 3/22/2028 | 12,000 | 10,487 |
50,682 | ||
Electric Utilities — 1.2% | ||
American Electric Power Co., Inc. Series N, 1.00%, 11/1/2025 | 2,000 | 1,817 |
Duke Energy Corp. 0.90%, 9/15/2025 | 37,000 | 33,777 |
Entergy Corp. 0.90%, 9/15/2025 | 10,000 | 9,083 |
Eversource Energy Series Q, 0.80%, 8/15/2025 | 44,000 | 40,148 |
ITC Holdings Corp. 3.25%, 6/30/2026 | 10,000 | 9,443 |
NextEra Energy Capital Holdings, Inc. (ICE LIBOR USD 3 Month + 2.41%), 4.80%, 12/1/2077 (a) | 7,000 | 6,201 |
Pacific Gas and Electric Co. | ||
3.15%, 1/1/2026 | 4,000 | 3,724 |
2.95%, 3/1/2026 | 6,000 | 5,535 |
3.00%, 6/15/2028 | 5,000 | 4,345 |
Union Electric Co. 2.95%, 6/15/2027 | 34,000 | 31,614 |
Xcel Energy, Inc. 1.75%, 3/15/2027 | 35,000 | 31,030 |
176,717 | ||
Electrical Equipment — 0.1% | ||
Emerson Electric Co. 0.88%, 10/15/2026 | 25,000 | 22,130 |
August 31, 2023 | J.P. Morgan Exchange-Traded Funds | 25 |
AS OF August 31, 2023 (Unaudited) (continued)
INVESTMENTS | PRINCIPAL AMOUNT($) | VALUE($) |
Corporate Bonds — continued | ||
Electronic Equipment, Instruments & Components — 0.0% ^ | ||
Jabil, Inc. 3.95%, 1/12/2028 | 5,000 | 4,682 |
Energy Equipment & Services — 0.2% | ||
Schlumberger Investment SA 4.50%, 5/15/2028 | 29,000 | 28,471 |
Entertainment — 0.0% ^ | ||
TWDC Enterprises 18 Corp. 2.95%, 6/15/2027 | 5,000 | 4,689 |
Financial Services — 0.6% | ||
Berkshire Hathaway, Inc. 3.13%, 3/15/2026 | 6,000 | 5,750 |
Block Financial LLC 2.50%, 7/15/2028 | 37,000 | 31,705 |
Global Payments, Inc. 4.95%, 8/15/2027 | 10,000 | 9,745 |
PayPal Holdings, Inc. 2.40%, 10/1/2024 | 8,000 | 7,737 |
Private Export Funding Corp. Series PP, 1.40%, 7/15/2028 | 37,000 | 31,903 |
Visa, Inc. 0.75%, 8/15/2027 | 8,000 | 6,917 |
93,757 | ||
Food Products — 0.4% | ||
Bunge Ltd. Finance Corp. 1.63%, 8/17/2025 | 14,000 | 12,965 |
Hormel Foods Corp. 1.70%, 6/3/2028 | 5,000 | 4,326 |
JBS USA LUX SA 2.50%, 1/15/2027 | 33,000 | 29,668 |
Kellogg Co. 3.25%, 4/1/2026 | 8,000 | 7,613 |
54,572 | ||
Gas Utilities — 0.1% | ||
Southern California Gas Co. Series TT, 2.60%, 6/15/2026 | 11,000 | 10,267 |
Ground Transportation — 0.2% | ||
BNSF Funding Trust I (ICE LIBOR USD 3 Month + 2.35%), 6.61%, 12/15/2055 (a) | 3,000 | 2,930 |
JB Hunt Transport Services, Inc. 3.88%, 3/1/2026 | 5,000 | 4,840 |
Ryder System, Inc. 4.63%, 6/1/2025 | 17,000 | 16,665 |
Union Pacific Corp. 2.15%, 2/5/2027 | 12,000 | 10,958 |
35,393 | ||
Health Care Equipment & Supplies — 0.2% | ||
Baxter International, Inc. 1.92%, 2/1/2027 | 36,000 | 32,023 |
Health Care Providers & Services — 0.9% | ||
CVS Health Corp. 1.30%, 8/21/2027 | 60,000 | 51,640 |
Elevance Health, Inc. | ||
3.35%, 12/1/2024 | 6,000 | 5,837 |
1.50%, 3/15/2026 | 30,000 | 27,237 |
Humana, Inc. 1.35%, 2/3/2027 | 29,000 | 25,515 |
Sutter Health Series 20A, 1.32%, 8/15/2025 | 31,000 | 28,385 |
138,614 | ||
INVESTMENTS | PRINCIPAL AMOUNT($) | VALUE($) |
Health Care REITs — 0.2% | ||
Healthpeak OP LLC 1.35%, 2/1/2027 | 10,000 | 8,774 |
Welltower OP LLC 4.00%, 6/1/2025 | 25,000 | 24,243 |
33,017 | ||
Hotels, Restaurants & Leisure — 0.2% | ||
Hyatt Hotels Corp. 4.85%, 3/15/2026 | 31,000 | 30,374 |
Starbucks Corp. 2.00%, 3/12/2027 | 5,000 | 4,511 |
34,885 | ||
Household Durables — 0.1% | ||
DR Horton, Inc. 1.40%, 10/15/2027 | 2,000 | 1,717 |
Lennar Corp. 5.00%, 6/15/2027 | 10,000 | 9,844 |
11,561 | ||
Household Products — 0.2% | ||
Procter & Gamble Co. (The) 2.80%, 3/25/2027 | 27,000 | 25,323 |
Industrial Conglomerates — 0.2% | ||
Honeywell International, Inc. 1.10%, 3/1/2027 | 42,000 | 37,166 |
Industrial REITs — 0.0% ^ | ||
Prologis LP 2.13%, 4/15/2027 | 4,000 | 3,605 |
Insurance — 0.3% | ||
Aflac, Inc. 1.13%, 3/15/2026 | 30,000 | 27,040 |
Assurant, Inc. 4.90%, 3/27/2028 | 9,000 | 8,698 |
Enstar Finance LLC (US Treasury Yield Curve Rate T Note Constant Maturity 5 Year + 5.47%), 5.75%, 9/1/2040 (a) | 7,000 | 6,117 |
Prudential Financial, Inc. 1.50%, 3/10/2026 | 10,000 | 9,149 |
51,004 | ||
Interactive Media & Services — 0.1% | ||
Alphabet, Inc. 0.80%, 8/15/2027 | 25,000 | 21,677 |
IT Services — 0.2% | ||
Kyndryl Holdings, Inc. 2.05%, 10/15/2026 | 33,000 | 29,012 |
Machinery — 0.1% | ||
Otis Worldwide Corp. 5.25%, 8/16/2028 | 7,000 | 7,048 |
Media — 0.5% | ||
Comcast Corp. | ||
3.38%, 8/15/2025 | 12,000 | 11,599 |
3.95%, 10/15/2025 | 35,000 | 34,086 |
WPP Finance 2010 (United Kingdom) 3.75%, 9/19/2024 | 28,000 | 27,224 |
72,909 | ||
Metals & Mining — 0.2% | ||
BHP Billiton Finance USA Ltd. (Australia) | ||
6.42%, 3/1/2026 | 1,000 | 1,027 |
26 | J.P. Morgan Exchange-Traded Funds | August 31, 2023 |
INVESTMENTS | PRINCIPAL AMOUNT($) | VALUE($) |
Corporate Bonds — continued | ||
Metals & Mining — continued | ||
4.75%, 2/28/2028 | 5,000 | 4,953 |
Nucor Corp. 2.00%, 6/1/2025 | 28,000 | 26,340 |
Reliance Steel & Aluminum Co. 1.30%, 8/15/2025 | 5,000 | 4,596 |
36,916 | ||
Multi-Utilities — 0.3% | ||
DTE Energy Co. Series F, 1.05%, 6/1/2025 | 38,000 | 35,040 |
NiSource, Inc. 0.95%, 8/15/2025 | 10,000 | 9,164 |
44,204 | ||
Office REITs — 0.0% ^ | ||
Brandywine Operating Partnership LP 3.95%, 11/15/2027 | 7,000 | 5,764 |
Oil, Gas & Consumable Fuels — 1.3% | ||
Chevron Corp. 2.00%, 5/11/2027 | 38,000 | 34,444 |
Energy Transfer LP | ||
2.90%, 5/15/2025 | 36,000 | 34,221 |
4.75%, 1/15/2026 | 7,000 | 6,856 |
Enterprise Products Operating LLC 3.75%, 2/15/2025 | 25,000 | 24,326 |
Equinor ASA (Norway) 1.75%, 1/22/2026 | 6,000 | 5,563 |
Marathon Petroleum Corp. 4.70%, 5/1/2025 | 27,000 | 26,532 |
MPLX LP 4.00%, 3/15/2028 | 5,000 | 4,694 |
ONEOK, Inc. 2.20%, 9/15/2025 | 29,000 | 26,994 |
Ovintiv, Inc. 5.65%, 5/15/2025 | 15,000 | 14,974 |
Petroleos Mexicanos (Mexico) 6.84%, 1/23/2030 (c) | 1 | 1 |
Pioneer Natural Resources Co. 1.13%, 1/15/2026 | 15,000 | 13,593 |
192,198 | ||
Pharmaceuticals — 0.5% | ||
GlaxoSmithKline Capital, Inc. (United Kingdom) 3.63%, 5/15/2025 | 2,000 | 1,950 |
Merck & Co., Inc. 1.70%, 6/10/2027 | 39,000 | 34,962 |
Novartis Capital Corp. (Switzerland) 1.75%, 2/14/2025 | 36,000 | 34,256 |
71,168 | ||
Professional Services — 0.1% | ||
Concentrix Corp. 6.60%, 8/2/2028 | 14,000 | 13,709 |
Residential REITs — 0.1% | ||
AvalonBay Communities, Inc. 3.50%, 11/15/2025 | 2,000 | 1,913 |
INVESTMENTS | PRINCIPAL AMOUNT($) | VALUE($) |
Residential REITs — continued | ||
ERP Operating LP 2.85%, 11/1/2026 | 1,000 | 931 |
Mid-America Apartments LP 1.10%, 9/15/2026 | 10,000 | 8,835 |
11,679 | ||
Retail REITs — 0.0% ^ | ||
Agree LP 2.00%, 6/15/2028 | 6,000 | 5,035 |
Semiconductors & Semiconductor Equipment — 0.2% | ||
Broadcom, Inc. 3.63%, 10/15/2024 | 5,000 | 4,890 |
Intel Corp. 3.40%, 3/25/2025 | 2,000 | 1,942 |
NVIDIA Corp. 1.55%, 6/15/2028 | 7,000 | 6,079 |
QUALCOMM, Inc. 1.30%, 5/20/2028 | 18,000 | 15,321 |
28,232 | ||
Software — 0.7% | ||
Microsoft Corp. | ||
3.13%, 11/3/2025 | 5,000 | 4,825 |
3.30%, 2/6/2027 | 28,000 | 26,902 |
Roper Technologies, Inc. 1.00%, 9/15/2025 | 37,000 | 33,881 |
Salesforce, Inc. 1.50%, 7/15/2028 | 39,000 | 33,544 |
99,152 | ||
Specialized REITs — 0.5% | ||
American Tower Corp. | ||
1.45%, 9/15/2026 | 23,000 | 20,374 |
1.50%, 1/31/2028 | 11,000 | 9,234 |
Crown Castle, Inc. | ||
5.00%, 1/11/2028 | 5,000 | 4,909 |
3.80%, 2/15/2028 | 6,000 | 5,583 |
Equinix, Inc. | ||
1.25%, 7/15/2025 | 16,000 | 14,758 |
1.00%, 9/15/2025 | 5,000 | 4,561 |
2.00%, 5/15/2028 | 21,000 | 17,937 |
77,356 | ||
Specialty Retail — 0.7% | ||
Home Depot, Inc. (The) | ||
3.35%, 9/15/2025 | 5,000 | 4,830 |
0.90%, 3/15/2028 | 14,000 | 11,811 |
Lowe's Cos., Inc. | ||
3.13%, 9/15/2024 | 30,000 | 29,278 |
3.38%, 9/15/2025 | 6,000 | 5,760 |
O'Reilly Automotive, Inc. 3.60%, 9/1/2027 | 31,000 | 29,362 |
TJX Cos., Inc. (The) 1.15%, 5/15/2028 | 32,000 | 27,188 |
108,229 | ||
August 31, 2023 | J.P. Morgan Exchange-Traded Funds | 27 |
AS OF August 31, 2023 (Unaudited) (continued)
INVESTMENTS | PRINCIPAL AMOUNT($) | VALUE($) |
Corporate Bonds — continued | ||
Technology Hardware, Storage & Peripherals — 0.5% | ||
Apple, Inc. | ||
2.75%, 1/13/2025 | 10,000 | 9,687 |
2.50%, 2/9/2025 | 7,000 | 6,748 |
0.55%, 8/20/2025 | 6,000 | 5,513 |
3.00%, 11/13/2027 | 20,000 | 18,768 |
1.40%, 8/5/2028 | 11,000 | 9,462 |
Dell International LLC 5.85%, 7/15/2025 | 14,000 | 14,024 |
Western Digital Corp. 4.75%, 2/15/2026 | 17,000 | 16,198 |
80,400 | ||
Tobacco — 0.2% | ||
BAT Capital Corp. (United Kingdom) | ||
2.79%, 9/6/2024 | 15,000 | 14,553 |
2.26%, 3/25/2028 | 10,000 | 8,606 |
Philip Morris International, Inc. 1.50%, 5/1/2025 | 3,000 | 2,817 |
25,976 | ||
Trading Companies & Distributors — 0.2% | ||
Air Lease Corp. 4.25%, 9/15/2024 | 33,000 | 32,376 |
GATX Corp. 3.25%, 9/15/2026 | 5,000 | 4,643 |
37,019 | ||
Water Utilities — 0.0% ^ | ||
American Water Capital Corp. 3.40%, 3/1/2025 | 1,000 | 969 |
Wireless Telecommunication Services — 0.2% | ||
Rogers Communications, Inc. (Canada) 2.95%, 3/15/2025 | 24,000 | 22,875 |
Total Corporate Bonds (Cost $4,048,611) | 3,934,877 | |
Mortgage-Backed Securities — 6.7% | ||
FHLMC Gold Pools, 15 Year | ||
Pool # J14776, 3.00%, 3/1/2026 | 3,805 | 3,702 |
Pool # G18568, 2.50%, 9/1/2030 | 6,714 | 6,248 |
Pool # J33012, 3.00%, 10/1/2030 | 16,518 | 15,613 |
Pool # G18600, 2.50%, 5/1/2031 | 5,011 | 4,620 |
Pool # J35495, 2.50%, 10/1/2031 | 10,472 | 9,631 |
Pool # G18632, 3.00%, 2/1/2032 | 5,294 | 5,003 |
Pool # J37147, 3.00%, 6/1/2032 | 6,739 | 6,368 |
Pool # G18715, 3.00%, 12/1/2033 | 3,649 | 3,417 |
FHLMC UMBS, 15 Year | ||
Pool # ZS8617, 2.50%, 8/1/2031 | 11,168 | 10,280 |
Pool # ZS7938, 2.50%, 1/1/2033 | 1,510 | 1,390 |
Pool # ZK9341, 3.00%, 3/1/2033 | 2,048 | 1,911 |
Pool # ZT0716, 3.00%, 10/1/2033 | 1,944 | 1,818 |
Pool # SB0194, 2.50%, 12/1/2033 | 4,246 | 3,909 |
INVESTMENTS | PRINCIPAL AMOUNT($) | VALUE($) |
Pool # SB0109, 2.50%, 11/1/2034 | 7,297 | 6,634 |
Pool # SB0264, 2.50%, 2/1/2035 | 10,340 | 9,324 |
Pool # SB0401, 2.00%, 7/1/2035 | 16,257 | 14,333 |
Pool # SB0394, 2.50%, 7/1/2035 | 8,842 | 7,973 |
Pool # SB8501, 2.00%, 8/1/2035 | 12,361 | 10,898 |
Pool # SB0406, 2.50%, 8/1/2035 | 16,696 | 15,057 |
Pool # SB8058, 2.50%, 8/1/2035 | 11,898 | 10,730 |
Pool # RC1591, 1.50%, 10/1/2035 | 18,438 | 15,825 |
Pool # QN4278, 2.00%, 11/1/2035 | 6,388 | 5,626 |
Pool # QN4490, 1.50%, 12/1/2035 | 16,085 | 13,808 |
Pool # SB0450, 2.00%, 12/1/2035 | 31,092 | 27,488 |
Pool # SB8102, 1.50%, 5/1/2036 | 24,219 | 20,785 |
Pool # SB8118, 1.50%, 9/1/2036 | 52,296 | 44,880 |
Pool # SB8222, 4.50%, 4/1/2038 | 13,829 | 13,470 |
FNMA UMBS, 15 Year | ||
Pool # AV4793, 3.50%, 5/1/2029 | 6,813 | 6,514 |
Pool # AS4489, 2.50%, 3/1/2030 | 1,494 | 1,389 |
Pool # AL6583, 3.00%, 3/1/2030 | 3,346 | 3,158 |
Pool # AL9852, 3.00%, 9/1/2030 | 9,304 | 8,783 |
Pool # AS7467, 2.50%, 7/1/2031 | 5,366 | 4,940 |
Pool # FM6169, 3.50%, 5/1/2032 | 16,143 | 15,637 |
Pool # BM3276, 3.50%, 12/1/2032 | 6,875 | 6,571 |
Pool # CA1089, 3.00%, 2/1/2033 | 5,894 | 5,563 |
Pool # FM4036, 2.50%, 12/1/2033 | 7,329 | 6,746 |
Pool # BN3975, 3.00%, 1/1/2034 | 736 | 688 |
Pool # MA3631, 3.00%, 4/1/2034 | 6,462 | 6,010 |
Pool # MA3709, 2.50%, 6/1/2034 | 4,103 | 3,731 |
Pool # BJ5549, 3.00%, 8/1/2034 | 1,758 | 1,634 |
Pool # FM2403, 3.50%, 9/1/2034 | 6,801 | 6,501 |
Pool # FM5400, 2.50%, 10/1/2034 | 9,378 | 8,634 |
Pool # MA3828, 3.00%, 11/1/2034 | 6,416 | 5,967 |
Pool # BP5762, 2.50%, 6/1/2035 | 20,812 | 18,765 |
Pool # FM3936, 2.50%, 8/1/2035 | 4,117 | 3,790 |
Pool # CA7497, 2.50%, 10/1/2035 | 8,414 | 7,588 |
Pool # FM4850, 2.00%, 11/1/2035 | 14,140 | 12,467 |
Pool # FM5396, 2.00%, 12/1/2035 | 31,464 | 27,786 |
Pool # FM6510, 2.00%, 3/1/2036 | 30,793 | 27,189 |
Pool # FM6512, 2.00%, 3/1/2036 | 33,148 | 29,223 |
Pool # MA4298, 2.50%, 3/1/2036 | 17,582 | 15,854 |
Pool # CB0302, 1.50%, 5/1/2036 | 48,340 | 41,488 |
Pool # FM7113, 2.00%, 5/1/2036 | 37,489 | 32,965 |
Pool # MA4329, 2.00%, 5/1/2036 | 58,700 | 51,494 |
Pool # BP3507, 2.00%, 6/1/2036 | 58,024 | 50,936 |
Pool # CB0747, 2.50%, 6/1/2036 | 9,431 | 8,479 |
Pool # MA4384, 2.50%, 7/1/2036 | 4,383 | 3,947 |
28 | J.P. Morgan Exchange-Traded Funds | August 31, 2023 |
INVESTMENTS | PRINCIPAL AMOUNT($) | VALUE($) |
Mortgage-Backed Securities — continued | ||
Pool # FM9020, 2.00%, 9/1/2036 | 7,634 | 6,737 |
Pool # FM9367, 1.50%, 11/1/2036 | 45,883 | 39,164 |
Pool # MA4470, 2.00%, 11/1/2036 | 32,563 | 28,585 |
Pool # MA4497, 2.00%, 12/1/2036 | 31,516 | 27,617 |
FNMA/FHLMC UMBS, Single Family, 15 Year | ||
TBA, 1.50%, 9/25/2038 (d) | 77,000 | 65,672 |
TBA, 2.00%, 9/25/2038 (d) | 35,000 | 30,660 |
TBA, 2.50%, 9/25/2038 (d) | 7,000 | 6,295 |
TBA, 3.00%, 9/25/2038 (d) | 40,000 | 36,959 |
TBA, 3.50%, 9/25/2038 (d) | 5,000 | 4,714 |
TBA, 4.00%, 9/25/2038 (d) | 15,000 | 14,401 |
TBA, 5.00%, 9/25/2038 (d) | 10,000 | 9,883 |
TBA, 5.50%, 9/25/2038 (d) | 10,000 | 10,000 |
GNMA II, 15 Year | ||
Pool # MA4559, 3.00%, 7/20/2032 | 4,686 | 4,381 |
Pool # MA7107, 2.50%, 1/20/2036 | 17,914 | 16,078 |
Total Mortgage-Backed Securities (Cost $1,145,120) | 1,016,324 | |
Supranational — 2.7% | ||
African Development Bank (Supranational) 0.88%, 3/23/2026 | 30,000 | 27,230 |
Asian Development Bank (Supranational) | ||
0.38%, 6/11/2024 | 16,000 | 15,387 |
2.00%, 1/22/2025 | 11,000 | 10,531 |
0.38%, 9/3/2025 | 33,000 | 30,188 |
Asian Infrastructure Investment Bank (The) (Supranational) 0.50%, 5/28/2025 | 30,000 | 27,686 |
European Bank for Reconstruction & Development (Supranational) | ||
1.50%, 2/13/2025 | 5,000 | 4,745 |
0.50%, 11/25/2025 | 4,000 | 3,638 |
European Investment Bank (Supranational) | ||
0.38%, 3/26/2026 | 48,000 | 43,080 |
3.88%, 3/15/2028 | 35,000 | 34,264 |
Inter-American Development Bank (Supranational) | ||
0.50%, 9/23/2024 | 5,000 | 4,749 |
0.88%, 4/20/2026 | 63,000 | 57,099 |
1.13%, 7/20/2028 | 29,000 | 24,869 |
International Bank for Reconstruction & Development (Supranational) | ||
2.50%, 11/25/2024 | 15,000 | 14,500 |
0.63%, 4/22/2025 | 89,000 | 82,809 |
1.38%, 4/20/2028 | 37,000 | 32,358 |
INVESTMENTS | PRINCIPAL AMOUNT($) | VALUE($) |
International Finance Corp. (Supranational) 0.75%, 10/8/2026 | 6,000 | 5,341 |
Total Supranational (Cost $432,892) | 418,474 | |
Commercial Mortgage-Backed Securities — 2.1% | ||
Benchmark Mortgage Trust Series 2019-B12, Class A2, 3.00%, 8/15/2052 | 6,182 | 5,957 |
CGMS Commercial Mortgage Trust Series 2017-B1, Class AAB, 3.24%, 8/15/2050 | 13,229 | 12,529 |
Citigroup Commercial Mortgage Trust | ||
Series 2016-C1, Class AAB, 3.00%, 5/10/2049 | 6,117 | 5,892 |
Series 2020-GC46, Class A2, 2.71%, 2/15/2053 | 20,000 | 18,826 |
CSAIL Commercial Mortgage Trust Series 2015-C3, Class A4, 3.72%, 8/15/2048 | 20,000 | 19,069 |
FHLMC, Multi-Family Structured Pass-Through Certificates Series K092, Class A1, 3.13%, 10/25/2028 | 135,542 | 128,616 |
FNMA ACES Series 2017-M10, Class AV2, 2.62%, 7/25/2024 (e) | 11,295 | 11,062 |
GS Mortgage Securities Trust Series 2014-GC18, Class AS, 4.38%, 1/10/2047 | 17,000 | 16,077 |
JPMBB Commercial Mortgage Securities Trust Series 2014-C19, Class C, 4.78%, 4/15/2047 (e) | 10,000 | 9,439 |
JPMorgan Chase Commercial Mortgage Securities Trust Series 2015-JP1, Class D, 4.38%, 1/15/2049 (e) | 10,000 | 7,281 |
Morgan Stanley Bank of America Merrill Lynch Trust | ||
Series 2014-C19, Class A3, 3.25%, 12/15/2047 | 5,552 | 5,395 |
Series 2016-C31, Class A5, 3.10%, 11/15/2049 | 32,000 | 29,169 |
Wells Fargo Commercial Mortgage Trust Series 2015-C31, Class A4, 3.70%, 11/15/2048 | 24,000 | 22,852 |
WFRBS Commercial Mortgage Trust | ||
Series 2012-C10, Class B, 3.74%, 12/15/2045 | 13,121 | 11,657 |
Series 2014-C20, Class A5, 4.00%, 5/15/2047 | 12,000 | 11,789 |
Total Commercial Mortgage-Backed Securities (Cost $336,020) | 315,610 | |
U.S. Government Agency Securities — 1.9% | ||
FFCB Funding Corp. | ||
0.32%, 12/23/2024 | 10,000 | 9,356 |
2.51%, 4/1/2025 | 4,000 | 3,838 |
August 31, 2023 | J.P. Morgan Exchange-Traded Funds | 29 |
AS OF August 31, 2023 (Unaudited) (continued)
INVESTMENTS | PRINCIPAL AMOUNT($) | VALUE($) |
U.S. Government Agency Securities — continued | ||
3.32%, 2/25/2026 | 10,000 | 9,647 |
3.00%, 8/3/2026 | 7,000 | 6,671 |
1.00%, 10/7/2026 | 46,000 | 40,913 |
0.75%, 12/16/2026 | 18,000 | 15,727 |
FHLB | ||
0.66%, 10/28/2024 | 10,000 | 9,463 |
0.38%, 9/4/2025 | 10,000 | 9,146 |
0.75%, 2/24/2026 | 20,000 | 18,087 |
1.25%, 12/21/2026 | 75,000 | 67,398 |
0.90%, 2/26/2027 | 15,000 | 13,160 |
FHLMC 5.20%, 1/10/2025 | 5,000 | 4,972 |
FNMA | ||
0.50%, 12/16/2024 | 14,000 | 13,159 |
0.50%, 11/7/2025 | 49,000 | 44,645 |
Tennessee Valley Authority | ||
0.75%, 5/15/2025 | 20,000 | 18,576 |
3.88%, 3/15/2028 | 10,000 | 9,751 |
Total U.S. Government Agency Securities (Cost $305,134) | 294,509 | |
Foreign Government Securities — 0.9% | ||
Canada Government Bond 0.75%, 5/19/2026 | 45,000 | 40,587 |
Export Development Canada 2.63%, 2/21/2024 | 15,000 | 14,800 |
Province of Alberta 1.00%, 5/20/2025 | 13,000 | 12,106 |
Province of British Columbia 0.90%, 7/20/2026 | 10,000 | 8,985 |
Province of Ontario | ||
0.63%, 1/21/2026 | 22,000 | 19,911 |
1.05%, 4/14/2026 | 8,000 | 7,267 |
Province of Quebec 3.63%, 4/13/2028 | 20,000 | 19,237 |
Republic of Panama 8.88%, 9/30/2027 | 8,000 | 8,982 |
Total Foreign Government Securities (Cost $140,745) | 131,875 | |
Asset-Backed Securities — 0.8% | ||
AmeriCredit Automobile Receivables Trust Series 2020-3, Class B, 0.76%, 12/18/2025 | 29,054 | 28,582 |
Capital One Multi-Asset Execution Trust Series 2022-A2, Class A, 3.49%, 5/15/2027 | 30,000 | 29,072 |
CarMax Auto Owner Trust Series 2021-1, Class A3, 0.34%, 12/15/2025 | 10,412 | 10,125 |
Discover Card Execution Note Trust Series 2022-A1, Class A1, 1.96%, 2/15/2027 | 10,000 | 9,515 |
Exeter Automobile Receivables Trust Series 2021-3A, Class C, 0.96%, 10/15/2026 | 10,000 | 9,679 |
Ford Credit Floorplan Master Owner Trust A Series 2019-2, Class A, 3.06%, 4/15/2026 | 8,000 | 7,864 |
INVESTMENTS | PRINCIPAL AMOUNT($) | VALUE($) |
GM Financial Consumer Automobile Receivables Trust Series 2020-2, Class A4, 1.74%, 8/18/2025 | 22,000 | 21,736 |
World Omni Auto Receivables Trust Series 2021-C, Class A3, 0.44%, 8/17/2026 | 7,545 | 7,266 |
Total Asset-Backed Securities (Cost $126,417) | 123,839 | |
Municipal Bonds — 0.2% (f) | ||
California — 0.0% ^ | ||
University of California, Taxable Series 2020BG, Rev., 0.88%, 5/15/2025 | 5,000 | 4,647 |
Florida — 0.2% | ||
State Board of Administration Finance Corp. Series 2020A, Rev., 1.71%, 7/1/2027 | 36,000 | 31,761 |
Total Municipal Bonds (Cost $38,750) | 36,408 | |
SHARES | ||
Short-Term Investments — 1.4% | ||
Investment Companies — 1.4% | ||
JPMorgan U.S. Government Money Market Fund Class IM Shares, 5.27% (g) (h) (Cost $214,237) | 214,237 | 214,237 |
Total Investments — 100.4% (Cost $16,034,582) | 15,351,606 | |
Liabilities in Excess of Other Assets — (0.4)% | (57,600 ) | |
NET ASSETS — 100.0% | 15,294,006 | |
Percentages indicated are based on net assets. |
Abbreviations | |
ACES | Alternative Credit Enhancement Securities |
CME | Chicago Mercantile Exchange |
FFCB | Federal Farm Credit Bank |
FHLB | Federal Home Loan Bank |
FHLMC | Federal Home Loan Mortgage Corp. |
FNMA | Federal National Mortgage Association |
GNMA | Government National Mortgage Association |
ICE | Intercontinental Exchange |
LIBOR | London Interbank Offered Rate |
REIT | Real Estate Investment Trust |
Rev. | Revenue |
SOFR | Secured Overnight Financing Rate |
TBA | To Be Announced; Security is subject to delayed delivery. |
UMBS | Uniform Mortgage-Backed Securities |
USD | United States Dollar |
^ | Amount rounds to less than 0.1% of net assets. | |
30 | J.P. Morgan Exchange-Traded Funds | August 31, 2023 |
(a) | Variable or floating rate security, linked to the referenced benchmark. The interest rate shown is the current rate as of August 31, 2023. | |
(b) | Contingent Capital security (“CoCo”). CoCos are hybrid debt securities that may be convertible into equity or may be written down if a pre-specified trigger event occurs. The total value of aggregate CoCo holdings at August 31, 2023 is $6,533 or 0.04% of the Fund’s net assets as of August 31, 2023. | |
(c) | Security exempt from registration pursuant to Regulation S under the Securities Act of 1933, as amended. Regulation S applies to securities offerings that are made outside of the United States and do not involve direct selling efforts in the United States and as such may have restrictions on resale. | |
(d) | All or a portion of the security is a when-issued security, delayed delivery security, or forward commitment. |
(e) | Variable or floating rate security, the interest rate of which adjusts periodically based on changes in current interest rates and prepayments on the underlying pool of assets. The interest rate shown is the current rate as of August 31, 2023. | |
(f) | The date shown represents the earliest of the prerefunded date, next put date or final maturity date. | |
(g) | Investment in an affiliated fund, which is registered under the Investment Company Act of 1940, as amended, and is advised by J.P. Morgan Investment Management Inc. | |
(h) | The rate shown is the current yield as of August 31, 2023. |
August 31, 2023 | J.P. Morgan Exchange-Traded Funds | 31 |
AS OF August 31, 2023 (Unaudited)
INVESTMENTS | PRINCIPAL AMOUNT($) | VALUE($) |
U.S. Treasury Obligations — 40.9% | ||
U.S. Treasury Bonds | ||
6.13%, 11/15/2027 | 2,134,000 | 2,275,544 |
5.25%, 11/15/2028 | 2,000,000 | 2,085,469 |
6.13%, 8/15/2029 | 2,100,000 | 2,301,633 |
5.38%, 2/15/2031 | 3,169,000 | 3,404,694 |
4.50%, 2/15/2036 | 3,877,000 | 4,050,859 |
4.75%, 2/15/2037 | 3,728,000 | 3,980,805 |
5.00%, 5/15/2037 | 3,978,000 | 4,348,451 |
4.38%, 2/15/2038 | 3,889,000 | 3,981,364 |
4.50%, 5/15/2038 | 4,189,000 | 4,338,233 |
3.50%, 2/15/2039 | 4,101,000 | 3,769,075 |
4.25%, 5/15/2039 | 4,314,000 | 4,324,785 |
4.50%, 8/15/2039 | 1,196,000 | 1,232,254 |
4.38%, 11/15/2039 | 1,148,000 | 1,163,785 |
4.63%, 2/15/2040 | 2,598,000 | 2,711,663 |
1.13%, 5/15/2040 | 397,000 | 245,644 |
4.38%, 5/15/2040 | 4,256,000 | 4,305,875 |
1.13%, 8/15/2040 | 6,351,000 | 3,896,934 |
3.88%, 8/15/2040 | 3,782,000 | 3,588,172 |
1.38%, 11/15/2040 | 6,944,400 | 4,431,395 |
1.88%, 2/15/2041 | 5,922,000 | 4,107,462 |
2.25%, 5/15/2041 | 5,423,000 | 3,994,378 |
1.75%, 8/15/2041 | 5,121,000 | 3,439,872 |
2.00%, 11/15/2041 | 5,327,000 | 3,727,235 |
3.13%, 11/15/2041 | 1,536,000 | 1,295,520 |
2.38%, 2/15/2042 | 5,398,000 | 4,014,762 |
3.13%, 2/15/2042 | 1,436,000 | 1,205,791 |
3.00%, 5/15/2042 | 1,559,000 | 1,278,624 |
2.75%, 8/15/2042 | 1,600,000 | 1,257,500 |
3.38%, 8/15/2042 | 3,664,000 | 3,179,092 |
4.00%, 11/15/2042 | 562,000 | 533,110 |
3.13%, 2/15/2043 | 466,000 | 386,853 |
3.88%, 2/15/2043 | 4,338,000 | 4,035,696 |
2.88%, 5/15/2043 | 3,272,000 | 2,604,308 |
3.63%, 8/15/2043 | 808,000 | 721,645 |
2.50%, 2/15/2045 | 4,600,000 | 3,375,250 |
3.00%, 5/15/2045 | 38,000 | 30,430 |
2.88%, 8/15/2045 | 4,081,000 | 3,190,194 |
2.50%, 5/15/2046 | 6,324,000 | 4,590,829 |
2.25%, 8/15/2046 | 5,873,000 | 4,044,111 |
3.00%, 2/15/2047 | 174,000 | 138,303 |
3.00%, 5/15/2047 | 4,835,000 | 3,842,314 |
2.75%, 11/15/2047 | 3,311,000 | 2,506,530 |
3.13%, 5/15/2048 | 5,020,000 | 4,076,397 |
3.38%, 11/15/2048 | 4,383,000 | 3,724,180 |
INVESTMENTS | PRINCIPAL AMOUNT($) | VALUE($) |
2.88%, 5/15/2049 | 4,223,000 | 3,274,145 |
2.25%, 8/15/2049 | 3,980,000 | 2,707,022 |
2.38%, 11/15/2049 | 6,078,000 | 4,248,902 |
2.00%, 2/15/2050 | 5,760,000 | 3,687,300 |
1.25%, 5/15/2050 | 14,017,400 | 7,326,282 |
1.38%, 8/15/2050 | 4,995,000 | 2,698,861 |
1.63%, 11/15/2050 | 11,750,000 | 6,792,969 |
1.88%, 2/15/2051 | 6,689,000 | 4,125,232 |
2.38%, 5/15/2051 | 5,783,000 | 4,019,185 |
2.00%, 8/15/2051 | 6,025,000 | 3,823,992 |
1.88%, 11/15/2051 | 5,895,000 | 3,621,741 |
2.25%, 2/15/2052 | 5,336,000 | 3,600,132 |
2.88%, 5/15/2052 | 3,484,000 | 2,704,455 |
3.00%, 8/15/2052 | 5,152,000 | 4,106,305 |
4.00%, 11/15/2052 | 898,000 | 866,570 |
3.63%, 2/15/2053 | 2,503,000 | 2,255,047 |
3.63%, 5/15/2053 | 599,000 | 540,223 |
U.S. Treasury Notes | ||
1.75%, 6/30/2024 | 2,257,000 | 2,190,524 |
2.00%, 6/30/2024 | 531,000 | 516,377 |
3.00%, 6/30/2024 | 1,349,000 | 1,322,652 |
0.38%, 7/15/2024 | 2,827,000 | 2,706,853 |
1.75%, 7/31/2024 | 41,000 | 39,666 |
3.00%, 7/31/2024 | 1,045,000 | 1,022,508 |
1.25%, 8/31/2024 | 3,929,000 | 3,771,687 |
1.88%, 8/31/2024 | 3,677,000 | 3,551,896 |
3.25%, 8/31/2024 | 35,000 | 34,275 |
0.38%, 9/15/2024 | 20,119,000 | 19,113,836 |
1.50%, 9/30/2024 | 122,000 | 117,130 |
0.63%, 10/15/2024 | 4,140,000 | 3,930,574 |
1.50%, 10/31/2024 | 1,533,000 | 1,468,027 |
0.75%, 11/15/2024 | 4,576,000 | 4,336,475 |
2.25%, 11/15/2024 | 2,244,000 | 2,164,671 |
1.50%, 11/30/2024 | 8,182,000 | 7,812,212 |
4.50%, 11/30/2024 | 2,937,000 | 2,909,925 |
1.00%, 12/15/2024 | 1,512,000 | 1,432,974 |
4.25%, 12/31/2024 | 2,865,000 | 2,829,523 |
1.38%, 1/31/2025 | 2,884,000 | 2,736,308 |
2.50%, 1/31/2025 | 479,000 | 461,655 |
4.13%, 1/31/2025 | 4,336,000 | 4,274,856 |
1.50%, 2/15/2025 | 4,508,000 | 4,279,254 |
2.00%, 2/15/2025 | 3,434,000 | 3,284,031 |
1.13%, 2/28/2025 | 4,568,000 | 4,307,660 |
2.75%, 2/28/2025 | 3,137,000 | 3,030,636 |
4.63%, 2/28/2025 | 4,429,000 | 4,398,032 |
32 | J.P. Morgan Exchange-Traded Funds | August 31, 2023 |
INVESTMENTS | PRINCIPAL AMOUNT($) | VALUE($) |
U.S. Treasury Obligations — continued | ||
1.75%, 3/15/2025 | 915,000 | 870,144 |
0.50%, 3/31/2025 | 4,691,000 | 4,368,677 |
2.63%, 3/31/2025 | 3,603,000 | 3,469,576 |
3.88%, 3/31/2025 | 4,484,000 | 4,402,727 |
2.63%, 4/15/2025 | 2,632,000 | 2,533,300 |
0.38%, 4/30/2025 | 4,692,000 | 4,347,431 |
2.88%, 4/30/2025 | 4,526,000 | 4,371,303 |
3.88%, 4/30/2025 | 4,467,000 | 4,385,512 |
2.13%, 5/15/2025 | 4,121,000 | 3,928,472 |
2.75%, 5/15/2025 | 4,480,000 | 4,316,200 |
0.25%, 5/31/2025 | 4,718,300 | 4,347,287 |
2.88%, 5/31/2025 | 6,189,000 | 5,970,693 |
4.25%, 5/31/2025 | 4,433,000 | 4,378,453 |
2.88%, 6/15/2025 | 4,483,000 | 4,324,169 |
0.25%, 6/30/2025 | 4,847,000 | 4,454,128 |
2.75%, 6/30/2025 | 2,525,000 | 2,428,833 |
4.63%, 6/30/2025 | 10,000 | 9,944 |
3.00%, 7/15/2025 | 949,000 | 916,452 |
0.25%, 7/31/2025 | 3,859,000 | 3,534,000 |
2.88%, 7/31/2025 | 3,649,000 | 3,514,301 |
2.00%, 8/15/2025 | 1,564,000 | 1,480,424 |
0.25%, 8/31/2025 | 3,157,000 | 2,881,749 |
0.25%, 9/30/2025 | 17,171,000 | 15,643,049 |
0.25%, 10/31/2025 | 16,549,000 | 15,022,096 |
3.00%, 10/31/2025 | 621,000 | 598,149 |
2.25%, 11/15/2025 | 2,117,000 | 2,005,361 |
4.00%, 12/15/2025 | 10,000 | 9,838 |
2.63%, 12/31/2025 | 1,539,000 | 1,468,062 |
0.38%, 1/31/2026 | 15,746,000 | 14,209,535 |
1.63%, 2/15/2026 | 584,000 | 542,846 |
4.00%, 2/15/2026 | 4,505,000 | 4,433,905 |
0.50%, 2/28/2026 | 27,692,000 | 25,002,847 |
2.50%, 2/28/2026 | 3,004,000 | 2,852,157 |
4.63%, 3/15/2026 | 706,000 | 705,504 |
0.75%, 3/31/2026 | 2,845,000 | 2,582,060 |
2.25%, 3/31/2026 | 2,971,000 | 2,801,096 |
3.75%, 4/15/2026 | 4,552,000 | 4,453,492 |
0.75%, 5/31/2026 | 400,000 | 360,750 |
1.50%, 8/15/2026 | 3,478,000 | 3,188,076 |
0.75%, 8/31/2026 | 134,000 | 119,982 |
1.38%, 8/31/2026 | 1,096,000 | 1,000,014 |
0.88%, 9/30/2026 | 4,763,000 | 4,273,676 |
1.63%, 9/30/2026 | 2,943,000 | 2,702,502 |
1.13%, 10/31/2026 | 12,866,000 | 11,598,498 |
1.63%, 10/31/2026 | 3,770,000 | 3,452,495 |
INVESTMENTS | PRINCIPAL AMOUNT($) | VALUE($) |
2.00%, 11/15/2026 | 4,605,000 | 4,263,942 |
1.25%, 11/30/2026 | 4,735,000 | 4,276,297 |
1.63%, 11/30/2026 | 4,027,000 | 3,682,188 |
1.25%, 12/31/2026 | 4,713,000 | 4,250,537 |
1.75%, 12/31/2026 | 4,409,000 | 4,042,502 |
1.50%, 1/31/2027 | 4,682,000 | 4,247,086 |
2.25%, 2/15/2027 | 4,606,000 | 4,282,500 |
1.13%, 2/28/2027 | 4,766,000 | 4,261,102 |
1.88%, 2/28/2027 | 4,627,000 | 4,244,911 |
0.63%, 3/31/2027 | 5,036,000 | 4,407,680 |
2.50%, 3/31/2027 | 4,527,000 | 4,241,587 |
0.50%, 4/30/2027 | 4,351,800 | 3,780,286 |
2.75%, 4/30/2027 | 4,499,000 | 4,246,634 |
2.38%, 5/15/2027 | 2,420,000 | 2,252,302 |
0.50%, 5/31/2027 | 1,891,000 | 1,637,931 |
2.63%, 5/31/2027 | 4,534,000 | 4,255,938 |
0.50%, 6/30/2027 | 5,073,000 | 4,383,389 |
3.25%, 6/30/2027 | 4,366,000 | 4,191,701 |
2.75%, 7/31/2027 | 4,475,000 | 4,212,793 |
2.25%, 8/15/2027 | 4,577,000 | 4,225,501 |
0.50%, 8/31/2027 | 5,077,000 | 4,362,254 |
3.13%, 8/31/2027 | 2,278,000 | 2,173,888 |
0.38%, 9/30/2027 | 5,244,000 | 4,469,281 |
4.13%, 9/30/2027 | 1,323,000 | 1,310,804 |
0.50%, 10/31/2027 | 8,580,000 | 7,331,208 |
4.13%, 10/31/2027 | 750,000 | 743,086 |
2.25%, 11/15/2027 | 1,546,000 | 1,421,595 |
0.63%, 11/30/2027 | 12,953,000 | 11,101,126 |
3.88%, 11/30/2027 | 2,983,000 | 2,928,467 |
0.63%, 12/31/2027 | 3,141,000 | 2,685,064 |
3.88%, 12/31/2027 | 2,449,000 | 2,404,421 |
0.75%, 1/31/2028 | 6,795,000 | 5,827,243 |
3.50%, 1/31/2028 | 4,397,000 | 4,252,723 |
2.75%, 2/15/2028 | 983,000 | 920,795 |
1.13%, 2/29/2028 | 2,311,000 | 2,011,653 |
4.00%, 2/29/2028 | 3,482,000 | 3,439,291 |
1.25%, 3/31/2028 | 4,631,000 | 4,046,698 |
3.63%, 3/31/2028 | 4,396,000 | 4,273,393 |
1.25%, 4/30/2028 | 4,628,000 | 4,035,761 |
3.50%, 4/30/2028 | 4,370,000 | 4,225,244 |
2.88%, 5/15/2028 | 4,355,000 | 4,093,360 |
1.25%, 5/31/2028 | 4,666,000 | 4,061,607 |
3.63%, 5/31/2028 | 4,232,000 | 4,116,281 |
1.25%, 6/30/2028 | 5,142,000 | 4,467,112 |
2.88%, 8/15/2028 | 4,304,000 | 4,035,336 |
August 31, 2023 | J.P. Morgan Exchange-Traded Funds | 33 |
AS OF August 31, 2023 (Unaudited) (continued)
INVESTMENTS | PRINCIPAL AMOUNT($) | VALUE($) |
U.S. Treasury Obligations — continued | ||
1.13%, 8/31/2028 | 2,902,000 | 2,494,133 |
1.25%, 9/30/2028 | 222,000 | 191,579 |
1.38%, 10/31/2028 | 5,167,000 | 4,478,739 |
3.13%, 11/15/2028 | 2,140,000 | 2,026,145 |
1.50%, 11/30/2028 | 4,794,000 | 4,175,649 |
1.38%, 12/31/2028 | 5,721,000 | 4,942,855 |
1.75%, 1/31/2029 | 4,525,000 | 3,978,465 |
2.63%, 2/15/2029 | 3,824,000 | 3,520,470 |
1.88%, 2/28/2029 | 5,034,000 | 4,451,550 |
2.38%, 3/31/2029 | 945,000 | 856,849 |
2.88%, 4/30/2029 | 4,299,000 | 4,000,757 |
2.38%, 5/15/2029 | 4,689,000 | 4,247,208 |
2.75%, 5/31/2029 | 4,576,000 | 4,226,008 |
3.25%, 6/30/2029 | 3,118,000 | 2,956,497 |
2.63%, 7/31/2029 | 4,736,000 | 4,337,140 |
1.63%, 8/15/2029 | 5,982,000 | 5,180,038 |
3.13%, 8/31/2029 | 4,234,000 | 3,984,260 |
3.88%, 9/30/2029 | 1,415,000 | 1,386,368 |
4.00%, 10/31/2029 | 3,995,000 | 3,941,317 |
1.75%, 11/15/2029 | 4,847,000 | 4,214,618 |
3.88%, 11/30/2029 | 4,296,000 | 4,209,409 |
3.88%, 12/31/2029 | 3,517,000 | 3,445,836 |
3.50%, 1/31/2030 | 4,337,000 | 4,159,793 |
1.50%, 2/15/2030 | 6,212,000 | 5,269,038 |
4.00%, 2/28/2030 | 4,153,000 | 4,099,790 |
3.63%, 3/31/2030 | 4,245,000 | 4,100,405 |
3.50%, 4/30/2030 | 4,309,000 | 4,131,254 |
0.63%, 5/15/2030 | 20,326,000 | 16,121,059 |
3.75%, 5/31/2030 | 4,457,000 | 4,336,522 |
3.75%, 6/30/2030 | 2,777,000 | 2,701,934 |
4.00%, 7/31/2030 | 256,000 | 252,960 |
0.63%, 8/15/2030 | 5,275,000 | 4,156,535 |
0.88%, 11/15/2030 | 7,325,000 | 5,862,289 |
1.13%, 2/15/2031 | 5,102,000 | 4,144,578 |
1.63%, 5/15/2031 | 5,222,000 | 4,373,425 |
1.25%, 8/15/2031 | 5,468,000 | 4,415,410 |
1.38%, 11/15/2031 | 4,892,000 | 3,964,813 |
1.88%, 2/15/2032 | 5,228,000 | 4,393,971 |
2.88%, 5/15/2032 | 4,837,000 | 4,395,624 |
2.75%, 8/15/2032 | 4,433,000 | 3,979,310 |
4.13%, 11/15/2032 | 4,318,000 | 4,315,976 |
3.50%, 2/15/2033 | 4,575,000 | 4,356,973 |
3.38%, 5/15/2033 | 4,074,000 | 3,838,472 |
Total U.S. Treasury Obligations (Cost $878,813,398) | 817,179,884 | |
INVESTMENTS | PRINCIPAL AMOUNT($) | VALUE($) |
Mortgage-Backed Securities — 26.7% | ||
FHLMC Gold Pools, 15 Year | ||
Pool # J10548, 4.00%, 8/1/2024 | 4,463 | 4,386 |
Pool # J15449, 4.00%, 5/1/2026 | 38,917 | 38,122 |
Pool # G14781, 3.50%, 3/1/2027 | 20,811 | 20,342 |
Pool # G15201, 4.00%, 5/1/2027 | 5,310 | 5,227 |
Pool # J20129, 2.50%, 8/1/2027 | 47,015 | 44,956 |
Pool # G15438, 4.00%, 9/1/2027 | 5,418 | 5,332 |
Pool # G15602, 2.50%, 11/1/2027 | 32,382 | 31,005 |
Pool # E09028, 2.00%, 3/1/2028 | 60,893 | 57,446 |
Pool # J23362, 2.00%, 4/1/2028 | 58,676 | 55,324 |
Pool # G18466, 2.00%, 5/1/2028 | 8,425 | 7,935 |
Pool # G18465, 2.50%, 5/1/2028 | 15,884 | 15,117 |
Pool # G15601, 2.50%, 1/1/2029 | 34,252 | 32,591 |
Pool # G14957, 3.50%, 1/1/2029 | 76,444 | 74,055 |
Pool # G16570, 4.00%, 7/1/2029 | 3,509 | 3,454 |
Pool # G18540, 2.50%, 2/1/2030 | 22,122 | 20,586 |
Pool # G18556, 2.50%, 6/1/2030 | 29,059 | 27,040 |
Pool # V60840, 3.00%, 6/1/2030 | 7,416 | 7,010 |
Pool # G16622, 3.00%, 11/1/2030 | 28,986 | 27,396 |
Pool # G16019, 3.50%, 12/1/2030 | 9,314 | 9,095 |
Pool # G16044, 2.50%, 1/1/2032 | 82,748 | 76,270 |
Pool # J36524, 3.00%, 3/1/2032 | 91,830 | 86,590 |
Pool # J36660, 3.00%, 3/1/2032 | 29,189 | 27,585 |
Pool # J38270, 2.50%, 1/1/2033 | 231,378 | 213,266 |
Pool # G16568, 2.50%, 4/1/2033 | 103,794 | 95,666 |
FHLMC Gold Pools, 30 Year | ||
Pool # V81680, 4.50%, 12/1/2034 | 68,511 | 66,661 |
Pool # A30892, 5.00%, 1/1/2035 | 52,105 | 51,497 |
Pool # A39210, 5.50%, 10/1/2035 | 19,465 | 19,760 |
Pool # V83754, 5.50%, 1/1/2036 | 30,274 | 30,776 |
Pool # A82255, 5.50%, 9/1/2036 | 103,024 | 101,925 |
Pool # G03381, 5.50%, 9/1/2037 | 19,165 | 19,254 |
Pool # A89760, 4.50%, 12/1/2039 | 18,442 | 17,989 |
Pool # A92197, 5.00%, 5/1/2040 | 52,384 | 52,259 |
Pool # G06856, 6.00%, 5/1/2040 | 3,600 | 3,719 |
Pool # A93359, 4.00%, 8/1/2040 | 844 | 806 |
Pool # G06222, 4.00%, 1/1/2041 | 184,114 | 175,134 |
Pool # G07794, 5.50%, 6/1/2041 | 9,088 | 9,273 |
Pool # Q03516, 4.50%, 9/1/2041 | 20,445 | 19,889 |
Pool # Q04088, 3.50%, 10/1/2041 | 19,033 | 17,550 |
Pool # Q04688, 4.00%, 11/1/2041 | 2,846 | 2,697 |
Pool # G08477, 3.50%, 2/1/2042 | 6,850 | 6,317 |
Pool # Q06771, 3.00%, 3/1/2042 | 34,791 | 30,846 |
Pool # C03858, 3.50%, 4/1/2042 | 92,602 | 85,391 |
Pool # Q08646, 3.50%, 6/1/2042 | 21,043 | 19,404 |
34 | J.P. Morgan Exchange-Traded Funds | August 31, 2023 |
INVESTMENTS | PRINCIPAL AMOUNT($) | VALUE($) |
Mortgage-Backed Securities — continued | ||
Pool # G60737, 4.50%, 8/1/2042 | 87,143 | 85,002 |
Pool # Q11220, 3.50%, 9/1/2042 | 78,617 | 72,495 |
Pool # Q13477, 3.00%, 12/1/2042 | 109,134 | 96,714 |
Pool # Q14321, 3.00%, 12/1/2042 | 26,702 | 23,669 |
Pool # C04420, 3.00%, 1/1/2043 | 158,358 | 140,397 |
Pool # Q14694, 3.00%, 1/1/2043 | 1,184,152 | 1,049,680 |
Pool # G61723, 3.50%, 1/1/2043 | 62,362 | 57,528 |
Pool # C09031, 2.50%, 2/1/2043 | 84,253 | 71,180 |
Pool # V80026, 3.00%, 4/1/2043 | 47,714 | 42,289 |
Pool # Q17374, 4.00%, 4/1/2043 | 84,154 | 80,046 |
Pool # G62033, 4.00%, 11/1/2043 | 112,855 | 107,348 |
Pool # Z40090, 4.50%, 9/1/2044 | 25,326 | 24,546 |
Pool # G61769, 4.50%, 12/1/2044 | 62,284 | 60,752 |
Pool # G61617, 4.50%, 1/1/2045 | 20,573 | 20,068 |
Pool # G08651, 4.00%, 6/1/2045 | 88,480 | 83,968 |
Pool # G08653, 3.00%, 7/1/2045 | 43,073 | 38,130 |
Pool # Q35223, 4.00%, 8/1/2045 | 10,265 | 9,591 |
Pool # G60238, 3.50%, 10/1/2045 | 621,938 | 568,130 |
Pool # G60506, 3.50%, 4/1/2046 | 35,072 | 31,991 |
Pool # G08710, 3.00%, 6/1/2046 | 29,512 | 25,943 |
Pool # Q41024, 3.00%, 6/1/2046 | 509,509 | 449,154 |
Pool # G08724, 2.50%, 9/1/2046 | 10,990 | 9,280 |
Pool # G61070, 3.00%, 9/1/2046 | 427,854 | 379,096 |
Pool # G61730, 3.00%, 9/1/2046 | 116,743 | 103,468 |
Pool # G61235, 4.50%, 9/1/2046 | 20,660 | 20,024 |
Pool # G08736, 2.50%, 12/1/2046 | 11,526 | 9,723 |
Pool # Q45872, 3.00%, 1/1/2047 | 299,353 | 262,593 |
Pool # G08747, 3.00%, 2/1/2047 | 150,822 | 132,302 |
Pool # G61623, 3.00%, 4/1/2047 | 22,081 | 19,509 |
Pool # G60985, 3.00%, 5/1/2047 | 83,072 | 73,280 |
Pool # G60996, 3.50%, 5/1/2047 | 6,803 | 6,198 |
Pool # Q47884, 4.00%, 5/1/2047 | 20,197 | 19,021 |
Pool # V83233, 4.00%, 6/1/2047 | 83,730 | 78,836 |
Pool # G08775, 4.00%, 8/1/2047 | 28,573 | 26,687 |
Pool # Q50152, 4.00%, 8/1/2047 | 68,244 | 63,738 |
Pool # Q51268, 3.50%, 10/1/2047 | 43,655 | 39,725 |
Pool # G08787, 3.00%, 11/1/2047 | 270,150 | 236,672 |
Pool # G61681, 3.00%, 12/1/2047 | 6,187 | 5,421 |
Pool # Q52866, 3.00%, 12/1/2047 | 23,108 | 20,355 |
Pool # G08793, 4.00%, 12/1/2047 | 26,756 | 25,192 |
Pool # Q53751, 3.50%, 1/1/2048 | 78,570 | 71,495 |
Pool # G08812, 3.00%, 4/1/2048 | 9,518 | 8,334 |
Pool # G61866, 4.00%, 6/1/2048 | 21,522 | 20,472 |
Pool # G61607, 4.50%, 9/1/2048 | 101,124 | 97,746 |
Pool # G08842, 4.00%, 10/1/2048 | 11,010 | 10,329 |
INVESTMENTS | PRINCIPAL AMOUNT($) | VALUE($) |
Pool # G61885, 4.50%, 11/1/2048 | 24,589 | 23,760 |
Pool # G08862, 4.00%, 2/1/2049 | 18,185 | 17,070 |
Pool # Q61487, 4.00%, 2/1/2049 | 30,820 | 28,980 |
Pool # G08876, 3.50%, 5/1/2049 | 34,840 | 31,702 |
FHLMC UMBS, 15 Year | ||
Pool # ZS5890, 4.00%, 7/1/2024 | 23,019 | 22,994 |
Pool # ZK2080, 4.00%, 1/1/2025 | 11,753 | 11,554 |
Pool # ZA2587, 4.00%, 9/1/2025 | 3,793 | 3,728 |
Pool # ZK2723, 3.50%, 11/1/2025 | 7,689 | 7,522 |
Pool # ZK3540, 3.00%, 9/1/2026 | 39,212 | 37,973 |
Pool # ZS8460, 3.00%, 4/1/2027 | 11,936 | 11,512 |
Pool # SB0031, 3.50%, 10/1/2027 | 15,222 | 14,891 |
Pool # ZS6674, 2.50%, 4/1/2028 | 265,539 | 252,707 |
Pool # ZS7140, 2.00%, 1/1/2029 | 152,133 | 142,850 |
Pool # ZS7751, 3.00%, 1/1/2029 | 77,813 | 74,734 |
Pool # SB0071, 2.50%, 5/1/2030 | 19,854 | 18,938 |
Pool # ZS7331, 3.00%, 12/1/2030 | 21,427 | 20,225 |
Pool # ZS7888, 2.50%, 10/1/2032 | 255,140 | 234,835 |
Pool # ZK9070, 3.00%, 11/1/2032 | 572,880 | 540,601 |
Pool # ZS7938, 2.50%, 1/1/2033 | 58,594 | 53,937 |
Pool # SB0256, 4.00%, 11/1/2033 | 27,469 | 27,005 |
Pool # SB0077, 3.50%, 10/1/2034 | 40,325 | 38,544 |
Pool # QN1148, 2.50%, 12/1/2034 | 60,186 | 54,667 |
Pool # SB8031, 2.50%, 2/1/2035 | 127,668 | 116,083 |
Pool # SB0302, 3.00%, 4/1/2035 | 447,231 | 416,816 |
Pool # QN2407, 2.00%, 6/1/2035 | 120,032 | 105,752 |
Pool # SB8500, 2.50%, 7/1/2035 | 335,715 | 303,710 |
Pool # SB0424, 2.00%, 10/1/2035 | 792,596 | 701,262 |
Pool # RC1712, 1.50%, 12/1/2035 | 1,041,710 | 894,176 |
Pool # SB8090, 2.50%, 2/1/2036 | 893,107 | 805,317 |
Pool # QN6095, 2.00%, 5/1/2036 | 137,837 | 121,313 |
Pool # QN6718, 2.00%, 6/1/2036 | 286,986 | 251,871 |
Pool # QN7057, 2.00%, 7/1/2036 | 162,883 | 142,959 |
Pool # SB8111, 2.00%, 7/1/2036 | 152,402 | 133,790 |
Pool # QN8347, 1.50%, 10/1/2036 | 342,428 | 292,288 |
Pool # SB8127, 1.50%, 11/1/2036 | 332,463 | 283,778 |
Pool # SB0570, 2.00%, 11/1/2036 | 315,222 | 277,776 |
Pool # SB8131, 1.50%, 12/1/2036 | 674,414 | 575,650 |
Pool # SB8136, 1.50%, 1/1/2037 | 426,217 | 363,797 |
Pool # SB8140, 1.50%, 2/1/2037 | 517,461 | 441,673 |
Pool # SB8147, 1.50%, 4/1/2037 | 886,876 | 756,421 |
FHLMC UMBS, 20 Year | ||
Pool # ZA2277, 3.00%, 9/1/2032 | 64,752 | 60,399 |
Pool # ZJ9491, 3.50%, 12/1/2032 | 14,949 | 14,210 |
Pool # ZS9164, 3.00%, 9/1/2033 | 400,346 | 373,427 |
August 31, 2023 | J.P. Morgan Exchange-Traded Funds | 35 |
AS OF August 31, 2023 (Unaudited) (continued)
INVESTMENTS | PRINCIPAL AMOUNT($) | VALUE($) |
Mortgage-Backed Securities — continued | ||
Pool # SC0107, 3.50%, 11/1/2034 | 891,897 | 847,804 |
Pool # ZA2463, 3.50%, 6/1/2037 | 27,950 | 26,010 |
Pool # RB5026, 2.50%, 11/1/2039 | 34,854 | 30,254 |
Pool # QK0157, 2.50%, 1/1/2040 | 15,638 | 13,562 |
Pool # RB5032, 2.50%, 2/1/2040 | 28,497 | 24,720 |
Pool # RB5037, 2.50%, 3/1/2040 | 89,875 | 77,956 |
Pool # RB5043, 2.50%, 4/1/2040 | 38,504 | 33,416 |
Pool # RB5048, 2.50%, 5/1/2040 | 82,696 | 71,719 |
Pool # QK0665, 2.00%, 2/1/2041 | 1,060,283 | 893,651 |
Pool # SC0131, 1.50%, 3/1/2041 | 200,915 | 161,139 |
Pool # SC0134, 1.50%, 3/1/2041 | 204,459 | 163,981 |
Pool # RB5142, 2.50%, 1/1/2042 | 431,643 | 368,652 |
Pool # RB5145, 2.00%, 2/1/2042 | 1,527,298 | 1,268,361 |
Pool # RB5154, 2.50%, 4/1/2042 | 910,149 | 777,497 |
Pool # RB5166, 3.00%, 7/1/2042 | 917,994 | 807,094 |
FHLMC UMBS, 30 Year | ||
Pool # ZI3765, 5.50%, 11/1/2035 | 28,397 | 28,325 |
Pool # ZS2546, 5.00%, 2/1/2039 | 15,214 | 15,204 |
Pool # ZJ0449, 4.00%, 9/1/2040 | 19,016 | 18,066 |
Pool # ZL3548, 3.50%, 8/1/2042 | 63,393 | 58,384 |
Pool # ZA4209, 3.00%, 4/1/2043 | 732,956 | 648,817 |
Pool # ZS3712, 3.50%, 4/1/2043 | 146,365 | 134,837 |
Pool # ZS4077, 3.50%, 1/1/2044 | 20,053 | 18,467 |
Pool # ZS4592, 4.00%, 11/1/2044 | 131,450 | 124,757 |
Pool # ZS4609, 3.00%, 4/1/2045 | 35,751 | 31,607 |
Pool # ZS9618, 3.50%, 3/1/2046 | 428,142 | 390,347 |
Pool # SD0146, 3.00%, 11/1/2046 | 118,309 | 103,936 |
Pool # ZM2209, 3.50%, 12/1/2046 | 277,762 | 252,489 |
Pool # SD0388, 3.50%, 6/1/2047 | 432,925 | 395,452 |
Pool # ZS4729, 3.00%, 8/1/2047 | 280,609 | 246,709 |
Pool # ZM4635, 4.00%, 11/1/2047 | 385,713 | 362,715 |
Pool # SD0225, 3.00%, 12/1/2047 | 542,651 | 475,659 |
Pool # ZT0534, 3.50%, 12/1/2047 | 279,519 | 254,827 |
Pool # ZS4750, 3.00%, 1/1/2048 | 22,698 | 19,855 |
Pool # SD0343, 3.00%, 3/1/2048 | 741,694 | 655,720 |
Pool # SI2002, 4.00%, 3/1/2048 | 455,079 | 427,950 |
Pool # ZM6887, 3.00%, 5/1/2048 | 41,616 | 36,333 |
Pool # ZM7669, 3.50%, 8/1/2048 | 69,381 | 63,053 |
Pool # ZN4476, 3.50%, 12/1/2048 | 245,761 | 223,345 |
Pool # ZA6286, 4.00%, 2/1/2049 | 118,898 | 111,563 |
Pool # ZT1776, 3.50%, 3/1/2049 | 21,553 | 19,587 |
Pool # ZN5087, 4.00%, 4/1/2049 | 112,610 | 105,937 |
Pool # ZT1864, 4.00%, 4/1/2049 | 2,864 | 2,683 |
Pool # ZT1951, 3.50%, 5/1/2049 | 6,947 | 6,314 |
Pool # ZT1952, 4.00%, 5/1/2049 | 45,803 | 42,845 |
INVESTMENTS | PRINCIPAL AMOUNT($) | VALUE($) |
Pool # QA4907, 3.00%, 6/1/2049 | 104,833 | 91,885 |
Pool # ZT2086, 3.50%, 6/1/2049 | 39,020 | 35,450 |
Pool # SD7502, 3.50%, 7/1/2049 | 115,617 | 105,770 |
Pool # SD8001, 3.50%, 7/1/2049 | 13,722 | 12,420 |
Pool # SD7501, 4.00%, 7/1/2049 | 71,550 | 67,311 |
Pool # QA1997, 3.00%, 8/1/2049 | 17,320 | 15,070 |
Pool # RA1202, 3.50%, 8/1/2049 | 379,502 | 344,492 |
Pool # SD8005, 3.50%, 8/1/2049 | 48,211 | 43,744 |
Pool # SD8006, 4.00%, 8/1/2049 | 28,582 | 26,724 |
Pool # SD8023, 2.50%, 11/1/2049 | 7,992 | 6,682 |
Pool # QA4509, 3.00%, 11/1/2049 | 381,242 | 331,632 |
Pool # SD8025, 3.50%, 11/1/2049 | 144,253 | 131,031 |
Pool # SD8029, 2.50%, 12/1/2049 | 151,161 | 126,372 |
Pool # RA1878, 3.50%, 12/1/2049 | 103,353 | 93,631 |
Pool # SD8037, 2.50%, 1/1/2050 | 401,691 | 335,819 |
Pool # QA7416, 3.00%, 2/1/2050 | 363,960 | 316,323 |
Pool # QA7554, 3.00%, 2/1/2050 | 935,354 | 820,329 |
Pool # RA2116, 3.00%, 2/1/2050 | 541,890 | 472,847 |
Pool # SD0303, 2.50%, 4/1/2050 | 680,540 | 571,233 |
Pool # QA9653, 3.50%, 5/1/2050 | 34,831 | 31,653 |
Pool # SD8080, 2.00%, 6/1/2050 | 60,630 | 48,605 |
Pool # QB1691, 2.00%, 7/1/2050 | 813,496 | 651,962 |
Pool # SD8089, 2.50%, 7/1/2050 | 1,614,934 | 1,351,467 |
Pool # SD8083, 2.50%, 8/1/2050 | 1,192,705 | 997,135 |
Pool # RA3727, 2.00%, 10/1/2050 | 1,902,845 | 1,522,789 |
Pool # SD8104, 1.50%, 11/1/2050 | 1,211,485 | 914,262 |
Pool # RA4197, 2.50%, 12/1/2050 | 514,528 | 429,619 |
Pool # RA4349, 2.50%, 1/1/2051 | 334,451 | 280,817 |
Pool # QB8583, 1.50%, 2/1/2051 | 1,215,534 | 919,301 |
Pool # RA4530, 2.50%, 2/1/2051 | 519,040 | 430,089 |
Pool # SD8129, 2.50%, 2/1/2051 | 652,367 | 542,986 |
Pool # SD8140, 2.00%, 4/1/2051 | 392,885 | 313,991 |
Pool # SD8142, 3.00%, 4/1/2051 | 1,026,615 | 886,480 |
Pool # SD8145, 1.50%, 5/1/2051 | 1,031,897 | 779,932 |
Pool # QC2565, 2.00%, 6/1/2051 | 1,751,454 | 1,399,456 |
Pool # QC3259, 2.00%, 6/1/2051 | 699,562 | 557,041 |
Pool # SD8158, 3.50%, 6/1/2051 | 287,319 | 257,403 |
Pool # SD8155, 2.00%, 7/1/2051 | 1,294,736 | 1,031,854 |
Pool # RA5559, 2.50%, 7/1/2051 | 490,833 | 407,016 |
Pool # SD8156, 2.50%, 7/1/2051 | 612,048 | 509,054 |
Pool # QC5125, 2.00%, 8/1/2051 | 265,262 | 211,909 |
Pool # QC6057, 2.50%, 8/1/2051 | 255,574 | 212,744 |
Pool # SD8163, 3.50%, 8/1/2051 | 119,715 | 107,306 |
Pool # RA5832, 2.50%, 9/1/2051 | 706,756 | 587,976 |
Pool # SD8168, 3.00%, 9/1/2051 | 234,718 | 202,787 |
36 | J.P. Morgan Exchange-Traded Funds | August 31, 2023 |
INVESTMENTS | PRINCIPAL AMOUNT($) | VALUE($) |
Mortgage-Backed Securities — continued | ||
Pool # SD8172, 2.00%, 10/1/2051 | 802,458 | 640,498 |
Pool # SD8173, 2.50%, 10/1/2051 | 1,108,293 | 920,267 |
Pool # RA6507, 2.00%, 12/1/2051 | 1,847,504 | 1,473,597 |
Pool # QD3500, 2.50%, 12/1/2051 | 1,827,189 | 1,528,705 |
Pool # RA6694, 2.00%, 1/1/2052 | 456,839 | 364,446 |
Pool # SD0963, 3.50%, 1/1/2052 | 1,034,399 | 926,554 |
Pool # RA6816, 2.00%, 2/1/2052 | 523,967 | 417,223 |
Pool # SD0897, 2.00%, 2/1/2052 | 945,696 | 757,069 |
Pool # SD8199, 2.00%, 3/1/2052 | 955,637 | 761,044 |
Pool # SD8204, 2.00%, 4/1/2052 | 1,872,334 | 1,490,887 |
Pool # QD9578, 2.50%, 4/1/2052 | 1,495,772 | 1,239,359 |
Pool # QD9765, 2.50%, 4/1/2052 | 1,482,669 | 1,229,191 |
Pool # SD8205, 2.50%, 4/1/2052 | 509,625 | 422,264 |
Pool # SD0945, 3.50%, 4/1/2052 | 1,052,254 | 941,412 |
Pool # SD1461, 3.00%, 5/1/2052 | 956,342 | 830,206 |
Pool # SD8214, 3.50%, 5/1/2052 | 1,112,725 | 994,587 |
Pool # SD1840, 3.00%, 6/1/2052 | 469,781 | 405,126 |
Pool # RA7502, 5.00%, 6/1/2052 | 1,043,437 | 1,011,767 |
Pool # SD1406, 2.00%, 8/1/2052 | 474,610 | 378,472 |
Pool # SD8234, 2.50%, 8/1/2052 | 480,203 | 397,885 |
Pool # RA8112, 4.50%, 10/1/2052 | 1,887,237 | 1,789,374 |
Pool # SD2580, 6.00%, 3/1/2053 | 984,127 | 986,654 |
Pool # RA8736, 6.50%, 3/1/2053 | 932,603 | 949,373 |
Pool # SD2688, 5.50%, 4/1/2053 | 972,140 | 962,469 |
Pool # SD2693, 6.50%, 4/1/2053 | 986,754 | 1,018,576 |
Pool # SD8322, 4.50%, 5/1/2053 | 1,469,996 | 1,393,724 |
Pool # SD8324, 5.50%, 5/1/2053 | 725,894 | 716,580 |
Pool # SD8341, 5.00%, 7/1/2053 | 1,961,668 | 1,902,090 |
FNMA / FHLMC UMBS, Single Family, 30 Year TBA, 6.00%, 9/25/2053 (a) | 1,000 | 1,003 |
FNMA UMBS, 15 Year | ||
Pool # AC8711, 4.00%, 12/1/2024 | 81,249 | 79,870 |
Pool # AC7007, 4.50%, 1/1/2025 | 6,007 | 5,894 |
Pool # AL9580, 4.00%, 3/1/2025 | 4,103 | 4,034 |
Pool # 932724, 4.00%, 4/1/2025 | 2,757 | 2,709 |
Pool # AE0971, 4.00%, 5/1/2025 | 7,162 | 7,043 |
Pool # AE0939, 3.50%, 2/1/2026 | 20,859 | 20,356 |
Pool # FM2968, 4.00%, 5/1/2026 | 5,579 | 5,469 |
Pool # AJ6632, 3.00%, 11/1/2026 | 29,642 | 28,644 |
Pool # AJ9357, 3.50%, 1/1/2027 | 58,318 | 56,732 |
Pool # AK4047, 3.00%, 2/1/2027 | 11,155 | 10,771 |
Pool # AL4586, 4.00%, 2/1/2027 | 20,715 | 20,306 |
Pool # AO0527, 3.00%, 5/1/2027 | 15,413 | 14,876 |
Pool # AO4400, 2.50%, 7/1/2027 | 37,207 | 35,521 |
Pool # AB5823, 3.50%, 8/1/2027 | 61,205 | 59,382 |
Pool # AL8138, 4.00%, 9/1/2027 | 11,561 | 11,333 |
INVESTMENTS | PRINCIPAL AMOUNT($) | VALUE($) |
Pool # AB6811, 2.50%, 10/1/2027 | 9,764 | 9,308 |
Pool # AQ9442, 2.00%, 12/1/2027 | 21,096 | 19,904 |
Pool # AB8447, 2.50%, 2/1/2028 | 17,804 | 16,940 |
Pool # AR4180, 2.50%, 2/1/2028 | 8,150 | 7,749 |
Pool # AL3802, 3.00%, 2/1/2028 | 48,881 | 47,007 |
Pool # AB8787, 2.00%, 3/1/2028 | 56,956 | 53,674 |
Pool # AP6059, 2.00%, 6/1/2028 | 7,303 | 6,854 |
Pool # BM5381, 3.00%, 6/1/2028 | 54,103 | 52,037 |
Pool # BM1892, 2.50%, 9/1/2028 | 16,373 | 15,608 |
Pool # AS0761, 3.00%, 10/1/2028 | 21,526 | 20,613 |
Pool # AU6961, 3.00%, 10/1/2028 | 42,296 | 40,508 |
Pool # AL6132, 4.50%, 3/1/2029 | 3,433 | 3,363 |
Pool # FM1105, 2.50%, 6/1/2029 | 35,179 | 33,497 |
Pool # AS3345, 2.00%, 7/1/2029 | 11,571 | 10,488 |
Pool # MA2061, 3.00%, 10/1/2029 | 55,877 | 52,750 |
Pool # FM1465, 3.00%, 5/1/2030 | 88,721 | 85,059 |
Pool # 890666, 2.00%, 6/1/2030 | 23,032 | 21,445 |
Pool # MA2684, 3.00%, 7/1/2031 | 102,102 | 96,357 |
Pool # AL9418, 3.50%, 8/1/2031 | 33,701 | 32,267 |
Pool # BD5647, 2.00%, 11/1/2031 | 14,897 | 13,352 |
Pool # 890776, 3.50%, 11/1/2031 | 21,625 | 20,709 |
Pool # BM5490, 3.50%, 11/1/2031 | 13,941 | 13,352 |
Pool # AS8708, 2.50%, 2/1/2032 | 339,032 | 312,049 |
Pool # BM4993, 3.50%, 3/1/2032 | 28,502 | 27,655 |
Pool # BM4741, 3.00%, 4/1/2032 | 9,253 | 8,857 |
Pool # FM1645, 3.00%, 4/1/2032 | 114,665 | 109,509 |
Pool # MA3124, 2.50%, 9/1/2032 | 32,463 | 29,883 |
Pool # FM3099, 3.50%, 9/1/2032 | 30,305 | 29,570 |
Pool # CA0775, 2.50%, 11/1/2032 | 23,776 | 21,853 |
Pool # MA3188, 3.00%, 11/1/2032 | 17,535 | 16,548 |
Pool # BH7081, 2.50%, 12/1/2032 | 35,735 | 32,820 |
Pool # BH8720, 3.50%, 12/1/2032 | 31,592 | 30,192 |
Pool # FM1161, 2.50%, 1/1/2033 | 34,631 | 31,882 |
Pool # FM1691, 2.50%, 1/1/2033 | 13,518 | 12,581 |
Pool # FM2549, 2.50%, 1/1/2033 | 75,180 | 69,865 |
Pool # CA9078, 3.00%, 9/1/2033 | 420,745 | 397,154 |
Pool # FM1123, 4.00%, 9/1/2033 | 98,809 | 96,071 |
Pool # FM2153, 4.00%, 11/1/2033 | 63,586 | 62,503 |
Pool # BD9105, 4.00%, 1/1/2034 | 29,549 | 28,701 |
Pool # BM5306, 4.00%, 1/1/2034 | 4,267 | 4,128 |
Pool # FM1733, 3.50%, 5/1/2034 | 579,943 | 554,683 |
Pool # FM1842, 3.50%, 6/1/2034 | 115,464 | 109,987 |
Pool # FM6946, 3.00%, 7/1/2034 | 349,587 | 329,980 |
Pool # BO1822, 3.50%, 7/1/2034 | 60,354 | 57,502 |
Pool # MA3764, 2.50%, 9/1/2034 | 7,861 | 7,147 |
August 31, 2023 | J.P. Morgan Exchange-Traded Funds | 37 |
AS OF August 31, 2023 (Unaudited) (continued)
INVESTMENTS | PRINCIPAL AMOUNT($) | VALUE($) |
Mortgage-Backed Securities — continued | ||
Pool # MA3910, 2.00%, 1/1/2035 | 25,170 | 22,301 |
Pool # FM3569, 3.00%, 1/1/2035 | 107,258 | 101,243 |
Pool # FM7941, 2.50%, 2/1/2035 | 322,866 | 297,214 |
Pool # FM8550, 3.00%, 2/1/2035 | 233,003 | 219,911 |
Pool # FM2708, 3.00%, 3/1/2035 | 52,292 | 49,364 |
Pool # MA4075, 2.50%, 7/1/2035 | 373,584 | 336,882 |
Pool # FM4035, 2.50%, 8/1/2035 | 63,996 | 58,180 |
Pool # MA4099, 2.50%, 8/1/2035 | 946,668 | 853,645 |
Pool # CA7497, 2.50%, 10/1/2035 | 1,141,945 | 1,029,813 |
Pool # BP7572, 2.50%, 11/1/2035 | 696,423 | 626,691 |
Pool # FM5396, 2.00%, 12/1/2035 | 727,854 | 642,793 |
Pool # BR3349, 1.50%, 1/1/2036 | 1,300,940 | 1,116,929 |
Pool # BR1309, 2.00%, 1/1/2036 | 493,931 | 435,497 |
Pool # FM5537, 2.00%, 1/1/2036 | 554,755 | 487,005 |
Pool # FM5797, 2.00%, 1/1/2036 | 546,404 | 481,739 |
Pool # FM5367, 1.50%, 2/1/2036 | 415,327 | 356,453 |
Pool # MA4261, 2.00%, 2/1/2036 | 606,551 | 532,480 |
Pool # CB0305, 1.50%, 5/1/2036 | 846,419 | 726,429 |
Pool # FM7843, 1.50%, 6/1/2036 | 76,366 | 65,553 |
Pool # BP3507, 2.00%, 6/1/2036 | 152,694 | 134,041 |
Pool # FM8292, 2.00%, 7/1/2036 | 254,814 | 224,028 |
Pool # MA4430, 1.00%, 8/1/2036 | 161,888 | 134,127 |
Pool # BT0273, 1.50%, 9/1/2036 | 425,238 | 364,707 |
Pool # MA4417, 1.50%, 9/1/2036 | 325,853 | 278,039 |
Pool # MA4418, 2.00%, 9/1/2036 | 157,271 | 137,960 |
Pool # MA4441, 1.50%, 10/1/2036 | 455,884 | 391,238 |
Pool # BT9452, 1.50%, 11/1/2036 | 165,829 | 141,540 |
Pool # FM9247, 2.00%, 11/1/2036 | 333,250 | 291,904 |
Pool # MA4497, 2.00%, 12/1/2036 | 2,332,206 | 2,043,657 |
Pool # MA4516, 2.00%, 1/1/2037 | 499,587 | 437,793 |
Pool # BV7189, 2.00%, 3/1/2037 | 854,285 | 748,543 |
Pool # MA4581, 1.50%, 4/1/2037 | 884,208 | 753,954 |
Pool # MA4582, 2.00%, 4/1/2037 | 1,146,155 | 1,004,080 |
Pool # FS2037, 1.50%, 5/1/2037 | 891,678 | 760,520 |
Pool # MA4604, 3.00%, 5/1/2037 | 849,563 | 785,189 |
Pool # FS4059, 1.50%, 8/1/2037 | 2,376,660 | 2,028,583 |
Pool # FS4794, 2.00%, 8/1/2037 | 973,717 | 853,209 |
Pool # MA4724, 3.00%, 9/1/2037 | 908,929 | 840,056 |
Pool # MA4861, 3.50%, 1/1/2038 | 1,843,922 | 1,738,095 |
Pool # MA4944, 4.50%, 3/1/2038 | 450,048 | 438,374 |
FNMA UMBS, 20 Year | ||
Pool # AE6799, 4.50%, 11/1/2030 | 1,937 | 1,894 |
Pool # MA0885, 3.50%, 10/1/2031 | 24,988 | 23,755 |
Pool # AB4853, 3.00%, 4/1/2032 | 25,091 | 23,405 |
Pool # MA1058, 3.00%, 5/1/2032 | 11,354 | 10,598 |
INVESTMENTS | PRINCIPAL AMOUNT($) | VALUE($) |
Pool # MA1165, 3.00%, 9/1/2032 | 62,432 | 58,237 |
Pool # MA2079, 4.00%, 11/1/2034 | 12,490 | 11,964 |
Pool # AL7654, 3.00%, 9/1/2035 | 55,851 | 51,525 |
Pool # MA2472, 3.00%, 12/1/2035 | 11,213 | 10,333 |
Pool # FM1133, 4.00%, 6/1/2036 | 26,840 | 25,693 |
Pool # BM3089, 4.00%, 8/1/2037 | 465,773 | 441,522 |
Pool # MA3099, 4.00%, 8/1/2037 | 81,197 | 76,969 |
Pool # BM5330, 2.50%, 12/1/2037 | 35,962 | 32,222 |
Pool # FM3204, 4.00%, 10/1/2038 | 30,638 | 29,193 |
Pool # FS3933, 4.00%, 3/1/2040 | 95,320 | 88,476 |
Pool # MA4072, 2.50%, 7/1/2040 | 138,041 | 119,734 |
Pool # MA4128, 2.00%, 9/1/2040 | 1,287,406 | 1,086,734 |
Pool # MA4204, 2.00%, 12/1/2040 | 802,295 | 674,670 |
Pool # CA9019, 2.00%, 2/1/2041 | 346,271 | 292,235 |
Pool # MA4310, 1.50%, 4/1/2041 | 736,088 | 590,447 |
Pool # MA4333, 2.00%, 5/1/2041 | 485,122 | 406,911 |
Pool # MA4422, 2.00%, 9/1/2041 | 379,340 | 316,428 |
Pool # MA4446, 2.00%, 10/1/2041 | 380,734 | 317,177 |
Pool # FS0316, 1.50%, 11/1/2041 | 629,540 | 504,960 |
Pool # MA4474, 2.00%, 11/1/2041 | 483,048 | 399,978 |
Pool # MA4519, 1.50%, 1/1/2042 | 492,680 | 395,179 |
Pool # MA4521, 2.50%, 1/1/2042 | 519,750 | 445,779 |
Pool # BV7697, 2.50%, 4/1/2042 | 917,996 | 784,920 |
Pool # MA4587, 2.50%, 4/1/2042 | 426,768 | 364,905 |
Pool # MA4632, 3.00%, 6/1/2042 | 1,109,493 | 975,474 |
FNMA UMBS, 30 Year | ||
Pool # 254447, 6.00%, 9/1/2032 | 19,575 | 20,017 |
Pool # 711215, 5.50%, 6/1/2033 | 16,522 | 16,337 |
Pool # AA1005, 5.00%, 12/1/2033 | 11,545 | 11,537 |
Pool # 725232, 5.00%, 3/1/2034 | 9,136 | 9,129 |
Pool # 725228, 6.00%, 3/1/2034 | 47,166 | 48,417 |
Pool # 790003, 6.00%, 8/1/2034 | 15,326 | 15,627 |
Pool # 735503, 6.00%, 4/1/2035 | 33,955 | 34,759 |
Pool # 190360, 5.00%, 8/1/2035 | 25,076 | 25,059 |
Pool # 904601, 6.00%, 11/1/2036 | 35,962 | 37,117 |
Pool # 888538, 5.50%, 1/1/2037 | 18,933 | 19,280 |
Pool # AB0284, 6.00%, 2/1/2037 | 34,439 | 35,544 |
Pool # AL2627, 5.00%, 7/1/2037 | 16,552 | 16,541 |
Pool # 956965, 6.50%, 12/1/2037 | 11,752 | 11,938 |
Pool # BH7907, 6.50%, 12/1/2037 | 17,816 | 18,866 |
Pool # 961793, 5.00%, 3/1/2038 | 65,088 | 65,044 |
Pool # 985661, 5.50%, 6/1/2038 | 12,799 | 12,834 |
Pool # AU7519, 3.50%, 9/1/2038 | 9,438 | 8,693 |
Pool # AA7402, 4.50%, 6/1/2039 | 100,511 | 97,917 |
Pool # AC2638, 5.00%, 10/1/2039 | 125,194 | 125,110 |
38 | J.P. Morgan Exchange-Traded Funds | August 31, 2023 |
INVESTMENTS | PRINCIPAL AMOUNT($) | VALUE($) |
Mortgage-Backed Securities — continued | ||
Pool # AL0100, 6.00%, 10/1/2039 | 48,510 | 50,067 |
Pool # AC4886, 5.00%, 11/1/2039 | 22,698 | 22,683 |
Pool # 190399, 5.50%, 11/1/2039 | 75,112 | 76,366 |
Pool # AB1143, 4.50%, 6/1/2040 | 77,633 | 75,629 |
Pool # AD6938, 4.50%, 6/1/2040 | 115,223 | 112,248 |
Pool # AD5479, 5.00%, 6/1/2040 | 23,075 | 23,060 |
Pool # AB1259, 5.00%, 7/1/2040 | 26,377 | 26,359 |
Pool # AB1292, 5.00%, 8/1/2040 | 13,669 | 13,579 |
Pool # AL5437, 5.00%, 8/1/2040 | 79,148 | 78,899 |
Pool # AB1421, 5.00%, 9/1/2040 | 37,971 | 37,945 |
Pool # AE4142, 5.00%, 9/1/2040 | 31,027 | 30,677 |
Pool # AE3857, 5.00%, 10/1/2040 | 542,378 | 542,012 |
Pool # AE8289, 4.00%, 12/1/2040 | 84,086 | 79,886 |
Pool # MA0622, 3.50%, 1/1/2041 | 29,052 | 26,756 |
Pool # AH2312, 5.00%, 1/1/2041 | 67,734 | 67,231 |
Pool # AE0828, 3.50%, 2/1/2041 | 16,404 | 14,836 |
Pool # AH3804, 4.00%, 2/1/2041 | 18,775 | 17,837 |
Pool # MA0639, 4.00%, 2/1/2041 | 29,212 | 27,752 |
Pool # AB2676, 3.50%, 4/1/2041 | 100,821 | 92,854 |
Pool # AL0241, 4.00%, 4/1/2041 | 58,438 | 55,518 |
Pool # AI1887, 4.50%, 5/1/2041 | 233,553 | 226,961 |
Pool # BM3118, 6.00%, 7/1/2041 | 74,773 | 77,156 |
Pool # AJ2293, 4.00%, 9/1/2041 | 19,194 | 18,183 |
Pool # AL0933, 5.00%, 10/1/2041 | 75,149 | 74,990 |
Pool # AW8154, 3.50%, 1/1/2042 | 19,507 | 17,966 |
Pool # AX5318, 4.50%, 1/1/2042 | 63,999 | 62,346 |
Pool # BD4480, 4.50%, 1/1/2042 | 345,994 | 337,064 |
Pool # AL1998, 4.00%, 3/1/2042 | 93,189 | 88,532 |
Pool # AO4134, 3.50%, 6/1/2042 | 11,832 | 10,897 |
Pool # AO8694, 4.50%, 7/1/2042 | 35,190 | 33,930 |
Pool # AP4258, 3.00%, 8/1/2042 | 80,818 | 71,550 |
Pool # AB6632, 3.50%, 10/1/2042 | 116,126 | 106,949 |
Pool # AB6633, 3.50%, 10/1/2042 | 21,573 | 19,769 |
Pool # AL3344, 4.50%, 10/1/2042 | 127,997 | 124,692 |
Pool # AB6828, 3.50%, 11/1/2042 | 105,638 | 97,291 |
Pool # AL3182, 3.50%, 12/1/2042 | 18,496 | 17,034 |
Pool # AQ9316, 2.50%, 1/1/2043 | 51,927 | 43,812 |
Pool # AB7580, 3.00%, 1/1/2043 | 116,826 | 103,588 |
Pool # AQ1104, 3.00%, 1/1/2043 | 28,079 | 24,836 |
Pool # AR0168, 3.00%, 2/1/2043 | 47,753 | 42,281 |
Pool # AB7964, 3.50%, 2/1/2043 | 64,222 | 59,164 |
Pool # AR2271, 3.50%, 2/1/2043 | 259,853 | 239,306 |
Pool # BM4751, 3.50%, 3/1/2043 | 30,243 | 27,956 |
Pool # AB8742, 4.00%, 3/1/2043 | 13,235 | 12,574 |
Pool # AR6770, 4.00%, 3/1/2043 | 15,748 | 14,960 |
INVESTMENTS | PRINCIPAL AMOUNT($) | VALUE($) |
Pool # AT2015, 3.00%, 4/1/2043 | 31,963 | 28,290 |
Pool # AT2016, 3.00%, 4/1/2043 | 481,158 | 425,869 |
Pool # AB9194, 3.50%, 5/1/2043 | 110,245 | 101,527 |
Pool # FM4462, 3.50%, 5/1/2043 | 759,313 | 699,292 |
Pool # AU1629, 3.00%, 7/1/2043 | 74,811 | 66,207 |
Pool # BM3785, 3.50%, 7/1/2043 | 118,571 | 109,198 |
Pool # AS0241, 4.00%, 8/1/2043 | 765,721 | 722,479 |
Pool # BM3704, 3.00%, 9/1/2043 | 32,788 | 29,023 |
Pool # AT2612, 3.50%, 9/1/2043 | 74,411 | 68,737 |
Pool # AU4256, 3.50%, 9/1/2043 | 20,935 | 19,130 |
Pool # AU4283, 3.50%, 9/1/2043 | 17,904 | 16,489 |
Pool # AL4062, 4.00%, 9/1/2043 | 27,279 | 25,915 |
Pool # BM4635, 2.50%, 10/1/2043 | 149,067 | 125,775 |
Pool # AS1121, 4.00%, 11/1/2043 | 27,488 | 26,114 |
Pool # AV0022, 4.00%, 11/1/2043 | 428,929 | 407,482 |
Pool # AL7696, 3.00%, 12/1/2043 | 52,725 | 46,669 |
Pool # AV6103, 4.00%, 1/1/2044 | 158,537 | 150,745 |
Pool # BC1737, 4.00%, 1/1/2044 | 62,684 | 59,560 |
Pool # BM5365, 4.00%, 3/1/2044 | 64,126 | 60,923 |
Pool # FM1744, 3.50%, 5/1/2044 | 29,576 | 27,238 |
Pool # AS2700, 4.00%, 6/1/2044 | 37,182 | 35,323 |
Pool # AW6233, 4.50%, 6/1/2044 | 1,631,175 | 1,569,254 |
Pool # AS2947, 4.00%, 7/1/2044 | 37,112 | 35,256 |
Pool # AL9072, 5.00%, 7/1/2044 | 65,648 | 66,170 |
Pool # AL9569, 5.00%, 8/1/2044 | 97,408 | 97,563 |
Pool # AX0152, 4.50%, 9/1/2044 | 23,046 | 22,308 |
Pool # BM4620, 3.00%, 10/1/2044 | 81,956 | 72,608 |
Pool # AS3867, 4.00%, 11/1/2044 | 9,820 | 9,324 |
Pool # FM1746, 3.50%, 1/1/2045 | 90,460 | 83,310 |
Pool # FM0015, 4.00%, 2/1/2045 | 93,904 | 89,211 |
Pool # MA2193, 4.50%, 2/1/2045 | 11,026 | 10,673 |
Pool # FM3414, 4.00%, 3/1/2045 | 592,828 | 560,381 |
Pool # BM3398, 3.50%, 4/1/2045 | 13,428 | 12,367 |
Pool # CA2709, 4.00%, 9/1/2045 | 1,167,554 | 1,109,204 |
Pool # AS5851, 4.50%, 9/1/2045 | 10,607 | 10,268 |
Pool # AS6184, 3.50%, 11/1/2045 | 125,910 | 115,052 |
Pool # BA0315, 3.50%, 11/1/2045 | 419,495 | 381,835 |
Pool # FM1869, 4.00%, 11/1/2045 | 61,082 | 57,985 |
Pool # BM4833, 3.00%, 12/1/2045 | 532,353 | 470,737 |
Pool # FM1708, 3.00%, 12/1/2045 | 37,642 | 33,329 |
Pool # BC0066, 3.50%, 12/1/2045 | 28,109 | 25,575 |
Pool # FM3413, 4.00%, 1/1/2046 | 74,889 | 71,145 |
Pool # FM2323, 4.00%, 2/1/2046 | 37,763 | 35,877 |
Pool # AL9128, 4.50%, 2/1/2046 | 18,339 | 17,804 |
Pool # AS6811, 3.00%, 3/1/2046 | 27,413 | 24,168 |
August 31, 2023 | J.P. Morgan Exchange-Traded Funds | 39 |
AS OF August 31, 2023 (Unaudited) (continued)
INVESTMENTS | PRINCIPAL AMOUNT($) | VALUE($) |
Mortgage-Backed Securities — continued | ||
Pool # BM4834, 3.00%, 3/1/2046 | 27,700 | 24,520 |
Pool # FM1782, 4.00%, 3/1/2046 | 11,769 | 11,181 |
Pool # FM2195, 4.00%, 3/1/2046 | 27,948 | 26,552 |
Pool # AS7003, 3.00%, 4/1/2046 | 34,591 | 30,367 |
Pool # AS7198, 4.50%, 5/1/2046 | 94,454 | 91,430 |
Pool # BD0166, 2.50%, 6/1/2046 | 113,325 | 95,614 |
Pool # BM5168, 2.50%, 6/1/2046 | 23,991 | 20,242 |
Pool # BC6105, 3.50%, 6/1/2046 | 934,050 | 849,335 |
Pool # FM1780, 4.00%, 7/1/2046 | 654,025 | 621,049 |
Pool # AS7660, 2.50%, 8/1/2046 | 218,338 | 184,152 |
Pool # MA2730, 2.50%, 8/1/2046 | 30,574 | 25,742 |
Pool # FM3810, 3.00%, 10/1/2046 | 99,260 | 87,803 |
Pool # AL9385, 3.00%, 11/1/2046 | 48,029 | 42,091 |
Pool # MA2806, 3.00%, 11/1/2046 | 147,688 | 129,885 |
Pool # BM3288, 3.50%, 12/1/2046 | 20,775 | 18,913 |
Pool # BM4990, 2.50%, 1/1/2047 | 11,438 | 9,651 |
Pool # FM2807, 3.00%, 1/1/2047 | 77,346 | 68,385 |
Pool # 890856, 3.50%, 1/1/2047 | 122,063 | 110,858 |
Pool # FM3374, 3.50%, 1/1/2047 | 142,235 | 130,995 |
Pool # FM0041, 3.00%, 2/1/2047 | 581,561 | 509,781 |
Pool # BM5955, 4.00%, 2/1/2047 | 33,548 | 31,865 |
Pool # BM5270, 4.50%, 2/1/2047 | 15,514 | 15,113 |
Pool # BM4350, 3.00%, 3/1/2047 | 735,905 | 646,520 |
Pool # MA2920, 3.00%, 3/1/2047 | 7,343 | 6,433 |
Pool # FM3107, 3.50%, 3/1/2047 | 244,035 | 222,309 |
Pool # AS9313, 4.00%, 3/1/2047 | 15,494 | 14,576 |
Pool # FM4735, 3.00%, 4/1/2047 | 153,141 | 133,011 |
Pool # FM6073, 4.00%, 4/1/2047 | 1,117,212 | 1,051,431 |
Pool # AS9480, 4.50%, 4/1/2047 | 26,743 | 25,886 |
Pool # FM1772, 4.50%, 5/1/2047 | 14,485 | 14,111 |
Pool # BD0667, 4.50%, 6/1/2047 | 387,446 | 371,954 |
Pool # AS9937, 3.00%, 7/1/2047 | 562,793 | 493,060 |
Pool # AS9946, 3.50%, 7/1/2047 | 41,339 | 37,659 |
Pool # BM1568, 3.50%, 7/1/2047 | 63,960 | 58,921 |
Pool # BH7375, 3.50%, 8/1/2047 | 44,403 | 40,376 |
Pool # CA0148, 4.50%, 8/1/2047 | 10,203 | 9,826 |
Pool # CA0850, 3.00%, 9/1/2047 | 32,354 | 28,325 |
Pool # MA3147, 3.00%, 10/1/2047 | 37,951 | 33,217 |
Pool # BM2003, 4.00%, 10/1/2047 | 148,913 | 140,057 |
Pool # BH9392, 3.50%, 11/1/2047 | 12,538 | 11,395 |
Pool # CA0681, 3.50%, 11/1/2047 | 209,539 | 191,781 |
Pool # MA3182, 3.50%, 11/1/2047 | 958,197 | 870,853 |
Pool # FM0028, 3.00%, 12/1/2047 | 44,637 | 39,476 |
Pool # MA3209, 3.00%, 12/1/2047 | 261,994 | 229,261 |
Pool # FM1420, 3.50%, 12/1/2047 | 201,381 | 183,746 |
INVESTMENTS | PRINCIPAL AMOUNT($) | VALUE($) |
Pool # CA4015, 3.00%, 1/1/2048 | 8,838 | 7,732 |
Pool # BJ6154, 3.50%, 1/1/2048 | 159,432 | 144,896 |
Pool # MA3238, 3.50%, 1/1/2048 | 46,153 | 42,002 |
Pool # BJ5910, 3.50%, 2/1/2048 | 193,096 | 178,404 |
Pool # MA3305, 3.50%, 3/1/2048 | 737,364 | 670,153 |
Pool # FM3494, 2.50%, 4/1/2048 | 10,721 | 9,046 |
Pool # CA2687, 3.00%, 5/1/2048 | 21,641 | 18,959 |
Pool # BM4054, 4.00%, 5/1/2048 | 90,298 | 85,117 |
Pool # MA3425, 3.00%, 6/1/2048 | 31,416 | 27,447 |
Pool # BM4757, 3.50%, 7/1/2048 | 36,244 | 33,097 |
Pool # FM3438, 3.00%, 8/1/2048 | 648,483 | 568,391 |
Pool # BM2007, 4.00%, 9/1/2048 | 4,046 | 3,803 |
Pool # CA2368, 4.00%, 9/1/2048 | 26,388 | 24,771 |
Pool # MA3472, 5.00%, 9/1/2048 | 8,402 | 8,293 |
Pool # CA4655, 3.50%, 10/1/2048 | 86,391 | 78,700 |
Pool # MA3495, 4.00%, 10/1/2048 | 26,593 | 24,954 |
Pool # CA2432, 4.50%, 10/1/2048 | 49,284 | 47,557 |
Pool # FM7895, 3.50%, 11/1/2048 | 257,019 | 234,112 |
Pool # FM1248, 4.50%, 11/1/2048 | 15,287 | 14,769 |
Pool # CA2797, 4.50%, 12/1/2048 | 580,962 | 560,612 |
Pool # FM0030, 3.00%, 2/1/2049 | 48,360 | 42,370 |
Pool # FM6237, 3.50%, 4/1/2049 | 532,130 | 484,535 |
Pool # MA3637, 3.50%, 4/1/2049 | 16,529 | 15,022 |
Pool # MA3638, 4.00%, 4/1/2049 | 15,556 | 14,552 |
Pool # BN5418, 4.50%, 4/1/2049 | 18,832 | 18,174 |
Pool # MA3663, 3.50%, 5/1/2049 | 947,294 | 858,081 |
Pool # MA3664, 4.00%, 5/1/2049 | 7,767 | 7,258 |
Pool # FM4074, 4.50%, 5/1/2049 | 270,047 | 260,568 |
Pool # CA4358, 3.50%, 7/1/2049 | 16,008 | 14,528 |
Pool # MA3692, 3.50%, 7/1/2049 | 946,778 | 857,408 |
Pool # FM1672, 4.50%, 7/1/2049 | 755,317 | 735,053 |
Pool # MA3745, 3.50%, 8/1/2049 | 76,910 | 70,257 |
Pool # MA3746, 4.00%, 8/1/2049 | 11,636 | 10,869 |
Pool # FM1385, 5.00%, 8/1/2049 | 341,606 | 339,218 |
Pool # BO4012, 3.00%, 9/1/2049 | 107,863 | 93,808 |
Pool # FM1449, 3.50%, 9/1/2049 | 133,306 | 120,980 |
Pool # FM4430, 3.50%, 9/1/2049 | 526,579 | 478,588 |
Pool # FM3572, 4.50%, 9/1/2049 | 73,451 | 70,896 |
Pool # MA3803, 3.50%, 10/1/2049 | 37,383 | 34,113 |
Pool # MA3833, 2.50%, 11/1/2049 | 878,906 | 736,611 |
Pool # BK0350, 3.00%, 11/1/2049 | 802,470 | 702,447 |
Pool # MA3834, 3.00%, 11/1/2049 | 491,420 | 427,399 |
Pool # MA3870, 2.50%, 12/1/2049 | 188,993 | 158,044 |
Pool # FM2363, 3.00%, 1/1/2050 | 1,524,164 | 1,336,725 |
Pool # MA3905, 3.00%, 1/1/2050 | 825,723 | 716,706 |
40 | J.P. Morgan Exchange-Traded Funds | August 31, 2023 |
INVESTMENTS | PRINCIPAL AMOUNT($) | VALUE($) |
Mortgage-Backed Securities — continued | ||
Pool # CA5021, 3.50%, 1/1/2050 | 34,672 | 31,404 |
Pool # FM5922, 3.50%, 1/1/2050 | 349,761 | 318,316 |
Pool # MA3906, 3.50%, 1/1/2050 | 34,407 | 31,164 |
Pool # CA5135, 2.50%, 2/1/2050 | 140,166 | 117,949 |
Pool # MA3936, 2.50%, 2/1/2050 | 138,546 | 115,858 |
Pool # MA3937, 3.00%, 2/1/2050 | 963,630 | 837,793 |
Pool # FM2733, 2.50%, 3/1/2050 | 97,057 | 81,164 |
Pool # FM4883, 2.50%, 3/1/2050 | 1,963,606 | 1,642,059 |
Pool # FM4372, 3.50%, 3/1/2050 | 487,493 | 443,332 |
Pool # BP2403, 3.50%, 4/1/2050 | 253,735 | 227,810 |
Pool # BP5001, 2.50%, 5/1/2050 | 560,160 | 468,422 |
Pool # FM3257, 3.00%, 5/1/2050 | 224,951 | 198,131 |
Pool # BK2753, 2.50%, 7/1/2050 | 885,667 | 740,600 |
Pool # MA4078, 2.50%, 7/1/2050 | 339,634 | 284,323 |
Pool # FS2252, 3.00%, 7/1/2050 | 894,397 | 784,372 |
Pool # BP6626, 2.00%, 8/1/2050 | 2,284,211 | 1,829,623 |
Pool # MA4100, 2.00%, 8/1/2050 | 1,070,614 | 857,546 |
Pool # BP9500, 2.50%, 8/1/2050 | 87,969 | 73,563 |
Pool # BQ0723, 3.50%, 8/1/2050 | 1,273,159 | 1,148,340 |
Pool # FM5750, 4.00%, 8/1/2050 | 315,352 | 293,965 |
Pool # MA4119, 2.00%, 9/1/2050 | 144,457 | 115,672 |
Pool # BK3044, 2.50%, 9/1/2050 | 750,473 | 627,568 |
Pool # BP6702, 2.50%, 9/1/2050 | 566,988 | 474,025 |
Pool # FM8260, 4.00%, 9/1/2050 | 528,400 | 496,948 |
Pool # MA4158, 2.00%, 10/1/2050 | 1,686,833 | 1,352,430 |
Pool # MA4159, 2.50%, 10/1/2050 | 561,607 | 469,616 |
Pool # MA4182, 2.00%, 11/1/2050 | 1,768,500 | 1,416,550 |
Pool # CA7603, 2.50%, 11/1/2050 | 306,013 | 255,884 |
Pool # MA4183, 2.50%, 11/1/2050 | 2,515,245 | 2,104,330 |
Pool # CA8005, 1.50%, 12/1/2050 | 165,862 | 125,461 |
Pool # CA8222, 1.50%, 12/1/2050 | 1,426,968 | 1,079,363 |
Pool # MA4209, 1.50%, 12/1/2050 | 1,255,262 | 947,410 |
Pool # BQ5160, 2.00%, 12/1/2050 | 2,575,622 | 2,059,077 |
Pool # FM5849, 2.00%, 12/1/2050 | 880,639 | 701,551 |
Pool # MA4208, 2.00%, 12/1/2050 | 454,722 | 364,089 |
Pool # BR2807, 2.50%, 12/1/2050 | 1,270,979 | 1,062,706 |
Pool # MA4210, 2.50%, 12/1/2050 | 1,405,110 | 1,177,954 |
Pool # FM5597, 2.00%, 1/1/2051 | 217,684 | 174,058 |
Pool # FM6241, 2.00%, 1/1/2051 | 3,656,555 | 2,922,907 |
Pool # FM5854, 2.50%, 1/1/2051 | 173,159 | 144,783 |
Pool # MA4254, 1.50%, 2/1/2051 | 335,466 | 253,762 |
Pool # CA9190, 2.00%, 2/1/2051 | 828,207 | 661,933 |
Pool # FM6037, 2.00%, 2/1/2051 | 1,738,850 | 1,396,868 |
Pool # FM6126, 2.00%, 2/1/2051 | 211,790 | 169,394 |
Pool # MA4255, 2.00%, 2/1/2051 | 4,577,215 | 3,659,217 |
INVESTMENTS | PRINCIPAL AMOUNT($) | VALUE($) |
Pool # BR3515, 2.50%, 2/1/2051 | 162,023 | 135,459 |
Pool # FM6244, 2.00%, 3/1/2051 | 803,498 | 642,922 |
Pool # MA4281, 2.00%, 3/1/2051 | 251,496 | 201,033 |
Pool # FM6523, 2.50%, 3/1/2051 | 288,539 | 240,689 |
Pool # FM6764, 2.50%, 3/1/2051 | 837,610 | 694,580 |
Pool # FM6537, 2.00%, 4/1/2051 | 2,813,612 | 2,277,334 |
Pool # MA4306, 2.50%, 4/1/2051 | 243,573 | 202,604 |
Pool # FM7099, 3.00%, 4/1/2051 | 771,897 | 676,106 |
Pool # MA4343, 1.50%, 5/1/2051 | 392,104 | 296,487 |
Pool # MA4325, 2.00%, 5/1/2051 | 2,268,029 | 1,806,614 |
Pool # FM7066, 2.50%, 5/1/2051 | 776,414 | 659,324 |
Pool # MA4326, 2.50%, 5/1/2051 | 1,645,341 | 1,371,462 |
Pool # MA4354, 1.50%, 6/1/2051 | 2,510,176 | 1,896,861 |
Pool # MA4355, 2.00%, 6/1/2051 | 426,717 | 341,062 |
Pool # CB0727, 2.50%, 6/1/2051 | 1,403,417 | 1,169,298 |
Pool # FM7418, 2.50%, 6/1/2051 | 868,773 | 725,551 |
Pool # MA4356, 2.50%, 6/1/2051 | 4,354,992 | 3,627,836 |
Pool # MA4377, 1.50%, 7/1/2051 | 1,465,079 | 1,106,007 |
Pool # FM8194, 2.00%, 7/1/2051 | 360,434 | 288,038 |
Pool # MA4378, 2.00%, 7/1/2051 | 2,070,424 | 1,653,242 |
Pool # CB1027, 2.50%, 7/1/2051 | 262,042 | 217,721 |
Pool # MA4379, 2.50%, 7/1/2051 | 3,978,216 | 3,311,782 |
Pool # CB1150, 3.00%, 7/1/2051 | 484,832 | 418,012 |
Pool # MA4380, 3.00%, 7/1/2051 | 213,968 | 184,786 |
Pool # FM8278, 3.50%, 7/1/2051 | 381,280 | 342,023 |
Pool # BT9030, 2.00%, 8/1/2051 | 181,907 | 145,310 |
Pool # MA4398, 2.00%, 8/1/2051 | 2,085,675 | 1,664,903 |
Pool # BR2236, 2.50%, 8/1/2051 | 259,209 | 215,376 |
Pool # BR2237, 2.50%, 8/1/2051 | 509,021 | 423,223 |
Pool # BR2258, 2.50%, 8/1/2051 | 166,656 | 138,735 |
Pool # CB1276, 2.50%, 8/1/2051 | 741,069 | 615,728 |
Pool # MA4399, 2.50%, 8/1/2051 | 2,374,155 | 1,974,443 |
Pool # MA4401, 3.50%, 8/1/2051 | 128,231 | 114,940 |
Pool # BT0240, 2.00%, 9/1/2051 | 177,101 | 141,229 |
Pool # FM8730, 2.00%, 9/1/2051 | 967,109 | 770,100 |
Pool # MA4413, 2.00%, 9/1/2051 | 752,739 | 601,428 |
Pool # MA4414, 2.50%, 9/1/2051 | 2,151,907 | 1,789,078 |
Pool # MA4436, 1.50%, 10/1/2051 | 977,859 | 738,325 |
Pool # MA4437, 2.00%, 10/1/2051 | 1,246,937 | 994,675 |
Pool # MA4438, 2.50%, 10/1/2051 | 513,919 | 426,735 |
Pool # CB1917, 3.00%, 10/1/2051 | 1,878,946 | 1,628,512 |
Pool # MA4464, 1.50%, 11/1/2051 | 550,714 | 415,640 |
Pool # MA4465, 2.00%, 11/1/2051 | 1,745,174 | 1,391,359 |
Pool # MA4492, 2.00%, 12/1/2051 | 3,156,721 | 2,516,287 |
Pool # FM9868, 2.50%, 12/1/2051 | 533,595 | 446,629 |
August 31, 2023 | J.P. Morgan Exchange-Traded Funds | 41 |
AS OF August 31, 2023 (Unaudited) (continued)
INVESTMENTS | PRINCIPAL AMOUNT($) | VALUE($) |
Mortgage-Backed Securities — continued | ||
Pool # FM9870, 2.50%, 12/1/2051 | 538,173 | 448,633 |
Pool # MA4493, 2.50%, 12/1/2051 | 885,358 | 734,604 |
Pool # MA4511, 2.00%, 1/1/2052 | 1,798,886 | 1,433,364 |
Pool # MA4512, 2.50%, 1/1/2052 | 943,559 | 782,696 |
Pool # MA4513, 3.00%, 1/1/2052 | 2,386,865 | 2,065,781 |
Pool # CB2850, 2.00%, 2/1/2052 | 235,268 | 187,337 |
Pool # FS2040, 2.00%, 2/1/2052 | 744,958 | 594,033 |
Pool # MA4547, 2.00%, 2/1/2052 | 4,166,625 | 3,321,168 |
Pool # FS3091, 2.50%, 2/1/2052 | 951,550 | 793,635 |
Pool # MA4548, 2.50%, 2/1/2052 | 953,627 | 790,192 |
Pool # BV4248, 2.00%, 3/1/2052 | 933,383 | 749,525 |
Pool # MA4562, 2.00%, 3/1/2052 | 3,409,915 | 2,716,791 |
Pool # FS2099, 1.50%, 4/1/2052 | 187,203 | 141,348 |
Pool # MA4577, 2.00%, 4/1/2052 | 1,508,234 | 1,201,725 |
Pool # MA4578, 2.50%, 4/1/2052 | 4,492,585 | 3,725,344 |
Pool # FS1538, 3.00%, 4/1/2052 | 480,235 | 414,142 |
Pool # MA4579, 3.00%, 4/1/2052 | 1,042,964 | 898,679 |
Pool # MA4598, 2.50%, 5/1/2052 | 1,596,125 | 1,322,744 |
Pool # MA4599, 3.00%, 5/1/2052 | 487,582 | 420,419 |
Pool # CB3608, 3.50%, 5/1/2052 | 188,343 | 168,470 |
Pool # MA4600, 3.50%, 5/1/2052 | 2,198,204 | 1,966,237 |
Pool # CB4209, 3.50%, 7/1/2052 | 947,276 | 846,710 |
Pool # MA4654, 3.50%, 7/1/2052 | 472,493 | 422,449 |
Pool # MA4743, 2.50%, 8/1/2052 | 1,693,385 | 1,403,432 |
Pool # MA4698, 3.00%, 8/1/2052 | 3,829,880 | 3,300,846 |
Pool # MA4699, 3.50%, 8/1/2052 | 1,957,608 | 1,750,301 |
Pool # MA4700, 4.00%, 8/1/2052 | 2,893,000 | 2,670,229 |
Pool # MA4701, 4.50%, 8/1/2052 | 968,660 | 918,507 |
Pool # FS2619, 5.00%, 8/1/2052 | 945,239 | 917,207 |
Pool # MA4732, 4.00%, 9/1/2052 | 484,803 | 447,571 |
Pool # MA4733, 4.50%, 9/1/2052 | 1,455,177 | 1,379,795 |
Pool # MA4761, 5.00%, 9/1/2052 | 964,247 | 935,427 |
Pool # MA4783, 4.00%, 10/1/2052 | 977,449 | 902,282 |
Pool # MA4784, 4.50%, 10/1/2052 | 1,942,524 | 1,841,847 |
Pool # MA4803, 3.50%, 11/1/2052 | 982,212 | 878,071 |
Pool # MA4805, 4.50%, 11/1/2052 | 5,924,062 | 5,616,885 |
Pool # MA4838, 3.50%, 12/1/2052 | 1,936,969 | 1,731,596 |
Pool # MA4839, 4.00%, 12/1/2052 | 3,404,971 | 3,142,974 |
Pool # MA4840, 4.50%, 12/1/2052 | 961,723 | 911,862 |
Pool # FS3455, 5.00%, 12/1/2052 | 954,499 | 931,239 |
Pool # MA4866, 4.00%, 1/1/2053 | 972,629 | 897,787 |
Pool # MA4868, 5.00%, 1/1/2053 | 773,419 | 750,143 |
Pool # MA4869, 5.50%, 1/1/2053 | 1,451,331 | 1,432,708 |
Pool # MA4894, 6.00%, 1/1/2053 | 931,424 | 933,868 |
Pool # MA4933, 3.50%, 2/1/2053 | 1,273,670 | 1,138,623 |
INVESTMENTS | PRINCIPAL AMOUNT($) | VALUE($) |
Pool # MA4918, 5.00%, 2/1/2053 | 4,815,976 | 4,670,891 |
Pool # CB5600, 5.50%, 2/1/2053 | 971,667 | 962,385 |
Pool # MA4919, 5.50%, 2/1/2053 | 5,748,900 | 5,678,415 |
Pool # CB5704, 6.00%, 2/1/2053 | 2,388,052 | 2,414,959 |
Pool # MA4920, 6.00%, 2/1/2053 | 2,555,815 | 2,562,376 |
Pool # MA4962, 4.00%, 3/1/2053 | 1,959,148 | 1,808,390 |
Pool # MA4943, 6.50%, 3/1/2053 | 1,065,181 | 1,082,166 |
Pool # MA4964, 7.00%, 3/1/2053 | 441,021 | 453,133 |
Pool # MA4978, 5.00%, 4/1/2053 | 972,168 | 942,643 |
Pool # MA4979, 5.50%, 4/1/2053 | 961,489 | 949,151 |
Pool # MA5009, 5.00%, 5/1/2053 | 2,450,230 | 2,376,130 |
Pool # MA5038, 5.00%, 6/1/2053 | 1,962,988 | 1,903,370 |
Pool # FS4932, 6.00%, 6/1/2053 | 986,354 | 990,462 |
Pool # MA5070, 4.50%, 7/1/2053 | 989,475 | 938,193 |
Pool # MA5072, 5.50%, 7/1/2053 | 1,947,798 | 1,922,872 |
FNMA/FHLMC UMBS, Single Family, 15 Year | ||
TBA, 1.50%, 9/25/2038 (a) | 5,252,000 | 4,479,345 |
TBA, 2.00%, 9/25/2038 (a) | 12,703,000 | 11,127,939 |
TBA, 2.50%, 9/25/2038 (a) | 4,514,000 | 4,059,250 |
TBA, 3.00%, 9/25/2038 (a) | 1,449,000 | 1,338,853 |
FNMA/FHLMC UMBS, Single Family, 30 Year | ||
TBA, 1.50%, 9/25/2053 (a) | 2,627,000 | 1,980,820 |
TBA, 2.00%, 9/25/2053 (a) | 31,395,000 | 24,997,042 |
TBA, 2.50%, 9/25/2053 (a) | 30,580,000 | 25,331,230 |
TBA, 3.00%, 9/25/2053 (a) | 22,617,000 | 19,485,076 |
TBA, 3.50%, 9/25/2053 (a) | 16,585,000 | 14,823,492 |
TBA, 4.00%, 9/25/2053 (a) | 16,697,000 | 15,410,809 |
TBA, 4.50%, 9/25/2053 (a) | 5,685,000 | 5,390,091 |
TBA, 5.00%, 9/25/2053 (a) | 1,240,000 | 1,202,340 |
TBA, 5.50%, 9/25/2053 (a) | 24,000 | 23,696 |
GNMA I, 30 Year | ||
Pool # 704155, 5.50%, 1/15/2039 | 15,988 | 16,063 |
Pool # 726769, 5.00%, 9/15/2039 | 12,803 | 12,589 |
Pool # 721340, 5.00%, 12/15/2039 | 46,078 | 45,282 |
Pool # 754439, 3.50%, 12/15/2041 | 98,169 | 91,071 |
Pool # 711674, 3.00%, 9/15/2042 | 43,948 | 39,569 |
Pool # 783748, 3.50%, 4/15/2043 | 60,731 | 56,363 |
Pool # 784660, 4.00%, 4/15/2043 | 5,231 | 4,980 |
Pool # AC2224, 3.50%, 6/15/2043 | 41,206 | 38,214 |
Pool # 785088, 3.50%, 7/15/2043 | 51,901 | 47,882 |
Pool # AJ4151, 4.00%, 9/15/2044 | 187,629 | 178,158 |
Pool # AL9314, 3.00%, 3/15/2045 | 37,436 | 33,150 |
Pool # 784664, 4.00%, 4/15/2045 | 20,047 | 19,085 |
Pool # AO0544, 3.00%, 8/15/2045 | 21,603 | 19,129 |
Pool # 627030, 3.00%, 12/15/2045 | 21,602 | 19,128 |
42 | J.P. Morgan Exchange-Traded Funds | August 31, 2023 |
INVESTMENTS | PRINCIPAL AMOUNT($) | VALUE($) |
Mortgage-Backed Securities — continued | ||
Pool # 784429, 3.00%, 8/15/2046 | 74,560 | 67,045 |
Pool # 784652, 4.00%, 11/15/2047 | 418,041 | 398,046 |
Pool # 784766, 3.50%, 3/15/2048 | 479,562 | 440,603 |
GNMA II, 15 Year | ||
Pool # MA0513, 2.50%, 11/20/2027 | 44,061 | 42,028 |
Pool # MA4625, 3.50%, 8/20/2032 | 19,499 | 18,460 |
Pool # MA6906, 2.50%, 10/20/2035 | 340,561 | 305,683 |
GNMA II, 30 Year | ||
Pool # 711773, 3.50%, 6/20/2033 | 44,327 | 40,281 |
Pool # 3459, 5.50%, 10/20/2033 | 42,402 | 42,964 |
Pool # AQ5932, 3.50%, 1/20/2036 | 67,669 | 61,453 |
Pool # 4222, 6.00%, 8/20/2038 | 8,060 | 8,405 |
Pool # 709148, 4.50%, 2/20/2039 | 27,851 | 26,696 |
Pool # 4446, 4.50%, 5/20/2039 | 2,469 | 2,417 |
Pool # 4467, 4.00%, 6/20/2039 | 11,358 | 10,863 |
Pool # 4468, 4.50%, 6/20/2039 | 2,190 | 2,144 |
Pool # 4494, 4.00%, 7/20/2039 | 12,508 | 11,963 |
Pool # 4495, 4.50%, 7/20/2039 | 9,524 | 9,323 |
Pool # 4519, 4.50%, 8/20/2039 | 3,519 | 3,445 |
Pool # 4558, 4.50%, 10/20/2039 | 2,995 | 2,931 |
Pool # 4576, 4.00%, 11/20/2039 | 5,600 | 5,358 |
Pool # 4598, 4.50%, 12/20/2039 | 5,907 | 5,780 |
Pool # 4617, 4.50%, 1/20/2040 | 3,198 | 3,129 |
Pool # 4636, 4.50%, 2/20/2040 | 4,591 | 4,492 |
Pool # 4656, 4.00%, 3/20/2040 | 9,362 | 8,955 |
Pool # 4677, 4.00%, 4/20/2040 | 25,205 | 24,105 |
Pool # 4678, 4.50%, 4/20/2040 | 1,115 | 1,091 |
Pool # 4695, 4.00%, 5/20/2040 | 2,796 | 2,674 |
Pool # 4696, 4.50%, 5/20/2040 | 1,116 | 1,092 |
Pool # 4712, 4.00%, 6/20/2040 | 4,255 | 4,069 |
Pool # 4800, 4.00%, 9/20/2040 | 4,449 | 4,255 |
Pool # 737727, 4.00%, 12/20/2040 | 39,620 | 37,648 |
Pool # 4945, 4.00%, 2/20/2041 | 9,538 | 9,123 |
Pool # 759342, 4.50%, 2/20/2041 | 202,385 | 195,633 |
Pool # 4950, 5.50%, 2/20/2041 | 17,775 | 18,208 |
Pool # 4976, 3.50%, 3/20/2041 | 11,297 | 10,453 |
Pool # 4977, 4.00%, 3/20/2041 | 17,524 | 16,760 |
Pool # 5016, 4.00%, 4/20/2041 | 6,797 | 6,500 |
Pool # 5054, 4.00%, 5/20/2041 | 10,701 | 10,234 |
Pool # 5114, 4.00%, 7/20/2041 | 1,405 | 1,344 |
Pool # 779497, 3.50%, 10/20/2041 | 7,564 | 6,914 |
Pool # 5233, 4.00%, 11/20/2041 | 1,728 | 1,652 |
Pool # 5258, 3.50%, 12/20/2041 | 105,143 | 97,312 |
Pool # 5259, 4.00%, 12/20/2041 | 6,631 | 6,338 |
Pool # 5279, 3.50%, 1/20/2042 | 19,553 | 18,098 |
INVESTMENTS | PRINCIPAL AMOUNT($) | VALUE($) |
Pool # 5330, 3.00%, 3/20/2042 | 13,035 | 11,694 |
Pool # 754406, 3.50%, 5/20/2042 | 50,650 | 46,200 |
Pool # MA0220, 3.50%, 7/20/2042 | 8,203 | 7,599 |
Pool # MA0318, 3.50%, 8/20/2042 | 114,674 | 106,236 |
Pool # MA0391, 3.00%, 9/20/2042 | 478,008 | 429,456 |
Pool # 796468, 4.00%, 9/20/2042 | 17,729 | 16,955 |
Pool # AA6040, 3.00%, 1/20/2043 | 88,782 | 78,278 |
Pool # AD1584, 3.00%, 1/20/2043 | 114,606 | 100,764 |
Pool # AD2125, 3.50%, 1/20/2043 | 78,844 | 73,418 |
Pool # AA6054, 3.00%, 2/20/2043 | 172,484 | 152,424 |
Pool # AD1744, 3.00%, 2/20/2043 | 14,619 | 13,211 |
Pool # 783755, 3.00%, 4/20/2043 | 115,448 | 103,901 |
Pool # 783976, 3.50%, 4/20/2043 | 19,055 | 17,454 |
Pool # MA1012, 3.50%, 5/20/2043 | 97,877 | 90,886 |
Pool # MA1157, 3.50%, 7/20/2043 | 19,386 | 17,976 |
Pool # MA1284, 3.00%, 9/20/2043 | 15,439 | 13,893 |
Pool # 785065, 3.50%, 10/20/2043 | 200,519 | 182,063 |
Pool # MA1376, 4.00%, 10/20/2043 | 90,862 | 86,490 |
Pool # AI7106, 4.00%, 6/20/2044 | 29,470 | 27,957 |
Pool # 784026, 3.50%, 12/20/2044 | 177,429 | 164,325 |
Pool # MA2678, 3.50%, 3/20/2045 | 119,793 | 110,484 |
Pool # MA2679, 4.00%, 3/20/2045 | 41,723 | 39,688 |
Pool # MA2753, 3.00%, 4/20/2045 | 61,455 | 55,135 |
Pool # 626942, 3.00%, 5/20/2045 | 140,943 | 122,169 |
Pool # MA2825, 3.00%, 5/20/2045 | 155,152 | 139,205 |
Pool # MA2829, 5.00%, 5/20/2045 | 22,217 | 22,315 |
Pool # 784800, 3.00%, 6/20/2045 | 30,602 | 26,953 |
Pool # AM9881, 3.00%, 6/20/2045 | 14,546 | 12,824 |
Pool # MA3247, 5.00%, 11/20/2045 | 20,532 | 20,575 |
Pool # AO9442, 3.50%, 12/20/2045 | 18,222 | 16,797 |
Pool # 784119, 3.00%, 2/20/2046 | 134,645 | 120,832 |
Pool # MA3458, 5.50%, 2/20/2046 | 28,723 | 29,424 |
Pool # MA3520, 3.00%, 3/20/2046 | 363,310 | 324,626 |
Pool # MA3735, 3.00%, 6/20/2046 | 248,787 | 222,591 |
Pool # AT7138, 3.50%, 6/20/2046 | 260,464 | 236,945 |
Pool # MA3935, 2.50%, 9/20/2046 | 66,350 | 57,431 |
Pool # 784768, 3.00%, 9/20/2046 | 71,440 | 63,844 |
Pool # AT8215, 3.00%, 9/20/2046 | 21,229 | 18,785 |
Pool # MA4002, 2.50%, 10/20/2046 | 360,647 | 311,333 |
Pool # AW0199, 3.00%, 10/20/2046 | 49,223 | 43,500 |
Pool # MA4068, 3.00%, 11/20/2046 | 10,542 | 9,416 |
Pool # MA4072, 5.00%, 11/20/2046 | 22,845 | 22,990 |
Pool # MA4125, 2.50%, 12/20/2046 | 333,243 | 287,239 |
Pool # MA4126, 3.00%, 12/20/2046 | 49,577 | 44,321 |
Pool # MA4260, 2.50%, 2/20/2047 | 57,808 | 49,941 |
August 31, 2023 | J.P. Morgan Exchange-Traded Funds | 43 |
AS OF August 31, 2023 (Unaudited) (continued)
INVESTMENTS | PRINCIPAL AMOUNT($) | VALUE($) |
Mortgage-Backed Securities — continued | ||
Pool # AZ3119, 3.50%, 3/20/2047 | 29,825 | 27,077 |
Pool # AZ7084, 3.50%, 4/20/2047 | 80,645 | 73,762 |
Pool # MA4511, 4.00%, 6/20/2047 | 152,902 | 144,853 |
Pool # BA5041, 5.00%, 6/20/2047 | 94,982 | 93,659 |
Pool # MA4584, 2.50%, 7/20/2047 | 81,485 | 70,530 |
Pool # MA4718, 3.00%, 9/20/2047 | 6,786 | 6,043 |
Pool # MA4721, 4.50%, 9/20/2047 | 28,642 | 27,777 |
Pool # MA4836, 3.00%, 11/20/2047 | 329,834 | 293,875 |
Pool # BC2742, 3.50%, 11/20/2047 | 633,210 | 572,517 |
Pool # BD6940, 3.50%, 12/20/2047 | 145 | 129 |
Pool # MA4900, 3.50%, 12/20/2047 | 80,275 | 74,006 |
Pool # MA5019, 3.50%, 2/20/2048 | 208,678 | 191,870 |
Pool # MA5077, 3.50%, 3/20/2048 | 31,009 | 28,484 |
Pool # MA5138, 4.50%, 4/20/2048 | 12,166 | 11,757 |
Pool # 785033, 3.50%, 5/20/2048 | 201,668 | 190,082 |
Pool # MA5194, 5.00%, 5/20/2048 | 74,779 | 73,872 |
Pool # MA5329, 3.50%, 7/20/2048 | 7,451 | 6,843 |
Pool # MA5468, 5.00%, 9/20/2048 | 5,783 | 5,701 |
Pool # MA5527, 3.50%, 10/20/2048 | 27,508 | 25,286 |
Pool # MA5595, 4.00%, 11/20/2048 | 34,187 | 32,257 |
Pool # BJ6759, 4.50%, 11/20/2048 | 257,268 | 246,615 |
Pool # MA5650, 3.50%, 12/20/2048 | 11,326 | 10,424 |
Pool # MA5651, 4.00%, 12/20/2048 | 163,301 | 153,958 |
Pool # MA5709, 3.50%, 1/20/2049 | 78,528 | 72,343 |
Pool # BI6473, 4.00%, 1/20/2049 | 702,256 | 670,347 |
Pool # BJ9901, 3.00%, 2/20/2049 | 55,202 | 48,630 |
Pool # MA5930, 3.50%, 5/20/2049 | 10,034 | 9,204 |
Pool # MA5983, 2.50%, 6/20/2049 | 114,367 | 98,994 |
Pool # MA5985, 3.50%, 6/20/2049 | 40,271 | 36,937 |
Pool # MA5987, 4.50%, 6/20/2049 | 35,492 | 34,119 |
Pool # MA5988, 5.00%, 6/20/2049 | 6,519 | 6,420 |
Pool # MA6039, 3.50%, 7/20/2049 | 67,595 | 61,997 |
Pool # BM5450, 4.50%, 7/20/2049 | 72,663 | 69,455 |
Pool # MA6220, 4.00%, 10/20/2049 | 175,409 | 164,194 |
Pool # BR4627, 3.00%, 11/20/2049 | 478,115 | 422,070 |
Pool # MA6283, 3.00%, 11/20/2049 | 486,433 | 431,916 |
Pool # 785067, 3.50%, 12/20/2049 | 387,123 | 343,785 |
Pool # MA6478, 5.00%, 2/20/2050 | 22,978 | 22,716 |
Pool # MA6542, 3.50%, 3/20/2050 | 223,367 | 206,355 |
Pool # MA6545, 5.00%, 3/20/2050 | 26,253 | 25,959 |
Pool # BV1348, 2.50%, 6/20/2050 | 47,909 | 39,285 |
Pool # MA6709, 2.50%, 6/20/2050 | 669,303 | 572,597 |
Pool # MA6818, 2.00%, 8/20/2050 | 1,257,579 | 1,041,936 |
Pool # BY8818, 2.00%, 10/20/2050 | 482,376 | 395,404 |
Pool # 785401, 2.50%, 10/20/2050 | 721,899 | 601,229 |
INVESTMENTS | PRINCIPAL AMOUNT($) | VALUE($) |
Pool # MA6994, 2.00%, 11/20/2050 | 1,382,948 | 1,144,935 |
Pool # BY8832, 2.50%, 11/20/2050 | 439,199 | 364,945 |
Pool # MA7051, 2.00%, 12/20/2050 | 2,145,680 | 1,778,700 |
Pool # CA4485, 2.50%, 12/20/2050 | 538,539 | 446,099 |
Pool # MA7052, 2.50%, 12/20/2050 | 877,961 | 748,599 |
Pool # MA7055, 4.00%, 12/20/2050 | 225,136 | 212,048 |
Pool # MA7135, 2.00%, 1/20/2051 | 2,454,664 | 2,028,748 |
Pool # MA7254, 2.00%, 3/20/2051 | 1,063,653 | 880,572 |
Pool # MA7311, 2.00%, 4/20/2051 | 2,518,868 | 2,082,184 |
Pool # 785449, 3.00%, 4/20/2051 | 282,832 | 249,372 |
Pool # MA7367, 2.50%, 5/20/2051 | 1,445,155 | 1,231,103 |
Pool # MA7368, 3.00%, 5/20/2051 | 441,433 | 390,164 |
Pool # MA7417, 2.00%, 6/20/2051 | 2,921,347 | 2,415,835 |
Pool # MA7418, 2.50%, 6/20/2051 | 1,594,515 | 1,357,400 |
Pool # MA7420, 3.50%, 6/20/2051 | 399,752 | 364,322 |
Pool # MA7471, 2.00%, 7/20/2051 | 2,385,733 | 1,971,437 |
Pool # MA7472, 2.50%, 7/20/2051 | 769,275 | 654,978 |
Pool # MA7473, 3.00%, 7/20/2051 | 481,227 | 425,025 |
Pool # MA7533, 2.00%, 8/20/2051 | 994,623 | 821,551 |
Pool # MA7588, 2.00%, 9/20/2051 | 1,013,886 | 837,115 |
Pool # MA7589, 2.50%, 9/20/2051 | 418,881 | 356,612 |
Pool # MA7766, 2.00%, 12/20/2051 | 2,213,721 | 1,828,179 |
Pool # MA7826, 2.00%, 1/20/2052 | 1,416,359 | 1,169,529 |
Pool # 785881, 2.50%, 1/20/2052 | 1,985,115 | 1,644,552 |
Pool # 785945, 3.00%, 2/20/2052 | 904,593 | 797,614 |
Pool # 786017, 3.00%, 3/20/2052 | 923,746 | 814,942 |
Pool # MA7937, 3.00%, 3/20/2052 | 898,582 | 790,573 |
Pool # MA7986, 2.00%, 4/20/2052 | 1,100,075 | 907,469 |
Pool # MA7987, 2.50%, 4/20/2052 | 1,907,097 | 1,622,502 |
Pool # MA7988, 3.00%, 4/20/2052 | 916,663 | 806,840 |
Pool # MA8043, 3.00%, 5/20/2052 | 2,369,697 | 2,083,231 |
Pool # MA8098, 3.00%, 6/20/2052 | 484,662 | 426,049 |
Pool # MA8267, 4.00%, 9/20/2052 | 1,154,953 | 1,075,894 |
Pool # MA8269, 5.00%, 9/20/2052 | 617,551 | 601,491 |
Pool # MA8270, 5.50%, 9/20/2052 | 923,507 | 914,221 |
Pool # MA8492, 6.00%, 12/20/2052 | 1,446,771 | 1,452,243 |
Pool # MA8493, 6.50%, 12/20/2052 | 383,086 | 388,068 |
Pool # MA8573, 7.00%, 1/20/2053 | 972,189 | 993,091 |
Pool # MA8800, 5.00%, 4/20/2053 | 2,475,166 | 2,408,724 |
Pool # 786633, 6.00%, 4/20/2053 | 1,983,320 | 1,996,150 |
Pool # MA8946, 4.50%, 6/20/2053 | 498,113 | 474,639 |
Pool # MA8947, 5.00%, 6/20/2053 | 1,992,128 | 1,938,653 |
Pool # MA8948, 5.50%, 6/20/2053 | 2,488,405 | 2,463,257 |
Pool # MA9017, 5.50%, 7/20/2053 | 2,744,600 | 2,716,878 |
Pool # MA9018, 6.00%, 7/20/2053 | 748,625 | 751,457 |
44 | J.P. Morgan Exchange-Traded Funds | August 31, 2023 |
INVESTMENTS | PRINCIPAL AMOUNT($) | VALUE($) |
Mortgage-Backed Securities — continued | ||
Pool # MA9019, 6.50%, 7/20/2053 | 748,847 | 758,881 |
GNMA II, Single Family, 30 Year | ||
TBA, 2.00%, 9/15/2053 (a) | 7,926,000 | 6,537,092 |
TBA, 2.50%, 9/15/2053 (a) | 8,844,000 | 7,523,618 |
TBA, 3.00%, 9/15/2053 (a) | 6,700,000 | 5,890,504 |
TBA, 3.50%, 9/15/2053 (a) | 5,000,000 | 4,540,039 |
TBA, 4.00%, 9/15/2053 (a) | 3,059,000 | 2,850,128 |
TBA, 4.50%, 9/15/2053 (a) | 2,200,000 | 2,096,531 |
TBA, 5.00%, 9/15/2053 (a) | 1,250,000 | 1,216,333 |
Total Mortgage-Backed Securities (Cost $581,892,866) | 533,947,584 | |
Corporate Bonds — 24.7% | ||
Aerospace & Defense — 0.5% | ||
Boeing Co. (The) | ||
3.25%, 3/1/2028 | 2,439,000 | 2,221,879 |
5.15%, 5/1/2030 | 782,000 | 769,156 |
3.60%, 5/1/2034 | 685,000 | 580,381 |
3.55%, 3/1/2038 | 50,000 | 38,336 |
3.90%, 5/1/2049 | 47,000 | 35,169 |
Huntington Ingalls Industries, Inc. 2.04%, 8/16/2028 | 70,000 | 59,371 |
L3Harris Technologies, Inc. 4.85%, 4/27/2035 | 166,000 | 156,488 |
Lockheed Martin Corp. | ||
5.10%, 11/15/2027 | 403,000 | 407,353 |
1.85%, 6/15/2030 | 811,000 | 672,452 |
3.60%, 3/1/2035 | 3,233,000 | 2,844,657 |
4.50%, 5/15/2036 | 357,000 | 338,747 |
Northrop Grumman Corp. | ||
4.40%, 5/1/2030 | 30,000 | 28,839 |
4.70%, 3/15/2033 | 150,000 | 145,220 |
5.25%, 5/1/2050 | 272,000 | 266,615 |
Precision Castparts Corp. 4.38%, 6/15/2045 | 82,000 | 71,029 |
RTX Corp. | ||
5.00%, 2/27/2026 | 163,000 | 162,250 |
1.90%, 9/1/2031 | 1,100,000 | 861,117 |
2.38%, 3/15/2032 | 350,000 | 281,379 |
4.35%, 4/15/2047 | 237,000 | 199,300 |
3.03%, 3/15/2052 | 961,000 | 630,105 |
10,769,843 | ||
Air Freight & Logistics — 0.1% | ||
CH Robinson Worldwide, Inc. 4.20%, 4/15/2028 | 502,000 | 477,670 |
INVESTMENTS | PRINCIPAL AMOUNT($) | VALUE($) |
Air Freight & Logistics — continued | ||
FedEx Corp. | ||
4.90%, 1/15/2034 | 30,000 | 28,995 |
3.90%, 2/1/2035 | 20,000 | 17,393 |
3.25%, 5/15/2041 | 30,000 | 21,815 |
3.88%, 8/1/2042 | 992,000 | 789,250 |
4.05%, 2/15/2048 | 286,000 | 222,758 |
United Parcel Service, Inc. | ||
2.20%, 9/1/2024 | 17,000 | 16,467 |
4.88%, 3/3/2033 | 50,000 | 49,888 |
3.75%, 11/15/2047 | 300,000 | 242,177 |
3.40%, 9/1/2049 | 465,000 | 354,048 |
2,220,461 | ||
Automobile Components — 0.0% ^ | ||
Aptiv plc | ||
3.25%, 3/1/2032 | 149,000 | 126,217 |
3.10%, 12/1/2051 | 238,000 | 144,889 |
BorgWarner, Inc. 2.65%, 7/1/2027 | 50,000 | 45,308 |
Lear Corp. 5.25%, 5/15/2049 | 85,000 | 73,934 |
Magna International, Inc. (Canada) 4.15%, 10/1/2025 | 300,000 | 291,517 |
681,865 | ||
Automobiles — 0.1% | ||
General Motors Co. | ||
5.40%, 10/15/2029 | 30,000 | 28,999 |
5.00%, 4/1/2035 | 707,000 | 631,461 |
5.15%, 4/1/2038 | 400,000 | 348,554 |
5.20%, 4/1/2045 | 110,000 | 90,335 |
Mercedes-Benz Finance North America LLC (Germany) 8.50%, 1/18/2031 | 152,000 | 185,388 |
Toyota Motor Corp. (Japan) 1.34%, 3/25/2026 | 72,000 | 65,576 |
1,350,313 | ||
Banks — 4.0% | ||
Australia & New Zealand Banking Group Ltd. (Australia) 5.38%, 7/3/2025 | 445,000 | 445,238 |
Bank of America Corp. | ||
4.00%, 1/22/2025 | 163,000 | 158,938 |
(SOFR + 0.91%), 0.98%, 9/25/2025 (b) | 379,000 | 358,744 |
(3-MONTH CME TERM SOFR + 1.13%), 2.46%, 10/22/2025 (b) | 632,000 | 607,364 |
(3-MONTH CME TERM SOFR + 0.90%), 2.02%, 2/13/2026 (b) | 67,000 | 63,196 |
August 31, 2023 | J.P. Morgan Exchange-Traded Funds | 45 |
AS OF August 31, 2023 (Unaudited) (continued)
INVESTMENTS | PRINCIPAL AMOUNT($) | VALUE($) |
Corporate Bonds — continued | ||
Banks — continued | ||
3.50%, 4/19/2026 | 1,846,000 | 1,756,520 |
(SOFR + 1.15%), 1.32%, 6/19/2026 (b) | 430,000 | 395,600 |
(SOFR + 1.75%), 4.83%, 7/22/2026 (b) | 30,000 | 29,439 |
4.25%, 10/22/2026 | 648,000 | 621,726 |
(SOFR + 1.01%), 1.20%, 10/24/2026 (b) | 1,168,000 | 1,058,563 |
(SOFR + 1.29%), 5.08%, 1/20/2027 (b) | 30,000 | 29,606 |
(SOFR + 0.96%), 1.73%, 7/22/2027 (b) | 30,000 | 26,846 |
(SOFR + 1.05%), 2.55%, 2/4/2028 (b) | 1,060,000 | 958,889 |
(3-MONTH CME TERM SOFR + 1.30%), 3.42%, 12/20/2028 (b) | 26,000 | 23,829 |
(SOFR + 1.06%), 2.09%, 6/14/2029 (b) | 1,939,000 | 1,653,142 |
(3-MONTH CME TERM SOFR + 1.47%), 3.97%, 2/7/2030 (b) | 250,000 | 230,095 |
(3-MONTH CME TERM SOFR + 1.25%), 2.50%, 2/13/2031 (b) | 275,000 | 228,544 |
(SOFR + 1.37%), 1.92%, 10/24/2031 (b) | 198,000 | 155,105 |
Series N, (SOFR + 1.22%), 2.65%, 3/11/2032 (b) | 2,500,000 | 2,049,459 |
(SOFR + 1.32%), 2.69%, 4/22/2032 (b) | 50,000 | 40,866 |
(SOFR + 1.83%), 4.57%, 4/27/2033 (b) | 50,000 | 46,301 |
(US Treasury Yield Curve Rate T Note Constant Maturity 5 Year + 1.20%), 2.48%, 9/21/2036 (b) | 1,634,000 | 1,242,082 |
(SOFR + 1.58%), 3.31%, 4/22/2042 (b) | 319,000 | 238,788 |
5.00%, 1/21/2044 | 2,305,000 | 2,191,847 |
(3-MONTH CME TERM SOFR + 2.25%), 4.44%, 1/20/2048 (b) | 57,000 | 48,621 |
(3-MONTH CME TERM SOFR + 1.45%), 3.95%, 1/23/2049 (b) | 1,536,000 | 1,207,094 |
(3-MONTH CME TERM SOFR + 3.41%), 4.08%, 3/20/2051 (b) | 100,000 | 80,343 |
Bank of Montreal (Canada) | ||
1.50%, 1/10/2025 | 1,108,000 | 1,048,335 |
1.85%, 5/1/2025 | 235,000 | 220,777 |
(SOFR + 0.60%), 0.95%, 1/22/2027 (b) | 710,000 | 637,198 |
5.20%, 2/1/2028 | 150,000 | 148,788 |
INVESTMENTS | PRINCIPAL AMOUNT($) | VALUE($) |
Banks — continued | ||
(USD Swap Semi 5 Year + 1.43%), 3.80%, 12/15/2032 (b) (c) | 138,000 | 121,874 |
Bank of Nova Scotia (The) (Canada) | ||
1.45%, 1/10/2025 | 150,000 | 141,865 |
2.20%, 2/3/2025 | 30,000 | 28,583 |
5.45%, 6/12/2025 | 30,000 | 29,846 |
1.30%, 9/15/2026 | 250,000 | 221,393 |
1.95%, 2/2/2027 | 50,000 | 44,712 |
2.15%, 8/1/2031 | 234,000 | 186,070 |
Barclays plc (United Kingdom) | ||
4.84%, 5/9/2028 | 2,001,000 | 1,852,878 |
(US Treasury Yield Curve Rate T Note Constant Maturity 1 Year + 1.30%), 2.89%, 11/24/2032 (b) | 454,000 | 353,914 |
(US Treasury Yield Curve Rate T Note Constant Maturity 1 Year + 3.00%), 5.75%, 8/9/2033 (b) | 754,000 | 722,737 |
Canadian Imperial Bank of Commerce (Canada) | ||
5.14%, 4/28/2025 | 30,000 | 29,757 |
5.00%, 4/28/2028 | 30,000 | 29,384 |
Citigroup, Inc. | ||
3.75%, 6/16/2024 | 315,000 | 310,355 |
4.40%, 6/10/2025 | 97,000 | 94,583 |
(SOFR + 2.84%), 3.11%, 4/8/2026 (b) | 350,000 | 334,955 |
3.40%, 5/1/2026 | 25,000 | 23,658 |
4.30%, 11/20/2026 | 650,000 | 623,679 |
4.45%, 9/29/2027 | 25,000 | 23,898 |
Series VAR, (SOFR + 1.28%), 3.07%, 2/24/2028 (b) | 25,000 | 22,957 |
4.13%, 7/25/2028 | 471,000 | 439,296 |
(SOFR + 1.42%), 2.98%, 11/5/2030 (b) | 720,000 | 619,053 |
(SOFR + 3.91%), 4.41%, 3/31/2031 (b) | 1,059,000 | 983,141 |
(SOFR + 2.11%), 2.57%, 6/3/2031 (b) | 1,213,000 | 1,001,774 |
6.63%, 6/15/2032 | 77,000 | 80,237 |
(SOFR + 1.18%), 2.52%, 11/3/2032 (b) | 2,951,000 | 2,337,228 |
(SOFR + 1.35%), 3.06%, 1/25/2033 (b) | 50,000 | 41,185 |
(SOFR + 2.09%), 4.91%, 5/24/2033 (b) | 250,000 | 237,792 |
6.00%, 10/31/2033 | 10,000 | 10,065 |
(SOFR + 2.34%), 6.27%, 11/17/2033 (b) | 1,500,000 | 1,563,272 |
5.30%, 5/6/2044 | 95,000 | 86,656 |
46 | J.P. Morgan Exchange-Traded Funds | August 31, 2023 |
INVESTMENTS | PRINCIPAL AMOUNT($) | VALUE($) |
Corporate Bonds — continued | ||
Banks — continued | ||
Cooperatieve Rabobank UA (Netherlands) 3.75%, 7/21/2026 | 267,000 | 250,715 |
Fifth Third Bancorp | ||
2.38%, 1/28/2025 | 673,000 | 640,218 |
(SOFR + 2.34%), 6.34%, 7/27/2029 (b) | 30,000 | 30,353 |
Fifth Third Bank NA 3.85%, 3/15/2026 | 200,000 | 186,550 |
First Citizens BancShares, Inc. (3-MONTH CME TERM SOFR + 2.47%), 3.38%, 3/15/2030 (b) | 966,000 | 889,378 |
First-Citizens Bank & Trust Co. (3-MONTH CME TERM SOFR + 1.72%), 2.97%, 9/27/2025 (b) | 454,000 | 433,933 |
Goldman Sachs Capital I 6.35%, 2/15/2034 | 247,000 | 248,354 |
HSBC Holdings plc (United Kingdom) | ||
(SOFR + 1.54%), 1.64%, 4/18/2026 (b) | 651,000 | 606,306 |
(SOFR + 1.93%), 2.10%, 6/4/2026 (b) | 267,000 | 248,849 |
(SOFR + 1.97%), 6.16%, 3/9/2029 (b) | 928,000 | 934,227 |
(3-MONTH CME TERM SOFR + 1.80%), 4.58%, 6/19/2029 (b) | 1,026,000 | 968,497 |
(SOFR + 2.39%), 2.85%, 6/4/2031 (b) | 3,103,000 | 2,558,751 |
(SOFR + 1.95%), 2.36%, 8/18/2031 (b) | 1,183,000 | 938,069 |
6.50%, 5/2/2036 | 185,000 | 187,708 |
HSBC USA, Inc. 5.63%, 3/17/2025 | 2,178,000 | 2,172,281 |
Huntington National Bank (The) (SOFRINDX + 1.65%), 4.55%, 5/17/2028 (b) | 469,000 | 443,821 |
ING Groep NV (Netherlands) 3.95%, 3/29/2027 | 500,000 | 474,328 |
KeyCorp (SOFRINDX + 2.06%), 4.79%, 6/1/2033 (b) | 141,000 | 121,522 |
Korea Development Bank (The) (South Korea) | ||
1.00%, 9/9/2026 | 646,000 | 568,631 |
1.38%, 4/25/2027 | 637,000 | 561,733 |
Kreditanstalt fuer Wiederaufbau (Germany) | ||
1.38%, 8/5/2024 | 10,000 | 9,639 |
2.50%, 11/20/2024 | 54,000 | 52,211 |
2.00%, 5/2/2025 | 160,000 | 152,230 |
0.63%, 1/22/2026 | 80,000 | 72,616 |
1.00%, 10/1/2026 (d) | 468,000 | 420,564 |
3.00%, 5/20/2027 | 55,000 | 52,215 |
1.75%, 9/14/2029 | 321,000 | 278,665 |
0.75%, 9/30/2030 | 747,000 | 588,203 |
Zero Coupon, 4/18/2036 | 1,088,000 | 627,509 |
INVESTMENTS | PRINCIPAL AMOUNT($) | VALUE($) |
Banks — continued | ||
Zero Coupon, 6/29/2037 | 1,405,000 | 767,313 |
Landwirtschaftliche Rentenbank (Germany) | ||
2.00%, 1/13/2025 | 45,000 | 43,078 |
2.38%, 6/10/2025 | 70,000 | 66,795 |
0.88%, 3/30/2026 | 386,000 | 350,205 |
1.75%, 7/27/2026 | 399,000 | 367,658 |
Lloyds Banking Group plc (United Kingdom) 4.45%, 5/8/2025 | 1,000,000 | 975,739 |
M&T Bank Corp. (SOFR + 1.85%), 5.05%, 1/27/2034 (b) | 1,003,000 | 912,516 |
Mitsubishi UFJ Financial Group, Inc. (Japan) | ||
(US Treasury Yield Curve Rate T Note Constant Maturity 1 Year + 1.55%), 5.06%, 9/12/2025 (b) | 200,000 | 198,112 |
(US Treasury Yield Curve Rate T Note Constant Maturity 1 Year + 0.45%), 0.96%, 10/11/2025 (b) | 200,000 | 188,682 |
3.75%, 7/18/2039 | 1,542,000 | 1,272,334 |
Mizuho Financial Group, Inc. (Japan) 4.02%, 3/5/2028 | 508,000 | 478,933 |
National Australia Bank Ltd. (Australia) 2.50%, 7/12/2026 | 315,000 | 292,676 |
National Bank of Canada (Canada) Series FXD, 0.75%, 8/6/2024 | 250,000 | 238,441 |
NatWest Group plc (United Kingdom) (US Treasury Yield Curve Rate T Note Constant Maturity 1 Year + 2.55%), 3.07%, 5/22/2028 (b) | 716,000 | 645,770 |
Oesterreichische Kontrollbank AG (Austria) | ||
0.50%, 9/16/2024 | 16,000 | 15,200 |
1.50%, 2/12/2025 | 123,000 | 116,579 |
0.38%, 9/17/2025 | 84,000 | 76,660 |
4.63%, 11/3/2025 | 100,000 | 99,418 |
0.50%, 2/2/2026 | 630,000 | 568,438 |
PNC Bank NA 3.10%, 10/25/2027 | 629,000 | 573,979 |
PNC Financial Services Group, Inc. (The) (SOFR + 1.93%), 5.07%, 1/24/2034 (b) | 50,000 | 47,398 |
Royal Bank of Canada (Canada) | ||
0.65%, 7/29/2024 | 150,000 | 143,287 |
0.75%, 10/7/2024 | 150,000 | 142,175 |
3.38%, 4/14/2025 | 105,000 | 101,574 |
6.00%, 11/1/2027 | 452,000 | 462,544 |
5.00%, 2/1/2033 | 150,000 | 145,395 |
August 31, 2023 | J.P. Morgan Exchange-Traded Funds | 47 |
AS OF August 31, 2023 (Unaudited) (continued)
INVESTMENTS | PRINCIPAL AMOUNT($) | VALUE($) |
Corporate Bonds — continued | ||
Banks — continued | ||
Santander UK Group Holdings plc (United Kingdom) (US Treasury Yield Curve Rate T Note Constant Maturity 1 Year + 1.25%), 1.53%, 8/21/2026 (b) | 1,177,000 | 1,067,246 |
Sumitomo Mitsui Financial Group, Inc. (Japan) | ||
0.95%, 1/12/2026 | 2,244,000 | 2,015,537 |
3.78%, 3/9/2026 | 332,000 | 317,909 |
2.63%, 7/14/2026 | 150,000 | 138,402 |
3.01%, 10/19/2026 | 141,000 | 130,678 |
3.45%, 1/11/2027 | 644,000 | 602,783 |
Toronto-Dominion Bank (The) (Canada) | ||
0.70%, 9/10/2024 | 100,000 | 95,096 |
Series FXD, 1.45%, 1/10/2025 | 50,000 | 47,380 |
0.75%, 9/11/2025 | 126,000 | 114,897 |
0.75%, 1/6/2026 | 2,426,000 | 2,178,454 |
5.10%, 1/9/2026 | 30,000 | 29,756 |
4.11%, 6/8/2027 | 30,000 | 28,638 |
3.20%, 3/10/2032 | 100,000 | 85,075 |
Truist Bank 2.15%, 12/6/2024 | 1,400,000 | 1,336,605 |
Truist Financial Corp. | ||
(SOFR + 0.61%), 1.27%, 3/2/2027 (b) | 1,109,000 | 989,269 |
1.13%, 8/3/2027 | 2,636,000 | 2,228,646 |
(SOFR + 0.86%), 1.89%, 6/7/2029 (b) | 96,000 | 80,133 |
US Bancorp | ||
(SOFR + 0.73%), 2.22%, 1/27/2028 (b) | 10,000 | 8,922 |
(SOFR + 1.02%), 2.68%, 1/27/2033 (b) | 626,000 | 497,562 |
(SOFR + 2.11%), 4.97%, 7/22/2033 (b) | 50,000 | 45,560 |
Wells Fargo & Co. | ||
3.55%, 9/29/2025 | 79,000 | 75,792 |
(3-MONTH CME TERM SOFR + 1.09%), 2.41%, 10/30/2025 (b) | 483,000 | 463,364 |
(3-MONTH CME TERM SOFR + 1.01%), 2.16%, 2/11/2026 (b) | 282,000 | 266,668 |
3.00%, 4/22/2026 | 1,019,000 | 954,441 |
(SOFR + 2.00%), 2.19%, 4/30/2026 (b) | 488,000 | 458,987 |
4.10%, 6/3/2026 | 30,000 | 28,767 |
3.00%, 10/23/2026 | 30,000 | 27,780 |
4.30%, 7/22/2027 | 2,352,000 | 2,252,205 |
(3-MONTH CME TERM SOFR + 1.57%), 3.58%, 5/22/2028 (b) | 110,000 | 102,102 |
(SOFR + 2.10%), 2.39%, 6/2/2028 (b) | 2,351,000 | 2,090,877 |
INVESTMENTS | PRINCIPAL AMOUNT($) | VALUE($) |
Banks — continued | ||
(3-MONTH CME TERM SOFR + 1.43%), 2.88%, 10/30/2030 (b) | 2,626,000 | 2,246,592 |
(SOFR + 1.99%), 5.56%, 7/25/2034 (b) | 58,000 | 57,245 |
5.95%, 12/15/2036 | 7,000 | 6,837 |
(SOFR + 2.53%), 3.07%, 4/30/2041 (b) | 285,000 | 204,033 |
3.90%, 5/1/2045 | 1,174,000 | 918,745 |
4.75%, 12/7/2046 | 616,000 | 511,086 |
Westpac Banking Corp. (Australia) | ||
1.15%, 6/3/2026 | 357,000 | 320,858 |
(US Treasury Yield Curve Rate T Note Constant Maturity 5 Year + 1.35%), 2.89%, 2/4/2030 (b) (c) | 545,000 | 514,754 |
4.42%, 7/24/2039 (c) | 409,000 | 329,190 |
79,476,526 | ||
Beverages — 0.4% | ||
Anheuser-Busch Cos. LLC (Belgium) 4.70%, 2/1/2036 | 79,000 | 75,604 |
Anheuser-Busch InBev Finance, Inc. (Belgium) 4.70%, 2/1/2036 | 17,000 | 16,304 |
Anheuser-Busch InBev Worldwide, Inc. (Belgium) | ||
4.00%, 4/13/2028 | 1,186,000 | 1,141,895 |
4.90%, 1/23/2031 | 330,000 | 331,077 |
4.95%, 1/15/2042 | 146,000 | 139,136 |
5.55%, 1/23/2049 | 50,000 | 51,198 |
4.50%, 6/1/2050 | 10,000 | 8,902 |
4.75%, 4/15/2058 | 1,421,000 | 1,271,301 |
Coca-Cola Co. (The) | ||
1.75%, 9/6/2024 | 213,000 | 205,331 |
1.45%, 6/1/2027 | 340,000 | 303,576 |
1.50%, 3/5/2028 (d) | 224,000 | 196,253 |
2.50%, 6/1/2040 | 713,000 | 514,072 |
2.88%, 5/5/2041 | 10,000 | 7,554 |
3.00%, 3/5/2051 | 641,000 | 462,263 |
2.75%, 6/1/2060 | 40,000 | 25,952 |
Coca-Cola Consolidated, Inc. 3.80%, 11/25/2025 | 50,000 | 48,365 |
Constellation Brands, Inc. 3.60%, 2/15/2028 | 884,000 | 824,443 |
Diageo Capital plc (United Kingdom) | ||
1.38%, 9/29/2025 | 200,000 | 184,658 |
2.13%, 4/29/2032 | 700,000 | 562,706 |
Keurig Dr Pepper, Inc. | ||
3.40%, 11/15/2025 | 250,000 | 239,125 |
48 | J.P. Morgan Exchange-Traded Funds | August 31, 2023 |
INVESTMENTS | PRINCIPAL AMOUNT($) | VALUE($) |
Corporate Bonds — continued | ||
Beverages — continued | ||
3.20%, 5/1/2030 | 30,000 | 26,532 |
3.80%, 5/1/2050 | 10,000 | 7,573 |
Keurig Dr. Pepper, Inc. | ||
3.95%, 4/15/2029 | 901,000 | 848,561 |
4.05%, 4/15/2032 | 50,000 | 45,790 |
PepsiCo, Inc. | ||
2.25%, 3/19/2025 | 10,000 | 9,571 |
2.75%, 4/30/2025 | 250,000 | 240,421 |
4.45%, 2/15/2033 | 50,000 | 49,736 |
2.63%, 10/21/2041 | 55,000 | 39,897 |
2.75%, 10/21/2051 | 10,000 | 6,757 |
7,884,553 | ||
Biotechnology — 0.4% | ||
AbbVie, Inc. | ||
3.85%, 6/15/2024 | 334,000 | 329,060 |
3.80%, 3/15/2025 | 150,000 | 146,054 |
3.60%, 5/14/2025 | 150,000 | 145,459 |
2.95%, 11/21/2026 | 150,000 | 140,347 |
4.50%, 5/14/2035 | 98,000 | 92,186 |
4.05%, 11/21/2039 | 479,000 | 410,697 |
4.45%, 5/14/2046 | 21,000 | 18,164 |
4.25%, 11/21/2049 | 1,219,000 | 1,026,368 |
Amgen, Inc. | ||
3.20%, 11/2/2027 | 2,148,000 | 1,995,889 |
2.30%, 2/25/2031 | 750,000 | 618,745 |
2.00%, 1/15/2032 | 275,000 | 215,471 |
4.20%, 3/1/2033 | 50,000 | 45,960 |
4.56%, 6/15/2048 | 200,000 | 170,466 |
3.38%, 2/21/2050 | 187,000 | 130,922 |
4.66%, 6/15/2051 | 230,000 | 197,615 |
5.75%, 3/2/2063 | 295,000 | 290,990 |
Biogen, Inc. 2.25%, 5/1/2030 | 637,000 | 523,927 |
Gilead Sciences, Inc. | ||
3.65%, 3/1/2026 | 100,000 | 96,174 |
2.95%, 3/1/2027 | 10,000 | 9,318 |
4.60%, 9/1/2035 | 420,000 | 398,883 |
4.00%, 9/1/2036 | 803,000 | 710,179 |
2.60%, 10/1/2040 | 1,000,000 | 696,115 |
4.75%, 3/1/2046 | 15,000 | 13,688 |
8,422,677 | ||
Broadline Retail — 0.2% | ||
Alibaba Group Holding Ltd. (China) 3.40%, 12/6/2027 | 437,000 | 405,956 |
INVESTMENTS | PRINCIPAL AMOUNT($) | VALUE($) |
Broadline Retail — continued | ||
Amazon.com, Inc. | ||
3.15%, 8/22/2027 | 2,365,000 | 2,224,063 |
1.65%, 5/12/2028 (d) | 311,000 | 271,659 |
4.05%, 8/22/2047 | 1,351,000 | 1,166,655 |
2.70%, 6/3/2060 | 275,000 | 169,222 |
eBay, Inc. | ||
2.60%, 5/10/2031 | 110,000 | 90,951 |
4.00%, 7/15/2042 | 192,000 | 150,179 |
JD.com, Inc. (China) 3.38%, 1/14/2030 | 200,000 | 175,989 |
4,654,674 | ||
Building Products — 0.1% | ||
Carrier Global Corp. | ||
2.49%, 2/15/2027 | 596,000 | 542,204 |
2.70%, 2/15/2031 | 30,000 | 25,156 |
3.58%, 4/5/2050 | 406,000 | 290,216 |
Fortune Brands Innovations, Inc. 4.00%, 3/25/2032 | 128,000 | 112,635 |
Johnson Controls International plc | ||
1.75%, 9/15/2030 | 230,000 | 184,162 |
4.50%, 2/15/2047 | 162,000 | 136,675 |
Lennox International, Inc. | ||
1.35%, 8/1/2025 | 117,000 | 107,837 |
1.70%, 8/1/2027 | 257,000 | 224,700 |
Owens Corning | ||
3.88%, 6/1/2030 | 30,000 | 27,295 |
4.30%, 7/15/2047 | 108,000 | 86,771 |
1,737,651 | ||
Capital Markets — 2.1% | ||
Affiliated Managers Group, Inc. 3.50%, 8/1/2025 | 591,000 | 563,933 |
Ameriprise Financial, Inc. | ||
3.00%, 4/2/2025 | 133,000 | 127,872 |
5.15%, 5/15/2033 | 100,000 | 97,777 |
Ares Capital Corp. | ||
3.25%, 7/15/2025 | 175,000 | 164,067 |
3.88%, 1/15/2026 | 179,000 | 167,484 |
2.88%, 6/15/2028 | 625,000 | 528,052 |
Bank of New York Mellon Corp. (The) | ||
(SOFR + 0.57%), 3.43%, 6/13/2025 (b) | 150,000 | 147,308 |
0.75%, 1/28/2026 | 62,000 | 55,934 |
(SOFRINDX + 1.80%), 5.80%, 10/25/2028 (b) | 10,000 | 10,114 |
(SOFR + 1.51%), 4.71%, 2/1/2034 (b) | 150,000 | 141,183 |
August 31, 2023 | J.P. Morgan Exchange-Traded Funds | 49 |
AS OF August 31, 2023 (Unaudited) (continued)
INVESTMENTS | PRINCIPAL AMOUNT($) | VALUE($) |
Corporate Bonds — continued | ||
Capital Markets — continued | ||
Series J, (SOFR + 1.61%), 4.97%, 4/26/2034 (b) | 3,557,000 | 3,414,945 |
Blackstone Private Credit Fund 3.25%, 3/15/2027 | 1,121,000 | 976,648 |
Blackstone Secured Lending Fund 2.85%, 9/30/2028 | 572,000 | 472,390 |
Blue Owl Capital Corp. 2.88%, 6/11/2028 | 402,000 | 333,370 |
Charles Schwab Corp. (The) | ||
1.15%, 5/13/2026 | 150,000 | 133,525 |
3.20%, 3/2/2027 | 938,000 | 868,323 |
3.20%, 1/25/2028 | 50,000 | 45,575 |
2.00%, 3/20/2028 | 987,000 | 850,245 |
3.25%, 5/22/2029 | 243,000 | 216,074 |
CME Group, Inc. | ||
3.00%, 3/15/2025 | 562,000 | 543,023 |
2.65%, 3/15/2032 (d) | 50,000 | 41,918 |
4.15%, 6/15/2048 | 144,000 | 126,599 |
Credit Suisse AG (Switzerland) 1.25%, 8/7/2026 | 1,390,000 | 1,220,126 |
Deutsche Bank AG (Germany) | ||
(SOFR + 1.87%), 2.13%, 11/24/2026 (b) | 2,283,000 | 2,070,665 |
(SOFR + 1.22%), 2.31%, 11/16/2027 (b) | 560,000 | 490,872 |
(SOFR + 3.04%), 3.55%, 9/18/2031 (b) | 150,000 | 125,590 |
(SOFR + 3.65%), 7.08%, 2/10/2034 (b) | 994,000 | 945,214 |
FactSet Research Systems, Inc. 2.90%, 3/1/2027 | 189,000 | 174,280 |
FS KKR Capital Corp. | ||
3.40%, 1/15/2026 | 213,000 | 195,357 |
2.63%, 1/15/2027 (d) | 1,025,000 | 884,814 |
Goldman Sachs Group, Inc. (The) | ||
3.85%, 7/8/2024 | 1,235,000 | 1,213,918 |
5.70%, 11/1/2024 | 10,000 | 9,982 |
3.50%, 1/23/2025 | 362,000 | 350,744 |
(3-MONTH CME TERM SOFR + 1.46%), 3.27%, 9/29/2025 (b) | 43,000 | 41,725 |
Series VAR, (SOFR + 0.79%), 1.09%, 12/9/2026 (b) | 254,000 | 227,966 |
(SOFR + 1.11%), 2.64%, 2/24/2028 (b) | 2,482,000 | 2,245,497 |
(3-MONTH CME TERM SOFR + 1.42%), 3.81%, 4/23/2029 (b) | 24,000 | 22,200 |
(3-MONTH CME TERM SOFR + 1.56%), 4.22%, 5/1/2029 (b) | 78,000 | 73,419 |
INVESTMENTS | PRINCIPAL AMOUNT($) | VALUE($) |
Capital Markets — continued | ||
2.60%, 2/7/2030 | 258,000 | 217,780 |
(SOFR + 1.09%), 1.99%, 1/27/2032 (b) | 98,000 | 76,328 |
(SOFR + 1.28%), 2.62%, 4/22/2032 (b) | 548,000 | 443,606 |
(SOFR + 1.25%), 2.38%, 7/21/2032 (b) | 2,225,000 | 1,756,162 |
(SOFR + 1.26%), 2.65%, 10/21/2032 (b) | 71,000 | 56,971 |
6.13%, 2/15/2033 | 708,000 | 751,277 |
(SOFR + 1.41%), 3.10%, 2/24/2033 (b) | 380,000 | 316,205 |
6.75%, 10/1/2037 | 136,000 | 144,204 |
(3-MONTH CME TERM SOFR + 1.69%), 4.41%, 4/23/2039 (b) | 463,000 | 399,761 |
(SOFR + 1.63%), 3.44%, 2/24/2043 (b) | 1,069,000 | 787,884 |
4.75%, 10/21/2045 | 63,000 | 56,561 |
Intercontinental Exchange, Inc. | ||
4.00%, 9/15/2027 | 10,000 | 9,581 |
3.00%, 6/15/2050 | 187,000 | 124,729 |
Janus Henderson US Holdings, Inc. 4.88%, 8/1/2025 | 31,000 | 30,366 |
Lazard Group LLC 3.75%, 2/13/2025 | 537,000 | 519,101 |
Moody's Corp. | ||
4.25%, 2/1/2029 | 30,000 | 28,891 |
3.10%, 11/29/2061 | 424,000 | 268,343 |
Morgan Stanley | ||
Series F, 3.88%, 4/29/2024 | 1,801,000 | 1,778,114 |
(SOFR + 1.15%), 2.72%, 7/22/2025 (b) | 125,000 | 121,306 |
Series I, (SOFR + 0.75%), 0.86%, 10/21/2025 (b) | 100,000 | 94,099 |
(SOFR + 1.99%), 2.19%, 4/28/2026 (b) | 100,000 | 94,284 |
(SOFR + 1.77%), 6.14%, 10/16/2026 (b) | 25,000 | 25,170 |
(SOFR + 0.72%), 0.98%, 12/10/2026 (b) | 2,452,000 | 2,198,593 |
3.63%, 1/20/2027 | 25,000 | 23,616 |
3.95%, 4/23/2027 | 337,000 | 317,649 |
(SOFR + 0.88%), 1.59%, 5/4/2027 (b) | 10,000 | 8,965 |
(SOFR + 1.00%), 2.48%, 1/21/2028 (b) | 250,000 | 225,511 |
3.59%, 7/22/2028 (e) | 1,051,000 | 971,925 |
(3-MONTH CME TERM SOFR + 1.40%), 3.77%, 1/24/2029 (b) | 308,000 | 285,562 |
50 | J.P. Morgan Exchange-Traded Funds | August 31, 2023 |
INVESTMENTS | PRINCIPAL AMOUNT($) | VALUE($) |
Corporate Bonds — continued | ||
Capital Markets — continued | ||
(SOFR + 1.14%), 2.70%, 1/22/2031 (b) | 748,000 | 629,959 |
(SOFR + 1.03%), 1.79%, 2/13/2032 (b) | 1,534,000 | 1,179,221 |
(SOFR + 1.02%), 1.93%, 4/28/2032 (b) | 1,769,000 | 1,363,713 |
(SOFR + 1.18%), 2.24%, 7/21/2032 (b) | 10,000 | 7,846 |
(SOFR + 1.88%), 5.42%, 7/21/2034 (b) | 10,000 | 9,828 |
(SOFR + 1.36%), 2.48%, 9/16/2036 (b) | 405,000 | 305,129 |
3.97%, 7/22/2038 (e) | 83,000 | 69,181 |
(SOFR + 1.49%), 3.22%, 4/22/2042 (b) | 946,000 | 696,624 |
4.30%, 1/27/2045 | 664,000 | 564,439 |
(SOFR + 4.84%), 5.60%, 3/24/2051 (b) | 128,000 | 128,660 |
Nasdaq, Inc. 3.85%, 6/30/2026 | 519,000 | 499,439 |
Nomura Holdings, Inc. (Japan) | ||
5.71%, 1/9/2026 | 200,000 | 198,559 |
2.61%, 7/14/2031 | 294,000 | 231,051 |
Raymond James Financial, Inc. 4.95%, 7/15/2046 | 40,000 | 34,905 |
S&P Global, Inc. 3.25%, 12/1/2049 | 308,000 | 219,951 |
State Street Corp. | ||
3.55%, 8/18/2025 | 50,000 | 48,262 |
(SOFR + 0.94%), 2.35%, 11/1/2025 (b) | 500,000 | 480,042 |
(SOFR + 1.72%), 5.82%, 11/4/2028 (b) (d) | 30,000 | 30,456 |
2.20%, 3/3/2031 | 215,000 | 171,215 |
(SOFR + 1.57%), 4.82%, 1/26/2034 (b) | 1,936,000 | 1,836,653 |
UBS Group AG (Switzerland) 3.75%, 3/26/2025 | 520,000 | 502,150 |
41,658,555 | ||
Chemicals — 0.2% | ||
Air Products and Chemicals, Inc. 4.80%, 3/3/2033 | 50,000 | 49,663 |
Albemarle Corp. | ||
5.05%, 6/1/2032 | 10,000 | 9,416 |
5.45%, 12/1/2044 | 83,000 | 76,260 |
Cabot Corp. 4.00%, 7/1/2029 | 104,000 | 95,848 |
CF Industries, Inc. | ||
4.95%, 6/1/2043 | 300,000 | 253,052 |
INVESTMENTS | PRINCIPAL AMOUNT($) | VALUE($) |
Chemicals — continued | ||
5.38%, 3/15/2044 | 113,000 | 100,240 |
Dow Chemical Co. (The) | ||
2.10%, 11/15/2030 (d) | 525,000 | 428,132 |
6.30%, 3/15/2033 (d) | 50,000 | 52,979 |
5.25%, 11/15/2041 | 480,000 | 448,048 |
DuPont de Nemours, Inc. 4.73%, 11/15/2028 | 10,000 | 9,866 |
Eastman Chemical Co. 5.75%, 3/8/2033 | 50,000 | 49,208 |
EIDP, Inc. | ||
1.70%, 7/15/2025 | 613,000 | 571,641 |
4.80%, 5/15/2033 | 30,000 | 28,846 |
FMC Corp. 3.45%, 10/1/2029 | 174,000 | 151,655 |
Huntsman International LLC 4.50%, 5/1/2029 | 112,000 | 103,708 |
LYB International Finance III LLC | ||
2.25%, 10/1/2030 (d) | 232,000 | 188,417 |
4.20%, 10/15/2049 | 359,000 | 267,079 |
NewMarket Corp. 2.70%, 3/18/2031 | 69,000 | 55,982 |
Sherwin-Williams Co. (The) | ||
3.13%, 6/1/2024 | 10,000 | 9,798 |
4.25%, 8/8/2025 | 150,000 | 146,773 |
2.95%, 8/15/2029 | 30,000 | 26,438 |
2.20%, 3/15/2032 | 100,000 | 79,342 |
4.00%, 12/15/2042 | 233,000 | 183,471 |
4.50%, 6/1/2047 | 492,000 | 419,215 |
3.30%, 5/15/2050 | 26,000 | 17,659 |
Westlake Corp. | ||
0.88%, 8/15/2024 | 200,000 | 190,584 |
5.00%, 8/15/2046 | 490,000 | 412,709 |
4.38%, 11/15/2047 | 367,000 | 283,192 |
4,709,221 | ||
Commercial Services & Supplies — 0.1% | ||
RELX Capital, Inc. (United Kingdom) 4.75%, 5/20/2032 | 97,000 | 93,458 |
Republic Services, Inc. | ||
2.50%, 8/15/2024 | 242,000 | 234,606 |
2.38%, 3/15/2033 (d) | 1,437,000 | 1,140,796 |
Waste Connections, Inc. | ||
3.50%, 5/1/2029 | 30,000 | 27,666 |
2.20%, 1/15/2032 | 40,000 | 31,904 |
4.20%, 1/15/2033 | 293,000 | 270,551 |
2.95%, 1/15/2052 | 649,000 | 424,788 |
August 31, 2023 | J.P. Morgan Exchange-Traded Funds | 51 |
AS OF August 31, 2023 (Unaudited) (continued)
INVESTMENTS | PRINCIPAL AMOUNT($) | VALUE($) |
Corporate Bonds — continued | ||
Commercial Services & Supplies — continued | ||
Waste Management, Inc. | ||
4.63%, 2/15/2033 | 30,000 | 28,840 |
2.95%, 6/1/2041 | 636,000 | 458,469 |
2,711,078 | ||
Communications Equipment — 0.1% | ||
Cisco Systems, Inc. | ||
2.95%, 2/28/2026 | 1,941,000 | 1,862,006 |
2.50%, 9/20/2026 | 113,000 | 105,767 |
5.90%, 2/15/2039 | 12,000 | 13,001 |
Juniper Networks, Inc. 2.00%, 12/10/2030 | 144,000 | 111,240 |
Motorola Solutions, Inc. | ||
2.30%, 11/15/2030 | 80,000 | 63,646 |
5.60%, 6/1/2032 | 30,000 | 29,548 |
Nokia OYJ (Finland) 4.38%, 6/12/2027 | 37,000 | 34,895 |
2,220,103 | ||
Construction & Engineering — 0.0% ^ | ||
Quanta Services, Inc. 2.35%, 1/15/2032 | 244,000 | 192,852 |
Valmont Industries, Inc. 5.25%, 10/1/2054 | 48,000 | 41,040 |
233,892 | ||
Construction Materials — 0.0% ^ | ||
Eagle Materials, Inc. 2.50%, 7/1/2031 | 30,000 | 24,241 |
Martin Marietta Materials, Inc. Series CB, 2.50%, 3/15/2030 | 10,000 | 8,399 |
Vulcan Materials Co. 4.70%, 3/1/2048 | 96,000 | 83,885 |
116,525 | ||
Consumer Finance — 0.8% | ||
AerCap Ireland Capital DAC (Ireland) | ||
3.50%, 1/15/2025 | 250,000 | 241,317 |
6.50%, 7/15/2025 | 250,000 | 251,157 |
4.45%, 10/1/2025 | 150,000 | 145,256 |
3.65%, 7/21/2027 | 150,000 | 138,107 |
3.88%, 1/23/2028 | 150,000 | 138,043 |
3.30%, 1/30/2032 | 1,001,000 | 813,686 |
3.40%, 10/29/2033 | 250,000 | 198,351 |
Ally Financial, Inc. | ||
4.75%, 6/9/2027 | 37,000 | 34,636 |
7.10%, 11/15/2027 | 104,000 | 105,383 |
2.20%, 11/2/2028 | 1,419,000 | 1,147,361 |
American Express Co. | ||
2.25%, 3/4/2025 | 10,000 | 9,508 |
4.20%, 11/6/2025 | 534,000 | 520,025 |
INVESTMENTS | PRINCIPAL AMOUNT($) | VALUE($) |
Consumer Finance — continued | ||
4.90%, 2/13/2026 | 30,000 | 29,619 |
(SOFR + 1.00%), 4.99%, 5/1/2026 (b) | 30,000 | 29,575 |
3.13%, 5/20/2026 | 68,000 | 64,279 |
1.65%, 11/4/2026 | 1,373,000 | 1,224,568 |
(SOFR + 0.97%), 5.39%, 7/28/2027 (b) | 30,000 | 29,830 |
American Honda Finance Corp. | ||
2.00%, 3/24/2028 | 328,000 | 286,976 |
4.60%, 4/17/2030 | 30,000 | 29,176 |
1.80%, 1/13/2031 | 287,000 | 229,923 |
Capital One Financial Corp. | ||
4.20%, 10/29/2025 | 23,000 | 22,108 |
3.75%, 7/28/2026 | 2,204,000 | 2,061,103 |
3.80%, 1/31/2028 | 237,000 | 217,488 |
(SOFR + 2.08%), 5.47%, 2/1/2029 (b) | 150,000 | 145,342 |
Caterpillar Financial Services Corp. 0.80%, 11/13/2025 | 1,364,000 | 1,242,405 |
Discover Financial Services | ||
3.95%, 11/6/2024 | 1,013,000 | 986,171 |
4.50%, 1/30/2026 | 11,000 | 10,565 |
6.70%, 11/29/2032 | 50,000 | 49,739 |
General Motors Financial Co., Inc. | ||
1.20%, 10/15/2024 | 150,000 | 142,311 |
3.50%, 11/7/2024 | 283,000 | 274,872 |
2.90%, 2/26/2025 | 150,000 | 143,287 |
5.25%, 3/1/2026 | 150,000 | 147,782 |
1.50%, 6/10/2026 | 50,000 | 44,384 |
2.40%, 4/10/2028 | 150,000 | 129,499 |
2.35%, 1/8/2031 | 46,000 | 35,730 |
2.70%, 6/10/2031 | 19,000 | 14,990 |
3.10%, 1/12/2032 | 145,000 | 115,879 |
John Deere Capital Corp. | ||
4.95%, 6/6/2025 | 593,000 | 590,366 |
0.70%, 1/15/2026 | 209,000 | 189,139 |
4.75%, 1/20/2028 | 1,000,000 | 996,028 |
1.45%, 1/15/2031 | 88,000 | 69,725 |
2.00%, 6/17/2031 | 202,000 | 164,845 |
PACCAR Financial Corp. 3.55%, 8/11/2025 | 881,000 | 856,110 |
Synchrony Financial 3.95%, 12/1/2027 | 10,000 | 8,925 |
Toyota Motor Credit Corp. | ||
0.50%, 6/18/2024 | 200,000 | 192,091 |
0.63%, 9/13/2024 | 50,000 | 47,588 |
3.00%, 4/1/2025 | 150,000 | 144,775 |
3.05%, 3/22/2027 | 150,000 | 140,770 |
3.05%, 1/11/2028 | 500,000 | 464,152 |
52 | J.P. Morgan Exchange-Traded Funds | August 31, 2023 |
INVESTMENTS | PRINCIPAL AMOUNT($) | VALUE($) |
Corporate Bonds — continued | ||
Consumer Finance — continued | ||
4.55%, 5/17/2030 | 30,000 | 29,220 |
1.65%, 1/10/2031 | 616,000 | 491,068 |
1.90%, 9/12/2031 | 99,000 | 79,150 |
15,914,383 | ||
Consumer Staples Distribution & Retail — 0.4% | ||
Costco Wholesale Corp. | ||
2.75%, 5/18/2024 | 91,000 | 89,184 |
3.00%, 5/18/2027 | 200,000 | 188,925 |
1.38%, 6/20/2027 | 132,000 | 116,693 |
1.75%, 4/20/2032 | 224,000 | 177,721 |
Dollar General Corp. | ||
4.15%, 11/1/2025 | 10,000 | 9,725 |
3.88%, 4/15/2027 | 52,000 | 49,628 |
4.13%, 5/1/2028 | 200,000 | 190,139 |
5.00%, 11/1/2032 | 50,000 | 47,538 |
4.13%, 4/3/2050 | 26,000 | 19,219 |
Dollar Tree, Inc. 2.65%, 12/1/2031 | 167,000 | 134,674 |
Kroger Co. (The) 5.40%, 7/15/2040 | 294,000 | 276,158 |
Sysco Corp. | ||
2.40%, 2/15/2030 | 19,000 | 16,047 |
2.45%, 12/14/2031 | 10,000 | 8,082 |
3.15%, 12/14/2051 | 351,000 | 232,754 |
Target Corp. 2.95%, 1/15/2052 | 2,452,000 | 1,633,097 |
Walmart, Inc. | ||
1.05%, 9/17/2026 | 3,224,000 | 2,888,337 |
3.70%, 6/26/2028 | 859,000 | 827,862 |
2.95%, 9/24/2049 | 611,000 | 433,070 |
4.50%, 9/9/2052 | 122,000 | 113,397 |
7,452,250 | ||
Containers & Packaging — 0.1% | ||
Avery Dennison Corp. | ||
4.88%, 12/6/2028 | 201,000 | 196,476 |
5.75%, 3/15/2033 | 50,000 | 50,457 |
Berry Global, Inc. 1.57%, 1/15/2026 | 1,151,000 | 1,046,312 |
International Paper Co. | ||
4.80%, 6/15/2044 | 200,000 | 172,069 |
5.15%, 5/15/2046 | 195,000 | 175,153 |
Packaging Corp. of America 3.00%, 12/15/2029 | 220,000 | 192,056 |
WestRock MWV LLC 7.95%, 2/15/2031 | 166,000 | 186,589 |
2,019,112 | ||
Distributors — 0.0% ^ | ||
Genuine Parts Co. 1.88%, 11/1/2030 | 30,000 | 23,504 |
INVESTMENTS | PRINCIPAL AMOUNT($) | VALUE($) |
Diversified Consumer Services — 0.1% | ||
American University (The) Series 2019, 3.67%, 4/1/2049 | 63,000 | 48,628 |
California Institute of Technology 4.70%, 11/1/2111 | 58,000 | 48,248 |
Case Western Reserve University Series 22-C, 5.41%, 6/1/2122 | 29,000 | 27,316 |
George Washington University (The) Series 2018, 4.13%, 9/15/2048 | 104,000 | 88,127 |
Georgetown University (The) Series B, 4.32%, 4/1/2049 | 10,000 | 8,546 |
Johns Hopkins University Series 2013, 4.08%, 7/1/2053 | 76,000 | 64,812 |
Northwestern University 4.64%, 12/1/2044 | 55,000 | 51,839 |
Trustees of Boston College 3.13%, 7/1/2052 | 53,000 | 37,468 |
Trustees of Princeton University (The) Series 2020, 2.52%, 7/1/2050 | 894,000 | 586,290 |
Trustees of the University of Pennsylvania (The) 3.61%, 2/15/2119 | 816,000 | 566,467 |
University of Miami Series 2022, 4.06%, 4/1/2052 | 921,000 | 756,486 |
University of Southern California | ||
Series 2017, 3.84%, 10/1/2047 | 20,000 | 16,589 |
5.25%, 10/1/2111 | 227,000 | 216,822 |
Washington University (The) Series 2022, 3.52%, 4/15/2054 | 128,000 | 99,107 |
William Marsh Rice University 3.77%, 5/15/2055 | 70,000 | 56,455 |
Yale University Series 2020, 1.48%, 4/15/2030 | 284,000 | 232,582 |
2,905,782 | ||
Diversified REITs — 0.2% | ||
Digital Realty Trust LP 3.70%, 8/15/2027 | 20,000 | 18,649 |
Rayonier LP 2.75%, 5/17/2031 | 171,000 | 136,643 |
Simon Property Group LP | ||
3.38%, 10/1/2024 | 500,000 | 487,698 |
3.38%, 12/1/2027 | 338,000 | 312,803 |
2.20%, 2/1/2031 | 650,000 | 517,701 |
2.25%, 1/15/2032 | 254,000 | 196,550 |
VICI Properties LP | ||
4.75%, 2/15/2028 | 1,396,000 | 1,328,802 |
5.13%, 5/15/2032 | 823,000 | 762,993 |
Vornado Realty LP 2.15%, 6/1/2026 | 407,000 | 350,823 |
WP Carey, Inc. 3.85%, 7/15/2029 | 200,000 | 180,163 |
4,292,825 | ||
August 31, 2023 | J.P. Morgan Exchange-Traded Funds | 53 |
AS OF August 31, 2023 (Unaudited) (continued)
INVESTMENTS | PRINCIPAL AMOUNT($) | VALUE($) |
Corporate Bonds — continued | ||
Diversified Telecommunication Services — 0.8% | ||
AT&T, Inc. | ||
3.88%, 1/15/2026 | 30,000 | 28,903 |
1.70%, 3/25/2026 | 129,000 | 117,594 |
2.30%, 6/1/2027 | 30,000 | 26,858 |
1.65%, 2/1/2028 | 30,000 | 25,643 |
2.75%, 6/1/2031 | 50,000 | 41,243 |
4.50%, 5/15/2035 | 747,000 | 663,105 |
5.35%, 9/1/2040 | 720,000 | 670,383 |
3.10%, 2/1/2043 | 300,000 | 209,171 |
4.65%, 6/1/2044 | 400,000 | 330,419 |
4.35%, 6/15/2045 | 400,000 | 315,199 |
5.15%, 11/15/2046 | 59,000 | 51,769 |
4.50%, 3/9/2048 | 10,000 | 7,980 |
4.55%, 3/9/2049 | 400,000 | 321,166 |
3.65%, 6/1/2051 | 490,000 | 335,151 |
3.30%, 2/1/2052 | 55,000 | 35,833 |
3.80%, 12/1/2057 | 10,000 | 6,733 |
3.85%, 6/1/2060 | 2,059,000 | 1,399,762 |
Bell Canada (The) (Canada) Series US-5, 2.15%, 2/15/2032 | 681,000 | 535,724 |
Bell Telephone Co. of Canada or Bell Canada (The) (Canada) 5.10%, 5/11/2033 | 10,000 | 9,645 |
Deutsche Telekom International Finance BV (Germany) 9.25%, 6/1/2032 | 136,000 | 171,028 |
Orange SA (France) 5.38%, 1/13/2042 | 189,000 | 181,061 |
Telefonica Emisiones SA (Spain) | ||
4.10%, 3/8/2027 | 1,243,000 | 1,183,161 |
7.05%, 6/20/2036 | 29,000 | 30,948 |
4.67%, 3/6/2038 | 1,264,000 | 1,045,564 |
TELUS Corp. (Canada) 3.40%, 5/13/2032 | 1,264,000 | 1,062,933 |
Verizon Communications, Inc. | ||
1.45%, 3/20/2026 | 2,030,000 | 1,841,048 |
4.13%, 3/16/2027 | 14,000 | 13,483 |
4.33%, 9/21/2028 | 231,000 | 221,175 |
1.75%, 1/20/2031 | 2,814,000 | 2,188,624 |
2.55%, 3/21/2031 | 176,000 | 144,838 |
2.36%, 3/15/2032 | 150,000 | 118,627 |
4.86%, 8/21/2046 | 150,000 | 131,796 |
2.88%, 11/20/2050 | 451,000 | 276,486 |
3.55%, 3/22/2051 | 238,000 | 166,401 |
5.01%, 8/21/2054 | 390,000 | 346,372 |
2.99%, 10/30/2056 | 248,000 | 148,118 |
3.00%, 11/20/2060 | 2,757,000 | 1,618,634 |
16,022,578 | ||
INVESTMENTS | PRINCIPAL AMOUNT($) | VALUE($) |
Electric Utilities — 1.5% | ||
AEP Texas, Inc. Series I, 2.10%, 7/1/2030 | 314,000 | 254,504 |
Alabama Power Co. | ||
Series 20-A, 1.45%, 9/15/2030 | 180,000 | 141,276 |
3.05%, 3/15/2032 | 975,000 | 836,650 |
3.75%, 3/1/2045 | 424,000 | 323,570 |
Series B, 3.70%, 12/1/2047 | 87,000 | 65,383 |
American Electric Power Co., Inc. 5.63%, 3/1/2033 | 62,000 | 62,121 |
Appalachian Power Co. | ||
Series AA, 2.70%, 4/1/2031 | 24,000 | 19,917 |
Series BB, 4.50%, 8/1/2032 | 150,000 | 139,364 |
Arizona Public Service Co. 6.35%, 12/15/2032 | 30,000 | 31,594 |
Avangrid, Inc. 3.80%, 6/1/2029 | 30,000 | 27,209 |
CenterPoint Energy Houston Electric LLC | ||
Series ai., 4.45%, 10/1/2032 | 50,000 | 47,370 |
Series AD, 2.90%, 7/1/2050 | 10,000 | 6,491 |
Cleveland Electric Illuminating Co. (The) 5.95%, 12/15/2036 | 100,000 | 98,696 |
Commonwealth Edison Co. | ||
2.55%, 6/15/2026 | 18,000 | 16,817 |
3.65%, 6/15/2046 | 100,000 | 75,195 |
Series 130, 3.13%, 3/15/2051 | 174,000 | 117,114 |
Connecticut Light and Power Co. (The) | ||
Series A, 2.05%, 7/1/2031 | 69,000 | 55,577 |
5.25%, 1/15/2053 | 304,000 | 296,927 |
Dayton Power & Light Co. (The) 3.95%, 6/15/2049 | 96,000 | 72,612 |
Dominion Energy South Carolina, Inc. 5.10%, 6/1/2065 | 1,000,000 | 930,790 |
DTE Electric Co. | ||
Series A, 1.90%, 4/1/2028 | 227,000 | 199,126 |
Series C, 2.63%, 3/1/2031 | 30,000 | 25,528 |
3.70%, 6/1/2046 | 300,000 | 227,783 |
3.75%, 8/15/2047 | 1,137,000 | 867,686 |
3.95%, 3/1/2049 | 240,000 | 190,254 |
Duke Energy Carolinas LLC | ||
2.45%, 2/1/2030 | 90,000 | 77,233 |
6.45%, 10/15/2032 | 30,000 | 32,077 |
3.75%, 6/1/2045 | 269,000 | 204,835 |
3.70%, 12/1/2047 | 1,076,000 | 812,895 |
3.95%, 3/15/2048 | 158,000 | 124,404 |
Duke Energy Corp. | ||
0.90%, 9/15/2025 | 90,000 | 82,160 |
3.75%, 9/1/2046 | 200,000 | 146,710 |
54 | J.P. Morgan Exchange-Traded Funds | August 31, 2023 |
INVESTMENTS | PRINCIPAL AMOUNT($) | VALUE($) |
Corporate Bonds — continued | ||
Electric Utilities — continued | ||
(US Treasury Yield Curve Rate T Note Constant Maturity 5 Year + 2.32%), 3.25%, 1/15/2082 (b) | 425,000 | 314,216 |
Duke Energy Florida LLC | ||
3.20%, 1/15/2027 | 31,000 | 29,310 |
6.40%, 6/15/2038 | 1,885,000 | 2,026,569 |
3.85%, 11/15/2042 | 20,000 | 15,732 |
Duke Energy Ohio, Inc. | ||
2.13%, 6/1/2030 | 200,000 | 164,598 |
5.25%, 4/1/2033 | 30,000 | 30,017 |
Duke Energy Progress LLC | ||
2.00%, 8/15/2031 | 10,000 | 7,947 |
5.25%, 3/15/2033 | 50,000 | 50,025 |
4.10%, 5/15/2042 | 275,000 | 226,439 |
Enel Americas SA (Chile) 4.00%, 10/25/2026 | 236,000 | 223,321 |
Entergy Arkansas LLC 2.65%, 6/15/2051 | 125,000 | 74,342 |
Entergy Corp. | ||
2.80%, 6/15/2030 | 20,000 | 16,879 |
2.40%, 6/15/2031 | 80,000 | 63,863 |
Entergy Louisiana LLC | ||
0.95%, 10/1/2024 | 99,000 | 93,982 |
1.60%, 12/15/2030 | 420,000 | 324,989 |
2.35%, 6/15/2032 | 75,000 | 59,598 |
Entergy Mississippi LLC | ||
3.85%, 6/1/2049 | 249,000 | 186,105 |
3.50%, 6/1/2051 | 503,000 | 351,872 |
Evergy Metro, Inc. Series 2020, 2.25%, 6/1/2030 | 300,000 | 248,257 |
Evergy, Inc. 2.45%, 9/15/2024 | 192,000 | 185,210 |
Eversource Energy | ||
Series L, 2.90%, 10/1/2024 | 155,000 | 150,358 |
4.60%, 7/1/2027 | 100,000 | 97,306 |
Exelon Corp. | ||
3.40%, 4/15/2026 | 500,000 | 475,393 |
4.70%, 4/15/2050 | 846,000 | 717,740 |
Florida Power & Light Co. | ||
4.80%, 5/15/2033 | 30,000 | 29,299 |
3.70%, 12/1/2047 | 1,376,000 | 1,068,549 |
Georgia Power Co. 4.95%, 5/17/2033 | 30,000 | 29,029 |
Hydro-Quebec (Canada) 8.50%, 12/1/2029 | 50,000 | 59,091 |
Iberdrola International BV (Spain) 5.81%, 3/15/2025 | 721,000 | 722,441 |
Interstate Power and Light Co. 3.50%, 9/30/2049 | 152,000 | 106,911 |
INVESTMENTS | PRINCIPAL AMOUNT($) | VALUE($) |
Electric Utilities — continued | ||
ITC Holdings Corp. | ||
3.65%, 6/15/2024 | 200,000 | 196,507 |
3.35%, 11/15/2027 | 10,000 | 9,288 |
MidAmerican Energy Co. 2.70%, 8/1/2052 | 25,000 | 15,168 |
National Grid USA 5.80%, 4/1/2035 | 41,000 | 40,380 |
Nevada Power Co. Series EE, 3.13%, 8/1/2050 | 1,115,000 | 707,693 |
NextEra Energy Capital Holdings, Inc. | ||
6.05%, 3/1/2025 | 1,338,000 | 1,343,539 |
1.88%, 1/15/2027 | 794,000 | 709,875 |
3.55%, 5/1/2027 | 100,000 | 94,250 |
4.90%, 2/28/2028 | 150,000 | 147,539 |
2.75%, 11/1/2029 | 287,000 | 248,233 |
5.00%, 2/28/2030 | 30,000 | 29,436 |
2.44%, 1/15/2032 | 130,000 | 104,145 |
5.00%, 7/15/2032 | 50,000 | 48,331 |
5.05%, 2/28/2033 | 150,000 | 145,112 |
3.00%, 1/15/2052 | 97,000 | 61,624 |
Northern States Power Co. 4.50%, 6/1/2052 | 500,000 | 432,761 |
NSTAR Electric Co. | ||
3.25%, 5/15/2029 | 172,000 | 157,574 |
3.95%, 4/1/2030 | 15,000 | 13,967 |
Oklahoma Gas and Electric Co. | ||
5.40%, 1/15/2033 | 30,000 | 29,984 |
4.15%, 4/1/2047 | 2,052,000 | 1,630,445 |
Oncor Electric Delivery Co. LLC | ||
4.55%, 9/15/2032 | 50,000 | 47,596 |
7.25%, 1/15/2033 | 459,000 | 523,247 |
Pacific Gas and Electric Co. | ||
3.30%, 12/1/2027 | 223,000 | 198,830 |
3.00%, 6/15/2028 | 285,000 | 247,651 |
3.25%, 6/1/2031 | 30,000 | 24,326 |
5.90%, 6/15/2032 | 50,000 | 47,871 |
4.45%, 4/15/2042 | 95,000 | 70,351 |
3.75%, 8/15/2042 (f) | 776,000 | 522,107 |
4.95%, 7/1/2050 | 948,000 | 733,610 |
3.50%, 8/1/2050 | 870,000 | 547,897 |
PacifiCorp | ||
3.30%, 3/15/2051 | 184,000 | 117,544 |
5.35%, 12/1/2053 | 100,000 | 86,307 |
PECO Energy Co. 3.05%, 3/15/2051 | 30,000 | 19,921 |
PG&E Wildfire Recovery Funding LLC Series A-4, 4.45%, 12/1/2047 | 250,000 | 218,025 |
August 31, 2023 | J.P. Morgan Exchange-Traded Funds | 55 |
AS OF August 31, 2023 (Unaudited) (continued)
INVESTMENTS | PRINCIPAL AMOUNT($) | VALUE($) |
Corporate Bonds — continued | ||
Electric Utilities — continued | ||
Potomac Electric Power Co. 4.15%, 3/15/2043 | 834,000 | 694,359 |
PPL Electric Utilities Corp. 4.15%, 10/1/2045 | 271,000 | 224,329 |
Public Service Co. of Colorado Series 36, 2.70%, 1/15/2051 | 408,000 | 245,430 |
Public Service Electric and Gas Co. | ||
3.00%, 5/15/2027 | 10,000 | 9,370 |
1.90%, 8/15/2031 | 764,000 | 610,691 |
SCE Recovery Funding LLC Series A-2, 2.94%, 11/15/2042 | 266,000 | 209,455 |
Southern California Edison Co. Series 20C, 1.20%, 2/1/2026 | 50,000 | 45,425 |
Southern Co. (The) | ||
4.48%, 8/1/2024 (f) | 150,000 | 148,121 |
Series A, 3.70%, 4/30/2030 | 397,000 | 359,566 |
5.70%, 10/15/2032 | 30,000 | 30,446 |
Series B, (US Treasury Yield Curve Rate T Note Constant Maturity 5 Year + 3.73%), 4.00%, 1/15/2051 (b) | 869,000 | 807,391 |
Southwestern Electric Power Co. | ||
Series J, 3.90%, 4/1/2045 | 802,000 | 590,925 |
3.25%, 11/1/2051 | 321,000 | 207,528 |
Tampa Electric Co. | ||
2.40%, 3/15/2031 | 50,000 | 40,756 |
4.35%, 5/15/2044 | 170,000 | 138,554 |
Union Electric Co. 3.90%, 9/15/2042 | 238,000 | 187,145 |
Virginia Electric & Power Co. 4.00%, 1/15/2043 | 15,000 | 12,175 |
Virginia Electric and Power Co. | ||
Series B, 2.95%, 11/15/2026 | 10,000 | 9,325 |
Series A, 3.80%, 4/1/2028 | 258,000 | 244,312 |
Series B, 3.80%, 9/15/2047 | 1,042,000 | 782,198 |
2.45%, 12/15/2050 | 87,000 | 50,242 |
Wisconsin Electric Power Co. | ||
2.05%, 12/15/2024 | 100,000 | 95,573 |
4.30%, 10/15/2048 | 179,000 | 149,782 |
Wisconsin Public Service Corp. 3.30%, 9/1/2049 | 10,000 | 6,926 |
Xcel Energy, Inc. | ||
3.40%, 6/1/2030 | 30,000 | 26,603 |
4.60%, 6/1/2032 | 30,000 | 28,020 |
30,285,037 | ||
Electrical Equipment — 0.0% ^ | ||
Eaton Corp. 4.15%, 3/15/2033 | 321,000 | 302,195 |
INVESTMENTS | PRINCIPAL AMOUNT($) | VALUE($) |
Electrical Equipment — continued | ||
Emerson Electric Co. 2.00%, 12/21/2028 | 45,000 | 39,100 |
Hubbell, Inc. 2.30%, 3/15/2031 | 30,000 | 24,521 |
Legrand France SA (France) 8.50%, 2/15/2025 | 300,000 | 312,466 |
Regal Rexnord Corp. 6.05%, 2/15/2026 (g) | 123,000 | 122,279 |
800,561 | ||
Electronic Equipment, Instruments & Components — 0.1% | ||
Allegion US Holding Co., Inc. 5.41%, 7/1/2032 | 30,000 | 29,211 |
Amphenol Corp. | ||
2.05%, 3/1/2025 | 280,000 | 266,213 |
2.80%, 2/15/2030 | 165,000 | 143,719 |
2.20%, 9/15/2031 | 50,000 | 40,435 |
Arrow Electronics, Inc. 2.95%, 2/15/2032 | 116,000 | 93,067 |
Avnet, Inc. 5.50%, 6/1/2032 | 16,000 | 15,153 |
CDW LLC | ||
5.50%, 12/1/2024 | 50,000 | 49,688 |
2.67%, 12/1/2026 | 59,000 | 53,639 |
Corning, Inc. 4.38%, 11/15/2057 | 233,000 | 188,280 |
Keysight Technologies, Inc. 3.00%, 10/30/2029 | 30,000 | 26,272 |
TD SYNNEX Corp. 2.65%, 8/9/2031 | 162,000 | 124,756 |
Teledyne Technologies, Inc. 2.75%, 4/1/2031 | 299,000 | 249,275 |
Trimble, Inc. 6.10%, 3/15/2033 | 1,112,000 | 1,123,731 |
Vontier Corp. 1.80%, 4/1/2026 | 149,000 | 133,945 |
2,537,384 | ||
Energy Equipment & Services — 0.0% ^ | ||
Halliburton Co. | ||
3.80%, 11/15/2025 | 30,000 | 29,238 |
4.85%, 11/15/2035 | 438,000 | 410,348 |
NOV, Inc. 3.60%, 12/1/2029 | 220,000 | 197,124 |
636,710 | ||
Entertainment — 0.3% | ||
Activision Blizzard, Inc. | ||
3.40%, 9/15/2026 | 30,000 | 28,665 |
3.40%, 6/15/2027 | 41,000 | 38,751 |
1.35%, 9/15/2030 | 198,000 | 158,105 |
2.50%, 9/15/2050 | 1,590,000 | 1,011,113 |
Electronic Arts, Inc. | ||
4.80%, 3/1/2026 (d) | 397,000 | 392,596 |
1.85%, 2/15/2031 | 185,000 | 147,942 |
56 | J.P. Morgan Exchange-Traded Funds | August 31, 2023 |
INVESTMENTS | PRINCIPAL AMOUNT($) | VALUE($) |
Corporate Bonds — continued | ||
Entertainment — continued | ||
Netflix, Inc. | ||
4.38%, 11/15/2026 | 30,000 | 29,170 |
4.88%, 4/15/2028 | 30,000 | 29,569 |
5.88%, 11/15/2028 | 30,000 | 30,849 |
Take-Two Interactive Software, Inc. 3.70%, 4/14/2027 | 242,000 | 229,304 |
TWDC Enterprises 18 Corp. | ||
2.95%, 6/15/2027 | 10,000 | 9,378 |
3.00%, 7/30/2046 | 2,593,000 | 1,775,491 |
Walt Disney Co. (The) | ||
1.75%, 8/30/2024 | 69,000 | 66,494 |
1.75%, 1/13/2026 | 30,000 | 27,758 |
2.65%, 1/13/2031 | 210,000 | 179,810 |
2.75%, 9/1/2049 | 452,000 | 290,030 |
3.60%, 1/13/2051 | 1,114,000 | 835,728 |
Warnermedia Holdings, Inc. | ||
3.64%, 3/15/2025 | 30,000 | 29,027 |
3.76%, 3/15/2027 | 10,000 | 9,374 |
5,319,154 | ||
Financial Services — 0.6% | ||
Berkshire Hathaway, Inc. 4.50%, 2/11/2043 | 35,000 | 32,791 |
Citigroup Global Markets Holdings, Inc. 0.75%, 6/7/2024 | 728,000 | 700,145 |
Corebridge Financial, Inc. | ||
3.50%, 4/4/2025 | 50,000 | 48,094 |
3.65%, 4/5/2027 | 100,000 | 94,014 |
Equitable Holdings, Inc. | ||
7.00%, 4/1/2028 | 100,000 | 105,428 |
4.35%, 4/20/2028 | 513,000 | 485,513 |
Fidelity National Information Services, Inc. | ||
2.25%, 3/1/2031 | 30,000 | 24,179 |
3.10%, 3/1/2041 | 30,000 | 20,843 |
4.50%, 8/15/2046 | 165,000 | 131,182 |
Fiserv, Inc. | ||
3.85%, 6/1/2025 | 350,000 | 339,661 |
2.65%, 6/1/2030 | 30,000 | 25,246 |
5.60%, 3/2/2033 | 50,000 | 50,219 |
Global Payments, Inc. | ||
2.15%, 1/15/2027 | 10,000 | 8,918 |
2.90%, 5/15/2030 | 504,000 | 425,536 |
2.90%, 11/15/2031 | 12,000 | 9,817 |
Mastercard, Inc. | ||
3.30%, 3/26/2027 | 10,000 | 9,512 |
INVESTMENTS | PRINCIPAL AMOUNT($) | VALUE($) |
Financial Services — continued | ||
4.85%, 3/9/2033 | 50,000 | 50,234 |
National Rural Utilities Cooperative Finance Corp. | ||
Series D, 1.00%, 10/18/2024 | 723,000 | 686,349 |
4.80%, 3/15/2028 | 20,000 | 19,779 |
1.35%, 3/15/2031 | 30,000 | 22,671 |
PayPal Holdings, Inc. | ||
2.40%, 10/1/2024 | 267,000 | 258,212 |
1.65%, 6/1/2025 | 202,000 | 189,241 |
2.85%, 10/1/2029 | 30,000 | 26,485 |
5.25%, 6/1/2062 | 108,000 | 102,781 |
Private Export Funding Corp. | ||
Series OO, 1.75%, 11/15/2024 | 100,000 | 95,645 |
Series PP, 1.40%, 7/15/2028 | 543,000 | 468,195 |
Shell International Finance BV (Netherlands) | ||
2.00%, 11/7/2024 | 568,000 | 546,169 |
2.88%, 5/10/2026 | 180,000 | 170,696 |
2.50%, 9/12/2026 | 160,000 | 148,794 |
3.88%, 11/13/2028 | 30,000 | 28,770 |
2.38%, 11/7/2029 | 177,000 | 153,799 |
4.13%, 5/11/2035 | 42,000 | 38,311 |
6.38%, 12/15/2038 | 782,000 | 860,092 |
3.13%, 11/7/2049 | 403,000 | 280,327 |
3.00%, 11/26/2051 | 2,098,000 | 1,405,131 |
Visa, Inc. | ||
0.75%, 8/15/2027 | 1,478,000 | 1,277,892 |
2.75%, 9/15/2027 | 30,000 | 27,819 |
2.70%, 4/15/2040 | 100,000 | 74,577 |
2.00%, 8/15/2050 | 1,972,000 | 1,166,344 |
Voya Financial, Inc. | ||
3.65%, 6/15/2026 | 170,000 | 160,557 |
5.70%, 7/15/2043 | 77,000 | 71,123 |
Western Union Co. (The) 2.85%, 1/10/2025 | 150,000 | 143,730 |
10,984,821 | ||
Food Products — 0.4% | ||
Archer-Daniels-Midland Co. 4.54%, 3/26/2042 | 205,000 | 184,185 |
Bunge Ltd. Finance Corp. | ||
3.75%, 9/25/2027 | 163,000 | 153,433 |
2.75%, 5/14/2031 | 50,000 | 41,830 |
Campbell Soup Co. 4.80%, 3/15/2048 | 81,000 | 70,016 |
Conagra Brands, Inc. | ||
1.38%, 11/1/2027 | 499,000 | 423,820 |
August 31, 2023 | J.P. Morgan Exchange-Traded Funds | 57 |
AS OF August 31, 2023 (Unaudited) (continued)
INVESTMENTS | PRINCIPAL AMOUNT($) | VALUE($) |
Corporate Bonds — continued | ||
Food Products — continued | ||
5.30%, 11/1/2038 | 302,000 | 278,770 |
Flowers Foods, Inc. 2.40%, 3/15/2031 | 94,000 | 76,096 |
Hormel Foods Corp. 1.70%, 6/3/2028 | 524,000 | 453,395 |
Ingredion, Inc. 2.90%, 6/1/2030 | 30,000 | 25,698 |
J M Smucker Co. (The) 3.38%, 12/15/2027 | 1,953,000 | 1,824,432 |
JBS USA LUX SA | ||
5.13%, 2/1/2028 | 150,000 | 145,799 |
3.00%, 2/2/2029 | 266,000 | 228,437 |
5.50%, 1/15/2030 | 1,030,000 | 995,573 |
3.75%, 12/1/2031 | 150,000 | 124,592 |
Kellogg Co. | ||
4.30%, 5/15/2028 | 510,000 | 490,315 |
5.25%, 3/1/2033 | 50,000 | 49,360 |
Kraft Heinz Foods Co. 6.50%, 2/9/2040 | 488,000 | 515,908 |
McCormick & Co., Inc. | ||
0.90%, 2/15/2026 | 11,000 | 9,900 |
4.95%, 4/15/2033 | 30,000 | 29,010 |
Mondelez International, Inc. | ||
1.50%, 2/4/2031 | 210,000 | 162,806 |
3.00%, 3/17/2032 | 30,000 | 25,624 |
Pilgrim's Pride Corp. 4.25%, 4/15/2031 | 10,000 | 8,657 |
Tyson Foods, Inc. | ||
3.55%, 6/2/2027 | 194,000 | 182,284 |
5.15%, 8/15/2044 | 211,000 | 187,861 |
Unilever Capital Corp. (United Kingdom) 2.90%, 5/5/2027 | 2,189,000 | 2,043,131 |
8,730,932 | ||
Gas Utilities — 0.1% | ||
Atmos Energy Corp. 1.50%, 1/15/2031 | 477,000 | 372,075 |
CenterPoint Energy Resources Corp. | ||
5.40%, 3/1/2033 | 30,000 | 30,006 |
5.85%, 1/15/2041 | 65,000 | 64,911 |
National Fuel Gas Co. 5.20%, 7/15/2025 | 488,000 | 479,764 |
Piedmont Natural Gas Co., Inc. 5.40%, 6/15/2033 | 21,000 | 20,689 |
Southern California Gas Co. Series VV, 4.30%, 1/15/2049 | 458,000 | 372,581 |
Washington Gas Light Co. 3.65%, 9/15/2049 | 129,000 | 92,170 |
1,432,196 | ||
Ground Transportation — 0.4% | ||
Burlington Northern Santa Fe LLC | ||
3.40%, 9/1/2024 | 447,000 | 437,653 |
INVESTMENTS | PRINCIPAL AMOUNT($) | VALUE($) |
Ground Transportation — continued | ||
3.55%, 2/15/2050 | 10,000 | 7,632 |
Canadian National Railway Co. (Canada) 2.75%, 3/1/2026 | 255,000 | 241,020 |
Canadian Pacific Railway Co. (Canada) | ||
1.35%, 12/2/2024 | 185,000 | 175,318 |
3.00%, 12/2/2041 | 315,000 | 261,232 |
4.30%, 5/15/2043 | 170,000 | 143,752 |
6.13%, 9/15/2115 | 123,000 | 127,497 |
CSX Corp. | ||
3.40%, 8/1/2024 | 210,000 | 205,747 |
4.10%, 11/15/2032 | 30,000 | 28,163 |
4.75%, 5/30/2042 | 686,000 | 620,721 |
4.30%, 3/1/2048 | 24,000 | 20,223 |
3.35%, 9/15/2049 | 37,000 | 26,242 |
2.50%, 5/15/2051 | 1,000,000 | 604,995 |
Norfolk Southern Corp. | ||
4.45%, 3/1/2033 | 50,000 | 47,393 |
4.45%, 6/15/2045 | 27,000 | 22,842 |
3.40%, 11/1/2049 | 228,000 | 161,353 |
2.90%, 8/25/2051 | 972,000 | 618,004 |
3.70%, 3/15/2053 | 514,000 | 382,058 |
3.16%, 5/15/2055 | 10,000 | 6,573 |
Ryder System, Inc. 1.75%, 9/1/2026 | 220,000 | 198,099 |
Union Pacific Corp. | ||
3.70%, 3/1/2029 | 10,000 | 9,473 |
2.80%, 2/14/2032 | 78,000 | 66,600 |
3.38%, 2/1/2035 | 1,184,000 | 999,812 |
3.38%, 2/14/2042 | 1,237,000 | 965,466 |
2.95%, 3/10/2052 | 705,000 | 470,092 |
4.10%, 9/15/2067 | 727,000 | 576,080 |
7,424,040 | ||
Health Care Equipment & Supplies — 0.3% | ||
Abbott Laboratories | ||
2.95%, 3/15/2025 | 122,000 | 118,099 |
6.15%, 11/30/2037 | 375,000 | 415,787 |
Baxter International, Inc. | ||
1.92%, 2/1/2027 | 99,000 | 88,064 |
2.27%, 12/1/2028 | 680,000 | 582,121 |
1.73%, 4/1/2031 | 485,000 | 373,677 |
2.54%, 2/1/2032 | 547,000 | 438,803 |
3.13%, 12/1/2051 | 1,646,000 | 1,046,797 |
Becton Dickinson & Co. | ||
2.82%, 5/20/2030 | 30,000 | 25,920 |
1.96%, 2/11/2031 | 645,000 | 518,650 |
58 | J.P. Morgan Exchange-Traded Funds | August 31, 2023 |
INVESTMENTS | PRINCIPAL AMOUNT($) | VALUE($) |
Corporate Bonds — continued | ||
Health Care Equipment & Supplies — continued | ||
4.30%, 8/22/2032 | 50,000 | 46,694 |
DENTSPLY SIRONA, Inc. 3.25%, 6/1/2030 | 1,459,000 | 1,251,449 |
Koninklijke Philips NV (Netherlands) 6.88%, 3/11/2038 | 79,000 | 85,440 |
Medtronic, Inc. 4.00%, 4/1/2043 | 77,000 | 65,387 |
Smith & Nephew plc (United Kingdom) 2.03%, 10/14/2030 | 30,000 | 23,734 |
Zimmer Biomet Holdings, Inc. | ||
2.60%, 11/24/2031 | 80,000 | 65,181 |
5.75%, 11/30/2039 | 82,000 | 78,936 |
5,224,739 | ||
Health Care Providers & Services — 1.1% | ||
Advocate Health & Hospitals Corp. Series 2020, 2.21%, 6/15/2030 | 52,000 | 43,105 |
Baptist Healthcare System Obligated Group Series 20B, 3.54%, 8/15/2050 | 54,000 | 38,565 |
Bon Secours Mercy Health, Inc. Series 20-2, 3.21%, 6/1/2050 | 118,000 | 79,667 |
Cardinal Health, Inc. | ||
3.75%, 9/15/2025 | 150,000 | 144,839 |
4.60%, 3/15/2043 | 51,000 | 41,446 |
4.50%, 11/15/2044 | 119,000 | 95,224 |
4.37%, 6/15/2047 | 250,000 | 199,910 |
Cencora, Inc. | ||
3.25%, 3/1/2025 | 55,000 | 53,219 |
2.70%, 3/15/2031 | 233,000 | 195,848 |
Centene Corp. | ||
4.63%, 12/15/2029 | 10,000 | 9,195 |
3.38%, 2/15/2030 | 698,000 | 596,947 |
Cigna Group (The) | ||
3.25%, 4/15/2025 | 10,000 | 9,632 |
3.40%, 3/1/2027 | 10,000 | 9,396 |
5.40%, 3/15/2033 | 50,000 | 50,188 |
3.40%, 3/15/2051 | 720,000 | 502,271 |
Cleveland Clinic Foundation (The) 4.86%, 1/1/2114 | 34,000 | 29,774 |
Cottage Health Obligated Group Series 2020, 3.30%, 11/1/2049 | 61,000 | 43,237 |
CVS Health Corp. | ||
3.88%, 7/20/2025 | 1,335,000 | 1,294,913 |
5.00%, 2/20/2026 | 150,000 | 148,875 |
3.00%, 8/15/2026 | 180,000 | 168,532 |
3.63%, 4/1/2027 | 50,000 | 47,321 |
4.30%, 3/25/2028 | 1,000,000 | 961,083 |
3.25%, 8/15/2029 | 30,000 | 26,792 |
INVESTMENTS | PRINCIPAL AMOUNT($) | VALUE($) |
Health Care Providers & Services — continued | ||
1.75%, 8/21/2030 | 238,000 | 188,700 |
2.13%, 9/15/2031 | 214,000 | 168,730 |
4.78%, 3/25/2038 | 30,000 | 26,887 |
6.13%, 9/15/2039 | 500,000 | 505,384 |
4.13%, 4/1/2040 | 690,000 | 561,231 |
2.70%, 8/21/2040 | 500,000 | 334,490 |
5.05%, 3/25/2048 | 993,000 | 871,950 |
Elevance Health, Inc. | ||
1.50%, 3/15/2026 | 181,000 | 164,331 |
2.25%, 5/15/2030 | 190,000 | 158,638 |
5.50%, 10/15/2032 | 1,036,000 | 1,055,345 |
4.75%, 2/15/2033 | 150,000 | 145,172 |
4.63%, 5/15/2042 | 10,000 | 8,879 |
4.38%, 12/1/2047 | 100,000 | 84,350 |
3.70%, 9/15/2049 | 761,000 | 567,161 |
Fred Hutchinson Cancer Center Series 2022, 4.97%, 1/1/2052 | 42,000 | 39,071 |
HCA, Inc. 3.13%, 3/15/2027 | 2,590,000 | 2,380,067 |
Humana, Inc. | ||
3.85%, 10/1/2024 | 10,000 | 9,793 |
2.15%, 2/3/2032 | 37,000 | 28,997 |
5.88%, 3/1/2033 | 50,000 | 51,717 |
4.80%, 3/15/2047 | 190,000 | 167,881 |
Iowa Health System Series 2020, 3.67%, 2/15/2050 | 194,000 | 141,155 |
Laboratory Corp. of America Holdings | ||
2.30%, 12/1/2024 | 25,000 | 23,905 |
3.60%, 2/1/2025 | 48,000 | 46,554 |
4.70%, 2/1/2045 | 202,000 | 172,936 |
Mass General Brigham, Inc. Series 2020, 3.34%, 7/1/2060 | 227,000 | 155,577 |
McKesson Corp. 5.10%, 7/15/2033 | 478,000 | 474,188 |
McLaren Health Care Corp. Series A, 4.39%, 5/15/2048 | 51,000 | 42,597 |
Memorial Sloan-Kettering Cancer Center 5.00%, 7/1/2042 | 147,000 | 140,691 |
Mount Nittany Medical Center Obligated Group Series 2022, 3.80%, 11/15/2052 | 43,000 | 32,229 |
MyMichigan Health Series 2020, 3.41%, 6/1/2050 | 273,000 | 188,161 |
New York and Presbyterian Hospital (The) Series 2019, 3.95%, 8/1/2119 | 268,000 | 188,761 |
Northwell Healthcare, Inc. 4.26%, 11/1/2047 | 91,000 | 72,007 |
August 31, 2023 | J.P. Morgan Exchange-Traded Funds | 59 |
AS OF August 31, 2023 (Unaudited) (continued)
INVESTMENTS | PRINCIPAL AMOUNT($) | VALUE($) |
Corporate Bonds — continued | ||
Health Care Providers & Services — continued | ||
OhioHealth Corp. Series 2020, 3.04%, 11/15/2050 | 79,000 | 55,306 |
Quest Diagnostics, Inc. 2.95%, 6/30/2030 | 30,000 | 25,995 |
Summa Health 3.51%, 11/15/2051 | 318,000 | 216,379 |
Toledo Hospital (The) 5.75%, 11/15/2038 | 81,000 | 78,345 |
Trinity Health Corp. 4.13%, 12/1/2045 | 1,582,000 | 1,311,123 |
UMass Memorial Health Care Obligated Group 5.36%, 7/1/2052 | 811,000 | 758,697 |
UnitedHealth Group, Inc. | ||
2.38%, 8/15/2024 (d) | 590,000 | 573,607 |
3.45%, 1/15/2027 | 30,000 | 28,619 |
3.38%, 4/15/2027 | 20,000 | 18,955 |
4.25%, 1/15/2029 | 30,000 | 29,076 |
2.00%, 5/15/2030 | 90,000 | 75,083 |
4.50%, 4/15/2033 | 18,000 | 17,334 |
5.80%, 3/15/2036 | 147,000 | 155,614 |
2.90%, 5/15/2050 | 520,000 | 345,585 |
3.25%, 5/15/2051 | 1,923,000 | 1,363,710 |
3.13%, 5/15/2060 | 1,845,000 | 1,213,648 |
UPMC Series D-1, 3.60%, 4/3/2025 | 2,335,000 | 2,251,254 |
22,505,844 | ||
Health Care REITs — 0.1% | ||
Healthpeak OP LLC | ||
3.25%, 7/15/2026 | 150,000 | 141,867 |
2.88%, 1/15/2031 (d) | 514,000 | 430,352 |
6.75%, 2/1/2041 | 82,000 | 85,666 |
Omega Healthcare Investors, Inc. 4.50%, 1/15/2025 | 400,000 | 390,022 |
Physicians Realty LP 4.30%, 3/15/2027 | 202,000 | 193,296 |
Ventas Realty LP | ||
4.00%, 3/1/2028 | 317,000 | 294,614 |
5.70%, 9/30/2043 | 156,000 | 143,195 |
Welltower OP LLC | ||
4.00%, 6/1/2025 | 250,000 | 242,427 |
2.75%, 1/15/2031 | 50,000 | 41,256 |
4.95%, 9/1/2048 | 160,000 | 139,245 |
2,101,940 | ||
Hotels, Restaurants & Leisure — 0.2% | ||
Booking Holdings, Inc. | ||
3.55%, 3/15/2028 | 307,000 | 289,679 |
4.63%, 4/13/2030 | 650,000 | 635,432 |
Darden Restaurants, Inc. 3.85%, 5/1/2027 (d) | 22,000 | 20,870 |
INVESTMENTS | PRINCIPAL AMOUNT($) | VALUE($) |
Hotels, Restaurants & Leisure — continued | ||
Expedia Group, Inc. | ||
5.00%, 2/15/2026 | 517,000 | 510,652 |
3.25%, 2/15/2030 | 601,000 | 523,267 |
2.95%, 3/15/2031 | 30,000 | 25,089 |
Hyatt Hotels Corp. 5.75%, 4/23/2030 (f) | 100,000 | 100,100 |
Marriott International, Inc. Series GG, 3.50%, 10/15/2032 | 30,000 | 25,481 |
McDonald's Corp. | ||
1.45%, 9/1/2025 | 15,000 | 13,931 |
4.60%, 9/9/2032 | 30,000 | 29,291 |
4.70%, 12/9/2035 | 101,000 | 96,458 |
4.60%, 5/26/2045 | 656,000 | 580,257 |
Starbucks Corp. | ||
2.00%, 3/12/2027 | 274,000 | 247,225 |
3.00%, 2/14/2032 | 793,000 | 680,194 |
4.80%, 2/15/2033 | 50,000 | 48,802 |
3,826,728 | ||
Household Durables — 0.1% | ||
DR Horton, Inc. 2.50%, 10/15/2024 | 200,000 | 192,848 |
Leggett & Platt, Inc. 4.40%, 3/15/2029 | 179,000 | 169,164 |
Lennar Corp. 4.75%, 11/29/2027 | 150,000 | 145,368 |
NVR, Inc. 3.00%, 5/15/2030 | 115,000 | 98,458 |
PulteGroup, Inc. | ||
7.88%, 6/15/2032 | 85,000 | 97,191 |
6.00%, 2/15/2035 | 30,000 | 30,153 |
Toll Brothers Finance Corp. 4.88%, 11/15/2025 | 50,000 | 48,926 |
Whirlpool Corp. | ||
4.70%, 5/14/2032 | 100,000 | 94,556 |
5.50%, 3/1/2033 | 30,000 | 29,752 |
906,416 | ||
Household Products — 0.1% | ||
Church & Dwight Co., Inc. | ||
5.60%, 11/15/2032 | 250,000 | 258,576 |
3.95%, 8/1/2047 | 104,000 | 84,356 |
Clorox Co. (The) 4.40%, 5/1/2029 | 219,000 | 211,922 |
Colgate-Palmolive Co. | ||
3.25%, 8/15/2032 | 229,000 | 206,865 |
4.60%, 3/1/2033 | 80,000 | 80,026 |
Kimberly-Clark Corp. | ||
3.10%, 3/26/2030 | 40,000 | 36,086 |
6.63%, 8/1/2037 | 1,000,000 | 1,149,195 |
5.30%, 3/1/2041 | 181,000 | 183,257 |
60 | J.P. Morgan Exchange-Traded Funds | August 31, 2023 |
INVESTMENTS | PRINCIPAL AMOUNT($) | VALUE($) |
Corporate Bonds — continued | ||
Household Products — continued | ||
Procter & Gamble Co. (The) | ||
4.10%, 1/26/2026 | 150,000 | 147,950 |
3.00%, 3/25/2030 | 30,000 | 27,402 |
4.05%, 1/26/2033 | 533,000 | 517,986 |
2,903,621 | ||
Independent Power and Renewable Electricity Producers — 0.0% ^ | ||
AES Corp. (The) | ||
1.38%, 1/15/2026 | 120,000 | 107,858 |
2.45%, 1/15/2031 | 30,000 | 23,828 |
Constellation Energy Generation LLC | ||
6.25%, 10/1/2039 | 10,000 | 10,127 |
5.75%, 10/1/2041 | 90,000 | 86,055 |
5.60%, 6/15/2042 | 106,000 | 100,139 |
Oglethorpe Power Corp. 3.75%, 8/1/2050 | 163,000 | 115,906 |
443,913 | ||
Industrial Conglomerates — 0.1% | ||
3M Co. | ||
2.88%, 10/15/2027 (d) | 150,000 | 138,132 |
3.63%, 9/14/2028 | 29,000 | 27,128 |
3.63%, 10/15/2047 | 306,000 | 228,587 |
3.25%, 8/26/2049 (d) | 495,000 | 342,582 |
GE Capital Funding LLC 4.55%, 5/15/2032 (d) | 278,000 | 265,104 |
Honeywell International, Inc. | ||
2.70%, 8/15/2029 | 176,000 | 156,645 |
5.00%, 2/15/2033 | 426,000 | 429,303 |
4.50%, 1/15/2034 | 544,000 | 525,524 |
Pentair Finance SARL 4.50%, 7/1/2029 | 30,000 | 28,042 |
2,141,047 | ||
Industrial REITs — 0.0% ^ | ||
LXP Industrial Trust 2.70%, 9/15/2030 | 10,000 | 7,912 |
Prologis LP | ||
4.88%, 6/15/2028 | 50,000 | 49,487 |
3.88%, 9/15/2028 | 130,000 | 122,857 |
1.75%, 7/1/2030 | 150,000 | 119,863 |
1.75%, 2/1/2031 | 542,000 | 427,626 |
5.13%, 1/15/2034 | 50,000 | 49,167 |
Rexford Industrial Realty LP 2.13%, 12/1/2030 | 26,000 | 20,295 |
797,207 | ||
Insurance — 0.7% | ||
Allstate Corp. (The) | ||
3.28%, 12/15/2026 | 637,000 | 602,017 |
INVESTMENTS | PRINCIPAL AMOUNT($) | VALUE($) |
Insurance — continued | ||
1.45%, 12/15/2030 | 329,000 | 252,062 |
4.50%, 6/15/2043 | 242,000 | 203,199 |
American International Group, Inc. | ||
3.88%, 1/15/2035 | 430,000 | 371,501 |
4.75%, 4/1/2048 | 149,000 | 131,084 |
Aon Corp. | ||
2.60%, 12/2/2031 | 50,000 | 41,024 |
3.90%, 2/28/2052 | 175,000 | 133,937 |
Aon Global Ltd. | ||
3.88%, 12/15/2025 | 62,000 | 59,999 |
4.75%, 5/15/2045 | 251,000 | 218,775 |
Arch Capital Finance LLC 4.01%, 12/15/2026 | 30,000 | 28,622 |
Arch Capital Group Ltd. 3.64%, 6/30/2050 | 167,000 | 120,404 |
Arthur J Gallagher & Co. 2.40%, 11/9/2031 | 130,000 | 103,092 |
Berkshire Hathaway Finance Corp. 2.50%, 1/15/2051 | 273,000 | 170,170 |
Brighthouse Financial, Inc. 3.70%, 6/22/2027 | 25,000 | 23,108 |
Brown & Brown, Inc. 4.50%, 3/15/2029 | 253,000 | 238,040 |
Chubb INA Holdings, Inc. | ||
3.35%, 5/3/2026 | 10,000 | 9,580 |
3.05%, 12/15/2061 | 269,000 | 174,288 |
CNA Financial Corp. | ||
3.90%, 5/1/2029 | 10,000 | 9,305 |
5.50%, 6/15/2033 | 126,000 | 123,085 |
Hanover Insurance Group, Inc. (The) 4.50%, 4/15/2026 | 432,000 | 419,379 |
Hartford Financial Services Group, Inc. (The) 2.80%, 8/19/2029 | 668,000 | 584,312 |
Lincoln National Corp. | ||
3.80%, 3/1/2028 (d) | 269,000 | 246,671 |
3.05%, 1/15/2030 (d) | 1,413,000 | 1,188,355 |
3.40%, 1/15/2031 (d) | 674,000 | 568,451 |
7.00%, 6/15/2040 | 152,000 | 159,577 |
Loews Corp. 3.75%, 4/1/2026 | 414,000 | 398,695 |
Manulife Financial Corp. (Canada) | ||
(USD ICE Swap Rate 5 Year + 1.65%), 4.06%, 2/24/2032 (b) | 98,000 | 91,751 |
3.70%, 3/16/2032 | 233,000 | 208,984 |
Markel Group, Inc. | ||
3.35%, 9/17/2029 | 73,000 | 65,368 |
4.30%, 11/1/2047 | 157,000 | 121,161 |
Marsh & McLennan Cos., Inc. | ||
3.75%, 3/14/2026 | 72,000 | 69,564 |
August 31, 2023 | J.P. Morgan Exchange-Traded Funds | 61 |
AS OF August 31, 2023 (Unaudited) (continued)
INVESTMENTS | PRINCIPAL AMOUNT($) | VALUE($) |
Corporate Bonds — continued | ||
Insurance — continued | ||
2.25%, 11/15/2030 | 1,794,000 | 1,480,948 |
MetLife, Inc. | ||
6.38%, 6/15/2034 | 750,000 | 805,502 |
5.70%, 6/15/2035 | 831,000 | 850,593 |
4.13%, 8/13/2042 | 60,000 | 49,723 |
4.88%, 11/13/2043 | 586,000 | 534,323 |
4.05%, 3/1/2045 | 222,000 | 181,479 |
Nationwide Financial Services, Inc. 6.75%, 5/15/2037 | 260,000 | 249,524 |
Principal Financial Group, Inc. 5.38%, 3/15/2033 | 50,000 | 49,501 |
Progressive Corp. (The) 4.00%, 3/1/2029 | 44,000 | 42,301 |
Prudential Financial, Inc. | ||
(ICE LIBOR USD 3 Month + 3.03%), 5.38%, 5/15/2045 (b) | 677,000 | 662,126 |
3.94%, 12/7/2049 | 731,000 | 561,450 |
3.70%, 3/13/2051 | 93,000 | 69,312 |
Reinsurance Group of America, Inc. 3.90%, 5/15/2029 | 28,000 | 25,649 |
Selective Insurance Group, Inc. 5.38%, 3/1/2049 | 34,000 | 30,554 |
Travelers Cos., Inc. (The) | ||
4.60%, 8/1/2043 | 127,000 | 114,141 |
3.05%, 6/8/2051 | 23,000 | 15,860 |
Willis North America, Inc. 3.60%, 5/15/2024 | 100,000 | 98,207 |
12,956,753 | ||
Interactive Media & Services — 0.2% | ||
Alphabet, Inc. | ||
0.45%, 8/15/2025 | 1,754,000 | 1,609,615 |
2.05%, 8/15/2050 | 742,000 | 443,971 |
Baidu, Inc. (China) | ||
1.72%, 4/9/2026 | 946,000 | 857,060 |
2.38%, 10/9/2030 | 200,000 | 162,262 |
Meta Platforms, Inc. 4.45%, 8/15/2052 | 307,000 | 260,232 |
3,333,140 | ||
IT Services — 0.2% | ||
Amdocs Ltd. 2.54%, 6/15/2030 | 203,000 | 166,721 |
Genpact Luxembourg SARL 1.75%, 4/10/2026 | 380,000 | 343,476 |
International Business Machines Corp. | ||
4.50%, 2/6/2026 | 450,000 | 442,685 |
3.45%, 2/19/2026 | 150,000 | 143,790 |
4.40%, 7/27/2032 | 100,000 | 95,218 |
5.88%, 11/29/2032 | 1,233,000 | 1,307,978 |
INVESTMENTS | PRINCIPAL AMOUNT($) | VALUE($) |
IT Services — continued | ||
4.75%, 2/6/2033 (d) | 150,000 | 146,316 |
4.00%, 6/20/2042 | 97,000 | 79,695 |
Kyndryl Holdings, Inc. 2.05%, 10/15/2026 | 286,000 | 251,438 |
VeriSign, Inc. 2.70%, 6/15/2031 | 164,000 | 134,334 |
3,111,651 | ||
Leisure Products — 0.0% ^ | ||
Brunswick Corp. 4.40%, 9/15/2032 | 30,000 | 25,752 |
Hasbro, Inc. 3.90%, 11/19/2029 | 227,000 | 206,163 |
231,915 | ||
Life Sciences Tools & Services — 0.1% | ||
Revvity, Inc. 2.55%, 3/15/2031 | 15,000 | 12,264 |
Thermo Fisher Scientific, Inc. | ||
1.75%, 10/15/2028 | 2,962,000 | 2,549,937 |
2.00%, 10/15/2031 | 225,000 | 181,232 |
2,743,433 | ||
Machinery — 0.2% | ||
CNH Industrial Capital LLC 5.45%, 10/14/2025 | 150,000 | 149,510 |
Cummins, Inc. | ||
1.50%, 9/1/2030 | 76,000 | 61,084 |
2.60%, 9/1/2050 (d) | 1,155,000 | 714,705 |
Dover Corp. 3.15%, 11/15/2025 | 645,000 | 613,933 |
Flowserve Corp. 2.80%, 1/15/2032 | 50,000 | 39,672 |
IDEX Corp. 3.00%, 5/1/2030 | 30,000 | 26,061 |
Illinois Tool Works, Inc. 4.88%, 9/15/2041 | 128,000 | 124,118 |
Otis Worldwide Corp. 2.29%, 4/5/2027 | 10,000 | 9,086 |
Parker-Hannifin Corp. 4.25%, 9/15/2027 | 150,000 | 145,632 |
Snap-on, Inc. 3.10%, 5/1/2050 | 256,000 | 180,748 |
Stanley Black & Decker, Inc. 2.30%, 2/24/2025 | 1,434,000 | 1,364,910 |
Xylem, Inc. 4.38%, 11/1/2046 | 66,000 | 53,497 |
3,482,956 | ||
Media — 0.5% | ||
Charter Communications Operating LLC | ||
2.25%, 1/15/2029 | 330,000 | 273,782 |
6.83%, 10/23/2055 | 878,000 | 818,697 |
3.95%, 6/30/2062 | 1,095,000 | 659,190 |
Comcast Corp. | ||
3.38%, 8/15/2025 | 372,000 | 359,586 |
3.95%, 10/15/2025 | 30,000 | 29,217 |
3.15%, 3/1/2026 | 489,000 | 466,987 |
3.30%, 2/1/2027 | 306,000 | 289,298 |
3.30%, 4/1/2027 | 30,000 | 28,301 |
62 | J.P. Morgan Exchange-Traded Funds | August 31, 2023 |
INVESTMENTS | PRINCIPAL AMOUNT($) | VALUE($) |
Corporate Bonds — continued | ||
Media — continued | ||
4.40%, 8/15/2035 | 38,000 | 35,133 |
3.20%, 7/15/2036 | 445,000 | 359,597 |
3.25%, 11/1/2039 | 2,735,000 | 2,106,027 |
4.00%, 11/1/2049 | 491,000 | 391,019 |
2.80%, 1/15/2051 | 69,000 | 43,585 |
2.89%, 11/1/2051 | 250,000 | 159,750 |
Discovery Communications LLC 4.90%, 3/11/2026 | 150,000 | 147,364 |
Fox Corp. 4.71%, 1/25/2029 | 1,112,000 | 1,071,889 |
Interpublic Group of Cos., Inc. (The) 2.40%, 3/1/2031 | 40,000 | 32,301 |
Omnicom Group, Inc. | ||
2.45%, 4/30/2030 | 30,000 | 24,866 |
2.60%, 8/1/2031 | 435,000 | 355,879 |
Paramount Global | ||
3.70%, 6/1/2028 | 30,000 | 26,858 |
4.20%, 5/19/2032 (d) | 2,074,000 | 1,725,320 |
4.38%, 3/15/2043 | 541,000 | 372,663 |
Time Warner Cable LLC | ||
6.55%, 5/1/2037 | 22,000 | 20,877 |
5.50%, 9/1/2041 | 92,000 | 75,441 |
9,873,627 | ||
Metals & Mining — 0.3% | ||
ArcelorMittal SA (Luxembourg) | ||
6.55%, 11/29/2027 | 150,000 | 153,627 |
4.25%, 7/16/2029 | 20,000 | 18,941 |
Barrick Gold Corp. (Canada) 6.45%, 10/15/2035 | 63,000 | 65,941 |
BHP Billiton Finance USA Ltd. (Australia) 4.75%, 2/28/2028 | 150,000 | 148,601 |
Freeport-McMoRan, Inc. | ||
4.38%, 8/1/2028 | 763,000 | 708,758 |
5.45%, 3/15/2043 | 798,000 | 715,120 |
Newmont Corp. | ||
2.25%, 10/1/2030 | 252,000 | 204,736 |
4.88%, 3/15/2042 | 2,000,000 | 1,797,820 |
5.45%, 6/9/2044 | 176,000 | 167,395 |
Rio Tinto Finance USA plc (Australia) | ||
5.00%, 3/9/2033 | 50,000 | 49,670 |
4.75%, 3/22/2042 | 274,000 | 253,842 |
Southern Copper Corp. (Mexico) | ||
7.50%, 7/27/2035 | 423,000 | 479,856 |
6.75%, 4/16/2040 | 229,000 | 248,582 |
Steel Dynamics, Inc. 3.25%, 10/15/2050 | 39,000 | 25,196 |
INVESTMENTS | PRINCIPAL AMOUNT($) | VALUE($) |
Metals & Mining — continued | ||
Teck Resources Ltd. (Canada) 5.40%, 2/1/2043 | 10,000 | 8,767 |
Vale Overseas Ltd. (Brazil) | ||
3.75%, 7/8/2030 | 100,000 | 87,631 |
6.88%, 11/21/2036 | 10,000 | 10,394 |
Yamana Gold, Inc. (Canada) 2.63%, 8/15/2031 | 1,899,000 | 1,497,318 |
6,642,195 | ||
Multi-Utilities — 0.5% | ||
Ameren Corp. 1.75%, 3/15/2028 | 3,719,000 | 3,194,632 |
Avista Corp. 4.00%, 4/1/2052 | 172,000 | 131,338 |
Berkshire Hathaway Energy Co. | ||
1.65%, 5/15/2031 (d) | 348,000 | 269,073 |
2.85%, 5/15/2051 | 517,000 | 320,316 |
Black Hills Corp. | ||
3.95%, 1/15/2026 | 100,000 | 95,824 |
5.95%, 3/15/2028 | 996,000 | 1,010,599 |
2.50%, 6/15/2030 | 30,000 | 24,596 |
CenterPoint Energy, Inc. 2.95%, 3/1/2030 | 30,000 | 25,813 |
Consolidated Edison Co. of New York, Inc. | ||
2.40%, 6/15/2031 | 65,000 | 53,903 |
Series 12-A, 4.20%, 3/15/2042 | 23,000 | 19,153 |
3.70%, 11/15/2059 | 1,861,000 | 1,314,977 |
Consumers Energy Co. | ||
3.95%, 5/15/2043 | 406,000 | 330,357 |
3.25%, 8/15/2046 | 160,000 | 114,922 |
3.10%, 8/15/2050 | 10,000 | 6,855 |
Dominion Energy, Inc. | ||
Series D, 2.85%, 8/15/2026 | 150,000 | 139,488 |
Series C, 3.38%, 4/1/2030 | 30,000 | 26,469 |
Series A, 4.35%, 8/15/2032 | 150,000 | 138,623 |
Series C, 4.05%, 9/15/2042 | 40,000 | 30,917 |
4.70%, 12/1/2044 | 249,000 | 209,163 |
DTE Energy Co. 2.95%, 3/1/2030 | 538,000 | 462,496 |
NiSource, Inc. | ||
0.95%, 8/15/2025 | 10,000 | 9,164 |
3.49%, 5/15/2027 | 10,000 | 9,384 |
2.95%, 9/1/2029 | 30,000 | 26,399 |
5.40%, 6/30/2033 | 30,000 | 29,720 |
5.25%, 2/15/2043 | 283,000 | 262,872 |
NorthWestern Corp. 4.18%, 11/15/2044 | 54,000 | 43,121 |
PG&E Energy Recovery Funding LLC Series A-1, 1.46%, 7/15/2031 | 414,449 | 358,795 |
Public Service Enterprise Group, Inc. 1.60%, 8/15/2030 | 84,000 | 66,059 |
August 31, 2023 | J.P. Morgan Exchange-Traded Funds | 63 |
AS OF August 31, 2023 (Unaudited) (continued)
INVESTMENTS | PRINCIPAL AMOUNT($) | VALUE($) |
Corporate Bonds — continued | ||
Multi-Utilities — continued | ||
Puget Sound Energy, Inc. | ||
5.80%, 3/15/2040 | 80,000 | 79,220 |
3.25%, 9/15/2049 | 232,000 | 158,348 |
San Diego Gas & Electric Co. Series XXX, 3.00%, 3/15/2032 | 50,000 | 42,519 |
Sempra | ||
5.50%, 8/1/2033 | 30,000 | 29,753 |
(US Treasury Yield Curve Rate T Note Constant Maturity 5 Year + 2.87%), 4.13%, 4/1/2052 (b) | 9,000 | 7,287 |
Southern Co. Gas Capital Corp. | ||
5.15%, 9/15/2032 | 850,000 | 829,719 |
4.40%, 5/30/2047 | 100,000 | 80,580 |
9,952,454 | ||
Office REITs — 0.2% | ||
Alexandria Real Estate Equities, Inc. | ||
3.95%, 1/15/2028 | 50,000 | 46,928 |
2.00%, 5/18/2032 | 229,000 | 173,464 |
3.55%, 3/15/2052 | 11,000 | 7,508 |
Boston Properties LP | ||
3.20%, 1/15/2025 | 10,000 | 9,592 |
3.65%, 2/1/2026 | 150,000 | 141,332 |
2.75%, 10/1/2026 | 65,000 | 58,639 |
3.25%, 1/30/2031 | 660,000 | 537,368 |
2.55%, 4/1/2032 | 708,000 | 530,330 |
2.45%, 10/1/2033 | 532,000 | 376,837 |
Highwoods Realty LP 4.13%, 3/15/2028 | 158,000 | 142,059 |
Hudson Pacific Properties LP | ||
5.95%, 2/15/2028 | 91,000 | 76,895 |
3.25%, 1/15/2030 | 814,000 | 552,746 |
Kilroy Realty LP | ||
4.75%, 12/15/2028 | 50,000 | 45,028 |
2.65%, 11/15/2033 | 1,723,000 | 1,196,468 |
3,895,194 | ||
Oil, Gas & Consumable Fuels — 1.7% | ||
Boardwalk Pipelines LP 4.80%, 5/3/2029 | 183,000 | 174,138 |
BP Capital Markets America, Inc. | ||
3.80%, 9/21/2025 | 30,000 | 29,205 |
1.75%, 8/10/2030 | 150,000 | 121,652 |
2.72%, 1/12/2032 | 230,000 | 192,518 |
3.06%, 6/17/2041 | 25,000 | 18,301 |
3.00%, 2/24/2050 | 923,000 | 614,535 |
2.94%, 6/4/2051 | 198,000 | 129,430 |
3.00%, 3/17/2052 | 185,000 | 121,458 |
INVESTMENTS | PRINCIPAL AMOUNT($) | VALUE($) |
Oil, Gas & Consumable Fuels — continued | ||
BP Capital Markets plc (United Kingdom) 3.28%, 9/19/2027 | 30,000 | 28,249 |
Canadian Natural Resources Ltd. (Canada) | ||
2.05%, 7/15/2025 | 2,136,000 | 2,001,278 |
3.85%, 6/1/2027 | 30,000 | 28,389 |
2.95%, 7/15/2030 | 30,000 | 25,602 |
Cenovus Energy, Inc. (Canada) | ||
2.65%, 1/15/2032 | 25,000 | 20,108 |
5.40%, 6/15/2047 | 183,000 | 164,442 |
Cheniere Energy, Inc. 4.63%, 10/15/2028 | 391,000 | 368,199 |
Chevron Corp. | ||
1.55%, 5/11/2025 | 74,000 | 69,620 |
2.00%, 5/11/2027 | 10,000 | 9,064 |
Chevron USA, Inc. 0.69%, 8/12/2025 | 1,996,000 | 1,836,041 |
CNOOC Finance 2014 ULC (China) 4.25%, 4/30/2024 | 250,000 | 247,464 |
CNOOC Finance 2015 USA LLC (China) 3.50%, 5/5/2025 (d) | 401,000 | 388,098 |
CNOOC Petroleum North America ULC (China) 5.88%, 3/10/2035 | 275,000 | 283,942 |
Continental Resources, Inc. 4.38%, 1/15/2028 | 229,000 | 215,503 |
Devon Energy Corp. | ||
4.50%, 1/15/2030 | 1,048,000 | 979,881 |
7.95%, 4/15/2032 | 30,000 | 34,041 |
Diamondback Energy, Inc. | ||
3.13%, 3/24/2031 | 50,000 | 42,965 |
4.40%, 3/24/2051 | 53,000 | 41,166 |
6.25%, 3/15/2053 | 10,000 | 9,967 |
Enbridge, Inc. (Canada) | ||
2.50%, 2/14/2025 | 50,000 | 47,767 |
2.50%, 8/1/2033 | 1,389,000 | 1,077,234 |
3.40%, 8/1/2051 | 10,000 | 6,717 |
Energy Transfer LP | ||
4.75%, 1/15/2026 | 30,000 | 29,382 |
5.50%, 6/1/2027 | 150,000 | 149,146 |
4.95%, 6/15/2028 | 30,000 | 29,050 |
5.25%, 4/15/2029 | 1,000,000 | 976,561 |
5.75%, 2/15/2033 | 30,000 | 29,794 |
5.35%, 5/15/2045 | 851,000 | 727,162 |
6.25%, 4/15/2049 | 321,000 | 306,830 |
5.00%, 5/15/2050 | 299,000 | 246,046 |
Enterprise Products Operating LLC | ||
4.45%, 2/15/2043 | 1,238,000 | 1,051,975 |
64 | J.P. Morgan Exchange-Traded Funds | August 31, 2023 |
INVESTMENTS | PRINCIPAL AMOUNT($) | VALUE($) |
Corporate Bonds — continued | ||
Oil, Gas & Consumable Fuels — continued | ||
(3-MONTH CME TERM SOFR + 2.83%), 5.38%, 2/15/2078 (b) | 398,000 | 330,765 |
EOG Resources, Inc. | ||
3.15%, 4/1/2025 | 1,115,000 | 1,078,465 |
4.15%, 1/15/2026 | 1,268,000 | 1,241,405 |
3.90%, 4/1/2035 | 30,000 | 26,508 |
Equinor ASA (Norway) 2.88%, 4/6/2025 | 897,000 | 865,330 |
Exxon Mobil Corp. | ||
2.99%, 3/19/2025 | 297,000 | 287,562 |
3.29%, 3/19/2027 | 30,000 | 28,609 |
3.48%, 3/19/2030 | 1,000,000 | 925,141 |
4.11%, 3/1/2046 | 483,000 | 410,098 |
3.45%, 4/15/2051 | 230,000 | 171,065 |
Hess Corp. 7.30%, 8/15/2031 | 287,000 | 312,927 |
Kinder Morgan Energy Partners LP | ||
6.50%, 2/1/2037 | 105,000 | 104,904 |
6.95%, 1/15/2038 | 98,000 | 104,867 |
6.38%, 3/1/2041 | 250,000 | 247,268 |
Kinder Morgan, Inc. | ||
2.00%, 2/15/2031 | 326,000 | 256,215 |
4.80%, 2/1/2033 | 2,001,000 | 1,865,056 |
5.55%, 6/1/2045 | 217,000 | 196,303 |
5.20%, 3/1/2048 | 842,000 | 725,342 |
Marathon Oil Corp. | ||
4.40%, 7/15/2027 | 195,000 | 185,923 |
6.80%, 3/15/2032 | 98,000 | 102,158 |
Marathon Petroleum Corp. | ||
5.13%, 12/15/2026 | 83,000 | 82,614 |
6.50%, 3/1/2041 | 170,000 | 173,613 |
MPLX LP | ||
4.88%, 12/1/2024 | 185,000 | 182,639 |
5.20%, 3/1/2047 | 490,000 | 422,272 |
4.70%, 4/15/2048 | 165,000 | 132,486 |
Occidental Petroleum Corp. | ||
5.50%, 12/1/2025 | 30,000 | 29,721 |
5.55%, 3/15/2026 | 30,000 | 29,739 |
8.50%, 7/15/2027 | 559,000 | 604,286 |
ONEOK, Inc. | ||
4.55%, 7/15/2028 | 560,000 | 533,981 |
3.10%, 3/15/2030 | 27,000 | 23,177 |
4.45%, 9/1/2049 | 100,000 | 74,990 |
Ovintiv, Inc. | ||
5.65%, 5/15/2028 | 497,000 | 493,924 |
6.25%, 7/15/2033 | 28,000 | 27,940 |
Phillips 66 2.15%, 12/15/2030 | 250,000 | 202,530 |
INVESTMENTS | PRINCIPAL AMOUNT($) | VALUE($) |
Oil, Gas & Consumable Fuels — continued | ||
Phillips 66 Co. 3.75%, 3/1/2028 | 1,141,000 | 1,074,001 |
Pioneer Natural Resources Co. 1.13%, 1/15/2026 | 814,000 | 737,630 |
Plains All American Pipeline LP | ||
3.55%, 12/15/2029 | 30,000 | 26,407 |
6.65%, 1/15/2037 | 36,000 | 36,536 |
Sabine Pass Liquefaction LLC | ||
5.88%, 6/30/2026 | 150,000 | 150,688 |
4.20%, 3/15/2028 | 150,000 | 142,142 |
Targa Resources Partners LP | ||
6.50%, 7/15/2027 | 450,000 | 452,456 |
4.00%, 1/15/2032 | 50,000 | 43,328 |
TC PipeLines LP | ||
4.38%, 3/13/2025 | 400,000 | 389,953 |
3.90%, 5/25/2027 | 79,000 | 74,593 |
Tosco Corp. 8.13%, 2/15/2030 | 343,000 | 395,678 |
TotalEnergies Capital International SA (France) | ||
2.43%, 1/10/2025 | 27,000 | 25,970 |
3.39%, 6/29/2060 | 180,000 | 124,468 |
TransCanada PipeLines Ltd. (Canada) | ||
2.50%, 10/12/2031 | 225,000 | 179,264 |
4.75%, 5/15/2038 | 726,000 | 635,040 |
5.00%, 10/16/2043 | 20,000 | 17,322 |
Transcontinental Gas Pipe Line Co. LLC 4.45%, 8/1/2042 | 272,000 | 226,413 |
Valero Energy Corp. | ||
3.40%, 9/15/2026 | 648,000 | 612,685 |
2.80%, 12/1/2031 | 220,000 | 180,519 |
3.65%, 12/1/2051 | 504,000 | 343,782 |
Western Midstream Operating LP | ||
4.75%, 8/15/2028 | 30,000 | 28,410 |
5.30%, 3/1/2048 | 624,000 | 510,723 |
Williams Cos., Inc. (The) | ||
3.75%, 6/15/2027 | 1,037,000 | 976,392 |
8.75%, 3/15/2032 (f) | 30,000 | 35,122 |
5.65%, 3/15/2033 | 75,000 | 75,277 |
5.40%, 3/4/2044 | 10,000 | 9,017 |
4.90%, 1/15/2045 | 143,000 | 121,819 |
3.50%, 10/15/2051 | 281,000 | 188,579 |
33,166,957 | ||
August 31, 2023 | J.P. Morgan Exchange-Traded Funds | 65 |
AS OF August 31, 2023 (Unaudited) (continued)
INVESTMENTS | PRINCIPAL AMOUNT($) | VALUE($) |
Corporate Bonds — continued | ||
Paper & Forest Products — 0.0% ^ | ||
Fibria Overseas Finance Ltd. (Brazil) 5.50%, 1/17/2027 | 200,000 | 199,777 |
Suzano Austria GmbH (Brazil) 6.00%, 1/15/2029 | 364,000 | 361,434 |
561,211 | ||
Passenger Airlines — 0.0% ^ | ||
Southwest Airlines Co. | ||
5.13%, 6/15/2027 | 150,000 | 148,122 |
2.63%, 2/10/2030 | 30,000 | 25,324 |
173,446 | ||
Personal Care Products — 0.1% | ||
Estee Lauder Cos., Inc. (The) | ||
4.38%, 5/15/2028 | 300,000 | 292,748 |
2.38%, 12/1/2029 | 30,000 | 25,693 |
4.38%, 6/15/2045 | 64,000 | 54,898 |
Kenvue, Inc. | ||
5.35%, 3/22/2026 (g) | 300,000 | 301,492 |
5.05%, 3/22/2028 (g) | 300,000 | 300,751 |
5.00%, 3/22/2030 (g) | 330,000 | 330,124 |
4.90%, 3/22/2033 (g) | 330,000 | 328,068 |
1,633,774 | ||
Pharmaceuticals — 0.8% | ||
Astrazeneca Finance LLC (United Kingdom) | ||
1.75%, 5/28/2028 | 3,642,000 | 3,158,182 |
4.90%, 3/3/2030 | 30,000 | 29,835 |
AstraZeneca plc (United Kingdom) 3.38%, 11/16/2025 | 199,000 | 191,184 |
Bristol-Myers Squibb Co. | ||
1.13%, 11/13/2027 | 168,000 | 145,814 |
3.40%, 7/26/2029 | 30,000 | 27,769 |
1.45%, 11/13/2030 | 35,000 | 27,756 |
2.35%, 11/13/2040 | 100,000 | 67,441 |
3.25%, 8/1/2042 | 10,000 | 7,461 |
4.63%, 5/15/2044 | 27,000 | 24,452 |
4.25%, 10/26/2049 | 820,000 | 692,086 |
3.90%, 3/15/2062 | 300,000 | 227,345 |
Eli Lilly & Co. | ||
4.70%, 2/27/2033 | 150,000 | 149,650 |
2.25%, 5/15/2050 | 2,409,000 | 1,483,736 |
2.50%, 9/15/2060 | 336,000 | 199,892 |
Johnson & Johnson | ||
0.55%, 9/1/2025 | 2,426,000 | 2,222,193 |
2.95%, 3/3/2027 | 92,000 | 87,091 |
INVESTMENTS | PRINCIPAL AMOUNT($) | VALUE($) |
Pharmaceuticals — continued | ||
0.95%, 9/1/2027 | 149,000 | 129,878 |
3.40%, 1/15/2038 | 267,000 | 226,524 |
2.10%, 9/1/2040 | 160,000 | 109,404 |
3.70%, 3/1/2046 | 302,000 | 250,773 |
Merck & Co., Inc. | ||
1.70%, 6/10/2027 | 613,000 | 549,535 |
3.40%, 3/7/2029 | 785,000 | 730,721 |
3.60%, 9/15/2042 | 10,000 | 8,165 |
Pfizer Investment Enterprises Pte. Ltd. 4.75%, 5/19/2033 | 30,000 | 29,519 |
Pfizer, Inc. | ||
3.00%, 12/15/2026 | 10,000 | 9,469 |
3.60%, 9/15/2028 (d) | 835,000 | 795,040 |
3.45%, 3/15/2029 | 220,000 | 206,245 |
1.75%, 8/18/2031 | 325,000 | 261,419 |
4.00%, 12/15/2036 | 318,000 | 288,411 |
Royalty Pharma plc | ||
1.75%, 9/2/2027 | 989,000 | 853,289 |
3.30%, 9/2/2040 | 80,000 | 55,017 |
3.55%, 9/2/2050 | 47,000 | 30,650 |
Takeda Pharmaceutical Co. Ltd. (Japan) | ||
2.05%, 3/31/2030 | 894,000 | 735,116 |
3.03%, 7/9/2040 | 500,000 | 362,583 |
Utah Acquisition Sub, Inc. 5.25%, 6/15/2046 | 120,000 | 94,938 |
Viatris, Inc. | ||
2.30%, 6/22/2027 | 450,000 | 393,535 |
3.85%, 6/22/2040 | 1,108,000 | 774,987 |
4.00%, 6/22/2050 | 795,000 | 526,141 |
Wyeth LLC 5.95%, 4/1/2037 | 557,000 | 596,066 |
Zoetis, Inc. 2.00%, 5/15/2030 | 30,000 | 24,704 |
16,784,016 | ||
Professional Services — 0.1% | ||
Automatic Data Processing, Inc. 1.25%, 9/1/2030 | 15,000 | 11,951 |
Broadridge Financial Solutions, Inc. 2.90%, 12/1/2029 | 30,000 | 25,861 |
Equifax, Inc. 2.35%, 9/15/2031 | 390,000 | 305,928 |
Thomson Reuters Corp. (Canada) 3.35%, 5/15/2026 | 606,000 | 575,669 |
Verisk Analytics, Inc. 5.75%, 4/1/2033 | 30,000 | 30,591 |
950,000 | ||
Real Estate Management & Development — 0.0% ^ | ||
CBRE Services, Inc. 2.50%, 4/1/2031 | 22,000 | 17,647 |
66 | J.P. Morgan Exchange-Traded Funds | August 31, 2023 |
INVESTMENTS | PRINCIPAL AMOUNT($) | VALUE($) |
Corporate Bonds — continued | ||
Residential REITs — 0.1% | ||
American Homes 4 Rent LP 4.90%, 2/15/2029 | 224,000 | 215,375 |
AvalonBay Communities, Inc. | ||
3.50%, 11/15/2024 | 178,000 | 173,938 |
2.30%, 3/1/2030 | 516,000 | 431,190 |
2.45%, 1/15/2031 | 32,000 | 26,597 |
Camden Property Trust 4.10%, 10/15/2028 | 245,000 | 233,206 |
ERP Operating LP 4.15%, 12/1/2028 | 427,000 | 406,611 |
Essex Portfolio LP | ||
1.70%, 3/1/2028 | 16,000 | 13,574 |
4.50%, 3/15/2048 | 109,000 | 85,293 |
Spirit Realty LP 3.20%, 1/15/2027 | 276,000 | 251,342 |
Sun Communities Operating LP | ||
2.70%, 7/15/2031 | 90,000 | 71,464 |
4.20%, 4/15/2032 | 130,000 | 114,283 |
UDR, Inc. 3.00%, 8/15/2031 | 222,000 | 186,254 |
2,209,127 | ||
Retail REITs — 0.0% ^ | ||
Kimco Realty OP LLC 4.60%, 2/1/2033 | 288,000 | 264,345 |
Realty Income Corp. 0.75%, 3/15/2026 | 11,000 | 9,771 |
274,116 | ||
Semiconductors & Semiconductor Equipment — 0.5% | ||
Analog Devices, Inc. | ||
2.10%, 10/1/2031 | 150,000 | 122,511 |
2.80%, 10/1/2041 | 95,000 | 67,396 |
2.95%, 10/1/2051 | 189,000 | 126,728 |
Applied Materials, Inc. 2.75%, 6/1/2050 | 243,000 | 165,398 |
Broadcom, Inc. | ||
4.11%, 9/15/2028 | 46,000 | 43,270 |
4.30%, 11/15/2032 | 47,000 | 42,471 |
3.14%, 11/15/2035 (g) | 200,000 | 152,465 |
3.19%, 11/15/2036 (g) | 10,000 | 7,516 |
4.93%, 5/15/2037 (g) | 1,104,000 | 993,067 |
3.50%, 2/15/2041 (g) | 350,000 | 256,171 |
Intel Corp. | ||
3.15%, 5/11/2027 | 30,000 | 28,087 |
2.45%, 11/15/2029 | 30,000 | 26,035 |
4.15%, 8/5/2032 | 150,000 | 141,091 |
2.80%, 8/12/2041 | 1,570,000 | 1,088,219 |
4.25%, 12/15/2042 | 2,000,000 | 1,687,629 |
3.73%, 12/8/2047 | 20,000 | 15,127 |
5.70%, 2/10/2053 | 255,000 | 252,395 |
KLA Corp. 3.30%, 3/1/2050 | 289,000 | 207,516 |
INVESTMENTS | PRINCIPAL AMOUNT($) | VALUE($) |
Semiconductors & Semiconductor Equipment — continued | ||
Lam Research Corp. | ||
3.75%, 3/15/2026 | 30,000 | 29,084 |
2.88%, 6/15/2050 | 20,000 | 13,362 |
Marvell Technology, Inc. 2.45%, 4/15/2028 | 150,000 | 131,768 |
Micron Technology, Inc. | ||
4.98%, 2/6/2026 | 507,000 | 499,512 |
3.48%, 11/1/2051 | 100,000 | 64,720 |
NXP BV (China) | ||
4.30%, 6/18/2029 | 30,000 | 28,105 |
2.65%, 2/15/2032 | 125,000 | 100,054 |
3.25%, 5/11/2041 | 1,261,000 | 896,873 |
QUALCOMM, Inc. | ||
5.40%, 5/20/2033 (d) | 30,000 | 31,043 |
4.50%, 5/20/2052 | 10,000 | 8,712 |
Skyworks Solutions, Inc. 1.80%, 6/1/2026 | 13,000 | 11,655 |
Texas Instruments, Inc. | ||
2.90%, 11/3/2027 | 1,758,000 | 1,634,989 |
2.70%, 9/15/2051 | 30,000 | 19,795 |
TSMC Arizona Corp. (Taiwan) 1.75%, 10/25/2026 | 1,030,000 | 926,659 |
9,819,423 | ||
Software — 0.5% | ||
Adobe, Inc. 2.15%, 2/1/2027 | 30,000 | 27,541 |
Microsoft Corp. | ||
3.30%, 2/6/2027 | 150,000 | 144,120 |
3.50%, 2/12/2035 | 146,000 | 132,681 |
4.20%, 11/3/2035 | 182,000 | 175,739 |
2.53%, 6/1/2050 | 520,000 | 343,692 |
4.00%, 2/12/2055 | 1,111,000 | 970,918 |
Oracle Corp. | ||
2.50%, 4/1/2025 | 700,000 | 666,648 |
2.95%, 5/15/2025 | 951,000 | 910,460 |
2.80%, 4/1/2027 | 30,000 | 27,550 |
3.25%, 11/15/2027 | 688,000 | 637,422 |
3.65%, 3/25/2041 | 30,000 | 22,625 |
4.00%, 7/15/2046 | 200,000 | 149,963 |
3.60%, 4/1/2050 | 1,222,000 | 841,291 |
3.95%, 3/25/2051 | 2,119,000 | 1,545,269 |
5.55%, 2/6/2053 | 10,000 | 9,294 |
3.85%, 4/1/2060 | 10,000 | 6,777 |
4.10%, 3/25/2061 | 298,000 | 211,671 |
Roper Technologies, Inc. | ||
1.00%, 9/15/2025 | 200,000 | 183,138 |
August 31, 2023 | J.P. Morgan Exchange-Traded Funds | 67 |
AS OF August 31, 2023 (Unaudited) (continued)
INVESTMENTS | PRINCIPAL AMOUNT($) | VALUE($) |
Corporate Bonds — continued | ||
Software — continued | ||
1.40%, 9/15/2027 | 30,000 | 25,982 |
2.95%, 9/15/2029 | 30,000 | 26,505 |
1.75%, 2/15/2031 | 79,000 | 61,958 |
Salesforce, Inc. | ||
1.50%, 7/15/2028 | 30,000 | 25,803 |
1.95%, 7/15/2031 | 3,211,000 | 2,611,690 |
VMware, Inc. | ||
3.90%, 8/21/2027 | 190,000 | 178,818 |
1.80%, 8/15/2028 | 100,000 | 83,808 |
2.20%, 8/15/2031 | 156,000 | 121,398 |
Workday, Inc. 3.70%, 4/1/2029 | 250,000 | 230,931 |
10,373,692 | ||
Specialized REITs — 0.2% | ||
American Tower Corp. | ||
3.38%, 10/15/2026 | 30,000 | 28,117 |
2.75%, 1/15/2027 | 130,000 | 118,794 |
3.65%, 3/15/2027 | 30,000 | 28,157 |
3.55%, 7/15/2027 | 18,000 | 16,687 |
3.60%, 1/15/2028 | 30,000 | 27,673 |
5.50%, 3/15/2028 | 30,000 | 29,862 |
5.25%, 7/15/2028 | 30,000 | 29,534 |
Crown Castle, Inc. | ||
3.65%, 9/1/2027 | 150,000 | 139,758 |
3.80%, 2/15/2028 | 20,000 | 18,609 |
4.80%, 9/1/2028 | 30,000 | 29,126 |
4.30%, 2/15/2029 | 56,000 | 52,628 |
3.10%, 11/15/2029 | 920,000 | 800,501 |
2.25%, 1/15/2031 | 185,000 | 148,405 |
2.10%, 4/1/2031 | 350,000 | 275,713 |
2.90%, 4/1/2041 | 430,000 | 289,645 |
3.25%, 1/15/2051 | 1,000,000 | 650,103 |
Equinix, Inc. | ||
2.63%, 11/18/2024 | 392,000 | 377,836 |
2.50%, 5/15/2031 | 566,000 | 459,049 |
3.90%, 4/15/2032 | 125,000 | 111,224 |
3.00%, 7/15/2050 | 42,000 | 26,368 |
Extra Space Storage LP | ||
2.20%, 10/15/2030 | 139,000 | 110,885 |
2.35%, 3/15/2032 | 10,000 | 7,771 |
Public Storage Operating Co. 1.50%, 11/9/2026 | 200,000 | 179,976 |
3,956,421 | ||
INVESTMENTS | PRINCIPAL AMOUNT($) | VALUE($) |
Specialty Retail — 0.3% | ||
AutoNation, Inc. | ||
1.95%, 8/1/2028 | 225,000 | 186,368 |
4.75%, 6/1/2030 | 30,000 | 27,914 |
3.85%, 3/1/2032 | 150,000 | 126,866 |
AutoZone, Inc. | ||
4.00%, 4/15/2030 | 275,000 | 254,556 |
5.20%, 8/1/2033 | 30,000 | 29,307 |
Best Buy Co., Inc. 1.95%, 10/1/2030 | 30,000 | 24,038 |
Dick's Sporting Goods, Inc. 4.10%, 1/15/2052 | 403,000 | 261,477 |
Home Depot, Inc. (The) | ||
2.13%, 9/15/2026 | 500,000 | 461,105 |
2.80%, 9/14/2027 | 1,000,000 | 928,589 |
1.88%, 9/15/2031 | 50,000 | 40,206 |
3.50%, 9/15/2056 | 1,023,000 | 749,184 |
Lowe's Cos., Inc. | ||
5.15%, 7/1/2033 | 30,000 | 29,645 |
4.38%, 9/15/2045 | 557,000 | 457,175 |
4.05%, 5/3/2047 | 191,000 | 149,036 |
O'Reilly Automotive, Inc. 3.90%, 6/1/2029 | 428,000 | 401,778 |
Ross Stores, Inc. 0.88%, 4/15/2026 | 150,000 | 133,848 |
TJX Cos., Inc. (The) | ||
1.15%, 5/15/2028 (d) | 859,000 | 729,826 |
3.88%, 4/15/2030 | 238,000 | 224,545 |
Tractor Supply Co. 5.25%, 5/15/2033 | 10,000 | 9,780 |
5,225,243 | ||
Technology Hardware, Storage & Peripherals — 0.4% | ||
Apple, Inc. | ||
1.13%, 5/11/2025 | 350,000 | 327,436 |
3.20%, 5/13/2025 | 29,000 | 28,133 |
0.70%, 2/8/2026 | 1,780,000 | 1,609,656 |
3.00%, 11/13/2027 | 30,000 | 28,153 |
1.20%, 2/8/2028 | 30,000 | 25,912 |
3.25%, 8/8/2029 | 30,000 | 27,901 |
2.20%, 9/11/2029 | 30,000 | 26,223 |
2.38%, 2/8/2041 | 1,168,000 | 834,228 |
3.45%, 2/9/2045 | 2,180,000 | 1,762,485 |
4.38%, 5/13/2045 | 2,104,000 | 1,934,822 |
2.95%, 9/11/2049 | 10,000 | 7,135 |
2.65%, 5/11/2050 | 176,000 | 117,195 |
2.65%, 2/8/2051 | 243,000 | 161,064 |
2.55%, 8/20/2060 | 163,000 | 102,453 |
2.85%, 8/5/2061 | 10,000 | 6,470 |
68 | J.P. Morgan Exchange-Traded Funds | August 31, 2023 |
INVESTMENTS | PRINCIPAL AMOUNT($) | VALUE($) |
Corporate Bonds — continued | ||
Technology Hardware, Storage & Peripherals — continued | ||
Dell International LLC | ||
5.85%, 7/15/2025 | 200,000 | 200,349 |
4.90%, 10/1/2026 | 250,000 | 245,380 |
5.25%, 2/1/2028 | 150,000 | 149,651 |
3.38%, 12/15/2041 (g) | 458,000 | 321,892 |
Hewlett Packard Enterprise Co. | ||
4.90%, 10/15/2025 (f) | 150,000 | 147,982 |
1.75%, 4/1/2026 | 27,000 | 24,630 |
HP, Inc. | ||
3.00%, 6/17/2027 | 23,000 | 21,141 |
2.65%, 6/17/2031 | 303,000 | 244,509 |
5.50%, 1/15/2033 | 150,000 | 145,605 |
NetApp, Inc. 2.70%, 6/22/2030 | 30,000 | 25,009 |
Western Digital Corp. 2.85%, 2/1/2029 | 408,000 | 328,671 |
8,854,085 | ||
Textiles, Apparel & Luxury Goods — 0.1% | ||
NIKE, Inc. | ||
2.38%, 11/1/2026 | 10,000 | 9,263 |
3.38%, 11/1/2046 | 22,000 | 17,011 |
PVH Corp. 4.63%, 7/10/2025 | 351,000 | 339,501 |
Ralph Lauren Corp. 3.75%, 9/15/2025 | 543,000 | 525,963 |
Tapestry, Inc. 4.13%, 7/15/2027 | 188,000 | 175,543 |
VF Corp. 2.95%, 4/23/2030 (d) | 205,000 | 170,142 |
1,237,423 | ||
Tobacco — 0.3% | ||
Altria Group, Inc. | ||
2.45%, 2/4/2032 | 12,000 | 9,364 |
3.40%, 2/4/2041 | 56,000 | 38,103 |
5.38%, 1/31/2044 | 658,000 | 611,936 |
3.88%, 9/16/2046 | 50,000 | 34,397 |
BAT Capital Corp. (United Kingdom) | ||
2.26%, 3/25/2028 | 248,000 | 213,421 |
3.46%, 9/6/2029 | 250,000 | 218,010 |
4.39%, 8/15/2037 | 1,662,000 | 1,313,798 |
4.76%, 9/6/2049 | 216,000 | 160,027 |
3.98%, 9/25/2050 | 30,000 | 19,821 |
Philip Morris International, Inc. | ||
3.25%, 11/10/2024 | 1,737,000 | 1,691,437 |
3.38%, 8/15/2029 | 40,000 | 35,956 |
4.88%, 11/15/2043 | 449,000 | 394,534 |
INVESTMENTS | PRINCIPAL AMOUNT($) | VALUE($) |
Tobacco — continued | ||
4.25%, 11/10/2044 | 239,000 | 193,350 |
Reynolds American, Inc. (United Kingdom) 5.70%, 8/15/2035 | 30,000 | 27,693 |
4,961,847 | ||
Trading Companies & Distributors — 0.0% ^ | ||
Air Lease Corp. 4.25%, 9/15/2024 | 306,000 | 300,209 |
WW Grainger, Inc. 1.85%, 2/15/2025 | 121,000 | 114,989 |
415,198 | ||
Water Utilities — 0.1% | ||
American Water Capital Corp. | ||
3.45%, 6/1/2029 | 870,000 | 797,730 |
6.59%, 10/15/2037 | 275,000 | 305,803 |
Essential Utilities, Inc. 4.28%, 5/1/2049 | 127,000 | 98,871 |
1,202,404 | ||
Wireless Telecommunication Services — 0.5% | ||
America Movil SAB de CV (Mexico) 3.63%, 4/22/2029 | 934,000 | 855,064 |
Rogers Communications, Inc. (Canada) | ||
2.95%, 3/15/2025 | 315,000 | 300,231 |
2.90%, 11/15/2026 | 392,000 | 360,932 |
3.20%, 3/15/2027 | 82,000 | 75,745 |
3.80%, 3/15/2032 | 93,000 | 79,492 |
5.00%, 3/15/2044 | 339,000 | 287,814 |
T-Mobile USA, Inc. | ||
2.63%, 4/15/2026 | 150,000 | 139,384 |
4.75%, 2/1/2028 | 203,000 | 197,320 |
2.55%, 2/15/2031 | 377,000 | 310,537 |
2.88%, 2/15/2031 | 215,000 | 180,938 |
2.25%, 11/15/2031 | 2,007,000 | 1,591,877 |
4.38%, 4/15/2040 | 1,503,000 | 1,289,850 |
3.00%, 2/15/2041 | 3,674,000 | 2,589,865 |
Vodafone Group plc (United Kingdom) 4.38%, 5/30/2028 | 1,776,000 | 1,742,722 |
10,001,771 | ||
Total Corporate Bonds (Cost $509,419,698) | 494,521,780 | |
Commercial Mortgage-Backed Securities — 1.9% | ||
BANK | ||
Series 2017-BNK4, Class ASB, 3.42%, 5/15/2050 | 20,917 | 20,042 |
Series 2019-BN16, Class A4, 4.01%, 2/15/2052 | 60,000 | 55,608 |
August 31, 2023 | J.P. Morgan Exchange-Traded Funds | 69 |
AS OF August 31, 2023 (Unaudited) (continued)
INVESTMENTS | PRINCIPAL AMOUNT($) | VALUE($) |
Commercial Mortgage-Backed Securities — continued | ||
Series 2019-BN21, Class A5, 2.85%, 10/17/2052 | 60,000 | 51,393 |
Series 2019-BN23, Class A3, 2.92%, 12/15/2052 | 142,000 | 122,305 |
Series 2018-BN10, Class A5, 3.69%, 2/15/2061 | 20,000 | 18,527 |
Series 2018-BN10, Class AS, 3.90%, 2/15/2061 (e) | 180,000 | 161,527 |
Series 2019-BN19, Class A3, 3.18%, 8/15/2061 | 100,000 | 86,070 |
Series 2018-BN13, Class C, 4.68%, 8/15/2061 (e) | 500,000 | 357,943 |
Series 2019-BN22, Class A4, 2.98%, 11/15/2062 | 260,000 | 224,954 |
Series 2020-BN26, Class A4, 2.40%, 3/15/2063 | 500,000 | 414,790 |
Series 2021-BN36, Class A5, 2.47%, 9/15/2064 | 500,000 | 403,072 |
Bank of America Merrill Lynch Commercial Mortgage Trust Series 2017-BNK3, Class A4, 3.57%, 2/15/2050 | 20,000 | 18,670 |
BBCMS Mortgage Trust Series 2018-C2, Class A5, 4.31%, 12/15/2051 | 40,000 | 37,657 |
Benchmark Mortgage Trust | ||
Series 2018-B1, Class A5, 3.67%, 1/15/2051 (e) | 50,000 | 45,732 |
Series 2018-B2, Class B, 4.43%, 2/15/2051 (e) | 20,000 | 16,755 |
Series 2018-B5, Class A4, 4.21%, 7/15/2051 | 110,000 | 103,037 |
Series 2018-B6, Class A2, 4.20%, 10/10/2051 | 33,065 | 32,746 |
Series 2018-B8, Class A5, 4.23%, 1/15/2052 | 40,000 | 36,819 |
Series 2019-B11, Class A2, 3.41%, 5/15/2052 | 207,429 | 201,934 |
Series 2020-B16, Class AM, 2.94%, 2/15/2053 (e) | 180,000 | 147,951 |
Series 2021-B31, Class A5, 2.67%, 12/15/2054 | 600,000 | 486,769 |
Series 2019-B13, Class A3, 2.70%, 8/15/2057 | 450,000 | 383,643 |
Cantor Commercial Real Estate Lending Series 2019-CF2, Class AS, 3.12%, 11/15/2052 | 75,000 | 62,136 |
CD Mortgage Trust | ||
Series 2017-CD6, Class ASB, 3.33%, 11/13/2050 | 17,008 | 16,190 |
Series 2017-CD6, Class AM, 3.71%, 11/13/2050 (e) | 30,000 | 26,313 |
INVESTMENTS | PRINCIPAL AMOUNT($) | VALUE($) |
Series 2018-CD7, Class A3, 4.01%, 8/15/2051 | 397,874 | 363,852 |
CFCRE Commercial Mortgage Trust | ||
Series 2017-C8, Class A4, 3.57%, 6/15/2050 | 30,000 | 27,639 |
Series 2016-C7, Class ASB, 3.64%, 12/10/2054 | 12,140 | 11,690 |
Citigroup Commercial Mortgage Trust | ||
Series 2014-GC21, Class AAB, 3.48%, 5/10/2047 | 2,312 | 2,299 |
Series 2014-GC23, Class B, 4.17%, 7/10/2047 (e) | 30,000 | 28,707 |
Series 2015-GC29, Class C, 4.28%, 4/10/2048 (e) | 40,000 | 37,201 |
Series 2016-C1, Class AAB, 3.00%, 5/10/2049 | 50,975 | 49,102 |
Series 2019-GC43, Class A4, 3.04%, 11/10/2052 | 1,000,000 | 860,835 |
Commercial Mortgage Trust | ||
Series 2013-CR13, Class B, 5.03%, 11/10/2046 (e) | 364,000 | 359,457 |
Series 2014-UBS5, Class AM, 4.19%, 9/10/2047 (e) | 40,000 | 38,644 |
Series 2014-CR20, Class A3, 3.33%, 11/10/2047 | 36,746 | 35,941 |
Series 2014-UBS6, Class A4, 3.38%, 12/10/2047 | 113,898 | 110,786 |
Series 2015-LC19, Class A4, 3.18%, 2/10/2048 | 250,000 | 239,804 |
Series 2015-LC21, Class AM, 4.04%, 7/10/2048 (e) | 30,000 | 28,366 |
Series 2015-CR25, Class A4, 3.76%, 8/10/2048 | 30,000 | 28,675 |
Series 2015-PC1, Class A5, 3.90%, 7/10/2050 | 300,000 | 288,799 |
CSAIL Commercial Mortgage Trust | ||
Series 2015-C3, Class A4, 3.72%, 8/15/2048 | 30,000 | 28,604 |
Series 2016-C5, Class A5, 3.76%, 11/15/2048 | 27,000 | 25,795 |
Series 2019-C15, Class A4, 4.05%, 3/15/2052 | 210,000 | 192,270 |
DBGS Mortgage Trust Series 2018-C1, Class A4, 4.47%, 10/15/2051 | 20,000 | 18,568 |
DBJPM Mortgage Trust Series 2017-C6, Class A5, 3.33%, 6/10/2050 | 20,000 | 18,189 |
70 | J.P. Morgan Exchange-Traded Funds | August 31, 2023 |
INVESTMENTS | PRINCIPAL AMOUNT($) | VALUE($) |
Commercial Mortgage-Backed Securities — continued | ||
FHLMC, Multi-Family Structured Pass-Through Certificates | ||
Series K725, Class AM, 3.10%, 2/25/2024 (e) | 50,000 | 49,297 |
Series K728, Class A2, 3.06%, 8/25/2024 (e) | 48,161 | 47,084 |
Series K040, Class A2, 3.24%, 9/25/2024 | 70,000 | 68,344 |
Series K731, Class A2, 3.60%, 2/25/2025 (e) | 45,357 | 44,197 |
Series K733, Class A2, 3.75%, 8/25/2025 | 497,761 | 483,209 |
Series K051, Class A2, 3.31%, 9/25/2025 | 40,000 | 38,562 |
Series K054, Class A2, 2.75%, 1/25/2026 | 1,000,000 | 947,167 |
Series K734, Class A2, 3.21%, 2/25/2026 | 370,000 | 354,065 |
Series K056, Class A2, 2.53%, 5/25/2026 | 1,000,000 | 936,993 |
Series K735, Class A2, 2.86%, 5/25/2026 | 49,230 | 46,543 |
Series K057, Class A2, 2.57%, 7/25/2026 | 63,000 | 58,998 |
Series K063, Class A1, 3.05%, 8/25/2026 | 26,977 | 25,951 |
Series K059, Class A2, 3.12%, 9/25/2026 (e) | 2,000,000 | 1,894,157 |
Series K062, Class A2, 3.41%, 12/25/2026 | 1,000,000 | 951,673 |
Series K064, Class A2, 3.22%, 3/25/2027 | 1,000,000 | 944,111 |
Series K072, Class A2, 3.44%, 12/25/2027 | 400,000 | 377,883 |
Series K092, Class A1, 3.13%, 10/25/2028 | 1,807,228 | 1,714,886 |
Series K084, Class A2, 3.78%, 10/25/2028 (e) | 500,000 | 476,530 |
Series K087, Class A2, 3.77%, 12/25/2028 | 2,000,000 | 1,905,224 |
Series K091, Class A2, 3.51%, 3/25/2029 | 1,000,000 | 937,868 |
Series K097, Class A2, 2.51%, 7/25/2029 | 2,000,000 | 1,765,065 |
Series K096, Class A2, 2.52%, 7/25/2029 | 295,000 | 260,883 |
Series K099, Class A2, 2.60%, 9/25/2029 | 400,000 | 353,980 |
Series K100, Class A2, 2.67%, 9/25/2029 | 400,000 | 355,023 |
INVESTMENTS | PRINCIPAL AMOUNT($) | VALUE($) |
Series K102, Class A2, 2.54%, 10/25/2029 | 400,000 | 352,012 |
Series K113, Class A2, 1.34%, 6/25/2030 | 700,000 | 561,576 |
Series K158, Class A1, 3.90%, 7/25/2030 | 1,124,830 | 1,081,892 |
Series K117, Class A2, 1.41%, 8/25/2030 | 1,265,000 | 1,011,698 |
Series K159, Class A2, 3.95%, 11/25/2030 (e) | 400,000 | 377,987 |
Series K123, Class A2, 1.62%, 12/25/2030 | 500,000 | 402,530 |
Series K125, Class A2, 1.85%, 1/25/2031 | 300,000 | 244,720 |
Series K127, Class A2, 2.11%, 1/25/2031 | 600,000 | 498,701 |
Series K-1512, Class A2, 2.99%, 5/25/2031 | 75,000 | 66,280 |
Series K155, Class A3, 3.75%, 4/25/2033 | 545,000 | 499,919 |
Series K157, Class A2, 3.99%, 5/25/2033 (e) | 250,000 | 237,176 |
Series K156, Class A3, 3.70%, 6/25/2033 (e) | 91,000 | 83,092 |
Series K-1512, Class A3, 3.06%, 4/25/2034 | 150,000 | 127,087 |
Series K-1513, Class A3, 2.80%, 8/25/2034 | 325,000 | 266,888 |
Series K-1514, Class A2, 2.86%, 10/25/2034 | 400,000 | 328,293 |
Series K-1518, Class A2, 1.86%, 10/25/2035 | 1,100,000 | 794,537 |
FNMA ACES | ||
Series 2014-M2, Class A2, 3.51%, 12/25/2023 (e) | 11,296 | 11,214 |
Series 2014-M3, Class A2, 3.50%, 1/25/2024 (e) | 3,001 | 2,969 |
Series 2017-M10, Class AV2, 2.62%, 7/25/2024 (e) | 40,337 | 39,506 |
Series 2017-M1, Class A2, 2.50%, 10/25/2026 (e) | 150,769 | 140,013 |
Series 2017-M2, Class A2, 2.90%, 2/25/2027 (e) | 289,977 | 271,575 |
Series 2017-M7, Class A2, 2.96%, 2/25/2027 (e) | 279,052 | 261,798 |
Series 2017-M12, Class A2, 3.16%, 6/25/2027 (e) | 133,227 | 124,977 |
Series 2017-M14, Class A2, 2.96%, 11/25/2027 (e) | 1,000,744 | 925,743 |
August 31, 2023 | J.P. Morgan Exchange-Traded Funds | 71 |
AS OF August 31, 2023 (Unaudited) (continued)
INVESTMENTS | PRINCIPAL AMOUNT($) | VALUE($) |
Commercial Mortgage-Backed Securities — continued | ||
Series 2018-M10, Class A2, 3.47%, 7/25/2028 (e) | 40,000 | 37,635 |
Series 2018-M14, Class A2, 3.70%, 8/25/2028 (e) | 429,559 | 407,415 |
Series 2019-M1, Class A2, 3.67%, 9/25/2028 (e) | 74,744 | 70,810 |
Series 2019-M22, Class A2, 2.52%, 8/25/2029 | 581,159 | 513,697 |
Series 2021-M2S, Class A2, 1.87%, 10/25/2031 (e) | 700,000 | 562,346 |
GS Mortgage Securities Trust | ||
Series 2014-GC24, Class AAB, 3.65%, 9/10/2047 | 4,308 | 4,258 |
Series 2014-GC24, Class AS, 4.16%, 9/10/2047 (e) | 170,000 | 159,007 |
Series 2015-GC28, Class A4, 3.14%, 2/10/2048 | 36,839 | 35,903 |
Series 2015-GC30, Class A4, 3.38%, 5/10/2050 | 25,000 | 23,815 |
Series 2018-GS9, Class A4, 3.99%, 3/10/2051 (e) | 200,000 | 186,114 |
Series 2019-GSA1, Class A4, 3.05%, 11/10/2052 | 260,000 | 225,173 |
JPMBB Commercial Mortgage Securities Trust | ||
Series 2013-C12, Class C, 4.10%, 7/15/2045 (e) | 23,955 | 21,534 |
Series 2015-C29, Class B, 4.12%, 5/15/2048 (e) | 40,000 | 36,726 |
Series 2015-C31, Class A3, 3.80%, 8/15/2048 | 552,527 | 528,125 |
JPMCC Commercial Mortgage Securities Trust Series 2017-JP5, Class A5, 3.72%, 3/15/2050 | 600,000 | 557,773 |
JPMDB Commercial Mortgage Securities Trust | ||
Series 2016-C2, Class B, 3.99%, 6/15/2049 (e) | 20,000 | 16,023 |
Series 2017-C5, Class B, 4.01%, 3/15/2050 (e) | 20,000 | 15,363 |
Morgan Stanley Bank of America Merrill Lynch Trust | ||
Series 2015-C22, Class AS, 3.56%, 4/15/2048 | 40,000 | 37,658 |
Series 2015-C25, Class ASB, 3.38%, 10/15/2048 | 17,612 | 17,091 |
Series 2015-C25, Class A5, 3.64%, 10/15/2048 | 40,000 | 38,008 |
Series 2016-C31, Class A5, 3.10%, 11/15/2049 | 450,000 | 410,187 |
INVESTMENTS | PRINCIPAL AMOUNT($) | VALUE($) |
Series 2016-C32, Class A4, 3.72%, 12/15/2049 | 295,000 | 275,483 |
Morgan Stanley Capital I Trust | ||
Series 2016-UB12, Class A3, 3.34%, 12/15/2049 | 540,925 | 504,964 |
Series 2017-H1, Class C, 4.28%, 6/15/2050 (e) | 25,000 | 21,513 |
Series 2019-L2, Class A4, 4.07%, 3/15/2052 | 50,000 | 46,339 |
Series 2019-L3, Class A4, 3.13%, 11/15/2052 | 100,000 | 86,748 |
UBS Commercial Mortgage Trust | ||
Series 2017-C2, Class A4, 3.49%, 8/15/2050 | 700,000 | 643,140 |
Series 2017-C4, Class ASB, 3.37%, 10/15/2050 | 32,414 | 30,945 |
Series 2017-C5, Class AS, 3.78%, 11/15/2050 (e) | 70,000 | 61,951 |
Series 2017-C7, Class AS, 4.06%, 12/15/2050 (e) | 50,000 | 44,738 |
Wells Fargo Commercial Mortgage Trust | ||
Series 2015-C27, Class A4, 3.19%, 2/15/2048 | 28,047 | 26,888 |
Series 2015-C28, Class A4, 3.54%, 5/15/2048 | 20,000 | 19,120 |
Series 2015-C29, Class A4, 3.64%, 6/15/2048 | 120,000 | 114,699 |
Series 2017-C38, Class A5, 3.45%, 7/15/2050 | 500,000 | 459,519 |
Series 2018-C45, Class A3, 3.92%, 6/15/2051 | 38,984 | 36,068 |
Series 2019-C51, Class A3, 3.06%, 6/15/2052 | 500,000 | 436,478 |
Series 2019-C52, Class A5, 2.89%, 8/15/2052 | 500,000 | 429,960 |
Series 2019-C53, Class A4, 3.04%, 10/15/2052 | 125,000 | 108,066 |
Series 2020-C55, Class A5, 2.73%, 2/15/2053 | 240,000 | 202,883 |
WFRBS Commercial Mortgage Trust | ||
Series 2014-C22, Class A4, 3.49%, 9/15/2057 | 31,287 | 30,473 |
Series 2014-C22, Class A5, 3.75%, 9/15/2057 | 25,000 | 24,170 |
Total Commercial Mortgage-Backed Securities (Cost $41,136,300) | 37,586,488 | |
72 | J.P. Morgan Exchange-Traded Funds | August 31, 2023 |
INVESTMENTS | PRINCIPAL AMOUNT($) | VALUE($) |
Foreign Government Securities — 1.7% | ||
Canada Government Bond 1.63%, 1/22/2025 | 20,000 | 19,069 |
Export Development Canada 3.00%, 5/25/2027 | 105,000 | 99,622 |
Export-Import Bank of Korea | ||
2.38%, 6/25/2024 | 490,000 | 477,711 |
0.75%, 9/21/2025 | 215,000 | 195,895 |
1.13%, 12/29/2026 | 200,000 | 174,621 |
1.25%, 9/21/2030 | 215,000 | 168,390 |
Hungary Government Bond 7.63%, 3/29/2041 | 298,000 | 328,942 |
Italian Republic Government Bond | ||
2.88%, 10/17/2029 | 452,000 | 394,589 |
5.38%, 6/15/2033 | 387,000 | 380,055 |
3.88%, 5/6/2051 | 80,000 | 56,240 |
Japan Bank for International Cooperation | ||
0.50%, 4/15/2024 (d) | 200,000 | 193,767 |
3.00%, 5/29/2024 | 201,000 | 196,992 |
1.75%, 10/17/2024 | 55,000 | 52,717 |
2.13%, 2/10/2025 | 5,000 | 4,772 |
2.50%, 5/28/2025 | 220,000 | 209,662 |
2.75%, 1/21/2026 | 1,001,000 | 949,976 |
2.38%, 4/20/2026 | 250,000 | 233,866 |
2.25%, 11/4/2026 | 1,380,000 | 1,270,850 |
2.88%, 6/1/2027 | 202,000 | 188,539 |
2.88%, 7/21/2027 | 218,000 | 203,325 |
2.75%, 11/16/2027 | 60,000 | 55,466 |
3.50%, 10/31/2028 | 450,000 | 424,614 |
1.25%, 1/21/2031 | 208,000 | 163,640 |
1.88%, 4/15/2031 | 65,000 | 53,276 |
Japan International Cooperation Agency | ||
2.13%, 10/20/2026 | 1,098,000 | 1,006,090 |
2.75%, 4/27/2027 | 65,000 | 60,317 |
3.38%, 6/12/2028 | 876,000 | 822,921 |
1.00%, 7/22/2030 | 710,000 | 553,645 |
Oriental Republic of Uruguay | ||
4.38%, 10/27/2027 | 166,000 | 165,362 |
4.38%, 1/23/2031 (d) | 202,000 | 198,832 |
5.75%, 10/28/2034 (d) | 76,000 | 81,709 |
4.13%, 11/20/2045 | 805,000 | 710,429 |
Province of Alberta | ||
1.00%, 5/20/2025 | 663,000 | 617,422 |
3.30%, 3/15/2028 | 100,000 | 94,752 |
Province of British Columbia | ||
1.75%, 9/27/2024 | 1,056,000 | 1,015,181 |
2.25%, 6/2/2026 | 354,000 | 331,246 |
INVESTMENTS | PRINCIPAL AMOUNT($) | VALUE($) |
0.90%, 7/20/2026 | 705,000 | 633,403 |
Province of Ontario | ||
2.50%, 4/27/2026 | 311,000 | 293,251 |
2.30%, 6/15/2026 (d) | 490,000 | 458,488 |
1.05%, 5/21/2027 | 10,000 | 8,778 |
2.00%, 10/2/2029 | 175,000 | 152,325 |
2.13%, 1/21/2032 (d) | 212,000 | 177,286 |
Province of Quebec | ||
2.88%, 10/16/2024 | 141,000 | 137,007 |
1.50%, 2/11/2025 | 789,000 | 747,839 |
0.60%, 7/23/2025 | 1,464,000 | 1,348,726 |
2.50%, 4/20/2026 | 99,000 | 93,431 |
Republic of Chile | ||
3.13%, 1/21/2026 | 190,000 | 181,643 |
2.45%, 1/31/2031 | 1,543,000 | 1,311,573 |
2.55%, 1/27/2032 | 70,000 | 58,771 |
2.55%, 7/27/2033 | 541,000 | 435,279 |
3.10%, 5/7/2041 | 1,384,000 | 1,009,905 |
4.34%, 3/7/2042 (d) | 370,000 | 318,542 |
Republic of Indonesia | ||
4.15%, 9/20/2027 | 247,000 | 238,460 |
3.85%, 10/15/2030 | 249,000 | 230,375 |
4.35%, 1/11/2048 | 785,000 | 671,527 |
5.65%, 1/11/2053 | 55,000 | 56,179 |
Republic of Panama | ||
8.88%, 9/30/2027 | 654,000 | 734,312 |
3.88%, 3/17/2028 | 256,000 | 240,739 |
2.25%, 9/29/2032 | 1,500,000 | 1,138,962 |
6.70%, 1/26/2036 | 78,000 | 81,870 |
6.85%, 3/28/2054 | 615,000 | 629,267 |
Republic of Peru | ||
2.39%, 1/23/2026 (d) | 305,000 | 285,700 |
4.13%, 8/25/2027 | 70,000 | 67,793 |
8.75%, 11/21/2033 | 10,000 | 12,439 |
3.23%, 7/28/2121 | 335,000 | 193,628 |
Republic of Philippines | ||
7.50%, 9/25/2024 | 717,333 | 724,612 |
10.63%, 3/16/2025 | 190,000 | 205,244 |
5.17%, 10/13/2027 | 90,000 | 90,749 |
9.50%, 2/2/2030 | 304,000 | 376,175 |
5.00%, 7/17/2033 | 80,000 | 80,001 |
2.95%, 5/5/2045 | 1,282,000 | 887,251 |
3.20%, 7/6/2046 | 201,000 | 142,930 |
4.20%, 3/29/2047 | 70,000 | 58,630 |
August 31, 2023 | J.P. Morgan Exchange-Traded Funds | 73 |
AS OF August 31, 2023 (Unaudited) (continued)
INVESTMENTS | PRINCIPAL AMOUNT($) | VALUE($) |
Foreign Government Securities — continued | ||
Republic of Poland | ||
3.25%, 4/6/2026 | 100,000 | 95,719 |
5.50%, 11/16/2027 | 50,000 | 50,862 |
5.75%, 11/16/2032 | 18,000 | 18,721 |
5.50%, 4/4/2053 | 309,000 | 300,503 |
State of Israel Government Bond 2.75%, 7/3/2030 | 305,000 | 266,282 |
Svensk Exportkredit AB | ||
0.38%, 7/30/2024 | 375,000 | 357,874 |
0.63%, 10/7/2024 | 100,000 | 94,833 |
United Mexican States | ||
4.50%, 4/22/2029 | 457,000 | 441,166 |
3.25%, 4/16/2030 | 505,000 | 447,135 |
2.66%, 5/24/2031 | 500,000 | 414,109 |
4.75%, 4/27/2032 | 750,000 | 711,088 |
3.50%, 2/12/2034 | 250,000 | 207,597 |
6.75%, 9/27/2034 | 335,000 | 359,235 |
6.35%, 2/9/2035 | 500,000 | 518,717 |
4.28%, 8/14/2041 | 565,000 | 456,328 |
4.75%, 3/8/2044 | 34,000 | 28,521 |
5.00%, 4/27/2051 (d) | 300,000 | 254,323 |
4.40%, 2/12/2052 | 670,000 | 515,858 |
6.34%, 5/4/2053 | 60,000 | 60,064 |
3.77%, 5/24/2061 | 1,810,000 | 1,190,230 |
Total Foreign Government Securities (Cost $34,809,280) | 33,456,757 | |
Supranational — 1.3% | ||
African Development Bank (Supranational) | ||
3.38%, 7/7/2025 | 354,000 | 344,192 |
0.88%, 3/23/2026 | 127,000 | 115,274 |
0.88%, 7/22/2026 | 440,000 | 395,150 |
4.38%, 11/3/2027 | 65,000 | 64,823 |
Asian Development Bank (Supranational) | ||
0.63%, 10/8/2024 | 1,153,000 | 1,096,066 |
1.50%, 10/18/2024 | 450,000 | 431,432 |
0.38%, 9/3/2025 | 1,927,000 | 1,762,769 |
0.50%, 2/4/2026 | 885,000 | 799,859 |
1.00%, 4/14/2026 | 998,000 | 908,346 |
1.25%, 6/9/2028 | 1,870,000 | 1,618,662 |
5.82%, 6/16/2028 | 80,000 | 84,439 |
Asian Infrastructure Investment Bank (The) (Supranational) | ||
0.50%, 10/30/2024 | 120,000 | 113,354 |
0.50%, 5/28/2025 | 50,000 | 46,143 |
INVESTMENTS | PRINCIPAL AMOUNT($) | VALUE($) |
Corp. Andina de Fomento (Supranational) | ||
1.63%, 9/23/2025 (d) | 1,232,000 | 1,139,148 |
2.25%, 2/8/2027 (d) | 123,000 | 110,791 |
Council of Europe Development Bank (Supranational) 1.38%, 2/27/2025 (d) | 281,000 | 265,868 |
European Bank for Reconstruction & Development (Supranational) 0.50%, 5/19/2025 | 201,000 | 186,060 |
European Investment Bank (Supranational) | ||
1.88%, 2/10/2025 | 479,000 | 457,360 |
1.63%, 3/14/2025 | 815,000 | 773,490 |
0.38%, 12/15/2025 | 2,320,000 | 2,101,195 |
0.38%, 3/26/2026 | 3,057,000 | 2,743,683 |
2.13%, 4/13/2026 | 375,000 | 351,702 |
1.63%, 10/9/2029 | 130,000 | 111,864 |
0.88%, 5/17/2030 | 455,000 | 365,659 |
3.63%, 7/15/2030 | 35,000 | 33,567 |
0.75%, 9/23/2030 | 171,000 | 134,912 |
Inter-American Development Bank (Supranational) | ||
3.25%, 7/1/2024 | 30,000 | 29,462 |
1.75%, 3/14/2025 | 55,000 | 52,279 |
0.88%, 4/3/2025 | 10,000 | 9,362 |
7.00%, 6/15/2025 | 91,000 | 93,626 |
0.88%, 4/20/2026 | 115,000 | 104,228 |
2.00%, 6/2/2026 | 536,000 | 499,069 |
4.00%, 1/12/2028 | 350,000 | 344,134 |
1.13%, 7/20/2028 | 79,000 | 67,747 |
3.50%, 9/14/2029 | 15,000 | 14,356 |
3.20%, 8/7/2042 | 1,145,000 | 934,827 |
International Bank for Reconstruction & Development (Supranational) | ||
2.50%, 11/25/2024 | 470,000 | 454,327 |
1.63%, 1/15/2025 | 30,000 | 28,594 |
2.13%, 3/3/2025 | 90,000 | 86,111 |
0.75%, 3/11/2025 | 98,000 | 91,781 |
0.63%, 4/22/2025 | 550,000 | 511,739 |
0.38%, 7/28/2025 | 1,239,000 | 1,137,335 |
2.50%, 7/29/2025 | 1,296,000 | 1,239,308 |
0.50%, 10/28/2025 | 70,000 | 63,865 |
3.13%, 11/20/2025 | 85,000 | 81,958 |
0.88%, 7/15/2026 | 130,000 | 117,057 |
2.50%, 11/22/2027 | 44,000 | 40,782 |
0.75%, 11/24/2027 | 31,000 | 26,657 |
1.38%, 4/20/2028 | 85,000 | 74,336 |
74 | J.P. Morgan Exchange-Traded Funds | August 31, 2023 |
INVESTMENTS | PRINCIPAL AMOUNT($) | VALUE($) |
Supranational — continued | ||
3.50%, 7/12/2028 | 575,000 | 553,131 |
1.13%, 9/13/2028 | 2,600,000 | 2,221,850 |
3.88%, 2/14/2030 (d) | 1,000,000 | 973,439 |
2.50%, 3/29/2032 | 30,000 | 26,325 |
4.75%, 2/15/2035 | 162,000 | 165,706 |
International Finance Corp. (Supranational) | ||
2.13%, 4/7/2026 | 5,000 | 4,690 |
0.75%, 10/8/2026 | 56,000 | 49,854 |
0.75%, 8/27/2030 | 65,000 | 51,100 |
Nordic Investment Bank (Supranational) 2.63%, 4/4/2025 | 55,000 | 52,916 |
Total Supranational (Cost $27,842,896) | 26,757,759 | |
U.S. Government Agency Securities — 1.2% | ||
FFCB Funding Corp. | ||
0.39%, 6/17/2024 | 662,000 | 635,041 |
0.57%, 7/2/2024 | 45,000 | 43,137 |
0.88%, 11/18/2024 | 32,000 | 30,319 |
0.69%, 7/22/2025 | 225,000 | 206,706 |
0.57%, 8/12/2025 | 150,000 | 137,305 |
0.61%, 8/25/2025 | 50,000 | 45,715 |
0.53%, 9/29/2025 | 50,000 | 45,311 |
0.60%, 11/24/2025 | 283,000 | 256,389 |
0.75%, 12/16/2026 | 100,000 | 87,373 |
0.69%, 2/2/2027 | 245,000 | 213,482 |
1.30%, 3/30/2027 | 820,000 | 724,246 |
0.79%, 6/21/2027 | 110,000 | 94,966 |
0.84%, 2/2/2028 | 50,000 | 42,328 |
1.12%, 9/1/2028 | 35,000 | 29,448 |
1.10%, 8/10/2029 | 39,000 | 31,700 |
1.23%, 9/10/2029 | 35,000 | 28,616 |
1.68%, 4/29/2030 | 55,000 | 45,305 |
1.23%, 7/29/2030 | 194,000 | 153,751 |
1.15%, 8/12/2030 | 93,000 | 73,278 |
1.24%, 9/3/2030 | 129,000 | 101,868 |
1.32%, 9/9/2030 | 373,000 | 296,249 |
1.24%, 12/23/2030 | 120,000 | 93,724 |
1.38%, 1/14/2031 | 135,000 | 106,374 |
1.30%, 2/3/2031 | 125,000 | 97,253 |
2.23%, 3/12/2035 | 12,000 | 9,020 |
1.69%, 8/20/2035 | 11,000 | 7,682 |
FHLB | ||
2.50%, 2/13/2024 | 565,000 | 557,382 |
2.75%, 6/28/2024 | 75,000 | 73,356 |
1.50%, 8/15/2024 | 2,235,000 | 2,154,214 |
INVESTMENTS | PRINCIPAL AMOUNT($) | VALUE($) |
2.88%, 9/13/2024 | 430,000 | 418,881 |
2.75%, 12/13/2024 | 325,000 | 314,691 |
2.38%, 3/14/2025 | 325,000 | 311,729 |
0.50%, 4/14/2025 | 1,895,000 | 1,761,775 |
0.38%, 9/4/2025 | 100,000 | 91,458 |
0.58%, 2/11/2026 | 65,000 | 58,438 |
0.92%, 2/26/2027 | 150,000 | 131,654 |
3.25%, 6/9/2028 | 1,000,000 | 950,706 |
3.25%, 11/16/2028 | 770,000 | 732,247 |
2.13%, 9/14/2029 | 125,000 | 109,392 |
5.50%, 7/15/2036 | 35,000 | 38,556 |
FHLMC | ||
0.38%, 7/21/2025 | 300,000 | 275,656 |
0.38%, 9/23/2025 | 514,000 | 468,989 |
0.60%, 9/30/2025 | 59,000 | 53,904 |
0.63%, 10/27/2025 | 300,000 | 274,410 |
0.70%, 12/23/2025 | 56,000 | 50,920 |
0.80%, 10/27/2026 | 151,000 | 133,772 |
0.90%, 10/13/2027 | 65,000 | 56,008 |
3.84%, 12/14/2029 (h) | 2,086,000 | 1,578,399 |
6.75%, 3/15/2031 | 458,000 | 527,296 |
6.25%, 7/15/2032 | 726,000 | 828,178 |
4.56%, 11/15/2038 (h) | 641,000 | 313,425 |
3.46%, 11/15/2038 (h) | 918,000 | 448,797 |
FNMA | ||
1.75%, 7/2/2024 | 75,000 | 72,732 |
2.63%, 9/6/2024 | 1,088,000 | 1,059,661 |
0.65%, 8/14/2025 | 290,000 | 266,567 |
0.38%, 8/25/2025 | 300,000 | 274,665 |
0.50%, 11/7/2025 | 46,000 | 41,912 |
0.56%, 11/17/2025 | 290,000 | 262,494 |
2.13%, 4/24/2026 | 25,000 | 23,431 |
1.88%, 9/24/2026 | 1,231,000 | 1,137,446 |
0.75%, 10/8/2027 | 450,000 | 389,208 |
6.25%, 5/15/2029 | 310,000 | 339,525 |
7.13%, 1/15/2030 | 31,000 | 35,692 |
7.25%, 5/15/2030 | 14,000 | 16,339 |
0.88%, 8/5/2030 | 961,000 | 762,583 |
6.63%, 11/15/2030 | 55,000 | 62,617 |
Israel Government AID Bond (Israel) 5.50%, 9/18/2023 | 473,000 | 472,931 |
Tennessee Valley Authority | ||
2.88%, 9/15/2024 | 37,000 | 36,052 |
7.13%, 5/1/2030 | 166,000 | 189,776 |
4.70%, 7/15/2033 | 1,907,000 | 1,917,894 |
6.15%, 1/15/2038 | 35,000 | 39,480 |
August 31, 2023 | J.P. Morgan Exchange-Traded Funds | 75 |
AS OF August 31, 2023 (Unaudited) (continued)
INVESTMENTS | PRINCIPAL AMOUNT($) | VALUE($) |
U.S. Government Agency Securities — continued | ||
5.25%, 9/15/2039 | 80,000 | 82,324 |
4.25%, 9/15/2065 | 572,000 | 495,968 |
Total U.S. Government Agency Securities (Cost $25,339,912) | 24,330,116 | |
Asset-Backed Securities — 0.4% | ||
American Airlines Pass-Through Trust Series 2016-2, Class AA, 3.20%, 6/15/2028 | 117,096 | 105,989 |
American Express Credit Account Master Trust | ||
Series 2022-2, Class A, 3.39%, 5/15/2027 | 800,000 | 774,096 |
Series 2022-3, Class A, 3.75%, 8/15/2027 | 200,000 | 194,341 |
Capital One Multi-Asset Execution Trust | ||
Series 2022-A2, Class A, 3.49%, 5/15/2027 | 750,000 | 726,809 |
Series 2019-A3, Class A3, 2.06%, 8/15/2028 | 400,000 | 366,913 |
CarMax Auto Owner Trust Series 2022-1, Class A4, 1.70%, 8/16/2027 | 365,000 | 335,249 |
Citibank Credit Card Issuance Trust Series 2018-A7, Class A7, 3.96%, 10/13/2030 | 100,000 | 95,396 |
Delta Air Lines Pass-Through Trust Series 2020-1, Class AA, 2.00%, 6/10/2028 | 868,214 | 765,701 |
Discover Card Execution Note Trust Series 2022-A3, Class A3, 3.56%, 7/15/2027 | 750,000 | 726,187 |
Evergy Metro, Inc., 4.20%, 3/15/2048 | 199,000 | 161,936 |
Ford Credit Floorplan Master Owner Trust | ||
Series 2020-2, Class A, 1.06%, 9/15/2027 | 600,000 | 547,681 |
Series 2018-4, Class A, 4.06%, 11/15/2030 | 600,000 | 566,932 |
GM Financial Consumer Automobile Receivables Trust Series 2020-3, Class A4, 0.58%, 1/16/2026 | 500,000 | 482,082 |
Toyota Auto Receivables Owner Trust Series 2022-B, Class A3, 2.93%, 9/15/2026 | 600,000 | 582,065 |
United Airlines Pass-Through Trust | ||
Series 2014-1, Class A, 4.00%, 4/11/2026 | 851,141 | 808,714 |
Series 2023-1, Class A, 5.80%, 1/15/2036 | 100,000 | 99,698 |
Verizon Master Trust Series 2022-4, Class A, 3.40%, 11/20/2028 | 1,000,000 | 965,803 |
INVESTMENTS | PRINCIPAL AMOUNT($) | VALUE($) |
World Omni Select Auto Trust Series 2019-A, Class D, 2.59%, 12/15/2025 | 182,000 | 181,241 |
Total Asset-Backed Securities (Cost $8,611,781) | 8,486,833 | |
Municipal Bonds — 0.3% (i) | ||
Arizona — 0.0% ^ | ||
City of Tucson, Taxable Series 2021A, COP, AGM, 2.86%, 7/1/2047 | 865,000 | 613,259 |
California — 0.1% | ||
Bay Area Toll Authority, Toll Bridge | ||
Series 2010S-1, Rev., 6.92%, 4/1/2040 | 40,000 | 45,693 |
Series 2009F-2, Rev., 6.26%, 4/1/2049 | 100,000 | 113,611 |
California State University, Systemwide Series 2021B, Rev., 2.72%, 11/1/2052 | 1,070,000 | 704,023 |
East Bay Municipal Utility District, Water System Series 2010B, Rev., 5.87%, 6/1/2040 | 155,000 | 166,868 |
Golden State Tobacco Securitization Corp., Enhanced Tobacco Settlement Series 2021B, Rev., 3.29%, 6/1/2042 | 455,000 | 331,788 |
Los Angeles Unified School District, Build America Bonds | ||
Series 2009 KRY, GO, 5.75%, 7/1/2034 (d) | 20,000 | 20,701 |
Series 2010RY, GO, 6.76%, 7/1/2034 | 105,000 | 116,014 |
Regents of the University of California Medical Center Pooled | ||
Series 2010H, Rev., 6.55%, 5/15/2048 | 40,000 | 46,000 |
Series 2020N, Rev., 3.71%, 5/15/2120 | 140,000 | 90,437 |
State of California, Various Purpose | ||
GO, 7.50%, 4/1/2034 | 235,000 | 280,612 |
GO, 7.55%, 4/1/2039 | 400,000 | 491,953 |
Total California | 2,407,700 | |
Connecticut — 0.0% ^ | ||
State of Connecticut Series A, GO, 5.85%, 3/15/2032 | 75,000 | 78,728 |
Florida — 0.0% ^ | ||
State Board of Administration Finance Corp. Series 2020A, Rev., 2.15%, 7/1/2030 | 147,000 | 120,538 |
Georgia — 0.0% ^ | ||
Municipal Electric Authority of Georgia Series 2010A, Rev., 7.06%, 4/1/2057 | 48,000 | 49,980 |
Illinois — 0.0% ^ | ||
Chicago O'Hare International Airport, General Airport, Senior Lien Series 2018C, Rev., 4.47%, 1/1/2049 | 25,000 | 22,811 |
76 | J.P. Morgan Exchange-Traded Funds | August 31, 2023 |
INVESTMENTS | PRINCIPAL AMOUNT($) | VALUE($) |
Municipal Bonds — continued | ||
Illinois — continued | ||
Metropolitan Water Reclamation District of Greater Chicago GO, 5.72%, 12/1/2038 | 55,000 | 57,933 |
Sales Tax Securitization Corp. Series 2019A, Rev., 4.64%, 1/1/2040 | 55,000 | 52,205 |
State of Illinois GO, 5.10%, 6/1/2033 | 410,000 | 397,612 |
Total Illinois | 530,561 | |
Nebraska — 0.0% ^ | ||
University of Nebraska Facilities Corp., Taxable Series 2019A, Rev., 3.04%, 10/1/2049 | 50,000 | 36,228 |
New Jersey — 0.0% ^ | ||
New Jersey Economic Development Authority, Pension Funding Series 1997A, Rev., NATL - RE, 7.43%, 2/15/2029 | 35,000 | 37,483 |
New Jersey Turnpike Authority Series 2009F, Rev., 7.41%, 1/1/2040 | 250,000 | 306,196 |
Total New Jersey | 343,679 | |
New York — 0.0% ^ | ||
Port Authority of New York and New Jersey, Consolidated Series 192, Rev., 4.81%, 10/15/2065 | 120,000 | 113,704 |
Ohio — 0.0% ^ | ||
American Municipal Power, Inc., Combined Hydroelectric Projects Series 2010A, Rev., 7.83%, 2/15/2041 | 25,000 | 30,720 |
Texas — 0.1% | ||
Dallas Area Rapid Transit, Senior Lien, Sales Tax Series 2021A, Rev., 2.61%, 12/1/2048 | 100,000 | 67,077 |
Grand Parkway Transportation Corp., System Toll Series 2020B, Rev., 3.24%, 10/1/2052 | 100,000 | 70,452 |
Permanent University Fund - Texas A&M University System Series 2017B, Rev., 3.66%, 7/1/2047 | 325,000 | 265,115 |
State of Texas, Transportation Commission Highway Improvement Series 2010A, GO, 4.68%, 4/1/2040 | 45,000 | 43,602 |
INVESTMENTS | PRINCIPAL AMOUNT($) | VALUE($) |
Texas — continued | ||
State of Texas, Transportation Commission Mobility Fund Series 2009A, GO, 5.52%, 4/1/2039 | 120,000 | 125,297 |
Texas Private Activity Bond Surface Transportation Corp., North Tarrant Express Managed Lanes Project, Mobility Partners LLC Series 2019B, Rev., 3.92%, 12/31/2049 | 300,000 | 240,857 |
Total Texas | 812,400 | |
Virginia — 0.1% | ||
University of Virginia Series 2020, Rev., 2.26%, 9/1/2050 | 1,120,000 | 665,402 |
Total Municipal Bonds (Cost $7,205,942) | 5,802,899 | |
SHARES | ||
Short-Term Investments — 9.3% | ||
Investment Companies — 8.6% | ||
JPMorgan U.S. Government Money Market Fund Class IM Shares, 5.27% (j) (k) (Cost $172,100,666) | 172,100,666 | 172,100,666 |
Investment of Cash Collateral from Securities Loaned — 0.7% | ||
JPMorgan Securities Lending Money Market Fund Agency SL Class Shares, 5.50% (j) (k) | 10,990,747 | 10,992,945 |
JPMorgan U.S. Government Money Market Fund Class IM Shares, 5.27% (j) (k) | 3,521,611 | 3,521,611 |
Total Investment of Cash Collateral from Securities Loaned (Cost $14,514,556) | 14,514,556 | |
Total Short-Term Investments (Cost $186,615,222) | 186,615,222 | |
Total Investments — 108.4% (Cost $2,301,687,295) | 2,168,685,322 | |
Liabilities in Excess of Other Assets — (8.4)% | (168,571,208 ) | |
NET ASSETS — 100.0% | 2,000,114,114 | |
Percentages indicated are based on net assets. |
Abbreviations | |
ACES | Alternative Credit Enhancement Securities |
AGM | Insured by Assured Guaranty Municipal Corp. |
CME | Chicago Mercantile Exchange |
COP | Certificate of Participation |
FFCB | Federal Farm Credit Bank |
August 31, 2023 | J.P. Morgan Exchange-Traded Funds | 77 |
AS OF August 31, 2023 (Unaudited) (continued)
FHLB | Federal Home Loan Bank |
FHLMC | Federal Home Loan Mortgage Corp. |
FNMA | Federal National Mortgage Association |
GNMA | Government National Mortgage Association |
GO | General Obligation |
ICE | Intercontinental Exchange |
LIBOR | London Interbank Offered Rate |
NATL | Insured by National Public Finance Guarantee Corp. |
OYJ | Public Limited Company |
RE | Reinsured |
REIT | Real Estate Investment Trust |
Rev. | Revenue |
SOFR | Secured Overnight Financing Rate |
SOFRINDX | Compounding index of the Secured Overnight Financing Rate |
TBA | To Be Announced; Security is subject to delayed delivery. |
UMBS | Uniform Mortgage-Backed Securities |
USD | United States Dollar |
^ | Amount rounds to less than 0.1% of net assets. | |
(a) | All or a portion of the security is a when-issued security, delayed delivery security, or forward commitment. | |
(b) | Variable or floating rate security, linked to the referenced benchmark. The interest rate shown is the current rate as of August 31, 2023. | |
(c) | Contingent Capital security (“CoCo”). CoCos are hybrid debt securities that may be convertible into equity or may be written down if a pre-specified trigger event occurs. The total value of aggregate CoCo holdings at August 31, 2023 is $965,818 or 0.05% of the Fund’s net assets as of August 31, 2023. | |
(d) | The security or a portion of this security is on loan at August 31, 2023. The total value of securities on loan at August 31, 2023 is $13,939,821. | |
(e) | Variable or floating rate security, the interest rate of which adjusts periodically based on changes in current interest rates and prepayments on the underlying pool of assets. The interest rate shown is the current rate as of August 31, 2023. | |
(f) | Step bond. Interest rate is a fixed rate for an initial period that either resets at a specific date or may reset in the future contingent upon a predetermined trigger. The interest rate shown is the current rate as of August 31, 2023. | |
(g) | Securities exempt from registration under Rule 144A or section 4(a)(2), of the Securities Act of 1933, as amended. | |
(h) | The rate shown is the effective yield as of August 31, 2023. | |
(i) | The date shown represents the earliest of the prerefunded date, next put date or final maturity date. | |
(j) | Investment in an affiliated fund, which is registered under the Investment Company Act of 1940, as amended, and is advised by J.P. Morgan Investment Management Inc. | |
(k) | The rate shown is the current yield as of August 31, 2023. |
78 | J.P. Morgan Exchange-Traded Funds | August 31, 2023 |
AS OF August 31, 2023 (Unaudited)
INVESTMENTS | PRINCIPAL AMOUNT($) | VALUE($) |
U.S. Treasury Obligations — 99.2% | ||
U.S. Treasury Inflation Indexed Bonds | ||
1.75%, 1/15/2028 | 145,639 | 143,134 |
3.63%, 4/15/2028 | 150,914 | 160,749 |
U.S. Treasury Inflation Indexed Notes | ||
0.63%, 1/15/2024 | 453,748 | 447,692 |
0.25%, 1/15/2025 | 376,146 | 361,492 |
0.63%, 1/15/2026 | 346,699 | 330,600 |
0.38%, 1/15/2027 | 334,716 | 313,362 |
0.13%, 4/15/2027 | 398,749 | 368,726 |
0.38%, 7/15/2027 | 354,230 | 331,306 |
0.75%, 7/15/2028 | 314,812 | 296,808 |
U.S. Treasury Inflation Linked Bonds | ||
2.38%, 1/15/2025 | 257,364 | 254,411 |
2.00%, 1/15/2026 | 169,097 | 166,412 |
2.38%, 1/15/2027 | 163,398 | 163,446 |
U.S. Treasury Inflation Linked Notes | ||
0.50%, 4/15/2024 | 263,725 | 258,063 |
0.13%, 7/15/2024 | 424,037 | 412,663 |
0.13%, 10/15/2024 | 366,277 | 354,094 |
0.13%, 4/15/2025 | 298,849 | 285,024 |
0.38%, 7/15/2025 | 425,864 | 408,164 |
0.13%, 10/15/2025 | 364,526 | 346,068 |
0.13%, 4/15/2026 | 293,184 | 274,969 |
0.13%, 7/15/2026 | 344,948 | 323,924 |
INVESTMENTS | PRINCIPAL AMOUNT($) | VALUE($) |
0.13%, 10/15/2026 | 390,796 | 365,444 |
1.63%, 10/15/2027 | 413,022 | 405,161 |
0.50%, 1/15/2028 | 374,790 | 349,228 |
1.25%, 4/15/2028 | 407,897 | 392,649 |
Total U.S. Treasury Obligations (Cost $7,638,688) | 7,513,589 | |
SHARES | ||
Short-Term Investments — 0.2% | ||
Investment Companies — 0.2% | ||
JPMorgan Prime Money Market Fund Class IM Shares, 5.46% (a) (b) (Cost $17,008) | 17,005 | 17,010 |
Total Investments — 99.4% (Cost $7,655,696) | 7,530,599 | |
Other Assets Less Liabilities — 0.6% | 48,479 | |
NET ASSETS — 100.0% | 7,579,078 | |
Percentages indicated are based on net assets. |
(a) | Investment in an affiliated fund, which is registered under the Investment Company Act of 1940, as amended, and is advised by J.P. Morgan Investment Management Inc. |
(b) | The rate shown is the current yield as of August 31, 2023. |
August 31, 2023 | J.P. Morgan Exchange-Traded Funds | 79 |
AS OF August 31, 2023 (Unaudited)
INVESTMENTS | PRINCIPAL AMOUNT($) | VALUE($) |
U.S. Treasury Obligations — 99.2% | ||
U.S. Treasury Bonds 6.75%, 8/15/2026 | 29,000 | 30,748 |
U.S. Treasury Notes | ||
0.38%, 9/15/2024 | 32,000 | 30,404 |
1.50%, 9/30/2024 | 18,000 | 17,283 |
2.13%, 9/30/2024 | 2,000 | 1,933 |
4.25%, 9/30/2024 | 97,000 | 95,913 |
0.63%, 10/15/2024 | 27,000 | 25,638 |
4.38%, 10/31/2024 | 96,000 | 95,006 |
0.75%, 11/15/2024 | 27,000 | 25,594 |
2.25%, 11/15/2024 | 119,000 | 114,830 |
1.50%, 11/30/2024 | 85,000 | 81,192 |
2.13%, 11/30/2024 | 2,000 | 1,925 |
4.50%, 11/30/2024 | 87,000 | 86,218 |
1.00%, 12/15/2024 | 76,000 | 72,049 |
1.75%, 12/31/2024 | 85,000 | 81,261 |
4.25%, 12/31/2024 | 95,000 | 93,839 |
1.13%, 1/15/2025 | 19,000 | 17,991 |
2.50%, 1/31/2025 | 77,000 | 74,230 |
4.13%, 1/31/2025 | 96,000 | 94,661 |
1.50%, 2/15/2025 | 108,000 | 102,541 |
2.00%, 2/15/2025 | 21,000 | 20,088 |
1.13%, 2/28/2025 | 1,000 | 943 |
4.63%, 2/28/2025 | 96,000 | 95,336 |
1.75%, 3/15/2025 | 14,000 | 13,315 |
0.50%, 3/31/2025 | 3,000 | 2,794 |
2.63%, 3/31/2025 | 64,000 | 61,640 |
3.88%, 3/31/2025 | 96,000 | 94,264 |
2.63%, 4/15/2025 | 102,000 | 98,183 |
0.38%, 4/30/2025 | 39,000 | 36,141 |
2.88%, 4/30/2025 | 28,000 | 27,045 |
3.88%, 4/30/2025 | 96,000 | 94,256 |
2.13%, 5/15/2025 | 18,000 | 17,160 |
2.75%, 5/15/2025 | 11,000 | 10,599 |
0.25%, 5/31/2025 | 45,000 | 41,467 |
2.88%, 5/31/2025 | 73,000 | 70,434 |
4.25%, 5/31/2025 | 79,000 | 78,034 |
2.88%, 6/15/2025 | 100,000 | 96,457 |
0.25%, 6/30/2025 | 102,000 | 93,736 |
2.75%, 6/30/2025 | 67,000 | 64,456 |
4.63%, 6/30/2025 | 9,000 | 8,950 |
3.00%, 7/15/2025 | 25,000 | 24,147 |
0.25%, 7/31/2025 | 51,000 | 46,719 |
2.88%, 7/31/2025 | 26,000 | 25,042 |
4.75%, 7/31/2025 | 9,000 | 8,976 |
2.00%, 8/15/2025 | 115,000 | 108,864 |
INVESTMENTS | PRINCIPAL AMOUNT($) | VALUE($) |
3.13%, 8/15/2025 | 7,000 | 6,772 |
0.25%, 8/31/2025 | 105,000 | 95,870 |
5.00%, 8/31/2025 | 13,000 | 13,037 |
3.50%, 9/15/2025 | 7,000 | 6,818 |
0.25%, 9/30/2025 | 109,000 | 99,309 |
3.00%, 9/30/2025 | 64,000 | 61,690 |
4.25%, 10/15/2025 | 6,000 | 5,933 |
0.25%, 10/31/2025 | 49,000 | 44,485 |
3.00%, 10/31/2025 | 1,000 | 963 |
2.25%, 11/15/2025 | 27,000 | 25,579 |
4.50%, 11/15/2025 | 7,000 | 6,957 |
0.38%, 11/30/2025 | 111,000 | 100,750 |
2.88%, 11/30/2025 | 52,000 | 49,932 |
4.00%, 12/15/2025 | 6,000 | 5,903 |
0.38%, 12/31/2025 | 104,000 | 94,234 |
2.63%, 12/31/2025 | 1,000 | 954 |
3.88%, 1/15/2026 | 6,000 | 5,887 |
0.38%, 1/31/2026 | 123,000 | 111,012 |
2.63%, 1/31/2026 | 8,000 | 7,623 |
1.63%, 2/15/2026 | 108,000 | 100,389 |
4.00%, 2/15/2026 | 20,000 | 19,684 |
0.50%, 2/28/2026 | 124,000 | 111,958 |
2.50%, 2/28/2026 | 79,000 | 75,004 |
4.63%, 3/15/2026 | 84,000 | 83,938 |
0.75%, 3/31/2026 | 118,000 | 107,094 |
2.25%, 3/31/2026 | 48,000 | 45,257 |
3.75%, 4/15/2026 | 6,000 | 5,870 |
0.75%, 4/30/2026 | 118,000 | 106,716 |
2.38%, 4/30/2026 | 70,000 | 66,112 |
1.63%, 5/15/2026 | 65,000 | 60,110 |
3.63%, 5/15/2026 | 94,000 | 91,679 |
0.75%, 5/31/2026 | 122,000 | 110,029 |
4.13%, 6/15/2026 | 6,000 | 5,931 |
0.88%, 6/30/2026 | 17,000 | 15,367 |
1.88%, 6/30/2026 | 1,000 | 930 |
4.50%, 7/15/2026 | 6,000 | 5,989 |
0.63%, 7/31/2026 | 100,000 | 89,426 |
1.50%, 8/15/2026 | 20,000 | 18,332 |
4.38%, 8/15/2026 | 44,000 | 43,801 |
0.75%, 8/31/2026 | 46,000 | 41,183 |
1.38%, 8/31/2026 | 59,000 | 53,828 |
Total U.S. Treasury Obligations (Cost $4,417,018) | 4,384,637 | |
80 | J.P. Morgan Exchange-Traded Funds | August 31, 2023 |
INVESTMENTS | SHARES | VALUE($) |
Short-Term Investments — 0.3% | ||
Investment Companies — 0.3% | ||
JPMorgan Prime Money Market Fund Class IM Shares, 5.46% (a) (b) (Cost $13,853) | 13,849 | 13,853 |
Total Investments — 99.5% (Cost $4,430,871) | 4,398,490 | |
Other Assets Less Liabilities — 0.5% | 23,272 | |
NET ASSETS — 100.0% | 4,421,762 | |
Percentages indicated are based on net assets. |
(a) | Investment in an affiliated fund, which is registered under the Investment Company Act of 1940, as amended, and is advised by J.P. Morgan Investment Management Inc. |
(b) | The rate shown is the current yield as of August 31, 2023. |
August 31, 2023 | J.P. Morgan Exchange-Traded Funds | 81 |
AS OF August 31, 2023 (Unaudited)
INVESTMENTS | PRINCIPAL AMOUNT($) | VALUE($) |
U.S. Treasury Obligations — 99.0% | ||
U.S. Treasury Bonds | ||
3.75%, 11/15/2043 | 812,000 | 738,635 |
3.63%, 2/15/2044 | 1,009,000 | 900,060 |
3.38%, 5/15/2044 | 935,000 | 801,763 |
3.13%, 8/15/2044 | 1,181,000 | 971,742 |
3.00%, 11/15/2044 | 1,066,000 | 857,505 |
2.50%, 2/15/2045 | 1,307,000 | 959,777 |
3.00%, 5/15/2045 | 619,000 | 496,022 |
2.88%, 8/15/2045 | 777,000 | 607,972 |
3.00%, 11/15/2045 | 547,000 | 437,002 |
2.50%, 2/15/2046 | 1,151,000 | 836,813 |
2.50%, 5/15/2046 | 1,160,000 | 842,314 |
2.25%, 8/15/2046 | 1,419,000 | 977,447 |
2.88%, 11/15/2046 | 636,000 | 494,714 |
3.00%, 2/15/2047 | 1,262,000 | 1,003,241 |
3.00%, 5/15/2047 | 1,048,000 | 832,873 |
2.75%, 8/15/2047 | 1,290,000 | 977,729 |
2.75%, 11/15/2047 | 1,395,000 | 1,056,277 |
3.00%, 2/15/2048 | 1,600,000 | 1,270,063 |
3.13%, 5/15/2048 | 1,718,000 | 1,395,338 |
3.00%, 8/15/2048 | 1,702,000 | 1,350,630 |
3.38%, 11/15/2048 | 1,932,000 | 1,641,898 |
3.00%, 2/15/2049 | 2,034,000 | 1,614,567 |
2.88%, 5/15/2049 | 1,988,000 | 1,540,933 |
2.25%, 8/15/2049 | 1,668,000 | 1,134,696 |
2.38%, 11/15/2049 | 1,852,000 | 1,295,170 |
2.00%, 2/15/2050 | 2,222,000 | 1,422,861 |
1.25%, 5/15/2050 | 2,582,000 | 1,349,599 |
1.38%, 8/15/2050 | 2,714,000 | 1,466,938 |
1.63%, 11/15/2050 | 2,877,000 | 1,664,165 |
1.88%, 2/15/2051 | 2,937,000 | 1,811,877 |
2.38%, 5/15/2051 | 3,231,000 | 2,245,671 |
2.00%, 8/15/2051 | 3,096,000 | 1,965,597 |
1.88%, 11/15/2051 | 2,978,000 | 1,829,841 |
2.25%, 2/15/2052 | 2,622,000 | 1,768,826 |
2.88%, 5/15/2052 | 2,577,000 | 2,000,497 |
3.00%, 8/15/2052 | 2,252,000 | 1,794,650 |
4.00%, 11/15/2052 | 2,387,000 | 2,303,175 |
3.63%, 2/15/2053 | 2,449,000 | 2,206,396 |
3.63%, 5/15/2053 | 2,268,000 | 2,045,452 |
4.13%, 8/15/2053 | 856,000 | 844,498 |
Total U.S. Treasury Obligations (Cost $54,276,789) | 51,755,224 | |
INVESTMENTS | SHARES | VALUE($) |
Short-Term Investments — 0.1% | ||
Investment Companies — 0.1% | ||
JPMorgan Prime Money Market Fund Class IM Shares, 5.46% (a) (b) (Cost $23,665) | 23,660 | 23,667 |
Total Investments — 99.1% (Cost $54,300,454) | 51,778,891 | |
Other Assets Less Liabilities — 0.9% | 492,096 | |
NET ASSETS — 100.0% | 52,270,987 | |
Percentages indicated are based on net assets. |
(a) | Investment in an affiliated fund, which is registered under the Investment Company Act of 1940, as amended, and is advised by J.P. Morgan Investment Management Inc. |
(b) | The rate shown is the current yield as of August 31, 2023. |
82 | J.P. Morgan Exchange-Traded Funds | August 31, 2023 |
AS OF August 31, 2023 (Unaudited)
INVESTMENTS | PRINCIPAL AMOUNT($) | VALUE($) |
U.S. Treasury Obligations — 99.1% | ||
U.S. Treasury Notes | ||
0.88%, 9/30/2026 | 3,000 | 2,692 |
1.63%, 9/30/2026 | 50,000 | 45,920 |
1.13%, 10/31/2026 | 24,000 | 21,636 |
1.63%, 10/31/2026 | 58,000 | 53,115 |
1.25%, 11/30/2026 | 6,000 | 5,419 |
1.25%, 12/31/2026 | 99,000 | 89,286 |
1.75%, 12/31/2026 | 68,000 | 62,332 |
1.50%, 1/31/2027 | 111,000 | 100,685 |
2.25%, 2/15/2027 | 76,000 | 70,671 |
1.13%, 2/28/2027 | 10,000 | 8,941 |
1.88%, 2/28/2027 | 1,000 | 917 |
0.63%, 3/31/2027 | 36,000 | 31,508 |
0.50%, 4/30/2027 | 54,000 | 46,912 |
2.75%, 4/30/2027 | 88,000 | 83,060 |
2.38%, 5/15/2027 | 4,000 | 3,722 |
0.50%, 5/31/2027 | 10,000 | 8,662 |
2.63%, 5/31/2027 | 47,000 | 44,118 |
0.50%, 6/30/2027 | 56,000 | 48,390 |
3.25%, 6/30/2027 | 32,000 | 30,720 |
2.75%, 7/31/2027 | 27,000 | 25,417 |
2.25%, 8/15/2027 | 86,000 | 79,406 |
0.50%, 8/31/2027 | 84,000 | 72,174 |
3.13%, 8/31/2027 | 37,000 | 35,306 |
0.38%, 9/30/2027 | 44,000 | 37,507 |
4.13%, 9/30/2027 | 82,000 | 81,241 |
4.13%, 10/31/2027 | 64,000 | 63,402 |
0.63%, 11/30/2027 | 95,000 | 81,411 |
3.88%, 11/30/2027 | 82,000 | 80,495 |
0.63%, 12/31/2027 | 69,000 | 58,987 |
3.88%, 12/31/2027 | 42,000 | 41,231 |
0.75%, 1/31/2028 | 11,000 | 9,435 |
3.50%, 1/31/2028 | 49,000 | 47,383 |
2.75%, 2/15/2028 | 9,000 | 8,432 |
1.13%, 2/29/2028 | 42,000 | 36,565 |
4.00%, 2/29/2028 | 80,000 | 79,016 |
1.25%, 3/31/2028 | 2,000 | 1,748 |
3.63%, 3/31/2028 | 79,000 | 76,797 |
1.25%, 4/30/2028 | 88,000 | 76,746 |
3.50%, 4/30/2028 | 26,000 | 25,137 |
2.88%, 5/15/2028 | 47,000 | 44,171 |
1.25%, 5/31/2028 | 81,000 | 70,511 |
1.25%, 6/30/2028 | 58,000 | 50,392 |
1.00%, 7/31/2028 | 105,000 | 89,857 |
2.88%, 8/15/2028 | 12,000 | 11,251 |
INVESTMENTS | PRINCIPAL AMOUNT($) | VALUE($) |
1.13%, 8/31/2028 | 105,000 | 90,247 |
1.25%, 9/30/2028 | 104,000 | 89,753 |
1.38%, 10/31/2028 | 2,000 | 1,734 |
3.13%, 11/15/2028 | 9,000 | 8,522 |
1.50%, 11/30/2028 | 97,000 | 84,492 |
1.38%, 12/31/2028 | 100,000 | 86,379 |
1.75%, 1/31/2029 | 10,000 | 8,793 |
2.63%, 2/15/2029 | 85,000 | 78,253 |
2.38%, 3/31/2029 | 60,000 | 54,415 |
2.88%, 4/30/2029 | 37,000 | 34,437 |
2.38%, 5/15/2029 | 64,000 | 57,970 |
2.75%, 5/31/2029 | 27,000 | 24,941 |
3.25%, 6/30/2029 | 47,000 | 44,573 |
2.63%, 7/31/2029 | 12,000 | 10,990 |
1.63%, 8/15/2029 | 91,000 | 78,807 |
3.13%, 8/31/2029 | 79,000 | 74,356 |
3.88%, 9/30/2029 | 54,000 | 52,918 |
4.00%, 10/31/2029 | 35,000 | 34,531 |
1.75%, 11/15/2029 | 33,000 | 28,697 |
3.50%, 1/31/2030 | 17,000 | 16,307 |
1.50%, 2/15/2030 | 2,000 | 1,697 |
4.00%, 2/28/2030 | 74,000 | 73,058 |
3.63%, 3/31/2030 | 73,000 | 70,513 |
3.50%, 4/30/2030 | 29,000 | 27,804 |
0.63%, 5/15/2030 | 69,000 | 54,739 |
3.75%, 5/31/2030 | 37,000 | 36,001 |
4.00%, 7/31/2030 | 12,000 | 11,857 |
0.63%, 8/15/2030 | 53,000 | 41,760 |
0.88%, 11/15/2030 | 152,000 | 121,671 |
1.13%, 2/15/2031 | 125,000 | 101,558 |
1.63%, 5/15/2031 | 95,000 | 79,574 |
1.25%, 8/15/2031 | 137,000 | 110,627 |
1.38%, 11/15/2031 | 47,000 | 38,090 |
1.88%, 2/15/2032 | 119,000 | 100,020 |
2.88%, 5/15/2032 | 102,000 | 92,696 |
2.75%, 8/15/2032 | 135,000 | 121,178 |
4.13%, 11/15/2032 | 59,000 | 58,972 |
3.50%, 2/15/2033 | 117,000 | 111,424 |
3.38%, 5/15/2033 | 48,000 | 45,217 |
3.88%, 8/15/2033 | 29,000 | 28,483 |
Total U.S. Treasury Obligations (Cost $4,444,955) | 4,330,778 | |
August 31, 2023 | J.P. Morgan Exchange-Traded Funds | 83 |
AS OF August 31, 2023 (Unaudited) (continued)
INVESTMENTS | SHARES | VALUE($) |
Short-Term Investments — 0.5% | ||
Investment Companies — 0.5% | ||
JPMorgan Prime Money Market Fund Class IM Shares, 5.46% (a) (b) (Cost $19,814) | 19,808 | 19,814 |
Total Investments — 99.6% (Cost $4,464,769) | 4,350,592 | |
Other Assets Less Liabilities — 0.4% | 18,365 | |
NET ASSETS — 100.0% | 4,368,957 | |
Percentages indicated are based on net assets. |
(a) | Investment in an affiliated fund, which is registered under the Investment Company Act of 1940, as amended, and is advised by J.P. Morgan Investment Management Inc. |
(b) | The rate shown is the current yield as of August 31, 2023. |
84 | J.P. Morgan Exchange-Traded Funds | August 31, 2023 |
AS OF August 31, 2023 (Unaudited)
INVESTMENTS | PRINCIPAL AMOUNT($) | VALUE($) |
Corporate Bonds — 97.8% | ||
Aerospace & Defense — 2.2% | ||
Bombardier, Inc. (Canada) | ||
7.50%, 3/15/2025 (a) | 35,000 | 35,021 |
7.13%, 6/15/2026 (a) | 853,000 | 838,827 |
7.88%, 4/15/2027 (a) | 1,011,000 | 1,008,387 |
6.00%, 2/15/2028 (a) | 76,000 | 71,032 |
7.50%, 2/1/2029 (a) | 156,000 | 152,862 |
BWX Technologies, Inc. 4.13%, 4/15/2029 (a) | 130,000 | 115,680 |
Moog, Inc. 4.25%, 12/15/2027 (a) | 336,000 | 305,761 |
Rolls-Royce plc (United Kingdom) 5.75%, 10/15/2027 (a) | 600,000 | 582,489 |
Spirit AeroSystems, Inc. | ||
7.50%, 4/15/2025 (a) | 523,000 | 516,518 |
3.85%, 6/15/2026 | 165,000 | 153,951 |
4.60%, 6/15/2028 | 128,000 | 103,687 |
9.38%, 11/30/2029 (a) | 460,000 | 479,373 |
TransDigm, Inc. | ||
6.25%, 3/15/2026 (a) | 1,698,000 | 1,681,817 |
6.38%, 6/15/2026 | 660,000 | 659,926 |
5.50%, 11/15/2027 | 1,379,000 | 1,308,700 |
6.75%, 8/15/2028 (a) | 229,000 | 229,803 |
4.88%, 5/1/2029 | 735,000 | 661,343 |
Triumph Group, Inc. | ||
7.75%, 8/15/2025 | 612,000 | 577,422 |
9.00%, 3/15/2028 (a) | 5,000 | 5,034 |
9,487,633 | ||
Air Freight & Logistics — 0.0% ^ | ||
Rand Parent LLC 8.50%, 2/15/2030 (a) | 81,000 | 77,113 |
Automobile Components — 2.1% | ||
Adient Global Holdings Ltd. | ||
4.88%, 8/15/2026 (a) | 350,000 | 337,067 |
7.00%, 4/15/2028 (a) | 191,000 | 192,966 |
8.25%, 4/15/2031 (a) | 280,000 | 287,056 |
Allison Transmission, Inc. 5.88%, 6/1/2029 (a) | 359,000 | 346,731 |
American Axle & Manufacturing, Inc. | ||
6.50%, 4/1/2027 | 489,000 | 463,445 |
5.00%, 10/1/2029 | 263,000 | 216,516 |
Clarios Global LP | ||
6.75%, 5/15/2025 (a) | 127,000 | 126,951 |
6.25%, 5/15/2026 (a) | 207,000 | 205,007 |
8.50%, 5/15/2027 (a) | 756,000 | 763,611 |
Cooper-Standard Automotive, Inc. | ||
13.50% (Blend (Cash 9.00% + PIK 4.50%)), 3/31/2027 (a) (b) | 253,346 | 257,335 |
INVESTMENTS | PRINCIPAL AMOUNT($) | VALUE($) |
Automobile Components — continued | ||
10.63% (PIK), 5/15/2027 (a) (b) | 115,520 | 72,549 |
Dana, Inc. | ||
5.38%, 11/15/2027 | 411,000 | 388,816 |
5.63%, 6/15/2028 | 101,000 | 95,077 |
4.50%, 2/15/2032 | 253,000 | 204,270 |
Dealer Tire LLC 8.00%, 2/1/2028 (a) | 262,000 | 244,549 |
Dornoch Debt Merger Sub, Inc. 6.63%, 10/15/2029 (a) | 231,000 | 199,144 |
Goodyear Tire & Rubber Co. (The) | ||
5.00%, 5/31/2026 | 407,000 | 392,741 |
4.88%, 3/15/2027 | 679,000 | 638,737 |
5.00%, 7/15/2029 | 332,000 | 294,649 |
5.25%, 4/30/2031 | 485,000 | 425,437 |
5.63%, 4/30/2033 | 172,000 | 147,262 |
Icahn Enterprises LP | ||
6.38%, 12/15/2025 | 161,000 | 153,494 |
6.25%, 5/15/2026 | 889,000 | 823,623 |
5.25%, 5/15/2027 | 602,000 | 528,255 |
4.38%, 2/1/2029 | 142,000 | 112,145 |
IHO Verwaltungs GmbH (Germany) 6.37% (Cash), 5/15/2029 (a) (b) | 393,000 | 363,652 |
Patrick Industries, Inc. | ||
7.50%, 10/15/2027 (a) | 111,000 | 108,225 |
4.75%, 5/1/2029 (a) | 164,000 | 140,220 |
Real Hero Merger Sub 2, Inc. 6.25%, 2/1/2029 (a) | 387,000 | 315,146 |
ZF North America Capital, Inc. (Germany) | ||
4.75%, 4/29/2025 (a) | 150,000 | 145,740 |
6.88%, 4/14/2028 (a) | 300,000 | 299,033 |
9,289,449 | ||
Automobiles — 1.3% | ||
Aston Martin Capital Holdings Ltd. (Jersey) 10.50%, 11/30/2025 (a) | 200,000 | 203,130 |
Ford Motor Co. | ||
4.35%, 12/8/2026 | 12,000 | 11,583 |
6.63%, 10/1/2028 | 297,000 | 299,400 |
3.25%, 2/12/2032 | 1,406,000 | 1,097,536 |
6.10%, 8/19/2032 | 1,049,000 | 1,002,351 |
4.75%, 1/15/2043 | 379,000 | 283,342 |
5.29%, 12/8/2046 | 911,000 | 715,375 |
Jaguar Land Rover Automotive plc (United Kingdom) | ||
7.75%, 10/15/2025 (a) | 419,000 | 420,481 |
4.50%, 10/1/2027 (a) | 211,000 | 184,099 |
5.50%, 7/15/2029 (a) | 295,000 | 256,320 |
August 31, 2023 | J.P. Morgan Exchange-Traded Funds | 85 |
AS OF August 31, 2023 (Unaudited) (continued)
INVESTMENTS | PRINCIPAL AMOUNT($) | VALUE($) |
Corporate Bonds — continued | ||
Automobiles — continued | ||
Mclaren Finance plc (United Kingdom) 7.50%, 8/1/2026 (a) | 454,000 | 399,520 |
PM General Purchaser LLC 9.50%, 10/1/2028 (a) | 304,000 | 292,658 |
Thor Industries, Inc. 4.00%, 10/15/2029 (a) | 261,000 | 219,263 |
Winnebago Industries, Inc. 6.25%, 7/15/2028 (a) | 291,000 | 283,294 |
5,668,352 | ||
Banks — 0.7% | ||
Intesa Sanpaolo SpA (Italy) | ||
5.02%, 6/26/2024 (a) | 200,000 | 195,555 |
5.71%, 1/15/2026 (a) | 715,000 | 687,266 |
(US Treasury Yield Curve Rate T Note Constant Maturity 1 Year + 2.60%), 4.20%, 6/1/2032 (a) (c) | 338,000 | 257,592 |
(US Treasury Yield Curve Rate T Note Constant Maturity 1 Year + 2.75%), 4.95%, 6/1/2042 (a) (c) | 219,000 | 145,945 |
Pacific Western Bank (3-MONTH CME TERM SOFR + 2.52%), 3.25%, 5/1/2031 (c) | 157,000 | 130,310 |
Popular, Inc. (Puerto Rico) 7.25%, 3/13/2028 | 190,000 | 191,187 |
UniCredit SpA (Italy) | ||
(USD ICE Swap Rate 5 Year + 3.70%), 5.86%, 6/19/2032 (a) (c) | 946,000 | 870,659 |
(US Treasury Yield Curve Rate T Note Constant Maturity 5 Year + 4.75%), 5.46%, 6/30/2035 (a) (c) | 423,000 | 367,308 |
Western Alliance Bancorp (3-MONTH CME TERM SOFR + 2.25%), 3.00%, 6/15/2031 (c) | 133,000 | 105,186 |
2,951,008 | ||
Beverages — 0.1% | ||
Primo Water Holdings, Inc. (Canada) 4.38%, 4/30/2029 (a) | 145,000 | 127,237 |
Triton Water Holdings, Inc. 6.25%, 4/1/2029 (a) | 276,000 | 234,615 |
361,852 | ||
Biotechnology — 0.1% | ||
Emergent BioSolutions, Inc. 3.88%, 8/15/2028 (a) | 297,000 | 142,560 |
Grifols SA (Spain) 4.75%, 10/15/2028 (a) | 340,000 | 298,292 |
440,852 | ||
Broadline Retail — 1.3% | ||
ANGI Group LLC 3.88%, 8/15/2028 (a) | 376,000 | 301,745 |
Go Daddy Operating Co. LLC 3.50%, 3/1/2029 (a) | 727,000 | 624,888 |
INVESTMENTS | PRINCIPAL AMOUNT($) | VALUE($) |
Broadline Retail — continued | ||
Kohl's Corp. 4.62%, 5/1/2031 (d) | 425,000 | 312,906 |
Macy's Retail Holdings LLC | ||
5.88%, 4/1/2029 (a) | 617,000 | 557,756 |
5.88%, 3/15/2030 (a) | 5,000 | 4,375 |
4.50%, 12/15/2034 | 316,000 | 225,308 |
Match Group Holdings II LLC | ||
5.00%, 12/15/2027 (a) | 295,000 | 276,811 |
4.63%, 6/1/2028 (a) | 110,000 | 101,488 |
5.63%, 2/15/2029 (a) | 149,000 | 140,451 |
4.13%, 8/1/2030 (a) | 392,000 | 336,187 |
3.63%, 10/1/2031 (a) | 100,000 | 81,521 |
Millennium Escrow Corp. 6.63%, 8/1/2026 (a) | 392,000 | 322,983 |
NMG Holding Co., Inc. 7.13%, 4/1/2026 (a) | 488,000 | 463,803 |
Nordstrom, Inc. | ||
4.00%, 3/15/2027 | 5,000 | 4,362 |
6.95%, 3/15/2028 | 33,000 | 32,065 |
4.38%, 4/1/2030 | 505,000 | 403,482 |
4.25%, 8/1/2031 | 91,000 | 68,458 |
5.00%, 1/15/2044 | 241,000 | 153,035 |
Photo Holdings Merger Sub, Inc. 8.50%, 10/1/2026 (a) | 259,000 | 124,644 |
QVC, Inc. | ||
4.45%, 2/15/2025 | 136,000 | 122,269 |
4.75%, 2/15/2027 | 764,000 | 504,313 |
5.95%, 3/15/2043 | 99,000 | 45,630 |
Rakuten Group, Inc. (Japan) (US Treasury Yield Curve Rate T Note Constant Maturity 5 Year + 4.96%), 6.25%, 4/22/2031 (a) (c) (e) (f) | 528,000 | 269,229 |
5,477,709 | ||
Building Products — 1.4% | ||
Advanced Drainage Systems, Inc. | ||
5.00%, 9/30/2027 (a) | 78,000 | 74,490 |
6.38%, 6/15/2030 (a) | 408,000 | 401,896 |
Builders FirstSource, Inc. | ||
5.00%, 3/1/2030 (a) | 862,000 | 791,814 |
4.25%, 2/1/2032 (a) | 139,000 | 118,174 |
Camelot Return Merger Sub, Inc. 8.75%, 8/1/2028 (a) | 421,000 | 419,947 |
CP Atlas Buyer, Inc. 7.00%, 12/1/2028 (a) | 235,000 | 197,321 |
Eco Material Technologies, Inc. 7.88%, 1/31/2027 (a) | 51,000 | 49,724 |
Emerald Debt Merger Sub LLC 6.63%, 12/15/2030 (a) | 455,000 | 447,911 |
Griffon Corp. 5.75%, 3/1/2028 | 584,000 | 544,290 |
86 | J.P. Morgan Exchange-Traded Funds | August 31, 2023 |
INVESTMENTS | PRINCIPAL AMOUNT($) | VALUE($) |
Corporate Bonds — continued | ||
Building Products — continued | ||
James Hardie International Finance DAC 5.00%, 1/15/2028 (a) | 300,000 | 282,981 |
JELD-WEN, Inc. 4.88%, 12/15/2027 (a) | 96,000 | 85,438 |
Masonite International Corp. | ||
5.38%, 2/1/2028 (a) | 113,000 | 107,068 |
3.50%, 2/15/2030 (a) | 373,000 | 312,328 |
MIWD Holdco II LLC 5.50%, 2/1/2030 (a) | 39,000 | 33,057 |
New Enterprise Stone & Lime Co., Inc. 5.25%, 7/15/2028 (a) | 32,000 | 29,526 |
Oscar AcquisitionCo LLC 9.50%, 4/15/2030 (a) | 325,000 | 304,202 |
PGT Innovations, Inc. 4.38%, 10/1/2029 (a) | 380,000 | 352,617 |
Standard Industries, Inc. | ||
5.00%, 2/15/2027 (a) | 22,000 | 20,856 |
4.75%, 1/15/2028 (a) | 863,000 | 794,822 |
3.38%, 1/15/2031 (a) | 294,000 | 234,431 |
Summit Materials LLC 6.50%, 3/15/2027 (a) | 399,000 | 395,688 |
Victors Merger Corp. 6.38%, 5/15/2029 (a) | 265,000 | 190,792 |
6,189,373 | ||
Capital Markets — 0.6% | ||
AG TTMT Escrow Issuer LLC 8.63%, 9/30/2027 (a) | 510,000 | 525,610 |
Aretec Escrow Issuer, Inc. 7.50%, 4/1/2029 (a) | 105,000 | 94,327 |
Brightsphere Investment Group, Inc. 4.80%, 7/27/2026 | 170,000 | 162,245 |
Coinbase Global, Inc. 3.38%, 10/1/2028 (a) | 252,000 | 185,375 |
Compass Group Diversified Holdings LLC | ||
5.25%, 4/15/2029 (a) | 509,000 | 467,445 |
5.00%, 1/15/2032 (a) | 35,000 | 29,362 |
Dresdner Funding Trust I 8.15%, 6/30/2031 (a) | 382,000 | 406,830 |
Jane Street Group 4.50%, 11/15/2029 (a) | 453,000 | 397,514 |
StoneX Group, Inc. 8.63%, 6/15/2025 (a) | 320,000 | 324,029 |
2,592,737 | ||
Chemicals — 2.9% | ||
Ashland, Inc. | ||
3.38%, 9/1/2031 (a) | 261,000 | 208,670 |
6.88%, 5/15/2043 | 96,000 | 93,837 |
ASP Unifrax Holdings, Inc. 7.50%, 9/30/2029 (a) | 249,000 | 129,616 |
Avient Corp. | ||
5.75%, 5/15/2025 (a) | 237,000 | 233,846 |
7.13%, 8/1/2030 (a) | 412,000 | 411,606 |
INVESTMENTS | PRINCIPAL AMOUNT($) | VALUE($) |
Chemicals — continued | ||
Axalta Coating Systems LLC 4.75%, 6/15/2027 (a) | 525,000 | 494,032 |
Cerdia Finanz GmbH (Germany) 10.50%, 2/15/2027 (a) | 248,000 | 243,985 |
Chemours Co. (The) | ||
5.38%, 5/15/2027 | 38,000 | 35,772 |
5.75%, 11/15/2028 (a) | 767,000 | 689,011 |
4.63%, 11/15/2029 (a) | 5,000 | 4,157 |
Cornerstone Chemical Co. 8.11% (Blend (Cash 8.25% + PIK 2.00%)), 9/1/2027 (a) (b) | 16,000 | 13,611 |
CVR Partners LP 6.13%, 6/15/2028 (a) | 301,000 | 269,476 |
Element Solutions, Inc. 3.88%, 9/1/2028 (a) | 247,000 | 217,143 |
FXI Holdings, Inc. 12.25%, 11/15/2026 (a) | 448,000 | 402,080 |
GPD Cos., Inc. 10.13%, 4/1/2026 (a) | 330,000 | 309,516 |
INEOS Finance plc (Luxembourg) 6.75%, 5/15/2028 (a) | 234,000 | 224,032 |
INEOS Quattro Finance 2 plc (United Kingdom) 3.38%, 1/15/2026 (a) | 300,000 | 274,422 |
Ingevity Corp. 3.88%, 11/1/2028 (a) | 56,000 | 47,583 |
LSB Industries, Inc. 6.25%, 10/15/2028 (a) | 433,000 | 396,001 |
LSF11 A5 HoldCo LLC 6.63%, 10/15/2029 (a) | 55,000 | 45,833 |
Mativ Holdings, Inc. 6.88%, 10/1/2026 (a) | 321,000 | 290,685 |
Methanex Corp. (Canada) | ||
5.13%, 10/15/2027 | 120,000 | 112,556 |
5.25%, 12/15/2029 | 685,000 | 623,992 |
5.65%, 12/1/2044 | 91,000 | 74,430 |
NOVA Chemicals Corp. (Canada) | ||
4.88%, 6/1/2024 (a) | 17,000 | 16,721 |
5.25%, 6/1/2027 (a) | 78,000 | 69,346 |
4.25%, 5/15/2029 (a) | 460,000 | 373,636 |
Nufarm Australia Ltd. (Australia) 5.00%, 1/27/2030 (a) | 340,000 | 302,428 |
Olin Corp. | ||
5.13%, 9/15/2027 | 337,000 | 322,637 |
5.63%, 8/1/2029 | 378,000 | 362,692 |
5.00%, 2/1/2030 | 51,000 | 46,699 |
Olympus Water US Holding Corp. | ||
4.25%, 10/1/2028 (a) | 680,000 | 558,266 |
9.75%, 11/15/2028 (a) | 200,000 | 201,465 |
6.25%, 10/1/2029 (a) | 75,000 | 60,380 |
Rain CII Carbon LLC 7.25%, 4/1/2025 (a) | 8,000 | 7,859 |
Rayonier AM Products, Inc. 7.63%, 1/15/2026 (a) | 460,000 | 374,396 |
SCIH Salt Holdings, Inc. | ||
4.88%, 5/1/2028 (a) | 388,000 | 349,132 |
6.63%, 5/1/2029 (a) | 376,000 | 331,795 |
August 31, 2023 | J.P. Morgan Exchange-Traded Funds | 87 |
AS OF August 31, 2023 (Unaudited) (continued)
INVESTMENTS | PRINCIPAL AMOUNT($) | VALUE($) |
Corporate Bonds — continued | ||
Chemicals — continued | ||
SCIL IV LLC 5.38%, 11/1/2026 (a) | 381,000 | 356,646 |
Scotts Miracle-Gro Co. (The) | ||
4.50%, 10/15/2029 | 237,000 | 198,208 |
4.00%, 4/1/2031 | 255,000 | 200,425 |
4.38%, 2/1/2032 | 249,000 | 197,158 |
SK Invictus Intermediate II SARL 5.00%, 10/30/2029 (a) | 419,000 | 344,238 |
SNF Group SACA (France) 3.13%, 3/15/2027 (a) | 330,000 | 292,830 |
Trinseo Materials Operating SCA | ||
5.38%, 9/1/2025 (a) | 5,000 | 4,658 |
5.13%, 4/1/2029 (a) | 281,000 | 151,815 |
Tronox, Inc. 4.63%, 3/15/2029 (a) | 587,000 | 483,709 |
Vibrantz Technologies, Inc. 9.00%, 2/15/2030 (a) | 386,000 | 318,375 |
WR Grace Holdings LLC 5.63%, 8/15/2029 (a) | 684,000 | 578,459 |
12,349,865 | ||
Commercial Services & Supplies — 3.5% | ||
ACCO Brands Corp. 4.25%, 3/15/2029 (a) | 405,000 | 346,000 |
ADT Security Corp. (The) | ||
4.13%, 8/1/2029 (a) | 250,000 | 218,205 |
4.88%, 7/15/2032 (a) | 686,000 | 591,744 |
Allied Universal Holdco LLC | ||
6.63%, 7/15/2026 (a) | 1,123,000 | 1,068,135 |
9.75%, 7/15/2027 (a) | 619,000 | 568,517 |
6.00%, 6/1/2029 (a) | 209,000 | 159,839 |
APi Group DE, Inc. 4.13%, 7/15/2029 (a) | 5,000 | 4,300 |
Aptim Corp. 7.75%, 6/15/2025 (a) | 13,000 | 12,034 |
APX Group, Inc. 5.75%, 7/15/2029 (a) | 687,000 | 591,846 |
Aramark Services, Inc. | ||
6.38%, 5/1/2025 (a) | 307,000 | 307,517 |
5.00%, 2/1/2028 (a) | 436,000 | 406,751 |
Brink's Co. (The) 4.63%, 10/15/2027 (a) | 512,000 | 476,094 |
Clean Harbors, Inc. | ||
4.88%, 7/15/2027 (a) | 25,000 | 23,888 |
6.38%, 2/1/2031 (a) | 414,000 | 411,695 |
CoreCivic, Inc. | ||
8.25%, 4/15/2026 | 568,000 | 570,254 |
4.75%, 10/15/2027 | 31,000 | 27,642 |
Covanta Holding Corp. | ||
4.88%, 12/1/2029 (a) | 459,000 | 394,740 |
5.00%, 9/1/2030 | 102,000 | 86,404 |
Deluxe Corp. 8.00%, 6/1/2029 (a) | 329,000 | 277,634 |
Enviri Corp. 5.75%, 7/31/2027 (a) | 307,000 | 266,230 |
INVESTMENTS | PRINCIPAL AMOUNT($) | VALUE($) |
Commercial Services & Supplies — continued | ||
Garda World Security Corp. (Canada) | ||
4.63%, 2/15/2027 (a) | 99,000 | 91,586 |
9.50%, 11/1/2027 (a) | 395,000 | 382,042 |
7.75%, 2/15/2028 (a) | 275,000 | 272,954 |
6.00%, 6/1/2029 (a) | 205,000 | 167,024 |
GEO Group, Inc. (The) 10.50%, 6/30/2028 | 301,000 | 301,089 |
GFL Environmental, Inc. (Canada) | ||
4.25%, 6/1/2025 (a) | 272,000 | 263,084 |
5.13%, 12/15/2026 (a) | 555,000 | 537,026 |
4.75%, 6/15/2029 (a) | 486,000 | 440,275 |
Interface, Inc. 5.50%, 12/1/2028 (a) | 142,000 | 121,275 |
Madison IAQ LLC | ||
4.13%, 6/30/2028 (a) | 359,000 | 317,619 |
5.88%, 6/30/2029 (a) | 458,000 | 385,635 |
Neptune Bidco US, Inc. 9.29%, 4/15/2029 (a) | 1,179,000 | 1,100,970 |
Pitney Bowes, Inc. | ||
6.88%, 3/15/2027 (a) | 339,000 | 255,962 |
7.25%, 3/15/2029 (a) | 75,000 | 54,397 |
Prime Security Services Borrower LLC | ||
5.75%, 4/15/2026 (a) | 820,000 | 804,703 |
6.25%, 1/15/2028 (a) | 651,000 | 620,013 |
Steelcase, Inc. 5.13%, 1/18/2029 | 351,000 | 310,397 |
Stericycle, Inc. 3.88%, 1/15/2029 (a) | 421,000 | 366,557 |
Vericast Corp. 11.00%, 9/15/2026 (a) | 728,000 | 758,991 |
Waste Pro USA, Inc. 5.50%, 2/15/2026 (a) | 305,000 | 287,458 |
West Technology Group LLC 8.50%, 10/15/2025 (a) | 315,000 | 283,500 |
14,932,026 | ||
Communications Equipment — 0.6% | ||
CommScope Technologies LLC 5.00%, 3/15/2027 (a) | 389,000 | 216,276 |
CommScope, Inc. | ||
6.00%, 3/1/2026 (a) | 953,000 | 866,053 |
8.25%, 3/1/2027 (a) | 791,000 | 524,045 |
7.13%, 7/1/2028 (a) | 15,000 | 8,357 |
4.75%, 9/1/2029 (a) | 152,000 | 112,957 |
Viasat, Inc. | ||
5.63%, 4/15/2027 (a) | 361,000 | 322,509 |
6.50%, 7/15/2028 (a) | 289,000 | 225,984 |
Viavi Solutions, Inc. 3.75%, 10/1/2029 (a) | 106,000 | 88,236 |
2,364,417 | ||
Construction & Engineering — 0.8% | ||
AECOM 5.13%, 3/15/2027 | 490,000 | 470,123 |
Arcosa, Inc. 4.38%, 4/15/2029 (a) | 140,000 | 125,926 |
88 | J.P. Morgan Exchange-Traded Funds | August 31, 2023 |
INVESTMENTS | PRINCIPAL AMOUNT($) | VALUE($) |
Corporate Bonds — continued | ||
Construction & Engineering — continued | ||
Artera Services LLC 9.03%, 12/4/2025 (a) | 503,000 | 467,975 |
ATP Tower Holdings LLC (Chile) 4.05%, 4/27/2026 (a) | 277,000 | 240,990 |
Brundage-Bone Concrete Pumping Holdings, Inc. 6.00%, 2/1/2026 (a) | 431,000 | 413,760 |
Dycom Industries, Inc. 4.50%, 4/15/2029 (a) | 161,000 | 143,754 |
Fluor Corp. 4.25%, 9/15/2028 | 163,000 | 151,988 |
Global Infrastructure Solutions, Inc. 5.63%, 6/1/2029 (a) | 144,000 | 120,932 |
INNOVATE Corp. 8.50%, 2/1/2026 (a) | 49,000 | 37,485 |
Pike Corp. 5.50%, 9/1/2028 (a) | 374,000 | 336,565 |
Tutor Perini Corp. 6.88%, 5/1/2025 (a) | 345,000 | 312,006 |
VM Consolidated, Inc. 5.50%, 4/15/2029 (a) | 215,000 | 195,962 |
Weekley Homes LLC 4.88%, 9/15/2028 (a) | 364,000 | 321,230 |
3,338,696 | ||
Consumer Finance — 4.3% | ||
Ally Financial, Inc. | ||
5.75%, 11/20/2025 | 560,000 | 543,183 |
6.70%, 2/14/2033 | 188,000 | 170,194 |
Cobra AcquisitionCo LLC 6.38%, 11/1/2029 (a) | 101,000 | 69,942 |
Credit Acceptance Corp. 6.63%, 3/15/2026 | 493,000 | 479,857 |
Curo Group Holdings Corp. 7.50%, 8/1/2028 (a) | 337,000 | 80,257 |
Enova International, Inc. 8.50%, 9/15/2025 (a) | 220,000 | 216,458 |
Finance of America Funding LLC 7.88%, 11/15/2025 (a) | 66,000 | 54,693 |
FirstCash, Inc. | ||
4.63%, 9/1/2028 (a) | 80,000 | 71,153 |
5.63%, 1/1/2030 (a) | 298,000 | 270,534 |
Ford Motor Credit Co. LLC | ||
5.58%, 3/18/2024 | 368,000 | 366,103 |
3.66%, 9/8/2024 | 1,178,000 | 1,142,671 |
4.06%, 11/1/2024 | 1,062,000 | 1,028,963 |
2.30%, 2/10/2025 | 1,331,000 | 1,250,445 |
5.13%, 6/16/2025 | 1,432,000 | 1,394,069 |
4.13%, 8/4/2025 | 900,000 | 857,183 |
4.13%, 8/17/2027 | 1,048,000 | 950,923 |
5.11%, 5/3/2029 | 792,000 | 728,491 |
7.35%, 3/6/2030 | 917,000 | 933,316 |
4.00%, 11/13/2030 | 200,000 | 169,230 |
3.63%, 6/17/2031 | 1,113,000 | 901,799 |
Global Aircraft Leasing Co. Ltd. (Cayman Islands) 6.50% (Cash), 9/15/2024 (a) (b) | 770,557 | 723,707 |
INVESTMENTS | PRINCIPAL AMOUNT($) | VALUE($) |
Consumer Finance — continued | ||
goeasy Ltd. (Canada) | ||
5.38%, 12/1/2024 (a) | 365,000 | 359,964 |
4.38%, 5/1/2026 (a) | 148,000 | 135,877 |
LFS Topco LLC 5.88%, 10/15/2026 (a) | 189,000 | 163,487 |
Macquarie Airfinance Holdings Ltd. (United Kingdom) 8.38%, 5/1/2028 (a) | 31,000 | 31,652 |
Navient Corp. | ||
5.88%, 10/25/2024 | 824,000 | 811,643 |
6.75%, 6/25/2025 | 6,000 | 5,958 |
5.00%, 3/15/2027 | 488,000 | 443,875 |
9.38%, 7/25/2030 | 23,000 | 23,103 |
5.63%, 8/1/2033 | 437,000 | 331,185 |
OneMain Finance Corp. | ||
6.13%, 3/15/2024 | 412,000 | 411,729 |
7.13%, 3/15/2026 | 1,165,000 | 1,146,061 |
3.50%, 1/15/2027 | 270,000 | 234,967 |
3.88%, 9/15/2028 | 564,000 | 462,480 |
9.00%, 1/15/2029 | 30,000 | 30,412 |
5.38%, 11/15/2029 | 116,000 | 100,201 |
4.00%, 9/15/2030 | 124,000 | 96,551 |
PRA Group, Inc. | ||
7.38%, 9/1/2025 (a) | 137,000 | 133,957 |
8.38%, 2/1/2028 (a) | 172,000 | 157,039 |
5.00%, 10/1/2029 (a) | 272,000 | 205,121 |
PROG Holdings, Inc. 6.00%, 11/15/2029 (a) | 405,000 | 363,487 |
Synchrony Financial 7.25%, 2/2/2033 | 375,000 | 344,799 |
World Acceptance Corp. 7.00%, 11/1/2026 (a) | 195,000 | 168,935 |
18,565,654 | ||
Consumer Staples Distribution & Retail — 1.1% | ||
Albertsons Cos., Inc. | ||
3.25%, 3/15/2026 (a) | 50,000 | 46,474 |
4.63%, 1/15/2027 (a) | 644,000 | 608,210 |
5.88%, 2/15/2028 (a) | 639,000 | 620,176 |
3.50%, 3/15/2029 (a) | 407,000 | 352,063 |
4.88%, 2/15/2030 (a) | 741,000 | 679,874 |
C&S Group Enterprises LLC 5.00%, 12/15/2028 (a) | 88,000 | 67,905 |
Ingles Markets, Inc. 4.00%, 6/15/2031 (a) | 70,000 | 58,521 |
Performance Food Group, Inc. | ||
6.88%, 5/1/2025 (a) | 89,000 | 89,132 |
5.50%, 10/15/2027 (a) | 650,000 | 625,890 |
4.25%, 8/1/2029 (a) | 183,000 | 161,051 |
Rite Aid Corp. 8.00%, 11/15/2026 (a) | 357,000 | 226,695 |
August 31, 2023 | J.P. Morgan Exchange-Traded Funds | 89 |
AS OF August 31, 2023 (Unaudited) (continued)
INVESTMENTS | PRINCIPAL AMOUNT($) | VALUE($) |
Corporate Bonds — continued | ||
Consumer Staples Distribution & Retail — continued | ||
Safeway, Inc. 7.25%, 2/1/2031 | 261,000 | 273,165 |
US Foods, Inc. | ||
6.25%, 4/15/2025 (a) | 240,000 | 240,628 |
4.75%, 2/15/2029 (a) | 413,000 | 376,954 |
4.63%, 6/1/2030 (a) | 253,000 | 224,872 |
4,651,610 | ||
Containers & Packaging — 2.8% | ||
ARD Finance SA (Luxembourg) 6.50% (Cash), 6/30/2027 (a) (b) | 250,000 | 200,931 |
Ardagh Metal Packaging Finance USA LLC | ||
3.25%, 9/1/2028 (a) | 599,000 | 509,399 |
4.00%, 9/1/2029 (a) | 350,000 | 284,480 |
Ardagh Packaging Finance plc | ||
5.25%, 4/30/2025 (a) | 209,000 | 204,188 |
4.13%, 8/15/2026 (a) | 800,000 | 748,251 |
5.25%, 8/15/2027 (a) | 532,000 | 455,807 |
Ball Corp. | ||
5.25%, 7/1/2025 | 176,000 | 173,546 |
4.88%, 3/15/2026 | 809,000 | 785,903 |
2.88%, 8/15/2030 | 515,000 | 421,276 |
3.13%, 9/15/2031 | 766,000 | 620,167 |
Berry Global, Inc. 5.63%, 7/15/2027 (a) | 185,000 | 181,346 |
Cascades, Inc. (Canada) 5.38%, 1/15/2028 (a) | 312,000 | 293,670 |
Clydesdale Acquisition Holdings, Inc. 8.75%, 4/15/2030 (a) | 516,000 | 466,638 |
Crown Americas LLC | ||
4.75%, 2/1/2026 | 631,000 | 608,452 |
5.25%, 4/1/2030 | 280,000 | 263,852 |
Graphic Packaging International LLC | ||
4.75%, 7/15/2027 (a) | 274,000 | 260,271 |
3.50%, 3/15/2028 (a) | 91,000 | 81,066 |
3.50%, 3/1/2029 (a) | 129,000 | 110,583 |
3.75%, 2/1/2030 (a) | 372,000 | 317,076 |
Iris Holding, Inc. 10.00%, 12/15/2028 (a) | 120,000 | 95,400 |
LABL, Inc. | ||
6.75%, 7/15/2026 (a) | 363,000 | 354,808 |
10.50%, 7/15/2027 (a) | 288,000 | 275,649 |
9.50%, 11/1/2028 (a) | 38,000 | 39,112 |
8.25%, 11/1/2029 (a) | 156,000 | 130,527 |
Mauser Packaging Solutions Holding Co. | ||
7.88%, 8/15/2026 (a) | 338,000 | 332,844 |
9.25%, 4/15/2027 (a) | 664,000 | 601,645 |
INVESTMENTS | PRINCIPAL AMOUNT($) | VALUE($) |
Containers & Packaging — continued | ||
Owens-Brockway Glass Container, Inc. | ||
6.38%, 8/15/2025 (a) | 30,000 | 29,929 |
6.63%, 5/13/2027 (a) | 619,000 | 611,869 |
7.25%, 5/15/2031 (a) | 206,000 | 207,844 |
Pactiv Evergreen Group Issuer LLC 4.38%, 10/15/2028 (a) | 318,000 | 282,226 |
Pactiv Evergreen Group Issuer, Inc. 4.00%, 10/15/2027 (a) | 88,000 | 79,149 |
Sealed Air Corp. | ||
5.50%, 9/15/2025 (a) | 127,000 | 125,609 |
6.13%, 2/1/2028 (a) | 338,000 | 332,111 |
5.00%, 4/15/2029 (a) | 165,000 | 153,103 |
6.88%, 7/15/2033 (a) | 410,000 | 412,337 |
Silgan Holdings, Inc. 4.13%, 2/1/2028 | 414,000 | 379,303 |
TriMas Corp. 4.13%, 4/15/2029 (a) | 286,000 | 249,535 |
Trivium Packaging Finance BV (Netherlands) 5.50%, 8/15/2026 (a) (d) | 600,000 | 565,896 |
12,245,798 | ||
Distributors — 0.2% | ||
American Builders & Contractors Supply Co., Inc. | ||
4.00%, 1/15/2028 (a) | 469,000 | 424,615 |
3.88%, 11/15/2029 (a) | 35,000 | 30,172 |
BCPE Empire Holdings, Inc. 7.63%, 5/1/2027 (a) | 292,000 | 277,123 |
Ritchie Bros Holdings, Inc. (Canada) 6.75%, 3/15/2028 (a) | 225,000 | 227,756 |
959,666 | ||
Diversified Consumer Services — 0.5% | ||
Adtalem Global Education, Inc. 5.50%, 3/1/2028 (a) | 165,000 | 153,780 |
Carriage Services, Inc. 4.25%, 5/15/2029 (a) | 219,000 | 190,048 |
Grand Canyon University 4.13%, 10/1/2024 | 135,000 | 127,717 |
Metis Merger Sub LLC 6.50%, 5/15/2029 (a) | 340,000 | 295,276 |
Service Corp. International | ||
5.13%, 6/1/2029 | 644,000 | 606,165 |
3.38%, 8/15/2030 | 262,000 | 216,280 |
Signal Parent, Inc. 6.13%, 4/1/2029 (a) | 241,000 | 156,650 |
StoneMor, Inc. 8.50%, 5/15/2029 (a) | 60,000 | 50,071 |
WW International, Inc. 4.50%, 4/15/2029 (a) | 383,000 | 265,227 |
2,061,214 | ||
Diversified REITs — 0.6% | ||
HAT Holdings I LLC | ||
6.00%, 4/15/2025 (a) | 21,000 | 20,613 |
90 | J.P. Morgan Exchange-Traded Funds | August 31, 2023 |
INVESTMENTS | PRINCIPAL AMOUNT($) | VALUE($) |
Corporate Bonds — continued | ||
Diversified REITs — continued | ||
3.38%, 6/15/2026 (a) | 503,000 | 451,710 |
3.75%, 9/15/2030 (a) | 360,000 | 285,031 |
Iron Mountain Information Management Services, Inc. 5.00%, 7/15/2032 (a) | 495,000 | 427,414 |
Uniti Group LP | ||
10.50%, 2/15/2028 (a) | 637,000 | 635,493 |
4.75%, 4/15/2028 (a) | 439,000 | 370,052 |
6.50%, 2/15/2029 (a) | 670,000 | 457,275 |
6.00%, 1/15/2030 (a) | 12,000 | 7,927 |
2,655,515 | ||
Diversified Telecommunication Services — 5.1% | ||
Altice France Holding SA (Luxembourg) 10.50%, 5/15/2027 (a) | 800,000 | 434,080 |
Altice France SA (France) | ||
8.13%, 2/1/2027 (a) | 344,000 | 290,728 |
5.50%, 1/15/2028 (a) | 241,000 | 180,604 |
5.13%, 7/15/2029 (a) | 400,000 | 282,771 |
5.50%, 10/15/2029 (a) | 1,341,000 | 968,632 |
British Telecommunications plc (United Kingdom) (US Treasury Yield Curve Rate T Note Constant Maturity 5 Year + 3.49%), 4.88%, 11/23/2081 (a) (c) | 433,000 | 355,198 |
CCO Holdings LLC | ||
5.50%, 5/1/2026 (a) | 776,000 | 757,892 |
5.13%, 5/1/2027 (a) | 1,595,000 | 1,499,443 |
5.38%, 6/1/2029 (a) | 928,000 | 844,618 |
4.75%, 3/1/2030 (a) | 1,635,000 | 1,405,761 |
4.50%, 8/15/2030 (a) | 415,000 | 349,097 |
4.25%, 2/1/2031 (a) | 529,000 | 433,930 |
4.75%, 2/1/2032 (a) | 1,244,000 | 1,029,410 |
4.50%, 5/1/2032 | 15,000 | 12,160 |
4.50%, 6/1/2033 (a) | 1,566,000 | 1,236,154 |
4.25%, 1/15/2034 (a) | 680,000 | 520,742 |
Consolidated Communications, Inc. 6.50%, 10/1/2028 (a) | 257,000 | 196,895 |
Embarq Corp. 8.00%, 6/1/2036 | 508,000 | 309,453 |
Frontier Communications Holdings LLC | ||
5.88%, 10/15/2027 (a) | 699,000 | 636,651 |
5.00%, 5/1/2028 (a) | 553,000 | 473,840 |
6.75%, 5/1/2029 (a) | 735,000 | 570,408 |
5.88%, 11/1/2029 | 180,000 | 133,305 |
6.00%, 1/15/2030 (a) | 149,000 | 110,081 |
8.75%, 5/15/2030 (a) | 406,000 | 394,605 |
8.63%, 3/15/2031 (a) | 215,000 | 207,056 |
INVESTMENTS | PRINCIPAL AMOUNT($) | VALUE($) |
Diversified Telecommunication Services — continued | ||
Frontier Florida LLC Series E, 6.86%, 2/1/2028 | 15,000 | 14,049 |
Iliad Holding SASU (France) 6.50%, 10/15/2026 (a) | 750,000 | 715,639 |
Intelsat Jackson Holdings SA (Luxembourg) 6.50%, 3/15/2030 (a) | 979,000 | 897,657 |
Level 3 Financing, Inc. | ||
3.40%, 3/1/2027 (a) | 198,000 | 182,743 |
4.63%, 9/15/2027 (a) | 847,000 | 636,974 |
4.25%, 7/1/2028 (a) | 388,000 | 254,395 |
3.88%, 11/15/2029 (a) | 517,000 | 456,560 |
10.50%, 5/15/2030 (a) | 521,000 | 529,227 |
Lumen Technologies, Inc. | ||
4.00%, 2/15/2027 (a) | 581,000 | 366,158 |
4.50%, 1/15/2029 (a) | 182,000 | 60,060 |
Series P, 7.60%, 9/15/2039 | 209,000 | 62,062 |
Series U, 7.65%, 3/15/2042 | 160,000 | 47,512 |
Qwest Corp. 7.25%, 9/15/2025 | 81,000 | 77,004 |
Sable International Finance Ltd. (Chile) 5.75%, 9/7/2027 (a) | 200,000 | 185,098 |
Telecom Italia Capital SA (Italy) | ||
6.38%, 11/15/2033 | 817,000 | 717,959 |
6.00%, 9/30/2034 | 361,000 | 302,474 |
7.20%, 7/18/2036 | 35,000 | 31,633 |
7.72%, 6/4/2038 | 311,000 | 287,574 |
Telesat Canada (Canada) | ||
5.63%, 12/6/2026 (a) | 228,000 | 160,900 |
4.88%, 6/1/2027 (a) | 145,000 | 97,594 |
6.50%, 10/15/2027 (a) | 147,000 | 72,765 |
Virgin Media Finance plc (United Kingdom) 5.00%, 7/15/2030 (a) | 753,000 | 608,996 |
Virgin Media Secured Finance plc (United Kingdom) 5.50%, 5/15/2029 (a) | 729,000 | 666,378 |
Windstream Escrow LLC 7.75%, 8/15/2028 (a) | 595,000 | 482,374 |
Zayo Group Holdings, Inc. | ||
4.00%, 3/1/2027 (a) | 208,000 | 155,883 |
6.13%, 3/1/2028 (a) | 512,000 | 332,800 |
22,035,982 | ||
Electric Utilities — 1.6% | ||
DPL, Inc. 4.35%, 4/15/2029 | 107,000 | 92,154 |
Drax Finco plc (United Kingdom) 6.63%, 11/1/2025 (a) | 201,000 | 197,129 |
Edison International (US Treasury Yield Curve Rate T Note Constant Maturity 5 Year + 3.86%), 8.13%, 6/15/2053 (c) | 175,000 | 177,998 |
August 31, 2023 | J.P. Morgan Exchange-Traded Funds | 91 |
AS OF August 31, 2023 (Unaudited) (continued)
INVESTMENTS | PRINCIPAL AMOUNT($) | VALUE($) |
Corporate Bonds — continued | ||
Electric Utilities — continued | ||
Emera, Inc. (Canada) Series 16-A, (ICE LIBOR USD 3 Month + 5.44%), 6.75%, 6/15/2076 (c) | 336,000 | 322,560 |
FirstEnergy Corp. | ||
2.65%, 3/1/2030 | 615,000 | 515,368 |
Series B, 2.25%, 9/1/2030 | 80,000 | 64,209 |
Series C, 7.38%, 11/15/2031 | 352,000 | 391,583 |
Series C, 5.10%, 7/15/2047 (d) | 203,000 | 176,658 |
Series C, 3.40%, 3/1/2050 | 453,000 | 299,830 |
Leeward Renewable Energy Operations LLC 4.25%, 7/1/2029 (a) | 110,000 | 95,627 |
NextEra Energy Operating Partners LP | ||
4.25%, 7/15/2024 (a) | 126,000 | 123,627 |
4.50%, 9/15/2027 (a) | 368,000 | 341,584 |
NRG Energy, Inc. | ||
5.75%, 1/15/2028 | 213,000 | 201,514 |
5.25%, 6/15/2029 (a) | 524,000 | 471,653 |
3.63%, 2/15/2031 (a) | 419,000 | 327,000 |
3.88%, 2/15/2032 (a) | 311,000 | 240,628 |
Pattern Energy Operations LP 4.50%, 8/15/2028 (a) | 125,000 | 113,801 |
PG&E Corp. | ||
5.00%, 7/1/2028 | 346,000 | 318,288 |
5.25%, 7/1/2030 | 816,000 | 724,952 |
Terraform Global Operating LP 6.13%, 3/1/2026 (a) | 8,000 | 7,690 |
Vistra Operations Co. LLC | ||
5.50%, 9/1/2026 (a) | 400,000 | 385,827 |
5.63%, 2/15/2027 (a) | 895,000 | 861,625 |
5.00%, 7/31/2027 (a) | 25,000 | 23,513 |
4.38%, 5/1/2029 (a) | 282,000 | 248,639 |
6,723,457 | ||
Electrical Equipment — 0.2% | ||
EnerSys 4.38%, 12/15/2027 (a) | 104,000 | 95,160 |
Sensata Technologies BV | ||
5.63%, 11/1/2024 (a) | 248,000 | 245,781 |
5.00%, 10/1/2025 (a) | 40,000 | 38,984 |
Vertiv Group Corp. 4.13%, 11/15/2028 (a) | 548,000 | 491,973 |
871,898 | ||
Electronic Equipment, Instruments & Components — 0.2% | ||
Coherent Corp. 5.00%, 12/15/2029 (a) | 394,000 | 349,951 |
Likewize Corp. 9.75%, 10/15/2025 (a) | 12,000 | 11,760 |
INVESTMENTS | PRINCIPAL AMOUNT($) | VALUE($) |
Electronic Equipment, Instruments & Components — continued | ||
Sensata Technologies, Inc. | ||
4.38%, 2/15/2030 (a) | 726,000 | 642,767 |
3.75%, 2/15/2031 (a) | 40,000 | 33,517 |
1,037,995 | ||
Energy Equipment & Services — 1.6% | ||
Archrock Partners LP 6.88%, 4/1/2027 (a) | 372,000 | 365,732 |
Bristow Group, Inc. 6.88%, 3/1/2028 (a) | 10,000 | 9,354 |
CGG SA (France) 8.75%, 4/1/2027 (a) | 250,000 | 215,148 |
Enerflex Ltd. (Canada) 9.00%, 10/15/2027 (a) | 322,000 | 320,334 |
Nabors Industries Ltd. 7.25%, 1/15/2026 (a) | 189,000 | 181,812 |
Nabors Industries, Inc. | ||
5.75%, 2/1/2025 | 55,000 | 53,978 |
7.38%, 5/15/2027 (a) | 209,000 | 203,963 |
Noble Finance II LLC 8.00%, 4/15/2030 (a) | 325,000 | 336,053 |
Oceaneering International, Inc. 6.00%, 2/1/2028 | 239,000 | 224,677 |
Patterson-UTI Energy, Inc. | ||
3.95%, 2/1/2028 | 266,000 | 244,047 |
5.15%, 11/15/2029 | 258,000 | 237,744 |
Petrofac Ltd. (United Kingdom) 9.75%, 11/15/2026 (a) | 239,000 | 183,432 |
Precision Drilling Corp. (Canada) | ||
7.13%, 1/15/2026 (a) | 125,000 | 123,906 |
6.88%, 1/15/2029 (a) | 336,000 | 319,416 |
Transocean, Inc. | ||
7.25%, 11/1/2025 (a) | 216,000 | 213,068 |
7.50%, 1/15/2026 (a) | 47,000 | 46,516 |
11.50%, 1/30/2027 (a) | 433,000 | 457,047 |
8.00%, 2/1/2027 (a) | 80,000 | 78,042 |
8.75%, 2/15/2030 (a) | 865,450 | 885,368 |
7.50%, 4/15/2031 | 16,000 | 13,946 |
6.80%, 3/15/2038 | 337,000 | 262,472 |
USA Compression Partners LP | ||
6.88%, 4/1/2026 | 429,000 | 424,182 |
6.88%, 9/1/2027 | 127,000 | 123,803 |
Valaris Ltd. 8.38%, 4/30/2030 (a) | 410,000 | 417,605 |
Weatherford International Ltd. | ||
6.50%, 9/15/2028 (a) | 445,000 | 446,073 |
8.63%, 4/30/2030 (a) | 131,000 | 134,171 |
Welltec International ApS (Denmark) 8.25%, 10/15/2026 (a) | 329,000 | 333,935 |
6,855,824 | ||
92 | J.P. Morgan Exchange-Traded Funds | August 31, 2023 |
INVESTMENTS | PRINCIPAL AMOUNT($) | VALUE($) |
Corporate Bonds — continued | ||
Entertainment — 0.9% | ||
Allen Media LLC 10.50%, 2/15/2028 (a) | 282,000 | 161,445 |
AMC Entertainment Holdings, Inc. | ||
10.00% (Cash), 6/15/2026 (a) (b) | 430,000 | 298,426 |
7.50%, 2/15/2029 (a) | 681,000 | 464,824 |
Banijay Entertainment SASU (France) 5.38%, 3/1/2025 (a) | 250,000 | 243,600 |
Cinemark USA, Inc. | ||
8.75%, 5/1/2025 (a) | 120,000 | 121,212 |
5.25%, 7/15/2028 (a) | 349,000 | 309,996 |
Lions Gate Capital Holdings LLC 5.50%, 4/15/2029 (a) | 407,000 | 248,046 |
Live Nation Entertainment, Inc. | ||
4.88%, 11/1/2024 (a) | 276,000 | 271,116 |
5.63%, 3/15/2026 (a) | 94,000 | 91,174 |
6.50%, 5/15/2027 (a) | 828,000 | 828,642 |
3.75%, 1/15/2028 (a) | 117,000 | 104,184 |
ROBLOX Corp. 3.88%, 5/1/2030 (a) | 97,000 | 80,025 |
WMG Acquisition Corp. 3.88%, 7/15/2030 (a) | 545,000 | 472,953 |
3,695,643 | ||
Financial Services — 2.0% | ||
Armor Holdco, Inc. 8.50%, 11/15/2029 (a) | 20,000 | 17,517 |
Block, Inc. 3.50%, 6/1/2031 | 817,000 | 669,912 |
CPI CG, Inc. 8.63%, 3/15/2026 (a) | 357,000 | 346,290 |
Freedom Mortgage Corp. | ||
8.13%, 11/15/2024 (a) | 234,000 | 232,693 |
8.25%, 4/15/2025 (a) | 73,000 | 71,935 |
7.63%, 5/1/2026 (a) | 246,000 | 226,264 |
6.63%, 1/15/2027 (a) | 230,000 | 201,415 |
Home Point Capital, Inc. 5.00%, 2/1/2026 (a) | 32,000 | 30,047 |
Jefferson Capital Holdings LLC 6.00%, 8/15/2026 (a) | 57,000 | 49,959 |
LD Holdings Group LLC 6.50%, 11/1/2025 (a) | 517,000 | 435,496 |
MGIC Investment Corp. 5.25%, 8/15/2028 | 487,000 | 464,774 |
Midcap Financial Issuer Trust 5.63%, 1/15/2030 (a) | 436,000 | 350,980 |
MPH Acquisition Holdings LLC | ||
5.50%, 9/1/2028 (a) | 464,000 | 394,045 |
5.75%, 11/1/2028 (a) | 354,000 | 265,171 |
Nationstar Mortgage Holdings, Inc. 5.50%, 8/15/2028 (a) | 886,000 | 802,878 |
NMI Holdings, Inc. 7.38%, 6/1/2025 (a) | 381,000 | 383,579 |
Paysafe Finance plc 4.00%, 6/15/2029 (a) | 372,000 | 315,285 |
PennyMac Financial Services, Inc. | ||
5.38%, 10/15/2025 (a) | 5,000 | 4,839 |
4.25%, 2/15/2029 (a) | 171,000 | 141,548 |
INVESTMENTS | PRINCIPAL AMOUNT($) | VALUE($) |
Financial Services — continued | ||
5.75%, 9/15/2031 (a) | 494,000 | 415,206 |
PHH Mortgage Corp. 7.88%, 3/15/2026 (a) | 409,000 | 365,871 |
Rocket Mortgage LLC | ||
3.88%, 3/1/2031 (a) | 582,000 | 473,728 |
4.00%, 10/15/2033 (a) | 557,000 | 440,395 |
Sabre GLBL, Inc. | ||
9.25%, 4/15/2025 (a) | 243,000 | 239,385 |
7.38%, 9/1/2025 (a) | 120,000 | 117,936 |
11.25%, 12/15/2027 (a) | 336,000 | 320,321 |
Shift4 Payments LLC 4.63%, 11/1/2026 (a) | 214,000 | 200,090 |
United Wholesale Mortgage LLC | ||
5.75%, 6/15/2027 (a) | 40,000 | 36,853 |
5.50%, 4/15/2029 (a) | 416,000 | 360,880 |
Verscend Escrow Corp. 9.75%, 8/15/2026 (a) | 372,000 | 370,083 |
8,745,375 | ||
Food Products — 1.2% | ||
B&G Foods, Inc. | ||
5.25%, 4/1/2025 | 260,000 | 254,300 |
5.25%, 9/15/2027 | 476,000 | 421,744 |
Chobani LLC 7.50%, 4/15/2025 (a) | 166,000 | 165,585 |
Darling Ingredients, Inc. 5.25%, 4/15/2027 (a) | 413,000 | 401,570 |
H-Food Holdings LLC 8.50%, 6/1/2026 (a) | 152,000 | 59,660 |
Lamb Weston Holdings, Inc. | ||
4.88%, 5/15/2028 (a) | 303,000 | 286,162 |
4.13%, 1/31/2030 (a) | 366,000 | 321,874 |
4.38%, 1/31/2032 (a) | 260,000 | 225,661 |
Pilgrim's Pride Corp. | ||
5.88%, 9/30/2027 (a) | 400,000 | 395,666 |
4.25%, 4/15/2031 | 74,000 | 64,021 |
3.50%, 3/1/2032 | 903,000 | 727,195 |
6.25%, 7/1/2033 | 78,000 | 77,403 |
Post Holdings, Inc. | ||
5.75%, 3/1/2027 (a) | 55,000 | 53,752 |
5.63%, 1/15/2028 (a) | 20,000 | 19,178 |
5.50%, 12/15/2029 (a) | 1,089,000 | 1,007,384 |
4.50%, 9/15/2031 (a) | 619,000 | 533,260 |
Simmons Foods, Inc. 4.63%, 3/1/2029 (a) | 51,000 | 42,444 |
5,056,859 | ||
Gas Utilities — 0.4% | ||
AmeriGas Partners LP | ||
5.50%, 5/20/2025 | 268,000 | 263,018 |
5.88%, 8/20/2026 | 684,000 | 648,910 |
August 31, 2023 | J.P. Morgan Exchange-Traded Funds | 93 |
AS OF August 31, 2023 (Unaudited) (continued)
INVESTMENTS | PRINCIPAL AMOUNT($) | VALUE($) |
Corporate Bonds — continued | ||
Gas Utilities — continued | ||
Ferrellgas LP | ||
5.38%, 4/1/2026 (a) | 81,000 | 76,142 |
5.88%, 4/1/2029 (a) | 528,000 | 465,856 |
Suburban Propane Partners LP 5.00%, 6/1/2031 (a) | 441,000 | 379,075 |
1,833,001 | ||
Ground Transportation — 1.2% | ||
AerCap Global Aviation Trust (Ireland) (3-MONTH CME TERM SOFR + 4.56%), 6.50%, 6/15/2045 (a) (c) | 500,000 | 493,018 |
Albion Financing 1 SARL (Luxembourg) 6.13%, 10/15/2026 (a) | 520,000 | 492,050 |
Avis Budget Car Rental LLC | ||
5.75%, 7/15/2027 (a) | 20,000 | 19,096 |
5.38%, 3/1/2029 (a) | 387,000 | 355,736 |
Carriage Purchaser, Inc. 7.88%, 10/15/2029 (a) | 15,000 | 11,250 |
EquipmentShare.com, Inc. 9.00%, 5/15/2028 (a) | 161,000 | 159,793 |
First Student Bidco, Inc. 4.00%, 7/31/2029 (a) | 260,000 | 221,002 |
Hertz Corp. (The) | ||
4.63%, 12/1/2026 (a) | 248,000 | 224,537 |
5.00%, 12/1/2029 (a) | 580,000 | 476,872 |
NESCO Holdings II, Inc. 5.50%, 4/15/2029 (a) | 414,000 | 375,437 |
PECF USS Intermediate Holding III Corp. 8.00%, 11/15/2029 (a) | 309,000 | 197,069 |
Uber Technologies, Inc. | ||
7.50%, 5/15/2025 (a) | 117,000 | 118,129 |
7.50%, 9/15/2027 (a) | 533,000 | 544,221 |
4.50%, 8/15/2029 (a) | 957,000 | 876,241 |
Watco Cos. LLC 6.50%, 6/15/2027 (a) | 29,000 | 27,985 |
Williams Scotsman International, Inc. 4.63%, 8/15/2028 (a) | 349,000 | 318,463 |
XPO CNW, Inc. 6.70%, 5/1/2034 | 245,000 | 243,322 |
XPO Escrow Sub LLC 7.50%, 11/15/2027 (a) | 120,000 | 122,011 |
5,276,232 | ||
Health Care Equipment & Supplies — 0.9% | ||
Avantor Funding, Inc. 4.63%, 7/15/2028 (a) | 905,000 | 840,097 |
Embecta Corp. 5.00%, 2/15/2030 (a) | 352,000 | 286,000 |
Garden Spinco Corp. 8.63%, 7/20/2030 (a) | 147,000 | 156,940 |
Hologic, Inc. 3.25%, 2/15/2029 (a) | 448,000 | 389,126 |
INVESTMENTS | PRINCIPAL AMOUNT($) | VALUE($) |
Health Care Equipment & Supplies — continued | ||
Medline Borrower LP | ||
3.88%, 4/1/2029 (a) | 1,720,000 | 1,501,518 |
5.25%, 10/1/2029 (a) | 898,000 | 797,447 |
3,971,128 | ||
Health Care Providers & Services — 3.9% | ||
Acadia Healthcare Co., Inc. 5.50%, 7/1/2028 (a) | 355,000 | 336,309 |
AdaptHealth LLC | ||
6.13%, 8/1/2028 (a) | 555,000 | 501,002 |
4.63%, 8/1/2029 (a) | 68,000 | 55,563 |
5.13%, 3/1/2030 (a) | 89,000 | 73,005 |
AHP Health Partners, Inc. 5.75%, 7/15/2029 (a) | 330,000 | 282,925 |
Air Methods Corp. 8.00%, 5/15/2025 (a) | 250,000 | 1,250 |
Akumin Escrow, Inc. 7.50%, 8/1/2028 (a) | 376,000 | 249,100 |
Cano Health LLC 6.25%, 10/1/2028 (a) | 67,000 | 22,780 |
Community Health Systems, Inc. | ||
8.00%, 3/15/2026 (a) | 745,000 | 727,237 |
5.63%, 3/15/2027 (a) | 1,023,000 | 900,183 |
8.00%, 12/15/2027 (a) | 144,000 | 138,403 |
6.88%, 4/1/2028 (a) | 38,000 | 22,809 |
6.00%, 1/15/2029 (a) | 301,000 | 252,087 |
6.88%, 4/15/2029 (a) | 896,000 | 549,535 |
6.13%, 4/1/2030 (a) | 236,000 | 135,806 |
5.25%, 5/15/2030 (a) | 179,000 | 141,164 |
4.75%, 2/15/2031 (a) | 799,000 | 595,255 |
DaVita, Inc. | ||
4.63%, 6/1/2030 (a) | 1,375,000 | 1,179,411 |
3.75%, 2/15/2031 (a) | 357,000 | 284,294 |
Encompass Health Corp. 4.75%, 2/1/2030 | 560,000 | 510,072 |
Global Medical Response, Inc. 6.50%, 10/1/2025 (a) | 108,000 | 74,614 |
HealthEquity, Inc. 4.50%, 10/1/2029 (a) | 48,000 | 42,565 |
Heartland Dental LLC 10.50%, 4/30/2028 (a) | 411,000 | 415,110 |
Legacy LifePoint Health LLC 4.38%, 2/15/2027 (a) | 573,000 | 495,989 |
LifePoint Health, Inc. 5.38%, 1/15/2029 (a) | 148,000 | 102,317 |
ModivCare Escrow Issuer, Inc. 5.00%, 10/1/2029 (a) | 435,000 | 320,812 |
ModivCare, Inc. 5.88%, 11/15/2025 (a) | 189,000 | 179,314 |
Molina Healthcare, Inc. | ||
4.38%, 6/15/2028 (a) | 540,000 | 495,509 |
3.88%, 5/15/2032 (a) | 562,000 | 466,303 |
Owens & Minor, Inc. | ||
4.50%, 3/31/2029 (a) | 152,000 | 128,820 |
94 | J.P. Morgan Exchange-Traded Funds | August 31, 2023 |
INVESTMENTS | PRINCIPAL AMOUNT($) | VALUE($) |
Corporate Bonds — continued | ||
Health Care Providers & Services — continued | ||
6.63%, 4/1/2030 (a) | 333,000 | 302,934 |
Pediatrix Medical Group, Inc. 5.38%, 2/15/2030 (a) | 321,000 | 292,736 |
Prime Healthcare Services, Inc. 7.25%, 11/1/2025 (a) | 409,000 | 383,166 |
Radiology Partners, Inc. 9.25%, 2/1/2028 (a) | 294,000 | 115,395 |
RegionalCare Hospital Partners Holdings, Inc. 9.75%, 12/1/2026 (a) | 341,000 | 318,789 |
RP Escrow Issuer LLC 5.25%, 12/15/2025 (a) | 57,000 | 43,903 |
Select Medical Corp. 6.25%, 8/15/2026 (a) | 372,000 | 368,474 |
Team Health Holdings, Inc. 6.38%, 2/1/2025 (a) | 45,000 | 34,650 |
Tenet Healthcare Corp. | ||
4.88%, 1/1/2026 | 768,000 | 744,486 |
6.25%, 2/1/2027 | 934,000 | 919,697 |
5.13%, 11/1/2027 | 1,086,000 | 1,032,607 |
4.63%, 6/15/2028 | 741,000 | 682,326 |
6.13%, 10/1/2028 | 1,317,000 | 1,268,442 |
6.88%, 11/15/2031 | 410,000 | 409,916 |
Toledo Hospital (The) 6.02%, 11/15/2048 | 150,000 | 102,525 |
US Acute Care Solutions LLC 6.38%, 3/1/2026 (a) | 337,000 | 293,166 |
16,992,755 | ||
Health Care REITs — 0.3% | ||
Diversified Healthcare Trust | ||
4.75%, 5/1/2024 | 121,000 | 114,846 |
9.75%, 6/15/2025 | 82,000 | 80,632 |
4.75%, 2/15/2028 | 11,000 | 8,400 |
4.38%, 3/1/2031 | 150,000 | 113,177 |
MPT Operating Partnership LP | ||
5.00%, 10/15/2027 | 540,000 | 426,570 |
4.63%, 8/1/2029 | 761,000 | 549,563 |
3.50%, 3/15/2031 | 236,000 | 152,951 |
1,446,139 | ||
Health Care Technology — 0.2% | ||
IQVIA, Inc. 5.00%, 10/15/2026 (a) | 800,000 | 772,741 |
Hotel & Resort REITs — 0.8% | ||
Park Intermediate Holdings LLC | ||
7.50%, 6/1/2025 (a) | 70,000 | 70,080 |
5.88%, 10/1/2028 (a) | 547,000 | 505,963 |
RHP Hotel Properties LP 4.75%, 10/15/2027 | 602,000 | 559,701 |
RLJ Lodging Trust LP 4.00%, 9/15/2029 (a) | 409,000 | 342,041 |
Service Properties Trust | ||
4.35%, 10/1/2024 | 163,000 | 156,823 |
INVESTMENTS | PRINCIPAL AMOUNT($) | VALUE($) |
Hotel & Resort REITs — continued | ||
4.50%, 3/15/2025 | 288,000 | 272,088 |
7.50%, 9/15/2025 | 678,000 | 669,893 |
5.50%, 12/15/2027 | 135,000 | 119,487 |
4.38%, 2/15/2030 | 633,000 | 480,565 |
XHR LP | ||
6.38%, 8/15/2025 (a) | 182,000 | 179,815 |
4.88%, 6/1/2029 (a) | 5,000 | 4,326 |
3,360,782 | ||
Hotels, Restaurants & Leisure — 8.5% | ||
1011778 BC ULC (Canada) | ||
3.88%, 1/15/2028 (a) | 939,000 | 854,062 |
4.38%, 1/15/2028 (a) | 634,000 | 581,919 |
3.50%, 2/15/2029 (a) | 89,000 | 77,921 |
4.00%, 10/15/2030 (a) | 839,000 | 710,760 |
Affinity Interactive 6.88%, 12/15/2027 (a) | 7,000 | 6,198 |
Bloomin' Brands, Inc. 5.13%, 4/15/2029 (a) | 327,000 | 296,625 |
Boyd Gaming Corp. 4.75%, 12/1/2027 | 707,000 | 661,894 |
Boyne USA, Inc. 4.75%, 5/15/2029 (a) | 335,000 | 302,340 |
Caesars Entertainment, Inc. | ||
6.25%, 7/1/2025 (a) | 1,048,000 | 1,039,865 |
8.13%, 7/1/2027 (a) | 963,000 | 977,765 |
4.63%, 10/15/2029 (a) | 835,000 | 730,903 |
Caesars Resort Collection LLC 5.75%, 7/1/2025 (a) | 285,000 | 285,204 |
Carnival Corp. | ||
7.63%, 3/1/2026 (a) | 912,000 | 909,231 |
5.75%, 3/1/2027 (a) | 1,438,000 | 1,353,320 |
9.88%, 8/1/2027 (a) | 571,000 | 603,557 |
4.00%, 8/1/2028 (a) | 818,000 | 731,952 |
10.50%, 6/1/2030 (a) | 710,000 | 756,242 |
Carnival Holdings Bermuda Ltd. 10.38%, 5/1/2028 (a) | 5,000 | 5,438 |
Carrols Restaurant Group, Inc. 5.88%, 7/1/2029 (a) | 126,000 | 108,436 |
CCM Merger, Inc. 6.38%, 5/1/2026 (a) | 60,000 | 58,307 |
CDI Escrow Issuer, Inc. 5.75%, 4/1/2030 (a) | 347,000 | 322,712 |
CEC Entertainment LLC 6.75%, 5/1/2026 (a) | 5,000 | 4,781 |
Cedar Fair LP | ||
5.50%, 5/1/2025 (a) | 377,000 | 374,028 |
5.38%, 4/15/2027 | 314,000 | 296,849 |
Churchill Downs, Inc. 5.50%, 4/1/2027 (a) | 446,000 | 429,693 |
Constellation Merger Sub, Inc. 8.50%, 9/15/2025 (a) | 220,000 | 183,700 |
Dave & Buster's, Inc. 7.63%, 11/1/2025 (a) | 62,000 | 62,616 |
Empire Resorts, Inc. 7.75%, 11/1/2026 (a) | 227,000 | 178,558 |
August 31, 2023 | J.P. Morgan Exchange-Traded Funds | 95 |
AS OF August 31, 2023 (Unaudited) (continued)
INVESTMENTS | PRINCIPAL AMOUNT($) | VALUE($) |
Corporate Bonds — continued | ||
Hotels, Restaurants & Leisure — continued | ||
Everi Holdings, Inc. 5.00%, 7/15/2029 (a) | 311,000 | 277,521 |
Fertitta Entertainment LLC | ||
4.63%, 1/15/2029 (a) | 504,000 | 435,995 |
6.75%, 1/15/2030 (a) | 482,000 | 398,024 |
Full House Resorts, Inc. 8.25%, 2/15/2028 (a) | 297,000 | 264,253 |
GPS Hospitality Holding Co. LLC 7.00%, 8/15/2028 (a) | 60,000 | 40,539 |
Hilton Domestic Operating Co., Inc. | ||
5.75%, 5/1/2028 (a) | 146,000 | 143,248 |
4.88%, 1/15/2030 | 996,000 | 929,179 |
4.00%, 5/1/2031 (a) | 146,000 | 126,904 |
3.63%, 2/15/2032 (a) | 173,000 | 144,679 |
Hilton Grand Vacations Borrower Escrow LLC | ||
5.00%, 6/1/2029 (a) | 476,000 | 422,002 |
4.88%, 7/1/2031 (a) | 137,000 | 115,502 |
Hilton Worldwide Finance LLC 4.88%, 4/1/2027 | 705,000 | 679,455 |
International Game Technology plc | ||
6.50%, 2/15/2025 (a) | 231,000 | 231,205 |
4.13%, 4/15/2026 (a) | 553,000 | 524,931 |
IRB Holding Corp. 7.00%, 6/15/2025 (a) | 377,000 | 377,000 |
Jacobs Entertainment, Inc. 6.75%, 2/15/2029 (a) | 79,000 | 71,594 |
KFC Holding Co. 4.75%, 6/1/2027 (a) | 882,000 | 848,925 |
Las Vegas Sands Corp. | ||
2.90%, 6/25/2025 | 375,000 | 354,138 |
3.50%, 8/18/2026 | 234,000 | 216,984 |
3.90%, 8/8/2029 | 644,000 | 566,956 |
Life Time, Inc. | ||
5.75%, 1/15/2026 (a) | 435,000 | 424,406 |
8.00%, 4/15/2026 (a) | 258,000 | 256,065 |
Light & Wonder International, Inc. | ||
7.00%, 5/15/2028 (a) | 400,000 | 398,509 |
7.25%, 11/15/2029 (a) | 343,000 | 344,447 |
MajorDrive Holdings IV LLC 6.38%, 6/1/2029 (a) | 338,000 | 278,532 |
Marriott Ownership Resorts, Inc. | ||
4.75%, 1/15/2028 | 398,000 | 355,215 |
4.50%, 6/15/2029 (a) | 108,000 | 91,262 |
Merlin Entertainments Ltd. (United Kingdom) 5.75%, 6/15/2026 (a) | 401,000 | 388,926 |
MGM Resorts International | ||
5.75%, 6/15/2025 | 280,000 | 276,116 |
4.63%, 9/1/2026 | 533,000 | 502,014 |
5.50%, 4/15/2027 | 5,000 | 4,777 |
INVESTMENTS | PRINCIPAL AMOUNT($) | VALUE($) |
Hotels, Restaurants & Leisure — continued | ||
4.75%, 10/15/2028 | 200,000 | 181,504 |
Mohegan Tribal Gaming Authority 8.00%, 2/1/2026 (a) | 676,000 | 629,525 |
NCL Corp. Ltd. | ||
3.63%, 12/15/2024 (a) | 129,000 | 123,460 |
5.88%, 3/15/2026 (a) | 916,000 | 863,677 |
5.88%, 2/15/2027 (a) | 414,000 | 401,186 |
8.38%, 2/1/2028 (a) | 5,000 | 5,154 |
7.75%, 2/15/2029 (a) | 249,000 | 236,880 |
Penn Entertainment, Inc. 4.13%, 7/1/2029 (a) | 491,000 | 401,554 |
Premier Entertainment Sub LLC | ||
5.63%, 9/1/2029 (a) | 314,000 | 250,635 |
5.88%, 9/1/2031 (a) | 174,000 | 134,537 |
Resorts World Las Vegas LLC 4.63%, 4/16/2029 (a) | 300,000 | 244,290 |
Royal Caribbean Cruises Ltd. | ||
11.50%, 6/1/2025 (a) | 280,000 | 295,707 |
5.50%, 8/31/2026 (a) | 707,000 | 677,459 |
11.63%, 8/15/2027 (a) | 664,000 | 723,511 |
7.50%, 10/15/2027 | 583,000 | 587,876 |
3.70%, 3/15/2028 | 275,000 | 239,547 |
8.25%, 1/15/2029 (a) | 486,000 | 506,179 |
9.25%, 1/15/2029 (a) | 207,000 | 220,630 |
Scientific Games Holdings LP 6.63%, 3/1/2030 (a) | 397,000 | 349,959 |
Six Flags Entertainment Corp. | ||
5.50%, 4/15/2027 (a) | 103,000 | 96,949 |
7.25%, 5/15/2031 (a) | 399,000 | 382,607 |
Six Flags Theme Parks, Inc. 7.00%, 7/1/2025 (a) | 277,000 | 276,930 |
Sizzling Platter LLC 8.50%, 11/28/2025 (a) | 251,000 | 248,579 |
Station Casinos LLC | ||
4.50%, 2/15/2028 (a) | 329,000 | 294,455 |
4.63%, 12/1/2031 (a) | 237,000 | 195,376 |
Sugarhouse HSP Gaming Prop Mezz LP 5.88%, 5/15/2025 (a) | 45,000 | 43,539 |
TKC Holdings, Inc. 10.50%, 5/15/2029 (a) | 176,000 | 146,080 |
Travel + Leisure Co. | ||
6.60%, 10/1/2025 (d) | 50,000 | 49,809 |
6.63%, 7/31/2026 (a) | 164,000 | 162,763 |
6.00%, 4/1/2027 (d) | 553,000 | 537,709 |
4.63%, 3/1/2030 (a) | 101,000 | 86,900 |
Vail Resorts, Inc. 6.25%, 5/15/2025 (a) | 323,000 | 321,867 |
96 | J.P. Morgan Exchange-Traded Funds | August 31, 2023 |
INVESTMENTS | PRINCIPAL AMOUNT($) | VALUE($) |
Corporate Bonds — continued | ||
Hotels, Restaurants & Leisure — continued | ||
Viking Cruises Ltd. | ||
6.25%, 5/15/2025 (a) | 141,000 | 138,885 |
5.88%, 9/15/2027 (a) | 447,000 | 417,945 |
Viking Ocean Cruises Ship VII Ltd. 5.63%, 2/15/2029 (a) | 337,000 | 313,303 |
VOC Escrow Ltd. 5.00%, 2/15/2028 (a) | 530,000 | 491,942 |
Wyndham Hotels & Resorts, Inc. 4.38%, 8/15/2028 (a) | 138,000 | 125,856 |
Wynn Las Vegas LLC | ||
5.50%, 3/1/2025 (a) | 261,000 | 257,837 |
5.25%, 5/15/2027 (a) | 132,000 | 124,941 |
Wynn Resorts Finance LLC 5.13%, 10/1/2029 (a) | 697,000 | 623,958 |
Yum! Brands, Inc. | ||
4.75%, 1/15/2030 (a) | 743,000 | 684,204 |
6.88%, 11/15/2037 | 221,000 | 232,798 |
5.35%, 11/1/2043 | 41,000 | 36,072 |
36,758,753 | ||
Household Durables — 1.4% | ||
Ashton Woods USA LLC | ||
4.63%, 8/1/2029 (a) | 45,000 | 38,988 |
4.63%, 4/1/2030 (a) | 195,000 | 167,945 |
Beazer Homes USA, Inc. | ||
5.88%, 10/15/2027 | 286,000 | 269,526 |
7.25%, 10/15/2029 | 121,000 | 117,236 |
Brookfield Residential Properties, Inc. (Canada) | ||
6.25%, 9/15/2027 (a) | 261,000 | 239,535 |
5.00%, 6/15/2029 (a) | 114,000 | 94,956 |
4.88%, 2/15/2030 (a) | 271,000 | 223,817 |
CD&R Smokey Buyer, Inc. 6.75%, 7/15/2025 (a) | 16,000 | 15,484 |
Century Communities, Inc. | ||
6.75%, 6/1/2027 | 31,000 | 30,904 |
3.88%, 8/15/2029 (a) | 288,000 | 248,133 |
Empire Communities Corp. (Canada) 7.00%, 12/15/2025 (a) | 144,000 | 138,974 |
KB Home | ||
4.80%, 11/15/2029 | 437,000 | 394,174 |
4.00%, 6/15/2031 | 240,000 | 202,171 |
M/I Homes, Inc. | ||
4.95%, 2/1/2028 | 80,000 | 74,228 |
3.95%, 2/15/2030 | 115,000 | 98,037 |
Mattamy Group Corp. (Canada) 5.25%, 12/15/2027 (a) | 107,000 | 100,918 |
Meritage Homes Corp. 5.13%, 6/6/2027 | 61,000 | 58,451 |
INVESTMENTS | PRINCIPAL AMOUNT($) | VALUE($) |
Household Durables — continued | ||
Newell Brands, Inc. | ||
4.88%, 6/1/2025 | 73,000 | 70,844 |
4.70%, 4/1/2026 (d) | 1,030,000 | 986,849 |
6.38%, 9/15/2027 | 315,000 | 308,585 |
6.63%, 9/15/2029 | 123,000 | 121,729 |
5.87%, 4/1/2036 (d) | 47,000 | 41,775 |
6.00%, 4/1/2046 (d) | 146,000 | 118,482 |
Shea Homes LP 4.75%, 2/15/2028 | 315,000 | 289,872 |
SWF Escrow Issuer Corp. 6.50%, 10/1/2029 (a) | 273,000 | 177,368 |
Taylor Morrison Communities, Inc. 5.88%, 6/15/2027 (a) | 506,000 | 497,160 |
Tempur Sealy International, Inc. 4.00%, 4/15/2029 (a) | 616,000 | 529,133 |
TopBuild Corp. | ||
3.63%, 3/15/2029 (a) | 178,000 | 153,169 |
4.13%, 2/15/2032 (a) | 53,000 | 44,123 |
Tri Pointe Homes, Inc. 5.70%, 6/15/2028 | 201,000 | 190,556 |
6,043,122 | ||
Household Products — 0.5% | ||
Central Garden & Pet Co. | ||
5.13%, 2/1/2028 | 222,000 | 207,772 |
4.13%, 10/15/2030 | 436,000 | 375,258 |
Energizer Holdings, Inc. | ||
4.75%, 6/15/2028 (a) | 418,000 | 369,072 |
4.38%, 3/31/2029 (a) | 240,000 | 205,557 |
Kronos Acquisition Holdings, Inc. (Canada) | ||
5.00%, 12/31/2026 (a) | 113,000 | 105,372 |
7.00%, 12/31/2027 (a) | 320,000 | 281,600 |
Spectrum Brands, Inc. | ||
5.00%, 10/1/2029 (a) | 184,000 | 168,746 |
5.50%, 7/15/2030 (a) | 400,000 | 372,085 |
2,085,462 | ||
Independent Power and Renewable Electricity Producers — 0.6% | ||
Calpine Corp. | ||
5.25%, 6/1/2026 (a) | 60,000 | 58,871 |
4.50%, 2/15/2028 (a) | 857,000 | 793,347 |
5.13%, 3/15/2028 (a) | 468,000 | 426,386 |
5.00%, 2/1/2031 (a) | 393,000 | 332,507 |
3.75%, 3/1/2031 (a) | 159,000 | 132,562 |
Clearway Energy Operating LLC | ||
4.75%, 3/15/2028 (a) | 206,000 | 190,477 |
3.75%, 2/15/2031 (a) | 655,000 | 538,526 |
August 31, 2023 | J.P. Morgan Exchange-Traded Funds | 97 |
AS OF August 31, 2023 (Unaudited) (continued)
INVESTMENTS | PRINCIPAL AMOUNT($) | VALUE($) |
Corporate Bonds — continued | ||
Independent Power and Renewable Electricity Producers — continued | ||
Talen Energy Supply LLC 8.63%, 6/1/2030 (a) | 20,000 | 20,824 |
TransAlta Corp. (Canada) 6.50%, 3/15/2040 | 219,000 | 209,333 |
2,702,833 | ||
Insurance — 1.6% | ||
Acrisure LLC | ||
10.13%, 8/1/2026 (a) | 97,000 | 100,000 |
4.25%, 2/15/2029 (a) | 35,000 | 30,267 |
6.00%, 8/1/2029 (a) | 532,000 | 462,146 |
Alliant Holdings Intermediate LLC | ||
4.25%, 10/15/2027 (a) | 298,000 | 270,563 |
6.75%, 10/15/2027 (a) | 583,000 | 551,063 |
6.75%, 4/15/2028 (a) | 334,000 | 329,062 |
5.88%, 11/1/2029 (a) | 15,000 | 13,135 |
AmWINS Group, Inc. 4.88%, 6/30/2029 (a) | 255,000 | 228,798 |
Assurant, Inc. (ICE LIBOR USD 3 Month + 4.14%), 7.00%, 3/27/2048 (c) | 72,000 | 69,748 |
AssuredPartners, Inc. | ||
7.00%, 8/15/2025 (a) | 457,000 | 452,348 |
5.63%, 1/15/2029 (a) | 310,000 | 269,305 |
BroadStreet Partners, Inc. 5.88%, 4/15/2029 (a) | 147,000 | 129,364 |
Genworth Holdings, Inc. 6.50%, 6/15/2034 | 6,000 | 5,133 |
Global Atlantic Fin Co. (US Treasury Yield Curve Rate T Note Constant Maturity 5 Year + 3.80%), 4.70%, 10/15/2051 (a) (c) | 421,000 | 303,932 |
HUB International Ltd. | ||
7.00%, 5/1/2026 (a) | 775,000 | 773,548 |
5.63%, 12/1/2029 (a) | 196,000 | 173,325 |
7.25%, 6/15/2030 (a) | 300,000 | 305,367 |
Jones Deslauriers Insurance Management, Inc. (Canada) | ||
8.50%, 3/15/2030 (a) | 416,000 | 424,570 |
10.50%, 12/15/2030 (a) | 138,000 | 140,238 |
Liberty Mutual Group, Inc. | ||
7.80%, 3/15/2037 (a) | 165,000 | 169,743 |
(US Treasury Yield Curve Rate T Note Constant Maturity 5 Year + 3.32%), 4.13%, 12/15/2051 (a) (c) | 44,000 | 35,530 |
4.30%, 2/1/2061 (a) | 81,000 | 49,573 |
NFP Corp. | ||
4.88%, 8/15/2028 (a) | 193,000 | 172,076 |
6.88%, 8/15/2028 (a) | 911,000 | 802,203 |
7.50%, 10/1/2030 (a) | 180,000 | 174,709 |
INVESTMENTS | PRINCIPAL AMOUNT($) | VALUE($) |
Insurance — continued | ||
Ryan Specialty LLC 4.38%, 2/1/2030 (a) | 462,000 | 412,931 |
USI, Inc. 6.88%, 5/1/2025 (a) | 214,000 | 213,653 |
7,062,330 | ||
Interactive Media & Services — 0.3% | ||
Cars.com, Inc. 6.38%, 11/1/2028 (a) | 225,000 | 208,031 |
Rackspace Technology Global, Inc. 3.50%, 2/15/2028 (a) | 277,000 | 131,479 |
TripAdvisor, Inc. 7.00%, 7/15/2025 (a) | 355,000 | 354,154 |
Ziff Davis, Inc. 4.63%, 10/15/2030 (a) | 528,000 | 454,150 |
ZipRecruiter, Inc. 5.00%, 1/15/2030 (a) | 55,000 | 46,140 |
1,193,954 | ||
IT Services — 0.9% | ||
Ahead DB Holdings LLC 6.63%, 5/1/2028 (a) | 223,000 | 193,459 |
Arches Buyer, Inc. 6.13%, 12/1/2028 (a) | 234,000 | 200,702 |
Cablevision Lightpath LLC 5.63%, 9/15/2028 (a) | 320,000 | 245,800 |
Conduent Business Services LLC 6.00%, 11/1/2029 (a) | 432,000 | 356,499 |
Gartner, Inc. | ||
4.50%, 7/1/2028 (a) | 529,000 | 493,312 |
3.63%, 6/15/2029 (a) | 255,000 | 223,979 |
3.75%, 10/1/2030 (a) | 219,000 | 189,119 |
Newfold Digital Holdings Group, Inc. 6.00%, 2/15/2029 (a) | 61,000 | 46,255 |
Northwest Fiber LLC | ||
4.75%, 4/30/2027 (a) | 378,000 | 332,556 |
10.75%, 6/1/2028 (a) | 136,000 | 126,043 |
Presidio Holdings, Inc. | ||
4.88%, 2/1/2027 (a) | 294,000 | 274,876 |
8.25%, 2/1/2028 (a) | 195,000 | 188,911 |
Tempo Acquisition LLC 5.75%, 6/1/2025 (a) | 56,000 | 55,037 |
Twilio, Inc. 3.88%, 3/15/2031 | 496,000 | 415,458 |
Unisys Corp. 6.88%, 11/1/2027 (a) | 418,000 | 329,764 |
3,671,770 | ||
Leisure Products — 0.1% | ||
Universal Entertainment Corp. (Japan) 8.75%, 12/11/2024 (a) (d) | 392,000 | 396,199 |
Life Sciences Tools & Services — 0.2% | ||
Charles River Laboratories International, Inc. 3.75%, 3/15/2029 (a) | 507,000 | 447,493 |
98 | J.P. Morgan Exchange-Traded Funds | August 31, 2023 |
INVESTMENTS | PRINCIPAL AMOUNT($) | VALUE($) |
Corporate Bonds — continued | ||
Life Sciences Tools & Services — continued | ||
Fortrea Holdings, Inc. 7.50%, 7/1/2030 (a) | 200,000 | 195,750 |
PRA Health Sciences, Inc. 2.88%, 7/15/2026 (a) | 375,000 | 342,130 |
985,373 | ||
Machinery — 1.4% | ||
Amsted Industries, Inc. 4.63%, 5/15/2030 (a) | 498,000 | 437,409 |
ATS Corp. (Canada) 4.13%, 12/15/2028 (a) | 5,000 | 4,439 |
Calderys Financing LLC (France) 11.25%, 6/1/2028 (a) | 341,000 | 349,512 |
Chart Industries, Inc. 7.50%, 1/1/2030 (a) | 688,000 | 704,955 |
EnPro Industries, Inc. 5.75%, 10/15/2026 | 315,000 | 306,041 |
GrafTech Finance, Inc. 4.63%, 12/15/2028 (a) | 324,000 | 254,340 |
GrafTech Global Enterprises, Inc. 9.88%, 12/15/2028 (a) | 316,000 | 308,100 |
Hillenbrand, Inc. | ||
5.75%, 6/15/2025 | 228,000 | 226,575 |
3.75%, 3/1/2031 | 387,000 | 324,982 |
Husky III Holding Ltd. (Canada) 13.00% (Cash), 2/15/2025 (a) (b) | 428,000 | 426,930 |
Manitowoc Co., Inc. (The) 9.00%, 4/1/2026 (a) | 47,000 | 47,232 |
Maxim Crane Works Holdings Capital LLC 10.13%, 8/1/2024 (a) | 269,000 | 269,238 |
Mueller Water Products, Inc. 4.00%, 6/15/2029 (a) | 391,000 | 346,297 |
Park-Ohio Industries, Inc. 6.63%, 4/15/2027 | 363,000 | 314,903 |
Roller Bearing Co. of America, Inc. 4.38%, 10/15/2029 (a) | 211,000 | 188,775 |
SPX FLOW, Inc. 8.75%, 4/1/2030 (a) | 199,000 | 189,233 |
Terex Corp. 5.00%, 5/15/2029 (a) | 405,000 | 371,851 |
Titan International, Inc. 7.00%, 4/30/2028 | 301,000 | 286,780 |
TK Elevator US Newco, Inc. (Germany) 5.25%, 7/15/2027 (a) | 498,000 | 466,825 |
Werner FinCo. LP 8.75% (Blend (Cash 8.75% + PIK 5.75%)), 10/15/2028 (a) (b) | 7,000 | 6,086 |
5,830,503 | ||
Marine Transportation — 0.0% ^ | ||
Danaos Corp. (Greece) 8.50%, 3/1/2028 (a) | 188,000 | 190,830 |
Media — 6.5% | ||
Advantage Sales & Marketing, Inc. 6.50%, 11/15/2028 (a) | 379,000 | 330,397 |
Altice Financing SA (Luxembourg) | ||
5.00%, 1/15/2028 (a) | 529,000 | 430,135 |
5.75%, 8/15/2029 (a) | 561,000 | 444,402 |
INVESTMENTS | PRINCIPAL AMOUNT($) | VALUE($) |
Media — continued | ||
AMC Networks, Inc. | ||
4.75%, 8/1/2025 | 473,000 | 443,370 |
4.25%, 2/15/2029 | 200,000 | 127,486 |
Beasley Mezzanine Holdings LLC 8.63%, 2/1/2026 (a) | 60,000 | 39,637 |
Cable One, Inc. 4.00%, 11/15/2030 (a) | 83,000 | 64,737 |
Clear Channel International BV (United Kingdom) 6.63%, 8/1/2025 (a) | 205,000 | 203,134 |
Clear Channel Outdoor Holdings, Inc. | ||
5.13%, 8/15/2027 (a) | 220,000 | 197,041 |
7.50%, 6/1/2029 (a) | 800,000 | 596,233 |
CMG Media Corp. 8.88%, 12/15/2027 (a) | 342,000 | 268,620 |
CSC Holdings LLC | ||
7.50%, 4/1/2028 (a) | 611,000 | 388,373 |
11.25%, 5/15/2028 (a) | 428,000 | 422,147 |
6.50%, 2/1/2029 (a) | 1,226,000 | 1,013,483 |
5.75%, 1/15/2030 (a) | 950,000 | 525,331 |
4.13%, 12/1/2030 (a) | 529,000 | 377,216 |
4.63%, 12/1/2030 (a) | 400,000 | 209,272 |
3.38%, 2/15/2031 (a) | 200,000 | 137,354 |
4.50%, 11/15/2031 (a) | 738,000 | 524,767 |
Cumulus Media New Holdings, Inc. 6.75%, 7/1/2026 (a) | 359,000 | 263,160 |
Directv Financing LLC 5.88%, 8/15/2027 (a) | 1,450,000 | 1,285,016 |
DISH DBS Corp. | ||
5.88%, 11/15/2024 | 1,167,000 | 1,085,448 |
7.75%, 7/1/2026 | 380,000 | 284,202 |
5.25%, 12/1/2026 (a) | 1,205,000 | 1,015,749 |
7.38%, 7/1/2028 | 310,000 | 194,184 |
5.75%, 12/1/2028 (a) | 1,390,000 | 1,079,015 |
5.13%, 6/1/2029 | 415,000 | 224,391 |
DISH Network Corp. 11.75%, 11/15/2027 (a) | 770,000 | 781,274 |
Gannett Holdings LLC 6.00%, 11/1/2026 (a) | 67,000 | 57,473 |
GCI LLC 4.75%, 10/15/2028 (a) | 40,000 | 34,700 |
Gray Television, Inc. | ||
7.00%, 5/15/2027 (a) | 519,000 | 465,833 |
4.75%, 10/15/2030 (a) | 618,000 | 431,506 |
iHeartCommunications, Inc. | ||
6.38%, 5/1/2026 | 555,417 | 484,607 |
8.38%, 5/1/2027 | 484,864 | 335,734 |
5.25%, 8/15/2027 (a) | 292,000 | 230,892 |
4.75%, 1/15/2028 (a) | 45,000 | 34,681 |
Lamar Media Corp. | ||
4.00%, 2/15/2030 | 397,000 | 347,375 |
3.63%, 1/15/2031 | 70,000 | 58,450 |
August 31, 2023 | J.P. Morgan Exchange-Traded Funds | 99 |
AS OF August 31, 2023 (Unaudited) (continued)
INVESTMENTS | PRINCIPAL AMOUNT($) | VALUE($) |
Corporate Bonds — continued | ||
Media — continued | ||
LCPR Senior Secured Financing DAC 6.75%, 10/15/2027 (a) | 638,000 | 600,517 |
Liberty Interactive LLC 8.25%, 2/1/2030 | 13,000 | 5,048 |
McGraw-Hill Education, Inc. | ||
5.75%, 8/1/2028 (a) | 235,000 | 208,563 |
8.00%, 8/1/2029 (a) | 417,000 | 371,268 |
News Corp. | ||
3.88%, 5/15/2029 (a) | 643,000 | 564,676 |
5.13%, 2/15/2032 (a) | 140,000 | 126,700 |
Nexstar Media, Inc. | ||
5.63%, 7/15/2027 (a) | 756,000 | 710,597 |
4.75%, 11/1/2028 (a) | 162,000 | 142,108 |
Outfront Media Capital LLC | ||
5.00%, 8/15/2027 (a) | 447,000 | 404,535 |
4.25%, 1/15/2029 (a) | 367,000 | 301,004 |
Paramount Global | ||
(ICE LIBOR USD 3 Month + 3.90%), 6.25%, 2/28/2057 (c) | 13,000 | 10,179 |
(US Treasury Yield Curve Rate T Note Constant Maturity 5 Year + 4.00%), 6.38%, 3/30/2062 (c) | 458,000 | 377,850 |
Radiate Holdco LLC | ||
4.50%, 9/15/2026 (a) | 59,000 | 45,984 |
6.50%, 9/15/2028 (a) | 612,000 | 330,503 |
Scripps Escrow II, Inc. | ||
3.88%, 1/15/2029 (a) | 196,000 | 157,357 |
5.38%, 1/15/2031 (a) | 69,000 | 49,287 |
Scripps Escrow, Inc. 5.88%, 7/15/2027 (a) | 424,000 | 342,584 |
Sinclair Television Group, Inc. | ||
5.50%, 3/1/2030 (a) | 473,000 | 252,013 |
4.13%, 12/1/2030 (a) | 168,000 | 108,266 |
Sirius XM Radio, Inc. | ||
5.00%, 8/1/2027 (a) | 687,000 | 635,186 |
4.00%, 7/15/2028 (a) | 12,000 | 10,391 |
5.50%, 7/1/2029 (a) | 1,006,000 | 905,657 |
4.13%, 7/1/2030 (a) | 789,000 | 643,216 |
3.88%, 9/1/2031 (a) | 40,000 | 31,132 |
Spanish Broadcasting System, Inc. 9.75%, 3/1/2026 (a) | 48,000 | 33,256 |
Stagwell Global LLC 5.63%, 8/15/2029 (a) | 244,000 | 203,774 |
TEGNA, Inc. | ||
4.75%, 3/15/2026 (a) | 180,000 | 171,510 |
5.00%, 9/15/2029 | 892,000 | 784,960 |
Telenet Finance Luxembourg Notes SARL (Belgium) 5.50%, 3/1/2028 (a) | 400,000 | 365,200 |
INVESTMENTS | PRINCIPAL AMOUNT($) | VALUE($) |
Media — continued | ||
Townsquare Media, Inc. 6.88%, 2/1/2026 (a) | 292,000 | 281,050 |
Univision Communications, Inc. | ||
5.13%, 2/15/2025 (a) | 197,000 | 194,291 |
4.50%, 5/1/2029 (a) | 634,000 | 545,707 |
7.38%, 6/30/2030 (a) | 446,000 | 431,652 |
UPC Broadband Finco BV (Netherlands) 4.88%, 7/15/2031 (a) | 510,000 | 420,928 |
UPC Holding BV (Netherlands) 5.50%, 1/15/2028 (a) | 363,000 | 323,070 |
Urban One, Inc. 7.38%, 2/1/2028 (a) | 211,000 | 183,476 |
Videotron Ltd. (Canada) 5.13%, 4/15/2027 (a) | 309,000 | 295,868 |
Virgin Media Vendor Financing Notes IV DAC (United Kingdom) 5.00%, 7/15/2028 (a) | 223,000 | 197,605 |
VZ Secured Financing BV (Netherlands) 5.00%, 1/15/2032 (a) | 322,000 | 262,512 |
Ziggo Bond Co. BV (Netherlands) 5.13%, 2/28/2030 (a) | 966,000 | 749,736 |
28,216,041 | ||
Metals & Mining — 1.9% | ||
Baffinland Iron Mines Corp. (Canada) 8.75%, 7/15/2026 (a) | 293,000 | 285,580 |
Big River Steel LLC 6.63%, 1/31/2029 (a) | 505,000 | 502,055 |
Carpenter Technology Corp. 6.38%, 7/15/2028 | 454,000 | 443,560 |
Cleveland-Cliffs, Inc. | ||
6.75%, 3/15/2026 (a) | 30,000 | 30,009 |
5.88%, 6/1/2027 | 618,000 | 595,144 |
6.75%, 4/15/2030 (a) | 51,000 | 48,620 |
4.88%, 3/1/2031 (a) | 522,000 | 455,449 |
Coeur Mining, Inc. 5.13%, 2/15/2029 (a) | 191,000 | 167,427 |
Commercial Metals Co. | ||
4.13%, 1/15/2030 | 279,000 | 246,801 |
4.38%, 3/15/2032 | 40,000 | 34,327 |
Constellium SE 5.63%, 6/15/2028 (a) | 350,000 | 330,787 |
FMG Resources August 2006 Pty. Ltd. (Australia) | ||
4.50%, 9/15/2027 (a) | 1,228,000 | 1,132,941 |
5.88%, 4/15/2030 (a) | 107,000 | 99,290 |
6.13%, 4/15/2032 (a) | 290,000 | 269,923 |
Hudbay Minerals, Inc. (Canada) | ||
4.50%, 4/1/2026 (a) | 159,000 | 150,075 |
6.13%, 4/1/2029 (a) | 457,000 | 429,655 |
IAMGOLD Corp. (Burkina Faso) 5.75%, 10/15/2028 (a) | 240,000 | 184,122 |
100 | J.P. Morgan Exchange-Traded Funds | August 31, 2023 |
INVESTMENTS | PRINCIPAL AMOUNT($) | VALUE($) |
Corporate Bonds — continued | ||
Metals & Mining — continued | ||
Infrabuild Australia Pty. Ltd. (Australia) 12.00%, 10/1/2024 (a) | 27,000 | 26,212 |
Kaiser Aluminum Corp. | ||
4.63%, 3/1/2028 (a) | 351,000 | 310,399 |
4.50%, 6/1/2031 (a) | 269,000 | 217,357 |
Mineral Resources Ltd. (Australia) | ||
8.13%, 5/1/2027 (a) | 270,000 | 269,330 |
8.00%, 11/1/2027 (a) | 165,000 | 164,423 |
8.50%, 5/1/2030 (a) | 235,000 | 235,840 |
New Gold, Inc. (Canada) 7.50%, 7/15/2027 (a) | 209,000 | 199,528 |
Novelis Corp. | ||
3.25%, 11/15/2026 (a) | 20,000 | 18,120 |
4.75%, 1/30/2030 (a) | 1,073,000 | 960,272 |
3.88%, 8/15/2031 (a) | 126,000 | 104,323 |
SunCoke Energy, Inc. 4.88%, 6/30/2029 (a) | 130,000 | 110,625 |
United States Steel Corp. | ||
6.88%, 3/1/2029 | 130,000 | 129,500 |
6.65%, 6/1/2037 | 219,000 | 215,091 |
8,366,785 | ||
Mortgage Real Estate Investment Trusts (REITs) — 0.4% | ||
Apollo Commercial Real Estate Finance, Inc. 4.63%, 6/15/2029 (a) | 489,000 | 383,484 |
Ladder Capital Finance Holdings LLLP | ||
4.25%, 2/1/2027 (a) | 354,000 | 320,139 |
4.75%, 6/15/2029 (a) | 405,000 | 340,488 |
Starwood Property Trust, Inc. | ||
3.75%, 12/31/2024 (a) | 432,000 | 415,260 |
3.63%, 7/15/2026 (a) | 373,000 | 333,771 |
1,793,142 | ||
Multi-Utilities — 0.1% | ||
Algonquin Power & Utilities Corp. (Canada) (US Treasury Yield Curve Rate T Note Constant Maturity 5 Year + 3.25%), 4.75%, 1/18/2082 (c) | 418,000 | 341,906 |
Office REITs — 0.1% | ||
Office Properties Income Trust | ||
4.50%, 2/1/2025 | 130,000 | 116,230 |
2.65%, 6/15/2026 | 85,000 | 63,585 |
2.40%, 2/1/2027 | 131,000 | 88,610 |
3.45%, 10/15/2031 | 370,000 | 188,205 |
456,630 | ||
Oil, Gas & Consumable Fuels — 9.6% | ||
Aethon United BR LP 8.25%, 2/15/2026 (a) | 237,000 | 238,185 |
INVESTMENTS | PRINCIPAL AMOUNT($) | VALUE($) |
Oil, Gas & Consumable Fuels — continued | ||
Alliance Resource Operating Partners LP 7.50%, 5/1/2025 (a) | 242,000 | 241,093 |
Antero Midstream Partners LP | ||
7.88%, 5/15/2026 (a) | 27,000 | 27,469 |
5.75%, 3/1/2027 (a) | 496,000 | 480,730 |
5.75%, 1/15/2028 (a) | 521,000 | 498,899 |
Ascent Resources Utica Holdings LLC | ||
7.00%, 11/1/2026 (a) | 583,000 | 579,576 |
5.88%, 6/30/2029 (a) | 157,000 | 142,997 |
Baytex Energy Corp. (Canada) 8.75%, 4/1/2027 (a) | 354,000 | 362,284 |
Berry Petroleum Co. LLC 7.00%, 2/15/2026 (a) | 18,000 | 17,307 |
Blue Racer Midstream LLC | ||
7.63%, 12/15/2025 (a) | 392,000 | 393,139 |
6.63%, 7/15/2026 (a) | 70,000 | 68,797 |
Buckeye Partners LP | ||
4.13%, 3/1/2025 (a) | 200,000 | 192,606 |
4.13%, 12/1/2027 | 200,000 | 181,858 |
4.50%, 3/1/2028 (a) | 693,000 | 628,897 |
5.85%, 11/15/2043 | 166,000 | 128,853 |
5.60%, 10/15/2044 | 42,000 | 31,326 |
California Resources Corp. 7.13%, 2/1/2026 (a) | 339,000 | 339,871 |
Callon Petroleum Co. | ||
6.38%, 7/1/2026 | 244,000 | 240,560 |
8.00%, 8/1/2028 (a) | 307,000 | 311,322 |
7.50%, 6/15/2030 (a) | 154,000 | 152,215 |
Calumet Specialty Products Partners LP | ||
11.00%, 4/15/2025 (a) | 64,000 | 65,470 |
8.13%, 1/15/2027 (a) | 241,000 | 230,336 |
Chesapeake Energy Corp. 5.50%, 2/1/2026 (a) | 423,000 | 412,992 |
Chord Energy Corp. 6.38%, 6/1/2026 (a) | 15,000 | 14,784 |
Civitas Resources, Inc. | ||
5.00%, 10/15/2026 (a) | 506,000 | 480,214 |
8.75%, 7/1/2031 (a) | 250,000 | 258,750 |
CNX Midstream Partners LP 4.75%, 4/15/2030 (a) | 268,000 | 231,268 |
CNX Resources Corp. | ||
7.25%, 3/14/2027 (a) | 316,000 | 315,677 |
7.38%, 1/15/2031 (a) | 275,000 | 274,489 |
Comstock Resources, Inc. 6.75%, 3/1/2029 (a) | 916,000 | 857,080 |
CQP Holdco LP 5.50%, 6/15/2031 (a) | 500,000 | 456,240 |
August 31, 2023 | J.P. Morgan Exchange-Traded Funds | 101 |
AS OF August 31, 2023 (Unaudited) (continued)
INVESTMENTS | PRINCIPAL AMOUNT($) | VALUE($) |
Corporate Bonds — continued | ||
Oil, Gas & Consumable Fuels — continued | ||
Crestwood Midstream Partners LP | ||
5.63%, 5/1/2027 (a) | 663,000 | 643,110 |
8.00%, 4/1/2029 (a) | 184,000 | 190,130 |
7.38%, 2/1/2031 (a) | 200,000 | 206,032 |
CrownRock LP | ||
5.63%, 10/15/2025 (a) | 122,000 | 120,074 |
5.00%, 5/1/2029 (a) | 495,000 | 459,711 |
CVR Energy, Inc. 5.25%, 2/15/2025 (a) | 55,000 | 53,353 |
Delek Logistics Partners LP 7.13%, 6/1/2028 (a) | 299,000 | 277,944 |
DT Midstream, Inc. | ||
4.13%, 6/15/2029 (a) | 820,000 | 726,454 |
4.38%, 6/15/2031 (a) | 157,000 | 135,917 |
Earthstone Energy Holdings LLC 8.00%, 4/15/2027 (a) | 299,000 | 305,186 |
Encino Acquisition Partners Holdings LLC 8.50%, 5/1/2028 (a) | 163,000 | 154,557 |
Endeavor Energy Resources LP 5.75%, 1/30/2028 (a) | 567,000 | 554,639 |
EnLink Midstream LLC | ||
5.38%, 6/1/2029 | 540,000 | 514,839 |
6.50%, 9/1/2030 (a) | 211,000 | 211,539 |
EnLink Midstream Partners LP | ||
4.85%, 7/15/2026 | 370,000 | 355,200 |
5.60%, 4/1/2044 | 107,000 | 91,239 |
5.05%, 4/1/2045 | 189,000 | 150,736 |
5.45%, 6/1/2047 | 318,000 | 263,940 |
Enviva Partners LP 6.50%, 1/15/2026 (a) | 145,000 | 123,613 |
EQM Midstream Partners LP | ||
4.00%, 8/1/2024 | 401,000 | 391,244 |
5.50%, 7/15/2028 | 892,000 | 852,201 |
4.75%, 1/15/2031 (a) | 583,000 | 515,185 |
6.50%, 7/15/2048 | 275,000 | 249,631 |
Genesis Energy LP | ||
6.50%, 10/1/2025 | 11,000 | 10,854 |
8.00%, 1/15/2027 | 1,004,000 | 989,773 |
Global Partners LP 6.88%, 1/15/2029 | 52,000 | 49,140 |
Gran Tierra Energy International Holdings Ltd. (Colombia) 6.25%, 2/15/2025 (a) | 219,000 | 191,485 |
Gulfport Energy Corp. 8.00%, 5/17/2026 | 271,999 | 276,223 |
Hess Infrastructure Partners LP 5.63%, 2/15/2026 (a) | 25,000 | 24,463 |
Hess Midstream Operations LP | ||
5.63%, 2/15/2026 (a) | 14,000 | 13,699 |
5.13%, 6/15/2028 (a) | 755,000 | 708,206 |
INVESTMENTS | PRINCIPAL AMOUNT($) | VALUE($) |
Oil, Gas & Consumable Fuels — continued | ||
Hilcorp Energy I LP | ||
6.25%, 11/1/2028 (a) | 53,000 | 51,128 |
5.75%, 2/1/2029 (a) | 111,000 | 102,953 |
6.00%, 2/1/2031 (a) | 234,000 | 214,352 |
6.25%, 4/15/2032 (a) | 609,000 | 558,858 |
Holly Energy Partners LP 6.38%, 4/15/2027 (a) | 270,000 | 268,587 |
Ithaca Energy North Sea plc (United Kingdom) 9.00%, 7/15/2026 (a) | 342,000 | 327,548 |
ITT Holdings LLC 6.50%, 8/1/2029 (a) | 208,000 | 187,720 |
Kinetik Holdings LP 5.88%, 6/15/2030 (a) | 499,000 | 483,286 |
Martin Midstream Partners LP 11.50%, 2/15/2028 (a) | 175,000 | 177,058 |
Matador Resources Co. 6.88%, 4/15/2028 (a) | 585,000 | 584,075 |
MEG Energy Corp. (Canada) | ||
7.13%, 2/1/2027 (a) | 185,000 | 187,334 |
5.88%, 2/1/2029 (a) | 333,000 | 318,125 |
Moss Creek Resources Holdings, Inc. | ||
7.50%, 1/15/2026 (a) | 409,000 | 391,502 |
10.50%, 5/15/2027 (a) | 152,000 | 150,816 |
Murphy Oil Corp. | ||
6.38%, 7/15/2028 | 200,000 | 199,896 |
7.05%, 5/1/2029 | 63,000 | 63,663 |
5.87%, 12/1/2042 (d) | 280,000 | 234,550 |
Neptune Energy Bondco plc (United Kingdom) 6.63%, 5/15/2025 (a) | 438,000 | 435,810 |
New Fortress Energy, Inc. | ||
6.75%, 9/15/2025 (a) | 588,000 | 568,290 |
6.50%, 9/30/2026 (a) | 284,000 | 263,984 |
NGL Energy Operating LLC 7.50%, 2/1/2026 (a) | 392,000 | 390,266 |
NGL Energy Partners LP | ||
6.13%, 3/1/2025 | 108,000 | 106,107 |
7.50%, 4/15/2026 | 311,000 | 298,994 |
Northern Oil and Gas, Inc. 8.13%, 3/1/2028 (a) | 5,000 | 5,012 |
Northriver Midstream Finance LP (Canada) 5.63%, 2/15/2026 (a) | 143,000 | 137,459 |
NuStar Logistics LP | ||
6.00%, 6/1/2026 | 164,000 | 160,733 |
5.63%, 4/28/2027 | 546,000 | 529,757 |
Parkland Corp. (Canada) | ||
5.88%, 7/15/2027 (a) | 25,000 | 24,162 |
4.50%, 10/1/2029 (a) | 377,000 | 332,182 |
4.63%, 5/1/2030 (a) | 476,000 | 419,627 |
102 | J.P. Morgan Exchange-Traded Funds | August 31, 2023 |
INVESTMENTS | PRINCIPAL AMOUNT($) | VALUE($) |
Corporate Bonds — continued | ||
Oil, Gas & Consumable Fuels — continued | ||
PBF Holding Co. LLC | ||
7.25%, 6/15/2025 | 473,000 | 473,032 |
6.00%, 2/15/2028 | 121,000 | 114,455 |
PDC Energy, Inc. 5.75%, 5/15/2026 | 264,000 | 263,340 |
Permian Resources Operating LLC | ||
7.75%, 2/15/2026 (a) | 21,000 | 21,173 |
6.88%, 4/1/2027 (a) | 9,000 | 8,941 |
5.88%, 7/1/2029 (a) | 644,000 | 621,103 |
Range Resources Corp. | ||
8.25%, 1/15/2029 | 442,000 | 458,862 |
4.75%, 2/15/2030 (a) | 194,000 | 175,176 |
Rockcliff Energy II LLC 5.50%, 10/15/2029 (a) | 473,000 | 436,023 |
Rockies Express Pipeline LLC | ||
4.95%, 7/15/2029 (a) | 588,000 | 538,186 |
4.80%, 5/15/2030 (a) | 342,000 | 298,769 |
6.88%, 4/15/2040 (a) | 44,000 | 39,580 |
SM Energy Co. | ||
5.63%, 6/1/2025 | 180,000 | 177,277 |
6.75%, 9/15/2026 | 459,000 | 457,072 |
6.63%, 1/15/2027 | 85,000 | 83,938 |
Southwestern Energy Co. | ||
5.70%, 1/23/2025 (d) | 276,000 | 273,312 |
8.38%, 9/15/2028 | 159,000 | 165,495 |
5.38%, 3/15/2030 | 657,000 | 615,074 |
4.75%, 2/1/2032 | 440,000 | 389,777 |
Strathcona Resources Ltd. (Canada) 6.88%, 8/1/2026 (a) | 292,000 | 273,513 |
Summit Midstream Holdings LLC | ||
5.75%, 4/15/2025 | 244,000 | 224,480 |
9.00%, 10/15/2026 (a) (d) | 451,000 | 435,215 |
Sunnova Energy Corp. 5.88%, 9/1/2026 (a) | 403,000 | 354,622 |
Sunoco LP | ||
6.00%, 4/15/2027 | 426,000 | 421,545 |
5.88%, 3/15/2028 | 35,000 | 33,996 |
4.50%, 4/30/2030 | 599,000 | 534,063 |
Tallgrass Energy Partners LP | ||
6.00%, 3/1/2027 (a) | 64,000 | 61,327 |
5.50%, 1/15/2028 (a) | 631,000 | 586,048 |
6.00%, 12/31/2030 (a) | 100,000 | 89,459 |
6.00%, 9/1/2031 (a) | 357,000 | 317,059 |
Talos Production, Inc. 12.00%, 1/15/2026 | 418,000 | 435,765 |
Teine Energy Ltd. (Canada) 6.88%, 4/15/2029 (a) | 301,000 | 279,178 |
INVESTMENTS | PRINCIPAL AMOUNT($) | VALUE($) |
Oil, Gas & Consumable Fuels — continued | ||
TerraForm Power Operating LLC | ||
5.00%, 1/31/2028 (a) | 603,000 | 547,615 |
4.75%, 1/15/2030 (a) | 90,000 | 77,131 |
Topaz Solar Farms LLC 5.75%, 9/30/2039 (a) | 227,000 | 214,644 |
TransMontaigne Partners LP 6.13%, 2/15/2026 | 207,000 | 177,761 |
Venture Global Calcasieu Pass LLC | ||
3.88%, 8/15/2029 (a) | 1,117,000 | 966,231 |
4.13%, 8/15/2031 (a) | 354,000 | 300,283 |
3.88%, 11/1/2033 (a) | 210,000 | 170,623 |
Venture Global LNG, Inc. | ||
8.13%, 6/1/2028 (a) | 877,000 | 884,668 |
8.38%, 6/1/2031 (a) | 674,000 | 679,860 |
Vermilion Energy, Inc. (Canada) 6.88%, 5/1/2030 (a) | 369,000 | 349,358 |
Viper Energy Partners LP 5.38%, 11/1/2027 (a) | 26,000 | 25,053 |
Vital Energy, Inc. | ||
9.50%, 1/15/2025 | 94,000 | 94,470 |
10.13%, 1/15/2028 | 254,000 | 257,810 |
7.75%, 7/31/2029 (a) | 176,000 | 158,400 |
W&T Offshore, Inc. 11.75%, 2/1/2026 (a) | 220,000 | 222,747 |
41,622,944 | ||
Paper & Forest Products — 0.3% | ||
Ahlstrom Holding 3 Oy (Finland) 4.88%, 2/4/2028 (a) | 227,000 | 188,503 |
Domtar Corp. 6.75%, 10/1/2028 (a) | 531,000 | 459,345 |
Glatfelter Corp. 4.75%, 11/15/2029 (a) | 74,000 | 51,696 |
Louisiana-Pacific Corp. 3.63%, 3/15/2029 (a) | 362,000 | 311,499 |
Mercer International, Inc. (Germany) | ||
5.50%, 1/15/2026 | 83,000 | 79,207 |
5.13%, 2/1/2029 | 432,000 | 353,401 |
1,443,651 | ||
Passenger Airlines — 1.8% | ||
Air Canada (Canada) 3.88%, 8/15/2026 (a) | 535,000 | 494,030 |
Allegiant Travel Co. 7.25%, 8/15/2027 (a) | 481,000 | 470,779 |
American Airlines Group, Inc. 3.75%, 3/1/2025 (a) | 335,000 | 320,595 |
American Airlines, Inc. | ||
11.75%, 7/15/2025 (a) | 60,000 | 65,673 |
5.50%, 4/20/2026 (a) | 922,174 | 904,915 |
7.25%, 2/15/2028 (a) | 195,000 | 191,552 |
5.75%, 4/20/2029 (a) | 1,601,009 | 1,531,174 |
August 31, 2023 | J.P. Morgan Exchange-Traded Funds | 103 |
AS OF August 31, 2023 (Unaudited) (continued)
INVESTMENTS | PRINCIPAL AMOUNT($) | VALUE($) |
Corporate Bonds — continued | ||
Passenger Airlines — continued | ||
Delta Air Lines, Inc. | ||
7.38%, 1/15/2026 | 425,000 | 437,260 |
4.38%, 4/19/2028 | 331,000 | 312,629 |
3.75%, 10/28/2029 | 315,000 | 280,193 |
Hawaiian Brand Intellectual Property Ltd. 5.75%, 1/20/2026 (a) | 441,111 | 408,188 |
Spirit Loyalty Cayman Ltd. 8.00%, 9/20/2025 (a) | 292,000 | 292,320 |
United Airlines Holdings, Inc. 4.88%, 1/15/2025 | 45,000 | 43,899 |
United Airlines, Inc. | ||
4.38%, 4/15/2026 (a) | 279,000 | 262,938 |
4.63%, 4/15/2029 (a) | 1,179,000 | 1,048,309 |
VistaJet Malta Finance plc (Switzerland) | ||
7.88%, 5/1/2027 (a) | 567,000 | 513,135 |
9.50%, 6/1/2028 (a) | 161,000 | 148,571 |
6.38%, 2/1/2030 (a) | 161,000 | 132,017 |
7,858,177 | ||
Personal Care Products — 0.5% | ||
BellRing Brands, Inc. 7.00%, 3/15/2030 (a) | 604,000 | 604,252 |
Coty, Inc. | ||
5.00%, 4/15/2026 (a) | 448,000 | 430,653 |
6.50%, 4/15/2026 (a) | 163,000 | 162,563 |
Edgewell Personal Care Co. 4.13%, 4/1/2029 (a) | 100,000 | 86,664 |
Herbalife Nutrition Ltd. 7.88%, 9/1/2025 (a) | 604,000 | 581,205 |
Prestige Brands, Inc. | ||
5.13%, 1/15/2028 (a) | 26,000 | 24,572 |
3.75%, 4/1/2031 (a) | 507,000 | 419,542 |
2,309,451 | ||
Pharmaceuticals — 1.5% | ||
Bausch Health Americas, Inc. | ||
9.25%, 4/1/2026 (a) | 108,000 | 97,824 |
8.50%, 1/31/2027 (a) | 65,000 | 36,156 |
Bausch Health Cos., Inc. | ||
5.50%, 11/1/2025 (a) | 1,037,000 | 933,881 |
9.00%, 12/15/2025 (a) | 261,000 | 238,824 |
6.13%, 2/1/2027 (a) | 242,000 | 159,115 |
5.75%, 8/15/2027 (a) | 1,112,000 | 696,177 |
5.00%, 1/30/2028 (a) | 669,000 | 290,691 |
11.00%, 9/30/2028 (a) | 524,000 | 374,103 |
5.00%, 2/15/2029 (a) | 202,000 | 83,830 |
6.25%, 2/15/2029 (a) | 10,000 | 4,375 |
5.25%, 1/30/2030 (a) | 5,000 | 2,111 |
INVESTMENTS | PRINCIPAL AMOUNT($) | VALUE($) |
Pharmaceuticals — continued | ||
5.25%, 2/15/2031 (a) | 190,000 | 80,598 |
Catalent Pharma Solutions, Inc. | ||
5.00%, 7/15/2027 (a) | 513,000 | 479,014 |
3.13%, 2/15/2029 (a) | 225,000 | 189,356 |
Cheplapharm Arzneimittel GmbH (Germany) 5.50%, 1/15/2028 (a) | 287,000 | 259,820 |
Elanco Animal Health, Inc. 6.65%, 8/28/2028 (d) | 268,000 | 264,315 |
Jazz Securities DAC 4.38%, 1/15/2029 (a) | 450,000 | 403,172 |
Mallinckrodt International Finance SA | ||
Series 144#, 10.00%, 4/15/2025 (a) | 50,000 | 4,750 |
11.50%, 12/15/2028 (a) (g) | 461,000 | 415,161 |
Organon & Co. 5.13%, 4/30/2031 (a) | 825,000 | 702,903 |
P&L Development LLC 7.75%, 11/15/2025 (a) | 129,000 | 111,501 |
Perrigo Finance Unlimited Co. | ||
4.38%, 3/15/2026 | 325,000 | 309,134 |
4.65%, 6/15/2030 (d) | 550,000 | 487,465 |
6,624,276 | ||
Professional Services — 0.2% | ||
AMN Healthcare, Inc. | ||
4.63%, 10/1/2027 (a) | 130,000 | 119,243 |
4.00%, 4/15/2029 (a) | 90,000 | 76,976 |
CoreLogic, Inc. 4.50%, 5/1/2028 (a) | 470,000 | 384,225 |
Dun & Bradstreet Corp. (The) 5.00%, 12/15/2029 (a) | 401,000 | 359,890 |
KBR, Inc. 4.75%, 9/30/2028 (a) | 28,000 | 25,166 |
Science Applications International Corp. 4.88%, 4/1/2028 (a) | 51,000 | 47,474 |
1,012,974 | ||
Real Estate Management & Development — 0.6% | ||
Cushman & Wakefield US Borrower LLC 6.75%, 5/15/2028 (a) | 300,000 | 285,595 |
Five Point Operating Co. LP 7.88%, 11/15/2025 (a) | 321,000 | 299,337 |
Forestar Group, Inc. | ||
3.85%, 5/15/2026 (a) | 55,000 | 50,924 |
5.00%, 3/1/2028 (a) | 65,000 | 60,068 |
Howard Hughes Corp. (The) | ||
5.38%, 8/1/2028 (a) | 165,000 | 148,557 |
4.13%, 2/1/2029 (a) | 225,000 | 185,625 |
4.38%, 2/1/2031 (a) | 466,000 | 371,379 |
Hunt Cos., Inc. 5.25%, 4/15/2029 (a) | 279,000 | 213,111 |
Kennedy-Wilson, Inc. 4.75%, 3/1/2029 | 593,000 | 476,487 |
104 | J.P. Morgan Exchange-Traded Funds | August 31, 2023 |
INVESTMENTS | PRINCIPAL AMOUNT($) | VALUE($) |
Corporate Bonds — continued | ||
Real Estate Management & Development — continued | ||
Realogy Group LLC | ||
5.75%, 1/15/2029 (a) | 613,000 | 439,025 |
5.25%, 4/15/2030 (a) | 142,000 | 98,571 |
WeWork Cos. LLC 5.00%, 7/10/2025 (a) | 217,000 | 21,965 |
2,650,644 | ||
Retail REITs — 0.2% | ||
Brookfield Property REIT, Inc. | ||
5.75%, 5/15/2026 (a) | 522,000 | 478,849 |
4.50%, 4/1/2027 (a) | 280,000 | 233,800 |
712,649 | ||
Semiconductors & Semiconductor Equipment — 0.4% | ||
Amkor Technology, Inc. 6.63%, 9/15/2027 (a) | 489,000 | 488,697 |
ams-OSRAM AG (Austria) 7.00%, 7/31/2025 (a) | 442,000 | 405,226 |
Entegris Escrow Corp. | ||
4.75%, 4/15/2029 (a) | 51,000 | 47,448 |
5.95%, 6/15/2030 (a) | 619,000 | 592,764 |
ON Semiconductor Corp. 3.88%, 9/1/2028 (a) | 53,000 | 47,179 |
Synaptics, Inc. 4.00%, 6/15/2029 (a) | 224,000 | 190,552 |
1,771,866 | ||
Software — 2.9% | ||
ACI Worldwide, Inc. 5.75%, 8/15/2026 (a) | 293,000 | 286,621 |
AthenaHealth Group, Inc. 6.50%, 2/15/2030 (a) | 739,000 | 641,800 |
Boxer Parent Co., Inc. 9.13%, 3/1/2026 (a) | 108,000 | 107,731 |
Camelot Finance SA 4.50%, 11/1/2026 (a) | 287,000 | 268,437 |
Capstone Borrower, Inc. 8.00%, 6/15/2030 (a) | 82,000 | 80,647 |
Clarivate Science Holdings Corp. 3.88%, 7/1/2028 (a) | 544,000 | 479,346 |
Cloud Software Group, Inc. | ||
6.50%, 3/31/2029 (a) | 1,382,000 | 1,236,136 |
9.00%, 9/30/2029 (a) | 1,318,000 | 1,178,131 |
Consensus Cloud Solutions, Inc. 6.50%, 10/15/2028 (a) | 495,000 | 447,386 |
Crowdstrike Holdings, Inc. 3.00%, 2/15/2029 | 475,000 | 408,405 |
CWT Travel Group, Inc. 8.50%, 11/19/2026 (a) | 124,000 | 64,588 |
Elastic NV 4.13%, 7/15/2029 (a) | 119,000 | 102,296 |
Fair Isaac Corp. | ||
5.25%, 5/15/2026 (a) | 368,000 | 356,960 |
4.00%, 6/15/2028 (a) | 230,000 | 210,323 |
Gen Digital, Inc. | ||
5.00%, 4/15/2025 (a) | 453,000 | 444,071 |
INVESTMENTS | PRINCIPAL AMOUNT($) | VALUE($) |
Software — continued | ||
6.75%, 9/30/2027 (a) | 192,000 | 192,484 |
7.13%, 9/30/2030 (a) | 386,000 | 388,596 |
GoTo Group, Inc. 5.50%, 9/1/2027 (a) | 250,000 | 146,297 |
McAfee Corp. 7.38%, 2/15/2030 (a) | 830,000 | 726,174 |
MicroStrategy, Inc. 6.13%, 6/15/2028 (a) | 349,000 | 312,433 |
NCR Corp. | ||
5.75%, 9/1/2027 (a) | 205,000 | 206,982 |
5.00%, 10/1/2028 (a) | 35,000 | 32,123 |
5.13%, 4/15/2029 (a) | 94,000 | 85,487 |
6.13%, 9/1/2029 (a) | 734,000 | 755,972 |
5.25%, 10/1/2030 (a) | 269,000 | 241,416 |
Open Text Corp. (Canada) | ||
3.88%, 2/15/2028 (a) | 5,000 | 4,450 |
3.88%, 12/1/2029 (a) | 590,000 | 500,333 |
Open Text Holdings, Inc. (Canada) | ||
4.13%, 2/15/2030 (a) | 507,000 | 436,900 |
4.13%, 12/1/2031 (a) | 325,000 | 269,775 |
PTC, Inc. 4.00%, 2/15/2028 (a) | 183,000 | 168,131 |
Rocket Software, Inc. 6.50%, 2/15/2029 (a) | 305,000 | 253,150 |
SS&C Technologies, Inc. 5.50%, 9/30/2027 (a) | 827,000 | 796,153 |
Veritas US, Inc. 7.50%, 9/1/2025 (a) | 727,000 | 595,609 |
12,425,343 | ||
Specialized REITs — 0.6% | ||
Iron Mountain, Inc. | ||
4.88%, 9/15/2027 (a) | 785,000 | 739,022 |
5.00%, 7/15/2028 (a) | 126,000 | 116,684 |
4.88%, 9/15/2029 (a) | 915,000 | 826,857 |
5.25%, 7/15/2030 (a) | 60,000 | 54,140 |
SBA Communications Corp. | ||
3.88%, 2/15/2027 | 821,000 | 759,072 |
3.13%, 2/1/2029 | 340,000 | 291,104 |
2,786,879 | ||
Specialty Retail — 3.2% | ||
99 Escrow Issuer, Inc. 7.50%, 1/15/2026 (a) | 137,000 | 54,007 |
Abercrombie & Fitch Management Co. 8.75%, 7/15/2025 (a) | 258,000 | 262,515 |
Arko Corp. 5.13%, 11/15/2029 (a) | 185,000 | 151,939 |
Asbury Automotive Group, Inc. | ||
4.50%, 3/1/2028 | 454,000 | 414,150 |
4.63%, 11/15/2029 (a) | 489,000 | 431,388 |
5.00%, 2/15/2032 (a) | 77,000 | 66,057 |
At Home Group, Inc. 4.88%, 7/15/2028 (a) | 229,000 | 110,126 |
August 31, 2023 | J.P. Morgan Exchange-Traded Funds | 105 |
AS OF August 31, 2023 (Unaudited) (continued)
INVESTMENTS | PRINCIPAL AMOUNT($) | VALUE($) |
Corporate Bonds — continued | ||
Specialty Retail — continued | ||
Bath & Body Works, Inc. | ||
9.38%, 7/1/2025 (a) | 539,000 | 563,907 |
5.25%, 2/1/2028 | 5,000 | 4,797 |
7.50%, 6/15/2029 | 176,000 | 177,446 |
6.88%, 11/1/2035 | 857,000 | 801,329 |
6.75%, 7/1/2036 | 46,000 | 42,463 |
BCPE Ulysses Intermediate, Inc. 7.75% (Cash), 4/1/2027 (a) (b) | 30,000 | 27,460 |
Carvana Co. | ||
5.63%, 10/1/2025 (a) | 271,000 | 235,636 |
5.50%, 4/15/2027 (a) | 50,000 | 36,500 |
10.25%, 5/1/2030 (a) | 1,447,000 | 1,121,722 |
eG Global Finance plc (United Kingdom) 8.50%, 10/30/2025 (a) | 357,000 | 353,432 |
Evergreen Acqco 1 LP 9.75%, 4/26/2028 (a) | 36,000 | 37,541 |
Foot Locker, Inc. 4.00%, 10/1/2029 (a) | 172,000 | 129,459 |
Gap, Inc. (The) | ||
3.63%, 10/1/2029 (a) | 454,000 | 345,623 |
3.88%, 10/1/2031 (a) | 125,000 | 90,582 |
Group 1 Automotive, Inc. 4.00%, 8/15/2028 (a) | 502,000 | 445,726 |
LBM Acquisition LLC 6.25%, 1/15/2029 (a) | 538,000 | 469,449 |
LCM Investments Holdings II LLC 4.88%, 5/1/2029 (a) | 308,000 | 267,341 |
Lithia Motors, Inc. | ||
3.88%, 6/1/2029 (a) | 742,000 | 637,048 |
4.38%, 1/15/2031 (a) | 123,000 | 104,653 |
LSF9 Atlantis Holdings LLC 7.75%, 2/15/2026 (a) | 508,000 | 462,919 |
Michaels Cos., Inc. (The) | ||
5.25%, 5/1/2028 (a) | 379,000 | 315,991 |
7.88%, 5/1/2029 (a) | 482,000 | 334,122 |
Murphy Oil USA, Inc. | ||
5.63%, 5/1/2027 | 501,000 | 487,814 |
3.75%, 2/15/2031 (a) | 5,000 | 4,206 |
Park River Holdings, Inc. | ||
5.63%, 2/1/2029 (a) | 54,000 | 42,255 |
6.75%, 8/1/2029 (a) | 86,000 | 68,824 |
Penske Automotive Group, Inc. 3.75%, 6/15/2029 | 639,000 | 548,309 |
PetSmart, Inc. | ||
4.75%, 2/15/2028 (a) | 450,000 | 403,663 |
7.75%, 2/15/2029 (a) | 400,000 | 382,005 |
Sonic Automotive, Inc. | ||
4.63%, 11/15/2029 (a) | 161,000 | 137,638 |
INVESTMENTS | PRINCIPAL AMOUNT($) | VALUE($) |
Specialty Retail — continued | ||
4.88%, 11/15/2031 (a) | 300,000 | 249,524 |
Specialty Building Products Holdings LLC 6.38%, 9/30/2026 (a) | 439,000 | 420,316 |
SRS Distribution, Inc. | ||
4.63%, 7/1/2028 (a) | 343,000 | 305,278 |
6.13%, 7/1/2029 (a) | 565,000 | 491,259 |
Staples, Inc. | ||
7.50%, 4/15/2026 (a) | 1,140,000 | 943,233 |
10.75%, 4/15/2027 (a) | 233,000 | 127,080 |
TPro Acquisition Corp. 11.00%, 10/15/2024 (a) | 137,000 | 136,830 |
Victoria's Secret & Co. 4.63%, 7/15/2029 (a) | 373,000 | 270,063 |
White Cap Buyer LLC 6.88%, 10/15/2028 (a) | 246,000 | 225,712 |
White Cap Parent LLC 8.25% (Cash), 3/15/2026 (a) (b) | 176,000 | 173,712 |
13,913,049 | ||
Technology Hardware, Storage & Peripherals — 0.6% | ||
Seagate HDD Cayman | ||
4.88%, 6/1/2027 | 621,000 | 594,719 |
4.09%, 6/1/2029 | 420,000 | 370,059 |
4.13%, 1/15/2031 | 202,000 | 164,984 |
8.50%, 7/15/2031 (a) | 40,000 | 41,908 |
9.63%, 12/1/2032 (a) | 162,000 | 179,448 |
Western Digital Corp. | ||
4.75%, 2/15/2026 | 248,000 | 236,449 |
3.10%, 2/1/2032 | 446,000 | 333,123 |
Xerox Corp. | ||
4.80%, 3/1/2035 | 75,000 | 50,590 |
6.75%, 12/15/2039 | 254,000 | 197,900 |
Xerox Holdings Corp. | ||
5.00%, 8/15/2025 (a) | 331,000 | 315,672 |
5.50%, 8/15/2028 (a) | 353,000 | 307,096 |
2,791,948 | ||
Textiles, Apparel & Luxury Goods — 0.4% | ||
Crocs, Inc. | ||
4.25%, 3/15/2029 (a) | 27,000 | 22,767 |
4.13%, 8/15/2031 (a) | 80,000 | 63,400 |
G-III Apparel Group Ltd. 7.88%, 8/15/2025 (a) | 282,000 | 276,360 |
Hanesbrands, Inc. | ||
4.88%, 5/15/2026 (a) | 321,000 | 300,070 |
9.00%, 2/15/2031 (a) | 98,000 | 98,383 |
Levi Strauss & Co. 3.50%, 3/1/2031 (a) | 418,000 | 339,637 |
Under Armour, Inc. 3.25%, 6/15/2026 | 230,000 | 210,805 |
106 | J.P. Morgan Exchange-Traded Funds | August 31, 2023 |
INVESTMENTS | PRINCIPAL AMOUNT($) | VALUE($) |
Corporate Bonds — continued | ||
Textiles, Apparel & Luxury Goods — continued | ||
William Carter Co. (The) 5.63%, 3/15/2027 (a) | 204,000 | 197,766 |
Wolverine World Wide, Inc. 4.00%, 8/15/2029 (a) | 372,000 | 278,632 |
1,787,820 | ||
Tobacco — 0.1% | ||
Turning Point Brands, Inc. 5.63%, 2/15/2026 (a) | 15,000 | 14,001 |
Vector Group Ltd. | ||
10.50%, 11/1/2026 (a) | 126,000 | 126,400 |
5.75%, 2/1/2029 (a) | 535,000 | 465,740 |
606,141 | ||
Trading Companies & Distributors — 1.7% | ||
Alta Equipment Group, Inc. 5.63%, 4/15/2026 (a) | 70,000 | 64,786 |
Beacon Roofing Supply, Inc. | ||
4.50%, 11/15/2026 (a) | 275,000 | 258,723 |
4.13%, 5/15/2029 (a) | 24,000 | 20,640 |
BlueLinx Holdings, Inc. 6.00%, 11/15/2029 (a) | 80,000 | 71,416 |
Boise Cascade Co. 4.88%, 7/1/2030 (a) | 283,000 | 254,972 |
Fly Leasing Ltd. (India) 7.00%, 10/15/2024 (a) | 267,000 | 236,375 |
Fortress Transportation and Infrastructure Investors LLC | ||
6.50%, 10/1/2025 (a) | 278,000 | 274,506 |
5.50%, 5/1/2028 (a) | 683,000 | 634,449 |
Foundation Building Materials, Inc. 6.00%, 3/1/2029 (a) | 225,000 | 190,406 |
H&E Equipment Services, Inc. 3.88%, 12/15/2028 (a) | 774,000 | 675,819 |
Herc Holdings, Inc. 5.50%, 7/15/2027 (a) | 644,000 | 619,255 |
Imola Merger Corp. 4.75%, 5/15/2029 (a) | 935,000 | 831,081 |
United Rentals North America, Inc. | ||
5.50%, 5/15/2027 | 693,000 | 679,223 |
3.88%, 11/15/2027 | 155,000 | 143,556 |
4.88%, 1/15/2028 | 483,000 | 459,551 |
5.25%, 1/15/2030 | 736,000 | 699,435 |
3.75%, 1/15/2032 | 301,000 | 253,127 |
WESCO Distribution, Inc. 7.25%, 6/15/2028 (a) | 913,000 | 929,192 |
7,296,512 | ||
Wireless Telecommunication Services — 1.1% | ||
C&W Senior Financing DAC (Panama) 6.88%, 9/15/2027 (a) | 465,000 | 427,800 |
INVESTMENTS | PRINCIPAL AMOUNT($) | VALUE($) |
Wireless Telecommunication Services — continued | ||
Connect Finco SARL (United Kingdom) 6.75%, 10/1/2026 (a) | 700,000 | 664,060 |
Hughes Satellite Systems Corp. | ||
5.25%, 8/1/2026 | 165,000 | 151,671 |
6.63%, 8/1/2026 | 549,000 | 476,257 |
Millicom International Cellular SA (Guatemala) | ||
5.13%, 1/15/2028 (a) | 180,000 | 161,325 |
4.50%, 4/27/2031 (a) | 559,000 | 439,005 |
Rogers Communications, Inc. (Canada) (US Treasury Yield Curve Rate T Note Constant Maturity 5 Year + 3.59%), 5.25%, 3/15/2082 (a) (c) | 44,000 | 39,885 |
United States Cellular Corp. 6.70%, 12/15/2033 | 268,000 | 261,139 |
Vmed O2 UK Financing I plc (United Kingdom) | ||
4.25%, 1/31/2031 (a) | 329,000 | 269,097 |
4.75%, 7/15/2031 (a) | 300,000 | 250,772 |
Vodafone Group plc (United Kingdom) | ||
(USD Swap Semi 5 Year + 4.87%), 7.00%, 4/4/2079 (c) | 694,000 | 699,007 |
(US Treasury Yield Curve Rate T Note Constant Maturity 5 Year + 2.45%), 3.25%, 6/4/2081 (c) | 131,000 | 115,752 |
(US Treasury Yield Curve Rate T Note Constant Maturity 5 Year + 2.77%), 4.13%, 6/4/2081 (c) | 177,000 | 138,207 |
(US Treasury Yield Curve Rate T Note Constant Maturity 5 Year + 3.07%), 5.13%, 6/4/2081 (c) | 621,000 | 432,934 |
4,526,911 | ||
Total Corporate Bonds (Cost $443,138,912) | 423,573,218 | |
SHARES | ||
Short-Term Investments — 0.9% | ||
Investment Companies — 0.9% | ||
JPMorgan U.S. Government Money Market Fund Class IM Shares, 5.27% (h) (i) (Cost $3,924,056) | 3,924,056 | 3,924,056 |
Total Investments — 98.7% (Cost $447,062,968) | 427,497,274 | |
Other Assets Less Liabilities — 1.3% | 5,757,480 | |
NET ASSETS — 100.0% | 433,254,754 | |
Percentages indicated are based on net assets. |
August 31, 2023 | J.P. Morgan Exchange-Traded Funds | 107 |
AS OF August 31, 2023 (Unaudited) (continued)
Abbreviations | |
CME | Chicago Mercantile Exchange |
ICE | Intercontinental Exchange |
LIBOR | London Interbank Offered Rate |
PIK | Payment In Kind |
REIT | Real Estate Investment Trust |
SCA | Limited partnership with share capital |
SOFR | Secured Overnight Financing Rate |
USD | United States Dollar |
^ | Amount rounds to less than 0.1% of net assets. | |
(a) | Securities exempt from registration under Rule 144A or section 4(a)(2), of the Securities Act of 1933, as amended. | |
(b) | Security has the ability to pay in kind (“PIK”) or pay income in cash. When applicable, separate rates of such payments are disclosed. | |
(c) | Variable or floating rate security, linked to the referenced benchmark. The interest rate shown is the current rate as of August 31, 2023. | |
(d) | Step bond. Interest rate is a fixed rate for an initial period that either resets at a specific date or may reset in the future contingent upon a predetermined trigger. The interest rate shown is the current rate as of August 31, 2023. | |
(e) | Security is an interest bearing note with preferred security characteristics. | |
(f) | Security is perpetual and thus, does not have a predetermined maturity date. The coupon rate for this security is fixed for a period of time and may be structured to adjust thereafter. The date shown, if applicable, reflects the next call date. The coupon rate shown is the rate in effect as of August 31, 2023. | |
(g) | Defaulted security. | |
(h) | Investment in an affiliated fund, which is registered under the Investment Company Act of 1940, as amended, and is advised by J.P. Morgan Investment Management Inc. | |
(i) | The rate shown is the current yield as of August 31, 2023. |
108 | J.P. Morgan Exchange-Traded Funds | August 31, 2023 |
AS OF August 31, 2023 (Unaudited)
INVESTMENTS | PRINCIPAL AMOUNT($) | VALUE($) |
Corporate Bonds — 98.2% | ||
Aerospace & Defense — 2.2% | ||
Boeing Co. (The) | ||
4.88%, 5/1/2025 | 108,000 | 106,487 |
3.60%, 5/1/2034 | 251,000 | 212,665 |
5.71%, 5/1/2040 | 75,000 | 72,857 |
3.75%, 2/1/2050 | 10,000 | 7,291 |
3.83%, 3/1/2059 | 5,000 | 3,443 |
General Dynamics Corp. 4.25%, 4/1/2050 | 12,000 | 10,550 |
Hexcel Corp. 4.20%, 2/15/2027 (a) | 10,000 | 9,397 |
L3Harris Technologies, Inc. | ||
4.40%, 6/15/2028 | 159,000 | 152,871 |
2.90%, 12/15/2029 | 18,000 | 15,660 |
Lockheed Martin Corp. | ||
3.55%, 1/15/2026 | 54,000 | 52,256 |
2.80%, 6/15/2050 | 10,000 | 6,729 |
5.90%, 11/15/2063 | 32,000 | 35,105 |
Northrop Grumman Corp. | ||
3.25%, 1/15/2028 | 90,000 | 83,811 |
4.03%, 10/15/2047 | 41,000 | 33,718 |
Precision Castparts Corp. 3.90%, 1/15/2043 | 95,000 | 78,225 |
RTX Corp. | ||
3.13%, 5/4/2027 | 121,000 | 112,767 |
4.45%, 11/16/2038 | 107,000 | 94,777 |
3.75%, 11/1/2046 | 23,000 | 17,449 |
1,106,058 | ||
Air Freight & Logistics — 0.3% | ||
FedEx Corp. | ||
2.40%, 5/15/2031 | 60,000 | 49,538 |
3.25%, 5/15/2041 | 21,000 | 15,271 |
4.05%, 2/15/2048 | 10,000 | 7,789 |
United Parcel Service, Inc. | ||
4.25%, 3/15/2049 | 98,000 | 84,466 |
5.30%, 4/1/2050 | 18,000 | 18,204 |
175,268 | ||
Automobile Components — 0.3% | ||
Aptiv plc 3.10%, 12/1/2051 | 8,000 | 4,870 |
Lear Corp. 3.80%, 9/15/2027 | 140,000 | 131,116 |
135,986 | ||
Automobiles — 0.5% | ||
General Motors Co. | ||
6.13%, 10/1/2025 | 158,000 | 158,756 |
5.00%, 4/1/2035 | 5,000 | 4,466 |
5.40%, 4/1/2048 | 10,000 | 8,335 |
INVESTMENTS | PRINCIPAL AMOUNT($) | VALUE($) |
Automobiles — continued | ||
5.95%, 4/1/2049 | 64,000 | 57,329 |
Honda Motor Co. Ltd. (Japan) 2.97%, 3/10/2032 | 10,000 | 8,729 |
237,615 | ||
Banks — 16.4% | ||
Banco Santander SA (Spain) (US Treasury Yield Curve Rate T Note Constant Maturity 1 Year + 2.00%), 4.18%, 3/24/2028 (b) | 200,000 | 187,359 |
Bank of America Corp. | ||
(SOFR + 1.75%), 4.83%, 7/22/2026 (b) | 16,000 | 15,701 |
4.25%, 10/22/2026 | 311,000 | 298,390 |
(SOFR + 1.01%), 1.20%, 10/24/2026 (b) | 52,000 | 47,128 |
(SOFR + 1.29%), 5.08%, 1/20/2027 (b) | 100,000 | 98,686 |
(3-MONTH CME TERM SOFR + 1.32%), 3.56%, 4/23/2027 (b) | 135,000 | 127,903 |
(3-MONTH CME TERM SOFR + 1.84%), 3.82%, 1/20/2028 (b) | 146,000 | 137,610 |
(SOFR + 2.04%), 4.95%, 7/22/2028 (b) | 5,000 | 4,894 |
(3-MONTH CME TERM SOFR + 1.30%), 3.42%, 12/20/2028 (b) | 112,000 | 102,646 |
(3-MONTH CME TERM SOFR + 1.47%), 3.97%, 2/7/2030 (b) | 26,000 | 23,930 |
(3-MONTH CME TERM SOFR + 1.25%), 2.50%, 2/13/2031 (b) | 237,000 | 196,963 |
(SOFR + 1.32%), 2.69%, 4/22/2032 (b) | 237,000 | 193,707 |
(US Treasury Yield Curve Rate T Note Constant Maturity 5 Year + 1.20%), 2.48%, 9/21/2036 (b) | 5,000 | 3,801 |
(3-MONTH CME TERM SOFR + 2.08%), 4.24%, 4/24/2038 (b) | 59,000 | 51,292 |
(SOFR + 1.93%), 2.68%, 6/19/2041 (b) | 23,000 | 15,838 |
(3-MONTH CME TERM SOFR + 1.45%), 3.95%, 1/23/2049 (b) | 225,000 | 176,820 |
(3-MONTH CME TERM SOFR + 3.41%), 4.08%, 3/20/2051 (b) | 78,000 | 62,668 |
Bank of Nova Scotia (The) (Canada) | ||
3.45%, 4/11/2025 | 180,000 | 173,861 |
(US Treasury Yield Curve Rate T Note Constant Maturity 5 Year + 2.05%), 4.59%, 5/4/2037 (b) (c) | 26,000 | 22,411 |
Barclays plc (United Kingdom) (ICE LIBOR USD 3 Month + 1.90%), 4.97%, 5/16/2029 (b) | 288,000 | 273,554 |
Canadian Imperial Bank of Commerce (Canada) 3.60%, 4/7/2032 | 66,000 | 58,754 |
Citigroup, Inc. | ||
(SOFR + 2.84%), 3.11%, 4/8/2026 (b) | 9,000 | 8,613 |
(SOFR + 1.55%), 5.61%, 9/29/2026 (b) | 36,000 | 35,835 |
August 31, 2023 | J.P. Morgan Exchange-Traded Funds | 109 |
AS OF August 31, 2023 (Unaudited) (continued)
INVESTMENTS | PRINCIPAL AMOUNT($) | VALUE($) |
Corporate Bonds — continued | ||
Banks — continued | ||
3.20%, 10/21/2026 | 188,000 | 175,321 |
(SOFR + 1.89%), 4.66%, 5/24/2028 (b) | 100,000 | 97,365 |
(SOFR + 1.15%), 2.67%, 1/29/2031 (b) | 107,000 | 89,577 |
(SOFR + 3.91%), 4.41%, 3/31/2031 (b) | 179,000 | 166,178 |
6.63%, 6/15/2032 | 83,000 | 86,489 |
6.00%, 10/31/2033 | 39,000 | 39,253 |
(3-MONTH CME TERM SOFR + 1.43%), 3.88%, 1/24/2039 (b) | 87,000 | 71,364 |
(SOFR + 4.55%), 5.32%, 3/26/2041 (b) | 95,000 | 90,179 |
4.75%, 5/18/2046 | 47,000 | 39,308 |
4.65%, 7/23/2048 | 39,000 | 33,820 |
Comerica, Inc. 4.00%, 2/1/2029 | 74,000 | 63,685 |
Cooperatieve Rabobank UA (Netherlands) 5.25%, 5/24/2041 | 100,000 | 101,786 |
Fifth Third Bancorp | ||
(SOFRINDX + 2.19%), 6.36%, 10/27/2028 (b) | 121,000 | 121,948 |
8.25%, 3/1/2038 | 40,000 | 45,164 |
FNB Corp. 5.15%, 8/25/2025 | 147,000 | 142,432 |
HSBC Holdings plc (United Kingdom) | ||
(SOFR + 1.51%), 4.18%, 12/9/2025 (b) | 253,000 | 246,508 |
(3-MONTH CME TERM SOFR + 1.61%), 4.29%, 9/12/2026 (b) | 227,000 | 218,903 |
(SOFR + 2.87%), 5.40%, 8/11/2033 (b) | 271,000 | 258,452 |
6.10%, 1/14/2042 | 80,000 | 83,767 |
KeyCorp (SOFRINDX + 2.06%), 4.79%, 6/1/2033 (b) | 100,000 | 86,186 |
Lloyds Banking Group plc (United Kingdom) 4.55%, 8/16/2028 | 200,000 | 189,635 |
M&T Bank Corp. (SOFR + 1.85%), 5.05%, 1/27/2034 (b) | 48,000 | 43,670 |
Mitsubishi UFJ Financial Group, Inc. (Japan) | ||
3.96%, 3/2/2028 | 50,000 | 47,597 |
4.05%, 9/11/2028 | 5,000 | 4,746 |
3.74%, 3/7/2029 | 325,000 | 300,733 |
Mizuho Financial Group, Inc. (Japan) 4.02%, 3/5/2028 | 200,000 | 188,556 |
NatWest Group plc (United Kingdom) (US Treasury Yield Curve Rate T Note Constant Maturity 1 Year + 0.90%), 1.64%, 6/14/2027 (b) | 228,000 | 202,511 |
PNC Financial Services Group, Inc. (The) | ||
2.60%, 7/23/2026 | 24,000 | 22,297 |
(SOFRINDX + 1.85%), 4.63%, 6/6/2033 (b) | 24,000 | 21,711 |
Regions Financial Corp. | ||
2.25%, 5/18/2025 | 32,000 | 29,908 |
INVESTMENTS | PRINCIPAL AMOUNT($) | VALUE($) |
Banks — continued | ||
7.38%, 12/10/2037 | 25,000 | 26,484 |
Royal Bank of Canada (Canada) | ||
2.25%, 11/1/2024 | 155,000 | 149,022 |
3.38%, 4/14/2025 | 114,000 | 110,280 |
2.30%, 11/3/2031 | 98,000 | 78,725 |
Santander Holdings USA, Inc. | ||
3.24%, 10/5/2026 | 10,000 | 9,158 |
4.40%, 7/13/2027 | 38,000 | 35,980 |
Santander UK Group Holdings plc (United Kingdom) (SOFR + 1.22%), 2.47%, 1/11/2028 (b) | 208,000 | 182,998 |
Sumitomo Mitsui Financial Group, Inc. (Japan) 2.70%, 7/16/2024 | 200,000 | 194,656 |
Toronto-Dominion Bank (The) (Canada) | ||
3.77%, 6/6/2025 | 181,000 | 175,699 |
1.15%, 6/12/2025 | 18,000 | 16,693 |
2.45%, 1/12/2032 | 66,000 | 53,354 |
Truist Financial Corp. | ||
3.70%, 6/5/2025 | 10,000 | 9,637 |
1.20%, 8/5/2025 | 185,000 | 169,711 |
3.88%, 3/19/2029 | 107,000 | 95,659 |
US Bancorp | ||
(SOFR + 2.11%), 4.97%, 7/22/2033 (b) | 101,000 | 92,031 |
(SOFR + 1.60%), 4.84%, 2/1/2034 (b) | 21,000 | 19,477 |
Wells Fargo & Co. | ||
(SOFR + 1.56%), 4.54%, 8/15/2026 (b) | 13,000 | 12,693 |
(3-MONTH CME TERM SOFR + 1.57%), 3.58%, 5/22/2028 (b) | 317,000 | 294,239 |
(SOFR + 1.98%), 4.81%, 7/25/2028 (b) | 100,000 | 97,024 |
(3-MONTH CME TERM SOFR + 1.43%), 2.88%, 10/30/2030 (b) | 323,000 | 276,333 |
(SOFR + 2.02%), 5.39%, 4/24/2034 (b) | 31,000 | 30,200 |
5.95%, 12/15/2036 | 100,000 | 97,671 |
(SOFR + 2.53%), 3.07%, 4/30/2041 (b) | 28,000 | 20,045 |
5.38%, 11/2/2043 | 55,000 | 50,613 |
5.61%, 1/15/2044 | 110,000 | 103,582 |
4.75%, 12/7/2046 | 55,000 | 45,633 |
Westpac Banking Corp. (Australia) | ||
3.74%, 8/26/2025 | 81,000 | 78,568 |
(US Treasury Yield Curve Rate T Note Constant Maturity 5 Year + 1.35%), 2.89%, 2/4/2030 (b) (c) | 50,000 | 47,225 |
(USD SOFR Spread-Adjusted ICE Swap Rate 5 Year + 2.24%), 4.32%, 11/23/2031 (b) (c) | 160,000 | 149,356 |
110 | J.P. Morgan Exchange-Traded Funds | August 31, 2023 |
INVESTMENTS | PRINCIPAL AMOUNT($) | VALUE($) |
Corporate Bonds — continued | ||
Banks — continued | ||
(US Treasury Yield Curve Rate T Note Constant Maturity 5 Year + 2.00%), 4.11%, 7/24/2034 (b) (c) | 27,000 | 23,676 |
3.13%, 11/18/2041 (c) | 14,000 | 9,123 |
8,382,958 | ||
Beverages — 2.0% | ||
Anheuser-Busch Cos. LLC (Belgium) | ||
3.65%, 2/1/2026 | 101,000 | 97,601 |
4.70%, 2/1/2036 | 54,000 | 51,679 |
4.90%, 2/1/2046 | 149,000 | 138,491 |
Anheuser-Busch InBev Finance, Inc. (Belgium) 4.70%, 2/1/2036 | 36,000 | 34,526 |
Anheuser-Busch InBev Worldwide, Inc. (Belgium) | ||
4.90%, 1/23/2031 | 16,000 | 16,052 |
4.60%, 4/15/2048 | 19,000 | 17,099 |
4.75%, 4/15/2058 | 53,000 | 47,417 |
5.80%, 1/23/2059 | 55,000 | 57,662 |
Coca-Cola Co. (The) | ||
1.75%, 9/6/2024 | 159,000 | 153,275 |
1.45%, 6/1/2027 | 10,000 | 8,929 |
2.25%, 1/5/2032 | 5,000 | 4,193 |
2.88%, 5/5/2041 | 78,000 | 58,920 |
2.60%, 6/1/2050 | 55,000 | 36,456 |
2.75%, 6/1/2060 | 16,000 | 10,381 |
Constellation Brands, Inc. 3.15%, 8/1/2029 | 66,000 | 58,972 |
Keurig Dr Pepper, Inc. 3.80%, 5/1/2050 | 20,000 | 15,146 |
Molson Coors Beverage Co. 4.20%, 7/15/2046 | 46,000 | 36,422 |
PepsiCo, Inc. | ||
3.60%, 3/1/2024 | 53,000 | 52,495 |
2.75%, 3/19/2030 | 18,000 | 16,013 |
2.63%, 10/21/2041 | 64,000 | 46,426 |
2.75%, 10/21/2051 | 77,000 | 52,030 |
1,010,185 | ||
Biotechnology — 1.9% | ||
AbbVie, Inc. | ||
3.60%, 5/14/2025 | 47,000 | 45,577 |
2.95%, 11/21/2026 | 141,000 | 131,927 |
4.05%, 11/21/2039 | 147,000 | 126,039 |
4.70%, 5/14/2045 | 68,000 | 61,044 |
Amgen, Inc. | ||
2.20%, 2/21/2027 | 68,000 | 61,785 |
2.45%, 2/21/2030 | 113,000 | 96,089 |
2.30%, 2/25/2031 | 70,000 | 57,750 |
5.25%, 3/2/2033 | 98,000 | 97,443 |
INVESTMENTS | PRINCIPAL AMOUNT($) | VALUE($) |
Biotechnology — continued | ||
3.15%, 2/21/2040 | 29,000 | 21,628 |
2.80%, 8/15/2041 | 84,000 | 57,914 |
5.65%, 6/15/2042 | 41,000 | 40,272 |
5.60%, 3/2/2043 | 10,000 | 9,815 |
4.40%, 5/1/2045 | 20,000 | 16,788 |
3.38%, 2/21/2050 | 20,000 | 14,002 |
4.40%, 2/22/2062 | 74,000 | 58,582 |
Biogen, Inc. 3.15%, 5/1/2050 | 48,000 | 31,328 |
Gilead Sciences, Inc. 4.15%, 3/1/2047 | 64,000 | 53,467 |
981,450 | ||
Broadline Retail — 1.4% | ||
Alibaba Group Holding Ltd. (China) 2.13%, 2/9/2031 | 200,000 | 160,292 |
Amazon.com, Inc. | ||
2.80%, 8/22/2024 | 10,000 | 9,752 |
0.80%, 6/3/2025 | 122,000 | 113,275 |
1.00%, 5/12/2026 | 214,000 | 193,347 |
3.60%, 4/13/2032 | 8,000 | 7,354 |
3.88%, 8/22/2037 | 249,000 | 224,542 |
2.88%, 5/12/2041 | 12,000 | 8,986 |
4.10%, 4/13/2062 | 23,000 | 19,062 |
eBay, Inc. 3.65%, 5/10/2051 | 10,000 | 7,131 |
743,741 | ||
Building Products — 0.2% | ||
Carlisle Cos., Inc. 2.75%, 3/1/2030 | 10,000 | 8,466 |
Carrier Global Corp. 3.58%, 4/5/2050 | 15,000 | 10,722 |
Masco Corp. 2.00%, 10/1/2030 | 125,000 | 98,878 |
118,066 | ||
Capital Markets — 7.7% | ||
Ares Capital Corp. 2.88%, 6/15/2028 | 25,000 | 21,122 |
Bank of New York Mellon Corp. (The) | ||
1.60%, 4/24/2025 | 241,000 | 226,354 |
3.30%, 8/23/2029 | 81,000 | 72,322 |
(SOFR + 1.51%), 4.71%, 2/1/2034 (b) | 16,000 | 15,060 |
BlackRock, Inc. 1.90%, 1/28/2031 | 178,000 | 144,304 |
Blue Owl Capital Corp. 2.63%, 1/15/2027 | 46,000 | 39,826 |
Blue Owl Technology Finance Corp. 2.50%, 1/15/2027 | 17,000 | 14,307 |
Brookfield Finance, Inc. (Canada) 3.63%, 2/15/2052 | 42,000 | 27,973 |
Charles Schwab Corp. (The) | ||
2.00%, 3/20/2028 | 34,000 | 29,289 |
2.75%, 10/1/2029 | 48,000 | 41,323 |
August 31, 2023 | J.P. Morgan Exchange-Traded Funds | 111 |
AS OF August 31, 2023 (Unaudited) (continued)
INVESTMENTS | PRINCIPAL AMOUNT($) | VALUE($) |
Corporate Bonds — continued | ||
Capital Markets — continued | ||
2.90%, 3/3/2032 | 9,000 | 7,426 |
(SOFR + 2.50%), 5.85%, 5/19/2034 (b) | 45,000 | 45,067 |
CI Financial Corp. (Canada) 4.10%, 6/15/2051 | 26,000 | 15,732 |
CME Group, Inc. | ||
3.00%, 3/15/2025 | 10,000 | 9,662 |
4.15%, 6/15/2048 | 44,000 | 38,683 |
Credit Suisse USA, Inc. (Switzerland) 7.13%, 7/15/2032 | 50,000 | 55,577 |
Deutsche Bank AG (Germany) | ||
(SOFR + 1.87%), 2.13%, 11/24/2026 (b) | 151,000 | 136,956 |
(SOFR + 1.32%), 2.55%, 1/7/2028 (b) | 150,000 | 132,435 |
Franklin Resources, Inc. 1.60%, 10/30/2030 | 54,000 | 42,318 |
FS KKR Capital Corp. 3.25%, 7/15/2027 | 60,000 | 52,058 |
Goldman Sachs Group, Inc. (The) | ||
3.85%, 7/8/2024 | 95,000 | 93,378 |
3.50%, 4/1/2025 | 76,000 | 73,356 |
(SOFR + 1.51%), 4.39%, 6/15/2027 (b) | 49,000 | 47,529 |
(SOFR + 1.85%), 3.62%, 3/15/2028 (b) | 80,000 | 74,830 |
(3-MONTH CME TERM SOFR + 1.56%), 4.22%, 5/1/2029 (b) | 393,000 | 369,920 |
3.80%, 3/15/2030 | 193,000 | 175,631 |
(SOFR + 1.25%), 2.38%, 7/21/2032 (b) | 42,000 | 33,150 |
6.13%, 2/15/2033 | 19,000 | 20,161 |
(3-MONTH CME TERM SOFR + 1.63%), 4.02%, 10/31/2038 (b) | 83,000 | 68,877 |
(3-MONTH CME TERM SOFR + 1.69%), 4.41%, 4/23/2039 (b) | 34,000 | 29,356 |
Hercules Capital, Inc. 3.38%, 1/20/2027 | 47,000 | 41,574 |
Intercontinental Exchange, Inc. | ||
3.75%, 12/1/2025 | 43,000 | 41,504 |
5.20%, 6/15/2062 | 63,000 | 59,869 |
Lazard Group LLC 3.63%, 3/1/2027 | 9,000 | 8,341 |
Morgan Stanley | ||
(SOFR + 1.99%), 2.19%, 4/28/2026 (b) | 129,000 | 121,626 |
4.35%, 9/8/2026 | 6,000 | 5,778 |
(SOFR + 1.77%), 6.14%, 10/16/2026 (b) | 100,000 | 100,682 |
3.63%, 1/20/2027 | 128,000 | 120,915 |
3.95%, 4/23/2027 | 111,000 | 104,626 |
(3-MONTH CME TERM SOFR + 1.40%), 3.77%, 1/24/2029 (b) | 254,000 | 235,496 |
(SOFR + 3.12%), 3.62%, 4/1/2031 (b) | 183,000 | 162,658 |
7.25%, 4/1/2032 | 23,000 | 26,153 |
(US Treasury Yield Curve Rate T Note Constant Maturity 5 Year + 2.43%), 5.95%, 1/19/2038 (b) | 46,000 | 44,764 |
3.97%, 7/22/2038 (d) | 252,000 | 210,043 |
INVESTMENTS | PRINCIPAL AMOUNT($) | VALUE($) |
Capital Markets — continued | ||
Nomura Holdings, Inc. (Japan) 2.33%, 1/22/2027 | 200,000 | 177,247 |
Northern Trust Corp. | ||
(ICE LIBOR USD 3 Month + 1.13%), 3.38%, 5/8/2032 (b) | 46,000 | 41,037 |
6.13%, 11/2/2032 | 57,000 | 58,192 |
Prospect Capital Corp. 3.44%, 10/15/2028 | 9,000 | 7,089 |
S&P Global, Inc. 3.70%, 3/1/2052 | 66,000 | 51,350 |
State Street Corp. | ||
2.20%, 3/3/2031 | 24,000 | 19,112 |
(SOFR + 1.00%), 2.62%, 2/7/2033 (b) | 150,000 | 123,022 |
(SOFR + 1.49%), 3.03%, 11/1/2034 (b) | 46,000 | 39,568 |
3,954,628 | ||
Chemicals — 1.5% | ||
Albemarle Corp. | ||
4.65%, 6/1/2027 | 100,000 | 96,710 |
5.05%, 6/1/2032 | 19,000 | 17,891 |
Celanese US Holdings LLC | ||
6.05%, 3/15/2025 | 37,000 | 37,028 |
6.33%, 7/15/2029 | 33,000 | 32,795 |
Dow Chemical Co. (The) 6.90%, 5/15/2053 | 27,000 | 30,046 |
DuPont de Nemours, Inc. 5.42%, 11/15/2048 | 49,000 | 47,401 |
EIDP, Inc. 1.70%, 7/15/2025 | 13,000 | 12,123 |
International Flavors & Fragrances, Inc. 4.45%, 9/26/2028 | 90,000 | 84,108 |
LYB International Finance III LLC | ||
1.25%, 10/1/2025 | 73,000 | 66,613 |
3.38%, 10/1/2040 | 122,000 | 87,662 |
Mosaic Co. (The) 4.88%, 11/15/2041 | 47,000 | 39,341 |
Nutrien Ltd. (Canada) | ||
4.13%, 3/15/2035 | 32,000 | 27,776 |
5.88%, 12/1/2036 | 51,000 | 50,627 |
Sherwin-Williams Co. (The) | ||
3.45%, 6/1/2027 | 7,000 | 6,598 |
2.95%, 8/15/2029 | 124,000 | 109,278 |
745,997 | ||
Commercial Services & Supplies — 0.4% | ||
Cintas Corp. No. 2 4.00%, 5/1/2032 | 5,000 | 4,669 |
Nature Conservancy (The) Series A, 3.96%, 3/1/2052 | 28,000 | 22,866 |
RELX Capital, Inc. (United Kingdom) 4.00%, 3/18/2029 | 90,000 | 85,482 |
Republic Services, Inc. | ||
3.20%, 3/15/2025 | 5,000 | 4,832 |
112 | J.P. Morgan Exchange-Traded Funds | August 31, 2023 |
INVESTMENTS | PRINCIPAL AMOUNT($) | VALUE($) |
Corporate Bonds — continued | ||
Commercial Services & Supplies — continued | ||
3.05%, 3/1/2050 | 14,000 | 9,541 |
Waste Connections, Inc. 2.95%, 1/15/2052 | 45,000 | 29,454 |
Waste Management, Inc. 3.13%, 3/1/2025 | 52,000 | 50,385 |
207,229 | ||
Communications Equipment — 0.5% | ||
Cisco Systems, Inc. | ||
2.50%, 9/20/2026 | 82,000 | 76,751 |
5.90%, 2/15/2039 | 91,000 | 98,590 |
Nokia OYJ (Finland) | ||
4.38%, 6/12/2027 | 56,000 | 52,814 |
6.63%, 5/15/2039 | 15,000 | 14,272 |
242,427 | ||
Construction & Engineering — 0.1% | ||
Quanta Services, Inc. | ||
2.90%, 10/1/2030 | 50,000 | 42,101 |
2.35%, 1/15/2032 | 12,000 | 9,484 |
51,585 | ||
Construction Materials — 0.1% | ||
Eagle Materials, Inc. 2.50%, 7/1/2031 | 40,000 | 32,321 |
Martin Marietta Materials, Inc. 3.20%, 7/15/2051 | 36,000 | 24,099 |
56,420 | ||
Consumer Finance — 2.5% | ||
AerCap Ireland Capital DAC (Ireland) | ||
6.50%, 7/15/2025 | 150,000 | 150,694 |
1.75%, 1/30/2026 | 150,000 | 135,839 |
American Express Co. 2.50%, 7/30/2024 | 83,000 | 80,628 |
American Honda Finance Corp. 1.00%, 9/10/2025 | 63,000 | 57,748 |
Capital One Financial Corp. 3.30%, 10/30/2024 | 161,000 | 156,407 |
Caterpillar Financial Services Corp. 1.10%, 9/14/2027 | 5,000 | 4,326 |
Discover Financial Services 3.75%, 3/4/2025 | 17,000 | 16,297 |
General Motors Financial Co., Inc. 3.60%, 6/21/2030 | 180,000 | 154,586 |
John Deere Capital Corp. 1.30%, 10/13/2026 | 249,000 | 222,952 |
Synchrony Financial | ||
4.88%, 6/13/2025 | 19,000 | 18,305 |
4.50%, 7/23/2025 | 20,000 | 19,078 |
5.15%, 3/19/2029 | 14,000 | 12,840 |
Toyota Motor Credit Corp. | ||
3.40%, 4/14/2025 | 13,000 | 12,624 |
INVESTMENTS | PRINCIPAL AMOUNT($) | VALUE($) |
Consumer Finance — continued | ||
3.65%, 8/18/2025 | 214,000 | 207,691 |
2.40%, 1/13/2032 | 11,000 | 9,094 |
1,259,109 | ||
Consumer Staples Distribution & Retail — 1.3% | ||
Costco Wholesale Corp. | ||
1.38%, 6/20/2027 | 134,000 | 118,462 |
1.75%, 4/20/2032 | 32,000 | 25,389 |
Dollar General Corp. 5.50%, 11/1/2052 | 30,000 | 27,145 |
Dollar Tree, Inc. 3.38%, 12/1/2051 | 27,000 | 17,465 |
Kroger Co. (The) 5.40%, 1/15/2049 | 44,000 | 41,937 |
Sysco Corp. 6.60%, 4/1/2050 | 38,000 | 41,740 |
Target Corp. 3.38%, 4/15/2029 | 250,000 | 233,691 |
Walgreens Boots Alliance, Inc. 4.10%, 4/15/2050 | 36,000 | 24,558 |
Walmart, Inc. | ||
7.55%, 2/15/2030 | 11,000 | 12,734 |
1.80%, 9/22/2031 | 96,000 | 78,546 |
4.05%, 6/29/2048 | 47,000 | 41,249 |
662,916 | ||
Containers & Packaging — 0.1% | ||
Sonoco Products Co. 5.75%, 11/1/2040 | 29,000 | 28,186 |
WRKCo, Inc. | ||
4.90%, 3/15/2029 | 10,000 | 9,628 |
3.00%, 6/15/2033 | 10,000 | 8,097 |
45,911 | ||
Diversified Consumer Services — 0.3% | ||
Duke University Series 2020, 2.83%, 10/1/2055 | 6,000 | 3,962 |
Georgetown University (The) Series A, 5.22%, 10/1/2118 | 6,000 | 5,359 |
Johns Hopkins University Series 2013, 4.08%, 7/1/2053 | 11,000 | 9,381 |
Massachusetts Institute of Technology 3.89%, 7/1/2116 | 6,000 | 4,478 |
Northwestern University Series 2020, 2.64%, 12/1/2050 | 23,000 | 15,061 |
University of Southern California 3.03%, 10/1/2039 | 48,000 | 38,330 |
Yale University Series 2020, 2.40%, 4/15/2050 | 98,000 | 61,865 |
138,436 | ||
Diversified REITs — 0.6% | ||
American Assets Trust LP 3.38%, 2/1/2031 | 31,000 | 23,970 |
GLP Capital LP 5.75%, 6/1/2028 | 27,000 | 26,229 |
August 31, 2023 | J.P. Morgan Exchange-Traded Funds | 113 |
AS OF August 31, 2023 (Unaudited) (continued)
INVESTMENTS | PRINCIPAL AMOUNT($) | VALUE($) |
Corporate Bonds — continued | ||
Diversified REITs — continued | ||
Simon Property Group LP | ||
2.45%, 9/13/2029 | 78,000 | 66,031 |
4.75%, 3/15/2042 | 40,000 | 34,062 |
STORE Capital Corp. | ||
4.50%, 3/15/2028 | 39,000 | 34,896 |
2.75%, 11/18/2030 | 10,000 | 7,346 |
VICI Properties LP | ||
4.95%, 2/15/2030 | 50,000 | 47,018 |
5.63%, 5/15/2052 | 14,000 | 12,334 |
Vornado Realty LP 2.15%, 6/1/2026 | 47,000 | 40,513 |
292,399 | ||
Diversified Telecommunication Services — 2.6% | ||
AT&T, Inc. | ||
3.80%, 2/15/2027 | 244,000 | 232,101 |
1.65%, 2/1/2028 | 11,000 | 9,402 |
2.55%, 12/1/2033 | 106,000 | 80,864 |
6.38%, 3/1/2041 | 12,000 | 12,348 |
3.50%, 9/15/2053 | 259,000 | 170,450 |
3.55%, 9/15/2055 | 193,000 | 125,944 |
3.65%, 9/15/2059 | 30,000 | 19,414 |
Bell Canada (The) (Canada) Series US-5, 2.15%, 2/15/2032 | 52,000 | 40,907 |
Deutsche Telekom International Finance BV (Germany) 9.25%, 6/1/2032 | 10,000 | 12,576 |
Orange SA (France) 5.38%, 1/13/2042 | 5,000 | 4,790 |
Telefonica Emisiones SA (Spain) 7.05%, 6/20/2036 | 84,000 | 89,643 |
Verizon Communications, Inc. | ||
3.38%, 2/15/2025 | 153,000 | 148,393 |
4.02%, 12/3/2029 | 10,000 | 9,287 |
3.40%, 3/22/2041 | 493,000 | 366,103 |
3.85%, 11/1/2042 | 10,000 | 7,759 |
3.00%, 11/20/2060 | 40,000 | 23,484 |
1,353,465 | ||
Electric Utilities — 5.9% | ||
AEP Transmission Co. LLC Series M, 3.65%, 4/1/2050 | 128,000 | 96,605 |
Alabama Power Co. | ||
3.94%, 9/1/2032 | 38,000 | 34,584 |
4.30%, 1/2/2046 | 10,000 | 8,232 |
Series A, 4.30%, 7/15/2048 | 133,000 | 109,376 |
Arizona Public Service Co. | ||
4.25%, 3/1/2049 | 20,000 | 15,265 |
3.50%, 12/1/2049 | 23,000 | 15,589 |
INVESTMENTS | PRINCIPAL AMOUNT($) | VALUE($) |
Electric Utilities — continued | ||
Baltimore Gas and Electric Co. | ||
3.20%, 9/15/2049 | 57,000 | 38,899 |
2.90%, 6/15/2050 | 76,000 | 48,866 |
Commonwealth Edison Co. | ||
4.00%, 3/1/2049 | 5,000 | 3,987 |
3.00%, 3/1/2050 | 62,000 | 40,978 |
Connecticut Light and Power Co. (The) Series A, 4.15%, 6/1/2045 | 83,000 | 68,952 |
Dominion Energy South Carolina, Inc. Series A, 2.30%, 12/1/2031 | 43,000 | 34,526 |
DTE Electric Co. 2.95%, 3/1/2050 | 130,000 | 86,213 |
Duke Energy Corp. | ||
2.65%, 9/1/2026 | 168,000 | 155,432 |
3.75%, 9/1/2046 | 106,000 | 77,756 |
(US Treasury Yield Curve Rate T Note Constant Maturity 5 Year + 2.32%), 3.25%, 1/15/2082 (b) | 29,000 | 21,441 |
Duke Energy Indiana LLC | ||
Series YYY, 3.25%, 10/1/2049 | 20,000 | 13,625 |
2.75%, 4/1/2050 | 48,000 | 29,310 |
Duke Energy Ohio, Inc. 4.30%, 2/1/2049 | 18,000 | 14,685 |
Emera US Finance LP (Canada) 4.75%, 6/15/2046 | 10,000 | 7,830 |
Entergy Louisiana LLC 4.00%, 3/15/2033 | 141,000 | 126,566 |
Evergy, Inc. | ||
2.45%, 9/15/2024 | 114,000 | 109,968 |
2.90%, 9/15/2029 | 88,000 | 76,500 |
Exelon Corp. 3.95%, 6/15/2025 | 10,000 | 9,704 |
Florida Power & Light Co. | ||
2.85%, 4/1/2025 | 76,000 | 73,100 |
5.69%, 3/1/2040 | 64,000 | 65,586 |
3.80%, 12/15/2042 | 14,000 | 11,415 |
3.95%, 3/1/2048 | 40,000 | 32,426 |
3.15%, 10/1/2049 | 25,000 | 17,446 |
Fortis, Inc. (Canada) 3.06%, 10/4/2026 | 173,000 | 160,584 |
Gulf Power Co. Series A, 3.30%, 5/30/2027 | 10,000 | 9,386 |
Idaho Power Co. 5.50%, 3/15/2053 | 47,000 | 46,195 |
MidAmerican Energy Co. 4.25%, 5/1/2046 | 126,000 | 103,328 |
NextEra Energy Capital Holdings, Inc. 1.90%, 6/15/2028 | 106,000 | 91,093 |
Northern States Power Co. 3.60%, 5/15/2046 | 101,000 | 76,340 |
Oklahoma Gas and Electric Co. 4.15%, 4/1/2047 | 73,000 | 58,003 |
Oncor Electric Delivery Co. LLC 4.10%, 11/15/2048 | 26,000 | 21,128 |
114 | J.P. Morgan Exchange-Traded Funds | August 31, 2023 |
INVESTMENTS | PRINCIPAL AMOUNT($) | VALUE($) |
Corporate Bonds — continued | ||
Electric Utilities — continued | ||
Pacific Gas and Electric Co. | ||
3.00%, 6/15/2028 | 75,000 | 65,171 |
2.50%, 2/1/2031 | 10,000 | 7,799 |
3.25%, 6/1/2031 | 127,000 | 102,980 |
4.50%, 7/1/2040 | 47,000 | 36,259 |
3.30%, 8/1/2040 | 54,000 | 36,284 |
6.75%, 1/15/2053 | 5,000 | 4,865 |
PECO Energy Co. 3.00%, 9/15/2049 | 5,000 | 3,332 |
Pinnacle West Capital Corp. 1.30%, 6/15/2025 | 150,000 | 138,652 |
PPL Electric Utilities Corp. 5.00%, 5/15/2033 | 48,000 | 47,490 |
Public Service Co. of Colorado | ||
Series 17, 6.25%, 9/1/2037 | 16,000 | 16,686 |
3.60%, 9/15/2042 | 63,000 | 47,779 |
4.05%, 9/15/2049 | 19,000 | 14,784 |
Southern California Edison Co. | ||
Series E, 3.70%, 8/1/2025 | 44,000 | 42,526 |
Series D, 4.70%, 6/1/2027 | 27,000 | 26,545 |
Series 13-A, 3.90%, 3/15/2043 | 6,000 | 4,595 |
Series C, 3.60%, 2/1/2045 | 32,000 | 23,110 |
4.00%, 4/1/2047 | 98,000 | 75,857 |
System Energy Resources, Inc. 6.00%, 4/15/2028 | 100,000 | 98,215 |
Tampa Electric Co. 4.10%, 6/15/2042 | 92,000 | 75,076 |
Virginia Electric and Power Co. | ||
Series A, 3.15%, 1/15/2026 | 17,000 | 16,185 |
Series A, 3.50%, 3/15/2027 | 43,000 | 40,634 |
4.60%, 12/1/2048 | 112,000 | 96,020 |
3,031,763 | ||
Electrical Equipment — 0.2% | ||
Emerson Electric Co. 2.20%, 12/21/2031 | 100,000 | 82,212 |
Rockwell Automation, Inc. 2.80%, 8/15/2061 | 35,000 | 21,601 |
103,813 | ||
Electronic Equipment, Instruments & Components — 0.6% | ||
Amphenol Corp. 2.20%, 9/15/2031 | 71,000 | 57,418 |
CDW LLC 3.28%, 12/1/2028 | 45,000 | 39,451 |
Corning, Inc. | ||
4.75%, 3/15/2042 | 76,000 | 68,023 |
5.45%, 11/15/2079 | 18,000 | 16,133 |
Keysight Technologies, Inc. 4.60%, 4/6/2027 | 9,000 | 8,800 |
Teledyne Technologies, Inc. 2.75%, 4/1/2031 | 61,000 | 50,855 |
Vontier Corp. 2.95%, 4/1/2031 | 55,000 | 43,577 |
284,257 | ||
INVESTMENTS | PRINCIPAL AMOUNT($) | VALUE($) |
Energy Equipment & Services — 0.1% | ||
Halliburton Co. | ||
4.85%, 11/15/2035 | 10,000 | 9,369 |
4.50%, 11/15/2041 | 40,000 | 33,676 |
43,045 | ||
Entertainment — 0.9% | ||
Activision Blizzard, Inc. 2.50%, 9/15/2050 | 111,000 | 70,587 |
Electronic Arts, Inc. 1.85%, 2/15/2031 | 37,000 | 29,588 |
Walt Disney Co. (The) | ||
2.20%, 1/13/2028 | 57,000 | 51,315 |
2.65%, 1/13/2031 | 175,000 | 149,841 |
3.50%, 5/13/2040 | 141,000 | 112,948 |
Warnermedia Holdings, Inc. 5.39%, 3/15/2062 | 39,000 | 30,907 |
445,186 | ||
Financial Services — 2.2% | ||
Berkshire Hathaway, Inc. 3.13%, 3/15/2026 | 148,000 | 141,846 |
Citigroup Global Markets Holdings, Inc. 0.75%, 6/7/2024 | 32,000 | 30,776 |
Corebridge Financial, Inc. | ||
4.40%, 4/5/2052 | 5,000 | 3,862 |
(US Treasury Yield Curve Rate T Note Constant Maturity 5 Year + 3.85%), 6.88%, 12/15/2052 (b) | 15,000 | 14,498 |
Equitable Holdings, Inc. 4.35%, 4/20/2028 | 75,000 | 70,981 |
Fidelity National Information Services, Inc. 5.10%, 7/15/2032 | 10,000 | 9,798 |
Fiserv, Inc. 4.40%, 7/1/2049 | 10,000 | 8,150 |
Global Payments, Inc. 2.65%, 2/15/2025 | 222,000 | 211,941 |
Mastercard, Inc. | ||
4.85%, 3/9/2033 | 30,000 | 30,141 |
3.85%, 3/26/2050 | 75,000 | 62,203 |
National Rural Utilities Cooperative Finance Corp. | ||
1.35%, 3/15/2031 | 65,000 | 49,120 |
2.75%, 4/15/2032 | 25,000 | 20,481 |
4.02%, 11/1/2032 | 10,000 | 9,067 |
(ICE LIBOR USD 3 Month + 3.63%), 5.25%, 4/20/2046 (b) | 30,000 | 28,501 |
PayPal Holdings, Inc. | ||
1.65%, 6/1/2025 | 13,000 | 12,179 |
5.25%, 6/1/2062 | 10,000 | 9,517 |
Shell International Finance BV (Netherlands) | ||
3.25%, 5/11/2025 | 73,000 | 70,694 |
4.38%, 5/11/2045 | 60,000 | 52,017 |
4.00%, 5/10/2046 | 29,000 | 23,802 |
3.75%, 9/12/2046 | 61,000 | 47,870 |
August 31, 2023 | J.P. Morgan Exchange-Traded Funds | 115 |
AS OF August 31, 2023 (Unaudited) (continued)
INVESTMENTS | PRINCIPAL AMOUNT($) | VALUE($) |
Corporate Bonds — continued | ||
Financial Services — continued | ||
3.00%, 11/26/2051 | 5,000 | 3,349 |
Visa, Inc. | ||
0.75%, 8/15/2027 | 48,000 | 41,501 |
2.05%, 4/15/2030 | 82,000 | 69,542 |
2.00%, 8/15/2050 | 80,000 | 47,316 |
Voya Financial, Inc. (ICE LIBOR USD 3 Month + 2.08%), 4.70%, 1/23/2048 (b) | 43,000 | 34,719 |
Western Union Co. (The) 2.75%, 3/15/2031 | 10,000 | 7,857 |
1,111,728 | ||
Food Products — 1.6% | ||
Bunge Ltd. Finance Corp. 2.75%, 5/14/2031 | 60,000 | 50,196 |
Conagra Brands, Inc. 5.40%, 11/1/2048 | 28,000 | 25,388 |
Hershey Co. (The) 0.90%, 6/1/2025 | 154,000 | 142,974 |
Hormel Foods Corp. 1.70%, 6/3/2028 | 149,000 | 128,923 |
J M Smucker Co. (The) 3.55%, 3/15/2050 | 34,000 | 23,826 |
JBS USA LUX SA | ||
5.13%, 2/1/2028 | 64,000 | 62,207 |
4.38%, 2/2/2052 | 64,000 | 45,127 |
Kraft Heinz Foods Co. | ||
3.00%, 6/1/2026 | 241,000 | 227,178 |
5.50%, 6/1/2050 | 18,000 | 17,368 |
Mondelez International, Inc. 1.88%, 10/15/2032 | 39,000 | 30,100 |
Pilgrim's Pride Corp. | ||
4.25%, 4/15/2031 | 39,000 | 33,762 |
3.50%, 3/1/2032 | 52,000 | 41,835 |
Tyson Foods, Inc. 5.10%, 9/28/2048 | 10,000 | 8,666 |
837,550 | ||
Gas Utilities — 0.3% | ||
Atmos Energy Corp. | ||
1.50%, 1/15/2031 | 19,000 | 14,820 |
5.75%, 10/15/2052 | 10,000 | 10,405 |
National Fuel Gas Co. 2.95%, 3/1/2031 | 12,000 | 9,664 |
Piedmont Natural Gas Co., Inc. 5.05%, 5/15/2052 | 69,000 | 60,804 |
Southern California Gas Co. | ||
3.75%, 9/15/2042 | 30,000 | 22,722 |
Series VV, 4.30%, 1/15/2049 | 55,000 | 44,742 |
Southwest Gas Corp. 3.18%, 8/15/2051 | 6,000 | 3,701 |
Spire Missouri, Inc. 4.80%, 2/15/2033 | 6,000 | 5,833 |
172,691 | ||
Ground Transportation — 1.5% | ||
Burlington Northern Santa Fe LLC 4.45%, 1/15/2053 | 78,000 | 69,314 |
INVESTMENTS | PRINCIPAL AMOUNT($) | VALUE($) |
Ground Transportation — continued | ||
Canadian National Railway Co. (Canada) 4.40%, 8/5/2052 | 10,000 | 8,842 |
Canadian Pacific Railway Co. (Canada) | ||
1.75%, 12/2/2026 | 171,000 | 153,560 |
2.45%, 12/2/2031 | 24,000 | 21,287 |
6.13%, 9/15/2115 | 10,000 | 10,366 |
CSX Corp. | ||
2.60%, 11/1/2026 | 36,000 | 33,350 |
4.65%, 3/1/2068 | 44,000 | 37,833 |
Norfolk Southern Corp. | ||
4.15%, 2/28/2048 | 96,000 | 78,739 |
3.16%, 5/15/2055 | 15,000 | 9,860 |
5.10%, 8/1/2118 | 20,000 | 16,795 |
4.10%, 5/15/2121 | 16,000 | 11,227 |
Ryder System, Inc. 2.85%, 3/1/2027 | 35,000 | 32,177 |
Triton Container International Ltd. (Bermuda) 3.25%, 3/15/2032 | 17,000 | 13,188 |
Union Pacific Corp. | ||
3.25%, 1/15/2025 | 102,000 | 99,157 |
2.89%, 4/6/2036 | 55,000 | 43,393 |
4.05%, 11/15/2045 | 134,000 | 108,383 |
3.25%, 2/5/2050 | 34,000 | 24,490 |
3.75%, 2/5/2070 | 27,000 | 19,665 |
791,626 | ||
Health Care Equipment & Supplies — 1.3% | ||
Abbott Laboratories | ||
1.15%, 1/30/2028 | 34,000 | 29,325 |
4.75%, 4/15/2043 | 11,000 | 10,534 |
4.90%, 11/30/2046 | 80,000 | 77,923 |
Baxter International, Inc. | ||
1.73%, 4/1/2031 | 66,000 | 50,851 |
3.13%, 12/1/2051 | 56,000 | 35,614 |
Becton Dickinson & Co. | ||
2.82%, 5/20/2030 | 35,000 | 30,240 |
4.69%, 12/15/2044 | 61,000 | 54,059 |
Boston Scientific Corp. 4.70%, 3/1/2049 | 33,000 | 29,559 |
DENTSPLY SIRONA, Inc. 3.25%, 6/1/2030 | 37,000 | 31,737 |
DH Europe Finance II SARL | ||
2.60%, 11/15/2029 | 132,000 | 116,226 |
3.40%, 11/15/2049 | 10,000 | 7,461 |
Medtronic, Inc. | ||
4.38%, 3/15/2035 | 58,000 | 54,856 |
4.63%, 3/15/2045 | 10,000 | 9,372 |
116 | J.P. Morgan Exchange-Traded Funds | August 31, 2023 |
INVESTMENTS | PRINCIPAL AMOUNT($) | VALUE($) |
Corporate Bonds — continued | ||
Health Care Equipment & Supplies — continued | ||
Stryker Corp. | ||
1.15%, 6/15/2025 | 5,000 | 4,644 |
4.38%, 5/15/2044 | 91,000 | 78,063 |
2.90%, 6/15/2050 | 7,000 | 4,656 |
Zimmer Biomet Holdings, Inc. 2.60%, 11/24/2031 | 69,000 | 56,218 |
681,338 | ||
Health Care Providers & Services — 4.0% | ||
Aetna, Inc. 3.88%, 8/15/2047 | 46,000 | 34,436 |
Ascension Health 3.95%, 11/15/2046 | 53,000 | 43,185 |
Cardinal Health, Inc. 4.37%, 6/15/2047 | 35,000 | 27,987 |
Centene Corp. | ||
2.45%, 7/15/2028 | 126,000 | 107,782 |
3.38%, 2/15/2030 | 17,000 | 14,539 |
2.63%, 8/1/2031 | 120,000 | 95,392 |
Cigna Group (The) | ||
4.80%, 8/15/2038 | 76,000 | 69,821 |
3.40%, 3/15/2051 | 5,000 | 3,488 |
CommonSpirit Health 6.07%, 11/1/2027 | 181,000 | 185,014 |
CVS Health Corp. | ||
2.63%, 8/15/2024 | 147,000 | 142,626 |
3.75%, 4/1/2030 | 117,000 | 106,406 |
2.13%, 9/15/2031 | 56,000 | 44,154 |
6.13%, 9/15/2039 | 11,000 | 11,118 |
2.70%, 8/21/2040 | 112,000 | 74,926 |
5.05%, 3/25/2048 | 104,000 | 91,322 |
5.63%, 2/21/2053 | 40,000 | 37,866 |
6.00%, 6/1/2063 | 5,000 | 4,895 |
Elevance Health, Inc. | ||
4.55%, 5/15/2052 | 62,000 | 53,392 |
6.10%, 10/15/2052 | 10,000 | 10,598 |
HCA, Inc. | ||
5.00%, 3/15/2024 | 64,000 | 63,601 |
4.13%, 6/15/2029 | 11,000 | 10,156 |
3.50%, 7/15/2051 | 97,000 | 64,609 |
4.63%, 3/15/2052 | 15,000 | 12,031 |
Humana, Inc. | ||
4.50%, 4/1/2025 | 140,000 | 137,937 |
4.80%, 3/15/2047 | 31,000 | 27,391 |
Kaiser Foundation Hospitals Series 2021, 3.00%, 6/1/2051 | 20,000 | 13,555 |
Laboratory Corp. of America Holdings | ||
2.95%, 12/1/2029 | 37,000 | 32,481 |
4.70%, 2/1/2045 | 26,000 | 22,259 |
INVESTMENTS | PRINCIPAL AMOUNT($) | VALUE($) |
Health Care Providers & Services — continued | ||
Mass General Brigham, Inc. Series 2020, 3.34%, 7/1/2060 | 10,000 | 6,854 |
New York and Presbyterian Hospital (The) Series 2019, 3.95%, 8/1/2119 | 10,000 | 7,043 |
Novant Health, Inc. 3.32%, 11/1/2061 | 10,000 | 6,681 |
PeaceHealth Obligated Group Series 2020, 3.22%, 11/15/2050 | 14,000 | 9,011 |
Quest Diagnostics, Inc. 2.80%, 6/30/2031 | 75,000 | 63,640 |
UnitedHealth Group, Inc. | ||
3.75%, 7/15/2025 | 98,000 | 95,492 |
3.70%, 5/15/2027 | 18,000 | 17,280 |
3.50%, 8/15/2039 | 146,000 | 119,296 |
2.75%, 5/15/2040 | 79,000 | 56,850 |
4.63%, 11/15/2041 | 65,000 | 59,559 |
3.25%, 5/15/2051 | 60,000 | 42,549 |
3.13%, 5/15/2060 | 67,000 | 44,073 |
2,071,295 | ||
Health Care REITs — 0.5% | ||
Healthpeak OP LLC | ||
3.40%, 2/1/2025 | 123,000 | 118,897 |
2.88%, 1/15/2031 | 68,000 | 56,934 |
Ventas Realty LP 2.50%, 9/1/2031 | 59,000 | 46,494 |
Welltower OP LLC 4.95%, 9/1/2048 | 26,000 | 22,627 |
244,952 | ||
Hotels, Restaurants & Leisure — 0.6% | ||
Expedia Group, Inc. 3.25%, 2/15/2030 | 60,000 | 52,240 |
Marriott International, Inc. Series II, 2.75%, 10/15/2033 | 49,000 | 38,274 |
McDonald's Corp. | ||
3.30%, 7/1/2025 | 88,000 | 85,060 |
2.13%, 3/1/2030 | 50,000 | 42,167 |
4.60%, 9/9/2032 | 18,000 | 17,574 |
5.15%, 9/9/2052 | 35,000 | 33,499 |
Starbucks Corp. | ||
4.50%, 11/15/2048 | 60,000 | 51,418 |
3.50%, 11/15/2050 | 10,000 | 7,237 |
327,469 | ||
Household Durables — 0.3% | ||
Leggett & Platt, Inc. 3.50%, 11/15/2051 | 22,000 | 15,133 |
Lennar Corp. 4.75%, 11/29/2027 | 125,000 | 121,140 |
Toll Brothers Finance Corp. 4.88%, 11/15/2025 | 14,000 | 13,699 |
149,972 | ||
August 31, 2023 | J.P. Morgan Exchange-Traded Funds | 117 |
AS OF August 31, 2023 (Unaudited) (continued)
INVESTMENTS | PRINCIPAL AMOUNT($) | VALUE($) |
Corporate Bonds — continued | ||
Household Products — 0.5% | ||
Colgate-Palmolive Co. | ||
4.80%, 3/2/2026 | 50,000 | 50,051 |
4.00%, 8/15/2045 | 25,000 | 22,067 |
Kimberly-Clark Corp. | ||
6.63%, 8/1/2037 | 100,000 | 114,920 |
2.88%, 2/7/2050 | 13,000 | 8,994 |
Procter & Gamble Co. (The) 3.50%, 10/25/2047 | 88,000 | 71,038 |
267,070 | ||
Industrial Conglomerates — 0.5% | ||
3M Co. 5.70%, 3/15/2037 | 66,000 | 69,998 |
GE Capital Funding LLC 4.55%, 5/15/2032 | 50,000 | 47,680 |
Honeywell International, Inc. | ||
5.70%, 3/15/2036 | 79,000 | 82,787 |
2.80%, 6/1/2050 | 81,000 | 57,701 |
258,166 | ||
Insurance — 2.2% | ||
ACE Capital Trust II 9.70%, 4/1/2030 | 10,000 | 11,889 |
Aflac, Inc. 3.60%, 4/1/2030 | 100,000 | 91,043 |
Alleghany Corp. 3.25%, 8/15/2051 | 11,000 | 7,674 |
Allstate Corp. (The) | ||
5.25%, 3/30/2033 | 99,000 | 96,961 |
(ICE LIBOR USD 3 Month + 2.12%), 6.50%, 5/15/2057 (b) | 10,000 | 9,562 |
American Equity Investment Life Holding Co. 5.00%, 6/15/2027 | 15,000 | 14,386 |
American International Group, Inc. | ||
3.90%, 4/1/2026 | 14,000 | 13,505 |
3.88%, 1/15/2035 | 6,000 | 5,184 |
Aon Corp. 6.25%, 9/30/2040 | 10,000 | 10,411 |
Arch Capital Group Ltd. 3.64%, 6/30/2050 | 64,000 | 46,143 |
Athene Holding Ltd. 3.50%, 1/15/2031 | 131,000 | 109,613 |
AXIS Specialty Finance LLC (US Treasury Yield Curve Rate T Note Constant Maturity 5 Year + 3.19%), 4.90%, 1/15/2040 (b) (c) | 9,000 | 7,195 |
Berkshire Hathaway Finance Corp. | ||
4.20%, 8/15/2048 | 85,000 | 73,968 |
4.25%, 1/15/2049 | 10,000 | 8,801 |
2.85%, 10/15/2050 | 31,000 | 20,797 |
Chubb INA Holdings, Inc. 6.70%, 5/15/2036 | 11,000 | 12,314 |
Cincinnati Financial Corp. 6.13%, 11/1/2034 | 30,000 | 30,869 |
Enstar Finance LLC (US Treasury Yield Curve Rate T Note Constant Maturity 5 Year + 5.47%), 5.75%, 9/1/2040 (b) | 11,000 | 9,612 |
Enstar Group Ltd. 4.95%, 6/1/2029 | 68,000 | 63,643 |
INVESTMENTS | PRINCIPAL AMOUNT($) | VALUE($) |
Insurance — continued | ||
F&G Annuities & Life, Inc. 7.40%, 1/13/2028 (e) | 33,000 | 33,602 |
Lincoln National Corp. | ||
3.80%, 3/1/2028 | 59,000 | 54,103 |
4.35%, 3/1/2048 | 5,000 | 3,623 |
Loews Corp. 6.00%, 2/1/2035 | 36,000 | 37,180 |
Manulife Financial Corp. (Canada) (USD ICE Swap Rate 5 Year + 1.65%), 4.06%, 2/24/2032 (b) | 50,000 | 46,812 |
Marsh & McLennan Cos., Inc. 6.25%, 11/1/2052 | 10,000 | 10,927 |
MetLife, Inc. | ||
10.75%, 8/1/2039 | 11,000 | 14,111 |
5.25%, 1/15/2054 | 26,000 | 24,617 |
Principal Financial Group, Inc. | ||
4.63%, 9/15/2042 | 14,000 | 11,719 |
5.50%, 3/15/2053 | 5,000 | 4,662 |
Progressive Corp. (The) 4.13%, 4/15/2047 | 56,000 | 46,524 |
Prudential Financial, Inc. (ICE LIBOR USD 3 Month + 2.38%), 4.50%, 9/15/2047 (b) | 18,000 | 16,172 |
Selective Insurance Group, Inc. 5.38%, 3/1/2049 | 18,000 | 16,176 |
Transatlantic Holdings, Inc. 8.00%, 11/30/2039 | 22,000 | 26,871 |
Travelers Cos., Inc. (The) 4.10%, 3/4/2049 | 15,000 | 12,412 |
Travelers Property Casualty Corp. 6.38%, 3/15/2033 | 111,000 | 121,834 |
Willis North America, Inc. 3.88%, 9/15/2049 | 33,000 | 23,298 |
WR Berkley Corp. 4.75%, 8/1/2044 | 7,000 | 5,966 |
1,154,179 | ||
Interactive Media & Services — 0.3% | ||
Alphabet, Inc. | ||
1.90%, 8/15/2040 | 57,000 | 38,224 |
2.25%, 8/15/2060 | 93,000 | 54,238 |
Meta Platforms, Inc. | ||
3.50%, 8/15/2027 | 21,000 | 20,006 |
4.65%, 8/15/2062 | 40,000 | 33,985 |
146,453 | ||
IT Services — 0.7% | ||
International Business Machines Corp. | ||
4.00%, 7/27/2025 | 280,000 | 273,580 |
5.88%, 11/29/2032 | 22,000 | 23,338 |
7.13%, 12/1/2096 | 37,000 | 45,314 |
VeriSign, Inc. 2.70%, 6/15/2031 | 46,000 | 37,679 |
379,911 | ||
118 | J.P. Morgan Exchange-Traded Funds | August 31, 2023 |
INVESTMENTS | PRINCIPAL AMOUNT($) | VALUE($) |
Corporate Bonds — continued | ||
Leisure Products — 0.3% | ||
Hasbro, Inc. | ||
3.00%, 11/19/2024 | 100,000 | 96,681 |
3.90%, 11/19/2029 | 64,000 | 58,125 |
154,806 | ||
Life Sciences Tools & Services — 0.7% | ||
Agilent Technologies, Inc. 2.30%, 3/12/2031 | 107,000 | 87,547 |
Illumina, Inc. 5.75%, 12/13/2027 | 84,000 | 83,853 |
Revvity, Inc. 3.63%, 3/15/2051 | 40,000 | 27,594 |
Thermo Fisher Scientific, Inc. | ||
1.22%, 10/18/2024 | 59,000 | 56,236 |
1.75%, 10/15/2028 | 57,000 | 49,070 |
2.80%, 10/15/2041 | 78,000 | 56,150 |
360,450 | ||
Machinery — 0.9% | ||
Caterpillar, Inc. | ||
6.05%, 8/15/2036 | 18,000 | 19,733 |
4.75%, 5/15/2064 | 16,000 | 14,783 |
CNH Industrial Capital LLC 1.45%, 7/15/2026 | 182,000 | 162,810 |
Deere & Co. 2.88%, 9/7/2049 | 41,000 | 29,645 |
Illinois Tool Works, Inc. 2.65%, 11/15/2026 | 152,000 | 142,357 |
Otis Worldwide Corp. | ||
2.57%, 2/15/2030 | 40,000 | 34,196 |
3.36%, 2/15/2050 | 5,000 | 3,598 |
Snap-on, Inc. 4.10%, 3/1/2048 | 40,000 | 33,626 |
Stanley Black & Decker, Inc. 2.30%, 2/24/2025 | 42,000 | 39,976 |
480,724 | ||
Media — 2.4% | ||
Charter Communications Operating LLC | ||
4.91%, 7/23/2025 | 98,000 | 96,247 |
3.75%, 2/15/2028 | 39,000 | 35,652 |
2.80%, 4/1/2031 | 23,000 | 18,517 |
4.40%, 4/1/2033 | 24,000 | 21,124 |
5.38%, 5/1/2047 | 30,000 | 23,931 |
4.80%, 3/1/2050 | 108,000 | 79,705 |
5.50%, 4/1/2063 | 50,000 | 39,310 |
Comcast Corp. | ||
3.90%, 3/1/2038 | 204,000 | 173,614 |
4.00%, 11/1/2049 | 298,000 | 237,319 |
2.45%, 8/15/2052 | 18,000 | 10,540 |
2.94%, 11/1/2056 | 38,000 | 23,611 |
2.99%, 11/1/2063 | 7,000 | 4,222 |
Discovery Communications LLC | ||
3.95%, 3/20/2028 | 181,000 | 168,277 |
INVESTMENTS | PRINCIPAL AMOUNT($) | VALUE($) |
Media — continued | ||
3.63%, 5/15/2030 | 12,000 | 10,532 |
4.65%, 5/15/2050 | 75,000 | 56,020 |
4.00%, 9/15/2055 | 21,000 | 13,682 |
Fox Corp. 5.58%, 1/25/2049 | 10,000 | 8,908 |
Omnicom Group, Inc. 2.60%, 8/1/2031 | 27,000 | 22,089 |
Paramount Global | ||
2.90%, 1/15/2027 | 48,000 | 43,253 |
3.70%, 6/1/2028 | 9,000 | 8,057 |
4.95%, 1/15/2031 | 5,000 | 4,466 |
5.90%, 10/15/2040 | 56,000 | 46,834 |
5.25%, 4/1/2044 | 29,000 | 21,718 |
4.90%, 8/15/2044 | 17,000 | 12,117 |
Time Warner Cable LLC 6.55%, 5/1/2037 | 72,000 | 68,325 |
1,248,070 | ||
Metals & Mining — 0.9% | ||
ArcelorMittal SA (Luxembourg) 6.75%, 3/1/2041 (a) | 31,000 | 30,851 |
Barrick Gold Corp. (Canada) 6.45%, 10/15/2035 | 45,000 | 47,100 |
Kinross Gold Corp. (Canada) 4.50%, 7/15/2027 | 85,000 | 81,907 |
Newmont Corp. 2.25%, 10/1/2030 | 20,000 | 16,249 |
Nucor Corp. | ||
4.30%, 5/23/2027 | 10,000 | 9,698 |
2.98%, 12/15/2055 | 5,000 | 3,045 |
Rio Tinto Alcan, Inc. (Canada) 6.13%, 12/15/2033 | 51,000 | 53,910 |
Rio Tinto Finance USA Ltd. (Australia) 2.75%, 11/2/2051 | 47,000 | 30,315 |
Rio Tinto Finance USA plc (Australia) 5.13%, 3/9/2053 | 16,000 | 15,457 |
Southern Copper Corp. (Mexico) | ||
5.25%, 11/8/2042 | 35,000 | 32,229 |
5.88%, 4/23/2045 | 53,000 | 51,993 |
Teck Resources Ltd. (Canada) 5.40%, 2/1/2043 | 25,000 | 21,917 |
Vale Overseas Ltd. (Brazil) 6.88%, 11/10/2039 | 42,000 | 43,764 |
438,435 | ||
Multi-Utilities — 1.8% | ||
Ameren Corp. | ||
2.50%, 9/15/2024 | 129,000 | 124,444 |
3.50%, 1/15/2031 | 112,000 | 98,818 |
Avista Corp. 4.00%, 4/1/2052 | 61,000 | 46,579 |
Berkshire Hathaway Energy Co. 2.85%, 5/15/2051 | 50,000 | 30,978 |
Black Hills Corp. 3.88%, 10/15/2049 | 39,000 | 27,665 |
August 31, 2023 | J.P. Morgan Exchange-Traded Funds | 119 |
AS OF August 31, 2023 (Unaudited) (continued)
INVESTMENTS | PRINCIPAL AMOUNT($) | VALUE($) |
Corporate Bonds — continued | ||
Multi-Utilities — continued | ||
CenterPoint Energy, Inc. 2.65%, 6/1/2031 | 143,000 | 117,383 |
Consolidated Edison Co. of New York, Inc. | ||
Series 20B, 3.95%, 4/1/2050 | 76,000 | 60,119 |
3.20%, 12/1/2051 | 64,000 | 42,881 |
3.70%, 11/15/2059 | 18,000 | 12,719 |
Series C, 3.00%, 12/1/2060 | 7,000 | 4,269 |
3.60%, 6/15/2061 | 40,000 | 27,638 |
Consumers Energy Co. | ||
3.95%, 7/15/2047 | 85,000 | 68,285 |
2.50%, 5/1/2060 | 16,000 | 8,829 |
Dominion Energy, Inc. 3.90%, 10/1/2025 | 8,000 | 7,732 |
NiSource, Inc. | ||
0.95%, 8/15/2025 | 17,000 | 15,579 |
3.49%, 5/15/2027 | 22,000 | 20,646 |
3.60%, 5/1/2030 | 11,000 | 9,852 |
1.70%, 2/15/2031 | 15,000 | 11,590 |
5.00%, 6/15/2052 | 13,000 | 11,504 |
Puget Energy, Inc. 2.38%, 6/15/2028 | 6,000 | 5,179 |
San Diego Gas & Electric Co. | ||
Series VVV, 1.70%, 10/1/2030 | 36,000 | 28,628 |
2.95%, 8/15/2051 | 57,000 | 37,121 |
Southern Co. Gas Capital Corp. Series 20-A, 1.75%, 1/15/2031 | 142,000 | 110,500 |
928,938 | ||
Office REITs — 0.7% | ||
Alexandria Real Estate Equities, Inc. | ||
2.75%, 12/15/2029 | 50,000 | 42,372 |
2.00%, 5/18/2032 | 58,000 | 43,934 |
Boston Properties LP | ||
2.75%, 10/1/2026 | 223,000 | 201,177 |
4.50%, 12/1/2028 | 8,000 | 7,384 |
Hudson Pacific Properties LP 4.65%, 4/1/2029 | 10,000 | 7,625 |
Kilroy Realty LP 2.50%, 11/15/2032 | 77,000 | 54,279 |
Piedmont Operating Partnership LP | ||
9.25%, 7/20/2028 | 12,000 | 12,271 |
3.15%, 8/15/2030 | 19,000 | 13,719 |
382,761 | ||
Oil, Gas & Consumable Fuels — 6.5% | ||
Apache Corp. | ||
4.25%, 1/15/2030 | 42,000 | 38,319 |
5.35%, 7/1/2049 | 42,000 | 33,759 |
Boardwalk Pipelines LP 3.60%, 9/1/2032 | 45,000 | 37,865 |
BP Capital Markets America, Inc. | ||
4.23%, 11/6/2028 | 144,000 | 138,984 |
INVESTMENTS | PRINCIPAL AMOUNT($) | VALUE($) |
Oil, Gas & Consumable Fuels — continued | ||
3.00%, 2/24/2050 | 89,000 | 59,256 |
3.38%, 2/8/2061 | 67,000 | 45,026 |
BP Capital Markets plc (United Kingdom) 3.28%, 9/19/2027 | 13,000 | 12,241 |
Canadian Natural Resources Ltd. (Canada) 4.95%, 6/1/2047 | 30,000 | 26,045 |
Cenovus Energy, Inc. (Canada) 3.75%, 2/15/2052 | 21,000 | 14,728 |
Cheniere Energy Partners LP | ||
4.00%, 3/1/2031 | 60,000 | 52,905 |
3.25%, 1/31/2032 | 69,000 | 56,922 |
Cheniere Energy, Inc. 4.63%, 10/15/2028 | 100,000 | 94,169 |
Chevron Corp. 2.95%, 5/16/2026 | 88,000 | 83,858 |
Columbia Pipeline Group, Inc. 4.50%, 6/1/2025 | 79,000 | 77,104 |
ConocoPhillips 5.90%, 10/15/2032 | 50,000 | 53,460 |
ConocoPhillips Co. 4.03%, 3/15/2062 | 48,000 | 36,740 |
DCP Midstream Operating LP 5.60%, 4/1/2044 | 28,000 | 25,994 |
Devon Energy Corp. | ||
5.60%, 7/15/2041 | 62,000 | 57,519 |
5.00%, 6/15/2045 | 10,000 | 8,563 |
Diamondback Energy, Inc. 3.50%, 12/1/2029 | 70,000 | 63,323 |
Enbridge Energy Partners LP Series B, 7.50%, 4/15/2038 | 23,000 | 25,368 |
Enbridge, Inc. (Canada) 2.50%, 8/1/2033 | 67,000 | 51,962 |
Energy Transfer LP | ||
4.95%, 5/15/2028 | 80,000 | 77,737 |
4.95%, 6/15/2028 | 32,000 | 30,986 |
3.75%, 5/15/2030 | 12,000 | 10,725 |
5.40%, 10/1/2047 | 96,000 | 82,674 |
5.00%, 5/15/2050 | 17,000 | 13,989 |
Enterprise Products Operating LLC | ||
3.70%, 2/15/2026 | 10,000 | 9,647 |
3.95%, 2/15/2027 | 23,000 | 22,113 |
2.80%, 1/31/2030 | 130,000 | 112,717 |
4.85%, 8/15/2042 | 126,000 | 113,081 |
3.95%, 1/31/2060 | 35,000 | 25,881 |
(3-MONTH CME TERM SOFR + 2.83%), 5.38%, 2/15/2078 (b) | 17,000 | 14,128 |
EQT Corp. 7.00%, 2/1/2030 (a) | 48,000 | 50,350 |
Exxon Mobil Corp. | ||
2.99%, 3/19/2025 | 105,000 | 101,663 |
3.00%, 8/16/2039 | 126,000 | 96,995 |
3.45%, 4/15/2051 | 17,000 | 12,644 |
Hess Corp. | ||
7.88%, 10/1/2029 | 10,000 | 11,044 |
120 | J.P. Morgan Exchange-Traded Funds | August 31, 2023 |
INVESTMENTS | PRINCIPAL AMOUNT($) | VALUE($) |
Corporate Bonds — continued | ||
Oil, Gas & Consumable Fuels — continued | ||
5.80%, 4/1/2047 | 10,000 | 9,573 |
Kinder Morgan, Inc. | ||
4.30%, 6/1/2025 | 110,000 | 107,537 |
4.80%, 2/1/2033 | 203,000 | 189,209 |
Magellan Midstream Partners LP 4.20%, 10/3/2047 | 43,000 | 31,682 |
Marathon Oil Corp. | ||
4.40%, 7/15/2027 | 90,000 | 85,811 |
6.60%, 10/1/2037 | 12,000 | 12,078 |
Marathon Petroleum Corp. | ||
4.75%, 9/15/2044 | 17,000 | 14,153 |
5.00%, 9/15/2054 | 28,000 | 22,870 |
MPLX LP | ||
4.50%, 4/15/2038 | 36,000 | 30,498 |
4.95%, 3/14/2052 | 84,000 | 69,191 |
4.90%, 4/15/2058 | 10,000 | 7,956 |
Occidental Petroleum Corp. 5.55%, 3/15/2026 | 24,000 | 23,791 |
ONEOK, Inc. 5.20%, 7/15/2048 | 70,000 | 59,866 |
Ovintiv, Inc. | ||
6.50%, 8/15/2034 | 14,000 | 14,189 |
6.50%, 2/1/2038 | 33,000 | 32,464 |
Phillips 66 4.88%, 11/15/2044 | 10,000 | 9,024 |
Plains All American Pipeline LP 6.65%, 1/15/2037 | 10,000 | 10,149 |
Sabine Pass Liquefaction LLC 5.63%, 3/1/2025 | 140,000 | 139,603 |
Suncor Energy, Inc. (Canada) 3.75%, 3/4/2051 | 11,000 | 7,787 |
Targa Resources Corp. 6.50%, 2/15/2053 | 15,000 | 14,999 |
Targa Resources Partners LP | ||
5.50%, 3/1/2030 | 13,000 | 12,487 |
4.88%, 2/1/2031 | 25,000 | 22,992 |
TC PipeLines LP | ||
4.38%, 3/13/2025 | 43,000 | 41,920 |
3.90%, 5/25/2027 | 97,000 | 91,589 |
TotalEnergies Capital International SA (France) 2.83%, 1/10/2030 | 218,000 | 193,538 |
TransCanada PipeLines Ltd. (Canada) | ||
6.10%, 6/1/2040 | 48,000 | 48,319 |
4.88%, 5/15/2048 | 10,000 | 8,498 |
Transcontinental Gas Pipe Line Co. LLC 4.60%, 3/15/2048 | 48,000 | 40,050 |
Valero Energy Corp. 3.65%, 12/1/2051 | 40,000 | 27,284 |
Western Midstream Operating LP | ||
4.50%, 3/1/2028 | 24,000 | 22,609 |
INVESTMENTS | PRINCIPAL AMOUNT($) | VALUE($) |
Oil, Gas & Consumable Fuels — continued | ||
5.25%, 2/1/2050 (a) | 17,000 | 13,737 |
Williams Cos., Inc. (The) 5.40%, 3/4/2044 | 17,000 | 15,329 |
3,311,266 | ||
Paper & Forest Products — 0.1% | ||
Suzano Austria GmbH (Brazil) 3.75%, 1/15/2031 | 67,000 | 56,783 |
Passenger Airlines — 0.1% | ||
American Airlines Pass-Through Trust Series 2021-1, Class A Shares, 2.88%, 7/11/2034 | 75,710 | 62,496 |
Personal Care Products — 0.5% | ||
Conopco, Inc. Series E, 7.25%, 12/15/2026 | 28,000 | 29,848 |
Estee Lauder Cos., Inc. (The) | ||
3.15%, 3/15/2027 | 168,000 | 158,897 |
6.00%, 5/15/2037 | 19,000 | 20,192 |
Kenvue, Inc. | ||
5.00%, 3/22/2030 (e) | 24,000 | 24,009 |
4.90%, 3/22/2033 (e) | 6,000 | 5,965 |
238,911 | ||
Pharmaceuticals — 3.0% | ||
Astrazeneca Finance LLC (United Kingdom) 0.70%, 5/28/2024 | 27,000 | 26,051 |
AstraZeneca plc (United Kingdom) | ||
3.38%, 11/16/2025 | 52,000 | 49,958 |
4.00%, 1/17/2029 | 6,000 | 5,754 |
4.38%, 11/16/2045 | 68,000 | 60,427 |
3.00%, 5/28/2051 | 26,000 | 18,341 |
Bristol-Myers Squibb Co. | ||
2.90%, 7/26/2024 | 65,000 | 63,528 |
3.90%, 2/20/2028 | 50,000 | 47,980 |
3.40%, 7/26/2029 | 22,000 | 20,364 |
4.13%, 6/15/2039 | 70,000 | 61,790 |
4.35%, 11/15/2047 | 32,000 | 27,578 |
2.55%, 11/13/2050 | 70,000 | 42,803 |
3.90%, 3/15/2062 | 10,000 | 7,578 |
Eli Lilly & Co. | ||
2.25%, 5/15/2050 | 97,000 | 59,744 |
4.15%, 3/15/2059 | 33,000 | 28,026 |
2.50%, 9/15/2060 | 35,000 | 20,822 |
GlaxoSmithKline Capital, Inc. (United Kingdom) | ||
6.38%, 5/15/2038 | 7,000 | 7,968 |
4.20%, 3/18/2043 | 21,000 | 18,472 |
Johnson & Johnson | ||
4.38%, 12/5/2033 | 27,000 | 26,649 |
August 31, 2023 | J.P. Morgan Exchange-Traded Funds | 121 |
AS OF August 31, 2023 (Unaudited) (continued)
INVESTMENTS | PRINCIPAL AMOUNT($) | VALUE($) |
Corporate Bonds — continued | ||
Pharmaceuticals — continued | ||
5.95%, 8/15/2037 | 99,000 | 109,561 |
3.40%, 1/15/2038 | 50,000 | 42,420 |
4.50%, 9/1/2040 | 10,000 | 9,545 |
2.45%, 9/1/2060 | 39,000 | 23,938 |
Merck & Co., Inc. | ||
0.75%, 2/24/2026 | 50,000 | 45,262 |
2.90%, 12/10/2061 | 63,000 | 39,519 |
Pfizer, Inc. | ||
0.80%, 5/28/2025 | 5,000 | 4,638 |
3.00%, 12/15/2026 | 89,000 | 84,274 |
4.00%, 12/15/2036 | 5,000 | 4,535 |
Royalty Pharma plc 3.30%, 9/2/2040 | 53,000 | 36,449 |
Shire Acquisitions Investments Ireland DAC 3.20%, 9/23/2026 | 236,000 | 221,495 |
Viatris, Inc. | ||
1.65%, 6/22/2025 | 36,000 | 33,335 |
2.70%, 6/22/2030 | 35,000 | 28,407 |
4.00%, 6/22/2050 | 35,000 | 23,163 |
Wyeth LLC 6.50%, 2/1/2034 | 215,000 | 239,712 |
1,540,086 | ||
Professional Services — 0.1% | ||
Automatic Data Processing, Inc. 1.25%, 9/1/2030 | 14,000 | 11,154 |
Jacobs Engineering Group, Inc. 5.90%, 3/1/2033 | 41,000 | 40,540 |
Thomson Reuters Corp. (Canada) 5.65%, 11/23/2043 | 5,000 | 4,549 |
56,243 | ||
Real Estate Management & Development — 0.2% | ||
CBRE Services, Inc. 2.50%, 4/1/2031 | 103,000 | 82,618 |
Residential REITs — 0.4% | ||
American Homes 4 Rent LP 3.38%, 7/15/2051 | 10,000 | 6,417 |
Camden Property Trust 2.80%, 5/15/2030 | 84,000 | 72,911 |
Essex Portfolio LP 2.65%, 9/1/2050 | 13,000 | 7,278 |
Spirit Realty LP 3.20%, 2/15/2031 | 42,000 | 34,621 |
UDR, Inc. | ||
3.00%, 8/15/2031 | 20,000 | 16,780 |
2.10%, 6/15/2033 | 93,000 | 68,290 |
206,297 | ||
Retail REITs — 0.3% | ||
Brixmor Operating Partnership LP 4.05%, 7/1/2030 | 60,000 | 54,258 |
Federal Realty OP LP 3.25%, 7/15/2027 | 10,000 | 9,193 |
INVESTMENTS | PRINCIPAL AMOUNT($) | VALUE($) |
Retail REITs — continued | ||
Kimco Realty OP LLC 2.25%, 12/1/2031 | 10,000 | 7,755 |
NNN REIT, Inc. 3.10%, 4/15/2050 | 39,000 | 23,950 |
Realty Income Corp. | ||
5.05%, 1/13/2026 | 54,000 | 53,683 |
4.65%, 3/15/2047 | 10,000 | 8,690 |
157,529 | ||
Semiconductors & Semiconductor Equipment — 2.8% | ||
Analog Devices, Inc. 3.50%, 12/5/2026 | 5,000 | 4,788 |
Broadcom Corp. 3.13%, 1/15/2025 | 72,000 | 69,478 |
Broadcom, Inc. | ||
3.47%, 4/15/2034 (e) | 6,000 | 4,901 |
4.93%, 5/15/2037 (e) | 110,000 | 98,947 |
Intel Corp. | ||
2.88%, 5/11/2024 | 6,000 | 5,883 |
3.40%, 3/25/2025 | 98,000 | 95,140 |
3.90%, 3/25/2030 | 10,000 | 9,353 |
4.15%, 8/5/2032 | 11,000 | 10,347 |
4.25%, 12/15/2042 | 129,000 | 108,852 |
5.63%, 2/10/2043 | 10,000 | 9,969 |
4.90%, 7/29/2045 | 39,000 | 37,763 |
3.25%, 11/15/2049 | 195,000 | 132,468 |
3.20%, 8/12/2061 | 47,000 | 29,346 |
KLA Corp. 4.10%, 3/15/2029 | 185,000 | 177,814 |
Micron Technology, Inc. | ||
5.88%, 9/15/2033 | 48,000 | 47,024 |
3.48%, 11/1/2051 | 10,000 | 6,472 |
NVIDIA Corp. | ||
0.58%, 6/14/2024 | 80,000 | 77,032 |
2.00%, 6/15/2031 | 123,000 | 101,750 |
NXP BV (China) | ||
2.70%, 5/1/2025 | 14,000 | 13,331 |
4.30%, 6/18/2029 | 5,000 | 4,684 |
3.25%, 5/11/2041 | 42,000 | 29,872 |
3.25%, 11/30/2051 | 22,000 | 14,181 |
QUALCOMM, Inc. | ||
3.25%, 5/20/2027 | 161,000 | 152,016 |
1.30%, 5/20/2028 | 104,000 | 88,525 |
Skyworks Solutions, Inc. 3.00%, 6/1/2031 | 50,000 | 40,751 |
Texas Instruments, Inc. | ||
4.10%, 8/16/2052 | 55,000 | 46,486 |
5.00%, 3/14/2053 | 5,000 | 4,857 |
1,422,030 | ||
122 | J.P. Morgan Exchange-Traded Funds | August 31, 2023 |
INVESTMENTS | PRINCIPAL AMOUNT($) | VALUE($) |
Corporate Bonds — continued | ||
Software — 2.0% | ||
Microsoft Corp. | ||
2.70%, 2/12/2025 | 10,000 | 9,670 |
3.13%, 11/3/2025 | 13,000 | 12,546 |
3.50%, 2/12/2035 | 11,000 | 9,996 |
4.10%, 2/6/2037 | 288,000 | 273,486 |
3.95%, 8/8/2056 | 12,000 | 10,278 |
2.68%, 6/1/2060 | 6,000 | 3,855 |
Oracle Corp. | ||
3.40%, 7/8/2024 | 203,000 | 199,191 |
2.95%, 11/15/2024 | 19,000 | 18,404 |
2.50%, 4/1/2025 | 40,000 | 38,094 |
4.30%, 7/8/2034 | 5,000 | 4,481 |
6.50%, 4/15/2038 | 15,000 | 15,806 |
3.60%, 4/1/2050 | 206,000 | 141,821 |
3.95%, 3/25/2051 | 73,000 | 53,235 |
3.85%, 4/1/2060 | 10,000 | 6,777 |
4.10%, 3/25/2061 | 69,000 | 49,011 |
Roper Technologies, Inc. 1.75%, 2/15/2031 | 79,000 | 61,958 |
Salesforce, Inc. | ||
0.63%, 7/15/2024 | 9,000 | 8,629 |
1.50%, 7/15/2028 | 67,000 | 57,627 |
3.05%, 7/15/2061 | 10,000 | 6,451 |
VMware, Inc. 2.20%, 8/15/2031 | 62,000 | 48,248 |
1,029,564 | ||
Specialized REITs — 1.5% | ||
American Tower Corp. | ||
3.38%, 10/15/2026 | 159,000 | 149,020 |
2.10%, 6/15/2030 | 170,000 | 135,817 |
Crown Castle, Inc. | ||
1.35%, 7/15/2025 | 75,000 | 69,253 |
3.10%, 11/15/2029 | 39,000 | 33,934 |
5.20%, 2/15/2049 | 32,000 | 28,349 |
3.25%, 1/15/2051 | 61,000 | 39,656 |
EPR Properties 4.50%, 6/1/2027 | 16,000 | 14,435 |
Equinix, Inc. | ||
2.00%, 5/15/2028 | 10,000 | 8,542 |
3.20%, 11/18/2029 | 130,000 | 113,975 |
Public Storage Operating Co. | ||
1.85%, 5/1/2028 | 109,000 | 94,714 |
2.25%, 11/9/2031 | 45,000 | 36,429 |
Weyerhaeuser Co. 4.00%, 3/9/2052 | 36,000 | 27,875 |
751,999 | ||
INVESTMENTS | PRINCIPAL AMOUNT($) | VALUE($) |
Specialty Retail — 1.2% | ||
AutoZone, Inc. 1.65%, 1/15/2031 | 80,000 | 62,162 |
Home Depot, Inc. (The) | ||
2.70%, 4/15/2030 | 186,000 | 163,444 |
5.88%, 12/16/2036 | 20,000 | 21,458 |
3.30%, 4/15/2040 | 68,000 | 53,680 |
4.20%, 4/1/2043 | 21,000 | 18,349 |
3.13%, 12/15/2049 | 53,000 | 37,132 |
2.38%, 3/15/2051 | 30,000 | 17,805 |
3.50%, 9/15/2056 | 11,000 | 8,056 |
Lowe's Cos., Inc. | ||
3.10%, 5/3/2027 | 40,000 | 37,240 |
2.80%, 9/15/2041 | 122,000 | 83,694 |
3.70%, 4/15/2046 | 32,000 | 23,926 |
4.05%, 5/3/2047 | 40,000 | 31,212 |
4.45%, 4/1/2062 | 8,000 | 6,241 |
5.85%, 4/1/2063 | 20,000 | 19,504 |
O'Reilly Automotive, Inc. 4.35%, 6/1/2028 | 44,000 | 42,734 |
626,637 | ||
Technology Hardware, Storage & Peripherals — 1.6% | ||
Apple, Inc. | ||
1.80%, 9/11/2024 | 43,000 | 41,496 |
2.75%, 1/13/2025 | 50,000 | 48,435 |
0.55%, 8/20/2025 | 14,000 | 12,864 |
0.70%, 2/8/2026 | 29,000 | 26,225 |
2.90%, 9/12/2027 | 27,000 | 25,260 |
1.40%, 8/5/2028 | 74,000 | 63,651 |
4.50%, 2/23/2036 | 50,000 | 49,949 |
3.45%, 2/9/2045 | 29,000 | 23,446 |
4.65%, 2/23/2046 | 153,000 | 146,240 |
2.65%, 5/11/2050 | 83,000 | 55,268 |
2.65%, 2/8/2051 | 52,000 | 34,466 |
2.55%, 8/20/2060 | 47,000 | 29,542 |
Dell International LLC | ||
6.02%, 6/15/2026 | 80,000 | 80,812 |
5.30%, 10/1/2029 | 40,000 | 39,491 |
3.45%, 12/15/2051 (e) | 43,000 | 28,078 |
HP, Inc. 6.00%, 9/15/2041 | 13,000 | 12,800 |
Western Digital Corp. | ||
4.75%, 2/15/2026 | 22,000 | 20,962 |
2.85%, 2/1/2029 | 98,000 | 78,945 |
817,930 | ||
August 31, 2023 | J.P. Morgan Exchange-Traded Funds | 123 |
AS OF August 31, 2023 (Unaudited) (continued)
INVESTMENTS | PRINCIPAL AMOUNT($) | VALUE($) |
Corporate Bonds — continued | ||
Textiles, Apparel & Luxury Goods — 0.1% | ||
NIKE, Inc. | ||
2.40%, 3/27/2025 | 29,000 | 27,768 |
3.88%, 11/1/2045 | 20,000 | 17,081 |
44,849 | ||
Tobacco — 0.8% | ||
Altria Group, Inc. | ||
4.25%, 8/9/2042 | 16,000 | 12,103 |
4.50%, 5/2/2043 | 10,000 | 7,802 |
5.95%, 2/14/2049 | 46,000 | 42,778 |
4.00%, 2/4/2061 | 70,000 | 47,394 |
BAT Capital Corp. (United Kingdom) | ||
3.22%, 8/15/2024 | 19,000 | 18,535 |
4.39%, 8/15/2037 | 118,000 | 93,278 |
5.28%, 4/2/2050 | 46,000 | 36,849 |
3.98%, 9/25/2050 | 15,000 | 9,910 |
5.65%, 3/16/2052 | 10,000 | 8,357 |
Philip Morris International, Inc. | ||
3.25%, 11/10/2024 | 16,000 | 15,580 |
4.38%, 11/15/2041 | 91,000 | 75,282 |
Reynolds American, Inc. (United Kingdom) 4.45%, 6/12/2025 | 48,000 | 46,957 |
414,825 | ||
Trading Companies & Distributors — 0.3% | ||
Air Lease Corp. | ||
3.38%, 7/1/2025 | 8,000 | 7,626 |
3.13%, 12/1/2030 | 11,000 | 9,185 |
2.88%, 1/15/2032 | 101,000 | 80,514 |
GATX Corp. 3.50%, 6/1/2032 | 38,000 | 31,938 |
WW Grainger, Inc. 3.75%, 5/15/2046 | 17,000 | 13,500 |
142,763 | ||
Water Utilities — 0.3% | ||
American Water Capital Corp. | ||
2.80%, 5/1/2030 | 90,000 | 78,020 |
3.75%, 9/1/2047 | 19,000 | 14,745 |
4.20%, 9/1/2048 | 11,000 | 9,069 |
3.45%, 5/1/2050 | 22,000 | 15,957 |
Essential Utilities, Inc. | ||
3.57%, 5/1/2029 | 6,000 | 5,496 |
5.30%, 5/1/2052 | 15,000 | 13,591 |
136,878 | ||
Wireless Telecommunication Services — 1.6% | ||
America Movil SAB de CV (Mexico) 3.63%, 4/22/2029 | 200,000 | 183,097 |
INVESTMENTS | PRINCIPAL AMOUNT($) | VALUE($) |
Wireless Telecommunication Services — continued | ||
Rogers Communications, Inc. (Canada) | ||
4.50%, 3/15/2042 | 92,000 | 73,963 |
3.70%, 11/15/2049 | 27,000 | 18,302 |
T-Mobile USA, Inc. | ||
3.50%, 4/15/2025 | 44,000 | 42,538 |
3.75%, 4/15/2027 | 31,000 | 29,357 |
2.40%, 3/15/2029 | 150,000 | 129,014 |
3.88%, 4/15/2030 | 218,000 | 198,544 |
3.00%, 2/15/2041 | 14,000 | 9,869 |
3.60%, 11/15/2060 | 18,000 | 12,042 |
Vodafone Group plc (United Kingdom) | ||
4.38%, 5/30/2028 | 54,000 | 52,988 |
5.00%, 5/30/2038 | 30,000 | 27,886 |
5.13%, 6/19/2059 | 71,000 | 60,579 |
838,179 | ||
Total Corporate Bonds (Cost $54,315,694) | 50,336,380 | |
Asset-Backed Securities — 0.2% | ||
Delta Air Lines Pass-Through Trust Series 2020-1, Class AA, 2.00%, 6/10/2028 | 45,134 | 39,805 |
United Airlines Pass-Through Trust Series 2020-1, Class B, 4.88%, 1/15/2026 | 62,064 | 60,260 |
Total Asset-Backed Securities (Cost $99,203) | 100,065 | |
SHARES | ||
Short-Term Investments — 0.8% | ||
Investment Companies — 0.8% | ||
JPMorgan U.S. Government Money Market Fund Class IM Shares, 5.27% (f) (g) (Cost $383,195) | 383,195 | 383,195 |
Total Investments — 99.2% (Cost $54,798,092) | 50,819,640 | |
Other Assets Less Liabilities — 0.8% | 433,716 | |
NET ASSETS — 100.0% | 51,253,356 | |
Percentages indicated are based on net assets. |
Abbreviations | |
CME | Chicago Mercantile Exchange |
ICE | Intercontinental Exchange |
LIBOR | London Interbank Offered Rate |
OYJ | Public Limited Company |
REIT | Real Estate Investment Trust |
SOFR | Secured Overnight Financing Rate |
124 | J.P. Morgan Exchange-Traded Funds | August 31, 2023 |
SOFRINDX | Compounding index of the Secured Overnight Financing Rate |
USD | United States Dollar |
(a) | Step bond. Interest rate is a fixed rate for an initial period that either resets at a specific date or may reset in the future contingent upon a predetermined trigger. The interest rate shown is the current rate as of August 31, 2023. |
(b) | Variable or floating rate security, linked to the referenced benchmark. The interest rate shown is the current rate as of August 31, 2023. |
(c) | Contingent Capital security (“CoCo”). CoCos are hybrid debt securities that may be convertible into equity or may be written down if a pre-specified trigger event occurs. The total value of aggregate CoCo holdings at August 31, 2023 is $258,986 or 0.51% of the Fund’s net assets as of August 31, 2023. |
(d) | Variable or floating rate security, the interest rate of which adjusts periodically based on changes in current interest rates and prepayments on the underlying pool of assets. The interest rate shown is the current rate as of August 31, 2023. |
(e) | Securities exempt from registration under Rule 144A or section 4(a)(2), of the Securities Act of 1933, as amended. |
(f) | Investment in an affiliated fund, which is registered under the Investment Company Act of 1940, as amended, and is advised by J.P. Morgan Investment Management Inc. |
(g) | The rate shown is the current yield as of August 31, 2023. |
August 31, 2023 | J.P. Morgan Exchange-Traded Funds | 125 |
AS OF August 31, 2023 (Unaudited)
INVESTMENTS | PRINCIPAL AMOUNT($) | VALUE($) |
Foreign Government Securities — 88.1% | ||
Angola — 1.7% | ||
Republic of Angola | ||
8.25%, 5/9/2028 (a) | 5,804,000 | 5,065,151 |
8.75%, 4/14/2032 (a) | 1,717,000 | 1,407,991 |
9.13%, 11/26/2049 (a) | 5,933,000 | 4,388,403 |
10,861,545 | ||
Azerbaijan — 0.4% | ||
Republic of Azerbaijan | ||
3.50%, 9/1/2032 (a) | 2,742,000 | 2,291,160 |
3.50%, 9/1/2032 (b) | 1,000 | 836 |
2,291,996 | ||
Bahrain — 4.3% | ||
CBB International Sukuk Co. 5 SPC 5.62%, 2/12/2024 (a) | 1,263,000 | 1,256,773 |
CBB International Sukuk Co. 7 SPC 6.88%, 10/5/2025 (a) | 659,000 | 670,974 |
CBB International Sukuk Programme Co. SPC | ||
6.25%, 11/14/2024 (a) | 486,000 | 484,756 |
3.95%, 9/16/2027 (a) | 1,815,000 | 1,687,424 |
CBB International Sukuk Programme Co. WLL 3.88%, 5/18/2029 (a) | 206,000 | 182,784 |
Kingdom of Bahrain | ||
7.00%, 1/26/2026 (a) | 3,391,000 | 3,436,473 |
7.00%, 10/12/2028 (a) | 2,727,000 | 2,797,493 |
7.00%, 10/12/2028 (b) | 402,000 | 412,392 |
6.75%, 9/20/2029 (a) | 3,603,000 | 3,591,758 |
5.63%, 9/30/2031 (a) | 2,792,000 | 2,564,033 |
5.45%, 9/16/2032 (a) | 3,576,000 | 3,199,805 |
5.25%, 1/25/2033 (a) | 3,582,000 | 3,138,441 |
5.63%, 5/18/2034 (a) | 3,942,000 | 3,458,435 |
6.00%, 9/19/2044 (a) | 576,000 | 462,298 |
27,343,839 | ||
Bolivia, Plurinational State of — 0.2% | ||
Plurinational State of Bolivia 4.50%, 3/20/2028 (a) | 2,268,000 | 1,416,797 |
Brazil — 7.6% | ||
Federative Republic of Brazil | ||
8.88%, 4/15/2024 | 220,000 | 223,278 |
4.25%, 1/7/2025 | 1,759,000 | 1,725,544 |
2.88%, 6/6/2025 (c) | 3,823,000 | 3,639,190 |
6.00%, 4/7/2026 | 3,208,000 | 3,276,619 |
4.63%, 1/13/2028 | 2,332,000 | 2,259,032 |
4.50%, 5/30/2029 | 5,692,000 | 5,376,094 |
3.88%, 6/12/2030 | 5,911,000 | 5,231,472 |
INVESTMENTS | PRINCIPAL AMOUNT($) | VALUE($) |
Brazil—continued | ||
3.75%, 9/12/2031 | 5,105,000 | 4,388,666 |
6.00%, 10/20/2033 | 6,155,000 | 5,988,815 |
8.25%, 1/20/2034 | 3,991,000 | 4,489,356 |
5.00%, 1/27/2045 | 2,951,000 | 2,293,901 |
5.63%, 2/21/2047 | 1,583,000 | 1,321,599 |
4.75%, 1/14/2050 | 10,583,000 | 7,764,112 |
47,977,678 | ||
Chile — 1.4% | ||
Republic of Chile | ||
2.45%, 1/31/2031 | 1,223,000 | 1,038,217 |
2.55%, 7/27/2033 (c) | 3,886,000 | 3,117,777 |
3.10%, 5/7/2041 | 4,183,000 | 3,044,638 |
3.50%, 4/15/2053 | 272,000 | 195,661 |
3.25%, 9/21/2071 (c) | 2,351,000 | 1,473,019 |
8,869,312 | ||
China — 1.1% | ||
People's Republic of China | ||
1.95%, 12/3/2024 (a) | 3,027,000 | 2,908,977 |
1.25%, 10/26/2026 (a) | 804,000 | 719,427 |
1.25%, 10/26/2026 (a) (c) | 1,221,000 | 1,092,563 |
2.63%, 11/2/2027 (a) | 1,448,000 | 1,350,984 |
3.50%, 10/19/2028 (a) | 776,000 | 747,335 |
1.75%, 10/26/2031 (a) | 426,000 | 355,919 |
7,175,205 | ||
Colombia — 6.7% | ||
Republic of Colombia | ||
4.00%, 2/26/2024 | 358,000 | 353,214 |
3.88%, 4/25/2027 | 4,407,000 | 4,056,864 |
4.50%, 3/15/2029 | 3,986,000 | 3,551,247 |
3.00%, 1/30/2030 | 3,089,000 | 2,450,967 |
3.13%, 4/15/2031 | 2,701,000 | 2,079,770 |
3.25%, 4/22/2032 | 4,462,000 | 3,346,188 |
8.00%, 4/20/2033 (c) | 2,725,000 | 2,817,160 |
7.50%, 2/2/2034 | 1,483,000 | 1,470,958 |
7.38%, 9/18/2037 | 5,194,000 | 5,026,701 |
6.13%, 1/18/2041 | 3,527,000 | 2,912,420 |
4.13%, 2/22/2042 | 5,821,000 | 3,761,705 |
5.63%, 2/26/2044 | 3,007,000 | 2,282,373 |
5.00%, 6/15/2045 | 3,987,000 | 2,802,223 |
5.20%, 5/15/2049 | 5,202,000 | 3,657,474 |
4.13%, 5/15/2051 | 1,460,000 | 876,730 |
3.88%, 2/15/2061 (c) | 2,396,000 | 1,345,737 |
42,791,731 | ||
126 | J.P. Morgan Exchange-Traded Funds | August 31, 2023 |
INVESTMENTS | PRINCIPAL AMOUNT($) | VALUE($) |
Foreign Government Securities — continued | ||
Costa Rica — 1.2% | ||
Republic of Costa Rica | ||
6.13%, 2/19/2031 (a) | 2,659,000 | 2,647,965 |
7.00%, 4/4/2044 (a) (c) | 2,389,000 | 2,360,595 |
7.00%, 4/4/2044 (a) | 256,000 | 252,956 |
7.16%, 3/12/2045 (a) | 2,260,000 | 2,265,402 |
7,526,918 | ||
Dominican Republic — 7.1% | ||
Dominican Republic Government Bond | ||
5.50%, 1/27/2025 (a) | 2,120,000 | 2,094,369 |
6.88%, 1/29/2026 (a) | 2,416,000 | 2,425,712 |
5.95%, 1/25/2027 (a) | 3,169,000 | 3,096,208 |
5.95%, 1/25/2027 (b) | 198,000 | 193,452 |
6.00%, 7/19/2028 (a) | 4,988,000 | 4,813,271 |
6.00%, 7/19/2028 (b) | 208,000 | 200,714 |
4.50%, 1/30/2030 (a) | 6,967,000 | 6,058,434 |
4.88%, 9/23/2032 (a) | 5,037,000 | 4,259,841 |
6.00%, 2/22/2033 (a) | 4,333,000 | 3,994,679 |
6.00%, 2/22/2033 (a) (c) | 1,339,000 | 1,234,451 |
5.30%, 1/21/2041 (a) | 3,711,000 | 2,899,812 |
7.45%, 4/30/2044 (b) | 302,000 | 290,089 |
6.85%, 1/27/2045 (a) | 3,093,000 | 2,764,338 |
6.85%, 1/27/2045 (b) | 357,000 | 319,065 |
6.50%, 2/15/2048 (a) | 925,000 | 790,126 |
6.50%, 2/15/2048 (a) (c) | 343,000 | 292,987 |
6.40%, 6/5/2049 (b) | 2,968,000 | 2,479,348 |
6.40%, 6/5/2049 (a) | 3,176,000 | 2,653,104 |
5.88%, 1/30/2060 (a) | 5,184,000 | 3,974,625 |
44,834,625 | ||
Ethiopia — 0.3% | ||
Federal Democratic Republic of Ethiopia 6.63%, 12/11/2024 (a) | 2,502,000 | 1,627,551 |
Guatemala — 0.4% | ||
Republic of Guatemala | ||
6.60%, 6/13/2036 (a) (c) | 212,000 | 212,530 |
6.60%, 6/13/2036 (a) | 200,000 | 200,500 |
6.13%, 6/1/2050 (a) | 2,694,000 | 2,454,045 |
2,867,075 | ||
Hungary — 1.3% | ||
Hungary Government Bond | ||
5.38%, 3/25/2024 | 110,000 | 109,573 |
6.13%, 5/22/2028 (a) | 1,394,000 | 1,411,439 |
5.25%, 6/16/2029 (a) | 3,098,000 | 3,026,994 |
2.13%, 9/22/2031 (a) | 616,000 | 473,494 |
INVESTMENTS | PRINCIPAL AMOUNT($) | VALUE($) |
Hungary—continued | ||
7.63%, 3/29/2041 | 912,000 | 1,006,839 |
3.13%, 9/21/2051 (a) | 759,000 | 457,457 |
6.75%, 9/25/2052 (a) | 1,564,000 | 1,585,677 |
8,071,473 | ||
India — 0.5% | ||
Export-Import Bank of India | ||
3.25%, 1/15/2030 (a) | 974,000 | 845,490 |
2.25%, 1/13/2031 (a) | 2,738,000 | 2,173,370 |
3,018,860 | ||
Indonesia — 2.6% | ||
Perusahaan Penerbit SBSN Indonesia III | ||
4.35%, 9/10/2024 (a) | 1,112,000 | 1,098,623 |
4.33%, 5/28/2025 (a) | 367,000 | 360,926 |
2.80%, 6/23/2030 (a) | 781,000 | 676,697 |
2.55%, 6/9/2031 (a) | 600,000 | 502,950 |
Republic of Indonesia | ||
3.85%, 7/18/2027 (a) | 2,032,000 | 1,940,682 |
3.50%, 1/11/2028 | 3,780,000 | 3,524,170 |
4.55%, 1/11/2028 | 200,000 | 195,320 |
4.10%, 4/24/2028 | 2,225,000 | 2,124,675 |
8.50%, 10/12/2035 (a) | 769,000 | 976,645 |
6.63%, 2/17/2037 (a) | 1,007,000 | 1,119,673 |
6.63%, 2/17/2037 (b) | 145,000 | 161,224 |
7.75%, 1/17/2038 (a) | 100,000 | 122,508 |
4.20%, 10/15/2050 (c) | 3,444,000 | 2,859,691 |
3.05%, 3/12/2051 | 1,484,000 | 1,053,863 |
16,717,647 | ||
Iraq — 0.5% | ||
Republic of Iraq 5.80%, 1/15/2028 (a) | 3,521,250 | 3,235,606 |
Ivory Coast — 0.4% | ||
Republic of Cote d'Ivoire | ||
6.13%, 6/15/2033 (a) | 2,831,000 | 2,411,785 |
6.13%, 6/15/2033 (b) | 415,000 | 353,547 |
2,765,332 | ||
Jamaica — 1.9% | ||
Jamaica Government Bond | ||
6.75%, 4/28/2028 | 5,224,000 | 5,390,123 |
8.00%, 3/15/2039 | 204,000 | 239,773 |
7.88%, 7/28/2045 | 5,890,000 | 6,687,094 |
12,316,990 | ||
August 31, 2023 | J.P. Morgan Exchange-Traded Funds | 127 |
AS OF August 31, 2023 (Unaudited) (continued)
INVESTMENTS | PRINCIPAL AMOUNT($) | VALUE($) |
Foreign Government Securities — continued | ||
Jordan — 1.5% | ||
Hashemite Kingdom of Jordan | ||
6.13%, 1/29/2026 (b) | 346,000 | 343,962 |
5.75%, 1/31/2027 (a) | 4,160,000 | 4,042,522 |
5.85%, 7/7/2030 (a) | 3,620,000 | 3,331,015 |
7.38%, 10/10/2047 (a) | 1,771,000 | 1,544,684 |
9,262,183 | ||
Kazakhstan — 0.8% | ||
Republic of Kazakhstan | ||
3.88%, 10/14/2024 (b) | 350,000 | 346,339 |
3.88%, 10/14/2024 (a) | 2,395,000 | 2,369,949 |
5.13%, 7/21/2025 (a) | 307,000 | 313,057 |
4.88%, 10/14/2044 (a) | 300,000 | 266,886 |
6.50%, 7/21/2045 (a) | 1,451,000 | 1,516,643 |
4,812,874 | ||
Kenya — 2.0% | ||
Republic of Kenya | ||
6.88%, 6/24/2024 (a) | 839,000 | 793,182 |
7.25%, 2/28/2028 (b) | 355,000 | 300,461 |
7.25%, 2/28/2028 (a) | 4,076,000 | 3,449,804 |
8.00%, 5/22/2032 (a) | 1,592,000 | 1,314,499 |
6.30%, 1/23/2034 (a) | 3,631,000 | 2,618,968 |
8.25%, 2/28/2048 (a) | 5,617,000 | 4,175,958 |
12,652,872 | ||
Kuwait — 0.4% | ||
State of Kuwait 3.50%, 3/20/2027 (a) | 2,440,000 | 2,331,591 |
Malaysia — 0.1% | ||
Malaysia Sovereign Sukuk Bhd. 3.04%, 4/22/2025 (a) | 341,000 | 329,965 |
Mexico — 2.0% | ||
United Mexican States | ||
4.13%, 1/21/2026 | 261,000 | 256,740 |
3.75%, 1/11/2028 | 1,594,000 | 1,508,020 |
4.50%, 4/22/2029 | 200,000 | 192,982 |
2.66%, 5/24/2031 (c) | 3,574,000 | 2,959,129 |
2.66%, 5/24/2031 | 235,000 | 194,571 |
6.05%, 1/11/2040 | 370,000 | 369,097 |
4.75%, 3/8/2044 | 2,268,000 | 1,902,217 |
4.60%, 1/23/2046 | 3,869,000 | 3,121,122 |
4.40%, 2/12/2052 (c) | 2,721,000 | 2,084,150 |
3.75%, 4/19/2071 | 298,000 | 190,422 |
5.75%, 10/12/2110 | 122,000 | 106,699 |
12,885,149 | ||
INVESTMENTS | PRINCIPAL AMOUNT($) | VALUE($) |
Morocco — 1.4% | ||
Kingdom of Morocco | ||
5.95%, 3/8/2028 (a) | 785,000 | 783,100 |
3.00%, 12/15/2032 (a) | 6,193,000 | 4,825,338 |
6.50%, 9/8/2033 (a) | 1,877,000 | 1,881,336 |
4.00%, 12/15/2050 (a) | 2,378,000 | 1,544,535 |
9,034,309 | ||
Oman — 7.8% | ||
Oman Sovereign Sukuk SAOC | ||
4.40%, 6/1/2024 (a) | 877,000 | 861,197 |
5.93%, 10/31/2025 (a) | 1,371,000 | 1,374,538 |
4.88%, 6/15/2030 (a) | 3,810,000 | 3,759,137 |
Sultanate of Oman Government Bond | ||
4.88%, 2/1/2025 (a) | 3,251,000 | 3,194,628 |
4.75%, 6/15/2026 (a) | 4,694,000 | 4,569,186 |
5.38%, 3/8/2027 (a) | 3,516,000 | 3,454,681 |
6.75%, 10/28/2027 (a) | 4,066,000 | 4,186,557 |
5.63%, 1/17/2028 (a) | 4,587,000 | 4,528,561 |
6.00%, 8/1/2029 (a) | 3,997,000 | 4,018,184 |
6.00%, 8/1/2029 (b) | 221,000 | 222,171 |
6.25%, 1/25/2031 (a) | 5,205,000 | 5,261,370 |
7.38%, 10/28/2032 (a) | 3,035,000 | 3,304,022 |
6.50%, 3/8/2047 (a) | 3,115,000 | 2,918,444 |
6.50%, 3/8/2047 (b) | 1,016,000 | 951,890 |
6.75%, 1/17/2048 (a) | 3,263,000 | 3,149,643 |
7.00%, 1/25/2051 (a) | 3,893,000 | 3,856,250 |
49,610,459 | ||
Panama — 1.7% | ||
Republic of Panama | ||
3.16%, 1/23/2030 | 2,062,000 | 1,794,600 |
2.25%, 9/29/2032 | 4,038,000 | 3,062,459 |
6.70%, 1/26/2036 | 717,000 | 752,334 |
4.30%, 4/29/2053 | 1,102,000 | 792,680 |
3.87%, 7/23/2060 | 3,672,000 | 2,348,244 |
4.50%, 1/19/2063 (c) | 2,742,000 | 1,959,159 |
10,709,476 | ||
Paraguay — 1.0% | ||
Republic of Paraguay | ||
4.95%, 4/28/2031 (a) | 853,000 | 805,138 |
6.10%, 8/11/2044 (a) | 3,650,000 | 3,376,067 |
5.40%, 3/30/2050 (a) | 2,317,000 | 1,933,375 |
6,114,580 | ||
128 | J.P. Morgan Exchange-Traded Funds | August 31, 2023 |
INVESTMENTS | PRINCIPAL AMOUNT($) | VALUE($) |
Foreign Government Securities — continued | ||
Peru — 1.7% | ||
Republic of Peru | ||
4.13%, 8/25/2027 | 545,000 | 526,759 |
1.86%, 12/1/2032 | 2,363,000 | 1,782,269 |
8.75%, 11/21/2033 | 1,166,000 | 1,452,241 |
3.00%, 1/15/2034 | 2,014,000 | 1,634,905 |
6.55%, 3/14/2037 | 769,000 | 836,802 |
3.30%, 3/11/2041 | 2,868,000 | 2,128,659 |
2.78%, 12/1/2060 | 1,039,000 | 608,449 |
3.23%, 7/28/2121 | 3,217,000 | 1,861,163 |
10,831,247 | ||
Philippines — 2.2% | ||
Republic of Philippines | ||
10.63%, 3/16/2025 | 1,501,000 | 1,619,624 |
5.50%, 3/30/2026 | 2,114,000 | 2,135,943 |
3.75%, 1/14/2029 | 229,000 | 215,533 |
9.50%, 2/2/2030 | 613,000 | 755,584 |
2.46%, 5/5/2030 | 1,509,000 | 1,285,185 |
5.00%, 1/13/2037 (c) | 1,406,000 | 1,369,036 |
3.70%, 3/1/2041 | 2,190,000 | 1,755,942 |
3.70%, 2/2/2042 | 2,092,000 | 1,667,931 |
2.65%, 12/10/2045 | 4,781,000 | 3,095,124 |
13,899,902 | ||
Poland — 0.5% | ||
Republic of Poland | ||
3.25%, 4/6/2026 | 1,960,000 | 1,872,721 |
5.75%, 11/16/2032 | 426,000 | 442,541 |
5.50%, 4/4/2053 | 790,000 | 767,438 |
3,082,700 | ||
Qatar — 2.1% | ||
State of Qatar | ||
3.40%, 4/16/2025 (a) | 4,025,000 | 3,902,881 |
4.50%, 4/23/2028 (a) | 732,000 | 723,297 |
4.00%, 3/14/2029 (a) | 773,000 | 745,195 |
9.75%, 6/15/2030 (a) | 311,000 | 399,769 |
6.40%, 1/20/2040 (a) | 922,000 | 1,045,447 |
4.63%, 6/2/2046 (b) | 276,000 | 252,874 |
5.10%, 4/23/2048 (a) | 413,000 | 395,922 |
4.82%, 3/14/2049 (a) | 1,687,000 | 1,571,440 |
4.40%, 4/16/2050 (a) | 5,196,000 | 4,568,739 |
13,605,564 | ||
INVESTMENTS | PRINCIPAL AMOUNT($) | VALUE($) |
Romania — 1.4% | ||
Romania Government Bond | ||
3.00%, 2/27/2027 (a) | 3,170,000 | 2,900,994 |
5.25%, 11/25/2027 (a) | 440,000 | 430,909 |
3.63%, 3/27/2032 (a) | 476,000 | 398,460 |
6.00%, 5/25/2034 (a) | 434,000 | 422,364 |
6.13%, 1/22/2044 (a) | 4,078,000 | 3,844,290 |
4.00%, 2/14/2051 (a) | 688,000 | 469,285 |
7.63%, 1/17/2053 (a) | 632,000 | 678,515 |
9,144,817 | ||
Saudi Arabia — 3.3% | ||
Kingdom of Saudi Arabia | ||
4.00%, 4/17/2025 (a) | 3,159,000 | 3,078,098 |
2.50%, 2/3/2027 (a) | 3,594,000 | 3,300,945 |
3.63%, 3/4/2028 (a) | 3,838,000 | 3,621,575 |
4.50%, 4/17/2030 (b) | 282,000 | 274,502 |
2.25%, 2/2/2033 (a) | 3,610,000 | 2,857,098 |
4.50%, 10/26/2046 (a) | 4,410,000 | 3,714,058 |
4.63%, 10/4/2047 (a) | 2,167,000 | 1,836,186 |
4.63%, 10/4/2047 (b) | 247,000 | 209,293 |
5.25%, 1/16/2050 (a) | 1,358,000 | 1,253,869 |
KSA Sukuk Ltd. 2.25%, 5/17/2031 (a) | 861,000 | 716,068 |
20,861,692 | ||
Serbia — 0.7% | ||
Republic of Serbia | ||
2.13%, 12/1/2030 (a) | 2,122,000 | 1,609,643 |
6.50%, 9/26/2033 (a) | 2,929,000 | 2,885,270 |
4,494,913 | ||
South Africa — 5.6% | ||
Republic of South Africa | ||
5.88%, 9/16/2025 | 3,752,000 | 3,712,942 |
4.88%, 4/14/2026 | 3,260,000 | 3,130,513 |
4.85%, 9/27/2027 | 3,601,000 | 3,363,946 |
4.30%, 10/12/2028 | 2,946,000 | 2,598,136 |
4.85%, 9/30/2029 | 7,669,000 | 6,748,643 |
5.88%, 6/22/2030 | 3,637,000 | 3,305,196 |
5.38%, 7/24/2044 | 1,935,000 | 1,374,876 |
5.00%, 10/12/2046 | 2,721,000 | 1,794,064 |
5.65%, 9/27/2047 | 6,622,000 | 4,696,190 |
5.75%, 9/30/2049 | 1,751,000 | 1,237,379 |
7.30%, 4/20/2052 | 4,562,000 | 3,844,352 |
35,806,237 | ||
August 31, 2023 | J.P. Morgan Exchange-Traded Funds | 129 |
AS OF August 31, 2023 (Unaudited) (continued)
INVESTMENTS | PRINCIPAL AMOUNT($) | VALUE($) |
Foreign Government Securities — continued | ||
Trinidad and Tobago — 0.3% | ||
Republic of Trinidad and Tobago 4.50%, 8/4/2026 (a) | 1,906,000 | 1,833,763 |
Turkey — 8.1% | ||
Hazine Mustesarligi Varlik Kiralama A/S | ||
4.49%, 11/25/2024 (b) | 1,000 | 971 |
5.13%, 6/22/2026 (a) | 2,390,000 | 2,246,218 |
7.25%, 2/24/2027 (a) | 2,764,000 | 2,723,867 |
Republic of Turkey | ||
6.35%, 8/10/2024 | 1,600,000 | 1,597,696 |
7.38%, 2/5/2025 (c) | 3,732,000 | 3,747,786 |
6.38%, 10/14/2025 | 252,000 | 246,005 |
4.75%, 1/26/2026 | 4,696,000 | 4,404,331 |
4.25%, 4/14/2026 | 2,412,000 | 2,219,618 |
4.88%, 10/9/2026 | 3,967,000 | 3,655,035 |
6.00%, 3/25/2027 | 3,042,000 | 2,859,085 |
5.13%, 2/17/2028 | 2,737,000 | 2,460,289 |
6.13%, 10/24/2028 | 1,791,000 | 1,649,153 |
9.38%, 3/14/2029 | 322,000 | 333,608 |
7.63%, 4/26/2029 | 1,452,000 | 1,409,093 |
11.88%, 1/15/2030 | 245,000 | 288,211 |
9.13%, 7/13/2030 | 200,000 | 203,638 |
5.95%, 1/15/2031 | 5,289,000 | 4,571,706 |
5.88%, 6/26/2031 | 4,151,000 | 3,556,037 |
9.38%, 1/19/2033 | 1,806,000 | 1,880,245 |
6.50%, 9/20/2033 | 3,252,000 | 2,867,061 |
8.00%, 2/14/2034 | 113,000 | 111,252 |
6.88%, 3/17/2036 | 504,000 | 441,630 |
6.75%, 5/30/2040 | 1,639,000 | 1,362,124 |
6.00%, 1/14/2041 | 1,794,000 | 1,378,330 |
4.88%, 4/16/2043 | 1,466,000 | 971,386 |
5.75%, 5/11/2047 | 5,654,000 | 4,009,817 |
51,194,192 | ||
United Arab Emirates — 2.0% | ||
Sharjah Sukuk Program Ltd. 4.23%, 3/14/2028 (a) | 200,000 | 189,184 |
United Arab Emirates Government Bond | ||
2.50%, 4/16/2025 (a) | 3,098,000 | 2,956,452 |
3.13%, 10/11/2027 (a) | 2,028,000 | 1,907,070 |
1.63%, 6/2/2028 (a) | 2,942,000 | 2,559,540 |
1.88%, 9/15/2031 (a) | 234,000 | 191,424 |
2.88%, 10/19/2041 (a) | 319,000 | 232,286 |
5.25%, 1/30/2043 (a) | 200,000 | 181,656 |
3.13%, 9/30/2049 (a) | 1,604,000 | 1,118,726 |
3.13%, 9/30/2049 (b) | 265,000 | 184,827 |
INVESTMENTS | PRINCIPAL AMOUNT($) | VALUE($) |
United Arab Emirates—continued | ||
3.88%, 4/16/2050 (a) | 200,000 | 160,514 |
4.00%, 7/28/2050 (a) | 547,000 | 335,978 |
3.90%, 9/9/2050 (a) | 630,000 | 446,311 |
3.00%, 9/15/2051 (a) | 211,000 | 142,980 |
4.95%, 7/7/2052 (a) | 831,000 | 785,403 |
3.25%, 10/19/2061 (a) | 500,000 | 340,590 |
2.70%, 9/2/2070 (a) | 1,775,000 | 1,040,452 |
12,773,393 | ||
Uruguay — 1.5% | ||
Oriental Republic of Uruguay | ||
4.38%, 10/27/2027 (c) | 2,079,000 | 2,071,474 |
4.38%, 1/23/2031 (c) | 2,620,000 | 2,577,923 |
7.63%, 3/21/2036 | 100,000 | 120,981 |
5.10%, 6/18/2050 (c) | 2,895,000 | 2,791,967 |
4.98%, 4/20/2055 | 1,983,000 | 1,872,507 |
9,434,852 | ||
Vietnam — 0.4% | ||
Socialist Republic of Vietnam 4.80%, 11/19/2024 (a) | 2,642,000 | 2,582,872 |
Total Foreign Government Securities (Cost $570,179,280) | 558,999,782 | |
Corporate Bonds — 9.9% | ||
Azerbaijan — 0.6% | ||
Southern Gas Corridor CJSC | ||
6.88%, 3/24/2026 (a) | 3,475,000 | 3,505,545 |
6.88%, 3/24/2026 (b) | 393,000 | 396,455 |
3,902,000 | ||
Bahrain — 0.3% | ||
Oil and Gas Holding Co. BSCC (The) | ||
7.50%, 10/25/2027 (b) | 203,000 | 205,964 |
7.50%, 10/25/2027 (a) | 1,910,000 | 1,937,886 |
2,143,850 | ||
Chile — 0.6% | ||
Corp. Nacional del Cobre de Chile | ||
3.00%, 9/30/2029 (a) | 2,598,000 | 2,248,907 |
4.38%, 2/5/2049 (a) | 401,000 | 317,664 |
3.70%, 1/30/2050 (a) | 1,558,000 | 1,093,404 |
Empresa de Transporte de Pasajeros Metro SA 4.70%, 5/7/2050 (a) | 416,000 | 337,551 |
3,997,526 | ||
130 | J.P. Morgan Exchange-Traded Funds | August 31, 2023 |
INVESTMENTS | PRINCIPAL AMOUNT($) | VALUE($) |
Corporate Bonds — continued | ||
China — 1.4% | ||
CNAC HK Finbridge Co. Ltd. 4.13%, 7/19/2027 (a) | 200,000 | 188,366 |
Minmetals Bounteous Finance BVI Ltd. (US Treasury Yield Curve Rate T Note Constant Maturity 5 Year + 5.21%), 3.38%, 9/3/2024 (a) (d) (e) (f) | 762,000 | 739,872 |
Sinopec Group Overseas Development 2012 Ltd. 4.88%, 5/17/2042 (a) | 714,000 | 669,611 |
Sinopec Group Overseas Development 2017 Ltd. 3.63%, 4/12/2027 (b) | 200,000 | 191,464 |
Sinopec Group Overseas Development 2018 Ltd. | ||
2.15%, 5/13/2025 (a) | 2,214,000 | 2,088,732 |
2.95%, 11/12/2029 (a) | 805,000 | 719,903 |
2.70%, 5/13/2030 (a) | 791,000 | 697,559 |
2.30%, 1/8/2031 (a) | 748,000 | 634,274 |
SPIC MTN Co. Ltd. 1.63%, 7/27/2025 (a) | 1,921,000 | 1,780,921 |
State Grid Overseas Investment BVI Ltd. | ||
3.50%, 5/4/2027 (b) | 2,000 | 1,903 |
3.50%, 5/4/2027 (a) | 954,000 | 907,893 |
8,620,498 | ||
Hungary — 0.2% | ||
MFB Magyar Fejlesztesi Bank Zrt. 6.50%, 6/29/2028 (a) | 1,082,000 | 1,082,909 |
Indonesia — 0.7% | ||
Pelabuhan Indonesia Persero PT 4.25%, 5/5/2025 (a) | 1,686,000 | 1,643,412 |
Pertamina Persero PT | ||
5.63%, 5/20/2043 (a) | 200,000 | 185,916 |
4.18%, 1/21/2050 (a) | 1,842,000 | 1,394,670 |
Perusahaan Perseroan Persero PT Perusahaan Listrik Negara | ||
6.15%, 5/21/2048 (a) | 476,000 | 449,115 |
4.00%, 6/30/2050 (a) | 700,000 | 486,591 |
4,159,704 | ||
Malaysia — 1.4% | ||
Petronas Capital Ltd. | ||
3.50%, 3/18/2025 (a) | 1,338,000 | 1,295,612 |
3.50%, 4/21/2030 (a) | 1,586,000 | 1,440,802 |
2.48%, 1/28/2032 (a) | 4,593,000 | 3,768,006 |
4.55%, 4/21/2050 (a) | 320,000 | 278,166 |
3.40%, 4/28/2061 (a) (c) | 2,940,000 | 1,976,238 |
8,758,824 | ||
INVESTMENTS | PRINCIPAL AMOUNT($) | VALUE($) |
Mexico — 1.6% | ||
Banco Nacional de Comercio Exterior SNC 4.38%, 10/14/2025 (a) | 1,004,000 | 977,776 |
Mexico City Airport Trust 5.50%, 7/31/2047 (a) | 409,000 | 338,448 |
Petroleos Mexicanos | ||
4.50%, 1/23/2026 (c) | 2,057,000 | 1,807,074 |
6.88%, 8/4/2026 (c) | 853,000 | 775,249 |
6.70%, 2/16/2032 | 2,141,000 | 1,610,567 |
6.63%, 6/15/2035 | 1,556,000 | 1,062,942 |
6.50%, 6/2/2041 | 3,451,000 | 2,135,134 |
6.75%, 9/21/2047 | 2,777,000 | 1,704,773 |
10,411,963 | ||
Panama — 0.2% | ||
Aeropuerto Internacional de Tocumen SA 5.13%, 8/11/2061 (a) | 579,000 | 433,775 |
Banco Nacional de Panama 2.50%, 8/11/2030 (a) | 801,000 | 637,476 |
1,071,251 | ||
Peru — 0.2% | ||
Petroleos del Peru SA | ||
4.75%, 6/19/2032 (a) | 913,000 | 675,419 |
5.63%, 6/19/2047 (a) | 1,191,000 | 761,978 |
1,437,397 | ||
Poland — 0.1% | ||
Bank Gospodarstwa Krajowego 5.38%, 5/22/2033 (a) | 774,000 | 756,585 |
Qatar — 0.4% | ||
QatarEnergy Trading LLC 3.13%, 7/12/2041 (a) | 3,829,000 | 2,804,628 |
Saudi Arabia — 0.2% | ||
Gaci First Investment Co. | ||
4.88%, 2/14/2035 (a) | 1,017,000 | 955,604 |
5.13%, 2/14/2053 (a) | 502,000 | 433,878 |
1,389,482 | ||
South Africa — 1.0% | ||
Eskom Holdings SOC Ltd. | ||
7.13%, 2/11/2025 (b) | 327,000 | 322,200 |
7.13%, 2/11/2025 (a) | 1,403,000 | 1,382,404 |
6.35%, 8/10/2028 (b) | 240,000 | 224,431 |
6.35%, 8/10/2028 (a) | 2,311,000 | 2,161,085 |
Transnet SOC Ltd. 8.25%, 2/6/2028 (a) | 2,230,000 | 2,164,862 |
6,254,982 | ||
August 31, 2023 | J.P. Morgan Exchange-Traded Funds | 131 |
AS OF August 31, 2023 (Unaudited) (continued)
INVESTMENTS | PRINCIPAL AMOUNT($) | VALUE($) |
Corporate Bonds — continued | ||
United Arab Emirates — 1.0% | ||
Abu Dhabi Crude Oil Pipeline LLC 4.60%, 11/2/2047 (a) | 805,000 | 713,987 |
DP World Ltd. | ||
6.85%, 7/2/2037 (a) | 630,000 | 673,381 |
5.63%, 9/25/2048 (a) | 253,000 | 233,446 |
DP World Salaam (US Treasury Yield Curve Rate T Note Constant Maturity 5 Year + 5.75%), 6.00%, 10/1/2025 (a) (d) (e) (f) | 618,000 | 612,963 |
MDGH GMTN RSC Ltd. | ||
2.88%, 11/7/2029 (a) | 1,500,000 | 1,333,800 |
2.88%, 5/21/2030 (a) | 402,000 | 352,956 |
3.38%, 3/28/2032 (a) | 2,414,000 | 2,149,305 |
3.40%, 6/7/2051 (a) | 200,000 | 142,086 |
6,211,924 | ||
Total Corporate Bonds (Cost $64,817,142) | 63,003,523 | |
SHARES | ||
Short-Term Investments — 2.1% | ||
Investment Companies — 0.2% | ||
JPMorgan U.S. Government Money Market Fund Class IM Shares, 5.27% (g) (h)(Cost $1,266,971) | 1,266,971 | 1,266,971 |
Investment of Cash Collateral from Securities Loaned — 1.9% | ||
JPMorgan U.S. Government Money Market Fund Class IM Shares, 5.27% (g) (h)(Cost $12,190,150) | 12,190,150 | 12,190,150 |
Total Short-Term Investments (Cost $13,457,121) | 13,457,121 | |
Total Investments — 100.1% (Cost $648,453,543) | 635,460,426 | |
Liabilities in Excess of Other Assets — (0.1)% | (916,735 ) | |
NET ASSETS — 100.0% | 634,543,691 | |
Percentages indicated are based on net assets. |
Abbreviations | |
CJSC | Closed Joint Stock Company |
GMTN | Global Medium Term Note |
MTN | Medium Term Note |
PT | Limited liability company |
SPC | Special purpose company |
(a) | Security exempt from registration pursuant to Regulation S under the Securities Act of 1933, as amended. Regulation S applies to securities offerings that are made outside of the United States and do not involve direct selling efforts in the United States and as such may have restrictions on resale. |
(b) | Securities exempt from registration under Rule 144A or section 4(a)(2), of the Securities Act of 1933, as amended. |
(c) | The security or a portion of this security is on loan at August 31, 2023. The total value of securities on loan at August 31, 2023 is $11,783,585. |
(d) | Security is an interest bearing note with preferred security characteristics. |
(e) | Security is perpetual and thus, does not have a predetermined maturity date. The coupon rate for this security is fixed for a period of time and may be structured to adjust thereafter. The date shown, if applicable, reflects the next call date. The coupon rate shown is the rate in effect as of August 31, 2023. |
(f) | Variable or floating rate security, linked to the referenced benchmark. The interest rate shown is the current rate as of August 31, 2023. |
(g) | Investment in an affiliated fund, which is registered under the Investment Company Act of 1940, as amended, and is advised by J.P. Morgan Investment Management Inc. |
(h) | The rate shown is the current yield as of August 31, 2023. |
132 | J.P. Morgan Exchange-Traded Funds | August 31, 2023 |
AS OF August 31, 2023 (Unaudited)
JPMorgan BetaBuilders 1-5 Year U.S. Aggregate Bond ETF | JPMorgan BetaBuilders U.S. Aggregate Bond ETF | JPMorgan BetaBuilders U.S. TIPS 0-5 Year ETF | |
ASSETS: | |||
Investments in non-affiliates, at value | $15,137,369 | $1,982,070,100 | $7,513,589 |
Investments in affiliates, at value | 214,237 | 172,100,666 | 17,010 |
Investments of cash collateral received from securities loaned, at value (See Note 2.D.) | — | 14,514,556 | — |
Cash | — | 930,211 | 93 |
Foreign currency, at value | 22 | 165 | — |
Segregated cash balance with Authorized Participant for deposit securities | 23,440 | 16,482,200 | — |
Receivables: | |||
Investment securities sold | 501,414 | 14,084,102 | 36,610 |
Investment securities sold — delayed delivery securities | — | 21,063,324 | — |
Interest from non-affiliates | 65,497 | 10,741,519 | 12,314 |
Dividends from affiliates | 31 | 24,869 | 3 |
Securities lending income (See Note 2.D.) | 233 | 14,210 | — |
Total Assets | 15,942,243 | 2,232,025,922 | 7,579,619 |
LIABILITIES: | |||
Payables: | |||
Due to custodian | 2,743 | — | — |
Investment securities purchased | 443,086 | 18,281,080 | 93 |
Investment securities purchased — delayed delivery securities | 178,327 | 182,607,440 | — |
Collateral received on securities loaned (See Note 2.D.) | — | 14,514,556 | — |
Collateral upon return of deposit securities | 23,440 | 16,482,200 | — |
Accrued liabilities: | |||
Management fees (See Note 3.A.) | 641 | 26,532 | 448 |
Total Liabilities | 648,237 | 231,911,808 | 541 |
Net Assets | $15,294,006 | $2,000,114,114 | $7,579,078 |
NET ASSETS: | |||
Paid-in-Capital | $17,816,023 | $2,199,229,778 | $7,679,062 |
Total distributable earnings (loss) | (2,522,017 ) | (199,115,664 ) | (99,984 ) |
Total Net Assets | $15,294,006 | $2,000,114,114 | $7,579,078 |
Outstanding number of shares (unlimited number of shares authorized - par value $0.0001) | 324,946 | 43,923,203 | 77,500 |
Net asset value, per share | $47.07 | $45.54 | $97.79 |
Cost of investments in non-affiliates | $15,820,345 | $2,115,072,073 | $7,638,688 |
Cost of investments in affiliates | 214,237 | 172,100,666 | 17,008 |
Cost of foreign currency | 20 | 162 | — |
Investment securities on loan, at value (See Note 2.D.) | — | 13,939,821 | — |
Cost of investment of cash collateral (See Note 2.D.) | — | 14,514,556 | — |
August 31, 2023 | J.P. Morgan Exchange-Traded Funds | 133 |
AS OF August 31, 2023 (Unaudited) (continued)
JPMorgan BetaBuilders U.S. Treasury Bond 1-3 Year ETF | JPMorgan BetaBuilders U.S. Treasury Bond 20+ Year ETF | JPMorgan BetaBuilders U.S. Treasury Bond 3-10 Year ETF | |
ASSETS: | |||
Investments in non-affiliates, at value | $4,384,637 | $51,755,224 | $4,330,778 |
Investments in affiliates, at value | 13,853 | 23,667 | 19,814 |
Cash | 45 | 274 | 47 |
Receivables: | |||
Investment securities sold | 401,392 | 1,530,515 | 200,737 |
Interest from non-affiliates | 22,142 | 322,616 | 19,671 |
Dividends from affiliates | 2 | 3 | 3 |
Total Assets | 4,822,071 | 53,632,299 | 4,571,050 |
LIABILITIES: | |||
Payables: | |||
Investment securities purchased | 400,049 | 1,358,260 | 201,835 |
Accrued liabilities: | |||
Management fees (See Note 3.A.) | 260 | 3,052 | 258 |
Total Liabilities | 400,309 | 1,361,312 | 202,093 |
Net Assets | $4,421,762 | $52,270,987 | $4,368,957 |
NET ASSETS: | |||
Paid-in-Capital | $4,483,871 | $54,716,187 | $4,477,639 |
Total distributable earnings (loss) | (62,109 ) | (2,445,200 ) | (108,682 ) |
Total Net Assets | $4,421,762 | $52,270,987 | $4,368,957 |
Outstanding number of shares (unlimited number of shares authorized - par value $0.0001) | 45,000 | 565,000 | 45,000 |
Net asset value, per share | $98.26 | $92.52 | $97.09 |
Cost of investments in non-affiliates | $4,417,018 | $54,276,789 | $4,444,955 |
Cost of investments in affiliates | 13,853 | 23,665 | 19,814 |
134 | J.P. Morgan Exchange-Traded Funds | August 31, 2023 |
JPMorgan BetaBuilders USD High Yield Corporate Bond ETF | JPMorgan BetaBuilders USD Investment Grade Corporate Bond ETF | JPMorgan USD Emerging Markets Sovereign Bond ETF | |
ASSETS: | |||
Investments in non-affiliates, at value | $423,573,218 | $50,436,445 | $622,003,305 |
Investments in affiliates, at value | 3,924,056 | 383,195 | 1,266,971 |
Investments of cash collateral received from securities loaned, at value (See Note 2.D.) | — | — | 12,190,150 |
Cash | 18,276 | — | 223,811 |
Foreign currency, at value | — | — | 1,964 |
Segregated cash balance with Authorized Participant for deposit securities | 5,157,489 | — | 3,071,276 |
Receivables: | |||
Investment securities sold | 5,000,082 | 490,679 | 9,788,897 |
Interest from non-affiliates | 7,304,511 | 570,481 | 8,911,567 |
Dividends from affiliates | 567 | 55 | 183 |
Securities lending income (See Note 2.D.) | — | — | 8,732 |
Total Assets | 444,978,199 | 51,880,855 | 657,466,856 |
LIABILITIES: | |||
Payables: | |||
Due to custodian | — | 483 | — |
Investment securities purchased | 6,385,563 | 623,308 | 7,460,356 |
Collateral received on securities loaned (See Note 2.D.) | — | — | 12,190,150 |
Fund shares redeemed | 135,289 | — | — |
Collateral upon return of deposit securities | 5,157,489 | — | 3,071,276 |
Accrued liabilities: | |||
Management fees (See Note 3.A.) | 45,104 | 3,708 | 201,383 |
Total Liabilities | 11,723,445 | 627,499 | 22,923,165 |
Net Assets | $433,254,754 | $51,253,356 | $634,543,691 |
NET ASSETS: | |||
Paid-in-Capital | $514,881,769 | $58,728,798 | $660,149,466 |
Total distributable earnings (loss) | (81,627,015 ) | (7,475,442 ) | (25,605,775 ) |
Total Net Assets | $433,254,754 | $51,253,356 | $634,543,691 |
Outstanding number of shares (unlimited number of shares authorized - par value $0.0001) | 9,700,000 | 1,150,000 | 16,500,000 |
Net asset value, per share | $44.67 | $44.57 | $38.46 |
Cost of investments in non-affiliates | $443,138,912 | $54,414,897 | $634,996,422 |
Cost of investments in affiliates | 3,924,056 | 383,195 | 1,266,971 |
Cost of foreign currency | — | — | 1,949 |
Investment securities on loan, at value (See Note 2.D.) | — | — | 11,783,585 |
Cost of investment of cash collateral (See Note 2.D.) | — | — | 12,190,150 |
August 31, 2023 | J.P. Morgan Exchange-Traded Funds | 135 |
FOR THE SIX MONTHS ENDED August 31, 2023 (Unaudited)
JPMorgan BetaBuilders 1-5 Year U.S. Aggregate Bond ETF | JPMorgan BetaBuilders U.S. Aggregate Bond ETF | JPMorgan BetaBuilders U.S. TIPS 0-5 Year ETF (a) | |
INVESTMENT INCOME: | |||
Interest income from non-affiliates | $221,082 | $30,215,315 | $136,583 |
Interest income from affiliates | — | 12 | — |
Dividend income from affiliates | 4,617 | 4,129,704 | 2,715 |
Income from securities lending (net) (See Note 2.D.) | 733 | 56,785 | — |
Total investment income | 226,432 | 34,401,816 | 139,298 |
EXPENSES: | |||
Management fees (See Note 3.A.) | 4,009 | 182,213 | 1,542 |
Interest expense to affiliates | — | 59 | — |
Total expenses | 4,009 | 182,272 | 1,542 |
Net investment income (loss) | 222,423 | 34,219,544 | 137,756 |
REALIZED/UNREALIZED GAINS (LOSSES): | |||
Net realized gain (loss) on transactions from: | |||
Investments in non-affiliates | (377,410 ) | (12,611,620 ) | (13,110 ) |
Investments in affiliates | — | — | 2 |
In-kind redemptions of investments in non-affiliates (See Note 4) | (1,085,141 ) | (11,891,268 ) | — |
Foreign currency transactions | — | (1 ) | — |
Net realized gain (loss) | (1,462,551 ) | (24,502,889 ) | (13,108 ) |
Change in net unrealized appreciation/depreciation on: | |||
Investments in non-affiliates | 1,484,328 | (8,155,385 ) | (125,099 ) |
Investments in affiliates | — | — | 2 |
Foreign currency translations | — | 4 | — |
Change in net unrealized appreciation/depreciation | 1,484,328 | (8,155,381 ) | (125,097 ) |
Net realized/unrealized gains (losses) | 21,777 | (32,658,270 ) | (138,205 ) |
Change in net assets resulting from operations | $244,200 | $1,561,274 | $(449 ) |
136 | J.P. Morgan Exchange-Traded Funds | August 31, 2023 |
JPMorgan BetaBuilders U.S. Treasury Bond 1-3 Year ETF (a) | JPMorgan BetaBuilders U.S. Treasury Bond 20+ Year ETF (a) | JPMorgan BetaBuilders U.S. Treasury Bond 3-10 Year ETF (a) | |
INVESTMENT INCOME: | |||
Interest income from non-affiliates | $94,526 | $549,440 | $61,678 |
Dividend income from affiliates | 169 | 578 | 144 |
Total investment income | 94,695 | 550,018 | 61,822 |
EXPENSES: | |||
Management fees (See Note 3.A.) | 1,477 | 9,137 | 1,123 |
Total expenses | 1,477 | 9,137 | 1,123 |
Net investment income (loss) | 93,218 | 540,881 | 60,699 |
REALIZED/UNREALIZED GAINS (LOSSES): | |||
Net realized gain (loss) on transactions from: | |||
Investments in non-affiliates | (39,773 ) | (113,900 ) | (8,505 ) |
Investments in affiliates | 3 | 20 | 1 |
Net realized gain (loss) | (39,770 ) | (113,880 ) | (8,504 ) |
Change in net unrealized appreciation/ depreciation on: | |||
Investments in non-affiliates | (32,381 ) | (2,521,565 ) | (114,177 ) |
Investments in affiliates | — | 2 | — |
Change in net unrealized appreciation/ depreciation | (32,381 ) | (2,521,563 ) | (114,177 ) |
Net realized/unrealized gains (losses) | (72,151 ) | (2,635,443 ) | (122,681 ) |
Change in net assets resulting from operations | $21,067 | $(2,094,562 ) | $(61,982 ) |
August 31, 2023 | J.P. Morgan Exchange-Traded Funds | 137 |
FOR THE SIX MONTHS ENDED August 31, 2023 (Unaudited) (continued)
JPMorgan BetaBuilders USD High Yield Corporate Bond ETF | JPMorgan BetaBuilders USD Investment Grade Corporate Bond ETF | JPMorgan USD Emerging Markets Sovereign Bond ETF | |
INVESTMENT INCOME: | |||
Interest income from non-affiliates | $11,437,108 | $1,114,566 | $9,954,014 |
Interest income from affiliates | 10 | — | 5 |
Dividend income from affiliates | 43,464 | 5,659 | 26,689 |
Income from securities lending (net) (See Note 2.D.) | — | — | 58,223 |
Total investment income | 11,480,582 | 1,120,225 | 10,038,931 |
EXPENSES: | |||
Management fees (See Note 3.A.) | 249,908 | 21,853 | 583,513 |
Interest expense to affiliates | 53 | — | — |
Excise tax expense | — | — | 6,205 |
Total expenses | 249,961 | 21,853 | 589,718 |
Net investment income (loss) | 11,230,621 | 1,098,372 | 9,449,213 |
REALIZED/UNREALIZED GAINS (LOSSES): | |||
Net realized gain (loss) on transactions from: | |||
Investments in non-affiliates | (4,792,861 ) | (234,956 ) | (2,328,984 ) |
In-kind redemptions of investments in non-affiliates (See Note 4) | (5,227,736 ) | (450,982 ) | (989,274 ) |
Net realized gain (loss) | (10,020,597 ) | (685,938 ) | (3,318,258 ) |
Change in net unrealized appreciation/depreciation on: | |||
Investments in non-affiliates | 11,812,520 | 379,332 | (3,296,167 ) |
Investments in affiliates | — | — | 200 |
Foreign currency translations | — | — | 16 |
Change in net unrealized appreciation/depreciation | 11,812,520 | 379,332 | (3,295,951 ) |
Net realized/unrealized gains (losses) | 1,791,923 | (306,606 ) | (6,614,209 ) |
Change in net assets resulting from operations | $13,022,544 | $791,766 | $2,835,004 |
138 | J.P. Morgan Exchange-Traded Funds | August 31, 2023 |
FOR THE PERIODS INDICATED
JPMorgan BetaBuilders 1-5 Year U.S. Aggregate Bond ETF | JPMorgan BetaBuilders U.S. Aggregate Bond ETF | |||
Six Months Ended August 31, 2023 (Unaudited) | Year Ended February 28, 2023 | Six Months Ended August 31, 2023 (Unaudited) | Year Ended February 28, 2023 | |
CHANGE IN NET ASSETS RESULTING FROM OPERATIONS: | ||||
Net investment income (loss) | $222,423 | $618,439 | $34,219,544 | $27,085,611 |
Net realized gain (loss) | (1,462,551 ) | (671,516 ) | (24,502,889 ) | (60,818,934 ) |
Change in net unrealized appreciation/depreciation | 1,484,328 | (1,509,960 ) | (8,155,381 ) | (86,597,705 ) |
Change in net assets resulting from operations | 244,200 | (1,563,037 ) | 1,561,274 | (120,331,028 ) |
DISTRIBUTIONS TO SHAREHOLDERS: | ||||
Total distributions to shareholders | (252,831 ) | (595,951 ) | (30,726,236 ) | (25,156,927 ) |
CAPITAL TRANSACTIONS: | ||||
Change in net assets resulting from capital transactions | (19,916,154 ) | 2,484,884 | 717,178,099 | 433,321,856 |
NET ASSETS: | ||||
Change in net assets | (19,924,785 ) | 325,896 | 688,013,137 | 287,833,901 |
Beginning of period | 35,218,791 | 34,892,895 | 1,312,100,977 | 1,024,267,076 |
End of period | $15,294,006 | $35,218,791 | $2,000,114,114 | $1,312,100,977 |
CAPITAL TRANSACTIONS: | ||||
Proceeds from shares issued | $2,347,957 | $9,656,173 | $1,132,070,692 | $874,225,342 |
Cost of shares redeemed | (22,264,111 ) | (7,171,289 ) | (414,892,593 ) | (440,903,486 ) |
Total change in net assets resulting from capital transactions | $(19,916,154 ) | $2,484,884 | $717,178,099 | $433,321,856 |
SHARE TRANSACTIONS: | ||||
Issued | 50,000 | 200,000 | 24,375,000 | 18,200,000 |
Redeemed | (475,000 ) | (150,000 ) | (9,025,000 ) | (9,275,000 ) |
Net increase (decrease) in shares from share transactions | (425,000 ) | 50,000 | 15,350,000 | 8,925,000 |
August 31, 2023 | J.P. Morgan Exchange-Traded Funds | 139 |
FOR THE PERIODS INDICATED (continued)
JPMorgan BetaBuilders U.S. TIPS 0-5 Year ETF | JPMorgan BetaBuilders U.S. Treasury Bond 1-3 Year ETF | |
Period Ended August 31, 2023 (Unaudited)(a) | Period Ended August 31, 2023 (Unaudited)(b) | |
CHANGE IN NET ASSETS RESULTING FROM OPERATIONS: | ||
Net investment income (loss) | $137,756 | $93,218 |
Net realized gain (loss) | (13,108 ) | (39,770 ) |
Change in net unrealized appreciation/depreciation | (125,097 ) | (32,381 ) |
Change in net assets resulting from operations | (449 ) | 21,067 |
DISTRIBUTIONS TO SHAREHOLDERS: | ||
Total distributions to shareholders | (99,535 ) | (83,176 ) |
CAPITAL TRANSACTIONS: | ||
Change in net assets resulting from capital transactions | 7,679,062 | 4,483,871 |
NET ASSETS: | ||
Change in net assets | 7,579,078 | 4,421,762 |
Beginning of period | — | — |
End of period | $7,579,078 | $4,421,762 |
CAPITAL TRANSACTIONS: | ||
Proceeds from shares issued | $7,679,062 | $9,421,491 |
Cost of shares redeemed | — | (4,937,620 ) |
Total change in net assets resulting from capital transactions | $7,679,062 | $4,483,871 |
SHARE TRANSACTIONS: | ||
Issued | 77,500 | 95,000 |
Redeemed | — | (50,000 ) |
Net increase (decrease) in shares from share transactions | 77,500 | 45,000 |
140 | J.P. Morgan Exchange-Traded Funds | August 31, 2023 |
JPMorgan BetaBuilders U.S. Treasury Bond 20+ Year ETF | JPMorgan BetaBuilders U.S. Treasury Bond 3-10 Year ETF | |
Period Ended August 31, 2023 (Unaudited)(a) | Period Ended August 31, 2023 (Unaudited)(a) | |
CHANGE IN NET ASSETS RESULTING FROM OPERATIONS: | ||
Net investment income (loss) | $540,881 | $60,699 |
Net realized gain (loss) | (113,880 ) | (8,504 ) |
Change in net unrealized appreciation/depreciation | (2,521,563 ) | (114,177 ) |
Change in net assets resulting from operations | (2,094,562 ) | (61,982 ) |
DISTRIBUTIONS TO SHAREHOLDERS: | ||
Total distributions to shareholders | (350,638 ) | (46,700 ) |
CAPITAL TRANSACTIONS: | ||
Change in net assets resulting from capital transactions | 54,716,187 | 4,477,639 |
NET ASSETS: | ||
Change in net assets | 52,270,987 | 4,368,957 |
Beginning of period | — | — |
End of period | $52,270,987 | $4,368,957 |
CAPITAL TRANSACTIONS: | ||
Proceeds from shares issued | $54,716,187 | $4,477,639 |
Total change in net assets resulting from capital transactions | $54,716,187 | $4,477,639 |
SHARE TRANSACTIONS: | ||
Issued | 565,000 | 45,000 |
Net increase (decrease) in shares from share transactions | 565,000 | 45,000 |
August 31, 2023 | J.P. Morgan Exchange-Traded Funds | 141 |
FOR THE PERIODS INDICATED (continued)
JPMorgan BetaBuilders USD High Yield Corporate Bond ETF | JPMorgan BetaBuilders USD Investment Grade Corporate Bond ETF | |||
Six Months Ended August 31, 2023 (Unaudited) | Year Ended February 28, 2023 | Six Months Ended August 31, 2023 (Unaudited) | Year Ended February 28, 2023 | |
CHANGE IN NET ASSETS RESULTING FROM OPERATIONS: | ||||
Net investment income (loss) | $11,230,621 | $27,163,062 | $1,098,372 | $1,436,779 |
Net realized gain (loss) | (10,020,597 ) | (110,265,808 ) | (685,938 ) | (4,223,398 ) |
Change in net unrealized appreciation/depreciation | 11,812,520 | 25,674,401 | 379,332 | (2,465,567 ) |
Change in net assets resulting from operations | 13,022,544 | (57,428,345 ) | 791,766 | (5,252,186 ) |
DISTRIBUTIONS TO SHAREHOLDERS: | ||||
Total distributions to shareholders | (11,063,018 ) | (32,446,703 ) | (1,071,674 ) | (1,407,883 ) |
CAPITAL TRANSACTIONS: | ||||
Change in net assets resulting from capital transactions | 93,815,922 | (1,026,204,410 ) | 6,830,508 | (115,868 ) |
NET ASSETS: | ||||
Change in net assets | 95,775,448 | (1,116,079,458 ) | 6,550,600 | (6,775,937 ) |
Beginning of period | 337,479,306 | 1,453,558,764 | 44,702,756 | 51,478,693 |
End of period | $433,254,754 | $337,479,306 | $51,253,356 | $44,702,756 |
CAPITAL TRANSACTIONS: | ||||
Proceeds from shares issued | $173,270,904 | $175,355,945 | $13,600,452 | $25,305,039 |
Cost of shares redeemed | (79,454,982 ) | (1,201,560,355 ) | (6,769,944 ) | (25,420,907 ) |
Total change in net assets resulting from capital transactions | $93,815,922 | $(1,026,204,410 ) | $6,830,508 | $(115,868 ) |
SHARE TRANSACTIONS: | ||||
Issued | 3,900,000 | 3,900,000 | 300,000 | 550,000 |
Redeemed | (1,800,000 ) | (25,600,000 ) | (150,000 ) | (550,000 ) |
Net increase (decrease) in shares from share transactions | 2,100,000 | (21,700,000 ) | 150,000 | — |
142 | J.P. Morgan Exchange-Traded Funds | August 31, 2023 |
JPMorgan USD Emerging Markets Sovereign Bond ETF | ||
Six Months Ended August 31, 2023 (Unaudited) | Year Ended February 28, 2023 | |
CHANGE IN NET ASSETS RESULTING FROM OPERATIONS: | ||
Net investment income (loss) | $9,449,213 | $5,523,518 |
Net realized gain (loss) | (3,318,258 ) | (8,459,957 ) |
Change in net unrealized appreciation/depreciation | (3,295,951 ) | (1,837,558 ) |
Change in net assets resulting from operations | 2,835,004 | (4,773,997 ) |
DISTRIBUTIONS TO SHAREHOLDERS: | ||
Total distributions to shareholders | (7,314,412 ) | (4,644,990 ) |
CAPITAL TRANSACTIONS: | ||
Change in net assets resulting from capital transactions | 411,438,734 | 167,527,357 |
NET ASSETS: | ||
Change in net assets | 406,959,326 | 158,108,370 |
Beginning of period | 227,584,365 | 69,475,995 |
End of period | $634,543,691 | $227,584,365 |
CAPITAL TRANSACTIONS: | ||
Proceeds from shares issued | $488,286,118 | $167,527,357 |
Cost of shares redeemed | (76,847,384 ) | — |
Total change in net assets resulting from capital transactions | $411,438,734 | $167,527,357 |
SHARE TRANSACTIONS: | ||
Issued | 12,600,000 | 4,300,000 |
Redeemed | (2,000,000 ) | — |
Net increase (decrease) in shares from share transactions | 10,600,000 | 4,300,000 |
August 31, 2023 | J.P. Morgan Exchange-Traded Funds | 143 |
FOR THE PERIODS INDICATED
Per share operating performance | |||||||
Investment operations | Distributions | ||||||
Net asset value, beginning of period | Net investment income (loss) (b) | Net realized and unrealized gains (losses) on investments | Total from investment operations | Net investment income | Net realized gain | Total distributions | |
JPMorgan BetaBuilders 1-5 Year U.S. Aggregate Bond ETF | |||||||
Six Months Ended August 31, 2023 (Unaudited) | $46.96 | $0.63 | $0.14 | $0.77 | $(0.66 ) | $— | $(0.66 ) |
Year Ended February 28, 2023 | 49.85 | 0.81 | (2.92 ) | (2.11 ) | (0.78 ) | — | (0.78 ) |
Year Ended February 28, 2022 (f) | 51.87 | 0.53 | (1.72 ) | (1.19 ) | (0.57 ) | (0.26 ) | (0.83 ) |
Year Ended February 28, 2021 (f) | 51.72 | 0.85 | 0.34 | 1.19 | (0.83 ) | (0.21 ) | (1.04 ) |
March 12, 2019 (g) through February 29, 2020 (f) | 50.00 | 1.17 | 1.76 | 2.93 | (1.21 ) | — | (1.21 ) |
JPMorgan BetaBuilders U.S. Aggregate Bond ETF | |||||||
Six Months Ended August 31, 2023 (Unaudited) | 45.92 | 0.87 | (0.47 ) | 0.40 | (0.78 ) | — | (0.78 ) |
Year Ended February 28, 2023 | 52.13 | 1.13 | (6.27 ) | (5.14 ) | (1.07 ) | — | (1.07 ) |
Year Ended February 28, 2022 (f) | 54.39 | 0.71 | (2.19 ) | (1.48 ) | (0.72 ) | (0.06 ) | (0.78 ) |
Year Ended February 28, 2021 (f) | 54.86 | 0.89 | (0.32 ) | 0.57 | (0.85 ) | (0.19 ) | (1.04 ) |
Year Ended February 29, 2020 (f) | 50.63 | 1.39 | 4.35 | 5.74 | (1.44 ) | (0.07 ) | (1.51 ) |
December 12, 2018 (g) through February 28, 2019 (f) | 50.00 | 0.36 | 0.58 | 0.94 | (0.31 ) | — | (0.31 ) |
JPMorgan BetaBuilders U.S. TIPS 0-5 Year ETF | |||||||
May 10, 2023 (g) through August 31, 2023 (Unaudited) | 99.50 | 1.88 | (2.31 ) | (0.43 ) | (1.28 ) | — | (1.28 ) |
JPMorgan BetaBuilders U.S. Treasury Bond 1-3 Year ETF | |||||||
April 19, 2023 (g) through August 31, 2023 (Unaudited) | 99.50 | 1.59 | (1.30 ) | 0.29 | (1.53 ) | — | (1.53 ) |
JPMorgan BetaBuilders U.S. Treasury Bond 20+ Year ETF | |||||||
April 19, 2023 (g) through August 31, 2023 (Unaudited) | 99.50 | 1.44 | (7.38 ) | (5.94 ) | (1.04 ) | — | (1.04 ) |
JPMorgan BetaBuilders U.S. Treasury Bond 3-10 Year ETF | |||||||
April 19, 2023 (g) through August 31, 2023 (Unaudited) | 99.50 | 1.35 | (2.72 ) | (1.37 ) | (1.04 ) | — | (1.04 ) |
(a) | Annualized for periods less than one year, unless otherwise noted. |
(b) | Calculated based upon average shares outstanding. |
(c) | Not annualized for periods less than one year. |
(d) | Includes adjustments in accordance with accounting principles generally accepted in the United States of America and as such, the net asset values for financial reporting purposes and the returns based upon those net asset values may differ from the net asset values and returns for shareholder transactions. |
(e) | Prior to December 9, 2019, market price return was calculated assuming an initial investment made at the market price at the beginning of the reporting period, reinvestment of all dividends and distributions at market price during the period, and sale at the market price on the last day of the period. The price used to calculate the market price return was the midpoint of the bid/ask spread at the close of business on the listing exchange of the Fund. Effective December 9, 2019, the closing price was used to calculate the market price return; however, any prices used in the calculation for market price return prior to December 9, 2019, would have used the midpoint of the bid/ask spread at the close of business on the exchange. |
(f) | Per share amounts reflects a 1:2 reverse stock split that occurred on April 12, 2021. See Note 1. |
(g) | Commencement of operations. |
(h) | Since the shares of the Fund did not trade in the secondary market until the day after the Fund’s inception, for the period from the inception to the first day of secondary market trading, the net asset value is used as a proxy for the secondary market trading price to calculate the market returns. |
(i) | Prior to November 1, 2019, the Fund may have waived fees if expenses exceeded the expense cap. On November 1, 2019, the Fund adopted a unitary fee structure where a management fee is accrued by the Fund based on prior day net assets and other expenses are paid by the Advisor. |
(j) | Certain non-recurring expenses incurred by the Portfolio were not annualized for the period indicated. |
144 | J.P. Morgan Exchange-Traded Funds | August 31, 2023 |
Ratios/Supplemental data | ||||||||
Ratios to average net assets (a) | ||||||||
Net asset value, end of period | Market price, end of period | Total return (c)(d) | Market price total return (c)(e) | Net assets, end of period | Net expenses | Net investment income (loss) | Expenses without waivers and reimbursements | Portfolio turnover rate (c) |
$47.07 | $47.08 | 1.65 % | 1.58 % | $15,294,006 | 0.05 % | 2.66 % | 0.05 % | 25 % |
46.96 | 47.00 | (4.24 ) | (4.20 ) | 35,218,791 | 0.10 | 1.70 | 0.10 | 60 |
49.85 | 49.87 | (2.31 ) | (2.44 ) | 34,892,895 | 0.05 | 1.02 | 0.05 | 45 |
51.87 | 51.96 | 2.32 | 2.55 | 59,654,406 | 0.05 | 1.62 | 0.05 | 40 |
51.72 | 51.68 | 5.93 | 5.85 (h) | 37,495,084 | 0.05 | 2.38 | 0.05 | 56 |
45.54 | 45.60 | 0.87 | 1.00 | 2,000,114,114 | 0.02 | 3.75 | 0.02 | 70 |
45.92 | 45.92 | (9.91 ) | (9.93 ) | 1,312,100,977 | 0.06 | 2.39 | 0.06 | 107 |
52.13 | 52.14 | (2.76 ) | (2.69 ) | 1,024,267,076 | 0.07 | 1.32 | 0.07 | 78 |
54.39 | 54.36 | 1.04 | 0.85 | 826,789,330 | 0.07 | 1.60 | 0.07 | 64 |
54.86 | 54.92 | 11.46 | 11.49 | 543,070,946 | 0.07 | 2.61 | 0.20 (i) | 57 |
50.63 | 50.68 | 1.90 | 1.98 (h) | 98,730,082 | 0.07 (j) | 3.26 | 1.14 (i)(j) | 53 |
97.79 | 97.88 | (0.42 ) | (0.33 ) | 7,579,078 | 0.07 | 6.22 | 0.07 | 9 |
98.26 | 98.31 | 0.30 | 0.35 | 4,421,762 | 0.07 | 4.37 | 0.07 | 121 |
92.52 | 92.58 | (6.01 ) | (5.95 ) | 52,270,987 | 0.07 | 4.15 | 0.07 | 15 |
97.09 | 97.13 | (1.39 ) | (1.35 ) | 4,368,957 | 0.07 | 3.75 | 0.07 | 17 |
August 31, 2023 | J.P. Morgan Exchange-Traded Funds | 145 |
FOR THE PERIODS INDICATED (continued)
Per share operating performance | |||||||
Investment operations | Distributions | ||||||
Net asset value, beginning of period | Net investment income (loss) (b) | Net realized and unrealized gains (losses) on investments | Total from investment operations | Net investment income | Net realized gain | Total distributions | |
JPMorgan BetaBuilders USD High Yield Corporate Bond ETF | |||||||
Six Months Ended August 31, 2023 (Unaudited) | $44.41 | $1.49 | $0.23 | $1.72 | $(1.46 ) | $— | $(1.46 ) |
Year Ended February 28, 2023 | 49.61 | 2.26 | (4.84 ) | (2.58 ) | (2.62 ) | — | (2.62 ) |
Year Ended February 28, 2022 | 51.64 | 1.97 | (1.79 ) | 0.18 | (2.21 ) | — | (2.21 ) |
Year Ended February 28, 2021 | 50.31 | 2.12 | 1.31 (f) | 3.43 | (2.07 ) | (0.03 ) | (2.10 ) |
Year Ended February 29, 2020 | 49.86 | 2.50 | 0.53 | 3.03 | (2.58 ) | — | (2.58 ) |
Year Ended February 28, 2019 | 50.09 | 2.47 | (0.23 ) | 2.24 | (2.47 ) | — | (2.47 ) |
JPMorgan BetaBuilders USD Investment Grade Corporate Bond ETF | |||||||
Six Months Ended August 31, 2023 (Unaudited) | 44.70 | 1.01 | (0.16 ) | 0.85 | (0.98 ) | — | (0.98 ) |
Year Ended February 28, 2023 | 51.48 | 1.55 | (6.80 ) | (5.25 ) | (1.53 ) | — | (1.53 ) |
Year Ended February 28, 2022 | 55.33 | 1.38 | (3.34 ) | (1.96 ) | (1.40 ) | (0.49 ) | (1.89 ) |
Year Ended February 28, 2021 | 56.27 | 1.58 | (0.31 ) | 1.27 | (1.46 ) | (0.75 ) | (2.21 ) |
Year Ended February 29, 2020 | 51.19 | 1.95 | 5.96 | 7.91 | (1.93 ) | (0.90 ) | (2.83 ) |
December 12, 2018 (h) through February 28, 2019 | 50.00 | 0.44 | 1.19 | 1.63 | (0.44 ) | — | (0.44 ) |
JPMorgan USD Emerging Markets Sovereign Bond ETF | |||||||
Six Months Ended August 31, 2023 (Unaudited) | 38.57 | 1.20 | (0.14 ) | 1.06 | (1.17 ) | — | (1.17 ) |
Year Ended February 28, 2023 | 43.42 | 2.20 | (5.07 ) | (2.87 ) | (1.98 ) | — | (1.98 ) |
Year Ended February 28, 2022 | 49.27 | 2.03 | (5.81 ) | (3.78 ) | (2.07 ) | — | (2.07 ) |
Year Ended February 28, 2021 | 50.95 | 2.17 | (1.83 ) | 0.34 | (2.02 ) | — | (2.02 ) |
Year Ended February 29, 2020 | 47.52 | 2.32 | 3.40 | 5.72 | (2.29 ) | — | (2.29 ) |
Year Ended February 28, 2019 | 48.83 | 2.31 | (1.30 ) | 1.01 | (2.32 ) | — | (2.32 ) |
(a) | Annualized for periods less than one year, unless otherwise noted. |
(b) | Calculated based upon average shares outstanding. |
(c) | Not annualized for periods less than one year. |
(d) | Includes adjustments in accordance with accounting principles generally accepted in the United States of America and as such, the net asset values for financial reporting purposes and the returns based upon those net asset values may differ from the net asset values and returns for shareholder transactions. |
(e) | Prior to December 9, 2019, market price return was calculated assuming an initial investment made at the market price at the beginning of the reporting period, reinvestment of all dividends and distributions at market price during the period, and sale at the market price on the last day of the period. The price used to calculate the market price return was the midpoint of the bid/ask spread at the close of business on the listing exchange of the Fund. Effective December 9, 2019, the closing price was used to calculate the market price return; however, any prices used in the calculation for market price return prior to December 9, 2019, would have used the midpoint of the bid/ask spread at the close of business on the exchange. |
(f) | Calculation of the net realized and unrealized gains (losses) per share does not correlate with the Fund’s net realized and unrealized gains (losses) presented in the Statement of Operations due to the timing of capital transactions in relation to the fluctuating market values of the Fund’s investments. |
(g) | Prior to November 1, 2019, the Fund may have waived fees if expenses exceeded the expense cap. On November 1, 2019, the Fund adopted a unitary fee structure where a management fee is accrued by the Fund based on prior day net assets and other expenses are paid by the Advisor. |
(h) | Commencement of operations. |
(i) | Since the shares of the Fund did not trade in the secondary market until the day after the Fund’s inception, for the period from the inception to the first day of secondary market trading, the net asset value is used as a proxy for the secondary market trading price to calculate the market returns. |
(j) | Certain non-recurring expenses incurred by the Portfolio were not annualized for the period indicated. |
146 | J.P. Morgan Exchange-Traded Funds | August 31, 2023 |
Ratios/Supplemental data | ||||||||
Ratios to average net assets (a) | ||||||||
Net asset value, end of period | Market price, end of period | Total return (c)(d) | Market price total return (c)(e) | Net assets, end of period | Net expenses | Net investment income (loss) | Expenses without waivers and reimbursements | Portfolio turnover rate (c) |
$44.67 | $44.84 | 3.96 % | 4.27 % | $433,254,754 | 0.15 % | 6.71 % | 0.15 % | 9 % |
44.41 | 44.44 | (5.16 ) | (5.20 ) | 337,479,306 | 0.23 | 4.93 | 0.23 | 39 |
49.61 | 49.65 | 0.26 | 0.40 | 1,453,558,764 | 0.24 | 3.83 | 0.24 | 46 |
51.64 | 51.61 | 7.16 | 6.43 | 1,559,634,055 | 0.23 | 4.18 | 0.23 | 50 |
50.31 | 50.62 | 6.15 | 6.88 | 171,037,324 | 0.32 | 4.90 | 0.44 (g) | 128 |
49.86 | 49.82 | 4.66 | 4.00 | 154,570,385 | 0.40 | 5.01 | 0.57 (g) | 23 |
44.57 | 44.60 | 1.91 | 1.88 | 51,253,356 | 0.09 | 4.49 | 0.09 | 7 |
44.70 | 44.74 | (10.25 ) | (10.32 ) | 44,702,756 | 0.14 | 3.36 | 0.14 | 35 |
51.48 | 51.56 | (3.70 ) | (3.83 ) | 51,478,693 | 0.14 | 2.51 | 0.14 | 36 |
55.33 | 55.48 | 2.24 | 2.09 | 55,332,638 | 0.14 | 2.81 | 0.14 | 41 |
56.27 | 56.50 | 15.74 | 15.95 | 35,170,394 | 0.14 | 3.58 | 0.65 (g) | 67 |
51.19 | 51.30 | 3.26 | 3.48 (i) | 25,595,493 | 0.14 (j) | 3.98 | 2.13 (g)(j) | 12 |
38.46 | 38.63 | 1.91 | 2.52 | 634,543,691 | 0.39 | 6.20 | 0.39 | 11 |
38.57 | 38.83 | (6.59 ) | (7.36 ) | 227,584,365 | 0.39 | 5.63 | 0.39 | 34 |
43.42 | 44.06 | (8.06 ) | (6.78 ) | 69,475,995 | 0.39 | 4.17 | 0.39 | 38 |
49.27 | 49.30 | 0.85 | 0.50 | 83,750,663 | 0.39 | 4.50 | 0.39 | 59 |
50.95 | 51.15 | 12.25 | 12.44 | 91,713,454 | 0.39 | 4.64 | 0.58 (g) | 53 |
47.52 | 47.62 | 2.29 | 2.23 | 61,776,747 | 0.39 | 4.96 | 0.87 (g) | 28 |
August 31, 2023 | J.P. Morgan Exchange-Traded Funds | 147 |
AS OF August 31, 2023 (Unaudited)
Diversification Classification | |
JPMorgan BetaBuilders 1-5 Year U.S. Aggregate Bond ETF | Diversified |
JPMorgan BetaBuilders U.S. Aggregate Bond ETF | Diversified |
JPMorgan BetaBuilders U.S. TIPS 0-5 Year ETF(1) | Diversified |
JPMorgan BetaBuilders U.S. Treasury Bond 1-3 Year ETF(2) | Diversified |
JPMorgan BetaBuilders U.S. Treasury Bond 20+ Year ETF(2) | Diversified |
JPMorgan BetaBuilders U.S. Treasury Bond 3-10 Year ETF(2) | Diversified |
JPMorgan BetaBuilders USD High Yield Corporate Bond ETF | Diversified |
JPMorgan BetaBuilders USD Investment Grade Corporate Bond ETF | Diversified |
JPMorgan USD Emerging Markets Sovereign Bond ETF | Diversified |
(1) | Commencement of operations was May 10, 2023. |
(2) | Commencement of operations was April 19, 2023. |
148 | J.P. Morgan Exchange-Traded Funds | August 31, 2023 |
Listing Exchange | |
BetaBuilders 1-5 Year U.S. Aggregate Bond ETF | Cboe BZX Exchange, Inc. |
BetaBuilders U.S. Aggregate Bond ETF | NYSE Arca |
BetaBuilders U.S. TIPS 0-5 Year ETF | Cboe BZX Exchange, Inc. |
BetaBuilders U.S. Treasury Bond 1-3 Year ETF | Cboe BZX Exchange, Inc. |
BetaBuilders U.S. Treasury Bond 20+ Year ETF | Cboe BZX Exchange, Inc. |
BetaBuilders U.S. Treasury Bond 3-10 Year ETF | Cboe BZX Exchange, Inc. |
BetaBuilders USD High Yield Corporate Bond ETF | Cboe BZX Exchange, Inc. |
BetaBuilders USD Investment Grade Corporate Bond ETF | NYSE Arca |
USD Emerging Markets Sovereign Bond ETF | NYSE Arca |
August 31, 2023 | J.P. Morgan Exchange-Traded Funds | 149 |
AS OF August 31, 2023 (Unaudited) (continued)
BetaBuilders 1-5 Year U.S. Aggregate Bond ETF | ||||
Level 1 Quoted prices | Level 2 Other significant observable inputs | Level 3 Significant unobservable inputs | Total | |
Investments in Securities | ||||
Asset-Backed Securities | $— | $123,839 | $— | $123,839 |
Commercial Mortgage-Backed Securities | — | 315,610 | — | 315,610 |
Corporate Bonds | — | 3,934,877 | — | 3,934,877 |
Foreign Government Securities | — | 131,875 | — | 131,875 |
Mortgage-Backed Securities | — | 1,016,324 | — | 1,016,324 |
Municipal Bonds | — | 36,408 | — | 36,408 |
Supranational | — | 418,474 | — | 418,474 |
U.S. Government Agency Securities | — | 294,509 | — | 294,509 |
U.S. Treasury Obligations | — | 8,865,453 | — | 8,865,453 |
Short-Term Investments | ||||
Investment Companies | 214,237 | — | — | 214,237 |
Total Investments in Securities | $214,237 | $15,137,369 | $— | $15,351,606 |
BetaBuilders U.S. Aggregate Bond ETF | ||||
Level 1 Quoted prices | Level 2 Other significant observable inputs | Level 3 Significant unobservable inputs | Total | |
Investments in Securities | ||||
Asset-Backed Securities | $— | $8,486,833 | $— | $8,486,833 |
Commercial Mortgage-Backed Securities | — | 37,586,488 | — | 37,586,488 |
Corporate Bonds | — | 494,521,780 | — | 494,521,780 |
Foreign Government Securities | — | 33,456,757 | — | 33,456,757 |
Mortgage-Backed Securities | — | 533,947,584 | — | 533,947,584 |
Municipal Bonds | — | 5,802,899 | — | 5,802,899 |
Supranational | — | 26,757,759 | — | 26,757,759 |
U.S. Government Agency Securities | — | 24,330,116 | — | 24,330,116 |
U.S. Treasury Obligations | — | 817,179,884 | — | 817,179,884 |
Short-Term Investments | ||||
Investment Companies | 172,100,666 | — | — | 172,100,666 |
Investment of Cash Collateral from Securities Loaned | 14,514,556 | — | — | 14,514,556 |
Total Short-Term Investments | 186,615,222 | — | — | 186,615,222 |
Total Investments in Securities | $186,615,222 | $1,982,070,100 | $— | $2,168,685,322 |
150 | J.P. Morgan Exchange-Traded Funds | August 31, 2023 |
BetaBuilders U.S. TIPS 0-5 Year ETF | ||||
Level 1 Quoted prices | Level 2 Other significant observable inputs | Level 3 Significant unobservable inputs | Total | |
Investments in Securities | ||||
U.S. Treasury Obligations | $— | $7,513,589 | $— | $7,513,589 |
Short-Term Investments | ||||
Investment Companies | 17,010 | — | — | 17,010 |
Total Investments in Securities | $17,010 | $7,513,589 | $— | $7,530,599 |
BetaBuilders U.S. Treasury Bond 1-3 Year ETF | ||||
Level 1 Quoted prices | Level 2 Other significant observable inputs | Level 3 Significant unobservable inputs | Total | |
Investments in Securities | ||||
U.S. Treasury Obligations | $— | $4,384,637 | $— | $4,384,637 |
Short-Term Investments | ||||
Investment Companies | 13,853 | — | — | 13,853 |
Total Investments in Securities | $13,853 | $4,384,637 | $— | $4,398,490 |
BetaBuilders U.S. Treasury Bond 20+ Year ETF | ||||
Level 1 Quoted prices | Level 2 Other significant observable inputs | Level 3 Significant unobservable inputs | Total | |
Investments in Securities | ||||
U.S. Treasury Obligations | $— | $51,755,224 | $— | $51,755,224 |
Short-Term Investments | ||||
Investment Companies | 23,667 | — | — | 23,667 |
Total Investments in Securities | $23,667 | $51,755,224 | $— | $51,778,891 |
BetaBuilders U.S. Treasury Bond 3-10 Year ETF | ||||
Level 1 Quoted prices | Level 2 Other significant observable inputs | Level 3 Significant unobservable inputs | Total | |
Investments in Securities | ||||
U.S. Treasury Obligations | $— | $4,330,778 | $— | $4,330,778 |
Short-Term Investments | ||||
Investment Companies | 19,814 | — | — | 19,814 |
Total Investments in Securities | $19,814 | $4,330,778 | $— | $4,350,592 |
BetaBuilders USD High Yield Corporate Bond ETF | ||||
Level 1 Quoted prices | Level 2 Other significant observable inputs | Level 3 Significant unobservable inputs | Total | |
Investments in Securities | ||||
Corporate Bonds | $— | $423,573,218 | $— | $423,573,218 |
Short-Term Investments | ||||
Investment Companies | 3,924,056 | — | — | 3,924,056 |
Total Investments in Securities | $3,924,056 | $423,573,218 | $— | $427,497,274 |
August 31, 2023 | J.P. Morgan Exchange-Traded Funds | 151 |
AS OF August 31, 2023 (Unaudited) (continued)
BetaBuilders USD Investment Grade Corporate Bond ETF | ||||
Level 1 Quoted prices | Level 2 Other significant observable inputs | Level 3 Significant unobservable inputs | Total | |
Investments in Securities | ||||
Asset-Backed Securities | $— | $100,065 | $— | $100,065 |
Corporate Bonds | — | 50,336,380 | — | 50,336,380 |
Short-Term Investments | ||||
Investment Companies | 383,195 | — | — | 383,195 |
Total Investments in Securities | $383,195 | $50,436,445 | $— | $50,819,640 |
USD Emerging Markets Sovereign Bond ETF | ||||
Level 1 Quoted prices | Level 2 Other significant observable inputs | Level 3 Significant unobservable inputs | Total | |
Investments in Securities | ||||
Corporate Bonds | $— | $63,003,523 | $— | $63,003,523 |
Foreign Government Securities | — | 558,999,782 | — | 558,999,782 |
Short-Term Investments | ||||
Investment Companies | 1,266,971 | — | — | 1,266,971 |
Investment of Cash Collateral from Securities Loaned | 12,190,150 | — | — | 12,190,150 |
Total Short-Term Investments | 13,457,121 | — | — | 13,457,121 |
Total Investments in Securities | $13,457,121 | $622,003,305 | $— | $635,460,426 |
152 | J.P. Morgan Exchange-Traded Funds | August 31, 2023 |
Investment Securities on Loan, at value, Presented on the Statements of Assets and Liabilities | Cash Collateral Posted by Borrower* | Net Amount Due to Counterparty (not less than zero) | |
BetaBuilders U.S. Aggregate Bond ETF | $13,939,821 | $(13,939,821 ) | $— |
USD Emerging Markets Sovereign Bond ETF | 11,783,585 | (11,783,585 ) | — |
* | Collateral posted reflects the value of securities on loan and does not include any additional amounts received from the borrower. |
BetaBuilders 1-5 Year U.S. Aggregate Bond ETF | $733 |
BetaBuilders U.S. Aggregate Bond ETF | 740 |
USD Emerging Markets Sovereign Bond ETF | 808 |
August 31, 2023 | J.P. Morgan Exchange-Traded Funds | 153 |
AS OF August 31, 2023 (Unaudited) (continued)
BetaBuilders 1-5 Year U.S. Aggregate Bond ETF | |||||||||
For the six months ended August 31, 2023 | |||||||||
Security Description | Value at February 28, 2023 | Purchases at Cost | Proceeds from Sales | Net Realized Gain (Loss) | Change in Unrealized Appreciation/ (Depreciation) | Value at August 31, 2023 | Shares at August 31, 2023 | Dividend Income | Capital Gain Distributions |
JPMorgan U.S. Government Money Market Fund Class IM Shares, 5.27% (a) (b) | $758,888 | $1,125,307 | $1,669,958 | $— | $— | $214,237 | 214,237 | $4,617 | $— |
(a) | Investment in an affiliated fund, which is registered under the Investment Company Act of 1940, as amended, and is advised by J.P. Morgan Investment Management Inc. |
(b) | The rate shown is the current yield as of August 31, 2023. |
BetaBuilders U.S. Aggregate Bond ETF | |||||||||
For the six months ended August 31, 2023 | |||||||||
Security Description | Value at February 28, 2023 | Purchases at Cost | Proceeds from Sales | Net Realized Gain (Loss) | Change in Unrealized Appreciation/ (Depreciation) | Value at August 31, 2023 | Shares at August 31, 2023 | Dividend Income | Capital Gain Distributions |
JPMorgan Securities Lending Money Market Fund Agency SL Class Shares, 5.50% (a) (b) | $12,994,643 | $27,000,001 | $29,000,000 | $(1,699 )* | $— | $10,992,945 | 10,990,747 | $250,323 * | $— |
JPMorgan U.S. Government Money Market Fund Class IM Shares, 5.27% (a) (b) | 2,787,225 | 37,758,623 | 37,024,237 | — | — | 3,521,611 | 3,521,611 | 46,031 * | — |
JPMorgan U.S. Government Money Market Fund Class IM Shares, 5.27% (a) (b) | 91,260,954 | 291,812,688 | 210,972,976 | — | — | 172,100,666 | 172,100,666 | 4,129,704 | — |
Total | $107,042,822 | $356,571,312 | $276,997,213 | $(1,699 ) | $— | $186,615,222 | $4,426,058 | $— | |
(a) | Investment in an affiliated fund, which is registered under the Investment Company Act of 1940, as amended, and is advised by J.P. Morgan Investment Management Inc. |
(b) | The rate shown is the current yield as of August 31, 2023. |
* | Amount is included on the Statements of Operations as Income from securities lending (net) (after payments of rebates and Citibank’s fee). |
BetaBuilders U.S. TIPS 0-5 Year ETF | |||||||||
For the period ended August 31, 2023 | |||||||||
Security Description | Value at May 10, 2023(a) | Purchases at Cost | Proceeds from Sales | Net Realized Gain (Loss) | Change in Unrealized Appreciation/ (Depreciation) | Value at August 31, 2023 | Shares at August 31, 2023 | Dividend Income | Capital Gain Distributions |
JPMorgan Prime Money Market Fund Class IM Shares, 5.46% (b) (c) | $— | $3,791,615 | $3,774,609 | $2 | $2 | $17,010 | 17,005 | $2,715 | $— |
(a) | Commencement of operations was May 10, 2023. |
(b) | Investment in an affiliated fund, which is registered under the Investment Company Act of 1940, as amended, and is advised by J.P. Morgan Investment Management Inc. |
154 | J.P. Morgan Exchange-Traded Funds | August 31, 2023 |
(c) | The rate shown is the current yield as of August 31, 2023. |
BetaBuilders U.S. Treasury Bond 1-3 Year ETF | |||||||||
For the period ended August 31, 2023 | |||||||||
Security Description | Value at April 19, 2023(a) | Purchases at Cost | Proceeds from Sales | Net Realized Gain (Loss) | Change in Unrealized Appreciation/ (Depreciation) | Value at August 31, 2023 | Shares at August 31, 2023 | Dividend Income | Capital Gain Distributions |
JPMorgan Prime Money Market Fund Class IM Shares, 5.46% (b) (c) | $— | $119,670 | $105,820 | $3 | $— | $13,853 | 13,849 | $169 | $— |
(a) | Commencement of operations was April 19, 2023. |
(b) | Investment in an affiliated fund, which is registered under the Investment Company Act of 1940, as amended, and is advised by J.P. Morgan Investment Management Inc. |
(c) | The rate shown is the current yield as of August 31, 2023. |
BetaBuilders U.S. Treasury Bond 20+ Year ETF | |||||||||
For the period ended August 31, 2023 | |||||||||
Security Description | Value at April 19, 2023(a) | Purchases at Cost | Proceeds from Sales | Net Realized Gain (Loss) | Change in Unrealized Appreciation/ (Depreciation) | Value at August 31, 2023 | Shares at August 31, 2023 | Dividend Income | Capital Gain Distributions |
JPMorgan Prime Money Market Fund Class IM Shares, 5.46% (b) (c) | $— | $867,611 | $843,966 | $20 | $2 | $23,667 | 23,660 | $578 | $— |
(a) | Commencement of operations was April 19, 2023. |
(b) | Investment in an affiliated fund, which is registered under the Investment Company Act of 1940, as amended, and is advised by J.P. Morgan Investment Management Inc. |
(c) | The rate shown is the current yield as of August 31, 2023. |
BetaBuilders U.S. Treasury Bond 3-10 Year ETF | |||||||||
For the period ended August 31, 2023 | |||||||||
Security Description | Value at April 19, 2023(a) | Purchases at Cost | Proceeds from Sales | Net Realized Gain (Loss) | Change in Unrealized Appreciation/ (Depreciation) | Value at August 31, 2023 | Shares at August 31, 2023 | Dividend Income | Capital Gain Distributions |
JPMorgan Prime Money Market Fund Class IM Shares, 5.46% (b) (c) | $— | $86,394 | $66,581 | $1 | $— | $19,814 | 19,808 | $144 | $— |
(a) | Commencement of operations was April 19, 2023. |
(b) | Investment in an affiliated fund, which is registered under the Investment Company Act of 1940, as amended, and is advised by J.P. Morgan Investment Management Inc. |
(c) | The rate shown is the current yield as of August 31, 2023. |
BetaBuilders USD High Yield Corporate Bond ETF | |||||||||
For the six months ended August 31, 2023 | |||||||||
Security Description | Value at February 28, 2023 | Purchases at Cost | Proceeds from Sales | Net Realized Gain (Loss) | Change in Unrealized Appreciation/ (Depreciation) | Value at August 31, 2023 | Shares at August 31, 2023 | Dividend Income | Capital Gain Distributions |
JPMorgan U.S. Government Money Market Fund Class IM Shares, 5.27% (a) (b) | $3,094,499 | $29,524,860 | $28,695,303 | $— | $— | $3,924,056 | 3,924,056 | $43,464 | $— |
(a) | Investment in an affiliated fund, which is registered under the Investment Company Act of 1940, as amended, and is advised by J.P. Morgan Investment Management Inc. |
August 31, 2023 | J.P. Morgan Exchange-Traded Funds | 155 |
AS OF August 31, 2023 (Unaudited) (continued)
(b) | The rate shown is the current yield as of August 31, 2023. |
BetaBuilders USD Investment Grade Corporate Bond ETF | |||||||||
For the six months ended August 31, 2023 | |||||||||
Security Description | Value at February 28, 2023 | Purchases at Cost | Proceeds from Sales | Net Realized Gain (Loss) | Change in Unrealized Appreciation/ (Depreciation) | Value at August 31, 2023 | Shares at August 31, 2023 | Dividend Income | Capital Gain Distributions |
JPMorgan U.S. Government Money Market Fund Class IM Shares, 5.27% (a) (b) | $265,119 | $2,035,390 | $1,917,314 | $— | $— | $383,195 | 383,195 | $5,659 | $— |
(a) | Investment in an affiliated fund, which is registered under the Investment Company Act of 1940, as amended, and is advised by J.P. Morgan Investment Management Inc. |
(b) | The rate shown is the current yield as of August 31, 2023. |
USD Emerging Markets Sovereign Bond ETF | |||||||||
For the six months ended August 31, 2023 | |||||||||
Security Description | Value at February 28, 2023 | Purchases at Cost | Proceeds from Sales | Net Realized Gain (Loss) | Change in Unrealized Appreciation/ (Depreciation) | Value at August 31, 2023 | Shares at August 31, 2023 | Dividend Income | Capital Gain Distributions |
JPMorgan Securities Lending Money Market Fund Agency SL Class Shares, 5.50% (a) (b) | $8,802,300 | $35,000,000 | $43,799,341 | $(3,159 )* | $200 | $— | — | $173,959 * | $— |
JPMorgan U.S. Government Money Market Fund Class IM Shares, 5.27% (a) (b) | 1,809,720 | 59,843,253 | 49,462,823 | — | — | 12,190,150 | 12,190,150 | 48,522 * | — |
JPMorgan U.S. Government Money Market Fund Class IM Shares, 5.27% (a) (b) | 1,134,608 | 67,396,576 | 67,264,213 | — | — | 1,266,971 | 1,266,971 | 26,689 | — |
Total | $11,746,628 | $162,239,829 | $160,526,377 | $(3,159 ) | $200 | $13,457,121 | $249,170 | $— | |
(a) | Investment in an affiliated fund, which is registered under the Investment Company Act of 1940, as amended, and is advised by J.P. Morgan Investment Management Inc. |
(b) | The rate shown is the current yield as of August 31, 2023. |
* | Amount is included on the Statements of Operations as Income from securities lending (net) (after payments of rebates and Citibank’s fee). |
156 | J.P. Morgan Exchange-Traded Funds | August 31, 2023 |
BetaBuilders 1-5 Year U.S. Aggregate Bond ETF | 0.05 % |
BetaBuilders U.S. Aggregate Bond ETF | 0.03 |
BetaBuilders U.S. TIPS 0-5 Year ETF | 0.07 |
BetaBuilders U.S. Treasury Bond 1-3 Year ETF | 0.07 |
BetaBuilders U.S. Treasury Bond 20+ Year ETF | 0.07 |
BetaBuilders U.S. Treasury Bond 3-10 Year ETF | 0.07 |
BetaBuilders USD High Yield Corporate Bond ETF | 0.15 |
BetaBuilders USD Investment Grade Corporate Bond ETF | 0.09 |
USD Emerging Markets Sovereign Bond ETF | 0.39 |
August 31, 2023 | J.P. Morgan Exchange-Traded Funds | 157 |
AS OF August 31, 2023 (Unaudited) (continued)
Purchases (excluding U.S. Government) | Sales (excluding U.S. Government) | Purchases of U.S. Government | Sales of U.S. Government | |
BetaBuilders 1-5 Year U.S. Aggregate Bond ETF | $2,572,041 | $5,110,308 | $1,972,630 | $1,667,728 |
BetaBuilders U.S. Aggregate Bond ETF | 1,406,640,699 | 1,202,739,554 | 83,035,777 | 66,299,698 |
BetaBuilders U.S. TIPS 0-5 Year ETF | — | — | 7,371,391 | 559,264 |
BetaBuilders U.S. Treasury Bond 1-3 Year ETF | — | — | 10,730,595 | 6,321,889 |
BetaBuilders U.S. Treasury Bond 20+ Year ETF | — | — | 8,745,417 | 4,344,029 |
BetaBuilders U.S. Treasury Bond 3-10 Year ETF | — | — | 5,195,686 | 767,711 |
BetaBuilders USD High Yield Corporate Bond ETF | 35,262,036 | 30,409,887 | — | — |
BetaBuilders USD Investment Grade Corporate Bond ETF | 3,236,340 | 3,568,381 | — | — |
USD Emerging Markets Sovereign Bond ETF | 31,636,418 | 33,043,511 | — | — |
In-Kind Purchases | In-Kind Sales | |
BetaBuilders 1-5 Year U.S. Aggregate Bond ETF | $19,977,555 | $2,284,770 |
BetaBuilders U.S. Aggregate Bond ETF | 330,646,383 | 819,892,522 |
BetaBuilders U.S. Treasury Bond 20+ Year ETF | — | 49,881,149 |
BetaBuilders USD High Yield Corporate Bond ETF | 77,637,643 | 163,305,915 |
BetaBuilders USD Investment Grade Corporate Bond ETF | 6,631,169 | 13,690,474 |
USD Emerging Markets Sovereign Bond ETF | 74,520,257 | 481,249,695 |
158 | J.P. Morgan Exchange-Traded Funds | August 31, 2023 |
Aggregate Cost | Gross Unrealized Appreciation | Gross Unrealized Depreciation | Net Unrealized Appreciation (Depreciation) | |
BetaBuilders 1-5 Year U.S. Aggregate Bond ETF | $16,034,582 | $3,018 | $685,994 | $(682,976 ) |
BetaBuilders U.S. Aggregate Bond ETF | 2,301,687,295 | 730,514 | 133,732,487 | (133,001,973 ) |
BetaBuilders U.S. TIPS 0-5 Year ETF | 7,655,696 | 2 | 125,099 | (125,097 ) |
BetaBuilders U.S. Treasury Bond 1-3 Year ETF | 4,430,871 | 21 | 32,402 | (32,381 ) |
BetaBuilders U.S. Treasury Bond 20+ Year ETF | 54,300,454 | 2 | 2,521,565 | (2,521,563 ) |
BetaBuilders U.S. Treasury Bond 3-10 Year ETF | 4,464,769 | 8 | 114,185 | (114,177 ) |
BetaBuilders USD High Yield Corporate Bond ETF | 447,062,968 | 2,896,513 | 22,462,207 | (19,565,694 ) |
BetaBuilders USD Investment Grade Corporate Bond ETF | 54,798,092 | 53,082 | 4,031,534 | (3,978,452 ) |
USD Emerging Markets Sovereign Bond ETF | 648,453,543 | 765,228 | 13,758,345 | (12,993,117 ) |
Capital Loss Carryforward Character | ||
Short-Term | Long-Term | |
BetaBuilders 1-5 Year U.S. Aggregate Bond ETF | $151,051 | $48,464 |
BetaBuilders U.S. Aggregate Bond ETF | 21,534,095 | 7,132,326 |
BetaBuilders USD High Yield Corporate Bond ETF | 16,746,886 | 23,888,630 |
BetaBuilders USD Investment Grade Corporate Bond ETF | 347,685 | 857,232 |
USD Emerging Markets Sovereign Bond ETF | 6,234,645 * | 5,462,321 * |
* | Amount includes capital loss carryforwards which are limited in future years under Internal Revenue Code sections 381-384. |
Net Capital Losses (Gains) | Specified Ordinary Losses | ||
Short-Term | Long-Term | ||
BetaBuilders 1-5 Year U.S. Aggregate Bond ETF | $9,602 | $181,944 | $— |
BetaBuilders U.S. Aggregate Bond ETF | 5,308,587 | 14,088,928 | — |
BetaBuilders USD High Yield Corporate Bond ETF | (66,904 ) | 11,593,685 | — |
BetaBuilders USD Investment Grade Corporate Bond ETF | 233,427 | 1,534,655 | — |
USD Emerging Markets Sovereign Bond ETF | 9,870 | 689,791 | 1 |
August 31, 2023 | J.P. Morgan Exchange-Traded Funds | 159 |
AS OF August 31, 2023 (Unaudited) (continued)
JPMorgan SmartRetirement Funds | JPMorgan SmartRetirement Blend Funds | |
BetaBuilders U.S. Aggregate Bond ETF | — % | 36.4 % |
BetaBuilders USD High Yield Corporate Bond ETF | 18.5 | 10.6 |
160 | J.P. Morgan Exchange-Traded Funds | August 31, 2023 |
% of Ownership | |
BetaBuilders USD Investment Grade Corporate Bond ETF | 43 % |
August 31, 2023 | J.P. Morgan Exchange-Traded Funds | 161 |
AS OF August 31, 2023 (Unaudited) (continued)
162 | J.P. Morgan Exchange-Traded Funds | August 31, 2023 |
(Unaudited)
Hypothetical $1,000 Investment
Beginning Account Value March 1, 2023 | Ending Account Value August 31, 2023 | Expenses Paid During the Period | Annualized Expense Ratio | |
JPMorgan BetaBuilders 1-5 Year U.S. Aggregate Bond ETF | ||||
Actual * | $1,000.00 | $1,016.50 | $0.25 | 0.05 % |
Hypothetical * | 1,000.00 | 1,024.89 | 0.25 | 0.05 |
JPMorgan BetaBuilders U.S. Aggregate Bond ETF | ||||
Actual * | 1,000.00 | 1,008.70 | 0.10 | 0.02 |
Hypothetical * | 1,000.00 | 1,025.04 | 0.10 | 0.02 |
JPMorgan BetaBuilders U.S. TIPS 0-5 Year ETF | ||||
Actual ** | 1,000.00 | 995.80 | 0.22 | 0.07 |
Hypothetical * | 1,000.00 | 1,024.79 | 0.36 | 0.07 |
JPMorgan BetaBuilders U.S. Treasury Bond 1-3 Year ETF | ||||
Actual *** | 1,000.00 | 1,003.00 | 0.26 | 0.07 |
Hypothetical * | 1,000.00 | 1,024.79 | 0.36 | 0.07 |
JPMorgan BetaBuilders U.S. Treasury Bond 20+ Year ETF | ||||
Actual *** | 1,000.00 | 939.90 | 0.25 | 0.07 |
Hypothetical * | 1,000.00 | 1,024.79 | 0.36 | 0.07 |
JPMorgan BetaBuilders U.S. Treasury Bond 3-10 Year ETF | ||||
Actual *** | 1,000.00 | 986.10 | 0.26 | 0.07 |
Hypothetical * | 1,000.00 | 1,024.79 | 0.36 | 0.07 |
JPMorgan BetaBuilders USD High Yield Corporate Bond ETF | ||||
Actual * | 1,000.00 | 1,039.60 | 0.77 | 0.15 |
Hypothetical * | 1,000.00 | 1,024.38 | 0.76 | 0.15 |
JPMorgan BetaBuilders USD Investment Grade Corporate Bond ETF | ||||
Actual * | 1,000.00 | 1,019.10 | 0.46 | 0.09 |
Hypothetical * | 1,000.00 | 1,024.68 | 0.46 | 0.09 |
163 |
(Unaudited)
Hypothetical $1,000 Investment
Beginning Account Value March 1, 2023 | Ending Account Value August 31, 2023 | Expenses Paid During the Period | Annualized Expense Ratio | |
JPMorgan USD Emerging Markets Sovereign Bond ETF | ||||
Actual * | $1,000.00 | $1,019.10 | $1.97 | 0.39 % |
Hypothetical * | 1,000.00 | 1,023.18 | 1.98 | 0.39 |
* | Expenses are equal to each Fund's annualized net expense ratio, multiplied by the average account value over the period, multiplied by 184/366 (to reflect the one-half year period). |
** | Expenses are equal to the Fund’s annualized net expense ratio, multiplied by the average account value over the period, multiplied by 114/366 (to reflect the actual period). The Fund commenced operations on May 10, 2023. |
*** | Expenses are equal to each Fund’s annualized net expense ratio, multiplied by the average account value over the period, multiplied by 135/366 (to reflect the actual period). Each Fund commenced operations on April 19, 2023. |
164 |
(Unaudited)
August 31, 2023 | J.P. Morgan Exchange-Traded Funds | 165 |
(Unaudited)
166 | J.P. Morgan Exchange-Traded Funds | August 31, 2023 |
August 31, 2023 | J.P. Morgan Exchange-Traded Funds | 167 |
(Unaudited) (continued)
168 | J.P. Morgan Exchange-Traded Funds | August 31, 2023 |
August 31, 2023 | J.P. Morgan Exchange-Traded Funds | 169 |
(Unaudited)
170 | J.P. Morgan Exchange-Traded Funds | August 31, 2023 |
August 31, 2023 | J.P. Morgan Exchange-Traded Funds | 171 |

ITEM 2. CODE OF ETHICS.
Not applicable to a semi-annual report.
ITEM 3. AUDIT COMMITTEE FINANCIAL EXPERT.
Not applicable to a semi-annual report.
ITEM 4. PRINCIPAL ACCOUNTANT FEES AND SERVICES.
Not applicable to a semi-annual report.
ITEM 5. AUDIT COMMITTEE OF LISTED REGISTRANTS.
Not applicable to a semi-annual report.
ITEM 6. SCHEDULE OF INVESTMENTS.
File Schedule I – Investments in securities of unaffiliated issuers as of the close of the reporting period as set forth in Section 210.12-12 of Regulation S-X, unless the schedule is included as part of the report to shareholders filed under Item 1 of this Form.
Included in Item 1.
ITEM 7. DISCLOSURE OF PROXY VOTING POLICIES AND PROCEDURES FOR CLOSED-END MANAGEMENT INVESTMENT COMPANIES.
Not applicable.
ITEM 8. PORTFOLIO MANAGERS OF CLOSED-END MANAGEMENT INVESTMENT COMPANIES.
Not applicable.
ITEM 9. PURCHASE OF EQUITY SECURITIES BY CLOSED-END MANAGEMENT INVESTMENT COMPANY AND AFFILIATED PURCHASERS.
Not applicable.
ITEM 10. SUBMISSION OF MATTERS TO A VOTE OF SECURITY HOLDERS.
Describe any material changes to the procedures by which shareholders may recommend nominees to the registrant`s board of directors, where those changes were implemented after the registrant last provided disclosure in response to the requirements of Item 7(d)(2)(ii)(G) of Schedule 14A (17 CFR 240.14a-101), or this Item.
No material changes to report.
ITEM 11. CONTROLS AND PROCEDURES.
(a) Disclose the conclusions of the registrant’s principal executive and principal financial officers, or persons performing similar functions, regarding the effectiveness of the registrant’s disclosure controls and procedures (as defined in Rule 30a-3(c) under the Act (17 CFR 270.30a-3(c))) as of a date within 90 days of the filing date of the report that includes the disclosure required by this paragraph, based on the evaluation of these controls and procedures required by Rule 30a-3(b) under the Act (17 CFR 270.30a-3(b))and Rules 13a-15(b) or 15d-15(b) under the Exchange Act (17 CFR 240.13a-15(b) or 240.15d-15(b)).
The Registrant’s principal executive and principal financial officers have concluded, based on their evaluation of the Registrant’s disclosure controls and procedures as of a date within 90 days of the filing date of this report, that the Registrant’s disclosure controls and procedures are reasonably designed to ensure that information required to be disclosed by the Registrant on Form N-CSR is recorded, processed, summarized and reported within the required time periods and that information required to be disclosed by the Registrant in the reports that it files or submits on Form N-CSR is accumulated and communicated to the Registrant’s management, including its principal executive and principal financial officers, as appropriate to allow timely decisions regarding required disclosure.
(b) Disclose any change in the registrant’s internal control over financial reporting (as defined in Rule 30a-3(d) under the Act (17 CFR 270.30a-3(d)) that occurred during the period covered by this report that has materially affected, or is reasonably likely to materially affect, the registrant’s internal control over financial reporting.
There were no changes in the Registrant’s internal control over financial reporting that occurred during the last fiscal quarter covered by this report that have materially affected, or are reasonably likely to materially affect, the Registrant’s internal control over financial reporting.
ITEM 12. DISCLOSURE OF SECURITIES LENDING ACTIVITIES FOR CLOSED-END MANAGEMENT INVESTMENT COMPANIES.
Not applicable.
ITEM 13. EXHIBITS.
| (a) | File the exhibits listed below as part of this Form. Letter or number the exhibits in the sequence indicated. |
(1) Any code of ethics, or amendment thereto, that is the subject of the disclosure required by Item 2, to the extent that the registrant intends to satisfy the Item 2 requirements through filing of an exhibit.
Not applicable.
(2) A separate certification for each principal executive officer and principal financial officer of the registrant as required by Rule 30a-2(a) under the Act (17 CFR 270.30a-2), exactly as set forth below:
(1) Any written solicitation to purchase securities under Rule 23c-1 under the Act (17 CFR 270.23c-1) sent or given during the period covered by the report by or on behalf of the registrant to 10 or more persons.
Not applicable.
(2) Change in the registrant’s independent public accountant. Provide the information called for by Item 4 of Form 8-K under the Exchange Act (17 CFR 249.308). Unless otherwise specified by Item 4, or related to and necessary for a complete understanding of information not previously disclosed, the information should relate to events occurring during the reporting period.
Not applicable.
| (b) | A separate or combined certification for each principal executive officer and principal officer of the registrant as required by Rule 30a-2(b) under the Act of 1940. |
SIGNATURES
Pursuant to the requirements of the Securities Exchange Act of 1934 and the Investment Company Act of 1940, the registrant has duly caused this report to be signed on its behalf by the undersigned, thereunto duly authorized.
J.P. Morgan Exchange-Traded Fund Trust
| By: | /s/ Brian S. Shlissel | |
| Brian S. Shlissel | ||
| President and Principal Executive Officer | ||
| November 2, 2023 |
Pursuant to the requirements of the Securities Exchange Act of 1934 and the Investment Company Act of 1940, this report has been signed below by the following persons on behalf of the registrant and in the capacities and on the dates indicated.
| By: | /s/ Brian S. Shlissel | |
| Brian S. Shlissel | ||
| President and Principal Executive Officer | ||
| November 2, 2023 | ||
| By: | /s/ Timothy J. Clemens | |
| Timothy J. Clemens | ||
| Treasurer and Principal Financial Officer | ||
| November 2, 2023 | ||